Exhibit 99.19
Section F
QUÉBEC'S FINANCIAL SITUATION
Summary | F.3 |
| | |
1. Québec's budgetary situation | F.5 |
| | |
| 1.1 | Recent developments in the budgetary situation | F.6 |
| | | | |
| 1.2 | Detailed adjustments for 2019-2020 | F.12 |
| | | | |
| | 1.2.1 | Targeted initiatives in 2019-2020 | F.20 |
| | | | | |
| 1.3 | Budgetary outlook | F.24 |
| | | | |
| | 1.3.1 | Five-year financial framework | F.24 |
| | | | | |
| 1.4 | Major investments in public infrastructure | F.29 |
| | | | |
2. Revenue and expenditure forecasts | F.33 |
| | |
| 2.1 | Change in revenue | F.34 |
| | | | |
| | 2.1.1 | Own-source revenue excluding revenue from government enterprises | F.35 |
| | | | | |
| | 2.1.2 | Revenue from government enterprises | F.41 |
| | | | | |
| | 2.1.3 | Federal transfers | F.42 |
| | | | | |
| 2.2 | Change in expenditure | F.43 |
| | | | |
| | 2.2.1 | Portfolio expenditures | F.45 |
| | | | | |
| | 2.2.2 | Debt service | F.53 |
| | | | | |
3. Québec's demands with regard to federal transfers | F.57 |
| | | | |
| | 3.1 | For an increase in the federal contribution to health and social programs | F.57 |
| | | | |
| | 3.2 | Strengthening of the fiscal stabilization program | F.61 |
| | | | |
| | 3.3 | Equalization | F.62 |
| | | | |
| APPENDIX 1: Expenditure by departmental portfolio | F.67 |
| | | | |
| APPENDIX 2: Additional information | F.69 |
F.1

SUMMARY
Budget 2020-2021 is an opportunity for the government to present its fiscal policy directions and announce new initiatives for the benefit of all Quebecers.
Québec's economic and fiscal policy directions include:
— actions to provide environmental leadership;
— initiatives to increase the potential of Québec's economy and create wealth;
— measures to improve services and meet the needs of Quebecers;
— maintenance of a balanced budget and further debt reduction;
— further public infrastructure investment, in particular in the education, health and public transit sectors.
Budget 2020-2021 contains:
— positive adjustments in the financial framework since March 2019;
— additional investments totalling $1.8 billion in 2019-2020, $2.6 billion in 2020-2021 and $3.5 billion in 2021-2022 to implement new initiatives;
— a budgetary surplus of $1.9 billion in 2019-2020 and a balanced budget as of 2020-2021;
— in 2020-2021, a spending increase of 4.5% for the Éducation et Enseignement supérieur portfolio and 5.3% for the Santé et Services sociaux portfolio.
In addition, the Québec government is reiterating its intention to have the QST collected on sales of movable corporeal property from abroad and plans to work with the federal government to implement a harmonized solution.
Québec’s | |
Financial Situation | F.3 |
1. QUÉBEC'S BUDGETARY SITUATION
❏ Québec's 2020-2021 budget
The Québec government's revenue in 2020-2021 stands at $121.3 billion, making it possible to fund:
— portfolio expenditures, that is, spending for the government's various functions, totalling $110.3 billion;
— debt service, totalling $8.3 billion;
— deposits of dedicated revenues in the Generations Fund, totalling $2.7 billion. A balanced budget is forecast for 2020-2021.
TABLE F.1
Québec's budget – March 2020
(millions of dollars)
| | | 2020-2021 | |
| Revenue | | | |
| Own-source revenue | | 95 603 | |
| % change | | 3.0 | |
| Federal transfers | | 25 692 | |
| % change | | 2.4 | |
| Total revenue | | 121 295 | |
| % change | | 2.8 | |
| Expenditure | | | |
| Portfolio expenditures | | –110 300 | |
| % change | | 5.1 | |
| Debt service | | –8 266 | |
| % change | | 5.4 | |
| Total expenditure | | –118 566 | |
| % change | | 5.1 | |
| SURPLUS | | 2 729 | |
| BALANCED BUDGET ACT | | | |
| Deposits of dedicated revenues in the Generations Fund | | –2 729 | |
| BUDGETARY BALANCE(1) | | — | |
(1) Budgetary balance within the meaning of the Balanced Budget Act.
Québec’s | |
Financial Situation | F.5 |
1.1 Recent developments in the budgetary situation
Since March 2019, robust economic growth has resulted in positive adjustments as of 2019-2020.
Favourable adjustments stemming from changes in the economic and budgetary situation total $4.3 billion in 2019-2020, $2.6 billion in 2020-2021 and $3.3 billion in 2021-2022.
These improvements allow the government to continue delivering on its commitments by investing $1.8 billion in 2019-2020, $2.6 billion in 2020-2021 and $3.5 billion in 2021-2022 in Quebecers' priorities.
For 2019-2020, spending is down $227 million relative to March 2019.
| Budget 2020-2021 |
F.6 | Budget Plan |
TABLE F.2
Adjustments to the financial framework since March 2019
(millions of dollars)
| | | 2019-2020 | | | 2020-2021 | | | 2021-2022 | |
| BUDGETARY BALANCE(1) – MARCH 2019 | | — | | | — | | | — | |
| ECONOMIC AND BUDGETARY SITUATION | | | | | | | | | |
| Own-source revenue excluding revenue | | | | | | | | | |
| from government enterprises | | | | | | | | | |
| – Tax revenue | | 1 454 | | | 1 989 | | | 2 267 | |
| – Other revenue | | 763 | | | 360 | | | 69 | |
| Subtotal | | 2 217 | | | 2 348 | | | 2 336 | |
| Revenue from government enterprises | | –85 | | | –253 | | | –184 | |
| Federal transfers | | 173 | | | 92 | | | 343 | |
| Portfolio expenditures | | 880 | | | –490 | | | 167 | |
| Debt service | | 1 151 | | | 872 | | | 662 | |
| Deposits of dedicated revenues in the Generations Fund | | –129 | | | –45 | | | –83 | |
| Use of the contingency reserve | | 100 | | | 100 | | | 100 | |
| TOTAL IMPROVEMENTS | | 4 307 | | | 2 624 | | | 3 341 | |
| MARCH 2020 INITIATIVES | | | | | | | | | |
| Providing environmental leadership(2) | | –266 | | | –322 | | | –1 007 | |
| Increasing the potential of the economy and creating wealth(3) | | –388 | | | –843 | | | –971 | |
| Improving services and meeting the needs of Quebecers | | –294 | | | –582 | | | –615 | |
| Subtotal | | –947 | | | –1 747 | | | –2 594 | |
| NOVEMBER 2019 INITIATIVES | | –857 | | | –876 | | | –872 | |
| TOTAL INITIATIVES | | –1 804 | | | –2 624 | | | –3 466 | |
| OTHER ADJUSTMENTS | | | | | | | | | |
| Estimated losses on the CSeries investment | | –603 | | | — | | | — | |
| Shortfall to be offset | | — | | | — | | | 125 | |
| BUDGETARY BALANCE(1) – MARCH 2020 | | 1 900 | | | — | | | — | |
Note: Totals may not add due to rounding.
(1) Budgetary balance within the meaning of the Balanced Budget Act.
(2) These initiatives include investments totalling $6.2 billion over six years under the first implementation plan for the electrification and climate change framework policy, as well as environmental protection measures totalling $472.7 million. Funding for this plan is presented on page F.27.
(3) These initiatives exclude amounts of $45.5 million in 2019-2020, $82.8 million in 2020-2021 and $104.7 million in 2021-2022 since they are included under the heading “Providing environmental leadership” in this table.
Québec’s | |
Financial Situation | F.7 |
❏ Adjustments related to the economic and budgetary situation
Adjustments related to the economic and budgetary situation are due to, in particular:
— an increase of $2.2 billion in own-source revenue excluding revenue from government enterprises in 2019-2020 and $2.3 billion in 2020-2021 and 2021-2022;
— Tax revenue, which includes, among other things, personal income tax and corporate taxes, is adjusted upward by $1.5 billion in 2019-2020, $2.0 billion in 2020-2021 and $2.3 billion in 2021-2022 owing, in particular, to the stronger-than-anticipated economy.
— Other revenue is adjusted upward by $763 million in 2019-2020, $360 million in 2020-2021 and $69 million in 2021-2022. The adjustments for 2019-2020 are explained by the higher-than-anticipated results for carbon market auctions and the increase in the revenue of the Natural Resources and Energy Capital Fund,1 tied to the sale of shares held in Quebec Iron Ore.
— a reduction of $85 million in revenue from government enterprises in 2019-2020, $253 million in 2020-2021 and $184 million in 2021-2022 resulting from, in particular, the decrease in the results of Hydro-Québec which is tied to the rate freeze in 2020-2021, the decline in energy prices on export markets and the drop in the price of aluminum;
— an increase of $173 million in revenues from federal transfers in 2019-2020, owing to, in particular, the reimbursement of expenditures related to asylum seekers. The increase of $92 million in 2020-2021 and $343 million in 2021-2022 is attributable to, in particular, the implementation of infrastructure projects for which a federal contribution is received, in particular, as part of the one-off increase in the Gas Tax Fund announced in 2019;
— a decrease of $880 million in portfolio expenditures in 2019-2020 representing funding that became available during the year and an increase of $490 million in 2020-2021 stemming from:
— the reassessment of the cost of certain programs related to, in particular, the demand for services in health and education,
— the implementation of infrastructure projects that receive a federal contribution;
— a decrease of $1.2 billion in debt service in 2019-2020, $872 million in 2020-2021 and $662 million in 2021-2022, mainly because of lower-than-expected interest rates and the return on the Retirement Plans Sinking Fund (RPSF), which was higher than anticipated in 2018-2019 and has an impact on future years.
_________________________________________
1 After the Act respecting mainly government organization as regards the economy and innovation was assented to (December 11, 2019), the name Mining and Hydrocarbon Capital Fund was replaced by Natural Resources and Energy Capital Fund.
| Budget 2020-2021 |
F.8 | Budget Plan |
❏ March 2020 initiatives
The favourable budgetary situation allows the government to announce new initiatives so as to continue implementing its commitments.
In Budget 2020-2021, the government is providing for additional investments of $947 million in 2019-2020, $1.7 billion in 2020-2021 and $2.6 billion in 2021-2022, to:
— provide environmental leadership;
— increase the potential of the economy and create wealth;
— improve services and meet the needs of Quebecers.
These investments are in addition to those announced in the November 2019 Update on Québec's Economic and Financial Situation, that is, $857 million in 2019-2020, $876 million in 2020-2021 and $872 million in 2021-2022.
❏ Other adjustments
Other adjustments stem from factoring in:
— the losses estimated at $603 million on the CSeries investment in 2019-2020;
— a shortfall to be offset of $125 million in 2021-2022. This shortfall will be managed so as to eliminate it by the time Budget 2021-2022 is prepared.
Québec’s | |
Financial Situation | F.9 |
| | Recap of the November 2019 initiatives | |
| | | |
| | In the November 2019 Update on Québec's Economic and Financial Situation, the government announced investments of $857 million in 2019-2020, $876 million in 2020-2021 and $872 million in 2021-2022. The government put money back in the pockets of Quebecers through, in particular: – the full enhancement of the family allowance; – the immediate elimination of the additional contribution for childcare; – the reduction in healthcare institution parking fees. The government has also implemented many targeted initiatives to meet specific needs.
November 2019 initiatives
(millions of dollars) | |
| | | | 2019-2020 | | | 2020-2021 | | | 2021-2022 | | |
| | Putting money back in the pockets of Quebecers | | –332 | | | –758 | | | –717 | | |
| | Targeted initiatives to meet specific needs | | –525 | | | –119 | | | –155 | | |
| | TOTAL | | –857 | | | –876 | | | –872 | | |
| Note: Totals may not add due to rounding. | | |
| Budget 2020-2021 |
F.10 | Budget Plan |
| | Adjustments to the financial framework since November 2019 | |
| |
Acceleration of economic growth has resulted in positive adjustments to the financial framework for 2019-2020 and subsequent years relative to the data presented in the November 2019 Update on Québec's Economic and Financial Situation.
– Overall, adjustments related to the economic and budgetary situation total $2.1 billion in 2019-2020, $1.6 billion in 2020-2021 and $2.4 billion in 2021-2022.
The improvements in the financial framework are enabling the government to fund initiatives totalling $947 million in 2019-2020, $1.7 billion in 2020-2021 and $2.6 billion in 2021-2022. | |
| | Adjustments to the financial framework since November 2019 (millions of dollars) | |
| | | | 2019- | | | 2020- | | | 2021- | | |
| | | | 2020 | | | 2021 | | | 2022 | | |
| | BUDGETARY BALANCE(1) – NOVEMBER 2019 | | 1 400 | | | 100 | | | 100 | | |
| | ECONOMIC AND BUDGETARY SITUATION | | | | | | | | | | |
| | | | | | | | | | | | |
| | Own-source revenue excluding revenue from government enterprises | | 651 | | | 1 111 | | | 1 101 | | |
| | Revenue from government enterprises | | 257 | | | 116 | | | 178 | | |
| | Federal transfers | | –339 | | | 359 | | | 610 | | |
| | Portfolio expenditures | | 1 447 | | | –244 | | | 152 | | |
| | Debt service | | –104 | | | 197 | | | 204 | | |
| | Deposits of dedicated revenues in the Generations Fund | | 38 | | | 9 | | | 24 | | |
| | Use of the contingency reserve | | 100 | | | 100 | | | 100 | | |
| | TOTAL IMPROVEMENTS | | 2 050 | | | 1 647 | | | 2 369 | | |
| | MARCH 2020 INITIATIVES | | | | | | | | | | |
| | Providing environmental leadership(2) | | –266 | | | –322 | | | –1 007 | | |
| | Increasing the potential of the economy and creating wealth(3) | | –388 | | | –843 | | | –971 | | |
| | Improving services and meeting the needs of Quebecers | | –294 | | | –582 | | | –615 | | |
| | TOTAL INITIATIVES | | –947 | | | –1 747 | | | –2 594 | | |
| | OTHER ADJUSTMENTS | | | | | | | | | | |
| | Estimated losses on the CSeries investment | | –603 | | | — | | | — | | |
| | Shortfall to be offset | | — | | | — | | | 125 | | |
| | BUDGETARY BALANCE(1) – MARCH 2020 | | 1 900 | | | — | | | — | | |
| Note: Totals may not add due to rounding. (1) Budgetary balance within the meaning of the Balanced Budget Act. (2) These initiatives include investments totalling $6.2 billion over six years under the first implementation plan for the electrification and climate change framework policy, as well as environmental protection measures totalling $472.7 million. Funding for this plan is presented on page F.27. (3) These initiatives exclude amounts of $45.5 million in 2019-2020, $82.8 million in 2020-2021 and $104.7 million in 2021-2022 since they are included under the heading “Providing environmental leadership” in this table. |
|
Québec’s | |
Financial Situation | F.11 |
1.2 Detailed adjustments for 2019-2020
The adjustments to the financial framework since March 2019 are making it possible to keep the budget balanced.
The economic and budgetary situation leads to a $4.3-billion positive adjustment in the budgetary balance in 2019-2020. Thanks to this improvement, targeted initiatives and the estimated losses on the CSeries investment totalling $2.4 billion can be funded.
A budgetary surplus of $1.9 billion results from these adjustments for 2019-2020.
TABLE F.3
Adjustments to the financial framework since March 2019
(millions of dollars)
| | | | | | | | | 2019-2020 | | | | | | | |
| | | March 2019 | | | | | | Adjustments | | | | | | March 2020 | |
| | | | | | Economic and | | | | | | | | | | |
| | | | | | budgetary | | | Initiatives | | | | | | | |
| | | | | | situation | | | and other | | | Total | | | | |
| Own-source revenue | | | | | | | | | | | | | | | |
| Tax revenue | | 71 027 | | | 1 454 | | | — | | | 1 454 | | | 72 481 | |
| Other revenue | | 14 909 | | | 763 | | | — | | | 763 | | | 15 672 | |
| Subtotal | | 85 936 | | | 2 217 | | | — | | | 2 217 | | | 88 153 | |
| Revenue from government enterprises | | 4 778 | | | –85 | | | — | | | –85 | | | 4 693 | |
| Total | | 90 714 | | | 2 132 | | | — | | | 2 132 | | | 92 846 | |
| Federal transfers | | 24 924 | | | 173 | | | — | | | 173 | | | 25 097 | |
| Revenue | | 115 638 | | | 2 305 | | | — | | | 2 305 | | | 117 943 | |
| Portfolio expenditures | | –104 038 | | | 880 | | | –1 804 | | | –924 | | | –104 962 | |
| Debt service | | –8 996 | | | 1 151 | | | — | | | 1 151 | | | –7 845 | |
| Expenditure | | –113 034 | | | 2 031 | | | –1 804 | | | 227 | | | –112 807 | |
| Estimated losses on the CSeries investment | | — | | | — | | | –603 | | | –603 | | | –603 | |
| Contingency reserve | | –100 | | | 100 | | | — | | | 100 | | | — | |
| SURPLUS | | 2 504 | | | 4 436 | | | –2 407 | | | 2 029 | | | 4 533 | |
| BALANCED BUDGET ACT | | | | | | | | | | | | | | | |
| Deposits of dedicated revenues in the Generations Fund | | –2 504 | | | –129 | | | — | | | –129 | | | –2 633 | |
| BUDGETARY BALANCE(1) | | — | | | 4 307 | | | –2 407 | | | 1 900 | | | 1 900 | |
Note: Totals may not add due to rounding.
(1) Budgetary balance within the meaning of the Balanced Budget Act.
| Budget 2020-2021 |
F.12 | Budget Plan |
❏ Own-source revenue excluding revenue from government enterprises
For 2019-2020, own-source revenue excluding revenue from government enterprises shows a positive adjustment of $2.2 billion compared to the March 2019 forecast and totals $88.2 billion.
TABLE F.4
Adjustments to own-source revenue excluding revenue
from government enterprises
(millions of dollars)
| | | 2019-2020 | |
| OWN-SOURCE REVENUE(1) – MARCH 2019 | | 85 936 | |
| Tax revenue | | | |
| Personal income tax | | 1 004 | |
| Contributions for health services | | –3 | |
| Corporate taxes | | 196 | |
| School property tax | | 3 | |
| Consumption taxes | | 254 | |
| Subtotal | | 1 454 | |
| Other revenue | | | |
| Duties and permits | | 283 | |
| Miscellaneous revenue | | 480 | |
| Subtotal | | 763 | |
| Total adjustments | | 2 217 | |
| OWN-SOURCE REVENUE(1) – MARCH 2020 | | 88 153 | |
(1) Own-source revenue excluding revenue from government enterprises.
Québec’s | |
Financial Situation | F.13 |
◼ Tax revenue
For 2019-2020, revenue from personal income tax is adjusted upward by $1.0 billion relative to the March 2019 forecast.
— This adjustment is explained by higher-than-expected withholdings at source since the beginning of fiscal 2019-2020 owing to, in particular, the fact that the growth of 5.9% in wages and salaries is 2.7 percentage points higher than forecast in March 2019.
In 2019-2020, revenue from corporate taxes is adjusted upward by $196 million compared to the March 2019 forecast. This adjustment is due essentially to more-favourable-than-expected tax revenues since the beginning of the fiscal year despite the downward adjustment of 0.7 percentage point in the net operating surplus of corporations in 2019.
Revenue from consumption taxes is adjusted upward by $254 million in 2019-2020. This adjustment, which stems mainly from the Québec sales tax, is explained by, in particular, the fact that growth in residential construction is 5.6 percentage points higher than forecast in 2019 and by higher-than-expected growth in household consumption2 (0.1 percentage point in 2019).
◼ Other revenue
Revenue from duties and permits is adjusted upward by $283 million in 2019-2020 due to, in particular, the higher-than-expected revenue collected under Québec's cap-and-trade system for GHG emission allowances (carbon market).
In addition, miscellaneous revenue is adjusted upward by $480 million in 2019-2020 owing to, in particular, the higher-than-anticipated investment income of the Generations Fund and the higher-than-anticipated revenue of the Natural Resources and Energy Capital Fund, tied to the sale of shares held in Quebec Iron Ore.
__________________________________
2 Household consumption excluding food expenditures and shelter.
| Budget 2020-2021 |
F.14 | Budget Plan |
❏ Revenue from government enterprises
For 2019-2020, revenue from government enterprises is adjusted downward by $85 million, to $4.7 billion.
This adjustment can be attributed to, in particular, a decrease in the results of Hydro-Québec, which is tied to the downward adjustment in sales in Québec and in energy prices on export markets.
TABLE F.5
Adjustments to revenue from government enterprises
(millions of dollars)
| | | 2019-2020 | |
| REVENUE FROM GOVERNMENT ENTERPRISES – MARCH 2019 | | 4 778 | |
| Hydro-Québec | | –250 | |
| Loto-Québec | | 91 | |
| Société des alcools du Québec | | 35 | |
| Investissement Québec | | 9 | |
| Société québécoise du cannabis(1) | | 7 | |
| Other(2) | | 23 | |
| Total adjustments | | –85 | |
| REVENUE FROM GOVERNMENT ENTERPRISES – MARCH 2020 | | 4 693 | |
(1) Revenue allocated to the Cannabis Sales Revenue Fund.
(2) Other revenue includes, in particular, the forecast for other government enterprises and the impact of the Electricity Discount Program for Consumers Billed at Rate L.
Québec’s | |
Financial Situation | F.15 |
❏ Federal transfers
For 2019-2020, revenues from federal transfers stand at $25.1 billion, or $173 million more than forecast in the March 2019 budget.
This upward adjustment is explained by a $442-million increase in other programs, attributable to, in particular, the agreement concluded with the federal government in August 2019 regarding the reimbursement of expenses related to asylum seekers.
In addition, transfers for health and for post-secondary education and other social programs have been adjusted downward by $165 million and $104 million, respectively, due to an increase in the value of the special Québec abatement, which is subtracted from these transfers.
— The increase in the value of the special Québec abatement is explained by higher growth in wages and salaries in Québec since the March 2019 budget.
TABLE F.6
Adjustments to federal transfers
(millions of dollars)
| | | 2019-2020 | |
| FEDERAL TRANSFERS – MARCH 2019 | | 24 924 | |
| Equalization | | — | |
| Health transfers | | –165 | |
| Transfers for post-secondary education and other social programs | | –104 | |
| Other programs | | 442 | |
| Total adjustments | | 173 | |
| FEDERAL TRANSFERS – MARCH 2020 | | 25 097 | |
| Budget 2020-2021 |
F.16 | Budget Plan |
❏ Portfolio expenditures
For 2019-2020, portfolio expenditures amount to $105.0 billion, which represents an upward adjustment of $924 million relative to the March 2019 forecasts.
TABLE F.7
Adjustments to portfolio expenditures
(millions of dollars)
| | | 2019-2020 | |
| PORTFOLIO EXPENDITURES – MARCH 2019 | | 104 038 | |
| Éducation et Enseignement supérieur | | | |
| Increased support for college centres for technology transfer (March 2020 initiative) | | 50 | |
| Spending by education and higher education institutions | | 141 | |
| Subtotal | | 191 | |
| Santé et Services sociaux | | | |
| Improvement of the accessibility and quality of health services (March 2020 initiative) | | 200 | |
| Medication costs and other funding that became available during the year | | –256 | |
| Subtotal | | –56 | |
| Other portfolios | | | |
| Initiatives to meet specific needs (fall 2019) | | 525 | |
| Full enhancement of the family allowance (fall 2019) | | 132 | |
| Immediate elimination of the additional contribution for childcare (fall 2019) | | 161 | |
| Other March 2020 initiatives | | 697 | |
| Reallocation of funding that became available during the year and other adjustments | | –726 | |
| Subtotal | | 789 | |
| Total adjustments | | 924 | |
| PORTFOLIO EXPENDITURES – MARCH 2020 | | 104 962 | |
Note: Totals may not add due to rounding.
Spending for the Éducation et Enseignement supérieur portfolio increased by $191 million in 2019-2020 owing to additional support for college centres for technology transfer and increased spending by education and higher education institutions.
Spending for the Santé et Services sociaux portfolio was adjusted downward by $56 million in 2019-2020. Savings relative to the cost of medication made it possible to fund additional investments for improving the accessibility and quality of health services.
Québec’s | |
Financial Situation | F.17 |
Spending for other portfolios was adjusted upward by $789 million in 2019-2020 due to, in particular:
— the initiatives announced in fall 2019, which include initiatives to meet specific needs, full enhancement of the family allowance and immediate elimination of the additional contribution for childcare;
— new non-recurring initiatives to fight climate change, create wealth, improve services and meet the needs of Quebecers;
— reallocation of funding that became available during the year, making it possible to fund new targeted initiatives in 2019-2020.
| | Spending is down relative to March 2019 | |
| | The government is managing spending responsibly and efficiently. Government spending for 2019-2020 is $227 million less than forecast a year ago in the March 2019 Budget. Savings on debt service, coupled with funds that became available in portfolio expenditures, have made it possible to implement new initiatives totalling: – $857 million in the Update on Québec's Economic and Financial Situation of last November; – $947 million in this budget. | |
| | Expenditure management, 2019-2020
(millions of dollars) | | | | |
| | | | 2019-2020 | | |
| | EXPENDITURE – MARCH 2019 | | –113 034 | | |
| | ADJUSTMENTS RELATED TO THE ECONOMIC AND BUDGETARY SITUATION | | | | |
| | Portfolio expenditures | | | | |
| | November 2019 adjustments (page A.17 of the November 2019 update) | | –567 | | |
| | Funding available in March 2020 to finance new initiatives | | 1 447 | | |
| | Subtotal | | 880 | | |
| | Debt service | | 1 151 | | |
| | INITIATIVES | | | | |
| | November 2019 initiatives | | –857 | | |
| | March 2020 initiatives | | –947 | | |
| | Subtotal | | –1 804 | | |
| | Total expenditure adjustments | | 227 | | |
| | EXPENDITURE – MARCH 2020 | | –112 807 | | |
| | | | | | |
| Budget 2020-2021 |
F.18 | Budget Plan |
❏ Debt service
For 2019-2020, debt service is adjusted downward by $1.2 billion to $7.8 billion.
— Interest on the direct debt is $1 040 million less because of lower-than-expected interest rates and improvement of the budgetary situation.
— The $111-million downward adjustment in interest on the liability for the retirement plans and other employee future benefits is due to the higher-than-anticipated return on the Retirement Plans Sinking Fund (RPSF) in 2018-2019. The income of the RPSF is applied against debt service.
TABLE F.8
Adjustments to debt service
(millions of dollars)
| | | 2019-2020 | |
| DEBT SERVICE – MARCH 2019 | | 8 996 | |
| Interest on the direct debt(1) | | –1 040 | |
| Interest on the liability for the retirement plans and other employee future benefits(2) | | –111 | |
| Total adjustments | | –1 151 | |
| DEBT SERVICE – MARCH 2020 | | 7 845 | |
(1) Interest on the direct debt includes the income of the Sinking Fund for Government Borrowings. This income, which is applied against debt service, consists of interest generated on investments as well as gains and losses on disposal. Given that the forecast for this revenue is closely tied to the change in interest rates, it may be adjusted upward or downward.
(2) This corresponds to the interest on obligations relating to the retirement plans and other employee future benefits of public and parapublic sector employees, minus mainly the investment income of the RPSF.
Québec’s | |
Financial Situation | F.19 |
1.2.1 Targeted initiatives in 2019-2020
As part of Budget 2020-2021, the government is investing additional sums as of 2019-2020, mainly by implementing targeted, non-recurring measures. These investments are being made thanks to funding that became available during the year in expenditures.
❏ Providing environmental leadership
The government is taking actions to fight climate change. To ensure environmental leadership as of 2019-2020, the government is:
— transferring $150.0 million to the Ville de Montréal for making green infrastructure investments for water management under the “Montréal Reflex” framework agreement;
— investing $70.0 million to promote the enhancement and accessibility of natural environments by renewing agreements to fund greenways and blueways with the Communauté métropolitaine de Montréal and the Communauté métropolitaine de Québec and by supporting projects to improve the supply and accessibility of bicycle paths in the other regions;
— announcing $45.0 million to support the production and distribution of renewable natural gas;
— investing $0.5 million to promote the development of sustainable tourism projects.
❏ Increasing the potential of the economy and creating wealth
To increase the potential of Québec's economy and create wealth, the government is:
— granting $140.0 million to partially reimburse the deficit of the Fonds d'assurance stabilisation des revenus agricoles assumed by La Financière agricole du Québec;
— allocating $81.0 million to increase clinical research and genomics research by providing financial support to Génome Québec and the Montreal Clinical Research Institute;
— increasing by $50.0 million the funding granted to college centres for technology transfer, which contribute to the economic development of their respective regions and Québec as a whole;
— investing $47.3 million for the purpose of revising the farm property tax credit program;
— granting $44.5 million for implementing the 2020-2025 tourism industry growth strategy;
| Budget 2020-2021 |
F.20 | Budget Plan |
— providing $10.0 million to attract skilled foreign workers;
— awarding a subsidy of $7.0 million to the Ville de Québec to redevelop the Espace de la Capitale-Nationale;
— providing $3.2 million for rebuilding the fuel facilities of the Coopérative de consommation de l'île d'Anticosti in order to ensure energy supplies for the population and businesses;
— granting $2.6 million to encourage cultural vision and innovation;
— allocating $2.0 million to implement Québec's new international vision.
❏ Improving services and meeting the needs of Quebecers
To improve services and meet the needs of Quebecers as of 2019-2020, the government is:
— allocating $200.0 million to improve the accessibility and quality of health services;
— granting $58.0 million to support the building of housing units under the AccèsLogis Québec program that were previously announced but are not yet completed;
— providing $15.0 million in support of infrastructure projects in the Eeyou Istchee James Bay region in partnership with the Cree community;
— allocating $13.5 million to roll out a free mediation program for small claims and for family mediation for couples without children, and thereby improve access to legal services for people throughout Québec;
— awarding $4.0 million to build a warehouse to support the social housing stock in Nunavik;
— transferring $3.0 million to the Fondation Forces AVENIR to enhance recognition programs for science and technological application projects.
❏ Renewal of the collective agreements
The government is providing $400.0 million to cover the financial impact of the government offers proposed as part of the renewal of the collective agreements of government employees.
Québec’s | |
Financial Situation | F.21 |
TABLE F.9
Targeted initiatives in 2019-2020
(millions of dollars)
| | | | 2019-2020 | |
| Providing environmental leadership | | –265.5 | |
| – | Enhancing the “Montréal Reflex” framework agreement | | –150.0 | |
| – | Improving the draw of natural environments | | –70.0 | |
| – | Supporting the production and distribution of renewable natural gas | | –45.0 | |
| – | Promoting the development of sustainable tourism projects | | –0.5 | |
| Increasing the potential of the economy and creating wealth | | –387.6 | |
| – | Reimbursing La Financière agricole du Québec's share of the deficit of the Fonds d'assurance stabilisation des revenus agricoles | | –140.0 | |
| – | Increasing clinical research and genomics research | | –81.0 | |
| – | Increasing support for college centres for technology transfer | | –50.0 | |
| – | Revising the farm property tax credit program | | –47.3 | |
| – | Implementing the 2020-2025 tourism industry growth strategy | | –44.5 | |
| – | Attracting skilled foreign workers | | –10.0 | |
| – | Redeveloping the Espace de la Capitale-Nationale | | –7.0 | |
| – | Ensuring energy supplies for the île d'Anticosti | | –3.2 | |
| – | Stimulating cultural vision and innovation | | –2.6 | |
| – | Implementing Québec's new international vision | | –2.0 | |
| Improving services and meeting the needs of Quebecers | | –293.5 | |
| – | Improving the accessibility and quality of health services | | –200.0 | |
| – | Supporting the building of housing units previously announced under the AccèsLogis Québec program | | –58.0 | |
| – | Supporting the development of infrastructure in the Eeyou Istchee James Bay region | | –15.0 | |
| – | Rolling out a free mediation program | | –13.5 | |
| – | Funding the construction of a warehouse in Nunavik | | –4.0 | |
| – Enhancing Fondation Forces AVENIR programs | | –3.0 | |
| Subtotal March 2020 initiatives | | –946.6 | |
| Government offers for the renewal of the collective agreements of government employees | | –400.0 | |
| TOTAL | | –1 346.6 | |
| Budget 2020-2021 |
F.22 | Budget Plan |
| | Budgetary surpluses generated by the strong performance of the economy over the past three years | |
| | Surpluses of roughly $2.8 billion, or about 2.5% of the government's annual budget, have been recorded over the past five years. – While the surpluses for 2015-2016 and 2016-2017 stem mainly from expenditures that were less than originally planned, the surpluses recorded over the past three years can be attributed chiefly to the strong performance of the economy.
Indeed, in 2015-2016 and 2016-2017, differences of $2.1 billion and $1.6 billion, respectively, were recorded relative to expenditure. For these two years, the differences associated with revenue were −$37 million and $318 million, respectively. However, the budgetary surpluses recorded since 2017-2018 stem essentially from the adjustment of approximately $3.2 billion per year on average in revenue, resulting from the increase in tax revenue associated with the main sources of the government's own-source revenue, tied to sustained economic growth. – In 2018-2019, the improvements have made it possible to eliminate the use reserve that was forecast in the of $1.6 billion from the stabilization March 2018 budget. The recurring portion of the improvements linked to revenue, which is in the order of $2.3 billion, is being reinvested as of 2020-2021 as part of this budget. | |
| | | |
| | Differences in the budgetary balance, 2015-2016 to 2019-2020 (millions of dollars) | |
| | | | 2015- | | | 2016- | | | 2017- | | | 2018- | | | 2019- | | |
| | | | 2016 | | | 2017 | | | 2018 | | | 2019 | | | 2020 | | |
| | Revenues(1) | | –37 | | | 318 | | | 2 096 | | | 5 149 | | | 2 305 | | |
| | Portfolio expenditures(2) and debt service | | 2 095 | | | 1 616 | | | 231 | | | 2 227 | | | 227 | | |
| | Estimated losses on the CSeries investment | | — | | | — | | | — | | | — | | | –603 | | |
| | Other adjustments affecting the budgetary balance(3) | | 133 | | | 427 | | | 295 | | | –2 573 | | | –29 | | |
| | Budgetary balance(4) | | 2 191 | | | 2 361 | | | 2 622 | | | 4 803 | | | 1 900 | | |
| | Note: The differences in the budgetary balance represent the difference between the original budget forecast and the results in the Public Accounts. For 2019-2020, the forecasts in Budget 2019-2020 are compared to those in Budget 2020-2021. (1) For 2018-2019, the $5.1-billion adjustment in revenue takes into account an upward adjustment of nearly $1 billion in revenues dedicated to the Generations Fund. (2) The differences in expenditures take into account the implementation of targeted initiatives totalling $2 199 million in 2017-2018, $1 617 million in 2018-2019 (total initiatives of $1 661 million, less those of $44 million in revenue) and $1 804 million in 2019-2020. (3) Takes into account deposits of dedicated revenues in the Generations Fund, contingency reserves and elimination of the use of $1 587-million from the stabilization reserve in 2018-2019. (4) Budgetary balance within the meaning of the Balanced Budget Act. | |
Québec’s | |
Financial Situation | F.23 |
1.3 Budgetary outlook
This subsection presents Québec's budgetary outlook for the years 2019-2020 to 2024-2025.
— The government forecasts a balanced budget for the period covered by the financial framework.
1.3.1 Five-year financial framework
Revenue amounts to $121.3 billion in 2020-2021, with growth of 2.8%. In 2021-2022, it will grow by 3.2%.
Expenditure amounts to $118.6 billion in 2020-2021, with growth of 5.1%. In 2021-2022, it will grow by 3.1%.
Deposits of dedicated revenues in the Generations Fund amount to $2.7 billion in 2020-2021 and will reach $3.0 billion in 2021-2022.
Steps to offset a shortfall of $125 million in 2021-2022 and $250 million from 2022-2023 to 2024-2025 will be identified in the coming years.
— In the event that the shortfall has not been completely eliminated by the tabling of the budget for each of the years with a shortfall, the stabilization reserve would be used to achieve budgetary balance within the meaning of the Balanced Budget Act.
| Budget 2020-2021 |
F.24 | Budget Plan |
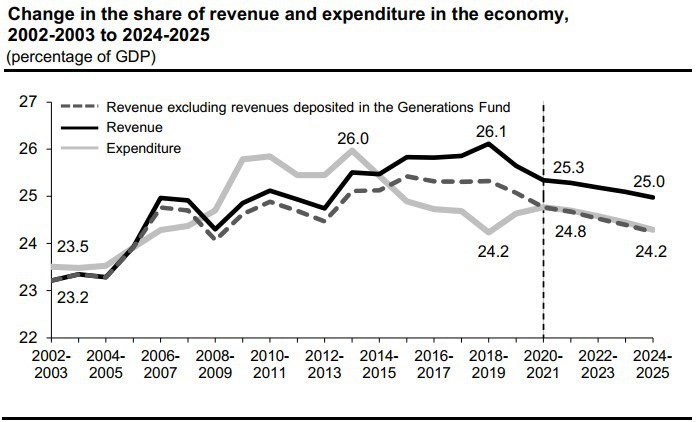
| Shares of revenue and expenditure in the economy |
| |
The shares of government revenue and expenditure in the economy usually follow a similar trajectory. From 2008-2009 to 2013-2014, the share of expenditure in the economy exceeded that of revenue owing to deficits. The share of expenditure rose steadily until 2013-2014, when it stood at 26.0%. From 2014-2015 to 2020-2021, the share of revenue in excess of that of expenditure can be attributed to the budgetary surpluses recorded and efforts to reduce the debt through deposits of dedicated revenues in the Generations Fund. – In particular, the share of expenditure will rise from 24.2% of GDP in 2018-2019 to 24.8% of GDP in 2020-2021. This increase reflects government investments, particularly in the environment, health and education. – As for revenue, its share in the economy will decrease from 26.1% in 2018-2019 to 25.3% in 2020-2021, particularly because of the measures announced in recent years. The government intends to continue its actions in this regard in order to reduce the share of revenue in the economy.
For subsequent years, the difference between the share of revenue and that of expenditure as a percentage of GDP will hold steady at nearly 1 percentage point. This difference can be attributed essentially to debt reduction efforts. |
 |
Québec’s
Financial Situation | F.25 |
TABLE F.10
Financial framework, 2019-2020 to 2024-2025
(millions of dollars)
| | | 2019- | | | 2020- | | | 2021- | | | 2022- | | | 2023- | | | 2024- | | | | |
| | | 2020 | | | 2021 | | | 2022 | | | 2023 | | | 2024 | | | 2025 | | | AAGR(1) | |
| Revenue | | | | | | | | | | | | | | | | | | | | | |
| Personal income tax | | 33 502 | | | 35 435 | | | 36 898 | | | 38 222 | | | 39 686 | | | 41 177 | | | | |
| Contributions for health services | | 6 593 | | | 6 896 | | | 7 059 | | | 7 210 | | | 7 323 | | | 7 501 | | | | |
| Corporate taxes | | 8 712 | | | 8 530 | | | 8 862 | | | 9 025 | | | 9 259 | | | 9 503 | | | | |
| School property tax | | 1 556 | | | 1 349 | | | 1 323 | | | 1 356 | | | 1 391 | | | 1 426 | | | | |
| Consumption taxes | | 22 118 | | | 22 961 | | | 23 702 | | | 24 351 | | | 25 142 | | | 25 894 | | | | |
| Duties and permits | | 4 512 | | | 4 643 | | | 4 546 | | | 4 653 | | | 4 756 | | | 4 877 | | | | |
| Miscellaneous revenue | | 11 160 | | | 10 975 | | | 11 354 | | | 11 742 | | | 12 099 | | | 12 493 | | | | |
| Government enterprises | | 4 693 | | | 4 814 | | | 5 115 | | | 5 535 | | | 5 967 | | | 6 190 | | | | |
| Own-source revenue | | 92 846 | | | 95 603 | | | 98 859 | | | 102 094 | | | 105 623 | | | 109 061 | | | | |
| % change | | 1.3 | | | 3.0 | | | 3.4 | | | 3.3 | | | 3.5 | | | 3.3 | | | 2.9 | |
| Federal transfers | | 25 097 | | | 25 692 | | | 26 293 | | | 26 529 | | | 26 598 | | | 26 808 | | | | |
| % change | | 8.6 | | | 2.4 | | | 2.3 | | | 0.9 | | | 0.3 | | | 0.8 | | | 2.5 | |
| Total revenue | | 117 943 | | | 121 295 | | | 125 152 | | | 128 623 | | | 132 221 | | | 135 869 | | | | |
| % change | | 2.8 | | | 2.8 | | | 3.2 | | | 2.8 | | | 2.8 | | | 2.8 | | | 2.9 | |
| Expenditure | | | | | | | | | | | | | | | | | | | | | |
| Portfolio expenditures | | –104 962 | | | –110 300 | | | –113 617 | | | –116 837 | | | –120 375 | | | –123 664 | | | | |
| % change | | 7.4 | | | 5.1 | | | 3.0 | | | 2.8 | | | 3.0 | | | 2.7 | | | 4.0 | |
| Debt service | | –7 845 | | | –8 266 | | | –8 630 | | | –8 683 | | | –8 420 | | | –8 460 | | | | |
| % change | | –10.1 | | | 5.4 | | | 4.4 | | | 0.6 | | | –3.0 | | | 0.5 | | | –0.5 | |
| Total expenditure | | –112 807 | | | –118 566 | | | –122 247 | | | –125 520 | | | –128 795 | | | –132 124 | | | | |
| % change | | 6.0 | | | 5.1 | | | 3.1 | | | 2.7 | | | 2.6 | | | 2.6 | | | 3.7 | |
| Estimated losses on the CSeries investment | | –603 | | | — | | | — | | | — | | | — | | | — | | | | |
| Shortfall to be offset | | — | | | — | | | 125 | | | 250 | | | 250 | | | 250 | | | | |
| SURPLUS | | 4 533 | | | 2 729 | | | 3 030 | | | 3 353 | | | 3 676 | | | 3 995 | | | | |
| BALANCED BUDGET ACT | | | | | | | | | | | | | | | | | | | | | |
| Deposits of dedicated revenues in the Generations Fund | | –2 633 | | | –2 729 | | | –3 030 | | | –3 353 | | | –3 676 | | | –3 995 | | | | |
| BUDGETARY BALANCE(2) | | 1 900 | | | — | | | — | | | — | | | — | | | — | | | | |
(1) Average annual growth rate (AAGR) from 2019-2020 to 2024-2025.
(2) Budgetary balance within the meaning of the Balanced Budget Act.
| Budget 2020-2021 |
F.26 | Budget Plan |
| | Funding for the first implementation plan for the electrification and climate change framework policy | |
| | The government will soon be tabling the electrification and climate change framework policy. With this framework policy, the government will set forth Québec's vision for fighting climate change, meeting the 2030 target for the reduction of GHG emissions and adapting to climate change, while also contributing to Québec's economic development. Over the next six years, the government will allocate $6.2 billion to the fight against climate change. These amounts are provided for in the government's financial framework. – Revenues of $4.1 billion from the Electrification and Climate Change Fund (ECCF),1 derived mainly from revenue from the carbon market, will be reinvested in their entirety in measures to fight climate change. – Given the urgent need for action, and recognizing the need to broaden the scope of its environmental action, the government is awarding an additional $2.1 billion in the form of budgetary appropriations funded by general and other taxes. These sums will be allocated to: ▪ public transit ($1.3 billion);2 ▪ initiatives introduced by various departments ($0.8 billion). | |
| | | |
| | Financing of the implementation plan for the electrification and climate change framework policy
(millions of dollars) | |
| | | | 2019- | | | 2020- | | | 2021- | | | 2022- | | | 2023- | | | 2024- | | | 2025- | | | | | |
| | | | 2020 | | | 2021 | | | 2022 | | | 2023 | | | 2024 | | | 2025 | | | 2026- | | | Total | | |
| | Revenue | | | | | | | | | | | | | | | | | | | | | | | | | |
| | ECCF(1) | | — | | | 192 | | | 795 | | | 754 | | | 770 | | | 788 | | | 817 | | | 4 116 | | |
| | General and other taxes | | 116 | | | 73 | | | 146 | | | 291 | | | 433 | | | 509 | | | 538 | | | 2 105 | | |
| | Total revenue | | 116 | | | 265 | | | 942 | | | 1 045 | | | 1 202 | | | 1 297 | | | 1 355 | | | 6 221 | | |
| | Expenditure | | | | | | | | | | | | | | | | | | | | | | | | | |
| | ECCF | | — | | | –192 | | | –795 | | | –754 | | | –770 | | | –788 | | | –817 | | | –4 116 | | |
| | Public transit (LTNF) | | — | | | — | | | — | | | –150 | | | –300 | | | –400 | | | –450 | | | –1 300 | | |
| | Budgetary appropriations for the departments | | –116 | | | –73 | | | –146 | | | –141 | | | –133 | | | –109 | | | –88 | | | –805 | | |
| | Total expenditure | | –116 | | | –265 | | | –942 | | | –1 045 | | | –1 202 | | | –1 297 | | | –1 355 | | | –6 221 | | |
| | (1) Consists mainly of revenues from the carbon market, investment income of the ECCF and revenues from the federal government's Leadership Fund. | |
1 Bill 44 stipulates that the Green Fund will become the Electrification and Climate Change Fund.
2 In this regard, budgetary appropriations will be allocated to the Ministère de l'Environnement et de la Lutte contre les changements climatiques to allow the transfer of funds from the Electrification and Climate Change Fund to the Land Transportation Network Fund (LTNF). The LTNF is responsible, in particular, for funding public transit projects.
Québec’s | |
Financial Situation | F.27 |
❏ Stabilization reserve
Under the Balanced Budget Act, a recorded surplus, which is a budgetary balance that is greater than zero, must be allocated to the stabilization reserve.
— As at March 31, 2020, the stabilization reserve will stand at $13.9 billion.
TABLE F.11
Stabilization reserve
(millions of dollars)
| | | Balance, | | | | | | | | | Balance, | |
| Fiscal year | | beginning of year | | | Allocations | | | Uses | | | end of year | |
| 2015-2016 | | — | | | 2 191 | | | — | | | 2 191 | |
| 2016-2017 | | 2 191 | | | 2 361 | | | — | | | 4 552 | |
| 2017-2018 | | 4 552 | | | 2 622 | | | — | | | 7 174 | |
| 2018-2019 | | 7 174 | | | 4 803 | | | — | | | 11 977 | |
| 2019-2020 | | 11 977 | | | 1 900 | | | — | | | 13 877 | |
| Stabilization reserve |
The stabilization reserve facilitates the government's multi-year budget planning, for it can be used in the event of an overrun, that is, a budgetary balance of less than zero. It thus helps to keep the budget balanced under the Balanced Budget Act. The reserve acts like a counter made up of surpluses achieved, but it does not consist of surplus cash. In other words, the stabilization reserve is not money in the bank. Such surpluses are used during the year to reduce the government's debt on financial markets. If the government uses the stabilization reserve to balance the budget, an amount corresponding to the overrun would have to be borrowed, giving rise to an increase in the debt as shown in the chart below. |
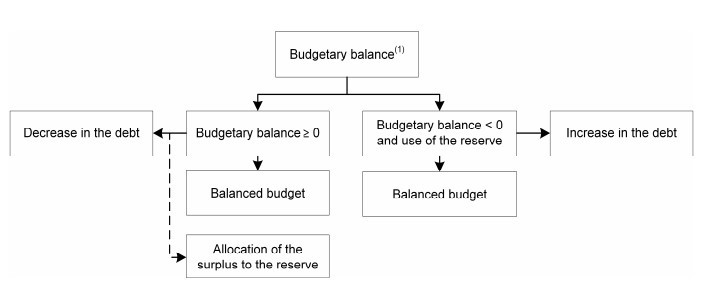 |
| (1) Budgetary balance after deposits of dedicated revenues in the Generations Fund. |
| Budget 2020-2021 |
F.28 | Budget Plan |
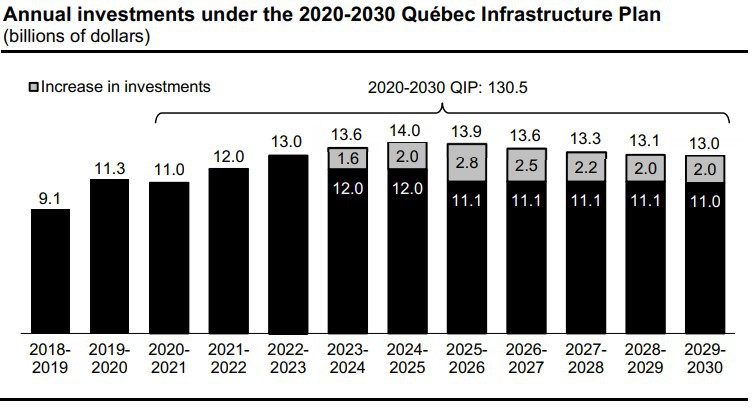
1.4 Major investments in public infrastructure
Québec has significant public infrastructure needs. To meet them, the government is announcing an increase of $15.1 billion over 10 years for the Québec Infrastructure Plan (QIP).
— The 2020-2030 QIP thus amounts to $130.5 billion, or more than $13 billion per year on average.
TABLE F.12
Investments under the 2020-2030 Québec Infrastructure Plan
(billions of dollars)
| | | 2020-2030 | |
| Investments under the 2019-2029 QIP | | 115.4 | |
| Increase in investments | | 15.1 | |
| INVESTMENTS UNDER THE 2020-2030 QIP | | 130.5 | |
The 2020-2030 QIP allocates substantial sums to public transit ($13.6 billion3) and is studying several new large-scale projects for the development of structuring networks.
In addition, it provides for major investments in education and higher education ($25.5 billion, including $19.2 billion in schools), in health and social services ($20.5 billion) and for keeping the road network in good condition ($26.8 billion).
CHART F.1
________________________________
3 Investments in public transit total $15.8 billion including the portion of the central envelope allocated to this sector.
Québec’s | |
Financial Situation | F.29 |
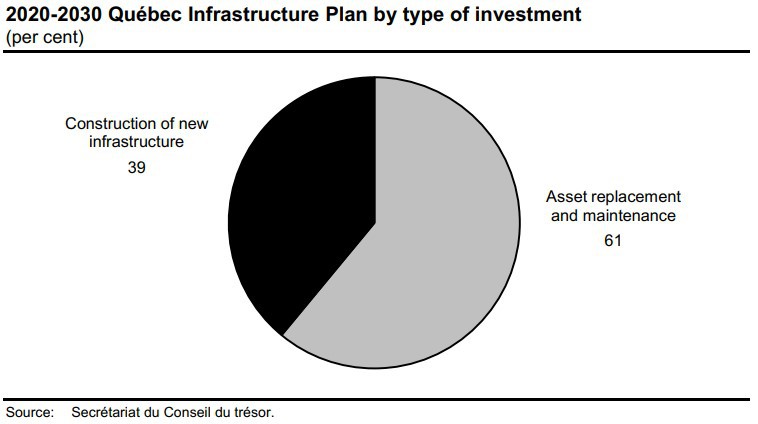
Under the 2020-2030 QIP, the major share of investments, or 61%,4 will go to replacing and maintaining assets. The share devoted to the construction of new infrastructure is 39%.
CHART F.2
_________________________________________
4 Excluding the central envelope.
| Budget 2020-2021 |
F.30 | Budget Plan |
In view of the investments currently planned under the 2020-2030 QIP, of which a large share will go to maintaining assets, the government expects that the proportion of assets in good condition will increase in the coming years.
— It is estimated5 that the proportion of infrastructure in good condition will increase from 60.8% in March 2020 to 70.7% in March 2030.
CHART F.3
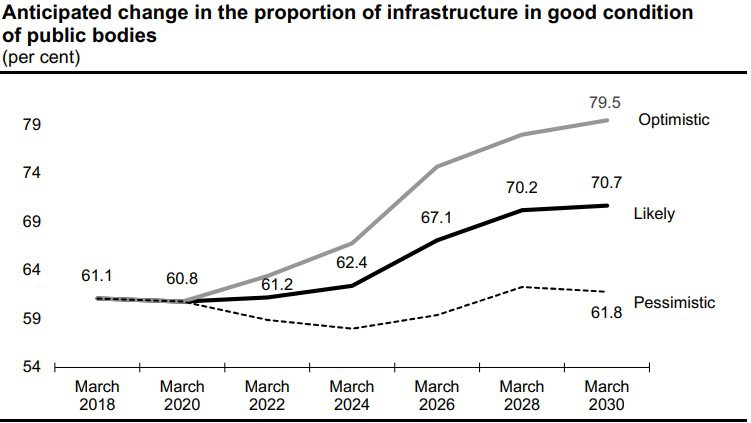
Note: The proportion of infrastructure in good condition could increase to a rate of 79.5% in March 2030 if future QIPs give priority to maintenance projects or not exceeding a rate of 61.8% if the rate of deterioration or inflation in the cost of work is higher than expected.
Source: Secrétariat du Conseil du trésor.
__________________________________________
5 These estimates are preliminary. They were obtained using an initial model. They will be refined and improved during future QIPs and could vary over time, particularly with regard to the investment choices made by departments and bodies and their ability to carry out planned work, as well as by the ability of the construction industry to respond.
Québec’s | |
Financial Situation | F.31 |
2. REVENUE AND EXPENDITURE FORECASTS
This section presents the revenue and expenditure outlook for three years, from 2019-2020 to 2021-2022.
TABLE F.13
Change in revenue and expenditure
(millions of dollars)
| | | 2019-2020 | | | 2020-2021 | | | 2021-2022 | | | AAGR(1) | |
| Revenue | | | | | | | | | | | | |
| Own-source revenue excluding revenue from government enterprises | | 88 153 | | | 90 789 | | | 93 744 | | | | |
| % change | | 2.4 | | | 3.0 | | | 3.3 | | | 2.9 | |
| Revenue from government enterprises | | 4 693 | | | 4 814 | | | 5 115 | | | | |
| % change | | –15.4 | | | 2.6 | | | 6.3 | | | –2.7 | |
| Federal transfers | | 25 097 | | | 25 692 | | | 26 293 | | | | |
| % change | | 8.6 | | | 2.4 | | | 2.3 | | | 4.4 | |
| Total revenue | | 117 943 | | | 121 295 | | | 125 152 | | | | |
| % change | | 2.8 | | | 2.8 | | | 3.2 | | | 2.9 | |
| Expenditure | | | | | | | | | | | | |
| Portfolio expenditures(2) | | –104 962 | | | –110 300 | | | –113 617 | | | | |
| % change | | 7.4 | | | 5.1 | | | 3.0 | | | 5.1 | |
| Debt service | | –7 845 | | | –8 266 | | | –8 630 | | | | |
| % change | | –10.1 | | | 5.4 | | | 4.4 | | | –0.4 | |
| Total expenditure(2) | | –112 807 | | | –118 566 | | | –122 247 | | | | |
| % change | | 6.0 | | | 5.1 | | | 3.1 | | | 4.7 | |
| Estimated losses on the CSeries investment | | –603 | | | — | | | — | | | | |
| Shortfall to be offset | | — | | | — | | | 125 | | | | |
| SURPLUS | | 4 533 | | | 2 729 | | | 3 030 | | | | |
| BALANCED BUDGET ACT | | | | | | | | | | | | |
| Deposits of dedicated revenues in the Generations Fund | | –2 633 | | | –2 729 | | | –3 030 | | | | |
| BUDGETARY BALANCE(3) | | 1 900 | | | — | | | — | | | | |
(1) Average annual growth rate (AAGR) from 2019-2020 to 2021-2022.
(2) Growth in portfolio expenditures went from 5.0% in Budget 2019-2020 to 7.4% in Budget 2020-2021 due mainly to the decrease in expenditure in 2018-2019.
(3) Budgetary balance within the meaning of the Balanced Budget Act.
Québec’s | |
Financial Situation | F.33 |
2.1 Change in revenue
Revenue encompasses own-source revenue, including revenue from government enterprises, as well as federal transfers.
Revenue totals $117.9 billion in 2019-2020, or $92.8 billion in own-source revenue and $25.1 billion from federal transfers.
Revenue will stand at $121.3 billion in 2020-2021 and $125.2 billion in 2021-2022, representing growth of 2.8% and 3.2%, respectively.
TABLE F.14
Change in revenue
(millions of dollars)
| | | 2019-2020 | | | 2020-2021 | | | 2021-2022 | | | AAGR(1) | |
| Own-source revenue | | | | | | | | | | | | |
| Own-source revenue excluding revenue from government enterprises | | 88 153 | | | 90 789 | | | 93 744 | | | | |
| % change | | 2.4 | | | 3.0 | | | 3.3 | | | 2.9 | |
| Revenue from government | | | | | | | | | | | | |
| enterprises | | 4 693 | | | 4 814 | | | 5 115 | | | | |
| % change | | –15.4 | | | 2.6 | | | 6.3 | | | –2.7 | |
| Subtotal | | 92 846 | | | 95 603 | | | 98 859 | | | | |
| % change | | 1.3 | | | 3.0 | | | 3.4 | | | 2.6 | |
| Federal transfers | | 25 097 | | | 25 692 | | | 26 293 | | | | |
| % change | | 8.6 | | | 2.4 | | | 2.3 | | | 4.4 | |
| TOTAL | | 117 943 | | | 121 295 | | | 125 152 | | | | |
| % change | | 2.8 | | | 2.8 | | | 3.2 | | | 2.9 | |
(1) Average annual growth rate (AAGR) from 2019-2020 to 2021-2022.
| Budget 2020-2021 |
F.34 | Budget Plan |
2.1.1 Own-source revenue excluding revenue from government enterprises
Own-source revenue excluding revenue from government enterprises consists mainly of tax revenue, which is made up of personal income tax, contributions for health services, corporate taxes, school property tax and consumption taxes. How it changes is tied to economic activity in Québec and to changes in the tax system.
Own-source revenue also includes other revenue sources, that is, duties and permits, in particular revenue from the carbon market, and miscellaneous revenue, such as interest, the sale of goods and services, as well as fines, forfeitures and recoveries.
Own-source revenue excluding revenue from government enterprises will reach $88.2 billion in 2019-2020, $90.8 billion in 2020-2021 and $93.7 billion in 2021-2022. It will grow by 2.4%, 3.0% and 3.3%, respectively. These changes reflect essentially the vitality of the economic activity forecast for those years and the impact of the fiscal measures announced and implemented.
TABLE F.15
Change in own-source revenue excluding revenue from government enterprises
(millions of dollars)
| | | 2019-2020 | | | 2020-2021 | | | 2021-2022 | | | AAGR(1) | |
| Tax revenue | | 72 481 | | | 75 171 | | | 77 844 | | | | |
| % change | | 3.3 | | | 3.7 | | | 3.6 | | | 3.5 | |
| Other revenue | | 15 672 | | | 15 618 | | | 15 900 | | | | |
| % change | | –1.5 | | | –0.3 | | | 1.8 | | | 0.0 | |
| TOTAL | | 88 153 | | | 90 789 | | | 93 744 | | | | |
| % change | | 2.4 | | | 3.0 | | | 3.3 | | | 2.9 | |
(1) Average annual growth rate (AAGR) from 2019-2020 to 2021-2022.
Québec’s | |
Financial Situation | F.35 |
❏ Tax revenue
Personal income tax, the government's largest revenue source, will grow by 5.4% in 2019-2020, 5.8% in 2020-2021 and 4.1% in 2021-2022, settling at $33.5 billion, $35.4 billion and $36.9 billion, respectively.
— These changes reflect, in particular, the growth of household income, including wages and salaries, and takes into account the parameters of the personal income tax system.
— They also reflect the contribution of pension income to the growth of income subject to tax, particularly income from private pension plans.
TABLE F.16
Change in own-source revenue excluding revenue from government enterprises
(millions of dollars)
| | | 2019-2020 | | | 2020-2021 | | | 2021-2022 | | | AAGR(1) | |
| Tax revenue | | | | | | | | | | | | |
| Personal income tax | | 33 502 | | | 35 435 | | | 36 898 | | | | |
| % change | | 5.4 | | | 5.8 | | | 4.1 | | | 5.1 | |
| Contributions for health services | | 6 593 | | | 6 896 | | | 7 059 | | | | |
| % change | | 3.7 | | | 4.6 | | | 2.4 | | | 3.5 | |
| Corporate taxes | | 8 712 | | | 8 530 | | | 8 862 | | | | |
| % change | | –5.1 | | | –2.1 | | | 3.9 | | | –1.2 | |
| School property tax | | 1 556 | | | 1 349 | | | 1 323 | | | | |
| % change | | –16.0 | | | –13.3 | | | –1.9 | | | –10.6 | |
| Consumption taxes | | 22 118 | | | 22 961 | | | 23 702 | | | | |
| % change | | 5.3 | | | 3.8 | | | 3.2 | | | 4.1 | |
| Subtotal | | 72 481 | | | 75 171 | | | 77 844 | | | | |
| % change | | 3.3 | | | 3.7 | | | 3.6 | | | 3.5 | |
| Other revenue | | | | | | | | | | | | |
| Duties and permits | | 4 512 | | | 4 643 | | | 4 546 | | | | |
| % change | | 3.5 | | | 2.9 | | | –2.1 | | | 1.4 | |
| Miscellaneous revenue | | 11 160 | | | 10 975 | | | 11 354 | | | | |
| % change | | –3.4 | | | –1.7 | | | 3.5 | | | –0.6 | |
| Subtotal | | 15 672 | | | 15 618 | | | 15 900 | | | | |
| % change | | –1.5 | | | –0.3 | | | 1.8 | | | 0.0 | |
| TOTAL | | 88 153 | | | 90 789 | | | 93 744 | | | | |
| % change | | 2.4 | | | 3.0 | | | 3.3 | | | 2.9 | |
(1) Average annual growth rate (AAGR) from 2019-2020 to 2021-2022.
| Budget 2020-2021 |
F.36 | Budget Plan |
Contributions for health services will grow by 3.7% in 2019-2020, 4.6% in 2020-2021 and 2.4% in 2021-2022, settling at $6.6 billion, $6.9 billion and $7.1 billion, respectively.
— These changes reflect the fact that wages and salaries are expected to grow by 5.9% in 2019, 4.8% in 2020 and 3.7% in 2021.
— They also take into account the impact of the reduction of the Health Services Fund contribution rate for all Québec SMBs.
Revenue from corporate taxes will decrease by 5.1% in 2019-2020 and 2.1% in 2020-2021 and increase by 3.9% in 2021-2022. It will stand at $8.7 billion, $8.5 billion and $8.9 billion, respectively, for those same three fiscal years.
— These changes reflect the projected growth of the net operating surplus of corporations, established at 4.0% in 2019, 3.6% in 2020 and 3.5% in 2021.
— They also reflect the measures implemented in recent years to ease the tax burden, in particular the depreciation measure to incentivize businesses to invest more, announced in the December 2018 Update on Québec's Economic and Financial Situation.
Revenue from the school property tax will decline by 16.0% in 2019-2020, 13.3% in 2020-2021 and 1.9% in 2021-2022, settling at $1.6 billion in 2019-2020 and $1.3 billion in 2020-2021 and 2021-2022. These changes are explained mainly by the impact of the projected tax rate reduction as part of the gradual implementation of a single school tax rate.
Revenue from consumption taxes will grow by 5.3% in 2019-2020, 3.8% in 2020-2021 and 3.2% in 2021-2022, reaching $22.1 billion, $23.0 billion and $23.7 billion, respectively.
— These changes reflect the projected growth of household consumption,6 established at 2.9% in 2019 and 3.3% in 2020 and 2021 and sustained mainly by the growth in wages and salaries.
— They also reflect the growth of residential construction, amounting to 7.5% in 2019, 4.1% in 2020 and 3.0% in 2021.
______________________________
6 Household consumption excluding food expenditures and shelter.
Québec’s | |
Financial Situation | F.37 |
❏ Other revenue
Revenue from duties and permits will increase by 3.5% in 2019-2020 and 2.9% in 2020-2021 and will decrease by 2.1% in 2021-2022, settling at $4.5 billion, $4.6 billion and $4.5 billion, respectively.
— These changes can be attributed to, in particular, the anticipated growth in carbon market revenue.
Miscellaneous revenue will decline by 3.4% and 1.7% in 2019-2020 and 2020-2021 and will climb by 3.5% in 2021-2022, reaching $11.2 billion, $11.0 billion and $11.4 billion, respectively.
— These changes stem mainly from the investment income of the Generations Fund and the anticipated revenue of special funds, non-budget-funded bodies and bodies in the health and social services and education networks.
— They also reflect the government's decision to make the first two hours of parking at healthcare institutions free of charge and to set the daily rate between $7 and $10 depending on the region.
| Budget 2020-2021 |
F.38 | Budget Plan |
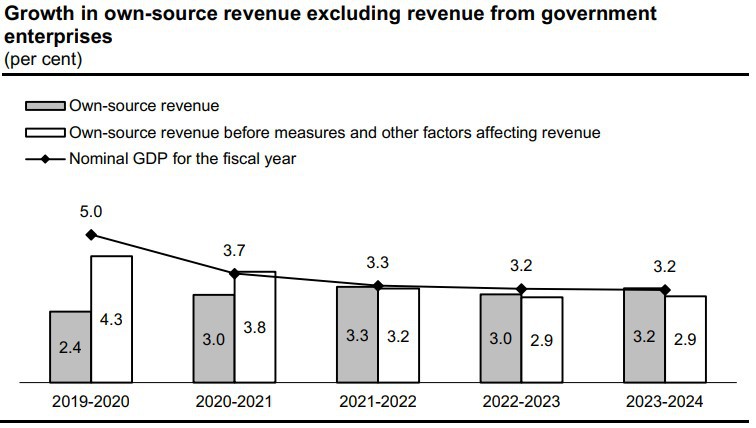
❏ Changes in line with those in the economy
Growth in own-source revenue excluding revenue from government enterprises generally reflects the changes in economic activity and the impact of measures introduced by the government.
Growth in this revenue will stand at 3.0% in 2020-2021 and reach 3.3% in 2021-2022.
— This growth reflects, in particular, various initiatives implemented in recent years, including the standardization of the school tax rates announced in budgets 2019-2020 and 2020-2021 and the depreciation measures announced in the December 2018 Update on Québec's Economic and Financial Situation.
— Had it not been for those measures, own-source revenue growth in 2020-2021 would stand at 3.8%, a rate in line with economic growth.
Over the forecast period, revenue growth will keep pace with economic growth.
CHART F.4
Québec’s | |
Financial Situation | F.39 |
| | Revenue growth in line with economic growth | |
| | Growth in own-source revenue excluding revenue from government enterprises, 2019-2020 to 2023-2024
(millions of dollars) | |
| | | | 2019- | | | 2020- | | | 2021- | | | 2022- | | | 2023- | | |
| | | | 2020 | | | 2021 | | | 2022 | | | 2023 | | | 2024 | | |
| | Own-source revenue | | 92 846 | | | 95 603 | | | 98 859 | | | 102 094 | | | 105 623 | | |
| | % change | | 1.3 | | | 3.0 | | | 3.4 | | | 3.3 | | | 3.5 | | |
| | Less: Government enterprises | | 4 693 | | | 4 814 | | | 5 115 | | | 5 535 | | | 5 967 | | |
| | Own-source revenue excluding revenue from government enterprises | | 88 153 | | | 90 789 | | | 93 744 | | | 96 559 | | | 99 656 | | |
| | % change | | 2.4 | | | 3.0 | | | 3.3 | | | 3.0 | | | 3.2 | | |
| | Less: Measures and other factors affecting revenue growth(1) | | | | | | | | | | | | | | | | |
| | Budget 2020-2021 | | — | | | –183 | | | –252 | | | –266 | | | –224 | | |
| | Fall 2019 update | | — | | | –99 | | | –75 | | | –87 | | | –90 | | |
| | Budget 2019-2020 | | –314 | | | –381 | | | –377 | | | –374 | | | –369 | | |
| | Fall 2018 update | | –436 | | | –581 | | | –383 | | | –270 | | | –230 | | |
| | Recovery measures – August 2018 | | –83 | | | –48 | | | –21 | | | — | | | — | | |
| | Budget 2018-2019 | | –998 | | | –1 104 | | | –1 190 | | | –1 219 | | | –1 227 | | |
| | Previous budgets and other(2) | | –173 | | | –403 | | | –563 | | | –661 | | | –566 | | |
| | Subtotal | | –2 004 | | | –2 798 | | | –2 861 | | | –2 877 | | | –2 706 | | |
| | Own-source revenue excluding revenue from government enterprises before measures | | 90 157 | | | 93 587 | | | 96 605 | | | 99 436 | | | 102 362 | | |
| | % change | | 4.3 | | | 3.8 | | | 3.2 | | | 2.9 | | | 2.9 | | |
| | Nominal GDP growth in % | | 5.0 | | | 3.7 | | | 3.3 | | | 3.2 | | | 3.2 | | |
| | Note: Totals may not add due to rounding. Save for some exceptions, the amounts correspond to those published in the budgets and fall updates.
(1) Main measures affecting revenue growth.
(2) This category includes, in particular, the revenue measures published in the budgets and fall updates since fall 2014, revenues from the carbon market, the elimination of restrictions on input tax refunds for large businesses and the investment income of the Generations Fund. | |
| Budget 2020-2021 |
F.40 | Budget Plan |
2.1.2 Revenue from government enterprises
Government enterprises consist of public corporations that play a commercial role, have managerial autonomy and are financially self-sufficient. Revenue from government enterprises corresponds in large part to the net earnings of these enterprises.
Revenue from government enterprises will stand at $4.7 billion in 2019-2020, for a decrease of 15.4%, at $4.8 billion in 2020-2021, for an increase of 2.6%, and at $5.1 billion in 2021-2022, for an increase of 6.3%.
— The decrease of 15.4% for 2019-2020 reflects, in particular, the anticipated decrease in the results of Hydro-Québec, attributable to the non-recurrence of gains associated with the partial disposal of the TM4 subsidiary by Hydro-Québec in 2018-2019 and to a decline in net exports of electricity.
— The change of 2.6% in 2020-2021 mainly reflects the increase in the anticipated results of Hydro-Québec resulting from the growth forecast for net exports of electricity and demand in Québec, taking into account the impact of the rate freeze.
— The change of 6.3% in 2021-2022 mainly reflects the increase in the anticipated
results of Hydro-Québec resulting from the growth forecast for demand in Québec.
The increase in revenue from government enterprises also includes the positive impact of the increased sales and productivity of Loto-Québec and the Société des alcools du Québec.
TABLE F.17
Change in revenue from government enterprises
(millions of dollars)
| | | 2019-2020 | | | 2020-2021 | | | 2021-2022 | | | AAGR(1) | |
| Hydro-Québec | | 2 175 | | | 2 275 | | | 2 500 | | | | |
| Loto-Québec | | 1 362 | | | 1 372 | | | 1 406 | | | | |
| Société des alcools du Québec | | 1 194 | | | 1 222 | | | 1 252 | | | | |
| Investissement Québec | | 148 | | | 131 | | | 137 | | | | |
| Société québécoise du cannabis(2) | | 27 | | | 50 | | | 71 | | | | |
| Other(3) | | –213 | | | –236 | | | –251 | | | | |
| TOTAL | | 4 693 | | | 4 814 | | | 5 115 | | | | |
| % change | | –15.4 | | | 2.6 | | | 6.3 | | | –2.7 | |
(1) Average annual growth rate (AAGR) from 2019-2020 to 2021-2022.
(2) Revenue allocated to the Cannabis Sales Revenue Fund.
(3) Other revenue includes, in particular, the forecast for other government enterprises and the impact of the Electricity Discount Program for Consumers Billed at Rate L.
Québec’s | |
Financial Situation | F.41 |
2.1.3 Federal transfers
Federal transfer revenues correspond to revenues from the federal government paid to Québec pursuant to the Federal-Provincial Fiscal Arrangements Act, to which is added revenue from other programs under bilateral agreements. They include mainly equalization and revenue from the Canada Health Transfer and the Canada Social Transfer.
— In 2020-2021, they will account for 21% of government revenue.
Federal transfers will stand at $25.1 billion in 2019-2020, $25.7 billion in 2020-2021 and $26.3 billion in 2021-2022. They will show a slight increase of 2.4% in 2020-2021 and 2.3% in 2021-2022, owing mainly to health transfers.
Growth in equalization revenue will be much lower in 2020-2021 and 2021-2022 than in 2019-2020, causing Québec's share of the equalization envelope to decline from 66.2% in 2019-2020 to 63.4% in 2021-2022. This weak growth is due to Québec's remarkable economic performance relative to that of the rest of Canada.
TABLE F.18
Change in federal transfer revenues
(millions of dollars)
| | | 2019-2020 | | | 2020-2021 | | | 2021-2022 | | | AAGR(1) | |
| Equalization | | 13 124 | | | 13 253 | | | 13 514 | | | | |
| % change | | 11.9 | (2) | | 1.0 | | | 2.0 | | | 4.8 | |
| Health transfers | | 6 463 | | | 6 768 | | | 6 998 | | | | |
| % change | | 2.5 | | | 4.7 | | | 3.4 | | | 3.5 | |
| Transfers for post-secondary | | | | | | | | | | | | |
| education and other social programs | | 1 516 | | | 1 581 | | | 1 600 | | | | |
| % change | | –5.0 | | | 4.3 | | | 1.2 | | | 0.1 | |
| Other programs | | 3 994 | | | 4 090 | | | 4 181 | | | | |
| % change | | 14.6 | | | 2.4 | | | 2.2 | | | 6.2 | |
| TOTAL | | 25 097 | | | 25 692 | | | 26 293 | | | | |
| % change | | 8.6 | | | 2.4 | | | 2.3 | | | 4.4 | |
(1) Average annual growth rate (AAGR) from 2019-2020 to 2021-2022.
(2) The equalization envelope grows in pace with Canada's nominal GDP. In addition, growing disparities in fiscal capacity compared to the average of the ten provinces have been observed. Equalization for 2019-2020 is based on data for the years 2015-2016 to 2017-2018.
| Budget 2020-2021 |
F.42 | Budget Plan |
2.2 Change in expenditure
Expenditure consists of portfolio expenditures, which are tied to the delivery of public services, and debt service.
Expenditure stands at $112.8 billion in 2019-2020, that is, $105.0 billion for portfolio expenditures and $7.8 billion for debt service.
Expenditure will stand at $118.6 billion in 2020-2021 and $122.2 billion in 2021-2022, up 5.1% and 3.1%, respectively.
— The decrease in expenditures in 2018-2019 and the increase in expenditures in 2019-2020 raise the growth in portfolio expenditures for 2019-2020, from 5.0% in Budget 2019-2020 to 7.4% in Budget 2020-2021.
— The higher growth in debt service in 2020-2021 is explained, in particular, by the low level in 2019-2020 stemming from very low interest rates.
TABLE F.19
Change in expenditure
(millions of dollars)
| | | 2019-2020 | | | 2020-2021 | | | 2021-2022 | | | AAGR(1) | |
| Portfolio expenditures | | 104 962 | | | 110 300 | | | 113 617 | | | | |
| % change | | 7.4 | | | 5.1 | | | 3.0 | | | 5.1 | |
| Debt service | | 7 845 | | | 8 266 | | | 8 630 | | | | |
| % change | | –10.1 | | | 5.4 | | | 4.4 | | | –0.4 | |
| TOTAL | | 112 807 | | | 118 566 | | | 122 247 | | | | |
| % change | | 6.0 | | | 5.1 | | | 3.1 | | | 4.7 | |
(1) Average annual growth rate (AAGR) from 2019-2020 to 2021-2022.
Québec’s | |
Financial Situation | F.43 |
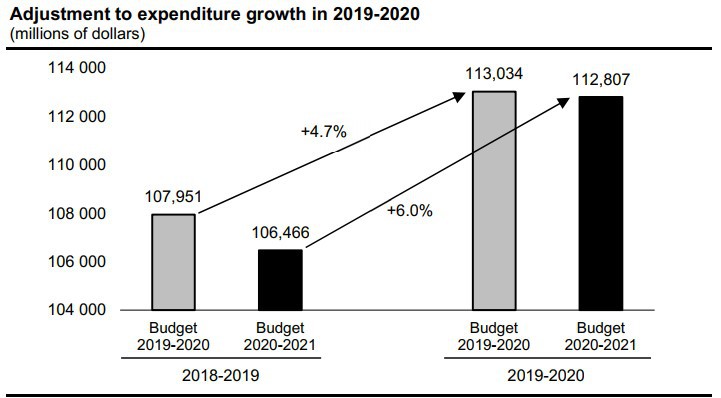
| Adjustment to expenditure growth in 2019-2020 |
Budget 2019-2020 established expenditure at $108.0 billion for 2018-2019 and $113.0 billion for 2019-2020. – This represented an annual spending growth of 4.7%. The results published in Public Accounts 2018-2019 in fall 2019 showed that the level of spending for 2018-2019 had reached $106.5 billion. – This is a downward adjustment of $1.5 billion compared to the March 2019 budget. This adjustment is due mainly to a difference between planned expenditures and those incurred by bodies and special funds. Lower-than-anticipated interest rates also generated savings.1 Budget 2020-2021 shows an expenditure level that is $227 million lower than the target set for 2019-2020 in the previous budget.2 Growth in portfolio expenditures went from 5.0% in Budget 2019-2020 to 7.4% in Budget 2020-2021 mainly because of the decrease in expenditures in 2018-2019. |
 |
|
1 For more information on the spending adjustments in 2018-2019, see page D.9 of the November 2019 Update on Québec's Economic and Financial Situation.
2 For more information on the spending adjustments in 2019-2020, see page F.18 of this document.
| Budget 2020-2021 |
F.44 | Budget Plan |
2.2.1 Portfolio expenditures
To achieve its objectives and carry out its activities, the government sets up programs that are administered by government entities, including departments and bodies. The array of entities for which a minister is responsible constitutes a portfolio.
Portfolio expenditures will stand at $105.0 billion in 2019-2020, $110.3 billion in 2020-2021 and $113.6 billion in 2021-2022, with growth reaching 7.4%, 5.1% and 3.0% respectively.
TABLE F.20
Change in expenditure by departmental portfolio
(millions of dollars)
| | | 2019-2020 | | | 2020-2021(1) | | | 2021-2022 | | | AAGR(2) | |
| Éducation et Enseignement supérieur | | 24 627 | | | 25 734 | | | 26 672 | | | | |
| % change | | 6.7 | | | 4.5 | | | 3.6 | | | 4.9 | |
| Santé et Services sociaux | | 45 377 | | | 47 760 | | | 49 780 | | | | |
| % change | | 6.6 | | | 5.3 | | | 4.2 | | | 5.4 | |
| Other portfolios(3) | | 34 958 | | | 36 806 | | | 37 165 | | | | |
| % change | | 8.9 | | | 5.3 | | | 1.0 | | | 5.0 | |
| TOTAL | | 104 962 | | | 110 300 | | | 113 617 | | | | |
| % change | | 7.4 | | | 5.1 | | | 3.0 | | | 5.1 | |
Note: Totals may not add due to rounding.
(1) The breakdown of expenditures in 2020-2021 for the portfolios as a whole is presented in Appendix 1.
(2) Average annual growth rate (AAGR) from 2019-2020 to 2021-2022.
(3) Other portfolios include inter-portfolio eliminations resulting from the elimination of reciprocal transactions between entities in different portfolios.
Québec’s | |
Financial Situation | F.45 |
| | The government's wage offers to public and parapublic sector union representatives | |
| | On December 12, 2019, the Minister Responsible for Government Administration and Chair of the Conseil du trésor presented the government's offers to public and parapublic sector union representatives as part of negotiations to renew the collective agreements of government employees. – The agreements entered into with most government employees for the period 2015-2020 expire on March 31, 2020. The government is offering wage parameters of 7.00% over five years, which, when fully implemented, will correspond to an additional $2.9 billion. The offer also provides for the payment of a lump sum of $1 000 to any employee who will actually perform work on March 31, 2020 and who will have reached the maximum in his or her compensation scale on that date. In addition, the government has proposed the creation of three discussion forums, for which additional sums are being provided. These forums will focus on these government priorities: – educational success; – accessibility of care for the clientele of residential and long-term care centres or people receiving home care; – the overall health of employees. All of these parameters are included in the financial framework of Budget 2020-2021 and represent a total increase of 9.00% of the payroll over five years. | |
| | Negotiation financial framework | |
| | | 2020- | 2021- | 2022- | Total | 2023- | 2024- | Total | |
| | | 2021 | 2022 | 2023 | 3 years | 2024 | 2025 | 5 years | |
| | Wage parameters | 1.75% | 1.75% | 1.50% | 5.00% | 1.00% | 1.00% | 7.00% | |
| | Lump sum | $1 000 | | | | | | | |
| | Discussion forums(1) | For priority groups | |
| | Sectoral measures | Sectoral measures to be determined | |
| | Impact on the payroll | 2.00% | 2.00% | 2.00% | 6.00% | 1.50% | 1.50% | 9.00% | |
| | (1) The forums will be made up of labour and union representatives and be aimed, in particular, at discussing special monetary measures for teachers at the beginning of their career, patient-care attendants working in CHSLDs and health and social services assistants for home care. Source: Secrétariat du Conseil du trésor. | |
| Budget 2020-2021 |
F.46 | Budget Plan |
❏ Expenditures of the Éducation et Enseignement supérieur portfolio
The expenditures of the Éducation et Enseignement supérieur portfolio are allocated primarily to the activities of educational institutions (school boards,7 CEGEPs, universities, private educational institutions and government schools). This portfolio also includes student financial assistance and programs to promote recreation and sports activities.
Spending for the Éducation et Enseignement supérieur portfolio will stand at $24.6 billion in 2019-2020, $25.7 billion in 2020-2021, $26.7 billion in 2021-2022 and $27.6 billion in 2022-2023. Spending for this portfolio represents roughly 23% of total portfolio expenditures, ranking it second in importance.
— Growth in spending for the Éducation et Enseignement supérieur portfolio stands at 6.7% in 2019-2020. It will reach 4.5% in 2020-2021, 3.6% in 2021-2022 and 3.5% in 2022-2023.
Over four years, that is, from 2019-2020 to 2022-2023, annual growth of the Éducation et Enseignement supérieur portfolio will average 4.6%.
— The Québec government is meeting its objective of reaching an average annual growth rate of 3.5% in education over the period covered by the financial framework.
TABLE F.21
Expenditures of the Éducation et Enseignement supérieur portfolio
(millions of dollars)
| | | 2019-2020 | | | 2020-2021 | | | 2021-2022 | | | 2022-2023 | | | AAGR(1) | |
| Program spending(2) | | 21 207 | | | 22 196 | | | 23 143 | | | 24 123 | | | | |
| Other spending(3) | | 3 420 | | | 3 538 | | | 3 529 | | | 3 484 | | | | |
| TOTAL | | 24 627 | | | 25 734 | | | 26 672 | | | 27 607 | | | | |
| % change | | 6.7 | | | 4.5 | | | 3.6 | | | 3.5 | | | 4.6 | |
(1) Average annual growth rate (AAGR) from 2019-2020 to 2022-2023.
(2) This spending corresponds to departments' expenditures and is funded mainly through general and other taxes.
(3) This spending corresponds to entities' expenditures funded through their own revenue and to tax-funded expenditures.
___________________________________
7 Now that the Act to amend mainly the Education Act with regard to school organization and governance has been assented to, school boards will be replaced by school service centres in fiscal 2020-2021 except in the case of the Cree and Kativik school boards.
Québec’s | |
Financial Situation | F.47 |
| | Financial impact of the initiatives announced in education | |
| | In Budget 2020-2021, the government is providing additional investments of $265 million in 2020-2021 and $298 million in 2021-2022 and 2022-2023. In 2020-2021, these investments will total: – $141 million to improve the educational success of young people; – $100 million to foster the graduation rate for higher education and bringing institutions closer to their communities; – $20 million to promote participation in recreation and sports opportunities; – $5 million for the Secrétariat à la condition féminine to provide better support to women who are victims of domestic violence. | |
| | | | |
| | Financial impact of the initiatives in education (millions of dollars) | | |
| | | | 2019- | | | 2020- | | | 2021- | | | 2022- | | | 2023- | | | 2024- | | | | | |
| | | | 2020 | | | 2021 | | | 2022 | | | 2023 | | | 2024 | | | 2025 | | | Total | | |
| | Improving the educational success of young people | | — | | | –141 | | | –169 | | | –169 | | | –169 | | | –169 | | | –817 | | |
| | Fostering the graduation rate for higher education and bringing institutions closer to their communities | | –50 | | | –100 | | | –100 | | | –100 | | | –100 | | | –100 | | | –550 | | |
| | Promoting participation in recreation and sports opportunities | | — | | | –20 | | | –20 | | | –20 | | | –20 | | | –20 | | | –99 | | |
| | Providing better support for women who are victims of domestic violence (Secrétariat à la condition féminine) | | — | | | –5 | | | –9 | | | –9 | | | –9 | | | –9 | | | –41 | | |
| | TOTAL | | –50 | | | –265 | | | –298 | | | –298 | | | –298 | | | –298 | | | –1 506 | | |
| | Note: Totals may not add due to rounding. | | |
| Budget 2020-2021 |
F.48 | Budget Plan |
❏ Expenditures of the Santé et Services sociaux portfolio
The expenditures of the Santé et Services sociaux portfolio consist primarily of the activities of the health and social services network and programs administered by the Régie de l'assurance maladie du Québec. This portfolio also includes the expenditures of other health-related government bodies, such as Héma-Québec.
Spending for the Santé et Services sociaux portfolio will stand at $45.4 billion in 2019-2020, $47.8 billion in 2020-2021, $49.8 billion in 2021-2022 and $51.8 billion in 2022-2023. Spending for this portfolio represents roughly 43% of total portfolio expenditures, ranking it first in importance.
— Growth in spending for the Santé et Services sociaux portfolio will reach 6.6% in 2019-2020, 5.3% in 2020-2021, 4.2% in 2021-2022 and 4.1% in 2022-2023.
Over four years, that is, from 2019-2020 to 2022-2023, annual growth of the Santé et Services sociaux portfolio will average 5.1%.
— The Québec government is meeting its objective of reaching an average annual growth rate of 4.1% in health over the period covered by the financial framework.
TABLE F.22
Expenditures of the Santé et Services sociaux portfolio
(millions of dollars)
| | | 2019-2020 | | | 2020-2021 | | | 2021-2022 | | | 2022-2023 | | | AAGR(1) | |
| Program spending(2) | | 40 625 | | | 42 787 | | | 44 678 | | | 46 657 | | | | |
| Other spending(3) | | 4 752 | | | 4 973 | | | 5 102 | | | 5 175 | | | | |
| TOTAL | | 45 377 | | | 47 760 | | | 49 780 | | | 51 832 | | | | |
| % change | | 6.6 | | | 5.3 | | | 4.2 | | | 4.1 | | | 5.1 | |
(1) Average annual growth rate (AAGR) from 2019-2020 to 2022-2023.
(2) This spending corresponds to expenditures of the Ministère de la Santé et des Services sociaux funded mainly through general and other taxes.
(3) This spending corresponds to entities' expenditures funded through their own revenue and to tax-funded expenditures.
Québec’s | |
Financial Situation | F.49 |
| | Impact of the initiatives announced in health and social services | |
| | | |
| | In Budget 2020-2021, the government is providing additional investments of $1.2 billion in 2020-2021 and 2021-2022 and $1.1 billion in 2022-2023 and subsequent years. In 2020-2021, the government will provide: – $489 million to improve access to health and social services; – $311 million to enhance senior care; – $190 million to continue enhancing services for youth in difficulty; – $220 million to increase services that address specific needs, including enhanced care and services for people with disabilities and more mental health initiatives; – $27 million to provide better support to women who are victims of domestic violence.
A portion of the funding required for these investments comes from the reallocation of health spending. In particular, for 2020-2021: – $313 million comes from savings made under the agreement entered into between the government and the Fédération des médecins spécialistes du Québec (FMSQ); – $487 million comes essentially from the reallocation of unrealized expenditures in health, in order to direct available funding more effectively toward the health services needs of the population. | |
| | | |
| | Financial impact of the initiatives in health and social services (millions of dollars) | |
| | | | 2019- | | | 2020- | | | 2021- | | | 2022- | | | 2023- | | | 2024- | | | | | |
| | | | 2020- | | | 2021- | | | 2022- | | | 2023- | | | 2024- | | | 2025- | | | Total | | |
| | Improving access to health and social services | | –409 | | | –489 | | | –489 | | | –585 | | | –585 | | | –585 | | | –3 141 | | |
| | Enhancing senior care | | — | | | –311 | | | –313 | | | –200 | | | –200 | | | –200 | | | –1 224 | | |
| | Continuing to enhance services for youth in difficulty | | — | | | –190 | | | –190 | | | –190 | | | –190 | | | –190 | | | –950 | | |
| | Increasing services for specific needs | | — | | | –220 | | | –220 | | | –100 | | | –101 | | | –101 | | | –741 | | |
| | Providing better support to women who are victims of domestic violence | | — | | | –27 | | | –27 | | | –27 | | | –27 | | | –27 | | | –134 | | |
| | Total initiatives | | –409 | | | –1 236 | | | –1 238 | | | –1 102 | | | –1 102 | | | –1 102 | | | –6 191 | | |
| | Available funding | | | | | | | | | | | | | | | | | | | | | | |
| | Agreement with the FMSQ(1),(2) | | 209 | | | 313 | | | 428 | | | 585 | | | — | | | — | | | 1 536 | | |
| | Reallocation of health spending | | — | | | 487 | | | 372 | | | 102 | | | 687 | | | 687 | | | 2 334 | | |
| | Total available funding | | 209 | | | 800 | | | 800 | | | 687 | | | 687 | | | 687 | | | 3 870 | | |
| | TOTAL | | –200 | | | –436 | | | –438 | | | –415 | | | –415 | | | –415 | | | –2 321 | | |
| | (1) A portion of the funding required to implement the initiatives in health and social services is drawn from savings made under the agreement entered into between the government and the FMSQ. Use of these sums will be determined according to the decisions of the Institut de la pertinence des actes médicaux. In addition to the available funding recorded as of 2019-2020, the agreement provides for savings of $69 million in 2018-2019, bringing total savings made over the period up to 2022-2023 to $1.6 billion. (2) The agreement with the FMSQ expires on March 31, 2023 and it is projected that all of the savings made will have been reinvested. | |
| Budget 2020-2021 |
F.50 | Budget Plan |
| | Program spending and other spending | |
| | Portfolio expenditures consist of program spending, that is, spending by departments, and other spending, namely, spending by entities funded through their own revenue and tax-funded expenditures. – Growth in program spending will stand at 4.4% in 2020-2021 and 3.5% in 2021-2022. | |
| | | |
| | Change in portfolio expenditures
(millions of dollars) | | | | | | | | | | |
| | | | 2019-2020 | | | 2020-2021 | | | 2021-2022 | | |
| | Program spending(1) | | 82 532 | | | 86 191 | | | 89 226 | | |
| | % change | | 8.0 | | | 4.4 | | | 3.5 | | |
| | Other spending(2) | | 22 430 | | | 24 109 | | | 24 391 | | |
| | % change | | 5.0 | | | 7.5 | | | 1.2(3) | | |
| | TOTAL | | 104 962 | | | 110 300 | | | 113 617 | | |
| | % change | | 7.4 | | | 5.1 | | | 3.0 | | |
| | (1) This spending corresponds to departments' expenditures and is funded mainly through general and other taxes. (2) This spending corresponds to entities' expenditures funded through their own revenue and to tax-funded expenditures. (3) The growth in spending for “Other portfolios” in 2021-2022 is explained mainly by the reallocation of planned environmental expenditures for the fight against climate change and by the expiry of certain programs or agreements with the federal government. | |
Québec’s | |
Financial Situation | F.51 |
| | Mission expenditures | |
| | Government expenditures are broken down into five public service missions. This breakdown of the government's expenditures into its main areas of activity is a stable indicator over time because it is not usually affected by Cabinet shuffles. Moreover, since this breakdown is also used in the Public Accounts, it facilitates comparisons of forecasts with actual results.
The public service missions are: – Health and Social Services, which consists primarily of the activities of the health and social services network and the programs administered by the Régie de l'assurance maladie du Québec; – Education and Culture, which consists primarily of the activities of the education networks, student financial assistance, programs in the culture sector and immigration-related programs; – Economy and Environment, which primarily includes programs related to economic development, employment assistance measures, international relations, the environment and infrastructure support; – Support for Individuals and Families, which includes, in particular, last resort financial assistance, assistance measures for families and seniors, and certain legal aid measures; – Administration and Justice, which consists of the activities of legislature, central bodies and public security, as well as administrative programs. | |
| | | |
| | Mission expenditures
(millions of dollars) | |
| | | 2019-2020 | 2020-2021 | 2021-2022 | |
| | Health and Social Services(1) | 44 124 | 46 562 | 48 520 | |
| | Education and Culture | 25 517 | 26 989 | 27 939 | |
| | Economy and Environment | 16 205 | 16 683 | 16 988 | |
| | Support for Individuals and Families | 10 899 | 11 413 | 11 558 | |
| | Administration and Justice(2) | 8 217 | 8 653 | 8 612 | |
| | TOTAL | 104 962 | 110 300 | 113 617 | |
| | % change | 7.4 | 5.1 | 3.0 | |
| | (1) The expenditures of the Health and Social Services mission are lower than those of the Santé et Services sociaux portfolio mainly because of the different treatment of expenditures made for entities in other portfolios. Such spending is eliminated in the missions when expenditures by mission are established, while it is eliminated under a separate heading “Inter-portfolio” eliminations when expenditures by portolio are established. (2) These amounts include the Contingency Fund reserve. | |
| Budget 2020-2021 |
F.52 | Budget Plan |
2.2.2 Debt service
Debt service consists of interest on the direct debt as well as interest on the liability for the retirement plans and other future benefits of public and parapublic sector employees.
Debt service changes primarily according to the level of the debt, interest rates and the return on the Retirement Plans Sinking Fund (RPSF).
Overall, debt service will stand at $7.8 billion in 2019-2020, $8.3 billion in 2020-2021 and $8.6 billion in 2021-2022, representing changes of −10.1%, 5.4% and 4.4%, respectively.
In 2019-2020, interest on the direct debt will decrease by 6.6% owing to lower interest rates and accelerated repayment of the debt from the Generations Fund.
In 2020-2021 and 2021-2022, it will increase by 10.0% and 9.2%, respectively, mainly because of the government's increased borrowing needs related, in particular, to public infrastructure investments, and the anticipated change in long-term interest rates. Interest on the direct debt was very low in 2019-2020 owing to, among other things, very low interest rates.
Interest on the liability for the retirement plans and other employee future benefits will decrease due to the annual increase in the investment income of the RPSF. The investment income of the RPSF is applied against debt service.
TABLE F.23
Change in debt service
(millions of dollars)
| | | 2019-2020 | | | 2020-2021 | | | 2021-2022 | |
| Interest on the direct debt(1) | | 6 944 | | | 7 639 | | | 8 341 | |
| % change | | –6.6 | | | 10.0 | | | 9.2 | |
| Interest on the liability for the retirement plans and other employee future benefits(2) | | 901 | | | 627 | | | 289 | |
| TOTAL | | 7 845 | | | 8 266 | | | 8 630 | |
| % change | | –10.1 | | | 5.4 | | | 4.4 | |
(1) Interest on the direct debt includes the income of the Sinking Fund for Government Borrowing. This income, which is applied against debt service, consists of interest generated on investments as well as gains and losses on disposal. Given that the forecast for this revenue is closely tied to the change in interest rates, it may be adjusted upward or downward.
(2) This interest corresponds to the interest on obligations relating to the retirement plans and other employee future benefits of public and parapublic sector employees, minus mainly the investment income of the RPSF.
Québec’s | |
Financial Situation | F.53 |
❏ Debt service burden relative to the economy
The debt service burden relative to the economy has decreased since 2013-2014, falling from 2.9% of GDP in 2013-2014 to 1.7% of GDP in 2019-2020.
The decrease in 2018-2019 and 2019-2020 is due to, in particular, the $10-billion repayment of the debt from the Generations Fund.
CHART F.5
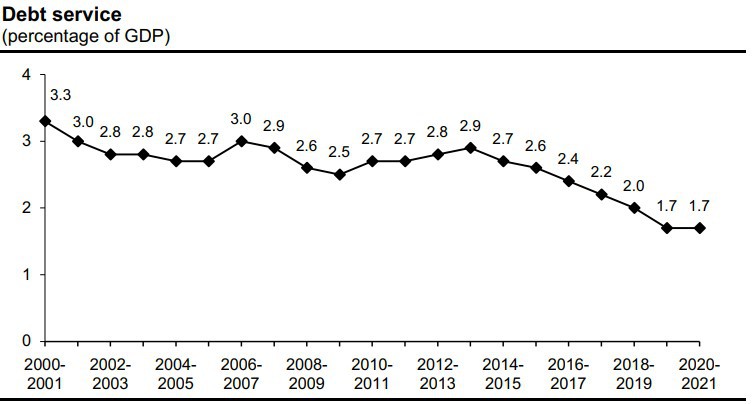
| Budget 2020-2021 |
F.54 | Budget Plan |
| Comparison of the debt service of governments in Canada |
| |
| In 2018-2019, Québec's debt service as a percentage of revenue was among the highest in Canada. |
| |
| – In 2018-2019, interest payments on the debt totalled $8.7 billion, which represents 7.6% of revenue, or $1 040 per capita. |
| |
| – Debt service is the third largest expenditure category of the government, after health and education. |
| |
| – Every dollar paid in interest is one dollar less for funding public services. |
| |
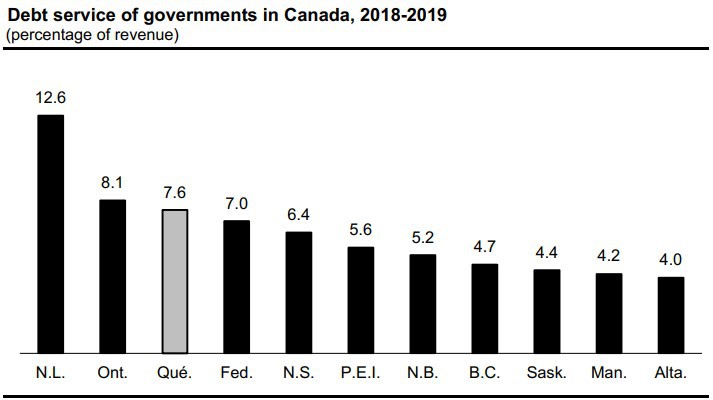 |
| Sources: Governments' public accounts. |
Québec’s | |
Financial Situation | F.55 |
3. QUÉBEC'S DEMANDS WITH REGARD TO FEDERAL TRANSFERS
3.1 For an increase in the federal contribution to health and social programs
The federal government contributes to provincial spending on health, post-secondary education and other social sectors mainly through the Canada Health Transfer (CHT) and the Canada Social Transfer (CST).
Québec is asking that these two transfers be increased so that the provinces have the means to fully shoulder their responsibilities.
— The CHT envelope for Canada as a whole should correspond to 25% of provincial health spending, whereas the CST should be brought back to its 1994-1995 level, after inflation.
In the area of health care in particular, Québec expects the federal government to give priority to increasing the CHT before implementing other initiatives.
Furthermore, if the federal government decides to introduce a Canada-wide public prescription drug insurance plan, Québec would ask for the right to opt out with full financial compensation given that a plan of this type has already been in place in Québec since 1997.
Québec’s | |
Financial Situation | F.57 |
❏ Priority must be given to increasing the CHT
The CHT has grown in pace with Canada's nominal GDP8 since 2017-2018, whereas prior to that it grew by 6% per year.
On account of this lower indexation, the federal contribution to provincial health spending will decline in a context where population aging is adding to the pressure placed on such spending.
— While the federal contribution to the provinces' health spending stood at roughly 25% in the late 1970s, it reached a record low in the late 1990s, before climbing back up following the signing of the federal-provincial-territorial agreement on health in September 2004.
— This contribution is expected to fall to 19.7% by 2026-2027, whereas it stood at 23.3% in 2016-2017.
CHART F.6
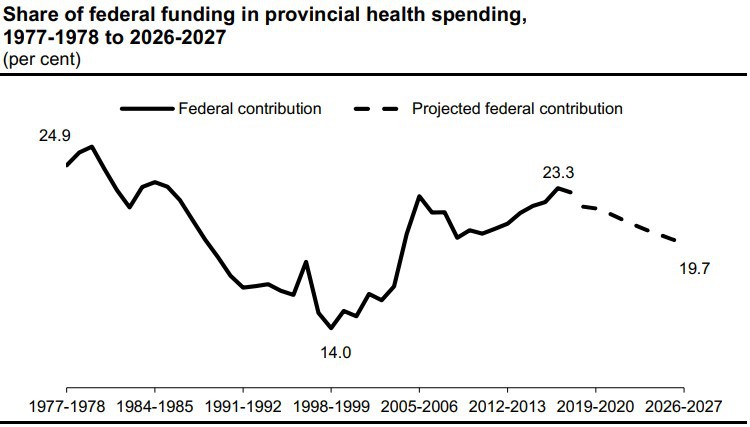
Sources: Canadian Institute for Health Information, Conference Board of Canada, Department of Finance Canada and Ministère des Finances du Québec.
_____________________________________________
8 Indexation is subject to a floor of 3% per year.
| Budget 2020-2021 |
F.58 | Budget Plan |
Like the other provinces, Québec is asking for the CHT to be increased so that it corresponds to 25% of provincial health spending, as was the case in the late 1970s.9
— The CHT could be raised gradually between now and 2022-2023 to 25% of the health spending of the provinces and territories as a whole.
— Subsequently, this share would be maintained. In this way, the CHT would grow in pace with provincial and territorial health spending.10
— A favourable response to this request would lead, for Canada as a whole, to an additional contribution to the CHT of $2.5 billion in 2020-2021 and $13.9 billion or $343 per capita in 2026-2027.
— For Québec, this increase would represent $557 million in 2020-2021 and $3.0 billion in 2026-2027.
CHART F.7
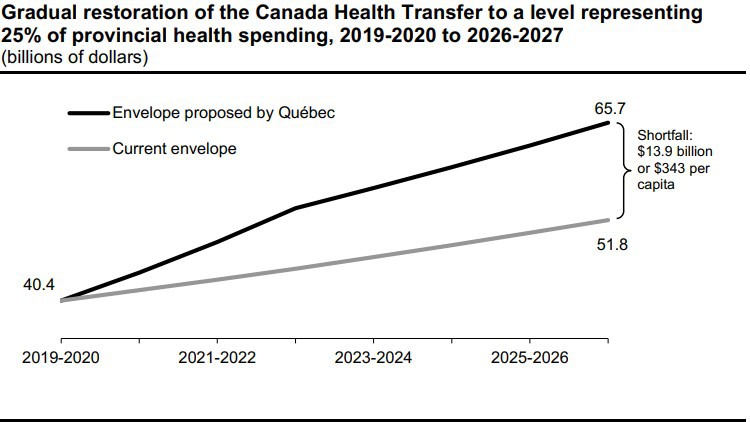
Note: The current envelope excludes targeted funds. If these funds were included, the additional funding required in 2026-2027 would be reduced from $13.9 billion to $12.7 billion for Canada as a whole.
Sources: Conference Board of Canada, Department of Finance Canada and Ministère des Finances du Québec.
_____________________________________________
9 During a meeting of the Council of the Federation in December 2019, the premiers of the provinces and territories asked the federal government to increase CHT funding using an annual growth factor of 5.2% in accordance with an independent analysis of financial pressures conducted by the Conference Board of Canada in 2016.
10 In July 2018, the Conference Board of Canada estimated this average annual growth rate at 5.1%.
Québec’s | |
Financial Situation | F.59 |
❏ Increasing the CST to its 1994-1995 level
Québec makes substantial investments in education. These investments are one of the pillars on which the potential of Québec's economy can be built.
The federal government contributes to provincial spending on post-secondary education and other social sectors through the CST.
The CST, which increases by 3% per year, will stand at $15.0 billion for Canada as a whole in 2020-2021. Taking inflation into account, this is lower than the level that prevailed in 1994-1995, prior to the substantial reductions in federal funding in the mid-1990s.
— Québec is asking the federal government to increase the CST envelope to its 1994-1995 level, after inflation. Québec is proposing that this funding shortfall be gradually eliminated by 2026-2027.
— A favourable response to this request would lead, for Canada as a whole, to an increase in the CST of $323 million in 2020-2021 and $2.9 billion or $71 per capita in 2026-2027.
— For Québec, this increase would represent $73 million in 2020-2021 and $627 million in 2026-2027.
CHART F.8
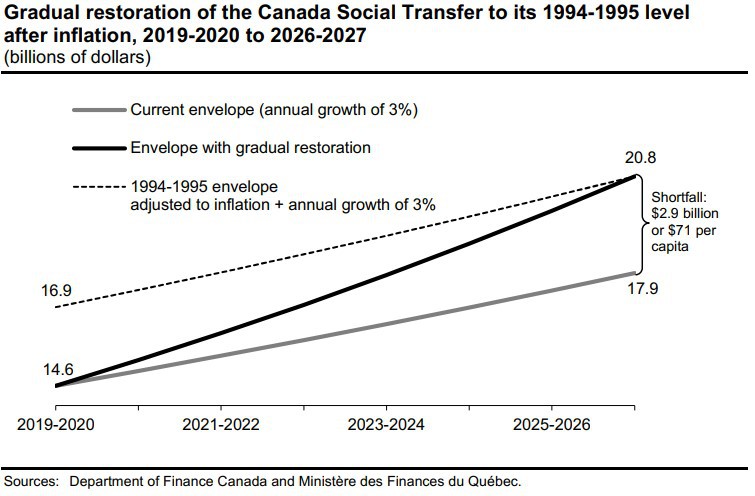
| Budget 2020-2021 |
F.60 | Budget Plan |
3.2 Strengthening of the fiscal stabilization program
The stabilization program, established since 1967, allows a province to qualify for federal compensation when it suffers a substantial decline in its revenues because of the economic situation.11
Three provinces have received payments under this program since 2015-2016, namely, Alberta, Saskatchewan and Newfoundland and Labrador. These three provinces were hard hit by the significant drop in the price of oil in 2014.
The fiscal stabilization program is subject to certain criteria (for example, a province must have seen its non-resource revenues decrease by at least 5% relative to the previous year).
Québec, like the other provinces, considers that this program is no longer adapted to the realities of today and must be revisited.
In December 2019, following a meeting of the Council of the Federation in Toronto, the finance ministers of the provinces asked their federal counterpart to make the following main improvements to the fiscal stabilization program:
— elimination of the maximum per capita payment, which has been $60 since 1987-1988;
— lowering of the qualifying threshold for non-resource revenues from 5% to 3% and that for resource revenues from 50% to 40%;
— retroactive payments based on these changes for the past five years, that is, back to 2015-2016.
However, it is crucial for Québec that the enhancement of the fiscal stabilization program does not occur at the expense of other transfers to the provinces.
_____________________________________________
11 Like equalization, the fiscal stabilization program is funded by the federal government from revenues collected throughout Canada.
Québec’s | |
Financial Situation | F.61 |
3.3 Equalization
The provinces do not all have the same fiscal capacity, that is, they do not all have the same capacity to generate revenue.
Provinces whose fiscal capacity, in dollars per capita, is below the average of the ten provinces receive equalization payments. They therefore have, after equalization, a fiscal capacity equivalent to the average of the ten provinces to provide public services.12
In 2020-2021, five provinces will receive equalization: Manitoba, Québec, New Brunswick, Nova Scotia and Prince Edward Island.
Québec is the recipient province that receives the least equalization per capita ($1 594 per capita).
CHART F.9
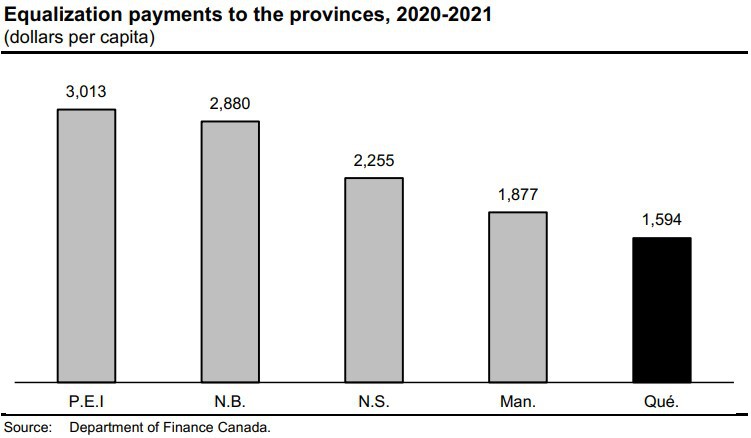
_____________________________________________
12 The provinces’ fiscal capacity is assessed using five tax bases (personal income tax, corporate income tax, consumption taxes, property taxes and natural resources).
| Budget 2020-2021 |
F.62 | Budget Plan |
Among the recipient provinces, Québec is the one that receives the least equalization, because it has the highest fiscal capacity per capita ($8 082 per capita).
CHART F.10
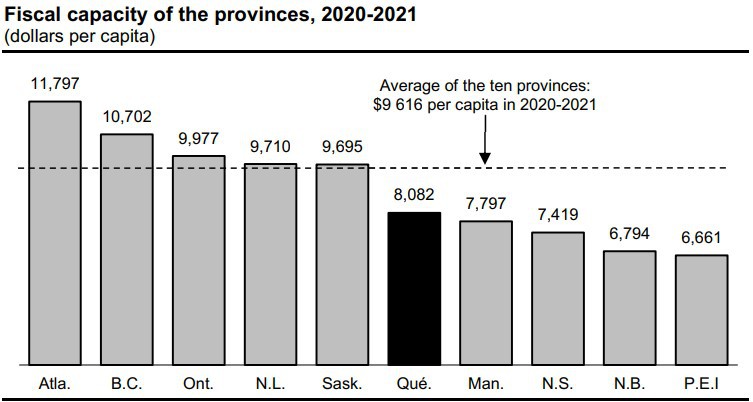
Note: Equalization payments for 2020-2021 are based on data for the years 2016-2017 (25%), 2017-2018 (25%) and 2018-2019 (50%). The fiscal capacity of the provinces takes into account 50% of revenues derived from natural resources.
Source: Department of Finance Canada.
Québec’s | |
Financial Situation | F.63 |
❏ A decline in Québec's share of the equalization envelope
The Québec government is determined to increase the potential of Québec's economy so that one day it will no longer receive equalization.
This is a key long-term objective. In fact, recent economic development initiatives taken by Québec are already bearing fruit.
Owing to the remarkable performance of Québec's economy relative to that of the rest of Canada, it is anticipated that Québec's share of the equalization envelope will decline in the coming years.
— Québec's share of the equalization envelope for Canada as a whole is expected to decrease to 56.5% in 2024-2025, compared to 66.2% in 2019-2020.
CHART F.11
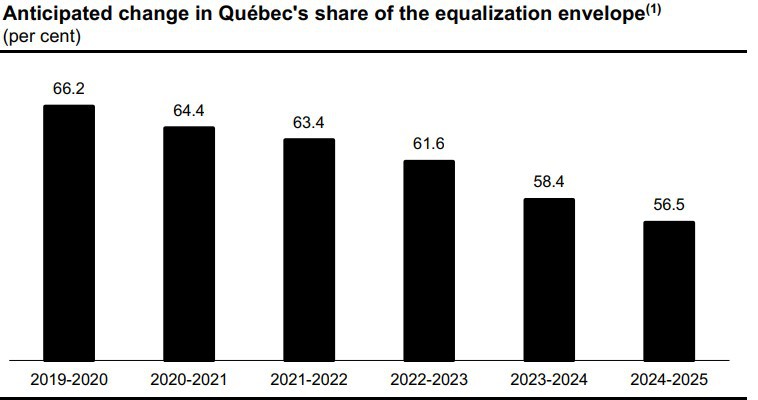
(1) A smoothing mechanism with lag is applied to determine equalization payments. For example, the equalization payments for the provinces for 2020-2021 are based on data for the years 2016-2017 (25%), 2017-2018 (25%) and 2018-2019 (50%).
Sources: Department of Finance Canada and Ministère des Finances du Québec.
| Budget 2020-2021 |
F.64 | Budget Plan |
❏ Fair treatment of Hydro-Québec dividends
In November 2008, the federal government changed the equalization program by transferring dividends paid to the Ontario government by Hydro One, a corporation that transports and distributes electricity, from the natural resource base to the corporate income tax base.
However, this decision by the federal government is unfair, because the dividends from activities in transporting and distributing electricity paid to the Québec government by Hydro-Québec (28.7% of the dividend in 2018) are still included in the natural resource base.
In 2018, the federal government renewed the equalization program until 2023-2024, without making the changes requested by Québec. Québec estimates the annual shortfall at roughly $200 million.
Québec’s | |
Financial Situation | F.65 |
APPENDIX 1: EXPENDITURE BY DEPARTMENTAL PORTFOLIO
TABLE F.24
Expenditure by portfolio, 2020-2021
(millions of dollars)
| | | 2020-2021 | | | Change % | |
| Affaires municipales et Habitation | | 3 078 | | | –11.5 | (1) |
| Agriculture, Pêcheries et Alimentation | | 1 066 | | | –14.7 | (2) |
| Conseil du trésor et Administration gouvernementale | | 2 858 | | | 14.3 | |
| Conseil exécutif | | 533 | | | 4.3 | |
| Culture et Communications | | 1 444 | | | 12.6 | |
| Économie et Innovation | | 2 759 | | | –1.0 | (3) |
| Éducation et Enseignement supérieur | | 25 734 | | | 4.5 | |
| Énergie et Ressources naturelles | | 748 | | | 20.8 | |
| Environnement et Lutte contre les changements climatiques | | 1 646 | | | 28.5 | |
| Famille | | 6 936 | | | 7.9 | |
| Finances | | 3 434 | | | 21.7 | |
| Forêts, Faune et Parcs | | 1 074 | | | 5.8 | |
| Immigration, Francisation et Intégration | | 581 | | | 43.5 | |
| Justice | | 1 274 | | | 4.2 | |
| National Assembly | | 138 | | | — | |
| Persons Appointed by the National Assembly | | 110 | | | 2.8 | |
| Relations internationales et Francophonie | | 132 | | | 7.3 | |
| Santé et Services sociaux | | 47 760 | | | 5.3 | |
| Sécurité publique | | 2 122 | | | –6.1 | (4) |
| Tourisme | | 399 | | | 5.8 | |
| Transports | | 5 370 | | | –3.6 | (5) |
| Travail, Emploi et Solidarité sociale | | 5 304 | | | 0.4 | |
| Inter-portfolio eliminations(6) | | –4 200 | | | n/a | |
| Subtotal | | 110 300 | | | 5.1 | |
| Debt service | | 8 266 | | | 5.4 | |
| TOTAL | | 118 566 | | | 5.1 | |
Note: Totals may not add due to rounding.
(1) The negative change is explained by the 2019-2020 initiatives for Ville de Montréal ($150 million), AccèsLogis ($58 million) and the agreements on greenways and blueways and support for bicycle paths ($70 million).
(2) The negative change is explained mainly by an expenditure of $140 million in 2019-2020 to partially reimburse the deficit of the Fonds d'assurance stabilisation des revenus agricoles assumed by La Financière Agricole du Québec.
(3) The negative change is explained mainly by the investment of $81 million in 2019-2020 to increase clinical research and genomics research.
(4) The negative change is explained by the costs related to the 2019 spring flooding.
(5) The negative change is explained mainly by the $260 million subsidy granted in 2019-2020 under the program to compensate the holders of a taxi owner's permit.
(6) Inter-portfolio eliminations result mainly from the elimination of reciprocal transactions between entities in different portfolios.
Québec’s | |
Financial Situation | F.67 |
APPENDIX 2: ADDITIONAL INFORMATION
Digital dissemination of content reflects the department's desire to improve the messages addressed to the public through the use of electronic documents that can be consulted on a smartphone, tablet or computer.
The Ministère des Finances is promoting the transition to digital documents. Therefore, certain additional budgetary information is presented exclusively on the department's website, including:
— Québec's Budgetary Statistics, which present, among other things, the government's revenue and expenditure on a historical basis;
— Budget by the Numbers and interactive charts;
— the financial framework according to the government's financial organization;
— additional information on own-source revenue and portfolio expenditures;
— margins of prudence, sensitivity analyses and the main risks to Québec's financial situation;
— entities included in the government's reporting entity, classified by portfolio;
— the government's net financial surpluses or requirements.
Additional information is available on the Ministère des Finances website. To consult it, visit the Budget 2020-2021 documents' page at: www.budget.finances.gouv.qc.ca/budget/2020-2021/en/index.asp |
Québec’s | |
Financial Situation | F.69 |