Exhibit 99.20
Section G
THE QUÉBEC GOVERNMENT'S DEBT
| Summary | G.3 |
| | |
| 1. | Québec's debt | G.5 |
| | | |
| | 1.1 | Different concepts of debt | G.5 |
| | | | |
| | 1.2 | Gross debt | G.7 |
| | | | |
| | 1.3 | Net debt | G.12 |
| | | | |
| | 1.4 | Debt representing accumulated deficits | G.14 |
| | | | |
| | 1.5 | Achievement of debt reduction targets | G.17 |
| | | | |
| 1.6 | Ongoing debt reduction: the need to initiate a reflection process | G.25 |
| | | | |
2. | Financing | G.31 |
| | | |
| 2.1 | Financing program | G.31 |
| | | | |
| 2.2 | Debt management strategy | G.35 |
| | | | |
| 2.3 | Yield on Québec's debt securities | G.37 |
| | | | |
3. | Public and parapublic sector retirement plans | G.39 |
| | | |
| 3.1 | Net liability for the retirement plans | G.39 |
| | | | |
4. | Credit ratings | G.45 |
| | | |
| 4.1 | Québec's credit ratings | G.45 |
| | | | |
| 4.2 | Comparison of the credit ratings of the Canadian provinces | G.48 |
G.1
SUMMARY
❏ Québec's debt
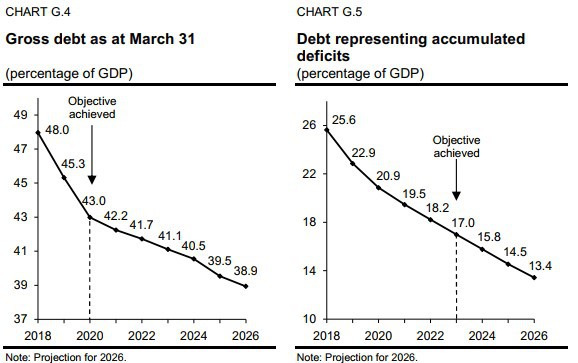
As at March 31, 2020, the gross debt will stand at $197.7 billion, or 43.0% of GDP. The objective of reducing the gross debt to 45% of GDP has thus been achieved.
— This objective has been achieved six years ahead of schedule.
The objective of reducing the debt representing accumulated deficits to 17% of GDP should be achieved as at March 31, 2023, three years ahead of schedule.
Reducing the debt has tangible benefits.
— Less interest is payable on the debt, which frees up resources for funding public services. This ensures stable funding for the government's main missions, including health and education.
— Québec can invest heavily in public infrastructure without increasing its
indebtedness. The 2020-2030 Québec Infrastructure Plan (QIP) stands at $130.5 billion.
— Québec's debt burden is lower than it was prior to the last recession, thus putting Québec in a good position to cope with a potential economic slowdown.
— In November 2019, the DBRS Morningstar credit rating agency announced an increase in Québec's credit rating, thus enabling the province to benefit from advantageous borrowing costs. Québec currently borrows at lower costs than Ontario.
❏ Debt reduction objectives
The government intends to define new policy directions on debt reduction within the context of achieving its target in 2023. A reflection process is being launched in this regard.
Indeed, it is time to reflect on:
— the need to continue debt reduction efforts;
— the determination of a new target and a new indicator, if applicable;
— the rate at which the new target should be met.
The fact that Québec is still fairly indebted compared to the Canadian provincial average will have to be considered in this reflection process, for it is important not to leave future generations with this heavy burden.
The Québec | |
Government’s Debt | G.3 |

1. QUÉBEC'S DEBT
1.1 Different concepts of debt
A number of different concepts of debt are used to measure a government's indebtedness.
— Gross debt corresponds to the debt on financial markets, plus the commitments made with regard to the retirement plans of government employees. The balance of the Generations Fund is subtracted from the gross debt.
— Net debt corresponds to the government's liabilities as a whole, less its financial assets.
— Debt representing accumulated deficits corresponds to the difference between the government's assets and liabilities. It is the debt that does not correspond to any assets.1
TABLE G.1
Debt of the Québec government as at March 31 according to various concepts
(millions of dollars)
| | | 2019 | | | 2020 | | | 2021 | |
| GROSS DEBT(1) | | 199 098 | | | 197 685 | | | 202 185 | |
| % of GDP | | 45.3 | | | 43.0 | | | 42.2 | |
| Less: Financial assets, net of other liabilities(2) | | –26 540 | | | –26 027 | | | –29 560 | |
| NET DEBT | | 172 558 | | | 171 658 | | | 172 625 | |
| % of GDP | | 39.3 | | | 37.3 | | | 36.1 | |
| Less: Non-financial assets | | –72 110 | | | –75 743 | | | –79 439 | |
| DEBT REPRESENTING ACCUMULATED DEFICITS WITHIN THE MEANING OF THE PUBLIC ACCOUNTS | | 100 448 | | | 95 915 | | | 93 186 | |
| % of GDP | | 22.9 | | | 20.9 | | | 19.5 | |
(1) The gross debt excludes pre-financing and takes into account the sums accumulated in the Generations Fund.
(2) Financial assets include, in particular, participations in government enterprises (e.g. Hydro-Québec) and accounts receivable, minus other liabilities (e.g. accounts payable).
______________________________
1 As announced in the November 2019 economic and financial update, the government intends, for the purpose of monitoring this objective, to use the debt representing accumulated deficits within the meaning of the Public Accounts, that is, without the addition of the stabilization reserve. To that end, amendments will have to be made to the Act to reduce the debt and establish the Generations Fund.
The Québec | |
Government’s Debt | G.5 |
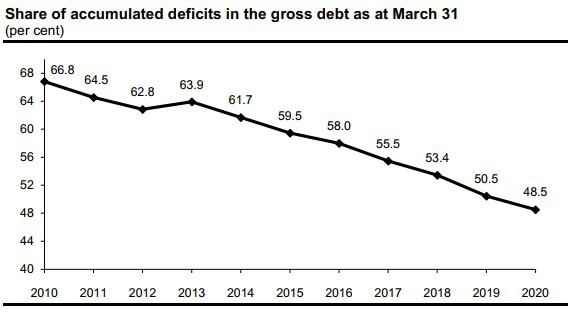
❏ Accumulated deficits account for slightly less than half of the gross debt
As at March 31, 2020, accumulated deficits will account for slightly less than half of the gross debt, that is, 48.5%. The share of accumulated deficits in the gross debt is decreasing thanks to maintenance of a balanced budget.
The gross debt is thus increasingly associated with assets, that is, public infrastructure and investments in government enterprises.
CHART G.1
Share of accumulated deficits in the gross debt as at March 31
(per cent)
| Budget 2020-2021 |
G.6 | Budget Plan |

1.2 Gross debt
The gross debt corresponds to the amount of debt issued on financial markets (consolidated direct debt) plus the net liability for the retirement plans and other future benefits of public and parapublic sector employees, minus the balance of the Generations Fund.
As at March 31, 2020, the gross debt will stand at $197.7 billion, or 43.0% of GDP. The debt burden is expected to gradually and steadily decline until 2024-2025.The gross debt-to-GDP ratio should stand at 39.5% as at March 31, 2025.
Furthermore, as at March 31, 2025, the sums accumulated in the Retirement Plans Sinking Fund (RPSF) to pay the retirement benefits of government employees will exceed the government's liability in this regard.
— Thus, the government will be in a net asset position with regard to the retirement plans and other employee future benefits.
— In the coming years, the government will be able to use the assets of the RPSF to pay for the retirement benefits of its employees.
TABLE G.2
Gross debt as at March 31
(millions of dollars)
| | | 2019 | | | 2020 | | | 2021 | | | 2022 | | | 2023 | | | 2024 | | | 2025 | |
| Consolidated direct debt | | 189 029 | | | 192 025 | | | 201 973 | | | 212 508 | | | 222 753 | | | 234 259 | | | 244 222 | |
| Plus: Retirement plans and other employee future benefits(1) | | 18 362 | | | 14 586 | | | 11 867 | | | 8 694 | | | 5 268 | | | 1 094 | | | –3 487 | |
| Less: Generations Fund | | –8 293 | | | –8 926 | | | –11 655 | | | –14 685 | | | –18 038 | | | –21 714 | | | –25 709 | |
| GROSS DEBT | | 199 098 | | | 197 685 | | | 202 185 | | | 206 517 | | | 209 983 | | | 213 639 | | | 215 026 | |
| % of GDP | | 45.3 | | | 43.0 | | | 42.2 | | | 41.7 | | | 41.1 | | | 40.5 | | | 39.5 | |
(1) A positive entry represents a net liability while a negative entry represents a net asset.
The Québec | |
Government’s Debt | G.7 |
❏ The debt is lower than it was prior to the last recession
As at March 31, 2008, that is, before the 2008-2009 recession, the gross debt burden stood at 48.8% of GDP. As at March 31, 2020, it will stand at 43.0% of GDP.
This puts Québec in a good position to counter a potential economic slowdown.
CHART G.2

| Budget 2020-2021 |
G.8 | Budget Plan |
❏ Adjustments to the gross debt compared to the March 2019 budget
The gross debt as at March 31, 2024 has been adjusted downward by $1.9 billion relative to the March 2019 budget.
— This downward adjustment is explained by the improvement in the budgetary situation in 2018-2019 and 2019-2020.
The gross debt-to-GDP ratio as at March 31, 2024 has been adjusted downward by 1.8 percentage points owing, in particular, to higher-than-anticipated growth in nominal GDP.
TABLE G.3
Adjustments to the gross debt as at March 31 since the March 2019 budget
(millions of dollars)
| | | 2019 | | | 2020 | | | 2021 | | | 2022 | | | 2023 | | | 2024 | |
| March 2020 | | 199 098 | | | 197 685 | | | 202 185 | | | 206 517 | | | 209 983 | | | 213 639 | |
| % of GDP | | 45.3 | | | 43.0 | | | 42.2 | | | 41.7 | | | 41.1 | | | 40.5 | |
| March 2019 | | 200 756 | | | 204 169 | | | 207 318 | | | 211 357 | | | 214 095 | | | 215 494 | |
| % of GDP | | 46.1 | | | 45.3 | | | 44.6 | | | 44.1 | | | 43.4 | | | 42.3 | |
| Adjustments | | –1 658 | | | –6 484 | | | –5 133 | | | –4 840 | | | –4 112 | | | –1 855 | |
| % of GDP | | –0.8 | | | –2.3 | | | –2.4 | | | –2.4 | | | –2.3 | | | –1.8 | |
The Québec | |
Government’s Debt | G.9 |
TABLE G.4
Factors responsible for the change in the Québec government's gross debt
(millions of dollars)
| Debt, beginning of year | Budgetary deficit (surplus) | Investments, loans and advances | Net capital investments(1) | Other factors(2) | Deposits in the Generations Fund | Total change | Debt, end of year | % of GDP |
2010-2011 | 163 318 | 3 150 | 2 507 | 4 923 | 298 | –760 | 10 118 | 173 436 | 52.7 |
2011-2012 | 173 436 | 2 628 | 1 861 | 5 071 | 1 228 | –840 | 9 948 | 183 384 | 53.0 |
2012-2013 | 183 384 | 3 476(3) | 659 | 4 863 | 445 | –961 | 8 482 | 191 866 | 54.0 |
2013-2014 | 191 866 | 2 824 | 1 349 | 3 977 | –788 | –1 421 | 5 941 | 197 807 | 54.1 |
2014-2015 | 197 807 | 1 143(4) | 2 146 | 2 980 | 1 160 | –1 279 | 6 150 | 203 957 | 54.1 |
2015-2016 | 203 957 | –2 191 | 808 | 2 695 | –338 | –1 584 | –610 | 203 347 | 52.5 |
2016-2017 | 203 347 | –2 361 | 2 527 | 1 784 | 194 | –2 001 | 143 | 203 490 | 51.0 |
2017-2018 | 203 490 | –2 622 | 1 859 | 2 173 | –1 536 | –2 293 | –2 419 | 201 071 | 48.0 |
2018-2019 | 201 071 | –4 803 | 1 296 | 3 002 | 2 009 | –3 477 | –1 973 | 199 098 | 45.3 |
2019-2020 | 199 098 | –1 900 | 1 841 | 3 633 | –2 354 | –2 633 | –1 413 | 197 685 | 43.0 |
2020-2021 | 197 685 | — | 2 737 | 3 696 | 796 | –2 729 | 4 500 | 202 185 | 42.2 |
2021-2022 | 202 185 | — | 2 926 | 4 821 | –385 | –3 030 | 4 332 | 206 517 | 41.7 |
2022-2023 | 206 517 | — | 1 969 | 4 737 | 113 | –3 353 | 3 466 | 209 983 | 41.1 |
2023-2024 | 209 983 | — | 1 803 | 4 769 | 760 | –3 676 | 3 656 | 213 639 | 40.5 |
2024-2025 | 213 639 | — | 1 808 | 4 873 | –1 299 | –3 995 | 1 387 | 215 026 | 39.5 |
(1) Investments made under public-private partnership agreements are included in net capital investments.
(2) Other factors include, in particular, the change in other accounts, such as accounts receivable and accounts payable.
(3) This amount includes the loss of $1 876 million stemming from activities abandoned following the closure of Hydro-Québec's Gentilly-2 nuclear power plan.
(4) Budgetary balance excluding the impact of accounting changes. The budgetary balance including accounting changes totalling $418 million is a deficit of $725 million.
| | Budget 2020-2021 |
| G.10 | Budget Plan |

| | Net capital investments | |
| | Net capital investments consist of the government's gross investments minus depreciation expenses. – The Québec government's contribution to the projects of partners (e.g. municipalities) is not included in net capital investments, whereas it is included in the annual investments of the Québec Infrastructure Plan. Even though gross investments have an impact on the gross debt, net capital investments are presented in the factors responsible for the change in the gross debt due to the fact that depreciation expenses are included in the budgetary balance. From 2020-2021 to 2024-2025, net capital investments will increase the gross debt by $4.6 billion per year on average. Net capital investments
(millions of dollars) | |
| | | | 2019- | | | 2020- | | | 2021- | | | 2022- | | | 2023- | | | 2024- | | |
| | | | 2020 | | | 2021 | | | 2022 | | | 2023 | | | 2024 | | | 2025 | | |
| | Gross investments(1) | | 7 836 | | | 8 070 | | | 9 374 | | | 9 560 | | | 9 830 | | | 10 177 | | |
| | Less: Depreciation | | –4 203 | | | –4 374 | | | –4 553 | | | –4 823 | | | –5 061 | | | –5 304 | | |
| | Net capital investments | | 3 633 | | | 3 696 | | | 4 821 | | | 4 737 | | | 4 769 | | | 4 873 | | |
| | (1) Gross investments include those made under public-private partnership agreements net of the value of disposals.
| |
| Investments, loans and advances |
Investments, loans and advances refer to investments made by the government in enterprises, mainly government enterprises. Such investments may be made through advances, capital outlays or by allowing government enterprises to keep part of their net earnings. – For example, every year, Hydro-Québec pays the government a dividend corresponding to 75% of its net earnings. Hydro-Québec uses the portion of net earnings not paid to the government (25%) to finance its investments, in particular hydroelectric dams. – For the government, this constitutes an investment in Hydro-Québec that creates a financial requirement and thus leads to an increase in the gross debt. |
The Québec | |
Government’s Debt | G.11 |
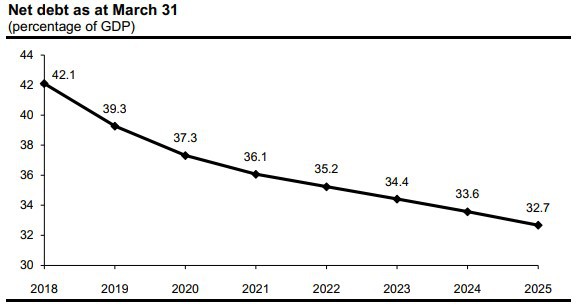
1.3 Net debt
The net debt corresponds to the government's liabilities less its financial assets. As at March 31, 2020, it will stand at $171.7 billion, or 37.3% of GDP.
TABLE G.5
Factors responsible for the change in the net debt
(millions of dollars)
| | | | | | | | | | | | | | | Deposits | | | | | | | | | | |
| | | Debt, | | | Budgetary | | | | | | | | | in the | | | | | | | | | | |
| | | beginning | | | deficit | | | Net capital | | | | | | Generations | | | Total | | | Debt, end | | | % of | |
| | | of year | | | (surplus) | | | investments | | | Other | | | Fund | | | change | | | of year | | | GDP | |
| 2018-2019 | | 176 543 | | | –4 803 | | | 3 002 | | | 1 293 | (1) | | –3 477 | | | –3 985 | | | 172 558 | | | 39.3 | |
| 2019-2020 | | 172 558 | | | –1 900 | | | 3 633 | | | — | | | –2 633 | | | –900 | | | 171 658 | | | 37.3 | |
| 2020-2021 | | 171 658 | | | — | | | 3 696 | | | — | | | –2 729 | | | 967 | | | 172 625 | | | 36.1 | |
| 2021-2022 | | 172 625 | | | — | | | 4 821 | | | — | | | –3 030 | | | 1 791 | | | 174 416 | | | 35.2 | |
| 2022-2023 | | 174 416 | | | — | | | 4 737 | | | — | | | –3 353 | | | 1 384 | | | 175 800 | | | 34.4 | |
| 2023-2024 | | 175 800 | | | — | | | 4 769 | | | — | | | –3 676 | | | 1 093 | | | 176 893 | | | 33.6 | |
| 2024-2025 | | 176 893 | | | — | | | 4 873 | | | — | | | –3 995 | | | 878 | | | 177 771 | | | 32.7 | |
(1) The increase in the net debt is due, in particular, to the other comprehensive income of Hydro-Québec. This includes accounting entries (e.g. unrealized exchange gains and losses) that, without affecting Hydro-Québec's net earnings, have an impact on its net assets and, consequently, the value of the government's participation in Hydro-Québec.
In the coming years, the net debt-to-GDP ratio will fall, reaching 32.7% as at March 31, 2025.
CHART G.3
| Budget 2020-2021 |
G.12 | Budget Plan |
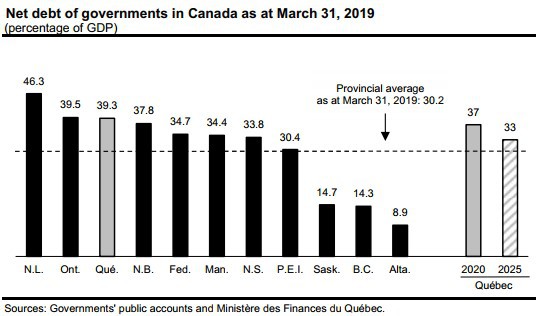
| Comparison of the net debt of governments in Canada |
As at March 31, 2019, Québec's net debt burden was 39.3% of GDP, compared with the provincial average of 30.2%.1 Québec's net debt burden is expected to decrease to 37% in 2020 and to 33% in 2025. |
 |
| |
1 Weighted average as a proportion of GDP.
The Québec | |
Government’s Debt | G.13 |
1.4 Debt representing accumulated deficits
The debt representing accumulated deficits consists of the accumulated deficits figuring in the government's financial statements.2 It is the debt that does not correspond to any assets.
The debt representing accumulated deficits will stand at 20.9% of GDP as at March 31, 2020.
— It is forecast to decrease to 14.5% of GDP as at March 31, 2025.
TABLE G.6
Factors responsible for the change in the debt representing accumulated deficits within the meaning of the Public Accounts
(millions of dollars)
| | | | | | | | | | | | Deposits | | | | | | | | | | |
| | | Debt, | | | Budgetary | | | | | | in the | | | | | | | | | | |
| | | beginning | | | deficit | | | Accounting | | | Generations | | | Total | | | Debt, end | | | % of | |
| | | of year | | | (surplus) | | | adjustments | | | Fund | | | change | | | of year | | | GDP | |
| 2018-2019 | | 107 470 | | | –4 803 | | | 1 258 | (1) | | –3 477 | | | –7 022 | | | 100 448 | | | 22.9 | |
| 2019-2020 | | 100 448 | | | –1 900 | | | — | | | –2 633 | | | –4 533 | | | 95 915 | | | 20.9 | |
| 2020-2021 | | 95 915 | | | — | | | — | | | –2 729 | | | –2 729 | | | 93 186 | | | 19.5 | |
| 2021-2022 | | 93 186 | | | — | | | — | | | –3 030 | | | –3 030 | | | 90 156 | | | 18.2 | |
| 2022-2023 | | 90 156 | | | — | | | — | | | –3 353 | | | –3 353 | | | 86 803 | | | 17.0 | |
| 2023-2024 | | 86 803 | | | — | | | — | | | –3 676 | | | –3 676 | | | 83 127 | | | 15.8 | |
| 2024-2025 | | 83 127 | | | — | | | — | | | –3 995 | | | –3 995 | | | 79 132 | | | 14.5 | |
(1) The change in the debt representing accumulated deficits in 2018-2019 as a result of accounting adjustments is due, in particular, to the other comprehensive income of Hydro-Québec. This includes accounting entries (e.g. unrealized exchange gains and losses) that, without affecting Hydro-Québec's net earnings, affect its net assets and, consequently, the value of the government's participation in Hydro-Québec.
___________________________________
2 As announced in the November 2019 economic and financial update, the government intends, for the purpose of monitoring this objective, to use the debt representing accumulated deficits within the meaning of the Public Accounts, that is, without the addition of the stabilization reserve. To that end, amendments will have to be made to the Act to reduce the debt and establish the Generations Fund.
| Budget 2020-2021 |
G.14 | Budget Plan |
❏ Adjustments to the debt representing accumulated deficits compared to the March 2019 budget
The debt representing accumulated deficits as at March 31, 2024 has been adjusted downward by $3.2 billion relative to the March 2019 budget.
— This downward adjustment is explained by the improvement in the budgetary situation in 2018-2019 and 2019-2020.
The ratio of debt representing accumulated deficits to GDP has been adjusted downward by 1.2 percentage points, owing, in particular, to higher-than-anticipated growth in nominal GDP.
TABLE G.7
Adjustments to the debt representing accumulated deficits within the meaning of the Public Accounts as at March 31 since the March 2019 budget
(millions of dollars)
| | | 2019 | | | 2020 | | | 2021 | | | 2022 | | | 2023 | | | 2024 | |
| March 2020 | | 100 448 | | | 95 915 | | | 93 186 | | | 90 156 | | | 86 803 | | | 83 127 | |
| % of GDP | | 22.9 | | | 20.9 | | | 19.5 | | | 18.2 | | | 17.0 | | | 15.8 | |
| March 2019 | | 101 864 | | | 99 360 | | | 96 676 | | | 93 729 | | | 90 369 | | | 86 337 | |
| % of GDP | | 23.4 | | | 22.1 | | | 20.8 | | | 19.6 | | | 18.3 | | | 17.0 | |
| Adjustments | | –1 416 | | | –3 445 | | | –3 490 | | | –3 573 | | | –3 566 | | | –3 210 | |
| % of GDP | | –0.5 | | | –1.2 | | | –1.3 | | | –1.4 | | | –1.3 | | | –1.2 | |
The Québec | |
Government’s Debt | G.15 |
| | Québec's public sector debt | |
| | The public sector debt includes the government's gross debt as well as the debt of Hydro-Québec, the municipalities, universities other than the Université du Québec and its constituents, and other government enterprises. This debt has served, in particular, to fund public infrastructure, such as roads, schools, hospitals, hydroelectric dams and water treatment plants. | |
| | | |
| | As at March 31, 2020, Québec's public sector debt will stand at $271.0 billion, or 58.9% of GDP. These figures must be seen in perspective for they do not take into account the economic value of certain assets held by the government, such as Hydro-Québec, the Société des alcools du Québec and Loto-Québec. | |
| | | |
| | Public sector debt as at March 31
(millions of dollars) | | |
| | | | 2016 | | | 2017 | | | 2018 | | | 2019 | | | 2020 | | |
| | Government's gross debt | | 203 347 | | | 203 490 | | | 201 071 | | | 199 098 | | | 197 685 | | |
| | Hydro-Québec | | 43 843 | | | 42 882 | | | 43 160 | | | 43 054 | | | 44 875 | | |
| | Municipalities | | 23 846 | | | 24 058 | | | 24 505 | | | 25 173 | | | 26 641 | | |
| | Universities other than the Université du Québec and its constituents | | 1 608 | | | 1 656 | | | 1 321 | | | 1 458 | | | 1 458 | | |
| | Other government enterprises | | 308 | | | 258 | | | 218 | | | 210 | | | 374 | | |
| | PUBLIC SECTOR DEBT | | 272 952 | | | 272 344 | | | 270 275 | | | 268 993 | | | 271 033 | | |
| | % of GDP | | 70.4 | | | 68.2 | | | 64.5 | | | 61.2 | | | 58.9 | | |
| | | | | | | | | | | | | | | | | | |
| Budget 2020-2021 |
G.16 | Budget Plan |
1.5 Achievement of debt reduction targets
The Act to reduce the debt and establish the Generations Fund stipulates that for fiscal 2025-2026, the gross debt must not exceed 45% of GDP, while the debt representing accumulated deficits must not exceed 17% of GDP.
— The objective of reducing the gross debt to 45% of GDP has been achieved. As at March 31, 2020, the ratio of gross debt to GDP will stand at 43.0%.
— The objective of reducing the debt representing accumulated deficits to 17% of GDP should be achieved in 2022-2023, three years ahead of schedule.
These targets will have been achieved thanks to:
— economic growth, which is helping to ease the debt burden;
— maintenance of a balanced budget;
— deposits in the Generations Fund.
The Québec | |
Government’s Debt | G.17 |
❏ Impact of the Generations Fund
The Generations Fund, which is dedicated exclusively to debt reduction, was created in 2006.
Since 2006-2007, the government has been allocating revenues to debt reduction every year.
— In 2020-2021, revenues totalling $2.7 billion will be dedicated to the Generations Fund.
CHART G.6
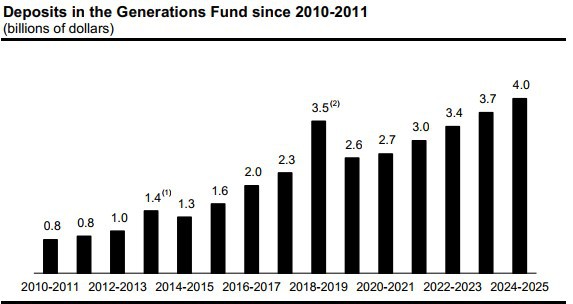
(1) In 2013-2014, a one-off payment of $300 million from the Territorial Information Fund was made to the Generations Fund.
(2) The larger deposits in 2018-2019 are explained by the materialization of investment gains resulting from accelerated debt repayment from the Generations Fund.
| Budget 2020-2021 |
G.18 | Budget Plan |
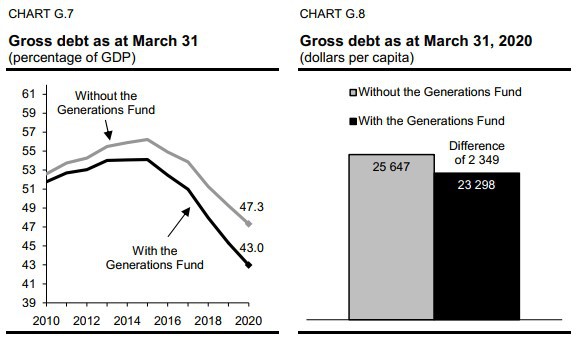
As at March 31, 2020, the gross debt burden will stand at 43.0% of GDP. It would have stood at 47.3% of GDP, or 4.3 percentage points higher, if the deposits in the Generations Fund had been excluded.
The gross debt per capita as at March 31, 2020 will stand at $23 298, whereas it would have stood at $25 647 excluding the deposits in the Generations Fund, a difference of $2 349 per capita.
The Québec | |
Government’s Debt | G.19 |
| The Act to reduce the debt and establish the Generations Fund |
In 2006, the National Assembly passed legislation setting debt reduction targets and establishing the Generations Fund, a fund dedicated exclusively to debt reduction. This Act flowed from the Balanced Budget Act passed in 1996. At the time, Québec was the most indebted province in Canada. The government set the objective of reducing Québec's debt burden to the provincial average, in particular to meet the challenge of demographic change. The objective was determined using the concept of total debt. By tackling the debt burden, the government wished to foster intergenerational fairness, hence the fund's name, and ensure the sustainability of social programs. In 2010, the government set new debt reduction targets for the gross debt and the debt representing accumulated deficits. This change was in keeping with the deficit situation resulting from the global financial crisis and the accounting reform leading to line-by-line consolidation of the health and social services and education networks that increased the gross debt by more than $5 billion as at March 31, 2009. The Act also specifies the revenue sources dedicated to the Generations Fund for repaying the debt, in particular: – water-power royalties paid by Hydro-Québec and private producers of hydro-electricity; – revenue stemming from the indexation of the price of heritage electricity; – mining revenues; – an amount from the specific tax on alcoholic beverage; – investment income. The sums making up the Generations Fund are deposited with the Caisse de dépôt et placement du Québec and managed in accordance with an investment policy determined by the Minister of Finance, in collaboration with representatives of the Caisse. In 2018-2019 and 2019-2020, for the purposes of sound risk management, $10 billion was withdrawn from the Generations Fund to reduce Québec's debt on financial markets and lower the government's interest charges. |
| Budget 2020-2021 |
G.20 | Budget Plan |

| | The Act to reduce the debt and establish the Generations Fund (cont.) | |
| | | |
| | In 2020-2021, deposits of dedicated revenues in the Generations Fund will amount to $2.7 billion. The Generations Fund will stand at $11.7 billion as at March 31, 2021. | |
| | | |
| | Generations Fund (millions of dollars) | |
| | | | 2019- | | | 2020- | | | 2021- | | | 2022- | | | 2023- | | | 2024- | | |
| | | | 2020(1) | | | 2021 | | | 2022- | | | 2023 | | | 2024 | | | 2025 | | |
| | Book value, beginning of year | | 8 293 | | | 8 926 | | | 11 655 | | | 14 685 | | | 18 038 | | | 21 714 | | |
| | Dedicated revenues | | | | | | | | | | | | | | | | | | | |
| | Water-power royalties | | | | | | | | | | | | | | | | | | | |
| | Hydro-Québec | | 741 | | | 763 | | | 776 | | | 818 | | | 829 | | | 838 | | |
| | Private producers | | 102 | | | 103 | | | 105 | | | 106 | | | 108 | | | 111 | | |
| | Subtotal | | 843 | | | 866 | | | 881 | | | 924 | | | 937 | | | 949 | | |
| | Indexation of the price of heritage electricity | | 317 | | | 388 | | | 525 | | | 635 | | | 750 | | | 855 | | |
| | Additional contribution from Hydro-Québec | | 215 | | | 215 | | | 215 | | | 215 | | | 215 | | | 215 | | |
| | Mining revenues | | 279 | | | 283 | | | 301 | | | 325 | | | 358 | | | 384 | | |
| | Specific tax on alcoholic beverages | | 500 | | | 500 | | | 500 | | | 500 | | | 500 | | | 500 | | |
| | Unclaimed property | | 20 | | | 15 | | | 15 | | | 15 | | | 15 | | | 15 | | |
| | Investment income(2) | | 459 | | | 462 | | | 593 | | | 739 | | | 901 | | | 1 077 | | |
| | Total dedicated revenues | | 2 633 | | | 2 729 | | | 3 030 | | | 3 353 | | | 3 676 | | | 3 995 | | |
| | Use of the Generations Fund to repay borrowings | | –2 000 | | | — | | | — | | | — | | | — | | | — | | |
| | BOOK VALUE, END OF YEAR | | 8 926 | | | 11 655 | | | 14 685 | | | 18 038 | | | 21 714 | | | 25 709 | | |
| (1) For information purposes, the market value of the Generations Fund as at December 31, 2019 was $9.2 billion, or $1.0 billion higher than its book value at that date. (2) The investment income of the Generations Fund corresponds to realized investment income (interest, dividends, gains on the disposal of assets, etc.). The forecast may thus be adjusted upward or downward according to the timing of realized gains or losses. In addition to the realized gains stemming from withdrawals from the Generations Fund, an annual return of 4.8% is expected, a rate based on five historic years. |
|
The Québec | |
Government’s Debt | G.21 |
| | Return of the Generations Fund | |
| | Since the first deposit was made in the Generations Fund in January 2007, the return has been higher than the cost of new borrowings by the government 12 years out of 13. – From 2007 to 2019, the average return was 5.8%, compared with an average cost of 3.3% for new borrowings, which represents a difference of 2.5 percentage points. Comparison of the Generations Fund's annual return and the Québec government's borrowing costs (per cent, on a calendar year basis) | |
| | | Return of the | Cost of new | Difference | |
| | | Generations Fund | borrowings(1) | (percentage points) | |
| | 2007 | 5.6 | 4.7 | 0.9 | |
| | 2008 | −22.4 | 4.5 | −26.9 | |
| | 2009 | 11.3 | 4.4 | 6.9 | |
| | 2010 | 12.3 | 4.1 | 8.2 | |
| | 2011 | 4.0 | 3.7 | 0.3 | |
| | 2012 | 8.4 | 3.0 | 5.4 | |
| | 2013 | 12.0 | 3.3 | 8.7 | |
| | 2014 | 11.7 | 3.2 | 8.5 | |
| | 2015 | 8.1 | 2.4 | 5.7 | |
| | 2016 | 7.3 | 2.2 | 5.1 | |
| | 2017 | 8.5 | 2.5 | 6.0 | |
| | 2018 | 4.4 | 2.9 | 1.5 | |
| | 2019 | 9.5 | 2.3 | 7.2 | |
| | (1) The government's borrowing costs correspond to the yield on 10-year maturity Québec bonds.
Source: PC-Bond for the yield on 10-year maturity Québec bonds. | |
| Budget 2020-2021 |
G.22 | Budget Plan |

❏ Tangible benefits of reducing the debt burden
Several tangible benefits are associated with reducing the debt burden.
— Québec is no longer the most indebted province.
— The interest savings generated by reducing the debt help to ensure stable funding for the government's chief missions, including health and education.
— They also contribute to the measures implemented by the government to put money back in the pockets of Quebecers and fight climate change.
— Québec can invest heavily in public infrastructure without increasing its indebtedness.
— The 2020-2030 Québec Infrastructure Plan (QIP) stands at $130.5 billion.
— Québec's debt burden is lower than it was prior to the last recession, thus putting Québec in a good position to cope with a potential economic slowdown.
— Québec's credit rating has been raised by two credit rating agencies in recent years.
— In June 2017, Standard & Poor's (S&P) raised Québec's credit rating from “A+” to “AA−”, a first since 1993. Québec has thus recovered the credit rating it had with S&P from 1982 to 1993.
— In November 2019, DBRS Morningstar raised Québec's credit rating by one notch, from “A (high)” to ”AA (low)”. It is the first time DBRS has assigned a credit rating in the “AA” category to Québec.
— Québec benefits from advantageous borrowing costs. It currently borrows at lower costs than Ontario.
The Québec | |
Government’s Debt | G.23 |
| A strategy recognized by credit rating agencies and investors |
Québec's debt reduction strategy is recognized by credit rating agencies and investors. When the Generations Fund was created in 2006, several credit rating agencies said that this initiative demonstrated Québec's determination to reduce its debt. In 2018, the National Bank of Canada published a note entitled “All hail Québec's mighty Generations Fund.” In it, the Bank noted: Since being established back in 2006, this Fund has become the very backbone of debt reduction strategy. To the extent debt containment has earned kudos from rating agencies (e.g. witness last year's upgrade to 'AA-' by closely watched S&P) and encouraged investors to scoop up Québec bonds at ever tighter spreads to provincial peers, it's hard to overplay the Generations Fund's importance to the province's overall credit story. It is also important to mention that the strategy of reducing the debt through the Generations Fund has gained credibility over the years, given that all political parties that have governed Québec since 2006 have maintained it. In this regard, Moody's credit rating agency noted the following in 2019: The continued adherence to the Generations Fund, despite the province undergoing multiple government changes, highlights the broad commitment for the debt reduction strategy.1 |
1 Moody's, Credit Opinion, June 21, 2019.
| Budget 2020-2021 |
G.24 | Budget Plan |

1.6 Ongoing debt reduction: the need to initiate a reflection process
The achievement of the debt reduction targets raises the issue of setting new policy directions on debt reduction.
It is time to initiate a reflection process focusing on:
— the need to continue debt reduction efforts;
— the determination of a new target and a new indicator, if applicable;
— the rate at which the new target should be met.
❏ Against the backdrop of intergenerational fairness
The Act to reduce the debt and establish the Generations Fund was born of the will to improve intergenerational fairness. Through the Generations Fund, the government dedicates revenues to reducing the debt that has served to pay current expenditures, with a view to improving fairness for future generations as well as preserving, and even enhancing the quality of public services.
— As at March 31, 2020, the debt representing accumulated deficits, that is, the debt that has served to pay current expenditures, will stand at $95.9 billion, or 20.9% of GDP.
For the government, intergenerational fairness is an objective that should be pursued, and reducing the debt burden is an excellent way to achieve it. In fact, debt reduction is one of the keys to improving intergenerational fairness. However, it is not the only way. Indeed, the government helps to improve intergenerational fairness when it:
— takes steps to increase Québec's economic potential;
— boosts the purchasing power of Québec families;
— invests in education, childcare services and public infrastructure;
— implements measures to reduce GHG emissions.
The government will have to take into account various avenues favouring intergenerational fairness in the reflection process that has been launched.
The Québec | |
Government’s Debt | G.25 |
❏ Target to be achieved
Québec's debt remains high compared to that of the other provinces, even though budgetary surpluses have been posted in recent years.
— As at March 31, 2019, Québec's net debt burden stood at 39.3% of GDP, compared to 34.7% for the federal government, 30.2%3 for the provincial average and 11.7%3 for the average of the three least indebted provinces, namely, British Columbia, Alberta and Saskatchewan.
CHART G.9
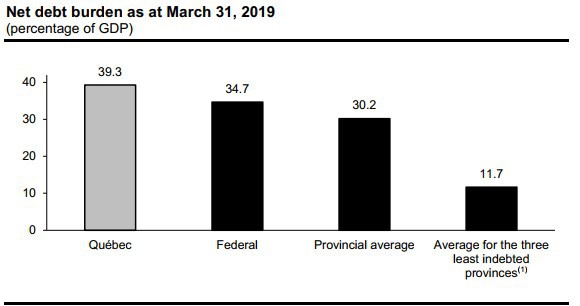
(1) Weighted average as a proportion of GDP for British Columbia, Alberta and Saskatchewan.
Sources: Governments' public accounts.
If the government sets a new debt reduction target, it could, for example, decide to reduce Québec's net debt burden to the current provincial average of 30%.
It could also decide to eliminate the debt representing accumulated deficits, that is, the debt that does not correspond to any assets.4
Like the federal and Ontario governments, the Québec government could limit itself to one target in order to simplify reporting.
— The federal government reports on changes in the burden of the debt representing accumulated deficits, whereas Ontario has set an objective for the net debt burden.
__________________________________
3 Weighted average as a proportion of GDP.
4 Three provinces, namely, British Columbia, Alberta and Saskatchewan, did not have any debt representing accumulated deficits as at March 31, 2019.
| Budget 2020-2021 |
G.26 | Budget Plan |
❏ Indicator to be used
Québec's main concepts of debt are gross debt, net debt and debt representing accumulated deficits. Each of these concepts has its own specific characteristics.
Like Ontario and certain other provinces, Québec could focus its reporting on the net debt, which:
— takes into account government borrowings arising from substantial capital investments;
— subtracts financial assets that will ultimately be used to reduce the debt on financial markets;
— is readily comparable from one province to another.
TABLE G.8
Change factors that affect each debt concept
| | | | Debt |
| | | | representing |
| | | | accumulated |
| | Gross debt | Net debt | deficits |
| | | | |
| The budgetary balance (including deposits in the Generations Fund) has an impact on all three concepts of debt (a surplus reduces the debt, while a deficit increases it) | ✓ | ✓ | ✓ |
| | | | |
| Capital investments lead to an increase in the gross debt and the net debt | ✓ | ✓ | |
| | | | |
| The government's investments, loans and advances affect only the gross debt (they have no impact on the net debt because the government owns financial assets in exchange; these assets will ultimately be used to reduce the debt on financial markets) | ✓ | | |
The Québec | |
Government’s Debt | G.27 |
❏ Target achievement rate
Since 2006-2007, the main component of the government's debt reduction strategy has been based on depositing revenues in the Generations Fund year after year.
The larger the deposits are, the faster the debt is reduced.
— The government plans to deposit $16.8 billion in the Generations Fund from 2020-2021 to 2024-2025, or nearly $3.4 billion a year on average.
It is important to stress that implementing the new policy directions on debt reduction must not call into question the relevance of the Generations Fund as a tool for reducing the debt burden in a context where:
— Québec remains one of the most indebted provinces;
— future generations must not be left with the burden of repaying the debt, so as to uphold the commitment made by every government since 2006;
— the Generations Fund is an effective tool recognized by credit rating agencies and investors.
| Budget 2020-2021 |
G.28 | Budget Plan |

❏ The benefits of future debt reduction
Reducing the debt burden contributes to economic growth by creating a climate of confidence conducive to private investment and higher productivity.
Accordingly, it is in the best interests of Québec to continue reducing the debt burden, for this would enable it to:
— ensure stable funding for the government's main missions, including health and education;
— cope with the costs associated with an aging population;
— fund investment in public infrastructure;
— fight climate change;
— ease the tax burden on Quebecers;
— counter a potential economic slowdown;
— increase Québec's financial autonomy within the federation.
| The importance of setting a long-term objective |
Setting a long-term debt reduction objective is an excellent way to ensure sound management of public finances. Since it makes the government accountable to parliamentarians and citizens year after year, it makes government action more transparent and efficient. This type of long-term policy direction reduces uncertainty and contributes to economic growth by anchoring the expectations of the public and businesses regarding the budgetary and financial policies to be issued by the government, enabling them to make better decisions. – For example, thanks to debt reduction objectives, the government can plan its annual infrastructure investments over a long period, that is, 10 years. It also makes it possible to work towards the achievement of a common objective, which, in this case, is to not leave future generations with the heavy burden of repaying the debt. Lastly, it sends a positive signal to credit rating agencies and investors. |
The Québec | |
Government’s Debt | G.29 |
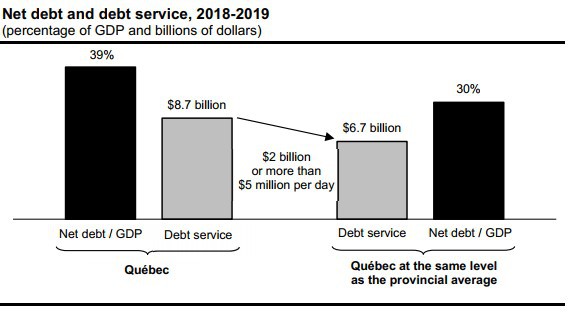
❏ Debt service savings of $2 billion per year
It is estimated that if Québec's net debt burden as at March 31, 2019 had been equivalent to the provincial average of 30%, debt service, or the interest paid on the debt, would have been $2 billion less in 2018-2019.
— This would have given the government an additional amount of more than $5 million per day for funding public services, clearly illustrating the benefits of reducing the debt.
CHART G.10
❏ New policy directions to be defined
The achievement of the debt reduction targets makes it necessary to begin reflecting on new policy directions for reducing the debt. This reflection process should focus on the setting of a new target, the debt concept to be used and the rate at which the government would like to achieve that objective.
The fact that Québec is still fairly indebted compared to the Canadian provincial average will have to be considered in this reflection process, for it is important not to leave future generations with this heavy burden.
| Budget 2020-2021 |
G.30 | Budget Plan |

2. FINANCING
2.1 Financing program
The financing program corresponds to long-term borrowings made, in particular, to repay maturing borrowings and to fund the government's capital investments.
For 2019-2020, the program amounts to $19.2 billion, which is $7.4 billion more than forecast in the March 2019 budget.
The main adjustments leading to this increase stem from repayments of borrowings, deposits in the Retirement Plans Sinking Fund and pre-financing.
TABLE G.9
The government's financing program, 2019-2020
(millions of dollars)
| | | March 2019 | | | Adjustments | | | March 2020 | |
| Net financial requirements | | 8 118 | | | –4 993 | | | 3 125 | |
| Repayments of borrowings | | 11 066 | | | 5 676 | | | 16 742 | |
| Use of Generations Fund to repay borrowings | | –2 000 | | | — | | | –2 000 | |
| Withdrawal from the Accumulated Sick Leave Fund | | — | | | –100 | | | –100 | |
| Use of pre-financing | | –4 167 | | | –1 782 | | | –5 949 | |
| Change in cash position | | –1 235 | | | 492 | | | –743 | |
| Deposits in the Retirement Plans Sinking Fund (RPSF)(1) | | — | | | 1 500 | | | 1 500 | |
| Transactions under the credit policy(2) | | — | | | 355 | | | 355 | |
| Pre-financing | | — | | | 6 299 | | | 6 299 | |
| TOTAL | | 11 782 | | | 7 447 | | | 19 229 | (3) |
Note: A negative entry indicates a source of financing and a positive entry, a financial requirement.
(1) Deposits in the RPSF are optional. They are recorded in the financing program only once they are made.
(2) Under the credit policy, which is designed to limit risk with respect to counterparties, the government disburses or receives amounts following, in particular, movements in exchange rates. These amounts have no effect on the debt.
(3) This data is based on borrowings contracted as at February 14, 2020.
The Québec | |
Government’s Debt | G.31 |
| | Borrowings contracted in 2019-2020 | |
| | | |
| | The government aims to borrow at the lowest possible cost. To that end, it applies a strategy for diversifying sources of funding by market, financial instrument and maturity. Thus far in 2019-2020, the government has contracted 36% of its borrowings on foreign markets, compared to an average of 21% for the past 10 years. However, the government keeps no exposure of its debt to foreign currencies so as to neutralize the impact of variations in foreign exchange rates on debt service. In 2019-2020, conventional bonds in Canadian dollars were the main debt instrument used. To date, approximately 68% of the borrowings contracted in 2019-2020 had a maturity of 10 years or more. As at March 31, 2020, the average maturity of the debt should be 11 years. Summary of long-term borrowings contracted in 2019-2020 | |
| | Currencies | | $million | | | % | | |
| | CANADIAN DOLLAR | | | | | | | |
| | Conventional bonds | | 11 163 | | | 58.1 | | |
| | Green Bonds | | 500 | | | 2.6 | | |
| | Immigrant investors(1) | | 371 | | | 1.9 | | |
| | Savings products issued by Épargne Placements Québec | | 295 | | | 1.5 | | |
| | Subtotal | | 12 329 | | | 64.1 | | |
| | OTHER CURRENCIES | | | | | | | |
| | U.S. dollar | | 4 633 | | | 24.1 | | |
| | Euro | | 1 461 | | | 7.6 | | |
| | Pound sterling | | 407 | | | 2.1 | | |
| | Swedish krona | | 245 | | | 1.3 | | |
| | Australian dollar | | 95 | | | 0.5 | | |
| | New Zealand dollar | | 59 | | | 0.3 | | |
| | Subtotal | | 6 900 | | | 35.9 | | |
| | TOTAL | | 19 229 | | | 100.0 | | |
| | Note: Borrowings contracted as at February 14, 2020. (1) These borrowings are from sums advanced by immigrant investors. These sums are lent to the government through Investissement Québec. | |
| Budget 2020-2021 |
G.32 | Budget Plan |

The financing program will amount to $13.9 billion in 2020-2021.
For the four subsequent years, that is, from 2021-2022 to 2024-2025, it will average $26.9 billion per year.
TABLE G.10
The government's financing program, 2020-2021 to 2024-2025
(millions of dollars)
| | | 2020-2021 | | | 2021-2022 | | | 2022-2023 | | | 2023-2024 | | | 2024-2025 | |
| Net financial requirements | | 9 843 | | | 10 377 | | | 10 238 | | | 11 382 | | | 9 632 | |
| Repayments of borrowings | | 10 364 | | | 16 680 | | | 14 433 | | | 16 057 | | | 18 968 | |
| Use of pre-financing | | –6 299 | | | — | | | — | | | — | | | — | |
| Use of the Generations Fund to repay borrowings | | — | | | — | | | — | | | — | | | — | |
| TOTAL | | 13 908 | | | 27 057 | | | 24 671 | | | 27 439 | | | 28 600 | |
Note: A negative entry indicates a source of financing and a positive entry, a financial requirement.
| Green Bond program |
In 2017, the government introduced a Green Bond program to fund projects providing tangible benefits with regard to protecting the environment, reducing GHG emissions or adapting to climate change. Through this program, the government is contributing to, among other things, the development of a socially responsible investment market. The program draws on the Green Bond Principles, a set of guidelines created to bring more transparency to the issuance process, disclosure and reporting. Québec's Green Bond framework received the highest rating possible from CICERO (Center for International Climate Research). Five issues totalling $2.8 billion have been made since the program was launched, including an issue of $500 million in February 2020. Given the demand for Québec's Green Bonds and the government's commitment to the environment, Québec will be a regular issuer of Green Bonds. For more information, visit www.finances.gouv.qc.ca/en/RI_GB_Green_Bonds.asp. |
The Québec | |
Government’s Debt | G.33 |
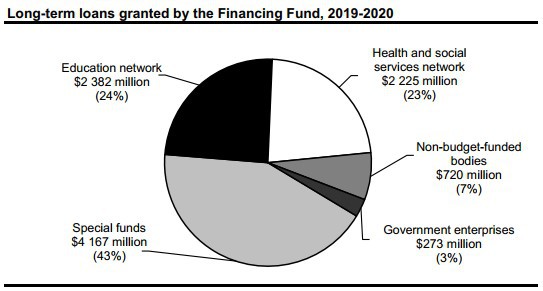
| Funding of public bodies |
| |
| The main mission of the Financing Fund and Financement-Québec is to offer Québec's public sector bodies financing at the lowest possible cost. The clientele of the Financing Fund consists of the public bodies included in the government reporting entity. In fiscal 2019-2020, the long-term loan program of the Financing Fund amounts to $9.8 billion. |
| |
 |
| |
| Financement-Québec also offers funding to public bodies not included in the government reporting entity, in particular universities other than the Université du Québec and its constituents, as well as certain municipal bodies. In fiscal 2019-2020, the long-term loan program of Financement-Québec amounts to $1.2 billion. |
| |
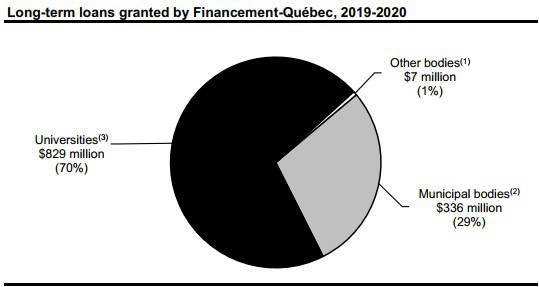 |
(1) Montreal Clinical Research Institute and Montreal Museum of Fine Arts. (2) Société de transport de Montréal, Autorité régionale de transport métropolitain and Réseau de transport métropolitain. (3) Universities other than the Université du Québec and its constituents. |
| Budget 2020-2021 |
G.34 | Budget Plan |

2.2 Debt management strategy
The government, through its debt management strategy, aims to minimize the cost of debt while limiting the risks related to fluctuations in foreign exchange and interest rates.
The government uses a range of financial instruments, particularly interest rate and currency swap agreements (swaps), to achieve desired debt proportions by currency and interest rate.
❏ Structure of the gross debt by currency
As at March 31, 2020, before taking swaps into account, 79.3% of the gross debt is expected to be in Canadian dollars, 12.8% in U.S. dollars, 5.1% in euros, 0.9% in Australian dollars, 0.8% in pounds sterling, 0.7% in Swiss francs and 0.4% in other foreign currencies (yen, New Zealand dollars, Hong Kong dollars and Swedish krona).
After taking swaps into account, the entire gross debt is denominated in Canadian dollar.
Since 2012-2013, the government has maintained no exposure of its debt to foreign currencies.
Swaps allow for neutralization of the impact of variations in foreign exchange rates on debt service.
TABLE G.11
Structure of the gross debt by currency as at March 31, 2020
(per cent)
| | | Before | | | After | |
| | | swaps | | | swaps | |
| Canadian dollar | | 79.3 | | | 100.0 | |
| U.S. dollar | | 12.8 | | | 0.0 | |
| Euro | | 5.1 | | | 0.0 | |
| Australian dollar | | 0.9 | | | 0.0 | |
| Pound sterling | | 0.8 | | | 0.0 | |
| Swiss franc | | 0.7 | | | 0.0 | |
| Other (yen, New Zealand dollar, Hong Kong dollar and Swedish krona) | | 0.4 | | | 0.0 | |
| TOTAL | | 100.0 | | | 100.0 | |
Note: Gross debt including pre-financing.
The Québec | |
Government’s Debt | G.35 |
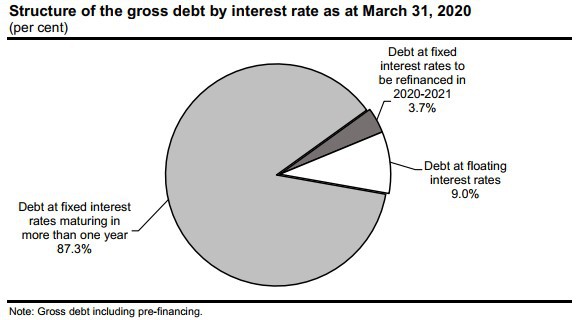
❏ Structure of the gross debt by interest rate
The government keeps part of its debt at fixed interest rates and part at floating interest rates.
As at March 31, 2020, after taking swaps into account, the proportion of the gross debt at fixed interest rates is expected to be 91.0%,5 while the proportion at floating rates is expected to be 9.0%.
In addition, as at March 31, 2020, the share of the gross debt subject to an interest rate change in 2020-2021 is expected to be 12.7%. This share includes the debt at floating interest rates (9.0%) as well as the debt at fixed rates, which will have to be refinanced in 2020-2021 (3.7%).
CHART G.11
_____________________________________
5 This proportion includes the debt at fixed interest rates maturing in more than one year (87.3%) as well as the debt at fixed interest rates to be refinanced in 2020-2021 (3.7%).
| Budget 2020-2021 |
G.36 | Budget Plan |
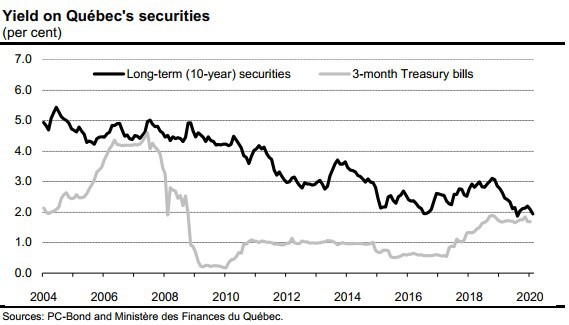
2.3 Yield on Québec's debt securities
The yield on the Québec's 10-year securities is approximately 1.9%. The yield on Treasury bills is around 1.7%.
CHART G.12
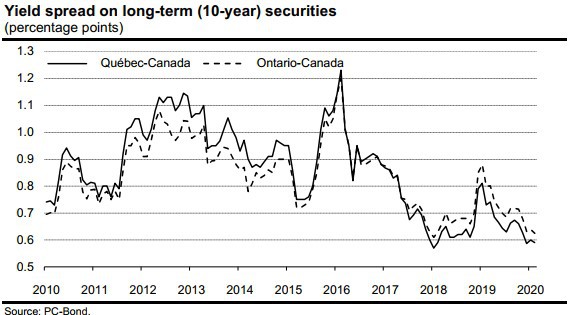
Since June 2017, a spread in favour of Québec has been observed between the yield on 10-year securities of Québec and those of Ontario.
CHART G.13
The Québec | |
Government’s Debt | G.37 |

3. PUBLIC AND PARAPUBLIC SECTOR RETIREMENT PLANS
3.1 Net liability for the retirement plans
The Québec government covers its share of the funding of its employees' retirement plans, which are defined-benefit plans.
In its financial statements, it discloses the pension obligation, which corresponds to the present value of the retirement benefits that it will pay to its employees. This obligation is re-evaluated annually using a method that gradually factors in differences observed relative to forecasts.6 It thus calculates the retirement plans liability.
Sums are accumulated in the Retirement Plans Sinking Fund (RPSF) and other funds in order to pay retirement benefits. The value of these assets is subtracted from the liability to measure the government's net commitment, called the net retirement plans liability. This amount is included in the gross debt.
____________________________________
6 The value of obligations relating to accrued retirement plan benefits undergoes actuarial valuations every three years. The value is extrapolated between two valuations.
The Québec | |
Government’s Debt | G.39 |
As at March 31, 2019, the net liability for the retirement plans and other employee future benefits stood at $18.4 billion.
TABLE G.12
Net liability for the retirement plans and other employee future benefits as at March 31, 2019
(millions of dollars)
| Retirement plans | | | |
| Retirement plans liability(1) | | 105 656 | |
| Less: Retirement Plans Sinking Fund (RPSF) and other funds(2) | | –87 075 | |
| Net retirement plans liability | | 18 581 | |
| Other employee future benefits | | | |
| Other employee future benefits liability | | 1 471 | |
| Less: Funds dedicated to other employee future benefits | | –1 690 | |
| Net other employee future benefits liability(3) | | –219 | |
| NET LIABILITY FOR THE RETIREMENT PLANS AND OTHER EMPLOYEE FUTURE BENEFITS | | 18 362 | |
(1) Mainly the Government and Public Employees Retirement Plan (RREGOP) and the Pension Plan of Management Personnel (PPMP).
(2) The value of the RPSF is $81 344 million. The other funds consist mainly of that of the Pension Plan of the Université du Québec.
(3) A negative entry means that the value of assets is higher than the value of liabilities.
| Budget 2020-2021 |
G.40 | Budget Plan |

❏ Annual retirement plan expenses
Every year, the government records the expenses it has to cover as an employer with regard to the pension plans. These expenses include:
— the cost of accrued benefits, namely, the present value of retirement benefits that employees have accumulated for work performed during the year ($2 492 million in 2018-2019);
— the net debt service expense, which corresponds to the interest expense on the pension obligation less the investment income of the RPSF and other funds ($1 327 million in 2018-2019);
— the amortization of revisions to the government's actuarial obligations arising from previous updates of actuarial valuations ($601 million in 2018-2019).
In 2018-2019, the government's expenses for the retirement plans stood at $4 420 million.
TABLE G.13
Retirement plan expenses
(millions of dollars)
| | | 2018-2019 | |
| Cost of accrued benefits | | 2 492 | |
| Net debt service expense | | 1 327 | |
| Amortization of revisions stemming from actuarial valuations(1) | | 601 | |
| RETIREMENT PLAN EXPENSES | | 4 420 | |
(1) This amount includes the cost of other items ($72 million in 2018-2019), concerning mainly the change in valuation allowances.
The Québec | |
Government’s Debt | G.41 |
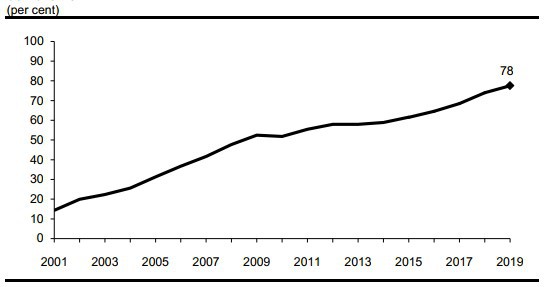
| Retirement Plans Sinking Fund |
| |
The Retirement Plans Sinking Fund (RPSF) is an asset that was created by the Québec government in 1993 for the purpose of paying the retirement benefits of public and parapublic sector employees. In December 1999, as part of the agreement concluded for the renewal of its employees' collective agreements, the government set the objective of ensuring that the book value of the sums accumulated in the RPSF would be equal, in 2020, to 70% of its actuarial obligations in respect of the retirement plans of public and parapublic sector employees. – This objective was achieved as at March 31, 2018, two years earlier than expected. – As at March 31, 2019, the RPSF was equal to 78% of the actuarial obligations in respect of the retirement plans. Sums will continue to be accumulated in the RPSF to ensure that the government continues reducing the gap between its actuarial obligations in respect of the retirement plans of public and parapublic sector employees and the sums it holds to meet these obligations. Book value of the RPSF in proportion to the government's actuarial obligations in respect of the retirement plans of public and parapublic sector employees as at March 31 |
| |
 |
| Budget 2020-2021 |
G.42 | Budget Plan |

| | Returns on funds deposited with the Caisse de dépôt et placement du Québec | |
| | | |
| | The main funds deposited by the Ministère des Finances with the Caisse de dépôt et placement du Québec (Retirement Plans Sinking Fund, Generations Fund and Accumulated Sick Leave Fund) are managed in accordance with an investment policy established by the Ministère des Finances in cooperation with representatives of the Caisse.
This investment policy is established taking several factors into account, including 10-year return forecasts, standard deviations and correlations for various categories of assets, opportunities for investing in these assets and recommendations of the Caisse. In 2019, the return on funds deposited by the Ministère des Finances with the Caisse was 10.1% for the Retirement Plans Sinking Fund, 9.5% for the Generations Fund and 10.1% for the Accumulated Sick Leave Fund. The investment policies of these funds are presented in the box on the next page. Return on and market value of funds deposited by the Ministère des Finances with the Caisse de dépôt et placement du Québec in 2019 | |
| | | Rate of | Market value as at | |
| | | return | December 31, 2019 | |
| | | (%) | ($billion) | |
| | Retirement Plans Sinking Fund (RPSF) | 10.1 | 93.0 | |
| | Generations Fund | 9.5 | 9.2 | |
| | Accumulated Sick Leave Fund (ASLF) | 10.1 | 1.4 | |
| | | | | |
The Québec | |
Government’s Debt | G.43 |
| Comparison of investment policies |
Investment policies as at January 1, 2020 (per cent) |
| | | | | | | | | Average benchmark | |
| | | RPSF and | | | Generations | | | portfolio of depositors | |
| Specialized portfolios | | ASLF | | | Fund(1) | | | as a whole(2) | |
| Short-Term Investments | | 1.0 | | | 1.0 | | | 1.1 | |
| Rates(3) | | 13.0 | | | 11.0 | | | 12.6 | |
| Credit(4) | | 19.0 | | | 12.2 | | | 16.7 | |
| Long-Term Bonds | | 0 | | | 0 | | | 0.9 | |
| Real Return Bonds | | 0 | | | 0 | | | 0.4 | |
| Total – Fixed income | | 33.0 | | | 24.2 | | | 31.7 | |
| Infrastructure | | 8.0 | | | 12.1 | | | 6.5 | |
| Real Estate | | 12.0 | | | 17.1 | | | 12.1 | |
| Total – Real assets | | 20.0 | | | 29.2 | | | 18.6 | |
| Public Equity | | 32.5 | | | 23.3 | | | 37.2 | |
| Private Equity | | 14.5 | | | 23.3 | | | 12.5 | |
| Total – Equity | | 47.0 | | | 46.6 | | | 49.7 | |
| TOTAL | | 100.0 | | | 100.0 | | | 100.0 | |
RPSF: Retirement Plans Sinking Fund. ASLF: Accumulated Sick Leave Fund. (1) The investment policy of the Generations Fund has been adjusted, in cooperation with the Caisse, to take into account withdrawals from this fund for accelerating debt repayment. (2) Data as at December 31, 2018 drawn from the 2018 Annual Report of the Caisse de dépôt et placement du Québec. (3) This portfolio consists of government bonds. (4) Broader range of instruments with fixed income securities characteristics. |
| Budget 2020-2021 |
G.44 | Budget Plan |
4. CREDIT RATINGS
4.1 Québec's credit ratings
A credit rating measures the ability of a borrower, such as the Québec government, to pay interest on its debt and repay the principal at maturity.
Québec's credit rating is evaluated by six credit rating agencies.
On November 12, 2019, DBRS Morningstar raised Québec's credit rating by one notch, from “A (high)” to “AA (low)”. It is the first time DBRS has assigned a credit rating in the “AA” category to Québec.
This increase in Québec's credit rating is explained by the outstanding performance of the Québec economy, as well as sound management of public finances thanks, in particular, to a significant reduction of the debt burden.
A higher credit rating means access to a broader pool of investors and advantageous borrowing costs.
TABLE G.14

(1) Credit rating for bond issues on the Chinese market.
The Québec | |
Government’s Debt | G.45 |
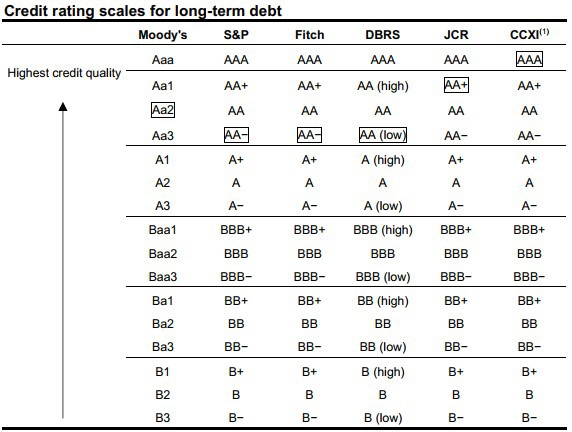
Québec's credit ratings, which are indicated in the table below, differ from one credit rating agency to another because of the methodology used to determine credit risk.
The four main credit rating agencies (Moody's, S&P, Fitch and DBRS) assign Québec a credit rating in the “AA” category.
It should be noted that the six credit rating agencies assign a stable outlook to Québec's credit rating.
TABLE G.15
(1) Credit rating for bond issues on the Chinese market.
| Budget 2020-2021 |
G.46 | Budget Plan |
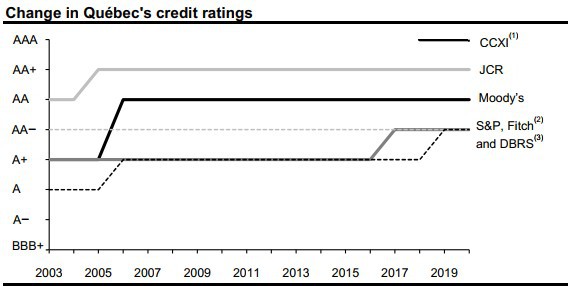
❏ Change in Québec's credit ratings
The following chart shows the change in Québec's credit ratings since 2003.
In November 2019, DBRS raised Québec's credit rating by one notch, from “A (high)” to “AA (low)”. It is the first time DBRS has assigned a credit rating in the “AA” category to Québec.
CHART G.14
Note: The credit ratings for 2020 are those that were in effect on February 20, 2020.
(1) CCXI has assigned Québec a credit rating since 2018.
(2) Fitch's credit rating is indicated by the dotted gray line.
(3) DBRS's credit rating corresponds to the dotted black line.
The Québec | |
Government’s Debt | G.47 |
4.2 Comparison of the credit ratings of the Canadian provinces
The following charts show the credit ratings of the Canadian provinces assigned by Moody's and Standard & Poor's as at February 20, 2020.
CHART G.15
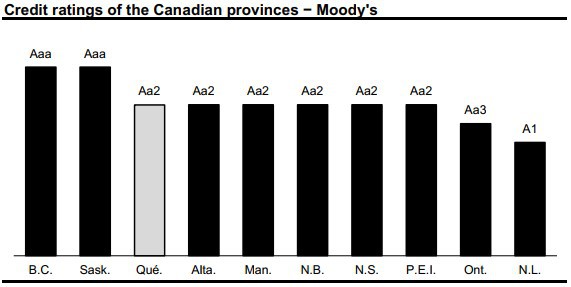
CHART G.16
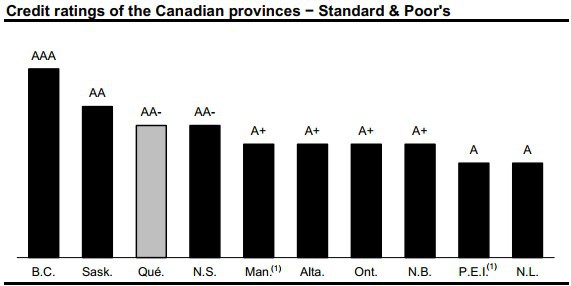
(1) Rating with a positive outlook.
| Budget 2020-2021 |
G.48 | Budget Plan |