Exhibit 99.17
Section C
The Government’s Financial Framework
INTRODUCTION | C.3 |
| | | | |
1. | STAYING THE COURSE ON RESTORING BUDGET BALANCE IN
2013-2014 | C.5 |
| | | | |
| 1.1 | Change in the budgetary balance | C.5 |
| | | |
| 1.2 | Adjustments to the financial framework | C.7 |
| | | | |
2. | UPDATING OF THE FINANCIAL FRAMEWORK | C.11 |
| | | | |
| 2.1 | Budgetary revenue | C.11 |
| | | | |
| | 2.1.1 | Own-source revenue excluding government enterprises | C.12 |
| | | | |
| | 2.1.2 | Revenue from government enterprises | C.15 |
| | | | |
| | 2.1.3 | Revenues from federal transfers | C.17 |
| | | | |
| 2.2 | Budgetary expenditure | C.20 |
| | | | |
| | 2.2.1 | Adjustments to program spending | C.21 |
| | | | |
| | 2.2.2 | Efforts on the part of all government departments | C.24 |
| | | | |
| | 2.2.3 | Weight of government spending in the economy | C.27 |
| | | | |
| | 2.2.4 | Consolidated expenditure | C.28 |
| | | | |
| | 2.2.5 | Debt service | C.33 |
| | | | |
3. | CONSOLIDATED BUDGETARY FORECASTS FOR REVENUE AND EXPENDITURE | C.35 |
| | | | |
| 3.1 | Change in consolidated revenue and expenditure from
2010-2011 to 2012-2013 | C.35 |
| | | |
| 3.2 | Consolidated entities | C.40 |
| | | | |
| | 3.2.1 | Special funds | C.40 |
| | | | |
| | 3.2.2 | Non-budget-funded bodies | C.43 |
C.1
| | 3.2.3 | The health and social services and education networks | C.45 |
| | | | |
| | 3.2.4 | Generations Fund | C.47 |
| | | | |
4. | GOVERNMENT INVESTMENTS | C.49 |
| | | |
| 4.1 | The Québec Infrastructures Plan | C.49 |
| | | |
| 4.2 | Investments by Québec government departments and organizations | C.50 |
| | | |
| 4.3 | Investments by government enterprises | C.51 |
| | | |
| 4.4 | Public investments in the economy | C.51 |
| | | |
5. | CONSOLIDATED NET FINANCIAL REQUIREMENTS | C.53 |
| | |
6. | CONSOLIDATED NON-BUDGETARY TRANSACTIONS | C.55 |
| | |
APPENDIX 1: | DETAILS OF THE 2010-2015 QUÉBEC INFRASTRUCTURES PLAN | C.61 |
| | |
APPENDIX 2: | INVESTMENT PROJECTS BY GOVERNMENT ENTERPRISES | C.65 |
| | |
APPENDIX 3: | RESTATEMENT OF THE FINANCIAL FRAMEWORK OF THE 2010-2011 BUDGET TO TAKE INTO ACCOUNT THE CREATION OF FORT AND FRAF | C.69 |
| | | | | |
C.2

INTRODUCTION
This section of the Budget Plan presents the preliminary results for fiscal 2010-2011 and the government’s budgetary and financial stance for 2011-2012 and 2012-2013.1
The information provided concerns:
— consolidated financial and budgetary transactions for the period from 2010-2011 to 2012-2013, including the impact of the various measures announced in the present budget;
— the change in budgetary revenue and expenditure, adjustments made since last year’s budget, and particularly the following:
— consolidated expenditure;
— the results of consolidated entities, including special funds, non-budget-funded bodies and the health and social services and education networks;
— government investments;
— the government’s consolidated net financial requirements and non-budgetary transactions.
The financial framework takes into account the creation of new special funds, namely, the Land Transportation Network Fund (FORT),2,3 the Fund to Finance Health and Social Services Institutions (FINESSS)2 and the Tax Adminstration Fund (FRAF),3,4 whose purpose is to fund the Agence du revenue du Québec.4 In addition, the Act respecting the Agence du revenu du Québec stipulates that from now on the allowance for doubtful accounts will be applied against budgetary revenue, whereas previously it was recorded under program spending.
The five-year financial framework of the 2011-2012 Budget, or the five year financial projections up to 2015-2016, is presented in Section A.
1 | Throughout this section, the budgetary data for 2010-2011 are preliminary, those for 2011-2012 and 2012-2013 are forecasts and those for subsequent years are projections. |
| |
2 | Bill 100 entitled An Act to implement certain provisions of the Budget Speech of 30 March 2010, reduce the debt and return to a balanced budget in 2013-2014 (2010, c. 20). |
| |
3 | This budget presents the 2010-2011 data in accordance with the 2011-2012 structure. Appendix 3 presents restatements in respect of the 2010-2011 Budget’s financial framework in order to take into account the creation of these special funds. Their creation does not affect the budgetary balance. |
| |
4 | Bill 107 entitled An Act respecting the Agence du revenu du Québec (R.S.Q., c. A-7.003). |
| |
The Government’s | |
Financial Framework | C.3 |
| |
This page intentionally left bank
1. STAYING THE COURSE ON RESTORING BUDGET
BALANCE IN 2013-2014
1.1 Change in the budgetary balance
Overall, the government’s budgetary situation remains the same as that presented in last year’s budget. In particular, the total of projected deficits from 2009-2010 to 2013-2014 stands at $12.7 billion and is the same as forecast in March 2010.
The budgetary balance within the meaning of the Balanced Budget Act will be in deficit by $4.2 billion for 2010-2011, $3.8 billion for 2011-2012 and $1.5 billion for 2012-2013. The government is staying the course towards a balanced budget in 2013-2014.
— The deficit will be reduced through the measures contained in the plan to restore fiscal balance, primarily spending control.
In addition, to help face unforeseen events, contingency reserves totalling $800 million from 2010-2011 to 2012-2013 are included in the deficits.
TABLE C.1
Summary of adjusted budgetary transactions – 2011-2012 Budget
(millions of dollars)
| | 2010-2011 | | 2011-2012 | | 2012-2013 | |
BUDGETARY TRANSACTIONS | | | | | | | |
Budgetary revenue | | 62 376 | | 65 375 | | 69 087 | |
% change | | 5.2 | | 4.8 | | 5.7 | |
Program spending | | - 59 819 | | - 61 284 | | - 62 113 | |
% change | | 2.4 | | 2.4 | | 1.4 | |
Debt service | | - 6 934 | | - 7 794 | | - 8 646 | |
Total budgetary expenditure | | - 66 753 | | - 69 078 | | - 70 759 | |
% change | | 3.5 | | 3.5 | | 2.4 | |
Net results of consolidated entities | | 1 209 | | 1 143 | | 1 119 | |
Contingency reserve | | - 300 | | - 300 | | - 200 | |
Measures to be identified | | ¾ | | ¾ | | 300 | |
DEFICIT | | - 3 468 | | - 2 860 | | - 453 | |
BALANCED BUDGET ACT | | | | | | | |
Deposits of dedicated revenues in the Generations Fund | | - 732 | | - 940 | | - 1 047 | |
BUDGETARY BALANCE WITHIN THE MEANING OF THE BALANCED BUDGET ACT | | - 4 200 | | - 3 800 | | - 1 500 | |
As a % of GDP | | - 1.3 | | - 1.2 | | - 0.4 | |
| |
The Government’s | |
Financial Framework | C.5 |
| |
q Spending control
In 2011-2012, the government will continue its rigorous management of program spending by limiting growth in such spending to 2.4%. In 2012-2013, program spending growth will stand at 1.4%.
— | | In the 2010-2011 Budget, the government undertook to assume, by 2013-2014, 62% of the total effort identified in the plan to restore fiscal balance. |
| | |
— | | Over the past year, all of the spending measures needed to deliver on that commitment were identified. In addition, the $1.4-billion effort planned for 2010-2011 will be achieved. |
The government’s reporting entity includes not only program spending but also public spending as a whole, i.e. consolidated expenditure. Additional information on consolidated expenditure is given in sections 2.2.4 and 3.1.
q Contingency reserve
When the 2010-2011 Budget was tabled, the government included a contingency reserve of $300 million in 2010-2011 in its financial framework to guard against contingencies arising in particular from economic uncertainty. New reserves of $300 million in 2011-2012 and $200 million in 2012-2013 were added in fall 2010.
— | | The 2011-2012 Budget maintains these contingency reserves, which total $800 million over these three years. |
TABLE C.2
Contingency reserves included in the financial framework
(millions of dollars)
| | 2010-2011 | | 2011-2012 | | 2012-2013 | | 2013-2014 | |
| | | | | | | | | |
2010-2011 Budget | | - 300 | | ¾ | | ¾ | | ¾ | |
| | | | | | | | | |
Adjustments | | ¾ | | - 300 | | - 200 | | ¾ | |
| | | | | | | | | |
TOTAL – 2011-2012 BUDGET | | - 300 | | - 300 | | - 200 | | ¾ | |
| | | | | | | | | |
| 2011-2012 Budget |
C.6 | Budget Plan |

1.2 Adjustments to the financial framework
The table below presents the main factors explaining the adjustments to the deficits for the years 2010-2011 to 2012-2013 since the last budget. Overall, the adjustments to budgetary expenditure are offset by additional revenue generated by the good economic performance.
For 2010-2011, the budgetary deficit will be $4.2 billion, an improvement of $306 million compared with last year’s budget.
The budgetary deficits for subsequent years are revised upward by $900 million in 2011-2012 and $300 million in 2012-2013, to $3.8 billion and $1.5 billion respectively.
TABLE C.3
Total adjustments since the 2010-2011 Budget
(millions of dollars)
| | 2010-2011 | | 2011-2012 | | 2012-2013 | |
| | | | | | | |
BALANCE IN THE 2010-2011 BUDGET | | - 4 506 | | - 2 900 | | - 1 200 | |
| | | | | | | |
Own-source revenue excluding government enterprises | | 569 | | 800 | | 791 | |
| | | | | | | |
Government enterprises | | 223 | | 53 | | 28 | |
| | | | | | | |
Federal transfers | | 126 | | 358 | | 271 | |
| | | | | | | |
Total budgetary revenue | | 918 | | 1 211 | | 1 090 | |
| | | | | | | |
Program spending | | | | | | | |
| | | | | | | |
– New actuarial valuations of the retirement plans | | - 356 | | - 357 | | - 358 | |
| | | | | | | |
– Increase in the allowance for doubtful accounts | | - 402 | | - 352 | | - 352 | |
| | | | | | | |
– Costs related to pay equity | | ¾ | | - 217 | | - 217 | |
| | | | | | | |
– Agreement with child-care- service providers | | ¾ | | - 137 | | - 143 | |
| | | | | | | |
– Measures in the 2011-2012 Budget | | ¾ | | - 120 | | - 118 | |
| | | | | | | |
– Other adjustments | | ¾ | | - 159 | | - 37 | |
| | | | | | | |
Total program spending | | - 758 | | - 1 342 | | - 1 225 | |
| | | | | | | |
Debt service | | 46 | | 38 | | 103 | |
| | | | | | | |
Total budgetary expenditure | | - 712 | | - 1 304 | | - 1 122 | |
| | | | | | | |
Consolidated entities1 | | 100 | | - 196 | | - 44 | |
| | | | | | | |
Contingency reserve | | ¾ | | - 300 | | - 200 | |
| | | | | | | |
Reduction in efforts to be identified | | ¾ | | - 311 | | - 24 | |
| | | | | | | |
Total adjustments to the budgetary balance | | 306 | | - 900 | | - 300 | |
| | | | | | | |
BUDGETARY BALANCE WITHIN THE MEANING OF THE BALANCED BUDGET ACT | | - 4 200 | | - 3 800 | | - 1 500 | |
| | | | | | | |
1 Excluding the Generations Fund.
The Government’s | | |
Financial Framework | | C.7 |
q Adjustments to the budgetary balance in 2010-2011
The budgetary balance within the meaning of the Balanced Budget Act for 2010-2011 is in deficit by $4.2 billion, an improvement of $306 million compared with the March 2010 Budget.
— | | This result is mainly attributable to the upward adjustments to budgetary revenue that are greater than those to budgetary expenditure. |
In addition, a $300-million contingency reserve is being maintained to deal with any additional shortfalls that could result from the change in revenue and expenditure at the end of the year.
TABLE C.4
Summary of budgetary transactions in 2010-2011
(millions of dollars)
| | 2010-2011
Budget | 1 | Adjustments | | Reclassification | 2 | 2011-2012
Budget | |
| | | | | | | | | |
BUDGETARY TRANSACTIONS | | | | | | | | | |
| | | | | | | | | |
Own-source revenue | | 42 543 | | 569 | | - 900 | | 42 212 | |
| | | | | | | | | |
Government enterprises | | 4 490 | | 223 | | | | 4 713 | |
| | | | | | | | | |
Federal transfers | | 15 325 | | 126 | | | | 15 451 | |
| | | | | | | | | |
Total budgetary revenue | | 62 358 | | 918 | | - 900 | | 62 376 | |
| | | | | | | | | |
Program spending | | - 59 961 | | - 758 | | 900 | | - 59 819 | |
| | | | | | | | | |
Debt service | | - 6 980 | | 46 | | | | - 6 934 | |
| | | | | | | | | |
Total budgetary expenditure | | - 66 941 | | - 712 | | 900 | | - 66 753 | |
| | | | | | | | | |
Net results of consolidated entities | | 1 269 | | - 60 | | | | 1 209 | |
| | | | | | | | | |
Contingency reserve | | - 300 | | ¾ | | | | - 300 | |
| | | | | | | | | |
DEFICIT | | - 3 614 | | 146 | | ¾ | | - 3 468 | |
| | | | | | | | | |
BALANCED BUDGET ACT | | | | | | | | | |
| | | | | | | | | |
Deposits of dedicated revenues in the Generations Fund | | - 892 | | 160 | | | | - 732 | |
| | | | | | | | | |
BUDGETARY BALANCE WITHIN THE MEANING OF THE BALANCED BUDGET ACT | | - 4 506 | | 306 | | ¾ | | - 4 200 | |
| | | | | | | | | |
As a % of GDP | | - 1.4 | | | | | | - 1.3 | |
| | | | | | | | | |
1 | | The data for the 2010-2011 Budget have been restated to reflect the creation of special funds since that budget was tabled. Appendix 3 gives the details of these restatements. |
2 | | The Act respecting the Agence du revenu du Québec stipulates that from now on the allowance for doubtful accounts will be applied against budgetary revenue, whereas previously it was recorded under program spending. |
| 2011-2012 Budget |
C.8 | Budget Plan |
■ Adjustment to budgetary revenue
The government’s budgetary revenue for 2010-2011 has been revised upward by $918 million. These results are due to:
— | | a positive adjustment of $569 million in own-source revenue excluding government enterprises, of which $290 million is from personal income tax; |
| | |
— | | a $223-million increase in revenue from government enterprises; |
| | |
— | | a $126-million rise in federal transfer revenues. |
■ Adjustment to budgetary expenditure
The government’s budgetary expenditure for 2010-2011 has been revised upward by $712 million. These results can be explained by:
— | | a $758-million upward adjustment of the program spending objective due to: |
| | |
| | – the $356-million impact of the new actuarial valuations of the retirement plans; |
| | |
| | – a $402-million increase in the allowance for doubtful accounts; |
| | |
— | | a $46-million decrease in debt service. |
■ Other elements
The $100-million improvement in the results of consolidated entities, excluding deposits of dedicated revenues in the Generations Fund, has also helped to bring down the deficit.
The Government’s | | |
Financial Framework | | C.9 |
q 2011-2012: a budgetary deficit of $3.8 billion
The budgetary deficit for 2011-2012 will amount to $3.8 billion, an increase of $900 million compared with last year’s budget. This increase stems from:
— | | the adjustments to budgetary revenue that are $93 million higher than the adjustments to budgetary expenditure. In this regard: |
| | |
| | – budgetary revenue is being revised upward by $1 211 million; |
| | |
| | – budgetary expenditure is being increased by $1 304 million, mainly because of the recurrence of overruns recognized in 2010-2011, coupled with certain wage costs and the impact of the budget measures; |
| | |
— | | the inclusion of a $300-million contingency reserve in the government’s financial framework; |
| | |
— | | the reduction of $311 million in efforts to be identified under the plan to restore fiscal balance; |
| | |
— | | the $196-million decrease in the results of consolidated entities excluding deposits of dedicated revenues in the Generations Fund. |
q 2012-2013: a budgetary deficit of $1.5 billion
The budgetary deficit for 2012-2013 will amount to $1.5 billion, an increase of $300 million compared with March 2010. This revision stems essentially from:
— | | the recurrence of adjustments to revenue and expenditure; |
| | |
— | | the creation of a $200-million contingency reserve. |
| 2011-2012 Budget |
C.10 | Budget Plan |
2. UPDATING OF THE FINANCIAL FRAMEWORK
This chapter presents the updated budgetary revenue and expenditure for 2010-2011 to 2012-2013 and the principal adjustments made since the last budget.
2.1 Budgetary revenue
The government’s budgetary revenue is expected to total $65.4 billion in 2011-2012, i.e. $50.3 billion in own-source revenue and $15.0 billion in federal transfers. Budgetary revenue should grow by 4.8% in 2011-2012 and 5.7% in 2012-2013.
The presentation of budgetary revenue includes the measures contained in the plan to restore fiscal balance,5 as well as the implementation of the special funds FORT and FRAF.
TABLE C.5
Consolidated revenue fund
Change in budgetary revenue
(millions of dollars)
| | 2010-2011
Budget | 1 | | | | | 2011-2012 Budget | |
| | | | | | | | | | | | | | |
| | 2010-2011 | | | Adjustments | | | 2010-2011 | | | 2011-2012 | | 2012-2013 | |
| | | | | | | | | | | | | | |
Own-source revenue | | | | | | | | | | | | | | |
| | | | | | | | | | | | | | |
Own-source revenue excluding government enterprises – according to the 2011-2012
Budget structure | | 42 543 | | | 569 | | | 43 112 | | | 46 396 | | 49 803 | |
| | | | | | | | | | | | | | |
% change | | 6.7 | | | | | | 7.4 | | | 7.6 | | 7.3 | |
| | | | | | | | | | | | | | |
Reclassification of the allowance for doubtful accounts against revenue | | - 900 | | | ¾ | | | - 900 | | | - 850 | | - 850 | |
| | | | | | | | | | | | | | |
Own-source revenue excluding government enterprises | | 41 643 | | | 569 | | | 42 212 | | | 45 546 | | 48 953 | |
| | | | | | | | | | | | | | |
% change | | 6.9 | | | | | | 7.5 | | | 7.9 | | 7.5 | |
| | | | | | | | | | | | | | |
Government enterprises | | 4 490 | | | 223 | | | 4 713 | | | 4 790 | | 4 930 | |
| | | | | | | | | | | | | | |
% change | | - 2.4 | | | | | | - 3.4 | | | 1.6 | | 2.9 | |
| | | | | | | | | | | | | | |
Total | | 46 133 | | | 792 | | | 46 925 | | | 50 336 | | 53 883 | |
| | | | | | | | | | | | | | |
% change | | 5.9 | | | | | | 6.3 | | | 7.3 | | 7.0 | |
| | | | | | | | | | | | | | |
Federal transfers | | 15 325 | | | 126 | | | 15 451 | | | 15 039 | | 15 204 | |
| | | | | | | | | | | | | | |
% change | | 0.6 | | | | | | 1.9 | | | - 2.7 | | 1.1 | |
| | | | | | | | | | | | | | |
Budgetary revenue | | 61 458 | | | 918 | | | 62 376 | | | 65 375 | | 69 087 | |
| | | | | | | | | | | | | | |
% change | | 4.5 | | | | | | 5.2 | | | 4.8 | | 5.7 | |
| | | | | | | | | | | | | | |
5 | Appendix 1 of Section A shows the change in budgetary revenue excluding the measures contained in the plan to restore fiscal balance. |
The Government’s | | |
Financial Framework | | C.11 |
1 The data for the 2010-2011 Budget have been restated to reflect the creation of special funds since that budget was tabled. Appendix 3 gives the details of these restatements.
2.1.1 Own-source revenue excluding government enterprises
q Upward adjustments in 2010-2011
Preliminary results for fiscal 2010-2011 show that own-source revenue, excluding government enterprises, is adjusted upward by $569 million compared with the March 2010 Budget and posts an increase of 7.5% compared with the previous year.
¡ Adjustments to own-source revenue by source
Revenue from personal income tax is revised upward by $290 million in 2010-2011. This revision can be explained essentially by the following factors:
— | the better employment performance, which resulted notably in stronger-than-anticipated growth in salaries and wages in 2010; |
| |
— | the recurrence of revenue higher than intially forecast for income tax payable in respect of 2009. In addition, tax instalments in respect of 2010, which are based on income tax payable in 2009, have been revised upward. |
Contributions to the health services fund are adjusted upward by $20 million, reflecting the positive revision of salaries and wages in 2010 and monitoring of tax receipts.
Compared with the 2010-2011 Budget, revenue from corporate taxes is revised downward by $130 million, bringing forecast annual growth to 0.9% in 2010-2011. This revision stems in particular from:
— | the downward adjustment in corporate profits in 2010; |
| |
— | the higher-than-expected refunds observed during the year because of past losses attributable to the 2009 recession, which put a greater-than-anticipated strain on revenue. |
| | |
| | 2011-2012 Budget |
| | |
C.12 | | Budget Plan |
| | |

Consumption tax revenue is adjusted upward by $249 million in 2010-2011. This adjustment is due in particular to the following factors:
— revenue from the Québec sales tax (QST) was revised upward because of stronger-than-forecast household consumption in 2010 and a higher-than-expected number of housing starts;
— revenue from the specific tax on tobacco products is revised upward by $120 million owing to the increase in the number of cigarettes sold legally following the stepping-up of efforts to combat the illegal trade of tobacco products.
Other revenue is adjusted upward by $140 million. This increase stems notably from higher-than-forecast revenue from natural resources and fines, forfeitures and recoveries.
TABLE C.6 |
|
Consolidated revenue fund |
Change in own-source revenue excluding government enterprises |
(millions of dollars) | | | | | | |
| | | | | | |
| | | | | | |
| | 2010-2011 Budget1 | | | | 2011-2012 Budget |
| | | | | | |
| | 2010-2011 | | Adjustments | | 2010-2011 | | 2011-2012 | | 2012-2013 | |
| | | | | | | | | | | |
Personal income tax | | 17 726 | | 290 | | 18 016 | | 18 786 | | 19 482 | |
| | | | | | | | | | | |
% change | | 6.7 | | | | 9.5 | | 4.3 | | 3.7 | |
| | | | | | | | | | | |
Health services fund | | 5 843 | | 20 | | 5 863 | | 6 047 | | 6 272 | |
| | | | | | | | | | | |
% change | | 3.5 | | | | 1.2 | | 3.1 | | 3.7 | |
| | | | | | | | | | | |
Corporate taxes | | 3 763 | | - 130 | | 3 633 | | 3 885 | | 4 356 | |
| | | | | | | | | | | |
% change | | 8.0 | | | | 0.9 | | 6.9 | | 12.1 | |
| | | | | | | | | | | |
Consumption taxes | | 12 603 | | 249 | | 12 852 | | 14 897 | | 16 754 | |
| | | | | | | | | | | |
% change | | 8.4 | | | | 10.9 | | 15.9 | | 12.5 | |
| | | | | | | | | | | |
Other revenue | | 1 708 | | 140 | | 1 848 | | 1 931 | | 2 089 | |
| | | | | | | | | | | |
% change | | 7.2 | | | | 2.2 | | 4.5 | | 8.2 | |
| | | | | | | | | | | |
Own-source revenue excluding government enterprises | | 41 643 | | 569 | | 42 212 | | 45 546 | | 48 953 | |
| | | | | | | | | | | |
% change | | 6.9 | | | | 7.5 | | 7.9 | | 7.5 | |
| | | | | | | | | | | |
1 The data for the 2010-2011 Budget have been restated to reflect the creation of special funds since that budget was tabled. Appendix 3 gives the details of these restatements.
| | |
The Government’s | | |
| | |
Financial Framework | | C.13 |
| | |
q Change in revenue by source
In 2011-2012 and 2012-2013, own-source revenue, excluding that from government enterprises, will increase by 7.9% and 7.5% respectively. This growth, which is above that of the economy, stems from the impact of the implementation of the revenue measures provided for in the plan to restore fiscal balance.
In particular, the increases in the QST and the additional tax recovery efforts of the Agence du revenu du Québec will contribute to this impact.
Personal income tax, the main source of government revenue, is expected to increase by 4.3% in 2011-2012 and 3.7% in 2012-2013, to $18.8 billion and $19.5 billion, respectively.
— These changes are compatible with the growth in personal income of 3.6% in 2011 and 3.3% in 2012, taking into account the progressive nature of the tax system.
Contributions to the health services fund should climb by 3.1% in 2011-2012 and 3.7% in 2012-2013, rates similar to the growth in salaries and wages.
Revenue from corporate taxes will show a sustained increase of 6.9% and 12.1% in 2011-2012 and 2012-2013 respectively, on account of the following factors:
— the resumption in the growth of profits will translate into an increase in taxable income and revenue from corporate taxes;
— however, use of the losses accumulated by businesses during the recession will continue to attenuate growth in revenue in 2011-2012.
In 2011-2012 and 2012-2013, revenue from consumption taxes should show an increase of 15.9% and 12.5% respectively. This growth reflects:
— the growth of 4.6% and 4.1% in household consumption in 2011 and 2012 respectively;
— the increase of one percentage point in the QST on January 1, 2011 and January 1, 2012.
q Change in revenue compatible with that of the economy
Overall, growth in own-source revenue, excluding government enterprises, is expected to be compatible with nominal economic growth for the next two years, leaving aside the financial impact of fiscal measures and the plan to restore fiscal balance.6
6 See the financial framework excluding the revenue measures of the plan to restore fiscal balance presented in Appendix 2 of Section A.
| | |
| | 2011-2012 Budget |
| | |
C.14 | | Budget Plan |
| | |
2.1.2 Revenue from government enterprises
q Results for 2010-2011
Revenue from government enterprises is adjusted upward by $223 million for 2010-2011. Hydro-Québec et the Société des alcools du Québec raised their forecast by $15 million and $5 million respectively, while the forecast for Loto-Québec was revised downward.
Revenue from Loto-Québec is revised downward by $45 million, mainly on account of the decline in revenue attributable to video lottery terminals and the renovation work under way at the Casino de Montréal, as well as the costs related to the start-up of the Espacejeux website.
Revenue from other government enterprises was re-evaluated upward mainly because of a $249-million upward adjustment of the results of the Société générale de financement du Québec. This increase is due to the higher-than-anticipated net gains on realized investments and higher-than-anticipated gains on interests.
TABLE C.7
Consolidated revenue fund | | | |
Change in revenue from government enterprises | | | |
(millions of dollars) | | | | | | | | | | | |
| | | | | | | | | | | |
| | | | | | | | | | | |
| | 2010-2011
Budget | | | | 2011-2012 Budget |
| | | | | | | | | | | |
| | 2010-2011 | | Adjustments | | 2010-2011 | | 2011-2012 | | 2012-2013 | |
| | | | | | | | | | | |
Hydro-Québec | | 2 425 | | 15 | | 2 440 | | 2 575 | | 2 625 | |
| | | | | | | | | | | |
Loto-Québec | | 1 282 | | - 45 | | 1 237 | | 1 246 | | 1 267 | |
| | | | | | | | | | | |
Société des alcools du Québec | | 882 | | 5 | | 887 | | 940 | | 973 | |
| | | | | | | | | | | |
Other | | - 99 | | 248 | | 149 | | 29 | | 65 | |
| | | | | | | | | | | |
Revenue from government enterprises | | 4 490 | | 223 | | 4 713 | | 4 790 | | 4 930 | |
| | | | | | | | | | | |
% change | | - 2.4 | | | | - 3.4 | | 1.6 | | 2.9 | |
| | | | | | | | | | | |
| | |
| | 2011-2012 Budget |
| | |
C.15 | | Budget Plan |
| | |
q Outlook for 2011-2012 and 2012-2013
Revenue from government enterprises for 2011-2012 and 2012-2013 will amount to $4 790 million and $4 930 million respectively. Anticipated revenue from Hydro-Québec, Loto-Québec and the Société des alcools du Québec will show a slight increase for these two years. The sustained effort to reduce spending and improve productivity will contribute to this result.
| | |
The Government’s | | |
| | |
Financial Framework | | C.16 |
| | |
2.1.3 Revenues from federal transfers
In 2010-2011, federal transfer revenues should reach $15.5 billion, or $126 million more than forecast in the March 2010 Budget.
Positive revisions of $45 million in health transfers and $23 million in transfers for post-secondary education and other social programs are forecast particularly because of the economic situation which reduced the value of the special Québec abatement that is subtracted from these transfers. The revision of federal transfers is also due to an $88-million increase in the offset payment for student financial assistance (see box on page C.19).
For 2011-2012 and 2012-2013, federal transfer revenues are expected to amount to $15.0 billion and $15.2 billion respectively.
TABLE C.8 | |
| |
Consolidated revenue fund
Change in federal transfer revenues | |
(millions of dollars) | | | | | | | | | | | |
| | | | | | | | | | | |
| | | | | | | | | | | |
| | 2010-2011
Budget | | | | 2011-2012 Budget |
| | | | | | | | | | | |
| | 2010-2011 | | Adjustments | | 2010-2011 | | 2011-2012 | | 2012-2013 | |
| | | | | | | | | | | |
Equalization | | 8 552 | | ¾ | | 8 552 | | 7 639 | | 8 040 | |
| | | | | | | | | | | |
% change | | 2.4 | | | | 2.4 | | - 10.7 | | 5.2 | |
| | | | | | | | | | | |
Protection payment | | | | | | | | 545 | | | |
| | | | | | | | | | | |
% change | | | | | | | | N/A | | | |
| | | | | | | | | | | |
Health transfers | | 4 264 | | 45 | | 4 309 | | 4 516 | | 4 817 | |
| | | | | | | | | | | |
% change | | 2.8 | | | | 3.9 | | 4.8 | | 6.7 | |
| | | | | | | | | | | |
Transfers for post-secondary education and other social programs | | 1 432 | | 23 | | 1 455 | | 1 475 | | 1 504 | |
| | | | | | | | | | | |
% change | | - 2.0 | | | | - 0.4 | | 1.4 | | 2.0 | |
| | | | | | | | | | | |
Other programs | | 1 077 | | 58 | | 1 135 | | 864 | | 843 | |
| | | | | | | | | | | |
% change | | - 14.9 | | | | - 5.2 | | - 23.9 | | - 2.4 | |
| | | | | | | | | | | |
Federal transfers | | 15 325 | | 126 | | 15 451 | | 15 039 | | 15 204 | |
| | | | | | | | | | | |
% change | | 0.6 | | | | 1.9 | | - 2.7 | | 1.1 | |
| | | | | | | | | | | |
| | |
| | 2011-2012 Budget |
| | |
C.17 | | Budget Plan |
| | |
Federal transfers are expected to decline by 2.7% in 2011-2012 due to a 10.7% decrease in equalization, stemming mainly from Québec’s relatively good economic performance during the 2009 recession. This delay results from the smoothing mechanism used by the federal government to determine equalization payments (three-year moving average delayed by two years).
TABLE C.9
Smoothing mechanism used by the federal government to determine
equalization payments

This substantial drop in equalization payments is partly offset by a “protection payment” of $545 million in 2011-2012. This payment was announced at the meeting of Finance Ministers in December 2010 and corresponds to the decrease, between 2010-2011 and 2011-2012, of total main federal transfers in each province (Canada Health Transfer (CHT), Canada Social Transfer (CST) and equalization). Three other provinces also qualified for a protection payment. It should be noted that Québec had indicated in Section E of the 2010-2011 Budget Plan, that the providing of such protection payments “…should be made systematic so that Québec can qualify for them if, for example, its federal transfer revenues decline from one year to the next, as is currently forecast in 2011-2012.”
As for revenue from other programs, the 23.9% decrease expected in 2011-2012 can be explained in particular by the end of federal compensation in respect of the elimination of the tax on capital and the anticipated $40-million decrease in the offset payment for student financial assistance.
Federal transfers should increase by 1.1% in 2012-2013. Growth in the major transfers will be slowed by the non-recurrence, in 2012-2013, of the protection payment that will be made in 2011-2012.
| | |
The Government’s | | |
| | |
Financial Framework | | C.18 |
| | |
Offset payment for student financial assistance |
Since the 1960s, Québec has exercised the right to opt out of federal student financial assistance programs. Québec offers its own program and receives, in this regard, financial compensation from the federal government under the Canada Student Financial Assistance Act. | |
This offset payment corresponds to the estimated cost, determined by the federal government, of applying its own programs in Québec if they were offered there instead of the program offered by Québec. In concrete terms, it corresponds to the average cost of federal programs for a person aged 18 to 24 in participating provinces, multiplied by the number of people aged 18 to 24 in Québec. Therefore, there is no link between the offset payment received from the federal government and spending by Québec on student financial assistance. |
In February 2011, the federal government announced that Québec would receive an offset payment of $275 million for the 2009-2010 school year. However, $180 million in revenue had been recorded in the 2009-2010 Public Accounts in this regard. Consequently, the $318 million in revenue forecast in 2010-2011 includes a major adjustment for previous years. This revenue has been revised by $88 million compared with the forecast in the March 2010 Budget. For 2011-2012 and subsequent years, offset payments are expected to be in the order of $280 million annually. |
The following table shows the offset and Millennium Scholarship payments received from the federal government since 1998, as well as Québec’s spending on student financial assistance. It can be seen that Québec has invested, on average, more than twice as much as the federal government would have done had its financial assistance programs been offered in Québec. |
Amounts received and spent by Québec in respect of student financial assistance |
| Offset | | | | |
payments | | Millennium Scholarships (MS) | | Total |
| Spending by Québec (including MS) | Ratio1 | | |
| $ million | | | $ million | % |
1998-99 | 159.1 | | 159.1 | 394.8 | 248.1 |
1999-00 | 124.8 | 63.8 | 188.5 | 394.1 | 209.0 |
2000-01 | 137.5 | 80.3 | 217.7 | 380.8 | 174.8 |
2001-02 | 143.2 | 75.7 | 219.0 | 368.0 | 168.1 |
2002-03 | 128.9 | 73.4 | 202.2 | 353.0 | 174.5 |
2003-04 | 158.3 | 71.7 | 229.9 | 382.8 | 166.4 |
2004-05 | 150.8 | 69.8 | 220.6 | 318.1 | 144.2 |
2005-06 | 159.5 | 73.6 | 233.1 | 395.0 | 169.5 |
2006-07 | 116.3 | 90.9 | 207.2 | 457.0 | 220.6 |
2007-08 | 112.0 | 77.2 | 189.2 | 497.3 | 262.8 |
2008-09 | 138.5 | 80.0 | 218.5 | 485.5 | 222.2 |
2009-102 | 180.1 | 0.2 | 180.3 | 534.6 | 296.5 |
2010-11 | 317.6 | | 317.6 | 531.9 | 167.5 |
1 Spending by Québec divided by total federal transfers received. |
2 The replacement of the Millennium Scholarships by the Canada Student Grants Program (CSGP) on August 1, 2009 explains the increase in offset payments since 2009-2010. |
Source: Québec public accounts and 2010-2011 Expenditure Budget. |
This table also shows that despite major fluctuations in federal offset payments from one year to the next, Québec has always maintained a high level of spending on student financial assistance. For example, between 2005-2006 and 2006-2007, spending by Québec on student financial assistance increased even though the offset payment from the federal government fell by $43 million. Lastly, it should be noted that the portion of student financial assistance offered under the Québec program in the form of non-repayable bursaries (rather than repayable loans) is greater than that offered under the federal government programs. |
| | | | | | |
| | |
| | 2011-2012 Budget |
| | |
C.19 | | Budget Plan |
| | |

2.2 Budgetary expenditure
The government’s budgetary expenditure, which includes program spending and debt service, is expected to reach $69.1 billion in 2011-2012, i.e. $61.3 billion for program spending and $7.8 billion for debt service. Program spending should increase by 2.4% in 2011-2012 and 1.4% in 2012-2013.
TABLEAU C.10
Consolidated revenue fund
Change in budgetary expenditure
(millions of dollars)
| | 2010-2011
Budget1 | | | | | | Budget 2011-2012 |
| | 2010-2011 | | Adjustments | | Reclassification | 2 | 2010-2011 | | 2011-2012 | | 2012-2013 |
| | | | | | | | | | | | |
Program spending | | 59 961 | | 758 | | - 900 | | 59 819 | | 61 284 | | 62 113 |
| | | | | | | | | | | | |
% change | | 2.5 | | | | | | 2.4 | | 2.4 | | 1.4 |
| | | | | | | | | | | | |
Debt service | | 6 980 | | - 46 | | | | 6 934 | | 7 794 | | 8 646 |
| | | | | | | | | | | | |
% change | | 13.4 | | | | | | 13.4 | | 12.4 | | 10.9 |
| | | | | | | | | | | | |
Budgetary expenditure | | 66 941 | | 712 | | - 900 | | 66 753 | | 69 078 | | 70 759 |
| | | | | | | | | | | | |
% change | | 3.6 | | | | | | 3.5 | | 3.5 | | 2.4 |
| | | | | | | | | | | | |
1 | In the 2010-2011 Budget, the program spending objective for 2010-2011 totalled $62 561 million. For purposes of comparison, the 2010-2011 data have been restated to take into account the implementation of FORT and FRAF. For additional information, see Appendix 3. |
2 | The Act respecting the Agence du revenu du Québec stipulates that from now on the allowance for doubtful accounts will be applied against budgetary revenue, whereas previously it was recorded under program spending. |
| | |
The Government’s | | |
| | |
Financial Framework | | C.20 |
| | |
2.2.1 Adjustments to program spending
q 2010-2011
Program spending in 2010-2011 stands at $59.8 billion, up 2.4% over 2009-2010 on a comparable basis. This represents an upward revision of $758 million.
This adjustment can be explained by:
— the increase of $356 million attributable to the new actuarial valuations of the retirement plans announced in the fall 2010 Update on Québec’s Economic and Financial Situation;
— the $402-million rise in the allowance for doubtful accounts.
q 2011-2012 and subsequent years
Growth in program spending for 2011-2012 will be 2.4%.
Compared with the March 2010 Budget, the program spending objective is revised upward by $1 342 million, particularly on account of the following:
— $120 million for all the spending measures announced in this budget;
— $357 million attributable to the new actuarial valuations of the retirement announced in the fall 2010 Update on Québec’s Economic and Financial Situation;
— $352 million stemming from the increase in the allowance for doubtful accounts;
— $217 million for costs related to pay equity;
— $137 million for financing the costs related to the agreement with child-care-service providers.
In 2012-2013, program spending growth will amount to 1.4%.
| | |
| | 2011-2012 Budget |
| | |
C.21 | | Budget Plan |
| | |
TABLE C.11
Change in program spending
(millions of dollars)
| | 2010-2011 | | 2011-2012 | | 2012-2013 | |
PROGRAM SPENDING OBJECTIVE ACCORDING TO THE
2010-2011 BUDGET STRUCTURE1 | | 59 961 | | 60 792 | | 61 738 | |
% change | | 2.5 | | 1.4 | | 1.6 | |
Measures in the 2011-2012 Budget | | ¾ | | 120 | | 118 | |
Adjustments | | | | | | | |
– New actuarial valuations of the retirement plans2 | | 356 | | 357 | | 358 | |
– Increase in the allowance for doubtful accounts | | 402 | | 352 | | 352 | |
– Costs related to pay equity | | ¾ | | 217 | | 217 | |
– Agreement with child-care-service providers | | ¾ | | 137 | | 143 | |
– Other adjustments | | ¾ | | 159 | | 37 | |
Subtotal | | 758 | | 1 222 | | 1 107 | |
TOTAL ADJUSTMENTS SINCE THE 2010-2011 BUDGET | | 758 | | 1 342 | | 1 225 | |
Reclassification of the allowance for doubtful accounts against revenue3 | | - 900 | | - 850 | | - 850 | |
PROGRAM SPENDING OBJECTIVE IN THE
2011-2012 BUDGET | | 59 819 | | 61 284 | | 62 113 | |
% change | | 2.4 | | 2.4 | | 1.4 | |
| | | | | | | |
1 After the implementation of FORT and FRAF.
2 Presented in the fall 2010 Update on Québec’s Economic and Financial Situation.
3 The Act respecting the Agence du revenu du Québec stipulates that from now on the allowance for doubtful accounts will be applied against budgetary revenue, whereas previously it was recorded under program spending.
| | |
The Government’s | | |
| | |
Financial Framework | | C.22 |
| | |
Change in spending since the 2010-2011 Budget |
| Change in spending since the 2010-2011 Budget
(millions of dollars) | | | | | | |
| | 2009-2010 | 2010-2011 | 2011-2012 | 2012-2013 | 2013-2014 | |
| Program spending in the 2010-2011 Budget | | – 60 769 | – 62 561 | – 63 907 | – 65 282 | – 66 686 | |
| % change | | 3.8 | 2.9 | 2.2 | 2.2 | 2.2 | |
| FINESSS expenditures | | ¾ | – 180 | – 575 | – 995 | – 1 445 | |
| Program spending in the 2010-2011 – | | | | | | | |
| Increased by FINESSS expenditures | | – 60 769 | – 62 741 | – 64 482 | – 66 277 | – 68 131 | |
| % change | | 3.8 | 3.2 | 2.8 | 2.8 | 2.8 | |
| Adjustments | | | | | | | |
| Actuarial valuations of the retirement plans | | ¾ | – 356 | – 357 | – 358 | – 360 | |
| Increase in the allowance for doubtful accounts | | – 402 | – 402 | – 352 | – 352 | – 352 | |
| Costs related to pay equity | | ¾ | ¾ | – 217 | – 217 | – 217 | |
| Agreement with child-care- service providers | | ¾ | ¾ | – 137 | – 143 | – 143 | |
| Other adjustments | | – 408 | ¾ | – 279 | – 155 | – 378 | |
| Total adjustments | | – 810 | – 758 | – 1 342 | – 1 225 | – 1 450 | |
| Program spending in the 2011-2012 Budget – | | | | | | | |
| Increased by FINESSS expenditures | | | | | | | |
| Basis comparable to that of the 2010-2011 Budget | | – 61 579 | – 63 499 | – 65 824 | – 67 502 | – 69 581 | |
| % change | | 5.2 | 3.1 | 3.7 | 2.5 | 3.1 | |
| | | | | | | | |
| Impact of FORT and FRAF | | 2 290 | 2 600 | 3 115 | 3 544 | 3 961 | |
| Impact of FINESSS | | ¾ | 180 | 575 | 995 | 1 445 | |
| Reclassification of the allowance for doubtful accounts against revenue | | 900 | 900 | 850 | 850 | 850 | |
| Program spending in the 2011-2012 Budget | | – 58 389 | – 59 819 | – 61 284 | – 62 113 | – 63 325 | |
| % change | | 5.3 | 2.4 | 2.4 | 1.4 | 2.0 | |
| | | | | | | | |
| | | | | | | | |
| Change in the program spending objective according to the presentation used in the
2010-2011 Budget (per cent) | | |
| 
| | |
| 1 Plan to restore fiscal balance. | | |
|
| | |
| | 2011-2012 Budget |
| | |
C.23 | | Budget Plan |
| | |
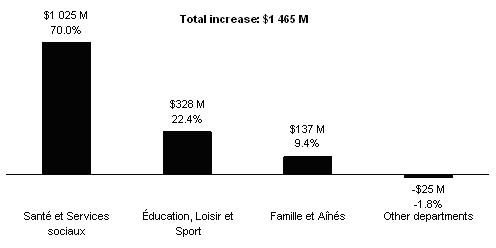
2.2.2 Efforts on the part of all government departments
Program spending will climb from $59.8 billion in 2010-2011 to $61.3 billion in 2011-2012, an increase of $1 465 million, or 2.4%.
TABLE C.12
Growth in program spending in 2011-2012
(millions of dollars)
| | | | | | Change | |
| | 2010-2011 | | 2011-2012 | | $ million | | % | |
Santé et Services sociaux | | 28 116 | | 29 141 | | 1 025 | | 3.6 | |
Éducation, Loisir et Sport | | 15 213 | | 15 541 | | 328 | | 2.2 | |
Famille et Aînés | | 2 250 | | 2 387 | | 137 | | 6.1 | |
Other departments | | 14 240 | | 14 215 | | - 25 | | - 0.2 | |
TOTAL | | 59 819 | | 61 284 | | 1 465 | | 2.4 | |
Note: Since figures are rounded, the sum of the amounts entered for each portfolio may not correspond to the total.
Source: Secrétariat du Conseil du trésor.
q Health: 3.6% increase in 2011-2012
Program spending by the Ministère de la Santé et des Services sociaux is being raised by $1 025 million, or 3.6%, for 2011-2012. This increase will make it possible to maintain current services. Moreover, total health spending in 2011-2012 will increase to 5.0% particularly as a result of the additional contribution of $395 million from FINESSS to health-care institutions, in keeping with the government’s commitment.
q Education: 2.2% budget increase
The increase of $328 million, or 2.2%, allocated to the Ministère de l’Éducation, du Loisir et du Sport, will make it possible to maintain and improve the quality of services offered in the education networks and pursue actions undertaken in recent years, in regard to student success and retention.
| | |
The Government’s | | |
| | |
Financial Framework | | C.24 |
| | |
q Family and seniors: 6.1% budget increase
The budget of the Ministère de la Famille et des Ainés is being raised by 6.1%, or $137 million. This increase will make it possible notably to fund the agreement with child-care-service providers.
q Other departments
The budget of the other departments is being reduced by 0.2%, or $25 million, in 2011-2012. This decrease can be explained in particular by the expiry of certain programs such as the RENFORT program and other economic support programs.
CHART C.1
Breakdown of program spending growth 2011-2012
(millions of dollars and per cent)
|
Source: Secrétariat du Conseil du trésor. |
| | |
| | 2011-2012 Budget |
| | |
C.25 | | Budget Plan |
| | |
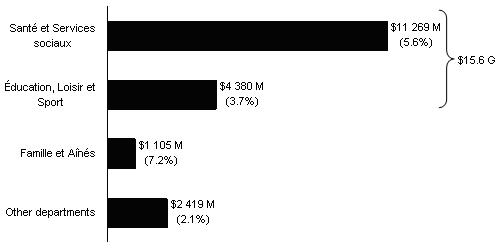
q The government’s action in its essential missions
The government continues to invest in its essential missions, including health and education. From 2003-2004 to 2011-2012, average annual spending in health and education will rise by 5.6% and 3.7% respectively, excluding the contribution of FINESSS to the growth in health spending.
In all, since 2003, the government has added $15.6 billion to the health and education budgets, i.e. $11.3 billion and $4.4 billion respectively.
CHART C.2
Increase in program spending
from 2003-20041 to 2011-2012
(dollars and average annual growth in per cent)
1 The 2003-2004 data have been restated to take into account the implementation of FORT and FRAF and the reclassification of the allowance for doubtful accounts following the creation of the Agence du revenue du Québec. For additional information, see Appendix 3.
| | |
The Government’s | | |
| | |
Financial Framework | | C.26 |
| | |
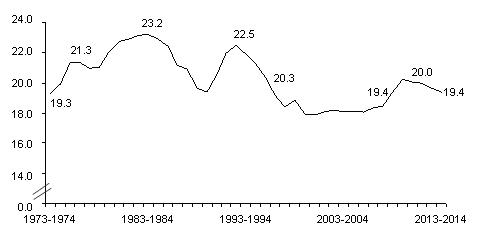
2.2.3 Weight of government spending in the economy
The forecast for program spending in 2011-2012 is in line with the government’s overall objective to restore fiscal balance by 2013-2014.
The weight of spending in the economy should be 20.0% in 2011-2012 prior to the implementation of FORT and FRAF and including FINESSS.
Thereafter, the government plans to stay the course of disciplined program spending management and, between now and 2014-2015, gradually bring the weight of spending in the economy down to a proportion equal to that observed prior to the economic recession.
CHART C.3
Program spending
(as a percentage of GDP)
| | |
| | 2011-2012 Budget |
| | |
C.27 | | Budget Plan |
| | |
2.2.4 Consolidated expenditure
When the government published the Public Accounts 2009-2010 last December, it used for the first time line-by-line consolidation for the health and social services and education networks.
Even though network organizations had been included in the government’s reporting entity at their equity value since 2006-2007, this new approach is an improvement in that it allows the level of government revenue and expenditure to be presented more accurately.
The following table shows not only the program spending of departments and budget-funded bodies, over which the government is committed to exercising tight control, but also all of the information on spending by special funds, non-budget-funded bodies, network organizations and specified purpose accounts. This presentation reflects the level and growth of the government’s total spending, i.e. consolidated expenditure.
This information improves the presentation of the budgetary data and facilitates their comparison with the data disclosed in Québec’s public accounts and with data of the other Canadian provinces.
| | |
The Government’s | | |
| | |
Financial Framework | | C.28 |
| | |
TABLE C.13
Change in consolidated expenditure1
(millions of dollars)
| | 2010-2011 | | 2011-2012 | | 2012-2013 | |
| | | | | | | |
Program spending | | 59 819 | | 61 284 | | 62 113 | |
| | | | | | | |
% change | | 2.4 | | 2.4 | | 1.4 | |
| | | | | | | |
Consolidated entities | | | | | | | |
| | | | | | | |
Special funds | | 10 234 | | 10 862 | | 11 939 | |
| | | | | | | |
% change | | 5.7 | | 6.1 | | 9.9 | |
| | | | | | | |
Non-budget-funded bodies | | 17 158 | | 17 947 | | 18 471 | |
| | | | | | | |
% change | | 4.1 | | 4.6 | | 2.9 | |
| | | | | | | |
Health and social services and education networks | | 34 748 | | 36 305 | | 37 924 | |
| | | | | | | |
% change | | 3.9 | | 4.5 | | 4.5 | |
| | | | | | | |
Total consolidated entities | | 62 140 | | 65 114 | | 68 334 | |
| | | | | | | |
% change | | 4.2 | | 4.8 | | 4.9 | |
| | | | | | | |
Elimination of inter-entity transactions1 | | - 49 936 | | - 51 639 | | - 53 214 | |
| | | | | | | |
Consolidated expenditure of departments and organizations | | 72 023 | | 74 759 | | 77 233 | |
| | | | | | | |
% change | | 3.9 | | 3.8 | | 3.3 | |
| | | | | | | |
Specified purpose accounts1 | | 1 942 | | 1 697 | | 1 397 | |
| | | | | | | |
Debt service of the consolidated revenue fund | | 6 934 | | 7 794 | | 8 646 | |
| | | | | | | |
% change | | 13.4 | | 12.4 | | 10.9 | |
| | | | | | | |
Consolidated expenditure2 | | 80 899 | | 84 250 | | 87 276 | |
| | | | | | | |
% change | | 5.7 | 3 | 4.1 | | 3.6 | |
1 Elimination of transactions between entities included in the reporting entity.
2 In 2009-2010, the consolidated expenditure shown in the public accounts was $76 566 million.
3 Excluding the $790-million increase in expenditures in respect of specified purpose accounts stemming essentially from infrastructure agreements with the federal government, growth of consolidated expenditure stands at 4.6% for 2010-2011.
q Expenditure of consolidated entities
The expenditure of consolidated entities includes spending by special funds, non-budget-funded bodies and organizations in the health and social services and education networks.7
7 It should be noted that the Generations Fund is a consolidated entity. However, since it does not show expenditures, it is not included in this list.
| | |
| | 2011-2012 Budget |
| | |
C.29 | | Budget Plan |
| | |

q Special funds
Growth in spending by special funds in 2010-2011, 2011-2012 and 2012-2013 amounts to 5.7%, 6.1% and 9.9% respectively. These rates include high growth in spending by certain special funds on account of their mission, such as:
— FINESSS, which is devoted to financing health-care institutions;
— FORT, which is devoted to financing public infrastructure;
— Fonds vert (Green Fund), which is devoted to funding initiatives to combat climate change.
If growth in spending by these three funds is not included in the growth of total special fund spending for this period, the change in spending by the 32 other special funds amounts to - 1.5%, - 4.1% and 3.1% respectively in 2010-2011, 2011-2012 and 2012-2013.
TABLE C.14
Change in spending by special funds
(millions of dollars)
| | | | | | | |
| | 2010-2011 | | 2011-2012 | | 2012-2013 | |
| | | | | | | |
Total special funds | | 10 234 | | 10 862 | | 11 939 | |
| | | | | | | |
% change | | 5.7 | | 6.1 | | 9.9 | |
| | | | | | | |
Including: | | | | | | | |
| | | | | | | |
FINESSS | | 180 | | 575 | | 995 | |
| | | | | | | |
FORT | | 2 103 | | 2 516 | | 2 940 | |
| | | | | | | |
Fonds vert | | 373 | | 507 | | 514 | |
| | | | | | | |
Subtotal | | 2 656 | | 3 598 | | 4 449 | |
| | | | | | | |
% change | | 33.7 | | 35.5 | | 23.7 | |
| | | | | | | |
Other special funds | | 7 578 | | 7 264 | | 7 490 | |
| | | | | | | |
% change | | - 1.5 | | - 4.1 | | 3.1 | |
| | | | | | | |
| | |
The Government’s | | |
| | |
Financial Framework | | C.30 |
| | |
Act to amend the special funds, among other things |
|
A new bill will be tabled in the National Assembly this spring, notably to improve oversight of the special funds. |
|
The purpose of the bill will be to propose legislative amendments so that: |
|
– the revenue of the special funds will be included in the consolidated revenue fund; |
|
– the expenditures and investments of the special funds will be subject to annual authorization by the members of the National Assembly. |
|
The present budget presents the results of the special funds separately from those of non-budget-funded bodies. |
|
q Non-budget-funded bodies
Non-budget-funded bodies show annual spending growth of 4.1%, 4.6% and 2.9% for 2010-2011, 2011-2012 and 2012-2013 respectively.
As with special funds, certain non-budget-funded bodies have a mission that entails strong growth in spending. This is the case, for example, of the Société de financement des infrastructures locales du Québec, which finances municipal infrastructure.
q Health and social services and education networks
Since they are deemed a priority, organizations in the health and social services and education networks show spending growth of 3.9%, 4.5% and 4.5% respectively for 2010-2011, 2011-201 and 2012-2013.
q Consolidated expenditure of departments and organizations
The consolidated expenditure of departments and agencies consists of all spending included in the government’s reporting entity for the purpose of providing services to the general public.
Growth in consolidated expenditure is expected to amount to 3.9%, 3.8 % and 3.3 % for 2010-2011, 2011-201 and 2012-2013 respectively. Although these growth rates are slightly higher than that of program spending because of the factors mentioned in regard to certain special funds, non-budget-funded bodies and the networks, there will be a marked slowdown in consolidated expenditure.
| | |
| | 2011-2012 Budget |
| | |
C.31 | | Budget Plan |
| | |
q Consolidated expenditure
The growth in consolidated expenditure comprises total government spending, including spending in respect of the specified purpose accounts and the debt service of the consolidated revenue fund.
Annual growth in consolidated expenditure for 2010-2011, 2011-2012 and 2012-2013 will amount to 5.7%, 4.1% and 3.6% respectively. This downward trend in the growth of consolidated expenditure is due mainly to control of program spending, whose growth will stand at 2.4% in 2011-2012 and 1.4% in 2012-2013. In addition, the rate at which funds will be paid into the specified purpose accounts will be more regular by 2012-2013, particularly because of the expiry of the Canada’s Economic Action Plan.
| | |
The Government’s | | |
| | |
Financial Framework | | C.32 |
| | |
2.2.5 Debt service
In 2010-2011, debt service should amount to $6.9 billion, i.e. $4.3 billion for direct debt service and $2.7 billion for interest ascribed to the retirement plans.
Overall, debt service is revised downward by $46 million compared with the March 2010 Budget mainly because of lower-than-anticipated interest rates.
In 2011-2012 and 2012-2013, debt service is expected to climb by 12.4% and 10.9% respectively. This increase can be explained by higher interest rates, the impact of the returns of the Caisse de dépôt et placement du Québec on the income of the Retirement Plans Sinking Fund, which is applied against the interest on the retirement plans account, and the rise in the debt.
TABLE C.15
Consolidated revenue fund
Change in debt service
(millions of dollars)
| | 2010-2011
Budget | | | | | 2011-2012 Budget | |
| | | | | | | | | | | | |
| | 2010-2011 | | | Adjustments | | 2010-2011 | | 2011-2012 | | 2012-2013 | |
| | | | | | | | | | | | |
Direct debt service | | 4 398 | | | - 112 | | 4 286 | | 5 007 | | 5 574 | |
| | | | | | | | | | | | |
Interest ascribed to the retirement plans | | 2 597 | | | 64 | | 2 661 | | 2 804 | | 3 091 | |
| | | | | | | | | | | | |
Interest ascribed to employee future benefits | | - 15 | | | 2 | | - 13 | | - 17 | | - 19 | |
| | | | | | | | | | | | |
Debt service | | 6 980 | | | - 46 | | 6 934 | | 7 794 | | 8 646 | |
| | | | | | | | | | | | |
% change | | 13.4 | | | | | 13.4 | | 12.4 | | 10.9 | |
| | | | | | | | | | | | |
| | |
| | 2011-2012 Budget |
| | |
C.33 | | Budget Plan |
| | |
q A smaller proportion of revenue is being devoted to servicing the debt of the consolidated revenue fund
The share of budgetary revenue devoted to the debt service of the consolidated revenue fund should stand at 12.5% in 2012-2013, compared with 16.1% in 1998-1999.
CHART C.4 |
|
Debt service of the consolidated revenue fund |
(as a percentage of the revenue of the consolidated revenue fund) |
|

|
Note: Preliminary results for 2010-2011 and forecasts for subsequent years. |
| | |
The Government’s | | |
| | |
Financial Framework | | C.34 |
| | |
3. CONSOLIDATED BUDGETARY FORECASTS FOR REVENUE AND EXPENDITURE
For the second year in a row, the government is presenting consolidated financial forecasts for its revenue and expenditure as whole. This consolidated presentation of the financial framework does not change the budgetary balance within the meaning of the Balance Budget Act presented in the preceding tables in Section C.
Essentially, the consolidated financial forecasts add the budgetary revenue and expenditure of all the entities in the government’s reporting entity, including the entities in the health and social services and education networks, to the budgetary revenue and expenditure of the consolidated revenue fund. They thus provide more complete and detailed information on the government’s financial projections, as well as better reconciliation with the actual results presented in the public accounts.
In this regard, it should be noted that the Public Accounts 2009-2010 tabled by the government on last December 2 presented for the first time the health and social services and education networks consolidated line by line.
Line-by-line consolidation involves eliminating transactions between related entities, particularly transfer expenditures from the government that are paid to consolidated entities and the corresponding revenues received by these entities.
3.1 Change in consolidated revenue and expenditure from 2010-2011 to 2012-2013
Table C.16 presents the government’s consolidated financial framework for fiscal 2010-2011 to 2012-2013.
More specifically, tables C.17, C.18 and C.19 detail the consolidated budgetary forecasts for 2010-2011 to 2012-2013. The consolidation includes transactions by consolidated entities and specified purpose accounts. Financial transactions between entities in the government’s reporting entity are subsequently eliminated to re-establish the consolidated revenue and expenditure levels. Since these transactions are carried out within the government, they do not affect the budgetary balance.
| | |
The Government’s | | |
| | |
Financial Framework | | C.35 |
| | |
TABLE C.16
Change in consolidated revenue and expenditure
Consolidated results by entity
(millions of dollars)
| | 2010-2011 | | 2011-2012 | | 2012-2013 |
| | | | | | |
Revenue | | | | | | |
Consolidated revenue fund | | 62 376 | | 65 375 | | 69 087 |
Special funds | | 10 704 | | 11 111 | | 11 941 |
Non-budget-funded bodies | | 17 217 | | 17 926 | | 18 541 |
Health and social services and education networks | | 34 696 | | 36 280 | | 37 924 |
Generations Fund | | 732 | | 940 | | 1 047 |
Specified purpose accounts | | 1 942 | | 1 697 | | 1 397 |
Less: Elimination of inter-entity transations1 | | - 49 936 | | - 51 639 | | - 53 214 |
| | | | | | |
Consolidated revenue | | 77 731 | | 81 690 | | 86 723 |
Expenditure | | | | | | |
Consolidated revenue fund | | - 59 819 | | - 61 284 | | - 62 113 |
Special funds | | - 10 234 | | - 10 862 | | - 11 939 |
Non-budget-funded bodies | | - 17 158 | | - 17 947 | | - 18 471 |
Health and social services and education networks | | - 34 748 | | - 36 305 | | - 37 924 |
Less: Elimination of inter-entity transations1 | | 49 936 | | 51 639 | | 53 214 |
| | | | | | |
Consolidated expenditure of departments and organizations | | - 72 023 | | - 74 759 | | - 77 233 |
Specified purpose accounts | | - 1 942 | | - 1 697 | | - 1 397 |
Debt service of the consolidated revenue fund | | - 6 934 | | - 7 794 | | - 8 646 |
| | | | | | |
Consolidated expenditure | | - 80 899 | | - 84 250 | | - 87 276 |
Contingency reserve | | - 300 | | - 300 | | - 200 |
Measures to be identified | | ¾ | | ¾ | | 300 |
| | | | | | |
DEFICIT | | - 3 468 | | - 2 860 | | - 453 |
| | | | | | |
Deposits of dedicated revenues in the Generations Fund | | - 732 | | - 940 | | - 1 047 |
| | | | | | |
BUDGETARY BALANCE WITHIN THE MEANING OF THE BALANCED BUDGET ACT | | - 4 200 | | - 3 800 | | - 1 500 |
1 Elimination of transactions between entities in the reporting entity.
| | |
| | 2011-2012 Budget |
| | |
C.36 | | Budget Plan |
| | |

TABLE C.17
Detailed consolidated financial framework
Consolidated results by entity
(millions of dollars)
| | 2010-2011 |
| | |
| | | Consolidated entities | | | | | |
| | Consolidated
revenue
fund | | Special
funds | | Non-budget-
funded
bodies | | Health and
social services
and education
networks | | Generations
Fund | | Specified
purpose
accounts | | Consolidation
adjustments | | Consolidated
results |
| | | | | | | | | | | | | | | | |
Revenue | | | | | | | | | | | | | | | | |
Income and property taxes | | 27 512 | | 1 884 | | | | 1 471 | | | | | | - 139 | | 30 728 |
Consumption taxes | | 12 852 | | 1 973 | | 93 | | | | | | | | | | 14 918 |
Duties and permits | | 337 | | 1 089 | | 476 | | 198 | | | | | | | | 2 100 |
Miscellaneous | | 1 511 | | 3 495 | | 8 496 | | 3 775 | | | | 221 | | - 10 691 | | 6 807 |
Government enterprises | | 4 713 | | | | | | | | | | | | | | 4 713 |
Other revenue sources | | | | | | | | | | 732 | | | | | | 732 |
| | | | | | | | | | | | | | | | |
Own-source revenue | | 46 925 | | 8 441 | | 9 065 | | 5 444 | | 732 | | 221 | | - 10 830 | | 59 998 |
Québec government transfers | | | | 1 980 | | 8 114 | | 29 012 | | | | | | - 39 106 | | ¾ |
Federal transfers | | 15 451 | | 283 | | 38 | | 240 | | | | 1 721 | | | | 17 733 |
| | | | | | | | | | | | | | | | |
Total revenue | | 62 376 | | 10 704 | | 17 217 | | 34 696 | | 732 | | 1 942 | | - 49 936 | | 77 731 |
Expenditure | | | | | | | | | | | | | | | | |
Expenditure | | - 59 819 | | - 9 294 | | - 15 852 | | - 33 954 | | | | - 1 942 | | 48 819 | | - 72 042 |
Debt service | | - 6 934 | | - 940 | | - 1 306 | | - 794 | | | | | | 1 117 | | - 8 857 |
| | | | | | | | | | | | | | | | |
Total expenditure | | - 66 753 | | - 10 234 | | - 17 158 | | - 34 748 | | ¾ | | - 1 942 | | 49 936 | | - 80 899 |
| | | | | | | | | | | | | | | | |
Contingency reserve | | - 300 | | | | | | | | | | | | | | - 300 |
| | | | | | | | | | | | | | | | |
SURPLUS (DEFICIT) | | - 4 677 | | 470 | | 59 | | - 52 | | 732 | | ¾ | | ¾ | | - 3 468 |
| | | | | | | | | | | | | | | | |
Deposits of dedicated revenues in the Generations Fund | | | | | | | | | | - 732 | | | | | | - 732 |
| | | | | | | | | | | | | | | | |
BUDGETARY BALANCE WITHIN THE MEANING OF THE BALANCED BUDGET ACT | | - 4 677 | | 470 | | 59 | | - 52 | | ¾ | | ¾ | | ¾ | | - 4 200 |
| | | | | | | | | | | | | | | | |
Note: The public accounts will present the results according to the non-restated 2010-2011 structure.
| | |
The Government’s | | |
| | |
Financial Framework | | C.37 |
| | |
TABLE C.18
Detailed consolidated financial framework
Consolidated results by entity
(millions of dollars)
| | 2011-2012 |
| | |
| | | Consolidated entities | | | | | |
| | Consolidated
revenue
fund | | Special
funds | | Non-budget-
funded
bodies | | Health and
social services
and education
networks | | Generations
Fund | | Specified
purpose
accounts | | Consolidation
adjustments | | Consolidated
results |
| | | | | | | | | | | | | | | | |
Revenue | | | | | | | | | | | | | | | | |
Income and property taxes | | 28 718 | | 2 244 | | | | 1 489 | | | | | | - 220 | | 32 231 |
Consumption taxes | | 14 897 | | 2 125 | | 103 | | | | | | | | | | 17 125 |
Duties and permits | | 524 | | 1 185 | | 491 | | 208 | | | | | | | | 2 408 |
Miscellaneous | | 1 407 | | 3 562 | | 8 468 | | 3 906 | | | | 357 | | - 10 757 | | 6 943 |
Government enterprises | | 4 790 | | | | | | | | | | | | | | 4 790 |
Other revenue sources | | | | | | | | | | 940 | | | | | | 940 |
| | | | | | | | | | | | | | | | |
Own-source revenue | | 50 336 | | 9 116 | | 9 062 | | 5 603 | | 940 | | 357 | | - 10 977 | | 64 437 |
Québec government transfers | | | | 1 938 | | 8 295 | | 30 429 | | | | | | - 40 662 | | ¾ |
Federal transfers | | 15 039 | | 57 | | 569 | | 248 | | | | 1 340 | | | | 17 253 |
| | | | | | | | | | | | | | | | |
Total revenue | | 65 375 | | 11 111 | | 17 926 | | 36 280 | | 940 | | 1 697 | | - 51 639 | | 81 690 |
Expenditure | | | | | | | | | | | | | | | | |
Expenditure | | - 61 284 | | - 9 663 | | - 16 692 | | - 35 465 | | | | - 1 697 | | 50 411 | | - 74 390 |
Debt service | | - 7 794 | | - 1 199 | | - 1 255 | | - 840 | | | | | | 1 228 | | - 9 860 |
| | | | | | | | | | | | | | | | |
Total expenditure | | - 69 078 | | - 10 862 | | - 17 947 | | - 36 305 | | ¾ | | - 1 697 | | 51 639 | | - 84 250 |
| | | | | | | | | | | | | | | | |
Contingency reserve | | - 300 | | | | | | | | | | | | | | - 300 |
| | | | | | | | | | | | | | | | |
SURPLUS (DEFICIT) | | - 4 003 | | 249 | | - 21 | | - 25 | | 940 | | ¾ | | ¾ | | - 2 860 |
| | | | | | | | | | | | | | | | |
Deposits of dedicated revenues in the Generations Fund | | | | | | | | | | - 940 | | | | | | - 940 |
| | | | | | | | | | | | | | | | |
BUDGETARY BALANCE WITHIN THE MEANING OF THE BALANCED BUDGET ACT | | - 4 003 | | 249 | | - 21 | | - 25 | | ¾ | | ¾ | | ¾ | | - 3 800 |
| | | | | | | | | | | | | | | | |
| | |
| | 2011-2012 Budget |
| | |
C.38 | | Budget Plan |
| | |
TABLE C.19
Detailed consolidated financial framework
Consolidated results by entity
(millions of dollars)
| | 2012-2013 |
| | |
| | | Consolidated entities | | | | | |
| | Consolidated
revenue
fund | | Special
funds | | Non-budget-
funded
bodies | | Health and social
services and
education
networks | | Generations
Fund | | Specified
purpose
accounts | | Consolidation
adjustments | | Consolidated
results |
| | | | | | | | | | | | | | | | |
Revenue | | | | | | | | | | | | | | | | |
Income and property taxes | | 30 110 | | 2 621 | | | | 1 512 | | | | | | - 252 | | 33 991 |
Consumption taxes | | 16 754 | | 2 280 | | 104 | | | | | | | | | | 19 138 |
Duties and permits | | 503 | | 1 224 | | 497 | | 212 | | | | | | | | 2 436 |
Miscellaneous | | 1 586 | | 3 832 | | 9 151 | | 4 431 | | | | 359 | | - 11 121 | | 8 238 |
Government enterprises | | 4 930 | | | | | | | | | | | | | | 4 930 |
Other revenue sources | | | | | | | | | | 1 047 | | | | | | 1 047 |
| | | | | | | | | | | | | | | | |
Own-source revenue | | 53 883 | | 9 957 | | 9 752 | | 6 155 | | 1 047 | | 359 | | - 11 373 | | 69 780 |
Québec government transfers | | | | 1 930 | | 8 399 | | 31 512 | | | | | | - 41 841 | | ¾ |
Federal transfers | | 15 204 | | 54 | | 390 | | 257 | | | | 1 038 | | | | 16 943 |
| | | | | | | | | | | | | | | | |
Total revenue | | 69 087 | | 11 941 | | 18 541 | | 37 924 | | 1 047 | | 1 397 | | - 53 214 | | 86 723 |
Expenditure | | | | | | | | | | | | | | | | |
Expenditure | | - 62 113 | | - 10 291 | | - 17 053 | | - 37 020 | | | | - 1 397 | | 51 725 | | - 76 149 |
Debt service | | - 8 646 | | - 1 648 | | - 1 418 | | - 904 | | | | | | 1 489 | | - 11 127 |
| | | | | | | | | | | | | | | | |
Total expenditure | | - 70 759 | | - 11 939 | | - 18 471 | | - 37 924 | | ¾ | | - 1 397 | | 53 214 | | - 87 276 |
| | | | | | | | | | | | | | | | |
Contingency reserve | | - 200 | | | | | | | | | | | | | | - 200 |
Measures to be identified | | 300 | | | | | | | | | | | | | | 300 |
| | | | | | | | | | | | | | | | |
SURPLUS (DEFICIT) | | - 1 572 | | 2 | | 70 | | ¾ | | 1 047 | | ¾ | | ¾ | | - 453 |
| | | | | | | | | | | | | | | | |
Deposits of dedicated revenues in the Generations Fund | | | | | | | | | | - 1 047 | | | | | | - 1 047 |
| | | | | | | | | | | | | | | | |
BUDGETARY BALANCE WITHIN THE MEANING OF THE BALANCED BUDGET ACT | | - 1 572 | | 2 | | 70 | | ¾ | | ¾ | | ¾ | | ¾ | | - 1 500 |
| | | | | | | | | | | | | | | | |
| | |
The Government’s | | |
| | |
Financial Framework | | C.39 |
| | |
3.2 Consolidated entities
In addition to the financial transactions of the consolidated revenue fund, the government’s budgetary forecasts take into account all of the consolidated entities in the government’s reporting entity:
— special funds;
— non-budget-funded bodies;
— the health and social services and education networks;
— the Generations Fund.
The following table shows the net results of each group of consolidated entities.
TABLE C.20
Net results of consolidated entities
(millions of dollars)
| | 2010-2011 | | 2011-2012 | | 2012-2013 |
| | | | | | |
Special funds | | 470 | | 249 | | 2 |
Non-budget-funded bodies | | 59 | | - 21 | | 70 |
Health and social services and education networks | | - 52 | | - 25 | | ¾ |
Generations Fund (dedicated revenues) | | 732 | | 940 | | 1 047 |
| | | | | | |
NET RESULTS | | 1 209 | | 1 143 | | 1 119 |
| | | | | | |
3.2.1 Special funds
The special funds consist of 35 entities set up in government departments or organizations. Their mission is to deliver services and sell goods or to fund government programs. Special fund activities can be financed through fees, dedicated revenues from taxes, tax revenues or budgetary appropriations allocated annually by the National Assembly.
| | |
| | 2011-2012 Budget |
| | |
C.40 | | Budget Plan |
| | |

The government has decided to create new special funds. In this way, it will provide Quebecers with more transparent information on the specific allocation of certain tax revenue that is used to finance priority missions such as road infrastructure, specific health services and tax adminstration.
The table below presents the net results of the special funds for 2010-2011, 2011-2012 and 2012-2013. Overall, the special funds show a surplus of $470 million, $249 million and $2 million respectively for these three years.
TABLE C.21
Special funds
Net results
(millions of dollars)
| | 2010-2011 | | 2011-2012 | | 2012-2013 |
| | | | | | |
Revenue | | | | | | |
Income and property taxes | | 1 884 | | 2 244 | | 2 621 |
Consumption taxes | | 1 973 | | 2 125 | | 2 280 |
Duties and permits | | 1 089 | | 1 185 | | 1 224 |
Miscellaneous | | 3 495 | | 3 562 | | 3 832 |
| | | | | | |
Own-source revenue | | 8 441 | | 9 116 | | 9 957 |
Québec government transfers | | 1 980 | | 1 938 | | 1 930 |
Federal transfers | | 283 | | 57 | | 54 |
| | | | | | |
Total revenue | | 10 704 | | 11 111 | | 11 941 |
| | | | | | |
Expenditure | | | | | | |
Expenditure | | - 9 294 | | - 9 663 | | - 10 291 |
Debt service | | - 940 | | - 1 199 | | - 1 648 |
| | | | | | |
Total expenditure | | - 10 234 | | - 10 862 | | - 11 939 |
| | | | | | |
NET RESULTS | | 470 | | 249 | | 2 |
| | | | | | |
| | |
The Government’s | | |
| | |
Financial Framework | | C.41 |
| | |
List of special funds |
| | | |
Fonds d’aide à l’action communautaire autonome | | Fonds des technologies de l’information du Conseil du trésor | |
Fonds d’aide aux victimes d’actes criminels | | Fonds des technologies de l’information du ministère de l’Emploi et de la Solidarité sociale | |
Fonds d’assistance financière pour certaines régions sinistrées | | Fonds d’information foncière | |
Fonds de développement du marché du travail | | Fonds d’information géographique | |
Fonds de développement régional | | Fonds du centre financier de Montréal | |
Fonds de financement | | Fonds du développement économique1 | |
Fonds de financement des établissements de santé et de services sociaux (Fund to Finance Health and Social Services Institutions) (FINESSS) | | Fonds du patrimoine culturel québécois | |
Fonds de fourniture de biens ou de services du ministère de l’Emploi et de la Solidarité sociale | | Fonds du patrimoine minier | |
Fonds de gestion de l’équipement roulant | | Fonds du service aérien gouvernemental | |
Fonds de la sécurité routière | | Fonds forestier | |
Fonds de l’assurance médicaments | | Fonds pour la promotion des saines habitudes de vie | |
Fonds de l’industrie des courses de chevaux | | Fonds pour le développement des jeunes enfants | |
Fonds de partenariat touristique | | Fonds pour le développement du sport et de l’activité physique | |
Fonds de soutien aux proches aidants | | Fonds québécois d’initiatives sociales | |
Fonds des pensions alimentaires | | Fonds relatif à la tempête de verglas | |
Fonds des registres du ministère de la Justice | | Fonds relatif à l’administration fiscale (Tax Administration Fund) (FRAF)1 | |
Fonds des réseaux de transport terrestre (Land Transportation Network Fund) (FORT) | | Fonds vert (Green Fund) | |
Fonds des services de police | | | |
| | | |
| | | |
| | | |
1 The Fonds du développement économique and the fonds relatif à l’administration fiscale will begin their activities on April 1, 2011.
| | |
| | 2011-2012 Budget |
| | |
C.42 | | Budget Plan |
| | |
3.2.2 Non-budget-funded bodies
The non-budget-funded bodies comprise 68 entities, which are listed in the box below.
These bodies were created to provide specific public services in sectors such as agriculture, through La Financière agricole du Québec, transportation, through the Agence métropolitaine de transport and the Société des traversiers du Québec, and culture, through museums and the Société de développement des entreprises culturelles.
The net results of non-budget-funded bodies stand at $59 million in 2010-2011, - $21 million in 2011-2012 and $70 million in 2012-2013.
TABLE C.22
Non-budget-funded bodies
Net results
(millions of dollars)
| | 2010-2011 | | 2011-2012 | | 2012-2013 |
| | | | | | |
Revenue | | | | | | |
Income and property taxes | | ¾ | | ¾ | | ¾ |
Consumption taxes | | 93 | | 103 | | 104 |
Duties and permits | | 476 | | 491 | | 497 |
Miscellaneous | | 8 496 | | 8 468 | | 9 151 |
| | | | | | |
Own-source revenue | | 9 065 | | 9 062 | | 9 752 |
Québec government transfers | | 8 114 | | 8 295 | | 8 399 |
Federal transfers | | 38 | | 569 | | 390 |
| | | | | | |
Total revenue | | 17 217 | | 17 926 | | 18 541 |
| | | | | | |
Expenditure | | | | | | |
Expenditure | | - 15 852 | | - 16 692 | | - 17 053 |
Debt service | | - 1 306 | | - 1 255 | | - 1 418 |
| | | | | | |
Total expenditure | | - 17 158 | | - 17 947 | | - 18 471 |
| | | | | | |
NET RESULTS | | 59 | | - 21 | | 70 |
| | | | | | |
| | |
The Government’s | | |
| | |
Financial Framework | | C.43 |
| | |
List of non-budget-funded bodies |
| | |
Agence de l’efficacité énergétique | | Institut national des mines |
Agence du revenu du Québec1 | | La Financière agricole du Québec |
Agence métropolitaine de transport | | Musée d’Art contemporain de Montréal |
Autorité des marchés financiers | | Musée de la Civilisation |
Bibliothèque et Archives nationales du Québec | | Musée national des beaux-arts du Québec |
Bureau de décision et de révision | | Office de la sécurité du revenu des chasseurs et piégeurs cris |
Centre de la francophonie des Amériques | | Office des professions du Québec |
Centre de recherche industrielle du Québec | | Office Québec-Amériques pour la jeunesse |
Centre de services partagés du Québec | | Office Québec-Monde pour la jeunesse |
Commission de la capitale nationale du Québec | | Régie de l’assurance maladie du Québec |
Commission des lésions professionnelles | | Régie de l’énergie |
Commission des normes du travail | | Régie des installations olympiques |
Commission des relations du travail | | Régie du bâtiment du Québec |
Commission des services juridiques | | Régie du cinéma |
Conseil des arts et des lettres du Québec | | Services Québec |
Conservatoire de musique et d’art dramatique du Québec | | Société d’habitation du Québec |
Corporation d’hébergement du Québec | | Société de développement de la Baie-James |
Corporation d’urgence-santé | | Société de développement des entreprises culturelles |
École nationale de police du Québec | | Société de financement des infrastructures locales du Québec |
École nationale des pompiers du Québec | | Société de l’assurance automobile du Québec |
Financement-Québec | | Société de la Place des Arts de Montréal |
Fondation de la faune du Québec | | Société de télédiffusion du Québec |
Fonds d’aide aux recours collectifs | | Société des établissements de plein air du Québec |
Fonds d’assurance-prêts agricoles et forestiers | | Société des traversiers du Québec |
Fonds de la recherche en santé du Québec | | Société du Centre des congrès de Québec |
Fonds québécois de la recherche sur la nature et les technologies | | Société du Grand Théâtre de Québec |
Fonds québécois de la recherche sur la société et la culture | | Société du Palais des congrès de Montréal |
Héma-Québec | | Société du parc industriel et portuaire de Bécancour |
Immobilière SHQ | | Société immobilière du Québec |
Infrastructure Québec | | Société nationale de l’amiante |
Institut de la statistique du Québec | | Société québécoise d’assainissement des eaux |
Institut de tourisme et d’hôtellerie du Québec | | Société québécoise de récupération et de recyclage |
Institut national d’excellence en santé et en services sociaux | | Société québécoise d’information juridique |
Institut national de santé publique du Québec | | Tribunal administratif du Québec |
| | |
| | |
| | |
| | |
| | |
| | |
| | |
| | |
| | |
| | |
| | |
| | |
| | |
| | |
| | |
| | |
| | |
| | |
| | |
| | |
| | |
| | |
| | |
1 The Agence du revenu du Québec will begin its activities on April 1, 2011.
| | |
| | 2011-2012 Budget |
| | |
C.44 | | Budget Plan |
| | |
3.2.3 The health and social services and education networks
The health and social services network is made up of 208 entities. These entities comprise 15 agencies and 3 regional authorities in health and social services, as well as 190 public health and social services institutions.
The education network is made of up 131 entities, including 73 school boards, 48 CEGEPs and the Université du Québec and its nine constituent universities.
The health and social services and education networks show combined deficits of $52 million in 2010-2011 and $25 million in 2011-2012. For fiscal 2012-2013, the health and social services and education networks show balanced combined results.
The deficit of the networks in 2010-2011 can be attributed to the deficit of the health and social services network, estimated at $139 million.
However, the government has introduced various measures to eliminate this deficit over the medium term, particularly through the creation of the Fund to Finance Health and Social Services Institutions (FINESSS). Spending control measures were also provided for in Bill 100, which was passed following the March 30, 2010 Budget.
Deficits of $114 million and $89 million are forecast for the health network in 2011-2012 and 2012-2013 respectively.
| | |
The Government’s | | |
| | |
Financial Framework | | C.45 |
| | |
TABLE C.23
Health and social services and education networks
Net results
(millions of dollars)
| | 2010-2011 | | 2011-2012 | | 2012-2013 |
| | | | | | |
Revenue | | | | | | |
School property taxes | | 1 471 | | 1 489 | | 1 512 |
Duties and permits | | 198 | | 208 | | 212 |
Miscellaneous | | 3 775 | | 3 906 | | 4 431 |
| | | | | | |
Own-source revenue | | 5 444 | | 5 603 | | 6 155 |
Québec government transfers | | 29 012 | | 30 429 | | 31 512 |
Federal transfers | | 240 | | 248 | | 257 |
| | | | | | |
Total revenue | | 34 696 | | 36 280 | | 37 924 |
| | | | | | |
Expenditure | | | | | | |
Expenditure | | - 33 954 | | - 35 465 | | - 37 020 |
Debt service | | - 794 | | - 840 | | - 904 |
| | | | | | |
Total expenditure | | - 34 748 | | - 36 305 | | - 37 924 |
| | | | | | |
NET RESULTS | | - 52 | | - 25 | | ¾ |
| | | | | | |
| | |
| | 2011-2012 Budget |
| | |
C.46 | | Budget Plan |
| | |
3.2.4 Generations Fund
Deposits in the Generations Fund are expected to reach $732 million for 2010-2011.
For 2011-2012 and 2012-2013, total deposits in the Generations Fund are expected to amount to $940 million and $1 047 million respectively. As a result, the book value of the Generations Fund will reach $5.4 billion as at March 31, 2013. Section H presents the results of and change in the Generations Fund in greater detail.
TABLE C.24
Deposits in the Generations Fund
(millions of dollars)
| | 2010-2011
Budget | | | | | 2011-2012 Budget |
| | | | | | | |
| | 2010-2011 | | | Adjustments | | 2010-2011 | | 2011-2012 | | 2012-2013 |
| | | | | | | | | | | |
Dedicated revenues | | | | | | | | | | | |
Water-power royalties | | 687 | | | - 54 | | 633 | | 689 | | 733 |
Unclaimed property | | 2 | | | 9 | | 11 | | 7 | | 7 |
Investment income | | 203 | | | - 115 | | 88 | | 244 | | 307 |
| | | | | | | | | | | |
TOTAL | | 892 | | | - 160 | | 732 | | 940 | | 1 047 |
| | | | | | | | | | | |
| | |
The Government’s | | |
| | |
Financial Framework | | C.47 |
| | |
This page intentionally left blank
4. GOVERNMENT INVESTMENTS
4.1 The Québec Infrastructures Plan
Over the coming years, the government will continue to invest in Québec’s public infrastructure. As prescribed by the Act to promote the maintenance and renewal of public infrastructures (R.S.Q., c. M-1.2), a substantial portion of these investments will be allocated to maintaining the quality of existing infrastructure and eliminating the maintenance deficit by 2022-2023.
Under the 2010-2015 Québec Infrastructures Plan, the government will invest $44.6 billion over five years, which represents an increase of $1 916 million compared with the previous plan. This growth rate of 4.5% is comparable to that of the economy.
Coupled with the contribution of the Québec government’s various partners in the projects included in the five-year plan, investments under the 2010-2015 Québec Infrastructures Plan will reach $57.0 billion over five years.
TABLE C.25
Infrastructure investments in 2010-2015
(millions of dollars)
2009-2014 Québec Infrastructures Plan | | 42 639.4 |
Increase in the five-year budget: 4.5% | | 1 916.4 |
| | |
2010-2015 Québec Infrastructures Plan | | 44 555.8 |
Contribution from partners1 | | 12 490.8 |
| | |
TOTAL INFRASTRUCTURE INVESTMENTS IN 2010-2015 | | 57 046.6 |
| | |
1 Federal government, municipalities and other partners.
q Investment targets for the coming years
Over the coming years, the government is committed to accelerating investments in public infrastructure, particularly to support the economy and employment.
To secure the economic recovery, the level of investment will be maintained until 2012-2013.
Thereafter, as of 2012-2013, the government will gradually reduce the annual level of investments while complying with the Act to promote the maintenance and renewal of public infrastructures.
| | |
The Government’s | | |
| | |
Financial Framework | | C.49 |
| | |
CHART C.5
Change in infrastructure investment
(Québec government contribution, billions of dollars)
1 Annual investments are detailed in Appendix 1 of this section.
4.2 Investments by Québec government departments and organizations
In addition to investments of roughly $9.6 billion in 2011-2012 under the Québec Infrastructures Plan, the Québec government will invest $1.5 billion through its various departments, agencies and special funds. These investments will include capital expenditures required for government functions and for maintaining the quality of public services.
TABLE C.26
Investments by government departments, agencies and special funds
(millions of dollars)
| | | |
| | 2011-2012 | |
| | | |
Departments and budget-funded bodies | | 407.9 | |
| | | |
Non-budget-funded bodies | | 640.4 | |
| | | |
Special funds | | 446.4 | |
| | | |
| | | |
TOTAL | | 1 494.7 | |
| | | |
Note: These investments exclude those made under the Québec Infrastructures Plan.
| | |
| | 2011-2012 Budget |
C.50 | | Budget Plan |
| | |

4.3 Investments by government enterprises
Government enterprises will make major investments in the coming years. In 2011-2012, investments by Hydro-Québec, Loto-Québec and the Société des alcools du Québec will reach $4.9 billion. Over the period from 2010-2011 to 2012-2013, investments by these corporations will total $15.1 billion.
TABLE C.27
Investments by government enterprises
(millions of dollars)
| | | | | | | | | |
| | 2010-2011 | | 2011-2012 | | 2012-2013 | | Total | |
| | | | | | | | | |
Hydro-Québec | | 4 220.0 | | 4 609.0 | | 5 257.0 | | 14 086.0 | |
| | | | | | | | | |
Loto-Québec | | 210.6 | | 253.9 | | 374.6 | | 839.1 | |
| | | | | | | | | |
Société des alcools du Québec | | 55.0 | | 65.0 | | 45.0 | | 165.0 | |
| | | | | | | | | |
| | | | | | | | | |
TOTAL | | 4 485.6 | | 4 927.9 | | 5 676.6 | | 15 090.1 | |
| | | | | | | | | |
4.4 Public investments in the economy
Public investments in Québec, including those by the Québec Infrastructures Plan, municipalities, the federal government and Hydro-Québec will reach 6.3% of GDP in 2011, a level not seen for over 25 years.
CHART C.6
Investments by governments1 and Hydro-Québec in Québec
(as a percentage of GDP)
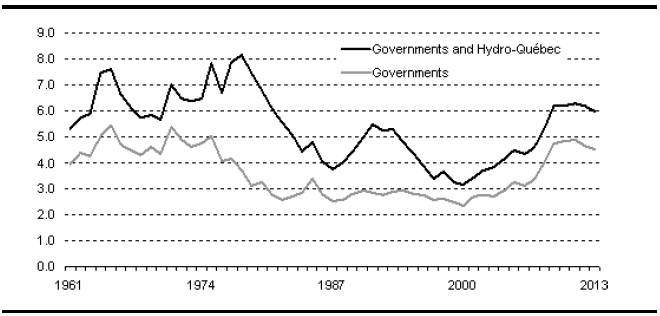
1 Québec government, federal government and municipalities.
Sources: Statistics Canada and Ministère des Finances du Québec.
| | |
The Government’s | | |
Financial Framework | | C.51 |
| | |
In fact, the forecast average investment of $13.7 billion in 2010-2011 to 2011-2012 by the government under its Québec Infrastructures Plan and by Hydro-Québec will create or support close to 100 000 jobs in Québec, i.e. 2.5% of all jobs.
— The increase in public investments by the Québec government and Hydro-Québec will support 29 000 more jobs.
TABLE C.28
Jobs supported by the Québec Infrastructures Plan1 and Hydro-Québec
| | | | | |
| | Average annual value of | | Average annual number | |
| | investments | | of jobs | 2 |
| | ($ billion) | | (units) | |
| | | | | |
2003-2004 to 2009-2010 | | 8.5 | | 65 000 | |
| | | | | |
Increase between the two periods | | 5.2 | | 29 000 | |
| | | | | |
| | | | | |
2010-2011 AND 2011-2012 | | 13.7 | | 94 000 | |
| | | | | |
1 | Ministère des Finances du Québec estimates based on the intersectoral model of the Institut de la statistique du Québec. |
2 | Québec government contributions only. |
| | |
| | 2011-2012 Budget |
C.52 | | Budget Plan |
| | |
5. CONSOLIDATED NET FINANCIAL REQUIREMENTS
Net surpluses or financial requirements represent the difference between the government’s cash inflow and disbursements. This measure takes into account not only changes in the budgetary balance on an accrual basis, but also resources or requirements arising from the government’s investments through the acquisition of fixed assets, through loans, investments and advances, and through other activities such as paying accounts payable and collecting accounts receivable. The difference between the budgetary balance and net financial requirements is recognized in non-budgetary transactions.
As a whole, the government’s consolidated net financial requirements stand at $6.5 billion in 2010-2011, $7.5 billion in 2011-2012 and $4.5 billion in 2012-2013.
TABLE C.29
Consolidated net financial requirements1
(millions of dollars)
| | | | | | | | | | | | |
| | 2010-2011
Budget | | | | | 2011-2012 Budget | |
| | | | | | | | | | | | |
| | 2010-2011 | | | Adjustments | | 2010-2011 | | 2011-2012 | | 2012-2013 | |
| | | | | | | | | | | | |
Budgetary balance within the meaning of the Balanced Budget Act | | - 4 506 | | | 306 | | - 4 200 | | - 3 800 | | - 1 500 | |
| | | | | | | | | | | | |
Deposits of dedicated revenues in the Generations Fund | | 892 | | | - 160 | | 732 | | 940 | | 1 047 | |
| | | | | | | | | | | | |
| | | | | | | | | | | | |
Total consolidated budgetary transactions | | - 3 614 | | | 146 | | - 3 468 | | - 2 860 | | - 453 | |
| | | | | | | | | | | | |
| | | | | | | | | | | | |
Consolidated non-budgetary transactions | | | | | | | | | | | | |
| | | | | | | | | | | | |
Investments, loans and advances | | - 1 281 | | | - 341 | | - 1 622 | | - 2 024 | | - 1 101 | |
| | | | | | | | | | | | |
Capital expenditures | | - 4 653 | | | - 441 | | - 5 094 | | - 4 222 | | - 5 373 | |
| | | | | | | | | | | | |
Retirement plans and employee future benefits | | 2 667 | | | 697 | | 3 364 | | 2 720 | | 2 597 | |
| | | | | | | | | | | | |
Other accounts | | - 98 | | | 448 | | 350 | | - 1 148 | | - 121 | |
| | | | | | | | | | | | |
| | | | | | | | | | | | |
Total consolidated non-budgetary transactions | | - 3 365 | | | 363 | | - 3 002 | | - 4 674 | | - 3 998 | |
| | | | | | | | | | | | |
| | | | | | | | | | | | |
CONSOLIDATED NET FINANCIAL REQUIREMENTS | | - 6 979 | | | 509 | | - 6 470 | | - 7 534 | | - 4 451 | |
| | | | | | | | | | | | |
1 A negative entry indicates a financial requirement and a positive entry, a source of financing.
| | |
The Government’s | | |
Financial Framework | | C.53 |
| | |
The consolidated net financial requirements shown in the above table come from the following sources:
— The net financial requirements of the consolidated revenue fund amount to $1.5 billion for 2010-2011, $3.5 billion for 2011-2012 and $600 million for 2012-2013. These variations mainly reflect the change in the deficits forecast for the coming years and the capital funding granted by Investissement Québec to provide assistance to businesses.
— The net financial requirements of consolidated entities, excluding the Generations Fund, stand at $5.7 billion for 2010-2011, $5.0 billion for 2011-2012 and $4.9 billion for 2012-2013. These net financial requirements stem largely from infrastructure investments provided for by the Land Transportation Network Fund and by the health and social services and education networks.
— The net financial surplus of the Generations Fund amounts to $732 million for 2010-2011, $940 million for 2011-2012 and $1.0 billion for 2012-2013.
TABLE C.30
Consolidated net financial requirements by entity1
(millions of dollars)
| | | | | | | | | | | | |
| | 2010-2011 Budget | | | | | 2011-2012 Budget | |
| | | | | | | | |
| | | | | | | | |
| | 2010-2011 | | | Adjustments | | 2010-2011 | | 2011-2012 | | 2012-2013 | |
| | | | | | | | | | | | |
Consolidated revenue fund | | - 3 000 | | | 1 500 | | - 1 500 | | - 3 500 | | - 600 | |
| | | | | | | | | | | | |
Consolidated entities2 | | - 4 871 | | | - 831 | | - 5 702 | | - 4 974 | | - 4 898 | |
| | | | | | | | | | | | |
Generations Fund | | 892 | | | - 160 | | 732 | | 940 | | 1 047 | |
| | | | | | | | | | | | |
| | | | | | | | | | | | |
CONSOLIDATED NET FINANCIAL REQUIREMENTS | | - 6 979 | | | 509 | | - 6 470 | | - 7 534 | | - 4 451 | |
| | | | | | | | | | | | |
1 A negative entry indicates a financial requirement and a positive entry, a source of financing.
2 Excluding the Generations Fund.
| | |
| | 2011-2012 Budget |
C.54 | | Budget Plan |
| | |
6. CONSOLIDATED NON-BUDGETARY TRANSACTIONS
Consolidated non-budgetary transactions consist of the non-budgetary transactions of the consolidated revenue fund and those of consolidated entities. They are presented by activity:
— investments, loans and advances;
— capital expenditures;
— retirement plans and employee future benefits;
— other accounts.
For 2010-2011, consolidated non-budgetary requirements stand at $3.0 billion, or $363 million less than forecast in the March 2010 Budget. For 2011-2012 and 2012-2013, consolidated non-budgetary requirements stand at $4.7 billion and $4.0 billion respectively.
| | |
The Government’s | | |
Financial Framework | | C.55 |
| | |
TABLE C.31
Summary of consolidated non-budgetary transactions1
(millions of dollars)
| | | | | | | |
| | 2010-2011
Budget | 2 | | | 2011-2012 Budget | |
| | | | | | | |
| | | | | | | | | | | |
| | 2010-2011 | | Adjustments | | 2010-2011 | | 2011-2012 | | 2012-2013 | |
| | | | | | | | | | | |
Consolidated revenue fund | | | | | | | | | | | |
Investments, loans and advances | | - 1 103 | | 817 | | - 286 | | - 1 118 | | - 968 | |
Capital expenditures | | - 266 | | - 76 | | - 342 | | - 369 | | - 376 | |
Retirement plans and employee future benefits | | 2 667 | | 697 | | 3 364 | | 2 720 | | 2 597 | |
Other accounts | | 585 | | - 144 | | 441 | | - 730 | | - 281 | |
| | | | | | | | | | | |
Total | | 1 883 | | 1 294 | | 3 177 | | 503 | | 972 | |
| | | | | | | | | | | |
Consolidated entities | | | | | | | | | | | |
Investments, loans and advances | | - 178 | | - 1 158 | | - 1 336 | | - 906 | | - 133 | |
Capital expenditures | | - 4 387 | | - 365 | | - 4 752 | | - 3 853 | | - 4 997 | |
Retirement plans and employee future benefits | | ¾ | | ¾ | | ¾ | | ¾ | | ¾ | |
Other accounts | | - 683 | | 592 | | - 91 | | - 418 | | 160 | |
| | | | | | | | | | | |
Total | | - 5 248 | | - 931 | | - 6 179 | | - 5 177 | | - 4 970 | |
| | | | | | | | | | | |
Consolidated non-budgetary transactions | | | | | | | | | | | |
Investments, loans and advances | | - 1 281 | | - 341 | | - 1 622 | | - 2 024 | | - 1 101 | |
Capital expenditures | | - 4 653 | | - 441 | | - 5 094 | | - 4 222 | | - 5 373 | |
Retirement plans and employee future benefits | | 2 667 | | 697 | | 3 364 | | 2 720 | | 2 597 | |
Other accounts | | - 98 | | 448 | | 350 | | - 1 148 | | - 121 | |
| | | | | | | | | | | |
TOTAL CONSOLIDATED NON-BUDGETARY TRANSACTIONS | | - 3 365 | | 363 | | - 3 002 | | - 4 674 | | - 3 998 | |
| | | | | | | | | | | |
1 | A negative entry indicates a financial requirement and a positive entry, a source of financing. |
2 | The data for the 2010-2011 Budget have been restated to reflect the creation of special funds since that budget was tabled. Appendix 3 gives the details of these restatements. |
| | |
| | 2011-2012 Budget |
C.56 | | Budget Plan |
| | |
q Investments, loans and advances
Consolidated financial requirements for investments, loans and advances for 2010-2011 amount to $1.6 billion. The forecasts for 2011-2012 and 2012-2013 stand at $2.0 billion and $1.1 billion respectively.
For 2010-2011, the investments, loans and advances of the consolidated revenue fund show financial requirements of $286 million, or $817 million less than forecast in last year’s budget.
This decrease can be attributed mainly to the change in the payment schedule for capital funding granted to government enterprises. This change is due to, among other things, the merger of Investissement Québec (IQ) and the Société générale de financement du Québec (SGF).
— The capital funding of $500 million provided for in 2010-2011 for the SGF will be allocated to IQ over the next two years, i.e. $400 million in 2011-2012 and $100 million in 2012-2013.
The financial requirements of consolidated entities in regard to investments, loans and advances amount to $1.3 billion for 2010-2011 and $906 million for 2011-2012. The requirements for 2010-2011 arise primarily from loans by Financement-Québec to municipal entities under the municipal infrastructure low-cost loans program set up under Canada’s Economic Action Plan.
q Retirement plans and employee future benefits
For 2010-2011, the balance of non-budgetary transactions in regard to the retirement plans and employee future benefits is $3.4 billion, which reduces the government’s financing needs.
For 2011-2012 and 2012-2013, the retirement plans and employee future benefits should help to reduce financing needs by $2.7 billion and $2.6 billion respectively.
| | |
The Government’s | | |
Financial Framework | | C.57 |
| | |
q Other accounts
Net financial requirements for other accounts consist of a series of changes in assets and liabilities such as accounts receivable, accounts payable and deferred revenue.
In 2010-2011, the change in other accounts will constitute a source of financing, amounting to $350 million.
q Capital expenditures
In 2010-2011, financial requirements associated with capital expenditures total $5.1 billion. As shown in the following table, they consist of investments of $7.9 billion minus the $2.8-billion depreciation.
Forecast financial requirements for 2011-2012 and 2012-2013 stand at $4.2 billion and $5.4 billion respectively.
Financial requirements in regard to consolidated entities for 2010-2011 are largely explained by investments of $4.1 billion by special funds, including $3.8 billion in road infrastructure. These investments also explain the increase in financial requirements for 2011-2012 and 2012-2013.
| | |
| | 2011-2012 Budget |
C.58 | | Budget Plan |
| | |
TABLE C.32
Net investments in capital expenditures1
(millions of dollars)
| | | | | | | |
| | 2010-2011 Budget | | | | | 2011-2012 Budget | |
| | | | | | | | |
| | | | | | | | | | | | |
| | 2010-2011 | | Adjustments | | 2010-2011 | | 2011-2012 | | 2012-2013 | |
| | | | | | | | | | | |
Consolidated revenue fund | | | | | | | | | | | |
Level of investment | | - 518 | | 25 | | - 493 | | - 523 | | - 533 | |
Depreciation | | 252 | | - 101 | | 151 | | 154 | | 157 | |
| | | | | | | | | | | |
Total – Consolidated revenue fund | | - 266 | | - 76 | | - 342 | | - 369 | | - 376 | |
| | | | | | | | | | | |
Consolidated entities | | | | | | | | | | | |
Special funds | | | | | | | | | | | |
– | Level of investment | | - 4 260 | | 184 | | - 4 076 | | - 3 061 | | - 3 253 | |
– | Depreciation | | 1 102 | | - 227 | | 875 | | 918 | | 1 011 | |
| | | | | | | | | | | |
– | Total – Special funds | | - 3 158 | | - 43 | | - 3 201 | | - 2 143 | | - 2 242 | |
Non-budget-funded bodies | | | | | | | | | | | |
– | Level of investment | | - 668 | | - 201 | | - 869 | | - 1 204 | | - 1 726 | |
– | Depreciation | | 499 | | 1 | | 500 | | 576 | | 631 | |
| | | | | | | | | | | | |
– | Total – Non-budget-funded bodies | | - 169 | | - 200 | | - 369 | | - 628 | | - 1 095 | |
Health and social services and education networks | | | | | | | | | | | |
– | Level of investment | | - 2 392 | | - 107 | | - 2 499 | | - 2 458 | | - 3 153 | |
– | Depreciation | | 1 332 | | - 15 | | 1 317 | | 1 376 | | 1 493 | |
| | | | | | | | | | | | |
– | Total – Health and social services and education networks | | - 1 060 | | - 122 | | - 1 182 | | - 1 082 | | - 1 660 | |
| | | | | | | | | | | | |
Consolidated entities | | | | | | | | | | | |
Level of investment | | - 7 320 | | - 124 | | - 7 444 | | - 6 723 | | - 8 132 | |
Depreciation | | 2 933 | | - 241 | | 2 692 | | 2 870 | | 3 135 | |
| | | | | | | | | | | |
Total – Consolidated entities | | - 4 387 | | - 365 | | - 4 752 | | - 3 853 | | - 4 997 | |
| | | | | | | | | | | |
CONSOLIDATED | | | | | | | | | | | |
Level of investment | | - 7 838 | | - 99 | | - 7 937 | | - 7 246 | | - 8 665 | |
Depreciation | | 3 185 | | - 342 | | 2 843 | | 3 024 | | 3 292 | |
| | | | | | | | | | | |
Total – Consolidated | | - 4 653 | | - 441 | | - 5 094 | | - 4 222 | | - 5 373 | |
| | | | | | | | | | | | |
1 A negative entry indicates a financial requirement and a positive entry, a source of financing.
| | |
The Government’s | | |
Financial Framework | | C.59 |
| | |
This page intentionally left blank

APPENDIX 1: | DETAILS OF THE 2010-2015 |
| QUÉBEC INFRASTRUCTURES PLAN |
q Breakdown by activity sector
Investments of $44.6 billion from 2010-2011 to 2014-2015 under the Québec Infrastructures Plan are distributed among the various sectors of government activity:
— $20.4 billion in transportation infrastructure (road network, public transit and maritime infrastructure);
— $10.1 billion in health infrastructure;
— $6.3 billion in education infrastructure;
— $3.9 billion in municipal infrastructure;
— $3.9 billion in other sectors (culture, social housing, research, justice and public security, agriculture, public dams and forest roads).
CHART C.7 Breakdown of investments under the 2010-2015
Québec Infrastructures Plan by activity sector |
(Québec government contribution) |
|

|
1 Includes investments in culture, social housing, research, justice and public security, agriculture, public dams and forest roads. |
| | |
The Government’s | | |
| | |
Financial Framework | | C.61 |
| | |
TABLE C.33
Breakdown of investments under the 2010-2015
Québec Infrastructures Plan by activity sector
(Québec government contribution, millions of dollars)
| | | | | | | | | | | | | |
| | 2010-11 | | 2011-12 | | 2012-13 | | 2013-14 | | 2014-15 | | Total | |
| | | | | | | | | | | | | |
Road network | | 3 416.5 | | 3 457.2 | | 3 414.1 | | 3 249.8 | | 3 323.3 | | 16 860.9 | |
| | | | | | | | | | | | | |
Public transit | | 534.5 | | 984.8 | | 623.7 | | 413.6 | | 396.5 | | 2 953.1 | |
| | | | | | | | | | | | | |
Maritime infrastructure | | 99.6 | | 147.3 | | 158.0 | | 152.1 | | 25.0 | | 582.0 | |
| | | | | | | | | | | | | |
Health and social services | | 1 714.1 | | 1 961.6 | | 1 951.8 | | 2 212.1 | | 2 234.8 | | 10 074.4 | |
| | | | | | | | | | | | | |
Education | | 1 367.3 | | 1 405.9 | | 1 222.2 | | 1 130.7 | | 1 128.1 | | 6 254.2 | |
| | | | | | | | | | | | | |
Culture | | 439.4 | | 185.5 | | 186.1 | | 161.8 | | 170.1 | | 1 142.9 | |
| | | | | | | | | | | | | |
Municipal infrastructure | | 831.3 | | 710.8 | | 774.9 | | 756.8 | | 796.0 | | 3 869.8 | |
| | | | | | | | | | | | | |
Social housing | | 212.3 | | 264.9 | | 312.7 | | 173.8 | | 100.5 | | 1 064.2 | |
| | | | | | | | | | | | | |
Research | | 106.1 | | 80.8 | | 168.7 | | 80.8 | | 80.8 | | 517.2 | |
| | | | | | | | | | | | | |
Justice and public security | | 166.8 | | 299.7 | | 284.0 | | 191.6 | | 80.6 | | 1 022.7 | |
| | | | | | | | | | | | | |
Other1 | | 47.0 | | 55.3 | | 39.8 | | 33.0 | | 39.3 | | 214.4 | |
| | | | | | | | | | | | | |
TOTAL | | 8 934.9 | | 9 553.8 | | 9 136.0 | | 8 556.1 | | 8 375.0 | | 44 555.8 | |
| | | | | | | | | | | | | |
1 Agriculture, public dams and forest roads. |
| | |
| | 2011-2012 Budget |
| | |
C.62 | | Budget Plan |
| | |
q Breakdown by type of investment
These investments include funds allocated to maintaining assets and improving and replacing infrastructure, as well as completing projects started before the first five-year plan came into effect.
The investment budget for maintaining assets comprises the regular budget needed to meet recognized asset maintenance standards (ranging from 1% to 3% of assets’ replacement value, depending on the sector) and investments allocated to eliminating the infrastructure maintenance deficit over 15 years as prescribed by the Act to promote the maintenance and renewal of public infrastructures.
CHART C.8 Breakdown of investments under the 2010-2015
Québec Infrastructures Plan by type of investment1 |
(Québec government contribution) |
|
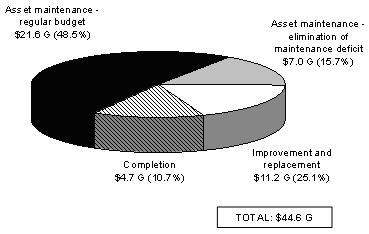
|
1 The difference between the total of the investments shown here and total investments under the 2010-2015 Québec Infrastructures Plan is due to rounding of the annual amounts. |
| | |
The Government’s | | |
| | |
Financial Framework | | C.63 |
| | |
TABLE C.34
Breakdown of investments under the 2010-2015 Québec Infrastructures Plan by activity sector and type of investment
(Québec government contribution, millions of dollars)
| | | | | | | | | |
| | Asset maintenance | | | | | | | | |
| | | | | | | | | | |
| | Regular
budget | | Elimination of
maintenance
deficit | | | Improvement
and
replacement | | Project
completion | | Total | |
| | | | | | | | | | | | |
Road network | | 9 434.6 | | 1 957.7 | | | 2 671.8 | | 2 796.8 | | 16 860.9 | |
| | | | | | | | | | | | |
Public transit | | 1 188.0 | | 588.4 | | | 717.9 | | 458.8 | | 2 953.1 | |
| | | | | | | | | | | | |
Maritime infrastructure | | ¾ | | ¾ | | | 582.0 | | ¾ | | 582.0 | |
| | | | | | | | | | | | |
Health and social services | | 4 428.5 | | 786.7 | | | 4 340.9 | | 518.3 | | 10 074.4 | |
| | | | | | | | | | | | |
Education | | 4 344.3 | | 1 176.7 | | | 727.0 | | 6.2 | | 6 254.2 | |
| | | | | | | | | | | | |
Culture | | 617.3 | | 250.7 | | | 163.5 | | 111.4 | | 1 142.9 | |
| | | | | | | | | | | | |
Municipal infrastructure | | 785.2 | | 2 024.2 | | | 395.4 | | 665.0 | | 3 869.8 | |
| | | | | | | | | | | | |
Social housing | | 279.4 | | 216.8 | | | 380.1 | | 187.9 | | 1 064.2 | |
| | | | | | | | | | | | |
Research | | ¾ | | ¾ | | | 517.2 | | ¾ | | 517.2 | |
| | | | | | | | | | | | |
Justice and public security | | 340.1 | | ¾ | | | 682.6 | | ¾ | | 1 022.7 | |
| | | | | | | | | | | | |
Other1 | | 192.7 | | ¾ | | | 21.7 | | ¾ | | 214.4 | |
| | | | | | | | | | | | |
TOTAL | | 21 610.1 | | 7 001.2 | | | 11 200.1 | | 4 744.4 | | 44 555.8 | |
| | | | | | | | | | | | |
1 Agriculture, public dams and forest roads. |
| | |
| | 2011-2012 Budget |
| | |
C.64 | | Budget Plan |
| | |
APPENDIX 2: | INVESTMENT PROJECTS BY |
| GOVERNMENT ENTERPRISES |
Certain government enterprises will continue to make substantial investments that will contribute to Québec’s economic prosperity. In 2011-2012, investments by these corporations will increase by $442 million compared with 2010-2011 and reach $4 928 million. They will climb again by nearly $750 million in 2012-2013, to $5 677 million.
q Hydro-Québec
Hydro-Québec will boost its investments by $389 million in 2011 compared with the previous year, for a total of $4 609 million. In 2012, its investments will grow by $648 million, to $5 257 million.
The funds devoted to the La Romaine complex will reach $543 million in 2011 and $872 million in 2012. As well, $512 million will be allocated to the Eastmain-1-A/Sarcelle/Rupert project in 2011. In addition to making a significant contribution to Québec’s economy, these two projects will play an important role in securing Québec’s energy future.
Renovation work on the Gentilly-2 power station will also generate major economic spinoffs, as $150 million will be devoted to this project in 2011 and $409 million in 2012.
Substantial amounts will also be allocated to boost Québec’s energy efficiency, with spending in this regard amounting to $386 million in 2011 and $425 million in 2012.
Hydro-Québec’s other projects will also have significant spinoffs in Québec. Overall, the investments devoted to these projects will reach $2 723 million in 2011 and $3 047 million in 2012.
| | |
The Government’s | | |
| | |
Financial Framework | | C.65 |
| | |
q Loto-Québec and the Société des alcools du Québec
Loto-Québec and the Société des alcools du Québec will also increase their investments through various projects.
Loto-Québec’s investments will reach $254 million in 2011-2012 and $375 million in 2012-2013. Of these amounts, $127 million will be allocated to the Casino de Montréal renovation project in 2011-2012 and $92 million will be invested in the project in 2012-2013. In 2012-2013 as well, $236 million will also be invested to replace video lottery machines that have reached the end of their useful life.
The Société des alcools du Québec will increase its investments to $65 million in 2011-2012, compared with $55 million in 2010-2011. These investments will be devoted mainly to developing or expanding its outlets, to real estate projects related to its corporate buildings, and to its computer resources. In 2012-2013, the Société plans to invest $45 million.
| | |
| | 2011-2012 Budget |
| | |
C.66 | | Budget Plan |
| | |
TABLE C.35
Forecast investment by government enterprises
(millions of dollars)
| | | | | | | |
| | 2010-2011 | | 2011-2012 | | 2012-2013 | |
| | | | | | | |
HYDRO-QUÉBEC1 | | | | | | | |
| | | | | | | |
Major projects | | | | | | | |
| | | | | | | |
Eastmain-1-A/Sarcelle/Rupert | | 794.0 | | 512.0 | | 119.0 | |
| | | | | | | |
Gentilly-2 – Repair project | | 282.0 | | 150.0 | | 409.0 | |
| | | | | | | |
La Romaine complex | | 387.0 | | 543.0 | | 872.0 | |
| | | | | | | |
Transmission integration – Wind turbines (990 MW and 2 000 MW) | | 92.0 | | 295.0 | | 385.0 | |
| | | | | | | |
Global Energy Efficiency Plan | | 216.0 | | 386.0 | | 425.0 | |
| | | | | | | |
Subtotal – Major projects | | 1 771.0 | | 1 886.0 | | 2 210.0 | |
| | | | | | | |
Other projects | | 2 449.0 | | 2 723.0 | | 3 047.0 | |
| | | | | | | |
Total – Hydro-Québec | | 4 220.0 | | 4 609.0 | | 5 257.0 | |
| | | | | | | |
LOTO-QUÉBEC | | | | | | | |
| | | | | | | |
Casino de Montréal | | 89.8 | | 126.6 | | 91.9 | |
| | | | | | | |
Video lottery machines | | 45.4 | | 43.2 | | 235.9 | |
| | | | | | | |
Other projects | | 75.4 | | 84.1 | | 46.8 | |
| | | | | | | |
Total – Loto-Québec | | 210.6 | | 253.9 | | 374.6 | |
| | | | | | | |
SOCIÉTÉ DES ALCOOLS DU QUÉBEC | | | | | | | |
| | | | | | | |
Outlet network | | 15.5 | | 17.6 | | 10.8 | |
| | | | | | | |
Other projects2 | | 39.5 | | 47.4 | | 34.2 | |
| | | | | | | |
Total – Société des alcools du Québec | | 55.0 | | 65.0 | | 45.0 | |
| | | | | | | |
TOTAL INVESTMENTS | | 4 485.6 | | 4 927.9 | | 5 676.6 | |
| | | | | | | |
1 For the fiscal year ending December 31.
2 Amount including, in 2010-2011, the expansion of the Québec City distribution centre ($11 million).
| | |
The Government’s | | |
| | |
Financial Framework | | C.67 |
| | |
This page intentionally left blank

APPENDIX 3: | RESTATEMENT OF THE FINANCIAL FRAMEWORK OF THE 2010-2011 BUDGET TO TAKE INTO ACCOUNT THE CREATION OF FORT AND FRAF | |
| | |
The following table presents the government’s five-year financial framework as published in the 2010-2011 Budget. It incorporates the measures identified in the plan to restore fiscal balance. The following pages present the impact of the implementation of FORT and FRAF on the financial framework so as to make the framework comparable with that of the 2011-2012 Budget. | |
TABLEAU C.36
Financial framework of the 2010-2011 Budget
(millions of dollars)
| | | | | | | | | | | | | |
| Preliminary
data | | Forecasts | | Projections | |
| | | | | | | | | | | | |
| | 2009-10 | | 2010-11 | | 2011-12 | | 2012-13 | | 2013-14 | | 2014-15 | |
| | | | | | | | | | | | | |
Budgetary revenue | | | | | | | | | | | | | |
| | | | | | | | | | | | | |
Own-source revenue | | 47 421 | | 50 152 | | 53 840 | | 57 563 | | 60 333 | | 62 703 | |
| | | | | | | | | | | | | |
% change | | - 3.0 | | 5.8 | | 7.4 | | 6.9 | | 4.8 | | 3.9 | |
| | | | | | | | | | | | | |
Federal transfers1 | | 15 229 | | 15 325 | | 14 681 | | 14 933 | | 15 395 | | 15 979 | |
| | | | | | | | | | | | | |
% change | | 8.6 | | 0.6 | | - 4.2 | | 1.7 | | 3.1 | | 3.8 | |
| | | | | | | | | | | | | |
Total budgetary revenue | | 62 650 | | 65 477 | | 68 521 | | 72 496 | | 75 728 | | 78 682 | |
| | | | | | | | | | | | | |
% change | | - 0.4 | | 4.5 | | 4.6 | | 5.8 | | 4.5 | | 3.9 | |
| | | | | | | | | | | | | |
Budgetary expenditure | | | | | | | | | | | | | |
| | | | | | | | | | | | | |
Program spending | | - 60 769 | | - 62 561 | | - 63 907 | | - 65 282 | | - 66 686 | | - 69 282 | |
| | | | | | | | | | | | | |
% change | | 3.8 | | 2.9 | | 2.2 | | 2.2 | | 2.2 | | 3.9 | |
| | | | | | | | | | | | | |
Debt service | | - 6 154 | | - 6 980 | | - 7 832 | | - 8 749 | | - 9 588 | | - 9 737 | |
| | | | | | | | | | | | | |
% change | | - 5.4 | | 13.4 | | 12.2 | | 11.7 | | 9.6 | | 1.6 | |
| | | | | | | | | | | | | |
Total budgetary expenditure | | - 66 923 | | - 69 541 | | - 71 739 | | - 74 031 | | - 76 274 | | - 79 019 | |
| | | | | | | | | | | | | |
% change | | 2.9 | | 3.9 | | 3.2 | | 3.2 | | 3.0 | | 3.6 | |
| | | | | | | | | | | | | |
Net results of consolidated entities | | 598 | | 750 | | 979 | | 1 072 | | 618 | | 828 | |
| | | | | | | | | | | | | |
Contingency reserve | | - 300 | | - 300 | | | | | | | | | |
| | | | | | | | | | | | | |
Other measures to be identified in the plan to restore fiscal balance | | | | | | 311 | | 324 | | 1 051 | | 1 051 | |
| | | | | | | | | | | | | |
SURPLUS (DEFICIT) | | - 3 975 | | - 3 614 | | - 1 928 | | - 139 | | 1 123 | | 1 542 | |
| | | | | | | | | | | | | |
Deposits in the Generations Fund | | - 715 | | - 892 | | - 972 | | - 1 061 | | - 1 123 | | - 1 542 | |
| | | | | | | | | | | | | |
Stabilization reserve | | 433 | | | | | | | | | | | |
| | | | | | | | | | | | | |
BUDGETARY BALANCE WITHIN THE MEANING OF THE BALANCED BUDGET ACT | | - 4 257 | | - 4 506 | | - 2 900 | | - 1 200 | | 0 | | 0 | |
| | | | | | | | | | | | | |
1 The fiscal arrangements legislation, which determines the payment formulas for equalization, the Canada Health Transfer and the Canada Social Transfer, is in force until 2013-2014. The projection for these transfers as of 2014-2015 was made using the formulas currently in effect.
The Government’s | |
| |
Financial Framework | C.69 |
q Impact of the implementation of FORT and FRAF
In its last budget, the government announced the creation of the following funds:
— FORT, which provides in particular that the fuel tax, as well as driver’s licence and registration fees, will be allocated to funding its infrastructures;
— FRAF, which will be used to finance the Agence du revenu du Québec. The Act respecting the Agence du revenu du Québec also stipulates that from now on the allowance for doubtful accounts will be accounted for by applying it against budgetary revenue.
It is important to note that the government created these funds in order to improve the budgetary management of certain government activities. Use of dedicated funds make it possible, for example, to better finance certain types of activities such as those related to the administration of the tax system, or to facilitate the use of the user-payer principle in such cases as the funding of land transportation infrastructure.
The allocation of FORT and FRAF revenue and expenditure to the government’s consolidated entities does not affect the government’s budgetary balance. However, it modifies the level of own-source revenue and program spending.
| Creation of FORT and FRAF | |
| | |
| Given that FORT and FRAF are distinct accounting entities financed by dedicated revenues, most of the funds associated with these funds will no longer be included in both own-source revenue and program spending. For purposes of comparison, the budgetary data for 2009-2010 and 2010-2011 have been restated. Therefore, the level of own-source revenue excluding government enterprises in 2010-2011 is reduced by $3 119 million, to $42 543 million. Impact of the implementation of FORT and FRAF on own-source revenue excluding government enterprises (millions of dollars) | |
| | |
| | | 2009-10 | | 2010-11 | | 2011-12 | | 2012-13 | | 2013-14 | | 2014-15 | |
| OWN-SOURCE REVENUE IN THE
2010-2011 BUDGET | | 42 819 | | 45 662 | | 49 103 | | 52 661 | | 55 271 | | 57 247 | |
| % change | | – 2.4 | | 6.6 | | 7.5 | | 7.2 | | 5.0 | | 3.6 | |
| FORT | | – 2 389 | | – 2 512 | | – 2 697 | | – 2 889 | | – 3 077 | | – 3 126 | |
| FRAF | | – 575 | | – 607 | | – 723 | | – 760 | | – 797 | | – 815 | |
| Subtotal | | – 2 964 | | – 3 119 | | – 3 420 | | – 3 649 | | – 3 874 | | – 3 941 | |
| OWN-SOURCE REVENUE AFTER THE IMPLEMENTATION OF FORT AND FRAF | | 39 855 | | 42 543 | | 45 5961 | | 49 012 | | 51 397 | | 53 306 | |
| % change | | – 2.7 | | 6.7 | | 7.2 | | 7.5 | | 4.9 | | 3.7 | |
1 | Including $87 million in non-recurring extraordinary expenditures of FRAF. | | | | | | | | | |
| | | | | | | | | | | | | | |
| | | | | | | | | | | | | | |
| | |
| | 2011-2012 Budget |
| | |
C.70 | | Budget Plan |
| | |
| | | | | | | | | | | | | | |
| Creation of FORT and FRAF (cont.) | |
| | |
| The creation of these two funds reduces program spending by $2 600 million, to $59 961 million, for 2010-2011. As a result, spending growth falls from 2.9% to 2.5% in 2010-2011. This decrease in the growth rate compared with the forecast rate of 2.9% stems from the fact that the commitments provided for under FORT increase by 16.2%, a rate much higher than the growth in other spending. | |
| | | | | | | | | | | | | | |
| Impact of the implementation of FORT and FRAF on program spending | | | | | |
| (millions of dollars) | | | | | | | | | | | | | |
| | | 2009-10 | | 2010-11 | | 2011-12 | | 2012-13 | | 2013-14 | | 2014-15 | |
| PROGRAM SPENDING IN THE 2010-2011 BUDGET | | 60 769 | | 62 561 | | 63 907 | | 65 282 | | 66 686 | | 69 282 | |
| % change | | 3.8 | | 2.9 | | 2.2 | | 2.2 | | 2.2 | | 3.9 | |
| FORT | | – 1 715 | | – 1 993 | | – 2 392 | | – 2 784 | | – 3 164 | | – 3 501 | |
| FRAF | | – 575 | | – 607 | | – 723 | | – 760 | | – 797 | | – 815 | |
| Subtotal | | – 2 290 | | – 2 600 | | – 3 115 | | – 3 544 | | – 3 961 | | –��4 316 | |
| PROGRAM SPENDING AFTER THE IMPLEMENTATION OF FORT AND FRAF | | 58 479 | | 59 961 | | 60 792 | | 61 738 | | 62 725 | | 64 966 | |
| % change | | 4.0 | | 2.5 | | 1.4 | | 1.6 | | 1.6 | | 3.6 | |
| | | | | | | | | | | | | | |
| The impact of the implementation of FORT and FRAF on the results of consolidated entities is due exclusively to the fact that the difference between FORT revenue and expenditure has been taken into account. Overall, therefore, the creation of these two funds does not have an impact on the government’s budgetary balance. | |
| | | | | | | | | | | | | | |
| Impact of the implementation of FORT and FRAF on the net results of consolidated entities | |
| (millions of dollars) | | | | | | | | | | | | | |
| | | 2009-10 | | 2010-11 | | 2011-12 | | 2012-13 | | 2013-14 | | 2014-15 | |
| NET RESULTS IN THE 2010-2011 BUDGET | | 598 | | 750 | | 979 | | 1 072 | | 618 | | 828 | |
| FORT1 | | 674 | | 519 | | 305 | | 105 | | – 87 | | – 375 | |
| FRAF | | ¾ | | ¾ | | ¾ | | ¾ | | ¾ | | ¾ | |
| Subtotal | | 674 | | 519 | | 305 | | 105 | | – 87 | | – 375 | |
| NET RESULTS AFTER THE IMPLEMENTATION OF FORT AND FRAF | | 1 272 | | 1 269 | | 1 3712 | | 1 177 | | 531 | | 453 | |
| | | | | | | | | | | | | | |
1 | The Fonds de conservation et d’amélioration du réseau routier, Fonds pour la vente de biens et de services du MTQ, Fonds des partenariats en matière d’infrastructures de transport and Fonds des contributions des automobilistes au transport en commun have been replaced by FORT. Since these entities have always balanced their revenue and expenditure, their exclusion from the net results of non-budget-funded bodies and special funds does not entail an adjustment of net results following the implementation of FORT. |
2 | Excluding $87 million in non-recurring extraordinary expenditures of FRAF. |
| | | | | | | | | | | | | | |
| | | | | | | | | | | | | | |
| | |
The Government’s | | |
| | |
Financial Framework | | C.71 |
|
Creation of FORT and FRAF (cont.) |
|
| Impact on the budgetary balance | | | | | | | | | | | | | |
| (millions of dollars) | | | | | | | | | | | | | |
| | | 2009-10 | | 2010-11 | | 2011-12 | | 2012-13 | | 2013-14 | | 2014-15 | |
| Own-source revenue | | | | | | | | | | | | | |
| FORT | | – 2 389 | | – 2 512 | | – 2 697 | | – 2 889 | | – 3 077 | | – 3 126 | |
| FRAF | | – 575 | | – 607 | | – 723 | | – 760 | | – 797 | | – 815 | |
| Subtotal | | – 2 964 | | – 3 119 | | – 3 420 | | – 3 649 | | – 3 874 | | – 3 941 | |
| | | | | | | | | | | | | | |
| Program spending | | | | | | | | | | | | | |
| FORT | | 1 715 | | 1 993 | | 2 392 | | 2 784 | | 3 164 | | 3 501 | |
| FRAF | | 575 | | 607 | | 723 | | 760 | | 797 | | 815 | |
| Subtotal | | 2 290 | | 2 600 | | 3 115 | | 3 544 | | 3 961 | | 4 316 | |
| | | | | | | | | | | | | | |
| Consolidated entities | | | | | | | | | | | | | |
| FORT | | 674 | | 519 | | 305 | | 105 | | – 87 | | – 375 | |
| FRAF | | — | | — | | — | | — | | — | | — | |
| Subtotal | | 674 | | 519 | | 305 | | 105 | | – 87 | | – 375 | |
| TOTAL | | 0 | | 0 | | 0 | | 0 | | 0 | | 0 | |
| | | | | | | | | | | | | | |
| | | | | | | | | | | | | | |
| | |
| | 2011-2012 Budget |
| | |
C.72 | | Budget Plan |
| | |
The following table presents the 2010-2011 five-year financial framework in order to take into account the implementation of FORT and FRAF.
TABLE C.37
Restated financial framework of the 2010-2011 Budget taking into account the creation of FORT and FRAF – Basis comparable to that of the 2011-2012 Budget
(millions of dollars)
| Preliminary
data | | Forecasts | | Projections | |
| | | | | | | | | | | | | |
| | 2009-10 | | 2010-11 | | 2011-12 | | 2012-13 | | 2013-14 | | 2014-15 | |
| | | | | | | | | | | | | |
Budgetary revenue | | | | | | | | | | | | | |
Own-source revenue | | 44 457 | | 47 033 | | 50 333 | | 53 914 | | 56 459 | | 58 762 | |
% change | | - 3.3 | | 5.8 | | 7.0 | | 7.1 | | 4.7 | | 4.1 | |
Federal transfers1 | | 15 229 | | 15 325 | | 14 681 | | 14 933 | | 15 395 | | 15 979 | |
% change | | 8.6 | | 0.6 | | - 4.2 | | 1.7 | | 3.1 | | 3.8 | |
| | | | | | | | | | | | | |
Total budgetary revenue | | 59 686 | | 62 358 | | 65 101 | | 68 847 | | 71 854 | | 74 741 | |
% change | | - 0.4 | | 6.1 | | 4.4 | | 5.9 | | 4.4 | | 4.0 | |
Budgetary expenditure | | | | | | | | | | | | | |
Program spending | | - 58 479 | | - 59 961 | | - 60 792 | | - 61 738 | | - 62 725 | | - 64 966 | |
% change | | 4.0 | | 2.5 | | 1.4 | | 1.6 | | 1.6 | | 3.6 | |
Debt service | | - 6 154 | | -6 980 | | - 7 832 | | - 8 749 | | - 9 588 | | - 9 737 | |
% change | | - 5.4 | | 13.4 | | 12.2 | | 11.7 | | 9.6 | | 1.6 | |
| | | | | | | | | | | | | |
Total budgetary expenditure | | - 64 633 | | - 66 941 | | - 68 624 | | - 70 487 | | - 72 313 | | - 74 703 | |
% change | | 2.9 | | 3.6 | | 2.5 | | 2.7 | | 2.6 | | 3.3 | |
Net results of consolidated entities | | 1 272 | | 1 269 | | 1 371 | | 1 177 | | 531 | | 453 | |
Contingency reserve | | - 300 | | - 300 | | | | | | | | | |
Measures to be identified | | — | | — | | 311 | | 324 | | 1 051 | | 1 051 | |
| | | | | | | | | | | | | |
SURPLUS (DEFICIT) | | - 3 975 | | - 3 614 | | - 1 928 | | - 139 | | 1 123 | | 1 542 | |
| | | | | | | | | | | | | |
Deposits in the Generations Fund | | - 715 | | - 892 | | - 972 | | - 1 061 | | - 1 123 | | - 1 542 | |
Stabilization reserve | | 433 | | | | | | | | | | | |
| | | | | | | | | | | | | |
BUDGETARY BALANCE WITHIN THE MEANING OF THE BALANCED BUDGET ACT | | - 4 257 | | - 4 506 | | - 2 900 | | - 1 200 | | 0 | | 0 | |
| | | | | | | | | | | | | |
1 | The fiscal arrangements legislation, which determines the payment formulas for equalization, the Canada Health Transfer and the Canada Social Transfer, is in force until 2013-2014. The projection for these transfers as of 2014-2015 was made using the formulas currently in effect. |
| | |
The Government’s | | |
| | |
Financial Framework | | C.73 |
The following table presents the 2010-2011 five-year financial framework in order to take into account the implementation of FORT and FRAF and the reclassification of the allowance for doubtful accounts.
TABLE C.38
Restated financial framework of the 2010-2011 Budget taking into account the creation of FORT and FRAF and the reclassification of the allowance for doubtful accounts – Basis comparable to that of the 2011-2012 Budget
(millions of dollars)
| Preliminary data | | Forecasts | | Projections | |
| | | | | | | | | | | | |
| | 2009-10 | | 2010-11 | | 2011-12 | | 2012-13 | | 2013-14 | | 2014-15 | |
| | | | | | | | | | | | | |
Budgetary revenue | | | | | | | | | | | | | |
Own-source revenue | | 43 557 | | 46 133 | | 49 483 | | 53 064 | | 55 609 | | 57 912 | |
% change | | - 3.6 | | 5.9 | | 7.3 | | 7.2 | | 4.8 | | 4.1 | |
Federal transfers1 | | 15 229 | | 15 325 | | 14 681 | | 14 933 | | 15 395 | | 15 979 | |
% change | | 8.6 | | 0.6 | | - 4.2 | | 1.7 | | 3.1 | | 3.8 | |
| | | | | | | | | | | | | |
Total budgetary revenue | | 58 786 | | 61 458 | | 64 164 | | 67 997 | | 71 004 | | 73 891 | |
% change | | - 0.7 | | 4.5 | | 4.4 | | 6.0 | | 4.4 | | 4.1 | |
Budgetary expenditure | | | | | | | | | | | | | |
Program spending | | - 57 579 | | - 59 061 | | - 59 942 | | - 60 888 | | - 61 875 | | - 64 116 | |
% change | | 3.9 | | 2.6 | | 1.5 | | 1.6 | | 1.6 | | 3.6 | |
Debt service | | - 6 154 | | -6 980 | | - 7 832 | | - 8 749 | | - 9 588 | | - 9 737 | |
% change | | - 5.4 | | 13.4 | | 12.2 | | 11.7 | | 9.6 | | 1.6 | |
| | | | | | | | | | | | | |
Total budgetary expenditure | | - 63 733 | | - 66 041 | | - 67 774 | | - 69 637 | | - 71 463 | | - 73 853 | |
% change | | 2.9 | | 3.6 | | 2.6 | | 2.7 | | 2.6 | | 3.3 | |
Net results of consolidated entities | | 1 272 | | 1 269 | | 1 371 | | 1 177 | | 531 | | 453 | |
Contingency reserve | | - 300 | | - 300 | | | | | | | | | |
Measures to be identified | | — | | — | | 311 | | 324 | | 1 051 | | 1 051 | |
| | | | | | | | | | | | | |
SURPLUS (DEFICIT) | | - 3 975 | | - 3 614 | | - 1 928 | | - 139 | | 1 123 | | 1 542 | |
| | | | | | | | | | | | | |
Deposits in the Generations Fund | | - 715 | | - 892 | | - 972 | | - 1 061 | | - 1 123 | | - 1 542 | |
Stabilization reserve | | 433 | | | | | | | | | | | |
| | | | | | | | | | | | | |
BUDGETARY BALANCE WITHIN THE MEANING OF THE BALANCED BUDGET ACT | | - 4 257 | | - 4 506 | | - 2 900 | | - 1 200 | | 0 | | 0 | |
| | | | | | | | | | | | | |
1 The fiscal arrangements legislation, which determines the payment formulas for equalization, the Canada Health Transfer and the Canada Social Transfer, is in force until 2013-2014. The projection for these transfers as of 2014-2015 was made using the formulas currently in effect.
| | |
| | 2011-2012 Budget |
| | |
C.74 | | Budget Plan |
| | |