Exhibit 99.18
Section D
Debt, Financing
and Debt Management
1. | DEBT | D.3 |
| | | | |
| 1.1 | Debt representing accumulated deficits | D.3 |
| | | | |
| 1.2 | Gross debt | D.5 |
| | | | |
| | 1.2.1 | Net retirement plans liability | D.6 |
| | | | |
| | 1.2.2 | Net employee future benefits liability | D.7 |
| | | | |
| | 1.2.3 | Change in gross debt in 2010-2011 | D.8 |
| | | | |
| | 1.2.4 | Debt burden | D.11 |
| | | | |
| | 1.2.5 | Debt reduction objectives | D.12 |
| | | | |
| 1.3 | Public sector debt | D.14 |
| | | | |
| 1.4 | Comparison of the debt of Canadian provinces | D.15 |
| | | | |
| 1.5 | Retirement plans | D.17 |
| | | | |
| 1.6 | Retirement Plans Sinking Fund | D.21 |
| | | | |
| 1.7 | Employee future benefits | D.26 |
| | | | |
| 1.8 | Generations Fund | D.27 |
| | | | |
| 1.9 | Returns of the Caisse de dépôt et placement du Québec on funds deposited by the Ministère des Finances | D.29 |
| | | | |
| | 1.9.1 | Retirement Plans Sinking Fund | D.29 |
| | | | |
| | 1.9.2 | Generations Fund | D.31 |
| | | | |
| | 1.9.3 | Accumulated Sick Leave Fund | D.32 |
| | | | |
| 1.10 | Impact of the returns of the Retirement Plans Sinking Fund on debt service | D.34 |
2. | FINANCING | D.37 |
| | | | |
| 2.1 | Financing strategy | D.37 |
| | | | |
| | 2.1.1 | Diversification by market | D.37 |
| | | | |
| | 2.1.2 | Diversification by instrument | D.38 |
| | | | |
| | 2.1.3 | Diversification by maturity | D.39 |
| | | | |
| 2.2 | Financing program | D.40 |
| | | | |
| | 2.2.1 | Yield | D.43 |
| | | | |
3. | DEBT MANAGEMENT | D.45 |
| | | | |
| 3.1 | Structure of the debt by currency | D.45 |
| | | | |
| 3.2 | Structure of the debt by interest rate | D.47 |
| | | | |
4. | CREDIT RATINGS | D.49 |
| | | | |
| 4.1 | The Québec government’s credit ratings | D.49 |
| | | | |
| 4.2 | Comparison of the credit ratings of Canadian provinces | D.54 |
| | | | |
5. | ADDITIONAL INFORMATION | D.57 |

1. DEBT
Several concepts of debt can be used to measure a government’s indebtedness. The following table presents data on the Québec government’s debt according to the two main concepts the government employs, namely, gross debt and debt representing accumulated deficits.
TABLE D.1
Debt of the Québec government as at March 31
(millions of dollars)
| | 2010 | | 2011P | | 2012P | | 2013P | | 2014P | | 2015P | | 2016P | |
| | | | | | | | | | | | | | | |
GROSS DEBT1 | | 163 318 | | 173 429 | | 183 770 | | 190 962 | | 196 086 | | 201 899 | | 207 298 | |
As a % of GDP | | 53.8 | | 54.7 | | 55.7 | | 55.5 | | 54.7 | | 54.1 | | 53.6 | |
Less: | Financial assets, net of other liabilities | | - 13 218 | | - 14 434 | | - 17 693 | | - 19 059 | | - 20 089 | | - 21 853 | | - 23 656 | |
Less: | Non-financial assets | | - 42 483 | | - 47 577 | | - 51 799 | | - 57 172 | | - 62 374 | | - 67 971 | | - 73 568 | |
| | | | | | | | | | | | | | | | |
EBT REPRESENTING ACCUMULATED DEFICITS | | 107 617 | | 111 418 | | 114 278 | | 114 731 | | 113 623 | | 112 075 | | 110 074 | |
As a % of GDP | | 35.4 | | 35.1 | | 34.7 | | 33.3 | | 31.7 | | 30.0 | | 28.5 | |
| | | | | | | | | | | | | | | |
P: Preliminary results for 2011 and forecasts for subsequent years.
Note: The data take into account the line-by-line consolidation of the results of network institutions with those of the government in 2009-2010.
1 The gross debt excludes pre-financing.
1.1 Debt representing accumulated deficits
Debt representing accumulated deficits is a simple concept that reflects the financial position of a government well, since it takes all of its liabilities and assets into account. The federal government and the governments of Ontario and Alberta use debt representing accumulated deficits as a measure of indebtedness in their budget documents.
The debt representing accumulated deficits corresponds to the difference between the government’s liabilities and its financial and non-financial assets as a whole. The debt representing accumulated deficits is calculated by subtracting financial assets, net of other liabilities, as well as non-financial assets from the gross debt.
Preliminary results show that the debt representing accumulated deficits should amount to $111 418 million as at March 31, 2011, or 35.1% of gross domestic product (GDP).
| | |
Debt, Financing
and Debt Management | | D.3 |
| | |
The debt representing accumulated deficits as at March 31, 2011 has been restated to take into account the reassessment of obligations stemming from the remediation of contaminated land under the responsibility of the government. An additional amount of $333 million has thus been recorded as an environmental liability.
Between 2011-2012 and 2015-2016, the debt representing accumulated deficits is expected to decline by $1.3 billion. This decrease is due to the growth of $6.6 billion in the Generations Fund, although this growth will be offset in part by the $5.3-billion deficits posted in 2011-2012 and 2012-2013. The debt representing accumulated deficits will stop rising once the budget is balanced in 2013-2014. It will then decline year after year at the rate of increase of the Generations Fund.
TABLE D.2
Factors responsible for growth in the debt representing accumulated deficits
(millions of dollars)
| | Debt,
beginning
of year | | Budgetary
deficit | | Generations
Fund | | Restatement | | Total
change | | Debt, end
of year | | As a%
of GDP | |
2010-2011P | | 107 617 | | 4 200 | | - 732 | | 333 | 1 | 3 801 | | 111 418 | | 35.1 | |
2011-2012P | | 111 418 | | 3 800 | | - 940 | | ¾ | | 2 860 | | 114 278 | | 34.7 | |
2012-2013P | | 114 278 | | 1 500 | | - 1 047 | | ¾ | | 453 | | 114 731 | | 33.3 | |
2013-2014P | | 114 731 | | ¾ | | - 1 108 | | ¾ | | - 1 108 | | 113 623 | | 31.7 | |
2014-2015P | | 113 623 | | ¾ | | - 1 548 | | ¾ | | - 1 548 | | 112 075 | | 30.0 | |
2015-2016P | | 112 075 | | ¾ | | - 2 001 | | ¾ | | - 2 001 | | 110 074 | | 28.5 | |
| | | | | | | | | | | | | | | |
P: Preliminary results for 2010-2011 and forecasts for subsequent years.
1 This amount corresponds to the restatement made in respect of the reassessment of obligations stemming from the remediation of contaminated land (environmental liability).
| | |
D.4 | | 2011-2012 Budget
Budget Plan |
| | |
1.2 Gross debt
The gross debt corresponds to the sum of the debt contracted on financial markets and the net liability for the retirement plans and for employee future benefits of public and parapublic sector employees, minus the balance of the Generations Fund.
Preliminary results show that, as at March 31, 2011, the gross debt should stand at $173 429 million, or 54.7% of GDP. As at March 31, 2016, the gross debt is expected to be $207 298 million, or 53.6% of GDP.
TABLE D.3
Gross debt as at March 31
(millions of dollars)
| | 2010 | | 2011 | P | 2012 | P | 2013 | P | 2014 | P | 2015 | P | 2016 | P |
| | | | | | | | | | | | | | | |
Consolidated direct debt1 | | 136 074 | | 147 666 | | 158 314 | | 165 881 | | 171 309 | | 178 229 | | 185 394 | |
Plus: Net retirement plans liability | | 29 789 | | 29 093 | | 29 776 | | 30 477 | | 31 281 | | 31 722 | | 31 957 | |
Plus: Net employee future benefits liability | | 132 | | 79 | | 29 | | ¾ | | ¾ | | ¾ | | ¾ | |
Less: Generations Fund | | - 2 677 | | - 3 409 | | - 4 349 | | - 5 396 | | - 6 504 | | - 8 052 | | - 10 053 | |
| | | | | | | | | | | | | | | |
GROSS DEBT1 | | 163 318 | | 173 429 | | 183 770 | | 190 962 | | 196 086 | | 201 899 | | 207 298 | |
As a % of GDP | | 53.8 | | 54.7 | | 55.7 | | 55.5 | | 54.7 | | 54.1 | | 53.6 | |
| | | | | | | | | | | | | | | |
P: Preliminary results for 2011 and forecasts for subsequent years.
1 The consolidated direct debt and the gross debt exclude pre-financing.
The consolidated direct debt represents the debt that has been contracted on financial markets. It includes the government’s debt and the debt of entities whose results are consolidated line by line with those of the government. As at March 31, 2011, the consolidated direct debt is expected to total $147 666 million.
The main consolidated entities are Financement-Québec, the Fonds des réseaux de transport terrestre, the Société immobilière du Québec and Immobilière SHQ.
| | |
Debt, Financing
and Debt Management | | D.5 |
| | |
As at March 31, 2011, the net retirement plans liability should amount to $29 093 million and the net employee future benefits liability should be $79 million.
As at March 31, 2011, the sums accumulated in the Generations Fund are expected to amount to $3 409 million.
1.2.1 Net retirement plans liability
The net retirement plans liability is calculated by subtracting from the retirement plans liability the balance of the Retirement Plans Sinking Fund (RPSF), an asset established to pay the retirement benefits of public and parapublic sector employees.
The liability for the retirement plans represents the present value of the retirement benefits that the government will pay to public and parapublic sector employees, taking into account the conditions of their plans and their years of service. This liability should stand at $71 371 million as at March 31, 2011.
The government created the RPSF in 1993. As at March 31, 2011, the book value of the RPSF is expected to be $42 278 million.
The net liability for the retirement plans should total $29 093 million as at March 31, 2011.
TABLE D.4
Net retirement plans liability as at March 31, 2011P
(millions of dollars)
Retirement plans liability: | | | |
| | | |
Government and Public Employees Retirement Plan (RREGOP) | | 40 934 | |
| | | |
Pension Plan of Management Personnel (PPMP) | | 9 331 | |
| | | |
Other plans1 | | 21 106 | |
| | | |
Subtotal | | 71 371 | |
| | | |
Less: Retirement Plans Sinking Fund | | - 42 278 | |
| | | |
NET RETIREMENT PLANS LIABILITY | | 29 093 | |
| | | |
P: Preliminary results.
1 Takes into account, among other things, the assets of the pension plan of the Université du Québec.
| | |
D.6 | | 2011-2012 Budget
Budget Plan |
| | |
1.2.2 Net employee future benefits liability
The government records under its debt the value of its commitments regarding future benefits programs for its employees, namely, accumulated sick leave and pensions paid to the survivors of a government employee. These programs give rise to long-term obligations whose costs are covered in full by the government.
As at March 31, 2011, the value of the assets established to pay for employee future benefits programs should amount to $1 156 million.
Given that assets have been established to cover future disbursements, the net employee future benefits liability is expected to be $79 million as at March 31, 2011.
TABLE D.5
Net employee future benefits liability as at March 31, 2011P
(millions of dollars)
Accumulated sick leave | | 664 | |
| | | |
Survivor’s pension plan | | 407 | |
| | | |
Université du Québec programs | | 164 | |
| | | |
Subtotal | | 1 235 | |
| | | |
Less: | Accumulated Sick Leave Fund | | - 700 | |
| | | |
| Survivor’s Pension Plan Fund | | - 456 | |
| | | |
Subtotal | | - 1 156 | |
| | | |
NET EMPLOYEE FUTURE BENEFITS LIABILITY | | 79 | |
| | | |
P: Preliminary results.
| | |
Debt, Financing
and Debt Management | | D.7 |
| | |
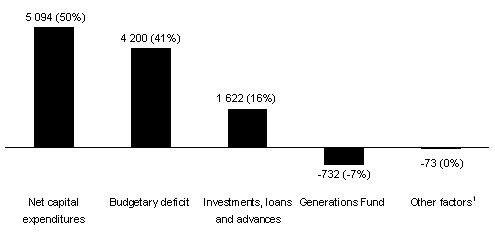
1.2.3 Change in gross debt in 2010-2011
In 2010-2011, the government’s gross debt should increase by $10 111 million.
CHART D.1
Factors responsible for growth in the gross debt in 2010-2011
(millions of dollars)
1 Other factors include in particular the change in “Other accounts”, such as accounts receivable and accounts payable, as well as the change in the value of the debt in foreign currency.
| | |
D.8 | | 2011-2012 Budget
Budget Plan |
| | |

The gross debt is increasing in 2010-2011 for the following reasons:
— | The budgetary deficit of $4 200 million. |
| |
— | Government investments in fixed assets (e.g. roads) that require borrowings. When these capital expenditures are made, they are posted to the government’s balance sheet. Subsequently, they are gradually recorded as expenditures based on the useful life of the assets concerned. In 2010-2011, net capital expenditures should cause the gross debt to increase by $5 094 million. |
| |
— | Government investments in its corporations. These investments are made through advances and direct capital outlays or by allowing these corporations to keep part of their earnings to finance their own investments. |
| |
| For example, Hydro-Québec pays 75% of its net earnings1 as dividends to the government and keeps 25% to fund its own investments, particularly hydroelectric dams. The portion of earnings that the government is leaving Hydro-Québec in 2010-2011 ($554 million) constitutes an investment by the government in Hydro-Québec, which creates a financial requirement for the government and thus leads to an increase in the gross debt. |
| |
| Overall, the government’s investments, loans and advances should lead to a $1 622-million increase in the gross debt in 2010-2011. |
| |
— | Changes in some of the government’s other asset and liability items, such as accounts payable and accounts receivable, which should reduce the gross debt by $73 million in 2010-2011. |
| |
— | Lastly, deposits in the Generations Fund, which should reduce the debt by $732 million in 2010-2011. |
The following table shows how the government’s gross debt has changed since March 31, 1998.
1 The amount of the dividend is calculated according to section 15.2 of the Act respecting Hydro-Québec, which stipulates that:
“The distributable surplus for a financial period is equal to 75% of the Company’s net profit. The net profit is computed on the basis of the annual consolidated financial statements established according to generally accepted accounting principles. However, no dividend may be declared in respect of a financial period if the payment thereof would result in a reduction of the rate of capitalization of the Company to less than 25% at the end of that period.”
| | |
Debt, Financing
and Debt Management | | D.9 |
| | |
As of 2009-2010, following the line-by-line consolidation of the results of network institutions with those of the government, the data for the gross debt include the debt that network institutions have contracted in their own name. Therefore, the gross debt for 2009-2010 and that for subsequent years are not comparable with that for 2008-2009 and previous years.
TABLE D.6
Growth factors of the Québec government’s gross debt
(millions of dollars)
| | Debt,
beginning
of year | | | Budgetary
deficit
(surplus) | | Investments,
loans and
advances | | Net
investment in
the networks | 1 | Net capital
Expenditures | 2 | Other
Factors | 3 | Generations
Fund | 4 | Total
change | | | Debt, end
of year | 5 | As a %
of GDP |
| | | | | | | | | | | | | | | | | | | | | | |
With networks consolidated at modified equity value6 | | | | | | | | | | | | | |
| | | | | | | | | | | | | | | | | | | | | | |
1998-1999 | | 111 525 | | | - 126 | | 1 312 | | 761 | | 396 | | 1 564 | | | | 3 907 | | | 115 432 | | 58.8 |
| | | | | | | | | | | | | | | | | | | | | | |
1999-2000 | | 115 432 | | | - 7 | | 1 989 | | 122 | | 200 | | - 975 | | | | 1 329 | | | 116 761 | | 55.4 |
| | | | | | | | | | | | | | | | | | | | | | |
2000-2001 | | 116 761 | | | - 427 | | 1 701 | | 841 | | 578 | | 1 108 | | | | 3 801 | | | 120 562 | | 53.6 |
| | | | | | | | | | | | | | | | | | | | | | |
2001-2002 | | 120 562 | | | - 22 | | 1 248 | | 934 | | 1 199 | | - 9 | | | | 3 350 | | | 123 912 | | 53.5 |
| | | | | | | | | | | | | | | | | | | | | | |
2002-2003 | | 123 912 | | | 728 | | 1 921 | | 631 | | 1 706 | | 237 | | | | 5 223 | | | 129 135 | | 53.5 |
| | | | | | | | | | | | | | | | | | | | | | |
2003-2004 | | 129 135 | | | 358 | | 1 367 | | 560 | | 1 186 | | 625 | | | | 4 096 | | | 133 231 | | 53.1 |
| | | | | | | | | | | | | | | | | | | | | | |
2004-2005 | | 133 231 | | | 664 | | 1 303 | | 1 486 | | 1 006 | | - 796 | | | | 3 663 | | | 136 894 | | 52.1 |
| | | | | | | | | | | | | | | | | | | | | | |
2005-2006 | | 136 894 | | | - 37 | | 1 488 | | 1 013 | | 1 179 | | - 809 | | | | 2 834 | | | 139 728 | | 51.4 |
| | | | | | | | | | | | | | | | | | | | | | |
2006-2007 | | 139 728 | | | - 109 | | 2 213 | | 1 002 | | 1 177 | | 1 078 | | - 584 | | 4 777 | | | 144 505 | | 51.2 |
| | | | | | | | | | | | | | | | | | | | | | |
2007-2008 | | 144 505 | | | ¾ | | 2 658 | | 487 | | 1 457 | | 767 | | - 649 | | 4 720 | | | 149 225 | | 50.4 |
| | | | | | | | | | | | | | | | | | | | | | |
2008-2009 | | 149 225 | | | ¾ | | 966 | | 622 | | 2 448 | | - 28 | | - 719 | | 3 289 | | | 152 514 | | 50.4 |
| | | | | | | | | | | | | | | | | | | | | | |
With networks consolidated line by line | | | | | | | | | | | | | |
| | | | | | | | | | | | | | | | | | | | | | |
2009-2010 | | 157 630 | | | 3 174 | | 2 009 | | | | 4 226 | | - 2 996 | | - 725 | | 5 688 | | | 163 318 | | 53.8 |
| | | | | | | | | | | | | | | | | | | | | | |
2010-2011P | | 163 318 | | | 4 200 | | 1 622 | | | | 5 094 | | - 73 | | - 732 | | 10 111 | | | 173 429 | | 54.7 |
| | | | | | | | | | | | | | | | | | | | | | |
2011-2012P | | 173 429 | | | 3 800 | | 2 024 | | | | 4 222 | | 1 235 | | - 940 | | 10 341 | | | 183 770 | | 55.7 |
| | | | | | | | | | | | | | | | | | | | | | |
2012-2013P | | 183 770 | | | 1 500 | | 1 101 | | | | 5 373 | | 265 | | - 1 047 | | 7 192 | | | 190 962 | | 55.5 |
| | | | | | | | | | | | | | | | | | | | | | |
2013-2014P | | 190 962 | | | ¾ | | 1 043 | | | | 5 202 | | - 13 | | - 1 108 | | 5 124 | | | 196 086 | | 54.7 |
| | | | | | | | | | | | | | | | | | | | | | |
2014-2015P | | 196 086 | | | ¾ | | 1 231 | | | | 5 597 | | 533 | | - 1 548 | | 5 813 | | | 201 899 | | 54.1 |
| | | | | | | | | | | | | | | | | | | | | | |
2015-2016P | | 201 899 | | | ¾ | | 1 307 | | | | 5 597 | | 496 | | - 2 001 | | 5 399 | | | 207 298 | | 53.6 |
P: | Preliminary results for 2010-2011 and forecasts for subsequent years. |
Note: A positive entry indicates an increase in the debt and a negative entry, a decrease. |
1 | The net investment in the networks includes mainly loans by Financement-Québec and the Corporation d’hébergement du Québec to institutions in the health and social services and education networks. As of 2006-2007, the net investment in the networks also includes the change in the accumulated deficits of network institutions. |
2 | These amounts correspond to investments in fixed assets made during the year less the yearly depreciation expenditure. They include in particular investments made in the course of private-public partnership agreements. |
3 | Other factors include in particular the change in “Other accounts”, such as accounts receivable and accounts payable, as well as the change in the value of the debt in foreign currency. |
4 | These amounts represent the increase in the balance of the Generations Fund during the fiscal year stemming from deposits in the fund and investment income. |
5 | The gross debt excludes pre-financing. |
6 | The data for 1998-1999 to 2008-2009 could not be restated to take into account the line-by-line consolidation of the network institutions’ results with those of the government. Therefore, the data for 2009-2010 to 2015-2016 are not comparable with those for previous years. The line-by-line consolidation of the results of network institutions with those of the government increased the gross debt by $5 116 million as at March 31, 2009. This amount corresponds to the debt of the health and social services and education networks contracted in their own name as at March 31, 2009. |
| | |
| | 2011-2012 Budget |
D.10 | | Budget Plan |
| | |
| | | |

1.2.4 Debt burden
One way to measure the extent of the government’s indebtedness is to compare its debt to the size of the economy, i.e. GDP. The debt/GDP ratio is then calculated. GDP represents the total value of goods and services produced in an economy during a given period. It is the source of the revenue the government collects to fund its activities, including payment of debt service. The comparison of the government’s debt to GDP is similar, for example, to the case of a person who wants to borrow to buy a house. The amount of the person’s debt (mortgage, car loan, etc.) is compared to his or her income to assess his or her level of indebtedness.
Since March 31, 1998, the Québec government’s gross debt/GDP ratio has fallen significantly. While the gross debt was equivalent to 59.2% of GDP as at March 31, 1998, this percentage stood at 50.4% as at March 31, 2009. The line-by-line consolidation of the network institutions’ results with those of the government raised the debt/GDP ratio to 52.1% as at March 31, 2009.
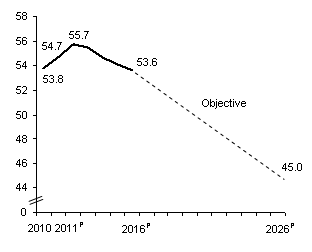
The ratio is expected to reach 55.7% as at March 31, 2012, mainly because of capital investments. The gross debt/GDP ratio should then decline to 53.6% as at March 31, 2016.
CHART D.2 Gross debt1 as at March 31 (as a percentage of GDP) |
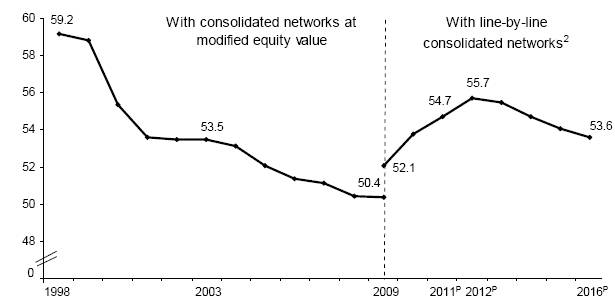
|
P: Preliminary results for 2011 and forecasts for subsequent years.
1 The gross debt excludes pre-financing.
2 The gross debt takes into account the debt that the health and social services and education networks have contracted in their own name. Therefore, the data for 2009 to 2016 are not comparable with those for 1998 to 2008, which do not include this debt.
| | |
Debt, Financing | | |
and Debt Management | | D.11 |
| | | | |
| | | | |
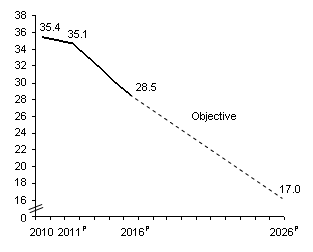
1.2.5 Debt reduction objectives
In last year’s budget, the government set two debt reduction objectives.
The first objective concerns the debt representing accumulated deficits. This debt corresponds to “bad debt”, or debt that does not correspond to any assets. As at March 31, 2011, it should stand at $111.4 billion, or 35.1% of GDP.
— The government’s objective is to reduce this ratio to 17% in 2025-2026. This is a maximum level.
The second objective concerns the gross debt. As at March 31, 2011, the government’s gross debt should amount to $173.4 billion, or 54.7% of GDP. It is forecast to reach a maximum of 55.7% of GDP in 2011-2012 and to begin falling thereafter.
— The government’s objective is to bring the gross debt/GDP ratio down to 45% in 2025-2026. Once again, this is a maximum level.
To achieve these objectives, the government will gradually raise the price of heritage pool electricity starting in 2014-2015. This increase represents 1 ¢/kWh over five years. All of the sums generated will be deposited in the Generations Fund.
In addition, the government is announcing in this budget that as of 2014-2015 it will make additional deposits in the Generations Fund stemming from the increase in mining, oil and gas royalties.
| | |
| | 2011-2012 Budget |
D.12 | | Budget Plan |
| | |
| | | |
CHART D.3 | | CHART D.4 |
| | |
Debt representing accumulated deficits | | Gross debt1 |
(as at March 31, as a percentage of GDP) | | (as at March 31, as a percentage of GDP ) |
| | 
|
P: Preliminary results for 2011, forecasts for 2012 to 2016 and projections for subsequent years. | | P: Preliminary results for 2011, forecasts for 2012 to 2016 and projections for subsequent years. Note: The gross debt takes into account the sums accumulated in the Generations Fund. 1 The gross debt excludes pre-financing. |
| | |
Debt, Financing | | |
and Debt Management | | D.13 |
| | | | |
| | | | |
1.3 Public sector debt
Public sector debt includes the government’s gross debt as well as the debt of Hydro-Québec, municipalities, universities other than the Université du Québec and its constituent universities and other government enterprises. This debt has served notably to finance public infrastructures, such as roads, schools, hospitals, hydroelectric dams and water treatment plants.
Preliminary results show that, as at March 31, 2011, Québec’s public sector debt should stand at $234 710 million, or 74.0% of GDP. These figures must be put into perspective for they do not take into account the economic value of certain assets held by the government, such as Hydro-Québec, the Société des alcools du Québec and Loto-Québec.
TABLE D.7
Public sector debt as at March 31 | | | | | | | |
(millions of dollars) | | | | | | | |
| | 2009 | | 2010 | | 2011 | P |
Government’s gross debt1 | | 157 630 | | 163 318 | | 173 429 | |
Hydro-Québec | | 36 668 | | 36 385 | | 37 671 | |
Municipalities2 | | 18 639 | | 19 538 | | 20 636 | |
Universities other than the Université du Québec and its constituent universities3 | | 1 964 | | 1 749 | | 1 511 | |
Other government enterprises4 | | 434 | | 697 | | 1 463 | |
PUBLIC SECTOR DEBT | | 215 335 | | 221 687 | | 234 710 | |
As a % of GDP | | 71.1 | | 73.0 | | 74.0 | |
| | | | | | | |
P: Preliminary results.
1 The gross debt excludes pre-financing.
2 These amounts correspond to the long-term debt contracted by municipalities in their own name. Part of this debt is subsidized by the government ($3 084 million as at March 31, 2011).
3 These amounts correspond to the debt contracted in their own name. Part of this debt is subsidized by the government ($336 million as at March 31, 2011).
4 These amounts correspond to the debt contracted by the Financing Fund to finance government enterprises and entities not included in the reporting entity. The amounts exclude the debt of organizations contracted in their own name that is guaranteed by a third party or secured by assets such as inventories and accounts receivable.
| | |
| | 2011-2012 Budget |
D.14 | | Budget Plan |
| | |
| | | |

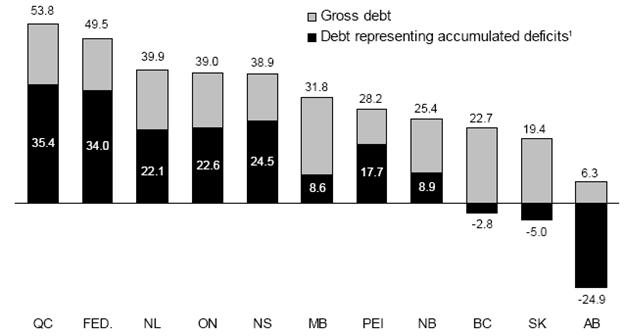
1.4 Comparison of the debt of Canadian provinces
It is worthwhile comparing the concepts of debt used by the Québec government with those used by other governments in Canada.
An analysis of the budget documents of the federal and provincial governments shows that the concepts of debt used to assess financial position vary widely from province to province.
The preferred concept of debt in British Columbia and Saskatchewan is direct debt. Ontario, Alberta, New Brunswick, Newfoundland and Labrador, Manitoba and Nova Scotia use the concept of net debt.
Four governments use the concept of debt representing accumulated deficits as a measure of indebtedness in their budget documents. They are the government of Québec, the federal government and the governments of Ontario and Alberta.
As for Prince Edward Island, its recent budget documents make no mention of its debt concept.
Be it on the basis of the gross debt or the debt representing accumulated deficits, Québec is the most heavily indebted province.
CHART D.5 Gross debt and debt representing accumulated deficits as at March 31, 2010 (as a percentage of GDP) |
|
1 A negative entry means that the government has an accumulated surplus.
Sources: Ministère des Finances du Québec, governments’ public accounts and Statistics Canada.
| | |
Debt, Financing | | |
and Debt Management | | D.15 |
| | | | |
| | | | |
The following table shows the debt of the federal government and each of the provinces as at March 31, 2010. The figures in boxes refer to the concept of debt used by the government concerned in its budget documents to measure its level of debt. Some governments use more than one concept.
TABLE D.8 Debt as at March 31, 2010 according to various concepts |
(millions of dollars) |
|
| | QC | | FED | | ON | | BC | | AB | | NB | | NL | | MB | | SK | | NS | | PEI | |
| | | | | | | | | | | | | | | | | | | | | | | |
| | | | | | | | | | | | | | | | | | | | | | | |
Consolidated direct debt | | 136 074 | | 559 126 | | 221 306 | | | 41 392 | | 6 204 | | 7 043 | | 6 012 | | 14 070 | | | 5 089 | | 11 372 | | 1 294 | |
| | | | | | | | | | | | | | | | | | | | | | | |
Net retirement plans liability | | 29 789 | | 142 843 | | - 5 266 | | 53 | | 9 481 | | - 197 | | 2 177 | | 1 800 | | 5 872 | | 558 | | 23 | |
| | | | | | | | | | | | | | | | | | | | | | | |
Net employee future benefits liability | | 132 | | 54 227 | | 9 582 | | 1 844 | | | | 134 | | 1 768 | | 362 | | | | 1 409 | | 23 | |
| | | | | | | | | | | | | | | | | | | | | | | |
Generations Fund | | - 2 677 | | | | | | | | | | | | | | | | | | | | | |
| | | | | | | | | | | | | | | | | | | | | | | |
| | | | | | | | | | | | | | | | | | | | | | | |
Gross debt1 | | | 163 318 | | 756 196 | | 225 622 | | 43 289 | | 15 685 | | 6 980 | | 9 957 | | 16 232 | | 10 961 | | 13 339 | | 1 340 | |
| | | | | | | | | | | | | | | | | | | | | | | |
As a % of GDP | | 53.8 | | 49.5 | | 39.0 | | 22.7 | | 6.3 | | 25.4 | | 39.9 | | 31.8 | | 19.4 | | 38.9 | | 28.2 | |
| | | | | | | | | | | | | | | | | | | | | | | |
Less: | | | | | | | | | | | | | | | | | | | | | | | |
| | | | | | | | | | | | | | | | | | | | | | | |
Net financial assets2 | | - 13 218 | | - 173 724 | | - 32 033 | | - 15 252 | | - 43 002 | | 1 373 | | - 1 737 | | - 4 438 | | - 7 401 | | - 320 | | 241 | |
| | | | | | | | | | | | | | | | | | | | | | | |
| | | | | | | | | | | | | | | | | | | | | | | |
Net debt3 | | 150 100 | | 582 472 | | | 193 589 | | 28 037 | | | - 27 317 | | | 8 353 | | | 8 220 | | | 11 794 | | 3 560 | | | 13 019 | | 1 581 | |
| | | | | | | | | | | | | | | | | | | | | | | |
As a % of GDP | | 49.4 | | 38.1 | | 33.5 | | 14.7 | | - 11.1 | | 30.0 | | 32.9 | | 23.1 | | 6.3 | | 38.0 | | 33.3 | |
| | | | | | | | | | | | | | | | | | | | | | | |
Less: | | | | | | | | | | | | | | | | | | | | | | | |
| | | | | | | | | | | | | | | | | | | | | | | |
Non-financial assets | | - 42 483 | | - 63 375 | | - 62 632 | | - 33 309 | | - 34 217 | | - 5 911 | | - 2 705 | | - 7 426 | | - 6 396 | | - 4 616 | | - 739 | |
| | | | | | | | | | | | | | | | | | | | | | | |
| | | | | | | | | | | | | | | | | | | | | | | |
Debt representing | | | | | | | | | | | | | | | | | | | | | | | |
accumulated deficits3 | | | 107 617 | | | 519 097 | | | 130 957 | | - 5 272 | | | - 61 534 | | 2 442 | | 5 515 | | 4 368 | | - 2 836 | | 8 403 | | 842 | |
| | | | | | | | | | | | | | | | | | | | | | | |
As a % of GDP | | 35.4 | | 34.0 | | 22.6 | | - 2.8 | | - 24.9 | | 8.9 | | 22.1 | | 8.6 | | - 5.0 | | 24.5 | | 17.7 | |
| | | | | | | | | | | | | | | | | | | | | | | |
| | | | | | | | | | | | | | | | | | | | | | | | | | | | | | | | | |
Note: The figures in boxes refer to the debt concept(s) used in the governments’ budget documents.
1 Gross debt is not shown in most government public accounts. However, the public accounts do show the components of gross debt, i.e. the consolidated direct debt, the net retirement plans liability and the net employee future benefits liability. It is therefore possible to deduce the amount of the gross debt.
2 Financial assets, net of other liabilities.
3 A negative entry indicates that the government has net assets or an accumulated surplus.
Sources: Ministère des Finances du Québec, governments’ public accounts and Statistics Canada.
| | |
| | 2011-2012 Budget |
D.16 | | Budget Plan |
| | |
| | | |
1.5 Retirement plans
The Québec government participates financially in the retirement plans of its employees. As at December 31, 2009, these plans had 555 783 active participants and 287 636 beneficiaries.
TABLE D.9 Retirement plans of public and parapublic sector employees as at December 31, 2009 | |
| | | | | |
| | Active participants | | Beneficiaries | |
| | | | | |
| | | | | |
Government and Public Employees Retirement Plan (RREGOP) | | 510 000 | | 185 854 | |
| | | | | |
Pension Plan of Management Personnel (PPMP) | | 28 000 | | 21 846 | |
| | | | | |
Other plans: | | | | | |
| | | | | |
– Teachers Pension Plan (TPP) and Pension Plan of Certain Teachers (PPCT)1 | | 240 | | 47 604 | |
| | | | | |
– Civil Service Superannuation Plan (CSSP)1 | | 100 | | 22 724 | |
| | | | | |
– Pension Plan for the Members of the Sûreté du Québec (PPMSQ) | | 5 375 | | 4 651 | |
| | | | | |
– Pension Plan of Peace Officers in Correctional Services (PPPOCS) | | 3 250 | | 1 504 | |
| | | | | |
– Pension Plan of the Judges of the Court of Québec and of Certain Municipal Courts (PPJCQM) | | 270 | | 329 | |
| | | | | |
– Pension Plan for Federal Employees Transferred to Employment with the Gouvernement du Québec (PPFEQ)2 | | 225 | | 117 | |
| | | | | |
– Pension Plan of the Members of the National Assembly (PPMNA) | | 123 | | 332 | |
| | | | | |
– Pension plan of the Université du Québec (PPUQ) | | 8 200 | | 2 675 | |
| | | | | |
Total for other plans | | 17 783 | | 79 936 | |
| | | | | |
TOTAL | | 555 783 | | 287 636 | |
1 These plans have not accepted any new participants since July 1, 1973.
2 This plan has not accepted any new participants since it came into effect on January 1, 1992.
Sources: Commission administrative des régimes de retraite et d’assurances and 2009-2010 Public Accounts.
| | |
Debt, Financing | | |
and Debt Management | | D.17 |
| | | | |
| | | | |
These plans are defined benefit retirement plans, which means that they guarantee participants a certain level of income upon retirement. Benefits are calculated on the basis of participants’ average income for the best paid years (generally five) and their number of years of service. The pension usually represents 2% of an employee’s average income per year of service, for a maximum of 70%2. Benefits are partially indexed to inflation.
The Commission administrative des régimes de retraite et d’assurances (CARRA) is responsible for administering the retirement plans, except the pension plan of the Université du Québec (PPUQ). In 2010-2011, the government should pay $3 925 million to cover its share of the benefits paid to its retired employees.
q Retirement plans liability
In its financial statements, the government discloses the present value of the retirement benefits it will pay to its employees, taking into account the conditions governing their plans, as well as their years of service. This value is called the retirement plans liability.
CARRA performs actuarial valuations of the liability for each retirement plan (except the PPUQ, whose liability valuation is performed by a private-sector actuarial firm) in conformity with the rules set for the public sector by the Canadian Institute of Actuaries (CIA) and the Canadian Institute of Chartered Accountants (CICA).
2 As of January 1, 2011, the maximum number of years of service for RREGOP and the PPMP will be gradually increased to 38 as at January 1, 2014. This change is designed to allow experienced workers to remain on the labour market longer and thus improve their retirement income. Accordingly, if people so wish, they will eventually be able to accumulate up to 38 years of service for the purposes of calculating their pension benefits.
| | |
| | 2011-2012 Budget |
| | |
D.18 | | Budget Plan |
| | |

As at March 31, 2011, the government’s retirement plans liability should stand at $71 371 million, an amount that is recognized in the government’s gross debt.
TABLE D.10
Retirement plans liability
(millions of dollars)
| | | |
| | March 31, 2011 | P |
| | | |
| | | |
Government and Public Employees Retirement Plan (RREGOP) | | 40 934 | |
| | | |
Pension Plan of Management Personnel (PPMP) | | 9 331 | |
| | | |
Other plans: | | | |
| | | |
– | Teachers Pension Plan (TPP) and Pension Plan of Certain Teachers (PPCT) | | 12 249 | |
| | | | |
– | Civil Service Superannuation Plan (CSSP) | | 4 160 | |
| | | | |
– | Pension Plan for the Members of the Sûreté du Québec (PPMSQ) | | 3 515 | |
| | | | |
– | Pension plan of the Université du Québec (PPUQ) | | 2 226 | |
| | | | |
– | Pension Plan of Peace Officers in Correctional Services (PPPOCS) | | 820 | |
| | | | |
– | Pension Plan of the Judges of the Court of Québec and of Certain Municipal Courts (PPJCQM) | | 507 | |
| | | | |
– | Pension credits under supplemental pension plans | | 391 | |
| | | | |
– | Supplemental pension plan arising from the transfer of the pension plan for non-teaching personnel of the Commission des écoles catholiques de Montréal (SPP of the CECM) to RREGOP | | 268 | |
| | | | |
– | Pension Plan of the Members of the National Assembly (PPMNA) | | 178 | |
| | | | |
– | Pension Plan for Federal Employees Transferred to Employment with the Gouvernement du Québec (PPFEQ) | | 114 | |
| | | | |
– | Supplemental pension plan arising from the transfer of the pension plan for certain employees of the Commission scolaire de la Capitale (SPP of the CSC) to RREGOP | | 44 | |
| | | | |
– | Plans assets | | - 3 366 | |
| | | | |
| | | |
Total for other plans | | 21 106 | |
| | | |
| | | |
RETIREMENT PLANS LIABILITY | | 71 371 | |
| | | |
P: Preliminary results.
| |
Debt, Financing | |
| |
and Debt Management | D.19 |
| |
q Annual retirement plans expenditure
Every year, the government records its expenditure as an employer with regard to the retirement plans.
In 2010-2011, this expenditure should total $2 546 million. It comprises two components:
— the net cost of vested benefits, that is, the present value of retirement benefits that employees have accumulated for work performed during the year, i.e. $1 806 million;
— the amortization of revisions to the government’s actuarial obligations that arise from the updating of actuarial valuations, for a cost of $740 million.
TABLE D.11
Retirement plans expenditure
(millions of dollars)
| | | |
| | 2010-2011 | P |
| | | |
| | | |
Net cost of vested benefits | | 1 806 | |
| | | |
Amortization of revisions arising from actuarial valuations | | 740 | |
| | | |
| | | |
RETIREMENT PLANS EXPENDITURE | | 2 546 | |
| | | |
P: Preliminary results.
| | |
| | 2011-2012 Budget |
| | |
D.20 | | Budget Plan |
| | |
1.6 Retirement Plans Sinking Fund
The Retirement Plans Sinking Fund (RPSF) was created in 1993. It is an asset that was established to pay the retirement benefits of public and parapublic sector employees.
As at March 31, 2011, the book value of the RPSF should amount to $42 278 million.
TABLE D.12
Change in the Retirement Plans Sinking Fund (RPSF)
(millions of dollars)
| | | | | | | | | |
| | | | | | | | | |
| | Book value,
beginning
of year | | Deposits | | Investment
income
imputed | | Book value,
end of
year | |
| | | | | | | | | |
1993-1994 | | ¾ | | 850 | | 4 | | 854 | |
| | | | | | | | | |
1994-1995 | | 854 | | ¾ | | - 5 | | 849 | |
| | | | | | | | | |
1995-1996 | | 849 | | ¾ | | 74 | | 923 | |
| | | | | | | | | |
1996-1997 | | 923 | | ¾ | | 91 | | 1 014 | |
| | | | | | | | | |
1997-1998 | | 1 095 | 1 | ¾ | | 84 | | 1 179 | |
| | | | | | | | | |
1998-1999 | | 1 179 | | 944 | | 86 | | 2 209 | |
| | | | | | | | | |
1999-2000 | | 2 209 | | 2 612 | | 219 | | 5 040 | |
| | | | | | | | | |
2000-2001 | | 5 040 | | 1 607 | | 412 | | 7 059 | |
| | | | | | | | | |
2001-2002 | | 7 059 | | 2 535 | | 605 | | 10 199 | |
| | | | | | | | | |
2002-2003 | | 10 199 | | 900 | | 741 | | 11 840 | |
| | | | | | | | | |
2003-2004 | | 11 840 | | 1 502 | | 862 | | 14 204 | |
| | | | | | | | | |
2004-2005 | | 14 204 | | 3 202 | | 927 | | 18 333 | |
| | | | | | | | | |
2005-2006 | | 18 333 | | 3 000 | | 1 230 | | 22 563 | |
| | | | | | | | | |
2006-2007 | | 22 437 | 1 | 3 000 | | 1 440 | | 26 877 | |
| | | | | | | | | |
2007-2008 | | 26 877 | | 3 000 | | 1 887 | | 31 764 | |
| | | | | | | | | |
2008-2009 | | 31 749 | 2 | 2 100 | | 2 176 | | 36 025 | |
| | | | | | | | | |
2009-2010 | | 36 025 | | ¾ | | 2 175 | | 38 200 | |
| | | | | | | | | |
2010-2011P | | 38 200 | | 2 000 | | 2 078 | | 42 278 | |
| | | | | | | | | |
P: | Preliminary results. |
1 | This amount takes into account restatements arising from the government accounting reforms of 1997-1998 and 2006-2007. |
2 | This amount takes into account an adjustment arising from consideration of the expected average remaining service life (EARSL) of participants under the PPMP. |
| |
Debt, Financing | |
| |
and Debt Management | D.21 |
| |
The information on the RPSF shown in the preceding table was established on the basis of the government’s accounting policies, which are in full compliance with generally accepted accounting principles (GAAP) for Canada’s public sector.
The book value of the RPSF as at March 31, 2011 is higher than its market value. As a result of the accounting policies, the difference between these two items will be fully amortized in the coming years. In addition, the financial impact of gradually amortizing the difference is fully incorporated into the government’s financial framework over the entire planning horizon. Sub-section 1.10 describes these items in greater detail.
The government’s accounting policies apply when the RPSF’s book value is higher than its market value as well as when it is lower. As shown by the following table, the book value of the RPSF has been lower than its market value 8 times in the past 17 years.
TABLE D.13
Book value and market value of the Retirement Plans Sinking Fund as at March 31
(millions of dollars)
| | | | | | | |
| | Book value | | Market value | | Difference | |
| | | | | | | |
1994-1995 | | 849 | | 831 | | 18 | |
1995-1996 | | 923 | | 954 | | - 31 | |
1996-1997 | | 1 014 | | 1 095 | | - 81 | |
1997-1998 | | 1 179 | | 1 321 | | - 142 | |
1998-1999 | | 2 209 | | 2 356 | | - 147 | |
1999-2000 | | 5 040 | | 5 703 | | - 663 | |
2000-2001 | | 7 059 | | 7 052 | | 7 | |
2001-2002 | | 10 199 | | 9 522 | | 677 | |
2002-2003 | | 11 840 | | 9 240 | | 2 600 | |
2003-2004 | | 14 204 | | 12 886 | | 1 318 | |
2004-2005 | | 18 333 | | 17 362 | | 971 | |
2005-2006 | | 22 563 | | 23 042 | | - 479 | |
2006-2007 | | 26 877 | | 28 859 | | - 1 982 | |
2007-2008 | | 31 764 | | 32 024 | | - 260 | |
2008-2009 | | 36 025 | | 25 535 | | 10 490 | |
2009-2010 | | 38 200 | | 29 559 | | 8 641 | |
2010-2011P | | 42 278 | | 35 248 | 1 | 7 030 | |
| | | | | | | |
P: Preliminary results.
1 Market value of $34 201 million as at December 31, 2010, plus $500 million deposited in the RPSF from January 1 to March 31, 2011 and the return forecast from January 1 to March 31, 2011, corresponding to the anticipated annual return of 6.50% for that period.
| | |
| | 2011-2012 Budget |
| | |
D.22 | | Budget Plan |
| | |
q Amounts deposited in the RPSF have no impact on gross debt
The government issues bonds on financial markets in order to make deposits in the RPSF. However, the amounts deposited in the RPSF do not affect the government’s gross debt.
Indeed, the amount of borrowings contracted to make deposits in the RPSF increases the direct debt. At the same time, however, these deposits reduce the net retirement plans liability by the same amount. Therefore, the net impact on the gross debt is nil.
TABLE D.14
Illustration of the impact on the government’s gross debt of borrowing $1 billion on financial markets and depositing it in the RPSF1
(millions of dollars)
| | | | | | | | |
| | | Before
deposit | | After
deposit | | Change | |
| | | | | | | | |
| | | | | | | | |
(A) | Consolidated direct debt | | 147 666 | | 148 666 | | 1 000 | |
| | | | | | | | |
| | | | | | | | |
| Retirement plans liability | | 71 371 | | 71 371 | | ¾ | |
| | | | | | | | |
| Less: Book value of the RPSF | | - 42 278 | | - 43 278 | | - 1 000 | |
| | | | | | | | |
| | | | | | | | |
(B) | Net retirement plans liability | | 29 093 | | 28 093 | | - 1 000 | |
| | | | | | | | |
| | | | | | | | |
(C) | Net employee future benefits liability | | 79 | | 79 | | ¾ | |
| | | | | | | | |
| | | | | | | | |
(D) | Less: Generations Fund | | - 3 409 | | - 3 409 | | ¾ | |
| | | | | | | | |
| | | | | | | | |
(E) | GROSS DEBT (E = A + B + C + D) | | 173 429 | | 173 429 | | ¾ | |
| | | | | | | | |
1 Illustration based on preliminary results as at March 31, 2011.
| |
Debt, Financing | |
| |
and Debt Management | D.23 |
| |
q A decline in debt service
Deposits in the RPSF entail a reduction in the government’s debt service. The rates of return on funds managed by the Caisse de dépôt et placement du Québec (the Caisse) are generally higher than interest rates on Québec government bonds issued to finance deposits in the RPSF. Therefore, the income of the RPSF, which is applied against the government’s debt service, is usually higher than the additional interest charges that arise from new borrowings. This leads to a net decrease in the government’s debt service.
Since the RPSF was created, its return has been higher than the cost of new borrowings by the government 13 years out of 17.
TABLE D.15
Comparison of the RPSF’s annual return and the Québec government’s borrowing costs
(per cent)
| | | | | | | |
| | Return of the
RPSF | 1 | Cost of
new borrowings | 2 | Difference | |
| | | | | | | |
| | | | | | | |
1994-1995 | | - 3.3 | 3 | 5.9 | | - 9.2 | |
| | | | | | | |
1995-1996 | | 17.0 | | 5.3 | | 11.7 | |
| | | | | | | |
1996-1997 | | 16.1 | | 6.3 | | 9.8 | |
| | | | | | | |
1997-1998 | | 13.4 | | 5.7 | | 7.7 | |
| | | | | | | |
1998-1999 | | 10.4 | | 5.8 | | 4.6 | |
| | | | | | | |
1999-2000 | | 15.3 | | 7.2 | | 8.1 | |
| | | | | | | |
2000-2001 | | 7.2 | | 6.2 | | 1.0 | |
| | | | | | | |
2001-2002 | | - 4.7 | | 5.5 | | - 10.2 | |
| | | | | | | |
2002-2003 | | - 8.5 | | 4.7 | | - 13.2 | |
| | | | | | | |
2003-2004 | | 14.9 | | 4.6 | | 10.3 | |
| | | | | | | |
2004-2005 | | 11.4 | | 4.4 | | 7.0 | |
| | | | | | | |
2005-2006 | | 13.5 | | 4.4 | | 9.1 | |
| | | | | | | |
2006-2007 | | 13.5 | | 4.4 | | 9.1 | |
| | | | | | | |
2007-2008 | | 5.2 | | 4.8 | | 0.4 | |
| | | | | | | |
2008-2009 | | - 25.6 | | 4.2 | | - 29.8 | |
| | | | | | | |
2009-2010 | | 10.7 | | 4.6 | | 6.1 | |
| | | | | | | |
2010-2011P | | 13.4 | | 4.4 | | 9.0 | |
| | | | | | | |
P: Preliminary results.
1 On a calendar year basis.
2 On a fiscal year basis.
3 From February to December 1994.
| | |
| | 2011-2012 Budget |
| | |
D.24 | | Budget Plan |
| | |
q A flexible deposit policy
In December 1999, as part of an agreement concluded for the renewal of its employees’ collective agreements, the government set the objective that the book value of the funds accumulated in the RPSF would be equal, in 2020, to 70% of its actuarial obligations in regard to the retirement plans of public and parapublic sector employees.
However, the government has all the flexibility needed to apply this policy. Deposits in the RPSF are made only when market conditions are favourable, particularly with respect to interest rates and market receptiveness to bond issues. For example, the government did not make any deposits in 2009-2010, but deposited $2 billion in 2010-2011.
The RPSF’s book value is expected to represent roughly 56% of the government’s actuarial obligations in regard to the retirement plans of public and parapublic sector employees in 2010-2011. The target of 70% should be attained three years earlier than anticipated, i.e. in 2016-2017. For example, it would take average annual deposits of roughly $225 million to reach this target in 2020.
CHART D.6
The RPSF in proportion to the government’s actuarial obligations regarding the retirement plans of public and parapublic sector employees
(per cent)

| |
Debt, Financing | |
| |
and Debt Management | D.25 |
| |
1.7 Employee future benefits
In addition to the retirement plans, the government records under its debt the value of its commitments regarding future benefits programs for its employees, namely, accumulated sick leave and pensions paid to the survivors of a government employee. These programs give rise to long-term obligations whose costs are covered in full by the government.
The net liability for employee future benefits should amount to $79 million as at March 31, 2011.
TABLE D.16
Net employee future benefits liability as at March 31, 2011P
(millions of dollars)
| | | |
Accumulated sick leave | | 664 | |
| | | |
Survivor’s pension plan | | 407 | |
| | | |
Université du Québec programs | | 164 | |
| | | |
| | | |
Subtotal | | 1 235 | |
| | | |
Less: | Accumulated Sick Leave Fund | | - 700 | |
| | | | |
| Survivor’s Pension Plan Fund | | - 456 | |
| | | | |
| | | |
Subtotal | | - 1 156 | |
| | | |
| | | |
NET EMPLOYEE FUTURE BENEFITS LIABILITY | | 79 | |
| | | |
P: Preliminary results.
| | |
| | 2011-2012 Budget |
| | |
D.26 | | Budget Plan |
| | |
1.8 Generations Fund
The Generations Fund was created in June 2006 by the adoption of the Act to reduce the debt and establish the Generations Fund. The sums accumulated in the fund are dedicated exclusively to repaying the debt.
Section H presents the results of the Generations Fund in accordance with the requirements of the Act.
As at March 31, 2011, the book value of the Generations Fund is expected to stand at $3 409 million. The following table shows the book and market values of the Generations Fund since its creation.
TABLE D.17
Book value and market value of the Generations Fund
as at March 31
(millions of dollars)
| | | | | | | |
| | Book value | | Market value | | Difference | |
| | | | | | | |
| | | | | | | |
2006-20071 | | 584 | | 576 | | 8 | |
| | | | | | | |
2007-2008 | | 1 233 | | 1 147 | | 86 | |
| | | | | | | |
2008-2009 | | 1 952 | | 1 598 | | 354 | |
| | | | | | | |
2009-2010 | | 2 677 | | 2 556 | | 121 | |
| | | | | | | |
2010-2011P | | 3 409 | | 3 533 | 2 | - 124 | |
| | | | | | | |
P: | Preliminary results. |
1 | The first payment was made to the Generations Fund on January 31, 2007. |
2 | Market value of $3 287 million as at December 31, 2010 plus the revenues dedicated to the Generations Fund from January 1 to March 31, 2011. |
| |
Debt, Financing | |
| |
and Debt Management | D.27 |
| |
q Faster reduction of the debt
Financing for the Generations Fund comes from Québec government revenues dedicated exclusively to repaying the debt.
If the Generations Fund did not exist, these dedicated revenues would reduce the Québec government’s financial requirements every year. They would also make it possible to reduce the growth of Québec’s indebtedness. However, it would not be easy for Quebecers to see, over time, how the debt is being brought down thanks to the revenues dedicated to that end.
The Generations Fund makes it possible to follow the change in the funds the government sets aside to repay the debt. These funds, which are administered by the Caisse, are subtracted from the government’s debt. The impact on the debt is thus clear and transparent.
In addition, the returns obtained by the Caisse are usually higher than the cost of new borrowings by the Québec government, which helps to accelerate debt burden reduction.
Ever since the first deposit was made in the Generations Fund in January 2007, the return has been higher than the cost of new borrowings by the government three years out of four. It should be noted that in the case of the RPSF, which has been in existence since 1993, this has occurred 13 years out of 17.
TABLE D.18
Comparison of the Generations Fund’s annual return and the Québec government’s borrowing costs
(per cent)
| | Return of the Generations Fund | 1 | Cost of new borrowings | 2 | Difference | |
| | | | | | | |
2007-2008 | | 5.6 | 3 | 4.8 | | 0.8 | |
2008-2009 | | - 22.4 | | 4.2 | | - 26.6 | |
2009-2010 | | 11.3 | | 4.6 | | 6.7 | |
2010-2011P | | 12.3 | | 4.4 | | 7.9 | |
| | | | | | | |
P: | Preliminary results. |
1 | On a calendar year basis. |
2 | On a fiscal year basis. |
3 | Return realized from February to December 2007, since the first deposit was made in the Generations Fund on January 31, 2007. |
| | |
| | 2011-2012 Budget |
| | |
D.28 | | Budget Plan |
| | |

1.9 Returns of the Caisse de dépôt et placement du Québec on funds deposited by the Ministère des Finances
In 2010, the return on funds deposited by the Ministère des Finances with the Caisse de dépôt et placement du Québec (the Caisse) was 13.43% for the Retirement Plans Sinking Fund, 12.32% for the Generations Fund and 12.94% for the Accumulated Sick Leave Fund. The details of the investment policy of these funds are presented in the box on page D.33.
TABLE D.19
Market value and return in 2010 of funds deposited with the
Caisse de dépôt et placement du Québec by the Ministère des Finances
| | Return | | Market value as at December 31, 2010 |
| | % | | $ million |
| | | | |
Retirement Plans Sinking Fund | | 13.43 | | 34 201 |
Generations Fund | | 12.32 | | 3 287 |
Accumulated Sick Leave Fund | | 12.94 | | 745 |
| | | | |
1.9.1 Retirement Plans Sinking Fund
The Retirement Plans Sinking Fund showed a return of 13.43% in 2010. Its market value was $34 201 million as at December 31, 2010.
The assets of the RPSF are managed by the Caisse in accordance with an investment policy established by the Ministère des Finances. This investment policy was established taking several factors into account, including the 10-year return, standard deviation and correlation forecasts for various categories of assets prepared by the Caisse, as well as opportunities for investing in these assets.
| |
Debt, Financing | |
| |
and Debt Management | D.29 |
| |
The investment policy of the RPSF consists of 37.25% fixed-income securities (bonds, real estate debt, etc.), 46.25% equities, 13.0% inflation-sensitive securities (real estate, infrastructure, etc.) and 3.5% other investments. These weightings are similar to those used on average by all depositors with the Caisse.
TABLE D.20
Investment policy of the RPSF as at January 1, 2011
(per cent)
| | Benchmark portfolio of the RPSF | | Average benchmark portfolio of all depositors | 1 |
| | | | | |
Fixed-income securities | | 37.25 | | 37.0 | |
Equities | | 46.25 | | 44.7 | |
Inflation-sensitive securities | | 13.00 | | 13.8 | |
Other investments | | 3.50 | | 4.5 | |
| | | | | |
TOTAL | | 100.0 | | 100.0 | |
| | | | | |
1 Data for 2009. Calculations performed by the MFQ using the following source: Caisse de dépôt et placement du Québec, Annual Report 2009. The annual report for 2010 is not available yet.
With its investment policy, the RPSF should generate a long-term (10-year or longer) annual return of about 6.75%. This return is slightly lower to that forecast by most retirement plans in Canada. According to a recent survey by Morneau Sobeco3, the anticipated long-term return on assets of two retirement plans out of three in Canada is equal to or above 7.0%.
It is important to note that the RPSF’s investment policy is based on a long-term horizon and constitutes the benchmark portfolio for the Caisse. However, through active management, the Caisse adjusts the allocation of the RPSF’s assets, particularly to take fluctuations in the economic and financial situation into account. The RPSF’s benchmark portfolio would have generated a return of 9.19% in 2010.
3 | Morneau Sobeco (2010), 2010 Survey of Economic Assumptions in Accounting for Pensions and Other Post-Retirement Benefits. |
| | |
| | 2011-2012 Budget |
| | |
D.30 | | Budget Plan |
| | |
1.9.2 Generations Fund
The Generations Fund posted a return of 12.32% in 2010. Its market value was $3 287 million as at December 31, 2010.
The assets of the Generations Fund are managed by the Caisse in accordance with an investment policy established by the Ministère des Finances. This investment policy was established taking several factors into account, including the 10-year return, standard deviation and correlation forecasts for various categories of assets prepared by the Caisse, as well as opportunities for investing in these assets.
The investment policy of the Generations Fund consists of 43.5% fixed-income securities (bonds, real estate debt, etc.), 42.5% equities, 11.0% inflation-sensitive securities (real estate, infrastructure, etc.) and 3.0% other investments.
TABLE D.21
Investment policy of the Generations Fund as at January 1, 2011
(per cent)
| | Benchmark portfolio of
the Generations Fund | | Average benchmark
portfolio of all depositors | 1 |
| | | | | |
Fixed-income securities | | 43.5 | | 37.0 | |
Equities | | 42.5 | | 44.7 | |
Inflation-sensitive securities | | 11.0 | | 13.8 | |
Other investments | | 3.0 | | 4.5 | |
| | | | | |
| | | | | |
TOTAL | | 100.0 | | 100.0 | |
| | | | | |
1 Data for 2009. Calculations performed by the MFQ using the following source: Caisse de dépôt et placement du Québec, Annual Report 2009. The annual report for 2010 is not available yet.
The investment policy of the Generations Fund aims to achieve a long-term (10-year or longer) annual return of about 6.5%. It is important to note that the investment policy of the Generations Fund is based on a long-term horizon and constitutes the benchmark portfolio for the Caisse. However, through active management, the Caisse adjusts the allocation of the Generations Fund’s assets, particularly to take fluctuations in the economic and financial situation into account. The benchmark portfolio of the Generations Fund would have generated a return of 9.20% in 2010.
| |
Debt, Financing | |
| |
and Debt Management | D.31 |
| |
1.9.3 Accumulated Sick Leave Fund
The Accumulated Sick Leave Fund (ASLF) showed a return of 12.94% in 2010. Its market value was $745 million as at December 31, 2010.
The assets of the ASLF are managed by the Caisse in accordance with an investment policy established by the Ministère des Finances. Since January 1, 2009, the ASLF’s investment policy has been identical to that of the RPSF, as the creation of the ASLF stems from a long-term commitment made by the government in regard to employee future benefits, which is similar to the commitment regarding the retirement plans.
It is important to note that the ASLF’s investment policy constitutes the benchmark portfolio for the Caisse. However, through active management, the Caisse adjusts the allocation of the ASLF’s assets, particularly to take fluctuations in the economic and financial situation into account. The ASLF’s benchmark portfolio would have generated a return of 9.19% in 2010.
| | |
| | 2011-2012 Budget |
| | |
D.32 | | Budget Plan |
| | |
|
Comparison of investment policies |
|
|
| Investment policies as at January 1, 2011 | |
| (per cent) | | | |
| | | | | |
| | | | Average benchmark | |
| Specialized portfolio | RPSF and ASLF | Generations Fund | portfolio of all depositors | 1 |
| Short-term investments | 1.0 | 1.0 | 1.1 | |
| Bonds | 29.75 | 36.0 | 26.9 | |
| Long-term bonds | 0.0 | 0.0 | 2.5 | |
| Real estate debt | 6.5 | 6.5 | 6.5 | |
| Total – Fixed income | 37.25 | 43.5 | 37.0 | |
| Canadian equity | 13.75 | 10.0 | 12.2 | |
| Global equity | 1.25 | 1.5 | 0.0 | |
| US equity | 3.6 | 3.8 | 3.4 | |
| Foreign equity | 8.2 | 6.5 | 5.5 | |
| Emerging markets equity | 4.0 | 4.0 | 3.2 | |
| Québec International | 5.45 | 8.7 | 10.6 | |
| Private equity | 10.0 | 8.0 | 9.8 | |
| Total – Equity | 46.25 | 42.5 | 44.7 | |
| Real return bonds | 0.0 | 0.0 | 0.4 | |
| Infrastructures | 4.0 | 3.5 | 3.3 | |
| Real estate | 9.0 | 7.5 | 10.1 | |
| Total – Inflation-sensitive investments | 13.0 | 11.0 | 13.8 | |
| Hedge funds | 3.5 | 3.0 | 3.0 | |
| Commodities | 0.0 | 0.0 | 1.5 | |
| Total – Other investments | 3.5 | 3.0 | 4.5 | |
| TOTAL | 100.0 | 100.0 | 100.0 | |
| RPSF: Retirement Plans Sinking Fund. | |
| ASLF: Accumulated Sick Leave Fund. | |
| 1 Data for 2009. Calculations performed by the MFQ using the following source: Caisse de dépôt et placement du Québec, Annual Report 2009. The annual report for 2010 is not available yet. | |
|
|
|
| | | | | | | |
| |
Debt, Financing | |
| |
and Debt Management | D.33 |
| |
1.10 Impact of the returns of the Retirement Plans Sinking Fund on debt service
As indicated in sub-section 1.6, the income of the RPSF is applied against the government’s debt service. The returns of the Caisse affect RPSF income and therefore debt service.
The returns realized by the Caisse on the RPSF are taken into account in the government’s balance sheet and results by applying the accounting policy adopted in the wake of the December 2007 reform of government accounting in accordance with generally accepted accounting principles (GAAP).
“When determining a government’s retirement benefit liability and expense, plan assets would be valued at market-related values. Under this method, plan assets are recorded at market value or they are adjusted to market value over a period not to exceed five years. Values adjusted to market closely approximate current economic value in a manner that can minimize short-term fluctuations. Market-related values would be used because they are objective and verifiable. Once a basis of valuation is chosen it would be applied consistently.” (Canadian Institute of Chartered Accountants (CICA), Public Sector Accounting Handbook, section 3250, paragraph .035)
Under the accounting policy, the “adjusted market value” of the RPSF is adjusted every year based on the returns realized by the fund. If, for a given year, the realized return differs from the anticipated long-term return, the difference between the two is spread over five years. All other things being equal, this means that the adjusted market value and the market value will converge over a five-year period. It is important to note that this method is applied when returns are higher than expected as well as when they are lower4.
4 Before the accounting reform of 2007, the value of the RPSF was adjusted only once every three years, that is, when actuarial valuations were carried out. Since the reform, it has been adjusted every year.
| | |
| | 2011-2012 Budget |
| | |
D.34 | | Budget Plan |
| | |
In addition, the differences between actual and expected return, which are spread over five years, are taken into account in RPSF income by amortizing them over a period of about 13 years, that is, the expected average remaining service life (EARSL) of retirement plan participants5. This amortization mechanism and the period used are prescribed by GAAP6.
Therefore, the losses incurred by the Caisse in 2008-2009 reduced the income of the RPSF as of 2009-2010. The returns realized by the Caisse in 2009-2010, which were higher than anticipated, led to an increase in the RPSF’s income as of 2010-2011. Similarly, the returns realized by the Caisse in 2010-2011, which were also higher than expected, will raise the RPSF’s income as of 2011-2012.
TABLE D.22
Impact of the returns of the Caisse de dépôt et placement du Québec on debt service1
(millions of dollars)
| 2009-2010 | 2010-2011 | P | 2011-2012P | | 2012-2013P | |
| | | | | | | |
Before 2008-2009 | - 48 | - 78 | | - 57 | | 11 | |
From 2008-2009 | 307 | 629 | | 972 | | 1 337 | |
From 2009-2010 | | - 65 | | - 133 | | - 207 | |
From 2010-2011 | | | | - 48 | | - 99 | |
| | | | | | | |
Impact on debt service | 259 | 486 | | 734 | | 1 042 | |
| | | | | | | |
P: Preliminary results for 2010-2011 and forecasts for subsequent years.
Note: A positive entry indicates an increase in debt service and a negative entry, a decrease.
1 These amounts represent the impact on RPSF income, and therefore on debt service, of returns of the Caisse that are lower or higher than the anticipated return for that period and that are amortized.
5 | As with recognition of the retirement plans liability, the RPSF accounting method draws a distinction between the Pension Plan of Management Personnel (PPMP) and the other plans. The EARSL under the PPMP is 9 years compared with 14 years under the other plans. |
| |
6 | “…actuarial gains and losses should be amortized to the liability or asset and the related expense in a systematic and rational manner over the expected average remaining service life of the related employee group.” Canadian Institute of Chartered Accountants (CICA), Public Sector Accounting Handbook, section 3250, paragraph .062. For the purposes of retirement assets, the CICA defines actuarial gains (losses) as changes in the value of plan assets that are caused notably by variances between actual results and expected results. |
| |
Debt, Financing | |
| |
and Debt Management | D.35 |
| |
This page intentionally left blank

2. FINANCING
In 2010-2011, the government contracted borrowings totalling $18 886 million, including $2 960 million in pre-financing carried out in the last few months of the year.
2.1 Financing strategy
The government aims to borrow at the lowest possible cost. To that end, it applies a strategy for diversifying sources of funding by market, financial instrument and maturity.
2.1.1 Diversification by market
Financing transactions are conducted regularly on most markets, i.e. in Canada, the United States, Europe and Asia.
Over the past 10 years, 22% of borrowings have been contracted in foreign currency. Nonetheless, the government has only a very low exposure to foreign currencies (see sub-section 3.1).
In 2010-2011, the government contracted 8.6% of its borrowings on foreign markets:
— one borrowing for 35 million euros (CAN$47 million) in April 2010;
— one borrowing for US$1 500 million (CAN$1 549 million) in July 2010.
| | |
Debt, Financing | | |
| | |
and Debt Management | | D.37 |
| | |
CHART D.7
Borrowings by currency1
(per cent)
P: Preliminary results.
1 Borrowings of the consolidated revenue fund, borrowings for the Financing Fund and borrowings of Financement-Québec.
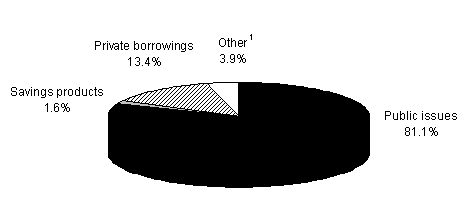
2.1.2 Diversification by instrument
To satisfy investors’ needs, an extensive array of financial products is used in the course of financing transactions.
Long-term instruments consist primarily of public bond issues, private borrowings and savings products.
The long-term instruments used in 2010-2011 consisted mainly of public issues (81.1%) and private borrowings (13.4%).
| | |
| | 2011-2012 Budget |
D.38 | | Budget Plan |
| | |
CHART D.8
Borrowings in 2010-2011P by instrument
P: Preliminary results.
1 Includes the Business Assistance – Immigrant Investor Program and borrowings from the Canada Pension Plan Investment Fund.
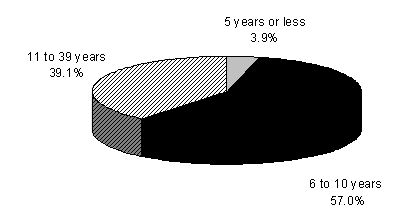
2.1.3 Diversification by maturity
Maturities of new borrowings are distributed over time to obtain a stable refinancing profile and ensure the government’s regular presence on capital markets.
In 2010-2011, 57.0% of borrowings contracted had a maturity of 6 to 10 years; 39.1%, 11 to 39 years; and 3.9%, 5 years or less.
CHART D.9
Borrowings in 2010-2011P by maturity
P: Preliminary results.
| | |
Debt, Financing | | |
| | |
and Debt Management | | D.39 |
| | |
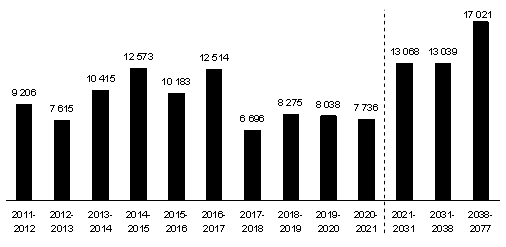
This diversification by maturity has an impact on the maturity of the debt shown in the following chart. As at March 31, 2011, the average maturity of the debt should be 11 years.
CHART D.10
Maturity of the long-term debt as at March 31, 2011P
(millions of dollars)
P: Preliminary results.
Note: Direct debt of the consolidated revenue fund, debt contracted to make advances to the Financing Fund and debt of Financement-Québec.
2.2 Financing program
The financing program of the consolidated revenue fund makes it possible to refinance maturing borrowings, contribute to the Retirement Plans Sinking Fund and meet new financial requirements, particularly for capital investments and investments in government corporations.
The Financing Fund makes loans to consolidated entities (e.g. Fonds des réseaux de transport terrestre, Société immobilière du Québec, etc.) and to certain government enterprises.
Financement-Québec makes borrowings on financial markets to meet the needs of institutions in the health and social services and education networks.
| | |
| | 2011-2012 Budget |
D.40 | | Budget Plan |
| | | |

In 2010-2011, Financement-Québec also contracted borrowings with the Canada Mortgage and Housing Corporation (CMHC) under the municipal infrastructure low-cost loans program. |
| |
— | Under this program, announced in the January 2009 federal budget, the CMHC is responsible for making low-cost loans to municipalities totalling up to $2 billion for Canada as a whole. |
| |
— | Following an agreement with the federal government, Financement-Québec administers this program with respect to loans to Québec municipalities: Financement-Québec contracts borrowings with the CMHC and then lends the funds to municipalities on the same conditions as those set by the CMHC. |
| |
— | In fiscal 2010-2011, Québec municipalities will have borrowed $1 172 million under this program. |
| |
— | These borrowings have been recorded under the government’s debt rather than under that of municipalities. However, they have the same impact on Québec’s public sector debt. |
| | |
Debt, Financing | | |
| | |
and Debt Management | | D.41 |
| | |
In 2010-2011, the government contracted borrowings totalling $18 886 million, including $2 960 million in pre-financing conducted over the last few months of the year.
In 2011-2012, the financing program is expected to amount to $17 355 million. It would have amounted to $20 315 million had there not been any pre-financing in 2010-2011. In 2012-2013, the financing program should total $15 036 million.
TABLE D.23
The government’s financing program
(millions of dollars)
| | 2010-2011 | P | 2011-2012 | P | 2012-2013 | P |
| | | | | | | |
CONSOLIDATED REVENUE FUND | | | | | | | |
Net financial requirements1, 2 | | 3 613 | | 5 587 | | 2 524 | |
Repayment of borrowings | | 4 324 | | 6 728 | | 4 512 | |
Change in cash position | | - 4 283 | | - 2 960 | | ¾ | |
Retirement Plans Sinking Fund, other retirement plan assets and funds dedicated to employee future benefits – Deposits | | 2 000 | | ¾ | | ¾ | |
Transactions under the credit policy3 | | 479 | | ¾ | | ¾ | |
Pre-financing | | 2 960 | | ¾ | | ¾ | |
TOTAL — Consolidated revenue fund | | 9 093 | | 9 355 | | 7 036 | |
FINANCING FUND | | 5 466 | | 4 500 | | 4 500 | |
Including: repayment of borrowings | | 1 769 | | 542 | | 1 264 | |
FINANCEMENT-QUÉBEC | | 4 327 | 4 | 3 500 | | 3 500 | |
Including: repayment of borrowings | | 400 | | 1 936 | | 1 839 | |
| | | | | | | |
TOTAL | | 18 886 | | 17 355 | | 15 036 | |
Including: repayment of borrowings | | 6 493 | | 9 206 | | 7 615 | |
| | | | | | | |
P: Preliminary results for 2010-2011 and forecasts for subsequent years.
Note: A negative entry indicates a source of financing and a positive entry, a financial requirement.
1 These amounts exclude the net financial requirements of consolidated entities.
2 Net financial requirements are adjusted to take into account the non-receipt of RPSF and ASLF income.
3 Under its credit policy, which is designed to limit financial risk with respect to counterparties, the government disbursed $479 million in 2010-2011 following the change in foreign exchange rates. These disbursements do not affect the debt.
4 This amount includes borrowings of $886 million contracted with the CMHC under the municipal infrastructure low-cost loans program and borrowings of $286 million to be made under this program by March 31, 2011.
| | |
| | 2011-2012 Budget |
D.42 | | Budget Plan |
| | |
| | | |
Pre-financing |
The government makes advance borrowings, or borrowings that would normally be made in the following fiscal year. The government obtains pre-financing to take advantage of favourable market conditions. Over the past 10 years, the government has obtained an average of $3 637 million in pre-financing per year. Pre-financing (millions of dollars) 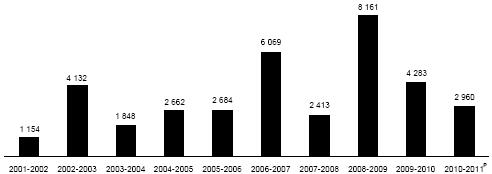
P: Preliminary results. |
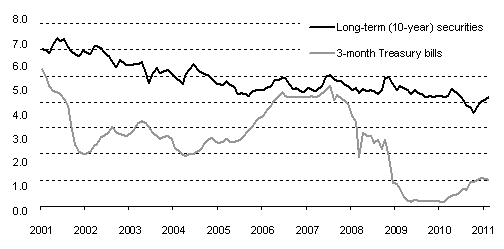
2.2.1 Yield
In 2010, the yield on long-term Québec securities fell during the year but rose during the last quarter. However, short-term interest rates increased constantly throughout the year.
| | |
Debt, Financing | | |
| | |
and Debt Management | | D.43 |
| | |
CHART D.11
Yield on Québec securities
(per cent)
Sources: PC-Bond and Ministère des Finances du Québec.
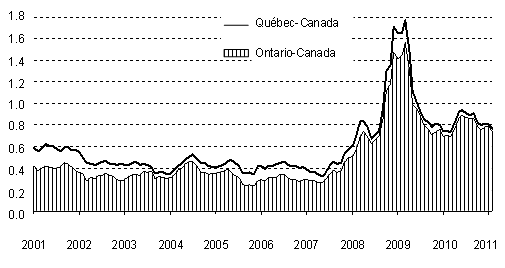
In addition, the substantial increase in the spread between the yield on Québec and federal government securities, observed starting in summer 2008, has been considerably reduced. The same situation has been observed in the other provinces.
CHART D.12
Yield spread on long-term (10-year) securities
(per cent)
Source: PC-Bond.
| | |
| | 2011-2012 Budget |
D.44 | | Budget Plan |
| | |
| | | |
3. DEBT MANAGEMENT
The government’s debt management strategy aims to minimize the cost of the debt and limit the risk related to fluctuations in foreign exchange and interest rates.
The government uses a range of financial instruments, particularly interest rate and currency swap agreements, to achieve desired debt proportions by currency and interest rate.
Debt management enables the government to save money on debt service.
3.1 Structure of the debt by currency
As at March 31, 2011, the proportion of the government’s gross debt in Canadian dollars should amount to 99.2% and the proportion in foreign currency, 0.8%.
TABLE D.24
Structure of the gross debt as at March 31, 2011P
(millions of dollars)
| | Consolidated direct debt | | | | | | | | | | | |
Currency | | Consolidated
revenue fund | | % | | Consolidated
entities | | Total | | | | Net
retirement
plans liability | | Net employee
future benefits
liability | | Less:
Generations
Fund | | Gross
debt | | % | |
| | | | | | | | | | | | | | | | | | | | | |
Canadian dollar1 | | 97 104 | | 98.6 | | 52 050 | | 149 154 | | 99.0 | | 29 093 | | 79 | | - 3 409 | | 174 917 | | 99.2 | |
US dollar1 | | 334 | | 0.3 | | ¾ | | 334 | | 0.2 | | ¾ | | ¾ | | ¾ | | 334 | | 0.2 | |
Euro | | 127 | | 0.1 | | ¾ | | 127 | | 0.1 | | ¾ | | ¾ | | ¾ | | 127 | | 0.1 | |
Swiss franc | | 632 | | 0.6 | | ¾ | | 632 | | 0.4 | | ¾ | | ¾ | | ¾ | | 632 | | 0.3 | |
Yen | | 379 | | 0.4 | | ¾ | | 379 | | 0.3 | | ¾ | | ¾ | | ¾ | | 379 | | 0.2 | |
| | | | | | | | | | | | | | | | | | | | | |
Subtotal | | 98 576 | | 100.0 | | 52 050 | | 150 626 | | 100.0 | | 29 093 | | 79 | | - 3 409 | | 176 389 | | 100.0 | |
Pre-financing | | - 2 960 | | | | ¾ | | - 2 960 | | | | ¾ | | ¾ | | ¾ | | - 2 960 | | | |
| | | | | | | | | | | | | | | | | | | | | |
TOTAL | | 95 616 | | | | 52 050 | | 147 666 | | | | 29 093 | | 79 | | - 3 409 | | 173 429 | | | |
| | | | | | | | | | | | | | | | | | | | | |
P: Preliminary results.
Note: The debt in foreign currency is expressed in the Canadian equivalent based on the exchange rates in effect on March 9, 2011.
1 The debt takes into account the borrowings sinking fund.
| | |
Debt, Financing | | |
| | |
and Debt Management | | D.45 |
| | |
Before interest rate and currency swap agreements are taken into account, the proportion of the debt in foreign currency as at March 31, 2011 should be 18.9%. After interest rate and currency swap agreements are taken into account, the proportion should be 0.8%. This proportion was 3.3% as at March 31, 2010.
CHART D.13
Structure of the gross debt by currency as at March 31, 2011P
P: Preliminary results.
| | |
| | 2011-2012 Budget |
| | |
D.46 | | Budget Plan |
| | |

3.2 Structure of the debt by interest rate
The government keeps part of its debt at variable rates and part at fixed rates. Since short-term interest rates are generally lower than long-term rates, keeping part of the debt at variable rates makes it possible to achieve substantial savings on debt service.
Before interest rate and currency swap agreements are taken into account, the proportion of the gross debt at variable rates should be 14.6% as at March 31, 2011. After interest rate and currency swap agreements are taken into account, the proportion should be 21.7%. This proportion was 27.9% as at March 31, 2010.
CHART D.14 Structure of the gross debt by interest rate as at March 31, 2011P |
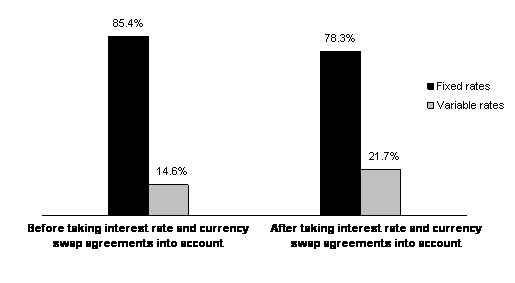
|
P: Preliminary results. |
| |
Debt, Financing | |
| |
and Debt Management | D.47 |
| |
This page intentionally left blank
4. CREDIT RATINGS
4.1 The Québec government’s credit ratings
A borrower’s credit rating measures its capacity to pay the interest on its debt and repay the principal at maturity. To establish the credit rating of a borrower like the Québec government, credit rating agencies analyze a range of economic, fiscal and financial factors. Among the main factors are the size, structure and vitality of the economy, the situation on the labour market, fiscal competitiveness, public finance situation and indebtedness.
To express the quality of a borrower’s credit, credit rating agencies use rating scales, namely, a scale for long-term debt and a scale for short-term debt.
The following table shows the rating scales used by agencies for long-term debt. The current credit ratings for Québec are indicated in bold.
TABLE D.25
Credit rating scales for long-term debt
Definition | | Moody’s | | Standard &
Poor’s | | DBRS | | Fitch
Ratings | | Japan Credit
Rating Agency |
| | | | | | | | | | |
Extremely strong capacity to pay interest and repay principal. | | Aaa | | AAA | | AAA | | AAA | | AAA |
|
|
Very strong capacity to pay interest and repay principal. | | Aa1 | | AA+ | | AA (high) | | AA+ | | AA+ |
| Aa2 | | AA | | AA | | AA | | AA |
| Aa3 | | AA- | | AA (low) | | AA- | | AA- |
|
|
Strong capacity to pay interest and repay principal, despite greater sensitivity to economic conditions than levels AAA and AA. | | A1 | | A+ | | A (high) | | A+ | | A+ |
| A2 | | A | | A | | A | | A |
| A3 | | A- | | A (low) | | A- | | A- |
|
|
Adequate capacity to pay interest and repay principal. Difficult economic conditions may reduce this capacity. | | Baa1 | | BBB+ | | BBB (high) | | BBB+ | | BBB+ |
| Baa2 | | BBB | | BBB | | BBB | | BBB |
| Baa3 | | BBB- | | BBB (low) | | BBB- | | BBB- |
|
|
Uncertain capacity to pay interest and repay principal, particularly under difficult economic conditions. | | Ba1 | | BB+ | | BB (high) | | BB+ | | BB+ |
| Ba2 | | BB | | BB | | BB | | BB |
| Ba3 | | BB- | | BB (low) | | BB- | | BB- |
|
|
Very uncertain capacity to pay interest and repay principal, particularly under difficult economic conditions. | | B1 | | B+ | | B (high) | | B+ | | B+ |
| B2 | | B | | B | | B | | B |
| B3 | | B- | | B (low) | | B- | | B- |
| | | | | | | | | | |
| |
Debt, Financing | |
| |
and Debt Management | D.49 |
| |
Agencies add an « outlook » to the rating that indicates the trend the credit rating may follow in the future. The outlook may be positive, stable or negative.
TABLE D.26
The Québec government’s current credit ratings
Agency | Rating | Outlook |
Moody’s | Aa2 | Stable |
Standard & Poor’s (S&P) | A+ | Stable |
Dominion Bond Rating Service (DBRS) | A (high) | Stable |
Fitch Ratings (Fitch) | AA– | Stable |
Japan Credit Rating Agency (JCR) | AA+ | Stable |
| | |
The following table shows the rating scales used by agencies for short-term debt. The current credit ratings for Québec are indicated in bold.
TABLE D.27
Credit rating scales for short-term debt
Definition | | Moody’s | | Standard &
Poor’s | | DBRS | | Fitch
Ratings |
| | | | | | | | |
Very strong capacity to pay interest and repay principal over the short term. | | P-1 | | A-1+ | | R-1high | | F1+ |
| | | A-1 | | R-1middle | | F1 |
| | | | | R-1low | | |
| | | | | | | | |
Very adequate capacity to pay interest and repay principal over the short term, despite greater sensitivity to economic conditions than upper level. | | P-2 | | A-2 | | R-2high | | F2 |
| | | | | | | | |
Adequate capacity to pay interest and repay principal over the short term. Difficult economic conditions may reduce this capacity. | | P-3 | | A-3 | | R-2middle | | F3 |
| | | | | R-2low | | |
| | | | | R-3 | | |
| | | | | | | | |
Uncertain capacity to pay interest and repay principal over the short term. Securities in this category are considered speculative securities. | | Not Prime1 | | B-1 | | R-4 | | B |
| | | B-2 | | R-5 | | C |
| | | B-3 | | | | |
| | | C | | | | |
| | | | | | | | |
Incapacity to pay interest and repay principal over the short term. Securities in this category are considered default securities. | | Not Prime1 | | D | | D | | D |
| | | | | | | | |
1 Moody’s uses the “Not Prime” category for all securities not included in the upper categories.
| | |
| | 2011-2012 Budget |
| | |
D.50 | | Budget Plan |
| | |
q Change in Québec’s credit ratings
The following charts show the change in the Québec government’s credit ratings.
CHART D.15 Credit rating assigned to Québec by Moody’s |
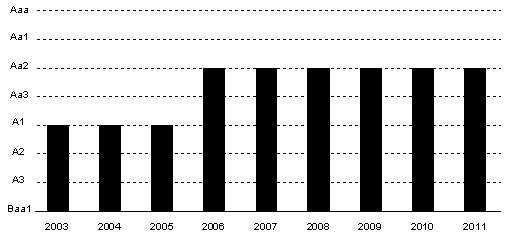
|
CHART D.16 Credit rating assigned to Québec by Standard & Poor’s |
|
| |
Debt, Financing | |
| |
and Debt Management | D.51 |
| |
CHART D.17 Credit rating assigned to Québec by DBRS |

|
CHART D.18 Credit rating assigned to Québec by Fitch |
|
| | |
| | 2011-2012 Budget |
| | |
D.52 | | Budget Plan |
| | |
CHART D.19 Credit rating assigned to Québec by JCR |
|
| |
Debt, Financing | |
| |
and Debt Management | D.53 |
| |
4.2 Comparison of the credit ratings of Canadian provinces
The following charts show the credit ratings of Canadian provinces in early March 2011. No chart is given for JCR since Québec is the only province that receives a credit rating from that agency.
CHART D.20 Credit rating of Canadian provinces – Moody’s |
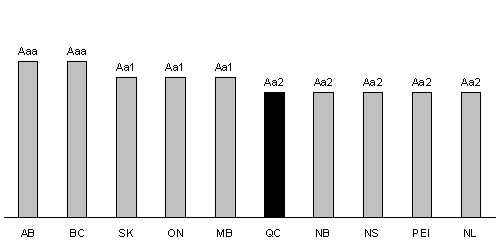
|
CHART D.21 Credit rating of Canadian provinces – Standard & Poor’s |
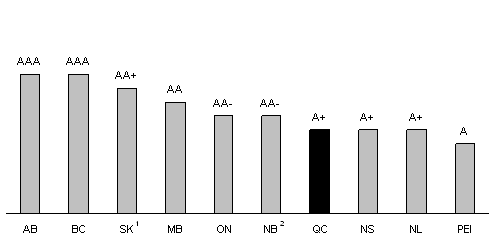
|
1 Positive outlook. |
2 Negative outlook. |
| | |
| | 2011-2012 Budget |
| | |
D.54 | | Budget Plan |
| | |
CHART D.22 Credit rating of Canadian provinces – DBRS |
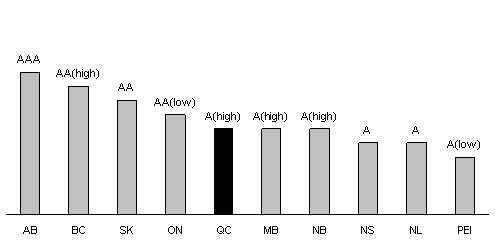
|
CHART D.23 Credit rating of Canadian provinces – Fitch |
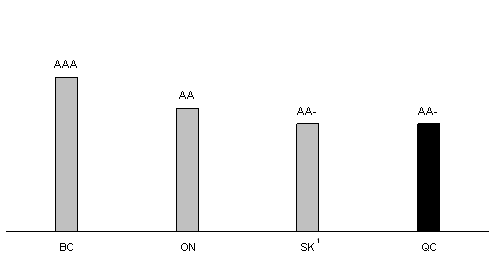
|
Note: British Columbia, Ontario, Saskatchewan and Québec are the only provinces rated by this agency. |
1 Positive outlook. |
| |
Debt, Financing | |
| |
and Debt Management | D.55 |
| |
This page intentionally left Blank

5. ADDITIONAL INFORMATION
TABLE D.28
Summary of consolidated financing transactions
(millions of dollars)
| | 2010-2011P | | | | |
| | March 2010
Budget | | Preliminary
results | | Change | | 2011-2012P | | 2012-2013P |
CHANGE IN CASH POSITION | | | | | | | | | | |
Consolidated revenue fund | | 3 855 | | 1 323 | | - 2 532 | | 2 960 | | ¾ |
Consolidated entities | | ¾ | | 172 | | 172 | | ¾ | | ¾ |
| | | | | | | | | | |
TOTAL - Change in cash position | | 3 855 | | 1 495 | | - 2 360 | | 2 960 | | ¾ |
| | | | | | | | | | |
NET BORROWINGS | | | | | | | | | | |
Consolidated revenue fund | | | | | | | | | | |
New borrowings | | 4 936 | | 9 093 | | 4 157 | | 9 355 | | 7 036 |
Repayment of borrowings | | - 3 658 | | - 4 803 | 1 | - 1 145 | | - 6 728 | | - 4 512 |
| | | | | | | | | | |
| | 1 278 | | 4 290 | | 3 012 | | 2 627 | | 2 524 |
Consolidated entities | | | | | | | | | | |
New borrowings | | 8 152 | | 9 633 | | 1 481 | | 7 867 | | 8 179 |
Repayment of borrowings | | - 3 281 | 2 | - 4 103 | 3 | - 822 | | - 2 893 | | - 3 281 |
| | | | | | | | | | |
| | 4 871 | | 5 530 | | 659 | | 4 974 | | 4 898 |
| | | | | | | | | | |
TOTAL - Net borrowings | | 6 149 | | 9 820 | | 3 671 | | 7 601 | | 7 422 |
| | | | | | | | | | |
Retirement Plans Sinking Fund, other retirement plan assets and funds dedicated to employee future benefits | | - 2 133 | | - 4 113 | | - 1 980 | | - 2 087 | | - 1 924 |
| | | | | | | | | | |
Generations Fund | | - 892 | | - 732 | | 160 | | - 940 | | - 1 047 |
| | | | | | | | | | |
TOTAL CONSOLIDATED FINANCING TRANSACTIONS | | 6 979 | | 6 470 | | - 509 | | 7 534 | | 4 451 |
| | | | | | | | | | |
P: Preliminary results for 2010-2011 and forecasts for subsequent years.
Note: A negative entry indicates a financial requirement and a positive entry, a source of financing. For the change in cash position, a negative entry indicates an increase and a positive entry, a decrease.
1 This amount includes disbursements of $479 million related to transactions carried out under the credit policy.
2 This amount has been restated to take into account the net borrowings of institutions in the health and social services and education networks contracted in their own name.
3 This amount includes a $1 494-million decrease in temporary borrowings.
Debt, Financing | | | |
and Debt Management | | | D.57 |
TABLE D.29
Québec government
Summary of long-term borrowings1 in 2010-2011P
Currency | | $ million | | % | |
| | | | | |
CANADIAN DOLLAR | | | | | |
Public issues | | 13 532 | | 72.8 | |
Private borrowings | | 2 440 | | 13.1 | |
Savings products | | 302 | | 1.6 | |
Business Assistance – Immigrant Investor Program | | 720 | | 3.9 | |
Canada Pension Plan Investment Fund | | 10 | | 0.0 | |
| | | | | |
Subtotal | | 17 004 | | 91.4 | |
OTHER CURRENCIES | | | | | |
US dollar | | 1 549 | | 8.3 | |
Euro | | 47 | | 0.3 | |
| | | | | |
Subtotal | | 1 596 | | 8.6 | |
| | | | | |
TOTAL | | 18 600 | 2 | 100.0 | |
| | | | | |
P: Preliminary results.
1 These amounts include borrowings of the consolidated revenue fund, borrowings for the Financing Fund and borrowings of Financement-Québec.
2 To this amount will be added $286 million in borrowings to be contracted by Financement-Québec with the CMHC under the municipal infrastructure low-cost loans program. Accordingly, borrowings will total $18 886 million in 2010-2011.
| | | 2011-2012 Budget |
D.58 | | | Budget Plan |
TABLE D.30
Québec government
Borrowings for the consolidated revenue fund in 2010-2011P
Amount in
Canadian
dollars | 1 | Face value
in foreign
currency | | Interest
rate | 2 | Date of
issue | | Date of
maturity | | Price to
investor | | Yield to
investor | 3 |
(millions) | | % | | | | | | $ | | % | |
47 | 4 | 35 € | | 4.02 | 5 | April 29 | | 2030-04-29 | | 100.000 | | 4.020 | |
204 | | ¾ | | 4.50 | | June 8 | | 2020-12-01 | | 100.907 | | 4.391 | |
517 | | ¾ | | 5.00 | | June 14 | | 2041-12-01 | | 103.476 | | 4.785 | |
214 | | ¾ | | 4.50 | | July 16 | | 2020-12-01 | | 102.202 | | 4.235 | |
1 549 | | US$1 500 | | 3.50 | | July 29 | | 2020-07-29 | | 99.607 | | 3.547 | |
523 | | ¾ | | 5.00 | | July 30 | | 2041-12-01 | | 104.534 | | 4.721 | |
417 | | ¾ | | 4.50 | | August 24 | | 2020-12-01 | | 105.249 | | 3.875 | |
492 | | ¾ | | 5.00 | | September 13 | | 2041-12-01 | | 109.099 | | 4.457 | |
192 | | ¾ | | 4.50 | | September 24 | | 2020-12-01 | | 105.300 | | 3.865 | |
562 | | ¾ | | 5.00 | | October 1 | | 2041-12-01 | | 112.378 | | 4.277 | |
499 | | ¾ | | 4.50 | | October 8 | | 2020-12-01 | | 107.133 | | 3.652 | |
465 | | ¾ | | 4.50 | | October 25 | | 2020-12-01 | | 107.967 | | 3.554 | |
356 | | ¾ | | 4.50 | | January 18 | | 2020-12-01 | | 103.199 | | 4.102 | |
530 | | ¾ | | 5.00 | | January 28 | | 2041-12-01 | | 105.952 | | 4.635 | |
499 | | ¾ | | 4.25 | | February 8 | | 2021-12-01 | | 99.652 | | 4.290 | |
498 | | ¾ | | 4.25 | | February 11 | | 2021-12-01 | | 99.660 | | 4.289 | |
497 | | ¾ | | 4.25 | | February 22 | | 2021-12-01 | | 99.388 | | 4.321 | |
302 | 6 | ¾ | | Various | | Various | | Various | | Various | | Various | |
720 | 7 | ¾ | | Zero coupon | | Various | | Various | | Various | | Various | |
10 | 8 | ¾ | | Various | | Various | | Various | | Various | | Various | |
9 093 | | | | | | | | | | | | | |
| | | | | | | | | | | | | |
P: Preliminary results.
1 Borrowings in foreign currency given in Canadian equivalent of their value on the date of borrowing.
2 Interest payable semi-annually except if another frequency is indicated in a note.
3 Yield to investor is determined on the basis of interest payable semi-annually.
4 Private borrowing.
5 Interest payable annually.
6 Savings products issued by Épargne Placements Québec.
7 Business Assistance – Immigrant Investor Program.
8 Borrowings from the Canada Pension Plan Investment Fund.
Debt, Financing | | |
and Debt Management | | D.59 |
TABLE D.31
Québec government
Borrowings for the Financing Fund in 2010-2011P
Amount in
Canadian dollars | | Face value
in foreign
currency | | Interest
rate | 1 | Date of
issue | | Date of
maturity | | Price to
investor | | Yield to
investor | 2 |
| | | | | | | | | | | | | |
(millions) | | % | | | | | | $ | | % | |
499 | | ¾ | | 4.50 | | April 9 | | 2020-12-01 | | 99.794 | | 4.524 | |
498 | | ¾ | | 4.50 | | April 16 | | 2020-12-01 | | 99.636 | | 4.543 | |
502 | | ¾ | | 5.00 | | April 29 | | 2041-12-01 | | 100.487 | | 4.969 | |
506 | | ¾ | | 5.00 | | May 17 | | 2041-12-01 | | 101.192 | | 4.925 | |
512 | | ¾ | | 5.00 | | June 1 | | 2041-12-01 | | 102.311 | | 4.856 | |
301 | | ¾ | | 4.50 | | June 8 | | 2020-12-01 | | 100.907 | | 4.391 | |
297 | | ¾ | | 4.50 | | July 16 | | 2020-12-01 | | 102.202 | | 4.235 | |
109 | | ¾ | | 4.50 | | August 24 | | 2020-12-01 | | 105.249 | | 3.875 | |
53 | | ¾ | | 5.00 | | September 13 | | 2041-12-01 | | 109.099 | | 4.457 | |
335 | | ¾ | | 4.50 | | September 24 | | 2020-12-01 | | 105.300 | | 3.865 | |
37 | | ¾ | | 4.50 | | October 8 | | 2020-12-01 | | 107.133 | | 3.652 | |
75 | | ¾ | | 4.50 | | October 25 | | 2020-12-01 | | 107.967 | | 3.554 | |
265 | | ¾ | | 4.50 | | November 19 | | 2019-12-01 | | 105.905 | | 3.724 | |
523 | | ¾ | | 4.50 | | November 24 | | 2020-12-01 | | 104.573 | | 3.943 | |
263 | | ¾ | | 4.50 | | November 29 | | 2019-12-01 | | 105.335 | | 3.795 | |
531 | | ¾ | | 5.00 | | December 14 | | 2041-12-01 | | 106.224 | | 4.620 | |
160 | | ¾ | | 4.50 | | January 18 | | 2020-12-01 | | 103.199 | | 4.102 | |
5 466 | | | | | | | | | | | | | |
| | | | | | | | | | | | | |
P: Preliminary results.
1 Interest payable semi-annually except if another frequency is indicated in a note.
2 Yield to investor is determined on the basis of interest payable semi-annually.
| | 2011-2012 Budget |
D.60 | | Budget Plan |
TABLE D.32
Borrowings by Financement-Québec in 2010-2011P
Amount in
Canadian
dollars | | Face value in
foreign
currency | | Interest
rate | 1 | Date of
issue | | Date of
maturity | | Price to
investor | | Yield to
investor | 2 |
(millions) | | % | | | | | | $ | | % | |
BORROWINGS FOR THE NETWORKS | | | | | | | | | |
252 | 3 | ¾ | | 5.25 | | May 4 | | 2034-06-01 | | 102.202 | | 5.090 | |
20 | 3 | ¾ | | Variable | 4 | May 14 | | 2016-06-02 | | 99.371 | | Variable | |
490 | | ¾ | | 3.50 | | June 18 | | 2016-12-01 | | 98.099 | | 3.835 | |
514 | | ¾ | | 3.50 | | August 26 | | 2016-12-01 | | 102.787 | | 3.008 | |
168 | 3 | ¾ | | Variable | 4 | October 8 | | 2016-06-02 | | 99.072 | | Variable | |
100 | 3 | ¾ | | Variable | 4 | October 15 | | 2016-06-02 | | 99.131 | | Variable | |
323 | 3 | ¾ | | Variable | 4 | October 29 | | 2016-06-02 | | 99.433 | | Variable | |
99 | 3 | ¾ | | Variable | 4 | November 1 | | 2016-06-02 | | 99.436 | | Variable | |
114 | 3 | ¾ | | Variable | 4 | November 2 | | 2016-06-02 | | 99.435 | | Variable | |
229 | 3 | ¾ | | Variable | 4 | November 5 | | 2016-06-02 | | 99.438 | | Variable | |
99 | 3 | ¾ | | Variable | 4 | November 9 | | 2016-06-02 | | 99.441 | | Variable | |
50 | 3 | ¾ | | Variable | 4 | November 17 | | 2016-06-02 | | 99.700 | | Variable | |
100 | 3 | ¾ | | Variable | 4 | December 10 | | 2016-06-02 | | 99.560 | | Variable | |
597 | | ¾ | | 3.50 | | January 21 | | 2017-12-01 | | 99.430 | | 3.594 | |
3 155 | | | | | | | | | | | | | |
BORROWINGS FOR MUNICIPALITIES5 | | | | | | | | | |
133 | 3 | ¾ | | 3.46 | 6 | July 1 | | 2020-07-01 | | 100.000 | | 3.460 | |
4 | 3 | ¾ | | 3.83 | 6 | July 1 | | 2025-07-01 | | 100.000 | | 3.830 | |
280 | 3 | ¾ | | 4.04 | 6 | July 1 | | 2030-07-01 | | 100.000 | | 4.040 | |
1 | 3 | ¾ | | 3.59 | 6 | August 1 | | 2025-08-01 | | 100.000 | | 3.590 | |
1 | 3 | ¾ | | 2.87 | 6 | October 1 | | 2020-10-01 | | 100.000 | | 2.870 | |
1 | 3 | ¾ | | 3.35 | 6 | October 1 | | 2025-10-01 | | 100.000 | | 3.350 | |
8 | 3 | ¾ | | 2.77 | 6 | November 1 | | 2020-11-01 | | 100.000 | | 2.770 | |
218 | 3 | ¾ | | 3.28 | 6 | November 1 | | 2025-11-01 | | 100.000 | | 3.280 | |
21 | 3 | ¾ | | 3.50 | 6 | November 1 | | 2030-11-01 | | 100.000 | | 3.500 | |
36 | 3 | ¾ | | 3.59 | 6 | December 1 | | 2025-12-01 | | 100.000 | | 3.590 | |
43 | 3 | ¾ | | 3.95 | 6 | February 1 | | 2031-02-01 | | 100.000 | | 3.952 | |
8 | 3 | ¾ | | 3.54 | 6 | March 1 | | 2021-03-01 | | 100.000 | | 3.540 | |
111 | 3 | ¾ | | 3.92 | 6 | March 1 | | 2026-03-01 | | 100.000 | | 3.920 | |
21 | 3 | ¾ | | 4.12 | 6 | March 1 | | 2031-03-01 | | 100.000 | | 4.120 | |
886 | 7 | | | | | | | | | | | | |
4 041 | 7 | | | | | | | | | | | | |
P: Preliminary results.
1 Interest payable semi-annually except if another frequency is indicated in a note.
2 Yield to investor is determined on the basis of interest payable semi-annually.
3 Private borrowings.
4 Interest payable quarterly.
5 Borrowings contracted with the CMHC under the municipal infrastructure low-cost loans program.
6 Interest payable annually.
7 To this amount will be added $286 million in borrowings to be contracted with the CMHC under the municipal infrastructure low-cost loans program. Accordingly, borrowings will total $4 327 million in 2010-2011.
Debt, Financing | | |
and Debt Management | | D.61 |
TABLE D.33
Borrowings by Hydro-Québec in 20101
Amount in
Canadian
dollars | | Face value
in foreign
currency | | Interest
rate | 2 | Date of
issue | | Date of
maturity | | Price to
investor | | Yield to
investor | 3 |
(millions) | | % | | | | | | $ | | % | |
15 | 4 | ¾ | | 3.29 | | February 23 | | 2016-03-01 | | 100.000 | | 3.290 | |
522 | | ¾ | | 5.00 | | March 2 | | 2050-02-15 | | 104.418 | | 4.752 | |
6 | 4 | ¾ | | Zero coupon | | April 22 | | 2022-04-15 | | 54.863 | | 5.135 | |
548 | | ¾ | | 5.00 | | August 26 | | 2050-02-15 | | 109.527 | | 4.483 | |
567 | | ¾ | | 5.00 | | October 19 | | 2050-02-15 | | 113.488 | | 4.287 | |
| | | | | | | | | | | | | |
1 658 | | | | | | | | | | | | | |
| | | | | | | | | | | | | |
1 Borrowings contracted from January 1 to December 31, 2010.
2 Interest payable semi-annually except if another frequency is indicated in a note.
3 Yield to investor is determined on the basis of interest payable semi-annually.
4 Private borrowings.
| | 2011-2012 Budget |
D.62 | | Budget Plan |