Exhibit 99.14
Section C
THE GOVERNMENT’S FINANCIAL FRAMEWORK
Introduction | C.3 |
| |
1. | Achivement of deficit reduction targets and return to fiscal balance in 2013-2014 | C.5 |
| | |
| 1.1 | Change in the budgetary balance | C.5 |
| | | |
| 1.2 | Adjustments to the financial framework | C.7 |
| | | |
2. | Updating of the financial framework | C.13 |
| | |
| 2.1 | Budgetary revenue | C.13 |
| | | |
| | 2.1.1 | Own-source revenue excluding government enterprises | C.14 |
| | | | |
| | 2.1.2 | Revenue from government enterprises | C.21 |
| | | | |
| | 2.1.3 | Revenues from federal transfers | C.22 |
| | | | |
| 2.2 | Budgetary expenditure | C.25 |
| | | | |
| | 2.2.1 | Program spending | C.26 |
| | | | |
| | 2.2.2 | Debt service | C.31 |
| | | | |
| 2.3 | Consolidated expenditure | C.33 |
| | | | |
3. | Consolidated revenue and expenditure | C.37 |
| | |
| 3.1 | Change in consolidated revenue and expenditure from 2011-2012 to 2013-2014 | C.37 |
| | | |
| 3.2 | Consolidated entities | C.46 |
| | | |
| | 3.2.1 | Special funds | C.47 |
| | | | |
| | 3.2.2 | Generations Fund | C.49 |
| | | | |
| | 3.2.3 | Non-budget-funded bodies | C.50 |
| | | | |
| | 3.2.4 | Health and social services and education networks | C.52 |
| | | | |
4. | Government investments | C.53 |
| | |
| 4.1 | The Québec Infrastructures Plan | C.53 |
| | | |
| 4.2 | Investments by government departments, organizations and special funds | C.60 |
| | | |
| 4.3 | Investments by government enterprises | C.60 |
C.1
5. | Non-budgetary transactions | C.61 |
| | | | |
6. | Net financial requirements | C.65 |
| | |
Appendix 1: | Investment projects by governement entreprises | C.67 |
| | |
Appendix 2: | Adjustments to the 2012-2013 spending objective since budget 2009-2010 | C.69 |
| | | | | |
C.2

INTRODUCTION
This section of the Budget Plan presents the preliminary results for fiscal 2011-2012 and the government’s budgetary and financial stance for 2012-2013 and 2013-2014.1
The information provided concerns:
— consolidated financial and budgetary transactions for the period from 2011-2012 to 2013-2014, including the impact of the various measures announced in the present budget;
— the change in budgetary revenue and expenditure, as well as adjustments made since last year’s budget;
— consolidated expenditure;
— the results of consolidated entities, including special funds,2 non-budget-funded bodies and the health and social services and education networks;
— government investments;
— the government’s non-budgetary transactions and net financial requirements.
Lastly, the five-year financial framework of Budget 2012-2013, or the financial projections up to 2016-2017, is presented in Section A.
1 | Throughout this section, the budgetary data for 2011-2012 are preliminary and those for 2012-2013 and subsequent years are forecasts. |
2 | Following the adoption of Bill 10 by the National Assembly in June 2011, the Consolidated Revenue Fund now consists of a general fund and all of the special funds. |
The Government’s | |
Financial Framework | C.3 |
Changes to the Consolidated Revenue Fund and the special funds |
|
Adopted by the National Assembly in June 2011, Bill 10 stipulates that the Consolidated Revenue Fund will henceforth consist of the general fund and the special funds.1 The general fund groups all of the transactions that used to be considered transactions of the Consolidated Revenue Fund prior to the adoption of the bill. |
|
For the purposes of this section, the special funds will nonetheless be presented with the consolidated entities in order to reflect separately all of their revenue and expenditure allocated to the funding of specific missions. |
|
|
| Before the adoption of Bill 10 | | Bill 10 | |
| | | | | Consolidated Revenue Fund | |
| Consolidated Revenue Fund | | Special funds | | General fund | | Special funds | |
|
|
Bill 10 also stipulates that the expenditure and investment budgets of the special funds will be subject to the approval of Parliament as of April 1, 2012.2 In this regard, the Chair of the Conseil du trésor tables Volume 3 when the Expenditure Budget is tabled. |
|
It is stipulated as well that any overruns noted will require a new authorization of Parliament. |
|
| | | | | | | | |
1 According to the provisions of Bill 10, the Generations Fund is considered a special fund.
2 A special fund’s expenditures are financed, in whole or in part, by appropriations voted by the National Assembly for the purposes of the expenditures presented in the Expenditure Budget under the supercategory “Allocation to a Special Fund” or by other government entities. Consolidation adjustments aimed at eliminating these inter-entity transactions are made to determine the consolidated expenditure.
| Budget 2012-2013 |
C.4 | Budget Plan |

1. ACHIVEMENT OF DEFICIT REDUCTION TARGETS AND RETURN TO FISCAL BALANCE IN 2013-2014
1.1 Change in the budgetary balance
The government’s budgetary objectives are being met over the time horizon for restoring fiscal balance. For 2011-2012, the deficit is estimated at $3.3 billion, an improvement of $500 million compared with the forecast in last year’s budget.
— For 2012-2013, the budgetary deficit objective of $1.5 billion is being maintained, as stipulated in the Balanced Budget Act.3 Fiscal balance is still expected to be restored as of 2013-2014.
In addition, the deficits include contingency reserves totalling $800 million for these three years.
TABLE C.1
Summary of budgetary transactions
(millions of dollars)
| | 2011-2012 | | 2012-2013 | | 2013-2014 | |
Budgetary revenue(1) | | 65 539 | | 69 395 | | 72 524 | |
% change | | 4.6 | | 5.9 | | 4.5 | |
Program spending | | –61 384 | | –62 642 | | –63 751 | |
% change | | 2.0 | | 2.0 | | 1.8 | |
Debt service | | –7 452 | | –8 237 | | –8 827 | |
Budgetary expenditure(1) | | –68 836 | | –70 879 | | –72 578 | |
% change | | 2.5 | | 3.0 | | 2.4 | |
Consolidated entities | | | | | | | |
Non-budget-funded bodies and special funds(2) | | 342 | | 384 | | 254 | |
Health and social services and education networks | | –45 | | –100 | | — | |
Generations Fund | | 848 | | 911 | | 1 041 | |
Total consolidated entities | | 1 145 | | 1 195 | | 1 295 | |
Contingency reserve | | –300 | | –300 | | –200 | |
SURPLUS (DEFICIT) | | –2 452 | | –589 | | 1 041 | |
| | | | | | | |
BALANCED BUDGET ACT | | | | | | | |
SURPLUS (DEFICIT) | | –2 452 | | –589 | | 1 041 | |
Deposit of dedicated revenues in the Generations Fund | | –848 | | –911 | | –1 041 | |
BUDGETARY BALANCE(3) | | –3 300 | | –1 500 | | — | |
As a % of GDP | | 1.0 | | 0.4 | | — | |
(1) Corresponds to the revenue and expenditure of the general fund.
(2) Including consolidation adjustments.
(3) Budgetary balance within the meaning of the Balanced Budget Act.
3 R.S.Q., c. E-12.00001.
The Government’s | |
Financial Framework | C.5 |
q Spending control
Several measures to tighten spending have been announced and put in place over the past two years, making it possible to reduce spending growth by 2013-2014.
¡ Program spending
After reaching 5.3% in 2009-2010, program spending growth was gradually rolled back to 3.0% in 2010-2011 and 2.0% in 2011-2012.
The government is continuing its rigorous management of program spending by limiting the growth in such spending to 2.0% in 2012-2013. For 2013-2014, program spending growth will amount to 1.8%.
¡ Consolidated expenditure
Consolidated expenditure, which takes into account the expenditures of all the special funds and public bodies included in the government’s reporting entity, have grown at a more moderate pace since 2009-2010.
— Growth in consolidated expenditure, excluding debt service, thus went from 5.6% in 2009-2010 to 3.6% in 2010-2011 and 3.5% in 2011-2012. Growth will be limited to 2.0% in 2012-2013.
q Contingency reserves
As a precaution, in Budget 2011-2012, the government’s financial framework incorporated a contingency reserve of $300 million in 2011-2012 and a reserve of $200 million in 2012-2013.
Budget 2012-2013 maintains the reserve of $300 million for 2011-2012, increases the reserve to $300 million for 2012-2013 and includes a new reserve of $200 million for 2013-2014. These reserves total $800 million over three years.
TABLE C.2
Contingency reserves
(millions of dollars)
| | 2011-2012 | | 2012-2013 | | 2013-2014 | |
Budget 2011-2012 | | 300 | | 200 | | — | |
Increase in the reserves | | — | | 100 | | 200 | |
BUDGET 2012-2013 | | 300 | | 300 | | 200 | |
| Budget 2012-2013 |
C.6 | Budget Plan |
1.2 Adjustments to the financial framework
In 2011-2012, the government is forecasting a $500-million improvement in the budgetary balance, which reduces the budgetary deficit from $3.8 billion to $3.3 billion.
For subsequent years, the government still intends to meet the objectives set in March 2011.
TABLE C.3
Adjustments to the budgetary balance since Budget 2011-2012(1)
(millions of dollars)
| | 2011-2012 | | 2012-2013 | | 2013-2014 | |
BUDGETARY BALANCE IN BUDGET 2011-2012 | | –3 800 | | –1 500 | | — | |
Adjustments to expenditure | | | | | | | |
Wage adjustments related to GDP | | — | | –142 | | –142 | |
Increases in education | | –100 | | –100 | | –100 | |
Budget 2012-2013 measures | | | | | | | |
Maintenance of existing programs | | — | | –65 | | –67 | |
New spending initiatives | | — | | –86 | | –117 | |
Other items | | — | | –136 | | — | |
Debt service | | 342 | | 409 | | 507 | |
Total adjustments to expenditure | | 242 | | –120 | | 81 | |
Adjustments to revenue | | | | | | | |
Own-source revenue | | –81 | | –360 | | –334 | |
Mining duties and forest royalties | | 109 | | 131 | | 108 | |
Federal transfers excluding compensation for the harmonization of the QST with the GST | | 136 | | –140 | | –259 | |
Budget 2012-2013 measures | | — | | –56 | | –115 | |
Total adjustments to revenue | | 164 | | –425 | | –600 | |
Adjustments to consolidated entities | | 94 | | 212 | | 277 | |
| | | | | | | |
Compensation for the harmonization of the QST with the GST | | — | | 733 | | 1 467 | |
Deferral to 2014-2015 of measures to be identified | | — | | –300 | | –1 025 | |
Increase in contingency reserves | | — | | –100 | | –200 | |
TOTAL ADJUSTMENTS | | 500 | | — | | — | |
BUDGETARY BALANCE IN BUDGET 2012-2013 | | –3 300 | | –1 500 | | — | |
(1) Budgetary balance within the meaning of the Balanced Budget Act.
The Government’s | |
Financial Framework | C.7 |
¡ Maintenance of the objectives for 2012-2013 and 2013-2014
Overall, the additional program spending planned for 2012-2013 and 2013-2014 in the financial framework is being offset by the downward revisions to debt service.
Accordingly, the downward adjustment of $409 million in 2012-2013 and $507 million in 2013-2014 in debt service offsets:
— a reserve of $142 million as of 2012-2013 for wage adjustments related to GDP. This revision comes from the reserve in respect of the anticipated enhancement of the pay parameters for public and parapublic sector employees linked to better economic performance in 2010. This reserve will be reviewed in the light of economic data for 2010 and 2011, which will be published in fall 2012;
— annual revisions of $100 million in education, including, in particular, the upward adjustment to clienteles, as well as the cost of the collective agreements;
— other items totalling $136 million in 2012-2013, including the impacts of the Justice Access Plan,4 the production of seedlings and the additional costs related to the Commission of Inquiry on the Awarding and Management of Public Contracts in the Construction Industry;
— budget measures that include, for 2012-2013, the maintenance of existing programs totalling $65 million, as well as $86 million in new initiatives.
Moreover, the additional revenue from mining duties and forest royalties and the agreement on the harmonization of the Québec sales tax (QST) with the goods and services tax (GST) are enabling the government to stay the course towards the objectives set in the last budget and to:
— offset the other revenue adjustments stemming mainly from the less favourable world economic outlook;
— defer until 2014-2015 the identification of new measures to maintain fiscal balance so as to ensure continued economic growth;
— increase the contingency reserve by $100 million in 2012-2013 and $200 million in 2013-2014.
4 The Justice Access Plan is a series of measures that will be implemented gradually to help simplify the judicial process and reduce delays while increasing the ability of the courts to hear cases and render judgments.
| Budget 2012-2013 |
C.8 | Budget Plan |

q Adjustments to the budgetary balance in 2011-2012
The budgetary balance within the meaning of the Balanced Budget Act for 2011-2012 is in deficit by $3.3 billion, an improvement of $500 million compared with the forecasts in the March 2011 budget.
— This result reflects the upward adjustments to budgetary revenue, primarily federal transfers, and the downward revisions to debt service arising from lower-than-anticipated interest rates.
In addition, the $300-million contingency reserve is being maintained to deal with any additional shortfalls that could result from the change in revenue and expenditure at the end of the year.
TABLE C.4
Summary of budgetary transactions in 2011-2012
(millions of dollars)
| | Budget
2011-2012 | | Adjustments | | Budget
2012-2013 | |
| | | | | | | |
Own-source revenue | | 45 546 | | 54 | | 45 600 | |
Government enterprises | | 4 790 | | –26 | | 4 764 | |
Federal transfers | | 15 039 | | 136 | | 15 175 | |
Total budgetary revenue | | 65 375 | | 164 | | 65 539 | |
Program spending | | –61 284 | | –100 | | –61 384 | |
Debt service | | –7 794 | | 342 | | –7 452 | |
Total budgetary expenditure | | –69 078 | | 242 | | –68 836 | |
Consolidated entities | | 1 143 | | 2 | | 1 145 | |
Contingency reserve | | –300 | | — | | –300 | |
SURPLUS (DEFICIT) | | –2 860 | | 408 | | –2 452 | |
| | | | | | | |
BALANCED BUDGET ACT | | | | | | | |
SURPLUS (DEFICIT) | | –2 860 | | 408 | | –2 452 | |
Deposits of dedicated revenues in the Generations Fund | | –940 | | 92 | | –848 | |
BUDGETARY BALANCE(1) | | –3 800 | | 500 | | –3 300 | |
As a % of GDP | | 1.2 | | | | 1.0 | |
(1) Budgetary balance within the meaning of the Balanced Budget Act.
The Government’s | |
Financial Framework | C.9 |
¡ Adjustment to budgetary revenue
The government’s budgetary revenue for 2011-2012 has been revised upward $164 million. These results are due to:
— an upward adjustment of $54 million in own-source revenue excluding government enterprises;
— a decrease of $26 million in revenue from government enterprises;
— an increase of $136 million in federal transfers stemming essentially from the renewal of the Canada-Québec Agreement Regarding the Participation of Handicapped Persons in the Labour Market and the upward revision of revenue related to the special tax on dividends from preferred shares.5
¡ Adjustment to budgetary expenditure
The government’s budgetary expenditure is being revised downward by $242 million in 2011-2012. These results can be explained by:
— a $100-million rise in the program spending objective due to the adjustment to education clienteles;
— a $342-million improvement in debt service reflecting lower-than-expected interest rates.
5 This is a special tax collected from corporations by the federal government, of which 35% of the revenues are paid to the provinces, including Québec.
| Budget 2012-2013 |
C.10 | Budget Plan |
q 2012-2013: deficit maintained at $1.5 billion
Overall, for 2012-2013, the $409-million downward adjustment in debt service offsets almost completely the $529-million increase in program spending arising from:
— a reserve of $142 million as of 2012-2013 for wage adjustments related to GDP. This revision comes from the reserve in respect of the anticipated enhancement of the pay parameters for public and parapublic sector employees linked to better economic performance in 2010. This reserve will be reviewed in the light of economic data for 2010 and 2011, which will be published in fall 2012;
— a revision of $100 million in education;
— other items totalling $136 million in 2012-2013, including the impacts of the Justice Access Plan,6 the production of seedlings and the additional costs related to the Commission of Inquiry on the Awarding and Management of Public Contracts in the Construction Industry;
— the 2012-2013 budget measures which include the maintenance of existing programs totalling $65 million, as well as $86 million in new initiatives.
Moreover, the additional revenue from mining duties and forest royalties and the agreement on the harmonization of the Québec sales tax (QST) with the goods and services tax (GST) will make it possible to:
— offset the other negative adjustments of $593 million to revenue stemming from two elements, namely, lower-than-forecast economic growth in 2012 compared with last year’s budget and lower-than-anticipated equalization revenue because of Québec’s relatively better economic performance in 2009 and 2010;
— increase the contingency reserve by $100 million;
— defer the $300 million in measures to be identified in order to ensure continued economic growth.
q 2013-2014: return to fiscal balance
The government is still planning to restore fiscal balance in 2013-2014. Essentially, the downward adjustments to debt service, additional revenue from mining duties and forest royalties and revenue from the agreement on the harmonization of the QST with the GST will make it possible to offset all of the other adjustments to the financial framework and to include a contingency reserve of $200 million.
Therefore, the government can defer to 2014-2015 the establishment of new measures to maintain fiscal balance in order to ensure continued economic growth.
6 See Note 4, page C.8.
The Government’s | |
Financial Framework | C.11 |
This page intentionally left blank
2. UPDATING OF THE FINANCIAL FRAMEWORK
This section presents the updated budgetary revenue and expenditure for 2011-2012 to 2013-2014 and the principal adjustments made since the last budget.
2.1 Budgetary revenue
The government’s budgetary revenue is expected to total $65.5 billion in 2011-2012, i.e. $50.4 billion in own-source revenue and $15.2 billion in federal transfers.
Budgetary revenue should grow by 5.9% in 2012-2013 and 4.5% in 2013-2014, or at a rate higher than that of the economy, owing essentially to the implementation of the revenue measures provided for in the plan to restore fiscal balance.
TABLE C.5
General fund(1)
Change in budgetary revenue
(millions of dollars)
| | Budget
2011-2012 | | | | Budget 2012-2013 |
| | | | | | | | | | | |
| | 2011-2012 | | Adjustments | | 2011-2012 | | 2012-2013 | | 2013-2014 | |
Own-source revenue | | | | | | | | | | | |
Own-source revenue excluding government enterprises | | 45 546 | | 54 | | 45 600 | | 48 703 | | 50 992 | |
% change | | 7.9 | | | | 7.6 | | 6.8 | | 4.7 | |
Government enterprises | | 4 790 | | –26 | | 4 764 | | 4 895 | | 5 018 | |
% change | | 1.6 | | | | –1.5 | | 2.7 | | 2.5 | |
Total | | 50 336 | | 28 | | 50 364 | | 53 598 | | 56 010 | |
% change | | 7.3 | | | | 6.6 | | 6.4 | | 4.5 | |
Federal transfers | | 15 039 | | 136 | | 15 175 | | 15 797 | | 16 514 | |
% change | | –2.7 | | | | –1.6 | | 4.1 | | 4.5 | |
BUDGETARY REVENUE | | 65 375 | | 164 | | 65 539 | | 69 395 | | 72 524 | |
% change | | 4.8 | | | | 4.6 | | 5.9 | | 4.5 | |
(1) Following the adoption of Bill 10 by the National Assembly in June 2011, the Consolidated Revenue Fund is now made up of a general fund and all of the special funds. The general fund includes all of the transactions that used to be considered transactions of the Consolidated Revenue Fund prior to the adoption of the bill.
The Government’s | |
Financial Framework | C.13 |
2.1.1 Own-source revenue excluding government enterprises
q Upward adjustments in 2011-2012
Preliminary results for fiscal 2011-2012 show that own-source revenue, excluding government enterprises, is adjusted upward by $54 million compared with the forecast in the March 2011 budget. It posts an increase of 7.6% compared with the previous year.
¡ Adjustments to own-source revenue by source
Reflecting tax receipts observed since the beginning of the fiscal year, revenue from personal income tax shows an improvement of $111 million compared with the level forecast in Budget 2011-2012.
— Consequently, the anticipated downward revision in employment did not result in a downward adjustment in revenue from personal income tax.
Contributions to the health services fund are adjusted upward by $115 million, reflecting the robust tax receipts observed in 2011, supported by the upward adjustment in salaries and wages for fiscal 2011-2012.
As for revenue from corporate taxes, it is revised upward by $193 million compared with the forecast in Budget 2011-2012. This adjustment is due essentially to higher-than-expected growth in corporate profits.
Consumption tax revenue is adjusted downward by $349 million in 2011-2012. This adjustment is due in particular to sales tax revenue, which is adjusted downward by $410 million, notably because household consumption was lower than forecast in Budget 2011-2012.
— Furthermore, this adjustment is partly offset by revenue from the specific tax on tobacco products, which is revised upward by $45 million.
| Budget 2012-2013 |
C.14 | Budget Plan |

Revenue in respect of natural resources is revised upward by $109 million, essentially because of the faster-than-anticipated progression of mining revenue, which can be attributed notably to:
— the impact of the mining regime reform;
— the increase in the output of certain mining corporations, which has led to an increase in tax instalments paid;
— the increase in the price of mineral substances, including metals.
Other revenue is adjusted downward by $125 million. This difference stems essentially from the fact that interest income is lower than forecast in Budget 2011-2012, particularly with regard to tax assessments.
TABLE C.6
General fund
Change in own-source revenue excluding government enterprises
| | Budget
2011-2012 | | | | Budget 2012-2013 |
| | 2011-2012 | | Adjustments | | 2011-2012 | | 2012-2013 | | 2013-2014 | |
Personal income tax | | 18 786 | | 111 | | 18 897 | | 19 547 | | 20 504 | |
% change | | 4.3 | | | | 5.5 | | 3.4 | | 4.9 | |
Health services fund | | 6 047 | | 115 | | 6 162 | | 6 386 | | 6 612 | |
% change | | 3.1 | | | | 3.1 | | 3.6 | | 3.5 | |
Corporate taxes | | 3 885 | | 193 | | 4 078 | | 4 324 | | 4 462 | |
% change | | 6.9 | | | | 12.1 | | 6.0 | | 3.2 | |
Consumption taxes | | 14 897 | | –349 | | 14 548 | | 16 450 | | 17 285 | |
% change | | 15.9 | | | | 14.8 | | 13.1 | | 5.1 | |
Natural resources | | 257 | | 109 | | 366 | | 357 | | 407 | |
% change | | 242.7 | | | | 18.1 | | –2.5 | | 14.0 | |
Other revenue | | 1 674 | | –125 | | 1 549 | | 1 639 | | 1 722 | |
% change | | –5.6 | | | | –17.7 | | 5.8 | | 5.1 | |
TOTAL | | 45 546 | | 54 | | 45 600 | | 48 703 | | 50 992 | |
% change | | 7.9 | | | | 7.6 | | 6.8 | | 4.7 | |
| | |
The Government’s | | |
Financial Framework | | C.15 |
| | |
q Change in revenue by source in 2012-2013 and 2013-2014
In 2012-2013, own-source revenue, excluding government enterprises, will increase by 6.8%. This growth, which is above that of the economy, stems in particular from the implementation of the revenue measures provided for in the plan to restore fiscal balance.
— The main revenue measures are the increase in the QST on January 1, 2012 and the additional tax recovery efforts made by Revenu Québec.
For 2013-2014, revenue growth amounts to 4.7%.
More specifically, personal income tax, the main source of government revenue, is expected to grow by 3.4% in 2012-2013 and 4.9% in 2013-2014, to $19.5 billion and $20.5 billion respectively. This change is slightly higher than the growth in personal income given the progressive nature of the tax system. It also reflects the additional tax recovery efforts.
Contributions to the health services fund will rise by 3.6% in 2012-2013 and 3.5% in 2013-2014 in keeping with the anticipated growth in salaries and wages.
Revenue from corporate taxes should increase by 6.0% in 2012-2013 and 3.2% in 2013-2014, to $4.3 billion and $4.5 billion respectively.
— This change is due essentially to growth in corporate profits of 6.9% in 2012 and 4.4% in 2013, which will translate into an increase in the taxable income and tax payable of corporations. Tax recovery efforts will also contribute to the growth in corporate taxes over the next two fiscal years.
— In addition, the elimination of the compensation tax for financial institutions as of January 1, 2013, a measure announced as part of the agreement on the harmonization of the QST with the GST, will mitigate the progression of corporate taxes, primarily in 2013-2014.
| | |
| | Budget 2012-2013 |
| | |
C.16 | | Budget Plan |
| | |
In 2012-2013 and 2013-2014, revenue from consumption taxes will increase by 13.1% and 5.1% respectively. This increase is explained, on the one hand, by anticipated growth of 3.4% in 2012 and 3.6% in 2013 in nominal consumption and, on the other, by the positive impact on revenue growth of the following two main factors:
— the increase of one percentage point in the QST, effective January 1, 2012, which has an upward impact on the growth in revenue from this tax in 2012-2013;
— the impact of the elimination of input tax refunds (ITRs) on the supply of financial services as of January 1, 2013, a measure stemming from the agreement on the harmonization of the QST with the GST.
After rising by 18.1% in 2011-2012, revenue from natural resources will stand at $357 million in 2012-2013 and climb by 14.0% in 2013-2014.
— The growth in 2013-2014 comes from the increase in mining duties and the rise in forest royalties, the latter of which is attributable to the increase in the volumes of timber harvested and the auctioning of part of the timber available on public lands.
q Change in revenue compatible with that of the economy
Overall, anticipated growth in own-source revenue, excluding government enterprises, is compatible with nominal economic growth for the next two years, leaving aside the financial impact of fiscal measures and the plan to restore fiscal balance.
| | |
The Government’s | | |
Financial Framework | | C.17 |
| | |
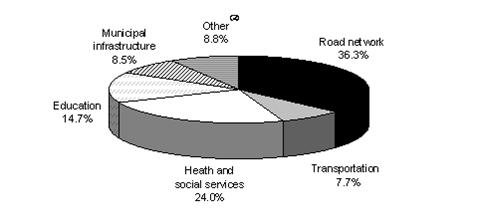
| Allocation of revenue from the specific taxes
on fuel and tobacco products | |
| | |
| | |
| The specific taxes on fuel are an integral part of consumption taxes. Revenue from these taxes is allocated in part to various funds dedicated to financing specific activities, such as the funding of the road network, public transit, culture or certain services aimed at the population (physical activity and healthy lifestyle incentives). Fuel tax For 2011-2012, the government’s own-source revenue from specific taxes on fuel totals $2.1 billion. This amount includes revenue from: – the specific tax of 3¢ per litre on kerosene fuel (domestic), aviation fuel and fuel oil for locomotives paid into the general fund to finance the government’s missions ($33 million); – the specific tax of 17.2¢ and 18.2¢ per litre on gasoline and diesel fuel (non-coloured fuel oil) respectively, paid into the Land Transportation Network Fund (FORT) to finance the road network and public transit infrastructures ($1 972 million); – the specific tax of 3¢ per litre of gasoline sold in the territory of the Agence métropolitaine de transport (AMT) for public transportation services in the metropolitan Montréal region ($95 million). | |
| | |
| Allocation of revenue from the specific taxes on fuel | |
| | | | | | | | | |
| | | 2011-2012 | | 2012-2013 | | 2013-2014 | | |
| | | | | | | | | |
| | | | | | | | | |
| General fund | | 33 | | 18 | | 19 | | |
| | | | | | | | | |
| FORT(1) | | 1 972 | | 2 126 | | 2 285 | | |
| | | | | | | | | |
| AMT | | 95 | | 97 | | 98 | | |
| | | | | | | | | |
| | | | | | | | | |
| TOTAL REVENUE | | 2 100 | | 2 241 | | 2 402 | | |
| | | | | | | | | |
| | |
| (1) As announced in Budget 2010-2011, the rate of the specific taxes on gasoline and diesel fuel will increase by 1¢ per litre on April 1, 2012 and April 1, 2013 to ensure the funding of FORT. On April 1, 2012, the rate of the specific tax on gasoline will be raised to 18.2¢ per litre, while that on diesel fuel (non-coloured fuel oil) will be increased to 19.2¢ per litre. | |
| | |
| | |
| | |
| | |
| | Budget 2012-2013 |
| | |
C.18 | | Budget Plan |
| | |

| Allocation of revenue from the specific taxes
on fuel and tobacco products (cont.) | |
| | |
| | |
| Tax on tobacco products Tax revenue from the sale of tobacco products amounts to $864 million in 2011-2012, including: – $752 million paid into the general fund; – $112 million allocated to various special funds. Allocation of revenue from the specific tax
on tobacco products | |
| | | | | | | | | |
| | | 2011-2012 | | 2012-2013 | | 2013-2014 | | |
| | | | | | | | | |
| General fund | | 752 | | 746 | | 722 | | |
| Special funds(1) | | | | | | | | |
| – Sports and Physical Activity Development Fund | | 52 | | 55 | | 55 | | |
| – Québec Cultural Heritage Fund | | 10 | | 16 | | 16 | | |
| – Fund for the Promotion of a Healthy Lifestyle | | 20 | | 20 | | 20 | | |
| – Early Childhood Development Fund | | 15 | | 15 | | 15 | | |
| – Caregiver Support Fund | | 15 | | 15 | | 15 | | |
| | | | | | | | | |
| Subtotal | | 112 | | 121 | | 121 | | |
| | | | | | | | | |
| TOTAL REVENUE | | 864 | | 867 | | 843 | | |
| | | | | | | | | |
| | | | | | | | | |
| (1) Including the fiscal measures in the present budget for 2012-2013 and 2013-2014. | | |
| | | | | | | | | |
| | |
| | |
The Government’s | | |
Financial Framework | | C.19 |
| | |
| Revenue from natural resources | |
| | |
| | |
| The government uses various means to enable Quebecers to benefit fully from our natural resources. For example, it collects royalties on resource development, as well as revenue from the attribution of licences. – An exploration licence confers on the holder an exclusive right for exploration and the future development of the resource concerned, on certain conditions. – A lease (or right) to develop enables the holder to develop the resource in exchange for the payment of an annual rent, on certain conditions. In addition, to enable future generations to benefit from natural resource development and to ensure the sustainable development of our resources, the government has decided to devote a portion of the revenue derived from natural resources to: – reducing the debt so that present and future generations may benefit from the development of natural resources (Generations Fund); – funding geoscientific work and data acquisition, as well as research and the development of techniques for the exploration, development, redevelopment and rehabilitation of mining sites (Natural Resources Fund (NRF)); – for forest management work to ensure the sustainability of Québec’s forest (sivilcultural work). The natural resource revenue of the general fund is estimated at $366 million in 2011-2012, $357 million in 2012-2013 and $407 million in 2013-2014. Revenue from natural resources | |
| | |
| | | 2009-2010 | | 2010-2011 | | 2011-2012 | | 2012-2013 | | 2013-2014 | | |
| | | | | | | | | | | | | |
| Gross royalties | | | | | | | | | | | | |
| – Mining | | 99 | | 305 | | 365 | | 355 | | 375 | | |
| – Forest | | 103 | | 120 | | 111 | | 170 | | 223 | | |
| – Water-power | | 663 | | 653 | | 699 | | 721 | | 732 | | |
| – Oil and natural gas | | — | | — | | — | | — | | — | | |
| | | | | | | | | | | | | |
| Total gross royalties | | 865 | | 1 078 | | 1 175 | | 1 246 | | 1 330 | | |
| Duties and licences | | 17 | | 19 | | 17 | | 16 | | 43 | | |
| Deposit in the Generations Fund | | –658 | | –650 | | –696 | | –718 | | –729 | | |
| Other | | | | | | | | | | | | |
| NRF – Mines | | –20 | | –20 | | –20 | | –20 | | –20 | | |
| Silvicultural work | | –154 | | –158 | | –113 | | –170 | | –200 | | |
| Other | | 55 | | 41 | | 3 | | 3 | | –17 | | |
| | | | | | | | | | | | | |
| Total – Other | | –119 | | –137 | | –130 | | –187 | | –237 | | |
| | | | | | | | | | | | | |
| REVENUE FROM NATURAL RESOURCES PAID INTO THE GENERAL FUND | | 105 | | 310 | | 366 | | 357 | | 407 | | |
| | | | | | | | | | | | | |
| | | | | | | | | |
| | |
| | | | | | | | | | | | | | | | | | | |
| | |
| | Budget 2012-2013 |
| | |
C.20 | | Budget Plan |
| | |
2.1.2 Revenue from government enterprises
q Results for 2011-2012
Revenue from government enterprises is adjusted downward by $26 million for 2011-2012. This is explained mainly by the downward revision of Loto-Québec’s forecast, which is partly offset by the increase in revenue from all of the other government enterprises.
Revenue from Loto-Québec is adjusted downward by $79 million. The major share of this adjustment, i.e. $54.5 million, can be attributed to the impact of the deterioration of the economic situation in Europe, which affected the value of Loto-Québec’s investment in JOAGROUPE, a French company that operates casinos.
Revenue from all of the other government enterprises is adjusted positively by $53 million and is explained by the upward revision of the results of the Société des alcools du Québec, Hydro-Québec and other government enterprises.
TABLE C.7
General fund
Change in revenue from government enterprises
| | Budget
2011-2012 | | | | Budget 2012-2013 | |
| | 2011-2012 | | Adjustments | | 2011-2012 | | 2012-2013 | | 2013-2014 | |
Hydro-Québec | | 2 575 | | 11 | | 2 586 | | 2 625 | | 2 725 | |
Loto-Québec | | 1 246 | | –79 | | 1 167 | | 1 221 | | 1 220 | |
Société des alcools du Québec | | 940 | | 22 | | 962 | | 990 | | 1 040 | |
Other | | 29 | | 20 | | 49 | | 59 | | 33 | |
REVENUE FROM GOVERNMENT ENTERPRISES | | 4 790 | | –26 | | 4 764 | | 4 895 | | 5 018 | |
% change | | 1.6 | | | | –1.5 | | 2.7 | | 2.5 | |
q Outlook for 2012-2013 and 2013-2014
Revenue from government enterprises for 2012-2013 and 2013-2014 will amount to $4.9 billion and $5.0 billion respectively. Anticipated revenue will thus grow by 2.7% in 2012-2013 and 2.5% in 2013-2014 and will be sustained by efforts to reduce the spending and improve the productivity of government enterprises.
| | |
The Government’s | | |
Financial Framework | | C.21 |
| | |
2.1.3 Revenues from federal transfers
In 2011-2012, federal transfer revenues should reach $15.2 billion, or $136 million more than forecast in the March 2011 budget. This upward adjustment can be explained essentially by the following factors:
— the renewal for two years of the Canada-Québec Agreement Regarding the Participation of Handicapped Persons in the Labour Market, which entails a $46-million increase in revenue in 2011-2012;
— the $25-million upward revision in revenue in respect of the special tax on dividends from preferred shares;
— an upward adjustment of $15 million in respect of the reduction of the reimbursement to be made to the federal government under the discontinued Youth Allowance Program.
TABLE C.8
Change in the federal transfer revenues of the general fund
| | Budget
2011-2012 | | | | Budget 2012-2013 |
| | 2011-2012 | | Adjustments | | 2011-2012 | | 2012-2013 | | 2013-2014 | |
Equalization | | 7 639 | | 176 | (1) | 7 815 | | 7 391 | | 7 905 | |
% change | | –10.7 | | | | –8.6 | | –5.4 | | 7.0 | |
Protection payment | | 545 | | –176 | (1) | 369 | | 362 | | — | |
Health transfers | | 4 516 | | –5 | | 4 511 | | 4 821 | | 5 133 | |
% change | | 4.8 | | | | 4.7 | | 6.9 | | 6.5 | |
Transfers for post-secondary education and other social programs | | 1 475 | | 13 | | 1 488 | | 1 515 | | 1 545 | |
% change | | 1.4 | | | | 2.3 | | 1.8 | | 2.0 | |
Other programs | | 864 | | 128 | | 992 | | 975 | | 894 | |
% change | | –23.9 | | | | –10.6 | | –1.7 | | –8.3 | |
Harmonization of the QST with the GST – Compensation | | — | | — | | — | | 733 | | 1 467 | |
| | | | | | | | | | | |
Subtotal | | 15 039 | | 136 | | 15 175 | | 15 797 | | 16 944 | |
% change | | –2.7 | | | | –1.6 | | 4.1 | | 7.3 | |
Allocation to FINESSS of a portion of the compensation for harmonization of the QST with the GST | | — | | — | | — | | — | | –430 | |
| | | | | | | | | | | |
FEDERAL TRANSFERS | | 15 039 | | 136 | | 15 175 | | 15 797 | | 16 514 | |
% change | | –2.7 | | — | | –1.6 | | 4.1 | | 4.5 | |
(1) In the March 17, 2011 budget, Québec entered amounts of $7 639 million in equalization and $545 million designated as a protection payment for 2011-2012, in keeping with what the federal government had announced to the provinces in December 2010. On March 21, 2011, the federal government informed Québec that it was correcting a Statistics Canada error for 2011-2012: as a result, Québec’s equalization payment was increased by $176 million, to $7 815 million, while the protection payment was reduced by the same amount, to $369 million.
| | |
| | Budget 2012-2013 |
| | |
C.22 | | Budget Plan |
| | |

Federal transfers are expected to increase by 4.1% in 2012-2013 and 4.5% in 2013-2014, essentially because of the payments in respect of federal compensation for sales tax harmonization.
The first payment of compensation will counterbalance a reduction of 5.4% in equalization in 2012-2013, which stems mainly from Québec’s comparatively good economic performance in 2009 and 2010. This delay results from the smoothing mechanism used by the federal government to determine equalization payments (three-year moving average delayed by two years).
TABLE C.9
Smoothing mechanism used by the federal government
to determine equalization payments
This reduction in the equalization payment is partly offset by a protection payment of $362 million in 2012-2013. This payment corresponds to the decrease, between 2011-2012 and 2012-2013, of total main federal transfers, i.e. the Canada Health Transfer (CHT), the Canada Social Transfer (CST) and equalization. Three other provinces also obtained a protection payment.
It should be noted that Québec has requested that such protection payments be granted to the provinces systematically to prevent their federal transfer revenues from declining from one year to the next, until the equalization program is once again based on a solid formula and principles.
| | |
The Government’s | | |
Financial Framework | | C.23 |
| | |
q Federal compensation for the harmonization
of the QST with the GST
On September 29, 2011, the Québec government and the Government of Canada concluded an agreement in principle that stipulates that the federal government will pay Québec $2.2 billion in compensation in respect of the harmonization of the QST with the GST.
The compensation will be used as follows:
— in 2012-2013, the amount of $733 million will be allocated in full to the debt service expenditure;
— in 2013-2014, the amount of $1 467 million will be used as follows:
— an amount of $1 037 million will be allocated to the debt service expenditure;
— an amount of $430 million will be paid into the Fund to Finance Health and Social Services Institutions (FINESSS), for which an equivalent shortfall subsisted, and will be used to finance health services.
As a result, the government can defer to 2014-2015 the establishment of new measures to maintain fiscal balance in order to ensure continued economic growth.
TABLE C.10
Use of federal compensation in 2012-2013 and 2013-2014
| | 2012-2013 | | 2013-2014 | | TOTAL | |
Federal compensation | | 733 | | 1 467 | | 2 200 | |
Use by the Québec government | | | | | | | |
Debt service | | –733 | | –1 037 | | –1 770 | |
FINESSS | | — | | –430 | | –430 | |
TOTAL | | — | | — | | — | |
| | |
| | Budget 2012-2013 |
| | |
C.24 | | Budget Plan |
| | |
2.2 Budgetary expenditure
The government’s budgetary expenditure, which includes program spending and debt service, is expected to reach $68.8 billion in 2011-2012, i.e. $61.4 billion for program spending and $7.5 billion for debt service.
Program spending should increase by 2.0% in 2012-2013 and 1.8% in 2013-2014.
TABLE C.11
General fund
Change in budgetary expenditure
| | Budget
2011-2012 | | | | Budget 2012-2013 | |
| | 2011-2012 | | Adjustments | | 2011-2012 | | 2012-2013 | | 2013-2014 | |
Program spending | | 61 284 | | 100 | | 61 384 | | 62 642 | | 63 751 | |
% change | | 2.4 | | | | 2.0 | | 2.0 | | 1.8 | |
Debt service | | 7 794 | | –342 | | 7 452 | | 8 237 | | 8 827 | |
% change | | 12.4 | | | | 6.7 | | 10.5 | | 7.2 | |
BUDGETARY EXPENDITURE | | 69 078 | | –242 | | 68 836 | | 70 879 | | 72 578 | |
% change | | 3.5 | | | | 2.5 | | 3.0 | | 2.4 | |
| | |
The Government’s | | |
Financial Framework | | C.25 |
| | |
2.2.1 Program spending
q 2011-2012
Program spending in 2011-2012 stands at $61.4 billion, up 2.0% over 2010-2011. The increase of $100 million can be attributed to the adjustment to education clienteles.
TABLE C.12
Change in program spending
| | 2011-2012 | | 2012-2013 | | 2013-2014 | |
PROGRAM SPENDING OBJECTIVE IN BUDGET 2011-2012 | | 61 284 | | 62 113 | | 63 325 | |
% change | | 2.4 | | 1.4 | | 2.0 | |
Adjustments to expenditure | | | | | | | |
– Wage adjustments related to GDP | | — | | 142 | | 142 | |
– Increases in education | | 100 | | 100 | | 100 | |
– Other items | | — | | 136 | | — | |
Subtotal | | 100 | | 378 | | 242 | |
Budget 2012-2013 measures | | | | | | | |
– Maintenance of existing programs | | — | | 65 | | 67 | |
– New initiatives | | — | | 86 | | 117 | |
Subtotal | | — | | 151 | | 184 | |
ADJUSTMENTS | | 100 | | 529 | | 426 | |
PROGRAM SPENDING OBJECTIVE IN BUDGET 2012-2013 | | 61 384 | | 62 642 | | 63 751 | |
% change | | 2.0 | | 2.0 | | 1.8 | |
q 2012-2013 and 2013-2014
In 2012-2013, program spending growth will stand at 2.0%. Compared with the March 2011 budget, the program spending objective is revised upward by $529 million, particularly on account of the following:
— a reserve of $142 million as of 2012-2013 for wage adjustments related to GDP. This revision comes from the reserve in respect of the anticipated enhancement of the pay parameters for public and parapublic sector employees linked to better economic performance in 2010. This reserve will be reviewed in the light of economic data for 2010 and 2011, which will be published in fall 2012;
— an upward adjustment of $100 million per year in education;
| | |
| | Budget 2012-2013 |
| | |
C.26 | | Budget Plan |
| | |

— a $136-million increase, making it possible, in particular, to finance the impact of the Justice Access Plan,7 the production of seedlings and the additional costs related to the Commission of Inquiry on the Awarding and Management of Public Contracts in the Construction Industry;
— the Budget 2012-2013 measures that include the maintenance of existing programs totalling $65 million, as well as $86 million in new initiatives.
In 2013-2014, program spending growth will amount to 1.8%.
q Efforts on the part of all government departments
Program spending will climb from $61.4 billion in 2011-2012 to $62.6 billion in 2012-2013, an increase of $1 258 million, or 2.0%.
TABLE C.13
Growth in program spending in 2012-2013
| | | | | | Change |
| | 2011-2012 | | 2012-2013 | | $ million | | % | |
Santé et Services sociaux | | 29 121 | | 30 121 | | 1 000 | | 3.4 | |
Éducation, Loisir et Sport | | 15 634 | | 15 976 | | 342 | | 2.2 | |
Famille et Aînés | | 2 411 | | 2 451 | | 40 | | 1.6 | |
Other departments | | 14 218 | | 14 095 | | –123 | | –0.9 | |
TOTAL | | 61 384 | | 62 642 | | 1 258 | | 2.0 | |
Note: Since figures are rounded, the sum of the amounts entered for each portfolio may not correspond to the total.
Source: Secrétariat du Conseil du trésor.
_______________________________
7 See Note 4, page C.8.
| | |
The Government’s | | |
Financial Framework | | C.27 |
| | |
■ Health: 3.4% increase in 2012-2013
Program spending by the Ministère de la Santé et des Services sociaux is being raised by $1 000 million, or 3.4%, in 2012-2013. With the contribution from FINESSS,8 the department will be able to finance the volume and cost of services and new initiatives that respond to Quebecers’ needs.
■ Education: 2.2% budget increase
The increase of $342 million, or 2.2%, allocated to the Ministère de l’Éducation, du Loisir et du Sport, will make it possible to maintain and improve the quality of services offered in the education networks and pursue actions undertaken in recent years.
■ Families and seniors: 1.6% budget increase
The budget of the Ministère de la Famille et des Ainés is being raised by 1.6%, or $40 million.
■ Other departments: 0.9% budget decrease
The budget of the other departments is being reduced by 0.9%, or $123 million, in 2012-2013.
CHART C.1
Increase in program spending in 2012-2013
Source: Secrétariat du Conseil du trésor.
____________________________
8 For additional information on government funding for health, see Section A.
| | |
| | Budget 2012-2013 |
| | |
C.28 | | Budget Plan |
| | |

q Increase in program spending for government priorities since 2003-2004
The government is continuing to invest in its priority missions, including health and education. From 2003-2004 to 2011-2012, average annual spending in health and education have risen by 5.4% and 3.7% respectively, excluding the contribution of FINESSS to the growth in health spending.
In all, since 2003, the government has added $17.1 billion to the health and education budgets, i.e. $12.2 billion and $4.8 billion respectively.
CHART C.2
Increase in program spending from 2003-2004 to 2012-2013
| | |
The Government’s | | |
Financial Framework | | C.29 |
| | |
q Weight of government spending in the economy
The forecast for program spending in 2012-2013 is in line with the government’s overall objective to restore fiscal balance by 2013-2014.
— The weight of spending in the economy should be 18.1% in 2012-2013.
Thereafter, the government plans to stay the course of disciplined program spending management and gradually bring the weight of spending in the economy down to a proportion equal to that observed prior to the recession.
CHART C.3
Program spending
(1) Plan to support employment and prepare for economic recovery after the recession.
| | |
| | Budget 2012-2013 |
| | |
C.30 | | Budget Plan |
| | |

2.2.2 Debt service
In 2011-2012, the debt service of the general fund should stand at $7.5 billion, i.e. $4.7 billion for direct debt service and $2.8 billion for interest ascribed to the retirement plans.
Overall, debt service is revised downward by $342 million compared with the forecast in the March 2011 budget, essentially because of lower-than-anticipated interest rates.
In 2011-2012 and 2012-2013, debt service is expected to climb by 6.7% and 10.5% respectively. This increase can be explained mainly by growth in the debt and by the impact of the returns of the Caisse de dépôt et placement du Québec on the income of the Retirement Plans Sinking Fund (which is applied against the interest ascribed to the retirement plans).
In addition, in 2012-2013, since it is expected that interest rates will not continue to fall, the sinking fund for government borrowings will not realize as many gains on the disposal of securities as in 2011-2012, such that the income of this fund, which is applied against direct debt service, will be lower than the previous year.
The increase of 7.2% in 2013-2014 is due to the anticipated increase in interest rates, the growth of the debt and the impact of the returns of the Caisse de dépôt et placement du Québec on the income of the Retirement Plans Sinking Fund.
TABLE C.14
General fund
Change in debt service
| | Budget
2011-2012 | | | | Budget 2012-2013 |
| | 2011-2012 | | Adjustments | | 2011-2012 | | 2012-2013 | | 2013-2014 | |
Direct debt service | | 5 007 | | –312 | | 4 695 | | 5 217 | | 5 555 | |
Interest ascribed to the retirement plans | | 2 804 | | –38 | | 2 766 | | 3 032 | | 3 293 | |
Interest ascribed to employee future benefits(1) | | –17 | | 8 | | –9 | | –12 | | –21 | |
DEBT SERVICE | | 7 794 | | –342 | | 7 452 | | 8 237 | | 8 827 | |
% change | | 12.4 | | | | 6.7 | | 10.5 | | 7.2 | |
(1) Including the interest on the obligation relating to the survivor’s pension plan minus the investment income of the Survivor’s Pension Plan Fund and the interest on the obligation relating to accumulated sick leave minus the investment income of the Accumulated Sick Leave Fund.
| | |
The Government’s | | |
Financial Framework | | C.31 |
| | |
q Proportion or revenue devoted to the debt service
of the general fund
The share of budgetary revenue devoted to the debt service of the general fund should stand at 12.2% in 2013-2014, compared with 16.3% in the late 1990s.
CHART C.4
Debt service of the general fund
(as a percentage of revenue)
| | |
| | Budget 2012-2013 |
| | |
C.32 | | Budget Plan |
| | |

2.3 Consolidated expenditure
In addition to the program spending of the departments and budget-funded bodies presented earlier, the following table presents the expenditures of the special funds, non-budget-funded bodies, organizations in the health and social services and education networks and specified purpose accounts, as well as expenditures related to the tax system.
This presentation reflects the level and growth of the government’s total spending, i.e. consolidated expenditure.
This table makes it possible to compare this expenditure with the data in Québec’s public accounts and the data of the other Canadian provinces.
TABLE C.15
Change in consolidated expenditure
| | 2011-2012 | | 2012-2013 | | 2013-2014 | |
Program spending | | 61 384 | | 62 642 | | 63 751 | |
% change | | 2.0 | | 2.0 | | 1.8 | |
Special funds | | 6 503 | | 7 350 | | 8 265 | |
% change | | 15.9 | | 13.0 | | 12.4 | |
Non-budget-funded bodies | | 16 567 | | 17 364 | | 18 334 | |
% change | | 4.6 | | 4.8 | | 5.6 | |
Health and social services and education networks | | 35 066 | | 36 659 | | 37 989 | |
% change | | 4.4 | | 4.5 | | 3.6 | |
Specified purpose accounts | | 2 143 | | 1 368 | | 1 201 | |
% change | | 21.9 | | –36.2 | | –12.2 | |
Expenditures related to the tax system | | 5 202 | | 5 286 | | 5 318 | |
Consolidation adjustments(1) | | –47 847 | | –50 036 | | –52 461 | |
Consolidated expenditure excluding debt service | | 79 018 | | 80 633 | | 82 397 | |
% change | | 3.5 | | 2.0 | | 2.2 | |
Debt service | | | | | | | |
General fund | | 7 452 | | 8 237 | | 8 827 | |
% change | | 6.7 | | 10.5 | | 7.2 | |
Consolidated entities(2) | | 2 039 | | 2 147 | | 2 316 | |
% change | | 4.5 | | 5.3 | | 7.9 | |
Consolidated debt service | | 9 491 | | 10 384 | | 11 143 | |
% change | | 6.2 | | 9.4 | | 7.3 | |
CONSOLIDATED EXPENDITURE | | 88 509 | | 91 017 | | 93 540 | |
% change | | 3.8 | | 2.8 | | 2.8 | |
(1) Elimination of inter-entity transactions and reclassifications.
(2) Including consolidation adjustments.
| | |
The Government’s | | |
Financial Framework | | C.33 |
| | |
q Consolidated expenditure excluding debt service
Consolidated expenditure excluding debt service includes program spending and spending by the special funds, non-budget-funded bodies, organizations in the health and social services and education networks and specified purpose accounts, as well as expenditures related to the tax system.
Growth in consolidated expenditure is expected to amount to 3.5%, 2.0% and 2.2% for 2011-2012, 2012-2013 and 2013-2014 respectively. Although these growth rates are slightly higher than that of program spending, growth in consolidated expenditure will also show a marked slowdown compared with the average of 5.7% observed from 2006-2007 to 2009-2010.
■ Special funds
Growth in spending by special funds in 2011-2012, 2012-2013 and 2013-2014 will amount to 15.9%, 13.0% and 12.4% respectively. These rates reflect the high growth of certain special funds such as:
— FINESSS, for financing health-care institutions;
— FORT, for financing road network and public transit infrastructures;
— the Green Fund, for financing initiatives to combat climate change.
If growth in spending by these three funds is not included in the growth of total special fund spending, the change in spending by the other special funds amounts to 6.7% in 2011-2012, 2.9% in 2012-2013 and 3.9% in 2013-2014.
TABLE C.16
Special funds – Spending excluding debt service
| | 2011-2012 | | 2012-2013 | | 2013-2014 | |
FINESSS | | 615 | | 1 005 | | 1 445 | |
FORT | | 1 783 | | 2 052 | | 2 361 | |
Green Fund | | 411 | | 491 | | 507 | |
Subtotal | | 2 809 | | 3 548 | | 4 313 | |
% change | | 30.6 | | 26.3 | | 21.6 | |
Other special funds | | 3 694 | | 3 802 | | 3 952 | |
% change | | 6.7 | | 2.9 | | 3.9 | |
SPECIAL FUNDS | | 6 503 | | 7 350 | | 8 265 | |
% change | | 15.9 | | 13.0 | | 12.4 | |
| | |
| | Budget 2012-2013 |
C.34 | | Budget Plan |
| | |

■ Non-budget-funded bodies
Non-budget-funded bodies show annual spending growth of 4.6%, 4.8% and 5.6% for 2011-2012, 2012-2013 and 2013-2014 respectively.
As with the special funds, the mission of certain non-budget-funded bodies explains the higher growth in their spending. This is the case, for example, of the Société de financement des infrastructures locales du Québec, which finances municipal infrastructure.
■ Health and social services and education networks
Organizations in the health and social services and education networks show spending growth of 4.4%, 4.5% and 3.6% respectively 2011-2012, 2012-2013 and 2013-2014.
■ Specified purpose accounts
Spending by the specified purpose accounts will increase by 21.9% in 2011-2012 and decline by 36.2% in 2012-2013 and 12.2% in 2013-2014. The decrease observed for the last two years is due, for the most part, to the end of federal infrastructure stimulus programs.
q Consolidated expenditure
The growth of consolidated expenditure comprises total government spending, including consolidated debt service, i.e. the debt service of the general fund and of consolidated entities as a whole.
Annual growth in consolidated expenditure will amount to 3.8% in 2011-2012 and 2.8% in the two following years.
The Government’s | | |
Financial Framework | | C.35 |
| | |
This page intentionally left blank
3. CONSOLIDATED REVENUE AND EXPENDITURE
The consolidated financial forecasts include the budgetary revenue and expenditure of the general fund as well as the budgetary revenue and expenditure of all the entities in the government’s reporting entity.
They provide more detailed information on the revenue and expenditure included in the government’s financial projections. In addition, these financial projections enable reconciliation with the actual results presented in the public accounts.
3.1 Change in consolidated revenue and expenditure from 2011-2012 to 2013-2014
Table C.17 presents the government’s consolidated financial framework for fiscal 2011-2012 to 2013-2014.
More specifically, tables C.18, C.19 and C.20 present the consolidated results by sector for 2011-2012 to 2013-2014.
This sector-based information shows separately the transactions carried out by the general fund, special funds, non-budget-funded bodies, health and social services and education networks and specified purpose accounts.
In addition, as of April 1, 2012, a new public sector accounting standard in Canada will require that refundable tax credits for individuals and corporations, which are similar to tax system expenditures, be classified in spending rather than in revenue reductions.
— This change in the presentation of financial information has no impact on the government’s budgetary balance. The total for these tax credits, which stands at $5.2 billion in 2011-2012, is presented under the heading “Expenditures related to the tax system”.9
9 | Following the coming into effect of the new accounting standard on tax revenue on April 1, 2012, most refundable tax credits, which were previously applied against revenue, will be charged to expenditure. This change has no impact on the budgetary balance. For more information, see Dépenses fiscales, 2011 edition, page A.65. |
The Government’s | | |
Financial Framework | | C.37 |
Lastly, to determine consolidated revenue and expenditure levels, financial transactions between entities in the government’s reporting entity are eliminated.
The financial framework of Budget 2012-2013 for consolidated revenue and expenditure from 2010-2011 to 2016-2017 is presented in Section A.
| Budget 2012-2013 |
C.38 | Budget Plan |
TABLE C.17
Financial framework for consolidated revenue and expenditure
(millions of dollars)
| | 2011-2012 | | 2012-2013 | | 2013-2014 | |
| | | | | | | |
Revenue | | | | | | | |
General fund | | 65 539 | | 69 395 | | 72 524 | |
Special funds | | 8 168 | | 8 882 | | 10 018 | |
Generations Fund | | 848 | | 911 | | 1 041 | |
Non-budget-funded bodies | | 17 621 | | 18 749 | | 19 768 | |
Health and social services and education networks | | 35 786 | | 37 303 | | 38 746 | |
Specified purpose accounts | | 2 143 | | 1 368 | | 1 201 | |
Transfers related to the tax system | | 5 202 | | 5 286 | | 5 318 | |
Consolidation adjustments(1) | | –48 950 | | –51 166 | | –53 835 | |
Consolidated revenue | | 86 357 | | 90 728 | | 94 781 | |
| | | | | | | |
Expenditure | | | | | | | |
General fund | | –61 384 | | –62 642 | | –63 751 | |
Special funds | | –6 503 | | –7 350 | | –8 265 | |
Non-budget-funded bodies | | –16 567 | | –17 364 | | –18 334 | |
Health and social services and education networks | | –35 066 | | –36 659 | | –37 989 | |
Specified purpose accounts | | –2 143 | | –1 368 | | –1 201 | |
Expenditures related to the tax system | | –5 202 | | –5 286 | | –5 318 | |
Consolidation adjustments(1) | | 47 847 | | 50 036 | | 52 461 | |
| | | | | | | |
Consolidated expenditure excluding debt service | | –79 018 | | –80 633 | | –82 397 | |
Debt service | | | | | | | |
General fund | | –7 452 | | –8 237 | | –8 827 | |
Consolidated entities(2) | | –2 039 | | –2 147 | | –2 316 | |
| | | | | | | |
Consolidated debt service | | –9 491 | | –10 384 | | –11 143 | |
| | | | | | | |
Consolidated expenditure | | –88 509 | | –91 017 | | –93 540 | |
| | | | | | | |
Contingency reserve | | –300 | | –300 | | –200 | |
| | | | | | | |
SURPLUS (DEFICIT) | | –2 452 | | –589 | | 1 041 | |
| | | | | | | |
BALANCED BUDGET ACT | | | | | | | |
| | | | | | | |
Deposits of dedicated revenues in the Generations Fund | | –848 | | –911 | | –1 041 | |
| | | | | | | |
BUDGETARY BALANCE(3) | | –3 300 | | –1 500 | | — | |
| | | | | | | |
(1) Elimination of inter-entity transactions and reclassifications.
(2) Including consolidation adjustments.
(3) Budgetary balance within the meaning of the Balanced Budget Act.
The Government’s | | |
Financial Framework | | C.39 |
TABLE C.18
Detailed consolidated financial framework
(millions of dollars)
| | 2011-2012 |
| | |
| | Consolidated Revenue Fund |
| | |
| | General
Fund | | Special
funds | | Generations
Fund | | Specified
purpose
accounts | |
| | | | | | | | | |
Revenue | | | | | | | | | |
Income and property taxes | | 29 137 | | 1 421 | | | | | |
Consumption taxes | | 14 548 | | 2 152 | | | | | |
Duties and permits | | 643 | | 1 205 | | | | | |
Miscellaneous | | 1 272 | | 1 259 | | | | 206 | |
Government enterprises | | 4 764 | | | | | | | |
Other revenue sources | | | | | | 848 | | | |
| | | | | | | | | |
Own-source revenue | | 50 364 | | 6 037 | | 848 | | 206 | |
Québec government transfers | | | | 2 049 | | | | | |
Federal transfers | | 15 175 | | 82 | | | | 1 937 | |
| | | | | | | | | |
Total revenue | | 65 539 | | 8 168 | | 848 | | 2 143 | |
| | | | | | | | | |
Expenditure | | | | | | | | | |
Expenditure | | –61 384 | | –6 503 | | | | –2 143 | |
Debt service | | –7 452 | | –1 110 | | | | | |
| | | | | | | | | |
Total expenditure | | –68 836 | | –7 613 | | — | | –2 143 | |
| | | | | | | | | |
Contingency reserve | | –300 | | | | | | | |
| | | | | | | | | |
SURPLUS (DEFICIT) | | –3 597 | | 555 | | 848 | | — | |
| | | | | | | | | |
BALANCED BUDGET ACT | | | | | | | | | |
| | | | | | | | | |
Deposits of dedicated revenues in the Generations Fund | | | | | | –848 | | | |
| | | | | | | | | |
BUDGETARY BALANCE(2) | | –3 597 | | 555 | | — | | — | |
| | | | | | | | | |
Note: The public accounts will present the results according to the non-restated 2011-2012 structure.
(1) Elimination of transactions between entities and reclassifications of the allowance for doubtful accounts and of abatements.
(2) Budgetary balance within the meaning of the Balanced Budget Act.
| Budget 2012-2013 |
C.40 | Budget Plan |

2011-2012 |
|
| | | | | | | | | | | |
| | Transfers
(expenditures)
related to the tax
system | | Non-
budget-
funded
bodies | | Health and
social services
and education
networks | | Consolidation
adjustments(1) | | Consolidated
results | |
| | | | | | | | | | | |
| | | | | | | | | | | |
| | 5 202 | | 846 | | 1 515 | | –207 | | 37 914 | |
| | | | 95 | | | | –1 354 | | 15 441 | |
| | | | 406 | | | | –75 | | 2 179 | |
| | | | 4 455 | | 3 550 | | –3 327 | | 7 415 | |
| | | | | | | | | | 4 764 | |
| | | | | | | | | | 848 | |
| | | | | | | | | | | |
| | 5 202 | | 5 802 | | 5 065 | | –4 963 | | 68 561 | |
| | | | 10 907 | | 30 419 | | –43 375 | | — | |
| | | | 912 | | 302 | | –612 | | 17 796 | |
| | | | | | | | | | | |
| | 5 202 | | 17 621 | | 35 786 | | –48 950 | | 86 357 | |
| | | | | | | | | | | |
| | | | | | | | | | | |
| | –5 202 | | –16 567 | | –35 066 | | 47 847 | | –79 018 | |
| | | | –1 181 | | –765 | | 1 017 | | –9 491 | |
| | | | | | | | | | | |
| | –5 202 | | –17 748 | | –35 831 | | 48 864 | | –88 509 | |
| | | | | | | | | | | |
| | | | | | | | | | –300 | |
| | | | | | | | | | | |
| | — | | –127 | | –45 | | –86 | | –2 452 | |
| | | | | | | | | | | |
| | | | | | | | | | | |
| | | | | | | | | | | |
| | | | | | | | | | | |
| | | | | | | | | | –848 | |
| | | | | | | | | | | |
| | — | | –127 | | –45 | | –86 | | –3 300 | |
| | | | | | | | | | | |
The Government’s | | |
Financial Framework | | C.41 |
TABLE C.19
Detailed consolidated financial framework
(millions of dollars)
| | | | | | | | | |
| | 2012-2013 |
| | | | | | | | | |
| | Consolidated Revenue Fund |
| | | | | | | | | |
| | General
fund | | Special
funds | | Generations
Fund | | Specified
purpose
accounts | |
| | | | | | | | | |
Revenue | | | | | | | | | |
Income and property taxes | | 30 257 | | 1 789 | | | | | |
Consumption taxes | | 16 450 | | 2 315 | | | | | |
Duties and permits | | 644 | | 1 270 | | | | | |
Miscellaneous | | 1 352 | | 1 344 | | | | 211 | |
Government enterprises | | 4 895 | | | | | | | |
Other revenue sources | | | | | | 911 | | | |
| | | | | | | | | |
Own-source revenue | | 53 598 | | 6 718 | | 911 | | 211 | |
Québec government transfers | | | | 2 075 | | | | | |
Federal transfers | | 15 797 | | 89 | | | | 1 157 | |
| | | | | | | | | |
Total revenue | | 69 395 | | 8 882 | | 911 | | 1 368 | |
| | | | | | | | | |
Expenditure | | | | | | | | | |
Expenditure | | –62 642 | | –7 350 | | | | –1 368 | |
Debt service | | –8 237 | | –1 302 | | | | | |
| | | | | | | | | |
Total expenditure | | –70 879 | | –8 652 | | — | | –1 368 | |
| | | | | | | | | |
Contingency reserve | | –300 | | | | | | | |
| | | | | | | | | |
SURPLUS (DEFICIT) | | –1 784 | | 230 | | 911 | | — | |
| | | | | | | | | |
BALANCED BUDGET ACT | | | | | | | | | |
| | | | | | | | | |
Deposits of dedicated revenues in the Generations Fund | | | | | | –911 | | | |
| | | | | | | | | |
BUDGETARY BALANCE(2) | | –1 784 | | 230 | | — | | — | |
| | | | | | | | | |
(1) Elimination of transactions between entities and reclassifications of the allowance for doubtful accounts and of abatements.
(2) Budgetary balance within the meaning of the Balanced Budget Act.
| Budget 2012-2013 |
C.42 | Budget Plan |
2012-2013 |
|
| | | | | | | | | | | |
| | Transfers
(expenditures)
related to the tax
system | | Non-
budget-
funded
bodies | | Health and
social services
and education
networks | | Consolidation
adjustments(1) | | Consolidated
results | |
| | | | | | | | | | | |
| | | | | | | | | | | |
| | 5 286 | | 869 | | 1 538 | | 43 | | 39 782 | |
| | | | 97 | | | | –1 694 | | 17 168 | |
| | | | 409 | | | | –78 | | 2 245 | |
| | | | 4 845 | | 3 594 | | –3 250 | | 8 096 | |
| | | | | | | | | | 4 895 | |
| | | | | | | | | | 911 | |
| | | | | | | | | | | |
| | 5 286 | | 6 220 | | 5 132 | | –4 979 | | 73 097 | |
| | | | 11 437 | | 31 861 | | –45 373 | | — | |
| | | | 1 092 | | 310 | | –814 | | 17 631 | |
| | | | | | | | | | | |
| | 5 286 | | 18 749 | | 37 303 | | –51 166 | | 90 728 | |
| | | | | | | | | | | |
| | | | | | | | | | | |
| | –5 286 | | –17 364 | | –36 659 | | 50 036 | | –80 633 | |
| | | | –1 140 | | –744 | | 1 039 | | –10 384 | |
| | | | | | | | | | | |
| | –5 286 | | –18 504 | | –37 403 | | 51 075 | | –91 017 | |
| | | | | | | | | | | |
| | | | | | | | | | –300 | |
| | | | | | | | | | | |
| | — | | 245 | | –100 | | –91 | | –589 | |
| | | | | | | | | | | |
| | | | | | | | | | | |
| | | | | | | | | | | |
| | | | | | | | | | | |
| | | | | | | | | | –911 | |
| | | | | | | | | | | |
| | — | | 245 | | –100 | | –91 | | –1 500 | |
| | | | | | | | | | | |
The Government’s | | |
Financial Framework | | C.43 |
TABLE C.20
Detailed consolidated financial framework
(millions of dollars)
| | | | | | | | | |
| | 2013-2014 |
| | | | | | | | | |
| | Consolidated Revenue Fund |
| | | | | | | | | |
| | General
fund | | Special
funds | | Generations
Fund | | Specified
purpose
accounts | |
| | | | | | | | | |
Revenue | | | | | | | | | |
Income and property taxes | | 31 578 | | 1 872 | | | | | |
Consumption taxes | | 17 285 | | 2 475 | | | | | |
Duties and permits | | 692 | | 1 338 | | | | | |
Miscellaneous | | 1 437 | | 1 516 | | | | 205 | |
Government enterprises | | 5 018 | | | | | | | |
Other revenue sources | | | | | | 1 041 | | | |
| | | | | | | | | |
Own-source revenue | | 56 010 | | 7 201 | | 1 041 | | 205 | |
Québec government transfers | | | | 2 249 | | | | | |
Federal transfers | | 16 514 | | 568 | | | | 996 | |
| | | | | | | | | |
Total revenue | | 72 524 | | 10 018 | | 1 041 | | 1 201 | |
| | | | | | | | | |
Expenditure | | | | | | | | | |
Expenditure | | –63 751 | | –8 265 | | | | –1 201 | |
Debt service | | –8 827 | | –1 614 | | | | | |
| | | | | | | | | |
Total expenditure | | –72 578 | | –9 879 | | — | | –1 201 | |
| | | | | | | | | |
Contingency reserve | | –200 | | | | | | | |
| | | | | | | | | |
SURPLUS (DEFICIT) | | –254 | | 139 | | 1 041 | | — | |
| | | | | | | | | |
BALANCED BUDGET ACT | | | | | | | | | |
| | | | | | | | | |
Deposits of dedicated revenues in the Generations Fund | | | | | | –1 041 | | | |
| | | | | | | | | |
BUDGETARY BALANCE(2) | | –254 | | 139 | | — | | — | |
| | | | | | | | | |
(1) Elimination of transactions between entities and reclassifications of the allowance for doubtful accounts and of abatements.
(2) Budgetary balance within the meaning of the Balanced Budget Act.
| Budget 2012-2013 |
C.44 | Budget Plan |
2013-2014 |
|
| | | | | | | | | | | |
| | Transfers
(expenditures)
related to the tax
system | | Non-
budget-
funded
bodies | | Health and
social services
and education
networks | | Consolidation
adjustments(1) | | Consolidated
results | |
| | | | | | | | | | | |
| | | | | | | | | | | |
| | 5 318 | | 927 | | 1 560 | | –14 | | 41 241 | |
| | | | 98 | | | | –1 750 | | 18 108 | |
| | | | 392 | | | | –67 | | 2 355 | |
| | | | 5 041 | | 3 544 | | –3 447 | | 8 296 | |
| | | | | | | | | | 5 018 | |
| | | | | | | | | | 1 041 | |
| | | | | | | | | | | |
| | 5 318 | | 6 458 | | 5 104 | | –5 278 | | 76 059 | |
| | | | 12 167 | | 33 319 | | –47 735 | | — | |
| | | | 1 143 | | 323 | | –822 | | 18 722 | |
| | | | | | | | | | | |
| | 5 318 | | 19 768 | | 38 746 | | –53 835 | | 94 781 | |
| | | | | | | | | | | |
| | | | | | | | | | | |
| | –5 318 | | –18 334 | | –37 989 | | 52 461 | | –82 397 | |
| | | | –1 225 | | –757 | | 1 280 | | –11 143 | |
| | | | | | | | | | | |
| | –5 318 | | –19 559 | | –38 746 | | 53 741 | | –93 540 | |
| | | | | | | | | | | |
| | | | | | | | | | –200 | |
| | | | | | | | | | | |
| | — | | 209 | | — | | –94 | | 1 041 | |
| | | | | | | | | | | |
| | | | | | | | | | | |
| | | | | | | | | | | |
| | | | | | | | | | | |
| | | | | | | | | | –1 041 | |
| | | | | | | | | | | |
| | — | | 209 | | — | | –94 | | — | |
| | | | | | | | | | | |
The Government’s | | |
Financial Framework | | C.45 |
3.2 Consolidated entities
In addition to the financial transactions of the general fund, the government’s budgetary forecasts take into account all of the consolidated entities10 in the government’s reporting entity, namely:
— special funds;
— Generations Fund;
— non-budget-funded bodies;
— health and social services and education networks.
The following table shows the net results of the consolidated entities.
TABLE C.21
Consolidated entities
(millions of dollars)
| | 2011-2012 | | 2012-2013 | | 2013-2014 | |
| | | | | | | |
Special funds(1) | | 555 | | 230 | | 139 | |
Generations Fund (dedicated revenues) | | 848 | | 911 | | 1 041 | |
Non-budget-funded bodies | | –127 | | 245 | | 209 | |
Health and social services and education networks | | –45 | | –100 | | — | |
Consolidation adjustments | | –86 | | –91 | | –94 | |
| | | | | | | |
SURPLUS (DEFICIT) | | 1 145 | | 1 195 | | 1 295 | |
| | | | | | | |
(1) Excluding the Generations Fund.
10 The results of the consolidated entities also include those of the special funds and the Generations Fund, which became entities of the Consolidated Revenue Fund following the adoption of Bill 10. The results of the consolidated entities also include the impact of consolidation adjustments.
| | |
| | Budget 2012-2013 |
C.46 | | Budget Plan |
| | |

3.2.1 Special funds
The special funds consist of 34 entities set up in government departments or organizations. Their mission is to deliver services and sell goods or to fund government programs.
Special fund activities can be financed through fees, tax revenues or budgetary appropriations allocated annually by Parliament.
The table below presents the net results of the special funds for 2011-2012 to 2013-2014. The special funds show surpluses of $555 million, $230 million and $139 million respectively for these three years.
TABLE C.22
Special funds(1)
Statements of results
(millions of dollars)
| | 2011-2012 | | 2012-2013 | | 2013-2014 | |
| | | | | | | |
Revenue | | | | | | | |
Income and property taxes | | 1 421 | | 1 789 | | 1 872 | |
Consumption taxes | | 2 152 | | 2 315 | | 2 475 | |
Duties and permits | | 1 205 | | 1 270 | | 1 338 | |
Miscellaneous | | 1 259 | | 1 344 | | 1 516 | |
| | | | | | | |
Own-source revenue | | 6 037 | | 6 718 | | 7 201 | |
Québec government transfers | | 2 049 | | 2 075 | | 2 249 | |
Federal transfers | | 82 | | 89 | | 568 | |
| | | | | | | |
Total revenue | | 8 168 | | 8 882 | | 10 018 | |
| | | | | | | |
Expenditure | | | | | | | |
Expenditure | | –6 503 | | –7 350 | | –8 265 | |
Debt service | | –1 110 | | –1 302 | | –1 614 | |
| | | | | | | |
Total expenditure | | –7 613 | | –8 652 | | –9 879 | |
| | | | | | | |
SURPLUS (DEFICIT) | | 555 | | 230 | | 139 | |
| | | | | | | |
(1) Excluding the Generations Fund presented in the next section.
| | |
The Government’s | | |
Financial Framework | | C.47 |
| | |
List of special funds | |
| | | |
Assistance Fund for Independent Community Action Fonds d’aide aux victimes d’actes criminels Territorial Information Fund Labour Market Development Fund Regional Development Fund Financing Fund Fund to Finance Health and Social Services Institutions (FINESSS) Fonds de fourniture de biens ou de services du ministère de l’Emploi et de la Solidarité sociale Rolling Stock Management Fund Fonds de la Commission des lésions professionnelles1 Fund of the Commission des relations du travail1 Highway Safety Fund Tourism Partnership Fund Caregiver Support Fund Generations Fund Register Fund of the Ministère de la Justice Land Transportation Network Fund | | Natural Resources Fund Police Services Fund Fonds des technologies de l’information du ministère de l’Emploi et de la Solidarité sociale Fonds du Bureau de décision et de révision1 Fonds du centre financier de Montréal Economic Development Fund Québec Cultural Heritage Fund Northern Plan Fund Fund of the Administrative Tribunal of Québec1 Fund for the Promotion of a Healthy Lifestyle Early Childhood Development Fund Sports and Physical Activity Development Fund University Excellence and Performance Fund Fonds québécois d’initiatives sociales Fonds relatif à certains sinistres Tax Administration Fund (FRAF) Green Fund | |
| | | |
1 Includes the operations of the body performing an adjudicative role.
| | |
| | Budget 2012-2013 |
C.48 | | Budget Plan |
| | |

3.2.2 Generations Fund
Revenues dedicated to the Generations Fund are expected to reach $848 million in 2011-2012.
In 2012-2013 and 2013-2014, revenues dedicated to the Generations Fund are expected to be $911 million and $1 041 million respectively. As a result, the book value of the Generations Fund will reach $6.5 billion as at March 31, 2014. Section I presents the results of and change in the Generations Fund in greater detail.
TABLE C.23
Revenues dedicated to the Generations Fund
(millions of dollars)
| | 2011-2012 | | 2012-2013 | (1) | 2013-2014 | |
| | | | | | | |
Dedicated revenues | | | | | | | |
Water-power royalties | | 696 | | 718 | | 729 | |
Unclaimed property | | 10 | | 10 | | 10 | |
Investment income | | 142 | | 183 | | 302 | |
| | | | | | | |
TOTAL | | 848 | | 911 | | 1 041 | |
| | | | | | | |
(1) Excluding the deposit of $300 million from the Territorial Information Fund. For more information, see Section I.
| | |
The Government’s | | |
Financial Framework | | C.49 |
| | |
3.2.3 Non-budget-funded bodies
Non-budget-funded bodies were created to provide specific public services; for example:
— La Financière agricole du Québec in the agricultural sector;
— the Agence métropolitaine de transport and Société des traversiers du Québec in the transportation sector;
— museums and the Société de développement des entreprises culturelles in the cultural sector.
The 62 non-budget-funded bodies show a deficit of $127 million in 2011-2012 and surpluses of $245 million in 2012-2013 and $209 million in 2013-2014.
TABLE C.24
Non-budget-funded bodies
Statements of results
(millions of dollars)
| | 2011-2012 | | 2012-2013 | | 2013-2014 | |
| | | | | | | |
Revenue | | | | | | | |
Income and property taxes | | 846 | | 869 | | 927 | |
Consumption taxes | | 95 | | 97 | | 98 | |
Duties and permits | | 406 | | 409 | | 392 | |
Miscellaneous | | 4 455 | | 4 845 | | 5 041 | |
| | | | | | | |
Own-source revenue | | 5 802 | | 6 220 | | 6 458 | |
Québec government transfers | | 10 907 | | 11 437 | | 12 167 | |
Federal transfers | | 912 | | 1 092 | | 1 143 | |
| | | | | | | |
Total revenue | | 17 621 | | 18 749 | | 19 768 | |
| | | | | | | |
| | | | | | | |
Expenditure | | | | | | | |
Expenditure | | –16 567 | | –17 364 | | –18 334 | |
Debt service | | –1 181 | | –1 140 | | –1 225 | |
| | | | | | | |
Total expenditure | | –17 748 | | –18 504 | | –19 559 | |
| | | | | | | |
SURPLUS (DEFICIT) | | –127 | | 245 | | 209 | |
| | | | | | | |
| | |
| | Budget 2012-2013 |
C.50 | | Budget Plan |
List of non-budget-funded bodies | |
| | | |
Agence du revenu du Québec Agence métropolitaine de transport Autorité des marchés financiers Bibliothèque et Archives nationales du Québec Centre de la francophonie des Amériques Centre de recherche industrielle du Québec Centre de services partagés du Québec Commission de la capitale nationale du Québec Commission des normes du travail Commission des services juridiques Conseil des arts et des lettres du Québec Conservatoire de musique et d’art dramatique du Québec Corporation d’urgences-santé École nationale de police du Québec École nationale des pompiers du Québec Financement-Québec Fondation de la faune du Québec Fonds d’aide aux recours collectifs Fonds de l’assurance médicaments Fonds de recherche du Québec – Nature et technologies Fonds de recherche du Québec – Santé Fonds de recherche du Québec – Société et culture Héma-Québec Infrastructure Québec Institut de la statistique du Québec Institut de tourisme et d’hôtellerie du Québec Institut national d’excellence en santé et services sociaux Institut national de la santé publique du Québec Institut national des mines La Financière agricole du Québec Musée d’Art contemporain de Montréal | | Musée de la Civilisation Musée national des beaux-arts du Québec Office de la sécurité du revenu des chasseurs et piégeurs cris Office des professions du Québec Office Québec-Amériques pour la jeunesse Office Québec-Monde pour la jeunesse Régie de l’assurance maladie du Québec Régie de l’énergie Régie des installations olympiques Régie du bâtiment du Québec Régie du cinéma Services Québec Société d’habitation du Québec Société de développement de la Baie-James Société de développement des entreprises culturelles Société de financement des infrastructures locales du Québec Société de l’assurance automobile du Québec Société de la Place des Arts de Montréal Société de télédiffusion du Québec Société des établissements de plein air du Québec Société des parcs de sciences naturelles du Québec Société des traversiers du Québec Société du Centre des congrès de Québec Société du Grand Théâtre de Québec Société du Palais des congrès de Montréal Société du parc industriel et portuaire de Bécancour Société immobilière du Québec Société nationale de l’amiante Société québécoise d’assainissement des eaux Société québécoise d’information juridique Société québécoise de récupération et de recyclage | |
| | | |
| | |
The Government’s | | |
Financial Framework | | C.51 |
3.2.4 Health and social services and education networks
The health and social services network is made up of 198 entities. These entities comprise 15 agencies and three regional authorities in health and social services, as well as 180 public health and social services institutions.
The education network is made of up 132 entities, including 73 school boards, 48 CEGEPs and the Université du Québec and its 10 constituent universities.
The health and social services and education networks show deficits of $45 million for 2011-2012 and $100 million for 2012-2013. These networks will show balanced budgets as of 2013-2014.
TABLE C.25
Health and social services and education networks
Statements of results
(millions de dollars)
| | 2011-2012 | | 2012-2013 | | 2013-2014 | |
| | | | | | | |
Revenue | | | | | | | |
Income and property taxes | | 1 515 | | 1 538 | | 1 560 | |
Miscellaneous | | 3 550 | | 3 594 | | 3 544 | |
| | | | | | | |
Own-source revenue | | 5 065 | | 5 132 | | 5 104 | |
Québec government transfers | | 30 419 | | 31 861 | | 33 319 | |
Federal transfers | | 302 | | 310 | | 323 | |
| | | | | | | |
Total revenue | | 35 786 | | 37 303 | | 38 746 | |
| | | | | | | |
| | | | | | | |
Expenditure | | | | | | | |
Expenditure | | –35 066 | | –36 659 | | –37 989 | |
Debt service | | –765 | | –744 | | –757 | |
| | | | | | | |
Total expenditure | | –35 831 | | –37 403 | | –38 746 | |
| | | | | | | |
SURPLUS (DEFICIT) | | –45 | | –100 | | — | |
| | | | | | | |
| | |
| | Budget 2012-2013 |
C.52 | | Budget Plan |

4. GOVERNMENT INVESTMENTS
4.1 The Québec Infrastructures Plan
After growing for several years in a row, the annual investment targets set under the Québec Infrastructures Plan (QIP) total $44.2 billion for 2011 to 2016, which represents a slight decrease (–0.8%) compared with the 2010-2015 five-year plan.
In accordance with the Act to promote the maintenance and renewal of public infrastructures,11 a substantial portion of these investments is being allocated to maintaining the quality of existing infrastructure and eliminating the maintenance deficit by 2022-2023.
Coupled with the contribution of the Québec government’s various partners in the projects included in the five-year plan, investments under the 2011-2016 Québec Infrastructures Plan will reach $55.1 billion over five years.
TABLE C.26
Infrastructure investments in 2011-2016
(millions of dollars)
2010-2015 Québec Infrastructures Plan | | 44 556 | |
Change in the five-year budget: –0.8% | | –375 | |
| | | |
2011-2016 Québec Infrastructures Plan | | 44 181 | |
Contribution from partners(1) | | 10 891 | |
| | | |
TOTAL INFRASTRUCTURE INVESTMENTS IN 2011-2016 | | 55 072 | |
| | | |
(1) Federal government, municipalities and other partners.
11 R.S.Q., c. M-1.2.
| | |
The Government’s | | |
Financial Framework | | C.53 |
q Investment targets under the QIP for the coming years
In recent years, the government has substantially increased investments in public infrastructures. To consolidate the economic recovery, the level of investment allocated to the Québec Infrastructures Plan will reach $9.8 billion in 2012-2013.
Thereafter, annual investment levels will be reduced gradually while ensuring and improving the quality of infrastructures and eliminating the maintenance deficit by 2022-2023.
CHART C.5
Change in infrastructure investments
(billions of dollars)
| | |
| | Budget 2012-2013 |
C.54 | | Budget Plan |

q Breakdown by sector
More than one third (36.3%) of the investments of $44.2 billion under the 2011-2016 Québec Infrastructures Plan is devoted to the road network, while nearly one quarter (24.0%) is devoted to the health and social services network.
The rest of the total budget is devoted to various other sectors, including education, municipal infrastructures and transportation.
CHART C.6
Breakdown of amounts allocated under the 2011-2016 Québec
Infrastructures Plan, by sector(1)
(1) Breakdown before realization adjustments.
(2) Culture, social housing, research, justice and public security, agriculture, public dams and forest roads.
| | |
The Government’s | | |
Financial Framework | | C.55 |
TABLE C.27
Annual investment levels under the 2011-2016 Québec Infrastructures Plan, by sector
(millions of dollars)
| | 2011-2012 | | 2012-2013 | | 2013-2014 | | 2014-2015 | | 2015-2016 | | Total | |
| | | | | | | | | | | | | |
Road network | | 3 263.9 | | 3 397.1 | | 3 193.8 | | 3 406.8 | | 3 264.5 | | 16 526.1 | |
Public transit | | 628.6 | | 868.3 | | 716.5 | | 387.0 | | 375.8 | | 2 976.2 | |
Maritime infrastructure | | 43.6 | | 140.9 | | 215.9 | | 141.3 | | 10.0 | | 551.7 | |
Health and social services | | 1 861.1 | | 2 202.6 | | 2 291.9 | | 2 440.6 | | 2 147.0 | | 10 943.2 | |
Education | | 1 516.8 | | 1 554.5 | | 1 308.4 | | 1 197.6 | | 1 100.6 | | 6 677.9 | |
Culture | | 432.8 | | 247.3 | | 174.5 | | 148.6 | | 150.0 | | 1 153.2 | |
Municipal infrastructure | | 721.1 | | 886.8 | | 855.3 | | 873.6 | | 516.2 | | 3 853.0 | |
Social housing | | 165.5 | | 269.5 | | 259.1 | | 256.9 | | 201.4 | | 1 152.4 | |
Research | | 110.9 | | 180.3 | | 140.5 | | 86.1 | | 37.2 | | 555.0 | |
Justice and public security | | 132.4 | | 275.8 | | 249.4 | | 122.0 | | 154.6 | | 934.2 | |
Other(1) | | 52.3 | | 38.9 | | 42.7 | | 48.9 | | 24.8 | | 207.6 | |
| | | | | | | | | | | | | |
Subtotal – Budgets allocated | | 8 929.0 | | 10 062.0 | | 9 448.0 | | 9 109.4 | | 7 982.1 | | 45 530.5 | |
| | | | | | | | | | | | | |
2011-2016 realization adjustment(2) | | –1 050.0 | | –300.0 | | — | | — | | — | | –1 350.0 | |
| | | | | | | | | | | | | |
2011-2016 QIP | | 7 879.0 | | 9 762.0 | | 9 448.0 | | 9 109.4 | | 7 982.1 | | 44 180.5 | |
| | | | | | | | | | | | | |
(1) Agriculture, public dams and forest roads.
(2) The adjustment of –$1.35 billion represents the estimate, based on the experience of the past few years, of the allocated amounts that will not be disbursed. Accordingly, the annual investment levels under the 2011-2016 QIP reflect investments that will be realized.
| | |
| | Budget 2012-2013 |
C.56 | | Budget Plan |

q Breakdown by type of investment
Public investments are allocated to:
— asset maintenance and the elimination of the maintenance deficit;
— improvements and replacements;
— project completion.
Under the 2011-2016 Québec Infrastructures Plan, over 60% of the funding is allocated first and foremost to regular investments in asset maintenance (48.4%) and to those needed to eliminate the maintenance deficit (13.2%).
To help support the improvement of public services, nearly one third (31.6%) of investments under the Québec Infrastructures Plan will be used to improve and replace existing assets.
Lastly, 6.8% of the funding will be allocated to finance the completion of projects started before the first five-year plan came into effect.
CHART C.7
Breakdown of amounts allocated under the 2011-2016 Québec
Infrastructures Plan, by type of investment(1)
(1) Breakdown before realization adjustments.
| | |
The Government’s | | |
Financial Framework | | C.57 |
| | |
q Review of the fixed-asset management process
To meet future challenges in infrastructure needs, the government is introducing a long-term fixed asset management process.
The first step was taken in 2011-2012, when it set long-term annual investment targets up to 2025-2026, thus helping to achieve the debt reduction objectives.
In addition, the government initiated work aimed at updating the estimates of the amounts required to eliminate the maintenance deficit and of asset maintenance needs, particularly by updating the asset stock inventory and doing a physical assessment of their condition.
The government will continue to review the fixed-asset management process and thus foster an overview that will make it possible to prioritize needs in regard to new initiatives and ensure that public infrastructures remain in good condition.
q Integration of the project management activities of the Société immobilière du Québec in Infrastructure Québec
¡ Role of these bodies
Infrastructure Québec was created in 2010 to contribute, through its advice and know-how, to the planning and implementation of the infrastructure projects of public bodies. It supports public bodies that plan to carry out major projects worth $40 million or more, in accordance with the Framework Policy for the Governance of Major Public Infrastructure Projects (framework policy), regardless of the project delivery approach.
At the same time, the Société immobilière du Québec (SIQ) manages the immovable property stock of the Québec government, which comprises nearly 3 million square metres in the more than 1 000 buildings it owns or rents throughout Québec. Moreover, in the case of certain construction projects (administrative buildings, court houses, prisons, certain health–care buildings), the SIQ also acts as the principal contractor for certain sectoral departments and institutions. In such situations, the departments and institutions have to deal with two central project management bodies, SIQ and Infrastructure Québec.
SIQ offers project management consulting services to the health network, as does Infrastructure Québec. In addition, SIQ prepares, on behalf of its clients, the functional and technical programs (FTPs) that are a key component of the business cases required under the framework policy. An FTP provides the basic data needed to do various evaluations, including value analysis and the choice of delivery approach. It can thus have a major impact on the results. Even though Infrastructure Québec is responsible for coordinating the business case preparation process, in accordance with the framework policy, it is SIQ that determines the content in preparing the FTP.
| | |
| | Budget 2012-2013 |
C.58 | | Budget Plan |

¡ Grouping of common activities
Since Infrastructure Québec must offer its expertise to public bodies that plan to carry out a major project in accordance with the framework policy, it is proposed that the activities related to the management and control of new constructions and major projects, currently carried out by SIQ, be grouped in Infrastructure Québec.
Such integration will facilitate access by offering a single gateway to public bodies that plan to erect a new construction or carry out a major project. This will make it possible to better coordinate the management of projects in keeping with the principles of the framework policy.
SIQ would continue to be responsible for the operation, upkeep and asset maintenance of its immovable property. However, activities related to the realization of major projects and new constructions will be transferred to Infrastructure Québec so as to consolidate project management within that body.
In the short term, an advisory committee will be set up to rapidly identify the mission and support activities that will be transferred from SIQ to Infrastructure Québec.
This measure demonstrates the government’s determination to streamline structures and boost government efficiency.
| | |
The Government’s | | |
Financial Framework | | C.59 |
| | |
4.2 Investments by government departments, organizations and special funds
In addition to investments of $9.8 billion under the Québec Infrastructures Plan in 2012-2013, the Québec government will invest $2.0 billion through its departments, organizations and special funds. These investments include capital expenditures required for government functions and for maintaining the quality of public services.
TABLE C.28
Investments by government departments, organizations and special funds
(millions of dollars)
| | 2012-2013 | |
| | | |
Departments and budget-funded bodies | | 375.8 | |
Non-budget-funded bodies | | 883.3 | |
Special funds | | 748.9 | |
| | | |
TOTAL | | 2 008.0 | |
| | | |
Note: These investments exclude those made under the Québec Infrastructures Plan.
4.3 Investments by government enterprises
Government enterprises will make major investments in the coming years. In 2012-2013, investments by Hydro-Québec, Loto-Québec and the Société des alcools du Québec will reach over $5.0 billion. Over the period from 2011-2012 to 2013-2014, investments by these corporations will total $14.4 billion.
TABLE C.29
Investments by government enterprises
(millions of dollars)
| | 2011-2012 | | 2012-2013 | | 2013-2014 | | Total | |
| | | | | | | | | |
Hydro-Québec | | 3 814.0 | | 4 729.0 | | 5 009.0 | | 13 552.0 | |
Loto-Québec | | 156.2 | | 244.2 | | 304.4 | | 704.8 | |
Société des alcools du Québec | | 48.4 | | 45.0 | | 45.0 | | 138.4 | |
| | | | | | | | | |
TOTAL | | 4 018.6 | | 5 018.2 | | 5 358.4 | | 14 395.2 | |
| | | | | | | | | |
| | |
| | Budget 2012-2013 |
C.60 | | Budget Plan |

5. NON-BUDGETARY TRANSACTIONS
Non-budgetary transactions consist of the transactions of the general fund and those of consolidated entities. They are presented by activity, namely:
— investments, loans and advances;
— capital expenditures;
— retirement plans and employee future benefits;
— other accounts.
For 2011-2012, non-budgetary transactions stand at $4.8 billion. In 2012-2013 and 2013-2014, non-budgetary transactions are expected to total $3.8 billion and $3.4 billion respectively.
TABLE C.30
Summary of non-budgetary transactions(1)
(millions of dollars)
| | 2011-2012 | | 2012-2013 | | 2013-2014 | |
| | | | | | | |
General fund | | | | | | | |
Investments, loans and advances | | –1 079 | | –1 156 | | –1 020 | |
Capital expenditures | | –290 | | –242 | | –249 | |
Retirement plans and employee future benefits | | 2 688 | | 2 628 | | 2 674 | |
Other accounts | | –1 722 | | –196 | | 399 | |
| | | | | | | |
Total | | –403 | | 1 034 | | 1 804 | |
| | | | | | | |
Consolidated entities | | | | | | | |
Investments, loans and advances | | –849 | | 118 | | –98 | |
Capital expenditures | | –4 512 | | –4 794 | | –5 447 | |
Retirement plans and employee future benefits | | 189 | | — | | — | |
Other accounts | | 733 | | –189 | | 305 | |
| | | | | | | |
Total | | –4 439 | | –4 865 | | –5 240 | |
| | | | | | | |
Summary of non-budgetary transactions | | | | | | | |
Investments, loans and advances | | –1 928 | | –1 038 | | –1 118 | |
Capital expenditures | | –4 802 | | –5 036 | | –5 696 | |
Retirement plans and employee future benefits | | 2 877 | | 2 628 | | 2 674 | |
Other accounts | | –989 | | –385 | | 704 | |
| | | | | | | |
TOTAL NON-BUDGETARY TRANSACTIONS | | –4 842 | | –3 831 | | –3 436 | |
| | | | | | | |
(1) A negative entry indicates a financial requirement and a positive entry, a source of financing.
| | |
The Government’s | | |
Financial Framework | | C.61 |
| | |
q Investments, loans and advances
Net financial requirements for investments, loans and advances for 2011-2012 amount to $1.9 billion. The forecasts for 2012-2013 and 2013-2014 stand at $1.0 billion and $1.1 billion respectively.
For 2011-2012, the investments, loans and advances of the general fund show financial requirements of $1.1 billion.
The net financial requirements of consolidated entities in regard to investments, loans and advances amount to $849 million for 2011-2012.
q Retirement plans and employee future benefits
For 2011-2012, the balance of non-budgetary transactions in regard to the retirement plans and employee future benefits is $2.9 billion, which reduces the government’s financing needs.
For 2012-2013 and 2013-2014, the retirement plans and employee future benefits should help to reduce financing needs by $2.6 billion and $2.7 billion respectively.
q Other accounts
Financial requirements for other accounts consist of a series of changes in assets and liabilities such as accounts receivable, accounts payable and deferred revenue.
In 2011-2012, the change in these other accounts will constitute a financial requirement of $989 million.
��
q Capital expenditures
In 2011-2012, financial requirements associated with capital expenditures will total $4.8 billion.
Forecast financial requirements for 2012-2013 and 2013-2014 stand at $5.0 billion and $5.7 billion respectively.
Financial requirements in regard to consolidated entities for 2011-2012 are largely explained by investments of $3.8 billion by the networks and $3.8 billion by the special funds, including $3.6 billion in road infrastructure and public transit. These investments also explain the financial requirements for 2012-2013 and 2013-2014.
| | |
| | Budget 2012-2013 |
C.62 | | Budget Plan |
TABLE C.31
Net capital investments(1)
(millions of dollars)
| | 2011-2012 | | 2012-2013 | | 2013-2014 | |
| | | | | | | |
General fund | | | | | | | |
Investments | | –448 | | –402 | | –413 | |
Depreciation | | 158 | | 160 | | 164 | |
| | | | | | | |
Net investments – General fund | | –290 | | –242 | | –249 | |
| | | | | | | |
Consolidated entities | | | | | | | |
Investments | | | | | | | |
– Special funds | | –3 765 | | –3 941 | | –3 406 | |
– Non-budget-funded bodies | | –832 | | –821 | | –1 732 | |
– Health and social services and education networks | | –3 835 | | –4 070 | | –4 200 | |
| | | | | | | |
Subtotal | | –8 432 | | –8 832 | | –9 338 | |
Depreciation | | 2 876 | | 3 233 | | 3 648 | |
| | | | | | | |
Net investments – Consolidated entities | | –5 556 | | –5 599 | | –5 690 | |
| | | | | | | |
CONSOLIDATED | | | | | | | |
Investments | | –8 880 | | –9 234 | | –9 751 | |
Depreciation | | 3 034 | | 3 393 | | 3 812 | |
| | | | | | | |
Net investments - Consolidated | | –5 846 | | –5 841 | | –5 939 | |
| | | | | | | |
| | | | | | | |
Less: PPP investments(2) | | 1 044 | | 805 | | 243 | |
| | | | | | | |
NET CAPITAL INVESTMENTS | | –4 802 | | –5 036 | | –5 696 | |
| | | | | | | |
(1) A negative entry indicates a financial requirement and a positive entry, a source of financing.
(2) Since PPP investments are made and financed by private-sector partners, they do not entail financial requirements for the government.
Capital investments made under public-private partnerships (PPPs) do not entail financial requirements for the government for the share of financing borne by the private partner. In accordance with the government’s accounting policies, PPP investments are recognized in the government’s assets as well as in its debt.
| | |
The Government’s | | |
Financial Framework | | C.63 |
This page intentionally left blank

6. NET FINANCIAL REQUIREMENTS
Net surpluses or financial requirements represent the difference between the government’s cash inflow and disbursements. This measure takes into account not only changes in the budgetary balance on an accrual basis, but also resources or requirements arising from the acquisition of fixed assets, loans, investments and advances, and from other activities such as paying accounts payable and collecting accounts receivable. The difference between the budgetary balance and net financial requirements is recognized in non-budgetary transactions.
As a whole, the government’s net financial requirements stand at $7.3 billion in 2011-2012, $4.4 billion in 2012-2013 and $2.4 billion in 2013-2014.
TABLE C.32
Net financial requirements(1)
(millions of dollars)
| 2011-2012 | 2012-2013 | 2013-2014 |
| | | |
SURPLUS (DEFICIT) | –2 452 | –589 | 1 041 |
Non-budgetary transactions | | | |
Investments, loans and advances | –1 928 | –1 038 | –1 118 |
Capital expenditures | –4 802 | –5 036 | –5 696 |
Retirement plans and employee future benefits | 2 877 | 2 628 | 2 674 |
Other accounts | –989 | –385 | 704 |
| | | |
Total non-budgetary transactions | –4 842 | –3 831 | –3 436 |
| | | |
NET FINANCIAL REQUIREMENTS | –7 294 | –4 420 | –2 395 |
| | | |
(1) A negative entry indicates a financial requirement and a positive entry, a source of financing.
| | |
The Government’s | | |
Financial Framewor | | C.65 |
| | |
The net financial requirements shown in the above table come from the following sources:
— The net financial requirements of the general fund amount to $4.0 billion for 2011-2012 and $750 million for 2012-2013. In 2013-2014, the general fund will show a surplus of $1.6 billion. These variations mainly reflect the change in the deficits forecast for the next two years and the return to fiscal balance in 2013-2014.
— The net financial requirements of consolidated entities, excluding the Generations Fund, stand at $4.1 billion for 2011-2012, $4.9 billion for 2012-2013 and $5.0 billion for 2013-2014. These net financial requirements stem largely from infrastructure investments provided for by the Land Transportation Network Fund and by the health and social services and education networks.
— The net financial surpluses of the Generations Fund amount to $848 million for 2011-2012, $1.2 billion for 2012-2013 and $1.0 billion for 2013-2014.
TABLE C.33
Net financial requirements by entity(1)
(millions of dollars)
| 2011-2012 | 2012-2013 | | 2013-2014 |
| | | | |
General fund | –4 000 | –750 | | 1 550 |
Consolidated entities(2) | –4 142 | –4 881 | | –4 986 |
Generations Fund | 848 | 1 211 | (3) | 1 041 |
| | | | |
NET FINANCIAL REQUIREMENTS | –7 294 | –4 420 | | –2 395 |
| | | | |
(1) A negative entry indicates a financial requirement and a positive entry, a source of financing.
(2) Excluding the Generations Fund.
(3) Including a deposit of $300 million from the accumulated surpluses of the Territorial Information Fund.
| | |
| | Budget 2012-2013 |
C.66 | | Budget Plan |
| | |
APPENDIX 1: INVESTMENT PROJECTS BY GOVERNEMENT ENTREPRISES
Certain government enterprises will continue to make substantial investments that will contribute to Québec’s economic prosperity. In 2012-2013, investments by these corporations will increase by $1.0 billion compared with 2011-2012 and reach $5.0 billion. They will climb again by $340 million in 2013-2014, to $5.4 billion.
q Hydro-Québec
In 2012, Hydro-Québec will boost its investments by a substantial $915 million compared with the previous year, for a total of $4.7 billion. In 2013, its investments will grow by $280 million, to $5.0 billion.
The funds devoted to the La Romaine complex will reach $707 million in 2012 and $882 million in 2013. As well, $135 million will be allocated to the Eastmain-1-A/Sarcelle/Rupert project in 2012. In addition to making a significant contribution to Québec’s economy, these two projects will play an important role in securing Québec’s energy future.
Renovation work on the Gentilly-2 power station will total $275 million in 2012 and $22 million in 2013.
Investments of $211 million in 2012 and $379 million in 2013 will also be devoted to boosting Québec’s energy efficiency.
Overall, Hydro-Québec’s other investment projects will reach $2.8 billion in 2012 and $3.2 billion in 2013.
q Loto-Québec and the Société des alcools du Québec
Investments by Loto-Québec will reach $244 million in 2012-2013 and $304 million in 2013-2014. Of these amounts, $95 million will be allocated to the Casino de Montréal renovation project in 2012-2013 and $57 million will be invested in the project in 2013-2014. In 2012-2013 and 2013-2014 as well, $65 million and $150 million respectively will be invested to replace video lottery machines that have reached the end of their useful life.
| | |
The Government’s | | |
Financial Framewor | | C.67 |
| | |
Investments by the Société des alcools du Québec will total $45 million in 2012-2013, compared with $48 million in 2011-2012. In 2013-2014, the Société plans to invest $45 million. These investments will be devoted mainly to its outlet network, to real estate projects relating to distribution and administrative centres, and to computer system development projects.
TABLE C.34
Forecast investments by government enterprises
(millions of dollars)
| 2011-2012 | 2012-2013 | 2013-2014 |
| | | |
HYDRO-QUÉBEC(1) | | | |
Major projects | | | |
Eastmain 1-A/ Sarcelle/Rupert | 368.0 | 135.0 | 1.0 |
Gentilly-2 – Repair project | 157.0 | 275.0 | 22.0 |
La Romaine complex | 567.0 | 707.0 | 882.0 |
Transmission integration – Wind turbines (990 MW and 2 000 MW) | 163.0 | 375.0 | 229.0 |
La Romaine – Integration into the power transmission grid | 52.0 | 227.0 | 272.0 |
Global Energy Efficiency Plan | 217.0 | 211.0 | 379.0 |
| | | |
Subtotal – Major projects | 1 524.0 | 1 930.0 | 1 785.0 |
Other projects | 2 290.0 | 2 799.0 | 3 224.0 |
| | | |
Total – Hydro-Québec | 3 814.0 | 4 729.0 | 5 009.0 |
LOTO-QUÉBEC | | | |
Modernization of the Casino de Montréal | 73.3 | 94.5 | 57.0 |
Replacement of video lottery machines | 8.9 | 64.8 | 150.0 |
Other projects | 74.0 | 84.9 | 97.4 |
| | | |
Total – Loto-Québec | 156.2 | 244.2 | 304.4 |
SOCIÉTÉ DES ALCOOLS DU QUÉBEC | | | |
Outlet network | 17.0 | 10.8 | 10.8 |
Other projects | 31.4 | 34.2 | 34.2 |
| | | |
Total – Société des alcools du Québec | 48.4 | 45.0 | 45.0 |
| | | |
TOTAL INVESTMENTS | 4 018.6 | 5 018.2 | 5 358.4 |
| | | |
(1) For the fiscal year ending December 31.
| | |
| | Budget 2012-2013 |
C.68 | | Budget Plan |
| | |

APPENDIX 2: ADJUSTMENTS TO THE 2012-2013 SPENDING OBJECTIVE SINCE BUDGET 2009-2010
In presenting the plan to restore fiscal balance in Budget 2009-2010, the government set the overall level of program spending for 2012-2013 at $65.8 billion.
— This level has now reached $68.0 billion, which corresponds to a difference of $2.2 billion.
This increase is due essentially to the valuation adjustment of certain expenditure items, the deployment of additional public services and the fulfilment of the government’s commitments regarding the remuneration of its employees.
The increase in the spending objective for 2012-2013 since Budget 2009-2010 is fully offset by the efforts made to reduce spending, additional revenue from the economy and downward revisions in debt service.
TABLE C.35
Increase in the program spending objective for 2012-2013
since Budget 2009-2010
(millions of dollars)
Spending | | |
– Budget 2012-2013 | –68 031 | (1) |
– Budget 2009-2010 | –65 840 | |
| | |
Difference | –2 191 | |
Breakdown of the difference in spending | | |
– Valuation adjustment of certain expenditure items | –710 | |
– Improvement of the supply of health services – FINESSS | –1 005 | |
– Increase in the volume of public services | –445 | |
– Fair remuneration of government employees | –502 | |
– Downward adjustment of 2012-2013 spending objectives | 471 | |
| | |
Subtotal | –2 191 | |
Offset of the difference in spending | | |
– Health contribution revenue | 1 005 | |
– Downward adjustments to debt service | 639 | |
– Compensation for the harmonization of the QST with the GST | 733 | |
– Other adjustments to revenue | –186 | |
| | |
Subtotal | 2 191 | |
| | |
TOTAL DIFFERENCE | 0 | |
(1) This amount includes program spending, as well as the expenditures of FORT, FINESSS and the Tax Administration Fund (FRAF) and the allowance for doubtful accounts.
| | |
The Government’s | | |
Financial Framewor | | C.69 |
| | |
q Increases in spending
Adjustments of $710 million are associated with valuation adjustments not related to the delivery of services or the management of efforts made by government departments and organizations:
— $358 million following the actuarial revaluations of the retirement plans and $352 million relating to the increase in the allowance for doubtful accounts.
Health services totalling $1.0 billion were funded by the introduction of the health contribution, whose revenues are paid into FINESSS.
Other adjustments, totalling $445 million, result essentially from additional demand for public services.
Adjustments of $502 million stem from the fulfilment of the government’s commitments regarding the remuneration of its employees: in particular, $217 million under the Pay Equity Act, $143 million for the agreements with child-care-service providers and $142 million in respect of a reserve for wage adjustments related to economic growth and provided for in the agreements on the collective agreements.
In addition, downward adjustments of $471 million in spending are due mainly to the slowdown in spending growth in 2012-2013, announced in Budget 2011-2012 and the fall 2011 Update on Québec’s Economic and Financial Situation.
q Spending increases offset by additional revenue and downward adjustments to debt service
The $2.3-billion increase in the program spending objective since Budget 2009-2010 has been mainly offset by:
— additional revenue of $1 005 million from the health contribution and revenue of $733 million from the agreement on the harmonization of the QST with the GST;
— downward adjustments of $639 million in debt service.
q Deficit forecast for 2012-2013
The deficit forecast in Budget 2009-2010 for 2012-2013 was $1 268 million, or $232 million less than the deficit of $1 500 million forecast in Budget 2012-2013.
If the $300-million contingency reserve is excluded, the deficit currently forecast is $68 million less than that presented in Budget 2009-2010.
| | |
| | Budget 2012-2013 |
C.70 | | Budget Plan |
| | |