Exhibit 99.15
Section D
DEBT, FINANCING
AND DEBT MANAGEMENT
1. | DEBT | D.3 |
| | |
| 1.1 | Gross debt | D.4 |
| | | |
| 1.2 | Debt representing accumulated deficits | D.11 |
| | | |
| 1.3 | Debt burden | D.14 |
| | | |
| 1.4 | Debt reduction objectives | D.15 |
| | | |
| 1.5 | Comparison of the debt of governments in Canada | D.17 |
| | | |
| 1.6 | Public sector debt | D.19 |
| | | |
| 1.7 | Retirement plans | D.20 |
| | | |
| | 1.7.1 | Retirement plans liability | D.22 |
| | | | |
| | 1.7.2 | Retirement Plans Sinking Fund | D.25 |
| | | | |
| 1.8 | Generations Fund | D.30 |
| | | |
| 1.9 | Returns of the Caisse de dépôt et placement du Québec on funds deposited by the Ministère des Finances | D.33 |
| | | |
| | 1.9.1 | Retirement Plans Sinking Fund | D.34 |
| | | | |
| | 1.9.2 | Generations Fund | D.35 |
| | | | |
| | 1.9.3 | Accumulated Sick Leave Fund | D.36 |
| | | | |
| 1.10 | Impact of the returns of the Retirement Plans Sinking Fund on debt service | D.38 |
| | | |
2. | FINANCING | D.41 |
| | |
| 2.1 | Financing strategy | D.41 |
| | | |
| | 2.1.1 | Diversification by market | D.41 |
| | | | |
| | 2.1.2 | Diversification by instrument | D.42 |
| | | | |
| | 2.1.3 | Diversification by maturity | D.43 |
| | | | |
| 2.2 | Financing program | D.44 |
| | | |
| | 2.2.1 | Yield | D.49 |
| | | | |
3. | DEBT MANAGEMENT | D.51 |
| | |
| 3.1 | Structure of the debt by currency | D.51 |
| | | |
| 3.2 | Structure of the debt by interest rate | D.53 |
4. | CREDIT RATINGS | D.55 |
| | |
| 4.1 | The Québec government’s credit ratings | D.55 |
| | | |
| 4.2 | Comparison of the credit ratings of Canadian provinces | D.61 |
| | | |
5. | ADDITIONAL INFORMATION | D.63 |
| | |
| 5.1 | Adjustments to the gross debt compared with the March 2010 budget | D.63 |
| | | |
| 5.2 | Adjustments to the debt representing accumulated deficits compared with the March 2010 budget | D.66 |
| | | |
| 5.3 | Information on borrowings contracted | D.67 |

1. DEBT
Several concepts of debt can be used to measure a government’s indebtedness. The following table presents data on the Québec government’s debt according to the two main concepts the government employs, namely, gross debt and debt representing accumulated deficits.
TABLE D.1
Debt of the Québec government as at March 31
(millions of dollars)
| 2011 | 2012P | 2013P | 2014P | 2015P | 2016P | 2017P |
| | | | | | | |
GROSS DEBT(1) | 173 436 | 183 780 | 191 717 | 197 130 | 203 032 | 207 138 | 210 802 |
As a % of GDP | 54.3 | 55.0 | 55.3 | 54.6 | 54.0 | 53.0 | 52.1 |
Less: Financial assets, net of other liabilities | –14 147 | –12 893 | –13 193 | –13 708 | –15 366 | –15 984 | –16 531 |
Less: Non-financial assets | –47 387 | –53 233 | –59 074 | –65 013 | –70 832 | –76 350 | –81 971 |
| | | | | | | |
DEBT REPRESENTING ACCUMULATED DEFICITS | 111 902 | 117 654 | 119 450 | 118 409 | 116 834 | 114 804 | 112 300 |
As a % of GDP | 35.0 | 35.2 | 34.5 | 32.8 | 31.1 | 29.4 | 27.7 |
| | | | | | | |
P: Preliminary results for 2012 and forecasts for subsequent years.
(1) The gross debt excludes pre-financing and takes into account the sums accumulated in the Generations Fund.
| | |
Debt, Financing
and Debt Management | | D.3 |
| | |
1.1 Gross debt
The gross debt corresponds to the sum of the debt contracted on financial markets and the net liabilities for the retirement plans and for the employee future benefits of public and parapublic sector employees, minus the balance of the Generations Fund.
Preliminary results show that, as at March 31, 2012, the gross debt should stand at $183 780 million, or 55.0% of GDP. As at March 31, 2017, the gross debt is expected to amount to $210 802 million, or 52.1% of GDP.
TABLE D.2
Gross debt as at March 31
(millions of dollars)
| 2011 | 2012P | 2013P | 2014P | 2015P | 2016P | 2017P |
| | | | | | | |
Consolidated direct debt(1) | 147 748 | 159 318 | 167 820 | 173 447 | 180 345 | 186 106 | 192 070 |
Plus: Net retirement plans liability | 29 050 | 28 715 | 29 393 | 30 220 | 30 799 | 31 174 | 31 378 |
Plus: Net employee future benefits liability | 75 | 32 | — | — | — | — | — |
Less: Generations Fund | –3 437 | –4 285 | –5 496 | –6 537 | –8 112 | –10 142 | –12 646 |
| | | | | | | |
GROSS DEBT(1) | 173 436 | 183 780 | 191 717 | 197 130 | 203 032 | 207 138 | 210 802 |
As a % of GDP | 54.3 | 55.0 | 55.3 | 54.6 | 54.0 | 53.0 | 52.1 |
| | | | | | | |
P: Preliminary results for 2012 and forecasts for subsequent years.
(1) The consolidated direct debt and the gross debt exclude pre-financing.
The consolidated direct debt represents the debt that has been contracted on financial markets. It includes the government’s debt and the debt of entities whose results are consolidated line by line with those of the government. As at March 31, 2012, the consolidated direct debt is expected to total $159 318 million.
The main consolidated entities are Financement-Québec, the Land Transportation Network Fund (FORT), the Société d’habitation du Québec (SHQ) and the Société immobilière du Québec (SIQ).
As at March 31, 2012, the net retirement plans liability should amount to $28 715 million and the net employee future benefits liability, $32 million. The net retirement plans liability and the net employee future benefits liability are discussed in the boxes on the next two pages.
As at March 31, 2012, the sums accumulated in the Generations Fund are expected to total $4 285 million. These sums are dedicated exclusively to repaying the debt.
| | |
D.4 | | Budget 2012-2013
Budget Plan |
| | |

| Retirement plans liability | |
| | |
| The net retirement plans liability is calculated by subtracting from the retirement plans liability the balance of the Retirement Plans Sinking Fund (RPSF), an asset established to pay the retirement benefits of public and parapublic sector employees. The liability for the retirement plans represents the present value of the retirement benefits that the government will pay to public and parapublic sector employees, taking into account the conditions of their plans and their years of service. The liability should stand at $74 067 million as at March 31, 2012. The government created the RPSF in 1993. As at March 31, 2012, the book value of the RPSF is expected to be $45 352 million. The net retirement plans liability should total $28 715 million as at March 31, 2012. | |
| | |
| Net retirement plans liability as at March 31, 2012P | |
| (millions of dollars) | |
| | |
| Retirement plans liability | | |
| Government and Public Employees Retirement Plan (RREGOP) | 43 402 | |
| Pension Plan of Management Personnel (PPMP) | 9 932 | |
| Other plans(1) | 20 733 | |
| Subtotal | 74 067 | |
| Less: Retirement Plans Sinking Fund | –45 352 | |
| NET RETIREMENT PLANS LIABILITY | 28 715 | |
| | | |
| | | | |
| P: | Preliminary results. | | |
| (1) | Takes into account, among other things, the assets of the pension plan of the Université du Québec. | | |
| | | | |
| | | | |
| | |
Debt, Financing
and Debt Management | | D.5 |
| | |
| Employee future benefits liability | |
| | |
| The government records in its debt the value of its commitments regarding future benefits programs for its employees, namely, programs for accumulated sick leave and for pensions paid to the survivors of a government employee. These programs give rise to long-term obligations whose costs are covered in full by the government. As at March 31, 2012, the value of the assets established to pay for employee future benefits programs should amount to $1 197 million. Given that assets have been established to cover these future disbursements, the net employee future benefits liability is expected to be only $32 million as at March 31, 2012. | |
| | |
| Net employee future benefits liability as at March 31, 2012P | |
| (millions of dollars) | |
| | |
| Employee future benefits liability | | |
| Accumulated sick leave | 658 | |
| Survivor’s pension plan | 406 | |
| Université du Québec programs | 165 | |
| Subtotal | 1 229 | |
| Less: | | |
| Accumulated Sick Leave Fund | –746 | |
| Survivor’s Pension Plan Fund | –451 | |
| Subtotal | –1 197 | |
| NET EMPLOYEE FUTURE BENEFITS LIABILITY | 32 | |
| | | |
| | | | |
| P: | Preliminary results. | | |
| | | | |
| | | | |
| | |
D.6 | | Budget 2012-2013
Budget Plan |
| | |
In 2011-2012, the government’s gross debt should increase by $10 344 million mainly because of capital investments, the budgetary deficit and investments, loans and advances.
CHART D.1
Factors responsible for growth in the gross debt in 2011-2012 |
(millions of dollars) |
|
|
|
|
(1) | Other factors include in particular the change in “Other accounts”, such as accounts payable and accounts receivable, as well as the change in the value of the debt in foreign currency. |
More specifically, the gross debt is increasing in 2011-2012 for the following reasons:
— The $3 300-million budgetary deficit.
— Government investments in fixed assets (e.g. roads) that require borrowings. When these capital expenditures are made, they are posted to the government’s balance sheet. Subsequently, they are gradually recorded as expenditures based on the useful life of the assets concerned. In 2011-2012, capital expenditures, net of the depreciation expenditure, should entail a $5 846-million increase in the gross debt.
| | |
Debt, Financing
and Debt Management | | D.7 |
| | |
— Government investments in its corporations. These investments are made through advances, direct cash contributions or by allowing these corporations to keep part of their earnings to finance their own investments.
For example, Hydro-Québec pays 75% of its net earnings1 as dividends to the government and keeps 25% to fund its own investments, notably hydroelectric dams. The portion of earnings that the government is leaving Hydro-Québec ($628 million in 2011-2012) constitutes an investment by the government in Hydro-Québec, which creates a financial requirement for the government and thus leads to an increase in the gross debt.
In addition, loans to universities by Financement-Québec not included in the government’s reporting entity (nearly $200 million in 2011-2012) to enable them to fund their capital investments are included in investments, loans and advances.
Overall, the government’s investments, loans and advances should entail a $1 928-million increase in the gross debt in 2011-2012.
— Changes in some of the government’s other asset and liability items, such as accounts receivable and accounts payable, which should increase the gross debt by $118 million in 2011-2012.
— Deposits in the Generations Fund, which should reduce the debt by $848 million in 2011-2012.
The following table shows how the government’s gross debt has changed since March 31, 2000.
1 The amount of the dividend is calculated according to section 15.2 of the Act respecting Hydro-Québec:
“The distributable surplus for a financial period is equal to 75% of the Company’s net profit. The net profit is computed on the basis of the annual consolidated financial statements established according to generally accepted accounting principles.
However, no dividend may be declared in respect of a financial period if the payment thereof would result in a reduction of the rate of capitalization of the Company to less than 25% at the end of that period.”
| | |
D.8 | | Budget 2012-2013
Budget Plan |
| | |

TABLE D.3
Factors responsible for growth in the Québec government’s gross debt
(millions of dollars)
| | Debt,
beginning
of year | | | Budgetary
deficit
(surplus) | | Investments,
loans and
advances | | Net investment
in the networks | (1) | Net capital
expenditures | (2) | Other
factors | (3) | Generations
Fund | (4) | Total
change | | | Debt,
end
of year | | As a %
of GDP |
| | | | | | | | | | | | | | | | | | | | | | |
With networks consolidated at modified equity value | | | | | | | | | | | | | |
| | | | | | | | | | | | | | | | | | | | | | |
2000-2001 | | 116 761 | | | –427 | | 1 701 | | 841 | | 578 | | 1 108 | | | | 3 801 | | | 120 562 | | 53.6 |
| | | | | | | | | | | | | | | | | | | | | | |
2001-2002 | | 120 562 | | | –22 | | 1 248 | | 934 | | 1 199 | | –9 | | | | 3 350 | | | 123 912 | | 53.5 |
| | | | | | | | | | | | | | | | | | | | | | |
2002-2003 | | 123 912 | | | 728 | | 1 921 | | 631 | | 1 706 | | 237 | | | | 5 223 | | | 129 135 | | 53.5 |
| | | | | | | | | | | | | | | | | | | | | | |
2003-2004 | | 129 135 | | | 358 | | 1 367 | | 560 | | 1 186 | | 625 | | | | 4 096 | | | 133 231 | | 53.1 |
| | | | | | | | | | | | | | | | | | | | | | |
2004-2005 | | 133 231 | | | 664 | | 1 303 | | 1 486 | | 1 006 | | –796 | | | | 3 663 | | | 136 894 | | 52.1 |
| | | | | | | | | | | | | | | | | | | | | | |
2005-2006 | | 136 894 | | | –37 | | 1 488 | | 1 013 | | 1 179 | | –809 | | | | 2 834 | | | 139 728 | | 51.4 |
| | | | | | | | | | | | | | | | | | | | | | |
2006-2007 | | 139 728 | | | –109 | | 2 213 | | 1 002 | | 1 177 | | 1 078 | | –584 | | 4 777 | | | 144 505 | | 51.2 |
| | | | | | | | | | | | | | | | | | | | | | |
2007-2008 | | 144 505 | | | — | | 2 658 | | 487 | | 1 457 | | 767 | | –649 | | 4 720 | | | 149 225 | | 50.4 |
| | | | | | | | | | | | | | | | | | | | | | |
2008-2009 | | 149 225 | | | — | | 966 | | 622 | | 2 448 | | –28 | | –719 | | 3 289 | | | 152 514 | | 50.1 |
| | | | | | | | | | | | | | | | | | | | | | |
With networks consolidated line by line(5) | | | | | | | | | | | | | |
| | | | | | | | | | | | | | | | | | | | | | |
2009-2010 | | 157 630 | | | 3 174 | | 1 746 | | | | 4 226 | | –2 733 | | –725 | | 5 688 | | | 163 318 | | 53.6 |
| | | | | | | | | | | | | | | | | | | | | | |
2010-2011 | | 163 318 | | | 3 150 | | 2 400 | | | | 4 923 | | 405 | | –760 | | 10 118 | | | 173 436 | | 54.3 |
| | | | | | | | | | | | | | | | | | | | | | |
2011-2012 | | 173 436 | | | 3 300 | | 1 928 | | | | 5 846 | | 118 | | –848 | | 10 344 | | | 183 780 | | 55.0 |
| | | | | | | | | | | | | | | | | | | | | | |
2012-2013 | | 183 780 | | | 1 500 | | 1 038 | | | | 5 841 | | 769 | | –1 211 | | 7 937 | | | 191 717 | | 55.3 |
| | | | | | | | | | | | | | | | | | | | | | |
2013-2014 | | 191 717 | | | — | | 1 118 | | | | 5 939 | | –603 | | –1 041 | | 5 413 | | | 197 130 | | 54.6 |
| | | | | | | | | | | | | | | | | | | | | | |
2014-2015 | | 197 130 | | | — | | 1 428 | | | | 5 819 | | 230 | | –1 575 | | 5 902 | | | 203 032 | | 54.0 |
| | | | | | | | | | | | | | | | | | | | | | |
2015-2016 | | 203 032 | | | — | | 1 351 | | | | 5 518 | | –733 | | –2 030 | | 4 106 | | | 207 138 | | 53.0 |
| | | | | | | | | | | | | | | | | | | | | | |
2016-2017 | | 207 138 | | | — | | 1 368 | | | | 5 621 | | –821 | | –2 504 | | 3 664 | | | 210 802 | | 52.1 |
(1) | The net investment in the networks includes mainly loans by Financement-Québec and the Corporation d’hébergement du Québec to institutions in the health and social services and education networks. As of 2009-2010, these items are part of net capital expenditures. |
(2) | Investments made in the course of private-public partnership agreements are included in net capital expenditures. |
(3) | Other factors include in particular the change in “Other accounts”, such as accounts payable and accounts receivable, as well as the change in the value of the debt in foreign currency. |
(4) | Deposits in the Generations Fund in 2012-2013 include $911 million in dedicated revenues and $300 million from the accumulated surpluses of the Territorial Information Fund (TIF). |
(5) | The line-by-line consolidation of the results of institutions in the health and social services and education networks raised the gross debt by $5 116 million as at March 31, 2009. This amount represents the debt contracted by the networks in their own name. The data prior to 2009-2010 could not be restated and are thus not comparable. |
| | |
Debt, Financing | | |
and Debt Management | | D.9 |
| | | | |
| | | | |
| Adjustments to the gross debt compared with the March 2011 budget | |
| The gross debt forecast for March 31, 2012 in the March 2011 budget was $183 770 million. The revised forecast in this budget is $183 780 million, or only $10 million more. The forecast for March 31, 2016 in the budget of last March was $207 298 million. The revised forecast is $207 138 million, or $160 million less. The increase to $1 billion, announced in this budget, of the $500-million funding envelope for taking equity interests in mining or hydrocarbon projects and the government’s decision to invest in the rehabilitation of contaminated sites will increase the government’s gross debt by $740 million as at March 31, 2016 compared with the forecast in the budget of last March. However, this increase in the government’s debt is offset in full by the improvement in budgetary balances in 2010-2011 and 2011-2012. | |
| | |
| Adjustments to the gross debt as at March 31 since the March 2011 budget | |
| (millions of dollars) | |
| | | | | | | | | |
| | | 2012 | 2013 | 2014 | 2015 | 2016 | | |
| | | | | | | | | |
| | | | | | | | | |
| | March 2011 budget | 183 770 | 190 962 | 196 086 | 201 899 | 207 298 | | |
| | | | | | | | | |
| | As a % of GDP | 55.7 | 55.5 | 54.7 | 54.1 | 53.6 | | |
| | | | | | | | | |
| | March 2012 budget | 183 780 | 191 717 | 197 130 | 203 032 | 207 138 | | |
| | | | | | | | | |
| | As a % of GDP | 55.0 | 55.3 | 54.6 | 54.0 | 53.0 | | |
| | | | | | | | | |
| | Adjustments | 10 | 755 | 1 044 | 1 133 | –160 | | |
| | | | | | | | | |
| | As a % of GDP | –0.7 | –0.2 | –0.1 | –0.1 | –0.6 | | |
| | Explanation of the adjustments | | | |
| | | | | |
| | Lower-than-anticipated deficits: | | | |
| | | | | |
| | In 2010-2011 (from $4 200 million to $3 150 million) | –1 050 | | |
| | | | | |
| | In 2011-2012 (from $3 800 million to $3 300 million) | –500 | | |
| | | | | |
| | Subtotal | –1 550 | | |
| | | | | |
| | Increase in the funding envelope for taking equity investments in mining or hydrocarbon projects ($500 million over five years) | 400 | | |
| | | | | |
| | Rehabilitation of contaminated sites | 340 | | |
| | | | | |
| | Other adjustments | 650 | | |
| | | | | |
| | Total adjustments | –160 | | |
| | | | |
| | |
| | Budget 2012-2013 |
D.10 | | Budget Plan |
| | |
| | | |

1.2 Debt representing accumulated deficits
The debt representing accumulated deficits corresponds to the difference between the government’s liabilities and its financial and non-financial assets as a whole. This debt is calculated by subtracting financial assets, net of other liabilities, as well as non-financial assets from the gross debt.
Preliminary results show that the debt representing accumulated deficits should amount to $117 654 million, or 35.2% of GDP, as at March 31, 2012.
The debt representing accumulated deficits will stop rising once the budget is balanced in 2013-2014. It will then decline year after year at the rate of increase of the Generations Fund. As a proportion of GDP, the debt representing accumulated deficits will decline as of 2012-2013.
TABLE D.4
Factors responsible for growth in the debt representing
accumulated deficits
(millions of dollars)
| | Debt,
beginning
of year | | Budgetary
deficit | | Generations
Fund | (1) | Restate-
ments | | Total
change | | Debt,
end of
year | | As a %
of GDP | |
2011-2012P | | 111 902 | | 3 300 | | –848 | | 3 300 | | 5 752 | | 117 654 | | 35.2 | |
2012-2013P | | 117 654 | | 1 500 | | –911 | | 1 207 | | 1 796 | | 119 450 | | 34.5 | |
2013-2014P | | 119 450 | | — | | –1 041 | | — | | –1 041 | | 118 409 | | 32.8 | |
2014-2015P | | 118 409 | | — | | –1 575 | | — | | –1 575 | | 116 834 | | 31.1 | |
2015-2016P | | 116 834 | | — | | –2 030 | | — | | –2 030 | | 114 804 | | 29.4 | |
2016-2017P | | 114 804 | | — | | –2 504 | | — | | –2 504 | | 112 300 | | 27.7 | |
| | | | | | | | | | | | | | | |
P: Preliminary results for 2011-2012 and forecasts for subsequent years. (1) The deposits of $911 million in 2012-2013 do not include the amount of $300 million from the accumulated surpluses of the Territorial Information Fund (TIF). This additional deposit of $300 million does not have an impact on the debt representing accumulated deficits in 2012-2013 since the amount was included in the assets of the consolidated entities, to which the TIF belongs. |
As at April 1, 2011, the debt representing accumulated deficits was restated to reflect the adoption by Hydro-Québec of IFRS2 accounting standards, which change, in particular, the recording of employee benefits. The adoption of these standards has reduced the balance of Hydro-Québec’s retained earnings by an estimated $3 300 million. Therefore, the value of the government’s participation in Hydro-Québec is being reduced by the same amount. This change thus increases the government’s debt representing accumulated deficits as at April 1, 2011, but does not affect the gross debt. The final impact of these new standards will be known at a later date and could lead to another adjustment of the debt representing accumulated deficits.
2 International Financial Reporting Standards.
| | |
Debt, Financing | | |
and Debt Management | | D.11 |
| | | | |
| | | | |
The debt representing accumulated deficits has also been restated by $1 207 million because of the new accounting standard for government transfers, which changes the way the Société de financement des infrastructures locales (SOFIL) and the Société d’habitation du Québec (SHQ) record subsidies in respect of debt service.
| | |
| | Budget 2012-2013 |
D.12 | | Budget Plan |
| | |
| | | |
| Adjustments to the debt representing accumulated deficits compared with the March 2011 budget | |
| In the March 2011 budget, the debt representing accumulated deficits as at March 31, 2012 was $114 278 million. The revised forecast for the present budget is $117 654 million, or $3 376 million more, essentially because of the decline in value of the government’s investment in Hydro-Québec due to the application of IFRS standards. The forecast for March 31, 2016 in the budget of last March was $110 074 million. The revised forecast is $114 804 million, or $4 730 million more. This $4 730-million adjustment is explained mainly by Hydro-Québec’s adoption of IFRS standards and the impact on SOFIL and the SHQ of the new accounting standard on government transfers. These accounting adjustments have more than offset the reduction in the debt representing accumulated deficits resulting from the improvement in budgetary balances in 2010-2011 and 2011-2012. | |
| | |
| Adjustments to the debt representing accumulated deficits as at March 31 since the March 2011 budget | |
| (millions of dollars) | |
| | | | | | | | | |
| | | 2012 | 2013 | 2014 | 2015 | 2016 | | |
| | | | | | | | | |
| | | | | | | | | |
| | March 2011 budget | 114 278 | 114 731 | 113 623 | 112 075 | 110 074 | | |
| | | | | | | | | |
| | As a % of GDP | 34.7 | 33.3 | 31.7 | 30.0 | 28.5 | | |
| | | | | | | | | |
| | March 2012 budget | 117 654 | 119 450 | 118 409 | 116 834 | 114 804 | | |
| | | | | | | | | |
| | As a % of GDP | 35.2 | 34.5 | 32.8 | 31.1 | 29.4 | | |
| | | | | | | | | |
| | Adjustments | 3 376 | 4 719 | 4 786 | 4 759 | 4 730 | | |
| | | | | | | | | |
| | As a % of GDP | 0.5 | 1.2 | 1.1 | 1.1 | 0.9 | | |
| | Explanation of the adjustments | | | |
| | | | | |
| | Lower-than-anticipated deficits: | | | |
| | | | | |
| | In 2010-2011 (from $4 200 million to $3 150 million) | –1 050 | | |
| | | | | |
| | In 2011-2012 (from $3 800 million to $3 300 million) | –500 | | |
| | | | | |
| | Subtotal | –1 550 | | |
| | | | | |
| | Adjustments to deposits in the Generations Fund | 211 | | |
| | | | | |
| | Accounting restatements: | | | |
| | | | | |
| | Adoption of IFRS standards by Hydro-Québec | 3 300 | | |
| | | | | |
| | New accounting standard on government transfers for SOFIL and the SHQ | 1 207 | | |
| | | | | |
| | Adjustment to the environmental liability | 1 080 | | |
| | | | | |
| | Adoption of IFRS standards by the SGF | 158 | | |
| | | | | |
| | Other | 324 | | |
| | | | | |
| | Total accounting restatements | 6 069 | | |
| | | | | |
| | Total adjustments | 4 730 | | |
| | | | |
| | |
Debt, Financing | | |
and Debt Management | | D.13 |
| | | | |
| | | | |
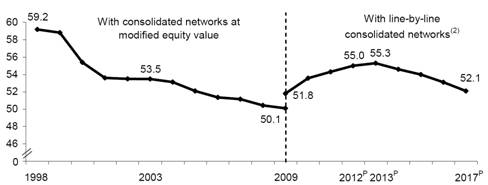
1.3 Debt burden
Since March 31, 1998, the Québec government’s debt/GDP ratio has fallen significantly. While the gross debt was equivalent to 59.2% of GDP as at March 31, 1998, this ratio stood at 50.1% as at March 31, 2009. The line-by-line consolidation of the network institutions’ results with those of the government raised the debt/GDP ratio to 51.8% as at March 31, 2009.
This ratio is expected to reach 55.3% as at March 31, 2013, mainly because of capital investments. The debt/GDP ratio should then decline to 52.1% as at March 31, 2017.
CHART D.2
Gross debt(1) as at March 31 (as a percentage of GDP) | |
|
P: | Preliminary results for 2012 and forecasts for subsequent years. |
(1) | The gross debt excludes pre-financing and takes into account the sums accumulated in the Generations Fund. |
(2) | The gross debt takes into account the debt that the health and social services and education networks have contracted in their own name. Therefore, the data as of 2009 are not comparable with those for previous years, which do not include this debt. |
| | |
| | |
| | Budget 2012-2013 |
D.14 | | Budget Plan |
| | |
| | | |

1.4 Debt reduction objectives
In the March 2010 budget, the government announced debt reduction objectives. These objectives were included in the Act to reduce the debt and establish the Generations Fund in June 2010.
As at March 31, 2012, the gross debt is expected to amount to 55.0% of GDP. The government’s objective is to reduce the ratio of gross debt to GDP to 45% as at March 31, 2026.
As at March 31, 2012, the debt representing accumulated deficits is expected to stand at 35.2% of GDP. The government’s objective is to reduce the ratio of debt representing accumulated deficits to GDP to 17% as at March 31, 2026.
CHART D.3 | | CHART D.4 |
| | |
Gross debt | | Debt representing accumulated deficits |
(as at March 31, as a percentage of GDP) | | (as at March 31, as a percentage of GDP) |
| | 
|
P: Preliminary results for 2012, forecasts for 2013 to 2017 and projections for subsequent years. Note: The gross debt excludes pre-financing and takes into account the sums accumulated in the Generations Fund. | | P: Preliminary results for 2012, forecasts for 2013 to 2017 and projections for subsequent years. |
| | |
Debt, Financing | | |
and Debt Management | | D.15 |
| | | | |
| | | | |
To achieve these objectives the government announced:
— in its March 2010 budget:
— that the price of heritage pool electricity will be increased gradually starting in 2014-2015 and that the resulting revenue will be deposited in the Generations Fund;
— in its March 2011 budget:
— that 25% of mining, oil and gas royalties in excess of $200 million will be deposited in the Generations Fund as of 2014-2015;
— that the investments provided for under the Québec Infrastructures Plan (QIP) will be capped at a level allowing the quality of public infrastructure to be improved.
In this budget, the government announces the deposit in the Generations Fund:
— of sums derived from the auctioning of exploration licences for oil, gas and underground reservoirs, up to a level of 25%, as in the case of other mining, oil and gas royalties;
— of $300 million from the accumulated surpluses of the Territorial Information Fund (TIF).
With all of the measures announced, the balance of the Generations Fund should reach $12.6 billion as at March 31, 2017.
| | |
| | Budget 2012-2013 |
D.16 | | Budget Plan |
| | |
| | | |

1.5 Comparison of the debt of governments in Canada
It is worthwhile to compare the concepts of debt used by the Québec government with those used by other governments in Canada.
An analysis of the budget documents of the federal and provincial governments shows that the concepts of debt used to assess financial position vary widely from one government to the other.
British Columbia and Saskatchewan use the concept of direct debt. Ontario, Alberta, New Brunswick, Newfoundland and Labrador, Manitoba and Nova Scotia use the concept of net debt.
Four governments use the concept of debt representing accumulated deficits as a measure of indebtedness in their budget documents. They are the Québec government, the federal government and the governments of Ontario and Alberta.
As for Prince Edward Island, its recent budget documents make no mention of its debt concept.
Be it on the basis of the gross debt or the debt representing accumulated deficits, Québec is the most heavily indebted province.
CHART D.5 Gross debt and debt representing accumulated deficits as at March 31, 2011 (as a percentage of GDP) |
|
(1) A negative entry means that the government has an accumulated surplus.
Sources: Ministère des Finances du Québec, government public accounts and Statistics Canada.
The table on the following page shows the debt of the federal government and each of the provinces as at March 31, 2011. The boxes indicate the concept of debt used by each government in its budget documents to measure its debt level. Some governments use more than one concept.
| | |
Debt, Financing | | |
and Debt Management | | D.17 |
| | | | |
| | | | |
TABLE D.5 Debt as at March 31, 2011 according to various concepts |
(millions of dollars) |
|
| | QC | | FED | | ON | | BC | | AB | | NB | | NL | | MB | | SK | | NS | | PEI | |
| | | | | | | | | | | | | | | | | | | | | | | |
| | | | | | | | | | | | | | | | | | | | | | | |
Consolidated direct debt | | 147 748 | | 597 470 | | 246 111 | | | 44 733 | | 6 446 | | 8 462 | | 5 696 | | 15 274 | | | 4 886 | | 12 447 | | 1 378 | |
| | | | | | | | | | | | | | | | | | | | | | | |
Net retirement plans liability | | 29 050 | | 146 135 | | –5 786 | | 87 | | 9 922 | | –220 | | 2 667 | | 1 772 | | 6 176 | | 41 | | 52 | |
| | | | | | | | | | | | | | | | | | | | | | | |
Net employee future benefits liability | | 75 | | 58 206 | | 10 236 | | 1 684 | | | | 133 | | 1 909 | | 387 | | | | 1 448 | | 3 | |
| | | | | | | | | | | | | | | | | | | | | | | |
Generations Fund | | –3 437 | | | | | | | | | | | | | | | | | | | | | |
| | | | | | | | | | | | | | | | | | | | | | | |
| | | | | | | | | | | | | | | | | | | | | | | |
Gross debt(1) | | | 173 436 | | 801 811 | | 250 561 | | 46 504 | | 16 368 | | 8 375 | | 10 272 | | 17 433 | | 11 062 | | 13 936 | | 1 433 | |
| | | | | | | | | | | | | | | | | | | | | | | |
As a % of GDP | | 54.3 | | 49.4 | | 40.9 | | 22.9 | | 6.2 | | 28.4 | | 36.4 | | 32.1 | | 17.4 | | 38.3 | | 28.6 | |
| | | | | | | | | | | | | | | | | | | | | | | |
Less: | | | | | | | | | | | | | | | | | | | | | | | |
| | | | | | | | | | | | | | | | | | | | | | | |
Net financial assets(2) | | –14 147 | | –184 903 | | –36 050 | | –15 867 | | –38 021 | | 1 105 | | –2 143 | | –4 596 | | –7 279 | | –1 109 | | 262 | |
| | | | | | | | | | | | | | | | | | | | | | | |
| | | | | | | | | | | | | | | | | | | | | | | |
Net debt(3) | | 159 289 | | 616 908 | | | 214 511 | | 30 637 | | | –21 653 | | | 9 480 | | | 8 129 | | | 12 837 | | 3 783 | | | 12 827 | | 1 695 | |
| | | | | | | | | | | | | | | | | | | | | | | |
As a % of GDP | | 49.9 | | 38.0 | | 35.0 | | 15.1 | | –8.2 | | 32.2 | | 28.8 | | 23.7 | | 6.0 | | 35.3 | | 33.8 | |
| | | | | | | | | | | | | | | | | | | | | | | |
Less: | | | | | | | | | | | | | | | | | | | | | | | |
| | | | | | | | | | | | | | | | | | | | | | | |
Non-financial assets | | -47 387 | | -66 581 | | -69 938 | | -35 469 | | -37 607 | | -6 518 | | -3 208 | | -8 334 | | -6 744 | | -4 967 | | -829 | |
| | | | | | | | | | | | | | | | | | | | | | | |
| | | | | | | | | | | | | | | | | | | | | | | |
Debt representing accumulated deficits(3) | | | 111 902 | | | 550 327 | | | 144 573 | | –4 832 | | | –59 260 | | 2 962 | | 4 921 | | 4 503 | | –2 961 | | 7 860 | | 866 | |
| | | | | | | | | | | | | | | | | | | | | | | |
As a % of GDP | | 35.0 | | 33.9 | | 23.6 | | –2.4 | | –22.5 | | 10.1 | | 17.5 | | 8.3 | | –4.7 | | 21.6 | | 17.3 | |
| | | | | | | | | | | | | | | | | | | | | | | |
| | | | | | | | | | | | | | | | | | | | | | | | | | | | | | | | | |
Note: The boxes indicate the debt concept(s) used in the budget documents of the government concerned.
(1) The gross debt is not shown in most government public accounts. However, the public accounts show the components of the gross debt, i.e. the consolidated direct debt, the net retirement plans liability and the net employee future benefits liability. It is possible, therefore, to calculate the gross debt.
(2) Financial assets, net of other liabilities.
(3) A negative entry indicates that the government has net assets or an accumulated surplus.
Sources: Ministère des Finances du Québec, government public accounts and Statistics Canada.
| | |
| | Budget 2012-2013 |
D.18 | | Budget Plan |
| | |

1.6 Public sector debt
Public sector debt includes the government’s gross debt as well as the debt of Hydro-Québec, municipalities, universities other than the Université du Québec and its constituent universities and other government enterprises. This debt has served notably to finance public infrastructures, such as roads, schools, hospitals, hydroelectric dams and water treatment plants.
Preliminary results show that, as at March 31, 2012, Québec’s public sector debt should stand at $248 621 million, or 74.5% of GDP. These figures must be put into perspective for they do not take into account the economic value of certain assets held by the government, such as Hydro-Québec, the Société des alcools du Québec and Loto-Québec.
TABLE D.6
Public sector debt as at March 31
(millions of dollars)
| | | | | | | | | |
| | 2009 | | 2010 | | 2011 | | 2012 | P |
| | | | | | | | | |
Government’s gross debt(1) | | 157 630 | | 163 318 | | 173 436 | | 183 780 | |
Hydro-Québec | | 36 668 | | 36 385 | | 37 723 | | 40 160 | |
Municipalities(2) | | 18 639 | | 19 538 | | 20 424 | | 21 364 | |
Universities other than the Université du Québec and its constitutent universities(3) | | 1 966 | | 1 930 | | 1 979 | | 1 888 | |
Other government enterprises(4) | | 434 | | 697 | | 1 363 | | 1 429 | |
PUBLIC SECTOR DEBT | | 215 337 | | 221 868 | | 234 925 | | 248 621 | |
As a % of GDP | | 70.7 | | 72.8 | | 73.6 | | 74.5 | |
| | | | | | | | | |
P: Preliminary results.
(1) The gross debt excludes pre-financing and takes into account the sums accumulated in the Generations Fund.
(2) These amounts correspond to the long-term debt contracted by municipalities in their own name. Part of this debt is subsidized by the government ($3 509 million as at March 31, 2012).
(3) These amounts correspond to the debt contracted in the universities’ own name. Part of this debt is subsidized by the government ($236 million as at March 31, 2012).
(4) These amounts correspond to the debt contracted by the Financing Fund to finance government enterprises and entities not included in the reporting entity.
| | |
Debt, Financing | | |
and Debt Management | | D.19 |
| | | | |
| | | | |
1.7 Retirement plans
The Québec government participates financially in the retirement plans of its employees. As at December 31, 2010, these plans had 561 536 active participants and 302 164 beneficiaries.
TABLE D.7 Retirement plans of public and parapublic sector employees as at December 31, 2010 | | | | | |
| | | | | |
| | Active
participants | | Beneficiairies | |
| | | | | |
| | | | | |
Government and Public Employees Retirement Plan (RREGOP) | | 515 000 | | 199 614 | |
| | | | | |
Pension Plan of Management Personnel (PPMP) | | 28 350 | | 23 434 | |
| | | | | |
Other plans: | | | | | |
| | | | | |
– Teachers Pension Plan (TPP)(1) and Pension Plan of Certain Teachers (PPCT)(1) | | 165 | | 46 979 | |
| | | | | |
– Civil Service Superannuation Plan (CSSP)(1) | | 75 | | 22 112 | |
| | | | | |
– Superannuation Plan of the Members of the Sûreté du Québec (SPMSQ) | | 5 500 | | 4 762 | |
| | | | | |
– Pension Plan of Peace Officers in Correctional Services (PPPOCS) | | 3 400 | | 1 560 | |
| | | | | |
– Pension Plan of the Judges of the Court of Québec and of Certain Municipal Courts (PPJCQM) | | 265 | | 335 | |
| | | | | |
– Pension Plan for Federal Employees Transferred to Employment with the Gouvernement du Québec (PPFEQ)(2) | | 215 | | 127 | |
| | | | | |
– Pension Plan of the Members of the National Assembly (PPMNA) | | 122 | | 332 | |
| | | | | |
– Pension plan of the Université du Québec (PPUQ) | | 8 444 | | 2 909 | |
| | | | | |
Total for other plans | | 18 186 | | 79 116 | |
| | | | | |
TOTAL | | 561 536 | | 302 164 | |
| | | | | |
(1) These plans have not accepted any new participants since July 1, 1973.
(2) This plan has not accepted any new participants since it came into effect on January 1, 1992.
Sources: Commission administrative des régimes de retraite et d’assurances (CARRA) and Public Accounts 2010-2011.
| | |
| | Budget 2012-2013 |
D.20 | | Budget Plan |
| | |
| | | |
q Summary description of the retirement plans
The retirement plans of public and parapublic sector employees are defined benefit retirement plans, which means that they guarantee participants a certain level of income upon retirement.
Benefits are calculated on the basis of participants’ average income for the best paid years (generally five) and their number of years of service. The pension usually represents 2% of an employee’s average income per year of service. Benefits are partially indexed to inflation.
RREGOP and the PPMP, which account for nearly 97% of active participants, are cost-sharing plans: the government is responsible for paying 50% of the benefits, and the participants are responsible for paying the other 50%.3
Most of the other retirement plans are cost-balance plans. The government covers the cost of these plans, net of contributions paid by participants.
Change in the employee contribution rate of certain retirement plans |
(per cent) |
| | | | | | | | | |
| | RREGOP | (1) | PPMP | (2) | SPMSQ | (3) | PPPOCS | (4) |
| | | | | | | | | |
2004 | | 5.35 | | 4.50 | | 8 / 6.2 / 8 | | 4.0 | |
2005 | | 7.06 | | 7.78 | | 8 / 6.2 / 8 | | 4.0 | |
2006 | | 7.06 | | 7.78 | | 8 / 6.2 / 8 | | 4.0 | |
2007 | | 7.06 | | 7.78 | | 8 / 6.2 / 8 | | 4.0 | |
2008 | | 8.19 | | 10.54 | | 8 / 6.2 / 8 | | 4.0 | |
2009 | | 8.19 | | 10.54 | | 8 / 6.2 / 8 | | 4.0 | |
2010 | | 8.19 | | 10.54 | | 8 / 6.2 / 8 | | 4.0 | |
2011 | | 8.69 | | 11.54 | | 8 / 6.2 / 8 | | 4.0 | |
2012 | | 8.94 | | 12.30 | | 8 / 6.2 / 8 | | 4.0 | |
| | | | | | | | | |
(1) Rate applicable to the excess of 35% of the amount of the maximum pensionable earnings (MPE), which is determined by the Régie des rentes du Québec (RRQ). For 2012, the rate applies to the excess of 33% of the MPE. The equivalent rate according to the old formula would be 9.19%. In 2012, the MPE is $50 100.
(2) Rate applicable to the excess of 35% of the MPE.
(3) Rate applicable up to the annual basic exemption under the QPP ($3 500) / rate applicable to the excess up to the amount of the MPE / rate applicable to the excess of the MPE.
(4) Rate applicable to the excess of 25% of the employee’s salary or of the MPE if it is lower.
The Commission administrative des régimes de retraite et d’assurances (CARRA) is responsible for administering the retirement plans.4
3 | This cost-sharing formula has been in effect since July 1, 1982. Previously, the government was responsible for paying 7/12 of the benefits. |
4 | Except for the pension plan of the Université du Québec (PPUQ). |
| | |
Debt, Financing | | |
and Debt Management | | D.21 |
| | | | |
| | | | |
q Recent changes
To retain qualified workers and delay their retirement, the government has modified RREGOP and the PPMP to enable participants to accumulate up to 38 years of service.5 This change, which was agreed upon during the latest renewal of the collective agreements with government employees, is aimed at ensuring that employees nearing the end of their career stay longer in the labour market and at facilitating the transfer of expertise.
Other changes are coming. Bill 58, entitled An Act to amend the Act respecting the Pension Plan of Management Personnel and other legislative provisions, was tabled in the National Assembly on February 22, 2012. It is the product of consultations with participant representatives and includes several amendments that will foster the financial health of the PPMP. In particular, it is proposed to tighten the pension eligibility criteria. As of January 1, 2013, new participants will have to complete an additional five-year period of membership in the plan for their retirement benefit to be calculated in accordance with the provisions of the PPMP. In addition, the reduction for early retirement will be increased.
1.7.1 Retirement plans liability
In its financial statements, the government discloses the present value of the retirement benefits it will pay to its employees, taking into account the conditions governing their plans, as well as their years of service. This value is called the retirement plans liability. It does not take into account the assets established to pay the retirement benefits, particularly, the Retirement Plans Sinking Fund (RPSF), which is discussed later on.
The actuarial valuations of the liability of the various retirement plans are carried out by CARRA,6 following the rules of the Canadian Institute of Actuaries (CIA) and the Canadian Institute of Chartered Accountants (CICA) for the public sector.
In the case of cost-sharing plans (e.g. RREGOP and the PPMP), only the portion payable by the government is included in the government liability. In the case of cost-balance plans, the total liability is presented in the government’s financial statements.
As at March 31, 2012, the liability for the retirement plans of public and parapublic sector employees should stand at $74 067 million. This amount is recognized in the government’s gross debt.
5 Measure implemented gradually until January 1, 2014.
6 Except for the PPUQ, whose liability valuation is performed by a private-sector actuarial firm.
| | |
| | Budget 2012-2013 |
D.22 | | Budget Plan |
| | |
| | | |

TABLE D.9
Retirement plans liability
(millions of dollars)
| | March 31, 2012 | P |
| | | |
Government and Public Employees Retirement Plan (RREGOP) | | 43 402 | |
| | | |
Pension Plan of Management Personnel (PPMP) | | 9 932 | |
| | | |
Other plans: | | | |
| | | |
– Teachers Pension Plan (TPP) and Pension Plan of Certain Teachers (PPCT) | | 11 902 | |
| | | |
– Civil Service Superannuation Plan (CSSP) | | 4 008 | |
| | | |
– Superannuation Plan for the Members of the Sûreté du Québec (SPMSQ) | | 3 603 | |
| | | |
– Pension plan of the Université du Québec (PPUQ) | | 2 730 | |
| | | |
– Pension Plan of Peace Officers in Correctional Services (PPPOCS) | | 826 | |
| | | |
– Pension Plan of the Judges of the Court of Québec and of Certain Municipal Courts (PPJCQM) | | 522 | |
| | | |
– Pension credits under supplemental pension plans | | 409 | |
| | | |
– Supplemental pension plan arising from the transfer of the pension plan for non-teaching personnel of the Commission des écoles catholiques de Montréal (SPP of the CECM) to RREGOP | | 256 | |
| | | |
– Pension Plan of the Members of the National Assembly (PPMNA) | | 181 | |
| | | |
– Pension Plan for Federal Employees Transferred to Employment with the Gouvernement du Québec (PPFEQ) | | 123 | |
| | | |
– Supplemental pension plan arising from the transfer of the pension plan for certain employees of the Commission scolaire de la Capitale (SPP of the CSC) to RREGOP | | 42 | |
| | | |
Plan assets(1) | | –3 869 | |
| | | |
Total for other plans | | 20 733 | |
| | | |
RETIREMENT PLANS LIABILITY | | 74 067 | |
| | | |
P: Preliminary results.
(1) Assets of the SPMSQ, PPUQ, SPP pension credits, SPP of the CECM, PPFEQ and the SPP of the CSC.
q Annual retirement plans expenditure
Every year, the government also records its expenditure as an employer with regard to the retirement plans. This expenditure comprises two components:
— the net cost of vested benefits, that is, the present value of retirement benefits that employees have accumulated for work performed during the year, i.e. $1 741 million in 2011-2012;
— the amortization of revisions to the government’s actuarial obligations that arise from the updating of actuarial valuations, for a cost of $639 million in 2011-2012.
| | |
Debt, Financing | | |
and Debt Management | | D.23 |
| | | | |
| | | | |
In 2011-2012, government program spending in respect of the retirement plans should total $2 380 million.
TABLE D.10
Program spending in respect of the retirement plans
(millions of dollars)
| | | |
| | 2011-2012 | P |
| | | |
Net cost of vested benefits | | 1 741 | |
Amortization of revisions arising from actuarial valuations | | 639 | |
| | | |
PROGRAM SPENDING IN RESPECT OF THE RETIREMENT PLANS | | 2 380 | |
| | | |
P: Preliminary results.
In addition, the government must record an interest charge on the obligation relating to the retirement plans from which the investment income of the RPSF is subtracted.
TABLE D.11
Interest ascribed to the retirement plans
(millions of dollars)
| | | |
| | 2011-2012 | P |
| | | |
Interest on the actuarial obligation | | 4 853 | |
Less: Investment income of the RPSF | | –2 087 | |
| | | |
INTEREST ASCRIBED TO THE RETIREMENT PLANS | | 2 766 | |
| | | |
P: Preliminary results.
Moreover, in 2011-2012, the government should pay $4 577 million to cover its share of the benefits paid to its retired employees. These disbursements do not affect either the government’s expenditures or its deficit, because they correspond to expenditures that were already recorded in the past. They are part of the government’s non-budgetary transactions.
| | |
| | Budget 2012-2013 |
D.24 | | Budget Plan |
| | |
| | | |
1.7.2 Retirement Plans Sinking Fund
The Retirement Plans Sinking Fund (RPSF) is an asset that was created in 1993 for the purpose of paying the retirement benefits of public and parapublic sector employees.
As at March 31, 2012, the book value of the RPSF should amount to $45 352 million.
TABLE D.12
Change in the Retirement Plans Sinking Fund
(millions of dollars)
| | | | | | | | | |
| | Book value,
beginning of year | | Deposits | | Investment
income imputed | | Book value,
end of year | |
| | | | | | | | | |
1993-1994 | | — | | 850 | | 4 | | 854 | |
1994-1995 | | 854 | | — | | —5 | | 849 | |
1995-1996 | | 849 | | — | | 74 | | 923 | |
1996-1997 | | 923 | | — | | 91 | | 1 014 | |
1997-1998 | | 1 095 | (1) | — | | 84 | | 1 179 | |
1998-1999 | | 1 179 | | 944 | | 86 | | 2 209 | |
1999-2000 | | 2 209 | | 2 612 | | 219 | | 5 040 | |
2000-2001 | | 5 040 | | 1 607 | | 412 | | 7 059 | |
2001-2002 | | 7 059 | | 2 535 | | 605 | | 10 199 | |
2002-2003 | | 10 199 | | 900 | | 741 | | 11 840 | |
2003-2004 | | 11 840 | | 1 502 | | 862 | | 14 204 | |
2004-2005 | | 14 204 | | 3 202 | | 927 | | 18 333 | |
2005-2006 | | 18 333 | | 3 000 | | 1 230 | | 22 563 | |
2006-2007 | | 22 437 | (1) | 3 000 | | 1 440 | | 26 877 | |
2007-2008 | | 26 877 | | 3 000 | | 1 887 | | 31 764 | |
2008-2009 | | 31 749 | (2) | 2 100 | | 2 176 | | 36 025 | |
2009-2010 | | 36 025 | | — | | 2 175 | | 38 200 | |
2010-2011 | | 38 200 | | 2 000 | | 2 065 | | 42 265 | |
2011-2012P | | 42 265 | | 1 000 | | 2 087 | | 45 352 | |
| | | | | | | | | |
P: Preliminary results.
(1) This amount takes into account restatements arising from the government accounting reforms of 1997-1998 and 2006-2007.
(2) This amount takes into account an adjustment arising from consideration of the expected average remaining service life (EARSL) of participants in the PPMP.
| | |
Debt, Financing | | |
and Debt Management | | D.25 |
| | | | |
| | | | |
The information on the RPSF shown in the preceding table is based on the government’s accounting policies, which are in full compliance with generally accepted accounting principles (GAAP) for Canada’s public sector.
The book value of the RPSF as at March 31, 2012 is higher than its market value. As a result of the accounting policies, the difference between these two items will be fully amortized in the coming years. In addition, the financial impact of gradually amortizing the difference is fully incorporated into the government’s financial framework over the entire planning horizon. Sub-section 1.10 describes these items in greater detail.
The government’s accounting policies apply when the RPSF’s book value is higher than its market value as well as when it is lower. As shown by the following table, the book value of the RPSF has been lower than its market value 8 times in the past 18 years.
TABLE D.13
Book value and market value of the Retirement Plans Sinking Fund
as at March 31
(millions of dollars)
| | | | | | | |
| | Book value | | Market value | | Difference | |
| | | | | | | |
1994-1995 | | 849 | | 831 | | 18 | |
1995-1996 | | 923 | | 954 | | –31 | |
1996-1997 | | 1 014 | | 1 095 | | –81 | |
1997-1998 | | 1 179 | | 1 321 | | –142 | |
1998-1999 | | 2 209 | | 2 356 | | –147 | |
1999-2000 | | 5 040 | | 5 703 | | –663 | |
2000-2001 | | 7 059 | | 7 052 | | 7 | |
2001-2002 | | 10 199 | | 9 522 | | 677 | |
2002-2003 | | 11 840 | | 9 240 | | 2 600 | |
2003-2004 | | 14 204 | | 12 886 | | 1 318 | |
2004-2005 | | 18 333 | | 17 362 | | 971 | |
2005-2006 | | 22 563 | | 23 042 | | –479 | |
2006-2007 | | 26 877 | | 28 859 | | –1 982 | |
2007-2008 | | 31 764 | | 32 024 | | –260 | |
2008-2009 | | 36 025 | | 25 535 | | 10 490 | |
2009-2010 | | 38 200 | | 29 559 | | 8 641 | |
2010-2011 | | 42 265 | | 35 427 | | 6 838 | |
2011-2012P | | 45 352 | | 37 431 | | 7 921 | |
| | | | | | | |
P: Preliminary results.
| | |
| | Budget 2012-2013 |
D.26 | | Budget Plan |
| | |
| | | |

q Amounts deposited in the RPSF have no impact on the gross debt
The government issues bonds on financial markets in order to make deposits in the RPSF. However, the amounts deposited in the RPSF do not affect the government’s gross debt.
Even though the amount of borrowings contracted to make deposits increases the direct debt, these deposits in turn reduce the net retirement plans liability by the same amount. Therefore, the net impact on the gross debt is nil.
TABLE D.14
Illustration of the impact on the government’s gross debt of borrowing $1 billion on financial markets and depositing it in the RPSF(1)
(millions of dollars)
| | | | | | | | | |
| | | | Before deposit | | After deposit | | Change | |
| | | | | | | | | |
(A) | | Consolidated direct debt | | 159 318 | | 160 318 | | 1 000 | |
| | Retirement plans liability | | 74 067 | | 74 067 | | — | |
| | Less: Book value of the RPSF | | –45 352 | | –46 352 | | –1 000 | |
| | | | | | | | | |
(B) | | Net retirement plans liability | | 28 715 | | 27 715 | | –1 000 | |
(C) | | Net employee future benefits liability | | 32 | | 32 | | — | |
(D) | | Less: Generations Fund | | –4 285 | | –4 285 | | — | |
| | | | | | | | | |
(E) | | GROSS DEBT (E = A + B + C + D) | | 183 780 | | 183 780 | | — | |
| | | | | | | | | |
(1) Illustration based on preliminary results as at March 31, 2012.
| | |
Debt, Financing | | |
and Debt Management | | D.27 |
| | | | |
| | | | |
q A decline in debt service
Deposits in the RPSF entail a reduction in the government’s debt service. The rates of return on funds managed by the Caisse de dépôt et placement du Québec (the Caisse) are generally higher than interest rates on Québec government bonds issued to finance deposits in the RPSF. Therefore, the income of the RPSF, which is applied against the government’s debt service, is usually higher than the additional interest charges that arise from new borrowings. This leads to a net decrease in the government’s debt service.
Since the RPSF was created, the return obtained by the Caisse has been higher than the cost of new borrowings by the government 13 years out of 18.
TABLE D.15
Comparison of the RPSF’s annual return and the Québec government’s borrowing costs
(per cent)
| | | | | | | |
| | Return of the
RPSF | (1) | Cost of new
borrowings | (2) | Difference
(in percentage points) | |
| | | | | | | |
1994-1995 | | –3.3 | (3) | 5.9 | | –9.2 | |
1995-1996 | | 17.0 | | 5.3 | | 11.7 | |
1996-1997 | | 16.1 | | 6.3 | | 9.8 | |
1997-1998 | | 13.4 | | 5.7 | | 7.7 | |
1998-1999 | | 10.4 | | 5.8 | | 4.6 | |
1999-2000 | | 15.3 | | 7.2 | | 8.1 | |
2000-2001 | | 7.2 | | 6.2 | | 1.0 | |
2001-2002 | | –4.7 | | 5.5 | | –10.2 | |
2002-2003 | | –8.5 | | 4.7 | | –13.2 | |
2003-2004 | | 14.9 | | 4.6 | | 10.3 | |
2004-2005 | | 11.4 | | 4.4 | | 7.0 | |
2005-2006 | | 13.5 | | 4.4 | | 9.1 | |
2006-2007 | | 13.5 | | 4.4 | | 9.1 | |
2007-2008 | | 5.2 | | 4.8 | | 0.4 | |
2008-2009 | | –25.6 | | 4.2 | | –29.8 | |
2009-2010 | | 10.7 | | 4.6 | | 6.1 | |
2010-2011 | | 13.4 | | 4.4 | | 9.0 | |
2011-2012P | | 3.5 | | 4.0 | | –0.5 | |
| | | | | | | |
P: Preliminary results.
(1) On a calendar year basis.
(2) On a fiscal year basis.
(3) From February to December 1994.
| | |
| | Budget 2012-2013 |
D.28 | | Budget Plan |
| | |
| | | |
q A flexible deposit policy
In December 1999, as part of an agreement concluded for the renewal of its employees’ collective agreements, the government set the objective that the book value of the funds accumulated in the RPSF would be equal, in 2020, to 70% of its actuarial obligations in regard to the retirement plans of public and parapublic sector employees.
However, the government has all the flexibility needed to apply this policy. Deposits in the RPSF are made only when market conditions are favourable, particularly with respect to interest rates and market receptiveness to bond issues. For example, the government did not make any deposits in 2009-2010, but deposited $2 billion in 2010-2011 and $1 billion in 2011-2012.
The RPSF’s book value is expected to represent roughly 58% of the government’s actuarial obligations in regard to the retirement plans of public and parapublic sector employees as at March 31, 2012. If deposits of $1 billion per year were made in the RPSF, the target of 70% would be attained three years earlier than anticipated, i.e. in 2016-2017.
CHART D.6
The RPSF in proportion to the government’s actuarial obligations regarding the retirement plans of public and parapublic sector employees
(per cent)
| | |
Debt, Financing | | |
and Debt Management | | D.29 |
| | | | |
| | | | |
1.8 Generations Fund
The Generations Fund was created in June 2006 by the adoption of the Act to reduce the debt and establish the Generations Fund. The sums accumulated in the fund are dedicated exclusively to repaying the debt.
As at March 31, 2012, the book value of the Generations Fund should amount to $4 285 million. Starting in 2014-2015, deposits in the Generations Fund will climb substantially owing mainly to the amounts stemming from the gradual increase, over five years, of 1¢/kWh in the price of heritage pool electricity.
The sums accumulated in the Generations Fund are expected to reach $12 646 million as at March 31, 2017.
TABLE D.16
Generations Fund
(millions of dollars)
| | | | | | | | | | | | | |
| | 2011-
2012P | | 2012-
2013P | | 2013-
2014P | | 2014-
2015P | | 2015-
2016P | | 2016-
2017P | |
| | | | | | | | | | | | | |
| | | | | | | | | | | | | |
BOOK VALUE,
BEGINNING OF YEAR | | 3 437 | | 4 285 | | 5 496 | | 6 537 | | 8 112 | | 10 142 | |
| | | | | | | | | | | | | |
DEDICATED REVENUES | | | | | | | | | | | | | |
| | | | | | | | | | | | | |
Water-power royalties | | | | | | | | | | | | | |
| | | | | | | | | | | | | |
Hydro-Québec | | 608 | | 628 | | 636 | | 648 | | 667 | | 682 | |
| | | | | | | | | | | | | |
Private producers | | 88 | | 90 | | 93 | | 96 | | 98 | | 100 | |
| | | | | | | | | | | | | |
| | 696 | | 718 | | 729 | | 744 | | 765 | | 782 | |
| | | | | | | | | | | | | |
Heritage pool electicity | | — | | — | | — | | 315 | | 630 | | 945 | |
| | | | | | | | | | | | | |
Mining, oil and gas royalties | | — | | — | | — | | 45 | | 50 | | 50 | |
| | | | | | | | | | | | | |
Unclaimed property | | 10 | | 10 | | 10 | | 10 | | 10 | | 10 | |
| | | | | | | | | | | | | |
Investment income | | 142 | | 183 | | 302 | | 461 | | 575 | | 717 | |
| | | | | | | | | | | | | |
Subtotal | | 848 | | 911 | | 1 041 | | 1 575 | | 2 030 | | 2 504 | |
| | | | | | | | | | | | | |
Deposit from the accumulated surpluses of the Territorial Information Fund | | — | | 300 | | — | | — | | — | | — | |
| | | | | | | | | | | | | |
| | | | | | | | | | | | | |
TOTAL | | 848 | | 1 211 | | 1 041 | | 1 575 | | 2 030 | | 2 504 | |
| | | | | | | | | | | | | |
| | | | | | | | | | | | | |
BOOK VALUE,
END OF YEAR | | 4 285 | | 5 496 | | 6 537 | | 8 112 | | 10 142 | | 12 646 | |
| | | | | | | | | | | | | |
P: Preliminary results for 2011-2012 and forecasts for subsequent years.
| | |
| | Budget 2012-2013 |
| | |
D.30 | | Budget Plan |
| | |

The following table shows the book and market values of the Generations Fund since its creation.
TABLE D.17
Book value and market value of the Generations Fund
as at March 31
(millions of dollars)
| | | | | | | |
| | Book value | | Market value | | Difference | |
| | | | | | | |
2006-2007(1) | | 584 | | 576 | | 8 | |
2007-2008 | | 1 233 | | 1 147 | | 86 | |
2008-2009 | | 1 952 | | 1 598 | | 354 | |
2009-2010 | | 2 677 | | 2 556 | | 121 | |
2010-2011 | | 3 437 | | 3 524 | | –87 | |
2011-2012P | | 4 285 | | 4 272 | | 13 | |
P: Preliminary results.
(1) The first deposit was made in the Generations Fund on January 31, 2007.
q Faster reduction of the debt
One of the advantages of the Act to reduce the debt and establish the Generations Fund is that it imposes discipline on the government by obliging it to devote sums to debt reduction every year.
If the Generations Fund did not exist, these dedicated revenues would reduce the government’s financial requirements every year, thus reducing the growth in its indebtedness. However, if there were no specific fund for depositing dedicated revenues, Quebecers would not know, over time, by how much the debt is being brought down thanks to these dedicated revenues.
The Generations Fund is thus a “transparency tool” that enables Quebecers to follow the change in the funds devoted to repaying the debt and to see the impact of these funds on the debt.
In addition, the sums in the Generations Fund are managed by the Caisse de dépôt et placement du Québec. Since the returns obtained by the Caisse are generally higher than the cost of new borrowings by the government, the existence of a fund of this type helps to accelerate debt reduction.
| |
Debt, Financing | |
| |
and Debt Management | D.31 |
| |
Ever since the first deposit was made in the Generations Fund in January 2007, the return has been higher than or equivalent to the cost of new borrowings by the government 4 years out of 5.
TABLE D.18
Comparison of the Generations’ Fund’s annual return and the Québec government’s borrowing costs
(per cent)
| | | | | | | |
| | Return of the
Generations Fund | (1) | Cost of new
borrrowings | (2) | Difference
(in percentage points) | |
| | | | | | | |
2007-2008 | | 5.6 | (3) | 4.8 | | 0.8 | |
2008-2009 | | –22.4 | | 4.2 | | –26.6 | |
2009-2010 | | 11.3 | | 4.6 | | 6.7 | |
2010-2011 | | 12.3 | | 4.4 | | 7.9 | |
2011-2012P | | 4.0 | | 4.0 | | — | |
| | | | | | | |
P: Preliminary results.
(1) On a calendar year basis.
(2) On a fiscal year basis.
(3) Return realized from February to December 2007, since the first deposit in the Generations Fund was made on January 31, 2007.
| | |
| | Budget 2012-2013 |
| | |
D.32 | | Budget Plan |
| | |
1.9 Returns of the Caisse de dépôt et placement du Québec on funds deposited by the Ministère des Finances
In 2011, the return on funds deposited by the Ministère des Finances with the Caisse de dépôt et placement du Québec (the Caisse) was 3.50% for the RPSF, 3.98% for the Generations Fund and 3.40% for the Accumulated Sick Leave Fund. The details of the investment policy of these funds are presented in the box on page D.37.
TABLE D.19
Market value and return in 2011 of funds deposited with the Caisse de dépôt et placement du Québec by the Ministère des Finances
| | | | | |
| | Return | | Market value as at
December 31, 2011 | |
| | | | | |
| | | | | |
| | % | | $ million | |
| | | | | |
| | | | | |
Retirement Plans Sinking Fund | | 3.50 | | 36 351 | |
| | | | | |
Generations Fund | | 3.98 | | 4 024 | |
| | | | | |
Accumulated Sick Leave Fund | | 3.40 | | 769 | |
| | | | | |
| |
Debt, Financing | |
| |
and Debt Management | D.33 |
| |
1.9.1 Retirement Plans Sinking Fund
The Retirement Plans Sinking Fund showed a return of 3.50% in 2011. Its market value was $36 351 million as at December 31, 2011.
The assets of the RPSF are managed by the Caisse in accordance with an investment policy established by the Minister of Finance in cooperation with the Caisse. This investment policy is established taking several factors into account, including the recommendations of the Caisse, the 10-year return, standard deviation and correlation forecasts for various categories of assets, as well as opportunities for investing in these assets.
The investment policy of the RPSF consists of 36.25% fixed-income securities (bonds, real estate debt, etc.), 14.50% inflation-sensitive investments (real estate, infrastructure, etc.), 45.75% equities and 3.50% other investments. These weightings are similar to those used on average by the Caisse’s depositors as a whole.
TABLE D.20
Investment policy of the RPSF as at January 1, 2012
| | Benchmark portfolio
of the RPSF | | Average benchmark portfolio
of depositors as a whole | (1) |
Fixed-income securities | | 36.25 | | 36.6 | |
Inflation-sensitive investments | | 14.50 | | 14.0 | |
Equities | | 45.75 | | 46.9 | |
Other investments | | 3.50 | | 2.5 | |
TOTAL | | 100.0 | | 100.0 | |
(1) Data for 2010. Annual Report 2010 of the Caisse de dépôt et placement du Québec. The annual report for 2011 is not available yet.
With its investment policy, the RPSF should generate a short- and medium-term annual return of 6.50%; the average annual long-term (10-year or longer) return is approximately 6.75%. It is important to note that the RPSF’s investment policy is based on a long-term horizon and constitutes the benchmark portfolio for the Caisse. However, through active management, the Caisse adjusts the allocation of the RPSF’s assets, particularly to take fluctuations in the economic and financial situation into account. The RPSF’s benchmark portfolio would have generated a return of 3.72% in 2011. In 2010, the RPSF obtained a return of 13.43% compared with 9.19% in the case of its benchmark portfolio.
| | |
| | Budget 2012-2013 |
| | |
D.34 | | Budget Plan |
| | |

1.9.2 Generations Fund
The Generations Fund posted a return of 3.98% in 2011. Its market value was $4 024 million as at December 31, 2011.
The assets of the Generations Fund are managed by the Caisse in accordance with an investment policy established by the Minister of Finance in cooperation with the Caisse. This investment policy is established taking several factors into account, including the recommendations of the Caisse, the 10-year return, standard deviation and correlation forecasts for various categories of assets prepared by the Caisse, as well as opportunities for investing in these assets.
The investment policy of the Generations Fund consists of 42.0% fixed-income securities (bonds, real estate debt, etc.), 12.5% inflation-sensitive investments (real estate, infrastructure, etc.), 42.5% equities and 3.0% other investments.
TABLE D.21
Investment policy of the Generations Fund as at January 1, 2012
| | Benchmark portfolio of
the Generations Fund | | Average benchmark portfolio
of depositors as a whole | (1) |
Fixed-income securities | | 42.0 | | 36.6 | |
Inflation-sensitive investments | | 12.5 | | 14.0 | |
Equities | | 42.5 | | 46.9 | |
Other investments | | 3.0 | | 2.5 | |
TOTAL | | 100.0 | | 100.0 | |
(1) Data for 2010. Annual Report 2010 of the Caisse de dépôt et placement du Québec. The annual report for 2011 is not available yet.
The investment policy of the Generations Fund aims to achieve a long-term (10-year or longer) annual return of about 6.5%. It is important to note that the investment policy of the Generations Fund is based on a long-term horizon and constitutes the benchmark portfolio for the Caisse. However, through active management, the Caisse adjusts the allocation of the Generations Fund’s assets, particularly to take fluctuations in the economic and financial situation into account. The benchmark portfolio of the Generations Fund would have generated a return of 4.23% in 2011. In 2010, the Generations Fund obtained a return of 12.32% compared with 9.20% in the case of its benchmark portfolio.
| | |
Debt, Financing | | |
and Debt Management | | D.35 |
| | |
1.9.3 Accumulated Sick Leave Fund
The Accumulated Sick Leave Fund (ASLF) showed a return of 3.40% in 2011. Its market value was $769 million as at December 31, 2011.
The assets of the ASLF are managed by the Caisse in accordance with an investment policy established by the Minister of Finance in cooperation with the Caisse. Since January 1, 2009, the ASLF’s investment policy has been identical to that of the RPSF, as the creation of the ASLF stems from a long-term commitment made by the government in regard to employee future benefits, which is similar to the commitment regarding the retirement plans.
The ASLF’s benchmark portfolio would have generated a return of 3.72% in 2011. In 2010, the ASLF obtained a return of 12.94% compared with 9.19% in the case of its benchmark portfolio.
| | |
| | Budget 2012-2013 |
| | |
D.36 | | Budget Plan |
| | |
|
Comparison of investment policies |
| | | | | | | | | |
| Investment policies as at January 1, 2012 (per cent) | | | | | | | | |
| Specialized Portfolios | | RPSF and ASLF | | Generations
Fund | | Average benchmark
portfolio of depositors
as a whole | (1) | |
| Short-Term Investments | | 1.0 | | 1.0 | | 1.2 | | |
| Bonds | | 29.25 | | 35.0 | | 26.5 | | |
| Long-Term bonds | | 0.0 | | 0.0 | | 2.4 | | |
| Real Estate Debt | | 6.0 | | 6.0 | | 6.5 | | |
| Total – Fixed Income | | 36.25 | | 42.0 | | 36.6 | | |
| Real Return Bonds | | 0.0 | | 0.0 | | 0.6 | | |
| Infrastructure | | 4.5 | | 4.0 | | 3.3 | | |
| Real Estate | | 10.0 | | 8.5 | | 10.1 | | |
| Total – Inflation-Sensitive Investments | | 14.5 | | 12.5 | | 14.0 | | |
| Canadian Equity | | 13.25 | | 10.0 | | 12.9 | | |
| Global Equity | | 6.05 | | 5.1 | | 3.4 | | |
| Québec International | | 2.45 | | 3.9 | | 6.4 | | |
| US Equity | | 5.0 | | 5.0 | | 4.0 | | |
| Foreign Equity | | 5.0 | | 6.5 | | 6.5 | | |
| Emerging Markets Equity | | 4.0 | | 4.0 | | 3.8 | | |
| Private Equity | | 10.0 | | 8.0 | | 9.9 | | |
| Total – Equity | | 45.75 | | 42.5 | | 46.9 | | |
| Hedge Funds | | 3.5 | | 3.0 | | 2.5 | | |
| Asset Allocation | | 0.0 | | 0.0 | | 0.0 | | |
| Total – Other Investments | | 3.5 | | 3.0 | | 2.5 | | |
| TOTAL | | 100.0 | | 100.0 | | 100.0 | | |
| RPSF: Retirement Plans Sinking Fund. | | | | | | | | |
| ASLF: Accumulated Sick Leave Fund. (1) Data for 2010. Annual Report 2010 of the Caisse de dépôt et placement du Québec. The annual report for 2011 is not available yet. | | |
| | | |
| | | |
| | |
Debt, Financing | | |
and Debt Management | | D.37 |
| | |
1.10 Impact of the returns of the Retirement Plans Sinking Fund on debt service
As indicated in sub-section 1.7.2, the income of the RPSF is applied against the government’s debt service. The returns of the Caisse affect RPSF income and therefore debt service.
The returns realized by the Caisse on the RPSF are taken into account in the government’s balance sheet and results by applying the accounting policy adopted in the wake of the December 2007 reform of government accounting in accordance with generally accepted accounting principles (GAAP).
“When determining a government’s retirement benefit liability and expense, plan assets would be valued at market-related values. Under this method, plan assets are recorded at market value or they are adjusted to market value over a period not to exceed five years. Values adjusted to market closely approximate current economic value in a manner that can minimize short-term fluctuations. Market-related values would be used because they are objective and verifiable. Once a basis of valuation is chosen it would be applied consistently.” (Canadian Institute of Chartered Accountants (CICA), Public Sector Accounting Handbook, section 3250, paragraph .035)
Under the accounting policy, the “adjusted market value” of the RPSF is adjusted every year based on the returns realized by the fund. If, for a given year, the realized return differs from the anticipated long-term return, the difference between the two is spread over five years. All other things being equal, this means that the adjusted market value and the market value will converge over a five-year period. It is important to note that this method is applied when returns are higher than expected as well as when they are lower.7
7 Before the accounting reform of 2007, the value of the RPSF was adjusted only once every three years, that is, when actuarial valuations were carried out. Since the reform, it is adjusted every year.
| | |
| | Budget 2012-2013 |
| | |
D.38 | | Budget Plan |
| | |
| | |

In addition, the differences between actual and expected return, which are spread over five years, are taken into account in RPSF income by amortizing them over a period of about 13 years, that is, the expected average remaining service life (EARSL) of retirement plan participants.8 This amortization mechanism and the period used are prescribed by GAAP.9
Therefore, the losses incurred by the Caisse in 2008-2009 reduced the income of the RPSF as of 2009-2010. The returns realized by the Caisse in 2009-2010, which were higher than anticipated, led to an increase in the RPSF’s income as of 2010-2011. Similarly, the returns realized by the Caisse in 2010-2011, which were also higher than expected, led to an increase in the RPSF’s income as of 2011-2012. Lastly, the preliminary rate of return in 2011-2012, which is lower than the projected long-term rate, will lead to a decline in RPSF income in 2012-2013.
TABLE D.22
Impact of the returns of the Caisse de dépôt et placement du Québec on debt service(1)
(millions of dollars)
| | | | | | | | | | | |
| | 2009-2010 | | 2010-2011 | | 2011-2012 | | 2012-2013P | | 2013-2014P | |
| | | | | | | | | | | |
| | | | | | | | | | | |
Before 2008-2009 | | –48 | | –78 | | –57 | | 11 | | 10 | |
| | | | | | | | | | | |
From 2008-2009 | | 307 | | 629 | | 972 | | 1 337 | | 1 726 | |
| | | | | | | | | | | |
From 2009-2010 | | | | –65 | | –134 | | –207 | | –285 | |
| | | | | | | | | | | |
From 2010-2011 | | | | | | –53 | | –110 | | –171 | |
| | | | | | | | | | | |
From 2011-2012P | | | | | | | | 37 | | 76 | |
| | | | | | | | | | | |
| | | | | | | | | | | |
IMPACT ON DEBT SERVICE | | 259 | | 486 | | 728 | | 1 068 | | 1 356 | |
| | | | | | | | | | | |
P: Preliminary results for 2011-2012 and forecasts for subsequent years.
Note: A positive entry indicates an increase in debt service and a negative entry, a decrease.
(1) These amounts represent the impact on RPSF income, and therefore on debt service, of returns of the Caisse that are lower or higher than the projected long-term rate for that period and that are amortized.
8 As with recognition of the retirement plans liability, the RPSF accounting method draws a distinction between the Pension Plan of Management Personnel (PPMP) and the other plans. The EARSL under the PPMP is 9 years compared with 14 years under the other plans.
9 “…actuarial gains and losses should be amortized to the liability or asset and the related expense in a systematic and rational manner over the expected average remaining service life of the related employee group.” Canadian Institute of Chartered Accountants (CICA), Public Sector Accounting Handbook, section 3250, paragraph .062. For the purposes of retirement assets, the CICA defines actuarial gains (losses) as changes in the value of plan assets that are caused notably by variances between actual results and expected results.
| |
Debt, Financing | |
| |
and Debt Management | D.39 |
| |
This page intentionally left blank
2. FINANCING
In 2011-2012, the government contracted borrowings totalling $20 148 million, including $4 401 million in pre-financing conducted over the last few months of the year.
2.1 Financing strategy
The government aims to borrow at the lowest possible cost. To that end, it applies a strategy for diversifying sources of funding by market, financial instrument and maturity.
2.1.1 Diversification by market
Financing transactions are conducted regularly on most markets, i.e. in Canada, the United States, Europe and Asia.
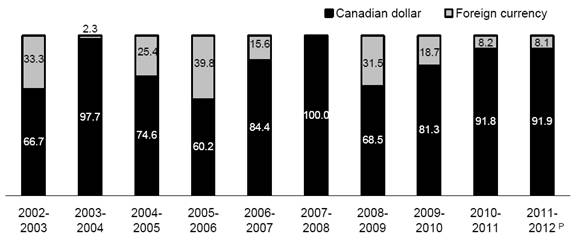
Over the past 10 years, 19% of borrowings have been contracted in foreign currency. Nonetheless, the government has only a very low exposure to these currencies: the exposure should be only 0.5% as at March 31, 2012 (see sub-section 3.1).
In 2011-2012, the government contracted 8.1% of its borrowings on foreign markets:
— one borrowing for US$1 400 million (CAN$1 373 million) in August 2011;
— one borrowing for AUS$225 million (CAN$231 million) in July 2011;
— one borrowing for 27 million euros (CAN$36 million) in December 2011.
| |
Debt, Financing | |
| |
and Debt Management | D.41 |
| |
CHART D.7
Borrowings by currency(1)
(per cent)
P: Preliminary results.
(1) Borrowings of the government’s general fund, borrowings for the Financing Fund and borrowings of Financement-Québec.
2.1.2 Diversification by instrument
To satisfy investors’ needs, an extensive array of financial products is used in the course of financing transactions.
Long-term instruments consist primarily of public bond issues, private borrowings and savings products.
The long-term instruments used in 2011-2012 consisted mainly of public issues (86.1%) and private borrowings (6.9%).
CHART D.8
Borrowings in 2011-2012P by instrument
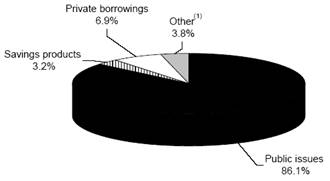
(1) Includes the Business Assistance – Immigrant Investor Program and borrowings from the Canada Pension Plan Investment Fund.
| | |
| | Budget 2012-2013 |
D.42 | | Budget Plan |

2.1.3 Diversification by maturity
Maturities of new borrowings are distributed over time to obtain a stable refinancing profile and ensure the government’s regular presence on capital markets.
In 2011-2012, 46.9% of borrowings contracted had a maturity of 10 years, 25.0%, 6 to 9 years, 24.4%, 30 years and 3.7%, 5 years.
CHART D.9
Borrowings in 2011-2012P by maturity
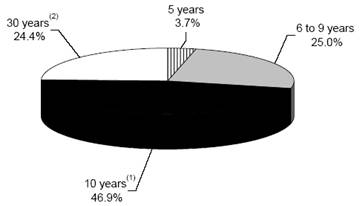
(1) Includes borrowings maturing in 2021 and 2022.
(2) Includes primarily borrowings maturing in 2041 and 2043.
This diversification by maturity has an impact on the maturity of the debt shown in the following chart. As at March 31, 2012, the average maturity of the debt should be 12 years.
CHART D.10
Maturity of the long-term debt as at March 31, 2012P
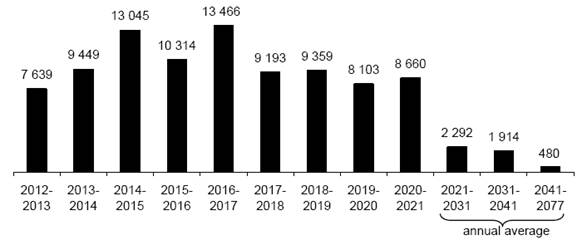
Note: Direct debt of the general fund, debt contracted to make advances to the Financing Fund and debt of Financement-Québec.
| | |
Debt, Financing | | |
| | |
and Debt Management | | D.43 |
| | |
2.2 Financing program
The financing program of the general fund makes it possible to refinance maturing borrowings, contribute to the Retirement Plans Sinking Fund and meet new financial requirements, particularly for capital investments and investments in government corporations.
The Financing Fund makes loans to consolidated entities (e.g. Land Transportation Network Fund, Société immobilière du Québec, etc.) and to certain government enterprises.
Financement-Québec makes borrowings on financial markets to meet the needs of institutions in the health and social services and education networks.
In 2011-2012, the government contracted borrowings totalling $20 148 million, including $4 401 million in pre-financing conducted over the last few months of the year.
In 2012-2013, the financing program is expected to amount to $14 950 million. It would have amounted to $19 351 million had there not been any pre-financing in 2011-2012. In 2013-2014, the financing program should total $17 773 million.
| | |
| | Budget 2012-2013 |
D.44 | | Budget Plan |
TABLE D.23
The government’s financing program
(millions of dollars)
| | 2011-2012 | P | 2012-2013 | P | 2013-2014 | P |
| | | | | | | |
GENERAL FUND(1) | | | | | | | |
| | | | | | | |
Net financial requirements(2),(3) | | 6 124 | | 2 732 | | 297 | |
| | | | | | | |
Repayment of borrowings | | 7 034 | | 4 519 | | 4 476 | |
| | | | | | | |
Change in cash position | | –4 518 | | –4 401 | | — | |
| | | | | | | |
Deposits in the Retirement Plans Sinking Fund | | 1 000 | | — | | — | |
| | | | | | | |
Transactions under the credit policy(4) | | –644 | | — | | — | |
| | | | | | | |
Additional contributions to the sinking fund for borrowings | | — | | 3 000 | | 3 000 | |
| | | | | | | |
Pre-financing | | 4 401 | | — | | — | |
| | | | | | | |
TOTAL - General fund | | 13 397 | | 5 850 | | 7 773 | |
| | | | | | | |
FINANCING FUND | | 3 360 | | 5 100 | | 4 500 | |
| | | | | | | |
Including: repayment of borrowings | | 548 | | 1 254 | | 1 251 | |
| | | | | | | |
FINANCEMENT-QUÉBEC | | 3 391 | | 4 000 | | 5 500 | |
| | | | | | | |
Including: repayment of borrowings | | 1 962 | | 1 866 | | 3 722 | |
| | | | | | | |
TOTAL | | 20 148 | | 14 950 | | 17 773 | |
| | | | | | | |
Including: repayment of borrowings | | 9 544 | | 7 639 | | 9 449 | |
| | | | | | | |
P: Preliminary results for 2011-2012 and forecasts for subsequent years.
Note: A negative entry indicates a source of financing and a positive entry, a financial requirement.
(1) The general fund corresponds to what used to be called the Consolidated Revenue Fund.
(2) These amounts exclude the net financial requirements of consolidated entities.
(3) Net financial requirements are adjusted to take into account the non-receipt of RPSF revenues and of funds dedicated to employee future benefits.
(4) Under its credit policy, which is designed to limit financial risk with respect to counterparties, the government received $644 million in 2011-2012 following the change in foreign exchange rates. These receipts reduce financial requirements that have to be met through new borrowings.
| | |
Debt, Financing | | |
| | |
and Debt Management | | D.45 |
| | |
q Additional contributions to the sinking fund for government borrowings
This year, the Ministère des Finances is putting forward a new policy aimed at raising the level of prudential liquidity. The goal is to increase the government’s liquid assets by $6 billion over the next two years. These liquid assets will be available for use in the event of major disturbances on financial markets.
Borrowings of $3 billion will be made for this purpose in 2012-2013 and 2013-2014.
The federal government announced a similar policy in its June 2011 budget. Borrowings by the federal government will be increased by $35 billion over three years in order to boost its liquid assets. Ontario has also increased its liquid assets substantially in recent years.
In the case of Québec, the $6 billion in additional liquid assets corresponds to roughly one third of the Québec government’s annual financing requirements in the coming years.
The $6 billion that is to be borrowed will be paid into the sinking fund for government borrowings, already in existence (see the box on the next page), and invested in very liquid, government short-term securities, such as federal Treasury bills. This will make it possible, in the event of a major financial market disturbance where it is difficult to contract short- or long-term borrowings, to sell these securities and rapidly recover the liquid assets. These assets could then be used to buy short-term securities issued by the Québec government, thus enabling it to meet its financial obligations. Once the disturbance is over and the short-term securities issued by the Québec government have matured, the sinking fund for government borrowings could again buy short-term securities such as federal Treasury bills.
Since the $6 billion in borrowings over two years will be paid into the sinking fund for government borrowings, there will be no impact on the government’s gross debt. This is because the value of a borrowings sinking fund is subtracted from the debt in accordance with accounting standards.
| | |
| | Budget 2012-2013 |
| | |
D.46 | | Budget Plan |
| | |

| Sinking fund for borrowings | |
| Some borrowings come with provisions that require borrowers to put sums aside annually for repaying the borrowings at maturity. These sums are paid into “sinking funds for borrowings.” As at March 31, 2011, there was a total of $5.9 billion in the sinking funds for government borrowings, invested for the most part in securities issued by Québec’s public sector (Québec government, Financement-Québec, Hydro-Québec, universities, municipalities, etc.). Sinking funds for borrowings are managed in prudent fashion by the Ministère des Finances in order to preserve the principal and earn income. Investments of sinking funds for borrowings(1)
(as at March 31, 2011) | |
| | | | | | |
| | | $ million | | % | |
| | | | | | |
| Québec bonds and bonds guaranteed by Québec | | 4 711 | | 79.7 | |
| Network and municipal bonds | | 783 | | 13.3 | |
| Bonds from other governments(2) | | 217 | | 3.7 | |
| Money market securities, cash on hand and other | | 196 | | 3.3 | |
| | | | | | |
| TOTAL | | 5 907 | | 100.0 | |
| | | | | | |
| (1) Includes the sinkings funds for borrowings by the government and by the health and social services and education networks. (2) Includes bonds from the federal government, the CMHC (guaranteed by the federal government), other provinces and the US government. | |
| | |
Debt, Financing | | |
| | |
and Debt Management | | D.47 |
| | |
| Pre-financing | |
| The government makes advance borrowings, i.e. borrowings that would normally be made in the following fiscal year. The government carries out pre-financing to take advantage of favourable market conditions. Over the past 10 years, the government has carried out an average of $4 117 million in pre-financing per year. | |
| | |
| Pre-financing | |
| (millions of dollars) | |
| 
| |
| P: Preliminary results. | |
| | |
| | |
| | |
| | Budget 2012-2013 |
| | |
D.48 | | Budget Plan |
| | |

2.2.1 Yield
In 2011, the yield on long-term Québec securities fell, while short-term interest rates stayed roughly the same.
CHART D.11
Yield on Québec securities
(per cent)
Sources: PC-Bond and ministère des Finances du Québec.
In addition, the substantial increase in the spread between the yield on Québec and federal government securities, observed starting in summer 2008, has been considerably reduced since then, without returning, however, to the levels observed prior to 2008. The same situation has been observed in the case of the other provinces.
CHART D.12
Yield spread on long-term (10-year) securities
(in percentage points)
Source: PC-Bond.
| | |
Debt, Financing | | |
| | |
and Debt Management | | D.49 |
| | |
This page intentionally left blank

3. DEBT MANAGEMENT
The government’s debt management strategy aims to minimize the cost of the debt and limit the risks related to fluctuations in foreign exchange and interest rates.
The government uses a range of financial instruments, particularly interest rate and currency swap agreements, to achieve desired debt proportions by currency and interest rate.
Debt management enables the government to save money on debt service.
3.1 Structure of the debt by currency
As at March 31, 2012, the proportion of the government’s gross debt in Canadian dollars should amount to 99.5% and the proportion in foreign currency, to 0.5%.
TABLE D.24
Structure of the gross debt as at March 31, 2012P
(millions of dollars)
| | | | | | | | | | | | | | | |
Currency | | Consolidated
direct debt | | % | | Net
retirement
plans
liability | | Net employee
future benefits
liability | | Less:
Generations
Fund | | Gross
debt | | % | |
| | | | | | | | | | | | | | | |
Canadian dollar(1) | | 162 757 | | 99.4 | | 28 715 | | 32 | | –4 285 | | 187 219 | | 99.5 | |
US dollar(1) | | 206 | | 0.1 | | — | | — | | — | | 206 | | 0.1 | |
Euro | | 137 | | 0.1 | | — | | — | | — | | 137 | | 0.1 | |
Swiss franc | | 206 | | 0.1 | | — | | — | | — | | 206 | | 0.1 | |
Yen | | 413 | | 0.3 | | — | | — | | — | | 413 | | 0.2 | |
| | | | | | | | | | | | | | | |
Subtotal | | 163 719 | | 100.0 | | 28 715 | | 32 | | –4 285 | | 188 181 | | 100.0 | |
Pre-financing | | –4 401 | | | | — | | — | | — | | –4 401 | | | |
| | | | | | | | | | | | | | | |
TOTAL | | 159 318 | | | | 28 715 | | 32 | | –4 285 | | 183 780 | | | |
| | | | | | | | | | | | | | | |
P: Preliminary results.
Note: The debt in foreign currency is expressed in the Canadian equivalent based on the exchange rates in effect on March 9, 2012.
(1) The debt takes into account the sinking fund for government borrowings.
Debt, Financing
and Debt Management | D.51 |
Before interest rate and currency swap agreements are taken into account, the proportion of the debt in foreign currency as at March 31, 2012 should be 16.6%. After interest rate and currency swap agreements are taken into account, the proportion should be 0.5%. This proportion was 0.7% as at March 31, 2011.
CHART D.13
Structure of the gross debt by currency as at March 31, 2012P
Before taking interest rate and currency swap
agreements into account | After taking interest rate and currency swap
agreements into account |
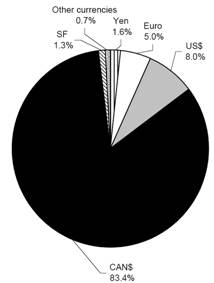
| 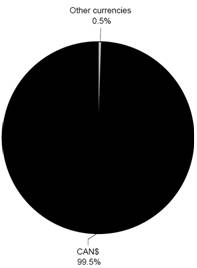
|
P: Preliminary results.
D.52 | Budget 2012-2013
Budget Plan |
3.2 Structure of the debt by interest rate
The government keeps part of its debt at variable rates and part at fixed rates.
Before interest rate and currency swap agreements are taken into account, the proportion of the gross debt at variable rates should be 14.2% as at March 31, 2012. After interest rate and currency swap agreements are taken into account, the proportion should be 12.1%. This proportion was 20.8% as at March 31, 2011.
CHART D.14
Structure of the gross debt by interest rate as at March 31, 2012P
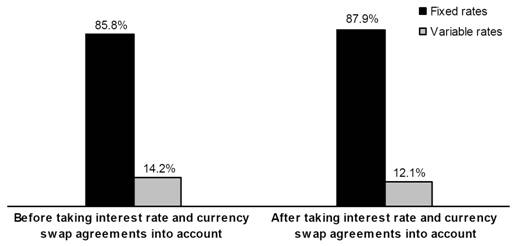
P: Preliminary results.
Debt, Financing
and Debt Management | D.53 |
This page intentionally left blank
4. CREDIT RATINGS
4.1 The Québec government’s credit ratings
A borrower’s credit rating measures its capacity to pay the interest on its debt and repay the principal at maturity. To establish the credit rating of a borrower like the Québec government, credit rating agencies analyze a series of economic, fiscal and financial factors. Among the main factors are the size, structure and vitality of the economy, the situation on the labour market, fiscal competitiveness, public finance situation and indebtedness.
To express the quality of a borrower’s credit, credit rating agencies use rating scales, namely, a scale for long-term debt and a scale for short-term debt.
Debt, Financing
and Debt Management | D.55 |
The following table shows the rating scales used by agencies for long-term debt. The current credit ratings for Québec are indicated in bold.
TABLE D.25
Credit rating scales for long-term debt
Definition | Moody’s | Standard &
Poor’s | DBRS | Fitch
Ratings | Japan Credit
Rating
Agency |
| | | | | |
Extremely strong capacity to pay interest and repay principal. | Aaa | AAA | AAA | AAA | AAA |
Very strong capacity to pay interest and repay principal. | Aa1 Aa2 Aa3 | AA+ AA AA- | AA (high) AA AA (low) | AA+ AA AA- | AA+ AA AA- |
Strong capacity to pay interest and repay principal, despite greater sensitivity to economic conditions than levels AAA and AA. | A1 A2 A3 | A+ A A- | A (high) A A (low) | A+ A A- | A+ A A- |
Adequate capacity to pay interest and repay principal. Difficult economic conditions may reduce this capacity. | Baa1 Baa2 Baa3 | BBB+ BBB BBB- | BBB (high) BBB BBB (low) | BBB+ BBB BBB- | BBB+ BBB BBB- |
Uncertain capacity to pay interest and repay principal, particularly under difficult economic conditions. | Ba1 Ba2 Ba3 | BB+ BB BB- | BB (high) BB BB (low) | BB+ BB BB- | BB+ BB BB- |
Very uncertain capacity to pay interest and repay principal, particularly under difficult economic conditions. | B1 B2 B3 | B+ B B- | B (high) B B (low) | B+ B B- | B+ B B- |
D.56 | Budget 2012-2013
Budget Plan |

Agencies add an “outlook” to the rating that indicates the trend the credit rating may follow in the future. The outlook may be positive, stable or negative. In the case of Québec, all of the agencies assign a “stable” outlook to its credit rating.
TABLE D.26
The Québec government’s current credit ratings
Agency | | Rating | | Outlook | |
| | | | | |
Moody's | | Aa2 | | Stable | |
Standard & Poor's (S&P) | | A+ | | Stable | |
Dominion Bond Rating Service (DBRS) | | A (high) | | Stable | |
Fitch Ratings (Fitch) | | AA- | | Stable | |
Japan Credit Rating Agency (JCR) | | AA+ | | Stable | |
| | | | | |
The following table shows the rating scales used by agencies for short-term debt. The current credit ratings for Québec are indicated in bold.
TABLE D.27
Credit rating scales for short-term debt(1)
Definition | | Moody's | | Standard &
Poor's | | DBRS | | Fitch
Ratings | |
| | | | | | | | | |
Very strong capacity to pay interest and repay principal over the short term. | | P-1 | | A-1+ A-1 | | R-1High R-1Middle R-1Low | | F1+ F1 | |
| | | | | | | | | |
Very adequate capacity to pay interest and repay principal over the short term, despite greater sensitivity to economic conditions than upper level. | | P-2 | | A-2 | | R-2High | | F2 | |
| | | | | | | | | |
Adequate capacity to pay interest and repay principal over the short term. Difficult economic conditions may reduce this capacity. | | P-3 | | A-3 | | R-2Middle R-2Low R-3 | | F3 | |
| | | | | | | | | |
Uncertain capacity to pay interest and repay principal over the short term. Securities in this category are considered speculative securities. | | Not
Prime(2) | | B-1 B-2 B-3 C | | R-4 R-5 | | B C | |
| | | | | | | | | |
Incapacity to pay interest and repay principal over the short term. Securities in this category are considered default securities. | | Not
Prime(2) | | D | | D | | D | |
| | | | | | | | | |
(1) Not applicable in the case of JCR.
(2) Moody’s uses the “Not Prime” category for all securities not included in the upper categories.
| | |
Debt, Financing
and Debt Management | | D.57 |
| | |
q Change in Québec’s credit ratings
The following charts show the change in the Québec government’s credit ratings. The credit ratings for 2012 are those in effect when the budget is tabled.
CHART D.15
Credit rating assigned to Québec by Moody’s
CHART D.16
Credit rating assigned to Québec by Standard & Poor’s
| | |
D.58 | | Budget 2012-2013
Budget Plan |
| | |

CHART D.17
Credit rating assigned to Québec by DBRS
CHART D.18
Credit rating assigned to Québec by Fitch
| | |
Debt, Financing
and Debt Management | | D.59 |
| | |
CHART D.19
Credit rating assigned to Québec by JCR
| | |
D.60 | | Budget 2012-2013
Budget Plan |
| | |
4.2 Comparison of the credit ratings of Canadian provinces
The following charts show the credit ratings of Canadian provinces in early March 2012. No chart is given for JCR since Québec is the only province that receives a credit rating from that agency.
CHART D.20
Credit ratings of Canadian provinces – Moody’s
(1) Negative outlook.
CHART D.21
Credit ratings of Canadian provinces – Standard & Poor’s
(1) Negative outlook.
| | |
Debt, Financing
and Debt Management | | D.61 |
| | |
CHART D.22
Credit ratings of Canadian provinces – DBRS
CHART D.23
Credit ratings of Canadian provinces – Fitch
Note: British Columbia, Saskatchewan, Ontario and Québec are the only provinces rated by this agency.
(1) Negative outlook.
| | |
D.62 | | Budget 2012-2013
Budget Plan |
| | |

5. ADDITIONAL INFORMATION
5.1 Adjustments to the gross debt compared with the March 2010 budget
When the government set new debt objectives in the March 2010 budget, the gross debt forecast as at March 31, 2012 was $180 084 million. It is now estimated at $183 780 million, an upward adjustment of $3 696 million.
The possibility that such a difference would arise, due to the implementation of the last phase of the accounting reform undertaken in 2007, was explained in the debt forecast tables published in March 2010. A note to table D.6 presenting the growth factors of the government’s gross debt informed readers that: “once line-by-line recording of the results of institutions in the health and social services and education networks is completed, gross debt data will be restated.”10
In December 2010, when the Update on Québec’s Economic and Financial Situation and Public Accounts 2009-2010 were published, the final debt figures, i.e. including an amount of $4 713 million for the debt contracted by network institutions in their own name, were made public.
According to the debt projection as at March 31, 2015, the last year of the forecast presented in the March 2010 budget, the gross debt was expected to amount to $192 169 million. It is now estimated at $203 032 million, a difference of $10 863 million.
The first reason for this difference is, of course, the fact that the aforementioned debt contracted by institutions in the health and social services and education networks in their own name ($4.7 billion) has been taken into account.
Another factor is the adjustment stemming from the change in the method used to record interest in respect of the retirement plans liability, which has led to a $1 164-million increase in the debt. Previously, interest was calculated on a calendar-year basis, whereas now it is calculated on a fiscal-year basis. This change in method, agreed upon with the Auditor General, has given rise to the recording of an amount of $1 164 million in the debt.
10 2010-2011 Budget Plan, page D.11.
Debt, Financing | | |
and Debt Management | | D.63 |
TABLE D.28
Adjustments to the gross debt as at March 31 since the March 2010 budget
(millions of dollars)
| | | | | | | | | |
| | 2012 | | 2013 | | 2014 | | 2015 | |
| | | | | | | | | |
March 2010 budget | | | 180 084 | | 186 490 | | 189 428 | | 192 169 | |
As a % of GDP | | | 55.1 | | 54.6 | | 53.3 | | 52.0 | |
| | | | | | | | | | |
March 2012 budget | | | 183 780 | | 191 717 | | 197 130 | | 203 032 | |
As a % of GDP | | | 55.0 | | 55.3 | | 54.6 | | 54.0 | |
| | | | | | | | | |
Adjustments | | 3 696 | | 5 227 | | 7 702 | | 10 863 | |
As a % of GDP | | | –0.1 | | 0.7 | | 1.3 | | 2.0 | |
| | | | | | | | | |
Explanation of the adjustments | | | | | | | | | |
Adjustments to budgetary deficits: | | | | | | | | | |
In 2009-2010 (from $4 257 million to $3 174 million) | | | | | | | | –1 083 | |
In 2010-2011 (from $4 506 million to $3 150 million) | | | | | | | | –1 356 | |
In 2011-2012 (from $2 900 million to $3 300 million) | | | | | | | | 400 | |
In 2012-2013 (from $1 200 million to $1 500 million) | | | | | | | | 300 | |
| | | | | | | | | |
Subtotal | | | | | | | | –1 739 | |
Accounting changes: | | | | | | | | | |
Line-by-line consolidation of the financial statements of institutions in the health and social services and education networks | | 4 713 | |
Restatement of the retirement plans liability to take into account the interest accrued on a fiscal year rather than a calendar year basis | | 1 164 | |
| | | | | | | | | |
Subtotal | | | | | | | | 5 877 | |
Agreement with the federal government to offer low-cost loans to Québec municipalities | | 1 208 | |
Adjustment to capital investments | | | | | | | | 1 680 | |
Commitments in regard to public-private partnerships taken into account in the government’s debt | | 2 058 | |
Envelope of $1 billion for taking equity interests in mining and hydrocarbon projects | | 600 | |
Rehabilitation of contaminated sites | | | | | | | | 220 | |
Other adjustments (change in certain asset or liability items such as accounts receivable and accounts payable, etc.) | | 959 | |
| | | | | | | | | |
Total adjustments | | | | | | | | 10 863 | |
| | | | | | | | | |
In addition, under the Economic Action Plan introduced by the federal government to deal with the last recession, a program administered by the Canada Mortgage and Housing Corporation (CMHC) was set up to offer municipalities low-cost loans for work in housing. Owing to Financement-Québec’s extensive experience in funding the networks, the Québec government decided that Financement-Québec would act as an intermediary for the purposes of the program. Financement-Québec contracted borrowings with the CMHC and then lent the money to municipalities.
| Budget 2012-2013 |
D.64 | Budget Plan |
The program had a Canada-wide funding envelope of $2 billion. Québec municipalities received $1.2 billion from the program, or 60% of the total envelope. The borrowings contracted by Financement-Québec were not forecast in the debt data included in the March 2010 budget. These borrowings have raised the government’s gross debt by $1.2 billion. However, as an offset to these borrowings, Financement-Québec has an equivalent financial asset in the form of the loans it made to the municipalities.11
The upward adjustment to the gross debt as at March 31, 2015 compared with the March 2010 budget can also be attributed to an increase of nearly $1.7 billion in capital investments. In addition, commitments made in respect of public-private partnerships explain a rise of roughly $2 billion in the gross debt. Indeed, the government presents these commitments in its debt.
Furthermore, the announcement in last year’s budget of an envelope of $500 million over five years for taking equity interests in mining or hydrocarbon projects and the announcement in the present budget to raise this envelope to $1 billion have led to a $600-million increase in the debt as at March 31, 2015 (the remaining $400 million will be invested after March 31, 2015).
Moreover, the decision to devote resources to the rehabilitation of contaminated sites has led to a $220-million rise in the debt as at March 31, 2015.
Overall, it can be noted therefore that over half of the adjustments made to the debt forecast as at March 31, 2015 since the March 2010 budget can be explained by accounting changes ($4 713 million + $1 164 million = $5 877 million). The other factors are related, for the most part, to increased investment in various fields and to changes in certain asset and liability items, such as accounts receivable and accounts payable.
11 The impact on the gross debt of Financement-Québec’s involvement in implementing the federal municipal loans program was explained in the 2011-2012 Budget Plan, page D.41.
Debt, Financing | | |
and Debt Management | | D.65 |
5.2 Adjustments to the debt representing accumulated deficits compared with the March 2010 budget
In the March 2010 budget, the debt representing accumulated deficits as at March 31, 2012 amounted to $112 170 million. The revised forecast in this budget is $117 654 million, or $5 484 million more.
The forecast for March 31, 2015 in the March 2010 budget was $109 644 million. The revised forecast is $116 834 million, or $7 190 million more.
These upward revisions to the debt representing accumulated deficits are explained, for the most part, by the many accounting adjustments that have more than offset the overall improvement in budgetary balances.
TABLE D.29
Adjustments to the debt representing accumulated deficits as at March 31 since the March 2010 budget
(millions of dollars)
| | | | | | | | | |
| | 2012 | | 2013 | | 2014 | | 2015 | |
| | | | | | | | | |
March 2010 budget | | | 112 170 | | 112 309 | | 111 186 | | 109 644 | |
As a % of GDP | | | 34.3 | | 32.9 | | 31.3 | | 29.7 | |
| | | | | | | | | | |
March 2012 budget | | | 117 654 | | 119 450 | | 118 409 | | 116 834 | |
As a % of GDP | | | 35.2 | | 34.5 | | 32.8 | | 31.1 | |
| | | | | | | | | |
Adjustments | | 5 484 | | 7 141 | | 7 223 | | 7 190 | |
As a % of GDP | | | 0.9 | | 1.6 | | 1.5 | | 1.4 | |
| | | | | | | | | |
Explanation of the adjustments | | | | | | | | | |
Adjustments to budgetary deficits: | | | | | | | | | |
In 2009-2010 (from $4 257 million to $3 174 million) | | | | | | | | –1 083 | |
In 2010-2011 (from $4 506 million to $3 150 million) | | | | | | | | –1 356 | |
In 2011-2012 (from $2 900 million to $3 300 million) | | | | | | | | 400 | |
In 2012-2013 (from $1 200 million to $1 500 million) | | | | | | | | 300 | |
| | | | | | | | | |
Subtotal | | | | | | | | –1 739 | |
Adjustment to deposits in the Generations Fund | | 445 | |
Accounting changes: | | | |
Adoption of IFRS standards by Hydro-Québec | | 3 300 | |
Adjustment to the environmental liability | | 2 096 | |
New accounting standard on government transfers for SOFIL and the SHQ | | 1 207 | |
Retirement plans liability for interest accrued on a fiscal year rather than a calendar year basis | | 1 164 | |
Adoption of IFRS standards by the SGF | | 158 | |
Other | | 559 | |
| | | |
Total accounting restatements | | 8 484 | |
| | | |
Total adjustments | | | | | | | | 7 190 | |
| | | | | | | | | |
| Budget 2012-2013 |
D.66 | Budget Plan |

5.3 Information on borrowings contracted
TABLE D.30
Québec government
Summary of long-term borrowings(1) in 2011-2012P
Currency | $ million | % |
CANADIAN DOLLAR | | |
Public issues | 15 741 | 78.1 |
Private borrowings | 1 361 | 6.8 |
Savings products | 643 | 3.2 |
Business Assistance – Immigrant Investor Program | 750 | 3.7 |
Canada Pension Plan Investment Fund | 13 | 0.1 |
Subtotal | 18 508 | 91.9 |
OTHER CURRENCIES | | |
US dollar | 1 373 | 6.8 |
Australian dollar | 231 | 1.2 |
Euro | 36 | 0.1 |
Subtotal | 1 640 | 8.1 |
TOTAL | 20 148 | 100.0 |
P: | Preliminary results. |
(1) | The amounts include borrowings of the general fund, borrowings for the Financing Fund and borrowings of Financement-Québec. |
Debt, Financing | |
and Debt Management | D.67 |
| |
TABLE D.31
Québec government
Borrowings for the general fund in 2011-2012P
Amount
received in
Canadian
dollars | (1) | Face value
in foreign
currency | | Interest
rate | (2) | Date of
issue | | Date of
maturity | | Price to
investor | | Yield to
investor | (3) |
millions | | % | | | | | | $ | | % | |
74 | | — | | 4.25 | | April 29 | | 2021-12-01 | | 101.163 | | 4.113 | |
169 | | — | | 5.00 | | May 20 | | 2041-12-01 | | 108.534 | | 4.484 | |
215 | | — | | 4.25 | | June 13 | | 2021-12-01 | | 103.053 | | 3.892 | |
364 | | — | | 5.00 | | June 16 | | 2041-12-01 | | 110.749 | | 4.359 | |
557 | | — | | 5.00 | | June 23 | | 2041-12-01 | | 111.307 | | 4.328 | |
231 | | AUS$225 | | 6.50 | | July 12 | | 2021-07-12 | | 99.927 | | 6.510 | |
350 | | — | | 4.25 | | July 18 | | 2021-12-01 | | 104.007 | | 3.779 | |
411 | | — | | 4.25 | | August 8 | | 2021-12-01 | | 106.264 | | 3.520 | |
519 | | — | | 4.25 | | August 17 | | 2043-12-01 | | 103.875 | | 4.034 | |
1 373 | | US$1 400 | | 2.75 | | August 25 | | 2021-08-25 | | 99.610 | | 2.795 | |
467 | | — | | 4.25 | | September 6 | | 2043-12-01 | | 103.467 | | 4.056 | |
356 | | — | | 4.25 | | September 12 | | 2021-12-01 | | 108.080 | | 3.311 | |
534 | | — | | 4.25 | | September 19 | | 2043-12-01 | | 106.764 | | 3.880 | |
449 | | — | | 4.25 | | September 28 | | 2021-12-01 | | 109.783 | | 3.120 | |
542 | | — | | 4.25 | | October 12 | | 2021-12-01 | | 108.430 | | 3.266 | |
330 | | — | | 4.50 | | October 17 | | 2020-12-01 | | 109.888 | | 3.239 | |
523 | | — | | 4.25 | | October 26 | | 2043-12-01 | | 104.680 | | 3.990 | |
113 | | — | | 3.50 | | December 2 | | 2022-12-01 | | 100.600 | | 3.434 | |
505 | | — | | 3.50 | | December 6 | | 2022-12-01 | | 101.029 | | 3.387 | |
554 | | — | | 4.25 | | December 14 | | 2043-12-01 | | 110.860 | | 3.670 | |
36(4) | | 27 € | | 3.50 | (5) | December 15 | | 2031-12-15 | | 100.000 | | 3.500 | |
340 | | — | | 4.50 | | December 23 | | 2020-12-01 | | 113.412 | | 2.794 | |
519 | | — | | 3.50 | | January 13 | | 2022-12-01 | | 103.875 | | 3.078 | |
523 | | — | | 3.50 | | February 7 | | 2022-12-01 | | 104.557 | | 3.003 | |
341 | | — | | 4.50 | | February 7 | | 2020-12-01 | | 113.805 | | 2.727 | |
518 | | — | | 3.50 | | February 13 | | 2022-12-01 | | 103.523 | | 3.113 | |
560 | | — | | 4.25 | | February 17 | | 2043-12-01 | | 111.957 | | 3.614 | |
518 | | — | | 3.50 | | March 13 | | 2022-12-01 | | 103.584 | | 3.104 | |
643 | (6) | — | | Various | | Various | | Various | | Various | | Various | |
750 | (7) | — | | Zero coupon | | Various | | Various | | Various | | Various | |
13 | (8) | — | | Various | | Various | | Various | | Various | | Various | |
13 397 | | | | | | | | | | | | | |
P: | Preliminary results. |
(1) | Borrowings in foreign currency given in Canadian equivalent of their value on the date of borrowing. |
(2) | Interest payable semi-annually except if another frequency is indicated in a note. |
(3) | Yield to investor is determined on the basis of interest payable semi-annually. |
(4) | Private borrowing. |
(5) | Interest payable annually. |
(6) | Savings products issued by Épargne Placements Québec. |
(7) | Business Assistance – Immigrant Investor Program. |
(8) | Borrowings from the Canada Pension Plan Investment Fund. |
| Budget 2012-2013 |
D.68 | Budget Plan |
TABLE D.32
Québec government
Borrowings for the Financing Fund in 2011-2012P
Amount
received in
Canadian
dollars | | Face value
in foreign
currency | | Interest
rate | (1) | Date of
issue | | Date of
maturity | | Price to
investor | | Yield to
investor | (2) |
millions | | % | | | | | | $ | | % | |
A. Borrowings for consolidated entities | | | | | | | | | |
502 | | — | | 4.25 | | April 4 | | 2021-12-01 | | 100.473 | | 4.194 | |
432 | | — | | 4.25 | | April 29 | | 2021-12-01 | | 101.163 | | 4.113 | |
374 | | — | | 5.00 | | May 20 | | 2041-12-01 | | 108.534 | | 4.484 | |
300 | | — | | 4.25 | | June 13 | | 2021-12-01 | | 103.053 | | 3.892 | |
190 | | — | | 5.00 | | June 16 | | 2041-12-01 | | 110.749 | | 4.359 | |
170 | | — | | 4.25 | | July 18 | | 2021-12-01 | | 104.007 | | 3.779 | |
120 | | — | | 4.25 | | August 8 | | 2021-12-01 | | 106.264 | | 3.520 | |
50 | | — | | 4.25 | | September 6 | | 2043-12-01 | | 103.467 | | 4.056 | |
5 | | — | | 4.25 | | September 12 | | 2021-12-01 | | 108.080 | | 3.311 | |
100 | | — | | 4.25 | | September 28 | | 2021-12-01 | | 109.783 | | 3.120 | |
547 | | — | | 4.25 | | November 14 | | 2021-12-01 | | 109.310 | | 3.161 | |
390 | | — | | 3.50 | | December 2 | | 2022-12-01 | | 100.600 | | 3.434 | |
| | | | | | | | | | | | | |
3 180 | | | | | | | | | | | | | |
| | | | | | | | | | | | | |
B. Borrowings for entities not included in the reporting entity | | | | | | | |
180 | | — | | 4.25 | | September 12 | | 2021-12-01 | | 108.080 | | 3.311 | |
| | | | | | | | | | | | | |
3 360 | | | | | | | | | | | | | |
P: | Preliminary results. |
(1) | Interest payable semi-annually except if another frequency is indicated in a note. |
(2) | Yield to investor is determined on the basis of interest payable semi-annually. |
Debt, Financing | |
and Debt Management | D.69 |
TABLE D.33
Québec government
Borrowings by Financement-Québec in 2011-2012P
Amount
received in
Canadian
dollars | | Face value
in foreign
currency | | Interest
rate | (1) | Date of
issue | | Date of
maturity | | Price to
investor | | Yield to
investor | (2) |
millions | | % | | | | | | $ | | % | |
502 | | — | | 3.50 | | May 25 | | 2017-12-01 | | 100.475 | | 3.418 | |
285 | (3) | — | | Variable | (4) | July 25 | | 2017-04-25 | | 100.001 | | Variable | |
10 | (3) | — | | Variable | (4) | July 29 | | 2017-04-25 | | 99.974 | | Variable | |
15 | (3) | — | | Variable | (4) | August 4 | | 2017-04-25 | | 99.922 | | Variable | |
20 | (3) | — | | Variable | (4) | August 8 | | 2017-04-25 | | 99.882 | | Variable | |
30 | (3) | — | | Variable | (4) | August 8 | | 2017-04-25 | | 99.855 | | Variable | |
26 | (3) | — | | Variable | (4) | August 9 | | 2017-04-25 | | 99.842 | | Variable | |
25 | (3) | — | | Variable | (4) | August 10 | | 2017-04-25 | | 99.801 | | Variable | |
50 | (3) | — | | Variable | (4) | August 11 | | 2017-04-25 | | 99.654 | | Variable | |
89 | (3) | — | | Variable | (4) | September 22 | | 2017-04-25 | | 98.812 | | Variable | |
20 | (3) | — | | Variable | (4) | September 23 | | 2017-04-25 | | 98.681 | | Variable | |
529 | | — | | 3.50 | | October 21 | | 2017-12-01 | | 105.797 | | 2.472 | |
295 | (3) | — | | Variable | (4) | December 20 | | 2017-04-25 | | 98.860 | | Variable | |
248 | (3) | — | | Variable | (4) | December 23 | | 2017-04-25 | | 99.140 | | Variable | |
49 | (3) | — | | Variable | (4) | January 13 | | 2017-04-25 | | 99.325 | | Variable | |
99 | (3) | — | | Variable | (4) | January 16 | | 2017-04-25 | | 99.325 | | Variable | |
50 | (3) | — | | Variable | (4) | January 16 | | 2017-04-25 | | 99.350 | | Variable | |
50 | (3) | — | | Variable | (4) | January 17 | | 2017-04-25 | | 99.400 | | Variable | |
500 | | — | | 2.40 | | January 24 | | 2018-12-01 | | 99.961 | | 2.406 | |
499 | | — | | 2.40 | | January 31 | | 2018-12-01 | | 99.823 | | 2.428 | |
3 391 | | | | | | | | | | | | | |
P: | Preliminary results. |
(1) | Interest payable semi-annually except if another frequency is indicated in a note. |
(2) | Yield to investor is determined on the basis of interest payable semi-annually. |
(3) | Private borrowings. |
(4) | Interest payable quarterly. |
| Budget 2012-2013 |
D.70 | Budget Plan |

TABLE D.34
Borrowings by Hydro-Québec in 2011(1)
Amount
received in
Canadian
dollars | | Face value
in foreign
currency | | Interest
rate | (2) | Date of
issue | | Date of
maturity | | Price to
investor | | Yield to
investor | (3) |
| | | | | | | | | | | | | |
millions | | % | | | | | | $ | | % | |
536 | | — | | 5.00 | | January 24 | | 2050-02-15 | | 107.145 | | 4.604 | |
53 | | — | | Variable | (4) | February 11 | | 2015-02-11 | | 100.000 | | Variable | |
300 | | — | | Variable | (4) | February 25 | | 2015-02-11 | | 99.910 | | Variable | |
25 | | — | | Variable | (4) | March 15 | | 2015-02-11 | | 99.929 | | Variable | |
63 | | — | | Variable | (4) | March 16 | | 2015-02-11 | | 99.876 | | Variable | |
116 | | — | | Variable | (4) | March 17 | | 2015-02-11 | | 99.896 | | Variable | |
25 | | — | | Variable | (4) | March 17 | | 2015-02-11 | | 99.895 | | Variable | |
50 | | — | | Variable | (4) | March 21 | | 2015-02-11 | | 99.892 | | Variable | |
150 | | — | | Variable | (4) | March 22 | | 2015-02-11 | | 99.840 | | Variable | |
75 | | — | | Variable | (4) | March 22 | | 2015-02-11 | | 99.858 | | Variable | |
25 | | — | | Variable | (4) | March 23 | | 2015-02-11 | | 99.821 | | Variable | |
334 | | — | | Variable | (4) | March 25 | | 2015-02-11 | | 99.859 | | Variable | |
200 | | — | | Variable | (4) | March 30 | | 2015-02-11 | | 99.897 | | Variable | |
20 | | — | | Variable | (4) | March 31 | | 2015-02-11 | | 99.897 | | Variable | |
100 | | — | | Variable | (4) | April 14 | | 2015-02-11 | | 99.990 | | Variable | |
100 | | — | | Variable | (4) | April 20 | | 2015-02-11 | | 99.935 | | Variable | |
100 | | — | | Variable | (4) | April 20 | | 2015-02-11 | | 99.936 | | Variable | |
7 | | — | | Zero coupon | | April 27 | | 2027-04-15 | | 46.389 | | 4.925 | |
100 | | — | | Variable | (4) | May 3 | | 2015-02-11 | | 99.896 | | Variable | |
200 | | — | | Variable | (4) | May 4 | | 2015-02-11 | | 99.906 | | Variable | |
964 | | US$1 000 | | 2.00 | | June 30 | | 2016-06-30 | | 99.981 | | 2.004 | |
610 | | — | | 5.00 | | September 30 | | 2050-02-15 | | 121.978 | | 3.892 | |
619 | | — | | 5.00 | | November 8 | | 2050-02-15 | | 123.836 | | 3.811 | |
4 772 | | | | | | | | | | | | | |
(1) | Borrowings contracted from January 1 to December 31, 2011. |
(2) | Interest payable semi-annually except if another frequency is indicated in a note. |
(3) | Yield to investor is determined on the basis of interest payable semi-annually. |
(4) | Interest payable quarterly. |
| | |
Debt, Financing
and Debt Management | | D.71 |
| | |