Exhibit 99.17
Section D from 2014-2015 Budget – Budget Plan
Section D
THE GOVERNMENT’S DETAILED FINANCIAL
FRAMEWORK
| | | | |
| Introduction | | D.3 |
| 1. | Return to a balanced budget in 2015-2016 | D.5 |
| | 1.1 | Change in the budgetary balance | D.5 |
| | 1.2 | Adjustments to the financial framework | D.7 |
| 2. | Revenue and expenditure of the general fund | D.11 |
| | 2.1 | Addjustments to revenue | D.11 |
| | | 2.1.1 | Own-source revenue excluding government enterprises | D.12 |
| | | 2.1.2 | Revenue from government enterprises | D.20 |
| | | 2.1.3 | Revenues from federal transfers | D.22 |
| | 2.2 | Expenditure adjustments | D.24 |
| | | 2.2.1 | Program spending | D.24 |
| | | 2.2.2 | Debt service | D.26 |
| | 2.3 | Consolidated expenditure | D.27 |
| 3. | Consolidated revenue and expenditure. | D.31 |
| | 3.1 | Change in consolidated revenue and expenditure by sector | D.34 |
| | 3.2 | Consolidated entities | D.42 |
| | | 3.2.1 | Special funds | D.43 |
| | | 3.2.2 | Generations Fund | D.45 |
| | | 3.2.3 | Non-budget-funded bodies | D.46 |
| | | 3.2.4 | Health and social services and education networks | D.48 |
| 4. | Net financial requirements | D.49 |
| APPENDIX: | SENSITIVITY ANALYSIS OF ECONOMIC VARIABLES | D.51 |
D.1
[This Page is Intentionally Left Blank]
INTRODUCTION
This section of the Budget Plan presents the preliminary results for fiscal 2013-2014 and the government's budgetary and financial stance for 2014-2015 and 2015-2016.1
The information provided concerns:
| |
| — | consolidated financial and budgetary transactions for the period from 2013-2014 to 2015-2016; |
| | |
| — | the change in the revenue and expenditure of the general fund, as well as adjustments made since the financial position as at February 20, 2014; |
| | |
| — | the change in consolidated revenue and expenditure; |
| | |
| — | the results of the consolidated entities, particularly the special funds, non-budget-funded bodies and the health and social services and education networks; |
| | |
| — | the government's non-budgetary transactions and net financial requirements. |
The five-year financial framework for Budget 2014-2015, i.e. the government's financial forecasts up to 2018-2019, is presented in Section A.
| | | |
| 1 | Throughout this section, the budgetary data for 2013-2014 are preliminary, while those for 2014-2015 and subsequent years are forecasts. |
D.3
[This Page is Intentionally Left Blank]
| 1. | RETURN TO A BALANCED BUDGET IN 2015-2016 |
|
|
| 1.1 | Change in the budgetary balance |
The budget will be balanced in 2015-2016. The government is forecasting a deficit of $3 100 million in 2013-2014 and $2 350 million in 2014-2015.
To return to a balanced budget, the expenditure of the general fund will increase less rapidly than revenue for the next two years.
Deposits in the Generations Fund to repay the debt will reach $1 301 million in 2014-2015 and $1 583 million in 2015-2016.
TABLE D.1
Summary of budgetary transactions from 2013-2014 to 2015-2016
(millions of dollars)
| | | | | | | | | |
| | | 2013-2014 | | | 2014-2015 | | | 2015-2016 | |
| GENERAL FUND REVENUE | | | | | | | | | |
| Own-source revenue | | 52 805 | | | 54 682 | | | 56 609 | |
| Federal transfers | | 16 701 | | | 16 691 | | | 17 190 | |
| Total | | 69 506 | | | 71 373 | | | 73 799 | |
| GENERAL FUND EXPENDITURE | | | | | | | | | |
| Program spending | | –64 518 | | | –65 704 | | | –66 141 | |
| Debt service | | –8 443 | | | –8 583 | | | –8 677 | |
| Total | | –72 961 | | | –74 287 | | | –74 818 | |
| CONSOLIDATED ENTITIES | | | | | | | | | |
| Non-budget-funded bodies and special funds(1) | | 485 | | | 636 | | | 400 | |
| Networks - Health and social services and education | | –130 | | | –72 | | | –31 | |
| Generations Fund | | 1 121 | | | 1 301 | | | 1 583 | |
| Total | | 1 476 | | | 1 865 | | | 1 952 | |
| Québec Taxation Review Committee | | — | | | — | | | 650 | |
| SURPLUS (DEFICIT) | | –1 979 | | | –1 049 | | | 1 583 | |
| BALANCED BUDGET ACT | | | | | | | | | |
| Deposits of dedicated revenues in the Generations Fund | | –1 121 | | | –1 301 | | | –1 583 | |
| BUDGETARY BALANCE(2) | | –3 100 | | | –2 350 | | | — | |
As a % of GDP | | –0.9 | | | –0.6 | | | — | |
| (1) | Includes consolidation adjustments. |
| (2) | Budgetary balance within the meaning of the Balanced Budget Act. |
D.5
| | | | | | | | | | | |
| | Summary of consolidated transactions in 2014-2015 | |
| | | | |
| | The following table provides a summary of the budgetary transactions of the general fund in 2014-2015, as well as the impact of the transactions of consolidated entities on the government’s consolidated results. | | |
|
|
| | | | | | | |
| | Summary of consolidated budgetary transactions in 2014-2015 | | | | | |
| | (millions of dollars) | | | | | | | | | | |
| | | | General | | | Consolidated | | | Consolidated | | |
| | | | fund | | | entities | (1) | | results | | |
| | Consolidated revenue | | | | | | | | | | |
| | Personal income tax | | 20 120 | | | 7 229 | | | 27 349 | | |
| | Contributions for health services | | 6 958 | | | –476 | | | 6 482 | | |
| | Corporate taxes | | 3 420 | | | 2 399 | | | 5 819 | | |
| | School property tax | | — | | | 1 901 | | | 1 901 | | |
| | Consumption taxes | | 17 045 | | | 612 | | | 17 657 | | |
| | Duties and permits | | 437 | | | 2 069 | | | 2 506 | | |
| | Miscellaneous | | 1 597 | | | 8 073 | | | 9 670 | | |
| | Government enterprises | | 5 105 | | | — | | | 5 105 | | |
| | Generations Fund revenue | | — | | | 1 301 | | | 1 301 | | |
| | Own-source revenue | | 54 682 | | | 23 108 | | | 77 790 | | |
| | Federal transfers | | 16 691 | | | 1 916 | | | 18 607 | | |
| | Total consolidated revenue | | 71 373 | | | 25 024 | | | 96 397 | | |
| | Consolidated expenditure | | | | | | | | | | |
| | Expenditure | | –65 704 | | | –20 911 | | | –86 615 | | |
| | Debt service | | –8 583 | | | –2 248 | | | –10 831 | | |
| | Total consolidated expenditure | | –74 287 | | | –23 159 | | | –97 446 | | |
| | SURPLUS (DEFICIT) | | –2 914 | | | 1 865 | | | –1 049 | | |
| | BALANCED BUDGET ACT | | | | | | | | | | |
| | Deposits of dedicated revenues in the | | | | | | | | | | |
| | Generations Fund | | — | | | –1 301 | | | –1 301 | | |
| | BUDGETARY BALANCE(2) | | –2 914 | | | 564 | | | –2 350 | | |
| | (1) | Including the other effects of consolidation. | | | | | | | |
| | (2) | Budgetary balance within the meaning of the Balanced Budget Act. | | | | | | | |
| | | | | | | | | | | | | |
D.6
| 1.2 | Adjustments to the financial framework |
Since last February 20, downward adjustments to revenue and anticipated program spending overruns have been identified.
| |
| — | Before taking into account the measures to return to a balanced budget, the adjustments to the financial framework and the anticipated spending overruns would raise the budgetary balance to $5 868 million in 2014-2015 and to $7 608 million in 2015-2016. |
The adjustments to the financial framework stemming from the economic outlook and the anticipated program spending overruns require major efforts.
|
| Budget 2014-2015 presents the first measures that are to be implemented to turn Québec’s budgetary situation around. These efforts to put public finances in order will be continued in Budget 2015-2016. |
| |
| q | Measures being taken as of 2014-20152 |
Several measures are being taken immediately to control government spending, in particular:
| |
| — | spending control measures within government departments, bodies and enterprises; |
| | |
| — | remuneration control, including a general freeze on the staffing levels of the public and parapublic sectors in 2014-2015 and 2015-2016; |
| | |
| — | immediate tightening of some tax expenditures. |
Revenue measures are also being implemented, in particular additional efforts to fight tax evasion, an increase in the specific tax on tobacco products and the standardization of the rates of the specific tax on alcoholic beverages.
The efforts needed to return to a balanced budget in 2015-2016 are completed by the use of the contingency reserve of $200 million.
| |
| q | Preparation of measures for Budget 2015-2016 |
As part of preparing Budget 2015-2016, other measures will be taken to control growth in spending, in particular by drawing on the recommendations of the Ongoing Program Review Committee and the Québec Taxation Review Committee.
| | | |
| 2 | The steps to be taken to return to a balanced budget in 2015-2016 are explained in detail in Section A. |
D.7
TABLE D.2
Adjustments since the financial position as at February 20 and measures to return to a balanced budget
(millions of dollars)
| | | | | | | | | |
| | | 2013-2014 | | | 2014-2015 | | | 2015-2016 | |
| BUDGETARY BALANCE(1) – AS AT FEBRUARY 20, 2014 | | –2 500 | | | –1 750 | | | — | |
| Shortfall to be offset identified in February 2014 | | — | | | — | | | –530 | |
| Adjustments related to the economy | | | | | | | | | |
Own-source revenue | | –666 | | | –791 | | | –970 | |
Government enterprises | | 323 | | | –125 | | | –306 | |
Federal transfers | | 32 | | | 193 | | | –158 | (2) |
Debt service | | 67 | | | 18 | | | 8 | |
Subtotal | | –244 | | | –705 | | | –1 426 | |
| Program spending overruns | | –693 | | | –3 248 | | | –5 797 | |
| Other adjustments(3) | | 337 | | | –165 | | | 145 | |
| BUDGETARY BALANCE BEFORE MEASURES | | –3 100 | | | –5 868 | | | –7 608 | |
| Measures to boost Québec’s economy | | — | | | –293 | | | –316 | |
| Revenue measures | | — | | | 291 | | | 365 | |
| Expenditure measures | | — | | | 3 520 | | | 7 359 | |
| Contingency reserves | | — | | | — | | | 200 | |
| BUDGETARY BALANCE(1) IN BUDGET 2014-2015 | | –3 100 | | | –2 350 | | | — | |
| (1) | Budgetary balance within the meaning of the Balanced Budget Act. |
| (2) | After taking into account the allocation of $389 million from federal health transfers to the Fund to Finance Health and Social Services Institutions (FINESSS). |
| (3) | Includes the use of the contingency reserve in 2013-2014 and excludes the Generations Fund. |
D.8
| |
| q | Deficit up $600 million in 2013-2014 |
For 2013-2014, the revenue of the general fund will decline by $311 million, compared with the revenue forecast on February 20, 2014.
The expenditure of the general fund has been raised by $626 million due to a $693-million increase in program spending and a $67-million decrease in debt service.
Taking into account the results of consolidated entities and the elimination of the contingency reserve, the budgetary deficit is expected to amount to $3.1 billion.
TABLE D.3
Summary of budgetary transactions in 2013-2014
(millions of dollars)
| | | | | | | | | |
| | | Financial | | | | | | | |
| | | position as at | | | | | | Budget | |
| | | February 20, 2014 | | | | | | 2014-2015 | |
| | | 2013-2014 | | | Adjustments | | | 2013-2014 | |
| Own-source revenue excluding | | | | | | | | | |
| government enterprises | | 48 027 | | | –666 | | | 47 361 | |
| Government enterprises | | 5 121 | | | 323 | | | 5 444 | |
| Federal transfers | | 16 669 | | | 32 | | | 16 701 | |
| Total general fund revenue | | 69 817 | | | –311 | | | 69 506 | |
| Program spending | | –63 825 | | | –693 | | | –64 518 | |
| Debt service | | –8 510 | | | 67 | | | –8 443 | |
| Total general fund expenditure | | –72 335 | | | –626 | | | –72 961 | |
| Consolidated entities | | 1 215 | | | 261 | | | 1 476 | |
| Contingency reserves | | –125 | | | 125 | | | — | |
| SURPLUS (DEFICIT) | | –1 428 | | | –551 | | | –1 979 | |
| BALANCED BUDGET ACT | | | | | | | | | |
| Deposits of dedicated revenues in the Generations Fund | | –1 072 | | | –49 | | | –1 121 | |
| BUDGETARY BALANCE(1) | | –2 500 | | | –600 | | | –3 100 | |
As a % of GDP | | –0.7 | | | | | | –0.9 | |
| (1) | Budgetary balance within the meaning of the Balanced Budget Act. |
D.9
[This Page is Intentionally Left Blank]
| |
| 2. | REVENUE AND EXPENDITURE OF THE GENERAL FUND |
This chapter presents the update to revenue and expenditure of the general fund for 2013-2014 to 2015-2016, as well as the main adjustments made since February 20, 2014.
The budgetary information in this chapter refers to the revenue and expenditure of the general fund, which receives most of the general income and taxes of the Québec government.
| 2.1 | Adjustments to revenue |
The government's revenue is expected to total $69.5 billion in 2013-2014, i.e. $52.8 billion in own-source revenue and $16.7 billion in federal transfers.
Revenue should rise by 2.9% in 2013-2014, 2.7% in 2014-2015 and 3.4% in 2015-2016.
TABLE D.4
General fund
Change in revenue
(millions of dollars)
| | | | | | | | | | | | | | | |
| | | Financial | | | | | | | | | | | | | |
| | | position as at | | | | | | | | | | | | | |
| | | February 20, 2014 | | | | | | Budget 2014-2015 | |
| | | 2013-2014 | | | Adjustments | | | 2013-2014 | | | 2014-2015 | | | 2015-2016 | |
| Own-source revenue | | | | | | | | | | | | | | | |
| Own-source revenue excluding government enterprises | | 48 027 | | | –666 | | | 47 361 | | | 49 577 | | | 51 814 | |
% change | | 2.7 | | | | | | 1.3 | | | 4.7 | | | 4.5 | |
| Government enterprises | | 5 121 | | | 323 | | | 5 444 | | | 5 105 | | | 4 795 | |
% change | | 0.3 | | | | | | 6.6 | | | –6.2 | | | –6.1 | |
| Subtotal | | 53 148 | | | –343 | | | 52 805 | | | 54 682 | | | 56 609 | |
% change | | 2.5 | | | | | | 1.8 | | | 3.6 | | | 3.5 | |
| Federal transfers | | 16 669 | | | 32 | | | 16 701 | | | 16 691 | | | 17 190 | |
% change | | 6.1 | | | | | | 6.3 | | | –0.1 | | | 3.0 | |
| TOTAL | | 69 817 | | | –311 | | | 69 506 | | | 71 373 | | | 73 799 | |
% change | | 3.3 | | | | | | 2.9 | | | 2.7 | | | 3.4 | |
D.11
| 2.1.1 | Own-source revenue excluding government enterprises |
The own-source revenue of the general fund, excluding government enterprises, consists chiefly of tax revenue, which is made up of personal income tax, contributions to the Health Services Fund, corporate taxes and consumption taxes. How it changes is closely tied to economic activity and changes to the tax systems.
Own-source revenue excluding government enterprises includes, apart from tax revenue, various revenues of an administrative nature, such as fees and permiits, interest and fines.
| |
| q | Downward adjustments in 2013-2014 |
For fiscal 2013-2014, own-source revenue excluding government enterprises is adjusted downward by $666 million compared with the forecast of February 2014. This adjustment stems largely from the adjustments observed in corporate taxes and personal income tax. However, it is partly offset by an improvement in revenue from consumption taxes and contributions to the Health Services Fund.
For 2013-2014, own-source revenue excluding government enterprises thus amounts to $47.4 billion, an increase of 1.3% compared with the revenue observed for fiscal 2012-2013.
| |
| n | Adjustments to own-source revenue by source |
Revenue from personal income tax is adjusted downward by $339 million for fiscal 2013-2014 compared with the level anticipated in the forecast of February 2014. This adjustment is mainly attributable to lower growth of salaries and wages in 2013 and 2014 and to weaker income tax payable in respect of the 2013 taxation year.
Contributions to the Health Services Fund are adjusted upward by $99 million, reflecting mainly an adjustment of the allocation among withholdings at source from personal income tax, the Régie des rentes du Québec and the Québec Parental Insurance Plan affecting previous years.
Revenue from corporate taxes is adjusted downward by $480 million for fiscal 2013-2014, reflecting the adjustment to the net operating surplus of corporations, but, especially, less-favourable-than-expected monitoring of tax revenues. Businesses continued to claim higher levels of refunds owing to weaker-than-forecast profits.
Revenue from consumption taxes is adjusted upward by $102 million in 2013-2014. This adjustment stems in particular from positive adjustments to consumption, excluding food and rent, but, especially, monitoring of tax revenues at the end of the fiscal year.
D.12
Revenue relating to natural resources is adjusted downward by $43 million in 2013-2014 owing to:
| |
| — | lower-than-expected payments of mining duties at the end of 2013-2014; |
| |
| — | lower-than-anticipated forest royalties stemming from a downward adjustment of the value of timber harvested. |
TABLE D.5
General fund
Change in own-source revenue excluding government enterprises
(millions of dollars)
| | | | | | | | | | | | | | | |
| | | Financial | | | | | | | | | | | | | |
| | | position as at | | | | | | | | | | | | | |
| | | February 20, 2014 | | | | | Budget 2014-2015 |
| | | 2013-2014 | | | Adjustments | | | 2013-2014 | | | 2014-2015 | | | 2015-2016 | |
| Personal income tax | | 19 502 | | | –339 | | | 19 163 | | | 20 120 | | | 21 093 | |
% change | | 4.0 | | | | | | 2.2 | | | 5.0 | | | 4.8 | |
| Health Services Fund | | 6 666 | | | 99 | | | 6 765 | | | 6 958 | | | 7 149 | |
% change | | 1.0 | | | | | | 2.5 | | | 2.9 | | | 2.7 | |
| Corporate taxes | | 3 643 | | | –480 | | | 3 163 | | | 3 420 | | | 3 905 | |
% change | | –7.0 | | | | | | –19.3 | | | 8.1 | | | 14.2 | |
| Consumption taxes | | 16 399 | | | 102 | | | 16 501 | | | 17 045 | | | 17 653 | |
% change | | 5.2 | | | | | | 5.9 | | | 3.3 | | | 3.6 | |
| Natural resources | | 84 | | | –43 | | | 41 | | | 159 | | | 51 | |
| Other revenue | | 1 733 | | | –5 | | | 1 728 | | | 1 875 | | | 1 963 | |
% change | | 1.9 | | | | | | 1.6 | | | 8.5 | | | 4.7 | |
| TOTAL | | 48 027 | | | –666 | | | 47 361 | | | 49 577 | | | 51 814 | |
% change | | 2.7 | | | | | | 1.3 | | | 4.7 | | | 4.5 | |
D.13
| |
| q | Change by revenue source in 2014-2015 and 2015-2016 |
Own-source revenue excluding government enterprises will rise annually by 4.7% in 2014-2015 and 4.5% in 2015-2016.
More specifically, personal income tax, the government's largest revenue source, should increase by 5.0% in 2014-2015 and 4.8% in 2015-2016, reaching $20.1 billion and $21.1 billion respectively.
| |
| — | This growth reflects primarily the change in household income and takes the progressive nature of the tax system into account. |
| | |
| — | Indeed, household income represents most of the revenue base subject to personal income tax and the change in this income illustrates well the progression of personal income tax. |
| |
| — | In addition, the increase in revenue is also supported by the growing contribution of pension income from private pension plans, which reflects the demographic trend observed in Québec. |
| | |
| — | Since the early 2000s, pension income has grown at an average annual rate of about 7.0%. |
| |
| — | Lastly, the growth in revenue from personal income tax in 2014-2015 and 2015-2016 is also affected by the impact on revenue of the fiscal measures announced since Budget 2013-2014 to revitalize the economy. |
| | |
| — | For 2014-2015, growth is affected by the impact of the cost of the LogiRénov tax credit announced on April 24, 2014. |
| | |
| — | For 2015-2016, the growth in revenue is supported by the end of the cost of the LogiRénov tax credit and the EcoRenov tax credit. |
| | |
Contributions to the Health Services Fund will rise by 2.9% in 2014-2015 and 2.7% in 2015-2016, in keeping with the growth expected in salaries and wages and adjusted by the impact of the fiscal measures in this budget, including the payroll tax holiday for SMEs for hiring specialized employees.
Revenue from corporations will increase by 8.1% in 2014-2015 and 14.2% in 2015-2016, reaching $3.4 billion and $3.9 billion respectively. This change is due to various factors.
| |
| — | The rise in the net operating surplus of corporations has an upward effect on their taxable income and tax payable. Remittances, particularly those in respect of instalment payments, will resume more sustained growth after the slowdown observed in 2013-2014. |
| | |
| — | Similarly, during a recovery period, refunds claimed by enterprises are expected to grow more moderately. |
| | |
| — | In addition, the fiscal measures announced in Budget 2014-2015, particularly the 20% reduction in the tax credit rates, add 2.7 percentage points and 7.0 percentage points to growth for 2014-2015 and 2015-2016 respectively. |
D.14
Growth in consumption tax revenue will amount to 3.3% in 2014-2015 and 3.6% in 2015-2016 as a result of growth in consumption, excluding food and rent, and investment in residential construction. This growth is also affected by:
| |
| — | the beginning, in 2014-2015, of the annual deposit of $100 million in the Generations Fund from revenue derived from the specific tax on alcoholic beverages, which will dampen growth in revenue for that year; |
| | |
| — | the standardization of the rates of the specific tax on alcoholic beverages as of August 1, 2014; |
| | |
| — | the increase in the specific tax on tobacco as of June 5, 2014. |
Revenue from natural resources deposited in the general fund will increase by $118 million in 2014-2015 and then decline by $108 million in 2015-2016, settling at $159 million and $51 million respectively.
| |
| — | For 2014-2015, the increase stems from the anticipated rise in mining duties, resulting from expected growth in the value of mining production. |
| | |
| — | In 2015-2016, the decline in revenue deposited in the general fund essentially results from the allocation of all mining revenues to the Generations Fund and is partly offset by the anticipated growth in forest royalties arising from an increase in the value of timber harvested. |
| |
| q | Change in revenue consistent with that of the economy |
Overall, for the next two years, the expected growth in own-source revenue excluding government enterprises is consistent with nominal economic growth, once it has been adjusted, particularly by the financial impact of the fiscal measures.
D.15
| | | | | | | | | | | | | | | | | |
| | | | | | |
| | | | Allocation of revenue from the specific taxes | | |
| | | | on fuel, tobacco products and alcoholic beverages | | |
| | | | | | |
| | The specific taxes on fuel, tobacco products and alcoholic beverages are consumption taxes. Revenue from these specific taxes is allocated in part to various funds used to finance specific activities, such as the funding of the road network, public transit and culture or to certain public services (e.g. incentives for physical activity and the adoption of a healthy lifestyle). | | |
| | | | | | | | | | | | | | | | | | |
| | Specific tax on fuel | | | | | | | | | | | | | | |
| | | | |
| | For 2014-2015, the government's own-source revenue from the specific taxes on fuel totals over $2.3 billion. This amount includes: | | |
| | | | | | | | | | | | | | | |
| | – | revenue from the specific tax of 19.2 cents and 20.2 cents per litre on gasoline and diesel fuel (non-coloured fuel oil) respectively, paid into the Land Transportation Network Fund (FORT) to finance the road network and public transit infrastructure ($2 211 million): | | |
| | | | | | |
| | | – | revenue from FORT also includes revenue from the specific tax of 1 cent per litre of gasoline sold within the territory of the Gaspésie-Îles-de-la-Madeleine administrative region to improve public transportation services in this region ($1 million); | | |
| | | | | | |
| | – | revenue from the specific tax of 3 cents per litre on kerosene fuel (domestic), aviation fuel and fuel oil for locomotives, paid into the general fund to finance the government's missions ($18 million); | | |
| | | | | | |
| | | | | | | | | | | | | | | |
| | – | revenue from the specific tax of 3 cents per litre of gasoline sold within the territory of the Agence métropolitaine de transport (AMT), paid to the AMT, for public transportation services in the metropolitan Montréal region ($101 million). | | |
| | | | | | | | | |
| | Allocation of revenue from the specific taxes on fuel | | | | | | | | |
| | (millions of dollars) | | | | | | | | | | | | | | |
| | | | | | | 2013-2014 | | | 2014-2015 | | | 2015-2016 | | | 2016-2017 | | |
| | FORT | | | 2 213 | | | 2 211 | | | 2 256 | | | 2 290 | | |
| | General fund | | | | 17 | | | 18 | | | 18 | | | 19 | | |
| | AMT | | | 101 | | | 101 | | | 101 | | | 101 | | |
| | TOTAL REVENUE | | | 2 331 | | | 2 330 | | | 2 375 | | | 2 410 | | |
| | | | | | | | | | | | | | | | | |
D.16
| | | | | | | | | | | | | | | |
| | | | |
| | Allocation of revenue from the specific taxes | |
| | on fuel, tobacco products and alcoholic beverages (cont.) | |
| | | | |
| | Specific tax on tobacco products | | | | | | | | | | | | | |
| | | | | | | | | | | | | | | |
| | For 2014-2015, tax revenue from the sale of tobacco products amounts to $1 108 million, including: | | |
| | | | | | | | | | | | | | | |
| | – | $977 million paid into the general fund, including additional revenue of $90 million resulting from the increase in the tax on tobacco products; | | |
| | | | | | | | | | | |
| | – | $131 million allocated to various special funds. | | | | | | | | | | | |
| | | | | | | | | | | | | | |
| | Allocation of revenue from the specific tax on tobacco products | | | | | |
| | (millions of dollars) | | | | | | | | | | | | | |
| | | | | 2013-2014 | | | 2014-2015 | | | 2015-2016 | | | 2016-2017 | | |
| | General fund | | 905 | | | 887 | | | 852 | | | 816 | | |
| | Impact of the tax increase | | — | | | 90 | | | 120 | | | 115 | | |
| | Subtotal | | 905 | | | 977 | | | 972 | | | 931 | | |
| | | | | | | | | | | | | | | |
| | Special funds | | | | | | | | | | | | | |
| | Sports and Physical Activity | | | | | | | | | | | | | |
| | Development Fund | | 55 | | | 60 | | | 60 | | | 60 | | |
| | Québec Cultural Heritage Fund | | 16 | | | 16 | | | 16 | | | 16 | | |
| | Fund for the Promotion of a Healthy | | | | | | | | | | | | | |
| | Lifestyle | | 20 | | | 20 | | | 20 | | | 20 | | |
| | Early Childhood Development Fund | | 15 | | | 15 | | | 15 | | | 15 | | |
| | Caregiver Support Fund | | 15 | | | 15 | | | 15 | | | 15 | | |
| | Fonds Avenir Mécénat Culture(1) | | — | | | 5 | | | 5 | | | 5 | | |
| | Subtotal | | 121 | | | 131 | | | 131 | | | 131 | | |
| | TOTAL REVENUE | | 1 026 | | | 1 108 | | | 1 103 | | | 1 062 | | |
| | (1) | This special fund will be created as part of the budget omnibus bill. | | | | | | | |
| | | | | | | | | | |
D.17
| | | | | | | | | | | | | | | | |
| | | | |
| | Allocation of revenue from the specific taxes | |
| | on fuel, tobacco products and alcoholic beverages (concluded) | |
| | | | | | | | | | | | | | | |
| | Specific tax on alcoholic beverages | | | | | | | | | | | | | |
| | | | | | | | | | | | | | | |
| | Tax revenue from the sale of alcoholic beverages totalled $552 million in 2013-2014. It will reach $631 million in 2016-2017, including the additional revenue of $55 million resulting from standardization of the specific tax on alcoholic beverages. | | |
| | | | | | | |
| | In 2013-2014, all tax revenues will be paid into the general fund. As of 2014-2015, a growing share of these revenues will go to the Generations Fund, reaching $500 million in 2016-2017. | | |
| | | | | | | | | | | | | | | |
| | – | In 2014-2015 and 2015-2016, an annual amount of $100 million from the specific tax will be allocated to the Generations Fund. | | |
| | | | | | | | | | | | | | | | |
| | – | As of 2016-2017, an additional amount of $400 million will be deposited in the Fund, bringing the total deposit from the specific tax on alcoholic beverages in the Generations Fund to $500 million annually. | | |
| | | | | |
| | Allocation of revenue from the specific tax on alcoholic beverages | | | | | |
| | (millions of dollars) | | | | | | | | | | | | | |
| | | | 2013-2014 | | | 2014-2015 | | | 2015-2016 | | | 2016-2017 | | |
| | General fund | | 552 | | | 462 | | | 469 | | | 76 | | |
| | Impact of standardization of the tax | | — | | | 36 | | | 55 | | | 55 | | |
| | Subtotal | | 552 | | | 498 | | | 524 | | | 131 | | |
| | Special funds | | | | | | | | | | | | | |
| | Generations Fund | | — | | | 100 | | | 100 | | | 500 | | |
| | TOTAL REVENUE | | 552 | | | 598 | | | 624 | | | 631 | | |
| | | | | | | | | | | | | | | |
D.18
| | | | | | | | | | | | | | | | | | |
| | | | |
| | Revenue from natural resources | | |
| | | | |
| | The government uses various means to enable Quebecers to benefit from their natural resources. For example, it collects royalties on resource development, as well as revenue from the attribution of licences. | | |
| | | | |
| | – | An exploration licence confers on the holder an exclusive right for exploration and the future development of the resource concerned. A lease (or right) to develop enables the holder to develop the resource in exchange for the payment of an annual rent. | | |
| | | | | |
| | In addition, to enable future generations to benefit from natural resource development and to ensure the sustainable development of our resources, the legislation currently stipulates that a portion of the revenue derived from natural resources must be devoted to: | | |
| | | | |
| | – | reducing the debt through deposits in the Generations Fund. As of 2015-2016, all mining revenues will be deposited in the Generations Fund. This will represent. $114 million in 2015-2016; | | |
| | | | | | | | | | | | | | | | | | | |
| | – | funding mining activity management, geoscientific work and data acquisition, as well as research on and the development of techniques for the exploration, development, redevelopment and rehabilitation of mining sites (Natural Resources Fund (NRF) –Mining activity management and mining heritage components); | | |
| | | | | |
| | – | forest management work to ensure the sustainability of Québec's forest. | | | | | |
| | | | |
| | Revenue from natural resources paid into the general fund is estimated at $41 million in 2013-2014, $159 million in 2014-2015 and $51 millions de dollars in 2015-2016. | | |
| | | | |
| | Revenue from natural resources | | | | | | | | | | | | | | |
| | (millions of dollars) | | | | | | | | | | | | | | | | |
| | | | 2012-2013 | | | 2013-2014 | | | 2014-2015 | | | 2015-2016 | | | 2016-2017 | | |
| | Gross royalties | | | | | | | | | | | | | | | | |
| | Mining | | 191 | | | 38 | | | 139 | | | 124 | | | 159 | | |
| | Forest | | 123 | | | 203 | | | 238 | | | 252 | | | 251 | | |
| | Water-power | | 723 | | | 767 | | | 755 | | | 773 | | | 789 | | |
| | Oil and natural gas | | — | | | — | | | — | | | — | | | — | | |
| | Total – Gross royalties | | 1 037 | | | 1 008 | | | 1 132 | | | 1 149 | | | 1 199 | | |
| | Duties and licences | | 20 | | | 36 | | | 41 | | | 48 | | | 52 | | |
| | Deposits in the Generations | | | | | | | | | | | | | | | | |
| | Fund | | –717 | | | –763 | | | –752 | | | –884 | | | –935 | | |
| | Natural Resources Fund | | | | | | | | | | | | | | | | |
| | Mining activity management and mining heritage components | | –20 | | | –20 | | | –23 | | | –23 | | | –23 | | |
| | Forest management component | | — | | | –220 | | | –239 | | | –239 | | | –239 | | |
| | Subtotal | | –20 | | | –240 | | | –262 | | | –262 | | | –262 | | |
| | Silvicultural work, forestry plans and programs | | –121 | | | — | | | — | | | — | | | — | | |
| | REVENUE – GENERAL FUND | | 199 | | | 41 | | | 159 | | | 51 | | | 54 | | |
| | | | | | | | | | | | | | | | | | |
D.19
| 2.1.2 | Revenue from government enterprises |
Revenue from government enterprises is adjusted upward by $323 million for 2013-2014. This increase is chiefly explained by the fact that Hydro-Québec’s result is better than anticipated, owing to very cold weather and higher revenue from exports.
This increase offsets the lower-than-anticipated result of Loto-Québec stemming from the downward trend observed in recent months in the gaming and gambling industry in Canada. According to Statistics Canada, spending on gaming and gambling fell by 2.3% in Canada from 2012 to 2013. For Loto-Québec, the decline is being felt primarily in the casino industry.
| |
| q | Outlook for 2014-2015 and 2015-2016 |
Revenue from government enterprises for 2014-2015 and 2015-2016 will amount to $5 176 million and $4 900 million respectively, before allocation to the Generations Fund.
As of 2014-2015, these forecasts will reflect the impact of the efforts that will have to be made to meet the targets set by the government.
Considering that the 2013-2014 results reflect in particular the impact of the cold weather on Hydro-Québec’s revenue, anticipated revenue in 2014-2015 will fall by 4.9%. For 2015-2016, the decrease of 5.3% in the forecast will be due in particular to the non-recurrence of part of the additional efforts required of Hydro-Québec in 2014-2015.
In addition, Hydro-Québec's revenue from the indexation of the price of heritage electricity will be allocated to the Generations Fund. Deposits will amount to $71 million in 2014-2015 and $105 million in 2015-2016.
D.20
TABLE D.6
General fund
Change in revenue from government enterprises
(millions of dollars)
| | | | | | | | | | | | | | | |
| | | Financial | | | | | | | | �� | | | | | |
| | | position as at | | | | | | | | | | | | | |
| | | February 20, 2014 | | | | | | Budget 2014-2015 | |
| | | 2013-2014 | | | Adjustments | | | 2013-2014 | | | 2014-2015 | | | 2015-2016 | |
| Hydro-Québec | | 2 942 | | | 403 | | | 3 345 | | | 3 050 | | | 2 745 | |
| Loto-Québec | | 1 157 | | | –102 | | | 1 055 | | | 1 065 | | | 1 075 | |
| Société des alcools du Québec | | 1 006 | | | –3 | | | 1 003 | | | 1 021 | | | 1 040 | |
| Other | | 16 | | | 25 | | | 41 | | | 40 | | | 40 | |
| Subtotal | | 5 121 | | | 323 | | | 5 444 | | | 5 176 | | | 4 900 | |
% change | | 0.3 | | | | | | 6.6 | | | –4.9 | | | –5.3 | |
| Hydro-Québec revenue allocated to the Generations Fund(1) | | — | | | — | | | — | | | –71 | | | –105 | |
| TOTAL | | 5 121 | | | 323 | | | 5 444 | | | 5 105 | | | 4 795 | |
| (1) | Corresponds to the amounts relating to the indexation of the price of heritage electricity. |
D.21
| 2.1.3 | Revenues from federal transfers |
Revenues from federal transfers, before the payment relating to federal compensation for harmonizing the QST with the GST, should reach $15.7 billion in 2013-2014, i.e. $32 million more than forecast on February 20, 2014.
| |
| — | Including the second payment of $1 467 million of federal compensation for harmonizing the QST with the GST and the allocation of $430 million from this compensation to the Fund to Finance Health and Social Services Institutions (FINESSS), federal transfers will grow by 6.3%, reaching $16.7 billion in 2013-2014. |
| | |
| — | The increase of $32 million in 2013-2014 compared with the financial position as at February 20, 2014 can be explained in particular by an upward adjustment of $24 million to other programs, arising mainly from an adjustment to federal compensation relating to the elimination of the tax on capital. |
In 2014-2015, federal transfers should rise by 9.3%, to $17.1 billion. This increase is chiefly explained by:
| |
| — | an increase in equalization payments in 2014-2015, resulting mainly from the impact of the decrease in Hydro-Québec's dividend in 2012-2013, attributable to the closure of the Gentilly-2 nuclear power plant, and of the incorporation of the upward adjustments to Québec's population stemming from the 2011 Census; |
| |
| — | an upward adjustment in Québec's population reduces its per capita fiscal capacity (fiscal capacity divided by a larger population) and distances it from the average fiscal capacity of the 10 provinces. The shortfall to be offset in relation to the average of the 10 provinces is thus bigger, which increases Québec's equalization payments; |
| |
| — | a decrease in health transfers, which can be explained by the end of the Wait Times Reduction Transfer ($58 million for Québec) and the fact that the value of tax points transferred to the provinces in 1977 are no longer taken into account in the allocation of the Canada Health Transfer (CHT) envelope, which represents a shortfall of $212 million for Québec. |
Including the allocation of $430 million from health transfers to FINESSS, federal transfers will stand at $16.7 billion in 2014-2015.
For 2015-2016, federal transfers are expected to reach $17.6 billion, an increase of 2.7% that can be attributed among other things to the growth in health transfers, which stems essentially from the increase in the CHT envelope for the provinces as a whole.
Including the allocation of $389 million from health transfers to FINESSS, federal transfers will stand at $17.2 billion in 2015-2016.
D.22
TABLE D.7
General fund
Change in federal transfer revenues
(millions of dollars)
| | | | | | | | | | | | | | | |
| | | Financial | | | | | | | | | | | | | |
| | | position as at | | | | | | | | | | | | | |
| | | February 20, 2014 | | | | | | Budget 2014-2015 | |
| | | 2013-2014 | | | Adjustments | | | 2013-2014 | | | 2014-2015 | | | 2015-2016 | |
| Equalization | | 7 833 | | | — | | | 7 833 | | | 9 286 | | | 9 403 | |
% change | | 6.0 | | | | | | 6.0 | | | 18.5 | | | 1.3 | |
| Health transfers | | 5 283 | | | 7 | | | 5 290 | | | 5 262 | | | 5 590 | |
% change | | 10.2 | | | | | | 10.4 | | | –0.5 | | | 6.2 | |
| Transfers for post-secondary education and other social programs | | 1 533 | | | 1 | | | 1 534 | | | 1 585 | | | 1 607 | |
% change | | 3.2 | | | | | | 3.2 | | | 3.3 | | | 1.4 | |
| Other programs | | 983 | | | 24 | | | 1 007 | | | 988 | | | 979 | |
% change | | 4.2 | | | | | | 6.8 | | | –1.9 | | | –0.9 | |
| Subtotal | | 15 632 | | | 32 | | | 15 664 | | | 17 121 | | | 17 579 | |
% change | | 4.4 | | | | | | 4.6 | | | 9.3 | | | 2.7 | |
| Harmonization of the QST with the GST - Compensation | | 1 467 | | | — | | | 1 467 | | | — | | | — | |
| Allocation to FINESSS(1) of a portion of the compensation for harmonization of the QST with the GST | | –430 | | | — | | | –430 | | | — | | | — | |
| Allocation to FINESSS of a portion of health transfers | | — | | | — | | | — | | | –430 | | | –389 | |
| FEDERAL TRANSFERS | | 16 669 | | | 32 | | | 16 701 | | | 16 691 | | | 17 190 | |
% change | | 6.1 | | | | | | 6.3 | | | –0.1 | | | 3.0 | |
| (1) | Fund to Finance Health and Social Services Institutions. |
D.23
| |
| 2.2 | Expenditure adjustments |
Expenditure of the general fund, which includes program spending and debt service, is adjusted upward by $626 million in 2013-2014.
Expenditure should increase by 1.8% in 2014-2015 and 0.7% in 2015-2016.
TABLE D.8
General fund
Change in expenditure
(millions of dollars)
| | | | | | | | | | | | | | | |
| | | Financial | | | | | | | | | | | | | |
| | | position as at | | | | | | | | | | | | | |
| | | February 20, 2014 | | | | | | Budget 2014-2015 | |
| | | 2013-2014 | | | Adjustments | | | 2013-2014 | | | 2014-2015 | | | 2015-2016 | |
| Program spending | | 63 825 | | | 693 | | | 64 518 | | | 65 704 | | | 66 141 | |
% change | | 2.5 | | | | | | 3.6 | | | 1.8 | | | 0.7 | |
| Debt service | | 8 510 | | | –67 | | | 8 443 | | | 8 583 | | | 8 677 | |
% change | | 9.6 | | | | | | 8.7 | | | 1.7 | | | 1.1 | |
| TOTAL | | 72 335 | | | 626 | | | 72 961 | | | 74 287 | | | 74 818 | |
% change | | 3.3 | | | | | | 4.2 | | | 1.8 | | | 0.7 | |
The program spending objectives are 1.8% in 2014-2015 and 0.7% in 2015-2016.
These spending objectives take into account in particular:
| |
| — | spending overruns of $693 million in 2013-2014, $3 248 million in 2014-2015 and $5 797 million in 2015-2016; |
| | |
| — | investments of $52 million in 2014-2015 and $91 million in 2015-2016 to fund economic recovery measures; |
| | |
| — | spending control measures for all government departments and bodies, totalling $2 728 million in 2014-2015 and $2 406 million in 2015-2016; |
| | |
| — | other spending measures, including those that will be proposed by the Ongoing Program Review Committee, amounting to $3 283 million in 2015-2016. |
| | |
| — | remuneration control, including a general freeze on the staffing levels in 2014-2015 and 2015-2016. |
Consequently, program spending objectives are being raised by $693 million for 2013-2014 and $572 million for 2014-2015, and lowered by $301 million for 2015-2016.
D.24
TABLE D.9
General fund
Change in program spending
(millions of dollars)
| | | | | | | | | | |
| | | | 2013-2014 | | | 2014-2015 | | | 2015-2016 | |
| PROGRAM SPENDING OBJECTIVE AS AT FEBRUARY 20, 2014 | | 63 825 | | | 65 132 | | | 66 442 | |
| | % change | | 2.5 | | | 2.0 | | | 2.0 | |
| Program spending overruns | | 693 | | | 3 248 | | | 5 797 | |
| Economic recovery measures and other adjustments | | — | | | 52 | | | 91 | |
| Additional measures to control spending | | | | | | | | | |
| – | Contribution of departments and bodies(1) | | — | | | –2 728 | | | –2 406 | |
| – | Other spending measures, including those proposed by the Ongoing Program Review Committee | | — | | | — | | | –3 283 | |
| – | Remuneration control through a general freeze on staffing levels | | — | | | — | | | –500 | |
| ADJUSTMENTS | | 693 | | | 572 | | | –301 | |
| PROGRAM SPENDING OBJECTIVE - BUDGET 2014-2015 | | 64 518 | | | 65 704 | | | 66 141 | |
| | % change | | 3.6 | | | 1.8 | | | 0.7 | |
| (1) | Includes the impact of spending control measures totalling $305 million as of 2014-2015 announced on April 24, 2014. |
| (2) | Remuneration control, including a general freeze on the staffing levels, will improve consolidate expenditure by $100 million in 2014-2015. |
D.25
On the basis of the preliminary results, the debt service of the general fund stood at $8.4 billion in 2013-2014, i.e. $5.1 billion for direct debt service and $3.3 billion for interest on the liability related to the retirement plans of public and parapublic sector employees.
Compared with the financial position as at February 20, 2014, debt service has been adjusted downward by $67 million in 2013-2014 owing in particular to lower-than-anticipated interest rates.
The increase in debt service in 2013-2014 is attributable to higher long-term interest rates, the rise in the debt, the impact of the new actuarial valuations of the retirement plans as well as the impact of the returns of the Caisse de dépôt et placement du Québec on the income of the Retirement Plans Sinking Fund (RPSF). The income of the RPSF is applied against the government's debt service.
Debt service is expected to rise by 1.7% in 2014-2015 and 1.1% in 2015-2016. As of 2014-2015, growth in the income of the RPSF, which reduces debt service, is no longer affected by the gradual incorporation, over five years, of the losses posted by the Caisse de dépôt et placement du Québec in 2008.
TABLE D.10
General fund
Change in debt service
(millions of dollars)
| | | | | | | | | | | | | | | |
| | | Financial | | | | | | | | | | | | | |
| | | position as at | | | | | | | | | | | | | |
| | | February 20, 2014 | | | | | | Budget 2014-2015 | |
| | | 2013-2014 | | | Adjustments | | | 2013-2014 | | | 2014-2015 | | | 2015-2016 | |
| Direct debt service | | 5 222 | | | –74 | | | 5 148 | | | 5 518 | | | 5 812 | |
| Interest on the retirement plans liability(1) | | 3 304 | | | — | | | 3 304 | | | 3 080 | | | 2 883 | |
| Interest on the employee future benefits liability(2) | | –16 | | | 7 | | | –9 | | | –15 | | | –18 | |
| DEBT SERVICE | | 8 510 | | | –67 | | | 8 443 | | | 8 583 | | | 8 677 | |
% change | | 9.6 | | | | | | 8.7 | | | 1.7 | | | 1.1 | |
| (1) | Corresponds to the interest on the obligations relating to the retirement plans of public and parapublic sector employees less the investment income of the Retirement Plans Sinking Fund. |
| (2) | Corresponds to the interest on the obligation relating to the survivor's pension plan less the investment income of the Survivor's Pension Plan Fund and the interest on the obligation relating to accumulated sick leave less the investment income of the Accumulated Sick Leave Fund. |
D.26
| |
| 2.3 | Consolidated expenditure |
The following table shows the amount and the change in the components of consolidated expenditure, i.e. all public expenditure included in the government's reporting entity.
| |
| — | In addition to program spending, consolidated expenditure includes the expenditure of special funds, non-budget-funded bodies, institutions in the health and social services and education networks, specified purpose accounts, tax-funded expenditures, and the debt service of these entities. |
Growth in consolidated expenditure, excluding debt service, will stand at 5.4% in 2013-2014, 1.9% in 2014-2015 and 1.3% in 2015-2016.
TABLE D.11
| | | | |
Change in consolidated expenditure
(millions of dollars) | | | | |
| | 2013-2014 | 2014-2015 | 2015-2016 | |
| Program spending | 64 518 | 65 704 | 66 141 | |
% change | 3.6 | 1.8 | 0.7 | |
| Special funds | 8 227 | 8 840 | 9 426 | |
% change | 18.2 | 7.5 | 6.6 | |
| Non-budget-funded bodies | 18 237 | 18 498 | 20 227 | |
% change | 5.2 | 1.4 | 9.3 | |
| Health and social services and education networks | 37 991 | 38 931 | 39 470 | |
% change | 3.3 | 2.5 | 1.4 | |
| Specified purpose accounts | 1 144 | 1 144 | 1 023 | |
% change | 4.2 | 0.0 | –10.6 | |
| Tax-funded expenditures(1) | 6 328 | 6 678 | 6 382 | |
% change | 5.2 | 5.5 | – 4.4 | |
| Consolidation adjustments(2) | –51 407 | –53 180 | –54 969 | |
| Consolidated expenditure, excluding debt service | 85 038 | 86 615 | 87 700 | |
% change | 5.4 | 1.9 | 1.3 | |
| Debt service | | | | |
| General fund | 8 443 | 8 583 | 8 677 | |
% change | 8.7 | 1.7 | 1.1 | |
| Consolidated entities(3) | 2 165 | 2 248 | 2 506 | |
% change | 4.4 | 3.8 | 11.5 | |
| Consolidated debt service | 10 608 | 10 831 | 11 183 | |
% change | 7.8 | 2.1 | 3.2 | |
| CONSOLIDATED EXPENDITURE | 95 646 | 97 446 | 98 883 | |
% change | 5.7 | 1.9 | 1.5 | |
| (1) | Includes doubtful tax accounts. |
| (2) | The consolidation adjustments stem mainly from the elimination of reciprocal transactions between entities in different sectors. |
| (3) | Includes consolidation adjustments. |
D.27
Excluding debt service, growth in spending by special funds will stand at 18.2% in 2013-2014, 7.5% in 2014-2015 and 6.6% in 2015-2016.
The growth in spending by special funds is chiefly attributable to the growth of those with own-source revenue, particularly:
| |
| — | FINESSS, for financing health care institutions; |
| |
| — | the Land Transportation Network Fund, for financing road and public transit infrastructures; |
| |
| — | the Green Fund, given the deployment of the 2013-2020 Climate Change Action Plan (2013-2020 CCAP). |
Two additional factors have also helped to raise growth to 18.2% in 2013-2014:
| |
| — | the Natural Resources Fund, following the coming into force of the new forest regime in 2013 that henceforth includes the cost of silviculture credits that, until 2012-2013, were charged against forest royalties; |
| |
| — | the creation of two new funds, namely, the Goods and Services Fund, which was previously a non-budget-funded body, and the Health and Social Services Information Resources Fund. |
| |
| q | Non-budget-funded bodies |
For 2013-2014 to 2015-2016, spending by non-budget-funded bodies will rise by 5.2%, 1.4% and 9.3% annually.
The primary mission of certain non-budget-funded bodies accounts for the higher growth in their spending. In particular, that is the case with the Régie de l'assurance maladie du Québec (RAMQ) and the Prescription Drug Insurance Fund (PDIF).
In addition, the change in growth between 2014-2015 and 2015-2016 can be attributed primarily to the change in spending by the Société de financement des infrastructures locales du Québec and La Financière agricole du Québec.
| |
| q | Health and social services and education networks |
Growth in spending by organizations in the health and social services and education networks will stand at 3.3 %, 2.5% and 1.4 % for 2013-2014 to 2015-2016. This growth excludes costs relating to the remuneration of physicians, which is covered by the RAMQ.
For 2014-2015 and 2015-2016, it takes into account the additional contribution from federal health transfers paid into FINESSS.
D.28
| |
| q | Specified purpose accounts |
Specified purpose accounts are used under an agreement or a contract with a third party that provides for the allocation of funds to a specific purpose.
Spending by the specified purpose accounts shows an increase of 4.2% and 0.0% in 2013-2014 and 2014-2015 respectively and a decrease of 10.6% in 2015-2016.
Refundable tax credits for individuals and corporations, which are similar to tax-funded expenditures, are recorded in spending rather than as reductions in revenue. Doubtful tax accounts are added to these expenditures.
Tax-funded expenditures will vary by 5.2 % in 2013-2014, 5.5% in 2014-2015 and 4.4% in 2015-2016.
| |
| — | The change in 2015-2016 takes into account in particular the greater impact than in 2014-2015 of the 20% reduction in the corporate tax credit rates announced in this budget. |
D.29
| |
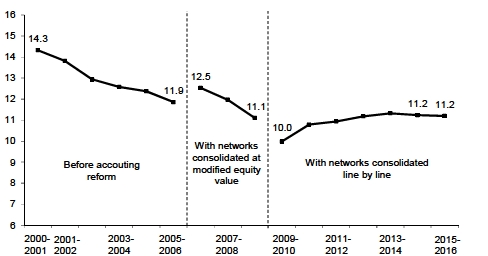
| q | Proportion of revenue devoted to consolidated debt service |
The proportion of revenue devoted to consolidated debt service should stand at 11.2% in 2014-2015 and 2015-2016, compared with 14.3% in 2000-2001.
|
| CHART D.1 |
| |
| Consolidated debt service |
| (as a percentage of consolidated revenue) |
 |
D.30
| |
| 3. | CONSOLIDATED REVENUE AND EXPENDITURE |
The consolidated financial forecasts add the impact of consolidated entities’ transactions on the government’s consolidated results to the revenue and expenditure of the general fund.
They provide more detailed information on the revenue and expenditure included in the government's financial projections. In addition, these financial forecasts enable reconciliation with the actual results presented in the public accounts.
With a view to improving quality and transparency and to ensure the information in the budget documents is better aligned with the presentation in the public accounts, the budget plan will henceforth present income and property taxes in greater detail.
D.31
[This Page is Intentionally Left Blank]
|
| TABLE D.12 |
| Consolidated financial framework from 2013-2014 to 2015-2016 |
| (millions of dollars) |
| | | | |
| | 2013-2014 | 2014-2015 | 2015-2016 | |
| Consolidated revenue | | | | |
| Personal income tax | 25 961 | 27 349 | 28 338 | |
| Contributions for health services | 6 305 | 6 482 | 6 657 | |
| Corporate taxes | 5 540 | 5 819 | 6 112 | |
| School property tax | 1 750 | 1 901 | 2 054 | |
| Consumption taxes | 17 156 | 17 657 | 18 288 | |
| Duties and permits | 2 167 | 2 506 | 2 649 | |
| Miscellaneous | 9 403 | 9 670 | 10 064 | |
| Government enterprises | 5 444 | 5 105 | 4 795 | |
| Generations Fund revenue | 1 121 | 1 301 | 1 583 | |
| Own-source revenue | 74 847 | 77 790 | 80 540 | |
% change | 3.4 | 3.9 | 3.5 | |
| Federal transfers | 18 820 | 18 607 | 19 276 | |
% change | 7.4 | –1.1 | 3.6 | |
| Total consolidated revenue | 93 667 | 96 397 | 99 816 | |
% change | 4.2 | 2.9 | 3.5 | |
| Consolidated expenditure | | | | |
| Expenditure | –85 038 | –86 615 | –87 700 | |
% change | 5.4 | 1.9 | 1.3 | |
| Debt service | –10 608 | –10 831 | –11 183 | |
| Total consolidated expenditure | –95 646 | –97 446 | –98 883 | |
% change | 5.7 | 1.9 | 1.5 | |
| Québec Taxation Review Committee | — | — | 650 | |
| SURPLUS (DEFICIT) | –1 979 | –1 049 | 1 583 | |
| BALANCED BUDGET ACT | | | | |
| Deposits of dedicated revenues in the Generations Fund | –1 121 | –1 301 | –1 583 | |
| BUDGETARY BALANCE(1) | –3 100 | –2 350 | — | |
| (1) | Budgetary balance within the meaning of the Balanced Budget Act. |
D.33
| |
3.1 | Change in consolidated revenue and expenditure by sector |
Table D.13 presents the government's consolidated financial framework by sector for fiscal 2013-2014 to 2015-2016.
More specifically, tables D.14, D.15 and D.16 present detailed consolidated results by sector for 2013-2014 to 2015-2016.
This segmented information shows separately the transactions carried out by the general fund, special funds, non-budget-funded bodies, health and social services and education networks and specified purpose accounts.
Lastly, to determine consolidated revenue and expenditure levels, financial transactions between entities in the government's reporting entity are eliminated.
D.34
|
| TABLE D.13 |
| |
| Financial framework for consolidated revenue and expenditure by sector |
| (millions of dollars) |
| | | | |
| | 2013-2014 | 2014-2015 | 2015-2016 | |
| Revenue | | | | |
| General fund | 69 506 | 71 373 | 73 799 | |
| Special funds | 9 915 | 10 603 | 11 503 | |
| Generations Fund | 1 121 | 1 301 | 1 583 | |
| Non-budget-funded bodies | 19 504 | 19 675 | 21 262 | |
| Health and social services and education networks | 38 736 | 39 768 | 40 495 | |
| Specified purpose accounts | 1 144 | 1 144 | 1 023 | |
| Tax-funded expenditures(1) | 6 328 | 6 678 | 6 382 | |
| Consolidation adjustments(2) | –52 587 | –54 145 | –56 231 | |
| Consolidated revenue | 93 667 | 96 397 | 99 816 | |
| Expenditure | | | | |
| General fund | –64 518 | –65 704 | –66 141 | |
| Special funds | –8 227 | –8 840 | –9 426 | |
| Non-budget-funded bodies | –18 237 | –18 498 | –20 227 | |
| Health and social services and education networks | –37 991 | –38 931 | –39 470 | |
| Specified purpose accounts | –1 144 | –1 144 | –1 023 | |
| Tax-funded expenditures(1) | –6 328 | –6 678 | –6 382 | |
| Consolidation adjustments(2) | 51 407 | 53 180 | 54 969 | |
| Consolidated expenditure excluding debt service | –85 038 | –86 615 | –87 700 | |
| Debt service | | | | |
| General fund | –8 443 | –8 583 | –8 677 | |
| Consolidated entities (3) | –2 165 | –2 248 | –2 506 | |
| Consolidated debt service | –10 608 | –10 831 | –11 183 | |
| Consolidated expenditure | –95 646 | –97 446 | –98 883 | |
| Québec Taxation Review Committee | — | — | 650 | |
| SURPLUS (DEFICIT) | –1 979 | –1 049 | 1 583 | |
| BALANCED BUDGET ACT | | | | |
| Deposits of dedicated revenues in the Generations Fund | –1 121 | –1 301 | –1 583 | |
| BUDGETARY BALANCE(4) | –3 100 | –2 350 | — | |
| (1) | Includes doubtful tax accounts. |
| (2) | The consolidation adjustments stem mainly from the elimination of reciprocal transactions between entities in different sectors. |
| (3) | Includes consolidation adjustments. |
| (4) | Budgetary balance within the meaning of the Balanced Budget Act. |
D.35
|
| TABLE D.14 |
| |
| Detailed consolidated financial framework |
| (millions of dollars) |
| | | | | |
| | 2013-2014 |
| | Consolidated Revenue Fund |
| | | | | |
| | General
fund | Special
funds | Generations
Fund | Specified
purpose
accounts | |
| Revenue | | | | | |
| Personal income tax | 19 163 | 1 083 | | | |
| Contributions for health services | 6 765 | 702 | | | |
| Corporate taxes | 3 163 | 185 | | | |
| School property tax | | | | | |
| Consumption taxes | 16 501 | 2 405 | | | |
| Duties and permits | 307 | 1 529 | | | |
| Miscellaneous | 1 462 | 1 497 | | 290 | |
| Government enterprises | 5 444 | | | | |
| Generations Fund revenue | | | 1 121 | | |
| Own-source revenue | 52 805 | 7 401 | 1 121 | 290 | |
| Québec government transfers | | 1 961 | | | |
| Federal transfers | 16 701 | 553 | | 854 | |
| Total revenue | 69 506 | 9 915 | 1 121 | 1 144 | |
| Expenditure | | | | | |
| Expenditure | –64 518 | –8 227 | | –1 144 | |
| Debt service | –8 443 | –1 186 | | | |
| Total expenditure | –72 961 | –9 413 | — | –1 144 | |
| SURPLUS (DEFICIT) | –3 455 | 502 | 1 121 | — | |
| BALANCED BUDGET ACT | | | | | |
| Deposits of dedicated revenues in the Generations Fund | | | –1 121 | | |
| BUDGETARY BALANCE(3) | –3 455 | 502 | — | — | |
| (1) | Includes doubtful tax accounts. |
| (2) | Reclassification of abatements and consolidation adjustments resulting mainly from the elimination of reciprocal transactions between entities in different sectors. |
| (3) | Budgetary balance within the meaning of the Balanced Budget Act. |
D.36
| | | | | | | | | |
| 2013-2014 |
| | | | | | | | | | |
Tax-funded
expenditures(1) | | Non-budget-
funded bodies | | Health and
social services
and education
networks | | Consolidation
adjustments(2) | | Consolidated
results | |
| | | | | | | | | | |
| 3 994 | | | | | | 1 721 | | 25 961 | |
| | | | | | | –1 162 | | 6 305 | |
| 2 124 | | 68 | | | | | | 5 540 | |
| | | | | 1 750 | | | | 1 750 | |
| 210 | | 122 | | | | –2 082 | | 17 156 | |
| | | 389 | | | | –58 | | 2 167 | |
| | | 5 732 | | 4 121 | | –3 699 | | 9 403 | |
| | | | | | | | | 5 444 | |
| | | | | | | | | 1 121 | |
| 6 328 | | 6 311 | | 5 871 | | –5 280 | | 74 847 | |
| | | 12 101 | | 32 586 | | –46 648 | | | |
| | | 1 092 | | 279 | | –659 | | 18 820 | |
| 6 328 | | 19 504 | | 38 736 | | –52 587 | | 93 667 | |
| | | | | | | | | | |
| –6 328 | | –18 237 | | –37 991 | | 51 407 | | –85 038 | |
| | | –1 077 | | –875 | | 973 | | –10 608 | |
| –6 328 | | –19 314 | | –38 866 | | 52 380 | | –95 646 | |
| — | | 190 | | –130 | | –207 | | –1 979 | |
| | | | | | | | | | |
| | | | | | | | | –1 121 | |
| — | | 190 | | –130 | | –207 | | –3 100 | |
D.37
|
| TABLE D.15 |
| |
| Detailed consolidated financial framework |
| (millions of dollars) |
| | | | | |
| | 2014-2015 |
| | Consolidated Revenue Fund |
| | | | | |
| | General
fund | Special
funds | Generations
Fund | Specified
purpose
accounts | |
| Revenue | | | | | |
| Personal income tax | 20 120 | 1 144 | | | |
| Contributions for health services | 6 958 | 719 | | | |
| Corporate taxes | 3 420 | 200 | | | |
| School property tax | | | | | |
| Consumption taxes | 17 045 | 2 417 | | | |
| Duties and permits | 437 | 1 719 | | | |
| Miscellaneous | 1 597 | 1 745 | | 243 | |
| Government enterprises | 5 105 | | | | |
| Generations Fund revenue | | | 1 301 | | |
| Own-source revenue | 54 682 | 7 944 | 1 301 | 243 | |
| Québec government transfers | | 2 134 | | | |
| Federal transfers | 16 691 | 525 | | 901 | |
| Total revenue | 71 373 | 10 603 | 1 301 | 1 144 | |
| Expenditure | | | | | |
| Expenditure | –65 704 | –8 840 | | –1 144 | |
| Debt service | –8 583 | –1 465 | | | |
| Total expenditure | –74 287 | –10 305 | — | –1 144 | |
| SURPLUS (DEFICIT) | –2 914 | 298 | 1 301 | — | |
| BALANCED BUDGET ACT | | | | | |
| Deposits of dedicated revenues in the Generations Fund | | | –1 301 | | |
| BUDGETARY BALANCE (3) | –2 914 | 298 | — | — | |
| (1) | Includes doubtful tax accounts. |
| (2) | Reclassification of abatements and consolidation adjustments resulting mainly from the elimination of reciprocal transactions between entities in different sectors. |
| (3) | Budgetary balance within the meaning of the Balanced Budget Act. |
D.38
| | | | | | | | | |
| 2014-2015 |
| | | | | | | | | | |
Tax-funded
expenditures | (1) | Non-budget-
funded bodies | | Health and social
services and
education
networks | | Consolidation
adjustments | (2) | Consolidated
results | |
| | | | | | | | | | |
| 4 334 | | | | | | 1 751 | | 27 349 | |
| | | | | | | –1 195 | | 6 482 | |
| 2 127 | | 72 | | | | | | 5 819 | |
| | | | | 1 901 | | | | 1 901 | |
| 217 | | 121 | | | | –2 143 | | 17 657 | |
| | | 406 | | | | –56 | | 2 506 | |
| | | 5 823 | | 4 240 | | –3 978 | | 9 670 | |
| | | | | | | | | 5 105 | |
| | | | | | | | | 1 301 | |
| 6 678 | | 6 422 | | 6 141 | | –5 621 | | 77 790 | |
| | | 12 439 | | 33 345 | | –47 918 | | | |
| | | 814 | | 282 | | –606 | | 18 607 | |
| 6 678 | | 19 675 | | 39 768 | | –54 145 | | 96 397 | |
| | | | | | | | | | |
| –6 678 | | –18 498 | | –38 931 | | 53 180 | | –86 615 | |
| | | –928 | | –909 | | 1 054 | | –10 831 | |
| –6 678 | | –19 426 | | –39 840 | | 54 234 | | –97 446 | |
| — | | 249 | | –72 | | 89 | | –1 049 | |
| | | | | | | | | | |
| | | | | | | | | –1 301 | |
| — | | 249 | | –72 | | 89 | | –2 350 | |
D.39
|
| TABLE D.16 |
| |
| Detailed consolidated financial framework |
| (millions of dollars) |
| | | | | |
| | 2015-2016 |
| | Consolidated Revenue Fund |
| | | | | |
| | General
fund | Special
funds | Generations
Fund | Specified
purpose
accounts | |
| Revenue | | | | | |
| Personal income tax | 21 093 | 1 216 | | | |
| Contributions for health services | 7 149 | 735 | | | |
| Corporate taxes | 3 905 | 214 | | | |
| School property tax | | | | | |
| Consumption taxes | 17 653 | 2 462 | | | |
| Duties and permits | 339 | 1 948 | | | |
| Miscellaneous | 1 675 | 2 135 | | 238 | |
| Government enterprises | 4 795 | | | | |
| Generations Fund revenue | | | 1 583 | | |
| Own-source revenue | 56 609 | 8 710 | 1 583 | 238 | |
| Québec government transfers | | 2 276 | | | |
| Federal transfers | 17 190 | 517 | | 785 | |
| Total revenue | 73 799 | 11 503 | 1 583 | 1 023 | |
| Expenditure | | | | | |
| Expenditure | –66 141 | –9 426 | | –1 023 | |
| Debt service | –8 677 | –1 833 | | | |
| Total expenditure | –74 818 | –11 259 | — | –1 023 | |
| Québec Taxation Review | | | | | |
| Committee | 650 | | | | |
| SURPLUS (DEFICIT) | –369 | 244 | 1 583 | — | |
| BALANCED BUDGET ACT | | | | | |
| Deposits of dedicated revenues in the Generations Fund | | | –1 583 | | |
| BUDGETARY BALANCE(3) | –369 | 244 | — | — | |
| (1) | Includes doubtful tax accounts. |
| (2) | Reclassification of abatements and consolidation adjustments resulting mainly from the elimination of reciprocal transactions between entities in different sectors. |
| (3) | Budgetary balance within the meaning of the Balanced Budget Act. |
D.40
| | | | | | | | | |
| 2015-2016 |
| | | | | | | | | | |
| | | Tax-funded
expenditures | (1) | Non-budget-
funded bodies | | Health and social
services and
education networks | | Consolidation
adjustments | (2) |
| | | | | | | | | | |
| 4 237 | | | | | | 1 792 | | 28 338 | |
| | | | | | | –1 227 | | 6 657 | |
| 1 920 | | 73 | | | | | | 6 112 | |
| | | | | 2 054 | | | | 2 054 | |
| 225 | | 121 | | | | –2 173 | | 18 288 | |
| | | 418 | | | | –56 | | 2 649 | |
| | | 6 003 | | 4 339 | | –4 326 | | 10 064 | |
| | | | | | | | | 4 795 | |
| | | | | | | | | 1 583 | |
| 6 382 | | 6 615 | | 6 393 | | –5 990 | | 80 540 | |
| | | 13 541 | | 33 818 | | –49 635 | | | |
| | | 1 106 | | 284 | | –606 | | 19 276 | |
| 6 382 | | 21 262 | | 40 495 | | –56 231 | | 99 816 | |
| | | | | | | | | | |
| –6 382 | | –20 227 | | –39 470 | | 54 969 | | –87 700 | |
| | | –920 | | –1 056 | | 1 303 | | –11 183 | |
| –6 382 | | –21 147 | | –40 526 | | 56 272 | | –98 883 | |
| | | | | | | | | | |
| | | | | | | | | 650 | |
| — | | 115 | | –31 | | 41 | | 1 583 | |
| | | | | | | | | | |
| | | | | | | | | | |
| | | | | | | | | –1 583 | |
| — | | 115 | | –31 | | 41 | | — | |
D.41
In addition to the financial transactions of the general fund, the government's budgetary forecasts take into account all of the consolidated entities in the government's reporting entity, namely:
| |
| — | the special funds; |
| |
| — | the Generations Fund; |
| |
| — | the non-budget-funded bodies; |
| |
| — | the health and social services and education networks. |
The following table shows the net results of consolidated entities.
| | | | |
TABLE D.17
Consolidated entities
(millions of dollars) | | | | |
| | 2013-2014 | 2014-2015 | 2015-2016 | |
| Special funds(1) | 502 | 298 | 244 | |
| Generations Fund (dedicated revenues) | 1 121 | 1 301 | 1 583 | |
| Non-budget-funded bodies | 190 | 249 | 115 | |
| Health and social services and education networks | –130 | –72 | –31 | |
| Consolidation adjustments | –207 | 89 | 41 | |
| SURPLUS (DEFICIT) | 1 476 | 1 865 | 1 952 | |
| (1) | Excludes the Generations Fund. |
D.42
The special funds consist of 36 entities set up within government departments or bodies. Their mission is to deliver services and sell goods or to fund government programs.
The activities of the special funds may be financed through fees, tax revenues or budgetary appropriations allocated annually by Parliament.
The table below presents the net results of the special funds for 2013-2014 to 2015-2016. The special funds show surpluses of $502 million for 2013-2014, $298 million for 2014-2015 and $244 million for 2015-2016.
| | | | |
TABLE D.18
Special funds(1) Statements of results
(millions of dollars) | | | | |
| | 2013-2014 | 2014-2015 | 2015-2016 | |
| Revenue | | | | |
| Income and property taxes | 1 970 | 2 063 | 2 165 | |
| Consumption taxes | 2 405 | 2 417 | 2 462 | |
| Duties and permits | 1 529 | 1 719 | 1 948 | |
| Miscellaneous | 1 497 | 1 745 | 2 135 | |
| Own-source revenue | 7 401 | 7 944 | 8 710 | |
| Québec government transfers | 1 961 | 2 134 | 2 276 | |
| Federal transfers | 553 | 525 | 517 | |
| Total revenue | 9 915 | 10 603 | 11 503 | |
| Expenditure | | | | |
| Expenditure | –8 227 | –8 840 | –9 426 | |
| Debt service | –1 186 | –1 465 | –1 833 | |
| Total expenditure | –9 413 | –10 305 | –11 259 | |
| SURPLUS (DEFICIT) | 502 | 298 | 244 | |
| (1) | Excludes the Generations Fund. |
D.43
| | | |
| List of special funds |
| | | |
| | Access to Justice Fund | Health and Social Services Information
Resources Fund | |
| | | | |
| | Assistance Fund for Independent Community
Action | Natural Resources Fund (NRF) | |
| | | | |
| | Fonds d'aide aux victimes d'actes criminels | Police Services Fund | |
| | | | |
| | Territorial Information Fund | Information Technology Fund of the Ministère
de l'Emploi et de la Solidarité sociale | |
| | | | |
| | Labour Market Development Fund | Fund of the Bureau de décision et de révision1 | |
| | | | |
| | Regional Development Fund | Fonds du centre financier de Montréal | |
| | | | |
| | Financing Fund | Economic Development Fund | |
| | | | |
| | Fund to Finance Health and Social Services
Institutions (FINESSS) | Northern Development Fund | |
| | | | |
| | Rolling Stock Management Fund | Québec Cultural Heritage Fund | |
| | | | |
| | Fonds de la Commission des lésions
professionnelles1 | Fund of the Administrative Tribunal of
Québec1 | |
| | | | |
| | Fund of the Commission des relations du
travail1 | University Excellence and Performance Fund | |
| | | | |
| | Highway Safety Fund | Fund for the Promotion of a Healthy Lifestyle | |
| | | | |
| | Tourism Partnership Fund | Early Childhood Development Fund | |
| | | | |
| | Caregiver Support Fund | Sports and Physical Activity Development
Fund | |
| | | | |
| | Goods and Services Fund | Fonds québécois d'initiatives sociales | |
| | | | |
| | Generations Fund | Natural Disaster Assistance Fund | |
| | | | |
| | Register Fund of the Ministère de la Justice | Tax Administration Fund (FRAF) | |
| | | | |
| | Land Transportation Network Fund (FORT) | Green Fund | |
| 1 | Includes the operations of the body that performs an adjudicative role. |
D.44
For 2013-2014, 2014-2015 and 2015-2016, projected revenues dedicated to the Generations Fund will amount to $1 121 million, $1 301 million and $1 583 million respectively. As a result, the book value of the Generations Fund will reach $8 543 million as at March 31, 2016. The results of and change in the Generations Fund are presented in greater detail in Section H.
| | | | | |
TABLE D.19
Revenues dedicated to the Generations Fund
(millions of dollars) | | | | | |
| | 2013-2014 | (1) | 2014-2015 | 2015-2016 | |
| Dedicated revenues | | | | | |
| Water-power royalties | 763 | | 752 | 770 | |
| Indexation of the price of heritage electricity | — | | 71 | 105 | |
| Mining revenues | — | | — | 114 | |
| Tax on alcoholic beverages | — | | 100 | 100 | |
| Unclaimed property | 19 | | 10 | 10 | |
| Investment income | 339 | | 368 | 484 | |
| TOTAL | 1 121 | | 1 301 | 1 583 | |
| (1) | Excludes the deposit of $300 million from the Territorial Information Fund and the use of $1 billion to repay maturing borrowings |
D.45
| |
| 3.2.3 | Non-budget-funded bodies |
Non-budget-funded bodies were created to provide specific public services. These bodies include:
| |
| — | La Financière agricole du Québec in the agricultural sector; |
| |
| — | the Agence métropolitaine de transport and the Société des traversiers du Québec in the transportation sector; |
| |
| — | government museums and the Société de développement des entreprises culturelles in the cultural sector. |
The 60 non-budget-funded bodies are expected to show surpluses of $190 million in 2013-2014, $249 million in 2014-2015 and $115 million in 2015-2016.
| | | | |
TABLE D.20
Non-budget-funded bodies
Statements of results
(millions of dollars) | | | | |
| | 2013-2014 | 2014-2015 | 2015-2016 | |
| Revenue | | | | |
| Income and property taxes | 68 | 72 | 73 | |
| Consumption taxes | 122 | 121 | 121 | |
| Duties and permits | 389 | 406 | 418 | |
| Miscellaneous | 5 732 | 5 823 | 6 003 | |
| Own-source revenue | 6 311 | 6 422 | 6 615 | |
| Québec government transfers | 12 101 | 12 439 | 13 541 | |
| Federal transfers | 1 092 | 814 | 1 106 | |
| Total revenue | 19 504 | 19 675 | 21 262 | |
| Expenditure | | | | |
| Expenditure | –18 237 | –18 498 | –20 227 | |
| Debt service | –1 077 | –928 | –920 | |
| Total expenditure | –19 314 | –19 426 | –21 147 | |
| SURPLUS (DEFICIT) | 190 | 249 | 115 | |
D.46
| | | |
| List of non-budget-funded bodies |
| | | |
| | Agence du revenu du Québec | Office de la sécurité du revenu des chasseurs | |
| | Agence métropolitaine de transport | et piégeurs cris | |
| | Autorité des marchés financiers | Office des professions du Québec | |
| | Bibliothèque et Archives nationales du | Office Québec-Amériques pour la jeunesse | |
| | Québec | Office Québec-Monde pour la jeunesse | |
| | Centre de la francophonie des Amériques | Régie de l'assurance maladie du Québec | |
| | Centre de recherche industrielle du Québec | Régie de l'énergie | |
| | Centre de services partagés du Québec | Régie des installations olympiques | |
| | Commission de la capitale nationale du | Régie du bâtiment du Québec | |
| | Québec | Régie du cinéma | |
| | Commission des normes du travail | Société de développement de la Baie-James | |
| | Commission des services juridiques | Société d'habitation du Québec | |
| | Conseil des arts et des lettres du Québec | Société de développement des entreprises | |
| | Conservatoire de musique et d'art dramatique | culturelles | |
| | du Québec | Société de financement des infrastructures | |
| | Corporation d'urgences-santé | locales du Québec | |
| | École nationale de police du Québec | Société de l'assurance automobile du Québec | |
| | École nationale des pompiers du Québec | Société de la Place des Arts de Montréal | |
| | Financement-Québec | Société de télédiffusion du Québec | |
| | Fondation de la faune du Québec | Société des établissements de plein air du | |
| | Fonds d'aide aux recours collectifs | Québec | |
| | Fonds de l'assurance médicaments | Société des parcs de sciences naturelles du | |
| | | Québec | |
| | Fonds de recherche du Québec – Nature et | | |
| | technologies | Société des traversiers du Québec | |
| | Fonds de recherche du Québec – Santé | Société du Centre des congrès de Québec | |
| | Fonds de recherche du Québec – Société et | Société du Grand Théâtre de Québec | |
| | culture | Société du Palais des congrès de Montréal | |
| | Héma-Québec | Société du parc industriel et portuaire de | |
| | Institut de la statistique du Québec | Bécancour | |
| | Institut de tourisme et d'hôtellerie du Québec | Société nationale de l'amiante | |
| | Institut national d'excellence en santé et | Société québécoise d’assainissement des | |
| | services sociaux | eaux | |
| | Institut national de la santé publique du | Société québécoise d'information juridique | |
| | Québec | Société québécoise de récupération et de | |
| | Institut national des mines | recyclage | |
| | La Financière agricole du Québec | Société québécoise des infrastructures | |
| | Musée d'art contemporain de Montréal | | |
| | Musée de la civilisation | | |
| | Musée national des beaux-arts du Québec | | |
D.47
| |
| 3.2.4 | Health and social services and education networks |
The health and social services network is made up of 197 entities. These entities comprise 15 agencies and the regional authority in health and social services, as well as 181 public health and social services institutions.
As for the education network, it is made up of 132 entities, including 72 school boards, the Comité de gestion de la taxe scolaire de l'île de Montréal, 48 CEGEPS and the Université du Québec and its 10 constituent universities.
The health and social services and education networks show a deficit of $130 million in 2013-2014, $72 million in 2014-2015 and $31 million in 2015-2016.
| | | | |
TABLE D.21
Health and social services and education networks
Statements of results
(millions of dollars) | | | | |
| | 2013-2014 | 2014-2015 | 2015-2016 | |
| Revenue | | | | |
| Income and property taxes | 1 750 | 1 901 | 2 054 | |
| Miscellaneous | 4 121 | 4 240 | 4 339 | |
| Own-source revenue | 5 871 | 6 141 | 6 393 | |
| Québec government transfers | 32 586 | 33 345 | 33 818 | |
| Federal transfers | 279 | 282 | 284 | |
| Total revenue | 38 736 | 39 768 | 40 495 | |
| Expenditure | | | | |
| Expenditure | –37 991 | –38 931 | –39 470 | |
| Debt service | –875 | –909 | –1 056 | |
| Total expenditure | –38 866 | –39 840 | –40 526 | |
| SURPLUS (DEFICIT) | –130 | –72 | –31 | |
D.48
| |
| 4. | NET FINANCIAL REQUIREMENTS |
Surpluses or net financial requirements represent the difference between the government's cash inflow and disbursements. These surpluses or net financial requirements take into account changes in the budgetary balance on an accrual basis and resources or requirements arising from the acquisition or disposal of fixed assets, investments, loans and advances, and from other activities such as paying accounts payable and collecting accounts receivable.
As a whole, the government's net financial requirements should amount to $1.4 billion in 2013-2014, $4.6 billion in 2014-2015 and $1.4 billion in 2015-2016.
| | | | |
TABLE D.22
Net financial requirements
(millions of dollars) | | | | |
| | 2013-2014 | 2014-2015 | 2015-2016 | |
| SURPLUS (DEFICIT) | –1 979 | –1 049 | 1 583 | |
| Non-budgetary transactions | | | | |
| Investments, loans and advances | –1 195 | –1 750 | –1 824 | |
| Capital expenditures | –3 436 | –4 627 | –4 101 | |
| Retirement plans and employee future benefits | 3 220 | 3 300 | 3 293 | |
| Other accounts | 1 996 | –488 | –356 | |
| Total non-budgetary transactions | 585 | –3 565 | –2 988 | |
| NET FINANCIAL REQUIREMENTS | –1 394 | –4 614 | –1 405 | |
| (1) | A negative entry indicates a financial requirement and a positive entry, a source of financing. |
| |
| q | Investments, loans and advances |
Net financial requirements for investments, loans and advances are estimated at $1.2 billion for fiscal 2013-2014 and $1.8 billion for 2014-2015 and 2015-2016 respectively.
In 2013-2014, net financial requirements associated with capital expenditures are expected to total $3.4 billion.
Forecast net financial requirements for 2014-2015 and 2015-2016 stand at $4.6 billion and $4.1 billion respectively.
D.49
|
| TABLE D.23 |
| |
| Consolidated net capital investments(1) |
| (millions of dollars) |
| | | | |
| | 2013-2014 | 2014-2015 | 2015-2016 | |
| Investments | –7 863 | –9 166 | –8 476 | |
| Depreciation | 3 364 | 3 632 | 3 933 | |
| Net investments | –4 499 | –5 534 | –4 543 | |
| Less: PPP investments(2) | 1 063 | 907 | 442 | |
| NET CAPITAL INVESTMENTS | –3 436 | –4 627 | –4 101 | |
| (1) | A negative entry indicates a financial requirement and a positive entry, a source of financing. |
| (2) | Investments made under public-private partnership (PPP) agreements correspond to new commitments that are taken into account in the government's gross debt. In accordance with the government's accounting policies, PPP investments are recognized in the government's assets as well as in its debt. |
| |
| q | Retirement plans and employee future benefits |
The non-budgetary balance for the retirement plans and employee future benefits is expected to increase by $3.2 billion for fiscal 2013-2014 and $3.3 billion for each subsequent fiscal year, which reduces the government’s net financial requirements.
Net financial requirements for other accounts consist of a series of changes in assets and liabilities such as accounts receivable and accounts payable.
In 2013-2014, the change in these other accounts provides the government with a decrease of approximately $2.0 billion in its net financial requirements. The change forecast for other accounts for fiscal 2014-2015 and 2015-2016 should generate net financial requirements of $488 million and $356 million respectively for each of those years.
The following table shows net financial requirements by entity.
| | | | |
TABLE D.24
Net financial requirements by entity(1)
(millions of dollars) | | | | |
| | 2013-2014 | 2014-2015 | 2015-2016 | |
| General fund | 61 | –1 694 | 1 760 | |
| Consolidated entities(2) | –2 876 | –4 221 | –4 748 | |
| Generations Fund | 1 421 | 1 301 | 1 583 | |
| NET FINANCIAL REQUIREMENTS | –1 394 | –4 614 | –1 405 | |
| (1) | A negative entry indicates a financial requirement and a positive entry, a source of financing. |
| (2) | Excludes the Generations Fund. |
D.50
| |
APPENDIX: | SENSITIVITY ANALYSIS OF ECONOMIC VARIABLES |
The financial framework's forecasts incorporate certain components of uncertainty that do not depend on the government directly, but which may cause actual results to differ from the forecasts.
| |
| q | Sensitivity of the Québec economy to external shocks |
The forecasts for the Québec economy are based on extensive analyses, including periodic assessments of the main economic statistics and the results obtained with various econometric models.
Given that the Québec economy is characterized by considerable openness to trade, Québec's economic variables are influenced by several external factors. The most important of these factors are related to the activities of Québec's main trading partners, the United States and Canada.
| |
The Government’s Detailed
Financial Framework | D.51 |
| |
| n | Impact of external variables on the Québec economy |
An analysis conducted with a Structural VAR3 model has made it possible to estimate, on the basis of historical data, the sensitivity of Québec’s economic variables to certain important external variables.
| |
| — | The findings show that a change of 1% in U.S. real GDP entails, on average, a change of 0.5% in Québec's real GDP. |
In addition, the model suggests that Québec's real GDP is influenced by the economic activity of Ontario.
| |
| — | Consequently, a change of 1% in Ontario's real GDP gives rise, on average, to a change of 0.4% in Québec's real GDP. |
| | |
| — | Ontario is the Canadian province with which Québec has the most commercial ties, in addition to having a similar economic structure. In 2010, exports to Ontario accounted for roughly 60% of Québec's interprovincial exports. |
TABLE D.25
Impact of external shocks on the growth rate of Québec's real GDP
| | | |
| | Maturity | (1) | Impact on Québec's real GDP |
| External shocks of 1% | (quarters) | | (percentage points) |
| U.S. real GDP | 2 | | 0.5 |
| Ontario real GDP | 2 | | 0.4 |
| (1) | Maturity corresponds to the number of quarters needed to record the greatest impact on Québec's real GDP, presented in the right-hand column. |
| Sources: | Institut de la statistique du Québec, Ontario Ministry of Finance, IHS Global Insight, Statistics Canada, Bloomberg and Ministère des Finances du Québec. |
___________________
| 3 | Vector autoregression. This econometric technique is used to estimate, on the basis of numerous observations, the extent to which changes in one economic variable affect another economic variable (impulse response). The estimates arrived at with this model were made using quarterly data from Statistics Canada's 1993 System of National Accounts (SNA 1993), for the 1981-2010 period. |
D.52
| |
| q | Sensitivity of own-source revenue to economic fluctuations |
In general, the nominal GDP forecast is a very good indicator of growth in own-source revenue given the direct link between tax bases and nominal GDP.
| |
| — | According to the overall sensitivity analysis, a change of one percentage point in nominal GDP has an impact of about $500 million on the government’s own-source revenue. |
This sensitivity analysis is based on a revision of each tax base in proportion to the revision of nominal GDP.
| |
| — | In reality, a change in economic outlook can have a greater impact on some economic variables and a larger impact on certain tax bases. |
The following table shows the sensitivity of the main economic variables affecting the tax bases following a change of one percentage point.
TABLE D.26
Sensitivity of own-source revenue to major economic variables
| | | |
| | | Growth forecasts | |
| Variables | for 2014 | Impacts for fiscal 2014-2015 |
| Nominal GDP | 3.4% | A difference of 1 percentage point changes own-source revenue by roughly $500 million. |
| | |
| – | Salaries and wages | 2.7% | A difference of 1 percentage point changes personal income tax revenue by roughly $260 million. |
| | | |
| – | Employment insurance | 0.8% | A difference of 1 percentage point changes personal income tax revenue by roughly $5 million. |
| | | |
| – | Pension income | 7.1% | A difference of 1 percentage point changes personal income tax revenue by roughly $40 million. |
| | | |
| – | Net corporate operating
surplus | 4.5% | A difference of 1 percentage point changes corporate income tax revenue by almost $30 million. |
| | | |
| – | Household consumption | 3.4% | A difference of 1 percentage point changes QST revenue by roughly $150 million. |
| | | |
| – | Residential investments | 1.2% | A difference of 1 percentage point changes QST revenue by roughly $20 million. |
| |
The Government’s Detailed
Financial Framework | D.53 |
It should be noted that sensitivity analyses set an average historical relationship between the change in own-source revenue and growth in nominal GDP. Accordingly, they may prove inaccurate for a given year depending on the economic situation and yet not lose their validity.
| |
| — | Indeed, for a given year, economic fluctuations may have various impacts on revenue depending on the change in behaviour of economic agents. |
| | |
| — | In these situations, the change in own-source revenue can be more pronounced than the change in nominal GDP. |
| q | Sensitivity of debt service to a change in interest rates and exchange rates |
A greater-than-anticipated rise in interest rates of one percentage point over a full year would increase the consolidated interest expenditure by roughly $250 million.
A change in the value of the Canadian dollar compared with other currencies would have no impact on debt service because the government's debt has no foreign currency exposure.
D.54