Exhibit 99.18
Section E from 2014-2015 Budget – Budget plan
Section E
THE QUÉBEC GOVERNMENT’S DEBT
| | | | |
| 1. | Debt | | | E.3 |
| | 1.1 | Gross debt | E.4 |
| | 1.2 | Net debt | E.11 |
| | 1.3 | Debt representing accumulated deficits | E.12 |
| | 1.4 | Debt reduction objectives | E.13 |
| | 1.5 | Public sector debt | E.15 |
| | 1.6 | Comparison of the debt of governments in Canada | E.16 |
| 2. | Financing and debt management | E.19 |
| | 2.1 | Financing program | E.19 |
| | 2.2 | Financing strategy | E.22 |
| | | 2.2.1 | Diversification by market | E.22 |
| | | 2.2.2 | Diversification by instrument | E.23 |
| | | 2.2.3 | Diversification by maturity | E.24 |
| | 2.3 | Increase in the government’s prudential liquidity | E.26 |
| | 2.4 | Pre-financing | E.26 |
| | 2.5 | Yield | | E.27 |
| | 2.6 | Debt management | E.28 |
| | 2.7 | Borrowings contracted | E.30 |
| 3. | Information on the retirement plans and on funds deposited by the Ministère des Finances with the Caisse de dépôt et placement du Québec | E.35 |
| | 3.1 | Retirement plans | E.35 |
| | | 3.1.1 | Retirement plans liability | E.37 |
| | | 3.1.2 | Retirement Plans Sinking Fund | E.40 |
| | 3.2 | Generations Fund | E.45 |
E.1
| | | | |
| | 3.3 | Returns of the Caisse de dépôt et placement du Québec on funds deposited by the Ministère des Finances | E.46 |
| | | 3.3.1 | Retirement Plans Sinking Fund | E.46 |
| | | 3.3.2 | Generations Fund | E.48 |
| | | 3.3.3 | Accumulated Sick Leave Fund | E.49 |
| | 3.4 | Impact of the returns of the Retirement Plans Sinking Fund on debt service | E.51 |
| 4. | Credit ratings | E.55 |
| | 4.1 | The Québec government’s credit ratings | E.55 |
| | 4.2 | Comparison of the credit ratings of Canadian provinces | E.62 |
E.2
Several concepts of debt are used to measure a government’s indebtedness. The following table presents data on the debt according to three concepts, i.e. gross debt, net debt and debt representing accumulated deficits.
TABLE E.1
Debt of the Québec government as at March 31
(millions of dollars)
| | | | | | | | |
| | 2013 | 2014P | 2015P | 2016P | 2017P | 2018P | 2019P | |
| GROSS DEBT(1) | 191 756 | 198 052 | 206 773 | 211 844 | 214 286 | 216 475 | 217 424 | |
As a % of GDP | 53.6 | 54.3 | 54.9 | 54.1 | 52.8 | 51.5 | 50.0 | |
Less: Financial assets, net of other liabilities | – 16 269 | – 16 087 | – 14 425 | – 16 536 | – 17 667 | – 19 651 | – 21 581 | |
| NET DEBT | 175 487 | 181 965 | 192 348 | 195 308 | 196 619 | 196 824 | 195 843 | |
As a % of GDP | 49.0 | 49.9 | 51.0 | 49.9 | 48.4 | 46.8 | 45.0 | |
| Less: Non-financial assets | – 57 392 | – 61 891 | – 67 425 | – 71 968 | – 75 533 | – 78 828 | – 81 373 | |
| DEBT REPRESENTING ACCUMULATED DEFICITS | 118 095 | 120 074 | 124 923 | 123 340 | 121 086 | 117 996 | 114 470 | |
As a % of GDP | 33.0 | 32.9 | 33.1 | 31.5 | 29.8 | 28.1 | 26.3 | |
| P: | Preliminary results for 2014 and forecasts for subsequent years. |
| (1) | The gross debt excludes pre-financing and takes into account the sums accumulated in the Generations Fund. |
E.3
Gross debt represents the amount of debt contracted on financial markets and the net liabilities in respect of the retirement plans and future benefits of public and parapublic sector employees, minus the balance of the Generations Fund.
As at March 31, 2014, preliminary results show that the gross debt stood at $198 052 million, or 54.3% of Québec’s GDP.
As at March 31, 2015, the gross debt should stand at $206 773 million, or 54.9% of GDP. As of 2015-2016, the ratio of gross debt to GDP should gradually decline to 50.0% as at March 31, 2019.
TABLE E.2
Gross debt as at March 31
(millions of dollars)
| | | | | | | | | |
| | | 2013 | 2014P | 2015P | 2016P | 2017P | 2018P | 2019P | |
| Consolidated direct debt(1) | 168 616 | 175 161 | 184 359 | 190 552 | 195 081 | 200 340 | 205 063 | |
| Plus: | Net retirement plans liability | 28 359 | 28 546 | 29 374 | 29 835 | 30 002 | 29 722 | 29 074 | |
| Plus: | Net employee future benefits liability | 19 | 4 | — | — | — | — | — | |
| Less: | Generations Fund | –5 238 | –5 659 | –6 960 | –8 543 | –10 797 | –13 587 | –16 713 | |
| GROSS DEBT(1) | 191 756 | 198 052 | 206 773 | 211 844 | 214 286 | 216 475 | 217 424 | |
As a % of GDP | 53.6 | 54.3 | 54.9 | 54.1 | 52.8 | 51.5 | 50.0 | |
| P: | Preliminary results for 2014 and forecasts for subsequent years. |
| (1) | The consolidated direct debt and the gross debt exclude pre-financing. |
E.4
| | | | |
Retirement plans liability |
| | | | |
| | The net retirement plans liability is calculated by subtracting from the retirement plans liability the balance of the Retirement Plans Sinking Fund (RPSF), an asset established to pay the retirement benefits of public and parapublic sector employees. | | |
| | | | | |
| | The retirement plans liability represents the present value of the retirement benefits the government will pay to public and parapublic sector employees, taking into account the conditions of their plans and their years of service. This liability stood at $76 703 million as at March 31, 2013. | | |
| | | | |
| | The government created the RPSF in 1993. As at March 31, 2013, the book value of the RPSF stood at $48 344 million. | | |
| | | | | |
| | Thus, the net retirement plans liability represented $28 359 million as at March 31, 2013. | | |
| | | | | |
| | Net retirement plans liability as at March 31, 2013 | | | |
| | (millions of dollars) | | | |
| | | | | |
| | Retirement plans liability | | | |
| | Government and Public Employees Retirement Plan (RREGOP) | 46 344 | | |
| | Pension Plan of Management Personnel (PPMP) and Retirement Plan for Senior Officials (RPSO) | 10 706 | | |
| | Other plans(1) | 19 653 | | |
| | | | | |
| | Subtotal | 76 703 | | |
| | Less: Retirement Plans Sinking Fund | –48 344 | | |
| | | | | |
| | NET RETIREMENT PLANS LIABILITY | 28 359 | | |
| | (1) | The liability for the other plans takes into account the assets of the other plans, including those of the Pension Plan of the Université du Québec. | | | |
| |
E.5
| | | | |
| Employee future benefits liability |
| | | | |
| | The government records in its debt the value of its commitments regarding future benefits programs for its employees, namely, programs for accumulated sick leave and for pensions paid to the survivors of government employees. These programs give rise to long-term obligations whose costs are covered in full by the government. | | |
| | | | |
| | As at March 31, 2013, the employee future benefits liability stood at $1 262 million. | | |
| | | | |
| | As at March 31, 2013, the value of the sums accumulated to pay for employee future benefits programs (Accumulated Sick Leave Fund and Survivor’s Pension Plan Fund) stood at $1 243 million. | | |
| | | | | |
| | The net employee future benefits liability was thus $19 million as at March 31, 2013. | | |
| | | | |
| | Net employee future benefits liability as at March 31, 2013 | | | |
| | (millions of dollars) | | | |
| | | | | |
| | Employee future benefits liability | | | |
| | Accumulated sick leave | 676 | | |
| | Survivor’s pension plan | 408 | | |
| | Université du Québec programs | 178 | | |
| | | | | |
| | Subtotal | 1 262 | | |
| | Less: | | | |
| | Accumulated Sick Leave Fund | –798 | | |
| | Survivor’s Pension Plan Fund | –445 | | |
| | | | | |
| | Subtotal | –1 243 | | |
| | | | | |
| | NET EMPLOYEE FUTURE BENEFITS LIABILITY | 19 | | |
| |
E.6
| | | | | | | | | | |
| Generations Fund |
| | | | |
| | The Generations Fund was created in June 2006 by the liberal government, through the adoption of the Act to reduce the debt and establish the Generations Fund. The sums accumulated in the fund are dedicated solely to repaying the debt. | | |
| | | | |
| | As at March 31, 2014, preliminary results show that the book value of the Generations Fund stood at $5 659 million. | | |
| | | | |
| | The sums accumulated in the Generations Fund are expected to reach $16 713 million as at March 31, 2019. | | |
| | | | | | | | | | | |
| | Generations Fund | | | | | | | | | |
| | (millions of dollars) | | | | | | | | | |
| | | 2012- | 2013- | 2014- | 2015- | 2016- | 2017- | 2018- | | |
| | | 2013 | 2014P | 2015P | 2016P | 2017P | 2018P | 2019P | | |
| | | | | | | | | | | |
| | Book value, beginning of year | 4 277 | 5 238 | 5 659 | 6 960 | 8 543 | 10 797 | 13 587 | | |
| | | | | | | | | | | |
| | Dedicated revenues | | | | | | | | | |
| | | | | | | | | | | |
| | Water-power royalties | | | | | | | | | |
| | Hydro-Québec | 625 | 670 | 661 | 677 | 691 | 707 | 726 | | |
| | Private producers | 92 | 93 | 91 | 93 | 95 | 97 | 99 | | |
| | | 717 | 763 | 752 | 770 | 786 | 804 | 825 | | |
| | Indexation of the price of heritage electricity | — | — | 71 | 105 | 205 | 305 | 410 | | |
| | Mining revenues | — | — | — | 114 | 149 | 194 | 219 | | |
| | Tax on alcoholic beverages | — | — | 100 | 100 | 500 | 500 | 500 | | |
| | Savings relative to the closure of | | | | | | | | | |
| | Gentilly-2 | — | — | — | — | — | 215 | 215 | | |
| | Unclaimed property | 12 | 19 | 10 | 10 | 10 | 10 | 10 | | |
| | Investment income | 232 | 339 | 368 | 484 | 604 | 762 | 947 | | |
| | | | | | | | | | | |
| | Total dedicated revenues | 961 | 1 121 | 1 301 | 1 583 | 2 254 | 2 790 | 3 126 | | |
| | | | | | | | | | | |
| | Deposit from the Territorial | | | | | | | | | |
| | Information Fund | — | 300 | — | — | — | — | — | | |
| | | | | | | | | | | |
| | Total deposits | 961 | 1 421 | 1 301 | 1 583 | 2 254 | 2 790 | 3 126 | | |
| | | | | | | | | | | |
| | Use of the Generations Fund to repay maturing borrowings | — | –1 000 | — | — | — | — | — | | |
| | | | | | | | | | | |
| | BOOK VALUE, END OF YEAR | 5 238 | 5 659 | 6 960 | 8 543 | 10 797 | 13 587 | 16 713 | | |
| | P: | Preliminary results for 2013-2014 and forecasts for subsequent years. | | |
| |
E.7
| |
| q | Factors responsible for the growth in the gross debt |
In 2014-2015, the gross debt is expected to increase by $8 721 million mainly because of capital investments ($5 534 million) and the budgetary deficit ($2 350 million).
CHART E.1
|
| Factors responsible for the growth in the gross debt in 2014-2015 |
| (millions of dollars) |
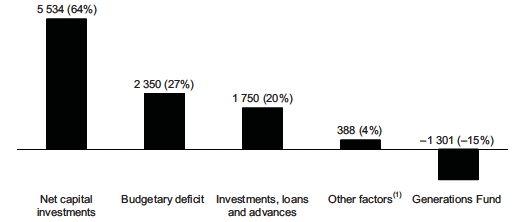
| (1) | Other factors include in particular the change in other accounts, such as accounts receivable and accounts payable. |
The table on the next page shows the factors responsible for the growth in the government’s gross debt since March 31, 2000.
E.8
TABLE E.3
Factors responsible for the growth in the Québec government’s gross debt
(millions of dollars)
| | | | | | | | | | | |
| | Debt, | Budgetary | | Investments, | Net investment | | | Deposits in the | | Debt, | |
| | beginning | (surplus) | Closure of | loans and | in the | Net capital | Other | Generations | Total | end of | As a % |
| | of year | deficit | Gentilly-2 | advances | networks(1) | investments(2) | factors(3) | Fund(4) | change | year | of GDP |
| With networks consolidated at modified equity value | | | | |
| 2000-2001 | 116 761 | –427 | | 1 701 | 841 | 578 | 1 108 | | 3 801 | 120 562 | 52.3 |
| 2001-2002 | 120 562 | –22 | | 1 248 | 934 | 1 199 | –9 | | 3 350 | 123 912 | 52.0 |
| 2002-2003 | 123 912 | 728 | | 1 921 | 631 | 1 706 | 237 | | 5 223 | 129 135 | 51.9 |
| 2003-2004 | 129 135 | 358 | | 1 367 | 560 | 1 186 | 625 | | 4 096 | 133 231 | 51.3 |
| 2004-2005 | 133 231 | 664 | | 1 303 | 1 486 | 1 006 | –796 | | 3 663 | 136 894 | 50.4 |
| 2005-2006 | 136 894 | –37 | | 1 488 | 1 013 | 1 179 | –809 | | 2 834 | 139 728 | 49.8 |
| 2006-2007 | 139 728 | –109 | | 2 213 | 1 002 | 1 177 | 1 078 | –584 | 4 777 | 144 505 | 49.7 |
| 2007-2008 | 144 505 | — | | 2 658 | 487 | 1 457 | 767 | –649 | 4 720 | 149 225 | 48.8 |
| 2008-2009 | 149 225 | — | | 966 | 622 | 2 448 | –28 | –719 | 3 289 | 152 514 | 48.6 |
| With networks consolidated line by line(5) | | | | |
| 2009-2010 | 157 630 | 3 174 | | 1 746 | | 4 226 | –2 733 | –725 | 5 688 | 163 318 | 51.8 |
| 2010-2011 | 163 318 | 3 150 | | 2 507 | | 4 923 | 298 | –760 | 10 118 | 173 436 | 52.6 |
| 2011-2012 | 173 436 | 2 628 | | 1 861 | | 5 071 | 1 228 | –840 | 9 948 | 183 384 | 53.1 |
| 2012-2013 | 183 384 | 1 600 | 1 876 | 659 | | 4 863 | 335 | –961 | 8 372 | 191 756 | 53.6 |
| 2013-2014 | 191 756 | 3 100 | | 1 195 | | 4 499 | –1 077 | –1 421 | 6 296 | 198 052 | 54.3 |
| 2014-2015 | 198 052 | 2 350 | | 1 750 | | 5 534 | 388 | –1 301 | 8 721 | 206 773 | 54.9 |
| 2015-2016 | 206 773 | — | | 1 824 | | 4 543 | 287 | –1 583 | 5 071 | 211 844 | 54.1 |
| 2016-2017 | 211 844 | — | | 1 539 | | 3 565 | –408 | –2 254 | 2 442 | 214 286 | 52.8 |
| 2017-2018 | 214 286 | –300 (6) | | 1 678 | | 3 295 | 306 | –2 790 | 2 189 | 216 475 | 51.5 |
| 2018-2019 | 216 475 | –400 (6) | | 1 639 | | 2 545 | 291 | –3 126 | 949 | 217 424 | 50.0 |
| |
| (1) | The net investment in the networks includes mainly loans by Financement-Québec and the Corporation d’hébergement du Québec to institutions in the health and social services and the education networks. Since 2009-2010, these items have been part of net capital investments. |
| (2) | Investments made under private-public partnership agreements are included in net capital investments. |
| (3) | Other factors include in particular the change in other accounts, such as accounts receivable and accounts payable. |
| (4) | Deposits in the Generations Fund in 2013-2014 include $1 121 million in dedicated revenues and $300 million from the accumulated surplus of the Territorial Information Fund. |
| (5) | The line-by-line consolidation of the financial statements of institutions of the health and social services and the education networks raised the gross debt by $5 116 million as at March 31, 2009. This amount represents the debt contracted by the networks in their own name. The data prior to 2009-2010 could not be restated and are thus not comparable. |
| (6) | Corresponds to half of the forecast budgetary surplus, in accordance with the government’s policy of allocating half of budgetary surpluses to reducing the debt and the other half to easing the tax burden, by giving priority to the gradual elimination of the health contribution. |
E.9
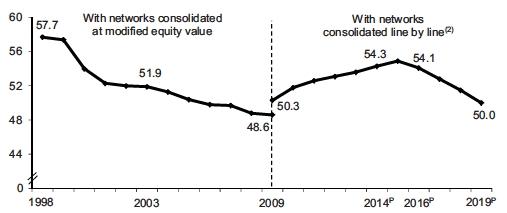
Between 1998 and 2009, the government’s gross-debt-to-GDP ratio fell significantly. While the gross debt was equivalent to 57.7% of GDP as at March 31, 1998, this ratio stood at 51.9% as at March 31, 2003 and 48.6% as at March 31, 2009. Line-by-line consolidation of the network institutions’ financial statements with those of the government raised the gross-debt-to-GDP ratio to 50.3% as at March 31, 2009.
The ratio has risen since 2009 mainly because of the increase in capital investments and the 2008-2009 recession. The gross debt burden is expected to decrease as of 2015-2016, once the budget has been balanced.
CHART E.2
|
| Gross debt as at March 31(1) |
| (as a percentage of GDP) |
| P: | Preliminary results for 2014 and forecasts for subsequent years. |
| (1) | The gross debt excludes pre-financing and takes into account the sums accumulated in the Generations Fund. |
| (2) | The gross debt takes into account the debt that the health and social services and the education networks have contracted in their own name. Accordingly, the data as of 2009 are not comparable with those for prior years since they do not include this debt. |
E.10
The net debt is equal to the Québec government’s liabilities less its financial assets. It represents the debt that has funded capital investments and current expenditures. The net debt is obtained by subtracting from the gross debt the government’s financial assets, net of other liabilities.
As at March 31, 2014, preliminary results show that the net debt stood at $181 965 million, or 49.9% of GDP. As a proportion of GDP, the net debt will gradually decline as of 2015-2016, to 45.0% as at March 31, 2019.
TABLE E.4
Factors responsible for the growth in the net debt
(millions of dollars)
| | | | | | | | | |
| | Debt, | Budgetary | Closure | Net | | | | Debt, | As a |
| | beginning | (surplus) | of | capital | | Generations | Total | end of | % of |
| | of year | deficit | Gentilly-2 | investments | Other | Fund | change | year | GDP |
| 2012-2013 | 167 700 | 1 600 | 1 876 | 4 863 | 409(1) | –961 | 7 787 | 175 487 | 49.0 |
| 2013-2014P | 175 487 | 3 100 | | 4 499 | — | –1 121 | 6 478 | 181 965 | 49.9 |
| 2014-2015P | 181 965 | 2 350 | | 5 534 | 3 800(2) | –1 301 | 10 383 | 192 348 | 51.0 |
| 2015-2016P | 192 348 | — | | 4 543 | — | –1 583 | 2 960 | 195 308 | 49.9 |
| 2016-2017P | 195 308 | — | | 3 565 | — | –2 254 | 1 311 | 196 619 | 48.4 |
| 2017-2018P | 196 619 | –300(3) | | 3 295 | — | –2 790 | 205 | 196 824 | 46.8 |
| 2018-2019P | 196 824 | –400(3) | | 2 545 | — | –3 126 | –981 | 195 843 | 45.0 |
| P: | Preliminary results for 2013-2014 and forecasts for subsequent years. |
| (1) | Includes other comprehensive income items of government enterprises and changes stemming from inventories and prepaid expenses that are non-financial assets. |
| (2) | Provision for the impact of the eventual transition of Hydro-Québec to International Financial Reporting Standards. This provision is explained on the next page. |
| (3) | Corresponds to half of the forecast budgetary surplus, in accordance with the government’s policy of allocating half of budgetary surpluses to reducing the debt and the other half to easing the tax burden, by giving priority to the gradual elimination of the health contribution. |
E.11
| |
| 1.3 | Debt representing accumulated deficits |
The debt representing accumulated deficits corresponds to the difference between the Québec government’s liabilities and its financial and non-financial assets as a whole. This debt is calculated by subtracting financial assets, net of other liabilities, as well as non-financial assets from the gross debt.
As at March 31, 2014, preliminary results show that the debt representing accumulated deficits stood at $120 074 million, or 32.9% of GDP. As a proportion of GDP, the debt representing accumulated deficits will gradually decline as of 2015-2016 to 26.3% as at March 31, 2019.
TABLE E.5
Factors responsible for the growth in the debt representing accumulated deficits
(millions of dollars)
| | | | | | | | |
| | Debt, | Budgetary | Closure | | | | Debt, | As a |
| | beginning | (surplus) | of | Accounting | Generations | Total | end of | % of |
| | of year | deficit | Gentilly-2 | adjustments | Fund | change | year | GDP |
| 2009-2010 | 103 433 | 3 174 | | 3 243 | –725 | 5 692 | 109 125 | 34.6 |
| 2010-2011 | 109 125 | 3 150 | | 431 | –760 | 2 821 | 111 946 | 34.0 |
| 2011-2012 | 111 946 | 2 628 | | 1 486 | –840 | 3 274 | 115 220 | 33.4 |
| 2012-2013 | 115 220 | 1 600 | 1 876 | 360 | –961 | 2 875 | 118 095 | 33.0 |
| 2013-2014P | 118 095 | 3 100 | | — | –1 121 | 1 979 | 120 074 | 32.9 |
| 2014-2015P | 120 074 | 2 350 | | 3 800 | –1 301 | 4 849 | 124 923 | 33.1 |
| 2015-2016P | 124 923 | — | | — | –1 583 | –1 583 | 123 340 | 31.5 |
| 2016-2017P | 123 340 | — | | — | –2 254 | –2 254 | 121 086 | 29.8 |
| 2017-2018P | 121 086 | –300 (1) | | — | –2 790 | –3 090 | 117 996 | 28.1 |
| 2018-2019P | 117 996 | –400 (1) | | — | –3 126 | –3 526 | 114 470 | 26.3 |
| P: | Preliminary results for 2013-2014 and forecasts for subsequent years. |
| (1) | Corresponds to half of the forecast budgetary surplus, in accordance with the government’s policy of allocating half of budgetary surpluses to reducing the debt and the other half to easing the tax burden, by giiving priority to the gradual elimination of the health contribution. |
As at March 31, 2015, the debt representing accumulated deficits takes into account a provision of $3.8 billion for the impact of the eventual transition of Hydro-Québec to International Financial Reporting Standards (IFRS). In February 2013, the Accounting Standards Board of Canada postponed, for the fourth time, the mandatory changeover to IFRS for corporations like Hydro-Québec that engage in rate-regulated activities. The anticipated date is now January 1, 2015, which would affect the government’s 2014-2015 fiscal year. It should be noted that Hydro-Québec’s eventual transition to IFRS will have no impact on the government’s gross debt.
E.12
| |
| 1.4 | Debt reduction objectives |
This budget confirms that the debt reduction objectives included in the Act to reduce the debt and establish the Generations Fund in 2010 will be maintained. These objectives are:
| |
— | 45% of GDP for the gross debt as at March 31, 2026; |
| | |
| — | 17% of GDP for the debt representing accumulated deficits as at March 31, 2026. |
| | |
| CHART E.3 | | CHART E.4 |
| | | |
| Gross debt as at March 31 | | Debt representing accumulated deficits as at March 31 |
| (as a percentage of GDP) | | (as a percentage of GDP) |
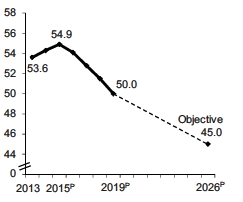 | |  |
| P: | Preliminary results for 2014, forecasts for 2015 to 2019 and projections for subsequent years. | | P: | Preliminary results for 2014, forecasts for 2015 to 2019 and projections for subsequent years. |
| | Note: The gross debt excludes pre-financing and takes into account the sums accumulated in the Generations Fund. | | | |
To achieve these debt reduction objectives, the government has the Generations Fund, established in 2006, at its disposal. In addition to the water-power royalties paid by Hydro-Québec and private producers of hydro-electricity,1 the current provisions of the Act to reduce the debt and establish the Generations Fund stipulate that the following revenue sources will be deposited in the Generations Fund:
| |
| — | the revenue generated by the indexation of the price of heritage electricity starting in 2014. This will amount to $71 million in 2014-2015, $105 million in 2015-2016, $205 million in 2016-2017, $305 million in 2017-2018 and $410 million in 2018-2019; |
| | | |
| 1 | The Act to reduce the debt and establish the Generations Fund also provides for the deposit in the Generations Fund of unclaimed property administered by Revenu Québec and income generated by the investment of the sums making up the fund. |
E.13
| |
| — | all mining revenues as of 2015-2016. This will amount to $114 million in 2015-2016, $149 million in 2016-2017, $194 million in 2017-2018 and $219 million in 2018-2019; |
| | |
| — | the savings, as of 2017-2018, stemming from the closure of the Gentilly-2 nuclear power plant, which will amount to $215 million per year; |
| | |
| — | an amount of $100 million per year, as of 2014-2015, generated by the increase in the specific tax on alcoholic beverages. |
| | |
This budget provides for the deposit of additional sums in the Generations Fund as of 2016-2017. These additional deposits will be drawn from the specific tax on alcoholic beverages and represent $400 million per year.
In addition, the government is announcing in this budget that, as of 2017-2018, the fiscal outlook will make it possible to generate surpluses, half of which will be used to reduce the debt and the other half to ease the tax burden of Quebecers, by giving priority to the gradual elimination of the health contribution.
The Generations Fund should reach $16.7 billion as at March 31, 2019.
E.14
Public sector debt includes the government’s gross debt as well as the debt of Hydro-Québec, the municipalities, universities other than the Université du Québec and its constituents and other government enterprises. This debt has served in particular to fund public infrastructure, such as roads, schools, hospitals, hydroelectric dams and water treatment plants.
As at March 31, 2014, preliminary results show that Québec’s public sector debt stood at $263 916 million, or 72.4% of GDP. These figures must be seen in perspective for they do not take into account the economic value of certain assets held by the government, such as Hydro-Québec, the Société des alcools du Québec and Loto-Québec.
TABLE E.6
Public sector debt as at March 31
(millions of dollars)
| | | | | | |
| | 2010 | 2011 | 2012 | 2013 | 2014P | |
| Government’s gross debt(1) | 163 318 | 173 436 | 183 384 | 191 756 | 198 052 | |
| Hydro-Québec | 36 385 | 37 723 | 38 514 | 39 631 | 40 361 | |
| Municipalities(2) | 19 538 | 20 307 | 20 719 | 21 820 | 22 622 | |
| Universities other than the Université du Québec and its constituents(3) | 1 930 | 1 925 | 1 797 | 1 739 | 1 739 | |
| Other government enterprises(4) | 697 | 1 363 | 1 363 | 1 479 | 1 142 | |
| | | | | | | |
| PUBLIC SECTOR DEBT | 221 868 | 234 754 | 245 777 | 256 425 | 263 916 | |
As a % of GDP | 70.3 | 71.2 | 71.2 | 71.7 | 72.4 | |
| P: | Preliminary results. |
| (1) | The gross debt excludes pre-financing and takes into account the sums accumulated in the Generations Fund. |
| (2) | These amounts correspond to the long-term debt contracted by municipalities in their own name. Part of this debt is subsidized by the government ($3 899 million as at March 31, 2014). |
| (3) | These amounts correspond to the debt contracted by universities other than the Université du Québec and its constituents in their own name. Part of this debt is subsidized by the government ($65 million as at March 31, 2014). |
| (4) | These amounts correspond to the debt contracted by the Financing Fund to finance government enterprises and entities not included in the reporting entity. |
E.15
| |
| 1.6 | Comparison of the debt of governments in Canada |
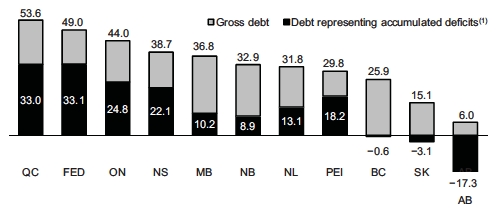
Whether on the basis of gross debt or debt representing accumulated deficits, as a percentage of GDP, Québec is the most heavily indebted province.
As at March 31, 2013, the ratio of gross debt to GDP was 53.6% in Québec compared with 44.0% in Ontario, the second most indebted province, and 38.7% in Nova Scotia, which ranks third.
CHART E.5
|
| Gross debt and debt representing accumulated deficits as at March 31, 2013 |
| (as a percentage of GDP) |
|
| (1) A negative entry means that the government has accumulated surpluses. |
| Sources: Governments’ public accounts, Statistics Canada and Ministère des Finances du Québec. |
The table on the following page shows the debt of the federal government and each province as at March 31, 2013. The boxes indicate the debt concept used by each government in its budget documents to measure its debt level. Some governments use more than one concept.
Contrary to the net debt and debt representing accumulated deficits, gross debt cannot be observed directly in the public accounts of the other governments in Canada. However, the public accounts show the components of gross debt, i.e. the consolidated direct debt, the net retirement plans liability and the net employee future benefits liability. Therefore, it is possible to calculate the level of the gross debt according to the concept used by Québec.
E.16
TABLE E.7
Debt as at March 31, 2013 according to various concepts
(millions of dollars)
| | | | | | | | | | | | |
| | QC | FED | ON | NS | MB | NB | NL | PEI | BC | SK | AB | |
| | | | | | | | | | | | | |
| Consolidated direct debt | 168 616 | 673 046 | 292 599 | 12 869 | 19 155 | 10 177 | 5 148 | 1 688 | | 55 061 | | 5 013 | 7 752 | |
| Net retirement plans liability | 28 359 | 151 667 | –6 352 | 230 | 1 828 | –150 | 3 270 | –86 | 165 | 6 774 | 10 852 | |
| Net employee future benefits liability | 19 | 67 301 | 10 714 | 1 774 | 434 | 347 | 2 323 | 52 | 1 760 | — | — | |
| Generations Fund | –5 238 | | | | | | | | | | | |
| | | | | | | | | | | | | |
| Gross debt | | 191 756 | 892 014 | 296 961 | 14 873 | 21 417 | 10 374 | 10 741 | 1 654 | 56 986 | 11 787 | 18 604 | |
As a % of GDP | 53.6 | 49.0 | 44.0 | 38.7 | 36.8 | 32.9 | 31.8 | 29.8 | 25.9 | 15.1 | 6.0 | |
| Less: Financial assets, net of other liabilities | –16 269 | –220 651 | –44 873 | –919 | –5 524 | 680 | –2 393 | 386 | –18 850 | –6 678 | –30 796 | |
| | | | | | | | | | | | | |
| Net debt(1) | | 175 487 | 671 363 | | 252 088 | | 13 954 | | 15 893 | | 11 054 | | 8 348 | 2 040 | 38 136 | 5 109 | | –12 192 | |
As a % of GDP | 49.0 | 36.9 | 37.4 | 36.3 | 27.3 | 35.0 | 24.7 | 36.8 | 17.3 | 6.6 | –3.9 | |
| Less: Non-financial assets | –57 392 | –68 922 | –84 956 | –5 472 | –9 957 | –8 258 | –3 916 | –1 031 | –39 521 | –7 558 | –41 780 | |
| | | | | | | | | | | | | |
Debt representing accumulated
deficits(1) | | | | | | | | | | | | | | | | |
| 118 095 | | 602 441 | | 167 132 | 8 482 | 5 936 | 2 796 | 4 432 | 1 009 | –1 385 | –2 449 | | –53 972 | |
As a % of GDP | 33.0 | 33.1 | 24.8 | 22.1 | 10.2 | 8.9 | 13.1 | 18.2 | –0.6 | –3.1 | –17.3 | |
Note: The boxes indicate the debt concept(s) used in the budget papers of the government concerned.
(1) A negative entry means that the government has net assets or accumulated surpluses.
Sources: Governments’ public accounts, Statistics Canada and Ministère des Finances du Québec.
E.17
[This Page is Intentionally Left Blank]
| |
| 2. | FINANCING AND DEBT MANAGEMENT |
Preliminary results show that the government’s financing program for 2013-2014 amounted to $19 586 million. It should stand at $15 034 million in 2014-2015. This is a decrease of $345 million compared with what was forecast in February 2014. This decrease is attributable to, among other things, pre-financing made in 2013-2014 that was $1 189 million higher than anticipated.
E.19
TABLE E.8
The government’s financing program in 2013-2014 and 2014-2015
(millions of dollars)
| | | | | | | |
| | | 2014-2015P | |
| | | Financial | | | | | |
| | | situation as at | | Revised | | | |
| | 2013-2014P | February 20, 2014 | Revisions | program | Completed(1) | % | |
| | | | | | | | |
| GENERAL FUND | | | | | | | |
Net financial requirements(2),(3) | 1 988 | 2 649 | 1 516 | 4 165 | | | |
Repayments of borrowings | 4 767 | 7 597 | 104 | 7 701 | | | |
Use of the Generations | | | | | | | |
Fund to repay maturing borrowings | -1 000 | — | — | — | | | |
Change in cash position(4) | -3 485 | -4 421 | -1 189 | -5 610 | | | |
Deposits in the Retirement | | | | | | | |
Plans Sinking Fund(5) | 1 000 | — | — | — | | | |
Transactions under the credit policy(6) | 1 216 | — | -55 | -55 | | | |
Additional contributions to the Sinking Fund for borrowings | 3 538 | — | 300 | 300 | | | |
Pre-financing | 5 610 | — | — | — | | | |
| | | | | | | | |
| GENERAL FUND | 11 202 | 5 825 | 676 | 6 501 | | | |
| | | | | | | | |
| FINANCING FUND | 7 384 | 8 554 | -1 021 | 7 533 | | | |
| | | | | | | | |
| Subtotal – General fund and Financing Fund | 18 586 | 14 379 | -345 | 14 034 | 4 698 | 33.5% | |
| | | | | | | | |
| FINANCEMENT-QUÉBEC | 1 000 | 1 000 | — | 1 000 | — | — | |
| | | | | | | | |
| TOTAL | 19 586 | 15 379 | -345 | 15 034 | 4 698 | 31.2% | |
Including: repayments of borrowings(7) | 9 741 | 12 261 | 102 | 12 363 | — | — | |
P: Preliminary results for 2013-2014 and forecasts for 2014-2015.
Note: A negative entry indicates a source of financing and a positive entry, a financial requirement.
| (1) | Borrowings contracted or negotiated as at May 29, 2014. |
| (2) | These amounts exclude the net financial requirements of consolidated entities funded through the Financing Fund. |
| (3) | Net financial requirements are adjusted to take into account the non-receipt of revenues of the RPSF and of funds dedicated to employee future benefits. |
| (4) | Corresponds to pre-financing made the previous year. |
| (5) | Deposits in the RPSF are optional. They are recorded in the financing program only once they are made. |
| (6) | Under the credit policy, which is designed to limit financial risk with respect to counterparties, the government disburses or receives amounts because of movements in exchange rates. These amounts have no effect on the debt. |
| (7) | The amounts include repayments of borrowings, for 2013-2014 and 2014-2015 respectively, of the general fund ($4 767 million and $7 701 million), the Financing Fund ($1 252 million and $1 151 million) and Financement-Québec ($3 722 million and $3 511 million). |
E.20
The financing program should amount to $17 880 million in 2015-2016 and $18 914 million in 2016-2017.
TABLE E.9
The government’s financing program in 2015-2016 and 2016-2017
(millions of dollars)
| | | |
| | 2015-2016F | 2016-2017F | |
| | | | |
| GENERAL FUND | | | |
Net financial requirements(1),(2) | 1 062 | 219 | |
Repayments of borrowings | 7 115 | 10 697 | |
| | | | |
| GENERAL FUND | 8 177 | 10 916 | |
| | | | |
| FINANCING FUND | 8 703 | 6 998 | |
| | | | |
| Subtotal – General fund and Financing Fund | 16 880 | 17 914 | |
| | | | |
| FINANCEMENT-QUÉBEC | 1 000 | 1 000 | |
| | | | |
| TOTAL | 17 880 | 18 914 | |
Including: repayments of borrowings(3) | 10 201 | 15 017 | |
F: Forecasts.
Note: A negative entry indicates a source of financing and a positive entry, a financial requirement.
| (1) | These amounts exclude the net financial requirements of consolidated entities funded through the Financing Fund. |
| (2) | Net financial requirements are adjusted to take into account the non-receipt of revenues of the RPSF and of funds dedicated to employee future benefits. |
| (3) | The amounts include repayments of borrowings, for 2015-2016 and 2016-2017 respectively, of the general fund ($7 115 million and $10 697 million), the Financing Fund ($1 206 million and $1 212 million) and Financement-Québec ($1 880 million and $3 108 million). |
E.21
The government aims to borrow at the lowest possible cost. To that end, it applies a strategy for diversifying sources of funding by market, financial instrument and maturity.
| |
| 2.2.1 | Diversification by market |
Financing transactions are carried out regularly on most markets, i.e. in Canada, the United States, Europe and Asia.
Over the past 10 years, 16.7% of borrowings were contracted in foreign currencies. Nonetheless, the government keeps no exposure of its gross debt to these currencies (see section 2.6).
In 2013-2014, the government carried out 16.2% of its borrowings on foreign markets, i.e.:
| |
| — | a public bond issue of €1 000 million (CAN$1 358 million) in July 2013; |
| | |
| — | a public bond issue of €1 000 million (CAN$1 485 million) in January 2014; |
| | |
| — | a public bond issue of 200 million CHF (CAN$244 million) in February 2014; |
| | |
| — | a borrowing of €65 million (CAN$88 million) in June 2013. |
|
| CHART E.6 |
| |
| Borrowings by currency(1) |
| (per cent) |
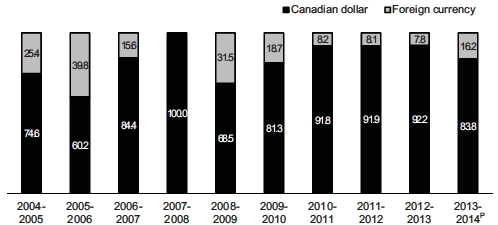
| P: | Preliminary results. |
| (1) | Borrowings of the general fund, borrowings for the Financing Fund and borrowings of Financement-Québec. |
E.22
| |
| 2.2.2 | Diversification by instrument |
To satisfy investors’ needs, an extensive array of financial products is used in the course of financing transactions.
Long-term instruments consist primarily of public bond issues and private borrowings.
In 2013-2014, public issues represented 64.0% of instruments used.
CHART E.7
|
| Long-term borrowings contracted in 2013-2014P by instrument |
| (per cent) |
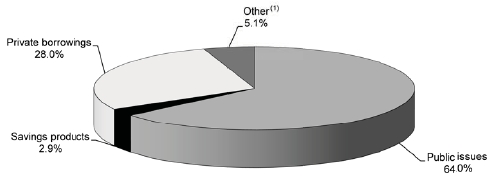
| P: | Preliminary results. |
| (1) | Business Assistance - Immigrant Investor Program. |
E.23
| |
| 2.2.3 | Diversification by maturity |
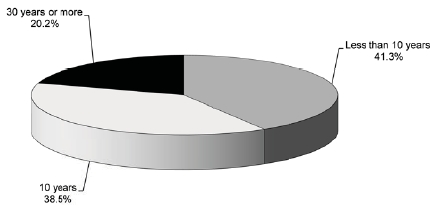
Maturities of new borrowings are distributed over time to obtain a stable refinancing profile and ensure the government’s regular presence on capital markets.
In the case of borrowings contracted in 2013-2014, 41.3% had a maturity of less than 10 years, 38.5% a maturity of 10 years and 20.2% a maturity of 30 years or more.
CHART E.8
|
| Long-term borrowings contracted in 2013-2014P by maturity |
| (per cent) |
E.24
This diversification by maturity is reflected on the maturity of the debt shown in the following chart. As at March 31, 2014, the average maturity of the debt was about 11 years.
CHART E.9
|
| Maturity of the long-term debt as at March 31, 2014P |
| (millions of dollars) |
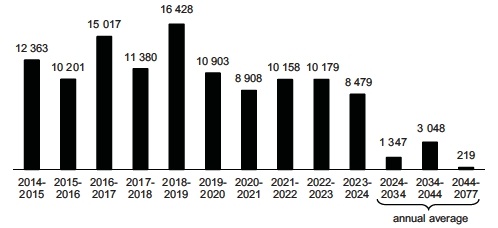
| |
| P: | Preliminary results. |
| Note: | Direct debt of the general fund, debt contracted to make advances to the Financing Fund and debt of Financement-Québec. |
E.25
| |
| 2.3 | Increase in the government’s prudential liquidity |
As indicated in the March 2012 budget, the Ministère des Finances implemented in 2012-2013 a policy aimed at increasing the level of the government’s prudential liquidity. These liquid assets will be available for use in the event of major turbulence on financial markets. As at March 31, 2014, they stood at $7.6 billion.
The government’s prudential liquidities are equivalent to close to half of the average annual financing requirements expected over the coming years.
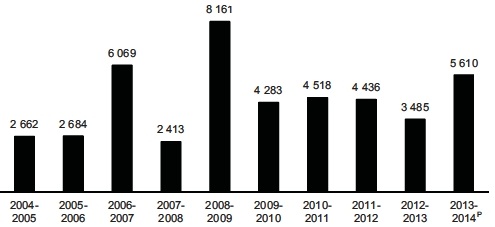
The government carries out pre-financing to take advantage of favourable market conditions. These are borrowings that would normally be contracted during the subsequent fiscal year.
In 2013-2014, the government contracted pre-financing of $5 610 million. The average for the past 10 years was $4 432 million a year.
CHART E.10
|
| Pre-financing |
| (millions of dollars) |
E.26
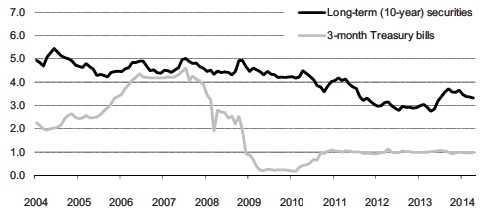
The yield on the Québec government’s long-term securities is currently about 3.3%, while that on short-term securities is roughly 1.0%.
CHART E.11
|
| Yield on Québec securities |
| (per cent) |
|
| Sources: PC-Bond and Ministère des Finances du Québec. |
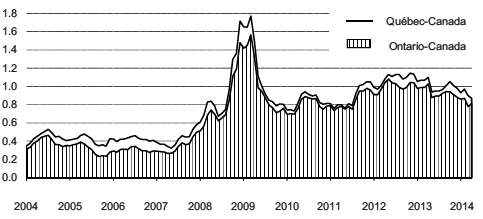
In addition, the substantial increase in the spread between the yield on Québec and federal government securities, observed starting in the summer of 2008 during the financial crisis, has narrowed considerably since then. However, the level of the spread has not returned to the levels observed prior to 2008. The same situation has also been observed in the case of the other provinces.
CHART E.12
|
| Yield spread on long-term (10-year) securities |
| (percentage points) |
E.27
The government’s debt management strategy aims to minimize the cost of the debt while limiting the risks related to fluctuations in foreign exchange and interest rates.
The government uses a range of financial instruments, particularly interest rate and currency swap agreements, to achieve desired debt proportions by currency and interest rate.
| |
| q | Structure of the debt by currency |
As at March 31, 2014, preliminary results show that the proportion of the government’s gross debt in foreign currency, after taking into account interest rate and currency swap agreements, stood at 0%. The proportion of the gross debt in foreign currency was also nil as at March 31, 2013.
CHART E.13
|
| Proportion of the debt in foreign currency as at March 31 |
| (per cent) |
|
| P: Preliminary results. |
| Note: Gross debt including pre-financing. |
E.28
| |
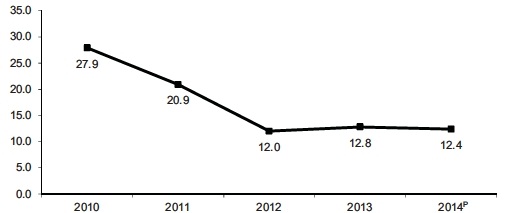
| q | Structure of the debt by interest rate |
The government keeps part of its debt at variable interest rates and part at fixed interest rates.
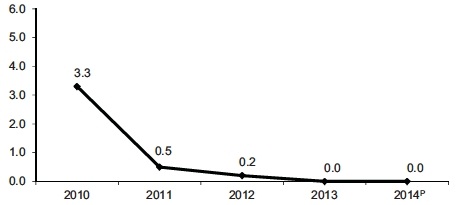
After taking into account interest rate and currency swap agreements, preliminary results show that the proportion of the gross debt at variable interest rates was 12.4% as at March 31, 2014. The proportion of the gross debt at variable interest rates has fallen since 2010.
CHART E.14
|
| Proportion of the gross debt at variable interest rates(1) as at March 31 |
| (per cent) |
| |
| P: | Preliminary results. |
| Note: Gross debt including pre-financing. |
| (1) | The debt at variable interest rates includes variable interest rate financial instruments as well as fixed interest rate financial instruments that mature in one year or less. |
E.29
TABLE E.10
Québec government
Summary of long-term borrowings(1) in 2013-2014P
| | | |
| Currency | $ million | % | |
| | | | |
| CANADIAN DOLLAR | | | |
Public issues | 9 446 | 48.2 | |
Private borrowings | 5 404 | 27.6 | |
Savings products | 558 | 2.9 | |
Business Assistance - Immigrant Investor Program | 1 003 | 5.1 | |
| | | | |
| Subtotal | 16 411 | 83.8 | |
| | | | |
| OTHER CURRENCIES | | | |
Euro | 2 931 | 15.0 | |
Swiss franc | 244 | 1.2 | |
| | | | |
| Subtotal | 3 175 | 16.2 | |
| | | | |
| TOTAL | 19 586 | 100.0 | |
| P: | Preliminary results. |
| (1) | The amounts include the borrowings of the general fund, borrowings for the Financing Fund and borrowings of Financement-Québec. |
E.30
TABLE E.11
Québec government
Borrowings contracted in 2013-2014P for the general fund
| | | | | | | | | |
| Amount | Face | | | | | | | |
| received in | value in | | | | | | | |
| Canadian | foreign | Interest | | Date of | Date of | Price to | Yield to | |
| dollars(1) | currency | rate | (2) | issue | maturity | investor | investor | (3) |
| (millions) | (%) | | | | ($) | (%) | |
| 303 | | — | 4.50 | | April 19 | 2017-12-01 | 112.199 | 1.739 | |
| 1 052 | (4) | — | Variable | (5) | April 23 | 2016-10-23 | 100.000 | Variable | |
| 358 | (4) | — | Variable | (5) | April 26 | 2016-10-23 | 100.000 | Variable | |
| 463 | | — | 3.50 | | April 30 | 2045-12-01 | 98.353 | 3.586 | |
| 497 | | — | 3.50 | | May 3 | 2045-12-01 | 99.420 | 3.530 | |
| 481 | | — | 3.50 | | June 7 | 2045-12-01 | 96.109 | 3.707 | |
| 88 | (4) | €65 | 2.644 | (6) | June 17 | 2033-06-17 | 100.000 | 2.644 | (7) |
| 556 | | — | 4.50 | | June 17 | 2018-12-01 | 111.203 | 2.303 | |
| 607 | | — | 5.00 | | June 19 | 2041-12-01 | 121.390 | 3.768 | |
| 460 | | — | 3.50 | | July 5 | 2045-12-01 | 91.984 | 3.940 | |
| 1 358 | | €1 000 | 2.25 | (6) | July 17 | 2023-07-17 | 99.514 | 2.305 | (7) |
| 386 | | — | 3.50 | | September 4 | 2045-12-01 | 87.245 | 4.228 | |
| 502 | | — | 3.75 | | January 13 | 2024-09-01 | 100.337 | 3.711 | |
| 347 | | — | 3.50 | | January 14 | 2045-12-01 | 87.872 | 4.193 | |
| 1 485 | | €1 000 | 2.375 | (6) | January 22 | 2024-01-22 | 99.045 | 2.484 | (7) |
| 244 | | 200 CHF | 1.50 | (6) | February 5 | 2024-02-05 | 99.426 | 1.563 | (7) |
| 454 | | — | 3.50 | | February 10 | 2045-12-01 | 90.758 | 4.017 | |
| 558 | (8) | — | Various | | Various | Various | Various | Various | |
| 1 003 | (9) | — | Zero coupon | | Various | Various | Various | Various | |
| 11 202 | | | | | | | | | |
| P: | Preliminary results. |
| (1) | Borrowings in foreign currency given in Canadian equivalent of their value on the date of borrowing. |
| (2) | Interest payable semi-annually except if another frequency is indicated in a note. |
| (3) | Yield to investor is determined on the basis of interest payable semi-annually except if another frequency is indicated in a note. |
| (4) | Private borrowings. |
| (5) | Interest payable quarterly. |
| (6) | Interest payable annually. |
| (7) | Yield to investor is determined on the basis of interest payable annually. |
| (8) | Savings products issued by Épargne Placements Québec. |
| (9) | Business Assistance - Immigrant Investor Program. |
E.31
TABLE E.12
Québec government
Borrowings contracted in 2013-2014P for the Financing Fund
| | | | | | | | | |
| Amount | | Face | | | | | | | |
| received in | | value in | | | | | | | |
| Canadian | | foreign | Interest | | Date of | Date of | Price to | Yield to | |
| dollars(1) | | currency | rate | (2) | issue | maturity | investor | investor | (3) |
| (millions) | (%) | | | | ($) | (%) | |
| 258 | | — | 4.50 | | April 19 | 2017-12-01 | 112.199 | 1.739 | |
| 29 | | — | 3.50 | | April 30 | 2045-12-01 | 98.353 | 3.586 | |
| 512 | | — | 3.00 | | May 7 | 2023-09-01 | 102.466 | 2.724 | |
| 506 | | — | 3.00 | | May 21 | 2023-09-01 | 101.121 | 2.873 | |
| 499 | | — | 3.00 | | June 3 | 2023-09-01 | 99.892 | 3.012 | |
| 494 | | — | 3.00 | | June 21 | 2023-09-01 | 98.844 | 3.133 | |
| 480 | | — | 3.00 | | August 12 | 2023-09-01 | 96.071 | 3.466 | |
| 50 | | — | 3.50 | | September 4 | 2045-12-01 | 87.245 | 4.228 | |
| 471 | | — | 3.00 | | September 25 | 2023-09-01 | 94.128 | 3.712 | |
| 500 | | — | 3.75 | | December 18 | 2024-09-01 | 99.926 | 3.758 | |
| 499 | | — | 3.75 | | December 18 | 2024-09-01 | 99.751 | 3.778 | |
| 2 994 | (4) | — | Variable | (5) | December 19 | 2018-12-19 | 100.000 | Variable | |
| 92 | | — | 3.50 | | January 14 | 2045-12-01 | 87.872 | 4.193 | |
| 7 384 | | | | | | | | | |
| P: | Preliminary results. |
| (1) | Borrowings in foreign currency given in Canadian equivalent of their value on the date of borrowing. |
| (2) | Interest payable semi-annually except if another frequency is indicated in a note. |
| (3) | Yield to investor is determined on the basis of interest payable semi-annually. |
| (4) | Private borrowings. |
| (5) | Interest payable quarterly. |
E.32
TABLE E.13
Québec government
Borrowings contracted in 2013-2014P by Financement-Québec
| | | | | | | | | |
| Amount | | Face | | | | | | | |
| received in | | value in | | | | | | | |
| Canadian | | foreign | Interest | | Date of | Date of | Price to | Yield to | |
| dollars(1) | | currency | rate | (2) | issue | maturity | investor | investor | (3) |
| (millions) | (%) | | | | ($) | (%) | |
| 1 000 | (4) | — | Variable | (5) | October 29 | 2019-05-29 | 100.000 | Variable | |
| 1 000 | | | | | | | | | |
| P: | Preliminary results. |
| (1) | Borrowings in foreign currency given in Canadian equivalent of their value on the date of borrowing. |
| (2) | Interest payable semi-annually except if another frequency is indicated in a note. |
| (3) | Yield to investor is established on the basis of interest payable semi-annually. |
| (4) | Private borrowings. |
| (5) | Interest payable quarterly. |
E.33
TABLE E.14
Borrowings contracted in 2013 by Hydro-Québec
| | | | | | | | | |
| Amount | | Face | | | | | | | |
| received in | | value in | | | | | | | |
| Canadian | | foreign | Interest | | Date of | Date of | Price to | Yield to | |
| dollars(1) | | currency | rate | (2) | issue | maturity | investor | investor | (3) |
| (millions) | (%) | | | | ($) | (%) | |
| 8 | (4) | — | Zero coupon | | April 25 | 2022-04-15 | 77.165 | 2.929 | |
| 601 | | — | 5.00 | | July 19 | 2050-02-15 | 120.133 | 3.954 | |
| 1 000 | (4) | — | Variable | (5) | September 3 | 2018-09-03 | 100.000 | Variable | |
| 582 | | — | 5.00 | | October 31 | 2050-02-15 | 116.386 | 4.125 | |
| 2 191 | | | | | | | | | |
Note: Borrowings contracted from January 1 to December 31, 2013.
| (1) | Borrowings in foreign currency given in Canadian equivalent of their value on the date of borrowing. |
| (2) | Interest payable semi-annually except if another frequency is indicated in a note. |
| (3) | Yield to investor is established on the basis of interest payable semi-annually. |
| (4) | Private borrowings. |
| (5) | Interest payable quarterly. |
E.34
| |
3. | INFORMATION ON THE RETIREMENT PLANS AND ON FUNDS DEPOSITED BY THE MINISTÈRE DES FINANCES WITH THE CAISSE DE DÉPÔT ET PLACEMENT DU QUÉBEC |
The Québec government participates financially in the retirement plans of its employees. These plans had 577 875 active participants and 326 755 beneficiaries as at December 31, 2012.
TABLE E.15
Retirement plans of public and parapublic sector employees as at December 31, 2012
| | | |
| | Active participants | Beneficiaries | |
| Government and Public Employees Retirement Plan (RREGOP) | 530 000 | 223 702 | |
| Pension Plan of Management Personnel (PPMP) and Retirement Plan for Senior Officials (RPSO) | 28 850 | 26 376 | |
| Other plans: | | | |
| — Teachers Pension Plan (TPP)(1) and Pension Plan of Certain | | | |
| Teachers (PPCT)(1) | 97 | 45 143 | |
| — Civil Service Superannuation Plan (CSSP)(1) | 35 | 20 526 | |
| — Superannuation Plan for the Members of the Sûreté du | | | |
| Québec (SPMSQ) | 5 850 | 4 901 | |
| — Pension Plan of Peace Officers in Correctional Services | | | |
| (PPPOCS) | 3 600 | 1 689 | |
| — Pension Plan of the Judges of the Court of Québec and of | | | |
| Certain Municipal Courts (PPJCQM) | 273 | 357 | |
| — Pension Plan for Federal Employees Transferred to | | | |
| Employment with the Gouvernement du Québec (PPFEQ)(2) | 200 | 149 | |
| — Pension Plan of the Members of the National Assembly | | | |
| (PPMNA) | 120 | 411 | |
| — Pension Plan of the Université du Québec (PPUQ) | 8 850 | 3 501 | |
| Total for other plans | 19 025 | 76 677 | |
| TOTAL | 577 875 | 326 755 | |
| (1) | These plans have not accepted any new participants since July 1, 1973. |
| (2) | This plan has not accepted any new participants since it came into effect on January 1, 1992. |
Source: 2012-2013 Public Accounts.
E.35
| |
| q | Summary description of the retirement plans |
The retirement plans of public and parapublic sector employees are defined benefit retirement plans. Benefits are calculated on the basis of participants’ average income for the best paid years (generally five) and their number of years of service. The pension usually represents 2% of an employee’s average income per year of service. Benefits are partially indexed to inflation.
RREGOP and PPMP, which account for nearly 97% of active participants, are cost-sharing plans: the government is responsible for paying 50% of the benefits, and the participants are responsible for paying the other 50%.2
Most of the other retirement plans are cost-balance plans. The government covers the cost of these plans, net of contributions paid by participants.
The Commission administrative des régimes de retraite et d'assurances (CARRA) is responsible for administering the retirement plans.3
TABLE E.16
Change in the employee contribution rate of certain retirement plans
(per cent)
| | | | |
| | RREGOP(1) | PPMP(2) | SPMSQ(3) | PPPOCS(4) |
| 2004 | 5.35 | 4.50 | 8 / 6.2 / 8 | 4.0 |
| 2005 | 7.06 | 7.78 | 8 / 6.2 / 8 | 4.0 |
| 2006 | 7.06 | 7.78 | 8 / 6.2 / 8 | 4.0 |
| 2007 | 7.06 | 7.78 | 8 / 6.2 / 8 | 4.0 |
| 2008 | 8.19 | 10.54 | 8 / 6.2 / 8 | 4.0 |
| 2009 | 8.19 | 10.54 | 8 / 6.2 / 8 | 4.0 |
| 2010 | 8.19 | 10.54 | 8 / 6.2 / 8 | 4.0 |
| 2011 | 8.69 | 11.54 | 8 / 6.2 / 8 | 4.0 |
| 2012 | 8.94 | 12.30 | 8 / 6.2 / 8 | 4.0 |
| 2013 | 9.18 | 12.30 | 8 / 6.2 / 8 | 6.5 |
| 2014 | 9.84 | 14.38 | 8 / 6.2 / 8 | 8.3 |
| (1) | For 2004 to 2012, rate applicable to the excess of 35% of maximum pensionable earnings (MPE), which is determined by the Régie des rentes du Québec (RRQ). The contribution formula as of 2012 was changed at the time of the collective agreements’ renewal. For 2012, the rate applies to the excess of 33% of the MPE. For 2013, the rate applies to the excess of 31% of the MPE. For 2014, the rate applies to the excess of 29% of the MPE. In 2014, the MPE is $52 500. |
| (2) | Rate applicable to the excess of 35% of the MPE. |
| (3) | Rate applicable up to the annual basic exemption of the RRQ ($3 500) / rate applicable to the excess up to the amount of the MPE / rate applicable to the excess of the MPE. |
| (4) | Rate applicable to the excess of 25% of the employee's salary or of 25% of the MPE if it is lower. |
| | | |
| 2 | This cost-sharing formula has been in effect since July 1, 1982. Previously, the government was responsible for payment of 7/12 of the benefits (58.3%). |
| 3 | Except for the Pension Plan of the Université du Québec (PPUQ). |
E.36
In 2010, to retain qualified workers and delay their retirement, the government modified RREGOP and the PPMP to enable participants to accumulate up to 38 years of service. This change, which was agreed upon during the latest renewal of the collective agreements with government employees, is aimed at ensuring that employees nearing the end of their career stay longer in the labour market, thus facilitating the transfer of expertise.
The PPMP was also modified with the adoption of Bill 58 by the National Assembly in 2012. The changes included in the Bill were the product of consultations with participant representatives and included several amendments fostering the financial health of the PPMP. In particular, the pension eligibility criteria were tightened. Since January 1, 2013, new participants must complete an additional five-year period of membership in the plan for their retirement benefit to be calculated in accordance with the provisions of the PPMP. In addition, the reduction of the benefit for early retirement was increased.
| |
| 3.1.1 | Retirement plans liability |
In its financial statements, the government discloses the present value of the retirement benefits it will pay to its employees, taking into account the conditions governing their plans as well as their years of service. This value is called the retirement plans liability. It does not take into account the sums accumulated to pay retirement benefits, particularly the Retirement Plans Sinking Fund (RPSF), which will be discussed later on.
The actuarial valuations of the liability of the various retirement plans are carried out by CARRA,4 following the rules of the Canadian Institute of Actuaries (CIA) and the Chartered Professional Accountants of Canada (CPA Canada) for the public sector.
As at March 31, 2013, the liability for the retirement plans of public and parapublic sector employees amounted to $76 703 million (net of the plans’ assets). This amount is recognized in the government’s gross debt.
| | | |
| 4 | Except in the case of the PPUQ, whose liability valuation is performed by a private-sector actuarial firm. |
E.37
TABLE E.17
Retirement plans liability
(millions of dollars)
| | |
| | March 31, 2013 | |
| Government and Public Employees Retirement Plan (RREGOP) | 46 344 | |
| Pension Plan of Management Personnel (PPMP) and Retirement Plan for Senior Officials (RPSO) | 10 706 | |
| Other plans: | | |
| — Teachers Pension Plan (TPP) and Pension Plan of Certain Teachers (PPCT) | 11 546 | |
| — Civil Service Superannuation Plan (CSSP) | 3 848 | |
| — Superannuation Plan for the Members of the Sûreté du Québec (SPMSQ) | 3 681 | |
| — Pension Plan of the Université du Québec (PPUQ) | 2 967 | |
| — Pension Plan of Peace Officers in Correctional Services (PPPOCS) | 842 | |
| — Pension Plan of the Judges of the Court of Québec and of Certain Municipal | | |
| Courts (PPJCQM) | 538 | |
| — Pension Plan of the Members of the National Assembly (PPMNA) | 186 | |
| — Pension Plan for Federal Employees Transferred to Employment with the | | |
| Gouvernement du Québec (PPFEQ) | 133 | |
| — Plans’ assets(1) | –4 088 | |
| Total for other plans | 19 653 | |
| RETIREMENT PLANS LIABILITY | 76 703 | |
| (1) | Plans’ assets, particularly those of the PPFEQ, SPMSQ and PPUQ. |
E.38
| |
| q | Annual retirement plans expenditure |
Every year, the government also records its expenditure as an employer with regard to the retirement plans. This expenditure comprises two components:
| |
| — | the net cost of vested benefits, that is, the present value of retirement benefits that employees have accumulated for work performed during the year, net of contributions paid, i.e. $1 900 million in 2012-2013; |
| | |
| — | the amortization of revisions to the government’s actuarial obligations arising from previous updates of actuarial valuations, for a cost of $619 million in 2012-2013. |
In 2012-2013, government spending in respect of the retirement plans stood at $2 519 million.
TABLE E.18
Spending in respect of the retirement plans
(millions of dollars)
| | |
| | 2012-2013 | |
| Net cost of vested benefits | 1 900 | |
| Amortization of revisions stemming from actuarial valuations | 619 | |
| SPENDING IN RESPECT OF THE RETIREMENT PLANS | 2 519 | |
E.39
| |
| 3.1.2 | Retirement Plans Sinking Fund |
The Retirement Plans Sinking Fund (RPSF) is an asset that was created in 1993 for the purpose of paying the retirement benefits of public and parapublic sector employees.
As at March 31, 2014, preliminary results show that the book value of the RPSF stood at $51 333 million.
TABLE E.19
Change in the Retirement Plans Sinking Fund (RPSF)
(millions of dollars)
| | | | |
| | Book value, | | Imputed investment | Book value, |
| | beginning of year | Deposits | income | end of year |
| 1993-1994 | — | 850 | 4 | 854 |
| 1994-1995 | 854 | — | –5 | 849 |
| 1995-1996 | 849 | — | 74 | 923 |
| 1996-1997 | 923 | — | 91 | 1 014 |
| 1997-1998 | 1 095 (1) | — | 84 | 1 179 |
| 1998-1999 | 1 179 | 944 | 86 | 2 209 |
| 1999-2000 | 2 209 | 2 612 | 219 | 5 040 |
| 2000-2001 | 5 040 | 1 607 | 412 | 7 059 |
| 2001-2002 | 7 059 | 2 535 | 605 | 10 199 |
| 2002-2003 | 10 199 | 900 | 741 | 11 840 |
| 2003-2004 | 11 840 | 1 502 | 862 | 14 204 |
| 2004-2005 | 14 204 | 3 202 | 927 | 18 333 |
| 2005-2006 | 18 333 | 3 000 | 1 230 | 22 563 |
| 2006-2007 | 22 437 (1) | 3 000 | 1 440 | 26 877 |
| 2007-2008 | 26 877 | 3 000 | 1 887 | 31 764 |
| 2008-2009 | 31 749 (2) | 2 100 | 2 176 | 36 025 |
| 2009-2010 | 36 025 | — | 2 175 | 38 200 |
| 2010-2011 | 38 200 | 2 000 | 2 065 | 42 265 |
| 2011-2012 | 42 265 | 1 000 | 2 087 | 45 352 |
| 2012-2013 | 45 352 | 1 000 | 1 992 | 48 344 |
| 2013-2014P | 48 344 | 1 000 | 1 989 | 51 333 |
| P: | Preliminary results. |
| (1) | These amounts take into account restatements arising from the government accounting reforms of 1997-1998 and 2006-2007. |
| (2) | This amount takes into account an adjustment arising from consideration of the expected average remaining service life (EARSL) of participants in the PPMP. |
E.40
The information on the RPSF shown in the preceding table is based on the government’s accounting policies, which are in full compliance with generally accepted accounting principles (GAAP) for Canada’s public sector.
The book value of the RPSF as at March 31, 2014 was higher than its market value. However, the difference between these two items has decreased substantially in recent years. As a result of the accounting policies, the difference will be fully amortized in the coming years. In addition, the financial impact of gradually amortizing the difference is fully incorporated into the government’s financial framework over the entire planning horizon. Section 3.4 describes these items in greater detail.
The government’s accounting policies apply when the return on the RPSF is higher than anticipated as well as when it is lower.
TABLE E.20
Book value and market value of the Retirement Plans Sinking Fund as at March 31
(millions of dollars)
| | | |
| | Book value | Market value | Difference |
| 1994-1995 | 849 | 831 | 18 |
| 1995-1996 | 923 | 954 | –31 |
| 1996-1997 | 1 014 | 1 095 | –81 |
| 1997-1998 | 1 179 | 1 321 | –142 |
| 1998-1999 | 2 209 | 2 356 | –147 |
| 1999-2000 | 5 040 | 5 703 | –663 |
| 2000-2001 | 7 059 | 7 052 | 7 |
| 2001-2002 | 10 199 | 9 522 | 677 |
| 2002-2003 | 11 840 | 9 240 | 2 600 |
| 2003-2004 | 14 204 | 12 886 | 1 318 |
| 2004-2005 | 18 333 | 17 362 | 971 |
| 2005-2006 | 22 563 | 23 042 | –479 |
| 2006-2007 | 26 877 | 28 859 | –1 982 |
| 2007-2008 | 31 764 | 32 024 | –260 |
| 2008-2009 | 36 025 | 25 535 | 10 490 |
| 2009-2010 | 38 200 | 29 559 | 8 641 |
| 2010-2011 | 42 265 | 35 427 | 6 838 |
| 2011-2012 | 45 352 | 38 222 | 7 130 |
| 2012-2013 | 48 344 | 42 562 | 5 782 |
| 2013-2014P | 51 333 | 49 034 | 2 299 |
P: Preliminary results.
E.41
q | Amounts deposited in the RPSF have no impact on the gross debt |
The government issues bonds on financial markets in order to make deposits in the RPSF. Nevertheless, the amounts deposited in the RPSF do not affect the government’s gross debt.
Even though the amount of borrowings contracted to make deposits increases the direct debt, these deposits in turn reduce the net retirement plans liability by the same amount. Therefore, the net impact on the gross debt is nil.
TABLE E.21
Illustration of the impact on the government’s gross debt of borrowing $1 billion on financial markets in order to deposit it in the RPSF(1)
(millions of dollars)
| | | | | |
| | | Before | After | | |
| | | deposit | deposit | Change | |
| (A) | Consolidated direct debt | 168 616 | 169 616 | 1 000 | |
| | Retirement plans liability | 76 703 | 76 703 | — | |
| | Less: Book value of the RPSF | –48 344 | –49 344 | –1 000 | |
| (B) | Net retirement plans liability | 28 359 | 27 359 | –1 000 | |
| (C) | Net employee future benefits liability | 19 | 19 | — | |
| (D) | Less: Generations Fund | –5 238 | –5 238 | — | |
| (E) | GROSS DEBT (E = A + B + C + D) | 191 756 | 191 756 | — | |
| (1) | Illustration based on results as at March 31, 2013. |
E.42
| |
| q | A decline in debt service |
Deposits in the RPSF entail a reduction in the government’s debt service. Indeed, the rates of return on funds managed by the Caisse de dépôt et placement du Québec (the Caisse) are generally higher than interest rates on Québec government bonds issued to finance deposits in the RPSF. Therefore, the income of the RPSF, which is applied against the government’s debt service, is usually higher than the additional interest charges that arise from new borrowings. This leads to a net decrease in the government’s debt service.
Since the RPSF was created, the return obtained by the Caisse has been higher than the cost of new borrowings by the government 15 years out of 20.
TABLE E.22
Comparison of the RPSF’s annual return and the Québec government’s borrowing costs
(per cent)
| | | |
| | Return of | Cost of new | Difference |
| | the RPSF(1) | borrowings(2) | (percentage points) |
| 1994-1995 | –3.3(3) | 5.9 | –9.2 |
| 1995-1996 | 17.0 | 5.3 | 11.7 |
| 1996-1997 | 16.1 | 6.3 | 9.8 |
| 1997-1998 | 13.4 | 5.7 | 7.7 |
| 1998-1999 | 10.4 | 5.8 | 4.6 |
| 1999-2000 | 15.3 | 7.2 | 8.1 |
| 2000-2001 | 7.2 | 6.2 | 1.0 |
| 2001-2002 | –4.7 | 5.5 | –10.2 |
| 2002-2003 | –8.5 | 4.7 | –13.2 |
| 2003-2004 | 14.9 | 4.6 | 10.3 |
| 2004-2005 | 11.4 | 4.4 | 7.0 |
| 2005-2006 | 13.5 | 4.4 | 9.1 |
| 2006-2007 | 13.5 | 4.4 | 9.1 |
| 2007-2008 | 5.2 | 4.8 | 0.4 |
| 2008-2009 | –25.6 | 4.2 | –29.8 |
| 2009-2010 | 10.7 | 4.6 | 6.1 |
| 2010-2011 | 13.4 | 4.4 | 9.0 |
| 2011-2012 | 3.5 | 4.0 | –0.5 |
| 2012-2013 | 9.4 | 3.6 | 5.8 |
| 2013-2014P | 12.6 | 2.9 | 9.7 |
| P: | Preliminary results. |
| (1) | On a calendar year basis. |
| (2) | On a fiscal year basis. |
| (3) | From February to December 1994. |
E.43
| |
| q | A flexible deposit policy |
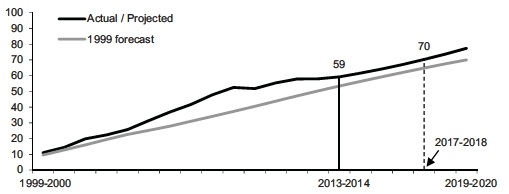
In December 1999, as part of an agreement concluded for the renewal of its employees’ collective agreements, the government set the objective that the book value of the amounts accumulated in the RPSF would be equal, in 2020, to 70% of its actuarial obligations in regard to the retirement plans of public and parapublic sector employees.
However, the government has all the necessary flexibility in applying this policy. Deposits in the RPSF are made only when market conditions are favourable, particularly with respect to interest rates and market receptiveness to bond issues.
As at March 31, 2014, the RPSF’s book value should represent 59% of the government’s actuarial obligations in regard to the retirement plans of public and parapublic sector employees. If deposits of $1 billion per year were made in the RPSF, the objective of 70% should be attained two years earlier than anticipated, i.e. in 2017-2018.
CHART E.15
|
| RPSF in proportion to the government’s actuarial obligations regarding the |
| retirement plans of public and parapublic sector employees |
| (per cent) |
The following table shows the book and market values of the Generations Fund since its creation. As at March 31, 2014, the market value of the Generations Fund was higher than its book value.
TABLE E.23
Book value and market value of the Generations Fund as at March 31
(millions of dollars)
| | | |
| | Book value | Market value | Difference |
| 2006-2007(1) | 584 | 576 | 8 |
| 2007-2008 | 1 233 | 1 147 | 86 |
| 2008-2009 | 1 952 | 1 598 | 354 |
| 2009-2010 | 2 677 | 2 556 | 121 |
| 2010-2011 | 3 437 | 3 524 | –87 |
| 2011-2012 | 4 277 | 4 375 | –98 |
| 2012-2013 | 5 238 | 5 550 | –312 |
| 2013-2014P | 5 659 | 6 299 | –640 |
| P: | Preliminary results. |
| (1) | The first deposit in the Generations Fund was made on January 31, 2007. |
Since the first deposit was made in the Generations Fund in January 2007, the return has been higher than or equivalent to the cost of new borrowings by the government six years out of seven.
TABLE E.24
Comparison of the Generations Fund’s annual return and the Québec government’s borrowing costs
(per cent)
| | | |
| | Return of the | Cost of new | Difference |
| | Generations Fund (1) | borrowings(2) | (percentage points) |
| 2007-2008 | 5.6(3) | 4.8 | 0.8 |
| 2008-2009 | –22.4 | 4.2 | –26.6 |
| 2009-2010 | 11.3 | 4.6 | 6.7 |
| 2010-2011 | 12.3 | 4.4 | 7.9 |
| 2011-2012 | 4.0 | 4.0 | — |
| 2012-2013 | 8.4 | 3.6 | 4.8 |
| 2013-2014P | 12.0 | 2.9 | 9.1 |
| P: | Preliminary results. |
| (1) | On a calendar year basis. |
| (2) | On a fiscal year basis. |
| (3) | Return realized from February to December 2007, since the first deposit was made in the Generations Fund on January 31, 2007. |
E.45
| |
3.3 | Returns of the Caisse de dépôt et placement du Québec on funds deposited by the Ministère des Finances |
In 2013, the return on funds deposited by the Ministère des Finances with the Caisse de dépôt et placement du Québec was 12.61% for the RPSF, 11.99% for the Generations Fund and 12.50% for the Accumulated Sick Leave Fund. The investment policy of these funds is presented in the box on page E.50.
TABLE E.25
Market value and return in 2013 on funds deposited with the Caisse de dépôt et placement du Québec by the Ministère des Finances
| | | |
| | | Market value as at | |
| | Return | December 31, 2013 | |
| | (%) | ($ million) | |
| Retirement Plans Sinking Fund | 12.61 | 46 863 | |
| Generations Fund | 11.99 | 5 908 | |
| Acc umulated Sick Leave Fund | 12.50 | 843 | |
| |
| 3.3.1 | Retirement Plans Sinking Fund |
The RPSF posted a return of 12.61% in 2013. Its market value was $46 863 million as at December 31, 2013.
The assets of the RPSF are managed by the Caisse in accordance with an investment policy established by the Ministère des Finances in cooperation with the Caisse. This investment policy is established taking several factors into account, including 10-year return, standard deviation and correlation forecasts for various categories of assets, opportunities for investing in these assets and recommendations of the Caisse.
The investment policy of the RPSF consists of 35.75% fixed-income securities (bonds, real estate debt, etc.), 16.0% inflation-sensitive investments (real estate, infrastructure, etc.) and 48.25% equities. These weightings are similar to those used on average by the Caisse’s depositors as a whole.
E.46
TABLE E.26
Investment policy of the RPSF as at January 1, 2014
(per cent)
| | | | |
| | Benchmark portfolio
of the RPSF | | Average benchmark portfolio of depositors as a whole(1) | |
| Fixed-income securities | 35.75 | | 34.6 | |
| Inflation-sensitive investments | 16.00 | | 16.9 | |
| Equities | 48.25 | | 46.5 | |
| Other investments | — | | 2.0 | |
| TOTAL | 100.00 | | 100.0 | |
| (1) | Data as at December 31, 2013. Annual Report 2013 of the Caisse de dépôt et placement du Québec. |
With its investment policy, the RPSF should generate an annual return of 6.45%. It is important to note that the RPSF’s investment policy is based on a long-term horizon and constitutes the benchmark portfolio for the Caisse. However, through active management, the Caisse adjusts the allocation of the RPSF’s assets, particularly to take fluctuations in the economic and financial situation into account. The RPSF’s benchmark portfolio would have generated a return of 12.11% in 2013.
E.47
The Generations Fund posted a return of 11.99% in 2013. Its market value was $5 908 million as at December 31, 2013.
The assets of the Generations Fund are managed by the Caisse in accordance with an investment policy established by the Ministère des Finances in cooperation with the Caisse. This investment policy is established taking several factors into account, including 10-year return, standard deviation and correlation forecasts for various categories of assets, opportunities for investing in these assets and recommendations of the Caisse.
The investment policy of the Generations Fund consists of 41.0% fixed-income securities (bonds, real estate debt, etc.), 14.0% inflation-sensitive investments (real estate, infrastructure, etc.) and 45.0% equities.
TABLE E.27
Investment policy of the Generations Fund as at January 1, 2014
(per cent)
| | | | |
| | Benchmark portfolio of | | Average benchmark portfolio | |
| | the Generations Fund | | of depositors as a whole(1) | |
| Fixed-income securities | 41.0 | | 34.6 | |
| Inflation-sensitive investments | 14.0 | | 16.9 | |
| Eq uities | 45.0 | | 46.5 | |
| Other investments | — | | 2.0 | |
| TOTAL | 100.0 | | 100.0 | |
| (1) | Data as at December 31, 2013. Annual Report 2013 of the Caisse de dépôt et placement du Québec. |
The investment policy of the Generations Fund aims to achieve a long-term return of 6.45% per year. It is important to note that the investment policy of the Generations Fund is based on a long-term horizon and is the benchmark portfolio for the Caisse. However, through active management, the Caisse adjusts the allocation of the Generations Fund’s assets, particularly to take fluctuations in the economic and financial situation into account. The benchmark portfolio of the Generations Fund would have generated a return of 11.39% in 2013.
E.48
| |
| 3.3.3 | Accumulated Sick Leave Fund |
The Accumulated Sick Leave Fund (ASLF) posted a return of 12.50% in 2013. Its market value was $843 million as at December 31, 2013.
The assets of the ASLF are managed by the Caisse in accordance with an investment policy established by the Ministère des Finances in cooperation with the Caisse. Since January 1, 2009, the ASLF’s investment policy has been identical to that of the RPSF, as the creation of the ASLF stems from a long-term commitment made by the government in regard to employee future benefits, which is similar to the commitment regarding the retirement plans. The ASLF’s benchmark portfolio would have generated a return of 12.11% in 2013.
E.49
| | | | | | | |
| Comparison of investment policies |
| | | | |
| | Investment policies as at January 1, 2014 | | |
| | (per cent) | | | | | |
| | | | | | Average benchmark | | |
| | | | RPSF and | Generations | portfolio of depositors | | |
| | Specialized portfolios | ASLF | Fund | as a whole(1) | | |
| | Short-Term Investments | 1.0 | 1.0 | 1.1 | | |
| | Bonds | 28.75 | 34.0 | 27.0 | | |
| | Long-Term Bonds | 0.0 | 0.0 | 1.0 | | |
| | Real Estate Debt | 6.0 | 6.0 | 5.5 | | |
| | Total – Fixed income | 35.75 | 41.0 | 34.6 | | |
| | Real Return Bonds | 0.0 | 0.0 | 0.6 | | |
| | Infrastructure | 5.0 | 4.5 | 4.9 | | |
| | Real Estate | 11.0 | 9.5 | 11.4 | | |
| | Total – Inflation-Sensitive | | | | | |
| | Investments | 16.0 | 14.0 | 16.9 | | |
| | Canadian Equity | 11.75 | 10.0 | 11.4 | | |
| | Global Equity | 2.0 | 2.0 | 2.0 | | |
| | Global Quality Equity | 8.5 | 8.0 | 6.6 | | |
| | US Equity | 4.5 | 5.0 | 5.5 | | |
| | Foreign Equity (EAFE) | 4.5 | 5.0 | 5.3 | | |
| | Emerging Markets Equity | 5.0 | 5.0 | 5.0 | | |
| | Private Equity | 12.0 | 10.0 | 10.7 | | |
| | Total – Equity | 48.25 | 45.0 | 46.5 | | |
| | Hedge Funds | — | — | 2.0 | | |
| | Total – Other Investments | 0.0 | 0.0 | 2.0 | | |
| | TOTAL | 100.0 | 100.0 | 100.0 | | |
| | RPSF: | Retirement Plans Sinking Fund. | | | | | |
| | ASLF: | Accumulated Sick Leave Fund. | | | | | |
| | EAFE: | Europe, Australasia, Far East. | | | | | |
| | (1) Data as at December 31, 2013. Annual Report 2013 of the Caisse de dépôt et placement du Québec. | |
| |
E.50
| |
3.4 | Impact of the returns of the Retirement Plans Sinking Fund on debt service |
The government records an interest charge on the retirement plans liability. This stems from the fact that, historically, it decided to manage its contributions to the retirement plans of its employees internally rather than have an external fund manage them. This reduced borrowings on financial markets and growth in the direct debt. On the other hand, the commitments in respect of the retirement plans of government employees are shown as a liability and the government must record an interest charge calculated on the value of the actuarial obligations in respect of these plans. However, the investment income of the RPSF must be subtracted from this amount. The interest charge on the retirement plans liability is included in the government’s debt service.
TABLE E.28
Interest on the retirement plans liability
(millions of dollars)
| | |
| | 2012-2013 | |
| Interest on the actuarial obligations relating to the retirement plans(1) | 5 066 | |
| Less: Investment income of the RPSF | –1 992 | |
| INTEREST ON THE RETIREMENT PLANS LIABILITY | 3 074 | |
| (1) | Net of the income of specific funds of the plans. |
The returns realized by the Caisse on the RPSF are taken into account in the government’s balance sheet and results by applying the accounting policy adopted in the wake of the December 2007 reform of government accounting in accordance with generally accepted accounting principles (GAAP).
When determining a government’s retirement benefit liability and expense, plan assets would be valued at market-related values. Under this method, plan assets are recorded at market value or they are adjusted to market value over a period not to exceed five years. Values adjusted to market closely approximate current economic value in a manner that can minimize short-term fluctuations. Market-related values would be used because they are objective and verifiable. Once a basis of valuation is chosen it would be applied consistently.5
| | | |
| 5 | CHARTERED PROFESSIONAL ACCOUNTANTS OF CANADA, CPA Canada Public Sector Accounting Handbook, Section PS 3250, paragraph .035. |
E.51
Under the accounting policy, the "adjusted market value" of the RPSF is adjusted every year based on realized returns. If, for a given year, the realized return differs from the anticipated long-term return, the difference between the two is spread over five years. All other things being equal, this means that the adjusted market value and the market value will converge over a five-year period. It is important to note that this method is applied when returns are higher than expected as well as when they are lower.6
In addition, the differences between the realized and expected return, which are spread over five years, are taken into account in RPSF income by amortizing them over a period of about 14 years, that is, the expected average remaining service life (EARSL) of retirement plan participants.7 This amortization mechanism and the period used are prescribed by GAAP.8
For example, the losses incurred by the Caisse in 2008-2009 reduced the income of the RPSF as of 2009-2010, while a higher-than-expected rate of return in 2013-2014 increases RPSF income as of 2014-2015.
| | | |
| 6 | Before the accounting reform of 2007, the value of the RPSF was adjusted only once every three years, that is, when actuarial valuations were carried out. Since the reform, it is adjusted every year. |
| 7 | As with recognition of the retirement plans liability, the RPSF accounting method draws a distinction between the Pension Plan of Management Personnel (PPMP) and the other plans. The EARSL under the PPMP is 10 years compared with 15 years under the other plans. |
| 8 | “…actuarial gains and losses should be amortized to the liability or asset and the related expense in a systematic and rational manner over the expected average remaining service life of the related employee group.” CHARTERED PROFESSIONAL ACCOUNTANTS OF CANADA, CPA Canada Public Sector Accounting Handbook, Section PS 3250, paragraph .062. For the purposes of retirement assets, the CPA Canada defines actuarial gains (losses) as changes in the value of plan assets that are caused notably by variances between actual results and projected results. |
E.52
TABLE E.29
Impact of the returns of the Caisse de dépôt et placement du Québec on debt service(1)
(millions of dollars)
| | | | | | | |
| | 2009-2010 | 2010-2011 | 2011-2012 | 2012-2013 | 2013-2014 | 2014-2015 | |
| Before 2008-2009 | –48 | –78 | –57 | 11 | 10 | 16 | |
| From 2008-2009 | 307 | 629 | 972 | 1 337 | 1 710 | 1 710 | |
| From 2009-2010 | | –65 | –134 | –207 | –280 | –360 | |
| From 2010-2011 | | | –53 | –110 | –169 | –232 | |
| From 2011-2012 | | | | 15 | 30 | 46 | |
| From 2012-2013 | | | | | –23 | –47 | |
| From 2013-2014 | | | | | | 73 | |
| IMPACT ON DEBT SERVICE | 259 | 486 | 728 | 1 046 | 1 278 | 1 060 | |
Note: A positive entry indicates an increase in debt service and a negative entry, a decrease.
| (1) | The amounts represent the impact on RPSF income, and therefore on debt service, of returns of the Caisse that are lower or higher than the projected rate for that period and that are amortized. |
E.53
[This Page is Intentionally Left Blank]
| |
| 4.1 | The Québec government’s credit ratings |
A borrower’s credit rating measures its capacity to pay the interest on its debt and repay the principal at maturity. To establish the credit rating of a borrower like the Québec government, credit rating agencies analyze a series of economic, fiscal and financial factors. Among the main factors are the size, structure and vitality of the economy, the situation on the labour market, fiscal competitiveness, public finance situation and indebtedness.
To express the quality of a borrower’s credit, credit rating agencies use rating scales, namely, a scale for long-term debt and a scale for short-term debt.
E.55
The following table shows the rating scales used by agencies for long-term debt. The current credit ratings for Québec are indicated in bold.
TABLE E.30
Credit rating scales for long-term debt
| | | | | |
| | | | | | Japan Credit |
| | | Standard & | | | Rating |
| Definition | Moody’s | Poor’s | DBRS | Fitch | Agency |
| Extremely strong capacity to pay interest and repay principal. | Aaa | AAA | AAA | AAA | AAA |
| Very strong capacity to pay interest and repay principal. | Aa1 | AA+ | AA (high) | AA+ | AA+ |
| Aa2 | AA | AA | AA | AA |
| Aa3 | AA– | AA (low) | AA– | AA– |
| Strong capacity to pay interest and repay principal, despite greater sensitivity to economic conditions than levels AAA and AA. | A1 | A+ | A (high) | A+ | A+ |
| A2 | A | A | A | A |
| A3 | A– | A (low) | A– | A– |
| Adequate capacity to pay interest and repay principal. Difficult economic conditions may reduce this capacity. | Baa1 | BBB+ | BBB (high) | BBB+ | BBB+ |
| Baa2 | BBB | BBB | BBB | BBB |
| Baa3 | BBB– | BBB (low) | BBB– | BBB– |
| Uncertain capacity to pay interest and repay principal, particularly under difficult economic conditions. | Ba1 | BB+ | BB (high) | BB+ | BB+ |
| Ba2 | BB | BB | BB | BB |
| Ba3 | BB– | BB (low) | BB– | BB– |
| Very uncertain capacity to pay interest and repay principal, particularly under difficult economic conditions. | B1 | B+ | B (high) | B+ | B+ |
| B2 | B | B | B | B |
| B3 | B– | B (low) | B– | B– |
E.56
Agencies add an "outlook" to the rating that indicates the trend the credit rating may follow in the future. The outlook may be positive, stable or negative. In the case of Québec, all of the agencies assign a "stable" outlook to its credit rating, except for Fitch, which has assigned a "negative" outlook since December 2013.
TABLE E.31
The Québec government’s credit ratings
| | |
| Agency | Rating | Outlook |
| Moody’s | Aa2 | Stable |
| Standard & Poor’s (S&P) | A+ | Stable |
| DBRS | A (high) | Stable |
| Fitch | AA– | Negative |
| Japan Credit Rating Agency (JCR) | AA+ | Stable |
E.57
The following table shows the rating scales used by agencies for short-term debt. The current credit ratings for Québec are indicated in bold.
TABLE E.32
Credit rating scales for short-term debt(1)
| | | | |
| | | Standard & | | |
| Definition | Moody’s | Poor’s | DBRS | Fitch |
| Very strong capacity to pay interest and repay principal over the short term. | | | R–1 (high) | |
| P–1 | A–1+
A–1 | R–1 (middle) | F1+
F1 |
| | | R–1 (low) | |
| Very adequate capacity to pay interest and repay principal over the short term, despite greater sensitivity to economic conditions than the upper level. | P–2 | A–2 | R–2 (high) | F2 |
| Adequate capacity to pay interest and repay principal over the short term. Difficult economic conditions may reduce this capacity. | | | R–2 (middle) | |
| P–3 | A–3 | R–2 (low) | F3 |
| | | R–3 | |
| Uncertain capacity to pay interest and repay principal over the short term. Securities in this category are considered speculative securities. | | B–1 | | |
| Not Prime(2) | B–2 | R–4 | B |
| | B–3 | R–5 | C |
| | C | | |
| Incapacity to pay interest and repay principal over the short term. Securities in this category are considered default securities. | Not Prime(2) | D | D | D |
| (1) | JCR does not assign a short-term credit rating to Québec. |
| (2) | Moody’s uses the "Not Prime" category for all securities not included in the upper categories. |
E.58
| |
| q | Change in Québec’s credit ratings |
The following charts show the change in the Québec government’s credit ratings. The credit ratings for 2014 are those in effect as at May 29, 2014.
CHART E.16
|
| Credit rating assigned to Québec by Moody’s |
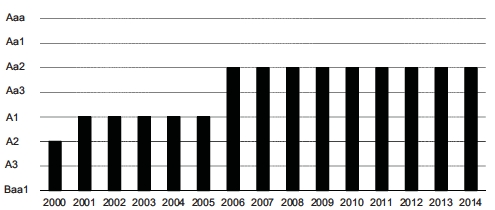
|
| |
| |
| CHART E.17 |
| |
| Credit rating assigned to Québec by Standard & Poor’s |
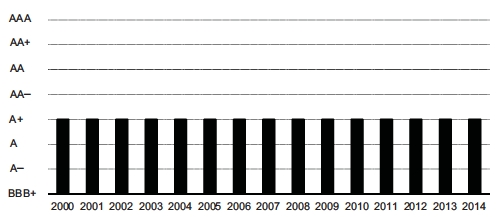
CHART E.18
|
| Credit rating assigned to Québec by DBRS |
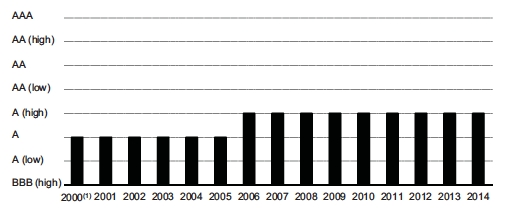
| (1) | The credit rating was raised from A (low) to A on June 14, 2000. |
CHART E.19
|
| Credit rating assigned to Québec by Fitch |
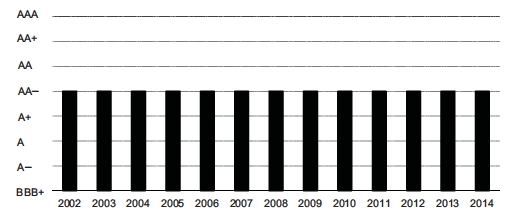
|
| Note: Fitch has assigned Québec a credit rating since 2002. |
E.60
CHART E.20
|
| Credit rating assigned to Québec by JCR |
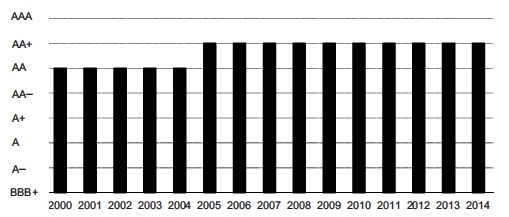
| |
| 4.2 | Comparison of the credit ratings of Canadian provinces |
The following charts show the credit ratings of Canadian provinces as at May 29, 2014. No chart is given for JCR since Québec is the only province that receives a credit rating from that agency.
CHART E.21
|
| Credit ratings of Canadian provinces – Moody’s |
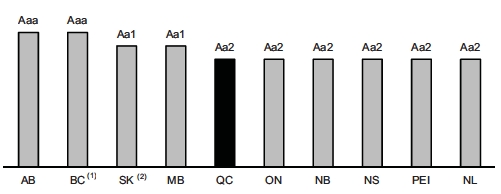
| (1) | Negative outlook. |
| (2) | Positive outlook. |
CHART E.22
|
| Credit ratings of Canadian provinces – Standard & Poor’s |
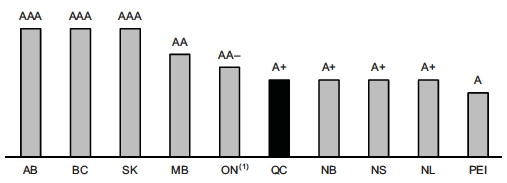
E.62
|
| Credit ratings of Canadian provinces – DBRS |
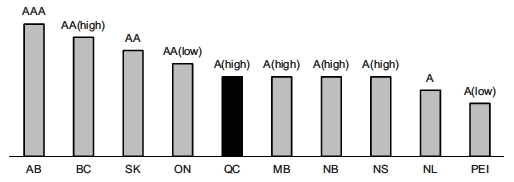
|
| |
| |
| CHART E.24 |
| |
| Credit ratings of Canadian provinces – Fitch |
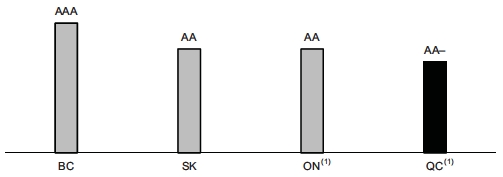
| |
| Note: | British Columbia, Saskatchewan, Ontario and Québec are the only provinces that receive credit ratings from this agency. |
| (1) | Negative outlook. |
E.63