Exhibit 99.23
Section E from « 2007-2008 Budget – Budget Plan », May 24, 2007
Section E
Debt, Financing and Debt Management
| | | | | | | | |
| 1. | | DEBT | | E.3 |
| | | |
| | 1.1 | | Total government debt as at March 31, 2007 | | E.3 |
| | | |
| | 1.2 | | Change in the total debt in 2006-2007 | | E.4 |
| | | |
| | 1.3 | | Retirement plans | | E.7 |
| | | |
| | 1.4 | | Retirement plans sinking fund | | E.10 |
| | | |
| | 1.5 | | The Generations Fund | | E.13 |
| | | |
| | 1.6 | | Québec’s credit rating | | E.14 |
| | | |
| | 1.7 | | Long-term public sector debt | | E.15 |
| | |
| 2. | | FINANCING | | E.17 |
| | | |
| | 2.1 | | Financing strategy | | E.17 |
| | | | |
| | | | 2.1.1 | | Diversification by market | | E.17 |
| | | | |
| | | | 2.1.2 | | Diversification by instrument | | E.19 |
| | | | |
| | | | 2.1.3 | | Diversification by maturity | | E.19 |
| | | |
| | 2.2 | | Financing programs | | E.21 |
| | | | |
| | | | 2.2.1 | | The government | | E.21 |
| | | | |
| | | | 2.2.2 | | Financement-Québec | | E.22 |
| | | | |
| | | | 2.2.3 | | Yield | | E.22 |
| | |
| 3. | | DEBTMANAGEMENT | | E.25 |
| | | |
| | 3.1 | | Structure of the debt by currency | | E.25 |
| | | |
| | 3.2 | | Structure of the debt by interest rate | | E.27 |
| | |
| 4. | | ADDITIONALINFORMATIONONFINANCINGTRANSACTIONSANDDEBT | | E.29 |
E.1
[THIS PAGE INTENTIONALLY LEFT BLANK]
E.2
| | 1.1 | Total government debt as at March 31, 2007 |
The government’s total debt consists of the consolidated direct debt, i.e. the debt contracted on financial markets, and the net retirement plans liability, minus the value of the Generations Fund.
Preliminary results show that the government’s consolidated direct debt amounted to $96 452 million as at March 31, 2007.
The net retirement plans liability represents the retirement plans liability minus the balance of the retirement plans sinking fund (RPSF), an asset established to pay the retirement benefits of public and parapublic sector employees. As at March 31, 2007, the net retirement plans liability totalled $32 608 million.
Given that the funds accumulated in the Generations Fund amounted to $578 million as at March 31, 2007, the total debt was $122 413 million. This amount excludes pre-financing of $6 069 million that will be used to cover part of the borrowing requirements for 2007-2008.
TABLE E.1
Total government debt as at March 31, 2007P
(millions of dollars)
| | | | | | | | | | | | | | | | |
| | | Consolidated direct debt | | Retirement plans | | | | |
| | | Consolidated
Revenue
Fund | | Consolidated
organizations | | Total | | Retirement
plans
liability | | Less:
retirement
plans sinking
fund | | Net
retirement
plans
liability | | Less:
Generations
Fund | | Total
debt |
Debt as at March 31, 2007 | | 83 983 | | 12 469 | | 96 452 | | 59 611 | | -27 003 | | 32 608 | | -578 | | 128 482 |
| | | | | | | | |
Pre-financing | | -6 069 | | — | | –6 069 | | — | | — | | — | | — | | -6 069 |
| | | | | | | | | | | | | | | | |
TOTAL | | 77 914 | | 12 469 | | 90 383 | | 59 611 | | -27 003 | | 32 608 | | -578 | | 122 413 |
| | | | | | | | | | | | | | | | |
Note: Table E.19 on page E.34 shows the transition from total debt to debt representing accumulated deficits.
E.3
| | 1.2 | Change in the total debt in 2006-2007 |
The government’s total debt increased by $4 111 million in 2006-2007. Even though the government maintains a balanced budget, the debt continues to increase for the following reasons:
| | • | | First of all, the government makes investments, mainly in its corporations. It makes such investments through advances and direct capital outlays or by allowing these corporations to keep part of their profits to finance their own investments. In 2006-2007, the government’s investments, loans and advances led to a $2 165-million increase in the debt. |
| | • | | Secondly, the government makes investments in fixed assets (e.g. roads) that require borrowings. When these capital expenditures are made, they are posted to the government’s balance sheet. Subsequently, they are gradually recorded as expenditures based on the useful life of the assets concerned. In 2006-2007, net capital expenditures led to a $1 394-million increase in the debt. |
| | • | | Lastly, changes in some of the government’s other asset and liability items, such as accounts payable and accounts receivable, raised the debt by $1 159 million in 2006-2007. In 2004-2005 and 2005-2006, these “Other factors” lowered the debt by $855 million and $605 million respectively. |
The volatility of “Other factors” in recent years can be attributed mainly to pay equity:
| | • | | In 2004-2005, an amount of $673 million was recorded as a pay equity expenditure for 2001 to 2005. As a result, a budgetary deficit of $664 million was recorded in 2004-2005. Since this amount of $673 million did not give rise to a disbursement, an account payable was created, reducing the government’s financial requirements in 2004-2005. |
| | • | | In 2005-2006, a $498-million expenditure was recorded for pay equity to reflect the most recent data on the cost of the adjustments being contemplated. As in the previous year, this amount was not disbursed in 2005-2006 and an account payable of $498 million was created, thus reducing the government’s financial requirements. |
E.4
| | • | | In 2006-2007, the amounts relating to pay equity began to be disbursed, leading to a rise in financial requirements. These disbursements will continue in 2007-2008 and 2008-2009. |
| | • | | The box in the following table shows the portion of “Other factors” relating to pay equity. From 2004-2005 to 2008-2009, the sum of these amounts is nil, demonstrating that, in all, pay equity will not have an impact on the government’s debt. Only those pay equity expenditures ($673 million) that gave rise to a budgetary deficit in 2004-2005 will increase the debt. |
| | • | | From 2004-2005 to 2008-2009, the growth in the debt will have served essentially to finance investments, loans and advances ($7 386 million) and the government’s net capital expenditures ($6 911 million). |
TABLE E.2
Main factors responsible for the growth in total government debt
(millions of dollars)
| | | | | | | | | | | | | | | | | | | | | |
| | | Debt,
beginning
of year | | Budgetary
deficit
(surplus) | | Investments,
loans and
advances | | Net capital expenditures1 | | Other factors2 | | | | | | | Generations
Fund | | Debt, end of year3 | | As a %
of GDP |
1998-1999 | | 98 385 | | -126 | | 1 402 | | 217 | | 1 235 | | | | | | | | | 101 113 | | 51.5 |
| | | | | | | | | | |
1999-2000 | | 101 113 | | -7 | | 2 006 | | 359 | | -1 351 | | | | | | | | | 102 120 | | 48.4 |
| | | | | | | | | | |
2000-2001 | | 102 120 | | -427 | | 1 632 | | 473 | | 1 050 | | | | | | | | | 104 848 | | 46.6 |
| | | | | | | | | | |
2001-2002 | | 104 848 | | -22 | | 1 142 | | 995 | | 212 | | | | | | | | | 107 175 | | 46.3 |
| | | | | | | | | | |
2002-2003 | | 107 175 | | 728 | | 1 651 | | 1 482 | | 306 | | | | | | | | | 111 342 | | 46.1 |
| | | | | | | | | | |
2003-2004 | | 111 342 | | 358 | | 1 125 | | 1 019 | | 881 | | | | Including:
accounts
payable in
regard
to pay equity |
| | | | 114 725 | | 45.8 |
| | | | | | | | | | |
2004-2005 | | 114 725 | | 664 | | 979 | | 1 083 | | -855 | |  | | -673 | | | | | 116 596 | | 44.3 |
2005-2006 | | 116 596 | | -37 | | 1 182 | | 1 166 | | -605 | | | -498 | | | | | 118 302 | | 43.2 |
2006-2007P | | 118 302 | | -29 | | 2 165 | | 1 394 | | 1 159 | | | 684 | 4 | | -578 | | 122 413 | | 43.1 |
2007-2008P | | 122 413 | | — | | 1 527 | | 1 980 | | -48 | | | 410 | | | -653 | | 125 219 | | 42.3 |
2008-2009P | | 125 219 | | — | | 1 533 | | 1 288 | | 483 | | | 77 | | | -740 | | 127 783 | | 41.7 |
| | P: | Preliminary results for 2006-2007 and forecasts for subsequent years. |
| | Note: | A positive entry indicates a financial requirement and a negative entry, a source of financing. |
| | 1 | Capital expenditures made during the year minus the yearly depreciation expenditure. |
| | 2 | Includes notably the change in “Other accounts,” such as accounts receivable and accounts payable, as well as foreign exchange losses (gains) following the revaluation of the debt in foreign currency. |
| | 3 | Excluding pre-financing. |
| | 4 | This amount includes the settlement of accounts payable recorded in 2004-2005 and 2005-2006 ($1 171 million), as well as the recording of a new account payable (-$487 million) that will be disbursed in 2007-2008 ($410 million) and 2008-2009 ($77 million). |
E.5
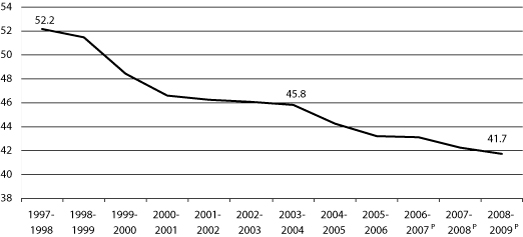
| | q | The debt burden continues to decline |
While the debt/GDP ratio was 52.2% in 1997-1998, it should be 41.7% in 2008-2009, which represents a decline of over 10 percentage points.
CHART E.1
Total government debt
(as a % of GDP)
| | P: | Preliminary results for 2006-2007 and forecasts for subsequent years. |
E.6
The Québec government participates financially in the retirement plans of its employees. As at December 31, 2005, these plans had 522 452 participants and 231 793 beneficiaries.
TABLE E.3
Retirement plans of public and parapublic sector employees as at December 31, 2005
| | | | |
| | | Active participants | | Beneficiaries |
Government and Public Employees Retirement Plan (RREGOP) | | 485 000 | | 136 332 |
| | |
Pension Plan of Management Personnel (PPMP) | | 25 750 | | 16 222 |
| | |
Other plans: | | | | |
| | |
Teachers Pension Plan (TPP) and Pension Plan of Certain Teachers (PPCT) | | 1 455 | | 49 048 |
| | |
Civil Service Superannuation Plan (CSSP) | | 1 400 | | 24 180 |
| | |
Superannuation Plan for the Members of the Sûreté du Québec (SPMSQ) | | 5 200 | | 4 112 |
| | |
Pension Plan of Peace Officers in Correctional Services (PPPOCS) | | 3 000 | | 1 202 |
| | |
Pension Plan of the Judges of the Court of Québec (PPJCQ) | | 270 | | 311 |
| | |
Pension Plan for Federal Employees Transferred to Employment with the Gouvernement du Québec (PPFEQ) | | 255 | | 90 |
| | |
Pension Plan of the Members of the National Assembly (PPMNA) | | 122 | | 296 |
| | | | |
Total for other plans | | 11 702 | | 79 239 |
| | | | |
TOTAL | | 522 452 | | 231 793 |
| | | | |
Source: Commission administrative des régimes de retraite et d’assurances (CARRA).
These plans are defined benefit retirement plans, which means that they guarantee participants a certain level of income upon retirement. Benefits are calculated on the basis of participants’ average income for the best paid years (generally five) and their number of years of service. The pension represents 2% of an employee’s average income per year of service, for a maximum of 70%. Benefits are partially indexed to inflation.
E.7
The Commission administrative des régimes de retraite et d’assurances (CARRA) is responsible for administering the retirement plans. The government paid $3 533 million in 2006-2007 to cover its share of the benefits paid to its retired employees.
| | q | Retirement plans liability |
In its financial statements, the government includes the present value of the retirement benefits it will pay to its employees, taking into account the conditions governing their plans, as well as their years of service. This value is called the retirement plans liability.
CARRA performs actuarial valuations of the liability for each retirement plan in conformity with the rules set for the public sector by the Canadian Institute of Actuaries (CIA) and the Canadian Institute of Chartered Accountants (CICA).
The government’s retirement plans liability amounted to $59 611 million as at March 31, 2007. It is important to note that this amount is recognized in full in the total government debt (see Table E.1).
TABLE E.4
Retirement plans liability
(millions of dollars)
| | |
| | | March 31, 2007P |
Government and Public Employees Retirement Plan (RREGOP) | | 30 511 |
| |
Pension Plan of Management Personnel (PPMP) | | 6 636 |
| |
Other plans | | 22 464 |
| | |
RETIREMENT PLANS LIABILITY | | 59 611 |
| | |
E.8
| | q | Annual retirement plans expenditure |
As an employer, the government records annually its expenditure with regard to the retirement plans.
In 2006-2007, this expenditure totalled $1 809 million. It comprises two components:
| | • | | the net cost of vested benefits, that is, the present value of retirement benefits that employees have accumulated for work performed during the year, i.e. $1 429 million; |
| | • | | the amortization of revisions to the government’s actuarial obligations that arise from the updating of actuarial valuations, for a cost of $380 million in 2006-2007. |
TABLE E.5
Retirement plans expenditure
(millions of dollars)
| | |
| | | 2006-2007P |
Net cost of vested benefits | | 1 429 |
Amortization of revisions arising from actuarial valuations | | 380 |
| | |
RETIREMENT PLANS EXPENDITURE | | 1 809 |
| | |
E.9
| | 1.4 | Retirement plans sinking fund |
The retirement plans sinking fund (RPSF) was created in 1993. It is an asset that was established to pay the retirement benefits of public and parapublic sector employees.
As at March 31, 2007, the value of the RPSF stood at $27 003 million, $4 440 million more than the previous fiscal year. This increase is due to deposits of $3 000 million made by the government in 2006-2007 and investment income estimated at $1 440 million.
TABLE E.6
Change in the retirement plans sinking fund (RPSF)
(millions of dollars)
| | | | | | | | | |
| | | Balance,
beginning
of year | | | Deposits | | Investment
income | | Balance,
end of year |
1993-1994 | | — | | | 850 | | 4 | | 854 |
1994-1995 | | 854 | | | — | | -5 | | 849 |
1995-1996 | | 849 | | | — | | 74 | | 923 |
1996-1997 | | 923 | | | — | | 91 | | 1 014 |
1997-1998 | | 1 095 | 1 | | — | | 84 | | 1 179 |
1998-1999 | | 1 179 | | | 944 | | 86 | | 2 209 |
1999-2000 | | 2 209 | | | 2 612 | | 219 | | 5 040 |
2000-2001 | | 5 040 | | | 1 607 | | 412 | | 7 059 |
2001-2002 | | 7 059 | | | 2 535 | | 605 | | 10 199 |
2002-2003 | | 10 199 | | | 900 | | 741 | | 11 840 |
2003-2004 | | 11 840 | | | 1 502 | | 862 | | 14 204 |
2004-2005 | | 14 204 | | | 3 202 | | 927 | | 18 333 |
2005-2006 | | 18 333 | | | 3 000 | | 1 230 | | 22 563 |
2006-2007P | | 22 563 | | | 3 000 | | 1 440 | | 27 003 |
| | 1 | Following the reform of government accounting, an amount of $81 million was posted to the net debt. |
E.10
| | q | Amounts deposited in the RPSF have no impact on the total debt |
The government issues bonds on financial markets to make deposits in the RPSF. However, the amounts deposited in the RPSF do not affect the government’s total debt.
Indeed, the amount of borrowings contracted to make deposits increases the direct debt. At the same time, however, these deposits reduce the net retirement plans liability by the same amount. Therefore, the net impact on the total debt is nil.
TABLE E.7
Illustration of the impact on the government’s total debt of borrowing $1 billion on financial markets and depositing it in the RPSF1
(millions of dollars)
| | | | | | | | |
| | | | | Before
deposit | | After
deposit | | Change |
(A) | | Consolidated direct debt | | 89 383 | | 90 383 | | 1 000 |
| | Retirement plans liability | | 59 611 | | 59 611 | | 0 |
| | Less: RPSF | | -26 003 | | -27 003 | | -1 000 |
| | | | | | | | |
(B) | | Net retirement plans liability | | 33 608 | | 32 608 | | -1 000 |
(C) | | Total debt before Generations Fund (C=A+B) | | 122 991 | | 122 991 | | 0 |
(D) | | Less: Generations Fund | | -578 | | -578 | | 0 |
| | | | | | | | |
(E) | | TOTAL DEBT (E=C+D) | | 122 413 | | 122 413 | | 0 |
| | | | | | | | |
| | 1 | Illustration based on preliminary results as at March 31, 2007. |
| | q | A decline in debt service |
Deposits in the RPSF entail a reduction in the government’s debt service. The rates of return on funds managed by the Caisse de dépôt et placement du Québec are generally higher than interest rates on Québec government bonds issued to finance deposits in the RPSF. Therefore, the income of the RPSF, which is applied against the government’s debt service, is usually higher than the additional interest charges that arise from new borrowings. This leads to a net decrease in the government’s debt service.
E.11
| | q | A flexible deposit policy |
In December 1999, as part of an agreement concluded for the renewal of employees’ collective agreements, the government set the objective that the funds accumulated in the RPSF would be equal, in 2020, to 70% of its actuarial obligations in regard to the retirement plans of public and parapublic sector employees.
However, the government has all the flexibility needed to apply this policy. Deposits in the RPSF are made only when conditions on financial markets are favourable, particularly with respect to interest rates and market receptiveness to bond issues.
| | q | Results of deposits made to date |
With a value of $27 003 million as at March 31, 2007, the assets of the RPSF are now equal to nearly 43% of the government’s actuarial obligations regarding the retirement plans of public and parapublic sector employees.
Given the deposits and rates of return anticipated in the coming years, the target of 70% should be reached seven years earlier than expected, i.e. in 2012-2013, which is a major improvement over the target set in December 1999. Indeed, the RPSF should represent 100% of actuarial obligations in 2020.
CHART E.2
The RPSF in proportion to the government’s actuarial obligations regarding the retirement plans of public and parapublic sector employees
(percent)

E.12
The assets of the RPSF are managed by the Caisse de dépôt et placement du Québec in accordance with the investment policy established by the Minister of Finance.
This policy provides for investments in a diversified portfolio that includes notably fixed income securities (e.g. bonds), investments in stock markets and investments in other investment categories (e.g. capital assets, private investments and infrastructure).
The Generations Fund was created in June 2006 by the adoption of the Act to reduce the debt and establish the Generations Fund. The sums accumulated in the fund will be dedicated exclusively to repaying the debt.
As at March 31, 2007, the balance of the Generations Fund amounted to $578 million.
Section I presents the results of the Generations Fund in accordance with the requirements of the Act.
The assets of the Generations Fund are managed by the Caisse de dépôt et placement du Québec in accordance with the investment policy established by the Minister of Finance.
This policy provides for investments in a diversified portfolio that includes notably fixed income securities (e.g. bonds), investments in stock markets and investments in other investment categories (e.g. capital assets, private investments and infrastructure).
E.13
| | 1.6 | Québec’s credit rating |
The Québec government is rated by five credit rating agencies.
TABLE E.8
Québec’s credit rating
| | | | |
Agency | | Rating | | Rating
outlook |
Moody’s | | Aa2 | | Stable |
| | |
Fitch | | AA– | | Stable |
| | |
Standard & Poor’s | | A+ | | Stable |
| | |
Dominion Bond Rating Service (DBRS) | | A (high) | | Stable |
| | |
Japan Credit Rating Agency | | AA+ | | Stable |
In 2006, two credit rating agencies, Moody’s and DBRS, raised Québec’s credit rating.
The decisions of these agencies were based on the following factors:
| | • | | a substantial improvement in the government’s financial position in recent years; |
| | • | | a commitment by the government to continue along this path; |
| | • | | rigorous spending management, particularly through the settlement of collective agreements until 2010; |
| | • | | the development of a clear debt burden reduction strategy with the creation of the Generations Fund, which will make it possible to reduce the debt/GDP ratio; |
| | • | | the size and diversification of the economy. |
E.14
| | 1.7 | Long-term public sector debt |
Long-term public sector debt includes the government’s total debt as well as the debt of the health and social services and education networks, Hydro-Québec, municipalities and other government enterprises. This debt has served notably to finance public infrastructure, such as roads, schools, hospitals, hydroelectric dams and water treatment plants.
Preliminary results show that the public sector debt amounted to $191 720 million as at March 31, 2007.
TABLE E.9
Long-term public sector debt as at March 31
(millions of dollars)
| | | | | | | | | | |
| | | 2003 | | 2004 | | 2005 | | 2006 | | 2007P |
Total government debt1 | | 111 342 | | 114 725 | | 116 596 | | 118 302 | | 122 413 |
| | | | | |
Health and social services and education networks | | 11 008 | | 10 877 | | 12 301 | | 13 078 | | 14 138 |
| | | | | |
Hydro-Québec | | 35 639 | | 34 348 | | 33 032 | | 32 367 | | 32 674 |
| | | | | |
Other government enterprises | | 3 955 | | 3 575 | | 3 726 | | 3 540 | | 3 564 |
| | | | | |
Municipalities and municipal bodies2 | | 16 530 | | 17 212 | | 17 053 | | 18 347 | | 18 931 |
| | | | | | | | | | |
TOTAL | | 178 474 | | 180 737 | | 182 708 | | 185 634 | | 191 720 |
| | | | | |
As a % of GDP | | 73.9 | | 72.1 | | 69.5 | | 67.9 | | 67.5 |
| | | | | | | | | | |
| | 1 | Excluding pre-financing. |
| | 2 | Includes the debt of the Société québécoise d’assainissement des eaux. |
E.15
[THIS PAGE INTENTIONALLY LEFT BLANK]
E.16
Borrowings in fiscal 2006-2007 totalled $14 815 million, i.e. $13 236 million for the Consolidated Revenue Fund and $1 579 million for the Financing Fund. Borrowings contracted for the Financing Fund are used to meet the financing needs of consolidated organizations and certain government enterprises. It should be noted that pre-financing of $6 069 million was realized in the last few months of the fiscal year because of particularly favourable conditions on financial markets. It will be used to cover part of the borrowing program in 2007-2008.
The government aims to contract borrowings at the lowest possible cost. To that end, it applies a strategy for diversifying sources of funding by market, financial instrument and maturity.
| | 2.1.1 | Diversification by market |
Financing transactions are carried out regularly on most markets, i.e. in Canada, the United States, Europe and Asia.
In 2006-2007, the government contracted 17.4% of its borrowings on foreign markets in five different currencies:
| | • | | two borrowings in US dollars, one for US$1 500 million in November 2006 (CAN$1 702 million) and the other for US$100 million in August 2006 (CAN$110 million); |
| | • | | two borrowings in Swiss francs, one for 300 million Swiss francs in December 2006 (CAN$286 million) and the other for 200 million Swiss francs in February 2007 (CAN$182 million); |
| | • | | one borrowing for 100 million euros in April 2006 (CAN$142 million); |
| | • | | one borrowing for 750 million Hong Kong dollars in February 2007 (CAN$114 million), Québec’s first issue on this market; |
| | • | | one borrowing for 5 000 million yen in February 2007 (CAN$49 million). |
E.17
TABLE E.10
Gouvernement du Québec
Summary of long-term borrowings in 2006-2007P
(millions of dollars)
| | | | | | | | | | |
| | | | | Financing Fund | | | | |
Currency | | Consolidated
Revenue Fund | | Consolidated
organizations | | Government
enterprises | | Total | | % |
Canadian dollar | | | | | | | | | | |
Public issues | | 5 756 | | 1 087 | | 52 | | 6 895 | | 56.4 |
Private borrowings | | 3 430 | | 440 | | — | | 3 870 | | 31.6 |
Savings products | | 1 006 | | — | | — | | 1 006 | | 8.2 |
Immigrant Investor Program | | 432 | | — | | — | | 432 | | 3.5 |
Canada Pension Plan Investment Fund | | 7 | | — | | — | | 7 | | 0.1 |
Amount received (disbursed) under interest rate and currency swap agreements | | 20 | | — | | — | | 20 | | 0.2 |
| | | | | | | | | | |
Sub-total | | 10 651 | | 1 527 | | 52 | | 12 230 | | 82.6 |
Other currencies | | | | | | | | | | |
US dollar | | 1 812 | | — | | — | | 1 812 | | 70.1 |
Hong Kong dollar | | 114 | | — | | — | | 114 | | 4.4 |
Euro | | 142 | | — | | — | | 142 | | 5.5 |
Swiss franc | | 468 | | — | | — | | 468 | | 18.1 |
Yen | | 49 | | — | | — | | 49 | | 1.9 |
| | | | | | | | | | |
Sub-total | | 2 585 | | — | | — | | 2 585 | | 17.4 |
| | | | | | | | | | |
TOTAL | | 13 236 | | 1 527 | | 52 | | 14 815 | | 100.0 |
| | | | | | | | | | |
E.18
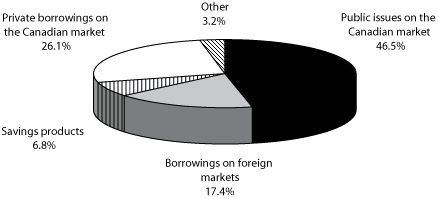
| | 2.1.2 | Diversification by instrument |
To satisfy investors’ needs, an extensive array of financial products is used in the course of financing transactions.
Long-term instruments consist primarily of public bond issues, private borrowings and savings products.
The long-term instruments used in 2006-2007 consisted mainly of public issues on the Canadian market (46.5%), private borrowings on the Canadian market (26.1%) and borrowings on foreign markets (17.4%).
CHART E.3
Borrowings in 2006-2007P by instrument
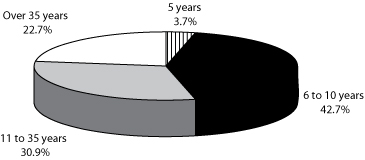
| | 2.1.3 | Diversification by maturity |
Maturities of new borrowings are distributed over time to obtain a stable refinancing profile and thus avoid overly wide fluctuations in the borrowing program.
In 2006-2007, 42.7% of borrowings contracted had a maturity of between 6 and 10 years; 30.9%, between 11 and 35 years; and 22.7%, over 35 years.
Over the past year, the government made $2 912 million worth of borrowings with a maturity of 50 years or more.
E.19
CHART E.4
Borrowings in 2006-2007P by maturity
This diversification by maturity has an impact on the maturity of the debt shown in the following chart. As at March 31, 2007, the average maturity of the debt was about 12 years.
CHART E.5
Maturity of the debt as at March 31, 2007P
(millions of dollars)
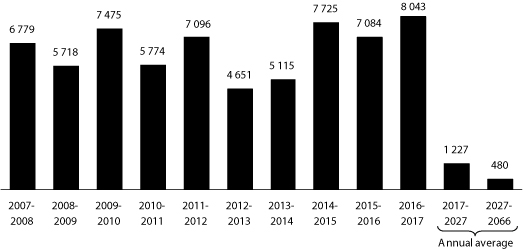
| | Note: | Direct debt of the Consolidated Revenue Fund and debt incurred to make advances to the Financing Fund. |
E.20
The financing program of the Consolidated Revenue Fund makes it possible to refinance maturing borrowings, contribute to the retirement plans sinking fund and meet new financial requirements, particularly for capital investments and investments in government corporations.
The Financing Fund makes loans to consolidated organizations (e.g. Fonds de conservation et d’amélioration du réseau routier, Investissement Québec, Société Immobilière du Québec) and to certain government enterprises (e.g. Corporation d’hébergement du Québec).
In 2006-2007, the government’s financing program reached $14 815 million, including $6 069 million in pre-financing realized over the last few months of the year to take advantage of particularly favourable conditions on financial markets.
The financing program is expected to amount to $5 167 million in 2007-2008. It would have amounted to $11 236 million had there not been any pre-financing. In 2008-2009, the financing program will total $12 437 million.
TABLE E.11
The government’s financing program
(millions of dollars)
| | | | | | |
| | | 2006-2007P | | 2007-2008P | | 2008-2009P |
Consolidated Revenue Fund | | | | | | |
Net financial requirements (surplus)1 | | 257 | | -500 | | -500 |
Repayment of borrowings | | 5 154 | | 5 110 | | 5 603 |
Change in cash position | | -2 684 | | -6 069 | | — |
Retirement plans sinking fund | | 4 440 | | 4 876 | | 5 334 |
Pre-financing | | 6 069 | | — | | — |
| | | | | | |
Sub-total | | 13 236 | | 3 417 | | 10 437 |
| | | | | | |
Financing Fund | | 1 579 | | 1 750 | | 2 000 |
| | | | | | |
TOTAL | | 14 815 | | 5 167 | | 12 437 |
| | | | | | |
| | P: | Preliminary results for 2006-2007 and forecasts for subsequent years. |
| | Note: | A negative entry indicates a source of financing and a positive entry, a financial requirement. |
| | 1 | Excluding consolidated organizations. |
E.21
Financement-Québec makes borrowings on financial markets to meet the needs of institutions in the health and social services and education networks. The borrowings of Financement-Québec are guaranteed by the Québec government.
In 2006-2007, borrowings by Financement-Québec amounted to $2 529 million.
Financement-Québec’s financing program is expected to total $2 000 million in 2007-2008 and 2008-2009.
TABLE E.12
Financement-Québec’s financing program
(millions of dollars)
| | | | | | |
| | | 2006-2007P | | 2007-2008P | | 2008-2009P |
| | 2 529 | | 2 000 | | 2 000 |
| | | | | | |
| | P: | Preliminary results for 2006-2007 and forecasts for subsequent years. |
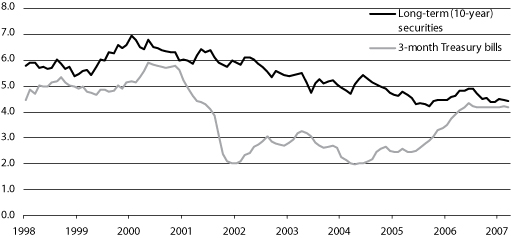
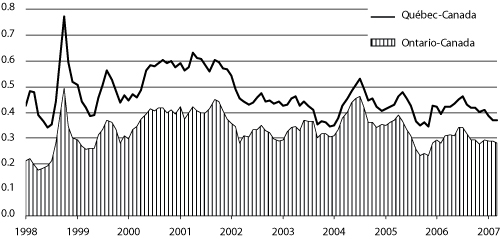
The following charts show the change in yield on 10-year bonds and 3-month Treasury bills, as well as the yield spread on long-term securities.
Over the past year, the spread between Québec long-term and short-term yields has declined significantly, reflecting the change in interest rates observed on financial markets. In addition, since the early 2000s, the yield on long-term Québec securities has dropped from 6.9% to 4.4%, making it possible to refinance borrowings at better interest rates.
E.22
CHART E.6
Yield on Québec securities
(percent)
| | Sources: | PC-Bond and ministère des Finances du Québec. |
CHART E.7
Yield spread on long-term (10-year) securities
(percent)
E.23
[THIS PAGE INTENTIONALLY LEFT BLANK]
E-24
The government’s debt management strategy aims to minimize the cost of the debt and limit the risk related to fluctuations in foreign exchange and interest rates.
The government uses a range of financial instruments, particularly interest rate and currency swap agreements, to achieve desired debt proportions by currency and interest rate.
Debt management enables the government to save money on debt service.
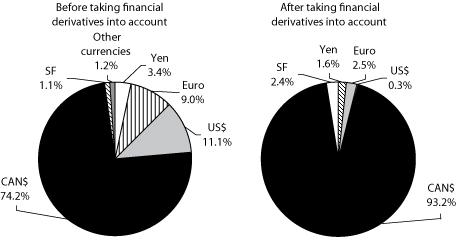
| | 3.1 | Structure of the debt by currency |
As at March 31, 2007, the proportion of the government’s total debt in Canadian dollars amounted to 93.2% and the proportion in foreign currency, 6.8%.
Table E.13
Structure of the total debt as at March 31, 2007P
(millions of dollars)
| | | | | | | | | | | | | | | | | | |
| | | Consolidated direct debt | | Net | | | | | | |
Currency | | Consolidated
Revenue
Fund | | % | | Consolidated
organizations | | Total | | % | | retirement
plans
liability | | Less:
Generations
Fund | | Total
debt | | % |
Canadian dollar | | 75 273 | | 89.6 | | 12 469 | | 87 742 | | 90.9 | | 32 608 | | -578 | | 119 772 | | 93.2 |
US dollar | | 382 | | 0.5 | | — | | 382 | | 0.4 | | — | | — | | 382 | | 0.3 |
Euro | | 3 144 | | 3.7 | | — | | 3 144 | | 3.3 | | — | | — | | 3 144 | | 2.5 |
Swiss franc | | 3 104 | | 3.7 | | — | | 3 104 | | 3.2 | | — | | — | | 3 104 | | 2.4 |
Yen | | 2 082 | | 2.5 | | — | | 2 082 | | 2.2 | | — | | — | | 2 082 | | 1.6 |
Pound sterling | | -2 | | — | | — | | -2 | | — | | — | | — | | -2 | | — |
| | | | | | | | | | | | | | | | | | |
Sub-total | | 83 983 | | 100.0 | | 12 469 | | 96 452 | | 100.0 | | 32 608 | | -578 | | 128 482 | | 100.0 |
Pre-financing | | -6 069 | | | | — | | -6 069 | | | | — | | — | | -6 069 | | |
| | | | | | | | | | | | | | | | | | |
TOTAL | | 77 914 | | | | 12 469 | | 90 383 | | | | 32 608 | | -578 | | 122 413 | | |
| | | | | | | | | | | | | | | | | | |
E.25
Before financial derivatives are taken into account, the proportion of the debt in foreign currency as at March 31, 2007 was 25.8%. After financial derivatives are taken into account, the proportion was 6.8%.
CHART E.8
Structure of the total debt by currency as at March 31, 2007P
E.26
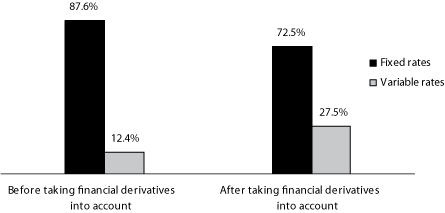
| | 3.2 | Structure of the debt by interest rate |
The government diversifies its debt by keeping part of it at variable rates and part at fixed rates. Since short-term interest rates are generally lower than long-term rates, keeping part of the debt at variable rates makes it possible to achieve substantial savings on debt service.
Before financial derivatives are taken into account, the proportion of the total debt at variable rates was 12.4% as at March 31, 2007. After financial derivatives are taken into account, the proportion was 27.5%.
CHART E.9
Structure of the total debt by interest rate as at March 31, 2007P
E.27
[THIS PAGE INTENTIONALLY LEFT BLANK]
E-28
| 4. | ADDITIONALINFORMATIONONFINANCINGTRANSACTIONSANDDEBT |
TABLE E.14
Summary of consolidated financing transactions
(millions of dollars)
| | | | | | | | | | | |
| | | 2006-2007P | | | | |
| | | March 2006
Budget | | Preliminary
results | | | Change | | 2007-2008P | | 2008-2009P |
Change in cash position | | | | | | | | | | | |
Consolidated Revenue Fund | | 2 590 | | -3 385 | | | -5 975 | | 6 069 | | — |
Consolidated organizations | | — | | -43 | | | -43 | | — | | — |
| | | | | | | | | | | |
Total change in cash position | | 2 590 | | -3 428 | | | -6 018 | | 6 069 | | — |
| | | | | | | | | | | |
Net borrowings | | | | | | | | | | | |
Consolidated Revenue Fund | | | | | | | | | | | |
New borrowings | | 4 702 | | 13 236 | | | 8 534 | | 3 417 | | 10 437 |
Repayment of borrowings | | -4 805 | | -5 154 | | | -349 | | -5 110 | | -5 603 |
| | | | | | | | | | | |
| | -103 | | 8 082 | | | 8 185 | | -1 693 | | 4 834 |
Consolidated organizations | | | | | | | | | | | |
New borrowings | | 1 527 | | 1 971 | 1 | | 444 | | 2 513 | | 1 908 |
Repayment of borrowings | | -458 | | -629 | | | -171 | | -922 | | -436 |
| | | | | | | | | | | |
| | 1 069 | | 1 342 | | | 273 | | 1 591 | | 1 472 |
| | | | | | | | | | | |
Total net borrowings | | 966 | | 9 424 | | | 8 458 | | -102 | | 6 306 |
| | | | | | | | | | | |
Retirement plans sinking fund | | -2 987 | | -4 440 | | | -1 453 | | -4 876 | | -5 334 |
| | | | | | | | | | | |
Generations Fund | | -74 | | -578 | | | -504 | | -653 | | -740 |
| | | | | | | | | | | |
TOTAL CONSOLIDATED FINANCING TRANSACTIONS | | 495 | | 978 | | | 483 | | 438 | | 232 |
| | | | | | | | | | | |
| P: | Preliminary results for 2006-2007 and forecasts for subsequent years. |
| Note: | A negative entry indicates a financial requirement and a positive entry, a source of financing. For the change in cash position, a negative entry indicates an increase and a positive entry, a decrease. |
| 1 | Includes a $444-million increase in temporary borrowings. |
E.29
TABLE E.15
Gouvernement du Québec
Borrowings for the Consolidated Revenue Fund in 2006-2007P
| | | | | | | | | | | | | | | | |
Amount in
Canadian dollars1 | | | Face value in
foreign currency | | | Interest rate2 | | | Date of issue | | Date of maturity | | Price to investor | | Yield to investor3 |
| (millions) | | | % | | | | | | | | | |
| 142 | | | € | 100 | | | 4.22 | 4 | | April 3 | | 2018-04-03 | | 100.000 | | 4.220 |
| 350 | 5 | | | — | | | Various | | | April 7 | | 2056-12-01 | | 100.084 | | 4.829 |
| 346 | 5 | | | — | | | Various | | | April 11 | | 2056-12-01 | | 98.889 | | 4.914 |
| 297 | | | | — | | | 4.50 | | | May 5 | | 2016-12-01 | | 96.390 | | 4.942 |
| 551 | | | | — | | | 5.75 | | | May 10 | | 2036-12-01 | | 110.189 | | 5.089 |
| 496 | 5 | | | — | | | Various | | | June 1 | | 2056-12-01 | | 99.289 | | 4.831 |
| 294 | 5 | | | — | | | Various | | | June 7 | | 2056-12-01 | | 98.123 | | 4.912 |
| 540 | | | | — | | | 5.75 | | | June 30 | | 2036-12-01 | | 107.918 | | 5.227 |
| 106 | | | | — | | | 4.50 | | | August 22 | | 2016-12-01 | | 98.346 | | 4.704 |
| 472 | | | | — | | | 5.00 | | | August 29 | | 2038-12-01 | | 102.278 | | 4.859 |
| 110 | | | US$ | 100 | | | 5.30 | | | August 31 | | 2016-08-31 | | 99.740 | | 5.334 |
| 457 | | | | — | | | 4.50 | | | September 18 | | 2016-12-01 | | 99.743 | | 4.531 |
| 991 | 5 | | | — | | | 6.35 | | | September 21 | | 2065-09-21 | | 132.179 | | 4.726 |
| 220 | 5 | | | — | | | 6.35 | | | September 25 | | 2065-09-21 | | 133.327 | | 4.681 |
| 528 | | | | — | | | 5.00 | | | October 6 | | 2038-12-01 | | 105.683 | | 4.657 |
| 15 | 5 | | | — | | | 5.35 | | | November 7 | | 2025-06-01 | | 109.266 | | 4.602 |
| 27 | 5 | | | — | | | 5.35 | | | November 8 | | 2025-06-01 | | 108.899 | | 4.630 |
| 22 | 5 | | | — | | | 5.35 | | | November 10 | | 2025-06-01 | | 108.090 | | 4.692 |
| 1 702 | | | US$ | 1 500 | | | 5.125 | | | November 14 | | 2016-11-14 | | 99.598 | | 5.177 |
| 129 | 5 | | | — | | | 5.00 | | | November 23 | | 2051-09-21 | | 107.657 | | 4.595 |
| 325 | 5 | | | — | | | 5.00 | | | November 23 | | 2051-09-21 | | 108.121 | | 4.572 |
| 215 | 5 | | | — | | | 6.70 | | | November 23 | | 2062-09-21 | | 143.107 | | 4.561 |
| 286 | | | | 300 | SF | | 2.625 | 4 | | December 21 | | 2017-06-21 | | 100.270 | | 2.594 |
| 527 | | | | — | | | 5.00 | | | December 21 | | 2038-12-01 | | 105.446 | | 4.670 |
| 500 | | | | — | | | Variable | 6 | | December 21 | | 2013-12-10 | | 100.000 | | Variable |
| 782 | | | | — | | | Variable | 6 | | January 15 | | 2013-12-10 | | 100.057 | | Variable |
| 497 | | | | — | | | 4.50 | | | January 29 | | 2017-12-01 | | 99.401 | | 4.570 |
| 114 | | | HK$ | 750 | | | 4.30 | 6 | | February 2 | | 2012-02-02 | | 100.000 | | 4.300 |
| 499 | | | | — | | | 4.50 | | | February 12 | | 2017-12-01 | | 99.757 | | 4.528 |
| 182 | | | | 200 | SF | | 2.625 | 4 | | February 15 | | 2017-06-21 | | 96.905 | | 2.977 |
| 49 | | | ¥ | 5 000 | | | 1.92 | | | February 15 | | 2017-02-15 | | 100.000 | | 1.920 |
| 1 006 | 7 | | | — | | | Various | | | Various | | Various | | Various | | Various |
| 7 | 8 | | | — | | | Various | | | Various | | Various | | Various | | Various |
| 432 | 9 | | | — | | | Various | | | Various | | Various | | Various | | Various |
| 20 | 10 | | | Various | | | Various | | | Various | | Various | | Various | | Various |
| | | | | | | | | | | | | | | | | |
| 13 236 | | | | | | | | | | | | | | | | |
| | | | | | | | | | | | | | | | | |
| Note: | The Québec government has credit lines with various banks and financial institutions for a total of US$3 500 million. None of these credit lines is being drawn upon. |
| 1 | Borrowings in foreign currency given in Canadian equivalent of their value on the date of borrowing. |
| 2 | Interest payable semi-annually except if another frequency is indicated in a note. |
| 3 | Yield to investor is determined on the basis of interest payable semi-annually. |
| 4 | Interest payable annually. |
| 6 | Interest payable quarterly. |
| 7 | Savings products issued by Épargne Placements Québec. |
| 8 | Borrowings from the Canada Pension Plan Investment Fund. |
| 9 | Immigrant Investor Program. |
| 10 | Amount received (disbursed) under interest rate and currency swap agreements. |
E.30
TABLE E.16
Gouvernement du Québec
Borrowings for the Financing Fund in 2006-2007P
| | | | | | | | | | | | | | | | |
| | | Amount in
Canadian
dollars 1 | | | Face value
in foreign
currency | | Interest
rate 2 | | | Date of issue | | Date of
maturity | | Price to
investor | | Yield to
investor 3 |
| | | (millions) | | | | | % | | | | | | | $ | | % |
A. Borrowings for consolidated organizations | | | | | | | | | | | | | | |
| | 459 | | | — | | 4.50 | | | April 17 | | 2016-12-01 | | 97.092 | | 4.853 |
| | 185 | | | — | | 4.50 | | | May 5 | | 2016-12-01 | | 96.390 | | 4.942 |
| | 361 | | | — | | 4.50 | | | August 22 | | 2016-12-01 | | 98.346 | | 4.704 |
| | 40 | | | — | | 5.00 | | | August 29 | | 2038-12-01 | | 102.278 | | 4.859 |
| | 42 | | | — | | 4.50 | | | September 18 | | 2016-12-01 | | 99.743 | | 4.531 |
| | 200 | 4 | | — | | Variable | 5 | | October 11 | | 2016-10-11 | | 100.000 | | Variable |
| | 40 | 4 | | — | | 5.35 | | | November 7 | | 2025-06-01 | | 109.266 | | 4.602 |
| | 200 | 4 | | — | | Variable | 5 | | December 14 | | 2017-05-14 | | 100.000 | | Variable |
| | | | | | | | | | | | | | | | |
Sub-total | | 1 527 | | | | | | | | | | | | | | |
| | | | | | | | | | | | | | | | |
B. Borrowings for certain government enterprises | | | | | | | | | | | | | | |
| | 27 | | | — | | 4.50 | | | April 17 | | 2016-12-01 | | 97.092 | | 4.853 |
| | 25 | | | — | | 4.50 | | | August 22 | | 2016-12-01 | | 98.346 | | 4.704 |
| | | | | | | | | | | | | | | | |
Sub-total | | 52 | | | | | | | | | | | | | | |
| | | | | | | | | | | | | | | | |
TOTAL | | 1 579 | | | | | | | | | | | | | | |
| | | | | | | | | | | | | | | | |
| 1 | Borrowings in foreign currency given in Canadian equivalent of their value on the date of borrowing. |
| 2 | Interest payable semi-annually except if another frequency is indicated in a note. |
| 3 | Yield to investor is determined on the basis of interest payable semi-annually. |
| 5 | Interest payable quarterly. |
E.31
TABLE E.17
Borrowings by Financement-Québec in 2006-2007P
| | | | | | | | | | | | | | |
Amount in Canadian
dollars1 | | | Face value in
foreign currency | | Interest rate2 | | | Date of issue | | Date of maturity | | Price to investor | | Yield to investor3 |
| (millions) | | % | | | | | | | $ | | % |
| 487 | | | — | | 4.25 | | | April 7 | | 2014-03-01 | | 97.370 | | 4.651 |
| 600 | | | — | | Variable | 4 | | June 9 | | 2012-04-25 | | 100.000 | | Variable |
| 47 | | | — | | 5.25 | | | July 26 | | 2034-06-01 | | 102.091 | | 5.108 |
| 195 | | | — | | 5.25 | | | September 29 | | 2034-06-01 | | 108.738 | | 4.683 |
| 499 | | | — | | 4.25 | | | November 3 | | 2014-03-01 | | 99.733 | | 4.292 |
| 220 | | | — | | Variable | 4 | | January 26 | | 2012-04-25 | | 99.976 | | Variable |
| 200 | 5 | | — | | Variable | 4 | | February 9 | | 2014-06-09 | | 100.000 | | Variable |
| 281 | | | — | | Variable | 4 | | February 16 | | 2013-09-16 | | 100.000 | | Variable |
| | | | | | | | | | | | | | | |
| 2 529 | | | | | | | | | | | | | | |
| | | | | | | | | | | | | | | |
| 1 | Borrowings in foreign currency given in Canadian equivalent of their value on the date of borrowing. |
| 2 | Interest payable semi-annually except if another frequency is indicated in a note. |
| 3 | Yield to investor is determined on the basis of interest payable semi-annually. |
| 4 | Interest payable quarterly. |
E.32
TABLE E.18
Borrowings by Hydro-Québec in 20061
| | | | | | | | | | | | |
Amount in
Canadian dollars2 | | Face value in
foreign currency | | Interest rate3 | | Date of issue | | Date of maturity | | Price to investor | | Yield to investor4 |
| (millions) | | % | | | | | | $ | | % |
| 596 | | — | | 6.00 | | January 17 | | 2040-02-15 | | 119.246 | | 4.841 |
| 590 | | — | | 6.00 | | February 3 | | 2040-02-15 | | 118.050 | | 4.904 |
| 591 | | — | | 6.00 | | April 3 | | 2040-02-15 | | 118.236 | | 4.892 |
| 575 | | — | | 6.00 | | April 18 | | 2040-02-15 | | 114.963 | | 5.070 |
| 520 | | — | | 5.00 | | October 17 | | 2045-02-15 | | 104.078 | | 4.767 |
| 533 | | — | | 5.00 | | November 14 | | 2045-02-15 | | 106.503 | | 4.635 |
| 165 5 | | Various | | Various | | Various | | Various | | Various | | Various |
| | | | | | | | | | | | | |
| 3 570 | | | | | | | | | | | | |
| | | | | | | | | | | | | |
| Note: | Hydro-Québec has credit lines with various banks and financial institutions for a total of US$2 000 million. None of these credit lines is being drawn upon. |
| 1 | Borrowings made from January 1 to December 31, 2006. |
| 2 | Borrowings in foreign currency given in Canadian equivalent of their value on the date of borrowing. |
| 3 | Interest payable semi-annually except if another frequency is indicated in a note. |
| 4 | Yield to investor is determined on the basis of interest payable semi-annually. |
| 5 | Amount received (disbursed) under interest rate and currency swap agreements. |
E.33
TABLE E.19
Transition from total debt to debt representing accumulated deficits
as at March 31, 20061
(millions of dollars)
| | | | |
Consolidated direct debt | | | | 83 672 |
| | |
Net retirement plans liability | | | | |
Gross retirement plans liability | | 57 193 | | |
Less: retirement plans sinking fund (RPSF) | | -22 563 | | |
| | | | 34 630 |
| | | | |
Total debt | | | | 118 302 |
| | |
Less: financial assets net of other liabilities | | | | |
| | |
Financial assets | | -40 355 | | |
| | |
Other liabilities | | 26 736 | | |
| | | | -13 619 |
| | | | |
Net debt | | | | 104 683 |
| | |
Less: capital expenditures | | | | -12 984 |
| | | | |
DEBT REPRESENTING ACCUMULATED DEFICITS | | | | 91 699 |
| | | | |
| 1 | The breakdown of financial assets and other liabilities is not available as at March 31, 2007. Therefore, this table presents data as at March 31, 2006. |
E.34