Exhibit 99.16
Section C
The Government’s Financial Framework
| | | | | | | | |
| INTRODUCTION | | C.3 |
| | |
1. | | TAKINGADVANTAGEOFTHERECOVERYTOBEGINRESTORINGFISCALBALANCE | | C.5 |
| | |
2. | | UPDATINGOFTHEFINANCIALFRAMEWORK | | C.11 |
| | | |
| | 2.1 | | Budgetary revenue | | C.11 |
| | | | |
| | | | 2.1.1 | | Own-source revenue excluding government enterprises | | C.12 |
| | | | |
| | | | 2.1.2 | | Revenue from government enterprises | | C.16 |
| | | | |
| | | | 2.1.3 | | Revenues from federal transfers | | C.18 |
| | | |
| | 2.2 | | Budgetary expenditure | | C.21 |
| | | | |
| | | | 2.2.1 | | Adjustments to program spending | | C.22 |
| | | | |
| | | | 2.2.2 | | Action plan to reduce spending growth so as to achieve fiscal balance | | C.24 |
| | | | |
| | | | 2.2.3 | | Efforts on the part of all government departments | | C.25 |
| | | | |
| | | | 2.2.4 | | Weight of government spending in the economy | | C.28 |
| | | | |
| | | | 2.2.5 | | Debt service | | C.29 |
| | | |
| | 2.3 | | Government investments | | C.31 |
| | | | |
| | | | 2.3.1 | | The Québec Infrastructures Plan | | C.31 |
| | | | |
| | | | 2.3.2 | | Investments by Québec government departments and organizations | | C.33 |
| | | | |
| | | | 2.3.3 | | Investments by government enterprises | | C.33 |
| | | | |
| | | | 2.3.4 | | Public investments in the economy | | C.34 |
C.1
| | | | | | | | |
3. | | BUDGETARYFORECASTSFORREVENUEANDCONSOLIDATEDEXPENDITURE | | C.35 |
| | | |
| | 3.1 | | Line-by-line consolidation | | C.37 |
| | | |
| | 3.2 | | Consolidated entities | | C.42 |
| | | | |
| | | | 3.2.1 | | Non-budget-funded bodies and special funds | | C.43 |
| | | | |
| | | | 3.2.2 | | Health and social services and education networks | | C.47 |
| | | | |
| | | | 3.2.3 | | Generations Fund | | C.49 |
| | |
4. | | CONSOLIDATEDNETFINANCIALREQUIREMENTS | | C.51 |
| | |
5. | | CONSOLIDATEDNON-BUDGETARYTRANSACTIONS | | C.55 |
| | | | | | | | |
| | |
| APPENDIX 1: | | INVESTMENTS | | C.61 |
| | |
| APPENDIX 2: | | INVESTMENTPROJECTSBYGOVERNMENTENTERPRISES | | C.65 |
| | |
| APPENDIX 3: | | PRESENTATIONOFCONSOLIDATEDFINANCIALREQUIREMENTSBEFORELINE-BY-LINECONSOLIDATIONOFTHEHEALTHANDSOCIALSERVICESANDEDUCATIONNETWORKS | | C.67 |
C.2

INTRODUCTION
This section of the Budget Plan presents the preliminary results for fiscal 2009-2010 and the government’s budgetary and financial stance for 2010-2011 and 2011-2012.
The information provided concerns:
| • | | consolidated financial and budgetary transactions for the period from 2009-2010 to 2011-2012, including the impact of the measures announced in the present budget; |
| • | | the change in revenue and expenditure, as well as adjustments made since last year’s budget; |
| • | | the government’s main expenditure items, capital expenditures, net financial requirements and non-budgetary transactions. |
Section A also contains five-year financial forecasts, up to 2014-2015.
| | |
The Government’s | | |
Financial Framework | | C.3 |
[THIS PAGE INTENTIONALLY LEFT BLANK]
| 1. | TAKINGADVANTAGEOFTHERECOVERYTOBEGINRESTORINGFISCALBALANCE |
Québec has been hit less hard than its main partners by the economic downturn. The $15-billion economic action plan over two years has played a major role in this regard, both economically and financially.
Despite a significant decrease in its revenues, the government has launched a vigorous action plan to support jobs and maintain the funding of public services, even at the price of budgetary deficits. The budgetary balance within the meaning of the Balanced Budget Act will be in deficit by $4.3 billion1 for the current year and $4.5 billion in 2010-2011. The measures arising from the plan to restore fiscal balance will help to bring the shortfall down to $2.9 billion in 2011-2012.
| • | | The government intends to take advantage of the economic recovery to start restoring fiscal balance. |
TABLE C.1
Summary of adjusted budgetary transactions – Budget 2010-2011P
(millions of dollars)
| | | | | | |
| | | 2009-2010 | | 2010-2011 | | 2011-2012 |
BUDGETARY TRANSACTIONS | | | | | | |
Budgetary revenue | | 62 650 | | 64 489 | | 65 936 |
% change | | – 0.4 | | 2.9 | | 2.2 |
Program spending | | – 60 769 | | – 62 561 | | – 63 907 |
% change | | 3.8 | | 2.9 | | 2.2 |
Debt service | | – 6 154 | | – 6 990 | | – 7 841 |
| | | | | | |
Total budgetary expenditure | | – 66 923 | | – 69 551 | | – 71 748 |
% change | | 2.9 | | 3.9 | | 3.2 |
Net results of consolidated entities | | 598 | | 697 | | 848 |
Contingency reserve | | – 300 | | – 300 | | — |
Impact of the plan to restore fiscal balance | | | | 1 051 | | 3 036 |
| | | | | | |
DEFICIT | | – 3 975 | | – 3 614 | | – 1 928 |
| | | | | | |
BALANCED BUDGET ACT | | | | | | |
Deposit of dedicated revenues in the Generations Fund | | – 715 | | – 892 | | – 972 |
Stabilization reserve | | 433 | | — | | — |
| | | | | | |
BUDGETARY BALANCE WITHIN THE MEANING OF THE BALANCED BUDGET ACT | | – 4 257 | | – 4 506 | | – 2 900 |
As a % of GDP | | – 1.4 | | – 1.4 | | – 0.9 |
| P: | Preliminary results for 2009-2010 and forecasts for subsequent years. |
| 1 | Had it not been for the stabilization reserve, the budgetary balance would have reached – $4.7 billion in 2009-2010. |
| | |
The Government’s | | |
Financial Framework | | C.5 |
As of 2010-2011, the government plans, on the one hand, to continue its rigorous management of program spending by limiting growth in such spending to 2.9% and, on the other hand, to implement other measures totalling $1.1 billion. In 2011-2012, growth in program spending will stand at 2.2% and the total for other measures will be $3.0 billion.
In addition, the government is incorporating a contingency reserve of $300 million into its financial framework for 2009-20102 and 2010-2011 respectively to provide for any shortfalls.
| 2 | A reserve of the same amount had been provided for 2009-2010 in the October 2009 Update on Québec’s Economic and Financial Situation. |
| | |
| | 2010-2011 Budget |
| C.6 | | Budget Plan |
| q | Adjustments to the budgetary balance in 2009-2010 |
The budgetary balance within the meaning of the Balanced Budget Act for 2009-2010 is in deficit by $4.3 billion, an upward adjustment of $311 million compared with the March 2009 Budget. The increase in spending is largely offset by the upward revisions in revenue. In addition, a $300-million contingency reserve, included in the financial framework last fall, is being maintained to deal with any additional shortfalls that could result from the change in revenue and expenditure late in the year.
TABLE C.2
Summary of budgetary transactions in 2009-2010P
(millions of dollars)
| | | | | | |
| | | 2009-2010
Budget | | Adjustments | | 2010-2011
Budget |
BUDGETARY TRANSACTIONS | | | | | | |
Own-source revenue | | 42 612 | | 207 | | 42 819 |
Government enterprises | | 4 759 | | – 157 | | 4 602 |
Federal transfers | | 14 841 | | 388 | | 15 229 |
| | | | | | |
Total budgetary revenue | | 62 212 | | 438 | | 62 650 |
Program spending | | – 59 989 | | – 780 | | – 60 769 |
Debt service | | – 6 104 | | – 50 | | – 6 154 |
| | | | | | |
Total budgetary expenditure | | – 66 093 | | – 830 | | – 66 923 |
Net results of consolidated entities | | 355 | | 243 | | 598 |
Contingency reserve | | — | | – 300 | | – 300 |
| | | | | | |
DEFICIT | | – 3 526 | | – 449 | | – 3 975 |
| | | | | | |
BALANCED BUDGET ACT | | | | | | |
Deposit of dedicated revenues in the Generations Fund | | – 715 | | — | | – 715 |
Stabilization reserve | | 295 | | 138 | | 433 |
| | | | | | |
BUDGETARY BALANCE WITHIN THE MEANING OF THE BALANCED BUDGET ACT | | – 3 946 | | – 311 | | – 4 257 |
As a % of GDP | | – 1.3 | | – 0.1 | | – 1.4 |
| | |
The Government’s | | |
Financial Framework | | C.7 |
Since the March 2009 Budget, a number of factors have enabled the government to offset the shortfall stemming from growth in spending. These factors are:
| • | | a $388-million increase in federal transfers; |
| • | | a $207-million rise in own-source revenue excluding government enterprise. |
These positive contributions have made it possible to reduce the impact of:
| • | | the $780-million upward adjustment of the program spending objective, including: |
| | • | | $380 million for the increase in the government’s contribution to La Financière agricole du Québec. This expenditure offset the anticipated deficit of La Financière agricole du Québec accounted for in consolidated entities. This also explains in part the upward revision of $243 million in respect of consolidated entities; |
| | • | | $150 million for enhancing the Renfort program to assist Québec companies facing liquidity problems; |
| | • | | $126 million attributable to spending in respect of the A (H1N1) flu pandemic; |
| • | | a decline of $157 million in revenue from government enterprises, including losses of $226 million at the Société générale de financement du Québec; |
| • | | a $50-million rise in debt service. |
Once the $300-million contingency reserve and the $433-million balance of the stabilization reserve are taken into account, the budgetary balance is in deficit by $4.3 billion.
| | |
| | 2010-2011 Budget |
| C.8 | | Budget Plan |
| q | Budgetary balance in 2010-2011 and 2011-2012 |
The budgetary balance for 2010-2011 is in deficit by $4.5 billion, up $746 million compared with the March 2009 Budget. This budgetary deficit is less than that of $4.7 billion presented last October.
For 2011-2012, the budgetary balance is in deficit by $2.9 billion, an upward adjustment of $261 million.
TABLE C.3
Total adjustments since the 2009-2010 BudgetF
(millions of dollars)
| | | | |
| | | 2010-2011 | | 2011-2012 |
BALANCE IN THE 2009-2010 BUDGET | | – 3 760 | | – 2 639 |
| | | | |
Budgetary revenue | | | | |
Own-source revenue excluding government enterprises | | 385 | | 73 |
Government enterprises | | – 348 | | – 305 |
Federal transfers | | 435 | | – 21 |
| | | | |
| | 472 | | – 253 |
Budgetary expenditure | | | | |
Program spending | | – 682 | | – 78 |
Debt service | | – 344 | | – 178 |
| | | | |
| | – 1 026 | | – 256 |
Consolidated entities1 | | 122 | | 145 |
Contingency reserve | | – 300 | | |
Impact of the plan to restore fiscal balance | | – 14 | | 103 |
| | | | |
Total adjustments to the budgetary balance | | – 746 | | – 261 |
| | | | |
BUDGETARY BALANCE WITHIN THE MEANING OF THE BALANCED BUDGET ACT | | – 4 506 | | – 2 900 |
| 1 | Excluding the adjustments relating to revenues dedicated to the Generations Fund. |
| | |
The Government’s | | |
Financial Framework | | C.9 |
| ¢ | 2010-2011: a budgetary balance of – $4.5 billion |
The $746-million upward adjustment to the budgetary deficit compared with the March 2009 Budget is explained primarily by:
| • | | the $682-million upward revision of the program spending objective, including $325 million stemming from an increase in the government contribution to La Financière agricole du Québec and $195 million for the cost of the new measures announced in this budget; |
| • | | the $348-million reduction in revenue from government enterprises, attributable for the most part to a decline of $300 million in Hydro-Québec’s net profits; |
| • | | the $344-million rise in debt service; |
| • | | the inclusion of a $300-million contingency reserve in the government’s financial framework. |
The $385-million upward adjustment in own-source revenue excluding government enterprises and the positive adjustments of $435 million in federal transfers improve the budgetary balance accordingly.
| ¢ | 2011-2012: a budgetary balance of – $2.9 billion |
The $261-million upward revision of the budgetary deficit compared with the March 2009 Budget can be attributed mainly to:
| • | | the $300-million decline in Hydro-Québec’s profits and the $178-million increase in debt service; |
| • | | the fact that these adjustments are partially offset by a $103-million increase in respect of the measures taken under the plan to restore fiscal balance. |
| | |
| | 2010-2011 Budget |
| C.10 | | Budget Plan |
| 2. | UPDATINGOFTHEFINANCIALFRAMEWORK |
This section explains the adjustments made since the last budget to the financial framework for 2009-2010 and presents the main factors affecting growth in the government’s revenue and expenditure for subsequent years.
The government’s budgetary revenue is expected to total $64.5 billion in 2010-2011, i.e. $49.2 billion in own-source revenue and $15.3 billion in federal transfers. Budgetary revenue should grow by 2.9% in 2010-2011 and 2.2% in 2011-2012.
For comparison purposes, the change in budgetary revenue does not include the measures provided for in the plan to restore fiscal balance.
TABLE C.4
Consolidated Revenue Fund
Change in budgetary revenue1
(millions of dollars)
| | | | | | | | | | |
| | | 2009-2010
Budget | | | | 2010-2011 BudgetP |
| | | 2009-2010 | | Adjustments | | 2009-2010 | | 2010-2011 | | 2011-2012 |
Own-source revenue | | | | | | | | | | |
Own-source revenue excluding government enterprises | | 42 612 | | 207 | | 42 819 | | 44 699 | | 46 660 |
% change | | – 2.8 | | | | – 2.4 | | 4.4 | | 4.4 |
Government enterprises | | 4 759 | | – 157 | | 4 602 | | 4 465 | | 4 595 |
% change | | 0.5 | | | | – 8.2 | | – 3.0 | | 2.9 |
| | | | | | | | | | |
Total | | 47 371 | | 50 | | 47 421 | | 49 164 | | 51 255 |
% change | | – 2.4 | | | | – 3.0 | | 3.7 | | 4.3 |
Federal transfers | | 14 841 | | 388 | | 15 229 | | 15 325 | | 14 681 |
% change | | 6.6 | | | | 8.6 | | 0.6 | | – 4.2 |
| | | | | | | | | | |
Budgetary revenue | | 62 212 | | 438 | | 62 650 | | 64 489 | | 65 936 |
% change | | – 0.4 | | | | – 0.4 | | 2.9 | | 2.2 |
| P: | Preliminary results for 2009-2010 and forecasts for subsequent years. |
| 1 | Excluding the measures provided for in the plan to restore fiscal balance (See Appendix 3 for the impact of the measures on the government’s financial framework). |
| | |
The Government’s | | |
Financial Framework | | C.11 |
| 2.1.1 | Own-source revenue excluding government enterprises |
| q | Upward adjustments in 2009-2010 |
Preliminary results for fiscal 2009-2010 show that own-source revenue, excluding the profits of government enterprises, is adjusted upward by $207 million compared with the March 2009 Budget and posts a decline of 2.4% compared with the previous year.
| ¢ | Adjustments to own-source revenue by source |
Revenue from personal income tax is revised downward by $705 million, despite the progression of salaries and wages in 2009. This revision reflects essentially the change in income tax payable, which was much lower than expected. In particular, the financial crisis and the recession led to a significant decline in capital gains realized in respect of 2008. This result had recurrent effects in 2009-2010. In addition, tax instalments in respect of 2009, which are based on income tax paid in 2008, have been revised downward.
Contributions to the Health Services Fund are adjusted upward slightly by $50 million, in accordance with the positive adjustment of salaries and wages in 2009.
Revenue from corporate taxes is revised upward by $496 million in 2009-2010. Nevertheless, it showed a decrease of close to 10% compared with the previous year.
| • | | Since the beginning of the year, tax receipts have declined less than was expected. |
| • | | The refunds requested by enterprises have continued to put a strain on corporate tax revenue. The accumulation of losses by corporations during the financial crisis and the economic recession enabled them to continue claiming larger refunds in 2009-2010. It should be noted that businesses can claim refunds, particularly by applying losses for the current year against their tax payable for the three previous years. This mechanism contributes to the volatility of this revenue source during a recession. |
| | |
| | 2010-2011 Budget |
| C.12 | | Budget Plan |
Consumption tax revenue is adjusted upward by $379 million on account of two main factors.
| • | | Revenue from the Québec sales tax is $302 million higher than forecast in the last budget and reflects, in particular, stronger household consumption in the last two quarters of 2009-2010 and the higher-than-anticipated number of housing starts in 2009. Input tax rebates to businesses were also lower than expected. |
| • | | Revenue from the specific tax on tobacco products is revised upward by $65 million owing to the increase in the number of cigarettes sold legally. Better control at the border and deployment of a new Sûreté du Québec team in the Valleyfield region interfered with smugglers’ tobacco supply. The reduced supply of illegal products led to an increase in legal sales of tobacco products. In 2009-2010, tobacco tax revenue paid into the Consolidated Revenue Fund will amount to $658 million compared with $594 million in 2008-2009. |
TABLE C.5
Consolidated Revenue Fund
Change in own-source revenue excluding government enterprises
(millions of dollars)
| | | | | | | | | | |
| | | 2009-2010
Budget | | Adjustments | | 2010-2011 BudgetP |
| | | 2009-2010 | | | 2009-2010 | | 2010-2011 | | 2011-2012 |
Personal income tax | | 18 203 | | – 705 | | 17 498 | | 18 551 | | 19 485 |
% change | | – 0.1 | | | | – 2.5 | | 6.0 | | 5.0 |
Health Services Fund | | 5 597 | | 50 | | 5 647 | | 5 843 | | 6 022 |
% change | | 0.4 | | | | 0.3 | | 3.5 | | 3.1 |
Corporate taxes | | 3 266 | | 496 | | 3 762 | | 3 849 | | 4 104 |
% change | | – 17.8 | | | | – 9.9 | | 2.3 | | 6.6 |
Consumption taxes | | 13 184 | | 379 | | 13 563 | | 14 081 | | 14 637 |
% change | | – 2.3 | | | | 1.2 | | 3.8 | | 3.9 |
Other revenue | | 2 362 | | – 13 | | 2 349 | | 2 375 | | 2 412 |
% change | | – 7.7 | | | | – 13.7 | | – 1.1 | | 1.6 |
| | | | | | | | | | |
Own-source revenue excluding government enterprises | | 42 612 | | 207 | | 42 819 | | 44 699 | | 46 660 |
% change | | – 2.8 | | | | – 2.4 | | 4.4 | | 4.4 |
| P: | Preliminary results for 2009-2010 and forecasts for subsequent years. |
| | |
The Government’s | | |
Financial Framework | | C.13 |
| q | Resumption of growth in own-source revenue in 2010-2011 |
After posting a decrease of 2.4% in 2009-2010, own-source revenue, excluding that from government enterprises, will increase by 4.4% in 2010-2011, a rate equivalent to economic growth.
| • | | The change in the government’s main tax bases is expected to reflect the growth of 4% in nominal GDP. |
In 2011-2012, own-source revenue, excluding that from government enterprises, will grow by 4.4%, a rate equivalent to the increase in nominal GDP, i.e. 4.5%.
| ¢ | Change in revenue by source |
Personal income tax, the main source of government revenue, will increase by 6.0% in 2010-2011 to $18.6 billion.
| • | | Excluding the impact of the refundable tax credit for home improvement and renovation, which ended on December 31, 2009, revenue from personal income tax would instead climb by 4.5%, an increase compatible with the growth in personal income, taking into account the progressive nature of the tax system. |
In 2011-2012, revenue from personal income tax should increase by 5.0%, while personal income is expected to grow by 3.5%.
| • | | This slightly stronger growth may be attributed, in particular, to the contribution from retirement income. From now on, income subject to tax will increase more rapidly than personal income given the growing share of income from private retirement plans. |
Contributions to the Health Services Fund should rise by 3.5% in 2010-2011 and 3.1% in 2011-2012, in accordance with the anticipated growth in salaries and wages.
After the decline observed in 2008-2009 and 2009-2010, revenue from corporate taxes will show an increase of 2.3% in 2010-2011 and 6.6% in 2011-2012. Essentially, this anticipated growth is due to two factors.
| • | | First, the fact that profits are expected to rise by 14.5% and 8.0% in 2010 and 2011 respectively will lead to a gradual increase in taxable income and corporate tax revenue. |
| | |
| | 2010-2011 Budget |
| C.14 | | Budget Plan |
| • | | In addition, use of the losses accumulated by businesses during the economic slowdown of the past two years and the gradual elimination of the tax on capital, a component of corporate taxes, by January 1, 2011 will continue to offset the growth in revenue from this source. |
In 2010-2011 and 2011-2012, revenue from consumption taxes should show an increase of 3.8% and 3.9% respectively, a growth rate comparable with that of household consumption.
| q | Change in revenue compatible with that of the economy |
Overall, growth in own-source revenue, excluding government enterprises, is expected to be compatible with nominal economic growth for the next two years, leaving aside the financial impact of fiscal measures. As indicated earlier, the measures provided for in the plan to restore fiscal balance have not been incorporated into own-source revenue in this section.
| | |
The Government’s | | |
Financial Framework | | C.15 |
| 2.1.2 | Revenue from government enterprises |
Revenue from government enterprises is adjusted downward by $157 million for 2009-2010. Hydro-Québec and the Société des alcools du Québec raised their forecast by $100 million and $47 million respectively, while the forecast for Loto-Québec and the Société générale de financement du Québec was revised downward.
Loto-Québec reduced its revenue by $79 million. This revision can be explained for the most part by lower-than-anticipated results for casinos and the Lotto Max lottery, coupled with the impact of the economic slowdown on gaming spending and certain one-time items.
Revenue from other government enterprises was affected mainly by a $226-million downward adjustment of the results of the Société générale de financement du Québec. This decrease is due, in particular, to losses and allowances for losses attributable to the petrochemical and forest product sectors.
TABLE C.6
Consolidated Revenue Fund
Change in revenue from government enterprises
(millions of dollars)
| | | | | | | | | | |
| | | 2009-2010
Budget | | Adjustments | | 2010-2011 BudgetP |
| | | 2009-2010 | | | 2009-2010 | | 2010-2011 | | 2011-2012 |
Hydro-Québec | | 2 700 | | 100 | | 2 800 | | 2 400 | | 2 400 |
Loto-Québec | | 1 295 | | – 79 | | 1 216 | | 1 287 | | 1 287 |
Société des alcools du Québec | | 800 | | 47 | | 847 | | 877 | | 915 |
Other | | – 36 | | – 225 | | – 261 | | – 99 | | – 7 |
| | | | | | | | | | |
Revenue from government enterprises | | 4 759 | | – 157 | | 4 602 | | 4 465 | | 4 595 |
% change | | 0.5 | | | | – 8.2 | | – 3.0 | | 2.9 |
| P: | Preliminary results for 2009-2010 and forecasts for subsequent years. |
| | |
| | 2010-2011 Budget |
| C.16 | | Budget Plan |
| q | Outlook for 2010-2011 and 2011-2012 |
Revenue from government enterprises for 2010-2011 and 2011-2012 will amount to $4.5 billion and $4.6 billion respectively.
The anticipated $2.4-billion reduction in Hydro-Québec revenues over the next two years, in accordance with its strategic plan tabled in summer 2009, will be partly offset by growth in the revenue of the Société des alcools du Québec and Loto-Québec.
Application of new capital expenditure accounting standards by Hydro-Québec
As of January 1, 2011, entities subject to public accountability and government enterprises will have to apply the new International Financial Reporting Standards (IFRS).
To prepare for the compulsory replacement of generally accepted accounting principles with IFRS in 2011, Hydro-Québec has employed the straight-line method of depreciation since January 1, 2010, because the compound interest method of depreciation at a rate of 3% is not a recognized method under IFRS. Hydro-Québec has applied this new depreciation method retrospectively with restatement of prior fiscal years for assets related to unregulated activities, including those of Hydro-Québec Production.
This accounting change has had an impact on Hydro-Québec’s financial position as at January 1, 2010, in the form of a roughly $3.8-billion decrease in tangible fixed assets and retained earnings. It has also substantially increased the annual amortization expense. In 2010, this expense will climb by close to $150 million for Hydro-Québec Production.
| | |
The Government’s | | |
Financial Framework | | C.17 |
| 2.1.3 | Revenues from federal transfers |
In 2009-2010, federal transfer revenues should reach $15.2 billion, or $388 million more than forecast in the March 2009 Budget. This revision stems essentially from the signing of new agreements between the federal government and the Québec government, particularly:
| • | | the Canada-Québec Labour Market Agreement, announced on April 30, 2009, which results in a roughly $700-million increase in transfer revenues over six years, i.e. $116 million per year as of 2008-2009; |
| • | | the Canada-Québec Base Fund Agreement on infrastructure (Building Canada) announced on May 22, 2009, which generates additional revenues of $175 million over two years, i.e. $100 million in 2009-2010 and $75 million in 2010-2011. |
For 2010-2011 and 2011-2012, federal transfer revenues are expected to amount to $15.3 billion and $14.7 billion.
TABLE C.7
Consolidated Revenue Fund
Change in federal transfers
(millions of dollars)
| | | | | | | | | | |
| | | 2009-2010
Budget | | Adjustments | | 2010-2011 BudgetP |
| | | 2009-2010 | | | 2009-2010 | | 2010-2011 | | 2011-2012 |
Equalization | | 8 355 | | — | | 8 355 | | 8 552 | | 7 888 |
% change | | 4.1 | | | | 4.1 | | 2.4 | | – 7.8 |
Health transfers | | 4 137 | | 11 | | 4 148 | | 4 264 | | 4 504 |
% change | | 10.6 | | | | 10.9 | | 2.8 | | 5.6 |
Transfers for post-secondary education and other social programs | | 1 413 | | 48 | | 1 461 | | 1 432 | | 1 452 |
% change | | 11.5 | | | | 15.3 | | – 2.0 | | 1.4 |
Other programs | | 936 | | 329 | | 1 265 | | 1 077 | | 837 |
% change | | 5.4 | | | | 28.0 | | – 14.9 | | – 22.3 |
| | | | | | | | | | |
Federal transfers | | 14 841 | | 388 | | 15 229 | | 15 325 | | 14 681 |
% change | | 6.6 | | | | 8.6 | | 0.6 | | – 4.2 |
| P: | Preliminary results for 2009-2010 and forecasts for subsequent years. |
| | |
| | 2010-2011 Budget |
| C.18 | | Budget Plan |
The equalization amounts for 2009-2010 and 2010-2011 are definitive.
Equalization revenues are expected to fall by 7.8% in 2011-2012 due to Québec’s relatively good performance during the 2009 recession. This delay results from the smoothing mechanism used by the federal government to determine equalization payments (three-year moving average delayed by two years).
TABLE C.8
Smoothing mechanism used by the federal government to determine equalization payments
In 2009-2010, health transfers and transfers for post-secondary education and other social programs are expected to grow by 10.9% and 15.3% respectively. This growth stems, in particular, from the impacts of the recession and the tax relief announced in the 2009 federal budget, which reduce the value of the special Québec abatement that is subtracted from these transfers.
As for revenues from other programs, the 14.9% decrease anticipated in 2010-2011 can be explained partly by the end of two trusts created by the federal government in 2008, namely, the Public Transit Capital Trust and the Community Development Trust. The decline of 22.3% expected in 2011-2012 is due, in particular, to the end of the Canada-Québec Base Fund Agreement on infrastructure (Building Canada) and of federal compensation in respect of the elimination of the tax on capital.
| | |
The Government’s | | |
Financial Framework | | C.19 |
Canada Student Grants Program
Since 1964, Québec has exercised the right to opt out with financial compensation in regard to federal student assistance.
In the 2008 Budget, the federal government announced the end of the Canada Millennium Scholarship Foundation and, on August 1, 2009, created the Canada Student Grants Program (CSGP).
On February 3, 2010, the federal government announced that Québec’s compensation in regard to the CSGP for the 2009-2010 loan year will be approximately $115 million. The exact amount should be known and paid in January 2011.
| • | | This compensation of $115 million includes both the $80 million stemming previously from the Canada Millennium Scholarship Foundation and the roughly $30 million in respect of grants included until just recently in the Canada Student Grants Program (CSGP). |
| • | | As of 2009-2010, $80 million in respect of the Millennium Scholarships, formerly accounted for in a specified purpose account, will be included in the appropriations of the Ministère de l’Éducation, du Loisir et du Sport. |
| • | | It should be noted that the “loans” component of the CSGP is being maintained by the federal government. This component generates roughly $90 million to $100 million in compensation per year. |
The total compensation expected from the federal government with regard to loans and grants for 2009-2010 is thus comparable to that for previous years, i.e. approximately $205 million.
However, the adjustment to federal transfer revenues takes into account the fact that the fiscal year of the federal program does not coincide with the fiscal year of the Québec government.
These adjustments to revenue and expenditure lead to a $40-million increase in the deficit in 2009-2010. The government has therefore decided to maintain a comparable level of service for students.
Compensation for Québec’s opting out of federal loans and grants programs
(millions of dollars)
| | | | | | |
| | | 2009-2010 | | 2010-2011 | | 2011-2012 |
Adjustment to federal transfer revenues1 | | 40 | | 77 | | 82 |
Less: Increase in program spending | | 80 | | 80 | | 80 |
| | | | | | |
Impact on the deficit | | – 40 | | – 3 | | 2 |
| | | | | | |
| 1 | The adjustment takes into account the government’s fiscal year (April 1 to March 31), which is different from that of the federal program (school year from August 1 to July 31). |
| | |
| | 2010-2011 Budget |
| C.20 | | Budget Plan |
The government’s budgetary expenditure, which includes program spending and debt service, is expected to reach $69.6 billion in 2010-2011, i.e. $62.6 billion for program spending and $7.0 billion for debt service. Program spending should increase by 2.9% in 2010-2011 and 2.2% in 2011-2012.
TABLE C.9
Consolidated Revenue Fund
Change in budgetary expenditure
(millions of dollars)
| | | | | | | | | | |
| | | 2009-2010
Budget | | Adjustments | | 2010-2011 BudgetP |
| | | 2009-2010 | | | 2009-2010 | | 2010-2011 | | 2011-2012 |
Program spending | | 59 989 | | 780 | | 60 769 | | 62 561 | | 63 907 |
% change | | 4.5 | | | | 3.8 | | 2.9 | | 2.2 |
Debt service | | 6 104 | | 50 | | 6 154 | | 6 990 | | 7 841 |
% change | | – 7.4 | | | | – 5.4 | | 13.6 | | 12.2 |
| | | | | | | | | | |
Budgetary expenditure | | 66 093 | | 830 | | 66 923 | | 69 551 | | 71 748 |
% change | | 3.3 | | | | 2.9 | | 3.9 | | 3.2 |
| P: | Preliminary results for 2009-2010 and forecasts for subsequent years. |
| | |
The Government’s | | |
Financial Framework | | C.21 |
| 2.2.1 | Adjustments to program spending |
Program spending in 2009-2010 stands at $60.8 billion, an increase of 3.8% compared with 2008-2009. This represents an upward revision of $780 million relative to the target of $60.0 billion.
This adjustment can be explained mainly by:
| • | | the $380-million increase in the government’s contribution for La Financière agricole du Québec; |
| • | | the cost of $126 million attributable to spending in respect of the A (H1N1) flu pandemic; |
| • | | the $150-million impact of the enhancement of the Renfort program from $1.2 billion to $2.0 billion in order to assist Québec companies facing liquidity problems; |
| • | | the $80 million in compensation from the federal government under its student loans and grants programs, in place of the Millennium Scholarship Program. |
| q | 2010-2011 and subsequent years |
Growth in program spending for 2010-2011 will be 2.9%, or less than the rate of 3.2% initially defined in the plan to restore fiscal balance.
The program spending objective for 2010-2011 is raised by $682 million and incorporates, in particular:
| • | | $317 million associated mainly with the recurrence of the 2009-2010 adjustments, including $325 million for the increase in the government’s contribution to La Financière agricole du Québec; |
| • | | $195 million for all the spending measures announced in this budget; |
| • | | $170 million for the recurrence of the Renfort program and the additional resources to fight tax evasion and avoidance announced in the Update on Québec’s Economic and Financial Situation. |
As of 2011-2012, program spending growth will be rolled back to 2.2% so as to restore fiscal balance.
| | |
| | 2010-2011 Budget |
| C.22 | | Budget Plan |
TABLE C.10
Change in program spendingP
(millions of dollars)
| | | | | | | | |
| | | 2009-2010 | | 2010-2011 | | | 2011-2012 | |
PROGRAM SPENDING OBJECTIVE IN THE 2009-2010 BUDGET | | 59 989 | | 61 879 | | | 63 829 | |
% change | | 4.5 | | 3.2 | | | 3.2 | |
| | | | | | | | |
ADJUSTMENTS | | | | | | | | |
Measures in the 2010-2011 Budget | | | | | | | | |
– Solidifying recovery | | — | | 67 | | | 16 | |
– Balancing public finances to protect our values | | — | | 43 | | | 53 | |
– Liberating the ambitions of Quebecers | | — | | 85 | | | 150 | |
| | | | | | | | |
Subtotal | | — | | 195 | | | 219 | |
2010-2011 Budget: other adjustments | | | | | | | | |
– Government contribution to La Financière agricole du Québec | | 380 | | 340 | 1 | | 345 | 1 |
– Cost attributable to the A (H1N1) flu pandemic | | 126 | | — | | | — | |
– Compensation for Québec’s opting out of federal loans and grants programs2 | | 80 | | 80 | | | 80 | |
– Other adjustments | | 44 | | – 103 | | | – 606 | |
| | | | | | | | |
Subtotal | | 630 | | 317 | | | – 181 | |
| | | | | | | | |
Total adjustments in the 2010-2011 Budget | | 630 | | 512 | | | 38 | |
| | | | | | | | |
Adjustments announced in the Update on Québec’s Economic and Financial Situation | | | | | | | | |
– Financing measures for businesses: increase in the Renfort program from $1.2 billion to $2.0 billion | | 150 | | 150 | | | — | |
– Additional resources to fight tax evasion and avoidance | | — | | 20 | | | 40 | |
| | | | | | | | |
Total adjustments in the Update on Québec’s Economic and Financial Situation | | 150 | | 170 | | | 40 | |
| | | | | | | | |
TOTAL ADJUSTMENTS SINCE THE 2009-2010 BUDGET | | 780 | | 682 | | | 78 | |
| | | | | | | | |
PROGRAM SPENDING OBJECTIVE IN THE 2010-2011 BUDGET | | 60 769 | | 62 561 | | | 63 907 | |
% change | | 3.8 | | 2.9 | | | 2.2 | |
| P: | Preliminary results for 2009-2010 and forecasts for subsequent years. |
| 1 | These amounts include $15 million in 2010-2011 and $20 million in 2011-2012 within the budget of the Ministère de l’Agriculture, des Pêcheries et de l’Alimentation for the measures to support the adaptation and multifunctionality of agriculture. |
| 2 | For more information on this adjustment, see the box in section 2.1.3. |
| | |
The Government’s | | |
Financial Framework | | C.23 |
| 2.2.2 | Action plan to reduce spending growth so as to achieve fiscal balance |
Reducing spending growth to 2.9% in 2010-2011 and 2.2% thereafter will help to achieve the goal of restoring fiscal balance. To that end, the Chair of the Conseil du trésor is introducing a spending control action plan.
The plan aims to:
| • | | demonstrate the government’s will to exert firm control over spending in the government as a whole; |
| | • | | comply with the rate set for spending growth in the coming years; |
| | • | | review certain programs, particularly as part of the review mandates already being carried out; |
| | • | | find leeway in the budgets provided in order to take new initiatives. |
Between now and 2013-2014, the government’s action plan will focus on the following three components:
| • | | fair and responsible remuneration of employees, through control over labour costs; |
| • | | a well-organized government, through ongoing restructuring of government bodies and continued staff reductions; |
| • | | continuous improvement of efficiency, through systematic assessment of program delivery and of administrative efficiency. |
| | |
| | 2010-2011 Budget |
| C.24 | | Budget Plan |
| 2.2.3 | Efforts on the part of all government departments |
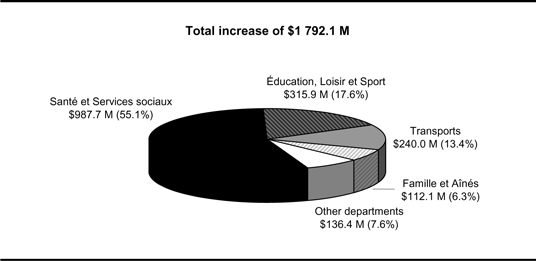
Program spending will climb from $60 769 million in 2009-2010 to $62 561 million in 2010-2011, an increase of $1 792 million, or 2.9%.
Over the coming years, all government departments will have to take part in the collective effort to restore fiscal balance.
TABLE C.11
Growth in program spending in 2010-2011P
(millions of dollars)
| | | | | | | | |
| | | | | | | Growth |
| | | 2009-2010 | | 2010-2011 | | $ million | | % |
Santé et Services sociaux | | 26 979.5 | | 27 967.2 | | 987.7 | | 3.7 |
Éducation, Loisir et Sport | | 14 489.2 | | 14 805.0 | | 315.9 | | 2.2 |
Transports | | 2 547.5 | | 2 787.5 | | 240.0 | | 9.4 |
Famille et Aînés | | 2 066.6 | | 2 178.6 | | 112.1 | | 5.4 |
Other departments | | 14 686.1 | | 14 822.7 | | 136.4 | | 0.9 |
| | | | | | | | |
TOTAL | | 60 768.9 | | 62 561.0 | | 1 792.1 | | 2.9 |
| | | | | | | | |
| P: | Preliminary results for 2009-2010 and forecasts for 2010-2011. |
| Source: | Secrétariat du Conseil du trésor. |
| Note: | Since figures are rounded, the sum of the amounts entered for each portfolio may not correspond to the total. |
| q | Health: 3.7% increase in 2010-2011 |
The budget allocated to health and social services is being raised by $988 million, or 3.7%, in 2010-2011. This increase, which accounts for 55.1% of the total growth in program spending, will make it possible to maintain public services.
Excluding the non-recurring cost of $126 million attributable to expenditures in respect of the A (H1N1) flu pandemic in 2009-2010, spending is expected to grow by 4.1% in 2010-2011.
| | |
The Government’s | | |
Financial Framework | | C.25 |
| q | Education: 2.2% budget increase |
The budget of the Ministère de l’Éducation, du Loisir et du Sport is being increased by 2.2%, or an additional $316 million. This increase accounts for 17.6% of total program spending growth. In addition, the education budget will make it possible to implement the action strategy on student retention and student success.
The program spending budget of the other departments is being raised by 2.5%, or $489 million, in 2010-2011. This increase will make it possible to continue supporting the government’s other priorities, particularly:
| • | | $240 million for the Ministère des Transports, an increase of 9.4%, in order to fund the investments announced in the road network and the public transit system; |
| • | | $112 million for the Ministère de la Famille et des Aînés, an increase of 5.4%, which will make it possible to fund the new reduced-contribution child-care spaces developed in 2009-2010 and to continue developing new spaces in 2010-2011; |
| • | | $136 million for the other departments. Excluding the $282 million provided in the Contingency Fund, the budgets of the other departments are reduced by 1.0% overall. |
CHART C.1
Breakdown of program spending growth in 2010-2011F
(millions of dollars and per cent)
| Source: | Secrétariat du Conseil du trésor. |
| | |
| | 2010-2011 Budget |
| C.26 | | Budget Plan |
| q | The government’s action in its essential missions |
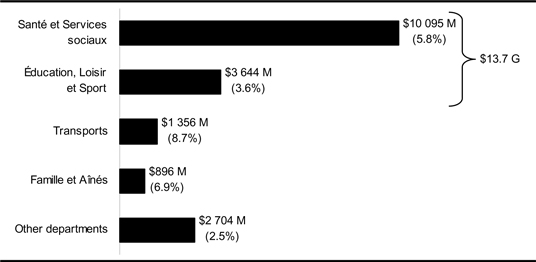
The government continues to invest in its essential missions, including health and education. From 2003-2004 to 2010-2011, average annual spending in health and education will rise by 5.8% and 3.6% respectively.
In all, since 2003, the government has added $13.7 billion to the health and education budgets, i.e. $10.1 billion and $3.6 billion respectively.
| • | | On their own, these expenditures account for over 73 % of the increase in program spending since 2003-2004. |
CHART C.2
Increase in program spending from
2003-2004 to 2010-2011
(dollars and average annual growth in per cent)
| Note: | Forecasts for 2010-2011. |
| | |
The Government’s | | |
Financial Framework | | C.27 |
| 2.2.4 | Weight of government spending in the economy |
The forecast for program spending in 2010-2011 is in line with the government’s overall objective to restore fiscal balance by 2013-2014.
The weight of spending in the economy should be 20% in 2010-2011.
Thereafter, the government plans to stay the course of disciplined program spending management and, between now and 2013-2014, gradually bring the weight of spending in the economy down to a proportion equal to that observed prior to the economic recession.
CHART C.3
Program spending
(as a percentage of GDP)
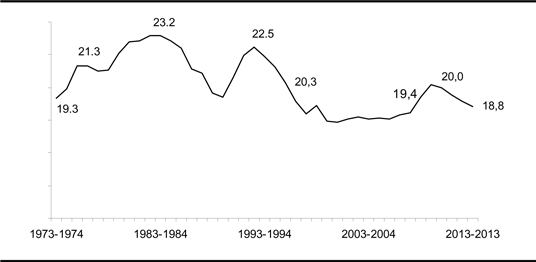
Note: Preliminary results for 2009-2010 and forecasts for subsequent years.
| | |
| | 2010-2011 Budget |
| C.28 | | Budget Plan |
In 2009-2010, debt service should amount to $6.2 billion, i.e. $3.8 billion for direct debt service and $2.4 billion for interest ascribed to the retirement plans.
Overall, debt service is revised upward by $50 million compared with the March 2009 Budget.
Debt service fell by 5.4% in 2009-2010 essentially because of the decline in interest rates. In 2010-2011 and 2011-2012, debt service is expected to climb by 13.6% and 12.2% respectively. This variance can be attributed to higher interest rates, the increase in the debt and the impact of the returns of the Caisse de dépôt et placement du Québec on the income of the Retirement Plans Sinking Fund (which is applied against the interest on the retirement plans account).
TABLE C.12
Consolidated Revenue Fund
Change in debt service
(millions of dollars)
| | | | | | | | | | |
| | | 2009-2010
Budget | | | | 2010-2011 BudgetP |
| | | 2009-2010 | | Adjustments | | 2009-2010 | | 2010-2011 | | 2011-2012 |
Direct debt service | | 3 760 | | 29 | | 3 789 | | 4 408 | | 4 925 |
Interest ascribed to the retirement plans | | 2 344 | | 31 | | 2 375 | | 2 597 | | 2 937 |
Employee future benefits1 | | 0 | | – 10 | | – 10 | | – 15 | | – 21 |
| | | | | | | | | | |
Debt service | | 6 104 | | 50 | | 6 154 | | 6 990 | | 7 841 |
% change | | – 7.4 | | | | – 5.4 | | 13.6 | | 12.2 |
| P: | Preliminary results for 2009-2010 and forecasts for subsequent years. |
| 1 | Including the interest on the obligation relating to the survivor’s pension plan minus the investment income of the Survivor’s Pension Plan Fund and the interest on the obligation relating to accumulated sick leave minus the investment income of the Accumulated Sick Leave Fund. |
| | |
The Government’s | | |
Financial Framework | | C.29 |
| q | A smaller proportion of revenue is being devoted to servicing the debt |
The share of budgetary revenue devoted to the debt service of the Consolidated Revenue Fund should stand at 11.4% in 2011-2012, compared with 17.2% in 1997-1998.
CHART C.4
Consolidated Revenue Fund debt service
(as a percentage of budgetary revenue)
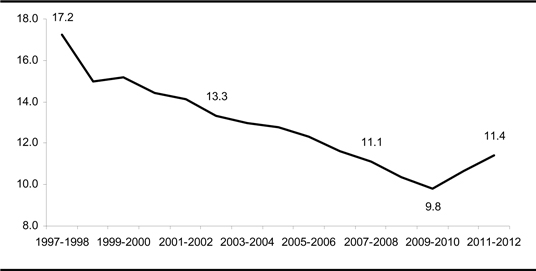
| Note: | Preliminary results for 2009-2010 and forecasts for subsequent years. |
| | |
| | 2010-2011 Budget |
| C.30 | | Budget Plan |
| 2.3 | Government investments |
| 2.3.1 | The Québec Infrastructures Plan |
Over the coming years, the government will continue to invest in Québec’s public infrastructures. As prescribed by the Act to promote the maintenance and renewal of public infrastructures, a substantial portion of these investments will be allocated to maintaining the quality of existing infrastructures and eliminating the maintenance deficit accumulated during the years prior to the adoption of the Act.
Under the 2009-2014 Québec Infrastructures Plan, the government will invest $42.6 billion over five years, which represents an increase of $831.3 million, or 2.0%, compared with the previous plan. If the impact of the addition of new sectors is excluded, the increase amounts to 1.5%.
Coupled with the contribution of the Québec government’s various partners in the projects included in the five-year plan, investments under the 2009-2014 Québec Infrastructures Plan will reach $56.2 billion over five years.
TABLE C.13
Infrastructure investments in 2009-2014
(millions of dollars)
| | |
2008-2013 Québec Infrastructures Plan | | 41 808.1 |
Increase in the five-year budget: 2% | | 831.3 |
| | |
2009-2014 Québec Infrastructures Plan | | 42 639.4 |
Contribution from partners1 | | 13 512.2 |
| | |
Total infrastructure investments in 2009-2014 | | 56 151.6 |
| | |
| 1 | Federal government, municipalities and other partners. |
| | |
The Government’s | | |
Financial Framework | | C.31 |
| q | Substantial acceleration of investment to support the economy |
Since the first five-year investment plan was adopted in 2007, government investments have risen substantially, from $4.2 billion in 2006-2007 to $5.0 billion in 2007-2008 and to $6.6 billion in 2008-2009. They will stand at $8.9 billion in 2009-2010 and reach $9.1 billion in 2010-2011.
This acceleration of infrastructure investment was undertaken to eliminate the maintenance deficit and support the Québec economy during an economic slowdown.
After 2010-2011, the annual level of investment will gradually be rolled back to a level compatible with the Act to promote the maintenance and renewal of public infrastructures, which makes provision for an asset maintenance budget and the elimination of the maintenance deficit over 15 years.
CHART C.5
Change in infrastructure investment
(contribution from the Québec government, billions of dollars)
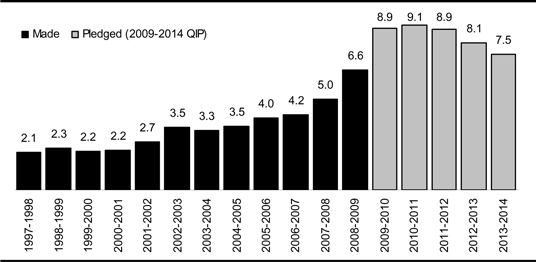
| (1) | The difference between total annual investments and total investments of $42.6 billion under the 2009-2014 Québec Infrastructures Plan is related to the rounding off of annual amounts. Annual investments are detailed in an appendix to this section. |
| | |
| | 2010-2011 Budget |
| C.32 | | Budget Plan |
| 2.3.2 | Investments by Québec government departments and organizations |
In addition to investments of roughly $9.1 billion under the 2010-2011 Québec Infrastructures Plan, the Québec government will invest $1.4 billion through its various departments, agencies and special funds. These investments will include capital expenditures required for government functions and for maintaining the quality of public services.
TABLE C.14
Investments by government departments, agencies and special funds
(millions of dollars)
| | |
| | | 2010-2011 |
Departments and budget-funded bodies | | 399.6 |
Non-budget-funded bodies | | 669.8 |
Special funds | | 315.4 |
| | |
TOTAL | | 1 384.8 |
| | |
| Note: | These investments exclude those made under the Québec Infrastructures Plan. |
| 2.3.3 | Investments by government enterprises |
Government enterprises will also make major investments in the coming years. In 2010-2011, investments by Hydro-Québec, Loto-Québec and the Société des alcools du Québec will reach $5.2 billion. Over the period from 2009-2010 to 2011-2012, investments by these corporations will total $15.0 billion.
TABLE C.15
Investments by government enterprises
(millions of dollars)
| | | | | | | | |
| | | 2009-2010 | | 2010-2011 | | 2011-2012 | | Total |
Hydro-Québec | | 4 340.0 | | 4 847.0 | | 4 997.0 | | 14 184.0 |
Loto-Québec | | 154.9 | | 251.0 | | 239.3 | | 645.2 |
Société des alcools du Québec | | 45.9 | | 63.9 | | 53.1 | | 162.9 |
| | | | | | | | |
TOTAL | | 4 540.8 | | 5 161.9 | | 5 289.4 | | 14 992.1 |
| | | | | | | | |
| | |
The Government’s | | |
Financial Framework | | C.33 |
| 2.3.4 | Public investments in the economy |
Public investments in Québec, including those by the Québec Infrastructures Plan, Hydro-Québec, the municipalities and the federal government reached 6.3% of GDP in 2009, a level not seen for over 25 years.
CHART C.6
Investments by governments1 and Hydro-Québec in Québec
(as a percentage of GDP)
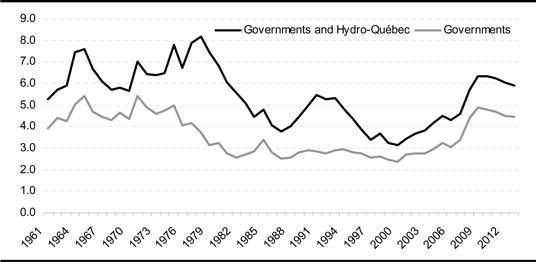
| Sources: | Statistics Canada and Ministère des Finances du Québec. |
| 1 | Québec government, federal government and municipalities. |
In fact, the forecast average investment of $13.6 billion in 2009-2010 and 2010-2011 by the government under its Québec Infrastructures Plan and by Hydro-Québec will create or support close to 100 000 jobs in Québec, i.e. 2.5% of all jobs.
The increase in public investments by the Québec government and Hydro-Québec will sustain 35 000 more jobs than five years ago.
TABLE C.16
Jobs supported by the Québec Infrastructures Plan1 and Hydro-Québec
| | | | |
| | | Average annual value of
investments
($ billion) | | Average annual number
of jobs2
(units) |
2003-2004 to 2008-2009 | | 7.8 | | 63 000 |
Increase between the two periods | | 5.8 | | 35 000 |
| | | | |
2009-2010 and 2010-2011 | | 13.6 | | 98 000 |
| 1 | Ministère des Finances du Québec estimates based on the intersectoral model of the ISQ. |
| 2 | Québec government contributions only. |
| | |
| | 2010-2011 Budget |
| C.34 | | Budget Plan |
| 3. | BUDGETARYFORECASTSFORREVENUEANDCONSOLIDATEDEXPENDITURE |
Starting with the 2010-2011 Budget, the government will present consolidated financial forecasts for revenue and expenditure. Accordingly, the budgetary revenue and expenditure of all the entities in the government’s reporting entity, including the entities in the health and social services and education networks and other government organizations, are being added to the budgetary revenue and expenditure of the Consolidated Revenue Fund. The results for the budgetary balance differ in no way from those shown in the preceding tables. This presentation makes it possible, among other things, to isolate the own-source revenues of consolidated entities and their attendant expenditures.
Consolidated budgetary transactions provide more complete information on the government’s financial projections.
The following table presents the government’s consolidated financial framework for fiscal 2009-2010 to 2011-2012.
Within the meaning of the Balanced Budget Act, the budgetary balance is in deficit by $4.3 billion for 2009-2010. Thereafter, it will be in deficit by $4.5 billion in 2010-2011 and $2.9 billion in 2011-2012.
| | |
The Government’s | | |
Financial Framework | | C.35 |
TABLE C.17
Consolidated financial framework for revenue and expenditure
Consolidated results by entity
(millions of dollars)
| | | | | | |
| | | 2010-2011 BudgetP |
| | | 2009-2010 | | 2010-2011 | | 2011-2012 |
Revenue1 | | | | | | |
Consolidated Revenue Fund | | 62 650 | | 64 489 | | 65 936 |
Consolidated entities2 | | 10 762 | | 11 212 | | 11 639 |
Specified purpose accounts2 | | 665 | | 1 647 | | 842 |
| | | | | | |
Consolidated revenue | | 74 077 | | 77 348 | | 78 417 |
Expenditure | | | | | | |
Consolidated Revenue Fund | | – 66 923 | | – 69 551 | | – 71 748 |
Consolidated entities2 | | – 10 164 | | – 10 515 | | – 10 791 |
Specified purpose accounts2 | | – 665 | | – 1 647 | | – 842 |
Contingency reserve | | – 300 | | – 300 | | — |
| | | | | | |
Consolidated expenditure | | – 78 052 | | – 82 013 | | – 83 381 |
Impact of the plan to restore fiscal balance | | | | 1 051 | | 3 036 |
| | | | | | |
DEFICIT | | – 3 975 | | – 3 614 | | – 1 928 |
| | | | | | |
Deposit of dedicated revenues in the Generations Fund | | – 715 | | – 892 | | – 972 |
Stabilization reserve | | 433 | | — | | — |
| | | | | | |
BUDGETARY BALANCE WITHIN THE MEANING OF THE BALANCED BUDGET ACT | | – 4 257 | | – 4 506 | | – 2 900 |
| P: | Preliminary results for 2009-2010 and forecasts for subsequent years. |
| 1 | For the purpose of presenting the Budget Plan, revenue of the government as employer that is contributed to the Health Services Fund is deducted from the revenue of consolidated entities. |
| 2 | Amounts from entities in the reporting entity are deducted from revenue and expenditure. |
| | |
| | 2010-2011 Budget |
| C.36 | | Budget Plan |
| 3.1 | Line-by-line consolidation |
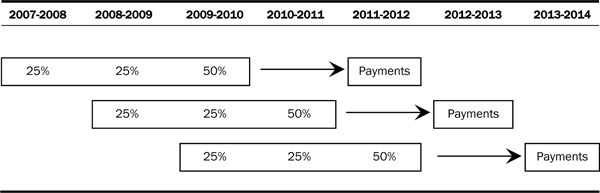
To ensure the information in the budget documents is better aligned with the presentation in the public accounts, the budget plan will henceforth present all of the consolidated revenues and expenditures of the entities included in the government’s reporting entity.
| • | | Until 2007-2008, the budget plan presented the net results of consolidated organizations, as well as certain summary information on the revenue and expenditure of non-budget-funded bodies and special funds. Those of the Generations Fund and the health and social services and education networks were added in 2008-2009. |
| • | | From now on, the revenue and expenditure of all these entities and the specified purpose accounts will be presented separately and added to those of the Consolidated Revenue Fund. This approach, which is called line-by-line consolidation, also requires eliminating transactions between related entities, particularly transfer expenditures from the government that are paid to consolidated entities and the corresponding revenues received by these entities. These transactions are carried out within the government and have no impact on its deficit or annual surplus. |
The presentation of the budget documents will thus correspond to that of the public accounts. Starting in fiscal 2009-2010, governments have been asked by the Public Sector Accounting Board (PSAB) of the Canadian Institute of Chartered Accountants (CICA) to consolidate line by line, in their financial statements, all the entities included in their reporting entity, including the transactions of their networks.
This will improve the quality and transparency of the information produced as part of the governent’s budget planning.
Table C.18 presents the main revenue and expenditure categories of the government’s consolidated financial framework for 2009-2010 and 2010-2011.
| | |
The Government’s | | |
Financial Framework | | C.37 |
TABLE C.18
Consolidated financial framework for revenue and expenditure
Consolidated results by activity
(millions of dollars)
| | | | |
| | | 2010-2011 BudgetP |
| | | 2009-2010 | | 2010-2011 |
Revenue | | | | |
Income and property taxes | | 26 881 | | 28 410 |
Consumption taxes | | 13 773 | | 14 287 |
School property taxes | | 1 453 | | 1 467 |
Duties and permits | | 1 886 | | 1 969 |
Miscellaneous | | 7 226 | | 7 465 |
Government enterprises | | 4 602 | | 4 465 |
Revenues dedicated to the Generations Fund | | 715 | | 892 |
| | | | |
Own-source revenue | | 56 536 | | 58 955 |
Federal transfers | | 17 541 | | 18 393 |
| | | | |
Total revenue | | 74 077 | | 77 348 |
Expenditure | | | | |
Expenditure | | – 69 824 | | – 72 712 |
Contingency reserve | | – 300 | | – 300 |
Debt service | | – 7 928 | | – 9 001 |
| | | | |
Total expenditure | | – 78 052 | | – 82 013 |
| | | | |
DEFICIT BEFORE PLAN TO RESTORE FISCAL BALANCE | | – 3 975 | | – 4 665 |
| | | | |
Plan to restore fiscal balance | | | | 1 051 |
| | | | |
DEFICIT | | – 3 975 | | – 3 614 |
| | | | |
Deposit of dedicated revenues in the Generations Fund | | – 715 | | – 892 |
Stabilization reserve | | 433 | | — |
| | | | |
BUDGETARY BALANCE WITHIN THE MEANING OF THE BALANCED BUDGET ACT | | – 4 257 | | – 4 506 |
| P: | Preliminary results for 2009-2010 and forecasts for 2010-2011. |
| | |
| | 2010-2011 Budget |
| C.38 | | Budget Plan |
Tables C.19 and C.20 detail the consolidated budgetary forecasts for 2009-2010 and 2010-2011. The consolidation takes into account transactions carried out in consolidated entities and in specified purpose accounts and eliminates financial transactions between entities in the government’s reporting entity. The latter transactions are carried out within the government and have no impact on the budgetary balance.
| | |
The Government’s | | |
Financial Framework | | C.39 |
TABLE C.19
Detailed consolidated financial framework
Consolidated results by activity
(millions of dollars)
| | | | | | | | | | | | | | |
| | | 2009-2010P |
| | | | | Consolidated entities | | Consolidation | | |
| | | Consolidated
Revenue
Fund | | Non-budget-
funded
bodies and
special
funds1 | | Health and social
services and
education
networks1 | | Generations
Fund | | Specified
purpose
accounts | | Consolidation
adjustments | | Consolidated
results |
Revenue | | | | | | | | | | | | | | |
Income and property taxes | | 26 907 | | 749 | | | | | | | | – 775 | | 26 881 |
Consumption taxes | | 13 563 | | 210 | | | | | | | | | | 13 773 |
School property taxes | | | | | | 1 453 | | | | | | | | 1 453 |
Duties and permits | | 950 | | 752 | | 184 | | | | | | | | 1 886 |
Miscellaneous | | 1 399 | | 2 133 | | 3 418 | | | | 283 | | – 7 | | 7 226 |
Government enterprises | | 4 602 | | | | | | | | | | | | 4 602 |
Generations Fund | | | | | | | | 715 | | | | | | 715 |
| | | | | | | | | | | | | | |
Own-source revenue | | 47 421 | | 3 844 | | 5 055 | | 715 | | 283 | | – 782 | | 56 536 |
Revenue from entities in the reporting entity | | | | 16 002 | | 28 189 | | | | 460 | | – 44 651 | | — |
Federal transfers | | 15 229 | | 1 670 | | 260 | | | | 557 | | – 175 | | 17 541 |
| | | | | | | | | | | | | | |
Total revenue | | 62 650 | | 21 516 | | 33 504 | | 715 | | 1 300 | | – 45 608 | | 74 077 |
Expenditure | | | | | | | | | | | | | | |
Expenditure | | – 60 769 | | – 19 623 | | – 33 120 | | | | – 1 300 | | 44 988 | | – 69 824 |
Contingency reserve | | – 300 | | | | | | | | | | | | – 300 |
Debt service | | – 6 154 | | – 1 608 | | – 786 | | | | | | 620 | | – 7 928 |
| | | | | | | | | | | | | | |
Total expenditure | | – 67 223 | | – 21 231 | | – 33 906 | | | | – 1 300 | | 45 608 | | – 78 052 |
| | | | | | | | | | | | | | |
(DEFICIT) SURPLUS | | – 4 573 | | 285 | | – 402 | | 715 | | — | | — | | – 3 975 |
| | | | | | | | | | | | | | |
Deposit of dedicated revenues in the Generations Fund | | | | | | | | – 715 | | | | | | – 715 |
Stabilization reserve | | 433 | | | | | | | | | | | | 433 |
| | | | | | | | | | | | | | |
BUDGETARY BALANCE WITHIN THE MEANING OF THE BALANCED BUDGET ACT | | – 4 140 | | 285 | | – 402 | | — | | — | | — | | – 4 257 |
| 1 | These data present transactions carried out within the government’s reporting entity, while the data given in Table C.17 do not take these transactions into account. This has no impact on consolidated results. |
| | |
| | 2010-2011 Budget |
| C.40 | | Budget Plan |
TABLE C.20
Detailed consolidated financial framework
Consolidated results by activity
(millions of dollars)
| | | | | | | | | | | | | | |
| | | 2010-2011P |
| | | | | Consolidated entities | | Consolidation | | |
| | | Consolidated
Revenue Fund | | Non-budget-
funded
bodies
and special
funds1 | | Health and
social services
and education
networks1 | | Generations
Fund | | Specified
purpose
accounts | | Consolidation
adjustments | | Consolidated
results |
Revenue | | | | | | | | | | | | | | |
Income and property taxes | | 28 243 | | 973 | | | | | | | | – 806 | | 28 410 |
Consumption taxes | | 14 081 | | 206 | | | | | | | | | | 14 287 |
School property taxes | | | | | | 1 467 | | | | | | | | 1 467 |
Duties and permits | | 972 | | 803 | | 194 | | | | | | | | 1 969 |
Miscellaneous | | 1 403 | | 2 240 | | 3 544 | | | | 285 | | – 7 | | 7 465 |
Government enterprises | | 4 465 | | | | | | | | | | | | 4 465 |
Generations Fund | | | | | | | | 892 | | | | | | 892 |
| | | | | | | | | | | | | | |
Own-source revenue | | 49 164 | | 4 222 | | 5 205 | | 892 | | 285 | | – 813 | | 58 955 |
Revenue from entities in the reporting entity | | | | 16 330 | | 29 345 | | | | 464 | | – 46 139 | | — |
Federal transfers | | 15 325 | | 1 424 | | 282 | | | | 1 548 | | – 186 | | 18 393 |
| | | | | | | | | | | | | | |
Total revenue | | 64 489 | | 21 976 | | 34 832 | | 892 | | 2 297 | | – 47 138 | | 77 348 |
Expenditure | | | | | | | | | | | | | | |
Expenditure | | – 62 561 | | – 20 144 | | – 34 173 | | | | – 2 297 | | 46 463 | | – 72 712 |
Contingency reserve | | – 300 | | | | | | | | | | | | – 300 |
Debt service | | – 6 990 | | – 1 828 | | – 858 | | | | | | 675 | | – 9 001 |
| | | | | | | | | | | | | | |
Total expenditure | | – 69 851 | | – 21 972 | | – 35 031 | | | | – 2 297 | | 47 138 | | – 82 013 |
| | | | | | | | | | | | | | |
(DEFICIT) SURPLUS BEFORE PLAN TO RESTORE FISCAL BALANCE | | – 5 362 | | 4 | | – 199 | | 892 | | — | | — | | – 4 665 |
| | | | | | | | | | | | | | |
Plan to restore fiscal balance | | 998 | | 28 | | 25 | | | | | | | | 1 051 |
| | | | | | | | | | | | | | |
(DEFICIT) SURPLUS | | – 4 364 | | 32 | | – 174 | | 892 | | — | | — | | – 3 614 |
| | | | | | | | | | | | | | |
Deposit of dedicated revenues in the Generations Fund | | | | | | | | – 892 | | | | | | – 892 |
| | | | | | | | | | | | | | |
BUDGETARY BALANCE WITHIN THE MEANING OF THE BALANCED BUDGET ACT | | – 4 364 | | 32 | | – 174 | | — | | — | | — | | – 4 506 |
| 1 | These data present transactions carried out within the government’s reporting entity, while the data given in Table C.17 do not take these transactions into account. This has no impact on consolidated results. |
| | |
The Government’s | | |
Financial Framework | | C.41 |
The government’s budgetary forecasts must take into account all financial transactions related to activities under its control.
They include the financial transactions of departments, budget-funded bodies and government enterprises, as well as consolidated entities, whose financial transactions must be taken into account in the government’s financial forecasts.
These consolidated entities are grouped as follows:
| • | | non-budget-funded bodies and special funds; |
| • | | the health and social services and education networks; |
The following table shows the net results of each group of consolidated entities.
TABLE C.9
Net results of consolidated entities
(millions of dollars)
| | | | | | |
| | | 2010-2011 BudgetP |
| | | 2009-2010 | | 2010-2011 | | 2011-2012 |
Non-budget-funded bodies and special funds | | 285 | | 4 | | 59 |
Health and social services and education networks | | – 402 | | – 199 | | – 183 |
Generations Fund (dedicated revenues) | | 715 | | 892 | | 972 |
| | | | | | |
NET RESULTS BEFORE PLAN TO RESTORE FISCAL BALANCE | | 598 | | 697 | | 848 |
| | | | | | |
Plan to restore fiscal balance | | | | 53 | | 131 |
| | | | | | |
NET RESULTS | | 598 | | 750 | | 979 |
| | | | | | |
| P: | Preliminary results for 2009-2010 and forecasts for subsequent years. |
| | |
| | 2010-2011 Budget |
| C.42 | | Budget Plan |
In December 2007, further to the recommendations of the Task Force on Government Accounting, the government adopted a reform of its accounting policies to bring them into full conformity with generally accepted accounting principles (GAAP). Accordingly, since 2006-2007, its reporting entity has included agencies and institutions in the health and social services network, school boards, CEGEPs, and the Université du Québec and its branches.
This year, in addition to presenting the net results of the health and social services and education networks, the budget presents a projection of the networks’ revenue and expenditure and their non–budgetary transactions.
| 3.2.1 | Non-budget-funded bodies and special funds |
Non-budget-funded bodies and special funds include 104 government entities whose mission is to sell goods and services or fund government programs. For instance:
| • | | the Fonds de conservation et d’am��lioration du réseau routier du Québec funds investments for maintaining and developing roads and structures; |
| • | | the Fonds de l’assurance médicaments pays the cost of medications and pharmaceutical services for people insured by the Régie de l’assurance maladie du Québec. |
For fiscal 2009-2010, the net results of non-budget-funded bodies and special funds show a surplus of $285 million. For 2010-2011 and 2011-2012, the net results of non-budget-funded bodies and special funds are expected to show surpluses of $32 million and $140 million respectively.
These surpluses are attributable mainly to an increase in the government’s contribution to La Financière agricole du Québec, up $380 million in 2009-2010 and $325 million as of 2010-2011.
These net results take into account the measures in the plan to restore fiscal balance, which amount to $28 million in 2010-2011 and $81 million in 2011-2012. These measures should total $165 million in 2013-2014.
| | |
The Government’s | | |
Financial Framework | | C.43 |
TABLE C.22
Non-budget-funded bodies and special funds
Net results
(millions of dollars)
| | | | | | |
| | | 2010-2011 BudgetP |
| | 2009-2010 | | 2010-2011 | | 2011-2012 |
Revenue | | | | | | |
Income and property taxes | | 749 | | 973 | | 1 414 |
Consumption taxes | | 210 | | 206 | | 207 |
Duties and permits | | 752 | | 803 | | 850 |
Miscellaneous | | 2 133 | | 2 240 | | 2 267 |
| | | | | | |
Own-source revenue | | 3 844 | | 4 222 | | 4 738 |
Revenue from entities in the reporting entity | | 16 002 | | 16 330 | | 17 423 |
Federal transfers | | 1 670 | | 1 424 | | 1 060 |
| | | | | | |
Total revenue | | 21 516 | | 21 976 | | 23 221 |
| | | |
Expenditure | | | | | | |
Remuneration | | – 2 138 | | – 2 185 | | – 2 188 |
Operating | | – 17 485 | | – 17 959 | | – 18 752 |
Debt service | | – 1 608 | | – 1 828 | | – 2 222 |
| | | | | | |
Total expenditure | | – 21 231 | | – 21 972 | | – 23 162 |
| | | | | | |
NET RESULTS BEFORE PLAN TO RESTORE FISCAL BALANCE | | 285 | | 4 | | 59 |
| | | | | | |
Plan to restore fiscal balance | | | | 28 | | 81 |
| | | | | | |
NET RESULTS | | 285 | | 32 | | 140 |
| | | | | | |
| P: | Preliminary results for 2009-2010 and forecasts for subsequent years. |
| | |
| | 2010-2011 Budget |
| C.44 | | Budget Plan |
List of non-budget-funded bodies and special funds
Non-budget-funded bodies
| | |
| Agence de l’efficacité énergétique | | Musée d’Art contemporain de Montréal |
| |
| Agence métropolitaine de transport | | Musée de la Civilisation |
| |
| Autorité des marchés financiers | | Musée national des beaux-arts du Québec |
| |
| Bibliothèque et Archives nationales du Québec | | Office de la sécurité du revenu des chasseurs et piégeurs cris |
| |
| Bureau de décision et de révision en valeurs mobilières | | Office des professions du Québec |
| |
| Centre de la francophonie des Amériques | | Office Québec-Amériques pour la jeunesse |
| |
| Centre de recherche industrielle du Québec | | Office Québec-Monde pour la jeunesse |
| |
| Centre de services partagés du Québec | | Régie de l’assurance maladie du Québec |
| |
| Commission de la capitale nationale du Québec | | Régie de l’énergie |
| |
| Commission des lésions professionnelles | | Régie des installations olympiques |
| |
| Commission des normes du travail | | Régie du bâtiment du Québec |
| |
| Commission des relations du travail | | Régie du cinéma |
| |
| Commission des services juridiques | | Services Québec |
| |
| Conseil des arts et des lettres du Québec | | Société de développement de la Baie-James |
| |
| Conservatoire de musique et d’art dramatique du Québec | | Société de développement des entreprises culturelles |
| |
| Corporation d’hébergement du Québec | | Société de financement des infrastructures locales du Québec |
| |
| Corporation d’urgences-santé | | Société de la Place des Arts de Montréal |
| |
| École nationale de police du Québec | | Société de l’assurance automobile du Québec |
| |
| École nationale des pompiers du Québec | | Société de télédiffusion du Québec |
| |
| Financement-Québec | | Société des établissements de plein air du Québec |
| |
| Fondation de la faune du Québec | | Société des parcs de sciences naturelles du Québec |
| |
| Fonds d’aide aux recours collectifs | | Société des traversiers du Québec |
| |
| Fonds d’assurance-prêts agricoles et forestiers | | Société d’habitation du Québec |
| |
| Fonds de la recherche en santé du Québec | | Société du Centre des congrès de Québec |
| |
| Fonds québécois de la recherche sur la nature et les technologies | | Société du Grand Théâtre de Québec |
| |
| Fonds québécois de la recherche sur la société et la culture | | Société du Palais des congrès de Montréal |
| |
| Héma-Québec | | Société du parc industriel et portuaire de Bécancour |
| |
| Immobilière SHQ | | Société immobilière du Québec |
| |
| Infrastructure Québec | | Société nationale de l’amiante |
| |
| Institut de la statistique du Québec | | Société québécoise d’assainissement des eaux |
| |
| Institut de tourisme et d’hôtellerie du Québec | | Société québécoise de récupération et de recyclage |
| |
| Institut national de santé publique du Québec | | Société québécoise d’information juridique |
| |
| Investissement Québec | | Tribunal administratif du Québec |
| |
| La Financière agricole du Québec | | |
| | |
The Government’s | | |
Financial Framework | | C.45 |
|
| List of non-budget-funded bodies and special funds (cont.) |
| | |
| Special funds |
| |
| Fonds d’aide à l’action communautaire autonome | | Fonds pour le développement des jeunes enfants |
| |
| Fonds d’aide aux victimes d’actes criminels | | Fonds pour le développement du sport et de l’activité physique |
| |
| Fonds d’assistance financière pour certaines régions sinistrées | | Fonds québécois d’initiatives sociales |
| |
| Fonds de conservation et d’amélioration du réseau routier | | Fonds relatif à la tempête de verglas |
| |
| Fonds de développement du marché du travail | | Fonds vert (Green Fund) |
| |
| Fonds de développement régional | | |
| |
| Fonds de financement | | |
| |
| Fonds de fourniture de biens ou de services du ministère de l’Emploi et de la Solidarité sociale | | |
| |
| Fonds de fourniture de biens ou de services du ministère du Revenu | | |
| |
| Fonds de gestion de l’équipement roulant | | |
| |
| Fonds de la sécurité routière | | |
| |
| Fonds de l’assurance médicaments | | |
| |
| Fonds de l’industrie des courses de chevaux | | |
| |
| Fonds de partenariat touristique | | |
| |
| Fonds de perception | | |
| |
| Fonds de soutien aux proches aidants | | |
| |
| Fonds des contributions des automobilistes au transport en commun | | |
| |
| Fonds des pensions alimentaires | | |
| |
| Fonds des registres du ministère de la Justice | | |
| |
| Fonds des services de police | | |
| |
| Fonds des technologies de l’information du Conseil du trésor | | |
| |
| Fonds des technologies de l’information du ministère de l’Emploi et de la Solidarité sociale | | |
| |
| Fonds des technologies de l’information du ministère du Revenu | | |
| |
| Fonds d’information foncière | | |
| |
| Fonds d’information géographique | | |
| |
| Fonds du centre financier de Montréal | | |
| |
| Fonds du patrimoine culturel québécois | | |
| |
| Fonds du patrimoine minier | | |
| |
| Fonds du service aérien gouvernemental | | |
| |
| Fonds forestier | | |
| |
| Fonds pour la promotion des saines habitudes de vie | | |
| |
| Fonds pour la vente de biens et services du ministère des Transports | | |
| | |
| | 2010-2011 Budget |
| C.46 | | Budget Plan |
| 3.2.2 | Health and social services and education networks |
The health and social services network is made up of 209 entities. These entities comprise 15 agencies and three regional authorities in the health and social services, as well as 191 public health and social services institutions.
The education network is made of up 131 entities, including 73 school boards, 48 CEGEPs and the Université du Québec and its nine branches.
As of fiscal 2009-2010, the public accounts have presented the revenue and expenditure of the networks and the assets and liabilities of their balance sheet line by line, whereas the previous budget essentially took into account the projected net financial results of the networks for the purpose of preparing the government’s financial framework.
In the interests of improving consistency between the financial data published in the budget and those disseminated in the public accounts, this budget presents, for the first time, detailed prospective financial information on the networks.
In the March 2009 Budget, the government provided $120 million for 2009-2010 to cover any overruns that might be incurred. The present budget is adjusting this amount upward by $282 million to $402 million. This adjustment is due to, in particular, the effects of harmonizing the network’s accounting policies with those of the government.
The deficits of the health and social services and education networks for 2010-2011 and 2011-2012 amount to $174 million and $133 million respectively after the measures under the plan to restore fiscal balance.
In cooperation with the Ministère de la Santé et des Services sociaux and the Ministère de l’Éducation, du Loisir et du Sport, the monitoring and budgetary control process for the networks has been improved. Other efforts will be deployed over the coming year to enhance the monitoring and budgetary control process for the entities that make up the networks.
| | |
The Government’s | | |
Financial Framework | | C.47 |
Lastly, the government is taking advantage of this budget to reiterate its determination to substantially reduce operating deficits in the health and social services network. The government is thus asking this network to introduce a budget management framework focused on achieving greater efficiency in order to gradually eliminate the network’s annual operating deficits. In exchange for attaining the fiscal balance targets, the government promises to gradually assume and repay the accumulated operating deficits of $1.6 billion as at March 31, 2008.
TABLE C.10
Health and social services and education networks
Net results
(millions of dollars)
| | | | | | |
| | | 2010-2011 BudgetP |
| | | 2009-2010 | | 2010-2011 | | 2011-2012 |
Revenue | | | | | | |
School property taxes | | 1 453 | | 1 467 | | 1 483 |
Revenue from users | | 1 594 | | 1 657 | | 1 724 |
Fees | | 184 | | 194 | | 204 |
Other | | 1 824 | | 1 887 | | 2 013 |
| | | | | | |
Own-source revenue | | 5 055 | | 5 205 | | 5 424 |
Revenue from entities in the reporting entity | | 28 189 | | 29 345 | | 30 613 |
Federal transfers | | 260 | | 282 | | 286 |
| | | | | | |
Total revenue | | 33 504 | | 34 832 | | 36 323 |
| | | |
Expenditure | | | | | | |
Remuneration and operating expenses | | – 32 920 | | – 34 173 | | – 35 585 |
Debt service | | – 786 | | – 858 | | – 921 |
Accounting harmonization | | – 200 | | — | | — |
| | | | | | |
Total expenditure | | – 33 906 | | – 35 031 | | – 36 506 |
| | | | | | |
NET RESULTS BEFORE PLAN TO RESTORE FISCAL BALANCE | | – 402 | | – 199 | | – 183 |
| | | | | | |
Impact of the plan to restore fiscal balance | | | | 25 | | 50 |
| | | | | | |
NET RESULTS | | – 402 | | – 174 | | – 133 |
| | | | | | |
| P: | Preliminary results for 2009-2010 and forecasts for subsequent years. |
| | |
| | 2010-2011 Budget |
| C.48 | | Budget Plan |
The amount deposited in the Generations Fund is expected to reach $715 million for 2009-2010.
For 2010-2011 and 2011-2012, total deposits in the Generations Fund are expected to amount to $892 million and $972 million respectively. As a result, the book value of the Generations Fund will reach $4.5 billion as at March 31, 2012. Section G presents the results of and change in the Generations Fund in greater detail.
TABLE C.24
Deposits in the Generations Fund
(millions of dollars)
| | | | | | | | | | |
| | | 2009-2010
Budget | | Adjustments | | 2010-2011 BudgetP |
| | | 2009-2010 | | | 2009-2010 | | 2010-2011 | | 2011-2012 |
Dedicated revenues | | | | | | | | | | |
Water-power royalties | | 647 | | 11 | | 658 | | 687 | | 706 |
Unclaimed property | | — | | 2 | | 2 | | 2 | | 2 |
Investment income | | 68 | | – 13 | | 55 | | 203 | | 264 |
| | | | | | | | | | |
TOTAL | | 715 | | — | | 715 | | 892 | | 972 |
| | | | | | | | | | |
| P: | Preliminary results for 2009-2010 and forecasts for subsequent years. |
| | |
The Government’s | | |
Financial Framework | | C.49 |
[THIS PAGE INTENTIONALLY LEFT BLANK]
| 4. | CONSOLIDATEDNETFINANCIALREQUIREMENTS |
The budgetary balance is presented on an accrual basis, with assets and liabilities being recognized, respectively, when they are acquired or incurred, regardless of when the corresponding funds are disbursed or received. Conversely, net surpluses or financial requirements represent the difference between the government’s cash inflow and disbursements. This measure thus takes into account not only changes in the budgetary balance but also resources or requirements arising from the government’s investments through the acquisition of fixed assets, through loans investments and advances, and through other activities such as paying accounts payable and collecting accounts receivable. The difference between the budgetary balance and net financial resources or requirements is recognized in non-budgetary transactions.
Moreover, for the first time, the government is presenting the non-budgetary transactions of the health and social services and education networks in detail. Previously, the government’s investments in the networks were presented on a net basis3 whereas, from now on, the networks’ non-budgetary transactions will be detailed like those of the Consolidated Revenue Fund.
As a whole, consolidated net financial requirements stand at $7.0 billion in 2009-2010 and 2010-2011, and at $6.9 billion in 2011-2012.
| 3 | The presentation of net financial requirements excluding the non-budgetary transactions of the health and social services and education networks is shown in Appendix 3. |
| | |
The Government’s | | |
Financial Framework | | C.51 |
TABLE C.25
Consolidated net financial requirements1
(millions of dollars)
| | | | | | | | | | |
| | | 2009-2010
Budget | | Adjustments | | 2010-2011 BudgetP |
| | | 2009-2010 | | | 2009-2010 | | 2010-2011 | | 2011-2012 |
Budgetary balance within the meaning of the Balanced Budget Act | | – 3 946 | | – 311 | | – 4 257 | | – 4 506 | | – 2 900 |
Deposit of dedicated revenues in the Generations Fund | | 715 | | — | | 715 | | 892 | | 972 |
| | | | | | | | | | |
Total consolidated budgetary transactions | | – 3 231 | | – 311 | | – 3 542 | | – 3 614 | | – 1 928 |
| | | | | | | | | | |
Consolidated non-budgetary transactions | | | | | | | | | | |
Activities relating to investments, loans and advances | | – 1 345 | | 849 | | – 496 | | – 1 281 | | – 1 205 |
Activities relating to investment in fixed assets | | – 3 304 | | – 1 295 | | – 4 599 | | – 4 653 | | – 4 917 |
Net investment in the networks3 | | – 1 004 | | 1 004 | | — | | — | | — |
Transactions relating to retirement plans and employee future benefits | | 2 490 | | – 80 | | 2 410 | | 2 667 | | 2 323 |
Change in other accounts (accounts payable, accounts receivable, reserves, etc.)4 | | 120 | | – 923 | | – 803 | | – 98 | | – 1 169 |
| | | | | | | | | | |
Total consolidated non-budgetary transactions | | – 3 043 | | – 445 | | – 3 488 | | – 3 365 | | – 4 968 |
| | | | | | | | | | |
CONSOLIDATED NET FINANCIAL REQUIREMENTS | | – 6 274 | | – 756 | | – 7 030 | | – 6 979 | | – 6 896 |
| | | | | | | | | | |
| P: | Preliminary results for 2009-2010 and forecasts for subsequent years. |
| 1 | A negative entry indicates a financial requirement and a positive entry, a source of financing. |
| 2 | The net financial requirements in the 2010-2011 Budget take into account the budgetary and non-budgetary transactions of the health and social services and education networks. |
| 3 | With line-by-line consolidation of the health and social services and education networks, the item “net investment in the networks” no longer exists because it is now part of transactions between related entities. |
| 4 | Including obligations stemming from public-private partnership agreements that have no effect on financial requirements. |
The consolidated net financial requirements shown in the above table come from the following sources:
| • | | The net financial requirements of the Consolidated Revenue Fund amount to $2.2 billion for 2009-2010, $3.0 billion for 2010-2011 and $2.1 billion for 2011-2012. These variations mainly reflect the change in the deficits forecast for the coming years and the capital funding granted to the Société générale de financement du Québec to provide assistance to businesses. |
| | |
| | 2010-2011 Budget |
| C.52 | | Budget Plan |
| • | | The net financial requirements of non-budget-funded bodies and special funds amount to $3.6 billion for 2009-2010, $2.9 billion for 2010-2011 and $4.4 billion for 2011-2012. They have been calculated after eliminating transactions with the health and social services and education networks. These net financial requirements stem largely from infrastructure investments provided for by the Fonds de conservation et d’amélioration du réseau routier. |
| • | | The net financial requirements of the health and social services and education networks stand at $2.0 billion for 2009-2010 and 2010-2011, and at $1.4 billion for 2011-2012. These net financial requirements stem essentially from capital investments. |
| • | | Deposits in the Generations Fund amount to $715 million for 2009-2010, $892 million for 2010-2011 and $972 million for 2011-2012. |
TABLE C.26
Consolidated net financial requirements by entity1
(millions of dollars)
| | | | | | | | | | |
| | | 2009-2010
Budget | | Adjustments | | 2010-2011 BudgetP |
| | | 2009-2010 | | | 2009-2010 | | 2010-2011 | | 2011-2012 |
Consolidated Revenue Fund | | – 2 800 | | 600 | | – 2 200 | | – 3 000 | | – 2 100 |
Non-budget-funded bodies and special funds | | – 4 189 | | 630 | | – 3 559 | | – 2 864 | | – 4 359 |
Health and social services and education networks | | — | | – 1 986 | | – 1 986 | | – 2 007 | | – 1 409 |
Deposits in the Generations Fund | | 715 | | — | | 715 | | 892 | | 972 |
| | | | | | | | | | |
CONSOLIDATED NET FINANCIAL REQUIREMENTS | | – 6 274 | | – 756 | | – 7 030 | | – 6 979 | | – 6 896 |
| | | | | | | | | | |
| P: | Preliminary results for 2009-2010 and forecasts for subsequent years. |
| 1 | A negative entry indicates a financial requirement and a positive entry, a source of financing. |
| | |
The Government’s | | |
Financial Framework | | C.53 |
[THIS PAGE INTENTIONALLY LEFT BLANK]
| 5. | CONSOLIDATEDNON-BUDGETARYTRANSACTIONS |
Consolidated non-budgetary transactions consist of the non-budgetary transactions of the Consolidated Revenue Fund and those of consolidated entities. They are presented by activity:
| • | | investments, loans and advances; |
| • | | retirement plans and employee future benefits; |
Non-budgetary transactions related to the health and social services and education networks are being consolidated in these activities for the first time. Over the past two years, they have been shown separately under the item “net investment in the networks.” The line-by-line consolidation of the networks’ transactions takes into account changes in asset and liability items, including capital expenditures and debts. Therefore, network assets funded directly through financial institutions are added to the government’s net financial requirements.
For 2009-2010, consolidated non-budgetary requirements stand at $3.5 billion, or $445 million less than forecast in the March 2009 Budget.
For 2010-2011 and 2011-2012, consolidated non-budgetary requirements stand at $3.4 billion and $5.0 billion respectively.
| | |
The Government’s | | |
Financial Framework | | C.55 |
TABLE C.27
Summary of consolidated non-budgetary transactions1
(millions of dollars)
| | | | | | | | | | |
| | | 2009-2010
Budget | | Adjustments | | 2010-2011 BudgetP,2 |
| | | 2009-2010 | | | 2009-2010 | | 2010-2011 | | 2011-2012 |
Consolidated Revenue Fund | | | | | | | | | | |
Investments, loans and advances | | – 1 119 | | 785 | | – 334 | | – 1 103 | | – 856 |
Capital expenditures | | – 179 | | – 65 | | – 244 | | – 266 | | – 247 |
Retirement plans and employee future benefits | | 2 490 | | – 80 | | 2 410 | | 2 667 | | 2 323 |
Other accounts | | – 406 | | 514 | | 108 | | 66 | | – 413 |
| | | | | | | | | | |
Total | | 786 | | 1 154 | | 1 940 | | 1 364 | | 807 |
| | | | | | | | | | |
Consolidated entities | | | | | | | | | | |
Investments, loans and advances | | – 226 | | 64 | | – 162 | | – 178 | | – 349 |
Capital expenditures | | – 3 125 | | – 1 230 | | – 4 355 | | – 4 387 | | – 4 670 |
Net investment in the networks3 | | – 1 004 | | 1 004 | | — | | — | | — |
Other accounts4 | | 526 | | – 1 437 | | – 911 | | – 164 | | – 756 |
| | | | | | | | | | |
Total | | – 3 829 | | – 1 599 | | – 5 428 | | – 4 729 | | – 5 775 |
| | | | | | | | | | |
Consolidated non-budgetary transactions | | | | | | | | | | |
Investments, loans and advances | | – 1 345 | | 849 | | – 496 | | – 1 281 | | – 1 205 |
Capital expenditures | | – 3 304 | | – 1 295 | | – 4 599 | | – 4 653 | | – 4 917 |
Net investment in the networks3 | | – 1 004 | | 1 004 | | — | | — | | — |
Retirement plans and employee future benefits | | 2 490 | | – 80 | | 2 410 | | 2 667 | | 2 323 |
Other accounts | | 120 | | – 923 | | – 803 | | – 98 | | – 1 169 |
| | | | | | | | | | |
TOTAL CONSOLIDATED NON-BUDGETARY REQUIREMENTS | | – 3 043 | | – 445 | | – 3 488 | | – 3 365 | | – 4 968 |
| | | | | | | | | | |
Preliminary results for 2009-2010 and forecasts for subsequent years.
| 1 | A negative entry indicates a financial requirement and a positive entry, a source of financing. |
| 2 | Line-by-line consolidation of network transactions requires taking into account the change in the various balance sheet items, including capital expenditures and debts. Therefore, assets funded through organizations outside the government’s reporting entity are added to the government’s net financial requirements. |
| 3 | With line-by-line consolidation of the transactions of the health and social services and education networks, the activity “net investment in the networks” was allocated to the other non-budgetary transaction activities. |
| 4 | Including obligations stemming from public-private partnership agreements that have no effect on financial requirements. |
| | |
| | 2010-2011 Budget |
| C.56 | | Budget Plan |
| q | Investments, loans and advances |
Consolidated financial requirements for investments, loans and advances for 2009-2010 amount to $496 million. The forecasts for 2010-2011 and 2011-2012 stand at $1.3 billion and $1.2 billion respectively.
For 2009-2010, the investments, loans and advances of the Consolidated Revenue Fund show financial requirements of $334 million, or $785 million less than forecast in last year’s budget. This change is due to, among other things, the downward adjustment from $625 million to $250 million in the capital funding granted to the Société générale de financement du Québec for implementing the assistance program for high-performance industries that are experiencing financial difficulties because of the economic situation. The Société générale de financement du Québec will be granted additional capital funding of $500 million in 2010-2011 and $50 million in 2011-2012. As a result, annual financial requirements for 2010-2011 and 2011-2012 will amount to $1.1 billion and $856 million respectively.
As regards non-budget-funded bodies and special funds, the financial requirements of $173 million for 2009-2010 arise essentially from investments, loans and advances attributable to Investissement Québec and the Green Fund.
TABLE C.28
Consolidated non-budgetary transactions for investments, loans and advances1
(millions of dollars)
| | | | | | | | | | |
| | | 2009-2010
Budget | | Adjustments | | 2010-2011 BudgetP |
| | | 2009-2010 | | | 2009-2010 | | 2010-2011 | | 2011-2012 |
Consolidated Revenue Fund | | – 1 119 | | 785 | | – 334 | | – 1 103 | | – 856 |
Non-budget-funded bodies and special funds2 | | – 226 | | 53 | | – 173 | | – 175 | | – 346 |
Health and social services and education networks | | — | | 11 | | 11 | | – 3 | | – 3 |
| | | | | | | | | | |
CONSOLIDATED NON-BUDGETARY TRANSACTIONS | | – 1 345 | | 849 | | – 496 | | – 1 281 | | – 1 205 |
| | | | | | | | | | |
| P: | Preliminary results for 2009-2010 and forecasts for subsequent years. |
| 1 | A negative entry indicates a financial requirement and a positive entry, a source of financing. |
| 2 | The revised data for 2009-2010 and those for subsequent years take into account adjustments arising from the line-by-line consolidation of the transactions of the health and social services and education networks. |
| | |
The Government’s | | |
Financial Framework | | C.57 |
For 2009-2010, consolidated investments in fixed assets amount to $7.5 billion. Taking into account a depreciation expense of $2.9 billion for these capital expenditures, the financial requirements associated with them total $4.6 billion. The forecasts for 2010-2011 and 2011-2012 stand at $4.7 billion and $4.9 billion respectively.
TABLE C.29
Capital investments and financial requirements1
(millions of dollars)
| | | | | | | | | | |
| | | 2009-2010
Budget | | Adjustments | | 2010-2011 BudgetP |
| | | 2009-2010 | | | 2009-2010 | | 2010-2011 | | 2011-2012 |
Consolidated Revenue Fund | | | | | | | | | | |
Level of investment | | – 436 | | – 62 | | – 498 | | – 518 | | – 510 |
Depreciation | | 257 | | – 3 | | 254 | | 252 | | 263 |
| | | | | | | | | | |
Financial requirements (capital expenditures) | | – 179 | | – 65 | | – 244 | | – 266 | | – 247 |
| | | | | | | | | | |
Non-budget-funded bodies and special funds2 | | | | | | | | | | |
Level of investment | | – 4 462 | | – 356 | | – 4 818 | | – 4 928 | | – 5 459 |
Depreciation | | 1 337 | | 105 | | 1 442 | | 1 601 | | 1 846 |
| | | | | | | | | | |
Financial requirements (capital expenditures) | | – 3 125 | | – 251 | | – 3 376 | | – 3 327 | | – 3 613 |
| | | | | | | | | | |
Health and social services and education networks | | | | | | | | | | |
Level of investment | | — | | – 2 231 | | – 2 231 | | – 2 392 | | – 2 497 |
Depreciation | | — | | 1 252 | | 1 252 | | 1 332 | | 1 440 |
| | | | | | | | | | |
Financial requirements (capital expenditures) | | — | | – 979 | | – 979 | | – 1 060 | | – 1 057 |
| | | | | | | | | | |
CONSOLIDED | | | | | | | | | | |
Level of investment | | – 4 898 | | – 2 649 | | – 7 547 | | – 7 838 | | – 8 466 |
Depreciation | | 1 594 | | 1 354 | | 2 948 | | 3 185 | | 3 549 |
| | | | | | | | | | |
Financial requirements (capital expenditures) | | – 3 304 | | – 1 295 | | – 4 599 | | – 4 653 | | – 4 917 |
| | | | | | | | | | |
| P: | Preliminary results for 2009-2010 and forecasts for subsequent years. |
| 1 | A negative entry indicates a financial requirement and a positive entry, a source of financing. |
| 2 | The revised data for 2009-2010 and those for subsequent years take into account adjustments arising from the line-by-line consolidation of the transactions of the health and social services and education networks. |
| | |
| | 2010-2011 Budget |
| C.58 | | Budget Plan |
The net financial requirements in respect of non-budget-funded bodies and special funds for 2009-2010 can be attributed mainly to road infrastructure investments of $3.6 billion financed by the Fonds de conservation et d’amélioration du réseau routier. These investments also explain the increase in financial requirements for 2010-2011 and 2011-2012.
In addition, investments of $2.2 billion are forecast for the networks’ fixed assets in 2009-2010. Of this amount, $1.2 billion is for the health and social services network and $1.0 billion for the education network. Network funding comes for the most part from Financement-Québec, the Corporation d’hébergement du Québec and financial institutions.
For 2009-2010, the balance of non-budgetary transactions in regard to the retirement plans and employee future benefits is $2.4 billion, which reduces the government’s financing needs.
For 2010-2011 and 2011-2012, the retirement plans and employee future benefits should help to reduce financing needs by $2.7 billion and $2.3 billion respectively.
Net financial requirements for other accounts consist of a series of changes in assets and liabilities such as accounts receivable, accounts payable and deferred revenue.
Consolidated financial requirements for other accounts amount to $803 million in 2009-2010. For 2010-2011, other accounts require additional funding of $98 million and of $1.2 billion for 2011-2012.
| | |
The Government’s | | |
Financial Framework | | C.59 |
[THIS PAGE INTENTIONALLY LEFT BLANK]
APPENDIX 1:INVESTMENTS
| q | 2009-2014 Québec Infrastructures Plan |
Investments of $42.6 billion from 2009-2010 to 2014-2015 under the Québec Infrastructures Plan are distributed among the various sectors of government intervention:
| • | | $19.6 billion in transportation infrastructures (road network, public transit and maritime infrastructures); |
| • | | $8.8 billion in health infrastructures; |
| • | | $6.0 billion in education infrastructures; |
| • | | $3.7 billion in municipal infrastructures; |
| • | | $4.5 billion in other sectors (culture, social housing, research, justice and public security, public dams, biomethanization and forest roads). |
CHART C.7
Breakdown of investments under the 2009-2014 Québec Infrastructures
Plan by intervention sector
(contribution from the Québec government, billions of dollars and per cent)
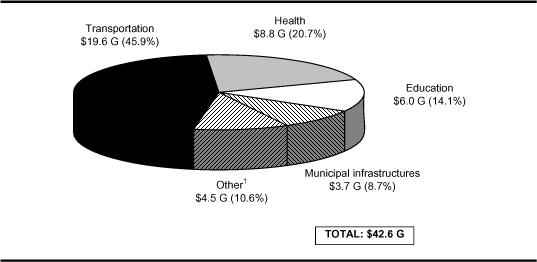
| 1 | Includes investments in social housing, culture, justice and public security, research, public dams, biomethanization and forest roads. |
| | |
The Government’s | | |
Financial Framework | | C.61 |
TABLE C.30
Breakdown of investments under the 2009-2014 Québec Infrastructures
Plan by intervention sector
(Contribution from the Québec government, millions of dollars)
| | | | | | | | | | | | |
| | | 2009-10 | | 2010-11 | | 2011-12 | | 2012-13 | | 2013-14 | | Total |
Road network | | 3 082.6 | | 3 467.3 | | 3 371.9 | | 3 181.5 | | 3 152.2 | | 16 255.5 |
Public transit | | 839.2 | | 734.6 | | 588.3 | | 352.7 | | 257.3 | | 2 772.1 |
Maritime infrastructures | | 7.4 | | 119.1 | | 142.9 | | 123.4 | | 133.4 | | 526.2 |
Health and social services | | 1 818.1 | | 1 804.5 | | 1 894.1 | | 1 685.2 | | 1 644.7 | | 8 846.6 |
Education | | 1 286.0 | | 1 298.4 | | 1 140.2 | | 1 137.1 | | 1 131.0 | | 5 992.7 |
Culture | | 380.7 | | 288.1 | | 187.0 | | 170.1 | | 159.1 | | 1 185.0 |
Municipal infrastructures | | 733.1 | | 716.7 | | 925.9 | | 785.2 | | 558.9 | | 3 719.8 |
Social housing | | 236.7 | | 240.4 | | 302.5 | | 253.8 | | 130.5 | | 1 163.9 |
Research | | 363.6 | | 234.4 | | 85.1 | | 185.1 | | 83.8 | | 952.0 |
Justice and public security | | 157.9 | | 193.6 | | 241.8 | | 230.7 | | 206.6 | | 1 030.6 |
Other1 | | 26.0 | | 44.5 | | 30.5 | | 26.0 | | 68.0 | | 195.0 |
| | | | | | | | | | | | |
TOTAL | | 8 931.3 | | 9 141.6 | | 8 910.2 | | 8 130.8 | | 7 525.5 | | 42 639.4 |
| | | | | | | | | | | | |
| 1 | Public dams, biomethanization and forest roads. |
| | |
| | 2010-2011 Budget |
| C.62 | | Budget Plan |
| ¢ | Breakdown by type of investment |
These investments include funds allocated to maintaining assets and improving and replacing infrastructures, as well as completing projects started before the first five-year plan came into effect.
The investment budget for maintaining assets comprises the regular budget needed to meet recognized asset maintenance standards (ranging from 1% to 3% of assets’ replacement value, depending on the sector) and investments allocated to eliminating the infrastructure maintenance deficit over 15 years as prescribed by the Act to promote the maintenance and renewal of public infrastructures.
CHART C.8
Breakdown of investments under the 2009-2014 Québec Infrastructures
Plan by type of investment
(contribution from the Québec government, billions of dollars and per cent)
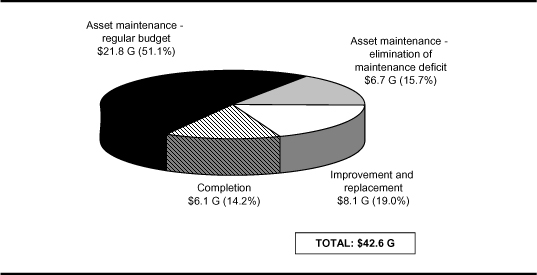
| | |
The Government’s | | |
Financial Framework | | C.63 |
TABLE C.31
Breakdown of investments under the 2009-2014 Québec Infrastructures
Plan by intervention sector and type of investment
(contribution from the Québec government, millions of dollars)
| | | | | | | | | | |
| | | Asset maintenance | | | | | | |
| | | Regular
budget | | Elimination of
maintenance
deficit | | Improvement
and
replacement | | Project
completion | | Total |
Road network | | 9 186.4 | | 1 501.4 | | 2 001.7 | | 3 566.0 | | 16 255.5 |
Public transit | | 1 353.7 | | 557.2 | | 335.1 | | 526.1 | | 2 772.1 |
Maritime infrastructures | | | | | | 526.2 | | | | 526.2 |
Health and social services | | 4 350.3 | | 1 270.6 | | 2 316.5 | | 909.2 | | 8 846.6 |
Education | | 4 339.5 | | 1 167.5 | | 451.3 | | 34.4 | | 5 992.7 |
Culture | | 623.3 | | 259.1 | | 148.0 | | 154.6 | | 1 185.0 |
Municipal infrastructures | | 1 194.8 | | 1 654.8 | | 288.0 | | 582.2 | | 3 719.8 |
Social housing | | 261.8 | | 286.6 | | 331.3 | | 284.2 | | 1 163.9 |
Research | | 18.9 | | | | 933.1 | | | | 952.0 |
Justice and public security | | 320.4 | | | | 710.2 | | | | 1 030.6 |
Other1 | | 150.0 | | | | 45.0 | | | | 195.0 |
| | | | | | | | | | |
TOTAL | | 21 799.1 | | 6 697.2 | | 8 086.4 | | 6 056.7 | | 42 639.4 |
| | | | | | | | | | |
| 1 | Public dams, biomethanization and forest roads. |
| | |
| | 2010-2011 Budget |
| C.64 | | Budget Plan |
APPENDIX 2:INVESTMENTPROJECTSBYGOVERNMENTENTERPRISES
Certain government enterprises will continue to make substantial investments that will contribute to Québec’s economic recovery. In 2010-2011, investments by these corporations will increase by over $620 million compared with 2009-2010 and reach nearly $5.2 billion. They will climb again in 2011-2012, to nearly $5.3 billion.
Hydro-Québec alone will boost its investments by over $500 million in 2010 compared with 2009, to which will be added $150 million in 2011.
The pace of the La Romaine project, launched in 2009, will be doubled, and the funding allocated to this project will reach over $400 million in 2010 and $515 million in 2011. As well, close to $1 billion will be allocated in 2010 to the Eastmain-1-A/Rupert and La Sarcelle project, which will be completed in 2012. In addition to making a significant contribution to Québec’s economy, these two projects will play an important role in securing Québec’s energy future.
Renovation work on the Gentilly power station will also generate major economic spinoffs, as more than $400 million will be devoted to this project in 2010 and 2011.
Substantial amounts will also be allocated to boost Québec’s energy efficiency, with spending in this regard amounting to nearly $300 million in 2010 and $325 million in 2011.
Hydro-Québec’s other projects will also have significant spinoffs in Québec. Overall, the investments devoted to these projects will reach $2.6 billion in 2010 and over $2.7 billion in 2011.
| q | Loto-Québec and Société des alcools du Québec |
Loto-Québec and the Société des alcools du Québec will also increase their investments through various projects.
Loto-Québec’s investments will reach $251 million in 2010-2011 and slightly more than $239 million in 2011-2012. Of these amounts, close to $102 million will be allocated to the Casino de Montréal renovation project in 2010-2011 and nearly $95 million will be invested in the project in 2011-2012.
| | |
The Government’s | | |
Financial Framework | | C.65 |
The Société des alcools du Québec will increase its investments by nearly $64 million in 2010-2011, compared with nearly $46 million in 2009-2010. These investments will be devoted mainly to developing or expanding its outlets, to expanding the Québec City distribution centre and to the Société’s computer ressources. The Société plans to invest slightly over $53 million in 2011-2012.
TABLE C.32
Projected investment by government enterprises
(millions of dollars)
| | | | | | | |
| | | 2009-2010 | | 2010-2011 | | | 2011-2012 |
HYDRO-QUÉBEC1 | | | | | | | |
Major projects | | | | | | | |
Eastmain 1-A/Rupert and La Sarcelle | | 1 161.0 | | 940.0 | | | 518.0 |
Gentilly-2 – repair project | | 271.0 | | 422.0 | | | 420.0 |
La Romaine complex | | 201.0 | | 407.0 | | | 515.0 |
Transmission integration – Wind turbines (990 MW and 2 000 MW) | | 102.0 | | 115.0 | | | 477.0 |
Interconnection with Ontario (Phases 1 and 2) | | 184.0 | | 55.0 | | | — |
Global Energy Efficiency Plan | | 257.0 | | 299.0 | | | 324.0 |
| | | | | | | |
Subtotal – Major projects | | 2 176.0 | | 2 238.0 | | | 2 254.0 |
Other projects | | 2 164.0 | | 2 609.0 | | | 2 743.0 |
| | | | | | | |
Total – Hydro-Québec | | 4 340.0 | | 4 847.0 | | | 4 997.0 |
LOTO-QUÉBEC | | | | | | | |
Casino de Montréal | | 27.6 | | 101.9 | | | 94.8 |
Other projects | | 127.3 | | 149.1 | | | 144.5 |
| | | | | | | |
Total – Loto-Québec | | 154.9 | | 251.0 | | | 239.3 |
SOCIÉTÉ DES ALCOOLS DU QUÉBEC | | | | | | | |
Outlet network | | 16.0 | | 15.4 | | | 15.5 |
Other projects | | 29.9 | | 48.5 | 2 | | 37.6 |
| | | | | | | |
Total – Société des alcools du Québec | | 45.9 | | 63.9 | | | 53.1 |
| | | | | | | |
TOTAL INVESTMENTS | | 4 540.8 | | 5 161.9 | | | 5 289.4 |
| | | | | | | |
| 1 | For the fiscal year ending December 31. |
| 2 | Amount including the expansion of the Québec City distribution centre ($14 million). |
| | |
| | 2010-2011 Budget |
| C.66 | | Budget Plan |
APPENDIX 3: PRESENTATIONOFCONSOLIDATEDFINANCIALREQUIREMENTSBEFORELINE-BY-LINECONSOLIDATIONOFTHEHEALTHANDSOCIALSERVICESANDEDUCATIONNETWORKS
TABLE C.33
Consolidated net financial requirements1
(millions of dollars)
| | | | | | | | | | |
| | | 2009-2010
Budget | | | | 2010-2011 BudgetP |
| | | 2009-2010 | | Adjustments | | 2009-2010 | | 2010-2011 | | 2011-2012 |
Budgetary balance within the meaning of the Balanced Budget Act | | – 3 946 | | – 311 | | – 4 257 | | – 4 506 | | – 2 900 |
Deposit of dedicated revenues in the Generations Fund | | 715 | | — | | 715 | | 892 | | 972 |
| | | | | | | | | | |
Total consolidated budgetary transactions | | – 3 231 | | – 311 | | – 3 542 | | – 3 614 | | – 1 928 |
| | | | | | | | | | |
Consolidated non-budgetary transactions | | | | | | | | | | |
Activities relating to investments, loans and advances | | – 1 345 | | 838 | | – 507 | | – 1 278 | | – 1 202 |
Activities relating to investment in fixed assets | | – 3 304 | | – 316 | | – 3 620 | | – 3 593 | | – 3 860 |
Net investment in the networks2 | | – 1 004 | | – 828 | | – 1 832 | | – 2 402 | | – 1 305 |
Transactions relating to retirement plans and employee future benefits | | 2 490 | | – 80 | | 2 410 | | 2 667 | | 2 323 |
Change in other accounts (accounts payable, accounts receivable, reserves, etc.)3 | | 120 | | – 307 | | – 187 | | 672 | | – 953 |
| | | | | | | | | | |
Total consolidated non-budgetary transactions | | – 3 043 | | – 693 | | – 3 736 | | – 3 934 | | – 4 997 |
| | | | | | | | | | |
CONSOLIDATED NET FINANCIAL REQUIREMENTS | | – 6 274 | | – 1 004 | | – 7 278 | | – 7 548 | | – 6 925 |
| | | | | | | | | | |
| P: | Preliminary results for 2009-2010 and forecasts for subsequent years. |
| 1 | A negative entry indicates a financial requirement and a positive entry, a source of financing. |
| 2 | The item “net investment in the networks” has not been allocated to other items such as investments, loans and advances, capital expenditures, and other accounts since line-by-line consolidation has not been done for the networks. |
| 3 | Including obligations stemming from public-private partnership agreements that have no effect on financial requirements. |
| | |
The Government’s | | |
Financial Framework | | C.67 |