Exhibit (99.17)
Section D
Debt, Financing
and Debt Management
| | | | | | | | |
1. | | DEBT | | D.3 |
| | | |
| | 1.1 | | Debt representing accumulated deficits | | D.4 |
| | | |
| | 1.2 | | Gross debt | | D.6 |
| | | | |
| | | | 1.2.1 | | Net retirement plans liability | | D.7 |
| | | | |
| | | | 1.2.2 | | Net employee future benefits liability | | D.8 |
| | | | |
| | | | 1.2.3 | | Change in gross debt in 2009-2010 | | D.9 |
| | | | |
| | | | 1.2.4 | | Debt burden | | D.12 |
| | | | |
| | | | 1.2.5 | | New debt reduction objectives | | D.13 |
| | | |
| | 1.3 | | Public sector debt | | D.16 |
| | | |
| | 1.4 | | Comparison of the debt of Canadian provinces | | D.17 |
| | | |
| | 1.5 | | Retirement plans | | D.19 |
| | | |
| | 1.6 | | Retirement Plans Sinking Fund | | D.23 |
| | | |
| | 1.7 | | Employee future benefits | | D.28 |
| | | |
| | 1.8 | | Generations Fund | | D.29 |
| | | |
| | 1.9 | | Returns of the Caisse de dépôt et placement du Québec on funds deposited by the Ministère des Finances | | D.31 |
| | | | |
| | | | 1.9.1 | | Retirement Plans Sinking Fund | | D.31 |
| | | | |
| | | | 1.9.2 | | Generations Fund | | D.33 |
| | | | |
| | | | 1.9.3 | | Accumulated Sick Leave Fund | | D.34 |
| | | |
| | 1.10 | | Impact of the returns of the Retirement Plans Sinking Fund on Debt Service | | D.36 |
| | |
2. | | FINANCING | | D.39 |
| | | |
| | 2.1 | | Financing strategy | | D.39 |
| | | | |
| | | | 2.1.1 | | Diversification by market | | D.39 |
| | | | |
| | | | 2.1.2 | | Diversification by instrument | | D.40 |
| | | | |
| | | | 2.1.3 | | Diversification by maturity | | D.41 |
D.1
| | | | | | | | |
| | 2.2 | | Financing program | | D.42 |
| | | | |
| | | | 2.2.1 | | Yield | | D.44 |
| | |
3. | | DEBT MANAGEMENT | | D.47 |
| | | |
| | 3.1 | | Structure of the debt by currency | | D.47 |
| | | |
| | 3.2 | | Structure of the debt by interest rate | | D.49 |
| | |
4. | | CREDIT RATINGS | | D.51 |
| | | |
| | 4.1 | | The Québec government’s credit ratings | | D.51 |
| | | |
| | 4.2 | | Comparison of the credit ratings of Canadian provinces | | D.56 |
| | |
5. | | ADDITIONAL INFORMATION | | D.59 |
D.2

This section presents data on the Québec government’s debt and compares the indebtedness of the Canadian provinces.
Several concepts of debt can be used to measure a government’s indebtedness. The following table presents data on the Québec government’s debt according to the two main concepts the government employs.
TABLE D.1
Debt of the Québec government as at March 31
(millions of dollars)
| | | | | | | | | | | | | | | | |
| | | 2009 | | | 2010P | | | 2011P | | 2012P | | 2013P | | 2014P | | 2015P |
GROSS DEBT1 | | 151 385 | | | 160 117 | | | 170 599 | | 180 084 | | 186 490 | | 189 428 | | 192 169 |
As a % of GDP | | 50.1 | | | 53.2 | | | 54.5 | | 55.1 | | 54.6 | | 53.3 | | 52.0 |
Less: Financial assets, net of other liabilities | | – 22 159 | 2 | | – 17 270 | 3 | | – 18 143 | | – 20 535 | | – 22 453 | | – 22 787 | | – 26 247 |
Less: Non-financial assets | | – 30 767 | | | – 36 219 | | | – 42 214 | | – 47 379 | | – 51 728 | | – 55 455 | | – 56 278 |
| | | | | | | | | | | | | | | | |
DEBT REPRESENTING ACCUMULATED DEFICITS | | 98 459 | 4 | | 106 628 | 3 | | 110 242 | | 112 170 | | 112 309 | | 111 186 | | 109 644 |
As a % of GDP | | 32.6 | | | 35.4 | | | 35.2 | | 34.3 | | 32.9 | | 31.3 | | 29.7 |
| P: | Preliminary results for 2010 and forecasts for subsequent years. |
| 2 | Includes the balance of the stabilization reserve. |
| 3 | Includes the restatement of $3 758 million stemming from a change made in Hydro-Québec’s accounting policies in 2010 for the purpose of complying with IFRS. This change reduces the value of the government’s participation in Hydro-Québec and increases the debt representing accumulated deficits. Also includes the restatement of $869 million arising from the implementation of line-by-line recording of the results of institutions in the health and social services and education networks, as required by the new CICA accounting standards established in 2009-2010. |
| 4 | After taking the stabilization reserve into account. |
| | |
Debt, Financing | | |
and Debt Management | | D.3 |
| 1.1 | Debt representing accumulated deficits |
Debt representing accumulated deficits is a simple concept that reflects the financial position of a government well, since it takes all of its liabilities and assets into account. The federal government and the governments of Ontario and Alberta use debt representing accumulated deficits as a measure of indebtedness in their budget documents.
The debt representing accumulated deficits corresponds to the difference between the government’s liabilities and its financial and non-financial assets as a whole. The debt representing accumulated deficits is calculated by subtracting financial assets, net of other liabilities, as well as non-financial assets from the gross debt.
Preliminary results show that the debt representing accumulated deficits should amount to $106 628 million as at March 31, 2010, or 35.4% of gross domestic product (GDP).
The debt representing accumulated deficits as at March 31, 2010 has been adjusted to take into account a change made by Hydro-Québec in its accounting policies in early 2010 for the purpose of complying with International Financial Reporting Standards (IFRS). All entities subject to public accountability and government enterprises will have to apply IFRS as of January 1, 2011. These standards differ significantly from those currently in effect, particularly with regard to the accounting method for capital expenditures. This change in accounting policies reduces Hydro-Québec’s retained earnings balance by $3 758 million. Therefore, the value of the government’s participation in Hydro-Québec is reduced by the same amount. This change thus increases the debt representing accumulated deficits by $3 758 million as at March 31, 2010, but does not affect the government’s gross debt.
The debt representing accumulated deficits as at March 31, 2010 has also been restated by $869 million. This restatement arises from the implementation of line by line recording of the results of institutions in the health and social services and education networks, as required by the new CICA accounting standards established in 2009-2010.
| | |
| | 2010-2011 Budget |
| D.4 | | Budget Plan |
Over the coming years, the debt representing accumulated deficits is expected to increase by $3.0 billion. This increase is due to the deficits of $8.6 billion that will be posted from 2010-2011 to 2012-2013 but that will be offset in part by the $5.6-billion increase in the Generations Fund. Note that the debt representing accumulated deficits will stop rising once the budget is balanced in 2013-2014. It will then decline year after year at the rate of increase of the Generations Fund.
TABLE D.2
Factors responsible for growth in the debt representing accumulated deficits
(millions of dollars)
| | | | | | | | | | | | | | | |
| | | Debt,
beginning of
year | | Budgetary
deficit | | Generations
Fund | | Restatements | | | Total
change | | Debt, end
of year | | As a %
of GDP |
2009-2010P | | 98 459 | | 4 257 | | – 715 | | 4 627 | 1 | | 8 169 | | 106 628 | | 35.4 |
2010-2011P | | 106 628 | | 4 506 | | – 892 | | — | | | 3 614 | | 110 242 | | 35.2 |
2011-2012P | | 110 242 | | 2 900 | | – 972 | | — | | | 1 928 | | 112 170 | | 34.3 |
2012-2013P | | 112 170 | | 1 200 | | – 1 061 | | — | | | 139 | | 112 309 | | 32.9 |
2013-2014P | | 112 309 | | — | | – 1 123 | | — | | | – 1 123 | | 111 186 | | 31.3 |
2014-2015P | | 111 186 | | — | | – 1 542 | | — | | | – 1 542 | | 109 644 | | 29.7 |
| P: | Preliminary results for 2009-2010 and forecasts for subsequent years. |
| 1 | Includes the restatement stemming from the change made in Hydro-Québec’s accounting policies in 2010 for the purpose of complying with IFRS and the restatement arising from the implementation of line-by-line recording of the results of institutions in the health and social services and education networks, as required by the new CICA accounting standards established in 2009-2010. |
| | |
Debt, Financing | | |
and Debt Management | | D.5 |
The government’s gross debt corresponds to the sum of the debt contracted on financial markets and the net liability for the retirement plans and for employee future benefits of public and parapublic sector employees, minus the balance of the Generations Fund.
Preliminary results show that, as at March 31, 2010, the gross debt should stand at $160 117 million, or 53.2% of GDP. As at March 31, 2015, the gross debt is expected to be $192 169 million, or 52.0% of GDP.
TABLE D.3
Gross debt as at March 31
(millions of dollars)
| | | | | | | | | | | | | | |
| | | 2009 | | 2010P | | 2011P | | 2012P | | 2013P | | 2014P | | 2015P |
Direct debt of the Consolidated Revenue Fund1 | | 87 043 | | 90 065 | | 95 292 | | 99 399 | | 101 375 | | 100 922 | | 101 121 |
Debt of consolidated entities2 | | 37 586 | | 43 956 | | 49 569 | | 55 546 | | 60 685 | | 64 543 | | 68 255 |
| | | | | | | | | | | | | | |
Consolidated direct debt3 | | 124 629 | | 134 021 | | 144 861 | | 154 945 | | 162 060 | | 165 465 | | 169 376 |
Plus: Net retirement plans liability | | 28 649 | | 28 763 | | 29 297 | | 29 670 | | 30 022 | | 30 678 | | 31 050 |
Plus: Net employee future benefits liability | | 59 | | — | | — | | — | | — | | — | | — |
Less: Generations Fund | | – 1 952 | | – 2 667 | | – 3 559 | | – 4 531 | | – 5 592 | | – 6 715 | | – 8 257 |
| | | | | | | | | | | | | | |
GROSS DEBT | | 151 385 | | 160 117 | | 170 599 | | 180 084 | | 186 490 | | 189 428 | | 192 169 |
As a % of GDP | | 50.1 | | 53.2 | | 54.5 | | 55.1 | | 54.6 | | 53.3 | | 52.0 |
| P: | Preliminary results for 2010 and forecasts for subsequent years. |
| 2 | Does not take into account the debt of institutions in the health and social services and education networks contracted in their own name. |
| 3 | The consolidated direct debt represents the debt that has been contracted on financial markets. |
The consolidated direct debt consists of the direct debt of the Consolidated Revenue Fund and the direct debt of entities whose results are consolidated line by line with those of the government. The main consolidated entities are Financement-Québec, the Fonds de conservation et d’amélioration du réseau routier, the Corporation d’hébergement du Québec, the Société québécoise d’assainissement des eaux, the Société immobilière du Québec, Investissement Québec, the Immobilière SHQ, the Agence métropolitaine de transport and the Société du Palais des congrès de Montréal. As at March 31, 2010, the consolidated direct debt is expected to total $134 021 million.
| | |
| | 2010-2011 Budget |
| D.6 | | Budget Plan |
The net retirement plans liability represents the retirement plans liability minus the balance of the Retirement Plans Sinking Fund (RPSF), an asset established that can be used to pay the retirement benefits of public and parapublic sector employees. As at March 31, 2010, the net retirement plans liability should amount to $28 763 million.
The net liability for employee future benefits consists of the government’s commitments for accumulated sick leave and the survivor’s pension plan, minus assets constituted in regard to these commitments. As at March 31, 2010, the net employee future benefits liability should be nil, since assets will be equal to liabilities.
As at March 31, 2010, the sums accumulated in the Generations Fund are expected to amount to $2 667 million.
| 1.2.1 | Net retirement plans liability |
The net retirement plans liability is calculated by subtracting the balance of the RPSF from the retirement plans liability.
The liability for the retirement plans represents the present value of the retirement benefits that the government will pay to public and parapublic sector employees, taking into account the conditions of their plans and their years of service. This liability should stand at $66 961 million as at March 31, 2010.
The government created the RPSF in 1993. As at March 31, 2010, the book value of the RPSF is expected to be $38 198 million.
| | |
Debt, Financing | | |
and Debt Management | | D.7 |
The net liability for the retirement plans should total $28 763 million as at March 31, 2010.
TABLE D.4
Net retirement plans liability as at March 31, 2010P
(millions of dollars)
| | |
Retirement plans liability: | | |
Government and Public Employees Retirement Plan (RREGOP) | | 37 332 |
Pension Plan of Management Personnel (PPMP) | | 8 458 |
Other plans | | 21 171 |
| | |
Subtotal | | 66 961 |
Less: Retirement Plans Sinking Fund | | – 38 198 |
| | |
NET RETIREMENT PLANS LIABILITY | | 28 763 |
| | |
| 1.2.2 | Net employee future benefits liability |
The government records under its debt the value of its commitments regarding future benefits programs for its employees, namely, accumulated sick leave, which is payable notably when an employee retires, and pensions paid to the survivors of a government employee. These programs give rise to long-term obligations whose costs are covered in full by the government.
Since the December 2007 accounting reform, an actuarial valuation is done of future employee benefits and, like the liability for the retirement plans, these benefits are included in the government’s gross debt. Previously, employee future benefits were entered in the government’s accounts payable and the Survivor’s Pension Plan Fund was entered under long-term investments.
In addition, as part of the December 2007 accounting reform, the government undertook to create the Accumulated Sick Leave Fund. This fund was created in October 2008. The sums accumulated in this new fund are subtracted from the liability for employee future benefits.
| | |
| | 2010-2011 Budget |
| D.8 | | Budget Plan |
The balance of the net employee future benefits liability is expected to be nil as at March 31, 2010.
TABLE D.5
Net employee future benefits liability as at March 31, 2010P
(millions of dollars)
| | |
Accumulated sick leave | | 703 |
Survivor’s pension plan | | 405 |
Less: Accumulated Sick Leave Fund | | – 657 |
Survivor’s Pension Plan Fund | | – 451 |
| | |
NET EMPLOYEE FUTURE BENEFITS LIABILITY | | — |
| | |
| 1.2.3 | Change in gross debt in 2009-2010 |
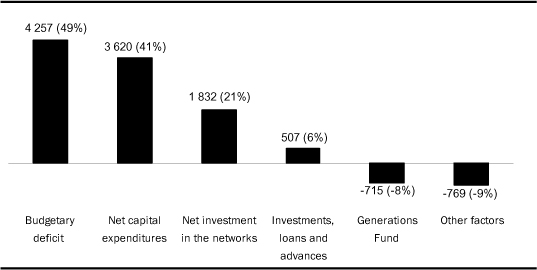
In 2009-2010, the government’s gross debt should increase by $8 732 million.
CHART D.1
Factors responsible for growth in the gross debt in 2009-2010
(millions of dollars)
| | |
Debt, Financing | | |
and Debt Management | | D.9 |
The gross debt continues to rise for the following reasons:
| • | | The deficit amounts to $4 257 million. |
| • | | The government makes investments in fixed assets (e.g. roads) that require borrowings. When these capital expenditures are made, they are posted to the government’s balance sheet. Subsequently, they are gradually recorded as expenditures based on the useful life of the assets concerned. In 2009-2010, net capital expenditures should cause the gross debt to increase by $3 620 million. |
| • | | Net investments in the health and social services and education networks, which include loans made by Financement-Québec and the Corporation d’hébergement du Québec to network institutions to fund their capital expenditures, should raise the gross debt by $1 832 million in 2009-2010. |
| • | | The government makes investments in its corporations through advances and direct capital outlays or by allowing these corporations to keep part of their earnings to finance their own investments. |
For example, Hydro-Québec pays 75% of its net earnings1 as dividends to the government and keeps 25% to fund its own investments, particularly hydroelectric dams. The portion of earnings that the government is leaving Hydro-Québec in 2009-2010 ($632 million) constitutes an investment by the government in Hydro-Québec, which creates a financial requirement for the government and thus leads to an increase in the gross debt.
In addition, the government invested $250 million in the Société générale de financement. This investment is part of the $1 000-million contribution announced in the January 2009 Economic Statement in order to stimulate investment in Québec businesses.
Overall, the government’s investments, loans and advances should lead to a $507-million increase in the gross debt in 2009-2010. This amount includes the withdrawal of the balance of the stabilization reserve that was deposited with the Caisse de dépôt et placement du Québec ($295 million).
| • | | Changes in some of the government’s other asset and liability items, such as accounts payable and accounts receivable, should lower the gross debt by $769 million in 2009-2010. |
| • | | Lastly, deposits in the Generations Fund should reduce the debt by $715 million in 2009-2010. |
| 1 | The amount of the dividend is calculated according to section 15.2 of the Act respecting Hydro-Québec, which stipulates that: |
15.2 “The distributable surplus for a particular financial period is equal to 75% of the total of the net operating income of the Company and of its net investment income for the same period, less the gross interest expenditure for the same period...”
| | |
| | 2010-2011 Budget |
| D.10 | | Budget Plan |
The following table shows how the government’s gross debt has changed since March 31, 1998. The data for years prior to the 2007 accounting reform have been restated to make them comparable with those following the reform, i.e. for 2006-2007 and subsequent years.
TABLE D.6
Growth factors of the Québec government’s gross debt
(millions of dollars)
| | | | | | | | | | | | | | | | | | | | |
| | | Debt,
beginning
of year | | Budgetary
deficit (surplus)1 | | Investments,
loans and
advances | | Net
investment in the networks2 | | Net capital expenditures3 | | Other factors4 | | Generations Fund5 | | Total
change | | Debt, end of year6 | | As a %
of GDP |
1998-1999 | | 110 900 | | – 126 | | 1 312 | | 761 | | 396 | | 1 476 | | | | 3 819 | | 114 719 | | 58.5 |
1999-2000 | | 114 719 | | – 7 | | 1 989 | | 122 | | 200 | | – 1 014 | | | | 1 290 | | 116 009 | | 55.0 |
2000-2001 | | 116 009 | | – 427 | | 1 701 | | 841 | | 578 | | 1 029 | | | | 3 722 | | 119 731 | | 53.2 |
2001-2002 | | 119 731 | | – 22 | | 1 248 | | 934 | | 1 199 | | – 25 | | | | 3 334 | | 123 065 | | 53.1 |
2002-2003 | | 123 065 | | 728 | | 1 921 | | 631 | | 1 706 | | 183 | | | | 5 169 | | 128 234 | | 53.1 |
2003-2004 | | 128 234 | | 358 | | 1 367 | | 560 | | 1 186 | | 597 | | | | 4 068 | | 132 302 | | 52.8 |
2004-2005 | | 132 302 | | 664 | | 1 303 | | 1 486 | | 1 006 | | – 882 | | | | 3 577 | | 135 879 | | 51.7 |
2005-2006 | | 135 879 | | – 37 | | 1 488 | | 1 013 | | 1 179 | | – 815 | | | | 2 828 | | 138 707 | | 51.0 |
2006-2007 | | 138 707 | | – 109 | | 2 213 | | 1 002 | | 1 177 | | 1 018 | | – 584 | | 4 717 | | 143 424 | | 50.8 |
2007-2008 | | 143 424 | | — | | 2 658 | | 487 | | 1 457 | | 774 | | – 649 | | 4 727 | | 148 151 | | 49.8 |
2008-2009 | | 148 151 | | — | | 1 086 | | 622 | | 2 297 | | – 52 | | – 719 | | 3 234 | | 151 385 | | 50.1 |
2009-2010P | | 151 385 | | 4 257 | | 507 | | 1 832 | | 3 620 | | – 769 | | – 715 | | 8 732 | | 160 117 | | 53.2 |
2010-2011P | | 160 117 | | 4 506 | | 1 278 | | 2 402 | | 3 593 | | – 405 | | – 892 | | 10 482 | | 170 599 | | 54.5 |
2011-2012P | | 170 599 | | 2 900 | | 1 202 | | 1 305 | | 3 860 | | 1 190 | | – 972 | | 9 485 | | 180 084 | | 55.1 |
2012-2013P | | 180 084 | | 1 200 | | 970 | | 1 202 | | 3 147 | | 948 | | – 1 061 | | 6 406 | | 186 490 | | 54.6 |
2013-2014P | | 186 490 | | — | | 630 | | 909 | | 2 818 | | – 296 | | – 1 123 | | 2 938 | | 189 428 | | 53.3 |
2014-2015P | | 189 428 | | — | | 1 024 | | 823 | | 2 502 | | – 66 | | – 1 542 | | 2 741 | | 192 169 | | 52.0 |
| Note: | Gross debt figures prior to 2006-2007 have been restated to reflect the impacts of the government’s accounting reform in December 2007. The purpose of this restatement was to obtain comparable debt levels over a long period. Moreover, once line-by-line recording of the results of institutions in the health and social services and education networks is completed, gross debt data will be restated. A positive entry indicates an increase in the debt and a negative entry, a decrease. |
| P: | Preliminary results for 2009-2010 and forecasts for subsequent years. |
| 1 | The budgetary balance prior to 2006-2007 could not be restated to reflect the impacts of the December 2007 government accounting reform because information on a comparable basis is not available. |
| 2 | Includes mainly loans by Financement-Québec and the Corporation d’hébergement du Québec to institutions in the health and social services and education networks. As of 2006-2007, the net investment in the networks also includes the change in the accumulated deficits of network institutions. |
| 3 | Corresponds to investments in fixed assets made during the year less the yearly depreciation expenditure. Includes investments made in the course of private-public partnership agreements. |
| 4 | Includes in particular the change in “Other accounts,” such as accounts receivable and accounts payable, as well as the change in the value of the debt in foreign currency. |
| 5 | Represents the increase in the balance of the Generations Fund during the fiscal year stemming from deposits in the fund and investment income. |
| | |
Debt, Financing | | |
and Debt Management | | D.11 |
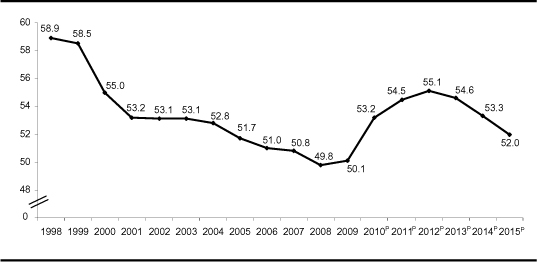
One way to measure the extent of the government’s indebtedness is to compare its debt to the size of the economy, i.e. gross domestic product (GDP). The debt/GDP ratio is then calculated. GDP represents the total value of goods and services produced in an economy during a given period. It is the source of the revenue the government collects to fund its activities, including payment of debt service. The comparison of the government’s debt to GDP is similar, for example, to the case of a person who wants to borrow to buy a house. The amount of the person’s debt (mortgage, car loan, etc.) is compared to his or her income to assess his or her level of indebtedness.
Since March 31, 1998, the Québec government’s gross debt/GDP ratio has fallen significantly. While gross debt was equivalent to 58.9% of GDP as at March 31, 1998, this percentage stood at 50.1% as at March 31, 2009. The ratio is expected to rise to 55.1% as at March 31, 2012, in particular because of the forecast deficits and the economic situation. The gross debt/GDP ratio should then decline to 52.0% as at March 31, 2015.
CHART D.2
Gross debt1 as at March 31
(as a percentage of GDP)
| P: | Preliminary results for 2010 and forecasts for subsequent years. |
| | |
| | 2010-2011 Budget |
| D.12 | | Budget Plan |
| 1.2.5 | New debt reduction objectives |
The Minister of Finance announced the creation of the Generations Fund in the March 23, 2006 Budget Speech. The government deposits certain revenues in the fund, which will be used later to pay down the debt.
The goal in establishing the fund was to ensure that the government’s total debt would represent 25% of GDP in 2025-2026. This objective was enshrined in the Act to reduce the debt and establish the Generations Fund, adopted on June 15, 2006. The objectives set in the Act concern the government’s total debt, the debt concept used for the purposes of the government reporting entity in effect at the time the Act was passed.
In December 2007, the government carried out a major accounting reform. In particular, this reform broadened the reporting entity to include institutions in the health and social services networks and most institutions in the education network. A new debt concept, gross debt, was created at the time to reflect the changes made to the reporting entity. The accounting reform added $21 billion in debt, or the equivalent of 7 percentage points of GDP. Previously, this additional amount of debt was included almost in its entirety in the debt of the other components of Québec’s public sector.
TABLE D.7
Total debt and gross debt of the Québec government as at March 31, 2007
(millions of dollars)
| | |
TOTAL DEBT FOR THE PURPOSES OF THE ACT TO REDUCE THE DEBT AND ESTABLISH THE GENERATIONS FUND1 | | 122 575 |
As a % of GDP | | 43.4 |
Plus: Debt of Financement-Québec | | 12 073 |
Debt of the Corporation d’hébergement du Québec and other entities | | 3 560 |
Debt of the Société québécoise d’assainissement des eaux | | 2 522 |
Debt of Immobilière SHQ | | 1 942 |
Net employee future benefits liability | | 752 |
| | |
Subtotal | | 20 849 |
| | |
GROSS DEBT1 | | 143 424 |
As a % of GDP | | 50.8 |
| | |
Debt, Financing | | |
and Debt Management | | D.13 |
In addition, the recession will have left budgetary deficits totalling $12 863 million from 2009-2010 to 2012-2013, causing the debt to rise.
Accordingly, as provided for in last year’s budget, the Generations Fund legislation will be amended to revise the debt reduction objectives.
The government is determined to reduce Québec’s indebtedness so as to ensure greater intergenerational fairness. To that end, additional deposits will be made in the Generations Fund starting in fiscal 2014-2015, that is, once fiscal balance has been restored. Revenue generated by the increase in the price of heritage pool electricity will be paid into the Generations Fund.
In recent years, discussions on the debt have highlighted the distinction between “good debt” and “bad debt”.
Good debt is debt that is contracted to acquire an asset: for example, to build a road, a school or a hospital. Bad debt is debt that does not correspond to any asset. This is the debt that needs to be addressed first.
Debt representing accumulated deficits, i.e. bad debt, is expected to amount to $106 628 million, or 35.4% of GDP, as at March 31, 2010.
The government’s first objective is to reduce this ratio by half to 17% in 2025-2026. This is a maximum level.
TABLE D.8
New debt reduction objectives
(as a percentage of GDP)
| | |
| | | March 31, 2026 |
Debt representing accumulated deficits | | 17 |
Gross debt | | 45 |
| | |
| | 2010-2011 Budget |
| D.14 | | Budget Plan |
In addition, another objective will be set for the gross debt. As at March 31, 2010, this debt should stand at $160 117 million, or 53.2% of GDP. This ratio is forecast to reach a maximum of 55.1% of GDP in 2011-2012 and to begin falling thereafter. The government’s objective is to bring the gross debt/GDP ratio down to 45% in 2025-2026. Once again, this is a maximum level.
CHART D.3
Debt representing accumulated deficits
(as a percentage of GDP)
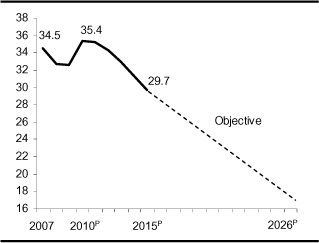
| P: | Preliminary results for 2010, forecasts for 2011 to 2015 and projections for subsequent years. |
CHART D.4
Gross debt1
(as a percentage of GDP)
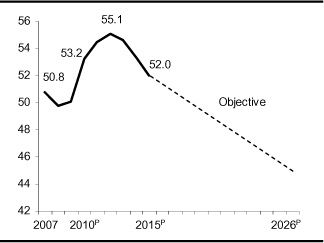
| P: | Preliminary results for 2010, forecasts for 2011 to 2015 and projections for subsequent years. |
| | |
Debt, Financing | | |
and Debt Management | | D.15 |
Public sector debt includes the government’s gross debt as well as the debt of the health and social services and education networks, Hydro-Québec, municipalities and other government enterprises. This debt has served notably to finance public infrastructures, such as roads, schools, hospitals, hydroelectric dams and water treatment plants.
Preliminary results show that, as at March 31, 2010, Québec’s public sector debt should stand at $218 489 million, or 72.6% of GDP. These figures must be put into perspective for they do not take into account the economic value of certain assets held by the government, such as Hydro-Québec, the Société des alcools and Loto-Québec.
TABLE D.9
Public sector debt as at March 31
(millions of dollars)
| | | | | | | | |
| | | 2007 | | 2008 | | 2009 | | 2010P |
Government’s gross debt1 | | 143 424 | | 148 151 | | 151 385 | | 160 117 |
Hydro-Québec | | 32 674 | | 32 399 | | 36 668 | | 36 803 |
Municipalities2 | | 16 409 | | 17 321 | | 18 639 | | 19 897 |
Health and social services and education networks3 | | 2 023 | | 1 552 | | 931 | | 974 |
Other government enterprises4 | | 56 | | 82 | | 434 | | 698 |
| | | | | | | | |
PUBLIC SECTOR DEBT | | 194 586 | | 199 505 | | 208 057 | | 218 489 |
As a % of GDP | | 68.9 | | 67.1 | | 68.8 | | 72.6 |
| 2 | Corresponds to the long-term debt contracted by municipalities in their own name. Part of this debt is subsidized by the government ($2 846 million as at March 31, 2010). |
| 3 | Corresponds to the long-term debt contracted by network institutions in their own name, for which the government subsidizes the debt service through transfers for repaying the principal and paying the interest on borrowings. |
| 4 | Excludes the debt of enterprises that is guaranteed by a third party or secured by assets such as inventories and accounts receivable. |
| | |
| | 2010-2011 Budget |
| D.16 | | Budget Plan |
| 1.4 | Comparison of the debt of Canadian provinces |
It is worthwhile comparing the concepts of debt used by the Québec government with those used by other governments in Canada.
An analysis of the budget documents of the federal and provincial governments shows that the concepts of debt used to assess financial position vary widely from province to province.
The preferred concept of debt in British Columbia and Saskatchewan is direct debt. Alberta, New Brunswick, Newfoundland and Labrador, Manitoba and Nova Scotia use the concept of net debt. As for Prince Edward Island, its recent budget documents make no mention of its debt.
Four governments use the concept of debt representing accumulated deficits as a measure of indebtedness in their budget documents. They are the government of Québec, the federal government and the governments of Ontario and Alberta.
Be it on the basis of the gross debt or the debt representing accumulated deficits, Québec is the most heavily indebted province.
CHART D.5
Gross debt and debt representing accumulated deficits as at March 31, 2009
(as a percentage of GDP)
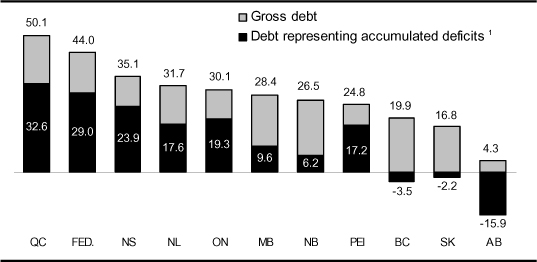
| 1 | A negative entry means that the government has an accumulated surplus. |
Sources: Ministère des Finances du Québec, governments’ public accounts and Statistics Canada.
| | |
Debt, Financing | | |
and Debt Management | | D.17 |
The following table shows the debt of the federal government and each of the provinces as at March 31, 2009. The figures in boxes refer to the concept of debt used by the government concerned in its budget documents to measure its level of debt. Some governments use more than one concept.
TABLE D.10
Debt as at March 31, 2009 according to various concepts
(millions of dollars)
| | | | | | | | | | | | | | | | | | | | | | | | | | | | | | | | | | | | | | | | | | | | | | |
| | | QC | | | | | FED | | | | | ON | | | BC | | | | | AB | | | | | NB | | | | | NL | | | | | MB | | | SK | | | | | NS | | | PEI |
| | | | | | | | | | | | | | | | | | | | | | | | | | | | | | | | | | | | | | | | | | | | | | |
Consolidated direct debt | | 124 629 | | | | | 514 020 | | | | | 176 825 | | | 37 562 | | | | | 2 064 | | | | | 6 755 | | | | | 6 595 | | | | | 12 446 | | | 4 796 | | | | | 10 225 | | | 1 092 |
Net retirement plans liability | | 28 649 | | | | | 139 909 | | | | | – 4 819 | | | 3 | | | | | 10 081 | | | | | – 210 | | | | | 1 704 | | | | | 2 003 | | | 5 475 | | | | | 1 788 | | | 34 |
Net employee future benefits liability | | 59 | | | | | 50 311 | | | | | 5 223 | | | 1 908 | | | | | 241 | | | | | 718 | | | | | 1 630 | | | | | — | | | 418 | | | | | — | | | 23 |
Generations Fund | | – 1 952 | | | | | | | | | | | | | | | | | | | | | | | | | | | | | | | | | | | | | | | | | | | | |
| | | | | | | | | | | | | | | | | | | | | | | | | | | | | | | | | | | | | | | | | | | | | | |
Gross debt1 | | 151 385 | | | | | 704 240 | | | | | 177 229 | | | 39 473 | | | | | 12 386 | | | | | 7 263 | | | | | 9 929 | | | | | 14 449 | | | 10 689 | | | | | 12 013 | | | 1 149 |
As a % of GDP | | 50.1 | | | | | 44.0 | | | | | 30.1 | | | 19.9 | | | | | 4.3 | | | | | 26.5 | | | | | 31.7 | | | | | 28.4 | | | 16.8 | | | | | 35.1 | | | 24.8 |
| | | | | | | | | | | | | | | | | | |
Less: | | | | | | | | | | | | | | | | | | | | | | | | | | | | | | | | | | | | | | | | | | | | | | |
Net financial assets2 | | – 22 159 | | | | | – 179 027 | | | | | – 23 904 | | | – 14 933 | | | | | – 42 812 | | | | | 125 | | | | | – 1 961 | | | | | – 2 951 | | | – 7 165 | | | | | 311 | | | 260 |
| | | | | | | | | | | | | | | | | | | | | | | | | | | | | | | | | | | | | | | | | | | | | | |
Net debt3 | | 129 226 | 4 | | | | 525 213 | | | | | 153 325 | | | 24 540 | | | | | – 30 426 | | | | | 7 388 | | | | | 7 968 | | | | | 11 498 | | | 3 524 | | | | | 12 324 | | | 1 409 |
As a % of GDP | | 42.8 | | | | | 32.8 | | | | | 26.1 | | | 12.4 | | | | | – 10.4 | | | | | 27.0 | | | | | 25.5 | | | | | 22.6 | | | 5.5 | | | | | 36.0 | | | 30.5 |
| | | | | | | | | | | | | | | | | | |
Less: | | | | | | | | | | | | | | | | | | | | | | | | | | | | | | | | | | | | | | | | | | | | | | |
Non-financial assets | | – 30 767 | | | | | – 61 503 | | | | | – 40 087 | | | – 31 459 | | | | | – 15 848 | | | | | – 5 679 | | | | | – 2 466 | | | | | – 6 594 | | | – 4 921 | | | | | – 4 157 | | | – 616 |
| | | | | | | | | | | | | | | | | | | | | | | | | | | | | | | | | | | | | | | | | | | | | | |
Debt representing accumulated deficits3 | | 98 459 | 4 | | | | 463 710 | | | | | 113 238 | | | – 6 919 | | | | | – 46 274 | | | | | 1 709 | | | | | 5 502 | | | | | 4 904 | | | – 1 397 | | | | | 8 167 | | | 793 |
As a % of GDP | | 32.6 | | | | | 29.0 | | | | | 19.3 | | | – 3.5 | | | | | – 15.9 | | | | | 6.2 | | | | | 17.6 | | | | | 9.6 | | | – 2.2 | | | | | 23.9 | | | 17.2 |
| Note: | The boxes show the debt concept(s) used in the government’s budget documents. |
| 1 | Gross debt is not shown in most government public accounts. However, the public accounts do show the components of gross debt, i.e. the consolidated direct debt, the net retirement plans liability and the net employee future benefits liability. It is therefore possible to deduce the amount of the gross debt. |
| 2 | Financial assets, net of other liabilities. |
| 3 | A negative entry indicates that the government has net assets or an accumulated surplus. |
| 4 | After taking the stabilization reserve into account. |
Sources: Ministère des Finances du Québec, governments’ public accounts and Statistics Canada.
| | |
| | 2010-2011 Budget |
| D.18 | | Budget Plan |
The Québec government participates financially in the retirement plans of its employees. As at December 31, 2008, these plans had 541 930 participants and 270 934 beneficiaries.
TABLE D.11
Retirement plans of public and parapublic sector employees as at December 31, 2008
| | | | |
| | | Active participants | | Beneficiaries |
Government and Public Employees Retirement Plan (RREGOP) | | 505 000 | | 172 294 |
Pension Plan of Management Personnel (PPMP) | | 27 400 | | 20 408 |
Other plans: | | | | |
– Teachers Pension Plan (TPP) and Pension Plan of Certain Teachers (PPCT)1 | | 330 | | 48 160 |
– Civil Service Superannuation Plan (CSSP)1 | | 175 | | 23 354 |
– Pension Plan for the Members of the Sûreté du Québec (PPMSQ) | | 5 300 | | 4 507 |
– Pension Plan of Peace Officers in Correctional Services (PPPOCS) | | 3 100 | | 1 452 |
– Pension Plan of the Judges of the Court of Québec and of Certain Municipal Courts (PPJCQM) | | 270 | | 324 |
– Pension Plan for Federal Employees Transferred to Employment with the Gouvernement du Québec (PPFEQ) | | 230 | | 112 |
– Pension Plan of the Members of the National Assembly (PPMNA) | | 125 | | 323 |
| | | | |
Total for other plans | | 9 530 | | 78 232 |
| | | | |
TOTAL | | 541 930 | | 270 934 |
| | | | |
| 1 | These plans have not accepted any new participants since July 1, 1973. |
Source: Commission administrative des régimes de retraite et d’assurances.
| | |
Debt, Financing | | |
and Debt Management | | D.19 |
These plans are defined benefit retirement plans, which means that they guarantee participants a certain level of income upon retirement. Benefits are calculated on the basis of participants’ average income for the best paid years (generally five) and their number of years of service. The pension usually represents 2% of an employee’s average income per year of service, for a maximum of 70%. Benefits are partially indexed to inflation.
The Commission administrative des régimes de retraite et d’assurances (CARRA) is responsible for administering the retirement plans. In 2009-2010, the government should pay $4 108 million to cover its share of the benefits paid to its retired employees.
| q | Retirement plans liability |
In its financial statements, the government discloses the present value of the retirement benefits it will pay to its employees, taking into account the conditions governing their plans, as well as their years of service. This value is called the retirement plans liability.
CARRA performs actuarial valuations of the liability for each retirement plan in conformity with the rules set for the public sector by the Canadian Institute of Actuaries (CIA) and the Canadian Institute of Chartered Accountants (CICA).
| | |
| | 2010-2011 Budget |
| D.20 | | Budget Plan |
As at March 31, 2010, the government’s retirement plans liability should stand at $66 961 million, an amount that is recognized in the government’s gross debt.
TABLE D.12
Retirement plans liability
(millions of dollars)
| | |
| | | 31 mars 2010P |
Government and Public Employees Retirement Plan (RREGOP) | | 37 332 |
Pension Plan of Management Personnel (PPMP) | | 8 458 |
Other plans: | | |
– Teachers Pension Plan (TPP) and Pension Plan of Certain Teachers (PPCT) | | 12 374 |
– Civil Service Superannuation Plan (CSSP) | | 4 242 |
– Pension Plan for the Members of the Sûreté du Québec (PPMSQ) | | 3 260 |
– Pension Plan of Peace Officers in Correctional Services (PPPOCS) | | 791 |
– Pension Plan of the Judges of the Court of Québec and of Certain Municipal Courts (PPJCQM) | | 481 |
– Pension credits under supplemental pension plans | | 376 |
– Supplemental pension plan arising from the transfer of the pension plan for non-teaching personnel of the Commission des écoles catholiques de Montréal (SPP of the CECM) to RREGOP | | 282 |
– Pension Plan of the Members of the National Assembly (PPMNA) | | 171 |
– Pension Plan for Federal Employees Transferred to Employment with the Gouvernement du Québec (PPFEQ) | | 106 |
– Supplemental pension plan arising from the transfer of the pension plan for certain employees of the Commission scolaire de la Capitale (SPP of the CSC) to RREGOP | | 46 |
– Plans assets | | – 958 |
| | |
Total for other plans | | 21 171 |
| | |
RETIREMENT PLANS LIABILITY | | 66 961 |
| | |
| |
P: Preliminary results. | | |
| | |
Debt, Financing | | |
and Debt Management | | D.21 |
| q | Annual retirement plans expenditure |
Every year, the government records its expenditure as an employer with regard to the retirement plans.
In 2009-2010, this expenditure should total $2 015 million. It comprises two components:
| • | | the net cost of vested benefits, that is, the present value of retirement benefits that employees have accumulated for work performed during the year, i.e. $1 529 million; |
| • | | the amortization of revisions to the government’s actuarial obligations that arise from the updating of actuarial valuations, for a cost of $486 million. |
TABLE D.13
Retirement plans expenditure
(millions of dollars)
| | |
| | | 2009-2010P |
Net cost of vested benefits | | 1 529 |
Amortization of revisions arising from actuarial valuations | | 486 |
| | |
RETIREMENT PLANS EXPENDITURE | | 2 015 |
| | |
| |
P: Preliminary results. | | |
| | |
| | 2010-2011 Budget |
| D.22 | | Budget Plan |
| 1.6 | Retirement Plans Sinking Fund |
The Retirement Plans Sinking Fund was created in 1993. The RPSF is an asset that can be used to pay the retirement benefits of public and parapublic sector employees.
As at March 31, 2010, the book value of the RPSF should amount to $38 198 million.
TABLE D.14
Change in the Retirement Plans Sinking Fund (RPSF)
(millions of dollars)
| | | | | | | | | |
| | | Book value,
beginning of
year | | | Deposits | | Investment
income
imputed | | Book value,
end of
year |
1993-1994 | | — | | | 850 | | 4 | | 854 |
1994-1995 | | 854 | | | — | | – 5 | | 849 |
1995-1996 | | 849 | | | — | | 74 | | 923 |
1996-1997 | | 923 | | | — | | 91 | | 1 014 |
1997-1998 | | 1 095 | 1 | | — | | 84 | | 1 179 |
1998-1999 | | 1 179 | | | 944 | | 86 | | 2 209 |
1999-2000 | | 2 209 | | | 2 612 | | 219 | | 5 040 |
2000-2001 | | 5 040 | | | 1 607 | | 412 | | 7 059 |
2001-2002 | | 7 059 | | | 2 535 | | 605 | | 10 199 |
2002-2003 | | 10 199 | | | 900 | | 741 | | 11 840 |
2003-2004 | | 11 840 | | | 1 502 | | 862 | | 14 204 |
2004-2005 | | 14 204 | | | 3 202 | | 927 | | 18 333 |
2005-2006 | | 18 333 | | | 3 000 | | 1 230 | | 22 563 |
2006-2007 | | 22 437 | 1 | | 3 000 | | 1 440 | | 26 877 |
2007-2008 | | 26 877 | | | 3 000 | | 1 887 | | 31 764 |
2008-2009 | | 31 749 | 2 | | 2 100 | | 2 176 | | 36 025 |
2009-2010P | | 36 025 | | | — | | 2 173 | | 38 198 |
| 1 | Taking into account restatements arising from the government accounting reforms of 1997-1998 and 2006-2007. |
| 2 | Taking into account an adjustment arising from consideration of the expected average remaining service life (EARSL) of participants under the PPMP (9 years instead of 14 years). |
| | |
Debt, Financing | | |
and Debt Management | | D.23 |
The information on the RPSF shown in the preceding table was established on the basis of the government’s accounting policies, which are in full compliance with generally accepted accounting principles (GAAP) for Canada’s public sector.
The book value of the RPSF as at March 31, 2010 is higher than its market value. As a result of the accounting policies, the difference between these two items will be fully amortized in the coming years. In addition, the financial impact of gradually amortizing the difference is fully incorporated into the government’s financial framework over the entire planning horizon. Section 1.10 describes these items in greater detail.
The government’s accounting policies apply when the RPSF’s book value is higher than its market value as well as when it is lower. As shown by the following table, the book value of the RPSF has been lower than its market value 8 times in the past 16 years.
TABLE D.15
Book value and market value of the Retirement Plans Sinking Fund as at March 31
(millions of dollars)
| | | | | | | |
| | | Book value | | Market value | | | Difference |
1994-1995 | | 849 | | 831 | | | 18 |
1995-1996 | | 923 | | 954 | | | – 31 |
1996-1997 | | 1 014 | | 1 095 | | | – 81 |
1997-1998 | | 1 179 | | 1 321 | | | – 142 |
1998-1999 | | 2 209 | | 2 356 | | | – 147 |
1999-2000 | | 5 040 | | 5 703 | | | – 663 |
2000-2001 | | 7 059 | | 7 052 | | | 7 |
2001-2002 | | 10 199 | | 9 522 | | | 677 |
2002-2003 | | 11 840 | | 9 240 | | | 2 600 |
2003-2004 | | 14 204 | | 12 886 | | | 1 318 |
2004-2005 | | 18 333 | | 17 362 | | | 971 |
2005-2006 | | 22 563 | | 23 042 | | | – 479 |
2006-2007 | | 26 877 | | 28 859 | | | – 1 982 |
2007-2008 | | 31 764 | | 32 024 | | | – 260 |
2008-2009 | | 36 025 | | 25 535 | | | 10 490 |
2009-2010P | | 38 198 | | 28 835 | 1 | | 9 363 |
| 1 | Market value as at December 31, 2009. |
| | |
| | 2010-2011 Budget |
| D.24 | | Budget Plan |
| q | Amounts deposited in the RPSF have no impact on gross debt |
The government issues bonds on financial markets in order to make deposits in the RPSF. However, the amounts deposited in the RPSF do not affect the government’s gross debt.
Indeed, the amount of borrowings contracted to make deposits in the RPSF increases the direct debt. At the same time, however, these deposits reduce the net retirement plans liability by the same amount. Therefore, the net impact on the gross debt is nil.
TABLE D.16
Illustration of the impact on the government’s gross debt of borrowing $1 billion on financial markets and depositing it in the RPSF1
(millions of dollars)
| | | | | | | | |
| | | | | Before
deposit | | After
deposit | | Change |
(A) | | Consolidated direct debt | | 134 021 | | 135 021 | | 1 000 |
| | Retirement plans liability | | 66 961 | | 66 961 | | — |
| | Less: Book value of the RPSF | | – 38 198 | | – 39 198 | | – 1 000 |
| | | | | | | | |
(B) | | Net retirement plans liability | | 28 763 | | 27 763 | | – 1 000 |
(C) | | Net employee future benefits liability | | — | | — | | — |
(D) | | Less: Generations Fund | | – 2 667 | | – 2 667 | | — |
| | | | | | | | |
(E) | | GROSS DEBT (E=A+B+C+D) | | 160 117 | | 160 117 | | — |
| | | | |
1 | | Illustrationbased on preliminary results as at March 31, 2010. | | | | | | |
| | |
Debt, Financing | | |
and Debt Management | | D.25 |
| q | A decline in debt service |
Deposits in the RPSF entail a reduction in the government’s debt service. The rates of return on funds managed by the Caisse de dépôt et placement du Québec are generally higher than interest rates on Québec government bonds issued to finance deposits in the RPSF. Therefore, the income of the RPSF, which is applied against the government’s debt service, is usually higher than the additional interest charges that arise from new borrowings. This leads to a net decrease in the government’s debt service.
Since the RPSF was created, its return has been higher than the cost of new long-term borrowings by the government 12 years out of 16.
TABLE D.17
Comparison of the RPSF’s annual return and the Québec government’s borrowing costs
(per cent)
| | | | | | | |
| | | Return of the
RPSF 1 | | | Cost of
new borrowings 2 | | Difference |
1994-1995 | | – 3.3 | 3 | | 5.9 | | – 9.2 |
1995-1996 | | 17.0 | | | 5.3 | | 11.7 |
1996-1997 | | 16.1 | | | 6.3 | | 9.8 |
1997-1998 | | 13.4 | | | 5.7 | | 7.7 |
1998-1999 | | 10.4 | | | 5.8 | | 4.6 |
1999-2000 | | 15.3 | | | 7.2 | | 8.1 |
2000-2001 | | 7.2 | | | 6.2 | | 1.0 |
2001-2002 | | – 4.7 | | | 5.5 | | – 10.2 |
2002-2003 | | – 8.5 | | | 4.7 | | – 13.2 |
2003-2004 | | 14.9 | | | 4.6 | | 10.3 |
2004-2005 | | 11.4 | | | 4.4 | | 7.0 |
2005-2006 | | 13.5 | | | 4.4 | | 9.1 |
2006-2007 | | 13.5 | | | 4.4 | | 9.1 |
2007-2008 | | 5.2 | | | 4.8 | | 0.4 |
2008-2009 | | – 25.6 | | | 4.2 | | – 29.8 |
2009-2010 | | 10.7 | | | 4.4 | | 6.3 |
| |
1 On a calendar year basis. 2 On a fiscal year basis. 3 From February to December 1994. | | |
| | |
| | 2010-2011 Budget |
| D.26 | | Budget Plan |
| q | A flexible deposit policy |
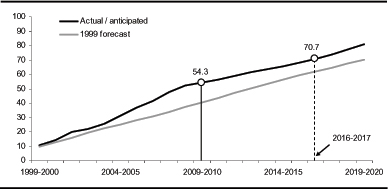
In December 1999, as part of an agreement concluded for the renewal of its employees’ collective agreements, the government set the objective that the funds accumulated in the RPSF would be equal, in 2020, to 70% of its actuarial obligations in regard to the retirement plans of public and parapublic sector employees.
However, the government has all the flexibility needed to apply this policy. Deposits in the RPSF are made only when market conditions are favourable, particularly with respect to interest rates and market receptiveness to bond issues.
The RPSF’s assets are expected to represent roughly 54% of the government’s actuarial obligations in regard to the retirement plans of public and parapublic sector employees in 2009-2010. The target of 70% should be attained three years earlier than anticipated, i.e. in 2016-2017.
CHART D.6
The RPSF in proportion to the government’s actuarial obligations regarding the retirement plans of public and parapublic sector employees
(per cent)
| | |
Debt, Financing | | |
and Debt Management | | D.27 |
| 1.7 | Employee future benefits |
In addition to the retirement plans, the government records under its debt the value of its commitments regarding two future benefits programs for its employees, namely, accumulated sick leave, which is payable notably when an employee retires, and pensions paid to the survivors of a government employee. These programs give rise to long-term obligations whose costs are covered in full by the government.
The balance of the net liability for employee future benefits should be nil as at March 31, 2010.
TABLE D.18
Net employee future benefits liability
(millions of dollars)
| | |
| | | March 31, 2010P |
Accumulated sick leave | | 703 |
Survivor’s pension plan | | 405 |
Less: Accumulated Sick Leave Fund | | – 657 |
Survivor’s Pension Plan Fund | | – 451 |
| | |
NET EMPLOYEE FUTURE BENEFITS LIABILITY | | — |
| | |
| | |
| | 2010-2011 Budget |
| D.28 | | Budget Plan |
The Generations Fund was created in June 2006 by the adoption of the Act to reduce the debt and establish the Generations Fund. The sums accumulated in the fund are dedicated exclusively to repaying the debt.
Section G presents the results of the Generations Fund in accordance with the requirements of the Act.
As at March 31, 2010, the book value of the Generations Fund is expected to stand at $2 667 million. The following table shows the book and market values of the Generations Fund since its creation.
TABLE D.19
Book value and market value of the Generations Fund as at March 31
(millions of dollars)
| | | | | | | |
| | | Book value | | Market value | | | Difference |
2006-20071 | | 584 | | 576 | | | 8 |
2007-2008 | | 1 233 | | 1 147 | | | 86 |
2008-2009 | | 1 952 | | 1 598 | | | 354 |
2009-2010P | | 2 667 | | 2 512 | 2 | | 155 |
| 1 | The first payment was made to the Generations Fund on January 31, 2007. |
| 2 | Market value of $2 304 million as at December 31, 2009 plus the revenues dedicated to the Generations Fund from January 1 to March 31, 2010. |
| | |
Debt, Financing | | |
and Debt Management | | D.29 |
| q | Faster reduction of the debt |
Financing for the Generations Fund comes from Québec government revenues dedicated exclusively to repaying the debt.
If the Generations Fund did not exist, these revenues would reduce the Québec government’s financial requirements every year. They would also make it possible to reduce Québec’s indebtedness. However, it would not be easy for Quebecers to see, over time, how the debt is being brought down thanks to the revenues dedicated to that end.
The Generations Fund makes it possible to follow the change in the funds the government sets aside to repay the debt. These funds, which are administered by the Caisse de dépôt et placement du Québec (the Caisse), are subtracted from the government’s debt. The impact on the debt is thus clear and transparent.
In addition, the returns obtained by the Caisse are usually higher than the cost of new borrowings by the Québec government, which helps to accelerate debt burden reduction.
Since the first deposit was made in the Generations Fund in January 2007, the return has been higher than the cost of new borrowings by the government two years out of three. It should be noted that in the case of the RPSF, which has existed since 1993, this has occurred 12 years out of 16.
TABLE D.20
Comparison of the Generations Fund’s annual return and the Québec government’s borrowing costs
(per cent)
| | | | | | | |
| | | Return of the
Generations Fund1 | | | Cost of new
borrowings2 | | Difference |
2007-2008 | | 5.6 | 3 | | 4.8 | | 0.8 |
2008-2009 | | – 22.4 | | | 4.2 | | – 26.6 |
2009-2010 | | 11.3 | | | 4.4 | | 6.9 |
| 1 | On a calendar year basis. |
| 3 | Return realized from February to December 2007, since the first deposit was made in the Generations Fund on January 31, 2007. |
| | |
| | 2010-2011 Budget |
| D.30 | | Budget Plan |
| 1.9 | Returns of the Caisse de dépôt et placement du Québec on funds deposited by the Ministère des Finances |
In 2009, the return on funds deposited by the Ministère des Finances with the Caisse was 10.74% for the Retirement Plans Sinking Fund, 11.25% for the Generations Fund and 10.14% for the Accumulated Sick Leave Fund. These results exceeded the average return for Caisse depositors as a whole (10.04%). The details of the investment policy are presented in the box on page D.35.
TABLE D.21
Market value and return in 2009 of funds deposited with the Caisse de dépôt et placement du Québec by the Ministère des Finances
(millions of dollars and per cent)
| | | | |
Fund | | Return | | Market value as at
December 31, 2009 |
| | | % | | $ million |
Retirement Plans Sinking Fund | | 10.74 | | 28 835 |
Generations Fund | | 11.25 | | 2 304 |
Accumulated Sick Leave Fund | | 10.14 | | 661 |
| 1.9.1 | Retirement Plans Sinking Fund |
The Retirement Plans Sinking Fund showed a return of 10.74% in 2009. Its market value was $28 835 million as at December 31, 2009.
The assets of the RPSF are managed by the Caisse in accordance with an investment policy established by the Ministère des Finances. This investment policy was established taking several factors into account, including the 10-year return, standard deviation and correlation forecasts for various categories of assets prepared by the Caisse, as well as opportunities for investing in these assets.
| | |
Debt, Financing | | |
and Debt Management | | D.31 |
The investment policy of the RPSF consists of 30.75% fixed-income securities (bonds, etc.), 36.25% equities and 33.0% other investments (real estate, private equity, etc.). These weightings are similar to those used on average by all depositors with the Caisse.
TABLE D.22
Investment policy of the RPSF as at January 1, 2010
(per cent)
| | | | |
| | | Benchmark
portfolio of the RPSF | | Average benchmark portfolio of
all depositors 1 |
Fixed-income securities | | 30.75 | | 31.1 |
Equities | | 36.25 | | 34.5 |
Other investments | | 33.00 | | 34.4 |
| | | | |
TOTAL | | 100.0 | | 100.0 |
| | | | |
| 1 | Data for 2008. Source: Caisse de dépôt et placement du Québec, Annual Report 2008. The annual report for 2009 is not available yet. |
With its investment policy, the RPSF should generate a long-term (10-year or longer) annual return of 7.0%. This return is comparable to that forecast by most retirement plans in Canada. According to a recent survey by Morneau Sobeco2, the anticipated long-term return on assets of two retirement plans out of three in Canada is equal to or above 7.0%.
It is important to note that the RPSF’s investment policy is based on a long-term horizon and constitutes the benchmark portfolio for the Caisse. However, through active management, the Caisse adjusts the allocation of the RPSF’s assets, particularly to take fluctuations in the economic and financial situation into account. The RPSF’s benchmark portfolio would have generated a return of 15.27% in 2009.
| 2 | Morneau Sobeco (2009), 2009 Survey of Economic Assumptions in Accounting for Pensions and Other Post-Retirement Benefits. |
| | |
| | 2010-2011 Budget |
| D.32 | | Budget Plan |
The Generations Fund posted a return of 11.25% in 2009. Its market value was $2 304 million as at December 31, 2009.
The assets of the Generations Fund are managed by the Caisse in accordance with an investment policy established by the Ministère des Finances. This investment policy was established taking several factors into account, including the 10-year return, standard deviation and correlation forecasts for various categories of assets prepared by the Caisse, as well as opportunities for investing in these assets.
The investment policy of the Generations Fund consists of 37.0% fixed-income securities (bonds, etc.), 35.0% equities and 28.0% other investments (real estate, private equity, etc.).
TABLE D.23
Investment policy of the Generations Fund as at January 1, 2010
(per cent)
| | | | |
| | | Benchmark portfolio of the
Generations Fund | | Average benchmark portfolio of all
depositors 1 |
Fixed-income securities | | 37.0 | | 31.1 |
Equities | | 35.0 | | 34.5 |
Other investments | | 28.0 | | 34.4 |
| | | | |
TOTAL | | 100.0 | | 100.0 |
| | | | |
| 1 | Data for 2008. Source: Caisse de dépôt et placement du Québec, Annual Report 2008. The annual report for 2009 is not available yet. |
The investment policy of the Generations Fund aims to achieve a long-term (10-year or longer) annual return of 6.8%. It is important to note that the investment policy of the Generations Fund is based on a long-term horizon and constitutes the benchmark portfolio for the Caisse. However, through active management, the Caisse adjusts the allocation of the Generations Fund’s assets, particularly to take fluctuations in the economic and financial situation into account. The benchmark portfolio of the Generations Fund would have generated a return of 15.04% in 2009.
| | |
Debt, Financing | | |
and Debt Management | | D.33 |
| 1.9.3 | Accumulated Sick Leave Fund |
The Accumulated Sick Leave Fund (ASLF) showed a return of 10.14% in 2009. Its market value was $661 million as at December 31, 2009.
The assets of the ASLF are managed by the Caisse in accordance with an investment policy established by the Ministère des Finances. Since January 1, 2009, the ASLF’s investment policy has been identical to that of the RPSF, as the creation of the ASLF stems from a long-term commitment made by the government in regard to employee future benefits, which is similar to the commitment regarding the retirement plans.
It is important to note that the ASLF’s investment policy constitutes the benchmark portfolio for the Caisse. However, through active management, the Caisse adjusts the allocation of the ASLF’s assets, particularly to take fluctuations in the economic and financial situation into account. The ASLF’s benchmark portfolio would have generated a return of 15.27% in 2009.
| | |
| | 2010-2011 Budget |
| D.34 | | Budget Plan |
Comparison of investment policies
Investment policies as at January 1, 2010
(per cent)
| | | | | | |
Specialized portfolio | | RPSF and ASLF | | Generations Fund | | Average benchmark portfolio of
all depositors1 |
Short-term investments | | 1.0 | | 1.0 | | 1.1 |
Bonds | | 29.75 | | 36.0 | | 26.9 |
Real return bonds | | 0.0 | | 0.0 | | 0.6 |
Long-term bonds | | 0.0 | | 0.0 | | 2.5 |
| | | | | | |
Total – Fixed income | | 30.75 | | 37.0 | | 31.1 |
| | | | | | |
Canadian equity | | 13.75 | | 10.0 | | 12.2 |
US equity – hedged | | 0.5 | | 0.5 | | 3.4 |
US equity – unhedged | | 2.0 | | 1.5 | |
Foreign equity – hedged | | 2.5 | | 2.0 | | 5.5 |
Foreign equity – unhedged | | 4.0 | | 2.0 | |
Emerging market equity | | 4.0 | | 4.0 | | 3.2 |
Québec International | | 9.5 | | 15.0 | | 10.2 |
| | | | | | |
Total – Equity markets | | 36.25 | | 35.0 | | 34.5 |
| | | | | | |
Investments and infrastructures | | 6.0 | | 5.0 | | 5.5 |
Private equity | | 8.0 | | 6.0 | | 8.0 |
Real estate debt | | 7.0 | | 7.0 | | 6.5 |
Real estate | | 8.5 | | 7.0 | | 9.8 |
Commodities | | 0.0 | | 0.0 | | 1.6 |
Hedge funds | | 3.5 | | 3.0 | | 3.0 |
| | | | | | |
Total – Other investments | | 33.0 | | 28.0 | | 34.4 |
| | | | | | |
TOTAL | | 100.0 | | 100.0 | | 100.0 |
| | | | | | |
| RPSF: | Retirement Plans Sinking Fund. |
| ASLF: | Accumulated Sick Leave Fund. |
| 1 | Source: Caisse de dépôt et placement du Québec, Annual Report 2008. The annual report for 2009 is not available yet. |
| | |
Debt, Financing | | |
and Debt Management | | D.35 |
| 1.10 | Impact of the returns of the Retirement Plans Sinking Fund on Debt Service |
As indicated in section 1.6, the income of the RPSF is applied against the government’s debt service. The returns of the Caisse affect RPSF income and therefore debt service.
The returns realized by the Caisse on RPSF income are taken into account in the government’s balance sheet and results by applying the accounting policy adopted in the wake of the December 2007 reform of government accounting in accordance with generally accepted accounting principles (GAAP).
“When determining a government’s retirement benefit liability and expense, plan assets would be valued at market-related values. Under this method, plan assets are recorded at market value or they are adjusted to market value over a period not to exceed five years. Values adjusted to market closely approximate current economic value in a manner that can minimize short-term fluctuations. Market-related values would be used because they are objective and verifiable. Once a basis of valuation is chosen it would be applied consistently.” (Canadian Institute of Chartered Accountants (CICA), Public Sector Accounting Handbook, section 3250, paragraph .035)
Under the accounting policy, the “adjusted market value” of the RPSF is adjusted every year based on the returns realized by the fund. If, for a given year, the realized return differs from the anticipated long-term return, the difference between the two is spread over five years. All other things being equal, this means that the adjusted market value and the market value will converge over a five-year period. It is important to note that this method is applied when returns are higher than expected as well as when they are lower.3
| 3 | Before the accounting reform of 2007, the value of the RPSF was adjusted only once every three years, that is, when actuarial valuations were carried out. Since the reform, it has been adjusted every year. |
| | |
| | 2010-2011 Budget |
| D.36 | | Budget Plan |
In addition, the differences between actual and expected return, which are spread over five years, are taken into account in RPSF income by amortizing them over a period of about 13 years, that is, the expected average remaining service life (EARSL) of retirement plan participants4. This amortization mechanism and the period used are prescribed by GAAP5.
Therefore, the returns realized by the Caisse in 2008-2009, which were lower than expected, reduce the income of the RPSF as of 2009-2010. The higher-than-anticipated returns realized by the Caisse in 2009-2010 will lead to an increase in the RPSF’s income as of 2010-2011.
TABLE D.24
Impact of the returns of the Caisse de dépôt et placement du Québec on debt service1
(millions of dollars)
| | | | | | |
| | | 2009-2010P | | 2010-2011P | | 2011-2012P |
Before 2008-2009 | | – 48 | | – 80 | | – 58 |
From 2008-2009 | | 307 | | 635 | | 985 |
From 2009-2010 | | | | – 24 | | – 49 |
| | | | | | |
Increase in debt service | | 259 | | 531 | | 878 |
| | | | | | |
| Note: | A positive entry indicates an increase in debt service and a negative entry, a decrease. |
| P: | Preliminary results for 2009-2010 and forecasts for subsequent years. |
| 1 | Represents the impact on RPSF income, and therefore on debt service, of returns of the Caisse that are lower or higher than the anticipated long-term return (6.75%) and that are amortized. |
| 4 | As with recognition of the retirement plans liability, the RPSF accounting method draws a distinction between the Pension Plan of Management Personnel (PPMP) and the other plans. The EARSL under the PPMP is 9 years compared with 14 years under the other plans. |
| 5 | “…actuarial gains and losses should be amortized to the liability or asset and the related expense in a systematic and rational manner over the expected average remaining service life of the related employee group.” Canadian Institute of Chartered Accountants (CICA), Public Sector Accounting Handbook, section 3250, paragraph .062. For the purposes of retirement assets, the CICA defines actuarial gains (losses) as changes in the value of plan assets that are caused notably by variances between actual results and expected results. |
| | |
Debt, Financing | | |
and Debt Management | | D.37 |
[THIS PAGE INTENTIONALLY LEFT BLANK]
Borrowings in fiscal 2009-2010 should total $15 475 million, i.e. $9 742 million for the Consolidated Revenue Fund, $2 415 million for the Financing Fund and $3 318 million for Financement-Québec.
It should be noted that pre-financing of $3 855 million was carried out in the last few months of the fiscal year. It will be used to cover part of the borrowing program in 2010-2011.
The government aims to borrow at the lowest possible cost. To that end, it applies a strategy for diversifying sources of funding by market, financial instrument and maturity.
| 2.1.1 | Diversification by market |
Financing transactions are conducted regularly on most markets, i.e. in Canada, the United States, Europe and Asia.
Over the past 10 years, nearly one quarter of borrowings, on average, has been contracted in foreign currency. Nonetheless, the government has only a very low exposure to foreign currencies (see section 3.1).
In 2009-2010, the government contracted 18.7% of its borrowings on foreign markets in three different currencies:
| • | | two borrowings totalling 1 575 million euros (CAN$2 496 million) in April 2009 and March 2010; |
| • | | two borrowings totalling 16 000 million yen (CAN$197 million) in April 2009; |
| • | | one borrowing for 200 million Swiss francs (CAN$206 million) in December 2009. |
| | |
Debt, Financing | | |
and Debt Management | | D.39 |
CHART D.7
Borrowings by currency1
(per cent)
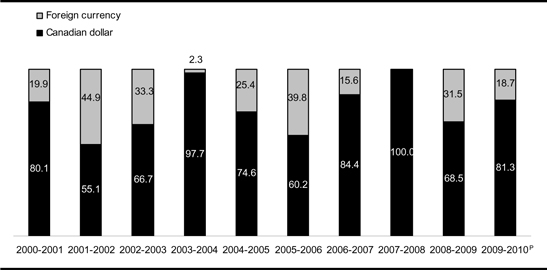
| 1 | Borrowings of the Consolidated Revenue Fund, borrowings for the Financing Fund and borrowings of Financement-Québec. |
| 2.1.2 | Diversification by instrument |
To satisfy investors’ needs, an extensive array of financial products is used in the course of financing transactions.
Long-term instruments consist primarily of public bond issues, private borrowings and savings products.
The long-term instruments used in 2009-2010 consisted mainly of public issues (76.0%) and private borrowings (15.4%).
| | |
| | 2010-2011 Budget |
| D.40 | | Budget Plan |
CHART D.8
Borrowings in 2009-2010P by instrument
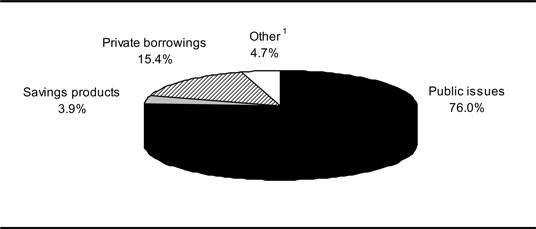
| 1 | Includes the Business Assistance – Immigrant Investor Program and borrowings from the Canada Pension Plan Investment Fund. |
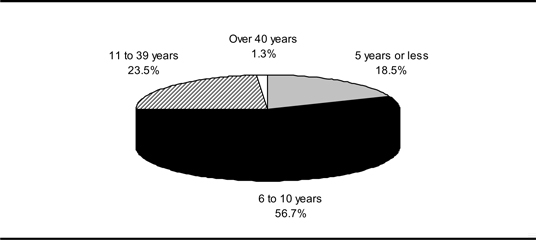
| 2.1.3 | Diversification by maturity |
Maturities of new borrowings are distributed over time to obtain a stable refinancing profile and ensure the government’s regular presence on capital markets.
In 2009-2010, 56.7% of borrowings contracted had a maturity of 6 to 10 years; 23.5%, 11 to 39 years; 18.5%, 5 years or less; and 1.3%, over 40 years.
CHART D.9
Borrowings in 2009-2010P by maturity
| | |
Debt, Financing | | |
and Debt Management | | D.41 |
This diversification by maturity has an impact on the maturity of the debt shown in the following chart. As at March 31, 2010, the average maturity of the debt should be 11 years.
CHART D.10
Maturity of the long-term debt as at March 31, 2010P
(millions of dollars)
| Note: | Direct debt of the Consolidated Revenue Fund, debt contracted to make advances to the Financing Fund and debt of Financement-Québec. |
The financing program of the Consolidated Revenue Fund makes it possible to refinance maturing borrowings, contribute to the Retirement Plans Sinking Fund and meet new financial requirements, particularly for capital investments and investments in government corporations.
The Financing Fund makes loans to consolidated entities (e.g. Fonds de conservation et d’amélioration du réseau routier, Investissement Québec, Société immobilière du Québec, Corporation d’hébergement du Québec) and to certain government enterprises.
Financement-Québec makes borrowings on financial markets to meet the needs of institutions in the health and social services and education networks.
| | |
| | 2010-2011 Budget |
| D.42 | | Budget Plan |
In 2009-2010, the government contracted borrowings totalling $15 475 million, including $3 855 million in pre-financing conducted over the last few months of the year.
In 2010-2011, the financing program is expected to amount to $12 936 million. It would have amounted to $16 791 million had there not been any pre-financing in 2009-2010. In 2011-2012, the financing program should total $17 857 million.
TABLE D.25
The government’s financing program
(millions of dollars)
| | | | | | | | |
| | | 2008-2009 | | 2009-2010P | | 2010-2011P | | 2011-2012P |
CONSOLIDATED REVENUE FUND | | | | | | | | |
Net financial requirements1, 2 | | 117 | | 4 443 | | 5 133 | | 4 050 |
Repayment of borrowings | | 4 549 | | 6 205 | | 3 658 | | 6 307 |
Change in cash position | | – 2 413 | | – 8 161 | | – 3 855 | | — |
Retirement Plans Sinking Fund, other retirement plan assets and funds dedicated to employee future benefits – Deposits | | 2 678 | | 112 | | — | | — |
Transactions under the credit policy3 | | – 3 792 | | 3 288 | | — | | — |
Pre-financing | | 8 161 | | 3 855 | | — | | — |
| | | | | | | | |
TOTAL — Consolidated Revenue Fund | | 9 300 | | 9 742 | | 4 936 | | 10 357 |
FINANCING FUND | | 1 439 | | 2 415 | | 4 500 | | 4 000 |
FINANCEMENT-QUÉBEC | | 2 675 | | 3 318 | | 3 500 | | 3 500 |
| | | | | | | | |
TOTAL | | 13 414 | | 15 475 | | 12 936 | | 17 857 |
| | | | | | | | |
| Note: | A negative entry indicates a source of financing and a positive entry, a financial requirement. |
| P: | Preliminary results for 2009-2010 and forecasts for subsequent years. |
| 1 | Excludes consolidated entities. |
| 2 | Net financial requirements are adjusted to take into account the non-receipt of RPSF and ASLF income. |
| 3 | Under its credit policy, which is designed to limit financial risk with respect to counterparties, the government disbursed $3 288 million in 2009-2010 following the change in foreign exchange rates. These disbursements do not affect the debt. In 2008-2009, the government received $3 792 million. |
| | |
Debt, Financing | | |
and Debt Management | | D.43 |
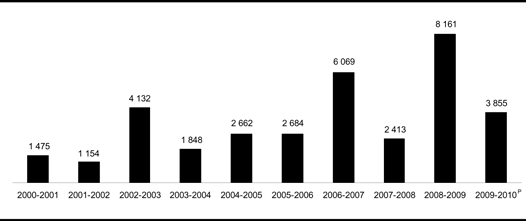
Pre-financing
The government makes advance borrowings, or borrowings that would normally be made in the following fiscal year. The government obtains pre-financing to take advantage of favourable market conditions.
Over the past 10 years, the government has obtained an average of $3 445 million in pre-financing per year.
Pre-financing
(millions of dollars)
Over the past two years, the yield on long-term Québec securities has been fairly stable. However, short-term interest rates have fallen considerably, reflecting the monetary policy pursued by the Bank of Canada during the financial crisis.
| | |
| | 2010-2011 Budget |
| D.44 | | Budget Plan |
CHART D.11
Yield on Québec securities
(per cent)
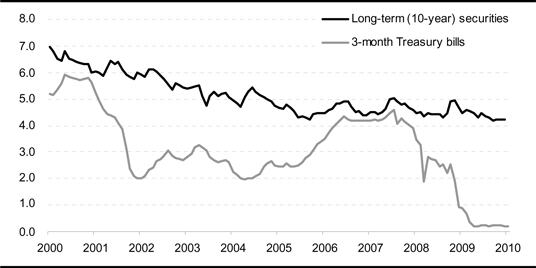
Sources: PC-Bond and Ministère des Finances du Québec.
In addition, the substantial increase in the spread between the yield on Québec and federal government securities, observed starting in summer 2008, has been reduced, with the spread returning to normal levels. The same situation has been observed in the other provinces.
CHART D.12
Yield spread on long-term (10-year) securities
(per cent)
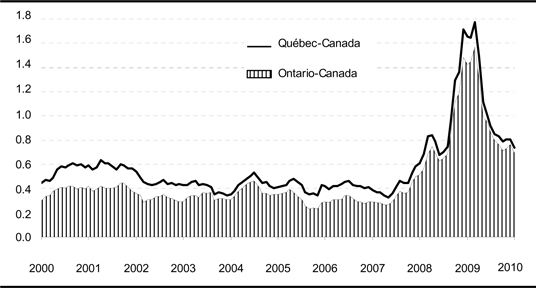
Source: PC-Bond.
| | |
Debt, Financing | | |
and Debt Management | | D.45 |
[THIS PAGE INTENTIONALLY LEFT BLANK]
The government’s debt management strategy aims to minimize the cost of the debt and limit the risk related to fluctuations in foreign exchange and interest rates.
The government uses a range of financial instruments, particularly interest rate and currency swap agreements, to achieve desired debt proportions by currency and interest rate.
Debt management enables the government to save money on debt service.
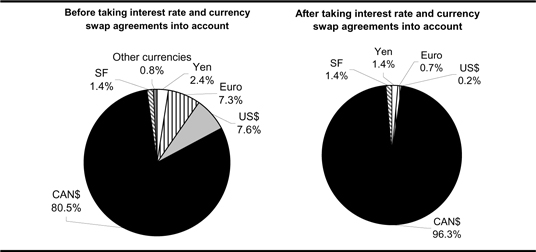
| 3.1 | Structure of the debt by currency |
As at March 31, 2010, the proportion of the government’s gross debt in Canadian dollars should amount to 96.3% and the proportion in foreign currency, 3.7%.
TABLE D.26
Structure of the gross debt as at March 31, 2010P
(millions of dollars)
| | | | | | | | | | | | | | | | | | | | |
| | | Consolidated direct debt | | |
Currency | | Consolidated
Revenue
Fund | | % | | Consolidated
entities | | Total | | % | | Net
retirement
plans
liability | | Net
employee
future
benefits
liability | | Less:
Generations
Fund | | Gross
debt | | % |
Canadian dollar | | 87 725 | | 93.4 | | 43 956 | | 131 681 | | 95.5 | | 28 763 | | — | | – 2 667 | | 157 777 | | 96.3 |
US dollar | | 308 | | 0.3 | | — | | 308 | | 0.2 | | — | | — | | — | | 308 | | 0.2 |
Euro | | 1 177 | | 1.3 | | — | | 1 177 | | 0.9 | | — | | — | | — | | 1 177 | | 0.7 |
Swiss franc | | 2 355 | | 2.5 | | — | | 2 355 | | 1.7 | | — | | — | | — | | 2 355 | | 1.4 |
Yen | | 2 355 | | 2.5 | | — | | 2 355 | | 1.7 | | — | | — | | — | | 2 355 | | 1.4 |
| | | | | | | | | | | | | | | | | | | | |
Subtotal | | 93 920 | | 100.0 | | 43 956 | | 137 876 | | 100.0 | | 28 763 | | — | | – 2 667 | | 163 972 | | 100.0 |
Pre-financing | | – 3 855 | | | | — | | – 3 855 | | | | — | | — | | — | | – 3 855 | | |
| | | | | | | | | | | | | | | | | | | | |
TOTAL | | 90 065 | | | | 43 956 | | 134 021 | | | | 28 763 | | — | | – 2 667 | | 160 117 | | |
| | | | | | | | | | | | | | | | | | | | |
| Note: | The debt in foreign currency is expressed in the Canadian equivalent based on the exchange rates in effect on March 22, 2010. |
| | |
Debt, Financing | | |
and Debt Management | | D.47 |
Before interest rate and currency swap agreements are taken into account, the proportion of the debt in foreign currency as at March 31, 2010 should be 19.5%. After interest rate and currency swap agreements are taken into account, the proportion should be 3.7%.
CHART D.13
Structure of the gross debt by currency as at March 31, 2010P
| | |
| | 2010-2011 Budget |
| D.48 | | Budget Plan |
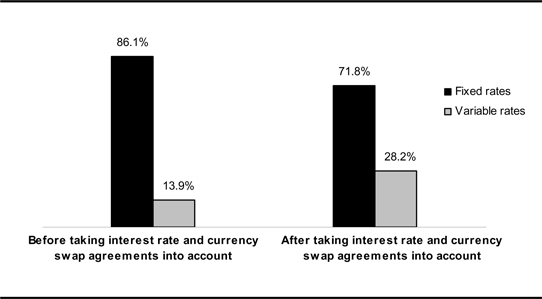
| 3.2 | Structure of the debt by interest rate |
The government keeps part of its debt at variable rates and part at fixed rates. Since short-term interest rates are generally lower than long-term rates, keeping part of the debt at variable rates makes it possible to achieve substantial savings on debt service.
Before interest rate and currency swap agreements are taken into account, the proportion of the gross debt at variable rates should be 13.9% as at March 31, 2010. After interest rate and currency swap agreements are taken into account, the proportion should be 28.2%.
CHART D.14
Structure of the gross debt by interest rate as at March 31, 2010P
| | |
Debt, Financing | | |
and Debt Management | | D.49 |
[THIS PAGE INTENTIONALLY LEFT BLANK]
| 4.1 | The Québec government’s credit ratings |
A borrower’s credit rating measures its capacity to pay the interest on its debt and repay the principal at maturity. To establish the credit rating of a borrower like the Québec government, credit rating agencies analyze a range of economic, fiscal and financial factors. Among the main factors are the size, structure and vitality of the economy, the situation on the labour market, fiscal competitiveness, public finance situation and indebtedness.
To express the quality of a borrower’s credit, credit rating agencies use rating scales, namely, a scale for short-term debt and a scale for long-term debt.
The following tables show the rating scales used by agencies for short- and long-term debt.
TABLE D.27
Credit rating scales for short-term debt
| | | | | | | | |
Definition | | Moody’s | | Standard &
Poor’s | | Fitch
Ratings | | DBRS |
Very strong capacity to pay interest and repay principal over the short term. | | P-1 | | A-1+ | | F1+ | | R-1high |
| | | | A-1 | | F1 | | R-1middle |
| | | | | | | | R-1low |
Very adequate capacity to pay interest and repay principal over the short term, despite greater sensitivity to economic conditions than the upper level. | | P-2 | | A-2 | | F2 | | R-2high |
| | | | | | | | |
| | | | | | | | |
Adequate capacity to pay interest and repay principal over the short term. Difficult economic conditions may reduce this capacity. | | P-3 | | A-3 | | F3 | | R-2middle |
| | | | | | | | R-2low |
| | | | | | | | R-3 |
Uncertain capacity to pay interest and repay principal over the short-term. Securities in this category are considered speculative securities. | | Not Prime1 | | B-1 | | B | | R-4 |
| | | | B-2 | | C | | R-5 |
| | | | B-3 | | | | |
| | | | C | | | | |
Incapacity to pay interest and repay principal over the short-term. Securities in this category are considered default securities. | | Not Prime1 | | D | | D | | D |
| Note: | The current credit ratings for Québec’s short-term debt are indicated in bold. |
| 1 | Moody’s uses the “Not Prime” category for all securities not included in the upper categories. |
| | |
Debt, Financing | | |
and Debt Management | | D.51 |
TABLE D.28
Credit rating scales for long-term debt
| | | | | | | | | | |
Definition | | Moody’s | | Standard &
Poor’s | | Fitch Ratings | | DBRS | | Japan Credit
Rating Agency |
Extremely strong capacity to pay interest and repay principal. | | Aaa | | AAA | | AAA | | AAA | | AAA |
Very strong capacity to pay interest and repay principal. | | Aa1 | | AA+ | | AA+ | | AA (high) | | AA+ |
| | Aa2 | | AA | | AA | | AA | | AA |
| | Aa3 | | AA- | | AA- | | AA (low) | | AA- |
Strong capacity to pay interest and repay principal, despite greater sensitivity to economic conditions than levels AAA and AA. | | A1 | | A+ | | A+ | | A (high) | | A+ |
| | A2 | | A | | A | | A | | A |
| | A3 | | A- | | A- | | A (low) | | A- |
Adequate capacity to pay interest and repay principal. Difficult economic conditions may reduce this capacity. | | Baa1 | | BBB+ | | BBB+ | | BBB (high) | | BBB+ |
| | Baa2 | | BBB | | BBB | | BBB | | BBB |
| | Baa3 | | BBB- | | BBB- | | BBB (low) | | BBB- |
Uncertain capacity to pay interest and repay principal, particularly under difficult economic conditions. | | Ba1 | | BB+ | | BB+ | | BB (high) | | BB+ |
| | Ba2 | | BB | | BB | | BB | | BB |
| | Ba3 | | BB- | | BB- | | BB (low) | | BB- |
Very uncertain capacity to pay interest and repay principal, particularly under difficult economic conditions. | | B1 | | B+ | | B+ | | B (high) | | B+ |
| | B2 | | B | | B | | B | | B |
| | B3 | | B- | | B- | | B (low) | | B- |
| Note: | The current credit ratings for Québec’s long-term debt are indicated in bold. |
Agencies add an “outlook” to the rating that indicates the trend the credit rating may follow in the future. The outlook may be positive, stable or negative.
TABLE D.29
The Québec government’s current credit ratings
| | | | |
Agency | | Rating | | Outlook |
Moody’s | | Aa2 | | Stable |
Standard & Poor’s (S&P) | | A+ | | Stable |
Dominion Bond Rating Service (DBRS) | | A (high) | | Stable |
Fitch Ratings (Fitch) | | AA– | | Stable |
Japan Credit Rating Agency (JCR) | | AA+ | | Stable |
| | |
| | 2010-2011 Budget |
| D.52 | | Budget Plan |
| q | Change in Québec’s credit ratings |
The following charts show the change in the Québec government’s credit ratings.
CHART D.15
Credit rating assigned to Québec by Moody’s
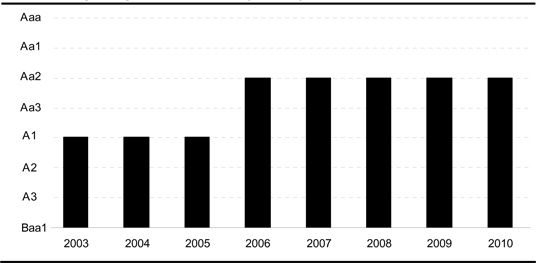
| | |
Debt, Financing | | |
and Debt Management | | D.53 |
CHART D.16
Credit rating assigned to Québec by Standard & Poor’s
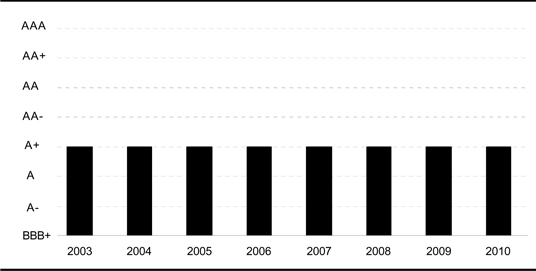
CHART D.17
Credit rating assigned to Québec by DBRS
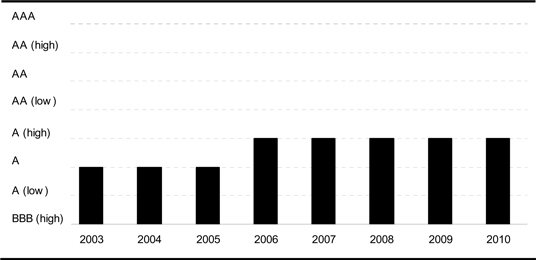
| | |
| | 2010-2011 Budget |
| D.54 | | Budget Plan |
CHART D.18
Credit rating assigned to Québec by Fitch
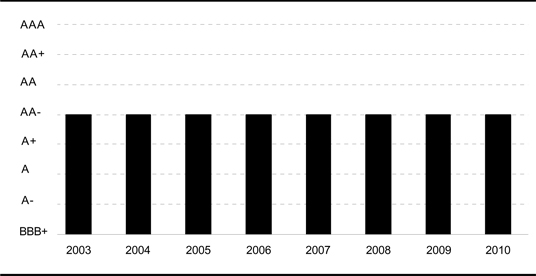
CHART D.19
Credit rating assigned to Québec by JCR
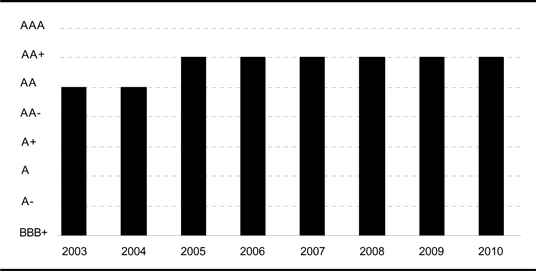
| | |
Debt, Financing | �� | |
and Debt Management | | D.55 |
| 4.2 | Comparison of the credit ratings of Canadian provinces |
The following charts show the credit ratings of Canadian provinces in early March 2010. No chart is given for JCR since Québec is the only province that receives a credit rating from that agency.
CHART D.20
Credit ratings of Canadian provinces – Moody’s
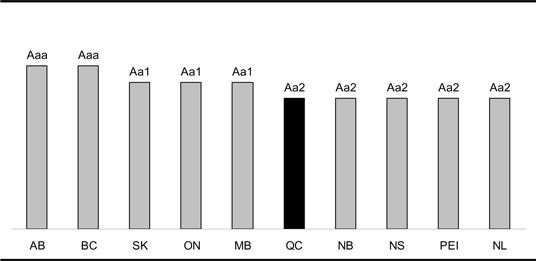
CHART D.21
Credit ratings of Canadian provinces – Standard & Poor’s
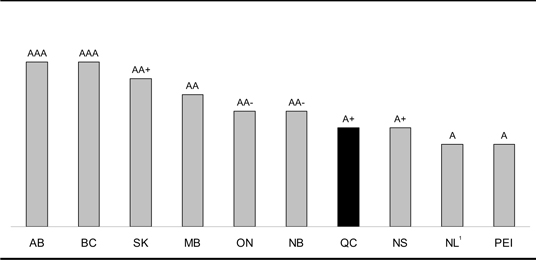
| | |
| | 2010-2011 Budget |
| D.56 | | Budget Plan |
CHART D.22
Credit ratings of Canadian provinces – DBRS
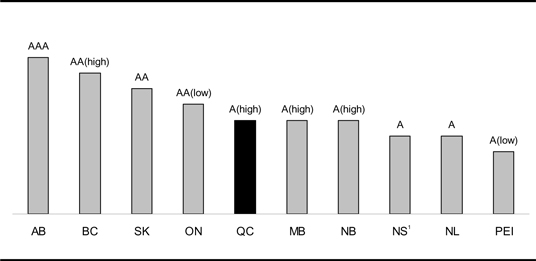
CHART D.23
Credit ratings of Canadian provinces – Fitch
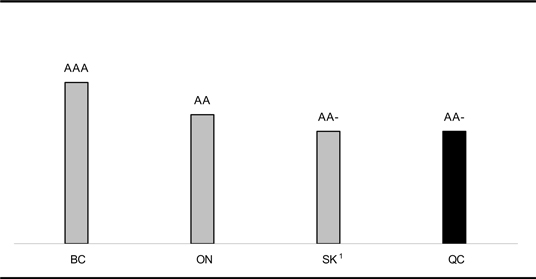
| Note: | British Columbia, Ontario, Saskatchewan and Québec are the only provinces rated by this agency. |
| | |
Debt, Financing | | |
and Debt Management | | D.57 |
[THIS PAGE INTENTIONALLY LEFT BLANK]
TABLE D.30
Summary of consolidated financing transactions
(millions of dollars)
| | | | | | | | | | | |
| | | 2009-2010P | | | | |
| | | March 2009
Budget | | Preliminary
results | | | Change | | 2010-2011P | | 2011-2012P |
CHANGE IN CASH POSITION | | | | | | | | | | | |
Consolidated Revenue Fund | | 5 984 | | 4 306 | | | – 1 678 | | 3 855 | | — |
Consolidated entities | | — | | – 170 | | | – 170 | | — | | — |
| | | | | | | | | | | |
TOTAL – Change in cash position | | 5 984 | | 4 136 | | | – 1 848 | | 3 855 | | — |
| | | | | | | | | | | |
NET BORROWINGS | | | | | | | | | | | |
Consolidated Revenue Fund | | | | | | | | | | | |
New borrowings | | 4 278 | | 7 094 | 1 | | 2 816 | | 4 936 | | 10 357 |
Repayment of borrowings | | – 5 245 | | – 6 845 | 1 | | – 1 600 | | – 3 658 | | – 6 307 |
| | | | | | | | | | | |
| | – 967 | | 249 | | | 1 216 | | 1 278 | | 4 050 |
| | | | | |
Consolidated entities2 | | | | | | | | | | | |
New borrowings | | 7 082 | | 9 247 | 3 | | 2 165 | | 8 152 | | 8 556 |
Repayment of borrowings | | – 2 893 | | – 3 284 | | | – 391 | | – 2 712 | | – 2 759 |
| | | | | | | | | | | |
| | 4 189 | | 5 963 | | | 1 774 | | 5 440 | | 5 797 |
| | | | | | | | | | | |
TOTAL – Net borrowings | | 3 222 | | 6 212 | | | 2 990 | | 6 718 | | 9 847 |
| | | | | | | | | | | |
Retirement Plans Sinking Fund, other retirement plan assets and funds dedicated to employee future benefits | | – 2 217 | | – 2 355 | | | – 138 | | – 2 133 | | – 1 950 |
| | | | | | | | | | | |
Generations Fund | | – 715 | | – 715 | | | — | | – 892 | | – 972 |
| | | | | | | | | | | |
TOTAL CONSOLIDATED FINANCING TRANSACTIONS | | 6 274 | | 7 278 | | | 1 004 | | 7 548 | | 6 925 |
| | | | | | | | | | | |
| Note: | A negative entry indicates a financial requirement and a positive entry, a source of financing. For the change in cash position, a negative entry indicates an increase and a positive entry, a decrease. |
| P: | Preliminary results for 2009-2010 and forecasts for subsequent years. |
| 1 | Disbursements totalling $3 288 million related to transactions carried out under the credit policy decrease new borrowings by $2 648 million and increase repayment of borrowings by $640 million. |
| 2 | Does not take into account the net borrowings of institutions in the health and social services and education networks contracted in their own name. |
| 3 | Includes a $3 568-million increase in temporary borrowings. |
| | |
Debt, Financing | | |
and Debt Management | | D.59 |
TABLE D.31
Québec government
Summary of long-term borrowings1 in 2009-2010P
| | | | |
Currency | | $ million | | % |
CANADIAN DOLLAR | | | | |
Public issues | | 9 169 | | 59.3 |
Private borrowings | | 2 079 | | 13.4 |
Savings products | | 602 | | 3.9 |
Business Assistance – Immigrant Investor Program | | 720 | | 4.7 |
Canada Pension Plan Investment Fund | | 6 | | — |
| | | | |
Subtotal | | 12 576 | | 81.3 |
OTHER CURRENCIES | | | | |
Euro | | 2 496 | | 16.1 |
Swiss franc | | 206 | | 1.3 |
Yen | | 197 | | 1.3 |
| | | | |
Subtotal | | 2 899 | | 18.7 |
| | | | |
TOTAL | | 15 475 | | 100.0 |
| | | | |
| 1 | Includes borrowings of the Consolidated Revenue Fund, borrowings for the Financing Fund and borrowings of Financement-Québec. |
| | |
| | 2010-2011 Budget |
| D.60 | | Budget Plan |
TABLE D.32
Québec government
Borrowings for the Consolidated Revenue Fund in 2009-2010P
| | | | | | | | | | | | | | |
Amount in
Canadian dollars1 | | | Face value in
foreign currency | | Interest rate2 | | | Date of issue | | Date of maturity | | Price to investor | | Yield to investor3 |
| (millions) | | % | | | | | | | $ | | % |
| 161 | 4 | | 13 000 yen | | 2.73 | | | April 3 | | 2029-04-03 | | 100.000 | | 2.730 |
| 472 | | | — | | 5.00 | | | April 9 | | 2038-12-01 | | 98.128 | | 5.123 |
| 10 | 4 | | — | | 5.10 | | | April 20 | | 2049-09-21 | | 101.322 | | 5.023 |
| 10 | 4 | | — | | 5.10 | | | April 22 | | 2053-09-21 | | 100.083 | | 5.095 |
| 455 | | | — | | 4.50 | | | April 24 | | 2018-12-01 | | 100.983 | | 4.373 |
| 2 391 | | | €1 500 | | 5.00 | 5 | | April 29 | | 2019-04-29 | | 99.615 | | 5.050 |
| 36 | 4 | | 3 000 yen | | 2.90 | | | April 30 | | 2029-04-27 | | 100.000 | | 2.900 |
| 139 | 4 | | — | | Various | | | May 6 | | 2065-06-01 | | 92.940 | | 4.668 |
| 302 | | | — | | 4.50 | | | May 8 | | 2019-12-01 | | 100.390 | | 4.453 |
| 492 | | | — | | 4.50 | | | May 15 | | 2019-12-01 | | 100.574 | | 4.431 |
| 166 | | | — | | 4.50 | | | June 8 | | 2019-12-01 | | 99.216 | | 4.595 |
| 494 | | | — | | 4.50 | | | June 15 | | 2019-12-01 | | 98.807 | | 4.645 |
| 301 | | | — | | 4.50 | | | August 4 | | 2019-12-01 | | 100.380 | | 4.453 |
| 321 | | | — | | 5.00 | | | September 22 | | 2041-12-01 | | 103.657 | | 4.776 |
| 524 | | | — | | 5.00 | | | September 30 | | 2041-12-01 | | 104.859 | | 4.705 |
| 449 | | | — | | 4.50 | | | November 17 | | 2019-12-01 | | 101.289 | | 4.340 |
| 440 | | | — | | 4.50 | | | December 3 | | 2019-12-01 | | 103.627 | | 4.055 |
| 16 | 4 | | — | | 5.10 | | | December 10 | | 2053-09-21 | | 107.704 | | 4.684 |
| 32 | 4 | | — | | 5.10 | | | December 14 | | 2058-09-21 | | 107.742 | | 4.694 |
| 206 | | | 200 SF | | 2.875 | 5 | | December 17 | | 2021-12-17 | | 100.624 | | 2.813 |
| 510 | | | — | | 5.00 | | | January 18 | | 2041-12-01 | | 102.071 | | 4.871 |
| 382 | 4 | | — | | 3.25 | | | February 5 | | 2036-12-01 | | 128.605 | | 1.886 |
| 105 | 4 | | €75 | | 4.14 | 5 | | March 12 | | 2030-03-12 | | 100.000 | | 4.140 |
| 602 | 6 | | — | | Various | | | Various | | Various | | Various | | Various |
| 720 | 7 | | — | | Zero-coupon | | | Various | | Various | | Various | | Various |
| 6 | 8 | | — | | Various | | | Various | | Various | | Various | | Various |
| | | | | | | | | | | | | | | |
| 9 742 | | | | | | | | | | | | | | |
| 1 | Borrowings in foreign currency given in Canadian equivalent of their value on the date of borrowing. |
| 2 | Interest payable semi-annually except if another frequency is indicated in a note. |
| 3 | Yield to investor is determined on the basis of interest payable semi-annually. |
| 5 | Interest payable annually. |
| 6 | Savings products issued by Épargne Placements Québec. |
| 7 | Business Assistance – Immigrant investor Program. |
| 8 | Borrowings from the Canada Pension Plan Investment Fund. |
| | |
Debt, Financing | | |
and Debt Management | | D.61 |
TABLE D.33
Québec government
Borrowings for the Financing Fund in 2009-2010P
| | | | | | | | | | | | |
Amount in
Canadian dollars | | Face value in
foreign currency | | Interest rate1 | | Date of issue | | Date of maturity | | Price to investor | | Yield to investor2 |
| (millions) | | % | | | | | | $ | | % |
BORROWINGS FOR CONSOLIDATED ENTITIES |
| 18 | | — | | 5.00 | | April 9 | | 2038-12-01 | | 98.128 | | 5.123 |
| 50 | | — | | 4.50 | | April 24 | | 2018-12-01 | | 100.983 | | 4.373 |
| 249 | | — | | 6.00 | | April 30 | | 2012-10-01 | | 112.965 | | 2.055 |
| 200 | | — | | 4.50 | | May 8 | | 2019-12-01 | | 100.390 | | 4.453 |
| 11 | | — | | 4.50 | | May 15 | | 2019-12-01 | | 100.574 | | 4.431 |
| 330 | | — | | 4.50 | | June 8 | | 2019-12-01 | | 99.216 | | 4.595 |
| 201 | | — | | 4.50 | | August 4 | | 2019-12-01 | | 100.380 | | 4.453 |
| 509 | | — | | 4.50 | | September 3 | | 2019-12-01 | | 101.728 | | 4.289 |
| 197 | | — | | 5.00 | | September 22 | | 2041-12-01 | | 103.657 | | 4.776 |
| 57 | | — | | 4.50 | | November 17 | | 2019-12-01 | | 101.289 | | 4.340 |
| 78 | | — | | 4.50 | | December 3 | | 2019-12-01 | | 103.627 | | 4.055 |
| 515 | | — | | 4.50 | | January 25 | | 2019-12-01 | | 102.997 | | 4.126 |
| | | | | | | | | | | | | |
| 2 415 | | | | | | | | | | | | |
| 1 | Interest payable semi-annually except if another frequency is indicated in a note. |
| 2 | Yield to investor is determined on the basis of interest payable semi-annually. |
| | |
| | 2010-2011 Budget |
| D.62 | | Budget Plan |
TABLE D.34
Borrowings by Financement-Québec in 2009-2010P
| | | | | | | | | | | | | | |
Amount in
Canadian dollars | | | Face value in
foreign currency | | Interest rate1 | | | Date of issue | | Date of maturity | | Price to investor | | Yield to investor2 |
| (millions) | | % | | | | | | | $ | | % |
| 51 | 3 | | — | | Variable | 4 | | April 1 | | 2014-12-01 | | 93.147 | | Variable |
| 505 | | | — | | 3.25 | | | April 6 | | 2014-06-01 | | 100.959 | | 3.047 |
| 69 | 3 | | — | | Variable | 4 | | April 7 | | 2014-12-01 | | 92.393 | | Variable |
| 505 | | | — | | 3.25 | | | April 29 | | 2014-06-01 | | 101.090 | | 3.017 |
| 29 | 3 | | — | | Variable | 4 | | May 20 | | 2014-12-01 | | 95.570 | | Variable |
| 10 | 3 | | — | | Variable | 4 | | May 26 | | 2014-12-01 | | 95.577 | | Variable |
| 29 | 3 | | — | | Variable | 4 | | May 28 | | 2014-12-01 | | 95.683 | | Variable |
| 97 | 3 | | — | | 5.25 | | | June 1 | | 2034-06-01 | | 96.823 | | 5.485 |
| 19 | 3 | | — | | 5.25 | | | June 5 | | 2034-06-01 | | 97.447 | | 5.438 |
| 29 | 3 | | — | | 5.25 | | | June 9 | | 2034-06-01 | | 97.888 | | 5.405 |
| 34 | 3 | | — | | Variable | 4 | | August 5 | | 2014-12-01 | | 97.501 | | Variable |
| 98 | 3 | | | | Variable | 4 | | August 14 | | 2014-12-01 | | 97.513 | | Variable |
| 245 | 3 | | — | | Variable | 4 | | September 23 | | 2014-12-01 | | 97.915 | | Variable |
| 319 | | | — | | 4.25 | | | December 4 | | 2015-12-01 | | 106.419 | | 3.069 |
| 292 | 3 | | — | | 5.25 | | | December 17 | | 2034-06-01 | | 103.633 | | 4.991 |
| 499 | | | — | | 3.50 | | | February 23 | | 2016-12-01 | | 99.733 | | 3.544 |
| 184 | 3 | | — | | Variable | 4 | | March 2 | | 2016-06-02 | | 100.000 | | Variable |
| 20 | 3 | | — | | Variable | 4 | | March 10 | | 2016-06-02 | | 99.998 | | Variable |
| 264 | 3 | | — | | 5.25 | | | March 12 | | 2034-06-01 | | 104.343 | | 4.940 |
| 20 | 3 | | — | | Variable | 4 | | March 12 | | 2016-06-02 | | 99.997 | | Variable |
| | | | | | | | | | | | | | | |
| 3 318 | | | | | | | | | | | | | | |
| 1 | Interest payable semi-annually except if another frequency is indicated in a note. |
| 2 | Yield to investor is determined on the basis of interest payable semi-annually. |
| 4 | Interest payable quarterly. |
| | |
Debt, Financing | | |
and Debt Management | | D.63 |
TABLE D.35
Borrowings by Hydro-Québec in 20091
| | | | | | | | | | | | | |
Amount in
Canadian dollars | | Face value in
foreign currency | | Interest rate2 | | | Date of issue | | Date of maturity | | Price to investor | | Yield to investor3 |
| (millions) | | % | | | | | | | $ | | % |
| 508 | | — | | 5.00 | | | January 15 | | 2050-02-15 | | 101.632 | | 4.905 |
| 501 | | — | | 5.00 | | | January 29 | | 2050-02-15 | | 100.171 | | 4.988 |
| 14 | | — | | 4.205 | | | March 2 | | 2017-03-02 | | 100.000 | | 4.205 |
| 15 | | — | | 4.678 | | | March 2 | | 2019-03-02 | | 100.000 | | 4.678 |
| 1 000 | | — | | Variable | 4 | | June 22 | | 2014-02-20 | | 100.000 | | Variable |
| 767 | | — | | Variable | 4 | | September 17 | | 2014-02-20 | | 100.956 | | Variable |
| 303 | | — | | Variable | 4 | | September 21 | | 2014-02-20 | | 101.086 | | Variable |
| 20 | | — | | Zero-coupon | | | October 14 | | 2017-04-15 | | 73.346 | | 4.216 |
| 19 | | — | | Zero-coupon | | | October 14 | | 2022-04-15 | | 52.450 | | 5.294 |
| 20 | | — | | Zero-coupon | | | October 14 | | 2027-04-15 | | 39.108 | | 5.507 |
| 517 | | — | | 5.00 | | | November 12 | | 2050-02-15 | | 103.360 | | 4.809 |
| 523 | | — | | 5.00 | | | December 10 | | 2050-02-15 | | 104.625 | | 4.740 |
| | | | | | | | | | | | | | |
| 4 207 | | | | | | | | | | | | | |
| 1 | Borrowings contracted from January 1 to December 31, 2009. |
| 2 | Interest payable semi-annually except if another frequency is indicated in a note. |
| 3 | Yield to investor is determined on the basis of interest payable semi-annually. |
| 4 | Interest payable quarterly. |
| | |
| | 2010-2011 Budget |
| D.64 | | Budget Plan |