Exhibit 99.13
Section D from “The Government’s Detailed Financial Framework” from “Budget 2015-2016 – The Québec Economic Plan”, March 26, 2015
Section D
THE GOVERNMENT’S DETAILED FINANCIAL FRAMEWORK
| | | | | | | | | | |
| |
Introduction | | | D.3 | |
| | |
1. | | Change in consolidated revenue and expenditure | | | D.5 | |
| | | |
| | 1.1 | | Change in the budgetary balance | | | D.5 | |
| | | |
| | 1.2 | | Change in consolidated revenue | | | D.7 | |
| | | | |
| | | | 1.2.1 | | Consolidated own-source revenue excluding government enterprises | | | D.8 | |
| | | | |
| | | | 1.2.2 | | Revenue from government enterprises | | | D.12 | |
| | | | |
| | | | 1.2.3 | | Revenues from federal transfers | | | D.15 | |
| | | |
| | 1.3 | | Change in consolidated expenditure | | | D.18 | |
| | |
2. | | Financial framework by sector | | | D.23 | |
| | | |
| | 2.1 | | General fund | | | D.25 | |
| | | |
| | 2.2 | | Special funds | | | D.27 | |
| | | | |
| | | | 2.2.1 | | Generations Fund | | | D.30 | |
| | | |
| | 2.3 | | Specified purpose accounts | | | D.31 | |
| | | |
| | 2.4 | | Non-budget-funded bodies | | | D.32 | |
| | | |
| | 2.5 | | Health and social services and education networks | | | D.35 | |
| | | |
| | 2.6 | | Tax-funded expenditures | | | D.37 | |
| | |
3. | | NET FINANCIAL REQUIREMENTS | | | D.39 | |
| | |
APPENDIX 1: | | SENSITIVITY ANALYSIS OF ECONOMIC VARIABLES | | | D.41 | |
| | |
APPENDIX 2: | | IMPACT OF THE PRICE OF OIL AND GAS ON PUBLIC FINANCES | | | D.45 | |
| | |
APPENDIX 3: | | CONSOLIDATED DATA BY DEPARTMENTAL PORTFOLIO | | | D.51 | |
| | |
APPENDIX 4: | | ALLOCATION OF REVENUE FROM CONSUMPTION TAXES AND NATURAL RESOURCES | | | D.67 | |
D.1
| | | | | | | | | | |
| | |
APPENDIX 5: | | DETAILED CONSOLIDATED FINANCIAL FRAMEWORK | | | D.73 | |
INTRODUCTION
This section of The Québec Economic Plan presents the government’s detailed financial framework for 2014-2015 to 2016-2017.1
The information provided concerns:
| — | consolidated budgetary transactions for the period from 2014-2015 to 2016-2017; |
| — | the detailed change in consolidated revenue and expenditure, as well as adjustments made since Budget 2014-2015; |
| — | the results of the reporting entity’s sectoral components, particularly the general fund, special funds, specified purpose accounts, non-budget-funded bodies and the health and social services and education networks. |
In addition, the five-year financial framework, i.e. the government’s financial forecasts up to 2019-2020, is presented in Section A of this document.
| q | | Changes to the presentation of budgetary information |
In the December 2014 Update on Québec’s Economic and Financial Situation, the government continued to improve the presentation of the budget documents by fulfilling its commitment to provide consolidated budgetary information.
Information on the impact of the changes in presentation, and the reasons why the government made these improvements are provided in Section E of the December 2014 Update. The improvement in the information presented in the Update was acknowledged by the Auditor General of Québec in his report of February 26, 2015.
In addition, in keeping with its intention to continue adopting better practices regarding the presentation of budgetary information, the government will gradually implement a consolidated presentation by portfolio between now and Budget 2017-2018. Appendix 3 discusses the objectives of this new presentation, the steps to be taken over the next two years and the results for 2013-2014 by departmental portfolio.
| 1 | Throughout this section, the budgetary data for 2014-2015 and subsequent years are forecasts. |
D.3
| 1. | CHANGE IN CONSOLIDATED REVENUE AND EXPENDITURE |
| 1.1 | Change in the budgetary balance |
Budget 2015-2016 confirms that fiscal balance will be restored as of 2015-2016.
| — | The budgetary deficit forecast for 2014-2015 remains at $2 350 million. |
Spending will continue to increase, but at a rate below that of revenue. Accordingly, consolidated expenditure will grow by 2.3% in 2014-2015 and 1.5% in 2015-2016, while consolidated revenue will grow by 3.0% and 4.3% respectively.
Deposits of dedicated revenues in the Generations Fund will total $1.3 billion in 2014-2015 and $1.6 billion in 2015-2016.
In addition, the financial framework includes a contingency reserve of $400 million in 2016-2017.
| | | | | | | | | | | | |
TABLE D.1 Summary of consolidated budgetary transactions from 2014-2015 to 2016-2017 | |
(millions of dollars) | |
| | | 2014-2015 | | | 2015-2016 | | | 2016-2017 | |
| | | | |
Own-source revenue | | | 77 293 | | | | 80 716 | | | | 83 362 | |
| | | |
% change | | | 3.5 | | | | 4.4 | | | | 3.3 | |
| | | |
Federal transfers | | | 18 720 | | | | 19 444 | | | | 19 929 | |
| | | |
% change | | | 0.9 | | | | 3.9 | | | | 2.5 | |
| | | |
Consolidated revenue | | | 96 013 | | | | 100 160 | | | | 103 291 | |
| | | |
% change | | | 3.0 | | | | 4.3 | | | | 3.1 | |
| | | |
Expenditure | | | –86 777 | | | | –88 091 | | | | –89 721 | |
| | | |
% change | | | 2.9 | | | | 1.5 | | | | 1.9 | |
| | | |
Debt service | | | –10 333 | | | | –10 483 | | | | –10 934 | |
| | | |
% change | | | –2.5 | | | | 1.5 | | | | 4.3 | |
| | | |
Consolidated expenditure | | | –97 110 | | | | –98 574 | | | | –100 655 | |
| | | |
% change | | | 2.3 | | | | 1.5 | | | | 2.1 | |
| | | |
Contingency reserve | | | — | | | | — | | | | –400 | |
| | | |
SURPLUS (DEFICIT) | | | –1 097 | | | | 1 586 | | | | 2 236 | |
| | | |
BALANCED BUDGET ACT | | | | | | | | | | | | |
| | | |
Deposits of dedicated revenues in the Generations Fund | | | –1 253 | | | | –1 586 | | | | –2 236 | |
| | | |
BUDGETARY BALANCE(1) | | | –2 350 | | | | — | | | | — | |
| (1) | Budgetary balance within the meaning of the Balanced Budget Act. |
D.5
| q | | Adjustments for 2014-2015 |
Budget 2015-2016 maintains the budgetary deficit forecast at $2 350 million in 2014-2015.
Adjustments related to the economy lead to a $243-million improvement in the budgetary balance. The shortfall of $317 million in own-source revenue is more than offset by a reduction in debt service.
Adjustments related to the economy make it possible to fund the cost of other adjustments to the financial framework, which affect essentially consolidated entities.
| | | | | | | | | | | | |
| TABLE D.2 | | | | | | | | | | | | |
| | | |
| Adjustments for 2014-2015 | | | | | | | | | | | | |
| (millions of dollars) | | | | | | | | | | | | |
| | | 2014-2015 | |
| | |
| Adjustments
related to the
economy |
| |
| Other
adjustments |
(1) | | | Total | |
| | | |
BUDGETARY BALANCE – BUDGET 2014-2015 | | | | | | | | | | | –2 350 | |
| | | |
Consolidated revenue | | | | | | | | | | | | |
| | | |
Own-source revenue excluding government enterprises | | | | | | | | | | | | |
| | | |
General fund | | | –478 | | | | –26 | | | | –504 | |
| | | |
Consolidated entities | | | — | | | | –154 | | | | –154 | |
| | | |
Subtotal | | | –478 | | | | –180 | | | | –658 | |
| | | |
Government enterprises | | | 161 | | | | — | | | | 161 | |
| | | |
Own-source revenue | | | –317 | | | | –180 | | | | –497 | |
| | | |
Federal transfers | | | 141 | | | | –28 | | | | 113 | |
| | | |
Total consolidated revenue | | | –176 | | | | –208 | | | | –384 | |
| | | |
Consolidated expenditure | | | | | | | | | | | | |
| | | |
Expenditure excluding debt service | | | | | | | | | | | | |
| | | |
Program spending | | | — | | | | — | | | | — | |
| | | |
Consolidated entities | | | — | | | | –162 | | | | –162 | |
| | | |
Debt service | | | 419 | | | | 79 | | | | 498 | |
| | | |
Total consolidated expenditure | | | 419 | | | | –83 | | | | 336 | |
| | | |
Deposits of dedicated revenues in the Generations Fund | | | — | | | | 48 | | | | 48 | |
| | | |
TOTAL | | | 243 | | | | –243 | | | | — | |
| | | |
BUDGETARY BALANCE – BUDGET 2015-2016 | | | | | | | | | | | –2 350 | |
| (1) | Include the recovery measures announced in the December 2014 Update. |
D.6
| 1.2 | Change in consolidated revenue |
This section presents the updated consolidated revenue of the government for 2014-2015 to 2016-2017, as well as the change in this revenue.
The government’s revenue will total $96.0 billion in 2014-2015, i.e. $77.3 billion in own-source revenue and $18.7 billion in federal transfers.
Revenue will rise by 3.0% in 2014-2015, 4.3% in 2015-2016 and 3.1% in 2016-2017.
| | | | | | | | | | | | | | | | | | | | |
| TABLE D.3 | | | | | | | | | | | | | | | | | | | | |
| | | | | |
Change in consolidated revenue | | | | | | | | | | | | | | | | | | | | |
(millions of dollars) | | | | | | | | | | | | | | | | | | | | |
| | | | |
| | | Budget 2014-2015 | | | | | | Budget 2015-2016 | |
| | | 2014-2015 | | | Adjustments | | | 2014-2015 | | | 2015-2016 | | | 2016-2017 | |
| | | | | |
Own-source revenue | | | | | | | | | | | | | | | | | | | | |
| | | | | |
| Own-source revenue excluding government enterprises | | | 72 685 | | | | –658 | | | | 72 027 | | | | 75 859 | | | | 78 567 | |
| | | | | |
% change | | | 4.7 | | | | | | | | 4.0 | | | | 5.3 | | | | 3.6 | |
| | | | | |
Government enterprises | | | 5 105 | | | | 161 | | | | 5 266 | | | | 4 857 | | | | 4 795 | |
| | | | | |
% change | | | –6.2 | | | | | | | | –3.0 | | | | –7.8 | | | | –1.3 | |
| | | | | |
Subtotal | | | 77 790 | | | | –497 | | | | 77 293 | | | | 80 716 | | | | 83 362 | |
| | | | | |
% change | | | 3.9 | | | | | | | | 3.5 | | | | 4.4 | | | | 3.3 | |
| | | | | |
Federal transfers | | | 18 607 | | | | 113 | | | | 18 720 | | | | 19 444 | | | | 19 929 | |
| | | | | |
% change | | | –1.1 | | | | | | | | 0.9 | | | | 3.9 | | | | 2.5 | |
| | | | | |
TOTAL | | | 96 397 | | | | –384 | | | | 96 013 | | | | 100 160 | | | | 103 291 | |
| | | | | |
% change | | | 2.9 | | | | | | | | 3.0 | | | | 4.3 | | | | 3.1 | |
D.7
| 1.2.1 | Consolidated own-source revenue excluding government enterprises |
Consolidated own-source revenue excluding government enterprises consists chiefly of tax revenue, which is made up of personal income tax, contributions for health services, corporate taxes, school property taxes and consumption taxes. How it changes is closely tied to economic activity in Québec and to changes in the tax systems.
Consolidated own-source revenue excluding government enterprises also includes revenue from other sources, i.e. duties and permits and miscellaneous revenue, such as interest, the sale of goods and services, as well as fines, forfeitures and recoveries.
Most consolidated own-source revenue excluding government enterprises is deposited in the general fund to finance the government’s missions. In addition, other revenue is paid, in particular, into special funds (for funding specific programs), the Generations Fund (for reducing the debt), as well as to non-budget-funded bodies and the health and social services and education networks.
| q | Adjustments for 2014-2015 |
For fiscal 2014-2015, consolidated own-source revenue excluding government enterprises amounts to $72.0 billion, an increase of 4.0% compared with the revenue observed for fiscal 2013-2014.
Compared with the forecast in the June 4, 2014 budget, consolidated own-source revenue excluding government enterprises is adjusted downward by $658 million, of which nearly $275 million is attributable to tax revenue. This represents an adjustment of 0.9% in forecast revenue. The balance of the adjustment is observed primarily in the miscellaneous revenue of consolidated entities, reflecting the recurrence of the lower real revenue observed for 2013-2014.2
Revenue from personal income tax is adjusted downward by $404 million for fiscal 2014-2015 compared with Budget 2014-2015. This adjustment is explained essentially by the lower-than-anticipated level of salaries and wages in 2014, which led to lower-than-expected withholdings at source since the beginning of the fiscal year.
| 2 | It should be noted that adjustments to the revenue of consolidated entities are usually accompanied by a decrease in spending. |
D.8
| | | | | | | | | | | | | | | | | | | | |
TABLE D.4 Change in consolidated own-source revenue excluding government enterprises (millions of dollars) | |
| | | | |
| | | Budget 2014-2015 | | | | | | Budget 2015-2016 | |
| | | | | |
| | | 2014-2015 | | | Adjustments | | | 2014-2015 | | | 2015-2016 | | | 2016-2017 | |
Tax revenue | | | | | | | | | | | | | | | | | | | | |
| | | | | |
Personal income tax | | | 27 349 | | | | –404 | | | | 26 945 | | | | 28 218 | | | | 29 532 | |
| | | | | |
% change | | | 5.3 | | | | | | | | 2.8 | | | | 4.7 | | | | 4.7 | |
| | | | | |
Contributions for health services | | | 6 482 | | | | –39 | | | | 6 443 | | | | 6 571 | | | | 6 656 | |
| | | | | |
% change | | | 2.8 | | | | | | | | 3.1 | | | | 2.0 | | | | 1.3 | |
| | | | | |
Corporate taxes | | | 5 819 | | | | –96 | | | | 5 723 | | | | 6 447 | | | | 6 774 | |
| | | | | |
% change | | | 5.0 | | | | | | | | 1.7 | | | | 12.7 | | | | 5.1 | |
| | | | | |
School property tax | | | 1 901 | | | | 8 | | | | 1 909 | | | | 2 030 | | | | 2 109 | |
| | | | | |
% change | | | 8.6 | | | | | | | | 6.9 | | | | 6.3 | | | | 3.9 | |
| | | | | |
Consumption taxes | | | 17 657 | | | | 259 | | | | 17 916 | | | | 18 601 | | | | 18 606 | |
| | | | | |
% change | | | 2.9 | | | | | | | | 4.6 | | | | 3.8 | | | | 0.0 | |
| | | | | |
Other revenue | | | | | | | | | | | | | | | | | | | | |
| | | | | |
Duties and permits | | | 2 506 | | | | –16 | | | | 2 490 | | | | 2 755 | | | | 2 761 | |
| | | | | |
% change | | | 15.6 | | | | | | | | 13.3 | | | | 10.6 | | | | 0.2 | |
| | | | | |
Miscellaneous revenue | | | 9 670 | | | | –322 | | | | 9 348 | | | | 9 651 | | | | 9 893 | |
| | | | | |
% change | | | 2.8 | | | | | | | | 4.7 | | | | 3.2 | | | | 2.5 | |
| | | | | |
Generations Fund revenue | | | 1 301 | | | | –48 | | | | 1 253 | | | | 1 586 | | | | 2 236 | |
| | | | | |
% change | | | 16.1 | | | | | | | | 11.8 | | | | 26.6 | | | | 41.0 | |
| | | | | |
TOTAL | | | 72 685 | | | | –658 | | | | 72 027 | | | | 75 859 | | | | 78 567 | |
| | | | | |
% change | | | 4.7 | | | | | | | | 4.0 | | | | 5.3 | | | | 3.6 | |
Contributions for health services are adjusted downward by $39 million for 2014-2015, also reflecting the lower-than-anticipated growth in salaries and wages in 2014 and 2015.
Revenue from corporate taxes is adjusted downward by $96 million for fiscal 2014-2015. This lower level reflects essentially a one-time adjustment in corporate revenue for previous years, which reduced anticipated tax revenue in 2014-2015. It also takes into account an upward adjustment in the growth of the net operating surplus of corporations in 2014 and 2015.
D.9
Revenue from consumption taxes is adjusted upward by $259 million in 2014-2015. This adjustment stems, in particular, from the increase in consumption, excluding food and rent, and in residential construction.
Revenue from duties and permits is adjusted downward by $16 million in 2014-2015, essentially in regard to mining revenues, owing to the downward adjustment in the value of mining production in Québec.
Miscellaneous revenue is adjusted downward by $322 million in 2014-2015, particularly because of the recurrence of the lower level of revenue observed in 2013-2014.
Revenue dedicated to the Generations Fund is adjusted downward by $48 million in 2014-2015, mainly on account of lower-than-forecast investment income.
| q | | Outlook for 2015-2016 and 2016-2017 |
Own-source revenue excluding government enterprises will increase by 5.3% in 2015-2016 and 3.6% in 2016-2017. The higher growth in 2015-2016 reflects, in particular, the anticipated acceleration of economic activity in Québec and the impact of the measures implemented to achieve fiscal balance.
Personal income tax will grow by 4.7% in 2015-2016 and 2016-2017, to $28.2 billion and $29.5 billion respectively.
| — | This growth reflects mainly the anticipated change in household income, which represents most of the revenue base subject to personal income tax. |
| — | It also reflects the growing contribution of pension income from private pension plans because of the increase in the number of retirees. |
| | — | Since the early 2000s, pension income has grown at an average annual rate of about 7.0%. |
| — | Lastly, as of 2015-2016, it also takes into account the impact of various fiscal measures announced in the December 2014 Update and this budget. |
Contributions for health services will grow by 2.0% in 2015-2016 and 1.3% in 2016-2017, to $6.6 billion and $6.7 billion respectively. This change stems essentially from the anticipated increase of 3.4% in 2015 and 2016 in salaries and wages. In addition, the change in revenue is partly offset by the impact of the measures announced since June 2014, particularly the reduction of the contribution rate for businesses in the primary and manufacturing sectors.
D.10
Revenue from corporate taxes will grow by 12.7% in 2015-2016 and 5.1% in 2016-2017, to $6.4 billion and $6.8 billion respectively.
| — | This change reflects essentially the growth rate of the net operating surplus of corporations, which is expected to be 8.7% in 2015 and 6.5% in 2016, as well as the elimination of the reduced rate of the tax on capital of insurance corporations applicable to personal insurance premiums and the implementation of a temporary surtax on financial institutions, two measures announced in the December 2014 Update. |
| — | The growth in 2015-2016 is also higher because of the non-recurrence of the one-time adjustment in revenue for 2014-2015. |
The growth of 6.3% and 3.9% in revenue from the school property tax in 2015-2016 and 2016-2017 respectively is mainly attributed to the increase in property values and changes to the school tax equalization program announced in Budget 2013-2014.
Growth in revenue from consumption taxes will be 3.8% in 2015-2016 and zero in 2016-2017, owing to the fact that consumption, excluding food and rent, will grow by 3.5% in 2015 and $3.8% in 2016.
| — | In 2015-2016, the growth in consumption tax revenue takes into account the elimination of the reduced rate of the tax on automobile insurance premiums, as well as the terms and conditions of the transitional fiscal pact with the municipalities announced on November 5, 2014. |
| — | In 2016-2017, the annual deposit of $500 million in the Generations Fund from revenue derived from the specific tax on alcoholic beverages, i.e. $400 million more than in 2015-2016, will slow the growth in consumption tax revenue. |
Revenue from duties and permits will increase by 10.6% in 2015-2016 and 0.2% in 2016-2017. In 2015-2016, this growth is mainly attributed to the additional revenue of the Green Fund since January 1, 2015, arising from the fact that fuel distributors are now subject to Québec’s cap-and-trade system for greenhouse gas emission allowances.
Miscellaneous revenue will rise by 3.2% in 2015-2016 and 2.5% in 2016-2017, primarily as a result of the revenue of organizations in the health and social services and education networks and non-budget-funded bodies.
Revenue dedicated to the Generations Fund will increase by $333 million in 2015-2016 to $1.6 billion, essentially because of the increase in the fund’s investment income and the deposit of total mining revenues in this fund. The $650-million increase in revenue in 2016-2017 is explained mainly by the additional deposit of $400 million drawn from the specific tax on alcoholic beverages in the Generations Fund. The fund’s revenue will thus reach $2.2 billion.
D.11
| 1.2.2 | Revenue from government enterprises |
| q | | Adjustments for 2014-2015 |
Revenue from government enterprises is adjusted upward by $161 million for 2014-2015. This increase is chiefly explained by the fact that Hydro-Québec’s result is better than anticipated due to the cold weather in recent months.
This increase offsets the lower-than-anticipated result of Loto-Québec, which stems primarily from lower revenue in the lottery sector.
| q | | Outlook for 2015-2016 and 2016-2017 |
For 2015-2016 and 2016-2017, revenue from government enterprises, before allocation to the Generations Fund, will stand at $5.0 billion.
| — | In 2015-2016, the decline of 7.0% stems, in particular, from Hydro-Québec’s results for 2014-2015, which reflect the impact of the cold weather for that year. |
| — | For 2016-2017, anticipated revenue will grow slightly, by 0.2%, because of the small increase in the anticipated results of Loto-Québec and the Société des alcools du Québec. |
In addition, Hydro-Québec’s revenue from the indexation of the price of heritage electricity will be allocated to the Generations Fund. The amount deposited will be $105 million in 2015-2016 and $175 million in 2016-2017, bringing the total revenue from government enterprises to $4.9 billion in 2015-2016 and $4.8 billion in 2016-2017.
Moreover, as of 2015-2016, public spending funded by contributions from Loto-Québec that are not related to its mission will henceforth be funded by budgetary appropriations.3 Accordingly, revenue from Loto-Québec will increase by $63.9 million a year. This change will have no impact on the government’s fiscal framework, because the revenue adjustment will finance the increase in program spending.
The revenue forecast for Loto-Québec also includes the impact of the measures that will be implemented to curb illegal online gambling.4
| 3 | See the details in the box on page D.14. |
| 4 | The details of the measures to curb illegal online gambling are presented in Section G of this document. |
D.12
|
| TABLE D.5 |
|
| Change in revenue from government enterprises |
| | | | | | | | | | | | | | | | | | | | |
| (millions of dollars) | |
| | | Budget 2014-2015 | | | | | | Budget 2015-2016 | |
| | | 2014-2015 | | | Adjustments | | | 2014-2015 | | | 2015-2016 | | | 2016-2017 | |
Hydro-Québec | | | 3 050 | | | | 200 | | | | 3 250 | | | | 2 750 | (1) | | | 2 735 | |
Loto-Québec | | | 1 065 | | | | –45 | | | | 1 020 | | | | 1 130 | (2) | | | 1 148 | |
Société des alcools du Québec | | | 1 021 | | | | — | | | | 1 021 | | | | 1 040 | (1) | | | 1 045 | |
| | | | | |
Other | | | 40 | | | | 6 | | | | 46 | | | | 42 | (3) | | | 42 | |
Subtotal | | | 5 176 | | | | 161 | | | | 5 337 | | | | 4 962 | | | | 4 970 | |
| | | | | |
% change | | | –4.9 | | | | | | | | –1.7 | | | | –7.0 | | | | 0.2 | |
Revenue from Hydro-Québec allocated to the Generations Fund(4) | | | –71 | | | | — | | | | –71 | | | | –105 | | | | –175 | |
TOTAL | | | 5 105 | | | | 161 | | | | 5 266 | | | | 4 857 | | | | 4 795 | |
| | | | | |
% change | | | –6.2 | | | | | | | | –3.0 | | | | –7.8 | | | | –1.3 | |
| (1) | Net result to be achieved by the corporation for 2015-2016 for the purposes of paying additional remuneration based on performance. |
| (2) | For the purposes of paying additional remuneration based on performance, the net result to be achieved by Loto-Québec for 2015-2016 is $1 155 million. The government’s revenue from Loto-Québec corresponds to the net result minus $25 million for public expenditures related to its mission. |
| (3) | Includes an amount of $43 million from Investissement Québec. This amount corresponds to the net result to be achieved by the corporation for 2015-2016 for the purposes of paying additional remuneration based on performance. |
| (4) | Corresponds to amounts relating to the indexation of the price of heritage electricity. |
D.13
|
Refocusing the contributions paid by Loto-Québec on its mission |
| |
Until now, Loto-Québec has financed activities similar to regular programs, some of which are not linked to its mission. |
| |
To more adequately represent the level of Loto-Québec’s net income and the level of public spending, contributions not related to Loto-Québec’s mission will henceforth be funded by budgetary appropriations. In 2015-2016, an envelope of $63.9 million will be paid from the budgetary allocations of the departments responsible for funding those activities, i.e.: |
| |
– $30.0 million to the Ministère de la Santé et des Services sociaux to support seniors losing their autonomy; |
| |
– $19.4 million to the Ministère du Travail, the Ministère de l’Emploi et de la Solidarité sociale and the Ministère des Relations internationales et de la Francophonie to finance the Assistance Fund for Independent Community Action; |
| |
– $8.5 million to the Ministère de la Culture et des Communications to support the Orchestre symphonique de Montréal; |
| |
– $6.0 million to the Ministère de l’Agriculture, des Pêcheries et de l’Alimentation to support farm producers. |
| |
Loto-Québec will continue to pay contributions of $22 million to fund the pathological gambling action plan and $3 million to control video lottery terminals. |
D.14
| 1.2.3 | Revenues from federal transfers |
| q | | Adjustments for 2014-2015 |
In 2014-2015, consolidated revenues from federal transfers are expected to reach over $18.7 billion and grow by 0.9 %. This represents $113 million more than forecast in Budget 2014-2015.
This adjustment is explained mainly by a $90-million increase in other programs resulting from the recent settlement of the dispute with the federal government regarding the revenue stabilization program. In that regard, the federal government paid, in March 2015, the $103.4 million claimed by Québec.
| q | | Outlook for 2015-2016 and 2016-2017 |
In 2015-2016, consolidated federal transfers should rise by 3.9%, to $19.4 billion. This positive adjustment is primarily due to:
| — | a 6.0% increase in transfers for health owing essentially to annual growth of 6% in the Canada Health Transfer (CHT) envelope for the provinces as a whole; |
| — | a 5.9% increase in other programs arising, in particular, from an increase in revenue associated with the Société de financement des infrastructures locales du Québec (SOFIL) because of an anticipated increase in infrastructure work to be carried out in 2015-2016: |
| | — | It should be noted that the mission of SOFIL is to grant financial assistance to municipalities and municipal bodies in order to contribute to municipal infrastructure and public transit projects. Its revenue is derived in particular from the federal contribution under the Canada-Québec agreement on the Gas Tax Fund. |
In 2016-2017, consolidated federal transfers should reach $19.9 billion. This represents an increase of 2.5% that results from, among other things, the increase in health transfers arising from annual growth of 6% in the CHT envelope for the provinces as a whole.
| — | It should be mentioned that as of 2017-2018, growth in the CHT envelope will be limited to the annual growth of Canada’s nominal GDP,5 subject to a floor of 3%. |
| — | Because of this cap, Québec will incur an estimated shortfall of $192 million in 2017-2018. |
| 5 | Starting in 2017-2018, the growth rate of the CHT envelope will correspond to the average annual growth rate of Canada’s nominal GDP over the previous three calendar years. For example, the annual growth rate of Canada’s nominal GDP in 2015, 2016 and 2017 will be used to establish the CHT envelope in 2017-2018. |
D.15
In addition, equalization revenue is expected to rise by 3.2%, particularly because of anticipated growth of 3.6% in the equalization envelope that is capped at Canada’s nominal GDP growth.
These increases will be offset by a decrease of 7.8% in other programs that is explained mainly by a decline in revenue following the end of the Canada-Québec agreement on the Communities and Large Urban Centres components of the Building Canada Fund 2007-2014.
| | | | | | | | | | | | | | | | | | | | |
|
| Change in consolidated federal transfer revenues | |
| (millions of dollars) | |
| | | Budget
2014-2015 | | | | | | Budget 2015-2016 | |
| | | 2014-2015 | | | Adjustments | | | 2014-2015 | | | 2015-2016 | | | 2016-2017 | |
Equalization | | | 9 286 | | | | — | | | | 9 286 | | | | 9 521 | | | | 9 826 | |
| | | | | |
% change | | | 18.5 | | | | | | | | 18.5 | | | | 2.5 | | | | 3.2 | |
| | | | | |
Health transfers | | | 5 262 | | | | 20 | | | | 5 282 | | | | 5 599 | | | | 5 963 | |
| | | | | |
% change | | | –0.5 | | | | | | | | –0.2 | | | | 6.0 | | | | 6.5 | |
| | | | | |
Transfers for post-secondary education and other social programs | | | 1 585 | | | | 3 | | | | 1 588 | | | | 1 609 | | | | 1 638 | |
| | | | | |
% change | | | 3.3 | | | | | | | | 3.5 | | | | 1.3 | | | | 1.8 | |
| | | | | |
Other programs | | | 2 474 | | | | 90 | | | | 2 564 | | | | 2 715 | | | | 2 502 | |
| | | | | |
% change | | | –8.2 | | | | | | | | 5.7 | | | | 5.9 | | | | –7.8 | |
TOTAL | | | 18 607 | | | | 113 | | | | 18 720 | | | | 19 444 | | | | 19 929 | |
| | | | | |
% change | | | –1.1 | | | | | | | | 0.9 | (1) | | | 3.9 | | | | 2.5 | |
| (1) | Consolidated federal transfer revenues, which included the second and last payment of $1 467 million for harmonization of the QST with the GST, stood at $18.6 billion in 2013-2014. The growth of 0.9% in consolidated federal transfer revenues in 2014-2015 is explained, in particular, by the non-recurrence of this last payment. |
D.16
|
Impact of the price of oil on Québec’s equalization payments |
Since summer 2014, the price of oil has fallen by more than half, causing major economic upheaval in Canada. The economic outlook of the oil-producing provinces has deteriorated, while the reverse is true for some of the other provinces. How is this situation affecting Québec’s equalization payments? |
|
The equalization payments for 2014-2015 and 2015-2016 were established by the Department of Finance Canada in December 2013 and December 2014 respectively and they will not be adjusted. For subsequent years, the decline in the price of oil will restrict the equalization envelope on account of the downward adjustment in the growth of Canada’s nominal GDP since fall 2014. For example, the 2016-2017 equalization envelope will be determined using the average growth of Canada’s nominal GDP for 2014, 2015 and 2016. |
|
The drop in the price of oil will also have a downward effect on the fiscal capacity1 of the oil-producing provinces, namely, Alberta, Saskatchewan and Newfoundland and Labrador. Québec’s fiscal capacity will thus move closer to that of the average of the ten provinces, thereby reducing its equalization payments as of 2016-2017. |
|
– The decrease in Québec’s equalization payments is estimated at $34 million in 2016-2017 and could reach $857 million in 2019-2020. However, this decline is offset by upward adjustments resulting from other factors. It should be noted that these impacts have been taken into account in the forecast for federal transfers. |
| | | | | | | | | | | | | | | | |
Impact of the decline in the price of oil on Québec’s equalization payments | |
| (millions of dollars) | |
| | | 2016-2017 | | | 2017-2018 | | | 2018-2019 | | | 2019-2020 | |
Equalization before the impact of oil | | | 9 860 | | | | 10 224 | | | | 10 774 | | | | 11 307 | |
Impact of oil | | | –34 | | | | –120 | | | | –573 | | | | –857 | |
Equalization after the impact of oil | | | 9 826 | | | | 10 104 | | | | 10 201 | | | | 10 450 | |
|
The impact of the negative adjustment in Québec’s equalization payments will be gradual due to the smoothing mechanism used in the equalization program. – For example, the equalization payment for 2016-2017 will take into account the fiscal capacity of the provinces for 2012-2013, 2013-2014 and 2014-2015. |
| Smoothing mechanism for determining equalization payments |
| | | | | | | | | | |
| | | 2012-2013 | | 2013-2014 | | 2014-2015 | | 2015-2016 | | 2016-2017 |
| | | | | | | | | | |
| | 25% | | 25% | | 50% | |  | | Payment |
| 1 | Fiscal capacity is defined as the revenue a province could obtain if it applied, to its tax bases (personal and corporate income tax, consumption taxes, natural resources and property taxes) the average tax rates in effect in the ten provinces. It is its capacity to collect revenue. |
D.17
| 1.3 | Change in consolidated expenditure |
Consolidated expenditure will stand at $97.1 billion in 2014-2015, $98.6 billion in 2015-2016 and $100.7 billion in 2016-2017, representing an increase of 2.3%, 1.5% and 2.1% respectively.
| | | | | | | | | | | | | | | | | | | | |
|
| Change in consolidated expenditure | |
(millions of dollars) | |
| | | |
| | | Budget
2014-2015 | | | | | | Budget 2015-2016 | |
| | | | | |
| | | 2014-2015 | | | Adjustments | | | 2014-2015 | | | 2015-2016 | | | 2016-2017 | |
Program spending(1) | | | 65 704 | | | | — | | | | 65 704 | | | | 66 460 | | | | 67 889 | |
| | | | | |
% change | | | 1.8 | | | | | | | | 2.1 | | | | 1.2 | | | | 2.2 | |
| | | | | |
Other consolidated expenditures(2) | | | 20 911 | | | | 162 | | | | 21 073 | | | | 21 631 | | | | 21 832 | |
| | | | | |
% change | | | 1.9 | | | | | | | | 5.3 | | | | 2.6 | | | | 0.9 | |
| | | | | |
Expenditure excluding debt service | | | 86 615 | | | | 162 | | | | 86 777 | | | | 88 091 | | | | 89 721 | |
| | | | | |
% change | | | 1.9 | | | | | | | | 2.9 | | | | 1.5 | | | | 1.9 | |
| | | | | |
Debt service | | | 10 831 | | | | –498 | | | | 10 333 | | | | 10 483 | | | | 10 934 | |
| | | | | |
% change | | | 2.1 | | | | | | | | –2.5 | | | | 1.5 | | | | 4.3 | |
| | | | | |
TOTAL | | | 97 446 | | | | –336 | | | | 97 110 | | | | 98 574 | | | | 100 655 | |
| | | | | |
% change | | | 1.9 | | | | | | | | 2.3 | | | | 1.5 | | | | 2.1 | |
| (1) | Program spending includes transfers intended for consolidated entities. |
| (2) | Other consolidated expenditures include, in particular, consolidation adjustments. |
D.18
| q | | Expenditure excluding debt service |
| n | | Adjustments for 2014-2015 |
In 2014-2015, consolidated expenditure excluding debt service will stand at $86.8 billion, which represents an upward adjustment of $162 million. This adjustment is attributable chiefly to increased spending related to the health and social services sector.
Program spending, which makes up the bulk of consolidated expenditure, has not been adjusted for 2014-2015. The level thus remains at $65.7 billion.
| n | | Outlook for 2015-2016 and 2016-2017 |
In 2015-2016 and 2016-2017, consolidated expenditure excluding debt service will amount to $88.1 billion and $89.7 billion respectively.
Growth in expenditure excluding debt service will stand at 1.5% in 2015-2016 and 1.9% in 2016-2017.
D.19
Adjustments to the program spending objectives in 2015-2016 and 2016-2017 in relation to Budget 2014-2015 stem mainly from reallocations between revenue and expenditure and have no impact on the budgetary balance.
| — | More specifically, some measures bringing in additional revenue for the government allow reallocations within the financial framework to fund program spending, particularly $130 million in fiscal measures for municipalities. |
| — | Other adjustments arise from reclassifications between different sources of consolidated revenue and expenditure, primarily those related to contributions that were paid by Loto-Québec for public spending not related to its mission. |
|
| TABLE D.8 |
|
| Change in program spending |
| | | | | | | | | | | | |
(millions of dollars) | |
| | | 2014-2015 | | | 2015-2016 | | | 2016-2017 | |
| | | |
PROGRAM SPENDING – BUDGET 2014-2015 | | | 65 704 | | | | 66 141 | | | | 67 631 | |
| | | |
% change | | | 1.8 | | | | 0.7 | | | | .2.3 | |
| | | |
Increase in program spending | | | | | | | | | | | | |
| | | |
Reclassification equivalent to the measures for municipalities agreed to in the December 2014 Update | | | — | | | | 130 | | | | 130 | |
| | | |
Reclassification of programs funded by Loto-Québec | | | — | | | | 64 | | | | 64 | |
| | | |
Other items, including The Québec Economic Plan | | | — | | | | 125 | | | | 64 | |
| | | |
ADJUSTMENTS | | | — | | | | 319 | | | | 258 | |
| | | |
PROGRAM SPENDING – BUDGET 2015-2016 | | | 65 704 | | | | 66 460 | | | | 67 889 | |
| | | |
% change | | | 2.1 | | | | 1.2 | | | | 2.2 | |
D.20
| n | | Adjustments for 2014-2015 |
In 2014-2015, consolidated debt service should stand at $10.3 billion, i.e. $7.2 billion for direct debt service and $3.1 billion for interest on the liability related to the retirement plans of public and parapublic sector employees. Compared with the June 2014 budget, debt service has been adjusted downward by $498 million in 2014-2015, mainly because of lower-than-expected interest rates.
| n | | Outlook for 2015-2016 and 2016-2017 |
Debt service is expected to rise by 1.5% in 2015-2016 and 4.3% in 2016-2017. The larger increase in 2016-2017 stems from the anticipated increase in interest rates.
|
| TABLE D.9 |
|
| Change in consolidated debt service |
| | | | | | | | | | | | | | | | | | | | |
(millions of dollars) | |
| | | |
| | | Budget 2014-2015 | | | | | | Budget 2015-2016 | |
| | | 2014-2015 | | | Adjustments | | | 2014-2015 | | | 2015-2016 | | | 2016-2017 | |
| | | | | |
Direct debt service | | | 7 683 | | | | –510 | | | | 7 173 | | | | 7 633 | | | | 8 273 | |
| | | | | |
Interest on the retirement plans liability(1) | | | 3 136 | | | | 13 | | | | 3 149 | | | | 2 844 | | | | 2 658 | |
| | | | | |
Interest on the employee future benefits liability(2) | | | 12 | | | | –1 | | | | 11 | | | | 6 | | | | 3 | |
| | | | | |
TOTAL | | | 10 831 | | | | –498 | | | | 10 333 | | | | 10 483 | | | | 10 934 | |
| | | | | |
% change | | | 2.1 | | | | | | | | –2.5 | | | | 1.5 | | | | 4.3 | |
| (1) | This corresponds to the interest on the obligations relating to the retirement plans of public and parapublic sector employees less the investment income of the Retirement Plans Sinking Fund. |
| (2) | This corresponds to the interest on the obligation relating to the survivor’s pension plan less the investment income of the Survivor’s Pension Plan Fund and the interest on the obligation relating to accumulated sick leave less the investment income of the Accumulated Sick Leave Fund. |
D.21
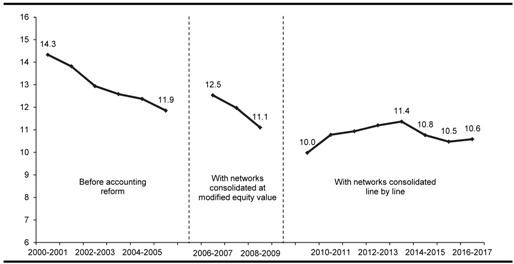
| n | | Proportion of revenue devoted to consolidated debt service |
The proportion of revenue devoted to consolidated debt service will stand at 10.8% in 2014-2015, 10.5% in 2015-2016 and 10.6% in 2016-2017, compared with 14.3% in 2000-2001.
|
| CHART D.1 |
|
| Consolidated debt service |
| (as a percentage of consolidated revenue) |
D.22
| 2. | FINANCIAL FRAMEWORK BY SECTOR |
The consolidated financial framework has several sectoral components included in the government reporting entity that reflect the financial organization of public and parapublic sector activities. Table D.10 presents the forecast revenue and expenditure of these different components for fiscal 2014-2015 to 2016-2017.
Tables D.11 to D.19 present, for 2014-2015 to 2016-2017, the transactions carried out by the general fund, special funds, specified purpose accounts, non-budget-funded bodies and the health and social services and education networks, as well as tax-funded expenditures.
Lastly, to determine consolidated revenue and expenditure levels, financial transactions between entities in the government reporting entity are eliminated.
D.23
|
|
| TABLE D.10 |
|
| Financial framework for consolidated revenue and expenditure by sector |
| | | | | | | | | | | | |
(millions of dollars) | |
| | | 2014-2015 | | | 2015-2016 | | | 2016-2017 | |
| | | |
Revenue | | | | | | | | | | | | |
| | | |
General fund | | | 71 171 | | | | 74 458 | | | | 76 956 | |
| | | |
Special funds | | | 10 698 | | | | 11 047 | | | | 11 210 | |
| | | |
Generations Fund | | | 1 253 | | | | 1 586 | | | | 2 236 | |
| | | |
Specified purpose accounts | | | 1 182 | | | | 1 055 | | | | 948 | |
| | | |
Non-budget-funded bodies | | | 19 703 | | | | 20 459 | | | | 21 006 | |
| | | |
Health and social services and education networks | | | 39 117 | | | | 39 579 | | | | 39 858 | |
| | | |
Tax-funded transfers(1) | | | 6 649 | | | | 6 308 | | | | 6 204 | |
| | | |
Consolidation adjustments(2) | | | –53 760 | | | | –54 332 | | | | –55 127 | |
Consolidated revenue | | | 96 013 | | | | 100 160 | | | | 103 291 | |
| | | |
Expenditure | | | | | | | | | | | | |
| | | |
General fund (program spending) | | | –65 704 | | | | –66 460 | | | | –67 889 | |
| | | |
Special funds | | | –8 694 | | | | –9 336 | | | | –9 365 | |
| | | |
Specified purpose accounts | | | –1 182 | | | | –1 055 | | | | –948 | |
| | | |
Non-budget-funded bodies | | | –18 523 | | | | –19 402 | | | | –20 057 | |
| | | |
Health and social services and education networks | | | –38 354 | | | | –38 774 | | | | –38 974 | |
| | | |
Tax-funded expenditures(1) | | | –6 649 | | | | –6 308 | | | | –6 204 | |
| | | |
Consolidation adjustments(2) | | | 52 329 | | | | 53 244 | | | | 53 716 | |
| | | |
Consolidated expenditure excluding debt service | | | –86 777 | | | | –88 091 | | | | –89 721 | |
| | | |
Debt service | | | | | | | | | | | | |
| | | |
General fund | | | –8 164 | | | | –8 331 | | | | –8 615 | |
| | | |
Consolidated entities(3) | | | –2 169 | | | | –2 152 | | | | –2 319 | |
| | | |
Consolidated debt service | | | –10 333 | | | | –10 483 | | | | –10 934 | |
Consolidated expenditure | | | –97 110 | | | | –98 574 | | | | –100 655 | |
| | | |
Contingency reserve | | | — | | | | — | | | | –400 | |
| | | |
SURPLUS (DEFICIT) | | | –1 097 | | | | 1 586 | | | | 2 236 | |
| | | |
BALANCED BUDGET ACT | | | | | | | | | | | | |
| | | |
Deposits of dedicated revenues in the Generations Fund | | | –1 253 | | | | –1 586 | | | | –2 236 | |
| | | |
BUDGETARY BALANCE(4) | | | –2 350 | | | | — | | | | — | |
| (1) | Includes doubtful tax accounts. |
| (2) | The consolidation adjustments stem mainly from the elimination of reciprocal transactions between entities in different sectors. |
| (3) | Includes consolidation adjustments. |
| (4) | Budgetary balance within the meaning of the Balanced Budget Act. |
D.24
The general fund is used to finance nearly three quarters of the government’s consolidated expenditure.
The revenue of the general fund, including own-source revenue and federal transfers, will amount to $71.2 billion in 2014-2015 and then gradually increase by 4.6% in 2015-2016 and 3.4% in 2016-2017, to $74.5 billion and $77.0 billion respectively.
The expenditure of the general fund, which includes, in particular, program spending, will stand at $73.9 billion in 2014-2015 and then grow by 1.2% in 2015-2016 and 2.3% in 2016-2017, to $74.8 billion and $76.5 billion respectively.
|
|
| TABLE D.11 |
|
| Summary of the budgetary transactions of the general fund |
| | | | | | | | | | | | |
(millions of dollars) | |
| | | 2014-2015 | | | 2015-2016 | | | 2016-2017 | |
| | | |
Revenue | | | | | | | | | | | | |
| | | |
Income and property taxes | | | 29 880 | | | | 32 300 | | | | 34 148 | |
| | | |
Consumption taxes | | | 17 377 | | | | 17 988 | | | | 17 996 | |
| | | |
Duties and permits | | | 372 | | | | 362 | | | | 389 | |
| | | |
Miscellaneous revenue | | | 1 444 | | | | 1 629 | | | | 1 627 | |
| | | |
Government enterprises | | | 5 266 | | | | 4 857 | | | | 4 795 | |
| | | |
Own-source revenue | | | 54 339 | | | | 57 136 | | | | 58 955 | |
| | | |
% change | | | 2.1 | | | | 5.1 | | | | 3.2 | |
| | | |
Federal transfers | | | 16 832 | | | | 17 322 | | | | 18 001 | |
| | | |
% change | | | 1.8 | | | | 2.9 | | | | 3.9 | |
| | | |
Total revenue | | | 71 171 | | | | 74 458 | | | | 76 956 | |
| | | |
% change | | | 2.0 | | | | 4.6 | | | | 3.4 | |
| | | |
Expenditure | | | | | | | | | | | | |
| | | |
Program spending | | | –65 704 | | | | –66 460 | | | | –67 889 | |
| | | |
% change | | | 2.1 | | | | 1.2 | | | | 2.2 | |
| | | |
Debt service | | | –8 164 | | | | –8 331 | | | | –8 615 | |
| | | |
% change | | | –3.2 | | | | 2.0 | | | | 3.4 | |
| | | |
Total expenditure | | | –73 868 | | | | –74 791 | | | | –76 504 | |
| | | |
% change | | | 1.5 | | | | 1.2 | | | | 2.3 | |
| | | |
Contingency reserve | | | — | | | | — | | | | –400 | |
| | | |
SURPLUS (DEFICIT) | | | –2 697 | | | | –333 | | | | 52 | |
D.25
Change in the revenue of the general fund
|
The following table shows the revenue of the general fund according to the reporting structure used in the monthly report on financial transaction. |
|
| Revenue of the general fund |
| | | | | | | | | | | | | | | | | | | | |
(millions of dollars) | |
| | | 2013-
2014 | | | 2014-
2015 | | | %
change | | | 2015-
2016 | | | %
change | |
| | | | | |
Own-source revenue excluding government enterprises | | | | | | | | | | | | | | | | | | | | |
| | | | | |
Income and property taxes | | | | | | | | | | | | | | | | | | | | |
| | | | | |
Personal income tax | | | 19 399 | | | | 19 635 | | | | 1.2 | | | | 20 950 | | | | 6.7 | |
| | | | | |
Contributions for health services | | | 6 780 | | | | 6 905 | | | | 1.8 | | | | 7 036 | | | | 1.9 | |
| | | | | |
Corporate taxes | | | 3 254 | | | | 3 340 | | | | 2.6 | | | | 4 314 | | | | 29.2 | |
| | | | | |
Consumption taxes | | | 16 607 | | | | 17 377 | | | | 4.6 | | | | 17 988 | | | | 3.5 | |
| | | | | |
Other revenue sources | | | 1 772 | | | | 1 816 | | | | 2.5 | | | | 1 991 | | | | 9.6 | |
| | | | | |
Total own-source revenue excluding government enterprises | | | 47 812 | | | | 49 073 | | | | 2.6 | | | | 52 279 | | | | 6.5 | |
| | | | | |
Government enterprises | | | 5 430 | | | | 5 266 | | | | –3.0 | | | | 4 857 | | | | –7.8 | |
| | | | | |
Total own-source revenue | | | 53 242 | | | | 54 339 | | | | 2.1 | | | | 57 136 | | | | 5.1 | |
| | | | | |
Federal transfers | | | | | | | | | | | | | | | | | | | | |
| | | | | |
Equalization | | | 7 833 | | | | 9 286 | | | | 18.5 | | | | 9 521 | | | | 2.5 | |
| | | | | |
Health transfers | | | 5 290 | | | | 4 852 | (1) | | | –8.3 | | | | 5 210 | (2) | | | 7.4 | |
| | | | | |
Transfers for post-secondary education and other social programs | | | 1 534 | | | | 1 588 | | | | 3.5 | | | | 1 609 | | | | 1.3 | |
| | | | | |
Other programs | | | 834 | | | | 1 106 | | | | 32.6 | | | | 982 | | | | –11.2 | |
| | | | | |
Subtotal | | | 15 491 | | | | 16 832 | | | | 8.7 | | | | 17 322 | | | | 2.9 | |
| | | | | |
Harmonization of the QST with the GST – Compensation | | | 1 037 | (3) | | | — | | | | — | | | | — | | | | — | |
| | | | | |
Total federal transfers | | | 16 528 | | | | 16 832 | | | | 1.8 | | | | 17 322 | | | | 2.9 | |
| | | | | |
TOTAL | | | 69 770 | | | | 71 171 | | | | 2.0 | | | | 74 458 | | | | 4.6 | |
| | (1) | An amount of $430 million from health transfers is being allocated in 2014-2015 to the Fund to Finance Health and Social Services Institutions (FINESSS), which is a consolidated entity. This allocation of $430 million has already been deducted from health transfers which, had it not been for the allocation, would have undergone a change of -0.2%. | |
| | (2) | An amount of $389 million from health transfers is being allocated in 2015-2016 to FINESSS, which is a consolidated entity. This allocation of $389 million has already been deducted from health transfers which, had it not been for the allocation, would have undergone a change of 6.0%. | |
| | (3) | Plus an amount of $430 million allocated to FINESSS, bringing total compensation to $1 467 million in 2013-2014. | |
D.26
The special funds consist of 36 entities set up by law to finance certain activities within government departments or bodies.
The activities of special funds may be financed, in particular, through program spending, fees or tax revenues.
The following table shows the forecasts pertaining to special funds for 2014-2015 to 2016-2017.
|
| TABLE D.12 |
|
| Summary of the budgetary transactions of special funds(1) |
| | | | | | | | | | | | |
(millions of dollars) | |
| | | 2014-2015 | | | 2015-2016 | | | 2016-2017 | |
| | | |
Revenue | | | | | | | | | | | | |
| | | |
Income and property taxes | | | 2 084 | | | | 2 117 | | | | 2 072 | |
| | | |
Consumption taxes | | | 2 416 | | | | 2 512 | | | | 2 531 | |
| | | |
Duties and permits | | | 1 766 | | | | 2 033 | | | | 2 001 | |
| | | |
Miscellaneous revenue | | | 1 806 | | | | 1 781 | | | | 2 030 | |
| | | |
Own-source revenue | | | 8 072 | | | | 8 443 | | | | 8 634 | |
| | | |
Québec government transfers | | | 2 105 | | | | 2 122 | | | | 2 096 | |
| | | |
Federal transfers | | | 521 | | | | 482 | | | | 480 | |
| | | |
Total revenue | | | 10 698 | | | | 11 047 | | | | 11 210 | |
| | | |
% change | | | 9.6 | | | | 3.3 | | | | 1.5 | |
| | | |
Expenditure | | | | | | | | | | | | |
| | | |
Expenditure excluding debt service | | | –8 694 | | | | –9 336 | | | | –9 365 | |
| | | |
% change | | | 5.3 | | | | 7.4 | | | | 0.3 | |
| | | |
Debt service | | | –1 372 | | | | –1 432 | | | | –1 652 | |
| | | |
Total expenditure | | | –10 066 | | | | –10 768 | | | | –11 017 | |
| | | |
% change | | | 6.4 | | | | 7.0 | | | | 2.3 | |
| | | |
SURPLUS (DEFICIT) | | | 632 | | | | 279 | | | | 193 | |
| (1) | Excludes the Generations Fund. |
The revenue of special funds will amount to $10.7 billion for 2014-2015, $11.0 billion for 2015-2016 and $11.2 billion for 2016-2017, representing an increase of 9.6%, 3.3% and 1.5% respectively.
The expenditure excluding debt service of special funds will stand at $8.7 billion in 2014-2015, $9.3 billion in 2015-2016 and $9.4 billion in 2016-2017, representing an increase of 5.3%, 7.4% and 0.3% respectively.
D.27
The growth in spending by special funds stems mainly from:
| — | the Land Transportation Network Fund, for financing road and public transit infrastructure; |
| — | the Green Fund, given the deployment of the 2013-2020 Climate Change Action Plan (2013-2020 CCAP). |
The higher growth in expenditure for 2014-2015 can also be attributed to:
| — | the transfer of the financial management of mandates pertaining to the Québec Health Record to the Health and Social Services Information Resources Fund. Previously, such mandates were the responsibility of the Régie de l’assurance maladie du Québec; |
| — | the additional investments in silvicultural work of the Natural Resources Fund – sustainable forest development component. |
|
| TABLE D.13 |
|
| Expenditure excluding debt service of special funds |
| | | | | | | | | | | | |
| (millions of dollars) | |
| | | 2014-2015 | | | 2015-2016 | | | 2016-2017 | |
| | | |
Land Transportation Network Fund (FORT) | | | 2 484 | | | | 2 749 | | | | 2 798 | |
| | | |
Green Fund | | | 467 | | | | 796 | | | | 800 | |
| | | |
Health and Social Services Information Resources Fund | | | 194 | | | | 215 | | | | 215 | |
| | | |
Natural Resources Fund – sustainable forest development component | | | 453 | | | | 463 | | | | 442 | |
| | | |
Elimination of reciprocal transactions between FORT and the Green Fund | | | –169 | | | | –243 | | | | –253 | |
| | | |
Subtotal | | | 3 429 | | | | 3 980 | | | | 4 002 | |
| | | |
% change | | | 11.8 | | | | 16.1 | | | | 0.6 | |
| | | |
Other special funds(1) | | | 5 265 | | | | 5 356 | | | | 5 363 | |
| | | |
% change | | | 1.5 | | | | 1.7 | | | | 0.1 | |
| | | |
TOTAL | | | 8 694 | | | | 9 336 | | | | 9 365 | |
| | | |
% change | | | 5.3 | | | | 7.4 | | | | 0.3 | |
| (1) | Includes other eliminations of reciprocal transactions between special funds. |
D.28
Reconciliation of the expenditure budget of special funds with the government’s consolidated financial framework
The Secrétariat du Conseil du trésor tables the Special Funds Budget in the National Assembly in order for the expenditure and investment forecasts of these entities to be approved.
Debt service of the Financing Fund is excluded from Parliamentary authorization since the advances received by the fund are derived from loans made by the government. Expenditures to service the debt of these borrowings are already covered by the general fund and are repaid by the clientele of the Financing Fund.
– The Act respecting the Ministère des Finances (CQLR, chapter M-24.01) provides for special treatment of the Financing Fund because of its role as financial intermediary between the general fund and its clientele, which consists of public bodies and special funds.
In addition, the Economic Plan presents the consolidated financial framework of the Québec government including the reporting entity’s various sectoral components. The spending forecasts for special funds included in the consolidated financial framework incorporate the elimination of reciprocal transactions between entities in the same sector (i.e. between special funds).
The following table illustrates the reconciliation of the expenditures presented in the special funds’ expenditure budget with those presented in the Economic Plan.
|
| Reconciliation of the special funds’ expenditure budget with the government’s consolidated financial framework |
| | | | |
(millions of dollars) | |
| | | 2015-2016 | |
| |
Expenditure budget of special funds to be approved by the National Assembly | | | 10 609 | |
| |
Debt service of the Financing Fund | | | 1 334 | |
| | | | |
| |
Subtotal | | | 11 943 | |
| |
Elimination of reciprocal transactions between special funds(1) | | | –1 175 | |
| |
Expenditure of special funds presented in the Economic Plan | | | 10 768 | |
| | (1) | Including $762 million attributable to reciprocal transactions of the Financing Fund with the other special funds and $294 million attributable to reciprocal transactions of the Land Transportation Network Fund and the Natural Resources Fund with the Green Fund. | |
D.29
For 2014-2015, 2015-2016 and 2016-2017, revenues dedicated to the Generations Fund will reach $1.3 billion, $1.6 billion and $2.2 billion respectively.
Thus, as March 31, 2017, the book value of the Generations Fund will be $10.8 billion. The results of and change in the Generations Fund are presented in greater detail in Section B of Additional Information.
|
| TABLE D.14 |
|
| Revenues dedicated to the Generations Fund |
| | | | | | | | | | | | |
(millions of dollars) | |
| | | 2014-2015 | | | 2015-2016 (1) | | | 2016-2017 | |
Dedicated revenues | | | | | | | | | | | | |
Water-power royalties | | | 749 | | | | 756 | | | | 772 | |
Indexation of the price of heritage electricity | | | 71 | | | | 105 | | | | 175 | |
Mining revenues | | | — | | | | 116 | | | | 171 | |
Specific tax on alcoholic beverages | | | 100 | | | | 100 | | | | 500 | |
Unclaimed property | | | 31 | | | | 25 | | | | 12 | |
Investment income | | | 302 | | | | 484 | | | | 606 | |
TOTAL | | | 1 253 | | | | 1 586 | | | | 2 236 | |
(1) Excludes the deposit of $89 million from the accumulated surplus of the Commission des normes du travail.
D.30
| 2.3 | Specified purpose accounts |
A specified purpose account is a financial management mechanism that enables a government department to record separately sums paid into the Consolidated Revenue Fund by a third party under a contract or agreement that provides for the sums to be allocated to a specific purpose.
The following table shows the forecasts pertaining to specified purpose accounts for 2014-2015 to 2016-2017.
|
| TABLE D.15 |
|
| Summary of the budgetary transactions of specified purpose accounts |
| | | | | | | | | | | | |
(millions of dollars) | |
| | | 2014-2015 | | | 2015-2016 | | | 2016-2017 | |
Revenue | | | | | | | | | | | | |
| | | |
Miscellaneous revenue | | | 214 | | | | 187 | | | | 187 | |
| | | |
Own-source revenue | | | 214 | | | | 187 | | | | 187 | |
| | | |
Federal transfers | | | 968 | | | | 868 | | | | 761 | |
| | | |
Total revenue | | | 1 182 | | | | 1 055 | | | | 948 | |
| | | |
% change | | | 16.9 | | | | –10.7 | | | | –10.1 | |
| | | |
Expenditure | | | | | | | | | | | | |
| | | |
Expenditure excluding debt service | | | –1 182 | | | | –1 055 | | | | –948 | |
| | | |
Total expenditure | | | –1 182 | | | | –1 055 | | | | –948 | |
| | | |
% change | | | 16.9 | | | | –10.7 | | | | –10.1 | |
SURPLUS (DEFICIT) | | | — | | | | — | | | | — | |
The revenue and expenditure of specified purpose accounts will amount to $1.2 billion for 2014-2015, $1.1 billion for 2015-2016 and $0.9 billion for 2016-2017.
The change in the revenue and expenditure of specified purpose accounts is explained chiefly by:
| — | the cessation of certain contributions by Loto-Québec through specified purpose accounts and the transfer of funding for these activities through appropriations allocated to program spending as of 2015-2016; |
| — | the end, in 2016-2017, of the financial assistance agreement stemming from the disaster in the town of Lac-Mégantic. |
D.31
| 2.4 | Non-budget-funded bodies |
The 60 non-budget-funded bodies were created to provide specific services to the public.
The following table shows the forecasts pertaining to non-budget-funded bodies for 2014-2015 to 2016-2017.
|
| TABLE D.16 |
|
| Summary of the budgetary transactions of non-budget-funded bodies |
| | | | | | | | | | | | |
| (millions of dollars) | |
| | | 2014-2015 | | | 2015-2016 | | | 2016-2017 | |
Revenue | | | | | | | | | | | | |
| | | |
Income and property taxes | | | 70 | | | | 71 | | | | 72 | |
| | | |
Consumption taxes | | | 120 | | | | 121 | | | | 122 | |
| | | |
Duties and permits | | | 410 | | | | 419 | | | | 430 | |
| | | |
Miscellaneous revenue | | | 5 897 | | | | 6 025 | | | | 6 061 | |
| | | | | | | | | | | | |
| | | | | | | | | | | | |
| | | |
Own-source revenue | | | 6 497 | | | | 6 636 | | | | 6 685 | |
| | | |
Québec government transfers | | | 12 479 | | | | 12 734 | | | | 13 255 | |
| | | |
Federal transfers | | | 727 | | | | 1 089 | | | | 1 066 | |
| �� | | | | | | | | | | | |
| | | | | | | | | | | | |
| | | |
Total revenue | | | 19 703 | | | | 20 459 | | | | 21 006 | |
| | | |
% change | | | 1.8 | | | | 3.8 | | | | 2.7 | |
| | | |
Expenditure | | | | | | | | | | | | |
| | | |
Expenditure excluding debt service | | | –18 523 | | | | –19 402 | | | | –20 057 | |
| | | |
% change | | | 1.8 | | | | 4.7 | | | | 3.4 | |
| | | |
Debt service | | | –919 | | | | –843 | | | | –836 | |
| | | | | | | | | | | | |
| | | | | | | | | | | | |
| | | |
Total expenditure | | | –19 442 | | | | –20 245 | | | | –20 893 | |
| | | |
% change | | | 0.9 | | | | 4.1 | | | | 3.2 | |
SURPLUS (DEFICIT) | | | 261 | | | | 214 | | | | 113 | |
The revenue of non-budget-funded bodies will amount to $19.7 billion for 2014-2015, $20.5 billion for 2015-2016 and $21.0 billion for 2016-2017, representing an increase of 1.8%, 3.8% and 2.7% respectively.
The expenditure excluding debt service of non-budget-funded bodies will stand at $18.5 billion in 2014-2015, $19.4 billion in 2015-2016 and $20.1 billion in 2016-2017, representing an increase of 1.8%, 4.7% and 3.4% respectively.
D.32
The priority missions of the Régie de l’assurance maladie du Québec and the Prescription Drug Insurance Fund account, in particular, for the higher growth in the revenue and expenditure of non-budget-funded bodies.
The low level of spending by the Société de financement des infrastructures locales du Québec in 2014-2015 can be attributed mainly to the late announcement of the envelopes for the program pertaining to the gasoline tax and Québec’s 2014-2019 contribution.
|
| TABLE D.17 |
|
| Expenditure excluding debt service of non-budget-funded bodies |
| | | | | | | | | | | | |
| (millions of dollars) | |
| | | |
| | | 2014-2015 | | | 2015-2016 | | | 2016-2017 | |
| | | |
Régie de l’assurance maladie du Québec (RAMQ) | | | 11 384 | | | | 11 760 | | | | 12 307 | |
| | | |
Prescription Drug Insurance Fund (PDIF) | | | 3 512 | | | | 3 566 | | | | 3 799 | |
| | | |
Société de financement des infrastructures locales du Québec | | | 340 | | | | 685 | | | | 661 | |
| | | |
Elimination of reciprocal transactions between RAMQ and the PDIF | | | –3 503 | | | | –3 557 | | | | –3 789 | |
| | | |
Subtotal | | | 11 733 | | | | 12 454 | | | | 12 978 | |
| | | |
% change | | | 3.4 | | | | 6.1 | | | | 4.2 | |
| | | |
Other non-budget-funded bodies(1) | | | 6 790 | | | | 6 948 | | | | 7 079 | |
| | | |
% change | | | –1.0 | | | | 2.3 | | | | 1.9 | |
| | | |
TOTAL | | | 18 523 | | | | 19 402 | | | | 20 057 | |
| | | |
% change | | | 1.8 | | | | 4.7 | | | | 3.4 | |
(1) Includes other eliminations of reciprocal transactions between non-budget-funded bodies.
D.33
Reconciliation of the expenditure budget
of non-budget-funded bodies
with the government’s consolidated financial framework
The Sécrétariat du Conseil du trésor tables the revenue and expenditure forecasts for non-budget-funded bodies in the National Assembly.
In addition, the Economic Plan presents the consolidated financial framework of the Québec government including the reporting entity’s various sectoral components. The forecasts for non-budget-funded bodies included in the consolidated financial framework incorporate:
– the elimination of reciprocal transactions between entities in the same sector;
– the harmonization entries intended to harmonize the entities’ forecasts with the government’s accounting policies.
The following table illustrates the reconciliation of the expenditures presented in the budget of non-budget-funded bodies with those presented in the Economic Plan.
Reconciliation of the expenditure budget of non-budget-funded bodies with the government’s consolidated financial framework
(millions of dollars)
| | | | |
| | |
| | | 2015-2016 | |
| |
Expenditure of non-budget-funded bodies to be tabled in the National Assembly | | | 24 158 | |
| |
Elimination of reciprocal transactions between non-budget-funded bodies and harmonizations(1) | | | –3 913 | |
| |
Expenditure of non-budget-funded bodies presented in the Economic Plan | | | 20 245 | |
(1) Including $3.6 billion attributable to reciprocal transactions of the Régie de l’assurance maladie du Québec with the Prescription Drug Insurance Fund. | |
| | | | |
D.34
| 2.5 | Health and social services and education networks |
In 2014-2015, the health and social services network is made up of 197 entities. These entities comprise 15 agencies and a regional authority in health and social services, as well as 181 public health and social services institutions.
The structure of the health and social services network was changed with the Act to modify the organization and governance of the health and social services network, in particular by abolishing the regional agencies (2015, chapter 1), assented to on February 9, 2015. As of April 1, 2015, governance will be reduced to two hierarchical levels consisting of the Ministère de la Santé et des Services sociaux and 34 public institutions.
As for the education networks, they are made up of 132 entities, including 72 school boards, the Comité de gestion de la taxe scolaire de l’île de Montréal, 48 CEGEPS, as well as the Université du Québec and its 10 constituents.
The following table shows the forecasts pertaining to the health and social services and education networks for 2014-2015 to 2016-2017.
|
| TABLE D.18 |
|
| Summary of the budgetary transactions of the health and social services and education networks |
| | | | | | | | | | | | |
| (millions of dollars) | |
| | | |
| | | 2014-2015 | | | 2015-2016 | | | 2016-2017 | |
| | | |
Revenue | | | | | | | | | | | | |
| | | |
Income and property taxes | | | 1 909 | | | | 2 030 | | | | 2 109 | |
| | | |
Miscellaneous revenue | | | 3 978 | | | | 4 053 | | | | 4 151 | |
| | | | |
| | | |
Own-source revenue | | | 5 887 | | | | 6 083 | | | | 6 260 | |
| | | |
Québec government transfers | | | 32 950 | | | | 33 213 | | | | 33 340 | |
| | | |
Federal transfers | | | 280 | | | | 283 | | | | 258 | |
| | | | |
| | | |
Total revenue | | | 39 117 | | | | 39 579 | | | | 39 858 | |
| | | |
% change | | | 2.1 | | | | 1.2 | | | | 0.7 | |
| | | |
Expenditure | | | | | | | | | | | | |
| | | |
Expenditure excluding debt service | | | –38 354 | | | | –38 774 | | | | –38 974 | |
| | | |
% change | | | 2.2 | | | | 1.1 | | | | 0.5 | |
| | | |
Debt service | | | –842 | | | | –815 | | | | –884 | |
| | | | |
| | | |
Total expenditure | | | –39 196 | | | | –39 589 | | | | –39 858 | |
| | | |
% change | | | 2.2 | | | | 1.0 | | | | 0.7 | |
| | | |
SURPLUS (DEFICIT) | | | –79 | | | | –10 | | | | — | |
D.35
The revenue of organizations in the health and social services and education networks will amount to $39.1 billion for 2014-2015, $39.6 billion for 2015-2016 and $39.9 billion for 2016-2017, representing an increase of 2.1%, 1.2% and 0.7% respectively.
The expenditure excluding debt service of the health and social services and education networks will stand at $38.4 billion in 2014-2015, $38.8 billion in 2015-2016 and $39.0 billion in 2016-2017, representing an increase of 2.2%, 1.1% and 0.5% respectively.
Act to modify the organization and governance of the health and social services network, in particular by abolishing the regional agencies
This Act changes the organization and governance of the health and social services network through regional integration of health and social services, the creation of institutions with broader missions and the introduction of two-hierarchy management in order to promote and simplify access to public services, help to improve the quality and safety of care and make the network more efficient and effective.
To that end, the Act provides for the creation, in each health region, of an integrated health and social services centre resulting from the amalgamation of the health and social services agency and public institutions in the region. However, in the case of the Gaspésie–Îles-de-la-Madeleine, Montérégie and Montréal regions, two, three and five integrated centres are provided for respectively, along with the maintenance of seven unamalgamated institutions and certain grouped institutions.
D.36
| 2.6 | Tax-funded expenditures |
Refundable tax credits for individuals and corporations, which are similar to tax-funded transfer expenditures, are recorded in spending rather than as reductions in revenue. Expenditures related to doubtful tax accounts are added to these refundable tax credits.
For fiscal 2014-2015, tax-funded expenditures will stand at $6.6 billion, representing an increase of 5.3%. This change is explained essentially by the implementation of the LogiRénov tax credit.
For 2015-2016 and 2016-2017, tax-funded expenditures will decline by 5.1% and 1.6% respectively. This change is explained by:
| — | certain measures announced since the June 2014 budget to reduce tax expenditures, in particular: |
| | — | the 20% reduction in the rates of tax credits granted to corporations, |
| | — | the introduction of a minimum eligible expenditure threshold for R&D tax credits and the investment tax credit, |
| | — | harmonization of the eligibility criteria for the work premium with those for the federal working income tax benefit; |
| — | some of the measures announced in this budget, including those intended to increase the effectiveness of the sectoral tax assistance granted to corporations and the introduction of a tax shield for individuals. |
|
| TABLE D.19 |
|
| Summary of budgetary transactions relating to tax-funded expenditures |
| | | | | | | | | | | | |
| (millions of dollars) | |
| | | |
| | | 2014-2015 | | | 2015-2016 | | | 2016-2017 | |
| | | |
Revenue | | | | | | | | | | | | |
| | | |
Personal income tax | | | 4 337 | | | | 4 244 | | | | 4 239 | |
| | | |
Corporate income tax | | | 2 111 | | | | 1 857 | | | | 1 752 | |
| | | |
Consumption taxes | | | 201 | | | | 207 | | | | 213 | |
| | | | |
| | | |
Total revenue | | | 6 649 | | | | 6 308 | | | | 6 204 | |
| | | |
% change | | | 5.3 | | | | –5.1 | | | | –1.6 | |
| | | |
Expenditure | | | –6 649 | | | | –6 308 | | | | –6 204 | |
| | | |
% change | | | 5.3 | | | | –5.1 | | | | –1.6 | |
| | | |
SURPLUS (DEFICIT) | | | — | | | | — | | | | — | |
D.37
| 3. | NET FINANCIAL REQUIREMENTS |
Surpluses or net financial requirements represent the difference between the government’s cash inflow and disbursements. These surpluses or net financial requirements take into account changes in the budgetary balance on an accrual basis, resources or requirements arising from the acquisition or disposal of fixed assets, investments, loans and advances, and from other activities such as paying accounts payable and collecting accounts receivable.
As a whole, the government’s net financial requirements should amount to $4.7 billion in 2014-2015, $314 million in 2015-2016 and $99 million in 2016-2017.
|
| TABLE D.20 |
|
| Net financial requirements(1) |
| | | | | | | | | | | | |
| (millions of dollars) | |
| | | |
| | | 2014-2015 | | | 2015-2016 | | | 2016-2017 | |
| | | |
SURPLUS (DEFICIT) | | | –1 097 | | | | 1 586 | | | | 2 236 | |
| | | |
Non-budgetary transactions | | | | | | | | | | | | |
| | | |
Investments, loans and advances | | | –2 372 | | | | –1 845 | | | | –1 600 | |
| | | |
Capital expenditures | | | –3 335 | | | | –3 743 | | | | –3 192 | |
| | | |
Retirement plans and employee future benefits | | | 3 468 | | | | 3 418 | | | | 3 451 | |
| | | |
Other accounts | | | –1 371 | | | | 270 | | | | –994 | |
| | | | |
| | | |
Total non-budgetary transactions | | | –3 610 | | | | –1 900 | | | | –2 335 | |
| | | |
NET FINANCIAL REQUIREMENTS | | | –4 707 | | | | –314 | | | | –99 | |
| (1) | A negative entry indicates a financial requirement and a positive entry, a source of financing. |
| q | | Investments, loans and advances |
Net financial requirements for investments, loans and advances are estimated at $2.4 billion for fiscal 2014-2015, and at $1.8 billion and $1.6 billion for 2015-2016 and 2016-2017 respectively.
In 2014-2015, forecast net financial requirements associated with capital expenditures amount to $3.3 billion.
Forecast net financial requirements attributable to capital expenditures for fiscal 2015-2016 and 2016-2017 stand at $3.7 billion and $3.2 billion respectively.
D.39
|
| TABLE D.21 |
|
| Consolidated net capital investments(1) |
| | | | | | | | | | | | |
| (millions of dollars) | |
| | | |
| | | 2014-2015 | | | 2015-2016 | | | 2016-2017 | |
| | | |
Investments | | | –7 767 | | | | –7 899 | | | | –7 185 | |
| | | |
Depreciation | | | 3 523 | | | | 3 713 | | | | 3 921 | |
| | | | |
| | | |
Net investments | | | –4 244 | | | | –4 186 | | | | –3 264 | |
| | | |
Less: PPP investments(2) | | | 909 | | | | 443 | | | | 72 | |
| | | |
NET CAPITAL INVESTMENTS | | | –3 335 | | | | –3 743 | | | | –3 192 | |
| (1) | A negative entry indicates a financial requirement and a positive entry, a source of financing. |
| (2) | Investments made under public-private partnership (PPP) agreements correspond to new commitments that are taken into account in the government’s gross debt. In accordance with the government’s accounting policies, PPP investments are recognized in the government’s assets as well as in its debt. |
| q | | Retirement plans and employee future benefits |
Forecast growth in the non-budgetary balance for the retirement plans and employee future benefits stands at $3.5 billion for fiscal 2014-2015 and at $3.4 billion and $3.5 billion for fiscal 2015-2016 and 2016-2017 respectively, which reduces the government’s net financial requirements.
Net financial requirements for other accounts consist of a series of changes in assets and liabilities such as accounts receivable and accounts payable.
In 2014-2015, the change in these other accounts provides the government with an increase of approximately $1.4 billion in its net financial requirements. However, the change forecast for other accounts should generate financial surpluses of about $270 million for 2015-2016 and net financial requirements of $1.0 billion for 2016-2017.
The following table shows net financial requirements by sector.
|
| TABLE D.22 |
|
| Net financial requirements by sector(1) |
| | | | | | | | | | | | |
| (millions of dollars) | |
| | | |
| | | 2014-2015 | | | 2015-2016 | | | 2016-2017 | |
| | | |
General fund | | | –2 196 | | | | 1 058 | | | | 2 563 | |
| | | |
Consolidated entities(2) | | | –3 764 | | | | –3 047 | | | | –4 898 | |
| | | |
Generations Fund | | | 1 253 | | | | 1 675 | | | | 2 236 | |
| | | |
NET FINANCIAL REQUIREMENTS | | | –4 707 | | | | –314 | | | | –99 | |
| (1) | A negative entry indicates a financial requirement and a positive entry, a source of financing. |
| (2) | Excludes the Generations Fund. |
D.40
APPENDIX 1: SENSITIVITY ANALYSIS OF ECONOMIC VARIABLES
The financial framework’s forecasts incorporate certain components of uncertainty that do not depend on the government directly, but which may cause actual results to differ from the forecasts.
| q | | Sensitivity of the Québec economy to external shocks |
The forecasts for the Québec economy are based on numerous analyses, including periodic assessments of the main economic statistics and the results obtained with various econometric models.
Given that the Québec economy is characterized by considerable openness to trade, Québec’s economic variables are influenced by several external factors. The most important of these factors are related to the activities of Québec’s main trading partners, the United States and the rest of Canada.
D.41
| n | | Impact of external variables on the Québec economy |
An analysis conducted with a Structural VAR6 model has made it possible to estimate, on the basis of historical data, the sensitivity of Québec’s economic variables to certain important external variables.
| — | The findings show that a change of 1% in U.S. real GDP entails, on average, a change of 0.5% in Québec’s real GDP. |
Moreover, the model makes it possible to quantify the extent to which the economy of Ontario influences that of Québec.
| — | Accordingly, a change of 1% in Ontario’s real GDP gives rise, on average, to a change of 0.4% in Québec’s real GDP. |
| — | Ontario is the Canadian province with which Québec has the most commercial ties, in addition to having a similar economic structure. In 2011, exports to Ontario accounted for roughly 60% of Québec’s interprovincial exports. |
|
| TABLE D.23 |
|
| Impact of external shocks on the growth rate of Québec’s real GDP |
| | | | | | | | |
External shocks of 1% | | Maturity(1) (quarters) | | | Impact on Québec’s real GDP
(percentage points) | |
| | |
U.S. real GDP | | | 2 | | | | 0.5 | |
| | |
Ontario real GDP | | | 2 | | | | 0.4 | |
| (1) | Maturity corresponds to the number of quarters needed to record the greatest impact on Québec’s real GDP, presented in the right-hand column. |
Sources: Institut de la statistique du Québec, Ontario Ministry of Finance, IHS Global Insight, Statistics Canada, Bloomberg and Ministère des Finances du Québec.
| 6 | Vector autoregression. This econometric technique is used to estimate, on the basis of numerous observations, the extent to which changes in one economic variable affect another economic variable (impulse response). The estimates were made using quarterly data from Statistics Canada’s 1993 System of National Accounts (SNA 1993), for the 1981-2010 period. |
D.42
| q | | Sensitivity of own-source revenue to economic fluctuations |
In general, the nominal GDP forecast is a very good indicator of growth in the own-source revenue of the general fund given the direct link between tax bases and nominal GDP.
| — | According to the overall sensitivity analysis, a change of 1 percentage point in nominal GDP has an impact of about $550 million on the own-source revenue of the government’s general fund. |
This sensitivity analysis is based on a revision of each tax base in proportion to the revision of nominal GDP.
| — | In reality, a change in economic outlook can have a greater impact on some economic variables, as well as greater repercussions on certain tax bases and smaller ones on others. |
Sensitivity analyses set an average historical relationship between the change in the general fund’s own-source revenue and growth in nominal GDP. Accordingly, they may prove inaccurate for a given year depending on the economic situation and yet not lose their validity.
| — | Indeed, for a given year, economic fluctuations may have various impacts on revenue because of changes in the behaviour of economic agents. |
| — | In these situations, the change in the general fund’s own-source revenue can be greater or lower than the change in nominal GDP. |
| | | | |
| TABLE D.24 |
|
| Sensitivity of own-source revenue to major economic variables |
Variables | | Growth forecasts
for 2015 | | Impacts for fiscal 2015-2016 |
Nominal GDP | | 3.8% | | A variation of 1 percentage point changes own-source revenue by roughly $550 million. |
| | |
– Salaries and wages | | 3.4% | | A variation of 1 percentage point changes personal income tax revenue by about $270 million. |
| | |
– Employment insurance | | 1.5% | | A variation of 1 percentage point changes personal income tax revenue by roughly $5 million. |
| | |
– Pension income | | 7.0% | | A variation of 1 percentage point changes personal income tax revenue by around $40 million. |
| | |
– Net operating surplus of corporations | | 8.7% | | A variation of 1 percentage point changes corporate income tax revenue by almost $30 million. |
| | |
– Household consumption | | 3.6% | | A variation of 1 percentage point changes QST revenue by about $160 million. |
| | |
– Residential investments | | 3.5% | | A variation of 1 percentage point changes QST revenue by approximately $20 million. |
D.43
| q | | Sensitivity of debt service to a change in interest rates and exchange rates |
A greater-than-anticipated rise in interest rates of 1 percentage point over a full year would increase the consolidated interest expenditure by roughly $250 million.
A change in the value of the Canadian dollar compared with other currencies would have no impact on debt service because the government’s debt has no foreign currency exposure.
D.44
APPENDIX 2: IMPACT OF THE PRICE OF OIL AND GAS ON PUBLIC FINANCES
| q | | Positive impact on Québec’s trade balance |
The recent drop in oil prices will have a positive effect for Québec in 2015 and 2016. Québec, which is an importer of oil, will see a reduction in the value of its energy bill, which will have a major positive impact on its trade balance.
| — | In addition, households will pay less for gasoline and have more leeway. The savings achieved should be injected back into the economy in the form of purchases of other goods and services. |
| — | Businesses will also see lower costs for their energy inputs, which will lead to improved profitability and increased business investment. |
However, the net impact of the decline in oil prices will be generally negative for Canada, which is a major producer and exporter of natural resources.
| — | The drop in oil prices will have a major negative impact on Canada’s trade balance due to a decline in the value of exports. In addition, investments in the oil and gas extraction sector should fall. |
| — | However, these repercussions on the Québec and Canadian economies will subside in the coming years since oil prices are expected to gradually increase. |
| q | | Impact on the government’s own-source revenue and expenditure |
The decline in the price of oil is also having an effect on the government’s financial situation, in particular:
| — | on the revenues it collects directly in taxes on oil and gas;7 |
| — | on the expenditures it covers, due to the decrease in the cost of fuel for transportation and the heating of public buildings. |
| 7 | In this analysis, the expression “oil and gas” refers to gasoline, diesel fuel, fuel oil, and natural gas. |
D.45
| n | | Substantial drop in the price of oil since Budget 2014-2015 |
The prices of the different types of oil and gas have not changed in step with one another since Budget 2014-2015. The decline in the price of oil has resulted essentially in a major decrease in the price of gasoline, which has become more pronounced since the month of September. It has also led, to a lesser degree, to a decrease in the prices of diesel fuel and light fuel oil, whereas the price of natural gas has remained fairly stable.
| — | Since June 2014, the price of gasoline in Québec has fallen from 141.4 cents per litre to 107.3 cents per litre in February 2015, which represents a drop of about 24%. |
| — | In February 2015, the prices of diesel fuel and light fuel oil stood at 126.1 cents per litre and 93.1 cents per litre respectively, representing decreases of 10% and 12% since the month of June 2014. |
| — | The price of natural gas8 varied little between June 2014 and February 2015, going from 40.5 cents per cubic metre to 39.5 cents per cubic metre, an overall decline of roughly 2%. |
|
| CHART D.2 |
|
| Change in the price of oil and gas from June 2014 to February 2015 |
| (cents per litre) |
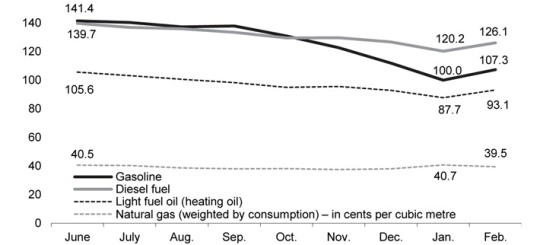
|
Sources: Régie de l’énergie, Gaz Métro and Statistics Canada. |
| 8 | Average price weighted by consumption. |
D.46
| n | | A marginal impact on the government’s revenue and expenditure |
The net impact of the changes in the price of oil and gas observed over the period from July 2014 to February 2015 on revenues related to the taxation of these products and government spending would have been marginal considering generally anticipated reactions.9
| — | Indeed, the decline in revenue from the QST collected on the sale of oil and gas would be offset by the decrease in public spending on fuel and heating and by the potential increase in revenue from the tax on fuel due to increased consumption. |
| — | It is estimated that government spending has changed little because of the stability of natural gas prices. In that regard, it should be noted that the government is one of the largest consumers of oil and gas in Québec and that natural gas is the government’s largest oil and gas expenditure item. |
However, the impact of the drop in the price of oil and gas on the government’s revenue and expenditure could have represented a gain of $65 million for the government’s fiscal framework, assuming that the decrease in QST revenue derived from the sale of oil products was fully offset by an increase in sales of other taxable goods and services.
|
| TABLE D.25 |
|
Estimated impact of the decline in the price of oil and gas on the government’s own-source revenue and
expenditure |
| | | | |
| (millions of dollars) | |
| | | July 2014 to
February 2015 | |
| |
Impact on revenue | | | | |
| |
Specific tax on fuel | | | 52.0 | |
| |
Québec sales tax | | | –64.6 | |
| |
Subtotal | | | –12.6 | |
| |
Impact on expenditure | | | | |
| |
Oil products | | | 8.2 | |
| |
Natural gas | | | 5.5 | |
| |
Subtotal | | | 13.7 | |
| |
Subtotal – Oil and gas | | | 1.1 | |
| |
QST – Other goods and services | | | 64.6 | |
| |
Total impact | | | 65.7 | |
Source : Ministère des Finances du Québec.
| 9 | The box on page D.48 shows the theoretical impact of an across-the-board decrease of 5 cents per litre per in the price of oil and gas on the government’s fiscal framework. |
D.47
|
Theoretical illustration of a decrease of 5 cents par litre
in the price of oil ans gas |
Generally speaking, an across-the-board decrease of 5 cents per litre in the price of the various types of oil and gas leads to a theoretical net gain of about $13 million for the government’s fiscal framework. – In such a case, the decline in revenue from the QST collected on the sale of oil and gas is more than offset by the decrease in spending on fuel and heating and by the increase in revenue from the tax on fuel due to increased consumption. |
Theoretical illustration of a decrease of 5 cents per litre in the price of oil and gas on the government’s own-source revenue and expenditure
| | | | |
(millions of dollars) | |
| |
| | | 2014-2015 | |
Impact on revenue | | | | |
| |
Specific tax on fuel | | | 26.8 | |
| |
Québec sales tax | | | –39.9 | |
| | | | |
Subtotal | | | –13.1 | |
| |
Impact on expenditure | | | | |
| |
Oil products | | | 5.2 | |
| |
Natural gas | | | 20.8 | |
| | | | |
Subtotal | | | 26.0 | |
| |
TOTAL | | | 12.9 | |
Source : Ministère des Finances du Québec.
However, this sensitivity analysis does not take into account the impact of the decline in oil and gas prices on the government’s other revenue sources, which are harder to quantify, in particular:
| | – | personal income tax, because of lower indexation of the taxation parameters stemming from the impact of the drop in the price of oil on the consumer price index, which increases government revenue: | |
| | ¡ | | however, a lower indexation rate reduces revenue from fees, since they are indexed to a lesser extent; |
| | – | corporate taxes, where the decline in input and transportation costs could boost the profitability of businesses. | |
In addition, it should be noted that revenue from the sales tax might not be affected by the drop in oil and gas prices if the decrease in revenue from the sale of oil products is generally offset by an increase in sales of other taxed goods and services.
Moreover, in the short and medium term, it is assumed that a decline in the price of oil and gas would not affect the government’s oil and gas consumption since the government continues to offer public services.
D.48
| q | | Impact on federal transfers |
The equalization payments for 2014-2015 and 2015-2016 were established by the Department of Finance Canada in December 2013 and December 2014 respectively and they will not be adjusted. For subsequent years, the decline in the price of oil will restrict the equalization envelope on account of the downward adjustment in the growth of Canada’s nominal GDP since fall 2014. For example, the 2016-2017 equalization envelope will be determined using the average growth of Canada’s nominal GDP for 2014, 2015 and 2016.
The drop in the price of oil will also have a downward effect on the fiscal capacity10 of the oil-producing provinces, namely, Alberta, Saskatchewan and Newfoundland and Labrador. Québec’s fiscal capacity will thus move closer to that of the average of the ten provinces, thereby reducing its equalization payments as of 2016-2017.
| — | The decrease in Québec’s equalization payments is estimated at more than $1.5 billion from 2016-2017 to 2019-2020. |
| — | However, this decline is offset by upward adjustments resulting from other factors. |
| 10 | Fiscal capacity is defined as the revenue a province could obtain if it applied, to its tax bases (personal and corporate income tax, consumption taxes, natural resources and property taxes) the average tax rates in effect in the ten provinces. It is its capacity to collect revenue. |
D.49
| APPENDIX 3: | CONSOLIDATED DATA BY DEPARTMENTAL PORTFOLIO |
The budget documents produced by the government present the budgets of each government entity. These documents group these entities by various sectoral components such as program spending, expenditure of special funds or expenditure of non-budget-funded bodies. However, these budgetary data are not presented on a consolidated basis by departmental portfolio.
Like many jurisdictions and with the intention to continue adopting best practices regarding the presentation of budgetary information,11 the government will gradually implement a new presentation of consolidated data by departmental portfolio between now and 2017-2018.
For the government, producing such information will ensure better monitoring of all public expenditures, whether they are financed by general taxes or by other revenue sources, and to report on them on the same basis.
|
Definition of a departmental portfolio |
To fulfil its missions, the government sets up programs that are administered directly by government departments or bodies. A portfolio includes all of the programs that fall under the responsibility of a minister. – The President of the National Assembly has his or her own portfolio, while persons appointed by the National Assembly, such as the Auditor General, are grouped in another portfolio. Accordingly, excluding the “National Assembly” and “Persons Appointed by the National Assembly” portfolios, there are as many portfolios as there are ministers. – There are 22 portfolios for 2015-2016. |
| 11 | Recommendation of the Council on Budgetary Governance of the Organization for Economic Cooperation and Development (OECD), February 18, 2015. |
D.51
| q | | Approach between now and Budget 2017-2018 |
The approach used to determine the level of consolidated data by portfolio is based on the following three main avenues:
| — | developing a model for consolidating data by departmental portfolio; |
| — | making the necessary improvements to budgetary information systems in order to adapt the budget documents to the new presentation and provide information for decision-making; |
| — | making any adjustments required for the government management framework, which contributes in particular to optimum use of the resources of the Administration, not only in the case of expenditures financed by general taxes but also in the case of those financed by other sources. |
The government will gradually implement the new presentation consolidated by portfolio until Budget 2017-2018.
The approach will be implemented in three phases:
| — | work in the first phase will make it possible, as of now, to show the most recent, real consolidated revenue and expenditure by portfolio. This presentation is shown in tables D.26 to D.29; |
| — | work in the second phase, which will continue until Budget 2016-2017, is aimed at presenting preliminary consolidated revenue and expenditure for the year coming to an end, i.e. 2015-2016; |
| — | lastly, at the end of the third phase, the government will present, in addition to preliminary data, a forecast for consolidated revenue and expenditure by portfolio for 2017-2018, in its Budget 2017-2018. |
The participation of government departments and bodies will be essential to implementing these new policy directions.
D.52
|
Experiences of other Canadian jurisdictions in presenting consolidated budgetary information |
Like Québec, most of the Canadian provinces present their budget on a consolidated basis. Although the breakdown of consolidated revenue is similar from one province to the next, there is greater disparity in the presentation of consolidated expenditure. Most of the provinces present their consolidated expenditure forecasts by mission. Some provinces go further by also presenting consolidated expenditure forecasts by portfolio. This is the case of Ontario, Manitoba and Newfoundland and Labrador. In addition, Ontario and British Columbia present three-year consolidated forecasts by mission. With its 26 portfolios (roughly the same number as in Québec), Ontario presents consolidated expenditure forecasts broken down by portfolio over one year, and indicates, for purposes of comparison, preliminary or historical data for the previous three years. |
| q | | Illustration of consolidated data by portfolio |
Tables D.26 and D.27 present consolidated revenue for 2013-2014 by portfolio according to the 2015-2016 budgetary structure. Table D.26 classifies the revenue by sector and Table D.27 by category of revenue.
Tables D.28 and D.29 present consolidated expenditure for 2013-2014 by portfolio according to the 2015-2016 budgetary structure. Table D.28 classifies expenditure by sector and Table D.29, by category of expenditure.
Since some programs are financed by reciprocal transactions between entities in different sectors or portfolios, some eliminations are necessary to avoid recording revenue and expenditure twice.
A list of the entities making up each portfolio is provided after the tables. The list also specifies the type of each entity.
D.53
|
| TABLE D.26 |
|
Consolidated revenue by portfolio and sector – 2013-2014 |
| | | | | | | | | | | | | | | | |
| (millions of dollars) | |
| | | Consolidated Revenue Fund | |
| | | | |
| Portfolio | | General
fund | | | Special
funds | | | Generations
Fund | | | Specified
purpose
accounts | |
| | | | |
Affaires municipales et Occupation du territoire | | | 17 | | | | 44 | | | | | | | | 94 | |
| | | | |
Agriculture, Pêcheries et Alimentation | | | 20 | | | | — | | | | — | | | | 127 | |
| | | | |
National Assembly(2) | | | 1 | | | | — | | | | — | | | | 1 | |
| | | | |
Conseil du trésor et Administration gouvernementale | | | 2 | | | | 1 | | | | — | | | | — | |
| | | | |
Conseil exécutif | | | — | | | | — | | | | — | | | | — | |
| | | | |
Culture et Communications | | | 2 | | | | 16 | | | | — | | | | 21 | |
| | | | |
Développement durable, Environnement et Lutte contre les changements climatiques | | | 11 | | | | 357 | | | | — | | | | 6 | |
| | | | |
Économie, Innovation et Exportations | | | 2 | | | | 346 | | | | — | | | | — | |
| | | | |
Éducation, Enseignement supérieur et Recherche | | | 162 | | | | 82 | | | | — | | | | 53 | |
| | | | |
Énergie et Ressources naturelles | | | 61 | | | | 291 | | | | — | | | | 1 | |
| | | | |
Famille | | | 16 | | | | 30 | | | | — | | | | — | |
| | | | |
Finances | | | 67 762 | (3) | | | 2 075 | | | | 1 121 | | | | 465 | |
| | | | |
Forêts, Faune et Parcs | | | 43 | | | | 410 | | | | — | | | | — | |
| | | | |
Immigration, Diversité et Inclusion | | | 374 | | | | — | | | | — | | | | 4 | |
| | | | |
Justice | | | 229 | | | | 95 | | | | — | | | | 1 | |
| | | | |
Relations internationales et Francophonie | | | — | | | | — | | | | — | | | | 1 | |
| | | | |
Santé et Services sociaux | | | 92 | | | | 1 519 | | | | — | | | | 162 | |
| | | | |
Sécurité publique | | | 56 | | | | 572 | | | | — | | | | 64 | |
| | | | |
Tourisme | | | — | | | | 140 | | | | — | | | | — | |
| | | | |
Transports | | | 48 | | | | 3 445 | | | | — | | | | — | |
| | | | |
Travail, Emploi et Solidarité sociale | | | 875 | | | | 1 240 | | | | — | | | | 11 | |
Subtotal | | | 69 773 | | | | 10 663 | | | | 1 121 | | | | 1 011 | |
Inter-portfolio eliminations(1),(4) | | | | | | | | | | | | | | | | |
TOTAL | | | 69 773 | | | | 10 663 | | | | 1 121 | | | | 1 011 | |
| Note: | Presentation according to the 2015-2016 budgetary structure. Some program restructurings have not been incorporated into the data, particularly those pertaining to the activities of local employment centres and communications divisions. |
| (1) | Consolidation adjustments resulting mainly from the elimination of reciprocal transactions between entities in different sectors (intra-portfolio) or different portfolios (inter-portfolio). |
| (2) | Includes the “Persons Appointed by the National Assembly” portfolio. |
| (3) | Includes the net result of government enterprises, i.e. $5 430 million, consisting of $20 916 million in revenue, $15 399 million in expenditure and $87 million in other adjustments. |
| (4) | Includes the cancellation of inter-portfolio gains for consolidation purposes. |
D.54
| | | | | | | | | | | | | | | | | | |
| | |
Tax-funded expenditures | | | Non-budget- funded bodies | | | Health and social services and education networks | | | Intra-portfolio eliminations (1) | | | Consolidated revenue | |
| | | | |
| | — | | | | 951 | | | | — | | | | –373 | | | | 733 | |
| | — | | | | 713 | | | | — | | | | –696 | | | | 164 | |
| | — | | | | — | | | | — | | | | — | | | | 2 | |
| | | | |
| | — | | | | 1 670 | | | | — | | | | –194 | | | | 1 479 | |
| | — | | | | 3 | | | | — | | | | –3 | | | | — | |
| | — | | | | 450 | | | | — | | | | –362 | | | | 127 | |
| | | | |
| | — | | | | 37 | | | | — | | | | –10 | | | | 401 | |
| | — | | | | 35 | | | | — | | | | –225 | | | | 158 | |
| | | | |
| | — | | | | 251 | | | | 15 794 | | | | –12 301 | | | | 4 041 | |
| | — | | | | 38 | | | | — | | | | –35 | | | | 356 | |
| | — | | | | — | �� | | | — | | | | — | | | | 46 | |
| | | | |
| | 6 317 | | | | 2 616 | | | | — | | | | –1 390 | | | | 78 966 | |
| | — | | | | 150 | | | | — | | | | –227 | | | | 376 | |
| | — | | | | — | | | | — | | | | — | | | | 378 | |
| | | | |
| | — | | | | 191 | | | | — | | | | –189 | | | | 327 | |
| | — | | | | 9 | | | | — | | | | –5 | | | | 5 | |
| | — | | | | 14 712 | | | | 23 495 | | | | –34 793 | | | | 5 187 | |
| | — | | | | 39 | | | | — | | | | –292 | | | | 439 | |
| | — | | | | 120 | | | | — | | | | –137 | | | | 123 | |
| | — | | | | 819 | | | | — | | | | –344 | | | | 3 968 | |
| | — | | | | 179 | | | | — | | | | –1 148 | | | | 1 157 | |
| | 6 317 | | | | 22 983 | | | | 39 289 | | | | –52 724 | | | | 98 433 | |
| | | | | | | | | | | | | | | | | | –5 202 | |
| | 6 317 | | | | 22 983 | | | | 39 289 | | | | –52 724 | | | | 93 231 | |
D.55
|
| TABLE D.27 |
|
Consolidated revenue by portfolio and category – 2013-2014 |
| | | | | | | | | | | | |
| (millions of dollars) | |
| | | |
| Portfolio | | Income and
property
taxes | | | Consumption
taxes | | | Duties and
permits | |
| | | |
Affaires municipales et Occupation du territoire | | | — | | | | — | | | | 5 | |
| | | |
Agriculture, Pêcheries et Alimentation | | | — | | | | — | | | | 26 | |
| | | |
National Assembly(2) | | | — | | | | — | | | | — | |
| | | |
Conseil du trésor et Administration gouvernementale | | | — | | | | — | | | | — | |
| | | |
Conseil exécutif | | | — | | | | — | | | | — | |
| | | |
Culture et Communications | | | — | | | | 15 | | | | — | |
| | | |
Développement durable, Environnement et Lutte contre les changements climatiques | | | — | | | | 18 | | | | 346 | |
| | | |
Économie, Innovation et Exportations | | | — | | | | — | | | | 2 | |
| | | |
Éducation, Enseignement supérieur et Recherche | | | 1 793 | | | | 55 | | | | — | |
| | | |
Énergie et Ressources naturelles | | | — | | | | — | | | | 72 | |
| | | |
Famille | | | — | | | | 30 | | | | 13 | |
| | | |
Finances | | | 38 199 | | | | 15 018 | | | | 249 | |
| | | |
Forêts, Faune et Parcs | | | — | | | | — | | | | 264 | |
| | | |
Immigration, Diversité et Inclusion | | | — | | | | — | | | | 51 | |
| | | |
Justice | | | — | | | | — | | | | 2 | |
| | | |
Relations internationales et Francophonie | | | — | | | | — | | | | — | |
| | | |
Santé et Services sociaux | | | 950 | | | | 20 | | | | 2 | |
| | | |
Sécurité publique | | | — | | | | — | | | | 39 | |
| | | |
Tourisme | | | — | | | | 71 | | | | — | |
| | | |
Transports | | | — | | | | 2 293 | | | | 1 063 | |
| | | |
Travail, Emploi et Solidarité sociale | | | 68 | | | | — | | | | 64 | |
Subtotal | | | 41 010 | | | | 17 520 | | | | 2 198 | |
Inter-portfolio eliminations(4) | | | –1 145 | | | | –385 | | | | — | |
TOTAL | | | 39 865 | | | | 17 135 | | | | 2 198 | |
| Note: | Presentation according to the 2015-2016 budgetary structure. Some program restructurings have not been incorporated into the data, particularly those pertaining to the activities of local employment centres and communications divisions. |
| (1) | Includes $386 million in transfers from entities of the Québec government. |
| (2) | Includes the “Persons Appointed by the National Assembly” portfolio. |
| (3) | Represents the net result of government enterprises, consisting of $20 916 million in revenue, $15 399 million in expenditure and $87 million in other adjustments. |
| (4) | Consolidation adjustments resulting mainly from the elimination of reciprocal transactions between entities in different portfolios. Includes the cancellation of inter-portfolio gains for consolidation purposes. |
D.56
| | | | | | | | | | | | | | | | | | |
| |
| | | | |
Miscellaneous revenue | | | Revenue from
government enterprises | | | Generations Fund | | | Federal transfers and other (1) | | | Consolidated revenue | |
| | | | |
| | 222 | | | | — | | | | — | | | | 506 | | | | 733 | |
| | | | |
| | 26 | | | | — | | | | — | | | | 112 | | | | 164 | |
| | | | |
| | 2 | | | | — | | | | — | | | | — | | | | 2 | |
| | | | |
| | 1 479 | | | | — | | | | — | | | | — | | | | 1 479 | |
| | | | |
| | — | | | | — | | | | — | | | | — | | | | — | |
| | | | |
| | 106 | | | | — | | | | — | | | | 6 | | | | 127 | |
| | | | |
| | 31 | | | | — | | | | — | | | | 6 | | | | 401 | |
| | | | |
| | 140 | | | | — | | | | — | | | | 16 | | | | 158 | |
| | | | |
| | 1 637 | | | | — | | | | — | | | | 556 | | | | 4 041 | |
| | | | |
| | 236 | | | | — | | | | — | | | | 48 | | | | 356 | |
| | | | |
| | 3 | | | | — | | | | — | | | | — | | | | 46 | |
| | | | |
| | 3 236 | | | | 5 430 | (3) | | | 1 121 | | | | 15 713 | | | | 78 966 | |
| | | | |
| | 112 | �� | | | — | | | | — | | | | — | | | | 376 | |
| | | | |
| | 7 | | | | — | | | | — | | | | 320 | | | | 378 | |
| | | | |
| | 290 | | | | — | | | | — | | | | 35 | | | | 327 | |
| | | | |
| | 2 | | | | — | | | | — | | | | 3 | | | | 5 | |
| | | | |
| | 3 525 | | | | | | | | — | | | | 690 | | | | 5 187 | |
| | | | |
| | 338 | | | | — | | | | — | | | | 62 | | | | 439 | |
| | | | |
| | 52 | | | | — | | | | — | | | | — | | | | 123 | |
| | | | |
| | 516 | | | | — | | | | — | | | | 96 | | | | 3 968 | |
| | 258 | | | | — | | | | — | | | | 767 | | | | 1 157 | |
| | 12 218 | | | | 5 430 | | | | 1 121 | | | | 18 936 | | | | 98 433 | |
| | –3 286 | | | | — | | | | — | | | | –386 | | | | –5 202 | |
| | 8 932 | | | | 5 430 | | | | 1 121 | | | | 18 550 | | | | 93 231 | |
| | | | | | | | | | | | | | | | | | |
D.57
|
| TABLE D.28 |
|
Consolidated expenditure by portfolio and sector – 2013-2014 |
| | | | | | | | | | | | | | | | |
| (millions of dollars) | |
| | | Consolidated Revenue Fund | |
| Portfolio | | General
fund | | | Special
funds | | | Specific
purpose
accounts | | | Tax-funded
expenditures | |
| | | | |
Affaires municipales et Occupation du territoire | | | 1 630 | | | | 44 | | | | 94 | | | | — | |
| | | | |
Agriculture, Pêcheries et Alimentation | | | 1 049 | | | | — | | | | 127 | | | | — | |
| | | | |
National Assembly(2) | | | 251 | | | | — | | | | 1 | | | | — | |
| | | | |
Conseil du trésor et Administration gouvernementale | | | 946 | | | | — | | | | — | | | | — | |
| | | | |
Conseil exécutif | | | 363 | | | | — | | | | — | | | | — | |
| | | | |
Culture et Communications | | | 662 | | | | 13 | | | | 21 | | | | 263 | |
| | | | |
Développement durable, Environnement et Lutte contre les changements climatiques | | | 167 | | | | 344 | | | | 6 | | | | — | |
| | | | |
Économie, Innovation et Exportations | | | 624 | | | | 269 | | | | — | | | | 1 377 | |
| | | | |
Éducation, Enseignement supérieur et Recherche | | | 16 639 | | | | 88 | | | | 53 | | | | 102 | |
| | | | |
Énergie et Ressources naturelles | | | 67 | | | | 216 | | | | 1 | | | | 268 | |
| | | | |
Famille | | | 2 536 | | | | — | | | | — | | | | 2 799 | |
| | | | |
Finances | | | 99 | | | | 903 | | | | 465 | | | | 660 | |
| | | | |
Forêts, Faune et Parcs | | | 476 | | | | 433 | | | | — | | | | 14 | |
| | | | |
Immigration, Diversité et Inclusion | | | 165 | | | | — | | | | 4 | | | | — | |
Justice | | | 864 | | | | 81 | | | | 1 | | | | — | |
| | | | |
Relations internationales et Francophonie | | | 106 | | | | — | | | | 1 | | | | — | |
| | | | |
Santé et Services sociaux | | | 31 088 | | | | 1 633 | | | | 162 | | | | 471 | |
| | | | |
Sécurité publique | | | 1 333 | | | | 572 | | | | 64 | | | | — | |
| | | | |
Tourisme | | | 136 | | | | 137 | | | | — | | | | 3 | |
| | | | |
Transports | | | 709 | | | | 2 366 | | | | — | | | | 4 | |
| | | | |
Travail, Emploi et Solidarité sociale | | | 4 411 | | | | 1 281 | | | | 11 | | | | 356 | |
| | | | |
Inter-portfolio eliminations(1) | | | | | | | | | | | | | | | | |
Subtotal | | | 64 321 | | | | 8 380 | | | | 1 011 | | | | 6 317 | |
Debt service | | | 8 434 | | | | 1 983 | | | | — | | | | — | |
TOTAL | | | 72 755 | | | | 10 363 | | | | 1 011 | | | | 6 317 | |
| Note: | Presentation according to the 2015-2016 budgetary structure. Some program restructurings have not been incorporated into the data, particularly those pertaining to the activities of local employment centres and communications divisions. |
| (1) | Consolidation adjustments resulting mainly from the elimination of reciprocal transactions between entities in different sectors (intra-portfolio) or different portfolios (inter-portfolio). |
| (2) | Includes the “Persons Appointed by the National Assembly” portfolio. |
D.58
| | | | | | | | | | | | | | | | |
| |
| | | | |
Non-budget- funded bodies | | Health and social services and
education networks | | | Intra-portfolio eliminations (1) | | | Inter -portfolio eliminations (1) | | | Consolidated expenditure | |
| | | | |
1 035 | | | — | | | | –373 | | | | | | | | 2 430 | |
| | | | |
546 | | | — | | | | –696 | | | | | | | | 1 026 | |
| | | | |
— | | | — | | | | — | | | | | | | | 252 | |
| | | | |
1 540 | | | — | | | | –182 | | | | | | | | 2 304 | |
| | | | |
3 | | | — | | | | –3 | | | | | | | | 363 | |
| | | | |
471 | | | — | | | | –401 | | | | | | | | 1 029 | |
| | | | |
33 | | | — | | | | –10 | | | | | | | | 540 | |
| | | | |
35 | | | — | | | | –224 | | | | | | | | 2 081 | |
| | | | |
250 | | | 15 291 | | | | –12 299 | | | | | | | | 20 124 | |
| | | | |
39 | | | — | | | | –7 | | | | | | | | 584 | |
| | | | |
— | | | — | | | | — | | | | | | | | 5 335 | |
| | | | |
1 744 | | | — | | | | –1 334 | | | | | | | | 2 537 | |
| | | | |
143 | | | — | | | | –241 | | | | | | | | 825 | |
| | | | |
— | | | — | | | | — | | | | | | | | 169 | |
| | | | |
186 | | | — | | | | –189 | | | | | | | | 943 | |
| | | | |
9 | | | — | | | | –5 | | | | | | | | 111 | |
| | | | |
14 707 | | | 23 136 | | | | –34 736 | | | | | | | | 36 461 | |
| | | | |
38 | | | — | | | | –292 | | | | | | | | 1 715 | |
| | | | |
112 | | | — | | | | –136 | | | | | | | | 252 | |
| | | | |
766 | | | — | | | | –376 | | | | | | | | 3 469 | |
| | | | |
157 | | | — | | | | –1 153 | | | | | | | | 5 063 | |
| | | | |
| | | | | | | | | | | | –3 277 | | | | –3 277 | |
21 814 | | | 38 427 | | | | –52 657 | | | | –3 277 | | | | 84 336 | |
1 085 | | | 923 | | | | –107 | | | | –1 720 | | | | 10 598 | |
22 899 | | | 39 350 | | | | –52 764 | | | | –4 997 | | | | 94 934 | |
D.59
|
| TABLE D.29 |
|
| Consolidated expenditure by portfolio and category – 2013-2014 |
| | | | | | | | |
| (millions of dollars) | |
| | |
Portfolio | | Remuneration | | | Operating | |
Affaires municipales et Occupation du territoire | | | 83 | | | | 147 | |
Agriculture, Pêcheries et Alimentation | | | 172 | | | | 83 | |
National Assembly(1) | | | 162 | | | | 72 | |
Conseil du trésor et Administration gouvernementale | | | 716 | | | | 1 549 | |
Conseil exécutif | | | 64 | | | | 22 | |
Culture et Communications | | | 183 | | | | 222 | |
Développement durable, Environnement et Lutte contre les changements climatiques | | | 139 | | | | 66 | |
Économie, Innovation et Exportations | | | 77 | | | | 144 | |
Éducation, Enseignement supérieur et Recherche | | | 12 489 | | | | 3 563 | |
Énergie et Ressources naturelles | | | 90 | | | | 139 | |
Famille | | | 73 | | | | 39 | |
Finances | | | 861 | | | | 393 | |
Forêts, Faune et Parcs | | | 258 | | | | 428 | |
Immigration, Diversité et Inclusion | | | 80 | | | | 50 | |
Justice | | | 503 | | | | 302 | |
Relations internationales et Francophonie | | | 58 | | | | 30 | |
Santé et Services sociaux | | | 23 209 | | | | 8 645 | |
Sécurité publique | | | 1 132 | | | | 440 | |
Tourisme | | | 53 | | | | 106 | |
Transports | | | 517 | | | | 2 246 | |
Travail, Emploi et Solidarité sociale | | | 502 | | | | 270 | |
Subtotal | | | 41 421 | | | | 18 956 | |
Inter-portfolio eliminations(3) | | | –1 126 | | | | –1 796 | |
TOTAL | | | 40 295 | | | | 17 160 | |
| Note: | Presentation according to the 2015-2016 budgetary structure. Some program restructurings have not been incorporated into the data, particularly those pertaining to the activities of local employment centres and communications divisions. |
| (1) | Includes the “Persons Appointed by the National Assembly” portfolio. |
| (2) | Includes $19 million for the change in the provision for environmental liability attributable to FORT. |
| (3) | Consolidation adjustments resulting mainly from the elimination of reciprocal transactions between entities in different portfolios. |
D.60
| | | | | | | | | | | | | | | | |
| | | | | | | | | | | | | |
Doubtful accounts and other allowances | | Transfers | | | Subtotal | | | Debt service | | | Consolidated
expenditure | |
5 | | | 2 195 | | | | 2 430 | | | | 78 | | | | 2 508 | |
–5 | | | 776 | | | | 1 026 | | | | 3 | | | | 1 029 | |
— | | | 18 | | | | 252 | | | | — | | | | 252 | |
— | | | 39 | (2) | | | 2 304 | | | | 160 | | | | 2 464 | |
— | | | 277 | | | | 363 | | | | — | | | | 363 | |
2 | | | 622 | | | | 1 029 | | | | 19 | | | | 1 048 | |
— | | | 335 | | | | 540 | | | | — | | | | 540 | |
131 | | | 1 729 | | | | 2 081 | | | | 96 | | | | 2 177 | |
41 | | | 4 031 | | | | 20 124 | | | | 480 | | | | 20 604 | |
2 | | | 353 | | | | 584 | | | | — | | | | 584 | |
— | | | 5 223 | | | | 5 335 | | | | — | | | | 5 335 | |
612 | | | 671 | | | | 2 537 | | | | 10 270 | | | | 12 807 | |
3 | | | 136 | | | | 825 | | | | 3 | | | | 828 | |
— | | | 39 | | | | 169 | | | | — | | | | 169 | |
8 | | | 130 | | | | 943 | | | | — | | | | 943 | |
— | | | 23 | | | | 111 | | | | — | | | | 111 | |
30 | | | 4 577 | | | | 36 461 | | | | 357 | | | | 36 818 | |
— | | | 143 | | | | 1 715 | | | | — | | | | 1 715 | |
— | | | 93 | | | | 252 | | | | 14 | | | | 266 | |
7 | | | 699 | | | | 3 469 | | | | 834 | | | | 4 303 | |
7 | | | 4 284 | | | | 5 063 | | | | 4 | | | | 5 067 | |
843 | | | 26 393 | | | | 87 613 | | | | 12 318 | | | | 99 931 | |
— | | | –355 | | | | –3 277 | | | | –1 720 | | | | –4 997 | |
843 | | | 26 038 | | | | 84 336 | | | | 10 598 | | | | 94 934 | |
D.61
| | |
| TABLE D.30 |
|
| List of entities by portfolio |
| | | | |
Affaires municipales et Occupation du
territoire | | | | |
| |
Ministère des Affaires municipales
et de l’Occupation du territoire | | | Dept | |
| |
| Commission municipale du Québec | | | BFB | |
| |
| Régie du logement | | | BFB | |
| |
| Regional Development Fund | | | SF | |
| |
| Société d’habitation du Québec | | | NBFB | |
| |
| Agriculture, Pêcheries et Alimentation | | | | |
| |
Ministère de l’Agriculture, des Pêcheries
et de l’Alimentation | | | Dept | |
| |
Commission de protection du territoire
agricole du Québec | | | BFB | |
| |
Régie des marchés agricoles et
alimentaires du Québec | | | BFB | |
| |
| La Financière agricole du Québec | | | NBFB | |
| |
| National Assembly | | | | |
| |
| National Assembly | | | Other | |
| |
Conseil du trésor et Administration
gouvernementale | | | | |
| |
| Secrétariat du Conseil du trésor | | | Dept | |
| |
| Commission de la fonction publique | | | BFB | |
| |
| Natural Disaster Assistance Fund | | | SF | |
| |
| Centre de services partagés du Québec | | | NBFB | |
| |
| Société québécoise des infrastructures | | | NBFB | |
| |
| Conseil exécutif | | | | |
| |
| Ministère du Conseil exécutif | | | Dept | |
| |
| Commission d’accès à l’information | | | BFB | |
| |
| Centre de la francophonie des Amériques | | | NBFB | |
| | | | |
| Culture et Communications | | | | |
| |
Ministère de la Culture et des
Communications | | | Dept | |
| |
| Commission de toponymie | | | BFB | |
| |
| Conseil du patrimoine culturel du Québec | | | BFB | |
| |
| Conseil supérieur de la langue française | | | BFB | |
| |
| Office québécois de la langue française | | | BFB | |
| |
| Québec Cultural Heritage Fund | | | SF | |
| |
Bibliothèque et Archives nationales
du Québec | | | NBFB | |
| |
| Conseil des arts et des lettres du Québec | | | NBFB | |
| |
Conservatoire de musique et d’art
dramatique du Québec | | | NBFB | |
| |
| Musée d’art contemporain de Montréal | | | NBFB | |
| |
| Musée de la civilisation | | | NBFB | |
| |
| Musée national des beaux-arts du Québec | | | NBFB | |
| |
| Régie du cinéma | | | NBFB | |
| |
Société de développement des entreprises
culturelles | | | NBFB | |
| |
| Société de la Place des Arts de Montréal | | | NBFB | |
| |
| Société de télédiffusion du Québec | | | NBFB | |
| |
| Société du Grand Théâtre de Québec | | | NBFB | |
| |
Développement durable, Environnement
et Lutte contre les changements
climatiques | | | | |
| |
Ministère du Développement durable, de
l’Environnement et de la Lutte contre les
changements climatiques | | | Dept | |
| |
Bureau d’audiences publiques sur
l’environnement | | | BFB | |
| |
| Green Fund | | | SF | |
| |
Société québécoise de récupération
et de recyclage | | | NBFB | |
| | |
Legend: | | Dept: department; BFB: budget-funded body; SF: special fund; NBFB: non-budget-funded body; HSSE: health and social services and education networks. |
D.62
| | |
|
List of entities by portfolio (cont.) |
| | | | |
| |
Économie, Innovation et Exportations | | | | |
| |
Ministère de l’Économie, de l’Innovation
et des Exportations | | | Dept | |
| |
Commission de l’éthique en science
et en technologie | | | BFB | |
| |
| Economic Development Fund | | | SF | |
| |
| Centre de recherche industrielle du Québec | | | NBFB | |
| |
Société du parc industriel et portuaire de
Bécancour | | | NBFB | |
| |
Éducation, Enseignement supérieur et
Recherche | | | | |
| |
Ministère de l’Éducation, de l’Enseignement
supérieur et de la Recherche | | | Dept | |
| |
Commission consultative de l’enseignement
privé | | | BFB | |
| |
Commission d’évaluation de l’enseignement
collégial | | | BFB | |
| |
Comité consultatif sur l’accessibilité
financière aux études | | | BFB | |
| |
| Conseil supérieur de l’éducation | | | BFB | |
| |
Sports and Physical Activity Development
Fund | | | SF | |
| |
University Excellence and Performance
Fund | | | SF | |
| |
Institut de tourisme et d’hôtellerie
du Québec | | | NBFB | |
| |
| Institut national des mines | | | NBFB | |
| |
Fonds de recherche du Québec – Nature
et technologies | | | NBFB | |
| |
| Fonds de recherche du Québec – Santé | | | NBFB | |
| |
Fonds de recherche du Québec – Société
et culture | | | NBFB | |
| |
| Cégeps | | | HSSE | |
| |
| Commissions scolaires | | | HSSE | |
| |
| Université du Québec and its constituents | | | HSSE | |
| | | | |
| |
| Énergie et Ressources naturelles | | | | |
| |
Ministère de l’Énergie et des Ressources
naturelles | | | Dept | |
| |
| Territorial Information Fund | | | SF | |
| |
| Natural Resources Fund | | | SF | |
| |
| Régie de l’énergie | | | NBFB | |
| |
Société de développement de
la Baie-James | | | NBFB | |
| |
| Société du Plan Nord | | | NBFB | |
| |
| Société nationale de l’amiante | | | NBFB | |
| |
| Famille | | | | |
| |
| Ministère de la Famille | | | Dept | |
| |
| Curateur public | | | BFB | |
| |
| Caregiver Support Fund | | | SF | |
| |
| Early Childhood Development Fund | | | SF | |
| |
| Finances | | | | |
| |
| Ministère des Finances | | | Dept | |
| |
| Financing Fund | | | SF | |
| |
| Generations Fund | | | SF | |
| |
Fonds of the Bureau de décision
et de révision | | | SF | |
| |
| Fonds du centre financier de Montréal | | | SF | |
| |
| Northern Plan Fund | | | SF | |
| |
| Tax Administration Fund | | | SF | |
| |
| Autorité des marchés financiers | | | NBFB | |
| |
| Agence du revenu du Québec | | | NBFB | |
| |
| Financement-Québec | | | NBFB | |
| |
| Institut de la statistique du Québec | | | NBFB | |
| |
Société de financement des infrastructures
locales du Québec | | | NBFB | |
D.63
| | |
|
List of entities by portfolio (cont.) |
| | | | |
| Forêts, Faune et Parcs | | | | |
Ministère des Forêts, de la Faune
et des Parcs | | | Dept | |
Natural Resources Fund – Sustainable
forest development component | | | SF | |
Fondation de la faune du Québec | | | NBFB | |
Société des établissements de plein air
du Québec | | | NBFB | |
Société des parcs de sciences naturelles
du Québec | | | NBFB | |
| |
| Immigration, Diversité et Inclusion | | | | |
Ministère de l’Immigration, de la Diversité
et de l’Inclusion | | | Dept | |
| |
| Justice | | | | |
Ministère de la Justice | | | Dept | |
Comité de la rémunération des juges | | | BFB | |
Comité de la rémunération des procureurs
aux poursuites criminelles et pénales | | | BFB | |
Commission des droits de la personne
et des droits de la jeunesse | | | BFB | |
Conseil de la justice administrative | | | BFB | |
Conseil de la magistrature | | | BFB | |
Conseil du statut de la femme | | | BFB | |
Directeur des poursuites criminelles
et pénales | | | BFB | |
Office de la protection du consommateur | | | BFB | |
Tribunal des droits de la personne | | | BFB | |
Access to Justice Fund | | | SF | |
Fonds d’aide aux victimes d’actes criminels | | | SF | |
Register Fund of the Ministère de la Justice | | | SF | |
Fund of the Administrative Tribunal
of Québec | | | SF | |
Commission des services juridiques | | | NBFB | |
Fonds d’aide aux recours collectifs | | | NBFB | |
Office des professions du Québec | | | NBFB | |
Société québécoise d’information juridique | | | NBFB | |
| | | | |
Persons Appointed by the National
Assembly | | | | |
Ethics Commissioner | | | BFB | |
Lobbyists Commissioner | | | BFB | |
Chief Electoral Officer | | | BFB | |
Public Protector | | | BFB | |
Auditor General | | | BFB | |
| |
Relations internationales et
Francophonie | | | | |
Ministère des Relations internationales
et de la Francophonie | | | Dept | |
Office Québec-Amériques pour la jeunesse | | | BFB | |
Office Québec-Monde pour la jeunesse | | | BFB | |
| |
| Santé et Services sociaux | | | | |
Ministère de la Santé et des Services
sociaux | | | Dept | |
Commissaire à la santé et au bien-être | | | BFB | |
Office des personnes handicapées
du Québec | | | BFB | |
Fund to Finance Health and Social
Services Institutions | | | SF | |
Health and Social Services Information
Resources Fund | | | SF | |
Fund for the Promotion of a Healthy
Lifestyle | | | SF | |
Corporation d’urgences-santé | | | NBFB | |
Prescription Drug Insurance Fund | | | NBFB | |
Héma-Québec | | | NBFB | |
Institut national de santé publique
du Québec | | | NBFB | |
Institut national d’excellence en santé
et en services sociaux | | | NBFB | |
Régie de l’assurance maladie du Québec | | | NBFB | |
Public health and social services
institutions | | | HSSE | |
D.64
| | | | | | |
| |
List of entities by portfolio (cont.) | | |
Sécurité publique | | | | Travail, Emploi et Solidarité sociale | | |
| | | |
Ministère de la Sécurité publique | | Dept | | Ministère du Travail, de l’Emploi et de la Solidarité sociale | | Dept |
| | | |
Bureau des enquêtes indépendantes | | BFB | | Commission de l’équité salariale | | BFB |
| | | |
Bureau du coroner | | BFB | | Commission des partenaires du marché du travail | | BFB |
| | | |
Comité de déontologie policière | | BFB | | Assistance Fund for Independent Community Action | | SF |
| | | |
Commissaire à la déontologie policière | | BFB | | Labour Market Development Fund | | SF |
| | | |
Commissaire à la lutte contre la corruption | | BFB | | Fonds de la Commission des lésions professionnelles | | SF |
| | | |
Commission québécoise des libérations conditionnelles | | BFB | | Fund of the Commission des relations du travail | | SF |
| | | |
Régie des alcools, des courses et des jeux | | BFB | | Goods and Services Fund | | SF |
| | | |
Police Services Fund | | SF | | Information Technology Fund of the Ministère de l’Emploi et de la Solidarité sociale | | SF |
| | | |
École nationale de police du Québec | | NBFB | | Fonds québécois d’initiatives sociales | | SF |
| | | |
École nationale des pompiers du Québec | | NBFB | | Commission de la capitale nationale du Québec | | NBFB |
| | | |
Tourisme | | | | Commission des normes du travail | | NBFB |
| | | | Office de la sécurité du revenu des chasseurs et piégeurs cris | | NBFB |
| | | |
Ministère du Tourisme | | Dept | | Régie du bâtiment du Québec | | NBFB |
| | | |
Tourism Partnership Fund | | SF | | | | |
| | | |
Régie des installations olympiques | | NBFB | | | | |
| | | |
Société du Centre des congrès de Québec | | NBFB | | | | |
| | | |
Société du Palais des congrès de Montréal | | NBFB | | | | |
| | | |
Transports | | | | | | |
| | | |
Ministère des Transports | | Dept | | | | |
| | | |
Commission des transports du Québec | | BFB | | | | |
| | | |
Rolling Stock Management Fund | | SF | | | | |
| | | |
Highway Safety Fund | | SF | | | | |
| | | |
Land Transportation Network Fund | | SF | | | | |
| | | |
Agence métropolitaine de transport | | NBFB | | | | |
| | | |
Société de l’assurance automobile du Québec | | NBFB | | | | |
| | | |
Société des traversiers du Québec | | NBFB | | | | |
D.65
| APPENDIX 4: | ALLOCATION OF REVENUE FROM CONSUMPTION TAXES AND NATURAL RESOURCES |
Consumption taxes include sales taxes and specific taxes. Sales taxes include, in particular, the Québec sales tax (QST) and the tax on insurance premiums, while specific taxes are applied to fuel, tobacco products and alcoholic beverages. For 2014-2015, revenue from consumption taxes will amount to $17.9 billion, i.e. $14.0 billion from sales taxes and $3.9 billion from specific taxes.
TABLE D.31
Revenue from consumption taxes
| | | | | | | | | | | | |
| (millions of dollars) | |
| | | |
| | | 2014-2015 | | | 2015-2016 | | | 2016-2017 | |
| | | |
Sales taxes(1) | | | 13 985 | | | | 14 556 | | | | 15 002 | |
| | | |
Fuel | | | 2 327 | | | | 2 425 | | | | 2 446 | |
| | | |
Tobacco products | | | 1 103 | | | | 1 093 | | | | 1 027 | |
| | | |
Alcoholic beverages(2) | | | 501 | | | | 527 | | | | 131 | |
| | | |
TOTAL | | | 17 916 | | | | 18 601 | | | | 18 606 | |
| (1) | Includes revenue from pari mutuel. |
| (2) | Excludes an annual amount of $100 million in 2014-2015 and 2015-2016 and an amount of $500 million in 2016-2017 dedicated to the Generations Fund. |
D.67
Within the meaning of the Act respecting the Québec sales tax,12 sales taxes include the QST as well as the tax on insurance premiums, the tax on lodging and the specific duty on new tires. For 2014-2015, sales tax revenue will reach $14.0 billion. More specifically:
| — | the revenue of the general fund, derived from the QST and the tax on insurance premiums, will amount to $15.9 billion; |
| — | revenue of $75 million, derived mainly from the tax on lodging, is allocated to the Tourism Partnership Fund to promote and develop tourism; |
| — | revenue of nearly $20 million, derived in particular from the specific duty on new tires ($3 per tire), is dedicated to the Société québécoise de récupération et de recyclage (RECYC-QUÉBEC) to finance the recycling of used tires. |
Consolidated revenue also takes into account the cost of the solidarity tax credit and consolidation adjustments, such as the elimination of reciprocal transactions between entities in different sectors.
TABLE D.32
Allocation of sales tax revenue(1)
| | | | | | | | | | | | |
(millions of dollars) | |
| | | |
| | | 2014-2015 | | | 2015-2016 | | | 2016-2017 | |
| | | |
General fund(2) | | | 15 888 | | | | 16 482 | | | | 16 951 | |
| | | |
Tourism Partnership Fund | | | 75 | | | | 75 | | | | 75 | |
| | | |
RECYC-QUÉBEC | | | 18 | | | | 19 | | | | 19 | |
| | | |
Solidarity tax credit and other(3) | | | –1 996 | | | | –2 020 | | | | –2 043 | |
| | | |
TOTAL | | | 13 985 | | | | 14 556 | | | | 15 002 | |
| (1) | Includes the tax on insurance premiums, the tax on lodging and the specific duty on new tires. |
| (2) | Includes revenue from pari mutuel. |
| (3) | Includes, in particular, the solidarity tax credit of $1.8 billion in 2014-2015 and the partial rebate of the QST paid on property and services acquired by institutions in the health and social services and education networks. |
| Note: | The structure of the solidarity tax credit is based on the replaced tax credits and has three components, i.e. a component to compensate for the QST, a component aimed at households that assume eligible housing expenses and a component for individuals living in northern villages. |
D.68
For 2014-2015, the government’s own-source revenue from the specific tax on fuel will total $2.3 billion. This amount includes:
| — | revenue from the specific tax of 19.2 cents per litre and 20.2 cents per litre on gasoline and diesel fuel (non-coloured fuel oil) respectively, paid into the Land Transportation Network Fund (FORT) to finance the road network and public transit infrastructure ($2.2 billion): |
| | — | revenue from FORT also includes revenue from the specific tax of 1 cent per litre of gasoline sold within the territory of the Gaspésie–Îles-de-la-Madeleine administrative region to improve public transportation services in this region ($1 million); |
| — | revenue from the specific tax of 3 cents per litre on kerosene fuel (domestic), aviation fuel and fuel oil for locomotives, paid into the general fund ($16 million); |
| — | revenue from the specific tax of 3 cents per litre of gasoline sold within the territory of the Agence métropolitaine de transport (AMT), paid to the AMT, for public transportation services in the metropolitan Montréal region ($101 million). |
TABLE D.33
Allocation of revenue from the specific taxes on fuel
| | | | | | | | | | | | |
| (millions of dollars) | |
| | | |
| | | 2014-2015 | | | 2015-2016 | | | 2016-2017 | |
| | | |
FORT | | | 2 210 | | | | 2 306 | | | | 2 325 | |
| | | |
General fund | | | 16 | | | | 17 | | | | 18 | |
| | | |
AMT | | | 101 | | | | 102 | | | | 103 | |
| | | |
TOTAL | | | 2 327 | | | | 2 425 | | | | 2 446 | |
D.69
| ¡ | Specific tax on tobacco products |
For 2014-2015, tax revenue from the sale of tobacco products amounts to $1.1 billion, including:
| — | $972 million paid into the general fund; |
| — | $131 million allocated to various special funds. |
TABLE D.34
| | | | | | | | | | | | |
Allocation of revenue from the specific tax on tobacco products (millions of dollars) | |
| | | |
| | | 2014-2015 | | | 2015-2016 | | | 2016-2017 | |
| | | |
General fund | | | 972 | | | | 962 | | | | 896 | |
| | | |
Special funds | | | | | | | | | | | | |
| | | |
Sports and Physical Activity Development Fund(1) | | | 60 | | | | 60 | | | | 60 | |
| | | |
Québec Cultural Heritage Fund | | | 16 | | | | 16 | | | | 16 | |
| | | |
Fund for the Promotion of a Healthy Lifestyle | | | 20 | | | | 20 | | | | 20 | |
| | | |
Early Childhood Development Fund | | | 15 | | | | 15 | | | | 15 | |
| | | |
Caregiver Support Fund | | | 15 | | | | 15 | | | | 15 | |
| | | |
Fonds Avenir Mécénat Culture(1),(2) | | | 5 | | | | 5 | | | | 5 | |
| | | |
Subtotal | | | 131 | | | | 131 | | | | 131 | |
| | | |
TOTAL | | | 1 103 | | | | 1 093 | | | | 1 027 | |
| (1) | Each of these funds includes an allocation of $5 million in 2014-2015 subject to the passage, by March 31, 2015 at the latest, of the bill entitled An Act mainly to implement certain provisions of the Budget Speech of 4 June 2014 and return to a balanced budget in 2015-2016. |
| (2) | This special fund will be created following the passage of the bill entitled An Act mainly to implement certain provisions of the Budget Speech of 4 June 2014 and return to a balanced budget in 2015-2016. |
D.70
| ¡ | Specific tax on alcoholic beverages |
Tax revenue from the sale of alcoholic beverages totals $601 million in 2014-2015. This revenue will reach $631 million in 2016-2017.
| — | In 2014-2015 and 2015-2016, $100 million from the specific tax will be allocated to the Generations Fund each year. |
| — | As of 2016-2017, an additional amount of $400 million will be deposited in the Fund, bringing the total deposit from the specific tax on alcoholic beverages in the Generations Fund to $500 million annually. |
TABLE D.35
| | | | | | | | | | | | |
Allocation of revenue from the specific tax on alcoholic beverages (millions of dollars) | |
| | | |
| | | 2014-2015 | | | 2015-2016 | | | 2016-2017 | |
| | | |
General fund | | | 501 | | | | 527 | | | | 131 | |
| | | |
Generations Fund | | | 100 | | | | 100 | | | | 500 | |
| | | | |
TOTAL | | | 601 | | | | 627 | | | | 631 | |
D.71
| q | | Natural resource duties and permits |
The government uses various means to enable Quebecers to benefit from the development of natural resources. It collects revenues from resource development, as well as revenue from the granting of permits.
| — | An exploration licence confers on the holder an exclusive right for exploration and the future development of the resource concerned. A lease (or right) to produce enables the holder to develop the resource in exchange for the payment of an annual rent. |
In addition, to enable future generations to benefit from natural resource development and to ensure the sustainable development of resources, the legislation currently stipulates that a portion of the revenue derived from natural resources must be devoted to:
| — | the Natural Resources Fund, in particular, to finance: |
| | — | activities fostering the development of mineral potential, including geoscientific knowledge acquisition activities, research and development on techniques for the exploration, development, redevelopment and rehabilitation of mining sites and support for the development of Québec entrepreneurship (mining heritage component), |
| | — | forest development work to ensure the sustainability of Québec’s forest (sustainable forest development component); |
| — | reduction of the debt through the deposit in the Generations Fund of revenue from mining resources (100% as of 2015-2016) and water-power royalties. |
Total revenue from natural resources will stand at $1.1 billion in 2014-2015 and $1.2 billion in 2015-2016.
TABLE D.36
| | | | | | | | | | | | |
Revenue from natural resources (millions of dollars) | |
| | | |
| | | 2014-2015 | | | 2015-2016 | | | 2016-2017 | |
Duties and royalties | | | | | | | | | | | | |
Mining | | | 65 | | | | 125 | | | | 180 | |
Forest | | | 240 | | | | 270 | | | | 279 | |
Water-power | | | 752 | | | | 759 | | | | 775 | |
Oil and natural gas | | | — | | | | — | | | | — | |
Subtotal | | | 1 057 | | | | 1 154 | | | | 1 234 | |
Other duties and permits | | | | | | | | | | | | |
Mining | | | 11 | | | | 11 | | | | 11 | |
Forest | | | 30 | | | | 35 | | | | 42 | |
Oil and natural gas | | | 1 | | | | 1 | | | | 2 | |
Subtotal | | | 42 | | | | 47 | | | | 55 | |
TOTAL | | | 1 099 | | | | 1 201 | | | | 1 289 | |
Allocation of revenue | | | | | | | | | | | | |
General fund | | | 90 | | | | 66 | | | | 84 | |
Special funds(1) | | | 260 | | | | 263 | | | | 262 | |
Generations Fund | | | 749 | | | | 872 | | | | 943 | |
| (1) | Includes, in particular, revenue paid into the Natural Resources Fund under the sustainable forest development component and the mining heritage component. |
D.72
| APPENDIX 5: | DETAILED CONSOLIDATED FINANCIAL FRAMEWORK |
D.73
| | | | | | | | | | | | | | | | |
TABLE D.37 Detailed consolidated financial framework | |
| (millions of dollars) | |
| | | 2014-2015 | |
| | | Consolidated Revenue Fund | |
| | | | |
| | | | |
| | | General
fund | | | Special
funds | | | Generations
Fund | | | Specified
purpose
accounts | |
Revenus | | | | | | | | | | | | | | | | |
| | | | |
Personal income tax | | | 19 635 | | | | 1 157 | | | | — | | | | — | |
| | | | |
Contributions for health services | | | 6 905 | | | | 725 | | | | — | | | | — | |
| | | | |
Corporate taxes | | | 3 340 | | | | 202 | | | | — | | | | — | |
| | | | |
School property tax | | | — | | | | — | | | | — | | | | — | |
| | | | |
Consumption taxes | | | 17 377 | | | | 2 416 | | | | — | | | | — | |
| | | | |
Duties and permits | | | 372 | | | | 1 766 | | | | — | | | | — | |
| | | | |
Miscellaneous revenue | | | 1 444 | | | | 1 806 | | | | — | | | | 214 | |
| | | | |
Government enterprises | | | 5 266 | | | | — | | | | — | | | | — | |
| | | | |
Generations Fund revenue | | | — | | | | — | | | | 1 253 | | | | — | |
| | | | |
Own-source revenue | | | 54 339 | | | | 8 072 | | | | 1 253 | | | | 214 | |
| | | | |
Québec government transfers | | | — | | | | 2 105 | | | | — | | | | — | |
| | | | |
Federal transfers | | | 16 832 | | | | 521 | | | | — | | | | 968 | |
| | | | |
Total revenue | | | 71 171 | | | | 10 698 | | | | 1 253 | | | | 1 182 | |
| | | | |
Expenditure | | | | | | | | | | | | | | | | |
| | | | |
Expenditure | | | –65 704 | | | | –8 694 | | | | — | | | | –1 182 | |
| | | | |
Debt service | | | –8 164 | | | | –1 372 | | | | — | | | | — | |
| | | | |
Total expenditure | | | –73 868 | | | | –10 066 | | | | — | | | | –1 182 | |
| | | | |
Contingency reserve | | | — | | | | | | | | | | | | | |
| | | | |
SURPLUS (DEFICIT) | | | –2 697 | | | | 632 | | | | 1 253 | | | | — | |
| | | | |
BALANCED BUDGET ACT | | | | | | | | | | | | | | | | |
| | | | |
Deposits of dedicated revenues in the Generations Fund | | | | | | | | | | | –1 253 | | | | | |
| | | | |
BUDGETARY BALANCE(3) | | | | | | | | | | | | | | | | |
| (1) | Includes doubtful tax accounts. |
| (2) | Reclassification of abatements and consolidation adjustments resulting mainly from the elimination of reciprocal transactions between entities in different sectors. |
| (3) | Budgetary balance within the meaning of the Balanced Budget Act. |
D.74
| | | | | | | | | | | | | | | | | | |
| | | |
| | | |
| 2014-2015 | |
| | | | | | | | | | | | | | |
| | | | | | | | | | | | | | |
| | | | |
Tax-funded
expenditures(1) | | | Non-budget- funded bodies | | | Health and
social services
and education
networks | | | Consolidation adjustments(2) | | | Consolidated
results | |
| | | | | | | | | | | | | | | | | | |
| | | | |
| | 4 337 | | | | — | | | | — | | | | 1 816 | | | | 26 945 | |
| | | | |
| | — | | | | — | | | | — | | | | –1 187 | | | | 6 443 | |
| | | | |
| | 2 111 | | | | 70 | | | | — | | | | — | | | | 5 723 | |
| | | | |
| | — | | | | — | | | | 1 909 | | | | — | | | | 1 909 | |
| | | | |
| | 201 | | | | 120 | | | | — | | | | –2 198 | | | | 17 916 | |
| | | | |
| | — | | | | 410 | | | | — | | | | –58 | | | | 2 490 | |
| | | | |
| | — | | | | 5 897 | | | | 3 978 | | | | –3 991 | | | | 9 348 | |
| | | | |
| | — | | | | — | | | | — | | | | — | | | | 5 266 | |
| | | | |
| | — | | | | — | | | | — | | | | — | | | | 1 253 | |
| | | | |
| | 6 649 | | | | 6 497 | | | | 5 887 | | | | –5 618 | | | | 77 293 | |
| | | | |
| | — | | | | 12 479 | | | | 32 950 | | | | –47 534 | | | | — | |
| | | | |
| | — | | | | 727 | | | | 280 | | | | –608 | | | | 18 720 | |
| | | | |
| | 6 649 | | | | 19 703 | | | | 39 117 | | | | –53 760 | | | | 96 013 | |
| | | | |
| | | | | | | | | | | | | | | | | | |
| | | | |
| | –6 649 | | | | –18 523 | | | | –38 354 | | | | 52 329 | | | | –86 777 | |
| | | | |
| | — | | | | –919 | | | | –842 | | | | 964 | | | | –10 333 | |
| | | | |
| | –6 649 | | | | –19 442 | | | | –39 196 | | | | 53 293 | | | | –97 110 | |
| | | | |
| | | | | | | | | | | | | | | | | | — | |
| | | | |
| | — | | | | 261 | | | | –79 | | | | –467 | | | | –1 097 | |
| | | | |
| | | | | | | | | | | | | | | | | | |
| | | | |
| | | | | | | | | | | | | | | | | | –1 253 | |
| | | | |
| | | | | | | | | | | | | | | | | | –2 350 | |
D.75
|
| TABLE D.38 |
|
Detailed consolidated financial framework |
| | | | | | | | | | | | | | | | |
| (millions of dollars) | | | |
| | | 2015-2016 | |
| | | Consolidated Revenue Fund | |
| | | | |
| | |
| General
fund |
| |
| Special
funds |
| |
| Generations
Fund |
| |
| Specified
purpose
accounts |
|
Revenus | | | | | | | | | | | | | | | | |
| | | | |
Personal income tax | | | 20 950 | | | | 1 178 | | | | — | | | | — | |
| | | | |
Contributions for health services | | | 7 036 | | | | 734 | | | | — | | | | — | |
| | | | |
Corporate taxes | | | 4 314 | | | | 205 | | | | — | | | | — | |
| | | | |
School property tax | | | — | | | | — | | | | — | | | | — | |
| | | | |
Consumption taxes | | | 17 988 | | | | 2 512 | | | | — | | | | — | |
| | | | |
Duties and permits | | | 362 | | | | 2 033 | | | | — | | | | — | |
| | | | |
Miscellaneous revenue | | | 1 629 | | | | 1 781 | | | | — | | | | 187 | |
| | | | |
Government enterprises | | | 4 857 | | | | — | | | | — | | | | — | |
| | | | |
Generations Fund revenue | | | — | | | | — | | | | 1 586 | | | | — | |
| | | | |
Own-source revenue | | | 57 136 | | | | 8 443 | | | | 1 586 | | | | 187 | |
| | | | |
Federal transfers | | | — | | | | 2 122 | | | | — | | | | — | |
| | | | |
Total revenue | | | 17 322 | | | | 482 | | | | — | | | | 868 | |
| | | | |
Expenditure | | | 74 458 | | | | 11 047 | | | | 1 586 | | | | 1 055 | |
| | | | |
Dépenses | | | | | | | | | | | | | | | | |
| | | | |
Expenditure | | | –66 460 | | | | –9 336 | | | | — | | | | –1 055 | |
| | | | |
Debt service | | | –8 331 | | | | –1 432 | | | | — | | | | — | |
Total expenditure | | | –74 791 | | | | –10 768 | | | | — | | | | –1 055 | |
Contingency reserve | | | — | | | | | | | | | | | | | |
SURPLUS (DEFICIT) | | | –333 | | | | 279 | | | | 1 586 | | | | — | |
BALANCED BUDGET ACT | | | | | | | | | | | | | | | | |
| | | | |
Deposits of dedicated revenues in the Generations Fund | | | | | | | | | | | –1 586 | | | | | |
BUDGETARY BALANCE(3) | | | | | | | | | | | | | | | | |
| (1) | Includes doubtful tax accounts. |
| (2) | Reclassification of abatements and consolidation adjustments resulting mainly from the elimination of reciprocal transactions between entities in different sectors. |
| (3) | Budgetary balance within the meaning of the Balanced Budget Act. |
D.76
| | | | | | | | | | | | | | | | | | |
| | | | | |
| 2015-2016 | |
| | | | | | | | | | | | | | | | | | | |
| | | | |
| Tax-funded
expenditures |
(1) | |
| Non-budget-
funded bodies |
| |
| Health and
social services and education networks |
| |
| Consolidation
adjustments |
(2) | |
| Consolidated
results |
|
| | 4 244 | | | | — | | | | — | | | | 1 846 | | | | 28 218 | |
| | | | |
| | — | | | | — | | | | — | | | | –1 199 | | | | 6 571 | |
| | | | |
| | 1 857 | | | | 71 | | | | — | | | | — | | | | 6 447 | |
| | | | |
| | — | | | | — | | | | 2 030 | | | | — | | | | 2 030 | |
| | | | |
| | 207 | | | | 121 | | | | — | | | | –2 227 | | | | 18 601 | |
| | | | |
| | — | | | | 419 | | | | — | | | | –59 | | | | 2 755 | |
| | | | |
| | — | | | | 6 025 | | | | 4 053 | | | | –4 024 | | | | 9 651 | |
| | | | |
| | — | | | | — | | | | — | | | | — | | | | 4 857 | |
| | | | |
| | — | | | | — | | | | — | | | | — | | | | 1 586 | |
| | | | | |
| | 6 308 | | | | 6 636 | | | | 6 083 | | | | –5 663 | | | | 80 716 | |
| | | | |
| | — | | | | 12 734 | | | | 33 213 | | | | –48 069 | | | | — | |
| | | | |
| | — | | | | 1 089 | | | | 283 | | | | –600 | | | | 19 444 | |
| | | | |
| | 6 308 | | | | 20 459 | | | | 39 579 | | | | –54 332 | | | | 100 160 | |
| | | | |
| | –6 308 | | | | –19 402 | | | | –38 774 | | | | 53 244 | | | | –88 091 | |
| | | | |
| | — | | | | –843 | | | | –815 | | | | 938 | | | | –10 483 | |
| | –6 308 | | | | –20 245 | | | | –39 589 | | | | 54 182 | | | | –98 574 | |
| | | | | | | | | | | | | | | | | | — | |
| | | | |
| | — | | | | 214 | | | | –10 | | | | –150 | | | | 1 586 | |
| | | | | | | | | | | | | | | | | | –1 586 | |
| | | | | | | | | | | | | | | | | | — | |
D.77
|
TABLE D.39 Consolidated financial framework |
| | | | | | | | | | | | | | | | |
| (millions of dollars) | |
| | | 2016-2017 | |
| | | Consolidated Revenue Fund | |
| | | | |
| | | General
fund | | | Special
funds | | | Generations
Fund | | | Specified
purpose
accounts | |
| | | | |
Revenus | | | | | | | | | | | | | | | | |
| | | | |
Personal income tax | | | 22 194 | | | | 1 204 | | | | — | | | | — | |
| | | | |
Contributions for health services | | | 7 210 | | | | 662 | | | | — | | | | — | |
| | | | |
Corporate taxes | | | 4 744 | | | | 206 | | | | — | | | | — | |
| | | | |
School property tax | | | — | | | | — | | | | — | | | | — | |
| | | | |
Consumption taxes | | | 17 996 | | | | 2 531 | | | | — | | | | — | |
| | | | |
Duties and permits | | | 389 | | | | 2 001 | | | | — | | | | — | |
| | | | |
Miscellaneous revenue | | | 1 627 | | | | 2 030 | | | | — | | | | 187 | |
| | | | |
Government enterprises | | | 4 795 | | | | — | | | | — | | | | — | |
| | | | |
Generations Fund revenue | | | — | | | | — | | | | 2 236 | | | | — | |
| | | | |
Own-source revenue | | | 58 955 | | | | 8 634 | | | | 2 236 | | | | 187 | |
| | | | |
Québec government transfers | | | — | | | | 2 096 | | | | — | | | | — | |
| | | | |
Federal transfers | | | 18 001 | | | | 480 | | | | — | | | | 761 | |
| | | | |
Total revenue | | | 76 956 | | | | 11 210 | | | | 2 236 | | | | 948 | |
| | | | |
Expenditure | | | | | | | | | | | | | | | | |
| | | | |
Expenditure | | | –67 889 | | | | –9 365 | | | | — | | | | –948 | |
| | | | |
Debt service | | | –8 615 | | | | –1 652 | | | | — | | | | — | |
| | | | |
Total expenditure | | | –76 504 | | | | –11 017 | | | | — | | | | –948 | |
| | | | | |
Contingency reserve | | | –400 | | | | | | | | | | | | | |
| | | | | |
SURPLUS (DEFICIT) | | | 52 | | | | 193 | | | | 2 236 | | | | — | |
| | | | |
BALANCED BUDGET ACT | | | | | | | | | | | | | | | | |
| | | | |
Deposits of dedicated revenues in the Generations Fund | | | | | | | | | | | –2 236 | | | | | |
| | | | | |
BUDGETARY BALANCE(3) | | | | | | | | | | | | | | | | |
| (1) | Includes doubtful tax accounts. |
| (2) | Reclassification of abatements and consolidation adjustments resulting mainly from the elimination of reciprocal transactions between entities in different sectors. |
| (3) | Budgetary balance within the meaning of the Balanced Budget Act. |
D.78
| | | | | | | | | | | | | | | | | | |
2016-2017 | |
| | | | | | | | | | | | | | | | | | |
| Tax-funded
expenditures |
(1) | |
| Non-budget-
funded
bodies |
| |
| Health and
social services
and education
networks |
| |
| Consolidation
adjustments |
(2) | |
| Consolidated
results |
|
| | 4 239 | | | | — | | | | — | | | | 1 895 | | | | 29 532 | |
| | | | |
| | — | | | | — | | | | — | | | | –1 216 | | | | 6 656 | |
| | | | |
| | 1 752 | | | | 72 | | | | — | | | | — | | | | 6 774 | |
| | | | |
| | — | | | | — | | | | 2 109 | | | | — | | | | 2 109 | |
| | | | |
| | 213 | | | | 122 | | | | — | | | | –2 256 | | | | 18 606 | |
| | | | |
| | — | | | | 430 | | | | — | | | | –59 | | | | 2 761 | |
| | | | |
| | — | | | | 6 061 | | | | 4 151 | | | | –4 163 | | | | 9 893 | |
| | | | |
| | — | | | | — | | | | — | | | | — | | | | 4 795 | |
| | | | |
| | — | | | | — | | | | — | | | | — | | | | 2 236 | |
| | | | | |
| | 6 204 | | | | 6 685 | | | | 6 260 | | | | –5 799 | | | | 83 362 | |
| | | | |
| | — | | | | 13 255 | | | | 33 340 | | | | –48 691 | | | | — | |
| | | | |
| | — | | | | 1 066 | | | | 258 | | | | –637 | | | | 19 929 | |
| | | | | |
| | 6 204 | | | | 21 006 | | | | 39 858 | | | | –55 127 | | | | 103 291 | |
| | | | |
| | | | | | | | | | | | | | | | | | |
| | | | |
| | –6 204 | | | | –20 057 | | | | –38 974 | | | | 53 716 | | | | –89 721 | |
| | | | |
| | — | | | | –836 | | | | –884 | | | | 1 053 | | | | –10 934 | |
| | | | | |
| | –6 204 | | | | –20 893 | | | | –39 858 | | | | 54 769 | | | | –100 655 | |
| | | | |
| | | | | | | | | | | | | | | | | –400 | |
| | | | | |
| | — | | | | 113 | | | | — | | | | –358 | | | | 2 236 | |
| | | | |
| | | | | | | | | | | | | | | | | –2 236 | |
| | | | | |
| | | | | | | | | | | | | | | | | | — | |
D.79