OMB APPROVAL
OMB Number:3235-0570
Expires: September 30, 2007
Estimated average burden
hours per response..... 19.4
UNITED STATES
SECURITIES AND EXCHANGE COMMISSION
Washington, D.C. 20549
FORM N-CSR
CERTIFIED SHAREHOLDER REPORT OF REGISTERED
MANAGEMENT INVESTMENT COMPANIES
Investment Company Act file number 811-3790
The Quantitative Group of Funds
(Exact name of registrant as specified in charter)
55 Old Bedford Road, Lincoln, MA 01773
(Address of principal executive offices)
Elizabeth A. Watson,
Quantitative Investment Advisors, Inc.
55 Old Bedford Road, Lincoln, MA 01773
(Name and address of agent for service)
Registrant’s telephone number, including area code: (781) 676-5900
Date of fiscal year end: | March 31 |
Date of reporting period: | April 1, 2006 through September 30, 2006 |
ITEM 1. REPORTS TO SHAREOWNERS.
QUANT FUNDS

SEPTEMBER 30, 2006
SEMI-ANNUAL
REPORT
U.S. EQUITY FUNDS
Quant Small Cap Fund
Quant Growth and Income Fund
INTERNATIONAL EQUITY FUNDS
Quant Emerging Markets Fund
Quant Foreign Value Fund
TABLE OF CONTENTS
| President's Letter | 1 | ||||||
| Useful Information About Your Fund Report | 2 | ||||||
| Portfolio Manager Commentaries | |||||||
| Quant Small Cap Fund | 3 | ||||||
| Quant Growth and Income Fund | 5 | ||||||
| Quant Emerging Markets Fund | 7 | ||||||
| Quant Foreign Value Fund | 9 | ||||||
| Schedules of Investments | |||||||
| Quant Small Cap Fund | 11 | ||||||
| Quant Growth and Income Fund | 13 | ||||||
| Quant Emerging Markets Fund | 15 | ||||||
| Quant Foreign Value Fund | 17 | ||||||
| Statement of Assets and Liabilities | 19 | ||||||
| Statement of Operations | 20 | ||||||
| Statement of Changes in Net Assets | 21 | ||||||
| Financial Highlights | 23 | ||||||
| Notes to Financial Statements | 27 | ||||||
| Information for Shareholders | 33 | ||||||
| Trustees and Officers | 42 | ||||||
| Service Providers | back cover | ||||||
This report must be preceded or accompanied by a current Quant Funds prospectus. You should read the prospectus carefully before investing because it contains more complete information on the Quant Funds' investment objectives, risks, charges and expenses. Please consider this information carefully. For a prospectus and other information, call (800) 326-2151 or visit www.quantfunds.com.
NOT FDIC INSURED • MAY LOSE VALUE • NO BANK GUARANTEE
Neither the Quant Funds nor U.S. Boston Capital Corporation is a bank.
QUANT FUNDS
Dear Fellow Shareholder:
We are pleased to provide you with the Quant Funds' Semi-Annual Report for the six months ended September 30, 2006 to update you on recent market conditions and the performance of the Quant Funds.
Economic, political and social concerns continue to be common themes when considering market conditions. Even in the face of such concerns, we have generally remained optimistic about the potential for positive equity market performance in fiscal 2007. Year-to-date our optimism appears to have been reasonable with both the Standard and Poor's 500 Index and the Dow Jones Industrial Average trending upward in the 6-month period of this report. In the weeks since the close of the third quarter, the Dow in particular has been setting and breaking records while experiencing some volatility.
World equity market performance was generally positive for the six-months ended September 30, 2006. The U.S. equity market was up 4.14% (as represented by the S&P 500 Index). Established foreign equity markets ended slightly higher than the U.S. market at 4.97% (as represented by the Morgan Stanley Capital International Europe, Australasia and Far East ("MSCI EAFE") Index). Equities in the emerging markets lagged somewhat ending up 0.53% (as represented by the Morgan Stanley Capital International Emerging Markets ("MSCI EM") Index). One notable exception to the positive trend was the U.S. small cap equities market which was down 4.60% (as represented by the Russell 2000 Index), significantly underperforming the broader U.S. market.
| 6-month Index Performance | |||||||
| S&P 500 |  4.14 4.14 | % | |||||
| Russell 2000 |  4.60 4.60 | % | |||||
| MSCI EAFE |  4.97 4.97 | % | |||||
| MSCI EM |  0.53 0.53 | % | |||||
We are encouraged by continuing investor interest in mutual funds as evidenced by recent reports that U.S. mutual fund assets passed the $10 trillion mark for the first time in the calendar quarter ended September 30, 2006. This asset level is up from $3.5 trillion in 1996 and from $716 billion in 1986. It is also encouraging that some political analysts believe that pro-business legislation will be proposed soon after the mid-term U.S. elections that will seek to relieve some of the regulatory burdens that have been unintended consequences of legislation adopted in recent years, which may reduce costs and free up capacity for development.
Other factors are decidedly mixed. U.S. consumers have welcomed the relief of falling gasoline prices and the softening of the price of oil which may have been enough to ease fears of inflation in the short-term, permitting the Federal Reserve to hold interest rates steady in August, September and October. On the other hand, there is some concern that the apparent decline in the U.S. housing market is a signal of a slowing U.S. economy. If this triggers a drop in consumer spending it could further slow economic growth both here and abroad. Economic, political and social concerns – such as nuclear developments in North Korea and the Middle East and the continuing conflict in Iraq – continue to create uncertainty for the markets.
Looking ahead, the portfolio managers for each of the Quant Funds are optimistic about the prospects for good investment opportunities for the remainder of the fiscal year. We invite you to review the Investment Commentary for your Fund for more information.
We thank you for your continued confidence in Quant Funds. We welcome your comments and feedback. Please feel free to email us at feedback@quantfunds.com or call us at 800-326-2151 with any questions or for assistance on your account.
Sincerely,

Willard Umphrey
President and Chairman
Any information in this shareholder letter regarding market or economic trends or the factors influencing the historical or future performance of the Quant Funds are the views of Fund management as of the date of this report. These views are subject to change at any time based upon market and other conditions, and Fund management disclaims any responsibility to update such views. These views may not be relied upon as investment advice or as an indication of trading intent on behalf of any Quant Fund. Any references to specific securities are not recommendations of such securities and may not be representative of any Quant Fund's current or future investments.
Past performance is no guarantee of future results, and there is no guarantee that market forecasts will be realized.
1
USEFUL INFORMATION
ABOUT YOUR FUND REPORT
PORTFOLIO MANAGER INVESTMENT COMMENTARIES
The portfolio manager commentaries in this report include valuable insight from the portfolio managers as well as statistical information to help you understand your fund's characteristics and how your fund's performance tracks that of a comparable index.
Please keep in mind that the opinions expressed by the portfolio managers in their commentaries are a reflection of their views at the time this report was compiled as of September 30, 2006. As economic, political, social and other changes occur, so could a manager's opinions. A manager's opinions are unique to that manager and are not necessarily the opinions of Quantitative Advisors or the subadviser or their employees.
FUND EXPENSES
We believe it's important for Fund shareholders to have a clear understanding of fund expenses and the impact expenses have on investment returns.
The following is important information about each Fund's Expense Example, which appears in each Fund's Portfolio Manager Commentary in this Shareholder Report. Please refer to this information when reviewing the Expense Example for each Fund.
Expense Example
As a shareholder of a fund, you incur two types of costs: (1) transaction costs, including deferred sales charges (on Ordinary Shares when redeemed) or redemption fees (on Institutional Shares redeemed within 60 days of purchase), and (2) ongoing costs, including management fees, distribution (12b-1) fees (on Ordinary Shares) and other Fund expenses. The example is intended to help you understand your ongoing costs (in dollars) of investing in a Fund and to compare these costs with the ongoing costs of investing in other mutual funds. These examples are based on $1,000 invested at the beginning of the period and held for the entire period from April 1, 2006 to September 30, 2006.
Actual Expenses and Returns
The first half of the table in the example provides information about actual account returns and actual expenses. You may use the information in this section, together with the amount you invested, to estimate the expenses that you paid over the period.
To estimate the expenses you paid over the period, simply divide your account value by $1,000, then multiply the result by the number in the third line under the heading "Expenses Paid During the Period."
Hypothetical Example for Comparison Purposes
The second half of the table in the example shows you hypothetical account values and hypothetical expenses based on the Fund's actual expense ratio and an assumed rate of return of 5% per year before expenses, which is not the Fund's actual return.
The hypothetical account values and hypothetical expenses may not be used to estimate the actual ending account balance or expenses you paid for the period. You may use this information to compare the ongoing expenses of investing in the Fund with the ongoing expenses of other funds. To do so, compare the Fund's 5% hypothetical example with the 5% hypothetical examples that appear in the shareholder reports of other funds.
Please note that the expenses shown in the table are meant to highlight your ongoing costs. They do not reflect any transactional costs, such as deferred sales charges or redemption fees (where applicable). Thus, the second line of each table is useful in comparing ongoing costs only, and will not help you determine the relative costs of owning different funds. In addition, if these transactional costs were included, your costs would have been higher. See the Funds' prospectus for a complete description of these transactional costs.
2
QUANT SMALL CAP FUND
INVESTMENT PROFILE All Data as of September 30, 2006
INVESTMENT COMMENTARY
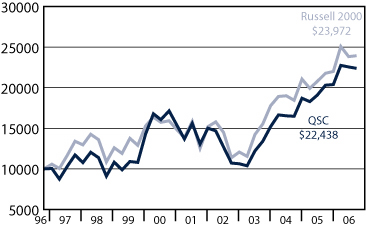
For the semi-annual period from April 1, 2006 though September 30, 2006, Small Cap Fund's Ordinary Shares outperformed its benchmark, the Russell 2000 Index. The Fund achieved a return of 0.61% at net asset value compared to -4.60% for the Russell 2000 Index (the "Index").
After a strong beginning to the year where U.S. equities showed broad gains, the market bowed to the continuing pressure of rising interest rates, persistently high energy prices, the ongoing war of words over Iran's nuclear program, and the prospects of a North Korean missile launch. Topping the list of investor concerns however, was the Federal Reserve's very visible fight against inflation. The Fed demonstrated its conviction to counter new evidence of rising prices with two more short-term interest rate hikes in May and June. These represented the sixteenth and seventeenth consecutive quarter point increases in the Federal Funds rate since the Fed began its campaign in June of 2004.
| FUND INFORMATION | |||||||||||
| Ticker Symbol | USBNX | (Ordinary) | |||||||||
| QBNAX | (Institutional) | ||||||||||
| Number of Companies | 62 | ||||||||||
| Price to Book Ratio | 4.1 | ||||||||||
| Price to Earnings Ratio | 19.9 | ||||||||||
| Net Assets Under Management | $110.4 Million | ||||||||||
The Russell 2000 Index peaked in early May, coincident with the Fed's May 10th meeting. This was followed by the mid-May report of consumer inflation when the Labor Department reported that the core (ex-food and energy) consumer price index ("CPI") rose by 0.3% for the second straight month. This number was above expectations and seemed to confirm the Fed's beliefs and it set the tone for possible additional rate increases. As a result, the Russell 2000 Index fell by 4.5% in May. The next report in June confirmed this trend as the core CPI once again posted a 0.3% increase above the expected level of 0.2%. Despite an impressive rally in the last days of June, the equity markets in general were on the defensive for much of the late spring and summer.
A turn for the better began when the Fed left rates unchanged at the August and September meetings, putting at least a temporary hold on its tightening campaign. As a result, interest rates in the market fell and reports of lower inflation followed. But the major catalyst for the market's change in sentiment was the sharp decline in oil, natural gas and gasoline prices in September. The equity markets liked the combination of lower rates and falling energy prices and stocks moved higher through the month with the Russell 2000 Index earning a positive return for September.
In terms of sector performance within the Index, Information Technology was the largest detractor to performance during this period, falling over 10%. Its impact was felt strongly due to the fact that it is one of the largest sector weightings in the Index at just over 18%, second only to Financials at roughly 22%. The Fund's underweight against the Index and better relative performance in this sector versus the Index helped contribute to the Fund's outperformance for the period. Conversely the Fund's overweight in Telecommunication Services, a positive performing sector, also contributed nicely to overall performance.
However, the factor most contributing to the Fund's outperformance of the Index for the semi-annual period was stock selection. Good stock selection in Health Care with Omnicell and Psychiatric Solutions, and in Financials with Ventas and Entertainment Properties Trust clearly lifted the Fund's returns above the index. Core Laboratories, in the Energy sector, was the best contributor to performance for the period and is now the Fund's largest holding.
Stock selection was not perfect however, as Wild Oats Markets, Coeur d'Alene Mines and Carbo Ceramics all fell over 20% for the period. In terms of sector underperformance, the Fund's returns in Utilities and Consumer Staples were negative versus positive for the index, marginally detracting from performance as they are small index and portfolio weightings.
During this semi-annual period, we decreased the Fund's exposure in the Consumer Discretionary sector from over 19% to just below 15%, and Materials from nearly 6% closer to 3%. In turn, we increased the Fund's emphasis in Financials from around 15% to over 18% and Health Care from 9% to over 12%.
Over the near term, we believe the U.S. equity markets will likely be focusing on the mid-term elections in early November as well as the next move by the Federal Reserve. Investors will also be looking for signs as to whether the recent drop in energy prices and interest rates will spark a resurgence of growth in the economy which in turn would be positive for corporate earnings and stocks in the months ahead.
The Fund is co-managed by Robert von Pentz, CFA, and Rhys Williams of Columbia Partners, L.L.C. Investment Management.
3
AVERAGE ANNUAL TOTAL RETURNS
| Three Months | Six Months | One Year | Five Year | Ten Year | Since Inception | Inception Date | |||||||||||||||||||||||||
| Ordinary Shares | 0.35 | % | -0.61 | % | 11.32 | % | 11.57 | % | 8.51 | % | 14.10 | % | 8/3/92 | ||||||||||||||||||
| Ordinary Shares (adjusted)1 | 0.65 | % | -1.60 | % | 10.20 | % | 11.34 | % | 8.40 | % | 14.02 | % | |||||||||||||||||||
| Institutional Shares2 | 0.48 | % | -0.35 | % | 11.85 | % | 12.13 | % | 9.06 | % | 13.06 | % | 1/6/93 | ||||||||||||||||||
| Russell 20003 | 0.44 | % | -4.60 | % | 9.92 | % | 13.78 | % | 9.06 | % | 11.29 | % | |||||||||||||||||||
1 Reflects deduction of a 1% deferred sales charge.
2 Institutional Shares may only be purchased by certain categories of investors and are not subject to sales charges or distribution fees.
3 The Russell 2000 Index is a market capitalization-weighted index of 2,000 small company stocks. It is widely recognized as representative of the general market for small company stocks. Index returns assume the reinvestment of dividends and, unlike Fund returns, do not reflect any fees or expenses. You cannot invest directly in an Index. The beginning date for the Index is 9/30/92.
Small company stocks may trade less frequently and in a limited volume, and their prices may fluctuate more than stocks of other companies. Small company stocks may therefore be more vulnerable to adverse developments than those of larger companies.
TOP TEN HOLDINGS
| Company | % Total Net Assets | ||||||
| Core Laboratories N.V. | 5.1 | ||||||
| Crown Castle International Corporation | 5.0 | ||||||
| Ventas, Inc. | 4.8 | ||||||
| Entertainment Properties Trust | 4.6 | ||||||
| Sierra Health Services, Inc. | 4.5 | ||||||
| Sotheby's | 2.5 | ||||||
| Vail Resorts, Inc. | 2.4 | ||||||
| Kforce Inc. | 2.4 | ||||||
| Psychiatric Solutions, Inc. | 2.3 | ||||||
| NICE-Systems, Ltd. | 2.2 | ||||||
There is no guarantee that such securities will continue to be viewed favorably or held in the Fund's portfolio.
SECTOR ALLOCATION
| % Total Net Assets | |||||||
| Financials | 19.1 | ||||||
| Industrials | 16.1 | ||||||
| Consumer Discretionary | 14.2 | ||||||
| Information Technology | 13.4 | ||||||
| Health Care | 12.2 | ||||||
| Energy | 7.7 | ||||||
| Telecommunication Services | 6.7 | ||||||
| Consumer Staples | 4.7 | ||||||
| Materials | 3.1 | ||||||
| Cash and Other Assets (Net) | 2.8 | ||||||
VALUE OF $10,000 INVESTED IN QUANT SMALL CAP (QSC)
ORDINARY SHARES VS. RUSSELL 2000
ANNUAL FUND OPERATING EXPENSES
Please refer to page 2 for an explanation of the information presented in the following Expense Example.
| Actual Performance | Hypothetical Performance (5% return before expenses) | ||||||||||||||||||
| Ordinary Shares | Institutional Shares | Ordinary Shares | Institutional Shares | ||||||||||||||||
| Beginning Account Value (04/01/06) | $ | 1,000.00 | $ | 1,000.00 | $ | 1,000.00 | $ | 1,000.00 | |||||||||||
| Ending Account Value (09/30/06) | $ | 993.91 | $ | 996.46 | $ | 1,015.90 | $ | 1,018.46 | |||||||||||
| Expenses Paid During The Period | $ | 9.14 | $ | 6.60 | $ | 9.24 | $ | 6.67 | |||||||||||
For each class of the Fund, expenses are equal to the annualized expense ratio for the class (1.83% for Ordinary and 1.32% for Institutional) multiplied by the average account value for the period, multiplied by 183/365 (to reflect the six month period).
Performance data quoted represents past performance and is no guarantee of future results. Current performance may be lower or higher than performance data quoted. Investment return and principal value will fluctuate so that an investor's shares, when redeemed, may be worth more or less than original cost. For the most recent month-end performance, visit the Fund's website at www.quantfunds.com. Before investing, carefully consider the Fund's investment objectives, risks, charges and expenses. For this and other information obtain the Fund's prospectus by calling (800) 326-2151 or visiting www.quantfunds.com. Please read the prospectus carefully before you invest.
4
QUANT GROWTH AND INCOME FUND
INVESTMENT PROFILE All Data as of September 30, 2006
Semi-annual performance for the Quant Growth and Income Fund's Ordinary Shares of 5.15% (at net asset value) as of September 30, 2006 was solid, beating the Fund's benchmark, the S&P 500 Index (the "Index"), return of 4.14% by approximately 1.01%. The Fund's stock selection model, which incorporates perspectives on valuation, quality and sentiment, offered positive results overall for this time period. Estimate revision, a proxy for earnings growth, offered strong performance at the start of the period, however, going into the most recent quarter, this perspective weakened.
INVESTMENT COMMENTARY
| FUND INFORMATION | |||||||||||
| Ticker Symbol | USBOX | (Ordinary) | |||||||||
| QGIAX | (Institutional) | ||||||||||
| Number of Companies | 70 | ||||||||||
| Price to Book Ratio | 2.6 | ||||||||||
| Price to Earnings Ratio | 13.8 | ||||||||||
| Net Assets Under Management | $65.3 Million | ||||||||||
The Fund's sector and industry exposures relative to the benchmark are a function of our stock selection process. A small overweight to utilities has added value over the past six months.
Performance results for the Fund are primarily driven by stock selection positions. Overweights against the Index among technology and consumer staples stocks led the Fund to outperform. For example, Hewlett-Packard gained 12% as the maker of personal computers beat profit expectations and announced plans for a $6 billion stock buyback. Energizer Holdings Inc. (+34%), the second largest US battery maker, reported stellar profit, also beating their prior year's profit. The top stock-level contribution stemmed from an overweight to Kerr-McGee Corp. Anadarko Petroleum Corp. agreed to pay $70.50 per share for the Oklahoma City-based Kerr-McGee, which was a 40% premium over the prior day trading range. An overweight in the stock bolstered performance. Merck & Co. (+21%) also contributed positively to returns. Investors rewarded the U.S. drug maker after their F.D.A. application for the experimental cancer drug Zolinza received an accelerated review status. While not sufficient to offset the Fund's gains, overweights among consumer discretionary and financials detracted from performance. The largest stock-level detraction was Barnes & Noble, which declined 17%. The U.S. book retailer's stock dropped sharply as fewer new books caused first quarter sales to come short of analyst estimates. In addition, the book retailer indicated that profits this year may also be lower. Capital One Financial Corp. declined 2% for the period as profit for the issuer of MasterCard and Visa credit cards lagged analyst expectations.
While this strategy remains consistent over time, during the 3/31/06 to 9/30/06 time period, we have increased our positions among computer hardware, medical providers & services and apparel stocks. In addition, we have decreased our positions within utilities and diversified retail stocks. Our sector and industry exposures relative to the benchmark are a function of bottom-up stock selection.
Looking ahead, equities appear underpinned by healthy levels of professional skepticism, both about economic prospects and about earnings sustainability. But, we believe low volatility levels and tight corporate bond spreads reflect a more subtle conviction that market risks are low. To be sure, softness in energy prices is giving economic activity a welcome stimulus. Profit margins, however, are already high and bond yields already low. It is hard to see how corporate earnings alone can take equity prices to the next level, especially as profit estimates for 2007 have begun slipping. Maybe momentum alone can spur additional buying, but longer-term investors will likely need an extra source of enthusiasm to expand valuations further. Clearer signs of economic resilience might do the trick, but these could heighten inflation risks and put a resumption of interest rate hikes back on the radar screen. We believe there may be attractive investme nt opportunities in pockets of the computer hardware, apparel, defense/aerospace and medical providers & services industries.
The Fund's portfolio is managed by a team of portfolio managers at SSgA Funds Management, Inc. The lead portfolio manager is James Johnson, CFA.
5
AVERAGE ANNUAL TOTAL RETURNS
| Three Months | Six Months | One Year | Five Year | Ten Year | Inception Since | Inception Date | |||||||||||||||||||||||||
| Ordinary Shares | 6.37 | % | 5.15 | % | 11.48 | % | 6.09 | % | 8.03 | % | 11.32 | % | 5/6/85 | ||||||||||||||||||
| Ordinary Shares (adjusted)1 | 5.31 | % | 4.10 | % | 10.37 | % | 5.88 | % | 7.92 | % | 11.27 | % | |||||||||||||||||||
| Institutional Shares2 | 6.49 | % | 5.45 | % | 12.05 | % | 6.61 | % | 8.56 | % | 10.01 | % | 3/25/91 | ||||||||||||||||||
| S & P 5003 | 5.67 | % | 4.14 | % | 10.79 | % | 6.97 | % | 8.58 | % | 12.23 | % | |||||||||||||||||||
1 Reflects deduction of a 1% deferred sales charge.
2 Institutional Shares may only be purchased by certain categories of investors and are not subject to sales charges or distribution fees.
3 The S&P 500 Index is an unmanaged index of stocks chosen for their size and industry characteristics. It is widely recognized as representative of stocks in the United States. Index returns assume the reinvestment of dividends and, unlike Fund returns, do not reflect any fees or expenses. You cannot invest directly in the Index. The beginning date for the Index is 6/30/85.
TOP TEN HOLDINGS
| Company | % Total Net Assets | ||||||
| Exxon Mobil Corporation | 6.2 | ||||||
| Bank of America Corporation | 4.6 | ||||||
| Merck & Co., Inc. | 4.2 | ||||||
| Citigroup Inc. | 3.7 | ||||||
| Hewlett-Packard Company | 3.1 | ||||||
| Cisco Systems, Inc. | 3.1 | ||||||
| Capital One Financial Corporation | 3.0 | ||||||
| Lockheed Martin Corporation | 2.9 | ||||||
| Comerica Incorporated | 2.9 | ||||||
| American Express Company | 2.9 | ||||||
There is no guarantee that such securities will continue to be viewed favorably or held in the Fund's portfolio.
SECTOR ALLOCATION
| % Total Net Assets | |||||||
| Financials | 23.0 | ||||||
| Consumer Discretionary | 17.4 | ||||||
| Information Technology | 16.1 | ||||||
| Health Care | 14.4 | ||||||
| Industrials | 9.7 | ||||||
| Energy | 9.5 | ||||||
| Consumer Staples | 4.6 | ||||||
| Telecommunication Services | 2.4 | ||||||
| Materials | 0.9 | ||||||
| Utilities | 0.6 | ||||||
| Cash and Other Assets (Net) | 1.4 | ||||||
VALUE OF $10,000 INVESTED IN QUANT GROWTH & INCOME
(QGI) ORDINARY SHARES VS. S&P 500

ANNUAL FUND OPERATING EXPENSES
Please refer to page 2 for an explanation of the information presented in the following Expense Example.
| Actual Performance | Hypothetical Performance (5% return before expenses) | ||||||||||||||||||
| Ordinary Shares | Institutional Shares | Ordinary Shares | Institutional Shares | ||||||||||||||||
| Beginning Account Value (04/01/06) | $ | 1,000.00 | $ | 1,000.00 | $ | 1,000.00 | $ | 1,000.00 | |||||||||||
| Ending Account Value (09/30/06) | $ | 1,051.49 | $ | 1,054.55 | $ | 1,017.25 | $ | 1,019.71 | |||||||||||
| Expenses Paid During The Period | $ | 8.02 | $ | 5.51 | $ | 7.88 | $ | 5.41 | |||||||||||
For each class of the Fund, expenses are equal to the annualized expense ratio for the class (1.56% for Ordinary and 1.07% for Institutional) multiplied by the average account value for the period, multiplied by 183/365 (to reflect the six month period).
Performance data quoted represents past performance and is no guarantee of future results. Current performance may be lower or higher than performance data quoted. Investment return and principal value will fluctuate so that an investor's shares, when redeemed, may be worth more or less than original cost. For the most recent month-end performance, visit the Fund's website at www.quantfunds.com. Before investing, carefully consider the Fund's investment objectives, risks, charges and expenses. For this and other information obtain the Fund's prospectus by calling (800) 326-2151 or visiting www.quantfunds.com. Please read the prospectus carefully before you invest.
6
QUANT EMERGING MARKETS FUND
INVESTMENT PROFILE All Data as of September 30, 2006
INVESTMENT COMMENTARY
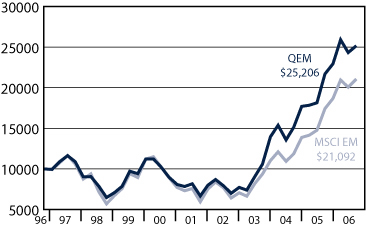
For the six month period ending September 30, 2006, the performance of the Quant Emerging Market Fund's Ordinary Shares at -1.91% (at net asset value) trailed the Fund's benchmark, the Morgan Stanley Capital International Emerging Markets Index (the "Index"), which returned 0.53%.
Emerging equity markets experienced large swings in performance over the past six months. For example, the Index achieved a monthly return of 7.1% in April, and then also achieved a monthly return of -10.5% in May of this year.
| FUND INFORMATION | |||||||||||
| Ticker Symbol | QFFOX | (Ordinary) | |||||||||
| QEMAX | (Institutional) | ||||||||||
| Number of Companies | 73 | ||||||||||
| Price to Book Ratio | 2.2 | ||||||||||
| Price to Earnings Ratio | 11.0 | ||||||||||
| Net Assets Under Management | $180.6 Million | ||||||||||
The Fund trailed the Index over the period due to both country selection factors as well as stock selection. The Fund is slightly over-weighted against the Index in Turkey, and Turkey was one of the lowest performing markets during the period. Inflation has been running very high in Turkey over the last year and the Central Bank has boosted interest rates in an attempt to slow that inflation. There is no tangible decrease in inflation yet, but there is evidence that prices may begin to decline soon. Commodity prices have begun a decline and should have a broad based positive effect.
Israel lagged the Index, primarily due to weak performance in its Pharmaceutical sector, and the Fund has a position in Israel's largest Pharmaceutical company. Israel as a whole was a strong performer and the Fund's positions in Telecommunications, Utilities and Energy companies contributed to its positive performance. The Fund benefited from its weighting in Philippine stocks over the last six months.
Looking ahead, we believe that the emerging markets will be subject to continuing global political and military developments. At this point in time, South Korea is the most affected by North Korea's reported testing of a nuclear weapon. From a security perspective, this is a very serious matter. From an economic perspective, any sanctions that are imposed on North Korea will affect South Korea and to a much smaller degree, China. The possible outcomes from this confrontation occupy a wide range, but we can say that there will certainly be an affect on North Korea's neighbors as well as all of its trading partners.
The influence of the United States on the emerging markets has been positive in the second half of the reporting period. Falling energy prices, lower than expected inflation and stable interest rates have all served to bolster the positive view of the U.S. economy. A healthy U.S. economy is critical to the exporting nations of the world, as the U.S. is such a huge source of demand to these nations. It looks now as if this demand will remain positive.
Although there are many global events that could alter the performance of any of the emerging equity markets, we have seen positive equity market growth over the past three months and we still see longer term economic growth in these countries. We believe the Fund is positioned to capitalize on that longer term growth.
The Fund's portfolio is managed by a team of portfolio managers at Panagora Asset Management, Inc. The Fund's co-lead portfolio managers are David P. Nolan and Brian R. Bruce.
7
AVERAGE ANNUAL TOTAL RETURNS
| Three Months | Six Months | One Year | Five Year | Ten Year | Since Inception | Inception Date | |||||||||||||||||||||||||
| Ordinary Shares | 4.51 | % | -1.91 | % | 18.28 | % | 30.85 | % | 9.93 | % | 7.02 | % | 9/30/94 | ||||||||||||||||||
| Ordinary Shares (adjusted)1 | 3.46 | % | -2.90 | % | 17.09 | % | 30.59 | % | 9.82 | % | 6.93 | % | |||||||||||||||||||
| Institutional Shares2 | 4.56 | % | -1.84 | % | 18.56 | % | 31.41 | % | 10.46 | % | 9.96 | % | 4/2/96 | ||||||||||||||||||
| MSCI EM3 | 5.01 | % | 0.53 | % | 20.83 | % | 28.85 | % | 7.58 | % | 5.10 | % | |||||||||||||||||||
1 Reflects deduction of a 1% deferred sales charge.
2 Institutional Shares may only be purchased by certain categories of investors and are not subject to sales charges or distribution fees.
3 The Morgan Stanley Capital International Emerging Markets ("MSCI EM") Index is an unmanaged index comprised of stocks located in countries other than the United States. It is widely recognized as representative of the general market for emerging markets. Index returns assume the reinvestment of dividends and, unlike Fund returns, do not reflect fees or expenses. You cannot invest directly in an Index. The beginning date for the Index is 6/30/85.
Investing in foreign markets, particularly emerging markets, can be more volatile than the U.S. market due to increased risks of adverse issuer, political, regulatory, market or economic developments and can perform differently than the U.S. market.
TOP TEN HOLDINGS
| Company | % Total Net Assets | ||||||
| Gazprom | 5.1 | ||||||
| Samsung Electronics Co., Ltd. | 3.2 | ||||||
| iShares MSCI Emerging Market Index Fund | 3.2 | ||||||
| China Mobile Limited | 3.1 | ||||||
| Shinhan Financial Group Co., Ltd. | 2.6 | ||||||
| Taiwan Semiconductor Manufacturing | |||||||
| Company Ltd. | 2.5 | ||||||
| LUKoil | 2.3 | ||||||
| Companhia Vale do Rio Doce | 2.3 | ||||||
| State Bank of India | 2.2 | ||||||
| Petroleo Brasileiro SA | 2.2 | ||||||
There is no guarantee that such securities will continue to be viewed favorably or held in the Fund's portfolio.
COUNTRY ALLOCATION
| % Total Net Assets | |||||||
| South Korea | 18.6 | ||||||
| Taiwan | 11.5 | ||||||
| Brazil | 10.9 | ||||||
| China | 9.6 | ||||||
| Russia | 9.2 | ||||||
| South Africa | 8.7 | ||||||
| Mexico | 6.0 | ||||||
| India | 4.0 | ||||||
| Turkey | 3.1 | ||||||
| Thailand | 2.8 | ||||||
| Israel | 2.2 | ||||||
| Czech Republic | 2.1 | ||||||
| Philippines | 2.0 | ||||||
| Poland | 1.9 | ||||||
| Hungary | 1.5 | ||||||
| Malaysia | 0.6 | ||||||
| Cash and Other Assets (Net) | 5.3 | ||||||
VALUE OF $10,000 INVESTED IN QUANT EMERGING MARKETS
(QEM) ORDINARY SHARES VS. MSCI EM
ANNUAL FUND OPERATING EXPENSES
Please refer to page 2 for an explanation of the information presented in the following Expense Example.
| Actual Performance | Hypothetical Performance (5% return before expenses) | ||||||||||||||||||
| Ordinary Shares | Institutional Shares | Ordinary Shares | Institutional Shares | ||||||||||||||||
| Beginning Account Value (04/01/06) | $ | 1,000.00 | $ | 1,000.00 | $ | 1,000.00 | $ | 1,000.00 | |||||||||||
| Ending Account Value (09/30/06) | $ | 980.86 | $ | 981.60 | $ | 1,016.66 | $ | 1,017.95 | |||||||||||
| Expenses Paid During The Period | $ | 8.33 | $ | 7.05 | $ | 8.48 | $ | 7.18 | |||||||||||
For each class of the Fund, expenses are equal to the annualized expense ratio for the class (1.68% for Ordinary and 1.42% for Institutional) multiplied by the average account value for the period, multiplied by 183/365 (to reflect the six month period).
Performance data quoted represents past performance and is no guarantee of future results. Current performance may be lower or higher than performance data quoted. Investment return and principal value will fluctuate so that an investor's shares, when redeemed, may be worth more or less than original cost. For the most recent month-end performance, visit the Fund's website at www.quantfunds.com. Before investing, carefully consider the Fund's investment objectives, risks, charges and expenses. For this and other information obtain the Fund's prospectus by calling (800) 326-2151 or visiting www.quantfunds.com. Please read the prospectus carefully before you invest.
8
QUANT FOREIGN VALUE FUND
INVESTMENT PROFILE All Data as of September 30, 2006
INVESTMENT COMMENTARY
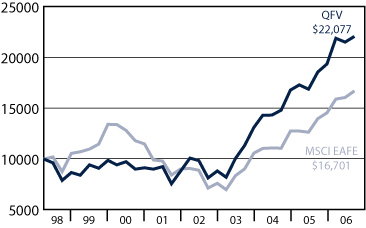
The Quant Foreign Value Fund's Ordinary Shares achieved a total return of 1.86% during the six month period that ended on September 30, 2006. The Morgan Stanley Capital International Europe, Australasia, Far East Index (MSCI EAFE) advanced 4.97%. The Fund holdings declined with markets in the June quarter and saw an improvement in the September quarter. The year-to-date and the longer term performance comparisons remain favorable.
Volatility underscored the June quarter, as May and June saw worldwide market fluctuations particularly in emerging markets. Approximately 14% of the portfolio was invested in three emerging market countries: Mexico, South Africa, and South Korea. The Fund's holding in Mexico declined 11%; holdings in the latter two countries declined about 9% and 3% respectively. Several Norwegian companies also declined. Western European holdings contributed positive results.
| FUND INFORMATION | |||||||||||
| Ticker Symbol | QFVOX | (Ordinary) | |||||||||
| QFVIX | (Institutional) | ||||||||||
| Number of Companies | 54 | ||||||||||
| Price to Book Ratio | 2.4 | ||||||||||
| Price to Earnings Ratio | 15.0 | ||||||||||
| Net Assets Under Management | $561.4 Million | ||||||||||
The volatile influences of the June quarter gave way to a more positive environment in the three months ending September. Positive influences on the portfolio stemmed from the numerous holdings invested in Consumer Discretionary stocks (primarily British Homebuilders) and a recovery in many of the portfolio's materials companies. Other smaller parts of the portfolio made strong gains including financials and utilities. Geographically, portfolio performance was strong in Britain, Finland, Norway, Spain and Sweden, which were partly offset by declines in South Africa, Australia, Austria and South Korea. For the six months, the Fund's two largest country weightings, Japan and Britain, contributed most to six-month performance and western European countries, including Finland and Sweden, also contributed positively.
The influence of a weaker U.S. dollar over the six months resulted in a 1% gain due to stronger foreign currencies. An exception was the South African Rand. Although the Fund's South African holdings advanced in local currency, decline in the Rand resulted in a 23% currency depreciation. The combined result was the Fund's South African holdings declined approximately 9.7% for the six months, the biggest decline for the period. Other geographical areas that were weak over the entire period included Austria and South Korea.
Positive sector performance was broad-based with portfolio holdings within the consumer discretionary, telecommunications, industrial, utilities, consumer staples, and finance sectors turning in the strongest performance over the entire six months. Three sectors declined over the period, with information technology, representing 4% of the portfolio, off approximately 9%. Energy and materials also declined. The Fund's weighting in materials was 27%. This sector declined in the second quarter and only partially recovered in the third quarter thereby holding back total Fund performance over the period. Going forward, we expect the Fund's holdings in the materials sector to experience continued strong cash flow growth. Performance in the energy sector labored under the prospect of a possible long-term peak in oil prices. The Fund's energy sector weighting was just under 4% at period end.
In the last six months, new investments were made in an Austrian industrial machinery company, a bank in Belgium with prospects in the growing economies of Eastern Europe, and a Norwegian seafood company that we believe is well positioned to benefit from the demand for more fish in worldwide diets.
Since Labor Day, members of the research team have traveled around the world visiting portfolio companies and potential investments. Visits to Japan, Russia, Europe and the UK reaffirmed the team's confidence in economic conditions throughout the developed and emerging economies. Numerous companies were identified, which exhibited strong cash flow at very reasonable prices. The investment team is in the process of refining views of these opportunities and anticipates making investments in a number of new companies in coming months.
The Fund's lead portfolio manager is Bernard R. Horn, Jr., of Polaris Capital Management, Inc.
9
AVERAGE ANNUAL TOTAL RETURNS
| Three Months | Six Months | One Year | Five Year | Ten Year | Since Inception | Inception Date | |||||||||||||||||||||||||
| Ordinary Shares | 3.63 | % | 1.86 | % | 20.11 | % | 24.17 | % | N/A | 10.05 | % | 5/15/98 | |||||||||||||||||||
| Ordinary Shares (adjusted)1 | 2.59 | % | 0.84 | % | 18.91 | % | 23.92 | % | N/A | 9.92 | % | ||||||||||||||||||||
| Institutional Shares2 | 3.71 | % | 1.95 | % | 20.39 | % | 24.49 | % | N/A | 13.55 | % | 12/18/98 | |||||||||||||||||||
| MSCI EAFE3 | 3.99 | % | 4.97 | % | 19.65 | % | 14.70 | % | 7.18 | % | 6.31 | % | |||||||||||||||||||
1 Reflects deduction of a 1% deferred sales charge.
2 Institutional Shares may only be purchased by certain categories of investors and are not subject to sales charges or distribution fees.
3 The Morgan Stanley Capital International Europe, Australasia, and Far East ("MSCI EAFE") Index is an unmanaged index comprised of stocks in countries other than the United States. It is widely recognized as representative of the general market for foreign markets. Index returns assume the reinvestment of dividends and, unlike Fund returns, do not reflect any fees or expenses. You cannot invest directly in an Index. The beginning date for the Index is 6/30/98.
Investing in foreign markets, particularly emerging markets, can be more volatile than the U.S. market due to increased risks of adverse issuer, political, regulatory, market or economic developments and can perform differently than the U.S. market.
TOP TEN HOLDINGS
| Company | % Total Net Assets | ||||||
| Kone Corporation OYJ-B | 2.3 | ||||||
| Continental AG | 2.2 | ||||||
| Bellway PLC | 2.2 | ||||||
| Barratt Developments PLC | 2.2 | ||||||
| Iino Kaiun Kaisha | 2.2 | ||||||
| Camillo Eitzen & Co., ASA | 2.1 | ||||||
| George Wimpey PLC | 2.1 | ||||||
| Repsol YPF SA | 2.1 | ||||||
| Imerys SA | 2.1 | ||||||
| Banco Bilbao Vizcaya Argentaria | 2.1 | ||||||
There is no guarantee that such securities will continue to be viewed favorably or held in the Fund's portfolio.
COUNTRY ALLOCATION
| % Total Net Assets | |||||||
| Japan | 19.3 | ||||||
| United Kingdom | 12.3 | ||||||
| Finland | 10.2 | ||||||
| France | 7.7 | ||||||
| Norway | 7.2 | ||||||
| South Africa | 6.6 | ||||||
| South Korea | 5.7 | ||||||
| Spain | 4.1 | ||||||
| Belgium | 3.6 | ||||||
| Ireland | 3.6 | ||||||
| Sweden | 3.0 | ||||||
| Germany | 2.2 | ||||||
| Netherlands | 2.0 | ||||||
| Canada | 2.0 | ||||||
| Portugal | 1.9 | ||||||
| Mexico | 1.9 | ||||||
| Austria | 1.8 | ||||||
| Australia | 1.7 | ||||||
| Cash and Other Assets (Net) | 3.2 | ||||||
VALUE OF A $10,000 INVESTED IN QUANT FOREIGN VALUE
(QFV) ORDINARY SHARES VS. MSCI EAFE
ANNUAL FUND OPERATING EXPENSES
Please refer to page 2 for an explanation of the information presented in the following Expense Example.
| Actual Performance | Hypothetical Performance (5% return before expenses) | ||||||||||||||||||
| Ordinary Shares | Institutional Shares | Ordinary Shares | Institutional Shares | ||||||||||||||||
| Beginning Account Value (04/02/06) | $ | 1,000.00 | $ | 1,000.00 | $ | 1,000.00 | $ | 1,000.00 | |||||||||||
| Ending Account Value (09/30/06) | $ | 1,018.58 | $ | 1,019.49 | $ | 1,016.97 | $ | 1,018.19 | |||||||||||
| Expenses Paid During The Period | $ | 8.17 | $ | 6.95 | $ | 8.17 | $ | 6.94 | |||||||||||
For each class of the Fund, expenses are equal to the annualized expense ratio for the class (1.62% for Ordinary and 1.38% for Institutional) multiplied by the average account value for the period, multiplied by 183/365 (to reflect the six month period).
Performance data quoted represents past performance and is no guarantee of future results. Current performance may be lower or higher than performance data quoted. Investment return and principal value will fluctuate so that an investor's shares, when redeemed, may be worth more or less than original cost. For the most recent month-end performance, visit the Fund's website at www.quantfunds.com. Before investing, carefully consider the Fund's investment objectives, risks, charges and expenses. For this and other information obtain the Fund's prospectus by calling (800) 326-2151 or visiting www.quantfunds.com. Please read the prospectus carefully before you invest.
10
QUANT FUNDS
PORTFOLIO OF INVESTMENTS September 30, 2006 (Unaudited)
QUANT SMALL CAP FUND
| COMMON STOCK—97.2% | |||||||||||
| Shares | Value | ||||||||||
| AEROSPACE & DEFENSE—1.0% | |||||||||||
| BE Aerospace, Inc. (a) | 52,997 | $ | 1,117,707 | ||||||||
| CHEMICALS—1.6% | |||||||||||
| Cambrex Corporation | 87,420 | 1,810,468 | |||||||||
| COMMERCIAL SERVICES & SUPPLIES—12.5% | |||||||||||
| AMN Healthcare Services, Inc. (a) | 56,080 | 1,331,900 | |||||||||
| CRA International, Inc. (a) | 20,899 | 996,046 | |||||||||
| Huron Consulting Group, Inc. (a) | 35,471 | 1,390,463 | |||||||||
| Kforce Inc. (a) | 218,931 | 2,611,847 | |||||||||
| Mobile Mini, Inc. (a) | 37,337 | 1,060,744 | |||||||||
| Sotheby's (a) | 85,939 | 2,770,673 | |||||||||
| Waste Connections, Inc. (a) | 45,895 | 1,739,879 | |||||||||
| Williams Scotsman International, Inc. (a) | 87,218 | 1,862,976 | |||||||||
| 13,764,528 | |||||||||||
| COMMUNICATIONS EQUIPMENT—7.0% | |||||||||||
| Comverse Technology, Inc. (a) | 73,227 | 1,569,987 | |||||||||
| DSP Group Inc. (a) | 54,845 | 1,253,208 | |||||||||
| NICE-Systems, Ltd. (a) (b) | 87,445 | 2,419,603 | |||||||||
| Polycom, Inc. (a) | 48,171 | 1,181,635 | |||||||||
| Sierra Wireless, Inc. (a) | 110,569 | 1,267,121 | |||||||||
| 7,691,554 | |||||||||||
| DIVISIFIED FINANCIAL SERVICES—0.8% | |||||||||||
| CompuCredit Corporation (a) | 27,798 | 839,778 | |||||||||
| Leesport Financial Corporation | 145 | 3,364 | |||||||||
| 843,142 | |||||||||||
| ENERGY EQUIPMENT & SERVICES—7.7% | |||||||||||
| Carbo Ceramics Inc. | 49,876 | 1,797,032 | |||||||||
| Core Laboratories N.V. (a) | 88,845 | 5,668,311 | |||||||||
| Hornbeck Offshore Services, Inc. (a) | 30,439 | 1,019,707 | |||||||||
| 8,485,050 | |||||||||||
| FOOD PRODUCTS—4.7% | |||||||||||
| The Great Atlantic & Pacific Tea Company, Inc. | 47,664 | 1,147,749 | |||||||||
| The Hain Celestial Group, Inc. (a) | 43,170 | 1,103,425 | |||||||||
| United Natural Foods, Inc. (a) | 36,925 | 1,144,306 | |||||||||
| Wild Oats Markets, Inc. (a) | 111,259 | 1,799,058 | |||||||||
| 5,194,538 | |||||||||||
| HEALTH CARE EQUIPMENT & SERVICES—12.2% | |||||||||||
| AngioDynamics, Inc. (a) | 18,432 | 381,727 | |||||||||
| Omnicell Inc. (a) | 100,071 | 1,790,270 | |||||||||
| Psychiatric Solutions, Inc. (a) | 75,132 | 2,561,250 | |||||||||
| Schein (Henry), Inc. (a) | 41,621 | 2,086,877 | |||||||||
| Sierra Health Services, Inc. (a) | 130,917 | 4,953,899 | |||||||||
| Stereotaxis, Inc. (a) | 31,370 | 324,680 | |||||||||
| Sunrise Senior Living, Inc. (a) | 45,264 | 1,352,035 | |||||||||
| 13,450,738 | |||||||||||
| HOTELS, RESTAURANTS & LEISURE—6.1% | |||||||||||
| RARE Hospitality International, Inc. (a) | 77,014 | 2,353,548 | |||||||||
| Sonic Corp. (a) | 77,077 | 1,742,711 | |||||||||
| Vail Resorts, Inc. (a) | 67,168 | 2,688,063 | |||||||||
| 6,784,322 | |||||||||||
| Shares | Value | ||||||||||
| INSURANCE—2.3% | |||||||||||
| FPIC Insurance Group, Inc. (a) | 21,316 | $ | 844,327 | ||||||||
| Selective Insurance Group, Inc. | 32,361 | 1,702,512 | |||||||||
| 2,546,839 | |||||||||||
| INTERNET & CATALOG RETAIL—2.0% | |||||||||||
| NutriSystem Inc. (a) | 34,687 | 2,160,653 | |||||||||
| MACHINERY—2.6% | |||||||||||
| Gardner Denver, Inc. (a) | 61,305 | 2,027,969 | |||||||||
| TurboChef Technologies, Inc. (a) | 65,285 | 907,462 | |||||||||
| 2,935,431 | |||||||||||
| MEDIA—4.2% | |||||||||||
| Entercom Communications Corporation | 83,775 | 2,111,130 | |||||||||
| Lions Gate Entertainment Corporation (a) | 192,969 | 1,931,620 | |||||||||
| Regal Entertainment Group | 28,365 | 562,194 | |||||||||
| 4,604,944 | |||||||||||
| METALS & MINING—1.5% | |||||||||||
| Coeur d'Alene Mines Corporation (a) | 356,548 | 1,679,341 | |||||||||
| REAL ESTATE—16.0% | |||||||||||
| American Campus Communities, Inc. | 56,620 | 1,444,376 | |||||||||
| Entertainment Properties Trust | 102,688 | 5,064,572 | |||||||||
| FelCor Lodging Trust Inc. | 67,075 | 1,344,854 | |||||||||
| Grubb & Ellis Company (a) | 111,900 | 1,082,073 | |||||||||
| Hersha Hospitality Trust | 137,791 | 1,322,794 | |||||||||
| Strategic Hotel & Resorts, Inc. | 106,090 | 2,109,069 | |||||||||
| Ventas, Inc. | 137,831 | 5,312,007 | |||||||||
| 17,679,745 | |||||||||||
| RETAILING—1.9% | |||||||||||
| GUESS?, Inc. (a) | 32,562 | 1,580,234 | |||||||||
| Urban Outfitters, Inc. (a) | 29,429 | 520,599 | |||||||||
| 2,100,833 | |||||||||||
| SEMICONDUCTOR EQUIPMENT—0.6% | |||||||||||
| RF Micro Devices, Inc. (a) | 88,703 | 672,369 | |||||||||
| SOFTWARE & SERVICES—5.8% | |||||||||||
| Euronet Worldwide, Inc. (a) | 42,587 | 1,045,511 | |||||||||
| Internet Capital Group, Inc. (a) | 72,828 | 688,225 | |||||||||
| Photon Dynamics, Inc. (a) | 11,981 | 158,988 | |||||||||
| Ulticom, Inc. (a) | 177,145 | 1,844,079 | |||||||||
| Verint Systems Inc. (a) | 52,424 | 1,575,341 | |||||||||
| webMethods, Inc. (a) | 145,492 | 1,113,014 | |||||||||
| 6,425,158 | |||||||||||
| TELECOMMUNICATION SERVICES—0.4% | |||||||||||
| Atlantic Tele-Network, Inc. | 25,745 | 475,768 | |||||||||
| WIRELESS TELECOMMUNICATION SERVICES—6.3% | |||||||||||
| Crown Castle International Corporation (a) | 157,008 | 5,532,962 | |||||||||
| SBA Communications Corporation (a) | 56,672 | 1,378,830 | |||||||||
| 6,911,792 | |||||||||||
| TOTAL COMMON STOCK (Cost $79,787,544) | 107,334,920 | ||||||||||
11
QUANT FUNDS
PORTFOLIO OF INVESTMENTS September 30, 2006 (Unaudited)
QUANT SMALL CAP FUND—Continued
| SHORT TERM INVESTMENTS—3.7% | |||||||||||
| Par Value | Value | ||||||||||
| State Street Bank & Trust Repurchase Agreement 1.700%, 10/02/06, (Dated 09/29/06), Collateralized by $3,285,000 U.S. Treasury Note 7.125%, 02/15/23, Market Value $4,151,810, Repurchase Proceeds $4,069,576 (Cost $4,069,000) | $ | 4,069,000 | $ | 4,069,000 | |||||||
| TOTAL INVESTMENTS—100.9% (Cost $83,856,544) (c) | 111,403,920 | ||||||||||
| OTHER ASSETS & LIABILITIES (NET)—(0.9)% | (1,038,797 | ) | |||||||||
| NET ASSETS—100% | $ | 110,365,123 | |||||||||
(a) Non-income producing security.
(b) ADR—American Depositary Receipts
(c) At September 30, 2006, the unrealized appreciation of investments based on aggregate cost for federal tax purposes of $83,737,184 was as follows:
| Aggregate gross unrealized appreciation for all investments in which there is an excess of value over tax cost | $ | 31,010,002 | |||||
| Aggregate gross unrealized depreciation for all investments in which there is an excess of tax cost over value | (3,343,266 | ) | |||||
| Net unrealized appreciation | $ | 27,666,736 | |||||
The percentage of each investment category is calculated as a percentage of net assets.
The accompanying notes are an integral part of these financial statements.
12
QUANT FUNDS
PORTFOLIO OF INVESTMENTS September 30, 2006 (Unaudited)
QUANT GROWTH AND INCOME FUND
| COMMON STOCK—98.6% | |||||||||||
| Shares | Value | ||||||||||
| AEROSPACE & DEFENSE—2.9% | |||||||||||
| Lockheed Martin Corporation | 22,100 | $ | 1,901,926 | ||||||||
| BANKS—8.2% | |||||||||||
| Bank of America Corporation | 56,400 | 3,021,348 | |||||||||
| Comerica Incorporated | 33,200 | 1,889,744 | |||||||||
| National City Corporation | 11,400 | 417,240 | |||||||||
| 5,328,332 | |||||||||||
| BEVERAGES—0.6% | |||||||||||
| The Pepsi Bottling Group, Inc. | 9,900 | 351,450 | |||||||||
| CHEMICALS—0.3% | |||||||||||
| Hercules Incorporated | 12,500 | 197,125 | |||||||||
| COMMERCIAL SERVICES AND SUPPLIES—0.3% | |||||||||||
| Convergys Corporation | 8,600 | 177,590 | |||||||||
| COMMUNICATIONS EQUIPMENT—5.4% | |||||||||||
| Cisco Systems, Inc. (a) | 88,800 | 2,042,400 | |||||||||
| Motorola, Inc. | 59,500 | 1,487,500 | |||||||||
| 3,529,900 | |||||||||||
| COMPUTERS & PERIPHERALS—5.9% | |||||||||||
| Hewlett-Packard Company | 55,700 | 2,043,633 | |||||||||
| International Business Machines | 4,800 | 393,312 | |||||||||
| Lexmark International, Inc. (a) | 19,500 | 1,124,370 | |||||||||
| NVIDIA Corporation (a) | 9,100 | 269,269 | |||||||||
| 3,830,584 | |||||||||||
| DIVERSIFIED FINANCIAL SERVICES—10.5% | |||||||||||
| American Express Company | 33,400 | 1,873,072 | |||||||||
| AmeriCredit Corporation (a) | 13,300 | 332,367 | |||||||||
| Capital One Financial Corporation | 24,900 | 1,958,634 | |||||||||
| Citigroup Inc. | 49,166 | 2,442,075 | |||||||||
| E*TRADE Financial Corporation (a) | 10,900 | 260,728 | |||||||||
| 6,866,876 | |||||||||||
| DIVERSIFIED TELECOMMUNICATION SERVICES—2.4% | |||||||||||
| AT&T Corporation | 37,087 | 1,207,553 | |||||||||
| CenturyTel, Inc. | �� | 8,500 | 337,195 | ||||||||
| 1,544,748 | |||||||||||
| ELECTRIC UTILITIES—0.6% | |||||||||||
| American Electric Power Company, Inc. | 10,600 | 385,522 | |||||||||
| ENERGY EQUIPMENT & SERVICES—0.2% | |||||||||||
| Tidewater, Inc. | 3,700 | 163,503 | |||||||||
| FOOD & STAPLES RETAILING—2.2% | |||||||||||
| Carolina Group | 6,100 | 337,879 | |||||||||
| Coca-Cola Enterprises, Inc. | 16,700 | 347,861 | |||||||||
| Dean Foods Company | 7,700 | 323,554 | |||||||||
| General Mills, Inc. | 7,800 | 441,480 | |||||||||
| 1,450,774 | |||||||||||
| HEALTH CARE EQUIPMENT & SERVICES—1.6% | |||||||||||
| Humana Inc. (a) | 3,700 | 244,533 | |||||||||
| McKesson Corporation | 7,100 | 374,312 | |||||||||
| Waters Corporation (a) | 9,000 | 407,520 | |||||||||
| 1,026,365 | |||||||||||
| Shares | Value | ||||||||||
| HEALTH CARE PROVIDERS & SERVICES—4.5% | |||||||||||
| AMERIGROUP Corporation (a) | 39,400 | $ | 1,164,270 | ||||||||
| Coventry Health Care, Inc. (a) | 10,500 | 540,960 | |||||||||
| Sierra Health Services, Inc. | 3,500 | 132,440 | |||||||||
| Wellcare Health Plans, Inc. | 20,200 | 1,143,926 | |||||||||
| 2,981,596 | |||||||||||
| HOTELS, RESTAURANTS & LEISURE—0.7% | |||||||||||
| McDonald's Corporation | 11,000 | 430,320 | |||||||||
| HOUSEHOLD DURABLES—1.7% | |||||||||||
| Newell Rubbermaid, Inc. | 39,500 | 1,118,640 | |||||||||
| HOUSEHOLD PRODUCTS—1.8% | |||||||||||
| Energizer Holdings, Inc. (a) | 16,300 | 1,173,437 | |||||||||
| INDUSTRIAL CONGLOMERATES—3.1% | |||||||||||
| Cooper Industries, Ltd | 16,200 | 1,380,564 | |||||||||
| General Electric Company | 18,500 | 653,050 | |||||||||
| 2,033,614 | |||||||||||
| INSURANCE—4.3% | |||||||||||
| AFLAC Inc. | 7,400 | 338,624 | |||||||||
| American International Group, Inc. | 10,800 | 715,608 | |||||||||
| MetLife, Inc. | 17,100 | 969,228 | |||||||||
| The St. Paul Travelers Companies, Inc. | 16,900 | 792,441 | |||||||||
| 2,815,901 | |||||||||||
| LEISURE EQUIPMENT & PRODUCTS—2.0% | |||||||||||
| Hasbro, Inc. | 57,900 | 1,317,225 | |||||||||
| MACHINERY—1.3% | |||||||||||
| Cummins, Inc. | 2,900 | 345,767 | |||||||||
| Terex Corporation | 11,700 | 529,074 | |||||||||
| 874,841 | |||||||||||
| MARINE—1.9% | |||||||||||
| Overseas Shipholding Group, Inc. | 19,600 | 1,210,692 | |||||||||
| MEDIA—4.6% | |||||||||||
| CBS Corporation Class B | 49,500 | 1,394,415 | |||||||||
| Gannett Co., Inc. | 11,600 | 659,228 | |||||||||
| Omnicom Group, Inc. | 10,100 | 945,360 | |||||||||
| 2,999,003 | |||||||||||
| METALS & MINING—0.6% | |||||||||||
| Nucor Corporation | 7,700 | 381,073 | |||||||||
| OIL & GAS—9.5% | |||||||||||
| Exxon Mobil Corporation | 60,100 | 4,032,710 | |||||||||
| Sunoco, Inc. | 15,600 | 970,164 | |||||||||
| Tesoro Corporation | 21,200 | 1,229,176 | |||||||||
| 6,232,050 | |||||||||||
| PHARMACEUTICALS & BIOTECHNOLOGY—8.3% | |||||||||||
| AmerisourceBergen Corporation | 15,800 | 714,160 | |||||||||
| Biogen Idec, Inc. (a) | 15,800 | 705,944 | |||||||||
| Merck & Co., Inc. | 65,900 | 2,761,210 | |||||||||
| Pfizer Inc. | 44,100 | 1,250,676 | |||||||||
| 5,431,990 | |||||||||||
| RETAILING—7.2% | |||||||||||
| Big Lots, Inc | 9,600 | 190,176 | |||||||||
| Kohl's Corporation | 6,900 | 447,948 | |||||||||
| Office Depot, Inc. | 37,500 | 1,488,750 | |||||||||
13
QUANT FUNDS
PORTFOLIO OF INVESTMENTS September 30, 2006 (Unaudited)
QUANT GROWTH AND INCOME FUND—Continued
| Shares | Value | ||||||||||
| Payless ShoeSource, Inc. (a) | 35,700 | $ | 888,930 | ||||||||
| Rent-A-Center, Inc. | 5,800 | 169,882 | |||||||||
| Sherwin-Williams Company | 27,000 | 1,506,060 | |||||||||
| 4,691,746 | |||||||||||
| SEMICONDUCTOR EQUIPMENT—1.4% | |||||||||||
| Advanced Micro Devices, Inc. | 5,300 | 131,705 | |||||||||
| Intel Corporation | 17,100 | 351,747 | |||||||||
| Lam Research Corporation (a) | 2,600 | 117,858 | |||||||||
| Texas Instruments Incorporated | 10,300 | 342,475 | |||||||||
| 943,785 | |||||||||||
| SOFTWARE & SERVICES—3.4% | |||||||||||
| BMC Software, Inc. (a) | 66,400 | 1,807,408 | |||||||||
| CSG Systems International, Inc (a) | 16,300 | 430,809 | |||||||||
| 2,238,217 | |||||||||||
| TEXTILES & APPAREL—1.2% | |||||||||||
| Jones Apparel Group, Inc. | 24,500 | 794,780 | |||||||||
| TOTAL COMMON STOCK (Cost $57,401,333) (b) | 64,423,605 | ||||||||||
| OTHER ASSETS & LIABILITIES (NET)—1.4% | 919,121 | ||||||||||
| NET ASSETS—100% | $ | 65,342,726 | |||||||||
(a) Non-income producing security.
(b) At September 30, 2006, the unrealized appreciation of investments based on aggregate cost for federal tax purposes of $57,401,333 was as follows:
| Aggregate gross unrealized appreciation for all investments in which there is an excess of value over tax cost | $ | 7,940,758 | |||||
| Aggregate gross unrealized depreciation for all investments in which there is an excess of tax cost over value | (918,486 | ) | |||||
| Net unrealized appreciation | $ | 7,022,272 | |||||
The percentage of each investment category is calculated as a percentage of net assets.
The accompanying notes are an integral part of these financial statements.
14
QUANT FUNDS
PORTFOLIO OF INVESTMENTS September 30, 2006 (Unaudited)
QUANT EMERGING MARKETS FUND
| COMMON STOCK—89.6% | |||||||||||
| Shares | Value | ||||||||||
| BRAZIL—6.9% | |||||||||||
| Companhia Energetica de Minas Gerais (a) | 23,615 | $ | 926,889 | ||||||||
| Gerdau SA (a) | 158,487 | 2,147,499 | |||||||||
| Petroleo Brasileiro SA (a) | 51,759 | 3,873,643 | |||||||||
| Unibanco-Uniao de Bancos Brasileiros SA (b) | 51,631 | 3,820,694 | |||||||||
| Usinas Siderurgicas de Minas Gerais SA (a) | 60,900 | 1,813,535 | |||||||||
| 12,582,260 | |||||||||||
| CHINA—9.6% | |||||||||||
| Angang New Steel Company Limited | 4,462,000 | 3,544,815 | |||||||||
| China Life Insurance Co., Limited | 878,000 | 1,717,326 | |||||||||
| China Mobile Limited | 781,500 | 5,536,578 | |||||||||
| Hopson Development Holdings Limited | 1,576,000 | 3,179,670 | |||||||||
| PetroChina Company Limited | 3,116,000 | 3,347,313 | |||||||||
| 17,325,702 | |||||||||||
| CZECH REPUBLIC—2.1% | |||||||||||
| Ceske Energeticke Zavody | 108,626 | 3,839,957 | |||||||||
| HUNGARY—1.5% | |||||||||||
| MOL Hungarian Oil an Gas Nyrt. | 17,400 | 1,584,243 | |||||||||
| OTP Bank Nyrt. | 35,700 | 1,124,383 | |||||||||
| 2,708,626 | |||||||||||
| INDIA—4.0% | |||||||||||
| Infosys Technologies Limited (a) | 32,200 | 1,536,906 | |||||||||
| Mahindra & Mahindra Ltd. (b) | 118,400 | 1,738,112 | |||||||||
| State Bank of India (b) | 71,727 | 3,980,849 | |||||||||
| 7,255,867 | |||||||||||
| ISRAEL—2.2% | |||||||||||
| Partner Communications Company Ltd. | 200,800 | 1,989,712 | |||||||||
| Teva Pharmaceutical Industries Ltd. | 56,509 | 1,887,922 | |||||||||
| 3,877,634 | |||||||||||
| MALAYSIA—0.6% | |||||||||||
| Bumiputra-Commerce Holdings Bhd | 617,700 | 1,113,803 | |||||||||
| MEXICO—6.0% | |||||||||||
| America Movil SA de CV | 1,813,807 | 3,584,174 | |||||||||
| Consorcio Ara S.A. de C.V. | 211,000 | 1,037,371 | |||||||||
| Controladora Comercial Mexicana SA de CV | 721,300 | 1,451,599 | |||||||||
| Grupo Mexico SAB de CV | 1,194,200 | 3,744,143 | |||||||||
| Telefonos De Mexico SA de CV (Telmex) | 752,000 | 965,551 | |||||||||
| 10,782,838 | |||||||||||
| PHILIPPINES—2.0% | |||||||||||
| First Philippine Holdings Corporation | 2,662,800 | 2,649,552 | |||||||||
| Petron Corporation | 6,825,000 | 563,657 | |||||||||
| Philippine Long Distance Telephone Company | 8,630 | 389,853 | |||||||||
| 3,603,062 | |||||||||||
| POLAND—1.9% | |||||||||||
| KGHM Polska Miedz SA | 105,100 | 3,380,252 | |||||||||
| RUSSIA—9.2% | |||||||||||
| Gazprom (a) | 211,758 | 9,169,121 | |||||||||
| LUKoil (a) | 55,000 | 4,152,500 | |||||||||
| Tatneft (a) | 38,950 | 3,262,063 | |||||||||
| 16,583,684 | |||||||||||
| Shares | Value | ||||||||||
| SOUTH AFRICA—8.7% | |||||||||||
| African Bank Investments Limited | 395,000 | $ | 1,127,114 | ||||||||
| Ellerine Holdings Limited | 338,054 | 2,848,034 | |||||||||
| Foschini Limited | 294,200 | 1,747,347 | |||||||||
| MTN Group Limited | 123,000 | 1,000,516 | |||||||||
| Reunert Limited | 34,823 | 306,370 | |||||||||
| Sasol Ltd. | 32,811 | 1,084,521 | |||||||||
| Standard Bank Group Limited | 368,097 | 3,698,080 | |||||||||
| Steinhoff International Holdings Limited | 541,900 | 1,756,889 | |||||||||
| Telkom South Africa Limited | 39,800 | 691,169 | |||||||||
| Tiger Brands Limited | 81,984 | 1,497,836 | |||||||||
| 15,757,876 | |||||||||||
| SOUTH KOREA—18.6% | |||||||||||
| Daelim Industrial Co., Ltd. | 16,610 | 1,132,141 | |||||||||
| GS Engineering & Construction Corp | 32,130 | 2,247,708 | |||||||||
| Hyundai Heavy Industries Co., Ltd. | 22,340 | 3,092,613 | |||||||||
| Hyundai Mipo Dockyard Co., Ltd. | 23,100 | 2,880,482 | |||||||||
| Hyundai Motor Company | 24,390 | 2,087,699 | |||||||||
| Hyundai Securites Co., Ltd. | 120,390 | 1,526,662 | |||||||||
| Kookmin Bank | 37,070 | 2,922,352 | |||||||||
| Korea Electric Power Corporation | 35,420 | 1,379,295 | |||||||||
| LG International Corporation | 87,820 | 2,111,281 | |||||||||
| Samsung Electronics Co., Ltd. | 8,340 | 5,852,013 | |||||||||
| Shinhan Financial Group Co., Ltd. | 103,460 | 4,662,971 | |||||||||
| SK Corporation | 43,180 | 2,870,149 | |||||||||
| SK Telecom Co., Ltd. | 4,090 | 870,903 | |||||||||
| 33,636,269 | |||||||||||
| TAIWAN—10.4% | |||||||||||
| AU Optronics Corp | 987,770 | 1,398,203 | |||||||||
| Delta Electronics Inc. | 302,518 | 868,320 | |||||||||
| High Tech Computer Corp | 141,600 | 3,747,763 | |||||||||
| Hon Hai Precision Industry Co., Ltd. | 477,182 | 2,905,119 | |||||||||
| MediaTek Incorporation | 90,750 | 860,956 | |||||||||
| Siliconware Precision Industries Company | 2,750,297 | 3,278,170 | |||||||||
| Taiwan Semiconductor Manufacturing Company Ltd. | 2,524,506 | 4,553,607 | |||||||||
| Wintek Corp. | 1,288,310 | 1,167,741 | |||||||||
| 18,779,879 | |||||||||||
| THAILAND—2.8% | |||||||||||
| Charoen Pokphand Foods Public Company Limited | 24,868,400 | 3,163,565 | |||||||||
| PTT Public Company Limited | 336,700 | 1,935,521 | |||||||||
| 5,099,086 | |||||||||||
| TURKEY—3.1% | |||||||||||
| Turkcell Iletisim Hizmetleri AS | 319,049 | 1,621,569 | |||||||||
| Turkiye Garanti Bankasi AS | 531,125 | 1,570,587 | |||||||||
| Turkiye Sise ve Cam Fabrikalari AS (c) | 561,000 | 1,807,050 | |||||||||
| Yapi ve Kredi Bankasi AS (c) | 290,466 | 502,324 | |||||||||
| 5,501,530 | |||||||||||
| TOTAL COMMON STOCK (Cost $125,314,600) | 161,828,325 | ||||||||||
15
QUANT FUNDS
PORTFOLIO OF INVESTMENTS September 30, 2006 (Unaudited)
QUANT EMERGING MARKETS FUND—Continued
| PREFERRED STOCK—4.0% | |||||||||||
| Shares | Value | ||||||||||
| BRAZIL—4.0% | |||||||||||
| Banco Bradesco SA (a) | 47,022 | $ | 1,568,184 | ||||||||
| Companhia Vale do Rio Doce (a) | 224,126 | 4,148,572 | |||||||||
| Tim Participacoes SA (a) | 52,400 | 1,459,340 | |||||||||
| 7,176,096 | |||||||||||
| TOTAL PREFERRED STOCK (Cost $7,125,179) | 7,176,096 | ||||||||||
| EXCHANGE TRADED FUNDS—4.3% | |||||||||||
| OTHER—3.2% | |||||||||||
| iShares MSCI Emerging Market Index Fund | 59,100 | 5,719,107 | |||||||||
| TAIWAN—1.1% | |||||||||||
| iShares MSCI Taiwan Index Fund | 158,000 | 2,046,100 | |||||||||
| TOTAL EXCHANGE TRADED FUNDS (Cost $7,959,233) | 7,765,207 | ||||||||||
| SHORT TERM INVESTMENTS—1.9% | |||||||||||
| Par Value | Value | ||||||||||
| State Street Bank & Trust Repurchase Agreement 1.7%, 10/02/06, (Dated 9/29/06), Collateralized by $2,785,000 U.S. Treasury Note 7.125%, 02/15/23, Market Value $3,519,875, Repurchase Proceeds $3,449,489 (Cost $3,449,000) | $ | 3,449,000 | $ | 3,449,000 | |||||||
| TOTAL INVESTMENTS—99.8% (Cost $143,848,012) (d) | 180,218,628 | ||||||||||
| OTHER ASSETS & LIABILITIES (Net)—0.2% | 336,517 | ||||||||||
| NET ASSETS—100% | $ | 180,555,145 | |||||||||
(a) ADR—American Depositary Receipts
(b) GDR—Global Depositary Receipts
(c) Non-income producing security.
(d) At September 30, 2006, the unrealized appreciation of investments based on aggregate cost for federal tax purposes of $143,848,012 was as follows:
| Aggregate gross unrealized appreciation for all investments in which there is an excess of value over tax cost | $ | 39,098,334 | |||||
| Aggregate gross unrealized depreciation for all investments in which there is an excess of tax cost over value | (2,727,718 | ) | |||||
| Net unrealized appreciation | $ | 36,370,616 | |||||
The percentage of each investment category is calculated as a percentage of net assets.
| SECTOR ALLOCATIONS (as a percentage of Total Common, Preferred Stock, and Exchange Traded Funds) | |||||||
| Consumer Discretionary | 7.4 | % | |||||
| Consumer Staples | 3.4 | % | |||||
| Energy | 18.0 | % | |||||
| Exchange Traded Funds | 4.4 | % | |||||
| Financial | 18.4 | % | |||||
| Health Care | 1.1 | % | |||||
| Industrial | 6.5 | % | |||||
| Information Technology | 15.0 | % | |||||
| Material | 10.6 | % | |||||
| Telecommunication Services | 10.2 | % | |||||
| Utilities | 5.0 | % | |||||
The accompanying notes are an integral part of these financial statements.
16
QUANT FUNDS
PORTFOLIO OF INVESTMENTS September 30, 2006 (Unaudited)
QUANT FOREIGN VALUE FUND
| COMMON STOCK—96.8% | |||||||||||
| Shares | Value | ||||||||||
| AUSTRALIA—1.7% | |||||||||||
| BHP Billiton Ltd. | 358,850 | $ | 6,862,585 | ||||||||
| BHP Billiton PLC | 155,380 | 2,681,192 | |||||||||
| 9,543,777 | |||||||||||
| Austria—1.8% | |||||||||||
| Andritz AG | 64,800 | 9,889,691 | |||||||||
| Belgium—3.6% | |||||||||||
| KBC Group NV | 84,200 | 8,871,434 | |||||||||
| Solvay SA | 88,810 | 11,492,225 | |||||||||
| 20,363,659 | |||||||||||
| CANADA—2.0% | |||||||||||
| Methanex Corporation | 457,390 | 11,110,738 | |||||||||
| FINLAND—10.2% | |||||||||||
| Cargotec Corp., Class B | 252,880 | 10,705,643 | |||||||||
| KCI Konecranes OYJ | 598,080 | 11,358,557 | |||||||||
| Kone Corporation OYJ-B | 262,500 | 12,738,046 | |||||||||
| UPM-Kymmene OYJ | 474,780 | 11,287,664 | |||||||||
| Yit-Yhtyma OYJ | 471,800 | 10,935,498 | |||||||||
| 57,025,408 | |||||||||||
| FRANCE—7.7% | |||||||||||
| Christian Dior SA | 110,303 | 11,488,744 | |||||||||
| Compagnie de Saint Gobain SA | 152,170 | 11,042,493 | |||||||||
| Imerys SA | 138,828 | 11,624,200 | |||||||||
| Peugeot SA | 160,390 | 9,048,707 | |||||||||
| 43,204,144 | |||||||||||
| GERMANY—2.2% | |||||||||||
| Continental AG | 108,627 | 12,601,321 | |||||||||
| IRELAND—3.6% | |||||||||||
| CRH PLC | 313,349 | 10,610,094 | |||||||||
| Greencore Group PLC | 1,908,126 | 9,440,906 | |||||||||
| 20,051,000 | |||||||||||
| JAPAN—19.3% | |||||||||||
| Asahi Breweries Ltd. | 722,300 | 10,540,683 | |||||||||
| Central Japan Railway Company | 1,062 | 11,340,000 | |||||||||
| Iino Kaiun Kaisha | 1,319,300 | 12,242,657 | |||||||||
| Kansai Electric Power Company Inc. | 422,800 | 9,763,813 | |||||||||
| KDDI Corporation | 1,790 | 11,164,746 | |||||||||
| Maruichi Steel Tube Ltd. | 419,000 | 9,960,127 | |||||||||
| Meiji Dairies Corporation | 1,607,000 | 10,867,678 | |||||||||
| Nippon Yusen Kabushiki Kaisha | 1,682,000 | 10,248,797 | |||||||||
| Showa Denko K.K. | 2,469,000 | 10,650,178 | |||||||||
| Tokyo Electric Power Company Inc. | 398,400 | 11,479,322 | |||||||||
| 108,258,001 | |||||||||||
| MEXICO—1.9% | |||||||||||
| Cemex S.A. de CV (a) | 349,058 | 10,499,665 | |||||||||
| NETHERLANDS—2.0% | |||||||||||
| ABN-AMRO Holdings NV | 392,534 | 11,453,737 | |||||||||
| NORWAY—7.2% | |||||||||||
| Aker Seafoods ASA | 702,740 | 3,077,126 | |||||||||
| Austevoll Seafood ASA | 613,980 | 3,867,620 | |||||||||
| Camillo Eitzen & Co., ASA | 1,073,826 | 12,043,772 | |||||||||
| DNB Holding ASA | 786,500 | 9,654,977 | |||||||||
| Eitzen Maritime Services ASA (b) | 231,851 | 81,574 | |||||||||
| Shares | Value | ||||||||||
| Yara International ASA | 750,600 | $ | 11,416,934 | ||||||||
| 40,142,003 | |||||||||||
| PORTUGAL—1.9% | |||||||||||
| Portugal Telecom SGPS SA | 850,450 | 10,627,402 | |||||||||
| SOUTH AFRICA—6.6% | |||||||||||
| Impala Platinum Holdings Ltd. | 56,960 | 9,450,432 | |||||||||
| Metorex Ltd. (b) | 5,192,918 | 8,347,557 | |||||||||
| Sappi Ltd. | 812,503 | 10,521,101 | |||||||||
| Sasol Ltd. | 265,270 | 8,768,124 | |||||||||
| 37,087,214 | |||||||||||
| SOUTH KOREA—5.7% | |||||||||||
| Samsung Electronics Company Ltd. | 15,910 | 11,163,733 | |||||||||
| Samsung SDI Company Ltd. | 131,828 | 10,866,093 | |||||||||
| SK Telecom Company Ltd. | 47,310 | 10,073,935 | |||||||||
| 32,103,761 | |||||||||||
| SPAIN—4.1% | |||||||||||
| Banco Bilbao Vizcaya Argentaria | 499,340 | 11,561,157 | |||||||||
| Repsol YPF SA | 392,800 | 11,695,712 | |||||||||
| 23,256,869 | |||||||||||
| SWEDEN—3.0% | |||||||||||
| Autoliv Inc. | 103,040 | 5,678,535 | |||||||||
| Svenska Cellulosa AB | 243,330 | 11,179,631 | |||||||||
| 16,858,166 | |||||||||||
| UNITED KINGDOM—12.3% | |||||||||||
| Barratt Developments PLC | 617,020 | 12,310,006 | |||||||||
| Bellway PLC | 511,390 | 12,327,355 | |||||||||
| Crest Nicholson PLC | 988,443 | 10,026,578 | |||||||||
| Lloyds TSB Group PLC | 1,109,982 | 11,207,512 | |||||||||
| Persimmon PLC | 459,324 | 11,502,098 | |||||||||
| George Wimpey PLC | 1,226,136 | 11,886,948 | |||||||||
| 69,260,497 | |||||||||||
| TOTAL COMMON STOCK (Cost $437,340,566) | 543,337,053 | ||||||||||
| SHORT TERM INVESTMENTS—2.9% | |||||||||||
| Par Value | Value | ||||||||||
| United States—2.9% | |||||||||||
| Prudential Funding Corporation Commercial Paper, Yield of 5.26%, Maturing on 10/02/06 (Cost $16,099,000) | $ | 16,099,000 | 16,099,000 | ||||||||
| TOTAL INVESTMENTS—99.7% (Cost $453,439,566) (c) | 559,436,053 | ||||||||||
| OTHER ASSETS & LIABILITIES (NET)—0.3% | 2,013,457 | ||||||||||
| NET ASSETS—100% | $ | 561,449,510 | |||||||||
17
QUANT FUNDS
PORTFOLIO OF INVESTMENTS September 30, 2006 (Unaudited)
QUANT FOREIGN VALUE FUND—Continued
(a) ADR—American Depository Receipts
(b) Non-income producing security.
(c) At September 30, 2006, the unrealized appreciation of investments based on aggregate cost for federal tax purposes of $453,831,868 was as follows:
| Aggregate gross unrealized appreciation for all investments in which there is an excess of value over tax cost | $ | 109,924,833 | |||||
| Aggregate gross unrealized depreciation for all investments in which there is an excess of tax cost over value | (4,320,648 | ) | |||||
| Net unrealized appreciation | $ | 105,604,185 | |||||
The percentage of each investment category is calculated as a percentage of net assets.
| SECTOR ALLOCATIONS (as a percentage of Total Common and Preferred Stock) | |||||||
| Consumer Discretionary | 17.8 | % | |||||
| Consumer Staples | 6.9 | % | |||||
| Energy | 3.8 | % | |||||
| Financial | 9.7 | % | |||||
| Industrial | 20.7 | % | |||||
| Information Technology | 4.1 | % | |||||
| Material | 27.2 | % | |||||
| Telecommunication Services | 5.9 | % | |||||
| Utilities | 3.9 | % | |||||
The accompanying notes are an integral part of these financial statements.
18
QUANT FUNDS
STATEMENT OF ASSETS AND LIABILITIES September 30, 2006 (Unaudited)
| Small Cap | Growth and Income | Emerging Markets | Foreign Value | ||||||||||||||||
| Assets: | |||||||||||||||||||
| Investments at value (Note 2) | $ | 107,334,920 | $ | 64,423,605 | $ | 176,769,628 | $ | 559,436,053 | |||||||||||
| Repurchase Agreements | 4,069,000 | — | 3,449,000 | — | |||||||||||||||
| Foreign currency at value (Cost $2,137,515 for Emerging Markets and $1,454 for Foreign Value) | — | — | 2,126,272 | 1,443 | |||||||||||||||
| Cash | 1,865 | 931,045 | 1,188 | 891 | |||||||||||||||
| Dividends, interest and foreign tax reclaims receivable | 123,816 | 83,747 | 162,797 | 1,348,799 | |||||||||||||||
| Receivable for investments sold | 1,581,252 | — | — | — | |||||||||||||||
| Receivable for shares of beneficial interest sold | 5,000 | 333 | 331,071 | 1,512,213 | |||||||||||||||
| Other assets | 13,863 | 7,527 | 7,238 | 22,386 | |||||||||||||||
| Total assets | 113,129,716 | 65,446,257 | 182,847,194 | 562,321,785 | |||||||||||||||
| Liabilities: | |||||||||||||||||||
| Payable for investments purchased | 2,619,268 | — | 1,955,008 | 137,959 | |||||||||||||||
| Payable for shares of beneficial interest repurchased | — | 29,409 | 7,732 | 56,275 | |||||||||||||||
| Payable for compensation of Manager (Note 3) | 90,425 | 39,835 | 139,616 | 447,127 | |||||||||||||||
| Payable for distribution fees (Note 3) | 41,064 | 26,133 | 34,042 | 100,938 | |||||||||||||||
| Payable to custodian | 2,121 | (386 | ) | 13,493 | 36,781 | ||||||||||||||
| Payable to transfer agent (Note 3) | 3,862 | 10,440 | 16,330 | 71,209 | |||||||||||||||
| Payable for foreign capital gain tax | — | — | 113,521 | — | |||||||||||||||
| Other accrued expenses | 7,853 | (1,900 | ) | 12,307 | 21,986 | ||||||||||||||
| Total liabilities | 2,764,593 | 103,531 | 2,292,049 | 872,275 | |||||||||||||||
| Net assets | $ | 110,365,123 | $ | 65,342,726 | $ | 180,555,145 | $ | 561,449,510 | |||||||||||
| Net Assets Consist Of: | |||||||||||||||||||
| Shares of beneficial interest | $ | 72,182,639 | $ | 60,251,631 | $ | 136,862,298 | $ | 426,178,913 | |||||||||||
| Undistributed net investment income | — | 147,166 | 1,981,077 | 4,307,078 | |||||||||||||||
| Accumulated net realized gain/(loss) on investments and foreign denominated assets, liabilities and currency | 10,635,108 | (2,078,343 | ) | 5,458,657 | 24,977,784 | ||||||||||||||
| Unrealized appreciation/(depreciation) of investments and foreign denominated assets, liabilities and currency | 27,547,376 | 7,022,272 | 36,253,113 | * | 105,985,735 | ||||||||||||||
| Net assets | $ | 110,365,123 | $ | 65,342,726 | $ | 180,555,145 | $ | 561,449,510 | |||||||||||
| Investments at cost | $ | 83,856,544 | $ | 57,401,333 | $ | 143,848,012 | $ | 453,439,566 | |||||||||||
| Net assets | |||||||||||||||||||
| Ordinary Shares | $ | 100,238,273 | $ | 64,293,222 | $ | 176,237,025 | $ | 504,489,557 | |||||||||||
| Institutional Shares | $ | 10,126,850 | $ | 1,049,504 | $ | 4,318,120 | $ | 56,959,953 | |||||||||||
| Shares of beneficial interest outstanding (Unlimited number of shares authorized) | |||||||||||||||||||
| Ordinary Shares | 4,387,680 | 4,143,403 | 9,053,890 | 24,874,016 | |||||||||||||||
| Institutional Shares | 400,261 | 64,641 | 218,726 | 2,791,815 | |||||||||||||||
| Net asset value and offering price per share** | |||||||||||||||||||
| Ordinary Shares | $ | 22.85 | $ | 15.52 | $ | 19.47 | $ | 20.28 | |||||||||||
| Institutional Shares | $ | 25.30 | $ | 16.24 | $ | 19.74 | $ | 20.40 | |||||||||||
* Net of foreign capital gain tax of $113,521.
** A deferred sales charge amounting to 1% of the net asset value of the Ordinary Shares redeemed is withheld and paid to the Distributor. No deferred sales charge is withheld from redemptions of the Institutional Shares. A redemption fee of 2% is withheld and paid to the Funds on redemptions of Institutional Shares made within 60 days of purchase.
The accompanying notes are an integral part of these financial statements.
19
QUANT FUNDS
STATEMENT OF OPERATIONS Six Months Ended September 30, 2006 (Unaudited)
| Small Cap | Growth and Income | Emerging Markets | Foreign Value | ||||||||||||||||
| Investment Income: | |||||||||||||||||||
| Dividends* | $ | 505,090 | $ | 507,084 | $ | 2,621,178 | $ | 5,864,282 | |||||||||||
| Interest | 34,140 | — | 37,377 | 313,276 | |||||||||||||||
| Miscellaneous | — | 2 | — | 7 | |||||||||||||||
| Total Investment Income | 539,230 | 507,086 | 2,658,555 | 6,177,565 | |||||||||||||||
| Expenses: | |||||||||||||||||||
| Compensation of Manager (Note 3) | 545,978 | 230,590 | 777,007 | 2,578,762 | |||||||||||||||
| Distribution fees, Ordinary Shares (Note 3) | 244,735 | 151,242 | 190,572 | 592,384 | |||||||||||||||
| Custodian fees | 18,702 | 12,720 | 112,568 | 240,565 | |||||||||||||||
| Transfer agent fees (Note 3): | |||||||||||||||||||
| Ordinary Shares | 85,074 | 52,027 | 127,685 | 406,621 | |||||||||||||||
| Institutional Shares | 9,309 | 906 | 2,429 | 37,342 | |||||||||||||||
| Audit and legal | 14,417 | 8,123 | 19,950 | 67,033 | |||||||||||||||
| Registration fees | 12,314 | 10,006 | 19,190 | 28,249 | |||||||||||||||
| Insurance | 7,099 | 4,000 | 9,823 | 33,005 | |||||||||||||||
| Compensation of Trustees (Note 3) | 2,398 | 1,358 | 3,340 | 11,247 | |||||||||||||||
| Printing | 5,438 | 3,066 | 7,531 | 25,315 | |||||||||||||||
| Miscellaneous | 24,102 | 15,549 | 31,138 | 93,276 | |||||||||||||||
| Total expenses before waivers/reimbursements/reductions | 969,566 | 489,587 | 1,301,233 | 4,113,799 | |||||||||||||||
| Waivers and/or reimbursements of expenses (Note 3) | — | — | — | — | |||||||||||||||
| Fees reduced by credits allowed by Custodian (Note 3) | (270 | ) | (12,660 | ) | (2,075 | ) | (875 | ) | |||||||||||
| Expenses, net | 969,296 | 476,927 | 1,299,158 | 4,112,924 | |||||||||||||||
| Net investment income/(loss) | (430,066 | ) | 30,159 | 1,359,397 | 2,064,641 | ||||||||||||||
| Realized and Unrealized Gain (Loss) on Investments, Foreign Currency, and Foreign Translation: | |||||||||||||||||||
| Net realized gain/(loss) (Note 2) on: Investments** | 6,822,603 | 1,606,938 | 1,822,176 | (1,834,712 | ) | ||||||||||||||
| Foreign denominated assets, liabilities, and currency | 4 | — | (50,890 | ) | (321,024 | ) | |||||||||||||
| Change in unrealized appreciation/(depreciation) of: Investments | (7,187,330 | ) | 1,577,441 | (7,011,946 | ) | 8,714,698 | |||||||||||||
| Foreign denominated assets, liabilities, and currency | — | — | 17,417 | (18,095 | ) | ||||||||||||||
| — | — | ||||||||||||||||||
| Net realized and unrealized gain/(loss) | (364,723 | ) | 3,184,379 | (5,223,243 | ) | 6,540,867 | |||||||||||||
| Net increase/(decrease) in net assets resulting from operations | $ | (794,789 | ) | $ | 3,214,538 | $ | (3,863,846 | ) | $ | 8,605,508 | |||||||||
* Dividends are net of foreign withholding taxes of $1,457 for Small Cap, $271,153 for Emerging Markets and $655,748 for Foreign Value.
The accompanying notes are an integral part of these financial statements.
20
QUANT FUNDS
STATEMENTS OF CHANGES IN NET ASSETS
| Small Cap | Growth and Income | ||||||||||||||||||
| Six Months Ended September 30, 2006 (Unaudited) | Year Ended March 31, 2006 | Six Months Ended September 30, 2006 (Unaudited) | Year Ended March 31, 2006 | ||||||||||||||||
| Increase (Decrease) in Net Assets: | |||||||||||||||||||
| Operations: | |||||||||||||||||||
| Net investment income/(loss) | $ | (430,066 | ) | $ | (913,312 | ) | $ | 30,159 | $ | 119,244 | |||||||||
| Net realized gain/(loss) on investments, foreign denominated assets, liabilities, and currency | 6,822,607 | 13,739,169 | 1,606,938 | 6,557,703 | |||||||||||||||
| Unrealized appreciation/(depreciation) of investments and foreign denominated assets, liabilities, and currency | (7,187,330 | ) | 8,842,777 | 1,577,441 | 701,430 | ||||||||||||||
| Net increase/(decrease) from operations | (794,789 | ) | 21,668,634 | 3,214,538 | 7,378,377 | ||||||||||||||
| Distributions to shareholders from: | |||||||||||||||||||
| Net investment income | |||||||||||||||||||
| Ordinary Shares | — | — | — | (35,346 | ) | ||||||||||||||
| Institutional Shares | — | — | — | (4,557 | ) | ||||||||||||||
| Net realized gains | |||||||||||||||||||
| Ordinary Shares | — | (11,455,318 | ) | — | — | ||||||||||||||
| Institutional Shares | — | (1,327,896 | ) | — | — | ||||||||||||||
| Total Distributions | — | (12,783,214 | ) | — | (39,903 | ) | |||||||||||||
| Net fund share transactions (note 8) | (17,479 | ) | 12,476,747 | 1,168,318 | 6,781,809 | ||||||||||||||
| Increase/(decrease) in net assets | (812,268 | ) | 21,362,167 | 4,382,856 | 14,120,283 | ||||||||||||||
| Net assets beginning of period | 111,177,391 | 89,815,224 | 60,959,870 | 46,839,587 | |||||||||||||||
| Net assets end of period* | $ | 110,365,123 | $ | 111,177,391 | $ | 65,342,726 | $ | 60,959,870 | |||||||||||
| * Includes undistributed net investment income/(loss) of | $ | — | $ | — | $ | 147,166 | $ | 117,007 | |||||||||||
The accompanying notes are an integral part of these financial statements.
21
QUANT FUNDS
STATEMENTS OF CHANGES IN NET ASSETS—Continued
| Emerging Markets | Foreign Value | ||||||||||||||||||
| Six Months Ended September 30, 2006 (Unaudited) | Year Ended March 31, 2006 | Six Months Ended September 30, 2006 (Unaudited) | Year Ended March 31, 2006 | ||||||||||||||||
| Increase (Decrease) in Net Assets: | |||||||||||||||||||
| Operations: | |||||||||||||||||||
| Net investment income (loss) | $ | 1,359,397 | $ | 1,101,406 | $ | 2,064,641 | $ | 4,311,338 | |||||||||||
| Net realized gain (loss) on investments foreign denominated assets, liabilities, and currency | 1,771,286 | 5,753,010 | (2,155,736 | ) | 31,982,527 | ||||||||||||||
| Unrealized appreciation (depreciation) of investments and foreign denominated assets, liabilities and currency | (6,994,529 | ) | 28,809,828 | 8,696,603 | 46,351,089 | ||||||||||||||
| Net increase (decrease) from operations | (3,863,846 | ) | 35,664,244 | 8,605,508 | 82,644,954 | ||||||||||||||
| Distributions to shareholders from: | |||||||||||||||||||
| Net investment income | |||||||||||||||||||
| Ordinary Shares | — | (1,206,849 | ) | — | (2,226,536 | ) | |||||||||||||
| Institutional Shares | (21,130 | ) | (213,426 | ) | |||||||||||||||
| Net realized gains | |||||||||||||||||||
| Ordinary Shares | — | (3,620,548 | ) | — | (1,332,469 | ) | |||||||||||||
| Institutional Shares | — | (50,994 | ) | — | (104,281 | ) | |||||||||||||
| Total Distributions | — | (4,899,521 | ) | — | (3,876,712 | ) | |||||||||||||
| Net fund share transactions (note 8) | 38,623,804 | 52,267,192 | 80,258,138 | 169,845,562 | |||||||||||||||
| Increase (decrease) in net assets | 34,759,958 | 83,031,915 | 88,863,646 | 248,613,804 | |||||||||||||||
| Net assets beginning of period | 145,795,187 | 62,763,272 | 472,585,864 | 223,972,060 | |||||||||||||||
| Net assets end of period* | $ | 180,555,145 | $ | 145,795,187 | $ | 561,449,510 | $ | 472,585,864 | |||||||||||
| * Includes undistributed net investment income/(loss) of | $ | 1,981,077 | $ | 621,680 | $ | 4,307,078 | $ | 2,242,437 | |||||||||||
The accompanying notes are an integral part of these financial statements.
22
QUANT FUNDS
FINANCIAL HIGHLIGHTS FOR QUANT SMALL CAP FUND
(For a share outstanding throughout each period)
| Ordinary Shares | |||||||||||||||||||||||||||
| Six Months Ended September 30, 2006 | Years Ended March 31, | ||||||||||||||||||||||||||
| (Unaudited) | 2006 | 2005 | 2004 | 2003 | 2002 | ||||||||||||||||||||||
| Net Asset Value, Beginning of Period | $ | 22.99 | $ | 21.13 | $ | 19.93 | $ | 12.44 | $ | 18.71 | $ | 17.46 | |||||||||||||||
| Income from Investment Operations: | |||||||||||||||||||||||||||
| Net investment income (loss) (a)(b)(c) | (0.10 | ) | (0.22 | ) | (0.24 | ) | (0.19 | ) | (0.12 | ) | (0.22 | ) | |||||||||||||||
| Net realized and unrealized gain/(loss) on securities | (0.04 | ) | 5.16 | 2.18 | 7.68 | (5.32 | ) | 1.48 | |||||||||||||||||||
| Total from Investment Operations | (0.14 | ) | 4.94 | 1.94 | 7.49 | (5.44 | ) | 1.26 | |||||||||||||||||||
| Less Distributions: | |||||||||||||||||||||||||||
| Dividends from net investment income | — | — | — | — | — | — | |||||||||||||||||||||
| Distributions from realized capital gains | — | (3.08 | ) | (0.74 | ) | — | (0.83 | ) | (0.01 | ) | |||||||||||||||||
| Total Distributions | — | (3.08 | ) | (0.74 | ) | — | (0.83 | ) | (0.01 | ) | |||||||||||||||||
| Net Asset Value, End of Period | $ | 22.85 | $ | 22.99 | $ | 21.13 | $ | 19.93 | $ | 12.44 | $ | 18.71 | |||||||||||||||
| Total Return (d) | (0.61 | )% | 24.51 | % | 9.76 | % | 60.21 | % | (29.24 | )% | 7.19 | % | |||||||||||||||
| Net Assets, End of Period (000's) | $ | 100,238 | $ | 98,879 | $ | 80,199 | $ | 69,851 | $ | 42,545 | $ | 65,153 | |||||||||||||||
| Ratios and Supplemental Data: | |||||||||||||||||||||||||||
| Ratios of expenses to average net assets: (e)(f) | |||||||||||||||||||||||||||
| Excluding credits | 1.83 | % | 1.88 | % | 1.98 | % | 2.00 | % | 2.04 | % | 1.97 | % | |||||||||||||||
| Gross | 1.83 | % | 1.88 | % | 1.98 | % | 2.00 | % | 2.04 | % | 1.97 | % | |||||||||||||||
| Including custody credits | 1.83 | % | 1.88 | % | 1.98 | % | 2.00 | % | 2.04 | % | 1.96 | % | |||||||||||||||
| Ratio of net investment income (loss) to average net assets (c)(f) | (0.84 | )% | (1.00 | )% | (1.17 | )% | (1.13 | )% | (0.81 | )% | (1.18 | )% | |||||||||||||||
| Portfolio Turnover | 23 | % | 57 | % | 43 | % | 67 | % | 62 | % | 93 | % | |||||||||||||||
| Institutional Shares | |||||||||||||||||||||||||||
| Six Months Ended September 30, 2006 | Years Ended March 31, | ||||||||||||||||||||||||||
| (Unaudited) | 2006 | 2005 | 2004 | 2003 | 2002 | ||||||||||||||||||||||
| Net Asset Value, Beginning of Period | $ | 25.39 | $ | 22.96 | $ | 21.48 | $ | 13.34 | $ | 19.88 | $ | 18.46 | |||||||||||||||
| Income from Investment Operations: | |||||||||||||||||||||||||||
| Net investment income (loss) (a)(b)(c) | (0.04 | ) | (0.12 | ) | (0.14 | ) | (0.11 | ) | (0.05 | ) | (0.14 | ) | |||||||||||||||
| Net realized and unrealized gain/(loss) on securities | (0.05 | ) | 5.63 | 2.36 | 8.25 | (5.66 | ) | 1.57 | |||||||||||||||||||
| Total from Investment Operations | (0.09 | ) | 5.51 | 2.22 | 8.14 | (5.71 | ) | 1.43 | |||||||||||||||||||
| Less Distributions: | |||||||||||||||||||||||||||
| Dividends from net investment income | — | — | — | — | — | — | |||||||||||||||||||||
| Distributions from realized capital gains | — | (3.08 | ) | (0.74 | ) | — | (0.83 | ) | (0.01 | ) | |||||||||||||||||
| Total Distributions | — | (3.08 | ) | (0.74 | ) | — | (0.83 | ) | (0.01 | ) | |||||||||||||||||
| Net Asset Value, End of Period | $ | 25.30 | $ | 25.39 | $ | 22.96 | $ | 21.48 | $ | 13.34 | $ | 19.88 | |||||||||||||||
| Total Return (d) | (0.35 | )% | 25.06 | % | 10.37 | % | 61.02 | % | (28.87 | )% | 7.72 | % | |||||||||||||||
| Net Assets, End of Period (000's) | $ | 10,127 | $ | 12,298 | $ | 9,616 | $ | 8,089 | $ | 5,459 | $ | 7,712 | |||||||||||||||
| Ratios and Supplemental Data: | |||||||||||||||||||||||||||
| Ratios of expenses to average net assets: (e)(f) | |||||||||||||||||||||||||||
| Excluding credits | 1.32 | % | 1.38 | % | 1.48 | % | 1.50 | % | 1.54 | % | 1.47 | % | |||||||||||||||
| Gross | 1.32 | % | 1.38 | % | 1.48 | % | 1.50 | % | 1.54 | % | 1.47 | % | |||||||||||||||
| Including custody credits | 1.32 | % | 1.38 | % | 1.48 | % | 1.50 | % | 1.54 | % | 1.46 | % | |||||||||||||||
| Ratio of net investment income (loss) to average net assets (c)(f) | (0.35 | )% | (0.50 | )% | (0.65 | )% | (0.63 | )% | (0.31 | )% | (0.69 | )% | |||||||||||||||
| Portfolio Turnover | 23 | % | 57 | % | 43 | % | 67 | % | 62 | % | 93 | % | |||||||||||||||
(a) Per share numbers have been calculated using the average shares method.
(b) Reflects expense waivers/reimbursements and reductions in effect during the period. See Note 3 to the Financial Statements.
(c) Net investment income (loss) per share and the ratio of net investment income (loss) to average net assets reflect net investment income prior to certain reclassifications for federal income or excise taxes.
(d) Total Return does not include the deferred sales charge of 1% for the Ordinary Shares. The total return would have been lower if certain fees had not been waived or if custodial fees had not been reduced by credits allowed by the custodian. See Note 3 to the financial statements.
(e) Ratios of expenses to average net assets shows:
— Excluding Credits (total expenses less fee waivers and reimbursements by the investment advisor, if any).
— Gross (total expenses not taking into account fee waivers and reimbursements by the investment advisor or custody earnings credits, if any).
— Including Credits (expenses less fee waivers and reimbursements by the investment advisor and reduced by custody earnings credits, if any).
(f) Ratios for six months ended September 30, 2006 have been annualized.
The accompanying notes are an integral part of these financial statements.
23
QUANT FUNDS
FINANCIAL HIGHLIGHTS FOR QUANT GROWTH AND INCOME FUND
(For a share outstanding throughout each period)
| Ordinary Shares | |||||||||||||||||||||||||||
| Six Months Ended September 30, 2006 | Years Ended March 31, | ||||||||||||||||||||||||||
| (Unaudited) | 2006 | 2005 | 2004 | 2003 | 2002 | ||||||||||||||||||||||
| Net Asset Value, Beginning of Period | $ | 14.76 | $ | 12.88 | $ | 12.19 | $ | 9.58 | $ | 12.87 | $ | 13.95 | |||||||||||||||
| Income from Investment Operations: | |||||||||||||||||||||||||||
| Net investment income (loss) (a)(b)(c) | 0.01 | 0.03 | 0.01 | (0.02 | ) | (0.06 | ) | (0.12 | ) | ||||||||||||||||||
| Net realized and unrealized gain/(loss) on securities | 0.75 | 1.86 | 0.68 | 2.63 | (3.23 | ) | (0.48 | ) | |||||||||||||||||||
| Total from Investment Operations | 0.76 | 1.89 | 0.69 | 2.61 | (3.29 | ) | (0.60 | ) | |||||||||||||||||||
| Less Distributions: | |||||||||||||||||||||||||||
| Dividends from net investment income | — | (0.01 | ) | — | — | — | — | ||||||||||||||||||||
| Distributions from realized capital gains | — | — | — | — | — | (0.48 | ) | ||||||||||||||||||||
| Total Distributions | — | (0.01 | ) | — | — | — | (0.48 | ) | |||||||||||||||||||
| Net Asset Value, End of Period | $ | 15.52 | $ | 14.76 | $ | 12.88 | $ | 12.19 | $ | 9.58 | $ | 12.87 | |||||||||||||||
| Total Return (d) | 5.15 | % | 14.67 | % | 5.66 | % | 27.24 | % | (25.56 | )% | (4.44 | )% | |||||||||||||||
| Net Assets, End of Period (000's) | $ | 64,293 | $ | 59,975 | $ | 46,015 | $ | 43,463 | $ | 36,484 | $ | 55,464 | |||||||||||||||
| Ratios and Supplemental Data: | |||||||||||||||||||||||||||
| Ratios of expenses to average net assets: (e)(f) | |||||||||||||||||||||||||||
| Excluding credits | 1.60 | % | 1.65 | % | 1.77 | % | 1.81 | % | 1.79 | % | 1.72 | % | |||||||||||||||
| Gross | 1.60 | % | 1.65 | % | 1.77 | % | 1.81 | % | 1.79 | % | 1.72 | % | |||||||||||||||
| Including custody credits | 1.56 | % | 1.61 | % | 1.76 | % | 1.80 | % | 1.76 | % | 1.67 | % | |||||||||||||||
| Ratio of net investment income (loss) to average net assets (c)(f) | 0.09 | % | 0.21 | % | 0.08 | % | (0.20 | )% | (0.61 | )% | (0.86 | )% | |||||||||||||||
| Portfolio Turnover | 46 | % | 105 | % | 160 | % | 180 | % | 36 | % | 46 | % | |||||||||||||||
| Institutional Shares | |||||||||||||||||||||||||||
| Six Months Ended September 30, 2006 | Years Ended March 31, | ||||||||||||||||||||||||||
| (Unaudited) | 2006 | 2005 | 2004 | 2003 | 2002 | ||||||||||||||||||||||
| Net Asset Value, Beginning of Period | $ | 15.40 | $ | 13.43 | $ | 12.65 | $ | 9.90 | $ | 13.23 | $ | 14.25 | |||||||||||||||
| Income from Investment Operations: | |||||||||||||||||||||||||||
| Net investment income (loss) (a)(b)(c) | 0.05 | 0.10 | 0.07 | 0.03 | (0.01 | ) | (0.05 | ) | |||||||||||||||||||
| Net realized and unrealized gain/(loss) on securities | 0.79 | 1.94 | 0.71 | 2.72 | (3.32 | ) | (0.49 | ) | |||||||||||||||||||
| Total from Investment Operations | 0.84 | 2.04 | 0.78 | 2.75 | (3.33 | ) | (0.54 | ) | |||||||||||||||||||
| Less Distributions: | |||||||||||||||||||||||||||
| Dividends from net investment income | — | (0.07 | ) | — | — | — | — | ||||||||||||||||||||
| Distributions from realized capital gains | — | — | — | — | — | (0.48 | ) | ||||||||||||||||||||
| Total Distributions | — | (0.07 | ) | — | — | — | (0.48 | ) | |||||||||||||||||||
| Net Asset Value, End of Period | $ | 16.24 | $ | 15.40 | $ | 13.43 | $ | 12.65 | $ | 9.90 | $ | 13.23 | |||||||||||||||
| Total Return (d) | 5.45 | % | 15.19 | % | 6.17 | % | 27.28 | % | (25.17 | )% | (3.92 | )% | |||||||||||||||
| Net Assets, End of Period (000's) | $ | 1,050 | $ | 984 | $ | 825 | $ | 747 | $ | 590 | $ | 1,415 | |||||||||||||||
| Ratios and Supplemental Data: | |||||||||||||||||||||||||||
| Ratios of expenses to average net assets: (e)(f) | |||||||||||||||||||||||||||
| Excluding credits | 1.11 | % | 1.16 | % | 1.27 | % | 1.31 | % | 1.29 | % | 1.22 | % | |||||||||||||||
| Gross | 1.11 | % | 1.16 | % | 1.27 | % | 1.31 | % | 1.29 | % | 1.22 | % | |||||||||||||||
| Including custody credits | 1.07 | % | 1.11 | % | 1.26 | % | 1.30 | % | 1.26 | % | 1.17 | % | |||||||||||||||
| Ratio of net investment income (loss) to average net assets (c)(f) | 0.58 | % | 0.71 | % | 0.54 | % | 0.30 | % | (0.13 | )% | (0.86 | )% | |||||||||||||||
| Portfolio Turnover | 46 | % | 105 | % | 160 | % | 180 | % | 36 | % | 46 | % | |||||||||||||||
(a) Per share numbers have been calculated using the average shares method.
(b) Reflects expense waivers/reimbursements and reductions in effect during the period. See Note 3 to the Financial Statements.
(c) Net investment income (loss) per share and the ratio of net investment income (loss) to average net assets reflect net investment income prior to certain reclassifications for federal income or excise taxes.
(d) Total Return does not include the deferred sales charge of 1% for the Ordinary Shares. The total return would have been lower if certain fees had not been waived or if custodial fees had not been reduced by credits allowed by the custodian. See Note 3 to the financial statements.
(e) Ratios of expenses to average net assets shows:
— Excluding Credits (total expenses less fee waivers and reimbursements by the investment advisor, if any).
— Gross (total expenses not taking into account fee waivers and reimbursements by the investment advisor or custody earnings credits, if any).
— Including Credits (expenses less fee waivers and reimbursements by the investment advisor and reduced by custody earnings credits, if any).
(f) Ratios for the six months ended September 30, 2006 have been annualized.
The accompanying notes are an integral part of these financial statements.
24
QUANT FUNDS
FINANCIAL HIGHLIGHTS FOR QUANT EMERGING MARKETS FUND
(For a share outstanding throughout each period)
| Ordinary Shares | |||||||||||||||||||||||||||
| Six Months Ended September 30, 2006 | Years Ended March 31, | ||||||||||||||||||||||||||
| (Unaudited) | 2006 | 2005 | 2004 | 2003 | 2002 | ||||||||||||||||||||||
| Net Asset Value, Beginning of Period | $ | 19.85 | $ | 14.23 | $ | 12.71 | $ | 6.12 | $ | 7.24 | $ | 6.57 | |||||||||||||||
| Income from Investment Operations: | |||||||||||||||||||||||||||
| Net investment income (loss) (a)(b)(c) | 0.17 | 0.21 | 0.14 | 0.04 | 0.06 | 0.04 | |||||||||||||||||||||
| Net realized and unrealized gain/(loss) on securities | (0.55 | ) | 6.28 | 1.86 | 6.58 | (1.14 | ) | 0.68 | |||||||||||||||||||
| Total from Investment Operations | (0.38 | ) | 6.49 | 2.00 | 6.62 | (1.08 | ) | 0.72 | |||||||||||||||||||
| Less Distributions: | |||||||||||||||||||||||||||
| Dividends from net investment income | — | (0.22 | ) | (0.20 | ) | (0.03 | ) | (0.04 | ) | (0.05 | ) | ||||||||||||||||
| Distributions from realized capital gains | — | (0.65 | ) | (0.28 | ) | — | — | — | |||||||||||||||||||
| Total Distributions | — | (0.87 | ) | (0.48 | ) | (0.03 | ) | (0.04 | ) | (0.05 | ) | ||||||||||||||||
| Net Asset Value, End of Period | $ | 19.47 | $ | 19.85 | $ | 14.23 | $ | 12.71 | $ | 6.12 | $ | 7.24 | |||||||||||||||
| Total Return (d) | (1.91 | )% | 46.77 | % | 15.89 | % | 108.18 | % | (14.97 | )% | 11.11 | % | |||||||||||||||
| Net Assets, End of Period (000's) | $ | 176,237 | $ | 144,3088 | $ | 61,681 | $ | 39,977 | $ | 11,207 | $ | 10,931 | |||||||||||||||
| Ratios and Supplemental Data: | |||||||||||||||||||||||||||
| Ratios of expenses to average net assets: (e)(f) | |||||||||||||||||||||||||||
| Excluding credits | 1.68 | % | 1.83 | % | 1.96 | % | 2.07 | % | 2.30 | % | 2.32 | % | |||||||||||||||
| Gross | 1.68 | % | 1.83 | % | 1.96 | % | 2.07 | % | 2.46 | % | 2.32 | % | |||||||||||||||
| Including custody credits | 1.68 | % | 1.83 | % | 1.96 | % | 2.07 | % | 2.29 | % | 2.31 | % | |||||||||||||||
| Ratio of net investment income (loss) to average net assets (c)(f) | 1.75 | % | 1.23 | % | 1.12 | % | 0.39 | % | 0.88 | % | 0.67 | % | |||||||||||||||
| Portfolio Turnover | 10 | % | 34 | % | 53 | % | 45 | % | 150 | % | 38 | % | |||||||||||||||
| Institutional Shares | |||||||||||||||||||||||||||
| Six Months Ended September 30, 2006 | Years Ended March 31, | ||||||||||||||||||||||||||
| (Unaudited) | 2006 | 2005 | 2004 | 2003 | 2002 | ||||||||||||||||||||||
| Net Asset Value, Beginning of Period | $ | 20.11 | $ | 14.39 | $ | 12.82 | $ | 6.17 | $ | 7.30 | $ | 6.62 | |||||||||||||||
| Income from Investment Operations: | |||||||||||||||||||||||||||
| Net investment income (loss) (a)(b)(c) | 0.17 | 0.29 | 0.24 | 0.04 | 0.07 | 0.08 | |||||||||||||||||||||
| Net realized and unrealized gain/(loss) on securities | (0.54 | ) | 6.35 | 1.84 | 6.68 | (1.13 | ) | 0.69 | |||||||||||||||||||
| Total from Investment Operations | (0.37 | ) | 6.64 | 2.08 | 6.72 | (1.06 | ) | 0.77 | |||||||||||||||||||
| Less Distributions: | |||||||||||||||||||||||||||
| Dividends from net investment income | — | (0.27 | ) | (0.23 | ) | (0.07 | ) | (0.07 | ) | (0.09 | ) | ||||||||||||||||
| Distributions from realized capital gains | — | (0.65 | ) | (0.28 | ) | — | — | — | |||||||||||||||||||
| Total Distributions | — | (0.92 | ) | (0.51 | ) | (0.07 | ) | (0.07 | ) | (0.09 | ) | ||||||||||||||||
| Net Asset Value, End of Period | $ | 19.74 | $ | 20.11 | $ | 14.39 | $ | 12.82 | $ | 6.17 | $ | 7.30 | |||||||||||||||
| Total Return (d) | (1.84 | )% | 47.39 | % | 16.42 | % | 109.05 | % | (14.58 | )% | 11.78 | % | |||||||||||||||
| Net Assets, End of Period (000's) | $ | 4,318 | $ | 1,707 | $ | 1,082 | $ | 2,365 | $ | 282 | $ | 2,037 | |||||||||||||||
| Ratios and Supplemental Data: | |||||||||||||||||||||||||||
| Ratios of expenses to average net assets: (e)(f) | |||||||||||||||||||||||||||
| Excluding credits | 1.43 | % | 1.45 | % | 1.46 | % | 1.57 | % | 1.80 | % | 1.82 | % | |||||||||||||||
| Gross | 1.43 | % | 1.45 | % | 1.46 | % | 1.57 | % | 1.96 | % | 1.82 | % | |||||||||||||||
| Including custody credits | 1.42 | % | 1.45 | % | 1.46 | % | 1.57 | % | 1.79 | % | 1.81 | % | |||||||||||||||
| Ratio of net investment income (loss) to average net assets (c)(f) | 1.79 | % | 1.75 | % | 1.84 | % | 0.36 | % | 1.22 | % | 1.18 | % | |||||||||||||||
| Portfolio Turnover | 10 | % | 34 | % | 53 | % | 45 | % | 150 | % | 38 | % | |||||||||||||||
(a) Per share numbers have been calculated using the average shares method.
(b) Reflects expense waivers/reimbursements and reductions in effect during the period. See Note 3 to the Financial Statements.
(c) Net investment income (loss) per share and the ratio of net investment income (loss) to average net assets reflect net investment income prior to certain reclassifications for federal income or excise taxes.
(d) Total Return does not include the deferred sales charge of 1% for the Ordinary Shares. The total return would have been lower if certain fees had not been waived or if custodial fees had not been reduced by credits allowed by the custodian. See Note 3 to the financial statements.
(e) Ratios of expenses to average net assets shows:
— Excluding Credits (total expenses less fee waivers and reimbursements by the investment advisor, if any).
— Gross (total expenses not taking into account fee waivers and reimbursements by the investment advisor or custody earnings credits, if any).
— Including Credits (expenses less fee waivers and reimbursements by the investment advisor and reduced by custody earnings credits, if any).
(f) Ratios for six months ended September 30, 2006 have been annualized.
The accompanying notes are an integral part of these financial statements.
25
QUANT FUNDS
FINANCIAL HIGHLIGHTS FOR QUANT FOREIGN VALUE FUND
(For a share outstanding throughout each period)
| Ordinary Shares | |||||||||||||||||||||||||||
| Six Months Ended September 30, 2006 | Years Ended March 31, | ||||||||||||||||||||||||||
| (Unaudited) | 2006 | 2005 | 2004 | 2003 | 2002 | ||||||||||||||||||||||
| Net Asset Value, Beginning of Period | $ | 19.91 | $ | 15.92 | $ | 13.50 | $ | 7.80 | $ | 9.67 | $ | 8.66 | |||||||||||||||
| Income from Investment Operations: | |||||||||||||||||||||||||||
| Net investment income (loss) (a)(b)(c) | 0.08 | 0.24 | (g) | 0.15 | 0.22 | 0.10 | 0.06 | ||||||||||||||||||||
| Net realized and unrealized gain/(loss) on securities | 0.29 | 3.96 | 2.66 | 5.60 | (1.91 | ) | 0.97 | ||||||||||||||||||||
| Total from Investment Operations | 0.37 | 4.20 | 2.81 | 5.82 | (1.81 | ) | 1.03 | ||||||||||||||||||||
| Less Distributions: | |||||||||||||||||||||||||||
| Dividends from net investment income | — | (0.13 | ) | (0.12 | ) | (0.12 | ) | (0.06 | ) | (0.02 | ) | ||||||||||||||||
| Distributions from realized capital gains | — | (0.08 | ) | (0.27 | ) | — | — | — | |||||||||||||||||||
| Total Distributions | — | (0.21 | ) | (0.39 | ) | (0.12 | ) | (0.06 | ) | (0.02 | ) | ||||||||||||||||
| Net Asset Value, End of Period | $ | 20.28 | $ | 19.91 | $ | 15.92 | $ | 13.50 | $ | 7.80 | $ | 9.67 | |||||||||||||||
| Total Return (d) | 1.86 | % | 26.59 | % | 20.99 | % | 74.77 | % | (18.80 | )% | 11.93 | % | |||||||||||||||
| Net Assets, End of Period (000's) | $ | 504,490 | $ | 441,614 | $ | 202,655 | $ | 88,425 | $ | 29,468 | $ | 32,471 | |||||||||||||||
| Ratios and Supplemental Data: | |||||||||||||||||||||||||||
| Ratios of expenses to average net assets: (e)(f) | |||||||||||||||||||||||||||
| Excluding credits | 1.62 | % | 1.69 | % | 1.80 | % | 1.81 | % | 1.93 | % | 1.93 | % | |||||||||||||||
| Gross | 1.62 | % | 1.69 | % | 1.80 | % | 1.81 | % | 1.93 | % | 1.93 | % | |||||||||||||||
| Including custody credits | 1.62 | % | 1.69 | % | 1.80 | % | 1.81 | % | 1.93 | % | 1.92 | % | |||||||||||||||
| Ratio of net investment income (loss) to average net assets (c)(f) | 0.79 | % | 1.41 | %(g) | 1.04 | % | 1.90 | % | 1.20 | % | 0.74 | % | |||||||||||||||
| Portfolio Turnover | 5 | % | 29 | % | 10 | % | 48 | % | 7 | % | 9 | % | |||||||||||||||
| Institutional Shares | |||||||||||||||||||||||||||
| Six Months Ended September 30, 2006 | Years Ended March 31, | ||||||||||||||||||||||||||
| (Unaudited) | 2006 | 2005 | 2004 | 2003 | 2002 | ||||||||||||||||||||||
| Net Asset Value, Beginning of Period | $ | 20.01 | $ | 15.98 | $ | 13.53 | $ | 7.83 | $ | 9.72 | $ | 8.68 | |||||||||||||||
| Income from Investment Operations: | |||||||||||||||||||||||||||
| Net investment income (loss) (a)(b)(c) | 0.10 | 0.29 | (h) | 0.17 | 0.30 | 0.12 | 0.09 | ||||||||||||||||||||
| Net realized and unrealized gain/(loss) on securities | 0.29 | 3.98 | 2.70 | 5.56 | (1.92 | ) | 0.98 | ||||||||||||||||||||
| Total from Investment Operations | 0.39 | 4.27 | 2.87 | 5.86 | (1.80 | ) | 1.07 | ||||||||||||||||||||
| Less Distributions: | |||||||||||||||||||||||||||
| Dividends from net investment income | — | (0.16 | ) | (0.15 | ) | (0.16 | ) | (0.09 | ) | (0.03 | ) | ||||||||||||||||
| Distributions from realized capital gains | — | (0.08 | ) | (0.27 | ) | — | — | — | |||||||||||||||||||
| Total Distributions | — | (0.24 | ) | (0.42 | ) | (0.16 | ) | (0.09 | ) | (0.03 | ) | ||||||||||||||||
| Net Asset Value, End of Period | $ | 20.40 | $ | 20.01 | $ | 15.98 | $ | 13.53 | $ | 7.83 | $ | 9.72 | |||||||||||||||
| Total Return (d) | 1.95 | % | 26.96 | % | 21.35 | % | 75.07 | % | (18.62 | )% | 12.37 | % | |||||||||||||||
| Net Assets, End of Period (000's) | $ | 56,960 | $ | 30,972 | $ | 21,317 | $ | 11,875 | $ | 862 | $ | 809 | |||||||||||||||
| Ratios and Supplemental Data: | |||||||||||||||||||||||||||
| Ratios of expenses to average net assets: (e)(f) | |||||||||||||||||||||||||||
| Excluding credits | 1.38 | % | 1.45 | % | 1.55 | % | 1.56 | % | 1.68 | % | 1.69 | % | |||||||||||||||
| Gross | 1.38 | % | 1.45 | % | 1.55 | % | 1.56 | % | 1.68 | % | 1.69 | % | |||||||||||||||
| Including custody credits | 1.38 | % | 1.45 | % | 1.55 | % | 1.56 | % | 1.68 | % | 1.68 | % | |||||||||||||||
| Ratio of net investment income (loss) to average net assets (c)(f) | 0.99 | % | 1.70 | %(h) | 1.22 | % | 2.52 | % | 1.40 | % | 0.99 | % | |||||||||||||||
| Portfolio Turnover | 5 | % | 29 | % | 10 | % | 48 | % | 7 | % | 9 | % | |||||||||||||||
(a) Per share numbers have been calculated using the average shares method.
(b) Reflects expense waivers/reimbursements and reductions in effect during the period. See Note 3 to the Financial Statements.
(c) Net investment income (loss) per share and the ratio of net investment income (loss) to average net assets reflect net investment income prior to certain reclassifications for federal income or excise taxes.
(d) Total Return does not include the deferred sales charge of 1% for the Ordinary Shares. The total return would have been lower if certain fees had not been waived or if custodial fees had not been reduced by credits allowed by the custodian. See Note 3 to the financial statements.
(e) Ratios of expenses to average net assets shows:
— Excluding Credits (total expenses less fee waivers and reimbursements by the investment advisor, if any).
— Gross (total expenses not taking into account fee waivers and reimbursements by the investment advisor or custody earnings credits, if any).
— Including Credits (expenses less fee waivers and reimbursements by the investment advisor and reduced by custody earnings credits, if any).
(f) Ratios for six months ended September 30, 2006 have been annualized.
(g) Includes non-recurring income of $277,072.
(h) Includes non-recurring income of $22,928.
The accompanying notes are an integral part of these financial statements.
26
QUANT FUNDS
NOTES TO FINANCIAL STATEMENTS
1. Organization of the Trust.
The Quantitative Group of Funds d/b/a "Quant Funds" (the "Trust") is organized as a Massachusetts business trust and is registered under the Investment Company Act of 1940, as amended, as a non-diversified, open-end management investment company. The Trust currently has four series (each a "Fund" and collectively the "Funds") each with a distinct investment objective.
Quant Small Cap Fund ("Small Cap") seeks maximum long-term capital appreciation.
Quant Growth and Income Fund ("Growth and Income") seeks long-term growth of capital and income.
Quant Emerging Markets Fund ("Emerging Markets") seeks long-term growth of capital.
Quant Foreign Value Fund ("Foreign Value") seeks long-term capital growth and income.
2. Significant Accounting Policies.
The following is a summary of significant accounting policies followed by the Funds in the preparation of their financial statements. The policies are in conformity with generally accepted accounting principles for investment companies, which require management to make estimates and assumptions that affect the reported amounts and disclosures in the financial statements. Actual results could differ from those estimates.
Security Valuation.
Portfolio securities are valued each business day at the last reported sale price on the principal exchange or market on which they are traded. If there is no such reported sale, the securities generally are valued at the mean between the last reported bid and asked prices. For certain securities, where no such sales have been reported, the Fund may value such securities at the last reported bid price. In the event that there is information suggesting that valuation of such securities based upon bid and/or asked prices may not be accurate, a Fund may value such securities in good faith at fair value in accordance with procedures established by the Funds' Trustees (the "Trustees"), which may include a determination to value such securities at the last reported sales price. Short-term investments that mature in 60 days or less are valued at amortized cost. Securities quoted in foreign currencies are translated into U.S. dollars based upon the prevailing exchange rate on each business day. Other assets and securities for which no quotations are readily available are valued at fair value as determined in good faith using procedures approved by the Trustees. As a result, changes in the value of those currencies in relation to the U.S. dollar may affect the Fund's NAV. Because foreign markets may be open at different times than the New York Stock Exchange, the value of the Fund's shares may change on days when shareholders are not able to buy or sell them. If events materially affecting the values of the Fund's foreign investments occur between the close of foreign markets and the close of regular trading on the New York Stock Exchange, these investments may be valued at their fair value as determined in good faith using procedures approved by the Trustees.
Security Transactions and Related Investment Income.
Security transactions are accounted for on the trade date (the date the order to buy or sell is executed). Dividend income is recorded on the ex-dividend date, except that certain dividends from foreign securities are recorded as soon as the Funds are informed of the ex-dividend date. Interest income is recorded on the accrual basis. In determining the net gain or loss on securities sold, the cost of securities is determined on the identified cost basis. Each Fund's investment income and realized and unrealized gains and losses are allocated among classes based upon the daily relative net assets.
Repurchase Agreements.
The Funds' custodian takes possession through the federal book-entry system of securities collateralizing repurchase agreements. Collateral is marked-to-market daily to ensure that the market value of the underlying assets remains sufficient to protect the Funds. The Funds may experience costs and delays in liquidating the collateral if the issuer defaults or enters into bankruptcy.
Foreign Currency Transactions.
All monetary items denominated in foreign currencies are translated into U.S. dollars based on the prevailing exchange rate at the close of each business day. Income and expenses denominated in foreign currencies are translated at the prevailing rates of exchange when accrued or incurred.
Reported net realized gains and losses on foreign currency transactions represent net gains and losses from currency gains and losses realized between the trade and settlement dates on investment transactions, and the difference between the amount of net investment income accrued and the U.S. dollar amount actually received. The effects of changes in foreign currency exchange rates on investments in securities are not segregated in the Statement of Operations from the effects of changes in market prices of those securities, but are included with the net realized and unrealized gain or loss on investments.
27
QUANT FUNDS
NOTES TO FINANCIAL STATEMENTS—Continued
Expenses.
The majority of the expenses of the Funds are attributed to the individual Fund for which they are incurred. Expenses that are not attributed to a specific Fund are allocated in proportion to the respective net assets of the Funds. Expenses allocable to a Fund are borne pro rata by the holders of both classes of shares of such Fund, except that 12b-1 Plan expenses will not be borne by the holders of Institutional Shares and each class has its own transfer agency fee.
New Accounting Pronouncement.
In July 2006, Financial Account Standards Board Interpretation No. 48, Accounting for Uncertainty in Income Taxes – an interpretation of FASB Statement 109 (FIN 48) was issued and is effective for fiscal years beginning after December 15, 2006. FIN 48 sets forth a threshold for financial statement recognition, measurement and disclosure of a tax position taken or expected to be taken on a tax return. The Manager is currently evaluating the impact, if any, the adoption of FIN 48 will have on each Fund's net assets and results of operations.
3. Management Fee, Advisory Contracts and Other Affiliate Transactions.
The Funds have entered into a management agreement (the "Management Agreement") with Quantitative Investment Advisors, Inc. (the "Manager") d/b/a Quantitative Advisors. Compensation of the Manager, for management and administration of the Funds, including selection and monitoring of the portfolio advisors, is paid monthly based on the average daily net asset value of each Fund for the month. The annual rate of such fees is 1.00% of the average daily total net assets of Small Cap, Emerging Markets, and Foreign Value; 0.75% of the average daily net total asset value of the Growth and Income Fund.
Under the Management Agreement, the Manager has agreed to reduce its compensation, and if necessary, assume expenses, with respect to Small Cap and Growth and Income to the extent that the total expenses of any of these Funds individually exceed 2% of average net assets for any fiscal year. Fund expenses subject to this limitation are exclusive of brokerage, interest, taxes and extraordinary expenses, which include incremental custody costs associated with international securities. Expenses are calculated gross of custody credits, if applicable.
For the six months ended September 30, 2006, aggregate management fees were $4,132,337 and no fees were reduced or waived.
The Manager has entered into advisory contracts with the following subadvisors (collectively the "Advisors") to provide investment advisory services to the following Funds: Columbia Partners, L.L.C., Investment Management (Small Cap,), SSgA Funds Management, Inc. (Growth and Income), PanAgora Asset Management, Inc. (Emerging Markets), and Polaris Capital Management, Inc. (Foreign Value).
For services rendered, the Manager pays to the Advisor of a Fund a fee based on a percentage of the average daily total net assets of the Fund. The fee for each Fund is determined separately. The fees paid by the Manager to the Advisors of the Funds are as follows: Small Cap – 0.50% of average daily total net assets; Emerging Markets – 0.40% of average daily total net assets; Growth and Income – 0.375% of the first $20 million and 0.30% of amounts in excess of $20 million of average daily total net assets, with an annual minimum of $25,000; and Foreign Value – 0.35% of the first $35 million, 0.40% of amounts in excess of $35 million but less than $200 million and 0.50% for assets in excess of $200 million of average daily total net assets.
The Funds have entered into a distribution agreement (the "Distribution Agreement") with U.S. Boston Capital Corporation (the "Distributor"). For its services under the Distribution Agreement, the Distributor receives a monthly fee at the annual rate of (i) 0.50% of the average daily total net asset value of Ordinary Share accounts of Small Cap, Growth and Income and Emerging Markets and (ii) 0.25% of the average daily total net asset value of Ordinary Share accounts of Foreign Value open during the period the plan is in effect. The Distributor is voluntarily contractually reducing the monthly fee it receives from Emerging Markets to 0.25% of the average daily total net asset value of Ordinary Shareholder accounts of Emerging Markets for the period from November 1, 2005 through July 31, 2007. This reduction is subject to review and there is no guarantee that the Distributor will continue the reduction. Holders of Institutional Shares bear no portion of the 12b-1 Plan expenses of the Funds and are not entitled to vote on matters involving the 12b-1 Plan. During the six months ended September 30, 2006, the aggregate distribution fees of the Funds were $1,178,933.
A deferred sales charge of 1% of the net asset value of Ordinary Shares redeemed of Small Cap, Growth and Income, Emerging Markets and Foreign Value is withheld from the redemption proceeds and paid to the Distributor. The deferred sales charge is not imposed on redemptions of Institutional Shares and certain other transactions. The Funds have been advised that during the six months ended September 30, 2006, such fees earned by the Distributor were $39,235.
Transfer agent functions are provided to the Funds by Quantitative Institutional Services, a division of the Manager (the "Transfer Agent") pursuant to a transfer agent agreement (the "Transfer Agent Agreement"). The Transfer Agent
28
QUANT FUNDS
NOTES TO FINANCIAL STATEMENTS—Continued
Agreement provides for base fees that are payable to the Transfer Agent at an annual rate of 0.16% of the average daily total net asset value of each class of shares of the Funds and for reimbursement of out of pocket expenses. During the six months ended September 30, 2006, the aggregate fees of the Funds were $721,393.
The Transfer Agent also provides the Fund with other services consisting of in-house legal services, preparation and review of semi-annual and annual reports and EDGAR administration services. These services are provided as additional services agreed to by the Board of Trustees of the Funds under the provisions of the Transfer Agent Agreement. For the six months ended September 30, 2006, aggregate transfer agent fees for these services were $65,801.
The By Laws of the Fund, as amended from time to time, permit the Board of Trustees of the Fund to approve reimbursement to the Manager for certain costs associated with providing regulatory and compliance services to the Fund. For the six months ended September 30, 2006, the Trustees have approved reimbursements that amounted to $64,939.
Custody and fund accounting services are provided by State Street Kansas City. Custody credits generated by interest earned on uninvested cash balances maintained by the Funds are used to offset custodial expenses of the Funds.
The Trustees receive an annual Trustee's fee of $5,000 except the audit committee members who receive an annual fee of $6,000. The fees are allocated to each Fund in proportion to its respective net assets.
4. Purchases and Sales.
During the six months ended September 30, 2006, purchases of investment securities other than U.S. Government obligations and short-term investments, for Small Cap, Growth and Income, Emerging Markets and Foreign Value were $25,009,342, $30,064,195, $55,202,988, and $133,964,007, respectively. Sales of such securities for the Funds were $26,757,784, $27,975,063, $15,747,377, and $25,997,949, respectively.
5. Contingent Liability.
The Trust insures itself and all Funds under a policy with ICI Mutual Insurance Company ("ICI Mutual"). The annual premium is allocated among the Funds and the Transfer Agent. Additionally, the Funds have committed to ICI Mutual up to 300% of the annual premium, one third of which was provided in cash, with each Fund's pro rata portion recorded as an asset. The remainder is secured with an irrevocable letter of credit.
6. Concentration of Risk.
The relatively large investments of Emerging Markets in countries with limited or developing capital markets may involve greater risks than investments in more developed markets and the prices of such investments may be volatile. The consequences of political, social or economic changes in these markets may have disruptive effects on the market prices of the Fund's investments and the income they generate, as well as the Fund's ability to repatriate such amounts.
7. Federal Income Taxes.
It is the policy of the Funds to distribute all of their taxable income within the prescribed time and otherwise comply with the provisions of the Internal Revenue Code ("IRC") applicable to regulated investment companies. Therefore no Federal income tax provision is required.
The tax components of capital shown in the following tables represent: (1) losses or deductions the Portfolios may be able to offset against income and gains realized in future years, (2) distribution requirements the Portfolios must satisfy under the income tax regulations, and (3) unrealized appreciation or depreciation of investments for federal income tax purposes.
29
QUANT FUNDS
NOTES TO FINANCIAL STATEMENTS—Continued
Certain Funds had capital loss carryovers at March 31, 2006. The accumulated capital losses noted in the table may be available to offset future realized capital gains and thereby reduce future taxable gain distributions. Foreign Value's capital loss carryover was acquired during a merger which took place on May 2, 2003 and may be subject to annual limitations under applicable tax laws and therefore may expire unutilized. As of March 31, 2006 the capital loss carryovers were as follows:
| Portfolio | Capital Loss Expires March 31, 2010 | Capital Loss Expires March 31, 2011 | Capital Loss Expires March 31, 2012 | Capital Loss Expires March 31, 2013 | Total Capital Loss | ||||||||||||||||||
| Small Cap Fund | $ | — | $ | — | $ | — | $ | — | $ | — | |||||||||||||
| Growth and Income Fund | — | (1,935,898 | ) | (1,505,389 | ) | (242,539 | ) | (3,683,826 | ) | ||||||||||||||
| Emerging Markets Fund | — | — | — | — | — | ||||||||||||||||||
| Foreign Value Fund | (3,055,405 | ) | (932,449 | ) | — | — | (3,987,854 | ) | |||||||||||||||
In 2006, the Portfolios noted in the table incurred no "Post-October" losses during the period from November 1, 2005 through March 31, 2006.
The primary differences between book and tax appreciation or depreciation of investments consist of wash sale loss deferrals, return of capital distributions by real estate investment trusts ("REITs"), mark to market on passive foreign investment companies ("PFICs") held and foreign capital gains taxes accrued. The net tax appreciation/depreciation in the table includes unrealized tax gain (loss) on foreign currency and investments.
| March 31, 2006 | September 30, 2006 | ||||||||||||||||||||||
| Portfolio | Undistributed Ordinary Income | Undistributed Long-Term Gains | Accumulated Capital Losses | Post- October Deferral | Net Tax Appreciation/ Depreciation | ||||||||||||||||||
| Small Cap Fund | $ | — | $ | 3,910,691 | $ | — | $ | — | $ | 27,666,736 | |||||||||||||
| Growth and Income Fund | 117,007 | — | (3,683,826 | ) | — | 7,022,272 | |||||||||||||||||
| Emerging Markets Fund | 1,094,794 | 3,215,544 | — | — | 36,253,113 | ||||||||||||||||||
| Foreign Value Fund | 2,242,437 | 31,214,360 | (3,987,854 | ) | — | 105,593,432 | |||||||||||||||||
At March 31, 2006 the tax composition of dividends was as follows:
| Portfolio | Ordinary Income | Long Term Capital Gains | Tax Return Of Capital | ||||||||||||
| Small Cap Fund | $ | — | $ | 12,783,214 | $ | — | |||||||||
| Growth & Income Fund | 39,903 | — | — | ||||||||||||
| Emerging Markets Fund | 1,227,979 | 3,671,542 | — | ||||||||||||
| Foreign Value Fund | 2,439,962 | 1,436,750 | — | ||||||||||||
For the six months ended September 30, 2006 Small Cap incurred a net operating loss of $430,066. This net operating loss was reclassified to Shares of Beneficial Interest.
Capital loss carryovers in the amount of $0, $6,530,758, $0, and $1,395,926 were utilized by Small Cap, Growth and Income, Emerging Markets and Foreign Value, respectively during the fiscal year ending March 31, 2006.
30
QUANT FUNDS
NOTES TO FINANCIAL STATEMENTS—Continued
8. Transactions in Shares of Beneficial Interest.
Transactions in shares of beneficial interest were as follows:
| Six Months Ended September 30, 2006 (Unaudited) | Year Ended March 31, 2006 | ||||||||||||||||||
| Shares | Dollars | Shares | Dollars | ||||||||||||||||
| Small Cap | |||||||||||||||||||
| Ordinary Shares | |||||||||||||||||||
| Shares sold | 284,586 | $ | 6,431,697 | 294,518 | $ | 6,459,521 | |||||||||||||
| Shares issued in reinvestment of distributions | — | — | 521,194 | 11,122,291 | |||||||||||||||
| Shares redeemed | (197,780 | ) | (4,456,542 | ) | (309,548 | ) | (6,655,536 | ) | |||||||||||
| Net Change | 86,806 | 1,975,155 | 506,164 | 10,926,276 | |||||||||||||||
| Institutional Shares | |||||||||||||||||||
| Shares sold | 15,567 | 390,315 | 24,093 | 588,442 | |||||||||||||||
| Shares issued in reinvestment of distributions | — | — | 54,915 | 1,292,152 | |||||||||||||||
| Shares redeemed | (99,576 | ) | (2,382,949 | ) | (13,607 | ) | (330,123 | ) | |||||||||||
| Redemption fees | — | — | — | — | |||||||||||||||
| Net Change | (84,009 | ) | (1,992,634 | ) | 65,401 | 1,550,471 | |||||||||||||
| Total Net Change For Fund | $ | (17,479 | ) | $ | 12,476,747 | ||||||||||||||
| Growth and Income | |||||||||||||||||||
| Ordinary Shares | |||||||||||||||||||
| Shares sold | 276,876 | $ | 4,082,219 | 754,982 | $ | 10,404,047 | |||||||||||||
| Shares issued in reinvestment of distributions | — | — | 2,314 | 33,410 | |||||||||||||||
| Shares redeemed | (197,808 | ) | (2,925,228 | ) | (265,055 | ) | (3,688,147 | ) | |||||||||||
| Net Change | 79,068 | 1,156,991 | 492,241 | 6,749,310 | |||||||||||||||
| Institutional Shares | |||||||||||||||||||
| Shares sold | 830 | 12,805 | 5,378 | 76,134 | |||||||||||||||
| Shares issued in reinvestment of distributions | — | — | 302 | 4,550 | |||||||||||||||
| Shares redeemed | (97 | ) | (1,478 | ) | (3,176 | ) | (48,185 | ) | |||||||||||
| Redemption fees | — | — | — | — | |||||||||||||||
| Net Change | 733 | 11,327 | 2,504 | 32,499 | |||||||||||||||
| Total Net Change For Fund | $ | 1,168,318 | $ | 6,781,809 | |||||||||||||||
| Emerging Markets | |||||||||||||||||||
| Ordinary Shares | |||||||||||||||||||
| Shares sold | 3,119,217 | $ | 61,140,522 | 4,076,268 | $ | 70,343,772 | |||||||||||||
| Shares issued in reinvestment of distributions | — | — | 282,375 | 4,721,307 | |||||||||||||||
| Shares redeemed | (1,324,354 | ) | (25,087,259 | ) | (1,435,106 | ) | (22,966,509 | ) | |||||||||||
| Net Change | 1,794,863 | 36,053,263 | 2,923,537 | 52,098,570 | |||||||||||||||
| Institutional Shares | |||||||||||||||||||
| Shares sold | 134,858 | 2,590,352 | 9,349 | 160,448 | |||||||||||||||
| Shares issued in reinvestment of distributions | — | — | 4,263 | 72,124 | |||||||||||||||
| Shares redeemed | (1,021 | ) | (19,812 | ) | (3,953 | ) | (63,950 | ) | |||||||||||
| Redemption fees | — | 1 | — | ||||||||||||||||
| Net Change | 133,837 | 2,570,541 | 9,659 | 168,622 | |||||||||||||||
| Total Net Change For Fund | $ | 38,623,804 | $ | 52,267,192 | |||||||||||||||
31
QUANT FUNDS
NOTES TO FINANCIAL STATEMENTS—Continued
| Six Months Ended September 30, 2006 (Unaudited) | Year Ended March 31, 2006 | ||||||||||||||||||
| Shares | Dollars | Shares | Dollars | ||||||||||||||||
| Foreign Value | |||||||||||||||||||
| Ordinary Shares | |||||||||||||||||||
| Shares sold | 5,428,898 | $ | 108,304,223 | 13,484,712 | $ | 233,143,864 | |||||||||||||
| Shares issued in reinvestment of distributions | — | — | 201,938 | 3,410,738 | |||||||||||||||
| Shares redeemed | (2,729,882 | ) | (53,235,939 | ) | (4,240,514 | ) | (70,950,401 | ) | |||||||||||
| Net Change | 2,699,016 | 55,068,284 | 9,446,136 | 165,604,201 | |||||||||||||||
| Institutional Shares | |||||||||||||||||||
| Shares sold | 1,290,273 | 26,095,175 | 504,191 | 8,822,178 | |||||||||||||||
| Shares issued in reinvestment of distributions | — | — | 18,026 | 305,537 | |||||||||||||||
| Shares redeemed | (46,566 | ) | (909,649 | ) | (307,861 | ) | (4,886,354 | ) | |||||||||||
| Redemption fees | — | 4,328 | |||||||||||||||||
| Net Change | 1,243,707 | 25,189,854 | 214,356 | 4,241,361 | |||||||||||||||
| Total Net Change For Fund | $ | 80,258,138 | $ | 169,845,562 | |||||||||||||||
9. Merger.
On May 2, 2003, the net assets of State Street Research International Equity Fund (SSR), a series of State Street Research Financial Trust, were acquired by Foreign Value. The merger was pursuant to a Plan of Reorganization approved by the shareholders of SSR on April 25, 2003. Foreign Value is the surviving fund for purposes of maintaining the financial statements and performance history in the post-reorganization periods.
Foreign Value acquired capital loss carryovers for federal income tax purposes of $8,053,584. These acquired capital loss carryovers may be subject to limitations on their use under the Internal Revenue Code, as amended.
10. Subsequent Events
Effective October 1, 2006, each Trustee receives an annual Trustees' fee of $10,000. Trustees' fees are allocated to each Fund in proportion to its respective net assets.
Effective November 1, 2006, Quant Growth and Income Fund was renamed Quant Long/Short Fund ("Long/Short") when it changed from a "long only" investment strategy to a "long/short" investment strategy. The investment objective of Long/Short is long term growth of capital.
Effective November 1, 2006, the management fee paid by Long/Short to the Manager as compensation for management and administration of the Fund, including selection and monitoring of the portfolio advisor, increased to 1.00% from 0.75% of the average daily net assets of Long/Short.
Effective November 1, 2006, the subadvisory fee paid by the Manager to the Advisor to Long/Short increased to 0.50% on the first $20 million and 0.35% on amounts in excess of $20 million of the average daily net assets of Long/Short from 0.375% on the first $20 million and 0.30% on amounts in excess of $20 million of the average daily net assets of Long/Short.
Federal Tax Information
(Unaudited)
Designation Requirements at March 31, 2006.
| Qualified Dividend Income Percentage | |||||||
| Growth and Income Fund | 100 | % | |||||
| Emerging Markets Fund | 100 | % | |||||
| Foreign Value Fund | 100 | % | |||||
32
QUANT FUNDS
INFORMATION FOR SHAREHOLDERS
Proxy Voting Results
Special Shareholder Meeting–October 24, 2006
Quant Growth and Income Fund, a series of Quantitative Groups of Funds
| For | Against | Abstain | |||||||||||||
| 1 To approve a change to the Fund's investment objective to long-term growth of capital. Shares Voted Percent of Outstanding Shares | 2,275,358.033 54.360% | 7,987.362 0.191% | 56,633.594 1.353% | ||||||||||||
| 2 To approve a change to the Fund's primary investment focus requiring that the Fund invest at least 80% of the Fund's net assets (plus any borrowings for investment purposes) in common stock. Shares Voted Percent of Outstanding Shares | 2,127,868.386 50.836% | 170,753.241 4.079% | 41,357.362 0.988% | ||||||||||||
| 3 To approve an amendment to the existing subadvisory agreement between Quantitative Investment Advisors, Inc. and SSgA Funds Management, Inc. to increase the subadvisory fees paid by Quantative Investment Advisors, Inc. (and not the Fund) to SSgA Funds Management, Inc. with respect to the fund. Shares Voted Percent of Outstanding Shares | 2,070,357.642 49.462% | 199,287.138 4.761% | 70,334.209 1.680% | ||||||||||||
| 4 To approve an amendment to the existing management contract between the Quant Funds and Quantative Investment Advisors, Inc. to increase the management fees paid by the fund. Shares Voted Percent of Outstanding Shares | 2,042,780.358 48.803% | 265,742.148 6.349% | 31,456.483 0.752% | ||||||||||||
| 5 To approve an amendment to the management contract eliminating the 2% expense limitation provision with respect to the Fund. Shares Voted Percent of Outstanding Shares | 2,188,835.641 52.292% | 87,277.001 2.085% | 63,866.347 1.526% | ||||||||||||
33
QUANT FUNDS
INFORMATION FOR SHAREHOLDERS
| For | Against | Abstain | |||||||||||||
| 6A To approve the elimination of the Fund's fundamental restriction prohibiting short sales other than short sales against the box. Shares Voted Percent of Outstanding Shares | 2,075,699.108 49.590% | 184,986.742 4.419% | 79,293.139 1.894% | ||||||||||||
| 6B To approve changes in the Fund's fundamental restrictions with respect to borrowing. Shares Voted Percent of Outstanding Shares | 2,102,221.012 50.223% | 191,164.902 4.567% | 46,593.075 1.113% | ||||||||||||
| 6C To approve changes in the Fund's fundamental restrictions with respect to senior securities. Shares Vo ted Percent of Outstanding Shares | 2,100,804.002 50.189% | 171,766.712 4.104% | 67,408.275 1.610% | ||||||||||||
| 6D To approve changes in the Fund's fundamental restrictions with respect to loans. Shares Voted Percent of Outstanding Shares | 2,100,027.830 50.171% | 173,350.196 4.141% | 66,600.963 1.591% | ||||||||||||
| 6E To approve changes in the Fund's fundamental restrictions with respect to industry concentration. Shar es Voted Percent of Outstanding Shares | 2,245,956.914 53.657% | 46,997.732 1.123% | 47,024.343 1.123% | ||||||||||||
| 6F To approve changes in the Fund's fundamental restrictions with respect to commodities and commodities contracts. Shares Voted Percent of Outstanding Shares | 2,230,044.861 53.277% | 43,333.165 1.035% | 66,600.963 1.591% | ||||||||||||
| 6G To approve changes in the Fund's fundamental restrictions with respect to real estate. Shares Voted Percent of Outstanding Shares | 2,234,072.050 53.373% | 58,882.596 1.407% | 47,024.343 1.123% | ||||||||||||
| 6H To approve changes in the Fund's fundamental restrictions with respect to acting as an underwriter. Shares Voted Percent of Outstanding Shares | 2,228,972.843 53.251% | 44,668.331 1.067% | 66,337.815 1.585% | ||||||||||||
34
QUANT FUNDS
INFORMATION FOR SHAREHOLDERS
| For | Against | Abstain | |||||||||||||
| 6I To approve the elimination of the Fund's fundamental restrictions with respect to exercising control. Shares Voted Percent of Outstanding Shares | 2,243,548.094 53.600% | 45,927.272 1.097% | 50,503.623 1.207% | ||||||||||||
| 6J To approve the elimination of the Fund's fundamental restrictions with respect to ownership of certain securities. Shares Voted Percent of Outstanding Shares | 2,085,558.910 49.825% | 188,434.882 4.502% | 65,985.197 1.576% | ||||||||||||
| 6K To approve the elimination of the Fund's fundamental restrictions with respect to ownership of more than 10% of certain securities. Shares Voted Percent of Outstanding Shares | 2,230,064.916 53.277% | 60,659.340 1.449% | 49,254.733 1.177% | ||||||||||||
| 6L To approve the elimination of the Fund's fundamental restrictions with respect to ownership of certain securities representing more than 10% of the Fund's net assets. Shares Voted Percent of Outstanding Shares | 2,228,430.323 53.238% | 45,210.851 1.080% | 66,337.815 1.585% | ||||||||||||
| 6M To approve the elimination of the Fund's fundamental restrictions with respect to joint participations. Shares Voted Percent of Outstanding Shares | 2,228,816.026 53.248% | 62,978.690 1.505% | 48,184.273 1.151% | ||||||||||||
| 6N To approve the elimination of the Fund's fundamental restrictions with respect to puts and calls. Shar es Voted Percent of Outstanding Shares | 2,216,931.162 52.964% | 44,825.148 1.071% | 78,222.679 1.869% | ||||||||||||
| 6O To approve the elimination of the Fund's fundamental restrictions with respect to interests in oil and gas programs. Shares Voted Percent of Outstanding Shares | 2,239,139.622 53.494% | 42,193.308 1.008% | 58,646.059 1.401% | ||||||||||||
35
QUANT FUNDS
INFORMATION FOR SHAREHOLDERS
Quarterly Portfolio Disclosure
Each Quant Fund files its complete schedule of portfolio holdings with the Securities and Exchange Commission (SEC) for the first and third quarters of each fiscal year on Form N-Q. The funds' Forms N-Q are available on the SEC's website at www.sec.gov and may be reviewed and copied at the SEC's Public Reference Room in Washington, D.C. (Call 1-800-SEC-0330 for more information.). For a complete list of a fund's portfolio holdings, you may also view the most recent quarterly holdings report, semiannual report or annual report on the Quant Funds' web site at www.quantfunds.com.
Portfolio Proxy Voting Policies and Information
Information on how the Quant Funds voted proxies related to portfolio securities for the 12-month period ended June 30, 2006 is available without charge online at www.quantfunds.com and at www.sec.gov. You may also call 1-800-326-2151 to request a free copy of the proxy voting information or the proxy voting policies.
Household Delivery of Fund Documents
With your consent, Quant may send a single proxy statement, prospectus and shareholder report to your residence for you and any other member of your household who has an account with the Quant Funds. If you wish to revoke your consent to this practice, you may do so by notifying Quant, by phone or in writing (see "For Account Information"). Quant will begin mailing separate proxy statements, prospectuses and shareholder reports to you within 30 days after receiving your notice.
Management Contract and Advisory Agreement Approval
A majority of the Board of Trustees, including at least a majority of the non-interested trustees voting separately, is required under the Investment Company Act of 1940 (the "1940 Act") to approve the Management Contract with Quantitative Advisors and the Advisory Contracts between Quantitative Advisors (the "Manager") and each of the subadvisors (the "Advisors") on an annual basis. In this regard, the Management and Advisory Contracts are reviewed each year by the Board of Trustees to determine whether the contracts should be renewed for an additional one-year period.
On April 11, 2006, the Board of Trustees, and the non-interested trustees voting separately, determined that the terms of the Management Contract and each of the Advisory Contracts are fair and reasonable and approved the continuance of each contract as being in the best interests of the Quant Funds and each respective Fund's shareholders.
On July 17, 2006, at the request of the Manager, the Board, and the non-interested trustees voting separately, reconsidered the terms of the Management Contract with respect to Quant Growth and Income Fund and the respective Advisory Agreement and determined the proposed amendments to the Management Contract and the Advisory Agreement were fair and reasonable and approved the amendments to each contract as being in the best interests of the Quant Growth and Income Fund and its shareholders.
In making its determinations, the Board considered materials relating to the contract review process that were specifically prepared by the Manager and the Advisors at the request of the Board and Fund counsel, and by an independent provider of investment company data contracted to assist the Board. The Board also considered information received periodically about the portfolio, performance, the investment strategy, portfolio management team and fees and expenses of each Fund. The Board considered each contract and the non-interested trustees held sessions both with the Manager and separate from the Manager in reviewing and considering the contracts.
In considering the contracts, the Board, including the non-interested trustees, did not identify any single factor as all-important or controlling, and the following summary does not detail all matters considered.
Management Contract with Quantitative Advisors
In approving the renewal of the Management Contract on April 11, 2006, the Board, including the non-interested Trustees, considered, among other things: the benefit to shareholders of investing in funds that are part of a small family of funds using a manager-of-managers approach and providing for a selection of shareholder services; the advisor's supervision of the subadvisors and whether each Quant Fund has operated within its investment objective and its record of compliance with its investment restrictions; each Quant Fund's management fee, subadvisory fee and expense ratio compared with the management fees, subadvisory fees and expense ratios of a peer group of funds; the use of fee breakpoints by some mutual funds; and the amount and nature of fees paid by shareholders. Although there are fee limitations and/or expense waivers in place with respect to Quant Growth and Income Fund (through October 31, 2006) and Quant Small
36
QUANT FUNDS
INFORMATION FOR SHAREHOLDERS
Cap Fund, expenses have not exceeded the limitations or been waived for either of the Funds during the last five fiscal years. Each Fund's advisory fee is discussed further in connection with consideration of the subadvisory fees.
The Board, including the non-interested Trustees, also considered the Managers personnel and methods. The Board reviews at least annually the background of the Manager's senior management, particularly the size, education and experience of the Manager's staff and the Manager's approach to recruiting, training and retaining senior management and other personnel. The non-interested Trustees have also had discussions with senior management responsible for supervising each Quant Fund's subadvisor and related investment program. The Board also considered the nature, quality, cost and extent of administrative and shareholder services performed by the advisor and affiliated companies under the existing Advisory Agreements and under separate agreements covering transfer agency functions and other services and the nature and extent of the Manager's supervision of third party service providers, principally fund accountants (pricing, recordkeeping and, if any, securities lending services) and custodians and subcustodians.
The Board, including the non-interested Trustees, considered the level of the Manager's profits in respect of the management of the Quant Funds. The Board considered whether the amount of profit is a fair entrepreneurial profit for the management of a family of funds like the Quantitative Group of Funds, the revenue potential that could be realized from non-fund businesses (such as transfer agency and distribution) which may benefit from or be related to a Quant Fund's business and the Manger's profit margins in comparison with available industry data.
The Board, including the non-interested Trustees, considered whether there have been economies of scale in respect of the management of the Quant Funds, whether the Quant Funds (at both the Trust and fund levels) have appropriately benefited from any economies of scale, and whether there is potential for realization of any further economies of scale. The Board, including the non-interested Trustees, has concluded that any potential economies of scale are being shared between Quant Fund shareholders and the Manager in an appropriate manner.
The Board, including the non-interested Trustees, considered the character and amount of fees paid by each Fund and each Fund's shareholders for services provided by the Manager and its affiliates, including fees for services like transfer agency and direct shareholder services. It also considered the receipt of sales loads and payments under Rule 12b-1 plans in respect of certain of the Quant Funds. The Board, including the non-interested Trustees, considered the revenues and profitability of advisor's businesses other than its mutual fund business, including the Manger's retail brokerage and private placement agent activities, pension record keeping, and others. The Board, including the non-interested Trustees, considered the intangible benefits that accrue to the Manager and its affiliates by virtue of its relationship with each Quant Fund.
Based on its evaluation of all material factors and assisted by the advice of independent counsel, the Board of Trustees, including the non-interested Trustees, concluded at the April 11, 2006 meeting that the existing advisory fee structure is fair and reasonable, and that the renewal of the existing management contract with Quantitative Advisors should be approved.
On July 17, 2006, the Board, including the non-interested Trustees voting separately approved proposed amendments (to be effective upon shareholder approval) to the existing Management Contract to: (1) increase the management fee paid by Quant Growth and Income Fund (subsequently renamed Quant Long/Short Fund) and (2) eliminate a provision limiting certain expenses to 2.00% of the Fund's average daily net assets. In approving the proposed amendments, the Board, including the non-interested Trustees voting separately, considered its recent April 2006 review of the existing Management Contract and again reviewed the factors listed above in light of the proposed implementation of a long/short strategy including, among other things, that: when the Fund was established the Manager had set its fee at a low level relative to peers and that both the current and proposed management fees are among the lowest in the long/short peer group; the Manager h ad never previously asked for a fee increase; the magnitude of the fee increase requested by the Manager was consistent with the proposed change in investment strategy and that, even after the fee increase, the Fund would earn only a reasonable profit for the Manager, and would continue to be among the lower-priced offerings in the long/short peer group; and that the Manager believes that some economies of scale may be achieved with significant growth in assets under management as the Fund is more aggressively positioned from a growth and income fund to a long/short fund.
The Board reviewed an independent analysis of comparative expenses and performance data for the Ordinary Shares of the Fund, prepared by Lipper, Inc., a Reuters company that is an independent provider of investment company data ("Lipper") and financial information about the Manager. The Board noted that the Fund's performance has been competitive with its benchmark, the S&P 500 Index, over both the short- and long-term as of the periods ended June 30, 2006. The Fund's Ordinary Shares outperformed its benchmark for the 1-year period (10.08% versus 8.63%); underperformed slightly for 10 years (7.48% versus 8.31%) and since inception (11.09% versus
37
QUANT FUNDS
INFORMATION FOR SHAREHOLDERS
12.09%); and underperformed for the 5-year period by 2.35% (0.14% versus 2.49%). The Board also noted that the Fund's historical performance is competitive with long/short peer-group performance data prepared by Lipper and against its Lipper index. For the periods ended June 30, 2006, the performance of the Fund's Ordinary Shares compared with its Lipper Performance Universe ranked 9 out of 33 in for the 1-year period, 8 out of 25 for the 3-year period and 12 out of 12 for the five-year period. The Fund's Ordinary Shares outperformed the Lipper Index for the long/short classification for the 1-year period ended June 30, 2006 (comparisons for the 3-, 5- and 10-year periods were not available because this is a new category). The Board noted that the management fee under the existing Management Contract is significantly lower than fees charged by competitor peer group funds, and that even with the proposed increase in management fee and total e xpense ratios, the Fund would continue to be competitively priced with pricing comparable to that of the average fund within the universe of mutual funds in the competitive long/short peer group. The Fund's current management fee ranks fifth lowest out of five for the universe of comparable long/short funds identified by Lipper for expense comparison purposes. The Fund's proposed management fee would rank fourth lowest out of five for the universe of comparable long/short funds identified by Lipper for expense comparison purposes. The Board concluded that the proposed management fee would continue to be competitive with fees for similar funds with a long/short strategy and is reasonable for the services to be provided.
In considering the elimination of the expense limitation provision, the Board, with the non-interested Trustees voting separately, considered, among other things, that the expense of the Fund for each of the last five fiscal years have been below the 2.00% expense limitation and that the Fund's expense ratio is expected to continue to be below 2.00% after the proposed implementation of the long/short strategy. The Board concluded that the expense limitation was no longer necessary.
Based on its evaluation of all material factors and assisted by the advice of independent counsel, the Board of Trustees, including the non-interested Trustees, concluded at the July 16, 2006 meeting that the proposed amendments to the existing Management Contract are fair and reasonable, and that the amended management contract with Quantitative Advisors should be approved and should be submitted to shareholders for their approval, which was received on October 24, 2006.
Quant Small Cap Fund - Columbia Partners, L.L.C. Investment Management
In approving the renewal of this Advisory Agreement on April 11, 2006, the Board, including the non-interested Trustees, considered whether Small Cap Fund has operated within its investment objective and its record of compliance with its investment restrictions. It also reviewed the Fund's investment performance as well as the performance of a peer group of mutual funds, and the performance of an appropriate index or combination of indices. The Trustees noted that the Fund's investment performance is comparable to the performance of its Lipper Index and peer group for the 1- and 3-year periods ended February 28, 2006, although its performance was below the performance of its Lipper Index and its peer group for the 5-year and 10-year periods ended February 28, 2006.
The Board, including the non-interested Trustees, considered the Fund's management fee, subadvisory fee and expense ratio compared with the management fees, subadvisory fees and expense ratios of a peer group of funds. It also considered the amount and nature of fees paid by shareholders. The Trustees noted that the Fund's fee structure and expense ratio are competitive with a peer group of funds.
The Board, including the non-interested Trustees, reviews at least annually the background of the Fund's portfolio manager and the Fund's investment objective and strategy. The non-interested Trustees have also had discussions with senior management and/or reviewed a questionnaire prepared by senior management of the subadvisor responsible for the Fund's investment program. Among other things, the Trustees considered the size, education and experience of the subadvisor's investment staff and the subadvisor's approach to recruiting, training and retaining portfolio managers and other research, advisory and management personnel.
The Board, including the non-interested Trustees, considered, among other things: the nature, quality, cost and extent of advisory services performed by the subadvisor (and affiliated companies, if any) under the existing Advisory Agreement; the nature and extent of the subadvisor's supervision of third party service providers, principally the fund accountant, custodian and subcustodians; financial information provided by the subadvisor; non-fund businesses which may benefit from or be related to the business of advising the Fund; whether there have been economies of scale in respect of the subadvisor's services to the Fund; whether the Fund has appropriately benefited from any economies of scale; whether there is potential for realization of any further economies of scale; the character and amount of fees paid by the Fund and the Fund's shareholders for services provided by the subadvisor (and its affiliates, if any); the allocation (if any ) of fund brokerage to brokers affiliated with the subadvisor, and benefits to the subadvisor from the use of "soft" commission dollars (if any) to pay for research and brokerage services; the revenues and profitability of the subadvisor's businesses other than their mutual fund business, if any; and the "fall-out" benefits that accrue to the subadvisor and any affiliates by virtue of their relationship with the Fund.
38
QUANT FUNDS
INFORMATION FOR SHAREHOLDERS
Based on its evaluation of all material factors and assisted by the advice of independent counsel, the Board of Trustees, including the non-interested Trustees, concluded that the existing subadvisory fee structure is fair and reasonable, and that the existing Advisory Agreement with this subadvisor should be approved.
Quant Growth and Income Fund - SSgA Fund Management, Inc.
In approving the renewal of this Advisory Agreement on April 11, 2006, the Board, including the non-interested Trustees, considered whether Growth and Income Fund has operated within its investment objective and its record of compliance with its investment restrictions. It also reviewed the Fund's investment performance as well as the performance of a peer group of mutual funds, and the performance of an appropriate index or combination of indices. The Board noted that the Fund's performance has improved in the last year with the Fund outperforming its Lipper Index and its peer group for the 1-, 3-, and 10-year periods ended February 28, 2006. The Fund's 5-year performance for the same period was only slightly below its Lipper Index and peer group.
The Board, including the non-interested Trustees, considered the Fund's management fee, subadvisory fee and expense ratio compared with the management fees, subadvisory fees and expense ratios of a peer group of funds. It also considered the amount and nature of fees paid by shareholders. The Trustees noted that the Fund's fee structure and expense ratio are low compared with a peer group of funds.
The Board, including the non-interested Trustees, reviews at least annually the background of the Fund's portfolio manager and the Fund's investment objective and strategy. The non-interested Trustees have also had discussions with senior management and/or reviewed a questionnaire prepared by senior management of the subadvisor responsible for the Fund's investment program. Among other things, the Trustees considered the size, education and experience of the subadvisor's investment staff and the subadvisor's approach to recruiting, training and retaining portfolio managers and other research, advisory and management personnel.
The Board, including the non-interested Trustees, considered, among other things: the nature, quality, cost and extent of advisory services performed by the subadvisor (and affiliated companies, if any) under the existing Advisory Agreement; the nature and extent of the subadvisor's supervision of third party service providers, principally the fund accountant, custodian and subcustodians; financial information provided by the subadvisor; non-fund businesses which may benefit from or be related to the business of advising the Fund; whether there have been economies of scale in respect of the subadvisor's services to the Fund; whether the Fund has appropriately benefited from any economies of scale; whether there is potential for realization of any further economies of scale; the character and amount of fees paid by the Fund and the Fund's shareholders for services provided by the subadvisor (and its affiliates, if any); the allocation (if any ) of fund brokerage to brokers affiliated with the subadvisor, and benefits to the subadvisor from the use of "soft" commission dollars (if any) to pay for research and brokerage services; the revenues and profitability of the subadvisor's businesses other than their mutual fund business, if any; and the "fall-out" benefits that accrue to the subadvisor and any affiliates by virtue of their relationship with the Fund.
Based on its evaluation of all material factors and assisted by the advice of independent counsel, the Board of Trustees, including the non-interested Trustees, concluded at the April 11, 2006 meeting that the existing subadvisory fee structure is fair and reasonable, and that the renewal of the existing Advisory Agreement with this subadvisor should be approved.
On July 17, 2006, the Board, including the non-interested Trustees voting separately, approved a proposed amendment (to be implemented upon approval by Fund shareholders) to increase the subadvisory fee paid by the Manager to the subadvisor under the current Subadvisory Agreement. In approving the amendment, the Board considered its recent April 2006 review of the current Subadvisory Agreement and again reviewed the factors listed above in light of the proposed implementation of a long/short strategy. The Board considered, among other things, the following factors: since the Fund's inception, the subadvisory fee has been low level when compared to peer group funds; the subadvisor had never previously asked for a fee increase; the Fund's proposed new long/short strategy would require more services to be provided by the subadvisor than under the current long only strategy; the magnitude of the fee increase requested by the subadvisor was moder ate; the proposed changes to the Fund's investment objective and strategy and the experience of the subadvisor's staff with respect to managing long/short strategies for other clients; the nature and extent of the subadvisor's supervision of third party service providers, principally the fund accountant, custodian and subcustodians, as they would be affected by the proposed long/short strategy; the modest increase in revenue the subadvisor would receive under the proposed amendment to the Subadvisory Agreement relative to financial information provided by the subadvisor on April 11, 2006; whether any non-fund businesses might benefit from or be related to the business of advising the Fund after the implementation of the long/short strategy; whether economies of scale in respect of the subadvisor's services might be achieved because of the proposed long/short strategy for the Fund; whether the Fund would appropriately benefit from any economies of scale; and whether there is potential for realization of any f urther economies of scale following the implementation of the long/short changes. The Board also considered: the character and amount of fees paid by the Fund and its
39
QUANT FUNDS
INFORMATION FOR SHAREHOLDERS
shareholders for services provided by the subadvisor (and its affiliates, if any); that the subadvisor does not allocate the Fund's brokerage to affiliated brokers; that the subadvisor does not participate in any "soft dollar" arrangements that could be used to pay for research and brokerage services; the effect of the proposed fee increase on the subadvisor's revenues; and whether any "fall-out" benefits might accrue to the subadvisor and any affiliates in their relationship with the Fund through the implementation of the proposed long/short strategy.
Based on its evaluation of all material factors and assisted by the advice of independent counsel, the Board of Trustees, including the non-interested Trustees, concluded at the July 17, 2006 meeting that the proposed amendment to the Subadvisory Agreement was fair and reasonable, and that proposed amendment to the Subadvisory Agreement should be approved and submitted to shareholders for their approval, which was received on October 24, 2006.
Quant Emerging Markets Fund - PanAgora Asset Management, Inc.
In approving the renewal of this Advisory Agreement on April 11, 2006, the Board, including the non-interested Trustees, considered whether Emerging Markets Fund has operated within its investment objective and its record of compliance with its investment restrictions. It also reviewed the Fund's investment performance as well as the performance of a peer group of mutual funds, and the performance of an appropriate index or combination of indices. The Trustees noted that the Fund has outperformed its Lipper Index and peer group for the 3-, 5-, and 10-year periods ended February 28, 2006 but that its 1-year performance was slightly below both its Lipper Index and its peer group for the same period.
The Board, including the non-interested Trustees, considered the Fund's management fee, subadvisory fee and expense ratio compared with the management fees, subadvisory fees and expense ratios of a peer group of funds. It also considered the amount and nature of fees paid by shareholders. The Board noted that the Fund's fee structure and expense ratio are very low compared with a peer group of funds.
The Board, including the non-interested Trustees, reviews at least annually the background of the Fund's portfolio manager and the Fund's investment objective and strategy. The non-interested Trustees have also had discussions with senior management and/or reviewed a questionnaire prepared by senior management of the subadvisor responsible for the Fund's investment program. Among other things, the Trustees considered the size, education and experience of the subadvisor's investment staff and the subadvisor's approach to recruiting, training and retaining portfolio managers and other research, advisory and management personnel.
The Board, including the non-interested Trustees, considered, among other things: the nature, quality, cost and extent of advisory services performed by the subadvisor (and affiliated companies, if any) under the existing Advisory Agreement; the nature and extent of the subadvisor's supervision of third party service providers, principally the fund accountant, custodian and subcustodians; financial information provided by the subadvisor; non-fund businesses which may benefit from or be related to the business of advising the Fund; whether there have been economies of scale in respect of the subadvisor's services to the Fund; whether the Fund has appropriately benefited from any economies of scale; whether there is potential for realization of any further economies of scale; the character and amount of fees paid by the Fund and the Fund's shareholders for services provided by the subadvisor (and its affiliates, if any); the allocation (if any ) of fund brokerage to brokers affiliated with the subadvisor, and benefits to the subadvisor from the use of "soft" commission dollars (if any) to pay for research and brokerage services; the revenues and profitability of the subadvisor's businesses other than their mutual fund business, if any; and the "fall-out" benefits that accrue to the subadvisor and any affiliates by virtue of their relationship with the Fund.
Based on its evaluation of all material factors and assisted by the advice of independent counsel, the Board of Trustees, including the non-interested Trustees, concluded that the existing subadvisory fee structure is fair and reasonable, and that the existing Advisory Agreement with this subadvisor should be approved.
Quant Foreign Value Fund - Polaris Capital Management, Inc.
In approving the renewal of this Advisory Agreement on April 11, 2006, the Board, including the non-interested Trustees, considered whether Foreign Value Fund has operated within its investment objective and its record of compliance with its investment restrictions. It also reviewed the Fund's investment performance as well as the performance of a peer group of mutual funds, and the performance of an appropriate index or combination of indices. The Trustees noted that the Fund has outperformed its Lipper Index and its peer group for the 3- and 5-year periods ended February 28, 2006 and that it outperformed its Lipper Index but underperformed its peer group for the 1-year period ended February 28, 2006.
The Board, including the non-interested Trustees, considered the Fund's management fee, subadvisory fee and expense ratio compared with the management fees, subadvisory fees and expense ratios of a peer group of funds. It also considered the amount and nature of fees
40
QUANT FUNDS
INFORMATION FOR SHAREHOLDERS
paid by shareholders. The Trustees noted that the Fund's contractual management fee and total expense ratio (excluding 12b-1 fees) are above the asset-weighted average of its peer group of funds. Management provided additional information on the Fund's portfolio turnover ratio which is very low and which provides certain economies for the Fund.
The Board, including the non-interested Trustees, reviews at least annually the background of the Fund's portfolio manager and the Fund's investment objective and strategy. The non-interested Trustees have also had discussions with senior management and/or reviewed a questionnaire prepared by senior management of the subadvisor responsible for the Fund's investment program. Among other things, the Trustees considered the size, education and experience of the subadvisor's investment staff and the subadvisor's approach to recruiting, training and retaining portfolio managers and other research, advisory and management personnel.
The Board of Trustees, including the non-interested Trustees, considered, among other things: the nature, quality, cost and extent of advisory services performed by the subadvisor (and affiliated companies, if any) under the existing Advisory Agreement; the nature and extent of the subadvisor's supervision of third party service providers, principally the fund accountant, custodian and subcustodians; financial information provided by the subadvisor; non-fund businesses which may benefit from or be related to the business of advising the Fund; whether there have been economies of scale in respect of the subadvisor's services to the Fund; whether the Fund has appropriately benefited from any economies of scale; whether there is potential for realization of any further economies of scale; the character and amount of fees paid by the Fund and the Fund's shareholders for services provided by the subadvisor (and its affiliates, if any); the alloca tion (if any) of fund brokerage to brokers affiliated with the subadvisor, and benefits to the subadvisor from the use of "soft" commission dollars (if any) to pay for research and brokerage services; the revenues and profitability of the subadvisor's businesses other than their mutual fund business, if any; and the "fall-out" benefits that accrue to the subadvisor and any affiliates by virtue of their relationship with the Fund.
Based on its evaluation of all material factors and assisted by the advice of independent counsel, the Board of Trustees, including the non-interested Trustees, concluded that the existing subadvisory fee structure is fair and reasonable, and that the existing Advisory Agreement with this subadvisor should be approved.
41
QUANT FUNDS
INTERESTED TRUSTEES* AND OFFICERS:
The business address of each interested Trustee is c/o Quant Funds, 55 Old Bedford Road, Lincoln, MA 01773.
| Name, Address and (Age) | Position(s) Held With Company, Term of Office And Length of Time Served | Principal Occupation(s) During Past Five Years | Number of Portfolios in Fund Complex Overseen by Director | Other Directorships Held by Director | |||||||||||||||
| Willard L. Umphrey* (65) | Trustee, President, Chairman (1985 to Present) | Director, U.S. Boston Capital Corporation | 4 | AB&T U.S. Boston Corporation U.S. Boston Asset Management Corporation Quantitative Investment Advisors, Inc. USB Corporation USB Greenville-86, Inc. USB-85 Restaurant Associates, Inc. USB Atlantic Associates, Inc. U.S. Boston Insurance Agency, Inc. U.S. Boston Capital Corporatio n | |||||||||||||||
| Leon Okurowski (64) | Vice President and Treasurer (1985 to Present) | Director and Vice President, U.S. Boston Capital Corporation; Trustee, Quant Funds (until 9/2004) | N/A | AB&T Everest USB Canadian Storage, Inc. Quantitative Investment Advisors, Inc. U.S. Boston Corporation U.S. Boston Asset Management Corporation USB Corporation USB Everest Management LLC USB Everest Storage LLC USB Greenville-86, Inc. USB-85 Restaurant Associates, Inc. USB Atlantic Associates, Inc. U.S. Boston Insurance Agency, Inc. U.S. Boston Capital Corporation | |||||||||||||||
| Elizabeth A. Watson (52) | Clerk (July 2004 to present); Chief Compliance Officer (July 2004 to December 2005 | Chief Compliance Officer of the Quantitative Group of Funds (7/2004-12/2005), President and General Counsel (since 5/2004), U.S. Boston Capital Corporation; Vice President and General Counsel (since 5/2004), and Chief Compliance Officer (7/2004 – 10/2006), Quantitative Investment Advisors, Inc.; Principal (2002-2004), Watson & Associates (law firm); Senior Counsel (1998-2002) and Director of Legal Product Management (1995-2002), Pioneer Investment Management USA Inc. (investment management firm) | N/A | None | |||||||||||||||
| Deborah A. Kessinger (43) | Assistant Clerk (April 2005 to present); Chief Compliance Officer (December 2005 to present) | Senior Counsel (since 9/04) and Chief Compliance Officer (since 12/05), U.S. Boston Capital Corporation; Senior Counsel (since 9/2004) and Chief Compliance Officer (since 10/2006), Quantitative Investment Advisors, Inc.; Chief Compliance Officer and General Counsel, Wainwright Investment Counsel, LLC (2000-2004); Compliance Attorney, Forefield, Inc. (2001-2004) | N/A | None | |||||||||||||||
42
QUANT FUNDS
NON-INTERESTED TRUSTEES:
The business address of each non-interested Trustee is c/o Quant Funds, 55 Old Bedford Road, Lincoln, MA 01773.
Each Trustee and officer holds office until his or her successor is chosen and qualified or until his or her earlier death, resignation, retirement or removal. Messrs. Armstrong, Bulbrook, Burrows and Marshall are members of the Funds' Audit Committee.
The Fund's Statement of Additional Information ("SAI") includes additional information about the Fund Trustees and is available without charge, upon request. To obtain a free copy of the current SAI, please access the Funds' web site at www.QuantFunds.com or call shareholder services at 1-800-326-2141.
| Name, Address and (Age) | Position(s) Held With Company, Term of Office And Length of Time Served | Principal Occupation(s) During Past Five Years | Number of Portfolios in Fund Complex Overseen by Director | Other Directorships Held by Director | |||||||||||||||
| Robert M. Armstrong (67) | Trustee (1985 to Present) | President, Alumni Career Services (consulting firm) | 4 | NewPage Corporation; NewPage Holding Corporation | |||||||||||||||
| John M. Bulbrook (64) | Trustee (1985 to Present) | CEO and Treasurer, John M. Bulbrook Insurance Agency, Inc. | 4 | John M. Bulbrook Insurance Agency, Inc. | |||||||||||||||
| Edward E. Burrows (74) | Trustee (1985 to Present) | Independent consulting actuary- employee benefit plans | 4 | None | |||||||||||||||
| Clinton S. Marshall (49) | Trustee (April 2003 to present) | Owner, Coastal CFO Solutions, CFO, Fore River Company, Finance Director, Northern York County Family YMCA, CFO and Board Member of Great Works Internet, CFO, Holographix, CFO, EVibe.com, CFO, HealthWatch Technologies. | 4 | None | |||||||||||||||
Mr. William Dunlap became a non-interested Trustee on October 17, 2006. Mr. Caruso resigned as Trustee on December 1, 2005. His resignation was ratified by the board on December 4, 2005.
* Trustees have been determined to be "Interested Trustees" by virtue of, among other things, affiliation with one or more of the trust, the Fund's investment advisor, Quantitative Advisors and the Fund's distributor, U.S. Boston Capital Corporation.
43
QUANT FUNDS
SERVICE PROVIDERS
| Manager | Quantitative Advisors, 55 Old Bedford Road, Lincoln, MA 01773 | ||||||
| Advisers | Columbia Partners, L.L.C., Investment Management, 1775 Pennsylvania Avenue, N.W., Washington, DC 20006 SSgA Funds Management, Inc., State Street Financial Center, One Lincoln Street, Boston, MA 02111 PanAgora Asset Management, Inc., 260 Franklin Street, Boston, MA 02110 Polaris Capital Management, Inc., 125 Summer Street, Boston, MA 02110 | ||||||
| Distributor | U.S. Boston Capital Corporation, 55 Old Bedford Road, Lincoln, MA 01773 | ||||||
| Custodian | State Street Kansas City, 801 Pennsylvania Avenue, Kansas City, MO 64105 | ||||||
| Transfer Agent | Quantitative Institutional Services, 55 Old Bedford Road, Lincoln, MA 01773 | ||||||
| Independent Registered Public Accounting Firm | PricewaterhouseCoopers LLP, 125 High Street, Boston, MA 02110 | ||||||
| Legal Counsel | Kirkpatrick & Lockhart Nicholson Graham LLP, State Street Financial Center, One Lincoln Street, Boston, MA 02111 | ||||||
| For Account Information | For Quant Funds information, contact your financial adviser or, if you receive account statements directly from Quant Funds, you can also call 1-800-326-2151. Telephone representatives are available from 9:00 a.m. to 5:00 p.m. Eastern Time. Or visit our web site, www.QuantFunds.com. | ||||||

55 Old Bedford Road
Lincoln, MA 01773
www.quantfunds.com
Address Service Requested
© 2006 U.S. Boston Capital Corporation
Distributor of the Quant Funds
Member NASD, SIPC
ITEM 2. CODE OF ETHICS.
(a) Disclose whether, as of the end of the period covered by the report, the registrant has adopted a code of ethics that applies to the registrant’s principal executive officer, principal financial officer, principal accounting officer or controller, or persons performing similar functions, regardless of whether these individuals are employed by the registrant or a third party. If the registrant has not adopted such a code of ethics, explain why it has not done so.
| Not Applicable for Report Period |
(b) For purposes of this Item, the term “code of ethics” means written standards that are reasonably designed to deter wrongdoing and to promote:
| (1) Honest and ethical conduct, including the ethical handling of actual |
| or apparent conflicts of interest between personal and professional |
| relationships; |
| (2) Full, fair, accurate, timely, and understandable disclosure in |
| reports and documents that a registrant files with, or submits to, the |
| Commission and in other public communications made by the registrant; |
| (3) Compliance with applicable governmental laws, rules, and |
| regulations; |
| (4) The prompt internal reporting of violations of the code to an |
| appropriate person or persons identified in the code; and |
| (5) Accountability for adherence to the code. |
(c) The registrant must briefly describe the nature of any amendment, during the period covered by the report, to a provision of its code of ethics that applies to the registrant’s principal executive officer, principal financial officer, principal accounting officer or controller, or persons performing similar functions, regardless of whether these individuals are employed by the
registrant or a third party, and that relates to any element of the code of ethics definition enumerated in paragraph (b) of this Item. The registrant must file a copy of any such amendment as an exhibit pursuant to Item 10(a), unless the registrant has elected to satisfy paragraph (f) of this Item by posting its code of ethics on its website pursuant to paragraph (f)(2) of this Item, or by undertaking to provide its code of ethics to any person without charge, upon request, pursuant to paragraph (f)(3) of this Item.
Not Applicable for Report Period
(d) If the registrant has, during the period covered by the report, granted a waiver, including an implicit waiver, from a provision of the code of ethics to the registrant’s principal executive officer, principal financial officer, principal accounting officer or controller, or persons performing similar functions, regardless of whether these individuals are employed by the registrant or a third party, that relates to one or more of the items set forth in paragraph (b) of this Item, the registrant must briefly describe the nature of the waiver, the name of the person to whom the waiver was granted, and the date of the waiver.
Not Applicable for Report Period.
(e) If the registrant intends to satisfy the disclosure requirement under paragraph (c) or (d) of this Item regarding an amendment to, or a waiver from, a provision of its code of ethics that applies to the registrant’s principal executive officer, principal financial officer, principal accounting officer or controller, or persons performing similar functions and that relates to any element of the code of ethics definition enumerated in paragraph (b) of this Item by posting such information on its Internet website, disclose the registrant’s Internet address and such intention.
Not Applicable for Report Period.
(f) The registrant must:
| (1) File with the Commission, pursuant to Item 10(a), a copy of its code |
| of ethics that applies to the registrant’s principal executive officer, |
| principal financial officer, principal accounting officer or controller, |
| or persons performing similar functions, as an exhibit to its annual |
| report on this Form N-CSR; |
| (2) Post the text of such code of ethics on its Internet website and |
| disclose, in its most recent report on this Form N-CSR, its Internet |
| address and the fact that it has posted such code of ethics on its |
| Internet website; or |
| (3) Undertake in its most recent report on this Form N-CSR to provide to |
| any person without charge, upon request, a copy of such code of ethics |
| and explain the manner in which such request may be made. |
| See Item 12(a) |
ITEM 3. AUDIT COMMITTEE FINANCIAL EXPERT.
(a) (1) Disclose that the registrant’s board of trustees has determined that
| the registrant either: |
| (i) Has at least one audit committee financial expert serving on its audit |
| committee; or |
| (ii) Does not have an audit committee financial expert serving on its audit |
| committee. |
| Not Applicable for Report Period |
| (2) If the registrant provides the disclosure required by paragraph |
(a)(1)(i) of this Item, it must disclose the name of the audit committee
financial expert and whether that person is “independent”. In order to be
considered “independent” for purposes of this Item, a member of an audit
committee may not, other than in his or her capacity as a member of the audit
committee, the board of trustees, or any other board committee:
| (i) Accept directly or indirectly any consulting, advisory, or other |
| compensatory fee from the issuer; or |
| (ii) Be an “interested person” of the investment company as defined in |
| Section 2(a)(19) of the Act (15 U.S.C. 80a-2(a)(19)). |
Not Applicable for Report Period
(3) If the registrant provides the disclosure required by paragraph (a)(1) (ii) of this Item, it must explain why it does not have an audit committee financial expert.
Not Applicable for Report Period.
ITEM 4. PRINCIPAL ACCOUNTANT FEES AND SERVICES.
(a) Disclose, under the caption AUDIT FEES, the aggregate fees billed for each
of the last two fiscal years for professional services rendered by the principal
accountant for the audit of the registrant’s annual financial statements or
services that are normally provided by the accountant in connection with
statutory and regulatory filings or engagements for those fiscal years.
Not Applicable for Report Period.
(b) Disclose, under the caption AUDIT-RELATED FEES, the aggregate fees billed in
each of the last two fiscal years for assurance and related services by the
principal accountant that are reasonably related to the performance of the audit
of the registrant’s financial statements and are not reported under
paragraph (a) of this Item. Registrants shall describe the nature of the
services comprising the fees disclosed under this category.
Not Applicable for Report Period.
.
(c) Disclose, under the caption TAX FEES, the aggregate fees billed in each of
the last two fiscal years for professional services rendered by the principal
accountant for tax compliance, tax advice, and tax planning. Registrants shall
describe the nature of the services comprising the fees disclosed under this
category.
Not Applicable for Report Period.
(d) Disclose, under the caption ALL OTHER FEES, the aggregate fees billed in
each of the last two fiscal years for products and services provided by the
principal accountant, other than the services reported in paragraphs (a) through
(c) of this Item. Registrants shall describe the nature of the services
comprising the fees disclosed under this category.
Not Applicable for Report Period.
(e)(1) Disclose the audit committee’s pre-approval policies and procedures
described in paragraph (c)(7) of Rule 2-01 of Regulation S-X.
Not Applicable for Report Period.
(e)(2) Disclose the percentage of services described in each of paragraphs (b) through (d) of this Item that were approved by the audit committee pursuant to paragraph (c)(7)(i)(C) of Rule 2-01 of Regulation S-X.
Not Applicable for Report Period.
(f) If greater than 50 percent, disclose the percentage of hours expended on the principal accountant’s engagement to audit the registrant’s financial statements for the most recent fiscal year that were attributed to work performed by persons other than the principal accountant’s full-time, permanent employees.
Not Applicable for Report Period.
(g) Disclose the aggregate non-audit fees billed by the registrant’s accountant for services rendered to the registrant, and rendered to the registrant’s investment adviser (not including any sub-adviser whose role is primarily portfolio management and is subcontracted with or overseen by another investment adviser), and any entity controlling, controlled by, or under common control with the adviser that provides ongoing services to the registrant for each of the last two fiscal years of the registrant.
Not Applicable for Report Period.
(h) Disclose whether the registrant’s audit committee of the board of directors has considered whether the provision of non-audit services that were rendered to the registrant’s investment adviser (not including any subadviser whose role
is primarily portfolio management and is subcontracted with or overseen by another investment adviser), and any entity controlling, controlled by, or under common control with the investment adviser that provides ongoing services to the
registrant that were not pre-approved pursuant to paragraph (c)(7)(ii) of Rule 2-01 of Regulation S-X is compatible with maintaining the principal accountant’s independence.
Not Applicable for Report Period.
ITEM 5. AUDIT COMMITTEE OF LISTED REGISTRANTS.
(a) If the registrant is a listed issuer as defined in Rule 10A-3 under the Exchange Act (17 CFR 240.10A-3), state whether or not the registrant has a separately-designated standing audit committee established in accordance with Section 3(a)(58)(A) of the Exchange Act (15 U.S.C. 78c(a)(58)(A)). If the registrant has such a committee, however designated, identify each committee member. If the entire board of directors is acting as the registrant’s audit committee as specified in Section 3(a)(58)(B) of the Exchange Act (15 U.S.C. 78c(a)(58)(B)), so state.
Not Applicable for Report Period.
(b) If applicable, provide the disclosure required by Rule 10A-3(d) under the Exchange Act (17 CFR 240.10A-3(d)) regarding an exemption from the listing standards for audit committees.
Not Applicable for Report Period.
ITEM 6. SCHEDULE OF INVESTMENTS
File Schedule I – Investments in securities of unaffiliated issuers as of the close of the reporting period as set forth in § 210.12-12 of Regulation S-X [17 CFR 210.12-12], unless the schedule is included as part of the report to shareholders filed under Item 1 of this Form.
A schedule of investments of the Registrant is included as part of the report to shareholders of the Registrant under Item 1 of this Form N-CSR.
ITEM 7. DISCLOSURE OF PROXY VOTING POLICIES AND PROCEDURES FOR CLOSED-END MANAGEMENT INVESTMENT COMPANIES.
A closed-end management investment company that is filing an annual report on this Form N-CSR must, unless it invests exclusively in non-voting securities, describe the policies and procedures that it uses to determine how to vote proxies relating to portfolio securities, including the procedures that the company uses when a vote presents a conflict between the interests of its shareholders, on the one hand, and those of the company’s investment adviser; principal underwriter; or any affiliated person (as defined in Section 2(a)(3) of the Investment Company Act of 1940 (15 U.S.C. 80a-2(a)(3)) and the rules thereunder) of the company, its investment adviser, or its principal underwriter, on the other. Include any policies and procedures of the company’s investment adviser, or any other third party, that the company uses, or that are used on the company’s behalf, to determine how to vote proxies relating to portfolio securities.
Not applicable to open-end management investment companies.
ITEM 8. PORTFOLIO MANAGERS OF CLOSED-END MANAGEMENT INVESTMENT COMPANIES.
If the registrant is a closed-end management investment company that is filing an annual report on this Form N-CSR, provide the following information:
(1) State the name, title, and length of service of the person or persons employed by or associated with the registrant or an investment adviser of the registrant who are primarily responsible for the day-to-day management of the registrant’s portfolio (“Portfolio Manager”). Also state each Portfolio Manager’s business experience during the past 5 years.
(2) If a Portfolio Manager required to be identified in response to paragraph (a)(1) of this Item is primarily responsible for the day-to-day management of the portfolio of any other account, provide the following information:
| (i) The Portfolio Manager’s name; |
(ii) The number of other accounts managed within each of the following categories and the total assets in the accounts managed within each category:
| (A) Registered investment companies; |
| (B) Other pooled investment vehicles; and |
| (C) Other accounts. |
(iii) For each of the categories in paragraph (a)(2)(ii) of this Item, the number of accounts and the total assets in the accounts with respect to which the advisory fee is based on the performance of the account; and
(iv) A description of any material conflicts of interest that may arise in connection with the Portfolio Manager’s management of the registrant’s investments, on the one hand, and the investments of the other accounts
included in response to paragraph (a)(2)(ii) of this Item, on the other. This description would include, for example, material conflicts between the investment strategy of the registrant and the investment strategy of other accounts managed by the Portfolio Manager and material conflicts in allocation of investment opportunities between the registrant and other accounts managed by the Portfolio Manager.
(3) Describe the structure of, and the method used to determine, the Compensation of each Portfolio Manager required to be identified in response to Paragraph (a)(1) of this Item. For each type of compensation (e.g., salary, bonus, deferred compensation, retirement plans and arrangements), describe with specificity the criteria on which that type of compensation is based, for example, whether compensation is fixed, whether (and, if so, how) compensation is based on the registrant’s pre- or after-tax performance over a certain time period, and whether (and, if so, how) compensation is based on the value of assets held in the registrant’s portfolio. For example, if compensation is based solely or in part on performance, identify any benchmark used to measure performance and state the length of the period over which performance is measured.
(4) For each Portfolio Manager required to be identified in response to Paragraph (a)(1) of this Item, state the dollar range of equity securities in the Registrant beneficially owned by the Portfolio Manager using the following ranges: none, $1-$10,000, $10,001-$50,000, $50,001-$100,000, $100,001-$500,000, $500,001-$1,000,000, or over $1,000,000.
Not applicable to open-end management investment companies.
ITEM 9. PURCHASES OF EQUITY SECURITIES BY CLOSED-END MANAGEMENT INVESTMENT
COMPANY AND AFFILIATED PURCHASERS.
If the registrant is a closed-end management investment company provide the information specified in paragraph (b) of this Item with respect to any purchase made by or on behalf of the registrant or any “affiliated purchaser,” as defined in Rule 10b-18(a)(3) under the Exchange Act (17 CFR 240.10b-18(a)(3)), of shares or other units of any class of the registrant’s equity securities that is registered by the registrant pursuant to Section 12 of the Exchange Act (15 U.S.C. 781).
Not applicable to open-end management investment companies.
ITEM 10. SUBMISSION OF MATTERS TO A VOTE OF SECURITY HOLDERS.
Describe any material changes to the procedures by which shareholders may recommend nominees to the registrant’s board of directors, where those changes were implemented after the registrant last provided disclosure in response to the requirements of Item 7(d)(2)(ii)(G) of Schedule 14A (17 CFR 240.14a-101), or this Item.
There were no material changes to the procedures by which shareholders may send
recommendations to the Board for nominees to the Registrant’s Board since the
Registrant last provided disclosure as to such procedures in response to the
requirements of Item 7(d)(2)(ii)(G) of Schedule 14A.
ITEM 11. CONTROLS AND PROCEDURES.
(a) Disclose the conclusions of the registrant’s principal executive officer or officers and principal financial officer or officers, or persons performing similar functions, about the effectiveness of the registrant’s disclosure controls and procedures (as defined in Rule 30a-2(c) under the Act (17 CFR 270.30a-2(c))) based on their evaluation of these controls and procedures as of a date within 90 days of the filing date of the report that includes the disclosure required by this paragraph.
The registrant’s principal executive officer and principal financial
officer have concluded, that the registrant’s disclosure controls and
procedures are effective based on their evaluation of these controls and
procedures as of a date within 90 days of the filing date of this report.
(b) Disclose whether or not there were significant changes in the registrant’s internal controls or in other factors that could significantly affect these controls subsequent to the date of their evaluation, including any corrective actions with regard to significant deficiencies and material weaknesses.
There were no significant changes in the registrant’s internal controls or
in other factors that could significantly affect these controls subsequent to
the date of their evaluation, including any corrective actions with regard
to significant deficiencies and material weaknesses.
ITEM 12. EXHIBITS.
File the exhibits listed below as part of this Form. Letter or number the exhibits in the sequence indicated.
(a) Any code of ethics, or amendment thereto, that is the subject of the disclosure required by Item 2, to the extent that the registrant intends to satisfy the Item 2 requirements through filing of an exhibit.
Not Applicable
(b) A separate certification for each principal executive officer and principal financial officer of the registrant as required by Rule 30a-2 under the Act (17 CFR 270.30a-2).
Filed herewith.
SIGNATURES
Pursuant to the requirements of the Securities Exchange Act of 1934 and the Investment Company Act of 1940, the registrant has duly caused this report to be signed on its behalf by the undersigned, thereunto duly authorized.
Quantitative Group of Funds
By /s/ Willard L. Umphrey
Willard L. Umphrey, President
Date: November 27, 2006
Pursuant to the requirements of the Securities Exchange Act of 1934 and the Investment Company Act of 1940, this report has been signed below by the following persons on behalf of the registrant and in the capacities and on the dates indicated.
By /s/ Willard L. Umphrey
Willard L. Umphrey, President
Date: November 27, 2006
By /s/ Leon Okurowski
Leon Okurowski, Treasurer
Date November 27 , 2006