OMB APPROVAL
OMB Number: 3235-0570
Expires: January 31, 2014
Estimated average burden
hours per response..... 20.6
UNITED STATES
SECURITIES AND EXCHANGE COMMISSION
Washington, D.C. 20549
FORM N-CSR
CERTIFIED SHAREHOLDER REPORT OF REGISTERED
MANAGEMENT INVESTMENT COMPANIES
Investment Company Act file number 811-3790
Pear Tree Funds
(Exact name of registrant as specified in charter)
55 Old Bedford Road, Lincoln, MA 01773
(Address of principal executive offices)
Willard L. Umphrey
Pear Tree Advisors, Inc.
55 Old Bedford Road, Lincoln, MA 01773
(Name and address of agent for service)
Registrant’s telephone number, including area code: (781) 676-5900
Date of fiscal year end: March 31
Date of reporting period: April 1, 2012 through September 30, 2012
ITEM 1. REPORTS TO SHAREOWNERS.
[Pear Tree Funds Logo]
PEAR TREE FUNDS
Pear Tree Columbia Small Cap Fund
Pear Tree Columbia Micro Cap Fund
Pear Tree Quality Fund
Pear Tree PanAgora Dynamic Emerging Markets Fund
Pear Tree Polaris Foreign Value Fund
Pear Tree Polaris Foreign Value Small Cap Fund
SEMI-ANNUAL REPORT
September 30, 2012
TABLE OF CONTENTS
President’s Letter 3
Fund Expenses 4
Portfolio Manager Commentaries 6
Pear Tree Columbia Small Cap Fund 6
Pear Tree Columbia Micro Cap Fund 9
Pear Tree Quality Fund 11
Pear Tree PanAgora Dynamic Emerging Markets Fund 13
Pear Tree Polaris Foreign Value Fund 15
Pear Tree Polaris Foreign Value Small Cap Fund 18
Schedules of Investments 21
Pear Tree Columbia Small Cap Fund 21
Pear Tree Columbia Micro Cap Fund 28
Pear Tree Quality Fund 33
Pear Tree PanAgora Dynamic Emerging Markets Fund 36
Pear Tree Polaris Foreign Value Fund 44
Pear Tree Polaris Foreign Value Small Cap Fund 47
Statements of Assets and Liabilities 52
Statements of Operations 56
Statements of Changes in Net Assets 58
Financial Highlights 64
Notes to Financial Statements 76
Information for Shareholders 92
Management Contract and Advisory Contract Approval 93
Service Providers inside back cover
This report must be preceded or accompanied by a current Pear Tree Funds prospectus for individuals who are not current shareholders of the Funds. If you are not a shareholder of a Pear Tree Fund, you should read the prospectus carefully before investing because it contains more complete information on the Pear Tree Funds’ investment objectives, risks, charges and expenses. Please consider this information carefully. For a prospectus and other information, visit www.peartreefunds.com or call (800) 326-2151.
NOT FDIC INSURED • MAY LOSE VALUE • NO BANK GUARANTEE
Neither Pear Tree Funds nor U.S. Boston Capital Corporation is a bank.
PEAR TREE FUNDS
Dear Fellow Shareholder,
We are pleased to provide you with the Pear Tree Funds’ Semi-Annual Report for the six month period ended September 30, 2012 and to update you on recent market conditions and the performance of the Pear Tree Funds.
For current performance information, please visit our website at www.peartreefunds.com. We thank you for your continued confidence in the Pear Tree Funds. Please feel free to e-mail us at feedback@peartreefunds.com or call us at 800-326-2151 with any questions or for assistance on your account.
Sincerely,

Willard Umphrey
President and Chairman
Any statements in this report regarding market or economic trends or the factors influencing the historical or future performance of the Pear Tree Funds are the views of Fund management as of the date of this report. These views are subject to change at any time based upon market and other conditions, and Fund management and the subadvisors to the Funds disclaim any responsibility to update such views. These views may not be relied upon as investment advice or as an indication of trading intent on behalf of any Pear Tree Fund. Any references to specific securities are not recommendations of such securities and may not be representative of any Pear Tree Fund’s current or future investments.
Past performance is no guarantee of future results, and there is no guarantee that market forecasts will be realized.
PEAR TREE FUNDS
FUND EXPENSES
We believe it’s important for Fund shareholders to have a clear understanding of fund expenses and the impact expenses have on investment returns. The following is important information about each Fund’s Expense Example, which appears below.
Expense Example
As a shareholder of a Fund, you incur two types of costs: (1) transaction costs, and (2) ongoing costs, including management fees, distribution (12b-1) fees (on Ordinary Shares) and other Fund expenses. The example is intended to help you understand your ongoing costs (in dollars) of investing in a Fund and to compare these costs with the ongoing costs of investing in other mutual funds. These examples are based on $1,000 invested at the beginning of the period and held for the entire period from April 1, 2012 to September 30, 2012.
Actual Expenses
The first line for each Share Class for each Fund provides information about actual account returns and actual expenses. You may use the information in this line, together with the amount you invested for that Fund and Share Class, to estimate the expenses that you paid over the period. To estimate the expenses you paid over the period, simply divide your account value by $1,000, then multiply the result by the number under the heading “Expenses Paid During the Period.”
Hypothetical Example for Comparison Purposes
The second line for each Share Class for each Fund shows you hypothetical account values and hypothetical expenses based on the Fund’s actual expense ratio and an assumed rate of return of 5% per year before expenses, which is not the Fund’s actual return.
The hypothetical account values and hypothetical expenses may not be used to estimate the actual ending account balance or expenses you paid for the period. You may use this information to compare the ongoing expenses of investing in the Fund with the ongoing expenses of other funds. To do so, compare the Fund’s 5% hypothetical example with the 5% hypothetical examples that appear in the shareholder reports of other funds.
PEAR TREE FUNDS
Expense Example for the 6 months ended September 30, 2012
| Pear Tree Fund | Share Class | Total Return Description | Beginning Account Value 4/1/12 | Ending Account Value 9/30/2012 | Annualized Expense Ratio | Expenses Paid* 4/1/12 – 9/30/2012 |
| Small Cap | Ordinary | Actual | $1,000.00 | $990.70 | 1.65% | $8.23 |
| Hypothetical | $1,000.00 | $1,016.80 | 1.65% | $8.34 | ||
| Institutional | Actual | $1,000.00 | $992.20 | 1.40% | $7.00 | |
| Hypothetical | $1,000.00 | $1,018.04 | 1.40% | $7.09 | ||
| Quality | Ordinary | Actual | $1,000.00 | $1,040.50 | 1.48% | $7.57 |
| Hypothetical | $1,000.00 | $1,017.65 | 1.48% | $7.49 | ||
| Institutional | Actual | $1,000.00 | $1,042.80 | 1.00% | $5.14 | |
| Hypothetical | $1,000.00 | $1,020.03 | 1.00% | $5.08 | ||
| Emerging Markets | Ordinary | Actual | $1,000.00 | $992.10 | 1.80% | $9.01 |
| Hypothetical | $1,000.00 | $1,016.02 | 1.80% | $9.12 | ||
| Institutional | Actual | $1,000.00 | $993.50 | 1.53% | $7.66 | |
| Hypothetical | $1,000.00 | $1,017.39 | 1.53% | $7.75 | ||
| Foreign Value | Ordinary | Actual | $1,000.00 | $1,036.70 | 1.61% | $8.23 |
| Hypothetical | $1,000.00 | $1,016.98 | 1.61% | $8.15 | ||
| Institutional | Actual | $1,000.00 | $1,038.20 | 1.36% | $6.95 | |
| Hypothetical | $1,000.00 | $1,018.25 | 1.36% | $6.88 | ||
| Foreign Value | Ordinary | Actual | $1,000.00 | $1,023.30 | 1.70% | $8.60 |
| Small Cap | Hypothetical | $1,000.00 | $1,016.57 | 1.70% | $8.57 | |
| Institutional | Actual | $1,000.00 | $1,024.40 | 1.45% | $7.34 | |
| Hypothetical | $1,000.00 | $1,017.81 | 1.45% | $7.32 | ||
| Micro-Cap | Ordinary | Actual | $1,000.00 | $987.20 | 1.97% | $9.84 |
| Hypothetical | $1,000.00 | $1,014.60 | 1.97% | $9.98 | ||
| Institutional | Actual | $1,000.00 | $987.70 | 1.83% | $9.13 | |
| Hypothetical | $1,000.00 | $1,015.95 | 1.83% | $9.26 |
| * | “Expenses Paid” for each Fund share class relating to actual or hypothetical returns, is the amount equal to the product of (a) that Fund’s and Share Class’ average account value for the six-month period ended September 30, 2012, multiplied by (b) the corresponding “Annualized Expense Ratio” multiplied by (c) the fraction 183/366 (which reflects the six-month period covered by this report). |
PEAR TREE COLUMBIA SMALL CAP FUND
INVESTMENT PROFILE
All Data as of September 30, 2012
Investment Commentary
For the semi-annual period ended September 30, 2012 the Pear Tree Columbia Small Cap Fund’s Ordinary Shares (the “Fund”) underperformed its benchmark, the Russell 2000 Index. The Fund achieved a return of –0.93% at net asset value compared to 1.60% for the Index.
| Fund Information | ||
| Net Assets Under Management | $96.2 Million | |
| Number of Companies | 168 | |
| Price to Book Ratio | 2.7 | |
| Price to Earnings Ratio | 19.0 | |
| Ordinary | Institutional | |
| Total Expense Ratio (Net) | 1.65% | 1.40% |
| Ticker Symbol | USBNX | QBNAX |
Market Conditions and Investment Strategies
The past six months have been a rollercoaster ride for investors as equity markets fell in the first three months in response to concerns over the European debt crisis and the evolving economic slowdown in the U.S. and China. The markets then turned up over the next three months as investor sentiment reversed after central banks around the world took action to provide stimulus measures in order to stabilize and promote growth through monetary easing and lower interest rates. The net result for the period was a modest gain for the benchmark index.
Health Care and Utilities were the two best performing sectors in the Index over the past six months with gains of over 10% and 8% respectively, while Energy, which fell over 7%, and Information Technology, which lost over 6%, were the laggards during the period.
Analyzing our performance versus the Index for the quarter, the largest detractor to our performance was the Industrial sector, which cost us over 2.3% of return relative to the benchmark. This was primarily due to one of our largest and historically best performing holdings, Acacia Research Corp., which fell over 34% during the period. The company reported better than expected results for the second quarter but about half of the revenue came from one specific customer. Some seemed concerned that the growth of the business was tied to one time deals and might not be repeatable. Our view of the company leads us to believe that this is an erroneous interpretation so we added to our position and anticipate that this will be a strong performer in the quarters ahead.
We also underperformed the benchmark in the Financials sector due to stock selection which detracted over 2% of return versus the Index. Portfolio holdings Hersha Hospitality Trust, a Real Estate Investment Trust, and Green Dot Corp., an issuer of prepaid credit cards, both declined during the period, each costing over 0.3% of relative return.
Conversely, our best performance during past six months came in the Information Technology and Telecommunications Services sectors. In Technology, portfolio holdings Alliance Data Systems Corp., which provides customer loyalty solutions, and OSI Systems Inc., which markets security and inspection systems, both performed well adding 0.6% and 0.5% respectively to relative return for the period. In Telecom, our largest position, SBA Communications Corp., was the portfolio’s best contributor to performance gaining over 23% as secular trends continued to provide a very robust growth outlook for wireless tower operators.
Portfolio Changes
The Consumer Discretionary and Materials sector weightings increased during the period, while the Information Technology, Energy, and Telecommunications Services sectors declined. Changes in all other sectors were not material.
A Look Ahead
We remain committed to our philosophy of investing in high quality companies with unique positions of market leadership and competitive positions that can be sustained. We look for companies with strong and predictable earnings growth, positive earnings revisions and valuations that are not excessive. As we view the period ahead, we are optimistic that the recent market trend, which we believe has favored lower quality issues, will reverse and our focus on higher quality will allow us to achieve our goal of outperforming the benchmark index and our peers.
The Fund is co-managed by Robert von Pentz, CFA, and Rhys Williams, CFA of Columbia Partners, L.L.C. Investment Management.
PEAR TREE COLUMBIA SMALL CAP FUND
Top 10 Holdings
| Percentage of total net assets | 32.2% |
| Alliance Data Systems Corporation | 4.7% |
| Entertainment Properties Trust | 4.3% |
| Acacia Research Corporation—Acacia Technologies | 3.8% |
| Hersha Hospitality Trust | 3.7% |
| Core Laboratories N.V. | 3.5% |
| Catamaran Corporation | 3.0% |
| United Natural Foods, Inc. | 2.6% |
| Hain Celestial Group, Inc. | 2.3% |
| OSI Systems, Inc. | 2.2% |
| Gardner Denver, Inc. | 2.1% |
There is no guarantee that such securities will continue to be viewed favorably or held in the Fund’s portfolio.
Sector Allocation
| Percentage of total net assets | 100.0% |
| Financials | 22.8% |
| Consumer Discretionary | 17.8% |
| Information Technology | 14.6% |
| Industrials | 14.5% |
| Health Care | 10.6% |
| Consumer Staples | 8.3% |
| Energy | 4.5% |
| Telecommunication Services | 1.8% |
| Materials | 0.9% |
| CASH + other assets (net) | 4.2% |
Value of a $10,000 Investment
Pear Tree Columbia Small Cap (PTSC) Ordinary Shares vs. Russell 2000 Index
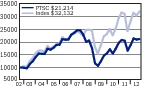
Average Annual Total Returns
| 3Q 2012 | Six Months | One Year | Five Year | Ten Year | Since Inception | Inception Date | |
| Ordinary Shares | 0.75% | –0.93% | 27.35% | –2.97% | 7.81% | 9.75% | 08/03/92 |
Institutional Shares1 | 0.80% | –0.78% | 27.72% | –2.73% | 8.21% | 9.05% | 01/06/93 |
Russell 20002 | 5.25% | 1.60% | 31.91% | 2.21% | 10.17% | 8.97% |
1 Institutional Shares may only be purchased by certain categories of investors and are not subject to sales charges or distribution fees.
2 The Russell 2000 Index is a market capitalization-weighted index of 2,000 small company stocks. It is widely recognized as representative of the general market for small company stocks. Index returns assume the reinvestment of dividends and, unlike Fund returns, do not reflect any fees or expenses. You cannot invest directly in an Index. The beginning date of the Index is 08/3/92.
Small company stocks may trade less frequently and in a limited volume, and their prices may fluctuate more than stocks of other companies. Small company stocks may therefore be more vulnerable to adverse developments than those of larger companies. The Fund may invest in the issuers in the real estate industry. Changes in real estate values or economic downturns can have a significant negative effect on these issuers.
PEAR TREE COLUMBIA MICRO CAP FUND
INVESTMENT PROFILE
All Data as of September 30, 2012
Investment Commentary
For the semi-annual period ended September 30, 2012 the Pear Tree Columbia Micro Cap Fund’s Ordinary Shares (the “Fund”) underperformed its benchmark, the Russell Microcap Index. The Fund achieved a return of –1.28% at net asset value compared to 3.82% for the Index.
| Fund Information | ||
| Net Assets Under Management | $4.6 Million | |
| Number of Companies | 100 | |
| Price to Book Ratio | 2.2 | |
| Price to Earnings Ratio | 16.2 | |
| Ordinary | Institutional | |
| Total Expense Ratio (Gross) | 1.98% | 2.07% |
| Total Expense Ratio (Net) | 1.98% | 1.83% |
| Ticker Symbol | PTFMX | MICRX |
Market Conditions and Investment Strategies
The equity markets over the past six months trended down initially as concerns over the European debt crisis and slowing global growth weighed on investors. After falling in May, stock markets bottomed in early June, traded sideways in July, moved higher in August, and continued their upward trajectory through the end of the period. This was somewhat surprising to us given the macro headwinds that confront global economies and businesses in this environment. In the end, investors concluded that the massive liquidity injected by the U.S. Federal Reserve and the European Central Bank offset weakening economies, gargantuan budget problems, and the inevitable inflationary consequence of “printing” money. The mantra for many years, “Don’t fight the Fed” has proved to be correct again, at least for the time being.
Health Care and Financials were the two best performing sectors in the Index over the past six months with gains of over 15% and 10% respectively, while Energy, which fell nearly 8%, and Information Technology, which lost almost 5%, were the laggards during the period.
Analyzing our performance versus the Index for the quarter, the largest detractor to our return was the Industrial sector, which cost us over 1.2% relative to the benchmark. This was due to stock selection and being overweight one of the poorer performing sectors in the Index. Portfolio holding MagneTek Inc., fell over 41% during the period, and detracted over 0.5% of relative return. We also underperformed in Information Technology, another negative performer for the benchmark, due to our stock selection during the period. Holding MEMSIC Inc., which fell over 34% in the period, cost over 0.3% of return versus the benchmark.
Conversely, our best performance during the past six months came in the Consumer Discretionary sector where we added nearly 0.7% of relative return due primarily to stock selection. Portfolio holding Overstock.com Inc., one of the best overall performers in the portfolio, gained over 97% during the period.
Portfolio Changes
The Industrials, Health Care and Materials sector weightings increased during the period, while the Information Technology, Consumer Staples and Energy sectors declined. Changes in all other sectors were not material.
A Look Ahead
Investor skepticism is at record highs, yet domestic equities are off to their best start in fifteen years. On the margin things appear to be improving. This can be attributed to lower input prices, global stimulus, and a resurgent U.S. housing market. Late-stage cyclicals that benefit from inflationary growth are particularly poised to outperform, explaining our increasing exposure to Materials and Industrials. Typically, when the business environment reaches a positive inflection point, microcaps benefit as they are more economically sensitive in nature.
The Fund is managed by Robert von Pentz, CFA, of Columbia Partners, L.L.C. Investment Management.
PEAR TREE COLUMBIA MICRO CAP FUND
Top 10 Holdings
| Percentage of total net assets | 12.9% |
| Overstock.com, Inc. | 1.4% |
| Alliance Healthcare Services, Inc. | 1.4% |
| Harris Interactive, Inc. | 1.3% |
| U.S. Concrete, Inc. | 1.3% |
| BioDelivery Sciences International, Inc. | 1.3% |
| NASB Financial, Inc. | 1.3% |
| Argan, Inc. | 1.3% |
| CECO Environmental Corp. | 1.2% |
| Homeowners Choice, Inc. | 1.2% |
| Smith & Wesson Holding Corporation | 1.2% |
There is no guarantee that such securities will continue to be viewed favorably or held in the Fund’s portfolio.
Sector Allocation
| Percentage of total net assets | 100.0% |
| Financials | 26.4% |
| Consumer Discretionary | 24.6% |
| Industrials | 16.1% |
| Information Technology | 11.4% |
| Health Care | 6.6% |
| Consumer Staples | 6.5% |
| Materials | 4.0% |
| Energy | 1.6% |
| Cash and Other Assets (Net) | 2.8% |
Value of a $10,000 Investment
Pear Tree Columbia Micro Cap (PTMC) Ordinary Shares vs. Russell Microcap Index
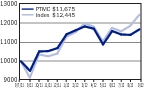
Average Annual Total Returns
| 3Q 2012 | Six Months | One Year | Five Year | Ten Year | Since Inception | Inception Date | |
| Ordinary Shares | 0.78% | –1.28% | 15.95% | 9/12/2011 | |||
Institutional Shares1 | 0.81% | –1.23% | 12.47% | 9/7/2011 | |||
Russell Microcap Index2 | 5.92% | 3.82% | 22.96% |
1 Institutional Shares may only be purchased by certain categories of investors and are not subject to sales charges or distribution fees.
2 The Russell Microcap Index measures the performance of the microcap segment of the U.S. equity market. Microcap stocks make up less than 3% of the U.S. equity market (by market cap) and consist of the smallest 1,000 securities in the small-cap Russell 2000®Index, plus the next smallest eligible securities by market cap. The Russell Microcap Index is constructed to provide a comprehensive and unbiased barometer for the microcap segment trading on national exchanges, while excluding lesser-regulated OTC bulletin board securities and pink-sheet stocks due to their failure to meet national exchange listing requirements. The Russell Microcap is completely reconstituted annually to ensure larger stocks do not distort performance and characteristics of the true microcap opportunity set.
Investing in foreign markets, particularly emerging markets, can be more volatile than the U.S. market due to increased risks of adverse issuer, political, regulatory, market or economic developments and can perform differently than the U.S. market.
PEAR TREE QUALITY FUND
INVESTMENT PROFILE
All Data as of September 30, 2012
Investment Commentary
For the semi-annual period ended September 30, 2012, the Pear Tree Quality Fund’s Ordinary Shares (the “Fund”) outperformed its benchmark, S&P 500 (the “Index”). The Fund achieved a return of 4.05% at net asset value compared to 3.43% for the Index.
| Fund Information | ||
| Net Assets Under Management | $97.8 Million | |
| Number of Companies | 62 | |
| Price to Book Ratio | 3.5 | |
| Price to Earnings Ratio | 13.5 | |
| Ordinary | Institutional | |
| Total Expense Ratio (Gross) | 1.63% | 1.37% |
| Total Expense Ratio (Net) | 1.48% | 1.00% |
| Ticker Symbol | USBOX | QGIAX |
Market Conditions and Investment Strategies
The Fund’s investment manager currently chooses securities for the Fund by periodically selecting a mutual fund (the “Target Portfolio”) and monitoring the Target Portfolio’s holdings. The Fund’s investment adviser, at the direction of the investment manager, rebalances the Fund’s portfolio to correspond to the Target Portfolio’s most recent holdings as publicly reported. From April 1, 2012 to September 30, 2012, the Fund’s Ordinary Shares, when compared to the Target Portfolio, had a tracking error of 0.23.
Over the previous six months, the Healthcare sector was the largest positive contributor to the Fund’s performance. The fact that the Fund has no holdings in the Financial sector also provided strong outperformance relative to the benchmark. The Fund’s large overweight position in Consumer Staples also contributed to outperformance.
The greatest detractor to performance came from the Telecom Services sector where the underweighting negatively affected relative performance. Other detractors were sector allocation in the Consumer Discretionary and Energy sectors.
Portfolio Changes
We expect the Fund to have a relatively low turnover rate given the historical stability and relatively low turnover rate of the current Target Portfolio.
For the six month period ending September 30, 2012, the Fund rebalanced the holdings twice to replicate the publicly disclosed holdings of the current target portfolio. The two rebalances resulted in the sale of six positions, four healthcare companies and two consumer staple positions. Also as a result of the rebalances, the Fund opened a new position in one Consumer Staple company.
A Look Ahead
For the foreseeable future, the Fund’s investment manager expects the Target Portfolio to remain the same. For more information on the selection of the Target Portfolio(s), please see the Fund’s Prospectus.
The Fund’s target portfolio is GMO Quality Fund III (GQETX) and the Fund is managed by Robert von Pentz, CFA of Columbia Partners, L.L.C. Investment Management.
PEAR TREE QUALITY FUND
Top 10 Holdings
| Percentage of total net assets | 43.8% |
| Johnson & Johnson | 5.5% |
| Oracle Corporation | 5.2% |
| Philip Morris International, Inc. | 4.8% |
| Pfizer Inc. | 4.5% |
| Coca-Cola Company (The) | 4.5% |
| Apple, Inc. | 4.3% |
| Google, Inc. | 4.3% |
| Microsoft Corporation | 4.1% |
| Chevron Corporation | 3.3% |
| Wal-Mart Stores, Inc. | 3.3% |
There is no guarantee that such securities will continue to be viewed favorably or held in the Fund’s portfolio.
Sector Allocation
| Percentage of total net assets | 100.0% |
| Information Technology | 30.0% |
| Consumer Staples | 28.4% |
| Health Care | 26.7% |
| Energy | 8.4% |
| Consumer Discretionary | 4.6% |
| Industrials | 0.8% |
| Telecommunication Services | 0.6% |
| CASH + other assets (net) | 0.5% |
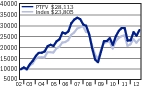
Value of a $10,000 Investment
Pear Tree Quality (PTQ) Ordinary Shares vs. S&P 500 Index
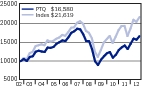
Average Annual Total Returns
| 3Q 2012 | Six Months | One Year | Five Year | Ten Year | Since Inception | Inception Date | |
| Ordinary Shares | 5.89% | 4.05% | 25.69% | –2.02% | 5.19% | 8.82% | 05/06/85 |
Institutional Shares1 | 5.98% | 4.28% | 26.34% | –1.93% | 5.49% | 7.27% | 03/25/91 |
S&P 5002 | 6.35% | 3.43% | 30.20% | 1.05% | 8.01% | 10.28% |
1 Institutional Shares may only be purchased by certain categories of investors and are not subject to sales charges or distribution fees.
2 The S&P 500 Index is an unmanaged index of stocks chosen to their size industry characteristics. It is widely recognized as representative of stocks in the United States. Index returns assume the reinvestment of dividends and, unlike Fund returns, do not reflect any fees or expenses. You cannot invest directly in the Index. The beginning date for the Index is 05/29/85.
Investing in foreign markets can be more volatile than the U.S. market due to increased risks of adverse issuer, political, regulatory, market or economic developments and can perform differently than the U.S. market.
PEAR TREE PANAGORA DYNAMIC EMERGING MARKETS FUND
INVESTMENT PROFILE
All Data as of September 30, 2012
Investment Commentary
For the semi-annual period ended September 30, 2012, the Pear Tree Panagora Dynamic Emerging Markets Fund’s Ordinary Shares (the “Fund”) outperformed its benchmark, MSCI Emerging Markets Index (the Index”). The Fund achieved a return of –0.79% at net asset value compared to
–1.59% for the Index.
| Fund Information | ||
| Net Assets Under Management | $151.1 Million | |
| Number of Companies | 197 | |
| Price to Book Ratio | 1.4 | |
| Price to Earnings Ratio | 9.2 | |
| Ordinary | Institutional | |
| Total Expense Ratio (Net) | 1.80% | 1.53% |
| Ticker Symbol | QFFOX | QEMAX |
Market Conditions and Investment Strategies
On a country basis, the largest contributors were South Korea (+1.07%) and Brazil (+0.60%). Among holdings in South Korea, the largest contributor was an overweight to Korea Zinc while among holdings in Brazil, the largest contributor was not holding OGX Petroleo e Gas Participacoes. The largest detractors were China (–0.40%) and India (–0.31%). Among holdings in China the largest detractor was an overweight to Dongfeng Motor Group Co while among holdings in India the largest detractor was not holding Hdfc Bank.
On a sector basis, the largest contributors were Materials (+0.73%) and Consumer Discretionary (+0.72%). Among the holdings in Materials the largest contributor was an overweight to Kghm Polska Miedz while among holdings in Consumer Discretionary the largest contributor was an overweight to Great Wall Motor Company. The largest detractors were Financials (–0.28%) and Health Care (–0.12%). Among holdings in Financials the largest detractor was an overweight to Banco Estado Rio Grande while among holdings in Health Care the largest detractor was not holding Sun Pharmaceuticals.
During the semi-annual period that ended September 2012, our proprietary Dynamic Alpha model performed well — our high-ranked alpha stocks outperformed the worst ranked alpha stocks. Our proprietary Valuation composite performed well — stocks with attractive valuations outperformed their more expensive peers. Our proprietary Quality composite performed well — stocks with strong business and management quality metrics outperformed lower quality peers. Our proprietary Momentum composite performed well — stocks with positive market sentiment outperformed stocks with poor earnings and price momentum.
Portfolio Changes
There were no significant portfolio changes during the semi-annual period ended September 30, 2012.
A Look Ahead
As a quantitative investment firm, we tend not to provide strategy-specific forward looking commentary. We believe that our systematic investment approach ensures that we deliver a portfolio of our highest conviction of ideas to all of our clients.
The Fund’s portfolio is managed by a team of portfolio managers at PanAgora Asset Management, Inc.
PEAR TREE PANAGORA DYNAMIC EMERGING MARKETS FUND
Top 10 Holdings
| Percentage of total net assets | 21.7% |
| Samsung Electronics Co., Ltd. | 4.9% |
| China Construction Bank Corporation | 2.2% |
| China Mobile Limited | 2.2% |
| Vale SA | 2.0% |
| Petroleo Brasileiro SA | 1.9% |
| CNOOC Limited | 1.9% |
| Taiwan Semiconductor Manufacturing Co., Ltd. | 1.7% |
| LUKoil | 1.7% |
| Hyundai Motor Co. | 1.6% |
| Bank of China Ltd. | 1.6% |
There is no guarantee that such securities will continue to be viewed favorably or held in the Fund’s portfolio.
Sector Allocation
| Percentage of total net assets | 100.0% |
| Financials | 23.4% |
| Information Technology | 15.3% |
| Energy | 14.4% |
| Consumer Discretionary | 10.0% |
| Materials | 9.6% |
| Consumer Staples | 9.3% |
| Industrials | 8.6% |
| Telecommunication Services | 6.6% |
| Utilities | 2.2% |
| Health Care | 0.4% |
| CASH + other assets (net) | 0.2% |
Top 10 Country Allocations
| Percentage of total net assets | 83.2% |
| South Korea | 17.3% |
| Taiwan | 12.0% |
| Brazil | 10.9% |
| China | 10.6% |
| South Africa | 7.3% |
| Hong Kong | 6.9% |
| Russia | 5.0% |
| India | 4.9% |
| Malaysia | 4.5% |
| Mexico | 3.8% |
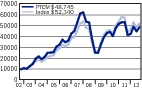
Value of a $10,000 Investment
Pear Tree PanAgora Dynamic Emerging Markets (PTEM) Ordinary Shares vs. MSCI EM Index
PEAR TREE PANAGORA DYNAMIC EMERGING MARKETS FUND
Average Annual Total Returns
| 3Q 2012 | Six Months | One Year | Five Year | Ten Year | Since Inception | Inception Date | |
| Ordinary Shares | 8.28% | –0.79% | 17.27% | –4.49% | 17.16% | 6.32% | 09/30/94 |
Institutional Shares1 | 8.36% | –0.65% | 17.58% | –4.26% | 17.54% | 8.21% | 04/02/96 |
MSCI EM2 | 7.89% | –1.59% | 17.33% | –0.98% | 17.37% | 5.70% |
1 Institutional Shares may only be purchased by certain categories of investors and are not subject to sales charges or distribution fees.
2 The Morgan Stanley Capital International Emerging Markets (“MSCI EM”) Index is an unmanaged index comprised of stocks located in countries other than the United States. It is widely recognized as representative of the general market for emerging markets. Index returns assume the reinvestment of dividends and, unlike Fund returns, do not reflect fees or expenses. You cannot invest directly in an Index. The beginning date for the Index is 09/30/94.
Investing in foreign markets, particularly emerging markets, can be more volatile than the U.S. market due to increased risks of adverse issuer, political, regulatory, market or economic developments and can perform differently than the U.S. market.
PEAR TREE POLARIS FOREIGN VALUE FUND
INVESTMENT PROFILE
All Data as of September 30, 2012
Investment Commentary
For the semi-annual period ended September 30, 2012, the Pear Tree Polaris Foreign Value Fund’s Ordinary Shares (the “Fund”) outperformed its benchmark, the MSCI EAFE Index (the “Index”). The Fund achieved a return of 3.67% at net asset value compared to –0.35% for the Index.
| Fund Information | ||
| Net Assets Under Management | $576.7 Million | |
| Number of Companies | 42 | |
| Price to Book Ratio | 1.7 | |
| Price to Earnings Ratio | 15.8 | |
| Ordinary | Institutional | |
| Total Expense Ratio (Net) | 1.62% | 1.36% |
| Ticker Symbol | QFVOX | QFVIX |
Market Conditions and Investment Strategies
Strong portfolio performance stemmed from returns in eight of 10 sectors, with only Information Technology and Materials in absolute negative territory. Consumer Discretionary stocks were the top contributors, with Barratt Developments and Persimmon, plc posting double digit returns. The performance of both British homebuilders was helped by their continued focus on margins over volumes (i.e. buying lower priced land, and building more houses at higher prices than apartments).
Japanese brewery Asahi Group, dairy supplier Meiji and refrigerated food storage and transport company Nichirei propelled the performance of the Consumer Staples sector. All three experienced a recovery in operations following the March 2011 earthquake, highlighted by stronger sales and operating profits. Asahi posted an extraordinary gain on a change in equity in Chinese soft drink affiliate, Tingyi-Asahi Beverages, which entered a strategic alliance with PepsiCo. Nichirei continued to see stable demand for its convenience foods and food logistics services.
Finnish industrial companies Kone OYJ and Konecranes OYJ produced strong returns for the six-month period, benefitting from new product developments, higher orders and healthy backlog. Italian ground engineering services company Trevi Finanziaria announced positive earnings, followed by news of international orders in Thailand, West Africa and Venezuela.
More than 65% of the Fund’s stocks achieved absolute positive returns; those that fared worse included French exploration and production company Maurel et Prom, German ATM manufacturer Wincor Nixdorf and Japanese chemical company Showa Denko. Growth in its retail point of sale outlets sustained Wincor Nixdorf, which has seen slower bank branch ATM sales due to reduced capital spending by stressed European banks. Showa Denko suffered from slowing demand in both of its product lines — petrochemicals and hard disc media.
Portfolio Changes
In early April, the Fund purchased Italy’s Lottomatica, a provider of video lottery terminals and other lottery programs. During difficult macro-economic times, lotteries are in high demand as governments rely on the higher reserves from consistent ticket sales. State Bank of India was sold during the period, as significant headwinds faced the company: Indian GDP is decreasing, while inflation, interest rates and non-performing assets are rising. We believe State Bank of India remains a good value; however, our concern to protect against declines led us to sell the company.
A Look Ahead
International markets experienced a healthy rebound, with four of the past six months in positive territory. However, guarded optimism must prevail, as stagnant macro-economic activity and slow global trade will likely persist. China GDP growth is slowing and export sales to Europe are lessening. In India, a lack of government productivity is holding back project development. With the Brazilian currency especially strong, the export of the country’s products is down, thereby threatening recession. Among developed countries, the U.S. economy will continue to experience fits and starts, benefitting from low cost energy and service sectors, offset by a still weak housing market and mixed job reports. With uncertainty comes volatility that can create market inefficiencies. We will continue our efforts to conduct bottom-up research to pinpoint some of the most fundamentally-strong, but undervalued companies worldwide.
The Fund’s lead portfolio manager is Bernard R. Horn, Jr., of Polaris Capital Management, LLC
PEAR TREE POLARIS FOREIGN VALUE FUND
Top 10 Holdings
| Percentage of total net assets | 25.1% |
| Samsung Electronics Company Ltd. | 3.4% |
| Taylor Wimpey plc | 2.7% |
| Smurfit Kappa Group plc | 2.6% |
| Kone OYJ, Class B | 2.5% |
| Barratt Developments plc | 2.5% |
| Persimmon plc | 2.4% |
| Konecranes OYJ | 2.3% |
| Imerys S.A. | 2.3% |
| Teva Pharmaceuticals SP | 2.2% |
| Sasol Ltd. | 2.2% |
There is no guarantee that such securities will continue to be viewed favorably or held in the Fund’s portfolio.
Sector Allocation
| Percentage of total net assets | 100.0% |
| Materials | 18.4% |
| Consumer Discretionary | 15.3% |
| Financials | 10.4% |
| Industrials | 8.7% |
| Consumer Staples | 8.1% |
| Information Technology | 7.5% |
| Energy | 5.9% |
| Health Care | 4.4% |
| Telecommunication Services | 3.9% |
| Utilities | 1.4% |
| Cash and Other Assets (Net) | 16.0% |
Top 10 Country Allocations
| Percentage of total net assets | 66.7% |
| Germany | 12.1% |
| United Kingdom | 10.5% |
| Japan | 9.8% |
| Finland | 6.8% |
| Ireland | 6.7% |
| France | 6.1% |
| Sweden | 5.9% |
| South Korea | 3.4% |
| Italy | 3.2% |
| Israel | 2.2% |
Value of a $10,000 Investment
Pear Tree Polaris Foreign Value (PTFV) Ordinary Shares vs. MSCI EAFE Index
PEAR TREE POLARIS FOREIGN VALUE FUND
Average Annual Total Returns
| 3Q 2012 | Six Months | One Year | Five Year | Ten Year | Since Inception | Inception Date | |
| Ordinary Shares | 10.30% | 3.67% | 21.03% | –3.22% | 10.89% | 5.91% | 05/15/98 |
Institutional Shares1 | 10.37% | 3.82% | 21.37% | –3.03% | 11.15% | 7.72% | 12/18/98 |
MSCI EAFE2 | 6.98% | –0.35% | 14.33% | –4.77% | 8.69% | 3.53% |
1 Institutional Shares may only be purchased by certain categories of investors and are not subject to sales charges or distribution fees.
2 The Morgan Stanley Capital International Europe, Australia, and Far East (“MSCI EAFE”) Index is an unmanaged index comprised of stocks located in countries other than the United States. It is widely recognized as representative of the general market for emerging markets. Index returns assume the reinvestment of dividends and, unlike Fund returns, do not reflect fees or expenses. You cannot invest directly in an Index. The beginning date for the Index is 05/29/98.
Investing in foreign markets, particularly emerging markets, can be more volatile than the U.S. market due to increased risks of adverse issuer, political, regulatory, market or economic developments and can perform differently than the U.S. market.
PEAR TREE POLARIS FOREIGN VALUE SMALL CAP FUND
INVESTMENT PROFILE
All Data as of September 30, 2012
Investment Commentary
For the semi-annual period ended September 30, 2012, the Pear Tree Polaris Foreign Value Small Cap Fund’s Ordinary Shares (the “Fund”) outperformed its benchmark, the S&P EPAC Small Cap Index (the “Index”). The Fund achieved a return of 2.33% at net asset value compared to
–0.85% for the Index.
| Fund Information | ||
| Net Assets Under Management | $92.3 Million | |
| Number of Companies | 67 | |
| Price to Book Ratio | 1.9 | |
| Price to Earnings Ratio | 18.5 | |
| Ordinary | Institutional | |
| Total Expense Ratio (Net) | 1.70% | 1.45% |
| Ticker Symbol | QUSOX | QUSIX |
Market Conditions and Investment Strategies
Stocks in the defensive sectors (i.e. Utilities, Consumer Staples and Healthcare) were among the top performers for the quarter, while cyclical stock contributed to a lesser extent. Absolute positive returns were achieved in eight of 10 sectors, with only Materials and Energy in negative territory.
United Drug, the Ireland-based pharmaceutical and healthcare services, was the top contributor to performance for the six month period. The company continued its growth through acquisition strategy, delivering strong earnings and margins. United Drug’s efforts to delist from the Irish stock exchange in favor of the London market were also met with resounding support.
British information technology company CSR added to the period’s returns, after selling its handset operations to Samsung Electronics for $310 million. The capital from this sale will be used to focus on CSR’s other high margin businesses.
Public water utility, Manila Water Company, posted strong gains as it experienced rising water connections in the Philippines. The company also benefitted from a tariff adjustment.
U.K. homebuilder Galliford Try also added to returns for the period. After a 2009 capital raise, the company purchased large parcels of inexpensive land in Southern England during the economic downturn, targeting significant improvement in production volumes and profitability metrics. It has successfully delivered on its target.
Materials sector stocks were among the underperformers for the six month period, with weak returns from India’s USHA Martin and Japan’s Chugoku Marine Paints. Chugoku suffered under high priced oil, which is the main raw material of the company’s paints. USHA Martin experienced falling auto demand and is dealing with a dispute at one of its coal mines. Textile and clothing maker Texwinca Holdings suffered margin contraction due to significantly higher cotton prices in China than in the international market.
Portfolio Changes
During the six-month period, the Fund purchased shares of SpareBank 1 SR Bank ASA of Norway, the Fund’s third purchase of a regional bank in Norway. All three have similar business models, with strong balance sheets, limited downside risks and good market positioning, but are defined by different geographic reach. The Fund’s position in Scandinavian gas station chain operator Statoil Fuel & Retail was sold at a profit, as a result of a friendly buyout from Canada’s Alimentation Couche-Tard.
A Look Ahead
International markets have experienced a healthy rebound in recent months. However, guarded optimism must prevail, as stagnant macro-economic activity and slow global trade will likely persist. China GDP growth is slowing and export sales to Europe are lessening. In India, a lack of government productivity could potentially slow project development. With the Brazilian currency especially strong, the export of the country’s products could become less profitable. Among developed countries, the U.S. economy should continue to experience fits and starts, benefitting from low cost energy and service sectors, offset by a weak housing market and mixed job reports. With uncertainty comes volatility that can create market inefficiencies. We will continue our efforts to conduct bottom-up research to pinpoint some of the most fundamentally-strong, but undervalued small-cap companies worldwide.
The Fund’s lead portfolio manager is Bernard R. Horn, Jr., of Polaris Capital Management, LLC
PEAR TREE POLARIS FOREIGN VALUE SMALL CAP FUND
Top 10 Holdings
| Percentage of total net assets | 24.6% |
| Manila Water Company, Inc. | 2.9% |
| United Drug plc | 2.8% |
| Dockwise Ltd. | 2.7% |
| Equatorial Energia S.A. | 2.6% |
| Galliford Try plc | 2.5% |
| M1 Ltd. | 2.4% |
| Freenet AG | 2.3% |
| DaiichiKosho Co., Ltd. | 2.2% |
| Thai Union Frozen Products PCL | 2.1% |
| BML, Inc. | 2.1% |
There is no guarantee that such securities will continue to be viewed favorably or held in the Fund’s portfolio.
Sector Allocation
| Percentage of total net assets | 100.0% |
| Consumer Discretionary | 23.0% |
| Consumer Staples | 13.0% |
| Financials | 11.7% |
| Information Technology | 11.6% |
| Industrials | 10.6% |
| Utilities | 7.6% |
| Health Care | 6.8% |
| Telecommunication Services | 6.5% |
| Materials | 5.5% |
| Energy | 2.7% |
| Cash and Other Assets (Net) | 1.0% |
Top 10 Country Allocations
| Percentage of total net assets | 74.6% |
| United Kingdom | 16.5% |
| Japan | 11.5% |
| India | 8.7% |
| Ireland | 8.2% |
| Hong Kong | 6.2% |
| Norway | 5.7% |
| Thailand | 5.7% |
| Sweden | 4.2% |
| Germany | 4.1% |
| Singapore | 3.8% |
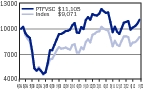
Value of a $10,000 Investment
Pear Tree Polaris Foreign Value Small Cap (PTFVSC) Ordinary Shares vs. S&P EPAC Small Cap Index
PEAR TREE POLARIS FOREIGN VALUE SMALL CAP FUND
Average Annual Total Returns
| 3Q 2012 | Six Months | One Year | Five Year | Ten Year | Since Inception | Inception Date | |
| Ordinary Shares | 8.97% | 2.33% | 15.26% | 2.36% | 5/1/2008 | ||
Institutional Shares1 | 8.95% | 2.44% | 15.48% | 2.58% | 5/1/2008 | ||
S&P/EPAC Small Cap Index2 | 7.86% | –0.85% | 13.92% | –1.79% |
1 Institutional Shares may only be purchased by certain categories of investors and are not subject to sales charges or distribution fees.
2 The S&P/Europe Pacific Asia Composite Small Cap (“S&P/EPAC”) Index measures the bottom 20% of institutionary investable capital of developed and emerging (after 09/30/1994) countries, selected by the index sponsor outside of the United States. It is widely recognized as representative of the general market for foreign markets. Index returns assume the reinvestment of dividends and, unlike Fund returns, do not reflect any fees or expenses. You cannot invest directly in an Index. The Index was established in 1989.
Investing in foreign markets, particularly emerging markets, can be more volatile than the U.S. market due to increased risks of adverse issuer, political, regulatory, market or economic developments and can perform differently than the U.S. market.
PEAR TREE COLUMBIA SMALL CAP FUND
SCHEDULE OF INVESTMENTS
September 30, 2012 (Unaudited)
Common Stock—95.8%
| Shares | Value | |
| AIR FREIGHT & LOGISTICS—0.0% | ||
| Echo Global Logistics, Inc. (a) | 1,882 | $32,276 |
| AIRLINES—0.7% | ||
| Spirit Airlines, Inc. (a) | 42,243 | 721,510 |
| BANKS—6.1% | ||
| BBX Capital Corporation (a) | 6,176 | 39,897 |
| Berkshire Bancorp, Inc. (a) | 3,884 | 31,965 |
| CoBiz Financial, Inc. | 91,266 | 638,862 |
| Codorus Valley Bancorp, Inc. | 2,526 | 36,337 |
| FBR & Co. (a) | 12,396 | 38,304 |
| F.N.B. Corporation | 159,469 | 1,787,647 |
| Guaranty Bancorp (a) | 15,675 | 31,664 |
| Intervest Bancshares Corporation (a) | 9,223 | 35,047 |
| Macatawa Bank Corporation (a) | 10,311 | 32,067 |
| NASB Financial, Inc. (a) | 1,795 | 44,588 |
| Pacific Mercantile Bancorp (a) | 4,788 | 31,314 |
| Pinnacle Financial Partners, Inc. (a) | 60,718 | 1,173,072 |
| Popular, Inc. (a) | 43,340 | 755,416 |
| Preferred Bank (a) | 2,481 | 35,181 |
| Republic First Bancorp, Inc. (a) | 17,220 | 35,645 |
| Susquehanna Bancshares, Inc. | 56,684 | 592,915 |
| Taylor Capital Group, Inc. (a) | 2,151 | 36,825 |
| United Bankshares, Inc. (b) | 16,595 | 413,381 |
| Wilshire Bancorp, Inc. (a) | 6,344 | 39,967 |
| 5,830,094 | ||
| BEVERAGES—1.7% | ||
| SodaStream International Ltd. (a)(b) | 42,457 | 1,663,041 |
| BIOTECHNOLOGY—0.0% | ||
| BioDelivery Sciences International, Inc. (a) | 7,062 | 44,632 |
| BUILDING PRODUCTS—1.6% | ||
| Builders FirstSource, Inc. (a) | 6,509 | 33,782 |
| NCI Building Systems, Inc. (a) | 41,898 | 420,237 |
| PGT, Inc. (a) | 11,204 | 36,749 |
| Trex Company, Inc. (a) | 30,684 | 1,046,938 |
| 1,537,706 | ||
| CHEMICALS—0.1% | ||
| Penford Corporation (a) | 3,854 | 28,828 |
| TPC Group, Inc. (a) | 890 | 36,321 |
| 65,149 |
The accompanying notes are an integral part of these financial statements.
| COMMERCIAL SERVICES & SUPPLIES—8.2% | ||
| Acacia Research Corporation—Acacia Technologies (a) | 133,228 | 3,651,780 |
| CECO Environmental Corp. | 4,510 | 44,063 |
| Core-Mark Holding Company, Inc. | 720 | 34,639 |
| Heartland Payment Systems, Inc. | 41,997 | 1,330,465 |
| Hudson Global, Inc. (a) | 8,940 | 32,452 |
| Intersections, Inc. | 2,145 | 22,608 |
| Kforce, Inc. (a) | 125,682 | 1,481,791 |
| Move, Inc. (a) | 3,691 | 31,816 |
| StarTek, Inc. (a) | 11,423 | 34,269 |
| Sypris Solutions, Inc. | 4,835 | 34,522 |
| Waste Connections, Inc. | 38,805 | 1,173,851 |
| 7,872,256 | ||
| COMMUNICATIONS EQUIPMENT—1.8% | ||
| Ambient Corporation (a) | 4,868 | 25,606 |
| Boingo Wireless, Inc. (a) | 3,000 | 23,820 |
| CalAmp Corp. (a) | 4,557 | 37,413 |
| NICE-Systems Ltd. (a)(c) | 41,569 | 1,380,922 |
| Ubiquiti Networks, Inc. (a)(b) | 21,431 | 255,029 |
| 1,722,790 | ||
| CONSTRUCTION MATERIALS—0.0% | ||
| U.S. Concrete, Inc. (a) | 7,076 | 45,852 |
| CONTAINERS & PACKAGING—0.0% | ||
| Myers Industries, Inc. | 2,019 | 31,537 |
| DISTRIBUTORS—0.0% | ||
| AMCON Distributing Company | 583 | 37,837 |
| DIVERSIFIED FINANCIALS—4.8% | ||
| CIFC Corp. (a) | 4,889 | 35,787 |
| First Cash Financial Services, Inc. (a) | 35,595 | 1,637,726 |
| FirstCity Financial Corporation (a) | 3,936 | 31,606 |
| ICG Group, Inc. (a) | 122,762 | 1,247,262 |
| Medley Capital Corporation | 92,602 | 1,302,910 |
| Meta Financial Group, Inc. | 1,753 | 42,510 |
| MicroFinancial, Inc. | 4,186 | 38,302 |
| NGP Capital Resources Co. | 4,889 | 36,472 |
| Nicholas Financial, Inc. | 2,718 | 35,090 |
| QC Holdings, Inc. | 8,505 | 30,448 |
| Tree.Com, Inc. (a) | 7,896 | 123,730 |
| White River Capital, Inc. | 1,524 | 34,427 |
| 4,596,270 | ||
| ELECTRICAL EQUIPMENT—0.0% | ||
| Magnetek, Inc. (a) | 2,337 | 26,315 |
| ELECTRONIC EQUIPMENT & INSTRUMENTS—3.0% | ||
| Finisar Corporation (a) | 48,132 | 688,287 |
| OSI Systems, Inc. (a) | 27,419 | 2,134,295 |
| TESSCO Technologies, Inc. | 1,534 | 32,475 |
| 2,855,057 |
The accompanying notes are an integral part of these financial statements.
| ENERGY EQUIPMENT & SERVICES—4.4% | ||
| Core Laboratories N.V. | 27,354 | 3,322,964 |
| Dawson Geophysical Company (a) | 17,547 | 443,237 |
| Hornbeck Offshore Services, Inc. (a) | 14,426 | 528,713 |
| 4,294,914 | ||
| FOOD & DRUG RETAILING—2.8% | ||
| Pantry, Inc. (The) (a) | 2,276 | 33,116 |
| PetMed Express, Inc. | 2,858 | 28,694 |
| United Natural Foods, Inc. (a) | 43,296 | 2,530,651 |
| Village Super Market, Inc., Class A | 1,023 | 37,606 |
| 2,630,067 | ||
| FOOD PRODUCTS—3.7% | ||
| Andersons, Inc. (The) | 35,287 | 1,328,908 |
| Chefs’ Warehouse, Inc. (The) (a) | 1,920 | 31,450 |
| Hain Celestial Group, Inc. (a) | 34,838 | 2,194,794 |
| John B. Sanfilippo & Son, Inc. (a) | 1,862 | 24,243 |
| 3,579,395 | ||
| HEALTH CARE EQUIPMENT & SUPPLIES—3.9% | ||
| Accuray Incorporated (a) | 123,924 | 877,382 |
| Natus Medical, Inc. (a) | 92,350 | 1,207,014 |
| Solta Medical, Inc. (a) | 281,034 | 882,447 |
| Syneron Medical Ltd. (a) | 77,833 | 758,872 |
| 3,725,715 | ||
| HEALTH CARE PROVIDERS & SERVICES—5.9% | ||
| Alliance Healthcare Services, Inc. (a) | 34,956 | 49,288 |
| Bio-Reference Laboratories, Inc. (a) | 39,913 | 1,140,714 |
| Catamaran Corporation (a) | 29,088 | 2,849,751 |
| Henry Schein, Inc. (a) | 19,172 | 1,519,764 |
| Psychemedics Corporation | 3,295 | 40,034 |
| U.S. Physical Therapy, Inc. | 1,341 | 37,052 |
5,636,603 | ||
| HOTELS, RESTAURANTS & LEISURE—1.2% | ||
| AFC Enterprises, Inc. (a) | 1,475 | 36,285 |
| Ark Restaurants Corp. | 2,462 | 41,300 |
| Einstein Noah Restaurant Group, Inc. | 2,023 | 35,787 |
| Jamba, Inc. (a) | 15,675 | 34,955 |
| Kona Grill, Inc. (a) | 4,018 | 35,961 |
| Multimedia Games Holding Company, Inc. (a) | 2,271 | 35,723 |
| Nathan’s Famous, Inc. (a) | 1,165 | 36,639 |
| National CineMedia, Inc. | 55,659 | 911,138 |
| 1,167,788 | ||
| HOUSEHOLD DURABLES—2.2% | ||
| Emerson Radio Corp. (a) | 17,305 | 35,735 |
| M.D.C. Holdings, Inc. | 18,119 | 697,763 |
| Standard Pacific Corporation (a) | 200,968 | 1,358,544 |
| U.S. Home Systems, Inc. | 3,454 | 43,071 |
| 2,135,113 |
The accompanying notes are an integral part of these financial statements.
| INDUSTRIAL CONGLOMERATES—0.5% | ||
| Lydall, Inc. (a) | 2,570 | 36,211 |
| Polypore International, Inc. (a)(b) | 12,180 | 430,563 |
| 466,774 | ||
| INSURANCE—0.1% | ||
| Homeowners Choice, Inc. | 1,868 | 43,898 |
| Imperial Holdings, Inc. (a) | 8,827 | 30,100 |
| 73,998 | ||
| INTERNET & CATALOG RETAIL—0.2% | ||
| 1-800-Flowers.com, Inc., Class A (a) | 9,737 | 36,319 |
| Nutrisystem, Inc. | 2,993 | 31,516 |
| Overstock.com, Inc. (a)(b) | 4,930 | 51,075 |
| 118,910 | ||
| INTERNET SOFTWARE & SERVICES—2.4% | ||
| Ancestry.com, Inc. (a)(b) | 47,090 | 1,416,467 |
| LivePerson (a) | 48,771 | 883,243 |
| 2,299,710 | ||
| IT CONSULTING & SERVICES—6.2% | ||
| Alliance Data Systems Corporation (a) | 32,190 | 4,569,371 |
| Computer Task Group, Inc. (a) | 2,458 | 39,770 |
| Hackett Group, Inc. (The) (a) | 6,633 | 27,726 |
| Industrial Services of America, Inc. (a) | 7,361 | 26,941 |
| InterNAP Network Services Corporation (a) | 166,656 | 1,174,925 |
| Lionbridge Technologies, Inc. (a) | 10,992 | 38,692 |
| Wayside Technology Group, Inc. | 2,833 | 35,327 |
| 5,912,752 | ||
| LEISURE EQUIPMENT & PRODUCTS—4.1% | ||
| Arctic Cat, Inc. (a) | 33,987 | 1,409,101 |
| Callaway Golf Company | 69,377 | 425,975 |
| Glu Mobile, Inc. (a)(b) | 187,403 | 867,676 |
| Nautilus, Inc. (a) | 10,132 | 26,546 |
| Smith & Wesson Holding Corporation (a) | 108,481 | 1,194,375 |
| 3,923,673 | ||
| MACHINERY—3.2% | ||
| Actuant Corporation | 19,296 | 552,252 |
| Argan, Inc. (a) | 2,552 | 44,532 |
| Gardner Denver, Inc. | 33,284 | 2,010,686 |
| Supreme Industries, Inc. (a) | 8,423 | 30,744 |
| Titan International, Inc. (b) | 22,331 | 394,366 |
| 3,032,580 | ||
| MEDIA—6.1% | ||
| Ballantyne Strong, Inc. | 5,855 | 24,357 |
| Cinemark Holdings, Inc. | 82,132 | 1,842,221 |
| Harris Interactive, Inc. (a) | 31,778 | 46,396 |
| IMAX Corporation (a) | 74,390 | 1,481,105 |
| Regal Entertainment Group, Class A | 117,014 | 1,646,387 |
| TiVo, Inc. (a) | 80,648 | 841,158 |
| 5,881,624 |
The accompanying notes are an integral part of these financial statements.
| METALS & MINING—0.8% | ||
| Silver Standard Resources, Inc. (a) | 45,534 | 729,910 |
| MULTILINE RETAIL—0.0% | ||
| Gordmans Stores, Inc. (a) | 1,986 | 36,642 |
| OFFICE ELECTRONICS—0.0% | ||
| PAR Technology Corporation (a) | 6,991 | 38,101 |
| OIL & GAS—0.1% | ||
| Adams Resources & Energy, Inc. | 813 | 24,797 |
| VAALCO Energy, Inc. (a) | 3,919 | 33,507 |
58,304 | ||
| PERSONAL PRODUCTS—0.1% | ||
| Female Health Company (The) | 5,730 | 40,970 |
| United-Guardian, Inc. | 1,904 | 35,985 |
| 76,955 | ||
| PHARMACEUTICALS—0.8% | ||
| Obagi Medical Products, Inc. (a) | 2,255 | 27,985 |
| Par Pharmaceutical Companies, Inc. (a) | 14,429 | 721,161 |
| POZEN, Inc. (a) | 5,163 | 34,231 |
| 783,377 | ||
| REAL ESTATE—11.8% | ||
| AG Mortgage Investment Trust, Inc. | 1,617 | 39,018 |
| American Campus Communities, Inc. | 30,684 | 1,346,414 |
| Apollo Commercial Real Estate Finance, Inc. | 2,133 | 36,986 |
| Brandywine Realty Trust | 83,586 | 1,018,913 |
| Dynex Capital, Inc. | 3,394 | 36,486 |
| Education Realty Trust, Inc. | 45,188 | 492,549 |
| Entertainment Properties Trust | 94,022 | 4,177,398 |
| Extra Space Storage, Inc. | 21,075 | 700,744 |
| Hersha Hospitality Trust | 722,381 | 3,539,667 |
| 11,388,175 | ||
| ROAD & RAIL—0.3% | ||
| Old Dominion Freight Line (a) | 7,309 | 220,439 |
| Pacer International, Inc. (a) | 6,122 | 24,366 |
| Saia, Inc. (a) | 1,626 | 32,748 |
| Universal Truckload Services, Inc. | 2,378 | 37,976 |
| 315,529 | ||
| SEMICONDUCTOR EQUIPMENT & PRODUCTS—0.4% | ||
| inTEST Corporation (a) | 10,251 | 27,165 |
| MIPS Technologies, Inc. (a) | 48,624 | 359,332 |
| Ultra Clean Holdings, Inc. (a) | 5,361 | 30,611 |
| 417,108 | ||
| SOFTWARE—0.8% | ||
| Majesco Entertainment Company (a) | 17,305 | 21,804 |
| MedAssets, Inc. (a) | 22,277 | 396,531 |
| Verint Systems, Inc. (a) | 12,561 | 344,674 |
| 763,009 |
The accompanying notes are an integral part of these financial statements.
| SPECIALTY RETAIL—2.7% | ||
| Destination Maternity Corporation | 1,572 | 29,396 |
| Fifth & Pacific Companies, Inc. (a) | 84,246 | 1,076,664 |
| Hot Topic, Inc. | 3,582 | 31,163 |
| PC Connection, Inc. | 3,080 | 35,451 |
| Pier 1 Imports, Inc. | 72,117 | 1,351,473 |
| Winmark Corporation | 606 | 32,773 |
| 2,556,920 | ||
| TEXTILES & APPAREL—1.3% | ||
| dELiA*s, Inc. (a) | 23,942 | 33,279 |
| DGSE Companies, Inc. (a) | 4,693 | 4,693 |
| Vera Bradley, Inc. (a)(b) | 51,574 | 1,230,040 |
| 1,268,012 | ||
| WIRELESS TELECOMMUNICATION SERVICES—4.8% | ||
| SBA Communications Corp., Class A (a) | 27,868 | 1,752,897 |
| TOTAL COMMON STOCK | ||
| (Cost $71,750,009) | 92,146,877 | |
Short Term Investments—5.8% | ||
| Par Value | Value | |
| State Street Bank & Trust Co., Repurchase Agreement .01%, 10/01/12, (Dated 09/28/12), Collateralized by $5,720,000 par U.S. Treasury Note-.375% due 04/15/2015, Market Value $5,741,347, Repurchase Proceeds $5,623,927 (Cost $5,623,922) | $5,623,922 | 5,623,922 |
TOTAL INVESTMENTS (EXCLUDING INVESTMENTS PURCHASED WITH CASH COLLATERAL FROM SECURITIES LOANED)—101.6% (Cost $77,373,931) | 97,770,799 | |
INVESTMENTS PURCHASED WITH CASH COLLATERAL FROM SECURITIES LOANED—6.2% | ||
| Money Market—6.2% | ||
| Western Asset Institutional Cash Reserves—Inst. | ||
| (Cost $5,971,584) | 5,971,584 | 5,971,584 |
TOTAL INVESTMENTS—107.8% (Cost $83,345,515) | 103,742,383 | |
| OTHER ASSETS & LIABILITIES (NET)—(7.8%) | (7,543,228) | |
| NET ASSETS—100% | $96,199,155 |
| (a) | Non-income producing security |
| (b) | All or a portion of this security was out on loan. |
| (c) | ADR—American Depositary Receipts |
The accompanying notes are an integral part of these financial statements.
PEAR TREE COLUMBIA MICRO CAP FUND
SCHEDULE OF INVESTMENTS
September 30, 2012 (Unaudited)
Common Stock—97.2%
| Shares | Value | |
| AIR FREIGHT & LOGISTICS—0.9% | ||
| Echo Global Logistics, Inc. (a) | 2,410 | $ 41,332 |
| BANKS—13.2% | ||
| BBX Capital Corporation (a) | 7,908 | 51,086 |
| Berkshire Bancorp, Inc. (a) | 4,973 | 40,928 |
| Codorus Valley Bancorp, Inc. | 3,234 | 46,521 |
| FBR & Co. (a) | 15,873 | 49,048 |
| Guaranty Bancorp (a) | 20,072 | 40,545 |
| Intervest Bancshares Corporation (a) | 11,810 | 44,878 |
| Macatawa Bank Corporation (a) | 13,204 | 41,064 |
| NASB Financial, Inc. (a) | 2,299 | 57,107 |
| Pacific Mercantile Bancorp (a) | 6,132 | 40,103 |
| Preferred Bank (a) | 3,177 | 45,050 |
| Republic First Bancorp, Inc. (a) | 22,050 | 45,644 |
| Taylor Capital Group, Inc. (a) | 2,754 | 47,148 |
| Wilshire Bancorp, Inc. (a) | 8,124 | 51,181 |
| 600,303 | ||
| BIOTECHNOLOGY—1.3% | ||
| BioDelivery Sciences International, Inc. (a) | 9,043 | 57,152 |
| BUILDING PRODUCTS—2.0% | ||
| Builders FirstSource, Inc. (a) | 8,335 | 43,259 |
| PGT, Inc. (a) | 14,346 | 47,055 |
| 90,314 | ||
| CHEMICALS—1.8% | ||
| Penford Corporation (a) | 4,935 | 36,914 |
| TPC Group, Inc. (a) | 1,140 | 46,523 |
| 83,437 | ||
| COMMERCIAL SERVICES & SUPPLIES—6.6% | ||
| CECO Environmental Corp. | 5,776 | 56,432 |
| Core-Mark Holding Company, Inc. | 922 | 44,357 |
| Hudson Technologies, Inc. (a) | 11,448 | 41,556 |
| Intersections, Inc. | 2,746 | 28,943 |
| Move, Inc. (a) | 4,727 | 40,747 |
| StarTek, Inc. (a) | 14,628 | 43,884 |
| Sypris Solutions, Inc. | 6,191 | 44,204 |
| 300,123 | ||
| COMMUNICATIONS EQUIPMENT—2.5% | ||
| Ambient Corporation (a) | 6,234 | 32,791 |
| Boingo Wireless, Inc. (a) | 3,842 | 30,505 |
| CalAmp Corp. (a) | 5,836 | 47,914 |
| 111,210 |
The accompanying notes are an integral part of these financial statements.
| CONSTRUCTION MATERIALS—1.3% | ||
| U.S. Concrete, Inc. (a) | 9,061 | 58,715 |
| CONTAINERS & PACKAGING—0.9% | ||
| Myers Industries, Inc. | 2,586 | 40,393 |
| DISTRIBUTORS—1.1% | ||
| AMCON Distributing Company | 746 | 48,415 |
| DIVERSIFIED FINANCIALS—8.0% | ||
| CIFC Corp. (a) | 6,260 | 45,823 |
| FirstCity Financial Corporation (a) | 5,041 | 40,479 |
| Meta Financial Group, Inc. | 2,245 | 54,441 |
| MicroFinancial, Inc. | 5,361 | 49,053 |
| NGP Capital Resources Co. | 6,260 | 46,700 |
| Nicholas Financial, Inc. | 3,481 | 44,940 |
| QC Holdings, Inc. | 10,891 | 38,990 |
| White River Capital, Inc. | 1,951 | 44,073 |
| 364,499 | ||
| ELECTRICAL EQUIPMENT—0.8% | ||
| Magnetek, Inc. (a) | 2,992 | 33,690 |
| ELECTRONIC EQUIPMENT & INSTRUMENTS—0.9% | ||
| TESSCO Technologies, Inc. | 1,964 | 41,578 |
| FOOD & DRUG RETAILING—2.8% | ||
| Pantry, Inc. (The) (a) | 2,914 | 42,399 |
| PetMed Express, Inc. | 3,660 | 36,746 |
| Village Super Market, Inc., Class A | 1,310 | 48,156 |
| 127,301 | ||
| FOOD PRODUCTS—1.6% | ||
| Chefs’ Warehouse, Inc. (The) (a) | 2,458 | 40,262 |
| John B. Sanfilippo & Son, Inc. (a) | 2,385 | 31,053 |
| 71,315 | ||
| HEALTH CARE PROVIDERS & SERVICES—3.6% | ||
| Alliance Healthcare Services, Inc. (a) | 44,761 | 63,113 |
| Psychemedics Corporation | 4,219 | 51,261 |
| U.S. Physical Therapy, Inc. | 1,718 | 47,468 |
| 161,842 | ||
| HOTELS, RESTAURANTS & LEISURE—7.2% | ||
| AFC Enterprises, Inc. (a) | 1,889 | 46,469 |
| Ark Restaurants Corp. | 3,152 | 52,875 |
| Einstein Noah Restaurant Group, Inc. | 2,590 | 45,817 |
| Jamba, Inc. (a) | 20,072 | 44,761 |
| Kona Grill, Inc. (a) | 5,145 | 46,048 |
| Multimedia Games Holding Company, Inc. (a) | 2,908 | 45,743 |
| Nathan’s Famous, Inc. (a) | 1,492 | 46,923 |
| 328,636 |
The accompanying notes are an integral part of these financial statements.
| HOUSEHOLD DURABLES—2.2% | ||
| Emerson Radio Corp. (a) | 22,159 | 45,758 |
| U.S. Home Systems, Inc. | 4,423 | 55,155 |
| 100,913 | ||
| INDUSTRIAL CONGLOMERATES—1.0% | ||
| Lydall, Inc. (a) | 3,291 | 46,370 |
| INSURANCE—2.1% | ||
| Homeowners Choice, Inc. | 2,392 | 56,212 |
| Imperial Holdings, Inc. (a) | 11,303 | 38,543 |
| 94,755 | ||
| INTERNET & CATALOG RETAIL—3.4% | ||
| 1-800-Flowers.com, Inc., Class A (a) | 12,468 | 46,505 |
| Nutrisystem, Inc. | 3,832 | 40,351 |
| Overstock.com, Inc. (a) | 6,313 | 65,403 |
| 152,259 | ||
| IT CONSULTING & SERVICES—4.7% | ||
| Computer Task Group, Inc. (a) | 3,148 | 50,935 |
| Hackett Group, Inc. (The) (a) | 8,493 | 35,501 |
| Industrial Services of America, Inc. (a) | 9,425 | 34,496 |
| Lionbridge Technologies, Inc. (a) | 14,076 | 49,548 |
| Wayside Technology Group, Inc. | 3,627 | 45,229 |
| 215,707 | ||
| LEISURE EQUIPMENT & PRODUCTS—3.0% | ||
| Artic Cat, Inc. (a) | 1,155 | 47,886 |
| Nautilus, Inc. (a) | 12,974 | 33,992 |
| Smith & Wesson Holding Corporation (a) | 5,058 | 55,689 |
| 137,567 | ||
| MACHINERY—2.1% | ||
| Argan, Inc. (a) | 3,267 | 57,009 |
| Supreme Industries, Inc. (a) | 10,786 | 39,369 |
| 96,378 | ||
| MEDIA—2.0% | ||
| Ballantyne Strong, Inc. | 7,498 | 31,192 |
| Harris Interactive, Inc. (a) | 40,691 | 59,409 |
| 90,601 | ||
| MULTILINE RETAIL—1.0% | ||
| Gordmans Stores, Inc. (a) | 2,543 | 46,918 |
| OFFICE ELECTRONICS—1.1% | ||
| PAR Technology Corporation (a) | 8,952 | 48,788 |
| OIL & GAS—1.7% | ||
| Adams Resources & Energy, Inc. | 1,040 | 31,720 |
| VAALCO Energy, Inc. (a) | 5,018 | 42,904 |
| 74,624 |
The accompanying notes are an integral part of these financial statements.
| PERSONAL PRODUCTS—2.1% | ||
| Female Health Company (The) | 7,338 | 52,467 |
| United-Guardian, Inc. | 2,438 | 46,078 |
| 98,545 | ||
| PHARMACEUTICALS—1.7% | ||
| Obagi Medical Products, Inc. (a) | 2,888 | 35,840 |
| POZEN, Inc. (a) | 6,612 | 43,838 |
| 79,678 | ||
| REAL ESTATE—3.1% | ||
| AG Mortgage Investment Trust, Inc. | 2,070 | 49,949 |
| Apollo Commercial Real Estate Finance, Inc. | 2,731 | 47,355 |
| Dynex Capital, Inc. | 4,346 | 46,720 |
| 144,024 | ||
| ROAD & RAIL—2.7% | ||
| Pacer International, Inc. (a) | 7,839 | 31,199 |
| Saia, Inc. (a) | 2,082 | 41,931 |
| Universal Truckload Services, Inc. | 3,045 | 48,629 |
| 121,759 | ||
| SEMICONDUCTOR EQUIPMENT & PRODUCTS—1.6% | ||
| inTEST Corporation (a) | 13,126 | 34,784 |
| Ultra Clean Holdings, Inc. (a) | 6,865 | 39,199 |
| 73,983 | ||
| SOFTWARE—0.6% | ||
| Majesco Entertainment Company (a) | 22,159 | 27,920 |
| SPECIALTY RETAIL—3.6% | ||
| Destination Maternity Corporation | 2,013 | 37,643 |
| Hot Topic, Inc. | 4,586 | 39,898 |
| PC Connection, Inc. | 3,944 | 45,396 |
| Winmark Corporation | 776 | 41,966 |
| 164,903 | ||
| TEXTILES & APPAREL—1.1% | ||
| dELiA*s, Inc. (a) | 30,658 | 42,615 |
| DGSE Companies, Inc. (a) | 5,810 | 5,810 |
| 48,425 | ||
| TOTAL COMMON STOCK | ||
| (Cost $3,966,352) | 4,424,372 | |
Short Term Investments—2.8% | ||
| Par Value | Value | |
State Street Bank & Trust Co., Repurchase Agreement .01%, 10/01/12, (Dated 09/28/12), Collateralized by $130,000 par U.S. Treasury Note-.375% due 04/15/2015, Market Value $130,485, Repurchase Proceeds $127,250 (Cost $127,250) | $127,250 | 127,250 |
| TOTAL INVESTMENTS—100.0% | ||
| (Cost $4,402,782) | 4,551,622 | |
| OTHER ASSETS & LIABILITIES (NET)—0.0% | 1,908 | |
| NET ASSETS—100% | $4,553,530 |
| (a) | Non-income producing security |
The Portfolio is actively managed and holdings are subject to change.
There is no guarantee the Fund will continue to invest in the securities referenced.
Reference to specific securities or holdings should not be considered recommendations for action by investors.
The accompanying notes are an integral part of these financial statements.
PEAR TREE QUALITY FUND
SCHEDULE OF INVESTMENTS
September 30, 2012 (Unaudited)
Common Stock—99.5%
| Shares | Value | |
| AEROSPACE & DEFENSE—0.0% | ||
| United Technologies Corporation | 19 | $1,488 |
| BEVERAGES—5.7% | ||
| Anheuser-Busch InBev SA (b) | 9,143 | 785,475 |
| Coca-Cola Company (The) | 116,871 | 4,432,917 |
| Monster Beverage Corporation (a) | 6,995 | 378,849 |
| 5,597,241 | ||
| COMMUNICATIONS EQUIPMENT—1.3% | ||
| QUALCOMM Incorporated | 20,284 | 1,267,547 |
| COMPUTERS & PERIPHERALS—8.5% | ||
| Apple, Inc. (a) | 6,356 | 4,241,104 |
| Hewlett-Packard Company | 110,882 | 1,891,647 |
| International Business Machines | 10,711 | 2,221,997 |
| 8,354,748 | ||
| FOOD PRODUCTS—3.2% | ||
| Nestle, S.A. (b) | 28,201 | 1,782,585 |
| Unilever N.V. | 39,119 | 1,387,942 |
| 3,170,527 | ||
| FOOD STAPLES & DRUG RETAILING—7.4% | ||
| PepsiCo, Inc. | 38,437 | 2,720,186 |
| SYSCO Corporation | 15,330 | 479,369 |
| Tesco PLC (a)(b) | 39,393 | 637,379 |
| Wal-Mart Stores, Inc. | 44,277 | 3,267,643 |
| Walgreen Co. | 1,915 | 69,783 |
| 7,174,360 | ||
| HEALTH CARE EQUIPMENT & SERVICES—6.2% | ||
| Baxter International Inc. | 28 | 1,687 |
| Express Scripts, Inc. (a) | 36,128 | 2,264,142 |
| Intuitive Surgical, Inc. (a) | 56 | 27,755 |
| Medtronic, Inc. | 24,699 | 1,065,021 |
| UnitedHealth Group, Inc. | 24,939 | 1,381,870 |
| Zimmer Holdings, Inc. (a) | 18,872 | 1,276,125 |
| 6,016,600 | ||
| HEALTH CARE PROVIDERS & SERVICES—0.7% | ||
| Henry Schein, Inc. (a) | 703 | 55,727 |
| Laboratory Corporation of America Holdings (a) | 2,077 | 192,060 |
| Quest Diagnostics Incorporated | 6,701 | 425,044 |
| 672,831 | ||
| HOTELS, RESTAURANTS & LEISURE—1.1% | ||
| McDonald’s Corporation | 11,385 | 1,044,574 |
The accompanying notes are an integral part of these financial statements.
| HOUSEHOLD PRODUCTS—4.7% | ||
| Church & Dwight Co., Inc. | 6,624 | 357,630 |
| Colgate-Palmolive Company | 19,290 | 2,068,274 |
| Procter & Gamble Company | 31,015 | 2,151,200 |
| 4,577,104 | ||
| INDUSTRIAL CONGLOMERATES—0.8% | ||
| 3M Company | 8,428 | 778,916 |
| MULTILINE RETAIL—2.6% | ||
| Target Corporation | 40,639 | 2,579,357 |
| OIL & GAS—8.4% | ||
| BP plc (b) | 23,445 | 993,130 |
| Chevron Corporation | 28,046 | 3,269,042 |
| Exxon Mobil Corporation | 19,053 | 1,742,396 |
| Royal Dutch Shell plc (b) | 15,766 | 1,094,318 |
| TOTAL S.A. (b) | 21,826 | 1,093,483 |
| 8,192,369 | ||
| PHARMACEUTICALS & BIOTECHNOLOGY—19.8% | ||
| Abbott Laboratories | 39,975 | 2,740,686 |
| Amgen, Inc. | 8,497 | 716,467 |
| AstraZeneca PLC (b) | 11,519 | 551,299 |
| Bristol-Myers Squibb Company | 38 | 1,283 |
| Eli Lilly and Company | 390 | 18,490 |
| GlaxoSmithKline plc (b) | 23,028 | 1,064,815 |
| Johnson & Johnson | 78,314 | 5,396,618 |
| Merck & Co., Inc. | 14,235 | 641,998 |
| Novartis AG (b) | 20,443 | 1,252,338 |
| Pfizer, Inc. | 178,745 | 4,441,813 |
| Roche Holding Ltd (b) | 25,562 | 1,201,159 |
| Sanofi-Aventis (b) | 25,206 | 1,085,370 |
| Takeda Pharmaceutical Company Limited (b) | 11,683 | 269,760 |
| 19,382,096 | ||
| SOFTWARE & SERVICES—20.2% | ||
| Cisco Systems, Inc. | 166,625 | 3,180,871 |
| Google, Inc. (a) | 5,557 | 4,192,757 |
| MasterCard Incorporated | 2,372 | 1,070,911 |
| Microsoft Corporation | 135,090 | 4,022,980 |
| Oracle Corporation (a) | 160,076 | 5,040,793 |
| SAP AG (b) | 12,618 | 900,042 |
| Visa, Inc. | 10,019 | 1,345,351 |
| Yahoo! Inc. (a) | 444 | 7,093 |
| 19,760,798 | ||
| SPECIALTY RETAIL—0.5% | ||
| Lowe’s Companies, Inc. | 17,127 | 517,921 |
| TEXTILES & APPAREL—0.4% | ||
| Nike, Inc. | 3,871 | 367,397 |
The accompanying notes are an integral part of these financial statements.
| TOBACCO—7.4% | ||
| British American Tobacco p.l.c. (b) | 12,899 | 1,323,953 |
| Lorillard, Inc. | 10,637 | 1,238,679 |
| Philip Morris International, Inc. | 51,720 | 4,651,697 |
| 7,214,329 | ||
| WIRELESS TELECOMMUNICATIONS—0.6% | ||
| NTT DOCOMO, Inc. (b) | 40,066 | 647,467 |
TOTAL COMMON STOCK (Cost $85,541,497) | 97,317,670 | |
TOTAL INVESTMENTS 99.5% (Cost $85,541,497) | $97,317,670 | |
| OTHER ASSETS & LIABILITIES (NET)—0.5% | 454,667 | |
| NET ASSETS—100% | $97,772,337 |
| (a) | Non-Income producing security |
| (b) | ADR—American Depositary Receipts |
The accompanying notes are an integral part of these financial statements.
PEAR TREE PANAGORA DYNAMIC EMERGING MARKETS FUND
SCHEDULE OF INVESTMENTS
September 30, 2012 (Unaudited)
Common Stock—96.2%
| Shares | Value | |
| BRAZIL—7.4% | ||
| Banco do Brasil SA | 142,212 | $ 1,738,996 |
| BM&F Bovespa SA | 321,824 | 1,943,861 |
| Companhia de Bebidas das Americas (c) | 43,066 | 1,648,136 |
| Embraer S.A. (c) | 7,764 | 206,678 |
| EZ TEC Empreendimentos e Participacoes SA | 60,035 | 745,368 |
| Obrascon Huarte Lain Brasil SA | 25,100 | 230,196 |
| Oi SA (c) | 11,298 | 56,038 |
| Petroleo Brasileiro SA | 89,183 | 1,024,586 |
| Petroleo Brasileiro SA (c) | 84,344 | 1,861,472 |
| Sao Martinho SA | 14,418 | 170,050 |
| Sul America SA | 72,612 | 537,044 |
| Vale SA | 57,653 | 1,037,305 |
| 11,199,730 | ||
| CHILE—1.6% | ||
| Banco Santander Chile (c) | 8,079 | 591,706 |
| Compania Cervecerias Unidas SA (c) | 6,660 | 475,058 |
| Enersis SA (c) | 40,692 | 666,942 |
| LATAM Airlines Group SA (b)(c) | 25,927 | 655,434 |
| 2,389,140 | ||
| CHINA—10.6% | ||
| Bank of China Ltd., Class H | 6,366,392 | 2,430,281 |
| China Communications Construction Co., Ltd., Class H | 656,680 | 530,998 |
| China Construction Bank Corporation | 4,837,422 | 3,356,353 |
| China Petroleum & Chemical Corporation | 2,015,239 | 1,881,640 |
| China Shenhua Energy Co., Ltd. | 208,105 | 805,147 |
| China Yuchai International Ltd. | 17,977 | 229,207 |
| Dongfeng Motor Group Company Limited | 780,881 | 909,377 |
| Giant Interactive Group, Inc. (b)(c) | 106,939 | 555,013 |
| Great Wall Motor Co., Ltd. (b) | 601,980 | 1,591,503 |
| Harbin Electric Company Limited | 444,945 | 341,998 |
| Industrial & Commercial Bank of China Ltd. | 2,208,911 | 1,304,713 |
| Inner Mongolia Yitai Coal Co., Ltd., Class B | 40,848 | 219,436 |
| PetroChina Company Limited | 1,383,778 | 1,816,710 |
| Tencent Holdings Limited | 1,600 | 54,681 |
| 16,027,057 | ||
| COLOMBIA—0.7% | ||
| Ecopetrol S.A. (b)(c) | 17,581 | 1,036,048 |
| CZECH REPUBLIC—0.5% | ||
| CEZ AS | 18,425 | 687,747 |
The accompanying notes are an integral part of these financial statements.
| HONG KONG—6.9% | ||
| Central China Real Estate Ltd. | 297,371 | 72,866 |
| Champion Real Estate Investment Trust | 595,000 | 272,406 |
| China Mobile Limited | 290,779 | 3,232,524 |
| China Zhongwang Holdings Limited (a)(b) | 278,800 | 105,349 |
| Chongqing Rural Commercial Bank Co. | 1,034,687 | 406,987 |
| CNOOC Limited | 1,396,218 | 2,859,401 |
| COSCO International Holdings Ltd. | 205,193 | 80,976 |
| Dairy Farm International Holdings Limited | 10,800 | 119,988 |
| Giordano International Limited (b) | 402,000 | 338,022 |
| KWG Property Holding Limited | 395,919 | 218,535 |
| Lenovo Group Limited | 1,267,489 | 1,054,327 |
| Skyworth Digital Holdings Limited (b) | 1,786,000 | 845,316 |
| Soho China Limited (b) | 1,220,979 | 751,100 |
| Yuexiu Real Estate Investment Trust | 215,088 | 105,130 |
| 10,462,927 | ||
| HUNGARY—0.3% | ||
| EGIS Pharmaceuticals PLC | 1,899 | 150,483 |
| Richter Gedeon Nyrt. | 1,411 | 246,495 |
| 396,978 | ||
| INDIA—4.9% | ||
| Allahabad Bank | 29,921 | 83,219 |
| Andhra Bank | 253,412 | 542,185 |
| Bajaj Holdings & Investment Limited | 14,136 | 211,055 |
| Bank of Baroda | 19,608 | 295,914 |
| Chambal Fertilizers & Chemicals Ltd. | 379,300 | 530,711 |
| Gitanjali Gems Limited | 87,208 | 572,155 |
| Grasim Industries Limited | 10,406 | 654,407 |
| Gujarat State Fertilisers & Chemicals Limited | 31,990 | 48,551 |
| Hexaware Technologies Limited | 145,863 | 337,383 |
| Indiabulls Financial Services Limited | 172,508 | 699,909 |
| Indian Bank | 140,982 | 515,869 |
| Oil and Natural Gas Corp. Limited | 140,610 | 746,703 |
| Oil India Limited | 19,730 | 184,227 |
| Rural Electrification Corporation Limited | 172,142 | 711,479 |
| South Indian Bank Limited | 458,831 | 198,338 |
| Syndicate Bank | 166,229 | 343,520 |
| Tata Chemicals Ltd. | 34,131 | 207,135 |
| TVS Motor Company Ltd. | 155,385 | 125,204 |
| UCO Bank | 319,644 | 466,331 |
| 7,474,295 |
The accompanying notes are an integral part of these financial statements.
| INDONESIA—2.4% | ||
| PT AKR Corporindo Tbk | 1,296,078 | 575,583 |
| PT Aneka Tambang Tbk | 2,183,989 | 308,086 |
| PT Astra Agro Lestari Tbk | 230,648 | 529,020 |
| PT Bank Bukopin Tbk | 3,526,000 | 235,804 |
| PT Holcim Indonesia Tbk | 522,500 | 155,603 |
| PT Indo Tambangraya Megah Tbk | 29,620 | 130,458 |
| PT Indofood CBP Sukses Makmur Tbk | 312,500 | 207,354 |
| PT PP London Sumatra Indonesia Tbk | 2,762,340 | 707,182 |
| PT Sampoerna Agro Tbk | 452,953 | 137,259 |
| PT Telekomunikasi Indonesia Tbk | 616,958 | 609,222 |
| 3,595,571 | ||
| ISRAEL—0.8% | ||
| First International Bank of Israel Ltd. (a) | 5,585 | 65,709 |
| Mizrahi Tefahot Bank Ltd. (a) | 137,759 | 1,221,206 |
| 1,286,915 | ||
| MALAYSIA—4.5% | ||
| Affin Holdings Berhad | 191,000 | 210,591 |
| Berjaya Sports Toto Berhad | 228,184 | 323,258 |
| British American Tobacco (Malaysia) Berhad | 28,544 | 564,063 |
| DiGi.Com Berhad | 414,051 | 715,259 |
| DRB-HICOM Berhad | 1,041,699 | 794,097 |
| Genting Malaysia Berhad | 542,209 | 620,884 |
| Hong Leong Financial Group Berhad | 99,655 | 386,687 |
| JCY International Berhad | 402,700 | 102,767 |
| KLCC Property Holdings Berhad | 78,800 | 150,046 |
| Kuala Lumpur Kepong Berhad | 58,300 | 420,775 |
| Kulim (Malaysia) Berhad | 237,200 | 382,593 |
| Lafarge Malayan Cement Berhad | 54,580 | 158,927 |
| Malaysia Building Society Berhad | 539,312 | 425,239 |
| Parkson Holdings Berhad | 169,900 | 267,927 |
| SapuraKencana Petroleum Berhad (a) | 108,119 | 82,066 |
| Telekom Malaysia Berhad | 253,578 | 513,544 |
| UMW Holdings Berhad | 230,093 | 752,799 |
| 6,871,522 | ||
| MEXICO—3.8% | ||
| Alfa S.A.B., Series A | 1,046,290 | 1,948,659 |
| America Movil S.A.B. de C.V., Series L | 1,394,870 | 1,778,175 |
| GRUMA, S.A.B. de C.V., Series B (a) | 210,207 | 594,765 |
| Grupo Herdez, S. A. B. de C. V., Series* | 32,954 | 84,890 |
| Grupo Mexico S.A.B. de C.V., Series B | 299,398 | 990,019 |
| Industrias CH, S.A.B. de C.V., Series B (a) | 29,088 | 173,649 |
| Organizacion Soriana S.A.B. de C.V., Series B | 53,500 | 174,205 |
| 5,744,362 | ||
| PERU—0.2% | ||
| Banco Continental S.A. | 86,167 | 221,902 |
| Intercorp Financial Services, Inc. | 3,786 | 123,045 |
| 344,947 |
The accompanying notes are an integral part of these financial statements.
| PHILIPPINES—0.5% | ||
| Manila Electric Company | 50,280 | 307,357 |
| Megaworld Corporation | 6,281,300 | 335,786 |
| Rizal Commercial Banking Corporation | 126,900 | 138,566 |
| 781,709 | ||
| POLAND—1.9% | ||
| KGHM Polska Miedz SA (b) | 40,010 | 1,906,995 |
| PGE SA | 169,648 | 980,915 |
| 2,887,910 | ||
| RUSSIA—5.0% | ||
| Gazprom (c) | 240,094 | 2,408,143 |
| LUKoil (c) | 41,213 | 2,538,721 |
| Norilsk Nickel Mining and Metallurgical Co. (c) | 32,496 | 518,311 |
| Sberbank of Russia (c) | 129,680 | 1,521,146 |
| Severstal (b)(d) | 39,700 | 496,647 |
| 7,482,968 | ||
| SINGAPORE—2.0% | ||
| ComfortDelGro Corporation Limited | 293,000 | 409,765 |
| DBS Group Holdings Ltd. | 49,000 | 574,990 |
| Golden Agri-Resources Ltd. | 2,343,327 | 1,261,189 |
| Indofood Agri Resources Ltd. | 252,941 | 281,550 |
| UOL Group Limited | 93,000 | 434,551 |
| 2,962,045 | ||
| SOUTH AFRICA—7.3% | ||
| Barloworld Limited | 77,302 | 670,347 |
| Exxaro Resources Ltd. | 25,132 | 487,833 |
| FirstRand Limited | 354,798 | 1,193,465 |
| Fountainhead Property Trust Management Ltd. | 44,420 | 43,342 |
| Gold Fields Ltd. (c) | 114,823 | 1,475,475 |
| Imperial Holdings Limited | 66,468 | 1,503,201 |
| Investec Limited | 132,791 | 818,407 |
| Liberty Holdings Limited | 87,087 | 1,042,471 |
| MTN Group Limited | 50,835 | 982,273 |
| Reunert Limited | 31,269 | 260,033 |
| RMB Holdings Ltd. | 254,948 | 1,137,715 |
| Sasol Ltd. | 27,651 | 1,241,573 |
| Tongaat Hulett Limited | 9,294 | 156,651 |
| 11,012,786 |
The accompanying notes are an integral part of these financial statements.
| SOUTH KOREA—17.3% | ||
| BS Financial Group, Inc. | 9,709 | 104,828 |
| Daelim Industrial Co., Ltd. | 15,552 | 1,327,921 |
| Daishin Securities Company | 17,151 | 136,106 |
| Daou Technology, Inc. | 89,225 | 1,400,883 |
| GS Home Shopping, Inc. | 642 | 63,829 |
| Hana Financial Group, Inc. | 21,693 | 664,594 |
| Hyundai Motor Company | 10,895 | 2,470,288 |
| KCC Corporation | 2,160 | 566,516 |
| Kia Motors Corporation | 10,609 | 662,451 |
| Korea Exchange Bank (a) | 76,230 | 582,309 |
| Korea Zinc Co., Ltd. | 4,253 | 1,869,303 |
| KP Chemical Corp. | 10,839 | 128,731 |
| KT&G Corporation | 23,246 | 1,771,542 |
| LG Display Co., Ltd. (a) | 25,110 | 640,501 |
| Meritz Fire & Marine Insurance Co., Ltd. | 5,460 | 62,145 |
| Nong Shim Co., Ltd. | 3,114 | 743,880 |
| Samsung Electronics Co., Ltd. | 6,129 | 7,422,574 |
| Samsung Heavy Industries Co., Ltd. | 42,521 | 1,442,330 |
| SK Holdings Co., Ltd. | 12,490 | 1,747,482 |
| SK Innovation Co., Ltd. | 11,997 | 1,818,831 |
| SK Telecom Co., Ltd. (c) | 34,465 | 501,121 |
| 26,128,165 | ||
| TAIWAN—12.0% | ||
| ASUSTeK Computer, Inc. | 145,488 | 1,580,771 |
| Chailease Holding Co., Ltd. | 108,000 | 203,742 |
| Chicony Electronics Co., Ltd. | 142,271 | 334,887 |
| Chunghwa Telecom Co., Ltd. | 483,600 | 1,549,117 |
| Compal Electronics, Inc. | 739,765 | 664,977 |
| Farglory Land Development Co., Ltd. | 306,302 | 572,615 |
| Formosa Chemicals & Fiber Corporation | 191,000 | 513,443 |
| Highwealth Construction Corp. | 203,645 | 342,147 |
| Hon Hai Precision Industry Co., Ltd. | 387,372 | 1,215,761 |
| Lite-On Technology Corp. | 807,844 | 1,043,099 |
| MStar Semiconductor, Inc. | 31,000 | 249,049 |
| Pegatron Corporation (a) | 832,416 | 1,083,346 |
| Phison Electronics Corp. | 133,015 | 1,073,159 |
| Pou Chen Corporation | 854,631 | 874,646 |
| President Chain Store Corp. | 105,915 | 567,270 |
| Radiant Opto-Electronics Corporation | 251,990 | 1,091,740 |
| Taiwan Semiconductor Manufacturing Co., Ltd. | 845,270 | 2,589,430 |
| TECO Electric & Machinery Co., Ltd. | 1,198,983 | 830,312 |
| U-Ming Marine Transport Corporation | 135,246 | 216,386 |
| Uni-President Enterprises Corporation | 508,702 | 902,400 |
| United Microelectronics Corporation | 1,381,401 | 574,926 |
| 18,073,223 |
The accompanying notes are an integral part of these financial statements.
| THAILAND—3.3% | ||
| Bangkok Bank PCL (e) | 151,836 | 956,991 |
| CP ALL PCL | 1,247,712 | 1,439,044 |
| Electricity Generating PCL | 62,179 | 262,614 |
| Kiatnakin Bank PCL | 199,500 | 299,769 |
| Krung Thai Bank PCL | 2,580,491 | 1,534,210 |
| Siam Makro PCL | 40,295 | 519,724 |
| 5,012,352 | ||
| TURKEY—2.3% | ||
| Arcelik AS | 120,877 | 643,546 |
| Eis Eczacibasi Ilac Ve Sinai | 131,796 | 136,519 |
| Ford Otomotiv Sanayi AS | 27,935 | 289,361 |
| Tekfen Holding AS | 57,812 | 209,915 |
| Tofas Turk Otomobil Fabrikasi AS | 153,067 | 774,009 |
| Tupras—Turkiye Petrol Rafinerileri AS | 31,228 | 713,028 |
| Turkiye Sise ve Cam Fabrikalari AS | 406,101 | 563,134 |
| Ulker Biskuvi Sanayi AS | 28,244 | 119,856 |
| 3,449,368 | ||
| TOTAL COMMON STOCK | ||
| (Cost $132,482,554) | 145,307,765 | |
| Preferred Stock—3.5% | ||
| BRAZIL—3.5% | ||
| Banco Bradesco SA | 27,809 | 446,595 |
| Banco do Estado do Rio Grande do Sul SA | 71,030 | 603,795 |
| Eletropaulo Metropolitana SA | 40,680 | 395,146 |
| Itau Unibanco Holding SA | 47,563 | 717,397 |
| Klabin SA | 143,881 | 752,004 |
| Metalurgica Gerdau SA | 42,529 | 512,294 |
| Vale SA, Class A | 110,271 | 1,917,685 |
| TOTAL PREFERRED STOCK | ||
| (Cost $6,649,106) | 5,344,916 | |
Rights—0.1% | ||
| THAILAND—0.1% | ||
Krung Thai Bank Rights (Cost $0) | 645,123 | 119,467 |
| TOTAL INVESTMENTS (EXCLUDING INVESTMENTS PURCHASED WITH CASH COLLATERAL FROM SECURITIES LOANED) | ||
| (Cost $139,131,660) | 150,772,148 |
The accompanying notes are an integral part of these financial statements.
| Par Value | Value | |
| INVESTMENTS PURCHASED WITH CASH COLLATERAL FROM SECURITIES LOANED—4.9% | ||
| Money Market—4.9% | ||
| Western Asset Institutional Cash Reserves—Inst. | ||
| (Cost $7,351,088) | $7,351,088 | 7,351,088 |
| TOTAL INVESTMENTS—104.7% | ||
| (Cost $146,482,748) | 158,123,236 | |
| OTHER ASSETS & LIABILITIES (Net)—(4.7%) | (7,041,053) | |
| NET ASSETS—100% | $151,082,183 |
| (a) | Non-income producing security. |
| (b) | All or a portion of this security was out on loan. |
| (c) | ADR—American Depositary Receipts |
| (d) | GDR—Global Depositary Receipts |
| (e) | NVDR—Non-Voting Depository Receipts |
The accompanying notes are an integral part of these financial statements.
PEAR TREE PANAGORA DYNAMIC EMERGING MARKETS FUND
SECTOR ALLOCATIONS (as a percentage of Total Net Assets) | |
| Financials | 23.4% |
| Information Technology | 15.3% |
| Energy | 14.4% |
| Consumer Discretionary | 10.0% |
| Materials | 9.6% |
| Consumer Staples | 9.3% |
| Industrials | 8.6% |
| Telecommunication Services | 6.6% |
| Utilities | 2.2% |
| Health Care | 0.4% |
| Cash and Other Assets (Net) | 0.2% |
The accompanying notes are an integral part of these financial statements.
PEAR TREE POLARIS FOREIGN VALUE FUND
SCHEDULE OF INVESTMENTS
September 30, 2012 (Unaudited)
Common Stock—84.0%
| Shares | Value | |
| AUSTRALIA—1.8% | ||
| BHP Billiton Ltd. | 294,500 | $ 10,107,324 |
| BELGIUM—2.0% | ||
| Solvay S.A. | 97,847 | 11,329,724 |
| CANADA—1.9% | ||
| Methanex Corporation | 375,307 | 10,705,810 |
| FINLAND—6.8% | ||
| Kone OYJ, Class B | 210,900 | 14,601,658 |
| Konecranes OYJ | 455,280 | 13,205,582 |
| YIT OYJ | 609,916 | 11,707,649 |
| 39,514,889 | ||
| FRANCE—6.1% | ||
| Christian Dior S.A. | 74,773 | 10,036,567 |
| Imerys S.A. | 223,383 | 13,113,720 |
| Maurel et Prom | 711,606 | 10,558,088 |
| Transgene S.A. (a) | 142,827 | 1,641,677 |
| 35,350,052 | ||
| GERMANY—12.1% | ||
| BASF SE | 145,300 | 12,264,228 |
| Deutsche Telekom AG | 875,715 | 10,780,563 |
| Hannover Rueckvers | 189,900 | 12,140,586 |
| Muenchener Rueckvers AG | 75,230 | 11,751,877 |
| Symrise AG | 342,950 | 11,618,533 |
| Wincor Nixdorf AG | 287,250 | 11,238,332 |
| 69,794,119 | ||
| HONG KONG- 1.4% | ||
| Guangdong Investment Limited | 10,190,000 | 8,016,327 |
| INDIA—2.1% | ||
| Infosys Technologies Ltd. (b) | 250,645 | 12,166,308 |
| IRELAND—6.7% | ||
| CRH plc | 606,708 | 11,700,673 |
| Greencore Group plc | 9,555,313 | 12,331,704 |
| Smurfit Kappa Group plc | 1,459,010 | 14,725,424 |
| 38,757,801 | ||
| ISRAEL—2.2% | ||
| Teva Pharmaceuticals SP (b) | 302,519 | 12,527,312 |
The accompanying notes are an integral part of these financial statements.
| ITALY—3.2% | ||||
| Lottomatica Group SpA | 548,865 | 12,081,175 | ||
| Trevi Finanziaria SpA | 974,526 | 6,289,803 | ||
| 18,370,978 | ||||
| JAPAN—9.8% | ||||
| Asahi Group Holdings Ltd. | 476,600 | 11,768,203 | ||
| KDDI Corporation | 151,000 | 11,743,583 | ||
| Meiji Holdings Co., Ltd. | 232,900 | 11,582,232 | ||
| Nichirei Corporation | 2,031,000 | 11,129,838 | ||
| Showa Denko K.K. | 6,593,000 | 10,491,941 | ||
| 56,715,797 | ||||
| NORWAY—2.0% | ||||
| DnB Bank ASA | 947,092 | 11,606,216 | ||
| SOUTH AFRICA—2.2% | ||||
| Sasol Ltd. | 276,835 | 12,430,321 | ||
| SOUTH KOREA—3.4% | ||||
| Samsung Electronics Company Ltd. | 16,285 | 19,722,078 | ||
| SWEDEN—5.9% | ||||
| Duni AB | 1,179,500 | 9,877,507 | ||
| Investor AB, Class B | 550,056 | 12,110,495 | ||
| Svenska Handelsbanken AB, Class A | 328,500 | 12,309,309 | ||
| 34,297,311 | ||||
| SWITZERLAND—2.0% | ||||
| Novartis AG | 187,950 | 11,506,939 | ||
| THAILAND—1.9% | ||||
| Thai Oil PCL | 5,178,900 | 10,978,662 | ||
| UNITED KINGDOM—10.5% | ||||
| Barratt Developments plc (a) | 5,339,856 | 14,601,162 | ||
| BBA Aviation plc | 1,325,064 | 4,221,746 | ||
| Bellway plc | 817,906 | 12,145,499 | ||
| Persimmon plc | 1,148,673 | 14,055,302 | ||
| Taylor Wimpey plc | 17,822,024 | 15,611,514 | ||
| 60,635,223 | ||||
TOTAL COMMON STOCK (Cost $444,785,223) | 484,533,191 | |||
| Short Term Investments—15.6% | ||||
| Par Value | Value | |||
| Commercial Paper—10.4% | ||||
Exxon Mobil Corp. 0.04%, due 10/9/12 (Cost $30,000,000) | $30,000,000 | $30,000,000 | ||
Toyota Credit DE PR Corp., 0.04%, due 10/1/2012 (Cost $30,000,000) | $30,000,000 | 30,000,000 | ||
| Total Commercial Paper | 60,000,000 | |||
The accompanying notes are an integral part of these financial statements.
| Money Market—5.2% | ||
State Street Global Advisors FDS (Cost $30,044,537) | $30,044,537 | 30,044,537 |
| TOTAL SHORT TERM INVESTMENTS—15.6% | 90,044,537 | |
TOTAL INVESTMENTS—99.6% (Cost $534,829,760) | 574,577,728 | |
| OTHER ASSETS & LIABILITIES (NET)—0.4% | 2,074,756 | |
| NET ASSETS—100% | $576,652,484 |
| (a) | Non-income producing security |
| (b) | ADR—American Depository Receipts |
| The percentage of each investment category is calculated as a percentage of net assets. |
SECTOR ALLOCATIONS (as a percentage of Total Net Assets) | |
| Materials | 18.4% |
| Consumer Discretionary | 15.3% |
| Financials | 10.4% |
| Industrials | 8.7% |
| Consumer Staples | 8.1% |
| Information Technology | 7.5% |
| Energy | 5.9% |
| Health Care | 4.4% |
| Telecommunication Services | 3.9% |
| Utilities | 1.4% |
| Other Assets & Liabilities | 16.0% |
The accompanying notes are an integral part of these financial statements.
PEAR TREE POLARIS FOREIGN VALUE SMALL CAP FUND
SCHEDULE OF INVESTMENTS
September 30, 2012 (Unaudited)
Common Stock—91.9%
| Shares | Value | |
| AUSTRALIA—2.1% | ||
| Austal Limited | 552,530 | $ 794,907 |
| Industrea Limited | 868,171 | 1,122,756 |
| 1,917,663 | ||
| BELGIUM���1.7% | ||
| Kinepolis Group | 15,900 | 1,577,150 |
| BRAZIL—2.6% | ||
| Equatorial Energia SA | 276,385 | 2,439,373 |
| CANADA—1.2% | ||
| Astral Media, Inc. | 22,800 | 1,116,650 |
| CHINA—2.4% | ||
| China Hongxing Sports Limited (a) | 10,258,400 | 83,653 |
| Sichuan Expressway Company Limited | 2,772,960 | 768,871 |
| Xinhua Winshare Publishing and Media Co., Ltd. | 2,701,500 | 1,337,851 |
| 2,190,375 | ||
| FRANCE—1.3% | ||
| Bonduelle SA | 13,900 | 1,192,906 |
| GERMANY—2.3% | ||
| Freenet AG | 127,700 | 2,085,137 |
| HONG KONG—6.2% | ||
| China Fishery Group Limited | 1,427,672 | 838,232 |
| Samson Holding Ltd. | 10,475,800 | 1,242,929 |
| Texwinca Holdings Limited | 1,226,300 | 789,167 |
| VST Holdings Ltd. | 7,922,800 | 1,450,903 |
| VTech Holdings Limited | 115,700 | 1,417,517 |
| 5,738,748 | ||
| INDIA—3.4% | ||
| KRBL Ltd. | 1,475,200 | 690,823 |
| LIC Housing Finance Ltd. | 146,600 | 785,461 |
| Manappuram General Finance and Leasing Ltd. | 1,064,700 | 804,404 |
| NIIT Technologies Ltd. | 83,400 | 474,358 |
| South Indian Bank Ltd. | 553,320 | 239,183 |
| Usha Martin Group Ltd. | 323,760 | 155,910 |
3,150,139 |
The accompanying notes are an integral part of these financial statements.
| IRELAND—8.2% | ||
| Glanbia plc | 189,900 | 1,684,666 |
| Greencore Group plc | 1,347,779 | 1,739,390 |
| IFG Group plc | 829,985 | 1,504,628 |
| United Drug plc | 691,867 | 2,624,125 |
| 7,552,809 | ||
| ITALY—2.6% | ||
| De’Longhi SpA | 118,910 | 1,391,232 |
| Trevi Finanziaria SpA | 152,900 | 986,850 |
| 2,378,082 | ||
| JAPAN—11.5% | ||
| Accordia Golf Co., Ltd. | 1,653 | 1,062,825 |
| BML, Inc. | 74,000 | 1,945,919 |
| Chugoku Marine Paints Ltd. | 268,100 | 1,293,706 |
| Daicel Corporation | 271,000 | 1,627,669 |
| DaiichiKosho Co., Ltd. | 83,600 | 2,011,679 |
| Nichirei Corporation | 333,000 | 1,824,833 |
| Unipres Corporation | 38,000 | 843,198 |
| 10,609,829 | ||
| NETHERLANDS—2.7% | ||
| Dockwise Ltd. (a) | 146,134 | 2,523,705 |
| NORWAY—5.7% | ||
| ABG Sundal Collier Holding ASA | 1,563,800 | 1,104,812 |
| SpareBank 1SMN | 247,265 | 1,595,940 |
| SpareBank 1 SR-Bank ASA | 243,300 | 1,566,104 |
| SpareBank Nord-Norge | 209,731 | 1,002,456 |
| 5,269,312 | ||
| PHILIPPINES—2.9% | ||
| Manila Water Company, Inc. | 4,081,170 | 2,641,534 |
| SINGAPORE—3.8% | ||
| Breadtalk Group Ltd. | 2,815,100 | 1,319,973 |
| M1 Ltd. | 987,300 | 2,214,038 |
| 3,534,011 | ||
| SOUTH AFRICA—1.8% | ||
| Clicks Group Limited | 232,300 | 1,621,652 |
| SWEDEN—4.2% | ||
| Duni AB | 156,400 | 1,309,743 |
| Loomis AB | 82,300 | 1,168,518 |
| Nolato AB | 129,700 | 1,382,371 |
| 3,860,632 | ||
| SWITZERLAND—1.7% | ||
| Vetropack Holding AG | 886 | 1,575,949 |
| TAIWAN—1.4% | ||
| Holtek Semiconductor Inc. | 1,204,000 | 1,269,163 |
The accompanying notes are an integral part of these financial statements.
| THAILAND—5.7% | ||
| Hana Microelectronics PCL | 2,059,080 | 1,398,141 |
| Ratchaburi Electricity Generating Holding PCL | 1,220,000 | 1,922,352 |
| Thai Union Frozen Products PCL | 821,274 | 1,954,461 |
| 5,274,954 | ||
| UNITED KINGDOM—16.5% | ||
| Alternative Networks plc | 488,200 | 1,740,517 |
| BBA Aviation plc | 413,804 | 1,318,408 |
| Character Group plc | 496,900 | 1,042,079 |
| Clarkson plc | 64,500 | 1,356,830 |
| CSR plc | 331,900 | 1,703,174 |
| Galliford Try plc | 193,828 | 2,282,588 |
| Halfords Group plc | 260,879 | 1,096,735 |
| The Restaurant Group plc | 250,600 | 1,446,471 |
| Vitec Group plc | 149,866 | 1,729,820 |
| Wetherspoon (J.D.) plc | 196,400 | 1,523,964 |
| 15,240,586 | ||
TOTAL COMMON STOCK (Cost $76,663,870) | 84,760,359 | |
Preferred Stock—1.8% | ||
| GERMANY—1.8% | ||
Dräegerwerk AG (Cost $821,879) | 16,900 | 1,675,907 |
Warrants—5.3% | ||
| India—5.3% | ||
| KRBL Limited Derivative | 1,679,000 | $786,276 |
| LIC Housing Finance Derivative | 204,200 | 1,094,083 |
| NIIT Technologies Derivative | 276,900 | 1,574,924 |
| South Indian Bank Derivative | 2,535,250 | 1,095,989 |
| Usha Martin Group Derivative | 807,100 | 388,699 |
| (Cost $2,692,091) | 4,939,971 | |
Short Term Investments—0.8% | ||
| Par Value | Value | |
| Money Market—0.8% | ||
State Street Global Advisors FDS (Cost $709,735) | $709,735 | 709,735 |
| TOTAL SHORT TERM INVESTMENTS—0.8% | 709,735 | |
TOTAL INVESTMENTS—99.8% (Cost $80,887,575) | 92,085,972 | |
| OTHER ASSETS & LIABILITIES (NET)—0.2% | 234,839 | |
| NET ASSETS—100% | $92,320,811 |
| (a) | Non-income producing security |
| The percentage of each investment category is calculated as a percentage of net assets. |
The accompanying notes are an integral part of these financial statements.
PEAR TREE POLARIS FOREIGN VALUE SMALL CAP FUND
SECTOR ALLOCATIONS (as a percentage of Total Net Assets) | |
| Consumer Discretionary | 23.0% |
| Consumer Staples | 13.0% |
| Financials | 11.7% |
| Information Technology | 11.6% |
| Industrials | 10.6% |
| Utilities | 7.6% |
| Telecommunication Services | 6.5% |
| Health Care | 6.8% |
| Materials | 5.5% |
| Energy | 2.7% |
| Cash and Other Assets | 1.0% |
The accompanying notes are an integral part of these financial statements.
PEAR TREE FUNDS
STATEMENT OF ASSETS AND LIABILITIES
September 30, 2012 (Unaudited)
| Small Cap | Micro Cap | |
| Assets: | ||
| Investments at value (Includes collateral from securities on loan of: $5,971,584: $0: $0: $7,351,088: $0,$0 respectively)* (Note 2) | $98,118,461 | $4,424,372 |
| Repurchase agreements/commercial paper | 5,623,922 | 127,250 |
| Foreign currency at value (Cost $345,792 for Emerging Markets, $0 for Foreign Value, and $18,827 for Foreign Value Small Cap) | — | — |
| Cash | — | — |
| Dividend, interest and foreign tax reclaims receivable | 125,579 | 5,422 |
| Receivable for investments sold | 60,206 | — |
| Receivable for shares of beneficial interest sold | 2,225 | 103 |
| Other assets | 13,864 | 1,003 |
| Total Assets | $103,944,257 | $4,558,150 |
| Liabilities: | ||
| Payable for investments purchased | $1,585,882 | $— |
| Payable for shares of beneficial interest repurchased | 33,132 | — |
| Payable for compensation of manager (Note 3) | 79,686 | 43 |
| Payable for distribution fees (Note 3) | 18,676 | 653 |
| Payable to custodian | 4,649 | 3,163 |
| Payable to transfer agent (Note 3) | 15,832 | 761 |
| Payable for collateral received for securities loaned | 5,971,584 | — |
| Payable for line of credit | — | — |
| Unrealized gain/(loss) on forward foreign currency contracts (Note 2) | — | — |
| Other accrued expenses and liabilities | 35,661 | — |
| Total Liabilities | $7,745,102 | $4,620 |
| Net Assets | $96,199,155 | $4,553,530 |
| * | Includes securities on loan to brokers with market value of $5,832,913; $0; $0; $6,839,665; $0; $0, respectively. |
| Quality | Emerging Markets | Foreign Value | Foreign Value Small Cap |
| $97,317,670 | $158,123,236 | $514,577,728 | $92,085,972 |
| — | — | 60,000,000 | — |
| — | 348,376 | — | 18,729 |
| — | — | — | — |
| 190,733 | 408,816 | 2,007,427 | 324,082 |
| 1,747,013 | — | 927,773 | 6,860 |
| — | 36,058 | — | — |
| 7,527 | 7,239 | 22,387 | — |
| $99,262,943 | $158,923,725 | $577,535,315 | $92,435,643 |
| $— | $— | $— | $— |
| 500 | 103,550 | 206,051 | 3,363 |
| 67,210 | 122,159 | 463,352 | 75,045 |
| 20,147 | 27,591 | 91,579 | 15,214 |
| 1,817 | (221) | 10,824 | 2,888 |
| 15,729 | 22,214 | 87,788 | 14,772 |
| — | 7,351,088 | — | — |
| 1,371,079 | 193,704 | — | — |
| — | — | — | — |
| 14,124 | 21,457 | 23,237 | 3,550 |
| $1,490,606 | $7,841,542 | $882,831 | $114,832 |
| $97,772,337 | $151,082,183 | $576,652,484 | $92,320,811 |
The accompanying notes are an integral part of these financial statements.
| Small Cap | Micro Cap | |
| Net Assets Consist Of: | ||
| Shares of beneficial interest | $93,139,132 | $4,193,610 |
| Undistributed net investment income | (386,473) | (16,832) |
| Accumulated net realized gain/(loss) on investments and foreign denominated assets, liabilities and currency | (16,950,372) | 227,912 |
| Unrealized appreciation/(depreciation) of investments and foreign denominated assets, liabilities and currency | 20,396,868 | 148,840 |
| Net Assets | $96,199,155 | $4,553,530 |
| Investments at cost | $83,345,515 | $4,402,782 |
| Net assets | ||
| Ordinary Shares | $90,170,012 | $3,184,293 |
| Institutional Shares | $6,029,143 | $1,369,237 |
| Shares of beneficial interest outstanding (unlimited number of shares authorized) | ||
| Ordinary Shares | 4,470,433 | 275,230 |
| Institutional Shares | 264,213 | 121,991 |
| Net asset value and offering price per share | ||
| Ordinary Shares | $20.17 | $11.57 |
| Institutional Shares | $22.82 | $11.22 |
| Quality | Emerging Markets | Foreign Value | Foreign Value Small Cap |
| $93,211,845 | $165,518,415 | $792,008,172 | $80,477,490 |
| 780,870 | 4,169,708 | 7,373,838 | 2,830,912 |
| (7,996,551) | (30,252,795) | (262,461,057) | (2,169,848) |
| 11,776,173 | 11,646,855 | 39,731,531 | 11,182,257 |
| $97,772,337 | $151,082,183 | $576,652,484 | $92,320,811 |
| $85,541,497 | $146,482,748 | $534,829,760 | $80,887,575 |
| $95,080,429 | $136,476,555 | $457,656,878 | $75,530,919 |
| $2,691,908 | $14,605,628 | $118,995,606 | $16,789,892 |
| 6,378,332 | 6,068,674 | 32,368,062 | 8,184,147 |
| 172,660 | 640,077 | 8,410,532 | 1,815,052 |
| $14.91 | $22.49 | $14.14 | $9.23 |
| $15.59 | $22.82 | $14.15 | $9.25 |
The accompanying notes are an integral part of these financial statements.
PEAR TREE FUNDS
STATEMENT OF OPERATIONS
6 Months Ended September 30, 2012 (Unaudited)
| Small Cap | Micro Cap | |
| Investment Income: | ||
| Dividends* | $608,969 | $27,480 |
| Interest | 101 | 5 |
| Sec Lending Income | 43,645 | — |
| Miscellaneous (Note 2) | — | — |
| Total Investment Income | $652,715 | $27,485 |
| Expenses: | ||
| Compensation of manager (Note 3) | 483,025 | 22,080 |
| Distribution fees, Ordinary Shares (Note 3) | 113,278 | 3,852 |
| Administrative Fees (Note 3) | 17,128 | 757 |
| Custodian and fund accounting fees | 23,542 | 4,450 |
| Regulatory and Compliance (Note 3) | 10,501 | 464 |
| Transfer agent fees (Note 3): | ||
| Ordinary Shares | 76,682 | 2,709 |
| Institutional Shares | 5,010 | 1,099 |
| Audit and legal | 19,802 | 869 |
| Registration fees | 17,165 | 7,037 |
| Insurance | 4,226 | 186 |
| Compensation of trustees (Note 3) | 7,002 | 309 |
| Printing | 5,792 | 256 |
| Miscellaneous | 6,011 | 174 |
| Total expenses before waivers/reimbursements/reductions | 789,164 | 44,242 |
| Waivers and/or reimbursements of expenses (Note 3) | — | 75 |
| Fees reduced by credits allowed by custodian (Note 3) | — | — |
| Expenses, Net | $789,164 | $44,317 |
| Net investment income/(loss) | $(136,449) | $(16,832) |
| Realized and unrealized gain/(loss) on investments, foreign currency, and foreign translation: | ||
| Net realized gain/(loss) (Note 2) on: | ||
| Investments | $4,678,993 | $179,861 |
| Foreign denominated assets, liabilities, and currency | — | — |
| Change in unrealized appreciation/(depreciation) of: | ||
| Investments | (5,566,898) | (211,057) |
| Foreign denominated assets, liabilities, and currency | — | — |
| Net realized and unrealized gain/(loss) on investment and foreign currency | (887,905) | (31,196) |
| Net increase/(decrease) in net assets resulting from operations | $(1,024,354) | $(48,028) |
| * | Dividends are net of withholding taxes of $2,762 for Small Cap, $111 for Micro Cap and $0 for Quality, net of foreign withholding taxes of $520,744 for Emerging Markets, $725,686 for Foreign Value, and $125,646 for Foreign Value Small Cap. |
| Quality | Emerging Markets | Foreign Value | Foreign Value Small Cap |
| $1,171,632 | $3,924,279 | $6,977,868 | $2,195,260 |
| 28 | — | 24,955 | 202 |
| — | 80,290 | — | — |
| — | 45 | 2,673 | — |
| $1,171,660 | $4,004,614 | $7,005,496 | $2,195,462 |
| 468,472 | 757,275 | 2,475,028 | 445,734 |
| 113,918 | 171,113 | 491,839 | 88,615 |
| 16,267 | 27,023 | 84,555 | 15,705 |
| 19,530 | 149,555 | 115,000 | 39,200 |
| 9,973 | 16,579 | 51,843 | 9,628 |
| 76,173 | 114,291 | 328,001 | 59,343 |
| 2,161 | 11,966 | 83,755 | 14,995 |
| 18,659 | 41,213 | 96,598 | 19,600 |
| 13,374 | 19,576 | 22,632 | 19,110 |
| 4,015 | 6,673 | 20,876 | 3,875 |
| 6,649 | 11,054 | 34,567 | 6,419 |
| 5,501 | 9,145 | 28,596 | 5,311 |
| 5,717 | 11,384 | 30,042 | 5,694 |
| 760,409 | 1,346,847 | 3,863,332 | 733,229 |
| (73,009) | — | — | — |
| — | — | — | 0 |
| $687,400 | $1,346,847 | $3,863,332 | $733,229 |
| $484,260 | $2,657,767 | $3,142,164 | $1,462,233 |
| $1,530,231 | $(3,581,247) | $277,723 | $667,543 |
| — | (44,219) | (186,445) | (50,450) |
| 1,587,153 | (739,854) | 19,257,115 | (186,591) |
| — | 106,858 | 563,442 | 83,639 |
| 3,117,384 | (4,258,462) | 19,911,835 | 514,141 |
| $3,601,644 | $(1,600,695) | $23,053,999 | $1,976,374 |
The accompanying notes are an integral part of these financial statements.
PEAR TREE FUNDS
STATEMENT OF CHANGES IN NET ASSETS
| Small Cap | ||
Semi-Annual Ended September 30, 2012 (Unaudited) | Year Ended March 31, 2012 | |
| Increase (Decrease) in Net Assets: | ||
| Operations: | ||
| Net investment income/(loss) | $(136,449) | $(440,739) |
Net realized gain/(loss) on investments Foreign denominated assets, liabilities, and currency | 4,678,993 | 9,436,737 |
| Unrealized appreciation/(depreciation) of investments, foreign denominated assets, liabilities, and currency | (5,566,898) | (8,042,519) |
| Net increase/(decrease) from operations | $(1,024,354) | $953,479 |
| Distributions to shareholders from: | ||
| Net investment income | ||
| Ordinary shares | $— | $(236,963) |
| Institutional shares | — | (27,904) |
| Net realized gains | ||
| Ordinary shares | — | — |
| Institutional shares | — | — |
| Total distributions | $— | $(264,867) |
| Fund share transactions (Note 8) | (4,887,597) | (20,058,907) |
| Contributions to capital from investment manager/brokers | — | — |
| Increase/(decrease) in net assets | $(5,911,951) | $(19,370,295) |
| Net assets beginning of period | 102,111,106 | 121,481,401 |
| Net assets end of period* | $96,199,155 | $102,111,106 |
| * Includes undistributed net investment income/(loss) of: | $(386,473) | $(250,024) |
The accompanying notes are an integral part of these financial statements.
| Micro Cap | ||
Semi-Annual Ended September 30, 2012 (Unaudited) | Year Ended March 31, 2012** | |
| Increase (Decrease) in Net Assets: | ||
| Operations: | ||
| Net investment income/(loss) | $(16,832) | $15,879 |
Net realized gain/(loss) on investments Foreign denominated assets, liabilities, and currency | 179,861 | 59,515 |
| Unrealized appreciation/(depreciation) of investments, foreign denominated assets, liabilities, and currency | (211,057) | 359,897 |
| Net increase/(decrease) from operations | $(48,028) | $435,291 |
| Distributions to shareholders from: | ||
| Net investment income | ||
| Ordinary shares | $— | $(21,193) |
| Institutional shares | — | (6,150) |
| Net realized gains | ||
| Ordinary shares | — | — |
| Institutional shares | — | — |
| Total distributions | $— | $(27,343) |
| Fund share transactions (Note 8) | 257,668 | 3,935,942 |
| Contributions to capital from investment manager/brokers | — | — |
| Increase/(decrease) in net assets | $209,640 | $4,343,890 |
| Net assets beginning of period | 4,343,890 | — |
| Net assets end of period* | $4,553,530 | $4,343,890 |
* Includes undistributed net investment income/(loss) of: | $(16,832) | $— |
** Commenced operations on September 7, 2011 — Information presented is for the period September 7, 2011 to March 31, 2012.
The accompanying notes are an integral part of these financial statements.
| Quality | ||
Semi-Annual Ended September 30, 2012 (Unaudited) | Year Ended March 31, 2012 | |
| Increase (Decrease) in Net Assets: | ||
| Operations: | ||
| Net investment income/(loss) | $484,260 | $1,008,186 |
Net realized gain/(loss) on investments Foreign denominated assets, liabilities, and currency | 1,530,231 | 2,984,631 |
| Unrealized appreciation/(depreciation) of investments, foreign denominated assets, liabilities, and currency | 1,587,153 | 9,457,654 |
| Net increase/(decrease) from operations | $3,601,644 | $13,450,471 |
| Distributions to shareholders from: | ||
| Net investment income | ||
| Ordinary shares | $— | $(767,633) |
| Institutional shares | — | (11,723) |
| Net realized gains | ||
| Ordinary shares | — | — |
| Institutional shares | — | — |
| Total distributions | $— | $(779,356) |
| Fund share transactions (Note 8) | (944,665) | 18,714,889 |
| Contributions to capital from investment manager/brokers | — | — |
| Increase/(decrease) in net assets | $2,656,979 | $31,386,004 |
| Net assets beginning of period | 95,115,358 | 63,729,354 |
| Net assets end of period* | $97,772,337 | $95,115,358 |
| * Includes undistributed net investment income/(loss) of: | $780,870 | $296,610 |
The accompanying notes are an integral part of these financial statements.
| Emerging Markets | ||
Semi-Annual Ended September 30, 2012 (Unaudited) | Year Ended March 31, 2012 | |
| Increase (Decrease) in Net Assets: | ||
| Operations: | ||
| Net investment income/(loss) | $2,657,767 | $2,935,954 |
Net realized gain/(loss) on investments Foreign denominated assets, liabilities, and currency | (3,625,466) | 9,264,704 |
| Unrealized appreciation/(depreciation) of investments, foreign denominated assets, liabilities, and currency | (632,996) | (26,146,156) |
| Net increase/(decrease) from operations | $(1,600,695) | $(13,945,498) |
| Distributions to shareholders from: | ||
| Net investment income | ||
| Ordinary shares | $— | $(3,007,245) |
| Institutional shares | — | (270,340) |
| Net realized gains | ||
| Ordinary shares | — | — |
| Institutional shares | — | — |
| Total distributions | $— | $(3,277,585) |
| Fund share transactions (Note 8) | (8,087,471) | (9,659,603) |
| Contributions to capital from investment manager/brokers | 272 | — |
| Increase/(decrease) in net assets | $(9,687,894) | $(26,882,686) |
| Net assets beginning of period | 160,770,077 | 187,652,763 |
| Net assets end of period* | $151,082,183 | $160,770,077 |
| * Includes undistributed net investment income/(loss) of: | $4,169,708 | $1,511,941 |
The accompanying notes are an integral part of these financial statements.
| Foreign Value | ||
Semi-Annual Ended September 30, 2012 (Unaudited) | Year Ended March 31, 2012 | |
| Increase (Decrease) in Net Assets: | ||
| Operations: | ||
| Net investment income/(loss) | $3,142,164 | $4,061,945 |
Net realized gain/(loss) on investments Foreign denominated assets, liabilities, and currency | 91,278 | (40,002,280) |
| Unrealized appreciation/(depreciation) of investments, foreign denominated assets, liabilities, and currency | 19,820,557 | 10,913,820 |
| Net increase/(decrease) from operations | $23,053,999 | $(25,026,515) |
| Distributions to shareholders from: | ||
| Net investment income | ||
| Ordinary shares | $— | $(1,725,884) |
| Institutional shares | — | (716,459) |
| Net realized gains | ||
| Ordinary shares | — | — |
| Institutional shares | — | — |
| Total distributions | $— | $(2,442,343) |
| Fund share transactions (Note 8) | 69,477,864 | 63,247,944 |
| Contributions to capital from investment manager/brokers | 1,021 | — |
| Increase/(decrease) in net assets | $92,532,884 | $35,779,086 |
| Net assets beginning of period | 484,119,600 | 448,340,514 |
| Net assets end of period* | $576,652,484 | $484,119,600 |
| * Includes undistributed net investment income/(loss) of: | $7,373,838 | $4,231,673 |
The accompanying notes are an integral part of these financial statements.
Foreign Value Small Cap | ||
Semi-Annual Ended September 30, 2012 (Unaudited) | Year Ended March 31, 2012 | |
| Increase (Decrease) in Net Assets: | ||
| Operations: | ||
| Net investment income/(loss) | $1,462,233 | $2,038,408 |
Net realized gain/(loss) on investments Foreign denominated assets, liabilities, and currency | 617,093 | (1,477,024) |
| Unrealized appreciation/(depreciation) of investments, foreign denominated assets, liabilities, and currency | (102,952) | (9,129,119) |
| Net increase/(decrease) from operations | $1,976,374 | $(8,567,735) |
| Distributions to shareholders from: | ||
| Net investment income | ||
| Ordinary shares | $— | $(674,094) |
| Institutional shares | — | (250,427) |
| Net realized gains | ||
| Ordinary shares | — | (6,678,061) |
| Institutional shares | — | (1,935,417) |
| Total distributions | $— | $(9,537,999) |
| Fund share transactions (Note 8) | (2,959,924) | 9,130,510 |
| Contributions to capital from investment manager/brokers | — | — |
| Increase/(decrease) in net assets | $(983,550) | $(8,975,224) |
| Net assets beginning of period | 93,304,361 | 102,279,585 |
| Net assets end of period* | $92,320,811 | $93,304,361 |
| * Includes undistributed net investment income/(loss) of: | $2,830,912 | $1,368,679 |
The accompanying notes are an integral part of these financial statements.
PEAR TREE COLUMBIA SMALL CAP FUND
FINANCIAL HIGHLIGHTS
(For a share outstanding throughout each period)
| Ordinary Shares | ||||||
For the six months ended September 30, | Years Ended March 31, | |||||
| 2012 | 2012 | 2011 | 2010 | 2009 | 2008 | |
| (unaudited) | ||||||
| Net Asset Value, Beginning of Period | $20.36 | $19.92 | $16.45 | $10.22 | $19.45 | $23.88 |
| Income from Investment Operations: | ||||||
| Net investment income (loss) (a)(b)(c) | (0.03) | (0.08) | 0.04 | 0.11 | 0.06 | 0.07 |
| Net realized and unrealized gain/(loss) on securities | (0.16) | 0.57 | 3.52 | 6.15 | (9.23) | (3.56) |
| Total from Investment Operations | (0.19) | 0.49 | 3.56 | 6.26 | (9.17) | (3.49) |
| Less Distributions: | ||||||
| Dividends from net investment income | — | (0.05) | (0.09) | (0.03) | — | (0.11) |
| Distributions from realized capital gains | — | — | — | — | (0.06) | (0.83) |
| Total Distributions | — | (0.05) | (0.09) | (0.03) | (0.06) | (0.94) |
| Net Asset Value, End of Period | $20.17 | $20.36 | $19.92 | $16.45 | $10.22 | $19.45 |
| Total Return (d) | (0.93)% | 2.48% | 21.69% | 61.27% | (47.11)% | (15.17)% |
| Net Assets, End of Period (000’s) | $90,170 | $95,870 | $113,675 | $99,444 | $61,943 | $119,949 |
| Ratios and Supplemental Data: | ||||||
| Ratios of expenses to average net assets: (e) | ||||||
| Gross | 1.65% | 1.67% | 1.64% | 1.65% | 1.64% | 1.59% |
| Net | 1.65% | 1.67% | 1.64% | 1.65% | 1.64% | 1.59% |
| Ratio of net investment income (loss) to average net assets (c) | (0.30)% | (0.44)% | 0.23% | 0.81% | 0.31% | 0.31% |
| Portfolio Turnover | 25% | 53% | 71% | 50% | 72% | 39% |
The accompanying notes are an integral part of these financial statements.
| Institutional Shares | ||||||
For the six months ended September 30, | Years Ended March 31, | |||||
| 2012 | 2012 | 2011 | 2010 | 2009 | 2008 | |
| (unaudited) | ||||||
| Net Asset Value, Beginning of Period | $23.00 | $22.50 | $18.56 | $11.51 | $21.86 | $26.71 |
| Income from Investment Operations: | ||||||
| Net investment income (loss) (a)(b)(c) | (0.01) | (0.04) | 0.09 | 0.20 | 0.10 | 0.12 |
| Net realized and unrealized gain/(loss) on securities | (0.17) | 0.63 | 3.98 | 6.91 | (10.39) | (3.94) |
| Total from Investment Operations | (0.18) | 0.59 | 4.07 | 7.11 | (10.29) | (3.82) |
| Less Distributions: | ||||||
| Dividends from net investment income | — | (0.09) | (0.13) | (0.06) | — | (0.20) |
| Distributions from realized capital gains | — | — | — | — | (0.06) | (0.83) |
| Total Distributions | — | (0.09) | (0.13) | (0.06) | (0.06) | (1.03) |
| Net Asset Value, End of Period | $22.82 | $23.00 | $22.50 | $18.56 | $11.51 | $21.86 |
| Total Return (d) | (0.78)% | 2.69% | 21.98% | 61.83% | (47.04)% | (14.87)% |
| Net Assets, End of Period (000’s) | $6,029 | $6,242 | $7,806 | $7,146 | $7,281 | $24,282 |
| Ratios and Supplemental Data: | ||||||
| Ratios of expenses to average net assets: (e) | ||||||
| Gross | 1.40% | 1.42% | 1.39% | 1.41% | 1.42% | 1.30% |
| Net | 1.40% | 1.42% | 1.39% | 1.41% | 1.42% | 1.30% |
| Ratio of net investment income (loss) to average net assets (c) | (0.05)% | (0.19)% | 0.48% | 1.35% | 0.48% | 0.45% |
| Portfolio Turnover | 25% | 53% | 71% | 50% | 72% | 39% |
| (a) | Per share numbers have been calculated using the average shares method. |
| (b) | Reflects expense waivers/reimbursements and reductions in effect during the period. See Note 3 to the Financial Statements. |
| (c) | Net investment income (loss) per share and the ratio of net investment income (loss) to average net assets reflect net investment income prior to certain reclassifications for federal income or excise taxes. |
| (d) | Total Return does not include the deferred sales charge of 1% for the Ordinary Shares. The total return would have been lower if certain fees had not been waived or if custodial fees had not been reduced by credits allowed by the custodian. See Note 3 to the financial statements. |
| (e) | Ratios of expenses to average net assets: |
— Gross (total expenses before fee waivers, reimbursements by the investment advisor, and custody earnings credits, if any).
— Net (total expenses net of fee waivers, reimbursements by the investment advisor, and custody earnings credits, if any).
The accompanying notes are an integral part of these financial statements.
PEAR TREE COLUMBIA MICRO CAP FUND
FINANCIAL HIGHLIGHTS
(For a share outstanding throughout each period)
| Ordinary Shares | ||
For the six months ended September 30, | Period Ended March 30, | |
| 2012 | 2012* | |
| (unaudited) | ||
| Net Asset Value, Beginning of Period | $11.72 | $10.00 |
| Income from Investment Operations: | ||
| Net investment income (loss) (a)(b)(c) | (0.04) | 0.06 |
| Net realized and unrealized gain/(loss) on securities | (0.11) | 1.76 |
| Total from Investment Operations | (0.15) | 1.82 |
| Less Distributions: | ||
| Dividends from net investment income | — | (0.10) |
| Distributions from realized capital gains | — | — |
| Total Distributions | — | (0.10) |
| Net Asset Value, End of Period* | $11.57 | $11.72 |
| Total Return (d) | (1.28)% | 18.36% |
| Net Assets, End of Period (000’s) | $3,184 | $3,000 |
| Ratios and Supplemental Data: | ||
| Ratios of expenses to average net assets: (e) | ||
| Gross | 1.98% | 4.58%** |
| Net | 1.98% | 2.00%** |
| Ratio of net investment income (loss) to average net assets (c) | (0.73)% | 1.08%** |
| Portfolio Turnover | 114% | 67% |
The accompanying notes are an integral part of these financial statements.
| Institutional Shares | ||
For the six months ended September 30, | Period Ended March 30, | |
| 2012 | 2012* | |
| (unaudited) | ||
| Net Asset Value, Beginning of Period | $11.36 | $10.00 |
| Income from Investment Operations: | ||
| Net investment income (loss) (a)(b)(c) | (0.03) | 0.08 |
| Net realized and unrealized gain/(loss) on securities | (0.11) | 1.38 |
| Total from Investment Operations | (0.14) | 1.46 |
| Less Distributions: | ||
| Dividends from net investment income | — | (0.10) |
| Distributions from realized capital gains | — | — |
| Total Distributions | — | (0.10) |
| Net Asset Value, End of Period* | $11.22 | $11.36 |
| Total Return (d) | (1.23)% | 14.75% |
| Net Assets, End of Period (000’s) | $1,369 | $1,344 |
| Ratios and Supplemental Data: | ||
| Ratios of expenses to average net assets: (e) | ||
| Gross | 2.07% | 4.28%** |
| Net | 1.83% | 1.75%** |
| Ratio of net investment income (loss) to average net assets (c) | (0.58)% | 1.34%** |
| Portfolio Turnover | 114% | 67% |
| * | Fund commenced operations on September 12, 2011 for Ordinary and September 7, 2011 for Institutional. |
| ** | Annualized. |
| (a) | Per share numbers have been calculated using the average shares method. |
| (b) | Reflects expense waivers/reimbursements and reductions in effect during the period. See Note 3 to the Financial Statements. |
| (c) | Net investment income (loss) per share and the ratio of net investment income (loss) to average net assets reflect net investment income prior to certain reclassifications for federal income or excise taxes. |
| (d) | Total Return does not include the deferred sales charge of 1% for the Ordinary Shares. The total return would have been lower if certain fees had not been waived or if custodial fees had not been reduced by credits allowed by the custodian. Not Annualized. See Note 3 to the financial statements. |
| (e) | Ratios of expenses to average net assets: |
— Gross (total expenses before fee waivers, reimbursements by the investment advisor, and custody earnings credits, if any).
— Net (total expenses net of fee waivers, reimbursements by the investment advisor, and custody earnings credits, if any).
The accompanying notes are an integral part of these financial statements.
PEAR TREE QUALITY FUND
FINANCIAL HIGHLIGHTS
(For a share outstanding throughout each period)
| Ordinary Shares | ||||||
For the six months ended September 30, | Years Ended March 31, | |||||
| 2012 | 2012 | 2011 | 2010 | 2009 | 2008 | |
| (unaudited) | ||||||
| Net Asset Value, Beginning of Period | $14.33 | $12.36 | $11.37 | $8.24 | $14.07 | $17.04 |
| Income from Investment Operations: | ||||||
| Net investment income (loss) (a)(b)(c) | 0.07 | 0.17 | 0.09 | 0.05 | (0.04) | (0.09) |
| Net realized and unrealized gain/(loss) on securities | 0.51 | 1.92 | 1.01 | 3.10 | (5.78) | (2.30) |
| Total from Investment Operations | 0.58 | 2.09 | 1.10 | 3.15 | (5.82) | (2.39) |
| Less Distributions: | ||||||
| Dividends from net investment income | — | (0.12) | (0.11) | (0.02) | (0.01) | — |
| Distributions from realized capital gains | — | — | — | — | — | (0.58) |
| Total Distributions | — | (0.12) | (0.11) | (0.02) | (0.01) | (0.58) |
| Net Asset Value, End of Period | $14.91 | $14.33 | $12.36 | $11.37 | $8.24 | $14.07 |
| Total Return (d) | 4.05% | 16.99% | 9.78% | 38.30% | (41.36)% | (14.43)% |
| Net Assets, End of Period (000’s) | $95,080 | $92,557 | $62,920 | $54,213 | $43,014 | $69,767 |
| Ratios and Supplemental Data: | ||||||
| Ratios of expenses to average net assets: (e) | ||||||
| Gross | 1.63% | 1.66% | 1.93% | 2.10% | 2.71% | 2.18% |
| Net including dividend and interest expense for securities sold short | 1.48% | 1.51% | 1.89% | 2.10% | 2.71% | 2.12% |
| Net excluding dividend and interest expense for securities sold short | 1.48% | 1.51% | 1.85% | 1.92% | 1.98% | 1.90% |
| Ratio of net investment income (loss) to average net assets (c) | 2.56% | 1.28% | 0.84% | 0.50% | (0.38)% | (0.52)% |
| Portfolio Turnover Excluding Short Positions (f) | 23% | 68% | 283% | 191% | 207% | 171% |
Note: This fund changed its investment strategy on January 27, 2011.
The accompanying notes are an integral part of these financial statements.
| Institutional Shares | |||||||
For the six months ended September 30, | Years Ended March 31, | ||||||
| 2012 | 2012 | 2011 | 2010 | 2009 | 2008 | ||
| (unaudited) | |||||||
| Net Asset Value, Beginning of Period | $14.95 | $12.85 | $11.80 | $8.54 | $14.71 | $17.80 | |
| Income from Investment Operations: | |||||||
| Net investment income (loss) (a)(b)(c) | 0.11 | 0.25 | 0.12 | 0.08 | (0.10) | (0.10) | |
| Net realized and unrealized gain/(loss) on securities | 0.53 | 1.99 | 1.06 | 3.22 | (6.02) | (2.41) | |
| Total from Investment Operations | 0.64 | 2.24 | 1.18 | 3.30 | (6.12) | (2.51) | |
| Less Distributions: | |||||||
| Dividends from net investment income | — | (0.14) | (0.13) | (0.04) | (0.05) | — | |
| Distributions from realized capital gains | — | — | — | — | — | (0.58) | |
| Total Distributions | — | (0.14) | (0.13) | (0.04) | (0.05) | (0.58) | |
| Net Asset Value, End of Period | $15.59 | $14.95 | $12.85 | $11.80 | $8.54 | $14.71 | |
| Total Return (d) | 4.28% | 17.57% | 10.07% | 38.71% | (41.66)% | (14.49)% | |
| Net Assets, End of Period (000’s) | $2,692 | $2,558 | $809 | $591 | $584 | $1,009 | |
| Ratios and Supplemental Data: | |||||||
| Ratios of expenses to average net assets: (e) | |||||||
| Gross | 1.37% | 1.41% | 1.71% | 1.81% | 3.19% | 2.23% | |
| Net including dividend and interest expense for securities sold short | 1.00% | 1.00% | 1.67% | 1.81% | 3.19% | 2.17% | |
| Net excluding dividend and interest expense for securities sold short | 1.00% | 1.00% | 1.63% | 1.63% | 2.46% | 1.95% | |
| Ratio of net investment income (loss) to average net assets (c) | 2.56% | 1.85% | 1.08% | 0.75% | (0.86)% | (0.56)% | |
| Portfolio Turnover Excluding Short Positions (f) | 23% | 68% | 283% | 191% | 207% | 171% | |
Note: This Fund changed its investment strategy on January 27, 2011 from Long/Short to Quality.
| (a) | Per share numbers have been calculated using the average shares method. |
| (b) | Reflects expense waivers/reimbursements and reductions in effect during the period. See Note 3 to the Financial Statements. |
| (c) | Net investment income (loss) per share and the ratio of net investment income (loss) to average net assets reflect net investment income prior to certain reclassifications for federal income or excise taxes. |
| (d) | Total Return does not include the deferred sales charge of 1% for the Ordinary Shares. The total return would have been lower if certain fees had not been waived or if custodial fees had not been reduced by credits allowed by the custodian. See Note 3 to the financial statements. |
| (e) | Ratios of expenses to average net assets: |
— Gross (total expenses before fee waivers, reimbursements by the investment advisor, and custody earnings credits, if any).
— Net (total expenses net fee waivers, reimbursements by the investment advisor, and custody earnings credits, if any).
| (f) | Portfolio turnover is calculated on long security positions only. Short positions are generally held for less than one year. |
The accompanying notes are an integral part of these financial statements.
PEAR TREE PANAGORA DYNAMIC EMERGING MARKETS FUND
FINANCIAL HIGHLIGHTS
(For a share outstanding throughout each period)
| Ordinary Shares | ||||||
For the six months ended September 30, | Years Ended March 31, | |||||
| 2012 | 2012 | 2011 | 2010 | 2009 | 2008 | |
| (unaudited) | ||||||
| Net Asset Value, Beginning of Period | $22.67 | $25.18 | $21.23 | $12.06 | $27.04 | $23.34 |
| Income from Investment Operations: | ||||||
| Net investment income (loss) (a)(b)(c) | 0.37 | 0.41 | 0.24 | 0.18 | 0.33 | 0.26 |
| Net realized and unrealized gain/(loss) on securities | (0.55) | (2.44) | 3.96 | 9.05 | (14.76) | 4.42 |
| Total from Investment Operations | (0.18) | (2.03) | 4.20 | 9.23 | (14.43) | 4.68 |
| Less Distributions: | ||||||
| Dividends from net investment income | — | (0.48) | (0.25) | (0.06) | (0.43) | (0.16) |
| Distributions from realized capital gains | — | — | — | — | (0.12) | (0.82) |
| Total Distributions | — | (0.48) | (0.25) | (0.06) | (0.55) | (0.98) |
| Net Asset Value, End of Period | $22.49 | $22.67 | $25.18 | $21.23 | $12.06 | $27.04 |
| Total Return (d) | (0.79)% | (7.80)% | 19.86% | 76.56% | (53.27)% | 19.35% |
| Net Assets, End of Period (000’s) | $136,476 | $145,201 | $176,386 | $205,727 | $164,133 | $491,462 |
| Ratios and Supplemental Data: | ||||||
| Ratios of expenses to average net assets: (e) | ||||||
| Gross | 1.80% | 1.76% | 1.77% | 1.74% | 1.67% | 1.60% |
| Net | 1.80% | 1.76% | 1.77% | 1.74% | 1.67% | 1.60% |
| Ratio of net investment income (loss) to average net assets (c) | 3.48% | 1.80% | 1.05% | 0.99% | 1.66% | 0.91% |
| Portfolio Turnover | 23% | 56% | 68% | 120% | 67% | 18% |
The accompanying notes are an integral part of these financial statements.
| Institutional Shares | ||||||
For the six months ended September 30, | Years Ended March 31, | |||||
| 2012 | 2012 | 2011 | 2010 | 2009 | 2008 | |
| (unaudited) | ||||||
| Net Asset Value, Beginning of Period | $22.97 | $25.53 | $21.48 | $12.19 | $27.46 | $23.67 |
| Income from Investment Operations: | ||||||
| Net investment income (loss) (a)(b)(c) | 0.41 | 0.41 | 0.42 | 0.27 | 0.34 | 0.33 |
| Net realized and unrealized gain/(loss) on securities | (0.56) | (2.42) | 3.89 | 9.11 | (14.98) | 4.50 |
| Total from Investment Operations | (0.15) | (2.01) | 4.31 | 9.38 | (14.64) | 4.83 |
| Less Distributions: | ||||||
| Dividends from net investment income | — | (0.55) | (0.26) | (0.09) | (0.51) | (0.22) |
| Distributions from realized capital gains | — | — | — | — | (0.12) | (0.82) |
| Total Distributions | — | (0.55) | (0.26) | (0.09) | (0.63) | (1.04) |
| Net Asset Value, End of Period | $22.82 | $22.97 | $25.53 | $21.48 | $12.19 | $27.46 |
| Total Return (d) | (0.65)% | (7.56)% | 20.14% | 77.02% | (53.17)% | 19.67% |
| Net Assets, End of Period (000’s) | $14,606 | $15,569 | $11,267 | $26,247 | $25,664 | $40,501 |
| Ratios and Supplemental Data: | ||||||
| Ratios of expenses to average net assets: (e) | ||||||
| Gross | 1.53% | 1.52% | 1.51% | 1.50% | 1.48% | 1.39% |
| Net | 1.53% | 1.52% | 1.51% | 1.50% | 1.48% | 1.39% |
| Ratio of net investment income (loss) to average net assets (c) | 3.76% | 1.81% | 1.94% | 1.48% | 1.82% | 1.12% |
| Portfolio Turnover | 23% | 56% | 68% | 120% | 67% | 18% |
| (a) | Per share numbers have been calculated using the average shares method. |
| (b) | Reflects expense waivers/reimbursements and reductions in effect during the period. See Note 3 to the Financial Statements. |
| (c) | Net investment income (loss) per share and the ratio of net investment income (loss) to average net assets reflect net investment income prior to certain reclassifications for federal income or excise taxes. |
| (d) | Total Return does not include the deferred sales charge of 1% for the Ordinary Shares. The total return would have been lower if certain fees had not been waived or if custodial fees had not been reduced by credits allowed by the custodian. See Note 3 to the financial statements. |
| (e) | Ratios of expenses to average net assets: |
— Gross (total expenses before fee waivers, reimbursements by the investment advisor, and custody earnings credits, if any).
— Net (total expenses net of fee waivers, reimbursements by the investment advisor, and custody earnings credits, if any).
The accompanying notes are an integral part of these financial statements.
PEAR TREE POLARIS FOREIGN VALUE FUND
FINANCIAL HIGHLIGHTS
(For a share outstanding throughout each period)
| Ordinary Shares | ||||||
For the six months ended September 30, | Years Ended March 31, | |||||
| 2012 | 2012 | 2011 | 2010 | 2009 | 2008 | |
| (unaudited) | ||||||
| Net Asset Value, Beginning of Period | $13.64 | $14.68 | $12.45 | $6.97 | $19.87 | $23.07 |
| Income from Investment Operations: | ||||||
| Net investment income (loss) (a)(b)(c) | 0.08 | 0.12 | 0.07 | 0.13 | 0.35 | 0.19 |
| Net realized and unrealized gain/(loss) on securities | 0.42 | (1.09) | 2.31 | 5.71 | (11.53) | (2.11) |
| Total from Investment Operations | 0.50 | (0.97) | 2.38 | 5.84 | (11.18) | (1.92) |
| Less Distributions: | ||||||
| Dividends from net investment income | — | (0.07) | (0.15) | (0.36) | (0.11) | (0.19) |
| Distributions from realized capital gains | — | — | — | — | (1.61) | (1.09) |
| Total Distributions | — | (0.07) | (0.15) | (0.36) | (1.72) | (1.28) |
| Net Asset Value, End of Period | $14.14 | $13.64 | $14.68 | $12.45 | $6.97 | $19.87 |
| Total Return (d) | 3.67% | (6.55)% | 19.17% | 84.05% | (55.95)% | (8.71)% |
| Net Assets, End of Period (000’s) | $457,657 | $386,011 | $369,550 | $369,626 | $193,798 | $781,136 |
| Ratios and Supplemental Data: | ||||||
| Ratios of expenses to average net assets: (e) | ||||||
| Gross | 1.61% | 1.64% | 1.62% | 1.62% | 1.62% | 1.56% |
| Net | 1.61% | 1.64% | 1.62% | 1.62% | 1.62% | 1.56% |
| Ratio of net investment income (loss) to average net assets (c) | 1.23% | 0.93% | 0.56% | 1.17% | 2.49% | 0.83% |
| Portfolio Turnover | 3% | 18% | 9% | 24% | 20% | 44% |
The accompanying notes are an integral part of these financial statements.
| Institutional Shares | ||||||
For the six months ended September 30, | Years Ended March 31, | |||||
| 2012 | 2012 | 2011 | 2010 | 2009 | 2008 | |
| (unaudited) | ||||||
| Net Asset Value, Beginning of Period | $13.63 | $14.68 | $12.45 | $6.98 | $19.98 | $23.19 |
| Income from Investment Operations: | ||||||
| Net investment income (loss) (a)(b)(c) | 0.09 | 0.14 | 0.10 | 0.14 | 0.38 | 0.26 |
| Net realized and unrealized gain/(loss) on securities | 0.43 | (1.09) | 2.31 | 5.71 | (11.60) | (2.13) |
| Total from Investment Operations | 0.52 | (0.95) | 2.41 | 5.85 | (11.22) | (1.87) |
| Less Distributions: | ||||||
| Dividends from net investment income | — | (0.10) | (0.18) | (0.38) | (0.17) | (0.25) |
| Distributions from realized capital gains | — | — | — | — | (1.61) | (1.09) |
| Total Distributions | — | (0.10) | (0.18) | (0.38) | (1.78) | (1.34) |
| Net Asset Value, End of Period | $14.15 | $13.63 | $14.68 | $12.45 | $6.98 | $19.98 |
| Total Return (d) | 3.82% | (6.34)% | 19.48% | 84.12% | (55.85)% | (8.49)% |
| Net Assets, End of Period (000’s) | $118,996 | $98,109 | $78,790 | $68,067 | $47,090 | $140,999 |
| Ratios and Supplemental Data: | ||||||
| Ratios of expenses to average net assets: (e) | ||||||
| Gross | 1.36% | 1.39% | 1.37% | 1.37% | 1.38% | 1.32% |
| Net | 1.36% | 1.39% | 1.37% | 1.37% | 1.38% | 1.32% |
| Ratio of net investment income (loss) to average net assets (c) | 1.42% | 1.07% | 0.79% | 1.29% | 2.77% | 1.18% |
| Portfolio Turnover | 3% | 18% | 9% | 24% | 20% | 44% |
| (a) | Per share numbers have been calculated using the average shares method. |
| (b) | Reflects expense waivers/reimbursements and reductions in effect during the period. See Note 3 to the Financial Statements. |
| (c) | Net investment income (loss) per share and the ratio of net investment income (loss) to average net assets reflect net investment income prior to certain reclassifications for federal income or excise taxes. |
| (d) | Total Return does not include the deferred sales charge of 1% for the Ordinary Shares. The total return would have been lower if certain fees had not been waived or if custodial fees had not been reduced by credits allowed by the custodian. See Note 3 to the financial statements. |
| (e) | Ratios of expenses to average net assets: |
— Gross (total expenses before fee waivers, reimbursements by the investment advisor, and custody earnings credits, if any).
— Net (total expenses net of fee waivers, reimbursements by the investment advisor, and custody earnings credits, if any).
The accompanying notes are an integral part of these financial statements.
PEAR TREE POLARIS FOREIGN VALUE SMALL CAP FUND
FINANCIAL HIGHLIGHTS
(For a share outstanding throughout each period)
| Ordinary Shares | |||||
For the six months ended September 30, | Period Ended March 31, | ||||
| 2012 | 2012 | 2011 | 2010 | 2009* | |
| (unaudited) | |||||
| Net Asset Value, Beginning of Period | $9.02 | $11.19 | $10.28 | $4.82 | $10.00 |
| Income from Investment Operations: | |||||
| Net investment income (loss) (a)(b)(c) | 0.14 | 0.21 | 0.09 | 0.07 | 0.03 |
| Net realized and unrealized gain/(loss) on securities | 0.07 | (1.29) | 1.25 | 5.42 | (5.15) |
| Total from Investment Operations | 0.21 | (1.08) | 1.34 | 5.49 | (5.12) |
| Less Distributions: | |||||
| Dividends from net investment income | — | (0.10) | (0.08) | (0.03) | (0.04) |
| Distributions from realized capital gains | — | (0.99) | (0.35) | — | (0.02) |
| Total Distributions | — | (1.09) | (0.43) | (0.03) | (0.06) |
| Net Asset Value, End of Period* | $9.23 | $9.02 | $11.19 | $10.28 | $4.82 |
| Total Return (d) | 2.33% | (8.20)% | 13.12% | 114.00% | (51.25)% |
| Net Assets, End of Period (000’s) | $75,531 | $72,737 | $78,307 | $124,971 | $18,978 |
| Ratios and Supplemental Data: | |||||
| Ratios of expenses to average net assets: (e) | |||||
| Gross | 1.70% | 1.70% | 1.69% | 1.64% | 2.00%** |
| Net | 1.70% | 1.70% | 1.69% | 1.64% | 1.97%** |
| Ratio of net investment income (loss) to average net assets (c) | 3.20% | 2.14% | 0.82% | 0.82% | 0.66%** |
| Portfolio Turnover | 3% | 22% | 54% | 14% | 10% |
The accompanying notes are an integral part of these financial statements.
| Institutional Shares | |||||
For the six months ended September 30, | Period Ended March 31, | ||||
| 2012 | 2012 | 2011 | 2010 | 2009* | |
| (unaudited) | |||||
| Net Asset Value, Beginning of Period | $9.03 | $11.21 | $10.30 | $4.82 | $10.00 |
| Income from Investment Operations: | |||||
| Net investment income (loss) (a)(b)(c) | 0.16 | 0.24 | 0.09 | 0.11 | 0.07 |
| Net realized and unrealized gain/(loss) on securities | 0.06 | (1.30) | 1.28 | 5.41 | (5.19) |
| Total from Investment Operations | 0.22 | (1.06) | 1.37 | 5.52 | (5.12) |
| Less Distributions: | |||||
| Dividends from net investment income | — | (0.13) | (0.11) | (0.04) | (0.04) |
| Distributions from realized capital gains | — | (0.99) | (0.35) | — | (0.02) |
| Total Distributions | — | (1.12) | (0.46) | (0.04) | (0.06) |
| Net Asset Value, End of Period* | $9.25 | $9.03 | $11.21 | $10.30 | $4.82 |
| Total Return (d) | 2.44% | (7.99)% | 13.40% | 114.55% | (51.20)% |
| Net Assets, End of Period (000’s) | $16,790 | $20,567 | $23,973 | $8,103 | $3,592 |
| Ratios and Supplemental Data: | |||||
| Ratios of expenses to average net assets: (e) | |||||
| Gross | 1.45% | 1.43% | 1.44% | 1.43% | 1.88%** |
| Net | 1.45% | 1.43% | 1.44% | 1.43% | 1.85%** |
| Ratio of net investment income (loss) to average net assets (c) | 3.60% | 2.45% | 0.92% | 1.27% | 1.10%** |
| Portfolio Turnover | 3% | 22% | 54% | 14% | 10% |
| * | Fund commenced operations May 1, 2008. |
| ** | Annualized. |
| (a) | Per share numbers have been calculated using the average shares method. |
| (b) | Reflects expense waivers/reimbursements and reductions in effect during the period. See Note 3 to the Financial Statements. |
| (c) | Net investment income (loss) per share and the ratio of net investment income (loss) to average net assets reflect net investment income prior to certain reclassifications for federal income or excise taxes. |
| (d) | Total Return does not include the deferred sales charge of 1% for the Ordinary Shares. The total return would have been lower if certain fees had not been waived or if custodial fees had not been reduced by credits allowed by the custodian. See Note 3 to the financial statements. |
| (e) | Ratios of expenses to average net assets: |
— Gross (total expenses before fee waivers, reimbursements by the investment advisor, and custody earnings credits, if any).
The accompanying notes are an integral part of these financial statements.
PEAR TREE FUNDS
NOTES TO FINANCIAL STATEMENTS
September 30, 2012 (unaudited)
1. Organization of the Trust
Pear Tree Funds, formerly known as Quantitative Group of Funds d/b/a “Quant Funds” (the “Trust”), is organized as a Massachusetts business trust and is registered under the Investment Company Act of 1940, as amended (the “1940 Act”), as a non-diversified, open-end management investment company. The Trust currently has six series (each a “Fund” and collectively the “Funds”) each with a distinct investment objective.
Pear Tree Columbia Small Cap Fund (“Small Cap Fund”) seeks maximum long-term capital appreciation.
Pear Tree Columbia Micro Cap Fund (“Micro Cap Fund”) seeks maximum long-term capital appreciation. Micro Cap accepted its first subscription and began trading securities on September 7, 2011.
Pear Tree Quality Fund (“Quality Fund”) seeks long-term growth of capital.
Pear Tree PanAgora Dynamic Emerging Markets Fund (“Emerging Markets Fund”) seeks long-term growth of capital. Prior to February 1, 2012, the Fund was called Pear Tree Emerging Markets Fund.
Pear Tree Polaris Foreign Value Fund (“Foreign Value Fund”) seeks long-term capital growth and income.
Pear Tree Polaris Foreign Value Small Cap Fund (“Foreign Value Small Cap Fund”) seeks long-term capital growth and income.
Each Fund offers two classes of shares, designated as Ordinary Shares and Institutional Shares. The classes differ principally in their respective expense structure and minimum investment requirements. Each class of shares represents an interest in the same portfolio of investments of the respective Fund and has equal rights to voting, redemptions, dividends and liquidation. Ordinary Shares bear distribution (Rule 12b-1) fees and have exclusive voting rights with respect to the distribution plan that has been adopted by Ordinary Share shareholders. There is no distribution plan for Institutional Shares.
At times, a Fund’s investments may represent industries or industry sectors that are interrelated or have common risks, making the Fund more susceptible to any economic, political, or regulatory developments or other risks affecting those industries and sectors. To the extent that a Fund is permitted to invest in foreign markets, emerging markets or countries with limited or developing markets, such investments may subject the Fund to a greater degree of risk than in the U.S. market or a developed market. Risks associated with these foreign and developing markets include political, social or economic factors and may affect the price of a Fund’s investments and income generated by these investments, as well as a Fund’s ability to repatriate any income earned or the proceeds from the sale of Funds investments. Information regarding each Fund’s principal risks is contained in the Fund’s prospectus. Please refer to those documents when considering a Fund’s risks.
2. Significant Accounting Policies
Each Fund’s financial statements have been prepared in conformity with U.S. generally accepted accounting principles. Those principals require the management of the Funds to, among other things, make estimates and assumptions that affect the reported amounts of assets and liabilities, the disclosure of contingent assets and liabilities at the date of the financial statements, and the reported amounts of income, expenses and gains and losses on investments during the reporting year. Actual results could differ from those estimates.
The following is a summary of significant accounting policies followed by one or more Funds in the preparation of their financial statements, which are consistent with those policies generally followed by the investment company industry.
Security Valuation
To determine each Fund’s share price for the purpose of effecting purchases and sales of the Fund shares, portfolio securities are generally valued each business day generally at the last reported sale price on the principal exchange or market on which they are traded. If on a business day there is no such reported sale, the securities generally are valued at the mean between the last reported bid and asked prices. For securities, where no such sales have been recently reported, a Fund may value such securities at the last reported bid price. In the event that there is information suggesting that valuation of such securities based upon bid and/or asked prices may not be accurate, a Fund may value such securities in good faith at fair value in accordance with procedures (the “Valuation Procedures”) established by the Funds’ Board of Trustees (the “Trustees”), which may include a determination to value such securities at the last reported sales price. Debt securities that mature in 60 days or less are valued at amortized cost.
Securities with prices that are quoted in foreign currencies are valued, for determining a Fund’s share price, in U.S. dollars based upon the prevailing exchange rate at the time of valuation. As a result, changes in the value of those currencies in relation to the U.S. dollar may affect a Fund’s NAV. Because foreign markets typically are open at different times than the New York Stock Exchange, the value of a Fund’s shares may change at times and on days when Fund shareholders are not able to buy or sell them. If events materially affecting the values of a Fund’s foreign investments occur between the close of the foreign markets on which these investments are traded and the close of regular trading on the New York Stock Exchange, these investments may be valued at their fair value as determined in good faith using the Valuation Procedures.
The Fund has adopted fair valuation accounting standards that establish a definition of fair value and set out a hierarchy for measuring fair value. These standards require additional disclosures about the various inputs used to develop the measurements of fair value. These inputs are summarized in the three broad levels listed below:
| • | Level 1 — Unadjusted quoted prices in active markets for identical assets or liabilities that the Fund has the ability to access. |
| • | Level 2 — Observable inputs other than quoted prices included in level 1 that are observable for the asset or liability, either directly or indirectly. These inputs may include quoted prices for the identical instrument on an inactive market, prices for similar instruments, interest rates, prepayment speeds, credit risk, yield curves, default rates and similar data. |
| • | Level 3 — Unobservable inputs for the asset or liability, to the extent relevant observable inputs are not available, representing the Fund’s own assumptions about the assumptions a market participant would use in valuing the asset liability, and would be based on the best information available. |
The availability of observable inputs can vary from security to security and is affected by a wide variety of factors, including, the type of security, whether the security is new and not yet established in the marketplace, the liquidity of the markets, and other characteristics particular to the security. To the extent that valuation is based on models or inputs that are less observable or unobservable in the market, the determination of fair value requires more judgment. Accordingly, the degree of judgment exercised in determining fair value is greatest for instruments categorized in Level 3.
For disclosure purposes, the level in the fair value hierarchy within which the fair value measurement falls in its entirety, is determined based on the lowest level input that is significant to the fair value measurement in its entirety.
Changes in valuation techniques may result in transfers in changing an investment’s assigned level within the hierarchy.
The inputs or methodology used for valuing securities are not necessarily an indication of the risk associated with investing in these securities. The following is a summary of the inputs used to value the Fund’s net assets as of September 30, 2012:
Quoted Prices In Active Markets | Significant Other Observable Inputs | Significant Unobservable Inputs | Market Value at September 30, 2012 | |
| Level 1 | Level 2 | Level 3 | Total | |
| Small Cap Fund | ||||
| Common Stock (1)(2) | $79,377,780 | $— | $— | $79,377,780 |
| Depository Receipts | 1,380,922 | — | — | 1,380,922 |
| Real Estate Inv. Trusts | 11,388,175 | — | — | 11,388,175 |
| Short Term Investments | 5,971,584 | 5,623,922 | — | 11,595,506 |
| Total | $98,118,461 | $5,623,922 | $— | $103,742,383 |
| Micro Cap | ||||
| Common Stock (1)(2) | $4,280,348 | $— | $— | $4,280,348 |
| Real Estate Inv. Trusts | 144,024 | — | — | 144,024 |
| Short Term Investments | — | 127,250 | — | 127,250 |
| Total | $4,424,372 | $127,250 | $— | $4,551,622 |
| Quality | ||||
| Common Stock (1)(2) | $82,635,097 | $— | $— | $82,635,097 |
| Depository Receipts | 14,682,573 | — | — | 14,682,573 |
| Total | $97,317,670 | $— | $— | $97,317,670 |
| Emerging Markets | ||||
| Common Stock (1)(2)(3) | $122,125,399 | $4,055,361 | $— | $126,180,760 |
| Common Stock Units | 537,045 | — | — | 537,045 |
| Depository Receipts | 18,169,082 | — | — | 18,169,082 |
| Preferred Stock | 5,344,916 | — | — | 5,344,916 |
| Real Estate Inv. Trusts | 420,878 | — | — | 420,878 |
| Rights | — | 119,467 | — | 119,467 |
| Short Term Investments | 7,351,088 | — | — | 7,351,088 |
| Total | $153,948,408 | $4,174,828 | $— | $158,123,236 |
| Foreign Value | ||||
| Common Stock (1)(2)(3) | $448,860,909 | $10,978,662 | $— | $459,839,571 |
| Depository Receipts | 24,693,620 | — | 24,693,620 | |
| Short Term Investments | 30,044,537 | 60,000,000 | — | 90,044,537 |
| Total | $503,599,066 | $70,978,662 | $— | $574,577,728 |
| Foreign Value Small Cap | ||||
| Common Stock (1)(2)(3)(4) | $79,401,752 | $5,274,954 | $83,653 | $84,760,359 |
| Preferred Stock | 1,675,907 | — | — | 1,675,907 |
| Short Term Investments | 709,735 | — | — | 709,735 |
| Warrants | — | 4,939,971 | — | 4,939,971 |
| Total | $81,787,394 | $10,214,925 | $83,653 | $92,085,972 |
The following is a reconciliation of Level 3 assets for which unobservable inputs were used to determine fair value.
Foreign Value Small Cap Fund Common Stock | |
| Balance as of 3/31/2012 | $244,762 |
| Realized gain (loss) | $— |
| Changed in unrealized appreciation (depreciation) | $(161,109) |
| Net purchases (sales) | $— |
| Transfer in and/or out of Level 3 | $— |
| Balances as of 09/30/2012 | $83,653 |
| (1) | Refer to Schedule of Investments for breakout by industry or country. |
| (2) | There were no transfers in or out of Level 1 or Level 2 securities for the six months ended September 30, 2012. |
| (3) | Common stock labeled as Level 2 for Emerging Markets, Foreign Value and Foreign Value Small Cap are categorized as Thailand securities in the Schedule of Investments. |
| (4) | Common Stock labeled as a Level 3 security in Foreign Value Small Cap is categorized as a China security in the Schedule of Investments. |
The following table presents additional information about valuation methodologies and inputs used for investments that are measured at fair value and categorized within Level 3 as of September 30, 2012;
Fair Value September 30, 2012 | Valuation Methodologies | Unobservable Input (1) | Range | Impact to Valuation from a Decrease in Input (2) | |
| Common Stock | .01 | Company Specific | Company Specific | 100% | Decrease |
| 1. | In determining certain of these inputs, management evaluates a variety of factors including economic conditions, industry and market developments, and company specific developments. |
| 2. | This column represents the directional change in the fair value of the level 3 investments that would result from an decrease to the corresponding unobservable input. A increase to the observable input would have the opposite effect. |
In May 2011, the Financial Accounting Standards Board issued Accounting Standards Update (“ASU”) No. 2011-04 “Amendments to Achieve Common Fair Value Measurement and Disclosure Requirements in U.S. GAAP and IFRSs”. ASU 2011-04 includes common requirements for measurement of and disclosure about fair value between U.S. GAAP and IFRS. ASU 2011-04 requires reporting entities to disclose the following information for fair value measurements categorized within Level 3 of the fair value hierarchy: quantitative information about the unobservable inputs used in the fair value measurement, the valuation processes used by the reporting entity and a narrative description of the sensitivity of the fair value measurement to changes in unobservable inputs and the interrelationships between those observable inputs. In addition, ASU 2011-04 requires reporting entities to make disclosures about amounts and reasons for all transfers in and out of Level 1 and Level 2 fair value measurements. The new and revised disclosures are effective for fiscal years beginning after December 15, 2011 and for interim periods within those fiscal years. The Funds’ current fiscal year began on April 1, 2012. Management is currently evaluating the implications of ASU No. 2011-04 and its impact on the financial statements.
In December 2011, FASB issued ASU No. 2011-11 related to disclosures about offsetting assets and liabilities. The amendments in this ASU require an entity to disclose information about offsetting and related arrangements to enable users of its financial statements to understand the effect of those arrangements on its financial position. The ASU is effective for annual reporting periods beginning on or after January 1, 2013, and interim periods within those annual periods. The guidance requires retrospective application for all comparative periods presented. Management is currently evaluating the impact ASU 2011-11 will have on the financial statements disclosures.
Use of Estimates
The preparation of financial statements in conformity with accounting principles generally accepted in the United States of America requires management to make estimates and assumptions that affect the reported amounts of assets and liabilities at the date of the financial statements and the reported amounts of revenue and expenses during the reporting period. Actual results could differ from those estimates.
Guarantees and Indemnifications
In the normal course of business, the Funds enter into contracts with service providers that contain general indemnification clauses. The Funds’ maximum exposure under these arrangements is unknown as this would involve future claims that may be made against the Funds that have not yet occurred. However, based on experience, the Funds expect the risk of loss to be remote.
Subsequent Events
In preparing these financial statements, the Funds have evaluated events and transactions for potential recognition or disclosure, through the date the financial statements were issued. There were no events or transactions that occurred during the period covered by the Funds financial statements that materially impacted the accounts or disclosures in the Funds’ financial statements.
Security Transactions and Related Investment Income
Security transactions by a Fund are accounted for on the trade date (the date the order to buy or sell is executed). Dividend income received by the fund, less foreign taxes withheld, is recorded on the ex-dividend date, except that certain dividends from foreign securities where the ex-dividend date may have passed are recorded as soon as a Fund becomes aware of the ex-dividend data in the exercise of reasonable diligence. Withholding taxes on foreign dividends have been provided for in accordance with the Trust’s understanding of the applicable country’s tax rules and rates. Distributions received on securities that represent a return of capital or a capital gain is recorded as a reduction of cost of investments and/or as a realized gain. Each Fund estimates the components of distributions that may be considered nontaxable distributions or capital gain distributions for tax purposes. Interest income is recorded on the accrual basis and includes accretion of discounts and amortization of premiums. In determining the net gain or loss on securities sold, the cost of securities is determined on the identified cost basis. Each Fund’s investment income and realized and unrealized gains and losses are allocated among classes based upon the daily relative net assets.
Repurchase Agreements
The Funds’ custodian takes possession of securities collateralizing repurchase agreements through the federal book-entry system. Collateral is marked-to-market daily to reduce the possibility that the market value of the underlying assets is insufficient to protect the Funds. The Funds may experience costs and delays in liquidating the collateral if the issuer defaults or enters into bankruptcy.
Foreign Currency Transactions
All monetary items denominated in foreign currencies that are held by the Funds are translated into U.S. dollars based on the prevailing exchange rate at the close of each business day. Income and expenses denominated in foreign currencies are translated at the prevailing rates of exchange when accrued or incurred.
Reported net realized gains and losses on foreign currency transactions represent net gains and losses from currency gains and losses realized between the trade and settlement dates on investment transactions, and the difference between the amount of net investment income accrued and the U.S. dollar amount actually received. The effects of changes in foreign currency exchange rates on investments in securities are not segregated in the Statement of Operations from the effects of changes in market prices of those securities, but are included with the net realized and unrealized gain or loss on investments.
Forward Foreign Currency Contracts
The Funds may enter into forward foreign currency contracts to manage their exposure to fluctuations in certain foreign currencies. A forward currency contract is a commitment to purchase or sell a foreign currency at a future date at a set price. The forward currency contracts are valued at the forward rate and are marked-to-market daily. The change in market value is recorded by the Fund as an unrealized gain or loss. When the contract is closed, the Fund records a realized gain or loss equal to the difference between the value of the contract at the time it was opened and the value at the time it was closed. In addition to the risks of financial investments mentioned above, risks arise from unanticipated movements in currency values.
Short Sales
From time to time, a Fund may engage in short sales (selling securities it did not own) as part of its investment activities. Upon selling a security short, the Fund’s Custodian segregates cash, cash equivalents or other appropriate liquid securities in an amount equal to the then current market value of the securities sold short and maintains such collateral until the Fund replaces the borrowed security. A Fund that borrows a security generally is required to pay any dividends or interest due on securities sold short. Such dividends and interest are recorded as an expense. Liabilities for securities sold short are valued daily and are recorded as unrealized appreciation (depreciation) on investments and securities sold short. The Fund records realized gain (loss) on a security sold short when a short position is terminated by the Fund. The Fund incurs a loss if the price of a security increased between the date of the short sale and the date on which the Fund replaces the borrowed security. The Fund realizes a gain if the price of borrowed security declines between the date of a short sale and the date the Fund replaces the borrowed security.
Securities Lending
To generate additional income, each of the Small Cap Fund and Emerging Markets Fund use Securities Finance Trust Company (“eSecLending”) as lending agent. The Small Cap Fund and Emerging Markets Fund may each lend up to 30% of its assets pursuant to certain agreements (“Securities Lending Agreements”) requiring that the loan be continuously secured by cash or securities. Securities are loaned by eSecLending to certain pre-approved brokers (“the borrowers”). The borrowers are required to provide cash or securities as collateral against loaned securities in the amount of 105% of the market value of borrowings for the Emerging Markets Fund, and 102% of the borrowings for the Small Cap Fund. Collateral is marked-to-market daily. Cash collateral is invested in a registered money market fund.
Risks such as delay in recovery of securities may occur should the borrower of the securities fail financially or should the value of the securities loaned increase above the value of the collateral received. eSecLending provides indemnification insurance via highly rated third party insurers to cover these potential risks.
At September 30, 2012, the following Funds had collateral and loans outstanding of:
| Value of Collateral | Value of Loaned Securities | |
| Small Cap Fund | $5,971,584 | $5,832,913 |
| Emerging Markets Fund | 7,351,088 | 6,839,665 |
Credit Facility
State Street has made available to the Trust an uncommitted unsecured demand line of credit in the amount of $15 million. State Street may look solely to the assets of the Fund for the enforcement of any claim against that Fund. For the six months ended September 30, 2012, the average interest rate on the outstanding principal amount was 1.41%. During the six months ended September 30, 2012 Small Cap Fund, Quality Fund, Emerging Markets Fund and Foreign Value Small Cap Fund had an outstanding average daily loan balance of $2,042, $26,220, $259,857, and $32,189 respectively. The maximum amount outstanding for the current lending agreement during the period was $269,895 for Small Cap, $3,051,277 for Quality Fund, $6,616,169 for Emerging Markets Fund and $1,044,798 for Foreign Value Small Cap Fund. Interest expense amounted to $14, $128, $1,588 and $204 respectively. At September 30, 2012 there were loan payable balances of $1,371,079 for Quality Fund and $193,704 for Emerging Markets Fund.
Expenses and Class Allocations
The majority of the expenses of the Funds are attributed to the individual Fund and class for which they are incurred. Expenses that are not attributed to a specific Fund are allocated in proportion to the respective net assets of the Funds. Expenses allocable to a Fund are borne pro rata by the holders of both classes of shares of such Fund, except that 12b-1 Plan expenses will not be borne by the holders of Institutional Shares.
Distribution fees on Ordinary Shares are calculated based on the average daily net asset value attributable to the Ordinary Shares of the respective Fund. Institutional Shares are not subject to distribution fees. Shareholders of each class share all expenses and fees paid to the transfer agent, Pear Tree Institutional Services, for its services, which are allocated based on the net assets in each class and the ratable allocation of related out-of-pocket expenses. Income, common expenses and realized and unrealized gains and losses are calculated at the Fund level and allocated daily to each class of shares below, based on their respective percentage of adjusted net assets at the beginning of the day. (See Note 3)
Distributions to Shareholders
Distributions to shareholders are recorded as of the ex-dividend date. Distributions paid by each Fund with respect to each class of shares are calculated in the same manner, at the same time, and in the same amount, except that Ordinary Shares incur 12b-1 distribution fees while Institutional Shares do not. Distributions from net investment income for each Fund, if any, are declared and paid annually. Distributions from net realized gains for each Fund, if any, are generally declared and paid annually.
3. Management Fee, Advisory Contracts and Other Affiliate Transactions
The Funds have entered into a management agreement (the “Management Agreement”) with Pear Tree Advisors, Inc. (the “Manager”). Compensation of the Manager, for management and administration of the Funds, including selection and monitoring of the portfolio advisors, is paid monthly based on the average daily net asset value of each Fund for the month. The annual rate of such fees is 1.00% of the average daily total net assets of each of the Funds.
Beginning January 27, 2011, the Manager has agreed until July 31, 2013 to waive 0.15 percent of its management fee if the Quality Fund’s average daily net assets are up to $100 million and 0.25 percent of its management fee if the Fund’s average daily net assets are $100 million or more. Beginning April 1, 2011, the Manager has agreed to waive or reimburse Fund expenses relating to Institutional Shares of Quality Fund such that the total annual fund operating expenses relating to Institutional Shares is not greater than 1.00 percent. The Board has the right to terminate either or both arrangements in its discretion. In addition, under the Management Agreement, the Manager has agreed to reduce its compensation, and if necessary, assume expenses, with respect to Small Cap Fund to the extent that the total expenses of this Fund individually exceeds 2% of average net assets for any fiscal year. Fund expenses subject to this limitation are exclusive of brokerage, interest, taxes and extraordinary expenses, which include incremental custody costs associated with international securities. Expenses are calculated gross of custody credits, if applicable.
For the six months ended September 30, 2012, aggregate management fees exclusive of fee waivers and Fund reimbursements, from all Funds were $4,651,615.
The Manager has entered into advisory contracts with the following subadvisors (collectively the “Advisors”) to provide investment advisory services to the following Funds: Columbia Partners, L.L.C., Investment Management (Small Cap Fund, Quality Fund and Micro Cap Fund), PanAgora Asset Management, Inc. (Emerging Markets Fund), and Polaris Capital Management, LLC (Foreign Value and Foreign Value Small Cap Fund).
For services rendered, the Manager pays to the Advisor of a Fund a fee based on a percentage of the average daily total net assets of the Fund. The fee for each Fund is determined separately. Currently, the fees paid by the Manager to the Advisors of the Funds are as follows:
| Small Cap | 0.47% of average daily total net assets |
| Micro Cap | 0.47% of average daily total net assets |
| Quality | 0.10% of the first $100 million and |
| 0.08% of amounts in excess of $100 million but less than $250 million and | |
| 0.06% of amounts in excess of $250 million of average daily total net assets | |
| Emerging Markets* | 0.47% of the first $300 million and |
| 0.50% of amounts in excess of $300 million of average daily total net assets | |
| Foreign Value | 0.35% of the first $35 million and |
| 0.40% of amounts in excess of $35 million but less than $200 million and | |
| 0.50% of assets in excess of $200 million of average daily total net assets | |
| Foreign Value Small Cap | 0.35% of the first $35 million and |
| 0.40% of amounts in excess of $35 million but less than $200 million and | |
| 0.50% of amounts in excess of $200 million of average daily total net assets; |
| * | Prior to February 1, 2012, the subadvisory fee paid was 0.40 as of the average daily net assets. |
The Funds have entered into a distribution agreement (the “Distribution Agreement”) with U.S. Boston Capital Corporation (the “Distributor”). For its services under the Distribution Agreement, the Distributor received a monthly fee at the annual rate of (i) 0.25% of the average daily net asset value of the Ordinary Shares of the Funds.
Holders of Institutional Shares pay no portion of the 12b-1 Plan expenses of the Funds and are not entitled to vote on matters involving the 12b-1 Plan. During the six months ended September 30, 2012 the aggregate distribution fees of the Funds were $982,615.
Transfer agent functions are provided to the Funds by Pear Tree Institutional Services, a division of the Manager (the “Transfer Agent”) pursuant to a transfer agent agreement (the “Transfer Agent Agreement”). The Transfer Agent Agreement provides for base fees that are payable to the Transfer Agent at an annual rate of 0.16% of the average daily total net asset value of each class of shares of the Funds and for reimbursement of out of pocket expenses. During the six months ended September 30, 2012, the aggregate fees of the Funds were $776,185.
Pursuant to an Administration Agreement, the Manager provides certain administrative services to the Funds. During the six months ended September 30, 2012, fees paid pursuant to this agreement were $161,435.
The Board of Trustees of the Funds has approved reimbursement to the Manager for certain costs associated with providing regulatory and compliance services to the Funds. For the six months ended September 30, 2012, the Trustees have approved reimbursements that amounted to $98,988.
Custody and fund accounting services are provided by State Street. Custody credits generated by interest earned on un-invested cash balances maintained by the Funds are used to offset custodial expenses of the Funds.
For the six months ended September 30, 2012, each Trustee of the Trust who was not an “interested person” of the Trust, as that term is defined in the 1940 Act, received fee for serving in that role of $13,500, and each of the Chairman of the Board’s Audit Committee and the Lead Independent Trustee of the Board received an additional $1,500. Compensation for the services of the Trustee who was an interested person of the Trust during that period was paid by the Manager. All fees paid to the Trustees were allocated among the Funds in proportion to their respective net assets.
4. Purchases and Sales
During the six months ended September 30, 2012, purchases of investment securities other than U.S. Government obligations and short-term investments, for Small Cap Fund, Quality Fund, Emerging Markets Fund, Foreign Value Fund, Foreign Value Small Cap Fund and Micro Cap Fund were $23,453,890, $21,667,856, $34,474,457, $79,519,575, $2,531,843 and $5,168,775, respectively. Sales of such securities for the Funds were $28,851,787, $21,701,227, $39,219,604, $6,291,027, $2,876,340 and $4,932,038, respectively.
5. Contingent Liability
The Trust maintains a joint fidelity bond with the Funds’ Transfer Agent through ICI Mutual Insurance Company (“ICI Mutual”). The annual premium is allocated among the Funds and the Transfer Agent.
6. Concentration of Risk
The relatively large investments of Emerging Markets Fund in countries with limited or developing capital markets may involve greater risks than investments in more developed markets and the prices of such investments may be volatile. The consequences of political, social or economic changes in these markets may have disruptive effects on the market prices of the Fund’s investments and the income they generate, as well as the Fund’s ability to repatriate such amounts.
7. Federal Income Taxes
It is the policy of the Funds to distribute all of their taxable income within the prescribed time and otherwise comply with the provisions of the Internal Revenue Code (“IRC”) applicable to regulated investment companies. Therefore no Federal income tax provision is required.
The tax components of capital shown in the following tables represent: (1) losses or deductions the portfolios may be able to offset against income and gains realized in future years, (2) distribution requirements the portfolios must satisfy under the income tax regulations, and (3) unrealized appreciation or depreciation of investments for federal income tax purposes.
Certain Funds had capital loss carryovers as of March 31, 2012. The accumulated capital losses noted in the table may be available to offset future realized capital gains and thereby reduce future taxable gain distributions. As of March 31, 2012, the capital loss carryovers were as follows:
| Portfolio | Capital Loss Expires March 31, 2017 | Capital Loss Expires March 31, 2018 | Capital Loss Expires March 31, 2019 | Capital Loss No Expiration Short Term | Total Capital Loss |
| Small Cap Fund | $ | $19,937,546 | $— | $— | $19,937,546 |
| Micro Cap Fund | — | — | — | — | — |
| Quality Fund | — | 8,935,504 | — | — | 8,935,504 |
| Emerging Markets Fund | — | 23,648,614 | — | — | 23,648,614 |
| Foreign Value Fund | 73,956,484 | 131,156,114 | 10,547,106 | — | 215,659,704 |
| Foreign Value Small Cap Fund | — | — | — | 1,085,262 | 1,085,262 |
As a result of the passage of the Registered Investment Company Modification Act of 2010 (“the Act”), losses incurred in this fiscal year and beyond retain their character as short-term or long-term and have no expiration date and are utilized before capital losses incurred prior to the Act. During the fiscal year ending March 31, 2012, capital loss carryovers in the amount of $9,577,081, $0, $3,509,557, $11,187,971, $6,652,336, and $0 were utilized by Small Cap Fund, Micro Cap Fund, Quality Fund, Emerging Markets Fund, Foreign Value Fund, and Foreign Value Small Cap Fund respectively.
The Funds recognize the tax benefits of uncertain tax positions only where the position is “more likely than not” to be sustained assuming examination by the tax authorities. Management has analyzed the Funds’ tax positions, and has concluded that no liability for unrecognized tax benefits should be recorded related to uncertain tax positions taken on returns filed for open tax years 2009-2011, or expected to be taken in the Funds’ 2012 tax returns. The Funds identify their major tax jurisdictions as U.S. Federal and Massachusetts State; however the Funds are not aware of any tax positions for which it is reasonably possible that the total amounts of unrecognized tax benefits will change materially in the next twelve months.
The primary differences between book and tax appreciation or depreciation of investments consist of wash sale loss deferrals, return of capital distributions by real estate investment trusts (“REITs”), mark to market on passive foreign investment companies (“PFICs”) held and foreign capital gains taxes accrued. The net tax appreciation/(depreciation) in the table below includes unrealized tax gain/(loss) on foreign currency and investments.
At September 30, 2012, the Funds’ aggregate security unrealized gains and losses based on cost for U.S. federal income tax purposes was as follows:
| Portfolio | Tax Cost | Gross Unrealized Gain | Gross Unrealized Loss | Net Unrealized Gain (Loss) |
| Small Cap Fund | $77,373,931 | $22,720,610 | $(2,323,742) | $20,396,868 |
| Quality Fund | 85,541,497 | 12,701,481 | (925,308) | 11,776,173 |
| Emerging Markets Fund | 139,131,660 | 24,182,700 | (12,542,212) | 11,640,488 |
| Foreign Value Fund | 534,829,760 | 93,778,886 | (54,030,917) | 39,747,969 |
| Foreign Value Small Cap Fund | 80,887,575 | 21,661,344 | (10,462,947) | 11,198,397 |
| Micro Cap Fund | 4,402,782 | 440,228 | (291,388) | 148,840 |
8. Transactions in Shares of Beneficial Interest
Transactions in shares of beneficial interest were as follows:
Six Months Ended September 30, 2012 | Year Ended March 31, 2012 | |||
| Shares | Dollars | Shares | Dollars | |
| Small Cap Fund | ||||
| Ordinary Shares | ||||
| Shares sold | 74,839 | $1,475,084 | 204,289 | $3,847,210 |
| Shares issued in reinvestment of distributions | — | — | 12,559 | 223,433 |
| Shares redeemed | (313,544) | (6,205,075) | (1,214,227) | (22,501,607) |
| Net Change | (238,705) | (4,729,991) | (997,379) | (18,430,964) |
| Institutional Shares | ||||
| Shares sold | 1,523 | $35,008 | 28,740 | $602,217 |
| Shares issued in reinvestment of distributions | — | — | 1,188 | 23,866 |
| Shares redeemed | (8,646) | (192,614) | (105,589) | (2,254,026) |
| Net Change | (7,123) | (157,606) | (75,661) | (1,627,943) |
| Total Net Change For Fund | $(4,887,597) | $(20,058,907) | ||
| Micro Cap Fund | ||||
| Ordinary Shares | ||||
| Shares sold | 23,028 | $259,263 | 257,286 | $2,709,402 |
| Shares issued in reinvestment of distributions | — | — | 1,977 | 20,696 |
| Shares redeemed | (3,692) | (42,060) | (3,369) | (38,426) |
| Net Change | 19,336 | 217,203 | 255,894 | 2,691,672 |
| Institutional Shares | ||||
| Shares sold | 3,661 | $40,487 | 117,795 | $1,238,876 |
| Shares issued in reinvestment of distributions | — | — | 606 | 6,150 |
| Shares redeemed | (2) | (22) | (69) | (756) |
| Net Change | 3,659 | 40,465 | 118,332 | 1,244,270 |
| Total Net Change For Fund | $257,668 | $3,935,942 | ||
| Quality Fund | ||||
| Ordinary Shares | ||||
| Shares sold | 583,688 | $8,333,803 | 2,193,162 | $28,121,497 |
| Shares issued in reinvestment of distributions | — | — | 57,406 | 738,822 |
| Shares redeemed | (664,540) | (9,301,942) | (881,877) | (11,630,783) |
| Net Change | (80,852) | (968,139) | 1,368,691 | 17,229,536 |
| Institutional Shares | ||||
| Shares sold | 13,220 | $194,909 | 109,858 | $1,509,683 |
| Shares issued in reinvestment of distributions | — | — | 875 | 11,723 |
| Shares redeemed | (11,646) | (171,435) | (2,617) | (36,053) |
| Net Change | 1,574 | 23,474 | 108,116 | 1,485,353 |
| Total Net Change For Fund | $(944,665) | $18,714,889 | ||
| Emerging Markets Fund | ||||
| Ordinary Shares | ||||
| Shares sold | 549,191 | $11,708,416 | 1,459,911 | $31,633,636 |
| Shares issued in reinvestment of distributions | — | — | 139,649 | 2,774,833 |
| Shares redeemed | (886,561) | (18,956,082) | (2,199,616) | (49,591,856) |
| Net Change | (337,370) | (7,247,666) | (600,056) | (15,183,387) |
| Institutional Shares | ||||
| Shares sold | 67,894 | $1,453,209 | 381,612 | $8,900,177 |
| Shares issued in reinvestment of distributions | — | — | 11,730 | 235,896 |
| Shares redeemed | (105,688) | (2,293,014) | (156,767) | (3,612,289) |
| Net Change | (37,794) | (839,805) | 236,575 | 5,523,784 |
| Total Net Change For Fund | $(8,087,471) | $(9,659,603) |
| Foreign Value Fund | ||||
| Ordinary Shares | ||||
| Shares sold | 6,027,994 | $79,404,754 | 8,250,958 | $105,991,337 |
| Shares issued in reinvestment of distributions | — | — | 143,827 | 1,675,579 |
| Shares redeemed | (1,962,027) | (25,598,897) | (5,266,706) | (70,053,784) |
| Net Change | 4,065,967 | 53,805,857 | 3,128,079 | 37,613,132 |
| Institutional Shares | ||||
| Shares sold | 1,686,573 | $21,889,237 | 2,584,272 | 35,601,604 |
| Shares issued in reinvestment of distributions | — | — | 54,464 | 633,418 |
| Shares redeemed | (473,816) | (6,217,230) | (809,126) | (10,600,210) |
| Net Change | 1,212,757 | 15,672,007 | 1,829,610 | 25,634,812 |
| Total Net Change For Fund | $69,477,864 | $63,247,944 | ||
| Foreign Value Small Cap Fund | ||||
| Ordinary Shares | ||||
| Shares sold | 412,321 | $3,594,840 | 1,176,878 | $11,068,644 |
| Shares issued in reinvestment of distributions | — | — | 926,810 | 7,256,917 |
| Shares redeemed | (295,044) | (2,561,308) | (1,032,500) | (10,170,266) |
| Net Change | 117,277 | 1,033,532 | 1,071,188 | 8,155,295 |
| Institutional Shares | ||||
| Shares sold | 82,553 | $719,851 | 315,655 | $3,043,564 |
| Shares issued in reinvestment of distributions | — | — | 254,131 | 1,992,383 |
| Shares redeemed | (546,054) | (4,713,307) | (429,734) | (4,060,732) |
| Net Change | (463,501) | (3,993,456) | 140,052 | 975,215 |
| Total Net Change for Fund | $(2,959,924) | $9,130,510 |
PEAR TREE FUNDS
INFORMATION FOR SHAREHOLDERS (unaudited)
Quarterly Portfolio Disclosure
Each Fund files its complete schedule of portfolio holdings with the Securities and Exchange Commission (“SEC”) for the first and third quarters of each fiscal year on Form N-Q. The Funds’ Forms N-Q are available on the SEC’s website at www.sec.gov and may be reviewed and copied at the SEC’s Public Reference Room in Washington, D.C. (Call 1-800-SEC-0330 for more information). For a complete list of a fund’s portfolio holdings, you may also view the most recent monthly holdings report, semi-annual report or annual report on the Pear Tree Funds’ web site at www.peartreefunds.com.
Portfolio Proxy Voting Policies and Information
Information on the Funds’ proxy voting policies and on how the Pear Tree Funds voted proxies related to portfolio securities for the 12-month period ended June 30, 2012 is available without charge online at www.peartreefunds.com and at www.sec.gov . You may also call 1-800-326-2151 to request a free copy of the proxy voting information or the proxy voting policies.
Household Delivery of Fund Documents
With your consent, the Trust may send a single proxy statement, prospectus and shareholder report to your residence for you and any other member of your household who has an account with the Funds. If you wish to revoke your consent to this practice, you may do so by notifying the Fund’s transfer agent, by phone or in writing (see “For Account Information”). The mailing of separate proxy statements, prospectuses and shareholder reports will begin within 30 days after receiving your notice.
PEAR TREE FUNDS
MANAGEMENT CONTRACT AND ADVISORY CONTRACT APPROVAL (unaudited)
On May 17, 2012, the Board of Trustees of the Trust, including those Trustees who were not “interested persons” of the Trust or the Manager (the “Independent Trustees”), approved the Management Agreement with the Manager and the Advisory Agreements with each sub-adviser to the following Funds: Pear Tree Columbia Small Cap Fund, Pear Tree Quality Fund, Pear Tree PanAgora Dynamic Emerging Markets Fund, Pear Tree Polaris Foreign Value Fund and Pear Tree Polaris Foreign Value Small Cap Fund. The following describes the Board’s considerations.
Pear Tree Advisors, Inc.
Nature and Quality of Manager’s Advisory Services. The Board reviewed the Managers’ senior management and other personnel. Among other factors, the Board considered the size, education and experience of the Managers’ staff and the Managers’ approach to recruiting, training, compensating and retaining personnel. The Board considered the Managers’ supervision of Sub-Advisers. The Board considered the benefit to shareholders of investing in a fund that is part of a small family of funds using a manager-of-managers approach and providing for a selection of shareholder services, including, the ability of shareholders to exchange or transfer investments within the same class of shares among each of the Funds without incurring additional sales charges.
Nature and Quality of Other Services. The Board considered the nature, quality, cost and extent of administrative and shareholder services performed by the Manager and affiliated companies under the existing Management Agreements and under separate agreements covering administrative services, transfer agency functions and other services. The Board, including the Independent Trustees, has also considered the nature and extent of the Manager’s supervision of third-party service providers, principally Fund accountants (pricing, recordkeeping), securities lending agents, custodians and subcustodians.
Fees and Expenses. The Board considered each Fund’s advisory fee, subadvisory fee and expense ratio compared with the management fees, subadvisory fees and expense ratios of the Selected Peer Group. Fees and expenses for each Fund are discussed below under each Fund.
Conclusion. Based on its evaluation of all material factors, the Board, including the Independent Trustees, concluded that the existing advisory fee structure is fair and reasonable, and that the existing Management Agreement should be approved.
Pear Tree Columbia Small Cap Fund — (Sub-Adviser: Columbia Partners, L.L.C. Investment Management)
Investment Performance. The Board reviewed the Fund’s investment performance as well as the performance of the Selected Peer Group, and the performance of an appropriate index or combination of indices. The Board noted that the Fund underperformed its Selected Peer Group for each of the one-, three-, five- and ten-year periods, but that the Fund outperformed the subsection of the Selected Peer Group comprised of funds managed via a similar adviser/sub-adviser structure (the “Sub-Advised Peer Group”) for the three- and ten-year periods.
Fees and Expenses. The Board considered the Fund’s management fee, subadvisory fee and expense ratio compared with fees and expense ratios of the Selected Peer Group. The Board noted that the Fund’s management fee and expense ratio are above the average and the median of the funds in its Selected Peer Group. Additionally, the Board noted that the Fund’s contractual management fee is higher than the assets weighted average of the Sub-Advised Peer Group at all asset levels presented.
Conclusion. Based on its evaluation of all material factors, the Board, including the Independent Trustees, concluded that the advisory fees for the Fund are fair and reasonable, and that the existing Sub-Advisory Agreement with this Sub-Adviser should be approved.
Pear Tree Quality Fund — (Sub-Adviser: Columbia Partners, L.L.C. Investment Management)
Investment Performance. The Board reviewed the Fund’s investment performance as well as the performance of the Selected Peer Group, and the performance of an appropriate index or combination of indices. The Board noted that the Fund underperformed its Selected Peer Group and its Sub-Advised Peer Group for each of the five- and ten-year periods and outperformed its Selected Peer Group and Sub-Advised Peer Group for the each of the one-, three-year periods. The Board noted that in February 2011, the sub-advisor for this Fund had changed, as had the investment strategy.
Fees and Expenses. The Board considered the Fund’s management fee, subadvisory fee and expense ratio compared with fees and expense ratios of the Selected Peer Group. The Board noted that the Fund’s management fee and expense ratio are above the average and the median of the funds in its Selected Peer Group. Additionally, the Board noted that the Fund’s contractual management fee is higher than the assets weighted average of the Sub-Advised Peer Group at all asset levels presented.
Conclusion. Based on its evaluation of all material factors, the Board, including the Independent Trustees, concluded that the advisory fees for the Fund are fair and reasonable, and that the existing Sub-Advisory Agreement with this Sub-Adviser should be approved.
Pear Tree PanAgora Dynamic Emerging Markets Fund — (Sub-Adviser: PanAgora Asset Management, Inc.)
Investment Performance. The Board reviewed the Fund’s investment performance as well as the performance of a Selected Peer Group of mutual funds, and the performance of an appropriate index or combination of indices. The Board noted that the Fund outperformed its Selected Peer Group and Sub-Advised Peer Group for each of the one-, three-, five- and ten-year periods.
Fees and Expenses. The Board considered the Fund’s management fee, subadvisory fee and expense ratio compared with the fees and expense ratios of the Selected Peer Group. The Board noted that the Fund’s management fee is above the average and the median of the funds in its Selected Peer Group, and that the Fund’s total expense ratio is above the average and the median of the Fund’s Sub-Advised Peer Group. Additionally, the Board noted that the Fund’s contractual management fee is competitive with the assets weighted average of the Selected Peer Group at all asset levels presented and is lower than the assets weighted average of the Sub-Advised Peer Group at all asset levels presented.
Conclusion. Based on its evaluation of all material factors, the Board, including the Independent Trustees, concluded that the advisory fees for the Fund are fair and reasonable, and that the existing Sub-Advisory Agreement with this Sub-Adviser should be approved.
Pear Tree Polaris Foreign Value Fund — (Sub-Adviser: Polaris Capital Management, LLC)
Investment Performance. The Board reviewed the Fund’s investment performance as well as the performance of the Selected Peer Group, and the performance of an appropriate index or combination of indices. The Board noted that the Fund outperformed its Selected Peer Group and Sub-Advised Peer Group for the three-, five- and ten- year periods, and underperformed its Selected Peer Group and Sub-Advised Peer Group for the one-year period.
Fees and Expenses. The Board considered the Fund’s management fee, subadvisory fee and expense ratio compared with the fees and expense ratios of the Selected Peer Group. It also considered the amount and nature of fees paid by shareholders. The Board noted that Fund’s management fee and expense ratio are above the average and the median for the Selected Peer Group; however, they are competitive with the average and the median of the Sub-Advised Peer Group. Additionally, the Board noted that the contractual management fee is above the assets-weighted average of the Selected Peer Group and the Subadvised Peer Group at all asset levels presented.
Conclusion. Based on its evaluation of all material factors, the Board, including the Independent Trustees, concluded that the advisory fees for the Fund are fair and reasonable, and that the existing Sub-Advisory Agreement with this Sub-Adviser should be approved.
Pear Tree Polaris Foreign Value Small Cap Fund — (Sub-Adviser: Polaris Capital Management, Inc.)
Investment Performance. The Board reviewed the Fund’s investment performance as well as the performance of the Selected Peer Group, and the performance of an appropriate index or combination of indices. The Board noted that the Fund underperformed its Selected Peer Group and Sub-Advised Peer Group for the one-year period but outperformed the Selected Peer Group and Sub-Advised Peer Group for the three-year period.
Fees and Expenses. The Board considered the Fund’s management fee, subadvisory fee and expense ratio compared with the fees and expense ratios of the Selected Peer Group. It also considered the amount and nature of fees paid by shareholders. The Board noted that the Fund’s management fee is above the median and slightly above the average of the Fund’s Selected Peer Group. The Board also noted that the expense ratio of the Fund is above the average and the median of the Selected Peer Group and the Sub-Advised Peer Group for the most recent period reviewed. Additionally, the Board noted that the contractual management fee is competitive with the assets-weighted average of the Selected Peer Group and higher than the assets weighted average of the Sub-Advised Peer Group at multiple asset levels presented.
Conclusion. Based on its evaluation of all material factors, the Board, including the Independent Trustees, concluded that the advisory fees for the Fund are fair and reasonable, and that the proposed Sub-Advisory Agreement with this Sub-Adviser be approved.
PEAR TREE FUNDS
NOTES
This page intentionally left blank.
PEAR TREE FUNDS
NOTES
This page intentionally left blank.
PEAR TREE FUNDS
NOTES
This page intentionally left blank.
PEAR TREE FUNDS
NOTES
This page intentionally left blank.
PEAR TREE FUNDS
NOTES
This page intentionally left blank.
PEAR TREE FUNDS
NOTES
This page intentionally left blank.
PEAR TREE FUNDS
NOTES
This page intentionally left blank.
PEAR TREE FUNDS
SERVICE PROVIDERS
| Manager | Pear Tree Advisors, Inc., 55 Old Bedford Road, Lincoln, MA 01772 |
| Subadvisers | Columbia Partners, L.L.C., Investment Management, 5425 Wisconsin Avenue, Suite 700, Chevy Chase, MD 20815 PanAgora Asset Management, Inc., 470 Atlantic Avenue, 8th Floor, Boston, MA 02210 Polaris Capital Management, LLC, 125 Summer Street, Boston, MA 02210 |
| Distributor | U.S. Boston Capital Corporation, 55 Old Bedford Road, Lincoln, MA 01773 |
| Custodian | State Street Bank and Trust Company, One Lincoln Street, Boston, MA 02111 |
| Fund Accountant | State Street Bank and Trust Company, One Lincoln Street, Boston, MA 02111 |
| Transfer Agent | Pear Tree Institutional Services, 55 Old Bedford Road, Lincoln, MA 01773 |
Independent Registered Public Accounting Firm | Tait, Weller & Baker LLP, 1818 Market Street, Suite 2400 Philadelphia, PA 19103 |
| Legal Counsel | Nutter, McClennen & Fish, Seaport West, 155 Seaport Boulevard, Boston, MA 02210 |
| For Account Information | For Pear Tree Funds information, contact your financial adviser or, if you receive account statements directly from Pear Tree Funds, you can also call 1-800-326-2151. Telephone representatives are available from 8:30 a.m. to 4:30 p.m. Eastern Time. Or visit our website, www.peartreefunds.com |
ITEM 2. Code of Ethics
Not applicable for report period.
ITEM 3. Audit Committee Financial Expert
Not applicable for report period.
ITEM 4. Principal Accountant Fees and Services
Not applicable for report period.
ITEM 5. Audit Committee of Listed Registrants
Not applicable.
ITEM 6. Schedule of Investments
Not applicable.
ITEM 7. Disclosure of Proxy Voting Policies and Procedures for Closed-End Management Investment Companies
Not applicable.
ITEM 8. Portfolio Managers of Closed-End Management Investment Companies.
Not applicable.
| ITEM 9 | Purchases of Equity Securities by Closed-End Management Investment Company and Affiliated Purchasers |
Not applicable.
ITEM 10 Submission of Matters to a Vote of Security Holders
Not applicable.
ITEM 11. Controls and Procedures
(a) The President and Treasurer of the registrant have concluded, based on their evaluation of the effectiveness of the registrant’s disclosure controls and procedures (as defined in Rule 30a-3(c) under the Act) as of a date within 90 days of the filing date of this report on Form N-CSR, that the design and operation of such procedures provide reasonable assurance that information required to be disclosed by the registrant in this report on Form N-CSR is recorded, processed, summarized, and reported within the time periods specified in the Securities and Exchange Commission’s rules and forms.
(b) There has been no change in the registrant’s internal controls over financial reporting (as defined in Rule 30a-3(d) under the Act) that occurred during the second fiscal quarter of the period covered by this report that has materially affected, or is reasonably likely to materially affect, the registrant’s internal control over financial reporting.
ITEM 12. Exhibits
(a) Certifications pursuant to Rule 30a-2(a) by the chief executive and financial officers.
| (b) | Certification pursuant to Rule 30a-2(b) and Section 906 by the chief executive and financial officers. |
SIGNATURES
Pursuant to the requirements of the Securities Exchange Act of 1934 and the Investment Company Act of 1940, the registrant has duly caused this report to be signed on its behalf by the undersigned, thereunto duly authorized.
Pear Tree Funds
By/s/ Willard L. Umphrey
Willard L. Umphrey, President
Date: November 29, 2012
Pursuant to the requirements of the Securities Exchange Act of 1934 and the Investment Company Act of 1940, this report has been signed below by the following persons on behalf of the registrant and in the capacities and on the dates indicated.
By /s/ Willard L. Umphrey
Willard L. Umphrey, President
Date: November 29, 2012
By /s/ Leon Okurowski
Leon Okurowski, Treasurer
Date: November 29, 2012
EXHIBIT LIST
(a) Certifications pursuant to Rule 30a-2(a) by the chief executive and financial officers.
(b) Certification pursuant to Rule 30a-2(b) and Section 906 by the chief executive and
financial officers.