OMB APPROVAL
OMB Number: 3235-0570
Expires: January 31, 2017
Estimated average burden
hours per response..... 20.6
UNITED STATES
SECURITIES AND EXCHANGE COMMISSION
Washington, D.C. 20549
FORM N-CSR
CERTIFIED SHAREHOLDER REPORT OF REGISTERED
MANAGEMENT INVESTMENT COMPANIES
Investment Company Act file number 811-3790
Pear Tree Funds
(Exact name of registrant as specified in charter)
55 Old Bedford Road, Lincoln, MA 01773
(Address of principal executive offices)
Willard L. Umphrey
Pear Tree Advisors, Inc.
55 Old Bedford Road, Lincoln, MA 01773
(Name and address of agent for service)
Registrant’s telephone number, including area code: (781) 676-5900
Date of fiscal year end: March 31
Date of reporting period: April 1, 2015 through September 30, 2015
ITEM 1. REPORTS TO SHAREOWNERS.
PEAR TREE FUNDS
Pear Tree Polaris Small Cap Fund
Pear Tree Quality Fund
Pear Tree PanAgora Dynamic Emerging Markets Fund
Pear Tree PanAgora Risk Parity Emerging Markets Fund
Pear Tree Polaris Foreign Value Fund
Pear Tree Polaris Foreign Value Small Cap Fund
SEMI-ANNUAL REPORT
September 30, 2015
TABLE OF CONTENTS
| President’s Letter | 1 |
| Fund Expenses | 2 |
| Portfolio Manager Commentaries | 4 |
| Pear Tree Polaris Small Cap Fund | 4 |
| Pear Tree Quality Fund | 6 |
| Pear Tree PanAgora Dynamic Emerging Markets Fund | 8 |
| Pear Tree PanAgora Risk Parity Emerging Markets Fund | 10 |
| Pear Tree Polaris Foreign Value Fund | 12 |
| Pear Tree Polaris Foreign Value Small Cap Fund | 14 |
| Schedules of Investments | 16 |
| Pear Tree Polaris Small Cap Fund | 16 |
| Pear Tree Quality Fund | 20 |
| Pear Tree PanAgora Dynamic Emerging Markets Fund | 25 |
| Pear Tree PanAgora Risk Parity Emerging Markets Fund | 33 |
| Pear Tree Polaris Foreign Value Fund | 51 |
| Pear Tree Polaris Foreign Value Small Cap Fund | 55 |
| Statements of Assets and Liabilities | 60 |
| Statements of Operations | 64 |
| Statements of Changes in Net Assets | 66 |
| Financial Highlights | 72 |
| Notes to Financial Statements | 84 |
| Information for Shareholders | 101 |
| Management Contract and Advisory Contract Approval | 102 |
| Service Providers | inside back cover |
This report must be preceded or accompanied by a current Pear Tree Funds prospectus for individuals who are not current shareholders of the Funds. If you are not a shareholder of a Pear Tree Fund, you should read the prospectus carefully before investing because it contains more complete information on the Pear Tree Funds’ investment objectives, risks, charges and expenses. Please consider this information carefully. For a prospectus and other information, visit www.peartreefunds.com or call (800) 326-2151.
NOT FDIC INSURED • MAY LOSE VALUE • NO BANK GUARANTEE
Neither Pear Tree Funds nor U.S. Boston Capital Corporation is a bank.
PEAR TREE FUNDS
Dear Fellow Shareholder,
We are pleased to provide you with the Pear Tree Funds’ Semi-Annual Report for the six-month period ended September 30, 2015 and to update you on recent market conditions and the performance of the Pear Tree Funds.
For current performance information, please visit our website at www.peartreefunds.com. We thank you for your continued confidence in the Pear Tree Funds. Please feel free to e-mail us at feedback@peartreefunds.com or call us at 800-326-2151 with any questions or for assistance on your account.
Sincerely,

Willard Umphrey
President and Chairman
Any statements in this report regarding market or economic trends or the factors influencing the historical or future performance of the Pear Tree Funds are the views of the Funds’ Investment Manager and Sub-Advisers as of the date of this report. These views are subject to change at any time based upon market and other conditions, and Fund management and the subadvisors to the Funds disclaim any responsibility to update such views. These views may not be relied upon as investment advice or as an indication of trading intent on behalf of any Pear Tree Fund. Any references to specific securities are not recommendations of such securities and may not be representative of any Pear Tree Fund’s current or future investments.
Past performance is no guarantee of future results, and there is no guarantee that market forecasts will be realized.
PEAR TREE FUNDS
FUND EXPENSES
We believe it’s important for Fund shareholders to have a clear understanding of fund expenses and the impact expenses have on investment returns. The following is important information about each Fund’s Expense Example, which appears below.
Expense Example
As a shareholder of a Fund, you incur two types of costs: (1) transaction costs, and (2) ongoing costs, including management fees, distribution (12b-1) fees (on Ordinary Shares) and other Fund expenses. The example is intended to help you understand your ongoing costs (in dollars) of investing in a Fund and to compare these costs with the ongoing costs of investing in other mutual funds. These examples are based on $1,000 being invested at the beginning of the period and held for the entire period from April 1, 2015 to September 30, 2015.
Actual Expenses
The first line for each Share Class for each Fund provides information about actual account returns and actual expenses. You may use the information in this line, together with the amount you invested for that Fund and Share Class, to estimate the expenses that you paid over the period. To estimate the expenses you paid over the period, simply divide your account value by $1,000, then multiply the result by the number under the heading “Expenses Paid During the Period.”
Hypothetical Example for Comparison Purposes
The second line for each Share Class for each Fund shows you hypothetical account values and hypothetical expenses based on the Fund’s actual expense ratio and an assumed rate of return of 5% per year before expenses, which is not the Fund’s actual return.
The hypothetical account values and hypothetical expenses may not be used to estimate the actual ending account balance or expenses you paid for the period. You may use this information only to compare the ongoing expenses of investing in the Fund with the ongoing expenses of other funds. To do so, compare the Fund’s 5% hypothetical example with the 5% hypothetical examples that appear in the shareholder reports of other funds.
PEAR TREE FUNDS
Expense Example for the 6 months ended September 30, 2015
| Pear Tree Fund | Share Class | Total Return Description | Beginning Account Value 4/1/2015 | Ending Account Value 9/30/2015 | Annualized Expense Ratio | Expenses Paid* 4/1/2015 – 9/30/2015 |
| Small Cap | Ordinary | Actual | $1,000.00 | $897.90 | 1.37% | $6.51 |
| Hypothetical | $1,000.00 | $1,018.14 | 1.37% | $6.92 | ||
| Institutional | Actual | $1,000.00 | $896.60 | 1.12% | $5.33 | |
| Hypothetical | $1,000.00 | $1,019.38 | 1.12% | $5.68 | ||
| Quality | Ordinary | Actual | $1,000.00 | $953.80 | 1.30% | $6.36 |
| Hypothetical | $1,000.00 | $1,018.49 | 1.30% | $6.57 | ||
| Institutional | Actual | $1,000.00 | $951.90 | 1.05% | $5.11 | |
| Hypothetical | $1,000.00 | $1,019.76 | 1.05% | $5.29 | ||
| Emerging Markets | Ordinary | Actual | $1,000.00 | $839.60 | 1.35% | $6.21 |
| Hypothetical | $1,000.00 | $1,018.25 | 1.35% | $6.81 | ||
| Institutional | Actual | $1,000.00 | $838.70 | 1.11% | $5.09 | |
| Hypothetical | $1,000.00 | $1,019.47 | 1.11% | $5.59 | ||
| Risk Parity | Ordinary | Actual | $1,000.00 | $841.50 | 1.48% | $6.83 |
| Emerging Markets | Hypothetical | $1,000.00 | $1,017.58 | 1.48% | $7.49 | |
| Institutional | Actual | $1,000.00 | $840.70 | 1.23% | $5.64 | |
| Hypothetical | $1,000.00 | $1,018.87 | 1.23% | $6.19 | ||
| Foreign Value | Ordinary | Actual | $1,000.00 | $899.40 | 1.52% | $7.23 |
| Hypothetical | $1,000.00 | $1,017.38 | 1.52% | $7.68 | ||
| Institutional | Actual | $1,000.00 | $898.20 | 1.27% | $6.04 | |
| Hypothetical | $1,000.00 | $1,018.64 | 1.27% | $6.42 | ||
| Foreign Value | Ordinary | Actual | $1,000.00 | $907.20 | 1.57% | $7.50 |
| Small Cap | Hypothetical | $1,000.00 | $1,017.13 | 1.57% | $7.94 | |
| Institutional | Actual | $1,000.00 | $905.60 | 1.32% | $6.27 | |
| Hypothetical | $1,000.00 | $1,018.42 | 1.32% | $6.65 |
| * | “Expenses Paid” for each Fund share class relating to actual or hypothetical returns, is the amount equal to the product of (a) that Fund’s and Share Class’ average account value for the six-month period ended September 30, 2015, multiplied by (b) the corresponding “Annualized Expense Ratio” multiplied by (c) the fraction 183/366 (which reflects the six-month period covered by this report). |
PEAR TREE POLARIS SMALL CAP FUND
(formerly Pear Tree Columbia Small Cap Fund)
INVESTMENT PROFILE
All Data as of September 30, 2015
| Fund Information | ||
| Net Assets Under Management | $90.9 Million | |
| Number of Companies | 65 | |
| Price to Book Ratio | 2.3 | |
| Price to Earnings Ratio | 19.6 | |
| Ordinary | Institutional | |
| Total Expense Ratio (Gross)* | 1.41% | 1.19% |
| Total Expense Ratio (Net)* | 1.41% | 1.19% |
| Ticker Symbol | USBNX | QBNAX |
| * per prospectus dated August 1, 2015. See financial highlights for total expense ratios for the fiscal year ended March 31, 2015. | ||
Investment Commentary
For the semi-annual period ended September 30, 2015, the Pear Tree Polaris Small Cap Fund’s Ordinary Shares (the “Fund”) outperformed its benchmark, the Russell 2000 Index (the “Index”). The Fund achieved a return of (10.34%) at net asset value compared to (11.55%) for the Index.
Market Conditions and Investment Strategies
Although U.S. small-cap markets were in positive territory through the end of June, commodity price volatility dragged down stocks in the subsequent months. While disappointed with negative absolute performance, we are pleased with the Fund’s relative outperformance in a down market, largely attributable to gains amongst select financial and information technology holdings. IT staffing company, Kforce Inc., announced its eighth consecutive quarter of double digit year-over-year organic revenue growth. Kforce’s flexible/temporary staffing is in high demand in the current economy. Astoria Financial had double digit gains after activist investor Basswood Capital reported a 9.2% stake in the company. Basswood cited opportunities to boost shareholder value. BNC Bancorp posted better-than-expected second quarter results, after successfully integrating recent acquisitions. Luxoft Holding Inc., an IT service for banks, announced strong second quarter 2015 results with revenues up more than 30%, strong margins and increased full-year guidance. The company gained momentum on the back of strategic acquisitions, growth of the Luxoft Global Upgrade program and continued investment in engineering.
Detractors included Ambarella, which experienced a stock decline after an underwhelming earnings report that pointed to fewer product launches for its customer GoPro. However, we believe the ubiquitous presence of digitization and video worldwide is a megatrend upon which the company can capitalize. Florida-based residential property insurer United Insurance Holdings expanded into New England over the last few years. A brutal winter season in the region caused a rise in insurance claims, and the stock suffered. United Insurance is expected to recoup some losses with increased reinsurance business. Other underperformers included Trex Company, Swift Transportation and Verint Systems Inc.
Portfolio Changes
Since assuming sub-advisory responsibility of the Fund in January 2015, the new sub-adviser has carefully assessed portfolio holdings. In the semi-annual period, we slowed the pace of portfolio change as our valuation models indicated strength among remaining holdings. We have added to current positions in certain banks and industrials; no sales have been conducted.
A Look Ahead
Our outlook remains constructive over the medium term. From a corporate perspective, the reset of commodity prices at lower levels will make it difficult for higher cost materials and energy producers, but will usher in a wave of disruptive technologies and lower-priced, efficient competitors — many of which will be small-cap entrants. At the consumer level, lower gasoline prices may ultimately have a positive effect on purchasing power. There is clear evidence of this trend in the U.S. with record car sales and solid housing demand.
The Fund’s lead portfolio manager is Bernard R. Horn, Jr. of Polaris Capital Management, LLC.
PEAR TREE POLARIS SMALL CAP FUND
Top 10 Holdings
| Percentage of total net assets | 32.5 |
| EPR Properties | 4.5 |
| Alliance Data Systems Corporation | 3.9 |
| Ameris Bancorp | 3.7 |
| Kforce, Inc. | 3.5 |
| Ambarella, Inc. | 3.5 |
| IMAX Corporation | 3.3 |
| Natus Medical, Inc. | 2.9 |
| Asbury Automotive Group, Inc. | 2.5 |
| Integrated Device Technology, Inc. | 2.4 |
| Ferro Corporation | 2.3 |
There is no guarantee that such securities will continue to be viewed favorably or held in the Fund’s portfolio.
Sector Allocation
| Percentage of total net assets | 100.0% |
| Financials | 39.0% |
| Consumer Discretionary | 18.0% |
| Information Technology | 16.9% |
| Industrials | 12.0% |
| Health Care | 4.0% |
| Materials | 2.9% |
| Energy | 1.8% |
| Utilities | 1.6% |
| Telecommunication Services | 1.5% |
| Consumer Staples | 0.8% |
| CASH + other assets (net) | 1.5% |
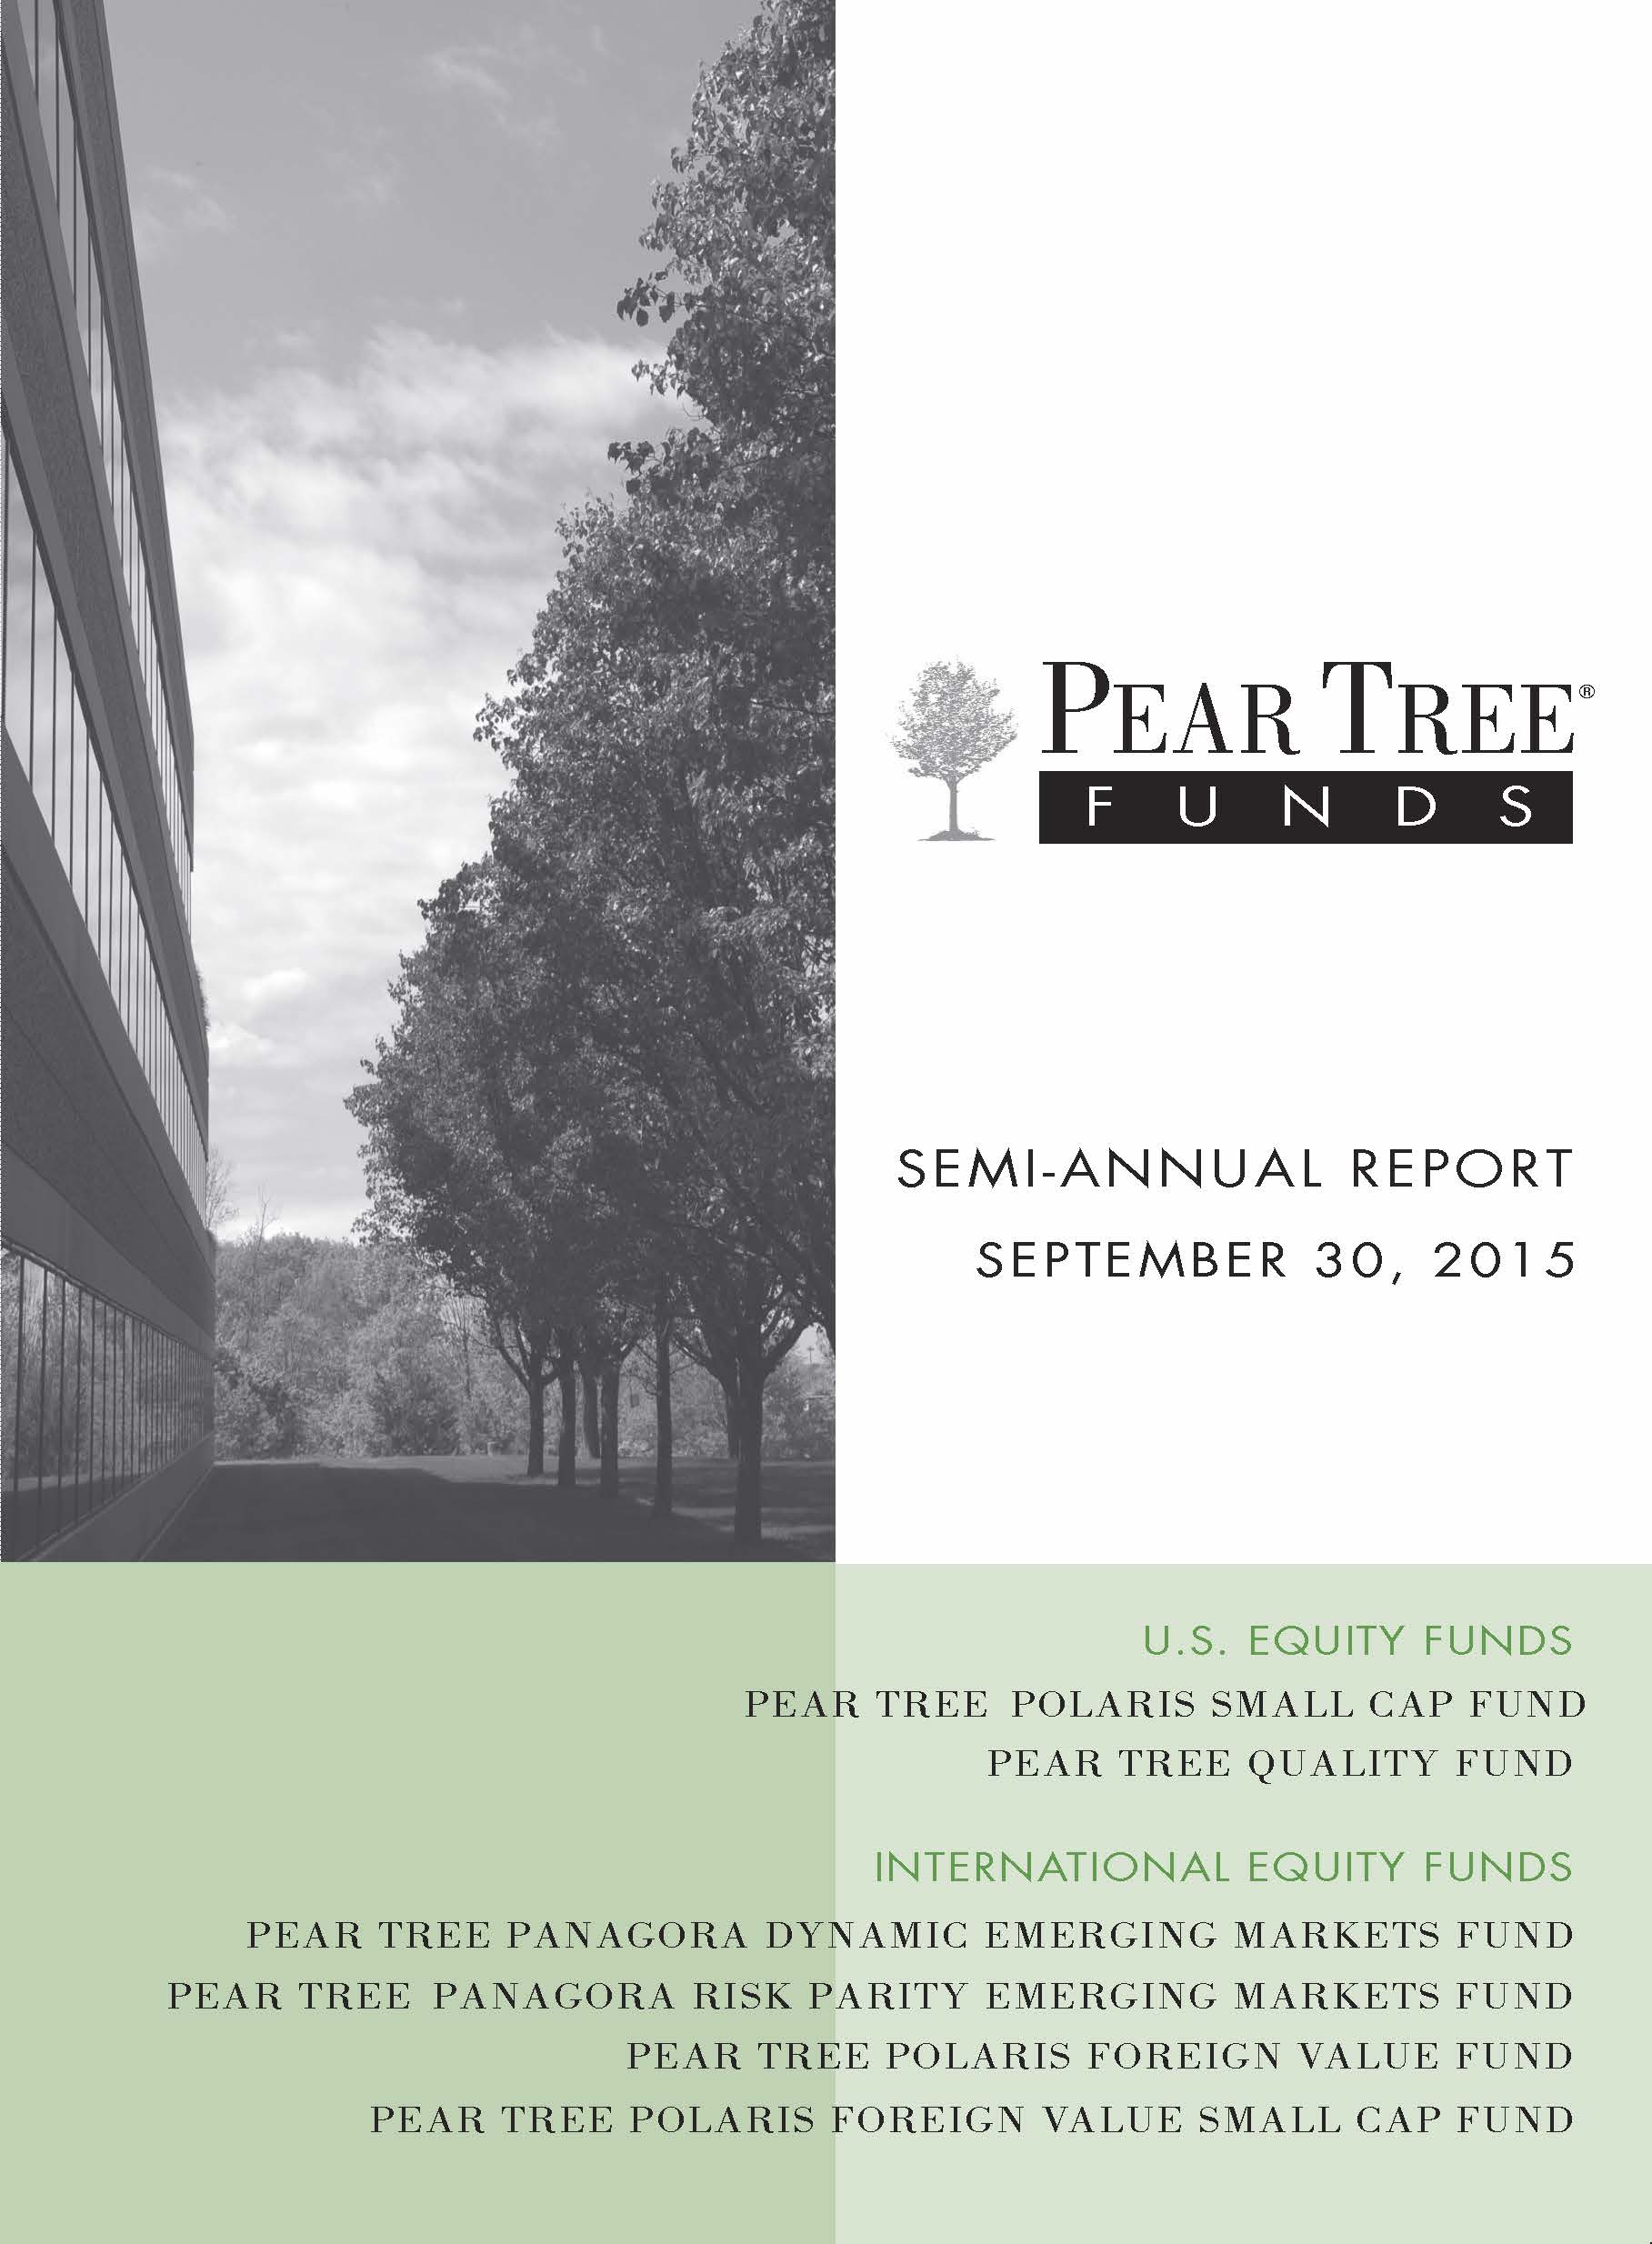
Value of a $10,000 Investment
Pear Tree Polaris Small Cap (PTSC) Ordinary Shares vs.
Russell 2000 Index
Average Annual Total Returns
| 3Q 2015 | Six Months | One Year | Five Year | Ten Year | Since Inception | Inception Date | |
| Ordinary Shares | (11.67)% | (10.34)% | (1.42)% | 8.26% | 3.21% | 9.38% | 08/03/92 |
Institutional Shares1 | (11.62)% | (10.21)% | (1.15)% | 8.54% | 3.52% | 8.81% | 01/06/93 |
Russell 20002 | (11.92)% | (11.55)% | 1.25% | 11.73% | 6.55% | 9.23% | ________ |
1 Institutional Shares may only be purchased by certain categories of investors and are not subject to sales charges or distribution fees.
2 The Russell 2000 Index is a market capitalization-weighted index of 2,000 small company stocks. It is widely recognized as representative of the general market for small company stocks. Index returns assume the reinvestment of dividends and, unlike Fund returns, do not reflect any fees or expenses. You cannot invest directly in an Index. The beginning date of the Index is 08/3/92.
Small company stocks may trade less frequently and in a limited volume, and their prices may fluctuate more than stocks of other companies. Small company stocks may therefore be more vulnerable to adverse developments than those of larger companies. The Fund may invest in issuers in the real estate industry. Changes in real estate values or economic downturns can have a significant negative effect on these issuers. The Fund may invest in foreign issuers that trade on U.S. stock exchanges. These issuers may be subject to special risks including different corporate governance rules and bankruptcy laws.
PEAR TREE QUALITY FUND
INVESTMENT PROFILE
All Data as of September 30, 2015
| Fund Information | ||
| Net Assets Under Management | $116.7 Million | |
| Number of Companies | 85 | |
| Price to Book Ratio | 4.0 | |
| Price to Earnings Ratio | 17.1 | |
| Ordinary | Institutional | |
| Total Expense Ratio (Gross)* | 1.54% | 1.29% |
| Total Expense Ratio (Net)* | 1.29% | 1.04% |
| Ticker Symbol | USBOX | QGIAX |
| * per prospectus dated August 1, 2015. See financial highlights for total expense ratios for the six months ended September 30, 2015. | ||
Investment Commentary
For the semi-annual period ended September 30, 2015, the Pear Tree Quality Fund’s Ordinary Shares (the “Fund”) outperformed its benchmark, S&P 500 (the “Index”). The Fund achieved a return of (4.81%) at net asset value compared to (6.18%) for the Index.
Market Conditions and Investment Strategies
The Fund’s investment manager currently chooses securities for the Fund by periodically selecting a mutual fund (the “Target Portfolio”) and monitoring the Target Portfolio’s holdings. The Fund’s investment adviser, at the direction of the investment manager, rebalances the Fund’s portfolio to correspond to the Target Portfolio’s most recent holdings as publicly reported. From April 1, 2015 to September 30, 2015, the Fund’s Ordinary Shares, when compared to the Target Portfolio, had a tracking error of 0.27.
During the semi-annual period, the Energy sector was the largest positive contributor to the Fund’s performance, due to an underweight position. The Fund’s large overweight positions in the Consumer Staples and Information Technology sectors also contributed to performance.
The greatest detractors from performance came from sector selection in the Consumer Discretionary, Financials and Utilities sectors. Stock selection in the Industrials and Materials sectors also detracted from performance.
Portfolio Changes
We expect the Fund to have a relatively low turnover rate given the historical stability and relatively low turnover rate of the current Target Portfolio.
For the semi-annual period ended September 30, 2015, the Fund rebalanced the holdings twice to replicate the publicly disclosed holdings of the current target portfolio. The two rebalances resulted in the sale of thirteen positions. Also as a result of the rebalances, the Fund opened new positions in ten companies; three Consumer Discretionary companies, three Health Care companies, two Technology companies, one Consumer Staples company and one Materials company.
A Look Ahead
For the foreseeable future, the Fund’s investment manager expects the Target Portfolio to remain the same. For more information on the selection of the Target Portfolio(s), please see the Fund’s Prospectus.
Fund trading execution is overseen by Robert von Pentz, CFA of Columbia Partners, L.L.C. Investment Management.
PEAR TREE QUALITY FUND
Top 10 Holdings
| Percentage of total net assets | 40.0% |
| Johnson & Johnson | 4.9% |
| Procter & Gamble Company (The) | 4.4% |
| Microsoft Corporation | 4.3% |
| Oracle Corporation | 4.2% |
| Coca-Cola Company (The) | 4.0% |
| Alphabet Inc. | 4.0% |
| AstraZeneca plc | 3.8% |
| Apple, Inc. | 3.6% |
| Express Scripts Holding Company | 3.4% |
| Cisco Systems, Inc. | 3.4% |
There is no guarantee that such securities will continue to be viewed favorably or held in the Fund’s portfolio.
Sector Allocation
| Percentage of total net assets | 100.0% |
| Information Technology | 32.4% |
| Consumer Staples | 26.8% |
| Health Care | 23.6% |
| Industrials | 7.8% |
| Consumer Discretionary | 5.8% |
| Telecommunication Services | 1.9% |
| Materials | 1.1% |
| Energy | 0.4% |
| Financials | 0.0% |
| Utilities | 0.0% |
| CASH + other assets (net) | 0.2% |
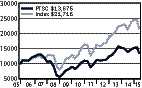
Value of a $10,000 Investment
Pear Tree Quality (PTQ) Ordinary Shares vs.
S&P 500 Index
Average Annual Total Returns
| 3Q 2015 | Six Months | One Year | Five Year | Ten Year | Since Inception | Inception Date | |
| Ordinary Shares | (4.15)% | (4.81)% | (0.10)% | 12.91% | 3.89% | 8.82% | 05/06/85 |
Institutional Shares1 | (4.05)% | (4.62)% | 0.17% | 13.31% | 4.14% | 7.50% | 03/25/91 |
S & P 5002 | (6.44)% | (6.18)% | (0.61)% | 13.34% | 6.80% | 10.49% | ________ |
1 Institutional Shares may only be purchased by certain categories of investors and are not subject to sales charges or distribution fees.
2 The S&P 500 Index is an unmanaged index of stocks chosen for their size and industry characteristics. It is widely recognized as representative of stocks in the United States. Index returns assume the reinvestment of dividends and, unlike Fund returns, do not reflect any fees or expenses. You cannot invest directly in the Index. The beginning date for the Index is 05/29/85. S&P 500 Index is a registered mark of Standard & Poor’s.
Securities issued by large-cap companies tend to be less volatile than securities issued by smaller companies. Larger companies, may not be able to attain the high growth rates of successful smaller companies, and may be unable to respond as quickly to competitive challenges.
Investing in foreign markets can be more volatile than the U.S. market due to increased risks of adverse issuer, political, regulatory, market or economic developments and can perform differently than the U.S. market. S&P 500 Index is the registered mark of Standard & Poor’s.
PEAR TREE PANAGORA DYNAMIC EMERGING MARKETS FUND
INVESTMENT PROFILE
All Data as of September 30, 2015
| Fund Information | ||
| Net Assets Under Management | $112.8 Million | |
| Number of Companies | 177 | |
| Price to Book Ratio | 1.2 | |
| Price to Earnings Ratio | 9.2 | |
| Ordinary | Institutional | |
| Total Expense Ratio (Gross)* | 1.88% | 1.62% |
| Total Expense Ratio (Net)* | 1.88% | 1.62% |
| Ticker Symbol | QFFOX | QEMAX |
| * per prospectus dated August 1, 2015. See financial highlights for total expense ratios for the six months ended September 30, 2015. | ||
Investment Commentary
For the semi-annual period ended September 30, 2015, the Pear Tree PanAgora Dynamic Emerging Markets Fund’s Ordinary Shares (the “Fund”) outperformed its benchmark, the MSCI Emerging Markets Index (the “Index”). The Fund achieved a return of (16.13%) at net asset value compared to (17.11%) for the Index.
Market Conditions and Investment Strategies
On a country basis, the largest contributors were China 0.57% and United States 0.36%. Among holdings in China, the largest contributor was an overweight position in Gome Electrical Appliances, while among the holdings in the United States; the largest contributor was holding Pear Tree PanAgora Risk Parity Emerging Markets Fund. The largest detractors for the period were Poland (0.25%) and Russia (0.20%). Among holdings in Poland, the largest detractor was an overweight in KGHM Polska Miedz SA, while among the holdings in Russia, the largest detractor was not holding Sberbank PAO.
On a sector basis, the largest contributors were Information Technology 0.41% and Materials 0.35%. Among the holdings in Information Technology, the largest contributor was not holding Hanergy Thin Film Power Group, while among the holdings in Materials; the largest contributor was an overweight position of Hyosung Corporation. The largest detractors for the period were Industrials (0.22%) and Health Care (0.06%). Among the holdings in Industrials, the largest detractor was an overweight position of Turk Hava Yollari AO, while among the holdings in Health Care; the largest detractor was not holding Dr. Reddy’s Laboratories.
For the semi-annual period ended September 2015, our proprietary Dynamic Alpha model performed well — best-ranked alpha stocks outperformed the worst-ranked alpha stocks. Our proprietary Quality composite performed well — stocks with strong business and management quality metrics outperformed their lower quality peers. Our proprietary Valuation composite performed well — stocks with attractive valuations outperformed their more expensive peers. Our proprietary Momentum composite did not perform well — stocks with positive market sentiment underperformed stocks with poor price and earnings momentum.
Portfolio Changes
There were no significant portfolio changes during the semi-annual period ending September 30, 2015.
A Look Ahead
As a quantitative investment firm, we tend not to provide strategy-specific forward looking commentary. We believe that our systematic investment approach ensures that we deliver a portfolio of our highest conviction of ideas to all of our clients.
The Fund’s portfolio is managed by Dmitri Kantsyrev Ph.D., CFA and Jane Zhou, Ph.D of PanAgora Asset Management, Inc.
PEAR TREE PANAGORA DYNAMIC EMERGING MARKETS FUND
Top 10 Holdings
| Percentage of total net assets | 46.8% |
| Pear Tree PanAgora Risk Parity Emerging Markets | 31.0% |
| Samsung Electronics Company, Ltd. | 3.8% |
| China Mobile Limited | 2.2% |
Taiwan Semiconductor Manufacturing Co., Ltd. | 2.0% |
| Tencent Holdings Limited | 1.9% |
| China Construction Bank Corporation | 1.6% |
| Bank of China Ltd., H | 1.3% |
| Naspers Limited N Shs | 1.1% |
| KT&G Corporation | 1.0% |
| FirstRand Limited | 0.9% |
There is no guarantee that such securities will continue to be viewed favorably or held in the Fund’s portfolio.
Sector Allocation
| Percentage of total net assets | 100.0% |
| Mutual Funds | 31.0% |
| Financials | 18.3% |
| Information Technology | 14.3% |
| Consumer Discretionary | 5.6% |
| Telecommunication Services | 5.5% |
| Materials | 5.3% |
| Industrials | 5.1% |
| Consumer Staples | 5.0% |
| Energy | 4.7% |
| Utilities | 3.0% |
| Health Care | 1.3% |
| CASH + other assets (net) | 0.9% |
Top 10 Country Allocations
| Percentage of total net assets | 59.8% |
| Taiwan | 11.0% |
| China | 10.9% |
| South Korea | 9.8% |
| Hong Kong | 7.2% |
| South Africa | 5.4% |
| India | 5.2% |
| Brazil | 3.9% |
| Russia | 2.7% |
| Mexico | 2.0% |
| Malaysia | 1.7% |
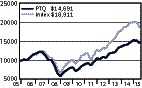
Value of a $10,000 Investment
Pear Tree PanAgora Dynamic Emerging Markets (PTEM) Ordinary Shares vs. MSCI EM Index
Average Annual Total Returns
| 3Q 2015 | Six Months | One Year | Five Year | Ten Year | Since Inception | Inception Date | |
| Ordinary Shares | (16.63)% | (16.13)% | (18.62)% | (2.83)% | 3.03% | 4.60% | 09/30/94 |
Institutional Shares1 | (16.56)% | (16.04)% | (18.41)% | (2.58)% | 3.30% | 6.08% | 04/02/96 |
MSCI EM2 | (17.78)% | (17.11)% | (18.98)% | (3.25)% | 4.60% | 4.11% | ________ |
1 Institutional Shares may only be purchased by certain categories of investors and are not subject to sales charges or distribution fees.
2 The Morgan Stanley Capital International Emerging Markets (“MSCI EM”) Index is an unmanaged index comprised of stocks located in countries other than the United States. It is widely recognized as representative of the general market for emerging markets. Index returns assume the reinvestment of dividends and, unlike Fund returns, do not reflect fees or expenses. You cannot invest directly in an Index. The beginning date for the Index is 09/30/94.
3 “Top 10 Holdings”, “Sector Allocation”, and “Top 10 Country Allocation” reflect the direct and indirect (through the Fund’s investment in Pear Tree PanAgora Risk Parity Emerging Markets Fund) securities holdings.
Investing in foreign markets, particularly emerging markets, can be more volatile than the U.S. market due to increased risks of adverse issuer, political, regulatory, market or economic developments and can perform differently than the U.S. market.
PEAR TREE PANAGORA RISK PARITY EMERGING MARKETS FUND
INVESTMENT PROFILE
All Data as of September 30, 2015
| Fund Information | ||
| Net Assets Under Management | $36.7 Million | |
| Number of Companies | 585 | |
| Price to Book Ratio | 1.6 | |
| Price to Earnings Ratio | 14.5 | |
| Ordinary | Institutional | |
| Total Expense Ratio (Gross) | 1.60% | 1.34% |
| Total Expense Ratio (Net) | 1.60% | 1.34% |
| Ticker Symbol | RPEMX | EMPRX |
| * per prospectus dated August 1, 2015. See financial highlights for total expense ratios for the six months ended September 30, 2015. | ||
Investment Commentary
For the semi-annual period ended September 30, 2015, the Pear Tree PanAgora Risk Parity Emerging Markets Fund’s Ordinary Shares (the “Fund”) outperformed its benchmark, the MSCI Emerging Markets Index (the “Index”). The Fund achieved a return of (15.93%) at net asset value compared to (17.11%) for the Index.
Market Conditions and Investment Strategies
On a country basis, the largest contributors were China 0.52% and Qatar 0.49%. Among holdings in China, the largest contributor was an underweight to Hanergy Thin Film Power Group, while among holdings in Qatar, the largest contributor was an overweight in Qatar Electricity & Water Co. The largest detractors were Indonesia (1.08%) and India (0.22%). Among holdings in Indonesia, the largest detractor was an overweight to Perusahaan Gas Negara Perser, while among holdings in India, the largest detractor was an underweighted holding in Infosys Ltd.
On a sector basis, the largest contributors were Financials 1.20% and Information Technology 0.47%. Among holdings in Financials, the largest contributor was holding Banco Bradesco SA-Pref, while among holdings in Information Technology, the largest contributor was holding. Samsung Electric-GDR. The largest detractors for the period were Telecom Services (0.18%) and Industrials (0.03%). Among holdings in Telecom Services, the largest detractor was holding China Mobile Ltd., while among holdings in Industrials, the largest detractor was holding Jasa Marga (Persero) TBK PT.
Portfolio Changes
There were no significant portfolio changes during the semi-annual period ended September 30, 2015.
A Look Ahead
As a quantitative investment firm, we tend not to provide strategy-specific forward looking commentary. We believe that our systematic investment approach ensures that we deliver a portfolio of our highest conviction of ideas to all of our clients.
The Fund’s portfolio is managed by Edward Qian, Ph.D., CFA and Mark Barnes of PanAgora Asset Management, Inc.
PEAR TREE PANAGORA RISK PARITY EMERGING MARKETS FUND
Top 10 Holdings
| Percentage of total net assets | 15.9% |
| iPath MSCI India Index ETN | 5.3% |
| Vanguard FTSE Emerging Markets ETF | 4.8% |
| Qatar Electricity & Water Company Q.S.C. | 1.1% |
| Industries Qatar Q.S.C. | 1.0% |
| Universal Robina Corporation | 0.7% |
| Jollibee Foods Corporation | 0.7% |
| Ooredoo Q.S.C. | 0.6% |
| Globe Telecom, Inc. | 0.6% |
| DP World Ltd. | 0.6% |
| Aboitiz Power Corporation | 0.5% |
There is no guarantee that such securities will continue to be viewed favorably or held in the Fund’s portfolio.
Sector Allocation
| Percentage of total net assets | 100.0% |
| Financials | 18.8% |
| Consumer Staples | 10.9% |
| Industrials | 10.8% |
| Telecommunication Services | 10.0% |
| Consumer Discretionary | 9.4% |
| Materials | 8.7% |
| Utilities | 8.1% |
| Energy | 6.4% |
| Health Care | 3.6% |
| Information Technology | 2.5% |
| Exchange Traded Funds | 5.0% |
| Exchange Traded Notes | 5.3% |
| Cash and Other Assets (Net) | 0.5% |
Top 10 Country Allocations
| Percentage of total net assets | 59.5% |
| Taiwan | 6.9% |
| Malaysia | 6.7% |
| Qatar | 6.7% |
| Indonesia | 6.6% |
| Philippines | 6.4% |
| Mexico | 5.7% |
| Thailand | 5.5% |
| South Korea | 5.3% |
| Chile | 4.9% |
| South Africa | 4.8% |
Value of a $10,000 Investment
Pear Tree PanAgora Risk Parity Emerging Markets (PTRP) Ordinary Shares vs. MSCI EM Index

Average Annual Total Returns
| 3Q 2015 | Six Months | One Year | Five Year | Ten Year | Since Inception | Inception Date | |
| Ordinary Shares | (15.41)% | (15.93)% | (22.24)% | (7.84)% | 6/27/2013 | ||
Institutional Shares1 | (15.42)% | (15.85)% | (22.05)% | (7.51)% | 6/27/2013 | ||
MSCI EM2 | (17.78)% | (17.11)% | (18.98)% | (3.69)% | ________ |
1 Institutional Shares may only be purchased by certain categories of investors and are not subject to sales charges or distribution fees.
2 The Morgan Stanley Capital International Emerging Markets (“MSCI EM”) Index is an unmanaged index comprised of stocks located in countries other than the United States. It is widely recognized as representative of the general market for emerging markets. Index returns assume the reinvestment of dividends and, unlike Fund returns, do not reflect fees or expenses. You cannot invest directly in an Index. The beginning date for the Index is 06/27/2013.
Investing in foreign markets, particularly emerging markets, can be more volatile than the U.S. market due to increased risks of adverse issuer, political, regulatory, market or economic developments and can perform differently than the U.S. market.
PEAR TREE POLARIS FOREIGN VALUE FUND
INVESTMENT PROFILE
All Data as of September 30, 2015
| Fund Information | ||
| Net Assets Under Management | $1,564.1 Million | |
| Number of Companies | 55 | |
| Price to Book Ratio | 1.7 | |
| Price to Earnings Ratio | 15.6 | |
| Ordinary | Institutional | |
| Total Expense Ratio (Gross)* | 1.52% | 1.27% |
| Total Expense Ratio (Net)* | 1.52% | 1.27% |
| Ticker Symbol | QFVOX | QFVIX |
| * per prospectus dated August 1, 2015. See financial highlights for total expense ratios for the six months ended September 30, 2015. | ||
Investment Commentary
For the semi-annual period ended September 30, 2015, the Pear Tree Polaris Foreign Value Fund’s Ordinary Shares (the “Fund”) underperformed its benchmark, the MSCI EAFE Index (the “Index”). The Fund achieved a return of (10.18%) at net asset value compared to (9.43%) for the Index.
Market Conditions and Investment Strategies
Although international markets were in positive territory through the end of June, commodity price volatility dragged down stocks in the subsequent months. Materials and energy companies bore the brunt of this commodity price decline. Defensive sectors fared well, with notable consumer discretionary, telecom and utilities returns. U.K. homebuilders experienced consistent sales progress in a more favorable regulatory environment. Freenet AG was a standout in the telecom industry, publishing strong revenues backed by demand for mobile digital lifestyle services. Hong Kong water utility Guangdong Investment Ltd. announced plans to acquire water treatment facilities. Investors were excited about the prospects for the water treatment plant in water-constrained China.
These gains could not offset losses elsewhere in the portfolio, including energy stocks WorleyParsons and Tullow Oil. Chinese lottery company REXlot Holdings detracted, as the trading suspension continued and the price was valued downward. Materials company Methanex saw methanol prices drop more than 30% due to lower commodity prices and competitive pressures from China. U.K.-based bank, Standard Chartered, was impacted by rising impairment levels in India, significant exposure to European commodity traders and lesser emerging-market lending. The company halved dividends to ensure sufficient capital on hand.
Portfolio Changes
During the semi-annual period, Irish building materials supplier CRH PLC was sold when the company exhibited a less favorable risk/return profile than new portfolio investments. Japanese dairy, confectionery and pharmaceutical company Meiji Holdings was sold, when optimistic market sentiment drove the stock price to the upper valuation target. Transgene, the French biopharmaceutical company, was sold when it did not meet expected operational expectations. The Fund purchased Australia’s WorleyParsons, a business involved in the engineering and design of oil and mining exploration and production. Kia Motors, a South Korean motor vehicle manufacturer, was also added.
A Look Ahead
Our outlook remains constructive over the medium term. The reset of commodity prices will make it difficult for higher cost materials and energy producers, but will usher in a wave of disruptive technologies and lower-priced, efficient competitors. Lower gasoline and other commodity prices may ultimately have a positive effect on consumer purchasing power. There is clear evidence of this consumer trend in the U.S., Japan, India and other countries. However, headwinds exist within China and many European countries. To that end, our research team has identified a wealth of foreign companies that can potentially weather stock market volatility and thrive in a recovery.
The Fund’s lead portfolio manager is Bernard R. Horn, Jr., of Polaris Capital Management, LLC.
PEAR TREE POLARIS FOREIGN VALUE FUND
Top 10 Holdings
| Percentage of total net assets | 28.0% |
| Taylor Wimpey plc | 3.4% |
| Barratt Developments plc | 3.2% |
| Infosys Technologies Ltd. | 2.9% |
| Bellway plc | 2.9% |
| Persimmon plc | 2.8% |
| Deutsche Telekom AG | 2.8% |
| Freenet AG | 2.6% |
| Kia Motors Corporation | 2.6% |
| Hannover Ruck SE | 2.4% |
| Teva Pharmaceuticals SP | 2.4% |
There is no guarantee that such securities will continue to be viewed favorably or held in the Fund’s portfolio.
Sector Allocation
| Percentage of total net assets | 100.0% |
| Consumer Discretionary | 23.7% |
| Materials | 20.5% |
| Financials | 13.1% |
| Industrials | 7.7% |
| Telecommunication Services | 7.7% |
| Information Technology | 7.0% |
| Energy | 5.6% |
| Consumer Staples | 4.6% |
| Health Care | 4.6% |
| Utilities | 2.3% |
| CASH + other assets (net) | 3.2% |
Top 10 Country Allocations
| Percentage of total net assets | 80.5% |
| Germany | 20.4% |
| United Kingdom | 19.5% |
| Sweden | 7.6% |
| France | 7.2% |
| Japan | 6.2% |
| South Korea | 4.4% |
| Finland | 4.3% |
| Norway | 4.3% |
| Australia | 3.7% |
| India | 2.9% |
Value of a $10,000 Investment
Pear Tree Polaris Foreign Value (PTFV) Ordinary Shares vs. MSCI EAFE Index
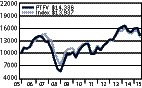
Average Annual Total Returns
| 3Q 2015 | Six Months | One Year | Five Year | Ten Year | Since Inception | Inception Date | |
| Ordinary Shares | (11.13)% | (10.18)% | (6.88)% | 6.28% | 4.10% | 6.05% | 05/15/98 |
Institutional Shares1 | (11.06)% | (10.06)% | (6.63)% | 6.56% | 4.34% | 7.59% | 12/18/98 |
MSCI EAFE2 | (10.19)% | (9.43)% | (8.27)% | 4.45% | 3.44% | 3.96% | ________ |
1 Institutional Shares may only be purchased by certain categories of investors and are not subject to sales charges or distribution fees.
2 The Morgan Stanley Capital International Europe, Australia, and Far East (“MSCI EAFE”) Index is an unmanaged index comprised of stocks in countries other than the United States. It is widely recognized as representative of the general market for developed foreign markets. Index returns assume the reinvestment of dividends and, unlike Fund returns, do not reflect any fees or expenses. You cannot invest directly in an Index. The beginning date for the Index is 05/29/98.
Investing in foreign markets, particularly emerging markets, can be more volatile than the U.S. market due to increased risks of adverse issuer, political, regulatory, market or economic developments and can perform differently than the U.S. market.
PEAR TREE POLARIS FOREIGN VALUE SMALL CAP FUND
INVESTMENT PROFILE
All Data as of September 30, 2015
| Fund Information | ||
| Net Assets Under Management | $563.6 Million | |
| Number of Companies | 77 | |
| Price to Book Ratio | 1.7 | |
| Price to Earnings Ratio | 13.3 | |
| Ordinary | Institutional | |
| Total Expense Ratio (Gross)* | 1.57% | 1.32% |
| Total Expense Ratio (Net)* | 1.57% | 1.32% |
| Ticker Symbol | QUSOX | QUSIX |
| * per prospectus dated August 1, 2015. See financial highlights for total expense ratios for the fiscal year ended March 31, 2015. | ||
Investment Commentary
For the semi-annual period ended September 30, 2015, the Pear Tree Polaris Foreign Value Small Cap Fund’s Ordinary Shares (the “Fund”) underperformed its benchmark, the MSCI ACWI ex USA Small Cap Index (the “Index”). The Fund achieved a return of (9.44%) at net asset value compared to (6.02%) for the Index.
Market Conditions and Investment Strategies
Although international small-cap markets were in positive territory through the end of June, commodity price volatility dragged down stocks in the subsequent months. Commodity price declines understandably hindered the global energy market. WorleyParsons, an Australian engineering and design company, saw slowing demand as its customers are primarily in oil and gas exploration and production business. Italian ground engineering company, Trevi Finanziaria, declined after a customer postponed delivery of oil rigs. Chinese lottery company REXlot Holdings detracted, as the stock trading suspension continued and the price was valued down.
However, there were many notable individual stock performers. Alternative Networks boosted telecom sector returns, as the company announced good earnings, healthy cash flows, market share gains and the successful integration of two recent acquisitions. Germany’s Freenet AG recorded subscriber growth coupled with stable revenue per subscriber. In consumer discretionary, Japanese car dealer VT Holdings Co. had strong returns after announcing a 3% increase in fiscal year-end sales and outperformance in a down market. Danish shipping and logistics company DFDS AS announced impressive quarterly earnings. All areas of shipping activity improved, including the U.K. passenger and English Channel business units. In IT, NIIT Technologies had double-digit gains, citing robust international sales and penetration in the banking and financial services industry.
Portfolio Changes
During the semi-annual period, the following purchases were conducted: Lancashire Holdings, a specialty insurance company out of the U.K.; IBJ Leasing Co., a Japanese general leasing group; Redes Energeticas Nacionais, a Portuguese utility company; Australia-based paper goods supplier Asaleo Care Ltd.; a small U.K. homebuilder; residential developer, Taiwan’s Chong Hong Construction; an oil and gas engineering company; and Egypt Kuwait Holding Company, a fertilizer and chemicals manufacturer as well as gas distributor. The Fund did not complete any sales.
A Look Ahead
Our outlook remains constructive over the medium term. The reset of commodity prices will make it difficult for higher cost materials and energy producers, but will usher in a wave of disruptive technologies and lower-priced, efficient competitors. Lower gasoline and other commodity prices may ultimately have a positive effect on consumer purchasing power. There is clear evidence of this consumer trend in the U.S., Japan, India and other countries. However, headwinds exist within China, many European countries and emerging economies in South America. To that end, our research team has identified a wealth of foreign small-cap companies that can potentially weather stock market volatility and thrive in a recovery.
The Fund’s lead portfolio manager is Bernard R. Horn, Jr., of Polaris Capital Management, LLC
PEAR TREE POLARIS FOREIGN VALUE SMALL CAP FUND
Top 10 Holdings
| Percentage of total net assets | 20.5% |
| Dräegerwerk AG | 2.2% |
| Wetherspoon (J.D.) plc | 2.2% |
| Lancashire Holdings Limited | 2.2% |
| Thai Union Group PCL | 2.1% |
| Alternative Networks plc | 2.1% |
| DFDS A.S. | 2.1% |
| UDG Healthcare plc | 2.0% |
| Freenet AG | 1.9% |
| Sixt SE | 1.9% |
Ratchaburi Electricity Generating Holding PCL | 1.8% |
There is no guarantee that such securities will continue to be viewed favorably or held in the Fund’s portfolio.
Sector Allocation
| Percentage of total net assets | 100.0% |
| Consumer Discretionary | 25.7% |
| Financials | 13.9% |
| Industrials | 13.0% |
| Consumer Staples | 10.3% |
| Information Technology | 7.8% |
| Utilities | 6.4% |
| Telecommunication Services | 6.1% |
| Health Care | 5.9% |
| Materials | 5.1% |
| Energy | 1.7% |
| CASH + other assets (net) | 4.1% |
Top 10 Country Allocations
| Percentage of total net assets | 70.9% |
| United Kingdom | 16.1% |
| Japan | 14.3% |
| Germany | 6.5% |
| Hong Kong | 6.3% |
| India | 5.9% |
| Ireland | 5.7% |
| Thailand | 5.0% |
| Norway | 4.2% |
| Taiwan | 3.5% |
| Australia | 3.4% |
Value of a $10,000 Investment
Pear Tree Polaris Foreign Value Small Cap (PTFVSC) Ordinary Shares vs. MSCI ACWI ex USA Small Cap Index
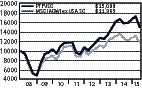
Average Annual Total Returns
| 3Q 2015 | Six Months | One Year | Five Year | Ten Year | Since Inception | Inception Date | |
Ordinary Shares | (13.08)% | (9.44)% | (4.95)% | 6.44% | — | 5.71% | 5/1/2008 |
Institutional Shares1 | (12.99)% | (9.28)% | (4.65)% | 6.72% | — | 5.96% | 5/1/2008 |
MSCI World ex USA Small Cap2 | (9.95)% | (6.02)% | (6.09)% | 4.21% | — | 2.45% | ________ |
1 Institutional Shares may only be purchased by certain categories of investors and are not subject to sales charges or distribution fees.
2 The MSCI ACWI ex USA Small Cap Index captures small cap representation across 22 of 23 Developed Markets (DM) countries (excluding the United States). With 2,372 constituents, the index covers approximately 14% of the free float-adjusted market capitalization in each country. You cannot invest directly in an index. The beginning date of the Index is May 01, 2008.
Investing in foreign markets, particularly emerging markets, can be more volatile than the U.S. market due to increased risks of adverse issuer, political, regulatory, market or economic developments and can perform differently than the U.S. market.
PEAR TREE POLARIS SMALL CAP FUND
SCHEDULE OF INVESTMENTS
September 30, 2015 (Unaudited)
Common Stock—98.5%
| Shares | Value | |
| AIRLINES—1.6% | ||
| Spirit Airlines, Inc. (a) | 13,226 | $ 625,590 |
| Virgin America Inc. (a)(b) | 24,696 | 845,344 |
| 1,470,934 | ||
| AUTO COMPONENTS—1.5% | ||
| Motorcar Parts of America, Inc. (a) | 43,206 | 1,354,076 |
| BUILDING PRODUCTS—1.5% | ||
| NCI Building Systems, Inc. (a) | 38,474 | 406,670 |
| Trex Company, Inc. (a) | 28,700 | 956,571 |
| 1,363,241 | ||
| CAPITAL MARKETS—1.8% | ||
| Greenhill & Co., Inc. | 31,132 | 886,328 |
| Hercules Technology Growth Capital, Inc. | 69,483 | 702,473 |
| 1,588,801 | ||
| CHEMICALS—2.3% | ||
| Ferro Corporation (a) | 188,035 | 2,058,983 |
| COMMERCIAL BANKS—23.1% | ||
| Ameris Bancorp (c) | 117,700 | 3,383,875 |
| Astoria Financial Corporation | 120,100 | 1,933,610 |
| BNC Bancorp | 86,200 | 1,916,226 |
| Brookline Bancorp, Inc. | 156,000 | 1,581,840 |
| Bryn Mawr Bank Corporation | 54,146 | 1,682,316 |
| Central Pacific Financial Corporation | 83,883 | 1,759,027 |
| CoBiz Financial, Inc. | 103,909 | 1,351,856 |
| Dime Community Bancshares, Inc. | 96,900 | 1,637,610 |
| F.N.B. Corporation | 117,880 | 1,526,546 |
| International Bancshares Corporation | 60,700 | 1,519,321 |
| Pinnacle Financial Partners, Inc. (a) | 28,369 | 1,401,713 |
| Southwest Bancorp, Inc. | 88,700 | 1,455,567 |
| 21,149,507 | ||
| COMMERCIAL SERVICES & SUPPLIES—0.8% | ||
| Acacia Research Corporation | 49,227 | 446,981 |
| ARC Document Solutions, Inc. (a) | 51,309 | 305,289 |
| 752,270 | ||
| COMMUNICATIONS EQUIPMENT—0.3% | ||
| Applied Optoelectronics, Inc. | 8,015 | 150,522 |
| Ubiquiti Networks, Inc. (b) | 2,775 | 94,045 |
| 244,567 | ||
| CONSTRUCTION & ENGINEERING—1.2% | ||
| Tutor Perini Corporation (a) | 67,371 | $ 1,108,927 |
| CONSTRUCTION MATERIALS—0.6% | ||
| U.S. Concrete, Inc. (a) | 10,960 | 523,778 |
| DIVERSIFIED TELECOMMUNICATIONS—1.5% | ||
| Fairpoint Communications, Inc. (a) | 88,200 | 1,359,162 |
| ELECTRIC UTILITIES—1.6% | ||
| ALLETE, Inc. | 29,600 | 1,494,504 |
| FOOD PRODUCTS—0.8% | ||
| Amira Nature Foods Ltd (a)(b) | 129,217 | 713,278 |
| HEALTH CARE EQUIPMENT & SUPPLIES—2.9% | ||
| Natus Medical, Inc. (a) | 66,220 | 2,612,379 |
| HOTELS, RESTAURANTS & LEISURE—1.7% | ||
| Papa Johns International, Inc. | 22,128 | 1,515,325 |
| INSURANCE—1.2% | ||
| United Insurance Holdings Corporation | 81,741 | 1,074,894 |
| IT SERVICES—7.4% | ||
| Alliance Data Systems Corporation (a) | 13,791 | 3,571,593 |
| Cardtronics, Inc. (a) | 46,183 | 1,510,184 |
| Luxoft Holding, Inc. (a) | 26,281 | 1,663,325 |
| 6,745,102 | ||
| LIFE SCIENCES TOOLS & SERVICES—0.9% | ||
| Cambrex Corporation (a) | 21,397 | 849,033 |
| MACHINERY—0.7% | ||
| Greenbrier Companies, Inc. (The) (b) | 21,068 | 676,493 |
| MEDIA—10.1% | ||
| Cinemark Holdings, Inc. | 43,191 | 1,403,276 |
| Entravision Communications Corporation, Class A | 222,064 | 1,474,505 |
| IMAX Corporation (a)(b) | 88,331 | 2,984,704 |
| National CineMedia, Inc. | 98,995 | 1,328,513 |
| Regal Entertainment Group (b) | 106,911 | 1,998,167 |
| 9,189,165 | ||
| OIL & GAS—0.4% | ||
| Carrizo Oil & Gas, Inc. (a) | 12,741 | 389,110 |
| OIL, GAS & CONSUMABLE FUELS—1.4% | ||
| Diamondback Energy, Inc. (a) | 16,670 | 1,076,882 |
| SemGroup Corporation | 4,302 | 186,018 |
| 1,262,900 | ||
| PHARMACEUTICALS—0.2% | ||
| Pernix Therapeutics Holdings, Inc. (a)(b) | 56,983 | $180,066 |
| PROFESSIONAL SERVICES—3.9% | ||
| Kforce, Inc. | 119,694 | 3,145,558 |
| WageWorks, Inc. (a) | 7,985 | 359,964 |
| 3,505,522 | ||
| REAL ESTATE TRUSTS (REITS)—12.9% | ||
| Brandywine Realty Trust | 27,912 | 343,876 |
| DuPont Fabros Technology, Inc. | 49,205 | 1,273,425 |
| Education Realty Trust, Inc. | 58,957 | 1,942,633 |
| EPR Properties | 79,410 | 4,095,174 |
| Hersha Hospitality Trust | 63,083 | 1,429,461 |
| Physicians Realty Trust | 115,622 | 1,744,736 |
| Select Income Reit | 45,722 | 869,175 |
| 11,698,480 | ||
| ROAD & RAIL—0.9% | ||
| Swift Transportation Company (a) | 54,714 | 821,804 |
SEMICONDUCTORS AND SEMICONDUCTOR EQUIPMENT—7.8% | ||
| Ambarella, Inc. (a) | 54,324 | 3,139,384 |
| Canadian Solar, Inc. (a)(b) | 30,403 | 505,298 |
| Integrated Device Technology, Inc. (a) | 107,839 | 2,189,132 |
| Microsemi Corporation (a) | 34,728 | 1,139,773 |
| 6,973,587 | ||
| SOFTWARE—1.4% | ||
| Verint Systems, Inc. (a) | 30,324 | 1,308,481 |
| SPECIALTY RETAIL—3.3% | ||
| Asbury Automotive Group, Inc. (a) | 27,946 | 2,267,818 |
| Restoration Hardware Holdings, Inc. (a) | 7,958 | 742,561 |
| 3,010,379 | ||
| TEXTILES & APPAREL & LUXURY GOODS—1.4% | ||
| Deckers Outdoor Corporation (a) | 21,663 | 1,257,754 |
| TRADING COMPANIES & DISTRIBUTORS—1.4% | ||
| Air Lease Corporation | 42,296 | 1,307,792 |
TOTAL COMMON STOCK (Cost $77,992,723) | 89,560,294 | |
| Short Term Investments—1.4% | Par Value | Value |
| State Street Bank & Trust Co., Repurchase Agreement 0.0%, 10/01/15, (Dated 09/30/15), Collateralized by $1,220,000 par U.S. Treasury Note-3.125% due 05/15/2021, Market Value $1,336,472, Repurchase Proceeds $1,308,283 (Cost $1,308,283) | $1,308,283 | 1,308,283 |
| TOTAL INVESTMENTS (EXCLUDING INVESTMENTS PURCHASED WITH CASH COLLATERAL FROM SECURITIES LOANED)—99.9% | ||
| (Cost $79,301,006) | 90,868,577 | |
| INVESTMENTS PURCHASED WITH CASH COLLATERAL FROM SECURITIES LOANED—5.6 % | ||
| Money Market—5.6 % | ||
Western Asset Institutional Cash Reserves—Inst. (Cost $5,142,860) | 5,142,860 | |
TOTAL INVESTMENTS—105.5 % (Cost $84,443,866) | 96,011,437 | |
| OTHER ASSETS & LIABILITIES (NET)—(5.5)% | (5,131,346) | |
| NET ASSETS—100% | $90,880,091 |
| (a) | Non-income producing security |
| (b) | All or a portion of this security was out on loan. |
| (c) | A portion of this security is restricted. |
| The percentage of each investment category is calculated as a percentage of net assets. |
PEAR TREE QUALITY FUND
SCHEDULE OF INVESTMENTS
September 30, 2015 (Unaudited)
Common Stock—99.8%
| Shares | Value | |
| AEROSPACE & DEFENSE—0.9% | ||
| Precision Castparts Corp. | 3,592 | $ 825,118 |
| United Technologies Corporation | 3,151 | 280,408 |
| 1,105,526 | ||
| BEVERAGES—4.0% | ||
| Coca-Cola Company (The) | 116,468 | 4,672,696 |
| BIOTECHNOLOGY—0.5% | ||
| Biogen Idec Inc. (a) | 2,099 | 612,509 |
| CHEMICALS—1.1% | ||
| Monsanto Company | 12,097 | 1,032,358 |
| Syngenta AG (c) | 3,754 | 239,430 |
| 1,271,788 | ||
| COMMUNICATIONS EQUIPMENT—2.5% | ||
| QUALCOMM Incorporated | 54,028 | 2,902,924 |
| COMPUTERS & PERIPHERALS—6.4% | ||
| Apple, Inc. | 38,270 | 4,221,181 |
| EMC Corporation | 44,930 | 1,085,509 |
| International Business Machines | 10,455 | 1,515,661 |
| Teradata Corporation (a) | 22,501 | 651,629 |
| 7,473,980 | ||
| DISTRIBUTORS—0.3% | ||
| Genuine Parts Company | 4,043 | 335,124 |
| ELECTRICAL EQUIPMENT—1.6% | ||
| Emerson Electric Co. | 20,592 | 909,549 |
| Honeywell International Inc. | 6,162 | 583,480 |
| Rockwell Automation, Inc. | 3,715 | 376,961 |
| 1,869,990 | ||
| ELECTRONIC EQUIPMENT & INSTRUMENTS—0.3% | ||
| Amphenol Corporation | 6,037 | 307,646 |
| FOOD PRODUCTS—4.9% | ||
| Nestle, S.A. (c) | 37,483 | 2,820,221 |
| Unilever N.V. (c) | 34,987 | 1,406,477 |
| Unilever plc (c) | 36,384 | 1,483,740 |
| 5,710,438 | ||
| FOOD STAPLES & DRUG RETAILING—4.1% | ||
| Costco Wholesale Corporation | 7,378 | 1,066,637 |
| CVS Caremark Corporation | 7,293 | 703,629 |
| PepsiCo, Inc. | 11,498 | 1,084,262 |
| Wal-Mart Stores, Inc. | 30,047 | 1,948,247 |
| 4,802,775 | ||
| HEALTH CARE EQUIPMENT & SUPPLIES—5.0% | ||
| Becton, Dickinson and Company | 5,863 | 777,786 |
| C. R. Bard, Inc. | 466 | 86,820 |
| Intuitive Surgical, Inc. (a) | 737 | 338,710 |
| Medtronic plc | 40,059 | 2,681,549 |
| St. Jude Medical, Inc. | 7,562 | 477,087 |
| Stryker Corporation | 10,755 | 1,012,046 |
| Zimmer Holdings, Inc. | 4,480 | 420,806 |
| 5,794,804 | ||
| HEALTH CARE PROVIDERS & SERVICES—6.9% | ||
| Anthem, Inc. | 1,136 | 159,040 |
| Express Scripts Holding Company (a) | 48,654 | 3,939,028 |
| Henry Schein, Inc. (a) | 365 | 48,443 |
| Humana Inc. | 5,003 | 895,537 |
| UnitedHealth Group, Inc. | 26,219 | 3,041,666 |
| 8,083,714 | ||
| HOTELS, RESTAURANTS & LEISURE—1.6% | ||
| Compass Group PLC (a)(c) | 53,682 | 863,744 |
| McDonald’s Corporation | 10,521 | 1,036,634 |
| 1,900,378 | ||
| HOUSEHOLD PRODUCTS—7.8% | ||
| Church & Dwight Co., Inc. | 3,892 | 326,539 |
| Colgate-Palmolive Company | 26,574 | 1,686,386 |
| Procter & Gamble Company (The) | 71,723 | 5,159,753 |
| Reckitt Benckiser Group plc | 21,019 | 1,904,216 |
| 9,076,894 | ||
| INDUSTRIAL CONGLOMERATES—2.4% | ||
| 3M Company | 19,897 | 2,820,798 |
| INTERNET & CATALOG RETAIL—0.0% | ||
| TripAdvisor, Inc. (a) | 162 | 10,209 |
| IT CONSULTING & SERVICES—2.8% | ||
| Accenture plc | 18,682 | 1,835,693 |
| Cognizant Technology Solutions Corporation (a) | 17,226 | 1,078,520 |
| Paychex, Inc. | 7,813 | 372,133 |
| 3,286,346 | ||
| MACHINERY—2.6% | ||
| Danaher Corporation | 19,622 | 1,671,991 |
| Dover Corporation | 3,524 | 201,502 |
| Illinois Tool Works, Inc. | 13,417 | 1,104,353 |
| 2,977,846 | ||
| OIL & GAS—0.4% | ||
| Chevron Corporation | 6,226 | 491,107 |
| PERSONAL PRODUCTS—0.2% | ||
| Estee Lauder Companies, Inc. (The) | 3,046 | 245,751 |
| PHARMACEUTICALS & BIOTECHNOLOGY—11.2% | ||
| Abbott Laboratories | 39,945 | 1,606,588 |
| AstraZeneca plc (c) | 139,725 | 4,446,049 |
| Eli Lilly and Company | 3,697 | 309,402 |
| Johnson & Johnson | 60,714 | 5,667,652 |
| Novartis AG (c) | 6,712 | 616,967 |
| Pfizer Inc. | 13,698 | 430,254 |
| 13,076,912 | ||
| RETAILING—0.4% | ||
| TJX Companies, Inc. (The) | 6,051 | 432,162 |
| SEMICONDUCTOR EQUIPMENTS & PRODUCTS—0.7% | ||
| Analog Devices, Inc. | 8,925 | 503,459 |
| Linear Technology Corporation | 1,685 | 67,990 |
| Xilinx, Inc. | 6,946 | 294,510 |
| 865,959 | ||
| SOFTWARE & SERVICES—19.7% | ||
| Cisco Systems, Inc. | 149,369 | 3,920,936 |
| Citrix Systems, Inc. (a) | 5,581 | 386,652 |
| eBay, Inc. (a) | 20,637 | 504,368 |
| Alphabet Inc. (a) | 7,216 | 4,606,478 |
| Alphabet Inc. C (a) | 2,380 | 1,448,040 |
| Intuit Inc. | 6,685 | 593,294 |
| MasterCard Incorporated | 7,702 | 694,104 |
| Microsoft Corporation | 112,080 | 4,960,661 |
| Oracle Corporation | 135,057 | 4,878,259 |
| PayPal Holdings, Inc. | 20,986 | 651,405 |
| SAP AG (b)(c) | 5,242 | 339,629 |
22,983,826 | ||
| SPECIALTY RETAIL—0.4% | ||
| Bed Bath & Beyond Inc. (a) | 6,687 | $381,293 |
| Ross Stores, Inc. | 746 | 36,159 |
| 417,452 | ||
| TEXTILES & APPAREL—3.1% | ||
| Burberry Group plc (a)(c) | 4,091 | 84,438 |
| LVMH Moët Hennessy-Louis Vuitton S.A. (a)(c) | 22,854 | 777,265 |
| Nike, Inc. B | 15,508 | 1,907,019 |
| Swatch Group AG (The) (a)(c) | 11,437 | 211,241 |
| V.F. Corporation | 9,675 | 659,932 |
| 3,639,895 | ||
| TOBACCO—5.8% | ||
| British American Tobacco p.l.c. (c) | 23,871 | 2,627,720 |
| Philip Morris International, Inc. | 47,301 | 3,752,388 |
| Reynolds American, Inc. | 9,902 | 438,362 |
| 6,818,470 | ||
| TRADING COMPANIES & DISTRIBUTION—0.3% | ||
| W.W. Grainger, Inc. | 1,739 | 373,902 |
| WIRELESS TELECOMMUNICATIONS—1.9% | ||
| KDDI Corporation (a)(c) | 90,040 | 1,012,050 |
| NTT DOCOMO, Inc. (a)(c) | 68,427 | 1,155,048 |
| 2,167,098 | ||
| TOTAL COMMON STOCK | ||
| (Cost $112,904,052) | 116,528,919 | |
| Short Term Investments—0.1% | ||
| Par Value | Value | |
| State Street Bank & Trust Co., Repurchase Agreement .0%, 10/01/15, (Dated 09/30/15), Collateralized by 120,000 par U.S. Treasury Note-3.125% due 05/15/2021, Market Value $313,456.28, Repurchase Proceeds $123,652.20 (Cost $123,652) | $123,652 | 123,652 |
| TOTAL INVESTMENTS (EXCLUDING INVESTMENTS PURCHASED WITH CASH COLLATERAL FROM SECURITIES LOANED)—99.9% | ||
| (Cost $113,027,704) | 116,652,571 | |
| Money Market—0.3% | ||
Western Asset Institutional Cash Reserves—Inst. (Cost $339,300) | $339,300 | $339,300 |
| TOTAL INVESTMENTS 100.2% | ||
| (Cost $113,367,004) | $116,991,871 | |
| OTHER ASSETS & LIABILITIES (NET)—(0.2%) | (243,563) | |
| NET ASSETS—100% | $116,748,308 |
| (a) | Non-Income producing security |
| (b) | All or a portion of this security is out on loan |
| (c) | ADR—American Depositary Receipts |
| The percentage of each investment category is calculated as a percentage of net assets. |
PEAR TREE PANAGORA DYNAMIC EMERGING MARKETS FUND
SCHEDULE OF INVESTMENTS
September 30, 2015 (Unaudited)
Common Stock—66.4%
| Shares | Value | |
| BRAZIL—3.1% | ||
| Ambev SA (c) | 73,334 | $ 359,337 |
| Banco do Brasil S.A. | 110,712 | 425,062 |
| Companhia Brasileira de Distribuicao SP (c) | 10,938 | 137,163 |
| Cyrela Brazil Realty S.A. Empreendimentos e Participacoes | 219,400 | 458,307 |
| Energias do Brasil S.A. | 86,200 | 249,956 |
| JBS S.A. | 161,000 | 683,203 |
| KLABIN S.A. | 111,000 | 613,458 |
| Petroleo Brasileiro S.A. | 43,583 | 94,013 |
| Petroleo Brasileiro S.A. (a)(c) | 37,232 | 137,014 |
| Sul America S.A. | 36,400 | 164,117 |
| Transmissora Alianca de Energia Eletrica S.A. | 37,200 | 179,188 |
| 3,500,818 | ||
| CHINA—10.9% | ||
| Agricultural Bank of China, Class H | 702,000 | 264,489 |
| Bank of China Ltd., H | 3,395,392 | 1,458,886 |
| Beijing Capital International Airport Co., Ltd. H | 230,000 | 214,562 |
| China Construction Bank Corporation | 2,735,422 | 1,817,685 |
| China Life Insurance Co,. Limited | 141,000 | 487,575 |
| China Petroleum & Chemical Corporation | 919,810 | 561,366 |
| China Telecom Corporation Limited | 1,426,000 | 682,622 |
| China Yuchai International Ltd. | 12,626 | 156,184 |
| Datang International Power Generation Co., Ltd. | 1,126,000 | 422,784 |
| Dongfeng Motor Group Company Limited | 352,881 | 439,838 |
| Great Wall Motor Co., Ltd. | 430,500 | 479,370 |
| Guangzhou R&F Properties Co., Ltd. H (a)(b) | 502,400 | 453,121 |
| Huaneng Power International Inc. H | 662,000 | 713,233 |
| Industrial & Commercial Bank of China Ltd. | 1,685,911 | 970,190 |
| Jiangsu Expressway Co. Ltd.—H | 156,000 | 199,272 |
| PetroChina Company Limited | 867,778 | 600,151 |
| Ping An Insurance Group H Share | 135,500 | 671,363 |
| Shanghai Electric Group Company Ltd. H (b) | 842,000 | 458,471 |
| Sino-Ocean Land Holdings Ltd. | 283,500 | 152,537 |
| Sinotrans Ltd. H Shares | 1,241,000 | 584,456 |
| Zhejiang Expressway Co., Ltd. | 486,000 | 531,764 |
| 12,319,919 | ||
| CZECH REPUBLIC—0.6% | ||
| CEZ A.S. | 33,471 | 695,542 |
| HONG KONG—7.2% | ||
| ANTA Sports Products, Ltd. | 257,000 | 664,867 |
| Central China Real Estate Ltd. | 364,371 | 68,171 |
| Cheung Kong Holdings Ltd. | 31,500 | 229,030 |
| China Mobile Limited | 206,279 | 2,435,360 |
| Chongqing Rural Commercial Bank Co. | 1,009,687 | 573,227 |
| CK Hutchison Holdings Ltd. | 37,000 | 480,271 |
| CNOOC Limited | 348,218 | 356,746 |
| Franshion Properties (China) Ltd. | 534,000 | 132,980 |
| KWG Property Holding Limited | 776,419 | 508,917 |
| Longfor Properties Co., Ltd. | 154,000 | 194,134 |
| Orient Overseas (International) Limited | 40,500 | 189,692 |
| Pacific Textiles Holdings Ltd. | 105,000 | 142,254 |
| Tencent Holdings Limited | 130,100 | 2,173,873 |
| 8,149,522 | ||
| HUNGARY—0.7% | ||
| MOL Hungarian Oil an Gas Nyrt. | 3,620 | 157,667 |
| Richter Gedeon Nyrt | 38,876 | 617,293 |
| 774,960 | ||
| INDIA—5.2% | ||
| Apollo Tyres Ltd. | 216,717 | 593,958 |
| Bharat Petroleum Corporation Ltd. | 31,040 | 401,572 |
| Cairn India Ltd. | 140,759 | 331,204 |
| Chambal Fertilizers & Chemicals Ltd. | 166,995 | 149,339 |
| Grasim Industries Limited | 1,766 | 94,945 |
| Hindustan Petroleum Corporation Ltd. | 52,688 | 617,784 |
| Hindustan Zinc Ltd. | 75,774 | 160,460 |
| Housing Development Finance Corp Ltd. | 17,371 | 320,744 |
| IFCI Ltd. | 309,512 | 101,615 |
| Indiabulls Housing Finance Limited | 16,703 | 202,044 |
| IndianOil Corporation Ltd. | 51,240 | 314,200 |
| Infosys Technologies Ltd. (c) | 23,342 | 445,599 |
| Power Finance Corporation Limited | 160,324 | 560,914 |
| Reliance Industries Ltd. | 11,098 | 145,750 |
| Rural Electrification Corporation Limited | 193,956 | 809,627 |
| SRF Limited | 6,678 | 114,963 |
| Tata Chemicals Ltd. | 23,612 | 137,791 |
| Tata Consultancy Services Ltd. | 3,299 | 129,919 |
| United Phosphorus Limited | 40,058 | 280,143 |
5,912,571 | ||
| INDONESIA—0.5% | ||
| PT Indofood CBP Sukses Makmur Tbk | 121,700 | 103,009 |
| PT Matahari Putra Prima Tbk | 733,200 | 96,092 |
| PT United Tractors Tbk | 334,400 | 398,883 |
| 597,984 | ||
| MALAYSIA—1.7% | ||
| British American Tobacco (Malaysia) Berhad | 19,044 | 261,328 |
| Cahya Mata Sarawak Berhad | 81,000 | 94,898 |
| DiGi.Com Berhad | 450,900 | 569,299 |
| JCY International Berhad | 351,500 | 53,576 |
| Lafarge Malaysia Berhad | 33,880 | 69,367 |
| Malaysia Building Society Berhad | 437,112 | 145,182 |
| MISC Berhad | 93,700 | 187,581 |
| Telekom Malaysia Berhad | 244,078 | 370,913 |
| YTL Corporation Berhad | 290,800 | 105,848 |
| 1,857,992 | ||
| MEXICO—2.0% | ||
| America Movil S.A.B. de C.V., Series L | 818,270 | 680,217 |
| Controladora Comercial Mexicana S.A. de C.V. | 61,200 | 177,500 |
| Fomento Economico Mexicano S.A.B. (c) | 3,048 | 272,034 |
| GRUMA, S.A.B. de C.V., Series B | 72,007 | 990,541 |
| Grupo Televisa S.A.B. (c) | 3,324 | 86,491 |
| 2,206,783 | ||
| PERU—0.6% | ||
| Credicorp Ltd. | 6,773 | 720,376 |
| PHILIPPINES—1.1% | ||
| Aboitiz Equity Ventures, Inc. | 109,830 | 135,584 |
| Aboitiz Power Corporation | 151,900 | 140,395 |
| BDO Unibank, Inc. | 179,840 | 398,234 |
| Globe Telecom, Inc. | 3,020 | 151,711 |
| Megaworld Corporation | 1,574,100 | 147,172 |
| Nickel Asia Corporation | 376,600 | 51,567 |
| Puregold Price Club, Inc. | 137,900 | 91,461 |
| Security Bank Corporation | 31,380 | 92,112 |
| Semirara Mining and Power Corporation | 26,640 | 77,572 |
| 1,285,808 | ||
| POLAND—1.2% | ||
| Asseco Poland S.A. | 9,174 | 130,236 |
| KGHM Polska Miedz S.A. | 25,065 | 539,900 |
| POLAND (continued) | ||
| PGE S.A. | 127,133 | 450,448 |
| Tauron Polska Energia S.A. | 247,010 | 212,954 |
| 1,333,538 | ||
| RUSSIA—2.7% | ||
| Gazprom (c) | 161,201 | 648,028 |
| LUKoil (c) | 21,648 | 735,166 |
| MMC Norilsk Nickel P.J.S.C. (c) | 53,022 | 760,600 |
| Severstal (b)(d) | 87,653 | 929,122 |
| 3,072,916 | ||
| SINGAPORE—1.2% | ||
| ComfortDelGro Corporation Limited | 196,000 | 395,236 |
| Mapletree Industrial Trust | 162,300 | 169,342 |
| Singapore Airlines Limited | 60,000 | 451,080 |
| Yangzijiang Shipbuilding Holdings Limited | 432,100 | 344,587 |
| 1,360,245 | ||
| SOUTH AFRICA—5.4% | ||
| African Rainbow Minerals Limited | 16,964 | 63,659 |
| AVI Limited | 35,317 | 223,719 |
| Barloworld Limited | 63,740 | 347,694 |
| FirstRand Limited | 298,175 | 1,060,249 |
| Investec Ltd. | 35,389 | 271,002 |
| Liberty Holdings Limited | 29,618 | 270,521 |
| Mediclinic International, Ltd. | 40,114 | 320,477 |
| Mondi Limited | 7,568 | 158,894 |
| MTN Group Limited | 28,460 | 366,495 |
| Naspers Limited N Shs | 9,502 | 1,189,707 |
| Netcare Limited | 181,349 | 476,250 |
| RMB Holdings Ltd. | 154,077 | 734,799 |
| Sappi Ltd. (a) | 58,572 | 180,091 |
| Sasol Ltd. | 4,770 | 133,757 |
| Standard Bank of South Africa Ltd. | 16,340 | 159,588 |
| Tsogo Sun Holdings Ltd. | 49,688 | 86,992 |
| 6,043,894 | ||
| SOUTH KOREA—8.9% | ||
| BGF Retail Co., Ltd. | 2,146 | 365,723 |
| Coway Co., Ltd. | 7,001 | 494,376 |
| GS Retail Co., Ltd. | 11,637 | 598,884 |
| Hanwha Corporation | 15,210 | 498,531 |
| Hite Jinro Co., Ltd. | 8,040 | 154,655 |
| Hyosung Corporation | 6,796 | 645,027 |
| Hyundai Motor Company Ltd. | 1,376 | 190,386 |
| Hyundai Steel Co., Ltd. | 4,482 | 194,738 |
| Kangwon Land Inc. | 17,197 | 613,712 |
| KT&G Corporation | 12,338 | 1,160,623 |
| LG Display Co., Ltd. | 31,963 | 610,784 |
| Samsung Electronics Company, Ltd. | 3,362 | 3,216,492 |
| Shinhan Financial Group Co., Ltd. | 3,798 | 132,656 |
| SK Hynix Inc. | 5,551 | 157,121 |
| SK Telecom Co., Ltd. (c) | 12,428 | 303,243 |
| Woori Bank | 85,742 | 679,252 |
| 10,016,203 | ||
| TAIWAN—11.0% | ||
| ASUSTeK Computer, Inc. | 106,488 | 913,609 |
| Chailease Holding Co., Ltd. | 144,876 | 226,592 |
| Chinatrust Financial Holding Co., Ltd. | 1,509,260 | 776,918 |
| Chunghwa Telecom Co., Ltd. | 202,600 | 607,908 |
| CTCI Corporation | 52,000 | 62,222 |
| Farglory Land Development Co., Ltd. | 143,302 | 151,016 |
| Fubon Financial Holding Co., Ltd. | 651,000 | 1,014,237 |
| Highwealth Construction Corp. | 146,300 | 206,160 |
| Hon Hai Precision Industry Co., Ltd. | 373,677 | 971,430 |
| Innolux Corporation | 226,000 | 70,352 |
| Kings Town Bank | 90,000 | 63,822 |
| MediaTek, Inc. | 34,000 | 251,431 |
| Mega Financial Holding Co., Ltd. | 869,000 | 601,722 |
| Pegatron Corporation | 392,416 | 955,790 |
| Pou Chen Corporation | 319,000 | 478,100 |
| Powertech Technology, Inc. | 492,000 | 886,056 |
| Realtek Semiconductor Corporation | 128,000 | 216,913 |
| Ruentex Development Company Limited | 147,000 | 160,047 |
| Ruentex Industries Ltd. | 47,000 | 83,216 |
| Simplo Technology Co., Ltd. | 54,000 | 173,836 |
| Taiwan Semiconductor Manufacturing Co., Ltd. | 576,270 | 2,275,153 |
| Transcend Information, Inc. | 28,000 | 70,579 |
| United Microelectronics Corporation | 2,262,401 | 742,052 |
| Vanguard International Semiconductor Corp. | 279,000 | 316,049 |
| Wan Hai Lines, Ltd. | 218,000 | 137,046 |
12,412,256 | ||
| THAILAND—1.2% | ||
| Delta Electronics PCL | 150,100 | $363,929 |
| Krung Thai Bank PCL | 1,405,146 | 662,019 |
| Thanachart Capital PCL | 320,300 | 280,191 |
| 1,306,139 | ||
| TURKEY—1.0% | ||
| Eregli Demir ve Celik Fabrikalari T.A.S. | 283,253 | 349,146 |
| Tofas Turk Otomobil Fabrikasi A.S. | 36,755 | 218,024 |
| Turk Hava Yollari A.O. | 133,156 | 350,706 |
| Turkiye Is Bankasi A.S. | 106,310 | 165,470 |
| 1,083,346 | ||
| UNITED ARAB EMERATES—0.2% | ||
| Abu Dhabi Commercial Bank | 108,344 | 225,655 |
| TOTAL COMMON STOCK | ||
| (Cost $86,788,754) | 74,876,467 | |
| Preferred Stock—1.7% | ||
| BRAZIL—0.8% | ||
| Banco Bradesco S.A. | 40,366 | 218,399 |
| Cia Energetica de Sao Paulo | 60,700 | 233,202 |
| Itau Unibanco Holding S.A. | 56,107 | 375,700 |
| Metalurgica Gerdau S.A. | 122,700 | 90,499 |
| 917,800 | ||
| SOUTH KOREA—0.9% | ||
| Samsung Electronics Co. Ltd. | 1,310 | 1,013,473 |
| TOTAL PREFERRED STOCK | ||
| (Cost $3,816,714) | 1,931,273 | |
Mutual Funds—31.0% | ||
| UNITED STATES—31.0% | ||
Pear Tree PanAgora Risk Parity Emerging Markets Fund* (Cost 42,984,903) | 4,254,123 | 35,011,431 |
| Short Term Investments—0.7% | ||
| Par Value | Value | |
| State Street Bank & Trust Co., Repurchase Agreement .0%, 10/01/15, (Dated 09/30/15), Collateralized by 695,000 par U.S. Treasury Note-3.125% due 05/15/2021, Market Value $761,350.96, Repurchase Proceeds $743,699.39 (Cost $743,669) | $743,669 | 743,669 |
| TOTAL INVESTMENTS (EXCLUDING INVESTMENTS PURCHASED WITH CASH COLLATERAL FROM SECURITIES LOANED) | ||
| (Cost $134,334,040) | 112,562,840 | |
| INVESTMENTS PURCHASED WITH CASH COLLATERAL FROM SECURITIES LOANED—1.0% | ||
| Money Market—1.0% | ||
| Western Asset Institutional Cash Reserves—Inst. (Cost $1,197,749) | 1,197,749 | $1,197,749 |
| TOTAL INVESTMENTS—100.8% | ||
| (Cost $135,531,789) | 113,760,589 | |
| OTHER ASSETS & LIABILITIES (Net)—(0.8%) | (940,942) | |
| NET ASSETS—100% | $112,819,647 |
| * | Investment in affiliated security. This Fund is advised by Pear Tree Advisors, Inc. which also serves as advisor to Pear Tree PanAgora Dynamic Emerging Markets Fund. |
| (a) | Non-income producing security. |
| (b) | All or a portion of this security was out on loan. |
| (c) | ADR—American Depositary Receipts |
| (d) | GDR—Global Depositary Receipts |
| The percentage of each investment category is calculated as a percentage of net assets. |
SECTOR ALLOCATIONS (as a percentage of Total Net Assets) | |
| Financials | 18.3% |
| Information Technology | 14.3% |
| Consumer Discretionary | 5.6% |
| Telecommunication Services | 5.5% |
| Materials | 5.3% |
| Industrials | 5.1% |
| Consumer Staples | 5.0% |
| Energy | 4.7% |
| Utilities | 3.0% |
| Health Care | 1.3% |
| Mutual Funds | 31.0% |
| Cash and Other Assets (Net) | 0.9% |
PEAR TREE PANAGORA RISK PARITY EMERGING MARKETS FUND
SCHEDULE OF INVESTMENTS
September 30, 2015 (Unaudited)
Common Stock—87.2%
| Shares | Value | |
| BRAZIL—2.5% | ||
| Banco do Brasil S.A. | 2,400 | $ 9,214 |
| BRF S.A. | 1,300 | 23,179 |
| CCR S.A. | 8,300 | 25,514 |
| Cetip S.A. Mercados Organizados | 2,200 | 18,282 |
| CIA Paranaense de Energia (c) | 3,284 | 26,962 |
| Cielo S.A. | 6,480 | 60,004 |
| Companhia Energetica de Minas Gerais (c) | 7,462 | 13,282 |
| Cosan S.A. Industria e Comercio | 9,000 | 45,762 |
| CPFL Energia S.A. (a)(c) | 1,707 | 12,803 |
| Cyrela Brazil Realty S.A. Empreendimentos e Participacoes | 10,300 | 21,516 |
| Embraer S.A. (c) | 2,049 | 52,413 |
| Fibria Celulose S.A. | 2,000 | 27,179 |
| Gerdau S.A. (c) | 9,500 | 13,015 |
| Hypermarcas S.A. (a) | 2,800 | 10,807 |
| KLABIN S.A. | 5,000 | 27,633 |
| Kroton Educacional S.A. | 7,792 | 15,175 |
| Localiza Rent a Car S.A. | 5,500 | 33,953 |
| Lojas Americanas S.A. | 11,375 | 33,875 |
| Lojas Renner S.A.. | 5,000 | 23,238 |
| Natura Cosméticos S.A. | 1,300 | 6,403 |
| Odontoprev S.A. | 21,500 | 51,863 |
| Porto Seguro S.A. | 2,600 | 19,768 |
| Qualicorp S.A. | 5,900 | 22,116 |
| Raia Drogasil S.A. | 4,400 | 43,455 |
| Souza Cruz S.A. | 2,100 | 14,216 |
| Telefonica Brasil S.A. (c) | 3,869 | 35,324 |
| TIM Participacoes S.A. (c) | 2,643 | 24,976 |
| Totvs S.A. | 8,300 | 63,188 |
| Tractebel Energia S.A. | 1,900 | 16,202 |
| Transmissora Alianca de Energia Eletrica S.A. | 6,100 | 29,383 |
| Ultrapar Participacoes S.A. | 2,800 | 47,244 |
| Vale S.A. | 3,500 | 14,658 |
| Via Varejo S.A. | 3,300 | 3,301 |
| Weg S.A. | 9,580 | 37,386 |
| 923,289 | ||
| CHILE—4.6% | ||
| AES Gener S.A. | 162,417 | 74,845 |
| Aguas Andinas S.A. | 138,946 | 72,205 |
| Banco de Chile | 842,384 | 87,768 |
| Banco de Crédito e Inversiones | 1,694 | 69,182 |
| Banco Santander Chile (c) | 4,438 | 80,860 |
| CHILE (continued) | ||
| Cencosud S.A. | 25,242 | 49,099 |
| Colbun S.A. | 329,877 | 84,296 |
| Compania Cervecerias Unidas S.A. (c) | 4,663 | 103,285 |
| Corpbanca S.A. (c) | 5,000 | 66,650 |
| Empresa Nacional de Electricidad S.A. (c) | 1,685 | 59,834 |
| Empresa Nacional de Telecomunicaciones S.A. | 16,707 | 157,138 |
| Empresas CMPC S.A. | 53,790 | 138,218 |
| Empresas Copec S.A. | 15,338 | 138,934 |
| Enersis S.A. (c) | 5,367 | 67,839 |
| LATAM Airlines Group S.A. (a) | 13,801 | 66,270 |
| Quimica y Minera de Chile S.A. (c) | 5,466 | 79,476 |
| S.A.C.I. Falabella | 25,236 | 156,301 |
| Sonda S.A. | 48,729 | 73,309 |
| Vina Concha y Toro S.A. | 44,985 | 74,464 |
| 1,699,973 | ||
| CHINA—4.0% | ||
| Air China Ltd H Shares | 34,000 | 27,068 |
| Aluminum Corporation of China Limited H Shares (a) | 114,000 | 35,449 |
| Anhui Conch Cement Company Limited H | 8,500 | 24,951 |
| Bank of Communications Co., Ltd. H | 40,000 | 27,715 |
| BBMG Corporation H | 30,000 | 20,632 |
| Beijing Capital International Airport Co., Ltd. H | 34,000 | 31,718 |
| Beijing Enterprises Holdings Limited | 2,500 | 15,000 |
| Belle International Holdings Limited | 18,000 | 15,561 |
| Brilliance China Automotive Holdings, Ltd. | 8,000 | 9,414 |
| BYD Co., Ltd. H Shares (a) | 2,500 | 13,161 |
| China Agri-Industries Holdings Limited (a) | 45,000 | 15,445 |
| China Coal Energy Co., Ltd. (b) | 49,000 | 19,916 |
| China Communications Construction Co., Ltd., Class H | 15,000 | 18,406 |
| China Communications Services Corporation Ltd. H | 106,000 | 40,758 |
| China Construction Bank Corporation | 37,000 | 24,586 |
| China Longyuan Power Group H | 33,000 | 35,426 |
| China National Building Material Co., Ltd. H | 38,000 | 21,868 |
| China Oilfield Services Limited H | 18,000 | 17,976 |
| China Petroleum & Chemical Corporation | 52,000 | 31,736 |
| China Pharmaceutical Group Limited | 44,000 | 38,549 |
| China Shenhua Energy Co., Ltd. | 18,500 | 28,310 |
| China Shipping Container Lines Co., Ltd. H (a) | 42,000 | 12,627 |
| China Taiping Insurance Holdings Co., Ltd. (a) | 7,400 | 22,963 |
| China Telecom Corporation Limited | 142,000 | 67,975 |
| Chongqing Changan Automobile Co., Ltd. B | 10,400 | 17,565 |
| CITIC Pacific Ltd. | 18,000 | 32,748 |
| Datang International Power Generation Co., Ltd. | 68,000 | 25,532 |
| Dongfeng Motor Group Company Limited | 14,000 | 17,450 |
| ENN Energy Holdings Ltd. | 4,000 | 19,200 |
| Fosun International | 23,500 | 40,267 |
| Haitian International Holdings Ltd. | 16,000 | 26,384 |
| Huadian Power International Corp. Ltd. Class H | 30,000 | 23,341 |
| Huaneng Power International Inc. H | 44,000 | 47,405 |
| Industrial & Commercial Bank of China Ltd. | 39,000 | 22,443 |
| Inner Mongolia Yitai Coal Co., Ltd., Class B | 27,000 | 22,059 |
| Jiangsu Expressway Co. Ltd.—H | 20,000 | 25,548 |
| Kingsoft Corporation Ltd. | 11,000 | 21,432 |
| PetroChina Company Limited (c) | 505 | 35,198 |
| Shandong Weigao Group Medical Polymer Co., Ltd. | 36,000 | 22,761 |
| Shanghai Fosun Pharmaceutical Group Class H | 12,000 | 37,702 |
| Shanghai Pharmaceuticals Holding Co., Ltd. | 18,500 | 38,622 |
| Shenzhou International Group | 6,000 | 30,889 |
| Sino Biopharmaceutical Limited | 40,000 | 49,031 |
| Sino-Ocean Land Holdings Ltd. | 49,000 | 26,364 |
| Sinopec Shanghai Petrochemical Co., Ltd. (a) | 111,000 | 42,394 |
| Sinopharm Group Co., Ltd. H | 9,600 | 33,630 |
| Tingyi (Cayman Islands) Holding Corporation | 10,000 | 15,922 |
| Tsingtao Brewery Co., Ltd. | 4,000 | 17,548 |
| Uni-President China Holdings Limited | 36,000 | 34,652 |
| Yanzhou Coal Mining Company Limited (b) | 38,000 | 16,867 |
| Zhejiang Expressway Co., Ltd. | 20,000 | 21,883 |
| Zijin Mining Group Co., Ltd. | 116,000 | 30,384 |
| ZTE Corporation H | 17,560 | 40,104 |
| 1,452,535 | ||
| COLOMBIA—1.6% | ||
| Almacenes Exito S.A. | 17,303 | 74,512 |
| Cementos Argos S.A. | 19,778 | 60,633 |
| Corporacion Financiera Colombiana S.A. | 3,321 | 40,962 |
| Ecopetrol S.A. | 119,423 | 51,582 |
| Grupo Argos S.A. | 11,384 | 66,177 |
| Grupo de Inversiones Suramericana SA | 6,194 | 72,174 |
| Interconexión Electrica S.A. | 45,457 | 105,552 |
| Isagen S.A. E.S.P. | 119,975 | 112,213 |
583,805 | ||
| CZECH REPUBLIC—0.5% | ||
| CEZ A.S. | 4,364 | 90,686 |
| Komercni Banka A.S. | 389 | 84,157 |
| 174,843 | ||
| EGYPT—0.7% | ||
| Commercial International Bank | 19,631 | 132,001 |
| Global Telecom Holding S.A.E. (a)(d) | 52,387 | 60,245 |
| Talaat Moustafa Group (TMG) Holding | 63,617 | 54,842 |
| 247,088 | ||
| GREECE—0.9% | ||
| Alpha Bank A.E. (a) | 90,703 | 10,833 |
| Eurobank Ergasias S.A. (a) | 237,768 | 5,839 |
| Folli-Follie S.A. | 1,701 | 34,555 |
| Hellenic Telecommunication Organization S.A. | 10,873 | 94,664 |
| Jumbo S.A. | 4,399 | 38,545 |
| Opap S.A. | 6,900 | 62,230 |
| Piraeus Bank S.A. (a) | 70,614 | 6,148 |
| Titan Cement Company S.A. | 4,109 | 92,647 |
| 345,461 | ||
| HONG KONG—1.9% | ||
| AAC Technologies Holdings Inc. (b) | 9,000 | 56,089 |
| Alibaba Health Information Technology Ltd. (a) | 24,000 | 15,112 |
| ANTA Sports Products, Ltd. | 12,000 | 31,044 |
| China Gas Holdings Ltd. | 20,000 | 27,406 |
| China Merchants Holdings International Co., Ltd. | 6,000 | 17,612 |
| China Mobile Limited | 5,000 | 59,031 |
| China Resources Cement Holdings Limited | 14,000 | 6,322 |
| China Resources Enterprise | 8,000 | 14,843 |
| China Resources Gas Group Limited | 12,000 | 30,781 |
| China Resources Power Holdings Co., Ltd. | 16,000 | 36,252 |
| China Unicom (Hong Kong) Limited (c) | 5,202 | 66,430 |
| Franshion Properties (China) Ltd. | 50,000 | 12,451 |
| GCL-Poly Energy Holdings Ltd. (a) | 104,000 | 20,129 |
| Guangdong Investment Limited | 48,000 | 71,596 |
| Hanergy Thin Film Power Group Ltd. (a) | 36,000 | 2,520 |
| Hengan International Group Co., Ltd. | 2,500 | 24,322 |
| Lee & Man Paper Manufacturing Ltd. | 47,000 | 23,833 |
| Lenovo Group Limited | 26,000 | 21,907 |
| Semiconductor Manufacturing International Corp. (a) | 267,000 | 24,460 |
| Shanghai Industrial Holdings Limited | 11,000 | 24,270 |
| Sihuan Pharmaceutical Holdings Group Ltd. | 48,000 | 13,656 |
| Soho China Limited | 31,000 | 12,040 |
| Sun Art Retail Group Ltd. (b) | 33,500 | 25,762 |
| Tencent Holdings Limited | 2,000 | 33,418 |
| Want Want China Holdings Limited | 29,000 | 23,686 |
| 694,972 | ||
| HUNGARY—0.5% | ||
| MOL Hungarian Oil an Gas Nyrt. | 1,311 | 57,100 |
| OTP Bank Nyrt. | 3,402 | 65,538 |
| Richter Gedeon Nyrt | 3,883 | 61,656 |
| 184,294 | ||
| INDONESIA—6.6% | ||
| PT Adaro Energy Tbk | 2,110,900 | 77,087 |
| PT Astra Agro Lestari Tbk | 50,400 | 62,355 |
| PT Astra International Tbk | 214,500 | 76,503 |
| PT Bank Central Asia Tbk | 71,500 | 59,909 |
| PT Bank Danamon Indonesia Tbk | 166,400 | 32,882 |
| PT Bank Mandiri Tbk | 86,500 | 46,793 |
| PT Bank Negara Indonesia (Persero) Tbk | 133,300 | 37,624 |
| PT Bank Rakyat Indonesia Tbk | 75,800 | 44,756 |
| PT Bumi Serpong Damai Tbk | 472,900 | 45,353 |
| PT Charoen Pokphand Indonesia Tbk | 379,300 | 51,782 |
| PT Global Mediacom Tbk | 910,600 | 58,428 |
| PT Gudang Garam Tbk | 35,000 | 100,341 |
| PT Indocement Tunggal Prakarsa Tbk | 108,800 | 122,168 |
| PT Indofood CBP Sukses Makmur Tbk | 105,400 | 89,212 |
| PT Indofood Sukses Makmur Tbk | 208,400 | 78,239 |
| PT Jasa Marga (Persero) Tbk | 411,400 | 135,495 |
| PT Kalbe Farma Tbk | 1,940,900 | 182,166 |
| PT Lippo Karawaci Tbk | 822,300 | 63,427 |
| PT Matahari Department Store Tbk | 68,000 | 74,730 |
| PT Media Nusantara Citra Tbk | 613,100 | 68,634 |
| PT Perusahaan Gas Negara (Persero) Tbk | 640,800 | 110,664 |
| PT Semen Indonesia (Persero) Tbk | 168,500 | 104,090 |
| PT Summarecon Agung Tbk | 481,800 | 36,834 |
| PT Surya Citra Media Tbk | 455,700 | 85,230 |
| PT Tambang Batubara Bukit Asam (Persero) Tbk | 207,900 | 79,825 |
| PT Telekomunikasi Indonesia Tbk (c) | 2,884 | 102,815 |
| PT Unilever Indonesia Tbk | 32,200 | 83,522 |
| PT United Tractors Tbk | 106,100 | 126,559 |
| PT XL Axiata Tbk (a) | 471,500 | 84,162 |
| Tower Bersama Infrastructure (a) | 211,200 | 94,427 |
| 2,416,012 | ||
| MALAYSIA—6.7% | ||
| AirAsia Berhad | 77,200 | 22,480 |
| Alliance Financial Group Berhad | 35,600 | 27,131 |
| AMMB Holdings Berhad | 14,900 | 15,457 |
| Astro Malaysia Holdings Berhad | 74,100 | 47,537 |
| Axiata Group Berhad | 68,600 | 90,515 |
| Berjaya Sports Toto Berhad | 91,581 | 64,169 |
| British American Tobacco (Malaysia) Berhad | 3,700 | 50,773 |
| Bumi Armada Berhad | 228,950 | 48,178 |
| CIMB Group Holdings Berhad | 19,100 | 19,379 |
| Dialog Group Berhad | 151,756 | 55,237 |
| DiGi.Com Berhad | 78,300 | 98,860 |
| Felda Global Ventures Holdings Berhad | 106,400 | 36,308 |
| Gamuda Berhad | 33,700 | 33,656 |
| Genting Berhad | 39,200 | 64,832 |
| Genting Malaysia Berhad | 93,400 | 88,178 |
| Genting Plantation Berhad | 33,500 | 75,524 |
| Hong Leong Bank Berhad | 16,000 | 47,755 |
| Hong Leong Financial Group Berhad | 7,700 | 24,524 |
| IHH Healthcare Berhad | 94,500 | 128,343 |
| IJM Corporation Berhad | 41,200 | 30,180 |
| IOI Corporation Berhad | 77,100 | 71,386 |
| IOI Properties Group Berhad | 70,000 | 31,530 |
| Kuala Lumpur Kepong Berhad | 17,800 | 87,871 |
| Lafarge Malaysia Berhad | 20,500 | 41,972 |
| Malayan Banking Berhad | 19,200 | 37,389 |
| Malaysia Airports Holdings Berhad | 24,400 | 29,142 |
| Maxis Berhad | 67,200 | 100,133 |
| MISC Berhad | 25,600 | 51,250 |
| Petronas Chemicals Group Berhad | 83,600 | 116,773 |
| Petronas Dagangan Berhad | 17,900 | 88,854 |
| Petronas Gas Berhad | 15,800 | 78,933 |
| PPB Group Berhad | 17,100 | 59,986 |
| Public Bank Bhd | 10,400 | 41,451 |
| RHB Capital Berhad | 15,900 | 21,522 |
| SapuraKencana Petroleum Berhad | 85,600 | 36,610 |
| Sime Darby Berhad | 24,800 | 43,950 |
| Telekom Malaysia Berhad | 72,600 | 110,327 |
| Tenaga Nasional Berhad | 33,300 | 91,057 |
| UEM Sunrise Berhad | 89,100 | 24,931 |
| UMW Holdings Berhad | 26,100 | 44,650 |
| YTL Corporation Berhad | 270,100 | 98,313 |
| YTL Power International Berhad | 244,100 | 89,405 |
| 2,466,451 | ||
| MEXICO—5.7% | ||
| Alfa S.A.B. de C.V., Series A | 38,800 | 75,481 |
| America Movil S.A.B. Series L (c) | 9,702 | 160,568 |
| Arca Continental S.A.B. de C.V. | 8,500 | 47,877 |
| Cemex S.A. de C.V. (a)(c) | 4,175 | 29,183 |
| Cemex S.A.B. CPO (a) | 37,315 | 26,052 |
| Coca-Cola FEMSA SAB de C.V. (c) | 744 | 51,619 |
| Compartamos, S.A.B de C.V. | 46,700 | 76,316 |
| Controladora Comercial Mexicana S.A. de C.V. | 17,900 | 51,916 |
| El Puerto de Liverpool S.A.B. de C.V. | 14,500 | 188,277 |
| Fibra Uno Administracion S.A. de C.V. | 27,484 | 56,768 |
| Fomento Economico Mexicano S.A.B. (c) | 514 | 45,875 |
| GRUMA, S.A.B. de C.V., Series B | 4,500 | 61,903 |
| Grupo Aeroportuario del Pacifico S.A.B. (c) | 1,395 | 121,142 |
| Grupo Aeroportuario del Sureste, S. A. B. de C.V., Series B | 4,900 | 74,789 |
| Grupo Bimbo, S.A. de C.V. (a) | 17,700 | 44,812 |
| Grupo Carso SAB de C.V., Series A1 | 17,700 | 79,591 |
| Grupo Comercial Chedraui S.A. de C.V | 21,800 | 56,881 |
| Grupo Financiero Banorte SAB de C.V. | 17,000 | 83,403 |
| Grupo Financiero Inbursa SAB de C.V. | 31,100 | 64,274 |
| Grupo Lala SAB de C.V. | 21,500 | 50,870 |
| Grupo Mexico S.A.B. de C.V., Series B | 17,500 | 42,338 |
| Grupo Televisa S.A.B. (c) | 3,723 | 96,873 |
| Industrias Penoles SAB de C.V. | 6,905 | 94,459 |
| Kimberly-Clark de Mexico S.A. de C.V., Class A | 13,400 | 30,310 |
| Mexichem SAB de C.V. | 21,900 | 53,838 |
| Minera Frisco S.A.B. De C.V. (a)(b) | 46,000 | 24,032 |
| OHL Mexico, S.A.B. de C.V. (a) | 57,400 | 74,036 |
| Promotora Y Operadora de Infraestructura, S.A.B. de C.V. (a) | 7,200 | 78,895 |
| Santander Mexico SAB de C.V. | 48,000 | 71,028 |
| Wal-Mart de Mexico, S.A.B. de C.V. | 30,500 | 75,269 |
2,088,675 | ||
| PERU—0.7% | ||
| Credicorp Ltd. | 934 | 99,340 |
| Companhia de Minas Buenaventura S.A. (c) | 8,926 | 53,199 |
| Southern Copper Corporation (b) | 3,566 | 95,284 |
| 247,823 | ||
| PHILIPPINES—6.4% | ||
| Aboitiz Equity Ventures, Inc. | 69,300 | 85,550 |
| Aboitiz Power Corporation | 208,400 | 192,616 |
| Alliance Global Group, Inc. | 202,900 | 66,505 |
| Ayala Corporation | 4,530 | 74,337 |
| Ayala Land Inc. | 88,100 | 64,086 |
| Bank of the Philippine Islands | 36,516 | 62,735 |
| BDO Unibank, Inc. | 36,690 | 81,246 |
| DMCI Holdings, Inc. | 346,550 | 94,904 |
| Energy Development Corporation | 1,252,300 | 147,361 |
| Globe Telecom, Inc. | 4,505 | 226,310 |
| GT Capital Holdings Inc. | 2,765 | 74,834 |
| International Container Terminal Services, Inc. | 34,340 | 55,139 |
| JG Summit Holdings, Inc. | 65,490 | 99,272 |
| Jollibee Foods Corporation | 63,990 | 263,955 |
| Megaworld Corporation | 569,000 | 53,199 |
| Metro Pacific Investments Corporation | 720,600 | 76,778 |
| Metropolitan Bank & Trust Company | 39,398 | 68,782 |
| Philippine Long Distance Telephone Company (c) | 2,406 | 111,061 |
| Philippine Long Distance Telephone Company (The) | 430 | 20,148 |
| SM Investments Corporation | 5,098 | 97,128 |
| SM Prime Holdings, Inc. | 179,300 | 79,216 |
| Universal Robina Corporation | 65,500 | 269,063 |
| 2,364,225 | ||
| POLAND—4.0% | ||
| Alior Bank S.A. (a) | 2,100 | 43,716 |
| Bank Handlowy w Warszawie S.A. | 1,260 | 26,760 |
| Bank Millennium S.A. (a) | 24,470 | 37,819 |
| Bank Pekao S.A. | 612 | 24,837 |
| Bank Zachodni WBK S.A. | 395 | 30,472 |
| CCC S.A. | 1,510 | 65,071 |
| Cyfrowy Polsat S.A. (a) | 17,925 | 110,107 |
| ENEA S.A. | 14,609 | 51,877 |
| Energa S.A. | 11,210 | 49,678 |
| Eurocash S.A. | 13,304 | 156,240 |
| Getin Noble Bank S.A. (a) | 52,529 | 11,874 |
| Grupa Azoty S.A. (a) | 4,328 | 100,676 |
| Grupa LOTOS S.A. (a) | 11,387 | 83,654 |
| KGHM Polska Miedz S.A. | 2,829 | 60,937 |
| LPP S.A. | 33 | 67,829 |
| mBank S.A. | 215 | 19,609 |
| Orange Polska S.A. | 50,359 | 96,230 |
| PGE S.A. | 13,573 | 48,091 |
| PKO Bank Polski S.A. (a) | 3,149 | 24,359 |
| Polski Koncern Naftowy ORLEN S.A. | 5,873 | 102,191 |
| Polskie Gornictwo Naftowe i Gazownictwo S.A. | 59,510 | 101,984 |
| PZU S.A. | 282 | 28,885 |
| Synthos S.A. | 68,146 | 67,706 |
| Tauron Polska Energia S.A. | 65,807 | 56,734 |
| 1,467,336 | ||
| QATAR—6.7% | ||
| Barwa Real Estate Company Q.S.C. | 9,010 | 105,633 |
| Commercial Bank of Qatar Q.S.C. | 11,751 | 181,971 |
| Doha Bank Q.S.C. | 10,019 | 138,094 |
| Ezdan Holding Group Q.S.C. | 16,396 | 84,184 |
| Gulf International Services Q.S.C. | 10,742 | 191,711 |
| Industries Qatar Q.S.C. | 10,903 | 368,213 |
| Masraf Al Rayan Q.S.C. | 10,116 | 119,433 |
| Ooredoo Q.S.C. | 11,078 | 234,207 |
| Qatar Electricity & Water Company Q.S.C. | 6,947 | 399,413 |
| Qatar Insurance Company | 5,818 | 148,721 |
| Qatar Islamic Bank SAQ | 4,664 | 146,370 |
| Qatar National Bank SAQ | 3,076 | 158,357 |
| Vodafone Qatar | 46,106 | 171,912 |
| 2,448,219 | ||
| RUSSIA—2.9% | ||
| ALROSA ao | 74,800 | 65,650 |
| Federal Hydro-Generating Company RusHydro OAO | 3,102,000 | 28,767 |
| Gazprom (c) | 11,237 | 45,173 |
| Magnit OJSC (Reg S) (d) | 2,394 | 114,361 |
| MegaFon (d) | 3,601 | 43,752 |
| MMC Norilsk Nickel P.J.S.C. (c) | 4,765 | 68,354 |
| Mobile TeleSystems (c) | 5,038 | 36,374 |
| Moscow Exchange MICEX-RTS | 57,010 | 69,693 |
| NovaTek OAO (Reg S) (d) | 370 | 34,225 |
| OAO Rostelecom | 45,640 | 59,130 |
| OC Rosneft OJSC (Reg S) (d) | 11,492 | 42,406 |
| RusHydro P.J.S.C. (b)(c) | 114,561 | 107,687 |
| Sberbank | 38,840 | 44,672 |
| Severstal (d) | 7,131 | 75,589 |
| Sistema JSFC (Reg S) (d) | 9,135 | 62,849 |
| Tatneft (a)(c) | 1,495 | 41,785 |
| Uralkali OJSC | 24,900 | 73,406 |
| VTB Bank OJSC | 58,400,000 | 60,275 |
| 1,074,148 | ||
| SOUTH AFRICA—4.8% | ||
| African Bank Investments Limited (a) | 47,336 | — |
| African Rainbow Minerals Limited | 3,044 | 11,423 |
| Anglogold Ashanti Ltd. (a)(c) | 3,117 | 25,528 |
| Aspen Pharmacare Holdings Limited | 2,007 | 42,688 |
| Barloworld Limited | 13,711 | 74,792 |
| Bidvest Group Limited | 4,777 | 112,740 |
| Discovery Ltd. | 1,769 | 17,618 |
| Exxaro Resources Ltd. | 10,631 | 40,378 |
| Foschini Limited | 3,981 | 40,416 |
| Gold Fields Limited | 3,713 | 9,684 |
| Gold Fields Ltd. (c) | 4,490 | 11,943 |
| Growthpoint Properties Limited | 21,002 | 38,973 |
| Hyprop Investments Limited | 2,183 | 19,064 |
| Impala Platinum Holdings Limited (a) | 2,939 | 8,169 |
| Imperial Holdings Limited | 4,233 | 51,920 |
| Investec Ltd. | 4,159 | 31,849 |
| Life Healthcare Group Holdings Ltd. | 20,143 | 51,893 |
| Massmart Holdings Ltd. | 4,531 | 35,435 |
| Mediclinic International, Ltd. | 7,243 | 57,865 |
| MMI Holdings Ltd. | 13,440 | 23,132 |
| Mondi Limited | 2,017 | 42,348 |
| Mr Price Group Ltd. | 2,605 | 36,373 |
| MTN Group Limited | 3,432 | 44,196 |
| Nampak Ltd. | 7,606 | 14,197 |
| Naspers Limited N Shs | 446 | 55,842 |
| Netcare Limited | 27,555 | 72,364 |
| Pick n Pay Stores Ltd. | 10,396 | 49,865 |
| PPC, Ltd. | 17,830 | 22,058 |
| Redefine Properties Ltd. | 26,601 | 22,516 |
| Remgro Limited | 1,906 | 34,765 |
| RMI Holdings Ltd. | 6,849 | 20,523 |
| Sanlam Limited | 7,618 | 32,958 |
| Sappi Ltd. (a) | 8,232 | 25,311 |
| Sasol Ltd. | 2,679 | 75,122 |
| Shoprite Holdings Ltd. | 3,148 | 35,792 |
| Spar Group Limited (The) | 5,801 | 77,640 |
| Steinoff International Holdings Limited | 14,100 | 86,604 |
| Telkom South Africa Limited | 15,627 | 75,227 |
| Tiger Brands Limited | 2,360 | 52,039 |
| Truworths International Ltd. | 6,076 | 37,372 |
| Vodacom Group (Proprietary) Limited | 8,778 | 87,320 |
| Woolworths Holdings Limited | 9,145 | 64,043 |
| 1,769,985 | ||
| SOUTH KOREA—5.1% | ||
| Amore Pacific Corporation | 162 | 52,620 |
| Amorepacific Group | 360 | 49,506 |
| BS Financial Group, Inc. | 1,490 | 17,222 |
| Celltrion Inc. (a) | 789 | 45,198 |
| CJ CheilJedang Corp. | 116 | 37,238 |
| Daewoo International Corporation | 420 | 7,353 |
| Daewoo Securities Co., Ltd. | 1,770 | 17,770 |
| DGB Financial Group Inc. | 1,410 | 12,491 |
| Dongbu Insurance Co., Ltd. | 443 | 22,911 |
| Doosan Heavy Industries & Construction Co., Ltd. | 1,230 | 21,948 |
| Doosan Infracore Co., Ltd. (a) | 3,730 | 20,675 |
| GS Holdings Corp. | 1,490 | 57,259 |
| Hana Financial Group, Inc. | 490 | 10,914 |
| Hankook Tire Co. Ltd. | 714 | 23,854 |
| Hanmi Pharmaceuticals, Co., Ltd. (a) | 103 | 32,283 |
| Hyosung Corporation | 364 | 34,548 |
| Hyundai Marine & Fire Insurance, Co., Ltd. | 912 | 23,275 |
| Hyundai Mobis Co.,Ltd. | 73 | 14,258 |
| Hyundai Steel Co., Ltd. | 364 | 15,815 |
| Hyundai Wia Corp. | 165 | 17,957 |
| Industrial Bank of Korea | 1,890 | 21,686 |
| Kangwon Land Inc. | 980 | 34,973 |
| KB Financial Group Inc. | 840 | 24,981 |
| Korea Aerospace Industries, Ltd. | 290 | 16,613 |
| Korea Electric Power Corporation | 2,346 | 96,983 |
| Korea Gas Corporation | 1,940 | 65,059 |
| Korea Kumho Petrochemical Co., Ltd. | 401 | 17,998 |
| Korea Zinc Co., Ltd. | 92 | 36,131 |
| KT Corporation (a)(c) | 7,023 | 91,791 |
| KT&G Corporation | 320 | 30,102 |
| LG Chem Ltd. | 141 | 33,962 |
| LG Display Co., Ltd. | 1,436 | 27,441 |
| LG Household & Healthcare | 45 | 32,422 |
| LG Innotek Co., Ltd. | 348 | 25,837 |
| LG Uplus Corp. | 6,740 | 68,805 |
| Lotte Chemical Corporation | 108 | 24,601 |
| Lotte Confectionery Co. Ltd. | 18 | 33,394 |
| Lotte Shopping Co., Ltd. | 148 | 35,648 |
| NCSoft Corporation | 168 | 26,788 |
| Orion Corporation | 42 | 33,379 |
| Paradise Co., Ltd. | 1,235 | 23,391 |
| POSCO | 77 | 10,946 |
| Samsung C&T Corp. (a) | 196 | 24,231 |
| Samsung Card Co, Ltd. | 907 | 27,739 |
| Samsung Electro-Mechanics Co., Ltd. | 282 | 15,298 |
| Samsung Electronics Company, Ltd. | 14 | 13,394 |
| Samsung Fire & Marine Insurance Co., Ltd. | 74 | 17,481 |
| Samsung Life Insurance Co., Ltd | 183 | 15,269 |
| Samsung SDI Company, Ltd. | 221 | 20,230 |
| Shinhan Financial Group Co., Ltd. | 600 | 20,957 |
| Shinsegae Co., Ltd. | 211 | 42,100 |
| SK C&C Co., Ltd. | 135 | 27,790 |
| SK Hynix Inc. | 700 | 19,814 |
| SK Innovation Co., Ltd. | 498 | 41,174 |
| SK Telecom Co., Ltd. (c) | 2,365 | 57,706 |
| S-Oil Corp. | 1,026 | 54,187 |
| Woori Bank | 2,508 | 19,868 |
| Woori Investment & Securities Co., Ltd. | 3,347 | 28,068 |
| Yuhan Co., Ltd. | 409 | 84,022 |
| 1,877,354 | ||
| TAIWAN—6.9% | ||
| Asia Cement Corporation | 56,808 | 55,553 |
| Asia Pacific Telecom Co., Ltd. (a) | 200,000 | 58,128 |
| Chailease Holding Co., Ltd. | 20,800 | 32,532 |
| Cheng Shin Rubber Industry Co., Ltd. | 27,900 | 45,755 |
| Chicony Electronics Co., Ltd. | 18,090 | 41,644 |
| China Airlines Ltd. (a) | 107,000 | 36,558 |
| China Life Insurance Co,. Limited | 41,140 | 31,235 |
| China Steel Corporation | 74,208 | 43,271 |
| Chinatrust Financial Holding Co., Ltd. | 29,985 | 15,435 |
| Chunghwa Telecom Co., Ltd. (c) | 3,356 | 101,418 |
| CTCI Corporation | 38,000 | 45,470 |
| Delta Electronics, Inc. | 10,000 | 46,769 |
| Eclat Textile Co., Ltd. | 2,160 | 34,111 |
| EVA Airways Corporation (a) | 102,108 | 57,058 |
| Evergreen Marine Corporation | 101,000 | 42,483 |
| Far Eastern Department Stores Ltd. | 36,720 | 19,516 |
| Far Eastern New Century Corporation | 61,473 | 54,701 |
| Far EasTone Telecommunications Co., Ltd. | 47,000 | 101,344 |
| Farglory Land Development Co., Ltd. | 18,000 | 18,969 |
| Feng Tay Enterprises Co., Ltd. | 11,330 | 70,366 |
| First Financial Holding Company Ltd. | 79,768 | 36,338 |
| Formosa Chemicals & Fiber Corporation | 11,330 | 22,985 |
| Formosa International Hotels Corporation | 2,623 | 17,525 |
| Formosa Petrochemical Corporation | 55,000 | 130,787 |
| Formosa Plastics Corporation | 32,480 | 68,457 |
| Formosa Taffeta Co., Ltd. | 32,000 | 30,175 |
| Fubon Financial Holding Co., Ltd. | 14,000 | 21,812 |
| Giant Manufacturing Co., Ltd. | 4,000 | 29,033 |
| Highwealth Construction Corp. | 27,300 | 38,470 |
| HIWIN Technologies Corp. | 3,182 | 16,911 |
| Hotai Motor Co., Ltd. | 2,000 | 21,259 |
| Hua Nan Financial Holdings Co., Ltd. | 42,495 | 19,746 |
| Lite-On Technology Corp. | 27,210 | 24,956 |
| Mega Financial Holding Co., Ltd. | 23,751 | 16,446 |
| Merida Industry Co., Ltd. | 3,150 | 16,933 |
| Nan Ya Plastics Corporation | 29,100 | 49,137 |
| Pou Chen Corporation | 21,000 | 31,474 |
| President Chain Store Corp. | 17,000 | 105,839 |
| Realtek Semiconductor Corporation | 10,000 | 16,946 |
| Ruentex Development Company Limited | 23,000 | 25,041 |
| Ruentex Industries Ltd. | 21,000 | 37,182 |
| SinoPac Financial Holdings Company | 65,489 | 20,684 |
| Standard Foods Corporation | 44,302 | 95,526 |
| Synnex Technology International Corp. | 18,000 | 17,930 |
| Taishin Financial Holding Co., Ltd. | 151,934 | 53,755 |
| Taiwan Cement Corporation | 42,000 | 42,539 |
| Taiwan Cooperative Financial Holding Co., Ltd. | 61,772 | 25,514 |
| Taiwan Fertilizer Co., Ltd. | 37,000 | 46,071 |
| Taiwan Glass Industry Corporation (a) | 101,000 | 36,808 |
| Taiwan Mobile Co., Ltd. | 34,000 | 103,773 |
| Taiwan Semiconductor Manufacturing Co., Ltd. (c) | 1,057 | 21,933 |
| TECO Electric & Machinery Co., Ltd. | 59,000 | 46,318 |
| U-Ming Marine Transport Corporation | 41,000 | 43,581 |
| Uni-President Enterprises Corporation | 72,339 | 125,224 |
| Wan Hai Lines, Ltd. | 51,000 | 32,061 |
| Wistron Corporation | 39,168 | 20,400 |
| Yang Ming Marine Transport Corporation (a) | 120,000 | 34,658 |
| Yuanta Financial Holding Co., Ltd. | 33,660 | 12,472 |
| Yulon Motor Co., Ltd. | 12,000 | 10,733 |
| Zhen Ding Technology Holding Limited | 7,000 | 20,026 |
| 2,539,774 | ||
| THAILAND—5.5% | ||
| Advanced Info Service For Rg | 18,200 | 113,327 |
| Airports of Thailand PCL | 10,400 | 80,518 |
| Bangkok Bank PCL (e) | 7,700 | 33,944 |
| Bangkok Dusit Medical Services PLC | 202,200 | 103,064 |
| Banpu Public Company Limited | 52,000 | 28,654 |
| BEC World PCL | 85,800 | 75,647 |
| BTS Group Holdings PCL | 399,300 | 107,265 |
| Bumrungrad Hospital PLC | 23,900 | 142,234 |
| Central Pattana PCL | 51,100 | 63,004 |
| Charoen Pokphand Foods PCL | 125,200 | 71,405 |
| CP ALL PCL | 82,600 | 108,669 |
| Delta Electronics PCL | 56,000 | 135,776 |
| Glow Energy PCL | 49,400 | 115,691 |
| Home Product Center PCL (b) | 479,619 | 90,519 |
| Indorama Ventures Public Company Limited | 85,500 | 54,181 |
| IRPC PCL | 263,500 | 27,297 |
| Kasikornbank PCL | 10,400 | 48,855 |
| Krung Thai Bank PCL | 134,200 | 63,227 |
| Minor International PCL | 83,490 | 66,134 |
| PTT Exploration & Production PCL | 16,300 | 31,437 |
| PTT Global Chemical PCL | 28,700 | 42,502 |
| PTT PCL | 7,100 | 46,949 |
| Siam Cement Pub Co-for Reg | 6,100 | 77,983 |
| Siam Commercial Bank PCL | 15,700 | 57,964 |
| Thai Oil PCL | 25,300 | 36,770 |
| Thai Union Group PCL | 195,700 | 99,212 |
| TMB Bank Public Company Limited | 647,600 | 43,179 |
| True Corp PCL (a) | 194,689 | 52,300 |
2,017,707 | ||
| TURKEY—4.8% | ||
| Akbank T.A.S. | 20,669 | 46,310 |
| Anadolu Efes Biracilik VE | 10,043 | 70,857 |
| Arcelik A.S. | 20,290 | 98,900 |
| BIM Birlesik Magazalar A.S. | 4,336 | 76,875 |
| Coca-Cola Icecek A.S. | 5,672 | 64,854 |
| Emlak Konut Gayrimenkul Yatirim Ortakligi A.S. | 58,131 | 48,218 |
| Enka Inşaat ve Sanayi A.S¸. | 35,848 | 59,232 |
| Eregli Demir ve Celik Fabrikalari T.A.S. | 71,778 | 88,476 |
| Ford Otomotiv Sanayi A.S. | 6,791 | 72,487 |
| Haci Omer Sabanci Holding A.S. | 12,469 | 36,549 |
| Koç¸ Holding A.S. | 17,783 | 69,344 |
| Petkim Petrokimya Holding A.S. (a) | 78,392 | 103,623 |
| TAV Havalimanlari Holding A.S. | 9,549 | 74,946 |
| Tofas Turk Otomobil Fabrikasi A.S. | 17,189 | 101,962 |
| Tupras—Turkiye Petrol Rafinerileri A.S. (a) | 7,476 | 183,068 |
| Turk Hava Yollari A.O. (a) | 20,144 | 53,055 |
| Turk Telekomunikasyon A.S. | 37,251 | 73,491 |
| Turkcell Iletisim Hizmetleri A.S. | 9,898 | 34,508 |
| Turkcell Iletisim Hizmetleri A.S. (a)(c) | 7,788 | 67,600 |
| Turkiye Garanti Bankasi A.S. | 21,704 | 50,422 |
| Turkiye Halk Bankasi A.S. | 12,329 | 41,150 |
| Turkiye Is Bankasi A.S. | 27,214 | 42,358 |
| Turkiye Sise ve Cam Fabrikalari A.S. | 58,273 | 55,268 |
| Turkiye Vakiflar Bankasi T-d | 25,635 | 32,446 |
| Ulker Biskuvi Sanayi A.S. | 15,037 | 95,160 |
| Yapi ve Kredi Bankasi A.S. (b) | 25,678 | 28,597 |
| 1,769,756 | ||
| UNITED ARAB EMERATES—3.2% | ||
| Abu Dhabi Commercial Bank | 60,933 | 126,909 |
| Aldar Properties PJSC | 116,412 | 76,066 |
| Arabtec Holding Company PJSC (a) | 163,385 | 81,848 |
| DP World Ltd. | 9,567 | 203,203 |
| Dubai Financial Market PJSC | 138,072 | 63,153 |
| Dubai Islamic Bank PSJ | 63,465 | 115,768 |
| Emaar Malls Group P.J.S.C. | 176,099 | 148,148 |
| Emaar Properties PJSC (a) | 46,137 | 81,145 |
| First Gulf Bank PJSC | 33,985 | 129,074 |
| National Bank of Abu Dhabi PJSC | 53,084 | 137,588 |
| 1,162,902 | ||
| TOTAL COMMON STOCK | ||
| (Cost $39,564,416) | 32,016,627 | |
| Preferred Stock—2.0% | ||
| BRAZIL—0.6% | ||
| AES Tiete S.A. | 6,400 | 22,745 |
| Banco Bradesco S.A. | 3,720 | 20,127 |
| Banco do Estado do Ria Grande do Sul S.A. | 4,900 | 6,906 |
| Bradespar S.A. | 6,800 | 14,084 |
| Centrais Eletricas Brasileiras S.A. | 11,200 | 24,754 |
| Itausa-Investimentos Itau S.A. | 7,018 | 12,657 |
| Lojas Americanas S.A. | 4,250 | 17,391 |
| Metalurgica Gerdau S.A. | 3,500 | 2,582 |
| Oi S.A. (a) | 35,080 | 24,722 |
| Suzano Papel e Celulose S.A. | 8,700 | 42,390 |
| Usiminas Usi Sd Mg | 10,200 | 8,631 |
| Vale S.A., Class A | 4,700 | 15,813 |
| 212,802 | ||
| CHILE—0.3% | ||
| Embotelladora Andina S.A. | 30,427 | 103,955 |
| COLOMBIA—0.6% | ||
| Banco Davivienda S.A. | 6,282 | 48,922 |
| Bancolombia S.A.. | 8,082 | 65,512 |
| Grupo Aval Acciones y Valores S.A. | 136,463 | 52,073 |
| Grupo de Inversiones Suramericana S.A. | 4,985 | 57,310 |
| 223,817 | ||
| RUSSIA—0.3% | ||
| AK Transneft OAO | 19 | 42,852 |
| Surgutneftegas OAO | 75,100 | 44,841 |
| 87,693 | ||
| SOUTH KOREA—0.2% | ||
| Hyundai Motor Company Ltd. | 252 | 24,237 |
| LG Chem Ltd. | 149 | 23,884 |
| Samsung Electronics Co. Ltd. | 27 | 20,888 |
| 69,009 | ||
| TOTAL PREFERRED STOCK | ||
| (Cost $1,155,651) | 697,276 | |
| Exchange Traded Funds—5.0% | ||
| United States—5.0% | ||
| iShares MSCI Emerging Markets Index Fund | 1,700 | 55,726 |
| Vanguard FTSE Emerging Markets ETF | 53,414 | 1,767,470 |
| (Cost $2,138,239) | 1,823,196 | |
| Exchange Traded Notes—5.3% | ||
| United Kingdom—5.3% | ||
iPath MSCI India Index ETN (a) (Cost $1,650,534) | 29,495 | 1,951,979 |
| Rights—0.0% | ||
| HONG KONG—0.0% | ||
Fosun International Ltd. (Cost $0) | 2,632 | — |
| Warrants—0.0% | ||
| THAILAND—0.0% | ||
Indorama Ventures Public Company Limited (Cost $0) | 1 | 0 |
| Short Term Investments—0.1% | ||
| Par Value | Value | |
| State Street Bank & Trust Co., Repurchase Agreement .0%, 10/01/15, (Dated 09/30/15), Collateralized by 25,000 par U.S. Treasury Note-3.125% due 05/15/2021, Market Value $27,386.72, Repurchase Proceeds $26,471.90 (Cost $26,472) | $26,472 | $26,472 |
| TOTAL INVESTMENTS (EXCLUDING INVESTMENTS PURCHASED WITH CASH COLLATERAL FROM SECURITIES LOANED) | ||
| (Cost $44,535,312) | 36,515,550 | |
| INVESTMENTS PURCHASED WITH CASH COLLATERAL FROM SECURITIES LOANED—1.2% | ||
| Money Market—1.2% | ||
Western Asset Institutional Cash Reserves—Inst. (Cost $423,506) | 423,506 | 423,506 |
| TOTAL INVESTMENTS—100.8% | 36,939,056 | |
| (Cost $44,958,818) | ||
| OTHER ASSETS & LIABILITIES (Net)—(0.8%) | (272,332) | |
| NET ASSETS—100% | $36,666,724 |
| (a) | Non-income producing security. |
| (b) | All or a portion of this security was out on loan. |
| (c) | ADR—American Depository Receipts |
| (d) | GDR—Global Depository Receipts |
| (e) | NVDR—Non-Voting Depository Receipts |
| The percentage of each investment category is calculated as a percentage of net assets. |
SECTOR ALLOCATIONS (as a percentage of Total Net Assets) | |
| Financials | 18.8% |
| Consumer Staples | 10.9% |
| Industrials | 10.8% |
| Telecommunication Services | 10.0% |
| Consumer Discretionary | 9.4% |
| Materials | 8.7% |
| Utilities | 8.1% |
| Energy | 6.4% |
| Health Care | 3.6% |
| Information Technology | 2.5% |
| Exchange Traded Notes | 5.3% |
| Exchange Traded Funds | 5.0% |
| Cash and Other Assets (Net) | 0.5% |
PEAR TREE POLARIS FOREIGN VALUE FUND
SCHEDULE OF INVESTMENTS
September 30, 2015 (Unaudited)
Common Stock—96.8%
| Shares | Value | |
| AUSTRALIA—3.7% | ||
| BHP Billiton plc (b) | 842,900 | $ 25,851,743 |
| Northern Star Resources Limited | 6,251,600 | 11,715,958 |
| South32 (b) | 203,800 | 970,088 |
| WorleyParsons Ltd. | 4,388,300 | 18,203,678 |
| 56,741,467 | ||
| BELGIUM—1.7% | ||
| Solvay S.A. | 256,747 | 26,141,913 |
| CANADA—1.3% | ||
| Methanex Corporation | 639,107 | 21,097,616 |
| FINLAND—4.3% | ||
| Caverion Corporation | 840,216 | 8,384,369 |
| Kone OYJ, Class B | 759,800 | 28,835,011 |
| Konecranes OYJ | 971,780 | 24,253,905 |
| YIT OYJ | 1,438,416 | 7,857,609 |
| 69,330,894 | ||
| FRANCE—7.2% | ||
| Christian Dior S.A. | 181,173 | 33,781,729 |
| Imerys S.A. | 420,183 | 26,916,378 |
| Ipsos | 738,780 | 14,476,310 |
| Maurel et Prom (a) | 1,853,506 | 6,850,071 |
| Michelin (CGDE) | 342,300 | 31,108,560 |
| 113,133,048 | ||
| GERMANY—20.4% | ||
| BASF SE | 384,500 | 29,321,496 |
| Deutsche Telekom AG | 2,451,119 | 43,460,381 |
| Freenet AG | 1,235,439 | 40,728,667 |
| Hannover Rueck SE | 365,800 | 37,376,319 |
| Lanxess AG | 647,100 | 30,202,676 |
| Linde Group (The) | 185,900 | 30,077,347 |
| Muenchener Rueckvers AG | 191,030 | 35,555,708 |
| Symrise AG | 603,150 | 36,213,358 |
| Wincor Nixdorf AG | 928,950 | 36,394,971 |
| 319,330,923 | ||
| HONG KONG- 2.4% | ||
| Guangdong Investment Limited | 24,309,800 | 36,259,876 |
| REXLot Holdings Limited * | 155,556,155 | 200,712 |
36,460,588 | ||
| INDIA—2.9% | ||
| Infosys Limited—SP (b) | 2,378,180 | 45,399,456 |
| IRELAND—2.3% | ||
| Greencore Group plc | 8,893,087 | 36,720,856 |
| ISRAEL—2.4% | ||
| Teva Pharmaceuticals SP (b) | 657,619 | 37,129,169 |
| ITALY—0.6% | ||
| Trevi Finanziaria SpA | 7,256,383 | 9,176,816 |
| JAPAN—6.2% | ||
| Asahi Group Holdings Limited | 1,105,400 | 35,710,155 |
| KDDI Corporation | 1,642,800 | 36,573,711 |
| Showa Denko K.K. | 23,365,000 | 25,550,440 |
| 97,834,306 | ||
| NORWAY—4.3% | ||
| DnB Bank ASA | 1,805,492 | 23,432,279 |
| SpareBank 1 SR-Bank ASA | 3,312,673 | 16,467,048 |
| Yara International ASA | 682,300 | 27,157,293 |
| 67,056,620 | ||
| RUSSIA—0.4% | ||
| Sberbank of Russia (b) | 1,312,300 | 6,476,857 |
| SOUTH AFRICA—1.1% | ||
| Sasol Limited | 604,135 | 16,940,693 |
| SOUTH KOREA—4.4% | ||
| Kia Motors Corporation | 886,500 | 40,088,079 |
| Samsung Electronics Company Limited | 29,145 | 27,883,599 |
| 67,971,678 | ||
| SWEDEN—7.6% | ||
| Duni AB | 1,779,500 | 26,078,386 |
| Investor AB, Class B | 904,856 | 30,952,110 |
| Loomis AB, Class B | 1,104,048 | 28,820,926 |
| Svenska Handelsbanken AB, Class A | 2,309,500 | 32,992,464 |
| 118,843,886 | ||
| SWITZERLAND—2.2% | ||
| Novartis AG | 374,850 | 34,291,727 |
| THAILAND—1.9% | ||
| Thai Oil PCL | 20,021,200 | 29,098,176 |
| UNITED KINGDOM—19.5% | ||
| Barratt Developments plc | 5,155,001 | 50,214,742 |
| BBA Aviation plc | 3,680,222 | 14,890,249 |
| Bellway plc | 1,201,206 | 45,133,413 |
| International Game Technology | 1,893,065 | 29,020,686 |
| Persimmon plc | 1,461,909 | 44,367,362 |
| Rexam plc | 3,983,418 | 31,517,527 |
| Standard Chartered plc | 2,170,358 | 21,020,035 |
| Taylor Wimpey plc | 17,765,087 | 52,492,065 |
| Tullow Oil plc | 5,944,857 | 15,193,736 |
| 303,849,815 | ||
| TOTAL COMMON STOCK | ||
| (Cost $1,472,249,307) | 1,513,026,504 | |
| Short Term Investments—3.1% | ||
| Par Value | Value | |
| Money Market—3.1% | ||
State Street Global Advisors FDS (Cost $48,019,183) | $48,019,183 | $48,019,183 |
| TOTAL INVESTMENTS—99.9% | ||
| (Cost $1,520,268,490) | 1,561,045,687 | |
| OTHER ASSETS & LIABILITIES (NET)—0.1% | 3,087,798 | |
| NET ASSETS—100% | $1,564,133,485 |
| * | Fair Valued by Valuation Committee as delegated by Pear Tree Funds Board of Trustees that represent 0.01% of net assets as of September 30, 2015. |
| (a) | Non-income producing security |
| (b) | ADR—American Depository Receipts |
| The percentage of each investment category is calculated as a percentage of net assets. |
SECTOR ALLOCATIONS (as a percentage of Total Net Assets) | |
| Consumer Discretionary | 23.7% |
| Materials | 20.5% |
| Financials | 13.1% |
| Industrials | 7.7% |
| Telecommunication Services | 7.7% |
| Information Technology | 7.0% |
| Energy | 5.6% |
| Consumer Staples | 4.6% |
| Health Care | 4.6% |
| Utilities | 2.3% |
| Cash and Other Assets (Net) | 3.2% |
PEAR TREE POLARIS FOREIGN VALUE SMALL CAP FUND
SCHEDULE OF INVESTMENTS
September 30, 2015 (Unaudited)
Common Stock—93.7%
| Shares | Value | |
| AUSTRALIA—3.4% | ||
| Asaleo Care Ltd. | 4,712,600 | $ 5,904,378 |
| Programmed Maintenance Services Limited | 2,147,900 | 3,995,170 |
| WorleyParsons Ltd. | 2,245,000 | 9,312,776 |
| 19,212,324 | ||
| AUSTRIA—0.5% | ||
| Semperit AG Holding | 100,500 | 3,042,830 |
| BELGIUM—1.6% | ||
| Kinepolis Group | 237,500 | 9,205,509 |
| BRAZIL—1.8% | ||
| Equatorial Energia S.A. | 1,164,537 | 9,959,895 |
| CHINA—2.2% | ||
| China Hongxing Sports Limited*(a) | 10,258,400 | 72,077 |
| Shanghai Mechanical & Electrical Industry Co.Limited—B | 3,010,889 | 6,846,762 |
| Xinhua Winshare Publishing and Media Co., Limited | 7,568,500 | 5,849,567 |
| 12,768,406 | ||
| DENMARK—2.1% | ||
| DFDS A/S | 365,000 | 11,604,291 |
| Egypt—0.8% | ||
| Egypt Kuwait Holding Company S.A.E. | 7,523,000 | 4,288,110 |
| FINLAND—1.3% | ||
| PKC Group OYJ | 396,300 | 7,188,187 |
| FRANCE—2.1% | ||
| Bonduelle S.A. | 177,500 | 4,556,885 |
| Ipsos | 367,067 | 7,192,636 |
| 11,749,521 | ||
| GERMANY- 4.3% | ||
| Freenet AG | 331,500 | 10,928,547 |
| QSC AG | 1,697,139 | 2,854,780 |
| Sixt SE | 218,377 | 10,606,884 |
| 24,390,211 | ||
| HONG KONG—6.3% | ||
| AMVIG Holdings Limited | 9,038,000 | 3,755,046 |
| Emperor Watch & Jewellery Limited | 103,340,000 | 3,400,132 |
| REXLot Holdings Limited* | 151,273,023 | 195,186 |
| Samson Holding Limited | 35,101,800 | 4,438,565 |
| Texwinca Holdings Limited | 10,558,200 | 9,495,323 |
| VST Holdings Limited (a) | 21,869,360 | 5,953,956 |
| VTech Holdings Limited | 674,600 | 7,990,540 |
| 35,228,748 | ||
| INDIA—5.9% | ||
| KRBL Limited | 3,154,200 | 7,604,390 |
| LIC Housing Finance Limited | 1,406,200 | 10,062,342 |
| NIIT Technologies Limited | 742,375 | 5,341,617 |
| South Indian Bank Limited (a) | 24,601,647 | 8,507,882 |
| Usha Martin Group Limited | 7,077,298 | 1,531,042 |
| 33,047,273 | ||
| IRELAND—5.7% | ||
| Glanbia plc | 459,100 | 8,527,123 |
| Greencore Group plc | 1,882,354 | 7,772,515 |
| IFG Group plc | 2,097,385 | 4,541,735 |
| UDG Healthcare plc | 1,494,075 | 11,358,473 |
| 32,199,846 | ||
| ITALY—2.2% | ||
| De’Longhi SpA | 398,910 | 9,773,528 |
| Trevi Finanziaria SpA | 2,415,385 | 3,054,627 |
| 12,828,155 | ||
| JAPAN—14.3% | ||
| BML Inc. | 339,400 | 9,420,301 |
| Chugoku Marine Paints Limited | 1,264,000 | 7,966,276 |
| Daicel Corporation | 742,700 | 9,064,046 |
| DaiichiKosho Co., Limited | 255,200 | 9,021,846 |
| IBJ Leasing Company, Limited | 519,300 | 10,074,320 |
| Nihon House Holdings Co., Limited | 2,001,700 | 8,421,527 |
| Prima Meat Packers Limited | 3,197,000 | 8,513,235 |
| Unipres Corporation | 440,600 | 8,348,946 |
| VT Holdings Co., Limited | 1,619,400 | 9,733,027 |
| 80,563,524 | ||
| Mexico—0.0% | ||
| Genomma Lab Internacional SAB de C.V. (a) | 82,370 | 67,840 |
| NORWAY—4.2% | ||
| ABG Sundal Collier Holding ASA | 5,586,800 | 4,440,830 |
| Borregaard ASA. | 174,260 | 1,047,039 |
| SpareBank Nord-Norge | 865,996 | 3,675,325 |
| SpareBank 1SMN | 1,119,065 | 7,084,683 |
| SpareBank 1 SR-Bank ASA | 1,405,626 | 6,987,261 |
| 23,235,138 | ||
| PHILIPPINES—1.7% | ||
| Manila Water Company, Inc. | 20,257,870 | 9,426,801 |
| Portugal—1.1% | ||
| Redes Energéticas Nacionais, SGPS, S.A. | 2,095,500 | 6,268,511 |
| SINGAPORE—2.2% | ||
| Breadtalk Group Limited | 4,217,100 | 3,363,013 |
| M1 Limited | 4,646,600 | 9,206,683 |
| 12,569,696 | ||
| SOUTH AFRICA—1.5% | ||
| Clicks Group Limited | 1,303,830 | 8,473,362 |
| SWEDEN—3.0% | ||
| Duni AB | 300,401 | 4,402,345 |
| Loomis AB, Class B | 294,800 | 7,695,688 |
| Nolato AB, Class B | 190,200 | 4,758,909 |
| 16,856,942 | ||
| SWITZERLAND—0.9% | ||
| Vetropack Holding AG | 3,186 | 5,131,506 |
| TAIWAN—3.5% | ||
| Chong Hong Construction Co., Ltd. | 4,136,055 | 5,438,955 |
| Holtek Semiconductor, Inc. | 5,489,900 | 7,085,893 |
| WT Microelectronics Co., Limited | 6,587,848 | 6,592,350 |
| 19,117,198 | ||
| THAILAND—5.0% | ||
| Hana Microelectronics PCL | 8,004,680 | 6,230,396 |
| Ratchaburi Electricity Generating Holding PCL | 6,951,000 | 10,245,998 |
| Thai Union Frozen Products PCL | 23,844,996 | 12,088,385 |
| 28,564,779 | ||
| UNITED KINGDOM—16.1% | ||
| Alternative Networks plc | 1,502,082 | 11,839,341 |
| BBA Aviation plc | 1,786,791 | 7,229,390 |
| Character Group plc | 496,900 | 3,800,135 |
| Clarkson plc | 116,300 | 3,580,555 |
| Crest Nicholson Holdings plc | 1,164,800 | 10,052,337 |
| Galliford Try plc | 344,528 | 8,258,616 |
| Halfords Group plc | 1,161,258 | 8,105,171 |
| Lancashire Holdings Limited | 1,159,500 | 12,109,560 |
| The Restaurant Group plc | 835,700 | 8,525,772 |
| Vitec Group plc | 464,803 | 4,387,134 |
| Wetherspoon (J.D.) plc | 1,109,100 | 12,337,526 |
| 90,225,537 | ||
| TOTAL COMMON STOCK | ||
| (Cost $538,341,608) | 527,214,140 | |
| Preferred Stock—2.2% | ||
| GERMANY | ||
Dräegerwerk AG (Cost $15,126,817) | 150,600 | 12,652,863 |
| Short Term Investments—3.6% | Par Value | Value |
| Money Market—3.6% | ||
State Street Global Advisors FDS (Cost $20,380,703) | $20,380,703 | 20,380,703 |
| TOTAL INVESTMENTS—99.5% | ||
| (Cost $573,849,128) | 560,247,706 | |
| OTHER ASSETS & LIABILITIES (NET)—0.5% | 3,326,889 | |
| NET ASSETS—100% | $563,574,595 |
| * | Fair Valued by Valuation Committee as delegated by Pear Tree Funds Board of Trustees that represent 0.05 % of net assets as of September 30, 2015. |
| (a) | Non-income producing security |
| The percentage of each investment category is calculated as a percentage of net assets. |
SECTOR ALLOCATIONS (as a percentage of Total Net Assets) | |
| Consumer Discretionary | 25.7% |
| Financials | 13.9% |
| Industrials | 13.0% |
| Consumer Staples | 10.3% |
| Information Technology | 7.8% |
| Utilities | 6.4% |
| Telecommunication Services | 6.1% |
| Health Care | 5.9% |
| Materials | 5.1% |
| Energy | 1.7% |
| Cash and Other Assets (Net) | 4.1% |
PEAR TREE FUNDS
STATEMENT OF ASSETS AND LIABILITIES
September 30, 2015 (Unaudited)
| Small Cap | Quality | |
| Assets: | ||
| Investments at value (Includes collateral from securities on loan of $5,142,860; $339,300; $1,197,749; $423,506; $0; $0, respectively)* (Note 2) | $94,703,154 | $116,868,219 |
| Investment at Value of Affliliated Securities | — | — |
| Repurchase agreements/commercial paper | 1,308,283 | 123,652 |
| Total Investments | 96,011,437 | 116,991,871 |
| Foreign currency at value (Cost, $16,156 for Quality; $299,555 for Emerging Markets,$112,808 for Risk Parity, $676,329 for Foreign Value, and $346,001 for Foreign Value Small Cap) | — | 16,096 |
| Cash | — | — |
| Dividend, interest and foreign tax reclaims receivable | 87,531 | 195,439 |
| Receivable for investments sold | — | 714 |
| Receivable for shares of beneficial interest sold | 726 | — |
| Other Assets | 19,602 | 7,527 |
| Total Assets | $96,119,296 | $117,211,647 |
| Liabilities: | ||
| Payable for investments purchased | — | — |
| Payable for shares of beneficial interest repurchased | 3,912 | 17,641 |
| Payable for compensation of manager (Note 3) | 59,911 | 65,661 |
| Payable for distribution fees (Note 3) | 18,180 | 22,327 |
| Payable to custodian | 1,032 | 218 |
| Payable to transfer agent (Note 3) | 13,310 | 16,755 |
| Payable for collateral received for securities loaned | 5,142,860 | 339,300 |
| Payable for Foreign Capital Gain Tax | — | — |
| Other accrued expenses and liabilities | — | 1,437 |
| Total Liabilities | $5,239,205 | $463,339 |
| Net Assets | $90,880,091 | $116,748,308 |
| * | Includes securities on loan to brokers with market value of $5,017,421; $332,592; $1,143,350; $400,403; $0; $0, respectively. |
Emerging Markets | Risk Parity | Foreign Value | Foreign Value Small Cap |
| $78,005,489 | $36,912,584 | $1,561,045,687 | $560,247,706 |
| 35,011,431 | — | — | — |
| 743,669 | 26,472 | — | — |
| 113,760,589 | 36,939,056 | 1,561,045,687 | 560,247,706 |
| 300,476 | 110,376 | 677,633 | 346,668 |
| — | 2,908 | 149,391 | — |
| 244,170 | 75,764 | 3,694,917 | 2,625,075 |
| — | — | 673,964 | 605,427 |
| 44,899 | — | 1,225,210 | 1,181,952 |
| 7,238 | — | 22,387 | — |
| $114,357,372 | $37,128,104 | $1,567,489,189 | $565,006,828 |
| — | 13,211 | 673,964 | — |
| 226,741 | — | 908,328 | 797,495 |
| 67,398 | 18,254 | 1,320,786 | 470,212 |
| 21,578 | 270 | 204,305 | 68,556 |
| 5,789 | 467 | 1,241 | 3,205 |
| 16,923 | 5,388 | 231,360 | 78,574 |
| 1,197,749 | 423,506 | — | — |
| — | — | — | — |
| 1,547 | 284 | 15,720 | 14,191 |
| $1,537,725 | $461,380 | $3,355,704 | $1,432,233 |
| $112,819,647 | $36,666,724 | $1,564,133,485 | $563,574,595 |
| Small Cap | Quality | |
| Net Assets Consist Of: | ||
| Shares of beneficial interest | $72,808,237 | $100,314,435 |
| Undistributed net investment income/(loss) | 508,357 | 663,592 |
| Accumulated net realized gain/(loss) on investments and foreign denominated assets, liabilities and currency | 5,995,926 | 12,145,552 |
| Unrealized appreciation/(depreciation) of investments and foreign denominated assets, liabilities and currency | 11,567,571 | 3,624,729 |
| Net Assets | $90,880,091 | $116,748,308 |
| Investments at cost Non-affiliated securities | 84,443,866 | 113,367,004 |
| Investments at cost—Affiliated securities | — | — |
| Total Investment cost | $84,443,866 | $113,367,004 |
| Net assets | ||
| Ordinary Shares | $87,510,618 | $107,312,844 |
| Institutional Shares | $3,369,473 | $9,435,464 |
| Shares of beneficial interest outstanding (unlimited number of shares authorized) | ||
| Ordinary Shares | 3,959,541 | 6,451,197 |
| Institutional Shares | 132,212 | 538,048 |
| Net asset value and offering price per share** | ||
| Ordinary Shares | $22.10 | $16.63 |
| Institutional Shares | $25.49 | $17.54 |
| ** | Includes securities on loan to brokers with market value of $5,017,421; $332,592; $1,143,350; $400,403; $0; $0, respectively. |
Emerging Markets | Risk Parity | Foreign Value | Foreign Value Small Cap |
| $152,692,806 | $45,126,048 | $1,709,282,805 | $566,925,272 |
| 3,508,244 | 452,692 | 33,970,313 | 8,493,544 |
| (21,603,703) | (889,650) | (219,727,408) | 1,835,014 |
| (21,777,700) | (8,022,366) | 40,607,775 | (13,679,235) |
| $112,819,647 | $36,666,724 | $1,564,133,485 | $563,574,595 |
| 92,546,886 | 44,958,818 | 1,520,268,490 | 573,849,128 |
| 42,984,903 | — | — | — |
| $135,531,789 | $44,958,818 | $1,520,268,490 | $573,849,128 |
| $100,338,273 | $1,338,515 | $961,456,033 | $327,203,926 |
| $12,481,374 | $35,328,209 | $602,677,452 | $236,370,669 |
| 5,451,983 | 163,673 | 57,326,582 | 27,059,896 |
| 667,782 | 4,292,811 | 35,873,516 | 19,500,508 |
| $18.40 | $8.18 | $16.77 | $12.09 |
| $18.69 | $8.23 | $16.80 | $12.12 |
PEAR TREE FUNDS
STATEMENT OF OPERATIONS
6 Months Ended September 30, 2015 (Unaudited)
| Small Cap | Quality | |
| Investment Income: | ||
| Dividends—Affiliated securities | $— | $— |
| Dividends—Non-affiliated securities* | 851,070 | 1,329,401 |
| Interest | — | — |
| Sec Lending Income | 368,145 | 1,140 |
| Miscellaneous | 6,832 | — |
| Total Investment Income | $1,226,047 | $1,330,541 |
| Expenses: | ||
| Compensation of manager (Note 3) | 401,087 | 629,671 |
| Distribution fees, Ordinary Shares (Note 3) | 120,689 | 143,788 |
| Administrative fees (Note 3) | 15,375 | 19,318 |
| Custodian and fund accounting fees | 15,058 | 19,800 |
| Regulatory and Compliance (Note 3) | 4,414 | 5,547 |
| Transfer agent fees (Note 3): | ||
| Ordinary Shares | 79,434 | 94,301 |
| Institutional Shares | 3,112 | 8,879 |
| Audit and legal | 5,830 | 8,216 |
| Registration fees | 27,920 | 22,351 |
| Insurance | 1,544 | 3,052 |
| Compensation of trustees (Note 3) | 2,669 | 3,355 |
| Printing | 2,951 | 3,707 |
| Miscellaneous | 2,942 | 3,711 |
| Total expenses before waivers/reimbursements/reductions | 683,025 | 965,696 |
| Waivers and/or reimbursements of expenses (Note 3) | — | (159,851) |
| Expenses, Net | $683,025 | $805,845 |
| Net investment income/(loss) | $543,022 | $524,696 |
| Realized and unrealized gain/(loss) on investments, | ||
| foreign currency, and foreign translation: | ||
| Net realized gain/(loss) (Note 2) on: | ||
| Investments | $4 | $7,296,326 |
| Foreign denominated assets, liabilities, and currency | — | (15) |
| Distribution by affiliated investment company | — | — |
| Change in unrealized appreciation/(depreciation) of: | ||
| Investments | (11,009,962) | (13,597,715) |
| Foreign denominated assets, liabilities, and currency | — | (60) |
| Net realized and unrealized gain/(loss) on investment and foreign currency | (11,009,958) | (6,301,464) |
| Net increase/(decrease) in net assets resulting from operations | $(10,466,936) | $(5,776,768) |
| * | Dividends are net of withholding taxes of $0 for Small Cap, and $20,248 for Quality, $340,805 for Emerging Markets, $83,998 for Risk Parity, $2,776,422 for Foreign Value, and $1,191,983 for Foreign Value Small Cap |
Emerging Markets | Risk Parity | Foreign Value | Foreign Value Small Cap |
| $— | $— | $— | $— |
| 2,543,397 | 618,971 | 28,839,185 | 11,963,710 |
| — | — | 6,686 | — |
| 10,527 | 6,239 | — | — |
| — | 19 | — | 38 |
| $2,553,924 | $625,229 | $28,845,871 | $11,963,748 |
| 488,971 | 120,313 | 8,474,574 | 2,793,120 |
| 154,266 | 1,917 | 1,329,405 | 393,203 |
| 21,106 | 6,112 | 256,951 | 77,138 |
| 74,000 | 71,500 | 258,000 | 160,000 |
| 6,076 | 1,757 | 73,725 | 22,025 |
| 101,180 | 1,343 | 867,540 | 256,456 |
| 10,270 | 31,267 | 511,164 | 197,217 |
| 11,576 | 3,652 | 97,362 | 31,198 |
| 16,944 | 4,290 | 78,782 | 96,350 |
| 6,569 | 2,281 | 25,789 | 10,455 |
| 3,672 | 1,062 | 44,580 | 13,265 |
| 4,049 | 1,173 | 49,305 | 14,816 |
| 5,002 | 1,263 | 50,680 | 16,791 |
| 903,681 | 247,930 | 12,117,857 | 4,082,034 |
| — | — | — | — |
| $903,681 | $247,930 | $12,117,857 | $4,082,034 |
| $1,650,243 | $377,299 | $16,728,014 | $7,881,714 |
| $(2,522,470) | $(453,103) | $33,952,734 | $209,128 |
| (96,147) | (18,144) | (421,761) | (247,983) |
| — | — | — | — |
| (21,405,322) | (6,625,061) | (228,531,343) | (73,486,599) |
| (93) | (1,418) | 188,532 | 50,309 |
| (24,024,032) | (7,097,726) | (194,811,838) | (73,475,145) |
| $(22,373,789) | $(6,720,427) | $(178,083,824) | $(65,593,431) |
PEAR TREE FUNDS
STATEMENT OF CHANGES IN NET ASSETS
______________ Small Cap ______________ | ||
Semi-Annual Ended September 30, 2015 (Unaudited) | Year Ended March 31, 2015 | |
| Increase (Decrease) in Net Assets: | ||
| Operations: | ||
| Net investment income/(loss) | $543,022 | $190,036 |
| Net realized gain/(loss) on investments, foreign denominated assets, liabilities, and currency | 4 | 9,433,215 |
| Unrealized appreciation/(depreciation) of investments, foreign denominated assets, liabilities, and currency | (11,009,962) | (10,797,282) |
| Net increase/(decrease) from operations | $(10,466,936) | $(1,174,031) |
| Distributions to shareholders from: | ||
| Net investment income | ||
| Ordinary shares | $— | $(717,823) |
| Institutional shares | — | (80,383) |
| Net realized gains | ||
| Ordinary shares | — | (8,875,367) |
| Institutional shares | — | (749,976) |
| Total distributions | $— | $(10,423,549) |
| Fund share transactions (Note 8) | (498,855) | (3,739,490) |
| Contributions to capital from investment manager/brokers | 873 | — |
| Increase/(decrease) in net assets | $(10,964,918) | $(15,337,070) |
| Net assets beginning of period | 101,845,009 | 117,182,079 |
| Net assets end of period* | $90,880,091 | $101,845,009 |
| * Commencement of operation | ||
| * Includes undistributed net investment income/(loss) of: | $508,357 | $(34,665) |
PEAR TREE FUNDS
STATEMENT OF CHANGES IN NET ASSETS (continued)
_______________ Quality _______________ | ||
Semi-Annual Ended September 30, 2015 (Unaudited) | Year Ended March 31, 2015 | |
| Increase (Decrease) in Net Assets: | ||
| Operations: | ||
| Net investment income/(loss) | $524,696 | $1,982,863 |
| Net realized gain/(loss) on investments, foreign denominated assets, liabilities, and currency | 7,296,311 | 13,649,116 |
| Unrealized appreciation/(depreciation) of investments, foreign denominated assets, liabilities, and currency | (13,597,775) | (4,487,480) |
| Net increase/(decrease) from operations | $(5,776,768) | $11,144,499 |
| Distributions to shareholders from: | ||
| Net investment income | ||
| Ordinary shares | $— | $(1,997,651) |
| Institutional shares | — | (200,406) |
| Net realized gains | ||
| Ordinary shares | — | (11,349,466) |
| Institutional shares | — | (995,926) |
| Total distributions | $— | $(14,543,449) |
| Fund share transactions (Note 8) | (4,787,806) | 5,809,679 |
| Contributions to capital from investment manager/brokers | — | — |
| Increase/(decrease) in net assets | $(10,564,574) | $2,410,729 |
| Net assets beginning of period | 127,312,882 | 124,902,153 |
| Net assets end of period* | $116,748,308 | $127,312,882 |
| * Commencement of operation | ||
| * Includes undistributed net investment income/(loss) of: | $663,592 | $138,896 |
PEAR TREE FUNDS
STATEMENT OF CHANGES IN NET ASSETS (continued)
___________ Emerging Markets ___________ | ||
Semi-Annual Ended September 30, 2015 (Unaudited) | Year Ended March 31, 2015 | |
| Increase (Decrease) in Net Assets: | ||
| Operations: | ||
| Net investment income/(loss) | $1,650,243 | $1,941,221 |
| Net realized gain/(loss) on investments, foreign denominated assets, liabilities, and currency | (2,618,617) | 754,697 |
| Unrealized appreciation/(depreciation) of investments, foreign denominated assets, liabilities, and currency | (21,405,415) | (1,569,436) |
| Net increase/(decrease) from operations | $(22,373,789) | $1,126,482 |
| Distributions to shareholders from: | ||
| Net investment income | ||
| Ordinary shares | $— | $(1,849,625) |
| Institutional shares | — | (198,656) |
| Net realized gains | ||
| Ordinary shares | — | — |
| Institutional shares | — | — |
| Total distributions | $— | $(2,048,281) |
| Fund share transactions (Note 8) | (4,525,040) | (6,636,939) |
| Contributions to capital from investment manager/brokers | — | — |
| Increase/(decrease) in net assets | $(26,898,829) | $(7,558,738) |
| Net assets beginning of period | 139,718,476 | 147,277,214 |
| Net assets end of period* | $112,819,647 | $139,718,476 |
| * Commencement of operation | ||
| * Includes undistributed net investment income/(loss) of: | $3,508,244 | $1,858,001 |
PEAR TREE FUNDS
STATEMENT OF CHANGES IN NET ASSETS (continued)
______________ Risk Parity ______________ | ||
Semi-Annual Ended September 30, 2015 (Unaudited) | Year Ended March 31, 2015 | |
| Increase (Decrease) in Net Assets: | ||
| Operations: | ||
| Net investment income/(loss) | $377,299 | $476,602 |
| Net realized gain/(loss) on investments, foreign denominated assets, liabilities, and currency | (471,247) | (148,295) |
| Unrealized appreciation/(depreciation) of investments, foreign denominated assets, liabilities, and currency | (6,626,479) | (2,413,017) |
| Net increase/(decrease) from operations | $(6,720,427) | $(2,084,710) |
| Distributions to shareholders from: | ||
| Net investment income | ||
| Ordinary shares | $— | $(10,947) |
| Institutional shares | — | (335,853) |
| Net realized gains | ||
| Ordinary shares | — | (3,231) |
| Institutional shares | — | (78,000) |
| Total distributions | $— | $(428,031) |
| Fund share transactions (Note 8) | 3,331,585 | 8,844,772 |
| Contributions to capital from investment manager/brokers | — | — |
| Increase/(decrease) in net assets | $(3,388,842) | $6,332,031 |
| Net assets beginning of period | 40,055,566 | 33,723,535 |
| Net assets end of period* | $36,666,724 | $40,055,566 |
| * Commencement of operation | ||
| * Includes undistributed net investment income/(loss) of: | $452,692 | $75,393 |
PEAR TREE FUNDS
STATEMENT OF CHANGES IN NET ASSETS (continued)
_____________ Foreign Value _____________ | ||
Semi-Annual Ended September 30, 2015 (Unaudited) | Year Ended March 31, 2015 | |
| Increase (Decrease) in Net Assets: | ||
| Operations: | ||
| Net investment income/(loss) | $16,728,014 | $25,835,461 |
| Net realized gain/(loss) on investments, foreign denominated assets, liabilities, and currency | 33,530,973 | 7,123,892 |
| Unrealized appreciation/(depreciation) of investments, foreign denominated assets, liabilities, and currency | (228,342,811) | (77,984,752) |
| Net increase/(decrease) from operations | $(178,083,824) | $(45,025,399) |
| Distributions to shareholders from: | ||
| Net investment income | ||
| Ordinary shares | $— | $(10,795,991) |
| Institutional shares | — | (8,142,787) |
| Net realized gains | ||
| Ordinary shares | — | — |
| Institutional shares | — | — |
| Total distributions | $— | $(18,938,778) |
| Fund share transactions (Note 8) | 116,885,351 | 210,393,828 |
| Contributions to capital from investment manager/brokers | 618 | 2,026 |
| Increase/(decrease) in net assets | $(61,197,855) | $146,431,677 |
| Net assets beginning of period | 1,625,331,340 | 1,478,899,663 |
| Net assets end of period* | $1,564,133,485 | $1,625,331,340 |
| * Commencement of operation | ||
| * Includes undistributed net investment income/(loss) of: | $33,970,313 | $17,242,299 |
PEAR TREE FUNDS
STATEMENT OF CHANGES IN NET ASSETS (continued)
Foreign Value ______________ Small Cap ______________ | ||
Semi-Annual Ended September 30, 2015 (Unaudited) | Year Ended March 31, 2015 | |
| Increase (Decrease) in Net Assets: | ||
| Operations: | ||
| Net investment income/(loss) | $7,881,714 | $3,143,933 |
| Net realized gain/(loss) on investments, foreign denominated assets, liabilities, and currency | (38,855) | 4,684,157 |
| Unrealized appreciation/(depreciation) of investments, foreign denominated assets, liabilities, and currency | (73,436,290) | 1,666,169 |
| Net increase/(decrease) from operations | $(65,593,431) | $9,494,259 |
| Distributions to shareholders from: | ||
| Net investment income | ||
| Ordinary shares | $— | $(1,863,942) |
| Institutional shares | — | (1,593,950) |
| Net realized gains | ||
| Ordinary shares | — | (51,740) |
| Institutional shares | — | (35,129) |
| Total distributions | $— | $(3,544,761) |
| Fund share transactions (Note 8) | 195,822,952 | 241,656,637 |
| Contributions to capital from investment manager/brokers | — | — |
| Increase/(decrease) in net assets | $130,229,521 | $247,606,135 |
| Net assets beginning of period | 433,345,074 | 185,738,939 |
| Net assets end of period* | $563,574,595 | $433,345,074 |
| * Commencement of operation | ||
| * Includes undistributed net investment income/(loss) of: | $8,493,544 | $611,830 |
PEAR TREE POLARIS SMALL CAP FUND
FINANCIAL HIGHLIGHTS
(For a share outstanding throughout each period)
| Ordinary Shares | ||||||
For the six months ended September 30, | Years Ended March 31, | |||||
| 2015 | 2015 | 2014 | 2013 | 2012 | 2011 | |
| Net Asset Value, Beginning of Period | $24.65 | $27.62 | $22.50 | $20.36 | $19.92 | $16.45 |
| Income from Investment Operations: | ||||||
| Net investment income (loss) (a)(b) | 0.13 | 0.04 | (0.08) | (0.03) | (0.08) | 0.04 |
| Net realized and unrealized gain/(loss) on securities | (2.68) | (0.37) | 5.20 | 2.17 | 0.57 | 3.52 |
| Total from Investment Operations | (2.55) | (0.33) | 5.12 | 2.14 | 0.49 | 3.56 |
| Less Distributions: | ||||||
| Dividends from net investment income | — | (0.20) | — | — | (0.05) | (0.09) |
| Distributions from realized capital gains | — | (2.44) | — | — | — | — |
| Total Distributions | — | (2.64) | — | — | (0.05) | (0.09) |
| Net Asset Value, End of Period | $22.10 | $24.65 | $27.62 | $22.50 | $20.36 | $19.92 |
| Total Return | (10.34)% | (0.36)% | 22.76% | 10.51% | 2.48% | 21.69% |
| Net Assets, End of Period (000’s) | $87,511 | $98,084 | $107,370 | $101,275 | $95,870 | $113,675 |
| Ratios and Supplemental Data: | ||||||
| Ratios of expenses to average net assets: (c) | ||||||
| Gross | 1.37% | 1.50% | 1.53% | 1.63% | 1.67% | 1.64% |
| Net | 1.37% | 1.50% | 1.53% | 1.63% | 1.67% | 1.64% |
| Ratio of net investment income (loss) to average net assets (b) | 1.07% | 0.17% | (0.30)% | (0.16)% | (0.44)% | 0.23% |
| Portfolio Turnover | 0% | 94% | 67% | 54% | 53% | 71% |
| Institutional Shares | ||||||
For the six months ended September 30, | Years Ended March 31, | |||||
| 2015 | 2015 | 2014 | 2013 | 2012 | 2011 | |
| Net Asset Value, Beginning of Period | $28.39 | $31.37 | $25.48 | $23.00 | $22.50 | $18.56 |
| Income from Investment Operations: | ||||||
| Net investment income (loss) (a)(b) | 0.19 | 0.11 | (0.02) | 0.02 | (0.04) | 0.09 |
| Net realized and unrealized gain/(loss) on securities | (3.09) | (0.39) | 5.91 | 2.46 | 0.63 | 3.98 |
| Total from Investment Operations | (2.90) | (0.28) | 5.89 | 2.48 | 0.59 | 4.07 |
| Less Distributions: | ||||||
| Dividends from net investment income | — | (0.26) | — | — | (0.09) | (0.13) |
| Distributions from realized capital gains | — | (2.44) | — | — | — | — |
| Total Distributions | — | (2.70) | — | — | (0.09) | (0.13) |
| Net Asset Value, End of Period | $25.49 | $28.39 | $31.37 | $25.48 | $23.00 | $22.50 |
| Total Return | (10.21)% | (0.11)% | 23.12% | 10.78% | 2.69% | 21.98% |
| Net Assets, End of Period (000’s) | $3,369 | $3,761 | $9,812 | $8,000 | $6,242 | $7,806 |
| Ratios and Supplemental Data: | ||||||
| Ratios of expenses to average net assets: (c) | ||||||
| Gross | 1.12% | 1.28% | 1.28% | 1.38% | 1.42% | 1.39% |
| Net | 1.12% | 1.28% | 1.28% | 1.38% | 1.42% | 1.39% |
| Ratio of net investment income (loss) to average net assets (b) | 1.32% | 0.36% | (0.08)% | 0.07% | (0.19)% | 0.48% |
| Portfolio Turnover | 0% | 94% | 67% | 54% | 53% | 71% |
| (a) | Per share numbers have been calculated using the average shares method. |
| (b) | Net investment income (loss) per share and the ratio of net investment income (loss) to average net assets reflect net investment income prior to certain reclassifications for federal income or excise tax purposes. |
| (c) | Ratios of expenses to average net assets: |
| — | Gross (total expenses before fee waivers, reimbursements by the investment advisor, and custody earnings credits, if any). |
| — | Net (total expenses net of fee waivers, reimbursements by the investment advisor, and custody earnings credits, if any). |
PEAR TREE QUALITY FUND
FINANCIAL HIGHLIGHTS
(For a share outstanding throughout each period)
| Ordinary Shares | ||||||
For the six months ended September 30, | Years Ended March 31, | |||||
| 2015 | 2015 | 2014 | 2013 | 2012 | 2011 | |
| Net Asset Value, Beginning of Period | $17.47 | $18.10 | $15.85 | $14.33 | $12.36 | $11.37 |
| Income from Investment Operations: | ||||||
| Net investment income (loss) (a)(b)(c) | 0.07 | 0.28 | 0.19 | 0.16 | 0.17 | 0.09 |
| Net realized and unrealized gain/(loss) on securities | (0.91) | 1.30 | 2.24 | 1.52 | 1.92 | 1.01 |
| Total from Investment Operations | (0.84) | 1.58 | 2.43 | 1.68 | 2.09 | 1.10 |
| Less Distributions: | ||||||
| Dividends from net investment income | — | (0.33) | (0.18) | (0.16) | (0.12) | (0.11) |
| Distributions from realized capital gains | — | (1.88) | — | — | — | — |
| Total Distributions | — | (2.21) | (0.18) | (0.16) | (0.12) | (0.11) |
| Net Asset Value, End of Period | $16.63 | $17.47 | $18.10 | $15.85 | $14.33 | $12.36 |
| Total Return | (4.81)% | 9.12% | 15.40% | 11.85% | 16.99% | 9.78%(d) |
| Net Assets, End of Period (000’s) | $107,313 | $116,104 | $114,857 | $98,033 | $92,557 | $62,920 |
| Ratios and Supplemental Data: | ||||||
| Ratios of expenses to average net assets: (e) | ||||||
| Gross | 1.56% | 1.54% | 1.55% | 1.62% | 1.66% | 1.93% |
| Net including dividend and interest expense for securities sold short | N/A | N/A | N/A | N/A | N/A | 1.89% |
| Net excluding dividend and interest expense for securities sold short | 1.30% | 1.29% | 1.30% | 1.46% | 1.51% | 1.85% |
| Ratio of net investment income (loss) to average net assets (c) | 0.81% | 1.52% | 1.13% | 1.11% | 1.28% | 0.84% |
| Portfolio Turnover | 22% | 49% | 35% | 40% | 68% | 283%(f) |
| Institutional Shares | ||||||
For the six months ended September 30, | Years Ended March 31, | |||||
| 2015 | 2015 | 2014 | 2013 | 2012 | 2011 | |
| Net Asset Value, Beginning of Period | $18.39 | $18.95 | $16.58 | $14.95 | $12.85 | $11.80 |
| Income from Investment Operations: | ||||||
| Net investment income (loss) (a)(b)(c) | 0.10 | 0.35 | 0.25 | 0.24 | 0.25 | 0.12 |
| Net realized and unrealized gain/(loss) on securities | (0.95) | 1.35 | 2.35 | 1.59 | 1.99 | 1.06 |
| Total from Investment Operations | (0.85) | 1.70 | 2.60 | 1.83 | 2.24 | 1.18 |
| Less Distributions: | ||||||
| Dividends from net investment income | — | (0.38) | (0.23) | (0.20) | (0.14) | (0.13) |
| Distributions from realized capital gains | — | (1.88) | — | — | — | — |
| Total Distributions | — | (2.26) | (0.23) | (0.20) | (0.14) | (0.13) |
| Net Asset Value, End of Period | $17.54 | $18.39 | $18.95 | $16.58 | $14.95 | $12.85 |
| Total Return | (4.62)% | 9.34% | 15.74% | 12.37% | 17.57% | 10.07%(d) |
| Net Assets, End of Period (000’s) | $9,435 | $11,209 | $10,045 | $3,576 | $2,558 | $809 |
| Ratios and Supplemental Data: | ||||||
| Ratios of expenses to average net assets: (e) | ||||||
| Gross | 1.30% | 1.29% | 1.31% | 1.35% | 1.41% | 1.71% |
| Net including dividend and interest expense for securities sold short | N/A | N/A | N/A | N/A | N/A | 1.67% |
| Net excluding dividend and interest expense for securities sold short | 1.05% | 1.04% | 1.03% | 1.01% | 1.00% | 1.63% |
| Ratio of net investment income (loss) to average net assets (c) | 1.05% | 1.83% | 1.38% | 1.58% | 1.85% | 1.08% |
| Portfolio Turnover | 22% | 49% | 35% | 40% | 68% | 283%(f) |
| Note: | This Fund changed its investment strategy on January 27, 2011. |
| (a) | Per share numbers have been calculated using the average shares method. |
| (b) | Reflects expense waivers/reimbursements and reductions in effect during the period. See Note 3 to the Financial Statements. |
| (c) | Net investment income (loss) per share and the ratio of net investment income (loss) to average net assets reflect net investment income prior to certain reclassifications for federal income or excise tax purposes. |
| (d) | The total return would have been lower if certain fees had not been waived or if custodial fees had not been reduced by credits allowed by the custodian. See Note 3 to the financial statements. |
| (e) | Ratios of expenses to average net assets: |
| — | Gross (total expenses before fee waivers, reimbursements by the investment advisor, and custody earnings credits, if any). |
| — | Net (total expenses net fee waivers, reimbursements by the investment advisor, and custody earnings credits, if any). |
| (f) | Portfolio turnover is calculated on long security positions only. Short positions are generally held for less than one year. |
PEAR TREE PANAGORA DYNAMIC EMERGING MARKETS FUND
FINANCIAL HIGHLIGHTS
(For a share outstanding throughout each period)
| Ordinary Shares | ||||||
For the six months ended September 30, | Years Ended March 31, | |||||
| 2015 | 2015 | 2014 | 2013 | 2012 | 2011 | |
| Net Asset Value, Beginning of Period | $21.94 | $22.15 | $23.56 | $22.67 | $25.18 | $21.23 |
| Income from Investment Operations: | ||||||
| Net investment income (loss) (a)(b) | 0.26 | 0.29 | 0.33 | 0.37 | 0.41 | 0.24 |
| Net realized and unrealized gain/(loss) on securities | (3.80) | (0.18) | (1.45) | 0.85 | (2.44) | 3.96 |
| Total from Investment Operations | (3.54) | 0.11 | (1.12) | 1.22 | (2.03) | 4.20 |
| Less Distributions: | ||||||
| Dividends from net investment income | — | (0.32) | (0.29) | (0.33) | (0.48) | (0.25) |
| Distributions from realized capital gains | — | — | — | — | — | — |
| Total Distributions | — | (0.32) | (0.29) | (0.33) | (0.48) | (0.25) |
| Net Asset Value, End of Period | $18.40 | $21.94 | $22.15 | $23.56 | $22.67 | $25.18 |
| Total Return | (16.13)% | 0.54% | (4.77)% | 5.41% | (7.80)% | 19.86% |
| Net Assets, End of Period (000’s) | $100,338 | $127,295 | $131,920 | $140,267 | $145,201 | $176,386 |
| Ratios and Supplemental Data: | ||||||
| Ratios of expenses to average net assets: (c) | ||||||
| Gross | 1.35% | 1.37% | 1.60% | 1.76% | 1.76% | 1.77% |
| Net | 1.35% | 1.37% | 1.60% | 1.76% | 1.76% | 1.77% |
| Ratio of net investment income (loss) to average net assets (b) | 2.41% | 1.26% | 1.50% | 1.66% | 1.80% | 1.05% |
| Portfolio Turnover | 24% | 35% | 61% | 25% | 56% | 68% |
| Institutional Shares | ||||||
For the six months ended September 30, | Years Ended March 31, | |||||
| 2015 | 2015 | 2014 | 2013 | 2012 | 2011 | |
| Net Asset Value, Beginning of Period | $22.26 | $22.46 | $23.88 | $22.97 | $25.53 | $21.48 |
| Income from Investment Operations: | ||||||
| Net investment income (loss) (a)(b) | 0.28 | 0.35 | 0.39 | 0.43 | 0.41 | 0.42 |
| Net realized and unrealized gain/(loss) on securities | (3.85) | (0.18) | (1.46) | 0.87 | (2.42) | 3.89 |
| Total from Investment Operations | (3.57) | 0.17 | (1.07) | 1.30 | (2.01) | 4.31 |
| Less Distributions: | ||||||
| Dividends from net investment income | — | (0.37) | (0.35) | (0.39) | (0.55) | (0.26) |
| Distributions from realized capital gains | — | — | — | — | — | — |
| Total Distributions | — | (0.37) | (0.35) | (0.39) | (0.55) | (0.26) |
| Net Asset Value, End of Period | $18.69 | $22.26 | $22.46 | $23.88 | $22.97 | $25.53 |
| Total Return | (16.04)% | 0.81% | (4.52)% | 5.69% | (7.56)% | 20.14% |
| Net Assets, End of Period (000’s) | $12,481 | $12,424 | $15,358 | $15,165 | $15,569 | $11,267 |
| Ratios and Supplemental Data: | ||||||
| Ratios of expenses to average net assets: (c) | ||||||
| Gross | 1.11% | 1.11% | 1.35% | 1.49% | 1.52% | 1.51% |
| Net | 1.11% | 1.11% | 1.35% | 1.49% | 1.52% | 1.51% |
| Ratio of net investment income (loss) to average net assets (b) | 2.61% | 1.52% | 1.74% | 1.92% | 1.81% | 1.94% |
| Portfolio Turnover | 24% | 35% | 61% | 25% | 56% | 68% |
| (a) | Per share numbers have been calculated using the average shares method. |
| (b) | Net investment income (loss) per share and the ratio of net investment income (loss) to average net assets reflect net investment income prior to certain reclassifications for federal income or excise tax purposes. |
| (c) | Ratios of expenses to average net assets: |
| — | Gross (total expenses before fee waivers, reimbursements by the investment advisor, and custody earnings credits, if any). |
| — | Net (total expenses net of fee waivers, reimbursements by the investment advisor, and custody earnings credits, if any). |
PEAR TREE PANAGORA RISK PARITY EMERGING MARKETS FUND
FINANCIAL HIGHLIGHTS
(For a share outstanding throughout each period)
| Ordinary Shares | |||
For the six months ended September 30, 2015 | Year Ended March 31, 2015 | June 27, 2013* through March 31, 2014 | |
| Net Asset Value, Beginning of Period | $9.73 | $10.30 | $10.00 |
| Income from Investment Operations: | |||
| Net investment income (loss) (a)(b) | 0.08 | 0.09 | (0.03) |
| Net realized and unrealized gain/(loss) on securities | (1.63) | (0.57) | 0.40 |
| Total from Investment Operations | (1.55) | (0.48) | 0.37 |
| Less Distributions: | |||
| Dividends from net investment income | — | (0.07) | — |
| Distributions from realized capital gains | — | (0.02) | (0.07) |
| Total Distributions | — | (0.09) | (0.07) |
| Net Asset Value, End of Period | $8.18 | $9.73 | $10.30 |
| Total Return | (15.93)% | (4.63)% | 3.68%*** |
| Net Assets, End of Period (000’s) | $1,339 | $1,558 | $652 |
| Ratios and Supplemental Data: | |||
| Ratios of expenses to average net assets: (c) | |||
| Gross | 1.48% | 1.54% | 2.10%** |
| Net | 1.48% | 1.54% | 2.10%** |
| Ratio of net investment income (loss) to average net assets (b) | 1.64% | 0.88% | (0.43)%** |
| Portfolio Turnover | 9% | 34% | 42%*** |
| Institutional Shares | |||
For the six months ended September 30, 2015 | Year Ended March 31, 2015 | June 27, 2013* through March 31, 2014 | |
| Net Asset Value, Beginning of Period | $9.78 | $10.35 | $10.00 |
| Income from Investment Operations: | |||
| Net investment income (loss) (a)(b) | 0.09 | 0.13 | 0.01 |
| Net realized and unrealized gain/(loss) on securities | (1.64) | (0.59) | 0.41 |
| Total from Investment Operations | (1.55) | (0.46) | 0.42 |
| Less Distributions: | |||
| Dividends from net investment income | — | (0.09) | — |
| Distributions from realized capital gains | — | (0.02) | (0.07) |
| Total Distributions | — | (0.11) | (0.07) |
| Net Asset Value, End of Period | $8.23 | $9.78 | $10.35 |
| Total Return | (15.85)% | (4.41)% | 4.19%*** |
| Net Assets, End of Period (000’s) | $35,328 | $38,497 | $33,071 |
| Ratios and Supplemental Data: | |||
| Ratios of expenses to average net assets: (c) | |||
| Gross | 1.23% | 1.28% | 1.69%** |
| Net | 1.23% | 1.28% | 1.69%** |
| Ratio of net investment income (loss) to average net assets (b) | 1.89% | 1.20% | 0.09%** |
| Portfolio Turnover | 9% | 34% | 42%*** |
| * | Fund commenced operations June 27, 2013. |
| ** | Annualized. |
| *** | Not Annualized. |
| (a) | Per share numbers have been calculated using the average shares method. |
| (b) | Net investment income (loss) per share and the ratio of net investment income (loss) to average net assets reflect net investment income prior to certain reclassifications for federal income or excise tax purposes. |
| (c) | Ratios of expenses to average net assets: |
| — | Gross (total expenses before fee waivers, reimbursements by the investment advisor, and custody earnings credits, if any). |
| — | Net (total expenses net of fee waivers, reimbursements by the investment advisor, and custody earnings credits, if any). |
PEAR TREE POLARIS FOREIGN VALUE FUND
FINANCIAL HIGHLIGHTS
(For a share outstanding throughout each period)
| Ordinary Shares | ||||||
For the six months ended September 30, | Years Ended March 31, | |||||
| 2015 | 2015 | 2014 | 2013 | 2012 | 2011 | |
| Net Asset Value, Beginning of Period | $18.67 | $19.38 | $15.83 | $13.64 | $14.68 | $12.45 |
| Income from Investment Operations: | ||||||
| Net investment income (loss) (a)(b) | 0.18 | 0.29 | 0.19 | 0.15 | 0.12 | 0.07 |
| Net realized and unrealized gain/(loss) on securities | (2.08) | (0.80) | 3.49 | 2.12 | (1.09) | 2.31 |
| Total from Investment Operations | (1.90) | (0.51) | 3.68 | 2.27 | (0.97) | 2.38 |
| Less Distributions: | ||||||
| Dividends from net investment income | — | (0.20) | (0.13) | (0.08) | (0.07) | (0.15) |
| Distributions from realized capital gains | — | — | — | — | — | — |
| Total Distributions | — | (0.20) | (0.13) | (0.08) | (0.07) | (0.15) |
| Net Asset Value, End of Period | $16.77 | $18.67 | $19.38 | $15.83 | $13.64 | $14.68 |
| Total Return | (10.18)% | (2.53)% | 23.28% | 16.73% | (6.55)% | 19.17%(c) |
| Net Assets, End of Period (000’s) | $961,456 | $1,030,641 | $908,108 | $705,210 | $386,011 | $369,550 |
| Ratios and Supplemental Data: | ||||||
| Ratios of expenses to average net assets: (d) | ||||||
| Gross | 1.52% | 1.52% | 1.54% | 1.59% | 1.64% | 1.62% |
| Net | 1.52% | 1.52% | 1.54% | 1.59% | 1.64% | 1.62% |
| Ratio of net investment income (loss) to average net assets (b) | 1.90% | 1.55% | 1.11% | 1.04% | 0.93% | 0.56% |
| Portfolio Turnover | 5% | 2% | 3% | 10% | 18% | 9% |
| Institutional Shares | ||||||
For the six months ended September 30, | Years Ended March 31, | |||||
| 2015 | 2015 | 2014 | 2013 | 2012 | 2011 | |
| Net Asset Value, Beginning of Period | $18.68 | $19.39 | $15.83 | $13.63 | $14.68 | $12.45 |
| Income from Investment Operations: | ||||||
| Net investment income (loss) (a)(b) | 0.20 | 0.33 | 0.24 | 0.17 | 0.14 | 0.10 |
| Net realized and unrealized gain/(loss) on securities | (2.08) | (0.80) | 3.48 | 2.15 | (1.09) | 2.31 |
| Total from Investment Operations | (1.88) | (0.47) | 3.72 | 2.32 | (0.95) | 2.41 |
| Less Distributions: | ||||||
| Dividends from net investment income | — | (0.24) | (0.16) | (0.12) | (0.10) | (0.18) |
| Distributions from realized capital gains | — | — | — | — | — | — |
| Total Distributions | — | (0.24) | (0.16) | (0.12) | (0.10) | (0.18) |
| Net Asset Value, End of Period | $16.80 | $18.68 | $19.39 | $15.83 | $13.63 | $14.68 |
| Total Return | (10.06)% | (2.29)% | 23.58% | 17.07% | (6.34)% | 19.48%(c) |
| Net Assets, End of Period (000’s) | $602,677 | $594,691 | $570,792 | $180,265 | $98,109 | $78,790 |
| Ratios and Supplemental Data: | ||||||
| Ratios of expenses to average net assets: (d) | ||||||
| Gross | 1.27% | 1.27% | 1.28% | 1.33% | 1.39% | 1.37% |
| Net | 1.27% | 1.27% | 1.28% | 1.33% | 1.39% | 1.37% |
| Ratio of net investment income (loss) to average net assets (b) | 2.10% | 1.76% | 1.37% | 1.22% | 1.07% | 0.79% |
| Portfolio Turnover | 5% | 2% | 3% | 10% | 18% | 9% |
| (a) | Per share numbers have been calculated using the average shares method. |
| (b) | Net investment income (loss) per share and the ratio of net investment income (loss) to average net assets reflect net investment income prior to certain reclassifications for federal income or excise tax purposes. |
| (c) | The total return would have been lower if certain fees had not been waived or if custodial fees had not been reduced by credits allowed by the custodian. See Note 3 to the financial statements. |
| (d) | Ratios of expenses to average net assets: |
| — | Gross (total expenses before fee waivers, reimbursements by the investment advisor, and custody earnings credits, if any). |
| — | Net (total expenses net of fee waivers, reimbursements by the investment advisor, and custody earnings credits, if any). |
PEAR TREE POLARIS FOREIGN VALUE SMALL CAP FUND
FINANCIAL HIGHLIGHTS
(For a share outstanding throughout each period)
| Ordinary Shares | ||||||
For the six months ended September 30, | Period Ended March 31, | |||||
| 2015 | 2015 | 2014 | 2013 | 2012 | 2011 | |
| Net Asset Value, Beginning of Period | $13.35 | $13.17 | $10.50 | $9.02 | $11.19 | $10.28 |
| Income from Investment Operations: | ||||||
| Net investment income (loss) (a)(b) | 0.18 | 0.15 | 0.14 | 0.14 | 0.21 | 0.09 |
| Net realized and unrealized gain/(loss) on securities | (1.44) | 0.17 | 2.66 | 1.50 | (1.29) | 1.25 |
| Total from Investment Operations | (1.26) | 0.32 | 2.80 | 1.64 | (1.08) | 1.34 |
| Less Distributions: | ||||||
| Dividends from net investment income | — | (0.14) | (0.13) | (0.16) | (0.10) | (0.08) |
| Distributions from realized capital gains | — | — | — | — | (0.99) | (0.35) |
| Total Distributions | — | (0.14) | (0.13) | (0.16) | (1.09) | (0.43) |
| Net Asset Value, End of Period | $12.09 | $13.35 | $13.17 | $10.50 | $9.02 | $11.19 |
| Total Return | (9.44)% | 2.57% | 26.80% | 18.34% | (8.20)% | 13.12%(c) |
| Net Assets, End of Period (000’s) | $327,204 | $233,185 | $138,321 | $92,806 | $72,737 | $78,307 |
| Ratios and Supplemental Data: | ||||||
| Ratios of expenses to average net assets: (d) | ||||||
| Gross | 1.57% | 1.56% | 1.58% | 1.66% | 1.70% | 1.69% |
| Net | 1.57% | 1.56% | 1.58% | 1.66% | 1.70% | 1.69% |
| Ratio of net investment income (loss) to average net assets (b) | 2.70% | 1.15% | 1.23% | 1.55% | 2.14% | 0.82% |
| Portfolio Turnover | 0% | 11% | 4% | 9% | 22% | 54% |
| Institutional Shares | ||||||
For the six months ended September 30, | Years Ended March 31, | |||||
| 2015 | 2015 | 2014 | 2013 | 2012 | 2011 | |
| Net Asset Value, Beginning of Period | $13.36 | $13.19 | $10.51 | $9.03 | $11.21 | $10.30 |
| Income from Investment Operations: | ||||||
| Net investment income (loss) (a)(b) | 0.20 | 0.14 | 0.16 | 0.17 | 0.24 | 0.09 |
| Net realized and unrealized gain/(loss) on securities | (1.44) | 0.21 | 2.67 | 1.49 | (1.30) | 1.28 |
| Total from Investment Operations | (1.24) | 0.35 | 2.83 | 1.66 | (1.06) | 1.37 |
| Less Distributions: | ||||||
| Dividends from net investment income | — | (0.18) | (0.15) | (0.18) | (0.13) | (0.11) |
| Distributions from realized capital gains | — | — | — | — | (0.99) | (0.35) |
| Total Distributions | — | (0.18) | (0.15) | (0.18) | (1.12) | (0.46) |
| Net Asset Value, End of Period | $12.12 | $13.36 | $13.19 | $10.51 | $9.03 | $11.21 |
| Total Return | (9.28)% | 2.79% | 27.16% | 18.59% | (7.99)% | 13.40%(c) |
| Net Assets, End of Period (000’s) | $236,371 | $200,160 | $47,418 | $22,459 | $20,567 | $23,973 |
| Ratios and Supplemental Data: | ||||||
| Ratios of expenses to average net assets: (d) | ||||||
| Gross | 1.32% | 1.31% | 1.33% | 1.41% | 1.43% | 1.44% |
| Net | 1.32% | 1.31% | 1.33% | 1.41% | 1.43% | 1.44% |
| Ratio of net investment income (loss) to average net assets (b) | 2.98% | 1.12% | 1.47% | 1.88% | 2.45% | 0.92% |
| Portfolio Turnover | 0% | 11% | 4% | 9% | 22% | 54% |
| (a) | Per share numbers have been calculated using the average shares method. |
| (b) | Net investment income (loss) per share and the ratio of net investment income (loss) to average net assets reflect net investment income prior to certain reclassifications for federal income or excise tax purposes. |
| (c) | The total return would have been lower if certain fees had not been waived or if custodial fees had not been reduced by credits allowed by the custodian. See Note 3 to the financial statements. |
| (d) | Ratios of expenses to average net assets: |
| — | Gross (total expenses before fee waivers, reimbursements by the investment advisor, and custody earnings credits, if any). |
| — | Net (total expenses net of fee waivers, reimbursements by the investment advisor, and custody earnings credits, if any). |
PEAR TREE FUNDS
NOTES TO FINANCIAL STATEMENTS
September 30, 2015 (unaudited)
1. Organization of the Trust
Pear Tree Funds (the “Trust”) is organized as a Massachusetts business trust and is registered under the Investment Company Act of 1940, as amended (the “1940 Act”), as an open-end management investment company. The Trust currently has six series (each a “Fund” and collectively the “Funds”), each with a distinct investment objective.
Pear Tree Polaris Small Cap Fund (“Small Cap”) seeks maximum long-term capital appreciation. Small Cap formerly was known as Pear Tree Columbia Small Cap Fund.
Pear Tree Quality Fund (“Quality”) seeks long-term growth of capital.
Pear Tree Polaris Foreign Value Fund (“Foreign Value”) seeks long-term capital growth and income.
Pear Tree Polaris Foreign Value Small Cap Fund (“Foreign Value Small Cap”) seeks long-term capital growth and income.
Pear Tree PanAgora Dynamic Emerging Markets Fund (“Emerging Markets”) seeks long-term growth of capital.
Pear Tree PanAgora Risk Parity Emerging Markets Fund (“Risk Parity”) seeks long-term growth of capital.
Each of the Funds is a “non-diversified company,” within the meaning of the 1940 Act, other than Emerging Markets, which is a “diversified company.”
Each Fund is an investment company and accordingly follows the investment company accounting and reporting guidance of the Financial Accounting Standards Board (FASB) Accounting Standard Codification Topic 946 “Financial Services-Investment Companies”.
Each Fund offers two classes of shares, designated as Ordinary Shares and Institutional Shares. The classes differ principally in their respective expense structure and minimum investment requirements. Each class of shares represents an interest in the same portfolio of investments of the respective Fund and has equal rights to voting (except as noted in the following sentence), redemptions, dividends and liquidation. Ordinary Shares bear distribution (Rule 12b-1) fees and have exclusive voting rights with respect to the distribution plan that has been adopted by Ordinary Share shareholders. There is no distribution plan for Institutional Shares.
At times, a Fund’s investments may represent industries or industry sectors that are interrelated or have common risks, making it more susceptible to any economic, political, or regulatory developments or other risks affecting those industries and sectors. To the extent that a Fund is permitted to invest in foreign markets, emerging markets or countries with limited or developing markets, such investments may subject the Fund to a greater degree of risk than in the U.S. market or a developed market. Risks associated with these foreign and developing markets include political, social or economic factors and may affect the price of a Fund’s investments and income generated by these investments, as well as a Fund’s ability to repatriate such amounts. Information regarding each Fund’s principal risks is contained in the Funds’ prospectus. Please refer to the Funds’ prospectus when considering a Fund’s risks.
2. Significant Accounting Policies
Each Fund’s financial statements have been prepared in conformity with U.S. generally accepted accounting principles. Those principals require the management of the Funds to, among other things, make estimates and assumptions that affect the reported amounts of assets and liabilities, the disclosure of contingent assets and liabilities at the date of the financial statements, and the reported amounts of income, expenses and gains and losses on investments during the reporting year. Actual results could differ from those estimates.
The following is a summary of significant accounting policies followed by each Fund in the preparation of its financial statements, which are consistent with those policies generally accepted in the investment company industry.
Security Valuation
Portfolio securities are valued each business day generally at the last reported sale price on the principal exchange or market on which they are traded. If on a business day there is no such reported sale, the securities generally are valued at the mean between the last reported bid and asked prices. For securities where no such sales have been reported, a Fund may value such securities at the last reported bid price. In the event that there is information suggesting that valuation of such securities based upon bid and/or asked prices may not be accurate, a Fund may value such securities in good faith at fair value in accordance with procedures (the “Valuation Procedures”) established by the Funds’ Trustees (the “Trustees”), which may include a determination to value such securities at the last reported sales price. Short-term investments that mature in 60 days or less are valued at amortized cost. Securities quoted in foreign currencies are translated into U.S. dollars based upon prevailing exchange rates at the time of valuation. As a result, changes in the value of those currencies in relation to the U.S. dollar may affect a Fund’s net asset value. Because foreign markets may be open at different times than when the New York Stock Exchange is open for regular trading, the value of a Fund’s shares may change on days when shareholders are not able to buy or sell them. If events materially affecting the values of a Fund’s foreign investments occur between the close of foreign markets and the close of regular trading on the New York Stock Exchange, these investments may be valued at their fair value as determined in good faith using the Valuation Procedures.
The Funds’ Valuation Procedures include fair valuation accounting standards that establish an authoritative definition of fair value and set out a hierarchy for measuring fair value. These standards require additional disclosures about the various inputs used to develop the measurements of fair value. These inputs are summarized in the three broad levels listed below:
| • | Level 1 — Unadjusted quoted prices in active markets for identical assets or liabilities that a Fund has the ability to access. |
| • | Level 2 — Observable inputs other than quoted prices included in level 1 that are observable for the asset or liability, either directly or indirectly. These inputs may include quoted prices for the identical instrument on an inactive market, prices for similar instruments, interest rates, prepayment speeds, credit risk, yield curves, default rates and similar data. |
| • | Level 3 — Unobservable inputs for the asset or liability, to the extent relevant observable inputs are not available; representing a Fund’s own assumptions about the assumptions a market participant would use in valuing the asset liability, and would be based on the best information available. |
The availability of observable inputs can vary from security to security and is affected by a wide variety of factors, including the type of security, whether the security is new and not yet established in the marketplace, the liquidity of the markets, and other characteristics particular to the security. To the extent that valuation is based on models or inputs that are less observable or unobservable in the market, the determination of fair value requires more judgment. Accordingly, the degree of judgment exercised in determining fair value is greatest for instruments categorized in Level 3.
The inputs used to measure fair value may fall into different levels of fair value hierarchy. In such cases, for disclosure purposes, the level in the fair value hierarchy within which the fair value measurement falls in its entirety, is determined based on the lowest level input that is significant to the fair value measurement in its entirety.
Changes in valuation techniques may result in transfers in changing an investment’s assigned level within the hierarchy.
The inputs or methodology used for valuing securities are not necessarily an indication of the risk associated with investing in these securities. The following is a summary of the inputs used to value the Fund’s net assets as of September 30, 2015:
Quoted Prices In Active Markets | Significant Other Observable Inputs | Significant Unobservable Inputs | Market Value at September 30, 2015 | |
| Level 1 | Level 2 | Level 3 | Total | |
| Small Cap | ||||
| Common Stock* | $77,861,814 | $— | $— | $77,861,814 |
| Real Estate Inv. Trusts | 11,698,480 | — | — | 11,698,480 |
| Short Term Investments | 5,142,860 | 1,308,283 | — | 6,451,143 |
| Total | $94,703,154 | $1,308,283 | — | $96,011,437 |
| Quality | ||||
| Common Stock* | $98,444,901 | $— | $— | $98,444,901 |
| Depository Receipts | 18,084,018 | — | — | 18,084,018 |
| Short Term Investments | 339,300 | 123,652 | — | 462,952 |
| Total | $116,868,219 | $123,652 | — | $116,991,871 |
| Emerging Markets | ||||
| Common Stock* | $67,452,927 | $1,306,139 | $— | $68,759,066 |
| Common Stock Units | 1,134,263 | — | — | 1,134,263 |
| Depository Receipts | 4,813,796 | — | — | 4,813,796 |
| Mutual Funds | 35,011,431 | — | — | 35,011,431 |
| Preferred Stock | 1,931,273 | — | — | 1,931,273 |
| Real Estate Inv. Trusts | 169,342 | — | — | 169,342 |
| Short Term Investments | 1,197,749 | 743,669 | — | 1,941,418 |
| Total | $111,710,781 | $2,049,808 | — | $113,760,589 |
| Risk Parity | ||||
| Common Stock* | $27,024,892 | $1,983,763 | $28,803 | $29,037,458 |
| Common Stock Units | 138,285 | — | — | 138,285 |
| Depository Receipts | 2,655,345 | — | — | 2,655,345 |
| Mutual Funds | 3,775,174 | — | — | 3,775,174 |
| Preferred Stock | 697,277 | — | — | 697,277 |
| Real Estate Inv. Trusts | 185,539 | — | — | 185,539 |
| Short Term Investments | 423,506 | 26,472 | — | 449,978 |
| Total | $34,900,018 | $2,010,235 | $28,803 | $36,939,056 |
| Foreign Value | ||||
| Common Stock* | $1,367,900,303 | $29,098,176 | $200,712 | $1,397,199,191 |
| Depository Receipts | 115,827,313 | — | — | 115,827,313 |
| Short Term Investments | 48,019,183 | — | — | 48,019,183 |
| Total | $1,531,746,799 | $29,098,176 | 200,712 | $1,561,045,687 |
| Foreign Value Small Cap | ||||
| Common Stock* | $498,382,098 | $28,564,779 | $267,263 | $527,214,140 |
| Preferred Stock | 12,652,863 | — | — | 12,652,863 |
| Short Term Investments | 20,380,703 | — | — | 20,380,703 |
| Total | $531,415,664 | $28,564,779 | $267,263 | $560,247,706 |
The following is a reconciliation of Level 3 assets for which unobservable inputs were used to determine fair value.
Risk Parity Common Stock | Foreign Value | Foreign Value Small Cap Common Stock | |
| Balances as of 3/31/2015 | $35,479 | $— | $74,762 |
| Realized gain (loss) | $8,823 | — | $— |
| Changed in unrealized appreciation (depreciation) | $(7,740) | — | $(2,685) |
| Purchases | $— | — | $— |
| Sales | $(21,450) | — | $— |
| Transfer in | $28,803 | $200,712 | $195,186 |
| Transfer out | $(15,112) | — | $ |
| Balances as of 9/30/2015 | $28,803 | $200,712 | $267,263 |
| * | Refer to Schedule of Investments for breakout by industry or country. |
| * | Transfers between Levels are recognized at the end of the reporting period. |
| * | Risk Parity Fund transferred $37,702 out of Level 2 and $15,112 out of Level 3 into Level 1. Risk Parity also transferred $15,147 out of Level 1 into Level 3 and $13,656 out of Level 2 into Level 3. Foreign Value Fund transferred $200,712 out of Level 1 into Level 3. Foreign Value Small Cap transferred $195,186 out of Level 1 into Level 3. Small Cap, Quality and Emerging Markets Funds had no transfers at period end. |
| * | Common stock labeled as Level 2 balance consists of the market value of the associated Level 2 investments in the following industries: |
Emerging Markets | Risk Parity | Foreign Value | Foreign Value Small Cap | |
| Banks | $662,019 | $213,225 | $— | $— |
| Chemicals | — | 96,683 | — | — |
| Construction Materials | — | 77,983 | — | — |
| Diversified Financials | 280,191 | — | — | — |
| Diversified Telecommunications | — | 52,300 | — | — |
| Electric Utilities | — | 115,691 | — | 10,245,998 |
| Electronic Equipment & Instruments | 363,929 | 135,776 | — | 6,230,396 |
| Food and Drug Retailing | — | 71,405 | — | — |
| Food Products | — | 99,212 | — | 12,088,385 |
| Health Care Providers & Services | — | 245,298 | — | — |
| Hotels, Restaurants & Leisure | — | 66,134 | — | — |
| Media | — | 75,647 | — | — |
| Multiline Retail | — | 108,669 | — | — |
| Oil & Gas | — | 171,107 | 29,098,176 | — |
| Real Estate | — | 63,004 | — | — |
| Specialty Retail | — | 90,519 | — | — |
| Transportation Infrastructure | — | 187,783 | — | — |
| Wireless Telecommunication Services | — | 113,327 | — | — |
| $1,306,139 | $1,983,763 | $29,098,176 | $28,564,779 |
| * | Common stock labeled as Level 3 balance consists of the market value of the associated Level 3 investments in the following industries: |
| Risk Parity | Foreign Value | Foreign Value Small Cap | |
| Hotel Restaurant & Leisure | $— | $200,712 | $195,186 |
| Leisure Equipment & Products | — | — | 72,077 |
| Marine | 12,627 | — | — |
| Pharmaceuticals & Biotechnology | 13,656 | — | — |
| Semi-Conductor Equipment & Products | 2,520 | — | — |
| $28,803 | $200,712 | $267,263 |
The following table presents additional information about valuation methodologies and inputs used for investments that are measured at fair value and categorized within Level 3 as of September 30, 2015;
Common Stock | Fair Value September 30, 2015 | Valuation Methodologies | Unobservable Input (1) | Range | Impact to Valuation from a Decrease in Input (2) |
| Risk Parity | $12,627 | Adjusted last trade | Adjustment | 100% | Decrease |
| $13,656 | Adjusted last trade | Adjustment | 100% | Decrease | |
| $2,520 | Adjusted last trade | Adjustment | 100% | Decrease | |
| Foreign Value | $200,712 | Market Comparability | Comparability Adjustment | 100% | Decrease |
| Foreign Value | |||||
| Small Cap | $195,186 | Market Comparability | Comparability Adjustment | 100% | Decrease |
| $72,077 | Market Comparability | Comparability Adjustment | 100% | Decrease |
| 1. | In determining certain of these inputs, management evaluates a variety of factors including economic conditions, industry and market developments, and company specific developments. |
| 2. | This column represents the directional change in the fair value of the Level 3 investments that would result from a decrease to the corresponding unobservable input. An increase to the observable input would have the opposite effect. |
Offsetting Assets and Liabilities
The Funds have adopted financial reporting rules regarding offsetting assets and liabilities and related arrangements to enable users of their financial statements to understand the effect of those arrangements on their financial position. During the 6-month period ended September 30, 2015, the Funds were not subject to any master netting arrangements or similar agreements.
The table below shows the offsetting assets and liabilities relating to the repurchase agreement and the securities lending agreements shown on the Statement of Assets and Liabilities.
Gross Amounts not offset in the statement of Financial Position | ||||||
Repurchase Agreements | Gross Amounts of Recognized Assets | Gross Amounts Offset in the Statement of Financial Position | Net Amounts Presented in the Statement of Financial Position | Financial Instruments | Collateral Pledged (Received) | Net Amount |
| Small Cap | $1,308,283 | $— | $1,308,283 | $1,308,283 | $— | $— |
| Quality | 123,652 | — | 123,652 | 123,652 | — | — |
| Emerging Markets | 743,669 | — | 743,669 | 743,669 | — | — |
| Risk Parity | 26,472 | — | 26,472 | 26,472 | — | — |
Gross Amounts not offset in the statement of Financial Position | ||||||
| Security Lending | Gross Amounts of Recognized Liabilities | Gross Amounts Offset in the Statement of Financial Position | Net Amounts Presented in the Statement of Financial Position | Financial Instruments | Collateral Pledged (Received) | Net Amount |
| Small Cap | $5,142,860 | $— | $5,142,860 | $5,142,860(a) | $— | — |
| Quality | 339,300 | — | 339,300 | 339,300(a) | — | — |
| Emerging Markets | 1,197,749 | — | 1,197,749 | 1,197,749(a) | — | — |
| Risk Parity | 423,506 | — | 423,506 | 423,506(a) | — | — |
| (a) | Collateral for securities on loan is included in the Schedule of Investments. |
Use of Estimates
The preparation of financial statements in conformity with accounting principles generally accepted in the U.S. requires management to make estimates and assumptions that affect the reported amounts of assets and liabilities at the date of the financial statements and the reported amounts of revenue and expenses during the reporting period. Actual results could differ from those estimates.
Guarantees and Indemnifications
In the normal course of business, the Funds enter into contracts with service providers that contain general indemnification clauses. The Funds’ maximum exposure under these arrangements is unknown as this would involve future claims that may be made against the Funds that have not yet occurred. However, based on experience, the Funds expect the risk of loss to be minimal.
Subsequent Events
In preparing these financial statements, the Funds have evaluated events and transactions for potential recognition or disclosure through the date the financials were issued. There were no events or transactions that occurred during the period that materially impacted the accounts or disclosures in the Funds’ financial statements.
Security Transactions and Related Investment Income
Security transactions are accounted for on the trade date (the date the order to buy or sell is executed). Dividend income, less foreign taxes withheld, is recorded on the ex-dividend date, except that certain dividends from foreign securities where the ex-dividend date may have passed are recorded as soon as a Fund becomes aware of the ex-dividend data in the exercise of reasonable diligence. Distributions received on securities that represent a return of capital or a capital gain is recorded as a reduction of cost of investments and/or as a realized gain. Each Fund estimates the components of distributions that may be considered nontaxable distributions or capital gain distributions for tax purposes. Interest income is recorded on the accrual basis and includes accretion of discounts and amortization of premiums. In determining the net gain or loss on securities sold, the cost of securities is determined on the identified cost basis. Each Fund’s investment income and realized and unrealized gains and losses are allocated among classes based upon the daily relative net assets.
Repurchase Agreements
The Funds’ custodian takes possession of securities collateralizing repurchase agreements through the federal book-entry system. Collateral is marked to market daily to confirm that the market value of the underlying assets remains sufficient to protect the Funds. The Funds may experience costs and delays in liquidating the collateral if the Repurchase Agreement counterparty defaults or enters into bankruptcy.
Counterparty Credit Risk
Some transactions in which a Fund may engage involve instruments that are not traded on an exchange. Rather, these instruments are traded between counterparties based on contractual relationships. As a result, a Fund is subject to the risk that the counterparty will not perform obligations under the related contract. Although a Fund expects to enter into transactions only with counterparties believed by the Fund’s investment manager or sub-adviser to be creditworthy, there can be no assurance that counterparty will not default and that the Fund will not sustain a loss on a transaction as a result.
The purchase of participatory notes involves risk that is in addition to the risks normally associated with a direct investment in the underlying securities. A Fund is subject to the risk that the issuer of the participatory note (i.e., the issuing bank or broker-dealer), which is the only responsible party under the note, is unable or refuses to perform under the terms of the participatory note.
Foreign Currency Transactions
All monetary items, including income and expenses, denominated in foreign currencies are translated into U.S. dollars based on prevailing exchange rates at the close of each business day.
A Fund’s reported net realized gains and losses on foreign currency transactions equals the sum of net gains and losses realized by the Fund between the trade and settlement dates on currency transactions, plus the difference between the amount of net investment income accrued by the Fund and the U.S. dollar amount actually received by the Fund. The effects of changes in foreign currency exchange rates on investments in securities are not segregated in the Statement of Operations from the effects of changes in market prices of those securities, but are included with the net realized and unrealized gain or loss on investments.
Forward Foreign Currency Contracts
The Funds may enter into forward foreign currency contracts to manage their exposure to fluctuations in certain foreign currencies. A forward currency contract is a commitment to purchase or sell a foreign currency at a future date at a set price. The forward currency contracts are valued at the forward rate and are marked-to-market daily. The change in market value is recorded by a Fund as an unrealized gain or loss. When the contract is closed, a Fund records a realized gain or loss equal to the difference between the value of the contract at the time it is opened and the value at the time it is closed. In addition to the risks of financial investments mentioned above, risks arise from unanticipated movements in currency values.
There were no open foreign currency contracts held by any Fund at September 30, 2015.
Securities Lending
To generate additional income, each of Small Cap, Quality, Emerging Markets and Risk Parity lend some of its securities to third-party borrowers using Securities Finance Trust Company (“eSecLending”) as the Funds’ lending agent. Small Cap, Quality, Emerging Markets and Risk Parity may each lend up to 30 percent of its assets pursuant to certain agreements (“Securities Lending Agreements”) requiring that the loan be continuously secured by cash or securities. Securities loaned are arranged by eSecLending with certain pre-approved borrowers, typically broker-dealers acting on behalf of their clients. The borrowers are required to provide cash or securities as collateral against loaned securities in the amount of 105 percent of the market value of borrowings for Emerging Markets and Risk Parity, and 102 percent of the borrowings for the Small Cap and Quality. Collateral is marked-to-market daily. Cash collateral is invested in a registered money market fund.
Risks such as delay in recovery of securities may occur should the borrower of the securities fail financially or should the value of the securities loaned increase above the value of the collateral received. eSecLending provides indemnification insurance via highly rated third-party insurers to cover these potential risks.
At September 30, 2015, the following Funds had collateral and loans outstanding of:
| Value of Collateral | Value of Loaned Securities | |
| Small Cap | $5,142,860 | 5,017,421 |
| Quality | 339,300 | 332,592 |
| Emerging Markets | 1,197,749 | 1,143,350 |
| Risk Parity | 423,506 | 400,403 |
Expenses and Class Allocations
The majority of the expenses of the Funds are attributed to the individual Fund and Class for which they are incurred. Expenses that are not attributed to a specific Fund are allocated in proportion to the respective net assets of the Funds. Expenses allocable to a Fund are borne pro rata by the holders of both classes of shares of such Fund, except that 12b-1 Plan expenses will not be borne by the holders of Institutional Shares.
Distribution (12b-1) fees on Ordinary Shares are calculated based on the average daily net asset value attributable to the Ordinary Shares of the respective Fund. Institutional Shares are not subject to distribution (12b-1) fees. Shareholders of each class share all expenses and fees paid to the transfer agent, Pear Tree Institutional Services, for its services, which are allocated based on the net assets in each class and the ratable allocation of related out-of-pocket expenses. Income, common expenses and realized and unrealized gains and losses are calculated at the Fund level and allocated daily to each class of shares based on their respective percentage of adjusted net assets at the beginning of the day. (See Note 3.)
Distributions to Shareholders
Distributions to shareholders are recorded as of the ex-dividend date. Distributions paid by each Fund with respect to each class of shares are calculated in the same manner, at the same time, and i the same amount, except that Ordinary Shares incur distribution (12b-1) fees while Institutional Shares do not. Distributions from net investment income for each Fund, if any, are declared and paid annually. Distributions from net realized gains for each Fund, if any, are generally declared and paid annually.
3. Management Fee, Advisery Contracts and Other Affiliate Transactions
The Funds have entered into a management agreement (the “Management Agreement”) with Pear Tree Advisers, Inc. (the “Manager”). Compensation of the Manager, for management and administration of the Funds, including selection and monitoring of the portfolio advisers, is paid monthly based on the average daily net asset value of each Fund for the month. The annual rate of such fees is 1.00 percent of the average daily total net assets of each of the Funds except for Risk Parity an annual rate 0.60 percent of the average daily total net assets. As of January 1, 2015, the annual rate relating to Small Cap decreased from 1.00 percent to 0.80 percent of the daily total net assets.
From January 27, 2011 to July 31, 2013, the Manager had waived a portion of its management fee relating to Quality Fund by an amount equal to the annualized rate of 0.15 percent of Qualitys average daily net assets if and when the Quality’s average daily net assets were up to $100 million, and in an amount equal to the annualized rate of 0.25 percent of Quality’s average daily net assets if and when Quality’s average daily net assets were equal to or greater than $100 million. From April 1, 2011 to August 1, 2013, the Manager had waived or reimbursed Fund expenses relating to Institutional Shares of Quality such that the total annualized fund operating expenses relating to Institutional Shares were not more than 1.00 percent.
Beginning December 1, 2013, the Manager has agreed until July 31, 2016 to waive a portion of its management fee relating to Quality by an amount equal to the annualized rate of 0.25 percent of Quality’s average daily net assets if and when the Quality’s average daily net assets up to and including $125 million, and in an amount equal to the annualized rate of 0.50 percent of Quality’s average daily net assets if and when Quality’s average daily net assets in excess of $125 million. The Trustees of the Fund may at any time terminate this arrangement .
In addition, under the Management Agreement, the Manager has agreed to reduce its compensation, and if necessary, assume expenses, with respect to Small Cap to the extent that the total expenses of Small Cap individually exceed 2 percent of average net assets for any fiscal year. Small Cap expenses subject to this limitation are exclusive of brokerage, interest, taxes and extraordinary expenses, which include incremental custody costs associated with international securities. Expenses are calculated gross of custody credits, if applicable.
For the six months ended September 30, 2015, aggregate management fees exclusive of fee waivers and Fund reimbursements, from all Funds were $12,907,736.
The Manager has entered into sub-advisory contracts with the following sub-advisers (collectively the “Sub-Advisers”) to provide investment sub-advisory services to the following Funds: Columbia Partners, L.L.C., Investment Management (Small Cap thru 12/31/14 and Quality), PanAgora Asset Management, Inc. (Emerging Markets and Risk Parity), and Polaris Capital Management, LLC (Small Cap commencing on 1/1/15, Foreign Value and Foreign Value Small Cap).
For services rendered, the Manager pays to the Sub-Advisers of a Fund a fee based on a percentage of the average daily total net assets of the Fund. The fee for each Fund is determined separately. During the six months ended September 30, 2015, the fees paid by the Manager to the Sub-Advisers of the Funds were as follows:
| Small Cap | 0.25% of the first $100 million and |
| 0.30% of amounts in excess of $100 million but less than $200 million and | |
| 0.325% of amounts in excess of $200 million of average daily total net assets | |
| Quality | 0.10% of the first $100 million and |
| 0.08% of amounts in excess of $100 million but less than $250 million and | |
| 0.06% of amounts in excess of $250 million of average daily total net assets | |
| Emerging Markets | 0.47% of the first $300 million and |
| 0.50% of amounts in excess of $300 million of average daily total net assets | |
| Risk Parity | 0.25% of the first $300 million and |
| 0.30% of amounts in excess of $300 million but less than $600 million and | |
| 0.35% of amounts in excess of $600 million of average daily total net assets | |
| Foreign Value | 0.35% of the first $35 million and |
| 0.40% of amounts in excess of $35 million but less than $200 million and | |
| 0.50% of assets in excess of $200 million of average daily total net assets | |
| Foreign Value Small Cap | 0.35% of the first $35 million and |
| 0.40% of amounts in excess of $35 million but less than $200 million and | |
| 0.50% of amounts in excess of $200 million of average daily total net assets. |
The Funds have entered into a distribution agreement (the “Distribution Agreement”) with U.S. Boston Capital Corporation (the “Distributor”). For its services under the Distribution Agreement, the Distributor receives the distribution (12b-1) fees, that is, 0.25 percent of the average daily net asset value of the Ordinary Shares of the Funds, payable monthly.
Holders of Institutional Shares pay no portion of the 12b-1 Plan expenses of the Funds and are not entitled to vote on matters involving the 12b-1 Plan. During the six months ended September 30, 2015 the aggregate distribution fees of the Funds were $2,143,268.
Transfer agent functions are provided to the Funds by Pear Tree Institutional Services, a division of the Manager (the “Transfer Agent”), pursuant to a transfer agent agreement (the “Transfer Agent Agreement”). The Transfer Agent Agreement provides for base fees that are payable to the Transfer Agent at an annual rate of 0.16 percent of the average daily total net asset value of each class of shares of the Funds and for reimbursement of out of pocket expenses. During the six months ended September 30, 2015, the aggregate fees of the Funds paid to the Transfer Agent were $2,162,163.
Pursuant to an Administration Agreement, the Manager provides certain administrative services to the Funds. During the six months ended September 30, 2015, fees paid to the Manager pursuant to this agreement were $396,000.
The Trustees have approved reimbursement to the Manager for a percentage of the compensation paid by the Manager to the Trust’s Chief Compliance Officer. For the six months ended September 30, 2015, the Trust reimbursed the Manager for the Chief Compliance Officer’s compensation in the aggregate amount of $113,544.
Custody and fund accounting services are provided by State Street Bank and Trust Company. Custody credits generated by interest earned on un-invested cash balances maintained by the Funds are used to offset custodial expenses of the Funds.
For the six months ended September 30, 2015, each Trustee who was not an “interested person” of the Trust, as that term is defined in the 1940 Act, received a fee for serving in that role in the amount of $15,750, and each of the Chairman of the Board’s Audit Committee and the Lead Independent Trustee of the Board received an additional $1,500. Compensation for the services of the Trustee who was an interested person of the Trust during that period was paid by the Manager. All fees paid to the Trustees by the Funds, were allocated among the Funds in proportion to their respective net assets.
As of September 30, 2015, the market value of all securities of affiliated companies held in Emerging Markets amounted to $35,011,431, representing approximately 31.0% of net assets.
Share Balance 3/31/15 | Purchases | Reinvested | Share Balance 9/30/15 | Realized Gain Loss | LT Cap Gain | Dividend Income | Value at 9/30/15 | Acquisition Cost |
| 3,912,134 | 341,989 | — | 4,254,123 | — | — | — | $35,011,431 | $42,984,903 |
4. Purchases and Sales
During the six months ended September 30, 2015, purchases of investment securities other than U.S. Government obligations and short-term investments for Small Cap, Quality, Emerging Markets, Risk Parity, Foreign Value, and Foreign Value Small Cap, were $5,984,239, $27,710,822, $32,032,812, $7,434,664, $201,818,421, and $217,807,975, respectively. Sales of such securities for the Funds were $0, $31,044,316, $35,010,484, $3,687,492, $82,879,010, and $1,545,753, respectively.
5. Contingent Liability
The Trust maintains a joint fidelity bond with the Funds’ Transfer Agent through ICI Mutual Insurance Company (“ICI Mutual”). The annual premium is allocated between the Funds and the Transfer Agent.
6. Concentration of Risk
The relatively large investments of Emerging Markets and Risk Parity in countries with limited or developing capital markets may involve greater risks than investments in more developed markets and the prices of such investments may be volatile. The consequences of political, social or economic changes in these markets may have disruptive effects on the market prices of each Fund’s investments and the income they generate, as well as each Fund’s ability to repatriate such amounts.
7. Federal Income Taxes
It is the policy of the Funds to distribute all of their taxable income within the prescribed time and otherwise comply with the provisions of the Internal Revenue Code (“IRC”) applicable to regulated investment companies. Therefore no Federal income tax provision is required.
The tax components of capital shown in the following tables represent: (1) losses or deductions the portfolios may be able to offset against income and gains realized in future years, (2) distribution requirements the portfolios must satisfy under the income tax regulations, and (3) unrealized appreciation or depreciation of investments for federal income tax purposes.
Certain Funds had capital loss carryovers at March 31, 2015. The accumulated capital losses noted in the table may be available to offset future realized capital gains and thereby reduce future taxable gain distributions.
| March 31, 2015 | ||||||
| Portfolio | Capital Loss Expires March 31, 2017 | Capital Loss Expires 2018 | Capital Loss Expires 2019 | Capital Loss No Expiration Short Term | Capital Loss No Expiration Long Term | Total Capital Loss |
| Small Cap | $— | $— | $— | $— | $— | $— |
| Quality | — | — | — | — | — | — |
| Emerging Markets | — | 18,600,611 | — | — | — | 18,600,611 |
| Risk Parity | — | — | — | — | — | — |
| Foreign Value | 73,956,484 | 131,156,114 | 10,547,106 | 132,769 | 31,155,708 | 246,948,181 |
| Foreign Value Small Cap | — | — | — | — | — | — |
As a result of the passage of the Registered Investment Company Modification Act of 2010 (“the Act”), losses incurred in fiscal year ended March 31, 2012 and beyond retain their character as short-term or long-term and have no expiration date and are utilized before capital losses incurred prior to the Act.
The Funds recognize the tax benefits of uncertain tax positions only where the position is “more likely than not” to be sustained assuming examination by the tax authorities. Management has analyzed the Funds’ tax positions, and has concluded that no liability for unrecognized tax benefits should be recorded related to uncertain tax positions taken on returns filed for open tax years 2012-2014, or expected to be taken in the Funds’ 2015 tax returns. The Funds identify their major tax jurisdictions as U.S. Federal and Massachusetts State; however the Funds are not aware of any tax positions for which it is reasonably possible that the total amounts of unrecognized tax benefits will change materially in the next twelve months.
The primary differences between book and tax appreciation or depreciation of investments consist of wash sale loss deferrals, return of capital distributions by real estate investment trusts (“REITs”), mark-to-market valuation on passive foreign investment companies (“PFICs”) held and foreign capital gains taxes accrued. The net tax appreciation/ (depreciation) in the table below includes unrealized tax gain/ (loss) on foreign currency and investments.
At September 30, 2015, the Funds’ aggregate security unrealized gains and losses based on cost for U.S. Federal Income Tax purposes were as follows:
| Portfolio | Tax Cost | Gross Unrealized Gain | Gross Unrealized Loss | Net Unrealized Gain (Loss) |
| Small Cap | $79,988,436 | $18,193,263 | $(7,313,122) | $10,880,141 |
| Quality | 113,131,716 | 8,862,646 | (5,341,791) | 3,520,855 |
| Emerging Markets | 134,675,452 | 7,656,366 | (29,768,978) | (22,112,612) |
| Risk Parity | 44,588,900 | 2,028,884 | (10,102,234) | (8,073,350) |
| Foreign Value | 1,523,286,572 | 346,366,042 | (308,606,927) | 37,759,115 |
| Foreign Value Small Cap | 573,974,834 | 67,638,363 | (81,365,490) | (13,727,127) |
8. Transactions in Shares of Beneficial Interest
Transactions in shares of beneficial interest were as follows:
Six months ended September 30, 2015 | Year ended March 31, 2015 | |||
| Shares | Dollars | Shares | Dollars | |
| Small Cap | ||||
| Ordinary Shares | ||||
| Shares sold | 58,355 | $1,420,553 | 109,729 | $2,808,732 |
| Shares issued in reinvestment of distributions | — | — | 397,572 | 8,989,103 |
| Shares redeemed | (78,055) | (1,913,078) | (415,480) | (10,583,003) |
| Net Change | (19,700) | (492,525) | 91,821 | 1,214,832 |
| Institutional Shares | ||||
| Shares sold | 662 | $18,790 | 18,517 | $550,893 |
| Shares issued in reinvestment of distributions | — | — | 24,523 | 638,081 |
| Shares redeemed | (930) | (25,120) | (223,385) | (6,143,296) |
| Net Change | (268) | (6,330) | (180,345) | (4,954,322) |
| Total Net Change For Fund | ($498,855) | ($3,739,490) | ||
| Quality | ||||
| Ordinary Shares | ||||
| Shares sold | 70,467 | $1,228,827 | 277,734 | $5,134,061 |
| Shares issued in reinvestment of distributions | — | — | 757,281 | 12,798,053 |
| Shares redeemed | (266,318) | (4,676,364) | (732,899) | (13,554,655) |
| Net Change | (195,851) | (3,447,537) | 302,116 | 4,377,459 |
| Institutional Shares | ||||
| Shares sold | 58,276 | $1,086,568 | 148,555 | $2,853,481 |
| Shares issued in reinvestment of distributions | — | — | 67,052 | 1,192,197 |
| Shares redeemed | (129,712) | (2,426,837) | (136,264) | (2,613,458) |
| Net Change | (71,436) | (1,340,269) | 79,343 | 1,432,220 |
| Total Net Change For Fund | $(4,787,806) | $5,809,679 | ||
| Emerging Markets | ||||
| Ordinary Shares | ||||
| Shares sold | 172,589 | $3,761,264 | 696,994 | $16,001,383 |
| Shares issued in reinvestment of distributions | — | — | 80,040 | 1,682,436 |
| Shares redeemed | (522,164) | (10,513,461) | (930,150) | (21,404,165) |
| Net Change | (349,575) | (6,752,197) | (153,116) | (3,720,346) |
| Institutional Shares | ||||
| Shares sold | 163,848 | $3,407,297 | 141,485 | $3,283,352 |
| Shares issued in reinvestment of distributions | — | — | 9,108 | 194,088 |
| Shares redeemed | (54,306) | (1,180,140) | (276,047) | (6,394,033) |
| Net Change | 109,542 | 2,227,157 | (125,454) | (2,916,593) |
| Total Net Change For Fund | ($4,525,040) | ($6,636,939) | ||
| Risk Parity | ||||
| Ordinary Shares | ||||
| Shares sold | 4,080 | $40,236 | 102,031 | $1,085,936 |
| Shares issued in reinvestment of distributions | — | — | 1,507 | 14,178 |
| Shares redeemed | (600) | (5,048) | (6,654) | (71,860) |
| Net Change | 3,480 | 35,188 | 96,884 | 1,028,254 |
| Institutional Shares | ||||
| Shares sold | 354,557 | $3,296,823 | 702,132 | $7,433,763 |
| Shares issued in reinvestment of distributions | — | — | 43,794 | 413,852 |
| Shares redeemed | (41) | (426) | (2,981) | (31,097) |
| Net Change | 354,516 | 3,296,397 | 742,945 | 7,816,518 |
| Total Net Change For Fund | $3,331,585 | $8,844,772 | ||
| Foreign Value | ||||
| Ordinary Shares | ||||
| Shares sold | 8,234,762 | $154,593,229 | 22,375,554 | $419,354,345 |
| Shares issued in reinvestment of distributions | — | — | 621,405 | 10,613,597 |
| Shares redeemed | (6,119,571) | (112,996,857) | (14,648,658) | (268,618,972) |
| Net Change | 2,115,191 | 41,596,372 | 8,348,301 | 61,348,970 |
| Institutional Shares | ||||
| Shares sold | 4,889,146 | $91,107,331 | 9,701,021 | $183,864,238 |
| Shares issued in reinvestment of distributions | — | — | 440,127 | 7,512,978 |
| Shares redeemed | (859,371) | (15,818,352) | (7,741,117) | (142,332,358) |
| Net Change | 4,029,775 | 75,288,979 | 2,400,031 | 49,044,858 |
| Total Net Change For Fund | $116,885,351 | $210,393,828 | ||
| Foreign Value Small Cap | ||||
| Ordinary Shares | ||||
| Shares sold | 12,077,502 | $165,283,925 | 11,712,584 | $154,429,715 |
| Shares issued in reinvestment of distributions | — | — | 150,797 | 1,881,952 |
| Shares redeemed | (2,488,508) | (33,015,256) | (4,895,038) | (63,630,016) |
| Net Change | 9,588,994 | 132,268,669 | 6,968,343 | 92,681,651 |
| Institutional Shares | ||||
| Shares sold | 7,633,306 | $103,986,461 | 13,245,895 | $172,971,087 |
| Shares issued in reinvestment of distributions | — | — | 80,531 | 1,005,032 |
| Shares redeemed | (3,111,672) | (40,432,178) | (1,942,393) | (25,001,133) |
| Net Change | 4,521,634 | 63,554,283 | 11,384,033 | 148,974,986 |
| Total Net Change for Fund | $195,822,952 | $241,656,637 | ||
PEAR TREE FUNDS
INFORMATION FOR SHAREHOLDERS (unaudited)
Quarterly Portfolio Disclosure
Each Fund files its complete schedule of portfolio holdings with the Securities and Exchange Commission (“SEC”) for the first and third quarters of each fiscal year on Form N-Q. The Funds’ Forms N-Q are available on the SEC’s website at www.sec.gov and may be reviewed and copied at the SEC’s Public Reference Room in Washington, D.C. (Call 1-800-SEC-0330 for more information). For a complete list of a fund’s portfolio holdings, you may also view the most recent monthly holdings report, semi-annual report or annual report on the Pear Tree Funds’ web site at www.peartreefunds.com.
Portfolio Proxy Voting Policies and Information
Information on the Funds’ proxy voting policies and on how the Pear Tree Funds voted proxies related to portfolio securities for the 12-month period ended June 30, 2015 is available without charge online at www.peartreefunds.com and at www.sec.gov. You may also call 1-800-326-2151 to request a free copy of the proxy voting information or the proxy voting policies.
Household Delivery of Fund Documents
With your consent, the Trust may send a single proxy statement, prospectus and shareholder report to your residence for you and any other member of your household who has an account with the Funds. If you wish to revoke your consent to this practice, you may do so by notifying the Fund’s transfer agent, by phone or in writing (see “For Account Information”). The mailing of separate proxy statements, prospectuses and shareholder reports will begin within 30 days after receiving your notice.
MANAGEMENT CONTRACT AND ADVISORY
CONTRACT APPROVAL (unaudited)
At an in-person meeting held on May 13, 2015, the Trustees, including the Independent Trustees, approved for an annual period the continuation of the Management Agreement and each sub-advisory agreement with respect to a Fund (collectively, the “Fund Advisory Agreements”).
In considering the Fund Advisory Agreements, the Trustees received in advance of and at the meeting a variety of materials relating to the Funds, the Manager, and the sub-advisers. Those materials included comparative performance, fee and expense information for peer groups of similar mutual funds prepared by an independent third-party provider of mutual fund data; performance information of a benchmark index for each Fund, as well as other information provided by the Manager and each sub-adviser regarding (a) the nature, extent, and quality of services provided by the Manager and the sub-adviser under their respective Fund Advisory Agreements, and (b) the Manager’s revenues and costs of providing services to each Fund and any compensation paid to affiliates of the Manager. Particular focus was given to information concerning fund performance, comparability of fees and total expenses, and profitability.
The Trustees noted that the evaluation process with respect to the Manager and each sub-adviser has been an ongoing one. In this regard, the Trustees also took into account discussions with management and information provided to the Trustees at prior meetings with respect to the services provided by the Manager and the sub-advisers to the Funds, including quarterly performance reports prepared by management containing reviews of investment results, and prior presentations from the sub-advisers with respect to the Funds. The Trustees also considered the nature, quality, and extent of non-advisory services, if any, to be provided to each Fund by the Manager’s affiliates, including distribution services. The Trustees also considered conditions and trends prevailing generally in the economy, the securities markets, and the industry.
In reaching their conclusions, the Trustees did not treat any single factor as determinative, and each Trustee may have attributed different weights to different factors.
Throughout the process, the Trustees asked questions of and requested additional information from the Manager and sub-advisers. Throughout the process, the Independent Trustees were assisted by independent legal counsel. The Independent Trustees also received a memorandum from independent legal counsel discussing the legal standards for their consideration of the proposed continuation of the Fund Advisory Agreements. The Independent Trustees also discussed the proposed continuation of the Fund Advisory Agreements in private sessions with their independent legal counsel at which no representatives of the Manager, the sub-advisers or Trust management were present.
Approval of Management Contract
Nature, Extent, and Quality of Services. Among the information received by the Trustees from the Manager relating to the nature, extent, and quality of services provided by the Manager to each Fund, the Trustees reviewed information provided by the Manager relating to its operations and personnel, descriptions of its organizational and management structure, and information regarding the Manager’s compliance and regulatory history, including its Form ADV. The Trustees noted that on a regular basis they have received and reviewed information from the Trust’s Chief Compliance Officer regarding the Trust’s compliance policies and procedures established pursuant to Rule 38a-1 under the 1940 Act. The Trustees also considered the Manager’s risk management processes. The Trustees considered that the Manager is responsible for the management of the day-to-day operations of each Fund, including general supervision of and coordination of the services provided by the sub-advisor for such Fund, and is also responsible for monitoring and reviewing the activities of each sub-advisor and other third-party service providers. The Trustees also considered that the Manager that in the case of Quality Fund, the Manager is responsible for the selection of the target fund or funds, as well as the monitoring of changes in the target fund’s portfolio, and determining from time to time the specific securities to be purchased, sold, and held by the Quality Fund.
In considering the nature, extent, and quality of the services provided by the Manager, the Trustees also took into account their knowledge of the Manager’s management and the quality of the performance of the Manager’s duties, through Trustees’ meetings, discussions and reports during the preceding year and through each Trustee’s experience as a Trustee of the Trust.
In the course of their deliberations regarding the Management Contract, the Trustees considered, among other things:
| • | The skills and competency with which the Manager has in the past managed the Trust’s affairs and its sub-advisory relationships, the Manager’s oversight and monitoring of each sub-advisor’s investment performance and compliance programs, such as the Sub-adviser’s compliance with fund policies and objectives, review of brokerage matters, including with respect to trade allocation and best execution and the Manager’s timeliness in responding to performance issues; |
| • | The background, qualifications and skills of the Manager’s personnel; |
| • | The Manager’s compliance policies and procedures and its responsiveness to regulatory changes and mutual fund industry developments; |
| • | The Manager’s administrative capabilities, including its ability to supervise the other service providers for each Fund; |
| • | The financial condition of the Manager and whether it has the financial wherewithal to provide a high level and quality of services to the fund; and |
| • | The Manager’s reputation and experience in serving as an investment manager to the Trust and each Fund and the benefit to Fund shareholders of investing in funds that are part of a small but focused family of funds offering different types of investments. |
The Trustees concluded that the Manager may reasonably be expected to continue to provide a high quality of services under the Management Contract with respect to each Fund.
Investment Performance. In considering each Fund’s performance, the Trustees noted that it reviews at its regularly scheduled meetings information about the Funds’ performance results. In connection with the consideration of the Management Agreement, the Trustees: (a) reviewed information prepared by management regarding each Fund’s performance; (b) considered the comparative performance of a benchmark; (c) considered the performance of comparable funds, if any, as included in the report prepared by an independent third-party provider of mutual fund data (such report included a Fund’s ranking within a smaller group of peer funds and a Fund’s ranking within broader groups, or universes, of funds; and (d) took into account the Manager’s analysis of each Fund’s performance and its plans and recommendations regarding the Funds’ sub-advisory arrangements generally.
The Trustees noted that for each of the most recent one-, three-, five-, and ten-year periods ended December 31, 2014:
| • | Emerging Markets Fund was in the second quintile of its performance group and performance universe, except for the ten-year period, where Emerging Markets Fund was in the fourth quintile of its performance universe (there was no data provided with respect to its performance group for the 10-year period); |
| • | Foreign Value Fund was in the first quintile of each of its performance group and performance universe, except for the one-year period, where Foreign Value Fund was in the third quintile of its performance group and performance universe; |
| • | Foreign Value Small Cap Fund was in the first quintile of its performance universe (there was no data provided with respect to its performance group); |
| • | Quality Fund was in the first or fourth quintile of its performance group and third or fifth quintile of its performance universe over the most recent one-year and three-year periods, that is, those periods occurring after the time Quality Fund had changed its investment strategy and investment sub-adviser to the current strategy and sub-adviser; and |
| • | Risk Parity Fund was in fourth quintile of its performance group and third quintile of its performance universe, each over the most recent one-year period, that is, the period occurring after the time Risk Parity Fund was launched. |
The Trustees took into account management’s discussion of specific Fund performance, including its discussion of the strategies used by Risk Parity Fund and the target portfolio of Quality Fund. Management noted, among other things, that those strategies were intended to out-perform their peers in certain market conditions, not necessarily to move in tandem with their peers, and thus, they are difficult to compare with their peers. The Trustees also took into account the fact that Small Cap Fund had recently replaced its sub-adviser, and thus, there was an insufficient performance record to evaluate Small Cap Fund’s current sub-adviser with respect to performance.
The Trustees concluded that, except as noted above, each Fund’s performance has generally been in line with or outperformed the historical performance of comparable funds.
Fees and Expenses. The Trustees reviewed comparative information prepared by an independent third-party provider of mutual fund data, including, among other data, each Fund’s contractual and actual management fees and actual total expenses as compared to similarly situated investment companies deemed to be comparable to the Fund. The Trustees considered each Fund’s ranking within a smaller group of peer funds chosen by the independent third-party provider, as well as the Fund’s ranking within a broader group of funds.
The Trustees noted that at December 31, 2014:
| • | Emerging Markets Fund’s contractual management fees were approximately equal to its peer group’s median, and its actual management fees and actual total expenses each were slightly higher than its peer group’s median; |
| • | Foreign Value Fund’s contractual management fees, actual management fees and actual total expenses each were higher than its peer group’s median; |
| • | Foreign Value Small Cap Fund’s contractual management fees and actual total expenses each were approximately equal to its peer group median, and its actual management fees were higher than its peer group’s median; |
| • | Quality Fund’s contractual management fees and actual total expenses each were higher than its peer group’s median, and its actual managements fees were approximately equal to its peer group’s median; |
| • | Risk Parity Fund’s contractual management fees were substantially lower than its peer group’s median, its actual management fees were lower than its peer group’s median, and its actual total expenses were higher than its peer group’s median; and |
| • | Small Cap Fund’s contractual management fees were approximately equal to its peer group’s median, and its actual management fees and actual total expenses each were higher than its peer group’s median. |
The Trustees took into account management’s discussion of each Fund’s expenses. The Trustees noted, among other things, that the Manager had negotiated significant reductions in the Funds’ custody and other expenses, which had not taken effect at the time the third-party materials were prepared, and thus, were not reflected in the data provided to the Trustees. The Trustees also noted that the contractual management fee rate used to determine the management fee payable by Small Cap Fund also had recently been decreased and that that decrease also had not been in effect when the materials were prepared.
The Trustees have concluded that the management fees payable with respect to each Fund are reasonable.
Profitability/Indirect Benefits. In considering the costs of the services to be provided and the profits to be realized by the Manager and its affiliates from the Manager’s relationship with the Funds, the Trustees: (a) reviewed financial information of the Manager; (b) reviewed and considered an analysis presented by the Manager regarding the net profitability to the Manager and its affiliates with respect to each Fund; (c) received and reviewed profitability information with respect to the Pear Tree Funds complex as a whole; (d) received information with respect to the Manager’s allocation methodologies used in preparing the profitability data; (e) considered that the Manager also provides administrative services to each Fund pursuant to an administrative services agreement; (f) noted that the Funds’ distributor also receives Rule 12b-1 payments to support distribution of the Funds; (g) noted that the Manager also derives reputational and other indirect benefits from providing advisory services to the Funds; (h) noted that the sub-advisory fees for each Fund are paid by the Manager and are negotiated at arm’s length; and (i) considered that the Manager should be entitled to earn a reasonable level of profits in exchange for the level of services it provides to each Fund and the entrepreneurial risk that it assumes as the Funds’ investment manager.
Based upon their review, the Trustees have concluded that the level of profitability, if any, of the Manager and its affiliates from their relationship with the Funds is reasonable and not excessive.
Economies of Scale. In considering the extent to which economies of scale would be realized as each Fund grows and whether a Fund’s fee levels reflect these economies of scale for the benefit of Fund shareholders, the Trustees: (a) considered that the Manager has agreed to continue to waive a portion of its management fee for Quality Fund or otherwise reimburse the expenses of Quality Fund; (b) took into account management’s discussion of each Fund’s advisory fee structure, and (c) considered the effect of each Fund’s growth in size on its performance and fees. The Trustees also noted that if Fund assets increase over time, each Fund may realize other economies of scale, such as lower fees for administration and legal services.
Approval of Sub-Advisory Agreements
In making its determination with respect to approval of each sub-advisory agreement, the Trustees reviewed: (a) information relating to each sub-adviser’s business, including current sub-advisory services to each Fund managed by the sub-adviser; (b) the historical and current performance of each Fund, and comparative performance information relating to a benchmark and, if applicable, comparable funds; (c) the sub-advisory fee for the Fund, including any breakpoints, and comparative fee information, where available, prepared by an independent third-party provider of mutual fund data; and (d) information relating to the nature and scope of any material relationships and their significance to the Manager and the applicable sub-adviser.
Nature, Extent, and Quality of Services. With respect to the services provided by each sub-adviser, the Trustees received information provided to the Trustees by the sub-adviser, including the sub-adviser’s Form ADV, as well as took into account information presented throughout the past year. The Trustees considered the sub-adviser’s current level of staffing and its overall resources, as well as received information relating to the sub-adviser’s compensation program. The Trustees reviewed the sub-adviser’s history and investment experience, as well as information regarding the qualifications, background, and responsibilities of the sub-adviser’s investment and compliance personnel who provide services to each Fund managed by that sub-adviser. The Trustees also considered, among other things, the sub-adviser’s compliance program and any disciplinary history. The Trustees also considered the sub-adviser’s risk assessment and monitoring process. The Trustees reviewed the sub-adviser’s regulatory history, including whether it was currently involved in any regulatory actions or investigations as well as material litigation, and any settlements and amelioratory actions undertaken, as appropriate. The Trustees noted that the Manager conducts regular, periodic reviews of each sub-adviser and its operations, including regarding investment processes and organizational and staffing matters. The Trustees also noted that the Trust’s Chief Compliance Officer conducts regular, periodic compliance reviews with each sub-adviser and presents reports to the Independent Trustees regarding the same, which reports include evaluating the regulatory compliance systems of each sub-adviser and procedures reasonably designed by it to assure compliance with the federal securities laws. The Trustees also took into account the financial condition of each sub-adviser.
The Trustees considered each sub-adviser’s investment process and philosophy with respect to each Fund that it sub-advises. The Trustees took into account that, other than the sub-adviser to Quality Fund, each sub-adviser’s responsibilities include the development and maintenance of an investment program for each Fund that it manages that is consistent with the Fund’s investment objective, the selection of investment securities and the placement of orders for the purchase and sale of such securities, as well as the implementation of compliance controls related to performance of these services. (With respect to Quality Fund, the Trustees noted that the sub-adviser’s responsibilities are more limited, which is reflected in the fee payable to the sub-adviser.) The Trustees also received information with respect to the sub-adviser’s brokerage policies and practices, including with respect to best execution and soft dollars.
Sub-Adviser Compensation. In considering the cost of services to be provided by each sub-adviser and the profitability to the sub-adviser of its relationship with each Fund managed by that sub-adviser, the Trustees noted that the fees under each sub-advisory agreement are paid by the Manager and not the Funds.
The Trustees also relied on the ability of the Manager to negotiate the sub-advisory agreement with each sub-adviser, none of which is affiliated with the Manager, and the fees thereunder are at arm’s length. As a result, the costs of the services to be provided and the profits to be realized by a sub-adviser from its relationship with the Trust were not a material factor in the Trustees’ consideration of the sub-advisory agreements.
The Trustees also received information and took into account other potential conflicts of interest the Manager might have in connection with any sub-advisory agreement.
In addition, the Trustees considered other potential indirect benefits that each sub-adviser and its affiliates may receive from the sub-adviser’s relationship with the Funds, such as reputational benefits.
Sub-Advisory Fees. The Trustees considered that each Fund pays an investment management fee to the Manager and that, in turn, the Manager pays a sub-advisory fee to the Fund’s sub-adviser. The Trustees also took into account the sub-advisory fees paid by the Manager to each sub-adviser with respect to the Fund to fees charged by the Fund’s sub-adviser to manage other sub-advised portfolios and portfolios not subject to regulation under the 1940 Act, as applicable.
Sub-Adviser Performance. As noted above, the Trustees considered each Fund’s performance as compared to the performance of the Fund’s peer group and its benchmark index and noted that the Trustees had reviewed information about each Fund’s performance results at their regularly scheduled meetings. The Trustees also noted the performance of other accounts managed by each sub-adviser using strategies similar to the strategy used by the sub-adviser to manage the assets of a Fund (other than with respect to Quality Fund, Risk Parity Fund, and Small Cap Fund, where the respective sub-adviser reported that it did not manage an account using a similar strategy). The Trustees noted the Manager’s expertise and resources in monitoring the performance, investment style and risk-adjusted performance of the sub-advisers. The Trustees were mindful of the Manager’s focus on each sub-adviser’s performance with respect to the Fund or Funds that they sub-advise.
The Trustees’ decision to approve each sub-advisory agreement was based on a number of determinations, including the following: (a) each sub-adviser has extensive experience and demonstrated skills as an investment adviser; (b) except as noted above, the performance of each Fund generally has been in line with or outperformed the historical performance of comparable funds and a benchmark, and each Fund’s overall performance is satisfactory; and (c) the sub-advisory fees relating to each Fund are reasonable in relation to the level and quality of services being provided.
* * *
Based on the Trustees’ evaluation of all factors that the Trustees deemed to be material, including those factors described above, the Trustees, including the Independent Trustees, concluded that renewal of each Fund Advisory Agreement would be in the best interest of each Fund and its shareholders. Accordingly, the Trustees, and the Independent Trustees voting separately, have approved each Fund Advisory Agreement for an additional one-year period.
SERVICE PROVIDERS
| Manager | Pear Tree Advisors, Inc., 55 Old Bedford Road, Suite 202, Lincoln, MA 01773 |
| Subadvisers | Columbia Partners, L.L.C., Investment Management, 5425 Wisconsin Avenue, Suite 700, Chevy Chase, MD 20815 PanAgora Asset Management, Inc., 470 Atlantic Avenue, 8th Floor, Boston, MA 02210 Polaris Capital Management, LLC, 121 High Street, Boston, MA 02110 |
| Distributor | U.S. Boston Capital Corporation, 55 Old Bedford Road, Suite 202, Lincoln, MA 01773 |
| Custodian | State Street Bank and Trust Company, One Lincoln Street, Boston, MA 02111 |
| Fund Accountant | State Street Bank and Trust Company, One Lincoln Street, Boston, MA 02111 |
| Transfer Agent | Pear Tree Institutional Services, 55 Old Bedford Road, Suite 202, Lincoln, MA 01773 |
Independent Registered Public Accounting Firm | Tait, Weller & Baker LLP, 1818 Market Street, Suite 2400 Philadelphia, PA 19103 |
| Legal Counsel | Nutter, McClennen & Fish, Seaport West, 155 Seaport Boulevard, Boston, MA 02210 |
| For Account Information | For Pear Tree Funds information, contact your financial adviser or, if you receive account statements directly from Pear Tree Funds, you can also call 1-800-326-2151. Telephone representatives are available from 8:30 a.m. to 4:30 p.m. Eastern Time. Or visit our website, www.peartreefunds.com |
ITEM 2. Code of Ethics
Not applicable for report period.
ITEM 3. Audit Committee Financial Expert
Not applicable for report period.
ITEM 4. Principal Accountant Fees and Services
Not applicable for report period.
ITEM 5. Audit Committee of Listed Registrants
Not applicable.
ITEM 6. Schedule of Investments
Not applicable.
ITEM 7. Disclosure of Proxy Voting Policies and Procedures for Closed-End Management Investment Companies
Not applicable.
ITEM 8. Portfolio Managers of Closed-End Management Investment Companies.
Not applicable.
| ITEM 9 | Purchases of Equity Securities by Closed-End Management Investment Company and Affiliated Purchasers |
Not applicable.
ITEM 10 Submission of Matters to a Vote of Security Holders
Not applicable.
ITEM 11. Controls and Procedures
(a) The President and Treasurer of the registrant have concluded, based on their evaluation of the effectiveness of the registrant’s disclosure controls and procedures (as defined in Rule 30a-3(c) under the Act) as of a date within 90 days of the filing date of this report on Form N-CSR, that the design and operation of such procedures provide reasonable assurance that information required to be disclosed by the registrant in this report on Form N-CSR is recorded, processed, summarized, and reported within the time periods specified in the Securities and Exchange Commission’s rules and forms.
(b) There has been no change in the registrant’s internal controls over financial reporting (as defined in Rule 30a-3(d) under the Act) that occurred during the second fiscal quarter of the period covered by this report that has materially affected, or is reasonably likely to materially affect, the registrant’s internal control over financial reporting.
ITEM 12. Exhibits
(a) Certifications pursuant to Rule 30a-2(a) by the chief executive and financial officers.
| (b) | Certification pursuant to Rule 30a-2(b) and Section 906 by the chief executive and financial officers. |
SIGNATURES
Pursuant to the requirements of the Securities Exchange Act of 1934 and the Investment Company Act of 1940, the registrant has duly caused this report to be signed on its behalf by the undersigned, thereunto duly authorized.
Pear Tree Funds
By /s/ Willard L. Umphrey
Willard L. Umphrey, President
Date: November 15, 2015
Pursuant to the requirements of the Securities Exchange Act of 1934 and the Investment Company Act of 1940, this report has been signed below by the following persons on behalf of the registrant and in the capacities and on the dates indicated.
By /s/ Willard L. Umphrey
Willard L. Umphrey, President
Date: November 15, 2015
By /s/ Leon Okurowski
Leon Okurowski, Treasurer
Date: November 15, 2015