UNITED STATES
SECURITIES AND EXCHANGE COMMISSION
Washington, D.C. 20549
FORM N-CSR
CERTIFIED SHAREHOLDER REPORT OF REGISTERED MANAGEMENT INVESTMENT
COMPANIES
Investment Company Act file number811-03851
| |
| Nicholas II, Inc. |
|
| (Exact Name of Registrant as specified in charter) |
| |
| 411 East Wisconsin Avenue, Milwaukee, Wisconsin 53202 |
| (Address of Principal Executive Offices) | (Zip Code) |
| |
| Jennifer R. Kloehn, Senior Vice President and Treasurer |
| 411 East Wisconsin Avenue |
| Milwaukee, Wisconsin 53202 |
|
| (Name and Address of Agent for Service) |
Registrant's telephone number, including area code:414-272-4650
Date of fiscal year end:09/30/2020
Date of reporting period:03/31/2020
Item 1. Report to Stockholders.
SEMIANNUAL REPORT
March 31, 2020
NICHOLAS II, INC.

Beginning on January 1, 2021, as permitted by regulations adopted by the Securities and Exchange
Commission, paper copies of the Fund’s shareholder reports will no longer be sent by mail, unless you
specifically request paper copies of the reports from the Fund or from your financial intermediary, such
as a broker-dealer or bank. Instead, the reports will be made available on the Fund’s website,
www.nicholasfunds.com, and you will be notified by mail each time a report is posted and provided
with a website link to access the report.
If you already elected to receive shareholder reports electronically, you will not be affected by this
change and you need not take any action. You may elect to receive shareholder reports and other
communications from the Fund or your financial intermediary electronically by contacting your financial
intermediary (such as a broker-dealer or bank); direct shareholders may call the Fund at 1-800-544-6547.
You may elect to receive all future reports in paper free of charge. You can inform the Fund or your
financial intermediary that you wish to continue receiving paper copies of your shareholder reports by
contacting your financial intermediary (such as a broker-dealer or bank); direct shareholders may call
the Fund at 1-800-544-6547. Your election to receive reports in paper will apply to all funds held with
the Fund complex or your financial intermediary.
WWW.NICHOLASFUNDS.COM
NICHOLAS II, INC.
May 2020
Dear Fellow Shareholders,
For the six-month period ended March 31, 2020, Nicholas II Class I returned -18.40% compared to the Russell Midcap Growth Index (RMG) of -13.50% and the Russell Midcap Index -21.92%. U.S. stock markets trended steadily higher from the start of 2020 through mid-February, but then collapsed due to the onset of the COVID-19 pandemic. The speed of the collapse was unprecedented, as it was the fastest 30% stock market decline ever recorded. Investors panicked as governments around the world essentially shut down their economies to try to slow the spread of the coronavirus.
Returns for Nicholas II, Inc. (the “Fund”) Class I and Class N and selected indices are provided in the chart below for the periods ended March 31, 2020.
| | | | | | | | | | | | | | | |
| | | | | | Average Annual Total Returns | |
| | | 6 Month | | | 1 | Year | | 3 | Year | | 5 | Year | | 10 | Year |
| Nicholas II, Inc. – Class I | | -18.40 | % | | -11.43 | % | | 4.59 | % | | 4.41 | % | | 9.76 | % |
| Nicholas II, Inc. – Class N | | -18.52 | % | | -11.71 | % | | 4.25 | % | | 4.06 | % | | 9.38 | % |
| Morningstar Mid-Cap | | | | | | | | | | | | | | | |
| Growth Category | | -14.25 | % | | -11.17 | % | | 4.66 | % | | 4.33 | % | | 9.46 | % |
| Russell Midcap Growth Index | | -13.50 | % | | -9.45 | % | | 6.53 | % | | 5.61 | % | | 10.89 | % |
| Standard & Poor’s 500 Index | | -12.31 | % | | -6.89 | % | | 5.10 | % | | 6.73 | % | | 10.53 | % |
| Ending value of $10,000 invested in | | | | | | | | | | | | | | | |
| Nicholas II, Inc. – Class I | $ | 8,160 | | $ | 8,857 | | $ | 11,442 | | $ | 12,408 | | $ | 25,379 | |
| Ending value of $10,000 invested in | | | | | | | | | | | | | | | |
| Nicholas II, Inc. – Class N | $ | 8,148 | | $ | 8,829 | | $ | 11,330 | | $ | 12,202 | | $ | 24,516 | |
| Fund’s Class I Expense Ratio (from 01/29/20 Prospectus): 0.60% | | | | | | | | | | |
| Fund’s Class N Expense Ratio (from 04/29/20 Prospectus): 0.95% | | | | | | | |
Performance data quoted represents past performance and is no guarantee of future results. The investment return and principal value of an investment will fluctuate so that an investor’s shares, when redeemed, may be worth more or less than their original cost. Current performance of the Fund may be lower or higher than the performance quoted. Performance data current to the most recent month-end may be obtained by visiting www.nicholasfunds.com/returns.html.
The Fund’s returns are reduced by expenses; while the market indices are not. The ending values above illustrate the performance of a hypothetical $10,000 investment made in the Fund over the timeframes listed. Assumes reinvestment of dividends and capital gains. Returns shown do not reflect the deduction of taxes that a shareholder would pay on Fund distributions or the redemption of Fund shares. These figures do not imply any future performance.
Class N of the Fund commenced operations on February 28, 2005. The annual returns shown for the Class I shares of this Fund would be substantially similar to the Class N because both classes of shares are invested in the same portfolio of securities. Annual returns will generally differ only to the extent that the classes do not have the same expenses. Please see the respective prospectus for details.
Given our concerns coming into 2020 about some of the underlying fundamentals of the U.S. economy as well as high valuations, we felt confident that our strategy of owning companies with defensible competitive advantages, recurring revenues and earnings, strong balance sheets, management teams with a track record of success, and reasonable valuations would serve us well in the event of a bear market due to a recession. However, investors punished stocks with direct negative impact from COVID-19, regardless of whether they were historically high-quality companies, which negatively impacted the Fund’s performance in the period. Higher market capitalization companies tended to outperform smaller market capitalization companies, which was a negative for the Fund given its smaller weighted-average market cap than the RMG. Expensive stocks outperformed cheaper stocks, which also acted as a headwind on the Fund’s relative performance given our philosophy of owning stocks at reasonable valuations. In summary, COVID-19 led to a perfect storm that was difficult to navigate.
The Fund’s relative underperformance vs. the Russell Midcap Growth Index was driven mainly by stock selection in the technology and healthcare sectors. In technology, the Fund’s holdings of payment-related stocks (FleetCor, Euronet Worldwide, EVO Payments) underperformed while the underweight of expensive software as a service stocks hurt relative performance as investors piled into these stocks as safe havens during the market swoon. In health care, the Fund’s exposure to companies whose businesses depend on elective procedures and medical device sales led to underperformance as investors rotated into pharmaceutical and biotechnology stocks as the market declined.
The Fund’s best-performing stocks in the period based on market value appreciation were Regeneron (+76%), Vertex Pharmaceuticals (+40%), Domino’s Pizza (+33%), Old Dominion Freight Line (+16%), Qualys (+15%), Skyworks (+14%) and Fiserv (+13). These stocks were among the positive contributors to the Fund’s return. Among the worst-performing stocks were Webster Financial (-60%), US Foods Holding Corp. (-57%), Expedia (-51%), KAR Auction Services (-50%), EVO Payments (-46%), CarMax (-39%) and LKQ Corporation (-35%).
As of March 31, 2020, the Fund had 73 stocks and approximately 9% cash. The approximate sector weightings were industrials 23%, technology 21%, health care 15%, consumer discretionary 12%, financials 7%, consumer staples 7%, materials 3%, and real estate 3%.
The recent market decline has created some large dislocations between stock prices and their intrinsic values that we believe are highly attractive risk/reward situations. We continue to focus on owning high quality companies with sustainable competitive advantages, consistent revenue and earnings growth, strong balance sheets and management teams, and that are trading at reasonable valuations. We do not know when the COVID-19 crisis will pass or when our lives will get back to normal, but we feel confident that the stocks we are buying today will be long-term winners on the other side of this crisis.
Thank you for your continued support.
Sincerely,

Mutual fund investing involves risk. Principal loss is possible. The Fund may invest in smaller companies, which involve additional risks such as limited liquidity and greater volatility. Diversification does not assure a profit or protect against loss in a declining market. Earnings growth is not representative of the Fund’s future performance.
Opinions expressed are subject to change at any time, are not guaranteed, and should not be considered investment advice.
Please refer to the schedule of investments in the report for complete fund holdings information. Fund holdings and sector allocations are subject to change and should not be considered a recommendation to buy or sell any security.
The Russell Midcap Index measures the performance of the 800 smallest companies in the Russell 1000 Index, which represent approximately 31% of the total market capitalization of the Russell 1000 Index. The Russell Midcap Growth Index measures the performance of those Russell Midcap companies with higher price-to-book ratios and higher forecasted growth values. The Standard & Poor’s (“S&P”) 500 Index is a broad-based unmanaged index of 500 stocks, which is widely recognized as representative of the equity market in general. One cannot invest directly in an index. Each Morningstar Category average represents a universe of Funds with similar investment objectives.
Must be preceded or accompanied by a prospectus.
The Nicholas Funds are distributed by Quasar Distributors, LLC.
Financial Highlights Class I (NCTWX)
For a share outstanding throughout each period
| | | | | | | | | | | | | | | | | | |
| | | Six Months | | | | | | | | | | | | | | | | |
| | | Ended | | | | | | | | | | | | | | | | |
| | | 03/31/2020 | | | | | | Years Ended September 30, | | | | |
| | | (unaudited) | | | 2019 | | | 2018 | | | 2017 | | | 2016 | | | 2015 | |
| NET ASSET VALUE, | | | | | | | | | | | | | | | | | | |
| BEGINNING OF PERIOD | $ | 29.61 | | $ | 30.37 | | $ | 28.79 | | $ | 25.41 | | $ | 25.39 | | $ | 27.41 | |
| INCOME (LOSS) FROM | | | | | | | | | | | | | | | | | | |
| INVESTMENT OPERATIONS | | | | | | | | | | | | | | | | | | |
| Net investment income(1) | | .04 | | | .10 | | | .18 | | | .04 | | | .09 | | | .07 | |
| Net gain (loss) on securities | | | | | | | | | | | | | | | | | | |
| (realized and unrealized) | | (4.74 | ) | | 2.08 | | | 4.45 | | | 4.59 | | | 1.49 | | | 1.49 | |
| Total from investment | | | | | | | | | | | | | | | | | | |
| operations | | (4.70 | ) | | 2.18 | | | 4.63 | | | 4.63 | | | 1.58 | | | 1.56 | |
| LESS DISTRIBUTIONS | | | | | | | | | | | | | | | | | | |
| From net investment income | | (.11 | ) | | (.18 | ) | | (.03 | ) | | (.07 | ) | | (.09 | ) | | (.10 | ) |
| From net capital gain | | (3.10 | ) | | (2.76 | ) | | (3.02 | ) | | (1.18 | ) | | (1.47 | ) | | (3.48 | ) |
| Total distributions | | (3.21 | ) | | (2.94 | ) | | (3.05 | ) | | (1.25 | ) | | (1.56 | ) | | (3.58 | ) |
| NET ASSET VALUE, | | | | | | | | | | | | | | | | | | |
| END OF PERIOD | $ | 21.70 | | $ | 29.61 | | $ | 30.37 | | $ | 28.79 | | $ | 25.41 | | $ | 25.39 | |
| |
| TOTAL RETURN | | (18.40 | )%(2) | | 9.97 | % | | 17.10 | % | | 19.02 | % | | 6.44 | % | | 5.35 | % |
| |
| SUPPLEMENTAL DATA: | | | | | | | | | | | | | | | | | | |
| Net assets, end of period (millions) | $ | 654.8 | | $ | 828.6 | | $ | 795.9 | | $ | 704.6 | | $ | 625.4 | | $ | 589.7 | |
| Ratio of expenses | | | | | | | | | | | | | | | | | | |
| to average net assets. | | .61 | %(3) | | .60 | % | | .60 | % | | .61 | % | | .61 | % | | .61 | % |
| Ratio of net investment income | | | | | | | | | | | | | | | | | | |
| to average net assets. | | .30 | %(3) | | .34 | % | | .63 | % | | .17 | % | | .39 | % | | .27 | % |
| Portfolio turnover rate | | 19.90 | %(3) | | 19.75 | % | | 26.63 | % | | 29.20 | % | | 29.92 | % | | 20.35 | % |
| (1) | Computed based on average shares outstanding. |
| (2) | Not annualized. |
| (3) | Annualized. |
The accompanying notes to financial statements are an integral part of these highlights.
– 3–
Financial Highlights Class N (NNTWX)
For a share outstanding throughout each period
| | | | | | | | | | | | | | | | | | |
| | | Six Months | | | | | | | | | | | | | | | | |
| | | Ended | | | | | | | | | | | | | | | | |
| | | 03/31/2020 | | | | | | Years Ended September 30, | | | | |
| | | (unaudited) | | | 2019 | | | 2018 | | | 2017 | | | 2016 | | | 2015 | |
| NET ASSET VALUE, | | | | | | | | | | | | | | | | | | |
| BEGINNING OF PERIOD | $ | 28.91 | | $ | 29.72 | | $ | 28.29 | | $ | 25.00 | | $ | 25.00 | | $ | 27.03 | |
| INCOME (LOSS) FROM | | | | | | | | | | | | | | | | | | |
| INVESTMENT OPERATIONS | | | | | | | | | | | | | | | | | | |
| Net investment income (loss)(1) | | (.00 | )(2) | | (.00 | )(2) | | .09 | | | (.04 | ) | | .01 | | | (.02 | ) |
| Net gain (loss) on securities | | | | | | | | | | | | | | | | | | |
| (realized and unrealized) | | (4.62 | ) | | 2.03 | | | 4.36 | | | 4.51 | | | 1.46 | | | 1.47 | |
| Total from investment | | | | | | | | | | | | | | | | | | |
| operations | | (4.62 | ) | | 2.03 | | | 4.45 | | | 4.47 | | | 1.47 | | | 1.45 | |
| LESS DISTRIBUTIONS | | | | | | | | | | | | | | | | | | |
| From net investment income | | (.02 | ) | | (.08 | ) | | — | | | — | | | — | | | (.00 | )(2) |
| From net capital gain | | (3.10 | ) | | (2.76 | ) | | (3.02 | ) | | (1.18 | ) | | (1.47 | ) | | (3.48 | ) |
| Total distributions | | (3.12 | ) | | (2.84 | ) | | (3.02 | ) | | (1.18 | ) | | (1.47 | ) | | (3.48 | ) |
| NET ASSET VALUE, | | | | | | | | | | | | | | | | | | |
| END OF PERIOD | $ | 21.17 | | $ | 28.91 | | $ | 29.72 | | $ | 28.29 | | $ | 25.00 | | $ | 25.00 | |
| |
| TOTAL RETURN | | (18.52 | )%(3) | | 9.55 | % | | 16.74 | % | | 18.61 | % | | 6.06 | % | | 5.00 | % |
| |
| SUPPLEMENTAL DATA: | | | | | | | | | | | | | | | | | | |
| Net assets, end of period (millions) | $ | 72.8 | | $ | 96.7 | | $ | 101.2 | | $ | 97.2 | | $ | 98.8 | | $ | 105.7 | |
| Ratio of expenses | | | | | | | | | | | | | | | | | | |
| to average net assets. | | .93 | )%(4) | | .95 | % | | .93 | % | | .94 | % | | .96 | % | | .96 | % |
| Ratio of net investment income (loss) | | | | | | | | | | | | | | | | | | |
| to average net assets. | | (.03 | )%(4) | | (.01 | )% | | .31 | % | | (.16 | )% | | .04 | % | | (.08 | )% |
| Portfolio turnover rate | | 19.90 | %(4) | | 19.75 | % | | 26.63 | % | | 29.20 | % | | 29.92 | % | | 20.35 | % |
| (1) | Computed based on average shares outstanding. |
| (2) | The amount rounds to $0.00. |
| (3) | Not annualized. |
| (4) | Annualized. |
The accompanying notes to financial statements are an integral part of these highlights.
– 4–
Top Ten Equity Portfolio Holdings
March 31, 2020 (unaudited)
| | |
| | Percentage | |
| Name | of Net Assets | |
| IHS Markit Ltd. | 2.25 | % |
| ResMed Inc. | 2.23 | % |
| TransUnion | 2.19 | % |
| Verisk Analytics, Inc. | 2.08 | % |
| Willis Towers Watson Public Limited Company | 1.96 | % |
| Global Payments Inc. | 1.82 | % |
| Domino’s Pizza, Inc. | 1.74 | % |
| BJ’s Wholesale Club, Inc. | 1.73 | % |
| Knight-Swift Transportation Holdings Inc. | 1.71 | % |
| Conagra Brands, Inc. | 1.71 | % |
| Total of top ten | 19.42 | % |
Sector Diversification(as a percentage of portfolio)
March 31, 2020 (unaudited)
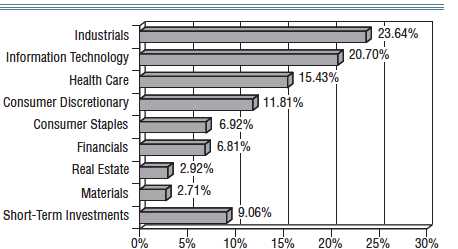
– 5–
Fund Expenses
For the six month period ended March 31, 2020 (unaudited)
As a shareholder of the Fund, you incur two types of costs: (1) transaction costs and
(2) ongoing costs, including management fees and other operating expenses. The following
table is intended to help you understand your ongoing costs (in dollars) of investing in the
Fund and to compare these costs with those of other mutual funds.
The example is based on an investment of $1,000 made at the beginning of the period and
held for the entire period.
The first line of the table below for each share class of the Fund provides information about
the actual account values and actual expenses. You may use the information in this line,
together with the amount you invested, to estimate the expenses that you paid over the
period. Simply divide your account value by $1,000 (for example, an $8,600 account value
divided by $1,000 = 8.6), then multiply the result by the number in the first line under the
heading entitled “Expenses Paid During Period” to estimate the expenses you paid on your
account during this period.
The second line of the table below provides information about hypothetical account values
and hypothetical expenses based on the Fund’s actual expense ratios for each class of the
Fund and an assumed rate of return of 5% per year before expenses, which are not the Fund’s
actual returns. The hypothetical account values and expenses may not be used to estimate the
actual ending account balance or expenses you paid for the period. You may use this
information to compare the ongoing costs of investing in the Fund with other funds. To do so,
compare this 5% hypothetical example with the 5% hypothetical examples that appear in the
shareholder reports of other funds.
Please note that the expenses shown in the table are meant to highlight your ongoing costs
only and do not reflect any transactional costs, such as wire fees. Therefore, the second line
of the table is useful in comparing ongoing costs only, and will not help you determine the
relative total costs of owning different funds. In addition, if these transactional costs were
included, your costs would have been higher.
| | | | | | |
| Class I | | | | | | |
| | | Beginning | | Ending | | Expenses Paid |
| | | Account Value | | Account Value | | During Period* |
| | | 09/30/19 | | 03/31/20 | | 10/01/19 - 03/31/20 |
| Actual | $ | 1,000.00 | $ | 816.00 | $ | 2.77 |
| Hypothetical | | 1,000.00 | | 1,021.95 | | 3.08 |
| (5% return before expenses) | | | | | | |
| * | Expenses are equal to the Class I six-month annualized expense ratio of 0.61%, multiplied by the average account value over the period, multiplied by 183 then divided by 366 to reflect the one-half year period. |
– 6–
Fund Expenses(continued)
For the six month period ended March 31, 2020 (unaudited)
| | | | | | |
| Class N | | | | | | |
| | | Beginning | | Ending | | Expenses Paid |
| | | Account Value | | Account Value | | During Period** |
| | | 09/30/19 | | 03/31/20 | | 10/01/19 - 03/31/20 |
| Actual | $ | 1,000.00 | $ | 814.80 | $ | 4.22 |
| Hypothetical | | 1,000.00 | | 1,020.35 | | 4.70 |
| (5% return before expenses) | | | | | | |
| ** | Expenses are equal to the Class N six-month annualized expense ratio of 0.93%, multiplied by the average account value over the period, multiplied by 183 then divided by 366 to reflect the one-half year period. |
– 7–
Schedule of Investments
March 31, 2020 (unaudited)
| | | |
| Shares or | | | |
| Principal | | | |
| Amount | | | Value |
| COMMON STOCKS — 91.22% | | |
| | Consumer Discretionary – Retailing — 7.17% | | |
| 63,865 | Burlington Stores, Inc.* | $ | 10,120,048 |
| 155,000 | CarMax, Inc.* | | 8,343,650 |
| 255,000 | LKQ Corporation* | | 5,230,050 |
| 191,860 | Ollie’s Bargain Outlet Holdings, Inc.* | | 8,890,792 |
| 37,000 | O’Reilly Automotive, Inc.* | | 11,138,850 |
| 48,000 | Ulta Beauty, Inc.* | | 8,433,600 |
| | | | 52,156,990 |
| | Consumer Discretionary – Services — 4.68% | | |
| 6,000 | Chipotle Mexican Grill, Inc.* | | 3,926,400 |
| 39,070 | Domino’s Pizza, Inc. | | 12,661,415 |
| 280,000 | Service Corporation International | | 10,950,800 |
| 439,000 | Wendy’s Company (The) | | 6,532,320 |
| | | | 34,070,935 |
| | Consumer Staples – Food & Staples Retailing — 2.80% | | |
| 495,000 | BJ’s Wholesale Club, Inc.* | | 12,607,650 |
| 440,000 | US Foods Holding Corp.* | | 7,792,400 |
| | | | 20,400,050 |
| | Consumer Staples – Food, Beverage & Tobacco — 4.14% | | |
| 423,904 | Conagra Brands, Inc. | | 12,437,343 |
| 63,500 | Constellation Brands, Inc. – Class A | | 9,103,360 |
| 150,000 | Lamb Weston Holdings, Inc. | | 8,565,000 |
| | | | 30,105,703 |
| | Financials – Diversified — 3.52% | | |
| 110,000 | Northern Trust Corporation | | 8,300,600 |
| 160,000 | Raymond James Financial, Inc. | | 10,112,000 |
| 155,000 | SEI Investments Company | | 7,182,700 |
| | | | 25,595,300 |
| | Financials – Insurance — 3.32% | | |
| 60,000 | Aon plc | | 9,902,400 |
| 83,917 | Willis Towers Watson Public Limited Company | | 14,253,302 |
| | | | 24,155,702 |
| | Health Care – Equipment & Services — 9.09% | | |
| 40,000 | Cooper Companies, Inc. (The) | | 11,026,800 |
| 147,500 | LivaNova PLC* | | 6,674,375 |
| 170,000 | NuVasive, Inc.* | | 8,612,200 |
| 30,000 | Quest Diagnostics Incorporated | | 2,409,000 |
| 110,000 | ResMed Inc. | | 16,201,900 |
| 280,000 | Smith & Nephew PLC sponsored ADR | | 10,043,600 |
The accompanying notes to financial statements are an integral part of this schedule.
– 8–
Schedule of Investments(continued)
March 31, 2020 (unaudited)
| | | |
| Shares or | | | |
| Principal | | | |
| Amount | | | Value |
| COMMON STOCKS — 91.22% (continued) | | |
| | Health Care – Equipment & Services — 9.09% (continued) | | |
| 20,000 | Teleflex Incorporated | $ | 5,857,200 |
| 34,000 | Veeva Systems Inc. – Class A* | | 5,316,580 |
| | | | 66,141,655 |
| | Health Care – Pharmaceuticals, | | |
| | Biotechnology & Life Sciences — 6.39% | | |
| 100,920 | IQVIA Holdings Inc.* | | 10,885,231 |
| 15,235 | Mettler-Toledo International Inc.* | | 10,519,920 |
| 130,000 | PerkinElmer, Inc. | | 9,786,400 |
| 14,500 | Regeneron Pharmaceuticals, Inc.* | | 7,080,205 |
| 34,500 | Vertex Pharmaceuticals Incorporated* | | 8,209,275 |
| | | | 46,481,031 |
| | Industrials – Capital Goods — 13.05% | | |
| 225,000 | A.O. Smith Corporation | | 8,507,250 |
| 127,500 | AMETEK, Inc. | | 9,182,550 |
| 322,000 | Fastenal Company | | 10,062,500 |
| 172,500 | Fortive Corporation | | 9,520,275 |
| 205,000 | Fortune Brands Home & Security, Inc. | | 8,866,250 |
| 70,000 | IDEX Corporation | | 9,667,700 |
| 68,500 | L3Harris Technologies, Inc. | | 12,338,220 |
| 39,000 | Lennox International Inc. | | 7,089,810 |
| 77,500 | Nordson Corporation | | 10,467,925 |
| 60,000 | Snap-on Incorporated | | 6,529,200 |
| 57,500 | Westinghouse Air Brake Technologies Corporation | | 2,767,475 |
| | | | 94,999,155 |
| | Industrials – Commercial & Professional Services — 7.86% | | |
| 225,000 | IAA, Inc.* | | 6,741,000 |
| 273,443 | IHS Markit Ltd. | | 16,406,580 |
| 40,000 | Republic Services, Inc. | | 3,002,400 |
| 240,500 | TransUnion | | 15,916,290 |
| 108,500 | Verisk Analytics, Inc. | | 15,122,730 |
| | | | 57,189,000 |
| | Industrials – Transportation — 2.79% | | |
| 380,000 | Knight-Swift Transportation Holdings Inc. | | 12,464,000 |
| 60,000 | Old Dominion Freight Line, Inc. | | 7,875,600 |
| | | | 20,339,600 |
| | Information Technology – Hardware & Equipment — 1.22% | | |
| 95,000 | CDW Corporation | | 8,860,650 |
The accompanying notes to financial statements are an integral part of this schedule.
– 9–
|
| Schedule of Investments(continued) |
| March 31, 2020 (unaudited) |
| | | |
| Shares or | | | |
| Principal | | | |
| Amount | | | Value |
| COMMON STOCKS — 91.22% (continued) | | |
| | Information Technology – Semiconductors | | |
| | & Semiconductor Equipment — 4.98% | | |
| 130,000 | Maxim Integrated Products, Inc. | $ | 6,319,300 |
| 113,750 | Microchip Technology Incorporated | | 7,712,250 |
| 124,000 | Skyworks Solutions, Inc. | | 11,083,120 |
| 142,640 | Xilinx, Inc. | | 11,117,362 |
| | | | 36,232,032 |
| | Information Technology – Software & Services — 14.57% | | |
| 117,500 | Broadridge Financial Solutions, Inc. | | 11,142,525 |
| 81,280 | CyberArk Software Ltd.* | | 6,954,317 |
| 91,500 | Euronet Worldwide, Inc.* | | 7,843,380 |
| 392,419 | EVO Payments, Inc. – Class A* | | 6,004,011 |
| 51,500 | FleetCor Technologies, Inc.* | | 9,606,810 |
| 67,500 | Gartner, Inc.* | | 6,720,975 |
| 91,762 | Global Payments Inc. | | 13,234,833 |
| 63,500 | Guidewire Software, Inc.* | | 5,036,185 |
| 57,000 | Palo Alto Networks, Inc.* | | 9,345,720 |
| 65,000 | Paylocity Holding Corporation* | | 5,740,800 |
| 126,000 | Qualys, Inc.* | | 10,960,740 |
| 83,500 | Twilio Inc. – Class A* | | 7,472,415 |
| 93,000 | Zendesk, Inc.* | | 5,952,930 |
| | | | 106,015,641 |
| | Materials — 2.72% | | |
| 90,000 | AptarGroup, Inc. | | 8,958,600 |
| 100,000 | Vulcan Materials Company | | 10,807,000 |
| | | | 19,765,600 |
| | Real Estate — 2.92% | | |
| 280,000 | CBRE Group, Inc.* | | 10,558,800 |
| 173,729 | CyrusOne Inc. | | 10,727,766 |
| | | | 21,286,566 |
| | TOTAL COMMON STOCKS | | |
| | (cost $510,419,883) | | 663,795,610 |
The accompanying notes to financial statements are an integral part of this schedule.
– 10 –
Schedule of Investments(continued)
March 31, 2020 (unaudited)
| | | | | |
| | Shares or | | | | |
| | Principal | | | | |
| | Amount | | | Value | |
| SHORT-TERM INVESTMENTS — 9.09% | | | |
| | | U.S. Government Security – 1.65% | | | |
| $ | 12,000,000 | U.S. Treasury Bill 04/02/2020, 1.532% | $ | 11,999,498 | |
| | | Money Market Funds – 7.44% | | | |
| | 31,621,281 | Invesco Treasury Portfolio Short-Term Investments Trust | | | |
| | | (Institutional Class), 7-day net yield 0.30% | | 31,621,281 | |
| | 22,501,574 | Morgan Stanley Liquidity Funds Government Portfolio | | | |
| | | (Institutional Class), 7-day net yield 0.25% | | 22,501,574 | |
| | | | | 54,122,855 | |
| | | TOTAL SHORT-TERM INVESTMENTS | | | |
| | | (cost $66,122,353) | | 66,122,353 | |
| | | TOTAL INVESTMENTS | | | |
| | | (cost $576,542,236) – 100.31% | | 729,917,963 | |
| | | LIABILITIES, NET OF OTHER ASSETS – (0.31)% | | (2,278,045 | ) |
| | | TOTAL NET ASSETS | | | |
| | | (basis of percentages above) – 100% | $ | 727,639,918 | |
| |
| | * Non-income producing security. | | | |
The accompanying notes to financial statements are an integral part of this schedule.
– 11 –
Statement of Assets and Liabilities
March 31, 2020 (unaudited)
| | |
| ASSETS | | |
| Investments in securities at value (cost $576,542,236) | $ | 729,917,963 |
| Receivables — | | |
| Investment securities sold | | 2,068,003 |
| Dividend and interest | | 530,978 |
| Capital stock subscription | | 5,605 |
| Total receivables | | 2,604,586 |
| Other | | 18,906 |
| Total assets | | 732,541,455 |
| |
| LIABILITIES | | |
| Payables — | | |
| Investment securities purchased | | 4,384,203 |
| Due to adviser — | | |
| Management fee | | 330,551 |
| Accounting and administrative fee | | 15,747 |
| Total due to adviser | | 346,298 |
| 12b-1 and servicing fee | | 91,433 |
| Other payables and accrued expense | | 79,603 |
| Total liabilities | | 4,901,537 |
| Total net assets | $ | 727,639,918 |
| |
| NET ASSETS CONSIST OF | | |
| Paid in capital | $ | 558,375,946 |
| Accumulated distributable earnings | | 169,263,972 |
| Total net assets | $ | 727,639,918 |
| |
| Class I | | |
| Net assets | $ | 654,844,220 |
| Shares outstanding | | 30,180,969 |
| NET ASSET VALUE PER SHARE ($.01 par value, | | |
| 125,000,000 shares authorized), offering price and redemption price | $ | 21.70 |
| |
| Class N | | |
| Net assets | $ | 72,795,698 |
| Shares outstanding | | 3,439,184 |
| NET ASSET VALUE PER SHARE ($.01 par value, | | |
| 75,000,000 shares authorized), offering price and redemption price | $ | 21.17 |
The accompanying notes to financial statements are an integral part of this statement.
– 12 –
Statement of Operations
For the six months ended March 31, 2020 (unaudited)
| | | |
| INCOME | | | |
| Dividend | $ | 3,860,753 | |
| Interest | | 399,828 | |
| Total income | | 4,260,581 | |
| |
| EXPENSES | | | |
| Management fee | | 2,418,717 | |
| 12b-1 fees – Class N | | 121,507 | |
| Accounting and administrative fees | | 116,561 | |
| Transfer agent fees | | 97,172 | |
| Registration fees | | 48,574 | |
| Servicing fees – Class N | | 45,715 | |
| Printing | | 29,785 | |
| Custodian fees | | 24,063 | |
| Postage and mailing | | 23,479 | |
| Audit and tax fees | | 19,061 | |
| Accounting system and pricing service fees | | 16,497 | |
| Insurance | | 14,110 | |
| Directors’ fees | | 10,706 | |
| Legal fees | | 7,678 | |
| Other operating expenses | | 16,934 | |
| Total expenses | | 3,010,559 | |
| Net investment income | | 1,250,022 | |
| |
| NET REALIZED GAIN ON INVESTMENTS | | 15,474,271 | |
| |
| CHANGE IN NET UNREALIZED | | | |
| APPRECIATION/DEPRECIATION ON INVESTMENTS | | (182,190,228 | ) |
| Net realized and unrealized loss on investments | | (166,715,957 | ) |
| Net decrease in net assets resulting from operations | $ | (165,465,935 | ) |
The accompanying notes to financial statements are an integral part of this statement.
– 13 –
Statements of Changes in Net Assets
For the six months ended March 31, 2020 (unaudited)
and the year ended September 30, 2019
| | | | | | |
| | | Six Months Ended | | | | |
| | | 03/31/2020 | | | Year Ended | |
| | | (unaudited) | | | 09/30/2019 | |
| INCREASE (DECREASE) IN NET ASSETS | | | | | | |
| FROM OPERATIONS | | | | | | |
| Net investment income | $ | 1,250,022 | | $ | 2,637,641 | |
| Net realized gain on investments | | 15,474,271 | | | 97,443,563 | |
| Change in net unrealized appreciation/ | | | | | | |
| depreciation on investments | | (182,190,228 | ) | | (18,474,726 | ) |
| Net increase (decrease) in net | | | | | | |
| assets resulting from operations | | (165,465,935 | ) | | 81,606,478 | |
| |
| DISTRIBUTIONS TO SHAREHOLDERS FROM | | | | | | |
| Investment operations – Class I | | (89,330,878 | ) | | (76,051,029 | ) |
| Investment operations – Class N | | (11,219,270 | ) | | (9,300,814 | ) |
| Total distributions | | (100,550,148 | ) | | (85,351,843 | ) |
| |
| CAPITAL SHARE TRANSACTIONS | | | | | | |
| Proceeds from shares issued – Class I | | | | | | |
| (471,714 and 530,183 shares, respectively) | | 13,100,506 | | | 14,507,403 | |
| Reinvestment of distributions – Class I | | | | | | |
| (2,934,592 and 3,078,481 shares, respectively) | | 83,166,328 | | | 70,681,913 | |
| Cost of shares redeemed – Class I | | | | | | |
| (1,210,349 and 1,828,488 shares, respectively) | | (31,964,574 | ) | | (49,800,405 | ) |
| Proceeds from shares issued – Class N | | | | | | |
| (476,699 and 146,455 shares, respectively) | | 13,379,673 | | | 4,063,419 | |
| Reinvestment of distributions – Class N | | | | | | |
| (401,760 and 411,069 shares, respectively) | | 11,116,712 | | | 9,240,821 | |
| Cost of shares redeemed – Class N | | | | | | |
| (785,077 and 618,073 shares, respectively) | | (20,484,987 | ) | | (16,696,855 | ) |
| Change in net assets derived | | | | | | |
| from capital share transactions | | 68,313,658 | | | 31,996,296 | |
| Total increase (decrease) in net assets | | (197,702,425 | ) | | 28,250,931 | |
| |
| NET ASSETS | | | | | | |
| Beginning of period | | 925,342,343 | | | 897,091,412 | |
| End of period | $ | 727,639,918 | | $ | 925,342,343 | |
The accompanying notes to financial statements are an integral part of these statements.
– 14 –
Notes to Financial Statements
March 31, 2020 (unaudited)
These financial statements have been prepared pursuant to reporting rules for interim
financial statements. Accordingly, these financial statements do not include all of the
information and footnotes required by generally accepted accounting principles (“GAAP”) for
annual financial statements. These financial statements should be read in conjunction with the
financial statements and financial highlights and notes in the Fund’s Annual Report on Form
N-CSR for the year ended September 30, 2019.
These financial statements have not been audited. Management believes that these financial
statements include all adjustments (which, unless otherwise noted, include only normal
recurring adjustments) necessary for a fair presentation of the financial results for each
period shown.
(1) Summary of Significant Accounting Policies —
Nicholas II, Inc. (the “Fund”) is organized as a Maryland corporation and is registered as
an open-end, diversified management investment company under the Investment
Company Act of 1940, as amended. The primary objective of the Fund is long-term
growth. The following is a summary of the significant accounting policies of the Fund:
(a) Equity securities traded on a stock exchange will ordinarily be valued on the basis of
the last sale price on the date of valuation on the securities principal exchange, or if
in the absence of any sale on that day, the closing bid price. For securities
principally traded on the NASDAQ market, the Fund uses the NASDAQ Official
Closing Price. Investments in shares of open-end mutual funds, including money
market funds, are valued at their daily net asset value, which is calculated as of the
close of regular trading on the New York Stock Exchange. Debt securities, excluding
short-term investments, are valued at their current evaluated bid price as determined
by an independent pricing service, which generates evaluations on the basis of
dealer quotes for normal institutional-sized trading units, issuer analysis, bond
market activity and various other factors. Securities for which market quotations
may not be readily available are valued at their fair value as determined in good faith
by procedures adopted by the Board of Directors. Short-term investments
purchased at par are valued at cost, which approximates market value. Short-term
investments purchased at a premium or discount are stated at amortized cost, which
approximates market value. The Fund did not maintain any positions in derivative
instruments or engage in hedging activities during the year. Investment transactions
for financial statement purposes are recorded on trade date.
In accordance with Accounting Standards Codification (“ASC”) 820-10, “Fair Value
Measurements and Disclosures” (“ASC 820-10”), fair value is defined as the price
that the Fund would receive upon selling an investment in a timely transaction to an
independent buyer in the principal or most advantageous market of the investment.
ASC 820-10 established a three-tier hierarchy to maximize the use of observable
market data and minimize the use of unobservable inputs and to establish
classification of fair value measurements for disclosure purposes. Inputs refer
broadly to the assumptions that market participants would use in pricing the asset
or liability, including assumptions about risk, for example, the risk inherent in a
particular valuation technique used to measure fair value such as a pricing model
– 15 –
Notes to Financial Statements(continued)
March 31, 2020 (unaudited)
and/or the risk inherent in the inputs to the valuation technique. Inputs may be
observable or unobservable. Observable inputs are inputs that reflect the
assumptions market participants would use in pricing the asset or liability based on
market data obtained from sources independent of the reporting entity.
Unobservable inputs are inputs that reflect the reporting entity’s own assumptions
about the assumptions market participants would use in pricing the asset or liability
based on the best information available in the circumstances. The three-tier
hierarchy of inputs is summarized in the three broad levels listed below.
Level 1 – quoted prices in active markets for identical investments
Level 2 – other significant observable inputs (including quoted prices for similar
investments, interest rates, benchmark yields, bids, offers, transactions,
spreads and other relationships observed in the markets among market
securities, underlying equity of the issuer, proprietary pricing models,
credit risk, etc.)
Level 3 – significant unobservable inputs (including the Fund’s own assumptions in
determining the fair value of investments)
The inputs or methodology used for valuing securities are not necessarily an
indication of the risk associated with investing in those securities.
The following is a summary of the inputs used as of March 31, 2020 in valuing the
Fund’s investments carried at value:
| | |
| | | Investments |
| Valuation Inputs | | in Securities |
| Level 1 – | | |
| Common Stocks(1) | $ | 663,795,610 |
| Money Market Funds | | 54,122,855 |
| Level 2 – | | |
| U.S. Government Securities | | 11,999,498 |
| Level 3 – | | |
| None | | — |
| Total | $ | 729,917,963 |
| (1) See Schedule of Investments for further detail by industry. | | |
The Fund did not hold any Level 3 investments during the period.
(b) Net realized gain (loss) on portfolio securities was computed on the basis of
specific identification.
(c) Dividend income is recorded on the ex-dividend date, and interest income is
recognized on an accrual basis. Non-cash dividends, if any, are recorded at value
on date of distribution. Generally, discounts and premiums on long-term debt
security purchases, if any, are amortized over the expected lives of the respective
securities using the effective yield method.
(d) Provision has not been made for federal income taxes or excise taxes since the
Fund has elected to be taxed as a “regulated investment company” and intends to
distribute substantially all net investment income and net realized capital gains on
– 16 –
Notes to Financial Statements(continued)
March 31, 2020 (unaudited)
sales of investments to its shareholders and otherwise comply with the provisions
of Subchapter M of the Internal Revenue Code applicable to regulated investment
companies.
Investment income, net capital gains (losses) and all expenses incurred by the Fund
are allocated based on the relative net assets of each class, except for service fees
and certain other fees and expenses related to one class of shares.
Class N shares are subject to a 0.25% 12b-1 fee and a 0.10% servicing fee, as
described in its prospectus. From May 1, 2017 through January 31, 2018, the
servicing fee was voluntarily reduced to 0.06%. From February 1, 2018 through
July 31, 2018, the servicing fee was increased to 0.08% and from August 1, 2018
through February 3, 2020 was increased to 0.10%. From February 4, 2020 to
period end, the servicing fee was reduced from 0.10% to 0.06%. From February 4,
2020 through period end, the 12b-1 fee was reduced from 0.25% to 0.20%.
Income, expenses (other than expenses attributable to a specific class), and
realized and unrealized gains and losses are allocated daily to each class of shares
based upon the relative net asset value of outstanding shares.
(e) Dividends and distributions paid to shareholders are recorded on the ex-dividend
date. Distributions from net investment income are generally declared and paid at
least annually. Distributions of net realized capital gain, if any, are declared and paid
at least annually.
The amount of distributions from net investment income and net realized capital
gain are determined in accordance with federal income tax regulations, which may
differ from U.S. generally accepted accounting principles (“U.S. GAAP”) for
financial reporting purposes. Financial reporting records are adjusted for permanent
book-to-tax differences to reflect tax character.
The tax character of distributions paid during the six months ended March 31, 2020
and the year ended September 30, 2019 was as follows:
| | | | |
| | | 03/31/2020 | | 09/30/2019 |
| Distributions paid from: | | | | |
| Ordinary income | $ | 4,274,264 | $ | 4,983,944 |
| Long-term capital gain | | 96,275,884 | | 80,367,899 |
| Total distributions paid | $ | 100,550,148 | $ | 85,351,843 |
As of March 31, 2020, investment cost for federal tax purposes was $576,515,030
and tax basis net unrealized appreciation were as follows:
| | | |
| Unrealized appreciation | $ | 198,378,644 | |
| Unrealized depreciation | | (44,975,711 | ) |
| Net unrealized appreciation | $ | 153,402,933 | |
The difference between financial statement and tax-basis investment cost is
attributable primarily to the tax character of distributions from certain investments
held by the Fund and the tax deferral of wash sales losses.
– 17 –
Notes to Financial Statements(continued)
March 31, 2020 (unaudited)
The Fund had no material uncertain tax positions and has not recorded a liability for
unrecognized tax benefits as of March 31, 2020. Also, the Fund recognized no
interest and penalties related to uncertain tax benefits during the period ended
March 31, 2020. At March 31, 2020 the fiscal years 2016 through 2019 remain
open to examination in the Fund’s major tax jurisdictions.
(f) The Fund is considered an investment company under U.S. GAAP and follows the
accounting and reporting guidance applicable to investment companies in the
Financial Accounting Standards Board (“FASB”) ASC 946, “Financial Services –
Investment Companies.” U.S. GAAP guidance requires management to make
estimates and assumptions that effect the amounts reported in the financial
statements and accompanying notes. Actual results could differ from estimates.
(g) In the normal course of business the Fund enters into contracts that contain general
indemnification clauses. The Fund’s maximum exposure under these arrangements
is unknown, as this would involve future claims against the Fund that have not yet
occurred. Based on experience, the Fund expects the risk of loss to be remote.
(h) In connection with the preparation of the Fund’s financial statements, management
evaluated subsequent events after the date of the Statement of Assets and
Liabilities of March 31, 2020. There have been no material subsequent events since
March 31, 2020 that would require adjustment to or additional disclosure in these
financial statements.
(2) Related Parties —
(a) Investment Adviser and Management Agreement —
The Fund has an agreement with Nicholas Company, Inc. (with whom certain
officers and directors of the Fund are affiliated) (the “Adviser”) to serve as
investment adviser and manager. Under the terms of the agreement, a monthly fee
is paid to the Adviser based on an annualized fee of 0.75% of the average net asset
value up to and including $50 million, 0.60% of the average net asset value over
$50 million up to and including $100 million and 0.50% of the average net asset
value in excess of $100 million.
The Adviser may be paid for accounting and administrative services rendered by its
personnel, subject to the following guidelines: (i) up to five basis points, on an
annual basis, of the average net asset value of the Fund up to and including
$2 billion and up to three basis points, on an annual basis, of the average net asset
value of the Fund greater than $2 billion, based on the average net asset value of
the Fund as determined by valuations made at the close of each business day of
each month, and (ii) where the preceding calculation results in an annual payment
of less than $50,000, the Adviser, in its discretion, may charge the Fund up to
$50,000 for such services.
(b) Legal Counsel —
A director of the Adviser is affiliated with a law firm that provides services to the
Fund. The Fund incurred expenses of $5,028 for the period ended March 31, 2020
for legal services rendered by this law firm.
– 18 –
Notes to Financial Statements(continued)
March 31, 2020 (unaudited)
(3) Investment Transactions —
For the period ended March 31, 2020, the cost of purchases and the proceeds from
sales of investment securities, other than short-term obligations, aggregated
$85,414,232 and $123,742,195, respectively.
– 19 –
Historical Record Class I
(unaudited)
| | | | | | | | | | | | |
| | | | | Net | | | | | | | | |
| | | | | Investment | | | | | Dollar | | | Growth of |
| | | Net | | Income | | | Capital Gain | | Weighted | | | an Initial |
| | | Asset Value | | Distributions | | | Distributions | | Price/Earnings | | | $10,000 |
| Class I | | Per Share | | Per Share | | | Per Share | | Ratio(2) | | | Investment(3) |
| October 17, 1983(1) | $ | 10.00 | $ | — | | $ | — | | — | $ | | 10,000 |
| September 30, 1984 | | 11.66 | | — | | | — | | 12.6 times | | | 11,660 |
| September 30, 1985 | | 14.39 | | 0.0930 | | | 0.1860 | | 11.7 | | | 14,742 |
| September 30, 1986 | | 16.90 | | 0.1630 | | | 0.0610 | | 15.0 | | | 17,581 |
| September 30, 1987 | | 21.01 | | 0.4200 | | | 0.5130 | | 20.9 | | | 23,108 |
| September 30, 1988 | | 18.58 | | 0.3380 | | | 1.3030 | | 15.0 | | | 22,766 |
| September 30, 1989 | | 21.76 | | 0.3350 | | | 0.0800 | | 17.1 | | | 27,291 |
| September 30, 1990 | | 17.39 | | 0.3124 | | | 0.6686 | | 14.8 | | | 22,888 |
| September 30, 1991 | | 23.87 | | 0.3422 | | | 0.1434 | | 17.8 | | | 32,250 |
| September 30, 1992 | | 24.53 | | 0.2447 | | | 0.4042 | | 17.3 | | | 34,052 |
| September 30, 1993 | | 26.94 | | 0.2350 | | | 0.8000 | | 18.1 | | | 38,885 |
| September 30, 1994 | | 26.71 | | 0.2000 | | | 1.4700 | | 18.5 | | | 41,020 |
| September 30, 1995 | | 30.07 | | 0.2056 | | | 1.8944 | | 20.8 | | | 50,205 |
| September 30, 1996 | | 33.34 | | 0.1750 | | | 2.4979 | | 28.9 | | | 60,922 |
| September 30, 1997 | | 40.65 | | 0.0779 | | | 3.1621 | | 31.4 | | | 82,206 |
| September 30, 1998 | | 34.78 | | 0.0810 | | | 5.2282 | | 28.6 | | | 80,845 |
| September 30, 1999 | | 31.83 | | 0.1337 | | | 4.0049 | | 29.0 | | | 82,864 |
| September 30, 2000 | | 36.58 | | 0.0100 | | | 0.4701 | | 35.1 | | | 96,527 |
| September 30, 2001 | | 17.54 | | — | | | 13.1200 | | 23.4 | | | 76,361 |
| September 30, 2002 | | 15.34 | | — | | | 0.5766 | | 22.2 | | | 68,730 |
| September 30, 2003 | | 18.97 | | — | | | — | | 22.9 | | | 84,994 |
| September 30, 2004 | | 21.88 | | — | | | 0.0015 | | 22.9 | | | 98,040 |
| September 30, 2005 | | 23.50 | | — | | | 0.9146 | | 23.3 | | | 109,547 |
| September 30, 2006 | | 23.11 | | 0.0083 | | | 2.1472 | | 22.4 | | | 118,142 |
| September 30, 2007 | | 25.18 | | 0.0643 | | | 1.0460 | | 23.4 | | | 134,908 |
| September 30, 2008 | | 19.15 | | 0.0978 | | | 2.5678 | | 17.5 | | | 115,141 |
| September 30, 2009 | | 17.02 | | 0.1072 | | | 1.1206 | | 19.2 | | | 111,845 |
| September 30, 2010 | | 19.31 | | 0.0957 | | | — | | 20.7 | | | 127,575 |
| September 30, 2011 | | 18.72 | | 0.0867 | | | 0.3831 | | 17.2 | | | 126,423 |
| September 30, 2012 | | 22.91 | | 0.0992 | | | 0.4903 | | 20.2 | | | 159,188 |
| September 30, 2013 | | 26.37 | | 0.1428 | | | 1.8746 | | 22.9 | | | 200,723 |
| September 30, 2014 | | 27.41 | | 0.0889 | | | 2.0445 | | 22.3 | | | 225,609 |
| September 30, 2015 | | 25.39 | | 0.0997 | | | 3.4844 | | 21.3 | | | 237,669 |
| September 30, 2016 | | 25.41 | | 0.0931 | | | 1.4736 | | 22.7 | | | 252,980 |
| September 30, 2017 | | 28.79 | | 0.0752 | | | 1.1754 | | 24.9 | | | 301,091 |
| September 30, 2018 | | 30.37 | | 0.0277 | | | 3.0205 | | 25.9 | | | 352,592 |
| September 30, 2019 | | 29.61 | | 0.1821 | | | 2.7546 | | 24.8 | | | 387,738 |
| March 31, 2020 | | 21.70 | | 0.1133 | (a) | | 3.1017 | (a) | 22.4 | | | 316,394 |
| (1) | Date of Initial Public Offering. |
| (2) | Based on latest 12 months accomplished earnings. |
| (3) | Assuming reinvestment of all distributions. |
| (a) | Paid on December 26, 2019 to shareholders of record on December 24, 2019. |
– 20 –
Historical Record Class N
(unaudited)
| | | | | | | | | | | |
| | | | | Net | | | | | | | |
| | | | | Investment | | | | | Dollar | | Growth of |
| | | Net | | Income | | | Capital Gain | | Weighted | | an Initial |
| | | Asset Value | | Distributions | | | Distributions | | Price/Earnings | | $10,000 |
| Class N | | Per Share | | Per Share | | | Per Share | | Ratio(2) | | Investment(3) |
| February 28, 2005(1) | $ | 22.59 | $ | — | | $ | — | | 23.1 times | $ | 10,000 |
| September 30, 2005 | | 23.45 | | — | | | — | | 23.3 | | 10,381 |
| September 30, 2006 | | 23.00 | | — | | | 2.1340 | | 22.4 | | 11,158 |
| September 30, 2007 | | 25.03 | | — | | | 1.0460 | | 23.4 | | 12,694 |
| September 30, 2008 | | 19.04 | | 0.0067 | | | 2.5678 | | 17.5 | | 10,800 |
| September 30, 2009 | | 16.87 | | 0.0969 | | | 1.1206 | | 19.2 | | 10,457 |
| September 30, 2010 | | 19.11 | | 0.0666 | | | — | | 20.7 | | 11,890 |
| September 30, 2011 | | 18.49 | | 0.0479 | | | 0.3831 | | 17.2 | | 11,741 |
| September 30, 2012 | | 22.63 | | 0.0191 | | | 0.4903 | | 20.2 | | 14,732 |
| September 30, 2013 | | 26.04 | | 0.0560 | | | 1.8746 | | 22.9 | | 18,516 |
| September 30, 2014 | | 27.03 | | — | | | 2.0445 | | 22.3 | | 20,734 |
| September 30, 2015 | | 25.00 | | 0.0002 | | | 3.4844 | | 21.3 | | 21,770 |
| September 30, 2016 | | 25.00 | | — | | | 1.4736 | | 22.7 | | 23,091 |
| September 30, 2017 | | 28.29 | | — | | | 1.1754 | | 24.9 | | 27,387 |
| September 30, 2018 | | 29.72 | | — | | | 3.0205 | | 25.9 | | 31,972 |
| September 30, 2019 | | 28.91 | | 0.0818 | | | 2.7546 | | 24.8 | | 35,025 |
| March 31, 2020 | | 21.17 | | 0.0182 | (a) | | 3.1017 | (a) | 22.4 | | 28,540 |
| (1) | Date of Initial Public Offering. |
| (2) | Based on latest 12 months accomplished earnings. |
| (3) | Assuming reinvestment of all distributions. |
| (a) | Paid on December 26, 2019 to shareholders of record on December 24, 2019. |
– 21 –
Approval of Investment Advisory Contract
(unaudited)
In November 2019, the Board of Directors of the Fund renewed the one-year term of the
Investment Advisory Agreement by and between the Fund and the Adviser through October
2020. In connection with the renewal of the Investment Advisory Agreement, no changes to
the amount or manner of calculation of the management fee or the terms of the agreement
were proposed by the Adviser or adopted by the Board. For the annual period ended
September 30, 2019, the management fee was 0.52% and the Fund’s Class I and Class N total
expense ratios (including the management fee) were 0.60% and 0.95%, respectively. In
renewing the Investment Advisory Agreement, the Board carefully considered the following
factors on an absolute basis and relative to the Fund’s peer group: (i) the Fund’s historical
performance; (ii) the Fund’s performance relative to its benchmark; (iii) the expense ratios for
peer group funds in the mid-cap growth category and the Fund’s risk/return profile as
measured by the standard deviation and the Sharpe Ratio; and (iv) the range and quality of
the services offered by the Adviser. The peer group fund data included mid-cap growth
focused funds with similar asset sizes, number of holdings and market capitalizations. In
terms of the peer group data used for performance comparisons, the Fund’s Class I was
ranked 4th, 12th, 12th and 13th out of 24 funds for the one-, three-, five- and ten-year
periods ending September 30, 2019. The Fund’s Class I had the third lowest expense ratio
among its peer group.
The Board considered the range of services to be provided by the Adviser to the Fund under
the Advisory Agreement. The Board concluded that the nature, extent and quality of the
services to be provided by the Adviser were consistent with the terms of the Advisory
Agreement and the needs of the Fund, and that the services provided were of a high quality.
The Board considered the investment performance of the Fund and the Adviser. Among other
things, the Board noted its consideration of the Fund’s performance relative to peer funds and
its benchmarks. The Board reviewed the actual and relative short-term and long-term
performance of the Fund. The Board agreed that the Fund demonstrated good performance
with respect to its benchmarks and peers. The Board also discussed the extent to which
economies of scale would be realized, and whether such economies were reflected in the
Fund’s fee levels and concluded that the Adviser had been instrumental in holding down Fund
costs, citing consistently low fees.
The Board considered the cost of services provided and the profits to be realized by the Adviser
from the relationship with the Fund. The Board concluded that given the Board’s focus on
performance and maintaining a low fee structure that the Adviser’s profits were not relevant.
The Board agreed that the Adviser had the resources, financial management and
administrative capacity to continue to provide quality services. The Board determined that the
Adviser had fully and adequately carried out the terms and conditions of its contract with the
Fund. The Board expressed satisfaction with the Fund’s absolute performance, strategies to
improve the absolute and relative performance of the Fund, management’s control of
expenses and the rate of the management fee for the Fund and the overall level of services
provided by the Adviser.
– 22 –
Liquidity Risk Management Program
(unaudited)
The Fund has adopted and implemented a liquidity risk management program (the
“Program”) in accordance with Rule 22e-4 under the 1940 Act. The Program seeks to assess
and manage the Fund’s liquidity risk, i.e., the risk that a Fund is unable to satisfy redemption
requests without significantly diluting remaining investors’ interests in the Fund. The Board of
Directors of the Fund has designated Nicholas Company, Inc., the Fund’s investment adviser,
to administer the Program. Certain aspects of the Program rely on third parties to perform
certain functions, including the provision of market data and application of models.
The Program is comprised of various components designed to support the assessment
and/or management of liquidity risk, including: (1) the periodic assessment (no less
frequently than annually) of certain factors that influence a Fund’s liquidity risk; (2) the
periodic classification (no less frequently than monthly) of a Fund’s investments into one of
four liquidity categories that reflect an estimate of their liquidity under current market
conditions; (3) a 15% limit on the acquisition of “illiquid investments” (as defined under
Rule 22e-4); (4) for a Fund that does not invest primarily in “highly liquid investments”
(as defined under Rule 22e-4), the determination of a minimum percentage of the Fund’s
assets that will generally be invested in highly liquid investments (a “Highly Liquid Investment
Minimum”); and (5) periodic reporting to the Board of Directors.
At a meeting of the Board of Trustees on February 3, 2020, Nicholas Company, Inc. provided
a written report to the Board addressing the operation, and the adequacy and effectiveness of
the implementation, of the Program, including, as applicable, the operation of any Highly
Liquid Investment Minimum and any material changes to the Program, for the initial period
from June 1, 2019 through December 31, 2019 (the “Reporting Period”). Among other things,
the annual report discussed: (1) the results of stress tests designed to assess liquidity under
a hypothetical stressed scenario involving elevated redemptions; and (2) an assessment of the
methodologies used to classify investments into one of four liquidity categories. The report
concluded that the Program was reasonably designed to assess and manage liquidity risk and
was adequately and effectively implemented during the Reporting Period.
There can be no assurance that the Program will achieve its objectives under all
circumstances in the future. Please refer to the Fund’s prospectus for more information
regarding the Fund’s exposure to liquidity risk and other risks to which it may be subject.
– 23 –
Information on Proxy Voting
(unaudited)
A description of the policies and procedures that the Fund uses to determine how to vote
proxies relating to portfolio securities is available, without charge, upon request by calling
800-544-6547 or 414-276-0535. It also appears in the Fund’s Statement of Additional
Information, which can be found on the SEC’s website, www.sec.gov. A record of how the
Fund voted its proxies for the most recent twelve-month period ended June 30, also is
available on the Fund’s website, www.nicholasfunds.com, and the SEC’s website,
www.sec.gov.
Quarterly Portfolio Schedule
(unaudited)
The Fund files its complete schedule of investments with the SEC for the first and third
quarters of each fiscal year as an exhibit to its reports on Form N-PORT (for first and third
quarters ending March 31, 2019 or after). The Fund’s Form N-PORT reports are available on
the SEC’s website at www.sec.gov and may be reviewed and copied at the SEC’s Public
Reference Room in Washington, D.C. Information on the operation of the Public Reference
Room may be obtained by calling 800-SEC-0330.
– 24 –
Privacy Policy
(unaudited)
Nicholas II, Inc. respects each shareholder’s right to privacy. We are committed to safeguarding the information that you provide us to maintain and execute transactions on your behalf.
We collect the following non-public personal information about you:
| * | Information we receive from you on applications or other forms, whether we receive the form in writing or electronically. This includes, but is not limited to, your name, address, phone number, tax identification number, date of birth, beneficiary information and investment selection. |
| * | Information about your transactions with us and account history with us. This includes, but is not limited to, your account number, balances and cost basis information. This also includes transaction requests made through our transfer agent. |
| * | Other general information that we may obtain about you such as demographic information. |
WE DO NOT SELL ANY NON-PUBLIC PERSONAL INFORMATION ABOUT CURRENT OR FORMER SHAREHOLDERS.
INFORMATION SHARED WITH OUR TRANSFER AGENT, A THIRD PARTY COMPANY, ALSO IS NOT SOLD.
We may share, only as permitted by law, non-public personal information about you with third party companies. Listed below are some examples of third parties to whom we may disclose non-public personal information. While these examples do not cover every circumstance permitted by law, we hope they help you understand how your information may be shared.
We may share non-public personal information about you:
| * | With companies who work for us to service your accounts or to process transactions that you may request. This would include, but is not limited to, our transfer agent to process your transactions, mailing houses to send you required reports and correspondence regarding the Fund and its Adviser, the Nicholas Company, Inc., and our dividend disbursing agent to process fund dividend checks. |
| * | With a party representing you, with your consent, such as your broker or lawyer. |
| * | When required by law, such as in response to a subpoena or other legal process. |
The Fund and its Adviser maintain policies and procedures to safeguard your non-public personal information. Access is restricted to employees who the Adviser determines need the information in order to perform their job duties. To guard your non-public personal information we maintain physical, electronic, and procedural safeguards that comply with federal standards.
In the event that you hold shares of the Fund with a financial intermediary, including, but not limited to, a broker-dealer, bank, or trust company, the privacy policy of your financial intermediary would govern how your non-public personal information would be shared with non-affiliated third parties.
– 25 –
Automatic Investment Plan – An Update
(unaudited)
The Nicholas Family of Funds’ Automatic Investment Plan provides a simple method to dollar
cost average into the fund(s) of your choice.
Dollar cost averaging involves making equal systematic investments over an extended time
period. A fixed dollar investment will purchase more shares when the market is low and fewer
shares when the market is high. The automatic investment plan is an excellent way for you to
become a disciplined investor.
The following table illustrates what dollar cost averaging can achieve. Please note that past
performance is no guarantee of future results. Nicholas Company recommends dollar cost
averaging as a practical investment method. It should be consistently applied for long periods
so that investments are made through several market cycles.
| | | | | |
| | | Nicholas II – Class I |
| $1,000 initial investment on | | 10/17/1983 | * | | 03/31/2010 |
| Number of years investing $100 each month | | | | | |
| following the date of initial investment | | 36.5 | | | 10 |
| Total cash invested | $ | 44,800 | | $ | 13,000 |
| Total dividend and capital gain distributions reinvested | $ | 302,270 | | $ | 10,223 |
| Total full shares owned at 03/31/20 | | 14,595 | | | 934 |
| Total market value at 03/31/20 | $ | 316,731 | | $ | 20,275 |
The results above assume purchase on the last day of the month. The Nicholas Automatic
Investment Plan actually invests on the date specified by the investor. Total market value
includes reinvestment of all distributions.
* Date of Initial Public Offering.
.
– 26 –
Nicholas Funds Services Offered
(unaudited)
| | |
| • | IRAs | |
| | • Traditional | • SIMPLE |
| | • Roth | • SEP |
| • | Coverdell Education Accounts |
| • | Automatic Investment Plan |
| • | Direct Deposit of Dividend and Capital Gain Distributions |
| • | Systematic Withdrawal Plan |
| • | Monthly Automatic Exchange between Funds |
| • | Telephone Purchase and Redemption |
| • | Telephone Exchange | |
| • | 24-hour Automated Account Information (800-544-6547) |
| • | 24-hour Internet Account Access (www.nicholasfunds.com) |
Please call a shareholder representative for further information on the
above services or with any other questions you may have regarding
the Nicholas Funds (800-544-6547).
– 27 –
Directors and Officers
DAVID O. NICHOLAS, President and Director
JOHN A. HAUSER, Director
DAVID P. PELISEK, Director
JAY H. ROBERTSON, Director
DAVID L. JOHNSON, Executive Vice President
JENNIFER R. KLOEHN, Senior Vice President,
Treasurer and Chief Compliance Officer
LAWRENCE J. PAVELEC, Senior Vice President and Secretary
BRIAN J. JANOWSKI, Vice President
CANDACE L. LESAK, Vice President
Investment Adviser
NICHOLAS COMPANY, INC.
Milwaukee, Wisconsin
www.nicholasfunds.com
414-276-0535 or 800-544-6547
Transfer Agent
U.S. BANCORP FUND SERVICES, LLC
Milwaukee, Wisconsin
414-276-0535 or 800-544-6547
Distributor
QUASAR DISTRIBUTORS, LLC
Milwaukee, Wisconsin
Custodian
U.S. BANK N.A.
Milwaukee, Wisconsin
Independent Registered Public Accounting Firm
DELOITTE & TOUCHE LLP
Milwaukee, Wisconsin
Counsel
MICHAEL BEST & FRIEDRICH LLP
Milwaukee, Wisconsin
This report is submitted for the information of shareholders of the Fund. It is not
authorized for distribution to prospective investors unless preceded or accompanied by
an effective prospectus.
Item 2. Code of Ethics.
Applicable only to annual reports.
Item 3. Audit Committee Financial Expert.
Applicable only to annual reports.
Item 4. Principal Accountant Fees and Services.
Applicable only to annual reports.
Item 5. Audit Committee of Listed Registrants.
Not applicable to this filing.
Item 6. Schedule of Investments.
The schedule of investments in securities of unaffiliated issuers is included as part of the report to shareholders filed under Item 1.
Item 7. Disclosure of Proxy Voting Policies and Procedures for Closed-End Management Investment Companies.
Applicable only to annual reports filed by closed-end funds.
Item 8. Portfolio Managers of Closed-End Management Investment Companies.
Applicable only to annual reports filed by closed-end funds.
Item 9. Purchases of Equity Securities by Closed-End Management Investment Companies and Affiliated Purchasers.
Applicable only to closed-end funds.
Item 10. Submission of Matters to a Vote of Security Holders.
Not applicable to this filing.
Item 11. Controls and Procedures.
The Fund's principal executive officer and principal financial officer have concluded that the Fund's disclosure controls and procedures are sufficient to ensure that information required to be disclosed by the Fund in this Form N-CSR was recorded, processed, summarized and reported within the time periods specified in the Securities and Exchange Commission's rules and forms, based upon such officers' evaluation of these controls and procedures as of a date within 90 days of the filing date of the report. There were no significant changes or corrective actions with regard to significant deficiencies or material weaknesses in the Fund's internal controls or in other factors that could significantly affect the Fund's internal controls subsequent to the date of their evaluation.
Item 12. Disclosure of Securities Lending Activities for Closed-End Management Investment Companies.
Applicable only to closed-end funds.
Item 13. Exhibits.
(a)(1) Code of Ethics -- Any code of ethics, or amendments thereto, that is the subject of the disclosure required by Item 2, to the extent that the registrant intends to satisfy the Item 2 requirements through filing of an exhibit.
Not applicable to this filing.
(a)(2) Certifications of Principal Executive Officer and Principal Financial Officer pursuant to Rule 30a-2(a) under the Investment Company Act of 1940, attached hereto as part of EX-99.CERT.
(a)(3) Any written solicitation to purchase securities under Rule 23c-1 under the Act sent or given during the period covered by the report by or on behalf of the registrant to 10 or more person.
Applicable only to closed-end funds.
(a)(4) Change in the registrant’s independent public accountant.
Not applicable to this filing.
(b) Certifications of Principal Executive Officer and Principal Financial Officer pursuant to Rule 30a-2(b) under the Investment Company Act of 1940, attached hereto as part of EX-99.906CERT.
SIGNATURES
Pursuant to the requirements of the Securities Exchange Act of 1934 and the Investment Company Act of 1940, the registrant has duly caused this report to be signed on its behalf by the undersigned, thereunto duly authorized.
(Registrant)Nicholas II, Inc.
By:/s/ David O. Nicholas
Name: David O. Nicholas
Title: Principal Executive Officer
Date:May 29, 2020
Pursuant to the requirements of the Securities Exchange Act of 1934 and the Investment Company Act of 1940, this report has been signed by the following persons on behalf of the registrant and in the capacities and on the dates indicated.
By:/s/ David O. Nicholas
Name: David O. Nicholas
Title: Principal Executive Officer
Date:May 29, 2020
By:/s/ Jennifer R. Kloehn
Name: Jennifer R. Kloehn
Title: Principal Financial Officer
Date:May 29, 2020