|
| UNITED STATES |
| SECURITIES AND EXCHANGE COMMISSION |
| Washington, D.C. 20549 |
| |
| FORM N-CSR |
| |
| CERTIFIED SHAREHOLDER REPORT OF REGISTERED |
| MANAGEMENT INVESTMENT COMPANIES |
Investment Company Act file number 811-03851
| |
| Nicholas II, Inc. |
|
| (Exact Name of Registrant as specified in charter) |
| |
| 411 East Wisconsin Avenue, Suite 2100, Milwaukee, Wisconsin 53202 |
| (Address of Principal Executive Offices) | (Zip Code) |
| |
| Jennifer R. Kloehn, Senior Vice President and Treasurer |
| 411 East Wisconsin Avenue, Suite 2100 |
| Milwaukee, Wisconsin 53202 |
|
| (Name and Address of Agent for Service) |
Registrant's telephone number, including area code: 414-272-4650
Date of fiscal year end: 09/30/2023
Date of reporting period: 03/31/2023
Item 1. Report to Stockholders.
SEMIANNUAL REPORT
March 31, 2023
NICHOLAS II, INC.

WWW.NICHOLASFUNDS.COM
NICHOLAS II, INC.
May 2023
Dear Fellow Shareholders,
For the six-month period ended March 31, 2023, Nicholas II (the “Fund”) – Class I returned 13.36% compared to the Russell Midcap Growth Index return of 16.67%.
Returns for Nicholas II, Inc. Class I and Class N and selected indices are provided in the chart below for the periods ended March 31, 2023.
| | | | | | | | | | | | | | | |
| | | | | | Average Annual Total Returns | |
| | | 6 Month | | | 1 Year | | | 3 Year | | | 5 Year | | | 10 Year | |
| Nicholas II, Inc. – Class I | | 13.36 | % | | -6.79 | % | | 16.72 | % | | 9.09 | % | | 10.84 | % |
| Nicholas II, Inc. – Class N | | 13.21 | % | | -7.09 | % | | 16.38 | % | | 8.75 | % | | 10.48 | % |
| Morningstar Mid-Cap | | | | | | | | | | | | | | | |
| Growth Category | | 12.95 | % | | -11.95 | % | | 14.85 | % | | 8.12 | % | | 10.34 | % |
| Russell Midcap Growth Index | | 16.67 | % | | -8.52 | % | | 15.20 | % | | 9.07 | % | | 11.17 | % |
| Russell Midcap Index | | 13.61 | % | | -8.78 | % | | 19.20 | % | | 8.05 | % | | 10.05 | % |
| Standard & Poor’s 500 Index | | 15.62 | % | | -7.73 | % | | 18.60 | % | | 11.19 | % | | 12.24 | % |
| Ending value of $10,000 invested in | | | | | | | | | | | | | | | |
| Nicholas II, Inc. – Class I | $ | 11,336 | | $ | 9,321 | | $ | 15,903 | | $ | 15,451 | | $ | 27,998 | |
| Ending value of $10,000 invested in | | | | | | | | | | | | | | | |
| Nicholas II, Inc. – Class N | $ | 11,321 | | $ | 9,291 | | $ | 15,763 | | $ | 15,212 | | $ | 27,096 | |
| Fund’s Class I Expense Ratio (from 01/28/23 Prospectus): 0.59% | | | | | | | | | | |
| Fund’s Class N Expense Ratio (from 04/30/23 Prospectus): 0.89% | | | | | | | |
Performance data quoted represents past performance and is no guarantee of future results. The investment return and principal value of an investment will fluctuate so that an investor’s shares, when redeemed, may be worth more or less than their original cost. Current performance of the Fund may be lower or higher than the performance quoted. Performance data current to the most recent month-end may be obtained by visiting www.nicholasfunds.com/returns.html.
The Fund’s returns are reduced by expenses; while the market indices are not. The ending values above illustrate the performance of a hypothetical $10,000 investment made in the Fund over the timeframes listed. Assumes reinvestment of dividends and capital gains. Returns shown do not reflect the deduction of taxes that a shareholder would pay on Fund distributions or the redemption of Fund shares. These figures do not imply any future performance.
Class N shares of the Fund commenced operations on February 28, 2005. The annual returns shown for the Class I shares of this Fund would be substantially similar to the Class N shares because both classes of shares are invested in the same portfolio of securities. Annual returns will generally differ only to the extent that the classes do not have the same expenses. Please see the respective prospectus for details.
Markets trended higher during the six-month period ending March 31, 2023, following a punishing period in the first nine months of 2022 as high inflation and interest rates catalyzed a revaluation of equities lower. Following these large market declines, investors began sifting through the rubble late in the year looking for values. The stocks that were beaten down the most in 2022 tended to experience the biggest rebounds in early 2023 as many of these stocks suffered heavy tax loss selling late in the year in addition to the declines they had already experienced. Sectors such as Information Technology and Communication Services, which underwent some of the largest declines earlier in 2022, also had the largest bounces in the first three months of 2023.
So, the question now is what happens next? While we refrain from attempting to predict the macro-outlook or immediate trajectory of the stock market as we believe both are unknowable,
we are “macro aware” and use history as a guide to influence some of our portfolio positioning. With that as a backdrop, below is a non-exhaustive list of items that inform our current positioning.
The Federal Reserve Bank has raised the Fed Funds rate almost 500 basis points (“bps”) in the past year which is working its way through the financial system and will ultimately slow the economy.
The recent bank crisis is causing banks to tighten underwriting standards which will eventually tighten credit and exacerbate the economic slowdown.
Trucking surveys, which have a high correlation to economic growth, are in recession territory with few signs of any near-term recovery.
Homebuilder surveys are in recession territory as housing affordability is near 30-year lows.
CEO confidence has only been this low during the recessions of 1980 and 2008.
Elevated transfer payments enacted during the pandemic (i.e., elevated food stamps, expanded Medicaid coverage, student loan repayment moratoriums) are set to roll off which will pressure consumer disposal personal incomes.
The yield curve has been inverted since March 2022 which historically has signaled an impending recession.
The Russia/Ukraine war continues which increases geopolitical risk and could cause substantial fluctuations in commodity prices.
Manufacturing Purchasing Managers Index (“PMIs”) are in contraction territory which historically signals declining corporate earnings per share (“EPS”).
High inflation has propped up corporate nominal sales which has allowed companies to maintain their workforces while still generating strong earnings. However, inflation is now decelerating which will pressure nominal sales and likely lead to increased layoffs and higher unemployment.
Given this economic environment, coupled with the Index’s last twelve months price-to-earnings (“P/E”) valuation of 22x that is still not inexpensive, we believe it is prudent to remain defensive with the Fund’s positioning. That said, over the long-term we believe the vibrance of the U.S. economy and the resulting positive corporate earnings growth will eventually drive stocks higher, although the appreciation is unlikely to be as robust as the past decade given higher inflation and discount rates.
The Fund’s relative underperformance versus the Index was driven primarily by unfavorable stock selection in Industrials, Health Care, and Financials. This reflects the Fund’s emphasis on owning companies that are both high quality and have reasonable valuations, as speculative, highly-valued stocks outperformed dramatically over this time period. In terms of sector allocation, the underweight in the outperforming Consumer Discretionary sector along with the holding in cash negatively impacted relative performance.
The Fund’s best-performing stocks in the period were Burlington Stores (+81%), Stevanato Group (+53%), Okta, Inc. (+52%), A.O. Smith Corporation (+44%), and Cooper Companies (+41%). The worst-performing stocks were Silicon Valley Bank (-100%), Elastic NV (-19%), Paylocity Holding Corp. (-18%), Jack Henry & Associates (-17%), and CrowdStrike Holdings (-17%).
As of March 31, 2023, the Fund owned 63 stocks and approximately 5% cash. The period end sector weightings were Information Technology 24%, Industrials 23%, Health Care 18%, Consumer Discretionary 12%, Financials 8%, Consumer Staples 6%, Materials 3%, and Real Estate 1%. Of the sectors in which the Fund was invested, the Fund’s largest sector overweighting’s compared to the Index were Industrials (25% vs. 18%) and Consumer Staples (6% vs. 3%) while the largest sector underweighting’s were Consumer Discretionary (12% vs. 15%) and Information Technology (20% vs. 24%). The overweightings were a drag on performance; whereas the underweightings helped boost performance relative to the Index.
We remain focused on owning high-quality companies with sustainable competitive advantages, consistent revenue and earnings growth, and strong balance sheets and management teams that are trading at reasonable valuations. We believe that if a recession occurs, the Fund’s strategy of holding defensive, secular growth, and “compounder” stocks trading at reasonable valuations will perform relatively well against the Index. We will remain patient waiting to purchase the stocks that meet our investment parameters.
Thank you for your continued support.

Mutual fund investing involves risk. Principal loss is possible. The Fund may invest in smaller companies, which involve additional risks such as limited liquidity and greater volatility. Diversification does not assure a profit or protect against loss in a declining market.
Earnings growth is not representative of the Fund’s future performance.
Opinions expressed are subject to change at any time, are not guaranteed, and should not be considered investment advice.
Please refer to the schedule of investments in the report for complete fund holdings information. Fund holdings and sector allocations are subject to change and should not be considered a recommendation to buy or sell any security.
Compounder stocks are high quality businesses that often possess several of the following characteristics: competitive advantages such as barriers to entry or intangible assets that protect them from competition, highly-recurring revenues and earnings, pricing power, low capital intensity, and superior returns on incremental invested capital and earnings per share growth.
The Russell Midcap Index measures the performance of the 800 smallest companies in the Russell 1000 Index, which represent approximately 27% of the total market capitalization of the Russell 1000 Index. The Russell Midcap Growth Index measures the performance of those Russell Midcap companies with higher price-to-book ratios and higher forecasted growth values. The Standard & Poor’s (“S&P”) 500 Index is a broad-based unmanaged index of 500 stocks, which is widely recognized as representative of the equity market in general. One cannot invest directly in an index. Each Morningstar Category average represents a universe of Funds with similar investment objectives.
Basis Points: A unit used to measure changes in interest rates and bond yields. One basis point equals .01% (or 1/100 of 1%).
Earnings per share (EPS): A company’s net profit divided by the number of common shares it has outstanding.
Gross Domestic Product (GDP): The monetary value of all the finished goods and services produced within a country’s borders in a specific time period.
Price-to-Earning (P/E): P/E is a valuation ratio of a company’s current share price compared to its per-share earnings.
Purchasing Managers Index (PMI): A measure of the prevailing direction of economic trends in manufacturing.
Must be preceded or accompanied by a prospectus.
The Nicholas Funds are distributed by Quasar Distributors, LLC.
Financial Highlights Class I (NCTWX)
For a share outstanding throughout each period
| | | | | | | | | | | | | | | | | | |
| | | Six Months | | | | | | | | | | | | | | | | |
| | | Ended | | | | | | | | | | | | | | | | |
| | | 03/31/2023 | | | | | | Years Ended September 30, | | | | |
| | | (unaudited) | | | 2022 | | | 2021 | | | 2020 | | | 2019 | | | 2018 | |
| NET ASSET VALUE, | | | | | | | | | | | | | | | | | | |
| BEGINNING OF PERIOD | $ | 26.69 | | $ | 35.98 | | $ | 28.68 | | $ | 29.61 | | $ | 30.37 | | $ | 28.79 | |
| INCOME (LOSS) FROM | | | | | | | | | | | | | | | | | | |
| INVESTMENT OPERATIONS | | | | | | | | | | | | | | | | | | |
| Net investment income(1) | | .05 | | | .05 | | | .05 | | | .07 | | | .10 | | | .18 | |
| Net gain (loss) on securities | | | | | | | | | | | | | | | | | | |
| (realized and unrealized) | | 3.44 | | | (5.90 | ) | | 8.45 | | | 2.21 | | | 2.08 | | | 4.45 | |
| Total from | | | | | | | | | | | | | | | | | | |
| investment operations | | 3.49 | | | (5.85 | ) | | 8.50 | | | 2.28 | | | 2.18 | | | 4.63 | |
| LESS DISTRIBUTIONS | | | | | | | | | | | | | | | | | | |
| From net investment income | | (.06 | ) | | (.05 | ) | | (.05 | ) | | (.11 | ) | | (.18 | ) | | (.03 | ) |
| From net capital gain | | (1.02 | ) | | (3.39 | ) | | (1.15 | ) | | (3.10 | ) | | (2.76 | ) | | (3.02 | ) |
| Total distributions | | (1.08 | ) | | (3.44 | ) | | (1.20 | ) | | (3.21 | ) | | (2.94 | ) | | (3.05 | ) |
| NET ASSET VALUE, | | | | | | | | | | | | | | | | | | |
| END OF PERIOD | $ | 29.10 | | $ | 26.69 | | $ | 35.98 | | $ | 28.68 | | $ | 29.61 | | $ | 30.37 | |
| |
| TOTAL RETURN | | 13.36 | %(2) | | (18.51 | )% | | 30.26 | % | | 7.85 | % | | 9.97 | % | | 17.10 | % |
| |
| SUPPLEMENTAL DATA: | | | | | | | | | | | | | | | | | | |
| Net assets, end of period (millions) | $ | 884.8 | | $ | 798.8 | | $ | 1,031.3 | | $ | 847.7 | | $ | 828.6 | | $ | 795.9 | |
| Ratio of expenses | | | | | | | | | | | | | | | | | | |
| to average net assets. | | .60 | %(3) | | .59 | % | | .59 | % | | .60 | % | | .60 | % | | .60 | % |
| Ratio of net investment income | | | | | | | | | | | | | | | | | | |
| to average net assets. | | .38 | %(3) | | .15 | % | | .15 | % | | .25 | % | | .34 | % | | .63 | % |
| Portfolio turnover rate | | 4.06 | %(3) | | 15.76 | % | | 19.57 | % | | 22.89 | % | | 19.75 | % | | 26.63 | % |
| (1) | Computed based on average shares outstanding. |
| (2) | Not annualized. |
| (3) | Annualized. |
The accompanying notes to financial statements are an integral part of these highlights.
– 4–
Financial Highlights Class N (NNTWX)
For a share outstanding throughout each period
| | | | | | | | | | | | | | | | | | |
| | | Six Months | | | | | | | | | | | | | | | | |
| | | Ended | | | | | | | | | | | | | | | | |
| | | 03/31/2023 | | | | | | Years Ended September 30, | | | | |
| | | (unaudited) | | | 2022 | | | 2021 | | | 2020 | | | 2019 | | | 2018 | |
| NET ASSET VALUE, | | | | | | | | | | | | | | | | | | |
| BEGINNING OF PERIOD | $ | 25.82 | | $ | 34.97 | | $ | 27.94 | | $ | 28.91 | | $ | 29.72 | | $ | 28.29 | |
| INCOME (LOSS) FROM | | | | | | | | | | | | | | | | | | |
| INVESTMENT OPERATIONS | | | | | | | | | | | | | | | | | | |
| Net investment income (loss)(1) | | .01 | | | (.05 | ) | | (.05 | ) | | (.01 | ) | | (.00 | )(2) | | .09 | |
| Net gain (loss) on securities | | | | | | | | | | | | | | | | | | |
| (realized and unrealized) | | 3.33 | | | (5.71 | ) | | 8.23 | | | 2.16 | | | 2.03 | | | 4.36 | |
| Total from | | | | | | | | | | | | | | | | | | |
| investment operations | | 3.34 | | | (5.76 | ) | | 8.18 | | | 2.15 | | | 2.03 | | | 4.45 | |
| LESS DISTRIBUTIONS | | | | | | | | | | | | | | | | | | |
| From net investment income | | (.05 | ) | | — | | | — | | | (.02 | ) | | (.08 | ) | | — | |
| From net capital gain | | (1.02 | ) | | (3.39 | ) | | (1.15 | ) | | (3.10 | ) | | (2.76 | ) | | (3.02 | ) |
| Total distributions | | (1.07 | ) | | (3.39 | ) | | (1.15 | ) | | (3.12 | ) | | (2.84 | ) | | (3.02 | ) |
| NET ASSET VALUE, | | | | | | | | | | | | | | | | | | |
| END OF PERIOD | $ | 28.09 | | $ | 25.82 | | $ | 34.97 | | $ | 27.94 | | $ | 28.91 | | $ | 29.72 | |
| |
| TOTAL RETURN | | 13.21 | %(3) | | (18.75 | )% | | 29.85 | % | | 7.54 | % | | 9.55 | % | | 16.74 | % |
| |
| SUPPLEMENTAL DATA: | | | | | | | | | | | | | | | | | | |
| Net assets, end of period (millions) | $ | 75.3 | | $ | 70.1 | | $ | 95.6 | | $ | 85.0 | | $ | 96.7 | | $ | 101.2 | |
| Ratio of expenses | | | | | | | | | | | | | | | | | | |
| to average net assets. | | .90 | %(4) | | .89 | % | | .89 | % | | .90 | % | | .95 | % | | .93 | % |
| Ratio of net investment income | | | | | | | | | | | | | | | | | | |
| (loss) to average net assets. | | .07 | %(4) | | (.16 | )% | | (.15 | )% | | (.05 | )% | | (.01 | )% | | .31 | % |
| Portfolio turnover rate | | 4.06 | %(4) | | 15.76 | % | | 19.57 | % | | 22.89 | % | | 19.75 | % | | 26.63 | % |
| (1) | Computed based on average shares outstanding. |
| (2) | The amount rounds to $0.00. |
| (3) | Not annualized. |
| (4) | Annualized. |
The accompanying notes to financial statements are an integral part of these highlights.
– 5–
Top Ten Equity Portfolio Holdings
March 31, 2023 (unaudited)
| | |
| | Percentage | |
| Name | of Net Assets | |
| O’Reilly Automotive, Inc. | 2.74 | % |
| Ulta Beauty Inc. | 2.42 | % |
| Lamb Weston Holdings, Inc. | 2.40 | % |
| Palo Alto Networks, Inc. | 2.34 | % |
| BJ’s Wholesale Club Holdings, Inc. | 2.14 | % |
| CDW Corporation | 2.10 | % |
| Verisk Analytics Inc. | 2.09 | % |
| AMETEK, Inc. | 1.93 | % |
| Westinghouse Air Brake Technologies Corporation | 1.91 | % |
| Microchip Technology Incorporated | 1.87 | % |
| Total of top ten | 21.94 | % |
Sector Diversification (as a percentage of portfolio)
March 31, 2023 (unaudited)
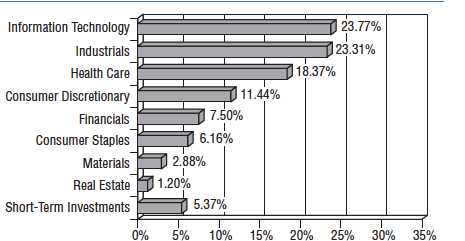
– 6–
Fund Expenses
For the six month period ended March 31, 2023 (unaudited)
As a shareholder of the Fund, you incur two types of costs: (1) transaction costs and (2) ongoing costs, including management fees and other operating expenses. The following table is intended to help you understand your ongoing costs (in dollars) of investing in the Fund and to compare these costs with those of other mutual funds.
The example is based on an investment of $1,000 made at the beginning of the period and held for the entire period.
The first line of the table below for each share class of the Fund provides information about the actual account values and actual expenses. You may use the information in this line, together with the amount you invested, to estimate the expenses that you paid over the period. Simply divide your account value by $1,000 (for example, an $8,600 account value divided by $1,000 = 8.6), then multiply the result by the number in the first line under the heading entitled “Expenses Paid During Period” to estimate the expenses you paid on your account during this period.
The second line of the table below provides information about hypothetical account values and hypothetical expenses based on the Fund’s actual expense ratios for each class of the Fund and an assumed rate of return of 5% per year before expenses, which are not the Fund’s actual returns. The hypothetical account values and expenses may not be used to estimate the actual ending account balance or expenses you paid for the period. You may use this information to compare the ongoing costs of investing in the Fund with other funds. To do so, compare this 5% hypothetical example with the 5% hypothetical examples that appear in the shareholder reports of other funds.
Please note that the expenses shown in the table are meant to highlight your ongoing costs only and do not reflect any transactional costs, such as wire fees. Therefore, the second line of the table is useful in comparing ongoing costs only, and will not help you determine the relative total costs of owning different funds. In addition, if these transactional costs were included, your costs would have been higher.
| | | | | | |
| Class I | | | | | | |
| | | Beginning | | Ending | | Expenses Paid |
| | | Account Value | | Account Value | | During Period* |
| | | 09/30/22 | | 03/31/23 | | 10/01/22 - 03/31/23 |
| Actual | | $1,000.00 | | $1,133.60 | | $3.19 |
| Hypothetical | | 1,000.00 | | 1,022.01 | | 3.02 |
| (5% return before expenses) | | | | | | |
| * Expenses are equal to the Class I six-month annualized expense ratio of 0.60%, multiplied by the |
| average account value over the period, multiplied by 182 then divided by 365 to reflect the |
| one-half year period. | | | | | | |
– 7–
Fund Expenses (continued)
For the six month period ended March 31, 2023 (unaudited)
| | | | | | |
| Class N | | | | | | |
| | | Beginning | | Ending | | Expenses Paid |
| | | Account Value | | Account Value | | During Period** |
| | | 09/30/22 | | 03/31/23 | | 10/01/22 - 03/31/23 |
| Actual | | $1,000.00 | | $1,132.10 | | $4.78 |
| Hypothetical | | 1,000.00 | | 1,020.51 | | 4.53 |
| (5% return before expenses) | | | | | | |
| ** Expenses are equal to the Class N six-month annualized expense ratio of 0.90%, multiplied by |
| the average account value over the period, multiplied by 182 then divided by 365 to reflect the |
| one-half year period. | | | | | | |
– 8–
Schedule of Investments
March 31, 2023 (unaudited)
| | | |
| Shares or | | | |
| Principal | | | |
| Amount | | | Value |
| COMMON STOCKS — 94.69% | | |
| | Consumer Discretionary – Consumer | | |
| | Discretionary Distribution & Retail — 7.04% | | |
| 46,070 | Burlington Stores, Inc.* | $ | 9,310,747 |
| 135,195 | CarMax, Inc.* | | 8,690,334 |
| 31,015 | O’Reilly Automotive, Inc.* | | 26,331,115 |
| 42,640 | Ulta Beauty Inc.* | | 23,267,369 |
| | | | 67,599,565 |
| | Consumer Discretionary – Consumer Services — 4.40% | | |
| 5,935 | Chipotle Mexican Grill, Inc.* | | 10,138,701 |
| 28,890 | Domino’s Pizza, Inc. | | 9,529,944 |
| 251,430 | Service Corporation International | | 17,293,355 |
| 244,745 | Wendy’s Company | | 5,330,546 |
| | | | 42,292,546 |
| | Consumer Staples – Consumer Staples | | |
| | Distribution & Retail — 2.14% | | |
| 269,706 | BJ’s Wholesale Club Holdings, Inc.* | | 20,516,536 |
| | Consumer Staples – Food Beverage & Tobacco — 4.03% | | |
| 69,500 | Constellation Brands, Inc. Class A | | 15,699,355 |
| 220,076 | Lamb Weston Holdings, Inc. | | 23,002,344 |
| | | | 38,701,699 |
| | Financials – Banks — 2.02% | | |
| 289,157 | Citizens Financial Group, Inc. | | 8,781,698 |
| 270,665 | Webster Financial Corporation | | 10,669,614 |
| | | | 19,451,312 |
| | Financials – Financial Services — 5.48% | | |
| 66,065 | FLEETCOR Technologies, Inc.* | | 13,929,805 |
| 87,281 | Jack Henry & Associates, Inc. | | 13,154,992 |
| 138,050 | Northern Trust Corporation | | 12,166,347 |
| 143,155 | Raymond James Financial, Inc. | | 13,352,067 |
| | | | 52,603,211 |
| | Health Care – Health Care Equipment & Services — 10.67% | | |
| 42,225 | Cooper Companies, Inc. | | 15,765,126 |
| 227,260 | Globus Medical Inc Class A* | | 12,872,006 |
| 138,310 | Hologic, Inc.* | | 11,161,617 |
| 44,886 | Insulet Corporation* | | 14,316,839 |
| 116,527 | LivaNova Plc* | | 5,078,247 |
| 64,960 | ResMed Inc. | | 14,225,590 |
| 82,515 | STERIS Plc | | 15,783,469 |
| 72,095 | Veeva Systems Inc Class A* | | 13,250,340 |
| | | | 102,453,234 |
The accompanying notes to financial statements are an integral part of this schedule.
– 9–
Schedule of Investments (continued)
March 31, 2023 (unaudited)
| | | |
| Shares or | | | |
| Principal | | | |
| Amount | | | Value |
| COMMON STOCKS — 94.69% (continued) | | |
| | Health Care – Pharmaceuticals | | |
| | Biotechnology & Life Sciences — 7.71% | | |
| 57,911 | Charles River Laboratories International, Inc.* | $ | 11,687,598 |
| 83,070 | IQVIA Holdings Inc* | | 16,521,792 |
| 11,335 | Mettler-Toledo International Inc.* | | 17,344,930 |
| 99,020 | PerkinElmer, Inc. | | 13,195,405 |
| 589,160 | Stevanato Group SpA | | 15,259,244 |
| | | | 74,008,969 |
| | Industrials – Capital Goods — 14.19% | | |
| 127,500 | AMETEK, Inc. | | 18,529,575 |
| 197,850 | A. O. Smith Corporation | | 13,681,328 |
| 234,370 | Fastenal Company | | 12,641,918 |
| 238,700 | Fortive Corp. | | 16,272,179 |
| 70,000 | IDEX Corporation | | 16,172,100 |
| 61,005 | L3Harris Technologies Inc | | 11,971,621 |
| 45,300 | Lennox International Inc. | | 11,382,984 |
| 77,500 | Nordson Corporation | | 17,225,150 |
| 181,487 | Westinghouse Air Brake Technologies Corporation | | 18,341,076 |
| | | | 136,217,931 |
| | Industrials – Commercial & Professional Services — 7.47% | | |
| 89,700 | Broadridge Financial Solutions, Inc. | | 13,147,329 |
| 121,710 | Republic Services, Inc. | | 16,457,626 |
| 126,048 | Ritchie Bros. Auctioneers Incorporated | | 7,095,242 |
| 240,500 | TransUnion | | 14,944,670 |
| 104,510 | Verisk Analytics Inc | | 20,051,289 |
| | | | 71,696,156 |
| | Industrials – Transportation — 1.67% | | |
| 47,130 | Old Dominion Freight Line, Inc. | | 16,063,789 |
| | Information Technology – Semiconductors & | | |
| | Semiconductor Equipment — 5.01% | | |
| 213,950 | Microchip Technology Incorporated | | 17,924,731 |
| 171,810 | Power Integrations, Inc. | | 14,541,998 |
| 132,320 | Skyworks Solutions, Inc. | | 15,611,114 |
| | | | 48,077,843 |
| | Information Technology – Software & Services — 15.23% | | |
| 96,855 | CrowdStrike Holdings, Inc. Class A* | | 13,294,317 |
| 89,040 | CyberArk Software Ltd.* | | 13,176,139 |
| 384,298 | Dynatrace, Inc.* | | 16,255,805 |
| 158,070 | Elastic NV* | | 9,152,253 |
| 48,940 | Gartner, Inc.* | | 15,943,184 |
| 167,220 | Okta, Inc. Class A* | | 14,421,053 |
The accompanying notes to financial statements are an integral part of this schedule.
– 10 –
Schedule of Investments (continued)
March 31, 2023 (unaudited)
| | | | | |
| | Shares or | | | | |
| | Principal | | | | |
| | Amount | | | Value | |
| | COMMON STOCKS — 94.69% (continued) | | | |
| | Information Technology – Software & Services — 15.23% (continued) | | | |
| | 112,575 | Palo Alto Networks, Inc.* | $ | 22,485,731 | |
| | 74,715 | Paylocity Holding Corp.* | | 14,851,848 | |
| | 125,045 | PTC Inc.* | | 16,034,520 | |
| | 159,487 | Twilio, Inc. Class A* | | 10,626,619 | |
| | | | | 146,241,469 | |
| | | Information Technology – Technology | | | |
| | | Hardware & Equipment — 3.55% | | | |
| | 103,625 | CDW Corporation | | 20,195,476 | |
| | 31,030 | Teledyne Technologies Incorporated* | | 13,881,581 | |
| | | | | 34,077,057 | |
| | | Materials – Materials — 2.88% | | | |
| | 93,725 | AptarGroup, Inc. | | 11,077,358 | |
| | 96,460 | Vulcan Materials Company | | 16,548,678 | |
| | | | | 27,626,036 | |
| | | Real Estate – Real Estate Management & Development — 1.20% | | | |
| | 158,175 | CBRE Group, Inc. Class A* | | 11,516,722 | |
| | | TOTAL COMMON STOCKS | | | |
| | | (cost $507,439,294) | | 909,144,075 | |
| |
| SHORT-TERM INVESTMENTS — 5.37 | | | |
| | | U.S. Government Securities — 4.67% | | | |
| $ | 10,000,000 | U.S. Treasury Bill 04/04/2023, 1.558% | | 9,998,724 | |
| | 10,000,000 | U.S. Treasury Bill 04/18/2023, 4.079% | | 9,981,036 | |
| | 10,000,000 | U.S. Treasury Bill 05/04/2023, 4.417% | | 9,960,217 | |
| | 5,000,000 | U.S. Treasury Bill 05/18/2023, 4.561% | | 4,970,807 | |
| | 10,000,000 | U.S. Treasury Bill 06/01/2023, 4.488% | | 9,925,554 | |
| | | | | 44,836,338 | |
| | | Money Market Fund — 0.70% | | | |
| | 6,691,447 | Morgan Stanley Liquidity Funds Government Portfolio | | | |
| | | (Institutional Class), 7-day net yield, 4.75% | | 6,691,447 | |
| | | TOTAL SHORT-TERM INVESTMENTS | | | |
| | | (cost $51,521,678) | | 51,527,785 | |
| | | TOTAL INVESTMENTS | | | |
| | | (cost $558,960,972) — 100.06% | | 960,671,860 | |
| | | LIABILITIES, NET OF OTHER ASSETS — (0.06)% | | (578,796 | ) |
| | | TOTAL NET ASSETS | | | |
| | | (basis of percentages disclosed above) — 100% | $ | 960,093,064 | |
| | * Non-income producing security. | | | |
The accompanying notes to financial statements are an integral part of this schedule.
– 11 –
Statement of Assets and Liabilities
March 31, 2023 (unaudited)
| | |
| ASSETS | | |
| Investments in securities at value (cost $558,960,972) | $ | 960,671,860 |
| Receivables — | | |
| Investment securities sold | | 946,736 |
| Dividend and interest | | 404,887 |
| Capital stock subscription | | 59,080 |
| Total receivables | | 1,410,703 |
| Other | | 79,377 |
| Total assets | | 962,161,940 |
| |
| LIABILITIES | | |
| Payables — | | |
| Investment securities purchased | | 1,420,189 |
| Due to adviser — | | |
| Management fee | | 413,327 |
| Accounting and administrative fee | | 13,149 |
| Total due to adviser | | 426,476 |
| Capital stock redemption | | 123,871 |
| 12b-1 and servicing fee | | 24,834 |
| Other payables and accrued expense | | 73,506 |
| Total liabilities | | 2,068,876 |
| Total net assets | $ | 960,093,064 |
| |
| NET ASSETS CONSIST OF | | |
| Paid in capital | $ | 550,186,006 |
| Accumulated distributable earnings | | 409,907,058 |
| Total net assets | $ | 960,093,064 |
| |
| Class I | | |
| Net assets | $ | 884,789,678 |
| Shares outstanding | | 30,406,031 |
| NET ASSET VALUE PER SHARE ($.01 par value, | | |
| 125,000,000 shares authorized), offering price and redemption price | $ | 29.10 |
| |
| Class N | | |
| Net assets | $ | 75,303,386 |
| Shares outstanding | | 2,680,981 |
| NET ASSET VALUE PER SHARE ($.01 par value, | | |
| 75,000,000 shares authorized), offering price and redemption price | $ | 28.09 |
The accompanying notes to financial statements are an integral part of this statement.
– 12 –
Statement of Operations
For the six months ended March 31, 2023 (unaudited)
| | |
| INCOME | | |
| Dividend (net of foreign taxes of $3,508) | $ | 3,487,871 |
| Interest | | 1,063,297 |
| Total income | | 4,551,168 |
| |
| EXPENSES | | |
| Management fee | | 2,423,916 |
| Accounting and administrative fees | | 117,748 |
| Transfer agent fees | | 95,918 |
| 12b-1 fees – Class N | | 78,201 |
| Servicing fees – Class N | | 35,407 |
| Registration fees | | 25,628 |
| Custodian fees | | 23,189 |
| Audit and tax fees | | 20,900 |
| Insurance | | 17,059 |
| Printing | | 13,621 |
| Directors’ fees | | 12,848 |
| Postage and mailing | | 9,060 |
| Legal fees | | 8,174 |
| Pricing service fees | | 5,864 |
| Other operating expenses | | 10,751 |
| Total expenses | | 2,898,284 |
| Net investment income | | 1,652,884 |
| |
| NET REALIZED GAIN ON INVESTMENTS | | 13,467,354 |
| |
| CHANGE IN NET UNREALIZED | | |
| APPRECIATION/DEPRECIATION ON INVESTMENTS | | 99,676,608 |
| Net realized and unrealized gain on investments | | 113,143,962 |
| Net increase in net assets resulting from operations | $ | 114,796,846 |
The accompanying notes to financial statements are an integral part of this statement.
– 13 –
Statements of Changes in Net Assets
For the six months ended March 31, 2023 (unaudited)
and the year ended September 30, 2022
| | | | | | | |
| | | | Six Months Ended | | | | |
| | | | 03/31/2023 | | | Year Ended | |
| | | | (unaudited) | | | 09/30/2022 | |
| INCREASE (DECREASE) IN NET ASSETS | | | | | | | |
| FROM OPERATIONS | | | | | | | |
| Net investment income | | $ | 1,652,884 | | $ | 1,312,790 | |
| Net realized gain on investments | | | 13,467,354 | | | 27,692,561 | |
| Change in net unrealized | | | | | | | |
| appreciation/depreciation on investments | | | 99,676,608 | | | (228,196,887 | ) |
| Net increase (decrease) in net assets | | | | | | | |
| resulting from operations | | | 114,796,846 | | | (199,191,536 | ) |
| |
| DISTRIBUTIONS TO SHAREHOLDERS FROM | | | | | | | |
| Investment operations – Class I | | | (32,017,621 | ) | | (97,747,796 | ) |
| Investment operations – Class N | | | (2,841,109 | ) | | (9,016,996 | ) |
| Total distributions | | | (34,858,730 | ) | | (106,764,792 | ) |
| |
| CAPITAL SHARE TRANSACTIONS | | | | | | | |
| Proceeds from shares issued – Class I | | | | | | | |
| (221,605 and 347,802 shares, respectively) | | | 6,426,760 | | | 11,254,591 | |
| Reinvestment of distributions – Class I | | | | | | | |
| (1,072,426 and 2,615,660 shares, respectively) | . | | 29,148,550 | | | 91,129,589 | |
| Cost of shares redeemed – Class I | | | | | | | |
| (814,240 and 1,698,790 shares, respectively) | | | (23,214,797 | ) | | (54,517,385 | ) |
| Proceeds from shares issued – Class N | | | | | | | |
| (17,070 and 46,615 shares, respectively) | | | 473,792 | | | 1,417,684 | |
| Reinvestment of distributions – Class N | | | | | | | |
| (107,402 and 264,192 shares, respectively) | | | 2,819,297 | | | 8,927,047 | |
| Cost of shares redeemed – Class N | | | | | | | |
| (159,146 and 330,292 shares, respectively) | | | (4,379,039 | ) | | (10,353,812 | ) |
| Change in net assets derived | | | | | | | |
| from capital share transactions | | | 11,274,563 | | | 47,857,714 | |
| Total increase (decrease) in net assets | | | 91,212,679 | | | (258,098,614 | ) |
| |
| NET ASSETS | | | | | | | |
| Beginning of period | | | 868,880,385 | | | 1,126,978,999 | |
| End of period | | $ | 960,093,064 | | $ | 868,880,385 | |
The accompanying notes to financial statements are an integral part of these statements.
– 14 –
Notes to Financial Statements
March 31, 2023 (unaudited)
These financial statements have been prepared pursuant to reporting rules for interim financial statements. Accordingly, these financial statements do not include all of the information and footnotes required by U.S. generally accepted accounting principles (“U.S. GAAP”) for annual financial statements. These financial statements should be read in conjunction with the financial statements and financial highlights and notes in the Fund’s Annual Report on Form N-CSR for the year ended September 30, 2022.
These financial statements have not been audited. Management believes that these financial statements include all adjustments (which, unless otherwise noted, include only normal recurring adjustments) necessary for a fair presentation of the financial results for each period shown.
(1) Summary of Significant Accounting Policies —
Nicholas II, Inc. (the “Fund”) is organized as a Maryland corporation and is registered as an open-end, diversified management investment company under the Investment Company Act of 1940, as amended. The primary objective of the Fund is long-term growth. The following is a summary of the significant accounting policies of the Fund: (a) Equity securities traded on a stock exchange will ordinarily be valued on the basis of the last sale price on the date of valuation on the securities principal exchange, or if in the absence of any sale on that day, the closing bid price. For securities principally traded on the NASDAQ market, the Fund uses the NASDAQ Official Closing Price. Investments in shares of open-end mutual funds, including money market funds, are valued at their daily closing net asset value. Debt securities, excluding short-term investments, are valued at their current evaluated bid price as determined by an independent pricing service, which generates evaluations on the basis of dealer quotes for normal institutional-sized trading units, issuer analysis, bond market activity and various other factors. Short-term investments are valued using evaluated bid prices. Securities for which market quotations may not be readily available are valued at their fair value as determined in good faith by procedures adopted by the Board of Directors. The Board of Directors has delegated fair value responsibilities to Nicholas Company, Inc., the Fund’s adviser.
The Fund did not maintain any positions in derivative instruments or engage in hedging activities during the year. Investment transactions for financial statement purposes are recorded on trade date.
In accordance with Accounting Standards Codification (“ASC”) 820-10, “Fair Value Measurement” (“ASC 820-10”), fair value is defined as the Price that the Fund would receive upon selling an investment in a timely transaction to an independent buyer in the principal or most advantageous market of the investment. ASC 820-10 established a three-tier hierarchy to maximize the use of observable market data and minimize the use of unobservable inputs and to establish classification of fair value measurements for disclosure purposes. Inputs refer broadly to the assumptions that market participants would use in pricing the asset or liability, including assumptions about risk, for example, the risk inherent in a particular valuation technique used to measure fair value such as a pricing model and/or the risk inherent in the inputs to the valuation technique. Inputs may be observable or unobservable. Observable inputs are inputs that reflect the assumptions market
– 15 –
Notes to Financial Statements (continued)
March 31, 2023 (unaudited)
participants would use in pricing the asset or liability based on market data obtained from sources independent of the reporting entity. Unobservable inputs are inputs that reflect the reporting entity’s own assumptions about the assumptions market participants would use in pricing the asset or liability based on the best information available in the circumstances. The three-tier hierarchy of inputs is summarized in the three broad levels listed below.
Level 1 – quoted prices in active markets for identical investments Level 2 – other significant observable inputs (including quoted prices for similar investments, interest rates, benchmark yields, bids, offers, transactions, spreads and other relationships observed in the markets among market securities, underlying equity of the issuer, proprietary pricing models, credit risk, etc.) Level 3 – significant unobservable inputs (including the Fund’s own assumptions in determining the fair value of investments) The inputs or methodology used for valuing securities are not necessarily an indication of the risk associated with investing in those securities.
The following is a summary of the inputs used as of March 31, 2023 in valuing the Fund’s investments carried at value:
| | |
| | | Investments |
| Valuation Inputs | | in Securities |
| Level 1 – | | |
| Common Stocks(1) | $ | 909,144,075 |
| Money Market Fund | | 6,691,447 |
| Level 2 – | | |
| U.S. Government Securities | | 44,836,338 |
| Level 3 – | | |
| None | | — |
| Total | $ | 960,671,860 |
| (1) See Schedule of Investments for further detail by industry. | | |
The Fund did not hold any Level 3 investments during the period.
(b) Net realized gain (loss) on portfolio securities was computed on the basis of specific identification.
(c) Dividend income is recorded on the ex-dividend date, and interest income is recognized on an accrual basis. Non-cash dividends, if any, are recorded at value on date of distribution. Generally, discounts and premiums on long-term debt security purchases, if any, are amortized over the expected lives of the respective securities using the effective yield method.
Investment income, net capital gains (losses) and all expenses incurred by the Fund are allocated based on the relative net assets of each class, except for 12b-1 fees and shareholder servicing fees and certain other fees and expenses related to one class of shares.
– 16 –
Notes to Financial Statements (continued)
March 31, 2023 (unaudited)
Class N shares are subject to a 0.25% 12b-1 fee and a 0.10% servicing fee, as described in its prospectus. During the period, the 12b-1 fee was 0.20% through February 14, 2023. From February 15, 2023 through period end, the 12b-1 fee was increased to 0.24%. During the period, the service fee was 0.10% through February 14, 2023. From February 15, 2023 through period end, the service fee was decreased to 0.08%. Income, expenses (other than expenses attributable to a specific class), and realized and unrealized gains and losses are allocated daily to each class of shares based upon the relative net asset value of outstanding shares.
(d) Provision has not been made for federal income taxes or excise taxes since the Fund has elected to be taxed as a “regulated investment company” and intends to distribute substantially all net investment income and net realized capital gains on sales of investments to its shareholders and otherwise comply with the provisions of Subchapter M of the Internal Revenue Code applicable to regulated investment companies.
(e) Dividends and distributions paid to shareholders are recorded on the ex-dividend date. Distributions from net investment income are generally declared and paid at least annually. Distributions of net realized capital gain, if any, are declared and paid at least annually.
The amount of distributions from net investment income and net realized capital gain are determined in accordance with federal income tax regulations, which may differ from U.S. GAAP for financial reporting purposes. Financial reporting records are adjusted for permanent book-to-tax differences to reflect tax character.
The tax character of distributions paid during the six months ended March 31, 2023 and the year ended September 30, 2022 was as follows:
| | | | |
| | | 03/31/2023 | | 09/30/2022 |
| Distributions paid from: | | | | |
| Ordinary income | $ | 2,013,644 | $ | 1,924,092 |
| Long-term capital gain | | 32,845,086 | | 104,840,700 |
| Total distributions paid | $ | 34,858,730 | $ | 106,764,792 |
The following information for the Fund is presented on an income tax basis as of September 30, 2022.
| | | |
| Investment cost for federal tax purposes | $ | 568,508,309 | |
| Unrealized appreciation | $ | 328,038,327 | |
| Unrealized depreciation | | (26,003,844 | ) |
| Net unrealized appreciation | $ | 302,034,483 | |
There were no differences between financial statement and tax-basis cost.
The Fund had no material uncertain tax positions and has not recorded a liability for unrecognized tax benefits as of March 31, 2023. Also, the Fund recognized no interest and penalties related to uncertain tax benefits during the period ended March 31, 2023. At March 31, 2023, the fiscal years 2019 through 2022 remain open to examination in the Fund’s major tax jurisdictions.
– 17 –
Notes to Financial Statements (continued)
March 31, 2023 (unaudited)
(f) The Fund is considered an investment company under U.S. GAAP and follows the accounting and reporting guidance applicable to investment companies in the Financial Accounting Standards Board (“FASB”) ASC 946, “Financial Services –Investment Companies.” U.S. GAAP guidance requires management to make estimates and assumptions that effect the amounts reported in the financial statements and accompanying notes. Actual results could differ from estimates.
(g) In the normal course of business the Fund enters into contracts that contain general indemnification clauses. The Fund’s maximum exposure under these arrangements is unknown, as this would involve future claims against the Fund that have not yet occurred. Based on experience, the Fund expects the risk of loss to be remote.
(h) In connection with the preparation of the Fund’s financial statements, management evaluated subsequent events after the date of the Statement of Assets and Liabilities of March 31, 2023. There have been no material subsequent events since March 31, 2023 that would require adjustment to or additional disclosure in these financial statements.
(2) Related Parties —
(a) Investment Adviser and Management Agreement —
The Fund has an agreement with Nicholas Company, Inc. (with whom certain officers and directors of the Fund are affiliated) (the “Adviser”) to serve as investment adviser and manager. Under the terms of the agreement, a monthly fee is paid to the Adviser based on an annualized fee of 0.75% of the average net asset value up to and including $50 million, 0.60% of the average net asset value over $50 million up to and including $100 million and 0.50% of the average net asset value in excess of $100 million.
The Adviser may be paid for accounting and administrative services rendered by its personnel, subject to the following guidelines: (i) up to five basis points, on an annual basis, of the average net asset value of the Fund up to and including $2 billion and up to three basis points, on an annual basis, of the average net asset value of the Fund greater than $2 billion, based on the average net asset value of the Fund as determined by valuations made at the close of each business day of each month, and (ii) where the preceding calculation results in an annual payment of less than $50,000, the Adviser, in its discretion, may charge the Fund up to $50,000 for such services.
(b) Legal Counsel —
A director of the Adviser is affiliated with a law firm that provides services to the Fund. The Fund incurred expenses of $4,458 for the period ended March 31, 2023 for legal services rendered by this law firm.
(3) Investment Transactions —
For the period ended March 31, 2023, the cost of purchases and the proceeds from sales of investment securities, other than short-term obligations, aggregated $17,891,366 and $33,614,715, respectively.
– 18 –
Historical Record Class I
(unaudited)
| | | | | | | | | | | |
| | | | | Net | | | | | | | |
| | | | | Investment | | | | | Dollar | | Growth of |
| | | Net | | Income | | | Capital Gain | | Weighted | | an Initial |
| | | Asset Value | | Distributions | | | Distributions | | Price/Earnings | | $10,000 |
| Class I | | Per Share | | Per Share(2) | | | Per Share(2) | | Ratio(3) | | Investment(4) |
| October 17, 1983(1) | $ | 10.00 | $ | — | | $ | — | | — | $ | 10,000 |
| September 30, 1984 | | 11.66 | | — | | | — | | 12.6 times | | 11,660 |
| September 30, 1985 | | 14.39 | | 0.0930 | | | 0.1860 | | 11.7 | | 14,742 |
| September 30, 1986 | | 16.90 | | 0.1630 | | | 0.0610 | | 15.0 | | 17,581 |
| September 30, 1987 | | 21.01 | | 0.4200 | | | 0.5130 | | 20.9 | | 23,108 |
| September 30, 1988 | | 18.58 | | 0.3380 | | | 1.3030 | | 15.0 | | 22,766 |
| September 30, 1989 | | 21.76 | | 0.3350 | | | 0.0800 | | 17.1 | | 27,291 |
| September 30, 1990 | | 17.39 | | 0.3124 | | | 0.6686 | | 14.8 | | 22,888 |
| September 30, 1991 | | 23.87 | | 0.3422 | | | 0.1434 | | 17.8 | | 32,250 |
| September 30, 1992 | | 24.53 | | 0.2447 | | | 0.4042 | | 17.3 | | 34,052 |
| September 30, 1993 | | 26.94 | | 0.2350 | | | 0.8000 | | 18.1 | | 38,885 |
| September 30, 1994 | | 26.71 | | 0.2000 | | | 1.4700 | | 18.5 | | 41,020 |
| September 30, 1995 | | 30.07 | �� | 0.2056 | | | 1.8944 | | 20.8 | | 50,205 |
| September 30, 1996 | | 33.34 | | 0.1750 | | | 2.4979 | | 28.9 | | 60,922 |
| September 30, 1997 | | 40.65 | | 0.0779 | | | 3.1621 | | 31.4 | | 82,206 |
| September 30, 1998 | | 34.78 | | 0.0810 | | | 5.2282 | | 28.6 | | 80,845 |
| September 30, 1999 | | 31.83 | | 0.1337 | | | 4.0049 | | 29.0 | | 82,864 |
| September 30, 2000 | | 36.58 | | 0.0100 | | | 0.4701 | | 35.1 | | 96,527 |
| September 30, 2001 | | 17.54 | | — | | | 13.1200 | | 23.4 | | 76,361 |
| September 30, 2002 | | 15.34 | | — | | | 0.5766 | | 22.2 | | 68,730 |
| September 30, 2003 | | 18.97 | | — | | | — | | 22.9 | | 84,994 |
| September 30, 2004 | | 21.88 | | — | | | 0.0015 | | 22.9 | | 98,040 |
| September 30, 2005 | | 23.50 | | — | | | 0.9146 | | 23.3 | | 109,547 |
| September 30, 2006 | | 23.11 | | 0.0083 | | | 2.1472 | | 22.4 | | 118,142 |
| September 30, 2007 | | 25.18 | | 0.0643 | | | 1.0460 | | 23.4 | | 134,908 |
| September 30, 2008 | | 19.15 | | 0.0978 | | | 2.5678 | | 17.5 | | 115,141 |
| September 30, 2009 | | 17.02 | | 0.1072 | | | 1.1206 | | 19.2 | | 111,845 |
| September 30, 2010 | | 19.31 | | 0.0957 | | | — | | 20.7 | | 127,575 |
| September 30, 2011 | | 18.72 | | 0.0867 | | | 0.3831 | | 17.2 | | 126,423 |
| September 30, 2012 | | 22.91 | | 0.0992 | | | 0.4903 | | 20.2 | | 159,188 |
| September 30, 2013 | | 26.37 | | 0.1428 | | | 1.8746 | | 22.9 | | 200,723 |
| September 30, 2014 | | 27.41 | | 0.0889 | | | 2.0445 | | 22.3 | | 225,609 |
| September 30, 2015 | | 25.39 | | 0.0997 | | | 3.4844 | | 21.3 | | 237,669 |
| September 30, 2016 | | 25.41 | | 0.0931 | | | 1.4736 | | 22.7 | | 252,980 |
| September 30, 2017 | | 28.79 | | 0.0752 | | | 1.1754 | | 24.9 | | 301,091 |
| September 30, 2018 | | 30.37 | | 0.0277 | | | 3.0205 | | 25.9 | | 352,592 |
| September 30, 2019 | | 29.61 | | 0.1821 | | | 2.7546 | | 24.8 | | 387,738 |
| September 30, 2020 | | 28.68 | | 0.1133 | | | 3.1017 | | 29.1 | | 418,165 |
| September 30, 2021 | | 35.98 | | 0.0487 | | | 1.1473 | | 25.5 | | 544,703 |
| September 30, 2022 | | 26.69 | | 0.0495 | | | 3.3930 | | 22.6 | | 443,863 |
| March 31, 2023 | | 29.10 | | 0.0635 | (a) | | 1.0161 | (a) | 27.3 | | 503,164 |
| (1) | Date of Initial Public Offering. |
| (2) | Rounded. |
| (3) | Based on latest 12 months accomplished earnings. |
| (4) | Assuming reinvestment of all distributions. |
| (a) | Paid on December 28, 2022 to shareholders of record on December 27, 2022. |
– 19 –
Historical Record Class N
(unaudited)
| | | | | | | | | | | |
| | | | | Net | | | | | | | |
| | | | | Investment | | | | | Dollar | | Growth of |
| | | Net | | Income | | | Capital Gain | | Weighted | | an Initial |
| | | Asset Value | | Distributions | | | Distributions | | Price/Earnings | | $10,000 |
| Class N | | Per Share | | Per Share(2) | | | Per Share(2) | | Ratio(3) | | Investment(4) |
| February 28, 2005(1) | $ | 22.59 | $ | — | | $ | — | | 23.1 times | $ | 10,000 |
| September 30, 2005 | | 23.45 | | — | | | — | | 23.3 | | 10,381 |
| September 30, 2006 | | 23.00 | | — | | | 2.1340 | | 22.4 | | 11,158 |
| September 30, 2007 | | 25.03 | | — | | | 1.0460 | | 23.4 | | 12,694 |
| September 30, 2008 | | 19.04 | | 0.0067 | | | 2.5678 | | 17.5 | | 10,800 |
| September 30, 2009 | | 16.87 | | 0.0969 | | | 1.1206 | | 19.2 | | 10,457 |
| September 30, 2010 | | 19.11 | | 0.0666 | | | — | | 20.7 | | 11,890 |
| September 30, 2011 | | 18.49 | | 0.0479 | | | 0.3831 | | 17.2 | | 11,741 |
| September 30, 2012 | | 22.63 | | 0.0191 | | | 0.4903 | | 20.2 | | 14,732 |
| September 30, 2013 | | 26.04 | | 0.0560 | | | 1.8746 | | 22.9 | | 18,516 |
| September 30, 2014 | | 27.03 | | — | | | 2.0445 | | 22.3 | | 20,734 |
| September 30, 2015 | | 25.00 | | 0.0002 | | | 3.4844 | | 21.3 | | 21,770 |
| September 30, 2016 | | 25.00 | | — | | | 1.4736 | | 22.7 | | 23,091 |
| September 30, 2017 | | 28.29 | | — | | | 1.1754 | | 24.9 | | 27,387 |
| September 30, 2018 | | 29.72 | | — | | | 3.0205 | | 25.9 | | 31,972 |
| September 30, 2019 | | 28.91 | | 0.0818 | | | 2.7546 | | 24.8 | | 35,025 |
| September 30, 2020 | | 27.94 | | 0.0182 | | | 3.1017 | | 29.1 | | 37,666 |
| September 30, 2021 | | 34.97 | | — | | | 1.1473 | | 25.5 | | 48,909 |
| September 30, 2022 | | 25.82 | | — | | | 3.3930 | | 22.6 | | 39,738 |
| March 31, 2023 | | 28.09 | | 0.0495 | (a) | | 1.0161 | (a) | 27.3 | | 44,987 |
| (1) | Date of Initial Public Offering. |
| (2) | Rounded. |
| (3) | Based on latest 12 months accomplished earnings. |
| (4) | Assuming reinvestment of all distributions. |
| (a) | Paid on December 28, 2022 to shareholders of record on December 27, 2022. |
– 20 –
Approval of Investment Advisory Contract
(unaudited)
In November 2022, the Board of Directors of the Fund renewed the one-year term of the Investment Advisory Agreement by and between the Fund and the Adviser through October 2023. In connection with the renewal of the Investment Advisory Agreement, no changes to the amount or manner of calculation of the management fee or the terms of the agreement were proposed by the Adviser or adopted by the Board. For the annual period ended September 30, 2022, the management fee was 0.52% and the Fund’s Class I and Class N total expense ratios (including the management fee) were 0.59% and 0.89%, respectively. In renewing the Investment Advisory Agreement, the Board carefully considered the following factors on an absolute basis and relative to the Fund’s peer group: (i) the Fund’s historical performance; (ii) the Fund’s performance relative to its benchmark; (iii) the expense ratios for peer group funds in the mid-cap growth category and the Fund’s risk/return profile as measured by the standard deviation and the Sharpe Ratio; and (iv) the range and quality of the services offered by the Adviser. The peer group fund data included mid-cap growth focused funds with similar asset sizes, number of holdings and market capitalizations. In terms of the peer group data used for performance comparisons, the Fund’s Class I was ranked 2nd, 13th, 12th and 12th out of 24 funds for the one-, three-, five- and ten-year periods ending September 30, 2022. The Fund’s Class I had the second lowest expense ratio among its peer group.
The Board considered the range of services to be provided by the Adviser to the Fund under the Advisory Agreement. The Board concluded that the nature, extent and quality of the services to be provided were consistent with the terms of the Advisory Agreement and the needs of the Fund, and that the services provided were of a high quality.
The Board considered the investment performance of the Fund and the Adviser. Among other things, the Board noted its consideration of the Fund’s performance relative to peer funds and its benchmarks. The Board reviewed the actual relative short-term and long-term performance of the Fund. The Board agreed that the Fund demonstrated satisfactory performance with respect to its benchmarks and peers. The Board also discussed the extent to which economies of scale would be realized, and whether such economies were reflected in the Fund’s fee levels and concluded that the Adviser had been instrumental in holding down Fund costs, citing consistently low fees.
The Board considered the cost of services provided and the profits to be realized by the Adviser from the relationship with the Fund. The Board concluded that given the Board’s focus on performance and maintaining a low fee structure that the Adviser’s profits were not relevant.
The Board determined that the Adviser had fully and adequately carried out the terms and conditions of its contract with the Fund. The Board expressed satisfaction with the Fund’s performance, strategies to improve performance, management’s control of expenses and the rate of the management fee for the Fund and the overall level of services provided by the Adviser.
– 21 –
Liquidity Risk Management Program
(unaudited)
The Fund has adopted and implemented a liquidity risk management program (the “Program”) in accordance with Rule 22e-4 under the 1940 Act. The Program seeks to assess and manage the Fund’s liquidity risk, i.e., the risk that the Fund is unable to satisfy redemption requests without significantly diluting remaining investors’ interests in the Fund. The Board of Directors of the Fund has designated Nicholas Company, Inc., the Fund’s investment adviser, to administer the Program. Certain aspects of the Program rely on third parties to perform certain functions, including the provision of market data and application of models.
The Program is comprised of various components designed to support the assessment and/or management of liquidity risk, including: (1) the periodic assessment (no less frequently than annually) of certain factors that influence the Fund’s liquidity risk; (2) the periodic classification (no less frequently than monthly) of the Fund’s investments into one of four liquidity categories that reflect an estimate of their liquidity under current market conditions; (3) a 15% limit on the acquisition of “illiquid investments” (as defined under Rule 22e-4); (4) for a Fund that does not invest primarily in “highly liquid investments” (as defined under Rule 22e-4), the determination of a minimum percentage of the Fund’s assets that will generally be invested in highly liquid investments (a “Highly Liquid Investment Minimum”); and (5) periodic reporting to the Board of Directors.
At a meeting of the Board of Directors on February 10, 2023, Nicholas Company, Inc. provided a written report to the Board addressing the operation, and the adequacy and effectiveness of the implementation, of the Program, including, as applicable, the operation of any Highly Liquid Investment Minimum and any material changes to the Program, for the period from January 1, 2022 through December 31, 2022 (the “Reporting Period”). Among other things, the annual report discussed: (1) the results of stress tests designed to assess liquidity under a hypothetical stressed scenario involving elevated redemptions; and (2) an assessment of the methodologies used to classify investments into one of four liquidity categories. The report concluded that the Program was reasonably designed to assess and manage liquidity risk and was adequately and effectively implemented during the Reporting Period.
There can be no assurance that the Program will achieve its objectives under all circumstances in the future. Please refer to the Fund’s prospectus for more information regarding the Fund’s exposure to liquidity risk and other risks to which it may be subject.
– 22 –
Information on Proxy Voting
(unaudited)
A description of the policies and procedures that the Fund uses to determine how to vote proxies relating to portfolio securities is available, without charge, upon request by calling 800-544-6547 or 414-276-0535. It also appears in the Fund’s Statement of Additional Information, which can be found on the SEC’s website, www.sec.gov. A record of how the Fund voted its proxies for the most recent twelve-month period ended June 30, also is available on the Fund’s website, www.nicholasfunds.com, and the SEC’s website, www.sec.gov.
Quarterly Portfolio Schedule
(unaudited)
The Fund files its complete schedule of investments with the SEC for the first and third quarters of each fiscal year as an exhibit to its reports on Form N-PORT. The Fund’s Form N-PORT reports are available on the SEC’s website at www.sec.gov and may be reviewed and copied at the SEC’s Public Reference Room in Washington, D.C. Information on the operation of the Public Reference Room may be obtained by calling 800-SEC-0330.
– 23 –
Privacy Policy
(unaudited)
Nicholas II, Inc. respects each shareholder’s right to privacy. We are committed to safeguarding the information that you provide us to maintain and execute transactions on your behalf.
We collect the following non-public personal information about you:
| * | Information we receive from you on applications or other forms, whether we receive the form in writing or electronically. This includes, but is not limited to, your name, address, phone number, tax identification number, date of birth, beneficiary information and investment selection. |
| * | Information about your transactions with us and account history with us. This includes, but is not limited to, your account number, balances and cost basis information. This also includes transaction requests made through our transfer agent. |
| * | Other general information that we may obtain about you such as demographic information. |
WE DO NOT SELL ANY NON-PUBLIC PERSONAL INFORMATION ABOUT CURRENT OR FORMER SHAREHOLDERS.
INFORMATION SHARED WITH OUR TRANSFER AGENT, A THIRD PARTY COMPANY, ALSO IS NOT SOLD.
We may share, only as permitted by law, non-public personal information about you with third party companies. Listed below are some examples of third parties to whom we may disclose non-public personal information. While these examples do not cover every circumstance permitted by law, we hope they help you understand how your information may be shared.
We may share non-public personal information about you:
| * | With companies who work for us to service your accounts or to process transactions that you may request. This would include, but is not limited to, our transfer agent to process your transactions, mailing houses to send you required reports and correspondence regarding the Fund and its Adviser, the Nicholas Company, Inc., and our dividend disbursing agent to process fund dividend checks. |
| * | With a party representing you, with your consent, such as your broker or lawyer. |
| * | When required by law, such as in response to a subpoena or other legal process. |
The Fund and its Adviser maintain policies and procedures to safeguard your non-public personal information. Access is restricted to employees who the Adviser determines need the information in order to perform their job duties. To guard your non-public personal information we maintain physical, electronic, and procedural safeguards that comply with federal standards.
In the event that you hold shares of the Fund with a financial intermediary, including, but not limited to, a broker-dealer, bank, or trust company, the privacy policy of your financial intermediary would govern how your non-public personal information would be shared with non-affiliated third parties.
– 24 –
Automatic Investment Plan – An Update
(unaudited)
The Nicholas Family of Funds’ Automatic Investment Plan provides a simple method to dollar cost average into the fund(s) of your choice.
Dollar cost averaging involves making equal systematic investments over an extended time period. A fixed dollar investment will purchase more shares when the market is low and fewer shares when the market is high. The automatic investment plan is an excellent way for you to become a disciplined investor.
The following table illustrates what dollar cost averaging can achieve. Please note that past performance is no guarantee of future results. Nicholas Company recommends dollar cost averaging as a practical investment method. It should be consistently applied for long periods so that investments are made through several market cycles.
| | | | | |
| | | Nicholas II – Class I |
| $1,000 initial investment on | | 10/17/1983 | * | | 03/31/2013 |
| Number of years investing $100 each month | | | | | |
| following the date of initial investment | | 39 | | | 10 |
| Total cash invested | $ | 48,400 | | $ | 13,000 |
| Total dividend and capital gain distributions reinvested | $ | 390,232 | | $ | 8,349 |
| Total full shares owned at 03/31/2023 | | 17,438 | | | 767 |
| Total market value at 03/31/2023 | $ | 507,451 | | $ | 22,323 |
The results above assume purchase on the last day of the month. The Nicholas Automatic Investment Plan actually invests on the date specified by the investor. Total market value includes reinvestment of all distributions.
| * | Date of Initial Public Offering. |
– 25 –
Nicholas Funds Services Offered
(unaudited)
| | |
| • | IRAs | |
| | • Traditional | • SIMPLE |
| | • Roth | • SEP |
| • | Coverdell Education Accounts |
| • | Automatic Investment Plan |
| • | Direct Deposit of Dividend and Capital Gain Distributions |
| • | Systematic Withdrawal Plan |
| • | Monthly Automatic Exchange between Funds |
| • | Telephone Purchase and Redemption |
| • | Telephone Exchange | |
| • | 24-hour Automated Account Information (800-544-6547) |
| • | 24-hour Internet Account Access (www.nicholasfunds.com) |
Please call a shareholder representative for further information on the above services or with any other questions you may have regarding the Nicholas Funds (800-544-6547).
– 26 –
Directors and Officers
DAVID O. NICHOLAS, President and Director
JOHN A. HAUSER, Director
DAVID P. PELISEK, Director
JULIE M. VAN CLEAVE, Director
BRIAN J. JANOWSKI, Senior Vice President
JENNIFER R. KLOEHN, Senior Vice President,
Treasurer and Chief Compliance Officer
LAWRENCE J. PAVELEC, Senior Vice President and Secretary
CANDACE L. LESAK, Vice President
Investment Adviser
NICHOLAS COMPANY, INC.
Milwaukee, Wisconsin
www.nicholasfunds.com
414-276-0535 or 800-544-6547
Accountant
Dividend Disbursing Agent
Transfer Agent
U.S. BANCORP FUND SERVICES, LLC
Milwaukee, Wisconsin
414-276-0535 or 800-544-6547
Distributor
QUASAR DISTRIBUTORS, LLC
Milwaukee, Wisconsin
Custodian
U.S. BANK N.A.
Milwaukee, Wisconsin
Independent Registered Public Accounting Firm
DELOITTE & TOUCHE LLP
Milwaukee, Wisconsin
Counsel
MICHAEL BEST & FRIEDRICH LLP
Milwaukee, Wisconsin
This report is submitted for the information of shareholders of the Fund. It is not authorized for distribution to prospective investors unless preceded or accompanied by an effective prospectus.
Item 2. Code of Ethics.
Applicable only to annual reports.
Item 3. Audit Committee Financial Expert.
Applicable only to annual reports.
Item 4. Principal Accountant Fees and Services.
Applicable only to annual reports.
Item 5. Audit Committee of Listed Registrants.
Not applicable to this filing.
Item 6. Schedule of Investments.
The schedule of investments in securities of unaffiliated issuers is included as part of the report to shareholders filed under Item 1 of this Form N-CSR.
Item 7. Disclosure of Proxy Voting Policies and Procedures for Closed-End Management Investment Companies.
Applicable only to annual reports filed by closed-end funds.
Item 8. Portfolio Managers of Closed-End Management Investment Companies.
Applicable only to annual reports filed by closed-end funds.
Item 9. Purchases of Equity Securities by Closed-End Management Investment Companies and Affiliated Purchasers.
Applicable only to closed-end funds.
Item 10. Submission of Matters to a Vote of Security Holders.
Not applicable to this filing.
Item 11. Controls and Procedures.
(a) The Fund’s principal executive officer and principal financial officer, or persons performing similar functions, have concluded that the registrant’s disclosure controls and procedures (as defined in Rule 30a-3(c) under the Investment Company Act of 1940, as amended (the “1940 Act”) are effective, based on their evaluation of these controls and procedures as of a date within 90 days of the filing date of the report that includes the disclosure required by this paragraph, based on their evaluation of these controls and procedures required by Rule 30a-3(b) under the 1940 Act and Rules 13a-15(b) or 15d-15(b) under the Securities Exchange Act of 1934, as amended.
(b) There were no changes in the registrant’s internal controls over financial reporting (as defined in
Rule 30a-3(d) under the 1940 Act) that occurred during the period covered by this report that have materially affected, or are reasonably likely to materially affect, the registrant’s internal control over financial reporting.
Item 12. Disclosure of Securities Lending Activities for Closed-End Management Investment Companies.
Applicable only to closed-end funds.
Item 13. Exhibits.
(a)(1) Sarbanes-Oxley Code of Ethics for Principal Executive and Senior Financial Officers (that is the subject of the disclosure required by Item 2).
Applicable only to annual reports.
(a)(2) Certifications of Principal Executive Officer and Principal Financial Officer pursuant to Rule 30a-2(a) under the Investment Company Act of 1940, attached hereto as EX-99.CERT.
(a)(3) Any written solicitation to purchase securities under Rule 23c-1 under the Act sent or given during the period covered by the report by or on behalf of the registrant to 10 or more person. Applicable only to closed-end funds.
(a)(4) Change in the registrant’s independent public accountant.
Not applicable to this filing.
(b) Certifications of Principal Executive Officer and Principal Financial Officer pursuant to Rule 30a-2(b) under the Investment Company Act of 1940, attached hereto as EX-99.906 CERT.
SIGNATURES
Pursuant to the requirements of the Securities Exchange Act of 1934 and the Investment Company Act of 1940, the registrant has duly caused this report to be signed on its behalf by the undersigned, thereunto duly authorized.
(Registrant) Nicholas II, Inc.
By: /s/ David O. Nicholas
Name: David O. Nicholas
Title: Principal Executive Officer
Date: 05/30/2023
Pursuant to the requirements of the Securities Exchange Act of 1934 and the Investment Company Act of 1940, this report has been signed by the following persons on behalf of the registrant and in the capacities and on the dates indicated.
By: /s/ David O. Nicholas
Name: David O. Nicholas
Title: Principal Executive Officer
Date: 05/30/2023
By: /s/ Jennifer R. Kloehn
Name: Jennifer R. Kloehn
Title: Principal Financial Officer
Date: 05/30/2023