|
| UNITED STATES |
| SECURITIES AND EXCHANGE COMMISSION |
| Washington, D.C. 20549 |
| |
| FORM N-CSR |
| |
| CERTIFIED SHAREHOLDER REPORT OF REGISTERED |
| MANAGEMENT INVESTMENT COMPANIES |
Investment Company Act file number 811-03851
| |
| Nicholas II, Inc. |
|
| (Exact Name of Registrant as specified in charter) |
| |
| 411 East Wisconsin Avenue, Suite 2100, Milwaukee, Wisconsin 53202 |
| (Address of Principal Executive Offices) | (Zip Code) |
| |
| Jennifer R. Kloehn, Senior Vice President and Treasurer |
| 411 East Wisconsin Avenue, Suite 2100 |
| Milwaukee, Wisconsin 53202 |
|
| (Name and Address of Agent for Service) |
Registrant's telephone number, including area code: 414-272-4650
Date of fiscal year end: 09/30/2023
Date of reporting period: 09/30/2023
Item 1. Report to Stockholders.
ANNUAL REPORT
September 30, 2023
NICHOLAS II, INC.

WWW.NICHOLASFUNDS.COM
NICHOLAS II, INC.
November 2023
Dear Fellow Shareholders,
For the twelve-month period ended September 30, 2023, Nicholas II – Class I (the “Fund”) returned 13.83% compared to the Russell Midcap Growth Index of 17.47% (the “Index”).
Coming into the final quarter of 2022, US equity markets were broadly negative for the year (year-to-date returns as September 30, 2022 were S&P 500 -23.87%, Nasdaq -32.40%, Russell 2000 -25.10%) reflecting the elevated risks and uncertainty that investors were facing. Inflation was unacceptably high despite a rapid tightening by the Federal Reserve; inflation was still nowhere near the Fed’s 2% goal. The US economy had posted two consecutive declines in GDP growth (-1.6% in 1Q22 and -0.9% in 2Q22) and the prevalent fear was that Fed rate hikes would eventually tip the economy into a hard landing recession. The Eurozone economy was struggling as the European Central Bank was hiking rates amidst high inflation and a deteriorating economy. Geopolitical tensions remained high and were weighing on global economies. However, as often happens when the news appears universally negative and investors are bearish, equity markets rebounded strongly off their lows and posted healthy returns over the past twelve months ended September 30, 2023 (S&P 500 21.62%, Nasdaq 25.00%, Russell 2000 8.93%). Investors gained comfort that inflation was on the proper path as the Consumer Price Index fell from a peak of 9.1% in June 2022 to below 4%. Large cap technology stocks, particularly those deemed beneficiaries of the revolutionary artificial intelligence trend, catalyzed by the launch of ChatGPT, were huge outperformers over this period. Fears of a recession were also staved off as consumers tapped excess savings amassed during the COVID period and increased leverage. The jobs and wages environment remained robust and strong fiscal stimulus helped propel GDP growth above what most investors were expecting, and markets responded accordingly.
Post this strong equity market performance, the market will have to climb a formidable “wall of worry” as the consensus is no longer bearish. There is also plenty of evidence suggesting the jury is still out on whether the economy can successfully navigate through this cycle without a recession. Excess savings that helped support consumer spending have been largely drawn down. Student loan repayments have restarted which will force some difficult spending decisions for the estimated 44 million Americans who hold them. The impacts of the Fed’s monetary tightening should increasingly become evident as the “long and variable lags” from monetary tightening are increasingly coming to fruition. Higher interest rates are pressuring leading economic indicators lower. Delinquencies and loan losses are rising leading banks to aggressively tighten underwriting standards, which historically chokes off loan growth. Manufacturing PMIs remain in contractionary territory which historically leads to negative earnings surprises. Low unemployment has been a key area of strength to date, but as inflation and nominal sales growth slow, margins will likely be pressured and the natural corporate response will be to lay off employees. It will be a herculean accomplishment if the Fed can ultimately guide the US economy to a soft landing.
For the twelve-month period ended September 30, 2023, the Fund’s relative performance versus the Russell Midcap Growth Index was negatively impacted by unfavorable stock selection in consumer discretionary, financials, industrials, and technology partially offset by favorable stock selection in consumer staples, healthcare, materials, and real estate. Sector allocation was a minor detraction from overall relative performance. The stocks which contributed the most to the Fund’s performance during the period were Old Dominion Freight Line, Stevanato Group, Palo Alto Networks, O’Reilly Automotive and Verisk Analytics. The stocks which detracted the most from the Fund’s performance during the period were Paylocity Holding, ResMed, Twilio, Jack Henry & Associates and Citizens Financial Group.
As of September 30, 2023, the Fund owned 61 stocks and approximately 6% cash. The period-end sector weightings were industrials 26%, technology 22%, health care 18%, consumer discretionary 11%, financials 7%, consumer staples 6%, materials 3%, and real estate 1%.
The Fund remains conservatively positioned as the odds of a recession and stock market decline appear higher than normal. We remain focused on owning high-quality companies with sustainable competitive advantages, consistent revenue and earnings growth, strong balance sheets, operated by responsible management teams, and that are trading at reasonable valuations. These “high quality” attributes have historically served our shareholders well, especially during turbulent times.
Returns for Nicholas II, Inc. (the “Fund”) Class I and Class N and selected indices are provided in the chart below for the periods ended September 30, 2023.
| | | | | | | | | | | | | | | |
| | | | | | Average Annual Total Returns | |
| | | 1 | Year | | 3 | Year | | 5 | Year | | 10 | Year | | 15 | Year |
| Nicholas II, Inc. – Class I | | 13.83 | % | | 6.51 | % | | 7.46 | % | | 9.67 | % | | 10.36 | % |
| Nicholas II, Inc. – Class N | | 13.49 | % | | 6.19 | % | | 7.12 | % | | 9.31 | % | | 10.00 | % |
| Morningstar Mid-Cap | | | | | | | | | | | | | | | |
| Growth Category | | 13.25 | % | | 1.64 | % | | 5.79 | % | | 8.98 | % | | 10.16 | % |
| Russell Midcap Growth Index | | 17.47 | % | | 2.61 | % | | 6.97 | % | | 9.94 | % | | 11.25 | % |
| Standard & Poor’s 500 Index | | 21.62 | % | | 10.15 | % | | 9.92 | % | | 11.91 | % | | 11.28 | % |
| Ending value of $10,000 invested in | | | | | | | | | | | | | | | |
| Nicholas II, Inc. – Class I | $ | 11,383 | | $ | 12,082 | | $ | 14,329 | | $ | 25,171 | | $ | 43,880 | |
| Ending value of $10,000 invested in | | | | | | | | | | | | | | | |
| Nicholas II, Inc. – Class N | $ | 11,349 | | $ | 11,973 | | $ | 14,106 | | $ | 24,357 | | $ | 41,759 | |
| Fund’s Class I Expense Ratio (from 01/28/23 Prospectus): 0.59% | | | | | | | | | | |
| Fund’s Class N Expense Ratio (from 04/30/23 Prospectus): 0.89% | | | | | | | |
Performance data quoted represents past performance and is no guarantee of future results. The investment return and principal value of an investment will fluctuate so that an investor’s shares, when redeemed, may be worth more or less than their original cost. Current performance of the Fund may be lower or higher than the performance quoted. Performance data current to the most recent month-end may be obtained by visiting www.nicholasfunds.com/returns.html.
The Fund’s returns are reduced by expenses, while the market indices are not. The ending values above illustrate the performance of a hypothetical $10,000 investment made in the Fund over the timeframes listed. Assumes reinvestment of dividends and capital gains. Returns shown do not reflect the deduction of taxes that a shareholder would pay on Fund distributions or the redemption of Fund shares. These figures do not imply any future performance.
Class N of the Fund commenced operations on February 28, 2005. The annual returns shown for the Class I shares of this Fund would be substantially similar to the Class N because both classes of shares are invested in the same portfolio of securities. Annual returns will generally differ only to the extent that the classes do not have the same expenses. Please see the respective prospectus for details.
Thank you for your continued support.

Mutual fund investing involves risk. Principal loss is possible. The Fund may invest in smaller companies, which involve additional risks such as limited liquidity and greater volatility. Diversification does not assure a profit or protect against loss in a declining market.
Earnings growth is not representative of the Fund’s future performance.
Opinions expressed are subject to change at any time, are not guaranteed, and should not be considered investment advice.
Please refer to the schedule of investments in the report for complete fund holdings information. Fund holdings and sector allocations are subject to change and should not be considered a recommendation to buy or sell any security.
Gross Domestic Product (GDP): The monetary value of all the finished goods and services produced within a country’s borders in a specific time period.
Purchasing Managers’ Index (PMI): An index of the prevailing direction of economic trends in the manufacturing and service sectors. It consists of a diffuse index that summarizes whether market conditions are expanding, staying the same, or contracting as viewed by the purchasing managers.
The Russell Midcap Index measures the performance of the 800 smallest companies in the Russell 1000 Index, which represent approximately 31% of the total market capitalization of the Russell 1000 Index. The Russell Midcap Growth Index measures the performance of those Russell Midcap companies with higher price-to-book ratios and higher forecasted growth values. The Standard & Poor’s (“S&P”) 500 Index is a broad-based unmanaged index of 500 stocks, which is widely recognized as representative of the equity market in general. One cannot invest directly in an index. Each Morningstar Category average represents a universe of Funds with similar investment objectives.
Must be preceded or accompanied by a prospectus.
The Nicholas Funds are distributed by Quasar Distributors, LLC.
COMPARISON OF CHANGE IN VALUE OF $100,000 INVESTMENT IN
NICHOLAS II, INC. – CLASS I, RUSSELL MIDCAP INDEX AND
RUSSELL MIDCAP GROWTH INDEX
The line graph which follows compares the initial account value and subsequent account values at the end of each of the most recently completed ten fiscal years of the Fund’s Class I, to the same investment over the same period in two peer group indices. The graph assumes a $100,000 investment in the Fund’s Class I and the indices at the beginning of the first fiscal year. The peer group in the graph includes the Russell Midcap Index and the Russell Midcap Growth Index. The Adviser believes the Russell Midcap Index and the Russell Midcap Growth Index are representative of the performance of small- and medium-capitalization growth companies in which the Fund primarily invests.
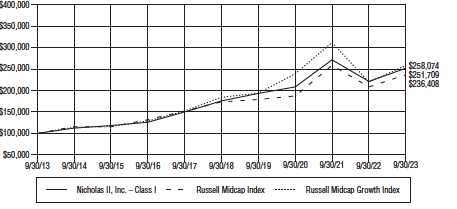
The Fund’s Class I average annual total returns for the one-, five- and ten-year periods ended on the last day of the most recent fiscal year are as follows:
| | | | | | |
| | One Year | | Five Years | | Ten Years | |
| | Ended | | Ended | | Ended | |
| | September 30, | | September 30, | | September 30, | |
| | 2023 | | 2023 | | 2023 | |
| Average Annual Total Return | 13.83 | % | 7.46 | % | 9.67 | % |
Past performance is not predictive of future performance, and the above graph and table do not reflect deduction of taxes that a shareholder would pay on Fund distributions or the redemption of Fund shares.
– 4–
Financial Highlights Class I (NCTWX)
For a share outstanding throughout each period
| | | | | | | | | | | | | | | |
| | | | | | Years Ended September 30, | | | | |
| | | 2023 | | | 2022 | | | 2021 | | | 2020 | | | 2019 | |
| NET ASSET VALUE, BEGINNING OF PERIOD | $ | 26.69 | | $ | 35.98 | | $ | 28.68 | | $ | 29.61 | | $ | 30.37 | |
| INCOME (LOSS) FROM | | | | | | | | | | | | | | | |
| INVESTMENT OPERATIONS | | | | | | | | | | | | | | | |
| Net investment income(1) | | .11 | | | .05 | | | .05 | | | .07 | | | .10 | |
| Net gain (loss) on securities | | | | | | | | | | | | | | | |
| (realized and unrealized) | | 3.50 | | | (5.90 | ) | | 8.45 | | | 2.21 | | | 2.08 | |
| Total from investment operations | | 3.61 | | | (5.85 | ) | | 8.50 | | | 2.28 | | | 2.18 | |
| LESS DISTRIBUTIONS | | | | | | | | | | | | | | | |
| From net investment income | | (.06 | ) | | (.05 | ) | | (.05 | ) | | (.11 | ) | | (.18 | ) |
| From net capital gain | | (1.02 | ) | | (3.39 | ) | | (1.15 | ) | | (3.10 | ) | | (2.76 | ) |
| Total distributions | | (1.08 | ) | | (3.44 | ) | | (1.20 | ) | | (3.21 | ) | | (2.94 | ) |
| NET ASSET VALUE, END OF PERIOD | $ | 29.22 | | $ | 26.69 | | $ | 35.98 | | $ | 28.68 | | $ | 29.61 | |
| |
| TOTAL RETURN | | 13.83 | % | | (18.51 | )% | | 30.26 | % | | 7.85 | % | | 9.97 | % |
| |
| SUPPLEMENTAL DATA: | | | | | | | | | | | | | | | |
| Net assets, end of period (millions) | $ | 882.4 | | $ | 798.8 | | $ | 1,031.3 | | $ | 847.7 | | $ | 828.6 | |
| Ratio of expenses to average net assets | | .60 | % | | .59 | % | | .59 | % | | .60 | % | | .60 | % |
| Ratio of net investment income | | | | | | | | | | | | | | | |
| to average net assets | | .39 | % | | .15 | % | | .15 | % | | .25 | % | | .34 | % |
| Portfolio turnover rate | | 6.26 | % | | 15.76 | % | | 19.57 | % | | 22.89 | % | | 19.75 | % |
| |
| (1) Computed based on average shares outstanding. | | | | | | | | | | | | | | | |
The accompanying notes to financial statements are an integral part of these highlights.
– 5–
Financial Highlights Class N (NNTWX)
For a share outstanding throughout each period
| | | | | | | | | | | | | | | |
| | | | | | Years Ended September 30, | | | | |
| | | 2023 | | | 2022 | | | 2021 | | | 2020 | | | 2019 | |
| NET ASSET VALUE, BEGINNING OF PERIOD | $ | 25.82 | | $ | 34.97 | | $ | 27.94 | | $ | 28.91 | | $ | 29.72 | |
| INCOME (LOSS) FROM | | | | | | | | | | | | | | | |
| INVESTMENT OPERATIONS | | | | | | | | | | | | | | | |
| Net investment income (loss)(1) | | .03 | | | (.05 | ) | | (.05 | ) | | (.01 | ) | | (.00 | )(2) |
| Net gain (loss) on securities | | | | | | | | | | | | | | | |
| (realized and unrealized) | | 3.38 | | | (5.71 | ) | | 8.23 | | | 2.16 | | | 2.03 | |
| Total from investment operations | | 3.41 | | | (5.76 | ) | | 8.18 | | | 2.15 | | | 2.03 | |
| LESS DISTRIBUTIONS | | | | | | | | | | | | | | | |
| From net investment income | | (.05 | ) | | — | | | — | | | (.02 | ) | | (.08 | ) |
| From net capital gain | | (1.02 | ) | | (3.39 | ) | | (1.15 | ) | | (3.10 | ) | | (2.76 | ) |
| Total distributions | | (1.07 | ) | | (3.39 | ) | | (1.15 | ) | | (3.12 | ) | | (2.84 | ) |
| NET ASSET VALUE, END OF PERIOD | $ | 28.16 | | $ | 25.82 | | $ | 34.97 | | $ | 27.94 | | $ | 28.91 | |
| |
| TOTAL RETURN | | 13.49 | % | | (18.75 | )% | | 29.85 | % | | 7.54 | % | | 9.55 | % |
| |
| SUPPLEMENTAL DATA: | | | | | | | | | | | | | | | |
| Net assets, end of period (millions) | $ | 72.5 | | $ | 70.1 | | $ | 95.6 | | $ | 85.0 | | $ | 96.7 | |
| Ratio of expenses to average net assets | | .91 | % | | .89 | % | | .89 | % | | .90 | % | | .95 | % |
| Ratio of net investment income (loss) | | | | | | | | | | | | | | | |
| to average net assets | | .08 | % | | (.16 | )% | | (.15 | )% | | (.05 | )% | | (.01 | )% |
| Portfolio turnover rate | | 6.26 | % | | 15.76 | % | | 19.57 | % | | 22.89 | % | | 19.75 | % |
| (1) | Computed based on average shares outstanding. |
| (2) | Amount rounds to $0.00. |
The accompanying notes to financial statements are an integral part of these highlights.
– 6–
Top Ten Equity Portfolio Holdings
September 30, 2023 (unaudited)
| | |
| | Percentage | |
| Name | of Net Assets | |
| O’Reilly Automotive, Inc. | 2.95 | % |
| Verisk Analytics Inc | 2.37 | % |
| BJ’s Wholesale Club Holdings, Inc. | 2.18 | % |
| Lamb Weston Holdings, Inc. | 2.13 | % |
| Palo Alto Networks, Inc. | 2.10 | % |
| CDW Corporation | 2.07 | % |
| Vulcan Materials Company | 2.04 | % |
| Westinghouse Air Brake Technologies Corporation | 2.02 | % |
| AMETEK, Inc. | 1.97 | % |
| Old Dominion Freight Line, Inc. | 1.91 | % |
| Total of top ten | 21.74 | % |
Sector Diversification (as a percentage of portfolio)
September 30, 2023 (unaudited)

– 7–
Fund Expenses
For the six month period ended September 30, 2023 (unaudited)
As a shareholder of the Fund, you incur two types of costs: (1) transaction costs and (2) ongoing costs, including management fees and other operating expenses. The following table is intended to help you understand your ongoing costs (in dollars) of investing in the Fund and to compare these costs with those of other mutual funds.
The example is based on an investment of $1,000 made at the beginning of the period and held for the entire period.
The first line of the table below for each share class of the Fund provides information about the actual account values and actual expenses. You may use the information in this line, together with the amount you invested, to estimate the expenses that you paid over the period. Simply divide your account value by $1,000 (for example, an $8,600 account value divided by $1,000 = 8.6), then multiply the result by the number in the first line under the heading entitled “Expenses Paid During Period” to estimate the expenses you paid on your account during this period.
The second line of the table below provides information about hypothetical account values and hypothetical expenses based on the Fund’s actual expense ratios for each class of the Fund and an assumed rate of return of 5% per year before expenses, which are not the Fund’s actual returns. The hypothetical account values and expenses may not be used to estimate the actual ending account balance or expenses you paid for the period. You may use this information to compare the ongoing costs of investing in the Fund with other funds. To do so, compare this 5% hypothetical example with the 5% hypothetical examples that appear in the shareholder reports of other funds.
Please note that the expenses shown in the table are meant to highlight your ongoing costs only and do not reflect any transactional costs, such as wire fees. Therefore, the second line of the table is useful in comparing ongoing costs only, and will not help you determine the relative total costs of owning different funds. In addition, if these transactional costs were included, your costs would have been higher.
| | | | | | |
| Class I | | | | | | |
| | | Beginning | | Ending | | Expenses Paid |
| | | Account Value | | Account Value | | During Period* |
| | | 03/31/23 | | 09/30/23 | | 04/01/23 - 09/30/23 |
| Actual | $ | 1,000.00 | $ | 1,004.10 | $ | 3.01 |
| Hypothetical | | 1,000.00 | | 1,021.99 | | 3.04 |
| (5% return before expenses) | | | | | | |
| * Expenses are equal to the Class I six-month annualized expense ratio of 0.60%, multiplied by the |
| average account value over the period, multiplied by 183 then divided by 365 to reflect the one- |
| half year period. | | | | | | |
– 8–
Fund Expenses (continued)
For the six month period ended September 30, 2023 (unaudited)
| | | | | | |
| Class N | | | | | | |
| | | Beginning | | Ending | | Expenses Paid |
| | | Account Value | | Account Value | | During Period** |
| | | 03/31/23 | | 09/30/23 | | 04/01/23 - 09/30/23 |
| Actual | $ | 1,000.00 | $ | 1,002.50 | $ | 4.57 |
| Hypothetical | | 1,000.00 | | 1,020.44 | | 4.61 |
| (5% return before expenses) | | | | | | |
| ** Expenses are equal to the Class N six-month annualized expense ratio of 0.91%, multiplied by |
| the average account value over the period, multiplied by 183 then divided by 365 to reflect the |
| one-half year period. | | | | | | |
– 9–
Schedule of Investments
September 30, 2023
| | | |
| Shares or | | | |
| Principal | | | |
| Amount | | | Value |
| COMMON STOCKS — 93.94% | | |
| | Consumer Discretionary – Consumer | | |
| | Discretionary Distribution & Retail — 6.19% | | |
| 46,070 | Burlington Stores, Inc.* | $ | 6,233,271 |
| 108,565 | CarMax, Inc.* | | 7,678,802 |
| 31,015 | O’Reilly Automotive, Inc.* | | 28,188,293 |
| 42,640 | Ulta Beauty Inc.* | | 17,032,548 |
| | | | 59,132,914 |
| | Consumer Discretionary – Consumer Services — 4.47% | | |
| 6,765 | Chipotle Mexican Grill, Inc.* | | 12,392,330 |
| 28,890 | Domino’s Pizza, Inc. | | 10,943,243 |
| 251,430 | Service Corporation International | | 14,366,710 |
| 244,745 | Wendy’s Company | | 4,995,245 |
| | | | 42,697,528 |
| | Consumer Staples – Consumer Staples | | |
| | Distribution & Retail — 2.18% | | |
| 291,486 | BJ’s Wholesale Club Holdings, Inc.* | | 20,803,356 |
| | Consumer Staples – Food, Beverage & Tobacco — 3.96% | | |
| 69,500 | Constellation Brands, Inc. Class A | | 17,467,435 |
| 220,076 | Lamb Weston Holdings, Inc. | | 20,348,227 |
| | | | 37,815,662 |
| | Financials – Banks — 1.04% | | |
| 246,480 | Webster Financial Corporation | | 9,935,609 |
| | Financials – Financial Services — 5.66% | | |
| 66,065 | FLEETCOR Technologies, Inc.* | | 16,869,037 |
| 87,281 | Jack Henry & Associates, Inc. | | 13,191,650 |
| 138,050 | Northern Trust Corporation | | 9,591,714 |
| 143,155 | Raymond James Financial, Inc. | | 14,377,057 |
| | | | 54,029,458 |
| | Health Care – Health Care Equipment & Services — 9.33% | | |
| 42,225 | Cooper Companies, Inc. | | 13,427,972 |
| 104,590 | DexCom, Inc.* | | 9,758,247 |
| 227,260 | Globus Medical Inc Class A* | | 11,283,459 |
| 150,250 | Hologic, Inc.* | | 10,427,350 |
| 77,440 | ResMed Inc. | | 11,451,053 |
| 82,515 | STERIS Plc | | 18,105,441 |
| 72,095 | Veeva Systems Inc Class A* | | 14,667,728 |
| | | | 89,121,250 |
The accompanying notes to financial statements are an integral part of this schedule.
– 10 –
Schedule of Investments (continued)
September 30, 2023
| | | |
| Shares or | | | |
| Principal | | | |
| Amount | | | Value |
| COMMON STOCKS — 93.94% (continued) | | |
| | Health Care – Pharmaceuticals, | | |
| | Biotechnology & Life Sciences — 8.36% | | |
| 163,224 | Bio-Techne Corporation | $ | 11,110,658 |
| 57,911 | Charles River Laboratories International, Inc.* | | 11,349,398 |
| 83,070 | IQVIA Holdings Inc* | | 16,344,023 |
| 12,475 | Mettler-Toledo International Inc.* | | 13,823,173 |
| 107,445 | Revvity, Inc. | | 11,894,162 |
| 515,270 | Stevanato Group SpA | | 15,313,824 |
| | | | 79,835,238 |
| | Industrials – Capital Goods — 14.78% | | |
| 127,500 | AMETEK, Inc. | | 18,839,400 |
| 234,370 | Fastenal Company | | 12,805,977 |
| 238,700 | Fortive Corp. | | 17,701,992 |
| 70,000 | IDEX Corporation | | 14,561,400 |
| 61,005 | L3Harris Technologies Inc | | 10,622,191 |
| 45,300 | Lennox International Inc. | | 16,962,132 |
| 77,500 | Nordson Corporation | | 17,295,675 |
| 197,850 | A. O. Smith Corporation | | 13,083,821 |
| 181,487 | Westinghouse Air Brake Technologies Corporation | | 19,286,623 |
| | | | 141,159,211 |
| | Industrials – Commercial & Professional Services — 9.79% | | |
| 89,700 | Broadridge Financial Solutions, Inc. | | 16,060,785 |
| 67,645 | Paylocity Holding Corp.* | | 12,291,097 |
| 126,048 | RB Global, Inc. | | 7,878,000 |
| 121,710 | Republic Services, Inc. | | 17,344,892 |
| 240,500 | TransUnion | | 17,265,495 |
| 95,755 | Verisk Analytics Inc | | 22,621,161 |
| | | | 93,461,430 |
| | Industrials – Transportation — 1.91% | | |
| 44,460 | Old Dominion Freight Line, Inc. | | 18,190,364 |
| | Information Technology – Semiconductors & | | |
| | Semiconductor Equipment — 4.58% | | |
| 213,950 | Microchip Technology Incorporated | | 16,698,798 |
| 171,810 | Power Integrations, Inc. | | 13,110,821 |
| 141,740 | Skyworks Solutions, Inc. | | 13,974,147 |
| | | | 43,783,766 |
| | Information Technology – Software & Services — 14.00% | | |
| 79,240 | CrowdStrike Holdings, Inc. Class A* | | 13,263,191 |
| 100,655 | CyberArk Software Ltd.* | | 16,484,269 |
| 384,298 | Dynatrace, Inc.* | | 17,958,246 |
| 180,000 | Elastic NV* | | 14,623,200 |
The accompanying notes to financial statements are an integral part of this schedule.
– 11 –
Schedule of Investments (continued)
September 30, 2023
| | | | |
| | Shares or | | | |
| | Principal | | | |
| | Amount | | | Value |
| | COMMON STOCKS — 93.94% (continued) | | |
| | Information Technology – Software & Services — 14.00% (continued) | | |
| | 48,940 | Gartner, Inc.* | $ | 16,816,273 |
| | 205,737 | Okta, Inc. Class A* | | 16,769,623 |
| | 85,485 | Palo Alto Networks, Inc.* | | 20,041,103 |
| | 125,045 | PTC Inc.* | | 17,716,376 |
| | | | | 133,672,281 |
| | | Information Technology – Technology | | |
| | | Hardware & Equipment — 3.40% | | |
| | 98,195 | CDW Corporation | | 19,811,823 |
| | 31,030 | Teledyne Technologies Incorporated* | | 12,678,237 |
| | | | | 32,490,060 |
| | | Materials – Materials — 3.07% | | |
| | 78,580 | AptarGroup, Inc. | | 9,825,643 |
| | 96,460 | Vulcan Materials Company | | 19,486,849 |
| | | | | 29,312,492 |
| | | Real Estate – Real Estate Management & Development — 1.22% | | |
| | 158,175 | CBRE Group, Inc. Class A* | | 11,682,805 |
| | | TOTAL COMMON STOCKS | | |
| | | (cost $487,551,349) | | 897,123,424 |
| |
| SHORT-TERM INVESTMENTS — 5.96% | | |
| | | Money Market Deposit Account – 1.49% | | |
| $ | 14,223,425 | U.S. Bank Money Market, 5.27% | | 14,223,425 |
| | | Money Market Fund – 1.34% | | |
| | 12,745,565 | Morgan Stanley Liquidity Funds Government Portfolio | | |
| | | (Institutional Class), 7-day net yield, 5.264% | | 12,745,565 |
| | | U.S. Government Securities – 3.13% | | |
| | 10,000,000 | U.S. Treasury Bill 10/03/2023, 1.777% | | 9,998,542 |
| | 10,000,000 | U.S. Treasury Bill 10/17/2023, 4.725% | | 9,978,044 |
| | 10,000,000 | U.S. Treasury Bill 11/02/2023, 5.065% | | 9,954,419 |
| | | | | 29,931,005 |
| | | TOTAL SHORT-TERM INVESTMENTS | | |
| | | (cost $56,896,539) | | 56,899,995 |
| | | TOTAL INVESTMENTS | | |
| | | (cost $544,447,888) – 99.90% | | 954,023,419 |
| | | OTHER ASSETS, NET OF LIABILITIES – 0.10% | | 957,453 |
| | | TOTAL NET ASSETS | | |
| | | (basis of percentages disclosed above) – 100% | $ | 954,980,872 |
| | * Non-income producing security. | | |
The accompanying notes to financial statements are an integral part of this schedule.
– 12 –
Statement of Assets and Liabilities
September 30, 2023
| | |
| ASSETS | | |
| Investments in securities at value (cost $544,447,888) | $ | 954,023,419 |
| Receivables — | | |
| Investment securities sold | | 1,108,119 |
| Dividend and interest | | 421,599 |
| Capital stock subscription | | 27,298 |
| Total receivables | | 1,557,016 |
| Other | | 32,832 |
| Total assets | | 955,613,267 |
| |
| LIABILITIES | | |
| Payables — | | |
| Due to adviser — | | |
| Management fee | | 418,357 |
| Accounting and administrative fee | | 13,331 |
| Total due to adviser | | 431,688 |
| Capital stock redemption | | 67,044 |
| 12b-1 and servicing fee | | 26,788 |
| Other payables and accrued expense | | 106,875 |
| Total liabilities | | 632,395 |
| Total net assets | $ | 954,980,872 |
| |
| NET ASSETS CONSIST OF | | |
| Paid in capital | $ | 541,617,305 |
| Accumulated distributable earnings | | 413,363,567 |
| Total net assets | $ | 954,980,872 |
| |
| Class I | | |
| Net assets | $ | 882,437,397 |
| Shares outstanding | | 30,203,200 |
| NET ASSET VALUE PER SHARE ($.01 par value, | | |
| 125,000,000 shares authorized), offering price and redemption price | $ | 29.22 |
| |
| Class N | | |
| Net assets | $ | 72,543,475 |
| Shares outstanding | | 2,576,454 |
| NET ASSET VALUE PER SHARE ($.01 par value, | | |
| 75,000,000 shares authorized), offering price and redemption price | $ | 28.16 |
The accompanying notes to financial statements are an integral part of this statement.
– 13 –
Statement of Operations
For the year ended September 30, 2023
| | |
| INCOME | | |
| Dividend (net of foreign taxes of $25,966) | $ | 7,040,547 |
| Interest | | 2,417,787 |
| Total income | | 9,458,334 |
| |
| EXPENSES | | |
| Management fee | | 4,954,011 |
| Transfer agent fees | | 189,293 |
| 12b-1 fees – Class N | | 169,040 |
| Administration services | | 157,708 |
| Accounting & pricing services | | 94,927 |
| Registration fees | | 75,075 |
| Servicing fees – Class N | | 65,686 |
| Custodian fees | | 48,070 |
| Audit and tax fees | | 42,600 |
| Insurance | | 33,841 |
| Directors’ fees | | 25,695 |
| Printing | | 22,411 |
| Postage and mailing | | 19,444 |
| Legal fees | | 14,300 |
| Other operating expenses | | 19,671 |
| Total expenses | | 5,931,772 |
| Net investment income | | 3,526,562 |
| |
| NET REALIZED GAIN ON INVESTMENTS | | 7,185,745 |
| |
| CHANGE IN NET UNREALIZED | | |
| APPRECIATION/DEPRECIATION ON INVESTMENTS | | 107,541,048 |
| Net realized and unrealized gain on investments | | 114,726,793 |
| Net increase in net assets resulting from operations | $ | 118,253,355 |
The accompanying notes to financial statements are an integral part of this statement.
– 14 –
Statements of Changes in Net Assets
For the years ended September 30, 2023 and 2022
| | | | | | |
| | | 2023 | | | 2022 | |
| INCREASE (DECREASE) IN NET ASSETS | | | | | | |
| FROM OPERATIONS | | | | | | |
| Net investment income | $ | 3,526,562 | | $ | 1,312,790 | |
| Net realized gain on investments | | 7,185,745 | | | 27,692,561 | |
| Change in net unrealized appreciation/ | | | | | | |
| depreciation on investments | | 107,541,048 | | | (228,196,887 | ) |
| Net increase (decrease) in net assets | | | | | | |
| resulting from operations | | 118,253,355 | | | (199,191,536 | ) |
| |
| DISTRIBUTIONS TO SHAREHOLDERS | | | | | | |
| From investment operations – Class I | | (32,017,621 | ) | | (97,747,796 | ) |
| From investment operations – Class N | | (2,841,109 | ) | | (9,016,996 | ) |
| Total distributions | | (34,858,730 | ) | | (106,764,792 | ) |
| |
| CAPITAL SHARE TRANSACTIONS | | | | | | |
| Proceeds from shares issued – Class I | | | | | | |
| (707,152 and 347,802 shares, respectively) | | 21,351,042 | | | 11,254,591 | |
| Reinvestment of distributions – Class I | | | | | | |
| (1,072,426 and 2,615,660 shares, respectively) | | 29,148,550 | | | 91,129,589 | |
| Cost of shares redeemed – Class I | | | | | | |
| (1,502,619 and 1,698,790 shares, respectively) | | (43,700,915 | ) | | (54,517,385 | ) |
| Proceeds from shares issued – Class N | | | | | | |
| (50,775 and 46,615 shares, respectively) | | 1,433,137 | | | 1,417,684 | |
| Reinvestment of distributions – Class N | | | | | | |
| (107,402 and 264,192 shares, respectively) | | 2,819,297 | | | 8,927,047 | |
| Cost of shares redeemed – Class N | | | | | | |
| (297,378 and 330,292 shares, respectively) | | (8,345,249 | ) | | (10,353,812 | ) |
| Change in net assets derived | | | | | | |
| from capital share transactions | | 2,705,862 | | | 47,857,714 | |
| Total increase (decrease) in net assets | | 86,100,487 | | | (258,098,614 | ) |
| |
| NET ASSETS | | | | | | |
| Beginning of period | | 868,880,385 | | | 1,126,978,999 | |
| End of period | $ | 954,980,872 | | $ | 868,880,385 | |
The accompanying notes to financial statements are an integral part of these statements.
– 15 –
Notes to Financial Statements
September 30, 2023
| | |
| (1 | ) | Summary of Significant Accounting Policies — |
| | | Nicholas II, Inc. (the “Fund”) is organized as a Maryland corporation and is registered as |
| | | an open-end, diversified management investment company under the Investment |
| | | Company Act of 1940, as amended. The primary objective of the Fund is long-term |
| | | growth. The following is a summary of the significant accounting policies of the Fund: |
| | | (a) Equity securities traded on a stock exchange will ordinarily be valued on the basis |
| | | of the last sale price on the date of valuation on the securities principal exchange, |
| | | or if in the absence of any sale on that day, the closing bid price. For securities |
| | | principally traded on the NASDAQ market, the Fund uses the NASDAQ Official |
| | | Closing Price. Investments in shares of open-end mutual funds, including money |
| | | market funds, are valued at their daily net asset value. Debt securities, excluding |
| short-term investments, are valued at their current evaluated bid price as |
| | | determined by an independent pricing service, which generates evaluations on the |
| | | basis of dealer quotes for normal institutional-sized trading units, issuer analysis, |
| | | bond market activity and various other factors. Short-term investments are valued |
| | | using evaluated bid prices. Securities for which market quotations may not be |
| readily available are valued at their fair value as determined in good faith by |
| procedures adopted by the Board of Directors. The Board of Directors has |
| | | delegated fair value responsibilities to Nicholas Company, Inc., the Fund’s adviser. |
| | | The Fund did not maintain any positions in derivative instruments or engage in |
| | | hedging activities during the period. Investment transactions for financial statement |
| | | purposes are recorded on trade date. |
| | | In accordance with Accounting Standards Codification (“ASC”) 820-10, “Fair Value |
| | | Measurement” (“ASC 820-10”), fair value is defined as the price that the Fund |
| | | would receive upon selling an investment in a timely transaction to an independent |
| | | buyer in the principal or most advantageous market of the investment. ASC 820-10 |
| | | established a three-tier hierarchy to maximize the use of observable market data |
| | | and minimize the use of unobservable inputs and to establish classification of fair |
| value measurements for disclosure purposes. Inputs refer broadly to the |
| | | assumptions that market participants would use in pricing the asset or liability, |
| | | including assumptions about risk, for example, the risk inherent in a particular |
| | | valuation technique used to measure fair value such as a pricing model and/or the |
| | | risk inherent in the inputs to the valuation technique. Inputs may be observable or |
| | | unobservable. Observable inputs are inputs that reflect the assumptions market |
| participants would use in pricing the asset or liability based on market data |
| | | obtained from sources independent of the reporting entity. Unobservable inputs are |
| | | inputs that reflect the reporting entity’s own assumptions about the assumptions |
| | | market participants would use in pricing the asset or liability based on the best |
| | | information available in the circumstances. The three-tier hierarchy of inputs is |
| | | summarized in the three broad levels listed below. |
| | | Level 1 – quoted prices in active markets for identical investments |
| | | Level 2 – other significant observable inputs (including quoted prices for |
| | | similar investments, interest rates, benchmark yields, bids, |
| | | offers, transactions, spreads and other relationships observed |
– 16 –
Notes to Financial Statements (continued)
September 30, 2023
|
| in the markets among market securities, underlying equity of |
| the issuer, proprietary pricing models, credit risk, etc.) |
| Level 3 – significant unobservable inputs (including the Fund’s own |
| assumptions in determining the fair value of investments) |
| The inputs or methodology used for valuing securities are not necessarily an |
| indication of the risk associated with investing in those securities. |
| The following is a summary of the inputs used as of September 30, 2023 in valuing |
| the Fund’s investments carried at value: |
| | |
| | | Investments |
| Valuation Inputs | | in Securities |
| Level 1 – | | |
| Common Stocks(1) | $ | 897,123,424 |
| Money Market Deposit Account | | 14,223,425 |
| Money Market Fund | | 12,745,565 |
| Level 2 – | | |
| U.S. Government Securities | | 29,931,005 |
| Level 3 – | | |
| None | | — |
| Total | $ | 954,023,419 |
| (1) See Schedule of Investments for further detail by industry. | | |
| | The Fund did not hold any Level 3 investments during the year. |
| (b) | Net realized gain (loss) on portfolio securities was computed on the basis of |
| | specific identification. |
| (c) | Dividend income is recorded on the ex-dividend date, and interest income is |
| | recognized on an accrual basis. Non-cash dividends, if any, are recorded at value |
| | on date of distribution. Generally, discounts and premiums on long-term debt |
| | security purchases, if any, are amortized over the expected lives of the respective |
| | securities using the effective yield method. |
| | Investment income, net capital gains (losses) and all expenses incurred by the Fund |
| | are allocated based on the relative net assets of each class, except for 12b-1 fees |
| | and shareholder servicing fees and certain other fees and expenses related to one |
| | class of shares. |
| | Class N shares are subject to a 0.25% 12b-1 fee and a 0.10% servicing fee, as |
| | described in its prospectus. During the period, the 12b-1 fee was 0.20% through |
| | February 14, 2023. From February 15, 2023 through period end, the 12b-1 fee was |
| | 0.24%. During the period, the servicing fee was 0.10% through February 14, 2023. |
| | From February 15, 2023 through period end, the service fee was 0.08%. Income, |
| | expenses (other than expenses attributable to a specific class), and realized and |
| | unrealized gains and losses are allocated daily to each class of shares based upon |
| | the relative net asset value of outstanding shares. |
– 17 –
Notes to Financial Statements (continued)
September 30, 2023
| |
| (d) | Provision has not been made for federal income taxes or excise taxes since the |
| | Fund has elected to be taxed as a “regulated investment company” and intends to |
| | distribute substantially all net investment income and net realized capital gains on |
| | sales of investments to its shareholders and otherwise comply with the provisions |
| | of Subchapter M of the Internal Revenue Code applicable to regulated investment |
| | companies. |
| (e) | Dividends and distributions paid to shareholders are recorded on the ex-dividend |
| | date. Distributions from net investment income are generally declared and paid at |
| | least annually. Distributions of net realized capital gain, if any, are declared and paid |
| | at least annually. |
| | The amount of distributions from net investment income and net realized capital |
| | gain are determined in accordance with federal income tax regulations, which may |
| | differ from U.S. generally accepted accounting principles (“U.S. GAAP”) for |
| | financial reporting purposes. Financial reporting records are adjusted for permanent |
| | book-to-tax differences to reflect tax character. At September 30, 2023, |
| | reclassifications were recorded to increase undistributed ordinary income by $181 |
| | and decrease accumulated undistributed net realized capital gains by $181. |
| | The tax character of distributions paid during the years ended September 30, was |
| | as follows: |
| | | | | |
| | | 09/30/2023 | | 09/30/2022 |
| Distributions paid from: | | | | |
| Ordinary income | $ | 2,013,644 | $ | 1,924,092 |
| Long-term capital gain | | 32,845,086 | | 104,840,700 |
| Total distributions paid | $ | 34,858,730 | $ | 106,764,792 |
| |
| As of September 30, 2023, investment cost for federal tax purposes was |
| $544,447,888 and the tax basis components of net assets were as follows: |
| | | | |
| Unrealized appreciation | $ | 415,894,845 | |
| Unrealized depreciation | | (6,319,314 | ) |
| Net unrealized appreciation | | 409,575,531 | |
| Undistributed ordinary income | | 2,763,939 | |
| Accumulated undistributed net realized capital gains | | 1,024,097 | |
| Paid in capital | | 541,617,305 | |
| Net assets | $ | 954,980,872 | |
| |
| | There were no differences between financial statement and tax-basis cost. |
| | The Fund had no material uncertain tax positions and has not recorded a liability for |
| | unrecognized tax benefits as of September 30, 2023. Also, the Fund recognized no |
| | interest and penalties related to uncertain tax benefits during the year ended |
| | September 30, 2023. At September 30, 2023, the fiscal years 2020 through 2023 |
| | remain open to examination in the Fund’s major tax jurisdictions. |
| (f) | The Fund is considered an investment company under U.S. GAAP and follows the |
| | accounting and reporting guidance applicable to investment companies in the |
– 18 –
Notes to Financial Statements (continued)
September 30, 2023
| | | |
| | | | Financial Accounting Standards Board (“FASB”) ASC 946, “Financial Services – |
| | | | Investment Companies.” U.S. GAAP guidance requires management to make |
| | | estimates and assumptions that effect the amounts reported in the financial |
| | | | statements and accompanying notes. Actual results could differ from estimates. |
| | | (g) | In the normal course of business the Fund enters into contracts that contain |
| | | | general indemnification clauses. The Fund’s maximum exposure under these |
| | | | arrangements is unknown, as this would involve future claims against the Fund that |
| | | | have not yet occurred. Based on experience, the Fund expects the risk of loss to be |
| | | | remote. |
| | | (h) | In connection with the preparation of the Fund’s financial statements, management |
| | | evaluated subsequent events after the date of the Statement of Assets and |
| | | | Liabilities of September 30, 2023. There have been no material subsequent events |
| | | | since September 30, 2023 that would require adjustment to or additional disclosure |
| | | | in these financial statements. |
| (2 | ) | Related Parties — |
| | | (a) | Investment Adviser and Management Agreement — |
| | | | The Fund has an agreement with Nicholas Company, Inc. (with whom certain |
| | | officers and directors of the Fund are affiliated) (the “Adviser”) to serve as |
| | | | investment adviser and manager. Under the terms of the agreement, a monthly fee |
| | | | is paid to the Adviser based on an annualized fee of 0.75% of the average net asset |
| | | | value up to and including $50 million, 0.60% of the average net asset value over |
| | | | $50 million up to and including $100 million and 0.50% of the average net asset |
| | | | value in excess of $100 million. |
| | | | The Adviser may be paid for accounting and administration services rendered by its |
| | | | personnel, subject to the following guidelines: (i) up to five basis points, on an |
| | | annual basis, of the average net asset value of the Fund up to and including |
| | | | $2 billion and up to three basis points, on an annual basis, of the average net asset |
| | | | value of the Fund greater than $2 billion, based on the average net asset value of |
| | | | the Fund as determined by valuations made at the close of each business day of |
| | | | each month, and (ii) where the preceding calculation results in an annual payment |
| | | | of less than $50,000, the Adviser, in its discretion, may charge the Fund up to |
| | | | $50,000 for such services. |
| | | (b) | Legal Counsel — |
| | | | A director of the Adviser is affiliated with a law firm that provides services to the |
| | | | Fund. The Fund incurred expenses of $7,834 for the year ended September 30, |
| | | | 2023 for legal services rendered by this law firm. |
| (3 | ) | Investment Transactions — |
| | | For the year ended September 30, 2023, the cost of purchases and the proceeds from |
| | | sales of investment securities, other than short-term obligations, aggregated |
| | | $56,450,450 and $85,752,405, respectively. |
– 19 –
Report of Independent Registered
Public Accounting Firm
To the shareholders and Board of Directors of Nicholas II, Inc.
Opinion on the Financial Statements and Financial Highlights
We have audited the accompanying statement of assets and liabilities of Nicholas II, Inc. (the “Fund”), including the schedule of investments, as of September 30, 2023, the related statement of operations for the year then ended, the statements of changes in net assets for each of the two years in the period then ended, the financial highlights for each of the five years in the period then ended, and the related notes. In our opinion, the financial statements and financial highlights present fairly, in all material respects, the financial position of the Fund as of September 30, 2023, and the results of its operations for the year then ended, the changes in its net assets for each of the two years in the period then ended, and the financial highlights for each of the five years in the period then ended, in conformity with accounting principles generally accepted in the United States of America.
Basis for Opinion
These financial statements and financial highlights are the responsibility of the Fund’s management. Our responsibility is to express an opinion on the Fund’s financial statements and financial highlights based on our audits. We are a public accounting firm registered with the Public Company Accounting Oversight Board (United States) (PCAOB) and are required to be independent with respect to the Fund in accordance with the U.S. federal securities laws and the applicable rules and regulations of the Securities and Exchange Commission and the PCAOB.
We conducted our audits in accordance with the standards of the PCAOB. Those standards require that we plan and perform the audit to obtain reasonable assurance about whether the financial statements and financial highlights are free of material misstatement, whether due to error or fraud. The Fund is not required to have, nor were we engaged to perform, an audit of its internal control over financial reporting. As part of our audits we are required to obtain an understanding of internal control over financial reporting but not for the purpose of expressing an opinion on the effectiveness of the Fund’s internal control over financial reporting. Accordingly, we express no such opinion.
Our audits included performing procedures to assess the risks of material misstatement of the financial statements and financial highlights, whether due to error or fraud, and performing procedures that respond to those risks. Such procedures included examining, on a test basis, evidence regarding the amounts and disclosures in the financial statements and financial highlights. Our audits also included evaluating the accounting principles used and significant estimates made by management, as well as evaluating the overall presentation of the financial statements and financial highlights. Our procedures included confirmation of securities owned as of September 30, 2023, by correspondence with the custodian and brokers. We believe that our audits provide a reasonable basis for our opinion.
/s/ Deloitte & Touche LLP
Milwaukee, Wisconsin
November 28, 2023
We have served as the auditor of one or more Nicholas investment companies since 1977.
– 20 –
Historical Record Class I
(unaudited)
| | | | | | | | | | | |
| | | | | Net | | | | | | | |
| | | | | Investment | | | | | Dollar | | Growth of |
| | | Net | | Income | | | Capital Gain | | Weighted | | an Initial |
| | | Asset Value | | Distributions | | | Distributions | | Price/Earnings | | $10,000 |
| Class I | | Per Share | | Per Share(2) | | | Per Share(2) | | Ratio(3) | | Investment(4) |
| October 17, 1983(1) | $ | 10.00 | $ | — | | $ | — | | — | $ | 10,000 |
| September 30, 1984 | | 11.66 | | — | | | — | | 12.6 times | | 11,660 |
| September 30, 1985 | | 14.39 | | 0.0930 | | | 0.1860 | | 11.7 | | 14,742 |
| September 30, 1986 | | 16.90 | | 0.1630 | | | 0.0610 | | 15.0 | | 17,581 |
| September 30, 1987 | | 21.01 | | 0.4200 | | | 0.5130 | | 20.9 | | 23,108 |
| September 30, 1988 | | 18.58 | | 0.3380 | | | 1.3030 | | 15.0 | | 22,766 |
| September 30, 1989 | | 21.76 | | 0.3350 | | | 0.0800 | | 17.1 | | 27,291 |
| September 30, 1990 | | 17.39 | | 0.3124 | | | 0.6686 | | 14.8 | | 22,888 |
| September 30, 1991 | | 23.87 | | 0.3422 | | | 0.1434 | | 17.8 | | 32,250 |
| September 30, 1992 | | 24.53 | | 0.2447 | | | 0.4042 | | 17.3 | | 34,052 |
| September 30, 1993 | | 26.94 | | 0.2350 | | | 0.8000 | | 18.1 | | 38,885 |
| September 30, 1994 | | 26.71 | | 0.2000 | | | 1.4700 | | 18.5 | | 41,020 |
| September 30, 1995 | | 30.07 | | 0.2056 | | | 1.8944 | | 20.8 | | 50,205 |
| September 30, 1996 | | 33.34 | | 0.1750 | | | 2.4979 | | 28.9 | | 60,922 |
| September 30, 1997 | | 40.65 | | 0.0779 | | | 3.1621 | | 31.4 | | 82,206 |
| September 30, 1998 | | 34.78 | | 0.0810 | | | 5.2282 | | 28.6 | | 80,845 |
| September 30, 1999 | | 31.83 | | 0.1337 | | | 4.0049 | | 29.0 | | 82,864 |
| September 30, 2000 | | 36.58 | | 0.0100 | | | 0.4701 | | 35.1 | | 96,527 |
| September 30, 2001 | | 17.54 | | — | | | 13.1200 | | 23.4 | | 76,361 |
| September 30, 2002 | | 15.34 | | — | | | 0.5766 | | 22.2 | | 68,730 |
| September 30, 2003 | | 18.97 | | — | | | — | | 22.9 | | 84,994 |
| September 30, 2004 | | 21.88 | | — | | | 0.0015 | | 22.9 | | 98,040 |
| September 30, 2005 | | 23.50 | | — | | | 0.9146 | | 23.3 | | 109,547 |
| September 30, 2006 | | 23.11 | | 0.0083 | | | 2.1472 | | 22.4 | | 118,142 |
| September 30, 2007 | | 25.18 | | 0.0643 | | | 1.0460 | | 23.4 | | 134,908 |
| September 30, 2008 | | 19.15 | | 0.0978 | | | 2.5678 | | 17.5 | | 115,141 |
| September 30, 2009 | | 17.02 | | 0.1072 | | | 1.1206 | | 19.2 | | 111,845 |
| September 30, 2010 | | 19.31 | | 0.0957 | | | — | | 20.7 | | 127,575 |
| September 30, 2011 | | 18.72 | | 0.0867 | | | 0.3831 | | 17.2 | | 126,423 |
| September 30, 2012 | | 22.91 | | 0.0992 | | | 0.4903 | | 20.2 | | 159,188 |
| September 30, 2013 | | 26.37 | | 0.1428 | | | 1.8746 | | 22.9 | | 200,723 |
| September 30, 2014 | | 27.41 | | 0.0889 | | | 2.0445 | | 22.3 | | 225,609 |
| September 30, 2015 | | 25.39 | | 0.0997 | | | 3.4844 | | 21.3 | | 237,669 |
| September 30, 2016 | | 25.41 | | 0.0931 | | | 1.4736 | | 22.7 | | 252,980 |
| September 30, 2017 | | 28.79 | | 0.0752 | | | 1.1754 | | 24.9 | | 301,091 |
| September 30, 2018 | | 30.37 | | 0.0277 | | | 3.0205 | | 25.9 | | 352,592 |
| September 30, 2019 | | 29.61 | | 0.1821 | | | 2.7546 | | 24.8 | | 387,738 |
| September 30, 2020 | | 28.68 | | 0.1133 | | | 3.1017 | | 29.1 | | 418,165 |
| September 30, 2021 | | 35.98 | | 0.0487 | | | 1.1473 | | 25.5 | | 544,703 |
| September 30, 2022 | | 26.69 | | 0.0495 | | | 3.3930 | | 22.6 | | 443,863 |
| September 30, 2023 | | 29.22 | | 0.0634 | (a) | | 1.0161 | (a) | 27.4 | | 505,239 |
| (1) | Date of Initial Public Offering. |
| (2) | Rounded. |
| (3) | Based on latest 12 months accomplished earnings. |
| (4) | Assuming reinvestment of all distributions. |
| |
| (a) | Paid on December 28, 2022 to shareholders of record on December 27, 2022. |
– 21 –
Historical Record Class N
(unaudited)
| | | | | | | | | | | |
| | | | | Net | | | | | | | |
| | | | | Investment | | | | | Dollar | | Growth of |
| | | Net | | Income | | | Capital Gain | | Weighted | | an Initial |
| | | Asset Value | | Distributions | | | Distributions | | Price/Earnings | | $10,000 |
| Class N | | Per Share | | Per Share | | | Per Share(2) | | Ratio(3) | | Investment(4) |
| February 28, 2005(1) | $ | 22.59 | $ | — | | $ | — | | 23.1 times | $ | 10,000 |
| September 30, 2005 | | 23.45 | | — | | | — | | 23.3 | | 10,381 |
| September 30, 2006 | | 23.00 | | — | | | 2.1340 | | 22.4 | | 11,158 |
| September 30, 2007 | | 25.03 | | — | | | 1.0460 | | 23.4 | | 12,694 |
| September 30, 2008 | | 19.04 | | 0.0067 | | | 2.5678 | | 17.5 | | 10,800 |
| September 30, 2009 | | 16.87 | | 0.0969 | | | 1.1206 | | 19.2 | | 10,457 |
| September 30, 2010 | | 19.11 | | 0.0666 | | | — | | 20.7 | | 11,890 |
| September 30, 2011 | | 18.49 | | 0.0479 | | | 0.3831 | | 17.2 | | 11,741 |
| September 30, 2012 | | 22.63 | | 0.0191 | | | 0.4903 | | 20.2 | | 14,732 |
| September 30, 2013 | | 26.04 | | 0.0560 | | | 1.8746 | | 22.9 | | 18,516 |
| September 30, 2014 | | 27.03 | | — | | | 2.0445 | | 22.3 | | 20,734 |
| September 30, 2015 | | 25.00 | | 0.0002 | | | 3.4844 | | 21.3 | | 21,770 |
| September 30, 2016 | | 25.00 | | — | | | 1.4736 | | 22.7 | | 23,091 |
| September 30, 2017 | | 28.29 | | — | | | 1.1754 | | 24.9 | | 27,387 |
| September 30, 2018 | | 29.72 | | — | | | 3.0205 | | 25.9 | | 31,972 |
| September 30, 2019 | | 28.91 | | 0.0818 | | | 2.7546 | | 24.8 | | 35,025 |
| September 30, 2020 | | 27.94 | | 0.0182 | | | 3.1017 | | 29.1 | | 37,666 |
| September 30, 2021 | | 34.97 | | — | | | 1.1473 | | 25.5 | | 48,909 |
| September 30, 2022 | | 25.82 | | — | | | 3.3930 | | 22.6 | | 39,738 |
| September 30, 2023 | | 28.16 | | 0.0495 | (a) | | 1.0161 | (a) | 27.4 | | 45,099 |
| (1) | Date of Initial Public Offering. |
| (2) | Rounded. |
| (3) | Based on latest 12 months accomplished earnings. |
| (4) | Assuming reinvestment of all distributions. |
| |
| (a) | Paid on December 28, 2022 to shareholders of record on December 27, 2022. |
– 22 –
Approval of Investment Advisory Contract
(unaudited)
A discussion of the Approval by the Board of Directors of the Fund’s Investment Advisory Contract can be found in the Fund’s Semiannual Report dated March 31, 2023.
Liquidity Risk Management Program
(unaudited)
The Fund has adopted and implemented a liquidity risk management program (the “Program”) in accordance with Rule 22e-4 under the 1940 Act. The Program seeks to assess and manage the Fund’s liquidity risk, i.e., the risk that the Fund is unable to satisfy redemption requests without significantly diluting remaining investors’ interests in the Fund. The Board of Directors of the Fund has designated Nicholas Company, Inc., the Fund’s investment adviser, to administer the Program. Certain aspects of the Program rely on third parties to perform certain functions, including the provision of market data and application of models.
The Program is comprised of various components designed to support the assessment and/or management of liquidity risk, including: (1) the periodic assessment (no less frequently than annually) of certain factors that influence the Fund’s liquidity risk; (2) the periodic classification (no less frequently than monthly) of the Fund’s investments into one of four liquidity categories that reflect an estimate of their liquidity under current market conditions; (3) a 15% limit on the acquisition of “illiquid investments” (as defined under Rule 22e-4); (4) for a Fund that does not invest primarily in “highly liquid investments” (as defined under Rule 22e-4), the determination of a minimum percentage of the Fund’s assets that will generally be invested in highly liquid investments (a “Highly Liquid Investment Minimum”); and (5) periodic reporting to the Board of Directors.
At a meeting of the Board of Directors on February 10, 2023, Nicholas Company, Inc. provided a written report to the Board addressing the operation, and the adequacy and effectiveness of the implementation, of the Program, including, as applicable, the operation of any Highly Liquid Investment Minimum and any material changes to the Program, for the period from January 1, 2022 through December 31, 2022 (the “Reporting Period”). Among other things, the annual report discussed: (1) the results of stress tests designed to assess liquidity under a hypothetical stressed scenario involving elevated redemptions; and (2) an assessment of the methodologies used to classify investments into one of four liquidity categories. The report concluded that the Program was reasonably designed to assess and manage liquidity risk and was adequately and effectively implemented during the Reporting Period.
There can be no assurance that the Program will achieve its objectives under all circumstances in the future. Please refer to the Fund’s prospectus for more information regarding the Fund’s exposure to liquidity risk and other risks to which it may be subject.
– 23 –
Information on Proxy Voting
(unaudited)
A description of the policies and procedures that the Fund uses to determine how to vote proxies relating to portfolio securities is available, without charge, upon request by calling 800-544-6547 or 414-276-0535. It also appears in the Fund’s Statement of Additional Information, which can be found on the SEC’s website, www.sec.gov. A record of how the Fund voted its proxies for the most recent twelve-month period ended June 30, also is available on the Fund’s website, www.nicholasfunds.com, and the SEC’s website, www.sec.gov.
Quarterly Portfolio Schedule
(unaudited)
The Fund files its complete schedule of investments with the SEC for the first and third quarters of each fiscal year as an exhibit to its reports on Form N-PORT. The Fund’s Form N-PORT reports are available on the SEC’s website at www.sec.gov and may be reviewed and copied at the SEC’s Public Reference Room in Washington, D.C. Information on the operation of the Public Reference Room may be obtained by calling 800-SEC-0330.
– 24 –
Directors and Officers of the Fund
(unaudited)
The following table sets forth the pertinent information about the Fund’s directors and officers as of September 30, 2023. Unless otherwise listed, the business address of each director and officer is 411 East Wisconsin Avenue, Milwaukee, WI 53202.
| | | | | | |
| | | | | | Number of | |
| | | | Term of | | Portfolios | |
| | | Positions | Office and | | in Fund | Other |
| | | Held | Length of | Principal | Complex | Directorships |
| | | With | Time | Occupations | Overseen | Held |
| Name and Age | | Fund | Served | During Past 5 Years | by Director | by Director |
| INTERESTED DIRECTOR | | | | | | |
| David O. Nicholas, CFA | | President, | (2), 19 years | President, Chief | 4 | None |
| 62(1) | | Director | | Executive Officer, | | |
| | | and Lead | | Chief Investment | | |
| | | Portfolio | | Officer and Director, | | |
| | | Manager | | Nicholas Company, | | |
| | | | | Inc., the Adviser to | | |
| | | | | the Fund. He is also | | |
| | | | | the Lead Portfolio | | |
| | | | | Manager of Nicholas | | |
| | | | | Fund, Inc. and | | |
| | | | | Nicholas Limited | | |
| | | | | Edition, Inc., and Co- | | |
| | | | | Portfolio Manager | | |
| | | | | of Nicholas Equity | | |
| | | | | Income Fund, Inc. | | |
– 25 –
Directors and Officers of the Fund (continued)
(unaudited)
| | | | | |
| | | | | Number of | |
| | | Term of | | Portfolios | |
| | Positions | Office and | | in Fund | Other |
| | Held | Length of | Principal | Complex | Directorships |
| | With | Time | Occupations | Overseen | Held |
| Name and Age | Fund | Served | During Past 5 Years | by Director | by Director |
| DISINTERESTED DIRECTORS | | | | |
| John A. Hauser | Director | (2), 7 years | Chaplain, Door County | 4 | None |
| 64 | | | Medical Center, 2019 | | |
| | | | to present. Private | | |
| | | | Investor, January 2017 | | |
| | | | to present. Senior Vice | | |
| | | | President Trust and | | |
| | | | Community Relations, | | |
| | | | Nicolet Bank, October | | |
| | | | 2016 to December 2016. | |
| | | | Senior Vice President – | | |
| | | | Director of Wealth | | |
| | | | Services, Nicolet Bank, | | |
| | | | April 2016 to | | |
| | | | October 2016. Prior to | | |
| | | | its acquisition by Nicolet | | |
| | | | Bank in April 2016, | | |
| | | | Mr. Hauser served in | | |
| | | | various senior | | |
| | | | management roles for | | |
| | | | Baylake Bank from | | |
| | | | 1984 to 2008 and from | | |
| | | | 2009 to April 2016. | | |
| |
| David P. Pelisek, CFA | Director | (2), 4 years | Private Investor, | 4 | None |
| 64 | | | September 2016 to | | |
| | | | present. Managing | | |
| | | | Director, Robert W. | | |
| | | | Baird & Co., Inc. and | | |
| | | | Partner, Baird Capital | | |
| | | | Partners Buyout | | |
| | | | Funds I-V, January 1994 | | |
| | | | to May 2016. | | |
| |
| Julie M. Van Cleave | Director | (2), 1 year | Private Investor, | 4 | None |
| 64 | | | July 2020 to present. | | |
| | | | Chief Investment Officer, | |
| | | | University of Wisconsin | | |
| | | | Foundation, July 2013 | | |
| | | | to June 2020. | | |
– 26 –
Directors and Officers of the Fund (continued)
(unaudited)
| | | |
| | | Term of | |
| | Positions | Office and | |
| | Held | Length of | |
| | With | Time | |
| Name and Age | Fund | Served | Principal Occupations During Past 5 Years |
| OFFICERS | | | |
| Lawrence J. Pavelec, CFA | Senior Vice | Annual, | Executive Vice President, Secretary and Chief |
| 64 | President | 19 years | Operating Officer, Nicholas Company, Inc., the |
| | and | | Adviser to the Fund, and employed by the |
| | Secretary | | Adviser since April 2003. |
| |
| Jennifer R. Kloehn, CPA | Senior Vice | Annual, | Executive Vice President, Treasurer, Chief |
| 50 | President, | 7 years | Financial Officer and Chief Compliance Officer, |
| | Treasurer | | Nicholas Company, Inc., the Adviser to the Fund, |
| | and Chief | | and employed by the Adviser since 1998. |
| | Compliance | | |
| | Officer | | |
| |
| Brian J. Janowski, | Senior Vice | Annual, | Senior Vice President, Nicholas Company, Inc. the |
| CFA, CPA | President | 6 years | Adviser to the Fund and employed by the Adviser |
| 50 | and | | since December 2016. He has been Co-Portfolio |
| | Co-Portfolio | | Manager of the Fund since April 2018. He was |
| | Manager | | Co-Portfolio Manager for BMO Small- and |
| | | | Mid-Cap Value Funds from 2008 to 2016. |
| |
| Candace L. Lesak, CFP | Vice | Annual, | Employee, Nicholas Company, Inc., the |
| 66 | President | 37 years | Adviser to the Fund. Retired from Nicholas |
| | | | Company, Inc. effective October 31, 2023. |
| (1) | David O. Nicholas is the only director of the Fund who is an “interested person” of the Fund, as that term is defined in the 1940 Act. Mr. Nicholas is a Director of the Adviser and owns 60% of the outstanding voting securities of the Adviser. |
| (2) | Until duly elected or re-elected at a subsequent annual meeting of the Fund. |
The Fund’s Statement of Additional Information includes additional information about the Fund directors and is available, without charge, upon request, by calling 800-544-6547 or 414-276-0535.
– 27 –
Privacy Policy
(unaudited)
Nicholas II, Inc. respects each shareholder’s right to privacy. We are committed to safeguarding the information that you provide us to maintain and execute transactions on your behalf.
We collect the following non-public personal information about you:
| * | Information we receive from you on applications or other forms, whether we receive the form in writing or electronically. This includes, but is not limited to, your name, address, phone number, tax identification number, date of birth, beneficiary information and investment selection. |
| * | Information about your transactions with us and account history with us. This includes, but is not limited to, your account number, balances and cost basis information. This also includes transaction requests made through our transfer agent. |
| * | Other general information that we may obtain about you such as demographic information. |
WE DO NOT SELL ANY NON-PUBLIC PERSONAL INFORMATION ABOUT CURRENT OR FORMER SHAREHOLDERS.
INFORMATION SHARED WITH OUR TRANSFER AGENT, A THIRD PARTY COMPANY, ALSO IS NOT SOLD.
We may share, only as permitted by law, non-public personal information about you with third party companies. Listed below are some examples of third parties to whom we may disclose non-public personal information. While these examples do not cover every circumstance permitted by law, we hope they help you understand how your information may be shared.
We may share non-public personal information about you:
| * | With companies who work for us to service your accounts or to process transactions that you may request. This would include, but is not limited to, our transfer agent to process your transactions, mailing houses to send you required reports and correspondence regarding the Fund and its Adviser, the Nicholas Company, Inc., and our dividend disbursing agent to process fund dividend checks. |
| * | With a party representing you, with your consent, such as your broker or lawyer. |
| * | When required by law, such as in response to a subpoena or other legal process. |
The Fund and its Adviser maintain policies and procedures to safeguard your non-public personal information. Access is restricted to employees who the Adviser determines need the information in order to perform their job duties. To guard your non-public personal information we maintain physical, electronic, and procedural safeguards that comply with federal standards.
In the event that you hold shares of the Fund with a financial intermediary, including, but not limited to, a broker-dealer, bank, or trust company, the privacy policy of your financial intermediary would govern how your non-public personal information would be shared with non-affiliated third parties.
– 28 –
Automatic Investment Plan – An Update
(unaudited)
The Nicholas Family of Funds’ Automatic Investment Plan provides a simple method to dollar cost average into the fund(s) of your choice.
Dollar cost averaging involves making equal systematic investments over an extended time period. A fixed dollar investment will purchase more shares when the market is low and fewer shares when the market is high. The automatic investment plan is an excellent way for you to become a disciplined investor.
The following table illustrates what dollar cost averaging can achieve. Please note that past performance is no guarantee of future results. Nicholas Company recommends dollar cost averaging as a practical investment method. It should be consistently applied for long periods so that investments are made through several market cycles.
| | | | | |
| | | Nicholas II – Class I |
| $1,000 initial investment on | | 10/17/1983 | * | | 9/30/2013 |
| Number of years investing $100 each month | | | | | |
| following the date of initial investment | | 40 | | | 10 |
| Total cash invested | $ | 49,000 | | $ | 13,000 |
| Total dividend and capital gain distributions reinvested | $ | 390,232 | | $ | 7,338 |
| Total full shares owned at 09/30/2023 | | 17,458 | | | 722 |
| Total market value at 09/30/2023 | $ | 510,131 | | $ | 21,098 |
The results above assume purchase on the last day of the month. The Nicholas Automatic Investment Plan actually invests on the date specified by the investor. Total market value includes reinvestment of all distributions.
| * | Date of Initial Public Offering. |
– 29 –
Nicholas Funds Services Offered
(unaudited)
| | |
| • | IRAs | |
| | • Traditional | • SIMPLE |
| | • Roth | • SEP |
| • | Coverdell Education Accounts |
| • | Automatic Investment Plan |
| • | Direct Deposit of Dividend and Capital Gain Distributions |
| • | Systematic Withdrawal Plan |
| • | Monthly Automatic Exchange between Funds |
| • | Telephone Purchase and Redemption |
| • | Telephone Exchange | |
| • | 24-hour Automated Account Information (800-544-6547) |
| • | 24-hour Internet Account Access (www.nicholasfunds.com) |
Please call a shareholder representative for further information on the above services or with any other questions you may have regarding the Nicholas Funds (800-544-6547).
– 30 –
Directors and Officers
DAVID O. NICHOLAS, President and Director
JOHN A. HAUSER, Director
DAVID P. PELISEK, Director
JULIE M. VAN CLEAVE, Director
BRIAN J. JANOWSKI, Senior Vice President
JENNIFER R. KLOEHN, Senior Vice President,
Treasurer and Chief Compliance Officer
LAWRENCE J. PAVELEC, Senior Vice President and Secretary
CANDACE L. LESAK, Vice President
Investment Adviser
NICHOLAS COMPANY, INC.
Milwaukee, Wisconsin
www.nicholasfunds.com
414-276-0535 or 800-544-6547
Accountant
Dividend Disbursing Agent
Transfer Agent
U.S. BANCORP FUND SERVICES, LLC
Milwaukee, Wisconsin
414-276-0535 or 800-544-6547
Distributor
QUASAR DISTRIBUTORS, LLC
Milwaukee, Wisconsin
Custodian
U.S. BANK N.A.
Milwaukee, Wisconsin
Independent Registered Public Accounting Firm
DELOITTE & TOUCHE LLP
Milwaukee, Wisconsin
Counsel
MICHAEL BEST & FRIEDRICH LLP
Milwaukee, Wisconsin
This report is submitted for the information of shareholders of the Fund. It is not authorized for distribution to prospective investors unless preceded or accompanied by an effective prospectus.
Item 2. Code of Ethics.
(a) The registrant has adopted a Code of Ethics that applies to the registrant’s principal executive officer and principal financial officer.
(b) Not applicable.
(c) During the period covered by the report, there were no amendments to the provisions of the Code of Ethics adopted in Item 2(a) above.
(d) During the period covered by the report, no implicit or explicit waivers were made with respect to the provisions of the Code of Ethics adopted in Item 2(a) above.
(e) Not applicable.
(f) The registrant’s Code of Ethics is attached as Exhibit 13(a)(1) to this Form N-CSR.
Item 3. Audit Committee Financial Expert.
The Fund's Board of Directors has determined that Mr. David P. Pelisek, an independent director, qualifies as an audit committee financial expert as that term is defined for purposes of this item. He was selected as the Fund’s Audit Committee Financial Expert at the Fund’s Board of Directors Meeting held on February 3, 2020.
Item 4. Principal Accountant Fees and Services.
(a) Audit Fees. The aggregate fees billed for each of the last two fiscal years (the "Reporting Periods") for professional services rendered by the Fund's principal accountant (the "Auditor") for the audit of the Fund's annual financial statements, or services that are normally provided by the Auditor in connection with the statutory and regulatory filings or engagements for the Reporting Periods, were $36,430 in 2023 and $34,700 in 2022.
(b) Audit-Related Fees. There were no fees billed in each of the last two fiscal years for assurance and related services rendered by the Auditor to the Fund that are reasonably related to the performance of the audit of the Fund's financial statements and are not reported under paragraph (a) of this Item 4.
(c) Tax Fees. The aggregate fees billed in the Reporting Periods for professional services rendered by the Auditor for tax compliance, tax advice and tax planning ("Tax Services") were $6,170 in 2023 and $5,875 in 2022. These services consisted of (i) review or preparation of U.S. federal, state, local and excise tax returns; (ii) U.S. federal, state and local tax planning, advice and assistance regarding statutory, regulatory or administrative developments, (iii) tax advice regarding tax qualification matters and/or treatment of various financial instruments held or proposed to be acquired or held.
(d) All Other Fees. The aggregate fees billed for professional services rendered by the Auditor to the Fund's investment adviser were approximately $20,650 in 2022 and $19,300 in 2021. These services were for the audit of the investment adviser for the adviser's fiscal year ended 10/31/2022 and 10/31/2021, respectively.
(e) (1) Audit Committee Pre-Approval Policies and Procedures. The Fund's Board of Director's has not adopted any pre-approval policies and procedures as described in paragraph (c)(7) of Rule 2-01 of Regulation S-X. The Fund's Board of Directors meets with the Auditors and management to review and authorize the Auditor's engagements for audit and non-audit services to the Fund and its Adviser prior to each engagement.
(e) (2) The percentage of services described in each of paragraphs (b) through (d) of this Item that were approved by the audit committee pursuant to paragraph (c)(7)(i)(C) of Rule 2-01 of Regulation S-X are as follows:
(f) No disclosures are required by this Item 4(f).
(g) There were no non-audit fees billed in each of the last two fiscal years by the Auditor for services rendered to the Fund or the Fund's investment adviser that provides ongoing services.
(h) No disclosures are required by this Item 4(h).
(i) Not applicable.
(j) Not applicable.
Item 5. Audit Committee of Listed Registrants.
Not applicable to this filing.
Item 6. Schedule of Investments.
The schedule of investments in securities of unaffiliated issuers is included as part of the report to shareholders filed under Item 1 of this Form N-CSR.
Item 7. Disclosure of Proxy Voting Policies and Procedures for Closed-End Management Investment Companies.
Applicable only to annual reports filed by closed-end funds.
Item 8. Portfolio Managers of Closed-End Management Investment Companies.
Applicable only to annual reports filed by closed-end funds.
Item 9. Purchases of Equity Securities by Closed-End Management Investment Companies and Affiliated Purchasers.
Applicable only to closed-end funds.
Item 10. Submission of Matters to a Vote of Security Holders.
Not applicable to this filing.
Item 11. Controls and Procedures.
(a) The Fund’s principal executive officer and principal financial officer, or persons performing similar functions, have concluded that the registrant’s disclosure controls and procedures (as defined in Rule 30a-3(c) under the Investment Company Act of 1940, as amended (the “1940 Act”) are effective, based on their evaluation of these controls and procedures as of a date within 90 days of the filing date of the report that includes the disclosure required by this paragraph, based on their evaluation of these controls and procedures required by Rule 30a-3(b) under the 1940 Act and Rules 13a-15(b) or 15d-15(b) under the Securities Exchange Act of 1934, as amended.
(b) There were no changes in the registrant’s internal controls over financial reporting (as defined in Rule 30a-3(d) under the 1940 Act) that occurred during the period covered by this report that have materially affected, or are reasonably likely to materially affect, the registrant’s internal control over financial reporting.
Item 12. Disclosure of Securities Lending Activities for Closed-End Management Investment Companies.
Applicable only to closed-end funds.
Item 13. Exhibits.
(a)(1) Sarbanes-Oxley Code of Ethics for Principal Executive and Senior Financial Officers (that is the subject of the disclosure required by Item 2), attached hereto as EX-99.CODE ETH.
(a)(2) Certifications of Principal Executive Officer and Principal Financial Officer pursuant to Rule 30a-2(a) under the Investment Company Act of 1940, attached hereto as EX-99.CERT.
(a)(3) Any written solicitation to purchase securities under Rule 23c-1 under the Act sent or given during the period covered by the report by or on behalf of the registrant to 10 or more person. Applicable only to closed-end funds.
(a)(4) Change in the registrant’s independent public accountant.
Not applicable to this filing.
(b) Certifications of Principal Executive Officer and Principal Financial Officer pursuant to Rule 30a-2(b) under the Investment Company Act of 1940, attached hereto as EX-99.906 CERT.
SIGNATURES
Pursuant to the requirements of the Securities Exchange Act of 1934 and the Investment Company Act of 1940, the registrant has duly caused this report to be signed on its behalf by the undersigned, thereunto duly authorized.
(Registrant) Nicholas II, Inc.
By: /s/ David O. Nicholas
Name: David O. Nicholas
Title: Principal Executive Officer
Date: November 29, 2023
Pursuant to the requirements of the Securities Exchange Act of 1934 and the Investment Company Act of 1940, this report has been signed by the following persons on behalf of the registrant and in the capacities and on the dates indicated.
By: /s/ David O. Nicholas
Name: David O. Nicholas
Title: Principal Executive Officer
Date: November 29, 2023
By: /s/ Jennifer R. Kloehn
Name: Jennifer R. Kloehn
Title: Principal Financial Officer
Date: November 29, 2023