UNITED STATES
SECURITIES AND EXCHANGE COMMISSION
Washington, D.C. 20549
FORM N-CSR
CERTIFIED SHAREHOLDER REPORT OF REGISTERED
MANAGEMENT INVESTMENT COMPANIES
Investment Company Act file number 811-03851
Nicholas, II, Inc.
(Exact Name of Registrant as specified in charter)
411 East Wisconsin Avenue, Suite 2100, Milwaukee, Wisconsin 53202
(Address of Principal Executive Offices) (Zip Code)
Jennifer R. Kloehn, Senior Vice President and Treasurer
411 East Wisconsin Avenue, Suite 2100
Milwaukee, Wisconsin 53202
(Name and Address of Agent for Service)
Registrant's telephone number, including area code: 414-272-4650
Date of fiscal year end: 09/30/2024
Date of reporting period: 09/30/2024
Item 1. Report to Stockholders.
(a)
 | Nicholas II, Inc. |
This annual shareholder report contains important information about Nicholas II, Inc. (the "Fund") - Class I (the "Class") for the period of October 1, 2023 to September 30, 2024. You can find additional information about the Fund at www.nicholasfunds.com. You can also request this information by contacting us at 1-800-544-6547.
For the one-year period ended September 30, 2024, the Fund's Class I returned 21.54%.
Positioning
The Fund has historically been exposed to more stable growth companies relative to its benchmark, the Russell Midcap Growth Index. With this positioning, the Fund generally lags in strong equity returns environments such as those observed in the last fiscal year.
Performance
The Fund's Class I posted a positive return during the period, while underperforming relative to its benchmark. Overall equity market returns were strong due to reasonably strong earnings growth, a stable employment picture and the anticipation of accommodative Federal Reserve action, with the first cut of this cycle occurring at the September 2024 Federal Open Markets Committee meeting. These factors also helped the Fund's performance.
What factors influenced performance?
The fiscal year was marked by strong equity performance, including relative strength in interest rate-sensitive sectors such as financials and real estate where the Fund had less exposure than its benchmark.
Top Contributors:
The largest contributors to the Fund's performance were the lack of exposure to the energy sector and positive security selection within communication services.
Individual name contributors (contribution to return basis):
Top Detractors:
Negative security selection within the consumer discretionary and information technology sectors detracted from the Fund's performance. Cash held within the Fund was also a 98 basis point drag on performance for the fiscal year.
Individual name detractors (contribution to return basis):
Investment styles can cycle in and out of favor, and our style with a focus on higher quality businesses with sustainable competitive advantages while being cognizant of the price paid has been out of favor during the current market cycle's infatuation with "growth at any price" technology stocks. We remain focused on owning what we believe are high-quality growth companies with sustainable competitive advantages, consistent revenue and earnings growth, strong balance sheets, operated by responsible management teams, and that are trading at reasonable valuations.
| 09/30/2014 | 100000 | 100000 | 100000 | 100000 |
| 09/30/2015 | 105346 | 99752 | 101448 | 99505 |
| 09/30/2016 | 112132 | 113966 | 112852 | 114395 |
| 09/30/2017 | 133457 | 131430 | 132963 | 135795 |
| 09/30/2018 | 156285 | 149804 | 161020 | 159667 |
| 09/30/2019 | 171863 | 154576 | 169398 | 164326 |
| 09/30/2020 | 185349 | 161613 | 208752 | 188977 |
| 09/30/2021 | 241437 | 223200 | 272319 | 249214 |
| 09/30/2022 | 196740 | 179912 | 191989 | 205284 |
| 09/30/2023 | 223944 | 204103 | 225523 | 247288 |
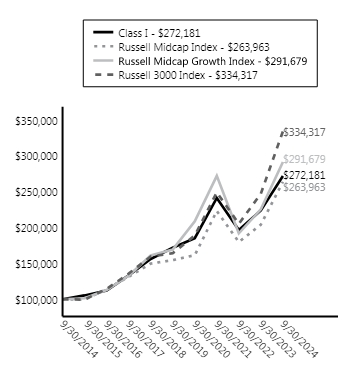
| 09/30/2024 | 272181 | 263963 | 291679 | 334317 |
The Russell 3000 Index measures the performance of the largest 3,000 US companies designed to represent approximately 98% of the investable US equity market.
The Russell Midcap Index measures the performance of the 800 smallest companies in the Russell 1000 Index, which represent approximately 27% of the total market capitalization of the Russell 1000 Index. The Russell Midcap Growth Index measures the performance of those Russell Midcap companies with higher price-to-book ratios and higher forecasted growth values.
The following graph compares the performance of the Class to that of the Russell 3000 Index, the Russell Midcap Index and the Russell Midcap Growth Index. The indices are not available for investment and are unmanaged. The returns for the indices do not reflect charges, expenses or taxes but do include the reinvestment of dividends, if any. The comparison is shown for illustrative purposes only.
| Nicholas II, Inc. - Class I | 21.54% | 9.63% | 10.53% |
| Russell 3000 Index | 35.19% | 15.26% | 12.83% |
| Russell Midcap Growth Index | 29.33% | 11.48% | 11.30% |
| Russell Midcap Index | 29.33% | 11.30% | 10.19% |
The performance data quoted represents past performance and are no guarantee of future performance. The investment return and principal value of the an investment will fluctuate so that an investment, when redeemed, may be worth more or less than its original cost. The performance data includes reinvestment of all dividends and distributions but does not reflect the deduction of taxes that a shareholder would pay on fund distributions or the redemption of fund shares. Performance data current to the most recent month-end may be obtained by visiting www.nicholasfunds.com/returns.html.
| Net Assets | $1,122,200,651 |
| Number of Portfolio Holdings | 65 |
| Portfolio Turnover Rate | 9.52% |
| Total Advisory Fees Paid | $5,507,273 |
| O'Reilly Automotive, Inc. | 2.78% |
| TransUnion | 2.52% |
| CyberArk Software Ltd. | 2.33% |
| Gartner, Inc. | 2.21% |
| Vulcan Materials Company | 2.15% |
| Dynatrace, Inc. | 2.09% |
| AMETEK, Inc. | 2.06% |
| BJ's Wholesale Club Holdings, Inc. | 2.01% |
| Mettler-Toledo International Inc. | 2.00% |
| CDW Corporation | 1.98% |
| Total of top ten | 22.13% |
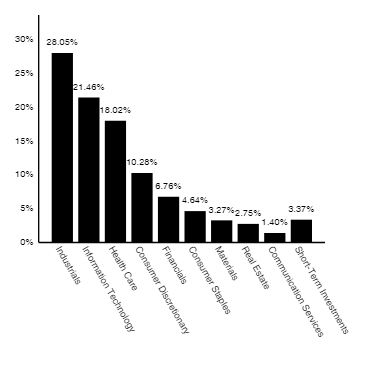
| Industrials | 28.05% |
| Information Technology | 21.46% |
| Health Care | 18.02% |
| Consumer Discretionary | 10.28% |
| Financials | 6.76% |
| Consumer Staples | 4.64% |
| Materials | 3.27% |
| Real Estate | 2.75% |
| Communication Services | 1.40% |
| Short-Term Investments | 3.37% |
Additional information is available on the Fund's website, www.nicholasfunds.com, including its:
prospectus
financial information
proxy voting information
Mailings of your shareholder documents may be householded indefinitely unless you instruct us otherwise. If you do not want the mailing of these documents to be combined with those of other members of your household, please call the Fund at 1-800-544-6547.
| Nicholas II, Inc. |
This annual shareholder report contains important information about Nicholas II, Inc. (the "Fund") - Class N (the "Class") for the period of October 1, 2023 to September 30, 2024. You can find additional information about the Fund at www.nicholasfunds.com. You can also request this information by contacting us at 1-800-544-6547.
For the one-year period ended September 30, 2024, the Fund's Class N returned 21.18%.
Positioning
The Fund has historically been exposed to more stable growth companies relative to its benchmark, the Russell Midcap Growth Index. With this positioning, the Fund generally lags in strong equity returns environments such as those observed in the last fiscal year.
Performance
The Fund's Class I posted a positive return during the period, while underperforming relative to its benchmark. Overall equity market returns were strong due to reasonably strong earnings growth, a stable employment picture and the anticipation of accommodative Federal Reserve action, with the first cut of this cycle occurring at the September 2024 Federal Open Markets Committee meeting. These factors also helped the Fund's performance.
What factors influenced performance?
The fiscal year was marked by strong equity performance, including relative strength in interest rate-sensitive sectors such as financials and real estate where the Fund had less exposure than its benchmark.
Top Contributors:
The largest contributors to the Fund's performance were the lack of exposure to the energy sector and positive security selection within communication services.
Individual name contributors (contribution to return basis):
Top Detractors:
Negative security selection within the consumer discretionary and information technology sectors detracted from the Fund's performance. Cash held within the Fund was also a 98 basis point drag on performance for the fiscal year.
Individual name detractors (contribution to return basis):
Investment styles can cycle in and out of favor, and our style with a focus on higher quality businesses with sustainable competitive advantages while being cognizant of the price paid has been out of favor during the current market cycle's infatuation with "growth at any price" technology stocks. We remain focused on owning what we believe are high-quality growth companies with sustainable competitive advantages, consistent revenue and earnings growth, strong balance sheets, operated by responsible management teams, and that are trading at reasonable valuations.
| 09/30/2014 | 10000 | 10000 | 10000 | 10000 |
| 09/30/2015 | 10500 | 9975 | 10145 | 9951 |
| 09/30/2016 | 11136 | 11397 | 11285 | 11440 |
| 09/30/2017 | 13208 | 13143 | 13296 | 13579 |
| 09/30/2018 | 15420 | 14980 | 16102 | 15967 |
| 09/30/2019 | 16892 | 15458 | 16940 | 16433 |
| 09/30/2020 | 18166 | 16161 | 20875 | 18898 |
| 09/30/2021 | 23588 | 22320 | 27232 | 24921 |
| 09/30/2022 | 19165 | 17991 | 19199 | 20528 |
| 09/30/2023 | 21751 | 20410 | 22552 | 24729 |
| 09/30/2024 | 26358 | 26396 | 29168 | 33432 |
The Russell 3000 Index measures the performance of the largest 3,000 US companies designed to represent approximately 98% of the investable US equity market.
The Russell Midcap Index measures the performance of the 800 smallest companies in the Russell 1000 Index, which represent approximately 27% of the total market capitalization of the Russell 1000 Index. The Russell Midcap Growth Index measures the performance of those Russell Midcap companies with higher price-to-book ratios and higher forecasted growth values.
The following graph compares the performance of the Class to that of the Russell 3000 Index, the Russell Midcap Index and the Russell Midcap Growth Index. The indices are not available for investment and are unmanaged. The returns for the indices do not reflect charges, expenses or taxes but do include the reinvestment of dividends, if any. The comparison is shown for illustrative purposes only.
| Nicholas II, Inc. - Class N | 21.18% | 9.31% | 10.18% |
| Russell 3000 Index | 35.19% | 15.26% | 12.83% |
| Russell Midcap Growth Index | 29.33% | 11.48% | 11.30% |
| Russell Midcap Index | 29.33% | 11.30% | 10.19% |
The performance data quoted represents past performance and are no guarantee of future performance. The investment return and principal value of the an investment will fluctuate so that an investment, when redeemed, may be worth more or less than its original cost. The performance data includes reinvestment of all dividends and distributions but does not reflect the deduction of taxes that a shareholder would pay on fund distributions or the redemption of fund shares. Performance data current to the most recent month-end may be obtained by visiting www.nicholasfunds.com/returns.html.
| Net Assets | $1,122,200,651 |
| Number of Portfolio Holdings | 65 |
| Portfolio Turnover Rate | 9.52% |
| Total Advisory Fees Paid | $5,507,273 |
| O'Reilly Automotive, Inc. | 2.78% |
| TransUnion | 2.52% |
| CyberArk Software Ltd. | 2.33% |
| Gartner, Inc. | 2.21% |
| Vulcan Materials Company | 2.15% |
| Dynatrace, Inc. | 2.09% |
| AMETEK, Inc. | 2.06% |
| BJ's Wholesale Club Holdings, Inc. | 2.01% |
| Mettler-Toledo International Inc. | 2.00% |
| CDW Corporation | 1.98% |
| Total of top ten | 22.13% |
| Industrials | 28.05% |
| Information Technology | 21.46% |
| Health Care | 18.02% |
| Consumer Discretionary | 10.28% |
| Financials | 6.76% |
| Consumer Staples | 4.64% |
| Materials | 3.27% |
| Real Estate | 2.75% |
| Communication Services | 1.40% |
| Short-Term Investments | 3.37% |

Additional information is available on the Fund's website, www.nicholasfunds.com, including its:
prospectus
financial information
proxy voting information
Mailings of your shareholder documents may be householded indefinitely unless you instruct us otherwise. If you do not want the mailing of these documents to be combined with those of other members of your household, please call the Fund at 1-800-544-6547.
Russell 3000 Index
Russell 3000 Index
Russell Midcap Index
Russell Midcap Index
Russell Midcap Growth Index
Russell Midcap Growth Index
(b) Not applicable.
Item 2. Code of Ethics.
(a) The registrant has adopted a Code of Ethics that applies to the registrant’s principal executive officer and principal financial officer.
(b) Not applicable.
(c) During the period covered by the report, there were no amendments to the provisions of the Code of Ethics adopted in Item 2(a) above.
(d) During the period covered by the report, no implicit or explicit waivers were made with respect to the provisions of the Code of Ethics adopted in Item 2(a) above.
(e) Not applicable.
(f) The registrant’s Code of Ethics is attached as Exhibit 19(a)(1) to this Form N-CSR.
Item 3. Audit Committee Financial Expert.
The Fund's Board of Directors has determined that Mr. David P. Pelisek, an independent director, qualifies as an audit committee financial expert as that term is defined for purposes of this item. He was selected as the Fund’s Audit Committee Financial Expert at the Fund’s Board of Directors Meeting held on February 3, 2020.
Item 4. Principal Accountant Fees and Services.
(a) Audit Fees. The aggregate fees billed for each of the last two fiscal years (the "Reporting Periods") for professional services rendered by the Fund's principal accountant (the "Auditor") for the audit of the Fund's annual financial statements, or services that are normally provided by the Auditor in connection with the statutory and regulatory filings or engagements for the Reporting Periods, were $34,363 in 2024 and $36,430 in 2023.
(b) Audit-Related Fees. There were no fees billed in each of the last two fiscal years for assurance and related services rendered by the Auditor to the Fund that are reasonably related to the performance of the audit of the Fund's financial statements and are not reported under paragraph (a) of this Item 4.
(c) Tax Fees. The aggregate fees billed in the Reporting Periods for professional services rendered by the Auditor for tax compliance, tax advice and tax planning ("Tax Services") were $6,355 in 2024 and $6,170 in 2023. These services consisted of (i) review or preparation of U.S. federal, state, local and excise tax returns; (ii) U.S. federal, state and local tax planning, advice and assistance regarding statutory, regulatory or administrative developments, (iii) tax advice regarding tax qualification matters and/or treatment of various financial instruments held or proposed to be acquired or held.
(d) All Other Fees. The aggregate fees billed for professional services rendered by the Auditor to the Fund's investment adviser were approximately $21,680 in 2023 and $20,650 in 2022. These services were for the audit of the investment adviser for the adviser's fiscal year ended 10/31/2023 and 10/31/2022, respectively.
(e) (1) Audit Committee Pre-Approval Policies and Procedures. The Fund's Board of Director's has not adopted any pre-approval policies and procedures as described in paragraph (c)(7) of Rule 2-01 of Regulation S-X. The Fund's Board of Directors meets with the Auditors and management to review and authorize the Auditor's engagements for audit and non-audit services to the Fund and its Adviser prior to each engagement.
(e) (2) The percentage of services described in each of paragraphs (b) through (d) of this Item that were approved by the audit committee pursuant to paragraph (c)(7)(i)(C) of Rule 2-01 of Regulation S-X are as follows:
(b) N/A
(c) N/A
(d) N/A
(f) No disclosures are required by this Item 4(f).
(g) There were no non-audit fees billed in each of the last two fiscal years by the Auditor for services rendered to the Fund or the Fund's investment adviser that provides ongoing services.
(h) No disclosures are required by this Item 4(h).
(i) Not applicable.
(j) Not applicable.
Item 5. Audit Committee of Listed Registrants.
Not applicable to this filing.
Item 6. Investments.
The schedule of investments in securities of unaffiliated issuers is included as part of the financial statements and financial highlights for open-end management investment companies under Item 7 of this Form N-CSR.
Item 7. Financial Statements and Financial Highlights for Open-End Management Investment Companies.

Financial Highlights Class I (NCTWX) For a share outstanding throughout each period |
| | | Years Ended September 30, | |
| | | 2024 | | | 2023 | | | 2022 | | | 2021 | | | 2020 | |
NET ASSET VALUE, BEGINNING OF PERIOD | | $ | 29.22 | | | $ | 26.69 | | | $ | 35.98 | | | $ | 28.68 | | | $ | 29.61 | |
INCOME (LOSS) FROM INVESTMENT OPERATIONS | | | | | | | | | | | | | | | | | | | | |
Net investment income (1) | | | .09 | | | | .11 | | | | .05 | | | | .05 | | | | .07 | |
Net gain (loss) on securities (realized and unrealized) | | | 6.19 | | | | 3.50 | | | | (5.90 | ) | | | 8.45 | | | | 2.21 | |
Total from investment operations | | | 6.28 | | | | 3.61 | | | | (5.85 | ) | | | 8.50 | | | | 2.28 | |
| | | | | | | | | | | | | | | | | | | | | |
LESS DISTRIBUTIONS | | | | | | | | | | | | | | | | | | | | |
From net investment income | | | (.12 | ) | | | (.06 | ) | | | (.05 | ) | | | (.05 | ) | | | (.11 | ) |
From net capital gain | | | (.12 | ) | | | (1.02 | ) | | | (3.39 | ) | | | (1.15 | ) | | | (3.10 | ) |
Total distributions | | | (.24 | ) | | | (1.08 | ) | | | (3.44 | ) | | | (1.20 | ) | | | (3.21 | ) |
| | | | | | | | | | | | | | | | | | | | | |
NET ASSET VALUE, END OF PERIOD | | $ | 35.26 | | | $ | 29.22 | | | $ | 26.69 | | | $ | 35.98 | | | $ | 28.68 | |
| | | | | | | | | | | | | | | | | | | | | |
TOTAL RETURN | | | 21.54 | % | | | 13.83 | % | | | (18.51 | )% | | | 30.26 | % | | | 7.85 | % |
| | | | | | | | | | | | | | | | | | | | | |
SUPPLEMENTAL DATA | | | | | | | | | | | | | | | | | | | | |
Net assets, end of period (millions) | | $ | 1,041.6 | | | $ | 882.4 | | | $ | 798.8 | | | $ | 1,031.3 | | | $ | 847.7 | |
Ratio of expenses to average net assets | | | .59 | % | | | .60 | % | | | .59 | % | | | .59 | % | | | .60 | % |
Ratio of net investment income to average net assets | | | .27 | % | | | .39 | % | | | .15 | % | | | .15 | % | | | .25 | % |
Portfolio turnover rate | | | 9.52 | % | | | 6.26 | % | | | 15.76 | % | | | 19.57 | % | | | 22.89 | % |
| (1) | Computed based on average shares outstanding. |
The accompanying notes to financial statements are an integral part of these highlights.
- 1 -
Financial Highlights Class N (NNTWX) For a share outstanding throughout each period |
| | | Years Ended September 30, | |
| | | 2024 | | | 2023 | | | 2022 | | | 2021 | | | 2020 | |
NET ASSET VALUE, BEGINNING OF PERIOD | | $ | 28.16 | | | $ | 25.82 | | | $ | 34.97 | | | $ | 27.94 | | | $ | 28.91 | |
INCOME (LOSS) FROM INVESTMENT OPERATIONS | | | | | | | | | | | | | | | | | | | | |
Net investment income (loss) (1) | | | (.01 | ) | | | .03 | | | | (.05 | ) | | | (.05 | ) | | | (.01 | ) |
Net gain (loss) on securities (realized and unrealized) | | | 5.96 | | | | 3.38 | | | | (5.71 | ) | | | 8.23 | | | | 2.16 | |
Total from investment operations | | | 5.95 | | | | 3.41 | | | | (5.76 | ) | | | 8.18 | | | | 2.15 | |
| | | | | | | | | | | | | | | | | | | | | |
LESS DISTRIBUTIONS | | | | | | | | | | | | | | | | | | | | |
From net investment income | | | (.10 | ) | | | (.05 | ) | | | — | | | | — | | | | (.02 | ) |
From net capital gain | | | (.12 | ) | | | (1.02 | ) | | | (3.39 | ) | | | (1.15 | ) | | | (3.10 | ) |
Total distributions | | | (.22 | ) | | | (1.07 | ) | | | (3.39 | ) | | | (1.15 | ) | | | (3.12 | ) |
| | | | | | | | | | | | | | | | | | | | | |
NET ASSET VALUE, END OF PERIOD | | $ | 33.89 | | | $ | 28.16 | | | $ | 25.82 | | | $ | 34.97 | | | $ | 27.94 | |
| | | | | | | | | | | | | | | | | | | | | |
TOTAL RETURN | | | 21.18 | % | | | 13.49 | % | | | (18.75 | )% | | | 29.85 | % | | | 7.54 | % |
| | | | | | | | | | | | | | | | | | | | | |
SUPPLEMENTAL DATA | | | | | | | | | | | | | | | | | | | | |
Net assets, end of period (millions) | | $ | 80.6 | | | $ | 72.5 | | | $ | 70.1 | | | $ | 95.6 | | | $ | 85.0 | |
Ratio of expenses to average net assets | | | .90 | % | | | .91 | % | | | .89 | % | | | .89 | % | | | .90 | % |
Ratio of net investment income (loss) to average net assets | | | (.05 | )% | | | .08 | % | | | (.16 | )% | | | (.15 | )% | | | (.05 | )% |
Portfolio turnover rate | | | 9.52 | % | | | 6.26 | % | | | 15.76 | % | | | 19.57 | % | | | 22.89 | % |
| (1) | Computed based on average shares outstanding. |
The accompanying notes to financial statements are an integral part of these highlights.
- 2 -
Schedule of Investments September 30, 2024 |
| | Shares or
Principal
Amount | | | | Value | |
COMMON STOCKS — 96.65% | | | | |
| | | | | Communication Services - Media & Entertainment — 1.40% | | | | |
| | | 142,905 | | Trade Desk, Inc. Class A* | | $ | 15,669,533 | |
| | | | | | | | | |
| | | | | Consumer Discretionary - Consumer Discretionary Distribution & Retail — 5.88% | | | | |
| | | 46,070 | | Burlington Stores, Inc.* | | | 12,138,524 | |
| | | 108,565 | | CarMax, Inc.* | | | 8,400,760 | |
| | | 27,070 | | O’Reilly Automotive, Inc.* | | | 31,173,812 | |
| | | 36,740 | | Ulta Beauty Inc.* | | | 14,296,269 | |
| | | | | | | | 66,009,365 | |
| | | | | Consumer Discretionary - Consumer Services — 4.40% | | | | |
| | | 286,255 | | Chipotle Mexican Grill, Inc.* | | | 16,494,013 | |
| | | 32,870 | | Domino’s Pizza, Inc. | | | 14,138,702 | |
| | | 237,485 | | Service Corporation International | | | 18,744,691 | |
| | | | | | | | 49,377,406 | |
| | | | | Consumer Staples - Consumer Staples Distribution & Retail — 2.01% | | | | |
| | | 273,400 | | BJ’s Wholesale Club Holdings, Inc.* | | | 22,550,032 | |
| | | | | | | | | |
| | | | | Consumer Staples - Food, Beverage & Tobacco — 2.63% | | | | |
| | | 69,500 | | Constellation Brands, Inc. Class A | | | 17,909,455 | |
| | | 179,421 | | Lamb Weston Holdings, Inc. | | | 11,615,716 | |
| | | | | | | | 29,525,171 | |
| | | | | Financials - Banks — 1.02% | | | | |
| | | 246,480 | | Webster Financial Corporation | | | 11,488,433 | |
| | | | | | | | | |
| | | | | Financials - Financial Services — 5.73% | | | | |
| | | 70,110 | | Corpay, Inc.* | | | 21,927,604 | |
| | | 87,281 | | Jack Henry & Associates, Inc. | | | 15,408,588 | |
| | | 125,570 | | Northern Trust Corporation | | | 11,305,067 | |
| | | 128,340 | | Raymond James Financial, Inc. | | | 15,716,516 | |
| | | | | | | | 64,357,775 | |
| | | | | Health Care - Health Care Equipment & Services — 8.99% | | | | |
| | | 168,900 | | Cooper Companies, Inc.* | | | 18,636,426 | |
| | | 227,260 | | Globus Medical Inc Class A* | | | 16,258,180 | |
| | | 150,250 | | Hologic, Inc.* | | | 12,239,365 | |
The accompanying notes to financial statements are an integral part of this schedule.
- 3 -
Schedule of Investments (continued) September 30, 2024 |
| | Shares or
Principal
Amount | | | | Value | |
COMMON STOCKS — 96.65% (continued) | | | | |
| | | | | Health Care - Health Care Equipment & Services — 8.99% (continued) | | | | |
| | | 77,440 | | ResMed Inc. | | $ | 18,904,653 | |
| | | 83,254 | | STERIS plc | | | 20,192,425 | |
| | | 69,445 | | Veeva Systems Inc Class A* | | | 14,574,422 | |
| | | | | | | | 100,805,471 | |
| | | | | Health Care - Pharmaceuticals, Biotechnology & Life Sciences — 9.05% | | | | |
| | | 255,609 | | Bio-Techne Corporation | | | 20,430,827 | |
| | | 68,606 | | Charles River Laboratories International, Inc.* | | | 13,513,324 | |
| | | 83,070 | | IQVIA Holdings Inc* | | | 19,685,098 | |
| | | 14,964 | | Mettler-Toledo International Inc.* | | | 22,441,511 | |
| | | 118,455 | | Revvity, Inc. | | | 15,132,626 | |
| | | 515,270 | | Stevanato Group SpA | | | 10,305,400 | |
| | | | | | | | 101,508,786 | |
| | | | | Industrials - Capital Goods — 14.79% | | | | |
| | | 197,850 | | A. O. Smith Corporation | | | 17,772,865 | |
| | | 134,415 | | AMETEK, Inc. | | | 23,080,400 | |
| | | 211,025 | | Fastenal Company | | | 15,071,405 | |
| | | 238,700 | | Fortive Corp. | | | 18,840,591 | |
| | | 80,640 | | IDEX Corporation | | | 17,297,280 | |
| | | 61,005 | | L3Harris Technologies Inc | | | 14,511,259 | |
| | | 29,845 | | Lennox International Inc. | | | 18,035,035 | |
| | | 77,500 | | Nordson Corporation | | | 20,353,825 | |
| | | 115,797 | | Westinghouse Air Brake Technologies Corporation | | | 21,048,421 | |
| | | | | | | | 166,011,081 | |
| | | | | Industrials - Commercial & Professional Services — 11.69% | | | | |
| | | 89,700 | | Broadridge Financial Solutions, Inc. | | | 19,288,191 | |
| | | 98,875 | | Paylocity Holding Corp.* | | | 16,311,409 | |
| | | 146,233 | | RB Global, Inc. | | | 11,770,294 | |
| | | 81,615 | | Republic Services, Inc. | | | 16,391,557 | |
| | | 269,765 | | TransUnion | | | 28,244,395 | |
| | | 82,583 | | Verisk Analytics Inc | | | 22,128,941 | |
| | | 95,092 | | Waste Connections, Inc. | | | 17,004,351 | |
| | | | | | | | 131,139,138 | |
| | | | | Industrials - Transportation — 1.57% | | | | |
| | | 88,920 | | Old Dominion Freight Line, Inc. | | | 17,663,069 | |
| | | | | | | | | |
The accompanying notes to financial statements are an integral part of this schedule.
- 4 -
Schedule of Investments (continued) September 30, 2024 |
| | Shares or
Principal
Amount | | | | Value | |
COMMON STOCKS — 96.65% (continued) | | | | |
| | | | | Information Technology - Semiconductors & Semiconductor Equipment — 3.71% | | | | |
| | | 175,982 | | Lattice Semiconductor Corporation* | | $ | 9,339,365 | |
| | | 227,745 | | Microchip Technology Incorporated | | | 18,285,646 | |
| | | 141,740 | | Skyworks Solutions, Inc. | | | 13,999,660 | |
| | | | | | | | 41,624,671 | |
| | | | | Information Technology - Software & Services — 14.10% | | | | |
| | | 43,355 | | CrowdStrike Holdings, Inc. Class A* | | | 12,159,777 | |
| | | 89,607 | | CyberArk Software Ltd.* | | | 26,130,297 | |
| | | 438,343 | | Dynatrace, Inc.* | | | 23,438,200 | |
| | | 216,436 | | Elastic NV* | | | 16,613,627 | |
| | | 48,940 | | Gartner, Inc.* | | | 24,800,834 | |
| | | 196,417 | | Okta, Inc. Class A* | | | 14,601,640 | |
| | | 55,482 | | Palo Alto Networks, Inc.* | | | 18,963,748 | |
| | | 118,985 | | PTC Inc.* | | | 21,495,830 | |
| | | | | | | | 158,203,953 | |
| | | | | Information Technology - Technology Hardware & Equipment — 3.66% | | | | |
| | | 98,195 | | CDW Corporation | | | 22,221,528 | |
| | | 42,965 | | Teledyne Technologies Incorporated* | | | 18,804,062 | |
| | | | | | | | 41,025,590 | |
| | | | | Materials - Materials — 3.27% | | | | |
| | | 78,580 | | AptarGroup, Inc. | | | 12,587,730 | |
| | | 96,460 | | Vulcan Materials Company | | | 24,156,478 | |
| | | | | | | | 36,744,208 | |
| | | | | Real Estate - Real Estate Management & Development — 2.75% | | | | |
| | | 158,175 | | CBRE Group, Inc. Class A* | | | 19,689,624 | |
| | | 148,695 | | CoStar Group, Inc.* | | | 11,217,551 | |
| | | | | | | | 30,907,175 | |
| | | | | TOTAL COMMON STOCKS (cost $512,952,809) | | | 1,084,610,857 | |
| | | | | | | | | |
The accompanying notes to financial statements are an integral part of this schedule.
- 5 -
Schedule of Investments (continued) September 30, 2024 |
| | Shares or
Principal
Amount | | | | Value | |
SHORT-TERM INVESTMENTS — 3.38% | | | | |
| | | | | Money Market Deposit Account — 0.70% | | | | |
| | $ | 7,878,139 | | U.S. Bank Money Market - 4.70% | | $ | 7,878,139 | |
| | | | | | | | | |
| | | | | Money Market Fund — 1.34% | | | | |
| | | 15,000,000 | | Morgan Stanley Institutional Liquidity Funds Government Portfolio (Institutional Class), 7-day net yield, 4.85% | | | 15,000,000 | |
| | | | | | | | | |
| | | | | U.S. Government Security — 1.34% | | | | |
| | | 15,000,000 | | U.S. Treasury Bill 10/01/2024, (1) | | | 15,000,000 | |
| | | | | | | | | |
| | | | | TOTAL SHORT-TERM INVESTMENTS (cost $37,878,139) | | | 37,878,139 | |
| | | | | TOTAL INVESTMENTS (cost $550,830,948) — 100.03% | | | 1,122,488,996 | |
| | | | | LIABILITIES, NET OF OTHER ASSETS — (0.03)% | | | (288,345 | ) |
| | | | | TOTAL NET ASSETS (basis of percentages disclosed above) — 100% | | $ | 1,122,200,651 | |
| * | Non-income producing security. |
| (1) | The Treasury Bill has reached full maturity. |
The accompanying notes to financial statements are an integral part of this schedule.
- 6 -
Statement of Assets and Liabilities September 30, 2024 |
ASSETS | | | | |
Investments in securities at value (cost $550,830,948) | | $ | 1,122,488,996 | |
Receivables | | | | |
Dividend and interest | | | 321,809 | |
Capital stock subscription | | | 52,114 | |
Total receivables | | | 373,923 | |
Other | | | 47,044 | |
Total assets | | | 1,122,909,963 | |
| | | | | |
LIABILITIES | | | | |
Payables | | | | |
Due to adviser | | | | |
Management fee | | | 466,093 | |
Accounting and administration fee | | | 14,908 | |
Total due to adviser | | | 481,001 | |
Capital stock redemption | | | 92,757 | |
12b-1 and servicing fee | | | 29,809 | |
Other payable and accrued expense | | | 105,745 | |
Total liabilities | | | 709,312 | |
Total net assets | | $ | 1,122,200,651 | |
| | | | | |
NET ASSETS CONSIST OF | | | | |
Paid in capital | | $ | 514,725,313 | |
Accumulated distributable earnings | | | 607,475,338 | |
Total net assets | | $ | 1,122,200,651 | |
| | | | | |
CLASS I | | | | |
Net assets | | $ | 1,041,601,747 | |
Shares outstanding | | | 29,537,785 | |
NET ASSET VALUE PER SHARE ($.01 par value, 125,000,000 shares authorized), offering price and redemption price | | $ | 35.26 | |
| | | | | |
CLASS N | | | | |
Net assets | | $ | 80,598,904 | |
Shares outstanding | | | 2,378,576 | |
NET ASSET VALUE PER SHARE ($.01 par value, 75,000,000 shares authorized), offering price and redemption price | | $ | 33.89 | |
The accompanying notes to financial statements are an integral part of this statement.
- 7 -
Statement of Operations For the year ended September 30, 2024 |
INCOME | | | | |
Dividend (net of foreign taxes of $47,031) | | $ | 7,034,797 | |
Interest | | | 2,118,647 | |
Total income | | | 9,153,444 | |
| | | | | |
EXPENSES | | | | |
Management fee | | | 5,507,273 | |
Transfer agent fees | | | 198,165 | |
12b-1 fees - Class N | | | 187,578 | |
Administration services | | | 175,965 | |
Accounting and pricing services | | | 101,777 | |
Servicing fees - Class N | | | 63,540 | |
Registration fees | | | 56,876 | |
Custodian fees | | | 53,263 | |
Audit and tax fees | | | 41,321 | |
Insurance | | | 38,826 | |
Directors’ fees | | | 25,695 | |
Printing | | | 17,833 | |
Postage and mailing | | | 16,956 | |
Legal fees | | | 12,812 | |
Other operating expenses | | | 19,124 | |
Total expenses | | | 6,517,004 | |
Net investment income | | | 2,636,440 | |
| | | | | |
NET REALIZED GAIN ON INVESTMENTS | | | 38,382,905 | |
| | | | | |
CHANGE IN NET UNREALIZED APPRECIATION/DEPRECIATION ON INVESTMENTS | | | 162,082,517 | |
Net realized and unrealized gain (loss) on investments | | | 200,465,422 | |
Net increase (decrease) in net assets resulting from operations | | $ | 203,101,862 | |
The accompanying notes to financial statements are an integral part of this statement.
- 8 -
Statements of Changes in Net Assets For the years ended September 30, 2024 and 2023 |
| | | Year Ended
9/30/2024 | | | Year Ended
9/30/2023 | |
INCREASE (DECREASE) IN NET ASSETS FROM OPERATIONS | | | | | | | | |
Net investment income | | $ | 2,636,440 | | | $ | 3,526,562 | |
Net realized gain on investments | | | 38,382,905 | | | | 7,185,745 | |
Change in net unrealized appreciation/depreciation on investments | | | 162,082,517 | | | | 107,541,048 | |
Net increase (decrease) in net assets resulting from operations | | | 203,101,862 | | | | 118,253,355 | |
| | | | | | | | | |
DISTRIBUTIONS TO SHAREHOLDERS FROM | | | | | | | | |
Investment operations - Class I | | | (7,079,407 | ) | | | (32,017,621 | ) |
Investment operations - Class N | | | (555,387 | ) | | | (2,841,109 | ) |
Total distributions | | | (7,634,794 | ) | | | (34,858,730 | ) |
| | | | | | | | | |
CAPITAL SHARE TRANSACTIONS | | | | | | | | |
Proceeds from shares issued - Class I (808,852 and 707,152 shares, respectively) | | | 26,619,902 | | | | 21,351,042 | |
Reinvestment of distributions - Class I (194,620 and 1,072,426 shares, respectively) | | | 6,399,104 | | | | 29,148,550 | |
Cost of shares redeemed - Class I (1,668,887 and 1,502,619 shares, respectively) | | | (54,993,731 | ) | | | (43,700,915 | ) |
Proceeds from shares issued - Class N (110,866 and 50,775 shares, respectively) | | | 3,583,219 | | | | 1,433,137 | |
Reinvestment of distributions - Class N (17,368 and 107,402 shares, respectively) | | | 550,042 | | | | 2,819,297 | |
Cost of shares redeemed - Class N (326,112 and 297,378 shares, respectively) | | | (10,405,825 | ) | | | (8,345,249 | ) |
Change in net assets derived from capital share transactions | | | (28,247,289 | ) | | | 2,705,862 | |
Total increase (decrease) in net assets | | | 167,219,779 | | | | 86,100,487 | |
| | | | | | | | | |
NET ASSETS | | | | | | | | |
Beginning of period | | | 954,980,872 | | | | 868,880,385 | |
End of period | | $ | 1,122,200,651 | | | $ | 954,980,872 | |
The accompanying notes to financial statements are an integral part of these statements.
- 9 -
Notes to Financial Statements September 30, 2024 |
(1) | Summary of Significant Accounting Policies — |
Nicholas II, Inc. (the “Fund”) is organized as a Maryland corporation and is registered as an open-end, diversified management investment company under the Investment Company Act of 1940, as amended. The primary objective of the Fund is long-term growth. The following is a summary of the significant accounting policies of the Fund:
| | (a) | Equity securities traded on a stock exchange will ordinarily be valued on the basis of the last sale price on the date of valuation on the securities principal exchange, or if in the absence of any sale on that day, the closing bid price. For securities principally traded on the NASDAQ market, the Fund uses the NASDAQ Official Closing Price. Investments in shares of open-end mutual funds, including money market funds, are valued at their daily closing net asset value. Debt securities, excluding short-term investments, are valued at their current evaluated bid price as determined by an independent pricing service, which generates evaluations on the basis of dealer quotes for normal institutional-sized trading units, issuer analysis, bond market activity and various other factors. Short-term investments are valued using evaluated bid prices. Securities for which market quotations may not be readily available are valued at their fair value as determined in good faith by procedures adopted by the Board of Directors. The Board of Directors has delegated fair value responsibilities to Nicholas Company, Inc., the Fund’s adviser. The Fund did not maintain any positions in derivative instruments or engage in hedging activities during the period. Investment transactions for financial statement purposes are recorded on trade date. |
In accordance with Accounting Standards Codification (“ASC”) 820-10, “Fair Value Measurement” (“ASC 820-10”), fair value is defined as the price that the Fund would receive upon selling an investment in a timely transaction to an independent buyer in the principal or most advantageous market of the investment. ASC 820-10 established a three-tier hierarchy to maximize the use of observable market data and minimize the use of unobservable inputs and to establish classification of fair value measurements for disclosure purposes. Inputs refer broadly to the assumptions that market participants would use in pricing the asset or liability, including assumptions about risk, for example, the risk inherent in a particular valuation technique used to measure fair value such as a pricing model and/or the risk inherent in the inputs to the valuation technique. Inputs may be observable or unobservable. Observable inputs are inputs that reflect the assumptions market participants would use in pricing the asset or liability based on market data obtained from sources independent of the reporting entity. Unobservable inputs are inputs that reflect the reporting entity’s own assumptions about the assumptions market participants would use in pricing the asset or liability based on the best information available in the circumstances. The three-tier hierarchy of inputs is summarized in the three broad levels listed below.
| | Level 1 - | quoted prices in active markets for identical investments |
- 10 -
Notes to Financial Statements (continued) September 30, 2024 |
| | Level 2 - | other significant observable inputs (including quoted prices for similar investments, interest rates, benchmark yields, bids, offers, transactions, spreads and other relationships observed in the markets among market securities, underlying equity of the issuer, proprietary pricing models, credit risk, etc.) |
| | Level 3 - | significant unobservable inputs (including the Fund’s own assumptions in determining the fair value of investments) |
The inputs or methodology used for valuing securities are not necessarily an indication of the risk associated with investing in those securities.
The following is a summary of the inputs used as of September 30, 2024 in valuing the Fund’s investments carried at value:
Valuation Inputs | | Investments
in Securities | |
Level 1 — | | | | |
Common Stocks(1) | | $ | 1,084,610,857 | |
Money Market Deposit Account | | | 7,878,139 | |
Money Market Fund | | | 15,000,000 | |
Level 2 — | | | | |
U.S. Government Security | | | 15,000,000 | |
Level 3 — | | | | |
None | | | — | |
Total | | $ | 1,122,488,996 | |
| | (1) | See Schedule of Investments for further detail by industry. |
The Fund did not hold any Level 3 investments during the period.
| | (b) | Net realized gain (loss) on portfolio securities was computed on the basis of specific identification. |
| | (c) | Dividend income is recorded on the ex-dividend date, and interest income is recognized on an accrual basis. Non-cash dividends, if any, are recorded at value on date of distribution. Generally, discounts and premiums on long-term debt security purchases, if any, are amortized over the expected lives of the respective securities using the effective yield method. |
Investment income, net capital gains (losses) and all expenses incurred by the Fund are allocated based on the relative net assets of each class, except for 12b-1 fees and shareholder servicing fees and certain other fees and expenses related to one class of shares.
Class N shares are subject to a 0.25% 12b-1 fee and a 0.10% servicing fee, as described in its prospectus. During the period, the 12b-1 fee was 0.24% through May 14, 2024. From May 15, 2024 through period end, the 12b-1 fee was 0.23%.
- 11 -
Notes to Financial Statements (continued) September 30, 2024 |
During the period, the service fee was 0.08%. Income, expenses (other than expenses attributable to a specific class), and realized and unrealized gains and losses are allocated daily to each class of shares based upon the relative net asset value of outstanding shares.
| | (d) | Provision has not been made for federal income taxes or excise taxes since the Fund has elected to be taxed as a “regulated investment company” and intends to distribute substantially all net investment income and net realized capital gains on sales of investments to its shareholders and otherwise comply with the provisions of Subchapter M of the Internal Revenue Code applicable to regulated investment companies. |
| | (e) | Dividends and distributions paid to shareholders are recorded on the ex-dividend date. Distributions from net investment income are generally declared and paid at least annually. Distributions of net realized capital gain, if any, are declared and paid at least annually. |
The amount of distributions from net investment income and net realized capital gain are determined in accordance with federal income tax regulations, which may differ from U.S. generally accepted accounting principles (“U.S. GAAP”) for financial reporting purposes. Financial reporting records are adjusted for permanent book-to-tax differences to reflect tax character. These reclassifications have no effect on net assets or net asset value per share. At September 30, 2024, reclassifications were recorded to decrease accumulated undistributed net realized gain by $1,355,297, and increase paid in capital by $1,355,297.
The tax character of distributions paid during the years ended September 30, was as follows:
| | | 09/30/2024 | | | 09/30/2023 | |
Distributions paid from: | | | | | | | | |
Ordinary income | | $ | 3,679,901 | | | $ | 2,013,644 | |
Long-term capital gain | | | 3,954,893 | | | | 32,845,086 | |
Total distributions paid | | $ | 7,634,794 | | | $ | 34,858,730 | |
- 12 -
Notes to Financial Statements (continued) September 30, 2024 |
As of September 30, 2024, investment cost for federal tax purposes was $550,830,948 and the tax basis components of net assets were as follows:
Unrealized appreciation | | $ | 576,482,833 | |
Unrealized depreciation | | | (4,824,785 | ) |
Net unrealized appreciation | | | 571,658,048 | |
Undistributed ordinary income | | | 1,720,476 | |
Accumulated undistributed net realized capital gains | | | 34,096,812 | |
Other accumulated gain/(loss) | | | 2 | |
Paid in capital | | | 514,725,313 | |
Net assets | | $ | 1,122,200,651 | |
There were no differences between U.S. GAAP financial statement and tax-basis cost.
The Fund had no material uncertain tax positions and has not recorded a liability for unrecognized tax benefits as of September 30, 2024. Also, the Fund recognized no interest and penalties related to uncertain tax benefits during the period ended September 30, 2024. At September 30, 2024, the fiscal years 2021 through 2024 remain open to examination in the Fund’s major tax jurisdictions.
| | (f) | The Fund is considered an investment company under U.S. GAAP and follows the accounting and reporting guidance applicable to investment companies in the Financial Accounting Standards Board (“FASB”) ASC 946, “Financial Services - Investment Companies.” U.S. GAAP guidance requires management to make estimates and assumptions that effect the amounts reported in the financial statements and accompanying notes. Actual results could differ from estimates. |
| | (g) | In the normal course of business the Fund enters into contracts that contain general indemnification clauses. The Fund’s maximum exposure under these arrangements is unknown, as this would involve future claims against the Fund that have not yet occurred. Based on experience, the Fund expects the risk of loss to be remote. |
| | (h) | In connection with the preparation of the Fund’s financial statements, management evaluated subsequent events after the date of the Statement of Assets and Liabilities of September 30, 2024. There have been no material subsequent events since September 30, 2024 that would require adjustment to or additional disclosure in these financial statements. |
| | (a) | Investment Adviser and Management Agreement — |
The Fund has an agreement with Nicholas Company, Inc. (with whom certain officers and directors of the Fund are affiliated) (the “Adviser”) to serve as investment adviser and manager. Under the terms of the agreement, a monthly fee is paid to the Adviser based on an annualized fee of 0.75% of the average net
- 13 -
Notes to Financial Statements (continued) September 30, 2024 |
asset value up to and including $50 million, 0.60% of the average net asset value over $50 million up to and including $100 million and 0.50% of the average net asset value in excess of $100 million.
The Adviser may be paid for accounting and administrative services rendered by its personnel, subject to the following guidelines: (i) up to five basis points, on an annual basis, of the average net asset value of the Fund up to and including $2 billion and up to three basis points, on an annual basis, of the average net asset value of the Fund greater than $2 billion, based on the average net asset value of the Fund as determined by valuations made at the close of each business day of each month, and (ii) where the preceding calculation results in an annual payment of less than $50,000, the Adviser, in its discretion, may charge the Fund up to $50,000 for such services.
A director of the Adviser is affiliated with a law firm that provides services to the Fund. The Fund incurred expenses of $6,757 for the period ended September 30, 2024 for legal services rendered by this law firm.
(3) | Investment Transactions — |
For the period ended September 30, 2024, the cost of purchases and the proceeds from sales of investment securities, other than short-term obligations, aggregated $97,573,133 and $110,554,575, respectively.
- 14 -
Report of Independent Registered Public Accounting Firm |
To the shareholders and Board of Directors of Nicholas II, Inc.
Opinion on the Financial Statements and Financial Highlights
We have audited the accompanying statement of assets and liabilities of Nicholas II, Inc. (the “Fund”), including the schedule of investments, as of September 30, 2024, the related statement of operations for the year then ended, the statements of changes in net assets for each of the two years in the period then ended, the financial highlights for each of the five years in the period then ended, and the related notes. In our opinion, the financial statements and financial highlights present fairly, in all material respects, the financial position of the Fund as of September 30, 2024, and the results of its operations for the year then ended, the changes in its net assets for each of the two years in the period then ended, and the financial highlights for each of the five years in the period then ended, in conformity with accounting principles generally accepted in the United States of America.
Basis for Opinion
These financial statements and financial highlights are the responsibility of the Fund’s management. Our responsibility is to express an opinion on the Fund’s financial statements and financial highlights based on our audits. We are a public accounting firm registered with the Public Company Accounting Oversight Board (United States) (PCAOB) and are required to be independent with respect to the Fund in accordance with the U.S. federal securities laws and the applicable rules and regulations of the Securities and Exchange Commission and the PCAOB.
We conducted our audits in accordance with the standards of the PCAOB. Those standards require that we plan and perform the audit to obtain reasonable assurance about whether the financial statements and financial highlights are free of material misstatement, whether due to error or fraud. The Fund is not required to have, nor were we engaged to perform, an audit of its internal control over financial reporting. As part of our audits we are required to obtain an understanding of internal control over financial reporting but not for the purpose of expressing an opinion on the effectiveness of the Fund’s internal control over financial reporting. Accordingly, we express no such opinion.
Our audits included performing procedures to assess the risks of material misstatement of the financial statements and financial highlights, whether due to error or fraud, and performing procedures that respond to those risks. Such procedures included examining, on a test basis, evidence regarding the amounts and disclosures in the financial statements and financial highlights. Our audits also included evaluating the accounting principles used and significant estimates made by management, as well as evaluating the overall presentation of the financial statements and financial highlights. Our procedures included confirmation of securities owned as of September 30, 2024, by correspondence with the custodian. We believe that our audits provide a reasonable basis for our opinion.
/s/ Deloitte & Touche LLP
Milwaukee, Wisconsin
November 26, 2024
We have served as the auditor of one or more Nicholas investment companies since 1977.
- 15 -
Approval of Investment Advisory Contract (unaudited) |
A discussion of the Approval by the Board of Directors of the Fund’s Investment Advisory Contract can be found in the Fund’s Semiannual Report dated March 31, 2024.
Information on Proxy Voting (unaudited) |
A description of the policies and procedures that the Fund uses to determine how to vote proxies relating to portfolio securities is available, without charge, upon request by calling 800-544-6547 or 414-276-0535. It also appears in the Fund’s Statement of Additional Information, which can be found on the SEC’s website, www.sec.gov. A record of how the Fund voted its proxies for the most recent twelve-month period ended June 30, also is available on the Fund’s website, www.nicholasfunds.com, and the SEC’s website, www.sec.gov.
- 16 -
Nicholas Funds Services Offered (unaudited) |
A description of the policies and procedures that the Fund uses to determine how to vote proxies
● | Traditional | ● | SEP |
● | Roth | ● | SIMPLE |
● | Coverdell Education Savings Accounts |
● | Automatic Investment Plan |
● | Direct Deposit of Dividend and Capital Gain Distributions |
● | Systematic Withdrawal Plan |
● | Monthly Automatic Exchange between Funds |
● | Telephone Purchase and Redemption |
● | 24-hour Automated Account Information (800-544-6547) |
● | 24-hour Internet Account Access (www.nicholasfunds.com) |
Please call a shareholder representative for further information on the above services or with any other questions you may have regarding the Nicholas Funds.
Directors and Officers
DAVID O. NICHOLAS, President and Director
JOHN A. HAUSER, Director
DAVID P. PELISEK, Director
JULIE M. VAN CLEAVE, Director
BRIAN J. JANOWSKI, Senior Vice President
JENNIFER R. KLOEHN, Senior Vice President,
Treasurer and Chief Compliance Officer
LAWRENCE J. PAVELEC, Senior Vice President and Secretary
JEFFREY J. STRONG, Senior Vice President
Investment Adviser
NICHOLAS COMPANY, INC.
Milwaukee, Wisconsin
www.nicholasfunds.com
414-276-0535 or 800-544-6547
Accountant
Dividend Disbursing Agent
Transfer Agent
U.S. BANCORP FUND SERVICES, LLC
Milwaukee, Wisconsin
414-276-0535 or 800-544-6547
Distributor
QUASAR DISTRIBUTORS, LLC
Portland, Maine
Custodian
U.S. BANK N.A.
Milwaukee, Wisconsin
Independent Registered Public Accounting Firm
DELOITTE & TOUCHE LLP
Milwaukee, Wisconsin
Counsel
MICHAEL BEST & FRIEDRICH LLP
Milwaukee, Wisconsin
The Fund’s investment objectives, risks, charges and expenses must be considered carefully before investing. The statutory and summary prospectus contain this and other important information about the investment company, and it may be obtained by calling 1-800-544-6547 or visiting www.nicholasfunds.com. Please read the prospectus carefully before investing.
Item 8. Changes in and Disagreements with Accountants for Open-End Management Investment Companies. |
There have been no such changes in or disagreements with accountants as contemplated by Item 304 of Regulation S-K.
Item 9. Proxy Disclosures for Open-End Management Investment Companies. |
Not applicable for this reporting period.
Item 10. Remuneration Paid to Directors, Officers, and Others of Open-End Management Investment Companies. |
The remuneration paid to directors, officers, and others is disclosed in the Statement of Operations included under Item 7.(a) Financial Statements and Financial Highlights for Open-End Management Investment Companies of this Report.
Item 11. Statement Regarding Basis for Approval of Investment Advisory Contract. |
The basis for approval of the investment advisory contract is included under Item 7.(a) Financial Statements and Financial Highlights for Open-End Management Investment Companies of this Report.
Item 12. Disclosure of Proxy Voting Policies and Procedures for Closed-End Management Investment Companies.
Applicable only to closed-end funds.
Item 13. Portfolio Managers of Closed-End Management Investment Companies.
Applicable only to closed-end funds.
Item 14. Purchases of Equity Securities by Closed-End Management Investment Company and Affiliated Purchasers.
Applicable only to closed-end funds.
Item 15. Submission of Matters to a Vote of Security Holders.
There have been no material changes to the procedures by which shareholders may recommend nominees to the registrant’s board of directors.
Item 16. Controls and Procedures.
(a) The Fund’s principal executive officer and principal financial officer, or persons performing similar functions, have concluded that the registrant’s disclosure controls and procedures (as defined in Rule 30a-3(c) under the Investment Company Act of 1940, as amended (the “1940 Act”) are effective, based on their evaluation of these controls and procedures as of a date within 90 days of the filing date of the report that includes the disclosure required by this paragraph, based on their evaluation of these controls and procedures required by Rule 30a-3(b) under the 1940 Act and Rules 13a-15(b) or 15d-15(b) under the Securities Exchange Act of 1934, as amended.
(b) There were no changes in the registrant’s internal controls over financial reporting (as defined in Rule 30a-3(d) under the 1940 Act) that occurred during the period covered by this report that have materially affected, or are reasonably likely to materially affect, the registrant’s internal control over financial reporting.
Item 17. Disclosure of Securities Lending Activities for Closed-End Management Investment Companies.
Applicable only to closed-end funds.
Item 18. Recovery of Erroneously Awarded Compensation.
Not applicable to this filing.
Item 19. Exhibits.
(a)(1) Sarbanes-Oxley Code of Ethics for Principal Executive and Senior Financial Officers (that is the subject of the disclosure required by Item 2), attached hereto as EX-99.CODE ETH.
(a)(2) Not applicable to this filing.
(a)(3) Certifications of Principal Executive Officer and Principal Financial Officer pursuant to Rule 30a-2(a) under the Investment Company Act of 1940, attached hereto as EX-99.CERT.
(a)(4) Change in the registrant’s independent public accountant. Not applicable to this filing.
(b) Certifications of Principal Executive Officer and Principal Financial Officer pursuant to Rule 30a-2(b) under the Investment Company Act of 1940, attached hereto as EX-99.906 CERT.
SIGNATURES
Pursuant to the requirements of the Securities Exchange Act of 1934 and the Investment Company Act of 1940, the registrant has duly caused this report to be signed on its behalf by the undersigned, thereunto duly authorized.
(Registrant) Nicholas II, Inc.
| By: | /s/ David O. Nicholas | |
| Name: | David O. Nicholas | |
| Title: | Principal Executive Officer | |
Pursuant to the requirements of the Securities Exchange Act of 1934 and the Investment Company Act of 1940, this report has been signed by the following persons on behalf of the registrant and in the capacities and on the dates indicated.
| Title: | Principal Executive Officer | |
| By: | /s/ Jennifer R. Kloehn | |
| Title: | Principal Financial Officer | |