Item 1. Reports to Shareholders

Lehman Brothers
Income Funds
Investor Class Shares
Institutional Class Shares
Trust Class Shares
| Lehman Brothers Core Bond Fund | | Lehman Brothers New York Municipal Money Fund |
| Lehman Brothers High Income Bond Fund | | Lehman Brothers Short Duration Bond Fund |
| Lehman Brothers Municipal Money Fund | | Lehman Brothers Strategic Income Fund |
| Lehman Brothers Municipal Securities Trust | | Neuberger Berman Cash Reserves |
Annual Report
October 31, 2007
Contents
THE FUNDS
PORTFOLIO COMMENTARY
| Lehman Brothers Core Bond Fund | | | 2 | | |
|
| Lehman Brothers High Income Bond Fund | | | 5 | | |
|
| Lehman Brothers Municipal Money Fund | | | 8 | | |
|
| Lehman Brothers New York Municipal Money Fund | | | 8 | | |
|
| Lehman Brothers Municipal Securities Trust | | | 10 | | |
|
| Lehman Brothers Short Duration Bond Fund | | | 13 | | |
|
| Lehman Brothers Strategic Income Fund | | | 15 | | |
|
| Neuberger Berman Cash Reserves | | | 18 | | |
|
| FUND EXPENSE INFORMATION | | | 23 | | |
|
SCHEDULE OF INVESTMENTS
| Lehman Brothers Core Bond Fund | | | 26 | | |
|
| Lehman Brothers High Income Bond Fund | | | 32 | | |
|
| Lehman Brothers Municipal Money Fund | | | 37 | | |
|
| Lehman Brothers Municipal Securities Trust | | | 47 | | |
|
| Lehman Brothers New York Municipal Money Fund | | | 50 | | |
|
| Lehman Brothers Short Duration Bond Fund | | | 54 | | |
|
| Lehman Brothers Strategic Income Fund | | | 57 | | |
|
| Neuberger Berman Cash Reserves | | | 67 | | |
|
| FINANCIAL STATEMENTS | | | 74 | | |
|
The "Neuberger Berman" name and logo are registered service marks of Neuberger Berman, LLC. "Neuberger Berman Management Inc." and the individual fund names in this report are either service marks or registered service marks of Neuberger Berman Management Inc. ©2007 Neuberger Berman Management Inc. All rights reserved. ©2007 Lehman Brothers Asset Management LLC. All rights reserved.
FINANCIAL HIGHLIGHTS/PER SHARE DATA
| Lehman Brothers Core Bond Fund | | | 94 | | |
|
| Lehman Brothers High Income Bond Fund | | | 96 | | |
|
| Lehman Brothers Municipal Money Fund | | | 97 | | |
|
| Lehman Brothers Municipal Securities Trust | | | 98 | | |
|
| Lehman Brothers New York Municipal Money Fund | | | 99 | | |
|
| Lehman Brothers Short Duration Bond Fund | | | 100 | | |
|
| Lehman Brothers Strategic Income Fund | | | 102 | | |
|
| Neuberger Berman Cash Reserves | | | 104 | | |
|
| Reports of Independent Registered Public Accounting Firms | | | 107 | | |
|
| Directory | | | 109 | | |
|
| Trustees and Officers | | | 110 | | |
|
| Proxy Voting Policies and Procedures | | | 118 | | |
|
| Quarterly Portfolio Schedule | | | 118 | | |
|
| Notice to Shareholders | | | 118 | | |
|
| Board Consideration of the Management and Sub-Advisory Agreements | | | 119 | | |
|
The "Neuberger Berman" name and logo are registered service marks of Neuberger Berman, LLC. "Neuberger Berman Management Inc." and the individual fund names in this report are either service marks or registered service marks of Neuberger Berman Management Inc. ©2007 Neuberger Berman Management Inc. All rights reserved. ©2007 Lehman Brothers Asset Management LLC. All rights reserved.
Chairman's Letter
Dear Fellow Shareholder,
For much of the fiscal year ended October 31, 2007, bond investors enjoyed the fruits of a long "pause" in interest rate increases by the Federal Reserve. After ending its previous two-year monetary tightening cycle in June 2006, the Fed appeared to be successfully walking a fine line between moderating economic growth and limiting price inflation.
For its part, the fixed income market experienced a period of relatively low volatility and historically narrow spreads between Treasuries and other fixed income securities. Overall, bond investors appeared confident both that the economy was slowing and that the Fed's pause would turn out to be more permanent.
However, the placid environment did not last. Beginning in July, concern over the spreading impact of subprime mortgage defaults helped trigger a crisis environment in the credit markets. Investors moved rapidly to the safety of Treasury securities at the expense of other fixed income instruments, and many financial institutions became highly reluctant to lend to all but the safest borrowers.
Concerned that this "credit crunch" would drive the economy into recession, Federal Reserve Chairman Ben Bernanke showed that he was willing to employ the full array of policy tools at his disposal. The Fed injected liquidity into the banking system, lowered the Discount rate and accepted a wider range of collateral at the discount window before proceeding with cuts to its Fed Funds rate. When those cuts came, they were dramatic, starting with a 50 basis point reduction in September and another 25 basis point cut in October. Investors responded with some relief to these measures, as non-Treasury securities recovered somewhat through the end of the fiscal year, but the markets remained under stress.
Like the Fed chairman, our portfolio managers were willing to use all the tools available to them — to attempt to preserve principal, extract value and maintain risk control. In the midst of the summer volatility, strongly ingrained risk management techniques were decided advantages, while their focus on fundamental, ongoing credit research helped them maintain portfolios that they believe are positioned to weather ongoing credit concerns. In addition, an emphasis on economic forecasting enabled them to position duration effectively, while continued vigilance allowed them to react quickly and decisively during the tumultuous summer months and beyond.
Looking forward, the credit markets have not left all their problems in the rear view mirror. Subprime mortgage exposure remains a serious issue and tighter credit conditions suggest that a keen focus on research remains essential. There are, of course, no guarantees in the financial markets. However, you can be assured that your managers will continue to exercise sound judgment in navigating a still challenging environment.
Sincerely,

Peter Sundman
Chairman of the Board
Lehman Brothers Income Funds
1
Lehman Brothers Core Bond Fund Portfolio Commentary
For the fiscal year ended October 31, 2007, the Lehman Brothers Core Bond Fund generated a positive return but trailed its benchmark, the Lehman Brothers U.S. Aggregate Index.
After performing strongly throughout most of the year, the portfolio struggled in the last several months as portfolio holdings suffered price declines related to the credit crises that developed beginning in July. We remain confident that the issues we hold are fundamentally solid and we believe that we will recoup any value lost to date. In our view, this will happen either through principal repayment, as the cash flows on these securities are realized, or through price appreciation, when the market has time to discriminate regarding the quality of collateral and structural protection. However, we are probably going to have to endure further volatility over the balance of the year and into 2008 as the data on the economy, housing and subprime delinquencies/losses evolve.
The bond market rallied in late calendar 2006, with advances driven by a combination of slower economic growth (which encouraged bond investors) and an end to the Federal Reserve's two-year campaign to raise interest rates. The Fed remained on hold throughout most of fiscal 2007, with rates at 5.25%. The minutes from the Federal Open Market Committee's March meeting (released in April) indicated the Fed's reluctance to cut rates, given the level of inflation, despite the slowing of the economy.
However, reports in early July of the collapse of two mortgage-related hedge funds, combined with the downgrade of a number of subprime-related collateralized debt obligations, intensified investors' worries and prompted a flight to quality. In a six-week period from early July to mid-August, the two-year Treasury rose in price as its yield fell 100 basis points (or one percentage point) and spreads on some investment grade securities (compared to Treasury levels) widened 50 basis points or more, as price declines were exacerbated by the unwinding of leveraged positions by some investors. High yield spreads widened 180 basis points as prices on below-investment-grade securities declined while Treasury prices rose.
These severe conditions prompted the Fed to respond with all its policy tools, starting in mid-August with an infusion of new liquidity into the banking system and culminating in a 50 basis-point cut in the Fed Funds rate in mid-September and a further 25 basis-point cut in October. With these actions, non-Treasury sectors managed to recover modestly from mid-August through the end of the reporting period.
In terms of portfolio strategy, we made several duration moves throughout the period to take advantage of expectations for interest rates. We shortened portfolio duration (or sensitivity to interest rates) from neutral to a quarter-year below the benchmark in response to the late calendar 2006 rally, believing that the market's expectation for an imminent rate cut was overly optimistic. As the crisis intensified, we initiated a long duration position in advance of a seemingly unavoidable rate cut by the Federal Reserve. The portfolio is currently modestly longer than the benchmark.
Early in the fiscal year, we reduced our overall position in mortgage-backed securities, as mortgage spreads narrowed to 17-year lows but increased the position later in the period. As of fiscal year-end, mortgage-backed securities remain, at approximately 50%, a substantial part of the portfolio. After decreasing exposure to corporate debt and increasing exposure to U.S. Treasury securities throughout much of the period, we reversed this position as spreads widened, to end with holdings at close to the same levels of a year earlier, at approximately 18% and 9% of the portfolio, respectively. Portfolio holdings of U.S. government agency securities and asset-backed securities remained at approximately 9% and 11%, respectively, of the portfolio.
We continue to believe that the economy will avoid a recession, as the impact of housing on the overall economy is not as large as the bond market appears to think. Global growth, combined with the decline in the dollar, should provide enough balance and time for the U.S. to work through the problems presented by the mortgage market and current conditions in the credit markets.
RATING SUMMARY
AAA/Government/
Government Agency | | | 79.6 | % | |
| AA | | | 3.1 | | |
| A | | | 5.7 | | |
| BBB | | | 9.5 | | |
| BB | | | 0.4 | | |
| B | | | 0.0 | | |
| CCC | | | 0.0 | | |
| CC | | | 0.0 | | |
| C | | | 0.0 | | |
| D | | | 0.0 | | |
| Short Term | | | 1.7 | | |
2
In closing, we believe that our systematic approach to managing risk continues to contribute to the returns of the Fund, and we expect to be able to continue to provide value for our shareholders in the future.
Sincerely,

Richard W. Knee
Portfolio Manager
3
Core Bond Fund
AVERAGE ANNUAL TOTAL RETURN ENDED 10/31/072, 6, 10, 12
| | | Investor
Class | | Institutional
Class | | Lehman Brothers
U.S. Aggregate Index | |
| 1 Year | | | 3.67 | % | | | 4.08 | % | | | 5.38 | % | |
| 5 Year | | | 3.88 | % | | | 4.32 | % | | | 4.41 | % | |
| 10 Year | | | 5.05 | % | | | 5.47 | % | | | 5.91 | % | |
| Life of Fund | | | 5.34 | % | | | 5.72 | % | | | 6.21 | %13 | |
| Inception Date | | | 02/01/1997 | | | | 10/01/1995 | | | | | | |
Performance data quoted represent past performance, which is no guarantee of future results. The investment return and principal value of an investment will fluctuate so that an investor's shares, when redeemed, may be worth more or less than their original cost. Results are shown on a "total return" basis and include reinvestment of all dividends and capital gain distributions. The composition, industries and holdings of the Fund are subject to change.
Current performance may be lower or higher than the performance data quoted. For performance data current to the most recent month end, please visit www.nb.com/performance.
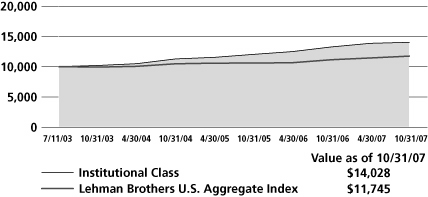
COMPARISON OF A $10,000 INVESTMENT
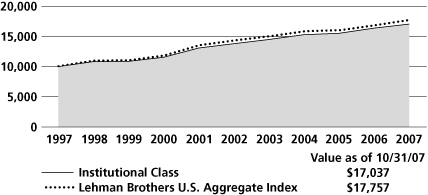 | | This chart shows the value of a hypothetical $10,000 investment in the Fund over the past 10 fiscal years. The graphs are based on the Institutional Class share only; performance of other classes will vary due to differences in fee structures (see Average Annual Total Return chart above). The result is compared with benchmarks, which may include a broad-based market index and/or a narrower index. Please note that market indices do not include expenses. All results include the reinvestment of dividends and capital gain distributions. Results represent past performance and do not indicate future results. The chart and table do not reflect the deduction of taxes that a shareholder would pay on Fund distributions or the redemption of Fund shares.
Please see Endnotes and Glossary of Indices for additional information.
The composition, industries and holdings of the Fund are subject to change.
For the period ending 10/31/07, the 30-day SEC yield of the Investor Class shares was 4.67%, and the Institutional Class shares was 5.08%. | |
|
4
Lehman Brothers High Income Bond Fund Portfolio Commentary
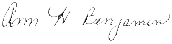
For the fiscal year ended October 31, 2007, the Lehman Brothers High Income Bond Fund generated a positive return, finishing just behind its benchmark, the Lehman Brothers U.S. Corporate High Yield 2% Issuer Cap Index.
High yield bonds materially outperformed Treasuries during the first seven months of the fiscal year. By the end of May 2007, this superior relative performance resulted in credit spreads (the difference in yield between comparable maturity U.S. Treasuries and high yield bonds) shrinking to 2.45%, near a historical low. However, high yield bond prices started to slide in June and retreated through August. This was largely due to investors' diminished appetite for risk caused in part by concerns about hedge funds' and financial institutions' exposure to subprime mortgage securities. At peaks in late July and early September, credit spreads reached almost 5%. The high yield market rallied in late September and remained stable in October, with credit spreads closing the fiscal year at 4.50%.
Investors' more risk-averse posture was clearly reflected in the new issue market. Prior to June, high yield investors were willing to support highly leveraged deals with structures beneficial to issuers such as toggle notes, which allow the issuer discretion to pay in cash or with additional notes. However, high yield investors' appetite for these types of transactions diminished significantly in June and several high profile bond offerings were pulled or restructured. We believe that the re-pricing of risk and structural improvements in the new issues market is positive for the longer term health of high yield securities. However, even with more reasonably priced and more conservatively structured new issues, we remain quite selective in our new issue purchases.
Longer term, we believe credit fundamentals are the most important factors in determining high yield bond performance. High yield fundamentals are directly linked to the health of the economy. We note that, despite the weak housing market and the credit crunch spawned by the sub-prime mortgage mess, the U.S. economy has remained strong. Third quarter GDP growth was initially reported at a robust 3.9% and later raised to 4.9%. Even if this figure is revised downward, it will likely exceed previous expectations by a wide margin. We suspect that fourth quarter GDP growth will be somewhat less impressive and, in the first half of 2008, we expect growth to slow to around 2%.
Still, even in a slower growth environment, we don't think that high yield default rates will increase to troubling levels. Interestingly, high yield default rates actually declined from 1.6% to 1.3% (near a record low) during the three months high yield bonds were retreating. Unless our economic forecasts are wrong and the economy slides into recession, we believe that high yield default rates will go no higher than 2% to 3% — still below the long-term historical average. We are confident that our commitment to high quality, in-house fundamental credit research will continue to help us effectively manage credit risk in the portfolio.
Over the course of fiscal 2007, security selection and overweights in the health care, services, energy, media and utilities sectors enhanced returns. The fact that we had almost no exposure to real estate or homebuilders was also a performance plus. Security selection in the food and beverage, and technology sectors detracted from returns. Anticipating more moderate economic growth, we have been gravitating to less economically sensitive industry groups, which historically enjoy more stable cash flows. Currently, the portfolio is overweight in health care, broadcasting, cable television, packaging, metals and publishing. The portfolio is underweight in more cyclical industries including energy, paper, homebuilders and capital goods.
The portfolio's weighted average maturity and duration (a standard measure of interest rate risk) fluctuated only modestly over the 12-month reporting period. This was a function of security selection rather than an attempt to anticipate interest rate trends. Our bias toward intermediate maturity securities, which we believe generally have more attractive risk/reward characteristics than longer maturity bonds, will usually result in weighted average maturity and duration that are slightly lower than benchmark levels. On the credit front, we increased our exposure to
RATING SUMMARY
AAA/Government/
Government Agency | | | 0.0 | % | |
| AA | | | 0.0 | | |
| A | | | 0.0 | | |
| BBB | | | 2.4 | | |
| BB | | | 36.3 | | |
| B | | | 46.6 | | |
| CCC | | | 14.1 | | |
| CC | | | 0.0 | | |
| C | | | 0.0 | | |
| D | | | 0.0 | | |
| Not Rated | | | 0.3 | | |
| Short Term | | | 0.3 | | |
5
BB rated securities (the highest rated securities in our investment universe) at attractive prices during the market volatility in September and the portfolio's present quality distribution stands in line with the benchmark.
Looking ahead, we expect the high yield bond market to remain relatively stable, producing moderate coupon-oriented returns in fiscal 2008.
Sincerely,

Ann H. Benjamin and Thomas P. O'Reilly
Portfolio Co-Managers
6
High Income Bond Fund
AVERAGE ANNUAL TOTAL RETURN ENDED 10/31/071, 6, 9, 12
| | | Investor
Class9 | | Lehman Brothers
US Corp High Yield 2%
Issuer Cap Index | | Lehman Brothers
Intermediate Ba
U.S. High Yield Index | |
| 1 Year | | | 6.73 | % | | | 6.88 | % | | | 5.55 | % | |
| 5 Year | | | 7.19 | % | | | 12.76 | % | | | 9.41 | % | |
| 10 Year | | | 6.31 | % | | | 5.97 | % | | | 6.36 | % | |
| Life of Fund | | | 7.77 | % | | | N/A | | | | 7.94 | %13 | |
| Inception Date | | | 02/01/1992 | | | | | | | | | | |
Performance data quoted represent past performance, which is no guarantee of future results. The investment return and principal value of an investment will fluctuate so that an investor's shares, when redeemed, may be worth more or less than their original cost. Results are shown on a "total return" basis and include reinvestment of all dividends and capital gain distributions. The composition, industries and holdings of the Fund are subject to change.
Current performance may be lower or higher than the performance data quoted. For performance data current to the most recent month end, please visit www.nb.com/performance.
COMPARISON OF A $10,000 INVESTMENT
 | | This chart shows the value of a hypothetical $10,000 investment in the Fund over the past 10 fiscal years. The result is compared with one or more benchmarks, which may include a broad-based market index and/or a narrower index. Please note that market indices do not include expenses. All results include the reinvestment of dividends and capital gain distributions. Results represent past performance and do not indicate future results. The chart and table do not reflect the deduction of taxes that a shareholder would pay on Fund distributions or the redemption of Fund shares.
Please see Endnotes and Glossary of Indices for additional information.
The composition, industries and holdings of the Fund are subject to change.
For the period ending 10/31/07, the 30-day SEC yield of the Investor Class shares was 7.78%. | |
|
7
Lehman Brothers Municipal Money Fund
Lehman Brothers New York Municipal Money Fund
Portfolio Commentary
The financial markets were relatively quiet during the first seven months of the fiscal year ended October 31, 2007. Then, investors became more concerned about the potential consequences that rising subprime mortgage defaults could have for the economy and financial institutions holding hard-to-value collateralized subprime mortgage debt. In response to subprime-related issues, the credit markets nearly seized up in July, sparking a flight to quality as investors waited until the depth and ultimate impact of the credit crunch could be evaluated. In response, the Federal Reserve injected liquidity into the financial system in August and subsequently cut the Federal Funds rate by 75 basis points in September and October. This temporarily calmed the financial markets, but they experienced additional turmoil toward the end of the 12-month reporting period.
The primary effect of subprime mortgage concerns late in the fiscal year was a strong flow of funds into short-term U.S. Treasuries and municipal money market funds. With demand for short-term U.S. Treasuries showing particular strength, municipal money funds provided relatively attractive after-tax yields.
Normally, when the Federal Reserve eases, the yield curve steepens (with longer maturity issues offering higher yields). As such, we would generally attempt to extend the Funds' weighted average maturity in such circumstances to lock in the higher yields of longer-term securities. This time around, however, the money market yield curve stayed inverted, with variable rate demand notes (VRDNs) — among the shortest maturity instruments in the market — providing higher yields than one-year securities. VDRNs also allow the Funds to be more liquid during periods of market stress. For these reasons, VRDNs, as of fiscal year-end, are by far our largest allocation and the Funds' weighted average maturity actually declined over the course of fiscal 2007.
Looking ahead, the Federal Reserve appears to be in a quandary. Should the subprime mortgage mess further damage the financial system and push the economy toward recession, we believe the Fed would reluctantly come to the rescue with additional rate cuts. However, further Fed easing would likely result in even more pressure on the already weak dollar and, with commodities prices rising (for oil, agricultural products, gold and industrial materials), possibly fan the flames of inflation.
We believe the Fed will sit on the fence as long as possible before making its next move. In the interim, as long as variable rate demand notes are priced so attractively, we will likely maintain the Funds' current weighted average maturities.
Lehman Brothers Municipal Money Fund1, 5, 7
Lehman Brothers Municipal Money Fund posted a positive total return for the fiscal year, surpassing its iMoneyNet Money Fund Report Tax-Free National Retail Average benchmark. Over the course of the fiscal year the Fund's seven-day tax-equivalent current yield* (taxable at the highest federal income tax bracket) decreased from 4.65% on October 31, 2006 to 4.52% on October 31, 2007. Its seven-day tax-equivalent effective yield (also taxable at the highest federal income tax bracket) went from 4.76% on October 31, 2006 to 4.62% on October 31, 2007.
MATURITY DIVERSIFICATION
| (% by Maturity) | |
| 1 - 7 Days | | | 86.4% | |
| 8 - 30 Days | | | 2.1 | | |
| 31 - 90 Days | | | 4.5 | | |
| 91 - 180 Days | | | 1.0 | | |
| 181+ Days | | | 6.0 | | |
8
Lehman Brothers New York Municipal Money Fund4, 5, 7
Lehman Brothers New York Municipal Money Fund posted a positive total return for the fiscal year, surpassing its iMoneyNet Money Fund Report Tax-Free State-Specific Retail Average benchmark. Over the course of the fiscal year, the Fund's seven-day tax-equivalent current yield* (taxable at the highest federal, New York State and New York City income tax brackets) decreased from 5.40% on October 31, 2006 to 5.21% on October 31, 2007. Its seven-day tax-equivalent effective yield (also taxable at the highest federal, New York State and New York City income tax brackets) went from 5.55% on October 31, 2006 to 5.35% on October 31, 2007.**
MATURITY DIVERSIFICATION
| (% by Maturity) | |
| 1 - 7 Days | | | 91.9% | |
| 8 - 30 Days | | | 4.2 | | |
| 31 - 90 Days | | | 0.0 | | |
| 91 - 180 Days | | | 0.0 | | |
| 181+ Days | | | 3.9 | | |
Sincerely,


William J. Furrer and Kristian Lind
Portfolio Co-Managers
* Current yield more closely reflects current earnings than does total return. Tax-equivalent yields are the taxable yields that an investor would have had to receive in order to realize the same level of yield after federal income taxes at the highest federal tax rate, currently 35%, assuming that all of a Fund's income is exempt from federal income taxes. For the Lehman Brothers New York Municipal Money Fund, tax-equivalent yields are is calculated based on federal, New York State, and New York City tax rates for a combined rate of 41.8%.
** The U.S. Supreme Court is considering a case from Kentucky involving the question of whether a state can give a tax deduction to holders of other states' bonds. Although it is not possible to predict how the court might decide the case, we will watch it carefully as it has the potential to affect single-state municipal funds.
A portion of the income of Lehman Brothers Municipal Money Fund and Lehman Brothers New York Municipal Money Fund may be a tax preference item for purposes of the federal alternative minimum tax for certain investors.
An investment in the Fund is not insured or guaranteed by the Federal Deposit Insurance Corporation or any other government agency. Although the Fund seeks to preserve the value of your investment at $1.00 per share, it is possible to lose money by investing in the Fund.
The composition, industries and holdings of the Fund are subject to change. Investment return will fluctuate. Past performance is no guarantee of future results.
Unaudited performance data current to the most recent month-end are available at www.lehmanam.com.
9
Lehman Brothers Municipal Securities Trust Portfolio Commentary
Lehman Brothers Municipal Securities Trust provided a modestly positive return for the fiscal year ended October 31, 2007, outperforming the Lipper Intermediate Municipal Debt Funds Average but lagging the Lehman Brothers 7-Year General Obligation Index.
The Fund got off to a good start with municipal securities prices firming as demand outpaced supply during the seasonally strong end of calendar 2006. However, starting in the first quarter of calendar 2007, new issuances surged on the way to what we expect will be a record year for municipal bonds. Although increased supply was absorbed by the market in an orderly fashion, it restrained municipal bond prices during the reporting period.
Credit spreads (the yield differential between higher and lower rated bonds), became tight relative to historical levels during the first half of the reporting period, a reflection of investors' willingness to assume risk. However, as problems with subprime mortgages and subprime mortgage-backed securities surfaced in July, investors became more risk averse and we saw a classic "flight to quality" to the relative safety of U.S. Treasury securities. Stocks and corporate bonds were hit hardest but municipal securities softened as well, in part due to the subprime mortgage problems facing hedge funds, which have been big buyers of municipal securities. Supported by an injection of liquidity by the Federal Reserve and two Fed Funds rate cuts, the financial markets stabilized in September and early October. However, toward the end of fiscal 2007, as prominent financial institutions began announcing large write-downs of the subprime mortgage backed securities in their portfolios, investors once again fled to Treasuries.
With credit spreads widening, some investors may have found it tempting to enhance portfolio yield by increasing exposure to lower rated investment grade municipal bonds. However, we believe that there are still sufficient uncertainties (the financial health of municipal bond insurers FGIC and Ambac being one of the marketplace's primary concerns), that we have decided to maintain the portfolio's AA+ average credit rating.
The Fed's monetary easing has resulted in a steeper yield curve (higher yields for longer maturity securities). Normally we would have extended the portfolio's weighted average maturity to lock in higher yields in the longer end of the market. However, concerns about hedge fund selling and inflationary pressures resulting from the Fed's rate cuts discouraged us from moving farther out on the yield curve. In addition, if the Fed continues to ease, we believe that short to intermediate maturity securities in the one- to seven-year range will benefit more than bonds in the longer end of the market.
Over the course of fiscal 2007, the portfolio's allocation to revenue bonds (primarily essential purpose bonds) increased from 55.5% of assets to 66.5%. Concurrently, the allocation to general obligation bonds (GO's) declined from 35.6% of assets to 27.1%. Our bias toward essential purpose revenue bonds is based on the fact that historically they have outperformed GO's during periods when economic growth was slowing. In addition, we are concerned about the potentially negative impact declining home prices and a softer labor market will have on the municipal tax revenues that fund GO bond principal and interest payments. Finally, essential purpose revenue bonds are often structured with secure legal provisions that further protect bondholders.
Moving forward, all eyes are on the Federal Reserve, which in our opinion is in a very tough position. On the one hand, the Fed must be willing to ease if the credit crunch further threatens the health of the financial system and the economy appears headed into recession. On the other hand, inflation remains a legitimate concern. Clearly, the Fed is worried about the impact rising commodity prices (oil, gold, agricultural products, and industrial materials) could have on the inflationary front. In addition, the Fed also seems concerned about the impact further rate cuts would have on the already sagging dollar. Our best guess is that the Fed will sit on its hands hoping that the credit markets will survive the subprime mortgage mess so that it doesn't have to make additional rate cuts that could fan inflation and put more pressure on the dollar. With the Fed in
RATING SUMMARY
| AAA | | | 63.1 | % | |
| AA | | | 23.5 | | |
| A | | | 9.5 | | |
| BBB | | | 2.8 | | |
| BB | | | 0.0 | | |
| B | | | 0.0 | | |
| CCC | | | 0.0 | | |
| CC | | | 0.0 | | |
| C | | | 0.0 | | |
| D | | | 0.0 | | |
| Not Rated | | | 0.0 | | |
| Short Term | | | 1.1 | | |
10
limbo, we will likely maintain the portfolio's current weighted average maturity and duration, until something good or bad happens to give us confidence that monetary policy is likely to change.
In closing, today municipal securities appear to us attractively priced relative to Treasuries. With intermediate maturity municipal bonds yields on average about 90% of the 10-year Treasury bond yield as of fiscal year end, municipal securities provide a significant yield advantage for investors in the 35% income tax bracket.
Sincerely,


William J. Furrer and James L. Iselin
Portfolio Co-Managers
11
Municipal Securities Trust
AVERAGE ANNUAL TOTAL RETURN ENDED 10/31/071, 6, 8, 12
| | | Investor
Class | | Lehman Brothers
7-Year GO Index | |
| 1 Year | | | 2.61 | % | | | 3.60 | % | |
| 5 Year | | | 2.95 | % | | | 3.99 | % | |
| 10 Year | | | 4.23 | % | | | 4.98 | % | |
| Life of Fund | | | 5.33 | % | | | 6.15 | %13 | |
| Inception Date | | | 07/09/1987 | | | | | | |
Performance data quoted represent past performance, which is no guarantee of future results. The investment return and principal value of an investment will fluctuate so that an investor's shares, when redeemed, may be worth more or less than their original cost. Results are shown on a "total return" basis and include reinvestment of all dividends and capital gain distributions. The composition, industries and holdings of the Fund are subject to change.
Current performance may be lower or higher than the performance data quoted. For performance data current to the most recent month end, please visit www.nb.com/performance.
COMPARISON OF A $10,000 INVESTMENT
 | | This chart shows the value of a hypothetical $10,000 investment in the Fund over the past 10 fiscal years. The result is compared with one or more benchmarks, which may include a broad-based market index and/or a narrower index. Please note that market indices do not include expenses. All results include the reinvestment of dividends and capital gain distributions. Results represent past performance and do not indicate future results. The chart and table do not reflect the deduction of taxes that a shareholder would pay on Fund distributions or the redemption of Fund shares.
Please see Endnotes and Glossary of Indices for additional information.
The composition, industries and holdings of the Fund are subject to change.
For the period ending 10/31/07, the 30-day SEC yield of the Investor Class Shares was 3.63% and the tax equivalent yield was 5.58% for an investor in the highest federal income tax bracket (35%). | |
|
12
Lehman Brothers Short Duration Bond Fund Portfolio Commentary
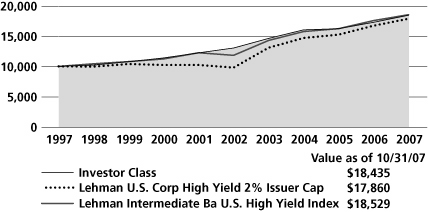
For the fiscal year ended October 31, 2007, the Lehman Brothers Short Duration Bond Fund generated a positive return but modestly trailed its benchmark, the Merrill Lynch 1-3 Year Treasury Index.
The Fund's underperformance relative to the Treasury benchmark is the result of the flight to the safety of Treasury securities prompted by the credit crises in the last months of the fiscal year. The performance of the Fund relative to its peer group remains quite strong due to the high quality bias in the portfolio's structure.
The beginning of the fiscal year was characterized by relatively low volatility — U.S. Treasuries were range-bound and corporate bond spreads remained tight. Concerns regarding the subprime mortgage market began to emerge in February, and by July the collapse of two mortgage-related hedge funds combined with the downgrade of a number of subprime-related collateralized debt obligations intensified investors' worries, prompting a flight to quality. In a six-week period from early July to mid-August, the two-year Treasury note rose in price as its yield fell almost 100 basis points (or one percentage point) and spreads on some investment grade securities (compared to Treasury levels) widened 50 basis points or more, as price declines were exacerbated by the unwinding of positions by leveraged investors, such as hedge funds.
The resurgence of market volatility this year has provided us with several interesting relative value opportunities. We took advantage of market dislocations and reallocated assets from U.S. Agencies and corporate bonds into higher-yielding, AAA-rated asset-backed securities and AAA-rated mortgage-backed securities that are primarily backed by shorter duration adjustable rate mortgages. These transactions allowed us to increase the yield of the portfolio and also increase credit quality. We believe that our extensive fundamental credit research process, supported by our proprietary portfolio management tools, will enable us to continue to uncover undervalued assets that will contribute to returns.
Despite issues in the credit markets and the weakness in the housing sector, concerns remain that higher commodity prices and a weaker U.S. dollar will fuel inflation. Federal Reserve Chairman Ben Bernanke has stated that further Fed action will be data dependant. We have maintained a slightly defensive duration position, with portfolio duration shorter than that of the benchmark, as we monitor these factors. We expect to continue to maintain this posture until the risks to the economy and inflation become more balanced. In the meantime, our defensive positioning provides yield enhancement due to the inversion in the front end of the yield curve.
To protect principal, we have focused intently on credit quality, and are maintaining a high credit quality bias, with the bulk of the portfolio in AAA, AA and A rated securities, with only a small allocation to BBB rated securities. We are also maintaining a highly diversified portfolio in order to attempt to further reduce credit risk. We expect that the market will remain volatile as we move into the end of the calendar year, and we will continue to look for investment opportunities as they present themselves.
In closing, our disciplined investment process, proprietary fundamental credit research and keen focus on risk management have allowed us to provide our investors with consistent and secure returns, regardless of interest rates and market cycles.
Sincerely,


John Dugenske and Thomas Sontag
Portfolio Co-Managers
RATING SUMMARY
AAA/Government/
Government Agency | | | 81.1 | % | |
| AA | | | 7.0 | | |
| A | | | 4.2 | | |
| BBB | | | 5.6 | | |
| BB | | | 0.0 | | |
| B | | | 0.0 | | |
| CCC | | | 0.0 | | |
| CC | | | 0.0 | | |
| C | | | 0.0 | | |
| D | | | 0.0 | | |
| Not Rated | | | 0.0 | | |
| Short Term | | | 2.1 | | |
13
Short Duration Bond Fund
AVERAGE ANNUAL TOTAL RETURN ENDED 10/31/071, 6, 12
| | | Investor
Class | | Trust
Class | | Merrill Lynch 1–3 Year
Treasury Index | |
| 1 Year | | | 5.24 | % | | | 5.15 | % | | | 5.78 | % | |
| 5 Year | | | 2.98 | % | | | 2.86 | % | | | 2.85 | % | |
| 10 Year | | | 4.10 | % | | | 3.99 | % | | | 4.64 | % | |
| Life of Fund | | | 5.62 | % | | | 5.56 | % | | | 6.07 | %13 | |
| Inception Date | | | 06/09/1986 | | | | 08/30/1993 | | | | | | |
Performance data quoted represent past performance, which is no guarantee of future results. The investment return and principal value of an investment will fluctuate so that an investor's shares, when redeemed, may be worth more or less than their original cost. Results are shown on a "total return" basis and include reinvestment of all dividends and capital gain distributions. The composition, industries and holdings of the Fund are subject to change.
Current performance may be lower or higher than the performance data quoted. For performance data current to the most recent month end, please visit www.nb.com/performance.
 | | This chart shows the value of a hypothetical $10,000 investment in the Fund over the past 10 fiscal years. The graphs are based on the Investor Class shares only; performance of other classes will vary due to differences in fee structures (see Average Annual Total Returns chart above). The result is compared with one or more benchmarks, which may include a broad-based market index and/or a narrower index. Please note that market indices do not include expenses. All results include the reinvestment of dividends and capital gain distributions. Results represent past performance and do not indicate future results. The chart and table do not reflect the deduction of taxes that a shareholder would pay on Fund distributions or the redemption of Fund shares.
Please see Endnotes and Glossary of Indices for additional information.
The composition, industries and holdings of the Fund are subject to change.
For the period ending 10/31/07, the 30-day SEC yield of the Investor Class Shares was 4.93% and the Trust Class shares was 4.83%. | |
|
14
Lehman Brothers Strategic Income Fund Portfolio Commentary
Lehman Brothers Strategic Income Fund generated a positive return in the fiscal year ended October 31, 2007, surpassing its benchmark, the Lehman Brothers U.S. Aggregate Index.
In our opinion, the Fund's performance for the period reflects the benefits of investing in a diversified portfolio of income producing securities. The portfolio represents an attractive mix of such investments, overseen by an asset allocation committee whose primary responsibility is to adjust the portfolio's structure among several market sectors.
As of October 31, 2007, the Fund included 37.3% in corporate bonds, 22.3% in common and preferred securities (including real estate investment trusts or REITs), 19.9% in foreign bonds, 17.1% in Treasury issues, agency obligations and mortgage backed securities, 2.6% in convertible debt and 0.8% in cash.
REITs
The FTSE NAREIT Equity REITs Index enjoyed strong performance early in the fiscal year but declined substantially in June and July due, in our opinion, to several factors including: investors' concerns about the summer's credit crunch and its impact on the economy, a rotation out of yield-oriented sectors by some investors, selling pressure from hedge funds unwinding large REIT positions, and a drop-off in merger and acquisition activity. However, a rally during the fall helped trim REITs' losses, leaving the index with a modest gain for the reporting period.
During the fiscal year, the Fund's real estate holdings declined slightly, hindered by weakness in apartment, office and mixed use holdings. In contrast, health care and regional mall holdings had a positive impact on results.
We believe that REITs can deliver favorable returns in the coming fiscal year, supported by our expectations for above-average earnings growth and favorable yields. Although REITs are currently valued at the higher end of historical norms, they still trade at a roughly 10% discount to net asset value. Looking forward, we anticipate that a tight supply of credit will limit commercial real estate development, helping to preserve favorable supply/demand dynamics in many REIT sectors.
High Yield Securities
The high yield bond market outperformed Treasuries during the first seven months of the reporting period, but investors' aversion to risk later in the time period dragged down performance. The high yield portfolio earned positive returns, but slightly trailed the performance of the Lehman Brothers High Yield 2% Issuer Cap Index during the fiscal year.
Security selection in the food and beverage and technology sectors detracted from returns. Portfolio performance was enhanced, however, by our security selection and overweighting of health care, services, energy, media and utilities sectors. We also had virtually no exposure to real estate firms or homebuilders, which further enhanced performance.
We anticipate that economic growth will moderate. As such, we have been gravitating to less economically sensitive industry groups, such as health care, broadcasting, cable television, packaging, metals and publishing. At the same time, the portfolio is underweight in more cyclical industries, including energy, paper, homebuilders and capital goods.
Investment Grade Fixed Income
The bond market saw significant turbulence during the fiscal year. Early on, volatility levels were relatively low. U.S. Treasuries traded within a limited range and corporate bond spreads remained tight. However, with new concerns regarding the subprime mortgage market, investors initiated a flight to quality. In a six-week period from early July to mid-August, the two-year Treasury note rose in price as its yield fell almost 100 basis points (or one percentage point) and spreads on some investment grade securities (compared to Treasury levels) widened 50 basis points or more, as price declines were exacerbated by the unwinding of positions by leveraged investors, such as hedge funds.
ASSET DIVERSIFICATION
| Corporate Debt | | | 37.3 | % | |
| Convertible Debt | | | 2.6 | | |
| Foreign Securities | | | 19.9 | | |
| U.S. Government Agency Securities | | | 0.9 | | |
| Mortgage-Backed Securities | | | 12.8 | | |
| U.S. Treasury Securities | | | 3.4 | | |
| Preferred Stock | | | 0.9 | | |
| Common Stock | | | 21.4 | | |
| Short Term Investments | | | 0.7 | | |
| Cash, receivables and other assets, less liabilities | | | 0.1 | | |
15
During the period, the investment grade fixed income portfolio allocation, which has an average overall AA credit quality, benefited from our strong interest in bonds perceived to be in the safest and most liquid sectors. We have selectively increased our allocation to the BBB sector and have been able to take advantage of higher yields available due to the widening of credit spreads. The portfolio also benefited from the attractive yields of longer bonds due to the steepening of the yield curve.
Foreign Securities
As in the U.S., economic uncertainty prompted volatility throughout the global capital markets during the fiscal year. Looking forward to 2008, we believe that theme will continue. As credit conditions tighten and economic growth rates decline, in our view, to a sub-trend pace globally, interest rates should remain low for some time.
We believe expectations for lower interest rates in Europe will grow and that the U.S. dollar will recoup some of its losses relative to other currencies. Conversely, the yen should continue to exhibit strength against the dollar. If, as we expect, high risk asset classes begin to underperform due to higher volatility, tighter credit conditions, and a shift in market psychology, the yen is likely to strengthen as investors begin selling their long positions and buying back their yen denominated short positions (unwinding what is known as the "carry trade").
Income Oriented Equity Securities
The portion of the portfolio focusing on income producing equity securities substantially outperformed the S&P 500 during the 12-month reporting period.
Our performance benefited from our overweighting in Energy and Utilities holdings, as both of those sectors had strong returns. Within the Energy sector, rising oil prices during the performance period helped boost petroleum firms' profits. We also enhanced returns by investing in convertible securities and covered calls. While covered calls limit upside potential they also offer protection during market declines.
We continue to maintain positions in Canadian income trusts (CIT), which are focused on energy related companies. CITs are similar to U.S. real estate investment trusts in that they avoid tax at the corporate level and offer relatively high income yields to investors. We believe these securities are reasonably valued, but due to the potential for a change in their tax status in 2011, we continue to monitor them closely.
Sincerely,
Strategic Income Fund
Asset Allocation Committee
16
Strategic Income Fund
AVERAGE ANNUAL TOTAL RETURN ENDED 10/31/073, 6, 11, 12
| | | Institutional
Class | | Trust
Class | | Lehman Brothers
U.S. Aggregate Index | |
| 1 Year | | | 5.64 | % | | | 5.54 | % | | | 5.38 | % | |
| Life of Fund | | | 8.16 | % | | | 8.14 | % | | | 3.80 | %13 | |
| Inception Date | | 07/11/2003 | | 04/02/2007 | | | |
Performance data quoted represent past performance, which is no guarantee of future results. The investment return and principal value of an investment will fluctuate so that an investor's shares, when redeemed may be worth more or less than their original cost. Results are shown on a "total return" basis and include reinvestment of all dividends and capital gain distributions. The composition, industries and holdings of the Fund are subject to change.
Current performance may be higher or lower than the performance data quoted. For performance data current to the most recent month end, please visit www.nb.com/performance.
 | | This chart shows the value of a hypothetical $10,000 investment in the Fund over the past 10 fiscal years, or since the Fund's inception, if it has not operated for 10 years. The graphs are based on the Institutional Class shares only; performance of other classes will vary due to differences in fee structures (see Average Annual Total Returns chart above).The result is compared with one or more benchmarks, which may include a broad-based market index and/or a narrower index. Please note that market indices do not include expenses. All results include the reinvestment of dividends and capital gain distributions. Results represent past performance and do not indicate future results. The chart and table do not reflect the deduction of taxes that a shareholder would pay on Fund distributions or the redemption of Fund shares.
Please see Endnotes and Glossary of Indices for additional information.
The composition, industries and holdings of the Fund are subject to change.
For the period ending 10/31/07, the 30-day SEC yield of the Institutional Class shares was 4.43% and the Trust Class Shares was 4.18%. | |
|
17
Neuberger Berman Cash Reserves Portfolio Commentary
We are pleased to report that Neuberger Berman Cash Reserves delivered positive returns and outperformed the iMoneyNet Money Fund Report Taxable First Tier Retail Average during the fiscal year ended October 31, 2007. The Fund closed the period with a seven-day effective yield of 4.80% and a seven-day current yield* of 4.69%.1, 5
The combination of slower economic growth and a continued pause in the Federal Reserve's two-year tightening campaign led to a rally in bonds early in the reporting period. The Fed remained on hold for much of this time, with the Fed Funds rate at 5.25%, as the central bank balanced concerns about inflation with indications of a slowing economy.
However, beginning in July, worries about reports of large losses at hedge funds in the subprime and collateralized debt space led to a flight-to-quality bid for Treasuries and a widening of risk premiums in the market. Investors became increasingly concerned about contagion to the broader market from the shakeout in subprime mortgages, leading to more investors taking refuge in Treasuries. The cost of borrowing increased dramatically, as the excesses of a prolonged period of liquidity began to be removed from the market.
September brought the release of August payroll figures — the first negative numbers in four years — as well as a sharp revision to the prior two months' data, which were seen as proof that the employment situation appears to be worsening. (August payroll figures were adjusted upward in October.) This, coupled with a housing market that continued to see declining prices and higher inventories, heightened the Fed's interest in preempting any material effects on economic growth.
As a result, the Fed reduced the Fed Funds rate by 50 basis points at its September meeting, marking its first rate reduction since 2003. The move to 4.75% was only the second time in the last 20 years that an easing cycle had commenced with a 50 basis-point reduction. This was followed by a further 25 basis-point cut in October. In taking rates lower, the Federal Open Market Committee commented that the action was "intended to help forestall some of the adverse effects on the broader economy that might otherwise arise from the disruptions in the financial markets." The committee added that it was prepared to "act as needed to foster price stability and sustainable economic growth."
Throughout the period, we maintained the bulk of the portfolio's holdings in corporate commercial paper and floating rate medium term corporate/bank notes, which ended the period at 56.3% and 28.6% of portfolio holdings, respectively. We also had a small percentage, 4.9% of the portfolio in repurchase agreements at the end of the fiscal year. The weighted average maturity of the portfolio ended the fiscal year at 44.5 days — almost exactly where it was a year prior, after reaching a high of 66 days in March, and a low of 26.8 days in the middle of October, prior to a second rate cut by the Federal Reserve.
The U.S. economy has been extremely resilient thus far. However, we anticipate that further deterioration in the housing market will start to take its toll on the consumer and ultimately business investment. The market is suffering from a crisis of confidence, and while the Fed remains reluctant to take rates lower, we believe that the easing cycle may continue. As always, we will seek to provide consistent and secure returns to our shareholders.
Sincerely,


John C. Donohue and Scott F. Riecke
Portfolio Co-Managers
* Current yield more closely reflects current earnings than does total return.
MATURITY DIVERSIFICATION
| (% by Maturity) | |
| 1 - 7 Days | | | 30.2% | | |
| 8 - 30 Days | | | 29.0 | | |
| 31 - 90 Days | | | 27.9 | | |
| 91 - 180 Days | | | 6.4 | | |
| 181+ Days | | | 6.5 | | |
18
Endnotes
1 Neuberger Berman Management Inc. ("Management") has contractually undertaken to forgo current payment of fees and/or expenses reimburse the following Funds so that the total annual operating expenses (exclusive of taxes, interest, brokerage commissions and extraordinary expenses) are limited to 0.65% for Neuberger Berman Cash Reserves (Investor Class), 1.00% for Lehman Brothers High Income Bond Fund (Investor Class), 0.70% for Lehman Brothers Short Duration Bond Fund (Investor Class), 0.80% for Lehman Brothers Short Duration Bond Fund (Trust Class), 0.65% for Lehman Brothers Municipal Securities Trust (Investor Class) and 0.59% for Lehman Brothers Municipal Money Fund (Investor Class) of average daily net assets. Each undertaking lasts until October 31, 2010. Absent such forgone fees and/or reimbursements, the performance of each listed c lass of each Fund except for Lehman Brothers High Income Bond Fund and Neuberger Berman Cash Reserves would have been less.
Each of these Funds has contractually undertaken to repay Management for fees and expenses forgone and/or its excess expenses paid by Management, provided the repayments do not cause its total annual operating expenses (exclusive of taxes, interest, brokerage commissions and extraordinary expenses) to exceed the above stated expense limitation and the repayments are made within three years after the year that Management incurred the expense. For the year ended October 31, 2007, there were no repayments of expenses to Management.
2 Management has contractually undertaken to forgo current payment of fees and/or reimburse Lehman Brothers Core Bond Fund so that total annual operating expenses (exclusive of taxes, interest, brokerage commissions and extraordinary expenses) of the Fund are limited to 0.85% and 0.45% of average daily net assets for the Investor Class and Institutional Class, respectively. The undertakings last until October 31, 2017. The Fund has contractually undertaken to repay Management for fees and expenses forgone and/or its excess expenses paid by Management, provided the repayments do not cause total annual operating expenses (exclusive of taxes, interest, brokerage commissions, and extraordinary expenses) to exceed the above-stated expense limitation and the repayments are made within three years after the year that Management incurred the expense. Absent such forgone fees and/or reimbursements, the performance of each class would have been lower. Management has voluntarily agreed to waive its management fee in the amount of 0.25% (0.20% prior to March 1, 2006) of the Fund's average daily net assets through October 31, 2007. Management has agreed to continue this voluntary waiver after this date. If this voluntary waiver was not in place, performance would be lower for the Fund.
3 Management has contractually undertaken to forgo current payment of fees and/or reimburse Lehman Brothers Strategic Income Fund so that total annual operating expenses (exclusive of taxes, interest, brokerage commissions and extraordinary expenses) of the Fund are limited to 1.10% and 0.85% of average daily net assets for the Trust Class and Institutional Class, respectively. The undertaking lasts until October 31, 2010 and October 31, 2017 for the Trust Class and Institutional Class, respectively. The Fund has contractually undertaken to repay Management for fees and expenses forgone and/or its excess expenses paid by Management, provided the repayments do not cause its total annual operating expenses (exclusive of taxes, interest, brokerage commissions, and extraordinary expenses) to exceed the above stated expense limitation and the re payments are made within three years after the year that Management incurred the expense. Absent such forgone fees and/or reimbursements, the performance of the Fund would have been lower.
4 Management has contractually undertaken to forgo current payment of fees and/or reimburse the Investor Class of Lehman Brothers New York Municipal Money Fund so that the total annual operating expenses (exclusive of taxes, interest, brokerage commissions and extraordinary expenses) of the Fund are limited to 0.59% of average daily net assets. The undertaking lasts until October 31, 2010. Absent such forgone fees and/or reimbursements, the performance of the Investor Class of the Fund would have been less. The Fund has contractually undertaken to repay Management for fees and expenses forgone and/or its excess expenses paid by Management, provided the repayments do not cause its total annual operating expenses (exclusive of taxes, interest, brokerage commissions and extraordinary expenses) to exceed the above stated expense limitation and the repayments are made within
19
three years after the year that Management incurred the expense. For the year ended October 31, 2007, there were no repayments of expenses to Management.
Effective June 5, 2006, Management voluntarily agreed to waive certain expenses of the Investor Class of New York Municipal Money, so that the total annual operating expenses (exclusive of taxes, interest, brokerage commissions and extraordinary expenses) of the Class are limited to 0.52% of the average daily net assets. In addition, effective January 17, 2007, Management voluntarily agreed to waive certain expenses of the Investor Class of the Fund, so that the total annual operating expenses (exclusive of taxes, interest, brokerage commissions and extraordinary expenses) of the Class are limited to 0.47% of the average daily net assets. Absent such waivers, the performance of the Investor Class of the Fund would have been less.
5 "Current yield" of a money market fund refers to the income generated by an investment in a Fund over a recent 7-day period. This income is then "annualized." The "effective yield" is calculated similarly but, when annualized, the income earned by an investment in the Fund is assumed to be reinvested. The "effective yield" will be slightly higher than the "current yield" because of the compounding effect of this assumed reinvestment. Yields of a money market fund will fluctuate and past performance is not a guarantee of future results.
6 Annual total returns are for the period end October 31, 2007. Returns are shown on a "total return" basis and assume reinvestment of all dividends and capital gain distributions.
7 Tax-equivalent effective yield is the taxable effective yield that an investor would have had to receive in order to realize the same level of yield after federal income taxes at the highest federal tax rate, currently 35%, assuming that all of a Fund's income is exempt from federal income taxes. For Lehman Brothers New York Municipal Money Fund, tax-equivalent yield is calculated based on federal, New York State, and New York City tax rates for a combined rate of 41.8%.
8 A portion of the income of Lehman Brothers Municipal Securities Trust may be a tax preference item for purposes of the federal alternative minimum tax for certain investors.
9 This Fund is the successor to the Lipper High Income Bond Fund ("Lipper Fund"). The total return data for the periods prior to September 7, 2002, are those of the Lipper High Income Bond Fund Premier Class. The data reflect performance of the Lipper Fund for the period April 1, 1996, through September 6, 2002. The investment policies, objectives, guidelines and restrictions of the Fund are in all material respects equivalent to those of the Lipper Fund. Returns would have been lower if the manager of the Lipper Fund had not waived certain of its fees during the periods shown.
10 The Fund is the successor to Ariel Premier Bond Fund ("Ariel Bond Fund"). The total return data for the periods prior to June 13, 2005 are those of the Ariel Bond Fund Investor Class and Institutional Class. The data reflects performance of Ariel Bond Fund Investor Class for the period February 1, 1997 through June 10, 2005 and the performance of Ariel Bond Fund Institutional Class for the period October 1, 1995 (date of inception) through January 31, 1997. The investment policies, guidelines and restrictions of the Fund are in all respects equivalent to Ariel Bond Fund. Ariel Bond Fund Institutional Class had lower expenses and typically higher returns than Ariel Bond Fund Investor Class. Returns would have been lower if the manager of Ariel Bond Fund had not waived certain of its fees during the periods shown.
11 Lehman Brothers Strategic Income Fund Trust Class commenced operations on April 2, 2007. The performance information for the Fund prior to its commencement of operations is for the Institutional Class.
12 Unaudited performance data current to the most recent month-end are available at www.nb.com.
13 The date used to calculate Life of Fund performance for the index is the inception date of the oldest share class.
20
Glossary of Indices
| Merrill Lynch 1-3 Year Treasury Index: | | An unmanaged total return market value index consisting of all coupon-bearing U.S. Treasury publicly placed debt securities with maturities between 1 and 3 years. | |
| |
| Lehman Brothers 7-Year General Obligation Index: | | An unmanaged total return performance benchmark for the intermediate-term, 7-year, investment grade General Obligations (State and Local) tax-exempt bond market. | |
| |
| Lehman Brothers Intermediate Ba U.S. High Yield Index: | | An unmanaged index comprised of BB-rated bonds with maturities of less than 10 years. | |
| |
| Lehman Brothers U.S. Aggregate Index: | | An unmanaged index that represents the U.S. domestic investment grade bond market. It is comprised of the Lehman Brothers Government/Corporate Bond Index, Mortgage-Backed Securities Index, and Asset-Backed Securities Index, including securities that are of investment-grade quality or better, have at least one year to maturity, and have an outstanding par value of at least $100 million. | |
| |
| Lehman Brothers U.S. Corporate High Yield 2% Issuer Cap Index: | | An unmanaged sub-index of the Lehman Brothers U.S. Corporate High Yield Index (which includes all U.S. dollar-denominated, taxable, fixed rate, non-investment grade debt), capped such that no single issuer accounts for more than 2% of the index weight. | |
| |
| Lipper Intermediate Municipal Debt Funds Average: | | Measures the performance of mutual funds that invest in municipal debt issues with dollar-weighted average maturities of five to ten years, as tracked by Lipper. | |
| |
| iMoneyNet Money Fund Report Tax-Free National Institutional Average: | | Measures all national tax-free and municipal institutional funds. Portfolio holdings of tax-free funds include Rated and Unrated Demand Notes, Rated and Unrated General Market Notes, Commercial Paper, Put Bonds — 6 months or less, Put Bonds — over 6 months, AMT Paper, and Other Tax-Free holdings. | |
| |
| iMoneyNet Money Fund Report Taxable First Tier Retail Average: | | Measures the performance of retail money market mutual funds which hold "First Tier" securities as defined by Rule 2a-7 of the Investment Company Act of 1940 (not including Second Tier Commercial Paper). First Tier securities are those rated in the highest short-term rating category by two or more nationally recognized statistical ratings organizations or one, if only one has rated the security. | |
| |
| iMoneyNet Money Fund Report Tax-Free National Retail Average: | | Measures all national tax-free and municipal retail funds. Portfolio holdings of tax-free funds include Rated and Unrated Demand Notes, Rated and Unrated General Market Notes, Commercial Paper, Put Bonds — 6 months or less, Put Bonds — over 6 months, AMT Paper, and Other Tax-Free holdings. | |
| |
| iMoneyNet Money Fund Report Tax-Free State-Specific Retail Average: | | Measures the performance of retail state-specific tax-free and municipal money mutual funds. Portfolio holdings of tax-free funds include Rated and Unrated Demand Notes, Rated and Unrated General Market Notes, Commercial Paper, Put Bonds — 6 months or less, Put Bonds — over 6 months, AMT Paper, and Other Tax-Free holdings. | |
|
21
| FTSE NAREIT Equity REITs Index: | | FTSE NAREIT Equity REITs Index tracks the performance of all Equity REITs currently listed on the New York Stock Exchange, the NASDAQ National Market System and the American Stock Exchange. REITs are classified as Equity if 75% or more of their gross invested book assets are invested directly or indirectly in equity of commercial properties. | |
| |
| S&P 500 Index: | | The S&P 500 Index is widely regarded as the standard for measuring the performance of large-cap stocks traded on U.S.markets and includes a representative sample of leading companies in leading industries. | |
| |
Please note that indices do not take into account any fees and expenses or any tax consequences of investing in the individual securities that they track and that investors cannot invest directly in any index or average. Data about the performance of each index or average are prepared or obtained by Management and include reinvestment of all dividends and capital gain distributions. Each Fund may invest in securities not included in its respective index.
22
Information About Your Fund's Expenses
These tables are designed to provide information regarding costs related to your investments. All mutual funds incur operating expenses, which include management fees, fees for administrative services and cost of shareholder reports, among others. The following examples are based on an investment of $1,000 made at the beginning of the six month period ended October 31, 2007 and held for the entire period. The tables illustrate the fund's costs in two ways:
| Actual Expenses and Performance: | | The first section of the tables provide information about actual account values and actual expenses in dollars, based on the fund's actual performance during the period. You may use the information in this line, together with the amount you invested, to estimate the expenses you paid over the period. Simply divide your account value by $1,000 (for example, an $8,600 account value divided by $1,000 = 8.6), then multiply the result by the number in the first section of the table under the heading entitled "Expenses Paid During the Period" to estimate the expenses you paid over the period. | |
|
| Hypothetical Example for Comparison Purposes: | | The second section of the tables provide information about hypothetical account values and hypothetical expenses based on the fund's actual expense ratio and an assumed rate of return at 5% per year before expenses. This return is not the fund's actual return. The hypothetical account values and expenses may not be used to estimate the actual ending account balance or expenses you paid for the period. You may use this information to compare the ongoing costs of investing in these funds versus other funds. To do so, compare the expenses shown in this 5% hypothetical example with the 5% hypothetical examples that appear in the shareholder reports of other funds. | |
|
23
Expense Information as of 10/31/07 (Unaudited)
LEHMAN BROTHERS CORE BOND FUND
| Actual | | Beginning Account
Value
5/1/07 | | Ending Account
Value
10/31/07 | | Expenses Paid During
the Period*
5/1/07 - 10/31/07 | | Expense
Ratio | |
| Investor Class | | $ | 1,000.00 | | | $ | 1,009.40 | | | $ | 4.31 | | | | .85 | % | |
| Institutional Class | | $ | 1,000.00 | | | $ | 1,011.40 | | | $ | 2.28 | | | | .45 | % | |
| Hypothetical (5% annual return before expenses)** | |
| Investor Class | | $ | 1,000.00 | | | $ | 1,020.92 | | | $ | 4.33 | | | | .85 | % | |
| Institutional Class | | $ | 1,000.00 | | | $ | 1,022.94 | | | $ | 2.29 | | | | .45 | % | |
LEHMAN BROTHERS HIGH INCOME BOND FUND
| Actual | | Beginning Account
Value
5/1/07 | | Ending Account
Value
10/31/07 | | Expenses Paid During
the Period*
5/1/07 - 10/31/07 | | Expense
Ratio | |
| Investor Class | | $ | 1,000.00 | | | $ | 997.50 | | | $ | 4.73 | | | | .94 | % | |
| Hypothetical (5% annual return before expenses)** | |
| Investor Class | | $ | 1,000.00 | | | $ | 1,020.47 | | | $ | 4.79 | | | | .94 | % | |
LEHMAN BROTHERS MUNICIPAL MONEY FUND
| Actual | | Beginning Account
Value
5/1/07 | | Ending Account
Value
10/31/07 | | Expenses Paid During
the Period*
5/1/07 - 10/31/07 | | Expense
Ratio | |
| Investor Class | | $ | 1,000.00 | | | $ | 1,016.10 | | | $ | 2.95 | | | | .58 | % | |
| Hypothetical (5% annual return before expenses)** | |
| Investor Class | | $ | 1,000.00 | | | $ | 1,022.28 | | | $ | 2.96 | | | | .58 | % | |
LEHMAN BROTHERS MUNICIPAL SECURITIES TRUST
| Actual | | Beginning Account
Value
5/1/07 | | Ending Account
Value
10/31/07 | | Expenses Paid During
the Period*
5/1/07 - 10/31/07 | | Expense
Ratio | |
| Investor Class | | $ | 1,000.00 | | | $ | 1,014.80 | | | $ | 3.30 | | | | .65 | % | |
| Hypothetical (5% annual return before expenses)** | |
| Investor Class | | $ | 1,000.00 | | | $ | 1,021.93 | | | $ | 3.31 | | | | .65 | % | |
24
Expense Information as of 10/31/07 cont'd (Unaudited)
LEHMAN BROTHERS NEW YORK MUNICIPAL MONEY FUND
| Actual | | Beginning Account
Value
5/1/07 | | Ending Account
Value
10/31/07 | | Expenses Paid During
the Period*
5/1/07- 10/31/07 | | Expense
Ratio | |
| Investor Class | | $ | 1,000.00 | | | $ | 1,016.60 | | | $ | 2.34 | | | | .46 | % | |
| Hypothetical (5% annual return before expenses)** | |
| Investor Class | | $ | 1,000.00 | | | $ | 1,022.89 | | | $ | 2.35 | | | | .46 | % | |
LEHMAN BROTHERS SHORT DURATION BOND FUND
| Actual | | Beginning Account
Value
5/1/07 | | Ending Account
Value
10/31/07 | | Expenses Paid During
the Period*
5/1/07 - 10/31/07 | | Expense
Ratio | |
| Investor Class | | $ | 1,000.00 | | | $ | 1,026.20 | | | $ | 3.57 | | | | .70 | % | |
| Trust Class | | $ | 1,000.00 | | | $ | 1,025.80 | | | $ | 4.08 | | | | .80 | % | |
| Hypothetical (5% annual return before expenses)** | |
| Investor Class | | $ | 1,000.00 | | | $ | 1,021.68 | | | $ | 3.57 | | | | .70 | % | |
| Trust Class | | $ | 1,000.00 | | | $ | 1,021.17 | | | $ | 4.08 | | | | .80 | % | |
LEHMAN BROTHERS STRATEGIC INCOME FUND
| Actual | | Beginning Account
Value
5/1/07 | | Ending Account
Value
10/31/07 | | Expenses Paid During
the Period*
5/1/07 - 10/31/07 | | Expense
Ratio | |
| Institutional Class | | $ | 1,000.00 | | | $ | 1,011.90 | | | $ | 4.31 | | | | .85 | % | |
| Trust Class | | $ | 1,000.00 | | | $ | 1,010.90 | | | $ | 5.58 | | | | 1.10 | % | |
| Hypothetical (5% annual return before expenses)** | |
| Institutional Class | | $ | 1,000.00 | | | $ | 1,020.92 | | | $ | 4.33 | | | | .85 | % | |
| Trust Class | | $ | 1,000.00 | | | $ | 1,019.66 | | | $ | 5.60 | | | | 1.10 | % | |
NEUBERGER BERMAN CASH RESERVES
| Actual | | Beginning Account
Value
5/1/07 | | Ending Account
Value
10/31/07 | | Expenses Paid During
the Period*
5/1/07 - 10/31/07 | | Expense
Ratio | |
| Investor Class | | $ | 1,000.00 | | | $ | 1,024.70 | | | $ | 2.65 | | | | .52 | % | |
| Hypothetical (5% annual return before expenses)** | |
| Investor Class | | $ | 1,000.00 | | | $ | 1,022.58 | | | $ | 2.65 | | | | .52 | % | |
* For each class of the Fund, expenses are equal to the annualized expense ratio for the class, multiplied by the average account value over the period, multiplied by 184/365 (to reflect the one-half year period shown).
** Hypothetical 5% annual return before expenses is calculated by multiplying the number of days in the most recent period divided by 365.
25
Schedule of Investments Lehman Brothers Core Bond Fund
| PRINCIPAL AMOUNT | | | | RATING§ | | VALUE† | |
| (000's omitted) | | | | Moody's | | S&P | | (000's omitted) | |
U.S. Treasury Securities-Backed by the Full Faith and Credit of
the U.S. Government (8.8%) | | | |
| $ | 445 | | | U.S. Treasury Bonds, 8.13%, due 8/15/19 | | TSY | | TSY | | $ | 584 | | |
| | 1,435 | | | U.S. Treasury Bonds, 6.00%, due 2/15/26 | | TSY | | TSY | | | 1,643 | ØØ | |
| | 4,685 | | | U.S. Treasury Notes, 4.38%, due 8/15/12 | | TSY | | TSY | | | 4,745 | ØØ | |
| | 625 | | | U.S. Treasury Strips, due 8/15/14 & 2/15/25 | | TSY | | TSY | | | 362 | | |
Total U.S. Treasury Securities-Backed by the Full
Faith and Credit of the U.S. Government (Cost $7,236) | | | | | | 7,334 | |
| U.S. Government Agency Securities (9.0%) | | | |
| | 850 | | | Fannie Mae, Notes, 5.25%, due 1/29/09 & 9/15/16 | | AGY | | AGY | | | 862 | | |
| | 1,320 | | | Fannie Mae, Notes, 4.30%, due 3/9/09 | | AGY | | AGY | | | 1,318 | | |
| | 660 | | | Fannie Mae, Notes, 5.38%, due 7/15/16 | | AGY | | AGY | | | 682 | | |
| | 725 | | | Fannie Mae, Notes, 5.00%, due 5/11/17 | | AGY | | AGY | | | 728 | | |
| | 200 | | | Federal Home Loan Bank, Bonds, 5.00%, due 11/17/17 | | AGY | | AGY | | | 202 | | |
| | 280 | | | Federal Home Loan Bank, Bonds, 5.50%, due 7/15/36 | | AGY | | AGY | | | 291 | | |
| | 700 | | | Federal Home Loan Bank, Bonds, 5.13%, due 6/18/08 | | AGY | | AGY | | | 702 | | |
| | 2,450 | | | Freddie Mac, Notes, 4.75%, due 1/18/11 | | AGY | | AGY | | | 2,473 | | |
| | 200 | | | Freddie Mac, Notes, 5.13%, due 7/15/12 | | AGY | | AGY | | | 204 | | |
| Total U.S. Government Agency Securities (Cost $7,412) | | | | | | 7,462 | |
Mortgage-Backed Securities (84.4%)
Adjustable Rate Mortgages (41.6%) | | | |
| | 60 | | | ACE Securities Corp., Ser. 2006-FM1, Class A2A, 4.91%, due 11/25/07 | | Aaa | | AAA | | | 60 | µØØ | |
| | 205 | | | ACE Securities Corp., Ser. 2006-FM1, Class A2B, 4.96%, due 11/25/07 | | Aaa | | AAA | | | 200 | µØØ | |
| | 171 | | | ACE Securities Corp., Ser. 2005-HE6, Class A2B, 5.07%, due 11/25/07 | | Aaa | | AAA | | | 171 | µØØ | |
| | 1,075 | | | Advanta Business Card Master Trust, Ser. 2001-A, Class A, 5.30%, due 11/20/07 | | Aaa | | AAA | | | 1,076 | µ | |
| | 209 | | | Asset Backed Securities Corp. Home Equity, Ser. 2005-HE6, Class A2B,
5.12%, due 11/25/07 | | Aaa | | AAA | | | 208 | µØØ | |
| | 570 | | | Bank of America Credit Card Trust, Ser. 2007-A7, Class A7,
5.09%, due 11/15/07 | | Aaa | | AAA | | | 567 | µØØ | |
| | 800 | | | Bank of America Credit Card Trust, Ser. 2007-A13, Class A13,
5.33%, due 11/15/07 | | Aaa | | AAA | | | 800 | µØØ | |
| | 92 | | | Banc of America Funding Corp., Ser. 2006-G, Class 2A2,
5.08%, due 11/20/07 | | Aaa | | AAA | | | 91 | µØØ | |
| | 116 | | | Banc of America Funding Corp., Ser. 2006-G, Class 2A1,
5.22%, due 11/20/07 | | Aaa | | AAA | | | 115 | µØØ | |
| | 327 | | | Banc of America Funding Corp., Ser. 2005-F, Class 4A1,
5.35%, due 11/20/07 | | Aaa | | AAA | | | 328 | µ | |
| | 386 | | | Banc of America Funding Corp., Ser. 2006-A, Class 3A2,
5.88%, due 11/20/07 | | | | AAA | | | 388 | µ | |
| | 800 | | | Bank One Issuance Trust, Ser. 2003-A3, Class A3, 5.20%, due 11/15/07 | | Aaa | | AAA | | | 800 | µØØ | |
| | 800 | | | Bank One Issuance Trust, Ser. 2003-A1, Class A1, 5.21%, due 11/15/07 | | Aaa | | AAA | | | 800 | µØØ | |
| | 164 | | | Bear Stearns ALT-A Trust, Ser. 2006-4, Class 32A1,
6.48%, due 7/25/36 | | Aaa | | AAA | | | 167 | | |
| | 406 | | | Bear Stearns ALT-A Trust, Ser. 2007-2, Class 2A1,
5.61%, due 11/25/07 | | Aaa | | AAA | | | 408 | µ | |
| | 330 | | | Carrington Mortgage Loan Trust, Ser. 2006-NC3, Class A3, 5.02%, due 11/25/07 | | Aaa | | AAA | | | 311 | µØØ | |
| | 220 | | | Carrington Mortgage Loan Trust, Ser. 2006-NC4, Class M2, 5.19%, due 11/25/07 | | Aa2 | | AA | | | 166 | µØØ | |
| | 810 | | | Chase Credit Card Master Trust, Ser. 2002-3, Class A, 5.26%, due 11/15/07 | | Aaa | | AAA | | | 810 | µ | |
| | 49 | | | Chase Funding Mortgage Loan Asset-Backed Certificates, Ser. 2004-1,
Class 2A2, 5.10%, due 11/25/07 | | Aaa | | AAA | | | 49 | µØØ | |
| | 800 | | | Chase Issuance Trust, Ser. 2006-A3, Class A3, 5.08%, due 11/15/07 | | Aaa | | AAA | | | 798 | µ | |
| | 350 | | | Chase Issuance Trust, Ser. 2007-A6, Class A6, 5.09%, due 11/15/07 | | Aaa | | AAA | | | 348 | µØØ | |
| | 800 | | | Chase Issuance Trust, Ser. 2007-A14, Class A14, 5.34%, due 11/15/07 | | Aaa | | AAA | | | 801 | µØØ | |
| | 800 | | | Citibank Credit Card Issuance Trust, Ser. 2003-A9, Class A9, 5.59%, due 11/20/07 | | Aaa | | AAA | | | 799 | µØØ | |
See Notes to Schedule of Investments 26
| PRINCIPAL AMOUNT | | | | RATING§ | | VALUE† | |
| (000's omitted) | | | | Moody's | | S&P | | (000's omitted) | |
| $ | 110 | | | Citigroup Mortgage Loan Trust, Inc., Ser. 2006-WFH1, Class M2,
5.24%, due 11/25/07 | | Aa2 | | AA | | $ | 90 | µØØ | |
| | 165 | | | Countrywide Alternative Loan Trust, Ser. 2006-0C9, Class A2B,
5.11%, due 11/25/07 | | Aaa | | AAA | | | 164 | µØØ | |
| | 616 | | | Countrywide Asset-Backed Certificates, Ser. 2007-BC2, Class 2A1,
4.96%, due 11/25/07 | | Aaa | | AAA | | | 606 | µØØ | |
| | 305 | | | Countrywide Asset-Backed Certificates, Ser. 2005-IM2, Class A3,
5.14%, due 11/25/07 | | Aaa | | AAA | | | 301 | µØØ | |
| | 697 | | | Countrywide Asset-Backed Certificates, Ser. 2007-7, Class 2A1,
4.95%, due 11/25/07 | | Aaa | | AAA | | | 688 | µØØ | |
| | 211 | | | Countrywide Asset-Backed Certificates, Ser. 2007-S3, Class A1,
5.01%, due 11/25/07 | | Aaa | | AAA | | | 206 | µØØ | |
| | 206 | | | Countrywide Asset-Backed Certificates, Ser. 2006-BC1, Class 1A,
5.07%, due 11/25/07 | | Aaa | | AAA | | | 198 | µØØ | |
| | 759 | | | Countrywide Asset-Backed Certificates, Ser. 2006-IM1, Class A2,
5.11%, due 11/25/07 | | Aaa | | AAA | | | 729 | µØØ | |
| | 135 | | | Countrywide Asset-Backed Certificates, Ser. 2005-13, Class MV6,
5.57%, due 11/25/07 | | A3 | | A | | | 103 | µØØ | |
| | 234 | | | Countrywide Home Equity Loan Trust, Ser. 2005-A, Class 2A,
5.33%, due 11/15/07 | | Aaa | | AAA | | | 229 | µØØ | |
| | 230 | | | Countrywide Home Equity Loan Trust, Ser. 2005-K, Class 2A1,
5.33%, due 11/15/07 | | Aaa | | AAA | | | 226 | µØØ | |
| | 422 | | | Countrywide Home Loans Mortgage Pass-Through Trust, Ser. 2007-HYB2,
Class 2A1, 5.46%, due 11/25/07 | | Aaa | | AAA | | | 426 | µ | |
| | 150 | | | Credit Suisse Mortgage Capital Certificates, Ser. 2007-TF2A,
Class A1, 5.27%, due 11/15/07 | | Aaa | | AAA | | | 150 | ñµØØ | |
| | 26 | | | Credit-Based Asset Servicing and Securitization, Ser. 2006-CB3, Class AV1,
4.93%, due 11/25/07 | | Aaa | | AAA | | | 26 | µØØ | |
| | 360 | | | Credit-Based Asset Servicing and Securitization, Ser. 2006-CB6, Class A22,
4.96%, due 11/25/07 | | Aaa | | AAA | | | 352 | µØØ | |
| | 462 | | | Credit-Based Asset Servicing and Securitization, Ser. 2007-SP2, Class A1,
5.02%, due 11/25/07 | | Aaa | | AAA | | | 454 | ñµØØ | |
| | 800 | | | Credit-Based Asset Servicing and Securitization, Ser. 2006-CB3, Class AV3,
5.04%, due 11/25/07 | | Aaa | | AAA | | | 775 | µØØ | |
| | 222 | | | Credit-Based Asset Servicing and Securitization, Ser. 2005-CB5, Class AV2,
5.13%, due 11/25/07 | | Aaa | | AAA | | | 217 | µØØ | |
| | 720 | | | Discover Card Master Trust I, Ser. 2005-4, Class A1, 5.15%, due 11/15/07 | | Aaa | | AAA | | | 716 | µØØ | |
| | 51 | | | Equifirst Mortgage Loan Trust, Ser. 2003-2, Class 3A3, 5.62%, due 11/25/07 | | Aaa | | AAA | | | 50 | µØØ | |
| | 44 | | | Fannie Mae Grantor Trust, Ser. 2002-T5, Class A1, 5.11%, due 11/25/07 | | | | | | | 44 | µØØ | |
| | 160 | | | Fannie Mae Whole Loan, Ser. 2003-W5, Class A, 5.09%, due 11/25/07 | | Aaa | | | | | 155 | µØØ | |
| | 385 | | | First Franklin Mortgage Loan Asset-Backed Certificates, Ser. 2006-FF4,
Class A2, 5.06%, due 11/25/07 | | Aaa | | AAA | | | 368 | µØØ | |
| | 49 | | | First Franklin Mortgage Loan Trust, Asset-Backed Certificates, Ser. 2006-FF5,
Class 2A1, 4.92%, due 11/25/07 | | Aaa | | AAA | | | 49 | µØØ | |
| | 99 | | | First Franklin Mortgage Loan Trust, Asset-Backed Certificates, Ser. 2006-FF3,
Class A2A, 4.95%, due 11/25/07 | | Aaa | | AAA | | | 99 | µØØ | |
| | 775 | | | First Franklin Mortgage Loan Trust, Asset-Backed Certificates, Ser. 2006-FF11,
Class 2A3, 5.02%, due 11/25/07 | | Aaa | | AAA | | | 711 | µØØ | |
| | 5 | | | First Franklin Mortgage Loan Trust, Asset-Backed Certificates, Ser. 2004-FFH3,
Class 2A1, 5.25%, due 11/25/07 | | Aaa | | | | | 5 | µØØ | |
| | 479 | | | First Horizon Mortgage Pass-Through Trust, Ser. 2005-AR5, Class 2A1,
5.44%, due 11/25/07 | | | | AAA | | | 479 | µ | |
| | 262 | | | GMAC Mortgage Corp. Loan Trust, Ser. 2006-AR1, Class 1A1,
5.60%, due 11/19/07 | | Aaa | | AAA | | | 263 | µ | |
| | 360 | | | GSAMP Trust, Ser. 2006-HE6, Class A3, 5.02%, due 11/25/07 | | Aaa | | AAA | | | 331 | µØØ | |
| | 280 | | | GSAMP Trust, Ser. 2006-HE6, Class M2, 5.18%, due 11/25/07 | | Aa2 | | AA | | | 200 | µØØ | |
| | 3 | | | GS Mortgage Securities Corp. II, Ser. 2006-FL8A, Class A1,
5.22%, due 11/6/07 | | Aaa | | AAA | | | 3 | ñµØØ | |
| | 366 | | | GSR Mortgage Loan Trust, Ser. 2005-AR3, Class 6A1,
5.02%, due 5/25/35 | | Aaa | | AAA | | | 363 | | |
| | 603 | | | GSR Mortgage Loan Trust, Ser. 2007-AR1, Class 2A1,
6.01%, due 11/25/07 | | | | AAA | | | 609 | µ | |
See Notes to Schedule of Investments 27
| PRINCIPAL AMOUNT | | | | RATING§ | | VALUE† | |
| (000's omitted) | | | | Moody's | | S&P | | (000's omitted) | |
| $ | 494 | | | Harborview Mortgage Loan Trust, Ser. 2006-3, Class 1A1A,
6.38%, due 11/19/07 | | Aaa | | AAA | | $ | 503 | µ | |
| | 132 | | | Household Home Equity Loan Trust, Ser. 2006-1, Class A1, 5.16%, due 11/20/07 | | Aaa | | AAA | | | 126 | µØØ | |
| | 161 | | | Household Home Equity Loan Trust, Ser. 2006-2, Class A2, 5.27%, due 11/20/07 | | Aaa | | AAA | | | 153 | µØØ | |
| | 340 | | | HSI Asset Loan Obligation, Ser. 2007-AR1, Class 2A1,
6.15%, due 11/25/07 | | | | AAA | | | 343 | µ | |
| | 195 | | | HSI Asset Securitization Corp. Trust, Ser. 2006-WMC1, Class A2,
4.97%, due 11/25/07 | | Aaa | | AAA | | | 187 | µØØ | |
| | 29 | | | HSI Asset Securitization Corp. Trust, Ser. 2005-I1, Class 2A1, 4.99%, due 11/25/07 | | Aaa | | AAA | | | 29 | µØØ | |
| | 720 | | | Impac Secured Assets Corp., Ser. 2006-3, Class A4, 4.96%, due 11/25/07 | | Aaa | | AAA | | | 715 | µØØ | |
| | 72 | | | Indymac Index Mortgage Loan Trust, Ser. 2006-AR7, Class 3A1,
6.10%, due 11/25/07 | | Aaa | | AAA | | | 73 | µ | |
| | 607 | | | Indymac Index Mortgage Loan Trust, Ser. 2006-AR11, Class 2A1,
5.86%, due 11/25/07 | | Aaa | | AAA | | | 607 | µ | |
| | 99 | | | Indymac Loan Trust, Ser. 2006-L2, Class A1, 4.92%, due 11/25/07 | | Aaa | | AAA | | | 99 | µØØ | |
| | 178 | | | Indymac Loan Trust, Ser. 2005-L2, Class A1, 5.09%, due 11/25/07 | | Aaa | | AAA | | | 175 | µØØ | |
| | 657 | | | Indymac Seconds Asset-Backed Trust, Ser. 2006-2B, Class A, 5.04%, due 11/25/07 | | Aaa | | AAA | | | 631 | µØØ | |
| | 57 | | | JP Morgan Alternative Loan Trust, Ser. 2006-A3, Class 1A2,
4.94%, due 11/25/07 | | Aaa | | AAA | | | 57 | µØØ | |
| | 135 | | | JP Morgan Alternative Loan Trust, Ser. 2006-A2, Class 1A2,
4.95%, due 11/25/07 | | Aaa | | AAA | | | 135 | µØØ | |
| | 195 | | | JP Morgan Alternative Loan Trust, Ser. 2006-S4, Class A1B,
4.95%, due 11/25/07 | | Aaa | | AAA | | | 195 | µØØ | |
| | 13 | | | JP Morgan Chase Commercial Mortgage Securities Corp., Ser. 2005-FL1A,
Class A1, 5.20%, due 11/15/07 | | Aaa | | AAA | | | 13 | ñµØØ | |
| | 997 | | | JP Morgan Mortgage Trust, Ser. 2005-A3, Class 7CA1, 5.11%, due 6/25/35 | | | | AAA | | | 993 | | |
| | 340 | | | JP Morgan Mortgage Acquisition Corp., Ser. 2006-CW2, Class AV3,
4.97%, due 11/25/07 | | Aaa | | AAA | | | 332 | µØØ | |
| | 642 | | | Knollwood CDO Ltd., Ser. 2006-2A, Class A2J, 5.66%, due 1/13/08 | | Aaa | | AAA | | | 193 | ñµØØ | |
| | 2,050 | | | MBNA Credit Card Master Note Trust, Ser. 2006-A4, Class A4,
5.08%, due 11/15/07 | | Aaa | | AAA | | | 2,045 | µØØ | |
| | 685 | | | MBNA Credit Card Master Note Trust, Ser. 2004-A7, Class A7,
5.19%, due 11/15/07 | | Aaa | | AAA | | | 684 | µØØ | |
| | 505 | | | MBNA Credit Card Master Note Trust, Ser. 2002-A13, Class A,
5.22%, due 11/15/07 | | Aaa | | AAA | | | 505 | µØØ | |
| | 697 | | | Merrill Lynch First Franklin Mortgage Loan, Ser. 2007-2, Class A2A,
4.98%, due 11/25/07 | | Aaa | | AAA | | | 689 | µØØ | |
| | 299 | | | MortgageIT Trust, Ser. 2005-3, Class A1, 5.17%, due 11/25/07 | | Aaa | | AAA | | | 296 | µØØ | |
| | 44 | | | Morgan Stanley Capital I, Ser. 2004-WMC3, Class B3, 7.57%, due 11/25/07 | | Baa3 | | BBB- | | | 29 | µØØ | |
| | 130 | | | MSCC Heloc Trust, Ser. 2003-2, Class A, 5.13%, due 11/25/07 | | Aaa | | AAA | | | 128 | µØØ | |
| | 395 | | | Nomura Asset Acceptance Corp., Ser. 2007-2, Class A1A, 4.99%, due 11/25/07 | | Aaa | | AAA | | | 394 | µØØ | |
| | 47 | | | Novastar Home Equity Loan, Ser. 2005-3, Class A2B, 5.06%, due 11/25/07 | | Aaa | | AAA | | | 47 | µØØ | |
| | 800 | | | Option One Mortgage Loan Trust, Ser. 2006-2, Class 2A2, 4.97%, due 11/25/07 | | Aaa | | AAA | | | 784 | µØØ | |
| | 176 | | | Popular ABS Mortgage Pass-Through Trust, Ser. 2006-E, Class A1,
4.96%, due 11/25/07 | | Aaa | | AAA | | | 174 | µØØ | |
| | 150 | | | Residential Accredit Loans, Inc., Ser. 2006-QO7, Class 3A2, 5.08%, due 11/25/07 | | Aaa | | AAA | | | 146 | µØØ | |
| | 364 | | | Residential Accredit Loans, Inc., Ser. 2005-QA10, Class A31, 5.60%, due 11/25/07 | | Aaa | | AAA | | | 365 | µ | |
| | 472 | | | Residential Accredit Loans, Inc., Ser. 2006-QA1, Class A21, 5.97%, due 11/25/07 | | Aaa | | AAA | | | 478 | µ | |
| | 23 | | | Residential Asset Mortgage Products, Inc., Ser. 2003-RS2, Class AII,
5.21%, due 11/25/07 | | Aaa | | AAA | | | 22 | µØØ | |
| | 61 | | | Residential Asset Mortgage Products, Inc., Ser. 2003-RS3, Class AII,
5.59%, due 11/25/07 | | Aaa | | AAA | | | 61 | µØØ | |
| | 9 | | | Saxon Asset Securities Trust, Ser. 2004-1, Class A, 5.41%, due 11/25/07 | | Aaa | | AAA | | | 9 | µØØ | |
| | 385 | | | SLM Student Loan Trust, Ser. 2005-A, Class A1, 5.73%, due 12/15/07 | | Aaa | | AAA | | | 383 | µØØ | |
| | 4 | | | Specialty Underwriting & Residential Finance, Ser. 2003-BC1, Class A,
5.21%, due 11/25/07 | | Aaa | | | | | 4 | µØØ | |
| | 350 | | | Textron Financial Floorplan Master Note Trust, Ser. 2005-1A, Class A,
5.21%, due 11/13/07 | | Aaa | | AAA | | | 350 | ñµØØ | |
| | 70 | | | Thornburg Mortgage Securities Trust, Ser. 2006-2, Class A1B,
4.92%, due 11/25/07 | | Aaa | | AAA | | | 70 | µØØ | |
| | 665 | | | Volkswagen Credit Auto Master Trust, Ser. 2005-1, Class A, 5.02%, due 11/20/07 | | Aaa | | AAA | | | 664 | µØØ | |
| | 96 | | | Wachovia Asset Securitization, Inc., Ser. 2003-HE3, Class A, 5.12%, due 11/25/07 | | Aaa | | AAA | | | 95 | µØØ | |
| | | | | | | | | | | | 34,627 | | |
See Notes to Schedule of Investments 28
| PRINCIPAL AMOUNT | | | | RATING§ | | VALUE† | |
| (000's omitted) | | | | Moody's | | S&P | | (000's omitted) | |
| Fannie Mae (37.0%) | | | |
| $ | 164 | | | Pass-Through Certificates, 6.00%, due 11/1/15 | | AGY | | AGY | | $ | 167 | | |
| | 493 | | | Pass-Through Certificates, 5.00%, due 3/1/21 & 8/1/35 | | AGY | | AGY | | | 479 | | |
| | 145 | | | Pass-Through Certificates, 8.50%, due 4/1/34 | | AGY | | AGY | | | 155 | | |
| | 399 | | | Pass-Through Certificates, 5.50%, due 7/1/37 | | AGY | | AGY | | | 393 | | |
| | 1,530 | | | Pass-Through Certificates, 6.00%, TBA, 30 Year Maturity | | AGY | | AGY | | | 1,541 | Ø | |
| | 8,425 | | | Pass-Through Certificates, 5.00%, TBA, 15 Year Maturity | | AGY | | AGY | | | 8,294 | Ø | |
| | 8,655 | | | Pass-Through Certificates, 5.00%, TBA, 30 Year Maturity | | AGY | | AGY | | | 8,301 | Ø | |
| | 11,550 | | | Pass-Through Certificates, 5.50%, TBA, 30 Year Maturity | | AGY | | AGY | | | 11,380 | Ø | |
| | | | | | | | | | | | 30,710 | | |
| Freddie Mac (5.8%) | | | |
| | 137 | | | Pass-Through Certificates, 6.50%, due 11/1/25 | | AGY | | AGY | | | 142 | | |
| | 261 | | | Pass-Through Certificates, 5.71%, due 6/1/36 | | AGY | | AGY | | | 264 | | |
| | 1,074 | | | Pass-Through Certificates, 5.78%, due 7/1/36 | | AGY | | AGY | | | 1,077 | | |
| | 719 | | | Pass-Through Certificates, 5.40%, due 2/1/37 | | AGY | | AGY | | | 721 | | |
| | 754 | | | Pass-Through Certificates, 5.55%, due 2/1/37 | | AGY | | AGY | | | 759 | | |
| | 1,808 | | | Pass-Through Certificates, 5.27%, due 4/1/37 | | AGY | | AGY | | | 1,806 | | |
| | | | | | | | | | | | 4,769 | | |
| Total Mortgage-Backed Securities (Cost 69,880) | | | | | | 70,106 | |
Corporate Debt Securities (18.0%)
Bank (1.3%) | | | |
| | 490 | | | Deutsche Bank AG, Senior Unsecured Notes, 5.38%, due 10/12/12 | | Aa1 | | AA | | | 494 | | |
| | 315 | | | JP Morgan Chase Capital XV, Guaranteed Notes, 5.88%, due 3/15/35 | | Aa3 | | A | | | 286 | | |
| | 255 | | | Wachovia Corp., Senior Medium-Term Notes, Ser. G, 5.70%, due 8/1/13 | | Aa3 | | AA- | | | 257 | | |
| | | | | | | | | | | | 1,037 | | |
| Electric (0.2%) | | | |
| | 240 | | | Exelon Generation Co., LLC, Senior Unsecured Notes, 6.20%, due 10/1/17 | | A3 | | BBB+ | | | 241 | | |
| Finance (5.1%) | | | |
| | 155 | | | American Express Co., Senior Unsecured Notes, 6.15%, due 8/28/17 | | A1 | | A+ | | | 158 | | |
| | 910 | | | Citigroup, Inc., Subordinated Notes, 5.00%, due 9/15/14 | | Aa3 | | AA- | | | 883 | | |
| | 475 | | | Countrywide Financial Corp., Guaranteed Medium Term Notes, 5.80%, due 6/7/12 | | Baa3 | | BBB+ | | | 409 | | |
| | 110 | | | Goldman Sachs Group, Inc., Subordinated Notes, 5.95%, due 1/15/27 | | A1 | | A+ | | | 102 | | |
| | 40 | | | Goldman Sachs Group, Inc., Subordinated Notes, 6.45%, due 5/1/36 | | A1 | | A+ | | | 39 | | |
| | 155 | | | Goldman Sachs Group, Inc., Subordinated Notes, 6.75%, due 10/1/37 | | A1 | | A+ | | | 156 | | |
| | 90 | | | Household Finance Corp., Senior Unsecured Notes, 4.13%, due 11/16/09 | | Aa3 | | AA- | | | 88 | | |
| | 390 | | | International Lease Finance Corp., Unsubordinated Notes, 4.75%, due 7/1/09 | | A1 | | AA- | | | 385 | | |
| | 245 | | | International Lease Finance Corp., Medium Term Notes, Ser. R, 5.63%, due 9/15/10 | | A1 | | AA | | | 248 | | |
| | 325 | | | JP Morgan Chase & Co., Senior Unsecured Notes, 5.38%, due 10/1/12 | | Aa2 | | AA- | | | 327 | | |
| | 210 | | | Merrill Lynch & Co., Subordinated Notes, 6.11%, due 1/29/37 | | A2 | | A | | | 193 | | |
| | 130 | | | Merrill Lynch & Co., Subordinated Notes, 6.22%, due 9/15/26 | | A2 | | A | | | 124 | | |
| | 790 | | | Simon Property Group L.P., Unsubordinated Notes, 5.25%, due 12/1/16 | | A3 | | A- | | | 748 | | |
| | 140 | | | Travelers Companies, Inc., Senior Unsecured Notes, 6.25%, due 6/15/37 | | A3 | | A- | | | 138 | | |
| | 260 | | | WEA Finance LLC/WCI Finance LLC, Senior Notes, 5.70%, due 10/1/16 | | A2 | | A- | | | 254 | ñ | |
| | | | | | | | | | | | 4,252 | | |
| Industrial (9.3%) | | | |
| | 490 | | | Comcast Corp., Guaranteed Notes, 6.30%, due 11/15/17 | | Baa2 | | BBB+ | | | 505 | | |
| | 425 | | | Continental Airlines, Inc., Pass-Through Certificates, Series A, 5.98%, due 4/19/22 | | Baa1 | | A | | | 418 | | |
| | 300 | | | Covidien International Finance S.A., Guaranteed Notes, 6.55%, due 10/15/37 | | Baa1 | | A- | | | 306 | ñ | |
| | 615 | | | CVS Caremark Corp., Senior Unsecured Notes, 6.25%, due 6/1/27 | | Baa2 | | BBB+ | | | 612 | | |
| | 300 | | | DaimlerChrysler N.A. Holding Corp., Notes, 4.88%, due 6/15/10 | | A3 | | BBB+ | | | 298 | | |
| | 105 | | | DCP Midstream LLC, Senior Unsecured Notes, 6.75%, due 9/15/37 | | Baa2 | | BBB+ | | | 108 | ñ | |
See Notes to Schedule of Investments 29
| PRINCIPAL AMOUNT | | | | RATING§ | | VALUE† | |
| (000's omitted) | | | | Moody's | | S&P | | (000's omitted) | |
| $ | 610 | | | Delta Air Lines, Pass-Through Certificates, 7.57%, due 11/18/10 | | | | BBB- | | $ | 630 | | |
| | 280 | | | Encana Corp., Senior Unsubordinated Notes, 6.63%, due 8/15/37 | | Baa2 | | A- | | | 296 | | |
| | 300 | | | Enterprise Products Operating L.P., Guaranteed Notes, 6.30%, due 9/15/17 | | Baa3 | | BBB- | | | 305 | | |
| | 460 | | | Erac USA Finance Co., Guaranteed Notes, 7.00%, due 10/15/37 | | Baa2 | | BBB | | | 453 | ñ | |
| | 205 | | | Fedex Corp., Guaranteed Notes, 5.50%, due 8/15/09 | | Baa2 | | BBB | | | 207 | | |
| | 355 | | | Marathon Oil Corp., Unsubordinated Notes, 6.60%, due 10/1/37 | | Baa1 | | BBB+ | | | 370 | | |
| | 185 | | | Motorola, Inc., Senior Unsecured Notes, 6.63%, due 11/15/37 | | Baa1 | | A- | | | 181 | | |
| | 190 | | | Motorola, Inc., Debentures, 5.22%, due 10/1/97 | | Baa1 | | | | | 139 | | |
| | 335 | | | Northwest Airlines, Inc., Pass-Through Certificates, 7.03%, due 11/1/19 | | A3 | | A- | | | 338 | | |
| | 220 | | | Oneok Parters L.P., Guaranteed Notes, 6.85%, due 10/15/37 | | Baa2 | | BBB | | | 230 | | |
| | 130 | | | Owens Corning, Inc., Guaranteed Notes, 7.00%, due 12/1/36 | | Baa3 | | BBB- | | | 121 | | |
| | 220 | | | Southwest Airlines Co., Pass-Through Certificates, Series 07-1, 6.15%, due 8/1/22 | | Aa3 | | AA- | | | 223 | | |
| | 280 | | | Suncor, Inc., Bonds, 6.50%, due 6/15/38 | | A3 | | A- | | | 293 | | |
| | 450 | | | Time Warner Cable, Inc., Senior Unsecured Notes, 5.85%, due 5/1/17 | | Baa2 | | BBB+ | | | 446 | ñ | |
| | 305 | | | Union Pacific Corp., Senior Unsubordinated Notes, 5.75%, due 11/15/17 | | Baa2 | | BBB | | | 304 | | |
| | 235 | | | United Airlines, Inc., Pass-Through Certificates, 6.64%, due 7/2/22 | | Baa2 | | BBB | | | 233 | | |
| | 180 | | | USG Corp., Senior Unsecured Notes, 6.30%, due 11/15/16 | | Baa3 | | BB+ | | | 165 | | |
| | 220 | | | Xerox Corp., Senior Unsecured Notes, 5.50%, due 5/15/12 | | Baa3 | | BBB- | | | 220 | | |
| | 265 | | | XTO Energy, Inc., Senior Unsecured Notes, 6.75%, due 8/1/37 | | Baa2 | | BBB | | | 284 | | |
| | | | | | | | | | | | 7,685 | | |
| Telecommunications (1.4%) | | | |
| | 390 | | | AT&T Wireless Services, Inc., Senior Unsubordinated Notes, 7.88%, due 3/1/11 | | A3 | | A | | | 423 | | |
| | 335 | | | Qwest Corp., Notes, 8.88%, due 3/15/12 | | Ba1 | | BBB- | | | 367 | | |
| | 355 | | | Sprint Nextel Corp., Unsecured Notes, 6.00%, due 12/1/16 | | Baa3 | | BBB | | | 341 | | |
| | | | | | | | | | | | 1,131 | | |
| Utility - Electric (0.7%) | | | |
| | 155 | | | DTE Energy Co., Senior Notes, 7.05%, due 6/1/11 | | Baa2 | | BBB- | | | 163 | | |
| | 285 | | | FirstEnergy Corp., Unsubordinated Notes, Ser. B, 6.45%, due 11/15/11 | | Baa3 | | BBB- | | | 294 | | |
| | 145 | | | MidAmerican Energy Co., Senior Unsecured Notes, 5.80%, due 10/15/36 | | A2 | | A- | | | 141 | | |
| | | | | | | | | | | | 598 | | |
| Total Corporate Debt Securities (Cost $15,001) | | | | | | 14,944 | |
| Asset-Backed Securities (11.2%) | | | |
| | 4 | | | ABSC NIMS Trust, Ser. 2005-HE6, Class A1, 5.05%, due 8/27/35 | | | | CCC | | | 3 | ñ | |
| | 43 | | | Adjustable Rate Mortgage NIM Trust, Ser. 2006-6, Class A,
6.50%, due 11/27/07 | | | | A- | | | 24 | ñ | |
| | 105 | | | ARCap REIT, Inc., Ser. 2004-1A, Class D, 5.64%, due 4/21/39 | | A1 | | A | | | 98 | ñ | |
| | 110 | | | Banc of America Commercial Mortgage, Inc., Ser. 2007-3, Class A4,
5.84%, due 11/10/07 | | Aaa | | AAA | | | 110 | µ | |
| | 37 | | | Carmax Auto Owner Trust, Ser. 2004-1, Class D, 3.52%, due 11/15/10 | | A2 | | AAA | | | 37 | | |
| | 106 | | | Chase Commercial Mortgage Securities Corp., Ser. 2000-3, Class A1,
7.09%, due 10/15/32 | | | | AAA | | | 106 | | |
| | 630 | | | Chase Commercial Mortgage Securities Corp., Ser. 2003-3, Class A2,
7.32%, due 10/15/32 | | | | AAA | | | 660 | | |
| | 165 | | | Credit Suisse First Boston Mortgage Securities Corp., Ser. 2001-CK6,
Class A3, 6.39%, due 8/15/36 | | Aaa | | AAA | | | 171 | | |
| | 225 | | | Credit Suisse First Boston Mortgage Securities Corp., Ser. 2005-C4,
Class A3, 5.12%, due 8/15/38 | | Aaa | | AAA | | | 222 | | |
| | 80 | | | Credit Suisse Mortgage Capital Certificates, Ser. 2007-C3,
Class A4, 5.91%, due 11/15/07 | | Aaa | | AAA | | | 81 | µ | |
| | 670 | | | Credit Suisse Mortgage Capital Certificates, Ser. 2006-C4, Class A2,
5.36%, due 9/15/39 | | Aaa | | AAA | | | 670 | | |
| | 45 | | | Credit Suisse Mortgage Capital Certificates, Ser. 2007-C4, Class A4,
6.01%, due 11/15/07 | | Aaa | | AAA | | | 46 | µ | |
| | 100 | | | Credit Suisse Mortgage Capital Certificates, Ser. 2007-C1, Class A3,
5.38%, due 2/15/40 | | Aaa | | | | | 98 | | |
| | 635 | | | Discover Card Master Trust, Ser. 2007-A1, Class A1, 5.65%, due 3/16/20 | | Aaa | | AAA | | | 640 | | |
See Notes to Schedule of Investments 30
| PRINCIPAL AMOUNT | | | | RATING§ | | VALUE† | |
| (000's omitted) | | | | Moody's | | S&P | | (000's omitted) | |
| $ | 6 | | | Fremont NIM Trust, Ser. 2005-C, 5.58%, due 7/25/35 | | | | CCC | | $ | 1 | ñ | |
| | 175 | | | Greenwich Capital Commercial Funding Corp., Ser. 2007-GG11,
Class A4, 5.74%, due 12/10/49 | | | | AAA | | | 177 | | |
| | 175 | | | GS Mortgage Securities Corp. II, Ser. 2007-GG10, Class A4,
5.99%, due 11/10/07 | | Aaa | | AAA | | | 177 | µ | |
| | 10 | | | Harborview NIM Corp., Ser. 2006-9A, Class N1,
6.41%, due 11/19/36 | | | | | | | 10 | ñ§§ | |
| | 148 | | | JP Morgan Chase Commercial Mortgage Securities Corp., Ser. 2005-CB11,
Class A1, 4.52%, due 8/12/37 | | Aaa | | AAA | | | 147 | | |
| | 220 | | | JP Morgan Chase Commercial Mortgage Securities Corp., Ser. 2005-LDP3,
Class A3, 4.96%, due 8/15/42 | | Aaa | | AAA | | | 215 | | |
| | 335 | | | JP Morgan Chase Commercial Mortgage Securities Corp., Ser. 2006-CB14,
Class ASB, 5.51%, due 12/12/44 | | Aaa | | AAA | | | 334 | | |
| | 180 | | | JP Morgan Chase Commercial Mortgage Securities Corp., Ser. 2006-LDP7,
Class A4, 6.07%, due 11/15/07 | | Aaa | | AAA | | | 184 | µ | |
| | 200 | | | JP Morgan Chase Commercial Mortgage Securities Corp., Ser. 2007-LDPX,
Class A3, 5.42%, due 1/15/49 | | Aaa | | | | | 196 | | |
| | 1,270 | | | JP Morgan Chase Commercial Mortgage Securities Corp., Ser. 2007-LD11,
Class A4, 6.01%, due 11/15/07 | | Aaa | | AAA | | | 1,287 | µ | |
| | 1,270 | | | JP Morgan Chase Commercial Mortgage Securities Corp., Ser. 2007-CB20,
Class A4, 5.79%, due 2/12/51 | | Aaa | | AAA | | | 1,279 | | |
| | 808 | | | LB Commercial Conduit Mortgage Trust, Ser. 1998-C4, Class A1B,
6.21%, due 10/15/35 | | Aaa | | AAA | | | 812 | | |
| | 123 | | | Merrill Lynch Mortgage Trust, Ser. 2005-MKB2, Class A1, 4.45%, due 9/12/42 | | Aaa | | AAA | | | 122 | | |
| | 300 | | | Merrill Lynch/Countrywide Commercial Mortgage Trust, Ser. 2007-5, Class A4,
5.38%, due 8/12/48 | | Aaa | | AAA | | | 294 | | |
| | 140 | | | Morgan Stanley Capital I, Ser. 2005-T17, Class A5, 4.78%, due 12/13/41 | | | | AAA | | | 133 | | |
| | 115 | | | Morgan Stanley Capital I, Ser. 2007-HQ11, Class A4, 5.45%, due 2/12/44 | | Aaa | | AAA | | | 113 | | |
| | 260 | | | Newcastle CDO Ltd., Ser. 2004-4A, Class 3FX, 5.11%, due 3/24/39 | | A2 | | A | | | 217 | ñ | |
| | 3 | | | Renaissance Home Equity Loan Trust, Ser. 2005-4, Class N, 7.14%, due 2/25/36 | | | | BBB | | | 2 | ñ | |
| | 40 | | | Wachovia Bank Commercial Mortgage Trust, Ser. 2005-C17, Class A1,
4.43%, due 3/15/42 | | Aaa | | AAA | | | 40 | | |
| | 245 | | | Wachovia Bank Commercial Mortgage Trust, Ser. 2007-C30, Class A5,
5.34%, due 12/15/43 | | Aaa | | AAA | | | 239 | | |
| | 330 | | | Wachovia Bank Commercial Mortgage Trust, Ser. 2005-C22, Class A4,
5.27%, due 11/15/07 | | Aaa | | AAA | | | 325 | µ | |
| | | | | Total Asset-Backed Securities (Cost $10,559) | | | | | | | 9,270 | | |
| NUMBER OF SHARES | | | | | | | |
| Short-Term Investments (3.7%) | | | |
| | 3,051,615 | | | Neuberger Berman Prime Money Fund Trust Class (Cost $3,052) | | | | | | | 3,052 | #@ | |
| | | | | Total Investments (135.1%) (Cost $113,140) | | | | | | | 112,168 | ## | |
| | | | | Liabilities, less cash, receivables and other assets [(35.1%)] | | | | | | | (29,145 | ) | |
| | | | | Total Net Assets (100.0%) | | | | | | $ | 83,023 | | |
See Notes to Schedule of Investments 31
Schedule of Investments Lehman Brothers High Income Bond Fund
| PRINCIPAL AMOUNT | | | | RATING§ | | VALUE† | |
| (000's omitted) | | | | Moody's | | S&P | | (000's omitted) | |
Corporate Debt Securities (98.0%)
Aerospace/Defense (1.9%) | | | |
| $ | 5,935 | | | L-3 Communications Corp., Guaranteed Senior Unsecured Subordinated Notes,
7.63%, due 6/15/12 | | Ba3 | | BB+ | | $ | 6,106 | | |
| | 375 | | | L-3 Communications Corp., Guaranteed Senior Unsecured Subordinated Notes,
6.13%, due 7/15/13 | | Ba3 | | BB+ | | | 372 | | |
| | 725 | | | L-3 Communications Corp., Guaranteed Notes, Ser. B, 6.38%, due 10/15/15 | | Ba3 | | BB+ | | | 725 | | |
| | | | | | | | | | | | 7,203 | | |
| Airlines (1.2%) | | | |
| | 4,130 | | | Continental Airlines, Inc., Pass-Through Certificates, 9.80%, due 4/1/21 | | Ba1 | | BB+ | | | 4,399 | | |
| Apparel/Textiles (0.7%) | | | |
| | 2,605 | | | Levi Strauss & Co., Senior Unsubordinated Notes, 9.75%, due 1/15/15 | | B2 | | B+ | | | 2,719 | | |
| Auto Loans (8.3%) | | | |
| | 6,115 | | | Ford Motor Credit Co., Senior Unsecured Notes, 9.75%, due 9/15/10 | | B1 | | B | | | 6,089 | | |
| | 7,430 | | | Ford Motor Credit Co., Notes, 7.80%, due 6/1/12 | | B1 | | B | | | 6,981 | | |
| | 12,785 | | | General Motors Acceptance Corp., Notes, 6.88%, due 9/15/11 | | Ba1 | | BB+ | | | 11,783 | | |
| | 6,300 | | | General Motors Acceptance Corp., Unsecured Notes, 7.00%, due 2/1/12 | | Ba1 | | BB+ | | | 5,754 | | |
| | | | | | | | | | | | 30,607 | | |
| Auto Parts & Equipment (1.1%) | | | |
| | 1,612 | | | Goodyear Tire & Rubber Co., Senior Notes, 8.63%, due 12/1/11 | | Ba3 | | B | | | 1,717 | | |
| | 2,270 | | | Goodyear Tire & Rubber Co., Senior Notes, 9.00%, due 7/1/15 | | Ba3 | | B | | | 2,483 | | |
| | | | | | | | | | | | 4,200 | | |
| Beverage (0.4%) | | | |
| | 1,375 | | | Constellation Brands, Inc., Guaranteed Notes, 7.25%, due 9/1/16 | | Ba3 | | BB- | | | 1,385 | | |
| Building & Construction (0.1%) | | | |
| | 650 | | | K. Hovnanian Enterprises, Senior Notes, 8.63%, due 1/15/17 | | Ba3 | | BB- | | | 543 | È | |
| Chemicals (1.6%) | | | |
| | 1,180 | | | Chemtura Corp., Guaranteed Notes, 6.88%, due 6/1/16 | | Ba2 | | BB+ | | | 1,127 | | |
| | 2,035 | | | Hexion US Finance Corp., Guaranteed Notes, 9.75%, due 11/15/14 | | B3 | | B | | | 2,233 | | |
| | 2,710 | | | MacDermid, Inc., Senior Subordinated Notes, 9.50%, due 4/15/17 | | Caa1 | | CCC+ | | | 2,588 | ñ | |
| | | | | | | | | | | | 5,948 | | |
| Consumer/Commercial/Lease Financing (0.6%) | | | |
| | 2,960 | | | Residential Capital LLC, Guaranteed Notes, 7.00%, due 2/22/11 | | Ba1 | | BBB- | | | 2,161 | | |
| Electric - Generation (4.4%) | | | |
| | 1,540 | | | AES Corp., Senior Notes, 7.75%, due 10/15/15 | | B1 | | B | | | 1,544 | ñ | |
| | 2,375 | | | AES Corp., Senior Notes, 8.00%, due 10/15/17 | | B1 | | B | | | 2,396 | ñ | |
| | 3,920 | | | Dynegy-Roseton Danskamme, Pass-Through Certificates, Ser. B,
7.67%, due 11/8/16 | | Ba3 | | B | | | 3,930 | | |
| | 780 | | | Edison Mission Energy, Senior Unsecured Notes, 7.50%, due 6/15/13 | | B1 | | BB- | | | 791 | | |
| | 1,885 | | | Edison Mission Energy, Senior Notes, 7.63%, due 5/15/27 | | B1 | | BB- | | | 1,795 | ñ | |
| | 4,565 | | | Mirant Americas Generation, Inc., Senior Unsecured Notes, 8.30%, due 5/1/11 | | Caa1 | | B- | | | 4,616 | | |
| | 1,085 | | | NRG Energy, Inc., Guaranteed Notes, 7.38%, due 2/1/16 | | B1 | | B | | | 1,082 | | |
| | | | | | | | | | | | 16,154 | | |
See Notes to Schedule of Investments 32
| PRINCIPAL AMOUNT | | | | RATING§ | | VALUE† | |
| (000's omitted) | | | | Moody's | | S&P | | (000's omitted) | |
| Electric - Integrated (1.8%) | | | |
| $ | 6,505 | | | Energy Future Holdings, Guaranteed Notes, 10.88%, due 11/1/17 | | B3 | | CCC+ | | $ | 6,578 | ñ | |
| Electronics (2.4%) | | | |
| | 5,725 | | | Freescale Semiconductor, Inc., Guaranteed Notes, 9.13%, due 12/15/14 | | B1 | | B | | | 5,181 | | |
| | 1,095 | | | NXP BV Funding LLC, Secured Notes, 7.88%, due 10/15/14 | | Ba3 | | BB | | | 1,069 | | |
| | 2,775 | | | NXP BV Funding LLC, Guaranteed Notes, 9.50%, due 10/15/15 | | B3 | | B | | | 2,622 | | |
| | | | | | | | | | | | 8,872 | | |
| Energy-Exploration & Production (3.0%) | | | |
| | 9,035 | | | Chesapeake Energy Corp., Guaranteed Notes, 7.50%, due 9/15/13 | | Ba2 | | BB | | | 9,284 | | |
| | 1,730 | | | Forest Oil Corp., Guaranteed Senior Unsecured Notes, 7.75%, due 5/1/14 | | B1 | | B+ | | | 1,747 | | |
| | | | | | | | | | | | 11,031 | | |
| Environmental (0.3%) | | | |
| | 985 | | | Allied Waste North America, Inc., Secured Notes, Ser. B, 5.75%, due 2/15/11 | | B1 | | BB+ | | | 960 | | |
| Food & Drug Retailers (1.3%) | | | |
| | 2,095 | | | Rite Aid Corp., Senior Unsecured Notes, 8.63%, due 3/1/15 | | Caa1 | | CCC+ | | | 1,859 | | |
| | 3,295 | | | Rite Aid Corp., Guaranteed Notes, 9.50%, due 6/15/17 | | Caa1 | | CCC+ | | | 3,048 | ñ | |
| | | | | | | | | | | | 4,907 | | |
| Forestry/Paper (0.6%) | | | |
| | 1,420 | | | Bowater, Inc., Debentures, 9.00%, due 8/1/09 | | B3 | | B | | | 1,392 | | |
| | 830 | | | Graphic Packaging Int'l, Inc., Guaranteed Notes, 8.50%, due 8/15/11 | | B2 | | B- | | | 842 | | |
| | | | | | | | | | | | 2,234 | | |
| Gaming (5.1%) | | | |
| | 2,735 | | | Chukchansi Economic Development Authority, Senior Notes,
8.00%, due 11/15/13 | | B2 | | BB- | | | 2,756 | ñ | |
| | 3,010 | | | Fontainebleau Las Vegas Holdings LLC, Second Mortgage, 10.25%, due 6/15/15 | | Caa1 | | CCC+ | | | 2,814 | ñ | |
| | 1,860 | | | Majestic Star LLC, Senior Unsecured Notes, 9.75%, due 1/15/11 | | Caa1 | | CCC+ | | | 1,581 | | |
| | 3,595 | | | Pokagon Gaming Authority, Senior Notes, 10.38%, due 6/15/14 | | B3 | | B | | | 3,972 | ñ | |
| | 3,225 | | | San Pasqual Casino, Notes, 8.00%, due 9/15/13 | | B2 | | B+ | | | 3,257 | ñ | |
| | 2,495 | | | Shingle Springs Tribal Gaming Authority, Senior Notes, 9.38%, due 6/15/15 | | B3 | | B | | | 2,507 | ñ | |
| | 645 | | | Station Casinos, Inc., Senior Unsecured Subordinated Notes, 6.88%, due 3/1/16 | | Ba3 | | B | | | 534 | | |
| | 1,525 | | | Station Casinos, Inc., Senior Unsecured Notes, 7.75%, due 8/15/16 | | Ba2 | | B+ | | | 1,493 | | |
| | | | | | | | | | | | 18,914 | | |
| Gas Distribution (5.7%) | | | |
| | 1,100 | | | AmeriGas Partners L.P., Senior Unsecured Notes, 7.25%, due 5/20/15 | | B1 | | | | | 1,089 | | |
| | 3,020 | | | Ferrellgas Partners L.P., Senior Unsecured Notes, 8.75%, due 6/15/12 | | B2 | | B- | | | 3,111 | | |
| | 6,115 | | | Kinder Morgan, Inc., Senior Unsecured Notes, 6.50%, due 9/1/12 | | Ba2 | | BB- | | | 6,061 | | |
| | 4,212 | | | Regency Energy Partners L.P., Guaranteed Notes, 8.38%, due 12/15/13 | | B1 | | B | | | 4,433 | | |
| | 1,095 | | | Sabine Pass L.P., Secured Notes, 7.25%, due 11/30/13 | | Ba3 | | BB | | | 1,073 | | |
| | 5,405 | | | Sabine Pass L.P., Secured Notes, 7.50%, due 11/30/16 | | Ba3 | | BB | | | 5,297 | | |
| | | | | | | | | | | | 21,064 | | |
| Health Services (10.1%) | | | |
| | 825 | | | Bausch & Lomb, Inc., Senior Unsecured Notes, 9.88%, due 11/1/15 | | Caa1 | | B- | | | 850 | ñ | |
| | 915 | | | Community Health Systems, Inc., Guaranteed Notes, 8.88%, due 7/15/15 | | B3 | | B- | | | 926 | ñ | |
| | 3,615 | | | HCA, Inc., Secured Notes, 9.25%, due 11/15/16 | | B2 | | BB- | | | 3,805 | | |
| | 6,880 | | | HCA, Inc., Secured Notes, 9.63%, due 11/15/16 | | B2 | | BB- | | | 7,276 | | |
| | 3,640 | | | LVB Acquisition Merger, Inc., Guaranteed Notes, 10.38%, due 10/15/17 | | B3 | | B- | | | 3,686 | ñ | |
| | 1,975 | | | LVB Acquisition Merger, Inc., Guaranteed Notes, 11.63%, due 10/15/17 | | Caa1 | | B- | | | 2,012 | ñ | |
See Notes to Schedule of Investments 33
| PRINCIPAL AMOUNT | | | | RATING§ | | VALUE† | |
| (000's omitted) | | | | Moody's | | S&P | | (000's omitted) | |
| $ | 2,726 | | | NMH Holdings, Inc., Senior Unsecured Floating Rate Notes, 12.82%, due 12/15/07 | | Caa2 | | CCC+ | | $ | 2,713 | ñµ | |
| | 2,310 | | | Service Corp. Int'l, Senior Unsecured Notes, 6.75%, due 4/1/15 | | B1 | | BB- | | | 2,304 | | |
| | 2,650 | | | Service Corp. Int'l, Senior Unsecured Notes, 7.50%, due 4/1/27 | | B1 | | BB- | | | 2,478 | | |
| | 1,795 | | | Tenet Healthcare Corp., Senior Notes, 9.88%, due 7/1/14 | | Caa1 | | CCC+ | | | 1,633 | | |
| | 2,890 | | | US Oncology, Inc., Guaranteed Notes, 9.00%, due 8/15/12 | | B2 | | CCC+ | | | 2,897 | | |
| | 3,065 | | | Ventas Realty L.P., Guaranteed Notes, 6.75%, due 6/1/10 | | Ba1 | | BB+ | | | 3,080 | | |
| | 1,415 | | | Ventas Realty L.P., Guaranteed Notes, 7.13%, due 6/1/15 | | Ba1 | | BB+ | | | 1,443 | | |
| | 1,060 | | | Ventas Realty L.P., Guaranteed Notes, 6.50%, due 6/1/16 | | Ba1 | | BB+ | | | 1,047 | | |
| | 1,060 | | | Ventas Realty L.P., Guaranteed Notes, 6.75%, due 4/1/17 | | Ba1 | | BB+ | | | 1,060 | | |
| | | | | | | | | | | | 37,210 | | |
| Hotels (0.3%) | | | |
| | 1,180 | | | Host Hotels & Resorts L.P., Secured Notes, 6.88%, due 11/1/14 | | | | BB | | | 1,189 | | |
| Investments & Misc. Financial Services (1.4%) | | | |
| | 3,795 | | | Cardtronics, Inc., Guaranteed Notes, 9.25%, due 8/15/13 | | Caa1 | | B- | | | 3,662 | | |
| | 1,695 | | | Cardtronics, Inc., Senior Subordinated Notes, Ser. B, 9.25%, due 8/15/13 | | Caa1 | | B- | | | 1,636 | ñ | |
| | | | | | | | | | | | 5,298 | | |
| Media - Broadcast (4.7%) | | | |
| | 6,130 | | | CMP Susquehanna Corp., Guaranteed Notes, 9.88%, due 5/15/14 | | Caa1 | | CCC | | | 5,632 | | |
| | 2,030 | | | Entercom Radio/Capital, Guaranteed Senior Unsecured Notes, 7.63%, due 3/1/14 | | B1 | | B | | | 2,020 | | |
| | 4,410 | | | LIN Television Corp., Guaranteed Notes, 6.50%, due 5/15/13 | | B1 | | B- | | | 4,278 | | |
| | 4,085 | | | Univision Communications, Inc., Guaranteed Notes, 9.75%, due 3/15/15 | | B3 | | CCC+ | | | 4,003 | ñ | |
| | 1,285 | | | Young Broadcasting, Inc., Guaranteed Senior Subordinated Notes,
10.00%, due 3/1/11 | | Caa1 | | CCC- | | | 1,208 | | |
| | 465 | | | Young Broadcasting, Inc., Senior Subordinated Notes, 8.75%, due 1/15/14 | | Caa1 | | CCC- | | | 401 | | |
| | | | | | | | | | | | 17,542 | | |
| Media - Cable (7.2%) | | | |
| | 2,890 | | | CCH I Holdings LLC, Secured Notes, 11.00%, due 10/1/15 | | Caa2 | | CCC | | | 2,803 | | |
| | 7,145 | | | Charter Communications Operating LLC, Senior Notes, 8.38%, due 4/30/14 | | B2 | | B+ | | | 7,145 | ñ | |
| | 5,340 | | | DirecTV Holdings LLC, Senior Notes, 8.38%, due 3/15/13 | | Ba3 | | BB- | | | 5,580 | | |
| | 255 | | | DirecTV Holdings LLC, Guaranteed Notes, 6.38%, due 6/15/15 | | Ba3 | | BB- | | | 246 | | |
| | 5,085 | | | EchoStar DBS Corp., Guaranteed Notes, 6.38%, due 10/1/11 | | Ba3 | | BB- | | | 5,149 | | |
| | 2,570 | | | EchoStar DBS Corp., Guaranteed Notes, 7.00%, due 10/1/13 | | Ba3 | | BB- | | | 2,676 | | |
| | 2,785 | | | EchoStar DBS Corp., Guaranteed Notes, 7.13%, due 2/1/16 | | Ba3 | | BB- | | | 2,911 | | |
| | | | | | | | | | | | 26,510 | | |
| Media - Diversified (0.5%) | | | |
| | 2,090 | | | Quebecor Media, Inc., Notes, 7.75%, due 3/15/16 | | B2 | | B | | | 2,017 | ñ | |
| Media - Services (2.6%) | | | |
| | 2,385 | | | Lamar Media Corp., Guaranteed Notes, 7.25%, due 1/1/13 | | Ba3 | | B | | | 2,391 | | |
| | 3,685 | | | WMG Acquisition Corp., Senior Subordinated Notes, 7.38%, due 4/15/14 | | B2 | | B | | | 3,271 | | |
| | 5,180 | | | WMG Holdings Corp., Guaranteed Notes, Step-Up, 0.00%/9.50%, due 12/15/14 | | B2 | | B | | | 3,807 | ** | |
| | | | | | | | | | | | 9,469 | | |
| Metals/Mining Excluding Steel (4.6%) | | | |
| | 2,900 | | | Aleris Int'l, Inc., Guaranteed Notes, 9.00%, due 12/15/14 | | B3 | | B- | | | 2,617 | | |
| | 3,460 | | | Aleris Int'l, Inc., Guaranteed Notes, 10.00%, due 12/15/16 | | Caa1 | | B- | | | 3,045 | | |
| | 3,820 | | | Arch Western Finance Corp., Guaranteed Notes, 6.75%, due 7/1/13 | | B1 | | BB- | | | 3,725 | | |
| | 2,020 | | | Freeport-McMoRan Copper & Gold, Senior Unsecured Notes, 8.38%, due 4/1/17 | | Ba3 | | BB | | | 2,212 | | |
| | 5,665 | | | Massey Energy Co., Guaranteed Notes, 6.88%, due 12/15/13 | | B2 | | B+ | | | 5,353 | | |
| | | | | | | | | | | | 16,952 | | |
See Notes to Schedule of Investments 34
| PRINCIPAL AMOUNT | | | | RATING§ | | VALUE† | |
| (000's omitted) | | | | Moody's | | S&P | | (000's omitted) | |
| Non-Food & Drug Retailers (1.5%) | | | |
| $ | 1,560 | | | Claire's Stores, Inc., Guaranteed Notes, 9.63%, due 6/1/15 | | Caa1 | | CCC+ | | $ | 1,276 | ñ | |
| | 2,175 | | | GSC Holdings Corp., Guaranteed Notes, 8.00%, due 10/1/12 | | Ba3 | | BB | | | 2,270 | | |
| | 1,915 | | | Michaels Stores, Inc., Guaranteed Notes, 11.38%, due 11/1/16 | | Caa1 | | CCC | | | 1,910 | È | |
| | | | | | | | | | | | 5,456 | | |
| Packaging (4.2%) | | | |
| | 7,815 | | | Ball Corp., Guaranteed Unsecured Notes, 6.88%, due 12/15/12 | | Ba1 | | BB | | | 7,932 | | |
| | 2,360 | | | Crown Americas LLC, Guaranteed Notes, 7.75%, due 11/15/15 | | B1 | | B | | | 2,431 | | |
| | 2,760 | | | Graham Packaging Co., Inc., Guaranteed Notes, 9.88%, due 10/15/14 | | Caa1 | | CCC+ | | | 2,732 | | |
| | 2,410 | | | Owens-Brockway Glass Container, Inc., Guaranteed Notes, 8.75%, due 11/15/12 | | Ba2 | | BB | | | 2,516 | | |
| | | | | | | | | | | | 15,611 | | |
| Printing & Publishing (4.8%) | | | |
| | 670 | | | Dex Media West LLC, Senior Unsecured Notes, Ser. B, 8.50%, due 8/15/10 | | Ba3 | | B | | | 688 | | |
| | 1,960 | | | Dex Media West LLC, Guaranteed Notes, Ser. B, 9.88%, due 8/15/13 | | B1 | | B | | | 2,090 | | |
| | 2,765 | | | Dex Media, Inc., Senior Disc. Notes, Step-Up, 0.00%/9.00%, due 11/15/13 | | B2 | | B | | | 2,620 | ** | |
| | 6,025 | | | Idearc, Inc., Guaranteed Notes, 8.00%, due 11/15/16 | | B2 | | B+ | | | 6,040 | | |
| | 2,580 | | | R.H. Donnelley Corp., Senior Unsecured Notes, 6.88%, due 1/15/13 | | B3 | | B | | | 2,425 | | |
| | 925 | | | R.H. Donnelley Corp., Senior Notes, 8.88%, due 10/15/17 | | B3 | | B | | | 925 | ñ | |
| | 3,345 | | | Reader's Digest Association, Inc., Senior Subordinated Notes, 9.00%, due 2/15/17 | | Caa1 | | CCC+ | | | 2,981 | ñ | |
| | | | | | | | | | | | 17,769 | | |
| Railroads (1.9%) | | | |
| | 1,140 | | | Kansas City Southern Mexico, Senior Notes, 7.38%, due 6/1/14 | | B2 | | B+ | | | 1,140 | ñ | |
| | 5,400 | | | TFM SA de C.V., Senior Notes, 9.38%, due 5/1/12 | | B2 | | | | | 5,724 | | |
| | | | | | | | | | | | 6,864 | | |
| Real Estate Dev. & Mgt. (1.9%) | | | |
| | 5,300 | | | American Real Estate Partners, L.P., Senior Notes, 8.13%, due 6/1/12 | | Ba3 | | BB+ | | | 5,340 | | |
| | 1,915 | | | Realogy Corp., Guaranteed Notes, 11.00%, due 4/15/14 | | Caa1 | | B- | | | 1,560 | ñ | |
| | | | | | | | | | | | 6,900 | | |
| Restaurants (0.5%) | | | |
| | 2,055 | | | NPC Int'l, Inc., Guaranteed Notes, 9.50%, due 5/1/14 | | Caa1 | | B- | | | 1,921 | | |
| Software/Services (1.5%) | | | |
| | 5,695 | | | First Data Corp., Guaranteed Notes, 9.88%, due 9/24/15 | | B3 | | B- | | | 5,453 | ñ | |
| Steel Producers/Products (1.7%) | | | |
| | 2,805 | | | Metals U.S.A. Holdings Corp., Senior Floating Rate Notes, 11.23%, due 1/2/08 | | Caa1 | | CCC | | | 2,545 | ñµ | |
| | 3,670 | | | Tube City IMS Corp., Guaranteed Notes, 9.75%, due 2/1/15 | | B3 | | B- | | | 3,606 | | |
| | | | | | | | | | | | 6,151 | | |
| Support-Services (1.4%) | | | |
| | 870 | | | Aramark Corp., Guaranteed Notes, 8.50%, due 2/1/15 | | B3 | | B- | | | 881 | | |
| | 4,285 | | | Knowledge Learning Corp., Inc., Guaranteed Notes, 7.75%, due 2/1/15 | | B2 | | B- | | | 4,188 | ñ | |
| | | | | | | | | | | | 5,069 | | |
| Telecom - Integrated/Services (6.1%) | | | |
| | 2,120 | | | Dycom Industries, Inc., Guaranteed Notes, 8.13%, due 10/15/15 | | Ba3 | | B+ | | | 2,157 | | |
| | 3,830 | | | Intelsat Subsidiary Holdings Co. Ltd., Guaranteed Notes, 8.63%, due 1/15/15 | | B2 | | B | | | 3,887 | | |
| | 3,165 | | | Nordic Telephone Co. Holdings, Secured Notes, 8.88%, due 5/1/16 | | B2 | | B | | | 3,347 | ñ | |
See Notes to Schedule of Investments 35
| PRINCIPAL AMOUNT | | | | RATING§ | | VALUE† | |
| (000's omitted) | | | | Moody's | | S&P | | (000's omitted) | |
| $ | 2,970 | | | Qwest Corp., Notes, 8.88%, due 3/15/12 | | Ba1 | | BBB- | | $ | 3,252 | | |
| | 3,215 | | | Qwest Corp., Senior Notes, 7.63%, due 6/15/15 | | Ba1 | | BBB- | | | 3,384 | | |
| | 2,480 | | | Windstream Corp., Guaranteed Notes, 8.13%, due 8/1/13 | | Ba3 | | BB- | | | 2,623 | | |
| | 3,695 | | | Windstream Corp., Guaranteed Notes, 8.63%, due 8/1/16 | | Ba3 | | BB- | | | 3,954 | | |
| | | | | | | | | | | | 22,604 | | |
| Theaters & Entertainment (0.6%) | | | |
| | 1,995 | | | AMC Entertainment, Inc., Guaranteed Notes, Ser. B, 8.63%, due 8/15/12 | | Ba3 | | B- | | | 2,069 | | |
| | | | | Total Corporate Debt Securities (Cost $364,965) | | | | | | | 361,933 | | |
| NUMBER OF SHARES | | | | | |
| Short-Term Investments (0.6%) | | | |
| | 216,828 | | | Neuberger Berman Prime Money Fund Trust Class | | | | | | | 217 | @ | |
| | 1,773,561 | | | Neuberger Berman Securities Lending Quality Fund, LLC | | | | | | | 1,774 | ‡ | |
| | | | | Total Short-Term Investments (Cost $1,991) | | | | | | | 1,991 | # | |
| | | | | Total Investments (98.6%) (Cost $366,956) | | | | | | | 363,924 | ## | |
| | | | | Cash, receivables and other assets, less liabilities (1.4%) | | | | | | | 5,322 | | |
| | | | | Total Net Assets (100.0%) | | | | | | $ | 369,246 | | |
See Notes to Schedule of Investments 36
Schedule of Investments Lehman Brothers Municipal Money Fund
| PRINCIPAL AMOUNT | | SECURITY@@ | | RATING‡‡§ | | VALUE†† | |
| (000's omitted) | | | | Moody's | | S&P | | (000's omitted) | |
| Municipal Notes (98.1%) | | | |
| Alabama (1.1%) | | | |
| $ | 300 | | | Decatur IDB Solid Waste Disp. Rev. (Amoco Chemical Co. Proj.),
Ser. 1995, 3.64%, due 11/1/07 | | VMIG1 | | | | $ | 300 | µß | |
| | 9,500 | | | Mobile IDB Rev. (Pwr. Theodore Plant), Ser. 2001 A,
3.66%, due 11/1/07 | | VMIG1 | | A-1 | | | 9,500 | µß | |
| | | | | | | | | | | | 9,800 | | |
| Arizona (4.6%) | | | |
| | 1,000 | | | Coconino Co. Ind. Dev. Au. IDR (Scuff Steel Proj.), Ser. 2007,
(LOC: Wells Fargo Bank NA), 3.53%, due 11/1/07 | | | | A-1+ | | | 1,000 | µß | |
| | 15,810 | | | Phoenix Ind. Dev. Au. Single Family Mtge. Rev. (Merlots), Ser. 2007 C59,
(LOC: Government National Mortgage Association), 3.39%, due 11/7/07 | | VMIG1 | | | | | 15,810 | µd | |
| | 23,595 | | | RBC Muni. Prod., Inc. Trust Var. St. Rev. (Floater Cert.), Ser. 2007 C-1,
(LOC: Royal Bank of Canada), 3.57%, due 11/1/07 | | VMIG1 | | | | | 23,595 | µ | |
| | | | | | | | | | | | 40,405 | | |
| Arkansas (0.2%) | | | |
| | 2,025 | | | Clarksville IDR (Baldor Elec. Co. Proj.), Ser. 1998,
(LOC: SunTrust Bank), 3.54%, due 11/7/07 | | | | | | | 2,025 | µß | |
| California (2.9%) | | | |
| | 2,620 | | | Arcadia Unified Sch. Dist. (Putters), Ser. 2007-1716,
(FSA Insured), 3.46%, due 11/1/07 | | VMIG1 | | | | | 2,620 | µs | |
| | 2,000 | | | BB&T Muni. Trust, Ser. 2000, (FSA Insured), 3.43%, due 11/1/07 | | VMIG1 | | | | | 2,000 | µg | |
| | 4,980 | | | California Infrastructure & Econ. Dev. Bank IDR (Kruger & Sons, Inc., Proj.),
Ser. 2002, (LOC: Bank of the West), 3.50%, due 11/1/07 | | VMIG1 | | | | | 4,980 | µß | |
| | 3,060 | | | California Infrastructure & Econ. Dev. Bank IDR (Studio Moulding Proj.),
Ser. 2001 A, (LOC: Comerica Bank), 3.53%, due 11/1/07 | | VMIG1 | | | | | 3,060 | µß | |
| | 6,765 | | | California Statewide CDA (Floaters), Ser. 2007-2114,
(LOC: Wells Fargo Bank & Trust Co.), 3.51%, due 11/1/07 | | | | A-1+ | | | 6,765 | µ | |
| | 5,000 | | | Contra Costa Co. Multi-Family Hsg. Rev. (Pleasant Hill BART Transit),
Ser. 2006 A, 3.95%, due 4/15/46 Putable 12/20/07 | | | | | | | 5,002 | ß | |
| | 1,245 | | | Deutsche Bank Spears/Lifers Trust Var. St. Rev., Ser. 2007-116,
(LOC: Deutsche Bank), 3.71%, due 11/1/07 | | | | | | | 1,245 | µ | |
| | | | | | | | | | | | 25,672 | | |
| Colorado (1.5%) | | | |
| | 2,000 | | | Colorado Hsg. & Fin. Au. Mfg. Rev. (Ready Foods, Inc. Proj.), Ser. 2007 A,
(LOC: U.S. Bank), 3.51%, due 11/1/07 | | | | A-1+ | | | 2,000 | µß | |
| | 2,500 | | | Denver City & Co. Arpt. Rev., Sub. Ser. 2005 C-2, (CIFG Insured),
3.43%, due 11/7/07 | | VMIG1 | | A-1+ | | | 2,500 | µy | |
| | 8,830 | | | Fort Collins PCR (Floaters), Ser. 2007-2036, (LOC: Morgan Stanley),
3.51%, due 11/1/07 | | | | A-1+ | | | 8,830 | µ | |
| | | | | | | | | | | | 13,330 | | |
| Connecticut (0.7%) | | | |
| | 5,805 | | | Connecticut Dev. Au. Arpt. Hotel Rev. (Bradley Arpt. Hotel Proj.), Ser. 2006,
(LOC: TD Banknorth N.A.), 3.46%, due 11/1/07 | | VMIG1 | | | | | 5,805 | µß | |
See Notes to Schedule of Investments 37
| PRINCIPAL AMOUNT | | SECURITY@@ | | RATING‡‡§ | | VALUE†† | |
| (000's omitted) | | | | Moody's | | S&P | | (000's omitted) | |
| District of Columbia (0.2%) | | | |
| $ | 1,500 | | | Washington Convention Ctr. Au. Dedicated Tax Rev. Sr. Lien, Ser. 1998,
(AMBAC Insured), 5.25%, due 10/1/12 Pre-Refunded 10/1/08 | | | | | | $ | 1,539 | | |
| Florida (4.8%) | | | |
| | 10,070 | | | Florida Hsg. Fin. Corp. Rev. (Floaters), Ser. 2007-2028,
(LOC: Government National Mortgage Association), 3.55%, due 11/1/07 | | | | | | | 10,070 | µy | |
| | 5,400 | | | Florida Hsg. Fin. Corp. Rev. (Merlots), Ser. 2007 C64,
(LOC: Bank of New York), 3.39%, due 11/7/07 | | | | A-1+ | | | 5,400 | µ | |
| | 6,670 | | | Florida Hsg. Fin. Corp. Rev. (Merlots), Ser. 2006 B17,
(LOC: Government National Mortgage Association), 3.39%, due 11/7/07 | | | | A-1+ | | | 6,670 | µii | |
| | 3,000 | | | Miami-Dade Co. Aviation Rev., Ser. 2007-10065,
(MBIA Insured), 3.59%, due 11/1/07 | | | | A-1+ | | | 3,000 | µk | |
| | 2,500 | | | Miami-Dade Co. Ind. Dev. Au. Solid Waste Disp. Rev.
(Florida Pwr. & Light Co. Proj.), Ser. 2003, 3.65%, due 11/1/07 | | VMIG1 | | | | | 2,500 | µß | |
| | 1,100 | | | Pinellas Co. Hlth. Fac. Au. Rev. Ref. (Pooled Hosp. Loan Prog.), Ser. 1985,
(AMBAC Insured), 3.59%, due 11/1/07 | | VMIG1 | | A-1+ | | | 1,100 | µßii | |
| | 5,000 | | | RBC Muni. Prod. Inc. Trust Var. St. (Floater Cert.), Ser. 2007 I-43,
(XLCA Insured), 3.50%, due 11/1/07 | | | | | | | 5,000 | µnn | |
| | 6,705 | | | St. John's Co. Ind. Dev. Au. IDR (Rulon Co. Proj.), Ser. 2004,
(LOC: Coastal Bank of Georgia), 3.53%, due 11/1/07 | | | | | | | 6,705 | µß | |
| | 1,000 | | | St. Lucie Co. Solid Waste Disp. Ref. Rev. (Florida Pwr. & Light Co. Proj.),
Ser. 2003, 3.65%, due 11/1/07 | | VMIG1 | | | | | 1,000 | µß | |
| | | | | | | | | | | | 41,445 | | |
| Georgia (2.7%) | | | |
| | 2,970 | | | Atlanta Arpt. Rev. (Merlots), Ser. 2004 C14,
(FSA Insured), 3.39%, due 11/7/07 | | VMIG1 | | | | | 2,970 | µii | |
| | 6,450 | | | Atlanta Urban Residential Fin. Au. Multi-Family Hsg. Rev.
(Capitol Gateway Apts.), Ser. 2005, (LOC: Bank of America),
3.54%, due 11/1/07 | | | | A-1+ | | | 6,450 | µß | |
| | 1,575 | | | Columbus Dev. Au. Rev. (Foundation Prop. Inc.), Ser. 2007,
(LOC: Columbus Bank & Trust), 3.48%, due 11/1/07 | | | | | | | 1,575 | µß | |
| | 2,875 | | | Crisp Co. Cordele IDA Rev. (Goldens Foundry & Machine Co. Proj.),
Ser. 2007, (LOC: Columbus Bank & Trust), 3.53%, due 11/1/07 | | | | | | | 2,875 | µß | |
| | 1,200 | | | Forsyth Co. Dev. Au. IDR (Selecto Scientific Inc. Proj.), Ser. 1998,
(RBC Centura Bank), 3.58%, due 11/1/07 | | | | A-1+ | | | 1,200 | µß | |
| | 3,100 | | | Georgia St. Hsg. & Fin. Au. Rev. (Merlots), Ser. 2006 B11,
(LOC: Wachovia Bank & Trust Co.), 3.39%, due 11/7/07 | | | | A-1+ | | | 3,100 | µ | |
| | 1,985 | | | Savannah Econ. Dev. Au. Rev. (Exempt Fac. Cons. Util. Proj.),
Ser. 1999, (LOC: Branch Banking & Trust Co.), 3.58%, due 11/1/07 | | VMIG1 | | | | | 1,985 | µß | |
| | 970 | | | Savannah Econ. Dev. Au. Rev. (Kennickell Printing Co. Proj.),
Ser. 2001, (LOC: Branch Banking & Trust Co.), 3.58%, due 11/1/07 | | VMIG1 | | | | | 970 | µß | |
| | 2,110 | | | Turner Co. Dev. Au. IDR (McElroy Metal Mill, Inc.), Ser. 2005,
(LOC: AmSouth Bank), 3.53%, due 11/1/07 | | P-1 | | | | | 2,110 | µ | |
| | | | | | | | | | | | 23,235 | | |
| Illinois (6.1%) | | | |
| | 5,295 | | | Aurora Single Family Mtge. Rev. (Merlots), Ser. 2007 E05,
(LOC: Government National Mortgage Association), 3.39%, due 11/7/07 | | | | A-1+ | | | 5,295 | µd | |
| | 2,350 | | | Chicago Enterprise Zone Rev. (J & A LLC Proj.), Ser. 2002,
(LOC: Charter One Bank), 3.56%, due 11/1/07 | | | | | | | 2,350 | µ | |
| | 1,695 | | | Chicago Multi-Family Hsg. Rev. (Claras Village Proj.), Ser. 2007 B,
(LOC: Harris Trust & Savings Bank), 3.55%, due 11/1/07 | | VMIG1 | | | | | 1,695 | µ | |
| | 2,500 | | | Chicago Single Family Mtge. Rev., Ser. 2007 2F,
(LOC: Government National Mortgage Association), 3.93%, due 7/1/08 | | | | | | | 2,500 | j | |
| | 2,400 | | | Illinois Dev. Fin. Au. IDR (Universal Press, Inc., Proj.), Ser. 2000 A,
(LOC: LaSalle National Bank), 3.55%, due 11/1/07 | | | | A-1+ | | | 2,400 | µß | |
| | 2,850 | | | Illinois Hlth. Fac. Au. Rev. (Advocate Hlth. Care Network), Ser. 2003 A,
3.78%, due 11/15/22 Putable 7/3/08 | | VMIG1 | | A-1+ | | | 2,850 | µß | |
See Notes to Schedule of Investments 38
| PRINCIPAL AMOUNT | | SECURITY@@ | | RATING‡‡§ | | VALUE†† | |
| (000's omitted) | | | | Moody's | | S&P | | (000's omitted) | |
| $ | 2,000 | | | Illinois Hsg. Dev. Au. Multi-Family Hsg. Rev. (Rome Meadows Proj.),
Ser. 2007, (LOC: First National Bank), 3.53%, due 11/1/07 | | | | A-1+ | | $ | 2,000 | µkk | |
| | 4,070 | | | Illinois Hsg. Dev. Au. Multi-Family Rev. (Galesburg Towers), Ser. 2005,
(LOC: Harris Trust & Savings), 3.50%, due 11/1/07 | | | | A-1 | | | 4,070 | µß | |
| | 1,135 | | | Illinois Std. Assist. Commission Std. Loan Rev., Ser. 2000 XX,
5.10%, due 9/1/08 | | | | | | | 1,148 | | |
| | 4,140 | | | Lake Co. Multi-Family Hsg. Rev. (Rosewood Apt. Proj.), Ser. 2004,
(LOC: Freddie Mac), 3.58%, due 11/1/07 | | | | A-1+ | | | 4,140 | µß | |
| | 14,390 | | | Puttable Floating Option Tax-Exempt Receipts (Floaters), Ser. 2007-4262,
(LOC: Government National Mortgage Association), 3.57%, due 11/1/07 | | | | | | | 14,390 | µx | |
| | 9,000 | | | Will Co. Solid Waste Disp. Rev. (BASF Corp. Proj.), Ser. 1997,
3.69%, due 11/1/07 | | P-1 | | | | | 9,000 | µß | |
| | 1,035 | | | Woodridge Ind. Rev. (McDavid Knee Guard), Ser. 1996,
(LOC: Marshall & Ilsley), 3.35%, due 11/7/07 | | | | A-1 | | | 1,035 | µß | |
| | | | | | | | | | | | 52,873 | | |
| Indiana (7.5%) | | | |
| | 13,795 | | | ABN Amro Munitops Cert. Trust Rev., Ser. 2003-27,
(FGIC Insured), 3.49%, due 11/1/07 | | VMIG1 | | | | | 13,795 | µa | |
| | 2,670 | | | Anderson Econ. Dev. Rev. (Gateway Village Proj.), Ser. 1996,
(LOC: Federal Home Loan Bank), 3.53%, due 11/1/07 | | VMIG1 | | | | | 2,670 | µ | |
| | 1,000 | | | Angola Ed. Fac. Rev. (Tri-State Univ. Proj.), Ser. 2006,
(LOC: Fifth Third Bank), 3.47%, due 11/2/07 | | | | | | | 1,000 | µß | |
| | 5,230 | | | Bartholomew Cons. Sch. Corp. Ind. Tax Anticipation Warrants, Ser. 2007,
4.00%, due 12/31/07 | | | | | | | 5,233 | | |
| | 7,660 | | | Columbus Econ. Dev. Rev. (Arbors at Waters Edge Apts.), Ser. 2004, (LOC: Federal Home Loan Bank), 3.58%, due 11/1/07 | | VMIG1 | | | | | 7,660 | µ | |
| | 2,300 | | | East Porter Co. Sch. Bldg. Corp. Rev., Ser. 2005-145,
(MBIA Insured), 3.57%, due 11/1/07 | | | | A-1+ | | | 2,300 | µo | |
| | 6,010 | | | Greencastle IDR (Crown Equip. Corp. Proj.), Ser. 1996,
(LOC: Key Bank), 3.52%, due 11/1/07 | | | | | | | 6,010 | µß | |
| | 2,500 | | | Hamilton Southeastern Sch. Warrants, Ser. 2007,
3.80%, due 12/31/07 | | | | | | | 2,501 | | |
| | 2,735 | | | Hammond Econ. Dev. Rev. (Annex at Douglas Pointe), Ser. 1996 A,
(LOC: Federal Home Loan Bank), 3.53%, due 11/1/07 | | VMIG1 | | | | | 2,735 | µß | |
| | 2,250 | | | Indiana Bond Bank Rev. (Adv. Fdg. Prog. Notes), Ser. 2007 A,
(LOC: Bank of New York), 4.25%, due 1/31/08 | | | | SP-1+ | | | 2,253 | | |
| | 400 | | | Indiana Hlth. & Ed. Fac. Fin. Au. Hosp. Rev. (Howard Reg. Hlth. Sys. Proj.),
Ser. 2005 B, (LOC: National City Bank), 3.63%, due 11/1/07 | | | | A-1 | | | 400 | µß | |
| | 7,725 | | | Indiana Hsg. & CDA Single Family Mtge Rev. (Putters), Ser. 2007-1847,
(LOC: JP Morgan Chase), 3.55%, due 11/1/07 | | VMIG1 | | | | | 7,725 | µ | |
| | 2,400 | | | Indiana St. Dev. Fin. Au. IDR (TTP, Inc. Proj.), Ser. 2001,
(LOC: LaSalle National Bank), 3.55%, due 11/1/07 | | | | A-1+ | | | 2,400 | µß | |
| | 1,178 | | | La Porte Co. Econ. Dev. Rev. (Pedcor Investments-Woodland Crossing Apt.),
Ser. 1994, (LOC: Federal Home Loan Bank), 3.56%, due 11/1/07 | | VMIG1 | | | | | 1,178 | µß | |
| | 4,800 | | | Noblesville Econ. Dev. Rev. (Greystone Apts. Proj.), Ser. 2006 A,
(LOC: LaSalle National Bank), 3.54%, due 11/1/07 | | | | A-1+ | | | 4,800 | µß | |
| | 2,500 | | | Northern Wells Comm. Sch. Tax Anticipation Warrants,
Ser. 2007, 3.70%, due 12/31/07 | | | | | | | 2,500 | | |
| | | | | | | | | | | | 65,160 | | |
| Iowa (0.3%) | | | |
| | 900 | | | Iowa Higher Ed. Loan Au. Rev. (Loras College), Ser. 2007 E,
(LOC: LaSalle National Bank), 4.50%, due 5/20/08 | | | | SP-1+ | | | 903 | ß | |
| | 1,250 | | | Iowa Higher Ed. Loan Au. Rev. (Morningside College), Ser. 2007 F,
(LOC: U.S. Bank), 4.50%, due 5/20/08 | | | | SP-1+ | | | 1,255 | ß | |
| | | | | | | | | | | | 2,158 | | |
See Notes to Schedule of Investments 39
| PRINCIPAL AMOUNT | | SECURITY@@ | | RATING‡‡§ | | VALUE†† | |
| (000's omitted) | | | | Moody's | | S&P | | (000's omitted) | |
| Kentucky (3.3%) | | | |
| $ | 3,285 | | | Boone Co. Ind. Bldg. Rev. (Bonfiglioli USA, Inc. Proj.), Ser. 2006,
(LOC: Fifth Third Bank), 3.54%, due 11/2/07 | | | | | | $ | 3,285 | µß | |
| | 11,975 | | | Deutsche Bank Spears/Lifers Trust Var. St., Ser. 2007-347,
(MBIA Insured), 3.50%, due 11/1/07 | | | | A-1+ | | | 11,975 | µo | |
| | 1,610 | | | Georgetown Ind. Bldg. Rev. (Georgetown College Proj.), Ser. 2006,
(LOC: Fifth Third Bank), 3.45%, due 11/2/07 | | VMIG1 | | | | | 1,610 | µß | |
| | 670 | | | Jefferson Co. Retirement Home Rev. (Nazareth Library Proj.), Ser. 1999,
(LOC: Fifth Third Bank), 3.47%, due 11/2/07 | | | | | | | 670 | µß | |
| | 3,000 | | | Kentucky Econ. Dev. Fin. Au. Ind. Bldg. Rev. (Republic Svcs., Inc. Proj.),
Ser. 2001, (LOC: Bank of America), 3.55%, due 11/1/07 | | | | A-1+ | | | 3,000 | µ | |
| | 2,000 | | | Kentucky Econ. Dev. Fin. Au. Ind. Bldg. Rev. (Republic Svcs., Inc. Proj.),
Ser. 2003, (LOC: Bank One), 3.55%, due 11/1/07 | | | | A-1+ | | | 2,000 | µß | |
| | 4,995 | | | Kentucky Hsg. Corp. Hsg. Rev., Ser. 2006-3478,
(LOC: Merrill Lynch Capital Markets), 3.61%, due 11/1/07 | | | | A-1+ | | | 4,995 | µ | |
| | 1,450 | | | Ohio Co. Solid Waste Disp. Rev. (Waste Management LLC Proj.), Ser. 2003,
(LOC: Wachovia Bank & Trust Co.), 3.52%, due 11/1/07 | | | | A-1+ | | | 1,450 | µß | |
| | | | | | | | | | | | 28,985 | | |
| Louisiana (2.4%) | | | |
| | 7,000 | | | Ascension Parish Rev. (BASF Corp. Proj.), Ser. 1997, 3.69%, due 11/1/07 | | P-1 | | | | | 7,000 | µß | |
| | 6,000 | | | Ascension Parish Rev. (BASF Corp. Proj.), Ser. 1998, 3.69%, due 11/1/07 | | P-1 | | | | | 6,000 | µß | |
| | 5,000 | | | Louisiana Local Gov't. Env. Facs. & CDA Rev. (Mid South Extrusion, Inc. Proj.),
Ser. 2006, (LOC: Regions Bank), 3.52%, due 11/1/07 | | | | A-1 | | | 5,000 | µß | |
| | 2,000 | | | Louisiana Local Gov't. Env. Facs. & Comm. Dev. Rev. (SRL Holdings LLC Proj.),
Ser. 2007, (LOC: Branch Banking & Trust Co.), 3.58%, due 11/1/07 | | | | | | | 2,000 | µß | |
| | 1,000 | | | Louisiana St. Gas & Fuels Tax Rev., Ser. 2006-7021, (FGIC Insured),
3.51%, due 11/1/07 | | VMIG1 | | | | | 1,000 | µl | |
| | | | | | | | | | | | 21,000 | | |
| Maine (0.9%) | | | |
| | 8,000 | | | Maine St. Hsg. Au. Mtge. Purchase Bonds, Ser. 2007 F,
3.85%, due 11/15/34 Putable 9/22/08 | | VMIG1 | | A-1+ | | | 8,000 | | |
| Maryland (0.3%) | | | |
| | 2,380 | | | Maryland St. Comm. Dev. Admin. Dept. Hsg. & Comm. Dev. Residential,
Ser. 2006 R, 3.64%, due 12/14/07 | | MIG1 | | | | | 2,380 | | |
| Massachusetts (3.4%) | | | |
| | 6,000 | | | Fall River G.O. BANS, Ser. 2007 A, 4.10%, due 1/30/08 | | MIG1 | | SP-1 | | | 6,005 | | |
| | 10,000 | | | Massachusetts Bay Trans. Au. Sales Tax Rev. (Floaters), Ser. 2006-3526,
(LOC: Dexia Credit Locale de France), 3.49%, due 11/1/07 | | | | A-1+ | | | 10,000 | µ | |
| | 12,115 | | | Massachusetts St. HFA (Floaters), Ser. 2007-2071,
(LOC: Morgan Stanley), 3.55%, due 11/1/07 | | | | | | | 12,115 | µ | |
| | 125 | | | Massachusetts St. Hlth. & Ed. Fac. Au. Rev. (Sherrill House),
Ser. 2002 A-1, (LOC: Sovereign Bank), 3.45%, due 11/1/07 | | | | A-1+ | | | 125 | µßm | |
| | 1,000 | | | Massachusetts St. Turnpike Au. Metro. Hwy. Sys. Rev. (Floaters), Ser. 2000,
(MBIA Insured), 3.49%, due 11/1/07 | | VMIG1 | | | | | 1,000 | µy | |
| | | | | | | | | | | | 29,245 | | |
| Michigan (4.0%) | | | |
| | 10,000 | | | ABN Amro Munitops Cert. Trust, Ser. 2002-35,
(FSA Insured), 3.49%, due 11/1/07 | | VMIG1 | | | | | 10,000 | µa | |
| | 1,600 | | | Eastern Michigan Univ. Rev., Ser. 2001,
(FGIC Insured), 3.58%, due 11/1/07 | | | | A-1+ | | | 1,600 | µp | |
| | 9,630 | | | Kent Co. Arpt. Rev. G.O. (Merlots), Ser. 2007-D28,
(LOC: Wachovia Bank & Trust Co.), 3.34%, due 11/7/07 | | | | A-1+ | | | 9,630 | µ | |
See Notes to Schedule of Investments 40
| PRINCIPAL AMOUNT | | SECURITY@@ | | RATING‡‡§ | | VALUE†† | |
| (000's omitted) | | | | Moody's | | S&P | | (000's omitted) | |
| $ | 1,370 | | | Michigan St. Hosp. Fin. Au. Rev., Ser. 2006,
(LOC: Citibank, N.A.), 3.51%, due 11/1/07 | | VMIG1 | | | | $ | 1,370 | µ | |
| | 1,000 | | | Michigan St. Hsg. Dev. Au. Ltd. Oblig. Rev. (JAS Non-Profit Hsg. Corp. IV),
Ser. 2000, (LOC: Bank One Michigan), 3.50%, due 11/1/07 | | | | A-1+ | | | 1,000 | µß | |
| | 1,900 | | | Michigan St. Job. Dev. Au. IDR (Kentwood Residence Assoc. Proj.), Ser. 1984,
(LOC: Wells Fargo & Co.), 3.85%, due 11/1/07 | | | | A-1+ | | | 1,900 | µ | |
| | 2,500 | | | Michigan St. Strategic Fund Ltd. Oblig. Rev. (Behr Sys., Inc. Proj.), Ser. 2001,
(LOC: National City Bank), 3.56%, due 11/1/07 | | | | | | | 2,500 | µß | |
| | 400 | | | Michigan St. Strategic Fund Ltd. Oblig. Rev. (Ultra Aluminum Mfg. Inc., Proj.),
Ser. 2003, (LOC: Fifth Third Bank), 3.54%, due 11/2/07 | | | | | | | 400 | µ | |
| | 6,770 | | | Muni. Sec. Trust Cert. G.O., Ser. 2003-9054,
(LOC: Bear Stearns), 3.50%, due 11/1/07 | | | | A-1 | | | 6,770 | ñµ | |
| | | | | | | | | | 35,170 | | |
| Minnesota (0.9%) | |
| | 6,595 | | | Dakota Co. Comm. Dev. Agcy. Multi-Family Hsg. Rev.
(Brentwood Hills Apts. Proj.), Ser. 2003 A,
(LOC: LaSalle National Bank), 3.68%, due 11/1/07 | | VMIG1 | | | | | 6,595 | µß | |
| | 1,400 | | | Plymouth Multi-Family Hsg. Ref. Rev. (At the Lake Apts. Proj.),
Ser. 2004, (LOC: Freddie Mac), 3.53%, due 11/1/07 | | VMIG1 | | | | | 1,400 | µß | |
| | | | | | | | | | 7,995 | | |
| Mississippi (1.3%) | |
| | 10,960 | | | Mississippi Home Corp. Single Family Mtge. Rev. (Merlots),
Ser. 2007 C60, (LOC: Government National Mortgage Association),
3.39%, due 11/7/07 | | VMIG1 | | | | | 10,960 | µd | |
| Missouri (2.6%) | |
| | 4,000 | | | Missouri Higher Ed. Loan Au. Std. Loan Rev., Ser. 2005 E,
(MBIA Insured), 3.53%, due 11/1/07 | | VMIG1 | | A-1 | | | 4,000 | µn | |
| | 800 | | | Missouri St. Dev. Fin. Board Infrastructure Fac. Rev.
(St. Louis Convention Ctr.), Ser. 2000 C, (LOC: U.S. Bank),
3.63%, due 11/1/07 | | | | A-1+ | | | 800 | µ | |
| | 1,435 | | | Missouri St. Hlth. & Ed. Fac. Au. Ed. Fac. Rev. (Drury College),
Ser. 1999, (LOC: Bank of America), 3.63%, due 11/1/07 | | VMIG1 | | | | | 1,435 | µß | |
| | 200 | | | Missouri St. Hlth. & Ed. Fac. Au. Ed. Fac. Rev. (St. Louis Univ.),
Ser. 1999 B, (LOC: Bank of America), 3.61%, due 11/1/07 | | VMIG1 | | A-1+ | | | 200 | µß | |
| | 4,520 | | | Missouri St. Hsg. Dev. Commission Single Family Mtge. Rev. (Putters),
Ser. 2006-1514, (LOC: Government National Mortgage Association),
3.55%, due 11/1/07 | | | | A-1+ | | | 4,520 | µs | |
| | 11,640 | | | Puttable Floating Option Tax Exempt Receipts (Floaters),
Ser. 2007-4085, (FSA Insured), 3.55%, due 11/1/07 | | | | | | | 11,640 | µp | |
| | | | | | | | | | 22,595 | | |
| Nevada (2.0%) | |
| | 9,365 | | | Muni. Sec. Trust Cert. G.O. (Clark Co. Passenger Fac.), Ser. 2007-321,
Class A, (AMBAC Insured), 3.55%, due 11/1/07 | | VMIG1 | | | | | 9,365 | ñµh | |
| | 4,580 | | | Nevada Hsg. Div. Multi-Unit Hsg. (Mesquite), Ser. 1996 B,
(LOC: U.S. Bank), 3.34%, due 11/7/07 | | VMIG1 | | | | | 4,580 | µ | |
| | 3,500 | | | Nevada Hsg. Div. Multi-Unit Hsg. (Sierra Port), Ser. 2005,
(LOC: Fannie Mae), 3.50%, due 11/1/07 | | | | A-1+ | | | 3,500 | µß | |
| | | | | | | | | | 17,445 | | |
| New Hampshire (2.4%) | |
| | 1,800 | | | Cheshire Co. G.O. TANS, Ser. 2007, 3.75%, due 12/27/07 | | | | | | | 1,800 | | |
| | 1,160 | | | Manchester Hsg. Au. Multi-Family Rev. (Wall Street Tower), Ser. 1990 B,
(LOC: PNC Bank), 3.50%, due 11/1/07 | | | | A-1 | | | 1,160 | µ | |
| | 2,000 | | | Merrimack Co. G.O. TANS, Ser. 2007, 4.25%, due 12/28/07 | | | | | | | 2,002 | | |
See Notes to Schedule of Investments 41
| PRINCIPAL AMOUNT | | SECURITY@@ | | RATING‡‡§ | | VALUE†† | |
| (000's omitted) | | | | Moody's | | S&P | | (000's omitted) | |
| $ | 5,000 | | | New Hampshire Hlth. & Ed. Fac. Au. Rev. (Kimball Union Academy),
Ser. 2007, (LOC: RBS Citizens N.A.), 3.50%, due 11/1/07 | | VMIG1 | | | | $ | 5,000 | µ | |
| | 4,200 | | | New Hampshire St. Bus. Fin. Au. Rev. (Taylor Home), Ser. 2005 B,
(LOC: TD Banknorth N.A.), 3.47%, due 11/1/07 | | VMIG1 | | | | | 4,200 | µß | |
| | 3,000 | | | New Hampshire St. Hsg. Fin. Au. Multi-Family Rev. (Floaters),
Ser. 2006-3438, (LOC: Merrill Lynch Capital Markets), 3.61%, due 11/1/07 | | VMIG1 | | | | | 3,000 | µ | |
| | 3,600 | | | Strafford Co. G.O. TANS, Ser. 2007, 3.75%, due 12/31/07 | | | | | | | 3,600 | | |
| | | | | | | | | | | | 20,762 | | |
| New Mexico (0.5%) | | | |
| | 2,800 | | | ABN Amro Munitops Cert. Trust, Ser. 2005-42,
(AMBAC Insured), 3.50%, due 11/1/07 | | | | | | | 2,800 | ñµa | |
| | 1,900 | | | Farmington PCR Ref. (Arizona Pub. Svc. Co.), Ser. 1994 A,
(LOC: Barclays Bank PLC), 3.59%, due 11/1/07 | | VMIG1 | | A-1+ | | | 1,900 | µß | |
| | | | | | | | | | | | 4,700 | | |
| New York (4.6%) | | | |
| | 7,000 | | | Jamestown City Sch. Dist. G.O. BANS, Ser. 2007, 3.75%, due 5/22/08 | | | | | | | 7,001 | | |
| | 16,100 | | | New York City IDA Spec. Fac. Rev. (Korean Air Lines Co.), Ser. 1997 B,
(LOC: HSBC Bank U.S.A. N.A.), 3.28%, due 11/7/07 | | VMIG1 | | A-1+ | | | 16,100 | µß | |
| | 9,000 | | | New York St. Dorm. Au. Rev. Secondary Issues (Floaters), Ser. 2006-1370,
(FHA Insured), 3.47%, due 11/1/07 | | | | A-1 | | | 9,000 | µx | |
| | 6,000 | | | Port Au. New York & New Jersey (Putters), Ser. 2007-2092,
(FSA Insured), 3.47%, due 11/1/07 | | | | A-1+ | | | 6,000 | µs | |
| | 10 | | | Utica IDA Civic Fac. Rev. (Utica College Proj.), Ser. 2005 A,
(LOC: Citizens Bank), 3.45%, due 11/1/07 | | VMIG1 | | | | | 10 | µß | |
| | 1,700 | | | Watervliet Hsg. Au. Sr. Residential Hsg. Rev. (Beltrone Living Ctr. Proj.),
Ser. 1998 A, 6.13%, due 6/1/38 Pre-Refunded 6/1/08 | | | | | | | 1,773 | ß | |
| | | | | | | | | | | | 39,884 | | |
| North Carolina (1.4%) | | | |
| | 2,800 | | | North Carolina Cap. Fac. Fin. Agcy. Rev. (Eagle), Ser. 2006-0139,
Class A, (LOC: Citibank, N.A.), 3.52%, due 11/1/07 | | | | A-1+ | | | 2,800 | µ | |
| | 9,190 | | | North Carolina HFA Rev. (Merlots), Ser. 2006 B12,
(LOC: Wachovia Bank & Trust Co.), 3.39%, due 11/7/07 | | VMIG1 | | | | | 9,190 | µ | |
| | | | | | | | | | | | 11,990 | | |
| Ohio (2.5%) | | | |
| | 3,855 | | | Hamilton Co. Hlth. Care Fac. Rev. (Sisters of Charity Sr. Care),
Ser. 2002, (LOC: Fifth Third Bank), 3.49%, due 11/1/07 | | | | | | | 3,855 | µß | |
| | 3,000 | | | Marysville G.O. BANS, Ser. 2007, 4.13%, due 6/5/08 | | MIG1 | | | | | 3,008 | | |
| | 5,000 | | | Ohio St. Higher Ed. Cap. Fac., Ser. 2002 II A, 5.00%, due 12/1/07 | | | | | | | 5,005 | | |
| | 2,325 | | | Ohio St. Wtr. Dev. Au. Rev. (Floaters), Ser. 2005-1118,
(LOC: Rabobank Nederland), 3.50%, due 11/1/07 | | | | A-1+ | | | 2,325 | µ | |
| | 2,000 | | | Univ. of Cincinnati Gen. Receipts Bonds BANS, Ser. 2007 C,
4.50%, due 1/24/08 | | MIG1 | | SP-1+ | | | 2,004 | | |
| | 3,850 | | | Warrensville Heights G.O. BANS (Var. Purp. Imp.), Ser. 2007,
4.05%, due 5/30/08 | | | | | | | 3,855 | | |
| | 2,132 | | | Wood Co. IDR (Reclamation Technologies), Ser. 2006,
(LOC: National City Bank), 3.56%, due 11/1/07 | | | | | | | 2,132 | µß | |
| | | | | | | | | | | | 22,184 | | |
| Oklahoma (1.7%) | | | |
| | 15,000 | | | Tulsa Co. Ind. Au. Cap. Imp. Rev., Ser. 2003 A,
(LOC: Bank of America), 3.70%, due 5/15/17 Putable 11/15/07 | | | | A-1+ | | | 15,000 | µ | |
See Notes to Schedule of Investments 42
| PRINCIPAL AMOUNT | | SECURITY@@ | | RATING‡‡§ | | VALUE†† | |
| (000's omitted) | | | | Moody's | | S&P | | (000's omitted) | |
| Pennsylvania (2.4%) | | | |
| $ | 900 | | | Berks Co. Ind. Dev. Au. Rev. (Mfg. Facs. RAM Ind. Proj.), Ser. 1996,
(LOC: PNC Bank), 3.36%, due 11/7/07 | | | | | | $ | 900 | µß | |
| | 2,385 | | | Bradford Co. Ind. Dev. Au. Rev. (Econ. Dev. Towanda Print), Ser. 2001,
(LOC: PNC Bank), 3.56%, due 11/1/07 | | | | | | | 2,385 | µß | |
| | 2,700 | | | Cumberland Co. Muni. Au. Rev. (Presbyterian Homes Proj.), Ser. 2005 B,
(Radian Insured), 3.65%, due 12/1/26 Putable 12/1/07 | | | | A-1+ | | | 2,700 | µßii | |
| | 1,765 | | | Lackawanna Co. Ind. Dev. Au. Rev. (Material Technology Proj.), Ser. 2006,
(LOC: Wachovia Bank & Trust Co.), 3.60%, due 11/1/07 | | | | | | | 1,765 | µß | |
| | 1,905 | | | Northampton Co. Ind. Dev. Au. IDR (Losco Family Properties LLC Proj.),
Ser. 2005, (LOC: Wachovia Bank & Trust Co.), 3.60%, due 11/1/07 | | | | | | | 1,905 | µß | |
| | 300 | | | Pennsylvania Econ. Dev. Fin. Au. Econ. Dev. Rev., Ser. 2000 B7,
(LOC: PNC Bank), 3.52%, due 11/1/07 | | VMIG1 | | | | | 300 | µß | |
| | 800 | | | Pennsylvania Econ. Dev. Fin. Au. Econ. Dev. Rev., Ser. 2000 H7,
(LOC: PNC Bank), 3.52%, due 11/1/07 | | | | A-1 | | | 800 | µß | |
| | 4,600 | | | Pennsylvania Econ. Dev. Fin. Au. Econ. Dev. Rev., Ser. 2002 B5,
(LOC: PNC Bank), 3.52%, due 11/1/07 | | | | A-1 | | | 4,600 | µß | |
| | 1,150 | | | Pennsylvania Econ. Dev. Fin. Au. Econ. Dev. Rev., Ser. 2006 A2,
(LOC: PNC Bank), 3.52%, due 11/1/07 | | | | A-1 | | | 1,150 | µß | |
| | 800 | | | Pennsylvania Econ. Dev. Fin. Au. Econ. Dev. Rev.
(North American Communication Proj.), Ser. 2004 A1,
(LOC: PNC Bank), 3.52%, due 11/1/07 | | | | A-1 | | | 800 | µß | |
| | 3,900 | | | West Cornwall Township Muni. Au. Rev. (Sr. Living Fac.-Lebanon Valley),
Ser. 2006, (LOC: PNC Bank), 3.47%, due 11/1/07 | | | | A-1 | | | 3,900 | µß | |
| | | | | | | | | | | | 21,205 | | |
| Puerto Rico (3.6%) | | | |
| | 7,230 | | | Deutsche Bank Spears/Lifers Trust Var. St., Ser. 2007,
(MBIA Insured), 3.45%, due 11/1/07 | | | | | | | 7,230 | µo | |
| | 11,000 | | | Puerto Rico Elec. Pwr. Au. Pwr. Rev. (Putters), Ser. 2005-815,
(FSA Insured), 3.45%, due 11/1/07 | | | | A-1+ | | | 11,000 | µs | |
| | 4,105 | | | Puerto Rico Ind. Tourist Ed. Med. & Env. Ctrl. Fac. Rev. (Floater Cert.),
Ser. 2000-377, (LOC: Morgan Stanley), 3.47%, due 11/1/07 | | VMIG1 | | | | | 4,105 | µß | |
| | 9,400 | | | Puerto Rico Sales Tax Financing Corp. Sales Tax Rev. (Floaters),
Ser. 2007-2006-1990, (LOC: Morgan Stanley), 3.50%, due 11/1/07 | | | | A-1+ | | | 9,400 | µ | |
| | | | | | | | | | | | 31,735 | | |
| Rhode Island (1.2%) | | | |
| | 5,000 | | | Rhode Island Hsg. & Mtge. Fin. Corp. (Floaters), Ser. 2006-1428R,
(LOC: Merrill Lynch Capital Markets), 3.61%, due 11/1/07 | | | | A-1 | | | 5,000 | µ | |
| | 5,750 | | | Rhode Island Hsg. & Mtge. Fin. Corp. (Floaters), Ser. 2007-1591,
(FGIC Insured), 3.55%, due 11/1/07 | | | | A-1+ | | | 5,750 | µy | |
| | | | | | | | | | | | 10,750 | | |
| South Carolina (0.7%) | | | |
| | 4,000 | | | Jasper Co. Rev. BANS, Ser. 2007, 3.85%, due 7/1/08 | | | | | | | 4,000 | | |
| | 2,000 | | | South Carolina Jobs Econ. Dev. Au. Econ. Dev. Rev. (Bondtax, Inc. Proj.),
Ser. 2007, (LOC: Branch Banking & Trust Co.), 3.58%, due 11/1/07 | | | | | | | 2,000 | µ | |
| | | | | | | | | | | | 6,000 | | |
| Tennessee (2.2%) | | | |
| | 930 | | | Franklin Co. Hlth. & Ed. Fac. Board Rev. (Univ. of the South Proj.), Ser. 1990,
3.65%, due 11/1/07 | | | | A-1 | | | 930 | µß | |
| | 7,995 | | | Muni. Sec. Trust Cert., Ser. 2007-3052, Class A,
(LOC: Bear Stearns), 3.55%, due 11/1/07 | | VMIG1 | | | | | 7,995 | ñµ | |
See Notes to Schedule of Investments 43
| PRINCIPAL AMOUNT | | SECURITY@@ | | RATING‡‡§ | | VALUE†† | |
| (000's omitted) | | | | Moody's | | S&P | | (000's omitted) | |
| $ | 7,000 | | | Sevier Co. Pub. Bldg. Au. Rev. (Loc. Gov't. Pub. Imp.), Ser. 2001,
(AMBAC Insured), 3.65%, due 11/1/07 | | VMIG1 | | | | $ | 7,000 | µp | |
| | 2,890 | | | Shelby Co. Hlth. Ed. & Hsg. Fac. Board Multi-Family Hsg. Rev. (Flag Manor),
Ser. 1995, (LOC: Federal Home Loan Bank), 3.53%, due 11/1/07 | | VMIG1 | | | | | 2,890 | µ | |
| | | | | | | | | | | | 18,815 | | |
| Texas (9.3%) | | | |
| | 2,800 | | | Austin Arpt. Sys. Rev., Ser. 1995 A, (LOC: JP Morgan Chase),
3.32%, due 11/7/07 | | P-1 | | A-1+ | | | 2,800 | µ | |
| | 1,800 | | | Brazoria Co. Hlth. Fac. Dev. Corp. Hosp. Rev. (Brazosport Mem. Hosp.),
Ser. 1999, (LOC: Chase Bank of Texas), 3.50%, due 11/1/07 | | VMIG1 | | | | | 1,800 | µß | |
| | 15,000 | | | Brazos River Harbor Navigation Dist. of Brazoria Co. Rev. (BASF Corp. Proj.),
Ser. 1997, 3.69%, due 11/1/07 | | P-1 | | | | | 15,000 | µß | |
| | 1,200 | | | Calhoun Co. Navigation Ind. Dev. Au. Port Rev. (Formosa Plastics Corp. Proj.),
Ser. 1994, (LOC: Bank of America), 3.32%, due 11/7/07 | | VMIG1 | | | | | 1,200 | µß | |
| | 1,200 | | | Dallas Fort Worth Int'l Arpt. Rev. (Putters), Ser. 2004-385,
(FGIC Insured), 3.55%, due 11/1/07 | | VMIG1 | | A-1+ | | | 1,200 | µs | |
| | 1,300 | | | Dallas Fort Worth Reg. Arpt. Rev. (Muni. Sec. Trust Receipts),
Ser. 1997 SGA 49, (MBIA Insured), 3.63%, due 11/1/07 | | | | A-1+ | | | 1,300 | µcc | |
| | 2,800 | | | Denton Independent Sch. Dist. G.O., Ser. 1996 B,
(PSF Insured), 3.75%, due 8/15/08 | | | | A-1+ | | | 2,800 | µmm | |
| | 13,535 | | | Deutsche Bank Spears/Lifers Trust Var. St., Ser. 2007-291,
(FGIC Insured), 3.50%, due 11/1/07 | | | | A-1+ | | | 13,535 | µo | |
| | 8,185 | | | El Paso Hsg. Fin. Corp. Multi-Family Hsg. Rev. (Viva Apts. Proj.),
Ser. 1993, (LOC: Bank of America), 3.31%, due 11/7/07 | | | | A-1+ | | | 8,185 | µß | |
| | 100 | | | Gulf Coast Waste Disp. Au. Env. Fac. Rev. (BP Amoco Chemical Co. Proj.),
Ser. 2003, 3.64%, due 11/1/07 | | VMIG1 | | A-1+ | | | 100 | µß | |
| | 1,800 | | | Gulf Coast Waste Disp. Au. Rev. Ref. (Armco, Inc. Proj.), Ser. 1998,
(LOC: PNC Bank), 3.46%, due 11/1/07 | | | | | | | 1,800 | µß | |
| | 1,000 | | | Houston Arpt. Sys. Rev. (Floaters), Ser. 2006-1382X,
(FGIC Insured), 3.53%, due 11/1/07 | | VMIG1 | | | | | 1,000 | µy | |
| | 4,000 | | | Northside G.O. Independent Sch. Dist. Ref., Ser. 2006 A,
(PSF Insured), 3.75%, due 8/1/33 Putable 8/1/08 | | VMIG1 | | | | | 4,000 | µp | |
| | 700 | | | San Antonio Arpt. Sys. Rev. Spec. Fac. (Cessna Aircraft), Ser. 1995,
(LOC: Bank of America), 3.53%, due 11/1/07 | | | | A-1+ | | | 700 | µß | |
| | 10,435 | | | San Antonio Hsg. Trust Fin. Corp. Single Family Mtge. Rev., Ser. 2007-10229,
(LOC: Government National Mortgage Association), 3.59%, due 11/1/07 | | VMIG1 | | | | | 10,435 | µl | |
| | 1,500 | | | Texas Muni. Gas Acquisition & Supply Corp. I Gas Supply Rev. Sr. Lien,
Ser. 2006 A, 5.00%, due 12/15/07 | | | | | | | 1,503 | | |
| | 7,925 | | | Texas St. Affordable Hsg. Corp. Single Family Mtge. Rev. (Merlots),
Ser. 2007-C62, (LOC: Federal Home Loan Mtge. Corp.), 3.39%, due 11/7/07 | | VMIG1 | | | | | 7,925 | µd | |
| | 5,770 | | | Victory Street Pub. Fac. Corp. Multi-Family Rev., Ser. 2007-832CE,
(LOC: Citigroup Global Markets), 3.63%, due 11/1/07 | | VMIG1 | | | | | 5,770 | µ | |
| | | | | | | | | | | | 81,053 | | |
| Utah (0.5%) | | | |
| | 1,810 | | | Utah St. HFA Rev. (Merlots), Ser. 2001 A14,
(LOC: Wachovia Bank & Trust Co.), 3.39%, due 11/7/07 | | VMIG1 | | | | | 1,810 | µ | |
| | 2,290 | | | Utah St. HFA Rev. (Merlots), Ser. 2001 A62,
(LOC: Wachovia Bank & Trust Co.), 3.39%, due 11/7/07 | | VMIG1 | | | | | 2,290 | µ | |
| | | | | | | | | | | | 4,100 | | |
| Vermont (1.2%) | | | |
| | 3,300 | | | Vermont Ed. & Hlth. Bldg. Fin. Agcy. Rev. (Middlebury College Proj.),
Ser. 2002 B, 3.58%, due 11/1/32 Putable 11/1/07 | | | | | | | 3,300 | µ | |
| | 7,000 | | | Vermont HFA Multi. Purp. Notes, Ser. 2007 D, (LOC: Calyon Bank),
3.85%, due 9/25/08 | | | | | | | 7,000 | | |
| | | | | | | | | | | | 10,300 | | |
See Notes to Schedule of Investments 44
| PRINCIPAL AMOUNT | | SECURITY@@ | | RATING‡‡§ | | VALUE†† | |
| (000's omitted) | | | | Moody's | | S&P | | (000's omitted) | |
| Virginia (1.7%) | | | |
| $ | 2,585 | | | Tazewell Co. Ind. Dev. Au. Rev. (Jennmar Corp., Inc.), Ser. 2007,
(LOC: PNC Bank), 3.56%, due 11/1/07 | | | | | | $ | 2,585 | µß | |
| | 6,285 | | | Virginia St. Hsg. Dev. Au. Commonwealth Mtge. (Merlots), Ser. 2006 B20,
(LOC: Wachovia Bank & Trust Co.), 3.39%, due 11/7/07 | | | | A-1+ | | | 6,285 | µ | |
| | 5,700 | | | Virginia St. Hsg. Dev. Au. Commonwealth Mtge. (Merlots), Ser. 2006 C07,
(LOC: Bank of New York), 3.39%, due 11/7/07 | | | | A-1+ | | | 5,700 | µ | |
| | | | | | | | | | | | 14,570 | | |
| Washington (6.8%) | | | |
| | 1 | | | King Co. Swr. Rev. (Floaters), Ser. 2005-1091,
(FSA Insured), 3.50%, due 11/1/07 | | | | | | | 1 | µy | |
| | 12,330 | | | NJB Prop. Lease Rev., Ser. 2007-9152, (LOC: Citigroup Global Markets),
3.51%, due 11/1/07 | | | | A-1+ | | | 12,330 | µ | |
| | 4,000 | | | Washington St. G.O. (Merlots), Ser. 2003 B23,
(MBIA Insured), 3.34%, due 11/7/07 | | VMIG1 | | | | | 4,000 | µii | |
| | 9,870 | | | Washington St. Hsg. Fin. Commission, Ser. 2007-11203,
(LOC: Government National Mortgage Association),
3.59%, due 11/1/07 | | VMIG1 | | | | | 9,870 | µk | |
| | 3,000 | | | Washington St. Hsg. Fin. Commission Multi-Family Hsg. Rev.
(Lake City Sr. Apts. Proj.), Ser. 2006 A, (LOC: Freddie Mac),
3.51%, due 11/1/07 | | | | A-1+ | | | 3,000 | µß | |
| | 6,130 | | | Washington St. Hsg. Fin. Commission Multi-Family Mtge. Rev.
(Canyon Lakes II Proj.), Ser. 1994, (LOC: Wells Fargo & Co.),
3.50%, due 11/1/07 | | VMIG1 | | | | | 6,130 | µß | |
| | 1,300 | | | Washington St. Hsg. Fin. Commission Multi-Family Mtge. Rev.
(Wandering Creek Proj.), Ser. 1995, (LOC: Freddie Mac),
3.31%, due 11/7/07 | | VMIG1 | | | | | 1,300 | µß | |
| | 2,325 | | | Washington St. Hsg. Fin. Commission Multi-Family Rev.
(Auburn Meadows Proj.), Ser. 2003 A, (LOC: Wells Fargo & Co.),
3.60%, due 11/1/07 | | | | A-1+ | | | 2,325 | µ | |
| | 5,775 | | | Washington St. Hsg. Fin. Commission Multi-Family Rev.
(Rosemont Apts. Proj.), Ser. 2003 A, (LOC: Umpqua Bank),
3.60%, due 11/1/07 | | | | A-1 | | | 5,775 | µße | |
| | 7,340 | | | Washington St. Hsg. Fin. Commission Multi-Family Rev.
(Silver Creek Retirement), Ser. 2004 A, (LOC: Wells Fargo & Co.),
3.60%, due 11/1/07 | | VMIG1 | | | | | 7,340 | µß | |
| | 6,400 | | | Washington St. Hsg. Fin. Commission Multi-Family Rev.
(Woodland Retirement Proj.), Ser. 2003 A, (LOC: Wells Fargo & Co.),
3.60%, due 11/1/07 | | | | A-1+ | | | 6,400 | µß | |
| | 700 | | | Washington St. Hsg. Fin. Commission Non-Profit Rev.
(Tacoma Art Museum Proj.), Ser. 2002, (LOC: Northern Trust Co.),
3.63%, due 11/1/07 | | VMIG1 | | | | | 700 | µß | |
| | | | | | | | | | | | 59,171 | | |
| Wisconsin (1.7%) | | | |
| | 1,210 | | | Germantown Ind. Rev. (Great Lakes Packaging Corp.), Ser. 1996,
(LOC: Marshall & Ilsley), 3.55%, due 11/1/07 | | | | A-1 | | | 1,210 | µß | |
| | 3,100 | | | Menomonee Falls Sch. Dist. BANS, Ser. 2007 A, 4.46%, due 12/1/07 | | MIG1 | | | | | 3,102 | | |
| | 4,000 | | | Muni. Sec. Trust Cert., Ser. 2007-7063, Class A,
(LOC: Bear Stearns), 3.55%, due 11/1/07 | | VMIG1 | | | | | 4,000 | ñµ | |
| | 2,925 | | | Wisconsin Sch. Dist. Cash Flow Management Prog. Cert. Participation,
Ser. 2006 B, 4.25%, due 11/1/07 | | MIG1 | | | | | 2,925 | | |
| | 3,895 | | | Wisconsin St. Hlth. & Ed. Fac. Au. Rev. (St. Joseph's Comm. Hosp. Proj.),
Ser. 2005, (LOC: Marshall & Ilsley), 3.47%, due 11/1/07 | | | | A-1 | | | 3,895 | µß | |
| | | | | | | | | | | | 15,132 | | |
| Total Municipal Notes | | | | | | | 854,573 | | |
See Notes to Schedule of Investments 45
| PRINCIPAL AMOUNT | | SECURITY@@ | | RATING‡‡§ | | VALUE†† | |
| (000's omitted) | | | | | | | | (000's omitted) | |
| Asset-Backed Securities (1.1%) | |
| $ 9,919 | | | FHLMC Multi-Family Certs., Ser. M010, Class A, 4.04%, due 11/15/07 | | | | | $ | 9,919 | µ | |
| Total Investments (99.2%) | | | | | | 864,492 | |
| | | Cash, receivables and other assets, less liabilities (0.8%) | | | | | | | 7,016 | | |
| Total Net Assets (100.0%) | | | | | | $871,508 | |
See Notes to Schedule of Investments 46
Schedule of Investments Lehman Brothers Municipal Securities Trust
| PRINCIPAL AMOUNT | | SECURITY@@ | | RATING§ | | VALUE† | |
| (000's omitted) | | | | Moody's | | S&P | | (000's omitted) | |
| Alabama (3.7%) | | | |
| $ | 1,000 | | | Jefferson Co. Cap. Imp. & Ref. Warrants, Ser. 2003-A,
(MBIA Insured), 5.00%, due 4/1/18 | | Aaa | | AAA | | $ | 1,039 | | |
| Alaska (3.0%) | | | |
| | 795 | | | Alaska St. Int'l Arpts. Ref. Rev., Ser. 2006 A,
(MBIA Insured), 5.00%, due 10/1/17 | | Aaa | | AAA | | | 841 | | |
| California (9.6%) | | | |
| | 500 | | | California St. Econ. Rec. G.O., Ser. 2004 A,
(MBIA Insured), 5.25%, due 7/1/13 | | Aaa | | AAA | | | 543 | | |
| | 1,000 | | | California St. Pub. Works Board Lease Rev. Dept. of Mental Hlth.
(Coalinga St. Hosp.), Ser. 2004 A, 5.50%, due 6/1/21 | | A2 | | A | | | 1,069 | | |
| | 1,000 | | | Sacramento Muni. Util. Dist. Fin. Au. Rev. (Cosumnes Proj.), Ser. 2006,
(MBIA Insured), 5.00%, due 7/1/20 | | Aaa | | AAA | | | 1,061 | | |
| | | | | | | | | | | | 2,673 | | |
| Colorado (3.8%) | | | |
| | 1,000 | | | Larimer Co. Sales & Use Tax Rev., Ser. 2000,
(AMBAC Insured), 5.75%, due 12/15/15 | | Aaa | | AAA | | | 1,068 | | |
| Georgia (3.8%) | | | |
| | 1,000 | | | George L. Smith II World Congress Center Au. Rev.
(Domed Stadium Proj.), Ser. 2000, (MBIA Insured), 5.75%, due 7/1/15 | | Aaa | | AAA | | | 1,055 | | |
| Illinois (10.9%) | | | |
| | 1,000 | | | Chicago O'Hare Int'l. Arpt. Gen. Arpt. Third Lien Ref. Rev., Ser. 2005 B,
(MBIA Insured), 5.25%, due 1/1/17 | | Aaa | | AAA | | | 1,094 | | |
| | 1,000 | | | Lake Co. Sch. Dist. No. 109 Deerfield Ref. G.O., Ser. 1999 C,
5.00%, due 12/15/14 | | Aa2 | | | | | 1,074 | | |
| | 800 | | | Will & Kendall Cos. Plainfield Comm. Cons. Sch. Dist. Number 202
Sch. Bldg. G.O., Ser. 2001, (FSA Insured),
5.38%, due 1/1/13 Pre-Refunded 1/1/12 | | Aaa | | AAA | | | 856 | | |
| | | | | | | | | | | | 3,024 | | |
| Indiana (3.7%) | | | |
| | 1,000 | | | Indiana St. Office Bldg. Commission Fac. Ref. Rev., Ser. 1998 A,
5.13%, due 7/1/14 | | Aa2 | | AA | | | 1,020 | | |
| Louisiana (3.8%) | | | |
| | 1,000 | | | Louisiana St. Citizens Prop. Insurance Corp. Assessment Rev.,
Ser. 2006 B, (AMBAC Insured), 5.00%, due 6/1/18 | | Aaa | | AAA | | | 1,065 | | |
| Massachusetts (1.9%) | | | |
| | 500 | | | Massachusetts St. Hlth. & Ed. Fac. Au. Rev. (Berklee College),
Ser. 2007 A, 5.00%, due 10/1/15 | | A2 | | A+ | | | 536 | ß | |
| Michigan (2.9%) | | | |
| | 750 | | | Detroit Wayne Co. Sch. Dist. Sch. Bldg. & Site Imp. Ref. G.O.,
Ser. 1998 C, (FGIC Insured), 5.25%, due 5/1/13 | | Aaa | | AAA | | | 807 | | |
See Notes to Schedule of Investments 47
| PRINCIPAL AMOUNT | | SECURITY@@ | | RATING§ | | VALUE† | |
| (000's omitted) | | | | Moody's | | S&P | | (000's omitted) | |
| Missouri (6.6%) | | | |
| $ | 500 | | | Curators Univ. Sys. Fac. Rev., Ser. 2003 A,
5.00%, due 11/1/31 Pre-Refunded 11/3/13 | | Aa2 | | AA | | $ | 537 | | |
| | 200 | | | Missouri St. Hlth. & Ed. Fac. Au. Ed. Fac. Rev. (The Washington Univ.),
Ser. 1996 A, (LOC: Morgan Guaranty Trust), 3.59%, due 11/1/07 | | VMIG1 | | A-1+ | | | 200 | µ | |
| | 1,000 | | | Springfield Sch. Dist. Number R-12, Ref. G.O., Ser. 2002 A,
(FSA Insured), 5.50%, due 3/1/13 | | Aaa | | AAA | | | 1,089 | | |
| | | | | | | | | | | | 1,826 | | |
| New Jersey (10.0%) | | | |
| | 1,000 | | | New Jersey Econ. Dev. Au. St. Lease Rev. (Liberty St. Park Proj.),
Ser. 2005 B, (MBIA Insured), 5.00%, due 3/1/17 | | Aaa | | AAA | | | 1,068 | | |
| | 575 | | | New Jersey Trans. Trust Fund Au. Trans. Sys. Rev., Ser. 1999 A,
5.63%, due 6/15/13 | | A1 | | AA- | | | 627 | | |
| | 1,000 | | | New Jersey Trans. Trust Fund Au. Trans. Sys. Rev., Ser. 2006 A,
5.25%, due 12/15/19 | | A1 | | AA- | | | 1,100 | | |
| | | | | | | | | | | | 2,795 | | |
| New York (9.6%) | | | |
| | 800 | | | Battery Park City Au. Sr. Rev., Ser. 2003 A, 5.25%, due 11/1/22 | | Aaa | | AAA | | | 858 | | |
| | 500 | | | Buffalo & Ft. Erie Pub. Bridge Au. Toll Bridge Sys. Ref. Rev., Ser. 2005,
(LOC: Bank of Nova Scotia), 4.00%, due 1/1/25 Putable 7/1/10 | | Aa1 | | AA- | | | 500 | µ | |
| | 250 | | | New York City IDA Spec. Fac. Rev. (Term. One Group Assoc., L.P. Proj.),
Ser. 2005, 5.50%, due 1/1/16 | | A3 | | BBB+ | | | 270 | ß | |
| | 500 | | | New York St. Env. Fac. Corp. Solid Waste Disp. Rev.
(Waste Management, Inc. Proj.), Ser. 2004 A,
4.45%, due 7/1/17 Putable 7/1/09 | | | | BBB | | | 501 | ß | |
| | 500 | | | New York St. Urban Dev. Corp. Ref. Rev. (Correctional Facs.),
Ser. 1994 A, (FSA Insured), 5.50%, due 1/1/14 | | Aaa | | AAA | | | 535 | | |
| | | | | | | | | | | | 2,664 | | |
| Oklahoma (0.4%) | | | |
| | 100 | | | Oklahoma St. Ind. Au. Rev. (Integris Baptist), Ser. 1999 B,
(MBIA Insured), 3.58%, due 11/1/07 | | VMIG1 | | A-1+ | | | 100 | µßs | |
| South Carolina (1.9%) | | | |
| | 500 | | | South Carolina St. Budget & Ctrl. Board St. Fac. Installment Purchase Rev.
(Dept. of Pub. Safety Proj.), Ser. 2003, 4.50%, due 1/1/11 | | Aa2 | | AA | | | 515 | | |
| Tennessee (3.8%) | | | |
| | 1,000 | | | Tennessee Energy Acquisition Corp. Gas Rev., Ser. 2006 A,
5.25%, due 9/1/17 | | Aa3 | | AA- | | | 1,050 | | |
| Texas (15.2%) | | | |
| | 1,000 | | | Brazosport Independent Sch. Dist. Ref. G.O., Ser. 2005,
(PSF Insured), 5.00%, due 2/15/15 | | Aaa | | | | | 1,066 | | |
| | 1,000 | | | Grapevine Combination Tax & Tax Increment Reinvestment Zone Rev.
Cert. of Oblig. G.O., Ser. 2000, (FGIC Insured), 5.63%, due 8/15/15 | | Aaa | | AAA | | | 1,055 | | |
| | 1,045 | | | San Antonio Passenger Fac. Charge & Sub. Lien Arpt. Sys. Imp. Rev.,
Ser. 2005, (FSA Insured), 5.25%, due 7/1/12 | | Aaa | | AAA | | | 1,108 | | |
| | 1,000 | | | Texas Muni. Gas Acquisition & Supply Corp. I Gas Supply Rev.,
Ser. 2006 B, 4.37%, due 12/15/07 | | A1 | | A+ | | | 1,000 | µ | |
| | | | | | | | | | | | 4,229 | | |
See Notes to Schedule of Investments 48
| PRINCIPAL AMOUNT | | SECURITY@@ | | RATING§ | | VALUE† | |
| (000's omitted) | | | | Moody's | | S&P | | (000's omitted) | |
| Wisconsin (3.8%) | |
| $ 1,000 | | | Wisconsin St. G.O., Ser. 2002 C, (MBIA Insured),
5.25%, due 5/1/14 Pre-Refunded 5/1/12 | | Aaa | | AAA | | $ | 1,070 | | |
| Total Investments (98.4%) (Cost $27,145) | | | | | | | 27,377 | ## | |
| | | Cash, receivables and other assets, less liabilities (1.6%) | | | | | | | 451 | | |
| Total Net Assets (100.0%) | | | | | | $ | 27,828 | | |
See Notes to Schedule of Investments 49
Schedule of Investments Lehman Brothers New York Municipal Money Fund
| PRINCIPAL AMOUNT | | SECURITY@@ | | RATING‡‡§ | | VALUE†† | |
| (000's omitted) | | | | Moody's | | S&P | | (000's omitted) | |
| New York (85.5%) | | | |
| $ | 8,870 | | | ABN Amro Munitops Cert. Trust, Ser. 2006, (FSA Insured),
3.52%, due 11/1/07 | | VMIG1 | | | | $ | 8,870 | ñµa | |
| | 6,710 | | | ABN Amro Munitops Cert. Trust, Ser. 2006, (LOC: ABN AMRO Bank NV),
3.48%, due 11/1/07 | | VMIG1 | | | | | 6,710 | ñµ | |
| | 8,330 | | | ABN Amro Munitops Cert. Trust, Ser. 2006, (XLCA Insured),
3.48%, due 11/1/07 | | VMIG1 | | | | | 8,330 | ñµa | |
| | 4,650 | | | Albany IDA Civic Fac. Rev. (Albany Med. Ctr. Proj.), Ser. 2006 A,
(LOC: Citizens Bank), 3.44%, due 11/1/07 | | VMIG1 | | | | | 4,650 | µß | |
| | 3,800 | | | Albany IDA Civic Fac. Rev. (Research Foundation of the St. Univ. of
New York Proj.), Ser. 2002 A, 3.55%, due 11/1/07 | | VMIG1 | | | | | 3,800 | µß | |
| | 3,310 | | | Albany IDA Civic Fac. Rev. (Univ. of Albany Foundation Std. Hsg.),
Ser. 2001 A, (AMBAC Insured), 3.47%, due 11/1/07 | | | | A-1 | | | 3,310 | µßu | |
| | 1,970 | | | Albany IDA Civic Fac. Rev. (Univ. of Albany Foundation Std. Hsg.),
Ser. 2001 D, (AMBAC Insured), 3.47%, due 11/1/07 | | | | A-1 | | | 1,970 | µßu | |
| | 1,650 | | | Allegany Co. IDA Env. Fac. Ref. Rev. (Atlantic Richfield Proj.),
Ser. 2002, (LOC: BP PLC), 3.57%, due 11/1/07 | | VMIG1 | | A-1+ | | | 1,650 | µß | |
| | 975 | | | Auburn Ind. Dev. Au. IDR (Goulds Pumps, Inc. Proj.), Ser. 1989,
(LOC: Deutsche Bank), 3.58%, due 11/7/07 | | | | | | | 975 | µ | |
| | 9,875 | | | Austin Trust Var. St., Ser. 2007-1017, (LOC: Bank of America),
3.52%, due 11/1/07 | | | | A-1+ | | | 9,875 | µ | |
| | 5,300 | | | Austin Trust Var. St., Ser. 2007-160, (LOC: Bank of America),
3.47%, due 11/1/07 | | | | A-1+ | | | 5,300 | µ | |
| | 1,970 | | | Battery Park City Au. Rev., Ser. 2003, (LOC: Merrill Lynch Capital Markets),
3.52%, due 11/1/07 | | | | | | | 1,970 | µ | |
| | 7,940 | | | BB&T Muni. Trust (Floaters), Ser. 2007-2025, (LOC: Branch Banking &
Trust Co.), 3.48%, due 11/1/07 | | VMIG1 | | | | | 7,940 | µ | |
| | 4,000 | | | Board Cooperative Ed. Svc. Sole Supervisory Dist. RANS, Ser. 2007,
3.85%, due 6/20/08 | | | | | | | 4,001 | | |
| | 9,500 | | | Board Cooperative Ed. Svc. Sole Supervisory Dist. RANS, Ser. 2007 A,
3.85%, due 6/19/08 | | | | | | | 9,503 | | |
| | 2,815 | | | Broome Co. IDA IDR (Parlor City Paper Box Proj.), Ser. 2006,
(LOC: NBT Bank N.A.), 3.51%, due 11/1/07 | | | | | | | 2,815 | µßd | |
| | 2,870 | | | Clinton Co. IDA Civic Fac. Rev. (Champlain Valley Hosp. Proj.),
Ser. 2006 A, (LOC: Key Bank), 3.44%, due 11/1/07 | | VMIG1 | | | | | 2,870 | µß | |
| | 4,700 | | | Dunkirk G.O. BANS, Ser. 2007, 3.82%, due 9/11/08 | | | | | | | 4,701 | | |
| | 3,725 | | | Dutchess Co. IDA Civic Fac. Rev. (Lutheran Ctr.), Ser. 2005,
(LOC: Key Bank), 3.47%, due 11/1/07 | | VMIG1 | | | | | 3,725 | µß | |
| | 10,490 | | | Eclipse Funding Trust (Solar Eclipse-New York St. Dorm Au. Rev.),
Ser. 2006-0148, (MBIA Insured), 3.63%, due 11/1/07 | | | | A-1+ | | | 10,490 | µhh | |
| | 1,900 | | | Eclipse Funding Trust Var. St., Ser. 2006-0028, (AMBAC Insured),
3.45%, due 11/1/07 | | | | | | | 1,900 | ñµhh | |
| | 8,295 | | | Enhanced Return Puttable Floating Option Tax Exempt Receipts Rev.
(New York City TRANS), Ser. 2007, (LOC: Merrill Lynch Capital Markets),
3.52%, due 11/1/07 | | | | | | | 8,295 | µ | |
| | 4,181 | | | Geneva G.O. BANS, Ser. 2007 B, 3.85%, due 5/22/08 | | | | | | | 4,182 | | |
| | 8,560 | | | Haverstraw Stony Point Central Sch. Dist. G.O. (Merlots), Ser. 2007 D,
(FSA Insured), 3.34%, due 11/7/07 | | VMIG1 | | | | | 8,560 | µii | |
| | 12,345 | | | Hempstead IDA IDR (Floater), Ser. 2007, (LOC: Goldman Sachs),
3.50%, due 11/1/07 | | | | | | | 12,345 | µ | |
| | 8,850 | | | Hempstead Town IDA Multi-Family Rev., Ser. 2007-300,
(LOC: Bank of America), 3.50%, due 11/1/07 | | VMIG1 | | | | | 8,850 | µ | |
| | 1,025 | | | Herkimer Co. IDA Civic Fac. Rev. (Templeton Foundation Proj.),
Ser. 2000, (LOC: Key Bank), 3.51%, due 11/1/07 | | | | | | | 1,025 | µß | |
| | 7,200 | | | Hudson Yards Infrastructure Corp. Rev., Ser. 2007-1608, (FGIC Insured),
3.52%, due 11/1/07 | | VMIG1 | | | | | 7,200 | µy | |
| | 10,440 | | | Hudson Yards Infrastructure Corp. Rev., Ser. 2007-9137, (FGIC Insured),
3.50%, due 11/1/07 | | | | A-1+ | | | 10,440 | µl | |
| | 6,500 | | | Jamestown City Sch. Dist. G.O. BANS, Ser. 2007, 3.75%, due 5/22/08 | | | | | | | 6,501 | | |
See Notes to Schedule of Investments 50
| PRINCIPAL AMOUNT | | SECURITY@@ | | RATING‡‡§ | | VALUE†† | |
| (000's omitted) | | | | Moody's | | S&P | | (000's omitted) | |
| $ | 1,500 | | | Liberty Dev. Corp. Rev., Ser. 2006, (LOC: Citibank, N.A.),
3.50%, due 11/1/07 | | VMIG1 | | | | $ | 1,500 | µ | |
| | 5,050 | | | Long Island Pwr. Au. Elec. Sys. Rev., Ser. 2003, (CIFG Insured),
3.47%, due 11/1/07 | | | | | | | 5,050 | µx | |
| | 2,400 | | | Long Island Pwr. Au. Elec. Sys. Rev., Ser. 2006, (MBIA Insured),
3.50%, due 11/1/07 | | VMIG1 | | | | | 2,400 | µk | |
| | 2,000 | | | Long Island Pwr. Au. Elec. Sys. Rev. (Floaters), Ser. 2007-1647,
(MBIA Insured), 3.49%, due 11/1/07 | | | | A-1+ | | | 2,000 | µy | |
| | 7,000 | | | Metro. Trans. Au. Dedicated Tax Fund, Ser. 2006 A, (MBIA Insured),
3.51%, due 11/1/07 | | | | A-1+ | | | 7,000 | µk | |
| | 7,000 | | | Metro. Trans. Au. Rev., Ser. 2007 A, (FSA Insured), 3.49%, due 11/1/07 | | | | A-1 | | | 7,000 | µo | |
| | 8,620 | | | Metro. Trans. Au. Rev. (Floaters), Ser. 2007-1942, (MBIA Insured),
3.49%, due 11/1/07 | | VMIG1 | | | | | 8,620 | µy | |
| | 5,110 | | | Muni. Sec. Trust Cert., Ser. 2007 A, (FGIC Insured), 3.47%, due 11/1/07 | | VMIG1 | | | | | 5,110 | µh | |
| | 11,200 | | | Muni. Sec. Trust Cert., Ser. 2007 A, (FHA Insured), 3.47%, due 11/1/07 | | | | A-1 | | | 11,200 | ñµh | |
| | 2,700 | | | Muni. Sec. Trust Cert., Ser. 2001, (LOC: Bear Stearns), 3.57%, due 11/1/07 | | VMIG1 | | | | | 2,700 | ñµ | |
| | 3,300 | | | Muni. Sec. Trust Cert., Ser. 2007 A, (LOC: Bear Stearns),
3.49%, due 11/1/07 | | VMIG1 | | | | | 3,300 | ñµ | |
| | 2,315 | | | Nassau Co. IDA Civic Fac. Rev. (North Shore Hebrew Academy Proj.),
Ser. 2005, (LOC: Sovereign Bank), 3.46%, due 11/1/07 | | VMIG1 | | | | | 2,315 | µßm | |
| | 18,000 | | | Nassau Co. IDA Rev. (Floater), Ser. 2007 75G, (LOC: Goldman Sachs),
3.51%, due 11/1/07 | | | | | | | 18,000 | µ | |
| | 1,000 | | | New York City Hsg. Dev. Corp. Multi-Family Mtge. Rev. (Target V. Apts.),
Ser. 2006 A, (LOC: Citibank, N.A.), 3.27%, due 11/7/07 | | | | A-1+ | | | 1,000 | µß | |
| | 13,275 | | | New York City Hsg. Dev. Corp. Multi-Family Rental Hsg. Rev. (Progress of
Peoples Dev.), Ser. 2005 A, (LOC: Fannie Mae), 3.30%, due 11/7/07 | | | | A-1+ | | | 13,275 | µ | |
| | 10,000 | | | New York City Hsg. Dev. Corp. Multi-Family Rev., Ser. 2003 A,
(LOC: Landesbank Baden), 3.26%, due 11/7/07 | | | | A-1+ | | | 10,000 | µß | |
| | 2,480 | | | New York City IDA Civic Fac. Rev. (American Society Technion Proj.),
Ser. 2003, (LOC: Allied Irish Bank), 3.19%, due 11/7/07 | | VMIG1 | | | | | 2,480 | µß | |
| | 236 | | | New York City IDA Rev. (Floaters), Ser. 2007-1875, (FGIC Insured),
3.49%, due 11/1/07 | | | | A-1+ | | | 236 | µy | |
| | 6,920 | | | New York City IDA Spec. Fac. Rev. (Korean Air Lines Co.), Ser. 1997 A,
(LOC: HSBC Bank N.A.), 3.28%, due 11/7/07 | | VMIG1 | | A-1+ | | | 6,920 | µß | |
| | 3,900 | | | New York City Muni. Wtr. Fin. Au. Rev., Ser. 2001, (LOC: Merrill Lynch
Capital Markets), 3.48%, due 11/1/07 | | | | A-1 | | | 3,900 | µ | |
| | 5,000 | | | New York City Muni. Wtr. Fin. Au. Wtr & Swr. Sys. Rev., Ser. 2006,
(LOC: Citibank N.A.), 3.50%, due 11/1/07 | | VMIG1 | | A-1+ | | | 5,000 | µ | |
| | 8,000 | | | New York City Muni. Wtr. Fin. Au. Wtr. & Swr. Sys. Rev., Ser. 2007 A,
(LOC: Citibank, N.A.), 3.50%, due 11/1/07 | | | | A-1+ | | | 8,000 | µ | |
| | 2,700 | | | New York City Trans. Fin. Au. Rev., Ser. 1998 C, (LOC: Bayerische
Landesbank), 3.49%, due 11/1/07 | | VMIG1 | | A-1+ | | | 2,700 | µ | |
| | 10,710 | | | New York City Trans. Fin. Au. Rev. (Putters), Ser. 2007,
(LOC: JP Morgan Chase), 3.48%, due 11/1/07 | | | | A-1+ | | | 10,710 | µ | |
| | 11,690 | | | New York G.O. (Putters), Ser. 2006, (AMBAC Insured), 3.48%, due 11/1/07 | | | | A-1+ | | | 11,690 | µs | |
| | 5,000 | | | New York G.O. (Putters), Ser. 2007-2207, (LOC: JP Morgan Chase),
3.48%, due 11/1/07 | | | | A-1+ | | | 5,000 | µ | |
| | 7,945 | | | New York St. Dorm. Au. Rev., Ser. 2000, (LOC: Merrill Lynch Capital
Markets), 3.49%, due 11/1/07 | | | | A-1+ | | | 7,945 | µ | |
| | 1,990 | | | New York St. Dorm. Au. Rev. (Merlots), Ser. 2003, (FGIC Insured),
3.34%, due 11/7/07 | | VMIG1 | | | | | 1,990 | µii | |
| | 1,995 | | | New York St. Dorm. Au. Rev. Secondary Issues, Ser. 2005, (AMBAC
Insured), 3.50%, due 11/1/07 | | VMIG1 | | | | | 1,995 | µk | |
| | 5,910 | | | New York St. Dorm. Au. Rev. Secondary Issues, Ser. 2006, (AMBAC
Insured), 3.45%, due 11/1/07 | | | | | | | 5,910 | µp | |
| | 5,840 | | | New York St. Dorm. Au. Rev. Secondary Issues, Ser. 2006, (AMBAC
Insured), 3.52%, due 11/1/07 | | | | | | | 5,840 | µp | |
| | 5,240 | | | New York St. Dorm. Au. Rev. Secondary Issues, Ser. 2005,
(CIFG Insured), 3.52%, due 11/1/07 | | | | A-1 | | | 5,240 | µx | |
| | 8,885 | | | New York St. Dorm. Au. Rev. Secondary Issues, Ser. 2007,
(LOC: Citibank, N.A.), 3.50%, due 11/1/07 | | VMIG1 | | | | | 8,885 | µ | |
| | 6,000 | | | New York St. Dorm. Au. Rev. Secondary Issues (Floaters), Ser. 2005,
(AMBAC Insured), 3.49%, due 11/1/07 | | | | | | | 6,000 | µy | |
| | 10,600 | | | New York St. Dorm. Au. Rev. Secondary Issues (Floaters), Ser. 2007-1959,
(AMBAC Insured), 3.49%, due 11/1/07 | | | | A-1+ | | | 10,600 | µy | |
See Notes to Schedule of Investments 51
| PRINCIPAL AMOUNT | | SECURITY@@ | | RATING‡‡§ | | VALUE†† | |
| (000's omitted) | | | | Moody's | | S&P | | (000's omitted) | |
| $ | 2,500 | | | New York St. Dorm. Au. Rev. Secondary Issues (Floaters), Ser. 2006-1370,
(FHA Insured), 3.47%, due 11/1/07 | | | | A-1 | | $ | 2,500 | µx | |
| | 5,010 | | | New York St. Dorm. Au. Rev. Secondary Issues (Floaters), Ser. 2006-1424,
(LOC: Morgan Stanley), 3.49%, due 11/1/07 | | | | A-1+ | | | 5,010 | µ | |
| | 1,980 | | | New York St. Dorm. Au. Rev. Secondary Issues (Putters), Ser. 2005,
(FSA Insured), 3.48%, due 11/1/07 | | | | | | | 1,980 | µs | |
| | 10,680 | | | New York St. Energy Research & Dev. Au. Elec. Fac. Rev. (Long Island
Lighting Co.), Ser. 1997 A, (LOC: Royal Bank of Scotland),
3.26%, due 11/7/07 | | VMIG1 | | | | | 10,680 | µß | |
| | 3,600 | | | New York St. Energy Research & Dev. Au. Fac. Rev. (Cons. Edison Co.),
Ser. 2004 C, (LOC: Citibank, N.A.), 3.33%, due 11/7/07 | | VMIG1 | | A-1+ | | | 3,600 | µß | |
| | 5,000 | | | New York St. HFA Rev., Ser. 2004, (LOC: Fannie Mae), 3.30%, due 11/7/07 | | VMIG1 | | | | | 5,000 | µß | |
| | 4,000 | | | New York St. HFA Rev., Ser. 2001 A, (LOC: Freddie Mac), 3.30%, due 11/7/07 | | VMIG1 | | | | | 4,000 | µß | |
| | 5,600 | | | New York St. HFA Rev. (360 West 43rd), Ser. 2002 A, (LOC: Fannie Mae),
3.30%, due 11/7/07 | | VMIG1 | | | | | 5,600 | µß | |
| | 8,700 | | | New York St. HFA Rev. (Biltmore Tower Hsg.), Ser. 2002 A, (LOC: Fannie
Mae), 3.26%, due 11/7/07 | | VMIG1 | | | | | 8,700 | µß | |
| | 7,000 | | | New York St. HFA Rev. (Capitol Green Apts.), Ser. 2006 A, (LOC: Fannie
Mae), 3.35%, due 11/7/07 | | VMIG1 | | | | | 7,000 | µ | |
| | 2,000 | | | New York St. HFA Rev. (Clinton Green South Hsg.), Ser. 2006 A, (LOC:
Bank of America), 3.26%, due 11/7/07 | | VMIG1 | | | | | 2,000 | µß | |
| | 6,000 | | | New York St. HFA Rev. (Eleventh Ave Hsg.), Ser. 2007 A, (LOC: Fannie
Mae), 3.30%, due 11/7/07 | | VMIG1 | | | | | 6,000 | µß | |
| | 5,000 | | | New York St. HFA Rev. (Theater Row), Ser. 2000 A, (LOC: Freddie Mac),
3.30%, due 11/7/07 | | VMIG1 | | | | | 5,000 | µ | |
| | 7,000 | | | New York St. HFA Rev. (Third Avenue Apts. Hsg.), Ser. 2006 A, (LOC: Bank
of America), 3.37%, due 11/7/07 | | VMIG1 | | | | | 7,000 | µß | |
| | 4,500 | | | New York St. HFA Rev. (Tribeca), Ser. 1997 A, (LOC: Fannie Mae),
3.32%, due 11/7/07 | | VMIG1 | | | | | 4,500 | µ | |
| | 5,700 | | | New York St. HFA Rev. (Worth St.), Ser. 2002 A, (LOC: Fannie Mae),
3.30%, due 11/7/07 | | VMIG1 | | | | | 5,700 | µß | |
| | 3,020 | | | New York St. HFA Rev. Multi-Family Hsg., Ser. 1988 A, (AMBAC Insured),
3.31%, due 11/7/07 | | VMIG1 | | A-1+ | | | 3,020 | µii | |
| | 8,295 | | | New York St. Local Gov't Assist. Corp., Ser. 2003, (FSA Insured),
3.25%, due 11/7/07 | | | | A-1+ | | | 8,295 | µt | |
| | 12,495 | | | New York St. Mtge. Agcy. Rev., Ser. 1998, (LOC: Merrill Lynch Capital
Markets), 3.50%, due 11/1/07 | | VMIG1 | | | | | 12,495 | µ | |
| | 1,000 | | | New York St. Mtge. Agcy. Rev. (AMT Homeowner Mtge.), Ser. 2005,
(LOC: Dexia Credit Locale de France), 3.27%, due 11/7/07 | | VMIG1 | | | | | 1,000 | µ | |
| | 2,020 | | | New York St. Mtge. Agcy. Rev. (Putters), Ser. 2005, (LOC: JP Morgan
Chase), 3.55%, due 11/1/07 | | VMIG1 | | | | | 2,020 | µ | |
| | 1,200 | | | New York St. Thruway Au. Gen. Rev., Ser. 2005, (FSA Insured),
3.50%, due 11/1/07 | | VMIG1 | | | | | 1,200 | µl | |
| | 5,526 | | | New York St. Thruway Au. Gen. Rev. (Floaters), Ser. 2006, (FSA Insured),
3.49%, due 11/1/07 | | | | A-1+ | | | 5,526 | µy | |
| | 6,495 | | | New York St. Thruway Au. Gen. Rev. (Putters), Ser. 2005-1102,
(FSA Insured), 3.48%, due 11/1/07 | | VMIG1 | | | | | 6,495 | µs | |
| | 2,000 | | | New York St. Thruway Au. Hwy. & Bridge Trust Fund Rev., Ser. 2005,
(AMBAC Insured), 3.45%, due 11/1/07 | | | | | | | 2,000 | µee | |
| | 1,390 | | | New York St. Urban Dev. Corp. Correctional & Youth Fac. Svcs. Contract Rev.
(Putters), Ser. 2002, (LOC: JP Morgan Chase), 3.56%, due 11/1/07 | | | | A-1+ | | | 1,390 | µ | |
| | 7,740 | | | New York St. Urban Dev. Corp. Rev., Ser. 2003, (FGIC Insured),
3.48%, due 11/1/07 | | | | A-1+ | | | 7,740 | µcc | |
| | 1,500 | | | Oneida Co. IDA Civic Fac. Rev. (Mohawk Valley St. Luke's), Ser. 2006 E,
(LOC: Bank of America), 3.43%, due 11/1/07 | | VMIG1 | | | | | 1,500 | µß | |
| | 3,180 | | | Onondaga Co. IDA Arpt. Fac. Rev., Ser. 2000 A, (LOC: Fleet
National Bank), 3.28%, due 11/7/07 | | | | A-1+ | | | 3,180 | µß | |
| | 3,825 | | | Onondaga Co. IDA Civic Fac. Rev. (Comm. College Hsg. Dev.),
Ser. 2005 A, (LOC: Citizens Bank), 3.44%, due 11/1/07 | | | | A-1+ | | | 3,825 | µ | |
| | 4,000 | | | Onondaga Co. IDA Civic Fac. Rev. (Crouse Hlth. Hosp.), Ser. 2007 A,
(LOC: M&T Bank), 3.35%, due 11/7/07 | | VMIG1 | | | | | 4,000 | µß | |
| | 6,400 | | | Ontario Co. IDA. Civic Fac. Rev. (F. F. Thompson Hosp.), Ser. 2003 B,
(LOC: Key Bank), 3.33%, due 11/7/07 | | VMIG1 | | | | | 6,400 | µß | |
See Notes to Schedule of Investments 52
| PRINCIPAL AMOUNT | | SECURITY@@ | | RATING‡‡§ | | VALUE†† | |
| (000's omitted) | | | | Moody's | | S&P | | (000's omitted) | |
| $ | 2,365 | | | Orange Co. IDA Civic Fac. Rev. (St. Luke's Cornwall Hosp. Proj.),
Ser. 2006, (LOC: Key Bank), 3.47%, due 11/1/07 | | VMIG1 | | | | $ | 2,365 | µß | |
| | 6,000 | | | Port Au. New York & New Jersey (Putters), Ser. 2007-2092,
(FSA Insured), 3.47%, due 11/1/07 | | | | A-1+ | | | 6,000 | µs | |
| | 4,345 | | | Puttable Floating Option Tax Exempt Receipts (New York St. Dorm),
Ser. 2007, (LOC: Merrill Lynch Capital Markets), 3.59%, due 11/1/07 | | | | | | | 4,345 | µ | |
| | 2,135 | | | Riverhead IDA Civic Fac. Rev. (Central Suffolk Hosp. Proj.), Ser. 2006 C,
(LOC: HSBC Bank N.A.), 3.43%, due 11/1/07 | | VMIG1 | | | | | 2,135 | µß | |
| | 1,000 | | | Sales Tax Asset Receivable Corp., Ser. 2006, (AMBAC Insured),
3.50%, due 11/1/07 | | VMIG1 | | | | | 1,000 | µk | |
| | 810 | | | Schenectady IDA IDR (Fortitech Holding Corp. Proj.), Ser. 1995 A,
(LOC: Bank of America), 3.55%, due 11/1/07 | | VMIG1 | | | | | 810 | µß | |
| | 5,371 | | | Spencerport G.O. BANS, Ser. 2007 A, 3.75%, due 9/4/08 | | | | | | | 5,372 | | |
| | 3,010 | | | Suffolk Co. IDA IDR (JBC Realty LLC), Ser. 1998, (LOC: Chase
Manhattan Bank), 3.28%, due 11/7/07 | | | | A-1+ | | | 3,010 | µß | |
| | 1,221 | | | Syracuse G.O. BANS, Ser. 2007, 3.80%, due 10/25/08 | | MIG1 | | | | | 1,222 | | |
| | 16,600 | | | Syracuse G.O. RANS, Ser. 2007 A, 4.50%, due 6/30/08 | | | | | | | 16,680 | | |
| | 1,975 | | | Triborough Bridge & Tunnel Au. Rev. (Putters), Ser. 2002, (MBIA Insured),
3.48%, due 11/1/07 | | | | A-1+ | | | 1,975 | µs | |
| | 2,200 | | | UBS Muni. CRVS (Floaters), Ser. 2007, (LOC: Bank of New York),
3.49%, due 11/1/07 | | | | A-1+ | | | 2,200 | µ | |
| | 1,600 | | | Utica IDA Civic Fac. Rev. (Utica College Proj.), Ser. 2005 A,
(LOC: Citizens Bank), 3.45%, due 11/1/07 | | VMIG1 | | | | | 1,600 | µß | |
| | 9,505 | | | Warren & Washington Cos. IDA Civic Fac. Rev. (Glen at Hiland
Meadows Proj.), Ser. 2000, (LOC: Sovereign Bank), 3.27%, due 11/7/07 | | | | A-1 | | | 9,505 | µßbb | |
| | 6,000 | | | Watervliet Hsg. Au. Sr. Residential Hsg. Rev. (Beltrone Living Ctr. Proj.),
Ser. 1998 A, 6.13%, due 6/1/38 Pre-Refunded 6/1/08 | | | | | | | 6,259 | ß | |
| | 15,000 | | | Westchester Co. IDA Rev. (Floater), Ser. 2007-103G,
(LOC: Goldman Sachs), 3.51%, due 11/1/07 | | | | | | | 15,000 | µ | |
| | | | | | | | | | | | 618,098 | | |
| Puerto Rico (13.8%) | | | |
| | 5,695 | | | Austin Trust Var. St., Ser. 2007-156, (MBIA Insured), 3.45%, due 11/1/07 | | | | A-1+ | | | 5,695 | µc | |
| | 20,000 | | | Deutsche Bank Spears/Lifers Trust Var. St., Ser. 2007, (MBIA Insured),
3.45%, due 11/1/07 | | | | | | | 20,000 | µo | |
| | 1,800 | | | DFA Muni. Trust Var. St. (Puerto Rico Pub. Bldg. Au.), Ser. 2007-02,
(MBIA Insured), 3.48%, due 11/1/07 | | | | | | | 1,800 | µn | |
| | 12,000 | | | Puerto Rico Commonwealth Aqueduct & Swr. Auth. Rev., Ser. 2007,
(LOC: Citigroup Global Markets), 3.51%, due 11/1/07 | | VMIG1 | | | | | 12,000 | µ | |
| | 10,465 | | | Puerto Rico Commonwealth G.O. (Floaters), Ser. 2004, (FGIC Insured),
3.47%, due 11/1/07 | | | | | | | 10,465 | µy | |
| | 6,480 | | | Puerto Rico Commonwealth Hwy. & Trans. Au. Trans. Rev. (Merlots),
Ser. 2007, (MBIA Insured), 3.32%, due 11/7/07 | | | | A-1+ | | | 6,480 | µd | |
| | 7,015 | | | Puerto Rico Commonwealth Hwy. & Trans. Au. Trans. Rev. (Putters),
Ser. 2002-246, (FSA Insured), 3.45%, due 11/1/07 | | | | A-1+ | | | 7,015 | ñµs | |
| | 8,340 | | | Puerto Rico Elec. Pwr. Au. Pwr. Rev. (Muni. Sec. Trust Receipts),
Ser. 2007 A, (FGIC Insured), 3.49%, due 11/1/07 | | | | A-1+ | | | 8,340 | µcc | |
| | 2,385 | | | Puerto Rico Elec. Pwr. Au. Pwr. Rev. (Putters), Ser. 2005-815,
(FSA Insured), 3.45%, due 11/1/07 | | | | A-1+ | | | 2,385 | µs | |
| | 300 | | | Puerto Rico Pub. Fin. Corp. (Putters), Ser. 2003-363, (AMBAC Insured),
3.45%, due 11/1/07 | | | | A-1+ | | | 300 | ñµs | |
| | 7,395 | | | Puerto Rico Sales Tax Fin. Corp. Sales Tax Rev., Ser. 2007-043,
(FGIC Insured), 3.45%, due 11/1/07 | | VMIG1 | | | | | 7,395 | µi | |
| | 7,000 | | | Puerto Rico Sales Tax Fin. Corp. Sales Tax Rev. (Floater), Ser. 2007-1984,
(LOC: Morgan Stanley), 3.50%, due 11/1/07 | | | | A-1+ | | | 7,000 | µ | |
| | 10,750 | | | UBS Muni. CRVS (Floaters), Ser. 2007, (FSA Insured), 3.46%, due 11/1/07 | | | | A-1+ | | | 10,750 | µi | |
| | | | | | | | | | | | 99,625 | | |
| | | | | Total Investments (99.3%) | | | | | | | 717,723 | | |
| | | | | Cash, receivables and other assets, less liabilities (0.7%) | | | | | | | 5,418 | | |
| | | | | Total Net Assets (100.0%) | | | | | | $ | 723,141 | | |
See Notes to Schedule of Investments 53
Schedule of Investments Lehman Brothers Short Duration Bond Fund
| PRINCIPAL AMOUNT | | | | RATING§ | | VALUE† | |
| (000's omitted) | | | | Moody's | | S&P | | (000's omitted) | |
| U.S. Government Agency Securities (0.7%) | | | |
| $ | 750 | | | Fannie Mae, Notes, 4.13%, due 5/15/10 (Cost $749) | | AGY | | AGY | | $ | 745 | | |
| Mortgage-Backed Securities (65.8%) | | | |
| Adjustable Alt-A Jumbo Balance (2.2%) | | | |
| | 2,287 | | | JP Morgan Alternative Loan Trust, Ser. 2006-A2, Class 3A1, 5.94%,
due 5/25/36 | | | | AAA | | | 2,309 | ØØ | |
| Adjustable Alt-A Mixed Balance (12.6%) | | | |
| | 3,573 | | | Bear Stearns ALT-A Trust, Ser. 2006-4, Class 32A1, 6.48%, due 7/25/36 | | Aaa | | AAA | | | 3,636 | ØØ | |
| | 1,246 | | | Bear Stearns ALT-A Trust, Ser. 2007-2, Class 2A1, 5.61%, due 4/25/37 | | Aaa | | AAA | | | 1,252 | | |
| | 2,194 | | | First Horizon Alternative Mortgage Securities Trust, Ser. 2006-AA7,
Class A1, 6.54%, due 1/25/37 | | Aaa | | | | | 2,237 | | |
| | 3,935 | | | Nomura Asset Acceptance Corp., Ser. 2006-AR2, Class 2A2, 6.57%,
due 4/25/36 | | Aaa | | AAA | | | 4,008 | | |
| | 2,277 | | | Residential Accredit Loans, Inc., Ser. 2005-QA10, Class A31, 5.60%,
due 9/25/35 | | Aaa | | AAA | | | 2,282 | | |
| | | | | | | | | | | | 13,415 | | |
| Adjustable Alt-B Mixed Balance (1.5%) | | | |
| | 1,637 | | | Lehman XS Trust, Ser. 2005-1, Class 2A1, 4.66%, due 5/25/08 | | Aaa | | AAA | | | 1,634 | µ | |
| Adjustable Conforming Balance (4.3%) | | | |
| | 2,344 | | | Adjustable Rate Mortgage Trust, Ser. 2005-10, Class 4A1,
5.38%, due 1/25/36 | | Aaa | | AAA | | | 2,336 | | |
| | 2,199 | | | IndyMac INDX Mortgage Loan Trust, Ser. 2005-AR23, Class 2A1,
5.53%, due 11/25/35 | | Aaa | | AAA | | | 2,207 | | |
| | | | | | | | | | | | 4,543 | | |
| Adjustable Jumbo Balance (7.6%) | | | |
| | 983 | | | Banc of America Funding Corp., Ser. 2005-F, Class 4A1,
5.35%, due 9/20/35 | | Aaa | | AAA | | | 984 | | |
| | 2,177 | | | Banc of America Funding Corp., Ser. 2006-H, Class 2A3, 6.70%,
due 9/20/46 | | | | AAA | | | 2,241 | | |
| | 3,351 | | | Harborview Mortgage Loan Trust, Ser. 2006-3, Class 1A1A, 6.38%,
due 6/19/36 | | Aaa | | AAA | | | 3,410 | ØØ | |
| | 1,500 | | | Wells Fargo Mortgage Backed Securities Trust, Ser. 2005-AR16,
Class 4A2, 4.99%, due 10/25/35 | | Aaa | | AAA | | | 1,493 | | |
| | | | | | | | | | | | 8,128 | | |
| Adjustable Mixed Balance (12.5%) | | | |
| | 2,226 | | | Banc of America Funding Corp., Ser. 2005-H, Class 7A1, 5.67%, due 11/20/35 | | | | AAA | | | 2,228 | | |
| | 1,267 | | | Countrywide Home Loans Mortgage Pass-Through Trust, Ser. 2006-HYB3,
Class 1A1A, 5.48%, due 5/20/36 | | Aaa | | AAA | | | 1,284 | | |
| | 2,345 | | | Credit Suisse First Boston Mortgage Securities Corp., Ser. 2004-AR4,
Class 2A1, 4.68%, due 5/25/34 | | Aaa | | AAA | | | 2,331 | ØØ | |
| | 2,492 | | | First Horizon Mortgage Pass-Through Trust, Ser. 2005-AR5, Class 2A1,
5.44%, due 11/25/35 | | | | AAA | | | 2,492 | | |
| | 2,336 | | | GMAC Mortgage Corp. Loan Trust, Ser. 2006-AR1, Class 1A1,
5.60%, due 4/19/36 | | Aaa | | AAA | | | 2,351 | | |
| | 464 | | | Harborview Mortgage Loan Trust, Ser. 2004-4, Class 3A, 6.79%, due 11/19/07 | | Aaa | | AAA | | | 463 | µ | |
| | 2,250 | | | WaMu Mortgage Pass-Through Certificates, Ser. 2004-AR9,
Class A7, 4.14%, due 8/25/34 | | Aaa | | AAA | | | 2,219 | | |
| | | | | | | | | | | | 13,368 | | |
| Commercial Mortgage-Backed (16.4%) | | | |
| | 2,320 | | | Credit Suisse First Boston Mortgage Securities Corp., Ser. 2005-C6,
Class A1, 4.94%, due 12/15/40 | | Aaa | | AAA | | | 2,311 | ØØ | |
| | 1,565 | | | GE Capital Commercial Mortgage Corp., Ser. 2002-2A, Class A2, 4.97%,
due 8/11/36 | | Aaa | | AAA | | | 1,563 | | |
| | 1,775 | | | GE Capital Commercial Mortgage Corp., Ser. 2005-C3, Class A2, 4.85%,
due 7/10/45 | | | | AAA | | | 1,761 | | |
See Notes to Schedule of Investments 54
| PRINCIPAL AMOUNT | | | | RATING§ | | VALUE† | |
| (000's omitted) | | | | Moody's | | S&P | | (000's omitted) | |
| $ | 733 | | | GMAC Commercial Mortgage Securities, Inc., Ser. 2006-C1, Class A1,
4.98%, due 11/10/45 | | | | AAA | | $ | 730 | | |
| | 2,108 | | | JP Morgan Chase Commercial Mortgage Securities Corp., Ser. 2004-C2,
Class A1, 4.28%, due 5/15/41 | | Aaa | | | | | 2,086 | | |
| | 2,908 | | | JP Morgan Chase Commercial Mortgage Securities Corp., Ser. 2005-LDP5,
Class A1, 5.04%, due 12/15/44 | | Aaa | | AAA | | | 2,899 | | |
| | 3,180 | | | JP Morgan Chase Commercial Mortgage Securities Corp., Ser. 2006-LDP7,
Class A1, 5.83%, due 4/15/45 | | Aaa | | AAA | | | 3,218 | | |
| | 2,883 | | | LB-UBS Commercial Mortgage Trust, Ser. 2006-C3, Class A1, 5.48%,
due 3/15/39 | | Aaa | | AAA | | | 2,899 | | |
| | | | | | | | | | | | 17,467 | | |
| Mortgage-Backed Non-Agency (4.3%) | | | |
| | 1,259 | | | Countrywide Home Loans, Ser. 2005-R2, Class 2A4, 8.50%, due 6/25/35 | | Aaa | | AAA | | | 1,392 | ñ | |
| | 2,483 | | | GSMPS Mortgage Loan Trust, Ser. 2005-RP2, Class 1A4, 8.50%, due 3/25/35 | | Aaa | | AAA | | | 2,667 | ñ | |
| | 517 | | | GSMPS Mortgage Loan Trust, Ser. 2005-RP3, Class 1A4, 8.50%, due 9/25/35 | | Aaa | | AAA | | | 555 | ñ | |
| | | | | | | | | | | | 4,614 | | |
| Fannie Mae (1.4%) | | | |
| | 1,303 | | | Whole Loan, Ser. 2004-W8, Class PT, 10.10%, due 6/25/44 | | AGY | | AGY | | | 1,451 | ØØ | |
| Freddie Mac (2.9%) | | | |
| | 15 | | | ARM Certificates, 6.50%, due 2/1/08 | | AGY | | AGY | | | 15 | µ | |
| | 1,664 | | | Pass-Through Certificates, 8.00%, due 11/1/26 | | AGY | | AGY | | | 1,767 | | |
| | 1,178 | | | Pass-Through Certificates, 8.50%, due 10/1/30 | | AGY | | AGY | | | 1,264 | | |
| | | | | | | | | | | | 3,046 | | |
| Government National Mortgage Association (0.1%) | | | |
| | 40 | | | Pass-Through Certificates, 7.00%, due 4/15/11 | | AGY | | AGY | | | 41 | ØØ | |
| | 3 | | | Pass-Through Certificates, 7.50%, due 10/15/09 – 8/15/10 | | AGY | | AGY | | | 3 | | |
| | 24 | | | Pass-Through Certificates, 12.00%, due 12/15/12 – 5/15/14 | | AGY | | AGY | | | 27 | | |
| | | | | | | | | | | | 71 | | |
| | | | | Total Mortgage-Backed Securities (Cost $69,846) | | | | | | | 70,046 | | |
| Corporate Debt Securities (19.2%) | | | |
| Automobile Manufacturing (1.2%) | | | |
| | 1,300 | | | DaimlerChrysler N.A. Holdings Corp., Guaranteed Unsecured Notes,
4.05%, due 6/4/08 | | A3 | | BBB+ | | | 1,289 | ØØ | |
| Banks (1.1%) | | | |
| | 1,200 | | | Bank of America Corp., Senior Unsecured Notes, 3.88%, due 1/15/08 | | Aa1 | | AA | | | 1,197 | ØØ | |
| Diversified Financial Services (11.4%) | | | |
| | 1,800 | | | Bear Stearns Co., Inc., Senior Unsecured Notes, 4.00%, due 1/31/08 | | A1 | | A+ | | | 1,793 | | |
| | 2,250 | | | General Electric Capital Corp., Medium-Term Notes,
Ser. A, 4.25%, due 9/13/10 | | Aaa | | AAA | | | 2,219 | ØØ | |
| | 2,200 | | | HSBC Finance Corp., Notes, 4.13%, due 12/15/08 | | Aa3 | | AA- | | | 2,177 | ØØ | |
| | 2,200 | | | International Lease Finance Corp., Unsubordinated Unsecured Notes,
3.50%, due 4/1/09 | | A1 | | AA- | | | 2,153 | ØØ | |
| | 1,700 | | | John Deere Capital Corp., Unsecured Notes, 3.90%, due 1/15/08 | | A2 | | A | | | 1,696 | ØØ | |
| | 825 | | | JP Morgan Chase & Co., Senior Notes, 3.63%, due 5/1/08 | | Aa2 | | AA- | | | 819 | | |
| | 1,250 | | | MBNA Corp., Notes, 4.63%, due 9/15/08 | | Aa1 | | AA | | | 1,245 | ØØ | |
| | | | | | | | | | | | 12,102 | | |
| Media (4.5%) | | | |
| | 1,250 | | | British Sky Broadcasting, Guaranteed Senior Unsecured Notes,
8.20%, due 7/15/09 | | Baa2 | | BBB | | | 1,309 | ØØ | |
| | 1,080 | | | Comcast Cable Communications, Guaranteed Unsecured Unsubordinated Notes,
6.20%, due 11/15/08 | | Baa2 | | BBB+ | | | 1,090 | ØØ | |
| | 1,210 | | | News America Holdings, Inc., Guaranteed Notes, 7.38%, due 10/17/08 | | Baa2 | | BBB+ | | | 1,231 | ØØ | |
| | 1,100 | | | Time Warner Entertainment LP, Debentures, 7.25%, due 9/1/08 | | Baa2 | | BBB+ | | | 1,115 | ØØ | |
| | | | | | | | | | | | 4,745 | | |
See Notes to Schedule of Investments 55
| PRINCIPAL AMOUNT | | | | RATING§ | | VALUE† | |
| (000's omitted) | | | | Moody's | | S&P | | (000's omitted) | |
| Retail (1.0%) | | | |
| $ | 1,100 | | | Target Corp., Notes, 3.38%, due 3/1/08 | | A1 | | A+ | | $ | 1,094 | ØØ | |
| | | | | Total Corporate Debt Securities (Cost $20,411) | | | | | | | 20,427 | | |
| Asset-Backed Securities (13.9%) | | | |
| | 1,000 | | | Ace Securities Corp. Home Equity Loan Trust, Ser. 2006-ASP5, Class A2B,
5.00%, due 11/25/07 | | Aaa | | AAA | | | 959 | µ | |
| | 400 | | | Ace Securities Corp. Home Equity Loan Trust, Ser. 2006-OP1, Class A2C,
5.02%, due 11/25/07 | | Aaa | | AAA | | | 381 | µ | |
| | 400 | | | Bear Stearns Asset Backed Securities Trust, Ser. 2006-HE9, Class 1A2,
5.02%, due 11/25/07 | | Aaa | | AAA | | | 383 | µ | |
| | 938 | | | Carrington Mortgage Loan Trust, Ser. 2006-RFC1, Class A1,
4.91%, due 11/25/07 | | Aaa | | AAA | | | 933 | µ | |
| | 1,250 | | | Carrington Mortgage Loan Trust, Ser. 2006-OPT1, Class A3,
5.05%, due 11/25/07 | | Aaa | | AAA | | | 1,196 | µ | |
| | 850 | | | Carrington Mortgage Loan Trust, Ser. 2007-FRE1, Class A3,
5.13%, due 11/25/07 | | Aaa | | AAA | | | 778 | µ | |
| | 589 | | | Chase Funding Mortgage Loan, Ser. 2003-6, Class 1A3,
3.34%, due 5/25/26 | | Aaa | | AAA | | | 582 | | |
| | 800 | | | Countrywide Asset-Backed Certificates, Ser. 2006-3, Class 2A2,
5.05%, due 11/25/07 | | Aaa | | AAA | | | 768 | µ | |
| | 500 | | | Countrywide Asset-Backed Certificates, Ser. 2006-5, Class 2A2,
5.05%, due 11/25/07 | | Aaa | | AAA | | | 485 | µ | |
| | 1,000 | | | Countrywide Asset-Backed Certificates, Ser. 2006-6, Class 2A2,
5.05%, due 11/25/07 | | Aaa | | AAA | | | 980 | µ | |
| | 2,136 | | | Fieldstone Mortgage Investment Corp., Ser. 2006-2, Class 2A1,
4.96%, due 11/25/07 | | Aaa | | AAA | | | 2,108 | µ | |
| | 736 | | | Impac Secured Assets Corp., Ser. 2006-3, Class A4, 4.96%, due 11/25/07 | | Aaa | | AAA | | | 731 | µ | |
| | 406 | | | John Deere Owner Trust, Ser. 2005-A, Class A3, 3.98%, due 6/15/09 | | Aaa | | AAA | | | 406 | | |
| | 413 | | | Knollwood CDO Ltd., Ser. 2006-2A, Class A2J, 5.66%, due 1/13/08 | | Aaa | | AAA | | | 124 | ñµ | |
| | 917 | | | Nomura Asset Acceptance Corp., Ser. 2005-S3, Class AIO, 20.00%,
Interest Only Security, due 8/25/35 | | Aaa | | AAA | | | 36 | | |
| | 2,373 | | | Nomura Asset Acceptance Corp., Ser. 2005-S4, Class AIO, 20.00%,
Interest Only Security, due 10/25/35 | | Aaa | | AAA | | | 147 | | |
| | 2,703 | | | Nomura Asset Acceptance Corp., Ser. 2006-AP1, Class AIO, 4.50%,
Interest Only Security, due 1/25/36 | | Aaa | | AAA | | | 16 | | |
| | 2,242 | | | Nomura Asset Acceptance Corp., Ser. 2006-S2, Class AIO, 10.00%,
Interest Only Security, due 4/25/36 | | Aaa | | AAA | | | 109 | ñ | |
| | 1,050 | | | Residential Asset Mortgage Products, Inc., Ser. 2006-RS1, Class AI2,
5.10%, due 11/25/07 | | Aaa | | AAA | | | 1,000 | µ | |
| | 350 | | | Securitized Asset Backed Receivables LLC Trust, Ser. 2006-WM4,
Class A2C, 5.03%, due 11/25/07 | | Aaa | | AAA | | | 332 | µ | |
| | 1,100 | | | Soundview Home Equity Loan Trust, Ser. 2006-OPT3, Class 2A3,
5.04%, due 11/25/07 | | Aaa | | AAA | | | 1,024 | µ | |
| | 91 | | | Soundview Home Equity Loan Trust, Ser. 2005-4, Class 2A2,
5.07%, due 11/25/07 | | Aaa | | AAA | | | 91 | µ | |
| | 1,325 | | | Structured Asset Investment Loan Trust, Ser. 2006-3, Class A4,
4.96%, due 11/25/07 | | Aaa | | AAA | | | 1,297 | µ | |
| | | | | Total Asset-Backed Securities (Cost $15,301) | | | | | | | 14,866 | | |
| Repurchase Agreements (2.1%) | | | |
| | 2,230 | | | Repurchase Agreement with Fixed Income Clearing Corp.,
4.45%, due 11/1/07, dated 10/31/07, Maturity Value $2,230,276,
Collateralized by $2,301,806 Fannie Mae, 4.35%, due 5/4/10
(Collateral Value $2,350,249), (Cost $2,230) | | | | | | | 2,230 | # | |
| | | | | Total Investments (101.7%) (Cost $108,537) | | | | | | | 108,314 | ## | |
| | | | | Liabilities, less cash, receivables and other assets [(1.7%)] | | | | | | | (1,816 | ) | |
| | | | | Total Net Assets (100.0%) | | | | | | $ | 106,498 | | |
See Notes to Schedule of Investments 56
Schedule of Investments Lehman Brothers Strategic Income Fund
| NUMBER OF SHARES | | | | MARKET VALUE†
(000's omitted) | |
| Common Stocks (21.4%) | | | |
| Apartments (1.2%) | | | |
| | 125 | | | Apartment Investment &
Management | | $ | 6 | | |
| | 500 | | | AvalonBay Communities | | | 61 | | |
| | 800 | | | Camden Property Trust | | | 50 | | |
| | 700 | | | Equity Residential | | | 29 | | |
| | 200 | | | Essex Property Trust | | | 25 | | |
| | 500 | | | Home Properties | | | 26 | | |
| | 400 | | | UDR, Inc. | | | 9 | | |
| | | | | | | | 206 | | |
| Basic Materials (0.2%) | | | |
| | 2,200 | | | Gold Fields ADR | | | 40 | | |
| Coal (0.6%) | | | |
| | 2,600 | | | Fording Canadian Coal Trust | | | 95 | ~ | |
| Community Centers (0.6%) | | | |
| | 800 | | | Acadia Realty Trust | | | 21 | | |
| | 100 | | | Developers Diversified Realty | | | 5 | | |
| | 700 | | | Equity One | | | 19 | | |
| | 600 | | | Federal Realty Investment Trust | | | 53 | | |
| | | | | | | | 98 | | |
| Consumer Products & Services (0.1%) | | | |
| | 2,500 | | | Great Lakes Dredge & Dock | | | 22 | * | |
| Diversified (1.0%) | | | |
| | 900 | | | Forest City Enterprises Class A | | | 51 | | |
| | 500 | | | Macquarie Infrastructure | | | 21 | | |
| | 950 | | | Vornado Realty Trust | | | 106 | | |
| | | | | | | | 178 | | |
| Energy (1.1%) | | | |
| | 5,000 | | | Cathedral Energy Services
Income Trust | | | 47 | | |
| | 1,155 | | | Enbridge Energy Management | | | 63 | * | |
| | 600 | | | Enerplus Resources Fund | | | 29 | | |
| | 800 | | | ENI ADR | | | 58 | | |
| | | | | | | | 197 | | |
| Entertainment (0.1%) | | | |
| | 1,400 | | | World Wrestling Entertainment | | | 21 | | |
| Finance (0.9%) | | | |
| | 1,000 | | | Bank of America | | | 48 | | |
| | 1,000 | | | Crystal River Capital | | | 15 | | |
| | 1,800 | | | Tortoise Energy Capital | | | 49 | | |
| | 1,400 | | | Tortoise Energy Infrastructure | | | 49 | | |
| | | | | | | | 161 | | |
| NUMBER OF SHARES | | | | MARKET VALUE†
(000's omitted) | |
| Financial Services (0.7%) | | | |
| | 2,700 | | | Aeroplan Income Fund | | $ | 64 | | |
| | 4,000 | | | PennantPark Investment Corp. | | | 52 | | |
| | | | | | | | 116 | | |
| Food & Beverage (0.3%) | | | |
| | 1,000 | | | Anheuser-Busch | | | 51 | | |
| Health Care (1.4%) | | | |
| | 700 | | | Health Care Property Investors | | | 24 | | |
| | 300 | | | Health Care REIT | | | 13 | | |
| | 1,200 | | | Nationwide Health Properties | | | 37 | | |
| | 1,000 | | | Novartis AG ADR | | | 53 | | |
| | 700 | | | OMEGA Healthcare Investors | | | 12 | | |
| | 2,300 | | | Ventas, Inc. | | | 99 | | |
| | | | | | | | 238 | | |
| Industrial (0.9%) | | | |
| | 1,500 | | | General Electric | | | 62 | ~ | |
| | 1,300 | | | ProLogis | | | 93 | | |
| | | | | | | | 155 | | |
| Insurance (0.6%) | | | |
| | 700 | | | American International Group | | | 44 | | |
| | 2,000 | | | Arthur J. Gallagher | | | 53 | | |
| | | | | | | | 97 | | |
| Lodging (0.2%) | | | |
| | 800 | | | Host Hotels & Resorts | | | 18 | | |
| | 100 | | | LaSalle Hotel Properties | | | 4 | | |
| | 100 | | | Starwood Hotels & Resorts Worldwide | | | 6 | | |
| | | | | | | | 28 | | |
| Office (2.3%) | | | |
| | 600 | | | Alexandria Real Estate Equities | | | 62 | | |
| | 800 | | | BioMed Realty Trust | | | 19 | | |
| | 600 | | | Boston Properties | | | 65 | | |
| | 2,550 | | | Brookfield Asset Management
Class A | | | 104 | | |
| | 2,350 | | | Brookfield Properties | | | 59 | | |
| | 700 | | | Corporate Office Properties Trust | | | 29 | | |
| | 500 | | | SL Green Realty | | | 60 | | |
| | | | | | | | 398 | | |
| Office - Industrial (0.3%) | | | |
| | 1,200 | | | Digital Realty Trust | | | 53 | | |
| Oil & Gas (1.0%) | | | |
| | 2,000 | | | Hugoton Royalty Trust | | | 49 | | |
| | 1,700 | | | Sasol Limited ADR | | | 86 | | |
| | 400 | | | Schlumberger Ltd. | | | 39 | ~ | |
| | | | | | | | 174 | | |
See Notes to Schedule of Investments 57
| NUMBER OF SHARES | | | | MARKET VALUE†
(000's omitted) | |
| Oil Services (0.4%) | | | |
| | 2,000 | | | Canadian Oil Sands Trust | | $ | 74 | | |
| Pharmaceutical (0.3%) | | | |
| | 800 | | | Johnson & Johnson | | | 52 | | |
| Real Estate (0.3%) | | | |
| | 800 | | | AMB Property | | | 52 | | |
| Regional Malls (1.4%) | | | |
| | 1,700 | | | Kimco Realty | | | 71 | | |
| | 500 | | | Macerich Co. | | | 43 | | |
| | 400 | | | Simon Property Group | | | 42 | | |
| | 1,400 | | | Taubman Centers | | | 82 | | |
| | | | | | | | 238 | | |
| Self Storage (1.0%) | | | |
| | 1,000 | | | Extra Space Storage | | | 16 | | |
| | 1,600 | | | Public Storage | | | 129 | | |
| | 400 | | | Sovran Self Storage | | | 19 | | |
| | | | | | | | 164 | | |
| Software (0.4%) | | | |
| | 2,000 | | | Microsoft Corp. | | | 74 | | |
| Specialty (0.3%) | | | |
| | 1,500 | | | Corrections Corporation of America | | | 42 | * | |
| Technology (0.5%) | | | |
| | 1,400 | | | Dupont Fabros Technology | | | 30 | * | |
| | 1,500 | | | Microchip Technology | | | 50 | | |
| | | | | | | | 80 | | |
| Utilities (3.3%) | | | |
| | 1,500 | | | California Water Service Group | | | 67 | | |
| | 2,500 | | | Duke Energy | | | 48 | | |
| | 900 | | | FPL Group | | | 62 | | |
| | 1,000 | | | National Fuel Gas | | | 48 | ~ | |
| | 750 | | | National Grid ADR | | | 61 | | |
| | 1,100 | | | New Jersey Resources | | | 54 | | |
| | 1,900 | | | NSTAR | | | 67 | | |
| | 1,500 | | | PNM Resources | | | 38 | | |
| | 5,700 | | | United Utilities | | | 86 | | |
| | 2,000 | | | Xcel Energy | | | 45 | | |
| | | | | | | | 576 | | |
| | | | | Total Common Stocks (Cost $3,251) | | | 3,680 | | |
| Convertible Preferred Stocks (0.9%) | | | |
| | 500 | | | Chesapeake Energy, Ser. D | | | 53 | | |
| | 1,000 | | | New York Community Capital Trust V | | | 50 | | |
| | 1,200 | | | Sovereign Capital Trust IV | | | 49 | | |
| | | | | Total Convertible Preferred Stocks (Cost $153) | | | 152 | | |
PRINCIPAL AMOUNT
(000's omitted) | | | | MARKET VALUE†
(000's omitted) | |
| Convertible Bonds (2.6%) | | | |
| $ | 50 | | | American Tower Corp.,
Notes, 5.00%, due 2/15/10,
Moody's Rating Ba1,
S&P Rating BB+ | | $ | 50 | | |
| | 75 | | | Edwards Lifesciences Corp.,
Debentures, 3.88%,
due 5/15/33 | | | 77 | ^ | |
| | 50 | | | Euronet Worldwide, Inc.,
Debentures, 3.50%, due
10/15/15, S&P Rating B+ | | | 53 | | |
| | 50 | | | Invitrogen Corp., Senior
Unsecured Notes, 3.25%,
due 6/15/25 | | | 57 | ^ | |
| | 50 | | | Ivax Corp., Senior
Subordinated Notes,
4.50%, due 5/15/08 | | | 52 | ^ | |
| | 50 | | | NII Holdings, Inc., Senior
Unsecured Notes, 3.13%,
due 6/15/12 | | | 48 | ^ | |
| | 60 | | | St. Jude Medical, Inc.,
Debentures, 2.80%,
due 12/15/35 | | | 60 | ^ | |
| | 50 | | | Vishay Intertechnology, Inc.,
Subordinated Notes,
3.63%, due 8/1/23,
Moody's Rating B3, S&P Rating B+ | | | 50 | | |
| | | | | Total Convertible Bonds (Cost $433) | | | 447 | | |
See Notes to Schedule of Investments 58
| PRINCIPAL AMOUNT | | | | RATING§ | | VALUE† | |
| (000's omitted) | | | | Moody's | | S&P | | (000's omitted) | |
U.S. Treasury Securities-Backed by the Full Faith and
Credit of the U.S. Government (3.4%) | | | |
| $ | 545 | | | U.S. Treasury Notes, 4.38%, due 8/15/12 | | TSY | | TSY | | $ | 552 | ØØ | |
| | 40 | | | U.S. Treasury Notes, 4.13%, due 5/15/15 | | TSY | | TSY | | | 39 | | |
| |
| | | Total U.S. Treasury Securities-Backed by the
Full Faith and Credit of the
U.S. Government (Cost $578) | | | | | | | 591 | | |
| U.S. Government Agency Securities (0.9%) | | | |
| | 70 | | | Fannie Mae, Notes, 5.38%, due 7/15/16 | | AGY | | AGY | | | 72 | | |
| | 75 | | | Freddie Mac, Notes, 5.13%, due 7/15/12 | | AGY | | AGY | | | 77 | | |
| | | | | Total U.S. Government Agency Securities (Cost $149) | | | | | | | 149 | | |
| Mortgage-Backed Securities (12.8%) | | | |
| Fannie Mae (10.8%) | | | |
| | 38 | | | Pass-Through Certificates, 4.50%, due 8/1/18 & 10/1/18 | | AGY | | AGY | | | 37 | | |
| | 1,237 | | | Pass-Through Certificates, 5.00%, due 11/1/17 – 5/1/37 | | AGY | | AGY | | | 1,191 | ØØ | |
| | 50 | | | Pass-Through Certificates, Notes, 5.50%, due 10/1/37 | | AGY | | AGY | | | 49 | | |
| | 421 | | | Pass-Through Certificates, 5.50%, due 9/1/16 – 6/1/37 | | AGY | | AGY | | | 416 | | |
| | 86 | | | Pass-Through Certificates, 6.00%, due 3/1/18 – 9/1/33 | | AGY | | AGY | | | 88 | | |
| | 63 | | | Pass-Through Certificates, 6.50%, due 11/1/13 – 9/1/32 | | AGY | | AGY | | | 65 | | |
| | 22 | | | Pass-Through Certificates, 7.00%, due 7/1/17 & 7/1/29 | | AGY | | AGY | | | 23 | | |
| | 4 | | | Pass-Through Certificates, 7.50%, due 12/1/32 | | AGY | | AGY | | | 4 | | |
| | | | | | | | | | | | 1,873 | | |
| Freddie Mac (1.9%) | | | |
| | 17 | | | Pass-Through Certificates, 4.50%, due 8/1/18 | | AGY | | AGY | | | 17 | | |
| | 59 | | | Pass-Through Certificates, 5.00%, due 5/1/18 & 8/1/33 | | AGY | | AGY | | | 57 | | |
| | 115 | | | Pass-Through Certificates, 5.50%, due 9/1/17 – 8/1/33 | | AGY | | AGY | | | 115 | | |
| | 86 | | | Pass-Through Certificates, 6.00%, due 4/1/17 – 12/1/33 | | AGY | | AGY | | | 88 | | |
| | 41 | | | Pass-Through Certificates, 6.50%, due 3/1/16 – 1/1/32 | | AGY | | AGY | | | 41 | | |
| | 6 | | | Pass-Through Certificates, 7.00%, due 6/1/32 | | AGY | | AGY | | | 6 | | |
| | | | | | | | | | | | 324 | | |
| Government National Mortgage Association (0.1%) | | | |
| | 7 | | | Pass-Through Certificates, 6.50%, due 7/15/32 | | AGY | | AGY | | | 8 | | |
| | 6 | | | Pass-Through Certificates, 7.00%, due 8/15/32 | | AGY | | AGY | | | 6 | | |
| | | | | | | | | | | | 14 | | |
| | | | | Total Mortgage-Backed Securities (Cost $2,231) | | | | | | | 2,211 | | |
| Corporate Debt Securities (37.3%) | | | |
| Aerospace (0.4%) | | | |
| | 55 | | | L-3 Communications Corp., Guaranteed Senior Unsecured
Subordinated Notes, 7.63%, due 6/15/12 | | Ba3 | | BB+ | | | 55 | | |
| | 15 | | | L-3 Communications Corp., Guaranteed Senior Unsecured
Subordinated Notes, 6.13%, due 7/15/13 | | Ba3 | | BB+ | | | 15 | | |
| | | | | | | | | | | | 70 | | |
| Airlines (0.3%) | | | |
| | 51 | | | Continental Airlines, Inc., Pass-Through Certificates, 9.80%, due 4/1/21 | | Ba1 | | BB+ | | | 54 | | |
See Notes to Schedule of Investments 59
| PRINCIPAL AMOUNT | | | | RATING§ | | VALUE† | |
| (000's omitted) | | | | Moody's | | S&P | | (000's omitted) | |
| Apparel/Textiles (0.2%) | | | |
| $ | 25 | | | Levi Strauss & Co., Senior Unsubordinated Notes, 9.75%, due 1/15/15 | | B2 | | B+ | | $ | 26 | | |
| Auto Loans (2.2%) | | | |
| | 125 | | | Ford Motor Credit Co., Bonds, 7.38%, due 2/1/11 | | B1 | | B | | | 118 | ØØ | |
| | 50 | | | Ford Motor Credit Co., Notes, 7.80%, due 6/1/12 | | B1 | | B | | | 47 | ØØ | |
| | 195 | | | General Motors Acceptance Corp., Notes, 6.88%, due 9/15/11 | | Ba1 | | BB+ | | | 180 | | |
| | 45 | | | General Motors Acceptance Corp., Unsecured Notes, 7.00%, due 2/1/12 | | Ba1 | | BB+ | | | 41 | | |
| | | | | | | | | | | | 386 | | |
| Auto Parts & Equipment (0.3%) | | | |
| | 17 | | | Goodyear Tire & Rubber Co., Senior Notes, 8.63%, due 12/1/11 | | Ba3 | | B | | | 18 | | |
| | 25 | | | Goodyear Tire & Rubber Co., Senior Notes, 9.00%, due 7/1/15 | | Ba3 | | B | | | 27 | | |
| | | | | | | | | | | | 45 | | |
| Automotive (0.4%) | | | |
| | 70 | | | DaimlerChrysler N.A. LLC, Guaranteed Notes, 8.00%, due 6/15/10 | | A3 | | BBB+ | | | 75 | | |
| Banks (1.3%) | | | |
| | 40 | | | Bank of America Corp., Unsecured Subordinated Notes,
6.80%, due 3/15/28 | | Aa2 | | AA- | | | 42 | | |
| | 20 | | | Bank One Corp., Unsecured Subordinated Notes, 7.88%, due 8/1/10 | | Aa3 | | A+ | | | 21 | | |
| | 70 | | | Deutsche Bank AG, Senior Unsecured Notes, 5.38%, due 10/12/12 | | Aa1 | | AA | | | 71 | | |
| | 85 | | | Wachovia Corp., Senior Medium-Term Notes, Ser. G, 5.70%, due 8/1/13 | | Aa3 | | AA- | | | 86 | | |
| | | | | | | | | | | | 220 | | |
| Beverages (0.3%) | | | |
| | 45 | | | Coca-Cola Enterprises, Inc., Unsecured Debentures, 6.95%, due 11/15/26 | | A3 | | A | | | 50 | | |
| | 5 | | | Constellation Brands, Inc., Guaranteed Notes, 7.25%, due 9/1/16 | | Ba3 | | BB- | | | 5 | | |
| | | | | | | | | | | | 55 | | |
| Building & Construction (0.0%) | | | |
| | 10 | | | K. Hovnanian Enterprises, Senior Notes, 8.63%, due 1/15/17 | | Ba3 | | BB- | | | 8 | È | |
| Chemicals (0.4%) | | | |
| | 10 | | | Chemtura Corp., Guaranteed Notes, 6.88%, due 6/1/16 | | Ba2 | | BB+ | | | 10 | | |
| | 25 | | | Hexion US Finance Corp., Guaranteed Notes, 9.75%, due 11/15/14 | | B3 | | B | | | 27 | | |
| | 35 | | | MacDermid, Inc., Senior Subordinated Notes, 9.50%, due 4/15/17 | | Caa1 | | CCC+ | | | 33 | ñ | |
| | | | | | | | | | | | 70 | | |
| Consumer/Commercial/Lease Financing (0.2%) | | | |
| | 35 | | | Residential Capital LLC, Guaranteed Notes, 6.00%, due 2/22/11 | | Ba1 | | BBB- | | | 26 | | |
| Diversified Financial Services (3.7%) | | | |
| | 70 | | | American Express Co., Senior Unsecured Notes, 6.15%, due 8/28/17 | | A1 | | A+ | | | 71 | | |
| | 75 | | | Associates Corp. NA, Senior Notes, 6.25%, due 11/1/08 | | Aa1 | | AA | | | 76 | | |
| | 75 | | | Bear Stearns Co., Senior Unsubordinated Notes, 5.35%, due 2/1/12 | | A1 | | A+ | | | 74 | | |
| | 85 | | | Citigroup, Inc., Senior Notes, 4.13%, due 2/22/10 | | Aa1 | | AA | | | 83 | | |
| | 45 | | | General Electric Capital Corp., Senior Unsecured Medium-Term Notes, Ser. A,
6.00%, due 6/15/12 | | Aaa | | AAA | | | 47 | | |
| | 60 | | | Goldman Sachs Group, Inc., Unsecured Notes, 4.13%, due 1/15/08 | | Aa3 | | AA- | | | 60 | ØØ | |
| | 100 | | | HSBC Finance Corp., Senior Unsecured Notes, 4.63%, due 1/15/08 | | Aa3 | | AA- | | | 100 | | |
| | 125 | | | JP Morgan Chase & Co., Senior Notes, 3.63%, due 5/1/08 | | Aa2 | | AA- | | | 124 | ØØ | |
| | | | | | | | | | | | 635 | | |
See Notes to Schedule of Investments 60
| PRINCIPAL AMOUNT | | | | RATING§ | | VALUE† | |
| (000's omitted) | | | | Moody's | | S&P | | (000's omitted) | |
| Electric (0.9%) | | | |
| $ | 100 | | | Dominion Resources, Inc., Notes, 4.13%, due 2/15/08 | | Baa2 | | BBB | | $ | 100 | | |
| | 55 | | | Exelon Generation Co., LLC, Senior Unsecured Notes, 6.20%, due 10/1/17 | | A3 | | BBB+ | | | 55 | | |
| | | | | | | | | | | | 155 | | |
| Electric - Generation (1.2%) | | | |
| | 30 | | | AES Corp., Senior Notes, 8.00%, due 10/15/17 | | B1 | | B | | | 30 | ñ | |
| | 20 | | | AES Corp., Senior Notes, 7.75%, due 10/15/15 | | B1 | | B | | | 20 | ñ | |
| | 45 | | | Dynegy-Roseton Danskamme, Pass-Through Certificates, Ser. B,
7.67%, due 11/8/16 | | Ba3 | | B | | | 45 | | |
| | 10 | | | Edison Mission Energy, Senior Unsecured Notes, 7.50%, due 6/15/13 | | B1 | | BB- | | | 10 | | |
| | 45 | | | Edison Mission Energy, Senior Notes, 7.63%, due 5/15/27 | | B1 | | BB- | | | 43 | ñ | |
| | 45 | | | Mirant Americas Generation, Inc., Senior Unsecured Notes,
8.30%, due 5/1/11 | | Caa1 | | B- | | | 46 | | |
| | 15 | | | NRG Energy, Inc., Guaranteed Notes, 7.38%, due 2/1/16 | | B1 | | B | | | 15 | | |
| | | | | | | | | | | | 209 | | |
| Electric - Integrated (0.5%) | | | |
| | 80 | | | Energy Future Holdings, Guaranteed Notes, 10.88%, due 11/1/17 | | B3 | | CCC+ | | | 81 | ñ | |
| Electronics (0.8%) | | | |
| | 70 | | | Freescale Semiconductor, Inc., Guaranteed Notes, 9.13%, due 12/15/14 | | B1 | | B | | | 63 | | |
| | 75 | | | NXP BV Funding LLC, Guaranteed Notes, 9.50%, due 10/15/15 | | B3 | | B | | | 71 | | |
| | | | | | | | | | | | 134 | | |
| Energy-Exploration & Production (1.1%) | | | |
| | 5 | | | Chesapeake Energy Corp., Guaranteed Notes, 6.88%, due 1/15/16 | | Ba2 | | BB | | | 5 | | |
| | 100 | | | Chesapeake Energy Corp., Guaranteed Notes, 7.50%, due 9/15/13 | | Ba2 | | BB | | | 103 | | |
| | 30 | | | Forest Oil Corp., Guaranteed Senior Unsecured Notes, 7.75%, due 5/1/14 | | B1 | | B+ | | | 30 | | |
| | 50 | | | XTO Energy, Inc., Senior Unsecured Notes, 6.75%, due 8/1/37 | | Baa2 | | BBB | | | 54 | | |
| | | | | | | | | | | | 192 | | |
| Environmental (0.1%) | | | |
| | 15 | | | Allied Waste North America, Inc., Secured Notes, Ser. B, 5.75%,
due 2/15/11 | | B1 | | BB+ | | | 15 | | |
| Food & Drug Retailers (0.3%) | | | |
| | 25 | | | Rite Aid Corp., Senior Unsecured Notes, 8.63%, due 3/1/15 | | Caa1 | | CCC+ | | | 22 | | |
| | 35 | | | Rite Aid Corp., Guaranteed Notes, 9.50%, due 6/15/17 | | Caa1 | | CCC+ | | | 33 | ñ | |
| | | | | | | | | | | | 55 | | |
| Forestry/Paper (0.2%) | | | |
| | 20 | | | Bowater, Inc., Debentures, 9.00%, due 8/1/09 | | B3 | | B | | | 20 | | |
| | 10 | | | Graphic Packaging Int'l, Inc., Guaranteed Notes, 8.50%, due 8/15/11 | | B2 | | B- | | | 10 | | |
| | | | | | | | | | | | 30 | | |
| Gaming (1.2%) | | | |
| | 30 | | | Chukchansi Economic Development Authority, Senior Notes,
8.00%, due 11/15/13 | | B2 | | BB- | | | 30 | ñ | |
| | 35 | | | Fontainebleau Las Vegas Holdings LLC, Second Mortgage,
10.25%, due 6/15/15 | | Caa1 | | CCC+ | | | 33 | ñ | |
| | 20 | | | Majestic Star LLC, Senior Unsecured Notes, 9.75%, due 1/15/11 | | Caa1 | | CCC | | | 17 | | |
| | 35 | | | Pokagon Gaming Authority, Senior Notes, 10.38%, due 6/15/14 | | B3 | | B | | | 39 | ñ | |
| | 35 | | | San Pasqual Casino, Notes, 8.00%, due 9/15/13 | | B2 | | B+ | | | 35 | ñ | |
| | 30 | | | Shingle Springs Tribal Gaming Authority, Senior Notes, 9.38%, due 6/15/15 | | B3 | | B | | | 30 | ñ | |
| | 20 | | | Station Casinos, Inc., Senior Unsecured Notes, 7.75%, due 8/15/16 | | Ba2 | | B+ | | | 20 | | |
See Notes to Schedule of Investments 61
| PRINCIPAL AMOUNT | | | | RATING§ | | VALUE† | |
| (000's omitted) | | | | Moody's | | S&P | | (000's omitted) | |
| $ | 5 | | | Station Casinos, Inc., Senior Unsecured Subordinated Notes,
6.88%, due 3/1/16 | | Ba3 | | B | | $ | 4 | | |
| | | | | | | | | | | | 208 | | |
| Gas Distribution (1.2%) | | | |
| | 15 | | | AmeriGas Partners L.P., Senior Unsecured Notes, 7.25%, due 5/20/15 | | B1 | | | | | 15 | | |
| | 25 | | | El Paso Natural Gas Co., Bonds, 8.38%, due 6/15/32 | | Baa3 | | BB | | | 29 | | |
| | 25 | | | Ferrellgas Partners L.P., Senior Unsecured Notes, 8.75%, due 6/15/12 | | B2 | | B- | | | 26 | | |
| | 70 | | | Kinder Morgan, Inc., Senior Unsecured Notes, 6.50%, due 9/1/12 | | Ba2 | | BB- | | | 69 | | |
| | 25 | | | Kinder Morgan, Inc., Guaranteed Notes, 5.70%, due 1/5/16 | | Ba2 | | BB- | | | 23 | | |
| | 42 | | | Regency Energy Partners L.P., Guaranteed Notes, 8.38%, due 12/15/13 | | B1 | | B | | | 44 | | |
| | | | | | | | | | | | 206 | | |
| Government (0.4%) | | | |
| | 75 | | | Province of Ontario, Senior Unsubordinated Unsecured Notes,
5.50%, due 10/1/08 | | Aa1 | | AA | | | 76 | | |
| Health Services (2.7%) | | | |
| | 10 | | | Bausch & Lomb, Inc., Senior Unsecured Notes, 9.88%, due 11/1/15 | | Caa1 | | B- | | | 10 | ñ | |
| | 10 | | | Community Health Systems, Inc., Guaranteed Notes, 8.88%, due 7/15/15 | | B3 | | B- | | | 10 | ñ | |
| | 70 | | | HCA, Inc., Secured Notes, 9.63%, due 11/15/16 | | B2 | | BB- | | | 74 | | |
| | 60 | | | HCA, Inc., Secured Notes, 9.25%, due 11/15/16 | | B2 | | BB- | | | 63 | | |
| | 45 | | | LVB Acquisition Merger, Inc., Guaranteed Notes, 10.38%, due 10/15/17 | | B3 | | B- | | | 46 | ñ | |
| | 20 | | | LVB Acquisition Merger, Inc., Guaranteed Notes, 11.63%, due 10/15/17 | | Caa1 | | B- | | | 20 | ñ | |
| | 41 | | | NMH Holdings, Inc., Senior Unsecured Floating Rate Notes,
12.82%, due 12/15/07 | | Caa2 | | CCC+ | | | 41 | ñµ | |
| | 35 | | | Service Corp. Int'l, Senior Unsecured Notes, 7.38%, due 10/1/14 | | B1 | | BB- | | | 36 | | |
| | 25 | | | Service Corp. Int'l, Senior Unsecured Notes, 6.75%, due 4/1/15 | | B1 | | BB- | | | 25 | | |
| | 20 | | | Tenet Healthcare Corp., Senior Notes, 9.88%, due 7/1/14 | | Caa1 | | CCC+ | | | 18 | | |
| | 35 | | | US Oncology, Inc., Guaranteed Notes, 9.00%, due 8/15/12 | | B2 | | CCC+ | | | 35 | | |
| | 30 | | | Ventas Realty L.P., Guaranteed Notes, 6.75%, due 6/1/10 | | Ba1 | | BB+ | | | 30 | | |
| | 15 | | | Ventas Realty L.P., Senior Notes, 6.63%, due 10/15/14 | | Ba1 | | BB+ | | | 15 | | |
| | 25 | | | Ventas Realty L.P., Guaranteed Notes, 7.13%, due 6/1/15 | | Ba1 | | BB+ | | | 26 | | |
| | 10 | | | Ventas Realty L.P., Guaranteed Notes, 6.50%, due 6/1/16 | | Ba1 | | BB+ | | | 10 | | |
| | 10 | | | Ventas Realty L.P., Guaranteed Notes, 6.75%, due 4/1/17 | | Ba1 | | BB+ | | | 10 | | |
| | | | | | | | | | | | 469 | | |
| Hotels (0.3%) | | | |
| | 45 | | | Host Hotels & Resorts L.P., Secured Notes, 6.88%, due 11/1/14 | | | | BB | | | 45 | | |
| Industrial (0.5%) | | | |
| | 85 | | | CVS Caremark Corp., Senior Unsecured Notes, 6.25%, due 6/1/27 | | Baa2 | | BBB+ | | | 85 | | |
| Insurance (0.3%) | | | |
| | 45 | | | American Int'l Group, Inc., Medium-Term Notes, Ser. G,
5.60%, due 10/18/16 | | Aa2 | | AA | | | 45 | | |
| Investments & Misc. Financial Services (0.4%) | | | |
| | 50 | | | Cardtronics, Inc., Guaranteed Notes, 9.25%, due 8/15/13 | | Caa1 | | B- | | | 48 | | |
| | 20 | | | Cardtronics, Inc., Senior Subordinated Notes, Ser. B, 9.25%, due 8/15/13 | | Caa1 | | B- | | | 20 | ñ | |
| | | | | | | | | | | | 68 | | |
| Media (1.7%) | | | |
| | 80 | | | AOL Time Warner, Inc., Guaranteed Unsecured Notes, 6.88%, due 5/1/12 | | Baa2 | | BBB+ | | | 84 | | |
| | 25 | | | AOL Time Warner, Inc., Guaranteed Unsecured Notes, 7.70%, due 5/1/32 | | Baa2 | | BBB+ | | | 28 | | |
| | 70 | | | Comcast Corp., Guaranteed Notes, 6.30%, due 11/15/17 | | Baa2 | | BBB+ | | | 72 | | |
See Notes to Schedule of Investments 62
| PRINCIPAL AMOUNT | | | | RATING§ | | VALUE† | |
| (000's omitted) | | | | Moody's | | S&P | | (000's omitted) | |
| $ | 120 | | | News America, Inc., Guaranteed Notes, 6.20%, due 12/15/34 | | Baa2 | | BBB+ | | $ | 117 | | |
| | | | | | | | | | | | 301 | | |
| Media - Broadcast (1.2%) | | | |
| | 75 | | | CMP Susquehanna Corp., Guaranteed Notes, 9.88%, due 5/15/14 | | Caa1 | | CCC | | | 69 | | |
| | 20 | | | Entercom Radio/Capital, Guaranteed Senior Unsecured Notes,
7.63%, due 3/1/14 | | B1 | | B | | | 20 | | |
| | 45 | | | LIN Television Corp., Guaranteed Notes, 6.50%, due 5/15/13 | | B1 | | B- | | | 43 | | |
| | 20 | | | LIN Television Corp., Guaranteed Notes, Ser. B, 6.50%, due 5/15/13 | | B1 | | B- | | | 19 | | |
| | 55 | | | Univision Communications, Inc., Guaranteed Notes, 9.75%, due 3/15/15 | | B3 | | CCC+ | | | 54 | ñ | |
| | 5 | | | Young Broadcasting, Inc., Guaranteed Senior Subordinated Notes,
10.00%, due 3/1/11 | | Caa1 | | CCC- | | | 5 | | |
| | | | | | | | | | | | 210 | | |
| Media - Cable (1.7%) | | | |
| | 35 | | | CCH I Holdings LLC, Secured Notes, 11.00%, due 10/1/15 | | Caa2 | | CCC | | | 34 | | |
| | 60 | | | Charter Communications Operating LLC, Senior Notes, 8.38%, due 4/30/14 | | B2 | | B+ | | | 60 | ñ | |
| | 5 | | | DirecTV Holdings LLC, Guaranteed Notes, 6.38%, due 6/15/15 | | Ba3 | | BB- | | | 5 | | |
| | 65 | | | DirecTV Holdings LLC, Senior Notes, 8.38%, due 3/15/13 | | Ba3 | | BB- | | | 68 | | |
| | 25 | | | EchoStar DBS Corp., Guaranteed Notes, 7.13%, due 2/1/16 | | Ba3 | | BB- | | | 26 | | |
| | 30 | | | EchoStar DBS Corp., Guaranteed Notes, 7.00%, due 10/1/13 | | Ba3 | | BB- | | | 31 | | |
| | 60 | | | EchoStar DBS Corp., Guaranteed Notes, 6.38%, due 10/1/11 | | Ba3 | | BB- | | | 61 | | |
| | | | | | | | | | | | 285 | | |
| Media - Diversified (0.1%) | | | |
| | 25 | | | Quebecor Media, Inc., Notes, 7.75%, due 3/15/16 | | B2 | | B | | | 24 | ñ | |
| Media - Services (0.6%) | | | |
| | 25 | | | Lamar Media Corp., Guaranteed Notes, 7.25%, due 1/1/13 | | Ba3 | | B | | | 25 | | |
| | 35 | | | WMG Acquisition Corp., Senior Subordinated Notes, 7.38%, due 4/15/14 | | B2 | | B | | | 31 | | |
| | 55 | | | WMG Holdings Corp., Guaranteed Notes, Step-Up,
0.00%/9.50%, due 12/15/14 | | B2 | | B | | | 41 | ** | |
| | | | | | | | | | | | 97 | | |
| Metals/Mining Excluding Steel (1.1%) | | | |
| | 35 | | | Aleris Int'l, Inc., Guaranteed Notes, 9.00%, due 12/15/14 | | B3 | | B- | | | 32 | | |
| | 35 | | | Aleris Int'l, Inc., Guaranteed Notes, 10.00%, due 12/15/16 | | Caa1 | | B- | | | 31 | | |
| | 35 | | | Arch Western Finance Corp., Guaranteed Notes, 6.75%, due 7/1/13 | | B1 | | BB- | | | 34 | | |
| | 5 | | | Freeport-McMoRan Copper & Gold, Senior Unsecured Notes,
8.25%, due 4/1/15 | | Ba3 | | BB | | | 5 | | |
| | 25 | | | Freeport-McMoRan Copper & Gold, Senior Unsecured Notes,
8.38%, due 4/1/17 | | Ba3 | | BB | | | 27 | | |
| | 70 | | | Massey Energy Co., Guaranteed Notes, 6.88%, due 12/15/13 | | B2 | | B+ | | | 66 | | |
| | | | | | | | | | | | 195 | | |
| Multi-National (0.2%) | | | |
| | 35 | | | Int'l Bank for Reconstruction & Development, Notes, 3.63%, due 5/21/13 | | Aaa | | AAA | | | 33 | | |
| Non-Food & Drug Retailers (0.3%) | | | |
| | 20 | | | Claire's Stores, Inc., Guaranteed Notes, 9.63%, due 6/1/15 | | Caa1 | | CCC+ | | | 16 | ñ | |
| | 15 | | | GSC Holdings Corp., Guaranteed Notes, 8.00%, due 10/1/12 | | Ba3 | | BB | | | 16 | | |
| | 20 | | | Michaels Stores, Inc., Guaranteed Notes, 11.38%, due 11/1/16 | | Caa1 | | CCC | | | 20 | È | |
| | | | | | | | | | | | 52 | | |
See Notes to Schedule of Investments 63
| PRINCIPAL AMOUNT | | | | RATING§ | | VALUE† | |
| (000's omitted) | | | | Moody's | | S&P | | (000's omitted) | |
| Oil & Gas (0.6%) | | | |
| $ | 50 | | | Canadian Natural Resources Ltd., Unsecured Notes, 5.70%, due 5/15/17 | | Baa2 | | BBB | | $ | 50 | | |
| | 55 | | | ConocoPhillips Corp., Unsecured Notes, 8.75%, due 5/25/10 | | A1 | | A | | | 60 | | |
| | | | | | | | | | | | 110 | | |
| Packaging (1.2%) | | | |
| | 115 | | | Ball Corp., Guaranteed Unsecured Notes, 6.88%, due 12/15/12 | | Ba1 | | BB | | | 117 | | |
| | 20 | | | Crown Americas LLC, Guaranteed Notes, 7.75%, due 11/15/15 | | B1 | | B | | | 21 | | |
| | 40 | | | Graham Packaging Co., Inc., Guaranteed Notes, 9.88%, due 10/15/14 | | Caa1 | | CCC+ | | | 39 | | |
| | 20 | | | Owens-Brockway Glass Container, Inc., Guaranteed Notes,
8.75%, due 11/15/12 | | Ba2 | | BB | | | 21 | | |
| | | | | | | | | | | | 198 | | |
| Pharmaceuticals (0.4%) | | | |
| | 70 | | | Astrazeneca PLC, Senior Unsubordinated Notes, 5.90%, due 9/15/17 | | A1 | | AA- | | | 72 | | |
| Printing & Publishing (1.2%) | | | |
| | 15 | | | Dex Media West LLC, Senior Unsecured Notes, Ser. B, 8.50%, due 8/15/10 | | Ba3 | | B | | | 15 | | |
| | 20 | | | Dex Media West LLC, Guaranteed Notes, Ser. B, 9.88%, due 8/15/13 | | B1 | | B | | | 21 | | |
| | 25 | | | Dex Media, Inc., Senior Disc. Notes, Step-Up, 0.00%/9.00%, due 11/15/13 | | B2 | | B | | | 24 | ** | |
| | 70 | | | Idearc, Inc., Guaranteed Notes, 8.00%, due 11/15/16 | | B2 | | B+ | | | 70 | | |
| | 30 | | | R.H. Donnelley Corp., Senior Unsecured Notes, 6.88%, due 1/15/13 | | B3 | | B | | | 28 | | |
| | 10 | | | R.H. Donnelley Corp., Senior Notes, 8.88%, due 10/15/17 | | B3 | | B | | | 10 | ñ | |
| | 40 | | | Reader's Digest Association, Inc., Senior Subordinated Notes,
9.00%, due 2/15/17 | | Caa1 | | CCC+ | | | 36 | ñ | |
| | | | | | | | | | | | 204 | | |
| Railroads (0.4%) | | | |
| | 10 | | | Kansas City Southern Mexico, Senior Notes, 7.38%, due 6/1/14 | | B2 | | B+ | | | 10 | ñ | |
| | 55 | | | TFM SA de C.V., Senior Notes, 9.38%, due 5/1/12 | | B2 | | | | | 58 | | |
| | | | | | | | | | | | 68 | | |
| Real Estate Dev. & Mgt. (0.4%) | | | |
| | 60 | | | American Real Estate Partners, L.P., Senior Notes, 8.13%, due 6/1/12 | | Ba3 | | BB+ | | | 61 | | |
| | 20 | | | Realogy Corp., Guaranteed Notes, 11.00%, due 4/15/14 | | Caa1 | | B- | | | 16 | ñ | |
| | | | | | | | | | | | 77 | | |
| Restaurants (0.1%) | | | |
| | 25 | | | NPC Int'l, Inc., Guaranteed Notes, 9.50%, due 5/1/14 | | Caa1 | | B- | | | 23 | | |
| Retail (0.3%) | | | |
| | 55 | | | Target Corp., Senior Unsecured Notes, 7.50%, due 8/15/10 | | A1 | | A+ | | | 59 | | |
| Software/Services (0.4%) | | | |
| | 65 | | | First Data Corp., Guaranteed Notes, 9.88%, due 9/24/15 | | B3 | | B- | | | 62 | ñ | |
| Steel Producers/Products (0.5%) | | | |
| | 30 | | | Metals U.S.A. Holdings Corp., Senior Floating Rate Notes,
11.23%, due 1/2/08 | | Caa1 | | CCC | | | 27 | ñµ | |
| | 25 | | | Steel Dynamics, Inc., Senior Notes, 7.38%, due 11/1/12 | | Ba2 | | BB+ | | | 25 | ñ | |
| | 35 | | | Tube City IMS Corp., Guaranteed Notes, 9.75%, due 2/1/15 | | B3 | | B- | | | 35 | | |
| | | | | | | | | | | | 87 | | |
See Notes to Schedule of Investments 64
| PRINCIPAL AMOUNT | | | | RATING§ | | VALUE† | |
| (000's omitted) | | | | Moody's | | S&P | | (000's omitted) | |
| Support - Services (0.4%) | | | |
| $ | 10 | | | Aramark Corp., Guaranteed Notes, 8.50%, due 2/1/15 | | B3 | | B- | | $ | 10 | | |
| | 55 | | | Knowledge Learning Corp., Inc., Guaranteed Notes, 7.75%, due 2/1/15 | | B2 | | B- | | | 54 | ñ | |
| | | | | | | | | | | | 64 | | |
| Telecom - Integrated/Services (1.3%) | | | |
| | 30 | | | Dycom Industries, Inc., Guaranteed Notes, 8.13%, due 10/15/15 | | Ba3 | | B+ | | | 30 | | |
| | 40 | | | Intelsat Subsidiary Holdings Co. Ltd., Guaranteed Notes, 8.63%,
due 1/15/15 | | B2 | | B | | | 41 | | |
| | 35 | | | Qwest Corp., Notes, 8.88%, due 3/15/12 | | Ba1 | | BBB- | | | 38 | | |
| | 30 | | | Qwest Corp., Senior Unsecured Notes, 7.50%, due 10/1/14 | | Ba1 | | BBB- | | | 31 | | |
| | 10 | | | Qwest Corp., Senior Notes, 7.63%, due 6/15/15 | | Ba1 | | BBB- | | | 11 | | |
| | 20 | | | Windstream Corp., Guaranteed Notes, 8.13%, due 8/1/13 | | Ba3 | | BB- | | | 21 | | |
| | 40 | | | Windstream Corp., Guaranteed Notes, 8.63%, due 8/1/16 | | Ba3 | | BB- | | | 43 | | |
| | | | | | | | | | | | 215 | | |
| Telecom - Wireless (0.1%) | | | |
| | 15 | | | Dobson Cellular Systems, Secured Notes, 8.38%, due 11/1/11 | | Ba2 | | B+ | | | 16 | | |
| Telecommunications (0.8%) | | | |
| | 45 | | | AT&T Wireless Services, Inc., Senior Unsubordinated Notes,
8.75%, due 3/1/31 | | A3 | | A | | | 58 | ØØ | |
| | 50 | | | Motorola, Inc., Senior Unsecured Notes, 6.00%, due 11/15/17 | | Baa1 | | A- | | | 49 | | |
| | 35 | | | Sprint Nextel Corp., Unsecured Notes, 6.00%, due 12/1/16 | | Baa3 | | BBB | | | 34 | | |
| | | | | | | | | | | | 141 | | |
| Theaters & Entertainment (0.2%) | | | |
| | 30 | | | AMC Entertainment, Inc., Guaranteed Notes, Ser. B, 8.63%, due 8/15/12 | | Ba3 | | B- | | | 31 | | |
| Transportation (0.3%) | | | |
| | 20 | | | Norfolk Southern Corp., Senior Notes, 7.80%, due 5/15/27 | | Baa1 | | BBB+ | | | 23 | | |
| | 25 | | | Norfolk Southern Corp., Senior Unsecured Notes, 6.00%, due 4/30/08 | | Baa1 | | BBB+ | | | 25 | | |
| | | | | | | | | | | | 48 | | |
| | | | | Total Corporate Debt Securities (Cost $6,364) | | | | | | | 6,415 | | |
| Foreign Government Securities^^ (19.9%) | | | |
| JPY | 12,000 | | | Bank Nederlandse Gemeenten, Notes, 1.85%, due 11/7/16 | | Aaa | | AAA | | | 106 | | |
| EUR | 129 | | | Belgium Kingdom, Bonds, 3.00%, due 3/28/10 | | Aa1 | | AA+ | | | 182 | ØØ | |
| EUR | 85 | | | Bundesobligation, 3.25%, due 4/17/09 | | Aaa | | AAA | | | 122 | | |
| EUR | 145 | | | Bundesrepublik Deutschland, Bonds, 4.00%, due 7/4/16 | | Aaa | | AAA | | | 207 | | |
| EUR | 75 | | | Bundesrepublik Deutschland, Bonds, 4.00%, due 1/4/37 | | Aaa | | AAA | | | 100 | | |
| CAD | 95 | | | Canadian Government, Bonds, 4.00%, due 6/1/16 | | Aaa | | AAA | | | 98 | | |
| JPY | 20,000 | | | Depfa ACS Bank, Medium-Term Notes, 1.65%, due 12/20/16 | | Aaa | | AAA | | | 171 | | |
| JPY | 14,000 | | | Development Bank of Japan, Guaranteed Unsecured Bonds,
1.05%, due 6/20/23 | | Aaa | | AA | | | 106 | ØØ | |
| EUR | 210 | | | France Government, Bonds, 4.00%, due 10/25/13 | | Aaa | | AAA | | | 301 | ØØ | |
| JPY | 27,000 | | | Inter-American Development Bank, Unsecured Bonds, 1.90%, due 7/8/09 | | Aaa | | AAA | | | 238 | ØØ | |
| JPY | 14,000 | | | Japan Finance Corp. for Municipal Enterprise, Guaranteed Bonds,
1.35%, due 11/26/13 | | Aaa | | AA | | | 122 | ØØ | |
| JPY | 11,000 | | | KFW, Guaranteed Bonds, 2.60%, due 6/20/37 | | Aaa | | AAA | | | 97 | | |
| DKK | 243 | | | Kingdom of Denmark, Bonds, 5.00%, due 11/15/13 | | Aaa | | AAA | | | 49 | | |
| JPY | 17,000 | | | Quebec Province, Bonds, 1.60%, due 5/9/13 | | | | A+ | | | 149 | ØØ | |
| AUD | 29 | | | Queensland Treasury Corp., Guaranteed Bonds, 6.00%, due 6/14/11 | | Aaa | | AAA | | | 26 | | |
| JPY | 23,000 | | | Republic of Austria, Senior Unsecured Unsubordinated Bonds,
3.75%, due 2/3/09 | | Aaa | | AAA | | | 206 | ØØ | |
| EUR | 175 | | | Republic of Germany, Bonds, 5.50%, due 1/4/31 | | Aaa | | AAA | | | 288 | | |
See Notes to Schedule of Investments 65
| PRINCIPAL AMOUNT | | | | RATING§ | | VALUE† | |
| (000's omitted) | | | | Moody's | | S&P | | (000's omitted) | |
| JPY | 19,000 | | | Republic of Italy, Bonds, 1.80%, due 2/23/10 | | Aa2 | | A+ | | | 168 | ØØ | |
| EUR | 225 | | | Spain Government, Bonds, 5.00%, due 7/30/12 | | Aaa | | AAA | | $ | 337 | ØØ | |
| GBP | 43 | | | UK Government, Bonds, 4.00%, due 9/7/16 | | Aaa | | AAA | | | 84 | ØØ | |
| GBP | 76 | | | UK Treasury, Bonds, 4.75%, due 6/7/10 | | Aaa | | AAA | | | 157 | ØØ | |
| GBP | 57 | | | UK Treasury, Bonds, 4.25%, due 3/7/36 | | Aaa | | AAA | | | 113 | | |
| | | | | Total Foreign Government Securities (Cost $3,266) | | | | | | | 3,427 | | |
| NUMBER OF SHARES | | | | | | | |
| Short-Term Investments (0.7%) | | | |
| | 95,812 | | | Neuberger Berman Prime Money Fund Trust Class | | | | | | | 96 | @ | |
| | 28,441 | | | Neuberger Berman Securities Lending Quality Fund, LLC | | | | | | | 28 | ‡ | |
| | | | | Total Short-Term Investments (Cost $124) | | | | | | | 124 | # | |
| | | | | Total Investments (99.9%) (Cost $16,549) | | | | | | | 17,196 | ## | |
| | | | | Cash, receivables and other assets, less liabilities (0.1%) | | | | | | | 25 | | |
| | | | | Total Net Assets (100.0%) | | | | | | $ | 17,221 | | |
See Notes to Schedule of Investments 66
Schedule of Investments Neuberger Berman Cash Reserves
| PRINCIPAL AMOUNT | | | | RATING§ | | VALUE†† | |
| (000's omitted) | | | | Moody's | | S&P | | (000's omitted) | |
| U.S. Government Agency Securities (2.0%) | | | |
| $ | 3,000 | | | Federal Home Loan Bank, Bonds, 5.38%, due 4/9/08 | | AGY | | AGY | | $ | 3,000 | | |
| | 3,000 | | | Federal Home Loan Bank, Bonds, 4.55%, due 11/5/08 | | AGY | | AGY | | | 3,000 | Ø | |
| | | | | Total U.S. Government Agency Securities | | | | | | | 6,000 | | |
| Certificates of Deposit (3.8%) | | | |
| | 5,000 | | | HBOS Treasury Services NY, Yankee CD, 4.80%, due 7/30/08 | | P-1 | | A-1+ | | | 5,015 | | |
| | 4,000 | | | Natixis NY, Yankee CD, 4.72%, due 4/29/08 | | P-1 | | A-1+ | | | 4,000 | | |
| | 2,000 | | | Royal Bank of Canada NY, Yankee CD, 5.38%, due 11/14/07 | | P-1 | | A-1+ | | | 2,000 | | |
| | 690 | | | Unicredito Italiano NY, Yankee CD, 5.30%, due 11/21/07 | | P-1 | | A-1 | | | 690 | | |
| | | | | Total Certificates of Deposit | | | | | | | 11,705 | | |
| Floating Rate Certificates of Deposit (1.4%)µ | | | |
| | 4,265 | | | Fortis Bank NY, Floating Rate Yankee CD, 5.06%, due 11/13/07 | | P-1 | | A-1 | | | 4,264 | | |
| Commercial Paper (57.6%) | | | |
| Asset-Backed Securities (26.4%) | | | |
| | 7,500 | | | Amsterdam Funding, 5.05%, due 12/4/07 | | P-1 | | A-1 | | | 7,465 | | |
| | 8,000 | | | Atlantic Asset Securitization Corp., 5.05%, due 11/19/07 | | P-1 | | A-1 | | | 7,980 | | |
| | 8,000 | | | Chariot Funding LLC, 5.00%, due 12/14/07 | | P-1 | | A-1 | | | 7,952 | | |
| | 7,500 | | | CRC Funding LLC, 4.91%, due 1/10/08 | | P-1 | | A-1+ | | | 7,428 | | |
| | 7,500 | | | Crown Point Capital Co., 5.20%, due 11/5/07 | | P-1 | | A-1 | | | 7,496 | | |
| | 6,125 | | | Fairway Finance, 5.07%, due 11/21/07 | | P-1 | | A-1 | | | 6,108 | | |
| | 2,000 | | | Grampian Funding LLC, 5.21%, due 12/14/07 | | P-1 | | A-1+ | | | 1,987 | | |
| | 1,000 | | | Mont Blanc Capital Corp., 4.82%, due 11/8/07 | | P-1 | | A-1+ | | | 999 | | |
| | 8,500 | | | Old Line Funding LLC, 5.04% & 5.15%, due 11/5/07 & 12/14/07 | | P-1 | | A-1+ | | | 8,490 | | |
| | 8,500 | | | Thames Asset Securitization LLC, 4.80%, due 11/9/07 | | P-1 | | A-1 | | | 8,491 | ñ | |
| | 9,000 | | | Thunder Bay Funding, Inc., 5.05% & 5.07%, due 12/3/07 & 12/17/07 | | P-1 | | A-1 | | | 8,950 | | |
| | 7,500 | | | Yorktown Capital, 5.05%, due 11/5/07 | | P-1 | | A-1+ | | | 7,496 | | |
| | | | | | | | | | | | 80,842 | | |
| Automotive/Auto Manufacturing (0.2%) | | | |
| | 725 | | | American Honda Finance Corp., 5.25%, due 11/27/07 | | P-1 | | A-1 | | | 723 | | |
| Banking/Domestic (8.4%) | | | |
| | 5,500 | | | Bank of America NA, 5.24%, due 11/16/07 | | P-1 | | A-1+ | | | 5,488 | | |
| | 3,000 | | | HSBC Bank USA, 5.20%, due 1/10/08 | | P-1 | | A-1+ | | | 2,970 | | |
| | 450 | | | ING America Insurance Holdings, 5.16%, due 1/4/08 | | P-1 | | A-1+ | | | 446 | | |
| | 3,500 | | | Merrill Lynch & Co., 4.57%, due 4/30/08 | | P-1 | | A-1 | | | 3,420 | | |
| | 4,000 | | | Morgan Stanley, 4.80% & 5.12%, due 2/1/08 & 4/28/08 | | P-1 | | A-1+ | | | 3,926 | | |
| | 544 | | | Scaldis Capital LLC, 5.24%, due 11/9/07 | | P-1 | | A-1+ | | | 543 | ñ | |
| | 9,000 | | | UBS Finance LLC, 4.65% & 5.10%, due 1/7/08 & 1/29/08 | | P-1 | | A-1+ | | | 8,902 | | |
| | | | | | | | | | | | 25,695 | | |
| Banking/Foreign (22.6%) | | | |
| | 5,000 | | | ABN AMRO North America Finance, Inc., 5.20%, due 11/30/07 | | P-1 | | A-1+ | | | 4,979 | | |
| | 3,500 | | | Bank of Ireland, 4.73% & 5.24%, due 11/8/07 & 2/4/08 | | P-1 | | A-1 | | | 3,462 | | |
| | 8,000 | | | Danske Corp., 4.98% - 5.25%, due 11/9/07 - 1/17/08 | | P-1 | | A-1+ | | | 7,972 | | |
| | 3,000 | | | Fairway Finance, 5.18%, due 11/2/07 | | P-1 | | A-1 | | | 3,000 | | |
| | 4,500 | | | Fortis Banque, 4.50%, due 5/1/08 | | P-1 | | A-1+ | | | 4,398 | | |
| | 3,000 | | | HBOS Treasury Services PLC, 5.25%, due 11/5/07 | | P-1 | | A-1+ | | | 2,998 | | |
| | 4,000 | | | Societe Generale NA, 5.22%, due 11/7/07 | | P-1 | | A-1+ | | | 3,996 | ØØ | |
| | 4,900 | | | Societe Generale NA, 4.50% - 5.24%, due 11/15/07 - 6/2/08 | | P-1 | | A-1+ | | | 4,802 | | |
See Notes to Schedule of Investments 67
| PRINCIPAL AMOUNT | | | | RATING§ | | VALUE†† | |
| (000's omitted) | | | | Moody's | | S&P | | (000's omitted) | |
| $ | 5,000 | | | Solitaire Funding Corp., 5.20%, due 1/11/08 | | P-1 | | A-1+ | | $ | 4,949 | | |
| | 7,800 | | | Svenska Handlesbanken Inc., 5.24%, due 11/6/07 | | P-1 | | A-1+ | | | 7,794 | | |
| | 9,000 | | | Swedbank Mortgage AB, 5.00% & 5.10%, due 1/11/08 & 1/22/08 | | P-1 | | A-1 | | | 8,903 | | |
| | 5,300 | | | Unicredito Italiano PLC, 4.86% & 4.95%, due 1/4/08 | | P-1 | | A-1 | | | 5,254 | | |
| | 7,000 | | | Westpac Bank, 4.66%, due 1/30/08 | | P-1 | | A-1+ | | | 6,918 | | |
| | | | | | | | | | | | 69,425 | | |
| | | | | Total Commercial Paper | | | | | | | 176,685 | | |
| Corporate Debt Securities (0.0%) | | | |
| Financial Services (0.0%) | | | |
| | 150 | | | Monument Global Funding II, Notes, 3.85%, due 3/3/08 | | P-1 | | A-1+ | | | 149 | ñ | |
| Floating Rate Corporate Debt Securities (29.2%)µ | | | |
| Asset-Backed Securities (7.1%) | | | |
| | 5,000 | | | Beta Finance, Inc., Guaranteed Floating Rate Medium-Term Notes,
4.56%, due 11/19/07 | | P-1 | | A-1+ | | | 5,000 | ñ | |
| | 2,800 | | | Dorada Finance, Inc., Floating Rate Medium-Term Notes, 5.01%, due 11/1/07 | | P-1 | | A-1+ | | | 2,800 | ñ | |
| | 4,000 | | | K2 (USA) LLC, Guaranteed Floating Rate Medium-Term Notes,
5.68%, due 12/10/07 | | P-1 | | A-1+ | | | 4,000 | ñ | |
| | 5,000 | | | Links Finance LLC, Floating Rate Medium-Term Notes, 5.46%, due 11/26/07 | | P-1 | | A-1+ | | | 5,000 | ñ | |
| | 5,000 | | | Tango Finance Corp., Floating Rate Medium-Term Notes, 4.87%, due 11/1/07 | | P-1 | | A-1+ | | | 5,000 | ñ | |
| | | | | | | | | | | | 21,800 | | |
| Automotive/Auto Manufacturing (0.3%) | | | |
| | 1,000 | | | BMW US Capital LLC, Guaranteed Floating Rate Notes, 5.11%, due 11/15/07 | | | | | | | 1,000 | ñ | |
| Banking/Domestic (1.6%) | | | |
| | 5,000 | | | Wachovia Bank NA, Senior Floating Rate Bank Notes, 4.98%, due 11/1/07 | | P-1 | | A-1 | | | 5,000 | | |
| Banking/Foreign (10.8%) | | | |
| | 5,000 | | | Bank of Ireland, Unsecured Floating Rate Medium-Term Notes,
5.01%, due 11/19/07 | | P-1 | | A-1 | | | 5,000 | ñ | |
| | 2,000 | | | DNB Norbank ASA, Floating Rate Medium-Term Notes,
Ser. E, 5.55%, due 11/26/07 | | P-1 | | A-1 | | | 2,000 | | |
| | 5,000 | | | La Caixa, Unsubordinated Floating Rate Notes, 5.15%, due 1/23/08 | | P-1 | | A-1 | | | 5,000 | ñ | |
| | 5,000 | | | Natexis Banque Populaires, Floating Rate Bonds, 5.11%, due 11/15/07 | | P-1 | | A-1+ | | | 5,000 | ñ | |
| | 5,000 | | | Nationwide Building, Floating Rate Medium-Term Notes, 5.18%, due 11/7/07 | | P-1 | | A-1 | | | 5,000 | ñ | |
| | 5,000 | | | Royal Bank of Canada, Floating Rate Medium-Term Notes, 5.12%,
due 11/1/07 | | P-1 | | A-1+ | | | 5,000 | ñ | |
| | 3,000 | | | Schreiber Capital Co., Floating Rate Bonds, 4.86%, due 11/1/07 | | P-1 | | | | | 3,000 | | |
| | 3,000 | | | Unicredito Italiano PLC, Guaranteed Floating Rate Medium-Term Notes,
5.14%, due 11/9/07 | | P-1 | | A-1 | | | 3,000 | ñ | |
| | | | | | | | | | | | 33,000 | | |
| Financial Services (9.4%) | | | |
| | 5,000 | | | American Express Bank FSB, Floating Rate Bank Notes, 5.05%, due 11/19/07 | | P-1 | | A-1 | | | 5,000 | | |
| | 5,500 | | | Bear Stearns Co., Inc., Floating Rate Medium-Term Notes,
Ser. B, 5.49% & 5.56%, due 11/5/07 & 11/8/07 | | P-1 | | A-1 | | | 5,503 | | |
| | 8,000 | | | CIT Group, Inc., Senior Unsecured Floating Rate Medium-Term Notes,
5.73%, due 11/23/07 | | P-1 | | A-1 | | | 8,001 | | |
| | 5,000 | | | Merrill Lynch & Co., Senior Unsecured Floating Rate Notes,
5.18%, due 11/19/07 | | P-1 | | A-1+ | | | 5,000 | | |
| | 5,370 | | | Morgan Stanley, Senior Floating Rate Medium-Term Notes,
Ser. F, 5.33%, due 1/18/08 | | P-1 | | A-1 | | | 5,370 | | |
| | | | | | | | | | | | 28,874 | | |
| | | | | Total Floating Rate Corporate Debt Securities | | | | | | | 89,674 | | |
See Notes to Schedule of Investments 68
| PRINCIPAL AMOUNT | | | | RATING§ | | VALUE†† | |
| (000's omitted) | | | | Moody's | | S&P | | (000's omitted) | |
| Promissory Notes (3.3%) | |
| $ | 10,000 | | | Goldman Sachs Promissory Notes, 5.37%, due 11/1/07 | | P-1 | | A-1+ | | $ | 10,000 | µ | |
| Repurchase Agreements (5.0%) | |
| | 15,500 | | | Bank of America Repurchase Agreement, 4.90%, due 11/1/07,
dated 10/31/07, Maturity Value $15,502,110,
Collateralized by $17,855,253, Freddie Mac, 5.50%,
due 9/1/35 and $2,685,417, Fannie Mae, 5.50%,
due 9/1/34 (Collateral Value $15,810,000) | | | | | | | 15,500 | | |
| | Total Investments (102.3%) | | | | | | | 313,977 | | |
| | | Liabilities, less cash, receivables and other assets [(2.3%)] | | | | | | | (7,111 | ) | |
| | Total Net Assets (100.0%) | | | | | | $ | 306,866 | | |
See Notes to Schedule of Investments 69
Notes to Schedule of Investments
† Investments in debt securities by Lehman Brothers Core Bond Fund ("Core Bond"), Lehman Brothers High Income Bond Fund ("High Income"), Lehman Brothers Municipal Securities Trust ("Municipal Securities Trust"), Lehman Brothers Short Duration Bond Fund ("Short Duration"), and Lehman Brothers Strategic Income Fund ("Strategic Income") are valued daily by obtaining bid price quotations from independent pricing services on all securities available in each service's data base. For all other debt securities requiring daily quotations, bid price quotations are obtained from principal market makers in those securities. Investments in equity securities are valued at the latest sale price where that price is readily available; equity securities for which no sales were reported, unless otherwise noted, are valued at the mean between the closing bid and asked prices. Securities traded primarily on the NASDAQ Stock Market are normally valued by a fund at the NASDAQ Official Closing Price ("NOCP") provided by NASDAQ each business day. The NOCP is the most recently reported price as of 4:00:02 p.m., Eastern time, unless that price is outside the range of the "inside" bid and asked prices (i.e., the bid and asked prices that dealers quote to each other when trading for their own accounts); in that case, NASDAQ will adjust the price to equal the inside bid or asked price, whichever is closer. Because of delays in reporting trades, the NOCP may not be based on the price of the last trade to occur before the market closes. Each Fund values all other securities, including securities for which the necessary last sale, asked and/or bid prices are not readily available, by methods the Board of Trustees of Lehman Brothers Income Funds (the "Board") has approved on the belief that they reflect fair value. Numerous factors may be considered when determining the fair value of a security, including available analyst, media or other reports, trading in futures or ADRs and whether the issuer of the security being fair valued has other securities outstanding. Foreign security prices are furnished by independent quotation services and expressed in local currency values. Foreign security prices are currently translated from the local currency into U.S. dollars using the exchange rate as of 4:00 p.m., Eastern time. The Board has approved the use of FT Interactive Data Corporation ("FT Interactive") to assist in determining the fair value of foreign equity securities when changes in the value of a certain index suggest that the closing prices on the foreign exchanges may no longer represent the amount that a fund could expect to receive for those securities. In this event, FT Interactive will provide adjusted prices for certain foreign equity securities using a statistical analysis of historical correlations of multiple factors. In the absence of precise information about the market values of these foreign securities as of the close of the New York Stock Exchange, the Board has determined on the basis of available data that prices adjusted in this way are likely to be closer to the prices a fund could realize on a current sale than are the prices of those securities established at the close of the foreign markets in which the securities primarily trade. However, fair value prices are necessarily estimates, and there is no assurance that such a price will be at or close to the price at which the security is next quoted or next trades. Short-term debt securities with less than 60 days until maturity may be valued at cost which, when combined with interest earned, approximates market value.
†† Investment securities of Lehman Brothers Municipal Money Fund ("Municipal Money"), Lehman Brothers New York Municipal Money Fund ("New York Municipal Money"), and Neuberger Berman Cash Reserves ("Cash Reserves") are valued at amortized cost, which approximates U.S. federal income tax cost.
70
Notes to Schedule of Investments (cont'd)
# At cost, which approximates market value.
## At October 31, 2007, selected fund information on a U.S. federal income tax basis was as follows:
| (000's omitted) | | Cost | | Gross
Unrealized
Appreciation | | Gross
Unrealized
Depreciation | | Net
Unrealized
Appreciation
(Depreciation) | |
| Core Bond | | $ | 113,174 | | | $ | 546 | | | $ | 1,552 | | | $ | (1,006 | ) | |
| High Income | | | 367,588 | | | | 3,750 | | | | 7,414 | | | | (3,664 | ) | |
| Municipal Securities Trust | | | 27,145 | | | | 375 | | | | 143 | | | | 232 | | |
| Short Duration | | | 108,753 | | | | 373 | | | | 812 | | | | (439 | ) | |
| Strategic Income | | | 16,671 | | | | 849 | | | | 324 | | | | 525 | | |
@@ Municipal securities held by Municipal Money and New York Municipal Money are within the two highest rating categories assigned by a nationally recognized statistical rating organization ("NRSRO") such as Moody's Investors Service, Inc. or Standard & Poor's or, where not rated, are determined by the fund's investment manager to be of comparable quality. Municipal securities held by Municipal Securities Trust are within the four highest rating categories assigned by a NRSRO or, where not rated, are determined by the fund's investment manager to be of comparable quality. Approximately 84%, 68% and 92% of the municipal securities held by Municipal Money, Municipal Securities Trust, and New York Municipal Money, respectively, have credit enhancement features backing them, which the funds may rely on, such as letters of credit, insurance, or guarantees. Without these credit enhancement features the securities may or may not meet the quality standards of the fund. Pre-refunded bonds are supported by securities in escrow issued or guaranteed by the U.S. Government, its agencies, or instrumentalities. The amount escrowed is sufficient to pay the periodic interest due and the principal of these bonds. Putable bonds give the funds the right to sell back the issue on the date specified.
‡‡ Where no rating appears from any NRSRO, the security is deemed unrated for purposes of Rule 2a-7 under the Investment Company Act of 1940, as amended. Each of these securities is an eligible security based on a comparable quality analysis performed by the fund's investment manager.
‡ Managed by an affiliate of Neuberger Berman Management Inc. ("Management") and could be deemed an affiliate of the fund (see Notes A & F of Notes to Financial Statements).
@ Neuberger Berman Prime Money Fund ("Prime Money") is also managed by Management and may be considered an affiliate since it has the same officers, Board members, and investment manager as the fund and because, at times, the fund may own 5% or more of the outstanding voting securities of Prime Money (see Notes A & F of Notes to Financial Statements).
* Security did not produce income during the last twelve months.
~ These securities were held in escrow at October 31, 2007, to cover the below listed outstanding call options written for Strategic Income:
Number of
Shares | | Securities and Options | | Market Value
of Options | |
| | 400 | | | Schlumberger Ltd. November 07 @ 85 | | $ | 4,000 | | |
| | 1,500 | | | General Electric January 08 @ 45 | | | 1,000 | | |
| | 1,000 | | | National Fuel Gas January 08 @ 50 | | | 1,000 | | |
| | 2,600 | | | Fording Canadian Coal Trust January 08 @ 45 | | | 1,000 | | |
71
Notes to Schedule of Investments (cont'd)
^^ Principal amount is stated in the currency in which the security is denominated.
AUD = Australian Dollar
CAD = Canadian Dollar
DKK = Danish Krone
EUR = Euro
GBP = British Pound
JPY = Japanese Yen
ñ Restricted security subject to restrictions on resale under federal securities laws. These securities may be resold in transactions exempt from registration, normally to qualified institutional buyers under Rule 144A under the Securities Act of 1933, as amended, and have been deemed by the investment manager to be liquid. At October 31, 2007, these securities amounted to approximately $3,085,000 or 3.7% of net assets for Core Bond, approximately $81,658,000 or 22.1% of net assets for High Income, approximately $30,930,000 or 3.5% of net assets for Municipal Money, approximately $50,325,000 or 7.0% of net assets for New York Municipal Money, approximately $4,847,000 or 4.6% of net assets for Short Duration, approximately $948,000 or 5.5% of net assets for Strategic Income, and approximately $59,983,000 or 19.5% of net assets for Cash Reserves.
È All or a portion of this security is on loan (see Note A of Notes to Financial Statements).
ß Security is guaranteed by the corporate or non-profit obligor.
Ø All or a portion of this security was purchased on a when-issued basis. At October 31, 2007, these securities amounted to $29,516,000 for Core Bond and $3,000,000 for Cash Reserves, respectively.
ØØ All or a portion of this security is segregated as collateral for when-issued purchase commitments, forward foreign currency contracts and/or financial futures contracts.
µ Floating rate securities are securities whose yields vary with a designated market index or market rate. These securities are shown at their current rates as of October 31, 2007.
** Denotes a step-up bond: a zero coupon bond that converts to a fixed rate of interest at a designated future date.
^ Not rated by a nationally recognized statistical rating organization.
§ Credit ratings are unaudited.
§§ Rated A- by Fitch Investors Services, Inc.
a Security is subject to a guarantee provided by ABN AMRO Bank NV, backing 100% of the total principal.
c Security is subject to a guarantee provided by Bank of America, backing 100% of the total principal.
d Security is subject to a guarantee provided by Bank of New York, backing 100% of the total principal.
e Security is subject to a guarantee provided by Bank of the West, backing 100% of the total principal.
g Security is subject to a guarantee provided by Branch Banking & Trust Co., backing 100% of the total principal.
h Security is subject to a guarantee provided by Bear Stearns, backing 100% of the total principal.
i Security is subject to a guarantee provided by BNP Paribas, backing 100% of the total principal.
j Security is subject to a guarantee provided by Calyon Bank, backing 100% of the total principal.
72
Notes to Schedule of Investments (cont'd)
k Security is subject to a guarantee provided by Citibank, N.A., backing 100% of the total principal.
l Security is subject to a guarantee provided by Citigroup Global Markets, backing 100% of the total principal.
m Security is subject to a guarantee provided by Comerica Bank, backing 100% of the total principal.
n Security is subject to a guarantee provided by Depfa Bank PLC, backing 100% of the total principal.
o Security is subject to a guarantee provided by Deutsche Bank, backing 100% of the total principal.
p Security is subject to a guarantee provided by Dexia Credit Locale de France, backing 100% of the total principal.
s Security is subject to a guarantee provided by JP Morgan Chase, backing 100% of the total principal.
t Security is subject to a guarantee provided by KBC Bank, backing 100% of the total principal.
u Security is subject to a guarantee provided by Key Bank, backing 100% of the total principal.
x Security is subject to a guarantee provided by Merrill Lynch Capital Markets, backing 100% of the total principal.
y Security is subject to a guarantee provided by Morgan Stanley, backing 100% of the total principal.
bb Security is subject to a guarantee provided by PNC Bank, backing 100% of the total principal.
cc Security is subject to a guarantee provided by Societe Generale, backing 100% of the total principal.
ee Security is subject to a guarantee provided by Svenska Handelsbank, backing 100% of the total principal.
hh Security is subject to a guarantee provided by U.S. Bank, backing 100% of the total principal.
ii Security is subject to a guarantee provided by Wachovia Bank & Trust Co., backing 100% of the total principal.
kk Security is subject to a guarantee provided by Federal Home Loan Bank, backing 100% of the total principal.
mm Security is subject to a guarantee provided by Westdeutsche Landesbank Girozentrale, backing 100% of the total principal.
nn Security is subject to a guarantee provided by Royal Bank of Canada, backing 100% of the total principal.
73
Statements of Assets and Liabilities
Lehman Brothers Income Funds
(000's omitted except per share amounts)
| | |
Core Bond
Fund | |
High Income
Bond Fund | |
Municipal
Money Fund | |
Municipal
Securities Trust | |
| | | October 31,
2007 | | October 31,
2007 | | October 31,
2007 | | October 31,
2007 | |
| Assets | |
| Investments in securities, at value*† (Notes A & F)—see Schedule of Investments: | |
| Unaffiliated issuers | | $ | 109,116 | | | $ | 361,933 | | | $ | 864,492 | | | $ | 27,377 | | |
| Affiliated issuers | | | 3,052 | | | | 1,991 | | | | — | | | | — | | |
| Repurchase agreements | | | — | | | | — | | | | — | | | | — | | |
| | | | 112,168 | | | | 363,924 | | | | 864,492 | | | | 27,377 | | |
| Cash | | | — | | | | 820 | | | | 820 | | | | 141 | | |
| Foreign currency | | | — | | | | — | | | | — | | | | — | | |
| Dividends and interest receivable | | | 609 | | | | 8,038 | | | | 6,559 | | | | 408 | | |
| Receivable for securities sold | | | 8,552 | | | | 7,025 | | | | 651 | | | | — | | |
| Receivable for Fund shares sold | | | 43 | | | | 62 | | | | 16 | | | | 4 | | |
| Receivable from administrator—net (Note B) | | | — | | | | — | | | | — | | | | — | | |
| Receivable for securities lending income (Note A) | | | — | | | | 167 | | | | — | | | | — | | |
| Prepaid expenses and other assets | | | — | | | | 5 | | | | 19 | | | | — | | |
| Total Assets | | | 121,372 | | | | 380,041 | | | | 872,557 | | | | 27,930 | | |
| Liabilities | |
| Distributions payable | | | 22 | | | | 215 | | | | 481 | | | | 16 | | |
| Options contracts written, at market value (Note A) | | | — | | | | — | | | | — | | | | — | | |
| Net payable for forward foreign currency exchange contracts (Note C) | | | — | | | | — | | | | — | | | | — | | |
| Due to custodian | | | — | | | | — | | | | — | | | | — | | |
| Payable for collateral on securities loaned (Note A) | | | — | | | | 1,774 | | | | — | | | | — | | |
| Payable for securities purchased | | | 38,156 | | | | 7,148 | | | | — | | | | — | | |
| Payable for Fund shares redeemed | | | 21 | | | | 1,090 | | | | — | | | | 18 | | |
| Payable to investment manager—net (Notes A & B) | | | — | | | | 152 | | | | 181 | | | | 6 | | |
| Payable to administrator—net (Note B) | | | 51 | | | | 86 | | | | 254 | | | | 1 | | |
| Payable for securities lending fees (Note A) | | | — | | | | 141 | | | | — | | | | — | | |
| Payable for variation margin (Note A) | | | — | | | | — | | | | — | | | | — | | |
| Accrued expenses and other payables | | | 99 | | | | 189 | | | | 133 | | | | 61 | | |
| Total Liabilities | | | 38,349 | | | | 10,795 | | | | 1,049 | | | | 102 | | |
| Net Assets at value | | $ | 83,023 | | | $ | 369,246 | | | $ | 871,508 | | | $ | 27,828 | | |
| Net Assets consist of: | |
| Paid-in capital | | $ | 84,870 | | | $ | 392,245 | | | $ | 871,488 | | | $ | 27,572 | | |
| Undistributed net investment income (loss) | | | — | | | | 25 | | | | 1 | | | | — | | |
| Distributions in excess of net investment income | | | (22 | ) | | | — | | | | — | | | | — | | |
| Accumulated net realized gains (losses) on investments | | | (853 | ) | | | (19,992 | ) | | | 19 | | | | 24 | | |
| Net unrealized appreciation (depreciation) in value of investments | | | (972 | ) | | | (3,032 | ) | | | — | | | | 232 | | |
| Net Assets at value | | $ | 83,023 | | | $ | 369,246 | | | $ | 871,508 | | | $ | 27,828 | | |
| Net Assets | |
| Investor Class | | $ | 35,869 | | | $ | 369,246 | | | $ | 871,508 | | | $ | 27,828 | | |
| Institutional Class | | | 47,154 | | | | — | | | | — | | | | — | | |
| Trust Class | | | — | | | | — | | | | — | | | | — | | |
| Shares Outstanding ($.001 par value; unlimited shares authorized) | |
| Investor Class | | | 3,675 | | | | 41,039 | | | | 871,562 | | | | 2,484 | | |
| Institutional Class | | | 4,826 | | | | — | | | | — | | | | — | | |
| Trust Class | | | — | | | | — | | | | — | | | | — | | |
| Net Asset Value, offering and redemption price per share | |
| Investor Class | | $ | 9.76 | | | $ | 9.00 | | | $ | 1.00 | | | $ | 11.20 | | |
| Institutional Class | | | 9.77 | | | | — | | | | — | | | | — | | |
| Trust Class | | | — | | | | — | | | | — | | | | — | | |
| †Securities on loan, at market value: | |
| Unaffiliated issuers | | $ | — | | | $ | 1,720 | | | $ | — | | | $ | — | | |
| *Cost of Investments: | |
| Unaffiliated issuers | | $ | 110,088 | | | $ | 364,965 | | | $ | 864,492 | | | $ | 27,145 | | |
| Affiliated issuers | | | 3,052 | | | | 1,991 | | | | — | | | | — | | |
| Total cost of investments | | $ | 113,140 | | | $ | 366,956 | | | $ | 864,492 | | | $ | 27,145 | | |
| Total cost of foreign currency | | $ | — | | | $ | — | | | $ | — | | | $ | — | | |
See Notes to Financial Statements 74
| | | New York
Municipal
Money Fund | |
Short Duration
Bond Fund | |
Strategic
Income Fund | |
Cash Reserves | |
| | | October 31,
2007 | | October 31,
2007 | | October 31,
2007 | | October 31,
2007 | |
| Assets | |
| Investments in securities, at value*† (Notes A & F)—see Schedule of Investments: | |
| Unaffiliated issuers | | $ | 717,723 | | | $ | 106,084 | | | $ | 17,072 | | | $ | 298,477 | | |
| Affiliated issuers | | | — | | | | — | | | | 124 | | | | — | | |
| Repurchase agreements | | | — | | | | 2,230 | | | | — | | | | 15,500 | | |
| | | | 717,723 | | | | 108,314 | | | | 17,196 | | | | 313,977 | | |
| Cash | | | — | | | | 946 | | | | 12 | | | | 272 | | |
| Foreign currency | | | — | | | | — | | | | 17 | | | | — | | |
| Dividends and interest receivable | | | 5,320 | | | | 604 | | | | 207 | | | | 1,066 | | |
| Receivable for securities sold | | | 771 | | | | — | | | | 117 | | | | — | | |
| Receivable for Fund shares sold | | | — | | | | 36 | | | | — | | | | 391 | | |
| Receivable from administrator—net (Note B) | | | — | | | | — | | | | 37 | | | | — | | |
| Receivable for securities lending income (Note A) | | | — | | | | — | | | | 1 | | | | — | | |
| Prepaid expenses and other assets | | | 1 | | | | 3 | | | | — | | | | 9 | | |
| Total Assets | | | 723,815 | | | | 109,903 | | | | 17,587 | | | | 315,715 | | |
| Liabilities | |
| Distributions payable | | | 355 | | | | 34 | | | | — | | | | 475 | | |
| Options contracts written, at market value (Note A) | | | — | | | | — | | | | 7 | | | | — | | |
| Net payable for forward foreign currency exchange contracts (Note C) | | | — | | | | — | | | | 72 | | | | — | | |
| Due to custodian | | | 24 | | | | 3 | | | | — | | | | — | | |
| Payable for collateral on securities loaned (Note A) | | | — | | | | — | | | | 28 | | | | — | | |
| Payable for securities purchased | | | — | | | | 3,037 | | | | 153 | | | | 8,000 | | |
| Payable for Fund shares redeemed | | | — | | | | 145 | | | | — | | | | 132 | | |
| Payable to investment manager—net (Notes A & B) | | | 155 | | | | 23 | | | | 9 | | | | 21 | | |
| Payable to administrator—net (Note B) | | | 125 | | | | 4 | | | | — | | | | 72 | | |
| Payable for securities lending fees (Note A) | | | — | | | | — | | | | 1 | | | | — | | |
| Payable for variation margin (Note A) | | | — | | | | 50 | | | | — | | | | — | | |
| Accrued expenses and other payables | | | 15 | | | | 109 | | | | 96 | | | | 149 | | |
| Total Liabilities | | | 674 | | | | 3,405 | | | | 366 | | | | 8,849 | | |
| Net Assets at value | | $ | 723,141 | | | $ | 106,498 | | | $ | 17,221 | | | $ | 306,866 | | |
| Net Assets consist of: | |
| Paid-in capital | | $ | 723,130 | | | $ | 122,788 | | | $ | 15,929 | | | $ | 306,917 | | |
| Undistributed net investment income (loss) | | | — | | | | 480 | | | | 55 | | | | 4 | | |
| Distributions in excess of net investment income | | | — | | | | — | | | | — | | | | — | | |
| Accumulated net realized gains (losses) on investments | | | 11 | | | | (16,639 | ) | | | 661 | | | | (55 | ) | |
| Net unrealized appreciation (depreciation) in value of investments | | | — | | | | (131 | ) | | | 576 | | | | — | | |
| Net Assets at value | | $ | 723,141 | | | $ | 106,498 | | | $ | 17,221 | | | $ | 306,866 | | |
| Net Assets | |
| Investor Class | | $ | 723,141 | | | $ | 93,389 | | | $ | — | | | $ | 306,866 | | |
| Institutional Class | | | — | | | | — | | | | 17,005 | | | | — | | |
| Trust Class | | | — | | | | 13,109 | | | | 216 | | | | — | | |
| Shares Outstanding ($.001 par value; unlimited shares authorized) | |
| Investor Class | | | 723,130 | | | | 10,230 | | | | — | | | | 306,917 | | |
| Institutional Class | | | — | | | | — | | | | 1,638 | | | | — | | |
| Trust Class | | | — | | | | 1,507 | | | | 21 | | | | — | | |
| Net Asset Value, offering and redemption price per share | |
| Investor Class | | $ | 1.00 | | | $ | 9.13 | | | $ | — | | | $ | 1.00 | | |
| Institutional Class | | | — | | | | — | | | | 10.38 | | | | — | | |
| Trust Class | | | — | | | | 8.70 | | | | 10.38 | | | | — | | |
| †Securities on loan, at market value: | |
| Unaffiliated issuers | | $ | — | | | $ | — | | | $ | 28 | | | $ | — | | |
| *Cost of Investments: | |
| Unaffiliated issuers | | $ | 717,723 | | | $ | 108,537 | | | $ | 16,425 | | | $ | 313,977 | | |
| Affiliated issuers | | | — | | | | — | | | | 124 | | | | — | | |
| Total cost of investments | | $ | 717,723 | | | $ | 108,537 | | | $ | 16,549 | | | $ | 313,977 | | |
| Total cost of foreign currency | | $ | — | | | $ | — | | | $ | 16 | | | $ | — | | |
75
Statements of Operations
Lehman Brothers Income Funds
(000's omitted)
| | | CORE BOND
FUND | | HIGH INCOME
BOND FUND | | MUNICIPAL
MONEY FUND | | MUNICIPAL
SECURITIES
TRUST | |
| | | For the
Year Ended
October 31, 2007 | | For the
Year Ended
October 31, 2007 | | For the
Year Ended
October 31, 2007 | | For the
Year Ended
October 31, 2007 | |
| Investment Income: | |
| Income (Note A): | |
| Interest income—unaffiliated issuers | | $ | 4,151 | | | $ | 38,366 | | | $ | 31,486 | | | $ | 1,271 | | |
| Dividend income—unaffiliated issuers | | | — | | | | 4 | | | | — | | | | — | | |
| Income from securities loaned—net (Note F) | | | — | | | | 261 | | | | — | | | | — | | |
| Income from investments in affiliated issuers (Note F) | | | 136 | | | | 643 | | | | — | | | | — | | |
| Foreign taxes withheld | | | (1 | ) | | | (6 | ) | | | — | | | | — | | |
| Total income | | $ | 4,286 | | | $ | 39,268 | | | $ | 31,486 | | | $ | 1,271 | | |
| Expenses: | |
| Investment management fees (Note B) | | | 200 | | | | 2,263 | | | | 2,031 | | | | 75 | | |
| Administration fees (Note B) | | | 48 | | | | 283 | | | | 508 | | | | 18 | | |
| Administration fees (Note B): | |
| Investor Class | | | 75 | | | | 990 | | | | 1,779 | | | | 62 | | |
| Institutional Class | | | 40 | | | | — | | | | — | | | | — | | |
| Trust Class | | | — | | | | — | | | | — | | | | — | | |
| Distribution fees (Note B): | |
| Investor Class | | | 88 | | | | — | | | | — | | | | — | | |
| Trust Class | | | — | | | | — | | | | — | | | | — | | |
| Shareholder servicing agent fees: | |
| Investor Class | | | 42 | | | | 273 | | | | 119 | | | | 23 | | |
| Institutional Class | | | 11 | | | | — | | | | — | | | | — | | |
| Trust Class | | | — | | | | — | | | | — | | | | — | | |
| Audit fees | | | 21 | | | | 44 | | | | 37 | | | | 43 | | |
| Custodian fees (Note B) | | | 84 | | | | 195 | | | | 187 | | | | 25 | | |
| Insurance expense | | | 3 | | | | 20 | | | | 24 | | | | 1 | | |
| Legal fees | | | 60 | | | | 43 | | | | 39 | | | | 39 | | |
| Registration and filing fees | | | 59 | | | | 57 | | | | 220 | | | | 26 | | |
| Shareholder reports | | | 70 | | | | 128 | | | | 82 | | | | 12 | | |
| Trustees' fees and expenses | | | 24 | | | | 25 | | | | 25 | | | | 24 | | |
| Miscellaneous | | | 5 | | | | 29 | | | | 35 | | | | 3 | | |
| Total expenses | | | 830 | | | | 4,350 | | | | 5,086 | | | | 351 | | |
| Expenses reimbursed by administrator (Note B) | | | (125 | ) | | | — | | | | (51 | ) | | | (154 | ) | |
| Management and administration fees waived (Notes A & B) | | | (200 | ) | | | (10 | ) | | | — | | | | — | | |
Expenses reduced by custodian fee expense offset and
commission recapture arrangements (Note B) | | | (3 | ) | | | (17 | ) | | | (69 | ) | | | (3 | ) | |
| Total net expenses | | | 502 | | | | 4,323 | | | | 4,966 | | | | 194 | | |
| Net investment income (loss) | | $ | 3,784 | | | $ | 34,945 | | | $ | 26,520 | | | $ | 1,077 | | |
Realized and Unrealized Gain (Loss) on Investments
(Note A) | |
| Net realized gain (loss) on : | |
| Sales of investment securities of unaffiliated issuers | | | 268 | | | | 6,088 | | | | 19 | | | | 24 | | |
| Financial futures contracts | | | — | | | | — | | | | — | | | | — | | |
| Option contracts written | | | — | | | | — | | | | — | | | | — | | |
| Foreign currency | | | — | | | | — | | | | — | | | | — | | |
| Net increase from payments by affiliates (Note B) | | | — | | | | — | | | | — | | | | — | | |
Change in net unrealized appreciation (depreciation) in
value of: | |
| Unaffiliated investment securities | | | (1,047 | ) | | | (7,504 | ) | | | — | | | | (358 | ) | |
| Financial futures contracts | | | — | | | | — | | | | — | | | | — | | |
| Option contracts | | | — | | | | — | | | | — | | | | — | | |
| Foreign currency | | | — | | | | — | | | | — | | | | — | | |
| Net gain (loss) on investments | | | (779 | ) | | | (1,416 | ) | | | 19 | | | | (334 | ) | |
| Net increase (decrease) in net assets resulting from operations | | $ | 3,005 | | | $ | 33,529 | | | $ | 26,539 | | | $ | 743 | | |
See Notes to Financial Statements 76
| | | NEW YORK
MUNICIPAL
MONEY FUND | | SHORT
DURATION
BOND FUND | | STRATEGIC
INCOME FUND | | CASH RESERVES | |
| | | For the
Year Ended
October 31, 2007 | | For the
Year Ended
October 31, 2007 | | For the
Year Ended
October 31, 2007 | | For the
Year Ended
October 31, 2007 | |
| Investment Income: | |
| Income (Note A): | |
| Interest income—unaffiliated issuers | | $ | 14,396 | | | $ | 6,019 | | | $ | 805 | | | $ | 21,871 | | |
| Dividend income—unaffiliated issuers | | | — | | | | — | | | | 132 | | | | — | | |
| Income from securities loaned—net (Note F) | | | — | | | | — | | | | 4 | | | | — | | |
| Income from investments in affiliated issuers (Note F) | | | — | | | | — | | | | 9 | | | | — | | |
| Foreign taxes withheld | | | — | | | | — | | | | (5 | ) | | | — | | |
| Total income | | $ | 14,396 | | | $ | 6,019 | | | $ | 945 | | | $ | 21,871 | | |
| Expenses: | |
| Investment management fees (Note B) | | | 970 | | | | 287 | | | | 114 | | | | 407 | | |
| Administration fees (Note B) | | | 234 | | | | 69 | | | | 11 | | | | 244 | | |
| Administration fees (Note B): | |
| Investor Class | | | 817 | | | | 211 | | | | — | | | | 855 | | |
| Institutional Class | | | — | | | | — | | | | 17 | | | | — | | |
| Trust Class | | | — | | | | 64 | | | | — | | | | — | | |
| Distribution fees (Note B): | |
| Investor Class | | | — | | | | — | | | | — | | | | — | | |
| Trust Class | | | — | | | | — | | | | — | | | | — | | |
| Shareholder servicing agent fees: | |
| Investor Class | | | 31 | | | | 101 | | | | — | | | | 167 | | |
| Institutional Class | | | — | | | | — | | | | 22 | | | | — | | |
| Trust Class | | | — | | | | 21 | | | | 1 | | | | — | | |
| Audit fees | | | 16 | | | | 46 | | | | 49 | | | | 37 | | |
| Custodian fees (Note B) | | | 76 | | | | 97 | | | | 118 | | | | 99 | | |
| Insurance expense | | | 6 | | | | 4 | | | | 1 | | | | 16 | | |
| Legal fees | | | 38 | | | | 57 | | | | 70 | | | | 48 | | |
| Registration and filing fees | | | 6 | | | | 54 | | | | 64 | | | | 74 | | |
| Shareholder reports | | | 15 | | | | 34 | | | | 30 | | | | 52 | | |
| Trustees' fees and expenses | | | 24 | | | | 24 | | | | 24 | | | | 24 | | |
| Miscellaneous | | | 9 | | | | 11 | | | | 3 | | | | 21 | | |
| Total expenses | | | 2,242 | | | | 1,080 | | | | 524 | | | | 2,044 | | |
| Expenses reimbursed by administrator (Note B) | | | (382 | ) | | | (259 | ) | | | (360 | ) | | | — | | |
| Management and administration fees waived (Notes A & B) | | | — | | | | — | | | | — | | | | (81 | ) | |
Expenses reduced by custodian fee expense offset and
commission recapture arrangements (Note B) | | | (53 | ) | | | (3 | ) | | | (1 | ) | | | (5 | ) | |
| Total net expenses | | | 1,807 | | | | 818 | | | | 163 | | | | 1,958 | | |
| Net investment income (loss) | | $ | 12,589 | | | $ | 5,201 | | | $ | 782 | | | $ | 19,913 | | |
Realized and Unrealized Gain (Loss) on Investments
(Note A) | |
| Net realized gain (loss) on : | |
| Sales of investment securities of unaffiliated issuers | | | 11 | | | | 302 | | | | 969 | | | | (11 | ) | |
| Financial futures contracts | | | — | | | | 108 | | | | — | | | | — | | |
| Option contracts written | | | — | | | | — | | | | 11 | | | | — | | |
| Foreign currency | | | — | | | | (78 | ) | | | (142 | ) | | | — | | |
| Net increase from payments by affiliates (Note B) | | | — | | | | 6 | | | | — | | | | — | | |
Change in net unrealized appreciation (depreciation) in
value of: | |
| Unaffiliated investment securities | | | — | | | | 179 | | | | (513 | ) | | | — | | |
| Financial futures contracts | | | — | | | | 60 | | | | — | | | | — | | |
| Option contracts | | | — | | | | — | | | | 17 | | | | — | | |
| Foreign currency | | | — | | | | 28 | | | | (62 | ) | | | — | | |
| Net gain (loss) on investments | | | 11 | | | | 605 | | | | 280 | | | | (11 | ) | |
| Net increase (decrease) in net assets resulting from operations | | $ | 12,600 | | | $ | 5,806 | | | $ | 1,062 | | | $ | 19,902 | | |
77
Statements of Changes in Net Assets
Lehman Brothers Income Funds
(000's omitted)
| | | CORE BOND FUND | | HIGH INCOME BOND FUND | | MUNICIPAL MONEY FUND | |
| | | Year Ended
October 31,
2007 | | Year Ended
October 31,
2006 | | Year Ended
October 31,
2007 | | Year Ended
October 31,
2006 | | Year Ended
October 31,
2007 | | Year Ended
October 31,
2006 | |
| Increase (Decrease) in Net Assets: | |
| From Operations: | |
| Net investment income (loss) | | $ | 3,784 | | | $ | 3,376 | | | $ | 34,945 | | | $ | 42,320 | | | $ | 26,520 | | | $ | 22,836 | | |
| Net realized gain (loss) on investments | | | 268 | | | | (643 | ) | | | 6,088 | | | | (16,526 | ) | | | 19 | | | | 16 | | |
| Net increase from payments by affiliates | | | — | | | | — | | | | — | | | | — | | | | — | | | | — | | |
Change in net unrealized appreciation (depreciation)
of investments | | | (1,047 | ) | | | 1,335 | | | | (7,504 | ) | | | 15,068 | | | | — | | | | — | | |
Net increase (decrease) in net assets resulting from
operations | | | 3,005 | | | | 4,068 | | | | 33,529 | | | | 40,862 | | | | 26,539 | | | | 22,852 | | |
| Distributions to Shareholders From: | |
| Net investment income: | |
| Investor Class | | | (1,605 | ) | | | (1,386 | ) | | | (34,830 | ) | | | (42,445 | ) | | | (26,520 | ) | | | (22,836 | ) | |
| Institutional Class | | | (2,197 | ) | | | (2,100 | ) | | | — | | | | — | | | | — | | | | — | | |
| Trust Class | | | — | | | | — | | | | — | | | | — | | | | — | | | | — | | |
| Net realized gain on investments: | |
| Investor Class | | | — | | | | (994 | ) | | | — | | | | — | | | | (14 | ) | | | — | | |
| Institutional Class | | | — | | | | (1,396 | ) | | | — | | | | — | | | | — | | | | — | | |
| Total distributions to shareholders | | | (3,802 | ) | | | (5,876 | ) | | | (34,830 | ) | | | (42,445 | ) | | | (26,534 | ) | | | (22,836 | ) | |
| From Fund Share Transactions (Note D): | |
| Proceeds from shares sold: | |
| Investor Class | | | 10,961 | | | | 12,621 | | | | 121,484 | | | | 182,483 | | | | 7,010,190 | | | | 5,104,293 | | |
| Institutional Class | | | 30,887 | | | | 4,949 | | | | — | | | | — | | | | — | | | | — | | |
| Trust Class | | | — | | | | — | | | | — | | | | — | | | | — | | | | — | | |
Proceeds from reinvestment of dividends and
distributions: | |
| Investor Class | | | 2,190 | | | | 2,061 | | | | 31,864 | | | | 38,915 | | | | 19,030 | | | | 10,110 | | |
| Institutional Class | | | 1,360 | | | | 3,491 | | | | — | | | | — | | | | — | | | | — | | |
| Trust Class | | | — | | | | — | | | | — | | | | — | | | | — | | | | — | | |
| Payments for shares redeemed: | |
| Investor Class | | | (10,096 | ) | | | (11,837 | ) | | | (371,084 | ) | | | (411,231 | ) | | | (6,930,867 | ) | | | (4,928,381 | ) | |
| Institutional Class | | | (29,846 | ) | | | (10,298 | ) | | | — | | | | — | | | | — | | | | — | | |
| Trust Class | | | — | | | | — | | | | — | | | | — | | | | — | | | | — | | |
Net increase (decrease) from Fund share
transactions | | | 5,456 | | | | 987 | | | | (217,736 | ) | | | (189,833 | ) | | | 98,353 | | | | 186,022 | | |
| Net Increase (Decrease) in Net Assets | | | 4,659 | | | | (821 | ) | | | (219,037 | ) | | | (191,416 | ) | | | 98,358 | | | | 186,038 | | |
| Net Assets: | |
| Beginning of period | | | 78,364 | | | | 79,185 | | | | 588,283 | | | | 779,699 | | | | 773,150 | | | | 587,112 | | |
| End of period | | $ | 83,023 | | | $ | 78,364 | | | $ | 369,246 | | | $ | 588,283 | | | $ | 871,508 | | | $ | 773,150 | | |
Undistributed net investment income (loss) at
end of period | | $ | — | | | $ | — | | | $ | 25 | | | $ | — | | | $ | 1 | | | $ | 1 | | |
Distributions in excess of net investment income
at end of period | | $ | (22 | ) | | $ | (17 | ) | | $ | — | | | $ | (100 | ) | | $ | — | | | $ | — | | |
See Notes to Financial Statements 78
| | | MUNICIPAL SECURITIES TRUST | | NEW YORK MUNICIPAL MONEY FUND | |
| | | Year Ended
October 31,
2007 | | Year Ended
October 31,
2006 | | Year Ended
October 31,
2007 | | Period From
December 19, 2006
(Commencement of
Operations ) to
October 31,
2006 | |
| Increase (Decrease) in Net Assets: | |
| From Operations: | |
| Net investment income (loss) | | $ | 1,077 | | | $ | 1,168 | | | $ | 12,589 | | | $ | 3,923 | | |
| Net realized gain (loss) on investments | | | 24 | | | | 126 | | | | 11 | | | | 4 | | |
| Net increase from payments by affiliates | | | — | | | | — | | | | — | | | | — | | |
Change in net unrealized appreciation (depreciation)
of investments | | | (358 | ) | | | 86 | | | | — | | | | — | | |
Net increase (decrease) in net assets resulting from
operations | | | 743 | | | | 1,380 | | | | 12,600 | | | | 3,927 | | |
| Distributions to Shareholders From: | |
| Net investment income: | |
| Investor Class | | | (1,077 | ) | | | (1,168 | ) | | | (12,589 | ) | | | (3,923 | ) | |
| Institutional Class | | | — | | | | — | | | | — | | | | — | | |
| Trust Class | | | — | | | | — | | | | — | | | | — | | |
| Net realized gain on investments: | |
| Investor Class | | | (126 | ) | | | (158 | ) | | | (4 | ) | | | — | | |
| Institutional Class | | | — | | | | — | | | | — | | | | — | | |
| Total distributions to shareholders | | | (1,203 | ) | | | (1,326 | ) | | | (12,593 | ) | | | (3,923 | ) | |
| From Fund Share Transactions (Note D): | |
| Proceeds from shares sold: | |
| Investor Class | | | 4,183 | | | | 4,122 | | | | 2,697,772 | | | | 851,383 | | |
| Institutional Class | | | — | | | | — | | | | — | | | | — | | |
| Trust Class | | | — | | | | — | | | | — | | | | — | | |
Proceeds from reinvestment of dividends and
distributions: | |
| Investor Class | | | 974 | | | | 1,101 | | | | 8,590 | | | | 1,866 | | |
| Institutional Class | | | — | | | | — | | | | — | | | | — | | |
| Trust Class | | | — | | | | — | | | | — | | | | — | | |
| Payments for shares redeemed: | |
| Investor Class | | | (8,962 | ) | | | (6,870 | ) | | | (2,156,418 | ) | | | (680,063 | ) | |
| Institutional Class | | | — | | | | — | | | | — | | | | — | | |
| Trust Class | | | — | | | | — | | | | — | | | | — | | |
Net increase (decrease) from Fund share
transactions | | | (3,805 | ) | | | (1,647 | ) | | | 549,944 | | | | 173,186 | | |
| Net Increase (Decrease) in Net Assets | | | (4,265 | ) | | | (1,593 | ) | | | 549,951 | | | | 173,190 | | |
| Net Assets: | |
| Beginning of period | | | 32,093 | | | | 33,686 | | | | 173,190 | | | | — | | |
| End of period | | $ | 27,828 | | | $ | 32,093 | | | $ | 723,141 | | | $ | 173,190 | | |
Undistributed net investment income (loss) at
end of period | | $ | — | | | $ | — | | | $ | — | | | $ | — | | |
Distributions in excess of net investment income
at end of period | | $ | — | | | $ | — | | | $ | — | | | $ | — | | |
79
Statements of Changes in Net Assets (cont'd)
Lehman Brothers Income Funds
(000's omitted)
| | | SHORT DURATION BOND FUND | | STRATEGIC INCOME FUND | |
| | | Year Ended
October 31,
2007 | | Year Ended
October 31,
2006 | | Year Ended
October 31,
2007 | | Year Ended
October 31,
2006 | |
| Increase (Decrease) in Net Assets: | |
| From Operations: | |
| Net investment income (loss) | | $ | 5,201 | | | $ | 6,264 | | | $ | 782 | | | $ | 855 | | |
| Net realized gain (loss) on investments | | | 332 | | | | (1,023 | ) | | | 838 | | | | 870 | | |
| Net increase from payments by affiliates | | | 6 | | | | — | | | | — | | | | — | | |
Change in net unrealized appreciation (depreciation)
of investments | | | 267 | | | | 1,641 | | | | (558 | ) | | | 525 | | |
Net increase (decrease) in net assets resulting from
operations | | | 5,806 | | | | 6,882 | | | | 1,062 | | | | 2,250 | | |
| Distributions to Shareholders From: | |
| Net investment income: | | | | | | | | | | | | | | | | | |
| Investor Class | | | (4,916 | ) | | | (6,508 | ) | | | — | | | | — | | |
| Institutional Class | | | — | | | | — | | | | (810 | ) | | | (1,024 | ) | |
| Trust Class | | | (694 | ) | | | (775 | ) | | | (4 | ) | | | — | | |
| Net realized gain on investments: | | | | | | | | | | | | | | | | | |
| Institutional Class | | | — | | | | — | | | | (727 | ) | | | (2,009 | ) | |
| Total distributions to shareholders | | | (5,610 | ) | | | (7,283 | ) | | | (1,541 | ) | | | (3,033 | ) | |
| From Fund Share Transactions (Note D): | |
| Proceeds from shares sold: | | | | | | | | | | | | | | | | | |
| Investor Class | | | 7,481 | | | | 18,507 | | | | — | | | | — | | |
| Institutional Class | | | — | | | | — | | | | 823 | | | | 1,994 | | |
| Trust Class | | | 3,314 | | | | 4,183 | | | | 272 | | | | — | | |
Proceeds from reinvestment of dividends and
distributions: | | | | | | | | | | | | | | | | | |
| Investor Class | | | 4,504 | | | | 6,086 | | | | — | | | | — | | |
| Institutional Class | | | — | | | | — | | | | 913 | | | | 1,980 | | |
| Trust Class | | | 673 | | | | 744 | | | | 4 | | | | — | | |
| Payments for shares redeemed: | | | | | | | | | | | | | | | | | |
| Investor Class | | | (26,840 | ) | | | (67,970 | ) | | | — | | | | — | | |
| Institutional Class | | | — | | | | — | | | | (4,654 | ) | | | (8,985 | ) | |
| Trust Class | | | (7,510 | ) | | | (8,420 | ) | | | (60 | ) | | | — | | |
Net increase (decrease) from Fund share
transactions | | | (18,378 | ) | | | (46,870 | ) | | | (2,702 | ) | | | (5,011 | ) | |
| Net Increase (Decrease) in Net Assets | | | (18,182 | ) | | | (47,271 | ) | | | (3,181 | ) | | | (5,794 | ) | |
| Net Assets: | |
| Beginning of period | | | 124,680 | | | | 171,951 | | | | 20,402 | | | | 26,196 | | |
| End of period | | $ | 106,498 | | | $ | 124,680 | | | $ | 17,221 | | | $ | 20,402 | | |
Undistributed net investment income (loss) at
end of period | | $ | 480 | | | $ | 168 | | | $ | 55 | | | $ | 51 | | |
Distributions in excess of net investment income at
end of period | | $ | — | | | $ | — | | | $ | — | | | $ | — | | |
See Notes to Financial Statements 80
| | | CASH RESERVES | |
| | | Year Ended
October 31,
2007 | | Year Ended
October 31,
2006 | |
| Increase (Decrease) in Net Assets: | |
| From Operations: | |
| Net investment income (loss) | | $ | 19,913 | | | $ | 24,485 | | |
| Net realized gain (loss) on investments | | | (11 | ) | | | (33 | ) | |
| Net increase from payments by affiliates | | | — | | | | — | | |
Change in net unrealized appreciation (depreciation)
of investments | | | — | | | | — | | |
Net increase (decrease) in net assets resulting from
operations | | | 19,902 | | | | 24,452 | | |
| Distributions to Shareholders From: | |
| Net investment income: | | | | | | | | | |
| Investor Class | | | (19,913 | ) | | | (24,485 | ) | |
| Institutional Class | | | — | | | | — | | |
| Trust Class | | | — | | | | — | | |
| Net realized gain on investments: | | | | | | | | | |
| Institutional Class | | | — | | | | — | | |
| Total distributions to shareholders | | | (19,913 | ) | | | (24,485 | ) | |
| From Fund Share Transactions (Note D): | |
| Proceeds from shares sold: | | | | | | | | | |
| Investor Class | | | 764,810 | | | | (796,495 | ) | |
| Institutional Class | | | — | | | | — | | |
| Trust Class | | | — | | | | — | | |
Proceeds from reinvestment of dividends and
distributions: | | | | | | | | | |
| Investor Class | | | 11,724 | | | | 14,143 | | |
| Institutional Class | | | — | | | | — | | |
| Trust Class | | | — | | | | — | | |
| Payments for shares redeemed: | | | | | | | | | |
| Investor Class | | | (1,075,515 | ) | | | (684,710 | ) | |
| Institutional Class | | | — | | | | — | | |
| Trust Class | | | — | | | | — | | |
Net increase (decrease) from Fund share
transactions | | | (298,981 | ) | | | 125,928 | | |
| Net Increase (Decrease) in Net Assets | | | (298,992 | ) | | | 125,895 | | |
| Net Assets: | |
| Beginning of period | | | 605,858 | | | | 479,963 | | |
| End of period | | $ | 306,866 | | | $ | 605,858 | | |
| Undistributed net investment income (loss) at end of period | | $ | 4 | | | $ | 4 | | |
| Distributions in excess of net investment income at end of period | | $ | — | | | $ | — | | |
81
Notes to Financial Statements Income Funds
Note A—Summary of Significant Accounting Policies:
1 General: Lehman Brothers Core Bond Fund ("Core Bond"), Lehman Brothers High Income Bond Fund ("High Income") (formerly, Neuberger Berman High Income Bond Fund), Lehman Brothers Municipal Money Fund ("Municipal Money"), Lehman Brothers Municipal Securities Trust ("Municipal Securities Trust") (formerly, Neuberger Berman Municipal Securities Trust), Lehman Brothers New York Municipal Money Fund ("New York Municipal Money"), Lehman Brothers Short Duration Bond Fund ("Short Duration") (formerly, Neuberger Berman Limited Maturity Bond Fund), Lehman Brothers Strategic Income Fund ("Strategic Income") (formerly, Neuberger Berman Strategic Income Fund), and Neuberger Berman Cash Reserves ("Cash Reserves"), (individually a "Fund", collectively, the "Funds") are separate operating series of Lehman Brothers Income Funds (formerly, Neuberger Berman Income Funds), (the "Trust"), a Delaware statutory trust organized pursuant to a Trust Instrument dated December 23, 1992. The Trust is registered as a diversified, open-end management investment company under the Investment Company Act of 1940, as amended (the "1940 Act"), and its shares are registered under the Securities Act of 1933, as amended (the "1933 Act"). Seven funds offer Investor Class shares, two offer Institutional Class shares, and two offer Trust Class shares. The Board of Trustees of the Trust (the "Board") may establish additional series or classes of shares without the approval of shareholders.
The assets of each Fund belong only to that Fund, and the liabilities of each Fund are borne solely by that Fund and no other.
It is the policy of Municipal Money, New York Municipal Money, and Cash Reserves to maintain a continuous net asset value per share of $1.00; each of these Funds has adopted certain investment, valuation, and dividend and distribution policies, which conform to general industry practice, to enable it to do so. However, there is no assurance each of these Funds will be able to maintain a stable net asset value per share. Each of these Funds complies with Rule 2a-7 of the 1940 Act.
The preparation of financial statements in accordance with U.S. generally accepted accounting principles requires Neuberger Berman Management Inc. ("Management") to make estimates and assumptions at the date of the financial statements. Actual results could differ from those estimates.
2 Portfolio valuation: Investment securities are valued as indicated in the notes following each Fund's Schedule of Investments.
3 Foreign currency translation: High Income, Short Duration and Strategic Income may invest in foreign securities denominated in foreign currencies. The accounting records of the Funds are maintained in U.S. dollars. Foreign currency amounts are currently translated into U.S. dollars using the exchange rate as of 4:00 p.m., Eastern time, to determine the value of investments, other assets and liabilities. Purchase and sale prices of securities, and income and expenses, are translated into U.S. dollars at the prevailing rate of exchange on the respective dates of such transactions. Net unrealized foreign currency gain (loss) arises from changes in the value of assets and liabilities, other than investments in securities, as a result of changes in exchange rates and is stated separately in the Statements of Operations.
4 Securities transactions and investment income: Securities transactions are recorded on trade date for financial reporting purposes. For Strategic Income, dividend income is recorded on the ex-dividend date or, for certain foreign dividends, as soon as the Fund becomes aware of the dividends. Non-cash dividends included in dividend income, if any, are recorded at the fair market value of the securities received. Interest income, including accretion of discount (adjusted for original issue discount, where applicable) and amortization of premium, where applicable, is recorded on the accrual basis. Realized gains and losses from securities transactions (for each Fund) and foreign currency transactions (for High Income, Short Duration and Strategic Income), if any, are recorded on the basis of identified cost and stated separately in the Statements of Operations. Included in net realized gain (loss) on investments are proceeds from the settlements of class action litigation in which Core Bond, High Income
82
and Short Duration participated as a plaintiff. The amounts of such proceeds for the year ended October 31, 2007 were $315,630, $22,732 and $275,015 for Core Bond, High Income and Short Duration, respectively.
5 Income tax information: Each Fund is treated as a separate entity for U.S. federal income tax purposes. It is the policy of each Fund to continue to qualify as a regulated investment company by complying with the requirements of Subchapter M of the Internal Revenue Code applicable to regulated investment companies and to distribute substantially all of its earnings to its shareholders. Therefore, no federal income or excise tax provision is required.
Income distributions and capital gain distributions are determined in accordance with income tax regulations, which may differ from U.S. generally accepted accounting principles. These differences are primarily due to differing treatments of income and gains on various investment securities held by each Fund, timing differences and differing characterization of distributions made by each Fund as a whole. The Funds may also utilize earnings and profits distributed to shareholders on redemption of shares as a part of the dividends paid deduction for income tax purposes.
As determined on October 31, 2007, permanent differences resulting primarily from different book and tax accounting for amortization of bond premium, paydown gains and losses, expiration of capital loss carryforwards, characterization of distributions, the tax character of the proceeds from the settlement of class action litigations, distribution redesignations, and foreign currency gains and losses were reclassified at fiscal year-end. These reclassifications had no effect on net income, net asset value or net asset value per share of each Fund.
The tax character of distributions paid during the years ended October 31, 2007 and October 31, 2006 were as follows:
| | | Distributions Paid From: | |
| | | Taxable Income | | Tax-Exempt
Income | | Long-Term
Capital Gain | | Total | |
| | | 2007 | | 2006 | | 2007 | | 2006 | | 2007 | | 2006 | | 2007 | | 2006 | |
| Core Bond | | $ | 3,802,047 | | | $ | 5,576,922 | | | $ | — | | | $ | — | | | $ | — | | | $ | 298,651 | | | $ | 3,802,047 | | | $ | 5,875,573 | | |
| High Income | | | 34,829,808 | | | | 42,445,085 | | | | — | | | | — | | | | — | | | | — | | | | 34,829,808 | | | | 42,445,085 | | |
| Municipal Money | | | 14,262 | | | | — | | | | 26,520,266 | | | | 22,836,205 | | | | — | | | | — | | | | 26,534,528 | | | | 22,836,205 | | |
| Municipal Securities Trust | | | 388 | | | | 309 | | | | 1,076,787 | | | | 1,167,212 | | | | 125,933 | | | | 157,909 | | | | 1,203,108 | | | | 1,325,430 | | |
| New York Municipal Money | | | 4,144 | | | | — | | | | 12,589,326 | | | | 3,923,358 | | | | — | | | | — | | | | 12,593,470 | | | | 3,923,358 | | |
| Short Duration | | | 5,609,665 | | | | 7,282,810 | | | | — | | | | — | | | | — | | | | — | | | | 5,609,665 | | | | 7,282,810 | | |
| Strategic Income | | | 981,159 | | | | 1,828,375 | | | | — | | | | — | | | | 559,884 | | | | 1,204,793 | | | | 1,541,043 | | | | 3,033,168 | | |
| Cash Reserves | | | 19,912,605 | | | | 24,484,476 | | | | — | | | | — | | | | — | | | | — | | | | 19,912,605 | | | | 24,484,476 | | |
As of October 31, 2007, the components of distributable earnings (accumulated losses) on a U.S. federal income tax basis were as follows:
| | | Undistributed
Ordinary
Income | | Undistributed
Tax-Exempt
Income | | Undistributed
Long-Term
Gain | | Unrealized
Appreciation
(Depreciation) | | Loss
Carryforwards
and Deferrals | | Total | |
| Core Bond | | $ | — | | | $ | — | | | $ | — | | | $ | (1,021,217 | ) | | $ | (804,070 | ) | | $ | (1,825,287 | ) | |
| High Income | | | 241,021 | | | | — | | | | — | | | | (3,663,807 | ) | | | (19,360,314 | ) | | | (22,783,100 | ) | |
| Municipal Money | | | 13,845 | | | | 482,289 | | | | 5,377 | | | | — | | | | — | | | | 501,511 | | |
| Municipal Securities Trust | | | — | | | | 16,172 | | | | 24,194 | | | | 231,360 | | | | — | | | | 271,726 | | |
| New York Municipal Money | | | 10,506 | | | | 394,644 | | | | 211 | | | | — | | | | — | | | | 405,361 | | |
| Short Duration | | | 514,177 | | | | — | | | | — | | | | (436,945 | ) | | | (16,332,861 | ) | | | (16,255,629 | ) | |
| Strategic Income | | | 156,311 | | | | — | | | | 611,379 | | | | 524,171 | | | | — | | | | 1,291,861 | | |
| Cash Reserves | | | 479,451 | | | | — | | | | — | | | | — | | | | (55,883 | ) | | | 423,568 | | |
83
The differences between book basis and tax basis distributable earnings are attributable primarily to timing differences of distribution payments, timing differences of wash sales, mark to market on certain foreign currency and futures contract transactions, capital loss carryforwards, amortization of bond premium, organization expenses and depletion basis adjustments.
To the extent each Fund's net realized capital gains, if any, can be offset by capital loss carryforwards, it is the policy of each Fund not to distribute such gains. As determined on October 31, 2007, the following Funds had unused capital loss carryforwards available for federal income tax purposes to offset net realized capital gains, if any, as follows:
| | | Expiring in: | |
| | | 2008 | | 2009 | | 2010 | | 2011 | | 2012 | | 2013 | | 2014 | | 2015 | |
| Core Bond | | $ | — | | | $ | — | | | $ | — | | | $ | — | | | $ | 67,315 | | | $ | 736,755 | | | $ | — | | | $ | — | | |
| High Income(1) | | | 2,021,774 | | | | 923,187 | | | | — | | | | — | | | | — | | | | — | | | | 16,415,353 | | | | — | | |
| Short Duration(2) | | | 7,177,986 | | | | 456,883 | | | | — | | | | — | | | | 2,468,731 | | | | 3,168,736 | | | | 2,244,689 | | | | 815,836 | | |
| Cash Reserves | | | — | | | | — | | | | — | | | | — | | | | — | | | | 10,879 | | | | 33,043 | | | | 11,961 | | |
(1) Of the total capital loss carryforwards shown above for High Income, $2,944,961 was acquired on September 6, 2002 in the merger with Neuberger Berman High Yield Bond Fund. The use of these losses to offset future gains may be limited in a given year.
(2) Of the total capital loss carryforwards shown above for Short Duration, $22,772 was acquired on February 9, 2001 in a tax-free reorganization. The use of these losses to offset future gains may be limited in a given year.
6 Distributions to shareholders: Each Fund earns income, net of expenses, daily on its investments. It is the policy of each Fund (except Strategic Income) to declare distributions from net investment income on each business day; such distributions are paid monthly. Strategic Income generally distributes substantially all of its net investment income, if any, at the end of each calendar quarter. Distributions from net realized capital gains, if any, are generally distributed in December. Distributions to shareholders are recorded on the ex-date.
Strategic Income invests a portion of its assets in securities issued by real estate companies, including real estate investment trusts ("REITs"). The distributions received from REITs held by the Fund are generally comprised of income, capital gains, and return of REIT capital, but the REITs do not report this information to the Fund until the following calendar year. At October 31, 2007, the Fund estimated these amounts within the financial statements since the information is not available from the REITs until after the Fund's fiscal year-end. For the year ended October 31, 2007, the character of distributions paid to shareholders is disclosed within the Statements of Changes and is also based on these estimates. All estimates are based upon REIT information sources available to the Fund together with actual IRS Forms 1099DIV received to date. Based on past experience it is probable that a portion of the Fund's distributions during the most recently completed fiscal year will be considered tax return of capital but the actual amount of tax return of capital, if any, is not determinable until after the Fund's fiscal year-end. After calendar year-end, when the Fund learns the nature of the distributions paid by REITs during that year, distributions previously identified as income are often recharacterized as return of capital and/or capital gain. After all applicable REITs have informed the Fund of the actual breakdown of distributions paid to the Fund during its fiscal year, estimates previously recorded are adjusted on the books of the Fund to reflect actual results. As a result, the composition of the Fund's distributions as reported herein may differ from the final composition determined after calendar year-end and reported to Fund shareholders on IRS Form 1099DIV.
7 Expense allocation: Certain expenses are applicable to multiple funds. Expenses directly attributable to a Fund are charged to that Fund. Expenses of the Trust that are not directly attributed to a Fund are allocated among the series of the Trust, on the basis of relative net assets, except where a more appropriate allocation of expenses to each of the series can otherwise be made fairly. Expenses borne by the complex of related investment companies, which includes open-end and closed-end investment companies for which Management serves as investment manager, that are not directly attributed to a Fund or the Trust are allocated among the Funds and the other investment companies in the complex or series thereof on the basis of relative net assets, except where a more appropriate
84
allocation of expenses to each investment company in the complex or series thereof can otherwise be made fairly. Each Fund's expenses (other than those specific to each class) are allocated proportionally each day between the classes based upon the relative net assets of each class.
8 Financial futures contracts: Core Bond, High Income, Municipal Securities Trust, Short Duration, and Strategic Income may each buy and sell financial futures contracts to hedge against changes in securities prices resulting from changes in prevailing interest rates. At the time a Fund enters into a financial futures contract, it is required to deposit with the futures commission merchant a specified amount of cash or liquid securities, known as "initial margin," ranging upward from 1.1% of the value of the financial futures contract being traded. Each day, the futures contract is valued at the official settlement price of the board of trade or U.S. commodity exchange on which such futures contract is traded. Subsequent payments, known as "variation margin," to and from the broker are made on a daily basis as the market price of the financial futures contract fluctuates. Daily variation margin adjustments, arising from this "mark to market," are recorded by the Funds as unrealized gains or losses.
Although some financial futures contracts by their terms call for actual delivery or acceptance of financial instruments, in most cases the contracts are closed out prior to delivery by offsetting purchases or sales of matching financial futures contracts. When the contracts are closed, a Fund recognizes a gain or loss. Risks of entering into futures contracts include the possibility there may be an illiquid market, possibly at a time of rapidly declining prices, and/or a change in the value of the contract may not correlate with changes in the value of the underlying securities.
For U.S. federal income tax purposes, the futures transactions undertaken by a Fund may cause that Fund to recognize gains or losses from marking to market even though its positions have not been sold or terminated, may affect the character of the gains or losses recognized as long-term or short-term, and may affect the timing of some capital gains and losses realized by the Fund. Also, a Fund's losses on transactions involving futures contracts may be deferred rather than being taken into account currently in calculating such Fund's taxable income.
During the year ended October 31, 2007, Core Bond, High Income, Municipal Securities Trust, and Strategic Income did not enter into any financial futures contracts. During the year ended October 31, 2007, Short Duration entered into financial futures contracts. At October 31, 2007, open positions in financial futures contracts were:
| Expiration | | Open Contracts | | Position | | Unrealized Appreciation | |
| December 2007 | | 120 U.S. Treasury Notes, 2 Year | | Long | | $ | 89,285 | | |
At October 31, 2007, Short Duration had deposited $269,000 in Fannie Mae Whole Loan, 10.10%, due 6/25/44, in a segregated account to cover margin requirements on open futures contracts.
9 Forward foreign currency contracts: High Income, Short Duration, and Strategic Income may each enter into forward foreign currency contracts ("contracts") in connection with planned purchases or sales of securities to hedge the U.S. dollar value of portfolio securities denominated in a foreign currency. The gain or loss arising from the difference between the original contract price and the closing price of such contract is included in net realized gains or losses on foreign currency transactions on settlement date. Fluctuations in the value of such contracts are recorded for financial reporting purposes as unrealized gains or losses by each Fund until the contractual settlement date. The Funds could be exposed to risks if a counter party to a contract were unable to meet the terms of its contract or if the value of the foreign currency changes unfavorably. The U.S. dollar value of foreign currency underlying all contractual commitments held by each Fund is determined using forward foreign currency exchange rates supplied by an independent pricing service.
10 Call options: Premiums received by Strategic Income upon writing a covered call option are recorded in the liability section of the Fund's Statement of Assets and Liabilities and are subsequently adjusted to the current market value. When an option is exercised, closed, or expired, the Fund realizes a gain or loss and the liability is eliminated. The Fund bears the risk of a decline in the price of the security during the period, although any potential loss during the period would be reduced by the amount of the option premium received. In general, written covered call options may serve as a partial hedge against decreases in value in the underlying securities to the extent of the premium received. All securities covering outstanding options are held in escrow by the custodian bank.
85
Summary of written option transactions for Strategic Income for the year ended October 31, 2007:
| | | Number | | Value When Written | |
| Contracts outstanding 10/31/2006 | | | 13,500 | | | $ | 14,000 | | |
| Contracts written | | | 12,300 | | | | 10,000 | | |
| Contracts expired | | | (6,200 | ) | | | (5,000 | ) | |
| Contracts exercised | | | (10,000 | ) | | | (10,000 | ) | |
| Contracts closed | | | (4,100 | ) | | | (5,000 | ) | |
| Contracts outstanding 10/31/2007 | | | 5,500 | | | $ | 4,000 | | |
11 Security lending: A third party, eSecLending, assists Core Bond, High Income, Short Duration and Strategic Income in conducting a bidding process to attempt to identify agents/principals that would pay a guaranteed amount to each Fund in consideration of that Fund entering into an exclusive securities lending arrangement. Pursuant to such arrangements, eSecLending currently acts as lending agent for these Funds. Currently, Core Bond and Short Duration are not guaranteed any particular level of income from the program. These arrangements will change for certain Funds as a result of an auction held on October 31, 2007.
Under the securities lending arrangements, Core Bond, High Income, Short Duration and Strategic Income each receives cash collateral at the beginning of each transaction equal to at least 102% of the prior day's market value of the loaned securities (105% in the case of international securities). Each of these Funds may invest all the cash collateral in Neuberger Berman Securities Lending Quality Fund, LLC ("Quality Fund"), a fund managed by Lehman Brothers Asset Management LLC ("LBAM"), an affiliate of Management.
Net income from the applicable lending program represents the guaranteed amount, if applicable, plus income earned on the cash collateral invested in Quality Fund or in other investments, if applicable, less cash collateral fees and other expenses associated with the loans. For the year ended October 31, 2007, the approximate amount of net income received by High Income and Strategic Income under the securities lending arrangements, which is reflected in the Statements of Operations under the caption "Income from securities loaned-net"; the approximate amount of income earned on cash collateral and guaranteed amounts; and the approximate amount of fees and expenses paid on securities loaned are as follows:
| | | Net Income | | Amount earned on cash
collateral and guaranteed amounts* | | Fees and Expenses Paid | |
| High Income | | $ | 260,895 | | | $ | 3,632,218 | | | $ | 3,371,323 | | |
| Strategic Income | | | 3,929 | | | | 16,763 | | | | 12,834 | | |
* The amount of income earned on cash collateral and guaranteed amounts includes the following approximate amounts of interest income earned from Quality Fund:
| | | Interest Income Earned
From the Quality Fund | |
| High Income | | $ | 3,327,576 | | |
| Strategic Income | | | 11,413 | | |
12 Repurchase agreements: Each Fund may enter into repurchase agreements with institutions that Management has determined are creditworthy. Each repurchase agreement is recorded at cost. Each Fund requires that the securities purchased in a repurchase agreement be transferred to the custodian in a manner sufficient to enable the Fund to assert a perfected security interest in those securities in the event of a default under the repurchase agreement. Each Fund monitors, on a daily basis, the value of the securities transferred to ensure that their value, including accrued interest, is greater than amounts owed to the Fund under each such repurchase agreement.
86
13 Dollar rolls: Core Bond, High Income, Short Duration, and Strategic Income may enter into dollar roll transactions with respect to mortgage-backed securities. In a dollar roll transaction, a Fund sells securities for delivery in the current month and simultaneously agrees to repurchase substantially similar (i.e., same type and coupon) securities on a specified future date from the same party. During the period before this repurchase, a Fund forgoes principal and interest payments on the securities. A Fund is compensated by the difference between the current sales price and the forward price for the future purchase (often referred to as the "drop"), as well as by the interest earned on the cash proceeds of the initial sale. Dollar rolls may increase fluctuations in a Fund's net asset value and may be viewed as a form of leverage. There i s a risk that the counter party will be unable or unwilling to complete the transaction as scheduled, which may result in losses to a Fund.
14 Other: All net investment income and realized and unrealized capital gains and losses of each Fund are allocated, on the basis of relative net assets, pro rata among its respective classes.
15 Transactions with other funds managed by Neuberger Berman Management Inc.: Pursuant to an exemptive rule, the Funds may invest in a money market fund managed by Management or an affiliate. The Funds invest in Neuberger Berman Prime Money Fund ("Prime Money"), as approved by the Board. Prime Money seeks to provide the highest available current income consistent with safety and liquidity. For any cash that the Funds invest in Prime Money, Management waives a portion of its management fee equal to the management fee it receives from Prime Money on those assets (the "Arrangement"). For the year ended October 31, 2007, management fees waived under this Arrangement are reflected in the Statements of Operations under the caption "Investment management fees waived." For the year ended October 31, 2007, income earned under this Arrangement is reflected in the Statements of Operations under the caption "Income from investments in affiliated issuers." For the year ended October 31, 2007, management fees waived and income earned under this Arrangement were as follows:
| | | Management Fees Waived | | Income Earned | |
| Core Bond | | $ | 2,122 | | | $ | 135,411 | | |
| High Income | | | 9,901 | | | | 643,053 | | |
| Strategic Income | | | 249 | | | | 9,218 | | |
16 Foreign taxes: Foreign taxes withheld represent amounts withheld by foreign tax authorities, net of refunds recoverable.
17 Indemnifications: Like many other companies, the Trust's organizational documents provide that its officers and trustees are indemnified against certain liabilities arising out of the performance of their duties to the Trust. In addition, both in some of its principal service contracts and in the normal course of its business, the Trust enters into contracts that provide indemnifications to other parties for certain types of losses or liabilities. The Trust's maximum exposure under these arrangements is unknown as this could involve future claims against the Trust.
Note B—Management Fees, Administration Fees, Distribution Arrangements, and Other Transactions with Affiliates:
Each Fund retains Management as its investment manager under a Management Agreement. For such investment management services, each Fund (except High Income, Strategic Income, and Cash Reserves) pays Management a fee at the annual rate of 0.25% of the first $500 million of that Fund's average daily net assets, 0.225% of the next $500 million, 0.20% of the next $500 million, 0.175% of the next $500 million, and 0.15% of average daily net assets in excess of $2 billion. High Income, Strategic Income, and Cash Reserves each pay Management a fee for investment management services at the annual rates of 0.48%, 0.60%, and 0.10%, respectively, of each Fund's average daily net assets. Management has voluntarily agreed to waive its management fee in the amount of 0.25% and 0.02% of the average daily net assets of Core Bond and Cash Reserves, respectively. Management may, at its sole discretion, terminate these agreements without notice to the Funds. For the year ended October 31, 2007, such waived fees amounted to $199,806 and $81,391 for Core Bond and Cash Reserves, respectively.
87
Each Fund retains Management as its administrator under an Administration Agreement. Each Fund pays Management an administration fee at the annual rate of 0.06% of its average daily net assets under this agreement. In addition, each Fund's Investor Class pays Management an administration fee at the annual rate of 0.21% of its average daily net assets, each Fund's Institutional Class pays Management an administration fee at the annual rate of 0.09% of its average daily net assets, and the Trust Class of Short Duration and Strategic Income pays Management an administration fee at the annual rate of 0.44% and 0.34%, respectively, of its average daily net assets under this agreement. Additionally, Management retains State Street Bank and Trust Company ("State Street") as its sub-administrator under a Sub-Administration Agreement. Management pays State Street a fee for all services received under the agreement.
Management has contractually undertaken to reimburse operating expenses (including fees payable to Management but excluding interest, taxes, brokerage commissions, and extraordinary expenses) ("Operating Expenses") which exceed the expense limitation as detailed in the following table:
| Class | | Contractual
Expense Limitation(1) | | Expiration | | Contractual Reimbursement
from Management
for the Year
Ended October 31, 2007 | |
| Core Bond Investor Class | | | 0.85 | % | | 10/31/17 | | $ | 68,273 | | |
| Core Bond Institutional Class | | | 0.45 | % | | 10/31/17 | | | 54,868 | | |
| High Income Investor Class | | | 1.00 | % | | 10/31/10 | | | — | | |
| Municipal Money Investor Class | | | 0.59 | % | | 10/31/10 | | | 50,949 | | |
| Municipal Securities Trust Investor Class | | | 0.65 | % | | 10/31/10 | | | 153,618 | | |
| New York Municipal Money Investor Class | | | 0.59 | %(2) | | 10/31/10 | | | — | | |
| Short Duration Investor Class | | | 0.70 | % | | 10/31/10 | | | 204,360 | | |
| Short Duration Trust Class | | | 0.80 | % | | 10/31/10 | | | 54,550 | | |
| Strategic Income Institutional Class | | | 0.85 | % | | 10/31/17 | | | 356,257 | | |
| Strategic Income Trust Class | | | 1.10 | % | | 10/31/10 | | | 3,394 | | |
| Cash Reserves Investor Class | | | 0.65 | % | | 10/31/10 | | | — | | |
(1) Expense limitation per annum of the respective class' average daily net assets.
(2) Effective January 17, 2007, Management voluntarily agreed to waive certain expenses of the Investor Class of New York Municipal Money, so that the total annual Operating Expenses of the Fund are limited to 0.47% of the average daily net assets. For the year ended October 31, 2007, such voluntarily waived fees amounted to $382,406.
The Investor Classes of Core Bond, High Income, Municipal Money, Municipal Securities Trust, New York Municipal Money, Short Duration and Cash Reserves, the Institutional Classes of Core Bond and Strategic Income, and the Trust Classes of Short Duration and Strategic Income have each agreed to repay Management for their excess Operating Expenses previously reimbursed by Management, pursuant to a contractual expense limitation, so long as their annual Operating Expenses during that period do not exceed their respective expense limitations, and the repayments are made within three years after the year in which Management issued the reimbursement. During
88
the year ended October 31, 2007, there was no reimbursement to Management. At October 31, 2007, contingent liabilities to Management under the agreement were as follows:
| | | Expiring in | |
| | | 2008 | | 2009 | | 2010 | | Total | |
| Core Bond Investor Class | | $ | 51,691 | (1) | | $ | 119,159 | | | $ | 68,273 | | | $ | 239,123 | | |
| Core Bond Institutional Class | | | 91,826 | (1) | | | 98,223 | | | | 54,868 | | | | 244,917 | | |
| Municipal Money Investor Class | | | — | | | | 193,464 | | | | 50,949 | | | | 244,413 | | |
| Municipal Securities Trust Investor Class | | | 157,589 | | | | 176,704 | | | | 153,618 | | | | 487,911 | | |
| New York Municipal Money Investor Class | | | — | | | | 123,196 | | | | — | | | | 123,196 | | |
| Short Duration Investor Class | | | 145,616 | | | | 144,034 | | | | 204,360 | | | | 494,010 | | |
| Short Duration Trust Class | | | 49,486 | | | | 47,206 | | | | 54,550 | | | | 151,242 | | |
| Strategic Income Institutional Class | | | 297,154 | | | | 336,211 | | | | 356,257 | | | | 989,622 | | |
| Strategic Income Trust Class | | | — | | | | — | | | | 3,394 | | | | 3,394 | | |
(1) Certain amounts expire during the period as a result of the change in year end.
Management, Neuberger, a member firm of the New York Stock Exchange, and LBAM, are wholly owned subsidiaries of Lehman Brothers Holdings Inc., a publicly-owned holding company. LBAM, as the sub-adviser to High Income, Municipal Money, Municipal Securities Trust, Short Duration, and Cash Reserves, and Neuberger as sub-adviser to Strategic Income, are retained by Management to furnish it with investment recommendations and research information without added cost to each Fund it sub-advises. LBAM, as sub-adviser to Core Bond and New York Municipal, is retained by Management to provide day-to-day investment management services and receives a monthly fee paid by Management. As investment manager, Management is responsible for overseeing the investment activities of LBAM. Several individuals who are officers and/or Trustees of the Trust are also employees of LBAM and Neuberger and/or Management.
Each Fund also has a distribution agreement with Management with respect to each class of shares. Management receives no compensation therefore and no commissions for sales or redemptions of shares of beneficial interest of each share class, but receives fees from the Core Bond Investor Class and the Strategic Income Trust Class under their Plans, as described below.
For Core Bond's Investor Class and Strategic Income's Trust Class, Management acts as agent in arranging for the sale of class shares without commission and bears advertising and promotion expenses. The Board has adopted distribution plans (each a "Plan", collectively, the "Plans") with respect to these classes, pursuant to Rule 12b-1 under the 1940 Act. The Plans provide that, as compensation for administrative and other services provided to these classes, Management's activities and expenses related to the sale and distribution of these classes of shares, and ongoing services provided to investors in these classes, Management receives from each of these classes a fee at the annual rate of 0.25% of Core Bond Investor Class' average daily net assets and 0.10% of Strategic Income Trust Class' average daily net assets. Management receives this amount to provide distribution and shareholder servicing for these classes and pays a portion of it to institutions that provide such services. Those institutions may use the payments for, among other purposes, compensating employees engaged in sales and/or shareholder servicing. The amount of fees paid by each class during any year may be more or less than the cost of distribution and other services provided to that class. NASD rules limit the amount of annual distribution fees that may be paid by a mutual fund and impose a ceiling on the cumulative distribution fees paid. The Trust's Plans comply with those rules.
For the year ended October 31, 2007, Short Duration recorded a capital contribution from Management in the amount of $6,457. This amount was paid in connection with losses outside the Fund's direct control incurred in the disposition of foreign currency contracts. Management does not normally make payments for losses incurred in the disposition of foreign currency contracts.
89
Strategic Income has entered into a commission recapture program, which enables the Fund to pay some of its operational expenses by recouping a portion of the commissions it pays to a broker that is not a related party of the Funds. Pursuant to the agreement, brokers pay recaptured commissions to the Fund's custodian and the custodian directs these amounts toward payment of expenses such as custodial, transfer agency or accounting services. For the year ended October 31, 2007, the impact of this arrangement on Strategic Income was a reduction of expenses of $720.
Each Fund has an expense offset arrangement in connection with its custodian contract. For the year ended October 31, 2007, the impact of this arrangement was a reduction of expenses of $2,607, $16,759, $68,538, $2,958, $52,704, $2,629, $343, and $4,998 for Core Bond, High Income, Municipal Money, Municipal Securities Trust, New York Municipal Money, Short Duration, Strategic Income, and Cash Reserves, respectively.
Note C—Securities Transactions:
Cost of purchases and proceeds of sales and maturities of long-term securities (excluding short-term securities, financial futures contracts, foreign currency contracts, and option contracts) for the year ended October 31, 2007 were as follows:
| | | Purchases of
U.S. Government and
Agency Obligations | | Purchases excluding
U.S. Government and
Agency Obligations | | Sales and
Maturities of
U.S. Government and
Agency Obligations | | Sales and
Maturities excluding
U.S. Government and
Agency Obligations | |
| Core Bond | | $ | 360,433,974 | | | $ | 59,192,340 | | | $ | 377,653,076 | | | $ | 33,848,889 | | |
| High Income | | | — | | | | 698,698,298 | | | | — | | | | 866,596,147 | | |
| Municipal Securities Trust | | | — | | | | 2,629,630 | | | | — | | | | 7,404,785 | | |
| Short Duration | | | 11,498,558 | | | | 47,632,533 | | | | 14,911,781 | | | | 58,490,165 | | |
| Strategic Income | | | 5,010,922 | | | | 13,310,834 | | | | 5,570,155 | | | | 15,967,989 | | |
All securities transactions for Municipal Money, New York Municipal Money, and Cash Reserves were short-term.
During the year ended October 31, 2007, Strategic Income had entered into various contracts to deliver currencies at specified future dates. At October 31, 2007, open contracts were as follows:
| Buy | | Contracts to
Deliver | | In
Exchange
For | | Settlement
Date | | Value | | Net Unrealized
Appreciation/
(Depreciation) | |
| British Pound | | | 202,000 | | | $ | 407,030 | | | 12/13/07 | | $ | 419,066 | | | $ | 12,036 | | |
| Euro | | | 273,000 | | | | 383,069 | | | 12/13/07 | | | 395,178 | | | | 12,109 | | |
| Sell | | Contracts to
Deliver | | In
Exchange
For | | Settlement
Date | | Value | | Net Unrealized
Appreciation/
(Depreciation) | |
| Australian Dollar | | | 29,000 | | | $ | 23,983 | | | 12/13/07 | | $ | 26,811 | | | $ | (2,828 | ) | |
| British Pound | | | 374,000 | | | | 758,501 | | | 12/13/07 | | | 775,894 | | | | (17,393 | ) | |
| Canadian Dollar | | | 102,000 | | | | 97,795 | | | 12/13/07 | | | 107,416 | | | | (9,621 | ) | |
| Danish Krone | | | 268,000 | | | | 49,784 | | | 12/13/07 | | | 52,045 | | | | (2,261 | ) | |
| Euro | | | 1,354,000 | | | | 1,873,340 | | | 12/13/07 | | | 1,959,964 | | | | (86,624 | ) | |
| Japanese Yen | | | 158,600,000 | | | | 1,405,323 | | | 12/13/07 | | | 1,382,709 | | | | 22,614 | | |
During the year ended October 31, 2007, brokerage commissions on securities transactions for Strategic Income amounted to $11,208, of which Neuberger received $410, Lehman Brothers received $1,810, and other brokers received $8,988.
90
Note D—Fund Share Transactions:
Share activity for the years ended October 31, 2007 and October 31, 2006 was as follows:
| | | For the Year Ended October 31, 2007 | | For the Year Ended October 31, 2006 | |
| (000's omitted) | |
Shares
Sold | | Shares
Issued on
Reinvestment
of Dividends
and
Distributions | |
Shares
Redeemed | |
Total | |
Shares
Sold | | Shares
Issued on
Reinvestment
of Dividends
and
Distributions | |
Shares
Redeemed | |
Total | |
| Core Bond: | |
| Investor Class | | | 3,171 | | | | 139 | | | | (3,072 | ) | | | 238 | | | | 1,293 | | | | 210 | | | | (1,208 | ) | | | 295 | | |
| Institutional Class | | | 1,120 | | | | 223 | | | | (1,029 | ) | | | 314 | | | | 505 | | | | 356 | | | | (1,046 | ) | | | (185 | ) | |
| High Income: | |
| Investor Class | | | 13,237 | | | | 3,483 | | | | (40,442 | ) | | | (23,722 | ) | | | 20,191 | | | | 4,309 | | | | (45,459 | ) | | | (20,959 | ) | |
| Municipal Money: | |
| Investor Class | | | 7,010,190 | | | | 19,030 | | | | (6,930,867 | ) | | | 98,353 | | | | 5,104,293 | | | | 10,110 | | | | (4,928,381 | ) | | | 186,022 | | |
Municipal Securities
Trust: | |
| Investor Class | | | 371 | | | | 87 | | | | (799 | ) | | | (341 | ) | | | 365 | | | | 98 | | | | (611 | ) | | | (148 | ) | |
New York Municipal
Money: | |
| Investor Class | | | 2,697,772 | | | | 8,590 | | | | (2,156,418 | ) | | | 549,944 | | | | 851,383 | (1)(2) | | | 1,866 | (1) | | | (680,063 | )(1) | | | 173,186 | (1) | |
| Short Duration: | |
| Investor Class | | | 821 | | | | 495 | | | | (2,947 | ) | | | (1,631 | ) | | | 2,040 | | | | 670 | | | | (7,473 | ) | | | (4,763 | ) | |
| Trust Class | | | 382 | | | | 78 | | | | (866 | ) | | | (406 | ) | | | 483 | | | | 86 | | | | (971 | ) | | | (402 | ) | |
| Strategic Income: | |
| Institutional Class | | | 79 | | | | 89 | | | | (446 | ) | | | (278 | ) | | | 188 | | | | 195 | | | | (870 | ) | | | (487 | ) | |
| Trust Class(3) | | | 26 | | | | 1 | | | | (6 | ) | | | 21 | | | | — | | | | — | | | | — | | | | — | | |
| Cash Reserves: | |
| Investor Class | | | 764,810 | | | | 11,724 | | | | (1,075,515 | ) | | | (298,981 | ) | | | 796,495 | | | | 14,143 | | | | (684,710 | ) | | | 125,928 | | |
(1) Period from December 19, 2005 (Commencement of operations) to October 31, 2006.
(2) Includes initial capitalization of $10 on December 19, 2005.
(3) Period from April 2, 2007 to October 31, 2007.
Note E—Line of Credit:
At October 31, 2007, Core Bond, High Income, Short Duration and Strategic Income were participants in a single committed, unsecured $150,000,000 line of credit with a consortium of banks organized by State Street, to be used only for temporary or emergency purposes. Other investment companies managed by Management also participate in this line of credit on the same terms. Interest is charged on borrowings under this agreement at the overnight Federal Funds Rate plus 0.50% per annum. A facility fee of 0.07% per annum of the available line of credit is charged, of which each Fund has agreed to pay its pro rata share, based on the ratio of its individual net assets to the net assets of all participants at the time the fee is due and payable. The fee is paid quarterly in arrears. Because
91
several investment companies participate, there is no assurance that an individual fund will have access to all or any part of the $150,000,000 at any particular time.
On May 25, 2007 Municipal Money, New York Municipal Money and Cash Reserves became participants in a single committed, unsecured $300,000,000 line of credit with State Street and Bank of New York, as agent, to be used only for temporary or emergency purposes. Other investment companies managed by Management also participate in this line of credit on the same terms. Interest is charged on borrowings under this agreement at the overnight Federal Funds Rate plus 0.375% per annum. A commitment fee of 0.075% per annum of the unused available line of credit is charged, of which each Fund has agreed to pay its pro rata share, based on the ratio of its individual net assets to the net assets of all participants at the time the fee is due and payable. The fee is paid quarterly in arrears. Because several investment companies participate, there is no assurance that an individual Fund will have access to all or any part of the $300,000,000 at any particular time.
On September 27, 2007 Municipal Money, New York Municipal Money and Cash Reserves became participants in a single uncommitted, unsecured $150,000,000 line of credit with State Street, as lender, to be used only for temporary or emergency purposes. Other investment companies managed by Management also participate in this line of credit on the same terms. Interest is charged on borrowings under this agreement at the overnight Federal Funds Rate plus 0.375% per annum. Because several investment companies participate, there is no assurance that an individual Fund will have access to all or any part of the $150,000,000 at any particular time.
The Funds had no loans outstanding pursuant to these lines of credit at October 31, 2007. During the year ended October 31, 2007, the Funds did not utilize these lines of credit.
Note F—Investments In Affiliates:
| Core Bond: | |
| Name of Issuer | |
Balance of
Shares Held
October 31, 2006 | |
Gross
Purchases
and
Additions | |
Gross
Sales and
Reductions | |
Balance of
Shares Held
October 31,
2007 | |
Value
October 31,
2007 | | Income from
Investments
in Affiliated
Issuers Included
in Total Income | |
Neuberger Berman Prime
Money Fund Trust Class* | | | 2,881,459 | | | | 52,909,747 | | | | 52,739,591 | | | | 3,051,615 | | | $ | 3,051,615 | | | $ | 135,411 | | |
| High Income: | |
| Name of Issuer | | Balance of
Shares Held
October 31,
2006 | | Gross
Purchases
and
Additions | | Gross
Sales and
Reductions | | Balance of
Shares Held
October 31,
2007 | | Value
October 31,
2007 | | Income from
Investments
in Affiliated
Issuers Included
in Total Income | |
Neuberger Berman Prime
Money Fund Trust Class* | | | 19,447,504 | | | | 497,767,939 | | | | 516,998,615 | | | | 216,828 | | | $ | 216,828 | | | $ | 643,053 | | |
Neuberger Berman
Securities Lending Quality
Fund, LLC** | | | 47,300,231 | | | | 352,555,377 | | | | 398,082,047 | | | | 1,773,561 | | | | 1,773,561 | | | | 3,327,576 | | |
| Total | | | | | | | | | | | | | | | | | | $ | 1,990,389 | | | $ | 3,970,629 | | |
92
| Strategic Income: | |
| Name of Issuer | | Balance of
Shares Held
October 31,
2006 | | Gross
Purchases
and
Additions | | Gross
Sales and
Reductions | | Balance of
Shares Held
October 31,
2007 | | Value
October 31,
2007 | | Income from
Investments
in Affiliated
Issuers Included
in Total Income | |
Neuberger Berman Prime
Money Fund Trust Class* | | | 100,979 | | | | 8,061,226 | | | | 8,066,393 | | | | 95,812 | | | $ | 95,812 | | | $ | 9,218 | | |
Neuberger Berman
Securities Lending Quality
Fund, LLC** | | | 60,751 | | | | 1,555,288 | | | | 1,587,598 | | | | 28,441 | | | | 28,441 | | | | 11,413 | | |
| Total | | | | | | | | | | $ | 124,253 | | | $ | 20,631 | | |
* Prime Money is also managed by Management and may be considered an affiliate since it has the same officers, Board Members, and investment manager as the Fund and because, at times, the Fund may own 5% or more of the outstanding voting securities of Prime Money.
** Quality Fund, a fund managed by LBAM, an affiliate of Management, is used to invest cash the Fund receives as collateral for securities loans as approved by the Board. Because all shares of Quality Fund are held by funds in the related investment management complex, Quality Fund may be considered an affiliate of the Fund.
Note G—Recent Accounting Pronouncements:
On July 13, 2006, the Financial Accounting Standards Board ("FASB") released FASB Interpretation No. 48 "Accounting for Uncertainty in Income Taxes" ("FIN 48"). FIN 48 provides guidance for how uncertain tax positions should be recognized, measured, presented and disclosed in the financial statements. FIN 48 clarifies the accounting for income taxes, by prescribing a minimum recognition threshold a tax position is required to meet before being recognized in the financial statements. FIN 48 requires that a "more-likely-than-not" threshold be met before the benefit of a tax position may be recognized in the financial statements and prescribes how such benefit should be measured. Adoption of FIN 48 is required for fiscal years beginning after December 15, 2006 and is to be applied to all open tax years as of the effective date. The Securities and Exchange Commission has permitted investment companies to delay implementation of FIN 48. Each Fund will have until April 30, 2008 to implement FIN 48. At this time, Management is evaluating the implications of FIN 48 and its impact in the financial statements has not yet been determined.
In September 2006, FASB issued FASB Statement No. 157, "Fair Value Measurement" ("SFAS 157"), which defines fair value, establishes a framework for measuring fair value, and expands disclosures about fair value measurements. SFAS 157 is effective for fiscal years beginning after November 15, 2007, and interim periods within those fiscal years. Management believes the adoption of SFAS 157 will not have a material impact on the Funds' financial position or results of operations.
93
Financial Highlights
Lehman Brothers Core Bond Fund
The following tables include selected data for a share outstanding throughout each period and other performance information derived from the Financial Statements.
Investor Class
| | | Year Ended October 31, | | Period from
October 1, 2005
to October 31, | | Year Ended September 30, | |
| | | 2007 | | 2006 | | 2005 | | 2005‡‡ | | 2004ÿ | | 2003§§ | |
| Net Asset Value, Beginning of Period | | $ | 9.85 | | | $ | 10.09 | | | $ | 10.21 | | | $ | 10.51 | | | $ | 10.80 | | | $ | 10.72 | | |
| Income From Investment Operations: | |
| Net Investment Income (Loss) | | | .44 | @ | | | .41 | @ | | | .03 | @ | | | .31 | @ | | | .23 | | | | .28 | | |
Net Gains or Losses on Securities
(both realized and unrealized) | | | (.09 | ) | | | .09 | | | | (.12 | ) | | | (.04 | ) | | | .11 | | | | .24 | | |
| Total From Investment Operations | | | .35 | | | | .50 | | | | (.09 | ) | | | .27 | | | | .34 | | | | .52 | | |
| Less Distributions From: | |
| Net Investment Income | | | (.44 | ) | | | (.43 | ) | | | (.03 | ) | | | (.31 | ) | | | (.23 | ) | | | (.28 | ) | |
| Net Capital Gains | | | — | | | | (.31 | ) | | | — | | | | (.26 | ) | | | (.40 | ) | | | (.16 | ) | |
| Total Distributions | | | (.44 | ) | | | (.74 | ) | | | (.03 | ) | | | (.57 | ) | | | (.63 | ) | | | (.44 | ) | |
| Net Asset Value, End of Period | | $ | 9.76 | | | $ | 9.85 | | | $ | 10.09 | | | $ | 10.21 | | | $ | 10.51 | | | $ | 10.80 | | |
| Total Return†† | | | +3.67 | % | | | +5.21 | % | | | (.87 | )%** | | | +2.64 | % | | | +3.29 | % | | | +5.01 | % | |
| Ratios/Supplemental Data | |
| Net Assets, End of Period (in millions) | | $ | 35.9 | | | $ | 33.9 | | | $ | 31.7 | | | $ | 31.2 | | | $ | 26.0 | | | $ | 26.1 | | |
Ratio of Gross Expenses to
Average Net Assets# | | | .85 | % | | | .86 | % | | | .85 | %* | | | .86 | % | | | .85 | % | | | .85 | % | |
| Ratio of Net Expenses to Average Net Assets | | | .85 | %‡ | | | .85 | %‡ | | | .85 | %*‡ | | | .85 | %‡ | | | .85 | % | | | .85 | % | |
Ratio of Net Investment Income (Loss) to
Average Net Assets | | | 4.51 | % | | | 4.22 | % | | | 3.51 | %* | | | 3.03 | % | | | 2.21 | % | | | 2.63 | % | |
| Portfolio Turnover Rate | | | 404 | % | | | 399 | % | | | 34 | %** | | | 462 | % | | | 390 | % | | | 343 | % | |
See Notes to Financial Highlights 94
Financial Highlights
Institutional Class
| | | Year Ended October 31, | | Period from
October 1, 2005
to October 31, | | Year Ended September 30, | |
| | | 2007 | | 2006 | | 2005 | | 2005‡‡ | | 2004ÿ | | 2003§§ | |
| Net Asset Value, Beginning of Period | | $ | 9.86 | | | $ | 10.11 | | | $ | 10.22 | | | $ | 10.52 | | | $ | 10.81 | | | $ | 10.73 | | |
| Income From Investment Operations | |
| Net Investment Income (Loss) | | | .48 | @ | | | .45 | @ | | | .03 | @ | | | .33 | @ | | | .28 | | | | .33 | | |
Net Gains or Losses on Securities
(both realized and unrealized) | | | (.09 | ) | | | .08 | | | | (.11 | ) | | | (.02 | ) | | | .11 | | | | .24 | | |
| Total From Investment Operations | | | .39 | | | | .53 | | | | (.08 | ) | | | .31 | | | | .39 | | | | .57 | | |
| Less Distributions From: | |
| Net Investment Income | | | (.48 | ) | | | (.47 | ) | | | (.03 | ) | | | (.35 | ) | | | (.28 | ) | | | (.33 | ) | |
| Net Capital Gains | | | — | | | | (.31 | ) | | | — | | | | (.26 | ) | | | (.40 | ) | | | (.16 | ) | |
| Total Distributions | | | (.48 | ) | | | (.78 | ) | | | (.03 | ) | | | (.61 | ) | | | (.68 | ) | | | (.49 | ) | |
| Net Asset Value, End of Period | | $ | 9.77 | | | $ | 9.86 | | | $ | 10.11 | | | $ | 10.22 | | | $ | 10.52 | | | $ | 10.81 | | |
| Total Return†† | | | +4.08 | % | | | +5.52 | % | | | (.73 | )%** | | | +3.05 | % | | | +3.72 | % | | | +5.43 | % | |
| Ratios/Supplemental Data | |
| Net Assets, End of Period (in millions) | | $ | 47.2 | | | $ | 44.5 | | | $ | 47.5 | | | $ | 48.5 | | | $ | 233.6 | | | $ | 215.5 | | |
Ratio of Gross Expenses
to Average Net Assets# | | | .45 | % | | | .46 | % | | | .45 | %* | | | .45 | % | | | .45 | % | | | .45 | % | |
| Ratio of Net Expenses to Average Net Assets | | | .45 | %‡ | | | .45 | %‡ | | | .45 | %*‡ | | | .45 | %‡ | | | .45 | % | | | .45 | % | |
Ratio of Net Investment Income (Loss) to
Average Net Assets | | | 4.91 | % | | | 4.60 | % | | | 3.91 | %* | | | 3.17 | % | | | 2.61 | % | | | 3.04 | % | |
| Portfolio Turnover Rate | | | 404 | % | | | 399 | % | | | 34 | %** | | | 462 | % | | | 390 | % | | | 343 | % | |
See Notes to Financial Highlights 95
Financial Highlights
Lehman Brothers High Income Bond Fund
The following table includes selected data for a share outstanding throughout each year and other performance information derived from the Financial Statements.
Investor Class
| | | Year Ended October 31, | |
| | | 2007 | | 2006 | | 2005 | | 2004 | | 2003 | |
| Net Asset Value, Beginning of Year | | $ | 9.08 | | | $ | 9.10 | | | $ | 9.54 | | | $ | 9.25 | | | $ | 8.81 | | |
| Income From Investment Operations: | |
| Net Investment Income (Loss)@ | | | .68 | | | | .59 | | | | .55 | | | | .58 | | | | .60 | | |
Net Gains or Losses on Securities
(both realized and unrealized) | | | (.08 | ) | | | (.02 | ) | | | (.44 | ) | | | .29 | | | | .44 | | |
| Total From Investment Operations | | | .60 | | | | .57 | | | | .11 | | | | .87 | | | | 1.04 | | |
| Less Distributions From: | |
| Net Investment Income | | | (.68 | ) | | | (.59 | ) | | | (.55 | ) | | | (.58 | ) | | | (.60 | ) | |
| Net Asset Value, End of Year | | $ | 9.00 | | | $ | 9.08 | | | $ | 9.10 | | | $ | 9.54 | | | $ | 9.25 | | |
| Total Return†† | | | +6.73 | % | | | +6.53 | % | | | +1.17 | % | | | +9.68 | % | | | +12.14 | % | |
| Ratios/Supplemental Data | |
| Net Assets, End of Year (in millions) | | $ | 369.2 | | | $ | 588.3 | | | $ | 779.7 | | | $ | 813.2 | | | $ | 519.7 | | |
| Ratio of Gross Expenses to Average Net Assets# | | | .92 | % | | | .90 | % | | | .91 | % | | | .90 | % | | | .90 | % | |
| Ratio of Net Expenses to Average Net Assets | | | .92 | %‡ | | | .89 | %‡ | | | .91 | % | | | .90 | % | | | .90 | %§ | |
Ratio of Net Investment Income (Loss) to
Average Net Assets | | | 7.41 | % | | | 6.52 | % | | | 5.88 | % | | | 6.16 | % | | | 6.54 | % | |
| Portfolio Turnover Rate | | | 153 | % | | | 136 | % | | | 63 | % | | | 79 | % | | | 148 | % | |
See Notes to Financial Highlights 96
Financial Highlights
Lehman Brothers Municipal Money Fund
The following table includes selected data for a share outstanding throughout each year and other performance information derived from the Financial Statements.
Investor Class
| | | Year Ended October 31, | |
| | | 2007 | | 2006 | | 2005 | | 2004 | | 2003 | |
| Net Asset Value, Beginning of Year | | $ | .9998 | | | $ | .9998 | | | $ | .9998 | | | $ | .9998 | | | $ | .9998 | | |
| Income From Investment Operations: | |
| Net Investment Income (Loss) | | | .0313 | | | | .0276 | | | | .0158 | | | | .0051 | | | | .0050 | | |
| Net Gains or Losses on Securities | | | .0001 | | | | .0000 | | | | — | | | | — | | | | — | | |
| Total From Investment Operations | | | .0314 | | | | .0276 | | | | .0158 | | | | .0051 | | | | .0050 | | |
| Less Distributions From: | |
| Net Investment Income | | | (.0313 | ) | | | (.0276 | ) | | | (.0158 | ) | | | (.0051 | ) | | | (.0050 | ) | |
| Net Capital Gains | | | (.0000 | ) | | | — | | | | — | | | | — | | | | — | | |
| Total Distributions | | | (.0313 | ) | | | (.0276 | ) | | | (.0158 | ) | | | (.0051 | ) | | | (.0050 | ) | |
| Net Asset Value, End of Year | | $ | .9999 | | | $ | .9998 | | | $ | .9998 | | | $ | .9998 | | | $ | .9998 | | |
| Total Return†† | | | +3.18 | % | | | +2.80 | % | | | +1.59 | % | | | +.51 | % | | | +.50 | % | |
| Ratios/Supplemental Data | |
| Net Assets, End of Year (in millions) | | $ | 871.5 | | | $ | 773.2 | | | $ | 587.1 | | | $ | 426.1 | | | $ | 410.9 | | |
| Ratio of Gross Expenses to Average Net Assets# | | | .59 | % | | | .59 | % | | | .60 | % | | | .61 | % | | | .61 | % | |
| Ratio of Net Expenses to Average Net Assets | | | .59 | %‡ | | | .59 | %‡ | | | .60 | % | | | .61 | % | | | .61 | % | |
Ratio of Net Investment Income (Loss) to
Average Net Assets | | | 3.13 | % | | | 2.81 | % | | | 1.62 | % | | | .51 | % | | | .50 | % | |
See Notes to Financial Highlights 97
Financial Highlights
Lehman Brothers Municipal Securities Trust
The following table includes selected data for a share outstanding throughout each year and other performance information derived from the Financial Statements.
Investor Class
| | | Year Ended October 31, | |
| | | 2007 | | 2006 | | 2005 | | 2004 | | 2003 | |
| Net Asset Value, Beginning of Year | | $ | 11.36 | | | $ | 11.33 | | | $ | 11.81 | | | $ | 11.86 | | | $ | 11.80 | | |
| Income From Investment Operations: | |
| Net Investment Income (Loss)@ | | | .41 | | | | .40 | | | | .40 | | | | .40 | | | | .40 | | |
Net Gains or Losses on Securities
(both realized and unrealized) | | | (.12 | ) | | | .08 | | | | (.41 | ) | | | (.00 | ) | | | .12 | | |
| Total From Investment Operations | | | .29 | | | | .48 | | | | (.01 | ) | | | .40 | | | | .52 | | |
| Less Distributions From: | |
| Net Investment Income | | | (.41 | ) | | | (.40 | ) | | | (.40 | ) | | | (.40 | ) | | | (.40 | ) | |
| Net Capital Gains | | | (.04 | ) | | | (.05 | ) | | | (.07 | ) | | | (.05 | ) | | | (.06 | ) | |
| Total Distributions | | | (.45 | ) | | | (.45 | ) | | | (.47 | ) | | | (.45 | ) | | | (.46 | ) | |
| Net Asset Value, End of Year | | $ | 11.20 | | | $ | 11.36 | | | $ | 11.33 | | | $ | 11.81 | | | $ | 11.86 | | |
| Total Return†† | | | +2.61 | % | | | +4.38 | % | | | (.09 | )% | | | +3.43 | % | | | +4.50 | % | |
| Ratios/Supplemental Data | |
| Net Assets, End of Year (in millions) | | $ | 27.8 | | | $ | 32.1 | | | $ | 33.7 | | | $ | 37.1 | | | $ | 42.3 | | |
| Ratio of Gross Expenses to Average Net Assets# | | | .66 | % | | | .66 | % | | | .66 | % | | | .65 | % | | | .65 | % | |
| Ratio of Net Expenses to Average Net Assets‡ | | | .65 | % | | | .65 | % | | | .66 | % | | | .65 | % | | | .65 | % | |
Ratio of Net Investment Income (Loss) to
Average Net Assets | | | 3.61 | % | | | 3.56 | % | | | 3.44 | % | | | 3.40 | % | | | 3.37 | % | |
| Portfolio Turnover Rate | | | 9 | % | | | 28 | % | | | 16 | % | | | 8 | % | | | 12 | % | |
See Notes to Financial Highlights 98
Financial Highlights
Lehman Brothers New York Municipal Money Fund
The following table includes selected data for a share outstanding throughout each period and other performance information derived from the Financial Statements.
Investor Class
| | | Year Ended
October 31,
2007 | | Period from
December 19, 2005^
to October 31
2006 | |
| Net Asset Value, Beginning of Period | | $ | 1.0000 | | | $ | 1.0000 | | |
| Income From Investment Operations: | |
| Net Investment Income (Loss) | | | .0322 | | | | .0249 | | |
| Net Gains or Losses on Securities | | | .0000 | | | | .0000 | | |
| Total From Investment Operations | | | .0322 | | | | .0249 | | |
| Less Distributions From: | |
| Net Investment Income | | | (.0322 | ) | | | (.0249 | ) | |
| Net Capital Gains | | | (.0000 | ) | | | — | | |
| Total Distributions | | | (.0322 | ) | | | (.0249 | ) | |
| Net Asset Value, End of Period | | $ | 1.0000 | | | $ | 1.0000 | | |
| Total Return†† | | | +3.27 | % | | | +2.51 | %** | |
| Ratios/Supplemental Data | |
| Net Assets, End of Period (in millions) | | $ | 723.1 | | | $ | 173.2 | | |
| Ratio of Gross Expenses to Average Net Assets# | | | .48 | % | | | .55 | %* | |
| Ratio of Net Expenses to Average Net Assets‡ | | | .46 | % | | | .54 | %* | |
| Ratio of Net Investment Income (Loss) to Average Net Assets | | | 3.22 | % | | | 2.94 | %* | |
See Notes to Financial Highlights 99
Financial Highlights
Lehman Brothers Short Duration Bond Fund
The following tables include selected data for a share outstanding throughout each year and other performance information derived from the Financial Statements.
Investor Class
| | | Year Ended October 31, | |
| | | 2007 | | 2006 | | 2005 | | 2004 | | 2003 | |
| Net Asset Value, Beginning of Year | | $ | 9.11 | | | $ | 9.13 | | | $ | 9.41 | | | $ | 9.61 | | | $ | 9.65 | | |
| Income From Investment Operations: | |
| Net Investment Income (Loss)@ | | | .41 | | | | .35 | | | | .25 | | | | .24 | | | | .28 | | |
Net Gains or Losses on Securities
(both realized and unrealized) | | | .06 | | | | .03 | | | | (.18 | ) | | | (.11 | ) | | | .03 | | |
| Total From Investment Operations | | | .47 | | | | .38 | | | | .07 | | | | .13 | | | | .31 | | |
| Less Distributions From: | |
| Net Investment Income | | | (.45 | ) | | | (.40 | ) | | | (.35 | ) | | | (.33 | ) | | | (.35 | ) | |
| Net Asset Value, End of Year | | $ | 9.13 | | | $ | 9.11 | | | $ | 9.13 | | | $ | 9.41 | | | $ | 9.61 | | |
| Total Return†† | | | +5.24 | % | | | +4.28 | % | | | +.77 | % | | | +1.43 | % | | | +3.23 | % | |
| Ratios/Supplemental Data | |
| Net Assets, End of Year (in millions) | | $ | 93.4 | | | $ | 108.1 | | | $ | 151.8 | | | $ | 162.6 | | | $ | 199.4 | | |
| Ratio of Gross Expenses to Average Net Assets# | | | .70 | % | | | .71 | % | | | .71 | % | | | .70 | % | | | .70 | % | |
| Ratio of Net Expenses to Average Net Assets‡ | | | .70 | % | | | .70 | % | | | .70 | % | | | .70 | % | | | .70 | % | |
Ratio of Net Investment Income (Loss) to
Average Net Assets | | | 4.54 | % | | | 3.80 | % | | | 2.75 | % | | | 2.49 | % | | | 2.88 | % | |
| Portfolio Turnover Rate | | | 53 | % | | | 74 | % | | | 166 | % | | | 94 | % | | | 129 | % | |
See Notes to Financial Highlights 100
Financial Highlights
Trust Class
| | | Year Ended October 31, | |
| | | 2007 | | 2006 | | 2005 | | 2004 | | 2003 | |
| Net Asset Value, Beginning of Year | | $ | 8.68 | | | $ | 8.70 | | | $ | 8.97 | | | $ | 9.15 | | | $ | 9.20 | | |
| Income From Investment Operations: | |
| Net Investment Income (Loss)@ | | | .39 | | | | .32 | | | | .23 | | | | .22 | | | | .26 | | |
Net Gains or Losses on Securities
(both realized and unrealized) | | | .05 | | | | .03 | | | | (.17 | ) | | | (.09 | ) | | | .01 | | |
| Total From Investment Operations | | | .44 | | | | .35 | | | | .06 | | | | .13 | | | | .27 | | |
| Less Distributions From: | |
| Net Investment Income | | | (.42 | ) | | | (.37 | ) | | | (.33 | ) | | | (.31 | ) | | | (.32 | ) | |
| Net Asset Value, End of Year | | $ | 8.70 | | | $ | 8.68 | | | $ | 8.70 | | | $ | 8.97 | | | $ | 9.15 | | |
| Total Return†† | | | +5.15 | % | | | +4.16 | % | | | +.64 | % | | | +1.44 | % | | | +3.00 | % | |
| Ratios/Supplemental Data | |
| Net Assets, End of Year (in millions) | | $ | 13.1 | | | $ | 16.6 | | | $ | 20.1 | | | $ | 27.0 | | | $ | 36.5 | | |
| Ratio of Gross Expenses to Average Net Assets# | | | .80 | % | | | .81 | % | | | .81 | % | | | .80 | % | | | .80 | % | |
| Ratio of Net Expenses to Average Net Assets‡ | | | .80 | % | | | .80 | % | | | .81 | % | | | .80 | % | | | .80 | % | |
Ratio of Net Investment Income (Loss) to
Average Net Assets | | | 4.44 | % | | | 3.69 | % | | | 2.64 | % | | | 2.38 | % | | | 2.80 | % | |
| Portfolio Turnover Rate | | | 53 | % | | | 74 | % | | | 166 | % | | | 94 | % | | | 129 | % | |
See Notes to Financial Highlights 101
Financial Highlights
Lehman Brothers Strategic Income Fund
The following tables include selected data for a share outstanding throughout each period and other performance information derived from the Financial Statements.
Institutional Class
| | | Year Ended October 31, | | Period from
July 11, 2003^
to October 31, | |
| | | 2007 | | 2006 | | 2005 | | 2004 | | 2003 | |
| Net Asset Value, Beginning of Period | | $ | 10.65 | | | $ | 10.90 | | | $ | 10.72 | | | $ | 10.11 | | | $ | 10.00 | | |
| Income From Investment Operations: | |
| Net Investment Income (Loss)@ | | | .43 | | | | .38 | | | | .37 | | | | .36 | | | | .10 | | |
Net Gains or Losses on Securities
(both realized and unrealized) | | | .15 | | | | .65 | | | | .34 | | | | .69 | | | | .09 | | |
| Total From Investment Operations | | | .58 | | | | 1.03 | | | | .71 | | | | 1.05 | | | | .19 | | |
| Less Distributions From: | |
| Net Investment Income | | | (.45 | ) | | | (.46 | ) | | | (.45 | ) | | | (.44 | ) | | | (.08 | ) | |
| Net Capital Gains | | | (.40 | ) | | | (.82 | ) | | | (.08 | ) | | | — | | | | — | | |
| Total Distributions | | | (.85 | ) | | | (1.28 | ) | | | (.53 | ) | | | (.44 | ) | | | (.08 | ) | |
| Net Asset Value, End of Period | | $ | 10.38 | | | $ | 10.65 | | | $ | 10.90 | | | $ | 10.72 | | | $ | 10.11 | | |
| Total Return†† | | | +5.64 | % | | | +10.34 | % | | | +6.68 | % | | | +10.65 | % | | | +1.95 | %** | |
| Ratios/Supplemental Data | |
| Net Assets, End of Period (in millions) | | $ | 17.0 | | | $ | 20.4 | | | $ | 26.2 | | | $ | 29.4 | | | $ | 23.6 | | |
| Ratio of Gross Expenses to Average Net Assets# | | | .86 | % | | | .86 | % | | | .86 | % | | | .85 | % | | | .85 | %* | |
| Ratio of Net Expenses to Average Net Assets‡ | | | .85 | % | | | .85 | % | | | .85 | % | | | .84 | % | | | .84 | %* | |
Ratio of Net Investment Income (Loss) to
Average Net Assets | | | 4.10 | % | | | 3.66 | % | | | 3.43 | % | | | 3.44 | % | | | 3.51 | %* | |
| Portfolio Turnover Rate | | | 99 | % | | | 111 | % | | | 89 | % | | | 85 | % | | | 34 | %** | |
See Notes to Financial Highlights 102
Financial Highlights
Trust Class
| | | Period from
April 2, 2007^
to October 31,
2007 | |
| Net Asset Value, Beginning of Period | | $ | 10.39 | | |
| Income From Investment Operations: | |
| Net Investment Income (Loss)@ | | | .24 | | |
| Net Gains or Losses on Securities (both realized and unrealized) | | | (.02 | ) | |
| Total From Investment Operations | | | .22 | | |
| Less Distributions From: | |
| Net Investment Income | | | (.23 | ) | |
| Total Distributions | | | (.23 | ) | |
| Net Asset Value, End of Period | | $ | 10.38 | | |
| Total Return†† | | | +2.16 | %** | |
| Ratios/Supplemental Data | |
| Net Assets, End of Period (in millions) | | $ | .2 | | |
| Ratio of Gross Expenses to Average Net Assets# | | | 1.11 | %* | |
| Ratio of Net Expenses to Average Net Assets‡ | | | 1.10 | %* | |
| Ratio of Net Investment Income (Loss) to Average Net Assets | | | 3.92 | %* | |
| Portfolio Turnover Rate | | | 99 | %^^ | |
See Notes to Financial Highlights 103
Financial Highlights
Neuberger Berman Cash Reserves
The following table includes selected data for a share outstanding throughout each year and other performance information derived from the Financial Statements.
Investor Class
| | | Year Ended October 31, | |
| | | 2007 | | 2006 | | 2005 | | 2004 | | 2003 | |
| Net Asset Value, Beginning of Year | | $ | 1.0000 | | | $ | 1.0000 | | | $ | 1.0000 | | | $ | 1.0000 | | | $ | 1.0000 | | |
| Income From Investment Operations: | |
| Net Investment Income (Loss) | | | .0488 | | | | .0441 | | | | .0239 | | | | .0056 | | | | .0066 | | |
| Net Gains or Losses on Securities | | | (.0000 | ) | | | (.0000 | ) | | | (.0000 | ) | | | .0000 | | | | .0000 | | |
| Total From Investment Operations | | | .0488 | | | | .0441 | | | | .0239 | | | | .0056 | | | | .0066 | | |
| Less Distributions From: | |
| Net Investment Income | | | (.0488 | ) | | | (.0441 | ) | | | (.0239 | ) | | | (.0056 | ) | | | (.0066 | ) | |
| Net Capital Gains | | | — | | | | — | | | | — | | | | (.0000 | ) | | | — | | |
| Total Distributions | | | (.0488 | ) | | | (.0441 | ) | | | (.0239 | ) | | | (.0056 | ) | | | (.0066 | ) | |
| Net Asset Value, End of Year | | $ | 1.0000 | | | $ | 1.0000 | | | $ | 1.0000 | | | $ | 1.0000 | | | $ | 1.0000 | | |
| Total Return†† | | | +5.00 | % | | | +4.50 | % | | | +2.42 | % | | | +.57 | % | | | +.66 | % | |
| Ratios/Supplemental Data | |
| Net Assets, End of Year (in millions) | | $ | 306.9 | | | $ | 605.9 | | | $ | 480.0 | | | $ | 481.2 | | | $ | 617.7 | | |
| Ratio of Gross Expenses to Average Net Assets# | | | .48 | % | | | .45 | % | | | .49 | % | | | .63 | % | | | .59 | % | |
| Ratio of Net Expenses to Average Net Assets | | | .48 | %‡ | | | .45 | %‡ | | | .49 | %‡ | | | .63 | % | | | .59 | % | |
Ratio of Net Investment Income (Loss) to
Average Net Assets | | | 4.89 | % | | | 4.45 | % | | | 2.40 | % | | | .55 | % | | | .68 | % | |
See Notes to Financial Highlights 104
Notes to Financial Highlights Income Funds
†† Total return based on per share net asset value reflects the effects of changes in net asset value on the performance of each Fund during each fiscal period and assumes dividends and other distributions, if any, were reinvested. Results represent past performance and do not guarantee future results. Current returns may be lower or higher than the performance data quoted. Investment returns and principal may fluctuate and shares when redeemed may be worth more or less than original cost. For each Fund, total return would have been lower if Management had not reimbursed and/or waived certain expenses. For the year ended October 31, 2007, Management reimbursed Short Duration for losses incurred in connection with the disposition of foreign currency contracts, which had no impact on total return.
# The Fund is required to calculate an expense ratio without taking into consideration any expense reductions related to expense offset arrangements.
‡ After reimbursement of expenses and/or waiver of a portion of the investment management fee by Management. Had Management not undertaken such actions, the annualized ratios of net expenses to average daily net assets would have been:
| | |
Year Ended October 31, | | Period from
October 1, 2005
to October 31, | |
Year Ended
September 30, | |
| | | 2007 | | 2006 | | 2005 | | 2005 | |
| Core Bond Fund Investor Class | | | 1.30 | % | | | 1.46 | % | | | 1.58 | % | | | 1.05 | % | |
| Core Bond Fund Institutional Class | | | .83 | % | | | .91 | % | | | 1.05 | % | | | .55 | % | |
| | | Year Ended October 31, | |
| | | 2007 | | 2006 | | 2005 | | 2004 | | 2003 | |
| Municipal Money Fund Investor Class | | | .59 | % | | | .61 | % | | | — | | | | — | | | | — | | |
| Municipal Securities Trust Investor Class | | | 1.17 | % | | | 1.19 | % | | | 1.10 | % | | | 1.06 | % | | | .98 | % | |
| Short Duration Bond Fund Investor Class | | | .90 | % | | | .80 | % | | | .80 | % | | | .77 | % | | | .74 | % | |
| Short Duration Bond Fund Trust Class | | | 1.18 | % | | | 1.06 | % | | | 1.02 | % | | | .95 | % | | | .93 | % | |
| Cash Reserves Investor Class | | | .50 | % | | | .47 | % | | | .51 | % | | | — | | | | — | | |
| | | Year Ended October 31, | |
| | | 2007 | | 2006 | | 2005 | | 2004 | | 2003 | |
| High Income Bond Fund Investor Class | | | .92 | % | | | .90 | % | | | — | | | | — | | | | — | | |
| | | Year Ended
October 31,
2007 | | Period from
December 19,
2005 to
October 31,
2006 | |
| New York Municipal Money Fund Investor Class | | | .57 | % | | | .69 | % | |
105
Notes to Financial Highlights Income Funds (cont'd)
| | | Year Ended October 31, | | Period from
July 11, 2003
to
October 31, | |
| | | 2007 | | 2006 | | 2005 | | 2004 | | 2003 | |
| Strategic Income Fund Institutional Class | | | 2.73 | % | | | 2.29 | % | | | 1.82 | % | | | 1.72 | % | | | 3.77 | % | |
| Strategic Income Fund Trust Class | | | 4.81 | %(1) | | | — | | | | — | | | | — | | | | — | | |
(1) Period from April 2, 2007 to October 31, 2007
§ After reimbursement of expenses previously paid by Management. Had Management not been reimbursed, the annualized ratio of net expenses to average daily net assets would have been:
| | | Year Ended
October 31,
2003 | |
| High Income Bond Fund Investor Class | | | .90 | % | |
^ The date investment operations commenced.
* Annualized.
** Not annualized.
@ The per share amounts which are shown for the periods ended October 31, 2003 and thereafter (September 30, 2005 and thereafter for Core Bond Fund) have been calculated based on the average number of shares outstanding during each fiscal period.
‡‡ Effective after the close of business on June 10, 2005, Management succeeded Ariel Capital Management, LLC, as the Fund's investment manager. The financial highlights for the year ended September 30, 2005 include the income and expenses attributable to the Ariel Premier Bond Fund for the period from October 1, 2004 through June 10, 2005 and the income and expenses of the Fund, thereafter.
ÿ Audited by other auditors whose report dated November 15, 2004 expressed an unqualified opinion.
§§ Audited by other auditors whose report dated October 17, 2003 expressed an unqualified opinion.
^^ Portfolio turnover is calculated at the Fund level. Percentage indicated was calculated for the year ended October 31, 2007 for Strategic Income Fund.
106
Report of Independent Registered Public Accounting Firm
To the Board of Trustees of Lehman Brothers Income Funds and Shareholders of:
Lehman Brothers High Income Bond Fund
Lehman Brothers Municipal Money Fund
Lehman Brothers Municipal Securities Trust
Lehman Brothers Short Duration Bond Fund
Lehman Brothers Strategic Income Fund
Neuberger Berman Cash Reserves
We have audited the accompanying statements of assets and liabilities, including the schedules of investments, of the Lehman Brothers High Income Bond Fund (formerly Neuberger Berman High Income Bond Fund), Lehman Brothers Municipal Money Fund, Lehman Brothers Municipal Securities Trust (formerly Neuberger Berman Municipal Securities Trust), Lehman Brothers Short Duration Bond Fund (formerly Neuberger Berman Limited Maturity Bond Fund), Lehman Brothers Strategic Income Fund (formerly Neuberger Berman Strategic Income Fund), and Neuberger Berman Cash Reserves, seven of the series constituting the Lehman Brothers Income Funds (formerly Neuberger Berman Income Funds) (the "Trust"), as of October 31, 2007, and the related statements of operations for the year then ended, the statements of changes in net assets for each of the two years in the period then ended, and the financial highlights for each of the periods indicated therein. These financial statements and financial highlights are the responsibility of the Trust's management. Our responsibility is to express an opinion on these financial statements and financial highlights based on our audits.
We conducted our audits in accordance with the standards of the Public Company Accounting Oversight Board (United States). Those standards require that we plan and perform the audits to obtain reasonable assurance about whether the financial statements and financial highlights are free of material misstatement. We were not engaged to perform an audit of the Trust's internal control over financial reporting. Our audits included consideration of internal control over financial reporting as a basis for designing audit procedures that are appropriate in the circumstances, but not for the purpose of expressing an opinion on the effectiveness of the Trust's internal control over financial reporting. Accordingly, we express no such opinion. An audit also includes examining, on a test basis, evidence supporting the amounts and disclosures in the financial statements and financial highlights, assessing the accounting principles used and significant estimates made by management, and evaluating the overall financial statement presentation. Our procedures included confirmation of securities owned as of October 31, 2007, by correspondence with the custodian and brokers or by other appropriate auditing procedures where replies from brokers were not received. We believe that our audits provide a reasonable basis for our opinion.
In our opinion, the financial statements and financial highlights referred to above present fairly, in all material respects, the financial position of each of the above-mentioned series of Lehman Brothers Income Funds at October 31, 2007, the results of its operations for the year then ended, the changes in its net assets for each of the two years in the period then ended, and the financial highlights for each of the periods indicated therein, in conformity with U.S. generally accepted accounting principles.

Boston, Massachusetts
December 14, 2007
107
Report of Independent Registered Public Accounting Firm
To the Board of Trustees
Lehman Brothers Income Funds and
Shareholders of
Lehman Brothers Core Bond Fund
Lehman Brothers New York Municipal Money Fund
We have audited the accompanying statement of assets and liabilities of the Lehman Brothers Core Bond Fund and the Lehman Brothers New York Municipal Money Fund, each a series of the Lehman Brothers Income Funds (the "Trust"), including the schedules of investments, as of October 31, 2007, and the related statements of operations for the year then ended, and for the Lehman Brothers Core Bond Fund, the statements of changes in net assets for each of the two years in the period then ended, and the financial highlights for the two years in the period then ended and for the period October 1, 2005 through October 31, 2005, and for the year ended September 30, 2005, and for the Lehman Brothers New York Municipal Money Fund, the statements of changes in net assets and the financial highlights for the year then ended and for the period December 19, 2005 (commencement of operations) to October 31, 2006. These financial statements and financial highlights are the responsibility of the Trust's management. Our responsibility is to express an opinion on these financial statements and financial highlights based on our audits. The financial highlights of the Lehman Brothers Core Bond Fund for each of the two years in the period ended September 30, 2004 have been audited by other auditors, whose reports dated November 15, 2004 and October 17, 2003 expressed unqualified opinions on such financial statements and financial highlights.
We conducted our audits in accordance with the standards of the Public Company Accounting Oversight Board (United States). Those standards require that we plan and perform the audit to obtain reasonable assurance about whether the financial statements and financial highlights are free of material misstatement. The Trust is not required to have, nor were we engaged to perform, an audit of its internal control over financial reporting. Our audits included consideration of internal control over financial reporting as a basis for designing audit procedures that are appropriate in the circumstances, but not for the purpose of expressing an opinion on the effectiveness of the Trust's internal control over financial reporting. Accordingly, we express no such opinion. An audit also includes examining, on a test basis, evidence supporting the amounts and disclosures in the financial statements, assessing the accounting principles used and significant estimates made by management, as well as evaluating the overall financial statement presentation. Our procedures included confirmation of securities owned as of October 31, 2007, by correspondence with the custodian and brokers or by other appropriate auditing procedures where replies from brokers were not received. We believe that our audits provide a reasonable basis for our opinion.
In our opinion, the financial statements and financial highlights referred to above present fairly, in all material respects, the financial position of the Lehman Brothers Core Bond Fund and the Lehman Brothers New York Municipal Money Fund, as of October 31, 2007, the results of their operations, the changes in their net assets, and the financial highlights for the periods indicated above, in conformity with accounting principles generally accepted in the United States of America.

Philadelphia, Pennsylvania
December 14, 2007
108
Directory
Investment Manager, Administrator and Distributor
Neuberger Berman Management Inc.
605 Third Avenue, 2nd Floor
New York, NY 10158-0180
800.877.9700 or 212.476.8800
Institutional Services 800.366.6264
Sub-Advisers
Lehman Brothers Asset Management LLC
200 South Wacker Drive
Suite 2100
Chicago, IL 60601
Neuberger Berman LLC
605 Third Avenue
New York, NY 10158-3698
Custodian and Shareholder Servicing Agent
State Street Bank and Trust Company
225 Franklin Street
Boston, MA 02110
For Investor Class Shareholders Address correspondence to:
Neuberger Berman Funds
Boston Service Center
P.O. Box 8403
Boston, MA 02266-8403
800.877.9700 or 212.476.8800
For Institutional Class, and Trust Class Shareholders Address correspondence to:
Neuberger Berman Management Inc.
605 Third Avenue, 2nd Floor
New York, NY 10158-0180
Attn: Institutional Services 800.366.6264
Legal Counsel
Kirkpatrick & Lockhart Preston Gates Ellis LLP
1601 K Street, NW
Washington, DC 20006
Independent Registered Public Accounting Firms
Ernst & Young LLP
200 Clarendon Street
Boston, MA 02116
Tait, Weller & Baker LLP
1818 Market Street
Suite 2400
Philadelphia, PA 19103
109
Trustee and Officer Information
The following tables set forth information concerning the trustees ("Trustees") and officers ("Officers") of Lehman Brothers Income Funds (the "Trust"). All persons named as Trustees and Officers also serve in similar capacities for other funds administered or managed by Neuberger Berman Management Inc. ("Management"), Lehman Brothers Asset Management LLC ("LBAM") and Neuberger Berman, LLC ("Neuberger"). The Statement of Additional Information includes additional information about the Trustees and Officers and is available upon request, without charge, by calling (800) 877-9700.
Information about the Board of Trustees
| Name, Age, and Address(1) | | Position and
Length of
Time Served(2) | | Principal Occupation(s)(3) | | Number of
Funds in
Fund Complex Overseen by
Trustee(4) | | Other Directorships Held
Outside Fund Complex by
Trustee
| |
| Independent Trustees | |
|
| John Cannon (77) | | Trustee since 1994 | | Consultant; formerly, Chairman, CDC Investment Advisers (registered investment adviser), 1993 to January 1999; formerly, President and Chief Executive Officer, AMA Investment Advisors, an affiliate of the American Medical Association. | | | 59 | | | Independent Trustee or Director of three series of Oppenheimer Funds: Oppenheimer Limited Term New York Municipal Fund, Rochester Fund Municipals, and Oppenheimer Convertible Securities Fund since 1992. | |
|
| Faith Colish (72) | | Trustee since 2000 | | Counsel, Carter Ledyard & Milburn LLP (law firm) since October 2002; formerly, Attorney-at-Law and President, Faith Colish, A Professional Corporation, 1980 to 2002. | | | 59 | | | Formerly, Director (1997 to 2003) and Advisory Director (2003 to 2006), ABA Retirement Funds (formerly, American Bar Retirement Association) (not-for-profit membership corporation). | |
|
110
| Name, Age, and Address(1) | | Position and
Length of
Time Served(2) | | Principal Occupation(s)(3) | | Number of
Funds in
Fund Complex Overseen by
Trustee(4) | | Other Directorships Held
Outside Fund Complex by
Trustee
| |
| Martha C. Goss (58) | | Trustee since 2007 | | President, Woodhill Enterprises Inc./Chase Hollow Associates LLC (personal investment vehicle), since 2006; Chief Operating and Financial Officer, Hopewell Holdings LLC/Amwell Holdings, LLC (a holding company for a healthcare reinsurance company start-up), since 2003; formerly, Consultant, Resources Connection (temporary staffing), 2002 to 2006. | | | 59 | | | Director, Ocwen Financial Corporation (mortgage servicing), since 2005; Director, American Water (water utility), since 2003; Director, Channel Reinsurance (financial guaranty reinsurance), since 2006; Advisory Board Member, Attensity (software developer), since 2005; Director, Allianz Life of New York (insurance), since 2005; Director, Financial Women's Association of New York (not for profit association), since 2003; Trustee Emerita, Brown University, since 1998. | |
|
| C. Anne Harvey (70) | | Trustee since 2000 | | President, C.A. Harvey Associates since October 2001; formerly, Director, AARP, 1978 to December 2001. | | | 59 | | | Formerly, President, Board of Associates to The National Rehabilitation Hospital's Board of Directors, 2001 to 2002; formerly, Member, Individual Investors Advisory Committee to the New York Stock Exchange Board of Directors, 1998 to June 2002. | |
|
| Robert A. Kavesh (80) | | Trustee since 1993 | | Marcus Nadler Professor Emeritus of Finance and Economics, New York University Stern School of Business; formerly, Executive Secretary-Treasurer, American Finance Association, 1961 to 1979. | | | 59 | | | Formerly, Director, The Caring Community (not-for-profit), 1997 to 2006; formerly, Director, DEL Laboratories, Inc. (cosmetics and pharmaceuticals), 1978 to 2004; formerly, Director, Apple Bank for Savings, 1979 to 1990; formerly, Director, Western Pacific Industries, Inc., 1972 to 1986 (public company). | |
|
111
| Name, Age, and Address(1) | | Position and
Length of
Time Served(2) | | Principal Occupation(s)(3) | | Number of
Funds in
Fund Complex Overseen by
Trustee(4) | | Other Directorships Held
Outside Fund Complex by
Trustee
| |
| Michael M. Knetter (47) | | Trustee since 2007 | | Dean, School of Business, University of Wisconsin — Madison; formerly, Professor of International Economics and Associate Dean, Amos Tuck School of Business — Dartmouth College, 1998 to 2002. | | | 59 | | | Trustee, Northwestern Mutual Series Fund, Inc. since February 2007; Director, Wausau Paper since 2005; Director, Great Wolf Resorts since 2004. | |
|
| Howard A. Mileaf (70) | | Trustee since 2000 | | Retired; formerly, Vice President and General Counsel, WHX Corporation (holding company), 1993 to 2001. | | | 59 | | | Director, Webfinancial Corporation (holding company) since December 2002; formerly, Director WHX Corporation (holding company), January 2002 to June 2005; formerly, Director, State Theatre of New Jersey (not-for-profit theater), 2000 to 2005. | |
|
| George W. Morriss (60) | | Trustee since 2007 | | Formerly, Executive Vice President and Chief Financial Officer, People's Bank (a financial services company), 1991 to 2001. | | | 59 | | | Manager, Old Mutual 2100 fund complex (consisting of six funds) since October 2006 for four funds and since February 2007 for two funds. | |
|
| Edward I. O'Brien (79) | | Trustee since 2000 | | Formerly, Member, Investment Policy Committee, Edward Jones, 1993 to 2001; President, Securities Industry Association ("SIA") (securities industry's representative in government relations and regulatory matters at the federal and state levels), 1974 to 1992; Adviser to SIA, November 1992 to November 1993. | | | 59 | | | Director, Legg Mason, Inc. (financial services holding company) since 1993; formerly, Director, Boston Financial Group (real estate and tax shelters), 1993 to 1999. | |
|
112
| Name, Age, and Address(1) | | Position and
Length of
Time Served(2) | | Principal Occupation(s)(3) | | Number of
Funds in
Fund Complex
Overseen by Trustee(4) | | Other Directorships Held
Outside Fund Complex by
Trustee
| |
| William E. Rulon (75) | | Trustee since 1993 | | Retired; formerly, Senior Vice President, Foodmaker, Inc. (operator and franchiser of restaurants) until January 1997. | | | 59 | | | Formerly, Director, Pro-Kids Golf and Learning Academy (teach golf and computer usage to "at risk" children), 1998 to 2006; formerly, Director, Prandium, Inc. (restaurants), March 2001 to July 2002. | |
|
| Cornelius T. Ryan (76) | | Trustee since 2000 | | Founding General Partner, Oxford Partners and Oxford Bioscience Partners (venture capital investing) and President, Oxford Venture Corporation since 1981. | | | 59 | | | None. | |
|
| Tom D. Seip (57) | | Trustee since 2000; Lead Independent Trustee beginning 2006 | | General Partner, Seip Investments LP (a private investment partnership); formerly, President and CEO, Westaff, Inc. (temporary staffing), May 2001 to January 2002; formerly, Senior Executive at the Charles Schwab Corporation, 1983 to 1998, including Chief Executive Officer, Charles Schwab Investment Management, Inc. and Trustee, Schwab Family of Funds and Schwab Investments, 1997 to 1998, and Executive Vice President-Retail Brokerage, Charles Schwab & Co., Inc., 1994 to 1997. | | | 59 | | | Director, H&R Block, Inc. (financial services company) since May 2001; Chairman, Compensation Committee, H&R Block, Inc. since 2006; Director, America One Foundation since 1998; formerly, Chairman, Governance and Nominating Committee, H&R Block, Inc., 2004 to 2006; formerly, Director, Forward Management, Inc. (asset management company), 1999 to 2006; formerly Director, E-Bay Zoological Society, 1999 to 2003; formerly, Director, General Magic (voice recognition software), 2001 to 2002; formerly, Director, E-Finance Corporation (credit decisioning services), 1999 to 2003; formerly, Director, Save-Daily.com (micro investing services), 1999 to 2003. | |
|
113
| Name, Age, and Address(1) | | Position and
Length of
Time Served(2) | | Principal Occupation(s)(3) | | Number of
Funds in
Fund Complex Overseen by
Trustee(4) | | Other Directorships Held
Outside Fund Complex by
Trustee | |
| Candace L. Straight (60) | | Trustee since 1993 | | Private investor and consultant specializing in the insurance industry; formerly, Advisory Director, Securitas Capital LLC (a global private equity investment firm dedicated to making investments in the insurance sector), 1998 to December 2003. | | | 59 | | | Director, Montpelier Re (reinsurance company) since 2006; Director, National Atlantic Holdings Corporation (property and casualty insurance company) since 2004; Director, The Proformance Insurance Company (property and casualty insurance company) since March 2004; formerly, Director, Providence Washington Insurance Company (property and casualty insurance company), December 1998 to March 2006; formerly, Director, Summit Global Partners (insurance brokerage firm), 2000 to 2005. | |
|
| Peter P. Trapp (63) | | Trustee since 2000 | | Retired; formerly, Regional Manager for Mid-Southern Region, Ford Motor Credit Company, September 1997 to 2007; formerly, President, Ford Life Insurance Company, April 1995 to August 1997. | | | 59 | | | None. | |
|
| Jack L. Rivkin* (67) | | President and Trustee since 2002 | | Executive Vice President and Chief Investment Officer, Neuberger Berman Inc. (holding company) since 2002 and 2003, respectively; Managing Director and Chief Investment Officer, Neuberger, since December 2005 and 2003, respectively; formerly, Executive Vice President, Neuberger, December 2002 to 2005; Director and Chairman, Management since December 2002; formerly, Executive Vice President, Citigroup Investments, Inc., September 1995 to February 2002; formerly, Executive Vice President, Citigroup Inc., September 1995 to February 2002. | | | 59 | | | Director, Dale Carnegie and Associates, Inc. (private company) since 1998; Director, Solbright, Inc. (private company) since 1998. | |
|
114
| Name, Age, and Address(1) | | Position and
Length of
Time Served(2) | | Principal Occupation(s)(3) | | Number of
Funds in
Fund Complex Overseen by
Trustee(4) | | Other Directorships Held
Outside Fund Complex by
Trustee
| |
| Peter E. Sundman* (48) | | Chairman of the Board and Trustee since 2000; Chief Executive Officer since 1999; President from 1999 to 2000 | | Executive Vice President, Neuberger Berman Inc. (holding company) since 1999; Head of Neuberger Berman Inc.'s Mutual Funds Business (since 1999) and Institutional Business (1999 to October 2005); responsible for Managed Accounts Business and intermediary distribution since October 1999; President and Director, Management since 1999; Managing Director, Neuberger since 2005; formerly, Executive Vice President, Neuberger, 1999 to December 2005; formerly, Principal, Neuberger, 1997 to 1999; formerly, Senior Vice President, Management, 1996 to 1999. | | | 59 | | | Director and Vice President, Neuberger & Berman Agency, Inc. since 2000; formerly, Director, Neuberger Berman Inc. (holding company), October 1999 to March 2003; Trustee, Frost Valley YMCA; Trustee, College of Wooster. | |
|
(1) The business address of each listed person is 605 Third Avenue, New York, New York 10158.
(2) Pursuant to the Trust's Trust Instrument, each Trustee shall hold office for life or until his or her successor is elected or the Trust terminates; except that (a) any Trustee may resign by delivering a written resignation; (b) any Trustee may be removed with or without cause at any time by a written instrument signed by at least two-thirds of the other Trustees; (c) any Trustee who requests to be retired, or who has become unable to serve, may be retired by a written instrument signed by a majority of the other Trustees; and (d) any Trustee may be removed at any shareholder meeting by a vote of at least two-thirds of the outstanding shares.
(3) Except as otherwise indicated, each individual has held the positions shown for at least the last five years.
(4) For funds organized in a master-feeder structure, we count the master fund and its associated feeder funds as a single portfolio.
* Indicates a Trustee who is an "interested person" within the meaning of the 1940 Act. Mr. Sundman and Mr. Rivkin are interested persons of the Trust by virtue of the fact that they are officers and/or directors of Management, LBAM and/or Neuberger.
115
Information about the Officers of the Trust
| Name, Age, and Address(1) | | Position and
Length of Time
Served(2) | | Principal Occupation(s)(3) | |
| Andrew B. Allard (46) | | Anti-Money Laundering Compliance Officer since 2002 | | Senior Vice President, Neuberger since 2006; Deputy General Counsel, Neuberger since 2004; formerly, Vice President, Neuberger, 2000 to 2005; formerly, Associate General Counsel, Neuberger, 1999 to 2004; Anti-Money Laundering Compliance Officer, sixteen registered investment companies for which Management acts as investment manager and administrator (six since 2002, three since 2003, four since 2004, one since 2005 and two since 2006). | |
|
| Michael J. Bradler (37) | | Assistant Treasurer since 2005 | | Vice President, Neuberger since 2006; Employee, Management since 1997; Assistant Treasurer, sixteen registered investment companies for which Management acts as investment manager and administrator (fourteen since 2005 and two since 2006). | |
|
| Claudia A. Brandon (51) | | Secretary since 1985 | | Senior Vice President, Neuberger since 2007; Vice President-Mutual Fund Board Relations, Management since 2000 and Assistant Secretary since 2004; formerly, Vice President, Neuberger, 2002 to 2006 and Employee since 1999; Secretary, sixteen registered investment companies for which Management acts as investment manager and administrator (three since 1985, three since 2002, three since 2003, four since 2004, one since 2005 and two since 2006). | |
|
| Robert Conti (51) | | Vice President since 2000 | | Managing Director, Neuberger since 2007; formerly, Senior Vice President, Neuberger, 2003 to 2006; formerly, Vice President, Neuberger, 1999 to 2003; Senior Vice President, Management since 2000; Vice President, sixteen registered investment companies for which Management acts as investment manager and administrator (three since 2000, three since 2002, three since 2003, four since 2004, one since 2005 and two since 2006). | |
|
| Brian J. Gaffney (54) | | Vice President since 2000 | | Managing Director, Neuberger since 1999; Senior Vice President, Management since 2000; Vice President, sixteen registered investment companies for which Management acts as investment manager and administrator (three since 2000, three since 2002, three since 2003, four since 2004, one since 2005 and two since 2006). | |
|
| Maxine L. Gerson (56) | | Chief Legal Officer since 2005 (only for purposes of sections 307 and 406 of the Sarbanes-Oxley Act of 2002) | | Senior Vice President, Neuberger since 2002; Deputy General Counsel and Assistant Secretary, Neuberger since 2001; Senior Vice President, Management since 2006; Secretary and General Counsel, Management since 2004; Chief Legal Officer (only for purposes of sections 307 and 406 of the Sarbanes-Oxley Act of 2002), sixteen registered investment companies for which Management acts as investment manager and administrator (fourteen since 2005 and two since 2006). | |
|
116
| Name, Age, and Address(1) | | Position and
Length of Time Served(2) | | Principal Occupation(s)(3)
| |
| Sheila R. James (42) | | Assistant Secretary since 2002 | | Assistant Vice President, Neuberger since 2007 and Employee since 1999; Assistant Secretary, sixteen registered investment companies for which Management acts as investment manager and administrator (six since 2002, three since 2003, four since 2004, one since 2005 and two since 2006). | |
|
| Kevin Lyons (52) | | Assistant Secretary since 2003 | | Employee, Neuberger since 1999; Assistant Secretary, sixteen registered investment companies for which Management acts as investment manager and administrator (nine since 2003, four since 2004, one since 2005 and two since 2006). | |
|
| John M. McGovern (37) | | Treasurer and Principal Financial and Accounting Officer since 2005; prior thereto, Assistant Treasurer since 2002 | | Senior Vice President, Neuberger since 2007; formerly, Vice President, Neuberger, 2004 to 2006; Employee, Management since 1993; Treasurer and Principal Financial and Accounting Officer, sixteen registered investment companies for which Management acts as investment manager and administrator (fourteen since 2005 and two since 2006); formerly, Assistant Treasurer, fourteen registered investment companies for which Management acts as investment manager and administrator, 2002 to 2005. | |
|
| Frank Rosato (36) | | Assistant Treasurer since 2005 | | Vice President, Neuberger since 2006; Employee, Management since 1995; Assistant Treasurer, sixteen registered investment companies for which Management acts as investment manager and administrator (fourteen since 2005 and two since 2006). | |
|
| Frederic B. Soule (61) | | Vice President since 2000 | | Senior Vice President, Neuberger since 2003; formerly, Vice President, Neuberger, 1999 to 2002; Vice President, sixteen registered investment companies for which Management acts as investment manager and administrator (three since 2000, three since 2002, three since 2003, four since 2004, one since 2005 and two since 2006). | |
|
| Chamaine Williams (36) | | Chief Compliance Officer since 2005 | | Senior Vice President, Neuberger since 2007; Chief Compliance Officer, Management since 2006; Senior Vice President, Lehman Brothers Inc. since 2007; formerly, Vice President, Lehman Brothers Inc., 2003 to 2006; Chief Compliance Officer, sixteen registered investment companies for which Management acts as investment manager and administrator (fifteen since 2005 and one since 2006); Chief Compliance Officer, Lehman Brothers Asset Management Inc. since 2003; Chief Compliance Officer, Lehman Brothers Alternative Investment Management LLC since 2003; formerly, Vice President, UBS Global Asset Management (US) Inc. (formerly, Mitchell Hutchins Asset Management, a wholly-owned subsidiary of PaineWebber Inc.), 1997 to 2003. | |
|
(1) The business address of each listed person is 605 Third Avenue, New York, New York 10158.
(2) Pursuant to the By-Laws of the Trust, each Officer elected by the Trustees shall hold office until his or her successor shall have been elected and qualified or until his or her earlier death, inability to serve, or resignation. Officers serve at the pleasure of the Trustees and may be removed at any time with or without cause.
(3) Except as otherwise indicated, each individual has held the positions shown for at least the last five years.
117
Proxy Voting Policies and Procedures
A description of the policies and procedures that the Trust uses to determine how to vote proxies relating to portfolio securities is available, without charge, by calling 1-800-877-9700 (toll-free) and on the website of the Securities and Exchange Commission, at www.sec.gov. Information regarding how the Trust voted proxies relating to portfolio securities during the most recent 12-month period ended June 30 is also available without charge, by calling 1-800-877-9700 (toll-free), on the website of the Securities and Exchange Commission, at www.sec.gov, and on Management's website at www.nb.com.
Quarterly Portfolio Schedule
The Trust files a complete schedule of portfolio holdings for each Fund with the Securities and Exchange Commission for the first and third quarters of each fiscal year on Form N-Q. The Trust's Forms N-Q are available on the Securities and Exchange Commission's website at www.sec.gov and may be reviewed and copied at the Securities and Exchange Commission's Public Reference Room in Washington, DC. Information on the operation of the Public Reference Room may be obtained by calling 1-800-SEC-0330. The information on Form N-Q is available upon request, without charge, by calling 1-800-877-9700 (toll-free).
Notice to Shareholders (Unaudited)
For Lehman Brothers Strategic Income Fund 3.9% of the dividends distributed during the fiscal year ended October 31, 2007 qualifies for the dividends received deduction for corporate shareholders.
Under most state tax laws, mutual fund dividends which are derived from direct investments in U.S. Government obligations are not taxable, as long as a Fund meets certain requirements. Some states require that a Fund must provide shareholders with a written notice, within 60 days of the close of a Fund's taxable year, designating the portion of the dividends which represents interest which those states consider to have been earned on U.S. Government obligations. The chart below shows the percentage of income derived from such investments for the twelve months ended October 31, 2007. This information should not be used to complete your tax returns.
| | |
U.S. Treasury
Obligations | | Other Direct U.S.
Government
Obligations | | Other Indirect
U.S. Government
Obligations | |
Repurchase
Agreements | |
Lehman Brothers High
Income Bond Fund | | | 0.0 | % | | | 0.0 | % | | | 0.0 | % | | | 0.0 | % | |
Lehman Brothers Short
Duration Bond Fund | | | 0.0 | | | | 0.0 | | | | 7.3 | | | | 2.0 | | |
Lehman Brothers Strategic
Income Fund | | | 2.9 | | | | 0.6 | | | | 10.7 | | | | 0.6 | | |
Neuberger Berman Cash
Reserves | | | 0.0 | | | | 0.9 | | | | 0.3 | | | | 6.0 | | |
In January 2008, you will receive information to be used in filing your 2007 tax returns, which will include a notice of the exact tax status of all dividends paid to you by each Fund during calendar year 2007. Please consult your own tax advisor for details as to how this information should be reflected on your tax returns.
For the fiscal year ended October 31, 2007, the percentage representing the portion of distributions from net investment income, which are exempt from federal income tax, other than alternative minimum tax for the Lehman Brothers Municipal Securities Trust Fund is 99.96%.
118
For the fiscal year ended October 31, 2007, Lehman Brothers High Income Bond Fund and Lehman Brothers Strategic Income Fund designates $3,750 and $153,683, respectively, or up to the maximum amount of such dividends allowable pursuant to the Internal Revenue Code, as qualified dividend income eligible for reduced tax rates. These lower rates range from 5% to 15% depending upon an individual's tax bracket. Complete information regarding the Fund's distributions during the calendar year 2007 will be reported in conjunction with Form 1099DIV.
For the fiscal period ended October 31, 2007, the percentages representing the portion of distributions from net investment income, which are exempt from federal tax, other than alternative minimum tax are as follows:
Lehman Brothers Municipal Money Fund 100%
Lehman Brothers New York Municipal Money Fund 100%
Lehman Brothers Municipal Securities Trust and Lehman Brothers Strategic Income Fund hereby designate $125,933 and $559,884, respectively, as a capital gain distribution.
Board Consideration of the Management and Sub-Advisory Agreements
At a meeting held on September 27, 2007, the Board of Trustees of Lehman Brothers Income Funds ("Board"), including the Trustees who are not "interested persons" of Neuberger Berman Management Inc. ("Management") or Lehman Brothers Income Funds ("Independent Fund Trustees"), approved the continuance of the Management and Sub-Advisory Agreements ("Agreements") between Management and each of Lehman Brothers Core Bond Fund, Lehman Brothers High Income Bond Fund, Lehman Brothers Municipal Money Fund, Lehman Brothers Municipal Securities Trust, Lehman Brothers New York Municipal Money Fund, Lehman Brothers Short Duration Bond Fund, Lehman Brothers Strategic Income Fund and Neuberger Berman Cash Reserves (each a "Fund").
In evaluating the Agreements, the Board, including the Independent Fund Trustees, reviewed materials furnished by Management and Lehman Brothers Asset Management LLC ("LBAM") in response to questions submitted by counsel to the Independent Fund Trustees, and met with senior representatives of Management and LBAM regarding their personnel and operations. The Independent Fund Trustees were advised by counsel that is experienced in Investment Company Act of 1940 matters and that is independent of Management and LBAM. The Independent Fund Trustees received a memorandum from independent counsel discussing the legal standards for their consideration of the proposed continuance of the Agreements. They met with such counsel separately from representatives of Management to discuss the annual contract review. The annual contract review extends over two regular meetings of the Board to ensure that Management and LBAM have time to respond t o any questions the Independent Fund Trustees may have on their initial review of the report and that the Independent Fund Trustees have time to consider those responses. In addition, during this process, the Board held a separate meeting devoted to reviewing and discussing Fund performance.
The Board considered the following factors, among others, in connection with its approval of the continuance of the Agreements: (1) the nature, extent, and quality of the services provided by Management and LBAM; (2) the performance of each Fund compared to relevant market indices and a peer group of investment companies; (3) the costs of the services provided and profits or losses historically realized by Management and its affiliates from their relationship with the Funds; (4) the extent to which economies of scale might be realized as each Fund grows; and (5) whether fee levels reflect any such potential economies of scale for the benefit of investors in each Fund. In their deliberations, the Board members did not identify any particular information that was all-important or controlling, and each Trustee may have attributed different weights to the various factors.
The Board evaluated the terms of the Agreements, the overall fairness of the Agreements to each Fund and whether the Agreements were in the best interests of each Fund and its shareholders.
With respect to the nature, extent and quality of the services provided, the Board considered the performance of each Fund and the experience and staffing of the portfolio management and investment research personnel who perform services for the Funds. The Board noted that Management also provides certain administrative services, including fund accounting and compliance oversight. The Board also considered Management's and LBAM's policies and practices regarding brokerage. The Board considered the quality of brokerage execution obtained by Management. The Board's
119
Portfolio Transactions and Pricing Committee from time to time reviews the quality of the brokerage services that Lehman Brothers Inc. provides, and periodically reviews studies by an independent firm engaged to review and evaluate the quality of brokerage execution received by the Funds. The Board also reviewed whether Management and LBAM used brokers to execute Fund transactions that provide research and other services to Management and LBAM, and the types of benefits potentially derived by Management, LBAM, the Funds and other clients of Management and LBAM from such services. In addition, the Board noted the positive compliance history of Management, as the firm has been free of significant compliance problems.
With respect to the performance of each Fund, the Board considered the performance of each Fund relative to its benchmark and a peer group of investment companies pursuing broadly similar strategies to the Fund. The Board also considered performance in relation to the degree of risk undertaken by the portfolio manager(s).
With respect to the overall fairness of the Agreements, the Board considered the fee structure for each Fund under the Agreements as compared to a peer group of comparable funds and fall-out benefits likely to accrue to Management or LBAM or their affiliates from their relationship with each Fund. The Board also considered the profitability of Management and its affiliates from their association with each Fund.
The Board reviewed a comparison of each Fund's management fee and overall expense ratio to a peer group of broadly comparable funds. Where a Fund's management fee was higher than the peer group mean and/or median, the Board considered whether specific portfolio management or administration needs contributed to the management fee. In addition, the Board considered the contractual limits on Fund expenses undertaken by Management for each class of each Fund. The Board noted that certain classes of certain Funds also have voluntary limits which further reduce Fund expenses. The Board noted that Management incurred a loss on Lehman Brothers Core Bond Fund, Lehman Brothers Municipal Securities Trust and Lehman Brothers Strategic Income Fund.
The Board considered whether there were other funds that were advised or sub-advised by Management or its affiliates or separate accounts managed by Management or its affiliates with similar investment objectives, policies and strategies to the Funds. The Board compared the fees charged to each Fund at various asset levels to the fees charged to any such funds or separate accounts. The Board considered the appropriateness and reasonableness of any differences between the fees charged to each Fund and any such funds or separate accounts and determined that the differences in fees were consistent with the management and other services provided.
The Board also evaluated any apparent or anticipated economies of scale in relation to the services Management provides to each Fund. The Board considered whether each Fund's fee structure provides for a reduction of payments resulting from the use of breakpoints and whether those breakpoints are set at appropriate asset levels.
In concluding that the benefits accruing to Management and its affiliates by virtue of their relationship to the Funds were reasonable in comparison with the benefits accruing to each Fund, the Board reviewed specific data as to Management's profit or loss on each Fund for a recent period and the trend in profit or loss over time. The Board also carefully examined Management's cost allocation methodology and in recent years had an independent consultant review the methodology. It also reviewed an analysis from an independent data service on profitability margins in the investment management industry. The Board recognized that Management should be entitled to earn a reasonable level of profits for services it provides to the Funds and, based on its review, concluded that Management's level of profitability was not excessive.
Conclusions
In approving the Agreements, the Board concluded that the terms of each Agreement are fair and reasonable and that approval of the Agreements is in the best interests of each Fund and its shareholders. In reaching this determination, the Board considered that Management and LBAM could be expected to provide a high level of service to each Fund; that the performance of each Fund was satisfactory; that each Fund's fee structure appeared to the Board to be reasonable given the nature and quality of services provided; and that the benefits accruing to Management and its affiliates by virtue of their relationship to the Funds were reasonable in comparison with the benefits accruing to each Fund.
120
This page has been left blank intentionally
This page has been left blank intentionally
Investment manager: Neuberger Berman Management Inc.
Sub-advisers: Lehman Brothers Asset Management LLC
Neuberger Berman LLC
Neuberger Berman Management Inc.
605 Third Avenue, 2nd Floor
New York, NY 10158-0180
Retail Services: 800.877.9700
Broker/Dealer and Institutional Services: 800.366.6264 Web site: www.nb.com
Lehman Brothers New York Municipal Money Fund Inquiries:
888.556.9030 Web site: www.lehmanam.com
Statistics and projections in this report are derived from sources deemed to be reliable but cannot be regarded as a representation of future results of the Funds. This report is prepared for the general information of shareholders and is not an offer of shares of the Funds. Shares are sold only through the currently effective prospectus, which must precede or accompany this report.
H0648 12/07

Lehman Brothers Tax-Free Money Fund
Lehman Brothers National Municipal Money Fund
Annual Report
October 31, 2007
Contents
THE FUNDS
PORTFOLIO COMMENTARY/MATURITY DIVERSIFICATION
| Lehman Brothers Tax-Free Money Fund | | | 2 | | |
|
| Lehman Brothers National Municipal Money Fund | | | 2 | | |
|
| Fund Expense Information | | | 6 | | |
|
| FINANCIAL STATEMENTS | | | 8 | | |
|
FINANCIAL HIGHLIGHTS/PER SHARE DATA
| Lehman Brothers Tax-Free Money Fund | | | 16 | | |
|
| Lehman Brothers National Municipal Money Fund | | | 17 | | |
|
| Reports of Independent Registered Public Accounting Firms | | | 19 | | |
|
THE MASTER SERIES
SCHEDULE OF INVESTMENTS
| Tax-Exempt Master Series | | | 21 | | |
|
| Municipal Master Series | | | 34 | | |
|
| FINANCIAL STATEMENTS | | | 46 | | |
|
FINANCIAL HIGHLIGHTS
| Tax-Exempt Master Series | | | 52 | | |
|
| Municipal Master Series | | | 53 | | |
|
| Reports of Independent Registered Public Accounting Firms | | | 55 | | |
|
| Directory | | | 57 | | |
|
| Trustees and Officers | | | 58 | | |
|
| Proxy Voting Policies and Procedures | | | 66 | | |
|
| Quarterly Portfolio Schedule | | | 66 | | |
|
| Notice to Shareholders | | | 66 | | |
|
| Board Consideration of the Management and Sub-Advisory Agreements | | | 66 | | |
|
©2007 Lehman Brothers Asset Management LLC. All rights reserved.
Chairman's Letter
We are pleased to present to you the annual report for the Lehman Brothers Tax-Free Money Fund and the Lehman Brothers National Municipal Money Fund for the fiscal year ended October 31, 2007.
The Funds' investment objectives are simple and straightforward—seeking the highest available current income exempt from federal income tax through investment strategies consistent with the highest standards for safety and liquidity. Portfolio Co-Managers William Furrer and Kristian Lind employ strategies including active weighted average maturity management (positioning the portfolio in the most advantageous points on the yield curve), sector allocation (taking advantage of opportunistic pricing in the different sectors of the municipal securities markets) and, most importantly, security selection.
Over the many years that we have been investing in municipal money markets, we have developed an extensive national network of regional brokers who provide considerable assistance in identifying high quality, attractively priced securities. We also do our own internal credit analysis on every issue we invest in. We believe that our ongoing commitment to assessing the credit quality of potential investments will continue to reward our shareholders.
Sincerely,

Peter Sundman
Chairman of the Board
Lehman Brothers Income Funds
1
Lehman Brothers Tax-Free Money Fund
Lehman Brothers National Municipal Money Fund
Portfolio Commentary
In the fiscal year ended October 31, 2007, activity in the financial markets was largely uneventful until June, when investors appeared to begin contemplating the repercussions of rising subprime mortgage defaults and the ownership by financial institutions of subprime mortgage-backed securities. By July, it became clear to many investors that it was difficult to quantify financial companies' exposure and the credit markets nearly ground to a halt. A large infusion of capital from the Federal Reserve and two subsequent Fed Funds rate cuts totaling 75 basis points helped get the credit markets working again. However, toward the end of this 12-month reporting period, the market continued to experience turmoil as prominent financial companies took big write-downs on their subprime mortgage-backed securities holdings.
This difficult situation penalized the stock and corporate bond markets as investors fled to the safety of U.S. Treasuries and municipal money market funds. Because demand for short-term Treasuries was particularly robust, municipal money market funds provided relatively attractive after-tax returns.
Usually, interest rate cuts by the Federal Reserve would result in a steeper yield curve (with higher yields for longer maturity debt). As such, generally, our response would be to extend the Funds' weighted average maturities to lock in the higher yields on longer maturity securities. However, this time, the municipal money market yield curve remained inverted as variable rate demand notes (VRDNs) with one-day, one-week or one-month maturities yielded more than one-year municipal debt. Also, maintaining large allocations to VRDNs can help keep the Funds more liquid to meet any demands due to market uncertainties. As such, we maintained a large commitment to VRDNs, which is the primary reason the Funds' weighted average maturity declined over the course of fiscal 2007.
After coming to the credit markets' rescue in July and August, the Federal Reserve now finds itself in an extremely difficult situation. On the one hand, the extent of the damage of the subprime mortgage debacle on financial institutions and the economy is still difficult to assess. If things are worse than currently perceived, we believe the Fed will probably be forced to ease further. However, this would likely undermine the already shaky dollar. Also, with commodities prices (oil, agricultural products, gold and industrial materials) rising, additional rate cuts could further fan inflationary flames. We think the Fed will wait as long as possible before making its next move. In the interim, as long as VRDNs are priced so attractively, they will remain by far our largest positions and we will likely maintain the Funds' relatively short weighted-average maturities.
Lehman Brothers Tax-Free Money Fund1,2
For the fiscal year, the Lehman Brothers Tax-Free Money Fund Reserve Class posted a total return of 3.56%, surpassing the iMoneyNet Money Fund Report Tax-Free National Institutional Average's 3.36% return. The Fund's seven-day tax-equivalent current yield (taxable at the highest federal income tax bracket) decreased from 5.22% on October 31, 2006 to 5.11% on October 31, 2007. Its seven-day tax-equivalent effective yield (also taxable at the highest federal income tax bracket) went from 5.36% on October 31, 2006 to 5.24% on October 31, 2007. Current yield and effective yield more closely reflect current earnings than six-month or one-year figures.
MATURITY DIVERSIFICATION
| (% by Maturity) | |
| 1 - 7 Days | | | 85.6 | % | |
| 8 - 30 Days | | | 2.2 | | |
| 31 - 90 Days | | | 2.7 | | |
| 91 - 180 Days | | | 2.8 | | |
| 181+ Days | | | 6.7 | | |
2
Lehman Brothers National Municipal Money Fund1,2,3
For the fiscal year, the Lehman Brothers National Municipal Money Fund Reserve Class posted a total return of 3.68%, outpacing the iMoneyNet Money Fund Report Tax-Free National Institutional Average's 3.36% return. Over the course of the reporting period, the Fund's seven-day tax-equivalent current yield (taxable at the highest federal income tax bracket) decreased from 5.32% on October 31, 2006 to 5.28% on October 31, 2007. Its seven-day tax-equivalent effective yield (also taxable at the highest federal income tax bracket) went from 5.46% on October 31, 2006 to 5.42% on October 31, 2007. Current yield and effective yield more closely reflect current earnings than six-month or one-year figures.
MATURITY DIVERSIFICATION
| (% by Maturity) | |
| 1 - 7 Days | | | 86.9 | % | |
| 8 - 30 Days | | | 0.3 | | |
| 31 - 90 Days | | | 4.8 | | |
| 91 - 180 Days | | | 1.5 | | |
| 181+ Days | | | 6.5 | | |
Sincerely,


William J. Furrer and Kristian Lind
Portfolio Co-Managers
Performance data quoted represent past performance, which is no guarantee of future results. The investment return on an investment in a money market fund will fluctuate. Current performance may be lower or higher than the performance data quoted. For performance data current to the most recent month-end visit www.lehmanam.com/publiccp/LAM/americas/cash_mgmt.html. The composition, industries and holdings of each Fund are subject to change.
An investment in a Fund is not insured or guaranteed by the Federal Deposit Insurance Corporation or any other government agency. Although each Fund seeks to preserve the value of your investment at $1.00 per share, it is possible to lose money by investing in a Fund.
3
Endnotes
1 Neuberger Berman Management Inc. ("Management") has voluntarily agreed to reimburse or waive certain expenses of the Reserve Class of Lehman Brothers Tax-Free Money Fund and Lehman Brothers National Municipal Money Fund so that the total annual operating expenses of the Reserve Class of each Fund (exclusive of taxes, interest, brokerage commissions and extraordinary expenses) are limited to 0.20% and 0.17% of average daily net assets, respectively. Absent such reimbursements or waivers, each Fund's yield would have been less. Management expects that, in the future, it may voluntarily reimburse or waive certain expenses of each Fund so that the total annual operating expenses exclusive of taxes, interest, brokerage commissions and extraordinary expenses are limited to 0.23% of average daily net assets. Management may, at its sole discretion, modify or terminate these voluntary commitments with notice to a Fund.
2 "Current yield" of a money market fund refers to the income generated by an investment in a Fund over a recent 7-day period. This income is then "annualized." The "effective yield" is calculated similarly but, when annualized, the income earned by an investment in the Fund is assumed to be reinvested. The "effective yield" will be slightly higher than the "current yield" because of the compounding effect of this assumed reinvestment. Yields of a money market fund will fluctuate and past performance is not a guarantee of future results. Tax-equivalent effective yield is the taxable effective yield that an investor would have had to receive in order to realize the same level of yield after federal income taxes at the highest federal tax rate, currently 35%, assuming that all of a Fund's income is exempt from federal income taxes.
3 A portion of the income of Lehman Brothers National Municipal Money Fund may be a tax preference item for purposes of the federal alternative minimum tax for certain investors.
4
Glossary of Indices
iMoneyNet Money Fund Report
Tax-Free National Institutional Average: | | Measures all national tax-free and municipal institutional funds. Portfolio holdings of tax-free funds include Rated and Unrated Demand Notes, Rated and Unrated General Market Notes, Commercial Paper, Put Bonds—6 months or less, Put Bonds—over 6 months, AMT Paper, and Other Tax-Free holdings. | |
|
Please note that the index does not take into account any fees and expenses or any tax consequences of investing in the individual securities that it tracks and that investors cannot invest directly in any index. Data about the performance of the index are prepared or obtained by Management and include reinvestment of all dividends and capital gain distributions. Each Fund may invest in securities not included in the above-described index.
5
Information About Your Fund's Expenses
These tables are designed to provide information regarding costs related to your investments. All mutual funds incur operating expenses, which include each fund's proportionate share of expenses of its corresponding master series, administrative service fees and other expenses. The following examples are based on an investment of $1,000 made at the beginning of the six month period ended October 31, 2007 and held for the entire period. The tables illustrate each fund's costs in two ways:
Actual Expenses
and Performance: | | The first section of the tables provide information about actual account values and actual expenses in dollars, based on the fund's actual performance during the period. You may use the information in this line, together with the amount you invested, to estimate the expenses you paid over the period. Simply divide your account value by $1,000 (for example, an $8,600 account value divided by $1,000 = 8.6), then multiply the result by the number in the first section of the table under the heading entitled "Expenses Paid During the Period" to estimate the expenses you paid over the period. | |
|
Hypothetical
Example for Comparison Purposes: | | The second section of the tables provide information about hypothetical account values and hypothetical expenses based on the fund's actual expense ratio and an assumed rate of return at 5% per year before expenses. This return is not the fund's actual return. The hypothetical account values and expenses may not be used to estimate the actual ending account balance or expenses you paid for the period. You may use this information to compare the ongoing costs of investing in these funds versus other funds. To do so, compare the expenses shown in this 5% hypothetical example with the 5% hypothetical examples that appear in the shareholder reports of other funds. | |
6
Expense Information as of 10/31/07 (Unaudited)
TAX-FREE MONEY FUND
| Actual | | Beginning Account
Value 5/1/07 | | Ending Account
Value 10/31/07 | | Expenses Paid
During the Period*
5/1/07 - 10/31/07 | | Expense
Ratio | |
| Reserve Class | | $ | 1,000.00 | | | $ | 1,018.00 | | | $ | 0.92 | | | | .18 | % | |
| Hypothetical (5% annual return before expenses)** | |
| Reserve Class | | $ | 1,000.00 | | | $ | 1,024.30 | | | $ | 0.92 | | | | .18 | % | |
NATIONAL MUNICIPAL MONEY FUND
| Actual | | Beginning Account
Value 5/1/07 | | Ending Account
Value 10/31/07 | | Expenses Paid
During the Period*
5/1/07 - 10/31/07 | | Expense
Ratio | |
| Reserve Class | | $ | 1,000.00 | | | $ | 1,018.50 | | | $ | 0.76 | | | | .15 | % | |
| Hypothetical (5% annual return before expenses) ** | |
| Reserve Class | | $ | 1,000.00 | | | $ | 1,024.45 | | | $ | 0.77 | | | | .15 | % | |
* Expenses are equal to the annualized expense ratio for the class, multiplied by the average account value over the period, multiplied by 184/365 (to reflect the one-half year period shown). Each fund's expense ratio includes its proportionate share of the expenses of its corresponding master series.
** Hypothetical 5% annual return before expenses is calculated by multiplying the number of days in the most recent half year divided by 365.
7
Statements of Assets and Liabilities
Lehman Brothers Income Funds
(000's omitted except per share amounts)
| | | TAX-FREE
MONEY FUND | | NATIONAL
MUNICIPAL
MONEY FUND | |
| | | October 31, 2007 | | October 31, 2007 | |
| Assets | |
| Investment in corresponding Master Series, at value (Note A) | | $ | 1,754,218 | | | $ | 479,153 | | |
| Interest receivable | | | 1 | | | | 4 | | |
| Receivable from administrator—net (Note B) | | | — | | | | 13 | | |
| Prepaid expenses and other assets | | | 59 | | | | 28 | | |
| Total Assets | | | 1,754,278 | | | | 479,198 | | |
| Liabilities | |
| Distributions payable | | | 850 | | | | — | | |
| Payable to administrator—net (Note B) | | | 115 | | | | — | | |
| Accrued expenses and other payables | | | 17 | | | | 67 | | |
| Total Liabilities | | | 982 | | | | 67 | | |
| Net Assets at value | | $ | 1,753,296 | | | $ | 479,131 | | |
| Net Assets consist of: | |
| Paid-in capital | | $ | 1,753,274 | | | $ | 479,146 | | |
| Distributions in excess of net investment income | | | (7 | ) | | | — | | |
| Accumulated net realized gains (losses) on investments | | | 29 | | | | (15 | ) | |
| Net Assets at value | | $ | 1,753,296 | | | $ | 479,131 | | |
| Shares Outstanding ($.001 par value; unlimited shares authorized) | |
| Reserve Class | | | 1,753,274 | | | | 479,146 | | |
| Net Asset Value, offering and redemption price per share | |
| Reserve Class | | $ | 1.00 | | | $ | 1.00 | | |
See Notes to Financial Statements 8
Statements of Operations
Lehman Brothers Income Funds
(000's omitted)
| | | TAX-FREE
MONEY FUND | | NATIONAL
MUNICIPAL
MONEY FUND | |
| | | For the Year
Ended
October 31, 2007 | | For the Year
Ended
October 31, 2007 | |
| Investment Income | |
| Investment income from corresponding Master Series (Note A) | | $ | 10,215 | | | $ | 2,873 | | |
| Expenses from corresponding Master Series (Notes A & B) | | | (186 | ) | | | (81 | ) | |
| Net investment income from corresponding Master Series | | | 10,029 | | | | 2,792 | | |
| Interest income—unaffiliated issuers | | | 42,477 | | | | 11,440 | | |
| Total income | | $ | 52,506 | | | $ | 14,232 | | |
| Expenses: | |
| Investment management fees (Note B) | | | 2,633 | | | | 759 | | |
| Administration fees (Note B) | | | 1,146 | | | | 304 | | |
| Shareholder servicing agent fees | | | 28 | | | | 26 | | |
| Audit fees | | | 15 | | | | 11 | | |
| Custodian fees (Note B) | | | 181 | | | | 83 | | |
| Insurance expense | | | 30 | | | | 8 | | |
| Legal fees | | | 36 | | | | 39 | | |
| Registration and filing fees | | | 160 | | | | 138 | | |
| Shareholder reports | | | 56 | | | | 12 | | |
| Trustees' fees and expenses | | | 24 | | | | 23 | | |
| Miscellaneous | | | 52 | | | | 16 | | |
| Total expenses | | | 4,361 | | | | 1,419 | | |
| Investment management fees waived (Notes A & B) | | | (1,869 | ) | | | (874 | ) | |
| Expenses reduced by custodian fee expense offset arrangement (Note B) | | | (222 | ) | | | (40 | ) | |
| Total net expenses | | | 2,270 | | | | 505 | | |
| Net investment income (loss) | | | 50,236 | | | | 13,727 | | |
| Realized and Unrealized Gain (Loss) on Investments (Note A) | |
| Net realized gain (loss): | |
| On sales of investment securities of unaffiliated issuers | | | 23 | | | | (20 | ) | |
| From corresponding Master Series | | | 6 | | | | 5 | | |
| Net gain (loss) on investments | | | 29 | | | | (15 | ) | |
| Net increase (decrease) in net assets resulting from operations | | $ | 50,265 | | | $ | 13,712 | | |
See Notes to Financial Statements 9
Statements of Changes in Net Assets
Lehman Brothers Income Funds
(000's omitted)
| | | TAX-FREE MONEY FUND | | NATIONAL MUNICIPAL
MONEY FUND | |
| | | Year
Ended
October 31,
2007 | | Period from
December 19, 2005
(Commencement of
Operations) to
October 31, 2006 | | Year
Ended
October 31,
2007 | | Period from
December 19, 2005
(Commencement of
Operations) to
October 31, 2006 | |
| Increase (Decrease) in Net Assets: | |
| From Operations: | |
| Net investment income (loss) | | $ | 50,236 | | | $ | 17,837 | | | $ | 13,727 | | | $ | 4,618 | | |
| Net realized gain (loss) on investments | | | 29 | | | | 52 | | | | (15 | ) | | | 16 | | |
Net increase (decrease) in net assets resulting from
operations | | | 50,265 | | | | 17,889 | | | | 13,712 | | | | 4,634 | | |
| Distributions to Shareholders From (Note A): | |
| Net investment income | | | (50,243 | ) | | | (17,837 | ) | | | (13,727 | ) | | | (4,618 | ) | |
| Net realized gain on investments | | | (52 | ) | | | — | | | | (16 | ) | | | — | | |
| Total distributions to shareholders | | | (50,295 | ) | | | (17,837 | ) | | | (13,743 | ) | | | (4,618 | ) | |
| From Fund Share Transactions (Note D): | |
| Proceeds from shares sold | | | 14,020,213 | | | | 7,375,109 | | | | 5,085,798 | | | | 1,805,891 | | |
Proceeds from reinvestment of dividends and
distributions | | | 39,270 | | | | 14,793 | | | | 13,225 | | | | 3,040 | | |
| Payments for shares redeemed | | | (13,471,278 | ) | | | (6,224,833 | ) | | | (4,790,405 | ) | | | (1,638,403 | ) | |
| Net increase (decrease) from Fund share transactions | | | 588,205 | | | | 1,165,069 | | | | 308,618 | | | | 170,528 | | |
| Net Increase (Decrease) in Net Assets | | | 588,175 | | | | 1,165,121 | | | | 308,587 | | | | 170,544 | | |
| Net Assets: | |
| Beginning of period | | | 1,165,121 | | | | — | | | | 170,544 | | | | — | | |
| End of period | | $ | 1,753,296 | | | $ | 1,165,121 | | | $ | 479,131 | | | $ | 170,544 | | |
Distributions in excess of net investment income
at end of period | | $ | (7 | ) | | $ | — | | | $ | — | | | $ | — | | |
See Notes to Financial Statements 10
Notes to Financial Statements Income Funds
Note A—Summary of Significant Accounting Policies:
1 General: Lehman Brothers Tax-Free Money Fund ("Tax-Free Money") and Lehman Brothers National Municipal Money Fund ("National Municipal Money") (individually a "Fund", collectively, the "Funds") are separate operating series of Lehman Brothers Income Funds (the "Trust"), a Delaware statutory trust organized pursuant to a Trust Instrument dated December 23, 1992. The Trust is registered as a diversified, open-end management investment company under the Investment Company Act of 1940, as amended (the "1940 Act"), and its shares are registered under the Securities Act of 1933, as amended (the "1933 Act"). The Funds offer Reserve Class shares. The Board of Trustees of the Trust (the "Board") may establish additional series or classes of shares without the approval of shareholders.
On September 10, 2007, each Fund converted from a single-fund structure to a "master-feeder" structure. Under the master feeder structure, rather than investing directly in securities, each Fund is a "feeder fund," meaning that it invests in a corresponding "master series." The master series in turn invests in securities, using the strategies as described in the Funds' prospectus.
Each Fund seeks to achieve its investment objective by investing all of its net investable assets in a Master Series of Institutional Liquidity Trust (each a "Master Series," collectively, the "Master Series") that has an investment objective identical to, and a name similar to, that of each respective Fund. Tax-Free Money invests in Tax-Exempt Master Series (commencement of operations September 10, 2007). National Municipal Money invests in Municipal Master Series (commencement of operations September 10, 2007). The value of each Fund's investment in its corresponding Master Series reflects the Fund's proportionate interest in the net assets of its corresponding Master Series (92.42% for Tax-Free Money and 77.59% for National Municipal Money, at October 31, 2007). The performance of each Fund is directly affected by the performance of its corresponding Master Series. The financial statements of the Master Series, including the Schedules of Investments, are included elsewhere in this report and should be read in conjunction with the Funds' financial statements.
The assets of each Fund belong only to that Fund, and the liabilities of each Fund are borne solely by that Fund and no other.
It is the policy of the Funds to maintain a continuous net asset value per share of $1.00; each of the Funds has adopted certain investment, valuation, and dividend and distribution policies, which conform to general industry practice, to enable it to do so. However, there is no assurance the Funds will be able to maintain a stable net asset value per share. Each of these Funds complies with Rule 2a-7 of the 1940 Act.
The preparation of financial statements in accordance with U.S. generally accepted accounting principles requires Neuberger Berman Management Inc. ("Management") to make estimates and assumptions at the date of the financial statements. Actual results could differ from those estimates.
2 Fund valuation: Each Fund records its investment in its corresponding Master Series at value. Investment securities held by the corresponding Master Series are valued as indicated in the notes following the Master Series' Schedules of Investments. Prior to September 10, 2007, investments in securities were valued at amortized cost, which approximated U.S. federal income tax cost.
3 Securities transactions and investment income: Prior to September 10, 2007, the Fund recorded securities transactions on trade date for financial reporting purposes. Interest income, including accretion of discount (adjusted for original issue discount, where applicable) and amortization of premium, where applicable, was recorded on the accrual basis. Realized gains and losses from securities transactions were recorded on the basis of identified cost and stated separately in the Statements of Operations.
4 Income tax information: Each Fund is treated as a separate entity for U.S. federal income tax purposes. It is the policy of each Fund to continue to qualify as a regulated investment company by complying with the requirements
11
of Subchapter M of the Internal Revenue Code applicable to regulated investment companies and to distribute substantially all of its earnings to its shareholders. Therefore, no federal income or excise tax provision is required.
Income distributions and capital gain distributions are determined in accordance with income tax regulations, which may differ from U.S. generally accepted accounting principles. These differences are primarily due to differing treatments of income and gains on various investment securities held by each Master Series, timing differences and differing characterization of distributions made by each Fund as a whole.
As determined on October 31, 2007, there were no permanent differences resulting primarily from different book and tax accounting for the Funds.
The tax character of distributions paid during the year ended October 31, 2007 and the period ended October 31, 2006 were as follows:
| | | | | Distributions Paid From: | | | |
| | | Taxable Income | | Tax-Exempt Income | | Total | |
| | | 2007 | | 2006 | | 2007 | | 2006 | | 2007 | | 2006 | |
| Tax-Free Money | | $ | 51,582 | | | $ | — | | | $ | 50,242,930 | | | $ | 17,837,465 | | | $ | 50,294,512 | | | $ | 17,837,465 | | |
| National Municipal Money | | | 16,762 | | | | — | | | | 13,726,404 | | | | 4,617,630 | | | | 13,743,166 | | | | 4,617,630 | | |
As of October 31, 2007, the components of distributable earnings (accumulated losses) on a U.S. federal income tax basis were as follows:
| | | Undistributed
Ordinary
Income | | Undistributed
Tax-Exempt
Income | | Loss
Carryforwards
and Deferrals | | Total | |
| Tax-Free Money | | $ | 29,078 | | | $ | 863,076 | | | $ | — | | | $ | 892,154 | | |
| National Municipal Money | | | — | | | | 20,210 | | | | (14,295 | ) | | | 5,915 | | |
The differences between book basis and tax basis distributable earnings are attributable primarily to timing differences of distribution payments and organization expenses.
To the extent each Fund's net realized capital gains, if any, can be offset by capital loss carryforwards, it is the policy of each Fund not to distribute such gains. As determined on October 31, 2007, each Fund had unused capital loss carryforwards available for federal income tax purposes to offset net realized capital gains, if any, as follows:
| | | Expiring in: | |
| | | 2015 | |
| Tax-Free Money | | $ | — | | |
| National Municipal Money | | | 14,295 | | |
5 Distributions to shareholders: Each Fund earns income, net of expenses, daily on its investment in the Master Series. It is the policy of each Fund to declare distributions from net investment income on each business day; such distributions are paid monthly. Distributions from net realized capital gains, if any, are generally distributed in December. Distributions to shareholders are recorded on the ex-date.
6 Expense allocation: Certain expenses are applicable to multiple funds. Expenses directly attributable to a Fund are charged to that Fund. Expenses of the Trust that are not directly attributed to a Fund are allocated among the series of the Trust, on the basis of relative net assets, except where a more appropriate allocation of expenses to each of the series can otherwise be made fairly. Expenses borne by the complex of related investment companies, which includes open-end and closed-end investment companies for which Management serves as investment manager, that are not directly attributed to a Fund or the Trust, are allocated among the Funds and the other investment companies in the complex or series thereof, on the basis of relative net assets, except where a more appropriate allocation of expenses to each investment company in the co mplex or series thereof can otherwise be made fairly.
Each Fund bears its proportionate share of its corresponding Master Series' expenses.
12
7 Other: All net investment income and realized and unrealized capital gains and losses of a Master Series are allocated pro rata among its respective Fund and any other investors in the Master Series (including any other investment companies), if any.
8 Indemnifications: Like many other companies, the Trust's organizational documents provide that its officers and trustees are indemnified against certain liabilities arising out of the performance of their duties to the Trust. In addition, both in some of its principal service contracts and in the normal course of its business, the Trust enters into contracts that provide indemnifications to other parties for certain types of losses or liabilities. The Trust's maximum exposure under these arrangements is unknown as this could involve future claims against the Trust.
Note B—Management Fees, Administration Fees, Distribution Arrangements, and Other Transactions with Affiliates:
Each Fund retains Management as its administrator under an Administration Agreement. The Reserve Class of each Fund pays Management an administration fee at the annual rate of 0.08% of its average daily net assets under this agreement. Additionally, Management retains State Street Bank and Trust Company ("State Street") as its sub-administrator under a Sub-Administration Agreement. Management pays State Street a fee for all services received under the agreement.
Prior to September 10, 2007, each Fund directly retained Management as its investment manager under a Management Agreement. For such investment management services, each Fund paid Management a fee at the annual rate of 0.25% of the first $500 million of that Fund's average daily net assets, 0.225% of the next $500 million, 0.20% of the next $500 million, 0.175% of the next $500 million, and 0.15% of average daily net assets in excess of $2 billion. Effective September 11, 2007, each Fund indirectly pays for investment management services through its investment in the corresponding Master Series at the same annual rate of its average daily net assets (see Note B of Notes to Financial Statements of the Institutional Liquidity Trust). As a result of a waiver at the Master Series level, each Fund indirectly received a management fee waiver limiting the management fee to 0.08% of its average daily net assets from Septembe r 10, 2007 to October 31, 2007. The waiver resulted in a reduction of expenses borne by the Fund from its corresponding Master Series of $363,178 for Tax-Free Money and $126,245 for National Municipal Money (See Note B of Notes to Financial Statements of the Institutional Liquidity Trust).
Prior to September 10, 2007, Lehman Brothers Asset Management, LLC ("LBAM"), as sub-adviser to the Funds, received a monthly fee paid by Management. These Funds did not pay a fee directly to LBAM for such services. During that time, LBAM was retained by Management to provide day-to-day investment management services. As investment manager, Management was responsible for overseeing the investment activities of LBAM.
Management has voluntarily undertaken to reimburse and/or waive operating expenses (including fees payable to Management but excluding interest, taxes, brokerage commissions, and extraordinary expenses) ("Operating Expenses") which exceed the expense limitation as detailed in the following table:
| Class | | Voluntary
Expense
Limitation(1) | | Investment Management
and Administration Fees
Waived for the Year
Ended October 31, 2007 | | Voluntary
Reimbursement from
Management for the
Year Ended
October 31, 2007 | |
| Tax-Free Money Reserve Class | | | 0.20 | %(2) | | $ | 1,868,708 | | | $ | — | | |
| National Municipal Money Reserve Class | | | 0.17 | %(2) | | | 874,059 | | | | — | | |
(1) Expense limitation per annum of the class' average daily net assets. Management may, at its sole discretion, terminate this agreement with notice to each Fund.
(2) Management expects that, in the future, it may voluntarily reimburse or waive certain expenses of each Fund so that the total annual Operating Expenses of each Fund are limited to 0.23% of average net assets.
13
Management and LBAM are wholly owned subsidiaries of Lehman Brothers Holdings Inc., a publicly-owned holding company. Several individuals who are officers and/or trustees of the Trust are also employees of LBAM and/or Management.
Each Fund also has a distribution agreement with Management. Management receives no compensation therefore and no commissions for sales or redemptions of shares of beneficial interest of the Funds.
Each Fund (for the period November 1, 2006 to September 10, 2007) and effective September 11, 2007, the Master Series has an expense offset arrangement in connection with its custodian contract. For the year ended October 31, 2007, the impact of this arrangement was a reduction of expenses of $324,702 and $73,657 for Tax-Free Money and National Municipal Money, respectively.
Note C—Investment Transactions:
Prior to September 11, 2007, all securities transactions for Tax-Free Money and National Municipal Money were short-term.
For the period September 11, 2007 to October 31, 2007, contributions and withdrawals in each Fund's investment in its corresponding Master Series were as follows:
| (000's omitted) | | Contributions | | Withdrawals | |
| Tax-Free Money | | $ | 3,080,286 | | | $ | 1,336,101 | | |
| National Municipal Money | | | 983,349 | | | | 506,994 | | |
Note D—Fund Share Transactions:
Share activity at $1.00 per share for the year ended October 31, 2007 and the period ended October 31, 2006 was as follows:
| | | For the Year Ended October 31, 2007 | | For the Period Ended October 31, 2006(1) | |
(000's
omitted) | | Shares
Sold | | Shares
Issued on
Reinvestment
of Dividends
and
Distributions | | Shares
Redeemed | | Total | | Shares
Sold | | Shares
Issued on
Reinvestment
of Dividends
and
Distributions | | Shares
Redeemed | | Total | |
Tax-Free
Money: | |
Reserve
Class | | | 14,020,213 | | | | 39,270 | | | | (13,471,278 | ) | | | 588,205 | | | | 7,375,109 | (2) | | | 14,793 | | | | (6,224,833 | ) | | | 1,165,069 | | |
National
Municipal
Money: | |
Reserve
Class | | | 5,085,798 | | | | 13,225 | | | | (4,790,405 | ) | | | 308,618 | | | | 1,805,891 | (2) | | | 3,040 | | | | (1,638,403 | ) | | | 170,528 | | |
(1) Period from December 19, 2005 (Commencement of operations) to October 31, 2006.
(2) Includes initial capitalization of $10 on December 19, 2005.
14
Note E—Line of Credit:
From May 25, 2007 to September 10, 2007, each Fund was a participant in a single committed, unsecured $300,000,000 line of credit with State Street and Bank of New York, as agent, to be used only for temporary or emergency purposes. Other investment companies managed by Management also participate in this line of credit on the same terms. Interest is charged on borrowings under this agreement at the overnight Federal Funds Rate plus 0.375% per annum. A commitment fee of 0.075% per annum of the unused available line of credit is charged, of which each Fund had agreed to pay its pro rata share, based on the ratio of its individual net assets to the net assets of all participants at the time the fee is due and payable. The fee is paid quarterly in arrears. Because several investment companies participate, there was no assurance that an individual Fund would have access to all or any part of the $300,000,000 at any particular time. During the period May 25, 2007 to September 10, 2007, the Funds did not utilize this line of credit. Effective September 11, 2007, each Master Series participates in this line of credit (See Note D of Notes to Financial Statements of the Master Series).
Note F—Recent Accounting Pronouncements:
On July 13, 2006, the Financial Accounting Standards Board ("FASB") released FASB Interpretation No. 48 "Accounting for Uncertainty in Income Taxes" ("FIN 48"). FIN 48 provides guidance for how uncertain tax positions should be recognized, measured, presented and disclosed in the financial statements. FIN 48 clarifies the accounting for income taxes, by prescribing a minimum recognition threshold a tax position is required to meet before being recognized in the financial statements. FIN 48 requires that a "more-likely-than-not" threshold be met before the benefit of a tax position may be recognized in the financial statements and prescribes how such benefit should be measured. Adoption of FIN 48 is required for fiscal years beginning after December 15, 2006 and is to be applied to all open tax years as of the effective date. The Securities and Exchange Commission has permitted investment companies to delay implementation of FIN 48. Each Fund has until March 31, 2008 to implement FIN 48. At this time, Management is evaluating the implications of FIN 48 and its impact in the financial statements has not yet been determined.
In September 2006, FASB issued FASB Statement No. 157, "Fair Value Measurement" ("SFAS 157"), which defines fair value, establishes a framework for measuring fair value, and expands disclosures about fair value measurements. SFAS 157 is effective for fiscal years beginning after November 15, 2007, and interim periods within those fiscal years. Management believes the adoption of SFAS 157 will not have a material impact on the Funds' financial position or results of operations.
Note G—Change in Year End:
The Board of Trustees adopted a change in each Fund's fiscal year and tax year end date to March 31. This change is effective with the next fiscal period, which runs from November 1, 2007 to March 31, 2008.
15
Financial Highlights
Lehman Brothers Tax-Free Money Fund†
The following table includes selected data for a share outstanding throughout each period and other performance information derived from the Financial Statements. It should be read in conjunction with its corresponding Master Series' Financial Statements and notes thereto.
Reserve Class
| | | Year Ended
October 31,
2007 | | Period from
December 19, 2005^
to October 31,
2006 | |
| Net Asset Value, Beginning of Period | | $ | 1.0000 | | | $ | 1.0000 | | |
| Income From Investment Operations: | |
| Net Investment Income (Loss) | | | .0350 | | | | .0282 | | |
| Net Gains or Losses on Securities | | | .0000 | | | | .0000 | | |
| Total From Investment Operations | | | .0350 | | | | .0282 | | |
| Less Distributions From: | |
| Net Investment Income | | | (.0350 | ) | | | (.0282 | ) | |
| Net Capital Gains | | | (.0000 | ) | | | — | | |
| Total Distributions | | | (.0350 | ) | | | (.0282 | ) | |
| Net Asset Value, End of Period | | $ | 1.0000 | | | $ | 1.0000 | | |
| Total Return††@@ | | | +3.56 | % | | | +2.86 | %** | |
| Ratios/Supplemental Data | |
| Net Assets, End of Period (in millions) | | $ | 1,753.3 | | | $ | 1,165.1 | | |
| Ratio of Gross Expenses to Average Net Assets# | | | .19 | % | | | .19 | %* | |
| Ratio of Net Expenses to Average Net Assets‡ | | | .18 | % | | | .17 | %* | |
Ratio of Net Investment Income (Loss) to Average
Net Assets | | | 3.51 | % | | | 3.30 | %* | |
See Notes to Financial Highlights 16
Financial Highlights
Lehman Brothers National Municipal Money Fund†
The following table includes selected data for a share outstanding throughout each period and other performance information derived from the Financial Statements. It should be read in conjunction with its corresponding Master Series' Financial Statements and notes thereto.
Reserve Class
| | | Year Ended
October 31,
2007 | | Period from
December 19, 2005^
to October 31,
2006 | |
| Net Asset Value, Beginning of Period | | $ | 1.0001 | | | $ | 1.0000 | | |
| Income From Investment Operations: | |
| Net Investment Income (Loss) | | | .0361 | | | | .0287 | | |
| Net Gains or Losses on Securities | | | (.0000 | ) | | | .0001 | | |
| Total From Investment Operations | | | .0361 | | | | .0288 | | |
| Less Distributions From: | |
| Net Investment Income | | | (.0361 | ) | | | (.0287 | ) | |
| Net Capital Gains | | | (.0001 | ) | | | — | | |
| Total Distributions | | | (.0362 | ) | | | (.0287 | ) | |
| Net Asset Value, End of Period | | $ | 1.0000 | | | $ | 1.0001 | | |
| Total Return††@@ | | | +3.68 | % | | | +2.90 | %** | |
| Ratios/Supplemental Data | |
| Net Assets, End of Period (in millions) | | $ | 479.1 | | | $ | 170.5 | | |
| Ratio of Gross Expenses to Average Net Assets# | | | .17 | % | | | .17 | %* | |
| Ratio of Net Expenses to Average Net Assets‡ | | | .16 | % | | | .16 | %* | |
Ratio of Net Investment Income (Loss) to Average
Net Assets | | | 3.61 | % | | | 3.28 | %* | |
See Notes to Financial Highlights 17
Notes to Financial Highlights Income Funds
† The per share amounts and ratios which are shown reflect income and expenses, including the Fund's proportionate share of its corresponding Master Series' income and expenses (except for the period from December 19, 2005 to September 10, 2007 when each Fund was organized in a single-fund structure).
†† Total return based on per share net asset value reflects the effects of changes in net asset value on the performance of each Fund during each fiscal period and assumes dividends and other distributions, if any, were reinvested. Results represent past performance and do not guarantee future results. Current returns may be lower or higher than the performance data quoted. Investment returns and principal may fluctuate and shares when redeemed may be worth more or less than original cost.
@@ Total return would have been lower if Management had not reimbursed and/or waived certain expenses (see Note B of Notes to Financial Statements of Income Funds).
# The Fund is required to calculate an expense ratio without taking into consideration any expense reductions related to expense offset arrangements.
‡ After reimbursement of expenses and/or waiver of a portion of the investment management fee by Management (see Note B of Notes to Financial Statements of Income Funds). Had Management not undertaken such actions, the annualized ratios of net expenses to average daily net assets would have been:
| | | Year Ended
October 31,
2007 | | Period from
December 19, 2005
(Commencement
of Operations)
to October 31,
2006 | |
| Tax-Free Money Fund Reserve Class | | | .33 | % | | | .36 | % | |
| National Municipal Money Fund Reserve Class | | | .42 | % | | | .53 | % | |
^ The date investment operations commenced.
* Annualized.
** Not annualized.
18
Report of Independent Registered Public Accounting Firm
To the Board of Trustees
Lehman Brothers Income Funds and
Shareholders of
Lehman Brothers Tax-Free Money Fund
We have audited the accompanying statement of assets and liabilities of the Lehman Brothers Tax-Free Money Fund (formerly, Tax-Free Money Fund), a series of the Lehman Brothers Income Funds (the "Trust"), as of October 31, 2007, and the related statement of operations for the year then ended, and the statement of changes in net assets and the financial highlights for the year then ended and for the period December 19, 2005 (commencement of operations) to October 31, 2006. These financial statements and financial highlights are the responsibility of the Trust's management. Our responsibility is to express an opinion on these financial statements and financial highlights based on our audits.
We conducted our audits in accordance with the standards of the Public Company Accounting Oversight Board (United States). Those standards require that we plan and perform the audit to obtain reasonable assurance about whether the financial statements and financial highlights are free of material misstatement. The Trust is not required to have, nor were we engaged to perform, an audit of its internal control over financial reporting. Our audits included consideration of internal control over financial reporting as a basis for designing audit procedures that are appropriate in the circumstances, but not for the purpose of expressing an opinion on the effectiveness of the Trust's internal control over financial reporting. Accordingly, we express no such opinion. An audit also includes examining, on a test basis, evidence supporting the amounts and disclosures in the financial statements, assessing the accounting principles used and significant estimates made by management, as well as evaluating the overall financial statement presentation. Our procedures included confirmation of securities owned as of October 31, 2007, by correspondence with the custodian. We believe that our audits provide a reasonable basis for our opinion.
In our opinion, the financial statements and financial highlights referred to above present fairly, in all material respects, the financial position of the Lehman Brothers Tax-Free Money Fund, as of October 31, 2007, and the result of its operations, the changes in its net assets, and the financial highlights for the periods indicated above, in conformity with accounting principles generally accepted in the United States of America.

Philadelphia, Pennsylvania
December 14, 2007
19
Report of Independent Registered Public Accounting Firm
To the Board of Trustees of Lehman Brothers Income Funds and Shareholders of Lehman Brothers National Municipal Money Fund:
We have audited the accompanying statement of assets and liabilities of Lehman Brothers National Municipal Money Fund (formerly, National Municipal Money Fund) (one of the series constituting Lehman Brothers Income Funds (formerly Neuberger Berman Income Funds) (the "Fund"), as of October 31, 2007, and the related statement of operations for the year then ended, the statement of changes in net assets for the year then ended and the period from December 19, 2005 (commencement of operations) to October 31, 2006, and the financial highlights for each of the periods indicated therein. These financial statements and financial highlights are the responsibility of the Fund's management. Our responsibility is to express an opinion on these financial statements and financial highlights based on our audits.
We conducted our audits in accordance with the standards of the Public Company Accounting Oversight Board (United States). Those standards require that we plan and perform the audit to obtain reasonable assurance about whether the financial statements and financial highlights are free of material misstatement. We were not engaged to perform an audit of the Fund's internal control over financial reporting. Our audits included consideration of internal control over financial reporting as a basis for designing audit procedures that are appropriate in the circumstances, but not for the purpose of expressing an opinion on the effectiveness of the Fund's internal control over financial reporting. Accordingly, we express no such opinion. An audit also includes examining, on a test basis, evidence supporting the amounts and disclosures in the financial statements and financial highlights, assessing the accounting principles used and significant estimates made by management, and evaluating the overall financial statement presentation. Our procedures included confirmation of securities owned as of October 31, 2007, by correspondence with the custodian and brokers. We believe that our audits provide a reasonable basis for our opinion.
In our opinion, the financial statements and financial highlights referred to above present fairly, in all material respects, the financial position of Lehman Brothers National Municipal Money Fund, a series of Lehman Brothers Income Funds, at October 31, 2007, the results of its operations for the year then ended, changes in its net assets for the year then ended and the period from December 19, 2005 (commencement of operations) to October 31, 2006, and the financial highlights for each of the periods indicated therein, in conformity with U.S. generally accepted accounting principles.

Boston, Massachusetts
December 14, 2007
20
Schedule of Investments Tax-Exempt Master Series
| PRINCIPAL AMOUNT | | SECURITY@@ | | RATING‡‡§ | | VALUE†† | |
| (000's omitted) | | | | Moody's | | S&P | | (000's omitted) | |
| Alabama (0.3%) | | | |
| $ | 1,600 | | | Gulf Shores Med. Clinic Board Rev. (Colonial Pinnacle MOB Proj.), Ser. 2007,
(LOC: Regions Bank), 3.53%, due 11/1/07 | | P-1 | | | | $ | 1,600 | µß | |
| | 1,245 | | | Lee Co. Ind. Dev. Au. Rev. (Lifesouth Comm. Blood Ctr.), Ser. 2001,
(LOC: SunTrust Bank), 3.31%, due 11/7/07 | | VMIG1 | | | | | 1,245 | µß | |
| | 3,100 | | | Mobile IDB PCR Ref. (Alabama Pwr. Co. Proj.), Ser. 1994,
3.58%, due 11/1/07 | | VMIG1 | | A-1 | | | 3,100 | µß | |
| | | | | | | | | | | | 5,945 | | |
| Alaska (0.1%) | | | |
| | 1,250 | | | Alaska Ind. Dev. & Export Au. Rev., Ser. 2004, (FSA Insured),
3.51%, due 11/1/07 | | VMIG1 | | | | | 1,250 | µi | |
| Arizona (1.9%) | | | |
| | 5,800 | | | ABN Amro Munitops Cert. Trust Rev., Ser. 2005, (MBIA Insured),
3.50%, due 11/1/07 | | VMIG1 | | | | | 5,800 | µa | |
| | 19,545 | | | Arizona Hlth. Fac. Au. Hosp. Sys. Rev., Ser. 2007,
(LOC: Citigroup Global Markets), 3.51%, due 11/1/07 | | VMIG1 | | | | | 19,545 | µ | |
| | 10,000 | | | Scottsdale Ind. Dev. Au. Hosp. Rev., Ser. 2006,
(LOC: Citigroup Global Markets), 3.51%, due 11/1/07 | | VMIG1 | | | | | 10,000 | µ | |
| | | | | | | | | | | | 35,345 | | |
| Arkansas (0.9%) | | | |
| | 11,500 | | | ABN Amro Munitops Cert. Trust Rev., Ser. 2006, (FGIC Insured),
3.50%, due 11/1/07 | | VMIG1 | | | | | 11,500 | ñµa | |
| | 6,330 | | | North Little Rock Residential Hsg. Fac. Board Multi-Family Rev. (Floaters),
Ser. 2004, (LOC: Government National Mortgage Association),
3.58%, due 11/1/07 | | VMIG1 | | | | | 6,330 | µr | |
| | | | | | | | | | | | 17,830 | | |
| California (1.8%) | | | |
| | 5,450 | | | Austin Trust St. Cert., Ser. 2007-315, (LOC: State Street Bank & Trust Co.),
3.49%, due 11/1/07 | | VMIG1 | | | | | 5,450 | µc | |
| | 3,215 | | | California Statewide Comm. Dev. Au. Rev. (Floaters), Ser. 2007-2089,
(LOC: Wells Fargo Bank & Trust Co.), 3.53%, due 11/1/07 | | VMIG1 | | | | | 3,215 | µ | |
| | 9,050 | | | Northern California Gas Au. Number 1 Gas Proj. Rev. (Floaters),
Ser. 2007-55, (LOC: Goldman Sachs), 3.49%, due 11/1/07 | | | | | | | 9,050 | µ | |
| | 16,280 | | | Puttable Floating Option Tax Exempt Receipts (Floaters), Ser. 2006,
(LOC: Merrill Lynch Capital Markets), 3.65%, due 11/1/07 | | | | | | | 16,280 | µ | |
| | | | | | | | | | | | 33,995 | | |
See Notes to Schedule of Investments 21
| PRINCIPAL AMOUNT | | SECURITY@@ | | RATING‡‡§ | | VALUE†† | |
| (000's omitted) | | | | Moody's | | S&P | | (000's omitted) | |
| Colorado (3.5%) | | | |
| $ | 4,300 | | | Adams 12 Five Star Sch. (Putters), Ser. 2007-1728, (MBIA Insured),
3.50%, due 11/1/07 | | VMIG1 | | | | $ | 4,300 | µo | |
| | 4,725 | | | Broomfield Cert. Participation (Floaters), Ser. 2002-1643, (AMBAC Insured),
3.52%, due 11/1/07 | | | | | | | 4,725 | µr | |
| | 1,500 | | | Central Platte Valley Metro. Dist., Ser. 2006, (LOC: BNP Paribas),
3.70%, due 12/1/07 | | | | A-1+ | | | 1,500 | µ | |
| | 9,875 | | | Colorado Ed. & Cultural Fac. Au. Rev. (Colorado Christian Univ. Proj.),
Ser. 2004, (LOC: Evangelical Christian Credit Union), 3.48%, due 11/1/07 | | | | A-1+ | | | 9,875 | µßw | |
| | 3,625 | | | Colorado Ed. & Cultural Fac. Au. Rev. (Emmanuel Sch. Religion Proj.),
Ser. 2006, (LOC: AmSouth Bank), 3.48%, due 11/1/07 | | VMIG1 | | | | | 3,625 | µß | |
| | 5,350 | | | Commerce City Northern Infrastructure Gen. Imp. Dist. G.O., Ser.2006,
(LOC: U.S. Bank), 3.48%, due 11/1/07 | | | | A-1+ | | | 5,350 | µ | |
| | 20,000 | | | Dawson Ridge Metro. Dist. Number 1 (Merlots), Ser. 2007-D03,
(LOC: Wachovia Bank & Trust Co.), 3.40%, due 11/7/07 | | VMIG1 | | | | | 20,000 | µ | |
| | 5,040 | | | Denver City & Co. Arpt. Rev. (Floaters), Ser. 2006-63TP, (FGIC Insured),
3.49%, due 11/1/07 | | | | | | | 5,040 | µm | |
| | 7,485 | | | Deutsche Bank Spears/Lifers Trust Var. St. (Colorado Health Facs. Au.),
Ser. 2007-132, (LOC: Deutsche Bank), 3.73%, due 11/1/07 | | | | | | | 7,485 | µ | |
| | 5,405 | | | Summit Co. Sch. Dist. G.O., Ser. 2004, (FSA Insured), 3.51%, due 11/1/07 | | VMIG1 | | | | | 5,405 | µi | |
| | | | | | | | | | | | 67,305 | | |
| Delaware (0.7%) | | | |
| | 12,585 | | | New Castle Co. Delaware Student Hsg. Rev. (University Courtyard Apts.),
Ser. 2005, (LOC: Bank of New York), 3.49%, due 11/1/07 | | VMIG1 | | | | | 12,585 | µß | |
| District of Columbia (0.3%) | | | |
| | 2,085 | | | District of Columbia G.O. (Merlots), Ser. 2001-A127, (MBIA Insured),
3.34%, due 11/7/07 | | | | A-1+ | | | 2,085 | µv | |
| | 2,235 | | | District of Columbia Rev. Ref. (Maret Sch., Inc.), Ser. 2003,
(LOC: SunTrust Bank), 3.26%, due 11/7/07 | | VMIG1 | | | | | 2,235 | µß | |
| | 1,435 | | | District of Columbia Wtr. & Swr. Au. Pub. Util. Rev. (Floaters), Ser. 2006,
(FSA Insured), 3.49%, due 11/1/07 | | | | | | | 1,435 | µl | |
| | | | | | | | | | | | 5,755 | | |
| Florida (4.7%) | | | |
| | 3,250 | | | Alachua Co. Hlth. Fac. Au. Continuing Care Rev.
(Oak Hammock Univ. Proj. A), Ser. 2002, 3.58%, due 11/1/07 | | VMIG1 | | | | | 3,250 | µß | |
| | 9,045 | | | Alachua Co. Sch. Board Cert. Participation, Ser. 2004, (AMBAC Insured),
3.52%, due 11/1/07 | | VMIG1 | | A-1+ | | | 9,045 | µd | |
| | 14,080 | | | Broward Co. Professional Sports Fac. Tax Rev. (Floaters), Ser. 2007-1939,
(AMBAC Insured), 3.50%, due 11/1/07 | | | | | | | 14,080 | µs | |
| | 7,700 | | | Deutsche Bank Spears/Lifers Trust Var. St. Rev. (Manatee Co.),
Ser. 2007-243, (MBIA Insured), 3.50%, due 11/1/07 | | | | A-1+ | | | 7,700 | µk | |
| | 2,755 | | | Eclipse Funding Trust (Solar Eclipse-Palm Bay Sales), Ser. 2006-0136,
(FSA Insured), 3.49%, due 11/1/07 | | | | A-1+ | | | 2,755 | µu | |
| | 8,980 | | | Eclipse Funding Trust (Solar Eclipse-Winter Haven Utils. Sys.),
Ser. 2006-0054, (MBIA Insured), 3.49%, due 11/1/07 | | | | A-1+ | | | 8,980 | ñµu | |
| | 2,690 | | | Florida St. Board of Ed. Muni. Sec. Trust Receipts, Ser. 2003-SGA138,
(MBIA Insured), 3.32%, due 11/7/07 | | | | A-1+ | | | 2,690 | µt | |
| | 6,000 | | | Martin Co. PCR (Florida Pwr. & Lt. Proj.), Ser. 2000, 3.59%, due 11/1/07 | | VMIG1 | | A-1 | | | 6,000 | µß | |
| | 1,000 | | | Miami-Dade Co. Sch. Board Cert. Participation (Putters), Ser. 2006-1317,
(AMBAC Insured), 3.49%, due 11/1/07 | | | | A-1+ | | | 1,000 | µo | |
| | 1,000 | | | Miami-Dade Co. Sch. Board Cert. Participation, (Eagle), Ser. 2006 A,
(AMBAC Insured), 3.52%, due 11/1/07 | | | | A-1+ | | | 1,000 | µh | |
| | 8,610 | | | Muni. Sec. Trust Cert. Rev., Ser. 2007-9068, (MBIA Insured), 3.50%,
due 11/1/07 | | | | A-1 | | | 8,610 | ñµe | |
| | 9,030 | | | Orlando Util. Commission Wtr. & Elec. Rev. (Floaters), Ser. 2006,
(LOC: Dexia Credit Locale de France), 3.52%, due 11/1/07 | | | | | | | 9,030 | µ | |
| | 15,355 | | | Puttable Floating Option Tax Exempt Receipts (Floaters)
(South Miami Hlth. Fac. Au.), Ser. 2007-1498,
(LOC: Merrill Lynch Capital Markets), 3.58%, due 11/1/07 | | | | A-1 | | | 15,355 | µ | |
| | | | | | | | | | | | 89,495 | | |
See Notes to Schedule of Investments 22
| PRINCIPAL AMOUNT | | SECURITY@@ | | RATING‡‡§ | | VALUE†† | |
| (000's omitted) | | | | Moody's | | S&P | | (000's omitted) | |
| Georgia (1.8%) | | | |
| $ | 7,555 | | | Athens Area Fac. Corp. Cert. Participation, Ser. 2007, (LOC: Citibank, N.A.),
3.51%, due 11/1/07 | | VMIG1 | | | | $ | 7,555 | µ | |
| | 3,135 | | | De Kalb Co. Wtr. & Swr. Rev., Ser. 2006, (LOC: Citibank, N.A.),
3.51%, due 11/1/07 | | VMIG1 | | | | | 3,135 | µ | |
| | 500 | | | Gwinnett Co. Dev. Au. Rev. (Greater Atlanta Christian), Ser. 1998,
(LOC: SunTrust Bank), 3.44%, due 11/7/07 | | | | | | | 500 | µß | |
| | 2,500 | | | Marietta Hsg. Au. Multi-Family Rev. (Franklin Walk Apts. Proj.), Ser. 1990,
(LOC: Freddie Mac), 3.58%, due 11/1/07 | | VMIG1 | | | | | 2,500 | µß | |
| | 4,715 | | | Muni. Elec. Au. Spec. Oblig., Ser. 1994-SGA1, (MBIA Insured),
3.32%, due 11/7/07 | | | | A-1+ | | | 4,715 | µt | |
| | 3,995 | | | Puttable Floating Option Tax Exempt Receipts (Floaters), Ser. 2007-4174,
(AMBAC Insured), 3.52%, due 11/1/07 | | | | | | | 3,995 | µl | |
| | 11,480 | | | Richmond Co. Dev. Au. Rev., Ser. 2007-10025Z,
(LOC: Citigroup Global Markets), 3.52%, due 11/1/07 | | | | A-1+ | | | 11,480 | µ | |
| | | | | | | | | | | | 33,880 | | |
| Illinois (6.9%) | | | |
| | 8,050 | | | Chicago Board Ed. (Floaters), Ser. 2006-3620, (AMBAC Insured),
3.49%, due 11/1/07 | | | | | | | 8,050 | µl | |
| | 7,145 | | | Chicago O'Hare Int'l. Arpt. Rev., Ser. 2005, (FGIC Insured), 3.57%,
due 11/1/07 | | | | | | | 7,145 | µk | |
| | 5,080 | | | Chicago O'Hare Int'l. Arpt. Rev. (Floaters), Ser. 2007-1933, (FGIC Insured),
3.50%, due 11/1/07 | | VMIG1 | | | | | 5,080 | µs | |
| | 3,845 | | | De Witt Ford Co. Comm. College Dist. Number 540 (Merlots),
Ser. 2007-D13, (FSA Insured), 3.34%, due 11/7/07 | | VMIG1 | | | | | 3,845 | µv | |
| | 16,520 | | | Deutsche Bank Spears/Lifers Trust Var. St. (Chicago Illinois Board),
Ser. 2007-315, (FGIC Insured), 3.51%, due 11/1/07 | | | | | | | 16,520 | µk | |
| | 14,180 | | | Deutsche Bank Spears/Lifers Trust Var. St. (Chicago Illinois Board),
Ser. 2007-316, (FGIC Insured), 3.51%, due 11/1/07 | | | | | | | 14,180 | µk | |
| | 15,670 | | | Deutsche Bank Spears/Lifers Trust Var. St. (Chicago), Ser. 2007-308,
(FGIC Insured), 3.51%, due 11/1/07 | | | | | | | 15,670 | µk | |
| | 4,555 | | | Deutsche Bank Spears/Lifers Trust Var. St. (Chicago), Ser. 2007-346,
(FGIC Insured), 3.57%, due 11/1/07 | | | | | | | 4,555 | µk | |
| | 3,815 | | | Deutsche Bank Spears/Lifers Trust Var. St. (Northern Illinois Muni.),
Ser. 2007-320, (MBIA Insured), 3.50%, due 11/1/07 | | | | | | | 3,815 | µk | |
| | 8,000 | | | Illinois Fin. Au. Rev. (Clare Oaks), Ser. 2006 D, (LOC: Sovereign Bank),
3.47%, due 11/1/07 | | | | | | | 8,000 | µbß | |
| | 1,900 | | | Illinois Fin. Au. Rev. (IIT Research Institute), Ser. 2004, (LOC: Fifth Third Bank),
3.47%, due 11/1/07 | | VMIG1 | | | | | 1,900 | µß | |
| | 1,850 | | | Illinois Fin. Au. Rev. (Lawrence Hall Youth Svcs.), Ser. 2006,
(LOC: Fifth Third Bank), 3.45%, due 11/2/07 | | VMIG1 | | | | | 1,850 | µß | |
| | 5,000 | | | Lake Co. Sch. Dist. Number 109 Deerfield Rev., Ser. 2006,
(LOC: JP Morgan Chase), 3.28%, due 11/7/07 | | VMIG1 | | | | | 5,000 | µ | |
| | 4,000 | | | Metro. Pier & Exposition Au. Hospitality Fac. Rev. (Floaters), Ser. 2006,
(LOC: Dexia Credit Locale de France), 3.49%, due 11/1/07 | | | | | | | 4,000 | µ | |
| | 8,260 | | | Muni. Sec. Trust Cert. G.O., Ser. 2007-347-A, (FSA Insured),
3.50%, due 11/1/07 | | VMIG1 | | | | | 8,260 | ñµe | |
| | 6,805 | | | Muni. Sec. Trust Cert. G.O., Ser. 2007-3031-A, (FGIC Insured),
3.51%, due 11/1/07 | | VMIG1 | | | | | 6,805 | ñµe | |
| | 2,780 | | | Quad Cities Reg. Econ. Dev. Au. Rev. (Two Rivers YMCA Proj.),
Ser. 2002, (LOC: U.S. Bank), 3.63%, due 11/1/07 | | | | A-1+ | | | 2,780 | µß | |
| | 5,905 | | | Reg. Trans. Au. G.O. (Floaters), Ser. 2006, (MBIA Insured),
3.58%, due 11/1/07 | | | | | | | 5,905 | µl | |
| | 8,445 | | | Reg. Trans. Au. G.O. (Merlots), Ser. 2002-A24, (MBIA Insured),
3.34%, due 11/7/07 | | VMIG1 | | | | | 8,445 | µd | |
| | | | | | | | | | | | 131,805 | | |
See Notes to Schedule of Investments 23
| PRINCIPAL AMOUNT | | SECURITY@@ | | RATING‡‡§ | | VALUE†† | |
| (000's omitted) | | | | Moody's | | S&P | | (000's omitted) | |
| Indiana (7.1%) | | | |
| $ | 8,055 | | | ABN Amro Munitops Cert. Trust Rev., Ser. 2006, (AMBAC Insured),
3.50%, due 11/1/07 | | | | | | $ | 8,055 | ñµa | |
| | 7,490 | | | Bartholomew Cons. Sch. Corp. Ind. Tax Anticipation Warrants,
Ser. 2007, 4.00%, due 12/31/07 | | | | | | | 7,494 | | |
| | 5,085 | | | Carmel Clay Parks Bldg. Corp. (Putters), Ser. 2004-539, (MBIA Insured),
3.50%, due 11/1/07 | | | | A-1+ | | | 5,085 | µo | |
| | 6,000 | | | Carmel Clay Sch. Tax Anticipation Warrants, Ser. 2007, 3.90%, due 12/28/07 | | | | | | | 6,001 | | |
| | 13,885 | | | Carmel Redev. Au. Lease Rental Rev. (Floaters), Ser. 2006-1275,
(LOC: Morgan Stanley), 3.50%, due 11/1/07 | | | | A-1+ | | | 13,885 | µ | |
| | 2,065 | | | Carmel Redev. Au. Lease Rental Rev. (Putters), Ser. 2006-1503,
(LOC: JP Morgan Chase), 3.50%, due 11/1/07 | | | | A-1+ | | | 2,065 | µ | |
| | 6,860 | | | Columbus Renovation Sch. Bldg. Corp. (Floaters), Ser. 2005, (MBIA Insured),
3.58%, due 11/1/07 | | | | A-1+ | | | 6,860 | µr | |
| | 11,530 | | | Eclipse Funding Trust (Solar Eclipse-Hamilton Southeastern Indiana),
Ser. 2007-0006, (FSA Insured), 3.50%, due 11/1/07 | | | | A-1+ | | | 11,530 | µu | |
| | 7,000 | | | Eclipse Funding Trust (Solar Eclipse-IPS Multi-Sch. Bldg. Corp. Ltd.),
Ser. 2007-0026, (MBIA Insured), 3.49%, due 11/1/07 | | | | A-1+ | | | 7,000 | µu | |
| | 3,990 | | | Eclipse Funding Trust (Solar Eclipse-Wayne Township Marion),
Ser. 2006-0015, (FGIC Insured), 3.49%, due 11/1/07 | | | | A-1+ | | | 3,990 | ñµu | |
| | 3,300 | | | Hamilton Southeastern Sch. Warrants, Ser. 2007, 3.80%, due 12/31/07 | | | | | | | 3,300 | | |
| | 2,500 | | | Indiana Bond Bank Rev. (Adv. Fdg. Prog. Notes), Ser. 2007 A,
(LOC: Bank of New York), 4.25%, due 1/31/08 | | | | SP-1+ | | | 2,504 | | |
| | 14,600 | | | Indiana Hlth. & Ed. Fac. Fin. Au. Hosp. Rev. (Floyd Mem. Hosp. & Hlth. Proj.),
Ser. 2006, (LOC: National City Bank), 3.63%, due 11/1/07 | | | | A-1 | | | 14,600 | µß | |
| | 4,000 | | | Indiana Hlth. & Ed. Fac. Fin. Au. Hosp. Rev. (Harrison Co. Hosp. Proj.),
Ser. 2005, (LOC: JP Morgan Chase), 3.58%, due 11/1/07 | | | | A-1+ | | | 4,000 | µß | |
| | 5,320 | | | Indiana Hlth. & Ed. Fac. Fin. Au. Hosp. Rev. (Schneck Mem. Hosp. Proj.),
Ser. 2006 B, (LOC: Fifth Third Bank), 3.58%, due 11/1/07 | | | | A-1+ | | | 5,320 | µß | |
| | 2,935 | | | Indiana Trans. Fin. Au. Hwy. Rev., Ser. 2003, (FSA Insured), 3.51%,
due 11/1/07 | | | | A-1+ | | | 2,935 | µi | |
| | 6,620 | | | Indianapolis Loc. Pub. Imp. Bond Bank (Putters), Ser. 2007-2120,
(MBIA Insured), 3.55%, due 11/1/07 | | VMIG1 | | | | | 6,620 | µo | |
| | 5,000 | | | Indianapolis Loc. Pub. Imp. Bond Bank Ltd. Recourse Notes, Ser. 2007 E,
4.25%, due 10/2/08 | | | | SP-1+ | | | 5,024 | | |
| | 4,420 | | | Lafayette Sewage Works Rev. (Merlots), Ser. 2006 D08, (FGIC Insured),
3.34%, due 11/7/07 | | | | A-1+ | | | 4,420 | µv | |
| | 2,000 | | | Logansport Comm. Sch. Corp. TANS, Ser. 2007, 4.00%, due 12/31/07 | | | | | | | 2,001 | | |
| | 2,085 | | | Puttable Floating Option Tax Exempt Receipts, Ser. 2007-212, (XLCA Insured),
3.58%, due 11/1/07 | | | | | | | 2,085 | µr | |
| | 5,720 | | | Univ. Southern Indiana Rev., Ser. 2004, (AMBAC Insured), 3.51%,
due 11/1/07 | | VMIG1 | | | | | 5,720 | µi | |
| | 4,745 | | | Wayne Township Marion Co. Sch. Bldg. Corp. (Merlots), Ser. 2006-D02,
(FGIC Insured), 3.34%, due 11/7/07 | | | | A-1+ | | | 4,745 | µv | |
| | | | | | | | | | | | 135,239 | | |
See Notes to Schedule of Investments 24
| PRINCIPAL AMOUNT | | SECURITY@@ | | RATING‡‡§ | | VALUE†† | |
| (000's omitted) | | | | Moody's | | S&P | | (000's omitted) | |
| Iowa (1.9%) | | | |
| $ | 6,840 | | | Ankeny G.O. BANS, Ser. 2006 A, 4.10%, due 6/1/08 | | MIG1 | | | | $ | 6,841 | | |
| | 4,255 | | | Austin Trust Various Sts. (Iowa Din Au.), Ser. 2007-1011,
(LOC: Bank of America), 3.53%, due 11/1/07 | | | | A-1+ | | | 4,255 | µ | |
| | 3,905 | | | Iowa Fin. Au. Private College Rev. (Morningside College Proj.), Ser. 2007,
(LOC: U.S. Bank), 3.63%, due 11/1/07 | | | | A-1+ | | | 3,905 | µ | |
| | 3,500 | | | Iowa Fin. Au. Private College Rev. (Morningside College Proj.), Ser. 2006,
(LOC: U.S. Bank), 3.63%, due 11/1/07 | | | | A-1+ | | | 3,500 | µß | |
| | 430 | | | Iowa Fin. Au. Rev. (Private Sch. Fac. Rev. Kuemper Proj.), Ser. 1998,
(LOC: Allied Irish Bank), 3.63%, due 11/1/07 | | | | | | | 430 | µß | |
| | 1,340 | | | Iowa Higher Ed. Loan Au. Rev. (Private College Des Moines Proj.), Ser. 2004,
(LOC: Allied Irish Bank), 3.63%, due 11/1/07 | | VMIG1 | | A-1+ | | | 1,340 | µß | |
| | 285 | | | Iowa Higher Ed. Loan Au. Rev. (Private College Des Moines Proj.), Ser. 2003,
(LOC: Allied Irish Bank), 3.63%, due 11/1/07 | | VMIG1 | | | | | 285 | µß | |
| | 5,545 | | | Iowa Higher Ed. Loan Au. Rev. (Private College Wartburg Proj.), Ser. 2000,
(LOC: American Trust & Savings), 3.63%, due 11/1/07 | | VMIG1 | | | | | 5,545 | µß | |
| | 3,535 | | | Iowa Higher Ed. Loan Au. Rev. (Univ. of Dubuque), Ser. 2007 C,
4.50%, due 5/20/08 | | | | SP-1 | | | 3,549 | ß | |
| | 1,860 | | | Iowa Higher Ed. Loan Au. Rev. RANS, Ser. 2007 B, 4.91%, due 5/20/08 | | | | SP-1 | | | 1,871 | ß | |
| | 4,125 | | | Mason City IDR (SUPERVALU, Inc. Proj.), Ser. 1994,
(LOC: Wachovia Bank & Trust Co.), 3.42%, due 11/7/07 | | | | | | | 4,125 | µß | |
| | | | | | | | | | | | 35,646 | | |
| Kansas (2.3%) | | | |
| | 6,145 | | | Junction City G.O. Temporary Notes, Ser. 2007 C, 5.00%, due 6/1/08 | | | | | | | 6,180 | | |
| | 3,865 | | | Shawnee Co. Temporary Notes, Ser. 2007-2, 3.70%, due 10/1/08 | | MIG1 | | | | | 3,866 | | |
| | 13,135 | | | Wyandotte Co. Kansas City Unified G.O. Gov't. Muni. Temp. Notes,
Ser. 2007 III, 3.55%, due 4/1/08 | | MIG1 | | | | | 13,135 | | |
| | 20,200 | | | Wyandotte Co. Kansas City Unified G.O. Gov't. Muni. Temp. Notes,
Ser. 2007 V, 3.55%, due 11/1/08 | | MIG1 | | | | | 20,200 | | |
| | | | | | | | | | | | 43,381 | | |
| Kentucky (1.3%) | | | |
| | 12,300 | | | Kentucky Rural Wtr. Fin. Corp. Pub. Proj. Rev. (Construction Notes),
Ser. 2007 A-1, 3.65%, due 4/1/09 Putable 4/1/08 | | MIG1 | | | | | 12,300 | µ | |
| | 9,990 | | | Muni. Sec. Trust Cert. Rev., Ser. 2002-9027, (FSA Insured),
3.50%, due 11/1/07 | | | | A-1 | | | 9,990 | ñµe | |
| | 3,530 | | | Simpson Co. Hosp. Rev. (Med. Ctr. Franklin, Inc.), Ser. 2006,
(LOC: Branch Banking & Trust Co.), 3.48%, due 11/1/07 | | | | | | | 3,530 | µß | |
| | | | | | | | | | | | 25,820 | | |
| Louisiana (0.3%) | | | |
| | 5,365 | | | Jefferson Sales Tax Dist. Spec. Sales Tax Rev., Ser. 2005,
(AMBAC Insured), 3.57%, due 11/1/07 | | | | | | | 5,365 | µk | |
| Maryland (2.9%) | | | |
| | 30,215 | | | JP Morgan Chase & Co. (Putters), Ser. 2007-1941P, (LOC: JP Morgan Chase),
3.54%, due 11/1/07 | | | | | | | 30,215 | µ | |
| | 15,815 | | | JP Morgan Chase & Co. (Putters), Ser. 2007-1684P, (LOC: JP Morgan Chase),
3.64%, due 11/1/07 | | | | | | | 15,815 | µ | |
| | 7,000 | | | Maryland St. Comm. Dev. Admin. Dept. Hsg. & Comm. Dev. (Residential),
Ser. 2006 Q, 3.59%, due 12/14/07 | | MIG1 | | | | | 7,000 | | |
| | 1,300 | | | Washington Suburban Sanitation Dist. BANS, Ser. 2003 A,
(LOC: Landesbank Hessen-Thveringen Girozentrale), 3.20%, due 11/7/07 | | VMIG1 | | | | | 1,300 | µ | |
| | | | | | | | | | | | 54,330 | | |
See Notes to Schedule of Investments 25
| PRINCIPAL AMOUNT | | SECURITY@@ | | RATING‡‡§ | | VALUE†† | |
| (000's omitted) | | | | Moody's | | S&P | | (000's omitted) | |
| Massachusetts (1.7%) | | | |
| $ | 10,495 | | | Deutsche Bank Spears/Lifers Trust Var. St., Ser. 2007-129,
(LOC: Deutsche Bank), 3.73%, due 11/1/07 | | | | | | $ | 10,495 | µ | |
| | 6,400 | | | Massachusetts St. Dev. Fin. Agcy. Rev. (Suffolk Univ.), Ser. 2005 A,
(LOC: JP Morgan Chase), 3.34%, due 11/7/07 | | VMIG1 | | | | | 6,400 | µß | |
| | 9,470 | | | Worcester G.O. BANS, Ser. 2006 A, 4.00%, due 11/8/07 | | MIG1 | | | | | 9,470 | | |
| | 6,300 | | | Worcester Reg. Trans. Au. RANS, Ser. 2007, 4.00%, due 6/27/08 | | | | | | | 6,302 | | |
| | | | | | | | | | | | 32,667 | | |
| Michigan (1.7%) | | | |
| | 11,675 | | | Detroit City Sch. Dist. G.O. (Floaters), Ser. 2006-3519, (FSA Insured),
3.49%, due 11/1/07 | | | | | | | 11,675 | µl | |
| | 3,955 | | | Detroit Sewage Disp. Rev. (Putters), Ser. 2006-1453, (FGIC Insured),
3.50%, due 11/1/07 | | | | A-1+ | | | 3,955 | µo | |
| | 2,400 | | | Eastern Michigan Univ. Rev., Ser. 2001, (FGIC Insured),
3.58%, due 11/1/07 | | | | A-1+ | | | 2,400 | µl | |
| | 3,775 | | | Grand Rapids Hsg. Corp. Rev. (Floaters), Ser. 2005-3152, (FHA Insured),
3.58%, due 11/1/07 | | | | A-1 | | | 3,775 | µ | |
| | 1,840 | | | Hartland Cons. Sch. Dist. G.O. (Floaters), Ser. 2005-1204,
(LOC: Morgan Stanley), 3.50%, due 11/1/07 | | VMIG1 | | | | | 1,840 | µ | |
| | 5,000 | | | Muni. Sec. Trust Cert. G.O., Ser. 2006-7012A, (FSA Insured),
3.50%, due 11/1/07 | | VMIG1 | | | | | 5,000 | ñµe | |
| | 3,000 | | | Waterford Sch. Dist. G.O. (St. Aid Anticipation Notes), Ser. 2006,
3.85%, due 11/30/07 | | | | | | | 3,001 | | |
| | | | | | | | | | | | 31,646 | | |
| Minnesota (1.7%) | | | |
| | 6,532 | | | Arden Hills Hsg. & Hlth. Care Fac. Rev. (Presbyterian Homes), Ser. 1999 A,
(LOC: U.S. Bank), 3.63%, due 11/1/07 | | | | A-1+ | | | 6,532 | µß | |
| | 11,905 | | | Deutsche Bank Spears/Lifers Trust Var. St. (Roseville), Ser. 2007-134,
(LOC: Deutsche Bank), 3.71%, due 11/1/07 | | | | | | | 11,905 | µ | |
| | 1,000 | | | Mankato Multi-Family Rev. Hsg. (Highland), Ser. 1997,
(LOC: LaSalle National Bank), 3.63%, due 11/1/07 | | | | A-1+ | | | 1,000 | µß | |
| | 3,950 | | | Mankato Rev. (Bethany Lutheran College), Ser. 2000 B,
(LOC: Wells Fargo & Co.), 3.58%, due 11/1/07 | | | | A-1+ | | | 3,950 | µß | |
| | 7,485 | | | Minneapolis & St. Paul Metro. Apts. Commission Arpt. Rev. (Merlots),
Ser. 2000 ZZ, (FGIC Insured), 3.34%, due 11/7/07 | | VMIG1 | | | | | 7,485 | µv | |
| | 935 | | | Roseville Private Sch. Fac. Rev. (Northwestern College Proj.), Ser. 2002,
(LOC: Marshall & Ilsley), 3.63%, due 11/1/07 | | VMIG1 | | | | | 935 | µß | |
| | | | | | | | | | | | 31,807 | | |
| Mississippi (0.1%) | | | |
| | 2,900 | | | Mississippi Bus. Fin. Corp. Rev. (Hattiesburg Clinic), Ser. 2006,
(LOC: AmSouth Bank), 3.49%, due 11/1/07 | | VMIG1 | | | | | 2,900 | µß | |
See Notes to Schedule of Investments 26
| PRINCIPAL AMOUNT | | SECURITY@@ | | RATING‡‡§ | | VALUE†† | |
| (000's omitted) | | | | Moody's | | S&P | | (000's omitted) | |
| Missouri (3.8%) | | | |
| $ | 9,435 | | | ABN Amro Munitops Cert. Trust Rev., Ser. 2004-35, (FGIC Insured),
3.50%, due 11/1/07 | | VMIG1 | | | | $ | 9,435 | µa | |
| | 4,440 | | | Deutsche Bank Spears/Lifers Trust Var. St., Ser. 2007-124,
(LOC: Deutsche Bank), 3.73%, due 11/1/07 | | | | A-1+ | | | 4,440 | µ | |
| | 2,000 | | | Kansas City Ind. Dev. Au. Rev. (Ewing Marion Kaufman Foundation),
Ser. 2001, 3.58%, due 11/1/07 | | | | A-1+ | | | 2,000 | µß | |
| | 1,500 | | | Missouri St. Dev. Fin. Board Infrastructure Fac. Rev. (St. Louis Convention Ctr.),
Ser. 2000 C, (LOC: U.S. Bank), 3.63%, due 11/1/07 | | | | A-1+ | | | 1,500 | µ | |
| | 11,650 | | | Missouri St. Hlth. & Ed. Fac. Au. Ed. Fac. Rev. (Christian Brothers),
Ser. 2002 A, (LOC: Commerce Bank N.A.), 3.63%, due 11/1/07 | | | | A-1 | | | 11,650 | µß | |
| | 5,015 | | | Missouri St. Hlth. & Ed. Fac. Au. Ed. Fac. Rev. (Drury College), Ser. 1999,
(LOC: Bank of America), 3.63%, due 11/1/07 | | VMIG1 | | | | | 5,015 | µß | |
| | 185 | | | Missouri St. Hlth. & Ed. Fac. Au. Ed. Fac. Rev. (Drury Univ.), Ser. 2003,
(LOC: Bank of America), 3.63%, due 11/1/07 | | VMIG1 | | | | | 185 | µß | |
| | 5,500 | | | Missouri St. Hlth. & Ed. Fac. Au. Ed. Fac. Rev. (Kansas City Art Institute),
Ser. 2005, (LOC: Commerce Bank N.A.), 3.63%, due 11/1/07 | | | | A-1 | | | 5,500 | µß | |
| | 1,800 | | | Missouri St. Hlth. & Ed. Fac. Au. Ed. Fac. Rev. (St. Louis Univ.), Ser. 1999 B,
(LOC: Bank of America), 3.61%, due 11/1/07 | | VMIG1 | | A-1+ | | | 1,800 | µß | |
| | 3,565 | | | Missouri St. Hlth. & Ed. Fac. Au. Ed. Fac. Rev. (St. Louis Univ.), Ser. 2002,
(LOC: U.S. Bank), 3.61%, due 11/1/07 | | VMIG1 | | | | | 3,565 | µß | |
| | 3,800 | | | Missouri St. Hlth. & Ed. Fac. Au. Hlth. Fac. Rev. (Bethesda Hlth. Group),
Ser. 2001 A, (LOC: U.S. Bank), 3.58%, due 11/1/07 | | VMIG1 | | | | | 3,800 | µß | |
| | 900 | | | Missouri St. Hlth. & Ed. Fac. Au. Hlth. Fac. Rev. (Lutheran Sr. Svcs.),
Ser. 2000, (LOC: U.S. Bank), 3.26%, due 11/7/07 | | VMIG1 | | | | | 900 | µß | |
| | 1,230 | | | Missouri St. Hlth. & Ed. Fac. Au. Hlth. Fac. Rev. (St. Francis Med. Ctr.),
Ser. 1996 A, (LOC: Bank of America), 3.58%, due 11/1/07 | | | | A-1+ | | | 1,230 | µß | |
| | 2,075 | | | Missouri St. Pub. Utils. Comm. Rev. Construction Notes, Ser. 2007,
4.75%, due 9/1/08 | | MIG1 | | | | | 2,091 | | |
| | 4,130 | | | Muni. Sec. Trust Cert. Rev., Ser. 2007-336A, (AMBAC Insured),
3.50%, due 11/1/07 | | VMIG1 | | | | | 4,130 | ñµe | |
| | 11,125 | | | OFallon Cert. Participation (Floaters), Ser. 2002-1396, (MBIA Insured),
3.52%, due 11/1/07 | | VMIG1 | | | | | 11,125 | µr | |
| | 3,950 | | | St. Louis Ind. Dev. Au. Ind. Rev. (Schnuck Markets, Inc.), Ser. 1985,
(LOC: U.S. Bank), 3.50%, due 11/1/07 | | P-1 | | | | | 3,950 | µß | |
| | | | | | | | | | | | 72,316 | | |
| Montana (0.2%) | | | |
| | 2,745 | | | Montana St. Board of Investments Rev. (Muni. Fin. Cons. Act-Intercap),
Ser. 1994, 3.85%, due 3/1/09 Putable 3/1/08 | | VMIG1 | | | | | 2,745 | µ | |
| | 2,000 | | | Montana St. Board of Investments Rev. (Muni. Fin. Cons. Act-Intercap),
Ser. 2000, 3.85%, due 3/1/25 Putable 3/1/08 | | VMIG1 | | | | | 2,000 | µ | |
| | | | | | | | | | | | 4,745 | | |
| Nebraska (0.3%) | | | |
| | 5,215 | | | Central Plains Energy Proj. Rev. (Nebgas Proj.), Ser. 2007-E09,
(LOC: Wachovia Bank & Trust Co.), 3.34%, due 11/7/07 | | | | A-1+ | | | 5,215 | µ | |
See Notes to Schedule of Investments 27
| PRINCIPAL AMOUNT | | SECURITY@@ | | RATING‡‡§ | | VALUE†† | |
| (000's omitted) | | | | Moody's | | S&P | | (000's omitted) | |
| Nevada (1.6%) | | | |
| $ | 1,900 | | | ABN Amro Munitops Cert. Trust Rev., Ser. 2006, (MBIA Insured),
3.50%, due 11/1/07 | | VMIG1 | | | | $ | 1,900 | ñµa | |
| | 1,065 | | | Clark Co. Sch. Dist. (Merlots), Ser. 2006-D12, (AMBAC Insured),
3.34%, due 11/7/07 | | | | A-1+ | | | 1,065 | µv | |
| | 10,000 | | | Henderson Hlth. Care Fac. Rev., Ser. 2007, (LOC: Citibank, N.A.),
3.51%, due 11/1/07 | | VMIG1 | | | | | 10,000 | µ | |
| | 9,660 | | | JP Morgan Chase & Co. (Putters), Ser. 2006-1633P,
(LOC: JP Morgan Chase), 3.64%, due 11/1/07 | | | | | | | 9,660 | µ | |
| | 3,300 | | | Nevada St. G.O. (Floaters), Ser. 2000-344, (FGIC Insured), 3.50%,
due 11/1/07 | | VMIG1 | | | | | 3,300 | µs | |
| | 4,265 | | | Nevada Sys. Higher Ed. Univ. Rev. (Floaters), Ser. 2005-1240,
(AMBAC Insured), 3.50%, due 11/1/07 | | | | A-1+ | | | 4,265 | µs | |
| | | | | | | | | | | | 30,190 | | |
| New Hampshire (1.1%) | | | |
| | 3,200 | | | Cheshire Co. G.O. TANS, Ser. 2007, 3.75%, due 12/27/07 | | | | | | | 3,200 | | |
| | 7,000 | | | Merrimack Co. G.O. TANS, Ser. 2007, 4.05%, due 12/28/07 | | | | | | | 7,001 | | |
| | 4,000 | | | Merrimack Co. G.O. TANS, Ser. 2007, 4.25%, due 12/28/07 | | | | | | | 4,003 | | |
| | 800 | | | New Hampshire Hlth. & Ed. Fac. Au. Rev. (Seacoast Hospice),
Ser. 2006, (LOC: Citizens Bank), 3.53%, due 11/1/07 | | | | | | | 800 | µ | |
| | 5,400 | | | Strafford Co. G.O. TANS, Ser. 2007, 3.75%, due 12/31/07 | | | | | | | 5,400 | | |
| | | | | | | | | | | | 20,404 | | |
| New Jersey (1.4%) | | | |
| | 4,900 | | | Allamuchy Township Board Ed. G.O. Temporary Notes, Ser. 2007,
4.00%, due 3/14/08 | | | | | | | 4,905 | | |
| | 3,289 | | | Highlands G.O. BANS, Ser. 2007, 4.00%, due 1/30/08 | | | | | | | 3,291 | | |
| | 14,200 | | | Hoboken G.O. BANS, Ser. 2007, 3.90%, due 9/12/08 | | | | | | | 14,212 | | |
| | 4,840 | | | New Jersey Econ. Dev. Au. Econ. Dev. Rev. (Comm. Options Inc. Proj.),
Ser. 2007, (LOC: Wachovia Bank & Trust Co.), 3.50%, due 11/1/07 | | | | | | | 4,840 | µß | |
| | | | | | | | | | | | 27,248 | | |
| New York (0.6%) | | | |
| | 1,900 | | | Muni. Sec. Trust Cert., Ser. 2001, (LOC: Bear Stearns), 3.57%, due 11/1/07 | | VMIG1 | | | | | 1,900 | ñµ | |
| | 4,970 | | | New York City Transitional Fin. Au. Rev., Ser. 2002-2A,
(LOC: Dexia Credit Locale de France), 3.50%, due 11/1/07 | | VMIG1 | | A-1+ | | | 4,970 | µ | |
| | 4,515 | | | New York G.O., Ser. 2004 H1, (LOC: Bank of New York), 3.50%,
due 11/1/07 | | VMIG1 | | A-1+ | | | 4,515 | µ | |
| | 495 | | | Sales Tax Asset Receivable Corp., Ser. 2006, (AMBAC Insured),
3.50%, due 11/1/07 | | VMIG1 | | | | | 495 | µh | |
| | | | | | | | | | | | 11,880 | | |
| North Carolina (0.5%) | | | |
| | 1,990 | | | Cabarrus Co. Cert. Participation, Ser. 2003-4520, (AMBAC Insured),
3.51%, due 11/1/07 | | | | A-1+ | | | 1,990 | µi | |
| | 2,485 | | | Eclipse Funding Trust (Solar Eclipse-Union Co.), Ser. 2006-0155,
(AMBAC Insured), 3.49%, due 11/1/07 | | | | A-1+ | | | 2,485 | µu | |
| | 3,600 | | | North Carolina Med. Care Comm. Hlth. Care Fac. Rev.
(Sisters of Mercy Svcs. Corp.), Ser. 2007, (LOC: Branch Banking & Trust Co.),
3.48%, due 11/1/07 | | VMIG1 | | | | | 3,600 | µß | |
| | 1,270 | | | Puttable Floating Option Tax Exempt Receipts (Floaters), Ser. 2000,
(LOC: Merrill Lynch Capital Markets), 3.63%, due 11/1/07 | | | | A-1 | | | 1,270 | µ | |
| | | | | | | | | | | | 9,345 | | |
See Notes to Schedule of Investments 28
| PRINCIPAL AMOUNT | | SECURITY@@ | | RATING‡‡§ | | VALUE†† | |
| (000's omitted) | | | | Moody's | | S&P | | (000's omitted) | |
| Ohio (4.3%) | | | |
| $ | 1,010 | | | Clermont Co. Econ. Dev. Rev. (John Q Hammons Proj.), Ser. 1989,
(LOC: Fifth Third Bank), 2.00%, due 5/1/12 Putable 11/1/07 | | | | | | $ | 1,010 | µß | |
| | 3,455 | | | Cleveland-Cuyahoga Co. Port Au. Ed. Fac. Rev. (Laurel Sch. Proj.),
Ser. 2004, (LOC: Key Bank), 3.51%, due 11/1/07 | | | | | | | 3,455 | µß | |
| | 3,850 | | | Deerfield Township G.O. BANS, Ser. 2006, 3.61%, due 11/29/07 | | MIG1 | | | | | 3,850 | | |
| | 4,750 | | | Hamilton G.O. BANS, Ser. 2007, 4.00%, due 9/11/08 | | | | | | | 4,760 | | |
| | 1,100 | | | Licking Co. Career & Technology Ed. Ctrs. G.O. BANS
(Sch. Fac. Construction), Ser. 2007, 4.50%, due 9/10/08 | | | | | | | 1,107 | | |
| | 3,500 | | | Lucas Co. G.O. Purp. Imp. Notes, Ser. 2007-1, 4.00%, due 9/18/08 | | MIG1 | | SP-1+ | | | 3,510 | | |
| | 4,660 | | | Marysville G.O. BANS, Ser. 2007, 4.13%, due 6/5/08 | | MIG1 | | | | | 4,672 | | |
| | 3,500 | | | Marysville Tax Increment Fin. Rev. (Coleman's Crossing Rd.), Ser. 2007,
(LOC: Fifth Third Bank), 4.25%, due 9/11/08 | | | | | | | 3,515 | | |
| | 6,650 | | | Muni. Sec. Trust Cert. G.O., Ser. 2001-133A, (FSA Insured), 3.49%, due 11/1/07 | | | | A-1 | | | 6,650 | ñµe | |
| | 2,830 | | | Ohio St. G.O., Ser. 2005-7508, (LOC: Citibank, N.A.), 3.51%, due 11/1/07 | | VMIG1 | | | | | 2,830 | µ | |
| | 3,200 | | | Ohio Univ. Gen. Receipts Athens BANS, Ser. 2007, 4.25%, due 1/16/08 | | MIG1 | | | | | 3,204 | | |
| | 3,000 | | | Richland Co. G.O. BANS (Correctional Fac.), Ser. 2007, 4.50%, due 2/21/08 | | | | | | | 3,007 | | |
| | 660 | | | Sidney City Sch. Dist. G.O. BANS (Energy Construction), Ser. 2006,
4.28%, due 11/29/07 | | | | | | | 660 | | |
| | 1,200 | | | Sidney City Sch. Dist. G.O. BANS (Sch. Construction), Ser. 2006,
4.07%, due 11/29/07 | | | | | | | 1,200 | | |
| | 4,850 | | | Stark Co. Port Au. Econ. Dev. Rev. (Vision FC LLC Proj.), Ser. 2007,
(LOC: Fifth Third Bank), 3.47%, due 11/2/07 | | | | | | | 4,850 | µ | |
| | 19,500 | | | Union Township Tax Increment Rev. BANS, Ser. 2007, 4.25%, due 9/17/08 | | MIG1 | | | | | 19,607 | | |
| | 3,000 | | | Univ. of Cincinnati Gen. Receipts Bonds BANS, Ser. 2007 C, 4.50%, due 1/24/08 | | MIG1 | | SP-1+ | | | 3,006 | | |
| | 1,485 | | | Univ. of Toledo Gen. Receipts Bonds, Ser. 2002, (FGIC Insured),
3.58%, due 11/1/07 | | VMIG1 | | A-1+ | | | 1,485 | µu | |
| | 7,300 | | | Univ. of Toledo Gen. Receipts Bonds, Ser. 2001-SGA125, (FGIC Insured),
3.30%, due 11/7/07 | | | | A-1+ | | | 7,300 | µt | |
| | 2,330 | | | Wickliffe BANS (Capital Improvements), Ser. 2007, 4.25%, due 12/6/07 | | | | | | | 2,331 | | |
| | | | | | | | | | | | 82,009 | | |
| Oklahoma (1.5%) | | | |
| | 5,995 | | | Hulbert Econ. Dev. Au. Econ. Dev. Rev., Ser. 2007-301,
(LOC: Bank of America), 3.52%, due 11/1/07 | | VMIG1 | | | | | 5,995 | µ | |
| | 22,000 | | | Tulsa Co. Ind. Au. Cap. Imp. Rev., Ser. 2003 A, (LOC: Bank of America),
3.70%, due 5/15/17 Putable 11/15/07 | | | | A-1+ | | | 22,000 | µ | |
| | | | | | | | | | | | 27,995 | | |
| Oregon (0.7%) | | | |
| | 1,000 | | | Multnomah Co. Higher Ed. Rev. (Concordia Univ. Portland Proj.), Ser. 1999,
(LOC: Key Bank), 3.63%, due 11/1/07 | | VMIG1 | | | | | 1,000 | µß | |
| | 6,315 | | | Oregon Sch. Boards Assoc. Short-Term Borrowing Prog. Cert. Participation,
Ser. 2007 A, 3.80%, due 5/30/08 | | | | | | | 6,315 | | |
| | 5,545 | | | Oregon St. Homeowner Rev. (Floaters), Ser. 2006-229, (LOC: Lloyd's Bank),
3.53%, due 11/1/07 | | VMIG1 | | | | | 5,545 | µ | |
| | | | | | | | | | | | 12,860 | | |
| Pennsylvania (3.3%) | | | |
| | 14,125 | | | Butler Co. Gen. Au. Rev. (Hampton Township Sch. Dist. Proj.), Ser. 2007,
(FSA Insured), 3.46%, due 11/1/07 | | | | | | | 14,125 | µv | |
| | 12,270 | | | Deutsche Bank Spears/Lifers Trust Var. St., Ser. 2007-247, (AMBAC Insured),
3.49%, due 11/1/07 | | | | A-1+ | | | 12,270 | µk | |
| | 2,115 | | | Lawrence Co. Ind. Dev. Au. Rev. (Villa Maria Proj.), Ser. 2003,
(LOC: Allied Irish Bank), 3.47%, due 11/1/07 | | VMIG1 | | | | | 2,115 | µß | |
| | 7,700 | | | Muni. Sec. Trust Cert. Rev., Ser. 2007-7065, (AMBAC Insured),
3.50%, due 11/1/07 | | VMIG1 | | | | | 7,700 | ñµe | |
| | 21,530 | | | Pennsylvania Econ. Dev. Fin. Au. Rev. (Merlots), Ser. 2007-F01,
(LOC: Wachovia Bank & Trust Co.), 3.34%, due 11/7/07 | | | | A-1+ | | | 21,530 | µ | |
| | 5,000 | | | St. Pub. Sch. Bldg. Au. Sch. Rev., Ser. 2006-566, (FSA Insured),
3.51%, due 11/1/07 | | VMIG1 | | | | | 5,000 | µh | |
| | | | | | | | | | | | 62,740 | | |
See Notes to Schedule of Investments 29
| PRINCIPAL AMOUNT | | SECURITY@@ | | RATING‡‡§ | | VALUE†† | |
| (000's omitted) | | | | Moody's | | S&P | | (000's omitted) | |
| Puerto Rico (0.9%) | | | |
| $ | 2,900 | | | Puerto Rico Sales Tax Fin. Corp. Sales Tax Rev. (Floater), Ser. 2007-1984,
(LOC: Morgan Stanley), 3.50%, due 11/1/07 | | | | A-1+ | | $ | 2,900 | µ | |
| | 13,500 | | | Puerto Rico Sales Tax Fin. Corp. Sales Tax Rev. (Floaters), Ser. 2007-2019,
(LOC: Morgan Stanley), 3.50%, due 11/1/07 | | | | A-1+ | | | 13,500 | µ | |
| | | | | | | | | | | | 16,400 | | |
| South Carolina (2.5%) | | | |
| | 3,700 | | | Charleston Ed. Excellence Fin. Corp. Rev., Ser. 2006-515,
(LOC: Citibank, N.A.), 3.51%, due 11/1/07 | | | | | | | 3,700 | µ | |
| | 23,385 | | | Greenville Co. Sch. Dist. Installment Purchase Ref. Rev. (Floaters),
Ser. 2004-982, (LOC: Morgan Stanley), 3.50%, due 11/1/07 | | | | A-1+ | | | 23,385 | µ | |
| | 4,505 | | | Jasper Co. Rev. BANS, Ser. 2007, 3.85%, due 7/1/08 | | | | | | | 4,505 | | |
| | 1,300 | | | Macon Trust Var. St., Ser. 2007-303, (LOC: Bank of America),
3.52%, due 11/1/07 | | VMIG1 | | | | | 1,300 | µ | |
| | 5 | | | Muni. Sec. Trust Cert. Rev., Ser. 2007-293A, (FSA Insured),
3.50%, due 11/1/07 | | VMIG1 | | | | | 5 | ñµe | |
| | 4,685 | | | Three Rivers Solid Waste Au. Solid Waste Disp. Fac. Rev. BANS,
Ser. 2007, 3.75%, due 6/1/08 | | | | SP-1+ | | | 4,685 | | |
| | 9,365 | | | Western Carolina Reg. Sewer Au. Sewer Sys. Rev., Ser. 2007-11123,
(FSA Insured), 3.51%, due 11/1/07 | | | | A-1+ | | | 9,365 | µh | |
| | | | | | | | | | | | 46,945 | | |
| South Dakota (0.3%) | | | |
| | 3,000 | | | South Dakota St. Hlth. & Ed. Fac. Au. Rev. (Rapid City Regional Hosp.),
Ser. 2003, (MBIA Insured), 3.58%, due 11/1/07 | | VMIG1 | | | | | 3,000 | µßu | |
| | 3,600 | | | Watertown IDR (SUPERVALU, Inc. Proj.), Ser. 1994,
(LOC: Wachovia Bank & Trust Co.), 3.42%, due 11/7/07 | | | | | | | 3,600 | µß | |
| | | | | | | | | | | | 6,600 | | |
| Tennessee (2.4%) | | | |
| | 600 | | | Blount Co. Pub. Bldg. Au. (Gov't. Pub. Imp.), Ser. 2001 A-2F,
(AMBAC Insured), 3.62%, due 11/1/07 | | VMIG1 | | | | | 600 | µy | |
| | 500 | | | Blount Co. Pub. Bldg. Au. (Local Gov't. Pub. Imp.), Ser. 2001 A-1-D,
(AMBAC Insured), 3.62%, due 11/1/07 | | VMIG1 | | | | | 500 | µy | |
| | 1,400 | | | Memphis-Shelby Co. IDB Rev. (Medical Group, Inc.), Ser. 1999,
(LOC: SunTrust Bank), 3.46%, due 11/1/07 | | P-1 | | | | | 1,400 | µß | |
| | 7,450 | | | Metro. Gov't. Nashville & Davidson Co. IDB Multi-Family Hsg. Rev.
(Spinnaker), Ser. 2002, (LOC: Fannie Mae), 3.30%, due 11/7/07 | | | | A-1+ | | | 7,450 | µß | |
| | 3,250 | | | Sevier Co. Pub. Bldg. Au. (Pub. Construction Notes Proj.), Ser. 2007-A6,
3.80%, due 4/1/10 Putable 4/1/08 | | MIG1 | | | | | 3,250 | µ | |
| | 450 | | | Sevier Co. Pub. Bldg. Au. Rev. (Local Gov't. Pub. Imp.), Ser. 2002
(AMBAC Insured), 3.62%, due 11/1/07 | | VMIG1 | | | | | 450 | µo | |
| | 14,785 | | | Tennessee Energy Acquisition Corp. Gas Rev. (Floaters), Ser. 2007-2020,
(LOC: Morgan Stanley), 3.55%, due 11/1/07 | | VMIG1 | | | | | 14,785 | µ | |
| | 3,355 | | | Tennessee Energy Acquisition Corp. Gas Rev. (Floaters), Ser. 2006-3646,
(LOC: Merrill Lynch Capital Markets), 3.58%, due 11/1/07 | | | | | | | 3,355 | µ | |
| | 14,135 | | | Tennessee Energy Acquisition Corp. Gas Rev. (Putters), Ser. 2007-2251,
(LOC: JP Morgan Chase), 3.53%, due 11/1/07 | | VMIG1 | | | | | 14,135 | µ | |
| | | | | | | | | | | | 45,925 | | |
| Texas (18.0%) | | | |
| | 11,675 | | | ABN Amro Munitops Cert. Trust Rev., Ser. 2006-30, (PSF Insured),
3.50%, due 11/1/07 | | VMIG1 | | | | | 11,675 | ñµa | |
| | 6,105 | | | Aledo Independent Sch. Dist. (Floaters), Ser. 2005-2769, (PSF Insured),
3.58%, due 11/1/07 | | | | | | | 6,105 | µr | |
| | 6,345 | | | Austin Convention Enterprises, Inc. Convention Ctr. (Putters),
Ser. 2006-1614, (XLCA Insured), 3.50%, due 11/1/07 | | | | A-1+ | | | 6,345 | µo | |
| | 7,945 | | | Austin Hsg. Fin. Corp. Multi-Family Hsg. Rev. (Merlots), Ser. 2007-G02,
(LOC: Bank of New York), 3.34%, due 11/7/07 | | | | A-1+ | | | 7,945 | µ | |
See Notes to Schedule of Investments 30
| PRINCIPAL AMOUNT | | SECURITY@@ | | RATING‡‡§ | | VALUE†† | |
| (000's omitted) | | | | Moody's | | S&P | | (000's omitted) | |
| $ | 4,600 | | | Austin Wtr. & Wastewater Sys. Rev. (Merlots), Ser. 2006-D10, (FSA Insured),
3.34%, due 11/7/07 | | | | A-1+ | | $ | 4,600 | µv | |
| | 10,565 | | | BB&T Muni. Trust Var. St. (Floaters), Ser. 2007-2010,
(LOC: Branch Banking & Trust Co.), 3.49%, due 11/1/07 | | VMIG1 | | | | | 10,565 | µ | |
| | 3,005 | | | BB&T Muni. Trust Var. St. (Floaters), Ser. 2007-2036,
(LOC: Branch Banking & Trust Co.), 3.51%, due 11/1/07 | | VMIG1 | | | | | 3,005 | µ | |
| | 5,360 | | | Beaumont G.O., Ser. 2006-2223, (CIFG Insured), 3.51%, due 11/1/07 | | VMIG1 | | | | | 5,360 | µi | |
| | 27,500 | | | Deutsche Bank Spears/Lifers Trust Var. St., Ser. 2007-292,
(LOC: Deutsche Bank), 3.53%, due 11/1/07 | | | | A-1+ | | | 27,500 | µ | |
| | 6,795 | | | Dickinson Independent Sch. Dist. (Putters), Ser. 2007-1518B, (PSF Insured),
3.50%, due 11/1/07 | | VMIG1 | | | | | 6,795 | µo | |
| | 2,970 | | | Dickinson Independent Sch. Dist. (Putters), Ser. 2007-1517B, (PSF Insured),
3.50%, due 11/1/07 | | VMIG1 | | | | | 2,970 | µo | |
| | 4,700 | | | Eclipse Funding Trust (Solar Eclipse-Houston Independent Sch.),
Ser. 2006-0019, (FSA Insured), 3.49%, due 11/1/07 | | VMIG1 | | | | | 4,700 | ñµu | |
| | 3,200 | | | El Paso Independent Sch. Dist. (Putters), Ser. 2007-2230, (PSF Insured),
3.50%, due 11/1/07 | | VMIG1 | | A-1+ | | | 3,200 | µo | |
| | 4,345 | | | Frenship Independent Sch. Dist. (Floaters), Ser. 2005, (PSF Insured),
3.58%, due 11/1/07 | | | | | | | 4,345 | µk | |
| | 6,480 | | | Harris Co. Hlth. Fac. Dev. Corp. Rev. (Putters), Ser. 2005-1018,
(LOC: JP Morgan Chase), 3.49%, due 11/1/07 | | VMIG1 | | A-1+ | | | 6,480 | µ | |
| | 1,370 | | | Hidalgo Co. G.O. (Merlots), Ser. 2007-C03, (FSA Insured), 3.34%,
due 11/7/07 | | | | A-1+ | | | 1,370 | µd | |
| | 7,780 | | | Keller Ind. Sch. Dist. G.O. (ABN Amro Munitops Cert. Trust), Ser. 2006-30,
(PSF Insured), 3.50%, due 11/1/07 | | VMIG1 | | | | | 7,780 | ñµa | |
| | 5,270 | | | Lufkin Hlth. Fac. Dev. Corp. Hlth. Sys. Ref. Rev. (Mem. Hlth. Sys. East Texas),
Ser. 1998, 5.70%, due 2/15/28 Pre-Refunded 2/15/08 | | | | | | | 5,450 | ß | |
| | 15,585 | | | Lufkin Hlth. Fac. Dev. Corp. Hlth. Sys. Ref. Rev. (Memorial Hlth. Sys.),
Ser. 2005 A, (LOC: Allied Irish Bank PLC), 3.61%, due 11/1/07 | | | | A-1 | | | 15,585 | µß | |
| | 9,935 | | | McKinney Independent Sch. Dist. (Floaters), Ser. 2006-26TP, (PSF Insured),
3.49%, due 11/1/07 | | | | | | | 9,935 | µx | |
| | 8,990 | | | Muni. Sec. Trust Cert. G.O., Ser. 2000-9005A, (FSA Insured),
3.50%, due 11/1/07 | | | | A-1 | | | 8,990 | ñµe | |
| | 7,995 | | | Muni. Sec. Trust Cert. G.O., Ser. 2007-312A, (LOC: Bear Stearns),
3.50%, due 11/1/07 | | VMIG1 | | | | | 7,995 | ñµe | |
| | 9,520 | | | Muni. Sec. Trust Cert. G.O., Ser. 2007-315A, (FSA Insured), 3.50%,
due 11/1/07 | | VMIG1 | | | | | 9,520 | ñµe | |
| | 3,775 | | | Muni. Sec. Trust Cert. G.O., Ser. 2006-279A, (PSF Insured), 3.51%,
due 11/1/07 | | VMIG1 | | | | | 3,775 | ñµe | |
| | 14,860 | | | Muni. Sec. Trust Cert. G.O., Ser. 2007-338A, (PSF Insured), 3.51%,
due 11/1/07 | | VMIG1 | | | | | 14,860 | ñµe | |
| | 8,450 | | | Muni. Sec. Trust Cert. G.O., Ser. 2007-3082A, (MBIA Insured), 3.60%,
due 11/1/07 | | VMIG1 | | | | | 8,450 | ñµe | |
| | 29,740 | | | Munitops II Trust, Ser. 2007-63, (PSF Insured), 3.50%, due 11/1/07 | | | | | | | 29,740 | µc | |
| | 22,695 | | | Munitops II Trust, Ser. 2007-67, (PSF Insured), 3.50%, due 11/1/07 | | | | | | | 22,695 | ñµc | |
| | 5,750 | | | Puttable Floating Option Tax Exempt Receipts, Ser. 2007, (MBIA Insured),
3.58%, due 11/1/07 | | | | | | | 5,750 | µr | |
| | 8,190 | | | Puttable Floating Option Tax Exempt Receipts (Lampasasa), Ser. 2007-4309,
(PSF Insured), 3.52%, due 11/1/07 | | | | | | | 8,190 | µr | |
| | 9,230 | | | Puttable Floating Option Tax Exempt Receipts (Leander Sch. Dist.),
Ser. 2007-256, (PSF Insured), 3.53%, due 11/1/07 | | | | | | | 9,230 | µr | |
| | 5,105 | | | San Antonio Wtr. Rev., Ser. 2006-7028, (MBIA Insured), 3.51%,
due 11/1/07 | | VMIG1 | | | | | 5,105 | µi | |
| | 20,525 | | | Texas Muni. Gas Acquisition & Supply Corp. II Gas Supply Rev.,
Ser. 2007-10014, (LOC: Dexia Credit Locale de France), 3.58%, due 11/1/07 | | | | A-1+ | | | 20,525 | µ | |
| | 24,745 | | | Texas St. Turnpike Au. Central Turnpike Sys. Rev., Ser. 2007-10041,
(AMBAC Insured), 3.51%, due 11/1/07 | | | | A-1+ | | | 24,745 | µi | |
| | 7,241 | | | Texas St. Turnpike Au. Central Turnpike Sys. Rev. (Floaters), Ser. 2006-1408,
(AMBAC Insured), 3.50%, due 11/1/07 | | | | A-1+ | | | 7,241 | µs | |
| | 3,520 | | | Univ. of Texas Univ. Rev., Ser. 2007-1080, (LOC: Citigroup Global Markets),
3.51%, due 11/1/07 | | VMIG1 | | | | | 3,520 | µ | |
| | | | | | | | | | | | 342,041 | | |
See Notes to Schedule of Investments 31
| PRINCIPAL AMOUNT | | SECURITY@@ | | RATING‡‡§ | | VALUE†† | |
| (000's omitted) | | | | Moody's | | S&P | | (000's omitted) | |
| Utah (0.8%) | | | |
| $ | 4,800 | | | Central Wtr. Conservancy Dist. G.O., Ser. 1998 E, (AMBAC Insured),
3.31%, due 11/7/07 | | VMIG1 | | A-1+ | | $ | 4,800 | µp | |
| | 2,950 | | | Lehi Elec. Util. Rev., Ser. 2005, (FSA Insured), 3.37%, due 11/7/07 | | | | | | | 2,950 | µl | |
| | 8,500 | | | Utah Trans. Au. Sales Tax Rev. (Floaters), Ser. 2007-63Z, (MBIA Insured),
3.50%, due 11/1/07 | | | | | | | 8,500 | µm | |
| | | | | | | | | | | | 16,250 | | |
| Vermont (0.2%) | | | |
| | 3,400 | | | Vermont Ed. & Hlth. Bldg. Fin. Agcy. Rev. (Middlebury College Proj.),
Ser. 2002 B, 3.58%, due 11/1/32 Putable 11/1/07 | | | | | | | 3,400 | µ | |
| | 195 | | | Vermont Ed. & Hlth. Bldg. Fin. Agcy. Rev. (Northeastern Hosp.), Ser. 2004 A,
(LOC: TD Banknorth N.A.), 3.55%, due 11/1/07 | | VMIG1 | | | | | 195 | µß | |
| | | | | | | | | | | | 3,595 | | |
| Virginia (3.0%) | | | |
| | 26,280 | | | BB&T Muni. Trust Var. St. (Floaters), Ser. 2007-1002,
(LOC: Branch Banking & Trust Co.), 3.61%, due 11/1/07 | | VMIG1 | | | | | 26,280 | µ | |
| | 15,265 | | | BB&T Muni. Trust Var. St. (Floaters), Ser. 2007-1004,
(LOC: Branch Banking & Trust Co.), 3.61%, due 11/1/07 | | VMIG1 | | | | | 15,265 | µ | |
| | 7,500 | | | ABN Amro Munitops. Cert. Trust Rev., Ser. 2005-48,
(LOC: ABN Amro Bank N.V.), 3.50%, due 11/1/07 | | VMIG1 | | | | | 7,500 | ñµ | |
| | 7,050 | | | BB&T Muni. Trust Var. St. (Floaters), Ser. 2007-1006,
(LOC: Branch Banking & Trust Co.), 3.61%, due 11/1/07 | | VMIG1 | | | | | 7,050 | µ | |
| | | | | | | | | | | | 56,095 | | |
| Washington (3.9%) | | | |
| | 6,865 | | | Deutsche Bank Spears/Lifers Trust Var. St. (Everett Hsg.), Ser. 2007-131,
(LOC: Deutsche Bank), 3.73%, due 11/1/07 | | | | | | | 6,865 | µ | |
| | 3,700 | | | Everett Pub. Fac. Dist. Proj. Rev., Ser. 2007,
(LOC: Dexia Credit Locale de France), 3.63%, due 11/1/07 | | | | A-1+ | | | 3,700 | µ | |
| | 4,622 | | | King Co. Swr. Rev. (Floaters), Ser. 2005-1091, (FSA Insured), 3.50%,
due 11/1/07 | | | | | | | 4,622 | µs | |
| | 5,335 | | | Muni. Sec. Trust Cert. G.O., Ser. 2007-301A, (AMBAC Insured),
3.50%, due 11/1/07 | | | | | | | 5,335 | ñµe | |
| | 12,335 | | | NJB Prop. Lease Rev., Ser. 2007, (LOC: Citigroup Global Markets),
3.51%, due 11/1/07 | | | | A-1+ | | | 12,335 | µ | |
| | 3,175 | | | Pierce Co. Sch. Dist. Number 010 Tacoma G.O. (Floaters), Ser. 2005-3316,
(FSA Insured), 3.58%, due 11/1/07 | | VMIG1 | | | | | 3,175 | µr | |
| | 2,607 | | | Port of Seattle Rev. (Floaters), Ser. 2002-739D, (FGIC Insured),
3.50%, due 11/1/07 | | | | A-1+ | | | 2,607 | µs | |
| | 7,240 | | | Port of Seattle Rev. (Floaters), Ser. 2006-3499, (XLCA Insured),
3.52%, due 11/1/07 | | | | | | | 7,240 | µr | |
| | 7,745 | | | Seattle Museum Dev. Au. Spec. Oblig. Rev. (Merlots), Ser. 2005-D03,
(LOC: Wachovia Bank & Trust Co.), 3.34%, due 11/7/07 | | | | A-1+ | | | 7,745 | µ | |
| | 17,000 | | | Washington St. Hlth. Care Fac. Au. Rev. (Swedish Hlth. Svcs.), Ser. 2006,
(LOC: Citibank, N.A.), 3.34%, due 11/7/07 | | VMIG1 | | A-1+ | | | 17,000 | µß | |
| | 1,000 | | | Washington St. Hsg. Fin. Commission Non-Profit Rev.
(St. Vincent de Paul Proj.), Ser. 2000 A,
(LOC: Wells Fargo Bank & Trust Co.), 3.44%, due 11/1/07 | | | | A-1+ | | | 1,000 | µß | |
| | 1,800 | | | Washington St. Hsg. Fin. Commission Non-Profit Rev.
(Tacoma Art Museum Proj.), Ser. 2002, (LOC: Northern Trust Co.),
3.63%, due 11/1/07 | | VMIG1 | | | | | 1,800 | µß | |
| | | | | | | | | | | | 73,424 | | |
See Notes to Schedule of Investments 32
| PRINCIPAL AMOUNT | | SECURITY@@ | | RATING‡‡§ | | VALUE†† | |
| (000's omitted) | | | | Moody's | | S&P | | (000's omitted) | |
| Wisconsin (4.0%) | | | |
| $ | 3,000 | | | Antigo Unified Sch. Dist. TRANS, Ser. 2006, 3.85%, due 11/1/07 | | | | | | $ | 3,000 | | |
| | 1,560 | | | Appleton Waterworks Rev., Ser. 2007-A, (MBIA Insured), 4.00%, due 1/1/08 | | | | | | | 1,561 | | |
| | 19,310 | | | Eclipse Funding Trust Var. St. (Solar Eclipse-Wisconsin St.), Ser. 2007-0004,
(FSA Insured), 3.50%, due 11/1/07 | | | | A-1+ | | | 19,310 | µu | |
| | 6,500 | | | Muni. Sec. Trust Cert. Rev., Ser. 2007-335, (LOC: Bear Stearns),
3.50%, due 11/1/07 | | VMIG1 | | | | | 6,500 | ñµ | |
| | 4,250 | | | New Richmond Sch. Dist. BANS, Ser. 2007, 4.13%, due 6/6/08 | | MIG1 | | | | | 4,255 | | |
| | 3,000 | | | Wisconsin Sch. Dist. Cash Flow Management Prog. Cert. Participation,
Ser. 2006 B, 4.25%, due 11/1/07 | | MIG1 | | | | | 3,000 | | |
| | 500 | | | Wisconsin St. Hlth. & Ed. Fac. Au. Rev. (Alverno College Proj.), Ser. 1997,
(LOC: Allied Irish Bank), 3.63%, due 11/1/07 | | VMIG1 | | | | | 500 | µß | |
| | 4,125 | | | Wisconsin St. Hlth. & Ed. Fac. Au. Rev. (Blood Ctr.), Ser. 1994 A,
(LOC: Marshall & Ilsley), 3.29%, due 11/7/07 | | | | A-1 | | | 4,125 | µß | |
| | 3,145 | | | Wisconsin St. Hlth. & Ed. Fac. Au. Rev.
(Concordia Univ. of Wisconsin, Inc. Proj.), Ser. 2006, (LOC: Marshall & Ilsley),
3.54%, due 11/1/07 | | | | | | | 3,145 | µß | |
| | 3,175 | | | Wisconsin St. Hlth. & Ed. Fac. Au. Rev. (Edgewood College), Ser. 2006,
(LOC: U.S. Bank), 3.63%, due 11/1/07 | | | | A-1+ | | | 3,175 | µß | |
| | 8,090 | | | Wisconsin St. Hlth. & Ed. Fac. Au. Rev. (Floaters), Ser. 2003-858,
(MBIA Insured), 3.52%, due 11/1/07 | | | | | | | 8,090 | µp | |
| | 12,100 | | | Wisconsin St. Hlth. & Ed. Fac. Au. Rev. (Fort Healthcare Inc.), Ser. 2007 A,
(LOC: JP Morgan Chase), 3.61%, due 11/1/07 | | | | A-1+ | | | 12,100 | µß | |
| | 1,390 | | | Wisconsin St. Hlth. & Ed. Fac. Au. Rev. (Gundersen Lutheran), Ser. 2000 A,
(FSA Insured), 3.58%, due 11/1/07 | | | | A-1+ | | | 1,390 | µßl | |
| | 1,400 | | | Wisconsin St. Hlth. & Ed. Fac. Au. Rev. (Lutheran College Proj.), Ser. 2003,
(LOC: U.S. Bank), 3.63%, due 11/1/07 | | | | A-1+ | | | 1,400 | µß | |
| | 3,100 | | | Wisconsin St. Hlth. & Ed. Fac. Au. Rev. (Prohealth Inc.), Ser. 2001 B,
(AMBAC Insured), 3.58%, due 11/1/07 | | VMIG1 | | A-1+ | | | 3,100 | µoß | |
| | 935 | | | Wisconsin St. Hlth. & Ed. Fac. Au. Rev. (Riverview Hosp. Assoc.), Ser. 2001,
(LOC: U.S. Bank), 3.63%, due 11/1/07 | | | | A-1+ | | | 935 | µß | |
| | | | | | | | | | | | 75,586 | | |
| | | | | Total Investments (99.2%) | | | | | | | 1,883,799 | | |
| | | | | Cash, receivables and other assets, less liabilities (0.8%) | | | | | | | 14,359 | | |
| | | | | Total Net Assets (100.0%) | | | | | | $ | 1,898,158 | | |
See Notes to Schedule of Investments 33
Schedule of Investments Municipal Master Series
| PRINCIPAL AMOUNT | | SECURITY@@ | | RATING‡‡§ | | VALUE†† | |
| (000's omitted) | | | | Moody's | | S&P | | (000's omitted) | |
| Alabama (0.2%) | | | |
| $ | 988 | | | Birmingham Pub. Park & Rec. Board Rev., Ser. 1997, (LOC: AmSouth Bank),
3.58%, due 11/1/07 | | | | | | $ | 988 | µß | |
| Arizona (1.5%) | | | |
| | 8,995 | | | RBC Muni. Prod., Inc. Trust Var. St. Rev. (Floater Cert.), Ser. 2007 C-6,
(LOC: Royal Bank of Canada), 3.57%, due 11/1/07 | | VMIG1 | | | | | 8,995 | µ | |
| Arkansas (1.4%) | | | |
| | 8,560 | | | Morgan Keegan Muni. Prod., Inc. Var. St. Trust Receipts, Ser. 2006 D,
(LOC: IXIS Funding Corp.), 3.57%, due 11/1/07 | | | | A-1+ | | | 8,560 | µq | |
| California (5.6%) | | | |
| | 1,335 | | | California Statewide Comm. Dev. Corp. Rev. (RL Group LLC), Ser. 1998 C,
(LOC: Mellon 1st Business Bank), 3.40%, due 11/7/07 | | | | | | | 1,335 | µß | |
| | 5,000 | | | Contra Costa Co. Multi-Family Hsg. Rev. (Pleasant Hill BART Transit),
Ser. 2006 A, 3.95%, due 4/15/46 Putable 12/20/07 | | | | | | | 5,002 | ß | |
| | 1,605 | | | Deutsche Bank Spears/Lifers Trust Var. St. Rev., Ser. 2007-386,
(FGIC Insured), 3.63%, due 11/1/07 | | | | | | | 1,605 | µk | |
| | 22,010 | | | Deutsche Bank Spears/Lifers Trust Var. St. Rev., Ser. 2007-116,
(LOC: Deutsche Bank), 3.71%, due 11/1/07 | | | | | | | 22,010 | µ | |
| | 4,890 | | | Puttable Floating Option Tax Exempt Receipts (Floaters), Ser. 2006,
(LOC: Merrill Lynch Capital Markets), 3.65%, due 11/1/07 | | | | | | | 4,890 | µ | |
| | | | | | | | | | | | 34,842 | | |
| Colorado (1.5%) | | | |
| | 1,000 | | | Central Platte Valley Metro. Dist., Ser. 2006, (LOC: BNP Paribas),
3.70%, due 12/1/07 | | | | A-1+ | | | 1,000 | µ | |
| | 2,225 | | | Colorado Hsg. & Fin. Au. Econ. Dev. Rev. (Kapteyn-Murnane Labs Inc.),
Ser. 2007, (LOC: Wells Fargo Bank & Trust Co.), 3.63%, due 11/1/07 | | | | | | | 2,225 | µ | |
| | 4,110 | | | Deutsche Bank Spears/Lifers Trust Var. St. Rev., Ser. 2007, (MBIA Insured),
3.52%, due 11/1/07 | | | | A-1+ | | | 4,110 | µk | |
| | 1,995 | | | El Paso Co. Single Family Mtge. Rev. (Merlots), Ser. 2007 C44,
(LOC: Government National Mortgage Association), 3.39%, due 11/7/07 | | VMIG1 | | | | | 1,995 | µd | |
| | | | | | | | | | | | 9,330 | | |
| Delaware (0.1%) | | | |
| | 450 | | | Delaware St. Econ. Dev. Au. Multi-Family Rev. (Sch. House Proj.), Ser. 1985,
(LOC: HSBC Bank), 3.40%, due 11/7/07 | | VMIG1 | | | | | 450 | µ | |
| District of Columbia (1.8%) | | | |
| | 5,000 | | | Metro. Washington DC Arpts. Au. Sys. Rev. (Merlots), Ser. 2007-B01,
(FGIC Insured), 3.39%, due 11/7/07 | | | | A-1+ | | | 5,000 | µv | |
| | 6,000 | | | Metro. Washington DC Arpts. Au. Sys. Rev. (Merlots), Ser. 2007-C96,
(MBIA Insured), 3.39%, due 11/7/07 | | | | A-1+ | | | 6,000 | µd | |
| | | | | | | | | | | | 11,000 | | |
See Notes to Schedule of Investments 34
| PRINCIPAL AMOUNT | | SECURITY@@ | | RATING‡‡§ | | VALUE†† | |
| (000's omitted) | | | | Moody's | | S&P | | (000's omitted) | |
| Florida (4.3%) | | | |
| $ | 2,400 | | | Deutsche Bank Spears/Lifers Trust Var. St. Rev., Ser. 2007-351,
(AMBAC Insured), 3.57%, due 11/1/07 | | | | A-1+ | | $ | 2,400 | µk | |
| | 5,505 | | | Deutsche Bank Spears/Lifers Trust Var. St. Rev., Ser. 2007, (MBIA Insured),
3.57%, due 11/1/07 | | | | | | | 5,505 | µk | |
| | 3,250 | | | Florida Dev. Fin. Corp. IDR (4504 30th Street West LLC Proj.), Ser. 2007,
(LOC: Branch Banking & Trust Co.), 3.58%, due 11/1/07 | | | | | | | 3,250 | µ | |
| | 960 | | | Ocean Hwy. & Port Au. Rev., Ser. 1990, (LOC: Wachovia Bank & Trust Co.),
3.40%, due 11/7/07 | | VMIG1 | | A-1+ | | | 960 | µ | |
| | 690 | | | Orange Co. Hsg. Fin. Au. Multi-Family Rev., Ser. 2000 E,
(LOC: Bank of America), 3.44%, due 11/7/07 | | VMIG1 | | | | | 690 | µß | |
| | 1,090 | | | Orange Co. Hsg. Fin. Au. Multi-Family Rev. (Putters), Ser. 2005-1179,
(LOC: JP Morgan Chase), 3.55%, due 11/1/07 | | VMIG1 | | | | | 1,090 | µ | |
| | 12,815 | | | Puttable Floating Option Tax Exempt Receipts (Floaters), Ser. 2007-1497,
(LOC: Merrill Lynch Capital Markets), 3.73%, due 11/1/07 | | | | A-1 | | | 12,815 | µ | |
| | | | | | | | | | | | 26,710 | | |
| Georgia (4.2%) | | | |
| | 1,000 | | | Atlanta Arpt. Rev. (Merlots), Ser. 2004 C14, (FSA Insured),
3.39%, due 11/7/07 | | VMIG1 | | | | | 1,000 | µv | |
| | 4,000 | | | Atlanta Arpt. Rev. (Merlots), Ser. 2000 CCC, (FGIC Insured),
3.39%, due 11/7/07 | | VMIG1 | | | | | 4,000 | µv | |
| | 1,800 | | | Atlanta Urban Residential Fin. Au. Multi-Family Hsg. Rev.
(Capitol Gateway Apts.), Ser. 2005, (LOC: Bank of America),
3.54%, due 11/1/07 | | | | A-1+ | | | 1,800 | µß | |
| | 355 | | | Canton Hsg. Au. Multi-Family Rev. (Canton Mill Lofts Proj.), Ser. 1999,
(LOC: Branch Banking &Trust Co.), 3.58%, due 11/1/07 | | | | A-1+ | | | 355 | µß | |
| | 2,450 | | | Carroll Co. Dev. Au. Rev. (Royal Metal Prod., Inc. Proj.), Ser. 2007,
(LOC: Branch Banking & Trust Co.), 3.58%, due 11/1/07 | | VMIG1 | | | | | 2,450 | µß | |
| | 2,000 | | | Cartersville Dev. Au. IDR (Bliss & Laughlin), Ser. 1988,
(LOC: Bank of America), 3.59%, due 11/1/07 | | | | | | | 2,000 | µß | |
| | 7,900 | | | Cobb Co. Hsg. Au. Multi-Family Hsg. Rev. (Woodchase Village Apts. Proj.),
Ser. 2003, (LOC: Regions Bank), 3.55%, due 11/1/07 | | VMIG1 | | | | | 7,900 | µß | |
| | 1,015 | | | Douglas Co. Dev. Au. IDR (Whirlwind Steel Bldg.), Ser. 1997,
(LOC: JP Morgan Chase), 3.73%, due 11/1/07 | | | | | | | 1,015 | µß | |
| | 2,405 | | | Gordon Co. Dev. Au. IDR (Nance Carpet & Rug, Inc. Proj.), Ser. 2006,
(LOC: Branch Banking & Trust Co.), 3.58%, due 11/1/07 | | | | | | | 2,405 | µß | |
| | 1,035 | | | Gwinnett Co. Dev. Au. IDR (Color Image Inc. Proj.), Ser. 1999,
(LOC: SouthTrust Bank), 3.58%, due 11/1/07 | | | | | | | 1,035 | µß | |
| | 2,250 | | | Jasper Co. Dev. Au. IDR (PermaTherm, Inc. Proj.), Ser. 2007,
(LOC: Branch Banking & Trust Co.), 3.58%, due 11/1/07 | | | | | | | 2,250 | µß | |
| | | | | | | | | | | | 26,210 | | |
| Idaho (4.3%) | | | |
| | 14,115 | | | Idaho Hsg. & Fin. Assoc. Single Family Mtge. Rev., Ser. 2007-11192,
(LOC: Citibank, N.A.), 3.59%, due 11/1/07 | | VMIG1 | | | | | 14,115 | µ | |
| | 12,695 | | | Puttable Floating Option Tax Exempt Receipts (Floaters), Ser. 2007-4049,
(LOC: Merrill Lynch Capital Markets), 3.61%, due 11/1/07 | | VMIG1 | | | | | 12,695 | µ | |
| | | | | | | | | | | | 26,810 | | |
See Notes to Schedule of Investments 35
| PRINCIPAL AMOUNT | | SECURITY@@ | | RATING‡‡§ | | VALUE†† | |
| (000's omitted) | | | | Moody's | | S&P | | (000's omitted) | |
| Illinois (12.8%) | | | |
| $ | 2,440 | | | Aurora IDR (FIS Aurora Invest LLC Proj.), Ser. 2001 A,
(LOC: National City Bank), 3.56%, due 11/1/07 | | | | | | $ | 2,440 | µß | |
| | 10,570 | | | Aurora Single Family Mtge. Rev., Ser. 2007-10213,
(LOC: Government National Mortgage Association), 3.59%, due 11/1/07 | | | | A-1+ | | | 10,570 | µi | |
| | 7,395 | | | Aurora Single Family Mtge. Rev. (Merlots), Ser. 2007 E04,
(LOC: Government National Mortgage Association), 3.39%, due 11/7/07 | | | | A-1+ | | | 7,395 | µd | |
| | 2,900 | | | Aurora Single Family Mtge. Rev. (Merlots), Ser. 2007 C55,
(LOC: Government National Mortgage Association), 3.39%, due 11/7/07 | | | | A-1+ | | | 2,900 | µd | |
| | 4,500 | | | Chicago Enterprise Zone Rev. (J & A LLC Proj.), Ser. 2002,
(LOC: Charter One Bank), 3.56%, due 11/1/07 | | | | | | | 4,500 | µ | |
| | 2,920 | | | Chicago IDR (Evans Food Prod. Co. Proj.), Ser. 1998,
(LOC: LaSalle National Bank), 3.55%, due 11/1/07 | | | | A-1+ | | | 2,920 | µ | |
| | 1,160 | | | Chicago Multi-Family Hsg. Rev. (Churchview Supportive Living Fac.),
Ser. 2003, (LOC: Harris Trust & Savings Bank), 3.58%, due 11/1/07 | | VMIG1 | | | | | 1,160 | µß | |
| | 7,245 | | | Chicago O'Hare Int'l. Arpt. Rev. (Putters), Ser. 2005-844Z, (MBIA Insured),
3.55%, due 11/1/07 | | | | A-1+ | | | 7,245 | µo | |
| | 2,500 | | | Chicago Single Family Mtge. Rev., Ser. 2007 2F,
(LOC: Government National Mortgage Association), 3.93%, due 7/1/08 | | | | | | | 2,500 | f | |
| | 4,000 | | | Chicago Single Family Mtge. Rev., Ser. 2007 2D,
(LOC: Government National Mortgage Association), 3.95%, due 7/1/08 | | | | | | | 4,000 | j | |
| | 2,011 | | | Decatur Park Dist. G.O., Ser. 2007 B, 4.25%, due 12/15/07 | | | | | | | 2,012 | | |
| | 1,639 | | | Dundee Township Park Dist. G.O., Ser. 2006, 4.35%, due 12/1/07 | | | | | | | 1,640 | | |
| | 1,400 | | | Elgin IDR (Bailey Dev. LLC Proj.), Ser. 1996 A, (LOC: LaSalle National Bank),
3.60%, due 11/1/07 | | | | A-1+ | | | 1,400 | µß | |
| | 1,500 | | | Elmhurst IDR (Randall Mfg. Prod. Proj.), Ser. 2002,
(LOC: LaSalle National Bank), 3.63%, due 11/1/07 | | | | A-1+ | | | 1,500 | µß | |
| | 4,150 | | | Illinois Dev. Fin. Au. IDR (Amtex Steel, Inc. Proj.), Ser. 1999,
(LOC: LaSalle National Bank), 3.55%, due 11/1/07 | | | | A-1+ | | | 4,150 | µß | |
| | 700 | | | Illinois Dev. Fin. Au. IDR (Florence Corp. Proj.), Ser. 1997, (LOC: Bank One),
3.73%, due 11/1/07 | | | | | | | 700 | µß | |
| | 915 | | | Illinois Dev. Fin. Au. IDR (JVM LLC Proj.), Ser. 2001, (LOC: Fifth Third Bank),
3.56%, due 11/1/07 | | | | | | | 915 | µß | |
| | 4,570 | | | Illinois Dev. Fin. Au. IDR (Trim-Rite Food Corp. Proj.), Ser. 2000,
(LOC: Fifth Third Bank), 3.54%, due 11/2/07 | | | | | | | 4,570 | µß | |
| | 700 | | | Illinois Dev. Fin. Au. Rev. (American Academy), Ser. 2001, (LOC: Bank One),
3.55%, due 11/1/07 | | | | | | | 700 | µß | |
| | 500 | | | Illinois Fin. Au. IDR (E Kinast Proj.), Ser. 2005 A, (LOC: JP Morgan Chase),
3.73%, due 11/1/07 | | | | | | | 500 | µß | |
| | 3,400 | | | Illinois Fin. Au. IDR (Injection Plastic Corp.), Ser. 2006 A,
(LOC: Wachovia Bank & Trust Co.), 3.43%, due 11/7/07 | | | | | | | 3,400 | µß | |
| | 1,000 | | | Illinois Fin. Au. IDR (Meyer Ind. LLC Proj.), Ser. 2006, (LOC: Fifth Third Bank),
3.56%, due 11/1/07 | | | | | | | 1,000 | µß | |
| | 930 | | | Illinois Fin. Au. IDR (Transparent Container Proj.), Ser. 2004,
(LOC: Bank One), 3.59%, due 11/1/07 | | VMIG1 | | | | | 930 | µß | |
| | 7,500 | | | Illinois Fin. Au. Rev. (Reliable Materials Proj.), Ser. 2006,
(LOC: Marshall & Ilsley), 3.44%, due 11/7/07 | | | | A-1 | | | 7,500 | µß | |
| | 2,620 | | | Upper Illinois River Valley Dev. Au. IDR (Advanced Drainage Sys.), Ser. 2002,
(LOC: National City Bank), 3.56%, due 11/1/07 | | | | | | | 2,620 | µß | |
| | | | | | | | | | | | 79,167 | | |
See Notes to Schedule of Investments 36
| PRINCIPAL AMOUNT | | SECURITY@@ | | RATING‡‡§ | | VALUE†† | |
| (000's omitted) | | | | Moody's | | S&P | | (000's omitted) | |
| Indiana (5.1%) | | | |
| $ | 2,000 | | | Bartholomew Cons. Sch. Corp. Ind. Tax Anticipation Warrants, Ser. 2007,
4.00%, due 12/31/07 | | | | | | $ | 2,001 | | |
| | 2,680 | | | Concord Comm. Sch. Tax Anticipation Warrants, Ser. 2007,
3.90%, due 12/31/07 | | | | | | | 2,681 | | |
| | 2,970 | | | Crawfordsville Econ. Dev. Ref. Rev. (Pedcor Investments-Shady),
Ser. 1993, (LOC: Federal Home Loan Bank), 3.55%, due 11/1/07 | | VMIG1 | | | | | 2,970 | µß | |
| | 3,540 | | | Elkhart Co. Econ. Dev. Rev. (Carriage, Inc. Proj.), Ser. 2006,
(LOC: National City Bank), 3.56%, due 11/1/07 | | | | | | | 3,540 | µ | |
| | 585 | | | Elkhart Co. Econ. Dev. Rev. (Pinnacle Bldg. Sys. Corp.), Ser. 1999,
(LOC: Bank One Indiana N.A.), 3.58%, due 11/7/07 | | | | | | | 585 | µß | |
| | 1,400 | | | Hamilton Southeastern Sch. Warrants, Ser. 2007, 3.80%, due 12/31/07 | | | | | | | 1,400 | | |
| | 500 | | | Hammond Econ. Dev. Rev. (A.M. Castle & Co. Proj.), Ser. 1994,
(LOC: Bank of America), 3.73%, due 11/1/07 | | | | | | | 500 | µß | |
| | 3,695 | | | Indiana St. Fin. Au. Wtr. Fac. Rev., Ser. 2006-111, (AMBAC Insured),
3.53%, due 11/1/07 | | VMIG1 | | A-1+ | | | 3,695 | µc | |
| | 2,650 | | | Johnson Co. Tax Anticipation Warrants, Ser. 2007, 4.35%, due 12/31/07 | | | | | | | 2,653 | | |
| | 970 | | | Kendallville Econ. Dev. Rev. (Metal Shred Ind. Proj.), Ser. 2006,
(LOC: Fifth Third Bank), 3.54%, due 11/2/07 | | | | | | | 970 | µß | |
| | 1,890 | | | Kokomo Econ. Dev. Rev. (Village Comm. Partners IV Proj.), Ser. 1995,
(LOC: Federal Home Loan Bank), 3.55%, due 11/1/07 | | VMIG1 | | | | | 1,890 | µß | |
| | 1,069 | | | La Porte Co. Econ. Dev. Rev. (Pedcor Investments-Woodland Crossing Apt.),
Ser. 1994, (LOC: Federal Home Loan Bank), 3.56%, due 11/1/07 | | VMIG1 | | | | | 1,069 | µß | |
| | 2,600 | | | La Porte Co. Econ. Dev. Rev. (Van Air Proj.), Ser. 2007,
(LOC: LaSalle National Bank), 3.60%, due 11/1/07 | | | | | | | 2,600 | µß | |
| | 1,087 | | | Noblesville Econ. Dev. Rev. (Princeton Lakes Apts. Proj.), Ser. 2003 B,
(LOC: Federal Home Loan Bank), 3.57%, due 11/1/07 | | | | A-1+ | | | 1,087 | µ | |
| | 1,105 | | | North Vernon Econ. Dev. Rev. (Oak Meadows Apt. Proj.), Ser. 1995,
(LOC: Federal Home Loan Bank), 3.40%, due 11/7/07 | | | | A-1+ | | | 1,105 | µß | |
| | 2,150 | | | Spencer Owen Comm. Schs. Tax Anticipation Warrants, Ser. 2007,
3.90%, due 12/31/07 | | | | | | | 2,150 | | |
| | 500 | | | Tippecanoe Co. Econ. Dev. Ref. Rev. (Lafayette Venetian Blind), Ser. 2004,
(LOC: PNC Bank), 3.56%, due 11/1/07 | | | | | | | 500 | µß | |
| | | | | | | | | | | | 31,396 | | |
| Iowa (1.5%) | | | |
| | 400 | | | Mason City IDR (SUPERVALU, Inc. Proj.), Ser. 1994,
(LOC: Wachovia Bank & Trust Co.), 3.42%, due 11/7/07 | | | | | | | 400 | µß | |
| | 6,315 | | | Muni. Sec. Trust Cert. G.O., Ser. 2007 7042A,
(LOC: Government National Mortgage Association), 3.55%, due 11/1/07 | | VMIG1 | | | | | 6,315 | ñµe | |
| | 2,215 | | | Sergeant Bluff IDR (Sioux City Brick & Tile Proj.), Ser.1996, (LOC: U.S. Bank),
3.59%, due 11/1/07 | | | | | | | 2,215 | µß | |
| | | | | | | | | | | | 8,930 | | |
| Kansas (0.6%) | | | |
| | 3,925 | | | Junction City G.O., Ser. 2007 A, 5.00%, due 6/1/08 | | | | | | | 3,947 | | |
See Notes to Schedule of Investments 37
| PRINCIPAL AMOUNT | | SECURITY@@ | | RATING‡‡§ | | VALUE†† | |
| (000's omitted) | | | | Moody's | | S&P | | (000's omitted) | |
| Kentucky (2.3%) | | | |
| $ | 200 | | | Bardstown Ind. Rev. (JAV Invt. LLC Proj.), Ser. 2001,
(LOC: Bank One Michigan), 3.73%, due 11/1/07 | | | | | | $ | 200 | µß | |
| | 2,790 | | | Boone Co. Ind. Bldg. Rev. (Benda-Lutz Corp. Proj.), Ser. 2005,
(LOC: Fifth Third Bank), 3.54%, due 11/2/07 | | | | | | | 2,790 | µß | |
| | 2,700 | | | Boone Co. Ind. Bldg. Rev. (Kiswel, Inc. Proj.), Ser. 2007,
(LOC: Branch Banking & Trust Co.), 3.58%, due 11/1/07 | | VMIG1 | | | | | 2,700 | µß | |
| | 2,665 | | | Fort Mitchell Ind. Bldg. Rev. (Grandview/Hemmer Proj.), Ser. 1986,
(LOC: PNC Bank), 3.90%, due 2/1/08 | | | | | | | 2,665 | µ | |
| | 4,000 | | | Fulton Co. Ind. Bldg. Rev. (Burke-Parsons-Bowlby Corp.), Ser. 2006,
(LOC: Branch Banking & Trust Co.), 3.58%, due 11/1/07 | | | | | | | 4,000 | µß | |
| | 1,800 | | | Lexington-Fayette Urban Co. Arpt. Corp. Rev. Ref. (1st Mtg.), Ser. 1998 C,
(MBIA Insured), 3.63%, due 11/1/07 | | VMIG1 | | | | | 1,800 | µl | |
| | 315 | | | Trimble Co. Econ. Dev. Rev. (Synthetic Materials Proj.), Ser. 2000,
(LOC: Citizens Bank), 3.60%, due 11/1/07 | | | | | | | 315 | µß | |
| | | | | | | | | | | | 14,470 | | |
| Louisiana (1.9%) | | | |
| | 300 | | | Ascension Parish Rev. (BASF Corp. Proj.), Ser. 1998, 3.69%, due 11/1/07 | | P-1 | | | | | 300 | µß | |
| | 1,000 | | | Calcasieu Parish Pub. Trust Au. Gulf Opportunity Zone Rev.
(Delta Equine Ctr. LLC Proj.), Ser. 2007, (LOC: Branch Banking & Trust Co.),
3.58%, due 11/1/07 | | | | | | | 1,000 | µß | |
| | 4,940 | | | Deutsche Bank Spears/Lifers Trust Var. St., Ser. 2007-137,
(LOC: Deutsche Bank), 3.71%, due 11/1/07 | | | | | | | 4,940 | µ | |
| | 3,310 | | | Louisiana HFA Single Family Mtge. Rev. (Floaters), Ser. 2006-1566,
(LOC: Depfa Bank), 3.55%, due 11/1/07 | | | | A-1+ | | | 3,310 | µs | |
| | 2,000 | | | Louisiana Local Gov't. Env. Facs. & Comm. Dev. Rev. (SRL Holdings LLC Proj.),
Ser. 2007, (LOC: Branch Banking & Trust Co.), 3.58%, due 11/1/07 | | | | | | | 2,000 | µß | |
| | | | | | | | | | | | 11,550 | | |
| Maine (1.1%) | | | |
| | 6,000 | | | Maine St. Hsg. Au. Mtge. Purchase Bonds, Ser. 2007 F,
3.85%, due 11/15/34 Putable 9/22/08 | | VMIG1 | | A-1+ | | | 6,000 | | |
| | 500 | | | Westbrook Rev. (Corriveau-Routhier, Inc. Proj.), Ser. 1986,
(LOC: Fleet National Bank), 3.90%, due 12/15/07 | | | | | | | 500 | µß | |
| | | | | | | | | | | | 6,500 | | |
| Maryland (1.8%) | | | |
| | 1,660 | | | Howard Co. IDR (Preston CT Ltd. Partnership), Ser. 1986,
(LOC: SunTrust Bank), 3.70%, due 11/1/07 | | | | A-1+ | | | 1,660 | µ | |
| | 9,280 | | | Maryland St. Comm. Dev. Admin. Dept. Hsg. & Comm. Dev.,
Ser. 2007 2078, (LOC: Wells Fargo Bank), 3.55%, due 11/1/07 | | VMIG1 | | | | | 9,280 | µ | |
| | | | | | | | | | | | 10,940 | | |
| Massachusetts (1.4%) | | | |
| | 3,000 | | | Cape Cod Reg. Transit Au. RANS, Ser. 2007, 4.00%, due 7/31/08 | | | | | | | 3,001 | | |
| | 2,400 | | | Greater Attleboro-Taunton Reg. Transit Au. RANS, Ser. 2007,
4.00%, due 8/22/08 | | | | | | | 2,402 | | |
| | 1,150 | | | Massachusetts St. HFA, Ser. 2005 A, (FSA Insured), 3.85%, due 6/1/08 | | | | | | | 1,150 | | |
| | 1,975 | | | Massachusetts St. Ind. Fin. Agcy. Rev. (Sr. Living Fac.-Forge Hill Proj.),
Ser. 1998, 6.75%, due 4/1/30 Pre Refunded 4/1/08 | | | | | | | 2,044 | ß | |
| | | | | | | | | | | | 8,597 | | |
See Notes to Schedule of Investments 38
| PRINCIPAL AMOUNT | | SECURITY@@ | | RATING‡‡§ | | VALUE†† | |
| (000's omitted) | | | | Moody's | | S&P | | (000's omitted) | |
| Michigan (1.1%) | | | |
| $ | 1,000 | | | ABN Amro Munitops Cert. Trust Rev., Ser. 2004-2,
(LOC: Government National Mortgage Association), 3.54%, due 11/1/07 | | VMIG1 | | | | $ | 1,000 | µa | |
| | 5,600 | | | Michigan St. Hsg. Dev. Au. Ltd. Oblig. Multi-Family Hsg. Rev.
(Benton Harbor Proj.), Ser. 2006, (LOC: Fifth Third Bank), 4.35%, due 6/1/41
Putable 7/1/08 | | VMIG1 | | | | | 5,604 | ß | |
| | | | | | | | | | | | 6,604 | | |
| Minnesota (1.6%) | | | |
| | 100 | | | Blaine IDR (SUPERVALU, Inc. Proj.), Ser. 1993,
(LOC: Wachovia Bank & Trust Co.), 3.42%, due 11/7/07 | | | | | | | 100 | µß | |
| | 5,600 | | | Dakota Co. Comm. Dev. Agcy. Multi-Family Hsg. Rev.
(Brentwood Hills Apts. Proj.), Ser. 2003 A, (LOC: LaSalle National Bank),
3.68%, due 11/1/07 | | VMIG1 | | | | | 5,600 | µß | |
| | 2,415 | | | Plymouth Multi-Family Hsg. Ref. Rev. (At the Lake Apts. Proj.), Ser. 2004,
(LOC: Freddie Mac), 3.53%, due 11/1/07 | | VMIG1 | | | | | 2,415 | µß | |
| | 280 | | | Roseville Private Sch. Fac. Rev. (Northwestern College Proj.), Ser. 2002,
(LOC: Marshall & Ilsley), 3.63%, due 11/1/07 | | VMIG1 | | | | | 280 | µß | |
| | 500 | | | Rush City IDR (Plastech Corp. Proj.), Ser. 1999, (LOC: U.S. Bank),
3.73%, due 11/1/07 | | | | | | | 500 | µ | |
| | 1,155 | | | St. Paul Hsg. & Redev. Au. Rev. (Goodwill/Easter Seals Proj.), Ser. 2000,
(LOC: U.S. Bank), 3.64%, due 11/1/07 | | | | | | | 1,155 | µß | |
| | 100 | | | Woodbury Private Sch. Fac. Rev. (St. Ambrose Proj.), Ser. 1999,
(LOC: U.S. Bank), 3.47%, due 11/7/07 | | | | | | | 100 | µß | |
| | | | | | | | | | | | 10,150 | | |
| Missouri (0.8%) | | | |
| | 1,000 | | | Clayton Ind. Dev. Au. Ind. Ref. Rev. (Bailey Court Proj.), Ser. 1989,
(LOC: Commerce Bank N.A.), 3.58%, due 11/1/07 | | | | A-1 | | | 1,000 | µ | |
| | 300 | | | Hannibal Ind. Dev. Au. Ind. Rev. (Buckhorn Rubber Prods. Proj.), Ser. 1995,
(LOC: JP Morgan Chase), 3.73%, due 11/1/07 | | | | | | | 300 | µß | |
| | 100 | | | Jefferson Co. Ind. Dev. Au. Ind. Rev. (GHF Holdings LLC Proj.), Ser. 1994,
(LOC: LaSalle National Bank), 3.73%, due 11/1/07 | | | | | | | 100 | µß | |
| | 4,000 | | | Missouri St. Env. Imp. & Energy Res. Au. Env. Imp. Rev.
(UtiliCorp United, Inc. Proj.), Ser. 1993, (LOC: Citibank, N.A.),
3.58%, due 11/7/07 | | P-1 | | A-1+ | | | 4,000 | µß | |
| | | | | | | | | | | | 5,400 | | |
| Montana (1.9%) | | | |
| | 9,965 | | | Montana St. Board Hsg. (Merlots), Ser. 2007-H11,
(LOC: Wachovia Bank & Trust Co.), 3.39%, due 11/7/07 | | | | A-1+ | | | 9,965 | µ | |
| | 2,000 | | | Montana St. Board of Investments Rev. (Muni. Fin. Cons. Act-Intercap),
Ser. 1994, 3.85%, due 3/1/09 Putable 3/1/08 | | VMIG1 | | | | | 2,000 | µ | |
| | | | | | | | | | | | 11,965 | | |
| Nebraska (0.1%) | | | |
| | 400 | | | Norfolk IDR Ref. (SUPERVALU, Inc. Proj.), Ser. 1994,
(LOC: Wachovia Bank & Trust Co.), 3.42%, due 11/7/07 | | | | | | | 400 | µß | |
| Nevada (0.2%) | | | |
| | 1,495 | | | Clark Co. IDR (Floaters), Ser. 2007-1843, (AMBAC Insured),
3.50%, due 11/1/07 | | | | A-1+ | | | 1,495 | µs | |
See Notes to Schedule of Investments 39
| PRINCIPAL AMOUNT | | SECURITY@@ | | RATING‡‡§ | | VALUE†† | |
| (000's omitted) | | | | Moody's | | S&P | | (000's omitted) | |
| New Hampshire (0.7%) | | | |
| $ | 1,200 | | | Cheshire Co. G.O. TANS, Ser. 2007, 3.75%, due 12/27/07 | | | | | | $ | 1,200 | | |
| | 1,500 | | | Merrimack Co. G.O. TANS, Ser. 2007, 4.25%, due 12/28/07 | | | | | | | 1,501 | | |
| | 1,660 | | | New Hampshire St. Hsg. Fin. Au. Multi-Family Rev. (Floaters),
Ser. 2006-3438, (LOC: Merrill Lynch Capital Markets), 3.61%, due 11/1/07 | | VMIG1 | | | | | 1,660 | µ | |
| | | | | | | | | | | | 4,361 | | |
| New Jersey (1.4%) | | | |
| | 7,665 | | | New Jersey Econ. Dev. Au. Econ. Dev. Rev. (Stamato Realty LLC Proj.),
Ser. 2001, (LOC: Comerica Bank), 3.65%, due 11/1/07 | | | | | | | 7,665 | µß | |
| | 705 | | | New Jersey Econ. Dev. Au. Econ. Dev. Rev. (Wearbest SIL-TEX Mills Proj.),
Ser. 2000, (LOC: Bank of New York), 3.45%, due 11/7/07 | | | | | | | 705 | µß | |
| | | | | | | | | | | | 8,370 | | |
| New Mexico (1.5%) | | | |
| | 225 | | | Las Cruces IDR (Parkview Metal Prod. Proj.), Ser. 1997,
(LOC: America National Bank & Trust Co.), 3.73%, due 11/1/07 | | | | | | | 225 | µß | |
| | 9,045 | | | New Mexico Ed. Assist. Foundation (Merlots), Ser. 2002-A26,
(LOC: Wachovia Bank & Trust Co.), 3.39%, due 11/7/07 | | VMIG1 | | | | | 9,045 | µ | |
| | | | | | | | | | | | 9,270 | | |
| New York (0.3%) | | | |
| | 1,806 | | | Rev. Bond Cert. Ser. Trust Var. St., (Sterling Park), Ser. 2006-6, (AIG Insured),
3.65%, due 11/1/07 | | | | | | | 1,806 | µ | |
| North Carolina (0.9%) | | | |
| | 1,550 | | | Iredell Co. Ind. Fac. & Poll. Ctrl. Fin. Au. Ind. Rev. (Riley Technologies Proj.),
Ser. 2006, (LOC: Branch Banking & Trust Co.), 3.58%, due 11/1/07 | | | | | | | 1,550 | µß | |
| | 2,000 | | | Lincoln Co. Ind. Fac. & Poll. Ctrl. Fin. Au. Rev. Ind. Dev. (Sabo USA, Inc. Proj.),
Ser. 2007, (LOC: LaSalle National Bank), 3.58%, due 11/1/07 | | VMIG1 | | | | | 2,000 | µß | |
| | 1,675 | | | North Carolina HFA, Ser. 2002, (LOC: Citibank, N.A.), 3.59%, due 11/1/07 | | VMIG1 | | | | | 1,675 | µ | |
| | | | | | | | | | | | 5,225 | | |
| North Dakota (0.3%) | | | |
| | 800 | | | Bismarck IDR Ref. (SUPERVALU, Inc. Proj.), Ser. 1995,
(LOC: Wachovia Bank & Trust Co.), 3.42%, due 11/7/07 | | | | | | | 800 | µß | |
| | 1,000 | | | North Dakota HFA Rev. (Fin. Prog. Home Mtge.), Ser. 2004 B,
(LOC: KBC Bank N.V.), 3.32%, due 11/7/07 | | VMIG1 | | | | | 1,000 | µ | |
| | | | | | | | | | | | 1,800 | | |
| Ohio (2.1%) | | | |
| | 1,750 | | | American Muni. Pwr. BANS (Montpelier Proj.), Ser. 2007, 3.95%, due 7/3/08 | | | | | | | 1,750 | | |
| | 2,060 | | | American Muni. Pwr. BANS (Shelby Proj.), Ser. 2006, 3.70%, due 11/15/07 | | | | | | | 2,060 | | |
| | 1,775 | | | Marion Co. IDR (Mid Ohio Packaging Co. Proj.), Ser. 1995,
(LOC: JP Morgan Chase), 3.61%, due 11/1/07 | | | | | | | 1,775 | µ | |
| | 1,910 | | | Marysville Wtr. & Swr. G.O. BANS, Ser. 2007, 4.50%, due 1/24/08 | | | | | | | 1,914 | | |
| | 1,800 | | | Revenue Bond Cert. Ser. Trust Var. St. (Park Trails), Ser. 2007-3 (AIG Insured),
3.65%, due 11/1/07 | | | | | | | 1,800 | ñµ | |
| | 115 | | | Trumbull Co. IDR (UTD Steel Svc., Inc. Proj.), Ser. 2000,
(LOC: JP Morgan Chase), 3.88%, due 11/1/07 | | | | | | | 115 | µß | |
| | 1,445 | | | Vandalia Land Acquisition G.O. BANS, Ser. 2007, 3.88%, due 8/22/08 | | | | | | | 1,445 | | |
| | 1,155 | | | Warren Co. IDR (PAC Mfg. Proj.), Ser. 2000, (LOC: Bank of America),
3.68%, due 11/1/07 | | | | A-1+ | | | 1,155 | µß�� | |
| | 946 | | | Wood Co. IDR (Reclamation Technologies), Ser. 2006, (LOC: National City Bank),
3.56%, due 11/1/07 | | | | | | | 946 | µß | |
| | | | | | | | | | | | 12,960 | | |
See Notes to Schedule of Investments 40
| PRINCIPAL AMOUNT | | SECURITY@@ | | RATING‡‡§ | | VALUE†† | |
| (000's omitted) | | | | Moody's | | S&P | | (000's omitted) | |
| Oregon (0.1%) | | | |
| $ | 705 | | | Marion Co. Hsg. Au. Rev. (Residence at Marian), Ser. 1997,
(LOC: U.S. Bank), 3.63%, due 11/1/07 | | | | A-1+ | | $ | 705 | µß | |
| Pennsylvania (4.0%) | | | |
| | 3,900 | | | Allegheny Co. Residential Fin. Au. Single Family Mtge. Rev., Ser. 2004 PP,
(LOC: Government National Mortgage Association), 3.50%, due 11/1/07 | | VMIG1 | | | | | 3,900 | z | |
| | 4,525 | | | Blair Co. Ind. Dev. Au. Rev. (NCP, Inc. Proj.), Ser. 2002, (LOC: NPC Bank),
3.56%, due 11/1/07 | | | | | | | 4,525 | µ | |
| | 4,000 | | | Crawford Co. Ind. Dev. Au. Rev. (Acutec Precision), Ser. 2007,
(LOC: National City Bank), 3.56%, due 11/1/07 | | | | | | | 4,000 | µß | |
| | 3,200 | | | Fayette Co. Ind. Dev. Au. IDR (Coastal Lumber Co. Proj.), Ser. 2006,
(LOC: Branch Banking & Trust Co.), 3.58%, due 11/1/07 | | | | | | | 3,200 | µß | |
| | 2,805 | | | Lackawanna Co. Ind. Dev. Au. Rev. (Material Technology Proj.), Ser. 2006,
(LOC: Wachovia Bank & Trust Co.), 3.60%, due 11/1/07 | | | | | | | 2,805 | µß | |
| | 3,425 | | | Montgomery Co. Ind. Dev. Au. Rev. (RAF Pennsburg Proj.), Ser. 2006 A,
(LOC: Wachovia Bank & Trust Co.), 3.55%, due 11/1/07 | | VMIG1 | | | | | 3,425 | µß | |
| | 3,000 | | | Pennsylvania Econ. Dev. Fin. Au. Econ. Dev. Rev., Ser. 1995 D7,
(LOC: PNC Bank), 3.52%, due 11/1/07 | | | | | | | 3,000 | µ | |
| | | | | | | | | | | | 24,855 | | |
| Rhode Island (0.2%) | | | |
| | 1,080 | | | Rhode Island St. Ind. Facs. Corp. IDR (Precision Turned Components Proj.),
Ser. 2000, (LOC: Bank of America), 3.45%, due 11/7/07 | | | | A-1+ | | | 1,080 | µß | |
| South Carolina (2.7%) | | | |
| | 2,775 | | | Jasper Co. BANS, Ser. 2007, 4.25%, due 2/15/08 | | | | | | | 2,778 | | |
| | 3,000 | | | South Carolina Jobs Econ. Dev. Au. Econ. Dev. Rev.
(Advanced Composite Materials), Ser. 2007,
(LOC: National Bank of South Carolina), 3.55%, due 11/1/07 | | | | | | | 3,000 | µ | |
| | 1,000 | | | South Carolina Jobs Econ. Dev. Au. Econ. Dev. Rev.
(Blue Ridge Log Cabins LLC), Ser. 2007, (LOC: Branch Banking & Trust Co.),
3.58%, due 11/1/07 | | VMIG1 | | | | | 1,000 | µß | |
| | 1,985 | | | South Carolina Jobs Econ. Dev. Au. Econ. Dev. Rev. (DCS Diversified Coating),
Ser. 2002, (LOC: Branch Banking & Trust Co.), 3.58%, due 11/1/07 | | VMIG1 | | | | | 1,985 | µß | |
| | 500 | | | South Carolina Jobs Econ. Dev. Au. Econ. Dev. Rev. (Mancor Ind., Inc. Proj.),
Ser. 1999, (LOC: PNC Bank), 3.56%, due 11/1/07 | | | | | | | 500 | µß | |
| | 4,125 | | | South Carolina Jobs Econ. Dev. Au. Econ. Dev. Rev. (Woodhead LLC Proj.),
Ser. 2007 A, (LOC: Columbus Bank & Trust), 3.53%, due 11/1/07 | | | | | | | 4,125 | µß | |
| | 50 | | | South Carolina Jobs Econ. Dev. Au. IDR (Florence RHF Hsg. Proj.),
Ser. 1987 A, (LOC: Wachovia Bank & Trust Co.), 3.60%, due 11/7/07 | | | | | | | 50 | µß | |
| | 3,420 | | | Three Rivers Solid Waste Au. Solid Waste Disposal Fac. Ref. Rev. BANS,
Ser. 2007, 3.72%, due 1/15/08 | | | | SP-1+ | | | 3,420 | | |
| | | | | | | | | | | | 16,858 | | |
| South Dakota (0.0%) | | | |
| | 125 | | | Watertown IDR (SUPERVALU, Inc. Proj.), Ser. 1994,
(LOC: Wachovia Bank & Trust Co.), 3.42%, due 11/7/07 | | | | | | | 125 | µß | |
| | 80 | | | Watertown IDR Ref. (Ramkota, Inc. Proj.), Ser. 1993, (LOC: U.S. Bank),
3.64%, due 11/1/07 | | | | | | | 80 | µß | |
| | | | | | | | | | | | 205 | | |
See Notes to Schedule of Investments 41
| PRINCIPAL AMOUNT | | SECURITY@@ | | RATING‡‡§ | | VALUE†† | |
| (000's omitted) | | | | Moody's | | S&P | | (000's omitted) | |
| Tennessee (3.5%) | | | |
| $ | 3,785 | | | Franklin Co. Ind. Dev. Board IDR (Zanini Proj.), Ser. 2005 B,
(LOC: Regions Bank), 3.57%, due 11/1/07 | | VMIG1 | | | | $ | 3,785 | µß | |
| | 11,410 | | | Morgan Keegan Muni. Prod. Inc. Var. St. Rev., Ser. 2007 F,
(LOC: BNP Paribas), 3.57%, due 11/1/07 | | | | A-1+ | | | 11,410 | µ | |
| | 2,110 | | | Rutherford Co. IDB IDR (Tenn. Farmers Coop. Proj.), Ser. 1999,
(LOC: AMSouth Bank), 3.58%, due 11/1/07 | | | | | | | 2,110 | µß | |
| | 3,200 | | | Shelby Co. Hlth., Ed. & Hsg. Fac. Board Multi-Family Hsg. Rev. (Lexington),
Ser. 2005 A, (LOC: Fannie Mae), 3.63%, due 11/1/07 | | VMIG1 | | | | | 3,200 | µ | |
| | 300 | | | Stewart Co. IDB Rev. (Synthetic Materials Proj.), Ser. 1999 A,
(LOC: Citizens Bank), 3.60%, due 11/1/07 | | | | | | | 300 | µß | |
| | 730 | | | Stewart Co. IDB Rev. (Synthetic Materials Proj.), Ser. 1999 C,
(LOC: Citizens Bank), 3.60%, due 11/1/07 | | | | | | | 730 | µß | |
| | | | | | | | | | | | 21,535 | | |
| Texas (12.1%) | | | |
| | 4,660 | | | Alliance Arpt. Au. Inc. Spec. Fac. Rev. (Floaters), Ser. 2007-2088,
(LOC: Wells Fargo & Co.), 3.58%, due 11/1/07 | | | | A-1+ | | | 4,660 | µ | |
| | 615 | | | Bell Co. Hlth. Fac. Dev. Corp. Rev. (Hlth. Fac. Baptist Care, Inc.), Ser. 1998,
(LOC: Broadway National Bank), 3.68%, due 11/1/07 | | VMIG1 | | | | | 615 | µßg | |
| | 5,625 | | | Bexar Co. Hsg. Fin. Corp. Multi-Family Hsg. Rev., Ser. 2007-749CE,
(LOC: Citigroup Global Markets), 3.63%, due 11/1/07 | | VMIG1 | | | | | 5,625 | µ | |
| | 20,000 | | | Brazos River Harbor Navigation Dist. Brazoria Co. Rev. (BASF Corp. Proj.),
Ser. 2001, 3.63%, due 11/7/07 | | | | A-1+ | | | 20,000 | µß | |
| | 1,300 | | | Dallas Fort Worth Int'l Arpt. Rev. (Putters), Ser. 2004-385, (FGIC Insured),
3.55%, due 11/1/07 | | VMIG1 | | A-1+ | | | 1,300 | µo | |
| | 5,095 | | | Dallas Fort Worth Int'l Arpt. Rev. (Putters), Ser. 2007-2236, (XLCA Insured),
3.55%, due 11/1/07 | | VMIG1 | | | | | 5,095 | µo | |
| | 5,140 | | | Deutsche Bank Spears/Lifers Trust Var. St., Ser. 2007-366, (AMBAC Insured),
3.57%, due 11/1/07 | | | | A-1+ | | | 5,140 | µk | |
| | 1,600 | | | Haltom City Ind. Dev. Corp. Rev. (Molded Prod. Co. Proj.), Ser. 1995,
(LOC: Bank of America), 3.45%, due 11/7/07 | | | | A-1+ | | | 1,600 | µß | |
| | 4,200 | | | McAllen Ind. Dev. Au. Rev. (Ridge Sharyland), Ser. 2000,
5.46%, due 11/1/07 | | | | | | | 4,263 | µ | |
| | 9,000 | | | Port of Houston Au. Harris Co. (Putters), Ser. 2007-2173, (MBIA Insured),
3.55%, due 11/1/07 | | | | A-1+ | | | 9,000 | µo | |
| | 1,200 | | | Port of Port Arthur Navigation Dist. Rev. (Fina Oil & Chemical Co. Proj.),
Ser. 1998, 3.64%, due 11/1/07 | | VMIG1 | | | | | 1,200 | µß | |
| | 8,200 | | | Tarrant Co. Hsg. Fin. Corp. Rev. (Floaters), Ser. 2007-2050,
(LOC: Government National Mortgage Association), 3.55%, due 11/1/07 | | | | A-1+ | | | 8,200 | µs | |
| | 7,970 | | | Victory Street Pub. Fac. Corp. Multi-Family Rev., Ser. 2007-832CE,
(LOC: Citigroup Global Markets), 3.63%, due 11/1/07 | | VMIG1 | | | | | 7,970 | µ | |
| | | | | | | | | | | | 74,668 | | |
| Vermont (1.0%) | | | |
| | 6,000 | | | Vermont HFA Multi. Purp. Notes, Ser. 2007 D, (LOC: Calyon Bank),
3.85%, due 9/25/08 | | | | | | | 6,000 | | |
See Notes to Schedule of Investments 42
| PRINCIPAL AMOUNT | | SECURITY@@ | | RATING‡‡§ | | VALUE†† | |
| (000's omitted) | | | | Moody's | | S&P | | (000's omitted) | |
| Virginia (3.4%) | | | |
| $ | 2,500 | | | Amherst Co. Econ. Dev. Au. IDR (Englands Stove Works Proj.), Ser. 2007,
(LOC: Branch Banking & Trust Co.), 3.58%, due 11/1/07 | | | | | | $ | 2,500 | µß | |
| | 7,050 | | | BB&T Muni. Trust Var. St. (Floaters), Ser. 2007-1006,
(LOC: Branch Banking & Trust Co.), 3.61%, due 11/1/07 | | VMIG1 | | | | | 7,050 | µ | |
| | 2,210 | | | Southampton Co. Ind. Dev. Au. Rev. (Feridies Proj.), Ser. 2006,
(LOC: Branch Banking & Trust Co.), 3.58%, due 11/1/07 | | | | | | | 2,210 | µß | |
| | 3,000 | | | Sussex Co. Ind. Dev. Au. IDR (McGill Env. Sys.), Ser. 2007,
(LOC: Branch Banking & Trust Co.), 3.58%, due 11/1/07 | | VMIG1 | | | | | 3,000 | µß | |
| | 2,865 | | | Tazewell Co. Ind. Dev. Au. Rev. (Jennmar Corp., Inc.), Ser. 2007,
(LOC: PNC Bank), 3.56%, due 11/1/07 | | | | | | | 2,865 | µß | |
| | 1,865 | | | Virginia St. Hsg. Dev. Au. Commonwealth Mtge. (Merlots), Ser. 2006 C07,
(LOC: Bank of New York), 3.39%, due 11/7/07 | | | | A-1+ | | | 1,865 | µ | |
| | 1,380 | | | Wythe Co. Ind. Dev. Au. Rev. (Klockner-Pentaplast of America), Ser. 1989,
(LOC: Bayerische Hypo-und Vereinsbank AG), 3.59%, due 11/1/07 | | | | | | | 1,380 | µß | |
| | | | | | | | | | | | 20,870 | | |
| Washington (1.2%) | | | |
| | 7,395 | | | Washington St. Hsg. Fin. Commission Multi-Family Hsg. Rev.,
Ser. 2007-10003CE, (LOC: Citigroup Global Markets), 3.63%, due 11/1/07 | | VMIG1 | | | | | 7,395 | µ | |
| | 300 | | | Washington St. Hsg. Fin. Commission Non-Profit Rev.
(Tacoma Art Museum Proj.), Ser. 2002, (LOC: Northern Trust Co.),
3.63%, due 11/1/07 | | VMIG1 | | | | | 300 | µß | |
| | | | | | | | | | | | 7,695 | | |
| Wisconsin (4.9%) | | | |
| | 2,000 | | | Antigo Unified Sch. Dist.TRANS, Ser. 2007, 3.60%, due 10/30/08 | | | | | | | 2,001 | | |
| | 425 | | | Elkhorn IDR (Lanco Precision Plus Proj.), Ser. 1999, (LOC: Bank One),
3.58%, due 11/7/07 | | | | | | | 425 | µß | |
| | 19,945 | | | Puttable Floating Option Tax Exempt Receipts (Floaters), Ser. 2007-4391,
(LOC: Dexia Credit Locale de France), 3.57%, due 11/1/07 | | VMIG1 | | | | | 19,945 | µ | |
| | 1,800 | | | Superior IDR (AMSOIL Inc. Proj.), Ser. 2007,
(LOC: Wells Fargo Bank & Trust Co.), 3.53%, due 11/1/07 | | | | A-1+ | | | 1,800 | µ | |
| | 6,000 | | | Whitehall IDR (Whitehall Specialties), Ser. 2007, (LOC: JP Morgan Chase),
3.59%, due 11/1/07 | | | | | | | 6,000 | µß | |
| | 200 | | | Wisconsin St. Hlth. & Ed. Fac. Au. Rev. (Meriter Hosp., Inc. Proj.), Ser. 2002,
(LOC: Marshall & Ilsley), 3.63%, due 11/1/07 | | | | A-1 | | | 200 | µß | |
| | | | | | | | | | | | 30,371 | | |
| | | | | Total Investments (99.4%) | | | | | | | 614,040 | | |
| | | | | Cash, receivables and other assets, less liabilities (0.6%) | | | | | | | 3,520 | | |
| | | | | Total Net Assets (100.0%) | | | | | | $ | 617,560 | | |
See Notes to Schedule of Investments 43
Notes to Schedule of Investments Institutional Liquidity Trust
†† Investment securities are valued at amortized cost, which approximates U.S. federal income tax cost.
@@ Municipal securities held by Tax-Exempt Master Series and Municipal Master Series are within the two highest rating categories assigned by a nationally recognized statistical rating organization ("NRSRO") such as Moody's Investors Service, Inc. or Standard & Poor's or, where not rated, are determined by the master series' investment manager to be of comparable quality. Approximately 87% and 91% of the municipal securities held by Tax-Exempt Master Series and Municipal Master Series, respectively, have credit enhancement features backing them, which the funds may rely on, such as letters of credit, insurance, or guarantees. Without these credit enhancement features the securities may or may not meet the quality standards of the fund. Pre-refunded bonds are supported by securities in escrow issued or guaranteed by the U.S. Government, its agencies, or instrumentalities. The amount escrowed is sufficient to pay the periodic interest due and the principal of these bonds. Putable bonds give the funds the right to sell back the issue on the date specified.
‡‡ Where no rating appears from any NRSRO, the security is deemed unrated for purposes of Rule 2a-7 under the Investment Company Act of 1940, as amended. Each of these securities is an eligible security based on a comparable quality analysis performed by the Master Series' investment manager.
ñ Restricted security subject to restrictions on resale under federal securities laws. These securities may be resold in transactions exempt from registration, normally to qualified institutional buyers under Rule 144A under the Securities Act of 1933, as amended, and have been deemed by the investment manager to be liquid. At October 31, 2007, these securities amounted to approximately $213,250,000 or 11.2% of net assets for Tax-Exempt Master Series and approximately $8,115,000 or 1.3% of net assets for Municipal Master Series.
ß Security is guaranteed by the corporate or non-profit obligor.
µ Floating rate securities are securities whose yields vary with a designated market index or market rate. These securities are shown at their current rates as of October 31, 2007.
§ Credit ratings are unaudited.
a Security is subject to a guarantee provided by ABN AMRO Bank NV, backing 100% of the total principal.
b Security is subject to a guarantee provided by Banco Santander, backing 100% of the total principal.
c Security is subject to a guarantee provided by Bank of America, backing 100% of the total principal.
d Security is subject to a guarantee provided by Bank of New York, backing 100% of the total principal.
e Security is subject to a guarantee provided by Bear Stearns, backing 100% of the total principal.
f Security is subject to a guarantee provided by Calyon Bank, backing 100% of the total principal.
g Security is subject to a guarantee provided by Chase Bank, backing 100% of the total principal.
h Security is subject to a guarantee provided by Citibank, N.A., backing 100% of the total principal.
i Security is subject to a guarantee provided by Citigroup Global Markets, backing 100% of the total principal.
j Security is subject to a guarantee provided by Depfa Bank PLC, backing 100% of the total principal.
k Security is subject to a guarantee provided by Deutsche Bank, backing 100% of the total principal.
l Security is subject to a guarantee provided by Dexia Credit Locale de France, backing 100% of the total principal.
m Security is subject to a guarantee provided by Goldman Sachs, backing 100% of the total principal.
o Security is subject to a guarantee provided by JP Morgan Chase, backing 100% of the total principal.
44
Notes to Schedule of Investments Institutional Liquidity Trust (cont'd)
p Security is subject to a guarantee provided by Landesbank Hessen-Thveringen Girozentrale, backing 100% of the total principal.
q Security is subject to a guarantee provided by Lloyd's Bank, backing 100% of the total principal.
r Security is subject to a guarantee provided by Merrill Lynch Capital Markets, backing 100% of the total principal.
s Security is subject to a guarantee provided by Morgan Stanley, backing 100% of the total principal.
t Security is subject to a guarantee provided by Societe Generale, backing 100% of the total principal.
u Security is subject to a guarantee provided by U.S. Bank, backing 100% of the total principal.
v Security is subject to a guarantee provided by Wachovia Bank & Trust Co., backing 100% of the total principal.
w Security is subject to a guarantee provided by Wescorp Credit Union, backing 100% of the total principal.
x Security is subject to a guarantee provided by Wells Fargo Bank & Trust Co., backing 100% of the total principal.
y Security is subject to a guarantee provided by KBC Bank, backing 50% of the total principal and Landesbank Baden-Wurttemberg, backing 50% of the total principal.
z Security is subject to a guarantee provided by PNC Bank, backing 100% of the total principal.
45
Statements of Assets and Liabilities
Institutional Liquidity Trust
(000's omitted)
| | | TAX-EXEMPT
MASTER SERIES | | MUNICIPAL
MASTER SERIES | |
| | | October 31, 2007 | | October 31, 2007 | |
| Assets | |
| Investments in securities, at value* (Note A)—see Schedule of Investments: | |
| Unaffiliated issuers | | $ | 1,883,799 | | | $ | 614,040 | | |
| Interest receivable | | | 16,234 | | | | 4,005 | | |
| Receivable for securities sold | | | 8,685 | | | | 8,979 | | |
| Prepaid expenses and other assets | | | 184 | | | | 32 | | |
| Total Assets | | | 1,908,902 | | | | 627,056 | | |
| Liabilities | |
| Due to custodian | | | 10,595 | | | | 9,429 | | |
| Payable to investment manager—net (Note B) | | | 149 | | | | 52 | | |
| Accrued expenses and other payables | | | — | | | | 15 | | |
| Total Liabilities | | | 10,744 | | | | 9,496 | | |
| Net Assets Applicable to investors' beneficial interests | | $ | 1,898,158 | | | $ | 617,560 | | |
| Net Assets consist of: | |
| Paid-in capital | | $ | 1,898,158 | | | $ | 617,560 | | |
| *Cost of investments: | |
| Unaffiliated issuers | | $ | 1,883,799 | | | $ | 614,040 | | |
See Notes to Financial Statements 46
Statements of Operations
Institutional Liquidity Trust
(000's omitted)
| | | TAX-EXEMPT
MASTER SERIES | | MUNICIPAL
MASTER SERIES | |
| | | Period from
September 10, 2007
(Commencement
of Operations) to
October 31, 2007 | | Period from
September 10, 2007
(Commencement
of Operations) to
October 31, 2007 | |
| Investment Income | |
| Income: | |
| Interest income—unaffiliated issuers (Note A) | | $ | 10,784 | | | $ | 3,484 | | |
| Expenses: | |
| Investment management fees (Note B) | | | 618 | | | | 228 | | |
| Audit fees | | | 11 | | | | 32 | | |
| Custodian fees (Note B) | | | 54 | | | | 30 | | |
| Legal fees | | | 1 | | | | 1 | | |
| Rating agency fees | | | 1 | | | | 1 | | |
| Trustees' fees and expenses | | | 4 | | | | 4 | | |
| Miscellaneous | | | 3 | | | | — | | |
| Total expenses | | | 692 | | | | 296 | | |
| Investment management fees waived (Note B) | | | (383 | ) | | | (153 | ) | |
| Expenses reduced by custodian fee expense offset arrangement (Note B) | | | (111 | ) | | | (45 | ) | |
| Total net expenses | | | 198 | | | | 98 | | |
| Net investment income | | $ | 10,586 | | | $ | 3,386 | | |
| Realized and Unrealized Gain (Loss) on Investments (Note A) | |
| Net realized gain (loss) on: | |
| Sales of investment securities of unaffiliated issuers | | | 5 | | | | 6 | | |
| Net increase (decrease) in net assets resulting from operations | | $ | 10,591 | | | $ | 3,392 | | |
See Notes to Financial Statements 47
Statements of Changes in Net Assets
Institutional Liquidity Trust
(000's omitted)
| | | TAX-EXEMPT
MASTER SERIES | | MUNICIPAL
MASTER SERIES | |
| | | Period from
September 10, 2007
(Commencement of
Operations) to
October 31, 2007 | | Period from
September 10, 2007
(Commencement of
Operations) to
October 31, 2007 | |
| Increase (Decrease) in Net Assets: | |
| From Operations: | |
| Net investment income (loss) | | $ | 10,586 | | | $ | 3,386 | | |
| Net realized gain (loss) on investments | | | 5 | | | | 6 | | |
| Net increase (decrease) in net assets resulting from operations | | | 10,591 | | | | 3,392 | | |
| Transactions in Investors' Beneficial Interest: | |
| Contributions | | | 3,250,661 | | | | 1,154,509 | | |
| Withdrawals | | | (1,363,094 | ) | | | (540,341 | ) | |
| Net increase (decrease) from transactions in investors' beneficial interest | | | 1,887,567 | | | | 614,168 | | |
| Net Increase (Decrease) in Net Assets | | | 1,898,158 | | | | 617,560 | | |
| Net Assets: | |
| Beginning of period | | | — | | | | — | | |
| End of period | | $ | 1,898,158 | | | $ | 617,560 | | |
See Notes to Financial Statements 48
Notes to Financial Statements Institutional Liquidity Trust
Note A—Summary of Significant Accounting Policies:
1 General: Tax-Exempt Master Series and Municipal Master Series (individually a "Master Series," collectively, the "Master Series") are separate operating series of Institutional Liquidity Trust (the "Trust"), a Delaware statutory trust organized pursuant to a Trust Instrument dated October 1, 2004. The Trust is registered as a diversified, open-end management investment company under the Investment Company Act of 1940, as amended. Tax-Exempt Master Series and Municipal Master Series each had no operations until September 10, 2007 other than matters relating to its organization.
Other investment companies sponsored by Neuberger Berman Management Inc. ("Management"), the Master Series' investment manager, whose financial statements are not presented herein, also invest in the Master Series.
The assets of each Master Series belong only to that Master Series, and the liabilities of each Master Series are borne solely by that Master Series and no other series of the Trust.
The preparation of financial statements in accordance with U.S. generally accepted accounting principles requires Management to make estimates and assumptions at the date of the financial statements. Actual results could differ from those estimates.
2 Portfolio valuation: Investment securities are valued as indicated in the notes following the Master Series' Schedule of Investments.
3 Securities transactions and investment income: Securities transactions are recorded on trade date for financial reporting purposes. Interest income, including accretion of discount (adjusted for original issue discount, where applicable), and amortization of premium, where applicable, is recorded on the accrual basis. Realized gains and losses from securities transactions are recorded on the basis of identified cost and stated separately in the Statements of Operations.
4 Income tax information: Each Master Series intends to comply with the requirements of the Internal Revenue Code. Each Master Series also intends to conduct their operations so that each of its investors that are regulated investment companies and invest substantially all of their net investable assets therein will be able to qualify as such. Each Master Series will be treated as a partnership for U.S. federal income tax purposes and is therefore not subject to U.S. federal income tax.
5 Expense allocation: Certain expenses are applicable to multiple funds. Expenses directly attributable to a Master Series are charged to that Master Series. Expenses of the Trust that are not directly attributed to a Master Series are allocated among the series of the Trust, on the basis of relative net assets, except where a more appropriate allocation of expenses to each of the series can otherwise be made fairly. Expenses borne by the complex of related investment companies, which includes open-end and closed-end investment companies for which Management serves as investment manager, that are not directly attributed to a Master Series or the Trust, are allocated among the Master Series and the other investment companies in the complex or series thereof, on the basis of relative net assets, except where a more appropriate allocation of expenses to each investment company in the complex or series thereof can otherwise be made fairly.
6 Repurchase agreements: Each Master Series may enter into repurchase agreements with institutions that Management has determined are creditworthy. Each repurchase agreement is recorded at cost. Each Master Series requires that the securities purchased in a repurchase agreement be transferred to the custodian in a manner sufficient to enable the Master Series to assert a perfected security interest in those securities in the event of a default under the repurchase agreement. Each Master Series monitors, on a daily basis, the value of the securities transferred to ensure that their value, including accrued interest, is greater than amounts owed to the Master Series under each such repurchase agreement.
49
7 Indemnifications: Like many other companies, the Trust's organizational documents provide that its officers and trustees are indemnified against certain liabilities arising out of the performance of their duties to the Trust. In addition, both in some of its principal service contracts and in the normal course of its business, the Trust enters into contracts that provide indemnifications to other parties for certain types of losses or liabilities. The Trust's maximum exposure under these arrangements is unknown as this could involve future claims against the Trust.
Note B—Management Fees and Other Transactions with Affiliates:
Each Master Series retains Management as its investment manager under a Management Agreement. For such investment management services, each Master Series pays Management a fee at the annual rate of 0.25% of the first $500 million of average daily net assets, 0.225% of the next $500 million, 0.20% of the next $500 million, 0.175% of the next $500 million, and 0.15% of average daily net assets in excess of $2 billion. Management contractually agreed to waive its management fee, limiting the management fee to 0.08% of each Master Series' average daily net assets. For the period ended October 31, 2007, such waived fees amounted to $383,486 for Tax-Exempt Master Series and $153,107 for Municipal Master Series, respectively.
Management and Lehman Brothers Asset Management LLC ("LBAM"), the sub-adviser to the Master Series, are wholly-owned subsidiaries of Lehman Brothers Holdings Inc., a publicly-owned holding company. LBAM is retained by Management to provide day-to-day investment management services. LBAM, as sub-adviser to each Master Series, receives a monthly fee paid by Management, based on an annual rate of each Master Series' average daily net assets. The Master Series do not pay a fee directly to LBAM for such services. As investment adviser, Management is responsible for overseeing the investment activities of LBAM. Several individuals who are officers and/or trustees of the Trust are also employees of LBAM and/or Management.
Each Master Series has an expense offset arrangement in connection with its custodian contract. For the period ended October 31, 2007, the impact of this arrangement was a reduction of expenses of $110,670 and $44,585 for Tax-Exempt Master Series and Municipal Master Series, respectively.
Note C—Securities Transactions:
All securities transactions for Tax-Exempt Master Series and Municipal Master Series were short-term.
Note D—Line of Credit:
At commencement of operations, the Master Series became a participant in a single committed, unsecured $300,000,000 line of credit with State Street Bank and Trust Company ("State Street") and Bank of New York, as agent, to be used only for temporary or emergency purposes. Other investment companies managed by Management also participate in this line of credit on the same terms. Interest is charged on borrowings under this agreement at the overnight Federal Funds Rate plus 0.375% per annum. A commitment fee of 0.075% per annum of the unused available line of credit is charged, of which the Master Series has agreed to pay its pro rata share, based on the ratio of its individual net assets to the net assets of all participants at the time the fee is due and payable. The fee is paid quarterly in arrears. Because several investment companies participate, there is no assurance that an individual Master Series will have access to all or any part of the $300,000,000 at any particular time.
On September 27, 2007 the Master Series became a participant in a single uncommitted, unsecured $150,000,000 line of credit with State Street, as lender, to be used only for temporary or emergency purposes. Other investment companies managed by Management also participate in this line of credit on the same terms. Interest is charged on borrowings under this agreement at the overnight Federal Funds Rate plus 0.375% per annum. Because several investment companies participate, there is no assurance that an individual Master Series will have access to all or any part of the $150,000,000 at any particular time.
50
The Master Series had no loans outstanding pursuant to either line of credit at October 31, 2007. During the period ended October 31, 2007, the Master Series did not utilize either line of credit.
Note E—Recent Accounting Pronouncement:
In September 2006, Financial Accounting Standards Board ("FASB") issued FASB Statement No. 157, "Fair Value Measurement" ("SFAS 157"), which defines fair value, establishes a framework for measuring fair value, and expands disclosures about fair value measurements. SFAS 157 is effective for fiscal years beginning after November 15, 2007, and interim periods within those fiscal years. Management believes the adoption of SFAS 157 will not have a material impact on the Master Series' financial position or results or operations.
Note F—Change in Year End:
The Board of Trustees adopted a change in each Master Series' fiscal year and tax year end date to March 31. This change is effective with the next fiscal period, which runs from November 1, 2007 to March 31, 2008.
51
Financial Highlights
Tax-Exempt Master Series
| | | Period from
September 10, 2007^
to October 31,
2007 | |
| Ratios to Average Net Assets: | |
| Gross Expenses# | | | .13 | %* | |
| Net Expenses‡ | | | .09 | %* | |
| Net Investment Income (Loss) | | | 3.61 | %* | |
| Total Return†@@ | | | +.52 | %** | |
| Net Assets, End of Period (in millions) | | $ | 1,898.2 | | |
See Notes to Financial Highlights 52
Financial Highlights
Municipal Master Series
| | | Period from
September 10, 2007^
to October 31,
2007 | |
| Ratios to Average Net Assets: | |
| Gross Expenses# | | | .18 | %* | |
| Net Expenses‡ | | | .13 | %* | |
| Net Investment Income (Loss) | | | 3.63 | %* | |
| Total Return†@@ | | | +.52 | %** | |
| Net Assets, End of Period (in millions) | | $ | 617.6 | | |
See Notes to Financial Highlights 53
Notes to Financial Highlights Institutional Liquidity Trust
# The Master Series is required to calculate an expense ratio without taking into consideration any expense reductions related to expense offset arrangements.
‡ After waiver of a portion of the investment management fee by Management. Had Management not undertaken such action, the annualized ratios of net expenses to average daily net assets would have been:
| | | Period Ended
October 31,
2007(1) | |
| Tax-Exempt Master Series | | | 0.22 | % | |
| Municipal Master Series | | | 0.30 | % | |
(1) Period from September 10, 2007 (commencement of operations) to October 31, 2007.
† Total return for the Master Series has been calculated based on the total return for the feeder funds that invest all of their net investable assets in the Master Series. Total return assumes all distributions were reinvested and adjusted for the difference in expenses as set forth in the Notes to the Financial Statements of the feeder funds. Results represent past performance and do not guarantee future results. Current returns may be lower or higher than the performance data quoted.
@@ Total return would have been lower had Management not waived a portion of the investment management fee.
^ The date investment operations commenced.
* Annualized.
** Not annualized.
54
Report of Independent Registered Public Accounting Firm
To the Board of Trustees of Institutional Liquidity Trust and Owners of Beneficial Interest of Tax-Exempt Master Series
We have audited the accompanying statement of assets and liabilities of Tax-Exempt Master Series (the "Portfolio"), a series of Institutional Liquidity Trust, including the schedule of investments, as of October 31, 2007, and the related statement of operations, the statement of changes in net assets, and the financial highlights for the period September 10, 2007 (commencement of operations) to October 31, 2007. These financial statements and financial highlights are the responsibility of the Portfolio's management. Our responsibility is to express an opinion on these financial statements and financial highlights based on our audit.
We conducted our audit in accordance with the standards of the Public Company Accounting Oversight Board (United States). Those standards require that we plan and perform the audit to obtain reasonable assurance about whether the financial statements and financial highlights are free of material misstatement. The Portfolio is not required to have, nor were we engaged to perform, an audit of its internal control over financial reporting. Our audit included consideration of internal control over financial reporting as a basis for designing audit procedures that are appropriate in the circumstances, but not for the purpose of expressing an opinion on the effectiveness of the Portfolio's internal control over financial reporting. Accordingly, we express no such opinion. An audit also includes examining, on a test basis, evidence supporting the amounts and disclosures in the financial statements, assessing the accounting principles used and significant estimates made by management, as well as evaluating the overall financial statement presentation. Our procedures included confirmation of securities owned as of October 31, 2007, by correspondence with the custodian. We believe that our audit provides a reasonable basis for our opinion.
In our opinion, the financial statements and financial highlights referred to above present fairly, in all material respects, the financial position of Tax-Exempt Master Series as of October 31, 2007, the results of its operations, the changes in its net assets, and the financial highlights for the period from September 10, 2007 to October 31, 2007, in conformity with accounting principles generally accepted in the United States of America.

Philadelphia, Pennsylvania
December 14, 2007
55
Report of Independent Registered Public Accounting Firm
To the Board of Trustees of Institutional Liquidity Trust and Owners of Beneficial Interest of Municipal Master Series:
We have audited the accompanying statement of assets and liabilities, including the schedule of investments, of Municipal Master Series (one of the series constituting Institutional Liquidity Trust) (the "Portfolio"), as of October 31, 2007, and the related statements of operations and changes in net assets, and the financial highlights for the period from September 10, 2007 (commencement of operations) to October 31, 2007. These financial statements and financial highlights are the responsibility of the Portfolio's management. Our responsibility is to express an opinion on these financial statements and financial highlights based on our audit.
We conducted our audit in accordance with the standards of the Public Company Accounting Oversight Board (United States). Those standards require that we plan and perform the audit to obtain reasonable assurance about whether the financial statements and financial highlights are free of material misstatement. We were not engaged to perform an audit of the Portfolio's internal control over financial reporting. Our audit included consideration of internal control over financial reporting as a basis for designing audit procedures that are appropriate in the circumstances, but not for the purpose of expressing an opinion on the effectiveness of the Portfolio's internal control over financial reporting. Accordingly, we express no such opinion. An audit also includes examining, on a test basis, evidence supporting the amounts and disclosures in the financial statements and financial highlights, assessing the accounting principles used and significant estimates made by management, and evaluating the overall financial statement presentation. Our procedures included confirmation of securities owned as of October 31, 2007, by correspondence with the custodian and brokers or by other appropriate auditing procedures where replies from brokers were not received. We believe that our audit provides a reasonable basis for our opinion.
In our opinion, the financial statements and financial highlights referred to above present fairly, in all material respects, the financial position of Municipal Master Series, a portfolio of Institutional Liquidity Trust, at October 31, 2007, the results of its operations, the changes in its net assets, and its financial highlights for the period from September 10, 2007 (commencement of operations) to October 31, 2007, in conformity with U.S. generally accepted accounting principles.

Boston, Massachusetts
December 14, 2007
56
Directory
Investment Manager, Administrator and Distributor
Neuberger Berman Management Inc.
605 Third Avenue, 2nd Floor
New York, NY 10158-0180
888.556.9030
Sub-Adviser
Lehman Brothers Asset Management LLC
200 South Wacker Drive
Suite 2100
Chicago, IL 60601
Custodian and Shareholder Servicing Agent
State Street Bank and Trust Company
225 Franklin Street
Boston, MA 02110
Legal Counsel
Kirkpatrick & Lockhart Preston Gates Ellis LLP
1601 K Street, NW
Washington, DC 20006
Independent Registered Public Accounting Firms
Ernst & Young LLP
200 Clarendon Street
Boston, MA 02116
Tait, Weller & Baker LLP
1818 Market Street
Suite 2400
Philadelphia, PA 19103
57
Trustee and Officer Information
The following tables set forth information concerning the trustees ("Trustees") and officers ("Officers") of Lehman Brothers Income Funds (the "Trust"). All persons named as Trustees and Officers also serve in similar capacities for other funds administered or managed by Neuberger Berman Management Inc. ("Management"), Lehman Brothers Asset Management LLC ("LBAM") and Neuberger Berman, LLC ("Neuberger"). The Statement of Additional Information includes additional information about the Trustees and Officers and is available upon request, without charge, by calling (800) 877-9700.
Information about the Board of Trustees
| Name, Age, and Address(1) | | Position and
Length of
Time Served(2) | | Principal Occupation(s)(3) | | Number of
Funds in
Fund Complex
Overseen by
Trustee(4) | | Other Directorships Held
Outside Fund Complex by
Trustee | |
| Independent Trustees | |
| John Cannon (77) | | Trustee since 1994 | | Consultant; formerly, Chairman, CDC Investment Advisers (registered investment adviser), 1993 to January 1999; formerly, President and Chief Executive Officer, AMA Investment Advisors, an affiliate of the American Medical Association. | | | 59 | | | Independent Trustee or Director of three series of Oppenheimer Funds: Oppenheimer Limited Term New York Municipal Fund, Rochester Fund Municipals, and Oppenheimer Convertible Securities Fund since 1992. | |
|
| Faith Colish (72) | | Trustee since 2000 | | Counsel, Carter Ledyard & Milburn LLP (law firm) since October 2002; formerly, Attorney-at-Law and President, Faith Colish, A Professional Corporation, 1980 to 2002. | | | 59 | | | Formerly, Director (1997 to 2003) and Advisory Director (2003 to 2006), ABA Retirement Funds (formerly, American Bar Retirement Association) (not-for-profit membership corporation). | |
58
| Name, Age, and Address(1) | | Position and
Length of
Time Served(2) | | Principal Occupation(s)(3) | | Number of
Funds in
Fund Complex
Overseen by
Trustee(4) | | Other Directorships Held
Outside Fund Complex by
Trustee | |
| Martha C. Goss (58) | | Trustee since 2007 | | President, Woodhill Enterprises Inc./Chase Hollow Associates LLC (personal investment vehicle), since 2006; Chief Operating and Financial Officer, Hopewell Holdings LLC/ Amwell Holdings, LLC (a holding company for a healthcare reinsurance company start-up), since 2003; formerly, Consultant, Resources Connection (temporary staffing), 2002 to 2006. | | | 59 | | | Director, Ocwen Financial Corporation (mortgage servicing), since 2005; Director, American Water (water utility), since 2003; Director, Channel Reinsurance (financial guaranty reinsurance), since 2006; Advisory Board Member, Attensity (software developer), since 2005; Director, Allianz Life of New York (insurance), since 2005; Director, Financial Women's Association of New York (not for profit association), since 2003; Trustee Emerita, Brown University, since 1998. | |
|
| C. Anne Harvey (70) | | Trustee since 2000 | | President, C.A. Harvey Associates since October 2001; formerly, Director, AARP, 1978 to December 2001. | | | 59 | | | Formerly, President, Board of Associates to The National Rehabilitation Hospital's Board of Directors, 2001 to 2002; formerly, Member, Individual Investors Advisory Committee to the New York Stock Exchange Board of Directors, 1998 to June 2002. | |
|
| Robert A. Kavesh (80) | | Trustee since 1993 | | Marcus Nadler Professor Emeritus of Finance and Economics, New York University Stern School of Business; formerly, Executive Secretary-Treasurer, American Finance Association, 1961 to 1979. | | | 59 | | | Formerly, Director, The Caring Community (not-for-profit), 1997 to 2006; formerly, Director, DEL Laboratories, Inc. (cosmetics and pharmaceuticals), 1978 to 2004; formerly, Director, Apple Bank for Savings, 1979 to 1990; formerly, Director, Western Pacific Industries, Inc., 1972 to 1986 (public company). | |
|
59
| Name, Age, and Address(1) | | Position and
Length of
Time Served(2) | | Principal Occupation(s)(3) | | Number of
Funds in
Fund Complex
Overseen by
Trustee(4) | | Other Directorships Held
Outside Fund Complex by
Trustee | |
| Michael M. Knetter (47) | | Trustee since 2007 | | Dean, School of Business, University of Wisconsin - Madison; formerly, Professor of International Economics and Associate Dean, Amos Tuck School of Business - Dartmouth College, 1998 to 2002. | | | 59 | | | Trustee, Northwestern Mutual Series Fund, Inc. since February 2007; Director, Wausau Paper since 2005; Director, Great Wolf Resorts since 2004. | |
|
| Howard A. Mileaf (70) | | Trustee since 2000 | | Retired; formerly, Vice President and General Counsel, WHX Corporation (holding company), 1993 to 2001. | | | 59 | | | Director, Webfinancial Corporation (holding company) since December 2002; formerly, Director WHX Corporation (holding company), January 2002 to June 2005; formerly, Director, State Theatre of New Jersey (not-for-profit theater), 2000 to 2005. | |
|
| George W. Morriss (60) | | Trustee since 2007 | | Formerly, Executive Vice President and Chief Financial Officer, People's Bank (a financial services company), 1991 to 2001. | | | 59 | | | Manager, Old Mutual 2100 fund complex (consisting of six funds) since October 2006 for four funds and since February 2007 for two funds. | |
|
| Edward I. O'Brien (79) | | Trustee since 2000 | | Formerly, Member, Investment Policy Committee, Edward Jones, 1993 to 2001; President, Securities Industry Association ("SIA") (securities industry's representative in government relations and regulatory matters at the federal and state levels), 1974 to 1992; Adviser to SIA, November 1992 to November 1993. | | | 59 | | | Director, Legg Mason, Inc. (financial services holding company) since 1993; formerly, Director, Boston Financial Group (real estate and tax shelters), 1993 to 1999. | |
|
60
| Name, Age, and Address(1) | | Position and
Length of
Time Served(2) | | Principal Occupation(s)(3) | | Number of
Funds in
Fund Complex
Overseen by
Trustee(4) | | Other Directorships Held
Outside Fund Complex by
Trustee | |
| William E. Rulon (75) | | Trustee since 1993 | | Retired; formerly, Senior Vice President, Foodmaker, Inc. (operator and franchiser of restaurants) until January 1997. | | | 59 | | | Formerly, Director, Pro-Kids Golf and Learning Academy (teach golf and computer usage to "at risk" children), 1998 to 2006; formerly, Director, Prandium, Inc. (restaurants), March 2001 to July 2002. | |
|
| Cornelius T. Ryan (76) | | Trustee since 2000 | | Founding General Partner, Oxford Partners and Oxford Bioscience Partners (venture capital investing) and President, Oxford Venture Corporation since 1981. | | | 59 | | | None. | |
|
| Tom D. Seip (57) | | Trustee since 2000; Lead Independent Trustee beginning 2006 | | General Partner, Seip Investments LP (a private investment partnership); formerly, President and CEO, Westaff, Inc. (temporary staffing), May 2001 to January 2002; formerly, Senior Executive at the Charles Schwab Corporation, 1983 to 1998, including Chief Executive Officer, Charles Schwab Investment Management, Inc. and Trustee, Schwab Family of Funds and Schwab Investments, 1997 to 1998, and Executive Vice President-Retail Brokerage, Charles Schwab & Co., Inc., 1994 to 1997. | | | 59 | | | Director, H&R Block, Inc. (financial services company) since May 2001; Chairman, Compensation Committee, H&R Block, Inc. since 2006; Director, America One Foundation since 1998; formerly, Chairman, Governance and Nominating Committee, H&R Block, Inc., 2004 to 2006; formerly, Director, Forward Management, Inc. (asset management company), 1999 to 2006; formerly Director, E-Bay Zoological Society, 1999 to 2003; formerly, Director, General Magic (voice recognition software), 2001 to 2002; formerly, Director, E-Finance Corporation (credit decisioning services), 1999 to 2003; formerly, Director, Save-Daily.com (micro investing services), 1999 to 2003. | |
|
61
| Name, Age, and Address(1) | | Position and
Length of
Time Served(2) | | Principal Occupation(s)(3) | | Number of
Funds in
Fund Complex
Overseen by
Trustee(4) | | Other Directorships Held
Outside Fund Complex by
Trustee | |
| Candace L. Straight (60) | | Trustee since 1993 | | Private investor and consultant specializing in the insurance industry; formerly, Advisory Director, Securitas Capital LLC (a global private equity investment firm dedicated to making investments in the insurance sector), 1998 to December 2003. | | | 59 | | | Director, Montpelier Re (reinsurance company) since 2006; Director, National Atlantic Holdings Corporation (property and casualty insurance company) since 2004; Director, The Proformance Insurance Company (property and casualty insurance company) since March 2004; formerly, Director, Providence Washington Insurance Company (property and casualty insurance company), December 1998 to March 2006; formerly, Director, Summit Global Partners (insurance brokerage firm), 2000 to 2005. | |
|
| Peter P. Trapp (63) | | Trustee since 2000 | | Retired; formerly, Regional Manager for Mid-Southern Region, Ford Motor Credit Company, September 1997 to 2007; formerly, President, Ford Life Insurance Company, April 1995 to August 1997. | | | 59 | | | None. | |
|
| Jack L. Rivkin* (67) | | President and Trustee since 2002 | | Executive Vice President and Chief Investment Officer, Neuberger Berman Inc. (holding company) since 2002 and 2003, respectively; Managing Director and Chief Investment Officer, Neuberger, since December 2005 and 2003, respectively; formerly, Executive Vice President, Neuberger, December 2002 to 2005; Director and Chairman, Management since December 2002; formerly, Executive Vice President, Citigroup Investments, Inc., September 1995 to February 2002; formerly, Executive Vice President, Citigroup Inc., September 1995 to February 2002. | | | 59 | | | Director, Dale Carnegie and Associates, Inc. (private company) since 1998; Director, Solbright, Inc. (private company) since 1998. | |
|
62
| Name, Age, and Address(1) | | Position and
Length of
Time Served(2) | | Principal Occupation(s)(3) | | Number of
Funds in
Fund Complex
Overseen by
Trustee(4) | | Other Directorships Held
Outside Fund Complex by
Trustee | |
| Peter E. Sundman* (48) | | Chairman of the Board and Trustee since 2000; Chief Executive Officer since 1999; President from 1999 to 2000 | | Executive Vice President, Neuberger Berman Inc. (holding company) since 1999; Head of Neuberger Berman Inc.'s Mutual Funds Business (since 1999) and Institutional Business (1999 to October 2005); responsible for Managed Accounts Business and intermediary distribution since October 1999; President and Director, Management since 1999; Managing Director, Neuberger since 2005; formerly, Executive Vice President, Neuberger, 1999 to December 2005; formerly, Principal, Neuberger, 1997 to 1999; formerly, Senior Vice President, Management, 1996 to 1999. | | | 59 | | | Director and Vice President, Neuberger & Berman Agency, Inc. since 2000; formerly, Director, Neuberger Berman Inc. (holding company), October 1999 to March 2003; Trustee, Frost Valley YMCA; Trustee, College of Wooster. | |
|
(1) The business address of each listed person is 605 Third Avenue, New York, New York 10158.
(2) Pursuant to the Trust's Trust Instrument, each Trustee shall hold office for life or until his or her successor is elected or the Trust terminates; except that (a) any Trustee may resign by delivering a written resignation; (b) any Trustee may be removed with or without cause at any time by a written instrument signed by at least two-thirds of the other Trustees; (c) any Trustee who requests to be retired, or who has become unable to serve, may be retired by a written instrument signed by a majority of the other Trustees; and (d) any Trustee may be removed at any shareholder meeting by a vote of at least two-thirds of the outstanding shares.
(3) Except as otherwise indicated, each individual has held the positions shown for at least the last five years.
(4) For funds organized in a master-feeder structure, we count the master fund and its associated feeder funds as a single portfolio.
* Indicates a Trustee who is an "interested person" within the meaning of the 1940 Act. Mr. Sundman and Mr. Rivkin are interested persons of the Trust by virtue of the fact that they are officers and/or directors of Management, LBAM and/or Neuberger.
63
Information about the Officers of the Trust
| Name, Age, and Address(1) | | Position and
Length of Time
Served(2) | | Principal Occupation(s)(3) | |
| Andrew B. Allard (46) | | Anti-Money Laundering Compliance Officer since 2002 | | Senior Vice President, Neuberger since 2006; Deputy General Counsel, Neuberger since 2004; formerly, Vice President, Neuberger, 2000 to 2005; formerly, Associate General Counsel, Neuberger, 1999 to 2004; Anti-Money Laundering Compliance Officer, sixteen registered investment companies for which Management acts as investment manager and administrator (six since 2002, three since 2003, four since 2004, one since 2005 and two since 2006). | |
|
| Michael J. Bradler (37) | | Assistant Treasurer since 2005 | | Vice President, Neuberger since 2006; Employee, Management since 1997; Assistant Treasurer, sixteen registered investment companies for which Management acts as investment manager and administrator (fourteen since 2005 and two since 2006). | |
|
| Claudia A. Brandon (51) | | Secretary since 1985 | | Senior Vice President, Neuberger since 2007; Vice President-Mutual Fund Board Relations, Management since 2000 and Assistant Secretary since 2004; formerly, Vice President, Neuberger, 2002 to 2006 and Employee since 1999; Secretary, sixteen registered investment companies for which Management acts as investment manager and administrator (three since 1985, three since 2002, three since 2003, four since 2004, one since 2005 and two since 2006). | |
|
| Robert Conti (51) | | Vice President since 2000 | | Managing Director, Neuberger since 2007; formerly, Senior Vice President, Neuberger, 2003 to 2006; formerly, Vice President, Neuberger, 1999 to 2003; Senior Vice President, Management since 2000; Vice President, sixteen registered investment companies for which Management acts as investment manager and administrator (three since 2000, three since 2002, three since 2003, four since 2004, one since 2005 and two since 2006). | |
|
| Brian J. Gaffney (54) | | Vice President since 2000 | | Managing Director, Neuberger since 1999; Senior Vice President, Management since 2000; Vice President, sixteen registered investment companies for which Management acts as investment manager and administrator (three since 2000, three since 2002, three since 2003, four since 2004, one since 2005 and two since 2006). | |
|
| Maxine L. Gerson (56) | | Chief Legal Officer since 2005 (only for purposes of sections 307 and 406 of the Sarbanes-Oxley Act of 2002) | | Senior Vice President, Neuberger since 2002; Deputy General Counsel and Assistant Secretary, Neuberger since 2001; Senior Vice President, Management since 2006; Secretary and General Counsel, Management since 2004; Chief Legal Officer (only for purposes of sections 307 and 406 of the Sarbanes-Oxley Act of 2002), sixteen registered investment companies for which Management acts as investment manager and administrator (fourteen since 2005 and two since 2006). | |
|
64
| Name, Age, and Address(1) | | Position and
Length of Time
Served(2) | | Principal Occupation(s)(3) | |
| Sheila R. James (42) | | Assistant Secretary since 2002 | | Assistant Vice President, Neuberger since 2007 and Employee since 1999; Assistant Secretary, sixteen registered investment companies for which Management acts as investment manager and administrator (six since 2002, three since 2003, four since 2004, one since 2005 and two since 2006). | |
|
| Kevin Lyons (52) | | Assistant Secretary since 2003 | | Employee, Neuberger since 1999; Assistant Secretary, sixteen registered investment companies for which Management acts as investment manager and administrator (nine since 2003, four since 2004, one since 2005 and two since 2006). | |
|
| John M. McGovern (37) | | Treasurer and Principal Financial and Accounting Officer since 2005; prior thereto, Assistant Treasurer since 2002 | | Senior Vice President, Neuberger since 2007; formerly, Vice President, Neuberger, 2004 to 2006; Employee, Management since 1993; Treasurer and Principal Financial and Accounting Officer, sixteen registered investment companies for which Management acts as investment manager and administrator (fourteen since 2005 and two since 2006); formerly, Assistant Treasurer, fourteen registered investment companies for which Management acts as investment manager and administrator, 2002 to 2005. | |
|
| Frank Rosato (36) | | Assistant Treasurer since 2005 | | Vice President, Neuberger since 2006; Employee, Management since 1995; Assistant Treasurer, sixteen registered investment companies for which Management acts as investment manager and administrator (fourteen since 2005 and two since 2006). | |
|
| Frederic B. Soule (61) | | Vice President since 2000 | | Senior Vice President, Neuberger since 2003; formerly, Vice President, Neuberger, 1999 to 2002; Vice President, sixteen registered investment companies for which Management acts as investment manager and administrator (three since 2000, three since 2002, three since 2003, four since 2004, one since 2005 and two since 2006). | |
|
| Chamaine Williams (36) | | Chief Compliance Officer since 2005 | | Senior Vice President, Neuberger since 2007; Chief Compliance Officer, Management since 2006; Senior Vice President, Lehman Brothers Inc. since 2007; formerly, Vice President, Lehman Brothers Inc., 2003 to 2006; Chief Compliance Officer, sixteen registered investment companies for which Management acts as investment manager and administrator (fifteen since 2005 and one since 2006); Chief Compliance Officer, Lehman Brothers Asset Management Inc. since 2003; Chief Compliance Officer, Lehman Brothers Alternative Investment Management LLC since 2003; formerly, Vice President, UBS Global Asset Management (US) Inc. (formerly, Mitchell Hutchins Asset Management, a wholly-owned subsidiary of PaineWebber Inc.), 1997 to 2003. | |
|
(1) The business address of each listed person is 605 Third Avenue, New York, New York 10158.
(2) Pursuant to the By-Laws of the Trust, each Officer elected by the Trustees shall hold office until his or her successor shall have been elected and qualified or until his or her earlier death, inability to serve, or resignation. Officers serve at the pleasure of the Trustees and may be removed at any time with or without cause.
(3) Except as otherwise indicated, each individual has held the positions shown for at least the last five years.
65
Proxy Voting Policies and Procedures
A description of the policies and procedures that the Trust uses to determine how to vote proxies relating to portfolio securities is available, without charge, by calling 1-888-556-9030 (toll-free) and on the website of the Securities and Exchange Commission, at www.sec.gov. Information regarding how the Trust voted proxies relating to portfolio securities during the most recent 12-month period ended June 30 is also available, without charge, by calling 1-888-556-9030 (toll-free) and on the website of the Securities and Exchange Commission, at www.sec.gov.
Quarterly Portfolio Schedule
The Trust files a complete schedule of portfolio holdings for each Master Series with the Securities and Exchange Commission for the first and third quarters of each fiscal year on Form N-Q. The Trust's Forms N-Q are available on the Securities and Exchange Commission's website at www.sec.gov and may be reviewed and copied at the Securities and Exchange Commission's Public Reference Room in Washington, DC. Information on the operation of the Public Reference Room may be obtained by calling 1-800-SEC-0330. The information on Form N-Q is available upon request, without charge, by calling 1-888-556-9030 (toll-free).
Notice to Shareholders (Unaudited)
For the fiscal year ended October 31, 2007, the percentages representing the portion of distributions from net investment income, which are exempt from federal tax, other than alternative minimum tax are as follows:
| Tax-Free Money Fund | | | 100 | % | |
| National Municipal Money Fund | | | 100 | % | |
Board Consideration of the Management and Sub-Advisory Agreements
Lehman Brothers Tax-Free Money Fund and Lehman Brothers National Municipal Money Fund (each, a "Feeder Portfolio") do not have their own management and sub-advisory agreements. Instead, each Feeder Portfolio invests all of its net investable assets in Tax-Exempt Master Series and Municipal Master Series, respectively, which are series of Institutional Liquidity Trust (each, a "Master Series"). At a meeting held on September 27, 2007, the Board of Trustees of Institutional Liquidity Trust ("Board"), including the Trustees who are not "interested persons" of Neuberger Berman Management Inc. ("Management") or Institutional Liquidity Trust ("Independent Fund Trustees"), approved the continuance of the Management and Sub-Advisory Agreements ("Agreements") between Management and Institutional Liquidity Trust, on behalf of each Master Series. The term "Fund" is used throughout this section to refer to each Feeder Portfolio or its corresponding Master Series, as appropriate.
In evaluating the Agreements, the Board, including the Independent Fund Trustees, reviewed materials furnished by Management and Lehman Brothers Asset Management LLC ("LBAM") in response to questions submitted by counsel to the Independent Fund Trustees, and met with senior representatives of Management and LBAM regarding their personnel and operations. The Independent Fund Trustees were advised by counsel that is experienced in Investment Company Act of 1940 matters and that is independent of Management and LBAM. The Independent Fund Trustees received a memorandum from independent counsel discussing the legal standards for their consideration of the proposed continuance of the Agreements. They met with such counsel separately from representatives of Management to discuss the annual contract review. The annual contract review extends over two regular meetings of the Board to ensure that Management and LBAM have time to respond t o any questions the Independent Fund Trustees may have on their initial review of the report and that the Independent Fund Trustees have time to consider those responses. In addition, during this process, the Board held a separate meeting devoted to reviewing and discussing Fund performance.
The Board considered the following factors, among others, in connection with its approval of the continuance of the Agreements: (1) the nature, extent, and quality of the services provided by Management and LBAM; (2) the performance of each Fund compared to a relevant market index and a peer group of investment companies; (3) the costs of the services
66
provided; (4) the extent to which economies of scale might be realized as each Fund grows; and (5) whether fee levels reflect any such potential economies of scale for the benefit of investors in each Fund. In their deliberations, the Board members did not identify any particular information that was all-important or controlling, and each Trustee may have attributed different weights to the various factors.
The Board evaluated the terms of the Agreements, the overall fairness of the Agreements to each Fund and whether the Agreements were in the best interests of each Fund and its shareholders.
With respect to the nature, extent and quality of the services provided, the Board considered the performance of each Fund and the experience and staffing of the portfolio management and investment research personnel who perform services for the Funds. The Board noted that Management also provides certain administrative services, including fund accounting and compliance oversight. In addition, the Board noted the positive compliance history of Management, as the firm has been free of significant compliance problems.
With respect to the performance of each Fund, the Board considered the previous performance of Management in managing each of Lehman Brothers Tax-Free Money Fund and Lehman Brothers National Municipal Money Fund prior to its investment of all of its net investable assets in a Master Series. The Board considered such performance relative to each Fund's benchmark and a peer group of investment companies pursuing broadly similar strategies to the Fund. The Board also considered performance in relation to the degree of risk undertaken by the portfolio managers.
With respect to the overall fairness of the Agreements, the Board considered the fee structure for each Fund under the Agreements as compared to a peer group of comparable funds and fall-out benefits likely to accrue to Management or LBAM or their affiliates from their relationship with each Fund.
The Board reviewed a comparison of each Fund's management fee and overall expense ratio to a peer group of broadly comparable funds. In addition, the Board considered the contractual limits on Fund expenses undertaken by Management for the Funds.
The Board considered whether there were other funds that were advised or sub-advised by Management or its affiliates or separate accounts managed by Management or its affiliates with similar investment objectives, policies and strategies to the Funds. The Board compared the fees charged to each Fund at various asset levels to the fees charged to such funds. The Board considered the appropriateness and reasonableness of any differences between the fees charged to each Fund and such other funds and determined that the differences in fees were consistent with the management and other services provided.
The Board considered the potential for economies of scale in relation to the services Management provides to each Fund. The Board considered that each Fund's fee structure provides for a reduction of payments resulting from the use of breakpoints and whether those breakpoints are set at appropriate levels.
The Board did not review profitability data from Management for Tax-Exempt Master Series and Municipal Master Series because each Fund has been operating for less than a year, but considered Management's profitability for each of Lehman Brothers Tax-Free Money Fund and Lehman Brothers National Municipal Money Fund prior to its investment of all of its net investable assets in a Master Series. The Board also carefully examined Management's cost allocation methodology and in recent years had an independent consultant review the methodology. It also reviewed an analysis from an independent data service on investment management profitability margins.
Conclusions
In approving the Agreements, the Board concluded that the terms of each Agreement are fair and reasonable and that approval of the Agreements is in the best interests of each Fund and its shareholders. In reaching this determination, the Board considered that Management and LBAM could be expected to provide a high level of service to each Fund; that each Fund's fee structure appeared to the Board to be reasonable given the nature and quality of services provided; and that the expected benefits accruing to Management and its affiliates by virtue of their relationship to the Funds were reasonable in comparison with the expected benefits accruing to each Fund.
67
This page has been left blank intentionally.
Investment manager: Neuberger Berman Management Inc.
Sub-adviser: Lehman Brothers Asset Management LLC
Neuberger Berman Management Inc.
605 Third Avenue, 2nd Floor
New York, NY 10158-0180
888.556.9030
Web site: www.lehmanam.com
Statistics and projections in this report are derived from sources deemed to be reliable but cannot be regarded as a representation of future results of the Funds. This report is prepared for the general information of shareholders and is not an offer of shares of the Funds. Shares are sold only through the currently effective prospectus, which must precede or accompany this report.
 H0679 12/07
Item 2. Code of Ethics
The Board of Trustees (“Board”) of Lehman Brothers Income Funds (“Registrant”) adopted a code of ethics that applies to the Registrant’s principal executive officer, principal financial officer, principal accounting officer or controller, or persons performing similar functions (“Code of Ethics”). For the period covered by this Form N-CSR, there were no amendments to the Code of Ethics and there were no waivers from the Code of Ethics granted to the Registrant’s principal executive officer, principal financial officer, principal accounting officer or controller, or persons performing similar functions.
A copy of the Code of Ethics is incorporated by reference to the Registrant’s Form N-CSR, Investment Company Act file number 811-03802 (filed on July 10, 2006). The Code of Ethics is also available, without charge, by calling 1-800-877-9700 (toll-free).
Item 3. Audit Committee Financial Expert
The Board has determined that the Registrant has three audit committee financial experts serving on its audit committee. The Registrant’s audit committee financial experts are Martha Goss, Howard Mileaf, and George Morriss. Ms. Goss, Mr. Mileaf and Mr. Morriss are independent trustees as defined by Form N-CSR.
Item 4. Principal Accountant Fees and Services
The financial information provided below is that of the Registrant, Lehman Brothers Income Funds. This N-CSR relates only to Lehman Brothers Core Bond Fund, Lehman Brothers High Income Bond Fund, Lehman Brothers Municipal Money Fund, Lehman Brothers Municipal Securities Trust, Lehman Brothers New York Municipal Money Fund, Lehman Brothers National Municipal Money Fund, Lehman Brothers Short Duration Fund, Lehman Brothers Strategic Income Fund, Lehman Brothers Tax-Free Money Fund and Neuberger Berman Cash Reserves (collectively, the “Funds”). Tait, Weller & Baker LLP (“Tait Weller”) serves as independent registered public accounting firm to Lehman Brothers Core Bond Fund, Lehman Brothers New York Municipal Money Fund and Lehman Brothers Tax-Free Money Fund. Ernst & Young, LLP (“E&Y”) serves as independent registered public accounting firm to all other series of the Registrant.
(a) Audit Fees
The aggregate fees billed for professional services rendered by E&Y for the audit of the annual financial statements or services that are normally provided by E&Y in connection with statutory and regulatory filings or engagements were $225,000 and $216,000 for the fiscal years ended 2006 and 2007, respectively.
The aggregate fees billed for professional services rendered by Tait Weller for the audit of the annual financial statements or services that are normally provided by Tait Weller in connection with statutory and regulatory filings or engagements were $44,900 and $38,700 for the fiscal years ended 2006 and 2007, respectively.
(b) Audit-Related Fees
The aggregate fees billed to the Registrant for assurance and related services by E&Y that are reasonably related to the performance of the audit of the Registrant’s financial statements and are not reported above in Audit Fees were $0 and $0 for the fiscal years ended 2006 and 2007, respectively.
The fees billed to other entities in the investment company complex for assurance and related services by E&Y that are reasonably related to the performance of the audit that the Audit Committee was required to approve because the engagement related directly to the operations and financial reporting of the Registrant were $0 and $0 for the fiscal years ended 2006 and 2007, respectively.
The aggregate fees billed to the Registrant for assurance and related services by Tait Weller that are reasonably related to the performance of the audit of the Registrant’s financial statements and are not reported above in Audit Fees were $0 and $0 for the fiscal years ended 2006 and 2007, respectively.
The fees billed to other entities in the investment company complex for assurance and related services by Tait Weller that are reasonably related to the performance of the audit that the Audit Committee was required to approve because the engagement related directly to the operations and financial reporting of the Registrant were $0 and $0 for the fiscal years ended 2006 and 2007, respectively.
(c) Tax Fees
The aggregate fees billed to the Registrant for professional services rendered by E&Y for tax compliance, tax advice, and tax planning were $71,000 and $63,600 for the fiscal years ended 2006 and 2007, respectively. The nature of the services provided was tax compliance, tax advice and tax planning. The Audit Committee approved 0% and 0% of these services provided by E&Y for the fiscal years ended 2006 and 2007, respectively, pursuant to the waiver provisions of Rule 2-01(c)(7)(i)(C) of Regulation S-X.
The fees billed to other entities in the investment company complex for professional services rendered by E&Y for tax compliance, tax advice, and tax planning that the Audit Committee was required to approve because the engagement related directly to the operations and financial reporting of the Registrant were $0 and $0 for the fiscal years ended 2006 and 2007, respectively.
The aggregate fees billed to the Registrant for professional services rendered by Tait Weller for tax compliance, tax advice, and tax planning were $6,600 and $6,400 for the fiscal years ended 2006 and 2007, respectively. The nature of the services provided comprised tax compliance, tax advice and tax planning. The Audit Committee approved 0% and 0% of these services provided by Tait Weller for the fiscal years ended 2006 and 2007, respectively, pursuant to the waiver provisions of Rule 2-01(c)(7)(i)(C) of Regulation S-X.
The fees billed to other entities in the investment company complex for professional services rendered by Tait Weller for tax compliance, tax advice, and tax planning that the Audit Committee was required to approve because the engagement related directly to the operations and financial reporting of the Registrant were $0 and $0 for the fiscal years ended 2006 and 2007, respectively.
(d) All Other Fees
The aggregate fees billed to the Registrant for products and services provided by E&Y, other than services reported in Audit Fees, Audit-Related Fees, and Tax Fees were $0 and $0 for the fiscal years ended 2006 and 2007, respectively.
The fees billed to other entities in the investment company complex for products and services provided by E&Y, other than services reported in Audit Fees, Audit-Related Fees, and Tax Fees, that the Audit Committee was required to approve because the engagement related directly to the operations and financial reporting of the Registrant were $0 and $0 for the fiscal years ended 2006 and 2007, respectively.
The aggregate fees billed to the Registrant for products and services provided by Tait Weller, other than services reported in Audit Fees, Audit-Related Fees, and Tax Fees were $0 and $0 for the fiscal years ended 2006 and 2007, respectively.
The fees billed to other entities in the investment company complex for products and services provided by Tait Weller, other than services reported in Audit Fees, Audit-Related Fees, and Tax Fees, that the Audit Committee was required to approve because the engagement related directly to the operations and financial reporting of the Registrant were $0 and $0 for the fiscal years ended 2006 and 2007, respectively.
(e) Audit Committee’s Pre-Approval Policies and Procedures
(1) The Audit Committee’s pre-approval policies and procedures for the Registrant to engage an accountant to render audit and non-audit services delegate to each member of the Committee the power to pre-approve services between meetings of the Committee.
(2) None of the services described in paragraphs (b) through (d) above were approved by the Audit Committee pursuant to paragraph (c)(7)(i)(C) of Rule 2-01 of Regulation S-X.
(f) Hours Attributed to Other Persons
Not applicable.
(g) Non-Audit Fees
Non-audit fees billed by E&Y for services rendered to the Registrant were $71,000 and $63,600 for the fiscal years ended 2006 and 2007, respectively.
Non-audit fees billed by E&Y for services rendered to the Registrant’s investment adviser and any entity controlling, controlled by, or under common control with the adviser that provides ongoing services to the Registrant were $475,000 and $425,000 for the fiscal years ended 2006 and 2007, respectively.
Non-audit fees billed by Tait Weller for services rendered to the Registrant were $6,600 and $6,400 for the fiscal years ended 2006 and 2007, respectively.
Non-audit fees billed by Tait Weller for services rendered to the Registrant’s investment adviser and any entity controlling, controlled by, or under common control with the adviser that provides ongoing services to the Registrant were $0 and $0 for the fiscal years ended 2006 and 2007, respectively.
(h) The Audit Committee of the Board considered whether the provision of non-audit services rendered to the Registrant’s investment adviser and any entity controlling, controlled by, or under common control with the adviser that provides ongoing services to the Registrant that were not pre-approved by the Audit Committee because the engagement did not relate directly to the operations and financial reporting of the Registrant is compatible with maintaining E&Y’s and Tait Weller’s independence.
Item 5. Audit Committee of Listed Registrants
Not applicable to the Registrant.
Item 6. Schedule of Investments
The complete schedule of investments for each series is disclosed in the Registrant’s Annual Report, which is included as Item 1 of this Form N-CSR.
Item 7. Disclosure of Proxy Voting Policies and Procedures for Closed-End Management Investment Companies
Not applicable to the Registrant.
Item 8. Portfolio Managers of Closed-End Management Investment Companies.
Not applicable to the Registrant.
Item 9. Purchases of Equity Securities by Closed-End Management Investment Company and Affiliated Purchasers
Not applicable to the Registrant.
Item 10. Submission of Matters to a Vote of Security Holders
There were no changes to the procedures by which shareholders may recommend nominees to the Board.
Item 11. Controls and Procedures
(a)
Based on an evaluation of the disclosure controls and procedures (as defined in rule 30a-3(c) under the Investment Company Act of 1940, as amended (the “Act”)) as of a date within 90 days of the filing date of this document, the Chief Executive Officer and Treasurer and Principal Financial and Accounting Officer of the Registrant have concluded that such disclosure controls and procedures are effectively designed to ensure that information required to be disclosed by the Registrant on Form N-CSR and Form N-Q is accumulated and communicated to the Registrant’s management to allow timely decisions regarding required disclosure.
(b)
There were no significant changes in the Registrant’s internal controls over financial reporting (as defined in rule 30a-3(d) under the Act) that occurred during the Registrant’s second fiscal quarter of the period covered by this report that have materially affected, or are reasonably likely to materially affect, the Registrant’s internal control over financial reporting.
Item 12. Exhibits
(a)(1)
A copy of the Code of Ethics is incorporated by reference to the Registrant’s Form N-CSR, Investment Company Act file number 811-3802 (filed July 10, 2006).
(a)(2)
The certifications required by Rule 30a-2(a) of the Act and Section 302 of the Sarbanes-Oxley Act of 2002 (“Sarbanes-Oxley Act”) are filed herewith.
(a)(3)
Not applicable to the Registrant.
(b)
The certifications required by Rule 30a-2(b) of the Act and Section 906 of the Sarbanes-Oxley Act are filed herewith.
The certifications provided pursuant to Rule 30a-2(b) of the Act and Section 906 of the Sarbanes-Oxley Act are not deemed “filed” for purposes of Section 18 of the Securities Exchange Act of 1934 (“Exchange Act”), or otherwise subject to the liability of that section. Such certifications will not be deemed to be incorporated by reference into any filing under the Securities Act of 1933 or the Exchange Act, except to the extent that the Registrant specifically incorporates them by reference.
SIGNATURES
Pursuant to the requirements of the Securities Exchange Act of 1934 and the Investment Company Act of 1940, the Registrant has duly caused this report to be signed on its behalf by the undersigned, thereunto duly authorized.
LEHMAN BROTHERS INCOME FUNDS
By: /s/ Peter E. Sundman
Peter E. Sundman
Chief Executive Officer
Date: January 3, 2008
Pursuant to the requirements of the Securities Exchange Act of 1934 and the Investment Company Act of 1940, this report has been signed below by the following persons on behalf of the Registrant and in the capacities and on the dates indicated.
By: /s/ Peter E. Sundman
Peter E. Sundman
Chief Executive Officer
Date: January 3, 2008
By: /s/ John M. McGovern
John M. McGovern
Treasurer and Principal Financial
and Accounting Officer
Date: January 3, 2008