As filed with the Securities and Exchange Commission on January 5, 2009
UNITED STATES
SECURITIES AND EXCHANGE COMMISSION
Washington, D.C. 20549
FORM N-CSR
CERTIFIED SHAREHOLDER REPORT OF
REGISTERED MANAGEMENT INVESTMENT COMPANIES
Investment Company Act file number: 811-3802
LEHMAN BROTHERS INCOME FUNDS
(Exact Name of the Registrant as Specified in Charter)
605 Third Avenue, 2nd Floor
New York, New York 10158-0180
(Address of Principal Executive Offices – Zip Code)
Registrant's telephone number, including area code: (212) 476-8800
Robert Conti, Chief Executive Officer
c/o Neuberger Berman Management LLC
Lehman Brothers Income Funds
605 Third Avenue, 2nd Floor
New York, New York 10158-0180
Arthur Delibert, Esq.
K&L Gates LLP
1601 K Street, N.W.
Washington, D.C. 20006-1600
(Names and Addresses of agents for service)
Date of fiscal year end: October 31, 2008
Date of reporting period: October 31, 2008
Form N-CSR is to be used by management investment companies to file reports with the Commission not later than 10 days after the transmission to stockholders of any report that is required to be transmitted to stockholders under Rule 30e-1 under the Investment Company Act of 1940 (17 CFR 270.30e-1). The Commission may use the information provided on Form N-CSR in its regulatory, disclosure review, inspection and policymaking roles.
A registrant is required to disclose the information specified by Form N-CSR, and the Commission will make this information public. A registrant is not required to respond to the collection of information contained in Form N-CSR unless the Form displays a currently valid Office of Management and Budget (“OMB”) control number. Please direct comments concerning the accuracy of the information collection burden estimate and any suggestions for reducing the burden to Secretary, Securities and Exchange Commission, 100 F Street, NE, Washington, DC 20549-0609. The OMB has reviewed this collection of information under the clearance requirements of 44 U.S.C. § 3507.
Item 1. Reports to Shareholders

Income Funds
Investor Class Shares
Institutional Class Shares
Reserve Class Shares
Trust Class Shares
Class A Shares
Class C Shares
Neuberger Berman California Tax-Free Money Fund
Neuberger Berman Core Bond Fund
Neuberger Berman Core Plus Bond Fund
Neuberger Berman High Income Bond Fund
Neuberger Berman Municipal Money Fund
Neuberger Berman Municipal Securities Trust
Neuberger Berman New York Municipal Money Fund
Neuberger Berman Short Duration Bond Fund
Neuberger Berman Strategic Income Fund
Neuberger Berman Cash Reserves
Annual Report
October 31, 2008
Contents
THE FUNDS
PORTFOLIO COMMENTARY
| Neuberger Berman California Tax-Free Money Fund | | | 2 | | |
|
| Neuberger Berman Municipal Money Fund | | | 2 | | |
|
| Neuberger Berman New York Municipal Money Fund | | | 3 | | |
|
| Neuberger Berman Core Bond Fund | | | 5 | | |
|
| Neuberger Berman Core Plus Bond Fund | | | 9 | | |
|
| Neuberger Berman High Income Bond Fund | | | 13 | | |
|
| Neuberger Berman Municipal Securities Trust | | | 15 | | |
|
| Neuberger Berman Short Duration Bond Fund | | | 18 | | |
|
| Neuberger Berman Strategic Income Fund | | | 21 | | |
|
| Neuberger Berman Cash Reserves | | | 25 | | |
|
| FUND EXPENSE INFORMATION | | | 32 | | |
|
SCHEDULE OF INVESTMENTS
| Neuberger Berman California Tax-Free Money Fund | | | 34 | | |
|
| Neuberger Berman Core Bond Fund | | | 35 | | |
|
| Neuberger Berman Core Plus Bond Fund | | | 40 | | |
|
| Neuberger Berman High Income Bond Fund | | | 43 | | |
|
| Neuberger Berman Municipal Money Fund | | | 48 | | |
|
| Neuberger Berman Municipal Securities Trust | | | 52 | | |
|
| Neuberger Berman New York Municipal Money Fund | | | 54 | | |
|
| Neuberger Berman Short Duration Bond Fund | | | 56 | | |
|
| Neuberger Berman Strategic Income Fund | | | 59 | | |
|
| Neuberger Berman Cash Reserves | | | 61 | | |
|
| FINANCIAL STATEMENTS | | | 66 | | |
|
The "Neuberger Berman" name and logo are registered service marks of Neuberger Berman, LLC. "Neuberger Berman Management LLC" and the individual fund names in this report are either service marks or registered service marks of Neuberger Berman Management LLC, formerly Neuberger Berman Management Inc. ©2008 Neuberger Berman Management LLC. All rights reserved. ©2008 Lehman Brothers Asset Management LLC. All rights reserved.
FINANCIAL HIGHLIGHTS/PER SHARE DATA
| Neuberger Berman California Tax-Free Money Fund | | | 92 | | |
|
| Neuberger Berman Core Bond Fund | | | 92 | | |
|
| Neuberger Berman Core Plus Bond Fund | | | 94 | | |
|
| Neuberger Berman High Income Bond Fund | | | 94 | | |
|
| Neuberger Berman Municipal Money Fund | | | 94 | | |
|
| Neuberger Berman Municipal Securities Trust | | | 94 | | |
|
| Neuberger Berman New York Municipal Money Fund | | | 96 | | |
|
| Neuberger Berman Short Duration Bond Fund | | | 96 | | |
|
| Neuberger Berman Strategic Income Fund | | | 96 | | |
|
| Neuberger Berman Cash Reserves | | | 98 | | |
|
| Reports of Independent Registered Public Accounting Firms | | | 102 | | |
|
| Directory | | | 104 | | |
|
| Trustees and Officers | | | 105 | | |
|
| Proxy Voting Policies and Procedures | | | 113 | | |
|
| Quarterly Portfolio Schedule | | | 113 | | |
|
| Notice to Shareholders | | | 113 | | |
|
| Board Consideration of the Management and Sub-Advisory Agreements | | | 114 | | |
|
The "Neuberger Berman" name and logo are registered service marks of Neuberger Berman, LLC. "Neuberger Berman Management LLC" and the individual fund names in this report are either service marks or registered service marks of Neuberger Berman Management LLC, formerly Neuberger Berman Management Inc. ©2008 Neuberger Berman Management LLC. All rights reserved. ©2008 Lehman Brothers Asset Management LLC. All rights reserved.
President's Letter
Dear Fellow Shareholder,
The last 12 months tested the resolve of novice and seasoned investors alike. The problems associated with the subprime mortgage market escalated, morphing into a global crisis as the period progressed. Stresses were particularly evident in September and October, as a series of truly remarkable events disrupted much of the financial marketplace.
During that two-month period, the U.S. Treasury essentially took over mortgage giants Fannie Mae and Freddie Mac, the government seized control of insurance leader AIG, Washington Mutual collapsed and was acquired by JP Morgan, Wachovia was taken over by Wells Fargo and a major money market fund "broke the buck," as its net asset value fell below $1.00 a share. The traditional idea of "Wall Street" also came to an end, as the March demise of Bear Stearns was followed in September by Lehman Brothers' bankruptcy filing, Bank of America's announced acquisition of Merrill Lynch and the decision by Goldman Sachs and Morgan Stanley to become bank holding companies subject to regulation by the Federal Reserve.
Governments in the U.S. and abroad took action in an attempt to stabilize the global financial system and restore investor confidence. In addition to coordinated interest rate cuts, certain central banks moved to directly invest in troubled financial organizations and institute other measures to unfreeze the credit markets. In October, the U.S. Congress approved the $700 billion Troubled Asset Relief Program (TARP), whose implementation continues to evolve.
During the fiscal year, the fixed income markets experienced periods of extreme volatility as the credit markets seized up and highly leveraged entities were forced to sell assets into an already illiquid market. Against this backdrop, investors looked to pare the risks in their portfolios by purchasing ultra-safe, short-term Treasuries. In contrast, the spreads (or yield over Treasuries) of corporate and other fixed income securities widened, in some cases reaching unprecedented — and in our view excessive — levels. Even securities with strong credit fundamentals performed poorly amid phases of indiscriminant selling.
Throughout this extremely challenging period, our portfolio managers adhered to their disciplined investment processes, which have proven reliable over a variety of market cycles. As in the past, they closely monitored the unfolding situation in the financial markets and conducted extensive research on existing and prospective Fund holdings. In our money market portfolios, managers heightened their emphasis on liquidity and reduced weighted average maturity, while in intermediate and longer strategies, they maintained asset mixes that we believe will benefit shareholders as markets resume more normal and fundamentals-driven performance patterns.
Looking ahead to the next fiscal year, we expect to see continued periods of heightened volatility in the financial markets. While it may be difficult to remain calm during these periods, we urge you to stay focused on the long term and avoid making emotion-based decisions that in our view could undermine your financial goals. Yes, challenges remain, but we believe that extensive and aggressive policy interventions by the U.S. and other governments will ultimately contribute to more normal market conditions and enhance opportunities for patient investors.
Sincerely,

Robert Conti
President and CEO
Neuberger Berman Mutual Funds
1
California Tax-Free Money Fund Commentary
Municipal Money Fund Commentary
New York Municipal Money Fund Commentary
The fiscal year ended October 31, 2008 was remarkably difficult for investors. Over much of the period, the subprime mortgage meltdown worsened and financial institutions in the U.S. and overseas took further multi-billion-dollar write-downs of troubled fixed-income assets. Concerns over the resulting slowdown of credit markets spread worldwide and inflicted considerable punishment on companies with exposure to mortgages and assets with complex structures. Markets were further rocked by high profile failures of institutions holding toxic debt, which led to consolidations and the government bailouts of Fannie Mae, Freddie Mac and others, as well as an historic U.S. rescue package involving the potential purchase of subprime assets from financial companies. Investors fled many credits and sought safety in U.S. Treasuries, which briefly traded at a premium in September.
During the reporting period, the Fed acted aggressively to fend off a potential recession. It made seven cuts to the Fed Funds rate (which was reduced from 4.5% to just 1%), created a liquidity facility letting banks borrow more easily from the Fed, opened up its discount window to primary fixed income dealers, and facilitated the acquisition of Bear Stearns by JPMorgan Chase. Toward the end of the reporting period, the Fed worked to create alternate forms of liquidity, such as the new Commercial Paper Funding Facility (CPPF) and the Money Market Investor Funding Facility (MMIFF) — programs employing the Fed balance sheet to fill a current void in the marketplace.
During these difficult times, we focused on liquidity and safety by investing a substantial portion of the Funds' assets in variable rate demand notes, or VRDNs. We believe they are the safest and most liquid securities in the municipal money markets.
Looking forward, we expect increasing demand from VRDN securities to drive down yields. In September, the SIFMA Municipal Swap Index, which is a proxy for weekly VRDNs, rose, we believe, in reaction to the severe market disruptions. Yet, more recently, the market has experienced strong demand for floating rate paper and, during October, yields dropped from 7.96% to 1.82% as of month-end.
California Tax-Free Money Fund6,8,13,14
From inception on December 27, 2007 through October 31, 2008, Neuberger Berman California Tax-Free Money Fund (formerly Lehman Brothers California Tax-Free Money Fund) Investor Class and Reserve Class returned 1.43% and 1.64%, respectively. From January 1, 2008, Investor Class returned 1.38%, compared to the iMoneyNet Money Fund Report Tax-Free State-Specific Retail Average return of 1.50%, while Reserve Class returned 1.58% compared to the iMoneyNet Money Fund Report Tax-Free State-Specific Institutional Average return of 1.66%. The Investor and Reserve Class' seven-day tax equivalent current yields (assuming the highest federal and California state income tax bracket) were 2.36% and 2.82%, respectively, on October 31, 2008, while their seven-day tax-equivalent effective yields (also assuming the highest federal and California state income tax bracket) were 2.39% and 2.86%.* The weighted average maturity of the Fund was 4.8 day s on October 31, 2008.
Municipal Money Fund1,5,6,8,9,13
The Neuberger Berman Municipal Money Fund (formerly Lehman Brothers Municipal Money Fund) returned 2.12% for the fiscal year ended October 31, 2008, compared to the iMoneyNet Money Fund Report Tax-Free National Retail Average return of 2.06% for the same time period. Over the course of the fiscal year, the Fund's seven-day tax-equivalent current yield (assuming the highest federal income tax bracket) decreased from 4.52% to 2.20%. Its seven-day tax-equivalent effective yield (also assuming the highest federal tax bracket) went from 4.62% on October 31, 2007 to 2.22% on October 31, 2008.* During that time period, the Fund's weighted average maturity decreased from 24.6 days on October 31, 2007 to 12.8 days on October 31, 2008.
2
New York Municipal Money Fund5,6,8,9,13
The Neuberger Berman New York Municipal Money Fund (formerly Lehman Brothers New York Municipal Money Fund) returned 2.19% for the fiscal year ended October 31, 2008, compared to the 1.97% return of its iMoneyNet Money Fund Report Tax-Free State-Specific Retail Average benchmark. Over the course of the fiscal year, the Fund's seven-day tax-equivalent current yield (taxable at the highest federal, New York State and New York City income tax brackets) decreased from 5.21% on October 31, 2007 to 2.60% on October 31, 2008. Its seven-day tax-equivalent effective yield (also taxable at the highest federal, New York State and New York City income tax brackets) went from 5.35% to 2.63% during that timeframe.* During that time period, the Fund's weighted average maturity decreased from 17.5 days on October 31, 2007 to 8.4 days on October 31, 2008.
Sincerely,


William J. Furrer and Kristian J. Lind
Portfolio Co-Managers
* Current yield more closely reflects current earnings than does total return. Tax-equivalent yields are the taxable yields that an investor would have had to receive in order to realize the same level of yield after federal income taxes at the highest federal tax rate, currently 35%, assuming that all of a Fund's income is exempt from federal income taxes. For Neuberger Berman California Tax-Free Money Fund, tax equivalent yields are calculated based on federal and California State tax rates for a combined rate of 45.3%. For Neuberger Berman New York Municipal Money Fund, tax-equivalent yields are calculated based on federal, New York State, and New York City tax rates for a combined rate of 41.8%.
A portion of the income of Neuberger Berman Municipal Money Fund and Neuberger Berman New York Municipal Money Fund may be a tax preference item for purposes of the federal alternative minimum tax for certain investors.
An investment in each Fund is not insured or guaranteed by the Federal Deposit Insurance Corporation or any other government agency. Notwithstanding the preceding statement, Fund shareholders will be guaranteed to receive $1.00 net asset value for amounts that they held as of September 19, 2008 subject to the terms of the U.S. Treasury's Temporary Guarantee Program for Money Market Funds. The Program generally does not guarantee any new investments in the Fund made after September 19, 2008, and is scheduled to expire on December 18, 2008 (See the Funds' current prospectus as supplemented and Note I — U.S. Treasury Temporary Guarantee Program for Money Market Funds for more information about the Program's scope and limitations.) Although each Fund seeks to preserve the value of your investment at $1.00 per share, it is possible to lose money by investing in the Fund.
The composition, industries and holdings of each fund are subject to change. Investment return will fluctuate. Past performance is no guarantee of future results.
Unaudited performance data current to the most recent month-end are available at www.nb.com.
3
California Tax-Free Money Fund
Municipal Money Fund
New York Municipal Money Fund
TICKER SYMBOLS
CALIFORNIA TAX-FREE MONEY FUND
| Investor Class: | | LCIXX | |
| Reserve Class: | | LCRXX | |
TICKER SYMBOLS
MUNICIPAL MONEY FUND
TICKER SYMBOLS
NEW YORK MUNICIPAL MONEY FUND
NB CALIFORNIA TAX-FREE MONEY FUND
MATURITY DIVERSIFICATION
| (% by Maturity) | |
| 1 – 7 Days | | | 100.0 | % | |
| 8 – 30 Days | | | 0.0 | | |
| 31 – 90 Days | | | 0.0 | | |
| 91 – 180 Days | | | 0.0 | | |
| 181+ Days | | | 0.0 | | |
NB MUNICIPAL MONEY FUND
MATURITY DIVERSIFICATION
| (% by Maturity) | |
| 1 – 7 Days | | | 90.6 | % | |
| 8 – 30 Days | | | 0.2 | | |
| 31 – 90 Days | | | 3.0 | | |
| 91 – 180 Days | | | 5.0 | | |
| 181+ Days | | | 1.2 | | |
NB NEW YORK MUNICIPAL MONEY FUND
MATURITY DIVERSIFICATION
| (% by Maturity) | |
| 1 – 7 Days | | | 94.8 | % | |
| 8 – 30 Days | | | 0.0 | | |
| 31 – 90 Days | | | 0.4 | | |
| 91 – 180 Days | | | 0.0 | | |
| 181+ Days | | | 4.8 | | |
4
Core Bond Fund Commentary
For the fiscal year ended October 31, 2008, Neuberger Berman Core Bond Fund (formerly Lehman Brothers Core Bond Fund) posted a negative return and underperformed its benchmark, the Barclays Capital U.S. Aggregate Index.
The fiscal year was among the most challenging periods in the financial markets since the Great Depression. What began as a fairly contained problem in the subprime mortgage market escalated and eventually dragged down the equity and fixed income markets in the U.S. and abroad. Even in hindsight, it would have been difficult to predict the series of events that have unfolded over the last 12 months. Massive deleveraging, illiquidity, seizing credit markets, extreme volatility and the end of "Wall Street" as it was once known were just a few of the factors that triggered a massive flight to quality. This served to drive short-term Treasury yields sharply lower. At one point, the yield available from the three-month Treasury bill fell to around zero percent — meaning that investors were content to earn next to nothing just to access a government guarantee that they wouldn't lose money.
Aside from government securities, every sector of the fixed income market posted a negative return during the reporting period. Investor risk aversion and a rapidly declining faith in our financial system even caused securities with strong underlying fundamentals to perform poorly. In this environment, fixed income mutual funds that held spread product (non-Treasuries) were likely to generate weak performance.
Indeed, while the Fund was defensively positioned and, overall, maintained a high quality portfolio, this was not enough to overcome its exposure to spread product. Compared to the benchmark, which contains a roughly 24% allocation to Treasuries, about 5% of the Fund's portfolio was invested in Treasuries during the reporting period. While this positioning was detrimental to the Fund's recent performance, we continue to believe that an overweight to spread product is essential to meet the Fund's objective of generating high total return through a combination of income and capital appreciation.
Looking more closely at the Fund's performance, its mortgage-related holdings, whether residential or commercial mortgage-backed securities, were the largest drag on results. While the Fund's overweight in the corporate sector hurt its absolute performance, security selection offset a portion of these losses. In particular, the Fund's exposure to large, highly diversified banks and brokerage companies held up fairly well. The Fund's interest rate positioning was also a modest contributor to performance. In January, we shortened the Fund's duration, reducing its sensitivity to interest rate fluctuations, relative to its benchmark. Since then, the Fund's duration has been tactically adjusted and relatively neutral versus that of the benchmark.
Given the market's gyrations, it may be tempting to "jump ship" and follow the herd into short-term Treasuries. We strongly believe this would be precisely the wrong action to take at this time. Such a course would call for selling into distressed and illiquid markets, locking in losses, and allocating whatever proceeds we can garner into low-yielding Treasuries with limited upside potential. In contrast, we believe spread sectors have indiscriminately widened to extreme levels, often with little regard to underlying fundamentals. More than ever, we believe this dislocation will lead to very attractive opportunities for disciplined, patient investors. In addition, we are optimistic that our disciplined investment approach and exposure to spread sectors exhibiting solid credit fundamentals will be rewarded. We would also like to point out that, as of October 31, 2008, the Fund has a significant yield advantage versus its benchmark.
5
In our view, a key catalyst for a turnaround will be the outcome of the aggressive financial intervention that has been implemented by the Federal Reserve and U.S. Treasury. In the short-term, we expect to see continued volatility in the financial markets given the uncertainties surrounding the outcome of the government's massive policy intervention and the depth and breadth of the economic recession.
Sincerely,


Richard W. Knee, Thanos Bardas, David Brown and Thomas Sontag
Portfolio Co-Managers
6
Core Bond Fund
TICKER SYMBOL
| Investor Class | | LBCNX | |
| Institutional Class | | LBCLX | |
| Class A | | LBIAX | |
| Class C | | LBICX | |
RATING SUMMARY
| (% by Ratings) | |
| AAA/Government/Government Agency | | | 76.6 | % | |
| AA | | | 3.5 | | |
| A | | | 8.8 | | |
| BBB | | | 10.2 | | |
| BB | | | 0.5 | | |
| B | | | 0.4 | | |
| CCC | | | 0.0 | | |
| Not Rated | | | 0.0 | | |
AVERAGE ANNUAL TOTAL RETURN ENDED 10/31/082,7,11,13
| | | Inception
Date | | 1 Year | | 5 Years | | 10 Years | | Life of
Fund15 | |
| At NAV | | | | | | | | | | | | | | | | | | | |
| Investor Class | | 02/01/1997 | | | (7.72 | %) | | | 1.33 | % | | | 3.42 | % | | | 4.28 | % | |
| Institutional Class | | 10/01/1995 | | | (7.34 | %) | | | 1.73 | % | | | 3.84 | % | | | 4.66 | % | |
| Class A | | 12/20/2007 | | | (7.68 | %) | | | 1.66 | % | | | 3.80 | % | | | 4.63 | % | |
| Class C | | 12/20/2007 | | | (8.29 | %) | | | 1.52 | % | | | 3.73 | % | | | 4.58 | % | |
| With Sales Charge | | | | | | | | | | | | | | | | | | | |
| Class A | | | | | (11.60 | %) | | | 0.78 | % | | | 3.35 | % | | | 4.29 | % | |
| Class C | | | | | (9.18 | %) | | | 1.52 | % | | | 3.73 | % | | | 4.58 | % | |
| Barclays Capital U.S. Aggregate Index | | | | | 0.30 | % | | | 3.48 | % | | | 5.00 | % | | | 5.75 | % | |
Performance data quoted represent past performance, which is no guarantee of future results. The investment return and principal value of an investment will fluctuate so that an investor's shares, when redeemed, may be worth more or less than their original cost. Results are shown on a "total return" basis and include reinvestment of all dividends and capital gain distributions. The composition, industries and holdings of the Fund are subject to change.
Current performance may be lower or higher than the performance data quoted. For performance data current to the most recent month end, please visit www.nb.com/performance.
Class A and Class C of Neuberger Berman Core Bond Fund each commenced operations on December 20, 2007. The performance information for Class A and Class C prior to the class' commencement of operations is for the Institutional Class of Neuberger Berman Core Bond Fund. Because the Institutional Class has lower expenses, its performance typically would have been better than that of Class A or Class C.
For the period ending October 31, 2008, the 30-day SEC yield was 4.79%, 4.24%, 5.42% and 5.00% for Class A, Class C, Institutional Class and Investor Class shares, respectively.
As stated in the Fund's most recent prospectus, the total annual fund operating expense ratios for fiscal year 2007 were 1.18%, 1.93%, 0.84% and 1.31% for Class A, Class C, Institutional Class and Investor Class shares, respectively (prior to any fee waivers or expense reimbursements). The net expense ratios are 0.86%, 1.61%, 0.46% and 0.86% for Class A, Class C, Institutional Class and Investor Class shares, respectively. Neuberger Berman Management LLC has contractually agreed to limit certain expenses of the Fund through 10/31/2018 for Class A, Class C, Institutional Class and Investor Class shares.
Total Returns shown with a sales charge reflect the deduction of current maximum initial sales charge of 4.25% for Class A shares and the applicable contingent deferred sales charges (CDSC) for Class C shares. The maximum CDSC for Class C shares is 1%, which is reduced to 0% after 1 year. The performance of the Fund's share classes will differ primarily due to different sales charge structures and class expenses. The performance information shown with a sales charge for Class A and Class C has been adjusted to reflect the appropriate sales charge applicable to Class A and Class C shares, but has not been adjusted to take into account differences in class specific operating expenses (such as Rule 12b-1 fees). Please see the prospectus for more information about sales charge structures, if any, and class expenses for your share class.
7
Core Bond Fund
COMPARISON OF A $10,000 INVESTMENT
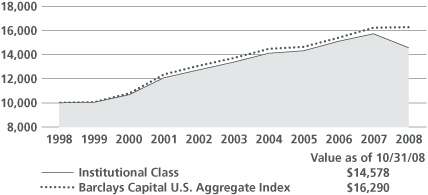
This chart shows the value of a hypothetical $10,000 investment in the Fund over the past 10 fiscal years, or since the Fund's inception, if it has not operated for 10 years. The graphs are based on the Institutional Class shares only; performance of other classes will vary due to differences in fee structures (see Average Annual Total Returns chart above). The result is compared with benchmarks, which may include a broad-based market index and/or a narrower index. Please note that market indices do not include expenses. All results include the reinvestment of dividends and capital gain distributions. Results represent past performance and do not indicate future results. The chart and table do not reflect the deduction of taxes that a shareholder would pay on Fund distributions or the redemption of Fund shares.
Please see Endnotes and Glossary of Indices for additional information.
8
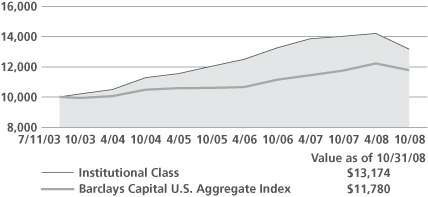
Core Plus Bond Fund Commentary
For the reporting period from its inception on May 1, 2008 through October 31, 2008, Neuberger Berman Core Plus Bond Fund (formerly Lehman Brothers Core Plus Bond Fund) posted a negative return and underperformed its benchmark, the Barclays Capital U.S. Aggregate Index. However, the Fund outperformed its peers as represented by the Lipper General Bond Funds Average.
The short time since the Fund's inception has included some of the greatest upheaval in the financial markets since the Great Depression. What had earlier been a fairly contained problem in the subprime mortgage market expanded during the period and dragged the global equity and fixed income markets lower. Even in hindsight, it would have been difficult to predict the series of events that have unfolded over the last five months. Massive deleveraging, illiquidity, seizing credit markets, extreme volatility and the end of "Wall Street" as it was once known were just a few of the factors that triggered a massive flight to quality. This served to drive short-term Treasury yields sharply lower. At one point, the yield available from the three-month Treasury bill fell to around zero percent — meaning that investors were content to earn next to nothing just to access a government guarantee that they wouldn't lose money.
Aside from government securities, virtually every sector of the fixed income market posted a negative return during the reporting period. Investor risk aversion and a rapidly declining faith in our financial system even caused securities with strong underlying fundamentals to perform poorly. In this environment, any fixed income mutual fund that held spread product (non-Treasuries) was destined to generate weak performance.
Indeed, while the Fund was defensively positioned and, overall, maintained a high quality portfolio, this was not enough to overcome its exposure to spread product. Compared to the benchmark, which contains a roughly 24% allocation to Treasuries, less than 1% of the Fund's portfolio was invested in Treasuries during the reporting period. While this positioning was detrimental to the Fund's performance, we continue to believe that an overweight to spread product is essential to meet the Fund's objective of generating high total return through a combination of income and capital appreciation.
Looking more closely at the Fund's performance, its residential mortgage-backed securities were the largest drag on results for the reporting period. While the Fund's overweights in investment grade and high yield corporate bonds hurt its absolute performance, security selection offset a portion of these losses. In the investment grade space, the Fund's exposure to large, highly diversified banks and brokerage companies held up fairly well. In the high yield sector, underweighting more speculative CCC rated securities, maintaining an emphasis on companies with superior cash flow stability and avoiding cyclical issues added value. In terms of the Fund's duration, it was tactically adjusted and relatively neutral versus that of its benchmark during the reporting period.
Given the market's gyrations, it may be tempting to "jump ship" and follow the herd into short-term Treasuries. We strongly believe this would be precisely the wrong action to take at this time. Such a course would call for selling into distressed and illiquid markets, locking in losses, and allocating whatever proceeds we can garner into low-yielding Treasuries with limited upside potential. In contrast, we believe spread sectors have indiscriminately widened to extreme levels, often with little regard to underlying fundamentals. More than ever, we believe this dislocation will lead to very attractive opportunities for disciplined, patient investors. In addition, we are optimistic that our disciplined investment approach and exposure to spread sectors exhibiting solid credit fundamentals will be rewarded. We would also like to point out that as of October 31, 2008, the Fund has a significant yield advantage versus its benchmark .
9
In our view, a key catalyst for a turnaround will be the outcome of the aggressive financial intervention that has been implemented by the Federal Reserve and U.S. Treasury. In the short-term, we expect to see continued volatility in the financial markets given the uncertainties surrounding the outcome of the government's massive policy intervention and the depth and breadth of the economic recession.
Sincerely,


Richard W. Knee, Thanos Bardas, David Brown and Thomas Sontag
Portfolio Co-Managers
10
Core Plus Bond Fund
TICKER SYMBOL
| Institutional Class | | LBPIX | |
| Class A | | LBPAX | |
| Class C | | LBPCX | |
RATING SUMMARY
| (% by Ratings) | |
| AAA/Government/Government Agency | | | 74.0 | % | |
| AA | | | 3.3 | | |
| A | | | 8.7 | | |
| BBB | | | 9.2 | | |
| BB | | | 1.0 | | |
| B | | | 3.8 | | |
| CCC | | | 0.0 | | |
| Not Rated | | | 0.0 | | |
CUMULATIVE TOTAL RETURN ENDED 10/31/083,7,13
| | | Inception
Date | | Life of
Fund15 | |
| At NAV | | | | | | | |
| Institutional Class | | 05/01/2008 | | | (8.09 | %) | |
| Class A | | 05/01/2008 | | | (8.26 | %) | |
| Class C | | 05/01/2008 | | | (8.61 | %) | |
| With Sales Charge | | | | | | | |
| Class A | | | | | (12.13 | %) | |
| Class C | | | | | (9.50 | %) | |
| Barclays Capital U.S. Aggregate Index | | | | | (3.63 | %) | |
Performance data quoted represent past performance, which is no guarantee of future results. The investment return and principal value of an investment will fluctuate so that an investor's shares, when redeemed, may be worth more or less than their original cost. Results are shown on a "total return" basis and include reinvestment of all dividends and capital gain distributions. The composition, industries and holdings of the Fund are subject to change.
Current performance may be lower or higher than the performance data quoted. For performance data current to the most recent month end, please visit www.nb.com/performance.
For the period ending October 31, 2008, the 30-day SEC yield was 5.73%, 4.95% and 6.11% for Class A, Class C and Institutional Class shares, respectively.
As stated in the Fund's most recent prospectus, the total annual fund operating expense ratios were 1.50%, 1.25%, and 0.94% for Class A, Class C and Institutional Class shares, respectively (prior to any fee waivers or expense reimbursements). The net expense ratios are 0.82%, 1.57% and 0.46% for Class A, Class C and Institutional Class Class shares, respectively. Neuberger Berman Management LLC has contractually agreed to limit certain expenses of the Fund through 10/31/2018 for Class A, Class C and Institutional Class shares.
Total Returns shown with a sales charge reflect the deduction of current maximum initial sales charge of 4.25% for Class A shares and the applicable contingent deferred sales charges (CDSC) for Class C shares. The maximum CDSC for Class C shares is 1%, which is reduced to 0% after 1 year. The performance of the Fund's share classes will differ primarily due to different sales charge structures and class expenses. The performance information shown with a sales charge for Class A and Class C has been adjusted to reflect the appropriate sales charge applicable to Class A and Class C shares, but has not been adjusted to take into account differences in class specific operating expenses (such as Rule 12b-1 fees). Please see the prospectus for more information about sales charge structures, if any, and class expenses for your share class.
11
Core Plus Bond Fund
COMPARISON OF A $10,000 INVESTMENT
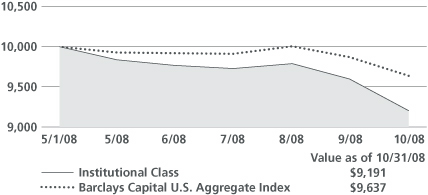
This chart shows the value of a hypothetical $10,000 investment in the Fund over the past 10 fiscal years, or since the Fund's inception, if it has not operated for 10 years. The graphs are based on the Institutional Class shares only; performance of other classes will vary due to differences in fee structures (see Cumulative Total Returns chart above). The result is compared with benchmarks, which may include a broad-based market index and/or a narrower index. Please note that market indices do not include expenses. All results include the reinvestment of dividends and capital gain distributions. Results represent past performance and do not indicate future results. The chart and table do not reflect the deduction of taxes that a shareholder would pay on Fund distributions or the redemption of Fund shares.
Please see Endnotes and Glossary of Indices for additional information.
12
High Income Bond Fund Commentary
For the fiscal year ended October 31, 2008, Neuberger Berman High Income Bond Fund (formerly Lehman Brothers High Income Bond Fund) posted a negative return in a difficult market environment. However, the Fund significantly outperformed its benchmark, the Barclays Capital U.S. Corporate High Yield 2% Issuer Cap Index.
Despite several rallies during the reporting period, high yield bonds ultimately fell victim to the turmoil in the financial markets, the weakening economy and heightened investor risk aversion. As the fiscal year began in November 2007, the spread on high yield bonds (or the difference between comparable maturity U.S. Treasuries and high yield issues) was 417 basis points (4.17%). While spreads had risen from their all-time low of 238 basis points in May 2007, they were still well below their 10-year average of roughly 500 basis points. High yield spreads then widened — and the bonds' prices fell — in November, as the fallout from the subprime mortgage market intensified and investors looked to shed riskier assets. After stabilizing somewhat, given better-than-expected economic data, spreads widened to 815 basis points in March 2008, coinciding with the collapse of Bear Stearns.
Hopes that this would represent the bottom of the high yield market's descent proved to be premature. While high yield prices rallied in April and early May — with spreads moving as low as 615 basis points — they again weakened in June and then largely tread water in July and August. This turned out to be the calm before the storm, as the financial markets then experienced a two-month period that often rivaled the tumultuous events of the Great Depression. This period was characterized by high profile corporate bankruptcies, plunging stock prices, stalled credits markets, forced deleveraging, illiquidity and massive government intervention that sought to stabilize the financial markets.
The turmoil triggered a massive flight to quality into short-term Treasuries; meanwhile virtually every spread (non-Treasury) sector performed poorly. Nowhere was this more evident than in the high yield bond market. After posting its worst monthly performance ever in September — with spreads reaching 997 basis points — the high yield market fell even further in October, as spreads soared to 1,492 basis points. During September and October, the overall high yield market, as measured by the Barclays Capital U.S. Corporate High Yield 2% Issuer Cap Index, fell 7.68% and 16.09%, respectively. As one would expect in this environment, more speculative CCC rated bonds significantly underperformed their BB rated counterparts (the highest rated securities in the non-investment grade universe).
While not much of a consolation, given the high yield market's decline, the Fund outperformed its benchmark (as noted above) during the reporting period. This was due to our relatively defensive positioning, which included underweighting CCC rated securities and overweighting BB rated issues. We also maintained an emphasis on companies with superior cash flow stability and avoided those cyclical issues that we believed were likely to be hurt by both a recession and weaker consumer spending. From an industry perspective, overweight positions and security selection in energy, cable, utilities, packaging and metals/mining contributed positively to relative performance. In contrast, security selection in non-cable media, retail and chemicals detracted from relative results.
Looking ahead, our analysis suggests that the high yield market will continue to face headwinds, which causes us to maintain our defensive positioning. In addition to the issues that triggered the sharp decline in September and October 2008, we believe that volatility is likely to persist in light of poor liquidity in the capital markets, continued deleveraging and uncertainties regarding the new administration's economic plans. We also expect to see rising default levels for high yield bonds given the weakening economy. Against this backdrop, we believe that our commitment to internally generated research, with a concentrated focus on assessing company and industry fundamentals, will be paramount as we seek to generate high total returns consistent with capital preservation.
Sincerely,

Ann Benjamin and Thomas R. O'Reilly
Portfolio Co-Managers
13
High Income Bond Fund
TICKER SYMBOL
RATING SUMMARY
| (% by Ratings) | |
| AAA/Government/Government Agency | | | 0.0 | % | |
| AA | | | 0.0 | | |
| A | | | 0.0 | | |
| BBB | | | 6.4 | | |
| BB | | | 53.1 | | |
| B | | | 31.0 | | |
| CCC | | | 5.7 | | |
| CC | | | 0.0 | | |
| Not Rated | | | 1.0 | | |
| Short Term | | | 2.8 | | |
AVERAGE ANNUAL TOTAL RETURN ENDED 10/31/081,7,10,13
| | | Inception
Date | | 1 Year | | 5 Years | | 10 Years | | Life of
Fund15 | |
| Investor Class | | | 02/01/1992 | | | | (20.86 | %) | | | (0.03 | %) | | | 3.63 | % | | | 5.80 | % | |
Barclays Capital U.S. Corp
High Yield 2% Issuer Cap Index | | | | | | | (25.41 | %) | | | 0.37 | % | | | 2.95 | % | | | N/A | | |
Performance data quoted represent past performance, which is no guarantee of future results. The investment return and principal value of an investment will fluctuate so that an investor's shares, when redeemed, may be worth more or less than their original cost. Results are shown on a "total return" basis and include reinvestment of all dividends and capital gain distributions. The composition, industries and holdings of the Fund are subject to change.
Current performance may be lower or higher than the performance data quoted. For performance data current to the most recent month end, please visit www.nb.com/performance.
For the period ending October 31, 2008, the 30-day SEC Yield of the Fund's Investor Class shares was 12.55%.
As stated in the Fund's most recent prospectus, the total annual fund operating expense ratio for fiscal year 2007 was 0.93% for Investor Class shares (prior to any fee waivers or expense reimbursements).
COMPARISON OF A $10,000 INVESTMENT

This chart shows the value of a hypothetical $10,000 investment in the Fund over the past 10 fiscal years. The result is compared with one or more benchmarks, which may include a broad-based market index and/or a narrower index. Please note that market indices do not include expenses. All results include the reinvestment of dividends and capital gain distributions. Results represent past performance and do not indicate future results. The chart and table do not reflect the deduction of taxes that a shareholder would pay on Fund distributions or the redemption of Fund shares.
Please see Endnotes and Glossary of Indices for additional information.
14
Municipal Securities Trust Commentary
For the fiscal year ended October 31, 2008, Neuberger Berman Municipal Securities Trust (formerly Lehman Brothers Municipal Securities Trust) posted a negative total return versus a gain for its Barclays Capital 7-Year General Obligation Index benchmark. However, the Fund outperformed its peers as represented by the Lipper Intermediate Municipal Debt Funds Index and the Lipper Intermediate Municipal Debt Funds Average.
Although the credit crunch did not impact the municipal securities market as directly or severely as it did the stock market and corporate bond market, municipal securities sustained collateral damage, most notably price erosion resulting from the forced liquidation of highly leveraged hedge funds' large municipal securities positions. The municipal bond market also faced challenges posed by a breakdown in its auction rate securities market as well as varying degrees of credit erosion to all seven of the once AAA rated municipal bond insurers. Finally, in September, demand for municipal securities was further undermined as sharp equity declines and unprecedented U.S. government intervention designed to support the ailing financial system sent investors rushing to the safe haven of U.S. Treasury securities.
During the darkest days of September, we saw investment grade municipal securities yields reach an almost unprecedented 125% to 150% of comparable maturity U.S. Treasury yields. This helped bring retail investors back into the market in early October and even attracted the attention of non-traditional municipal bond buyers such as foreign banks looking for high credit quality securities with higher yields than Treasuries. We also note that in October, California Governor Arnold Schwarzenegger indicated to the U.S. Treasury that California may have to borrow funds to meet the state's annual cash flow needs. That same month, a $4 billion issuance of California Revenue Anticipation Notes was over-subscribed by approximately 25%. Our conclusion is that investors never lost confidence in the municipal securities market, but rather temporarily withdrew until the all the financial dust settled.
In this challenging environment, we continued to focus on monitoring the credit quality of the securities in the portfolio and to diligently evaluate the credit worthiness and relative value of any new investment candidates. Rather than relying exclusively on the bond rating agencies, our research staff independently evaluates credit quality, helping us avoid securities vulnerable to credit downgrades and identify issues with the potential for credit upgrades. Also, as evidence mounted that the economy might be headed toward recession, we began eliminating positions in revenue bonds of more economically sensitive issuers and bolstering positions in securities with high debt service coverage and strong legal covenants protecting revenue streams. We also maintained high credit quality standards, closing fiscal year 2008 with a portfolio average credit quality of AA.
Over the course of the year, we maintained a neutral portfolio duration approximating 4.8 years. However, the fact that portfolio holdings were distributed over the one- to 15-year maturity range rather than concentrated in the better-performing six- to eight-year range of the Fund's index benchmark resulted in lagging relative performance.
In the year ahead, lower property, income and sales tax receipts, along with rising unemployment may reduce revenues for many municipal entities, which would exacerbate existing budget deficits. Municipal issuance is expected to be supported by a lack of "pay as you go" financing and pent-up demand for capital projects. Judging by the municipal securities market's late October rally, we expect still historically high yields relative to U.S. Treasuries to continue to support healthy demand. We also believe that hedge fund deleveraging will be more muted in the months ahead, providing additional support for municipal securities prices.
Moving forward, we will continue to focus on credit quality in an effort to avoid any of the potential potholes in the municipal securities market. We may also respond to the currently steep yield curve by taking advantage of evolving opportunities in longer maturity securities.
15
In closing, although we cannot rule out additional shocks to the financial system or the possibility of a prolonged global recession, we are hopeful that the relatively aggressive response by global monetary authorities to the financial crisis and additional fiscal stimulus here and abroad will eventually prove effective.
Sincerely,


William J. Furrer and James L. Iselin
Portfolio Co-Managers
16
Municipal Securities Trust
TICKER SYMBOL
RATING SUMMARY
| (% by Ratings) | |
| AAA/Government/Government Agency | | | 19.3 | % | |
| AA | | | 69.7 | | |
| A | | | 8.1 | | |
| BBB | | | 2.9 | | |
| BB | | | 0.0 | | |
| B | | | 0.0 | | |
| CCC | | | 0.0 | | |
| Not Rated | | | 0.0 | | |
| Short Term | | | 0.0 | | |
AVERAGE ANNUAL TOTAL RETURN ENDED 10/31/081,7,9,13
| | | Inception
Date | | 1 Year | | 5 Years | | 10 Years | | Life of
Fund15 | |
| Investor Class | | | 07/09/1987 | | | | (1.74 | %) | | | 1.69 | % | | | 3.32 | % | | | 4.99 | % | |
Barclays Capital
7-Year GO Index | | | | | | | 2.33 | % | | | 3.33 | % | | | 4.47 | % | | | 5.97 | % | |
Performance data quoted represent past performance, which is no guarantee of future results. The investment return and principal value of an investment will fluctuate so that an investor's shares, when redeemed, may be worth more or less than their original cost. Results are shown on a "total return" basis and include reinvestment of all dividends and capital gain distributions. The composition, industries and holdings of the Fund are subject to change.
Current performance may be lower or higher than the performance data quoted. For performance data current to the most recent month end, please visit www.nb.com/performance.
For the period ending October 31, 2008, the 30-day SEC yield of the Fund's Investor Class shares was 4.25% and the tax-equivalent yield was 6.54% for an investor in the highest federal income tax bracket (35%).
As stated in the Fund's most recent prospectus, the total annual fund operating expense ratio for fiscal year 2007 was 1.18% for Investor Class shares (prior to any fee waivers or expense reimbursements). The net expense ratio was 0.65%. Neuberger Berman Management LLC has contractually agreed to limit certain expenses of the Fund through 10/31/2011 for Investor Class shares.
COMPARISON OF A $10,000 INVESTMENT
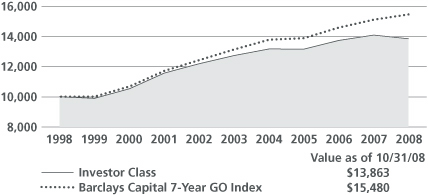
This chart shows the value of a hypothetical $10,000 investment in the Fund over the past 10 fiscal years. The result is compared with one or more benchmarks, which may include a broad-based market index and/or a narrower index. Please note that market indices do not include expenses. All results include the reinvestment of dividends and capital gain distributions. Results represent past performance and do not indicate future results. The chart and table do not reflect the deduction of taxes that a shareholder would pay on Fund distributions or the redemption of Fund shares.
Please see Endnotes and Glossary of Indices for additional information.
17
Short Duration Bond Fund Commentary
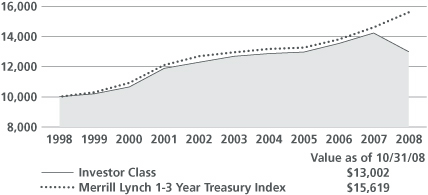
For the fiscal year ended October 31, 2008, Neuberger Berman Short Duration Bond Fund (formerly Lehman Brothers Short Duration Bond Fund) posted a negative return and underperformed its benchmark, the Merrill Lynch 1-3 Year Treasury Index.
The reporting period was characterized by periods of extreme volatility and upheaval in the financial markets. These factors, combined with a lack of liquidity and the rapidly weakening economy, served to undermine investor confidence and led to periods of extreme risk aversion. As is typical during times of stress, investors flocked to ultra-safe short-term Treasuries, driving their yields lower and their prices higher. During the fiscal year, the yield on the two-year Treasury fell from 3.94% to 1.56%. However, fixed income sectors that, in normal times, are considered safe havens saw their spreads widen dramatically relative to Treasuries. Even securities with strong underlying credit fundamentals were punished during periods of indiscriminate selling.
Given this backdrop, the Fund's relative underperformance was not unexpected, as its benchmark, the Merrill Lynch 1-3 Year Treasury Index, is comprised entirely of Treasury securities. In contrast, less than 2% of the Fund's portfolio was invested in Treasuries during the reporting period. As is typically the case, the majority of the Fund's assets were in spread product (non-Treasury securities), such as mortgage-related securities and corporate bonds.
During the reporting period, the Fund's mortgage securities were among its weakest performers. A constant drumbeat of bad news within the residential housing market extended to the commercial mortgage market as the period progressed. This was, in part, due to the weakening economy and fears that commercial mortgages would also be adversely affected. Even the Fund's highly rated investment grade corporate bonds were not immune to the market's sell-off. Toward the end of the reporting period, spreads on these securities widened to all-time records versus Treasuries. While the Fund's corporate holdings were not immune to this weakness, our emphasis on larger, highly diversified banks and brokerage companies held up relatively well. This was partially due to Treasury's direct capital infusion into certain financial institutions through the Troubled Asset Relief Program (TARP).
While we are disappointed with the Fund's performance over the reporting period, we remain confident in our disciplined investment process. In addition, we believe the securities the Fund holds are appropriate given its investment objective of generating the highest available current income, consistent with liquidity and low risk to principal.
We would also like to assure shareholders that we maintained the Fund's high quality bias throughout the 12-month reporting period, with our portfolio holdings rated AA+ on average. We also continued the Fund's diversification among a wide array of fixed-income securities. Prior to purchasing any security for the Fund, we conduct our own extensive fundamental research so that we can be confident in its quality rating and valuation. Risk management is also paramount in constructing and actively managing the portfolio.
At this point, the U.S. is in a recession. How prolonged and deep the recession will be is subject to conjecture. While the Federal Reserve and U.S. Treasury have been extremely aggressive in their policy response to the ongoing credit crisis, it will take time to determine the success of their actions. It will also take time for the Fed's recent interest rate cuts to work through the financial system. Finally, it is difficult to project the actions of the new Presidential administration. Collectively, we believe these factors will likely result in continued periods of elevated financial market volatility.
We remain confident in the holdings within the Fund's portfolio. With regard to the Fund's structured products, our extensive analysis indicates that there is a substantial amount of debt within the structures that is subordinate to our holdings and offers us some measure of protection. It is our belief that these holdings, which have been hurt by deleveraging and a lack of liquidity, are currently mispriced. We continue to receive principal payments at par (face value) on a monthly basis on these securities and feel that their prices will recover once the deleveraging in the financial system is complete. Looking at the investment grade corporate bond market, we believe certain industries are extremely attractive
18
given what we believe to be overly pessimistic default expectations and unsustainably wide spread levels. To seek to capitalize on this situation, we will continue to conduct extensive research to identify individual securities that have compelling valuations and solid credit fundamentals.
Sincerely,


Thomas Sontag, Michael Foster and Richard Grau
Portfolio Co-Managers
19
Short Duration Bond Fund
TICKER SYMBOL
| Investor Class | | LBSDX | |
| Trust Class | | LBDBX | |
RATING SUMMARY
| (% by Ratings) | |
| AAA/Government/Government Agency | | | 86.5 | % | |
| AA | | | 5.9 | | |
| A | | | 0.2 | | |
| BBB | | | 3.3 | | |
| BB | | | 0.0 | | |
| B | | | 0.0 | | |
| CCC | | | 0.0 | | |
| CC | | | 0.0 | | |
| Not Rated | | | 2.4 | | |
| Short Term | | | 1.7 | | |
AVERAGE ANNUAL TOTAL RETURN ENDED 10/31/081,7,13
| | | Inception
Date | | 1 Year | | 5 Years | | 10 Years | | Life of
Fund15 | |
| Investor Class | | 06/09/1986 | | | (8.70 | %) | | | 0.48 | % | | | 2.66 | % | | | 4.93 | % | |
| Trust Class | | 08/30/1993 | | | (8.76 | %) | | | 0.40 | % | | | 2.56 | % | | | 4.88 | % | |
| Merrill Lynch 1-3 Year Treasury Index | | | | | 6.85 | % | | | 3.81 | % | | | 4.56 | % | | | 6.10 | % | |
Performance data quoted represent past performance, which is no guarantee of future results. The investment return and principal value of an investment will fluctuate so that an investor's shares, when redeemed, may be worth more or less than their original cost. Results are shown on a "total return" basis and include reinvestment of all dividends and capital gain distributions. The composition, industries and holdings of the Fund are subject to change.
Current performance may be lower or higher than the performance data quoted. For performance data current to the most recent month end, please visit www.nb.com/performance.
For the period ending October 31, 2008, the 30-day SEC Yield was 5.66% and 5.55% for Investor Class and Trust Class shares, respectively.
As stated in the Fund's most recent prospectus, the total annual Fund operating expense ratios for fiscal year 2007 were 0.91% and 1.18% for Investor Class and Trust Class shares, respectively. The net expense ratio was 0.70% and 0.80% for Investor Class and Trust Class shares, respectively. Neuberger Berman Management LLC has contractually agreed to limit certain expenses of the Fund through 10/31/2011 for Investor Class and Trust Class shares.
COMPARISON OF A $10,000 INVESTMENT
This chart shows the value of a hypothetical $10,000 investment in the Fund over the past 10 fiscal years. The graphs are based on the Investor Class shares only; performance of other classes will vary due to differences in fee structures (see Average Annual Total Returns chart above). The result is compared with one or more benchmarks, which may include a broad-based market index and/or a narrower index. Please note that market indices do not include expenses. All results include the reinvestment of dividends and capital gain distributions. Results represent past performance and do not indicate future results. The chart and table do not reflect the deduction of taxes that a shareholder would pay on Fund distributions or the redemption of Fund shares.
Please see Endnotes and Glossary of Indices for additional information.
20
Strategic Income Fund Commentary
For the fiscal year ended October 31, 2008, Neuberger Berman Strategic Income Fund (formerly Lehman Brothers Strategic Income Fund) posted a negative return and underperformed its benchmark, the Barclays Capital U.S. Aggregate Index.
Neuberger Berman, LLC, the holder of shares representing a majority of the voting power of the Fund, approved changes to the Fund's fundamental investment policy on industry concentration during the reporting period. Effective February 28, 2008, the two of us assumed responsibility for the management of the Fund, which was previously managed by an asset allocation committee. In addition, the Fund's investment approach, which had included dividend-paying equities and real estate investment trust ("REIT") securities, was amended to seek high current income solely through investments in fixed income securities.
In brief, our investment process starts with a macro, or top-down, point of view that leads to strategic allocations across fixed income sectors. Once the sector strategy is set, we seek to purchase what we believe are the most attractive securities for the Fund. In evaluating both the sectors and the securities that comprise them, we rely on intensive research and proprietary analytical tools to help us identify what we believe are the best opportunities in the market. As such, we know our holdings well, which allows us to maintain our investment discipline even as market volatility negatively affects the prices of the Fund's holdings.
The fiscal year was among the most challenging periods in the financial markets since the Great Depression. What began as a fairly contained problem in the subprime mortgage market escalated and eventually dragged down the equity and fixed income markets in the U.S. and abroad. Even in hindsight, it would have been difficult to predict the series of events that have unfolded over the last 12 months. Massive deleveraging, illiquidity, seizing credit markets, extreme volatility and the end of "Wall Street" as it was once known were just a few of the factors that triggered a massive flight to quality. This served to drive short-term Treasury yields sharply lower. At one point, the yield available from the three-month Treasury bill fell to around zero percent — meaning that investors were content to earn next to nothing just to access a government guarantee that they wouldn't lose money.
Aside from government securities, every sector of the fixed income market posted a negative return during the reporting period. Investor risk aversion and a rapidly declining faith in our financial system even caused securities with strong underlying fundamentals to perform poorly. In this environment, any fixed income mutual fund that held spread product (non-Treasuries) was destined to generate weak performance.
Indeed, while the Fund was defensively positioned, this was not enough to overcome its exposure to spread product. Compared to the benchmark, which contains a roughly 24% allocation to Treasuries, about 2% of the Fund's portfolio was invested in Treasuries during the reporting period. While this positioning was detrimental to the Fund's performance, we continue to believe that an overweight to spread product is essential to meet the Fund's objective of generating high total return through a combination of income and capital appreciation.
Looking more closely at the Fund's performance, its overweights in investment grade and high yield corporate bonds were the largest drag on its absolute results. However, security selection offset a portion of these losses. For example, in the investment grade space, the Fund's exposure to large, highly diversified banks and brokerage companies held up fairly well. Within the high yield sector, underweighting more speculative CCC rated securities, maintaining an emphasis on companies with superior cash flow stability and avoiding cyclical issues added value.
Given the market's gyrations, it may be tempting to "jump ship" and follow the herd into short-term Treasuries. We strongly believe this would be precisely the wrong action to take at this time. Such a course would call for selling into distressed and illiquid markets, locking in losses, and allocating whatever proceeds we can garner into low-yielding Treasuries with limited upside potential. In contrast, we believe spread sectors have indiscriminately widened to extreme levels, often with little regard to underlying fundamentals. More than ever, we believe this dislocation will lead to very attractive opportunities for disciplined, patient investors. In addition, we are optimistic that our disciplined investment
21
approach and exposure to spread sectors exhibiting solid credit fundamentals will be rewarded. We would also like to point out that, as of October 31, 2008, the Fund has a significant yield advantage versus its benchmark.
In our view, a key catalyst for a turnaround will be the outcome of the aggressive financial intervention that has been implemented by the Federal Reserve and U.S. Treasury. In the short-term, we expect to see continued volatility in the financial market given the uncertainties surrounding the outcome of the government's massive policy intervention and the depth and breadth of the economic recession.
Sincerely,


Bradley C. Tank and Richard W. Knee
Portfolio Co-Managers
22
Strategic Income Fund
TICKER SYMBOL
| Institutional Class | | LBSIX | |
| Trust Class | | LBSTX | |
| Class A | | LBBAX | |
| Class C | | LBBCX | |
RATING SUMMARY
| (% by Ratings) | |
| AAA/Government/Government Agency | | | 56.5 | % | |
| AA | | | 3.9 | | |
| A | | | 11.1 | | |
| BBB | | | 10.6 | | |
| BB | | | 0.0 | | |
| B | | | 16.8 | | |
| CCC | | | 0.0 | | |
| Not Rated | | | 1.1 | | |
AVERAGE ANNUAL TOTAL RETURN ENDED 10/31/084,7,12,13
| | | Inception
Date | | 1 Year | | 5 Years | | Life of
Fund15 | |
| At NAV | | | | | | | | | | | | | | | |
| Institutional Class | | 07/11/2003 | | | (6.09 | %) | | | 5.26 | % | | | 5.32 | % | |
| Trust Class | | 04/02/2007 | | | (6.54 | %) | | | 5.14 | % | | | 5.21 | % | |
| Class A | | 12/20/2007 | | | (6.39 | %) | | | 5.19 | % | | | 5.26 | % | |
| Class C | | 12/20/2007 | | | (6.96 | %) | | | 5.06 | % | | | 5.14 | % | |
| With Sales Charge | | | | | | | | | | | | | | | |
| Class A | | | | | (10.37 | %) | | | 4.28 | % | | | 4.40 | % | |
| Class C | | | | | (7.80 | %) | | | 5.06 | % | | | 5.14 | % | |
| Barclays Capital U.S. Aggregate Index | | | | | 0.30 | % | | | 3.48 | % | | | 3.13 | % | |
Performance data quoted represent past performance, which is no guarantee of future results. The investment return and principal value of an investment will fluctuate so that an investor's shares, when redeemed may be worth more or less than their original cost. Results are shown on a "total return" basis and include reinvestment of all dividends and capital gain distributions.
Current performance may be higher or lower than the performance data quoted. For performance data current to the most recent month end, please visit www.nb.com/performance.
For the period ending October 31, 2008, the 30-day SEC yield was 5.93%, 5.56%, 6.49% and 6.17% for Class A, Class C, Institutional Class and Trust Class shares, respectively.
As stated in the Fund's most recent prospectus, the total annual fund operating expense ratios for fiscal year 2007 were 1.78%, 2.53%, 2.69% and 4.77% for Class A, Class C, Institutional Class and Trust Class shares, respectively (prior to any fee waivers or expense reimbursements). The net expense ratios are 1.16%, 1.86%, 0.76% and 1.11% for Class A, Class C, Institutional Class and Trust Class shares, respectively. Neuberger Berman Management LLC has contractually agreed to limit certain expenses of the Fund through 10/31/2018 for Class A, Class C and Institutional Class and through 10/31/2011 for Trust Class shares.
Total Returns shown with a sales charge reflect the deduction of current maximum initial sales charge of 4.25% for Class A shares and the applicable contingent deferred sales charges (CDSC) for Class C shares. The maximum CDSC for Class C shares is 1%, which is reduced to 0% after 1 year. The performance of the Fund's share classes will differ primarily due to different sales charge structures and class expenses. The performance information shown with a sales charge for Class A and Class C has been adjusted to reflect the appropriate sales charge applicable to Class A and Class C shares, but has not been adjusted to take into account differences in class specific operating expenses (such as Rule 12b-1 fees). Please see the prospectus for more information about sales charge structures, if any, and class expenses for your share class.
23
Strategic Income Fund
COMPARISON OF A $10,000 INVESTMENT
This chart shows the value of a hypothetical $10,000 investment in the Fund over the past 10 fiscal years, or since the Fund's inception, if it has not operated for 10 years. The graphs are based on the Institutional Class shares only; performance of other classes will vary due to differences in fee structures (see Average Annual Total Returns chart above).The result is compared with one or more benchmarks, which may include a broad-based market index and/or a narrower index. Please note that market indices do not include expenses. All results include the reinvestment of dividends and capital gain distributions. Results represent past performance and do not indicate future results. The chart and table do not reflect the deduction of taxes that a shareholder would pay on Fund distributions or the redemption of Fund shares.
Please see Endnotes and Glossary of Indices for additional information.
24
Cash Reserves Commentary1,6,13
We are pleased to report that Neuberger Berman Cash Reserves returned 2.94% for the fiscal year ended October 31, 2008, compared to the iMoneyNet Money Fund Report Taxable First Tier Retail Average return of 2.64%. The Fund closed the period with a seven-day current yield of 0.97% and a seven-day effective yield of 0.97%.*
The fiscal year was remarkably difficult for investors. Over much of the period, the subprime mortgage meltdown worsened and financial institutions in the U.S. and overseas took further multi-billion-dollar write-downs of troubled fixed-income assets. Concerns over the resulting slowdown of credit markets spread worldwide and inflicted considerable punishment on companies with exposure to mortgages and assets with complex structures. Markets were further rocked by high profile failures of institutions holding toxic debt, which led to consolidations and the government bailouts of Fannie Mae, Freddie Mac and others, as well as to an historic U.S. rescue package involving the potential purchase of subprime assets from financial companies. Investors fled many credits and sought safety in U.S. Treasuries.
During the reporting period, the Fed acted aggressively to fend off a potential recession. It made seven cuts to the Fed Funds rate (which was reduced from 4.5% to just 1%), created a liquidity facility letting banks borrow more easily from the Fed, opened up its discount window to primary fixed income dealers, and facilitated the acquisition of Bear Stearns by JPMorgan Chase. Toward the end of the reporting period, the Fed worked to create alternate forms of liquidity, such as the new Commercial Paper Funding Facility (CPPF) and the Money Market Investor Funding Facility (MMIFF) — programs employing the Fed balance sheet to fill a current void in the marketplace.
Throughout the period, we maintained the bulk of the Fund's holdings in highly rated commercial paper and certificates of deposits. As of October 31, 2008, the majority of the Fund's assets are allocated to commercial paper of high quality issuers coupled with overnight repurchase agreements which are over-collateralized by government agency securities. In terms of credit quality, roughly 86% of the portfolio is invested in A-1+ securities, and all securities are top tier. The portfolio remains highly liquid with no securities having a maturity date longer than 90 days and with a majority of the portfolio invested in overnight securities.
The Fund started the reporting period with a weighted average maturity (WAM) of 44.5 days. Due to ongoing liquidity strains in the credit markets, we shortened WAM throughout the fiscal year. Despite the aggressive easing cycle of the Federal Reserve, the portfolio continues to have a short WAM (9.1 days at fiscal year-end) and to be highly liquid. In our view, the state of the credit markets remains unprecedented and merits our already stringent focus on capital preservation and daily liquidity. Our fundamental outlook is that the market could remain strained well into 2009. We believe that current positioning leaves us with flexibility to purchase longer maturity securities in the event that the yield curve steepens and the credit markets return to a more traditional, functioning environment.
Sincerely,


John C. Donohue and Scott F. Riecke
Portfolio Co-Managers
* Current and effective yield more closely reflect current earnings than does total return.
An investment in the Fund is not insured or guaranteed by the Federal Deposit Insurance Corporation or any other government agency. Notwithstanding the preceding statement, Fund shareholders will be guaranteed to receive $1.00 net asset value for amounts that they held as of September 19, 2008 subject to the terms of the U.S. Treasury's Temporary Guarantee Program for Money Market Funds. The Program generally does not guarantee any new investments in the Fund made after September 19, 2008, and is scheduled to expire on December 18, 2008 (See the Funds' current prospectus as supplemented and Note I — U.S. Treasury Temporary Guarantee Program for Money Market Funds for more information about the Program's scope and limitations.)
Although the Fund seeks to preserve the value of your investment at $1.00 per share, it is possible to lose money by investing in the Fund.
The composition, industries and holdings of the Fund are subject to change. Investment return will fluctuate. Past performance is no guarantee of future results.
Unaudited performance data current to the most recent month-end are available at www.nb.com.
25
Cash Reserves
TICKER SYMBOL
MATURITY DIVERSIFICATION
| (% by Maturity) | |
| 1 - 7 Days | | | 75.8 | % | |
| 8 - 30 Days | | | 17.1 | | |
| 31 - 90 Days | | | 7.1 | | |
| 91 - 180 Days | | | 0.0 | | |
| 181+ Days | | | 0.0 | | |
26
Endnotes
1 Neuberger Berman Management LLC ("Management") has contractually agreed to forgo current payment of fees and/or reimburse expenses of the following Funds so that the total annual operating expenses (exclusive of taxes, interest, brokerage commissions and extraordinary expenses) are limited to 0.65% for Neuberger Berman Cash Reserves (Investor Class), 1.00% for Neuberger Berman High Income Bond Fund (Investor Class), 0.70% for Neuberger Berman Short Duration Bond Fund (Investor Class), 0.80% for Neuberger Berman Short Duration Bond Fund (Trust Class), 0.65% for Neuberger Berman Municipal Securities Trust (Investor Class) and 0.59% for Neuberger Berman Municipal Money Fund (Investor Class) of average daily net assets. Each undertaking lasts until October 31, 2011. Absent such forgone fees and/or reimbursements, the performance of each liste d class of each Fund would have been lower. Each of these Funds has contractually agreed to repay Management for fees and expenses forgone and/or its excess expenses paid by Management, provided the repayments do not cause its total annual operating expenses (exclusive of taxes, interest, brokerage commissions and extraordinary expenses) to exceed the above stated expense limitation and the repayments are made within three years after the year that Management incurred the expense. For the year ended October 31, 2008, the Investor Class of Neuberger Berman Municipal Money Fund repaid expenses to Management.
2 Management has contractually agreed to forgo current payment of fees and/or reimburse Neuberger Berman Core Bond Fund so that total annual operating expenses (exclusive of taxes, interest, brokerage commissions and extraordinary expenses) of the Fund are limited to 0.85%, 0.45%, 0.85% and 1.60% of average daily net assets for the Investor Class, Institutional Class, Class A and Class C, respectively. The undertakings last until October 31, 2018. The Fund has contractually undertaken to repay Management for fees and expenses forgone and/or its excess expenses paid by Management, provided the repayments do not cause total annual operating expenses (exclusive of taxes, interest, brokerage commissions, and extraordinary expenses) to exceed the above-stated expense limitation and the repayments are made within three years after the year that M anagement incurred the expense. Absent such forgone fees and/or reimbursements, the performance of each class of the Fund would have been lower. Management has voluntarily agreed to waive its management fee in the amount of 0.25% (0.20% prior to March 1, 2006) of the Fund's average daily net assets through October 31, 2008. Management has agreed to continue this voluntary waiver after this date but may, at its sole discretion, modify or terminate this voluntary waiver at any time without notice to the Fund. If this voluntary waiver was not in place, performance would be lower for the Fund. For the year ended October 31, 2008, there were no repayment of expenses to Management.
3 Management has contractually agreed to forgo current payment of fees and/or reimburse Neuberger Berman Core Plus Bond Fund so that total annual operating expenses (exclusive of taxes, interest, brokerage commissions and extraordinary expenses) of the Fund are limited to 0.45%, 0.82% and 1.57% of average daily net assets for the Institutional Class, Class A and Class C, respectively. The undertakings last until October 31, 2018 for Institutional Class and until October 31, 2011 for Class A and C. The Fund has contractually agreed to repay Management for fees and expenses forgone and/or its excess expenses paid by Management, provided the repayments do not cause total annual operating expenses (exclusive of taxes, interest, brokerage commissions, and extraordinary expenses) to exceed the above-stated expense limitation and the repayments ar e made within three years after the year that Management incurred the expense. Absent such forgone fees and/or reimbursements, the performance of each class of the Fund would have been lower. Management has voluntarily agreed to waive its management fee in the amount of 0.25% (0.20% prior to March 1, 2006) of the Fund's average daily net assets through October 31, 2008. Management has agreed to continue this voluntary waiver after this date but may, at its sole discretion, modify or terminate this voluntary waiver at any time without notice to the Fund. If this voluntary waiver was not in place, performance would be lower for the Fund. For the year ended October 31, 2008, there were no repayment of expenses to Management.
4 Management has contractually agreed to forgo current payment of fees and/or reimburse Neuberger Berman Strategic Income Fund so that total annual operating expenses (exclusive of taxes, interest, brokerage commissions and extraordinary expenses) of the Fund are limited to 1.10%, 0.85%, (through February 28, 2008, and 0.75%
27
effective March 31, 2008), 1.15% and 1.85% of average daily net assets for the Trust Class, Institutional Class, Class A and Class C, respectively. The undertaking lasts until October 31, 2011, October 31, 2018, October 31, 2018 and October 31, 2018 for the Trust Class, Institutional Class, Class A and Class C, respectively. The Fund has contractually agreed to repay Management for fees and expenses forgone and/or its excess expenses paid by Management, provided the repayments do not cause its total annual operating expenses (exclusive of taxes, interest, brokerage commissions, and extraordinary expenses) to exceed the above stated expense limitation and the repayments are made within three years after the year that Management incurred the expense. Absent such forgone fees and/or reimbursements, the performance of each class of the Fund would have been lower. For the year ended October 31, 2008, there were no repayment of expens es to Management.
5 Management has contractually agreed to forgo current payment of fees and/or reimburse the Investor Class of Neuberger Berman New York Municipal Money Fund so that the total annual operating expenses (exclusive of taxes, interest, brokerage commissions and extraordinary expenses) of the Fund are limited to 0.59% of average daily net assets. The undertaking lasts until October 31, 2011. Absent such forgone fees and/or reimbursements, the performance of the Investor Class of the Fund would have been lower. The Fund has contractually agreed to repay Management for fees and expenses forgone and/or its excess expenses paid by Management, provided the repayments do not cause its total annual operating expenses (exclusive of taxes, interest, brokerage commissions and extraordinary expenses) to exceed the above stated expense limitation and the re payments are made within three years after the year that Management incurred the expense. For the year ended October 31, 2008, there were no repayments of expenses to Management.
Effective June 5, 2006, Management voluntarily agreed to waive certain expenses of the Investor Class of Neuberger Berman New York Municipal Money Fund, so that the total annual operating expenses (exclusive of taxes, interest, brokerage commissions and extraordinary expenses) of the Investor Class are limited to 0.52% of the average daily net assets. In addition, effective January 17, 2007, Management voluntarily agreed to waive certain expenses of the Investor Class of the Fund, so that the total annual operating expenses (exclusive of taxes, interest, brokerage commissions and extraordinary expenses) of the Investor Class were limited to 0.47% (from January 17, 2007 through January 21, 2008) and 0.50% (from January 22, 2008 to August 25, 2008) and are currently limited to 0.55% (effective August 26, 2008) of the average daily net assets. Absent such waivers, the performance of the Investor Class of the Fund would have been lower.
6 "Current yield" of a money market fund refers to the income generated by an investment in a Fund over a recent 7-day period. This income is then "annualized." The "effective yield" is calculated similarly but, when annualized, the income earned by an investment in the Fund is assumed to be reinvested. The "effective yield" will be slightly higher than the "current yield" because of the compounding effect of this assumed reinvestment. Yields of a money market fund will fluctuate and past performance is not a guarantee of future results.
7 Annual total returns are for the period ended October 31, 2008. Returns are shown on a "total return" basis and assume reinvestment of all dividends and capital gain distributions.
8 Tax-equivalent effective yield is the taxable effective yield that an investor would have had to receive in order to realize the same level of yield after federal income taxes at the highest federal tax rate, currently 35%, assuming that all of a Fund's income is exempt from federal income taxes. For Neuberger Berman California Tax-Free Money Fund, tax equivalent yields are calculated based on federal and California State tax rates for a combined rate of 45.3%. For Neuberger Berman New York Municipal Money Fund, tax-equivalent yield is calculated based on federal, New York State, and New York City tax rates for a combined rate of 41.8%.
9 A portion of the income may be a tax preference item for purposes of the federal alternative minimum tax for certain investors.
10 This Fund is the successor to the Lipper High Income Bond Fund ("Lipper Fund"). The total return data for the periods prior to September 7, 2002, are those of the Lipper High Income Bond Fund Premier Class. The data reflect performance of the Lipper Fund for the period April 1, 1996, through September 6, 2002. The investment policies,
28
objectives, guidelines and restrictions of the Fund are in all material respects the same as those of the Lipper Fund. Returns would have been lower if the manager of the Lipper Fund had not waived certain of its fees during the periods shown.
11 The Fund is the successor to Ariel Premier Bond Fund ("Ariel Bond Fund"). The total return data for the periods prior to June 13, 2005 are those of the Ariel Bond Fund Investor Class and Institutional Class. The data reflects performance of Ariel Bond Fund Investor Class for the period February 1, 1997 through June 10, 2005 and the performance of Ariel Bond Fund Institutional Class for the period October 1, 1995 (date of inception) through January 31, 1997. The investment policies, guidelines and restrictions of the Fund are in all material respects the same as those of Ariel Bond Fund. Ariel Bond Fund Institutional Class had lower expenses and typically higher returns than Ariel Bond Fund Investor Class. Returns would have been lower if the manager of Ariel Bond Fund had not waived certain of its fees during the periods shown. Class A a nd Class C of Neuberger Berman Core Bond Fund each commenced operations on December 20, 2007. The performance information for Class A and Class C prior to the class' commencement of operations is for the Institutional Class of Neuberger Berman Core Bond Fund.
12 The Trust Class, Class A and Class C of Neuberger Berman Strategic Income Fund commenced operations on April 2, 2007, December 20, 2007 and December 20, 2007, respectively. The performance information for Trust Class, Class A and Class C prior to the class' commencement of operations is for the Institutional Class of Neuberger Berman Strategic Income Fund.
13 Unaudited performance data current to the most recent month-end are available at www.nb.com.
14 Management has voluntarily agreed to waive its management fee and/or reimburse certain expenses of Neuberger Berman California Tax-Free Fund so that total annual operating expenses (exclusive of taxes, interest, brokerage commissions and extraordinary expenses) of the Fund are limited to 0.50% and 0.25% of average daily net assets for the Investor Class and Reserve Class, respectively. These waivers may be terminated at any time without notice to the Fund. Absent such forgone fees and/or reimbursements, the performance of each class of the Fund would have been lower.
15 The date used to calculate Life of Fund performance for the index is the inception date of the oldest share class.
29
Glossary of Indices
| Merrill Lynch 1-3 Year Treasury Index: | | An unmanaged total return market value index consisting of all coupon-bearing U.S. Treasury publicly placed debt securities with maturities between 1 and 3 years. | |
|
| Barclays Capital 7-Year General Obligation Index*: | | An unmanaged total return performance benchmark for the intermediate-term, 7-year, investment grade General Obligations (State and Local) tax-exempt bond market. | |
|
| Barclays Capital U.S. Aggregate Index*: | | An unmanaged index that represents the U.S. domestic investment grade bond market. It is comprised of the Barclays Capital Government/Corporate Bond Index, Mortgage-Backed Securities Index, and Asset-Backed Securities Index, including securities that are of investment-grade quality or better, have at least one year to maturity, and have an outstanding par value of at least $100 million. | |
|
| Barclays Capital U.S. Corporate High Yield 2% Issuer Cap Index*: | | An unmanaged sub-index of the Barclays Capital U.S. Corporate High Yield Index (which includes all U.S. dollar-denominated, taxable, fixed rate, noninvestment grade debt), capped such that no single issuer accounts for more than 2% of the index weight. | |
|
| iMoneyNet Money Fund Report Taxable First Tier Retail Average: | | Measures the performance of retail money market mutual funds which hold "First Tier" securities as defined by Rule 2a-7 of the Investment Company Act of 1940 (not including Second Tier Commercial Paper). First Tier securities are those rated in the highest short-term rating category by two or more nationally recognized statistical ratings organizations or one, if only one has rated the security. | |
|
| iMoneyNet Money Fund Report Tax-Free State-Specific Institutional Average: | | Measures the performance of institutional state-specific tax-free and municipal money mutual funds. Portfolio holdings of tax-free funds include Rated and Unrated Demand Notes, Rated and Unrated General Market Notes, Commercial Paper, Put Bonds — 6 months or less, Put Bonds — over 6 months, AMT Paper, and Other Tax-Free holdings. | |
|
| iMoneyNet Money Fund Report Tax-Free National Retail Average: | | Measures all national tax-free and municipal retail funds. Portfolio holdings of tax-free funds include Rated and Unrated Demand Notes, Rated and Unrated General Market Notes, Commercial Paper, Put Bonds — 6 months or less, Put Bonds — over 6 months, AMT Paper, and Other Tax-Free holdings. | |
|
| iMoneyNet Money Fund Report Tax-Free State-Specific Retail Average: | | Measures the performance of retail state-specific tax-free and municipal money mutual funds. Portfolio holdings of tax-free funds include Rated and Unrated Demand Notes, Rated and Unrated General Market Notes, Commercial Paper, Put Bonds — 6 months or less, Put Bonds — over 6 months, AMT Paper, and Other Tax-Free holdings. | |
|
| Lipper Intermediate Municipal Debt Funds Average: | | Measures the performance of all intermediate municipal debt open-end funds as classified and tracked by Lipper. The Lipper classification includes funds that invest in municipal debt issues with dollar-weighted average maturities of five to ten years. | |
|
30
| Lipper Intermediate Municipal Debt Funds Index: | | Measures the performance of the thirty largest intermediate municipal debt open-end funds as classified and tracked by Lipper. The Lipper classification includes funds that invest in municipal debt issues with dollar-weighted average maturities of five to ten years. The selection of funds is based on year-end total net asset size. All components are equally weighted at the quarterly rebasing. Funds that fail to meet established criteria are removed from the index on the day of component failure and replaced quarterly. | |
|
| Lipper General Bond Funds Average: | | Consists of the average performance of funds tracked by Lipper that do not have quality or maturity restrictions and which are managed with the intent to keep the bulk of their assets in corporate and government debt issues. | |
|
| SIFMA Municipal Swap Index: | | The Securities Industry and Financial Markets Association (SIFMA) Municipal Swap Index, produced by Municipal Market Data (MMD), is a 7-day high-grade market index comprised of tax-exempt VRDOs (Variable Rate Demand Obligations) from MMD's extensive database. In order for an issue to qualify for inclusion in the index it must: be a weekly reset, effective on Wednesday (no lag resets considered); NOT be subject to Alternative Minimum Tax; have an outstanding amount of $10 million or more; have the highest short-term rating [VMIG1 by Moody's or A-1+ by S&P]; and pay interest on a monthly basis, calculated on an actual/actual basis. In addition, only one quote per obligor per remarketing agent will be included in the index. Issues from all states are eligible for inclusion. The index is calculated on a weekly basis. The index was formerly known as The Bond Market Association (BMA)/PSA Municipal Swap Index. | |
|
* Effective November 3, 2008 Barclays Capital announced the combination of the existing Lehman Brothers indices with the Barclays Capital indices into a single platform under the "Barclays Capital Indices" name. The renamed Lehman Brothers indices will continue to operate under their existing methodology. The index name changes will be reflected in all updates going forward.
Please note that indices or averages do not take into account any fees and expenses or any tax consequences of investing in the individual securities that they track and that investors cannot invest directly in any index or average. Data about the performance of each index or average are prepared or obtained by Management and include reinvestment of all dividends and capital gain distributions. Each Fund may invest in securities not included in its respective index or average.
31
Information About Your Fund's Expenses
These tables are designed to provide information regarding costs related to your investments. All mutual funds incur operating expenses, which include management fees, fees for administrative services and cost of shareholder reports, among others. You may also incur transactions costs, such as sales charges (loads). The following examples are intended to help you understand your ongoing costs of investing in a fund, which are the operating expenses described above and do not include transactions costs. The following examples are based on an investment of $1,000 made at the beginning of the six month period ended October 31, 2008 and held for the entire period. The tables illustrate the fund's costs in two ways:
| Actual Expenses and Performance: | | The first section of the tables provide information about actual account values and actual expenses in dollars, based on the fund's actual performance during the period. You may use the information in this line, together with the amount you invested, to estimate the expenses you paid over the period. Simply divide your account value by $1,000 (for example, an $8,600 account value divided by $1,000 = 8.6), then multiply the result by the number in the first section of the table under the heading entitled "Expenses Paid During the Period" to estimate the expenses you paid over the period. | |
|
Hypothetical Example for
Comparison Purposes: | | The second section of the tables provide information about hypothetical account values and hypothetical expenses based on the fund's actual expense ratio and an assumed rate of return at 5% per year before expenses. This return is not the fund's actual return. The hypothetical account values and expenses may not be used to estimate the actual ending account balance or expenses you paid for the period. You may use this information to compare the ongoing costs of investing in these funds versus other funds. To do so, compare the expenses shown in this 5% hypothetical example with the 5% hypothetical examples that appear in the shareholder reports of other funds. | |
|
Please note that the expenses in the tables are meant to highlight your ongoing costs only and do not reflect any transactional costs, such as sales charges (loads) or redemption fees. Therefore, the information under the heading "Hypothetical (5% annual return before expenses)" is useful in comparing ongoing costs only, and will not help you determine the relative total costs of owning different funds. In addition, if these transactional costs were included, your costs would have been higher.
32
Expense Information as of 10/31/08 (Unaudited)
| | | ACTUAL | | HYPOTHETICAL (5% ANNUAL RETURN BEFORE EXPENSES)(2) | |
| | | Beginning
Account
Value
5/1/08 | | Ending
Account
Value
10/31/08 | | Expenses Paid
During the
Period(1)
5/1/08 - 10/31/08 | | Expense
Ratio | | Beginning
Account
Value
5/1/08 | | Ending
Account
Value
10/31/08 | | Expenses Paid
During the
Period(1)
5/1/08 - 10/31/08 | | Expense
Ratio | |
| Neuberger Berman California Tax-Free Money Fund | |
| Investor Class | | $ | 1,000.00 | | | $ | 1,006.90 | | | $ | 2.42 | | | | .48 | % | | $ | 1,000.00 | | | $ | 1,022.72 | | | $ | 2.44 | | | | .48 | % | |
| Reserve Class | | $ | 1,000.00 | | | $ | 1,008.10 | | | $ | 1.21 | | | | .24 | % | | $ | 1,000.00 | | | $ | 1,023.93 | | | $ | 1.22 | | | | .24 | % | |
| Neuberger Berman Core Bond Fund | |
| Investor Class | | $ | 1,000.00 | | | $ | 917.70 | | | $ | 4.10 | | | | .85 | % | | $ | 1,000.00 | | | $ | 1,020.86 | | | $ | 4.32 | | | | .85 | % | |
| Institutional Class | | $ | 1,000.00 | | | $ | 919.70 | | | $ | 2.17 | | | | .45 | % | | $ | 1,000.00 | | | $ | 1,022.87 | | | $ | 2.29 | | | | .45 | % | |
| Class A | | $ | 1,000.00 | | | $ | 923.50 | | | $ | 4.06 | | | | .84 | % | | $ | 1,000.00 | | | $ | 1,020.91 | | | $ | 4.27 | | | | .84 | % | |
| Class C | | $ | 1,000.00 | | | $ | 919.90 | | | $ | 7.72 | | | | 1.60 | % | | $ | 1,000.00 | | | $ | 1,017.09 | | | $ | 8.11 | | | | 1.60 | % | |
| Neuberger Berman Core Plus Bond Fund | |
| Institutional Class | | $ | 1,000.00 | | | $ | 920.10 | | | $ | 2.17 | | | | .45 | % | | $ | 1,000.00 | | | $ | 1,022.87 | | | $ | 2.29 | | | | .45 | % | |
| Class A | | $ | 1,000.00 | | | $ | 918.40 | | | $ | 3.95 | | | | .82 | % | | $ | 1,000.00 | | | $ | 1,021.01 | | | $ | 4.17 | | | | .82 | % | |
| Class C | | $ | 1,000.00 | | | $ | 915.00 | | | $ | 7.56 | | | | 1.57 | % | | $ | 1,000.00 | | | $ | 1,017.24 | | | $ | 7.96 | | | | 1.57 | % | |
| Neuberger Berman High Income Bond Fund | |
| Investor Class | | $ | 1,000.00 | | | $ | 796.60 | | | $ | 4.20 | | | | .93 | % | | $ | 1,000.00 | | | $ | 1,020.46 | | | $ | 4.72 | | | | .93 | % | |
| Neuberger Berman Municipal Money Fund | |
| Investor Class | | $ | 1,000.00 | | | $ | 1,009.30 | | | $ | 2.98 | | | | .59 | % | | $ | 1,000.00 | | | $ | 1,022.17 | | | $ | 3.00 | | | | .59 | % | |
| Neuberger Berman Municipal Securities Trust | |
| Investor Class | | $ | 1,000.00 | | | $ | 971.30 | | | $ | 3.17 | | | | .64 | % | | $ | 1,000.00 | | | $ | 1,021.92 | | | $ | 3.25 | | | | .64 | % | |
| Neuberger Berman New York Municipal Money Fund | |
| Investor Class | | $ | 1,000.00 | | | $ | 1,009.60 | | | $ | 2.58 | | | | .51 | % | | $ | 1,000.00 | | | $ | 1,022.57 | | | $ | 2.59 | | | | .51 | % | |
| Neuberger Berman Short Duration Bond Fund | |
| Investor Class | | $ | 1,000.00 | | | $ | 946.20 | | | $ | 3.42 | | | | .70 | % | | $ | 1,000.00 | | | $ | 1,021.62 | | | $ | 3.56 | | | | .70 | % | |
| Trust Class | | $ | 1,000.00 | | | $ | 945.50 | | | $ | 3.91 | | | | .80 | % | | $ | 1,000.00 | | | $ | 1,021.11 | | | $ | 4.06 | | | | .80 | % | |
| Neuberger Berman Strategic Income Fund | |
| Institutional Class | | $ | 1,000.00 | | | $ | 926.60 | | | $ | 3.78 | | | | .78 | % | | $ | 1,000.00 | | | $ | 1,021.22 | | | $ | 3.96 | | | | .78 | % | |
| Trust Class | | $ | 1,000.00 | | | $ | 923.60 | | | $ | 5.46 | | | | 1.13 | % | | $ | 1,000.00 | | | $ | 1,019.46 | | | $ | 5.74 | | | | 1.13 | % | |
| Class A | | $ | 1,000.00 | | | $ | 928.70 | | | $ | 5.72 | | | | 1.18 | % | | $ | 1,000.00 | | | $ | 1,019.20 | | | $ | 5.99 | | | | 1.18 | % | |
| Class C | | $ | 1,000.00 | | | $ | 925.40 | | | $ | 9.10 | | | | 1.88 | % | | $ | 1,000.00 | | | $ | 1,015.69 | | | $ | 9.53 | | | | 1.88 | % | |
| Neuberger Berman Cash Reserves | |
| Investor Class | | $ | 1,000.00 | | | $ | 1,010.40 | | | $ | 2.02 | | | | .40 | % | | $ | 1,000.00 | | | $ | 1,023.13 | | | $ | 2.03 | | | | .40 | % | |
(1) For each class of the fund, expenses are equal to the annualized expense ratio for the class, multiplied by the average account value over the period, multiplied by 184/366 (to reflect the one-half year period shown), unless otherwise indicated.
(2) Hypothetical 5% annual return before expenses is calculated by multiplying the number of days in the most recent period divided by 366.
33
Schedule of Investments Neuberger Berman California Tax-Free Money Fund
| PRINCIPAL AMOUNT | | SECURITY@@ | | VALUE†† | |
| (000's omitted) | | | | (000's omitted) | |
| California (98.7%) | |
| $ | 200 | | | ABAG Fin. Au. for Nonprofit Corp. Rev. (Jewish Home San Francisco), Ser. 2005,
(LOC: Allied Irish Bank), 0.95%, due 11/3/08 | | $ | 200 | µ | |
| | 840 | | | ABAG Fin. Au. for Nonprofit Corp. Rev. (La Jolla Country Day Sch.), Ser. 2006 A,
(LOC: Allied Irish Bank), 1.70%, due 11/6/08 | | | 840 | µß | |
| | 1,000 | | | ABAG Fin. Au. for Nonprofit Corp. Rev. (San Francisco University), Ser. 2005 A,
(LOC: Allied Irish Bank), 1.70%, due 11/6/08 | | | 1,000 | µß | |
| | 1,200 | | | California Ed. Fac. Au. Rev., Ser. 2001, (LOC: Morgan Stanley), 3.00%, due 11/6/08 | | | 1,200 | µ | |
| | 100 | | | California Ed. Fac. Au. Rev. (Stanford Univ.), Ser. 2004 S4, 0.70%, due 11/3/08 | | | 100 | µß | |
| | 100 | | | California Infrastructure & Econ. Dev. Bank Rev. (Los Angeles Co. Museum), Ser. 2008 A,
(LOC: Allied Irish Bank), 0.95%, due 11/3/08 | | | 100 | µß | |
| | 500 | | | California Infrastructure & Econ. Dev. Bank Rev. (Rand Corp.), Ser. 2008 B, (LOC: Bank of America),
0.60%, due 11/3/08 | | | 500 | µß | |
| | 1,000 | | | California Muni. Fin. Au. Rev. (Notre Dame High Sch.), Ser. 2007, (LOC: Comerica Bank),
1.80%, due 11/6/08 | | | 1,000 | µß | |
| | 400 | | | California Poll. Ctrl. Fin. Au. PCR, Ser. 1996, (LOC: Bank One), 0.85%, due 11/3/08 | | | 400 | µß | |
| | 500 | | | California St. (Kindergarten Univ.), Ser. 2004 A2, (LOC: Citibank N.A.), 0.70%, due 11/3/08 | | | 500 | µa | |
| | 1,200 | | | California St. Dept. Wtr. Res. Pwr. Supply Rev., Ser. 2002 C7, (FSA Insured), 5.00%, due 11/6/08 | | | 1,200 | µp | |
| | 1,000 | | | California St. G.O., Ser. 2008, (AGC-ICC Insured), 2.11%, due 11/6/08 | | | 1,000 | µk | |
| | 1,500 | | | California St. Muni. Sec. Trust Receipts, Ser. 2001-136, (XLCA Insured), 2.90%, due 11/3/08 | | | 1,500 | µcc | |
| | 1,155 | | | California Statewide CDA (Trinity Children & Family), Ser. 2002, (LOC: Citizens Bank),
1.40%, due 11/5/08 | | | 1,155 | µßoo | |
| | 1,200 | | | California Statewide CDA Rev. (North Peninsula Jewish Campus Project), Ser. 2004,
(LOC: Bank of America), 0.60%, due 11/3/08 | | | 1,200 | µß | |
| | 1,200 | | | Contra Costa Wtr. Dist. Wtr. Rev. (Floaters), Ser. 2002-750, (FSA Insured), 3.00%, due 11/6/08 | | | 1,200 | µy | |
| | 500 | | | Hillsborough Cert. Participation Ref. (Wtr. & Swr. Sys. Proj.), Ser. 2000 B, (LOC: JP Morgan Chase),
1.40%, due 11/6/08 | | | 500 | µ | |
| | 900 | | | Irvine Imp. Bond Act 1915 (Dist. Number 87), Ser. 1999-8, (LOC: KBC Bank), 0.60%, due 11/3/08 | | | 900 | µ | |
| | 250 | | | Irvine Imp. Bond Act 1915 (Dist. Number 94), Ser. 1997-13, (LOC: State Street Bank & Trust Co.),
0.60%, due 11/3/08 | | | 250 | µ | |
| | 100 | | | Metro. Wtr. Dist. So. California Waterworks Rev., Ser. 2000 B3, (LOC: BNP Paribas), 0.60%, due 11/3/08 | | | 100 | µ | |
| | 650 | | | Metro. Wtr. Dist. So. California Waterworks Rev., Ser. 2001 C2, (LOC: Lloyd's Bank), 0.60%, due 11/3/08 | | | 650 | µ | |
| | 500 | | | Ontario IDA IDR (Brinkman & Co.), Ser. 1985, (LOC: Bank of America), 1.00%, due 11/3/08 | | | 500 | µß | |
| | 975 | | | Orange Co. Apt. Dev. Rev. Ref. (Villas La Paz), Ser. 1998 F, (LOC: Fannie Mae), 1.30%, due 11/6/08 | | | 975 | µß | |
| | 300 | | | Orange Co. Imp. Bond Act 1915 (Dist. Number 88), Ser. 1988-1, (LOC: KBC Bank), 0.95%, due 11/3/08 | | | 300 | µ | |
| | 1,000 | | | Orange Co. Sanitation Dist. Cert. Participation, Ser. 2000 B, (LOC: Dexia Credit Locale de France),
0.60%, due 11/3/08 | | | 1,000 | µ | |
| | 500 | | | Redwood City Cert. Participation (City Hall Proj.), Ser. 1998, (LOC: KBC Bank), 1.70%, due 11/6/08 | | | 500 | µ | |
| | 1,300 | | | Riverside Co. Hsg. Au. Multi-Family Hsg. Mtge. Rev. Ref. (Mountain View Apts.), Ser. 1995 A,
(LOC: Redlands Federal Savings & Loan), 1.24%, due 11/5/08 | | | 1,300 | µpp | |
| | 1,200 | | | Sacramento Co. Sanitation Dist. Fin. Au. Rev. Muni. Sec. Trust Receipts, Ser. 2008-47 A,
(FGIC Insured), 1.67%, due 11/6/08 | | | 1,200 | µcc | |
| | 1,100 | | | San Bernardino Co. Mulit-Family Rev. (Somerset Apts.), Ser. 1999 A, (LOC: Fannie Mae),
1.35%, due 11/6/08 | | | 1,100 | µß | |
| | 700 | | | San Francisco City & Co. Redev. Agcy. Comm. Fac. Dist. Spec. Number 7 (Hunters Point),
Ser. 2005 A, (LOC: KBC Bank), 1.70%, due 11/6/08 | | | 700 | µ | |
| | 950 | | | Santa Clara Co. Fin. Au. Lease Rev. (Hsg. Au. Office Proj.), Ser. 2004 A, (LOC: U.S. Bank),
1.21%, due 11/6/08 | | | 950 | µ | |
| | 1,000 | | | Sequoia Unified High Sch. Dist. (Floaters), Ser. 2007-2160, (FSA Insured), 1.60%, due 11/6/08 | | | 1,000 | µjj | |
| | 1,000 | | | Simi Valley Multi-Family Hsg. Rev. Ref. (Lincoln Wood Ranch), Ser. 1990, (LOC: Freddie Mac),
1.35%, due 11/6/08 | | | 1,000 | µ | |
| | 300 | | | So. California Pub. Pwr. Au. Pwr. Proj. Rev. (Mead Adelanto), Ser. 2008 A,
(LOC: JP Morgan Chase Bank), 0.95%, due 11/3/08 | | | 300 | µ | |
| | 1,200 | | | Union City Multi-Family Rev. (Floaters), Ser. 2007-122G, (LOC: Goldman Sachs), 1.84%, due 11/6/08 | | | 1,200 | µ | |
| | 300 | | | Western Riverside Co. Reg. Wastewater Au. Rev. (Reg. Wastewater Treatment), Ser. 1996,
(LOC: Dexia Credit Locale de France), 2.60%, due 11/3/08 | | | 300 | µ | |
| | | 27,820 | | |
| | Total Investments (98.7%) | | | 27,820 | | |
| | | Cash, receivables and other assets, less liabilities (1.3%) | | | 362 | | |
| | Total Net Assets (100.0%) | | $ | 28,182 | | |
See Notes to Schedule of Investments 34
Schedule of Investments Neuberger Berman Core Bond Fund
| PRINCIPAL AMOUNT | | | | VALUE† | |
| (000's omitted) | | | | (000's omitted) | |
| U.S. Treasury Securities-Backed by the Full Faith and Credit of the U.S. Government (3.0%) | | | |
| $ | 2,464 | | | U.S. Treasury Inflation Index Notes, 2.38%, due 4/15/11 & 1/15/17 (Cost $2,375) | | $ | 2,267 | | |
| Mortgage-Backed Securities (71.4%) | | | |
| Adjustable Rate Mortgages (17.0%) | | | |
| | 22 | | | ACE Securities Corp., Ser. 2006-FM1, Class A2A, 3.30%, due 11/25/08 | | | 21 | µØØ | |
| | 205 | | | ACE Securities Corp., Ser. 2006-FM1, Class A2B, 3.35%, due 11/25/08 | | | 182 | µØØ | |
| | 68 | | | Banc of America Funding Corp., Ser. 2006-G, Class 2A2, 4.36%, due 11/20/08 | | | 62 | µØØ | |
| | 105 | | | Banc of America Funding Corp., Ser. 2006-G, Class 2A1, 4.50%, due 11/20/08 | | | 60 | µØØ | |
| | 300 | | | Banc of America Funding Corp., Ser. 2005-F, Class 4A1, 5.33%, due 11/20/08 | | | 235 | µØØ | |
| | 340 | | | Banc of America Funding Corp., Ser. 2006-A, Class 3A2, 5.85%, due 11/20/08 | | | 201 | µØØ | |
| | 357 | | | Bear Stearns ALT-A Trust, Ser. 2007-2, Class 2A1, 5.58%, due 11/25/08 | | | 213 | µØØ | |
| | 147 | | | Bear Stearns ALT-A Trust, Ser. 2006-4, Class 32A1, 6.47%, due 11/25/08 | | | 103 | µØØ | |
| | 330 | | | Carrington Mortgage Loan Trust, Ser. 2006-NC3, Class A3, 3.41%, due 11/25/08 | | | 200 | µØØ | |
| | 220 | | | Carrington Mortgage Loan Trust, Ser. 2006-NC4, Class M2, 3.58%, due 11/25/08 | | | 32 | µØØ | |
| | 41 | | | Chase Funding Mortgage Loan Asset-Backed Certificates, Ser. 2004-1, Class 2A2, 3.49%,
due 11/25/08 | | | 36 | µØØ | |
| | 110 | | | Citigroup Mortgage Loan Trust, Inc., Ser. 2006-WFH1, Class M2, 3.63%, due 11/25/08 | | | 47 | µØØ | |
| | 485 | | | Commercial Mortgage Loan Trust, Ser. 2008-LS1, Class A4B, 6.02%, due 11/25/08 | | | 372 | µ | |
| | 165 | | | Countrywide Alternative Loan Trust, Ser. 2006-0C9, Class A2B, 3.50%, due 11/25/08 | | | 29 | µØØ | |
| | 454 | | | Countrywide Asset-Backed Certificates, Ser. 2007-7, Class 2A1, 3.34%, due 11/25/08 | | | 433 | µØØ | |
| | 404 | | | Countrywide Asset-Backed Certificates, Ser. 2007-BC2, Class 2A1, 3.35%, due 11/25/08 | | | 378 | µØØ | |
| | 120 | | | Countrywide Asset-Backed Certificates, Ser. 2006-BC1, Class 1A, 3.46%, due 11/25/08 | | | 102 | µØØ | |
| | 511 | | | Countrywide Asset-Backed Certificates, Ser. 2006-IM1, Class A2, 3.50%, due 11/25/08 | | | 372 | µØØ | |
| | 230 | | | Countrywide Asset-Backed Certificates, Ser. 2005-IM2, Class A3, 3.53%, due 11/25/08 | | | 208 | µØØ | |
| | 135 | | | Countrywide Asset-Backed Certificates, Ser. 2005-13, Class MV6, 3.96%, due 11/25/08 | | | 7 | µØØ | |
| | 197 | | | Countrywide Home Equity Loan Trust, Ser. 2005-A, Class 2A, 4.80%, due 11/17/08 | | | 121 | µØØ | |
| | 398 | | | Countrywide Home Loans Mortgage Pass-Through Trust, Ser. 2007-HYB2, Class 2A1, 5.38%,
due 11/25/08 | | | 260 | µØØ | |
| | 150 | | | Credit Suisse Mortgage Capital Certificates, Ser. 2007-TF2A, Class A1, 4.74%, due 11/17/08 | | | 132 | ñµØØ | |
| | 360 | | | Credit-Based Asset Servicing and Securitization, Ser. 2006-CB6, Class A22, 3.35%, due 11/25/08 | | | 333 | µØØ | |
| | 297 | | | Credit-Based Asset Servicing and Securitization, Ser. 2007-SP2, Class A1, 3.41%, due 11/25/08 | | | 286 | ñµØØ | |
| | 800 | | | Credit-Based Asset Servicing and Securitization, Ser. 2006-CB3, Class AV3, 3.43%, due 11/25/08 | | | 625 | µØØ | |
| | 115 | | | Credit-Based Asset Servicing and Securitization, Ser. 2005-CB5, Class AV2, 3.52%, due 11/25/08 | | | 110 | µØØ | |
| | 51 | | | Equifirst Mortgage Loan Trust, Ser. 2003-2, Class 3A3, 3.24%, due 11/17/08 | | | 43 | µØØ | |
| | 37 | | | Fannie Mae Grantor Trust, Ser. 2002-T5, Class A1, 3.50%, due 11/25/08 | | | 33 | µØØ | |
| | 129 | | | Fannie Mae Whole Loan, Ser. 2003-W5, Class A, 3.48%, due 11/25/08 | | | 120 | µØØ | |
| | 320 | | | First Franklin Mortgage Loan Asset-Backed Certificates, Ser. 2006-FF4, Class A2, 3.45%,
due 11/25/08 | | | 282 | µØØ | |
| | 5 | | | First Franklin Mortgage Loan Trust, Asset-Backed Certificates, Ser. 2004-FFH3, Class 2A1, 3.64%,
due 11/25/08 | | | 5 | µØØ | |
| | 443 | | | First Horizon Mortgage Pass-Through Trust, Ser. 2005-AR5, Class 2A1, 5.44%, due 11/25/08 | | | 349 | µØØ | |
| | 233 | | | GMAC Mortgage Corp. Loan Trust, Ser. 2006-AR1, Class 1A1, 5.60%, due 12/19/08 | | | 176 | µØØ | |
| | 360 | | | GSAMP Trust, Ser. 2006-HE6, Class A3, 3.41%, due 11/25/08 | | | 265 | µØØ | |
| | 280 | | | GSAMP Trust, Ser. 2006-HE6, Class M2, 3.57%, due 11/25/08 | | | 49 | µØØ | |
| | 332 | | | GSR Mortgage Loan Trust, Ser. 2005-AR3, Class 6A1, 5.02%, due 11/25/08 | | | 247 | µØØ | |
| | 522 | | | GSR Mortgage Loan Trust, Ser. 2007-AR1, Class 2A1, 6.00%, due 11/25/08 | | | 343 | µØØ | |
| | 426 | | | Harborview Mortgage Loan Trust, Ser. 2006-3, Class 1A1A, 6.34%, due 12/19/08 | | | 291 | µØØ | |
| | 109 | | | Household Home Equity Loan Trust, Ser. 2006-1, Class A1, 4.44%, due 11/20/08 | | | 95 | µØØ | |
| | 133 | | | Household Home Equity Loan Trust, Ser. 2006-2, Class A2, 4.46%, due 11/20/08 | | | 102 | µØØ | |
| | 307 | | | HSI Asset Loan Obligation, Ser. 2007-AR1, Class 2A1, 6.13%, due 11/25/08 | | | 218 | µØØ | |
| | 195 | | | HSI Asset Securitization Corp. Trust, Ser. 2006-WMC1, Class A2, 3.36%, due 11/25/08 | | | 129 | µØØ | |
| | 479 | | | Impac Secured Assets Corp., Ser. 2006-3, Class A4, 3.35%, due 11/25/08 | | | 452 | µØØ | |
| | 537 | | | IndyMac INDX Mortgage Loan Trust, Ser. 2006-AR11, Class 2A1, 5.81%, due 11/25/08 | | | 331 | µØØ | |
See Notes to Schedule of Investments 35
| PRINCIPAL AMOUNT | | | | VALUE† | |
| (000's omitted) | | | | (000's omitted) | |
| $ | 64 | | | IndyMac INDX Mortgage Loan Trust, Ser. 2006-AR7, Class 3A1, 6.03%, due 11/25/08 | | $ | 41 | µØØ | |
| | 3 | | | IndyMac Loan Trust, Ser. 2006-L2, Class A1, 3.31%, due 11/25/08 | | | 3 | µØØ | |
| | 144 | | | IndyMac Loan Trust, Ser. 2005-L2, Class A1, 3.48%, due 11/25/08 | | | 108 | µØØ | |
| | 464 | | | IndyMac Seconds Asset-Backed Trust, Ser. 2006-2B, Class A, 3.43%, due 11/25/08 | | | 210 | µØØ | |
| | 27 | | | JP Morgan Alternative Loan Trust, Ser. 2006-A3, Class 1A2, 3.33%, due 11/25/08 | | | 26 | µØØ | |
| | 72 | | | JP Morgan Alternative Loan Trust, Ser. 2006-A2, Class 1A2, 3.34%, due 11/25/08 | | | 69 | µØØ | |
| | 116 | | | JP Morgan Alternative Loan Trust, Ser. 2006-S4, Class A1B, 3.34%, due 11/25/08 | | | 113 | µØØ | |
| | 8 | | | JP Morgan Chase Commercial Mortgage Securities Corp., Ser. 2005-FL1A, Class A1, 4.67%,
due 11/17/08 | | | 8 | ñµØØ | |
| | 340 | | | JP Morgan Mortgage Acquisition Corp., Ser. 2006-CW2, Class AV3, 3.36%, due 11/25/08 | | | 323 | µØØ | |
| | 806 | | | JP Morgan Mortgage Trust, Ser. 2005-A3, Class 7CA1, 5.11%, due 11/25/08 | | | 739 | µ | |
| | 642 | | | Knollwood CDO Ltd., Ser. 2006-2A, Class A2J, 5.17%, due 1/13/09 | | | 6 | ñµØØ | |
| | 449 | | | Merrill Lynch First Franklin Mortgage Loan, Ser. 2007-2, Class A2A, 3.37%, due 11/25/08 | | | 419 | µØØ | |
| | 42 | | | Morgan Stanley Capital I, Ser. 2004-WMC3, Class B3, 5.96%, due 11/25/08 | | | 3 | µØØ | |
| | 259 | | | MortgageIT Trust, Ser. 2005-3, Class A1, 3.56%, due 11/25/08 | | | 182 | µØØ | |
| | 100 | | | MSCC Heloc Trust, Ser. 2003-2, Class A, 3.52%, due 11/25/08 | | | 75 | µØØ | |
| | 319 | | | Nomura Asset Acceptance Corp., Ser. 2007-2, Class A1A, 3.38%, due 11/25/08 | | | 254 | µØØ | |
| | 290 | | | Opteum Mortgage Acceptance Corp., Ser. 2005-3, Class A1B, 3.52%, due 11/25/08 | | | 242 | µØØ | |
| | 734 | | | Option One Mortgage Loan Trust, Ser. 2006-2, Class 2A2, 3.36%, due 11/25/08 | | | 685 | µØØ | |
| | 104 | | | Popular ABS Mortgage Pass-Through Trust, Ser. 2006-E, Class A1, 3.35%, due 11/25/08 | | | 100 | µØØ | |
| | 150 | | | Residential Accredit Loans, Inc., Ser. 2006-QO7, Class 3A2, 3.46%, due 11/25/08 | | | 63 | µØØ | |
| | 324 | | | Residential Accredit Loans, Inc., Ser. 2005-QA10, Class A31, 5.60%, due 11/25/08 | | | 209 | µ | |
| | 428 | | | Residential Accredit Loans, Inc., Ser. 2006-QA1, Class A21, 5.95%, due 11/25/08 | | | 309 | µ | |
| | 18 | | | Residential Asset Mortgage Products, Inc., Ser. 2003-RS2, Class AII, 3.94%, due 11/25/08 | | | 10 | µØØ | |
| | 48 | | | Residential Asset Mortgage Products, Inc., Ser. 2003-RS3, Class AII, 3.98%, due 11/25/08 | | | 34 | µØØ | |
| | 9 | | | Saxon Asset Securities Trust, Ser. 2004-1, Class A, 3.80%, due 11/25/08 | | | 6 | µØØ | |
| | 4 | | | Specialty Underwriting & Residential Finance, Ser. 2003-BC1, Class A, 3.94%, due 11/25/08 | | | 3 | µØØ | |
| | 32 | | | Thornburg Mortgage Securities Trust, Ser. 2006-2, Class A1B, 3.31%, due 11/25/08 | | | 32 | µØØ | |
| | 63 | | | Wachovia Asset Securitization, Inc., Ser. 2003-HE3, Class A, 3.51%, due 11/25/08 | | | 50 | µØØ | |
| | | | 13,012 | | |
| Fannie Mae (48.8%) | | | |
| | 408 | | | Pass-Through Certificates, 6.00%, due 11/1/15 & 2/1/38 | | | 410 | | |
| | 9,343 | | | Pass-Through Certificates, 5.00%, due 3/1/21 – 8/1/38 | | | 8,982 | | |
| | 119 | | | Pass-Through Certificates, 8.50%, due 4/1/34 | | | 127 | | |
| | 4,708 | | | Pass-Through Certificates, 5.50%, due 11/1/35 – 2/1/38 | | | 4,601 | | |
| | 4,025 | | | Pass-Through Certificates, 5.00%, TBA, 15 Year Maturity | | | 3,934 | Ø | |
| | 6,625 | | | Pass-Through Certificates, 5.00%, TBA, 30 Year Maturity | | | 6,275 | Ø | |
| | 13,360 | | | Pass-Through Certificates, 5.50%, TBA, 30 Year Maturity | | | 13,051 | Ø | |
| | | | 37,380 | | |
| Freddie Mac (5.6%) | | | |
| | 123 | | | Pass-Through Certificates, 5.00%, due 5/1/23 | | | 120 | | |
| | 129 | | | Pass-Through Certificates, 6.50%, due 11/1/25 | | | 132 | | |
| | 219 | | | Pass-Through Certificates, 5.71%, due 6/1/36 | | | 221 | ØØ | |
| | 955 | | | Pass-Through Certificates, 5.78%, due 7/1/36 | | | 961 | ØØ | |
| | 600 | | | Pass-Through Certificates, 5.35%, due 2/1/37 | | | 609 | ØØ | |
| | 678 | | | Pass-Through Certificates, 5.56%, due 2/1/37 | | | 687 | ØØ | |
| | 1,506 | | | Pass-Through Certificates, 5.25%, due 4/1/37 | | | 1,520 | ØØ | |
| | | | 4,250 | | |
| | | | | Total Mortgage-Backed Securities (Cost $60,290) | | | 54,642 | | |
Corporate Debt Securities (26.9%)
Bank (3.4%) | | | |
| | 295 | | | Bank of America Corp., Senior Unsecured Notes, 5.75%, due 12/1/17 | | | 254 | | |
| | 860 | | | Bank of America Corp., Senior Unsecured Notes, 5.65%, due 5/1/18 | | | 739 | | |
See Notes to Schedule of Investments 36
| PRINCIPAL AMOUNT | | | | VALUE† | |
| (000's omitted) | | | | (000's omitted) | |
| $ | 465 | | | Bear Stearns Co., Inc., Senior Unsecured Notes, 7.25%, due 2/1/18 | | $ | 438 | | |
| | 510 | | | HBOS PLC, Senior Subordinated Notes, 6.75%, due 5/21/18 | | | 382 | ñ | |
| | 215 | | | Household Finance Corp., Senior Unsecured Notes, 4.13%, due 11/16/09 | | | 206 | | |
| | 455 | | | JP Morgan Chase & Co., Senior Unsecured Notes, 6.40%, due 5/15/38 | | | 391 | | |
| | 315 | | | JP Morgan Chase Capital XV, Guaranteed Notes, 5.88%, due 3/15/35 | | | 197 | | |
| | | | 2,607 | | |
| Finance (8.9%) | | | |
| | 405 | | | American Express Credit Corp., Senior Unsecured Medium-Term Notes, 5.88%, due 5/2/13 | | | 339 | | |
| | 290 | | | American Express Credit Corp., Senior Unsecured Medium-Term Notes, Ser. C, 7.30%, due 8/20/13 | | | 256 | | |
| | 200 | | | American Express Credit Corp., Senior Unsecured Notes, 8.15%, due 3/19/38 | | | 157 | | |
| | 725 | | | Citigroup, Inc., Senior Unsecured Notes, 5.50%, due 4/11/13 | | | 663 | | |
| | 1,010 | | | Citigroup, Inc., Subordinated Notes, 5.00%, due 9/15/14 | | | 798 | | |
| | 755 | | | General Electric Capital Corp., Senior Unsecured Notes, 5.63%, due 5/1/18 | | | 621 | | |
| | 220 | | | General Electric Capital Corp., Senior Unsecured Medium-Term Notes, 5.88%, due 1/14/38 | | | 157 | | |
| | 40 | | | Goldman Sachs Group, Inc., Senior Unsecured Notes, 6.45%, due 5/1/36 | | | 26 | | |
| | 1,865 | | | Goldman Sachs Group, Inc., Subordinated Notes, 6.75%, due 10/1/37 | | | 1,215 | | |
| | 295 | | | International Lease Finance Corp., Senior Unsecured Medium-Term Notes, Ser. R, 5.63%, due 9/15/10 | | | 208 | | |
| | 165 | | | International Lease Finance Corp., Senior Unsecured Medium-Term Notes, Ser. R, 5.65%, due 6/1/14 | | | 105 | | |
| | 530 | | | Merrill Lynch & Co., Senior Unsecured Medium-Term Notes, Ser. C, 5.45%, due 2/5/13 | | | 478 | | |
| | 870 | | | Merrill Lynch & Co., Medium-Term Notes, 6.88%, due 4/25/18 | | | 773 | | |
| | 130 | | | Merrill Lynch & Co., Subordinated Notes, 6.22%, due 9/15/26 | | | 91 | | |
| | 210 | | | Merrill Lynch & Co., Subordinated Notes, 6.11%, due 1/29/37 | | | 139 | | |
| | 915 | | | Morgan Stanley, Senior Unsecured Medium-Term Notes, Ser. F, 6.63%, due 4/1/18 | | | 761 | | |
| | | | 6,787 | | |
| Industrial (12.0%) | | | |
| | 165 | | | Alcoa, Inc., Senior Unsecured Notes, 6.00%, due 7/15/13 | | | 142 | | |
| | 790 | | | ArcelorMittal, Senior Unsecured Notes, 6.13%, due 6/1/18 | | | 544 | ñ | |
| | 305 | | | Cameron International Corp., Senior Unsecured Notes, 6.38%, due 7/15/18 | | | 253 | | |
| | 565 | | | Comcast Corp., Guaranteed Notes, 6.30%, due 11/15/17 | | | 488 | | |
| | 475 | | | Continental Airlines, Inc., Pass-Through Certificates, Class A, 5.98%, due 4/19/22 | | | 330 | | |
| | 300 | | | DaimlerChrysler N.A. Holding Corp., Guaranteed Notes, 4.88%, due 6/15/10 | | | 258 | | |
| | 130 | | | DCP Midstream LLC, Senior Unsecured Notes, 6.75%, due 9/15/37 | | | 87 | ñ | |
| | 660 | | | Delta Air Lines, Pass-Through Certificates, Class A2, 7.57%, due 11/18/10 | | | 548 | | |
| | 240 | | | Enbridge Energy Partners L.P., Senior Unsecured Notes, Ser. B, 7.50%, due 4/15/38 | | | 191 | | |
| | 305 | | | Encana Corp., Senior Unsecured Notes, 6.63%, due 8/15/37 | | | 216 | | |
| | 460 | | | ERAC USA Finance Co., Guaranteed Notes, 7.00%, due 10/15/37 | | | 269 | ñ | |
| | 315 | | | Ingersoll-Rand Global Holding Co. Ltd., Guaranteed Notes, 6.00%, due 8/15/13 | | | 293 | | |
| | 215 | | | International Business Machines Corp., Senior Unsecured Notes, 8.00%, due 10/15/38 | | | 223 | | |
| | 180 | | | International Paper Co., Senior Unsecured Notes, 8.70%, due 6/15/38 | | | 138 | | |
| | 375 | | | Kinder Morgan, Inc., Senior Unsecured Notes, 5.95%, due 2/15/18 | | | 293 | | |
| | 215 | | | Kraft Foods, Inc., Senior Unsecured Notes, 6.13%, due 2/1/18 | | | 184 | | |
| | 430 | | | Nabors Industries, Inc., Guaranteed Notes, 6.15%, due 2/15/18 | | | 344 | | |
| | 360 | | | NGPL Pipeco LLC, Senior Unsecured Notes, 6.51%, due 12/15/12 | | | 335 | ñ | |
| | 360 | | | Northwest Airlines, Inc., Pass-Through Certificates, Class A, 7.03%, due 11/1/19 | | | 216 | | |
| | 245 | | | Oneok Partners L.P., Guaranteed Notes, 6.85%, due 10/15/37 | | | 166 | | |
| | 395 | | | Oracle Corp., Senior Unsecured Notes, 6.50%, due 4/15/38 | | | 329 | | |
| | 280 | | | PepsiCo, Inc., Senior Unsecured Notes, 7.90%, due 11/1/18 | | | 295 | | |
| | 305 | | | Rio Tinto Finance (USA) Ltd., Guaranteed Notes, 7.13%, due 7/15/28 | | | 223 | | |
| | 500 | | | Rogers Communications, Inc., Guaranteed Notes, 6.80%, due 8/15/18 | | | 438 | | |
| | 210 | | | TEPPCO Partners L.P., Guaranteed Notes, 7.55%, due 4/15/38 | | | 160 | | |
| | 760 | | | Time Warner Cable, Inc., Guaranteed Notes, 5.40%, due 7/2/12 | | | 681 | | |
| | 625 | | | Time Warner Cable, Inc., Guaranteed Notes, 6.75%, due 7/1/18 | | | 536 | | |
| | 305 | | | Time Warner Cable, Inc., Guaranteed Notes, 7.30%, due 7/1/38 | | | 255 | | |
| | 305 | | | Union Pacific Corp., Senior Unsecured Notes, 5.75%, due 11/15/17 | | | 259 | | |
See Notes to Schedule of Investments 37
| PRINCIPAL AMOUNT | | | | VALUE† | |
| (000's omitted) | | | | (000's omitted) | |
| $ | 224 | | | United Airlines, Inc., Pass-Through Certificates, Class A, 6.64%, due 7/2/22 | | $ | 134 | | |
| | 245 | | | Xerox Corp., Senior Unsecured Notes, 5.50%, due 5/15/12 | | | 190 | | |
| | 290 | | | XTO Energy, Inc., Senior Unsecured Notes, 6.75%, due 8/1/37 | | | 215 | | |
| | | | 9,233 | | |
| Telecommunications (1.2%) | | | |
| | 415 | | | AT&T Wireless Services, Inc., Senior Unsecured Notes, 7.88%, due 3/1/11 | | | 414 | | |
| | 360 | | | Qwest Corp., Senior Unsecured Notes, 8.88%, due 3/15/12 | | | 315 | | |
| | 205 | | | Verizon Communications, Inc., Senior Notes, 8.95%, due 3/1/39 | | | 208 | | |
| | | | 937 | | |
| Utility - Electric (1.4%) | | | |
| | 280 | | | Dominion Resources, Inc., Senior Unsecured Notes, 7.00%, due 6/15/38 | | | 215 | | |
| | 455 | | | Exelon Corp., LLC, Senior Unsecured Notes, 4.90%, due 6/15/15 | | | 341 | | |
| | 265 | | | Exelon Generation Co., LLC, Senior Unsecured Notes, 6.20%, due 10/1/17 | | | 210 | | |
| | 310 | | | FirstEnergy Corp., Senior Unsecured Notes, Ser. B, 6.45%, due 11/15/11 | | | 292 | | |
| | | | 1,058 | | |
| | | | | Total Corporate Debt Securities (Cost $24,913) | | | 20,622 | | |
| Asset-Backed Securities (27.0%) | | | |
| | 1,185 | | | AmeriCredit Automobile Receivables Trust, Ser. 2008-AF, Class A2B, 5.80%, due 11/6/08 | | | 1,124 | µØØ | |
| | 105 | | | ARCap REIT, Inc., Ser. 2004-1A, Class D, 5.64%, due 4/21/39 | | | 64 | ñ | |
| | 185 | | | Banc of America Commercial Mortgage, Inc., Ser. 2007-3, Class A4, 5.66%, due 11/3/08 | | | 139 | µ | |
| | 900 | | | Bank of America Credit Card Trust, Ser. 2007-A13, Class A13, 4.78%, due 11/17/08 | | | 862 | µØØ | |
| | 783 | | | Capital Auto Receivables Asset Trust, Ser. 2008-1, Class A2B, 5.26%, due 11/17/08 | | | 775 | µØØ | |
| | 1,000 | | | Capital One Multi-Asset Execution Trust, Ser. 2008-A1, Class A, 5.31%, due 11/17/08 | | | 956 | µØØ | |
| | 448 | | | Carmax Auto Owner Trust, Ser. 2008-1, Class A2, 5.07%, due 11/17/08 | | | 438 | µØØ | |
| | 561 | | | Chase Commercial Mortgage Securities Corp., Ser. 2003-3, Class A2, 7.32%, due 11/17/08 | | | 557 | µ | |
| | 1,205 | | | Chase Credit Card Master Trust, Ser. 2002-3, Class A, 4.73%, due 11/17/08 | | | 1,178 | µØØ | |
| | 100 | | | Chase Issuance Trust, Ser. 2008-A7, Class A7, 3.32%, due 11/17/08 | | | 96 | µØØ | |
| | 800 | | | Chase Issuance Trust, Ser. 2006-A3, Class A3, 4.55%, due 11/17/08 | | | 782 | µØØ | |
| | 350 | | | Chase Issuance Trust, Ser. 2007-A6, Class A6, 4.56%, due 11/17/08 | | | 327 | µØØ | |
| | 800 | | | Chase Issuance Trust, Ser. 2007-A14, Class A14, 4.81%, due 11/17/08 | | | 772 | µØØ | |
| | 890 | | | Chase Issuance Trust, Ser. 2008-A1, Class A1, 5.01%, due 11/17/08 | | | 848 | µØØ | |
| | 470 | | | Chase Issuance Trust, Ser. 2008-A5, Class A5, 5.46%, due 11/17/08 | | | 461 | µØØ | |
| | 1,580 | | | Citibank Credit Card Issuance Trust, Ser. 2003-A9, Class A9, 2.89%, due 11/20/08 | | | 1,576 | µØØ | |
| | 165 | | | Credit Suisse First Boston Mortgage Securities Corp., Ser. 2001-CK6, Class A3, 6.39%,
due 8/15/36 | | | 159 | | |
| | 225 | | | Credit Suisse First Boston Mortgage Securities Corp., Ser. 2005-C4, Class A3, 5.12%,
due 8/15/38 | | | 197 | | |
| | 80 | | | Credit Suisse Mortgage Capital Certificates, Ser. 2007-C3, Class A4, 5.72%, due 11/3/08 | | | 60 | µ | |
| | 45 | | | Credit Suisse Mortgage Capital Certificates, Ser. 2007-C4, Class A4, 5.81%, due 11/3/08 | | | 34 | µ | |
| | 250 | | | Credit Suisse Mortgage Capital Certificates, Ser. 2008-C1, Class A3, 6.22%, due 11/3/08 | | | 193 | µ | |
| | 670 | | | Credit Suisse Mortgage Capital Certificates, Ser. 2006-C4, Class A2, 5.36%, due 9/15/39 | | | 617 | | |
| | 100 | | | Credit Suisse Mortgage Capital Certificates, Ser. 2007-C1, Class A3, 5.38%, due 2/15/40 | | | 74 | | |
| | 130 | | | Credit Suisse Mortgage Capital Certificates, Ser. 2007-C5, Class A4, 5.70%, due 9/15/40 | | | 97 | | |
| | 476 | | | DaimlerChrysler Auto Trust, Ser. 2007-A, Class A2B, 4.67%, due 11/10/08 | | | 462 | µØØ | |
| | 785 | | | Discover Card Master Trust, Ser. 2008-A1, Class A1, 5.11%, due 11/17/08 | | | 747 | µØØ | |
| | 720 | | | Discover Card Master Trust I, Ser. 2005-4, Class A1, 4.62%, due 11/17/08 | | | 623 | µØØ | |
| | 706 | | | Ford Credit Auto Owner Trust, Ser. 2008-A, Class A2, 5.16%, due 11/17/08 | | | 692 | µØØ | |
| | 175 | | | Greenwich Capital Commercial Funding Corp., Ser. 2007-GG11, Class A4, 5.74%, due 12/10/49 | | | 130 | | |
| | 480 | | | GS Mortgage Securities Corp. II, Ser. 2007-GG10, Class A4, 5.80%, due 11/3/08 | | | 361 | µ | |
| | 1,680 | | | JP Morgan Chase Commercial Mortgage Securities Corp., Ser. 2007-CB19, Class A4, 5.75%,
due 11/3/08 | | | 1,261 | µ | |
See Notes to Schedule of Investments 38
| PRINCIPAL AMOUNT | | | | VALUE† | |
| (000's omitted) | | | | (000's omitted) | |
| $ | 1,270 | | | JP Morgan Chase Commercial Mortgage Securities Corp., Ser. 2007-CB20, Class A4, 5.79%,
due 11/3/08 | | $ | 943 | µ | |
| | 180 | | | JP Morgan Chase Commercial Mortgage Securities Corp., Ser. 2006-LDP7, Class A4, 5.88%,
due 11/3/08 | | | 143 | µ | |
| | 1,270 | | | JP Morgan Chase Commercial Mortgage Securities Corp., Ser. 2007-LD11, Class A4, 5.82%,
due 11/17/08 | | | 957 | µ | |
| | 83 | | | JP Morgan Chase Commercial Mortgage Securities Corp., Ser. 2005-CB11, Class A1, 4.52%,
due 8/12/37 | | | 81 | | |
| | 220 | | | JP Morgan Chase Commercial Mortgage Securities Corp., Ser. 2005-LDP3, Class A3, 4.96%,
due 8/15/42 | | | 190 | | |
| | 335 | | | JP Morgan Chase Commercial Mortgage Securities Corp., Ser. 2006-CB14, Class ASB, 5.51%,
due 12/12/44 | | | 282 | | |
| | 200 | | | JP Morgan Chase Commercial Mortgage Securities Corp., Ser. 2007-LDPX, Class A3, 5.42%,
due 1/15/49 | | | 147 | | |
| | 37 | | | Merrill Lynch Mortgage Trust, Ser. 2005-MKB2, Class A1, 4.45%, due 9/12/42 | | | 37 | | |
| | 300 | | | Merrill Lynch/Countrywide Commercial Mortgage Trust, Ser. 2007-5, Class A4, 5.38%,
due 8/12/48 | | | 221 | | |
| | 140 | | | Morgan Stanley Capital I, Ser. 2005-T17, Class A5, 4.78%, due 12/13/41 | | | 114 | | |
| | 260 | | | Newcastle CDO Ltd., Ser. 2004-4A, Class 3FX, 5.11%, due 3/24/39 | | | 21 | ñ | |
| | 221 | | | SLM Student Loan Trust, Ser. 2005-A, Class A1, 2.86%, due 12/15/08 | | | 216 | µØØ | |
| | 395 | | | SLM Student Loan Trust, Ser. 2008-6, Class A1, 3.94%, due 1/26/09 | | | 387 | µØØ | |
| | 299 | | | Soundview Home Equity Loan Trust, Ser. 2005-OPT3, Class A4, 3.56%, due 11/25/08 | | | 276 | µØØ | |
| | 10 | | | Wachovia Bank Commercial Mortgage Trust, Ser. 2007-C32, Class A3, 5.74%, due 11/17/08 | | | 7 | µ | |
| | | | | Total Asset-Backed Securities (Cost $23,210) | | | 20,684 | | |
| NUMBER OF SHARES | |
| Short-Term Investments (1.7%) | | | |
| | 1,337,111 | | | Neuberger Berman Prime Money Fund Trust Class (Cost $1,337) | | | 1,337 | @ | |
| | | | | Total Investments (130.0%) (Cost $112,125) | | | 99,552 | ## | |
| | | | | Liabilities, less cash, receivables and other assets [(30.0%)] | | | (22,994 | ) | |
| | | | | Total Net Assets (100.0%) | | $ | 76,558 | | |
See Notes to Schedule of Investments 39
Schedule of Investments Neuberger Berman Core Plus Bond Fund
| PRINCIPAL AMOUNT | | | | VALUE† | |
| (000's omitted) | | | | (000's omitted) | |
| U.S. Treasury Securities-Backed by the Full Faith and Credit of the U.S. Government (4.1%) | | | |
| $ | 708 | | | U.S. Treasury Inflation Index Notes, 2.38%, due 4/15/11 & 1/15/17 | | $ | 662 | | |
| | 90 | | | U.S. Treasury Inflation Index Bonds, 5.25%, due 2/15/29 | | | 95 | | |
| |
| | | Total U.S. Treasury Securities-Backed by the Full Faith and Credit
of the U.S. Government (Cost $796) | | |
757 | | |
| U.S. Government Agency Securities (3.3%) | | | |
| | 600 | | | Fannie Mae, Notes, 3.60%, due 5/19/11 (Cost $600) | | | 602 | | |
| Mortgage-Backed Securities (54.7%) | | | |
| Fannie Mae (50.3%) | | | |
| | 3,757 | | | Pass-Through Certificates, 5.00%, due 2/1/23 – 9/1/38 | | | 3,604 | | |
| | 4,312 | | | Pass-Through Certificates, 5.50%, due 3/1/38 | | | 4,215 | | |
| | 1,345 | | | Pass-Through Certificates, 6.00%, due 5/1/38 | | | 1,345 | | |
| | 100 | | | Pass-Through Certificates, 5.00%, TBA, 30 Year Maturity | | | 95 | Ø | |
| | | | 9,259 | | |
| Freddie Mac (1.5%) | | | |
| | 122 | | | Pass-Through Certificates, 5.00%, due 5/1/23 | | | 119 | | |
| | 170 | | | Pass-Through Certificates, 5.00%, TBA, 30 Year Maturity | | | 166 | Ø | |
| | | | 285 | | |
| Government National Mortgage Association (2.9%) | | | |
| | 299 | | | Pass-Through Certificates, 6.50%, due 7/15/38 | | | 303 | | |
| | 220 | | | Pass-Through Certificates, 6.50%, TBA, 30 Year Maturity | | | 222 | Ø | |
| | | | 525 | | |
| | | | | Total Mortgage-Backed Securities (Cost $10,264) | | | 10,069 | | |
Corporate Debt Securities (26.3%)
Bank (2.8%) | | | |
| | 250 | | | Bank of America Corp., Senior Unsecured Notes, 5.65%, due 5/1/18 | | | 215 | | |
| | 100 | | | Bear Stearns Co., Inc., Senior Unsecured Notes, 7.25%, due 2/1/18 | | | 94 | ØØ | |
| | 105 | | | HBOS PLC, Senior Subordinated Notes, 6.75%, due 5/21/18 | | | 79 | ñ | |
| | 95 | | | JP Morgan Chase & Co., Senior Unsecured Notes, 6.40%, due 5/15/38 | | | 81 | | |
| | 100 | | | UkrSibbank, Secured Medium-Term Loan Participation Notes, 9.25%, due 8/4/11 | | | 46 | ñ | |
| | | | 515 | | |
| Cash Substitute (3.6%) | | | |
| | 800 | | | CDX High Yield, Secured Notes, Ser. 10-T, 8.88%, due 6/29/13 | | | 664 | ñ | |
| Emerging Markets (0.4%) | | | |
| | 100 | | | TGI International Ltd., Guaranteed Notes, 9.50%, due 10/3/17 | | | 75 | | |
| Finance (7.9%) | | | |
| | 85 | | | American Express Credit Corp., Senior Unsecured Medium-Term Notes, 5.88%, due 5/2/13 | | | 71 | | |
| | 60 | | | American Express Credit Corp., Senior Unsecured Medium-Term Notes, Ser. C, 7.30%, due 8/20/13 | | | 53 | | |
| | 200 | | | Citigroup, Inc., Senior Unsecured Notes, 5.50%, due 4/11/13 | | | 183 | ØØ | |
| | 225 | | | Citigroup, Inc., Subordinated Notes, 5.00%, due 9/15/14 | | | 178 | ØØ | |
| | 50 | | | Citigroup, Inc., Senior Unsecured Notes, 6.88%, due 3/5/38 | | | 41 | ØØ | |
| | 165 | | | General Electric Capital Corp., Senior Unsecured Notes, 5.63%, due 5/1/18 | | | 136 | ØØ | |
See Notes to Schedule of Investments 40
| PRINCIPAL AMOUNT | | | | VALUE† | |
| (000's omitted) | | | | (000's omitted) | |
| $ | 50 | | | General Electric Capital Corp., Senior Unsecured Medium-Term Notes, 5.88%, due 1/14/38 | | $ | 36 | ØØ | |
| | 395 | | | Goldman Sachs Group, Inc., Subordinated Notes, 6.75%, due 10/1/37 | | | 257 | ØØ | |
| | 35 | | | International Lease Finance Corp., Senior Unsecured Medium-Term Notes, Ser. R, 5.65%, due 6/1/14 | | | 22 | | |
| | 125 | | | Merrill Lynch & Co., Senior Unsecured Medium-Term Notes, Ser. C, 5.45%, due 2/5/13 | | | 113 | ØØ | |
| | 200 | | | Merrill Lynch & Co., Medium-Term Notes, 6.88%, due 4/25/18 | | | 177 | ØØ | |
| | 100 | | | Merrill Lynch & Co., Subordinated Notes, 6.11%, due 1/29/37 | | | 66 | | |
| | 150 | | | Morgan Stanley, Senior Unsecured Medium-Term Notes, Ser. F, 6.63%, due 4/1/18 | | | 125 | ØØ | |
| | | | 1,458 | | |
| Industrial (9.4%) | | | |
| | 55 | | | Alcoa, Inc., Senior Unsecured Notes, 6.00%, due 7/15/13 | | | 47 | | |
| | 170 | | | ArcelorMittal, Senior Unsecured Notes, 6.13%, due 6/1/18 | | | 117 | ñ | |
| | 60 | | | Cameron International Corp., Senior Unsecured Notes, 6.38%, due 7/15/18 | | | 50 | | |
| | 125 | | | Comcast Corp., Guaranteed Notes, 6.30%, due 11/15/17 | | | 108 | ØØ | |
| | 175 | | | Continental Airlines, Inc., Pass-Through Certificates, Class A, 5.98%, due 4/19/22 | | | 122 | ØØ | |
| | 75 | | | DaimlerChrysler N.A. Holding Corp., Guaranteed Notes, 4.88%, due 6/15/10 | | | 64 | ØØ | |
| | 150 | | | Delta Air Lines, Pass-Through Certificates, Class A2, 7.57%, due 11/18/10 | | | 124 | ØØ | |
| | 50 | | | Enbridge Energy Partners L.P., Senior Unsecured Notes, Ser. B, 7.50%, due 4/15/38 | | | 40 | | |
| | 75 | | | Encana Corp., Senior Unsecured Notes, 6.63%, due 8/15/37 | | | 53 | ØØ | |
| | 125 | | | ERAC USA Finance Co., Guaranteed Notes, 7.00%, due 10/15/37 | | | 73 | ñØØ | |
| | 65 | | | Ingersoll-Rand Global Holding Co. Ltd., Guaranteed Notes, 6.00%, due 8/15/13 | | | 60 | | |
| | 40 | | | International Paper Co., Senior Unsecured Notes, 8.70%, due 6/15/38 | | | 31 | | |
| | 75 | | | Kinder Morgan, Inc., Senior Unsecured Notes, 5.95%, due 2/15/18 | | | 59 | ØØ | |
| | 50 | | | Kraft Foods, Inc., Senior Unsecured Notes, 6.13%, due 2/1/18 | | | 43 | ØØ | |
| | 85 | | | Nabors Industries, Inc., Guaranteed Notes, 6.15%, due 2/15/18 | | | 68 | | |
| | 100 | | | NGPL Pipeco LLC, Senior Unsecured Notes, 6.51%, due 12/15/12 | | | 93 | ñ | |
| | 50 | | | Oneok Partners L.P., Guaranteed Notes, 6.85%, due 10/15/37 | | | 34 | | |
| | 50 | | | Oracle Corp., Senior Unsecured Notes, 6.50%, due 4/15/38 | | | 42 | | |
| | 100 | | | Rogers Communications, Inc., Guaranteed Notes, 6.80%, due 8/15/18 | | | 87 | | |
| | 50 | | | TEPPCO Partners L.P., Guaranteed Notes, 7.55%, due 4/15/38 | | | 38 | | |
| | 175 | | | Time Warner Cable, Inc., Guaranteed Notes, 5.40%, due 7/2/12 | | | 157 | | |
| | 125 | | | Time Warner Cable, Inc., Guaranteed Notes, 6.75%, due 7/1/18 | | | 107 | | |
| | 75 | | | Time Warner Cable, Inc., Guaranteed Notes, 7.30%, due 7/1/38 | | | 63 | | |
| | 75 | | | XTO Energy, Inc., Senior Unsecured Notes, 6.75%, due 8/1/37 | | | 56 | ØØ | |
| | | | 1,736 | | |
| Telecommunications (1.3%) | | | |
| | 100 | | | AT&T Wireless Services, Inc., Senior Unsecured Notes, 7.88%, due 3/1/11 | | | 100 | | |
| | 100 | | | Qwest Corp., Senior Unsecured Notes, 8.88%, due 3/15/12 | | | 87 | | |
| | 45 | | | Verizon Communications, Inc., Senior Notes, 8.95%, due 3/1/39 | | | 46 | | |
| | | | 233 | | |
| Utility - Electric (0.9%) | | | |
| | 60 | | | Dominion Resources, Inc., Senior Unsecured Notes, 7.00%, due 6/15/38 | | | 46 | | |
| | 95 | | | Exelon Corp., LLC, Senior Unsecured Notes, 4.90%, due 6/15/15 | | | 71 | | |
| | 50 | | | Exelon Generation Co., LLC, Senior Unsecured Notes, 6.20%, due 10/1/17 | | | 40 | | |
| | | | 157 | | |
| | | | | Total Corporate Debt Securities (Cost $5,924) | | | 4,838 | | |
| Asset-Backed Securities (11.8%) | | | |
| | 250 | | | AmeriCredit Automobile Receivables Trust, Ser. 2008-AF, Class A2B, 5.80%, due 11/6/08 | | | 237 | µ | |
| | 500 | | | Banc of America Commercial Mortgage, Inc., Ser. 2007-3, Class A4, 5.66%, due 11/3/08 | | | 374 | µØØ | |
| | 300 | | | GS Mortgage Securities Corp. II, Ser. 2007-GG10, Class A4, 5.80%, due 11/3/08 | | | 226 | µØØ | |
See Notes to Schedule of Investments 41
| PRINCIPAL AMOUNT | | | | VALUE† | |
| (000's omitted) | | | | (000's omitted) | |
| $ | 500 | | | JP Morgan Chase Commercial Mortgage Securities Corp., Ser. 2007-LD11, Class A4, 5.82%,
due 11/3/08 | | $ | 377 | µØØ | |
| | 1,025 | | | JP Morgan Chase Commercial Mortgage Securities Corp., Ser. 2006-CB14, Class ASB, 5.51%,
due 12/12/44 | | | 864 | ØØ | |
| | 100 | | | SLM Student Loan Trust, Ser. 2008-6, Class A1, 3.94%, due 1/26/09 | | | 98 | µ | |
| | Total Asset-Backed Securities (Cost $2,680) | | | 2,176 | | |
| Foreign Government Securities (1.0%) | |
| | 25 | | | Lebanese Republic, Senior Unsubordinated Floating Rate Notes, 6.11%, due 11/28/08 | | | 23 | µ | |
| | 25 | | | Republic of Argentina, Senior Unsecured Bonds, Ser. V, 7.00%, due 3/28/11 | | | 7 | | |
| | 50 | | | Republic of Argentina, Bonds, Ser. VII, 7.00%, due 9/12/13 | | | 10 | | |
| | 25 | | | Republic of Brazil, Unsubordinated Bonds, 8.00%, due 1/15/18 | | | 25 | | |
| | 50 | | | Republic of Indonesia, Senior Unsecured Bonds, 6.75%, due 3/10/14 | | | 37 | | |
| | 25 | | | Republic of Turkey, Unsecured Notes, 7.38%, due 2/5/25 | | | 20 | | |
| | 25 | | | Republic of Venezuela, Unsecured Notes, 7.65%, due 4/21/25 | | | 11 | | |
| | 25 | | | Republic of Venezuela, Unsecured Bonds, 7.00%, due 3/31/38 | | | 10 | | |
| | 49 | | | Russian Federation, Unsubordinated Bonds, 7.50%, due 3/31/30 | | | 42 | ñ | |
| | Total Foreign Government Securities (Cost $258) | | | 185 | | |
| NUMBER OF SHARES | |
| Short-Term Investments (1.1%) | |
| | 204,548 | | | Neuberger Berman Prime Money Fund Trust Class (Cost $205) | | | 205 | @ | |
| | Total Investments (102.3%) (Cost $20,727) | | | 18,832 | ## | |
| | | Liabilities, less cash, receivables and other assets [(2.3%)] | | | (417 | ) | |
| | Total Net Assets (100.0%) | | $ | 18,415 | | |
See Notes to Schedule of Investments 42
Schedule of Investments Neuberger Berman High Income Bond Fund
| PRINCIPAL AMOUNT | | | | VALUE† | |
| (000's omitted) | | | | (000's omitted) | |
| Bank Loan Obligations (9.0%) | | | |
| Automotive (1.7%) | | | |
| $ | 3,980 | | | Ford Motor Co., Term Loan B, 5.24%, due 12/16/13 | | $ | 2,173 | ØØØ | |
| | 1,552 | | | General Motors Corp., Term Loan B, 5.80%, due 11/29/13 | | | 811 | | |
| | | | 2,984 | | |
| Chemicals (0.2%) | | | |
| | 350 | | | Huntsman Int'l LLC, Term Loan B, 6.50%, due 4/19/14 | | | 305 | ØØØ | |
| Electric - Integrated (1.7%) | | | |
| | 3,689 | | | Texas Competitive Electric Holdings Co. LLC, Term Loan B3, 6.30% – 7.64%, due 10/10/14 | | | 2,889 | ØØØ | |
| Health Services (2.0%) | | | |
| | 4,131 | | | HCA, Inc., Term Loan A, 5.26%, due 11/18/12 | | | 3,476 | | |
| Media - Cable (1.7%) | | | |
| | 3,170 | | | Charter Communications Operating LLC, Term Loan, 5.47% & 5.50%, due 3/6/14 | | | 2,341 | ØØØ | |
| | 545 | | | Mediacom Broadband LLC, Term Loan D2, 5.26%, due 1/31/15 | | | 392 | ØØØ | |
| | 330 | | | Mediacom Broadband LLC, Term Loan D1, 5.26%, due 1/31/15 | | | 238 | ØØØ | |
| | | | 2,971 | | |
| Packaging (1.2%) | | | |
| | 2,803 | | | Berry Plastics Holding Corp., Term Loan C, 4.80%, due 4/3/15 | | | 2,044 | ØØØ | |
| Software/Services (0.2%) | | | |
| | 517 | | | Sungard Data Systems, Inc., Term Loan B, 5.71%, due 2/28/14 | | | 395 | ØØØ | |
| Theaters & Entertainment (0.3%) | | | |
| | 608 | | | AMC Entertainment, Inc., Term Loan, 5.51%, due 1/26/13 | | | 452 | | |
| | | | | Total Bank Loan Obligations (Cost $17,374) | | | 15,516 | | |
| Corporate Debt Securities (86.1%) | | | |
| Aerospace/Defense (2.9%) | | | |
| | 5,150 | | | L-3 Communications Corp., Guaranteed Senior Unsecured Subordinated Notes,
7.63%, due 6/15/12 | | | 4,777 | | |
| | 190 | | | L-3 Communications Corp., Guaranteed Notes, 5.88%, due 1/15/15 | | | 156 | | |
| | 185 | | | L-3 Communications Corp., Guaranteed Notes, 6.38%, due 10/15/15 | | | 153 | | |
| | | | 5,086 | | |
| Auto Loans (0.6%) | | | |
| | 1,630 | | | General Motors Acceptance Corp., Senior Unsecured Notes, 6.88%, due 9/15/11 | | | 955 | | |
| Automotive (0.8%) | | | |
| | 1,890 | | | Ford Motor Co., Senior Unsecured Notes, 7.45%, due 7/16/31 | | | 595 | | |
| | 1,915 | | | General Motors Corp., Senior Unsecured Notes, 7.20%, due 1/15/11 | | | 776 | | |
| | | | 1,371 | | |
| Beverage (0.6%) | | | |
| | 1,265 | | | Constellation Brands, Inc., Guaranteed Notes, 8.38%, due 12/15/14 | | | 1,126 | | |
See Notes to Schedule of Investments 43
| PRINCIPAL AMOUNT | | | | VALUE† | |
| (000's omitted) | | | | (000's omitted) | |
| Chemicals (1.1%) | | | |
| $ | 995 | | | Airgas, Inc., Guaranteed Notes, 7.13%, due 10/1/18 | | $ | 821 | ñ | |
| | 500 | | | MacDermid, Inc., Senior Subordinated Notes, 9.50%, due 4/15/17 | | | 265 | ñ | |
| | 1,680 | | | Momentive Performance Materials, Inc., Guaranteed Notes, 10.13%, due 12/1/14 | | | 806 | | |
| | | | 1,892 | | |
| Electric - Generation (10.6%) | | | |
| | 2,062 | | | AES Corp., Senior Secured Notes, 8.75%, due 5/15/13 | | | 1,877 | ñ | |
| | 820 | | | AES Corp., Senior Unsecured Notes, 8.00%, due 6/1/20 | | | 603 | ñ | |
| | 1,790 | | | Dynegy Holdings, Inc., Senior Unsecured Notes, 7.75%, due 6/1/19 | | | 1,199 | | |
| | 6,715 | | | Dynegy-Roseton Danskammer, Pass-Through Cert., Ser. B, 7.67%, due 11/8/16 | | | 5,043 | | |
| | 825 | | | Edison Mission Energy, Senior Unsecured Notes, 7.50%, due 6/15/13 | | | 695 | | |
| | 3,700 | | | Edison Mission Energy, Senior Unsecured Notes, 7.63%, due 5/15/27 | | | 2,405 | | |
| | 1,205 | | | Mirant Americas Generation, Inc., Senior Unsecured Notes, 8.30%, due 5/1/11 | | | 1,106 | | |
| | 1,700 | | | Mirant Mid-Atlantic LLC, Pass-Through Certificates, Ser. A, 8.63%, due 6/30/12 | | | 1,598 | | |
| | 2,110 | | | NRG Energy, Inc., Guaranteed Notes, 7.25%, due 2/1/14 | | | 1,846 | | |
| | 2,175 | | | NRG Energy, Inc., Guaranteed Notes, 7.38%, due 1/15/17 | | | 1,881 | | |
| | | | 18,253 | | |
| Electric - Integrated (4.3%) | | | |
| | 1,930 | | | CMS Energy Corp., Senior Unsecured Notes, 8.50%, due 4/15/11 | | | 1,842 | | |
| | 2,005 | | | CMS Energy Corp., Senior Unsecured Notes, 6.88%, due 12/15/15 | | | 1,640 | | |
| | 2,440 | | | Energy Future Holdings Corp., Guaranteed Notes, 11.25%, due 11/1/17 | | | 1,525 | ñ | |
| | 2,000 | | | Exelon Corp., LLC, Senior Unsecured Notes, 4.90%, due 6/15/15 | | | 1,496 | | |
| | 1,180 | | | IPALCO Enterprises, Inc., Senior Secured Notes, 7.25%, due 4/1/16 | | | 985 | ñ | |
| | | | 7,488 | | |
| Electronics (1.9%) | | | |
| | 3,225 | | | Flextronics Int'l, Ltd., Senior Subordinated Notes, 6.25%, due 11/15/14 | | | 2,451 | | |
| | 935 | | | Freescale Semiconductor, Inc., Guaranteed Notes, 9.13%, due 12/15/14 | | | 341 | | |
| | 990 | | | NXP BV/NXP Funding LLC, Senior Secured Floating Rate Notes, 7.50%, due 1/15/09 | | | 436 | µ | |
| | | | 3,228 | | |
| Energy - Exploration & Production (5.0%) | | | |
| | 1,745 | | | Chesapeake Energy Corp., Guaranteed Notes, 7.50%, due 9/15/13 | | | 1,466 | | |
| | 130 | | | Chesapeake Energy Corp., Guaranteed Notes, 7.50%, due 6/15/14 | | | 107 | | |
| | 1,180 | | | Chesapeake Energy Corp., Guaranteed Notes, 7.00%, due 8/15/14 | | | 947 | | |
| | 1,000 | | | Chesapeake Energy Corp., Guaranteed Notes, 6.88%, due 1/15/16 | | | 802 | | |
| | 980 | | | Cimarex Energy Co., Guaranteed Notes, 7.13%, due 5/1/17 | | | 784 | | |
| | 410 | | | Newfield Exploration Co., Senior Unsecured Notes, 7.63%, due 3/1/11 | | | 367 | | |
| | 1,500 | | | Newfield Exploration Co., Senior Subordinated Notes, 6.63%, due 9/1/14 | | | 1,159 | | |
| | 2,420 | | | Pioneer Natural Resources Co., Senior Unsecured Notes, 6.65%, due 3/15/17 | | | 1,823 | | |
| | 1,435 | | | Southwestern Energy Co., Senior Notes, 7.50%, due 2/1/18 | | | 1,176 | ñ | |
| | | | 8,631 | | |
| Environmental (0.3%) | | | |
| | 500 | | | Allied Waste North America, Inc., Senior Secured Notes, Ser. B, 5.75%, due 2/15/11 | | | 460 | | |
| Food & Drug Retailers (0.7%) | | | |
| | 790 | | | Rite Aid Corp., Senior Secured Notes, 10.38%, due 7/15/16 | | | 549 | | |
| | 1,730 | | | Rite Aid Corp., Guaranteed Notes, 9.50%, due 6/15/17 | | | 623 | | |
| | | | 1,172 | | |
| Gaming (4.5%) | | | |
| | 905 | | | Chukchansi Economic Development Authority, Senior Unsecured Notes, 8.00%, due 11/15/13 | | | 480 | ñ | |
| | 1,885 | | | FireKeepers Development Authority, Senior Secured Notes, 13.88%, due 5/1/15 | | | 1,338 | ñ | |
| | 665 | | | Fontainebleau Las Vegas Holdings LLC, Second Mortgage, 10.25%, due 6/15/15 | | | 90 | ñØØ | |
See Notes to Schedule of Investments 44
| PRINCIPAL AMOUNT | | | | VALUE† | |
| (000's omitted) | | | | (000's omitted) | |
| $ | 1,040 | | | Harrah's Operating Co., Inc., Guaranteed Notes, 10.75%, due 2/1/16 | | $ | 338 | ñ | |
| | 915 | | | MGM Mirage, Inc., Senior Secured Notes, 13.00%, due 11/15/13 | | | 842 | ñØ | |
| | 1,160 | | | MGM Mirage, Inc., Guaranteed Notes, 7.50%, due 6/1/16 | | | 684 | ØØ | |
| | 2,140 | | | Pokagon Gaming Authority, Senior Notes, 10.38%, due 6/15/14 | | | 1,948 | ñ | |
| | 2,005 | | | San Pasqual Casino, Notes, 8.00%, due 9/15/13 | | | 1,544 | ñ | |
| | 560 | | | Shingle Springs Tribal Gaming Authority, Senior Notes, 9.38%, due 6/15/15 | | | 274 | ñ | |
| | | | 7,538 | | |
| Gas Distribution (11.9%) | | | |
| | 1,450 | | | AmeriGas Partners L.P., Senior Unsecured Notes, 7.13%, due 5/20/16 | | | 1,069 | | |
| | 360 | | | El Paso Natural Gas Co., Senior Unsecured Notes, 5.95%, due 4/15/17 | | | 278 | | |
| | 1,405 | | | El Paso Natural Gas Co., Senior Unsecured Notes, 8.38%, due 6/15/32 | | | 1,135 | | |
| | 1,920 | | | Ferrellgas Partners L.P., Senior Unsecured Notes, 8.75%, due 6/15/12 | | | 1,440 | ØØ | |
| | 760 | | | Ferrellgas L.P., Senior Unsecured Notes, 6.75%, due 5/1/14 | | | 540 | | |
| | 1,315 | | | Ferrellgas Partners L.P., Senior Notes, 6.75%, due 5/1/14 | | | 934 | ñ | |
| | 6,937 | | | Kinder Morgan, Inc., Senior Unsecured Notes, 6.50%, due 9/1/12 | | | 6,070 | | |
| | 555 | | | Kinder Morgan, Inc., Senior Unsecured Notes, 5.15%, due 3/1/15 | | | 427 | ØØ | |
| | 1,860 | | | MarkWest Energy Partners L.P., Senior Notes, Ser. B, 8.75%, due 4/15/18 | | | 1,339 | | |
| | 1,912 | | | Regency Energy Partners L.P., Guaranteed Notes, 8.38%, due 12/15/13 | | | 1,453 | | |
| | 4,580 | | | Sabine Pass L.P., Senior Secured Notes, 7.50%, due 11/30/16 | | | 3,160 | | |
| | 1,895 | | | Williams Cos., Inc., Senior Unsecured Notes, 7.13%, due 9/1/11 | | | 1,706 | | |
| | 1,300 | | | Williams Partners L.P., Senior Unsecured Notes, 7.25%, due 2/1/17 | | | 1,034 | | |
| | | | 20,585 | | |
| Health Services (7.9%) | | | |
| | 280 | | | DJO Finance LLC, Guaranteed Notes, 10.88%, due 11/15/14 | | | 225 | | |
| | 1,070 | | | HCA, Inc., Senior Secured Notes, 9.25%, due 11/15/16 | | | 909 | | |
| | 765 | | | LVB Acquisition Merger, Inc., Guaranteed Notes, 10.38%, due 10/15/17 | | | 637 | | |
| | 540 | | | LVB Acquisition Merger, Inc., Guaranteed Notes, 11.63%, due 10/15/17 | | | 470 | | |
| | 3,365 | | | NMH Holdings, Inc., Senior Unsecured Floating Rate Notes, 9.94%, due 12/15/08 | | | 2,490 | ñµ | |
| | 4,075 | | | Select Medical Corp., Guaranteed Notes, 7.63%, due 2/1/15 | | | 2,547 | | |
| | 705 | | | Service Corp. Int'l, Senior Unsecured Notes, 6.75%, due 4/1/15 | | | 555 | | |
| | 2,860 | | | Service Corp. Int'l, Senior Unsecured Notes, 7.50%, due 4/1/27 | | | 1,981 | ØØ | |
| | 130 | | | Ventas Realty L.P., Guaranteed Notes, 6.75%, due 6/1/10 | | | 123 | | |
| | 485 | | | Ventas Realty L.P., Senior Notes, 6.63%, due 10/15/14 | | | 415 | | |
| | 1,750 | | | Ventas Realty L.P., Guaranteed Notes, 7.13%, due 6/1/15 | | | 1,514 | | |
| | 1,045 | | | Ventas Realty L.P., Guaranteed Notes, 6.50%, due 6/1/16 | | | 857 | | |
| | 1,020 | | | Ventas Realty L.P., Guaranteed Notes, 6.75%, due 4/1/17 | | | 836 | | |
| | | | 13,559 | | |
| Hotels (0.4%) | | | |
| | 840 | | | Host Hotels & Resorts L.P., Senior Secured Notes, 7.13%, due 11/1/13 | | | 659 | ØØ | |
| Media - Broadcast (1.1%) | | | |
| | 3,520 | | | LIN Television Corp., Guaranteed Notes, 6.50%, due 5/15/13 | | | 1,971 | | |
| Media - Cable (8.7%) | | | |
| | 875 | | | CCH II Holdings LLC, Guaranteed Notes, 10.25%, due 10/1/13 | | | 547 | | |
| | 8,450 | | | DirecTV Holdings LLC, Guaranteed Notes, 8.38%, due 3/15/13 | | | 7,922 | | |
| | 2,605 | | | EchoStar DBS Corp., Guaranteed Notes, 6.38%, due 10/1/11 | | | 2,318 | ØØ | |
| | 820 | | | EchoStar DBS Corp., Guaranteed Notes, 7.13%, due 2/1/16 | | | 658 | | |
| | 1,180 | | | Mediacom Broadband LLC, Senior Unsecured Notes, 8.50%, due 10/15/15 | | | 873 | | |
| | 2,285 | | | Shaw Communications, Inc., Senior Unsecured Notes, 7.20%, due 12/15/11 | | | 2,114 | | |
| | 730 | | | Videotron Ltd., Guaranteed Notes, 9.13%, due 4/15/18 | | | 648 | ñ | |
| | | | 15,080 | | |
| Metals/Mining Excluding Steel (3.9%) | | | |
| | 1,075 | | | Aleris Int'l, Inc., Guaranteed Notes, 9.00%, due 12/15/14 | | | 371 | | |
| | 3,245 | | | Arch Western Finance Corp., Senior Secured Notes, 6.75%, due 7/1/13 | | | 2,726 | | |
See Notes to Schedule of Investments 45
| PRINCIPAL AMOUNT | | | | VALUE† | |
| (000's omitted) | | | | (000's omitted) | |
| $ | 3,245 | | | Massey Energy Co., Guaranteed Notes, 6.88%, due 12/15/13 | | $ | 2,628 | | |
| | 320 | | | Peabody Energy Corp., Guaranteed Notes, Ser. B, 6.88%, due 3/15/13 | | | 281 | | |
| | 995 | | | Peabody Energy Corp., Guaranteed Notes, 5.88%, due 4/15/16 | | | 766 | | |
| | | | 6,772 | | |
| Non-Food & Drug Retailers (0.2%) | | | |
| | 470 | | | Blockbuster, Inc., Guaranteed Notes, 9.00%, due 9/1/12 | | | 268 | ØØ | |
| Packaging (4.1%) | | | |
| | 6,415 | | | Ball Corp., Guaranteed Unsecured Notes, 6.88%, due 12/15/12 | | | 5,902 | | |
| | 360 | | | Berry Plastics Corp., Senior Secured Floating Rate Notes, 9.50%, due 1/15/09 | | | 270 | µ | |
| | 475 | | | Crown Americas LLC, Guaranteed Notes, 7.75%, due 11/15/15 | | | 414 | | |
| | 760 | | | Graham Packaging Co., Inc., Guaranteed Notes, 9.88%, due 10/15/14 | | | 479 | | |
| | | | 7,065 | | |
| Printing & Publishing (0.5%) | | | |
| | 1,405 | | | Dex Media West LLC, Senior Subordinated Notes, Ser. B, 9.88%, due 8/15/13 | | | 527 | | |
| | 665 | | | Dex Media, Inc., Senior Disc. Notes, Step-Up, 0.00%/9.00%, due 11/15/13 | | | 149 | ** | |
| | 1,180 | | | Idearc, Inc., Guaranteed Notes, 8.00%, due 11/15/16 | | | 164 | | |
| | | | 840 | | |
| Real Estate Dev. & Mgt. (1.0%) | | | |
| | 2,495 | | | American Real Estate Partners L.P., Senior Unsecured Notes, 8.13%, due 6/1/12 | | | 1,697 | | |
| Restaurants (0.5%) | | | |
| | 1,270 | | | NPC Int'l, Inc., Guaranteed Notes, 9.50%, due 5/1/14 | | | 787 | ØØ | |
| Software/Services (1.3%) | | | |
| | 1,185 | | | Lender Processing Services, Inc., Guaranteed Notes, 8.13%, due 7/1/16 | | | 1,013 | | |
| | 795 | | | Sungard Data Systems, Inc., Senior Unsecured Notes, 10.63%, due 5/15/15 | | | 672 | ñ | |
| | 815 | | | Sungard Data Systems, Inc., Guaranteed Notes, 10.25%, due 8/15/15 | | | 570 | | |
| | | | 2,255 | | |
| Steel Producers/Products (2.2%) | | | |
| | 2,010 | | | Metals U.S.A. Holdings Corp., Senior Unsecured Floating Rate Notes, 10.88%, due 1/1/09 | | | 1,106 | µ | |
| | 2,115 | | | Steel Dynamics, Inc., Guaranteed Notes, 7.38%, due 11/1/12 | | | 1,573 | | |
| | 1,950 | | | Tube City IMS Corp., Guaranteed Notes, 9.75%, due 2/1/15 | | | 1,131 | | |
| | | | 3,810 | | |
| Support-Services (2.8%) | | | |
| | 1,610 | | | Cardtronics, Inc., Guaranteed Notes, 9.25%, due 8/15/13 | | | 1,264 | | |
| | 3,110 | | | Knowledge Learning Corp., Inc., Guaranteed Notes, 7.75%, due 2/1/15 | | | 2,426 | ñ | |
| | 1,595 | | | United Rentals N.A., Inc., Guaranteed Senior Notes, 6.50%, due 2/15/12 | | | 1,116 | | |
| | | | 4,806 | | |
| Telecom - Integrated/Services (5.9%) | | | |
| | 2,120 | | | Dycom Industries, Inc., Guaranteed Notes, 8.13%, due 10/15/15 | | | 1,431 | | |
| | 2,310 | | | Intelsat Subsidiary Holdings Co. Ltd., Senior Unsecured Notes, 8.50%, due 1/15/13 | | | 2,010 | ñ | |
| | 1,260 | | | Nextel Communications, Inc., Guaranteed Notes, Ser. E, 6.88%, due 10/31/13 | | | 718 | | |
| | 1,938 | | | Qwest Corp., Senior Unsecured Notes, 8.88%, due 3/15/12 | | | 1,696 | | |
| | 1,820 | | | Sprint Capital Corp., Guaranteed Notes, 6.90%, due 5/1/19 | | | 1,283 | | |
| | 2,300 | | | Sprint Capital Corp., Guaranteed Notes, 6.88%, due 11/15/28 | | | 1,345 | | |
| | 1,325 | | | Sprint Nextel Corp., Senior Unsecured Notes, 6.00%, due 12/1/16 | | | 918 | | |
| | 995 | | | Windstream Corp., Guaranteed Notes, 8.13%, due 8/1/13 | | | 818 | | |
| | | | 10,219 | | |
See Notes to Schedule of Investments 46
| PRINCIPAL AMOUNT | | | | VALUE† | |
| (000's omitted) | | | | (000's omitted) | |
| Transportation Excluding Air/Rail (0.4%) | |
| $ | 1,260 | | | ERAC USA Finance Co., Guaranteed Notes, 7.00%, due 10/15/37 | | $ | 738 | ñ | |
| | Total Corporate Debt Securities (Cost $188,984) | | | 148,311 | | |
| NUMBER OF SHARES | |
| Short-Term Investments (9.0%) | |
| | 15,507,852 | | | Neuberger Berman Prime Money Fund Trust Class (Cost $15,508) | | | 15,508 | @ | |
| | Total Investments (104.1%) (Cost $221,866) | | | 179,335 | ## | |
| | Liabilities, less cash, receivables and other assets [(4.1%)] | | | (6,996 | ) | |
| | Total Net Assets (100.0%) | | $ | 172,339 | | |
See Notes to Schedule of Investments 47
Schedule of Investments Neuberger Berman Municipal Money Fund
| PRINCIPAL AMOUNT | | SECURITY@@ | | VALUE†† | |
| (000's omitted) | | | | (000's omitted) | |
| Municipal Notes (97.5%) | | | |
| Arizona (0.2%) | | | |
| $ | 910 | | | Coconino Co. Ind. Dev. Au. IDR (Scuff Steel Proj.), Ser. 2007, (LOC: Wells Fargo
Bank & Trust Co.), 1.80%, due 11/6/08 | | $ | 910 | µß | |
| California (6.7%) | | | |
| | 2,720 | | | California HFA Rev. (Home Mtge.), Ser. 2006 C, (LOC: Calyon Bank), 1.20%, due 11/3/08 | | | 2,720 | µ | |
| | 2,945 | | | California Infrastructure & Econ. Dev. Bank IDR (Studio Moulding Proj.), Ser. 2001 A,
(LOC: Comerica Bank), 2.32%, due 11/6/08 | | | 2,945 | µß | |
| | 1,100 | | | California St. Dept. Wtr. Res. Pwr. Supply Rev., Ser. 2002 C7, (FSA Insured), 5.00%, due 11/6/08 | | | 1,100 | µp | |
| | 12,450 | | | Sacramento Co. Sanitation Dist. Fin. Au. Rev. Muni. Sec. Trust Receipts, Ser. 2008-47
Class A, (FGIC Insured), 1.67%, due 11/6/08 | | | 12,450 | µcc | |
| | 4,625 | | | Sacramento Co. Sanitation Dist. Fin. Au. Rev. Muni. Sec. Trust Receipts, Ser. 2008-48
Class A, (FGIC Insured), 1.67%, due 11/6/08 | | | 4,625 | µcc | |
| | 2,500 | | | Sacramento Co. Sanitation Dist. Fin. Au. Rev. Muni. Sec. Trust Receipts, Ser. 2008-49
Class A, (FGIC Insured), 1.67%, due 11/6/08 | | | 2,500 | µcc | |
| | 200 | | | Three Valleys Muni. Wtr. Dist. Cert. Participation (Miramar Wtr. Treatment), Ser. 1984,
(LOC: Wells Fargo Bank & Trust Co.), 1.60%, due 11/5/08 | | | 200 | µ | |
| | | | 26,540 | | |
| Colorado (3.3%) | | | |
| | 1,000 | | | Central Platte Valley Metro. Dist., Ser. 2006, (LOC: BNP Paribas), 3.50%,
due 12/1/36 Putable 12/1/08 | | | 1,003 | µ | |
| | 11,925 | | | Colorado Ed. & Cultural Fac. Au. Rev. (Linfield Christian Sch. Proj.), Ser. 2005,
(LOC: Evangelical Christian Credit Union), 1.97%, due 11/6/08 | | | 11,925 | µßu | |
| | | | 12,928 | | |
| Florida (5.6%) | | | |
| | 11,800 | | | Jacksonville Hlth. Fac. Au. Hosp. Rev. (Baptist Med.), Ser. 2003 B, (LOC: Bank of America),
1.25%, due 11/3/08 | | | 11,800 | µß | |
| | 300 | | | Jacksonville IDR (Univ. Hlth. Science Ctr.), Ser. 1989, (LOC: Bank of America),
1.95%, due 11/6/08 | | | 300 | µ | |
| | 10,000 | | | RBC Muni. Prods. Inc. Trust Var. St. (Floater), Ser. 2008 E6, (LOC: Royal Bank of Canada),
1.82%, due 11/6/08 | | | 10,000 | µ | |
| | | | 22,100 | | |
| Georgia (1.4%) | | | |
| | 5,600 | | | De Kalb Co. Dev. Au. Rev. (Marist Sch., Inc. Proj.), Ser. 1999, (LOC: SunTrust Bank),
1.85%, due 11/5/08 | | | 5,600 | µß | |
| Idaho (3.8%) | | | |
| | 15,000 | | | Idaho Hlth. Fac. Au. Rev. (St. Luke's Med. Ctr.), Ser. 2000, (FSA Insured), 3.45%, due 11/3/08 | | | 15,000 | µßf | |
| Illinois (6.2%) | | | |
| | 2,600 | | | Aurora Econ. Dev. Rev. (Christian Sch., Inc. Proj.), Ser. 2004 B, (LOC: Fifth Third Bank),
2.50%, due 11/6/08 | | | 2,600 | µß | |
| | 14,035 | | | Chicago G.O. (Putters), Ser. 2008-2457, (MBIA Insured), 2.27%, due 11/6/08 | | | 14,035 | µbb | |
| | 7,800 | | | Will Co. Solid Waste Disp. Rev. (BASF Corp. Proj.), Ser. 1997, 1.60%, due 11/3/08 | | | 7,800 | µß | |
| | | | 24,435 | | |
| Indiana (3.3%) | | | |
| | 6,010 | | | Greencastle IDR (Crown Equipment Corp. Proj.), Ser. 1996, (LOC: KeyBank), 2.03%, due 11/6/08 | | | 6,010 | µß | |
| | 4,000 | | | Hamilton Southeastern Sch. (Temporary Loan Warrants), Ser. 2008, 2.50%, due 12/31/08 | | | 4,001 | | |
See Notes to Schedule of Investments 48
| PRINCIPAL AMOUNT | | SECURITY@@ | | VALUE†† | |
| (000's omitted) | | | | (000's omitted) | |
| $ | 3,000 | | | Indiana St. Dev. Fin. Au. Rev. (Cathedral High), Ser. 2001, (LOC: Fifth Third Bank),
2.70%, due 11/3/08 | | $ | 3,000 | µß | |
| | | | 13,011 | | |
| Iowa (2.3%) | | | |
| | 7,150 | | | Hills Hlth. Facs. Rev. (Mercy Hosp. Proj.), Ser. 2008, (LOC: Allied Irish Bank), 1.48%, due 11/3/08 | | | 7,150 | µß | |
| | 845 | | | Iowa Higher Ed. Loan Au. Rev. (Private College St. Ambrose ), Ser. 2003, (LOC: Northern Trust Co.),
1.45%, due 11/3/08 | | | 845 | µß | |
| | 1,300 | | | Iowa Higher Ed. Loan Au. Rev. RANS (Private Ed.), Ser. 2008 A, 3.30%, due 5/20/09 | | | 1,307 | ß | |
| | | | 9,302 | | |
| Kansas (4.3%) | | | |
| | 15,000 | | | Olathe Hlth. Facs. Rev. (Olathe Med. Ctr.), Ser. 2008, (LOC: Bank of America), 1.48%, due 11/3/08 | | | 15,000 | µß | |
| | 1,960 | | | Univ. of Kansas Hosp. Au. Hlth. Facs. Rev. (KU Hlth. Sys.), Ser. 2004, (LOC: Harris Trust & Savings),
1.45%, due 11/3/08 | | | 1,960 | µß | |
| | | | 16,960 | | |
| Kentucky (0.4%) | | | |
| | 1,500 | | | Lexington-Fayette Urban Co. Arpt. Corp. Rev., Ser. 1998 C, (MBIA Insured), 7.25%, due 11/3/08 | | | 1,500 | µp | |
| Michigan (4.2%) | | | |
| | 10,255 | | | Michigan St. Hsg. Dev. Au. Multi-Family Rev. (Jackson Proj.), Ser. 2005, (FHLB Insured),
1.65%, due 11/3/08 | | | 10,255 | µß | |
| | 4,000 | | | Oakland Co. Econ. Dev. Corp. Ltd. Oblig. Rev. (Bharatiya Temple Proj.), Ser. 2007,
(LOC: Fifth Third Bank), 2.31%, due 11/7/08 | | | 4,000 | µß | |
| | 2,350 | | | Wayne Charter Co. Arpt. Rev. (Detroit Metro. Wayne Co.), Ser. 1998 A, (MBIA Insured),
5.50%, due 12/1/08 | | | 2,355 | | |
| | | | 16,610 | | |
| Minnesota (2.9%) | | | |
| | 10,000 | | | Minnesota Agricultural & Econ. Dev. Board Rev. (Hlth. Care Fac.-Essentia), Ser. 2008 C4,
LOC: KBC Bank N.V.), 1.35%, due 11/3/08 | | | 10,000 | µß | |
| | 1,400 | | | Plymouth Multi-Family Hsg. Ref. Rev. (At the Lake Apts. Proj.), Ser. 2004,
(LOC: Freddie Mac), 2.02%, due 11/6/08 | | | 1,400 | µß | |
| | | | 11,400 | | |
| Missouri (3.0%) | | | |
| | 800 | | | Missouri St. Dev. Fin. Board Infrastructure Fac. Rev. (St. Louis Convention Ctr.), Ser. 2000 C,
(LOC: U.S. Bank), 1.48%, due 11/3/08 | | | 800 | µ | |
| | 1,385 | | | Missouri St. Hlth. & Ed. Fac. Au. Ed. Fac. Rev. (Drury College), Ser. 1999, (LOC: Bank of America),
1.48%, due 11/3/08 | | | 1,385 | µß | |
| | 4,495 | | | Missouri St. Hlth. & Ed. Fac. Au. Hlth. Fac. Rev. (Bethesda Hlth. Group, Inc.), Ser. 2006,
(LOC: U.S. Bank), 1.20%, due 11/3/08 | | | 4,495 | µß | |
| | 1,230 | | | Missouri St. Hlth. & Ed. Fac. Au. Hlth. Fac. Rev. (Bethesda Hlth. Group, Inc.), Ser. 2004,
(LOC: U.S. Bank), 1.20%, due 11/3/08 | | | 1,230 | µß | |
| | 4,000 | | | Missouri St. Hlth. & Ed. Fac. Au. Rev. RANS (Private Ed.), Ser. 2008 B, 3.00%, due 4/23/09 | | | 4,018 | ß | |
| | | | 11,928 | | |
| Nebraska (0.5%) | | | |
| | 1,800 | | | Central Plains Energy Proj. Gas Proj. Rev. Number 1, Ser. 2007 A, 5.00%, due 12/1/08 | | | 1,803 | | |
| Nevada (0.2%) | | | |
| | 615 | | | Nevada Sys. Higher Ed. Univ. Rev., Ser. 2008 A, 3.00%, due 7/1/09 | | | 619 | | |
See Notes to Schedule of Investments 49
| PRINCIPAL AMOUNT | | SECURITY@@ | | VALUE†† | |
| (000's omitted) | | | | (000's omitted) | |
| New Hampshire (2.7%) | | | |
| $ | 2,500 | | | Merrimack Co. G.O. TANS, Ser. 2008, 3.50%, due 12/30/08 | | $ | 2,505 | | |
| | 8,000 | | | New Hampshire Hlth. & Ed. Fac. Au. Rev. RANS (Wentworth), Ser. 2008 K, 2.75%, due 4/22/09 | | | 8,018 | ß | |
| | | | 10,523 | | |
| New Mexico (2.4%) | | | |
| | 9,500 | | | Bernalillo Co. Gross Receipts Tax Rev., Ser. 2004 B, (MBIA Insured), 3.32%, due 11/6/08 | | | 9,500 | µc | |
| New York (8.1%) | | | |
| | 7,000 | | | BB&T Muni. Trust Var. Sts. (Floaters), Ser. 2008-1012, (LOC: Branch Banking & Trust Co.),
1.50%, due 11/6/08 | | | 7,000 | µ | |
| | 2,400 | | | Metro. Trans. Au. Rev., Ser. 2002 D1, (FSA Insured), 2.70%, due 11/6/08 | | | 2,400 | µmm | |
| | 2,200 | | | New York City Muni. Wtr. Fin. Au. Wtr. & Swr. Sys. Rev., Ser. 2001 F1,
(LOC: Dexia Credit Locale de France), 2.70%, due 11/3/08 | | | 2,200 | µ | |
| | 20,000 | | | New York City Transitional Fin. Au. Rev., Ser. 2002 2A, (LOC: Dexia Credit Locale de France),
1.90%, due 11/3/08 | | | 20,000 | µ | |
| | 310 | | | Utica IDA Civic Fac. Rev. (Utica College Proj.), Ser. 2005 A, (LOC: Citizens Bank),
1.90%, due 11/6/08 | | | 310 | µß | |
| | | | 31,910 | | |
| North Carolina (3.3%) | | | |
| | 12,965 | | | Mecklenburg Co. Cert. Participation, Ser. 2008 A, (LOC: SunTrust Bank), 1.60%, due 11/6/08 | | | 12,965 | µ | |
| Ohio (1.4%) | | | |
| | 5,700 | | | East Liverpool Hosp. Rev. (East Liverpool City Hosp.), Ser. 2006, (LOC: Fifth Third Bank),
3.75%, due 11/6/08 | | | 5,700 | µß | |
| South Carolina (0.6%) | | | |
| | 2,500 | | | Jasper Co. Rev. BANS (Jasper Co. Sch.), Ser. 2008, 2.75%, due 2/12/09 | | | 2,503 | | |
| Tennessee (3.9%) | | | |
| | 7,275 | | | Blount Co. Pub. Bldg. Au., Ser. 2003 C1A, (LOC: Branch Banking & Trust Co.), 1.68%, due 11/6/08 | | | 7,275 | µ | |
| | 5,000 | | | Blount Co. Pub. Bldg. Au. (Local Gov't Pub. Imp.), Ser. 2008 E5A, (LOC: Branch Banking & Trust Co.),
1.68%, due 11/6/08 | | | 5,000 | µ | |
| | 600 | | | Franklin Co. Hlth. & Ed. Fac. Board Rev. (Univ. of the South Proj.), Ser. 1990, 5.00%, due 11/3/08 | | | 600 | µß | |
| | 2,745 | | | Shelby Co. Hlth. Ed. & Hsg. Fac. Board Multi-Family Hsg. Rev. (Flag Manor), Ser. 1995,
(LOC: U.S. Bank), 2.03%, due 11/6/08 | | | 2,745 | µ | |
| | | | 15,620 | | |
| Texas (1.3%) | | | |
| | 1,800 | | | Brazoria Co. Hlth. Fac. Dev. Corp. Hosp. Rev. (Brazosport Mem. Hosp.), Ser. 1999,
(LOC: Chase Bank of Texas), 1.80%, due 11/6/08 | | | 1,800 | µß | |
| | 2,800 | | | Denton Independent Sch. Dist. G.O., Ser. 1996 B, (PSF Insured), 2.20%, due 8/15/09 | | | 2,800 | µmm | |
| | 510 | | | Harris Co. Hlth. Fac. Dev. Corp. Hosp. Rev. (Hermann Healthcare Sys.), Ser. 2004 A,
5.00%, due 12/1/08 | | | 511 | ß | |
| | | | 5,111 | | |
| Utah (1.7%) | | | |
| | 6,800 | | | Utah Trans. Au. Sales Tax Rev. (Putters), Ser. 2008-2943, (MBIA Insured), 1.97%, due 11/6/08 | | | 6,800 | µs | |
| Vermont (2.9%) | | | |
| | 11,675 | | | Vermont Ed. & Hlth. Bldg. Fin. Agcy. (Rutland Med. Ctr.), Ser. 2001 A, (Radian Insured),
1.30%, due 11/3/08 | | | 11,675 | µßt | |
See Notes to Schedule of Investments 50
| PRINCIPAL AMOUNT | | SECURITY@@ | | VALUE†† | |
| (000's omitted) | | | | (000's omitted) | |
| Virginia (1.3%) | | | |
| $ | 5,200 | | | Roanoke IDA Hosp. Rev. (Carilion Hlth. Sys.), Ser. 2005 B2, (FSA Insured), 1.80%, due 11/3/08 | | $ | 5,200 | µßn | |
| Washington (4.9%) | | | |
| | 1 | | | King Co. Swr. Rev. (Floaters), Ser. 2005-1091, (FSA Insured), 8.88%, due 11/6/08 | | | 1 | ñµy | |
| | 3,300 | | | Washington St. Hlth. Care Fac. Au. Rev. (Catholic Hlth.), Ser. 2007 A2, (FSA Insured),
2.80%, due 11/5/08 | | | 3,300 | µß | |
| | 10,000 | | | Washington St. Hlth. Care Fac. Au. Rev. (Grays Harbor Comm. Hosp.), Ser. 2007, (Radian Insured),
2.20%, due 11/3/08 | | | 10,000 | µßh | |
| | 5,775 | | | Washington St. Hsg. Fin. Commission Multi-Family Rev. (Rosemont Apts. Proj.), Ser. 2003 A,
(LOC: Umpqua Bank), 1.35%, due 11/3/08 | | | 5,775 | µße | |
| | 200 | | | Washington St. Hsg. Fin. Commission Non-Profit Rev. (Tacoma Art Museum Proj.), Ser. 2002,
(LOC: Northern Trust Co.), 1.48%, due 11/3/08 | | | 200 | µß | |
| | | | 19,276 | | |
| Wisconsin (14.7%) | | | |
| | 5,250 | | | Holmen Sch. Dist. BANS, Ser. 2008, 3.00%, due 2/1/09 | | | 5,264 | | |
| | 5,700 | | | Whitehall IDR (Whitehall Specialties), Ser. 2007, (LOC: JP Morgan Chase), 2.30%, due 11/6/08 | | | 5,700 | µß | |
| | 8,000 | | | Wisconsin Hsg. & Econ. Dev. Au. Multi-Family Hsg., Ser. 2008 A, (LOC: Marshall & Ilsley),
1.82%, due 11/6/08 | | | 8,000 | µ | |
| | 15,000 | | | Wisconsin St. Hlth. & Ed. Fac. Au. Rev. (Aurora Hlth. Care), Ser. 2006 C, (LOC: Marshall & Ilsley),
1.45%, due 11/3/08 | | | 15,000 | µß | |
| | 8,000 | | | Wisconsin St. Hlth. & Ed. Fac. Au. Rev. (Bay Area Med. Ctr., Inc.), Ser. 2008, (LOC: Marshall & Ilsley),
2.20%, due 11/3/08 | | | 8,000 | µß | |
| | 100 | | | Wisconsin St. Hlth. & Ed. Fac. Au. Rev. (Goodwill Ind. North Ctr.), Ser. 2005,
(LOC: Wells Fargo Bank & Trust Co.), 1.65%, due 11/6/08 | | | 100 | µß | |
| | 13,440 | | | Wisconsin St. Hlth. & Ed. Fac. Au. Rev. (Gundersen Lutheran), Ser. 2000 A, (FSA Insured),
2.70%, due 11/3/08 | | | 13,440 | µßp | |
| | 2,500 | | | Wisconsin St. Hlth. & Ed. Fac. Au. Rev. (ProHealth Care, Inc.), Ser. 2008 A, (LOC: Marshall & Ilsley),
2.20%, due 11/3/08 | | | 2,500 | µß | |
| | | | 58,004 | | |
| | | | | Total Municipal Notes | | | 385,433 | | |
| Asset-Backed Securities (2.3%) | | | |
| | 9,149 | | | FHLMC Multi-Family Certs., Ser. M010, Class A, 5.28%, due 11/15/08 | | | 9,149 | µ | |
| | | | | Total Investments (99.8%) | | | 394,582 | | |
| | | | | Cash, receivables and other assets, less liabilities (0.2%) | | | 765 | | |
| | | | | Total Net Assets (100.0%) | | $ | 395,347 | | |
See Notes to Schedule of Investments 51
Schedule of Investments Neuberger Berman Municipal Securities Trust
| PRINCIPAL AMOUNT | | SECURITY@@ | | VALUE† | |
| (000's omitted) | | | | (000's omitted) | |
| Alaska (2.8%) | | | |
| $ | 795 | | | Alaska St. Int'l Arpts. Ref. Rev., Ser. 2006 A, (MBIA Insured), 5.00%, due 10/1/17 | | $ | 727 | | |
| California (9.5%) | | | |
| | 500 | | | California St. Econ. Rec. G.O., Ser. 2004 A, (MBIA Insured), 5.25%, due 7/1/13 | | | 533 | | |
| | 1,000 | | | California St. Pub. Works Board Lease Rev. Dept. of Mental Hlth. (Coalinga St. Hosp.), Ser. 2004 A,
5.50%, due 6/1/21 | | | 1,005 | | |
| | 1,000 | | | Sacramento Muni. Util. Dist. Fin. Au. Rev. (Cosumnes Proj.), Ser. 2006, (MBIA Insured),
5.00%, due 7/1/20 | | | 897 | | |
| | | | 2,435 | | |
| Colorado (4.2%) | | | |
| | 1,000 | | | Larimer Co. Sales & Use Tax Rev., Ser. 2000, (AMBAC Insured), 5.75%, due 12/15/15
Pre-Refunded 12/15/10 | | | 1,068 | ØØ | |
| Georgia (3.7%) | | | |
| | 1,000 | | | George L. Smith II World Congress Ctr. Au. Rev. (Domed Stadium Proj.), Ser. 2000, (MBIA Insured),
5.75%, due 7/1/15 | | | 954 | | |
| Illinois (11.7%) | | | |
| | 1,000 | | | Chicago O'Hare Int'l Arpt. Gen. Arpt. Third Lien Ref. Rev., Ser. 2005 B, (MBIA Insured),
5.25%, due 1/1/17 | | | 1,010 | | |
| | 600 | | | Illinois Fin. Au. Rev. (Univ. of Chicago), Ser. 2007, 5.00%, due 7/1/22 | | | 593 | ß | |
| | 800 | | | Will & Kendall Cos. Plainfield Comm. Cons. Sch. Dist. Number 202 Sch. Bldg. G.O., Ser. 2001,
(FSA Insured), 5.38%, due 1/1/13 Pre-Refunded 1/1/12 | | | 856 | | |
| | 500 | | | Will Grundy Cos. Comm. College Dist. Number 525 (Joliet Jr. College) G.O., Ser. 2008,
6.25%, due 6/1/24 | | | 527 | Ø | |
| | | | 2,986 | | |
| Indiana (4.0%) | | | |
| | 1,000 | | | Indiana St. Office Bldg. Commission Fac. Ref. Rev., Ser. 1998 A, 5.13%, due 7/1/14 | | | 1,011 | | |
| Louisiana (3.5%) | | | |
| | 1,000 | | | Louisiana St. Citizens Prop. Insurance Corp. Assessment Rev., Ser. 2006 B, (AMBAC Insured),
5.00%, due 6/1/18 | | | 899 | | |
| Massachusetts (2.0%) | | | |
| | 500 | | | Massachusetts St. Hlth. & Ed. Fac. Au. Rev. (Berklee College of Music), Ser. 2007 A, 5.00%, due 10/1/15 | | | 516 | ß | |
| Michigan (7.1%) | | | |
| | 750 | | | Detroit Wayne Co. Sch. Dist. Sch. Bldg. & Site Imp. Ref. G.O., Ser. 1998 C, (FGIC Insured),
5.25%, due 5/1/13 | | | 795 | | |
| | 1,000 | | | Kent Hosp. Fin. Au. Rev., Ref. (Spectrum Hlth. Sys.), Ser. 2008 A, 5.00%, due 1/15/47 Putable 1/15/12 | | | 1,009 | µß | |
| | | | 1,804 | | |
| Mississippi (2.0%) | | | |
| | 500 | | | Mississippi Dev. Bank Spec. Oblig. (Wilkinson Co. Correctional), Ser. 2008 D, 5.00%, due 8/1/15 | | | 508 | ß | |
| New Jersey (10.0%) | | | |
| | 1,000 | | | New Jersey Econ. Dev. Au. St. Lease Rev. (Liberty St. Park Proj.), Ser. 2005 B, (MBIA Insured),
5.00%, due 3/1/17 | | | 1,023 | | |
| | 470 | | | New Jersey St. Turnpike Au. Turnpike Rev., Ser. 1991 C, 6.50%, due 1/1/16 | | | 522 | | |
| | 1,000 | | | New Jersey Trans. Trust Fund Au. Trans. Sys. Rev., Ser. 2006 A, 5.25%, due 12/15/19 | | | 1,021 | | |
| | | | 2,566 | | |
See Notes to Schedule of Investments 52
| PRINCIPAL AMOUNT | | SECURITY@@ | | VALUE† | |
| (000's omitted) | | | | (000's omitted) | |
| New Mexico (7.8%) | | | |
| $ | 1,000 | | | Albuquerque Muni. Sch. Dist. Number 012 (Sch. Bldg.) G.O., Ser. 2008 B, 4.50%, due 8/1/19 | | $ | 979 | | |
| | 1,000 | | | New Mexico Fin. Au. St. Trans. Rev. Sr. Lien, Ser. 2004 A, (MBIA Insured), 5.25%, due 6/15/21 | | | 1,017 | | |
| | | | 1,996 | | |
| New York (8.9%) | | | |
| | 500 | | | Buffalo & Ft. Erie Pub. Bridge Au. Toll Bridge Sys. Ref. Rev., Ser. 2005, (LOC: Bank of Nova Scotia),
4.00%, due 1/1/25 Putable 7/1/10 | | | 506 | µ | |
| | 250 | | | New York City IDA Spec. Fac. Rev. (Term. One Group Assoc., L.P. Proj.), Ser. 2005, 5.50%, due 1/1/16 | | | 251 | ß | |
| | 500 | | | New York St. Env. Fac. Corp. Solid Waste Disp. Rev. (Waste Management, Inc. Proj.), Ser. 2004 A,
4.45%, due 7/1/17 Putable 7/1/09 | | | 494 | µß | |
| | 500 | | | New York Tobacco Settlement Fin. Corp. Asset-Backed Rev., Ser. 2003 A1, 5.50%, due 6/1/14 | | | 503 | | |
| | 500 | | | New York Urban Dev. Corp. Ref. Rev. (Correctional Facs.), Ser. 1994 A, (FSA Insured), 5.50%, due 1/1/14 | | | 529 | | |
| | | | 2,283 | | |
| North Carolina (1.2%) | | | |
| | 295 | | | Western Carolina Univ. Research & Dev. Corp. Cert. Participation (Western Carolina Univ. Std. Hsg.),
Ser. 2008, (Assured Guaranty), 5.25%, due 6/1/20 | | | 304 | ß | |
| Pennsylvania (1.4%) | | | |
| | 340 | | | State Pub. Sch. Bldg. Au. College Rev. (Montgomery Co. Comm. College), Ser. 2008, (FSA Insured),
5.00%, due 5/1/21 | | | 343 | ß | |
| Texas (15.2%) | | | |
| | 1,000 | | | Brazosport Independent Sch. Dist. Ref. G.O., Ser. 2005, (PSF Insured), 5.00%, due 2/15/15 | | | 1,050 | | |
| | 750 | | | Fort Bend Independent Sch. Dist. Ref. G.O. (Sch. Bldg.), Ser. 2008, (PSF Insured), 5.00%, due 8/15/21 | | | 757 | | |
| | 1,000 | | | Grapevine Combination Tax & Tax Increment Reinvestment Zone Rev. Cert. of Oblig. G.O., Ser. 2000,
(FGIC Insured), 5.63%, due 8/15/15 | | | 1,026 | | |
| | 1,045 | | | San Antonio Passenger Fac. Charge & Sub. Lien Arpt. Sys. Imp. Rev., Ser. 2005, (FSA Insured),
5.25%, due 7/1/12 | | | 1,050 | | |
| | | | 3,883 | | |
| Wisconsin (4.2%) | | | |
| | 1,000 | | | Wisconsin St. G.O., Ser. 2002 C, (MBIA Insured), 5.25%, due 5/1/14 Pre-Refunded 5/1/12 | | | 1,068 | | |
| | | | | Total Investments (99.2%) (Cost $26,250) | | | 25,351 | ## | |
| | | | | Cash, receivables and other assets, less liabilities (0.8%) | | | 214 | | |
| | | | | Total Net Assets (100.0%) | | $ | 25,565 | | |
See Notes to Schedule of Investments 53
Schedule of Investments Neuberger Berman New York Municipal Money Fund
| PRINCIPAL AMOUNT | | SECURITY@@ | | VALUE†† | |
| (000's omitted) | | | | (000's omitted) | |
| New York (98.4%) | | | |
| $ | 4,475 | | | Albany IDA Civic Fac. Rev. (Research Foundation of the St. Univ. of New York Proj.), Ser. 2002 A,
2.00%, due 11/6/08 | | $ | 4,475 | µß | |
| | 11,900 | | | Albany IDA Civic Fac. Rev. (The College of St. Rose), Ser. 2007 A, (MBIA Insured),
0.70%, due 11/3/08 | | | 11,900 | µßc | |
| | 975 | | | Auburn Ind. Dev. Au. IDR (Goulds Pumps, Inc. Proj.), Ser. 1989, (LOC: Deutsche Bank),
2.90%, due 11/5/08 | | | 975 | µ | |
| | 8,000 | | | Board Cooperative Ed. Svc. Sole Supervisory Dist. RANS, Ser. 2008, 2.40%, due 6/19/09 | | | 8,010 | | |
| | 2,565 | | | Broome Co. IDA IDR (Parlor City Paper Box Proj.), Ser. 2006, (LOC: NBT Bank N.A.),
2.00%, due 11/6/08 | | | 2,565 | µßd | |
| | 3,165 | | | Chautauqua Co. IDA Civic Fac. Rev. (Multi-Mode-Jamestown Comm.), Ser. 2007 A,
(LOC: Citizen's Bank), 1.90%, due 11/6/08 | | | 3,165 | µß | |
| | 10,720 | | | Clinton Co. IDA Civic Fac. Rev. (Champlain Valley Hosp. Proj.), Ser. 2006 A, (LOC: KeyBank),
2.65%, due 11/6/08 | | | 10,720 | µß | |
| | 7,260 | | | Dutchess Co. IDA Civic Fac. Rev. (Lutheran Ctr.), Ser. 2005, (LOC: KeyBank), 3.30%, due 11/6/08 | | | 7,260 | µß | |
| | 10,440 | | | Eclipse Funding Trust (Solar Eclipse-New York St. Dorm Au. Rev.), Ser. 2006-0148, (MBIA Insured),
1.80%, due 11/6/08 | | | 10,440 | µhh | |
| | 12,350 | | | Erie Co. IDA Sch. Fac. Rev. (Putters), Ser. 2007-2090, (FSA Insured), 2.52%, due 11/6/08 | | | 12,350 | µs | |
| | 9,350 | | | Hempstead Town IDA Multi-Family Rev., Ser. 2007-300, (LOC: Bank of America),
1.82%, due 11/6/08 | | | 9,350 | µ | |
| | 945 | | | Herkimer Co. IDA Civic Fac. Rev. (Templeton Foundation Proj.), Ser. 2000, (LOC: KeyBank),
2.65%, due 11/6/08 | | | 945 | µß | |
| | 14,210 | | | Long Island Pwr. Au. Elec. Sys. Rev., Ser. 1998 2B, (LOC: Bayerische Landesbank),
2.30%, due 11/3/08 | | | 14,210 | µ | |
| | 10,000 | | | Metro. Trans. Au. Rev., Ser. 2002-D1, (FSA Insured), 2.70%, due 11/6/08 | | | 10,000 | µmm | |
| | 3,860 | | | Monroe Co. IDA Rev., Ser. 1996, (LOC: M&T Bank), 3.35%, due 11/6/08 | | | 3,860 | µß | |
| | 6,875 | | | Nassau Co. IDA Civic Fac. Ref. Rev. (Cold Spring Harbor Lab), Ser. 1999,
(LOC: Morgan Guaranty Trust Co.), 1.05%, due 11/3/08 | | | 6,875 | µß | |
| | 2,465 | | | Nassau Co. IDA Civic Fac. Rev. (North Shore Hebrew Academy Proj.), Ser. 2005,
(LOC: Sovereign Bank), 1.87%, due 11/6/08 | | | 2,465 | µßm | |
| | 18,000 | | | Nassau Co. IDA Rev. (Floater), Ser. 2007-75G, (LOC: Goldman Sachs), 1.82%, due 11/6/08 | | | 18,000 | µ | |
| | 10,530 | | | New York City IDA Civic Fac. Rev. (Touro College Proj.), Ser. 1999 A, 6.35%, due 6/1/29
Pre-Refunded 6/1/09 | | | 11,210 | µß | |
| | 18,000 | | | New York City Transitional Fin. Au. Rev., Sub. Ser. 2002 3F, (LOC: Royal Bank of Canada),
1.15%, due 11/3/08 | | | 18,000 | µ | |
| | 9,750 | | | New York G.O., Ser. 1993-A4, (LOC: Landesbank Baden-Wurttemberg), 3.20%, due 11/3/08 | | | 9,750 | µ | |
| | 10,000 | | | New York G.O., Sub. Ser. 1993 A-4, (LOC: Bayerische Landesbank), 1.15%, due 11/3/08 | | | 10,000 | µ | |
| | 5,055 | | | New York IDA Civic Fac. Rev. (American Civil Liberties Proj.), Ser. 2005, (LOC: JP Morgan Chase),
1.15%, due 11/3/08 | | | 5,055 | µß | |
| | 15,000 | | | New York Muni. Wtr. Fin. Au. Wtr. & Sewer Sys. Rev., Ser. 2007, (LOC: Fortis Bank),
1.75%, due 11/6/08 | | | 15,000 | µ | |
| | 14,415 | | | New York St. Dorm. Au. Rev. (Oxford Univ. Press, Inc.), Ser. 1993, (LOC: Landesbank
Hessen-Thueringen Girozentrale), 1.10%, due 11/3/08 | | | 14,415 | µß | |
| | 1,200 | | | New York St. Dorm. Au. Rev. Non St. Supported Debt (Cornell University), Ser. 2008 C,
(LOC: Bank of America), 1.15%, due 11/3/08 | | | 1,200 | µß | |
| | 6,830 | | | New York St. Dorm. Au. Rev. Non St. Supported Debt (Long Island University), Ser. 2008 A-1,
(LOC: Allied Irish Bank PLC), 1.75%, due 11/6/08 | | | 6,830 | µß | |
| | 11,530 | | | New York St. Dorm. Au. Rev. Secondary Issues, Ser. 2008 R-11634, (SONYMA Insured),
1.84%, due 11/6/08 | | | 11,530 | ñµk | |
| | 17,000 | | | New York St. Dorm. Au. Rev. Secondary Issues (Floaters), Ser. 2006-1424, (LOC: Morgan Stanley),
3.00%, due 11/6/08 | | | 17,000 | µ | |
| | 2,230 | | | New York St. Dorm. Au. Rev. Secondary Issues (Putters), Ser. 2008-2846, (FHA Insured),
1.87%, due 11/6/08 | | | 2,230 | µs | |
| | 2,000 | | | New York St. HFA Rev. (Weyant Green Apts.), Ser. 2007 A, (Fannie Mae Insured),
1.85%, due 11/5/08 | | | 2,000 | µß | |
| | 4,500 | | | New York St. Hsg Fin. Agcy. Rev. (Baisley Park Gardens), Ser. 2008 A, (LOC: Citibank, N.A.),
1.78%, due 11/5/08 | | | 4,500 | µ | |
| | 17,000 | | | New York St. Local Gov't Assist. Corp., Ser. 2003 4V, (FSA Insured), 2.70%, due 11/5/08 | | | 17,000 | µmm | |
| | 18,000 | | | New York St. Mtge. Agcy. Homeowner Mtge. Rev., Ser. 2007-142,
(LOC: Dexia Credit Locale de France), 1.05%, due 11/3/08 | | | 18,000 | µ | |
See Notes to Schedule of Investments 54
| PRINCIPAL AMOUNT | | SECURITY@@ | | VALUE†† | |
| (000's omitted) | | | | (000's omitted) | |
| $ | 1,500 | | | New York St. Urban Dev. Corp. Correctional & Youth Fac. Svc. Contract Rev., Ser. 2003 A,
5.00%, due 1/1/27 Putable 1/1/09 | | $ | 1,529 | µ | |
| | 7,740 | | | New York St. Urban Dev. Corp. Rev., Ser. 2003-163, (FGIC Insured), 1.69%, due 11/6/08 | | | 7,740 | µcc | |
| | 4,250 | | | Onondaga Co. IDA Civic Fac. Rev. (Crouse Hlth. Hosp.), Ser. 2007 A, (LOC: KeyBank),
3.30%, due 11/5/08 | | | 4,250 | µß | |
| | 6,245 | | | Ontario Co. IDA. Civic Fac. Rev. (F. F. Thompson Hosp.), Ser. 2003 B, (LOC: KeyBank),
2.85%, due 11/5/08 | | | 6,245 | µß | |
| | 2,865 | | | Orange Co. IDA Civic Fac. Rev. (St. Luke's Cornwall Hosp. Proj.), Ser. 2006, (LOC: KeyBank),
3.30%, due 11/6/08 | | | 2,865 | µß | |
| | 18,790 | | | Port Au. New York & New Jersey (Floater), Ser. 2007-111TP, (CIFG Insured), 1.79%, due 11/6/08 | | | 18,790 | µjj | |
| | 17,000 | | | Sales Tax Asset Receivable Corp. (Custodial Receipts), Ser. 2008-2901-4, (AMBAC Insured),
3.00%, due 11/6/08 | | | 17,000 | µy | |
| | 1,100 | | | Sales Tax Asset Receivable Corp. (Putters), Ser. 2004-599, (MBIA Insured), 2.27%, due 11/6/08 | | | 1,100 | µs | |
| | 4,120 | | | Triborough Bridge & Tunnel Au. Rev., Ser. 2005 A, (LOC: Dexia Credit Locale de France),
4.50%, due 11/5/08 | | | 4,120 | µ | |
| | 3,830 | | | Triborough Bridge & Tunnel Au. Rev. (Muni. Sec. Trust Receipts), Ser. 2008 A, (FGIC Insured),
1.68%, due 11/6/08 | | | 3,830 | µcc | |
| | 8,940 | | | Ulster Co. IDA Civic Fac. Rev. (Kingston Regional Senior Living Corp.), Ser. 2007 C,
(LOC: Sovereign Bank), 1.75%, due 11/6/08 | | | 8,940 | µßd | |
| | 2,200 | | | Utica IDA Civic Fac. Rev. (Utica College Proj.), Ser. 2005-A, (LOC: Citizens Bank), 1.90%, due 11/6/08 | | | 2,200 | µß | |
| | 15,000 | | | Westchester Co. IDA Rev. (Floater), Ser. 2007-103G, (LOC: Goldman Sachs), 1.81%, due 11/6/08 | | | 15,000 | µ | |
| | | | 394,894 | | |
| Puerto Rico (0.2%) | | | |
| | 795 | | | Puerto Rico Commonwealth Hwy. & Trans. Au. Hwy. Rev. (Floaters), Ser. 2008, (FSA Insured),
4.00%, due 11/6/08 | | | 795 | µp | |
| | | | | Total Investments (98.6%) | | | 395,689 | | |
| | | | | Cash, receivables and other assets, less liabilities (1.4%) | | | 5,558 | | |
| | | | | Total Net Assets (100.0%) | | $ | 401,247 | | |
See Notes to Schedule of Investments 55
Schedule of Investments Neuberger Berman Short Duration Bond Fund
| PRINCIPAL AMOUNT | | | | VALUE† | |
| (000's omitted) | | | | (000's omitted) | |
| U.S. Treasury Securities-Backed by the Full Faith and Credit of the U.S. Government (3.4%) | | | |
| $ | 2,250 | | | U.S. Treasury Notes, 4.75%, due 3/31/11 (Cost $2,378) | | $ | 2,426 | | |
| Mortgage-Backed Securities (68.1%) | | | |
| Adjustable Alt-A Jumbo Balance (1.8%) | | | |
| | 2,062 | | | JP Morgan Alternative Loan Trust, Ser. 2006-A2, Class 3A1, 5.93%, due 11/3/08 | | | 1,293 | µØØ | |
| Adjustable Alt-A Mixed Balance (10.9%) | | | |
| | 1,096 | | | Bear Stearns ALT-A Trust, Ser. 2007-2, Class 2A1, 5.58%, due 11/3/08 | | | 652 | µ | |
| | 3,200 | | | Bear Stearns ALT-A Trust, Ser. 2006-4, Class 32A1, 6.47%, due 11/3/08 | | | 2,249 | µØØ | |
| | 1,868 | | | First Horizon Alternative Mortgage Securities Trust, Ser. 2006-AA7, Class A1, 6.52%, due 11/3/08 | | | 1,340 | µ | |
| | 3,296 | | | Nomura Asset Acceptance Corp., Ser. 2006-AR2, Class 2A2, 6.56%, due 11/3/08 | | | 2,181 | µ | |
| | 2,025 | | | Residential Accredit Loans, Inc., Ser. 2005-QA10, Class A31, 5.60%, due 11/3/08 | | | 1,305 | µ | |
| | | | 7,727 | | |
| Adjustable Alt-B Mixed Balance (1.1%) | | | |
| | 1,168 | | | Lehman XS Trust, Floating Rate, Ser. 2005-1, Class 2A1, 4.76%, due 11/3/08 | | | 785 | µ | |
| Adjustable Conforming Balance (4.3%) | | | |
| | 2,097 | | | Adjustable Rate Mortgage Trust, Ser. 2005-10, Class 4A1, 5.38%, due 11/3/08 | | | 1,664 | µ | |
| | 1,932 | | | IndyMac INDX Mortgage Loan Trust, Ser. 2005-AR23, Class 2A1, 5.50%, due 11/3/08 | | | 1,342 | µ | |
| | | | 3,006 | | |
| Adjustable Jumbo Balance (6.9%) | | | |
| | 901 | | | Banc of America Funding Corp., Ser. 2005-F, Class 4A1, 5.33%, due 11/3/08 | | | 705 | µ | |
| | 1,894 | | | Banc of America Funding Corp., Ser. 2006-H, Class 2A3, 6.69%, due 11/3/08 | | | 1,331 | µ | |
| | 2,890 | | | Harborview Mortgage Loan Trust, Ser. 2006-3, Class 1A1A, 6.34%, due 11/3/08 | | | 1,975 | µØØ | |
| | 1,500 | | | Wells Fargo Mortgage Backed Securities Trust, Ser. 2005-AR16, Class 4A2, 4.99%, due 10/25/35 | | | 893 | ØØ | |
| | | | 4,904 | | |
| Adjustable Mixed Balance (13.4%) | | | |
| | 2,019 | | | Banc of America Funding Corp., Ser. 2005-H, Class 7A1, 5.66%, due 11/3/08 | | | 1,495 | µ | |
| | 967 | | | Countrywide Home Loan Mortgage Pass-Through Trust, Ser. 2006-HYB3, Class 1A1A, 5.43%,
due 11/3/08 | | | 664 | µ | |
| | 1,945 | | | Credit Suisse First Boston Mortgage Securities Corp., Ser. 2004-AR4, Class 2A1, 4.72%, due 11/3/08 | | | 1,538 | µØØ | |
| | 2,301 | | | First Horizon Mortgage Pass-Through Trust, Ser. 2005-AR5, Class 2A1, 5.44%, due 11/3/08 | | | 1,812 | µ | |
| | 2,084 | | | GMAC Mortgage Corp. Loan Trust, Ser. 2006-AR1, Class 1A1, 5.60%, due 11/3/08 | | | 1,574 | µ | |
| | 325 | | | Harborview Mortgage Loan Trust, Ser. 2004-4, Class 3A, 4.47%, due 11/3/08 | | | 193 | µ | |
| | 2,250 | | | WaMu Mortgage Pass-Through Certificates, Ser. 2004-AR9, Class A7, 4.14%, due 11/3/08 | | | 2,183 | µØØ | |
| | | | 9,459 | | |
| Commercial Mortgage-Backed (19.2%) | | | |
| | 1,489 | | | Credit Suisse First Boston Mortgage Securities Corp., Ser. 2005-C6, Class A1, 4.94%, due 12/15/40 | | | 1,448 | ØØ | |
| | 1,194 | | | GE Capital Commercial Mortgage Corp., Ser. 2002-2A, Class A2, 4.97%, due 8/11/36 | | | 1,138 | | |
| | 1,775 | | | GE Capital Commercial Mortgage Corp., Ser. 2005-C3, Class A2, 4.85%, due 7/10/45 | | | 1,685 | | |
| | 568 | | | GMAC Commercial Mortgage Securities, Inc., Ser. 2006-C1, Class A1, 4.98%, due 11/10/45 | | | 543 | | |
| | 2,429 | | | JP Morgan Chase Commercial Mortgage Securities Corp., Ser. 2006-LDP7, Class A1, 5.83%,
due 11/3/08 | | | 2,344 | µØØ | |
| | 1,687 | | | JP Morgan Chase Commercial Mortgage Securities Corp., Ser. 2004-C2, Class A1, 4.28%, due 5/15/41 | | | 1,671 | ØØ | |
| | 2,642 | | | JP Morgan Chase Commercial Mortgage Securities Corp., Ser. 2005-LDP5, Class A1, 5.04%,
due 12/15/44 | | | 2,600 | ØØ | |
| | 2,274 | | | LB-UBS Commercial Mortgage Trust, Ser. 2006-C3, Class A1, 5.48%, due 3/15/32 | | | 2,185 | | |
| | | | 13,614 | | |
See Notes to Schedule of Investments 56
| PRINCIPAL AMOUNT | | | | VALUE† | |
| (000's omitted) | | | | (000's omitted) | |
| Mortgage-Backed Non-Agency (5.1%) | | | |
| $ | 1,024 | | | Countrywide Home Loans, Ser. 2005-R2, Class 2A4, 8.50%, due 6/25/35 | | $ | 1,009 | ñØØ | |
| | 2,132 | | | GSMPS Mortgage Loan Trust, Ser. 2005-RP2, Class 1A4, 8.50%, due 3/25/35 | | | 2,189 | ñ | |
| | 428 | | | GSMPS Mortgage Loan Trust, Ser. 2005-RP3, Class 1A4, 8.50%, due 9/25/35 | | | 435 | ñ | |
| | | | 3,633 | | |
| Fannie Mae (1.7%) | | | |
| | 1,091 | | | Whole Loan, Ser. 2004-W8, Class PT, 10.43%, due 11/3/08 | | | 1,195 | µØØ | |
| Freddie Mac (3.6%) | | | |
| | 11 | | | ARM Certificates, 5.25%, due 2/1/09 | | | 11 | µ | |
| | 1,415 | | | Pass-Through Certificates, 8.00%, due 11/1/26 | | | 1,495 | | |
| | 983 | | | Pass-Through Certificates, 8.50%, due 10/1/30 | | | 1,059 | | |
| | | | 2,565 | | |
| Government National Mortgage Association (0.1%) | | | |
| | 30 | | | Pass-Through Certificates, 7.00%, due 4/15/11 | | | 31 | ØØ | |
| | 1 | | | Pass-Through Certificates, 7.50%, due 10/15/09 – 8/15/10 | | | 1 | | |
| | 18 | | | Pass-Through Certificates, 12.00%, due 12/15/12 – 5/15/14 | | | 21 | | |
| | | | 53 | | |
| | | | | Total Mortgage-Backed Securities (Cost $59,669) | | | 48,234 | | |
| Corporate Debt Securities (12.3%) | | | |
| Banks (1.4%) | | | |
| | 1,000 | | | Bank of America Corp., Senior Subordinated Unsecured Notes, 7.80%, due 2/15/10 | | | 1,009 | ØØ | |
| Diversified Financial Services (7.6%) | | | |
| | 2,250 | | | General Electric Capital Corp., Senior Unsecured Medium-Term Notes, Ser. A, 4.25%, due 9/13/10 | | | 2,167 | ØØ | |
| | 2,200 | | | HSBC Finance Corp., Senior Unsecured Notes, 4.13%, due 12/15/08 | | | 2,186 | ØØ | |
| | 1,050 | | | Morgan Stanley, Senior Unsecured Notes, 4.00%, due 1/15/10 | | | 994 | ØØ | |
| | | | 5,347 | | |
| Media (3.3%) | | | |
| | 1,250 | | | British Sky Broadcasting Group PLC, Guaranteed Senior Unsecured Notes, 8.20%, due 7/15/09 | | | 1,239 | ØØ | |
| | 1,080 | | | Comcast Cable Communications, Guaranteed Unsecured Unsubordinated Notes, 6.20%, due 11/15/08 | | | 1,080 | ØØ | |
| | | | 2,319 | | |
| | | | | Total Corporate Debt Securities (Cost $8,846) | | | 8,675 | | |
| Asset-Backed Securities (14.1%) | | | |
| | 1,000 | | | ACE Securities Corp. Home Equity Loan Trust, Ser. 2006-ASP5, Class A2B, 3.39%, due 11/25/08 | | | 883 | µØØ | |
| | 400 | | | ACE Securities Corp. Home Equity Loan Trust, Ser. 2006-OP1, Class A2C, 3.41%, due 11/25/08 | | | 307 | µØØ | |
| | 400 | | | Bear Stearns Asset Backed Securities Trust, Ser. 2006-HE9, Class 1A2, 3.41%, due 11/25/08 | | | 228 | µ | |
| | 938 | | | Carrington Mortgage Loan Trust, Ser. 2006-OPT1, Class A3, 3.44%, due 11/25/08 | | | 857 | µ | |
| | 850 | | | Carrington Mortgage Loan Trust, Ser. 2007-FRE1, Class A3, 3.52%, due 11/25/08 | | | 479 | µ | |
| | 59 | | | Chase Funding Mortgage Loan, Ser. 2003-6, Class 1A3, 3.34%, due 5/25/26 | | | 59 | | |
| | 1,000 | | | Chase Issuance Trust, Ser. 2005-A9, Class A9, 4.58%, due 11/17/08 | | | 963 | µØØ | |
| | 684 | | | Countrywide Asset-Backed Certificates Trust, Ser. 2006-3, Class 2A2, 3.44%, due 11/25/08 | | | 607 | µ | |
| | 393 | | | Countrywide Asset-Backed Certificates Trust, Ser. 2006-5, Class 2A2, 3.44%, due 11/25/08 | | | 348 | µ | |
| | 682 | | | Countrywide Asset-Backed Certificates Trust, Ser. 2006-6, Class 2A2, 3.44%, due 11/25/08 | | | 623 | µ | |
| | 500 | | | DaimlerChrysler Auto Trust, Ser. 2008-B, Class A2B, 5.02%, due 11/10/08 | | | 485 | µ | |
| | 766 | | | Fieldstone Mortgage Investment Corp., Ser. 2006-2, Class 2A1, 3.35%, due 11/25/08 | | | 756 | µØØ | |
| | 489 | | | Impac Secured Assets Corp., Ser. 2006-3, Class A4, 3.35%, due 11/25/08 | | | 462 | µ | |
| | 413 | | | Knollwood CDO Ltd., Ser. 2006-2A, Class A2J, 5.17%, due 1/13/09 | | | 4 | ñµ | |
| | 172 | | | Nomura Asset Acceptance Corp., Ser. 2006-S2, Class AIO, 10.00%, Interest Only Security, due 4/25/36 | | | 2 | ñ | |
See Notes to Schedule of Investments 57
| PRINCIPAL AMOUNT | | | | VALUE† | |
| (000's omitted) | | | | (000's omitted) | |
| $ | 739 | | | Residential Asset Mortgage Products, Inc., Ser. 2006-RS1, Class AI2, 3.49%, due 11/25/08 | | $ | 656 | µ | |
| | 350 | | | Securitized Asset Backed Receivables LLC Trust, Ser. 2006-WM4, Class A2C, 3.42%, due 11/25/08 | | | 132 | µ | |
| | 1,100 | | | Soundview Home Equity Loan Trust, Ser. 2006-OPT3, Class 2A3, 3.43%, due 11/25/08 | | | 881 | µØØ | |
| | 1,325 | | | Structured Asset Investment Loan Trust, Ser. 2006-3, Class A4, 3.35%, due 11/25/08 | | | 1,256 | µØØ | |
| | Total Asset-Backed Securities (Cost $11,748) | | | 9,988 | | |
| Repurchase Agreements (1.7%) | |
| | 1,190 | | | Repurchase Agreement with Fixed Income Clearing Corp., 0.05%, due 11/3/08, dated 10/31/08,
Maturity Value $1,190,005 Collateralized by $1,220,000 Federal Home Loan Bank, 2.52%,
due 5/28/09 (Collateral Value $1,230,675) (Cost $1,190) | | | 1,190 | # | |
| | Total Investments (99.6%) (Cost $83,831) | | | 70,513 | ## | |
| | | Cash, receivables and other assets, less liabilities (0.4%) | | | 302 | | |
| | Total Net Assets (100.0%) | | $ | 70,815 | | |
See Notes to Schedule of Investments 58
Schedule of Investments Neuberger Berman Strategic Income Fund
| PRINCIPAL AMOUNT | | | | VALUE† | |
| (000's omitted) | | | | (000's omitted) | |
| U.S. Treasury Securities-Backed by the Full Faith and Credit of the U.S. Government (4.7%) | | | |
| $ | 70 | | | U.S. Treasury Inflation Index Bonds, 2.38%, due 1/15/25 | | $ | 60 | | |
| | 197 | | | U.S. Treasury Inflation Index Notes, 2.38%, due 4/15/11 & 1/15/17 | | | 184 | | |
| | | | | Total U.S. Treasury Securities-Backed by the Full Faith and Credit of the U.S. Government (Cost $258) | | | 244 | | |
| Mortgage-Backed Securities (49.4%) | | | |
| Fannie Mae (38.3%) | | | |
| | 600 | | | Pass-Through Certificates, 5.00%, due 8/1/33 – 5/1/37 | | | 569 | ØØ | |
| | 150 | | | Pass-Through Certificates, 5.00%, TBA, 30 Year Maturity | | | 142 | Ø | |
| | 1,281 | | | Pass-Through Certificates, 5.50%, due 7/1/33 – 6/1/38 | | | 1,253 | | |
| | 11 | | | Pass-Through Certificates, 6.00%, due 9/1/33 | | | 11 | | |
| | 5 | | | Pass-Through Certificates, 6.50%, due 9/1/32 | | | 5 | | |
| | 14 | | | Pass-Through Certificates, 7.00%, due 7/1/29 | | | 14 | | |
| | 3 | | | Pass-Through Certificates, 7.50%, due 12/1/32 | | | 3 | | |
| | | | 1,997 | | |
| Freddie Mac (4.4%) | | | |
| | 14 | | | Pass-Through Certificates, 4.50%, due 8/1/18 | | | 14 | | |
| | 52 | | | Pass-Through Certificates, 5.00%, due 5/1/18 & 8/1/33 | | | 49 | | |
| | 85 | | | Pass-Through Certificates, 5.50%, due 9/1/17 – 7/1/33 | | | 84 | | |
| | 73 | | | Pass-Through Certificates, 6.00%, due 4/1/17 – 12/1/33 | | | 74 | | |
| | 4 | | | Pass-Through Certificates, 6.50%, due 3/1/16 | | | 4 | | |
| | 4 | | | Pass-Through Certificates, 7.00%, due 6/1/32 | | | 4 | | |
| | | | 229 | | |
| Government National Mortgage Association (6.7%) | | | |
| | 344 | | | Pass-Through Certificates, 5.50%, due 7/15/36 | | | 338 | | |
| | 6 | | | Pass-Through Certificates, 6.50%, due 7/15/32 | | | 6 | | |
| | 5 | | | Pass-Through Certificates, 7.00%, due 8/15/32 | | | 5 | | |
| | | | 349 | | |
| | | | | Total Mortgage-Backed Securities (Cost $2,626) | | | 2,575 | | |
| Corporate Debt Securities (45.1%) | | | |
| Bank (5.7%) | | | |
| | 65 | | | Bank of America Corp., Subordinated Notes, 5.25%, due 12/1/15 | | | 52 | ØØ | |
| | 55 | | | Bank of America Corp., Senior Unsecured Notes, 5.65%, due 5/1/18 | | | 47 | ØØ | |
| | 65 | | | HBOS PLC, Senior Subordinated Notes, 6.75%, due 5/21/18 | | | 49 | ñØØ | |
| | 70 | | | Household Finance Corp., Senior Unsecured Notes, 6.38%, due 10/15/11 | | | 64 | ØØ | |
| | 65 | | | JP Morgan Chase & Co., Subordinated Notes, 4.88%, due 3/15/14 | | | 60 | ØØ | |
| | 30 | | | JP Morgan Chase & Co., Senior Unsecured Notes, 6.40%, due 5/15/38 | | | 26 | ØØ | |
| | | | 298 | | |
| Cash Substitute (17.0%) | | | |
| | 792 | | | CDX High Yield, Secured Notes, Ser. 9-T1, 8.75%, due 12/29/12 | | | 679 | ñ | |
| | 250 | | | CDX High Yield, Secured Notes, Ser. 10-T, 8.88%, due 6/29/13 | | | 208 | ñ | |
| | | | 887 | | |
| Finance (7.9%) | | | |
| | 45 | | | American Express Co., Senior Unsecured Notes, 6.15%, due 8/28/17 | | | 32 | ØØ | |
| | 30 | | | American Express Credit Corp., Senior Unsecured Medium-Term Notes, 5.88%, due 5/2/13 | | | 25 | ØØ | |
| | 75 | | | Citigroup, Inc., Senior Unsecured Notes, 5.50%, due 4/11/13 | | | 69 | ØØ | |
See Notes to Schedule of Investments 59
| PRINCIPAL AMOUNT | | | | VALUE† | |
| (000's omitted) | | | | (000's omitted) | |
| $ | 25 | | | General Electric Capital Corp., Senior Unsecured Medium-Term Notes, 5.88%, due 1/14/38 | | $ | 18 | | |
| | 35 | | | General Electric Capital Corp., Senior Unsecured Notes, 5.63%, due 5/1/18 | | | 29 | ØØ | |
| | 105 | | | Goldman Sachs Group, Inc., Subordinated Notes, 6.75%, due 10/1/37 | | | 68 | ØØ | |
| | 10 | | | International Lease Finance Corp., Senior Unsecured Medium-Term Notes, Ser. R, 5.65%, due 6/1/14 | | | 6 | | |
| | 55 | | | Merrill Lynch & Co., Medium-Term Notes, 6.88%, due 4/25/18 | | | 49 | ØØ | |
| | 75 | | | Merrill Lynch & Co., Subordinated Notes, 6.11%, due 1/29/37 | | | 50 | ØØ | |
| | 35 | | | Merrill Lynch & Co., Senior Unsecured Medium-Term Notes, Ser. C, 5.45%, due 2/5/13 | | | 32 | ØØ | |
| | 40 | | | Morgan Stanley, Senior Unsecured Medium-Term Notes, Ser. F, 6.63%, due 4/1/18 | | | 33 | ØØ | |
| | | | 411 | | |
| Industrial (13.2%) | |
| | 25 | | | Alcoa, Inc., Senior Unsecured Notes, 6.00%, due 7/15/13 | | | 21 | ØØ | |
| | 40 | | | ArcelorMittal, Senior Unsecured Notes, 6.13%, due 6/1/18 | | | 28 | ñ | |
| | 30 | | | Cameron International Corp., Senior Unsecured Notes, 6.38%, due 7/15/18 | | | 25 | ØØ | |
| | 50 | | | Canadian Natural Resources Ltd., Unsecured Notes, 5.70%, due 5/15/17 | | | 41 | ØØ | |
| | 55 | | | Comcast Corp., Guaranteed Notes, 6.30%, due 11/15/17 | | | 48 | ØØ | |
| | 15 | | | Continental Airlines, Inc., Pass-Through Certificates, Class A, 5.98%, due 4/19/22 | | | 10 | ØØ | |
| | 70 | | | DaimlerChrysler N.A. Holding Corp., Guaranteed Notes, 8.00%, due 6/15/10 | | | 62 | ØØ | |
| | 25 | | | Enbridge Energy Partners L.P., Senior Unsecured Notes, Ser. B, 7.50%, due 4/15/38 | | | 20 | | |
| | 50 | | | ERAC USA Finance Co., Guaranteed Notes, 7.00%, due 10/15/37 | | | 29 | ñ | |
| | 25 | | | Ingersoll-Rand Global Holding Co. Ltd., Guaranteed Notes, 6.00%, due 8/15/13 | | | 23 | | |
| | 20 | | | International Paper Co., Senior Unsecured Notes, 8.70%, due 6/15/38 | | | 15 | ØØ | |
| | 35 | | | Kinder Morgan, Inc., Senior Unsecured Notes, 5.95%, due 2/15/18 | | | 27 | ØØ | |
| | 20 | | | Nabors Industries, Inc., Guaranteed Notes, 6.15%, due 2/15/18 | | | 16 | | |
| | 50 | | | Northwest Airlines, Inc., Pass-Through Certificates, Class A, 7.03%, due 11/1/19 | | | 30 | ØØ | |
| | 25 | | | Oneok Partners L.P., Guaranteed Notes, 6.85%, due 10/15/37 | | | 17 | ØØ | |
| | 25 | | | Oracle Corp., Senior Unsecured Notes, 6.50%, due 4/15/38 | | | 21 | ØØ | |
| | 15 | | | PepsiCo, Inc., Senior Unsecured Notes, 7.90%, due 11/1/18 | | | 16 | | |
| | 20 | | | Rio Tinto Finance (USA) Ltd., Guaranteed Notes, 7.13%, due 7/15/28 | | | 15 | ØØ | |
| | 30 | | | Rogers Communications, Inc., Guaranteed Notes, 6.80%, due 8/15/18 | | | 26 | ØØ | |
| | 60 | | | St. Jude Medical, Inc., Senior Unsecured Notes, 2.80%, due 12/15/35 | | | 60 | ØØ | |
| | 60 | | | Time Warner Cable, Inc., Guaranteed Notes, 5.40%, due 7/2/12 | | | 54 | ØØ | |
| | 40 | | | Time Warner Cable, Inc., Guaranteed Notes, 6.75%, due 7/1/18 | | | 34 | ØØ | |
| | 67 | | | XTO Energy, Inc., Senior Unsecured Notes, 6.75%, due 8/1/37 | | | 50 | ØØ | |
| | | | 688 | | |
| Telecommunications (0.2%) | |
| | 10 | | | Verizon Communications, Inc., Senior Unsecured Notes, 8.95%, due 3/1/39 | | | 10 | | |
| Utility - Electric (1.1%) | |
| | 20 | | | Dominion Resources, Inc., Senior Unsecured Notes, 7.00%, due 6/15/38 | | | 15 | ØØ | |
| | 50 | | | Exelon Generation Co., LLC, Senior Unsecured Notes, 6.20%, due 10/1/17 | | | 40 | ØØ | |
| | | | 55 | | |
| | Total Corporate Debt Securities (Cost $2,777) | | | 2,349 | | |
| Asset-Backed Securities (2.2%) | |
| | 120 | | | AmeriCredit Automobile Receivables Trust, Ser. 2008-AF, Class A2B, 5.80%, due 11/6/08 (Cost $120) | | | 114 | µØØ | |
| | Total Investments (101.4%) (Cost $5,781) | | | 5,282 | ## | |
| | | Liabilities, less cash, receivables and other assets [(1.4%)] | | | (73 | ) | |
| | Total Net Assets (100.0%) | | $ | 5,209 | | |
See Notes to Schedule of Investments 60
Schedule of Investments Neuberger Berman Cash Reserves
| PRINCIPAL AMOUNT | | | | VALUE†† | |
| (000's omitted) | | | | (000's omitted) | |
| Certificates of Deposit (5.0%) | | | |
| $ | 10,000 | | | Banca Intesa NY, Yankee CD, 2.81%, due 11/20/08 | | $ | 10,000 | | |
| | 10,000 | | | Bank of Scotland PLC, Yankee CD, 2.82%, due 12/9/08 | | | 10,000 | | |
| | 10,000 | | | Fortis Bank NY, Yankee CD, 2.85%, due 11/6/08 | | | 10,000 | | |
| | 5,000 | | | Natixis NY, Yankee CD, 2.90%, due 11/26/08 | | | 5,000 | | |
| | 10,000 | | | Skandinaviska Enskilda Banken, Yankee CD, 2.81%, due 11/19/08 | | | 10,000 | | |
| | | | | Total Certificates of Deposit | | | 45,000 | | |
| Commercial Paper (27.4%) | | | |
| Asset Backed (23.6%) | | | |
| | 10,000 | | | Amstel Funding Corp., 4.30%, due 11/24/08 | | | 9,975 | ñ | |
| | 3,000 | | | Amsterdam Funding Corp., 2.75%, due 11/12/08 | | | 2,998 | | |
| | 39,000 | | | Antalis US Funding Corp., 1.55%, due 11/3/08 | | | 39,000 | ñ | |
| | 10,000 | | | Atlantic Asset Securitization Corp., 4.00%, due 11/10/08 | | | 9,992 | ñ | |
| | 10,000 | | | Barton Capital Corp., 2.75%, due 12/11/08 | | | 9,971 | ñ | |
| | 10,000 | | | Cancara Asset Securitization Ltd., 4.15%, due 12/16/08 | | | 9,950 | ñ | |
| | 10,000 | | | Chariot Funding LLC, 3.70%, due 11/21/08 | | | 9,982 | ñ | |
| | 10,000 | | | Ciesco LLC, 2.75%, due 12/8/08 | | | 9,973 | ñ | |
| | 10,000 | | | CRC Funding LLC, 2.73%, due 11/7/08 | | | 9,997 | | |
| | 10,000 | | | Galleon Capital LLC, 0.75%, due 11/3/08 | | | 10,000 | ñ | |
| | 10,000 | | | Grampian Funding LLC, 3.44%, due 12/29/08 | | | 9,946 | ñ | |
| | 11,521 | | | Jupiter Securitization Corp., 3.70%, due 11/14/08 | | | 11,508 | ñ | |
| | 10,000 | | | Regency Markets No. 1 LLC, 4.20%, due 11/17/08 | | | 9,984 | ñ | |
| | 10,000 | | | Sheffield Receivables Corp., 3.75%, due 11/18/08 | | | 9,984 | ñ | |
| | 10,000 | | | Solitaire Funding LLC, 4.45%, due 11/13/08 | | | 9,988 | ñ | |
| | 10,000 | | | Tempo Finance Ltd., 3.40%, due 12/1/08 | | | 9,974 | ñ | |
| | 10,000 | | | Thames Asset Securitization LLC, 4.30%, due 12/15/08 | | | 9,950 | ñ | |
| | 10,000 | | | Thunder Bay Funding, Inc., 3.50%, due 11/18/08 | | | 9,985 | ñ | |
| | 10,000 | | | Yorktown Capital LLC, 3.60%, due 12/1/08 | | | 9,972 | ñ | |
| | | | 213,129 | | |
| Banking/Foreign (3.8%) | | | |
| | 10,000 | | | Allied Irish Banks PLC, 3.18%, due 11/24/08 | | | 9,981 | ñ | |
| | 5,000 | | | Bank of Ireland, 2.84%, due 11/20/08 | | | 4,993 | ñ | |
| | 5,000 | | | Dexia Delaware LLC, 2.81%, due 11/12/08 | | | 4,997 | | |
| | 9,700 | | | HSBC Finance Corp., 2.73%, due 11/3/08 | | | 9,700 | | |
| | 5,000 | | | Societe Generale NA, 2.79%, due 11/6/08 | | | 4,999 | | |
| | | | 34,670 | | |
| | | | | Total Commercial Paper | | | 247,799 | | |
| Floating Rate Corporate Debt Securities (1.1%)µ | | | |
| Banking/Domestic (0.5%) | | | |
| | 5,000 | | | Wachovia Bank NA, Senior Unsecured Floating Rate Bank Notes, 2.99%, due 11/25/08 | | | 5,000 | | |
| Financial Services (0.6%) | | | |
| | 5,000 | | | Merrill Lynch & Co., Senior Unsecured Floating Rate Medium-Term Notes, 4.44%, due 11/17/08 | | | 5,000 | | |
| | | | | Total Floating Rate Corporate Debt Securities | | | 10,000 | | |
See Notes to Schedule of Investments 61
| PRINCIPAL AMOUNT | | | | VALUE†† | |
| (000's omitted) | | | | (000's omitted) | |
| Repurchase Agreements (66.5%) | |
| $ | 517,000 | | | Bank of America Repurchase Agreement, 0.20%, due 11/3/08, dated 10/31/08,
Maturity Value $517,008,617, Collateralized by $292,514,206, Fannie Mae, 4.50%-6.50%,
due 9/1/36-10/1/38 and $284,190,669, Freddie Mac, 5.00%-6.00%, due 8/1/37-8/1/38
(Collateral Value $527,340,001) | | $ | 517,000 | | |
| | 85,000 | | | Fortis Bank Repurchase Agreement, 0.17%, due 11/3/08, dated 10/31/08,
Maturity Value $85,001,204, Collateralized by $182,125,890, Fannie Mae, 2.88%-15.00%,
due 10/1/10-6/1/33, $28,770,000, Federal Home Loan Bank, 3.63%-5.50%,
due 9/16/11-8/13/14, $49,060,676, Freddie Mac, 4.13%-11.38%, due 9/27/13-8/1/30,
$66,367,171, Government National Mortgage Association, 5.13%-10.00%,
due 1/15/10-3/15/31, and $6,988,100, U.S. Treasury Bonds, 4.38%, due 2/15/38,
(Collateral Value $86,700,084) | | | 85,000 | | |
| | Total Repurchase Agreements | | | 602,000 | | |
| | Total Investments (100.0%) | | | 904,799 | | |
| | | Cash, receivables and other assets, less liabilities (0.0%) | | | 382 | | |
| | Total Net Assets (100.0%) | | $ | 905,181 | | |
See Notes to Schedule of Investments 62
Notes to Schedule of Investments
† Investments in debt securities by Neuberger Berman Core Bond Fund ("Core Bond"), Neuberger Berman Core Plus Bond Fund ("Core Plus Bond"), Neuberger Berman High Income Bond Fund ("High Income"), Neuberger Berman Municipal Securities Trust ("Municipal Securities Trust"), Neuberger Berman Short Duration Bond Fund ("Short Duration"), and Neuberger Berman Strategic Income Fund ("Strategic Income") are valued daily by obtaining valuations from independent pricing services based on readily available bid quotations, or if quotations are not available, by methods which include considerations such as: yields or prices of securities of comparable quality, coupon, maturity and type; indications as to values from dealers; and general market conditions. If a valuation is not available from an independent pricing service, the Funds seek to obtain quotatio ns from principal market makers. Investments in equity securities by each Fund are valued by obtaining valuations from an independent pricing service. The independent pricing service values equity securities at the latest sale price where that price is readily available. Securities traded primarily on the NASDAQ Stock Market are normally valued by the Funds at the NASDAQ Official Closing Price ("NOCP") provided by NASDAQ each business day. The NOCP is the most recently reported price as of 4:00:02 p.m., Eastern time, unless that price is outside the range of the "inside" bid and asked prices (i.e., the bid and asked prices that dealers quote to each other when trading for their own accounts); in that case, NASDAQ will adjust the price to equal the inside bid or asked price, whichever is closer. Because of delays in reporting trades, the NOCP may not be based on the price of the last trade to occur before the market closes. If there is no reported sale of a security on a particular day, the independent pricin g service may value the security based on reported market quotations. For both debt and equity securities, if such quotations are not readily available, securities are valued using methods the Board of Trustees of Lehman Brothers Income Funds (the "Board") has approved on the belief that they reflect fair value. Numerous factors may be considered when determining the fair value of a security, including available analyst, media or other reports, trading in futures or ADRs and whether the issuer of the security being fair valued has other securities outstanding. Foreign security prices are furnished by independent quotation services and expressed in local currency values. Foreign security prices are currently translated from the local currency into U.S. dollars using the exchange rate as of 4:00 p.m., Eastern time. The Board has approved the use of Interactive Data Pricing and Reference Data, Inc. ("Interactive") to assist in determining the fair value of the Funds' foreign equity securities when changes in th e value of a certain index suggest that the closing prices on the foreign exchanges may no longer represent the amount that a Fund could expect to receive for those securities. In this event, Interactive will provide adjusted prices for certain foreign equity securities using a statistical analysis of historical correlations of multiple factors. In the absence of precise information about the market values of these foreign securities as of the close of the New York Stock Exchange, the Board has determined on the basis of available data that prices adjusted in this way are likely to be closer to the prices the Funds could realize on a current sale than are the prices of those securities established at the close of the foreign markets in which the securities primarily trade. Fair value prices are necessarily estimates, and there is no assurance that such a price will be at or close to the price at which the security is next quoted or next trades. Short-term debt securities with less than 60 days until maturity may be valued at cost which, when combined with interest earned, approximates market value.
†† Investment securities of Neuberger Berman California Tax-Free Money Fund ("California Tax-Free Money"), Neuberger Berman Municipal Money Fund ("Municipal Money"), Neuberger Berman New York Municipal Money Fund ("New York Municipal Money"), and Neuberger Berman Cash Reserves ("Cash Reserves") are valued at amortized cost, which approximates U.S. federal income tax cost.
# At cost, which approximates market value.
See Notes to Financial Statements 63
Notes to Schedule of Investments (cont'd)
## At October 31, 2008, selected fund information on a U.S. federal income tax basis was as follows:
| (000's omitted) | |
Cost | |
Gross
Unrealized
Appreciation | |
Gross
Unrealized
Depreciation | | Net
Unrealized
Appreciation
(Depreciation) | |
| Core Bond | | $ | 112,246 | | | $ | 139 | | | $ | 12,833 | | | $ | (12,694 | ) | |
| Core Plus Bond | | | 20,736 | | | | 40 | | | | 1,944 | | | | (1,904 | ) | |
| High Income | | | 222,311 | | | | 129 | | | | 43,105 | | | | (42,976 | ) | |
| Municipal Securities Trust | | | 26,250 | | | | 210 | | | | 1,109 | | | | (899 | ) | |
| Short Duration | | | 84,028 | | | | 41 | | | | 13,556 | | | | (13,515 | ) | |
| Strategic Income | | | 5,801 | | | | 3 | | | | 522 | | | | (519 | ) | |
@@ Municipal securities held by California Tax-Free Money, Municipal Money and New York Municipal Money are within the two highest rating categories assigned by a nationally recognized statistical rating organization ("NRSRO") such as Moody's Investors Service, Inc. or Standard & Poor's or, where not rated, are determined by the fund's investment manager to be of comparable quality. Municipal securities held by Municipal Securities Trust are within the four highest rating categories assigned by a NRSRO or, where not rated, are determined by the fund's investment manager to be of comparable quality. Approximately 100%, 96%, 78% and 98% of the municipal securities held by California Tax-Free Money, Municipal Money, Municipal Securities Trust, and New York Municipal Money, respectively, have credit enhancement features backing them, which the funds may rely on, such as letters of credit, insurance, or guarantees. Wit hout these credit enhancement features the securities may or may not meet the quality standards of the fund. Pre-refunded bonds are supported by securities in escrow issued or guaranteed by the U.S. Government, its agencies, or instrumentalities. The amount escrowed is sufficient to pay the periodic interest due and the principal of these bonds. Putable bonds give the funds the right to sell back the issue on the date specified.
@ Neuberger Berman Prime Money Fund ("Prime Money") is also managed by Management and may be considered an affiliate since it has the same officers, Board members, and investment manager as the fund and because, at times, the fund may own 5% or more of the outstanding voting securities of Prime Money (see Notes A & F of Notes to Financial Statements).
ñ Restricted security subject to restrictions on resale under federal securities laws. These securities may be resold in transactions exempt from registration, normally to qualified institutional buyers under Rule 144A under the Securities Act of 1933, as amended, and have been deemed by the investment manager to be liquid. At October 31, 2008, these securities amounted to approximately $2,134,000 or 2.8% of net assets for Core Bond, approximately $1,114,000 or 6.0% of net assets for Core Plus Bond, approximately $24,024,000 or 13.9% of net assets for High Income, approximately $1,000 or 0.0% of net assets for Municipal Money, approximately $11,530,000 or 2.9% of net assets for New York Municipal Money, approximately $3,639,000 or 5.1% of net assets for Short Duration, approximately $993,000 or 19.1% of net assets for Strategic Income, and approximately $215,108,000 or 23.8% of net assets for Cash Reserves.
ß Security is guaranteed by the corporate or non-profit obligor.
Ø All or a portion of this security was purchased on a when-issued basis. At October 31, 2008, these securities amounted to $23,260,000 for Core Bond, $483,000 for Core Plus Bond, $663,079 for High Income, $527,000 for Municipal Securities Trust, and $142,000 for Strategic Income, respectively.
See Notes to Financial Statements 64
Notes to Schedule of Investments (cont'd)
ØØØ All or a portion of this security was purchased on a delayed delivery basis. As of October 31, 2008, High Income had unfunded loan commitments of approximately $6,145,000 pursuant to the following loan agreements:
| Borrower | | Principal
Amount | | Unfunded
Commitment | |
| Ford Motor Co., Term Loan B, 5.24%, due 12/16/13 | | | 3,980,000 | | | $ | 2,173,000 | | |
| Huntsman Int'l LLC, Term Loan B, 6.50%, due 4/19/14 | | | 350,000 | | | | 305,000 | | |
| AMC Entertainment, Inc., Term Loan, 5.51%, due 1/26/13 | | | 608,000 | | | | 452,000 | | |
| Berry Plastics Holding Corp., Term Loan C, 4.80%, due 4/3/15 | | | 495,000 | | | | 361,000 | | |
| Texas Competitive Electric Holdings Co. LLC, Term Loan B3, 6.30%-7.64%, due 10/10/14 | | | 1,500,000 | | | | 1,175,000 | | |
| Charter Communications Operating LLC, Term Loan, 5.47% & 5.50%, due 3/6/14 | | | 885,000 | | | | 654,000 | | |
| Mediacom Broadband LLC, Term Loan D2, 5.26%, due 1/31/15 | | | 545,000 | | | | 392,000 | | |
| Mediacom Broadband LLC, Term Loan D1, 5.26%, due 1/31/15 | | | 330,000 | | | | 238,000 | | |
| Sungard Data Systems, Inc., Term Loan B, 5.71%, due 2/28/14 | | | 517,000 | | | | 395,000 | | |
ØØ All or a portion of this security is segregated in connection with obligations for when-issued purchase commitments and/or financial futures contracts and/or delayed delivery purchase commitments.
µ Floating rate securities are securities whose yields vary with a designated market index or market rate. These securities are shown at their current rates as of October 31, 2008.
** Denotes a step-up bond: a zero coupon bond that converts to a fixed rate of interest at a designated future date.
a Security is subject to a guarantee provided by ABN AMRO Bank NV, backing 100% of the total principal.
c Security is subject to a guarantee provided by Bank of America, backing 100% of the total principal.
d Security is subject to a guarantee provided by Bank of New York, backing 100% of the total principal.
e Security is subject to a guarantee provided by Bank of the West, backing 100% of the total principal.
f Security is subject to a guarantee provided by Harris Trust & Savings Bank, backing 100% of the total principal.
h Security is subject to a guarantee provided by KeyBank, backing 100% of the total principal.
k Security is subject to a guarantee provided by Citibank, N.A., backing 100% of the total principal.
m Security is subject to a guarantee provided by Comerica Bank, backing 100% of the total principal.
n Security is subject to a guarantee provided by SunTrust Bank, backing 100% of the total principal.
p Security is subject to a guarantee provided by Dexia Credit Locale de France, backing 100% of the total principal.
s Security is subject to a guarantee provided by JP Morgan Chase, backing 100% of the total principal.
t Security is subject to a guarantee provided by TD Banknorth, backing 100% of the total principal.
u Security is subject to a guarantee provided by WesCorp Credit Union, backing 100% of the total principal.
y Security is subject to a guarantee provided by Morgan Stanley, backing 100% of the total principal.
bb Security is subject to a guarantee provided by PNC Bank, backing 100% of the total principal.
cc Security is subject to a guarantee provided by Societe Generale, backing 100% of the total principal.
hh Security is subject to a guarantee provided by U.S. Bank, backing 100% of the total principal.
jj Security is subject to a guarantee provided by Wells Fargo, backing 100% of the total principal.
mm Security is subject to a guarantee provided by Westdeutsche Landesbank Girozentrale, backing 100% of the total principal.
oo Security is subject to a guarantee provided by California State Teachers Retirement System, backing 100% of the total principal.
pp Security is subject to a guarantee provided by Federal Home Loan Bank, backing 100% of the total principal.
See Notes to Financial Statements 65
Statements of Assets and Liabilities
Income Funds
(000's omitted except per share amounts)
| | | CALIFORNIA
TAX-FREE
MONEY FUND | | CORE BOND
FUND | | CORE PLUS
BOND FUND | | HIGH INCOME
BOND FUND | | MUNICIPAL
MONEY FUND | |
| | | October 31,
2008 | | October 31,
2008 | | October 31,
2008 | | October 31,
2008 | | October 31,
2008 | |
| Assets | |
| Investments in securities, at value* (Notes A & F)—see Schedule of Investments: | |
| Unaffiliated issuers | | $ | 27,820 | | | $ | 98,215 | | | $ | 18,627 | | | $ | 163,827 | | | $ | 394,582 | | |
| Affiliated issuers | | | — | | | | 1,337 | | | | 205 | | | | 15,508 | | | | — | | |
| Repurchase Agreements | | | — | | | | — | | | | — | | | | — | | | | — | | |
| | | | 27,820 | | | | 99,552 | | | | 18,832 | | | | 179,335 | | | | 394,582 | | |
| Cash | | | 292 | | | | — | | | | — | | | | 433 | | | | — | | |
| Interest receivable | | | 130 | | | | 642 | | | | 179 | | | | 4,560 | | | | 2,150 | | |
| Receivable for securities sold | | | — | | | | 8,192 | | | | 95 | | | | — | | | | — | | |
| Receivable for Fund shares sold | | | — | | | | 81 | | | | — | | | | 111 | | | | 3 | | |
| Receivable from administrator—net (Note B) | | | 15 | | | | — | | | | 29 | | | | — | | | | — | | |
| Receivable for securities lending income (Note A) | | | — | | | | 2 | | | | — | | | | 15 | | | | — | | |
| Prepaid expenses and other assets | | | 2 | | | | — | | | | — | | | | — | | | | 40 | | |
| Total Assets | | | 28,259 | | | | 108,469 | | | | 19,135 | | | | 184,454 | | | | 396,775 | | |
| Liabilities | |
| Distributions payable | | | 22 | | | | 47 | | | | — | | | | 108 | | | | 3 | | |
| Due to custodian | | | — | | | | — | | | | — | | | | — | | | | 1,079 | | |
| Payable for securities purchased | | | — | | | | 31,734 | | | | 621 | | | | 11,492 | | | | — | | |
| Payable for Fund shares redeemed | | | — | | | | 39 | | | | — | | | | 360 | | | | 19 | | |
| Payable to investment manager—net (Notes A & B) | | | 7 | | | | — | | | | 4 | | | | 73 | | | | 100 | | |
| Payable to administrator—net (Note B) | | | — | | | | — | | | | — | | | | 41 | | | | 97 | | |
| Payable for securities lending fees (Note A) | | | — | | | | — | | | | — | | | | 13 | | | | — | | |
| Payable for variation margin (Note A) | | | — | | | | — | | | | — | | | | — | | | | — | | |
| Accrued expenses and other payables | | | 48 | | | | 91 | | | | 95 | | | | 28 | | | | 130 | | |
| Total Liabilities | | | 77 | | | | 31,911 | | | | 720 | | | | 12,115 | | | | 1,428 | | |
| Net Assets at value | | $ | 28,182 | | | $ | 76,558 | | | $ | 18,415 | | | $ | 172,339 | | | $ | 395,347 | | |
| Net Assets consist of: | |
| Paid-in capital | | $ | 28,182 | | | $ | 89,255 | | | $ | 20,528 | | | $ | 267,985 | | | $ | 395,328 | | |
| Undistributed net investment income (loss) | | | — | | | | — | | | | 2 | | | | 26 | | | | 1 | | |
| Distributions in excess of net investment income | | | — | | | | (42 | ) | | | — | | | | — | | | | — | | |
| Accumulated net realized gains (losses) on investments | | | — | | | | (82 | ) | | | (220 | ) | | | (53,141 | ) | | | 18 | | |
| Net unrealized appreciation (depreciation) in value of investments | | | — | | | | (12,573 | ) | | | (1,895 | ) | | | (42,531 | ) | | | — | | |
| Net Assets at value | | $ | 28,182 | | | $ | 76,558 | | | $ | 18,415 | | | $ | 172,339 | | | $ | 395,347 | | |
| Net Assets | |
| Investor Class | | $ | 23,182 | | | $ | 44,205 | | | $ | — | | | $ | 172,339 | | | $ | 395,347 | | |
| Institutional Class | | | — | | | | 32,073 | | | | 16,472 | | | | — | | | | — | | |
| Reserve Class | | | 5,000 | | | | — | | | | — | | | | — | | | | — | | |
| Trust Class | | | — | | | | — | | | | — | | | | — | | | | — | | |
| Class A | | | — | | | | 137 | | | | 914 | | | | — | | | | — | | |
| Class C | | | — | | | | 143 | | | | 1,029 | | | | — | | | | — | | |
| Shares Outstanding ($.001 par value; unlimited shares authorized) | |
| Investor Class | | | 23,182 | | | | 5,118 | | | | — | | | | 26,228 | | | | 395,402 | | |
| Institutional Class | | | — | | | | 3,709 | | | | 1,838 | | | | — | | | | — | | |
| Reserve Class | | | 5,000 | | | | — | | | | — | | | | — | | | | — | | |
| Trust Class | | | — | | | | — | | | | — | | | | — | | | | — | | |
| Class A | | | — | | | | 16 | | | | 102 | | | | — | | | | — | | |
| Class C | | | — | | | | 17 | | | | 115 | | | | — | | | | — | | |
| Net Asset Value, offering and redemption price per share | |
| Investor Class | | $ | 1.00 | | | $ | 8.64 | | | $ | — | | | $ | 6.57 | | | $ | 1.00 | | |
| Institutional Class | | | — | | | | 8.65 | | | | 8.96 | | | | — | | | | — | | |
| Reserve Class | | | 1.00 | | | | — | | | | — | | | | — | | | | — | | |
| Trust Class | | | — | | | | — | | | | — | | | | — | | | | — | | |
| Net Asset Value and redemption price per share | |
| Class A | | $ | — | | | $ | 8.64 | | | $ | 8.96 | | | $ | — | | | $ | — | | |
| Offering Price per share | |
| Class A‡ | | $ | — | | | $ | 9.02 | | | $ | 9.36 | | | $ | — | | | $ | — | | |
| Net Asset Value and offering price per share | |
| Class C^ | | $ | — | | | $ | 8.64 | | | $ | 8.96 | | | $ | — | | | $ | — | | |
| *Cost of Investments: | |
| Unaffiliated issuers | | $ | 27,820 | | | $ | 110,788 | | | $ | 20,522 | | | $ | 206,358 | | | $ | 394,582 | | |
| Affiliated issuers | | | — | | | | 1,337 | | | | 205 | | | | 15,508 | | | | — | | |
| Total cost of investments | | $ | 27,820 | | | $ | 112,125 | | | $ | 20,727 | | | $ | 221,866 | | | $ | 394,582 | | |
‡ On single retail sales of less than $50,000. On sales of $50,000 or more or in certain other circumstances described in the fund's prospectus, offering price is reduced.
^ Redemption price per share is equal to net asset value less any applicable contingent deferred sales charge.
See Notes to Financial Statements 66
| | | MUNICIPAL
SECURITIES
TRUST | | NEW YORK
MUNICIPAL
MONEY FUND | | SHORT
DURATION
BOND FUND | | STRATEGIC
INCOME FUND | | CASH
RESERVES | |
| | | October 31,
2008 | | October 31,
2008 | | October 31,
2008 | | October 31,
2008 | | October 31,
2008 | |
| Assets | |
| Investments in securities, at value* (Notes A & F)—see Schedule of Investments: | |
| Unaffiliated issuers | | $ | 25,351 | | | $ | 395,689 | | | $ | 69,323 | | | $ | 5,282 | | | $ | 302,799 | | |
| Affiliated issuers | | | — | | | | — | | | | — | | | | — | | | | — | | |
| Repurchase Agreements | | | — | | | | — | | | | 1,190 | | | | — | | | | 602,000 | | |
| | | | 25,351 | | | | 395,689 | | | | 70,513 | | | | 5,282 | | | | 904,799 | | |
| Cash | | | 157 | | | | 3,310 | | | | 9 | | | | — | | | | 488 | | |
| Interest receivable | | | 407 | | | | 2,578 | | | | 447 | | | | 76 | | | | 339 | | |
| Receivable for securities sold | | | — | | | | 20 | | | | — | | | | 567 | | | | — | | |
| Receivable for Fund shares sold | | | 261 | | | | — | | | | 86 | | | | 45 | | | | 316 | | |
| Receivable from administrator—net (Note B) | | | 9 | | | | — | | | | — | | | | 38 | | | | — | | |
| Receivable for securities lending income (Note A) | | | — | | | | — | | | | — | | | | — | | | | — | | |
| Prepaid expenses and other assets | | | — | | | | 38 | | | | 3 | | | | 1 | | | | 31 | | |
| Total Assets | | | 26,185 | | | | 401,635 | | | | 71,058 | | | | 6,009 | | | | 905,973 | | |
| Liabilities | |
| Distributions payable | | | 11 | | | | — | | | | 19 | | | | 4 | | | | 3 | | |
| Due to custodian | | | — | | | | — | | | | — | | | | 227 | | | | — | | |
| Payable for securities purchased | | | 519 | | | | 201 | | | | — | | | | 481 | | | | — | | |
| Payable for Fund shares redeemed | | | 16 | | | | — | | | | 65 | | | | — | | | | 341 | | |
| Payable to investment manager—net (Notes A & B) | | | 5 | | | | 93 | | | | 16 | | | | 3 | | | | 93 | | |
| Payable to administrator—net (Note B) | | | — | | | | 59 | | | | 3 | | | | — | | | | 232 | | |
| Payable for securities lending fees (Note A) | | | — | | | | — | | | | — | | | | — | | | | — | | |
| Payable for variation margin (Note A) | | | — | | | | — | | | | 31 | | | | — | | | | — | | |
| Accrued expenses and other payables | | | 69 | | | | 35 | | | | 109 | | | | 85 | | | | 123 | | |
| Total Liabilities | | | 620 | | | | 388 | | | | 243 | | | | 800 | | | | 792 | | |
| Net Assets at value | | $ | 25,565 | | | $ | 401,247 | | | $ | 70,815 | | | $ | 5,209 | | | $ | 905,181 | | |
| Net Assets consist of: | |
| Paid-in capital | | $ | 26,863 | | | $ | 401,385 | | | $ | 92,820 | | | $ | 5,732 | | | $ | 905,274 | | |
| Undistributed net investment income (loss) | | | — | | | | — | | | | 196 | | | | — | | | | 4 | | |
| Distributions in excess of net investment income | | | — | | | | — | | | | — | | | | (4 | ) | | | — | | |
| Accumulated net realized gains (losses) on investments | | | (399 | ) | | | (138 | ) | | | (9,178 | ) | | | (20 | ) | | | (97 | ) | |
| Net unrealized appreciation (depreciation) in value of investments | | | (899 | ) | | | — | | | | (13,023 | ) | | | (499 | ) | | | — | | |
| Net Assets at value | | $ | 25,565 | | | $ | 401,247 | | | $ | 70,815 | | | $ | 5,209 | | | $ | 905,181 | | |
| Net Assets | |
| Investor Class | | $ | 25,565 | | | $ | 401,247 | | | $ | 61,564 | | | $ | — | | | $ | 905,181 | | |
| Institutional Class | | | — | | | | — | | | | — | | | | 4,582 | | | | — | | |
| Reserve Class | | | — | | | | — | | | | — | | | | — | | | | — | | |
| Trust Class | | | — | | | | — | | | | 9,251 | | | | 340 | | | | — | | |
| Class A | | | — | | | | — | | | | — | | | | 164 | | | | — | | |
| Class C | | | — | | | | — | | | | — | | | | 123 | | | | — | | |
| Shares Outstanding ($.001 par value; unlimited shares authorized) | |
| Investor Class | | | 2,412 | | | | 401,385 | | | | 7,780 | | | | — | | | | 905,274 | | |
| Institutional Class | | | — | | | | — | | | | — | | | | 522 | | | | — | | |
| Reserve Class | | | — | | | | — | | | | — | | | | — | | | | — | | |
| Trust Class | | | — | | | | — | | | | 1,227 | | | | 39 | | | | — | | |
| Class A | | | — | | | | — | | | | — | | | | 19 | | | | — | | |
| Class C | | | — | | | | — | | | | — | | | | 14 | | | | — | | |
| Net Asset Value, offering and redemption price per share | |
| Investor Class | | $ | 10.60 | | | $ | 1.00 | | | $ | 7.91 | | | $ | — | | | $ | 1.00 | | |
| Institutional Class | | | — | | | | — | | | | — | | | | 8.78 | | | | — | | |
| Reserve Class | | | — | | | | — | | | | — | | | | — | | | | — | | |
| Trust Class | | | — | | | | — | | | | 7.54 | | | | 8.77 | | | | — | | |
| Net Asset Value and redemption price per share | |
| Class A | | $ | — | | | $ | — | | | $ | — | | | $ | 8.78 | | | $ | — | | |
| Offering Price per share | |
| Class A‡ | | $ | — | | | $ | — | | | $ | — | | | $ | 9.17 | | | $ | — | | |
| Net Asset Value and offering price per share | |
| Class C^ | | $ | — | | | $ | — | | | $ | — | | | $ | 8.78 | | | $ | — | | |
| *Cost of Investments: | |
| Unaffiliated issuers | | $ | 26,250 | | | $ | 395,689 | | | $ | 83,831 | | | $ | 5,781 | | | $ | 904,799 | | |
| Affiliated issuers | | | — | | | | — | | | | — | | | | — | | | | — | | |
| Total cost of investments | | $ | 26,250 | | | $ | 395,689 | | | $ | 83,831 | | | $ | 5,781 | | | $ | 904,799 | | |
67
Statements of Operations
Income Funds
(000's omitted)
| | | CALIFORNIA
TAX-FREE
MONEY FUND | | CORE BOND
FUND | | CORE PLUS
BOND FUND | | HIGH INCOME
BOND FUND | | MUNICIPAL
MONEY FUND | |
| | | For the Period from
December 27, 2007
(Commencement of
Operations) to
October 31,
2008 | | For the
Year Ended
October 31,
2008 | | For the Period from
May 1, 2008
(Commencement of
Operations) to
October 31,
2008 | | For the
Year Ended
October 31,
2008 | | For the
Year Ended
October 31,
2008 | |
| Investment Income: | |
| Income (Note A): | |
| Interest income—unaffiliated issuers | | $ | 545 | | | $ | 4,204 | | | $ | 493 | | | $ | 24,753 | | | $ | 22,755 | | |
| Dividend income—unaffiliated issuers | | | — | | | | — | | | | — | | | | — | | | | — | | |
| Income from securities loaned—net (Note F) | | | — | | | | 19 | | | | — | | | | 36 | | | | — | | |
| Income from investments in affiliated issuers (Notes A & F) | | | — | | | | 159 | | | | 33 | | | | 310 | | | | — | | |
| Foreign taxes withheld | | | — | | | | — | | | | — | | | | — | | | | — | | |
| Total income | | $ | 545 | | | $ | 4,382 | | | $ | 526 | | | $ | 25,099 | | | $ | 22,755 | | |
| Expenses: | |
| Investment management fees (Note B) | | | 66 | | | | 222 | | | | 25 | | | | 1,357 | | | | 2,072 | | |
| Administration fees (Note B) | | | 16 | | | | 54 | | | | 6 | | | | 170 | | | | 520 | | |
| Administration fees (Note B): | |
| Investor Class | | | 46 | | | | 88 | | | | — | | | | 594 | | | | 1,818 | | |
| Institutional Class | | | — | | | | 42 | | | | 8 | | | | — | | | | — | | |
| Reserve Class | | | 1 | | | | — | | | | — | | | | — | | | | — | | |
| Trust Class | | | — | | | | — | | | | — | | | | — | | | | — | | |
| Class A | | | — | | | | — | | | | 1 | | | | — | | | | — | | |
| Class C | | | — | | | | — | | | | 1 | | | | — | | | | — | | |
| Distribution fees (Note B): | |
| Investor Class | | | — | | | | 105 | | | | — | | | | — | | | | — | | |
| Class A | | | — | | | | — | | | | 1 | | | | — | | | | — | | |
| Class C | | | — | | | | 1 | | | | 5 | | | | — | | | | — | | |
| Shareholder servicing agent fees: | |
| Investor Class | | | 3 | | | | 35 | | | | — | | | | 51 | | | | 35 | | |
| Institutional Class | | | — | | | | 23 | | | | 1 | | | | — | | | | — | | |
| Reserve Class | | | 3 | | | | — | | | | — | | | | — | | | | — | | |
| Trust Class | | | — | | | | — | | | | — | | | | — | | | | — | | |
| Class A | | | — | | | | 2 | | | | 1 | | | | — | | | | — | | |
| Class C | | | — | | | | 2 | | | | 1 | | | | — | | | | — | | |
| Organization expense (Note A) | | | 47 | | | | — | | | | 91 | | | | — | | | | — | | |
| Audit fees | | | 15 | | | | 23 | | | | 22 | | | | 49 | | | | 37 | | |
| Custodian fees (Note B) | | | 8 | | | | 76 | | | | 12 | | | | 126 | | | | 76 | | |
| Insurance expense | | | 1 | | | | 2 | | | | — | | | | 14 | | | | 27 | | |
| Legal fees | | | 60 | | | | 98 | | | | 12 | | | | 46 | | | | 49 | | |
| Registration and filing fees | | | 3 | | | | 101 | | | | 97 | | | | 106 | | | | 149 | | |
Reimbursement of expenses previously assumed by administrator
(Note B) | | | — | | | | — | | | | — | | | | — | | | | 149 | | |
| Shareholder reports | | | 12 | | | | 3 | | | | 38 | | | | 50 | | | | 73 | | |
| Trustees' fees and expenses | | | 28 | | | | 36 | | | | 13 | | | | 30 | | | | 36 | | |
| Interest expense (Note E) | | | — | | | | — | | | | — | | | | — | | | | — | | |
| Miscellaneous | | | 3 | | | | 11 | | | | 1 | | | | 11 | | | | 56 | | |
| Total expenses | | | 312 | | | | 924 | | | | 336 | | | | 2,604 | | | | 5,097 | | |
See Notes to Financial Statements 68
| | | MUNICIPAL
SECURITIES
TRUST | | NEW YORK
MUNICIPAL
MONEY FUND | | SHORT
DURATION
BOND FUND | | STRATEGIC
INCOME FUND | | CASH
RESERVES | |
| | | For the
Year Ended
October 31,
2008 | | For the
Year Ended
October 31,
2008 | | For the
Year Ended
October 31,
2008 | | For the
Year Ended
October 31,
2008 | | For the
Year Ended
October 31,
2008 | |
| Investment Income: | |
| Income (Note A): | |
| Interest income—unaffiliated issuers | | $ | 1,219 | | | $ | 19,966 | | | $ | 5,069 | | | $ | 600 | | | $ | 13,471 | | |
| Dividend income—unaffiliated issuers | | | — | | | | — | | | | — | | | | 35 | | | | — | | |
| Income from securities loaned—net (Note F) | | | — | | | | — | | | | — | | | | — | | | | — | | |
| Income from investments in affiliated issuers (Notes A & F) | | | — | | | | — | | | | — | | | | 20 | | | | — | | |
| Foreign taxes withheld | | | — | | | | — | | | | — | | | | (1 | ) | | | — | | |
| Total income | | $ | 1,219 | | | $ | 19,966 | | | $ | 5,069 | | | $ | 654 | | | $ | 13,471 | | |
| Expenses: | |
| Investment management fees (Note B) | | | 71 | | | | 1,880 | | | | 233 | | | | 69 | | | | 450 | | |
| Administration fees (Note B) | | | 17 | | | | 468 | | | | 56 | | | | 7 | | | | 270 | | |
| Administration fees (Note B): | |
| Investor Class | | | 60 | | | | 1,639 | | | | 172 | | | | — | | | | 946 | | |
| Institutional Class | | | — | | | | — | | | | — | | | | 11 | | | | — | | |
| Reserve Class | | | — | | | | — | | | | — | | | | — | | | | — | | |
| Trust Class | | | — | | | | — | | | | 50 | | | | 1 | | | | — | | |
| Class A | | | — | | | | — | | | | — | | | | — | | | | — | | |
| Class C | | | — | | | | — | | | | — | | | | — | | | | — | | |
| Distribution fees (Note B): | |
| Investor Class | | | — | | | | — | | | | — | | | | — | | | | — | | |
| Class A | | | — | | | | — | | | | — | | | | — | | | | — | | |
| Class C | | | — | | | | — | | | | — | | | | 1 | | | | — | | |
| Shareholder servicing agent fees: | |
| Investor Class | | | 20 | | | | 35 | | | | 87 | | | | — | | | | 3 | | |
| Institutional Class | | | — | | | | — | | | | — | | | | 23 | | | | — | | |
| Reserve Class | | | — | | | | — | | | | — | | | | — | | | | — | | |
| Trust Class | | | — | | | | — | | | | 22 | | | | 13 | | | | — | | |
| Class A | | | — | | | | — | | | | — | | | | 3 | | | | — | | |
| Class C | | | — | | | | — | | | | — | | | | 3 | | | | — | | |
| Organization expense (Note A) | | | — | | | | — | | | | — | | | | — | | | | — | | |
| Audit fees | | | 45 | | | | 18 | | | | 54 | | | | 46 | | | | 37 | | |
| Custodian fees (Note B) | | | 21 | | | | 36 | | | | 81 | | | | 69 | | | | 52 | | |
| Insurance expense | | | 1 | | | | 14 | | | | 3 | | | | 1 | | | | 12 | | |
| Legal fees | | | 43 | | | | 56 | | | | 44 | | | | 121 | | | | 43 | | |
| Registration and filing fees | | | 26 | | | | 14 | | | | 52 | | | | 97 | | | | 62 | | |
Reimbursement of expenses previously assumed by administrator
(Note B) | | | — | | | | — | | | | — | | | | — | | | | — | | |
| Shareholder reports | | | 14 | | | | 32 | | | | 27 | | | | 4 | | | | 19 | | |
| Trustees' fees and expenses | | | 36 | | | | 36 | | | | 36 | | | | 36 | | | | 36 | | |
| Interest expense (Note E) | | | — | | | | 13 | | | | — | | | | — | | | | — | | |
| Miscellaneous | | | 2 | | | | 34 | | | | 6 | | | | 10 | | | | 31 | | |
| Total expenses | | | 356 | | | | 4,275 | | | | 923 | | | | 515 | | | | 1,961 | | |
69
Statements of Operations (cont'd)
Income Funds (cont'd)
(000's omitted)
| | | CALIFORNIA
TAX-FREE
MONEY FUND | | CORE BOND
FUND | | CORE PLUS
BOND FUND | | HIGH INCOME
BOND FUND | | MUNICIPAL
MONEY FUND | |
| | | For the Period from
December 27, 2007
(Commencement of
Operations) to
October 31,
2008 | | For the
Year Ended
October 31,
2008 | | For the Period from
May 1, 2008
(Commencement of
Operations) to
October 31,
2008 | | For the
Year Ended
October 31,
2008 | | For the
Year Ended
October 31,
2008 | |
| Expenses reimbursed by administrator (Note B) | | | (189 | ) | | | (131 | ) | | | (282 | ) | | | — | | | | — | | |
| Management and administration fees waived (Notes A & B) | | | — | | | | (222 | ) | | | (1 | ) | | | (8 | ) | | | — | | |
Expenses reduced by custodian fee expense offset and commission
recapture arrangements (Note B) | | | (8 | ) | | | (3 | ) | | | — | | | | (3 | ) | | | (118 | ) | |
| Total net expenses | | | 115 | | | | 568 | | | | 53 | | | | 2,593 | | | | 4,979 | | |
| Net investment income (loss) | | $ | 430 | | | $ | 3,814 | | | $ | 473 | | | $ | 22,506 | | | $ | 17,776 | | |
| Realized and Unrealized Gain (Loss) on Investments (Note A) | |
| Net realized gain (loss) on: | |
| Sales of investment securities of unaffiliated issuers | | | — | | | | 798 | | | | (206 | ) | | | (35,148 | ) | | | 18 | | |
| Financial futures contracts | | | — | | | | — | | | | — | | | | — | | | | — | | |
| Option contracts written | | | — | | | | — | | | | — | | | | — | | | | — | | |
| Foreign currency | | | — | | | | — | | | | — | | | | — | | | | — | | |
| Change in net unrealized appreciation (depreciation) in value of: | |
| Unaffiliated investment securities | | | — | | | | (11,601 | ) | | | (1,895 | ) | | | (39,499 | ) | | | — | | |
| Financial futures contracts | | | — | | | | — | | | | — | | | | — | | | | — | | |
| Option contracts | | | — | | | | — | | | | — | | | | — | | | | — | | |
| Foreign currency | | | — | | | | — | | | | — | | | | — | | | | — | | |
| Net gain (loss) on investments | | | — | | | | (10,803 | ) | | | (2,101 | ) | | | (74,647 | ) | | | 18 | | |
| Increase (Decrease) in Net Assets From Operations | | $ | 430 | | | $ | (6,989 | ) | | $ | (1,628 | ) | | $ | (52,141 | ) | | $ | 17,794 | | |
See Notes to Financial Statements 70
| | | MUNICIPAL
SECURITIES
TRUST | | NEW YORK
MUNICIPAL
MONEY FUND | | SHORT
DURATION
BOND FUND | | STRATEGIC
INCOME FUND | | CASH
RESERVES | |
| | | For the
Year Ended
October 31,
2008 | | For the
Year Ended
October 31,
2008 | | For the
Year Ended
October 31,
2008 | | For the
Year Ended
October 31,
2008 | | For the
Year Ended
October 31,
2008 | |
| Expenses reimbursed by administrator (Note B) | | | (170 | ) | | | (436 | ) | | | (256 | ) | | | (410 | ) | | | — | | |
| Management and administration fees waived (Notes A & B) | | | — | | | | — | | | | — | | | | (1 | ) | | | (90 | ) | |
Expenses reduced by custodian fee expense offset and commission
recapture arrangements (Note B) | | | (3 | ) | | | (126 | ) | | | (2 | ) | | | (1 | ) | | | (12 | ) | |
| Total net expenses | | | 183 | | | | 3,713 | | | | 665 | | | | 103 | | | | 1,859 | | |
| Net investment income (loss) | | $ | 1,036 | | | $ | 16,253 | | | $ | 4,404 | | | $ | 551 | | | $ | 11,612 | | |
| Realized and Unrealized Gain (Loss) on Investments (Note A) | |
| Net realized gain (loss) on: | |
| Sales of investment securities of unaffiliated issuers | | | (399 | ) | | | (138 | ) | | | (264 | ) | | | 230 | | | | (42 | ) | |
| Financial futures contracts | | | — | | | | — | | | | 1,030 | | | | — | | | | — | | |
| Option contracts written | | | — | | | | — | | | | — | | | | 5 | | | | — | | |
| Foreign currency | | | — | | | | — | | | | — | | | | (244 | ) | | | — | | |
| Change in net unrealized appreciation (depreciation) in value of: | |
| Unaffiliated investment securities | | | (1,131 | ) | | | — | | | | (13,098 | ) | | | (1,148 | ) | | | — | | |
| Financial futures contracts | | | — | | | | — | | | | 206 | | | | — | | | | — | | |
| Option contracts | | | — | | | | — | | | | — | | | | 3 | | | | — | | |
| Foreign currency | | | — | | | | — | | | | — | | | | 70 | | | | — | | |
| Net gain (loss) on investments | | | (1,530 | ) | | | (138 | ) | | | (12,126 | ) | | | (1,084 | ) | | | (42 | ) | |
| Increase (Decrease) in Net Assets From Operations | | $ | (494 | ) | | $ | 16,115 | | | $ | (7,722 | ) | | $ | (533 | ) | | $ | 11,570 | | |
71
Statements of Changes in Net Assets
Income Funds
(000's omitted)
| | | CALIFORNIA
TAX-FREE
MONEY FUND | | CORE BOND FUND | | CORE PLUS
BOND FUND | |
| | | Period from
December 27, 2007
(Commencement
of Operations) to
October 31,
2008 | | Year Ended
October 31,
2008 | | Year Ended
October 31,
2007 | | Period from
May 1, 2008
(Commencement
of Operations) to
October 31,
2008 | |
| Increase (Decrease) in Net Assets: | |
| From Operations: | |
| Net investment income (loss) | | $ | 430 | | | $ | 3,814 | | | $ | 3,784 | | | $ | 473 | | |
| Net realized gain (loss) on investments | | | — | | | | 798 | | | | 268 | | | | (206 | ) | |
| Net increase from payments by affiliates | | | — | | | | — | | | | — | | | | — | | |
| Change in net unrealized appreciation (depreciation) of investments | | | — | | | | (11,601 | ) | | | (1,047 | ) | | | (1,895 | ) | |
| Net increase (decrease) in net assets resulting from operations | | | 430 | | | | (6,989 | ) | | | 3,005 | | | | (1,628 | ) | |
| Distributions to Shareholders From: | |
| Net investment income: | |
| Investor Class | | | (349 | ) | | | (1,725 | ) | | | (1,605 | ) | | | — | | |
| Institutional Class | | | — | | | | (2,128 | ) | | | (2,197 | ) | | | (441 | ) | |
| Reserve Class | | | (81 | ) | | | — | | | | — | | | | — | | |
| Trust Class | | | — | | | | — | | | | — | | | | — | | |
| Class A | | | — | | | | (4 | ) | | | — | | | | (23 | ) | |
| Class C | | | — | | | | (4 | ) | | | — | | | | (21 | ) | |
| Net realized gain on investments: | |
| Investor Class | | | — | | | | — | | | | — | | | | — | | |
| Institutional Class | | | — | | | | — | | | | — | | | | — | | |
| Reserve Class | | | — | | | | — | | | | — | | | | — | | |
| Trust Class | | | — | | | | — | | | | — | | | | — | | |
| Class A | | | — | | | | — | | | | — | | | | — | | |
| Class C | | | — | | | | — | | | | — | | | | — | | |
| Tax return of capital: | |
| Institutional Class | | | — | | | | — | | | | — | | | | — | | |
| Trust Class | | | — | | | | — | | | | — | | | | — | | |
| Class A | | | — | | | | — | | | | — | | | | — | | |
| Class C | | | — | | | | — | | | | — | | | | — | | |
| Total distributions to shareholders | | | (430 | ) | | | (3,861 | ) | | | (3,802 | ) | | | (485 | ) | |
| From Fund Share Transactions (Note D): | |
| Proceeds from shares sold: | |
| Investor Class | | | 75,312 | | | | 26,660 | | | | 10,961 | | | | — | | |
| Institutional Class | | | — | | | | 8,639 | | | | 30,887 | | | | 18,000 | | |
| Reserve Class | | | 5,000 | | | | — | | | | — | | | | — | | |
| Trust Class | | | — | | | | — | | | | — | | | | — | | |
| Class A | | | — | | | | 149 | | | | — | | | | 1,000 | | |
| Class C | | | — | | | | 158 | | | | — | | | | 1,125 | | |
| Proceeds from reinvestment of dividends and distributions: | |
| Investor Class | | | 60 | | | | 1,458 | | | | 2,190 | | | | — | | |
| Institutional Class | | | — | | | | 2,096 | | | | 1,360 | | | | 363 | | |
| Reserve Class | | | — | | | | — | | | | — | | | | — | | |
| Trust Class | | | — | | | | — | | | | — | | | | — | | |
| Class A | | | — | | | | 4 | | | | — | | | | 19 | | |
| Class C | | | — | | | | 3 | | | | — | | | | 21 | | |
| Capital contribution from affiliate (Note B) | | | — | | | | — | | | | — | | | | — | | |
| Payments for shares redeemed: | |
| Investor Class | | | (52,190 | ) | | | (14,372 | ) | | | (10,096 | ) | | | — | | |
| Institutional Class | | | — | | | | (20,410 | ) | | | (29,846 | ) | | | — | | |
| Reserve Class | | | — | | | | — | | | | — | | | | — | | |
| Trust Class | | | — | | | | — | | | | — | | | | — | | |
| Class A | | | — | | | | — | | | | — | | | | — | | |
| Class C | | | — | | | | — | | | | — | | | | — | | |
| Net increase (decrease) from Fund share transactions | | | 28,182 | | | | 4,385 | | | | 5,456 | | | | 20,528 | | |
| Net Increase (Decrease) in Net Assets | | | 28,182 | | | | (6,465 | ) | | | 4,659 | | | | 18,415 | | |
| Net Assets: | |
| Beginning of year | | | — | | | | 83,023 | | | | 78,364 | | | | — | | |
| End of year | | $ | 28,182 | | | $ | 76,558 | | | $ | 83,023 | | | $ | 18,415 | | |
| Undistributed net investment income (loss) at end of year | | $ | — | | | $ | — | | | $ | — | | | $ | 2 | | |
| Distributions in excess of net investment income at end of year | | $ | — | | | $ | (42 | ) | | $ | (22 | ) | | $ | — | | |
See Notes to Financial Statements 72
| | | HIGH INCOME BOND FUND | | MUNICIPAL MONEY FUND | |
| | | Year Ended
October 31,
2008 | | Year Ended
October 31,
2007 | | Year Ended
October 31,
2008 | | Year Ended
October 31,
2007 | |
| Increase (Decrease) in Net Assets: | |
| From Operations: | |
| Net investment income (loss) | | $ | 22,506 | | | $ | 34,945 | | | $ | 17,776 | | | $ | 26,520 | | |
| Net realized gain (loss) on investments | | | (35,148 | ) | | | 6,088 | | | | 18 | | | | 19 | | |
| Net increase from payments by affiliates | | | — | | | | — | | | | — | | | | — | | |
| Change in net unrealized appreciation (depreciation) of investments | | | (39,499 | ) | | | (7,504 | ) | | | — | | | | — | | |
| Net increase (decrease) in net assets resulting from operations | | | (52,141 | ) | | | 33,529 | | | | 17,794 | | | | 26,539 | | |
| Distributions to Shareholders From: | |
| Net investment income: | |
| Investor Class | | | (22,528 | ) | | | (34,830 | ) | | | (17,776 | ) | | | (26,520 | ) | |
| Institutional Class | | | — | | | | — | | | | — | | | | — | | |
| Reserve Class | | | — | | | | — | | | | — | | | | — | | |
| Trust Class | | | — | | | | — | | | | — | | | | — | | |
| Class A | | | — | | | | — | | | | — | | | | — | | |
| Class C | | | — | | | | — | | | | — | | | | — | | |
| Net realized gain on investments: | |
| Investor Class | | | — | | | | — | | | | (19 | ) | | | (14 | ) | |
| Institutional Class | | | — | | | | — | | | | — | | | | — | | |
| Reserve Class | | | — | | | | — | | | | — | | | | — | | |
| Trust Class | | | — | | | | — | | | | — | | | | — | | |
| Class A | | | — | | | | — | | | | — | | | | — | | |
| Class C | | | — | | | | — | | | | — | | | | — | | |
| Tax return of capital: | |
| Institutional Class | | | — | | | | — | | | | — | | | | — | | |
| Trust Class | | | — | | | | — | | | | — | | | | — | | |
| Class A | | | — | | | | — | | | | — | | | | — | | |
| Class C | | | — | | | | — | | | | — | | | | — | | |
| Total distributions to shareholders | | | (22,528 | ) | | | (34,830 | ) | | | (17,795 | ) | | | (26,534 | ) | |
| From Fund Share Transactions (Note D): | |
| Proceeds from shares sold: | |
| Investor Class | | | 111,100 | | | | 121,484 | | | | 4,555,916 | | | | 7,010,190 | | |
| Institutional Class | | | — | | | | — | | | | — | | | | — | | |
| Reserve Class | | | — | | | | — | | | | — | | | | — | | |
| Trust Class | | | — | | | | — | | | | — | | | | — | | |
| Class A | | | — | | | | — | | | | — | | | | — | | |
| Class C | | | — | | | | — | | | | — | | | | — | | |
| Proceeds from reinvestment of dividends and distributions: | |
| Investor Class | | | 20,432 | | | | 31,864 | | | | 12,986 | | | | 19,030 | | |
| Institutional Class | | | — | | | | — | | | | — | | | | — | | |
| Reserve Class | | | — | | | | — | | | | — | | | | — | | |
| Trust Class | | | — | | | | — | | | | — | | | | — | | |
| Class A | | | — | | | | — | | | | — | | | | — | | |
| Class C | | | — | | | | — | | | | — | | | | — | | |
| Capital contribution from affiliate (Note B) | | | 383 | | | | — | | | | — | | | | — | | |
| Payments for shares redeemed: | |
| Investor Class | | | (254,153 | ) | | | (371,084 | ) | | | (5,045,062 | ) | | | (6,930,867 | ) | |
| Institutional Class | | | — | | | | — | | | | — | | | | — | | |
| Reserve Class | | | — | | | | — | | | | — | | | | — | | |
| Trust Class | | | — | | | | — | | | | — | | | | — | | |
| Class A | | | — | | | | — | | | | — | | | | — | | |
| Class C | | | — | | | | — | | | | — | | | | — | | |
| Net increase (decrease) from Fund share transactions | | | (122,238 | ) | | | (217,736 | ) | | | (476,160 | ) | | | 98,353 | | |
| Net Increase (Decrease) in Net Assets | | | (196,907 | ) | | | (219,037 | ) | | | (476,161 | ) | | | 98,358 | | |
| Net Assets: | |
| Beginning of year | | | 369,246 | | | | 588,283 | | | | 871,508 | | | | 773,150 | | |
| End of year | | $ | 172,339 | | | $ | 369,246 | | | $ | 395,347 | | | $ | 871,508 | | |
| Undistributed net investment income (loss) at end of year | | $ | 26 | | | $ | 25 | | | $ | 1 | | | $ | 1 | | |
| Distributions in excess of net investment income at end of year | | $ | — | | | $ | — | | | $ | — | | | $ | — | | |
73
Statements of Changes in Net Assets (cont'd)
Income Funds (cont'd)
(000's omitted)
| | | MUNICIPAL SECURITIES TRUST | | NEW YORK MUNICIPAL
MONEY FUND | | SHORT DURATION BOND FUND | |
| | | Year Ended
October 31, 2008 | | Year Ended
October 31, 2007 | | Year Ended
October 31, 2008 | | Year Ended
October 31, 2007 | | Year Ended
October 31, 2008 | | Year Ended
October 31, 2007 | |
| Increase (Decrease) in Net Assets: | |
| From Operations: | |
| Net investment income (loss) | | $ | 1,036 | | | $ | 1,077 | | | $ | 16,253 | | | $ | 12,589 | | | $ | 4,404 | | | $ | 5,201 | | |
| Net realized gain (loss) on investments | | | (399 | ) | | | 24 | | | | (138 | ) | | | 11 | | | | 766 | | | | 332 | | |
| Net increase from payments by affiliates | | | — | | | | — | | | | — | | | | — | | | | — | | | | 6 | | |
Change in net unrealized appreciation
(depreciation) of investments | | | (1,131 | ) | | | (358 | ) | | | — | | | | — | | | | (12,892 | ) | | | 267 | | |
Net increase (decrease) in net assets resulting
from operations | | | (494 | ) | | | 743 | | | | 16,115 | | | | 12,600 | | | | (7,722 | ) | | | 5,806 | | |
| Distributions to Shareholders From: | |
| Net investment income: | |
| Investor Class | | | (1,036 | ) | | | (1,077 | ) | | | (16,253 | ) | | | (12,589 | ) | | | (4,280 | ) | | | (4,916 | ) | |
| Institutional Class | | | — | | | | — | | | | — | | | | — | | | | — | | | | — | | |
| Reserve Class | | | — | | | | — | | | | — | | | | — | | | | — | | | | — | | |
| Trust Class | | | — | | | | — | | | | — | | | | — | | | | (583 | ) | | | (694 | ) | |
| Class A | | | — | | | | — | | | | — | | | | — | | | | — | | | | — | | |
| Class C | | | — | | | | — | | | | — | | | | — | | | | — | | | | — | | |
| Net realized gain on investments: | |
| Investor Class | | | (24 | ) | | | (126 | ) | | | (11 | ) | | | (4 | ) | | | — | | | | — | | |
| Institutional Class | | | — | | | | — | | | | — | | | | — | | | | — | | | | — | | |
| Reserve Class | | | — | | | | — | | | | — | | | | — | | | | — | | | | — | | |
| Trust Class | | | — | | | | — | | | | — | | | | — | | | | — | | | | — | | |
| Class A | | | — | | | | — | | | | — | | | | — | | | | — | | | | — | | |
| Class C | | | — | | | | — | | | | — | | | | — | | | | — | | | | — | | |
| Tax return of capital: | |
| Institutional Class | | | — | | | | — | | | | — | | | | — | | | | — | | | | — | | |
| Trust Class | | | — | | | | — | | | | — | | | | — | | | | — | | | | — | | |
| Class A | | | — | | | | — | | | | — | | | | — | | | | — | | | | — | | |
| Class C | | | — | | | | — | | | | — | | | | — | | | | — | | | | — | | |
| Total distributions to shareholders | | | (1,060 | ) | | | (1,203 | ) | | | (16,264 | ) | | | (12,593 | ) | | | (4,863 | ) | | | (5,610 | ) | |
| From Fund Share Transactions (Note D): | |
| Proceeds from shares sold: | |
| Investor Class | | | 6,449 | | | | 4,183 | | | | 2,999,266 | | | | 2,697,772 | | | | 9,812 | | | | 7,481 | | |
| Institutional Class | | | — | | | | — | | | | — | | | | — | | | | — | | | | — | | |
| Reserve Class | | | — | | | | — | | | | — | | | | — | | | | — | | | | — | | |
| Trust Class | | | — | | | | — | | | | — | | | | — | | | | 2,358 | | | | 3,314 | | |
| Class A | | | — | | | | — | | | | — | | | | — | | | | — | | | | — | | |
| Class C | | | — | | | | — | | | | — | | | | — | | | | — | | | | — | | |
Proceeds from reinvestment of dividends and
distributions: | |
| Investor Class | | | 870 | | | | 974 | | | | 12,177 | | | | 8,590 | | | | 3,934 | | | | 4,504 | | |
| Institutional Class | | | — | | | | — | | | | — | | | | — | | | | — | | | | — | | |
| Reserve Class | | | — | | | | — | | | | — | | | | — | | | | — | | | | — | | |
| Trust Class | | | — | | | | — | | | | — | | | | — | | | | 569 | | | | 673 | | |
| Class A | | | — | | | | — | | | | — | | | | — | | | | — | | | | — | | |
| Class C | | | — | | | | — | | | | — | | | | — | | | | — | | | | — | | |
| Capital contribution from affiliate | | | — | | | | — | | | | — | | | | — | | | | — | | | | — | | |
| Payments for shares redeemed: | |
| Investor Class | | | (8,028 | ) | | | (8,962 | ) | | | (3,333,188 | ) | | | (2,156,418 | ) | | | (34,544 | ) | | | (26,840 | ) | |
| Institutional Class | | | — | | | | — | | | | — | | | | — | | | | — | | | | — | | |
| Reserve Class | | | — | | | | — | | | | — | | | | — | | | | — | | | | — | | |
| Trust Class | | | — | | | | — | | | | — | | | | — | | | | (5,227 | ) | | | (7,510 | ) | |
| Class A | | | — | | | | — | | | | — | | | | — | | | | — | | | | — | | |
| Class C | | | — | | | | — | | | | — | | | | — | | | | — | | | | — | | |
| Net increase (decrease) from Fund share transactions | | | (709 | ) | | | (3,805 | ) | | | (321,745 | ) | | | 549,944 | | | | (23,098 | ) | | | (18,378 | ) | |
| Net Increase (Decrease) in Net Assets | | | (2,263 | ) | | | (4,265 | ) | | | (321,894 | ) | | | 549,951 | | | | (35,683 | ) | | | (18,182 | ) | |
| Net Assets: | |
| Beginning of year | | | 27,828 | | | | 32,093 | | | | 723,141 | | | | 173,190 | | | | 106,498 | | | | 124,680 | | |
| End of year | | $ | 25,565 | | | $ | 27,828 | | | $ | 401,247 | | | $ | 723,141 | | | $ | 70,815 | | | $ | 106,498 | | |
| Undistributed net investment income (loss) at end of year | | $ | — | | | $ | — | | | $ | — | | | $ | — | | | $ | 196 | | | $ | 480 | | |
Distributions in excess of net investment income at
end of year | | $ | — | | | $ | — | | | $ | — | | | $ | — | | | $ | — | | | $ | — | | |
See Notes to Financial Statements 74
| | | STRATEGIC INCOME FUND | | CASH RESERVES | |
| | | Year Ended
October 31, 2008 | | Year Ended
October 31, 2007 | | Year Ended
October 31, 2008 | | Year Ended
October 31, 2007 | |
| Increase (Decrease) in Net Assets: | |
| From Operations: | |
| Net investment income (loss) | | $ | 551 | | | $ | 782 | | | $ | 11,612 | | | $ | 19,913 | | |
| Net realized gain (loss) on investments | | | (9 | ) | | | 838 | | | | (42 | ) | | | (11 | ) | |
| Net increase from payments by affiliates | | | — | | | | — | | | | — | | | | — | | |
Change in net unrealized appreciation
(depreciation) of investments | | | (1,075 | ) | | | (558 | ) | | | — | | | | — | | |
Net increase (decrease) in net assets resulting
from operations | | | (533 | ) | | | 1,062 | | | | 11,570 | | | | 19,902 | | |
| Distributions to Shareholders From: | |
| Net investment income: | |
| Investor Class | | | — | | | | — | | | | (11,612 | ) | | | (19,913 | ) | |
| Institutional Class | | | (377 | ) | | | (810 | ) | | | — | | | | — | | |
| Reserve Class | | | — | | | | — | | | | — | | | | — | | |
| Trust Class | | | (9 | ) | | | (4 | ) | | | — | | | | — | | |
| Class A | | | (3 | ) | | | — | | | | — | | | | — | | |
| Class C | | | (3 | ) | | | — | | | | — | | | | — | | |
| Net realized gain on investments: | |
| Investor Class | | | — | | | | — | | | | — | | | | — | | |
| Institutional Class | | | (864 | ) | | | (727 | ) | | | — | | | | — | | |
| Reserve Class | | | — | | | | — | | | | — | | | | — | | |
| Trust Class | | | (14 | ) | | | — | | | | — | | | | — | | |
| Class A | | | (6 | ) | | | — | | | | — | | | | — | | |
| Class C | | | (6 | ) | | | — | | | | — | | | | — | | |
| Tax return of capital: | |
| Institutional Class | | | (114 | ) | | | — | | | | — | | | | — | | |
| Trust Class | | | (3 | ) | | | — | | | | — | | | | — | | |
| Class A | | | (1 | ) | | | — | | | | — | | | | — | | |
| Class C | | | (1 | ) | | | — | | | | — | | | | — | | |
| Total distributions to shareholders | | | (1,401 | ) | | | (1,541 | ) | | | (11,612 | ) | | | (19,913 | ) | |
| From Fund Share Transactions (Note D): | |
| Proceeds from shares sold: | |
| Investor Class | | | — | | | | — | | | | 1,801,441 | | | | 764,810 | | |
| Institutional Class | | | 279 | | | | 823 | | | | — | | | | — | | |
| Reserve Class | | | — | | | | — | | | | — | | | | — | | |
| Trust Class | | | 380 | | | | 272 | | | | — | | | | — | | |
| Class A | | | 173 | | | | — | | | | — | | | | — | | |
| Class C | | | 136 | | | | — | | | | — | | | | — | | |
Proceeds from reinvestment of dividends and
distributions: | |
| Investor Class | | | — | | | | — | | | | 7,384 | | | | 11,724 | | |
| Institutional Class | | | 817 | | | | 913 | | | | — | | | | — | | |
| Reserve Class | | | — | | | | — | | | | — | | | | — | | |
| Trust Class | | | 26 | | | | 4 | | | | — | | | | — | | |
| Class A | | | 11 | | | | — | | | | — | | | | — | | |
| Class C | | | 9 | | | | — | | | | — | | | | — | | |
| Capital contribution from affiliate | | | — | | | | — | | | | — | | | | — | | |
| Payments for shares redeemed: | |
| Investor Class | | | — | | | | — | | | | (1,210,468 | ) | | | (1,075,515 | ) | |
| Institutional Class | | | (11,669 | ) | | | (4,654 | ) | | | — | | | | — | | |
| Reserve Class | | | — | | | | — | | | | — | | | | — | | |
| Trust Class | | | (232 | ) | | | (60 | ) | | | — | | | | — | | |
| Class A | | | — | | | | — | | | | — | | | | — | | |
| Class C | | | (8 | ) | | | — | | | | — | | | | — | | |
| Net increase (decrease) from Fund share transactions | | | (10,078 | ) | | | (2,702 | ) | | | 598,357 | | | | (298,981 | ) | |
| Net Increase (Decrease) in Net Assets | | | (12,012 | ) | | | (3,181 | ) | | | 598,315 | | | | (298,992 | ) | |
| Net Assets: | |
| Beginning of year | | | 17,221 | | | | 20,402 | | | | 306,866 | | | | 605,858 | | |
| End of year | | $ | 5,209 | | | $ | 17,221 | | | $ | 905,181 | | | $ | 306,866 | | |
| Undistributed net investment income (loss) at end of year | | $ | — | | | $ | 55 | | | $ | 4 | | | $ | 4 | | |
Distributions in excess of net investment income at
end of year | | $ | (4 | ) | | $ | — | | | $ | — | | | $ | — | | |
75
Notes to Financial Statements Income Funds
Note A—Summary of Significant Accounting Policies:
1 General: Neuberger Berman California Tax-Free Money Fund ("California Tax-Free Money ") (formerly, Lehman Brothers California Tax-Free Money Fund), Neuberger Berman Core Bond Fund ("Core Bond") (formerly, Lehman Brothers Core Bond Fund), Neuberger Berman Core Plus Bond Fund ("Core Plus Bond") (formerly, Lehman Brothers Core Plus Bond Fund), Neuberger Berman High Income Bond Fund ("High Income") (formerly, Lehman Brothers High Income Bond Fund), Neuberger Berman Municipal Money Fund ("Municipal Money") (formerly, Lehman Brothers Municipal Money Fund), Neuberger Berman Municipal Securities Trust ("Municipal Securities Trust") (formerly, Lehman Brothers Municipal Securities Trust), Neuberger Berman New York Municipal Money Fund ("New York Municipal Money") (formerly, Lehman Brothers New York Municipal Money Fund), Neuberger Berman Short Dura tion Bond Fund ("Short Duration") (formerly, Lehman Brothers Short Duration Bond Fund), Neuberger Berman Strategic Income Fund ("Strategic Income") (formerly, Lehman Brothers Strategic Income Fund), and Neuberger Berman Cash Reserves ("Cash Reserves"), (individually a "Fund", collectively, the "Funds") are separate operating series of Lehman Brothers Income Funds, (the "Trust"), a Delaware statutory trust organized pursuant to a Trust Instrument dated December 23, 1992. The Trust is registered as a diversified, open-end management investment company under the Investment Company Act of 1940, as amended (the "1940 Act"), and its shares are registered under the Securities Act of 1933, as amended (the "1933 Act"). Eight funds offer Investor Class shares, three offer Institutional Class shares, one offers Reserve Class shares, two offer Trust Class shares, three offer Class A shares and three offer Class C shares. The Board of Trustees of the Trust (the "Board") may establish additional series or classes of share s without the approval of shareholders.
The assets of each Fund belong only to that Fund, and the liabilities of each Fund are borne solely by that Fund and no other.
It is the policy of California Tax-Free Money, Municipal Money, New York Municipal Money, and Cash Reserves to maintain a continuous net asset value per share of $1.00; each of these Funds has adopted certain investment, valuation, and dividend and distribution policies, which conform to general industry practice, to enable it to do so. However, there is no assurance each of these Funds will be able to maintain a stable net asset value per share. Each of these Funds complies with Rule 2a-7 of the 1940 Act.
The preparation of financial statements in accordance with U.S. generally accepted accounting principles requires Neuberger Berman Management LLC ("Management") to make estimates and assumptions at the date of the financial statements. Actual results could differ from those estimates.
Management, the investment manager of the Funds, and Lehman Brothers Asset Management LLC ("LBAM"), the Funds' sub-adviser, are wholly owned subsidiaries of Lehman Brothers Holdings Inc. ("Lehman Brothers"), a publicly owned holding company. On September 15, 2008, Lehman Brothers filed a voluntary petition under Chapter 11 of the U.S. Bankruptcy Code. On December 1, 2008, Lehman Brothers and NBSH Acquisition, LLC ("NBSH") entered into an agreement (the "Purchase Agreement") pursuant to which a group consisting of portfolio managers, the management team and certain key employees and senior professionals of the Investment Management Division of Lehman Brothers ("Management Members") will acquire a majority interest in Neuberger Berman's business and the fixed income and certain alternative asset management businesses of Lehman Brothers' Investment Management Division (together with Neuberger Berman, the "Acquired Businesses") (the "Proposed Acquisition"). Lehman Brothers will retain a 49% voting interest in the Acquired Businesses. On December 3, 2008, Lehman Brothers selected NBSH as the successful bidder in the public auction for the Acquired Businesses, which was overseen by the bankruptcy court having jurisdiction over the Lehman Brothers matter. The transaction is subject to certain conditions and approvals, including final approval by the bankruptcy court.
These events, while affecting Lehman Brothers, have not had a material impact on the Funds or their operations. Management and LBAM will continue to operate in the ordinary course of business as the investment manager and sub-adviser of the Funds.
76
Included in the Acquired Businesses are Management and LBAM. The consummation of the Proposed Acquisition could be deemed an "assignment" of the Funds' Management and Sub-Advisory Agreements which would, by law, automatically terminate those agreements. Accordingly, the Funds' Board of Trustees, including the Trustees who are not "interested persons" of the investment manager and its affiliates or the Funds, are engaged in a review of the new Management Agreements and Sub-Advisory Agreements for the Funds. The new agreements also will require the approval of the Funds' shareholders.
2 Portfolio valuation: Investment securities are valued as indicated in the notes following each Fund's Schedule of Investments.
3 Foreign currency translation: Core Bond, Core Plus Bond, High Income, Short Duration and Strategic Income may invest in foreign securities denominated in foreign currencies. The accounting records of the Funds are maintained in U.S. dollars. Foreign currency amounts are currently translated into U.S. dollars using the exchange rate as of 4:00 p.m., Eastern time, to determine the value of investments, other assets and liabilities. Purchase and sale prices of securities, and income and expenses, are translated into U.S. dollars at the prevailing rate of exchange on the respective dates of such transactions. Net unrealized foreign currency gain (loss) arises from changes in the value of assets and liabilities, other than investments in securities, as a result of changes in exchange rates and is stated separately in the Statements of Operatio ns.
4 Securities transactions and investment income: Securities transactions are recorded on trade date for financial reporting purposes. Dividend income is recorded on the ex-dividend date or, for certain foreign dividends, as soon as the Fund becomes aware of the dividends. Non-cash dividends included in dividend income, if any, are recorded at the fair market value of the securities received. Interest income, including accretion of discount (adjusted for original issue discount, where applicable) and amortization of premium, where applicable, is recorded on the accrual basis. Realized gains and losses from securities transactions (for each Fund) and foreign currency transactions (for High Income, Short Duration and Strategic Income), if any, are recorded on the basis of identified cost and stated separately in the Statements of Operations. I ncluded in net realized gain (loss) on investments are proceeds from the settlements of class action litigation in which Core Bond and Short Duration participated as a plaintiff. The amounts of such proceeds for the year ended October 31, 2008 were $106,648 and $61,062 for Core Bond and Short Duration, respectively.
5 Income tax information: Each Fund is treated as a separate entity for U.S. federal income tax purposes. It is the policy of each Fund, except California Tax-Free Money and Core Plus Bond, to continue to, and the intention of California Tax-Free Money and Core Plus Bond, to qualify as a regulated investment company by complying with the requirements of Subchapter M of the Internal Revenue Code applicable to regulated investment companies and to distribute substantially all of its earnings to its shareholders. Therefore, no federal income or excise tax provision is required.
The Funds have adopted the provisions of Financial Accounting Standards Board Interpretation No. 48 ("FIN 48") "Accounting for Uncertainty in Income Taxes - an interpretation of FASB Statement No. 109". FIN 48 sets forth a minimum threshold for financial statement recognition of the benefit of a tax position taken, or expected to be taken, in a tax return. The Funds recognize interest and penalties, if any, related to unrecognized tax benefits as an income tax expense in the Statements of Operations. The Funds are subject to examination by U.S. federal and state tax authorities for returns filed for the prior three fiscal years 2005 - 2007. As of October 31, 2008, the Funds did not have any unrecognized tax benefits.
Income distributions and capital gain distributions are determined in accordance with income tax regulations, which may differ from U.S. generally accepted accounting principles. These differences are primarily due to differing treatments of income and gains on various investment securities held by each Fund, timing differences and differing characterization of distributions made by each Fund as a whole. The Funds may also utilize earnings and profits distributed to shareholders on redemption of shares as a part of the dividends paid deduction for income tax purposes.
As determined on October 31, 2008, permanent differences resulting primarily from different book and tax accounting for amortization of bond premium, paydown gains and losses, expiration of capital loss carryforwards, characterization
77
of distributions, the tax character of the proceeds from the settlement of class action litigations, distribution redesignations, return of capital adjustments, and foreign currency gains and losses were reclassified at fiscal year-end. These reclassifications had no effect on net income, net asset value or net asset value per share of each Fund.
The tax character of distributions paid during the years ended October 31, 2008 and October 31, 2007 were as follows:
| | | Distributions Paid From: | |
| | | Taxable Income | | Tax-Exempt Income | | Long-Term
Capital Gain | | Return of
Capital | | Total | |
| | | 2008 | | 2007 | | 2008 | | 2007 | | 2008 | | 2007 | | 2008 | | 2007 | | 2008 | | 2007 | |
California Tax-Free
Money(1) | | $ | — | | | $ | — | | | $ | 430,485 | | | $ | — | | | $ | — | | | $ | — | | | $ | — | | | $ | — | | | $ | 430,485 | | | $ | — | | |
| Core Bond | | | 3,860,611 | | | | 3,802,047 | | | | — | | | | — | | | | — | | | | — | | | | — | | | | — | | | | 3,860,611 | | | | 3,802,047 | | |
| Core Plus Bond(2) | | | 484,806 | | | | — | | | | — | | | | — | | | | — | | | | — | | | | — | | | | — | | | | 484,806 | | | | — | | |
| High Income | | | 22,528,252 | | | | 34,829,808 | | | | — | | | | — | | | | — | | | | — | | | | — | | | | — | | | | 22,528,252 | | | | 34,829,808 | | |
| Municipal Money | | | 13,846 | | | | 14,262 | | | | 17,775,982 | | | | 26,520,266 | | | | 5,377 | | | | — | | | | — | | | | — | | | | 17,795,205 | | | | 26,534,528 | | |
Municipal Securities
Trust | | | 411 | | | | 388 | | | | 1,035,831 | | | | 1,076,787 | | | | 24,194 | | | | 125,933 | | | | — | | | | — | | | | 1,060,436 | | | | 1,203,108 | | |
New York Municipal
Money | | | 10,506 | | | | 4,144 | | | | 16,253,133 | | | | 12,589,326 | | | | 211 | | | | — | | | | — | | | | — | | | | 16,263,850 | | | | 12,593,470 | | |
| Short Duration | | | 4,863,512 | | | | 5,609,665 | | | | — | | | | — | | | | — | | | | — | | | | — | | | | — | | | | 4,863,512 | | | | 5,609,665 | | |
| Strategic Income | | | 557,000 | | | | 981,159 | | | | — | | | | — | | | | 724,810 | | | | 559,884 | | | | 119,014 | | | | — | | | | 1,400,824 | | | | 1,541,043 | | |
| Cash Reserves | | | 11,611,617 | | | | 19,912,605 | | | | — | | | | — | | | | — | | | | — | | | | — | | | | — | | | | 11,611,617 | | | | 19,912,605 | | |
(1) Period from December 27, 2007 (Commencement of Operations) to October 31, 2008.
(2) Period from May 1, 2008 (Commencement of Operations) to October 31, 2008.
As of October 31, 2008, the components of distributable earnings (accumulated losses) on a U.S. federal income tax basis were as follows:
| | | Undistributed
Ordinary
Income | | Undistributed
Tax-Exempt
Income | | Undistributed
Long-Term
Gain | | Unrealized
Appreciation
(Depreciation) | | Loss
Carryforwards
and Deferrals | | Total | |
| California Tax-Free Money | | $ | — | | | $ | 61,448 | | | $ | — | | | $ | — | | | $ | (301 | ) | | $ | 61,147 | | |
| Core Bond | | | 43,096 | | | | — | | | | — | | | | (12,693,596 | ) | | | — | | | | (12,650,500 | ) | |
| Core Plus Bond | | | 88,234 | | | | — | | | | — | | | | (1,903,595 | ) | | | (211,767 | ) | | | (2,027,128 | ) | |
| High Income | | | 134,075 | | | | — | | | | — | | | | (42,976,190 | ) | | | (52,696,019 | ) | | | (95,538,134 | ) | |
| Municipal Money | | | 17,971 | | | | 3,793 | | | | — | | | | — | | | | — | | | | 21,764 | | |
| Municipal Securities Trust | | | — | | | | 10,912 | | | | — | | | | (899,727 | ) | | | (398,772 | ) | | | (1,287,587 | ) | |
| New York Municipal Money | | | — | | | | 37,008 | | | | — | | | | — | | | | (138,731 | ) | | | (101,723 | ) | |
| Short Duration | | | 214,344 | | | | — | | | | — | | | | (13,217,475 | ) | | | (8,982,664 | ) | | | (21,985,795 | ) | |
| Strategic Income | | | — | | | | — | | | | — | | | | (519,247 | ) | | | — | | | | (519,247 | ) | |
| Cash Reserves | | | 6,956 | | | | — | | | | — | | | | — | | | | (97,444 | ) | | | (90,488 | ) | |
The differences between book basis and tax basis distributable earnings are attributable primarily to timing differences of distribution payments, timing differences of wash sales, partnership basis adjustments, non-deductible 12b-1 fees, mark to market on certain foreign currency and futures contract transactions, capital loss carryforwards, amortization of bond premium, organization expenses and depletion basis adjustments.
78
To the extent each Fund's net realized capital gains, if any, can be offset by capital loss carryforwards, it is the policy of each Fund not to distribute such gains. As determined on October 31, 2008, the following Funds had unused capital loss carryforwards available for federal income tax purposes to offset net realized capital gains, if any, as follows:
| | | Expiring in: | |
| | | 2009 | | 2010 | | 2011 | | 2012 | | 2013 | | 2014 | | 2015 | | 2016 | |
California
Tax-Free Money | | $ | — | | | $ | — | | | $ | — | | | $ | — | | | $ | — | | | $ | — | | | $ | — | | | $ | 301 | | |
| Core Plus Bond | | | — | | | | — | | | | — | | | | — | | | | — | | | | — | | | | — | | | | 211,767 | | |
| High Income(1) | | | 923,187 | | | | — | | | | — | | | | — | | | | — | | | | 16,417,263 | | | | — | | | | 35,355,569 | | |
Municipal Securities
Trust | | | — | | | | — | | | | — | | | | — | | | | — | | | | — | | | | — | | | | 398,772 | | |
New York Municipal
Money | | | — | | | | — | | | | — | | | | — | | | | — | | | | — | | | | — | | | | 138,731 | | |
| Short Duration | | | 456,883 | | | | — | | | | — | | | | 2,468,731 | | | | 3,168,736 | | | | 2,244,689 | | | | 643,625 | | | | — | | |
| Cash Reserves | | | — | | | | — | | | | — | | | | — | | | | 10,879 | | | | 33,043 | | | | 11,961 | | | | 41,561 | | |
(1) Of the total capital loss carryforwards shown above for High Income, $923,187 was acquired on September 6, 2002 in the merger with Neuberger Berman High Yield Bond Fund. The use of these losses to offset future gains may be limited in a given year.
6 Distributions to shareholders: Each Fund earns income, net of expenses, daily on its investments. It is the policy of each Fund to declare distributions from net investment income on each business day; such distributions are paid monthly. Prior to April 1, 2008, Strategic Income declared and paid income dividends quarterly. Distributions from net realized capital gains, if any, are generally distributed in December. Distributions to shareholders are recorded on the ex-date.
Prior to February 28, 2008, Strategic Income invested a portion of its assets in securities issued by real estate companies, including real estate investment trusts ("REITs"). The distributions received from REITs held by the Fund are generally comprised of income, capital gains, and return of REIT capital, but the REITs do not report this information to the Fund until the following calendar year. At October 31, 2008, the Fund estimated these amounts within the financial statements since the information is not available from the REITs until after the Fund's fiscal year-end. For the year ended October 31, 2008, the character of distributions paid to shareholders is disclosed within the Statements of Changes and is based on estimates made at that time. All estimates are based upon REIT information sources available to the Fund together with actual IRS Forms 1099DIV received to date. Based on past experience it is possible that a p ortion of the Fund's distributions during the current fiscal year will be considered tax return of capital but the actual amount of tax return of capital, if any, is not determinable until after the Fund's fiscal year-end. After calendar year-end, when the Fund learns the nature of the distributions paid by REITs during that year, distributions previously identified as income are often recharacterized as return of capital and/or capital gain. After all applicable REITs have informed the Fund of the actual breakdown of distributions paid to the Fund during its fiscal year, estimates previously recorded are adjusted on the books of the Fund to reflect actual results. As a result, the composition of the Fund's distributions as reported herein may differ from the final composition determined after calendar year-end and reported to Fund shareholders on IRS Form 1099DIV.
7 Organization expenses: Costs incurred by California Tax-Free Money and Core Plus Bond in connection with its organization, which amounted to $47,176 and $90,763 have been expensed as incurred.
79
8 Expense allocation: Certain expenses are applicable to multiple funds. Expenses directly attributable to a Fund are charged to that Fund. Expenses of the Trust that are not directly attributed to a Fund are allocated among the Funds, on the basis of relative net assets, except where a more appropriate allocation of expenses to each of the Funds can otherwise be made fairly. Expenses borne by the complex of related investment companies, which includes open-end and closed-end investment companies for which Management serves as investment manager, that are not directly attributed to a Fund or the Trust are allocated among the Funds and the other investment companies in the complex or series thereof on the basis of relative net assets, except where a more appropriate allocation of expenses to each investment company in the complex or series t hereof can otherwise be made fairly. Each Fund's expenses (other than those specific to each class) are allocated proportionally each day between the classes based upon the relative net assets of each class.
9 Financial futures contracts: Core Bond, Core Plus Bond, High Income, Municipal Securities Trust, Short Duration, and Strategic Income may each buy and sell financial futures contracts to hedge against changes in securities prices resulting from changes in prevailing interest rates. At the time a Fund enters into a financial futures contract, it is required to deposit with the futures commission merchant a specified amount of cash or liquid securities, known as "initial margin," ranging upward from 1.1% of the value of the financial futures contract being traded. Each day, the futures contract is valued at the official settlement price of the board of trade or U.S. commodity exchange on which such futures contract is traded. Subsequent payments, known as "variation margin," to and from the broker are made on a daily basis as the market pri ce of the financial futures contract fluctuates. Daily variation margin adjustments, arising from this "mark to market," are recorded by the Funds as unrealized gains or losses.
Although some financial futures contracts by their terms call for actual delivery or acceptance of financial instruments, in most cases the contracts are closed out prior to delivery by offsetting purchases or sales of matching financial futures contracts. When the contracts are closed, a Fund recognizes a gain or loss. Risks of entering into futures contracts include the possibility there may be an illiquid market, possibly at a time of rapidly declining prices, and/or a change in the value of the contract may not correlate with changes in the value of the underlying securities.
For U.S. federal income tax purposes, the futures transactions undertaken by a Fund may cause that Fund to recognize gains or losses from marking contracts to market even though its positions have not been sold or terminated, may affect the character of the gains or losses recognized as long-term or short-term, and may affect the timing of some capital gains and losses realized by the Fund. Also, a Fund's losses on transactions involving futures contracts may be deferred rather than being taken into account currently in calculating such Fund's taxable income.
During the year ended October 31, 2008, Core Bond, Core Plus Bond, High Income, Municipal Securities Trust, and Strategic Income did not enter into any financial futures contracts. During the year ended October 31, 2008, Short Duration entered into financial futures contracts. At October 31, 2008, open positions in financial futures contracts were:
| Expiration | | Open Contracts | | Position | | Unrealized Appreciation | |
| December 2008 | | 122 U.S. Treasury Notes, 2 Year | | Long | | $ | 294,769 | | |
At October 31, 2008, Short Duration had deposited $772,829 in Fannie Mae Whole Loan, 10.43%, due 11/3/08, in a segregated account to cover margin requirements on open futures contracts.
10 Forward foreign currency contracts: High Income, Short Duration, and Strategic Income may each enter into forward foreign currency contracts ("contracts") in connection with planned purchases or sales of securities to hedge the U.S. dollar value of portfolio securities denominated in a foreign currency. The gain or loss arising from the difference between the original contract price and the closing price of such contract is included in net realized gains or losses on foreign currency transactions on settlement date. Fluctuations in the value of such contracts are recorded for financial reporting purposes as unrealized gains or losses by each Fund until the contractual
80
settlement date. The Funds could be exposed to risks if a counter party to a contract were unable to meet the terms of its contract or if the value of the foreign currency changes unfavorably. The U.S. dollar value of foreign currency underlying all contractual commitments held by each Fund is determined using forward foreign currency exchange rates supplied by an independent pricing service.
11 Call options: Premiums received by Strategic Income upon writing a covered call option are recorded in the liability section of the Fund's Statement of Assets and Liabilities and are subsequently adjusted to the current market value. When an option is exercised, closed, or expired, the Fund realizes a gain or loss and the liability is eliminated. The Fund bears the risk of a decline in the price of the security during the period, although any potential loss during the period would be reduced by the amount of the option premium received. In general, written covered call options may serve as a partial hedge against decreases in value in the underlying securities to the extent of the premium received. All securities covering outstanding options are held in escrow by the custodian bank.
Summary of written option transactions for Strategic Income for the year ended October 31, 2008:
| | | Number | | Value When
Written | |
| Contracts outstanding 10/31/2007 | | | 5,500 | | | $ | 4,000 | | |
| Contracts written | | | 2,400 | | | | 4,500 | | |
| Contracts expired | | | (4,000 | ) | | | (2,500 | ) | |
| Contracts exercised | | | (400 | ) | | | (1,000 | ) | |
| Contracts closed | | | (3,500 | ) | | | (5,000 | ) | |
| Contracts outstanding 10/31/2008 | | | — | | | $ | — | | |
12 Security lending: A third party, eSecLending, has assisted Core Bond, High Income, Short Duration and Strategic Income in conducting a bidding process to identify agents/principals that would pay a guaranteed amount to each Fund in consideration of that Fund entering into an exclusive securities lending arrangement.
eSecLending currently serves as exclusive lending agent for Core Bond, High Income and Short Duration. Core Bond, High Income and Short Duration are currently not guaranteed any particular level of income. eSecLending previously served as exclusive lending agent for Strategic Income for part of the fiscal year. Currently, Strategic Income has no lending agent.
Neuberger Berman, LLC ("Neuberger"), an affiliate of each Fund, previously served as exclusive lending agent for Core Bond and High Income for part of the fiscal year. Each Fund selected Neuberger through the bidding process in accordance with an Exemptive Order issued by the Securities and Exchange Commission.
Under the securities lending arrangements, each Fund receives cash collateral at the beginning of each transaction equal to at least 102% of the prior day's market value of the loaned securities (105% in the case of international securities). Each Fund may invest all the cash collateral in Neuberger Berman Securities Lending Quality Fund, LLC ("Quality Fund"), a fund managed by Lehman Brothers Asset Management LLC, an affiliate of Management.
At various times during the course of the Funds' fiscal year ended October 31, 2008, the Quality Fund's NAV was below $1.00 per share, which could have affected the NAV of the Funds with securities loans outstanding during the period. The Quality Fund's price per share on October 31, 2008 was $0.99. Except for Core Bond and High Income Bond, the market value of each Funds' investments in the Quality Fund as of that date is reflected in the Fund's Schedule of Investments. If it were necessary to liquidate assets in the Quality Fund to meet returns on outstanding securities loans at a time when the Quality Fund's price per share was less than $1.00, a Fund may not receive an amount from the Quality Fund that is equal in amount to the collateral the Fund would be required to return to the borrower of the securities and the Fund would be required to make up for this shortfall. In addition, as a result of recent reduced liquidity in the credit and fixed income markets, it may be difficult to dispose quickly
81
of some securities in the Quality Fund at the price at which the Quality Fund is carrying them. The Quality Fund is not a money market fund that operates in accordance with Rule 2a-7 under the 1940 Act and there is no assurance that it will maintain a $1.00 share price.
Net income from the applicable lending program represents the guaranteed amount received from a principal, if applicable, plus income earned on the cash collateral invested in Quality Fund or in other investments, if applicable, less cash collateral fees and other expenses associated with the loans. For the fiscal year ended October 31, 2008, the approximate amount of net income received by each Fund under the securities lending arrangements, which is reflected in the Statements of Operations under the caption "Income from securities loaned-net"; the approximate amount of income earned on cash collateral and guaranteed amounts; and the approximate amount of fees and expenses paid on securities loaned are as follows:
| | | Total Interest
Income Earned
From the
Quality Fund
and Guaranteed
Amounts | | Fees and
Expenses
Paid | | Net
Income | | Interest
Income
Earned From
the Quality
Fund | | Guaranteed
Amounts
Received
From
Neuberger | | Fees and
Expenses Paid,
Retained by
Neuberger | |
| Core Bond | | $ | 20,479 | | | $ | 1,278 | | | $ | 19,201 | | | $ | — | | | $ | 20,479 | | | $ | — | | |
| High Income | | | 75,310 | | | | 39,339 | | | | 35,971 | | | | 33,448 | | | | 38,196 | | | | — | | |
| Strategic Income | | | 92 | | | | 59 | | | | 33 | | | | (11 | ) | | | — | | | | — | | |
13 Repurchase agreements: Each Fund may enter into repurchase agreements with institutions that Management has determined are creditworthy. Each repurchase agreement is recorded at cost. Each Fund requires that the securities purchased in a repurchase agreement be transferred to the custodian in a manner sufficient to enable the Fund to assert a perfected security interest in those securities in the event of a default under the repurchase agreement. Each Fund monitors, on a daily basis, the value of the securities transferred to ensure that their value, including accrued interest, is greater than amounts owed to the Fund under each such repurchase agreement.
14 Dollar rolls: Core Bond, Core Plus Bond, High Income, Short Duration, and Strategic Income may enter into dollar roll transactions with respect to mortgage-backed securities. In a dollar roll transaction, a Fund sells securities for delivery in the current month and simultaneously agrees to repurchase substantially similar (i.e., same type and coupon) securities on a specified future date from the same party. During the period before this repurchase, a Fund forgoes principal and interest payments on the securities. A Fund is compensated by the difference between the current sales price and the forward price for the future purchase (often referred to as the "drop"), as well as by the intere st earned on the cash proceeds of the initial sale. Dollar rolls may increase fluctuations in a Fund's net asset value and may be viewed as a form of leverage. There is a risk that the counter party will be unable or unwilling to complete the transaction as scheduled, which may result in losses to a Fund.
15 Other: All net investment income and realized and unrealized capital gains and losses of each Fund are allocated, on the basis of relative net assets, pro rata among its respective classes.
16 Transactions with other funds managed by Neuberger Berman Management LLC.: Pursuant to an Exemptive Order issued by the Securities and Exchange Commission, the Funds may invest in a money market fund managed by Management or an affiliate. The Funds invest in Neuberger Berman Prime Money Fund ("Prime Money"), as approved by the Board. Prime Money seeks to provide the highest available current income consistent with safety and liquidity. For any cash that the Funds invest in Prime Money, Management waives a portion of its management fee equal to the management fee it receives from Prime Money on those assets (the "Arrangement"). For the year ended October 31, 2008, management fees waived under this Arrangement are reflected in the Statements of Operations under the caption "Investment management fees waived." For the year ended October 31 , 2008, income earned under this Arrangement is reflected in the Statements of Operations under the caption "Income from
82
investments in affiliated issuers." For the year ended October 31, 2008, management fees waived and income earned under this Arrangement were as follows:
| | | Management
Fees Waived | | Income
Earned | |
| Core Bond | | $ | 4,539 | | | $ | 158,578 | | |
| Core Plus Bond | | | 1,111 | | | | 32,682 | | |
| High Income | | | 8,153 | | | | 309,495 | | |
| Strategic Income | | | 588 | | | | 19,979 | | |
17 Foreign taxes: Foreign taxes withheld represent amounts withheld by foreign tax authorities, net of refunds recoverable.
18 Indemnifications: Like many other companies, the Trust's organizational documents provide that its officers and trustees are indemnified against certain liabilities arising out of the performance of their duties to the Trust. In addition, both in some of its principal service contracts and in the normal course of its business, the Trust enters into contracts that provide indemnifications to other parties for certain types of losses or liabilities. The Trust's maximum exposure under these arrangements is unknown as this could involve future claims against the Trust.
Note B—Management Fees, Administration Fees, Distribution Arrangements, and Other Transactions with Affiliates:
Each Fund retains Management as its investment manager under a Management Agreement. For such investment management services, each Fund (except High Income, Strategic Income, and Cash Reserves) pays Management a fee at the annual rate of 0.25% of the first $500 million of that Fund's average daily net assets, 0.225% of the next $500 million, 0.20% of the next $500 million, 0.175% of the next $500 million, and 0.15% of average daily net assets in excess of $2 billion. High Income, Strategic Income, and Cash Reserves each pay Management a fee for investment management services at the annual rates of 0.48%, 0.55% (0.60% prior to February 28, 2008), and 0.10%, respectively, of each Fund's average daily net assets. Management has voluntarily agreed to waive its management fee in the amount of 0.25% and 0.02% of the average daily net assets of Core Bond and Cash Reserves, respectively. Management may, at its sole discretion, terminate these voluntary waivers without notice to the Funds. For the year ended October 31, 2008, such waived fees amounted to $222,482 and $90,041 for Core Bond and Cash Reserves, respectively.
Each Fund retains Management as its administrator under an Administration Agreement. Each Fund pays Management an administration fee at the annual rate of 0.06% of its average daily net assets under this agreement. In addition, each Fund's Investor Class pays Management an administration fee at the annual rate of 0.21% of its average daily net assets, each Fund's Institutional Class pays Management an administration fee at the annual rate of 0.09% of its average daily net assets, the Reserve Class of California Tax-Free Money pays Management an administration fee at the annual rate of 0.02% of its average daily net assets, the Trust Class of Short Duration and Strategic Income pays Management an administration fee at the annual rate of 0.44% and 0.34%, respectively, of its average daily net assets, and Class A and Class C of Core Bond, Core Plus Bond, and Strategic Income each pay Management an administration fee at the annual r ate of 0.21% of its average daily net assets under this agreement. Additionally, Management retains State Street Bank and Trust Company ("State Street") as its sub-administrator under a Sub-Administration Agreement. Management pays State Street a fee for all services received under the agreement.
Management has contractually undertaken to reimburse the Fund's direct operating expenses (including fees payable to Management but excluding interest, taxes, brokerage commissions, and extraordinary expenses) ("Operating Expenses") which exceed the expense limitation as detailed in the following table. The Investor Classes of Core Bond, High Income, Municipal Money, Municipal Securities Trust, New York Municipal Money, Short Duration and Cash Reserves, the Institutional Classes of Core Bond, Core Plus Bond, and Strategic Income, the
83
Trust Classes of Short Duration and Strategic Income, and Class A and Class C of Core Bond, Core Plus Bond, and Strategic Income have each agreed to repay Management for their excess Operating Expenses previously reimbursed by Management, pursuant to a contractual expense limitation, so long as their annual Operating Expenses during that period do not exceed their respective expense limitations, and the repayments are made within three years after the year in which Management issued the reimbursement. During the year ended October 31, 2008, the Investor Class of Municipal Money reimbursed Management $148,908, under the agreement. At October 31, 2008, contingent liabilities to Management under the agreement were as follows:
| | | | | | | Expenses Deferred in Fiscal Period, October 31, | |
| | | | | | | 2006 | | 2007 | | 2008 | |
| | | | | | | Subject to Repayment until October 31, | |
| Class | | Contractual
Expense
Limitation(1) | | Expiration | | 2009 | | 2010 | | 2011 | |
| Core Bond Investor Class | | | 0.85 | % | | 10/31/18 | | $ | 119,159 | | | $ | 68,273 | | | $ | 62,629 | | |
| Core Bond Institutional Class | | | 0.45 | % | | 10/31/18 | | | 98,223 | | | | 54,868 | | | | 60,609 | | |
| Core Bond Class A | | | 0.85 | % | | 10/31/18 | | | — | | | | — | | | | 1,700 | (2) | |
| Core Bond Class C | | | 1.60 | % | | 10/31/18 | | | — | | | | — | | | | 1,695 | (2) | |
| Core Plus Bond Institutional Class | | | 0.45 | % | | 10/31/18 | | | — | | | | — | | | | 250,899 | (5) | |
| Core Plus Bond Class A | | | 0.82 | % | | 10/31/11 | | | — | | | | — | | | | 15,065 | (5) | |
| Core Plus Bond Class C | | | 1.57 | % | | 10/31/11 | | | — | | | | — | | | | 16,295 | (5) | |
| High Income Investor Class | | | 1.00 | % | | 10/31/11 | | | — | | | | — | | | | — | | |
| Municipal Money Investor Class | | | 0.59 | % | | 10/31/11 | | | 44,556 | | | | 50,949 | | | | — | | |
| Municipal Securities Trust Investor Class | | | 0.65 | % | | 10/31/11 | | | 176,704 | | | | 153,618 | | | | 170,458 | | |
| New York Municipal Money Investor Class | | | 0.59 | %(3) | | 10/31/11 | | | 123,196 | | | | — | | | | — | | |
| Short Duration Investor Class | | | 0.70 | % | | 10/31/11 | | | 144,034 | | | | 204,360 | | | | 202,732 | | |
| Short Duration Trust Class | | | 0.80 | % | | 10/31/11 | | | 47,206 | | | | 54,550 | | | | 52,852 | | |
| Strategic Income Institutional Class | | | 0.75 | %(4) | | 10/31/18 | | | 336,211 | | | | 356,257 | | | | 372,887 | | |
| Strategic Income Trust Class | | | 1.10 | % | | 10/31/11 | | | — | | | | 3,394 | | | | 24,251 | | |
| Strategic Income Class A | | | 1.15 | % | | 10/31/18 | | | — | | | | — | | | | 6,744 | (2) | |
| Strategic Income Class C | | | 1.85 | % | | 10/31/18 | | | — | | | | — | | | | 6,026 | (2) | |
| Cash Reserves Investor Class | | | 0.65 | % | | 10/31/11 | | | — | | | | — | | | | — | | |
(1) Expense limitation per annum of the respective class' average daily net assets.
(2) Period from December 20, 2007 to October 31, 2008.
(3) From January 17, 2007 to January 21, 2008, Management voluntarily agreed to waive certain expenses of the Investor Class of New York Municipal Money, so that the total annual Operating Expenses of the Fund were limited to 0.47% of the average daily net assets. From January 22, 2008 to August 25, 2008, the voluntary waiver was changed to 0.50% of the average daily net assets. Effective August 26, 2008, the voluntary waiver was changed to .55% of the average daily net assets. For the year ended October 31, 2008, such voluntarily waived fees amounted to $436,079.
(4) Prior to February 28, 2008, the expense limitation was 0.85%.
(5) Period from May 1, 2008 (Commencement of Operations) to October 31, 2008.
84
Management has voluntarily undertaken to reimburse and/or waive Operating Expenses which exceed the expense limitation as detailed in the following table:
| Class | | Voluntary
Expense
Limitation(1) | | Voluntary
Reimbursement from
Management for the
Year Ended
October 31, 2008(2) | |
| California Tax-Free Money Investor Class | | | 0.50 | % | | $ | 151,896 | (3) | |
| California Tax-Free Money Reserve Class | | | 0.25 | % | | | 36,723 | (3) | |
(1) Expense limitation per annum of each class' average daily net assets. Management may, at its sole discretion, terminate this agreement with notice to each Fund.
(2) Period from December 27, 2007 (Commencement of Operations) to October 31, 2008.
(3) In addition to the contractual and voluntary limitations previously listed, Management also voluntarily reimbursed the following:
| | | 10/10/08 | | 10/14/08 | |
| California Tax-Free Money Investor Class | | | .39 | % | | | .42 | % | |
| California Tax-Free Money Reserve Class | | | .14 | % | | | .17 | % | |
Management, Neuberger, a member firm of the New York Stock Exchange, and LBAM, are wholly owned subsidiaries of Lehman. LBAM, as the sub-adviser to High Income, Municipal Money, Municipal Securities Trust, Short Duration, and Cash Reserves, and, effective April 1, 2008, Strategic Income, is retained by Management to furnish it with investment recommendations and research information without added cost to each Fund it sub-advises. Prior to April 1, 2008, Neuberger was the sub-advisor to Strategic Income. LBAM, as sub-adviser to California Tax-Free Money, Core Bond, Core Plus Bond and New York Municipal Money, is retained by Management to provide day-to-day investment management services and receives a monthly fee paid by Management. As investment manager, Management is responsible for overseeing the investment activities of LBAM. Several individuals who are officers and/or Trustees of the Trust are also employees of L BAM, Neuberger and/or Management.
Each Fund also has a distribution agreement with Management with respect to each class of shares. Management receives no compensation therefore and no commissions for sales or redemptions of shares of beneficial interest of each share class, except as described below for Class A and Class C shares, but receives fees from the Core Bond Investor Class and the Strategic Income Trust Class under their Plans, as described below.
For Core Bond's Investor Class, Class A, and Class C, Core Plus Bond's Class A and Class C, and Strategic Income's Trust Class, Class A, and Class C, Management acts as agent in arranging for the sale of class shares without commission and bears advertising and promotion expenses. The Board has adopted distribution plans (each a "Plan", collectively, the "Plans") with respect to these classes, pursuant to Rule 12b-1 under the 1940 Act. The Plans provide that, as compensation for administrative and other services provided to these classes, Management's activities and expenses related to the sale and distribution of these classes of shares, and ongoing services provided to investors in these classes, Management receives from each of these classes a fee at the annual rate of 0.25% of Core Bond Investor Class', Core Bond Class A's, Core Plus Bond Class A's and Strategic Income Class A's average daily net assets , 0.10% of Strategic Income Trust Class' average daily net assets, and 1.00% of Core Bond Class C's, Core Plus Bond Class C's and Strategic Income Class C's average daily net assets. Management receives this amount to provide distribution and shareholder servicing for these classes and pays a portion of it to institutions that provide such services. Those institutions may use the payments for, among other purposes, compensating employees engaged in sales and/or shareholder servicing. The amount of fees paid by each class during any year may be more or less than the cost of distribution and other services provided to that class. NASD rules limit the
85
amount of annual distribution fees that may be paid by a mutual fund and impose a ceiling on the cumulative distribution fees paid. The Trust's Plans comply with those rules.
Class A shares of each Fund are generally sold with an initial sales charge of up to 4.25% and no contingent deferred sales charge, except that a charge of 1.00% applies to certain redemptions made within 18 months following purchases of $1 million or more without an initial sales charge. Class C shares are sold with no initial sales charge and a 1.00% contingent deferred sales charge ("CDSC") if shares are sold within one year after purchase.
For the year ended October 31, 2008, Management, acting as underwriter and broker-dealer, received net commissions from the sale of Class A and Class C shares and CDSCs from the redemptions of Class A and Class C shares as follows:
| | | Underwriter
Net Commissions | | CDSC | | Broker-Dealer
Net Commissions | | CDSC | |
| Core Bond Class A | | $ | — | | | $ | — | | | $ | — | | | $ | — | | |
| Core Bond Class C | | | — | | | | — | | | | — | | | | — | | |
| Core Plus Bond Class A | | | — | | | | — | | | | — | | | | — | | |
| Core Plus Bond Class C | | | — | | | | — | | | | — | | | | — | | |
| Strategic Income Class A | | | — | | | | — | | | | — | | | | — | | |
| Strategic Income Class C | | | — | | | | — | | | | — | | | | — | | |
For the year ended October 31, 2007, Short Duration recorded a capital contribution from Management in the amount of $6,457. This amount was paid in connection with losses outside the Fund's direct control incurred in the disposition of foreign currency contracts. Management does not normally make payments for losses incurred in the disposition of foreign currency contracts.
For the year ended October 31, 2008, High Income recorded a capital contribution from Management in the amount of $383,334. This amount was paid in connection with a reallocation of expenses that are shared by the Fund and Management. This expense was paid to a third party that provides services to the Fund.
During the year ended October 31, 2008, California Tax-Free Money, Municipal Money, and New York Municipal Money engaged in purchase and sale transactions with funds that have a common investment adviser (or affiliated investment adviser), common trustees/directors and/or common officers ("Interfund Transactions"). These Interfund Transactions complied with Rule 17a-7 under the 1940 Act and were as follows:
| | | Purchases | | Sales | |
| California Tax-Free Money | | $ | 37,391,287 | | | $ | 13,247,358 | | |
| Municipal Money | | | 1,221,786,580 | | | | 610,335,479 | | |
| New York Municipal Money | | | 224,563,888 | | | | 180,646,801 | | |
Strategic Income had entered into a commission recapture program, which enabled the Fund to pay some of its operational expenses by recouping a portion of the commissions it paid to a broker that was not a related party of the Funds. Pursuant to the agreement, brokers paid recaptured commissions to the Fund's custodian and the custodian directed these amounts toward payment of expenses such as custodial, transfer agency or accounting services. Effective April 1, 2008, this commission recapture program was terminated. For the period ended March 31, 2008, the impact of this arrangement on Strategic Income was a reduction of expenses of $153.
Each Fund has an expense offset arrangement in connection with its custodian contract. For the year ended October 31, 2008, the impact of this arrangement was a reduction of expenses of $7,979, $3,007, $226, $3,364, $117,741, $3,353, $126,093, $1,560, $1,210, and $12,262 for California Tax-Free Money, Core Bond, Core Plus Bond, High Income, Municipal Money, Municipal Securities Trust, New York Municipal Money, Short Duration, Strategic Income, and Cash Reserves, respectively.
86
Note C—Securities Transactions:
Cost of purchases and proceeds of sales and maturities of long-term securities (excluding short-term securities, financial futures contracts, foreign currency contracts, and option contracts) for the year ended October 31, 2008 were as follows:
| | | Purchases of
U.S. Government and
Agency Obligations | | Purchases excluding
U.S. Government and
Agency Obligations | | Sales and
Maturities of
U.S. Government and
Agency Obligations | | Sales and
Maturities excluding
U.S. Government and
Agency Obligations | |
| Core Bond | | $ | 455,174,333 | | | $ | 39,260,635 | | | $ | 460,813,973 | | | $ | 33,562,627 | | |
| Core Plus Bond | | | 26,019,626 | | | | 10,633,231 | | | | 13,544,010 | | | | 2,365,666 | | |
| High Income | | | — | | | | 313,074,840 | | | | — | | | | 430,605,006 | | |
| Municipal Securities Trust | | | — | | | | 12,540,072 | | | | — | | | | 10,746,816 | | |
| Short Duration | | | 5,062,716 | | | | 3,612,233 | | | | 3,355,579 | | | | 28,146,131 | | |
| Strategic Income | | | 33,185,937 | | | | 4,232,278 | | | | 33,090,532 | | | | 15,086,716 | | |
All securities transactions for California Tax-Free Money, Municipal Money, New York Municipal Money, and Cash Reserves were short-term.
During the year ended October 31, 2008, Strategic Income had entered into various contracts to deliver currencies at specified future dates. At October 31, 2008, there were no open contracts.
During the year ended October 31, 2008, brokerage commissions on securities transactions from affiliated brokers for Strategic Income were as follows: Neuberger received $1,254 and Lehman Brothers Inc. received $961.
Note D—Fund Share Transactions:
Share activity for the years ended October 31, 2008 and October 31, 2007 were as follows:
| | | For the Year Ended October 31, 2008 | | For the Year Ended October 31, 2007 | |
| (000's omitted) | | Shares
Sold | | Shares Issued
on Reinvestment
of Dividends
and Distributions | | Shares
Redeemed | | Total | | Shares
Sold | | Shares Issued
on Reinvestment
of Dividends
and Distributions | | Shares
Redeemed | | Total | |
California Tax-Free
Money(2) | |
| Investor Class | | | 75,312 | | | | 60 | | | | (52,190 | ) | | | 23,182 | | | | — | | | | — | | | | — | | | | — | | |
| Reserve Class | | | 5,000 | | | | — | | | | — | | | | 5,000 | | | | — | | | | — | | | | — | | | | — | | |
| Core Bond: | |
| Investor Class | | | 2,812 | | | | 155 | | | | (1,524 | ) | | | 1,443 | | | | 3,171 | | | | 139 | | | | (3,072 | ) | | | 238 | | |
| Institutional Class | | | 896 | | | | 221 | | | | (2,234 | ) | | | (1,117 | ) | | | 1,120 | | | | 223 | | | | (1,029 | ) | | | 314 | | |
| Class A(3) | | | 15 | | | | 1 | | | | — | | | | 16 | | | | — | | | | — | | | | — | | | | — | | |
| Class C(3) | | | 16 | | | | 1 | | | �� | — | | | | 17 | | | | — | | | | — | | | | — | | | | — | | |
| Core Plus Bond(4): | |
| Institutional Class | | | 1,800 | | | | 38 | | | | — | | | | 1,838 | | | | — | | | | — | | | | — | | | | — | | |
| Class A | | | 100 | | | | 2 | | | | — | | | | 102 | | | | — | | | | — | | | | — | | | | — | | |
| Class C | | | 113 | | | | 2 | | | | — | | | | 115 | | | | — | | | | — | | | | — | | | | — | | |
| High Income: | |
| Investor Class | | | 13,297 | | | | 2,480 | | | | (30,588 | ) | | | (14,811 | ) | | | 13,237 | | | | 3,483 | | | | (40,442 | ) | | | (23,722 | ) | |
87
| | | For the Year Ended October 31, 2008 | | For the Year Ended October 31, 2007 | |
| (000's omitted) | | Shares
Sold | | Shares Issued
on Reinvestment
of Dividends
and Distributions | | Shares
Redeemed | | Total | | Shares
Sold | | Shares Issued
on Reinvestment
of Dividends
and Distributions | | Shares
Redeemed | | Total | |
| Municipal Money: | |
| Investor Class | | | 4,555,916 | | | | 12,986 | | | | (5,045,062 | ) | | | (476,160 | ) | | | 7,010,190 | | | | 19,030 | | | | (6,930,867 | ) | | | 98,353 | | |
Municipal
Securities Trust: | |
| Investor Class | | | 579 | | | | 79 | | | | (730 | ) | | | (72 | ) | | | 371 | | | | 87 | | | | (799 | ) | | | (341 | ) | |
New York
Municipal Money: | |
| Investor Class | | | 2,999,266 | | | | 12,177 | | | | (3,333,188 | ) | | | (321,745 | ) | | | 2,697,772 | | | | 8,590 | | | | (2,156,418 | ) | | | 549,944 | | |
| Short Duration: | |
| Investor Class | | | 1,136 | | | | 455 | | | | (4,041 | ) | | | (2,450 | ) | | | 821 | | | | 495 | | | | (2,947 | ) | | | (1,631 | ) | |
| Trust Class | | | 285 | | | | 69 | | | | (634 | ) | | | (280 | ) | | | 382 | | | | 78 | | | | (866 | ) | | | (406 | ) | |
| Strategic Income: | |
| Institutional Class | | | 29 | | | | 85 | | | | (1,230 | ) | | | (1,116 | ) | | | 79 | | | | 89 | | | | (446 | ) | | | (278 | ) | |
| Trust Class | | | 39 | | | | 3 | | | | (24 | ) | | | 18 | | | | 26 | | | | 1 | | | | (6 | ) | | | 21 | (1) | |
| Class A(3) | | | 18 | | | | 1 | | | | — | | | | 19 | | | | — | | | | — | | | | — | | | | — | | |
| Class C(3) | | | 14 | | | | 1 | | | | (1 | ) | | | 14 | | | | — | | | | — | | | | — | | | | — | | |
| Cash Reserves: | |
| Investor Class | | | 1,801,441 | | | | 7,384 | | | | (1,210,468 | ) | | | 598,357 | | | | 764,810 | | | | 11,724 | | | | (1,075,515 | ) | | | (298,981 | ) | |
(1) Period from April 2, 2007 to October 31, 2007.
(2) Period from December 27, 2007(Commencement of Operations) to October 31, 2008.
(3) Period from December 20, 2007 to October 31, 2008.
(4) Period from May 1, 2008 (Commencement of Operations) to October 31, 2008.
Note E—Lines of Credit:
At October 31, 2008, Core Bond, Core Plus Bond (joined as of September 18, 2008), High Income, Short Duration and Strategic Income were participants in a single committed, unsecured $150,000,000 line of credit with State Street, to be used only for temporary or emergency purposes. Other investment companies managed by Management also participate in this line of credit on the same terms. Interest is charged on borrowings under this line of credit at the overnight Federal Funds Rate plus 0.50% per annum. A facility fee of 0.07% (as of September 19, 2008, 0.09%) per annum of the available line of credit is charged, of which each Fund has agreed to pay its pro rata share, based on the ratio of its individual net assets to the net assets of all participants at the time the fee is due and payable. The fee is paid quarterly in arrears. Because several investment companies participate, there is no assurance that an individual Fund will have access to all or any part of the $150,000,000 at any particular time. There were no loans outstanding pursuant to this line of credit at October 31, 2008. During the fiscal year ended October 31, 2008, none of the Funds utilized this line of credit.
At October 31, 2008, California Tax-Free Money (joined as of May 23, 2008), Cash Reserves, Municipal Money and New York Municipal Money were participants in a single committed, unsecured $300,000,000 line of credit with The Bank of New York Mellon (formerly, The Bank of New York), as agent, to be used only for temporary or
88
emergency purposes. Other investment companies managed by Management also participate in this line of credit on the same terms. Interest is charged on borrowings under this line of credit at the overnight Federal Funds Rate plus 0.375% per annum. A commitment fee of 0.075% (as of May 23, 2008, 0.085%) per annum of the unused available line of credit is charged, of which each Fund has agreed to pay its pro rata share, based on the ratio of its individual net assets to the net assets of all participants at the time the fee is due and payable. The fee is paid quarterly in arrears. Because several investment companies participate, there is no assurance that an individual Fund will have access to all or any part of the $300,000,000 at any particular time. During the fiscal year ended October 31, 2008, New York Municipal Money had borrowings under this line of credit for a period of five days with the greatest amount borrowed being $4 0,003,527. On these borrowings, New York Municipal Money paid interest rates ranging from 1.855% to 3.175%. The total interest amount New York Municipal Money paid was $12,528, which is reflected in the Statements of Operations under the caption "Interest expense." During the fiscal year ended October 31, 2008, no other Funds utilized this line of credit. There were no loans outstanding pursuant to this line of credit at October 31, 2008.
At October 31, 2008, California Tax-Free Money (joined as of September 26, 2008), Municipal Money, New York Municipal Money and Cash Reserves were participants in a single uncommitted, unsecured $150,000,000 line of credit with State Street, as lender, to be used only for temporary or emergency purposes. Other investment companies managed by Management also participate in this line of credit on the same terms. Interest is charged on borrowings under this line of credit at the overnight Federal Funds Rate plus 0.375% per annum. Because several investment companies participate, there is no assurance that an individual Fund will have access to all or any part of the $150,000,000 at any particular time. There were no loans outstanding pursuant to this line of credit at October 31, 2008. During the fiscal year ended October 31, 2008, none of the Funds utilized this line of credit.
Note F—Investments In Affiliates:
| | | Balance of
Shares Held
October 31,
2007 | | Gross
Purchases
and Additions | | Gross
Sales and
Reductions | | Balance of
Shares Held
October 31,
2008 | | Value
October 31,
2008 | | Income from
Investments
in Affiliated
Issuers Included
in Total Income | |
| Core Bond: | |
Neuberger Berman Prime
Money Fund Trust Class* | | | 3,051,615 | | | | 69,081,190 | | | | 70,795,694 | | | | 1,337,111 | | | $ | 1,337,111 | | | $ | 158,578 | | |
| Core Plus Bond: | |
Neuberger Berman Prime
Money Fund Trust Class* | | | — | | | | 22,010,530 | | | | 21,805,982 | | | | 204,548 | | | $ | 204,548 | | | $ | 32,682 | | |
| High Income: | |
Neuberger Berman Prime
Money Fund Trust Class* | | | 216,828 | | | | 277,998,668 | | | | 262,707,644 | | | | 15,507,852 | | | $ | 15,507,852 | | | $ | 309,495 | | |
Neuberger Berman Securities
Lending Quality Fund, LLC** | | | 1,773,561 | | | | 27,971,260 | | | | 29,744,821 | | | | — | | | | — | | | | 33,448 | | |
| Total | | | | | | | | | | | | | | | | | | $ | 15,507,852 | | | $ | 342,943 | | |
89
| | | Balance of
Shares Held
October 31,
2007 | | Gross
Purchases
and Additions | | Gross
Sales and
Reductions | | Balance of
Shares Held
October 31,
2008 | | Value
October 31,
2008 | | Income from
Investments
in Affiliated
Issuers Included
in Total Income | |
| Strategic Income: | |
Neuberger Berman Prime
Money Fund Trust Class* | | | 95,812 | | | | 14,814,076 | | | | 14,909,888 | | | | — | | | $ | — | | | $ | 19,979 | | |
Neuberger Berman
Securities Lending
Quality Fund, LLC** | | | 28,441 | | | | — | | | | 28,441 | | | | — | | | | — | | | �� | (11 | ) | |
| Total | | | | | | | | | | $ | — | | | $ | 19,968 | | |
* Prime Money is also managed by Management and may be considered an affiliate since it has the same officers, Board members, and investment manager as the Fund and because, at times, the Fund may own 5% or more of the outstanding voting securities of Prime Money.
** Quality Fund, a fund managed by LBAM, an affiliate of Management, is used to invest cash the Fund receives as collateral for securities loans as approved by the Board. Because all shares of Quality Fund are held by funds in the related investment management complex, Quality Fund may be considered an affiliate of the Fund.
Note G—Recent Accounting Pronouncements:
In September 2006, the Financial Accounting Standards Board (FASB) issued Statement on Financial Accounting Standards No. 157, "Fair Value Measurements" (FAS 157). This standard clarifies the definition of fair value for financial reporting, establishes a framework for measuring fair value and requires additional disclosures about the use of fair value measurements. FAS 157 is effective for financial statements issued for fiscal years beginning after November 15, 2007 and interim periods within those fiscal years. As of October 31, 2008, the Funds do not believe the adoption of FAS 157 will impact the amounts reported in the financial statements, however, additional disclosures will be required about the inputs used to develop the measurements of fair value and the effect of certain of the measurements reported in the statement of operations for a fiscal period.
In March 2008, Statement of Financial Accounting Standards No. 161, "Disclosures about Derivative Instruments and Hedging Activities — an amendment of FASB Statement No. 133" ("FAS 161"), was issued. FAS 161 is intended to improve financial reporting for derivative instruments by requiring enhanced disclosure that enables investors to understand how and why an entity uses derivatives, how derivatives are accounted for, and how derivative instruments affect an entity's results of operations and financial position. In September 2008, FASB Staff Position No. 133-1 and FASB Interpretation No. 45-4 (the "FSP"), "Disclosures about Credit Derivatives and Certain Guarantees: An Amendment of FASB Statement No. 133 and FASB Interpretation No. 45; and Clarification of the Effective Date of FAS B Statement No. 161" was issued and is effective for fiscal years and interim periods ending after November 15, 2008. The FSP amends FASB Statement No. 133, "Accounting for Derivative Instruments and Hedging Activities," to require disclosures by sellers of credit derivatives, including credit derivatives embedded in hybrid instruments. The FSP also clarifies the effective date of FAS 161, whereby disclosures required by FAS 161 are effective for financial statements issued for fiscal years and interim periods beginning after November 15, 2008. The impact on the Trusts' financial statement disclosures, if any, is currently being assessed.
90
Note H—Recent Market Events
Recent events have resulted in fixed income instruments experiencing liquidity issues, increased price volatility, credit downgrades and increased likelihood of default. Due to the market turbulence, some investors have turned to the safety of securities issued or guaranteed by the U.S. Treasury, causing the prices of these securities to rise and their yields to decline.
The U.S. federal government and certain foreign governments have acted to calm credit markets and increase confidence in the U.S. and world economies. The U.S. government is injecting liquidity into certain large financial services companies and establishing programs to assist in the purchase of money market instruments. The ultimate effect of these efforts is, of course, not yet known.
Note I—U.S. Treasury Temporary Guarantee Program for Money Market Funds
On October 8, 2008, California Tax-Free Money, Cash Reserves, Municipal Money and New York Municipal Money, paid 0.01% of its net asset value as of September 19, 2008 to participate in the Temporary Guarantee Program for Money Market Funds (the "Program") offered by the United States Department of the Treasury ("U.S. Treasury"). The amount each Fund paid to participate is listed below under program payment. The amount expensed through October 31, 2008, which is reflected in the Statements of Operations under the caption "Miscellaneous" is listed below under program fees expensed through October 31, 2008.
| | | Program
Payment | | Program Fees Expensed
Through October 31, 1998 | |
| California Tax-Free Money | | $ | 3,486 | | | $ | 1,227 | | |
| Cash Reserves | | | 41,368 | | | | 14,566 | | |
| Municipal Money | | | 55,435 | | | | 19,520 | | |
| New York Municipal Money | | | 47,902 | | | | 16,867 | | |
Subject to certain conditions and limitations, in the event that the per share value of a Fund falls below $0.995 and the Fund liquidates its holdings, the Program guarantees investors of each Fund $1.00 per share for the lesser of either the number of shares the investor held in a Fund on September 19, 2008 or the number of shares the investor held on the date the net asset value fell below $0.995. The Program applies only to shareholders of record on September 19, 2008 who maintain an account with the Fund from the close of business on that date through the date on which the Fund's per share value falls below $0.995. Those shareholders may purchase and redeem shares in their account during the period covered by the Program. However, the number of shares covered by the guarantee cannot exceed the number of shares held by the shareholder at the close of business on September 19, 2008. Thus, to the extent the overall value of a s hareholder's account increases after September 19, 2008, the amount of the increase will not be covered by the guarantee.
The Program provides coverage for a period that was originally due to expire on December 18, 2008, unless extended by the Secretary of the U.S. Treasury. The Secretary of the U.S. Treasury has extended the Program until April 30, 2009, and the Board has decided to continue the Funds' participation. Each Fund will bear the expense of its participation in the Program. For the initial three months of the Program, each Fund paid 0.01% based on its net assets as of September 19, 2008. For the coverage beginning on December 19, 2008, and extending through April 30, 2009, each Fund will pay 0.015% based on its net assets as of September 19, 2008. The Secretary of the Treasury has authority to extend the Program through the close of business on September 18, 2009. If the Program is extended beyond April 30, 2009, the Board will consider whether to continue to participate and, if so, each Fund would be required to pay additional fees. Th ere is no assurance that the Funds will continue to participate in the Program.
As of the time of this report, assets available to the Program to support all participating money market funds are limited to $50 billion and payments under the Program are dependent on the availability of assets in the Program at the time a request for payment is made. Payments will be made on a first-come-first-serve basis.
91
Financial Highlights
The following tables include selected data for a share outstanding throughout each period and other performance information
derived from the Financial Statements.
| | |
Net Asset
Value,
Beginning
of Year | |
Net
Investment
Income (Loss) | | Net Gains or
Losses on
Securities
(both
realized and
unrealized) | |
Total From
Investment
Operations | |
Dividends
from Net
Investment
Income | |
Distributions
from Net
Realized
Capital Gains | |
Tax
Return of
Capital | |
Total
Distributions | |
| California Tax-Free Money Fund | |
| Investor Class | |
Period from 12/27/2007^ to
10/31/2008 | | $ | 1.0000 | | | $ | 0.0142 | | | $ | (0.000 | ) | | $ | 0.0142 | | | $ | (0.0142 | ) | | $ | — | | | $ | — | | | $ | (0.0142 | ) | |
| Reserve Class*** | |
Period from 12/27/2007^ to
10/31/2008 | | $ | 1.0000 | | | $ | 0.0163 | | | $ | (0.000 | ) | | $ | 0.0163 | | | $ | (0.0163 | ) | | $ | — | | | $ | — | | | $ | (0.0163 | ) | |
| Core Bond Fund | |
| Investor Class | |
| 10/31/2008 | | $ | 9.76 | | | $ | 0.39 | @ | | $ | (1.12 | ) | | $ | (0.73 | ) | | $ | (0.39 | ) | | $ | — | | | $ | — | | | $ | (0.39 | ) | |
| 10/31/2007 | | $ | 9.85 | | | $ | 0.44 | @ | | $ | (0.09 | ) | | $ | 0.35 | | | $ | (0.44 | ) | | $ | — | | | $ | — | | | $ | (0.44 | ) | |
| 10/31/2006 | | $ | 10.09 | | | $ | 0.41 | @ | | $ | 0.09 | | | $ | 0.50 | | | $ | (0.43 | ) | | $ | (0.31 | ) | | $ | — | | | $ | (0.74 | ) | |
Period from 10/1/2005 to
10/31/2005 | | $ | 10.21 | | | $ | 0.03 | @ | | $ | (0.12 | ) | | $ | (0.09 | ) | | $ | (0.03 | ) | | $ | — | | | $ | — | | | $ | (0.03 | ) | |
| 9/30/2005‡‡ | | $ | 10.51 | | | $ | 0.31 | @ | | $ | (0.04 | ) | | $ | 0.27 | | | $ | (0.31 | ) | | $ | (0.26 | ) | | $ | — | | | $ | (0.57 | ) | |
| 9/30/2004ÿ | | $ | 10.80 | | | $ | 0.23 | | | $ | 0.11 | | | $ | 0.34 | | | $ | (0.23 | ) | | $ | (0.40 | ) | | $ | — | | | $ | (0.63 | ) | |
| Institutional Class | |
| 10/31/2008 | | $ | 9.77 | | | $ | 0.43 | @ | | $ | (1.12 | ) | | $ | (0.69 | ) | | $ | (0.43 | ) | | $ | — | | | $ | — | | | $ | (0.43 | ) | |
| 10/31/2007 | | $ | 9.86 | | | $ | 0.48 | @ | | $ | (0.09 | ) | | $ | 0.39 | | | $ | (0.48 | ) | | $ | — | | | $ | — | | | $ | (0.48 | ) | |
| 10/31/2006 | | $ | 10.11 | | | $ | 0.45 | @ | | $ | 0.08 | | | $ | 0.53 | | | $ | (0.47 | ) | | $ | (0.31 | ) | | $ | — | | | $ | (0.78 | ) | |
Period from 10/1/2005 to
10/31/2005 | | $ | 10.22 | | | $ | 0.03 | @ | | $ | (0.11 | ) | | $ | (0.08 | ) | | $ | (0.03 | ) | | $ | — | | | $ | — | | | $ | (0.03 | ) | |
| 9/30/2005‡‡ | | $ | 10.52 | | | $ | 0.33 | @ | | $ | (0.02 | ) | | $ | 0.31 | | | $ | (0.35 | ) | | $ | (0.26 | ) | | $ | — | | | $ | (0.61 | ) | |
| 9/30/2004ÿ | | $ | 10.81 | | | $ | 0.28 | | | $ | 0.11 | | | $ | 0.39 | | | $ | (0.28 | ) | | $ | (0.40 | ) | | $ | — | | | $ | (0.68 | ) | |
| Class A | |
Period from 12/20/2007^ to
10/31/2008 | | $ | 9.77 | | | $ | 0.33 | @ | | $ | (1.13 | ) | | $ | (0.80 | ) | | $ | (0.33 | ) | | $ | — | | | $ | — | | | $ | (0.33 | ) | |
| Class C | |
Period from 12/20/2007^ to
10/31/2008 | | $ | 9.77 | | | $ | 0.26 | @ | | $ | (1.12 | ) | | $ | (0.86 | ) | | $ | (0.27 | ) | | $ | — | | | $ | — | | | $ | (0.27 | ) | |
See Notes to Financial Highlights 92
| | |
Capital
Contributions | |
Net Asset
Value, End of
Year | |
Total
Return†† | |
Net Assets,
End of Year
(in millions) | |
Ratio of
Gross
Expenses
to Average
Net Assets# | |
Ratio of Net
Expenses
to Average
Net Assets | | Ratio of Net
Investment
Income/
(Loss) to
Average Net
Assets | |
Portfolio
Turnover
Rate | |
| California Tax-Free Money Fund | |
| Investor Class | |
Period from 12/27/2007^ to
10/31/2008 | | $ | — | | | $ | 1.0000 | | | | 1.43 | %** | | $ | 23.2 | | | | .51 | %* | | | .48 | %*‡ | | | 1.59 | %* | | | n/a | | |
| Reserve Class*** | |
Period from 12/27/2007^ to
10/31/2008 | | $ | — | | | $ | 1.0000 | | | | 1.64 | %** | | $ | 5.0 | | | | .26 | %* | | | .23 | %*‡ | | | 1.91 | %* | | | n/a | | |
| Core Bond Fund | |
| Investor Class | |
| 10/31/2008 | | $ | — | | | $ | 8.64 | | | | (7.72 | )% | | $ | 44.2 | | | | .85 | % | | | .85 | %‡ | | | 4.08 | % | | | 430 | % | |
| 10/31/2007 | | $ | — | | | $ | 9.76 | | | | 3.67 | % | | $ | 35.9 | | | | .85 | % | | | .85 | %‡ | | | 4.51 | % | | | 404 | % | |
| 10/31/2006 | | $ | — | | | $ | 9.85 | | | | 5.21 | % | | $ | 33.9 | | | | .86 | % | | | .85 | %‡ | | | 4.22 | % | | | 399 | % | |
Period from 10/1/2005 to
10/31/2005 | | $ | — | | | $ | 10.09 | | | | (.87 | )%** | | $ | 31.7 | | | | .85 | %* | | | .85 | %*‡ | | | 3.51 | %* | | | 34 | %** | |
| 9/30/2005‡‡ | | $ | — | | | $ | 10.21 | | | | 2.64 | % | | $ | 31.2 | | | | .86 | % | | | .85 | %‡ | | | 3.03 | % | | | 462 | % | |
| 9/30/2004ÿ | | $ | — | | | $ | 10.51 | | | | 3.29 | % | | $ | 26.0 | | | | .85 | % | | | .85 | % | | | 2.21 | % | | | 390 | % | |
| Institutional Class | |
| 10/31/2008 | | $ | — | | | $ | 8.65 | | | | (7.34 | )% | | $ | 32.1 | | | | .45 | % | | | .45 | %‡ | | | 4.48 | % | | | 430 | % | |
| 10/31/2007 | | $ | — | | | $ | 9.77 | | | | 4.08 | % | | $ | 47.2 | | | | .45 | % | | | .45 | %‡ | | | 4.91 | % | | | 404 | % | |
| 10/31/2006 | | $ | — | | | $ | 9.86 | | | | 5.52 | % | | $ | 44.5 | | | | .46 | % | | | .45 | %‡ | | | 4.60 | % | | | 399 | % | |
Period from 10/1/2005 to
10/31/2005 | | $ | — | | | $ | 10.11 | | | | (.73 | )%** | | $ | 47.5 | | | | .45 | %* | | | .45 | %*‡ | | | 3.91 | %* | | | 34 | %** | |
| 9/30/2005‡‡ | | $ | — | | | $ | 10.22 | | | | 3.05 | % | | $ | 48.5 | | | | .45 | % | | | .45 | %‡ | | | 3.17 | % | | | 462 | % | |
| 9/30/2004ÿ | | $ | — | | | $ | 10.52 | | | | 3.72 | % | | $ | 233.6 | | | | .45 | % | | | .45 | % | | | 2.61 | % | | | 390 | % | |
| Class A | |
Period from 12/20/2007^ to
10/31/2008 | | $ | — | | | $ | 8.64 | | | | (8.37 | )%** | | $ | 0.1 | | | | .85 | %* | | | .85 | %*‡ | | | 4.01 | %* | | | 430 | %**^^ | |
| Class C | |
Period from 12/20/2007^ to
10/31/2008 | | $ | — | | | $ | 8.64 | | | | (8.98 | )%** | | $ | 0.1 | | | | 1.60 | %* | | | 1.60 | %* | | | 3.24 | %* | | | 430 | %**^^ | |
93
Financial Highlights (cont'd)
| | |
Net Asset
Value,
Beginning
of Year | |
Net
Investment
Income (Loss) | | Net Gains or
Losses on
Securities
(both
realized and
unrealized) | |
Total From
Investment
Operations | |
Dividends
from Net
Investment
Income | |
Distributions
from Net
Realized
Capital Gains | |
Tax
Return of
Capital | |
Total
Distributions | |
| Core Plus Bond Fund | |
| Institutional Class | |
Period from 5/1/2008^ to
10/31/2008 | | $ | 10.00 | | | $ | 0.24 | @ | | $ | (1.04 | ) | | $ | (0.80 | ) | | $ | (0.24 | ) | | $ | — | | | $ | — | | | $ | (0.24 | ) | |
| Class A | |
Period from 5/1/2008^ to
10/31/2008 | | $ | 10.00 | | | $ | 0.22 | @ | | $ | (1.04 | ) | | $ | (0.82 | ) | | $ | (0.22 | ) | | $ | — | | | $ | — | | | $ | (0.22 | ) | |
| Class C | |
Period from 5/1/2008^ to
10/31/2008 | | $ | 10.00 | | | $ | 0.18 | @ | | $ | (1.03 | ) | | $ | (0.85 | ) | | $ | (0.19 | ) | | $ | — | | | $ | — | | | $ | (0.19 | ) | |
| High Income Bond Fund | |
| Investor Class | |
| 10/31/2008 | | $ | 9.00 | | | $ | 0.66 | @ | | $ | (2.44 | ) | | $ | (1.78 | ) | | $ | (0.66 | ) | | $ | — | | | $ | — | | | $ | (0.66 | ) | |
| 10/31/2007 | | $ | 9.08 | | | $ | 0.68 | @ | | $ | (0.08 | ) | | $ | 0.60 | | | $ | (0.68 | ) | | $ | — | | | $ | — | | | $ | (0.68 | ) | |
| 10/31/2006 | | $ | 9.10 | | | $ | 0.59 | @ | | $ | (0.02 | ) | | $ | 0.57 | | | $ | (0.59 | ) | | $ | — | | | $ | — | | | $ | (0.59 | ) | |
| 10/31/2005 | | $ | 9.54 | | | $ | 0.55 | @ | | $ | (0.44 | ) | | $ | 0.11 | | | $ | (0.55 | ) | | $ | — | | | $ | — | | | $ | (0.55 | ) | |
| 10/31/2004 | | $ | 9.25 | | | $ | 0.58 | @ | | $ | 0.29 | | | $ | 0.87 | | | $ | (0.58 | ) | | $ | — | | | $ | — | | | $ | (0.58 | ) | |
| Municipal Money Fund | |
| Investor Class | |
| 10/31/2008 | | $ | 0.9999 | | | $ | 0.0209 | | | $ | 0.0000 | | | $ | 0.0209 | | | $ | (0.0209 | ) | | $ | (0.0000 | ) | | $ | — | | | $ | (0.0209 | ) | |
| 10/31/2007 | | $ | 0.9998 | | | $ | 0.0313 | | | $ | 0.0001 | | | $ | 0.0314 | | | $ | (0.0313 | ) | | $ | (0.0000 | ) | | $ | — | | | $ | (0.0313 | ) | |
| 10/31/2006 | | $ | 0.9998 | | | $ | 0.0276 | | | $ | 0.0000 | | | $ | 0.0276 | | | $ | (0.0276 | ) | | $ | — | | | $ | — | | | $ | (0.0276 | ) | |
| 10/31/2005 | | $ | 0.9998 | | | $ | 0.0158 | | | $ | — | | | $ | 0.0158 | | �� | $ | (0.0158 | ) | | $ | — | | | $ | — | | | $ | (0.0158 | ) | |
| 10/31/2004 | | $ | 0.9998 | | | $ | 0.0051 | | | $ | — | | | $ | 0.0051 | | | $ | (0.0051 | ) | | $ | — | | | $ | — | | | $ | (0.0051 | ) | |
| Municipal Securities Trust | |
| Investor Class | |
| 10/31/2008 | | $ | 11.20 | | | $ | 0.41 | @ | | $ | (0.59 | ) | | $ | (0.18 | ) | | $ | (0.41 | ) | | $ | (0.01 | ) | | $ | — | | | $ | (0.42 | ) | |
| 10/31/2007 | | $ | 11.36 | | | $ | 0.41 | @ | | $ | (0.12 | ) | | $ | 0.29 | | | $ | (0.41 | ) | | $ | (0.04 | ) | | $ | — | | | $ | (0.45 | ) | |
| 10/31/2006 | | $ | 11.33 | | | $ | 0.40 | @ | | $ | 0.08 | | | $ | 0.48 | | | $ | (0.40 | ) | | $ | (0.05 | ) | | $ | — | | | $ | (0.45 | ) | |
| 10/31/2005 | | $ | 11.81 | | | $ | 0.40 | @ | | $ | (0.41 | ) | | $ | (0.01 | ) | | $ | (0.40 | ) | | $ | (0.07 | ) | | $ | — | | | $ | (0.47 | ) | |
| 10/31/2004 | | $ | 11.86 | | | $ | 0.40 | @ | | $ | (0.00 | ) | | $ | 0.40 | | | $ | (0.40 | ) | | $ | (0.05 | ) | | $ | — | | | $ | (0.45 | ) | |
See Notes to Financial Highlights 94
| | |
Capital
Contributions | |
Net Asset
Value, End of
Year | |
Total
Return†† | |
Net Assets,
End of Year
(in millions) | |
Ratio of
Gross
Expenses
to Average
Net Assets# | |
Ratio of Net
Expenses
to Average
Net Assets | | Ratio of Net
Investment
Income/
(Loss) to
Average Net
Assets | |
Portfolio
Turnover
Rate | |
| Core Plus Bond Fund | |
| Institutional Class | |
Period from 5/1/2008^ to
10/31/2008 | | $ | — | | | $ | 8.96 | | | | (8.09 | )%** | | $ | 16.5 | | | | .46 | %* | | | .45 | %*‡ | | | 4.90 | %* | | | 85 | %** | |
| Class A | |
Period from 5/1/2008^ to
10/31/2008 | | $ | — | | | $ | 8.96 | | | | (8.26 | )%** | | $ | 0.9 | | | | .83 | %* | | | .82 | %*‡ | | | 4.53 | %* | | | 85 | %** | |
| Class C | |
Period from 5/1/2008^ to
10/31/2008 | | $ | — | | | $ | 8.96 | | | | (8.61 | )%** | | $ | 1.0 | | | | 1.57 | %* | | | 1.57 | %*‡ | | | 3.78 | %* | | | 85 | %** | |
| High Income Bond Fund | |
| Investor Class | |
| 10/31/2008 | | $ | 0.01 | | | $ | 6.57 | | | | (20.86 | )% | | $ | 172.3 | | | | .92 | % | | | .92 | %‡ | | | 7.96 | % | | | 115 | % | |
| 10/31/2007 | | $ | — | | | $ | 9.00 | | | | 6.73 | % | | $ | 369.2 | | | | .92 | % | | | .92 | %‡ | | | 7.41 | % | | | 153 | % | |
| 10/31/2006 | | $ | — | | | $ | 9.08 | | | | 6.53 | % | | $ | 588.3 | | | | .90 | % | | | .89 | %‡ | | | 6.52 | % | | | 136 | % | |
| 10/31/2005 | | $ | — | | | $ | 9.10 | | | | 1.17 | % | | $ | 779.7 | | | | .91 | % | | | .91 | % | | | 5.88 | % | | | 63 | % | |
| 10/31/2004 | | $ | — | | | $ | 9.54 | | | | 9.68 | % | | $ | 813.2 | | | | .90 | % | | | .90 | % | | | 6.16 | % | | | 79 | % | |
| Municipal Money Fund | |
| Investor Class | |
| 10/31/2008 | | $ | — | | | $ | 0.9999 | | | | 2.12 | % | | $ | 395.3 | | | | .59 | % | | | .58 | %§ | | | 2.06 | % | | | n/a | | |
| 10/31/2007 | | $ | — | | | $ | 0.9999 | | | | 3.18 | % | | $ | 871.5 | | | | .59 | % | | | .59 | %‡ | | | 3.13 | % | | | n/a | | |
| 10/31/2006 | | $ | — | | | $ | 0.9998 | | | | 2.80 | % | | $ | 773.2 | | | | .59 | % | | | .59 | %‡ | | | 2.81 | % | | | n/a | | |
| 10/31/2005 | | $ | — | | | $ | 0.9998 | | | | 1.59 | % | | $ | 587.1 | | | | .60 | % | | | .60 | % | | | 1.62 | % | | | n/a | | |
| 10/31/2004 | | $ | — | | | $ | 0.9998 | | | | .51 | % | | $ | 426.1 | | | | .61 | % | | | .61 | % | | | .51 | % | | | n/a | | |
| Municipal Securities Trust | |
| Investor Class | |
| 10/31/2008 | | $ | — | | | $ | 10.60 | | | | (1.74 | )% | | $ | 25.6 | | | | .66 | % | | | .64 | %‡ | | | 3.65 | % | | | 39 | % | |
| 10/31/2007 | | $ | — | | | $ | 11.20 | | | | 2.61 | % | | $ | 27.8 | | | | .66 | % | | | .65 | %‡ | | | 3.61 | % | | | 9 | % | |
| 10/31/2006 | | $ | — | | | $ | 11.36 | | | | 4.38 | % | | $ | 32.1 | | | | .66 | % | | | .65 | %‡ | | | 3.56 | % | | | 28 | % | |
| 10/31/2005 | | $ | — | | | $ | 11.33 | | | | (.09 | )% | | $ | 33.7 | | | | .66 | % | | | .66 | %‡ | | | 3.44 | % | | | 16 | % | |
| 10/31/2004 | | $ | — | | | $ | 11.81 | | | | 3.43 | % | | $ | 37.1 | | | | .65 | % | | | .65 | %‡ | | | 3.40 | % | | | 8 | % | |
95
Financial Highlights (cont'd)
| | |
Net Asset
Value,
Beginning
of Year | |
Net
Investment
Income (Loss) | | Net Gains or
Losses on
Securities
(both
realized and
unrealized) | |
Total From
Investment
Operations | |
Dividends
from Net
Investment
Income | |
Distributions
from Net
Realized
Capital Gains | |
Tax
Return of
Capital | |
Total
Distributions | |
| New York Municipal Money Fund | |
| Investor Class | |
| 10/31/2008 | | $ | 1.0000 | | | $ | 0.0216 | | | $ | (0.0003 | ) | | $ | 0.0213 | | | $ | (0.0216 | ) | | $ | (0.0000 | ) | | $ | — | | | $ | (0.0216 | ) | |
| 10/31/2007 | | $ | 1.0000 | | | $ | 0.0322 | | | $ | 0.0000 | | | $ | 0.0322 | | | $ | (0.0322 | ) | | $ | (0.0000 | ) | | $ | — | | | $ | (0.0322 | ) | |
Period from 12/19/2005^ to
10/31/2006 | | $ | 1.0000 | | | $ | 0.0249 | | | $ | 0.0000 | | | $ | 0.0249 | | | $ | (0.0249 | ) | | $ | — | | | $ | — | | | $ | (0.0249 | ) | |
| Short Duration Bond Fund | |
| Investor Class | |
| 10/31/2008 | | $ | 9.13 | | | $ | 0.41 | @ | | $ | (1.18 | ) | | $ | (0.77 | ) | | $ | (0.45 | ) | | $ | — | | | $ | — | | | $ | (0.45 | ) | |
| 10/31/2007 | | $ | 9.11 | | | $ | 0.41 | @ | | $ | 0.06 | | | $ | 0.47 | | | $ | (0.45 | ) | | $ | — | | | $ | — | | | $ | (0.45 | ) | |
| 10/31/2006 | | $ | 9.13 | | | $ | 0.35 | @ | | $ | 0.03 | | | $ | 0.38 | | | $ | (0.40 | ) | | $ | — | | | $ | — | | | $ | (0.40 | ) | |
| 10/31/2005 | | $ | 9.41 | | | $ | 0.25 | @ | | $ | (0.18 | ) | | $ | 0.07 | | | $ | (0.35 | ) | | $ | — | | | $ | — | | | $ | (0.35 | ) | |
| 10/31/2004 | | $ | 9.61 | | | $ | 0.24 | @ | | $ | (0.11 | ) | | $ | 0.13 | | | $ | (0.33 | ) | | $ | — | | | $ | — | | | $ | (0.33 | ) | |
| Trust Class | |
| 10/31/2008 | | $ | 8.70 | | | $ | 0.38 | @ | | $ | (1.12 | ) | | $ | (0.74 | ) | | $ | (0.42 | ) | | $ | — | | | $ | — | | | $ | (0.42 | ) | |
| 10/31/2007 | | $ | 8.68 | | | $ | 0.39 | @ | | $ | 0.05 | | | $ | 0.44 | | | $ | (0.42 | ) | | $ | — | | | $ | — | | | $ | (0.42 | ) | |
| 10/31/2006 | | $ | 8.70 | | | $ | 0.32 | @ | | $ | 0.03 | | | $ | 0.35 | | | $ | (0.37 | ) | | $ | — | | | $ | — | | | $ | (0.37 | ) | |
| 10/31/2005 | | $ | 8.97 | | | $ | 0.23 | @ | | $ | (0.17 | ) | | $ | 0.06 | | | $ | (0.33 | ) | | $ | — | | | $ | — | | | $ | (0.33 | ) | |
| 10/31/2004 | | $ | 9.15 | | | $ | 0.22 | @ | | $ | (0.09 | ) | | $ | 0.13 | | | $ | (0.31 | ) | | $ | — | | | $ | — | | | $ | (0.31 | ) | |
| Strategic Income Fund | |
| Institutional Class | |
| 10/31/2008 | | $ | 10.38 | | | $ | 0.44 | @ | | $ | (1.02 | ) | | $ | (0.58 | ) | | $ | (0.31 | )@ | | $ | (0.61 | )@ | | $ | (0.10 | )@ | | $ | (1.02 | ) | |
| 10/31/2007 | | $ | 10.65 | | | $ | 0.43 | @ | | $ | 0.15 | | | $ | 0.58 | | | $ | (0.45 | ) | | $ | (0.40 | ) | | $ | — | | | $ | (0.85 | ) | |
| 10/31/2006 | | $ | 10.90 | | | $ | 0.38 | @ | | $ | 0.65 | | | $ | 1.03 | | | $ | (0.46 | ) | | $ | (0.82 | ) | | $ | — | | | $ | (1.28 | ) | |
| 10/31/2005 | | $ | 10.72 | | | $ | 0.37 | @ | | $ | 0.34 | | | $ | 0.71 | | | $ | (0.45 | ) | | $ | (0.08 | ) | | $ | — | | | $ | (0.53 | ) | |
| 10/31/2004 | | $ | 10.11 | | | $ | 0.36 | @ | | $ | 0.69 | | | $ | 1.05 | | | $ | (0.44 | ) | | $ | — | | | $ | — | | | $ | (0.44 | ) | |
| Trust Class | |
| 10/31/2008 | | $ | 10.38 | | | $ | 0.42 | @ | | $ | (1.05 | ) | | $ | (0.63 | ) | | $ | (0.27 | )@ | | $ | (0.61 | )@ | | $ | (0.10 | )@ | | $ | (0.98 | ) | |
Period from 4/2/2007^ to
10/31/2007 | | $ | 10.39 | | | $ | 0.24 | @ | | $ | (0.02 | ) | | $ | 0.22 | | | $ | (0.23 | ) | | $ | — | | | $ | — | | | $ | (0.23 | ) | |
See Notes to Financial Highlights 96
| | |
Capital
Contributions | |
Net Asset
Value, End of
Year | |
Total
Return†† | |
Net Assets,
End of Year
(in millions) | |
Ratio of
Gross
Expenses
to Average
Net Assets# | |
Ratio of Net
Expenses
to Average
Net Assets | | Ratio of Net
Investment
Income/
(Loss) to
Average Net
Assets | |
Portfolio
Turnover
Rate | |
| New York Municipal Money Fund | |
| Investor Class | |
| 10/31/2008 | | $ | — | | | $ | 0.9997 | | | | 2.19 | % | | $ | 401.2 | | | | .49 | % | | | .48 | %‡ | | | 2.09 | % | | | n/a | | |
| 10/31/2007 | | $ | — | | | $ | 1.0000 | | | | 3.27 | % | | $ | 723.1 | | | | .48 | % | | | .46 | %‡ | | | 3.22 | % | | | n/a | | |
Period from 12/19/2005^ to
10/31/2006 | | $ | — | | | $ | 1.0000 | | | | 2.51 | %** | | $ | 173.2 | | | | .55 | %* | | | .54 | %*^^^ | | | 2.94 | %* | | | n/a | | |
| Short Duration Bond Fund | |
| Investor Class | |
| 10/31/2008 | | $ | — | | | $ | 7.91 | | | | (8.70 | )% | | $ | 61.6 | | | | .70 | % | | | .70 | %‡ | | | 4.73 | % | | | 10 | % | |
| 10/31/2007 | | $ | — | | | $ | 9.13 | | | | 5.24 | % | | $ | 93.4 | | | | .70 | % | | | .70 | %‡ | | | 4.54 | % | | | 53 | % | |
| 10/31/2006 | | $ | — | | | $ | 9.11 | | | | 4.28 | % | | $ | 108.1 | | | | .71 | % | | | .70 | %‡ | | | 3.80 | % | | | 74 | % | |
| 10/31/2005 | | $ | — | | | $ | 9.13 | | | | .77 | % | | $ | 151.8 | | | | .71 | % | | | .70 | %‡ | | | 2.75 | % | | | 166 | % | |
| 10/31/2004 | | $ | — | | | $ | 9.41 | | | | 1.43 | % | | $ | 162.6 | | | | .70 | % | | | .70 | %‡ | | | 2.49 | % | | | 94 | % | |
| Trust Class | |
| 10/31/2008 | | $ | — | | | $ | 7.54 | | | | (8.76 | )% | | $ | 9.3 | | | | .80 | % | | | .80 | %‡ | | | 4.64 | % | | | 10 | % | |
| 10/31/2007 | | $ | — | | | $ | 8.70 | | | | 5.15 | % | | $ | 13.1 | | | | .80 | % | | | .80 | %‡ | | | 4.44 | % | | | 53 | % | |
| 10/31/2006 | | $ | — | | | $ | 8.68 | | | | 4.16 | % | | $ | 16.6 | | | | .81 | % | | | .80 | %‡ | | | 3.69 | % | | | 74 | % | |
| 10/31/2005 | | $ | — | | | $ | 8.70 | | | | .64 | % | | $ | 20.1 | | | | .81 | % | | | .81 | %‡ | | | 2.64 | % | | | 166 | % | |
| 10/31/2004 | | $ | — | | | $ | 8.97 | | | | 1.44 | % | | $ | 27.0 | | | | .80 | % | | | .80 | %‡ | | | 2.38 | % | | | 94 | % | |
| Strategic Income Fund | |
| Institutional Class | |
| 10/31/2008 | | $ | — | | | $ | 8.78 | | | | (6.09 | )% | | $ | 4.6 | | | | .84 | % | | | .83 | %‡ | | | 4.54 | % | | | 323 | % | |
| 10/31/2007 | | $ | — | | | $ | 10.38 | | | | 5.64 | % | | $ | 17.0 | | | | .86 | % | | | .85 | %‡ | | | 4.10 | % | | | 99 | % | |
| 10/31/2006 | | $ | — | | | $ | 10.65 | | | | 10.34 | % | | $ | 20.4 | | | | .86 | % | | | .85 | %‡ | | | 3.66 | % | | | 111 | % | |
| 10/31/2005 | | $ | — | | | $ | 10.90 | | | | 6.68 | % | | $ | 26.2 | | | | .86 | % | | | .85 | %‡ | | | 3.43 | % | | | 89 | % | |
| 10/31/2004 | | $ | — | | | $ | 10.72 | | | | 10.65 | % | | $ | 29.4 | | | | .85 | % | | | .84 | %‡ | | | 3.44 | % | | | 85 | % | |
| Trust Class | |
| 10/31/2008 | | $ | — | | | $ | 8.77 | | | | (6.54 | )% | | $ | 0.3 | | | | 1.15 | % | | | 1.14 | %‡ | | | 4.36 | % | | | 323 | % | |
Period from 4/2/2007^ to
10/31/2007 | | $ | — | | | $ | 10.38 | | | | 2.16 | %** | | $ | 0.2 | | | | 1.11 | %* | | | 1.10 | %*‡ | | | 3.92 | %* | | | 99 | %^^ | |
97
Financial Highlights (cont'd)
| | |
Net Asset
Value,
Beginning
of Year | |
Net
Investment
Income (Loss) | | Net Gains or
Losses on
Securities
(both
realized and
unrealized) | |
Total From
Investment
Operations | |
Dividends
from Net
Investment
Income | |
Distributions
from Net
Realized
Capital Gains | |
Tax
Return of
Capital | |
Total
Distributions | |
| Class A | |
Period from 12/20/2007^ to
10/31/2008 | | $ | 10.19 | | | $ | 0.36 | @ | | $ | (0.78 | ) | | $ | (0.42 | ) | | $ | (0.28 | )@ | | $ | (0.61 | )@ | | $ | (0.10 | )@ | | $ | (0.99 | ) | |
| Class C | |
Period from 12/20/2007^ to
10/31/2008 | | $ | 10.19 | | | $ | 0.29 | @ | | $ | (0.77 | ) | | $ | (0.48 | ) | | $ | (0.22 | )@ | | $ | (0.61 | )@ | | $ | (0.10 | )@ | | $ | (0.93 | ) | |
| Cash Reserves | |
| Investor Class | |
| 10/31/2008 | | $ | 0.9998 | | | $ | 0.0290 | | | $ | 0.0001 | | | $ | 0.0291 | | | $ | (0.0290 | ) | | $ | — | | | $ | — | | | $ | (0.0290 | ) | |
| 10/31/2007 | | $ | 1.0000 | | | $ | 0.0488 | | | $ | (0.0002 | ) | | $ | 0.0486 | | | $ | (0.0488 | ) | | $ | — | | | $ | — | | | $ | (0.0488 | ) | |
| 10/31/2006 | | $ | 1.0000 | | | $ | 0.0441 | | | $ | (0.0000 | ) | | $ | 0.0441 | | | $ | (0.0441 | ) | | $ | — | | | $ | — | | | $ | (0.0441 | ) | |
| 10/31/2005 | | $ | 1.0000 | | | $ | 0.0239 | | | $ | (0.0000 | ) | | $ | 0.0239 | | | $ | (0.0239 | ) | | $ | — | | | $ | — | | | $ | (0.0239 | ) | |
| 10/31/2004 | | $ | 1.0000 | | | $ | 0.0056 | | | $ | 0.0000 | | | $ | 0.0056 | | | $ | (0.0056 | ) | | $ | — | | | $ | — | | | $ | (0.0056 | ) | |
See Notes to Financial Highlights 98
| | |
Capital
Contributions | |
Net Asset
Value, End of
Year | |
Total
Return†† | |
Net Assets,
End of Year
(in millions) | |
Ratio of
Gross
Expenses
to Average
Net Assets# | |
Ratio of Net
Expenses
to Average
Net Assets | | Ratio of Net
Investment
Income/
(Loss) to
Average Net
Assets | |
Portfolio
Turnover
Rate | |
| Class A | |
Period from 12/20/2007^ to
10/31/2008 | | $ | — | | | $ | 8.78 | | | | (4.64 | )%** | | $ | 0.2 | | | | 1.21 | %* | | | 1.20 | %*‡ | | | 4.36 | %* | | | 323 | %^^ | |
| Class C | |
Period from 12/20/2007^ to
10/31/2008 | | $ | — | | | $ | 8.78 | | | | (5.22 | )%** | | $ | 0.1 | | | | 1.91 | %* | | | 1.90 | %*‡ | | | 3.56 | %* | | | 323 | %^^ | |
| Cash Reserves | |
| Investor Class | |
| 10/31/2008 | | $ | — | | | $ | 0.9999 | | | | 2.94 | % | | $ | 905.2 | | | | .42 | % | | | .42 | %‡ | | | 2.59 | % | | n/a | |
| 10/31/2007 | | $ | — | | | $ | 0.9998 | | | | 5.00 | % | | $ | 306.9 | | | | .48 | % | | | .48 | %‡ | | | 4.89 | % | | n/a | |
| 10/31/2006 | | $ | — | | | $ | 1.0000 | | | | 4.50 | % | | $ | 605.9 | | | | .45 | % | | | .45 | %‡ | | | 4.45 | % | | n/a | |
| 10/31/2005 | | $ | — | | | $ | 1.0000 | | | | 2.42 | % | | $ | 480.0 | | | | .49 | % | | | .49 | %‡ | | | 2.40 | % | | n/a | |
| 10/31/2004 | | $ | — | | | $ | 1.0000 | | | | .57 | % | | $ | 481.2 | | | | .63 | % | | | .63 | % | | | .55 | % | | n/a | |
99
Notes to Financial Highlights Income Funds
†† Total return based on per share net asset value reflects the effects of changes in net asset value on the performance of each Fund during each fiscal period and assumes dividends and other distributions, if any, were reinvested. Results represent past performance and do not guarantee future results. Current returns may be lower or higher than the performance data quoted. Investment returns and principal may fluctuate and shares when redeemed may be worth more or less than original cost. For each Fund, total return would have been lower if Management had not reimbursed and/or waived certain expenses. For the year ended October 31, 2007, Management reimbursed Short Duration for losses incurred in connection with the disposition of foreign currency contracts, which had no impact on total return. For the year ended October 31, 2008, High Income recorded a capital contribution from Management in connection with a reallocation of expenses that are shared by the Fund and Management, which had (.12)% impact on total return.
# The Fund is required to calculate an expense ratio without taking into consideration any expense reductions related to expense offset arrangements.
‡ After reimbursement of expenses and/or waiver of a portion of the investment management fee by Management. Had Management not undertaken such actions, the annualized ratios of net expenses to average daily net assets would have been:
| | |
Year Ended October 31, | | Year Ended
September 30, | | Year Ended
October 31, | |
| | | 2008 | | 2007 | | 2006 | | 2005 | | 2005 | | 2004 | |
| California Tax-Free Money Fund Investor Class | | | 1.17 | %(2) | | | — | | | | — | | | | — | | | | — | | | | — | | |
| California Tax-Free Money Fund Reserve Class | | | 1.09 | %(2) | | | — | | | | — | | | | — | | | | — | | | | — | | |
| Core Bond Fund Investor Class | | | 1.25 | % | | | 1.30 | % | | | 1.46 | % | | | 1.58 | %(5) | | | 1.05 | % | | | — | | |
| Core Bond Fund Institutional Class | | | .83 | % | | | .83 | % | | | .91 | % | | | 1.05 | %(5) | | | .55 | % | | | — | | |
| Core Bond Fund Class A | | | 2.73 | %(1) | | | — | | | | — | | | | — | | | | — | | | | — | | |
| Core Bond Fund Class C | | | 3.43 | %(1) | | | — | | | | — | | | | — | | | | — | | | | — | | |
| Core Plus Bond Fund Institutional Class | | | 3.32 | %(4) | | | — | | | | — | | | | — | | | | — | | | | — | | |
| Core Plus Bond Fund Class A | | | 3.93 | %(4) | | | — | | | | — | | | | — | | | | — | | | | — | | |
| Core Plus Bond Fund Class C | | | 4.56 | %(4) | | | — | | | | — | | | | — | | | | — | | | | — | | |
| High Income Bond Fund Investor Class | | | .92 | % | | | .92 | % | | | .90 | % | | | — | | | | — | | | | — | | |
| Municipal Money Fund Investor Class | | | — | | | | .59 | % | | | .61 | % | | | — | | | | — | | | | — | | |
| Municipal Securities Trust Investor Class | | | 1.24 | % | | | 1.17 | % | | | 1.19 | % | | | 1.10 | % | | | — | | | | 1.06 | % | |
| Short Duration Bond Fund Investor Class | | | .95 | % | | | .90 | % | | | .80 | % | | | .80 | % | | | — | | | | .77 | % | |
| Short Duration Bond Fund Trust Class | | | 1.27 | % | | | 1.18 | % | | | 1.06 | % | | | 1.02 | % | | | — | | | | .95 | % | |
| Strategic Income Fund Institutional Class | | | 4.03 | % | | | 2.73 | % | | | 2.29 | % | | | 1.82 | % | | | — | | | | 1.72 | % | |
| Strategic Income Fund Trust Class | | | 9.14 | % | | | 4.81 | %(3) | | | — | | | | — | | | | — | | | | — | | |
| Strategic Income Fund Class A | | | 7.52 | %(1) | | | — | | | | — | | | | — | | | | — | | | | — | | |
| Strategic Income Fund Class C | | | 8.75 | %(1) | | | — | | | | — | | | | — | | | | — | | | | — | | |
| Cash Reserves Investor Class | | | .44 | % | | | .50 | % | | | .47 | % | | | .51 | % | | | — | | | | — | | |
(1) Period from December 20, 2007 to October 31, 2008.
(2) Period from December 27, 2007 to October 31, 2008.
(3) Period from April 2, 2007 to October 31, 2007.
(4) Period from May 1, 2008 to October 31, 2008.
(5) Period from October 1, 2005 to October 31, 2005.
100
Notes to Financial Highlights (cont'd)
§ After reimbursement of expenses previously paid by Management. Had Management not been reimbursed, the annualized ratio of net expenses to average daily net assets would have been:
| | | Year Ended
October 31,
2008 | |
| Municipal Money Fund Investor Class | | | .56 | % | |
^^^ After utilization of the Line of Credit by New York Municipal Money, reimbursement of expenses and/or waiver of a portion of the investment management fee by Management. Had Management not undertaken such actions and the Fund had not utilized the Line of Credit, the annualized ratio of net expenses to average daily net assets would have been:
| | | Year Ended October 31, | |
| | | 2008 | | 2007 | | 2006 | |
| New York Municipal Money Fund Investor Class | | | .53 | % | | | .57 | % | | | .69 | %(1) | |
(1) Period from December 19, 2005 to October 31, 2006.
^ The date investment operations commenced.
* Annualized.
** Not annualized.
@ The per share amounts which are shown for the periods ended October 31, 2004 and thereafter (September 30, 2005 and thereafter for Core Bond Fund) have been calculated based on the average number of shares outstanding during each fiscal period.
‡‡ Effective after the close of business on June 10, 2005, Management succeeded Ariel Capital Management, LLC, as the Fund's investment manager. The financial highlights for the year ended September 30, 2005 include the income and expenses attributable to the Ariel Premier Bond Fund for the period from October 1, 2004 through June 10, 2005 and the income and expenses of the Fund, thereafter.
ÿ Audited by other auditors whose report dated November 15, 2004 expressed an unqualified opinion.
^^ Portfolio turnover is calculated at the Fund level. Percentage indicated was calculated for the year ended October 31, 2007 for Strategic Income Fund and for the year ended October 31, 2008 for Core Bond Fund and Strategic Income Fund.
n/a not applicable.
*** On November 20, 2008 the Reserve Class of California Tax-Free Money Fund ceased operations.
101
Report of Independent Registered Public Accounting Firm
To the Board of Trustees and Shareholders of
Neuberger Berman Cash Reserves
Neuberger Berman High Income Bond Fund
Neuberger Berman Municipal Money Fund
Neuberger Berman Municipal Securities Trust
Neuberger Berman Short Duration Bond Fund
Neuberger Berman Strategic Income Fund
We have audited the accompanying statements of assets and liabilities, including the schedules of investments, of Neuberger Berman Cash Reserves, Neuberger Berman High Income Bond Fund (formerly Lehman Brothers High Income Bond Fund), Neuberger Berman Municipal Money Fund (formerly Lehman Brothers Municipal Money Fund), Neuberger Berman Municipal Securities Trust (formerly Lehman Brothers Municipal Securities Trust), Neuberger Berman Short Duration Bond Fund (formerly Lehman Brothers Short Duration Bond Fund), and Neuberger Berman Strategic Income Fund (formerly Lehman Brothers Strategic Income Fund), six of the series constituting the Lehman Brothers Income Funds (the "Trust") as of October 31, 2008, and the related statements of operations for the year then ended, the statements of changes in net assets for each of the two years in the period then ended, and the financial highlights for each of the periods indicated therein. T hese financial statements and financial highlights are the responsibility of the Trust's management. Our responsibility is to express an opinion on these financial statements and financial highlights based on our audits.
We conducted our audits in accordance with the standards of the Public Company Accounting Oversight Board (United States). Those standards require that we plan and perform the audits to obtain reasonable assurance about whether the financial statements and financial highlights are free of material misstatement. We were not engaged to perform an audit of the Trust's internal control over financial reporting. Our audits included consideration of internal control over financial reporting as a basis for designing audit procedures that are appropriate in the circumstances, but not for the purpose of expressing an opinion on the effectiveness of the Trust's internal control over financial reporting. Accordingly, we express no such opinion. An audit also includes examining, on a test basis, evidence supporting the amounts and disclosures in the financial statements and financial highlights, assessing the accounting principles used and significant estimates made by management, and evaluating the overall financial statement presentation. Our procedures included confirmation of securities owned as of October 31, 2008 by correspondence with the custodian and brokers or by other appropriate auditing procedures where replies from brokers were not received. We believe that our audits provide a reasonable basis for our opinion.
In our opinion, the financial statements and financial highlights referred to above present fairly, in all material respects, the financial position of Neuberger Berman Cash Reserves, Neuberger Berman High Income Bond Fund, Neuberger Berman Municipal Money Fund, Neuberger Berman Municipal Securities Trust, Neuberger Berman Short Duration Bond Fund, and Neuberger Berman Strategic Income Fund at October 31, 2008, the results of its operations for the year then ended, the changes in its net assets for each of the two years in the period then ended, and financial highlights for each of the periods indicated therein, in conformity with U.S. generally accepted accounting principles.
Boston, Massachusetts
December 19, 2008
102
Report of Independent Registered Public Accounting Firm
To the Board of Trustees
Lehman Brothers Income Funds and
Shareholders of
Neuberger Berman Core Bond Fund
Neuberger Berman New York Municipal Money Fund
Neuberger Berman Core Plus Bond Fund
Neuberger Berman California Tax-Free Money Fund
We have audited the accompanying statements of assets and liabilities of Neuberger Berman Core Bond Fund (formerly Lehman Brothers Core Bond Fund), Neuberger Berman New York Municipal Money Fund (formerly Lehman Brothers New York Municipal Money Fund), Neuberger Berman California Tax-Free Money Fund (formerly Lehman Brothers California Tax-Free Money Fund), and Neuberger Berman Core Plus Bond Fund (formerly Lehman Brothers Core Plus Bond Fund), each a series of the Lehman Brothers Income Funds (the "Trust"), including the schedules of investments, as of October 31, 2008, and for Neuberger Berman Core Bond Fund, the related statement of operations for the year then ended, the statements of changes in net assets for each of the two years in the period then ended, and the financial highlights for each of the three years in the period then ended, the period October 1, 2005 through October 31, 2005, and the year ended September 30, 2 005, and for Neuberger Berman New York Municipal Money Fund, the related statement of operations for the year then ended, the statements of changes in net assets for each of the two years in the period then ended, and the financial highlights for each of the two years in the period then ended and for the period December 19, 2005 (commencement of operations) to October 31, 2006, and for Neuberger Berman California Tax-Free Money Fund, the related statements of operations, changes in net assets and financial highlights for the period December 27, 2007 (commencement of operations) to October 31, 2008, and for Neuberger Berman Core Plus Bond Fund, the related statements of operations, changes in net assets and financial highlights for the period May 1, 2008 (commencement of operations) to October 31, 2008. These financial statements and financial highlights are the responsibility of the Trust's management. Our responsibility is to express an opinion on these financial statements and financial highlights based on our audits. The financial highlights of Neuberger Berman Core Bond Fund for the year ended September 30, 2004 have been audited by other auditors, whose report dated November 15, 2004 expressed an unqualified opinion on such financial highlights.
We conducted our audits in accordance with the standards of the Public Company Accounting Oversight Board (United States). Those standards require that we plan and perform the audit to obtain reasonable assurance about whether the financial statements and financial highlights are free of material misstatement. The Trust is not required to have, nor were we engaged to perform, an audit of its internal control over financial reporting. Our audits included consideration of internal control over financial reporting as a basis for designing audit procedures that are appropriate in the circumstances, but not for the purpose of expressing an opinion on the effectiveness of the Trust's internal control over financial reporting. Accordingly, we express no such opinion. An audit also includes examining, on a test basis, evidence supporting the amounts and disclosures in the financial statements, assessing the accounting principles used an d significant estimates made by management, as well as evaluating the overall financial statement presentation. Our procedures included confirmation of securities owned as of October 31, 2008, by correspondence with the custodian and brokers or by other appropriate auditing procedures where replies from brokers were not received. We believe that our audits provide a reasonable basis for our opinion.
In our opinion, the financial statements and financial highlights referred to above present fairly, in all material respects, the financial position of Neuberger Berman Core Bond Fund, Neuberger Berman New York Municipal Money Fund, Neuberger Berman California Tax-Free Money Fund, and Neuberger Berman Core Plus Bond Fund as of October 31, 2008, the results of their operations, the changes in their net assets, and the financial highlights for the periods indicated above, in conformity with accounting principles generally accepted in the United States of America.
Philadelphia, Pennsylvania
December 16, 2008
103
Directory
Investment Manager, Administrator and Distributor
Neuberger Berman Management LLC
605 Third Avenue, 2nd Floor
New York, NY 10158-0180
800.877.9700 or 212.476.8800
Institutional Services 800.366.6264
Sub-Advisers
Lehman Brothers Asset Management LLC
200 South Wacker Drive
Suite 2100
Chicago, IL 60601
Neuberger Berman LLC
605 Third Avenue
New York, NY 10158-3698
Custodian and Shareholder Servicing Agent
State Street Bank and Trust Company
2 Avenue de Lafayette
Boston, MA 02111
For Investor Class Shareholders Address correspondence to:
Neuberger Berman Funds
Boston Service Center
P.O. Box 8403
Boston, MA 02266-8403
800.877.9700 or 212.476.8800
For Reserve Class, Institutional Class, and Trust Class Shareholders Address correspondence to:
Neuberger Berman Management LLC
605 Third Avenue, 2nd Floor
New York, NY 10158-0180
Attn: Institutional Services 800.366.6264
Legal Counsel
K&L Gates LLP
1601 K Street, NW
Washington, DC 20006
Independent Registered Public Accounting Firms
Ernst & Young LLP
200 Clarendon Street
Boston, MA 02116
Tait, Weller & Baker LLP
1818 Market Street
Suite 2400
Philadelphia, PA 19103
104
Trustee and Officer Information
The following tables set forth information concerning the trustees ("Trustees") and officers ("Officers") of Lehman Brothers Income Funds (the "Trust"). All persons named as Trustees and Officers also serve in similar capacities for other funds administered or managed by Neuberger Berman Management LLC ("Management"), Lehman Brothers Asset Management LLC ("LBAM") and Neuberger Berman, LLC ("Neuberger"). The Statement of Additional Information includes additional information about the Trustees and Officers and is available upon request, without charge, by calling (800) 877-9700.
Information about the Board of Trustees
Name, (Year of Birth),
and Address(1) | | Position and
Length of
Time Served(2) | | Principal Occupation(s)(3) | | Number of
Funds in Fund
Complex
Overseen
by Trustee(4) | | Other Directorships
Held Outside Fund
Complex by Trustee | |
| Independent Trustees | |
|
| John Cannon (1930) | | Trustee since 1994 | | Consultant; formerly, Chairman, CDC Investment Advisers (registered investment adviser), 1993 to January 1999; formerly, President and Chief Executive Officer, AMA Investment Advisors, an affiliate of the American Medical Association. | | | 60 | | | Independent Trustee or Director of three series of Oppenheimer Funds: Oppenheimer Limited Term New York Municipal Fund, Rochester Fund Municipals, and Oppenheimer Convertible Securities Fund since 1992. | |
|
| Faith Colish (1935) | | Trustee since 2000 | | Counsel, Carter Ledyard & Milburn LLP (law firm) since October 2002; formerly, Attorney-at-Law and President, Faith Colish, A Professional Corporation, 1980 to 2002. | | | 60 | | | Formerly, Director (1997 to 2003) and Advisory Director (2003 to 2006), ABA Retirement Funds (formerly, American Bar Retirement Association) (not-for-profit membership corporation). | |
|
| Martha C. Goss (1949) | | Trustee since 2007 | | President, Woodhill Enterprises Inc./Chase Hollow Associates LLC (personal investment vehicle), since 2006; Chief Operating and Financial Officer, Hopewell Holdings LLC/ Amwell Holdings, LLC (a holding company for a healthcare reinsurance company start-up), since 2003; formerly, Consultant, Resources Connection (temporary staffing), 2002 to 2006. | | | 60 | | | Director, Ocwen Financial Corporation (mortgage servicing), since 2005; Director, American Water (water utility), since 2003; Director, Channel Reinsurance (financial guaranty reinsurance), since 2006; Advisory Board Member, Attensity (software developer), since 2005; Director, Allianz Life of New York (insurance), since 2005; Director, Financial Women's Association of New York (not for profit association), since 2003; Trustee Emerita, Brown University, since 1998. | |
|
105
Name, (Year of Birth),
and Address(1) | | Position and
Length of
Time Served(2) | | Principal Occupation(s)(3) | | Number of
Funds in Fund
Complex
Overseen
by Trustee(4) | | Other Directorships
Held Outside Fund
Complex by Trustee | |
| C. Anne Harvey (1937) | | Trustee since 2000 | | President, C.A. Harvey Associates, since October 2001; formerly, Director, AARP, 1978 to December 2001. | | | 60 | | | Formerly, President, Board of Associates to The National Rehabilitation Hospital's Board of Directors, 2001 to 2002; formerly, Member, Individual Investors Advisory Committee to the New York Stock Exchange Board of Directors, 1998 to June 2002. | |
|
| Robert A. Kavesh (1927) | | Trustee since 1993 | | Marcus Nadler Professor Emeritus of Finance and Economics, New York University Stern School of Business; formerly, Executive Secretary-Treasurer, American Finance Association, 1961 to 1979. | | | 60 | | | Formerly, Director, The Caring Community (not-for-profit), 1997 to 2006; formerly, Director, DEL Laboratories, Inc. (cosmetics and pharmaceuticals), 1978 to 2004; formerly, Director, Apple Bank for Savings, 1979 to 1990; formerly, Director, Western Pacific Industries, Inc., 1972 to 1986 (public company). | |
|
| Michael M. Knetter (1960) | | Trustee since 2007 | | Dean, School of Business, University of Wisconsin - Madison; formerly, Professor of International Economics and Associate Dean, Amos Tuck School of Business - Dartmouth College, 1998 to 2002. | | | 60 | | | Trustee, Northwestern Mutual Series Fund, Inc., since February 2007; Director, Wausau Paper, since 2005; Director, Great Wolf Resorts, since 2004. | |
|
| Howard A. Mileaf (1937) | | Trustee since 2000 | | Retired; formerly, Vice President and General Counsel, WHX Corporation (holding company), 1993 to 2001. | | | 60 | | | Director, Webfinancial Corporation (holding company), since December 2002; formerly, Director WHX Corporation (holding company), January 2002 to June 2005; formerly, Director, State Theatre of New Jersey (not-for-profit theater), 2000 to 2005. | |
|
106
Name, (Year of Birth),
and Address(1) | | Position and
Length of
Time Served(2) | | Principal Occupation(s)(3) | | Number of
Funds in Fund
Complex
Overseen
by Trustee(4) | | Other Directorships
Held Outside Fund
Complex by Trustee | |
| George W. Morriss (1947) | | Trustee since 2007 | | Formerly, Executive Vice President and Chief Financial Officer, People's Bank (a financial services company), 1991 to 2001. | | | 60 | | | Manager, Old Mutual 2100 fund complex (consisting of six funds) since October 2006 for four funds and since February 2007 for two funds. | |
|
| Edward I. O'Brien (1928) | | Trustee since 2000 | | Formerly, Member, Investment Policy Committee, Edward Jones, 1993 to 2001; President, Securities Industry Association ("SIA") (securities industry's representative in government relations and regulatory matters at the federal and state levels), 1974 to 1992; Adviser to SIA, November 1992 to November 1993. | | | 60 | | | Formerly, Director, Legg Mason, Inc. (financial services holding company), 1993 to July 2008; formerly, Director, Boston Financial Group (real estate and tax shelters), 1993 to 1999. | |
|
| William E. Rulon (1932) | | Trustee since 1993 | | Retired; formerly, Senior Vice President, Foodmaker, Inc. (operator and franchiser of restaurants), until January 1997. | | | 60 | | | Formerly, Director, Pro-Kids Golf and Learning Academy (teach golf and computer usage to "at risk" children), 1998 to 2006; formerly, Director, Prandium, Inc. (restaurants), March 2001 to July 2002. | |
|
| Cornelius T. Ryan (1931) | | Trustee since 2000 | | Founding General Partner, Oxford Partners and Oxford Bioscience Partners (venture capital investing) and President, Oxford Venture Corporation, since 1981. | | | 60 | | | None | |
|
107
Name, (Year of Birth),
and Address(1) | | Position and
Length of
Time Served(2) | | Principal Occupation(s)(3) | | Number of
Funds in Fund
Complex
Overseen
by Trustee(4) | | Other Directorships
Held Outside Fund
Complex by Trustee | |
| Tom D. Seip (1950) | | Trustee since 2000; Chairman of the Board since 2008; Lead Independent Trustee from 2006 to 2008 | | General Partner, Seip Investments LP (a private investment partnership); formerly, President and CEO, Westaff, Inc. (temporary staffing), May 2001 to January 2002; formerly, Senior Executive at the Charles Schwab Corporation, 1983 to 1998, including Chief Executive Officer, Charles Schwab Investment Management, Inc., and Trustee, Schwab Family of Funds and Schwab Investments, 1997 to 1998, and Executive Vice President-Retail Brokerage, Charles Schwab & Co., Inc., 1994 to 1997. | | | 60 | | | Director, H&R Block, Inc. (financial services company), since May 2001; Chairman, Compensation Committee, H&R Block, Inc., since 2006; Director, America One Foundation, since 1998; formerly, Chairman, Governance and Nominating Committee, H&R Block, Inc., 2004 to 2006; formerly, Director, Forward Management, Inc. (asset management company), 1999 to 2006; formerly, Director, E-Bay Zoological Society, 1999 to 2003; formerly, Director, General Magic (voice recognition software), 2001 to 2002; formerly, Director, E-Finance Corporation (credit decisioning services), 1999 to 2003; formerly, Director, Save-Daily.com (micro investing services), 1999 to 2003. | |
|
| Candace L. Straight (1947) | | Trustee since 1993 | | Private investor and consultant specializing in the insurance industry; formerly, Advisory Director, Securitas Capital LLC (a global private equity investment firm dedicated to making investments in the insurance sector), 1998 to December 2003. | | | 60 | | | Director, Montpelier Re (reinsurance company), since 2006; Director, National Atlantic Holdings Corporation (property and casualty insurance company), since 2004; Director, The Proformance Insurance Company (property and casualty insurance company), since March 2004; formerly, Director, Providence Washington Insurance Company (property and casualty insurance company), December 1998 to March 2006; formerly, Director, Summit Global Partners (insurance brokerage firm), 2000 to 2005. | |
|
| Peter P. Trapp (1944) | | Trustee since 2007 | | Retired; formerly, Regional Manager for Mid-Southern Region, Ford Motor Credit Company, September 1997 to 2007; formerly, President, Ford Life Insurance Company, April 1995 to August 1997. | | | 60 | | | None | |
|
108
Name, (Year of Birth),
and Address(1) | | Position and
Length of
Time Served(2) | | Principal Occupation(s)(3) | | Number of
Funds in Fund
Complex
Overseen
by Trustee(4) | | Other Directorships
Held Outside Fund
Complex by Trustee | |
| Trustees who are "Interested Persons" | |
|
| Jack L. Rivkin* (1940) | | Trustee since 2002; President from 2002 to 2008 | | Formerly, Executive Vice President and Chief Investment Officer, Neuberger Berman Holdings LLC (holding company), 2002 to August 2008 and 2003 to August 2008, respectively; formerly, Managing Director and Chief Investment Officer, Neuberger, December 2005 to August 2008 and 2003 to August 2008, respectively; formerly, Executive Vice President, Neuberger, December 2002 to 2005; formerly, Director and Chairman, Management, December 2002 to August 2008; formerly, Executive Vice President, Citigroup Investments, Inc., September 1995 to February 2002; formerly, Executive Vice President, Citigroup Inc., September 1995 to February 2002. | | | 60 | | | Director, Dale Carnegie and Associates, Inc. (private company), since 1998; Director, Solbright, Inc. (private company), since 1998. | |
|
109
Name, (Year of Birth),
and Address(1) | | Position and
Length of
Time Served(2) | | Principal Occupation(s)(3) | | Number of
Funds in Fund
Complex
Overseen
by Trustee(4) | | Other Directorships
Held Outside Fund
Complex by Trustee | |
| Robert Conti* (1956) | | Chief Executive Officer, President and Director since 2008; prior thereto, Executive Vice President in 2008 and Vice President 2000 to 2008 | | Managing Director, Neuberger, since 2007; formerly, Senior Vice President, Neuberger, 2003 to 2006; formerly, Vice President, Neuberger, 1999 to 2003; President and Chief Executive Officer, Management, since 2008; formerly, Senior Vice President, Management, 2000 to 2008. | | | 60 | | | Chairman of the Board, Staten Island Mental Health Society since 2008. | |
|
(1) The business address of each listed person is 605 Third Avenue, New York, New York 10158.
(2) Pursuant to the Trust's Trust Instrument, each Trustee shall hold office for life or until his or her successor is elected or the Trust terminates; except that (a) any Trustee may resign by delivering a written resignation; (b) any Trustee may be removed with or without cause at any time by a written instrument signed by at least two-thirds of the other Trustees; (c) any Trustee who requests to be retired, or who has become unable to serve, may be retired by a written instrument signed by a majority of the other Trustees; and (d) any Trustee may be removed at any shareholder meeting by a vote of at least two-thirds of the outstanding shares.
(3) Except as otherwise indicated, each individual has held the positions shown for at least the last five years.
(4) For funds organized in a master-feeder structure, we count the master fund and its associated feeder funds as a single portfolio.
* Indicates a Fund Trustee who is an "interested person" within the meaning of the 1940 Act. Mr. Conti is an interested person of the Trust by virtue of the fact that he is an officer of Management and Neuberger. Mr. Rivkin may be deemed an interested person of the Trust by virtue of the fact that, until August 2008, he was a director of Management and an officer of LBAM and Neuberger.
110
Information about the Officers of the Trust
| Name, Age, and Address(1) | | Position and
Length of Time
Served(2) | | Principal Occupation(s)(3) | |
| Andrew B. Allard (1961) | | Anti-Money Laundering Compliance Officer since 2002 | | Senior Vice President, Neuberger, since 2006; Deputy General Counsel, Neuberger, since 2004; formerly, Vice President, Neuberger, 2000 to 2005; formerly, Associate General Counsel, Neuberger, 1999 to 2004; Anti-Money Laundering Compliance Officer, fifteen registered investment companies for which Management acts as investment manager and administrator (six since 2002, two since 2003, four since 2004, one since 2005 and two since 2006). | |
|
| Michael J. Bradler (1970) | | Assistant Treasurer since 2005 | | Vice President, Neuberger, since 2006; Employee, Management, since 1997; Assistant Treasurer, fifteen registered investment companies for which Management acts as investment manager and administrator (thirteen since 2005 and two since 2006). | |
|
| Claudia A. Brandon (1956) | | Executive Vice President since 2008 and Secretary since 1985 | | Senior Vice President, Neuberger, since 2007; Senior Vice President, Management, since 2008 and Assistant Secretary since 2004; formerly, Vice President-Mutual Fund Board Relations, Management, 2000 to 2008; formerly, Vice President, Neuberger, 2002 to 2006 and Employee since 1999; Secretary, fifteen registered investment companies for which Management acts as investment manager and administrator (three since 1985, three since 2002, two since 2003, four since 2004, one since 2005 and two since 2006). | |
|
| Maxine L. Gerson (1950) | | Executive Vice President since 2008 and Chief Legal Officer since 2005 (only for purposes of sections 307 and 406 of the Sarbanes-Oxley Act of 2002) | | Senior Vice President, Neuberger, since 2002; Deputy General Counsel and Assistant Secretary, Neuberger, since 2001; Senior Vice President, Management, since 2006; Secretary and General Counsel, Management, since 2004; Chief Legal Officer (only for purposes of sections 307 and 406 of the Sarbanes-Oxley Act of 2002), fifteen registered investment companies for which Management acts as investment manager and administrator (thirteen since 2005 and two since 2006). | |
|
| Sheila R. James (1965) | | Assistant Secretary since 2002 | | Vice President, Neuberger, since 2008 and Employee since 1999; formerly, Assistant Vice President, Neuberger, 2007; Assistant Secretary, fifteen registered investment companies for which Management acts as investment manager and administrator (six since 2002, two since 2003, four since 2004, one since 2005 and two since 2006). | |
|
| Kevin Lyons (1955) | | Assistant Secretary since 2003 | | Assistant Vice President, Neuberger, since 2008 and Employee since 1999; Assistant Secretary, fifteen registered investment companies for which Management acts as investment manager and administrator (eight since 2003, four since 2004, one since 2005 and two since 2006). | |
|
111
| Name, Age, and Address(1) | | Position and
Length of Time
Served(2) | | Principal Occupation(s)(3) | |
| John M. McGovern (1970) | | Treasurer and Principal Financial and Accounting Officer since 2005; prior thereto, Assistant Treasurer since 2002 | | Senior Vice President, Neuberger, since 2007; formerly, Vice President, Neuberger, 2004 to 2006; Employee, Management, since 1993; Treasurer and Principal Financial and Accounting Officer, fifteen registered investment companies for which Management acts as investment manager and administrator (thirteen since 2005 and two since 2006); formerly, Assistant Treasurer, fourteen registered investment companies for which Management acts as investment manager and administrator, 2002 to 2005. | |
|
| Frank Rosato (1971) | | Assistant Treasurer since 2005 | | Vice President, Neuberger, since 2006; Employee, Management, since 1995; Assistant Treasurer, fifteen registered investment companies for which Management acts as investment manager and administrator (thirteen since 2005 and two since 2006). | |
|
| Chamaine Williams (1971) | | Chief Compliance Officer since 2005 | | Senior Vice President, Neuberger, since 2007; Chief Compliance Officer, Management, since 2006; Senior Vice President, Lehman Brothers Inc., since 2007; formerly, Vice President, Lehman Brothers Inc., 2003 to 2006; Chief Compliance Officer, fifteen registered investment companies for which Management acts as investment manager and administrator (fourteen since 2005 and one since 2006); formerly, Chief Compliance Officer, Lehman Brothers Asset Management Inc., 2003 to 2007; formerly, Chief Compliance Officer, Lehman Brothers Alternative Investment Management LLC, 2003 to 2007; formerly, Vice President, UBS Global Asset Management (US) Inc. (formerly, Mitchell Hutchins Asset Management, a wholly-owned subsidiary of PaineWebber Inc.), 1997 to 2003. | |
|
(1) The business address of each listed person is 605 Third Avenue, New York, New York 10158.
(2) Pursuant to the By-Laws of the Trust, each Officer elected by the Trustees shall hold office until his or her successor shall have been elected and qualified or until his or her earlier death, inability to serve, or resignation. Officers serve at the pleasure of the Trustees and may be removed at any time with or without cause.
(3) Except as otherwise indicated, each individual has held the positions shown for at least the last five years.
112
Proxy Voting Policies and Procedures
A description of the policies and procedures that the Trust uses to determine how to vote proxies relating to portfolio securities is available, without charge, by calling 1-800-877-9700 (toll-free) and on the website of the Securities and Exchange Commission, at www.sec.gov. Information regarding how the Trust voted proxies relating to portfolio securities during the most recent 12-month period ended June 30 is also available without charge, by calling 1-800-877-9700 (toll-free), on the website of the Securities and Exchange Commission, at www.sec.gov, and on Management's website at www.nb.com.
Quarterly Portfolio Schedule
The Trust files a complete schedule of portfolio holdings for each Fund with the Securities and Exchange Commission for the first and third quarters of each fiscal year on Form N-Q. The Trust's Forms N-Q are available on the Securities and Exchange Commission's website at www.sec.gov and may be reviewed and copied at the Securities and Exchange Commission's Public Reference Room in Washington, DC. Information on the operation of the Public Reference Room may be obtained by calling 1-800-SEC-0330. The information on Form N-Q is available upon request, without charge, by calling 1-800-877-9700 (toll-free).
Notice to Shareholders (Unaudited)
For Neuberger Berman Strategic Income Fund 3.9% of the dividends distributed during the fiscal year ended October 31, 2008 qualifies for the dividends received deduction for corporate shareholders.
Under most state tax laws, mutual fund dividends which are derived from direct investments in U.S. Government obligations are not taxable, as long as a Fund meets certain requirements. Some states require that a Fund must provide shareholders with a written notice, within 60 days of the close of a Fund's taxable year, designating the portion of the dividends which represents interest which those states consider to have been earned on U.S. Government obligations. The chart below shows the percentage of income derived from such investments for the twelve months ended October 31, 2008. This information should not be used to complete your tax returns.
| | | U.S. Treasury
Obligations | | Other Direct
U.S. Government
Obligations | | Other Indirect
U.S. Government
Obligations | | Repurchase
Agreements | |
| Neuberger Berman High Income Bond Fund | | | 0.0 | % | | | 0.0 | % | | | 0.0 | % | | | 0.0 | % | |
| Neuberger Berman Short Duration Bond Fund | | | 1.4 | | | | 0.0 | | | | 6.4 | | | | 1.0 | | |
| Neuberger Berman Strategic Income Fund | | | 1.4 | | | | 20.5 | | | | 0.2 | | | | 0.7 | | |
| Neuberger Berman Cash Reserves | | | 0.0 | | | | 0.8 | | | | 0.1 | | | | 0.0 | | |
In January 2009, you will receive information to be used in filing your 2008 tax returns, which will include a notice of the exact tax status of all dividends paid to you by each Fund during calendar year 2008. Please consult your own tax advisor for details as to how this information should be reflected on your tax returns.
For the fiscal year ended October 31, 2008, the percentage representing the portion of distributions from net investment income, which are exempt from federal income tax, other than alternative minimum tax for the Neuberger Berman Municipal Securities Trust is 99.96%.
For the fiscal year ended October 31, 2008, Neuberger Berman Strategic Income Fund designates $14,424, or up to the maximum amount of such dividends allowable pursuant to the Internal Revenue Code, as qualified dividend income eligible for reduced tax rates. These lower rates range from 5% to 15% depending upon an individual's tax bracket. Complete information regarding the Fund's distributions during the calendar year 2008 will be reported in conjunction with Form 1099DIV.
113
For the fiscal period ended October 31, 2008, the percentages representing the portion of distributions from net investment income, which are exempt from federal tax, other than alternative minimum tax are as follows:
| Neuberger Berman California Tax-Free Money Fund | | | 100 | % | |
|
| Neuberger Berman Municipal Money Fund | | | 100 | % | |
|
| Neuberger Berman New York Municipal Money Fund | | | 100 | % | |
|
Neuberger Berman Municipal Money Fund, Neuberger Berman Municipal Securities Trust, Neuberger Berman New York Municipal Money Fund and Neuberger Berman Strategic Income Fund hereby designate $5,377, $24,194, $211 and $724,810, respectively, as a capital gain distribution.
Board Consideration of the Management and Sub-Advisory Agreements
At a meeting held on September 25, 2008, the Board of Trustees of Lehman Brothers Income Funds ("Board"), including the Trustees who are not "interested persons" of Neuberger Berman Management LLC ("Management") (including its affiliates) or Lehman Brothers Income Funds ("Independent Fund Trustees"), approved the continuance of the Management and Sub-Advisory Agreements ("Agreements") between Management and each of Neuberger Berman California Tax-Free Money Fund, Neuberger Berman Cash Reserves, Neuberger Berman Core Bond Fund, Neuberger Berman High Income Bond Fund, Neuberger Berman Municipal Money Fund, Neuberger Berman Municipal Securities Trust, Neuberger Berman New York Municipal Money Fund, Neuberger Berman Short Duration Bond Fund and Neuberger Berman Strategic Income Fund (each a "Fund").
In evaluating the Agreements, the Board, including the Independent Fund Trustees, reviewed materials furnished by Management and Lehman Brothers Asset Management LLC ("Lehman Brothers Asset Management") in response to questions submitted by counsel to the Independent Fund Trustees, and met with senior representatives of Management and Lehman Brothers Asset Management regarding their personnel and operations. The Independent Fund Trustees were advised by counsel that is experienced in Investment Company Act of 1940 matters and that is independent of Management and Lehman Brothers Asset Management. The Independent Fund Trustees received a memorandum from independent counsel discussing the legal standards for their consideration of the proposed continuance of the Agreements. They met with such counsel separately from representatives of Management to discuss the annual contract review. The annual contract review extends over two reg ular meetings of the Board to ensure that Management and Lehman Brothers Asset Management have time to respond to any questions the Independent Fund Trustees may have on their initial review of the report and that the Independent Fund Trustees have time to consider those responses. In addition, during this process, the Board held a separate meeting devoted primarily to reviewing and discussing Fund performance.
The Board considered the following factors, among others, in connection with its approval of the continuance of the Agreements: (1) the nature, extent, and quality of the services provided by Management and Lehman Brothers Asset Management; (2) the performance of each Fund compared to a relevant market index and a peer group of investment companies; (3) the costs of the services provided and profits or losses realized by Management and its affiliates from their relationship with the Funds; (4) the extent to which economies of scale might be realized as each Fund grows; and (5) whether fee levels reflect any such potential economies of scale for the benefit of investors in each Fund. In their deliberations, the Board members did not identify any particular information that was all-important or controlling, and each Trustee may have attributed different weights to the various factors.
The Board considered the continued integrity of Management and Lehman Brothers Asset Management as organizations, despite the bankruptcy filing by Lehman Brothers Holdings Inc. The Board discussed the efforts made by Management and Lehman Brothers Asset Management to retain employees, and the reported likelihood that such employees would be retained. The Board discussed the provisions that were being made for ancillary services by Management, Lehman Brothers Asset Management and their affiliates.
The Board evaluated the terms of the Agreements, the overall fairness of the Agreements to each Fund and whether the Agreements were in the best interests of each Fund and its shareholders.
With respect to the nature, extent and quality of the services provided, the Board considered the performance of each Fund and the experience and staffing of the portfolio management and investment research personnel of Management and Lehman Brothers Asset Management who perform services for the Funds. The Board noted that Management also provides certain administrative services, including fund accounting and compliance oversight. The Board also considered Management's and Lehman Brothers Asset Management's policies and practices regarding brokerage. The Board considered the quality of brokerage execution obtained by Management. The Board's Portfolio Transactions and Pricing Committee from time to time
114
reviewed the quality of the brokerage services that Lehman Brothers Inc. had provided, and periodically reviews studies by an independent firm engaged to review and evaluate the quality of brokerage execution received by the Funds. The Board also reviewed whether Management and Lehman Brothers Asset Management used brokers to execute Fund transactions that provide research and other services to Management and Lehman Brothers Asset Management, and the types of benefits potentially derived from such services by Management, Lehman Brothers Asset Management, the Funds and other clients of Management and Lehman Brothers Asset Management. In addition, the Board noted the positive compliance history of Management and Lehman Brothers Asset Management, as each firm has been free of significant compliance problems.
The Board considered the performance of each Fund relative to its benchmark and a peer group of investment companies pursuing broadly similar strategies. The Board also considered performance in relation to the degree of risk undertaken by the portfolio manager(s). In the case of those Funds that had underperformed their peer groups and/or relevant market indices, the Board discussed with Management each Fund's performance and steps that Management had taken, or intended to take, to improve each Fund's performance. The Board also considered Management's resources and responsiveness with respect to the Funds that experienced lagging performance.
With respect to the overall fairness of the Agreements, the Board considered the fee structure for each Fund under the Agreements as compared to a peer group of comparable funds and any fall-out benefits likely to accrue to Management or Lehman Brothers Asset Management or their affiliates from their relationship with each Fund. The Board also considered the profitability of Management and its affiliates from their association with the Funds.
The Board reviewed a comparison of each Fund's management fee and overall expense ratio to a peer group of broadly comparable funds. The Board considered the mean and median of the management fees and expense ratios of each peer group. Where a Fund's management fee was higher than the peer group mean and/or median, the Board considered whether specific portfolio management or administration needs contributed to the management fee. In addition, the Board considered the contractual limits on Fund expenses undertaken by Management for certain classes of certain Funds. The Board noted that certain classes of certain Funds also have voluntary limits or waivers which further reduce Fund expenses. The Board noted that Management incurred a loss on Lehman Brothers Core Bond Fund, Lehman Brothers Municipal Securities Trust and Lehman Brothers Strategic Income Fund.
The Board considered whether there were other funds that were advised or sub-advised by Management or its affiliates or separate accounts managed by Management or its affiliates with similar investment objectives, policies and strategies as to certain of the Funds. The Board compared the fees charged to each Fund at various asset levels to the fees charged to any such funds and/or separate accounts. The Board considered the appropriateness and reasonableness of any differences between the fees charged to each Fund and any such funds and/or separate accounts and determined that the differences in fees were consistent with the management and other services provided.
The Board also evaluated any apparent or anticipated economies of scale in relation to the services Management provides to each Fund. The Board considered whether each Fund's fee structure provides for a reduction of payments resulting from the use of breakpoints and whether any such breakpoints are set at appropriate asset levels.
In concluding that the benefits accruing to Management and its affiliates by virtue of their relationship to each Fund were reasonable in comparison with the costs of providing the investment advisory services and the benefits accruing to each Fund, the Board reviewed specific data as to Management's profit or loss on each Fund for a recent period and the trend in profit or loss over recent years. The Board also carefully examined Management's cost allocation methodology and in recent years had an independent consultant review the methodology. It also reviewed an analysis from an independent data service on profitability margins in the investment management industry. The Board recognized that Management should be entitled to earn a reasonable level of profits for services it provides to the Funds and, based on its review, concluded that Management's level of profitability was not excessive.
Conclusions
In approving the Agreements, the Board concluded that the terms of each Agreement are fair and reasonable and that approval of the Agreements is in the best interests of each Fund and its shareholders. In reaching this determination, the Board considered that Management and Lehman Brothers Asset Management could be expected to provide a high level of service to each Fund; that the performance of each Fund was satisfactory over time, or, in the case of underperforming Funds, that it retained confidence in Management's and Lehman Brothers Asset Management's capabilities to manage the Funds; that each Fund's fee structure appeared to the Board to be reasonable given the nature and quality of services provided; and that the benefits accruing to Management and its affiliates by virtue of their relationship to the Funds were reasonable in comparison with the benefits accruing to each Fund.
115
Board Consideration of the Management and Sub-Advisory Agreements
At a meeting held on September 25, 2008, the Board, including the Trustees who are not "interested persons" of Management or Independent Fund Trustees approved the Management Agreements between Management and Core Plus Bond Fund (the "Fund").
In evaluating the Agreements, the Board, including the Independent Fund Trustees, reviewed materials furnished by Management and Lehman Brothers Asset Management and met with senior representatives of Management and Lehman Brothers Asset Management regarding their personnel and operations. The Independent Fund Trustees were advised by counsel that is experienced in Investment Company Act of 1940 matters and that is independent of Management and Lehman Brothers Asset Management.
The Board considered the following factors, among others, in connection with its approval of the Agreements: (1) the nature, extent, and quality of the services to be provided by Management and Lehman Brothers Asset Management; (2) the costs of the services to be provided; (3) the extent to which economies of scale might be realized as the Fund grows; and (4) whether fee levels reflect any such potential economies of scale for the benefit of investors in the Fund. In their deliberations, the Board members did not identify any particular information that was all-important or controlling, and each Trustee may have attributed different weights to the various factors.
The Board considered the continued integrity of Management and Lehman Brothers Asset Management as organizations, despite the bankruptcy filing by Lehman Brothers Holdings Inc. The Board discussed the efforts made by Management and Lehman Brothers Asset Management to retain employees, and the reported likelihood that such employees would be retained. The Board discussed the provisions that were being made for ancillary services by Management, Lehman Brothers Asset Management and their affiliates.
The Board evaluated the terms of the Agreements, the overall fairness of the Agreements to the Fund and whether the Agreements were in the best interests of the Fund and its shareholders.
With respect to the nature, extent and quality of the services to be provided, the Board considered the experience and staffing of the portfolio management and investment research personnel who would perform services for the Fund. The Board noted that Management would also provide certain administrative services, including fund accounting and compliance oversight. The Board also considered Management's and Lehman Brothers Asset Management's policies and practices regarding brokerage. In addition, the Board noted the positive compliance history of Management and Lehman Brothers Asset Management, as each firm has been free of significant compliance problems.
With respect to the overall fairness of the Agreements, the Board considered the Fund's fee structure under the Agreements as compared to a peer group of comparable funds and any fall-out benefits likely to accrue to Management or Lehman Brothers Asset Management or their affiliates from their relationship with the Fund. The Board reviewed a comparison of the Fund's management fee and overall expense ratio to a peer group of broadly comparable funds. In addition, the Board considered the contractual limit on Fund expenses undertaken by Management with regard to the Fund.
The Board also evaluated any anticipated economies of scale in relation to the services Management provides to the Fund. The Board considered whether the Fund's fee structure provides for a reduction of payments resulting from the use of breakpoints and whether those breakpoints are set at appropriate asset levels.
Conclusions
In approving the Agreements, the Board concluded that the terms of each Agreement are fair and reasonable and that approval of the Agreements is in the best interests of the Fund and its shareholders. In reaching this determination, the Board considered that Management and Lehman Brothers Asset Management could be expected to provide a high level of service to the Fund; that the Fund's fee structure appeared to the Board to be reasonable given the nature and quality of services expected to be provided; and that the expected benefits accruing to Management and its affiliates by virtue of their relationship to the Fund were reasonable in comparison with the expected costs of providing the investment advisory services and the expected benefits accruing to the Fund.
116
This page has been left blank intentionally
This page has been left blank intentionally
Investment manager: Neuberger Berman Management LLC
Sub-advisers: Lehman Brothers Asset Management LLC
Neuberger Berman LLC
Neuberger Berman Management LLC
605 Third Avenue, 2nd Floor
New York, NY 10158-0180
Retail Services: 800.877.9700
Broker/Dealer and Institutional Services: 800.366.6264 Web site: www.nb.com
California Tax-Free Money Fund and New York Municipal Money Fund Inquiries:
888.556.9030 Web site: www.lehmanam.com
Statistics and projections in this report are derived from sources deemed to be reliable but cannot be regarded as a representation of future results of the Funds. This report is prepared for the general information of shareholders and is not an offer of shares of the Funds. Shares are sold only through the currently effective prospectus, which must precede or accompany this report.
H0648 12/08
Item 2. Code of Ethics
The Board of Trustees (“Board”) of Lehman Brothers Income Funds (“Registrant”) adopted a code of ethics that applies to the Registrant’s principal executive officer, principal financial officer, principal accounting officer or controller, or persons performing similar functions (“Code of Ethics”). For the period covered by this Form N-CSR, there were no amendments to the Code of Ethics and there were no waivers from the Code of Ethics granted to the Registrant’s principal executive officer, principal financial officer, principal accounting officer or controller, or persons performing similar functions.
A copy of the Code of Ethics is incorporated by reference to the Registrant’s Form N-CSR, Investment Company Act file number 811-03802 (filed on July 10, 2006). The Code of Ethics is also available, without charge, by calling 1-800-877-9700 (toll-free).
Item 3. Audit Committee Financial Expert
The Board has determined that the Registrant has three audit committee financial experts serving on its audit committee. The Registrant’s audit committee financial experts are Martha Goss, Howard Mileaf, and George Morriss. Ms. Goss, Mr. Mileaf and Mr. Morriss are independent trustees as defined by Form N-CSR.
Item 4. Principal Accountant Fees and Services
The financial information provided below is that of the Registrant, Lehman Brothers Income Funds. This N-CSR relates only to Neuberger Berman California Tax-Free Money Fund, Neuberger Berman Core Bond Fund, Neuberger Berman Core Plus Bond Fund, Neuberger Berman High Income Bond Fund, Neuberger Berman Municipal Money Fund, Neuberger Berman Municipal Securities Trust, Neuberger Berman New York Municipal Money Fund, Neuberger Berman Short Duration Bond Fund, Neuberger Berman Strategic Income Fund and Neuberger Berman Cash Reserves (collectively, the “Funds”). Tait, Weller & Baker LLP (“Tait Weller”) serves as independent registered public accounting firm to Neuberger Berman California Tax-Free Money Fund, Neuberger Berman Core Bond Fund, Neuberger Berman Core Plus Bond Fund and Neuberger Berman New York Municipal Money Fund. Ernst & Young, LLP (“E&Y”) serves as independent registered public accounting firm to all other series of the Registrant.
(a) Audit Fees
The aggregate fees billed for professional services rendered by E&Y for the audit of the annual financial statements or services that are normally provided by E&Y in connection with statutory and regulatory filings or engagements were $216,000 and $231,000 for the fiscal years ended 2007 and 2008, respectively.
The aggregate fees billed for professional services rendered by Tait Weller for the audit of the annual financial statements or services that are normally provided by Tait Weller in connection with statutory and regulatory filings or engagements were $38,700 and $71,400 for the fiscal years ended 2007 and 2008, respectively.
(b) Audit-Related Fees
The aggregate fees billed to the Registrant for assurance and related services by E&Y that are reasonably related to the performance of the audit of the Registrant’s financial statements and are not reported above in Audit Fees were $0 and $0 for the fiscal years ended 2007 and 2008, respectively.
The fees billed to other entities in the investment company complex for assurance and related services by E&Y that are reasonably related to the performance of the audit that the Audit Committee was required to approve because the engagement related directly to the operations and financial reporting of the Registrant were $0 and $0 for the fiscal years ended 2007 and 2008 respectively.
The aggregate fees billed to the Registrant for assurance and related services by Tait Weller that are reasonably related to the performance of the audit of the Registrant’s financial statements and are not reported above in Audit Fees were $0 and $0 for the fiscal years ended 2007 and 2008, respectively.
The fees billed to other entities in the investment company complex for assurance and related services by Tait Weller that are reasonably related to the performance of the audit that the Audit Committee was required to approve because the engagement related directly to the operations and financial reporting of the Registrant were $0 and $0 for the fiscal years ended 2007 and 2008, respectively.
(c) Tax Fees
The aggregate fees billed to the Registrant for professional services rendered by E&Y for tax compliance, tax advice, and tax planning were $63,600 and $57,000 for the fiscal years ended 2007 and 2008, respectively. The nature of the services provided was tax compliance, tax advice and tax planning. The Audit Committee approved 0% and 0% of these services provided by E&Y for the fiscal years ended 2007 and 2008, respectively, pursuant to the waiver provisions of Rule 2-01(c)(7)(i)(C) of Regulation S-X.
The fees billed to other entities in the investment company complex for professional services rendered by E&Y for tax compliance, tax advice, and tax planning that the Audit Committee was required to approve because the engagement related directly to the operations and financial reporting of the Registrant were $0 and $0 for the fiscal years ended 2007 and 2008, respectively.
The aggregate fees billed to the Registrant for professional services rendered by Tait Weller for tax compliance, tax advice, and tax planning were $6,400 and $10,000 for the fiscal years ended 2007 and 2008, respectively. The nature of the services provided comprised tax compliance, tax advice and tax planning. The Audit Committee approved 0% and 0% of these services provided by Tait Weller for the fiscal years ended 2007 and 2008, respectively, pursuant to the waiver provisions of Rule 2-01(c)(7)(i)(C) of Regulation S-X.
The fees billed to other entities in the investment company complex for professional services rendered by Tait Weller for tax compliance, tax advice, and tax planning that the Audit Committee was required to approve because the engagement related directly to the operations and financial reporting of the Registrant were $0 and $0 for the fiscal years ended 2007 and 2008, respectively.
(d) All Other Fees
The aggregate fees billed to the Registrant for products and services provided by E&Y, other than services reported in Audit Fees, Audit-Related Fees, and Tax Fees were $0 and $0 for the fiscal years ended 2007 and 2008, respectively.
The fees billed to other entities in the investment company complex for products and services provided by E&Y, other than services reported in Audit Fees, Audit-Related Fees, and Tax Fees, that the Audit Committee was required to approve because the engagement related directly to the operations and financial reporting of the Registrant were $0 and $0 for the fiscal years ended 2007 and 2008, respectively.
The aggregate fees billed to the Registrant for products and services provided by Tait Weller, other than services reported in Audit Fees, Audit-Related Fees, and Tax Fees were $0 and $0 for the fiscal years ended 2007 and 2008, respectively.
The fees billed to other entities in the investment company complex for products and services provided by Tait Weller, other than services reported in
Audit Fees,
Audit-Related Fees, and
Tax Fees, that the Audit Committee was required to approve because the engagement related directly to the operations and financial reporting of the Registrant were $0 and $0 for the fiscal years ended 2007 and 2008, respectively.
(e) Audit Committee’s Pre-Approval Policies and Procedures
(1) The Audit Committee’s pre-approval policies and procedures for the Registrant to engage an accountant to render audit and non-audit services delegate to each member of the Committee the power to pre-approve services between meetings of the Committee.
(2) None of the services described in paragraphs (b) through (d) above were approved by the Audit Committee pursuant to paragraph (c)(7)(i)(C) of Rule 2-01 of Regulation S-X.
(f) Hours Attributed to Other Persons
Not applicable.
(g) Non-Audit Fees
Non-audit fees billed by E&Y for services rendered to the Registrant were $63,600 and $57,000 for the fiscal years ended 2007 and 2008, respectively.
Non-audit fees billed by E&Y for services rendered to the Registrant’s investment adviser and any entity controlling, controlled by, or under common control with the adviser that provides ongoing services to the Registrant were $425,000 and $400,000 for the fiscal years ended 2007 and 2008, respectively.
Non-audit fees billed by Tait Weller for services rendered to the Registrant were $6,400 and $10,000 for the fiscal years ended 2007 and 2008, respectively.
Non-audit fees billed by Tait Weller for services rendered to the Registrant’s investment adviser and any entity controlling, controlled by, or under common control with the adviser that provides ongoing services to the Registrant were $0 and $0 for the fiscal years ended 2007 and 2008, respectively.
(h) The Audit Committee of the Board considered whether the provision of non-audit services rendered to the Registrant’s investment adviser and any entity controlling, controlled by, or under common control with the adviser that provides ongoing services to the Registrant that were not pre-approved by the Audit Committee because the engagement did not relate directly to the operations and financial reporting of the Registrant is compatible with maintaining E&Y’s and Tait Weller’s independence.
Item 5. Audit Committee of Listed Registrants
Not applicable to the Registrant.
Item 6. Schedule of Investments
The complete schedule of investments for each series is disclosed in the Registrant’s Annual Report, which is included as Item 1 of this Form N-CSR.
Item 7. Disclosure of Proxy Voting Policies and Procedures for Closed-End Management Investment Companies
Not applicable to the Registrant.
Item 8. Portfolio Managers of Closed-End Management Investment Companies.
Not applicable to the Registrant.
Item 9. Purchases of Equity Securities by Closed-End Management Investment Company and Affiliated Purchasers
Not applicable to the Registrant.
Item 10. Submission of Matters to a Vote of Security Holders
There were no changes to the procedures by which shareholders may recommend nominees to the Board.
Item 11. Controls and Procedures
(a) | Based on an evaluation of the disclosure controls and procedures (as defined in Rule 30a-3(c) under the Investment Company Act of 1940, as amended (the “Act”)) as of a date within 90 days of the filing date of this document, the Chief Executive Officer and Treasurer and Principal Financial and Accounting Officer of the Registrant have concluded that such disclosure controls and procedures are effectively designed to ensure that information required to be disclosed by the Registrant on Form N-CSR and Form N-Q is accumulated and communicated to the Registrant’s management to allow timely decisions regarding required disclosure. |
| | |
(b) | There were no significant changes in the Registrant’s internal controls over financial reporting (as defined in Rule 30a-3(d) under the Act) that occurred during the Registrant’s second fiscal quarter of the period covered by this report that have materially affected, or are reasonably likely to materially affect, the Registrant’s internal control over financial reporting. |
Item 12. Exhibits
(a)(1) | A copy of the Code of Ethics is incorporated by reference to the Registrant’s Form N-CSR, Investment Company Act file number 811-3802 (filed July 10, 2006). |
| | |
(a)(2) | The certifications required by Rule 30a-2(a) of the Act and Section 302 of the Sarbanes-Oxley Act of 2002 (“Sarbanes-Oxley Act”) are filed herewith. |
| | |
(a)(3) | Not applicable to the Registrant. |
| | |
(b) | The certifications required by Rule 30a-2(b) of the Act and Section 906 of the Sarbanes-Oxley Act are filed herewith. |
The certifications provided pursuant to Rule 30a-2(b) of the Act and Section 906 of the Sarbanes-Oxley Act are not deemed “filed” for purposes of Section 18 of the Securities Exchange Act of 1934 (“Exchange Act”), or otherwise subject to the liability of that section. Such certifications will not be deemed to be incorporated by reference into any filing under the Securities Act of 1933 or the Exchange Act, except to the extent that the Registrant specifically incorporates them by reference.
SIGNATURES
Pursuant to the requirements of the Securities Exchange Act of 1934 and the Investment Company Act of 1940, the Registrant has duly caused this report to be signed on its behalf by the undersigned, thereunto duly authorized.
Lehman Brothers income FUNDS
By: /s/ Robert Conti
Robert Conti
Chief Executive Officer
Date: January 5, 2009
Pursuant to the requirements of the Securities Exchange Act of 1934 and the Investment Company Act of 1940, this report has been signed below by the following persons on behalf of the Registrant and in the capacities and on the dates indicated.
By: /s/ Robert Conti
Robert Conti
Chief Executive Officer
Date: January 5, 2009
By: /s/ John M. McGovern
John M. McGovern
Treasurer and Principal Financial
and Accounting Officer
Date: January 5, 2009