As filed with the Securities and Exchange Commission on January 4, 2010
UNITED STATES
SECURITIES AND EXCHANGE COMMISSION
Washington, D.C. 20549
FORM N-CSR
CERTIFIED SHAREHOLDER REPORT OF
REGISTERED MANAGEMENT INVESTMENT COMPANIES
Investment Company Act file number: 811-3802
NEUBERGER BERMAN INCOME FUNDS
(Exact Name of the Registrant as Specified in Charter)
605 Third Avenue, 2nd Floor
New York, New York 10158-0180
(Address of Principal Executive Offices – Zip Code)
Registrant's telephone number, including area code: (212) 476-8800
Robert Conti, Chief Executive Officer
c/o Neuberger Berman Management LLC
Neuberger Berman Income Funds
605 Third Avenue, 2nd Floor
New York, New York 10158-0180
Arthur Delibert, Esq.
K&L Gates LLP
1601 K Street, N.W.
Washington, D.C. 20006-1600
(Names and Addresses of agents for service)
Date of fiscal year end: October 31, 2009
Date of reporting period: October 31, 2009
Form N-CSR is to be used by management investment companies to file reports with the Commission not later than 10 days after the transmission to stockholders of any report that is required to be transmitted to stockholders under Rule 30e-1 under the Investment Company Act of 1940 (17 CFR 270.30e-1). The Commission may use the information provided on Form N-CSR in its regulatory, disclosure review, inspection and policymaking roles.
A registrant is required to disclose the information specified by Form N-CSR, and the Commission will make this information public. A registrant is not required to respond to the collection of information contained in Form N-CSR unless the Form displays a currently valid Office of Management and Budget (“OMB”) control number. Please direct comments concerning the accuracy of the information collection burden estimate and any suggestions for reducing the burden to Secretary, Securities and Exchange Commission, 100 F Street, NE, Washington, DC 20549-0609. The OMB has reviewed this collection of information under the clearance requirements of 44 U.S.C. § 3507.
Item 1. Report to Shareholders

Neuberger Berman
Income Funds
Investor Class Shares
Institutional Class Shares
Trust Class Shares
Class A Shares
Class C Shares
Class R3 Shares
Core Bond Fund
High Income Bond Fund
Municipal Intermediate Bond Fund
Municipal Money Fund
New York Municipal Money Fund
Short Duration Bond Fund
Strategic Income Fund
Annual Report
October 31, 2009
Contents
THE FUNDS
PORTFOLIO COMMENTARY
| Core Bond Fund | | | 2 | | |
|
| High Income Bond Fund | | | 6 | | |
|
| Municipal Intermediate Bond Fund | | | 9 | | |
|
| Municipal Money Fund | | | 11 | | |
|
| New York Municipal Money Fund | | | 11 | | |
|
| Short Duration Bond Fund | | | 14 | | |
|
| Strategic Income Fund | | | 16 | | |
|
| FUND EXPENSE INFORMATION | | | 23 | | |
|
SCHEDULE OF INVESTMENTS
| Core Bond Fund | | | 25 | | |
|
| High Income Bond Fund | | | 30 | | |
|
| Municipal Intermediate Bond Fund | | | 37 | | |
|
| Municipal Money Fund | | | 41 | | |
|
| New York Municipal Money Fund | | | 46 | | |
|
| Short Duration Bond Fund | | | 48 | | |
|
| Strategic Income Fund | | | 51 | | |
|
| FINANCIAL STATEMENTS | | | 70 | | |
|
"Neuberger Berman" and the Neuberger Berman logo are registered service marks of Neuberger Berman LLC. "Neuberger Berman Management LLC" and the individual fund names in this shareholder report are either service marks or registered service marks of Neuberger Berman Management LLC, formerly Neuberger Berman Management Inc. ©2009 Neuberger Berman Management LLC. All rights reserved. ©2009 Neuberger Berman Fixed Income LLC, formerly known as Lehman Brothers Asset Management LLC. All rights reserved.
FINANCIAL HIGHLIGHTS (ALL CLASSES)/PER SHARE DATA
| Core Bond Fund | | | 96 | | |
|
| High Income Bond Fund | | | 96 | | |
|
| Municipal Intermediate Bond Fund | | | 98 | | |
|
| Municipal Money Fund | | | 98 | | |
|
| New York Municipal Money Fund | | | 98 | | |
|
| Short Duration Bond Fund | | | 100 | | |
|
| Strategic Income Fund | | | 100 | | |
|
| Reports of Independent Registered Public Accounting Firms | | | 104 | | |
|
| Directory | | | 106 | | |
|
| Trustees and Officers | | | 107 | | |
|
| Proxy Voting Policies and Procedures | | | 115 | | |
|
| Quarterly Portfolio Schedule | | | 115 | | |
|
| Notice to Shareholders | | | 115 | | |
|
"Neuberger Berman" and the Neuberger Berman logo are registered service marks of Neuberger Berman LLC. "Neuberger Berman Management LLC" and the individual fund names in this shareholder report are either service marks or registered service marks of Neuberger Berman Management LLC, formerly Neuberger Berman Management Inc. ©2009 Neuberger Berman Management LLC. All rights reserved. ©2009 Neuberger Berman Fixed Income LLC, formerly known as Lehman Brothers Asset Management LLC. All rights reserved.
President's Letter
Dear Fellow Shareholder,
It would be difficult to overstate the dramatic events that occurred in the fixed income markets during the fiscal year ended October 31, 2009. As the period began, we were well into one of the most challenging market environments since the Great Depression. This was triggered by the continued fallout from the subprime mortgage market, seizing credit conditions, forced selling by leveraged investors into illiquid markets, and a rapidly weakening global economy. Collectively, this caused risk aversion to reach unprecedented levels, as investors sought refuge in extremely safe short-term U.S. Treasury securities. In contrast, investments that were perceived to be risky were often indiscriminately sold, sometimes at severely depressed prices.
Almost as dramatic was the remarkable shift seen in the markets that started only a few months into the reporting period, as fear was gradually replaced by renewed appetite for risk on the part of investors. This change was reflected in the strength of many non-Treasury sectors, which generated substantial returns and generally recouped their losses from earlier in the fiscal year.
Various factors caused the changes in the financial markets. A major contributor was the aggressive actions taken by the Federal Reserve, U.S. Treasury and other U.S. government entities. Together, they sought to stabilize the financial markets, restore investor confidence and revive the ailing economy. While some of these initiatives moved in fits and starts, as the reporting period continued, we saw progress on a number of fronts. This included the gradual thawing of the once frozen credit markets, some stabilization in the housing market, and the unofficial end of the recession as third quarter Gross Domestic Product (GDP) growth came in at positive 2.8%. In addition, investors were drawn to higher yielding fixed income securities as they looked to capture high yields both relative to Treasuries and on an absolute basis.
While it would have been easy for our portfolio managers to succumb to the market turmoil in late 2008 and follow the herd to U.S. Treasuries, they maintained their investment discipline — and emphasis on non-Treasury sectors. This proved to be rewarding for shareholders, as our Fixed Income Funds were well positioned to benefit from the market reversal that emerged during the reporting period.
As we look ahead, we expect to see continued, albeit tepid, economic growth, coupled with modest inflation. We intend to maintain our time-tested investment processes, which call for actively managing our portfolios and making investment decisions based on thorough fundamental research. We also urge our shareholders to maintain their discipline by avoiding emotion-driven investment decisions and remaining focused on their long-term financial goals.
Sincerely,

Robert Conti
President and CEO
Neuberger Berman Mutual Funds
1
Core Bond Fund Commentary
For the fiscal year ended October 31, 2009, Neuberger Berman Core Bond Fund posted a strong absolute return and significantly outperformed its benchmark, the Barclays Capital U.S. Aggregate Index.
As the reporting period began, the U.S. fixed income markets were still reeling due to fallout from turmoil in the financial markets, frozen credit conditions, deleveraging and forced selling into illiquid markets. Collectively, this caused risk aversion to remain elevated, as investors favored the safety of short-term U.S. Treasury securities and sold securities that were perceived to be risky.
Conditions in the fixed income markets then gradually started to improve in December 2008, as the government's aggressive initiatives to stabilize financial markets began to bear fruit. In addition, as the reporting period progressed, optimism grew regarding the outlook for the U.S. economy. These factors caused investor sentiment to reverse course, and risk aversion was replaced with increased risk appetite. Against this backdrop, the spread sectors (non-Treasuries) rallied sharply. Aside from a brief period of weakness in February 2009, these sectors outperformed Treasuries during the remainder of the 12-monrh reporting period.
Given our concerns regarding the turmoil in the financial system and the rapidly weakening global economy, the Fund was defensively positioned as the fiscal year began. While the Fund could not avoid the extremely weak performance in the spread sectors, it benefitted from not being more aggressively positioned. Given the significant and, in some cases, historic widening of yield spreads (the difference in yield between Treasuries and other bond sectors), in late 2008 and early 2009, we began to pare the Fund's Treasury and agency mortgage-backed security exposure and redeployed the proceeds into a number of what we considered attractively valued sectors of the market. We emphasized areas where our research indicated that spreads had moved to unsustainable levels and purchased individual securities that we believed had the ability to produce strong risk-adjusted results.
For example, we increased the Fund's exposure to investment grade corporate bonds and, within this sector, favored both financial and industrial securities. This proved to be extremely rewarding, as the sector in general, and financials and industrials in particular, generated extremely strong results over the last eight months of the fiscal year. Another area of emphasis that rallied sharply was the Fund's commercial mortgage-backed securities (CMBS). Their spreads substantially narrowed from elevated levels given expectations for more modest defaults than previously expected. Elsewhere, our Treasury inflation-protected securities (TIPS) performed well as concern increased over the potential for inflation due to the government's stimulus program and accommodative monetary policy. The Fund's underweights in Treasuries and agency securities were also rewarded.
Modestly dampening results was the Fund's exposure to non-agency hybrid adjustable-rate mortgages. While these securities started to rally late in the reporting period, they lagged the benchmark during the fiscal year as a whole.
2
In hindsight, maintaining investment discipline and emphasizing areas of the market that we believed offered attractive value were substantially rewarded during the reporting period. Looking ahead, we expect to see positive, albeit below-average, economic growth in the U.S. and continue to favor spread sectors within the fixed income market.
Sincerely,


Thanos Bardas, David M. Brown, Andrew A. Johnson and Bradley C. Tank
Portfolio Co-Managers
3
Core Bond Fund
TICKER SYMBOLS
| Investor Class | | NCRIX | |
| Institutional Class | | NCRLX | |
| Class A | | NCRAX | |
| Class C | | NCRCX | |
RATING SUMMARY
| (% by Ratings) | |
| AAA/Government/Government Agency | | | 65.3 | % | |
| AA | | | 3.2 | | |
| A | | | 12.7 | | |
| BBB | | | 13.9 | | |
| BB | | | 0.3 | | |
| B | | | 0.7 | | |
| CCC | | | 1.2 | | |
| CC | | | 0.0 | | |
| C | | | 0.0 | | |
| D | | | 0.0 | | |
| Short Term | | | 2.7 | | |
| Total | | | 100.0 | | |
AVERAGE ANNUAL TOTAL RETURN ENDED 10/31/093,11,15
| | | Inception
Date | |
1 Year | |
5 Years | |
10 Years | | Life of
Fund | |
| At NAV | | | | | | | | | | | | | | | | | | | |
| Investor Class | | 02/01/1997 | | | 23.10 | % | | | 4.58 | % | | | 5.59 | % | | | 5.51 | % | |
| Institutional Class | | 10/01/1995 | | | 23.70 | % | | | 5.02 | % | | | 6.03 | % | | | 5.91 | % | |
| Class A | | 12/20/2007 | | | 22.96 | % | | | 4.82 | % | | | 5.93 | % | | | 5.84 | % | |
| Class C | | 12/20/2007 | | | 22.04 | % | | | 4.52 | % | | | 5.78 | % | | | 5.73 | % | |
| With Sales Charge | | | | | | | | | | | | | | | | | | | |
| Class A | | | | | 17.78 | % | | | 3.91 | % | | | 5.47 | % | | | 5.51 | % | |
| Class C | | | | | 21.04 | % | | | 4.52 | % | | | 5.78 | % | | | 5.73 | % | |
| Barclays Capital U.S. Aggregate Index14 | | | | | 13.79 | % | | | 5.05 | % | | | 6.31 | % | | | 6.30 | % | |
Performance data quoted represent past performance, which is no guarantee of future results. The investment return and principal value of an investment will fluctuate so that an investor's shares, when redeemed, may be worth more or less than their original cost. Results are shown on a "total return" basis and include reinvestment of all dividends and capital gain distributions. The composition, industries and holdings of the Fund are subject to change.
Current performance may be lower or higher than the performance data quoted. For performance data current to the most recent month end, please visit www.nb.com/performance.
For the period ending October 31, 2009, the 30-day SEC yield was 3.42%, 3.81%, 3.26% and 2.67% for Investor Class, Institutional Class, Class A and Class C shares, respectively.
Neuberger Berman Management LLC has contractually agreed to limit certain expenses of the Fund through 10/31/2019 for Investor Class, Institutional Class, Class A and Class C shares. The net expense ratios were 0.87%, 0.47%, 0.87% and 1.63% for Investor Class, Institutional Class, Class A and Class C shares, respectively. As stated in the Fund's most recent prospectus, the total annual fund operating expense ratios for fiscal year 2008 were 1.27%, 0.85%, 2.75% and 3.46% for Investor Class, Institutional Class, Class A and Class C shares, respectively (prior to any fee waivers or expense reimbursements).
Total Returns shown with a sales charge reflect the deduction of the current maximum initial sales charge of 4.25% for Class A shares and the applicable contingent deferred sales charges (CDSC) for Class C shares. The maximum CDSC for Class C shares is 1%, which is reduced to 0% after 1 year. The performance of the Fund's share classes will differ primarily due to different sales charge structures and class expenses. Please see the prospectus for more information about sales charge structures, if any, and class expenses for your share class.
4
Core Bond Fund
COMPARISON OF A $10,000 INVESTMENT
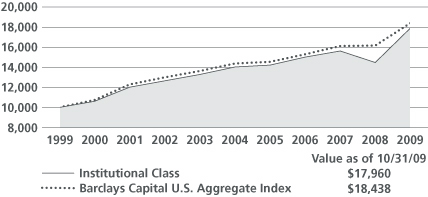
This chart shows the value of a hypothetical $10,000 investment in the Fund over the past 10 fiscal years. The graph is based on the Institutional Class shares only; performance of other classes will vary due to differences in fee structures (see Average Annual Total Return chart on previous page). The result is compared with one or more benchmarks, which may include a broad-based market index and/or a narrower index. Please note that market indices have not been reduced to reflect any of the fees and costs of investing. All results include the reinvestment of dividends and capital gain distributions. Neither the Fund's returns nor the market indices shown in the graph and table reflect the effect of taxes an investor would pay on Fund distributions or on the redemption of Fund shares. Results represent past performance and do not indicate future results.
Please see Endnotes and Glossary of Indices for additional information.
5
High Income Bond Fund Commentary
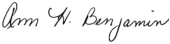
For the fiscal year ended October 31, 2009, Neuberger Berman High Income Bond Fund posted an extremely strong absolute return but it lagged its benchmark, the Barclays Capital U.S. Corporate High Yield 2% Issuer Cap Index.
While the high yield market generated exceptionally strong results during the reporting period, the ascent was far from steady. At the outset of the fiscal year in November 2008, the high yield market was in the midst of one of its worst stretches on record. After declining 7.68% and 16.09% in September and October 2008, respectively, the index fell an additional 8.77% in November. Continued turmoil in the financial markets, frozen credit conditions and a rapidly weakening economy led to a massive flight to quality, with investors fleeing securities that were perceived to be risky. While the high yield market regained its footing over the next two months, prices again weakened in February 2009. Over the first four months of the Fund's fiscal year, better rated high yield bonds, on average, outperformed their lower rated counterparts, as BB and CCC rated bonds returned 8.37% and -14.97%, respectively.
The high yield market then quickly reversed course, with the benchmark index posting positive returns during each of the last eight months of the reporting period. This turnaround was triggered by a number of factors, including signs that the credit markets were thawing, optimism that the federal government's aggressive monetary policy would stabilize the economy and some better-than-expected corporate earnings. Investor sentiment continued to improve as the reporting period progressed and risk aversion was replaced by increased risk appetite. This resulted in an impressive rally for lower-rated securities, as BB and CCC rated bonds returned 31.53% and 84.92%, respectively, over the last eight months of the fiscal year. All told, the index gained 48.65% during the 12-month period and BB and CCC rated bonds gained 42.54% and 57.23%, respectively.
For the first half of the reporting period, the Fund was somewhat defensively positioned. This was based on our expectation that economic conditions would remain weak, causing an increase in high yield default rates. However, later in the period, we began adding more cyclical-oriented names to the portfolio. This was due to indications that the economy was stabilizing. In addition, high yield companies were better able to refinance debt in the new-issue market. We also moved from an underweight in CCC securities to a more neutral posture versus the benchmark.
From an industry perspective, an underweight in paper, security selection in chemicals and an overweight in broadcasting were the largest positive contributors to the Fund's relative performance. In contrast, security selection in health care, an underweight and security selection in real estate/homebuilders and an underweight in banking were the largest detractors from relative results.
Looking ahead, we have a relatively positive long-term outlook for the high yield market. We believe a resumption of positive economic growth, low inflation and strong demand, if they occur, could collectively support high yield bond prices and lead to modest spread tightening over the next 12 months. In addition, better access to capital and an improved economic environment lead us to believe that high yield defaults will moderate significantly going forward. As always, we will continue to conduct extensive research on potential portfolio candidates as we seek to generate consistently strong risk-adjusted returns.
Sincerely,

Ann H. Benjamin and Thomas P. O'Reilly
Portfolio Co-Managers
6
High Income Bond Fund
TICKER SYMBOLS
| Investor Class | | NHINX | |
| Institutional Class | | NHILX | |
| Class A | | NHIAX | |
| Class C | | NHICX | |
| Class R3 | | NHIRX | |
RATING SUMMARY
| (% by Ratings) | |
| AAA/Government/Government Agency | | | 0.0 | % | |
| AA | | | 0.0 | | |
| A | | | 0.7 | | |
| BBB | | | 8.5 | | |
| BB | | | 25.6 | | |
| B | | | 37.9 | | |
| CCC | | | 18.8 | | |
| CC | | | 2.3 | | |
| C | | | 0.0 | | |
| D | | | 0.0 | | |
| Short Term | | | 6.2 | | |
| Total | | | 100.0 | | |
AVERAGE ANNUAL TOTAL RETURN ENDED 10/31/092,10,15
| | | Inception
Date | |
1 Year | |
5 Years | |
10 Years | | Life of
Fund | |
| At NAV | | | | | | | | | | | | | | | | | | | |
| Investor Class | | 02/01/1992 | | | 44.38 | % | | | 5.62 | % | | | 6.94 | % | | | 7.67 | % | |
| Institutional Class13 | | 05/27/2009 | | | 44.90 | % | | | 5.69 | % | | | 6.98 | % | | | 7.69 | % | |
| Class A13 | | 05/27/2009 | | | 44.25 | % | | | 5.60 | % | | | 6.93 | % | | | 7.66 | % | |
| Class C13 | | 05/27/2009 | | | 43.93 | % | | | 5.55 | % | | | 6.91 | % | | | 7.65 | % | |
| Class R313 | | 05/27/2009 | | | 44.32 | % | | | 5.61 | % | | | 6.94 | % | | | 7.66 | % | |
| With Sales Charge | | | | | | | | | | | | | | | | | | | |
| Class A13 | | | | | 38.12 | % | | | 4.69 | % | | | 6.47 | % | | | 7.40 | % | |
| Class C13 | | | | | 42.93 | % | | | 5.55 | % | | | 6.91 | % | | | 7.65 | % | |
Barclays Capital U.S. Corporate
High Yield 2% Issuer Cap Index14 | | | | | 48.65 | % | | | 6.17 | % | | | 6.66 | % | | | N/A | | |
Performance data quoted represent past performance, which is no guarantee of future results. The investment return and principal value of an investment will fluctuate so that an investor's shares, when redeemed, may be worth more or less than their original cost. Results are shown on a "total return" basis and include reinvestment of all dividends and capital gain distributions. The composition, industries and holdings of the Fund are subject to change.
Current performance may be lower or higher than the performance data quoted. For performance data current to the most recent month end, please visit www.nb.com/performance.
For the period ending October 31, 2009, the 30-day SEC yield was 9.40%, 9.64%, 9.10%, 8.45% and 8.98% for Investor Class, Institutional Class, Class A, Class C and Class R3 shares, respectively.
Neuberger Berman Management LLC has contractually agreed to limit certain expenses of the Fund through 10/31/2012 for Investor Class and Institutional Class shares and through 10/31/2013 for Class A, Class C and Class R3 shares. The net expense ratios were 0.75%, 1.12%, 1.87% and 1.37% for Institutional Class, Class A, Class C and Class R3 shares, respectively. As stated in the Fund's most recent prospectus, the total annual fund operating expense ratio for fiscal year 2008 were 0.93%, 0.87%, 1.22%, 1.97% and 1.47% for Investor Class, Institutional Class, Class A, Class C and Class R3 shares, respectively (prior to any fee waivers or expense reimbursements).
Total returns shown with a sales charge reflect the deduction of the current maximum initial sales charge of 4.25% for Class A shares and the applicable contingent deferred sales charges (CDSC) for Class C shares. The maximum CDSC for Class C shares is 1%, which is reduced to 0% after 1 year. The performance of the Fund's share classes will differ primarily due to different sales charge structures and class expenses. Please see the prospectus for more information about sales charge structures, if any, and class expenses for your share class.
7
High Income Bond Fund
COMPARISON OF A $10,000 INVESTMENT
This chart shows the value of a hypothetical $10,000 investment in the Fund over the past 10 fiscal years. The graph is based on the Investor Class shares only; performance of other classes will vary due to differences in fee structures (see Average Annual Total Return chart on previous page). The result is compared with one or more benchmarks, which may include a broad-based market index and/or a narrower index. Please note that market indices have not been reduced to reflect any of the fees and costs of investing. All results include the reinvestment of dividends and capital gain distributions. Neither the Fund's returns nor the market indices shown in the graph and table reflect the effect of taxes an investor would pay on Fund distributions or on the redemption of Fund shares. Results represent past performance and do not indicate future results.
Please see Endnotes and Glossary of Indices for additional information.
8
Municipal Intermediate Bond Fund Commentary
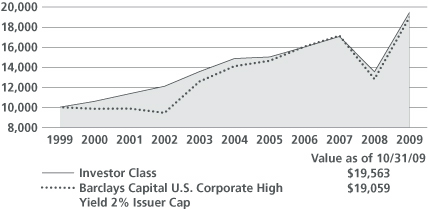
For the fiscal year ended October 31, 2009, Neuberger Berman Municipal Intermediate Bond Fund posted a solid absolute return but lagged its benchmark, the Barclays Capital 7-Year General Obligation Index.
As the reporting period began in November 2008, the municipal market was slowly beginning to emerge from one of its most challenging periods in recent memory. Collectively, the turmoil in the financial markets, frozen credit conditions, forced selling into illiquid markets and the rapidly weakening economy had caused risk aversion to spike. With investors seeking shelter in short-term Treasuries, even high quality municipal bonds where shunned. This, in turn, caused municipal prices to fall and AAA tax-exempt yields to reach 125% to 150% of comparable maturity U.S. Treasury yields.
After largely treading water in November 2008, interest in what we considered attractively valued municipal securities picked up steam in December, and demand remained strong for the remainder of the reporting period. Further supporting municipal bond prices were signs of stabilization in the financial markets, improved liquidity and sharply falling new issuance of tax-exempt bonds. We believe the decline in the new issue calendar for traditional tax-exempt municipal bonds can be partially attributed to the successful launch of the taxable Build America Bond program.
Demand for tax-exempt securities was robust as many investors were seeking better returns than were available in various money market options. In addition, toward the conclusion of the reporting period, there was evidence that the end of the most severe recession since the Great Depression might be at hand. With risk aversion being replaced with increased risk appetite, lower rated municipal bonds outperformed their higher quality counterparts as the fiscal year progressed.
While the Fund posted a nearly double-digit return during the fiscal year, it did not keep pace with its benchmark. This was due, in part, to our defensive positioning. Given our concerns regarding the weakness in the economy and strains on municipal budgets, we believed it was prudent to maintain the Fund's quality bias. For example, the Fund emphasized higher quality revenue and general obligation bonds that have historically held up well in difficult economic environments. While the defensive position was beneficial during the early stages of the reporting period, it detracted from relative results for the fiscal year as a whole.
From a yield curve perspective, we employed a barbell approach due to the steepness of the municipal yield curve. In contrast, the benchmark is concentrated in the six- to eight-year portion of the curve. This positioning was modestly additive to returns and we continue to believe a barbell structure is appropriate as the curve remains steep from an historical perspective.
Looking ahead, we maintain our positive outlook for the long-term prospects of the municipal bond market. We believe the economy appears to have turned the corner and inflation should be well contained for the time being. While we believe valuations are not as compelling as they were when the fiscal year began, we expect municipal bonds to remain appealing given their steady stream of tax-exempt income. In addition, the potential for higher personal income tax rates in the future could support the asset class.
In our opinion, it will take time for state and local municipalities to mend their balance sheets. Therefore, we believe an emphasis on higher quality securities is warranted. As always, we will continue to actively manage the Fund and conduct thorough in-house fundamental research on the underlying credit characteristics of our existing and potential holdings.
Sincerely,


William J. Furrer and James L. Iselin
Portfolio Co-Managers
9
Municipal Intermediate Bond Fund
TICKER SYMBOLS
RATING SUMMARY
| (% by Ratings) | |
| AAA/Government/Government Agency | | | 24.2 | % | |
| AA | | | 48.6 | | |
| A | | | 26.4 | | |
| BBB | | | 0.0 | | |
| BB | | | 0.0 | | |
| B | | | 0.0 | | |
| CCC | | | 0.0 | | |
| CC | | | 0.0 | | |
| C | | | 0.0 | | |
| D | | | 0.0 | | |
| Short Term | | | 0.8 | | |
| Total | | | 100.0 | | |
AVERAGE ANNUAL TOTAL RETURN ENDED 10/31/091,8,9,15
| | | Inception
Date | |
1 Year | |
5 Years | |
10 Years | | Life of
Fund | |
| Investor Class | | | 07/09/1987 | | | | 9.42 | % | | | 2.84 | % | | | 4.36 | % | | | 5.18 | % | |
| Barclays Capital 7-Year GO Index14 | | | | | | | 10.42 | % | | | 4.37 | % | | | 5.50 | % | | | 6.16 | % | |
Performance data quoted represent past performance, which is no guarantee of future results. The investment return and principal value of an investment will fluctuate so that an investor's shares, when redeemed, may be worth more or less than their original cost. Results are shown on a "total return" basis and include reinvestment of all dividends and capital gain distributions. The composition, industries and holdings of the Fund are subject to change.
Current performance may be lower or higher than the performance data quoted. For performance data current to the most recent month end, please visit www.nb.com/performance.
For the period ended October 31, 2009, the 30-day SEC yield for Investor Class shares was 2.55% and the tax-equivalent yield was 3.92% for an investor in the highest federal income tax bracket (35%).
Neuberger Berman Management LLC has contractually agreed to limit certain expenses of the Fund through 10/31/2012 for Investor Class shares. The net expense ratio was 0.65%. As stated in the Fund's most recent prospectus, the total annual fund operating expense ratio for fiscal year 2008 was 1.25% for Investor Class shares (prior to any fee waivers or expense reimbursements).
COMPARISON OF A $10,000 INVESTMENT
This chart shows the value of a hypothetical $10,000 investment in the Fund over the past 10 fiscal years. The graph is based on the Investor Class shares only. The result is compared with one or more benchmarks, which may include a broad-based market index and/or a narrower index. Please note that market indices have not been reduced to reflect any of the fees and costs of investing. All results include the reinvestment of dividends and capital gain distributions. Neither the Fund's returns nor the market indices shown in the graph and table reflect the effect of taxes an investor would pay on Fund distributions or on the redemption of Fund shares. Results represent past performance and do not indicate future results.
Please see Endnotes and Glossary of Indices for additional information.
10
Municipal Money Fund Commentary
New York Municipal Money Fund Commentary
Investors' fears of a potential economic catastrophe gave way to optimism regarding an economic rebound during the eventful fiscal year ended October 31, 2009.
Developments that emerged before the reporting period, including the failure of major financial institutions, mortgage-related losses and a freeze in the credit markets, helped worsen an already weak economy in the early months of the fiscal year. Investors, not surprisingly, struggled at that time in assessing whether stimulus programs and other actions to maintain liquidity and avoid steep economic decline would be effective.
Measures included the federal fiscal stimulus package, various corporate bailouts, the Temporary Guarantee Program for Money Market Funds, the support of struggling banks through the Troubled Asset Relief Program (TARP), and the purchase of vast quantities of mortgage-backed securities. In addition, the Federal Reserve lowered the Federal Funds target rate to an historically low range of 0%–0.25% in December and maintained this range through the end of the reporting period.
Although data releases were mixed for much of the fiscal year, they gradually became more favorable. Most significantly, after several straight quarters of declines, Gross Domestic Product (GDP) moved into positive territory in the third quarter of calendar year 2009. Unemployment trends also improved late in the reporting period, with average monthly job losses for the third quarter of calendar year 2009 falling to 199,000 from 691,000 in the first quarter. Still, unemployment reached 10.2% in October — its highest rate since 1983 — and joblessness remains a significant concern.
In terms of market performance, after fleeing to the perceived safety of Treasuries early in the fiscal year, many investors returned to municipal markets as economic indicators improved and the capital markets overall grew healthier. Variable Rate Demand Notes, as represented by the Securities Industry and Financial Markets Association Municipal Swap Index, started the period with an average yield of 1.82%, which is considerably lower than a nearly 8% yield reached during the credit market freeze in September of 2008. However, yields fell considerably during the reporting period, to only 0.26% by October 31, 2009.
Moving forward, we believe that despite the sizable overall GDP increase in the third quarter of calendar year 2009, which was due largely to economic stimulus dollars, the economy is likely to remain sluggish for a while, due in part to dampened consumer spending, high unemployment and a still sluggish real estate market. That, and limited short-term inflation risk, should in our opinion keep the Federal Reserve from raising the target Federal Funds rate from current low levels until at least early in calendar year 2010.
On a final note, our in-house credit team continues to implement a "belt and suspenders" approach when analyzing potential holdings for the Funds. This involves thoroughly reviewing the underlying credit fundamentals of potential issuers to ensure that they are of the highest quality and have the ability to make timely principal and interest payments. We believe this approach will continue to serve our shareholders well in light of the current economic environment.
Municipal Money Fund5,7,8,9,15
Neuberger Berman Municipal Money Fund returned 0.40% for the 12-month period ended October 31, 2009, compared to the 0.29% return of the Crane Tax Exempt Retail Money Fund Index.
Over the course of the reporting period, the Fund's seven-day tax-equivalent current yield decreased from 2.20% as of October 31, 2008 to 0.05% as of October 31, 2009 (assuming taxation at the highest federal tax bracket). Its seven-day tax-equivalent effective yield (also assuming the highest federal tax bracket) went from 2.22% as of October 31, 2008 to 0.05% as of October 31, 2009. These figures more closely reflect current earnings than one-year figures. During the 12-month period, the Fund's weighted average maturity went from 12.8 days on October 31, 2008 to 8.6 days on October 31, 2009.
New York Municipal Money Fund6,7,8,9,15
Neuberger Berman New York Municipal Fund returned 0.37% for the 12-month period ended October 31, 2009, compared to the 0.32% return of the Crane New York Tax Exempt Money Fund Index. Over the course of the 12-month
11
period, the Fund's seven-day tax-equivalent current yield (assuming taxation at the highest federal, New York State and New York City income tax brackets) decreased from 2.60% as of October 31, 2008 to 0.05% as of October 31, 2009. Its seven-day tax equivalent effective yield (also assuming taxation at the highest federal, New York State and New York City income tax brackets) decreased from 2.63% as of October 31, 2008 to 0.05% as of October 31, 2009. These figures more closely reflect current earnings than one-year figures. The Fund's weighted average maturity went from 8.4 days on October 31, 2008 to 10.2 days on October 31, 2009.
Sincerely,


William J. Furrer and Kristian J. Lind
Portfolio Co-Managers
Current and effective yield more closely reflect current earnings than does total return.
Performance data quoted represent past performance, which is no guarantee of future results. The investment return on an investment in a money market fund will fluctuate. Current performance may be lower or higher than the performance data quoted. For performance data current to the prior business day on which the New York Stock Exchange was open, visit www.nb.com/performance. The composition, industries and holdings of each Fund are subject to change.
An investment in a Fund is not insured or guaranteed by the Federal Deposit Insurance Corporation or any other government agency. Although each Fund seeks to preserve the value of your investment at $1.00 per share, it is possible to lose money by investing in a Fund.
12
Municipal Money Fund
New York Municipal Money Fund
TICKER SYMBOLS
| Municipal Money Fund | | NMNXX | |
| New York Municipal Money Fund | | NYNXX | |
NB MUNICIPAL MONEY FUND
MATURITY DIVERSIFICATION
| (% by Maturity) | |
| 1 – 7 Days | | | 96.6 | % | |
| 8 – 30 Days | | | 1.6 | | |
| 31 – 90 Days | | | 0.6 | | |
| 91 – 180 Days | | | 0.7 | | |
| 181+ Days | | | 0.5 | | |
NB NEW YORK MUNICIPAL MONEY FUND
MATURITY DIVERSIFICATION
| (% by Maturity) | |
| 1 – 7 Days | | | 97.7 | % | |
| 8 – 30 Days | | | 0.0 | | |
| 31 – 90 Days | | | 0.7 | | |
| 91 – 180 Days | | | 0.0 | | |
| 181+ Days | | | 1.6 | | |
13
Short Duration Bond Fund Commentary
For the fiscal year ended October 31, 2009, Neuberger Berman Short Duration Bond Fund posted a positive return and outperformed its benchmark, the Merrill Lynch 1-3 Year Treasury Index.
At the start of the reporting period in November 2008, volatility in the fixed income markets was at historically high levels due to turmoil in the financial markets, frozen credit conditions, deleveraging and forced selling into illiquid markets. Collectively, this had triggered an extreme flight to quality, as investors favored the safety of short-term U.S. Treasury securities and largely avoided many others.
Conditions in the fixed income markets gradually started to improve in December 2008, as the government's aggressive actions to stabilize financial markets began to bear fruit. In addition, as the fiscal year progressed, optimism grew regarding the outlook for the U.S. economy. These factors caused investor sentiment to abruptly shift and risk aversion was replaced with increased risk appetite. Against this backdrop, the spread sectors (non-Treasuries) rallied sharply. Aside from a brief period of weakness in February 2009, these sectors outperformed Treasuries for the remainder of the reporting period.
To a great extent, the factors that caused the Fund to lag its benchmark early in the fiscal year helped it to generate superior relative results over the full reporting period. Looking back, the Fund's exposure to non-Treasury sectors was detrimental to its results during the flight to quality in late 2008 and in early 2009. In particular, the Fund's commercial mortgage-backed securities, asset-backed securities, and non-agency adjustable-rate mortgages (ARMS) performed poorly.
While it would have been easy to abandon our investment discipline and reallocate the Fund's spread sector holdings into Treasuries, we chose not to do so. This was based on our extensive research which indicated that non-Treasuries had become extremely undervalued, given the intrinsic value of their future cash flows. This decision was rewarded, as these sectors subsequently rebounded and, for the fiscal year as a whole, positively contributed to the Fund's relative results.
In terms of the portfolio positioning, in recent months we have added to the Fund's position in investment grade corporate bonds as we continue to identify compelling opportunities. Toward the end of the fiscal year, we pared some of the Fund's exposure to non-agency ARMS and certain other spread sectors. This was achieved through outright sales as these securities rebounded in price by allowing many of these securities to mature and pay off at par. A majority of those proceeds were then reinvested in U.S. Treasury securities to broaden the diversification of the portfolio.
Looking ahead, we believe the economy will continue to grow, albeit at a modest pace. Given this scenario, we do not expect inflation to be an issue in the near future. However, in our view, the inflation question will primarily be determined by the Federal Reserve's future actions. The timing and the manner of the removal of quantitative easing will be closely monitored by our team.
Sincerely,


Thomas Sontag, Michael Foster and Richard Grau
Portfolio Co-Managers
14
Short Duration Bond Fund
TICKER SYMBOLS
| Investor Class | | NSBIX | |
| Trust Class | | NSBTX | |
RATING SUMMARY
| (% by Ratings) | |
| AAA/Government/Government Agency | | | 63.8 | % | |
| AA | | | 7.4 | | |
| A | | | 15.4 | | |
| BBB | | | 4.0 | | |
| BB | | | 2.2 | | |
| B | | | 5.2 | | |
| CCC | | | 1.1 | | |
| CC | | | 0.0 | | |
| C | | | 0.0 | | |
| D | | | 0.0 | | |
| Short Term | | | 0.9 | | |
| Total | | | 100.0 | | |
AVERAGE ANNUAL TOTAL RETURN ENDED 10/31/091,15
| | | Inception
Date | |
1 Year | |
5 Years | |
10 Years | | Life of
Fund | |
| Investor Class | | 06/09/1986 | | | 4.18 | % | | | 1.02 | % | | | 2.88 | % | | | 4.90 | % | |
| Trust Class | | 08/30/1993 | | | 4.02 | % | | | 0.91 | % | | | 2.78 | % | | | 4.84 | % | |
| Merrill Lynch 1-3 Year Treasury Index14 | | | | | 2.73 | % | | | 4.01 | % | | | 4.53 | % | | | 5.96 | % | |
Performance data quoted represent past performance, which is no guarantee of future results. The investment return and principal value of an investment will fluctuate so that an investor's shares, when redeemed, may be worth more or less than their original cost. Results are shown on a "total return" basis and include reinvestment of all dividends and capital gain distributions. The composition, industries and holdings of the Fund are subject to change.
Current performance may be lower or higher than the performance data quoted. For performance data current to the most recent month end, please visit www.nb.com/performance.
For the period ending October 31, 2009, the 30-day SEC yield for Investor Class shares was 2.59%, and 2.49% for Investor Class and Trust Class shares, respectively.
Neuberger Berman Management LLC has contractually agreed to limit certain expenses of the Fund through 10/31/2012 for Investor Class and Trust Class shares. The net expense ratios were 0.70% and 0.80% for Investor Class and Trust Class shares, respectively. As stated in the Fund's most recent prospectus, the total annual fund operating expense ratios for fiscal year 2008 were 0.95% and 1.27% for Investor Class and Trust Class shares, respectively.
COMPARISON OF A $10,000 INVESTMENT
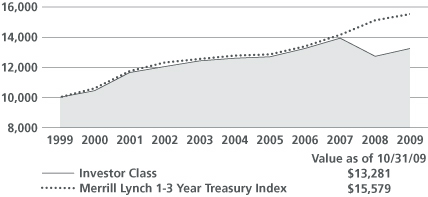
This chart shows the value of a hypothetical $10,000 investment in the Fund over the past 10 fiscal years. The graph is based on the Investor Class shares only; performance of other classes will vary due to differences in fee structures (see Average Annual Total Return chart above). The result is compared with one or more benchmarks, which may include a broad-based market index and/or a narrower index. Please note that market indices have not been reduced to reflect any of the fees and costs of investing. All results include the reinvestment of dividends and capital gain distributions. Neither the Fund's returns nor the market indices shown in the graph and table reflect the effect of taxes an investor would pay on Fund distributions or on the redemption of Fund shares. Results represent past performance and do not indicate future results.
Please see Endnotes and Glossary of Indices for additional information.
15
Strategic Income Fund Commentary
For the fiscal year ended October 31, 2009, Neuberger Berman Strategic Income Fund posted a strong absolute return and significantly outperformed its benchmark, the Barclays Capital U.S. Aggregate Index.
As the reporting period began, the U.S. fixed income markets were still reeling from the fallout from turmoil in the financial markets, frozen credit conditions, deleveraging and forced selling into illiquid markets. Collectively, this caused risk aversion to remain elevated, as investors favored the safety of short-term U.S. Treasury securities and sold securities that were perceived to be risky.
Conditions in the fixed income markets then started to gradually improve in December 2008, as the government's aggressive initiatives to stabilize financial markets began to bear fruit. In addition, as the reporting period progressed, optimism grew regarding the outlook for the U.S. economy. These factors caused investor sentiment to reverse course and risk aversion was replaced with increased risk appetite. Against this backdrop, spread sectors (non-Treasuries) rallied sharply. Aside from a brief period of weakness in February 2009, these sectors outperformed Treasuries during the remainder of the 12-month reporting period.
Given our concerns regarding the turmoil in the financial system and the rapidly weakening global economy, the Fund was conservatively positioned as the fiscal year began. While the Fund could not avoid the extremely weak performance of non-Treasuries, it benefitted from not being more aggressively positioned. With the significant and, in some cases, historic widening of credit spreads (the difference in yield between Treasuries and other fixed income securities), in late 2008 and early 2009 we began to pare the Fund's Treasury and agency mortgage-backed security exposure and opportunistically redeployed the proceeds into a number of what we considered attractively valued market sectors. We emphasized areas where our research indicated that spreads had moved to unsustainable levels and purchased individual securities that we believed had the ability to produce superior risk-adjusted results.
For example, we increased the Fund's exposure to investment grade corporate bonds and, within this sector, favored both financial and industrial securities. This proved to be extremely rewarding, as the sector in general, and financials and industrials in particular, generated strong results over the last eight months of the fiscal year. Moving from a zero weighting to roughly a 10% weighting in the Fund, commercial mortgage-backed securities (CMBS) positively contributed to performance as well. CMBS spreads (yields relative to Treasuries) substantially narrowed from elevated levels given expectations for more modest defaults. Elsewhere, our decision to increase holdings of Treasury inflation-protected securities in the third quarter of calendar year 2009 was helpful; they performed well given concerns about future inflation due to the federal government's stimulus program and accommodative monetary policy. Increasing the Fund's high yield exposure during the second half of the fiscal year was beneficial as well. The Fund's underweights in Treasuries and agency securities were also rewarded.
While the Fund generated very strong absolute and relative results, not all of our strategic allocation decisions were beneficial during the fiscal year. For example, not having an exposure to emerging market debt until late in the period detracted from results as the asset class produced exceptional returns. While we increased the Fund's exposure to the high yield bond market during the second half of the fiscal year, increasing this allocation earlier in the period would have further enhanced the Fund's results.
16
Overall, maintaining our investment discipline and emphasizing areas of the market that we believed offered attractive values were substantially rewarded during the reporting period. Looking ahead, we expect to see positive, albeit below-average, economic growth in the U.S. We remain positive on — and expect to maintain the Fund's overweight position in — non-Treasury sectors, while continuing to underweight Treasury securities.
Sincerely,


Thanos Bardas, David M. Brown, Andrew A. Johnson and Bradley C. Tank
Portfolio Co-Managers
17
Strategic Income Fund
TICKER SYMBOLS
| Institutional Class | | NSTLX | |
| Trust Class | | NSTTX | |
| Class A | | NSTAX | |
| Class C | | NSTCX | |
RATING SUMMARY
| (% by Ratings) | |
| AAA/Government/Government Agency | | | 42.0 | % | |
| AA | | | 2.7 | | |
| A | | | 11.9 | | |
| BBB | | | 19.3 | | |
| BB | | | 9.4 | | |
| B | | | 7.4 | | |
| CCC | | | 2.2 | | |
| CC | | | 0.1 | | |
| C | | | 0.0 | | |
| D | | | 0.0 | | |
| Short Term | | | 5.0 | | |
| Total | | | 100.0 | | |
AVERAGE ANNUAL TOTAL RETURN ENDED 10/31/094,15
| | | Inception
Date | | 1 Year | | 5 Years | | Life of
Fund | |
| At NAV | | | | | | | | | | | | | | | |
| Institutional Class | | 07/11/2003 | | | 25.97 | % | | | 8.03 | % | | | 8.35 | % | |
| Trust Class12 | | 04/02/2007 | | | 25.66 | % | | | 7.85 | % | | | 8.21 | % | |
| Class A12 | | 12/20/2007 | | | 25.51 | % | | | 7.88 | % | | | 8.23 | % | |
| Class C12 | | 12/20/2007 | | | 24.47 | % | | | 7.57 | % | | | 7.99 | % | |
| With Sales Charge | | | | | | | | | | | | | | | |
| Class A12 | | | | | 20.17 | % | | | 6.94 | % | | | 7.49 | % | |
| Class C12 | | | | | 23.47 | % | | | 7.57 | % | | | 7.99 | % | |
| Barclays Capital U.S. Aggregate Index14 | | | | | 13.79 | % | | | 5.05 | % | | | 4.75 | % | |
Performance data quoted represent past performance, which is no guarantee of future results. The investment return and principal value of an investment will fluctuate so that an investor's shares, when redeemed may be worth more or less than their original cost. Results are shown on a "total return" basis and include reinvestment of all dividends and capital gain distributions.
Current performance may be higher or lower than the performance data quoted. For performance data current to the most recent month end, please visit www.nb.com/performance.
For the period ended October 31, 2009, the 30-day SEC yield was 4.86%, 4.53%, 4.27% and 3.74% for Institutional Class, Trust Class, Class A and Class C shares, respectively.
Neuberger Berman Management LLC has contractually agreed to limit certain expenses of the Fund through 10/31/2012 for Trust Class and 10/31/2019 for Institutional Class, Class A and Class C shares. The net expense ratios were 0.82%, 1.17%, 1.23% and 1.94% for Institutional Class, Trust Class, Class A and Class C shares, respectively. As stated in the Fund's most recent prospectus, the total annual fund operating expense ratios for fiscal year 2008 were 4.03%, 9.14%, 7.53% and 8.77% for Institutional Class, Trust Class, Class A and Class C shares, respectively, (prior to any fee waivers or expense reimbursements).
Total returns shown with a sales charge reflect the deduction of the current maximum initial sales charge of 4.25% for Class A shares and the applicable contingent deferred sales charges (CDSC) for Class C shares. The maximum CDSC for Class C shares is 1%, which is reduced to 0% after 1 year. The performance of the Fund's share classes will differ primarily due to different sales charge structures and class expenses. Please see the prospectus for more information about sales charge structures, if any, and class expenses for your share class.
COMPARISON OF A $10,000 INVESTMENT
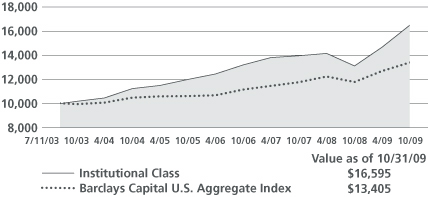
This chart shows the value of a hypothetical $10,000 investment in the Fund over the past 10 fiscal years, or since the Fund's inception, if it has not operated for 10 years. The graph is based on the Institutional Class shares only; performance of other classes will vary due to differences in fee structures (see Average Annual Total Return above).The result is compared with one or more benchmarks, which may include a broad-based market index and/or a narrower index. Please note that market indices have not been reduced to reflect any of the fees and costs of investing. All results include the reinvestment of dividends and capital gain distributions. Neither the Fund's returns nor the market indices shown in the graph and table reflect the effect of taxes an investor would pay on Fund distributions or on the redemption of Fund shares. Results represent past performance and do not indicate future results.
Please see Endnotes and Glossary of Indices for additional information.
18
Endnotes
1 Neuberger Berman Management LLC ("Management") has contractually undertaken to forgo current payment of fees and/or reimburse expenses of the following Funds so that the total annual operating expenses (excluding interest, taxes, brokerage commissions and extraordinary expenses) ("Operating Expenses") are limited to 0.70% for Neuberger Berman Short Duration Bond Fund (Investor Class), 0.80% for Neuberger Berman Short Duration Bond Fund (Trust Class), and 0.65% for Neuberger Berman Municipal Intermediate Bond Fund (Investor Class) of average daily net assets. Each undertaking lasts until October 31, 2012. Each of these Funds has agreed to repay Management for fees and expenses forgone and/or its excess Operating Expenses previously reimbursed by Management, pursuant to the contractual expense limitation, so long as its annual Operating Expenses during the period do not exceed its above-stated expense limitation, and the repayment is made within three years after the year in which Management issued the reimbursement or waived fees. Absent such forgone fees and/or reimbursements, the performance of each listed class of each Fund would have been lower. For the year ended October 31, 2009, there were no repayments of expenses to Management.
2 Management has contractually undertaken to forgo current payment of fees and/or reimburse Neuberger Berman High Income Bond Fund so that its total annual operating expenses (excluding interest, taxes, brokerage commissions and extraordinary expenses) ("Operating Expenses") are limited to 1.00%, 0.75%, 1.12%, 1.87% and 1.37% of average daily net assets for the Investor Class, Institutional Class, Class A, Class C and Class R3, respectively. These undertakings last until October 31, 2012 for Investor Class and Institutional Class and October 31, 2013 for Class A, Class C and Class R3. Each of the classes of the Fund listed above has agreed to repay Management for fees and expenses forgone and/or its excess Operating Expenses previously reimbursed by Management, pursuant to the contractual expense limitation, so long as its annual Operating Expenses during the period do not exceed its above-stated expense limitation, and the repayment is made within three years after the year in which Management issued the reimbursement or waived fees. Absent such forgone fees and/or reimbursements, the performance of each class of the Fund would have been lower.
3 Management has contractually undertaken to forgo current payment of fees and/or reimburse Neuberger Berman Core Bond Fund so that its total annual operating expenses (excluding interest, taxes, brokerage commissions and extraordinary expenses) ("Operating Expenses") are limited to 0.85%, 0.45%, 0.85% and 1.60% of average daily net assets for the Investor Class, Institutional Class, Class A and Class C, respectively. These undertakings last until October 31, 2019. Each of the classes of the Fund listed above has agreed to repay Management for fees and expenses forgone and/or its excess Operating Expenses previously reimbursed by Management, pursuant to the contractual expense limitation, so long as its annual Operating Expenses during the period do not exceed its above-stated expense limitation, and the repayment is made within three years after the year in which Management issued the reimbursement or waived fees. Absent such forgone fees and/or reimbursements, the performance of each class of the Fund would have been lower. Management voluntarily agreed to waive its management fee in the amount of 0.25% (0.20% prior to March 1, 2006) of the Fund's average daily net assets through October 31, 2009. Management has agreed to continue this voluntary waiver after this date, but may, at its sole discretion, modify or terminate this voluntary waiver at any time without notice to the Fund. If this voluntary waiver was not in place, performance for the Fund would be lower. For the year ended October 31, 2009, there were no repayments of expenses to Management.
4 Management has contractually undertaken to forgo current payment of fees and/or reimburse Neuberger Berman Strategic Income Fund so that its total annual operating expenses (excluding interest, taxes, brokerage commissions and extraordinary expenses) ("Operating Expenses") are limited to 1.10%, 0.75%, (effective March 1, 2008, and 0.85% through February 28, 2008), 1.15% and 1.85% of average daily net assets for the Trust Class, Institutional Class, Class A and Class C, respectively. These undertakings last until October 31, 2012 for the Trust Class and until October 31, 2019 for the Institutional Class, Class A and Class C. Each of the classes of the Fund listed above has agreed to repay Management for fees and expenses forgone and/or its excess Operating Expenses previously reimbursed by Management, pursuant to the contractual expense limitation, so long as its annual Operating
19
Expenses during the period do not exceed its above-stated expense limitation, and the repayment is made within three years after the year in which Management issued the reimbursement or waived fees. Absent such forgone fees and/or reimbursements, the performance of each class of the Fund would have been lower. For the year ended October 31, 2009, there were no repayments of expenses to Management.
5 Management has contractually undertaken to forgo current payment of fees and/or reimburse the Investor Class of Neuberger Berman Municipal Money Fund so that its total annual operating expenses (excluding interest, taxes, brokerage commissions and extraordinary expenses) ("Operating Expenses") are limited to 0.59% of average daily net assets. The undertaking lasts until October 31, 2012. The Investor Class of the Fund has agreed to repay Management for fees and expenses forgone and/or its excess Operating Expenses previously reimbursed by Management, pursuant to the contractual expense limitation, so long as its annual Operating Expenses during the period do not exceed the above-stated expense limitation, and the repayment is made within three years after the year in which Management issued the reimbursement or waived fees. Absent such forgone fees and/or reimbursements, the performance of the Investor Class of the Fund would have been lower. For the year ended October 31, 2009, there were no repayments of expenses to Management. In addition, Management has voluntarily undertaken to reimburse and/or waive certain expenses of the Investor Class of the Fund, so that its total annual Operating Expenses are limited to 0.52% of average daily net assets (from June 5, 2006 through January 16, 2007), 0.47% of average daily net assets (from January 17, 2007 through January 21, 2008), 0.50% of average daily net assets (from January 22, 2008 to August 25, 2008) and 0.55% of average daily net assets (effective August 26, 2008). Absent such waivers, the performance of the Investor Class of the Fund would have been lower. In addition to the contractual limitation, Management also voluntarily waived expenses as necessary to maintain a minimum yield for the Fund. Management may, at its sole discretion, modify or terminate this voluntary waiver without notice to the Fund. Absent such waivers, the performance of the Investor Class of the Fund may have been lower.
6 Management has contractually undertaken to forgo current payment of fees and/or reimburse the Investor Class of Neuberger Berman New York Municipal Money Fund so that its total annual operating expenses (excluding interest, taxes, brokerage commissions and extraordinary expenses) ("Operating Expenses") are limited to 0.59% of average daily net assets. The undertaking lasts until October 31, 2012. The Investor Class of the Fund has agreed to repay Management for fees and expenses forgone and/or its excess Operating Expenses previously reimbursed by Management, pursuant to the contractual expense limitation, so long as its annual Operating Expenses during the period do not exceed the above-stated expense limitation, and the repayment is made within three years after the year in which Management issued the reimbursement or waived fees. Absent such forgone fees and/or reimbursements, the performance of the Investor Class of the Fund would have been lower. For the year ended October 31, 2009, there were no repayments of expenses to Management. In addition, Management has voluntarily undertaken to reimburse and/or waive certain expenses of the Investor Class of the Fund, so that its total annual Operating Expenses are limited to 0.52% of average daily net assets (from June 5, 2006 through January 16, 2007), 0.47% of average daily net assets (from January 17, 2007 through January 21, 2008), 0.50% of average daily net assets (from January 22, 2008 to August 25, 2008) and 0.55% of average daily net assets (effective August 26, 2008). Absent such waivers, the performance of the Investor Class of the Fund would have been lower. In addition to these contractual and voluntary limitations, Management also voluntarily waived expenses as necessary to maintain a minimum yield for the Fund. Management may, at its sole discretion, modify or terminate this voluntary waiver without notice to the Fund.
7 "Current yield" of a money market fund refers to the income generated by an investment in a fund over a recent 7-day period. This income is then "annualized." The "effective yield" is calculated similarly but, when annualized, the income earned by an investment in the fund is assumed to be reinvested. The "effective yield" will be slightly higher than the "current yield" because of the compounding effect of this assumed reinvestment. Yields of a money market fund will fluctuate and past performance is not a guarantee of future results.
8 Tax-equivalent effective yield is the taxable effective yield that an investor would have had to receive in order to realize the same level of yield after federal income taxes at the highest federal tax rate, currently 35%, assuming that all of a fund's income is exempt from federal income taxes. For Neuberger Berman New York Municipal Money Fund, tax-equivalent yield is calculated based on federal, New York State, and New York City tax rates for a combined rate of 41.8%.
20
9 A portion of the income may be a tax preference item for purposes of the federal alternative minimum tax for certain investors.
10 The Fund is the successor to Lipper High Income Bond Fund ("Lipper Fund"). The total return data for the periods prior to September 7, 2002, are those of Lipper Fund Premier Class. The data reflect performance of Lipper Fund Premier Class for the period April 1, 1996, through September 6, 2002. The investment policies, objectives, guidelines and restrictions of the Fund are in all material respects the same as those of Lipper Fund. Returns would have been lower if the manager of Lipper Fund had not waived certain of its fees during the periods shown.
11 The Fund is the successor to Ariel Premier Bond Fund ("Ariel Bond Fund"). The total return data for the periods prior to June 13, 2005, are those of Ariel Bond Fund Investor Class and Institutional Class. The data reflects performance of Ariel Bond Fund Investor Class for the period February 1, 1997 through June 10, 2005 and the performance of Ariel Bond Fund Institutional Class for the period October 1, 1995 (date of inception) through January 31, 1997. The investment policies, guidelines and restrictions of the Fund are in all material respects the same as those of Ariel Bond Fund. Ariel Bond Fund Institutional Class had lower expenses and typically higher returns than Ariel Bond Fund Investor Class. Returns would have been lower if the manager of Ariel Bond Fund had not waived certain of its fees during the periods shown. Class A and Class C of Neuberger Berman Core Bond Fund each commenced operations on December 20, 2007. The performance information for Class A and Class C prior to the class' commencement of operations is for the Institutional Class of Neuberger Berman Core Bond Fund. The performance information shown with a sales charge for Class A and Class C shares has been adjusted to reflect the appropriate sales charge applicable to Class A and Class C shares, but has not been adjusted to take into account differences in class specific Operating Expenses (such as Rule 12b-1 fees).
12 The Trust Class, Class A and Class C of Neuberger Berman Strategic Income Fund commenced operations on April 2, 2007, December 20, 2007 and December 20, 2007, respectively. The performance information for Trust Class, Class A and Class C prior to the class' commencement of operations is that of the Institutional Class of Neuberger Berman Strategic Income Fund. In making this translation, the performance information of the Institutional Class has been adjusted to reflect the appropriate sales charge applicable to Class A and Class C shares, but has not been adjusted to take into account differences in class specific Operating Expenses (such as 12b-1 fees). The Institutional Class has lower expenses and typically higher returns than Class A, Class C or Class R3.
13 The Institutional Class, Class A, Class C and Class R3 of Neuberger Berman High Income Bond Fund commenced operations on May 27, 2009. The performance information for Institutional Class, Class A, Class C and Class R3 prior to the class' commencement of operations is that of the Investor Class of Neuberger Berman High Income Bond Fund. In making this translation, the performance information of the Investor Class has been adjusted to reflect the appropriate sales charge applicable to Class A and Class C shares, but has not been adjusted to take into account differences in class specific Operating Expenses (such as 12b-1 fees). The Investor Class has lower expenses and typically higher returns than Class A, Class C or Class R3. The Institutional Class has lower expenses and typically higher returns than Investor Class.
14 The date used to calculate Life of Fund performance for the index is the inception date of the oldest share class.
15 Please see "Glossary of Indices" starting on page 22 for a description of indices. Please note that indices do not take into account any fees and expenses or tax consequences of investing in the individual securities that they track, and that individuals cannot invest directly in any index. Data about the performance of these indices are prepared or obtained by Neuberger Berman Management LLC ("Management") and include reinvestment of all dividends and capital gain distributions. The Fund may invest in securities not included in the described indices or may not invest in all securities included in the described indices.
21
Glossary of Indices
| Barclays Capital 7-Year General Obligation Index: | | An unmanaged total return performance benchmark for the intermediate-term, 7-year, investment grade General Obligations (State and Local) tax-exempt bond market. | |
|
| Barclays Capital U.S. Aggregate Index: | | An unmanaged index that represents the U.S. domestic investment grade bond market. It is comprised of the Barclays Capital Government/Corporate Bond Index, Mortgage-Backed Securities Index, and Asset-Backed Securities Index, including securities that are of investment-grade quality or better, have at least one year to maturity, and have an outstanding par value of at least $100 million. | |
|
| Barclays Capital U.S. Corporate High Yield 2% Issuer Cap Index: | | An unmanaged sub-index of the Barclays Capital U.S. Corporate High Yield Index (which includes all U.S. dollar-denominated, taxable, fixed rate, noninvestment grade debt), capped such that no single issuer accounts for more than 2% of the index weight. | |
|
| Crane New York Tax Exempt Money Fund Index: | | An unmanaged simple average comprised of all money market mutual funds tracked by Crane Data investing primarily in New York municipal and tax-exempt money market securities. | |
|
| Crane Tax Exempt Retail Money Fund Index: | | An unmanaged simple average comprised of all money market mutual funds tracked by Crane Data investing primarily in municipal and tax-exempt money market securities. Crane Data classifies money funds as Retail based on minimum investment (normally less than $1 million), expense ratio (normally 0.35% or greater) and target customer base. | |
|
| Merrill Lynch 1-3 Year Treasury Index: | | An unmanaged total return market value index consisting of all coupon-bearing U.S. Treasury publicly placed debt securities with maturities between 1 and 3 years. | |
|
Please note that indices do not take into account any fees and expenses or any tax consequences of investing in the individual securities that they track and that individuals cannot invest directly in any index. Data about the performance of these indices or averages are prepared or obtained by Management and include reinvestment of all dividends and capital gain distributions. The Funds may invest in securities not included in the above-described indices.
22
Information About Your Fund's Expenses
These tables are designed to provide information regarding costs related to your investments. All mutual funds incur operating expenses, which include management fees, fees for administrative services and costs of shareholder reports, among others. You may also incur transactions costs, such as sales charges (loads). The following examples are intended to help you understand your ongoing costs of investing in a fund, which are the operating expenses described above, and do not include transactions costs. The following examples are based on an investment of $1,000 made at the beginning of the six month period ended October 31, 2009 and held for the entire period. The table illustrates each fund's costs in two ways:
| Actual Expenses and Performance: | | The first section of the table provides information about actual account values and actual expenses in dollars, based on the fund's actual performance during the period. You may use the information in this line, together with the amount you invested, to estimate the expenses you paid over the period. Simply divide your account value by $1,000 (for example, an $8,600 account value divided by $1,000 = 8.6), then multiply the result by the number in the first section of the table under the heading entitled "Expenses Paid During the Period" to estimate the expenses you paid over the period. | |
|
Hypothetical Example for
Comparison Purposes: | | The second section of the table provides information about hypothetical account values and hypothetical expenses based on the fund's actual expense ratio and an assumed rate of return at 5% per year before expenses. This return is not the fund's actual return. The hypothetical account values and expenses may not be used to estimate the actual ending account balance or expenses you paid for the period. You may use this information to compare the ongoing costs of investing in these funds versus other funds. To do so, compare the expenses shown in this 5% hypothetical example with the 5% hypothetical examples that appear in the shareholder reports of other funds. | |
|
Please note that the expenses in the tables are meant to highlight your ongoing costs only and do not reflect any transactional costs, such as sales charges (loads) or redemption fees. Therefore, the information under the heading "Hypothetical (5% annual return before expenses)" is useful in comparing ongoing costs only, and will not help you determine the relative total costs of owning different funds. In addition, if these transactional costs were included, your costs would have been higher.
23
Expense Information as of 10/31/09 (Unaudited)
| | | ACTUAL | | HYPOTHETICAL (5% ANNUAL RETURN BEFORE EXPENSES)(2) | |
| | | Beginning
Account
Value
5/1/09 | | Ending
Account
Value
10/31/09 | | Expenses Paid
During the
Period(1)
5/1/09 - 10/31/09 | | Expense
Ratio | | Beginning
Account
Value
5/1/09 | | Ending
Account
Value
10/31/09 | | Expenses Paid
During the
Period(1)
5/1/09 - 10/31/09 | | Expense
Ratio | |
| Neuberger Berman Core Bond Fund | |
| Investor Class | | $ | 1,000.00 | | | $ | 1,139.80 | | | $ | 4.58 | | | | .85 | % | | $ | 1,000.00 | | | $ | 1,020.92 | | | $ | 4.33 | | | | .85 | % | |
| Institutional Class | | $ | 1,000.00 | | | $ | 1,143.00 | | | $ | 2.43 | | | | .45 | % | | $ | 1,000.00 | | | $ | 1,022.94 | | | $ | 2.29 | | | | .45 | % | |
| Class A | | $ | 1,000.00 | | | $ | 1,139.90 | | | $ | 4.58 | | | | .85 | % | | $ | 1,000.00 | | | $ | 1,020.92 | | | $ | 4.33 | | | | .85 | % | |
| Class C | | $ | 1,000.00 | | | $ | 1,135.60 | | | $ | 8.61 | | | | 1.60 | % | | $ | 1,000.00 | | | $ | 1,017.14 | | | $ | 8.13 | | | | 1.60 | % | |
| Neuberger Berman High Income Bond Fund | |
| Investor Class | | $ | 1,000.00 | | | $ | 1,245.50 | | | $ | 5.66 | | | | 1.00 | % | | $ | 1,000.00 | | | $ | 1,020.16 | | | $ | 5.09 | | | | 1.00 | % | |
| Institutional Class(3) | | $ | 1,000.00 | | | $ | 1,202.30 | | | $ | 3.57 | | | | .75 | % | | $ | 1,000.00 | | | $ | 1,018.40 | | | $ | 3.28 | | | | .75 | % | |
| Class A(3) | | $ | 1,000.00 | | | $ | 1,196.90 | | | $ | 5.33 | | | | 1.12 | % | | $ | 1,000.00 | | | $ | 1,016.80 | | | $ | 4.89 | | | | 1.12 | % | |
| Class C(3) | | $ | 1,000.00 | | | $ | 1,194.30 | | | $ | 8.88 | | | | 1.87 | % | | $ | 1,000.00 | | | $ | 1,013.55 | | | $ | 8.15 | | | | 1.87 | % | |
| Class R3(3) | | $ | 1,000.00 | | | $ | 1,197.60 | | | $ | 6.52 | | | | 1.37 | % | | $ | 1,000.00 | | | $ | 1,015.71 | | | $ | 5.98 | | | | 1.37 | % | |
| Neuberger Berman Municipal Intermediate Bond Fund | |
| Investor Class | | $ | 1,000.00 | | | $ | 1,019.30 | | | $ | 3.31 | | | | .65 | % | | $ | 1,000.00 | | | $ | 1,021.93 | | | $ | 3.31 | | | | .65 | % | |
| Neuberger Berman Municipal Money Fund | |
| Investor Class | | $ | 1,000.00 | | | $ | 1,000.60 | | | $ | 2.52 | | | | .50 | % | | $ | 1,000.00 | | | $ | 1,022.68 | | | $ | 2.55 | | | | .50 | % | |
| Neuberger Berman New York Municipal Money Fund | |
| Investor Class | | $ | 1,000.00 | | | $ | 1,000.50 | | | $ | 2.22 | | | | .44 | % | | $ | 1,000.00 | | | $ | 1,022.99 | | | $ | 2.24 | | | | .44 | % | |
| Neuberger Berman Short Duration Bond Fund | |
| Investor Class | | $ | 1,000.00 | | | $ | 1,088.10 | | | $ | 3.68 | | | | .70 | % | | $ | 1,000.00 | | | $ | 1,021.68 | | | $ | 3.57 | | | | .70 | % | |
| Trust Class | | $ | 1,000.00 | | | $ | 1,087.90 | | | $ | 4.21 | | | | .80 | % | | $ | 1,000.00 | | | $ | 1,021.17 | | | $ | 4.08 | | | | .80 | % | |
| Neuberger Berman Strategic Income Fund | |
| Institutional Class | | $ | 1,000.00 | | | $ | 1,125.90 | | | $ | 4.02 | | | | .75 | % | | $ | 1,000.00 | | | $ | 1,021.42 | | | $ | 3.82 | | | | .75 | % | |
| Trust Class | | $ | 1,000.00 | | | $ | 1,124.00 | | | $ | 5.89 | | | | 1.10 | % | | $ | 1,000.00 | | | $ | 1,019.66 | | | $ | 5.60 | | | | 1.10 | % | |
| Class A | | $ | 1,000.00 | | | $ | 1,124.70 | | | $ | 6.16 | | | | 1.15 | % | | $ | 1,000.00 | | | $ | 1,019.41 | | | $ | 5.85 | | | | 1.15 | % | |
| Class C | | $ | 1,000.00 | | | $ | 1,119.50 | | | $ | 9.88 | | | | 1.85 | % | | $ | 1,000.00 | | | $ | 1,015.88 | | | $ | 9.40 | | | | 1.85 | % | |
(1) For each class of the fund, expenses are equal to the annualized expense ratio for the class, multiplied by the average account value over the period, multiplied by 184/365 (to reflect the one-half year period shown), unless otherwise indicated.
(2) Hypothetical 5% annual return before expenses is calculated by multiplying the number of days in the most recent period divided by 365.
(3) For each class of the fund, expenses are equal to the annualized expense ratio for the class, multiplied by the average account value over the period, multiplied by 158/365 (to reflect the period shown of May 27, 2009 to October 31, 2009).
24
Schedule of Investments Neuberger Berman Core Bond Fund
| PRINCIPAL AMOUNT | | | | VALUE† | |
| (000's omitted) | | | | (000's omitted) | |
U.S. Treasury Securities-Backed by the Full Faith
and Credit of the U.S. Government (18.3%)+ | |
| $ 7,000 | | | U.S. Treasury Bills, 0.10%, due 3/25/10 | | | $ 6,997 | | |
| | 210 | | | U.S. Treasury Inflation Index Notes, 3.00%, due 7/15/12 | | | 226 | | |
| | 10,793 | | | U.S. Treasury Inflation Index Notes, 2.38%, due 1/15/17 | | | 11,639 | ØØ | |
| | 100 | | | U.S. Treasury Notes, 2.38%, due 9/30/14 | | | 100 | | |
| | | | | Total U.S. Treasury Securities-Backed by the Full Faith and Credit of the U.S. Government (Cost $18,525) | | | 18,962 | | |
| U.S. Government Agency Securities (8.2%) | |
| | 8,500 | | | Freddie Mac, Discount Notes, 0.03%, due 1/20/10 (Cost $8,496) | | | 8,499 | | |
| Mortgage-Backed Securities (43.5%) | |
| Adjustable Rate Mortgages (6.7%) | |
| | 188 | | | ACE Securities Corp., Ser. 2006-FM1, Class A2B, 0.33%, due 11/25/09 | | | 76 | µØØ | |
| | 266 | | | Banc of America Funding Corp., Ser. 2005-F, Class 4A1, 5.30%, due 11/2/09 | | | 197 | µØØ | |
| | 42 | | | Banc of America Funding Corp., Ser. 2006-G, Class 2A2, 0.33%, due 11/20/09 | | | 38 | µØØ | |
| | 92 | | | Banc of America Funding Corp., Ser. 2006-G, Class 2A1, 0.47%, due 11/20/09 | | | 61 | µØØ | |
| | 136 | | | Bear Stearns ALT-A Trust, Ser. 2006-4, Class 32A1, 6.36%, due 11/2/09 | | | 76 | µØØ | |
| | 330 | | | Carrington Mortgage Loan Trust, Ser. 2006-NC3, Class A3, 0.39%, due 11/25/09 | | | 142 | µØØ | |
| | 220 | | | Carrington Mortgage Loan Trust, Ser. 2006-NC4, Class M2, 0.56%, due 11/25/09 | | | 21 | µØØ | |
| | 29 | | | Chase Funding Mortgage Loan Asset-Backed Certificates, Ser. 2004-1, Class 2A2, 0.70%, due 11/25/09 | | | 25 | µØØ | |
| | 110 | | | Citigroup Mortgage Loan Trust, Inc., Ser. 2006-WFH1, Class M2, 0.61%, due 11/25/09 | | | 25 | µØØ | |
| | 485 | | | Commercial Mortgage Loan Trust, Ser. 2008-LS1, Class A4B, 6.22%, due 11/2/09 | | | 418 | µØØ | |
| | 165 | | | Countrywide Alternative Loan Trust, Ser. 2006-0C9, Class A2B, 0.48%, due 11/25/09 | | | 20 | µØØ | |
| | 227 | | | Countrywide Asset-Backed Certificates, Ser. 2007-BC2, Class 2A1, 0.33%, due 11/25/09 | | | 209 | µØØ | |
| | 91 | | | Countrywide Asset-Backed Certificates, Ser. 2006-BC1, Class 1A, 0.44%, due 11/25/09 | | | 66 | µØØ | |
| | 171 | | | Countrywide Asset-Backed Certificates, Ser. 2005-IM2, Class A3, 0.51%, due 11/25/09 | | | 119 | µØØ | |
| | 365 | | | Countrywide Home Loans Mortgage Pass-Through Trust, Ser. 2007-HYB2, Class 2A1, 5.28%, due 11/2/09 | | | 192 | µØØ | |
| | 149 | | | Credit Suisse Mortgage Capital Certificates, Ser. 2007-TF2A, Class A1, 0.43%, due 11/16/09 | | | 126 | ñµØØ | |
| | 245 | | | Credit-Based Asset Servicing and Securitization, Ser. 2006-CB6, Class A22, 0.33%, due 11/25/09 | | | 237 | µØØ | |
| | 737 | | | Credit-Based Asset Servicing and Securitization, Ser. 2006-CB3, Class AV3, 0.41%, due 11/25/09 | | | 530 | µØØ | |
| | 61 | | | Credit-Based Asset Servicing and Securitization, Ser. 2005-CB5, Class AV2, 0.50%, due 11/25/09 | | | 50 | µØØ | |
| | 50 | | | Equifirst Mortgage Loan Trust, Ser. 2003-2, Class 3A3, 1.00%, due 11/16/09 | | | 40 | µØØ | |
| | 32 | | | Fannie Mae Grantor Trust, Ser. 2002-T5, Class A1, 0.48%, due 11/25/09 | | | 26 | µØØ | |
| | 114 | | | Fannie Mae Whole Loan, Ser. 2003-W5, Class A, 0.46%, due 11/25/09 | | | 100 | µØØ | |
| | 2 | | | First Franklin Mortgage Loan Trust, Asset-Backed Certificates, Ser. 2004-FFH3, Class 2A1, 0.62%, due 11/25/09 | | | 2 | µØØ | |
| | 358 | | | First Horizon Mortgage Pass-Through Trust, Ser. 2005-AR5, Class 2A1, 5.45%, due 11/2/09 | | | 319 | µØØ | |
| | 278 | | | GSR Mortgage Loan Trust, Ser. 2005-AR3, Class 6A1, 5.02%, due 11/2/09 | | | 229 | µØØ | |
| | 456 | | | GSR Mortgage Loan Trust, Ser. 2007-AR1, Class 2A1, 5.95%, due 11/2/09 | | | 314 | µØØ | |
| | 94 | | | Household Home Equity Loan Trust, Ser. 2006-1, Class A1, 0.41%, due 11/20/09 | | | 80 | µØØ | |
| | 113 | | | Household Home Equity Loan Trust, Ser. 2006-2, Class A2, 0.43%, due 11/20/09 | | | 98 | µØØ | |
| | 266 | | | HSI Asset Loan Obligation, Ser. 2007-AR1, Class 2A1, 6.03%, due 11/2/09 | | | 165 | µØØ | |
| | 188 | | | HSI Asset Securitization Corp. Trust, Ser. 2006-WMC1, Class A2, 0.34%, due 11/25/09 | | | 68 | µØØ | |
| | 272 | | | Impac Secured Assets Corp., Ser. 2006-3, Class A4, 0.33%, due 11/25/09 | | | 118 | µØØ | |
| | 494 | | | IndyMac INDX Mortgage Loan Trust, Ser. 2006-AR11, Class 2A1, 5.48%, due 11/2/09 | | | 271 | µØØ | |
| | 57 | | | IndyMac INDX Mortgage Loan Trust, Ser. 2006-AR7, Class 3A1, 5.65%, due 11/2/09 | | | 32 | µØØ | |
| | 122 | | | IndyMac Loan Trust, Ser. 2005-L2, Class A1, 0.46%, due 11/25/09 | | | 94 | µØØ | |
| | 9 | | | JP Morgan Alternative Loan Trust, Ser. 2006-A3, Class 1A2, 0.31%, due 11/25/09 | | | 9 | µØØ | |
| | 27 | | | JP Morgan Alternative Loan Trust, Ser. 2006-A2, Class 1A2, 0.32%, due 11/25/09 | | | 25 | µØØ | |
| | 40 | | | JP Morgan Alternative Loan Trust, Ser. 2006-S4, Class A1B, 0.32%, due 11/25/09 | | | 39 | µØØ | |
See Notes to Schedule of Investments
25
| PRINCIPAL AMOUNT | | | | VALUE† | |
| (000's omitted) | | | | (000's omitted) | |
| $ 8 | | | JP Morgan Chase Commercial Mortgage Securities Corp., Ser. 2005-FL1A, Class A1, 0.36%, due 11/16/09 | | | $ 8 | ñµØØ | |
| | 244 | | | JP Morgan Mortgage Acquisition Corp., Ser. 2006-CW2, Class AV3, 0.34%, due 11/25/09 | | | 235 | µØØ | |
| | 683 | | | JP Morgan Mortgage Trust, Ser. 2005-A3, Class 7CA1, 5.09%, due 11/2/09 | | | 581 | µØØ | |
| | 642 | | | Knollwood CDO Ltd., Ser. 2006-2A, Class A2J, 0.70%, due 1/13/10 | | | 0 | ñµØØ | |
| | 174 | | | Merrill Lynch First Franklin Mortgage Loan, Ser. 2007-2, Class A2A, 0.35%, due 11/25/09 | | | 166 | µØØ | |
| | 42 | | | Morgan Stanley Capital I, Ser. 2004-WMC3, Class B3, 4.29%, due 11/25/09 | | | 2 | µØØ | |
| | 80 | | | MSCC Heloc Trust, Ser. 2003-2, Class A, 0.50%, due 11/25/09 | | | 48 | µØØ | |
| | 235 | | | Nomura Asset Acceptance Corp., Ser. 2007-2, Class A1A, 0.36%, due 11/25/09 | | | 129 | µØØ | |
| | 212 | | | Opteum Mortgage Acceptance Corp., Ser. 2005-3, Class A1B, 0.50%, due 11/25/09 | | | 170 | µØØ | |
| | 522 | | | Option One Mortgage Loan Trust, Ser. 2006-2, Class 2A2, 0.34%, due 11/25/09 | | | 390 | µØØ | |
| | 46 | | | Popular ABS Mortgage Pass-Through Trust, Ser. 2006-E, Class A1, 0.33%, due 11/25/09 | | | 43 | µØØ | |
| | 285 | | | Residential Accredit Loans, Inc., Ser. 2005-QA10, Class A31, 5.60%, due 11/2/09 | | | 188 | µØØ | |
| | 374 | | | Residential Accredit Loans, Inc., Ser. 2006-QA1, Class A21, 5.93%, due 11/2/09 | | | 207 | µØØ | |
| | 150 | | | Residential Accredit Loans, Inc., Ser. 2006-QO7, Class 3A2, 0.45%, due 11/25/09 | | | 40 | µØØ | |
| | 16 | | | Residential Asset Mortgage Products, Inc., Ser. 2003-RS2, Class AII, 0.92%, due 11/25/09 | | | 10 | µØØ | |
| | 40 | | | Residential Asset Mortgage Products, Inc., Ser. 2003-RS3, Class AII, 0.96%, due 11/25/09 | | | 23 | µØØ | |
| | 8 | | | Saxon Asset Securities Trust, Ser. 2004-1, Class A, 0.78%, due 11/25/09 | | | 5 | µØØ | |
| | 4 | | | Specialty Underwriting & Residential Finance, Ser. 2003-BC1, Class A, 0.92%, due 11/25/09 | | | 2 | µØØ | |
| | 52 | | | Wachovia Asset Securitization, Inc., Ser. 2003-HE3, Class A, 0.49%, due 11/25/09 | | | 27 | µØØ | |
| | | | 6,931 | | |
| Fannie Mae (31.3%) | | | |
| | 320 | | | Pass-Through Certificates, 6.00%, due 11/1/15 & 2/1/38 | | | 342 | ØØ | |
| | 1,211 | | | Pass-Through Certificates, 5.00%, due 3/1/21 – 8/1/38 | | | 1,265 | ØØ | |
| | 101 | | | Pass-Through Certificates, 8.50%, due 4/1/34 | | | 115 | ØØ | |
| | 9,898 | | | Pass-Through Certificates, 5.50%, due 11/1/35 – 1/1/39 | | | 10,434 | ØØ | |
| | 8,000 | | | Pass-Through Certificates, 6.00%, TBA, 30 Year Maturity | | | 8,497 | Ø | |
| | 11,140 | | | Pass-Through Certificates, 5.50%, TBA, 30 Year Maturity | | | 11,725 | Ø | |
| | | | 32,378 | | |
| Freddie Mac (5.5%) | | | |
| | 761 | | | Pass-Through Certificates, 5.00%, due 5/1/23 & 1/1/39 | | | 792 | ØØ | |
| | 85 | | | Pass-Through Certificates, 6.50%, due 11/1/25 | | | 92 | ØØ | |
| | 826 | | | Pass-Through Certificates, 5.78%, due 7/1/36 | | | 868 | ØØ | |
| | 537 | | | Pass-Through Certificates, 5.34%, due 2/1/37 | | | 564 | ØØ | |
| | 577 | | | Pass-Through Certificates, 5.54%, due 2/1/37 | | | 609 | ØØ | |
| | 1,324 | | | Pass-Through Certificates, 5.24%, due 4/1/37 | | | 1,393 | ØØ | |
| | 1,303 | | | Pass-Through Certificates, 5.50%, due 10/1/38 & 11/1/38 | | | 1,374 | ØØ | |
| | | | 5,692 | | |
| | | | | Total Mortgage-Backed Securities (Cost $48,207) | | | 45,001 | | |
| Corporate Debt Securities (34.6%) | |
| Bank (8.0%) | | | |
| | 690 | | | Bank of America Corp., Senior Unsecured Medium-Term Notes, Ser. L, 7.38%, due 5/15/14 | | | 773 | ØØ | |
| | 790 | | | Bank of America Corp., Unsecured Notes, 6.50%, due 8/1/16 | | | 845 | | |
| | 595 | | | Bank of America Corp., Senior Unsecured Medium-Term Notes, Ser. L, 5.65%, due 5/1/18 | | | 601 | | |
| | 435 | | | Barclays Bank PLC, Senior Unsecured Notes, 5.00%, due 9/22/16 | | | 445 | | |
| | 685 | | | Goldman Sachs Group, Inc., Senior Medium-Term Notes, 3.63%, due 8/1/12 | | | 706 | | |
| | 325 | | | Goldman Sachs Group, Inc., Medium-Term Notes, 6.00%, due 5/1/14 | | | 357 | ØØ | |
| | 1,095 | | | Goldman Sachs Group, Inc., Subordinated Notes, 6.75%, due 10/1/37 | | | 1,153 | ØØ | |
| | 615 | | | JP Morgan Chase & Co., Senior Unsecured Notes, 3.70%, due 1/20/15 | | | 618 | | |
| | 315 | | | JP Morgan Chase Capital XV, Guaranteed Notes, 5.88%, due 3/15/35 | | | 280 | ØØ | |
| | 365 | | | Merrill Lynch & Co., Senior Unsecured Medium-Term Notes, Ser. C, 5.45%, due 2/5/13 | | | 382 | ØØ | |
See Notes to Schedule of Investments
26
| PRINCIPAL AMOUNT | | | | VALUE† | |
| (000's omitted) | | | | (000's omitted) | |
| $ 1,235 | | | Morgan Stanley, Senior Unsecured Medium-Term Notes, Ser. F, 5.63%, due 9/23/19 | | | $ 1,243 | | |
| | 415 | | | Royal Bank of Scotland PLC, Guaranteed Medium-Term Notes, 4.88%, due 8/25/14 | | | 422 | ñ | |
| | 465 | | | Wachovia Corp., Senior Unsecured Medium-Term Notes, Ser. G, 5.50%, due 5/1/13 | | | 498 | | |
| | | | 8,323 | | |
| Finance (6.0%) | | | |
| | 200 | | | American Express Co., Senior Unsecured Notes, 8.13%, due 5/20/19 | | | 239 | ØØ | |
| | 560 | | | American Express Credit Corp., Senior Unsecured Medium-Term Notes, Ser. C, 5.88%, due 5/2/13 | | | 601 | ØØ | |
| | 320 | | | American Express Credit Corp., Senior Unsecured Medium-Term Notes, Ser. D, 5.13%, due 8/25/14 | | | 337 | | |
| | 520 | | | Citigroup, Inc., Senior Unsecured Notes, 6.13%, due 11/21/17 | | | 531 | ÈØØ | |
| | 815 | | | Citigroup, Inc., Unsecured Notes, 8.50%, due 5/22/19 | | | 953 | ØØ | |
| | 840 | | | Citigroup, Inc., Senior Unsecured Notes, 6.88%, due 3/5/38 | | | 874 | | |
| | 830 | | | General Electric Capital Corp., Senior Unsecured Notes, 5.90%, due 5/13/14 | | | 908 | ØØ | |
| | 990 | | | General Electric Capital Corp., Senior Unsecured Medium-Term Notes, 5.88%, due 1/14/38 | | | 946 | ØØ | |
| | 450 | | | Hartford Financial Services Group, Inc., Senior Unsecured Notes, 5.38%, due 3/15/17 | | | 423 | | |
| | 330 | | | WEA Finance LLC, Guaranteed Notes, 7.50%, due 6/2/14 | | | 359 | ñØØ | |
| | | | 6,171 | | |
| Industrial (17.9%) | | | |
| | 295 | | | Altria Group, Inc., Guaranteed Notes, 9.70%, due 11/10/18 | | | 363 | ØØ | |
| | 185 | | | Altria Group, Inc., Guaranteed Notes, 9.95%, due 11/10/38 | | | 241 | ØØ | |
| | 645 | | | Anadarko Petroleum Corp., Senior Unsecured Notes, 5.95%, due 9/15/16 | | | 692 | ØØ | |
| | 335 | | | Analog Devices, Inc., Senior Unsecured Notes, 5.00%, due 7/1/14 | | | 352 | | |
| | 1,430 | | | Anheuser-Busch InBev Worldwide, Inc., Guaranteed Notes, 5.38%, due 1/15/20 | | | 1,454 | ñ | |
| | 920 | | | ArcelorMittal, Senior Unsecured Notes, 6.13%, due 6/1/18 | | | 909 | ØØ | |
| | 175 | | | ArcelorMittal, Senior Unsecured Notes, 9.85%, due 6/1/19 | | | 206 | ØØ | |
| | 530 | | | Bemis Co., Inc., Senior Unsecured Notes, 6.80%, due 8/1/19 | | | 594 | | |
| | 340 | | | CareFusion Corp., Senior Unsecured Notes, 6.38%, due 8/1/19 | | | 367 | ñ | |
| | 530 | | | Continental Airlines, Inc., Pass-Through Certificates, Ser. A, 7.25%, due 11/10/19 | | | 535 | Ø | |
| | 225 | | | Continental Airlines, Inc., Pass-Through Certificates, Ser. 2007-1, Class A, 5.98%, due 4/19/22 | | | 218 | ØØ | |
| | 185 | | | CVS Caremark Corp., Senior Unsecured Notes, 6.25%, due 6/1/27 | | | 192 | | |
| | 265 | | | DCP Midstream LLC, Senior Unsecured Notes, 9.75%, due 3/15/19 | | | 317 | ñØØ | |
| | 130 | | | DCP Midstream LLC, Senior Unsecured Notes, 6.75%, due 9/15/37 | | | 122 | ñØØ | |
| | 460 | | | DirecTV Holdings LLC, Guaranteed Notes, 4.75%, due 10/1/14 | | | 469 | ñ | |
| | 330 | | | Enterprise Products Operating LLC, Guaranteed Notes, 6.13%, due 10/15/39 | | | 331 | | |
| | 700 | | | ERAC USA Finance Co., Guaranteed Notes, 7.00%, due 10/15/37 | | | 676 | ñØØ | |
| | 90 | | | Express Scripts, Inc., Guaranteed Notes, 5.25%, due 6/15/12 | | | 96 | ØØ | |
| | 425 | | | Holcim US Finance Sarl & Cie SCS, Guaranteed Notes, 6.00%, due 12/30/19 | | | 438 | ñ | |
| | 315 | | | Ingersoll-Rand Global Holding Co. Ltd., Guaranteed Notes, 6.00%, due 8/15/13 | | | 342 | ØØ | |
| | 325 | | | Kinder Morgan Energy Partners L.P., Senior Unsecured Notes, 6.50%, due 9/1/39 | | | 331 | | |
| | 540 | | | Lorillard Tobacco Co., Senior Unsecured Notes, 8.13%, due 6/23/19 | | | 600 | ØØ | |
| | 500 | | | Mead Johnson Nutrition Co., Senior Unsecured Notes, 3.50%, due 11/1/14 | | | 502 | ñØ | |
| | 400 | | | Midcontinent Express Pipeline LLC, Senior Unsecured Notes, 6.70%, due 9/15/19 | | | 405 | ñ | |
| | 285 | | | News America, Inc., Guaranteed Notes, 6.90%, due 8/15/39 | | | 302 | ñ | |
| | 160 | | | NGPL Pipeco LLC, Senior Unsecured Notes, 6.51%, due 12/15/12 | | | 175 | ñØØ | |
| | 365 | | | Petrobras Int'l Finance Co., Guaranteed Notes, 5.75%, due 1/20/20 | | | 364 | | |
| | 425 | | | Plains All American Pipeline L.P., Guaranteed Notes, 4.25%, due 9/1/12 | | | 437 | | |
| | 305 | | | Republic Services, Inc., Guaranteed Notes, 5.50%, due 9/15/19 | | | 315 | ñ | |
| | 315 | | | Roche Holdings, Inc., Guaranteed Notes, 6.00%, due 3/1/19 | | | 351 | ñØØ | |
| | 570 | | | Roper Industries, Inc., Senior Unsecured Notes, 6.25%, due 9/1/19 | | | 598 | | |
| | 450 | | | The Dow Chemical Co., Senior Unsecured Notes, 5.90%, due 2/15/15 | | | 465 | | |
| | 845 | | | The Dow Chemical Co., Senior Unsecured Notes, 8.55%, due 5/15/19 | | | 965 | ØØ | |
| | 645 | | | Time Warner Cable, Inc., Guaranteed Notes, 6.75%, due 7/1/18 | | | 710 | ØØ | |
| | 430 | | | Time Warner Cable, Inc., Guaranteed Notes, 8.25%, due 4/1/19 | | | 517 | ØØ | |
| | 480 | | | Time Warner, Inc., Guaranteed Unsecured Notes, 6.88%, due 5/1/12 | | | 528 | ÈØØ | |
| | 215 | | | Tyco Int'l Finance SA, Guaranteed Notes, 4.13%, due 10/15/14 | | | 220 | | |
| | 705 | | | Valero Energy Corp., Guaranteed Notes, 6.63%, due 6/15/37 | | | 647 | | |
See Notes to Schedule of Investments
27
| PRINCIPAL AMOUNT | | | | VALUE† | |
| (000's omitted) | | | | (000's omitted) | |
| $ 485 | | | Volvo Treasury AB, Notes, 5.95%, due 4/1/15 | | | $ 493 | ñ | |
| | 415 | | | Watson Pharmaceuticals, Inc., Senior Unsecured Notes, 5.00%, due 8/15/14 | | | 426 | | |
| | 245 | | | Xerox Corp., Senior Unsecured Notes, 5.50%, due 5/15/12 | | | 258 | ØØ | |
| | | | 18,523 | | |
| REITs (0.5%) | | | |
| | 485 | | | Simon Property Group LP, Senior Unsecured Notes, 5.88%, due 3/1/17 | | | 494 | | |
| Telecommunications (1.7%) | |
| | 465 | | | AT&T, Inc., Senior Unsecured Notes, 4.85%, due 2/15/14 | | | 497 | | |
| | 360 | | | Qwest Corp., Senior Unsecured Notes, 8.88%, due 3/15/12 | | | 379 | ØØ | |
| | 430 | | | Telecom Italia Capital SA, Guaranteed Unsecured Notes, 4.95%, due 9/30/14 | | | 446 | | |
| | 195 | | | Telefonica Emisiones SAU, Guaranteed Notes, 5.88%, due 7/15/19 | | | 211 | ØØ | |
| | 230 | | | Vodafone Group PLC, Senior Unsecured Notes, 4.15%, due 6/10/14 | | | 238 | | |
| | | | 1,771 | | |
| Utility - Electric (0.5%) | | | |
| | 265 | | | Exelon Generation Co. LLC, Senior Unsecured Notes, 6.25%, due 10/1/39 | | | 276 | | |
| | 235 | | | FirstEnergy Solutions Corp., Guaranteed Notes, 4.80%, due 2/15/15 | | | 241 | ñ | |
| | | | 517 | | |
| | | | | Total Corporate Debt Securities (Cost $33,380) | | | 35,799 | | |
| Asset-Backed Securities (10.7%) | |
| | 105 | | | ARCap REIT, Inc., Ser. 2004-1A, Class D, 5.64%, due 4/21/39 | | | 20 | ñ^^ØØ | |
| | 185 | | | Banc of America Commercial Mortgage, Inc., Ser. 2007-3, Class A4, 5.84%, due 11/2/09 | | | 155 | µØØ | |
| | 500 | | | Banc of America Commercial Mortgage, Inc., Ser. 2007-4, Class ASB, 5.71%, due 11/2/09 | | | 496 | µ | |
| | 400 | | | Bear Stearns Commercial Mortgage Securities, Ser. 2007-PW17, Class A4, 5.69%, due 11/2/09 | | | 372 | µ | |
| | 92 | | | Carmax Auto Owner Trust, Ser. 2008-1, Class A2, 0.95%, due 11/16/09 | | | 92 | µØØ | |
| | 350 | | | Chase Issuance Trust, Ser. 2007-A6, Class A6, 0.25%, due 11/16/09 | | | 350 | µØØ | |
| | 161 | | | Credit Suisse First Boston Mortgage Securities Corp., Ser. 2001-CK6, Class A3, 6.39%, due 8/15/36 | | | 168 | ØØ | |
| | 225 | | | Credit Suisse First Boston Mortgage Securities Corp., Ser. 2005-C4, Class A3, 5.12%, due 8/15/38 | | | 228 | ØØ | |
| | 80 | | | Credit Suisse Mortgage Capital Certificates, Ser. 2007-C3, Class A4, 5.91%, due 11/2/09 | | | 66 | µØØ | |
| | 45 | | | Credit Suisse Mortgage Capital Certificates, Ser. 2007-C4, Class A4, 6.00%, due 11/2/09 | | | 37 | µØØ | |
| | 250 | | | Credit Suisse Mortgage Capital Certificates, Ser. 2008-C1, Class A3, 6.42%, due 11/2/09 | | | 213 | µØØ | |
| | 700 | | | Credit Suisse Mortgage Capital Certificates, Ser. 2006-C4, Class A3, 5.47%, due 9/15/39 | | | 611 | | |
| | 100 | | | Credit Suisse Mortgage Capital Certificates, Ser. 2007-C1, Class A3, 5.38%, due 2/15/40 | | | 81 | ØØ | |
| | 130 | | | Credit Suisse Mortgage Capital Certificates, Ser. 2007-C5, Class A4, 5.70%, due 9/15/40 | | | 107 | ØØ | |
| | 175 | | | Greenwich Capital Commercial Funding Corp., Ser. 2007-GG11, Class A4, 5.74%, due 12/10/49 | | | 161 | ØØ | |
| | 500 | | | GS Mortgage Securities Corp. II, Ser. 2007-GG10, Class A4, 6.00%, due 11/2/09 | | | 420 | µ | |
| | 600 | | | GS Mortgage Securities Corp. II, Ser. 2006-GG6, Class A4, 5.55%, due 4/10/38 | | | 564 | | |
| | 400 | | | GS Mortgage Securities Corp. II, Ser. 2006-GG8, Class A4, 5.56%, due 11/10/39 | | | 367 | | |
| | 2,380 | | | JP Morgan Chase Commercial Mortgage Securities Corp., Ser. 2007-CB19, Class A4, 5.94%, due 11/2/09 | | | 2,172 | µØØ | |
| | 1,270 | | | JP Morgan Chase Commercial Mortgage Securities Corp., Ser. 2007-LD11, Class A4, 6.01%, due 11/2/09 | | | 1,170 | µØØ | |
| | 480 | | | JP Morgan Chase Commercial Mortgage Securities Corp., Ser. 2006-LDP7, Class A4, 6.07%, due 11/2/09 | | | 469 | µØØ | |
| | 12 | | | JP Morgan Chase Commercial Mortgage Securities Corp., Ser. 2005-CB11, Class A1, 4.52%, due 8/12/37 | | | 12 | ØØ | |
| | 335 | | | JP Morgan Chase Commercial Mortgage Securities Corp., Ser. 2006-CB14, Class ASB, 5.51%, due 12/12/44 | | | 346 | ØØ | |
See Notes to Schedule of Investments
28
| PRINCIPAL AMOUNT | | | VALUE† | |
| (000's omitted) | | | (000's omitted) | |
| $ 325 | | | JP Morgan Chase Commercial Mortgage Securities Corp., Ser. 2006-LDP9, Class A3, 5.34%, due 5/15/47 | | | $ 293 | | |
| | 200 | | | JP Morgan Chase Commercial Mortgage Securities Corp., Ser. 2007-LDPX, Class A3, 5.42%, due 1/15/49 | | | 175 | ØØ | |
| | 555 | | | JP Morgan Chase Commercial Mortgage Securities Corp., Ser. 2007-CB20, Class ASB, 5.69%, due 2/12/51 | | | 544 | | |
| | 700 | | | Merrill Lynch/Countrywide Commercial Mortgage Trust, Ser. 2007-7, Class A4, 5.81%, due 11/2/09 | | | 589 | µ | |
| | 300 | | | Merrill Lynch/Countrywide Commercial Mortgage Trust, Ser. 2007-5, Class A4, 5.38%, due 8/12/48 | | | 236 | ØØ | |
| | 300 | | | Morgan Stanley Capital I, Ser. 2007-IQ16, Class A4, 5.81%, due 12/12/49 | | | 271 | | |
| | 263 | | | Newcastle CDO Ltd., Ser. 2004-4A, Class 3FX, 5.11%, due 3/24/39 | | | 3 | ñØØ | |
| | 265 | | | SLM Student Loan Trust, Ser. 2008-6, Class A1, 0.68%, due 1/25/10 | | | 265 | µØØ | |
| | 10 | | | Wachovia Bank Commercial Mortgage Trust, Ser. 2007-C32, Class A3, 5.74%, due 11/2/09 | | | 8 | µØØ | |
| | | | | Total Asset-Backed Securities (Cost $11,612) | | | 11,061 | | |
| NUMBER OF SHARES | |
| Short-Term Investments (4.8%) | |
| | 1,080,134 | | | Neuberger Berman Securities Lending Quality Fund, LLC | | | 1,102 | ‡ | |
| | 3,868,540 | | | State Street Institutional Liquid Reserves Fund Institutional Class | | | 3,869 | | |
| | | | | Total Short-Term Investments (Cost $4,960) | | | 4,971 | | |
| | | | | Total Investments (120.1%) (Cost $125,180) | | | 124,293 | ## | |
| | | | | Liabilities, less cash, receivables and other assets [(20.1%)] | | | (20,814 | ) | |
| | | | | Total Net Assets (100.0%) | | $ | 103,479 | | |
See Notes to Schedule of Investments
29
Schedule of Investments Neuberger Berman High Income Bond Fund
| PRINCIPAL AMOUNT | | | | VALUE† | |
| (000's omitted) | | | | (000's omitted) | |
| Bank Loan Obligations (8.2%) | |
| Airlines (2.2%) | | | |
| $ 14,955 | | | United Airlines, Inc., Term Loan B, 2.48%, due 2/1/14 | | | $ 11,683 | b | |
| Automotive (0.9%) | | | |
| | 5,452 | | | Ford Motor Co., Term Loan B1, 5.24%, due 12/16/13 | | | 4,844 | b | |
| Electric - Generation (3.4%) | | | |
| | 23,609 | | | Texas Competitive Electric Holdings Co. LLC, Term Loan DD, 3.28%, due 10/10/14 | | | 18,241 | | |
| Media - Cable (1.0%) | | | |
| | 2,222 | | | Cequel Communications LLC, Term Loan B, 6.28%, due 5/5/14 | | | 2,202 | | |
| | 3,000 | | | Cequel Communications LLC, Term Loan A, 7.36%, due 5/5/14 | | | 2,922 | | |
| | | | 5,124 | | |
| Software/Services (0.5%) | |
| | 2,284 | | | First Data Corp., Term Loan B2, 3.03%, due 9/24/14 | | | 1,959 | | |
| | 683 | | | First Data Corp., Term Loan B1, 4.95%, due 9/24/14 | | | 587 | | |
| | | | 2,546 | | |
| Support - Services (0.2%) | |
| | 1,484 | | | Rental Services Corp., Second Lien Term Loan, 3.78%, due 11/30/13 | | | 1,334 | | |
| | | | | Total Bank Loan Obligations (Cost $37,974) | | | 43,772 | | |
| Corporate Debt Securities (88.4%) | |
| Airlines (2.7%) | | | |
| | 1,125 | | | American Airlines, Inc., Pass-Through Certificates, Ser. 2009-1A, 10.38%, due 7/2/19 | | | 1,226 | ØØ | |
| | 3,505 | | | American Airlines, Inc., Senior Secured Notes, 10.50%, due 10/15/12 | | | 3,593 | ñ | |
| | 2,700 | | | Delta Air Lines, Inc., Pass-Through Certificates, Ser. 2001-1, Class B, 7.71%, due 9/18/11 | | | 2,592 | ØØ | |
| | 2,460 | | | Delta Air Lines, Inc., Senior Secured Notes, 9.50%, due 9/15/14 | | | 2,509 | ñ | |
| | 2,950 | | | Delta Air Lines, Inc., Pass-Through Certificates, Ser. 2007-1, Class A, 6.82%, due 8/10/22 | | | 2,721 | ØØ | |
| | 1,839 | | | United Airlines, Inc., Pass-Through Certificates, Ser. 2007-1, Class A, 6.64%, due 7/2/22 | | | 1,618 | ØØ | |
| | | | 14,259 | | |
| Auto Loans (3.2%) | | | |
| | 4,565 | | | Ford Motor Credit Co. LLC, Senior Unsecured Notes, 7.00%, due 10/1/13 | | | 4,331 | | |
| | 8,675 | | | Ford Motor Credit Co. LLC, Senior Unsecured Notes, 8.70%, due 10/1/14 | | | 8,665 | | |
| | 1,630 | | | Ford Motor Credit Co. LLC, Senior Unsecured Notes, 12.00%, due 5/15/15 | | | 1,836 | | |
| | 2,260 | | | Ford Motor Credit Co. LLC, Senior Unsecured Notes, 8.00%, due 12/15/16 | | | 2,183 | | |
| | | | 17,015 | | |
| Auto Parts & Equipment (1.1%) | |
| | 1,760 | | | Goodyear Tire & Rubber Co., Senior Unsecured Notes, 10.50%, due 5/15/16 | | | 1,905 | ØØ | |
| | 4,260 | | | Navistar Int'l Corp., Senior Notes, 8.25%, due 11/1/21 | | | 4,159 | | |
| | | | 6,064 | | |
See Notes to Schedule of Investments
30
| PRINCIPAL AMOUNT | | | | VALUE† | |
| (000's omitted) | | | | (000's omitted) | |
| Automotive (0.7%) | |
| $ 2,293 | | | Ford Holdings, Inc., Guaranteed Notes, 9.38%, due 3/1/20 | | | $ 1,969 | | |
| | 720 | | | Ford Holdings, Inc., Guaranteed Notes, 9.30%, due 3/1/30 | | | 623 | | |
| | 1,405 | | | Ford Motor Co., Senior Unsecured Notes, 9.98%, due 2/15/47 | | | 1,194 | | |
| | | | 3,786 | | |
| Banking (4.9%) | | | |
| | 1,745 | | | CIT Group, Inc., Senior Unsecured Medium-Term Notes, 5.13%, due 9/30/14 | | | 1,144 | ØØa | |
| | 2,845 | | | CIT Group, Inc., Senior Unsecured Notes, 5.40%, due 1/30/16 | | | 1,859 | ØØa | |
| | 670 | | | CIT Group, Inc., Senior Unsecured Notes, 5.85%, due 9/15/16 | | | 434 | ØØa | |
| | 902 | | | GMAC LLC, Guaranteed Notes, 6.88%, due 9/15/11 | | | 866 | ñØØ | |
| | 1,130 | | | GMAC LLC, Senior Unsecured Notes, due 12/1/12 | | | 780 | | |
| | 8,120 | | | GMAC LLC, Guaranteed Notes, 6.75%, due 12/1/14 | | | 7,369 | ñ | |
| | 280 | | | GMAC LLC, Senior Unsecured Notes, 0.00%, due 6/15/15 | | | 139 | | |
| | 6,990 | | | GMAC LLC, Subordinated Notes, 8.00%, due 12/31/18 | | | 5,732 | ñØØ | |
| | 5,255 | | | GMAC LLC, Guaranteed Notes, 8.00%, due 11/1/31 | | | 4,493 | ñØØ | |
| | 3,235 | | | Lloyds Banking Group PLC, Junior Subordinated Notes, 6.27%, due 11/14/16 | | | 2,103 | ñµ | |
| | 1,360 | | | Lloyds Banking Group PLC, Junior Subordinated Notes, Ser. A, 6.41%, due 10/1/35 | | | 884 | ñµ | |
| | 970 | | | Lloyds Banking Group PLC, Junior Subordinated Notes, 6.66%, due 5/21/37 | | | 630 | ñµ | |
| | | | 26,433 | | |
| Beverage (0.2%) | | | |
| | 560 | | | Constellation Brands, Inc., Guaranteed Notes, 8.38%, due 12/15/14 | | | 591 | ØØ | |
| | 750 | | | Constellation Brands, Inc., Guaranteed Notes, 7.25%, due 9/1/16 | | | 752 | ØØ | |
| | | | 1,343 | | |
| Building & Construction (0.3%) | |
| | 1,370 | | | Standard Pacific Escrow LLC, Senior Secured Notes, 10.75%, due 9/15/16 | | | 1,343 | ñ | |
| Building Materials (2.1%) | | | |
| | 535 | | | Associated Materials LLC, Senior Secured Notes, 9.88%, due 11/15/16 | | | 548 | ñ | |
| | 735 | | | Owens Corning, Inc., Guaranteed Notes, 9.00%, due 6/15/19 | | | 798 | ØØ | |
| | 7,605 | | | Ply Gem Industries, Inc., Senior Secured Notes, 11.75%, due 6/15/13 | | | 7,130 | | |
| | 2,605 | | | USG Corp., Guaranteed Notes, 9.75%, due 8/1/14 | | | 2,735 | ñ | |
| | | | 11,211 | | |
| Chemicals (2.7%) | | | |
| | 2,285 | | | Huntsman Int'l LLC, Guaranteed Notes, 7.88%, due 11/15/14 | | | 2,148 | | |
| | 5,620 | | | MacDermid, Inc., Senior Subordinated Notes, 9.50%, due 4/15/17 | | | 5,311 | ñØØ | |
| | 4,821 | | | Momentive Performance Materials, Inc., Guaranteed Notes, 12.50%, due 6/15/14 | | | 5,038 | ñÈØØ | |
| | 2,135 | | | Momentive Performance Materials, Inc., Guaranteed Notes, 9.75%, due 12/1/14 | | | 1,782 | | |
| | | | 14,279 | | |
| Consumer/Commercial/Lease Financing (3.8%) | |
| | 4,075 | | | American General Finance Corp., Senior Unsecured Medium-Term Notes, Ser. H, 5.38%,
due 10/1/12 | | | 3,141 | | |
| | 3,880 | | | American General Finance Corp., Senior Unsecured Medium-Term Notes, Ser. I, 5.85%,
due 6/1/13 | | | 2,904 | È | |
See Notes to Schedule of Investments
31
| PRINCIPAL AMOUNT | | | | VALUE† | |
| (000's omitted) | | | | (000's omitted) | |
| $ 5,735 | | | American General Finance Corp., Senior Unsecured Medium-Term Notes, Ser. I, 5.40%, due 12/1/15 | | | $ 3,954 | ØØ | |
| | 14,660 | | | American General Finance Corp., Senior Unsecured Medium-Term Notes, Ser. J, 6.90%, due 12/15/17 | | | 10,203 | ØØ | |
| | | | 20,202 | | |
| Diversified Capital Goods (0.4%) | |
| | 2,590 | | | Mueller Water Products, Inc., Guaranteed Notes, 7.38%, due 6/1/17 | | | 2,240 | ØØ | |
| Electric - Generation (5.4%) | |
| | 1,820 | | | Dynegy Holdings, Inc., Senior Unsecured Notes, 7.50%, due 6/1/15 | | | 1,674 | | |
| | 12,250 | | | Dynegy-Roseton/ Danskammer, Pass-Through Certificates, Ser. B, 7.67%, due 11/8/16 | | | 11,638 | ØØ | |
| | 7,638 | | | Edison Mission Energy, Senior Unsecured Notes, 7.63%, due 5/15/27 | | | 5,385 | ØØ | |
| | 4,006 | | | Energy Future Holdings Corp., Guaranteed Notes, 11.25%, due 11/1/17 | | | 2,604 | ØØ | |
| | 464 | | | Homer City Funding LLC, Senior Secured Notes, 8.14%, due 10/1/19 | | | 450 | ØØ | |
| | 987 | | | Mirant Mid-Atlantic LLC, Pass-Through Certificates, Ser. A, 8.63%, due 6/30/12 | | | 1,010 | ØØ | |
| | 2,335 | | | NRG Energy, Inc., Guaranteed Notes, 7.38%, due 2/1/16 | | | 2,320 | | |
| | 3,650 | | | NRG Energy, Inc., Guaranteed Notes, 7.38%, due 1/15/17 | | | 3,614 | ØØ | |
| | | | 28,695 | | |
| Electric - Integrated (0.2%) | |
| | 1,180 | | | IPALCO Enterprises, Inc., Senior Secured Notes, 7.25%, due 4/1/16 | | | 1,189 | ñØØ | |
| Electronics (0.7%) | | | |
| | 1,795 | | | NXP BV Funding LLC, Senior Secured Floating Rate Notes, 3.03%, due 1/15/10 | | | 1,355 | µÈ | |
| | 2,965 | | | NXP BV Funding LLC, Senior Secured Notes, 7.88%, due 10/15/14 | | | 2,446 | | |
| | | | 3,801 | | |
| Energy - Exploration & Production (1.8%) | |
| | 3,915 | | | Chesapeake Energy Corp., Guaranteed Notes, 9.50%, due 2/15/15 | | | 4,238 | ØØ | |
| | 3,280 | | | Chesapeake Energy Corp., Guaranteed Notes, 7.25%, due 12/15/18 | | | 3,174 | ÈØØ | |
| | 2,195 | | | Cimarex Energy Co., Guaranteed Notes, 7.13%, due 5/1/17 | | | 2,118 | ØØ | |
| | | | 9,530 | | |
| Food & Drug Retailers (1.4%) | |
| | 1,420 | | | Ingles Markets, Inc., Senior Unsecured Notes, 8.88%, due 5/15/17 | | | 1,456 | | |
| | 1,595 | | | Rite Aid Corp., Senior Secured Notes, 9.75%, due 6/12/16 | | | 1,723 | | |
| | 2,640 | | | Rite Aid Corp., Senior Secured Notes, 10.38%, due 7/15/16 | | | 2,653 | ØØ | |
| | 1,445 | | | Rite Aid Corp., Senior Secured Notes, 10.25%, due 10/15/19 | | | 1,452 | ñ | |
| | | | 7,284 | | |
| Forestry/Paper (0.9%) | |
| | 4,280 | | | PE Paper Escrow GmbH, Senior Secured Notes, 12.00%, due 8/1/14 | | | 4,687 | ñ | |
| Gaming (5.9%) | | | |
| | 405 | | | Chukchansi Economic Development Authority, Senior Unsecured Notes, 8.00%, due 11/15/13 | | | 263 | ñØØ | |
| | 4,385 | | | FireKeepers Development Authority, Senior Secured Notes, 13.88%, due 5/1/15 | | | 4,736 | ñØØ | |
| | 9,495 | | | Harrah's Operating Co., Inc., Guaranteed Notes, 10.75%, due 2/1/16 | | | 7,264 | | |
| | 1,800 | | | MGM Mirage, Inc., Senior Secured Notes, 10.38%, due 5/15/14 | | | 1,917 | ñØØ | |
See Notes to Schedule of Investments
32
| PRINCIPAL AMOUNT | | | | VALUE† | |
| (000's omitted) | | | | (000's omitted) | |
| $ 3,370 | | | MGM Mirage, Inc., Guaranteed Notes, 7.50%, due 6/1/16 | | | $ 2,578 | ØØ | |
| | 1,470 | | | MGM Mirage, Inc., Senior Secured Notes, 11.13%, due 11/15/17 | | | 1,617 | ñØØ | |
| | 1,530 | | | Peninsula Gaming LLC, Senior Secured Notes, 8.38%, due 8/15/15 | | | 1,518 | ñ | |
| | 1,780 | | | Peninsula Gaming LLC, Senior Unsecured Notes, 10.75%, due 8/15/17 | | | 1,767 | ñ | |
| | 2,825 | | | Pinnacle Entertainment, Inc., Senior Notes, 8.63%, due 8/1/17 | | | 2,811 | ñ | |
| | 4,345 | | | Pokagon Gaming Authority, Senior Notes, 10.38%, due 6/15/14 | | | 4,497 | ñØØ | |
| | 1,620 | | | San Pasqual Casino Development Group, Inc., Notes, 8.00%, due 9/15/13 | | | 1,539 | ñØØ | |
| | 1,860 | | | Shingle Springs Tribal Gaming Authority, Senior Notes, 9.38%, due 6/15/15 | | | 1,320 | ñØØ | |
| | | | 31,827 | | |
| Gas Distribution (7.1%) | |
| | 1,440 | | | AmeriGas Partners L.P., Senior Unsecured Notes, 7.13%, due 5/20/16 | | | 1,404 | ØØ | |
| | 2,435 | | | El Paso Corp., Senior Unsecured Medium-Term Notes, 8.25%, due 2/15/16 | | | 2,521 | ØØ | |
| | 6,695 | | | El Paso Energy Corp., Medium-Term Notes, 7.80%, due 8/1/31 | | | 6,273 | ØØ | |
| | 2,835 | | | Ferrellgas L.P., Senior Unsecured Notes, 6.75%, due 5/1/14 | | | 2,707 | ØØ | |
| | 1,575 | | | Ferrellgas Partners L.P., Senior Unsecured Notes, 8.75%, due 6/15/12 | | | 1,575 | ØØ | |
| | 3,640 | | | Ferrellgas Partners L.P., Senior Unsecured Notes, 6.75%, due 5/1/14 | | | 3,476 | | |
| | 2,880 | | | Ferrellgas Partners L.P., Senior Notes, 9.13%, due 10/1/17 | | | 3,009 | ñ | |
| | 1,905 | | | MarkWest Energy Partners L.P., Guaranteed Notes, 6.88%, due 11/1/14 | | | 1,791 | ñØØ | |
| | 2,305 | | | MarkWest Energy Partners L.P., Guaranteed Notes, Ser. B, 8.75%, due 4/15/18 | | | 2,357 | ØØ | |
| | 15,550 | | | Sabine Pass LNG L.P., Senior Secured Notes, 7.50%, due 11/30/16 | | | 13,140 | ØØ | |
| | | | 38,253 | | |
| Health Services (4.3%) | |
| | 620 | | | Columbia Healthcare Corp., Senior Unsecured Notes, 7.50%, due 12/15/23 | | | 531 | | |
| | 1,985 | | | Columbia/HCA, Senior Unsecured Notes, 7.69%, due 6/15/25 | | | 1,704 | | |
| | 1,370 | | | Columbia/HCA, Senior Unsecured Notes, 7.05%, due 12/1/27 | | | 1,098 | | |
| | 4,060 | | | HCA, Inc., Secured Notes, 9.13%, due 11/15/14 | | | 4,202 | ØØ | |
| | 1,850 | | | HCA, Inc., Secured Notes, 9.25%, due 11/15/16 | | | 1,933 | ØØ | |
| | 880 | | | HCA, Inc., Senior Secured Notes, 8.50%, due 4/15/19 | | | 933 | ñØØ | |
| | 4,686 | | | NMH Holdings, Inc., Senior Unsecured Floating Rate Notes, 7.42%, due 12/15/09 | | | 3,444 | ñµØØ | |
| | 2,225 | | | NMH Holdings, Inc., Guaranteed Notes, 11.25%, due 7/1/14 | | | 2,208 | | |
| | 3,650 | | | Service Corp. Int'l, Senior Unsecured Notes, 7.50%, due 4/1/27 | | | 3,249 | ØØ | |
| | 2,930 | | | Ventas Realty L.P., Guaranteed Notes, 6.50%, due 6/1/16 | | | 2,798 | ØØ | |
| | 745 | | | Ventas Realty L.P., Guaranteed Notes, 6.50%, due 6/1/16 | | | 712 | ØØ | |
| | | | 22,812 | | |
| Machinery (0.3%) | | | |
| | 2,035 | | | Terex Corp., Senior Subordinated Notes, 8.00%, due 11/15/17 | | | 1,877 | | |
| Media - Broadcast (4.2%) | |
| | 6,770 | | | Allbritton Communications Co., Senior Subordinated Notes, 7.75%, due 12/15/12 | | | 6,398 | ØØ | |
| | 3,345 | | | LIN Television Corp., Guaranteed Notes, Ser. B, 6.50%, due 5/15/13 | | | 3,036 | ØØ | |
| | 3,300 | | | Sinclair Television Group, Inc., Senior Secured Notes, 9.25%, due 11/1/17 | | | 3,250 | ñ | |
| | 5,048 | | | Umbrella Acquisition, Inc., Guaranteed Notes, 9.75%, due 3/15/15 | | | 3,912 | ñØØ | |
| | 3,505 | | | Univision Communications, Inc., Senior Secured Notes, 12.00%, due 7/1/14 | | | 3,790 | ñ | |
| | 1,855 | | | XM Satellite Radio, Inc., Senior Secured Notes, 11.25%, due 6/15/13 | | | 1,948 | ñ | |
| | | | 22,334 | | |
| Media - Cable (2.6%) | |
| | 4,735 | | | DISH DBS Corp., Guaranteed Notes, 7.88%, due 9/1/19 | | | 4,847 | | |
| | 3,380 | | | GCI, Inc., Senior Notes, 8.63%, due 11/15/19 | | | 3,380 | ñ | |
See Notes to Schedule of Investments
33
| PRINCIPAL AMOUNT | | | | VALUE† | |
| (000's omitted) | | | | (000's omitted) | |
| $ 3,215 | | | UPC Holding BV, Senior Unsecured Notes, 9.88%, due 4/15/18 | | | $ 3,400 | ñØØ | |
| | 1,375 | | | Videotron Ltee, Guaranteed Senior Unsecured Notes, 6.88%, due 1/15/14 | | | 1,375 | ØØ | |
| | 215 | | | Videotron Ltee, Guaranteed Notes, 9.13%, due 4/15/18 | | | 233 | | |
| | 485 | | | Videotron Ltee, Guaranteed Notes, 9.13%, due 4/15/18 | | | 525 | ñØØ | |
| | | | 13,760 | | |
| Media - Services (2.9%) | |
| | 2,565 | | | Nielsen Finance LLC, Guaranteed Notes, 11.50%, due 5/1/16 | | | 2,725 | | |
| | 6,535 | | | Nielsen Finance LLC, Guaranteed Notes, Step Up, 0.00%/12.50%, due 8/1/16 | | | 5,661 | ** | |
| | 3,385 | | | The Interpublic Group of Cos., Inc., Senior Unsecured Notes, 10.00%, due 7/15/17 | | | 3,639 | | |
| | 1,800 | | | WMG Acquisition Corp., Guaranteed Notes, 7.38%, due 4/15/14 | | | 1,710 | | |
| | 1,940 | | | WMG Acquisition Corp., Senior Secured Notes, 9.50%, due 6/15/16 | | | 2,071 | ñØØ | |
| | | | 15,806 | | |
| Metals/Mining Excluding Steel (1.0%) | |
| | 2,385 | | | Arch Coal, Inc., Guaranteed Notes, 8.75%, due 8/1/16 | | | 2,445 | ñ | |
| | 2,440 | | | Arch Western Finance LLC., Guaranteed Notes, 6.75%, due 7/1/13 | | | 2,354 | ØØ | |
| | 555 | | | Massey Energy Co., Guaranteed Notes, 6.88%, due 12/15/13 | | | 548 | ØØ | |
| | | | 5,347 | | |
| Non-Food & Drug Retailers (3.0%) | |
| | 4,210 | | | Blockbuster, Inc., Guaranteed Notes, 9.00%, due 9/1/12 | | | 2,221 | ØØ | |
| | 6,070 | | | Blockbuster, Inc., Senior Secured Notes, 11.75%, due 10/1/14 | | | 5,751 | ñ | |
| | 1,230 | | | Macy's Retail Holdings, Inc., Guaranteed Unsecured Notes, 7.00%, due 2/15/28 | | | 1,021 | ØØ | |
| | 2,950 | | | Macy's Retail Holdings, Inc., Senior Guaranteed Notes, 6.90%, due 4/1/29 | | | 2,434 | | |
| | 815 | | | Macy's Retail Holdings, Inc., Guaranteed Notes, 6.38%, due 3/15/37 | | | 664 | ØØ | |
| | 3,670 | | | Toys "R" Us Property Co. I LLC, Guaranteed Notes, 10.75%, due 7/15/17 | | | 3,982 | ñ | |
| | | | 16,073 | | |
| Packaging (0.2%) | | | |
| | 835 | | | Graham Packaging Co., L.P., Guaranteed Notes, 9.88%, due 10/15/14 | | | 852 | ØØ | |
| Printing & Publishing (1.6%) | |
| | 2,760 | | | Gannett Co., Inc., Guaranteed Notes, 8.75%, due 11/15/14 | | | 2,705 | ñ | |
| | 1,720 | | | Gannett Co., Inc., Guaranteed Notes, 9.38%, due 11/15/17 | | | 1,677 | ñ | |
| | 4,510 | | | TL Acquisitions, Inc., Senior Notes, 10.50%, due 1/15/15 | | | 4,262 | ñ | |
| | | | 8,644 | | |
| Real Estate Dev. & Mgt. (1.6%) | |
| | 1,710 | | | American Real Estate Partners L.P., Senior Unsecured Notes, 8.13%, due 6/1/12 | | | 1,710 | ØØ | |
| | 6,830 | | | American Real Estate Partners L.P., Guaranteed Notes, 7.13%, due 2/15/13 | | | 6,710 | ØØ | |
| | | | 8,420 | | |
| REITs (1.1%) | | | |
| | 2,160 | | | HCP, Inc., Senior Unsecured Medium-Term Notes, 6.30%, due 9/15/16 | | | 2,144 | ØØ | |
| | 3,860 | | | HCP, Inc., Senior Unsecured Medium-Term Notes, 6.70%, due 1/30/18 | | | 3,835 | ØØ | |
| | | | 5,979 | | |
See Notes to Schedule of Investments
34
| PRINCIPAL AMOUNT | | | | VALUE† | |
| (000's omitted) | | | | (000's omitted) | |
| Restaurants (0.2%) | | | |
| $ 1,315 | | | NPC Int'l, Inc., Guaranteed Notes, 9.50%, due 5/1/14 | | | $ 1,299 | ØØ | |
| Software/Services (3.8%) | |
| | 1,110 | | | Ceridian Corp., Senior Unsecured Notes, 11.25%, due 11/15/15 | | | 1,068 | | |
| | 225 | | | Ceridian Corp., Guaranteed Notes, 12.25%, due 11/15/15 | | | 203 | | |
| | 11,158 | | | First Data Corp., Guaranteed Notes, 10.55%, due 9/24/15 | | | 9,986 | | |
| | 2,025 | | | Lender Processing Services, Inc., Guaranteed Notes, 8.13%, due 7/1/16 | | | 2,131 | ØØ | |
| | 2,070 | | | Sungard Data Systems, Inc., Guaranteed Notes, 10.63%, due 5/15/15 | | | 2,230 | ñØØ | |
| | 4,340 | | | Sungard Data Systems, Inc., Guaranteed Notes, 10.25%, due 8/15/15 | | | 4,476 | ØØ | |
| | | | 20,094 | | |
| Steel Producers/Products (0.9%) | |
| | 4,810 | | | Tube City IMS Corp., Guaranteed Notes, 9.75%, due 2/1/15 | | | 4,377 | ØØ | |
| | 700 | | | United States Steel Corp., Senior Unsecured Notes, 6.65%, due 6/1/37 | | | 572 | ØØ | |
| | | | 4,949 | | |
| Support - Services (2.8%) | |
| | 1,750 | | | Cardtronics, Inc., Guaranteed Notes, 9.25%, due 8/15/13 | | | 1,776 | ØØ | |
| | 2,930 | | | Cardtronics, Inc., Guaranteed Notes, Ser. B, 9.25%, due 8/15/13 | | | 2,974 | ØØ | |
| | 1,655 | | | Hertz Corp., Guaranteed Notes, 10.50%, due 1/1/16 | | | 1,725 | ØØ | |
| | 1,365 | | | Knowledge Learning Corp., Inc., Guaranteed Notes, 7.75%, due 2/1/15 | | | 1,333 | ñØØ | |
| | 4,211 | | | United Rentals N.A., Inc., Guaranteed Notes, 7.75%, due 11/15/13 | | | 3,853 | ÈØØ | |
| | 3,235 | | | United Rentals N.A., Inc., Guaranteed Notes, 10.88%, due 6/15/16 | | | 3,510 | ñØØ | |
| | | | 15,171 | | |
| Telecom - Integrated/Services (5.6%) | |
| | 1,410 | | | Dycom Investments, Inc., Guaranteed Notes, 8.13%, due 10/15/15 | | | 1,297 | ØØ | |
| | 2,066 | | | Citizens Communications Corp., Senior Unsecured Notes, 6.25%, due 1/15/13 | | | 2,040 | ØØ | |
| | 5,665 | | | Citizens Communications Corp., Senior Unsecured Notes, 9.00%, due 8/15/31 | | | 5,594 | ÈØØ | |
| | 4,700 | | | Intelsat Jackson Holdings Ltd., Guaranteed Notes, 11.25%, due 6/15/16 | | | 5,006 | | |
| | 1,655 | | | Intelsat Jackson Holdings Ltd., Senior Notes, 8.50%, due 11/1/19 | | | 1,661 | ñ | |
| | 895 | | | Intelsat Subsidiary Holdings Co. Ltd., Guaranteed Notes, Ser. B, 8.88%, due 1/15/15 | | | 898 | ñØØ | |
| | 545 | | | Intelsat Subsidiary Holdings Co. Ltd., Guaranteed Notes, 8.88%, due 1/15/15 | | | 550 | ØØ | |
| | 1,070 | | | Level 3 Financing, Inc., Guaranteed Notes, 12.25%, due 3/15/13 | | | 1,115 | | |
| | 2,245 | | | Level 3 Financing, Inc., Guaranteed Notes, 9.25%, due 11/1/14 | | | 1,998 | | |
| | 5,780 | | | Level 3 Financing, Inc., Guaranteed Notes, 8.75%, due 2/15/17 | | | 4,942 | | |
| | 1,960 | | | Qwest Corp., Senior Unsecured Notes, 8.88%, due 3/15/12 | | | 2,063 | ØØ | |
| | 1,085 | | | Windstream Corp., Guaranteed Notes, 8.13%, due 8/1/13 | | | 1,126 | ØØ | |
| | 765 | | | Windstream Corp., Guaranteed Notes, 8.63%, due 8/1/16 | | | 786 | ØØ | |
| | 920 | | | Windstream Corp., Guaranteed Notes, 7.00%, due 3/15/19 | | | 873 | ØØ | |
| | | | 29,949 | | |
| Telecom - Wireless (6.8%) | |
| | 2,000 | | | CC Holdings GS V LLC/Crown Castle GS III Corp., Senior Secured Notes, 7.75%, due 5/1/17 | | | 2,100 | ñ | |
| | 2,750 | | | Cricket Communications, Inc., Senior Secured Notes, 7.75%, due 5/15/16 | | | 2,743 | ñ | |
| | 6,405 | | | MetroPCS Wireless, Inc., Guaranteed Notes, 9.25%, due 11/1/14 | | | 6,453 | È | |
| | 4,016 | | | Nextel Communications, Inc., Guaranteed Notes, Ser. E, 6.88%, due 10/31/13 | | | 3,715 | ØØ | |
| | 4,000 | | | Sprint Capital Corp., Guaranteed Notes, 6.90%, due 5/1/19 | | | 3,480 | ØØ | |
| | 16,710 | | | Sprint Capital Corp., Guaranteed Notes, 6.88%, due 11/15/28 | | | 12,532 | ØØ | |
See Notes to Schedule of Investments
35
| PRINCIPAL AMOUNT | | | | VALUE† | |
| (000's omitted) | | | | (000's omitted) | |
| $ 3,440 | | | Telesat Canada/Telesat LLC, Senior Unsecured Notes, 11.00%, due 11/1/15 | | | $ 3,732 | | |
| | 1,670 | | | Telesat Canada/Telesat LLC, Senior Subordinated Notes, 12.50%, due 11/1/17 | | | 1,831 | | |
| | | | 36,586 | | |
| | | | | Total Corporate Debt Securities (Cost $436,045) | | | 473,393 | | |
| NUMBER OF SHARES | |
| Preferred Stocks (0.0%) | |
| Banking (0.0%) | | | |
| | 218 | | | GMAC, 7.00%, due 12/31/49 (Cost $43) | | | 133 | ñØØ | |
| Short-Term Investments (8.8%) | |
| | 12,894,714 | | | Neuberger Berman Securities Lending Quality Fund, LLC | | | 13,153 | ‡ | |
| | 34,201,747 | | | State Street Institutional Liquid Reserves Fund Institutional Class | | | 34,202 | | |
| | | | | Total Short-Term Investments (Cost $47,355) | | | 47,355 | | |
| | | | | Total Investments (105.4%) (Cost $521,417) | | | 564,653 | ## | |
| | | | | Liabilities, less cash, receivables and other assets [(5.4%)] | | | (28,983 | ) | |
| | | | | Total Net Assets (100.0%) | | $ | 535,670 | | |
See Notes to Schedule of Investments
36
Schedule of Investments Neuberger Berman Municipal Intermediate
Bond Fund
| PRINCIPAL AMOUNT | | SECURITY@@ | | VALUE† | |
| (000's omitted) | | | | (000's omitted) | |
| Alaska (0.6%) | | | |
| $ 500 | | | Anchorage G.O., Ser. 2008-A, 5.00%, due 8/1/20 | | | $ 547 | | |
| Arizona (7.0%) | | | |
| | 875 | | | Northern Arizona Univ. Cert. of Participation (Research Infrastructure Proj.), Ser. 2005, (AMBAC Insured), 4.00%, due 9/1/14 | | | 904 | | |
| | 1,500 | | | Pima Co. Cert. of Participation, Ser. 2009, 4.00%, due 6/1/12 | | | 1,561 | | |
| | 1,550 | | | Salt River Proj. Agricultural Imp. & Pwr. Dist. Elec. Sys. Ref. Rev., Ser. 2002-A, 5.25%, due 1/1/18 | | | 1,648 | | |
| | 2,220 | | | Yuma Muni. Prop. Corp. Util. Sys Rev. Sr. Lien, Ser. 2007, (XLCA Insured), 5.00%, due 7/1/15 | | | 2,380 | | |
| | | | 6,493 | | |
| California (8.9%) | | | |
| | 1,000 | | | California Pub. Works Board Lease Rev. Dept. of Mental Hlth. (Coalinga St. Hosp.), Ser. 2004-A, 5.50%, due 6/1/21 | | | 1,007 | | |
| | 450 | | | California Ind. G.O., Ser. 2009-B, 5.00%, due 7/1/20 | | | 488 | | |
| | 2,475 | | | California St. G.O. (Muni. Sec. Trust Receipts), Ser. 2001-SGA136, (XLCA Insured), 0.20%, due 11/2/09 | | | 2,475 | µcc | |
| | 1,000 | | | Los Angeles Dept. of Wtr. & Pwr. Sys. Rev., Ser. 2009-B, 5.25%, due 7/1/23 | | | 1,103 | | |
| | 1,500 | | | San Diego Pub. Fac. Fin. Au. Sr. Swr. Ref. Rev., Ser. 2009-B, 5.00%, due 5/15/21 | | | 1,597 | | |
| | 1,500 | | | San Jose Redev. Agcy. Tax Allocation, (National Public Finance Guarantee Corp. Insured), Ser. 2005-A, 5.00%, due 8/1/19 | | | 1,532 | | |
| | | | 8,202 | | |
| Colorado (1.1%) | | | |
| | 1,000 | | | Larimer Co. Sales & Use Tax Rev., Ser. 2000, (AMBAC Insured), 5.75%, due 12/15/15 Pre-Refunded 12/15/10 | | | 1,060 | ØØ | |
| District of Columbia (2.1%) | |
| | 1,865 | | | Dist. of Columbia Univ. Ref. Rev. (Georgetown Univ.), Ser. 2009-A, 5.00%, due 4/1/21 | | | 1,915 | ß | |
| Florida (1.1%) | | | |
| | 1,000 | | | Hillsborough Co. Comm. Investment Tax Rev., Ser. 2004, (AMBAC Insured), 5.00%, due 5/1/20 | | | 1,050 | | |
| Illinois (3.3%) | | | |
| | 1,000 | | | Chicago O'Hare Int'l Arpt. Gen. Arpt. Third Lien Ref. Rev., Ser. 2005-B, (National Public Finance Guarantee Corp. Insured), 5.25%, due 1/1/17 | | | 1,097 | | |
| | 200 | | | Illinois Dev. Fin. Au. Rev. (Christian Heritage Academy), Ser. 2001, (LOC: Glenview State Bank), 0.77%, due 11/2/09 | | | 200 | µßo | |
| | 600 | | | Illinois Fin. Au. Rev. (Univ. of Chicago), Ser. 2007, 5.00%, due 7/1/22 | | | 660 | ßØØ | |
| | 1,000 | | | Illinois St. G.O., Ser. 2001, (FGIC Insured), 5.38%, due 11/1/12 Pre-Refunded 11/1/11 | | | 1,092 | | |
| | | | 3,049 | | |
| Indiana (0.4%) | | | |
| | 400 | | | Indiana Trans. Fin. Au. Hwy. Rev. (Muni. Sec. Trust Receipts), Ser. 2000-SGA113, (LOC: Societe Generale), 0.20%, due 11/2/09 | | | 400 | µ | |
See Notes to Schedule of Investments
37
| PRINCIPAL AMOUNT | | SECURITY@@ | | VALUE† | |
| (000's omitted) | | | | (000's omitted) | |
| Iowa (0.8%) | | | |
| $ 700 | | | Iowa Higher Ed. Loan Au. Rev. (Private College St. Ambrose), Ser. 2003, (LOC: Northern Trust Co.), 0.20%, due 11/2/09 | | | $ 700 | µß | |
| Kansas (2.9%) | | | |
| | 1,740 | | | Kansas St. Dev. Fin. Au. Rev. (Dept. of Commerce Impact Prog.), Ser. 2009, 5.00%, due 6/1/16 | | | 1,914 | | |
| | 750 | | | Wichita Hosp. Rev. (Facs. Imp.), Ser. 2009-IIIA, 4.50%, due 11/15/12 | | | 793 | ß | |
| | | | 2,707 | | |
| Kentucky (0.9%) | | | |
| | 800 | | | Kentucky Econ. Dev. Fin. Au. Hosp. Fac. Rev. (Harrison Mem. Hosp., Inc.), Ser. 2005, (LOC: Fifth Third Bank), 0.97%, due 11/6/09 | | | 800 | µß | |
| Massachusetts (3.7%) | | | |
| | 1,000 | | | Massachusetts Bay Trans. Au. Sales Tax Rev., Ser. 2006-A, 5.25%, due 7/1/34 | | | 1,132 | | |
| | 500 | | | Massachusetts St. Hlth. & Ed. Fac. Au. Rev. (Berklee College of Music), Ser. 2007-A, 5.00%, due 10/1/15 | | | 539 | ß | |
| | 1,225 | | | Massachusetts St. HFA Hsg. Rev. (Single Family), Ser. 2009-144, 3.95%, due 6/1/18 | | | 1,223 | Ø | |
| | 500 | | | Massachusetts St. Turnpike Au. Western Turnpike Rev., Ser. 1997-A, (National Public Finance Guarantee Corp. Insured), 5.55%, due 1/1/17 | | | 501 | | |
| | | | 3,395 | | |
| Michigan (3.4%) | | | |
| | 1,000 | | | Kent Hosp. Fin. Au. Rev., Ref. (Spectrum Hlth. Sys.), Ser. 2008-A, 5.00%, due 1/15/47 Putable 1/15/12 | | | 1,037 | µß | |
| | 1,000 | | | Michigan St. Hsg. Dev. Au., Ser. 2009-B, 3.10%, due 6/1/11 | | | 1,003 | | |
| | 1,000 | | | Michigan St. Trunk Line Ref. Rev., Ser. 2009, 5.00%, due 11/1/19 | | | 1,083 | Ø | |
| | | | 3,123 | | |
| Mississippi (0.6%) | |
| | 500 | | | Mississippi Dev. Bank Spec. Oblig. (Wilkinson Co. Correctional), Ser. 2008-D, 5.00%, due 8/1/15 | | | 538 | ß | |
| Missouri (1.2%) | | | |
| | 1,040 | | | Missouri St. Dev. Fin. Board Infrastructure Facs. Rev. Ref. Wtr Sys., Ser. 2009-E, 4.00%,
due 11/1/15 | | | 1,086 | | |
| Nebraska (2.0%) | | | |
| | 1,720 | | | Omaha Pub. Fac. Corp. Lease Rev. (Baseball Stadium Proj.), Ser. 2009, 5.00%, due 6/1/22 | | | 1,866 | | |
| Nevada (0.9%) | | | |
| | 750 | | | Las Vegas Redev. Agcy. Tax Increment Rev., Ser. 2009-A, 7.50%, due 6/15/23 | | | 861 | | |
| New Jersey (3.5%) | |
| | 1,000 | | | New Jersey Econ. Dev. Au. St. Lease Rev. (Liberty St. Park Proj.), Ser. 2005-B, (National Public Finance Guarantee Corp. Insured), 5.00%, due 3/1/17 | | | 1,057 | ØØ | |
| | 1,000 | | | New Jersey St. Turnpike Au. Turnpike Rev., Ser. 2009-H, 5.00%, due 1/1/20 | | | 1,068 | Ø | |
| | 1,000 | | | New Jersey Trans. Trust Fund Au. Trans. Sys. Rev., Ser. 2006-A, 5.25%, due 12/15/19 | | | 1,109 | | |
| | | | 3,234 | | |
See Notes to Schedule of Investments
38
| PRINCIPAL AMOUNT | | SECURITY@@ | | VALUE† | |
| (000's omitted) | | | | (000's omitted) | |
| New Mexico (2.3%) | | | |
| $ 1,000 | | | Albuquerque Muni. Sch. Dist. Number 012 (Sch. Bldg.) G.O., Ser. 2008-B, 4.50%, due 8/1/19 | | | $ 1,074 | ØØ | |
| | 1,000 | | | New Mexico Fin. Au. St. Trans. Rev. Sr. Lien, Ser. 2004-A, (National Public Finance Guarantee Corp. Insured), 5.25%, due 6/15/21 | | | 1,081 | ØØ | |
| | | | 2,155 | | |
| New York (17.6%) | | | |
| | 2,000 | | | Erie Co. IDA Sch. Fac. Rev. (City Sch. Dist. Buffalo Proj.), Ser. 2004, (FSA Insured), 5.75%, due 5/1/15 | | | 2,213 | | |
| | 400 | | | Long Island Pwr. Au. Elec. Sys. Rev., Ser. 2006-F, (National Public Finance Guarantee Corp. Insured), 5.00%, due 5/1/19 | | | 424 | | |
| | 925 | | | Nassau Co. Interim Fin. Au. (Sales Tax Secured), Ser. 2009-A, 5.00%, due 11/15/20 | | | 1,044 | ØØ | |
| | 2,000 | | | New York City Muni. Wtr. Fin. Au. Wtr. & Swr. Rev., Ser. 2008-DD, 4.50%, due 6/15/38 | | | 1,934 | | |
| | 1,500 | | | New York St. Dorm. Au. Rev. Non St. Supported Debt (Mtge. United Hlth. Hosp.), Ser. 2009, (FHA Insured), 4.00%, due 8/1/14 | | | 1,578 | ß | |
| | 2,000 | | | New York St. Dorm. Au. Rev., Ser. 2002-B, 5.25%, due 11/15/23 Putable 5/15/12 | | | 2,155 | µ | |
| | 1,500 | | | New York St. Env. Fac. Corp. Spec. Oblig. Rev. Ref. (Riverbank St. Park), Ser. 1996, (AMBAC Insured), 6.25%, due 4/1/12 | | | 1,576 | | |
| | 2,000 | | | New York St. Thruway Au. Gen. Rev. BANS, Ser. 2009, 4.00%, due 7/15/11 | | | 2,098 | | |
| | 250 | | | New York St. Urban Dev. Corp. Ref. Rev. (Correctional Facs.), Ser. 1994-A, (FSA Insured), 5.50%, due 1/1/14 | | | 269 | | |
| | 750 | | | New York St. Urban Dev. Corp. Rev. (St. Personal Income Tax), Ser. 2009-A1, 5.00%, due 12/15/19 | | | 837 | | |
| | 130 | | | New York Tobacco Settlement Fin. Corp. Asset-Backed Rev., Ser. 2003-A1, 5.50%, due 6/1/14 | | | 130 | | |
| | 2,000 | | | Port Au. New York & New Jersey (One Hundered Fifty-Third), Ser. 2008, 4.50%, due 7/15/27 | | | 2,038 | | |
| | | | 16,296 | | |
| North Carolina (1.2%) | |
| | 650 | | | North Carolina St. Cap. Imp. Ltd. Oblig. (Annual Appropriation), Ser. 2009-A, 5.00%, due 5/1/19 | | | 743 | | |
| | 295 | | | Western Carolina Univ. Research & Dev. Corp. Cert. of Participation (Western Carolina Univ. Std. Hsg.), Ser. 2008, (Assured Guaranty Insured), 5.25%, due 6/1/20 | | | 330 | ß | |
| | | | 1,073 | | |
| North Dakota (1.1%) | |
| | 1,000 | | | North Dakota St. HFA Hsg. (Home Mtge. Fin. Prog.), Ser. 2009-A, 3.25%, due 7/1/15 | | | 996 | | |
| Ohio (1.2%) | | | |
| | 1,040 | | | North Olmsted G.O., Ser. 1996, (AMBAC Insured), 6.20%, due 12/1/11 | | | 1,078 | | |
| Oregon (1.2%) | | | |
| | 1,000 | | | Oregon St. Bond Bank Rev. Econ. & Comm. Dev. Dept., Ser. 2009-A, 5.00%, due 1/1/22 | | | 1,085 | | |
| Pennsylvania (1.6%) | |
| | 1,000 | | | Souderton Area Sch. Dist. G.O., Ser. 2009, 5.00%, due 11/1/22 | | | 1,095 | | |
| | 340 | | | State Pub. Sch. Bldg. Au. College Rev. (Montgomery Co. Comm. College), Ser. 2008, (FSA Insured),
5.00%, due 5/1/21 | | | 376 | ß | |
| | | | 1,471 | | |
| Puerto Rico (1.1%) | |
| | 1,000 | | | Puerto Rico Sales Tax Fin. Corp. Sales Tax Rev., Ser. 2009-A, 5.00%, due 8/1/39 Putable 8/1/11 | | | 1,036 | µ | |
See Notes to Schedule of Investments
39
| PRINCIPAL AMOUNT | | SECURITY@@ | | VALUE† | |
| (000's omitted) | | | | (000's omitted) | |
| South Carolina (1.8%) | |
| $ 2,000 | | | Piedmont Muni. Pwr. Agcy. Elec. Rev. (Cap. Appreciation), Ser. 1988-A, (AMBAC Insured), due 1/1/13 | | | $ 1,623 | | |
| Texas (19.7%) | | | |
| | 2,150 | | | Austin Wtr. & Wastewater Sys. Rev. Ref., Ser. 2002-A, (AMBAC Insured), 5.50%, due 11/15/15 | | | 2,484 | | |
| | 1,000 | | | Brazosport Independent Sch. Dist. Ref. G.O., Ser. 2005, (PSF Insured), 5.00%, due 2/15/15 | | | 1,104 | | |
| | 1,000 | | | Dallas Fort Worth Int'l Arpt. Rev. Ref., Ser. 2009-A, 5.00%, due 11/1/13 | | | 1,104 | | |
| | 500 | | | Dallas Fort Worth Int'l Arpt. Rev. Ref., Ser. 2009-A, 5.00%, due 11/1/24 | | | 519 | | |
| | 750 | | | Fort Bend Independent Sch. Dist. Ref. G.O. (Sch. Bldg.), Ser. 2008, (PSF Insured), 5.00%, due 8/15/21 | | | 834 | | |
| | 1,000 | | | Grapevine Combination Tax & Tax Increment Reinvestment Zone Rev. Cert. of Oblig. G.O., Ser. 2000, (FGIC Insured), 5.63%, due 8/15/15 | | | 1,025 | | |
| | 1,500 | | | Gulf Coast Waste Disposal Au. Env. Fac. Rev. (BP Prod. North America, Inc.), Ser. 2007, 2.30%, due 1/1/42 Putable 9/3/13 | | | 1,503 | µß | |
| | 1,000 | | | Harris Co. Cultural Ed. Fac. Fin. Corp. Ref. Rev. (Methodist Hosp. Sys.), Ser. 2009-B1, 5.00%, due 12/1/28 Putable 6/1/12 | | | 1,074 | µß | |
| | 825 | | | Houston Ref. G.O. (Pub. Imp.), Ser. 2009-A, 4.00%, due 3/1/16 | | | 875 | | |
| | 1,000 | | | Houston Wtr. & Swr. Sys. Jr. Lien Ref. Rev., Ser. 2001-B, (National Public Finance Guarantee Corp. Insured), 5.50%, due 12/1/24 | | | 1,214 | | |
| | 2,500 | | | Keller Independent Sch. Dist. G.O. (Sch. Bldg), Ser. 2007, (PSF Insured), 4.75%, due 8/15/32 | | | 2,534 | | |
| | 450 | | | Mesquite Independent Sch. Dist. G.O. (Sch. Bldg.), Ser. 2009, 5.00%, due 8/15/17 | | | 507 | | |
| | 590 | | | Mesquite Independent Sch. Dist. G.O. (Sch. Bldg.), Ser. 2009, 5.00%, due 8/15/18 | | | 665 | | |
| | 1,000 | | | San Antonio Elec. & Gas Sys. Rev. Ref., Ser. 2002, (FSA Insured), 5.38%, due 2/1/14 | | | 1,140 | | |
| | 500 | | | Texas Muni. Pwr. Agcy. Sub. Lien Rev., Ser. 2004-A, (AMBAC Insured), 4.00%, due 9/1/13 | | | 500 | | |
| | 1,000 | | | Weatherford Independent Sch. Dist. G.O. (Sch. Bldg.), Ser. 2002-A, (PSF Insured), 5.00%, due 2/1/12 | | | 1,086 | | |
| | | | 18,168 | | |
| Virginia (1.6%) | | | |
| | 1,430 | | | Prince William Co. Cert. of Participation, Ser. 2005, (AMBAC Insured), 5.00%, due 6/1/18 | | | 1,526 | | |
| Washington (2.5%) | |
| | 2,000 | | | Port Tacoma Rev., Ser. 2004-A, (AMBAC Insured), 5.25%, due 12/1/29 Pre-Refunded 12/1/14 | | | 2,323 | | |
| Wisconsin (1.7%) | |
| | 500 | | | Wisconsin St. G.O., Ser. 2002-C, (National Public Finance Guarantee Corp. Insured), 5.25%, due 5/1/14 Pre-Refunded 5/1/12 | | | 551 | | |
| | 1,000 | | | Wisconsin St. Hlth. & Ed. Fac. Au. Rev. (Marquette Univ.), Ser. 1998, (National Public Finance Guarantee Corp. Insured), 5.25%, due 6/1/13 | | | 1,012 | ß | |
| | | | 1,563 | | |
| | | | | Total Investments (99.0%) (Cost $90,875) | | | 91,419 | ## | |
| | | | | Cash, receivables and other assets, less liabilities (1.0%) | | | 914 | | |
| | | | | Total Net Assets (100.0%) | | $ | 92,333 | | |
See Notes to Schedule of Investments
40
Schedule of Investments Neuberger Berman Municipal Money Fund
| PRINCIPAL AMOUNT | | SECURITY@@ | | VALUE†† | |
| (000's omitted) | | | | (000's omitted) | |
| Municipal Notes (99.6%) | |
| Arizona (0.1%) | | | |
| $ 370 | | | Maricopa Co. Ind. Dev. Au. Multi-Family Hsg. Rev. (Gran Victoria Hsg. LLC Proj.), Ser. 2000-A, (LOC: Fannie Mae), 0.24%, due 11/5/09 | | | $ 370 | µß | |
| Arkansas (0.6%) | |
| | 2,000 | | | Arkansas St. Dev. Fin. Au. Hosp. Rev. (Washington Reg. Med. Ctr.), Ser. 2000, 7.38%, due 2/1/29 Pre-Refunded 2/1/10 | | | 2,031 | ß | |
| California (9.1%) | |
| | 13,000 | | | California HFA Rev. Home Mtge., Ser. 2005-D, 1.15%, due 11/4/09 | | | 13,000 | µ | |
| | 3,500 | | | California St. G.O. (Muni. Sec. Trust Receipts), Ser. 2001-SGA136, (XLCA Insured), 0.20%, due 11/2/09 | | | 3,500 | µcc | |
| | 700 | | | Contra Costa Wtr. Dist. Wtr. Rev. (Floaters), Ser. 2002-750, (FSA Insured), 0.23%, due 11/5/09 | | | 700 | µy | |
| | 1,300 | | | Riverside Co. Hsg. Au. Multi-Family Hsg. Mtge. Ref. Rev. (Mountain View Apts.), Ser. 1995-A, (LOC: Redlands Federal Savings & Loan Assoc.), 0.20%, due 11/4/09 | | | 1,300 | µpp | |
| | 4,800 | | | Sacramento Co. Sanitation Dist. Fin. Au. Rev. Muni. Sec. Trust Receipts, Ser. 2008-48A, (FGIC Insured), 0.23%, due 11/5/09 | | | 4,800 | µcc | |
| | 2,500 | | | Sacramento Co. Sanitation Dist. Fin. Au. Rev. Muni. Sec. Trust Receipts, Ser. 2008-49A, (FGIC Insured), 0.23%, due 11/5/09 | | | 2,500 | ñµcc | |
| | 930 | | | Santa Clara Co. Fin. Au. Lease Rev. (Hsg. Au. Office Proj.), Ser. 2004-A, (LOC: U.S. Bank), 0.18%, due 11/5/09 | | | 930 | µ | |
| | 2,100 | | | Union City Multi-Family Rev. (Floater), Ser. 2007-122G, (LOC: Goldman Sachs), 0.18%, due 11/5/09 | | | 2,100 | µ | |
| | | | 28,830 | | |
| Colorado (2.1%) | |
| | 4,905 | | | Denver Urban Renewal Au. Tax Increment Rev. (Stapleton Sr.), Ser. 2008-A2, (LOC: U.S. Bank), 0.23%, due 11/5/09 | | | 4,905 | µ | |
| | 1,890 | | | El Paso Co. Sch. Dist. Number 20 (Merlots), Ser. 2008-K06, (FSA Insured), 0.20%, due 11/4/09 | | | 1,890 | µmm | |
| | | | 6,795 | | |
| Delaware (0.1%) | |
| | 450 | | | Delaware St. Econ. Dev. Au. Multi-Family Rev. (Sch. House Proj.), Ser. 1985, (LOC: HSBC Bank N.A.), 0.40%, due 11/4/09 | | | 450 | µ | |
| Florida (4.4%) | | | |
| | 2,920 | | | Alachua Co. Hlth. Fac. Au. Continuing Care Rev. (Oak Hammock Univ. Proj.), Ser. 2002-A, (LOC: Bank of Scotland), 0.28%, due 11/2/09 | | | 2,920 | µß | |
| | 10,000 | | | Highlands Co. Hlth. Fac. Au. Rev. (Adventist Hlth. Sys./Sunbelt, Inc.), Ser. 2009-D, (LOC: SunTrust Bank), 0.21%, due 11/5/09 | | | 10,000 | µßpp | |
| | 300 | | | Jacksonville IDR (Univ. Hlth. Science Ctr.), Ser. 1989, (LOC: Bank of America), 0.30%, due 11/5/09 | | | 300 | µ | |
| | 660 | | | Orange Co. Hsg. Fin. Au. Multi-Family Hsg. Rev., Ser. 2000-E, (LOC: Bank of America), 0.37%, due 11/4/09 | | | 660 | µß | |
| | | | 13,880 | | |
| Georgia (1.2%) | | | |
| | 3,705 | | | BB&T Muni. Trust Var. Sts. (Floaters), Ser. 2009-1037, (LOC: Branch Banking & Trust Co.), 0.36%, due 11/5/09 | | | 3,705 | ñµ | |
See Notes to Schedule of Investments
41
| PRINCIPAL AMOUNT | | SECURITY@@ | | VALUE†† | |
| (000's omitted) | | | | (000's omitted) | |
| Illinois (15.6%) | | | |
| $ 7,817 | | | BB&T Muni. Trust Var. Sts. (Floaters), Ser. 2008-5001, (LOC: Rabobank Int'l), 0.42%, due 11/5/09 | | | $ 7,817 | ñµ | |
| | 6,248 | | | Cook Co. G.O. (Floater Cert.), Ser. 2001-458, (FGIC Insured), 0.23%, due 11/5/09 | | | 6,248 | µy | |
| | 11,700 | | | Deutsche Bank Spears/Lifers Trust Var. Sts. (Chicago Illinois Board), Ser. 2007-315, (FGIC Insured), 0.20%, due 11/5/09 | | | 11,700 | µq | |
| | 2,835 | | | Elgin IDR (Nelson Graphic, Inc. Proj.), Ser. 2006, (LOC: LaSalle National Bank), 0.40%, due 11/5/09 | | | 2,835 | µß | |
| | 1,815 | | | Illinois Dev. Fin. Au. Ltd. Rev. (Decatur Mental Hlth. Ctr. Proj.), Ser. 1997, (LOC: National City Bank), 0.35%, due 11/5/09 | | | 1,815 | µß | |
| | 600 | | | Illinois Dev. Fin. Au. Rev. (American Academy of Dermatology), Ser. 2001, (LOC: Bank One), 0.30%, due 11/5/09 | | | 600 | µß | |
| | 4,000 | | | Illinois Fin. Au. Ref. Rev. (Andre's Imaging & Graphics, Inc.), Ser. 2007, (LOC: U.S. Bank), 0.40%, due 11/5/09 | | | 4,000 | µß | |
| | 6,745 | | | JP Morgan Chase Trust Var. Sts. G.O. (Putters), Ser. 2008-3258, (FGIC Insured), 0.51%, due 11/5/09 | | | 6,745 | ñµs | |
| | 7,495 | | | Univ. of Illinois Board of Trustees Cert. of Participation, Ser. 2008-11480, (FSA Insured), 0.24%, due 11/5/09 | | | 7,495 | µk | |
| | | | 49,255 | | |
| Indiana (2.9%) | | | |
| | 980 | | | Indiana Fin. Au. Hosp. Rev. (Floyd Mem. Hosp. & Hlth. Svcs.), Ser. 2008, (LOC: Branch Banking & Trust Co.), 0.20%, due 11/2/09 | | | 980 | µß | |
| | 1,985 | | | Indiana Hlth. Fac. Fin. Au. Rev. (Fayette Mem. Hosp. Assoc.), Ser. 2002-A, (LOC: U.S. Bank ), 0.20%, due 11/2/09 | | | 1,985 | µß | |
| | 4,775 | | | Indiana St. Fin. Au. Rev. Ed. Fac. (Lutheran Child & Family Svcs.), Ser. 2006, (LOC: National City Bank), 0.25%, due 11/5/09 | | | 4,775 | µß | |
| | 1,470 | | | Indianapolis Econ. Dev. Rev. (Electrical Joint Apprenticeship Proj.), Ser. 2001, (LOC: National City Bank), 0.40%, due 11/5/09 | | | 1,470 | µß | |
| | | | 9,210 | | |
| Iowa (1.4%) | | | |
| | 3,000 | | | Iowa Higher Ed. Loan Au. Rev. (Private College St. Ambrose), Ser. 2003, (LOC: Northern Trust Co.), 0.20%, due 11/2/09 | | | 3,000 | µß | |
| | 1,500 | | | Iowa Higher Ed. Loan Au. Rev. RANS (Private Ed.), Ser. 2009-E, (LOC: Wells Fargo Bank), 2.15%, due 5/20/10 | | | 1,508 | ß | |
| | | | 4,508 | | |
| Maine (1.3%) | | | |
| | 4,000 | | | Maine St. Hsg. Au. Mtge. Purp. Rev., Ser. 2006-B, (LOC: State Street Bank & Trust Co.), 0.31%, due 11/5/09 | | | 4,000 | µ | |
| Massachusetts (5.7%) | | | |
| | 6,400 | | | Macon Trust Var. Sts. Cert., Ser. 2007-343, (LOC: Bank of America), 0.76%, due 11/5/09 | | | 6,400 | µ | |
| | 5,933 | | | Macon Trust Var. Sts. Cert., Ser. 2007-344, (LOC: Bank of America), 0.76%, due 11/5/09 | | | 5,933 | µ | |
| | 5,560 | | | Massachusetts St. Dev. Fin. Agcy. Rev. (Assumption College), Ser. 2002-A, (LOC: Sovereign Bank), 0.25%, due 11/4/09 | | | 5,560 | µßii | |
| | | | 17,893 | | |
| Michigan (3.7%) | | | |
| | 1,865 | | | Mancelona Area Wtr. Swr. Au. Wtr. Supply Sys. Rev., Ser. 2002, (LOC: National City Bank), 0.40%, due 11/5/09 | | | 1,865 | µ | |
| | 6,285 | | | Michigan St. G.O. (Putters), Ser. 1999-125, (FGIC Insured), 0.36%, due 11/5/09 | | | 6,285 | µs | |
| | 3,500 | | | Michigan St. Strategic Fund Ltd. Oblig. Rev. (Kalamazoo Christian Sch. Proj.), Ser. 2003, (LOC: National City Bank), 0.25%, due 11/5/09 | | | 3,500 | µß | |
| | | | 11,650 | | |
See Notes to Schedule of Investments
42
| PRINCIPAL AMOUNT | | SECURITY@@ | | VALUE†† | |
| (000's omitted) | | | | (000's omitted) | |
| Minnesota (0.8%) | |
| $ 1,100 | | | Mankato Multi-Family Hsg. Rev. (Highland Hills of Mankato L.P.), Ser. 1997, (LOC: LaSalle Bank), 0.20%, due 11/2/09 | | | $ 1,100 | µß | |
| | 1,400 | | | Plymouth Multi-Family Hsg. Ref. Rev. (At the Lake Apts. Proj.), Ser. 2004, (LOC: Freddie Mac), 0.39%, due 11/5/09 | | | 1,400 | µß | |
| | | | 2,500 | | |
| Missouri (2.3%) | |
| | 4,900 | | | Kansas City Ind. Dev. Au. IDR (Century Avenue Assoc.), Ser. 1988, (LOC: Bank of America), 1.15%, due 11/2/09 | | | 4,900 | µß | |
| | 300 | | | Missouri Dev. Fin. Board Cultural Fac. Rev. (Nelson Gallery Foundation), Ser. 2004-A, (LOC: JP Morgan Chase), 0.20%, due 11/2/09 | | | 300 | µß | |
| | 800 | | | Missouri St. Dev. Fin. Board Infrastructure Fac. Rev. (St. Louis Convention Ctr.), Ser. 2000-C, (LOC: U.S. Bank), 0.20%, due 11/2/09 | | | 800 | µ | |
| | 1,320 | | | Missouri St. Hlth. & Ed. Fac. Au. Ed. Fac. Rev. (Drury College), Ser. 1999, (LOC: Bank of America), 0.20%, due 11/2/09 | | | 1,320 | µß | |
| | | | 7,320 | | |
| Nevada (1.4%) | | | |
| | 4,500 | | | Nevada Hsg. Div. Single Family Mtge. Rev. Gtd. Mtge.-Backed Sec. Prog., Ser. 2006-A, (LOC: Government National Mortgage Association), 0.45%, due 11/5/09 | | | 4,500 | µs | |
| New Hampshire (0.6%) | |
| | 2,000 | | | Merrimack Co. G.O. TANS, Ser. 2009, 3.25%, due 12/30/09 | | | 2,001 | | |
| New Jersey (2.9%) | |
| | 9,095 | | | Dexia Credit Local Cert. Trust Var. Sts., Ser. 2008-063, (FSA Insured), 0.51%, due 11/5/09 | | | 9,095 | ñµp | |
| | 100 | | | New Jersey Hlth. Care Fac. Fin. Au. Rev. (Underwood Mem. Hosp.), Ser. 2008, (LOC: UBS Financial Svcs. Inc.), 0.24%, due 11/4/09 | | | 100 | µß | |
| | | | 9,195 | | |
| New Mexico (0.2%) | |
| | 600 | | | Bernalillo Co. Gross Receipts Tax Rev., Ser. 2004-B, (National Public Finance Guarantee Corp. Insured), 0.36%, due 11/5/09 | | | 600 | µc | |
| New York (12.7%) | |
| | 2,000 | | | Albany IDA Civic Fac. Rev. (The College of St. Rose), Ser. 2007-A, (National Public Finance Guarantee Corp. Insured), 0.18%, due 11/2/09 | | | 2,000 | µßc | |
| | 3,000 | | | Eclipse Funding Trust (Solar Eclipse-New York St. Dorm. Au.), Ser. 2006-0148, (LOC: U.S. Bank), 0.20%, due 11/5/09 | | | 3,000 | µ | |
| | 1,050 | | | Forest City New Rochelle Rev. Cert. Trust (Beneficial Owner), Ser. 2003, (LOC: Wachovia Bank), 0.56%, due 11/5/09 | | | 1,050 | µß | |
| | 2,995 | | | Liberty Dev. Corp. Rev. (Floater), Ser. 2006-41TP, (LOC: Wells Fargo & Co.), 0.24%, due 11/5/09 | | | 2,995 | µ | |
| | 5,025 | | | Monroe Co. IDA Rev. (Rochester Institute Proj.), Ser. 1999-A, (LOC: First Union National Bank), 0.18%, due 11/4/09 | | | 5,025 | µß | |
| | 3,000 | | | Nassau Co. IDA Rev. (Floater), Ser. 2007-75G, (LOC: Goldman Sachs), 0.22%, due 11/5/09 | | | 3,000 | µ | |
| | 3,800 | | | New York City Transitional Fin. Au. Rev., Ser. 1998-C, (LOC: Bayerische Landesbank), 0.24%, due 11/2/09 | | | 3,800 | µ | |
| | 6,200 | | | New York City Transitional Fin. Au. Rev. (Future Tax Secured), Ser. 2001-B, (LOC: Landesbank Baden-Wurttemberg), 0.20%, due 11/2/09 | | | 6,200 | µ | |
| | 500 | | | New York City Transitional Fin. Au. Rev. (NYC Recovery Bonds), Ser. 2002-3F, (LOC: Royal Bank of Canada), 0.20%, due 11/2/09 | | | 500 | µ | |
See Notes to Schedule of Investments
43
| PRINCIPAL AMOUNT | | SECURITY@@ | | VALUE†† | |
| (000's omitted) | | | | | |
| $ 3,500 | | | New York St. Dorm. Au. Rev. Secondary Issues, Ser. 2008, (SONYMA Insured), 0.20%, due 11/5/09 | | | $ 3,500 | ñµk | |
| | 9,000 | | | Port Au. New York & New Jersey (Floater), Ser. 2007-111TP, (CIFG Insured), 0.27%, due 11/5/09 | | | 9,000 | µjj | |
| | | | 40,070 | | |
| North Carolina (3.6%) | |
| | 3,740 | | | BB&T Muni. Trust Var. Sts. (Floaters), Ser. 2008-1021, (LOC: Branch Banking & Trust Co.), 0.33%, due 11/5/09 | | | 3,740 | µ | |
| | 7,785 | | | BB&T Muni. Trust Var. Sts. (Floaters), Ser. 2008-1027, (LOC: Branch Banking & Trust Co.), 0.33%, due 11/5/09 | | | 7,785 | µ | |
| | | | 11,525 | | |
| Ohio (5.2%) | | | |
| | 1,485 | | | Franklin Co. Hlth. Care Fac. Rev., Ser.1999, (LOC: National City Bank), 0.35%, due 11/5/09 | | | 1,485 | µß | |
| | 3,175 | | | Franklin Co. Multi-Family Hsg. Rev. (Comm. Hsg. Network), Ser.1997, (LOC: National City Bank), 0.25%, due 11/5/09 | | | 3,175 | µß | |
| | 3,315 | | | Hamilton Co. Econ. Dev. Rev. (Cincinnati Symphony Orchestra), Ser. 2007, (LOC: National City Bank), 0.25%, due 11/5/09 | | | 3,315 | µß | |
| | 3,000 | | | Ohio St. Air Quality Dev. Au. Rev. (Ohio Valley Elec. Corp.), Ser. 2009-A, (LOC: Bank of Nova Scotia), 0.20%, due 11/5/09 | | | 3,000 | µß | |
| | 2,000 | | | Ohio St. G.O. (Infrastructure Imp.), Ser. 2003-B, 0.24%, due 11/4/09 | | | 2,000 | µ | |
| | 3,325 | | | Summit Co. Port Au. Port Fac. Rev. (Barberton YMCA Proj.), Ser. 2007, (LOC: National City Bank), 0.25%, due 11/4/09 | | | 3,325 | µß | |
| | | | 16,300 | | |
| Pennsylvania (3.5%) | |
| | 3,000 | | | Philadelphia Sch. Dist. G.O. Ref., Ser. 2009-C (LOC: TD Bank N.A.), 0.20%, due 11/5/09 | | | 3,000 | µ | |
| | 8,000 | | | RBC Muni. Prods., Inc. Trust Var. Sts. (Floaters) (Berks Co. Muni. Au.), Ser. 2008-C13, (LOC: Royal Bank of Canada), 0.28%, due 11/5/09 | | | 8,000 | ñµ | |
| | | | 11,000 | | |
| Puerto Rico (3.8%) | |
| | 2,020 | | | Puerto Rico Commonwealth Hwy. & Trans. Au. Hwy. Rev. (Floaters), Ser. 2008-008, (FSA Insured), 0.51%, due 11/5/09 | | | 2,020 | µp | |
| | 10,000 | | | Puerto Rico Sales Tax Fin. Corp. Sales Tax Rev., Ser. 2009, (LOC: Citibank, N.A.), 0.21%, due 11/5/09 | | | 10,000 | ñµ | |
| | | | 12,020 | | |
| Tennessee (2.7%) | | | |
| | 4,935 | | | Blount Co. Pub. Bldg. Au. (Local Gov't Pub. Imp.), Ser. 2008-E5A, (LOC: Branch Banking & Trust Co.), 0.26%, due 11/4/09 | | | 4,935 | µ | |
| | 300 | | | Franklin Co. Hlth. & Ed. Fac. Board Rev. (Univ. of the South Proj.), Ser. 1990, 0.50%, due 11/1/09 | | | 300 | µß | |
| | 600 | | | Sevier Co. Pub. Bldg. Au. (Local Gov't Pub. Imp.), Ser. 2008-A1, (LOC: KBC Bank), 0.21%, due 11/2/09 | | | 600 | µ | |
| | 2,660 | | | Shelby Co. Hlth. Ed. & Hsg. Fac. Board Multi-Family Hsg. Rev. (Flag Manor), Ser. 1995, (LOC: U.S. Bank), 0.34%, due 11/5/09 | | | 2,660 | µ | |
| | | | 8,495 | | |
| Texas (5.3%) | | | |
| | 1,450 | | | Deutsche Bank Spears/Lifers Trust Var. Sts., Ser. 2007-292, (LOC: Deutsche Bank), 0.20%, due 11/5/09 | | | 1,450 | µ | |
See Notes to Schedule of Investments
44
| PRINCIPAL AMOUNT | | SECURITY@@ | | VALUE†† | |
| (000's omitted) | | | | (000's omitted) | |
| $ 4,390 | | | Houston Wtr. & Swr. Sys. Rev., Ser. 2008-055, (FSA Insured), 0.51%, due 12/1/32 Putable 11/6/2009 | | | $ 4,390 | µp | |
| | 1,100 | | | Keller Independent Sch. Dist. G.O. (Muni. Sec. Trust Receipts), Ser. 2000-SGA111, (PSF Insured), 0.20%, due 11/2/09 | | | 1,100 | µcc | |
| | 9,875 | | | Tarrant Co. Cultural Ed. Fac. Fin. Corp. Rev. (Floaters), Ser. 2007-1760, (LOC: Morgan Stanley), 0.23%, due 11/5/09 | | | 9,875 | µ | |
| | | | 16,815 | | |
| Utah (1.9%) | | | |
| | 5,865 | | | Utah Trans. Au. Sales Tax Rev. (Putters), Ser. 2008-2943, (MBIA Insured), 0.31%, due 11/5/09 | | | 5,865 | µs | |
| Vermont (0.7%) | | | |
| | 2,350 | | | Winooski Spec. Oblig. Ref., Ser. 2006-A, (LOC: TD Bank N.A.), 0.21%, due 11/2/09 | | | 2,350 | µ | |
| Washington (1.0%) | |
| | 3,000 | | | Everett Pub. Fac. Dist. Proj. Rev., Ser. 2007, (LOC: Dexia Credit Locale de France), 0.65%, due 11/2/09 | | | 3,000 | µ | |
| | 200 | | | Washington St. Hsg. Fin. Commission Non-Profit Rev. (Tacoma Art Museum Proj.), Ser. 2002, (LOC: Northern Trust Co.), 0.20%, due 11/2/09 | | | 200 | µß | |
| | | | 3,200 | | |
| West Virginia (0.6%) | |
| | 1,755 | | | Cabell Co. Bldg. Commission Rev. (Pressley Ridge Sch. Proj.), Ser. 2002, (LOC: National City Bank), 0.40%, due 11/5/09 | | | 1,755 | µß | |
| Wisconsin (2.2%) | |
| | 5,800 | | | Wisconsin Hsg. & Econ. Dev. Au. Home Ownership Rev., Ser. 2004-A, (LOC: Westdeutsche Landesbank Girozentrale), 0.60%, due 11/4/09 | | | 5,800 | µ | |
| | 1,098 | | | Wisconsin St. Hlth. & Ed. Fac. Au. Rev. (Floater), Ser. 2007-2187, (LOC: Morgan Stanley), 0.33%, due 11/5/09 | | | 1,098 | µ | |
| | 100 | | | Wisconsin St. Hlth. & Ed. Fac. Au. Rev. (Goodwill Ind. North Central Wisconsin, Inc.), Ser. 2005, (LOC: Wells Fargo Bank), 0.22%, due 11/5/09 | | | 100 | µß | |
| | | | 6,998 | | |
| | | | | Total Investments (99.6%) | | | 315,086 | | |
| | | | | Cash, receivables and other assets, less liabilities (0.4%) | | | 1,377 | | |
| | | | | Total Net Assets (100.0%) | | $ | 316,463 | | |
See Notes to Schedule of Investments
45
Schedule of Investments Neuberger Berman New York Municipal
Money Fund
| PRINCIPAL AMOUNT | | SECURITY@@ | | VALUE†† | |
| (000's omitted) | | | | (000's omitted) | |
| New York (88.1%) | |
| $ | 980 | | | Albany IDA Civic Fac. Rev. (Albany Med. Ctr. Hosp. Proj.), Ser. 2007-A, (LOC: Bank of America), 0.23%, due 11/5/09 | | $ | 980 | µß | |
| | 5,540 | | | Albany IDA Civic Fac. Rev. (Research Foundation of the St. Univ. of New York Proj.), Ser. 2002-A, 0.46%, due 11/5/09 | | | 5,540 | µß | |
| | 6,450 | | | Austin Trust Var. Sts., Ser. 2008-3508, (FSA Insured), 0.31%, due 11/5/09 | | | 6,450 | µc | |
| | 5,000 | | | Eclipse Funding Trust (Solar Eclipse-New York St. Dorm. Au.), Ser. 2006-0148, (LOC: U.S. Bank), 0.20%, due 11/5/09 | | | 5,000 | µ | |
| | 5,000 | | | Erie Co. Fiscal Stability Au. BANS, Ser. 2009-A, 2.00%, due 5/19/10 | | | 5,029 | | |
| | 15,180 | | | Forest City New Rochelle Rev. Cert. Trust (Beneficial Owner), Ser. 2003, (LOC: Wachovia Bank), 0.56%, due 11/5/09 | | | 15,180 | µß | |
| | 9,795 | | | Hempstead Town IDA Civic Fac. Rev. (Hebrew Academy), Ser. 2006, (LOC: Sovereign Bank), 0.19%, due 11/5/09 | | | 9,795 | µßii | |
| | 4,400 | | | JP Morgan Chase Trust Var. Sts. (Putters), Ser. 2008-3195Z, (LOC: JP Morgan Chase), 0.20%, due 11/2/09 | | | 4,400 | ñµ | |
| | 2,000 | | | JP Morgan Chase Trust Var. Sts. (Putters), Ser. 2009-3561, (LOC: JP Morgan Chase), 0.20%, due 11/5/09 | | | 2,000 | ñµ | |
| | 3,085 | | | Liberty Dev. Corp. Rev. (Floater), Ser. 2006-41TP, (LOC: Wells Fargo Bank), 0.24%, due 11/5/09 | | | 3,085 | µ | |
| | 8,100 | | | Long Island Pwr. Au. Elec. Sys. Rev., Ser. 1998-2A, (LOC: Westdeutsche Landesbank Girozentrale), 0.24%, due 11/4/09 | | | 8,100 | µ | |
| | 450 | | | Metro. Trans. Au. Dedicated Tax Fund, Ser. 2002-B, (FSA Insured), 0.30%, due 11/5/09 | | | 450 | µp | |
| | 6,000 | | | Metro. Trans. Au. Rev., Ser. 2005-E2, (LOC: Fortis Bank), 0.18%, due 11/5/09 | | | 6,000 | µ | |
| | 2,365 | | | Nassau Co. IDA Civic Fac. Rev. (North Shore Hebrew Academy Proj.), Ser. 2005, (LOC: Sovereign Bank), 0.31%, due 11/5/09 | | | 2,365 | µßii | |
| | 15,000 | | | Nassau Co. IDA Rev. (Floater), Ser. 2007-75G, (LOC: Goldman Sachs), 0.22%, due 11/5/09 | | | 15,000 | µ | |
| | 600 | | | New York City Hsg. Dev. Corp. Multi-Family Mtge. Rev. (The Crest), Ser. 2005-A, (LOC: Landesbank Hessen-Thueringen Girozentrale), 0.22%, due 11/4/09 | | | 600 | µß | |
| | 1,100 | | | New York City Hsg. Dev. Corp. Rev. (Floaters), Ser. 2008-2899, (LOC: Morgan Stanley), 0.21%, due 11/5/09 | | | 1,100 | µ | |
| | 345 | | | New York City IDA Civic Fac. Rev. (Brooklyn United Methodist Proj.), Ser. 2000, (LOC: TD Bank N.A.), 0.21%, due 11/5/09 | | | 345 | µß | |
| | 3,300 | | | New York City IDA Civic Fac. Rev. (Lycee Francais de New York Proj.), Ser. 2002-B, (LOC: TD Bank N.A.), 0.18%, due 11/5/09 | | | 3,300 | µß | |
| | 100 | | | New York City IDA Civic Fac. Rev. (United Jewish Appeal Federation), Ser. 2004-B, 0.20%, due 11/4/09 | | | 100 | µß | |
| | 12,000 | | | New York City Muni. Fin. Au. Wtr. & Swr. Sys. Rev. (Second Gen. Fiscal 2008), Ser. 2007-BB4, (LOC: Fortis Bank), 0.20%, due 11/5/09 | | | 12,000 | µ | |
| | 3,000 | | | New York City Muni. Wtr. Fin. Au. Wtr. & Swr. Sys. Rev. (Second Gen. Resolution Rev. Bonds), Ser. 2006-CC2, (LOC: Bank of Nova Scotia), 0.20%, due 11/2/09 | | | 3,000 | µ | |
| | 100 | | | New York City Transitional Fin. Au. Rev. (Future Tax Secured), Ser. 1998-A2, (LOC: Bank of Nova Scotia), 0.20%, due 11/4/09 | | | 100 | µ | |
| | 2,350 | | | New York City Trust for Cultural Res. Ref. Rev. (American Museum of Natural History), Ser. 2008-A2, (LOC: Bank of America), 0.18%, due 11/2/09 | | | 2,350 | µß | |
| | 200 | | | New York City Trust for Cultural Res. Rev. (Alvin Ailey Dance Foundation), Ser. 2003, (LOC: Citibank, N.A.), 0.22%, due 11/4/09 | | | 200 | µß | |
| | 12,000 | | | New York Convention Ctr. Dev. Corp. Rev. (Floaters), Ser. 2008-2364, (BHAC/AMBAC Insured), 0.19%, due 11/5/09 | | | 12,000 | µy | |
| | 1,050 | | | New York G.O., Ser. 1993-A4, (LOC: Landesbank Baden-Wurttemberg), 0.21%, due 11/2/09 | | | 1,050 | µ | |
| | 500 | | | New York G.O., Ser. 1995-F3, (LOC: Morgan Guaranty Trust), 0.22%, due 11/4/09 | | | 500 | µ | |
| | 200 | | | New York G.O., Ser. 2003-A2, (LOC: Bank of America), 0.23%, due 11/4/09 | | | 200 | µ | |
| | 1,700 | | | New York St. Dorm. Au. Rev. (Oxford Univ. Press, Inc.), Ser. 1996,
(LOC: Landesbank Hessen-Thueringen Girozentrale), 0.20%, due 11/4/09 | | | 1,700 | µß | |
| | 4,940 | | | New York St. Dorm. Au. Rev. Non St. Supported Debt (Catholic Hlth. Sys.), Ser. 2008, (LOC: HSBC Bank N.A.), 0.20%, due 11/5/09 | | | 4,940 | µß | |
| | 1,200 | | | New York St. Dorm. Au. Rev. Non St. Supported Debt (Cornell Univ.), Ser. 2008-C, (LOC: Bank of America), 0.20%, due 11/2/09 | | | 1,200 | µß | |
| | 1,925 | | | New York St. Dorm. Au. Rev. Non St. Supported Debt (Culinary Institute of America), Ser. 2006, (LOC: TD Bank N.A.), 0.20%, due 11/5/09 | | | 1,925 | µß | |
| | 3,230 | | | New York St. Dorm. Au. Rev. Non St. Supported Debt (Long Island Univ.), Ser. 2006-A2, (LOC: Citizens Bank), 0.20%, due 11/5/09 | | | 3,230 | µpp | |
| | 3,765 | | | New York St. Dorm. Au. Rev. Non St. Supported Debt (Long Island Univ.), Ser. 2006-A2, (LOC: Citizens Bank), 0.20%, due 11/5/09 | | | 3,765 | µpp | |
| | 4,500 | | | New York St. Dorm. Au. Rev. Non St. Supported Debt (New York Law Sch.), Ser. 2009, (LOC: TD Bank N.A.), 0.18%, due 11/5/09 | | | 4,500 | µß | |
See Notes to Schedule of Investments
46
| PRINCIPAL AMOUNT | | SECURITY@@ | | VALUE†† | |
| (000's omitted) | | | | (000's omitted) | |
| $ | 6,720 | | | New York St. Dorm. Au. Rev. Non St. Supported Debt (Samaritan Med. Ctr.), Ser. 2009-B, (LOC: HSBC Bank N.A.), 0.25%, due 11/5/09 | | $ | 6,720 | µß | |
| | 4,000 | | | New York St. Dorm. Au. Rev. Non St. Supported Debt (Wagner College), Ser. 2009, (LOC: TD Bank N.A.), 0.19%, due 11/4/09 | | | 4,000 | µß | |
| | 15,950 | | | New York St. Dorm. Au. Rev. Secondary Issues, Ser. 2008, (FHA Insured), 0.20%, due 11/5/09 | | | 15,950 | ñµk | |
| | 1,000 | | | New York St. Dorm. Au. Rev. Secondary Issues, Ser. 2008, (LOC: Citibank, N.A.), 0.20%, due 11/5/09 | | | 1,000 | µ | |
| | 8,030 | | | New York St. Dorm. Au. Rev. Secondary Issues, Ser. 2008, (SONYMA Insured), 0.20%, due 11/5/09 | | | 8,030 | ñµk | |
| | 5,000 | | | New York St. Dorm. Au. Rev. St. Supported Debt (City Univ. Sys. Cons. Fifth Gen. Resolution), Ser. 2008-D, (LOC: TD Bank N.A.), 0.18%, due 11/5/09 | | | 5,000 | µß | |
| | 5,000 | | | New York St. HFA Rev. (100 Maiden Lane), Ser. 2004-A, (LOC: Fannie Mae), 0.18%, due 11/4/09 | | | 5,000 | µß | |
| | 6,800 | | | New York St. HFA Rev. (600 West 42nd Street), Ser. 2009-A, (LOC: Bank of New York), 0.22%, due 11/4/09 | | | 6,800 | µ | |
| | 2,000 | | | New York St. HFA Rev. (Weyant Green Apts.), Ser. 2007-A, (LOC: Fannie Mae), 0.20%, due 11/4/09 | | | 2,000 | µß | |
| | 400 | | | New York St. HFA Svc. Contract Ref. Rev., Ser. 2003-B, (LOC: BNP Paribas), 0.20%, due 11/4/09 | | | 400 | µ | |
| | 11,600 | | | New York St. Local Gov't Assist. Corp., Ser. 1995-E, (LOC: Landesbank Hessen-Thueringen Girozentrale), 0.18%, due 11/4/09 | | | 11,600 | µ | |
| | 4,500 | | | New York St. Thruway Au. Gen. Rev. (Floaters), Ser. 2006-1427, (FSA Insured), 0.21%, due 11/5/09 | | | 4,500 | ñµy | |
| | 7,740 | | | New York St. Urban Dev. Corp. Rev., Ser. 2003-163, (FGIC/TCRS Insured), 0.24%, due 11/5/09 | | | 7,740 | µcc | |
| | 770 | | | New York St. Urban Dev. Corp. Rev. (Putters), Ser. 2007-2283,
(National Public Finance Guarantee Corp. Insured), 0.29%, due 11/5/09 | | | 770 | µs | |
| | 3,000 | | | New York St. Urban Dev. Corp. Rev. (State Fac.), Ser. 2004-A3A, (LOC: Dexia Credit Locale de France), 0.31%, due 11/5/09 | | | 3,000 | µ | |
| | 9,790 | | | Port Au. New York & New Jersey (Floater), Ser. 2007-111TP, (CIFG Insured), 0.27%, due 11/5/09 | | | 9,790 | µjj | |
| | 500 | | | Rensselaer Co. IDA Sr. Hsg. Rev. (Brunswick Sr. Hsg. Proj.), Ser. 1999-A, (LOC: Troy Savings Bank), 0.30%, due 11/2/09 | | | 500 | µßpp | |
| | 620 | | | Rockland Co. IDA Rev. (Shock-Tech, Inc. Proj.), Ser. 1998, (LOC: JP Morgan Chase), 0.55%, due 11/4/09 | | | 620 | µß | |
| | 3,375 | | | Rotterdam IDA IDR Ref. (Rotterdam Ind. Park Proj.), Ser. 1993-A, (LOC: Bank of America), 0.19%, due 11/4/09 | | | 3,375 | µ | |
| | 8,000 | | | Sales Tax Asset Receivable Corp. (Floaters), Ser. 2008-2901, (LOC: Morgan Stanley), 0.21%, due 11/5/09 | | | 8,000 | µ | |
| | 3,080 | | | Sales Tax Asset Receivable Corp. (Putters), Ser. 2004-599, (National Public Finance Guarantee Corp. Insured), 0.29%, due 11/5/09 | | | 3,080 | µs | |
| | 620 | | | St. Lawrence Co. IDA Civic Fac. Rev. (United Helper's Independent Living Corp.), Ser. 1998, (LOC: Fleet National Bank), 0.19%, due 11/4/09 | | | 620 | µß | |
| | 2,390 | | | Triborough Bridge & Tunnel Au. Rev. (Convention Ctr. Proj.), Ser. 1990-E, 7.25%, due 1/1/10 | | | 2,414 | | |
| | 3,830 | | | Triborough Bridge & Tunnel Au. Rev. (Muni. Sec. Trust Receipts), Ser. 2008-A, (FGIC/TCRS Insured), 0.24%, due 11/5/09 | | | 3,830 | µcc | |
| | 7,940 | | | Ulster Co. IDA Civic Fac. Rev. (Kingston Reg. Senior Living Corp.), Ser. 2007-C, (LOC: Sovereign Bank), 0.25%, due 11/5/09 | | | 7,940 | µßii | |
| | 14,884 | | | Westchester Co. IDA Rev. (Floater), Ser. 2007-103G, (LOC: Goldman Sachs), 0.22%, due 11/5/09 | | | 14,884 | µ | |
| | | | 285,042 | | |
| Puerto Rico (11.4%) | |
| | 13,150 | | | Austin Trust Var. Sts. Cert., Ser. 2008-355, (LOC: Bank of America), 0.66%, due 11/5/09 | | | 13,150 | µ | |
| | 700 | | | Puerto Rico Commonwealth Hwy. & Trans. Au. Hwy. Rev. (Floaters), Ser. 2008-007, (FSA Insured), 0.51%, due 11/5/09 | | | 700 | µp | |
| | 4,630 | | | Puerto Rico Commonwealth Hwy. & Trans. Au. Hwy. Rev. (Floaters), Ser. 2008-008, (FSA Insured), 0.51%, due 11/5/09 | | | 4,630 | µp | |
| | 625 | | | Puerto Rico Commonwealth Hwy. & Trans. Au. Hwy. Rev. (Floaters), Ser. 2008-019, (FSA Insured), 0.51%, due 11/5/09 | | | 625 | µp | |
| | 1,000 | | | Puerto Rico Commonwealth Hwy. & Trans. Au. Trans. Rev., Ser. 1998-A, (LOC: Scotiabank), 0.32%, due 11/4/09 | | | 1,000 | µ | |
| | 1,800 | | | Puerto Rico Commonwealth Hwy. & Trans. Au. Trans. Rev. (Putters), Ser. 2002-246, (FSA Insured), 1.16%, due 11/5/09 | | | 1,800 | ñµs | |
| | 14,870 | | | Puerto Rico Elec. Pwr. Au. Pwr. Rev. (Floater), Ser. 2008-013, (FSA Insured), 0.51%, due 11/5/09 | | | 14,870 | µp | |
| | | | 36,775 | | |
| | | | | Total Investments (99.5%) | | | 321,817 | | |
| | | | | Cash, receivables and other assets, less liabilities (0.5%) | | | 1,589 | | |
| | | | | Total Net Assets (100.0%) | | $ | 323,406 | | |
See Notes to Schedule of Investments
47
Schedule of Investments Neuberger Berman Short Duration Bond Fund
| PRINCIPAL AMOUNT | | VALUE† | |
| (000's omitted) | | (000's omitted) | |
| U.S. Treasury Securities-Backed by the Full Faith and Credit of the U.S. Government (27.9%) | |
| $ | 9,050 | | | U.S. Treasury Notes, 4.75%, due 3/31/11 | | $ | 9,585 | | |
| | 5,700 | | | U.S. Treasury Notes, 1.00%, due 9/30/11 | | | 5,716 | | |
| | 1,550 | | | U.S. Treasury Notes, 3.88%, due 10/31/12 | | | 1,663 | | |
| | | | | Total U.S. Treasury Securities-Backed by the Full Faith and Credit of the U.S. Government
(Cost $16,870) | | | 16,964 | | |
| Mortgage-Backed Securities (40.3%) | |
| Adjustable Alt-A Mixed Balance (1.9%) | |
| | 1,781 | | | Residential Accredit Loans, Inc., Ser. 2005-QA10, Class A31, 5.60%, due 11/2/09 | | | 1,176 | µØØ | |
| Adjustable Alt-B Mixed Balance (1.0%) | |
| | 819 | | | Lehman XS Trust, Floating Rate, Ser. 2005-1, Class 2A1, 1.74%, due 11/2/09 | | | 600 | µ | |
| Adjustable Conforming Balance (1.8%) | |
| | 1,831 | | | Adjustable Rate Mortgage Trust, Ser. 2005-10, Class 4A1, 5.37%, due 11/2/09 | | | 1,058 | µ | |
| Adjustable Jumbo Balance (3.1%) | |
| | 799 | | | Banc of America Funding Corp., Ser. 2005-F, Class 4A1, 5.32%, due 11/2/09 | | | 593 | µ | |
| | 1,500 | | | Wells Fargo Mortgage Backed Securities Trust, Ser. 2005-AR16, Class 4A2, 4.99%, due 11/2/09 | | | 1,300 | µØØ | |
| | | | 1,893 | | |
| Adjustable Mixed Balance (7.9%) | |
| | 863 | | | Countrywide Home Loan Mortgage Pass-Through Trust, Ser. 2006-HYB3, Class 1A1A, 4.44%, due 11/2/09 | | | 420 | µ | |
| | 1,455 | | | Credit Suisse First Boston Mortgage Securities Corp., Ser. 2004-AR4, Class 2A1, 3.58%, due 11/2/09 | | | 1,279 | µØØ | |
| | 1,864 | | | First Horizon Mortgage Pass-Through Trust, Ser. 2005-AR5, Class 2A1, 5.45%, due 11/2/09 | | | 1,656 | µ | |
| | 1,804 | | | GMAC Mortgage Corp. Loan Trust, Ser. 2006-AR1, Class 1A1, 5.56%, due 11/2/09 | | | 1,338 | µ | |
| | 237 | | | Harborview Mortgage Loan Trust, Ser. 2004-4, Class 3A, 1.39%, due 11/2/09 | | | 113 | µ | |
| | | | 4,806 | | |
| Commercial Mortgage-Backed (14.1%) | |
| | 599 | | | Credit Suisse First Boston Mortgage Securities Corp., Ser. 2005-C6, Class A1, 4.94%, due 12/15/40 | | | 603 | ØØ | |
| | 739 | | | GE Capital Commercial Mortgage Corp., Ser. 2002-2A, Class A2, 4.97%, due 8/11/36 | | | 768 | ØØ | |
| | 1,775 | | | GE Capital Commercial Mortgage Corp., Ser. 2005-C3, Class A2, 4.85%, due 7/10/45 | | | 1,786 | | |
| | 343 | | | GMAC Commercial Mortgage Securities, Inc., Ser. 2006-C1, Class A1, 4.98%, due 11/10/45 | | | 348 | | |
| | 1,411 | | | JP Morgan Chase Commercial Mortgage Securities Corp., Ser. 2006-LDP7, Class A1, 5.83%, due 11/2/09 | | | 1,437 | µØØ | |
| | 51 | | | JP Morgan Chase Commercial Mortgage Securities Corp., Ser. 2004-C2, Class A1, 4.28%, due 5/15/41 | | | 51 | ØØ | |
| | 2,343 | | | JP Morgan Chase Commercial Mortgage Securities Corp., Ser. 2005-LDP5, Class A1, 5.04%, due 12/15/44 | | | 2,359 | ØØ | |
| | 1,207 | | | LB-UBS Commercial Mortgage Trust, Ser. 2006-C3, Class A1, 5.48%, due 3/15/32 | | | 1,229 | ØØ | |
| | | | 8,581 | | |
| Mortgage-Backed Non-Agency (4.8%) | |
| | 842 | | | Countrywide Home Loans, Ser. 2005-R2, Class 2A4, 8.50%, due 6/25/35 | | | 803 | ñØØ | |
| | 1,896 | | | GSMPS Mortgage Loan Trust, Ser. 2005-RP2, Class 1A4, 8.50%, due 3/25/35 | | | 1,789 | ñØØ | |
See Notes to Schedule of Investments
48
| PRINCIPAL AMOUNT | | | | VALUE† | |
| (000's omitted) | | | | (000's omitted) | |
| $ | 379 | | | GSMPS Mortgage Loan Trust, Ser. 2005-RP3, Class 1A4, 8.50%, due 9/25/35 | | $ | 342 | ñ | |
| | 413 | | | Knollwood CDO Ltd., Ser. 2006-2A, Class A2J, 0.70%, due 1/13/10 | | | 0 | ñµ | |
| | | | 2,934 | | |
| Fannie Mae (1.7%) | | | |
| | 926 | | | Whole Loan, Ser. 2004-W8, Class PT, 10.53%, due 11/2/09 | | | 1,009 | µØØ | |
| Freddie Mac (3.9%) | | | |
| | 9 | | | ARM Certificates, 3.25%, due 11/2/09 | | | 9 | µ | |
| | 1,235 | | | Pass-Through Certificates, 8.00%, due 11/1/26 | | | 1,407 | ØØ | |
| | 858 | | | Pass-Through Certificates, 8.50%, due 10/1/30 | | | 983 | ØØ | |
| | | | 2,399 | | |
| Government National Mortgage Association (0.1%) | |
| | 19 | | | Pass-Through Certificates, 7.00%, due 4/15/11 | | | 19 | ØØ | |
| | 0 | | | Pass-Through Certificates, 7.50%, due 5/15/10 – 8/15/10 | | | 0 | | |
| | 8 | | | Pass-Through Certificates, 12.00%, due 12/15/12 & 3/15/14 | | | 10 | | |
| | | | 29 | | |
| | | | | Total Mortgage-Backed Securities (Cost $28,035) | | | 24,485 | | |
| Corporate Debt Securities (22.2%) | |
| Banks (9.8%) | | | |
| | 1,000 | | | Bank of America Corp., Junior Subordinated Unsecured Notes, 7.80%, due 2/15/10 | | | 1,017 | ØØ | |
| | 300 | | | Bank of America Corp., Senior Unsecured Notes, 6.25%, due 4/15/12 | | | 324 | | |
| | 1,175 | | | Citigroup, Inc., Senior Unsecured Notes, 5.13%, due 2/14/11 | | | 1,215 | | |
| | 1,000 | | | Goldman Sachs Group, Inc., Senior Unsecured Notes, 5.30%, due 2/14/12 | | | 1,064 | | |
| | 1,050 | | | Morgan Stanley, Senior Unsecured Notes, 4.00%, due 1/15/10 | | | 1,056 | ØØ | |
| | 1,275 | | | Wells Fargo & Co., Guaranteed FDIC Floating Rate Notes, 0.52%, due 12/15/09 | | | 1,283 | µØØ | |
| | | | 5,959 | | |
| Beverages (1.0%) | | | |
| | 575 | | | Anheuser-Busch Cos., Inc., Senior Unsecured Notes, 4.95%, due 1/15/14 | | | 597 | | |
| Diversified Financial Services (7.6%) | |
| | 725 | | | American Express Credit Corp., Senior Unsecured Medium-Term Notes, Ser. C, 5.88%, due 5/2/13 | | | 778 | | |
| | 750 | | | Bear Stearns Cos. LLC, Senior Unsecured Notes, 5.35%, due 2/1/12 | | | 800 | | |
| | 325 | | | Bear Stearns Cos. LLC, Senior Unsecured Medium-Term Notes, Ser. B, 6.95%, due 8/10/12 | | | 365 | | |
| | 1,325 | | | Citigroup Funding, Inc., Guaranteed FDIC Floating Rate Notes, Ser. 1, 0.58%, due 12/30/09 | | | 1,336 | µØØ | |
| | 1,100 | | | General Electric Capital Corp., Senior Unsecured Medium-Term Notes, Ser. A, 4.25%, due 9/13/10 | | | 1,134 | ØØ | |
| | 175 | | | General Electric Capital Corp., Senior Unsecured Medium-Term Notes, 5.00%, due 4/10/12 | | | 185 | | |
| | | | 4,598 | | |
| Media (1.0%) | | | |
| | 600 | | | Time Warner Cable, Inc., Guaranteed Notes, 5.40%, due 7/2/12 | | | 641 | | |
| Office/Business Equipment (0.8%) | |
| | 450 | | | Xerox Corp., Senior Unsecured Notes, 5.50%, due 5/15/12 | | | 474 | | |
| Oil & Gas (0.7%) | | | |
| | 425 | | | XTO Energy, Inc., Senior Unsecured Notes, 5.90%, due 8/1/12 | | | 459 | | |
See Notes to Schedule of Investments
49
| PRINCIPAL AMOUNT | | | | VALUE† | |
| (000's omitted) | | | | (000's omitted) | |
| Pharmaceuticals (1.3%) | |
| $ | 735 | | | Pfizer, Inc., Senior Unsecured Notes, 4.45%, due 3/15/12 | | $ | 780 | | |
| | | | | Total Corporate Debt Securities (Cost $13,384) | | | 13,508 | | |
| Asset-Backed Securities (9.3%) | |
| | 949 | | | ACE Securities Corp. Home Equity Loan Trust, Ser. 2006-ASP5, Class A2B, 0.37%, due 11/25/09 | | | 477 | µØØ | |
| | 400 | | | ACE Securities Corp. Home Equity Loan Trust, Ser. 2006-OP1, Class A2C, 0.39%, due 11/25/09 | | | 243 | µØØ | |
| | 400 | | | Bear Stearns Asset Backed Securities Trust, Ser. 2006-HE9, Class 1A2, 0.39%, due 11/25/09 | | | 161 | µ | |
| | 660 | | | Carrington Mortgage Loan Trust, Ser. 2006-OPT1, Class A3, 0.42%, due 11/25/09 | | | 565 | µ | |
| | 850 | | | Carrington Mortgage Loan Trust, Ser. 2007-FRE1, Class A3, 0.50%, due 11/25/09 | | | 271 | µ | |
| | 800 | | | Chase Issuance Trust, Ser. 2009-A5, Class A5, 1.05%, due 11/16/09 | | | 803 | µØØ | |
| | 545 | | | Countrywide Asset-Backed Certificates Trust, Ser. 2006-3, Class 2A2, 0.42%, due 11/25/09 | | | 437 | µ | |
| | 319 | | | Countrywide Asset-Backed Certificates Trust, Ser. 2006-5, Class 2A2, 0.42%, due 11/25/09 | | | 211 | µ | |
| | 568 | | | Countrywide Asset-Backed Certificates Trust, Ser. 2006-6, Class 2A2, 0.42%, due 11/25/09 | | | 423 | µ | |
| | 202 | | | DaimlerChrysler Auto Trust, Ser. 2008-B, Class A2B, 1.17%, due 11/9/09 | | | 203 | µ | |
| | 279 | | | Impac Secured Assets Corp., Ser. 2006-3, Class A4, 0.33%, due 11/25/09 | | | 121 | µ | |
| | 546 | | | Residential Asset Mortgage Products, Inc., Ser. 2006-RS1, Class AI2, 0.47%, due 11/25/09 | | | 308 | µ | |
| | 350 | | | Securitized Asset Backed Receivables LLC Trust, Ser. 2006-WM4, Class A2C, 0.40%, due 11/25/09 | | | 130 | µ | |
| | 1,100 | | | Soundview Home Equity Loan Trust, Ser. 2006-OPT3, Class 2A3, 0.41%, due 11/25/09 | | | 737 | µØØ | |
| | 588 | | | Structured Asset Investment Loan Trust, Ser. 2006-3, Class A4, 0.33%, due 11/25/09 | | | 566 | µØØ | |
| | | | | Total Asset-Backed Securities (Cost $8,673) | | | 5,656 | | |
| NUMBER OF SHARES | |
| Short-Term Investments (0.9%) | |
| | 545,956 | | | State Street Institutional Liquid Reserves Fund Institutional Class (Cost $546) | | | 546 | | |
| | | | | Total Investments (100.6%) (Cost $67,508) | | | 61,159 | ## | |
| | | | | Liabilities, less cash, receivables and other assets [(0.6%)] | | | (372 | ) | |
| | | | | Total Net Assets (100.0%) | | $ | 60,787 | | |
See Notes to Schedule of Investments
50
Schedule of Investments Neuberger Berman Strategic Income Fund
| PRINCIPAL AMOUNT | | | | VALUE† | |
| (000's omitted) | | | | (000's omitted) | |
| Bank Loan Obligations (2.0%) | |
| Airlines (0.3%) | |
| $ | 470 | | | United Airlines, Inc., Term Loan B, 2.48%, due 2/1/14 | | $ | 367 | b | |
| Automotive (0.1%) | | | |
| | 179 | | | Ford Motor Co., Term Loan B1, 5.24%, due 12/16/13 | | | 159 | | |
| Electric (0.5%) | | | |
| | 429 | | | First Data Corp., Term Loan B3, 3.03%, due 9/24/14 | | | 368 | | |
| | 355 | | | First Data Corp., Term Loan B2, 3.03%, due 9/24/14 | | | 304 | | |
| | | | 672 | | |
| Electric - Generation (0.8%) | |
| | 1,230 | | | Texas Competitive Electric Holdings Co. LLC, Term Loan DD, 3.28%, due 10/10/14 | | | 950 | | |
| Media - Cable (0.3%) | | |
| | 403 | | | Cequel Communications LLC, Term Loan B, 6.28%, due 5/5/14 | | | 399 | | |
| | | | | Total Bank Loan Obligations (Cost $2,424) | | | 2,547 | | |
| U.S. Treasury Securities-Backed by the Full Faith and Credit of the U.S. Government (15.6%) | |
| | 5,000 | | | U.S. Treasury Bills, 0.10%, due 3/25/10 | | | 4,998 | | |
| | 140 | | | U.S. Treasury Bonds, 8.13%, due 8/15/19 | | | 195 | ØØ | |
| | 13,267 | | | U.S. Treasury Inflation Index Notes, 2.38%, due 4/15/11 & 1/15/17 | | | 14,301 | ØØ | |
| | 750 | | | U.S. Treasury Notes, 2.38%, due 9/30/14 | | | 753 | | |
| | | | | Total U.S. Treasury Securities-Backed by the Full Faith and Credit of the U.S. Government
(Cost $19,779) | | | 20,247 | | |
| U.S. Government Agency Securities (1.9%) | |
| | 2,500 | | | Freddie Mac, Discount Notes, 0.03%, due 1/20/10 (Cost $2,499) | | | 2,500 | | |
| Mortgage-Backed Securities (27.7%) | |
| Adjustable Rate Mortgages (2.9%) | |
| | 300 | | | Credit Suisse Mortgage Capital Certificates, Ser. 2007-C4, Class A4, 6.00%, due 11/2/09 | | | 248 | µØØ | |
| | 600 | | | CWCapital Cobalt Ltd., Ser. 2007-C3, Class A4, 6.02%, due 11/2/09 | | | 533 | µØØ | |
| | 700 | | | GS Mortgage Securities Corp. II, Ser. 2007-GG10, Class A4, 6.00%, due 11/2/09 | | | 588 | µØØ | |
| | 1,200 | | | JP Morgan Chase Commercial Mortgage Securities Corp., Ser. 2007-CB19, Class A4, 5.94%, due 11/2/09 | | | 1,095 | µØØ | |
| | 290 | | | JP Morgan Chase Commercial Mortgage Securities Corp., Ser. 2007-LD11, Class A4, 6.01%, due 11/2/09 | | | 267 | µØØ | |
| | 400 | | | JP Morgan Chase Commercial Mortgage Securities Corp., Ser. 2006-LDP7, Class A4, 6.07%, due 11/2/09 | | | 391 | µ | |
| | 700 | | | Merrill Lynch/Countrywide Commercial Mortgage Trust, Ser. 2007-7, Class A4, 5.81%, due 11/2/09 | | | 589 | µ | |
| | | | 3,711 | | |
| Commercial Mortgage-Backed (7.1%)(000's omitted) | |
| | 839 | | | Banc of America Commercial Mortgage, Inc., Ser. 2006-3, Class A4, 5.89%, due 7/10/44 | | | 770 | | |
| | 730 | | | Banc of America Commercial Mortgage, Inc., Ser. 2006-4, Class A4, 5.63%, due 7/10/46 | | | 721 | | |
See Notes to Schedule of Investments
51
| PRINCIPAL AMOUNT | | | | VALUE† | |
| (000's omitted) | | | | (000's omitted) | |
| $ | 700 | | | Banc of America Commercial Mortgage, Inc., Ser. 2006-5, Class A4, 5.41%, due 9/10/47 | | $ | 669 | | |
| | 550 | | | Bear Stearns Commercial Mortgage Securities, Ser. 2007-PW17, Class A4, 5.69%, due 6/11/50 | | | 511 | | |
| | 250 | | | Citigroup/Deutsche Bank Commercial Mortgage Trust, Ser. 2007-CD4, Class A4, 5.32%, due 12/11/49 | | | 224 | ØØ | |
| | 800 | | | Credit Suisse Mortgage Capital Certificates, Ser. 2006-C4, Class A3, 5.47%, due 9/15/39 | | | 698 | | |
| | 400 | | | Credit Suisse Mortgage Capital Certificates, Series 2006-C5, Class A3, 5.31%, due 12/15/39 | | | 346 | ØØ | |
| | 335 | | | Greenwich Capital Commercial Funding Corp., Ser. 2007-GG9, Class A4, 5.44%, due 3/10/39 | | | 299 | | |
| | 500 | | | GS Mortgage Securities Corp. II, Ser. 2005-GG4, Class A3, 4.61%, due 7/10/39 | | | 499 | ØØ | |
| | 700 | | | GS Mortgage Securities Corp. II, Ser. 2005-GG4, Class A4, 4.76%, due 7/10/39 | | | 651 | ØØ | |
| | 250 | | | JP Morgan Chase Commercial Mortgage Securities Corp., Ser. 2006-CB14, Class ASB, 5.51%, due 12/12/44 | | | 258 | ØØ | |
| | 500 | | | JP Morgan Chase Commercial Mortgage Securities Corp., Ser. 2006-LDP9, Class A3, 5.34%, due 5/15/47 | | | 450 | | |
| | 800 | | | JP Morgan Chase Commercial Mortgage Securities Corp., Ser. 2007-CB18, Class A4, 5.44%, due 6/12/47 | | | 728 | ØØ | |
| | 250 | | | JP Morgan Chase Commercial Mortgage Securities Corp., Ser. 2007-CB20, Class A4, 5.79%, due 2/12/51 | | | 227 | ØØ | |
| | 915 | | | LB-UBS Commercial Mortgage Trust, Ser. 2007-C6, Class A4, 5.86%, due 7/15/40 | | | 786 | ØØ | |
| | 900 | | | Morgan Stanley Capital I, Ser. 2007-IQ16, Class A4, 5.81%, due 12/12/49 | | | 813 | ØØ | |
| | 400 | | | Wachovia Bank Commercial Mortgage Trust, Ser. 2005-C19, Class A5, 4.66%, due 5/15/44 | | | 404 | | |
| | 250 | | | Wachovia Bank Commercial Mortgage Trust, Ser. 2007-C31, Class A4, 5.51%, due 4/15/47 | | | 203 | ØØ | |
| | | | 9,257 | | |
| Fannie Mae (14.6%) | |
| | 12 | | | Pass-Through Certificates, 7.00%, due 7/1/29 | | | 13 | ØØ | |
| | 4 | | | Pass-Through Certificates, 6.50%, due 9/1/32 | | | 4 | ØØ | |
| | 3 | | | Pass-Through Certificates, 7.50%, due 12/1/32 | | | 3 | ØØ | |
| | 8,928 | | | Pass-Through Certificates, 5.50%, due 7/1/33 – 1/1/39 | | | 9,410 | ØØ | |
| | 459 | | | Pass-Through Certificates, 5.00%, due 8/1/33 – 5/1/37 | | | 476 | ØØ | |
| | 779 | | | Pass-Through Certificates, 6.00%, due 9/1/33 & 7/1/38 | | | 829 | ØØ | |
| | 2,250 | | | Pass-Through Certificates, 6.00%, TBA, 30 Year Maturity | | | 2,390 | Ø | |
| | 5,600 | | | Pass-Through Certificates, 5.50%, TBA, 30 Year Maturity | | | 5,894 | Ø | |
| | | | 19,019 | | |
| Freddie Mac (3.1%) | |
| | 3 | | | Pass-Through Certificates, 6.50%, due 3/1/16 | | | 3 | ØØ | |
| | 39 | | | Pass-Through Certificates, 6.00%, due 4/1/17 – 12/1/33 | | | 43 | ØØ | |
| | 1,359 | | | Pass-Through Certificates, 5.50%, due 9/1/17 – 11/1/38 | | | 1,435 | ØØ | |
| | 2,387 | | | Pass-Through Certificates, 5.00%, due 5/1/18 – 8/1/39 | | | 2,477 | ØØ | |
| | 11 | | | Pass-Through Certificates, 4.50%, due 8/1/18 | | | 12 | ØØ | |
| | 4 | | | Pass-Through Certificates, 7.00%, due 6/1/32 | | | 4 | ØØ | |
| | | | 3,974 | | |
| Government National Mortgage Association (0.0%) | |
| | 5 | | | Pass-Through Certificates, 6.50%, due 7/15/32 | | | 5 | ØØ | |
| | 4 | | | Pass-Through Certificates, 7.00%, due 8/15/32 | | | 4 | ØØ | |
| | | | 9 | | |
| | | | | Total Mortgage-Backed Securities (Cost $33,688) | | | 35,970 | | |
See Notes to Schedule of Investments
52
| PRINCIPAL AMOUNT | | | | VALUE† | |
| (000's omitted) | | | | (000's omitted) | |
| Corporate Debt Securities (48.0%) | |
| Aerospace/Defense (0.1%) | |
| $ | 95 | | | Boeing Co., Senior Unsecured Notes, 6.00%, due 3/15/19 | | $ | 105 | ØØ | |
| Airlines (1.8%) | |
| | 200 | | | American Airlines, Inc., Pass-Through Certificates, Ser. 2009-1A, 10.38%, due 7/2/19 | | | 218 | | |
| | 100 | | | American Airlines, Inc., Senior Secured Notes, 10.50%, due 10/15/12 | | | 102 | ñ | |
| | 305 | | | Continental Airlines, Inc., Pass-Through Certificates, Ser. 2007-1, Class A, 5.98%, due 4/19/22 | | | 296 | ØØ | |
| | 470 | | | Continental Airlines, Inc., Pass-Through Certificates, Ser. A, 7.25%, due 11/10/19 | | | 475 | Ø | |
| | 150 | | | Delta Air Lines, Inc., Pass-Through Certificates, Ser. 2001-1, Class B, 7.71%, due 9/18/11 | | | 144 | | |
| | 438 | | | Delta Air Lines, Inc., Pass-Through Certificates, Ser. 2007-1, Class A, 6.82%, due 8/10/22 | | | 404 | ØØ | |
| | 440 | | | Delta Air Lines, Inc., Senior Secured Notes, 9.50%, due 9/15/14 | | | 449 | ñ | |
| | 273 | | | United Airlines, Inc., Pass-Through Certificates, Ser. 2007-1, Class A, 6.64%, due 7/2/22 | | | 240 | ØØ | |
| | | | 2,328 | | |
| Automotive (1.5%) | |
| | 330 | | | Ford Motor Credit Co. LLC, Senior Unsecured Notes, 7.00%, due 10/1/13 | | | 313 | | |
| | 725 | | | Ford Motor Credit Co. LLC, Senior Unsecured Notes, 12.00%, due 5/15/15 | | | 817 | | |
| | 125 | | | Goodyear Tire & Rubber Co., Senior Unsecured Notes, 10.50%, due 5/15/16 | | | 135 | ØØ | |
| | 235 | | | Navistar Int'l Corp., Senior Notes, 8.25%, due 11/1/21 | | | 229 | | |
| | 425 | | | Volvo Treasury AB, Notes, 5.95%, due 4/1/15 | | | 432 | ñ | |
| | | | 1,926 | | |
| Banking (8.0%) | |
| | 370 | | | American Express Co., Senior Unsecured Notes, 8.13%, due 5/20/19 | | | 443 | ØØ | |
| | 650 | | | American Express Credit Corp., Senior Unsecured Medium-Term Notes, Ser. C, 5.88%, due 5/2/13 | | | 698 | ØØ | |
| | 290 | | | American Express Credit Corp., Senior Unsecured Medium-Term Notes, Ser. D, 5.13%, due 8/25/14 | | | 305 | | |
| | 635 | | | Bank of America Corp., Senior Unsecured Medium-Term Notes, Ser. L, 7.38%, due 5/15/14 | | | 711 | ØØ | |
| | 370 | | | Bank of America Corp., Senior Unsecured Medium-Term Notes, Ser. L, 5.65%, due 5/1/18 | | | 374 | | |
| | 810 | | | Bank of America Corp., Unsecured Notes, 6.50%, due 8/1/16 | | | 867 | | |
| | 360 | | | Barclays Bank PLC, Senior Unsecured Notes, 5.00%, due 9/22/16 | | | 368 | | |
| | 400 | | | Citigroup, Inc., Senior Unsecured Notes, 6.13%, due 11/21/17 | | | 408 | | |
| | 735 | | | Citigroup, Inc., Senior Unsecured Notes, 6.88%, due 3/5/38 | | | 764 | | |
| | 630 | | | Citigroup, Inc., Unsecured Notes, 8.50%, due 5/22/19 | | | 736 | ØØ | |
| | 420 | | | Deutsche Bank AG, Senior Unsecured Notes, 3.88%, due 8/18/14 | | | 428 | | |
| | 285 | | | Goldman Sachs Group, Inc., Medium-Term Notes, 6.00%, due 5/1/14 | | | 313 | ØØ | |
| | 360 | | | Goldman Sachs Group, Inc., Senior Medium-Term Notes, 3.63%, due 8/1/12 | | | 371 | | |
| | 100 | | | Goldman Sachs Group, Inc., Senior Unsecured Notes, 5.15%, due 1/15/14 | | | 106 | ØØ | |
| | 990 | | | Goldman Sachs Group, Inc., Subordinated Notes, 6.75%, due 10/1/37 | | | 1,043 | ØØ | |
| | 500 | | | JP Morgan Chase & Co., Senior Unsecured Notes, 3.70%, due 1/20/15 | | | 502 | | |
| | 50 | | | JP Morgan Chase Capital XV, Guaranteed Notes, 5.88%, due 3/15/35 | | | 44 | ØØ | |
| | 225 | | | Lloyds Banking Group PLC, Junior Subordinated Notes, 6.27%, due 11/14/16 | | | 146 | ñ | |
| | 235 | | | Merrill Lynch & Co., Senior Unsecured Medium-Term Notes, Ser. C, 5.45%, due 2/5/13 | | | 246 | ØØ | |
| | 75 | | | Merrill Lynch & Co., Subordinated Notes, 6.11%, due 1/29/37 | | | 71 | ØØ | |
| | 830 | | | Morgan Stanley, Senior Unsecured Medium-Term Notes, Ser. F, 5.63%, due 9/23/19 | | | 835 | | |
| | 250 | | | Morgan Stanley, Subordinated Notes, 4.75%, due 4/1/14 | | | 251 | ØØ | |
| | 380 | | | Royal Bank of Scotland PLC, Guaranteed Medium-Term Notes, 4.88%, due 8/25/14 | | | 387 | ñ | |
| | | | 10,417 | | |
| Building Materials (0.5%) | |
| | 30 | | | Associated Materials LLC, Senior Secured Notes, 9.88%, due 11/15/16 | | | 31 | ñØ | |
| | 365 | | | Holcim US Finance Sarl & Cie SCS, Guaranteed Notes, 6.00%, due 12/30/19 | | | 376 | ñ | |
| | 180 | | | Ply Gem Industries, Inc., Senior Secured Notes, 11.75%, due 6/15/13 | | | 169 | | |
See Notes to Schedule of Investments
53
| PRINCIPAL AMOUNT | | VALUE† | |
| (000's omitted) | | (000's omitted) | |
| $ | 95 | | | USG Corp., Guaranteed Notes, 9.75%, due 8/1/14 | | $ | 100 | ñ | |
| | | | 676 | | |
| Chemicals (1.5%) | |
| | 405 | | | Huntsman Int'l LLC, Guaranteed Notes, 5.50%, due 6/30/16 | | | 351 | ñ | |
| | 300 | | | Nalco Co., Senior Notes, 8.25%, due 5/15/17 | | | 315 | ñ | |
| | 325 | | | The Dow Chemical Co., Senior Unsecured Notes, 5.90%, due 2/15/15 | | | 336 | | |
| | 840 | | | The Dow Chemical Co., Senior Unsecured Notes, 8.55%, due 5/15/19 | | | 959 | ØØ | |
| | | | 1,961 | | |
| Construction Machinery (0.5%) | |
| | 230 | | | Caterpillar Financial Services Corp., Senior Unsecured Medium-Term Notes, 7.15%, due 2/15/19 | | | 270 | ØØ | |
| | 175 | | | United Rentals N.A., Inc., Guaranteed Notes, 7.75%, due 11/15/13 | | | 160 | | |
| | 150 | | | United Rentals N.A., Inc., Guaranteed Notes, 10.88%, due 6/15/16 | | | 163 | ñ | |
| | | | 593 | | |
| Consumer Cyclical Services (0.3%) | |
| | 275 | | | Dycom Investments, Inc., Guaranteed Notes, 8.13%, due 10/15/15 | | | 253 | | |
| | 100 | | | Service Corp. Int'l, Senior Unsecured Notes, 7.50%, due 4/1/27 | | | 89 | | |
| | | | 342 | | |
| Distributors (0.6%) | | | |
| | 200 | | | AmeriGas Partners L.P., Senior Unsecured Notes, 7.13%, due 5/20/16 | | | 195 | | |
| | 440 | | | Ferrellgas Partners L.P., Senior Notes, 9.13%, due 10/1/17 | | | 460 | ñ | |
| | 200 | | | Ferrellgas Partners L.P., Senior Unsecured Notes, 6.75%, due 5/1/14 | | | 191 | | |
| | | | 846 | | |
| Diversified Manufacturing (1.0%) | |
| | 500 | | | Ingersoll-Rand Global Holding Co. Ltd., Guaranteed Notes, 6.00%, due 8/15/13 | | | 543 | ØØ | |
| | 525 | | | Roper Industries, Inc., Senior Unsecured Notes, 6.25%, due 9/1/19 | | | 551 | | |
| | 190 | | | Tyco Int'l Finance SA, Guaranteed Notes, 4.13%, due 10/15/14 | | | 194 | | |
| | | | 1,288 | | |
| Electric (2.1%) | |
| | 400 | | | Dominion Resources, Inc., Senior Unsecured Notes, 5.20%, due 8/15/19 | | | 414 | | |
| | 390 | | | Duke Energy Corp., Senior Unsecured Notes, 6.30%, due 2/1/14 | | | 431 | ØØ | |
| | 565 | | | Dynegy-Roseton/Danskammer, Pass-Through Certificates, Ser. B, 7.67%, due 11/8/16 | | | 537 | | |
| | 200 | | | Edison Mission Energy, Senior Unsecured Notes, 7.63%, due 5/15/27 | | | 141 | | |
| | 215 | | | Exelon Generation Co. LLC, Senior Unsecured Notes, 6.25%, due 10/1/39 | | | 224 | | |
| | 220 | | | FirstEnergy Solutions Corp., Guaranteed Notes, 4.80%, due 2/15/15 | | | 225 | ñ | |
| | 210 | | | NRG Energy, Inc., Guaranteed Notes, 7.38%, due 2/1/16 | | | 209 | | |
| | 200 | | | NRG Energy, Inc., Guaranteed Notes, 7.38%, due 1/15/17 | | | 198 | ØØ | |
| | 365 | | | Oncor Electric Delivery Co., Senior Secured Notes, 6.38%, due 5/1/12 | | | 397 | ØØ | |
| | | | 2,776 | | |
| Entertainment (0.8%) | |
| | 630 | | | Time Warner, Inc., Guaranteed Unsecured Notes, 6.88%, due 5/1/12 | | | 693 | ØØ | |
| | 285 | | | WMG Acquisition Corp., Senior Secured Notes, 9.50%, due 6/15/16 | | | 304 | ñØØ | |
| | | | 997 | | |
See Notes to Schedule of Investments
54
| PRINCIPAL AMOUNT | | | | VALUE† | |
| (000's omitted) | | | | (000's omitted) | |
| Environmental (0.2%) | | | |
| $ | 280 | | | Republic Services, Inc., Guaranteed Notes, 5.50%, due 9/15/19 | | $ | 289 | ñ | |
| Financial Other (0.4%) | | | |
| | 475 | | | American Real Estate Partners L.P., Guaranteed Notes, 7.13%, due 2/15/13 | | | 467 | ØØ | |
| Food & Beverage (1.7%) | |
| | 1,245 | | | Anheuser-Busch InBev Worldwide, Inc., Guaranteed Notes, 5.38%, due 1/15/20 | | | 1,266 | ñ | |
| | 150 | | | Constellation Brands, Inc., Guaranteed Notes, 7.25%, due 9/1/16 | | | 150 | | |
| | 315 | | | Kraft Foods, Inc., Senior Unsecured Notes, 6.75%, due 2/19/14 | | | 351 | ØØ | |
| | 440 | | | Mead Johnson Nutrition Co., Senior Unsecured Notes, 3.50%, due 11/1/14 | | | 442 | ñØ | |
| | | | 2,209 | | |
| Gaming (1.1%) | | | |
| | 205 | | | FireKeepers Development Authority, Senior Secured Notes, 13.88%, due 5/1/15 | | | 221 | ñ | |
| | 175 | | | Harrah's Operating Co., Inc., Guaranteed Notes, 10.75%, due 2/1/16 | | | 134 | | |
| | 295 | | | MGM Mirage, Inc., Senior Secured Notes, 11.13%, due 11/15/17 | | | 324 | ñØØ | |
| | 200 | | | Peninsula Gaming LLC, Senior Secured Notes, 8.38%, due 8/15/15 | | | 199 | ñ | |
| | 200 | | | Pinnacle Entertainment, Inc., Senior Notes, 8.63%, due 8/1/17 | | | 199 | ñ | |
| | 300 | | | Pokagon Gaming Authority, Senior Notes, 10.38%, due 6/15/14 | | | 311 | ñ | |
| | | | 1,388 | | |
| Health Care (1.4%) | | | |
| | 90 | | | CareFusion Corp., Senior Unsecured Notes, 6.38%, due 8/1/19 | | | 97 | ñ | |
| | 675 | | | Express Scripts, Inc., Guaranteed Notes, 5.25%, due 6/15/12 | | | 719 | ØØ | |
| | 200 | | | HCA, Inc., Secured Notes, 9.13%, due 11/15/14 | | | 207 | | |
| | 50 | | | HCA, Inc., Senior Secured Notes, 8.50%, due 4/15/19 | | | 53 | ñØØ | |
| | 120 | | | LVB Acquisition, Inc., Guaranteed Notes, 10.00%, due 10/15/17 | | | 130 | | |
| | 300 | | | NMH Holdings, Inc., Guaranteed Notes, 11.25%, due 7/1/14 | | | 297 | | |
| | 280 | | | Ventas Realty L.P., Guaranteed Notes, 6.75%, due 4/1/17 | | | 269 | | |
| | | | 1,772 | | |
| Home Construction (0.2%) | |
| | 215 | | | Standard Pacific Escrow LLC, Senior Secured Notes, 10.75%, due 9/15/16 | | | 211 | ñ | |
| Independent (1.7%) | | | |
| | 920 | | | Anadarko Petroleum Corp., Senior Unsecured Notes, 5.95%, due 9/15/16 | | | 987 | ØØ | |
| | 325 | | | Chesapeake Energy Corp., Guaranteed Notes, 9.50%, due 2/15/15 | | | 352 | | |
| | 295 | | | Chesapeake Energy Corp., Guaranteed Notes, 7.25%, due 12/15/18 | | | 285 | ØØ | |
| | 230 | | | Cimarex Energy Co., Guaranteed Notes, 7.13%, due 5/1/17 | | | 222 | | |
| | 340 | | | Devon Energy Corp., Senior Notes, 5.63%, due 1/15/14 | | | 369 | ØØ | |
| | | | 2,215 | | |
| Integrated (0.5%) | | | |
| | 205 | | | ConocoPhillips, Guaranteed Notes, 5.75%, due 2/1/19 | | | 224 | ØØ | |
| | 235 | | | ConocoPhillips, Guaranteed Notes, 6.00%, due 1/15/20 | | | 259 | ØØ | |
| | 115 | | | Suncor Energy, Inc., Senior Unsecured Notes, 6.10%, due 6/1/18 | | | 123 | | |
| | | | 606 | | |
See Notes to Schedule of Investments
55
| PRINCIPAL AMOUNT | | | | VALUE† | |
| (000's omitted) | | | | (000's omitted) | |
| Life (0.3%) | | | |
| $ | 390 | | | Hartford Financial Services Group, Inc., Senior Unsecured Notes, 5.38%, due 3/15/17 | | $ | 366 | | |
| Lodging (0.1%) | | | |
| | 85 | | | Host Hotels & Resorts L.P., Guaranteed Notes, 7.13%, due 11/1/13 | | | 85 | | |
| Media - Cable (1.7%) | |
| | 200 | | | CSC Holdings, Inc., Senior Unsecured Notes, 8.63%, due 2/15/19 | | | 214 | ñØØ | |
| | 405 | | | DirecTV Holdings LLC, Guaranteed Notes, 4.75%, due 10/1/14 | | | 413 | ñ | |
| | 345 | | | DISH DBS Corp., Guaranteed Notes, 7.88%, due 9/1/19 | | | 353 | | |
| | 380 | | | Time Warner Cable, Inc., Guaranteed Notes, 6.75%, due 7/1/18 | | | 418 | ØØ | |
| | 245 | | | Time Warner Cable, Inc., Guaranteed Notes, 8.25%, due 4/1/19 | | | 295 | ØØ | |
| | 150 | | | UPC Holding BV, Senior Unsecured Notes, 9.88%, due 4/15/18 | | | 159 | ñ | |
| | 300 | | | Videotron Ltee, Guaranteed Senior Unsecured Notes, 6.88%, due 1/15/14 | | | 300 | | |
| | | | 2,152 | | |
| Media Noncable (2.1%) | |
| | 50 | | | Gannett Co., Inc., Guaranteed Notes, 8.75%, due 11/15/14 | | | 49 | ñ | |
| | 100 | | | Gannett Co., Inc., Guaranteed Notes, 9.38%, due 11/15/17 | | | 98 | ñ | |
| | 225 | | | Intelsat Subsidiary Holding Co., Ltd., Guaranteed Notes, 8.50%, due 1/15/13 | | | 226 | | |
| | 305 | | | Intelsat Subsidiary Holding Co., Ltd., Guaranteed Notes, 8.88%, due 1/15/15 | | | 308 | | |
| | 115 | | | Lamar Media Corp., Guaranteed Notes, 9.75%, due 4/1/14 | | | 126 | | |
| | 330 | | | LIN Television Corp., Guaranteed Notes, Ser. B, 6.50%, due 5/15/13 | | | 299 | | |
| | 260 | | | News America, Inc., Guaranteed Notes, 6.90%, due 8/15/39 | | | 276 | ñ | |
| | 295 | | | News America, Inc., Guaranteed Notes, 6.90%, due 3/1/19 | | | 331 | | |
| | 85 | | | Nielsen Finance LLC, Guaranteed Notes, 11.50%, due 5/1/16 | | | 90 | | |
| | 185 | | | Sinclair Television Group, Inc., Senior Secured Notes, 9.25%, due 11/1/17 | | | 182 | ñ | |
| | 210 | | | Telesat Canada/Telesat LLC, Senior Unsecured Notes, 11.00%, due 11/1/15 | | | 228 | | |
| | 150 | | | The Interpublic Group of Cos., Inc., Senior Unsecured Notes, 10.00%, due 7/15/17 | | | 161 | | |
| | 285 | | | Univision Communications, Inc., Senior Secured Notes, 12.00%, due 7/1/14 | | | 308 | ñ | |
| | | | 2,682 | | |
| Metals & Mining (1.0%) | |
| | 685 | | | ArcelorMittal, Senior Unsecured Notes, 6.13%, due 6/1/18 | | | 676 | ØØ | |
| | 190 | | | ArcelorMittal, Senior Unsecured Notes, 9.85%, due 6/1/19 | | | 224 | ØØ | |
| | 115 | | | Arch Coal, Inc., Guaranteed Notes, 8.75%, due 8/1/16 | | | 118 | ñ | |
| | 255 | | | Arch Western Finance LLC, Guaranteed Notes, 6.75%, due 7/1/13 | | | 246 | ØØ | |
| | | | 1,264 | | |
| Non Captive Consumer (0.8%) | |
| | 110 | | | American General Finance Corp., Senior Unsecured Medium-Term Notes, Ser. H, 5.38%, due 10/1/12 | | | 85 | | |
| | 450 | | | American General Finance Corp., Senior Unsecured Medium-Term Notes, Ser. I, 5.85%, due 6/1/13 | | | 337 | | |
| | 575 | | | American General Finance Corp., Senior Unsecured Medium-Term Notes, Ser. I, 5.40%, due 12/1/15 | | | 396 | | |
| | 290 | | | American General Finance Corp., Senior Unsecured Medium-Term Notes, Ser. J, 6.90%, due 12/15/17 | | | 202 | | |
| | | | 1,020 | | |
| Non Captive Diversified (1.7%) | |
| | 200 | | | CIT Group, Inc., Senior Unsecured Medium-Term Notes, 5.13%, due 9/30/14 | | | 131 | ØØ | |
| | 670 | | | General Electric Capital Corp., Senior Unsecured Medium-Term Notes, 5.88%, due 1/14/38 | | | 640 | ØØ | |
See Notes to Schedule of Investments
56
| PRINCIPAL AMOUNT | �� | | | VALUE† | |
| (000's omitted) | | | | (000's omitted) | |
| $ | 150 | | | General Electric Capital Corp., Senior Unsecured Medium-Term Notes, Ser. A, 5.25%, due 10/19/12 | | $ | 161 | ØØ | |
| | 450 | | | General Electric Capital Corp., Senior Unsecured Notes, 5.90%, due 5/13/14 | | | 493 | ØØ | |
| | 75 | | | GMAC LLC, Guaranteed Notes, 6.88%, due 9/15/11 | | | 72 | ñ | |
| | 445 | | | GMAC LLC, Guaranteed Notes, 6.75%, due 12/1/14 | | | 404 | ñ | |
| | 290 | | | GMAC LLC, Guaranteed Notes, 8.00%, due 11/1/31 | | | 248 | ñ | |
| | | | 2,149 | | |
| Oil & Gas (0.2%) | | | |
| | 325 | | | Petrobras Int'l Finance Co., Guaranteed Notes, 5.75%, due 1/20/20 | | | 324 | | |
| Packaging (0.4%) | | | |
| | 150 | | | Ball Corp., Guaranteed Notes, 7.13%, due 9/1/16 | | | 154 | | |
| | 300 | | | Bemis Co., Inc., Senior Unsecured Notes, 6.80%, due 8/1/19 | | | 336 | | |
| | 60 | | | Graham Packaging Co., L.P., Guaranteed Notes, 9.88%, due 10/15/14 | | | 61 | | |
| | | | 551 | | |
| Paper (0.3%) | | | |
| | 50 | | | Georgia-Pacific LLC, Guaranteed Notes, 7.00%, due 1/15/15 | | | 50 | ñ | |
| | 150 | | | Georgia-Pacific LLC, Guaranteed Notes, 8.25%, due 5/1/16 | | | 159 | ñØØ | |
| | 230 | | | PE Paper Escrow GmbH, Senior Secured Notes, 12.00%, due 8/1/14 | | | 252 | ñ | |
| | | | 461 | | |
| Pharmaceuticals (0.5%) | | | |
| | 245 | | | Roche Holdings, Inc., Guaranteed Notes, 6.00%, due 3/1/19 | | | 273 | ñØØ | |
| | 385 | | | Watson Pharmaceuticals, Inc., Senior Unsecured Notes, 5.00%, due 8/15/14 | | | 395 | | |
| | | | 668 | | |
| Pipelines (3.9%) | | | |
| | 300 | | | DCP Midstream LLC, Senior Unsecured Notes, 9.75%, due 3/15/19 | | | 358 | ñØØ | |
| | 370 | | | El Paso Corp., Medium-Term Notes, 7.80%, due 8/1/31 | | | 347 | | |
| | 200 | | | El Paso Corp., Senior Unsecured Medium-Term Notes, 8.25%, due 2/15/16 | | | 207 | | |
| | 285 | | | Enterprise Products Operating LLC, Guaranteed Notes, 6.13%, due 10/15/39 | | | 286 | | |
| | 365 | | | Enterprise Products Operating LLC, Guaranteed Notes, Ser. G, 5.60%, due 10/15/14 | | | 391 | ØØ | |
| | 340 | | | Kinder Morgan Energy Partners L.P., Senior Unsecured Notes, 5.95%, due 2/15/18 | | | 357 | ØØ | |
| | 270 | | | Kinder Morgan Energy Partners L.P., Senior Unsecured Notes, 6.50%, due 9/1/39 | | | 275 | | |
| | 300 | | | Kinder Morgan Finance Co., Guaranteed Notes, 5.70%, due 1/5/16 | | | 285 | | |
| | 150 | | | MarkWest Energy Partners L.P., Guaranteed Notes, Ser. B, 8.75%, due 4/15/18 | | | 153 | | |
| | 365 | | | Midcontinent Express Pipeline LLC, Senior Unsecured Notes, 6.70%, due 9/15/19 | | | 369 | ñ | |
| | 475 | | | NGPL Pipeco LLC, Senior Unsecured Notes, 6.51%, due 12/15/12 | | | 519 | ñØØ | |
| | 170 | | | Plains All American Pipeline L.P., Guaranteed Notes, 4.25%, due 9/1/12 | | | 175 | | |
| | 300 | | | Regency Energy Partners L.P., Guaranteed Notes, 8.38%, due 12/15/13 | | | 308 | | |
| | 620 | | | Sabine Pass LNG L.P., Senior Secured Notes, 7.50%, due 11/30/16 | | | 524 | | |
| | 210 | | | Williams Cos., Inc., Senior Unsecured Notes, 8.75%, due 1/15/20 | | | 241 | | |
| | 290 | | | Williams Partners L.P., Senior Unsecured Notes, 7.25%, due 2/1/17 | | | 288 | | |
| | | | 5,083 | | |
| REITs (0.5%) | | | |
| | 300 | | | HCP, Inc., Senior Unsecured Medium-Term Notes, 6.70%, due 1/30/18 | | | 298 | | |
| | 380 | | | WEA Finance LLC, Guaranteed Notes, 7.50%, due 6/2/14 | | | 414 | ñØØ | |
| | | | 712 | | |
See Notes to Schedule of Investments 57
| PRINCIPAL AMOUNT | | | | VALUE† | |
| (000's omitted) | | | | (000's omitted) | |
| Refining (0.4%) | | | |
| $ | 605 | | | Valero Energy Corp., Guaranteed Notes, 6.63%, due 6/15/37 | | $ | 555 | | |
| Retailers (1.1%) | | | |
| | 495 | | | Blockbuster, Inc., Senior Secured Notes, 11.75%, due 10/1/14 | | | 469 | ñ | |
| | 160 | | | CVS Caremark Corp., Senior Unsecured Notes, 6.25%, due 6/1/27 | | | 166 | | |
| | 330 | | | Macy's Retail Holdings, Inc., Guaranteed Unsecured Notes, 7.00%, due 2/15/28 | | | 274 | | |
| | 165 | | | Macy's Retail Holdings, Inc., Senior Guaranteed Notes, 6.90%, due 4/1/29 | | | 136 | | |
| | 150 | | | Rite Aid Corp., Senior Secured Notes, 9.75%, due 6/12/16 | | | 162 | | |
| | 80 | | | Rite Aid Corp., Senior Secured Notes, 10.25%, due 10/15/19 | | | 80 | ñ | |
| | 120 | | | Toys "R" Us Property Co. I LLC, Guaranteed Notes, 10.75%, due 7/15/17 | | | 130 | ñ | |
| | | | 1,417 | | |
| Supermarkets (0.6%) | | | |
| | 365 | | | Delhaize Group, Guaranteed Notes, 5.88%, due 2/1/14 | | | 393 | ØØ | |
| | 150 | | | Ingles Markets, Inc., Senior Unsecured Notes, 8.88%, due 5/15/17 | | | 154 | | |
| | 275 | | | Safeway, Inc., Senior Unsecured Notes, 5.00%, due 8/15/19 | | | 279 | | |
| | | | 826 | | |
| Technology (1.3%) | | | |
| | 505 | | | Analog Devices, Inc., Senior Unsecured Notes, 5.00%, due 7/1/14 | | | 531 | | |
| | 340 | | | Lender Processing Services, Inc., Guaranteed Notes, 8.13%, due 7/1/16 | | | 358 | | |
| | 435 | | | SunGard Data Systems, Inc., Guaranteed Notes, 10.63%, due 5/15/15 | | | 468 | ñ | |
| | 315 | | | Xerox Corp., Senior Unsecured Notes, 5.50%, due 5/15/12 | | | 332 | ØØ | |
| | | | 1,689 | | |
| Tobacco (0.9%) | | | |
| | 270 | | | Altria Group, Inc., Guaranteed Notes, 9.70%, due 11/10/18 | | | 332 | ØØ | |
| | 125 | | | Altria Group, Inc., Guaranteed Notes, 9.95%, due 11/10/38 | | | 163 | ØØ | |
| | 595 | | | Lorillard Tobacco Co., Senior Unsecured Notes, 8.13%, due 6/23/19 | | | 662 | | |
| | | | 1,157 | | |
| Transportation Services (0.3%) | |
| | 385 | | | ERAC USA Finance Co., Guaranteed Notes, 7.00%, due 10/15/37 | | | 372 | ñØØ | |
| Wireless (1.6%) | | | |
| | 350 | | | CC Holdings GS V LLC/Crown Castle GS III Corp., Senior Secured Notes, 7.75%, due 5/1/17 | | | 367 | ñ | |
| | 200 | | | Cricket Communications, Inc., Senior Secured Notes, 7.75%, due 5/15/16 | | | 200 | ñØØ | |
| | 330 | | | MetroPCS Wireless, Inc., Guaranteed Notes, 9.25%, due 11/1/14 | | | 332 | | |
| | 300 | | | Nextel Communications, Inc., Guaranteed Notes, Ser. E, 6.88%, due 10/31/13 | | | 278 | | |
| | 980 | | | Sprint Capital Corp., Guaranteed Notes, 6.88%, due 11/15/28 | | | 735 | | |
| | 250 | | | Sprint Nextel Corp., Senior Unsecured Notes, 6.00%, due 12/1/16 | | | 215 | ØØ | |
| | | | 2,127 | | |
| Wirelines (2.4%) | | | |
| | 750 | | | AT&T, Inc., Senior Unsecured Notes, 4.85%, due 2/15/14 | | | 801 | | |
| | 240 | | | Citizens Communications Corp., Senior Unsecured Notes, 6.25%, due 1/15/13 | | | 237 | | |
| | 175 | | | Citizens Communications Corp., Senior Unsecured Notes, 9.00%, due 8/15/31 | | | 173 | | |
| | 185 | | | GCI, Inc., Senior Notes, 8.63%, due 11/15/19 | | | 185 | ñ | |
| | 650 | | | Qwest Corp., Senior Unsecured Notes, 8.88%, due 3/15/12 | | | 684 | ØØ | |
| | 150 | | | Qwest Corp., Senior Unsecured Notes, 8.38%, due 5/1/16 | | | 155 | ñØØ | |
See Notes to Schedule of Investments
58
| PRINCIPAL AMOUNT | | | | VALUE† | |
| (000's omitted) | | | | (000's omitted) | |
| $ | 360 | | | Telecom Italia Capital SA, Guaranteed Unsecured Notes, 4.95%, due 9/30/14 | | $ | 374 | | |
| | 295 | | | Verizon Communications, Inc., Senior Unsecured Notes, 6.35%, due 4/1/19 | | | 327 | ØØ | |
| | 225 | | | Windstream Corp., Guaranteed Notes, 8.63%, due 8/1/16 | | | 231 | ØØ | |
| | | | 3,167 | | |
| | | | | Total Corporate Debt Securities (Cost $58,546) | | | 62,239 | | |
| Asset-Backed Securities (0.3%) | |
| | 455 | | | GSAMP Trust, Ser. 2006-HE5, Class A2B, 0.34%, due 11/25/09 (Cost $373) | | | 375 | µ | |
| Government Securities (2.9%) | |
| Sovereign (2.9%) | | | |
| | 435 | | | Bolivarian Republic of Venezuela, Senior Unsecured Notes, 9.00%, due 5/7/23 | | | 307 | | |
| | 315 | | | Federative Republic of Brazil, Senior Unsecured Notes, 8.88%, due 10/14/19 | | | 401 | | |
| | 100 | | | KazMunaiGaz Finance Sub BV, Guaranteed Medium-Term Notes, 9.13%, due 7/2/18 | | | 110 | | |
| | 165 | | | Lebanese Republic, Senior Unsubordinated Notes, 8.25%, due 4/12/21 | | | 181 | | |
| | 285 | | | Majapahit Holding BV, Guaranteed Notes, 7.88%, due 6/29/37 | | | 270 | | |
| | 260 | | | Pemex Project Funding Master Trust, Guaranteed Notes, 5.75%, due 3/1/18 | | | 257 | | |
| | 620 | | | Republic of Argentina, Unsubordinated Notes, Step-Up, 1.33%/5.25%, due 12/31/38 | | | 220 | d | |
| | 85 | | | Republic of Bulgaria, Unsubordinated Notes, 8.25%, due 1/15/15 | | | 99 | | |
| | 150 | | | Republic of Colombia, Senior Unsecured Notes, 8.13%, due 5/21/24 | | | 178 | | |
| | 100 | | | Republic of Ecuador, Notes, 9.38%, due 12/15/15 | | | 93 | | |
| | 60 | | | Republic of El Salvador, Unsecured Notes, 7.65%, due 6/15/35 | | | 60 | | |
| | 125 | | | Republic of Panama, Senior Unsecured Notes, 6.70%, due 1/26/36 | | | 131 | | |
| | 235 | | | Republic of Peru, Senior Unsecured Notes, 6.55%, due 3/14/37 | | | 244 | | |
| | 155 | | | Republic of Philippines, Unsubordinated Notes, 9.88%, due 1/15/19 | | | 200 | | |
| | 170 | | | Republic of South Africa, Senior Unsecured Notes, 6.88%, due 5/27/19 | | | 190 | | |
| | 235 | | | Republic of Turkey, Unsecured Notes, 8.00%, due 2/14/34 | | | 267 | | |
| | 115 | | | Republic of Uruguay, Unsecured Notes, 8.00%, due 11/18/22 | | | 130 | | |
| | 225 | | | RSHB Capital SA, Senior Secured Notes, 6.30%, due 5/15/17 | | | 219 | | |
| | 215 | | | Russian Federation Bond, Senior Unsecured Notes, 7.50%, due 3/31/30 | | | 240 | | |
| | | | | Total Government Securities (Cost $3,900) | | | 3,797 | | |
| NUMBER OF SHARES | |
| Short-Term Investments (5.2%) | |
| | 6,772,498 | | | State Street Institutional Liquid Reserves Fund Institutional Class (Cost $6,772) | | | 6,772 | | |
| | | | | Total Investments (103.6%) (Cost $127,981) | | | 134,447 | ## | |
| | | | | Liabilities, less cash, receivables and other assets [(3.6%)] | | | (4,704 | ) | |
| | | | | Total Net Assets (100.0%) | | $ | 129,743 | | |
See Notes to Schedule of Investments
59
Notes to Schedule of Investments
† The value of investments in debt securities by Neuberger Berman Core Bond Fund ("Core Bond"), Neuberger Berman High Income Bond Fund ("High Income"), Neuberger Berman Municipal Intermediate Bond Fund ("Municipal Intermediate Bond"), Neuberger Berman Short Duration Bond Fund ("Short Duration"), and Neuberger Berman Strategic Income Fund ("Strategic Income") (each a "Bond Fund" or "Fund") and financial futures contracts by Core Bond, Short Duration and Strategic Income is determined by Neuberger Berman Management LLC ("Management") primarily by obtaining valuations from independent pricing services based on readily available bid quotations, or if quotations are not available, by methods which include considerations such as: yields or prices of securities of comparable quality, coupon, maturity and type; indications as to values from dealers; and general market conditions. If a valuation is not available from an independent pricing service, each Bond Fund seeks to obtain quotations from principal market makers. The value of investments in equity securities by each Bond Fund is determined by Management primarily by obtaining valuations from an independent pricing service based on the latest sale price when that price is readily available. Securities traded primarily on the NASDAQ Stock Market are normally valued by the Bond Funds at the NASDAQ Official Closing Price ("NOCP") provided by NASDAQ each business day. The NOCP is the most recently reported price as of 4:00:02 p.m., Eastern time, unless that price is outside the range of the "inside" bid and asked prices (i.e., the bid and asked prices that dealers quote to each other when trading for their own accounts); in that case, NASDAQ will adjust the price to equal the inside bid or asked price, whichever is closer. Because of delays in reporting trades, the NOCP may not be based on the price of the last trade to occur before the market closes. If there is no reported sale of a security on a particular day, the independent pricing service may value the security based on reported market quotations. In addition, for both debt and equity securities Management has developed a process to periodically review information provided by independent pricing services. For both debt and equity securities, if such quotations are not readily available, securities are valued using methods the Board of Trustees of Neuberger Berman Income Funds (the "Board") has approved on the belief that they reflect fair value. Numerous factors may be considered when determining the fair value of a security, including available analyst, media or other reports, trading in futures or ADRs and whether the issuer of the security being fair valued has other securities outstanding. Foreign security prices are furnished by independent quotation services and expressed in local currency values. Foreign security prices are currently translated from the local currency into U.S. dollars using the exchange rate as of 4:00 p.m., Eastern time. The Board has approved the use of Interactive Data Pricing and Reference Data, Inc. ("Interactive") to assist in determining the fair value of the Bond Funds' foreign equity securities when changes in the value of a certain index suggest that the closing prices on the foreign exchanges may no longer represent the amount that a Bond Fund could expect to receive for those securities. In this event, Interactive will provide adjusted prices for certain foreign equity securities using a statistical analysis of historical correlations of multiple factors. In the absence of precise information about the market values of these foreign securities as of the close of the New York Stock Exchange, the Board has determined on the basis of available data that prices adjusted in this way are likely to be closer to the prices the Bond Funds could realize on a current sale than are the prices of those securities established at the close of the foreign markets in which the securities primarily trade. Fair value prices are necessarily estimates, and there is no assurance that such a price will be at or close to the price at which the security is next quoted or next trades. Short-term debt securities with less than 60 days until maturity may be valued at cost, which, when combined with interest earned, is expected to approximate market value.
†† Investment securities of Neuberger Berman Municipal Money Fund ("Municipal Money"), and Neuberger Berman New York Municipal Money Fund ("New York Municipal Money") (each a "Fund") are valued at amortized cost, which approximates U.S. federal income tax cost.
In accordance with Accounting Standards Codification ("ASC") 820 "Fair Value Measurements and Disclosures" ("ASC 820"), formerly known as Financial Accounting Standards Board ("FASB") Statement of Financial Accounting Standards No. 157, Fair Value Measurements, investments held by a fund are carried at "fair value" as defined by ASC 820. Fair value is defined as the price that a Fund would receive upon selling an investment in an orderly transaction to an independent buyer in the principal or most advantageous market for the investment
See Notes to Financial Statements
60
Notes to Schedule of Investments (cont'd)
under current market conditions. Various inputs, including the volume and level of activity for the asset or liability in the market are considered in determining the value of the Funds' investments, some of which are discussed above. Significant management judgement may be necessary to estimate fair value in accordance with ASC 820.
In addition to defining fair value, ASC 820 established a three-tier hierarchy of inputs to establish a classification of fair value measurements for disclosure purposes. The three-tier hierarchy of inputs is summarized in the three broad Levels listed below.
• Level 1 – quoted prices in active markets for identical investments
• Level 2 – other significant observable inputs (including quoted prices for similar investments, interest rates, prepayment speeds, credit risk, amortized cost, etc.)
• Level 3 – significant unobservable inputs (including the Funds' own assumptions in determining the fair value of investments)
The inputs or methodology used for valuing an investment are not necessarily an indication of the risk associated with investing in those securities.
The following is a summary, by category of Level, of inputs used to value the Funds' investments as of October 31, 2009:
Asset Valuation Inputs
Neuberger Berman
(000's omitted) | | Level 1 | | Level 2 | | Level 3§ | | Total | |
| Core Bond | |
| Investments: | |
U.S. Treasury Securities-Backed by the Full Faith and
Credit of the U.S. Government | | $ | — | | | $ | 18,962 | | | $ | — | | | $ | 18,962 | | |
| U.S. Government Agency Securities | | | — | | | | 8,499 | | | | — | | | | 8,499 | | |
| Mortgage-Backed Securities | |
| Adjustable Rate Mortgages | | | — | | | | 6,931 | | | | 0 | | | | 6,931 | | |
| Fannie Mae | | | — | | | | 32,378 | | | | — | | | | 32,378 | | |
| Freddie Mac | | | — | | | | 5,692 | | | | — | | | | 5,692 | | |
| Total Mortgage-Backed Securities | | | — | | | | 45,001 | | | | 0 | | | | 45,001 | | |
| Corporate Debt Securities | |
| Bank | | | — | | | | 8,323 | | | | — | | | | 8,323 | | |
| Finance | | | — | | | | 6,171 | | | | — | | | | 6,171 | | |
| Industrial | | | — | | | | 17,268 | | | | 1,255 | | | | 18,523 | | |
| REITs | | | — | | | | 494 | | | | — | | | | 494 | | |
| Telecommunications | | | — | | | | 1,771 | | | | — | | | | 1,771 | | |
| Utility—Electric | | | — | | | | 517 | | | | — | | | | 517 | | |
| Total Corporate Debt Securities | | | — | | | | 34,544 | | | | 1,255 | | | | 35,799 | | |
| Asset-Backed Securities | | | — | | | | 11,038 | | | | 23 | | | | 11,061 | | |
| Short-Term Investments | | | — | | | | 4,971 | | | | — | | | | 4,971 | | |
| Total Investments | | | — | | | | 123,015 | | | | 1,278 | | | | 124,293 | | |
See Notes to Financial Statements
61
Notes to Schedule of Investments (cont'd)
Asset Valuation Inputs
Neuberger Berman
(000's omitted) | | Level 1 | | Level 2 | | Level 3§ | | Total | |
| High Income | |
| Investments: | |
| Bank Loan Obligations | |
| Airlines | | $ | — | | | $ | 11,683 | | | $ | — | | | $ | 11,683 | | |
| Automotive | | | — | | | | 4,844 | | | | — | | | | 4,844 | | |
| Electric—Generation | | | — | | | | 18,241 | | | | — | | | | 18,241 | | |
| Media—Cable | | | — | | | | 5,124 | | | | — | | | | 5,124 | | |
| Software/Services | | | — | | | | 2,546 | | | | — | | | | 2,546 | | |
| Support—Services | | | — | | | | 1,334 | | | | — | | | | 1,334 | | |
| Total Bank Loan Obligations | | | — | | | | 43,772 | | | | — | | | | 43,772 | | |
| Corporate Debt Securities | |
| Airlines | | | — | | | | 7,328 | | | | 6,931 | | | | 14,259 | | |
| Auto Loans | | | — | | | | 17,015 | | | | — | | | | 17,015 | | |
| Auto Parts & Equipment | | | — | | | | 6,064 | | | | — | | | | 6,064 | | |
| Automotive | | | — | | | | 3,786 | | | | — | | | | 3,786 | | |
| Banking | | | — | | | | 26,433 | | | | — | | | | 26,433 | | |
| Beverage | | | — | | | | 1,343 | | | | — | | | | 1,343 | | |
| Building & Construction | | | — | | | | 1,343 | | | | — | | | | 1,343 | | |
| Building Materials | | | — | | | | 11,211 | | | | — | | | | 11,211 | | |
| Chemicals | | | — | | | | 14,279 | | | | — | | | | 14,279 | | |
| Consumer/Commercial/Lease Financing | | | — | | | | 20,202 | | | | — | | | | 20,202 | | |
| Diversified Capital Goods | | | — | | | | 2,240 | | | | — | | | | 2,240 | | |
| Electric—Generation | | | — | | | | 27,685 | | | | 1,010 | | | | 28,695 | | |
| Electric—Integrated | | | — | | | | 1,189 | | | | — | | | | 1,189 | | |
| Electronics | | | — | | | | 3,801 | | | | — | | | | 3,801 | | |
| Energy—Exploration & Production | | | — | | | | 9,530 | | | | — | | | | 9,530 | | |
| Food & Drug Retailers | | | — | | | | 7,284 | | | | — | | | | 7,284 | | |
| Forestry/Paper | | | — | | | | 4,687 | | | | — | | | | 4,687 | | |
| Gaming | | | — | | | | 31,827 | | | | — | | | | 31,827 | | |
| Gas Distribution | | | — | | | | 38,253 | | | | — | | | | 38,253 | | |
| Health Services | | | — | | | | 22,812 | | | | — | | | | 22,812 | | |
| Machinery | | | — | | | | 1,877 | | | | — | | | | 1,877 | | |
| Media—Broadcast | | | — | | | | 22,334 | | | | — | | | | 22,334 | | |
| Media—Cable | | | — | | | | 13,760 | | | | — | | | | 13,760 | | |
| Media—Services | | | — | | | | 15,806 | | | | — | | | | 15,806 | | |
See Notes to Financial Statements
62
Notes to Schedule of Investments (cont'd)
Asset Valuation Inputs
Neuberger Berman
(000's omitted) | | Level 1 | | Level 2 | | Level 3§ | | Total | |
| Metals/Mining Excluding Steel | | $ | — | | | $ | 5,347 | | | $ | — | | | $ | 5,347 | | |
| Non-Food & Drug Retailers | | | — | | | | 16,073 | | | | — | | | | 16,073 | | |
| Packaging | | | — | | | | 852 | | | | — | | | | 852 | | |
| Printing & Publishing | | | — | | | | 8,644 | | | | — | | | | 8,644 | | |
| Real Estate Dev. & Mgt. | | | — | | | | 8,420 | | | | — | | | | 8,420 | | |
| REITs | | | — | | | | 5,979 | | | | — | | | | 5,979 | | |
| Restaurants | | | — | | | | 1,299 | | | | — | | | | 1,299 | | |
| Software/Services | | | — | | | | 20,094 | | | | — | | | | 20,094 | | |
| Steel Producers/Products | | | — | | | | 4,949 | | | | — | | | | 4,949 | | |
| Support—Services | | | — | | | | 15,171 | | | | — | | | | 15,171 | | |
| Telecom—Integrated/Services | | | — | | | | 29,949 | | | | — | | | | 29,949 | | |
| Telecom—Wireless | | | — | | | | 36,586 | | | | — | | | | 36,586 | | |
| Total Corporate Debt Securities | | | — | | | | 465,452 | | | | 7,941 | | | | 473,393 | | |
| Preferred Stocks | |
| Banking | | | — | | | | 133 | | | | — | | | | 133 | | |
| Short-Term Investments | | | — | | | | 47,355 | | | | — | | | | 47,355 | | |
| Total Investments | | | — | | | | 556,712 | | | | 7,941 | | | | 564,653 | | |
| Municipal Intermediate Bond | |
| Investments: | |
| Municipal Debt Securities^ | | | — | | | | 91,419 | | | | — | | | | 91,419 | | |
| Total Investments | | | — | | | | 91,419 | | | | — | | | | 91,419 | | |
| Municipal Money | |
| Investments: | |
| Municipal Notes^ | | | — | | | | 315,086 | | | | — | | | | 315,086 | | |
| Total Investments | | | — | | | | 315,086 | | | | — | | | | 315,086 | | |
| New York Municipal Money | |
| Investments: | |
| Municipal Notes^ | | | — | | | | 321,817 | | | | — | | | | 321,817 | | |
| Total Investments | | | — | | | | 321,817 | | | | — | | | | 321,817 | | |
| Short Duration | |
| Investments: | |
U.S. Treasury Securities-Backed by the Full Faith and
Credit of the U.S. Government | | | — | | | | 16,964 | | | | — | | | | 16,964 | | |
| Mortgage-Backed Securities^ | | | — | | | | 24,485 | | | | 0 | | | | 24,485 | | |
| Corporate Debt Securities^ | | | — | | | | 13,508 | | | | — | | | | 13,508 | | |
| Asset-Backed Securities | | | — | | | | 5,656 | | | | — | | | | 5,656 | | |
| Short-Term Investments | | | — | | | | 546 | | | | — | | | | 546 | | |
| Total Investments | | | — | | | | 61,159 | | | | 0 | | | | 61,159 | | |
See Notes to Financial Statements
63
Notes to Schedule of Investments (cont'd)
Asset Valuation Inputs
Neuberger Berman
(000's omitted) | | Level 1 | | Level 2 | | Level 3§ | | Total | |
| Strategic Income | |
| Investments: | |
| Bank Loan Obligations | |
| Airlines | | $ | — | | | $ | 367 | | | $ | — | | | $ | 367 | | |
| Automotive | | | — | | | | 159 | | | | — | | | | 159 | | |
| Electric | | | — | | | | 672 | | | | — | | | | 672 | | |
| Electric—Generation | | | — | | | | 950 | | | | — | | | | 950 | | |
| Media—Cable | | | — | | | | 399 | | | | — | | | | 399 | | |
| Total Bank Loan Obligations | | | — | | | | 2,547 | | | | — | | | | 2,547 | | |
U.S. Treasury Securities-Backed by the Full Faith and
Credit of the U.S. Government | | | — | | | | 20,247 | | | | — | | | | 20,247 | | |
| U.S. Government Agency Securities | | | — | | | | 2,500 | | | | — | | | | 2,500 | | |
| Mortgage-Backed Securities | |
| Adjustable Rate Mortgages | | | — | | | | 3,711 | | | | — | | | | 3,711 | | |
| Commercial Mortgage-Backed | | | — | | | | 9,257 | | | | — | | | | 9,257 | | |
| Fannie Mae | | | — | | | | 19,019 | | | | — | | | | 19,019 | | |
| Freddie Mac | | | — | | | | 3,974 | | | | — | | | | 3,974 | | |
| Government National Mortgage Association | | | — | | | | 9 | | | | — | | | | 9 | | |
| Total Mortgage-Backed Securities | | | — | | | | 35,970 | | | | — | | | | 35,970 | | |
| Corporate Debt Securities | |
| Aerospace/Defense | | | — | | | | 105 | | | | — | | | | 105 | | |
| Airlines | | | — | | | | 769 | | | | 1,559 | | | | 2,328 | | |
| Automotive | | | — | | | | 1,926 | | | | — | | | | 1,926 | | |
| Banking | | | — | | | | 10,417 | | | | — | | | | 10,417 | | |
| Building Materials | | | — | | | | 676 | | | | — | | | | 676 | | |
| Chemicals | | | — | | | | 1,961 | | | | — | | | | 1,961 | | |
| Construction Machinery | | | — | | | | 593 | | | | — | | | | 593 | | |
| Consumer Cyclical Services | | | — | | | | 342 | | | | — | | | | 342 | | |
| Distributors | | | — | | | | 846 | | | | — | | | | 846 | | |
| Diversified Manufacturing | | | — | | | | 1,288 | | | | — | | | | 1,288 | | |
| Electric | | | — | | | | 2,776 | | | | — | | | | 2,776 | | |
| Entertainment | | | — | | | | 997 | | | | — | | | | 997 | | |
| Environmental | | | — | | | | 289 | | | | — | | | | 289 | | |
| Financial Other | | | — | | | | 467 | | | | — | | | | 467 | | |
| Food & Beverage | | | — | | | | 1,767 | | | | 442 | | | | 2,209 | | |
| Gaming | | | — | | | | 1,388 | | | | — | | | | 1,388 | | |
| Health Care | | | — | | | | 1,772 | | | | — | | | | 1,772 | | |
| Home Construction | | | — | | | | 211 | | | | — | | | | 211 | | |
See Notes to Financial Statements
64
Notes to Schedule of Investments (cont'd)
Asset Valuation Inputs
Neuberger Berman
(000's omitted) | | Level 1 | | Level 2 | | Level 3§ | | Total | |
| Independent | | $ | — | | | $ | 2,215 | | | $ | — | | | $ | 2,215 | | |
| Integrated | | | — | | | | 606 | | | | — | | | | 606 | | |
| Life | | | — | | | | 366 | | | | — | | | | 366 | | |
| Lodging | | | — | | | | 85 | | | | — | | | | 85 | | |
| Media—Cable | | | — | | | | 2,152 | | | | — | | | | 2,152 | | |
| Media Noncable | | | — | | | | 2,682 | | | | — | | | | 2,682 | | |
| Metals & Mining | | | — | | | | 1,264 | | | | — | | | | 1,264 | | |
| Non Captive Consumer | | | — | | | | 1,020 | | | | — | | | | 1,020 | | |
| Non Captive Diversified | | | — | | | | 2,149 | | | | — | | | | 2,149 | | |
| Oil & Gas | | | — | | | | 324 | | | | — | | | | 324 | | |
| Packaging | | | — | | | | 551 | | | | — | | | | 551 | | |
| Paper | | | — | | | | 461 | | | | — | | | | 461 | | |
| Pharmaceuticals | | | — | | | | 668 | | | | — | | | | 668 | | |
| Pipelines | | | — | | | | 5,083 | | | | — | | | | 5,083 | | |
| REITs | | | — | | | | 712 | | | | — | | | | 712 | | |
| Refining | | | — | | | | 555 | | | | — | | | | 555 | | |
| Retailers | | | — | | | | 1,417 | | | | — | | | | 1,417 | | |
| Supermarkets | | | — | | | | 826 | | | | — | | | | 826 | | |
| Technology | | | — | | | | 1,689 | | | | — | | | | 1,689 | | |
| Tobacco | | | — | | | | 1,157 | | | | — | | | | 1,157 | | |
| Transportation Services | | | — | | | | 372 | | | | — | | | | 372 | | |
| Wireless | | | — | | | | 2,127 | | | | — | | | | 2,127 | | |
| Wirelines | | | — | | | | 3,167 | | | | — | | | | 3,167 | | |
| Total Corporate Debt Securities | | | — | | | | 60,238 | | | | 2,001 | | | | 62,239 | | |
| Asset-Backed Securities | | | — | | | | 375 | | | | — | | | | 375 | | |
| Government Securities | | | — | | | | 3,797 | | | | — | | | | 3,797 | | |
| Short-Term Investments | | | — | | | | 6,772 | | | | — | | | | 6,772 | | |
| Total Investments | | | — | | | | 132,446 | | | | 2,001 | | | | 134,447 | | |
^ The Schedule of Investments provides information on the industry or state categorization for the portfolio.
See Notes to Financial Statements
65
Notes to Schedule of Investments (cont'd)
§ The following is a reconciliation between the beginning and ending balances of investments in which significant unobservable inputs (Level 3) were used in determining value:
Neuberger Berman
(000's omitted) | | Beginning
balance, as
of 11/1/08 | | Accrued
discounts/
(premiums) | | Realized
gain/loss
and change
in unrealized
appreciation/
(depreciation) | | Net
purchases/
(sales) | | Net transfers
in and/or out
of Level 3 | | Balance, as
of 10/31/09 | | Net change
in unrealized
appreciation/
(depreciation)
from investments
still held as of
10/31/09 | |
Investments in
Securities: | |
| Core Bond | |
Mortgage-Backed
Securities | |
Adjustable Rate
Mortgages | | $ | 293 | | | $ | — | | | $ | (27 | ) | | $ | (266 | ) | | $ | — | | | $ | 0 | | | $ | (6 | ) | |
Corporate Debt
Securities | |
| Industrial | | | 350 | | | | — | | | | 181 | | | | 394 | | | | 330 | | | | 1,255 | | | | 146 | | |
| Asset-Backed Securities | | | 85 | | | | — | | | | (66 | ) | | | 4 | | | | — | | | | 23 | | | | (66 | ) | |
| Total | | | 728 | | | | — | | | | 88 | | | | 132 | | | | 330 | | | | 1,278 | | | | 74 | | |
| High Income | |
Corporate Debt
Securities | |
| Airlines | | | — | | | | — | | | | 1,552 | | | | 5,379 | | | | — | | | | 6,931 | | | | 1,306 | | |
| Electric—Generation | | | 1,598 | | | | — | | | | 123 | | | | (711 | ) | | | — | | | | 1,010 | | | | 165 | | |
| Total | | | 1,598 | | | | — | | | | 1,675 | | | | 4,668 | | | | — | | | | 7,941 | | | | 1,471 | | |
| Short Duration | |
| Asset-Backed Securities | | | 3 | | | | — | | | | (2 | ) | | | (1 | ) | | | — | | | | — | | | | — | | |
Mortgage-Backed
Securities | | | 4 | | | | — | | | | (4 | ) | | | — | | | | — | | | | 0 | | | | (4 | ) | |
| Total | | | 7 | | | | — | | | | (6 | ) | | | (1 | ) | | | — | | | | 0 | | | | (4 | ) | |
| Strategic Income | |
Corporate Debt
Securities | |
| Airlines | | | 30 | | | | 1 | | | | 245 | | | | 1,273 | | | | 10 | | | | 1,559 | | | | 216 | | |
| Food & Beverage | | | — | | | | — | | | | 4 | | | | 438 | | | | — | | | | 442 | | | | 4 | | |
| Total | | | 30 | | | | 1 | | | | 249 | | | | 1,711 | | | | 10 | | | | 2,001 | | | | 220 | | |
See Notes to Financial Statements
66
Notes to Schedule of Investments (cont'd)
The following is a summary, by category of Level, of inputs used to value the Funds' derivatives as of October 31, 2009:
Neuberger Berman
(000's omitted) | | Level 1 | | Level 2 | | Level 3 | | Total | |
| Short Duration | |
| Futures Contracts | | $ | 15 | | | $ | — | | | $ | — | | | $ | 15 | | |
| Liability Valuation Inputs | |
The following is a summary, by category of Level, of inputs used to value the Funds' derivatives as of October 31, 2009:
Neuberger Berman
(000's omitted) | | Level 1 | | Level 2 | | Level 3 | | Total | |
| Core Bond | |
| Futures Contracts | | $ | (14 | ) | | $ | — | | | $ | — | | | $ | (14 | ) | |
| Strategic Income | |
| Futures Contracts | | | (24 | ) | | | — | | | | — | | | | (24 | ) | |
## At October 31, 2009, selected Fund information on a U.S. federal income tax basis was as follows:
Neuberger Berman
(000's omitted) | | Cost | | Gross
Unrealized
Appreciation | | Gross
Unrealized
Depreciation | | Net
Unrealized
Appreciation
(Depreciation) | |
| Core Bond | | $ | 125,183 | | | $ | 3,831 | | | $ | 4,721 | | | $ | (890 | ) | |
| High Income | | | 522,618 | | | | 44,530 | | | | 2,495 | | | | 42,035 | | |
| Municipal Intermediate Bond | | | 90,874 | | | | 999 | | | | 454 | | | | 545 | | |
| Short Duration | | | 67,782 | | | | 363 | | | | 6,986 | | | | (6,623 | ) | |
| Strategic Income | | | 128,054 | | | | 6,572 | | | | 179 | | | | 6,393 | | |
@@ Municipal securities held by Municipal Money and New York Municipal Money are within the two highest rating categories assigned by a nationally recognized statistical rating organization ("NRSRO") such as Moody's Investors Service, Inc. or Standard & Poor's or, where not rated, are determined by the Fund's investment manager to be of comparable quality. Municipal securities held by Municipal Intermediate Bond are within the four highest rating categories assigned by a NRSRO or, where not rated, are determined by the Fund's investment manager to be of comparable quality. Approximately 55%, 95%, and 98% of the municipal securities held by Municipal Intermediate Bond, Municipal Money, and New York Municipal Money, respectively, have credit enhancement features backing them, which the Funds may rely on, such as letters of credit, insurance, or guarantees. Without these credit enhancement features the securities may or may not meet the quality standards of the Fund. Pre-refunded bonds are supported by securities in escrow issued or guaranteed by the U.S. Government, its agencies, or instrumentalities. The amount escrowed is sufficient to pay the periodic interest due and the principal of these bonds. Putable bonds give the Funds the right to sell back the issue on the date specified.
‡ Managed by an affiliate of Management and could be deemed an affiliate of the Fund (see Notes A & F of Notes to Financial Statements).
See Notes to Financial Statements
67
Notes to Schedule of Investments (cont'd)
ñ Restricted security subject to restrictions on resale under federal securities laws. These securities may be resold in transactions exempt from registration, normally to qualified institutional buyers under Rule 144A under the Securities Act of 1933, as amended, and have been deemed by the investment manager to be liquid. At October 31, 2009, these securities amounted to approximately $7,565,000 or 7.3% of net assets for Core Bond, approximately $139,350,000 or 26.0% of net assets for High Income, approximately $51,362,000 or 16.2% of net assets for Municipal Money, approximately $36,680,000 or 11.3% of net assets for New York Municipal Money, approximately $2,934,000 or 4.8% of net assets for Short Duration, and approximately $14,814,000 or 11.4% of net assets for Strategic Income.
ß Security is guaranteed by the corporate or non-profit obligor.
Ø All or a portion of this security was purchased on a when-issued basis. At October 31, 2009, these securities amounted to $21,259,000 for Core Bond, $3,374,000 for Municipal Intermediate Bond and $9,232,000 for Strategic Income, respectively.
b All or a portion of this security was purchased on a delayed delivery basis. As of October 31, 2009, the value of High Income's unfunded loan commitments were approximately $4,251,000 pursuant to the following loan agreements:
| Borrower | | Principal Amount | | Value | |
| Ford Motor Co., Term Loan B1, 5.24%, due 12/16/13 | | $ | 2,331,000 | | | $ | 2,071,000 | | |
| United Airlines, Inc., Term Loan B, 2.48%, due 2/1/14 | | | 2,790,000 | | | | 2,180,000 | | |
All or a portion of this security was purchased on a delayed delivery basis. As of October 31, 2009, the value of Strategic Income's unfunded loan commitment was approximately $441,000 pursuant to the following loan agreement:
| Borrower | | Principal Amount | | Value | |
| United Airlines, Inc., Term Loan B, 2.48%, due 2/1/14 | | $ | 565,000 | | | $ | 441,000 | | |
ØØ All or a portion of this security is segregated in connection with obligations for when-issued purchase commitments and/or financial futures contracts and/or delayed delivery purchase commitments.
µ Floating rate securities are securities whose yields vary with a designated market index or market rate. These securities are shown at their current rates as of October 31, 2009.
** Denotes a step-up bond: a zero coupon bond that converts to a fixed rate of interest at a designated future date.
È All or a portion of this security is on loan (see Note A of Notes to Financial Statements).
^^ Value of the security was determined using methods the Board has approved on the belief they reflect fair value.
a Security is in default.
c Security is subject to a guarantee provided by Bank of America, backing 100% of the total principal.
d Step Bond: Coupon rate is a fixed rate for an initial period then resets at a specified date and rate.
k Security is subject to a guarantee provided by Citibank, N.A., backing 100% of the total principal.
o Security is subject to a guarantee provided by Fifth Third Bank, backing 100% of the total principal.
p Security is subject to a guarantee provided by Dexia Credit Locale de France, backing 100% of the total principal.
q Security is subject to a guarantee provided by Deutsche Bank, backing 100% of the total principal.
See Notes to Financial Statements
68
Notes to Schedule of Investments (cont'd)
s Security is subject to a guarantee provided by JP Morgan Chase, backing 100% of the total principal.
y Security is subject to a guarantee provided by Morgan Stanley, backing 100% of the total principal.
cc Security is subject to a guarantee provided by Societe Generale, backing 100% of the total principal.
ii Security is subject to a guarantee provided by Banco Santander, backing 100% of the total principal.
jj Security is subject to a guarantee provided by Wells Fargo Bank, backing 100% of the total principal.
mm Security is subject to a guarantee provided by Wachovia Bank, backing 100% of the total principal.
pp Security is subject to a guarantee provided by Federal Home Loan Bank, backing 100% of the total principal.
See Notes to Financial Statements
69
Statements of Assets and Liabilities
Neuberger Berman Income Funds
(000's omitted except per share amounts)
| | | CORE BOND
FUND | | HIGH INCOME
BOND FUND | | MUNICIPAL
INTERMEDIATE
BOND FUND | | MUNICIPAL
MONEY FUND | |
| | | October 31,
2009 | | October 31,
2009 | | October 31,
2009 | | October 31,
2009 | |
| Assets | |
| Investments in securities, at value *† (Notes A & F)—see Schedule of Investments: | | | | | | | | | | | | | | | | | |
| Unaffiliated issuers | | $ | 123,191 | | | $ | 551,500 | | | $ | 91,419 | | | $ | 315,086 | | |
| Affiliated issuers | | | 1,102 | | | | 13,153 | | | | — | | | | — | | |
| | | | 124,293 | | | | 564,653 | | | | 91,419 | | | | 315,086 | | |
| Cash | | | — | | | | 886 | | | | 69 | | | | 479 | | |
| Deposits with brokers for futures contracts | | | 200 | | | | — | | | | — | | | | — | | |
| Dividends and interest receivable | | | 785 | | | | 12,685 | | | | 1,246 | | | | 520 | | |
| Receivable for securities sold | | | 954 | | | | 13,076 | | | | 4,716 | | | | 475 | | |
| Receivable for variation margin (Note A) | | | — | | | | — | | | | — | | | | — | | |
| Receivable for Fund shares sold | | | 187 | | | | 1,512 | | | | 97 | | | | 3 | | |
| Receivable from administrator—net (Note B) | | | — | | | | — | | | | 15 | | | | 65 | | |
| Receivable due from broker | | | — | | | | — | | | | — | | | | — | | |
| Receivable for securities lending income—net (Note A) | | | — | | | | 15 | | | | — | | | | — | | |
| Prepaid expenses and other assets | | | 4 | | | | 17 | | | | 2 | | | | 18 | | |
| Total Assets | | | 126,423 | | | | 592,844 | | | | 97,564 | | | | 316,646 | | |
| Liabilities | |
| Distributions payable | | | 92 | | | | 621 | | | | 111 | | | | — | | |
| Due to custodian | | | 1 | | | | — | | | | — | | | | — | | |
| Payable for collateral on securities loaned (Note A) | | | 1,091 | | | | 13,079 | | | | — | | | | — | | |
| Payable for securities purchased | | | 21,577 | | | | 29,943 | | | | 4,954 | | | | — | | |
| Payable for Fund shares redeemed | | | 77 | | | | 13,065 | | | | 68 | | | | — | | |
| Payable to investment manager—net (Notes A & B) | | | — | | | | 212 | | | | 19 | | | | 72 | | |
| Payable to administrator—net (Note B) | | | 6 | | | | 49 | | | | — | | | | — | | |
| Payable for variation margin (Note A) | | | 14 | | | | — | | | | — | | | | — | | |
| Accrued expenses and other payables | | | 86 | | | | 205 | | | | 79 | | | | 111 | | |
| Total Liabilities | | | 22,944 | | | | 57,174 | | | | 5,231 | | | | 183 | | |
| Net Assets at value | | $ | 103,479 | | | $ | 535,670 | | | $ | 92,333 | | | $ | 316,463 | | |
| Net Assets consist of: | |
| Paid-in capital | | $ | 103,918 | | | $ | 529,855 | | | $ | 92,125 | | | $ | 316,405 | | |
| Undistributed net investment income (loss) | | | — | | | | 3,029 | | | | — | | | | 18 | | |
| Accumulated net realized gains (losses) on investments | | | 462 | | | | (40,450 | ) | | | (336 | ) | | | 40 | | |
| Net unrealized appreciation (depreciation) in value of investments | | | (901 | ) | | | 43,236 | | | | 544 | | | | — | | |
| Net Assets at value | | $ | 103,479 | | | $ | 535,670 | | | $ | 92,333 | | | $ | 316,463 | | |
| Net Assets | |
| Investor Class | | $ | 24,974 | | | $ | 422,222 | | | $ | 92,333 | | | $ | 316,463 | | |
| Institutional Class | | | 59,142 | | | | 86,553 | | | | — | | | | — | | |
| Trust Class | | | — | | | | — | | | | — | | | | — | | |
| Class A | | | 18,531 | | | | 24,259 | | | | — | | | | — | | |
| Class C | | | 832 | | | | 2,556 | | | | — | | | | — | | |
| Class R3 | | | — | | | | 80 | | | | — | | | | — | | |
Shares Outstanding
($.001 par value; unlimited shares authorized) | |
| Investor Class | | | 2,452 | | | | 48,750 | | | | 8,229 | | | | 316,479 | | |
| Institutional Class | | | 5,795 | | | | 9,976 | | | | — | | | | — | | |
| Trust Class | | | — | | | | — | | | | — | | | | — | | |
| Class A | | | 1,821 | | | | 2,800 | | | | — | | | | — | | |
| Class C | | | 82 | | | | 295 | | | | — | | | | — | | |
| Class R3 | | | — | | | | 9 | | | | — | | | | — | | |
Net Asset Value,
offering and redemption price per share | |
| Investor Class | | $ | 10.19 | | | $ | 8.66 | | | $ | 11.22 | | | $ | 1.00 | | |
| Institutional Class | | | 10.21 | | | | 8.68 | | | | — | | | | — | | |
| Trust Class | | | — | | | | — | | | | — | | | | — | | |
| Class R3 | | | — | | | | 8.67 | | | | — | | | | — | | |
Net Asset Value
and redemption price per share | |
| Class A | | | 10.18 | | | | 8.66 | | | | — | | | | — | | |
| Offering Price per share | |
| Class A‡ | | | 10.63 | | | | 9.04 | | | | — | | | | — | | |
Net Asset Value
and offering price per share | |
| Class C^ | | | 10.18 | | | | 8.67 | | | | — | | | | — | | |
| † Securities on loan, at value: | |
| Unaffiliated issuers | | $ | 1,047 | | | $ | 12,829 | | | $ | — | | | $ | — | | |
| * Cost of Investments: | |
| Unaffiliated issuers | | $ | 124,089 | | | $ | 508,264 | | | $ | 90,875 | | | $ | 315,086 | | |
| Affiliated issuers | | | 1,091 | | | | 13,153 | | | | — | | | | — | | |
| Total cost of investments | | $ | 125,180 | | | $ | 521,417 | | | $ | 90,875 | | | $ | 315,086 | | |
‡ On single retail sales of less than $50,000. On sales of $50,000 or more or in certain other circumstances described in the Fund's prospectus, offering price is reduced.
^ Redemption price per share is equal to net asset value less any applicable contingent deferred sales charge.
See Notes to Financial Statements
70
| | | NEW YORK
MUNICIPAL
MONEY FUND | | SHORT
DURATION
BOND FUND | | STRATEGIC
INCOME FUND | |
| | | October 31,
2009 | | October 31,
2009 | | October 31,
2009 | |
| Assets | |
| Investments in securities, at value *† (Notes A & F)—see Schedule of Investments: | | | | | | | | | | | | | |
| Unaffiliated issuers | | $ | 321,817 | | | $ | 61,159 | | | $ | 134,447 | | |
| Affiliated issuers | | | — | | | | — | | | | — | | |
| | | | 321,817 | | | | 61,159 | | | | 134,447 | | |
| Cash | | | 2,511 | | | | — | | | | 296 | | |
| Deposits with brokers for futures contracts | | | — | | | | — | | | | 200 | | |
| Dividends and interest receivable | | | 447 | | | | 348 | | | | 1,488 | | |
| Receivable for securities sold | | | 383 | | | | — | | | | 2,286 | | |
| Receivable for variation margin (Note A) | | | — | | | | 15 | | | | — | | |
| Receivable for Fund shares sold | | | — | | | | 56 | | | | 2,575 | | |
| Receivable from administrator—net (Note B) | | | 76 | | | | 3 | | | | 4 | | |
| Receivable due from broker | | | — | | | | — | | | | 185 | | |
| Receivable for securities lending income—net (Note A) | | | — | | | | — | | | | — | | |
| Prepaid expenses and other assets | | | 22 | | | | 5 | | | | 2 | | |
| Total Assets | | | 325,256 | | | | 61,586 | | | | 141,483 | | |
| Liabilities | |
| Distributions payable | | | — | | | | 12 | | | | 173 | | |
| Due to custodian | | | — | | | | — | | | | — | | |
| Payable for collateral on securities loaned (Note A) | | | — | | | | — | | | | — | | |
| Payable for securities purchased | | | 1,700 | | | | 586 | | | | 11,098 | | |
| Payable for Fund shares redeemed | | | — | | | | 81 | | | | 269 | | |
| Payable to investment manager—net (Notes A & B) | | | 74 | | | | 13 | | | | 56 | | |
| Payable to administrator—net (Note B) | | | — | | | | — | | | | — | | |
| Payable for variation margin (Note A) | | | — | | | | — | | | | 24 | | |
| Accrued expenses and other payables | | | 76 | | | | 107 | | | | 120 | | |
| Total Liabilities | | | 1,850 | | | | 799 | | | | 11,740 | | |
| Net Assets at value | | $ | 323,406 | | | $ | 60,787 | | | $ | 129,743 | | |
| Net Assets consist of: | |
| Paid-in capital | | $ | 323,912 | | | $ | 83,711 | | | $ | 121,234 | | |
| Undistributed net investment income (loss) | | | — | | | | 294 | | | | 95 | | |
| Accumulated net realized gains (losses) on investments | | | (506 | ) | | | (16,940 | ) | | | 1,972 | | |
| Net unrealized appreciation (depreciation) in value of investments | | | — | | | | (6,278 | ) | | | 6,442 | | |
| Net Assets at value | | $ | 323,406 | | | $ | 60,787 | | | $ | 129,743 | | |
| Net Assets | |
| Investor Class | | $ | 323,406 | | | $ | 52,642 | | | $ | — | | |
| Institutional Class | | | — | | | | — | | | | 18,712 | | |
| Trust Class | | | — | | | | 8,145 | | | | 6,674 | | |
| Class A | | | — | | | | — | | | | 68,196 | | |
| Class C | | | — | | | | — | | | | 36,161 | | |
| Class R3 | | | — | | | | — | | | | — | | |
Shares Outstanding
($.001 par value; unlimited shares authorized) | |
| Investor Class | | | 323,912 | | | | 6,721 | | | | — | | |
| Institutional Class | | | — | | | | — | | | | 1,768 | | |
| Trust Class | | | — | | | | 1,091 | | | | 631 | | |
| Class A | | | — | | | | — | | | | 6,441 | | |
| Class C | | | — | | | | — | | | | 3,418 | | |
| Class R3 | | | — | | | | — | | | | — | | |
Net Asset Value,
offering and redemption price per share | |
| Investor Class | | $ | 1.00 | | | $ | 7.83 | | | $ | — | | |
| Institutional Class | | | — | | | | — | | | | 10.58 | | |
| Trust Class | | | — | | | | 7.46 | | | | 10.58 | | |
| Class R3 | | | — | | | | — | | | | — | | |
| Net Asset Value and redemption price per share | |
| Class A | | | — | | | | — | | | | 10.59 | | |
| Offering Price per share | |
| Class A‡ | | | — | | | | — | | | | 11.06 | | |
| Net Asset Value and offering price per share | |
| Class C^ | | | — | | | | — | | | | 10.58 | | |
| † Securities on loan, at value: | |
| Unaffiliated issuers | | $ | — | | | $ | — | | | $ | — | | |
| * Cost of Investments: | |
| Unaffiliated issuers | | $ | 321,817 | | | $ | 67,508 | | | $ | 127,981 | | |
| Affiliated issuers | | | — | | | | — | | | | — | | |
| Total cost of investments | | $ | 321,817 | | | $ | 67,508 | | | $ | 127,981 | | |
71
Statements of Operations
Neuberger Berman Income Funds
(000's omitted)
| | | CORE BOND
FUND | | HIGH INCOME
BOND FUND | | MUNICIPAL
INTERMEDIATE
BOND FUND | | MUNICIPAL
MONEY FUND | |
| | | For the
Year Ended
October 31,
2009 | | For the
Year Ended
October 31,
2009 | | For the
Year Ended
October 31,
2009 | | For the
Year Ended
October 31,
2009 | |
| Investment Income: | |
| Income (Note A): | | | | | | | | | | | | | | | | | |
| Interest income—unaffiliated issuers | | $ | 3,682 | | | $ | 34,559 | | | $ | 1,735 | | | $ | 4,007 | | |
| Dividend income—unaffiliated issuers | | | — | | | | 13 | | | | — | | | | — | | |
| Income from securities loaned—net (Note F) | | | — | | | | 29 | | | | — | | | | — | | |
| Income from investments in affiliated issuers (Note F) | | | 18 | | | | 56 | | | | — | | | | — | | |
| Total income | | $ | 3,700 | | | $ | 34,657 | | | $ | 1,735 | | | $ | 4,007 | | |
| Expenses: | |
| Investment management fees (Note B) | | | 181 | | | | 1,529 | | | | 114 | | | | 997 | | |
| Administration fees (Note B) | | | 43 | | | | 191 | | | | 27 | | | | 239 | | |
| Administration fees (Note B): | | | | | | | | | | | | | | | | | |
| Investor Class | | | 66 | | | | 631 | | | | 96 | | | | 838 | | |
| Institutional Class | | | 31 | | | | 13 | | | | — | | | | — | | |
| Trust Class | | | — | | | | — | | | | — | | | | — | | |
| Class A | | | 12 | | | | 7 | | | | — | | | | — | | |
| Class C | | | 1 | | | | 1 | | | | — | | | | — | | |
| Class R3 | | | — | | | | — | | | | — | | | | — | | |
| Distribution fees (Note B): | | | | | | | | | | | | | | | | | |
| Investor Class | | | 78 | | | | — | | | | — | | | | — | | |
| Trust Class | | | — | | | | — | | | | — | | | | — | | |
| Class A | | | 15 | | | | 8 | | | | — | | | | — | | |
| Class C | | | 5 | | | | 5 | | | | — | | | | — | | |
| Class R3 | | | — | | | | — | | | | — | | | | — | | |
| Shareholder servicing agent fees: | | | | | | | | | | | | | | | | | |
| Investor Class | | | 36 | | | | 152 | | | | 34 | | | | 36 | | |
| Institutional Class | | | 23 | | | | — | | | | — | | | | — | | |
| Trust Class | | | — | | | | — | | | | — | | | | — | | |
| Class A | | | 10 | | | | 1 | | | | — | | | | — | | |
| Class C | | | 3 | | | | — | | | | — | | | | — | | |
| Class R3 | | | — | | | | 1 | | | | — | | | | — | | |
| Audit fees | | | 25 | | | | 57 | | | | 47 | | | | 40 | | |
| U.S. Treasury Temporary Gurantee Program Fee (Note H) | | | — | | | | — | | | | — | | | | 202 | | |
| Custodian fees (Note B) | | | 114 | | | | 209 | | | | 43 | | | | 185 | | |
| Insurance expense | | | 3 | | | | 7 | | | | 1 | | | | 23 | | |
| Legal fees | | | 49 | | | | 227 | | | | 66 | | | | 72 | | |
| Registration and filing fees | | | 89 | | | | 109 | | | | 24 | | | | 53 | | |
| Shareholder reports | | | 14 | | | | 58 | | | | 7 | | | | 24 | | |
| Trustees' fees and expenses | | | 49 | | | | 55 | | | | 49 | | | | 49 | | |
| Miscellaneous | | | 10 | | | | 36 | | | | 3 | | | | 51 | | |
| Total expenses | | | 857 | | | | 3,297 | | | | 511 | | | | 2,809 | | |
See Notes to Financial Statements
72
| | | NEW YORK
MUNICIPAL
MONEY FUND | | SHORT
DURATION
BOND FUND | | STRATEGIC
INCOME
FUND | |
| | | For the
Year Ended
October 31,
2009 | | For the
Year Ended
October 31,
2009 | | For the
Year Ended
October 31,
2009 | |
| Investment Income: | |
| Income (Note A): | | | | | | | | | | | | | |
| Interest income—unaffiliated issuers | | $ | 4,050 | | | $ | 3,271 | | | $ | 2,592 | | |
| Dividend income—unaffiliated issuers | | | — | | | | — | | | | — | | |
| Income from securities loaned—net (Note F) | | | — | | | | — | | | | — | | |
| Income from investments in affiliated issuers (Note F) | | | — | | | | 3 | | | | 7 | | |
| Total income | | $ | 4,050 | | | $ | 3,274 | | | $ | 2,599 | | |
| Expenses: | |
| Investment management fees (Note B) | | | 1,120 | | | | 151 | | | | 265 | | |
| Administration fees (Note B) | | | 269 | | | | 36 | | | | 29 | | |
| Administration fees (Note B): | | | | | | | | | | | | | |
| Investor Class | | | 941 | | | | 110 | | | | — | | |
| Institutional Class | | | — | | | | — | | | | 8 | | |
| Trust Class | | | — | | | | 36 | | | | 9 | | |
| Class A | | | — | | | | — | | | | 54 | | |
| Class C | | | — | | | | — | | | | 24 | | |
| Class R3 | | | — | | | | — | | | | — | | |
| Distribution fees (Note B): | | | | | | | | | | | | | |
| Investor Class | | | — | | | | — | | | | — | | |
| Trust Class | | | — | | | | — | | | | 3 | | |
| Class A | | | — | | | | — | | | | 64 | | |
| Class C | | | — | | | | — | | | | 113 | | |
| Class R3 | | | — | | | | — | | | | — | | |
| Shareholder servicing agent fees: | | | | | | | | | | | | | |
| Investor Class | | | 42 | | | | 57 | | | | — | | |
| Institutional Class | | | — | | | | — | | | | 23 | | |
| Trust Class | | | — | | | | 22 | | | | 26 | | |
| Class A | | | — | | | | — | | | | 39 | | |
| Class C | | | — | | | | — | | | | 18 | | |
| Class R3 | | | — | | | | — | | | | — | | |
| Audit fees | | | 19 | | | | 48 | | | | 53 | | |
| U.S. Treasury Temporary Gurantee Program Fee (Note H) | | | 175 | | | | — | | | | — | | |
| Custodian fees (Note B) | | | 196 | | | | 85 | | | | 112 | | |
| Insurance expense | | | 28 | | | | 2 | | | | 1 | | |
| Legal fees | | | 120 | | | | 86 | | | | 68 | | |
| Registration and filing fees | | | — | | | | 42 | | | | 105 | | |
| Shareholder reports | | | 42 | | | | 13 | | | | 9 | | |
| Trustees' fees and expenses | | | 49 | | | | 49 | | | | 49 | | |
| Miscellaneous | | | 47 | | | | 6 | | | | 5 | | |
| Total expenses | | | 3,048 | | | | 743 | | | | 1,077 | | |
73
Statements of Operations (cont'd)
Neuberger Berman Income Funds (cont'd)
(000's omitted)
| | | CORE BOND
FUND | | HIGH INCOME
BOND FUND | | MUNICIPAL
INTERMEDIATE
BOND FUND | | MUNICIPAL
MONEY FUND | |
| | | For the
Year Ended
October 31,
2009 | | For the
Year Ended
October 31,
2009 | | For the
Year Ended
October 31,
2009 | | For the
Year Ended
October 31,
2009 | |
| Expenses reimbursed by administrator (Note B) | | | (192 | ) | | | (122 | ) | | | (213 | ) | | | (510 | ) | |
| Management and administration fees waived (Notes A & B) | | | (181 | ) | | | (12 | ) | | | — | | | | — | | |
| Expenses reduced by custodian fee expense offset arrangement (Note B) | | | — | | | | (1 | ) | | | (1 | ) | | | (4 | ) | |
| Total net expenses | | | 484 | | | | 3,162 | | | | 297 | | | | 2,295 | | |
| Net investment income (loss) | | $ | 3,216 | | | $ | 31,495 | | | $ | 1,438 | | | $ | 1,712 | | |
| Realized and Unrealized Gain (Loss) on Investments (Note A) | |
| Net realized gain (loss) on: | |
| Sales of investment securities of unaffiliated issuers | | | 582 | | | | 13,356 | | | | 63 | | | | 40 | | |
| Sales of investment securities of affiliated issuers | | | — | | | | 73 | | | | — | | | | — | | |
| Financial futures contracts | | | — | | | | — | | | | — | | | | — | | |
| Change in net unrealized appreciation (depreciation) in value of: | |
| Unaffiliated investment securities | | | 11,675 | | | | 85,767 | | | | 1,443 | | | | — | | |
| Affiliated investment securities | | | 11 | | | | — | | | | — | | | | — | | |
| Financial futures contracts | | | (14 | ) | | | — | | | | — | | | | — | | |
| Net gain (loss) on investments | | | 12,254 | | | | 99,196 | | | | 1,506 | | | | 40 | | |
| Net increase (decrease) in net assets resulting from operations | | $ | 15,470 | | | $ | 130,691 | | | $ | 2,944 | | | $ | 1,752 | | |
See Notes to Financial Statements
74
| | | NEW YORK
MUNICIPAL
MONEY FUND | | SHORT
DURATION
BOND FUND | | STRATEGIC
INCOME
FUND | |
| | | For the
Year Ended
October 31,
2009 | | For the
Year Ended
October 31,
2009 | | For the
Year Ended
October 31,
2009 | |
| Expenses reimbursed by administrator (Note B) | | | (700 | ) | | | (310 | ) | | | (476 | ) | |
| Management and administration fees waived (Notes A & B) | | | — | | | | (2 | ) | | | (2 | ) | |
| Expenses reduced by custodian fee expense offset arrangement (Note B) | | | (10 | ) | | | — | | | | — | | |
| Total net expenses | | | 2,338 | | | | 431 | | | | 599 | | |
| Net investment income (loss) | | $ | 1,712 | | | $ | 2,843 | | | $ | 2,000 | | |
| Realized and Unrealized Gain (Loss) on Investments (Note A) | |
| Net realized gain (loss) on: | |
| Sales of investment securities of unaffiliated issuers | | | (368 | ) | | | (8,836 | ) | | | 2,090 | | |
| Sales of investment securities of affiliated issuers | | | — | | | | — | | | | — | | |
| Financial futures contracts | | | — | | | | 959 | | | | — | | |
| Change in net unrealized appreciation (depreciation) in value of: | |
| Unaffiliated investment securities | | | — | | | | 6,969 | | | | 6,965 | | |
| Affiliated investment securities | | | — | | | | — | | | | — | | |
| Financial futures contracts | | | — | | | | (224 | ) | | | (24 | ) | |
| Net gain (loss) on investments | | | (368 | ) | | | (1,132 | ) | | | 9,031 | | |
| Net increase (decrease) in net assets resulting from operations | | $ | 1,344 | | | $ | 1,711 | | | $ | 11,031 | | |
75
Statements of Changes in Net Assets
Neuberger Berman Income Funds
(000's omitted)
| | | CORE BOND FUND | | HIGH INCOME BOND FUND | | MUNICIPAL INTERMEDIATE
BOND FUND | |
| | | Year Ended
October 31,
2009 | | Year Ended
October 31,
2008 | | Year Ended
October 31,
2009 | | Year Ended
October 31,
2008 | | Year Ended
October 31,
2009 | | Year Ended
October 31,
2008 | |
| Increase (Decrease) in Net Assets: | |
| From Operations (Note A): | |
| Net investment income (loss) | | $ | 3,216 | | | $ | 3,814 | | | $ | 31,495 | | | $ | 22,506 | | | $ | 1,438 | | | $ | 1,036 | | |
| Net realized gain (loss) on investments | | | 582 | | | | 798 | | | | 13,429 | | | | (35,148 | ) | | | 63 | | | | (399 | ) | |
Change in net unrealized appreciation
(depreciation) of investments | | | 11,672 | | | | (11,601 | ) | | | 85,767 | | | | (39,499 | ) | | | 1,443 | | | | (1,131 | ) | |
Net increase (decrease) in net assets resulting
from operations | | | 15,470 | | | | (6,989 | ) | | | 130,691 | | | | (52,141 | ) | | | 2,944 | | | | (494 | ) | |
| Distributions to Shareholders From (Note A): | |
| Net investment income: | |
| Investor Class | | | (1,356 | ) | | | (1,725 | ) | | | (27,611 | ) | | | (22,528 | ) | | | (1,438 | ) | | | (1,036 | ) | |
| Institutional Class | | | (1,584 | ) | | | (2,128 | ) | | | (1,317 | ) | | | — | | | | — | | | | — | | |
| Trust Class | | | — | | | | — | | | | — | | | | — | | | | — | | | | — | | |
| Class A | | | (219 | ) | | | (4 | ) | | | (264 | ) | | | — | | | | — | | | | — | | |
| Class C | | | (15 | ) | | | (4 | ) | | | (36 | ) | | | — | | | | — | | | | — | | |
| Class R3 | | | — | | | | — | | | | (2 | ) | | | — | | | | — | | | | — | | |
| Net realized gain on investments: | |
| Investor Class | | | (17 | ) | | | — | | | | — | | | | — | | | | — | | | | (24 | ) | |
| Institutional Class | | | (18 | ) | | | — | | | | — | | | | — | | | | — | | | | — | | |
| Trust Class | | | — | | | | — | | | | — | | | | — | | | | — | | | | — | | |
| Class A | | | (3 | ) | | | — | | | | — | | | | — | | | | — | | | | — | | |
| Class C | | | — | | | | — | | | | — | | | | — | | | | — | | | | — | | |
| Tax return of capital: | |
| Institutional Class | | | — | | | | — | | | | — | | | | — | | | | — | | | | — | | |
| Trust Class | | | — | | | | — | | | | — | | | | — | | | | — | | | | — | | |
| Class A | | | — | | | | — | | | | — | | | | — | | | | — | | | | — | | |
| Class C | | | — | | | | — | | | | — | | | | — | | | | — | | | | — | | |
| Total distributions to shareholders | | | (3,212 | ) | | | (3,861 | ) | | | (29,230 | ) | | | (22,528 | ) | | | (1,438 | ) | | | (1,060 | ) | |
| From Fund Share Transactions (Note D): | |
| Proceeds from shares sold: | |
| Investor Class | | | 9,831 | | | | 26,660 | | | | 369,323 | | | | 111,100 | | | | 73,302 | | | | 6,449 | | |
| Institutional Class | | | 54,887 | | | | 8,639 | | | | 83,277 | | | | — | | | | — | | | | — | | |
| Trust Class | | | — | | | | — | | | | — | | | | — | | | | — | | | | — | | |
| Class A | | | 19,189 | | | | 149 | | | | 23,619 | | | | — | | | | — | | | | — | | |
| Class C | | | 755 | | | | 158 | | | | 2,531 | | | | — | | | | — | | | | — | | |
| Class R3 | | | — | | | | — | | | | 70 | | | | — | | | | — | | | | — | | |
| Proceeds from reinvestment of dividends and distributions: | |
| Investor Class | | | 1,080 | | | | 1,458 | | | | 25,779 | | | | 20,432 | | | | 1,044 | | | | 870 | | |
| Institutional Class | | | 1,390 | | | | 2,096 | | | | 415 | | | | — | | | | — | | | | — | | |
| Trust Class | | | — | | | | — | | | | — | | | | — | | | | — | | | | — | | |
| Class A | | | 188 | | | | 4 | | | | 222 | | | | — | | | | — | | | | — | | |
| Class C | | | 6 | | | | 3 | | | | 8 | | | | — | | | | — | | | | — | | |
| Class R3 | | | — | | | | — | | | | 2 | | | | — | | | | — | | | | — | | |
| Capital contribution from affiliate (Note B) | | | — | | | | — | | | | — | | | | 383 | | | | — | | | | — | | |
| Payments for shares redeemed: | |
| Investor Class | | | (35,233 | ) | | | (14,372 | ) | | | (241,645 | ) | | | (254,153 | ) | | | (9,084 | ) | | | (8,028 | ) | |
| Institutional Class | | | (35,023 | ) | | | (20,410 | ) | | | (1,123 | ) | | | — | | | | — | | | | — | | |
| Trust Class | | | — | | | | — | | | | — | | | | — | | | | — | | | | — | | |
| Class A | | | (2,242 | ) | | | — | | | | (495 | ) | | | — | | | | — | | | | — | | |
| Class C | | | (165 | ) | | | — | | | | (113 | ) | | | — | | | | — | | | | — | | |
| Net increase (decrease) from Fund share transactions | | | 14,663 | | | | 4,385 | | | | 261,870 | | | | (122,238 | ) | | | 65,262 | | | | (709 | ) | |
| Net Increase (Decrease) in Net Assets | | | 26,921 | | | | (6,465 | ) | | | 363,331 | | | | (196,907 | ) | | | 66,768 | | | | (2,263 | ) | |
| Net Assets: | |
| Beginning of year | | | 76,558 | | | | 83,023 | | | | 172,339 | | | | 369,246 | | | | 25,565 | | | | 27,828 | | |
| End of year | | $ | 103,479 | | | $ | 76,558 | | | $ | 535,670 | | | $ | 172,339 | | | $ | 92,333 | | | $ | 25,565 | | |
| Undistributed net investment income (loss) at end of year | | $ | — | | | $ | — | | | $ | 3,029 | | | $ | 26 | | | $ | — | | | $ | — | | |
Distributions in excess of net investment income at
end of year | | $ | — | | | ($ | 42 | ) | | $ | — | | | $ | — | | | $ | — | | | $ | — | | |
See Notes to Financial Statements
76
| | | MUNICIPAL MONEY FUND | | NEW YORK MUNICIPAL
MONEY FUND | |
| | | Year Ended
October 31,
2009 | | Year Ended
October 31,
2008 | | Year Ended
October 31,
2009 | | Year Ended
October 31,
2008 | |
| Increase (Decrease) in Net Assets: | |
| From Operations (Note A): | |
| Net investment income (loss) | | $ | 1,712 | | | $ | 17,776 | | | $ | 1,712 | | | $ | 16,253 | | |
| Net realized gain (loss) on investments | | | 40 | | | | 18 | | | | (368 | ) | | | (138 | ) | |
Change in net unrealized appreciation
(depreciation) of investments | | | — | | | | — | | | | — | | | | — | | |
Net increase (decrease) in net assets resulting
from operations | | | 1,752 | | | | 17,794 | | | | 1,344 | | | | 16,115 | | |
| Distributions to Shareholders From (Note A): | |
| Net investment income: | |
| Investor Class | | | (1,695 | ) | | | (17,776 | ) | | | (1,712 | ) | | | (16,253 | ) | |
| Institutional Class | | | — | | | | — | | | | — | | | | — | | |
| Trust Class | | | — | | | | — | | | | — | | | | — | | |
| Class A | | | — | | | | — | | | | — | | | | — | | |
| Class C | | | — | | | | — | | | | — | | | | — | | |
| Class R3 | | | — | | | | — | | | | — | | | | — | | |
| Net realized gain on investments: | |
| Investor Class | | | (18 | ) | | | (19 | ) | | | — | | | | (11 | ) | |
| Institutional Class | | | — | | | | — | | | | — | | | | — | | |
| Trust Class | | | — | | | | — | | | | — | | | | — | | |
| Class A | | | — | | | | — | | | | — | | | | — | | |
| Class C | | | — | | | | — | | | | — | | | | — | | |
| Tax return of capital: | |
| Institutional Class | | | — | | | | — | | | | — | | | | — | | |
| Trust Class | | | — | | | | — | | | | — | | | | — | | |
| Class A | | | — | | | | — | | | | — | | | | — | | |
| Class C | | | — | | | | — | | | | — | | | | — | | |
| Total distributions to shareholders | | | (1,713 | ) | | | (17,795 | ) | | | (1,712 | ) | | | (16,264 | ) | |
| From Fund Share Transactions (Note D): | |
| Proceeds from shares sold: | |
| Investor Class | | | 524,114 | | | | 4,555,916 | | | | 466,801 | | | | 2,999,266 | | |
| Institutional Class | | | — | | | | — | | | | — | | | | — | | |
| Trust Class | | | — | | | | — | | | | — | | | | — | | |
| Class A | | | — | | | | — | | | | — | | | | — | | |
| Class C | | | — | | | | — | | | | — | | | | — | | |
| Class R3 | | | — | | | | — | | | | — | | | | — | | |
| Proceeds from reinvestment of dividends and distributions: | |
| Investor Class | | | 1,713 | | | | 12,986 | | | | 1,712 | | | | 12,177 | | |
| Institutional Class | | | — | | | | — | | | | — | | | | — | | |
| Trust Class | | | — | | | | — | | | | — | | | | — | | |
| Class A | | | — | | | | — | | | | — | | | | — | | |
| Class C | | | — | | | | — | | | | — | | | | — | | |
| Class R3 | | | — | | | | — | | | | — | | | | — | | |
| Capital contribution from affiliate (Note B) | | | — | | | | — | | | | — | | | | — | | |
| Payments for shares redeemed: | |
| Investor Class | | | (604,750 | ) | | | (5,045,062 | ) | | | (545,986 | ) | | | (3,333,188 | ) | |
| Institutional Class | | | — | | | | — | | | | — | | | | — | | |
| Trust Class | | | — | | | | — | | | | — | | | | — | | |
| Class A | | | — | | | | — | | | | — | | | | — | | |
| Class C | | | — | | | | — | | | | — | | | | — | | |
| Net increase (decrease) from Fund share transactions | | | (78,923 | ) | | | (476,160 | ) | | | (77,473 | ) | | | (321,745 | ) | |
| Net Increase (Decrease) in Net Assets | | | (78,884 | ) | | | (476,161 | ) | | | (77,841 | ) | | | (321,894 | ) | |
| Net Assets: | |
| Beginning of year | | | 395,347 | | | | 871,508 | | | | 401,247 | | | | 723,141 | | |
| End of year | | $ | 316,463 | | | $ | 395,347 | | | $ | 323,406 | | | $ | 401,247 | | |
| Undistributed net investment income (loss) at end of year | | $ | 18 | | | $ | 1 | | | $ | — | | | $ | — | | |
Distributions in excess of net investment income at
end of year | | $ | — | | | $ | — | | | $ | — | | | $ | — | | |
77
Statements of Changes in Net Assets (cont'd)
Neuberger Berman Income Funds (cont'd)
(000's omitted)
| | | SHORT DURATION BOND FUND | | STRATEGIC INCOME FUND | |
| | | Year Ended
October 31,
2009 | | Year Ended
October 31,
2008 | | Year Ended
October 31,
2009 | | Year Ended
October 31,
2008 | |
| Increase (Decrease) in Net Assets: | |
| From Operations (Note A): | |
| Net investment income (loss) | | $ | 2,843 | | | $ | 4,404 | | | $ | 2,000 | | | $ | 551 | | |
| Net realized gain (loss) on investments | | | (7,877 | ) | | | 766 | | | | 2,090 | | | | (9 | ) | |
Change in net unrealized appreciation
(depreciation) of investments | | | 6,745 | | | | (12,892 | ) | | | 6,941 | | | | (1,075 | ) | |
Net increase (decrease) in net assets resulting
from operations | | | 1,711 | | | | (7,722 | ) | | | 11,031 | | | | (533 | ) | |
| Distributions to Shareholders From (Note A): | |
| Net investment income: | |
| Investor Class | | | (2,678 | ) | | | (4,280 | ) | | | — | | | | — | | |
| Institutional Class | | | — | | | | — | | | | (397 | ) | | | (377 | ) | |
| Trust Class | | | (409 | ) | | | (583 | ) | | | (115 | ) | | | (9 | ) | |
| Class A | | | — | | | | — | | | | (1,089 | ) | | | (3 | ) | |
| Class C | | | — | | | | — | | | | (398 | ) | | | (3 | ) | |
| Class R3 | | | — | | | | — | | | | — | | | | — | | |
| Net realized gain on investments: | |
| Investor Class | | | — | | | | — | | | | — | | | | — | | |
| Institutional Class | | | — | | | | — | | | | — | | | | (864 | ) | |
| Trust Class | | | — | | | | — | | | | — | | | | (14 | ) | |
| Class A | | | — | | | | — | | | | — | | | | (6 | ) | |
| Class C | | | — | | | | — | | | | — | | | | (6 | ) | |
| Tax return of capital: | |
| Institutional Class | | | — | | | | — | | | | — | | | | (114 | ) | |
| Trust Class | | | — | | | | — | | | | — | | | | (3 | ) | |
| Class A | | | — | | | | — | | | | — | | | | (1 | ) | |
| Class C | | | — | | | | — | | | | — | | | | (1 | ) | |
| Total distributions to shareholders | | | (3,087 | ) | | | (4,863 | ) | | | (1,999 | ) | | | (1,401 | ) |
| From Fund Share Transactions (Note D): | |
| Proceeds from shares sold: | |
| Investor Class | | | 7,877 | | | | 9,812 | | | | — | | | | — | | |
| Institutional Class | | | — | | | | — | | | | 14,705 | | | | 279 | | |
| Trust Class | | | 2,444 | | | | 2,358 | | | | 6,948 | | | | 380 | | |
| Class A | | | — | | | | — | | | | 70,930 | | | | 173 | | |
| Class C | | | — | | | | — | | | | 34,836 | | | | 136 | | |
| Class R3 | | | — | | | | — | | | | — | | | | — | | |
| Proceeds from reinvestment of dividends and distributions: | |
| Investor Class | | | 2,480 | | | | 3,934 | | | | — | | | | — | | |
| Institutional Class | | | — | | | | — | | | | 382 | | | | 817 | | |
| Trust Class | | | 400 | | | | 569 | | | | 112 | | | | 26 | | |
| Class A | | | — | | | | — | | | | 558 | | | | 11 | | |
| Class C | | | — | | | | — | | | | 129 | | | | 9 | | |
| Class R3 | | | — | | | | — | | | | — | | | | — | | |
| Capital contribution from affiliate (Note B) | | | — | | | | — | | | | — | | | | — | | |
| Payments for shares redeemed: | |
| Investor Class | | | (18,058 | ) | | | (34,544 | ) | | | — | | | | — | | |
| Institutional Class | | | — | | | | — | | | | (2,534 | ) | | | (11,669 | ) | |
| Trust Class | | | (3,795 | ) | | | (5,227 | ) | | | (1,227 | ) | | | (232 | ) | |
| Class A | | | — | | | | — | | | | (8,316 | ) | | | — | | |
| Class C | | | — | | | | — | | | | (1,021 | ) | | | (8 | ) | |
| Net increase (decrease) from Fund share transactions | | | (8,652 | ) | | | (23,098 | ) | | | 115,502 | | | | (10,078 | ) | |
| Net Increase (Decrease) in Net Assets | | | (10,028 | ) | | | (35,683 | ) | | | 124,534 | | | | (12,012 | ) | |
| Net Assets: | |
| Beginning of year | | | 70,815 | | | | 106,498 | | | | 5,209 | | | | 17,221 | | |
| End of year | | $ | 60,787 | | | $ | 70,815 | | | $ | 129,743 | | | $ | 5,209 | | |
| Undistributed net investment income (loss) at end of year | | $ | 294 | | | $ | 196 | | | $ | 95 | | | $ | — | | |
Distributions in excess of net investment income at
end of year | | $ | — | | | $ | — | | | $ | — | | | $ | (4 | ) | |
See Notes to Financial Statements
78
Notes to Financial Statements Income Funds
Note A—Summary of Significant Accounting Policies:
1 General: Core Bond, High Income, Municipal Intermediate Bond (formerly, Neuberger Berman Municipal Securities Trust), Municipal Money, New York Municipal Money, Short Duration, and Strategic Income, (each individually a "Fund", and collectively the "Funds") are separate operating series of Neuberger Berman Income Funds (formerly, Lehman Brothers Income Funds), (the "Trust"), a Delaware statutory trust organized pursuant to an Amended and Restated Trust Instrument dated June 24, 2009. On June 1, 2009, the Trust changed its name from Lehman Brothers Income Funds to Neuberger Berman Income Funds. The Trust is registered as a diversified, open-end management investment company under the Investment Company Act of 1940, as amended (the "1940 Act"), and its shares are registered under the Securities Act of 1933, as amended (the "1933 Act"). Six Funds offer Investor Class shares, three offer Institutional Class shares, two offer Trust Class shares, three offer Class A shares, three offer Class C shares and one offers Class R3 shares. The Board of Trustees of the Trust (the "Board") may establish additional series or classes of shares without the approval of shareholders.
The assets of each Fund belong only to that Fund, and the liabilities of each Fund are borne solely by that Fund and no other.
It is the policy of Municipal Money and New York Municipal Money to maintain a continuous net asset value per share of $1.00; each of these Funds has adopted certain investment, valuation, and dividend and distribution policies, which conform to general industry practice, to enable it to do so. However, there is no assurance a Fund will be able to maintain a stable net asset value per share. Each of these Funds complies with Rule 2a-7 of the 1940 Act.
The preparation of financial statements in accordance with U.S. generally accepted accounting principles requires Management to make estimates and assumptions at the date of the financial statements. Actual results could differ from those estimates.
2 Portfolio valuation: Investment securities are valued as indicated in the notes following the Funds' Schedules of Investments.
3 Foreign currency translation: Core Bond, High Income, Short Duration and Strategic Income may invest in foreign securities denominated in foreign currencies. The accounting records of the Funds are maintained in U.S. dollars. Foreign currency amounts are currently translated into U.S. dollars using the exchange rate as of 4:00 p.m., Eastern time, to determine the value of investments, other assets and liabilities. Purchase and sale prices of securities, and income and expenses, are translated into U.S. dollars at the prevailing rate of exchange on the respective dates of such transactions. Net unrealized foreign currency gain (loss), if any, arises from changes in the value of assets and liabilities, other than investments in securities, as a result of changes in exchange rates and is stated separately in the Statements of Operations.
4 Securities transactions and investment income: Securities transactions are recorded on trade date for financial reporting purposes. Dividend income is recorded on the ex-dividend date or, for certain foreign dividends, as soon as the Fund becomes aware of the dividends. Non-cash dividends included in dividend income, if any, are recorded at the fair market value of the securities received. Interest income, including accretion of discount (adjusted for original issue discount, where applicable) and amortization of premium, where applicable, is recorded on the accrual basis. Realized gains and losses from securities transactions (for each Fund) and foreign currency transactions (for Core Bond, High Income, Short Duration and Strategic Income), if any, are recorded on the basis of identified cost and stated separately in the Statements of Operations. Included in net realized gain (loss) on investments are proceeds from the settlements of class action litigation in which Core Bond, High Income, Municipal Intermediate Bond, Short Duration and Strategic Income participated as class members. The amounts of such proceeds for the year ended October 31, 2009 were $34,576, $30,010, $1,374, $79,463 and $763 for Core Bond, High Income, Municipal Intermediate Bond, Short Duration and Strategic Income, respectively.
79
5 Income tax information: Each Fund is treated as a separate entity for U.S. federal income tax purposes. It is the policy of each Fund to continue to qualify as a regulated investment company by complying with the requirements of Subchapter M of the Internal Revenue Code applicable to regulated investment companies and to distribute substantially all of its earnings to its shareholders. Therefore, no federal income or excise tax provision is required.
The Funds have adopted the provisions of ASC 740 "Income Taxes"("ASC 740"), formerly known as FASB Interpretation No. 48 "Accounting for Uncertainty in Income Taxes — an interpretation of FASB Statement No. 109". ASC 740 sets forth a minimum threshold for financial statement recognition of the benefit of a tax position taken, or expected to be taken, in a tax return. The Funds recognize interest and penalties, if any, related to unrecognized tax benefits as an income tax expense in the Statements of Operations. The Funds are subject to examination by U.S. federal and state tax authorities for returns filed for the prior three fiscal years 2006 - 2008. As of October 31, 2009, the Funds did not have any unrecognized tax benefits.
Income distributions and capital gain distributions are determined in accordance with income tax regulations, which may differ from U.S. generally accepted accounting principles. These differences are primarily due to differing treatments of income and gains on various investment securities held by each Fund, timing differences and differing characterization of distributions made by each Fund as a whole. The Funds may also utilize earnings and profits distributed to shareholders on redemption of shares as a part of the dividends paid deduction for income tax purposes.
As determined on October 31, 2009, permanent differences resulting primarily from different book and tax accounting for amortization of bond premium, paydown gains and losses, expiration of capital loss carryforwards, characterization of distributions, delayed settlement compensation on bank loans, distribution redesignations, and contingent payment debt instrument basis adjustments were reclassified at fiscal year-end. These reclassifications had no effect on net income, net asset value or net asset value per share of each Fund.
The tax character of distributions paid during the years ended October 31, 2009 and October 31, 2008 was as follows:
| | | Distributions Paid From: | |
| | | Taxable Income | | Tax-Exempt Income | | Long-Term
Capital Gain | | Return of
Capital | | | Total | |
| | | 2009 | | 2008 | | 2009 | | 2008 | | 2009 | | 2008 | | 2009 | | 2008 | | 2009 | | 2008 | |
| Core Bond | | $ | 3,212,281 | | | $ | 3,860,611 | | | $ | — | | | $ | — | | | $ | — | | | $ | — | | | $ | — | | | $ | — | | | $ | 3,212,281 | | | $ | 3,860,611 | | |
| High Income | | | 29,230,047 | | | | 22,528,252 | | | | — | | | | — | | | | — | | | | — | | | | — | | | | — | | | | 29,230,047 | | | | 22,528,252 | | |
Municipal
Intermediate Bond | | | 16,815 | | | | 411 | | | | 1,421,035 | | | | 1,035,831 | | | | — | | | | 24,194 | | | | — | | | | — | | | | 1,437,850 | | | | 1,060,436 | | |
| Municipal Money | | | 18,308 | | | | 13,846 | | | | 1,694,560 | | | | 17,775,982 | | | | — | | | | 5,377 | | | | — | | | | — | | | | 1,712,868 | | | | 17,795,205 | | |
New York
Municipal Money | | | — | | | | 10,506 | | | | 1,712,449 | | | | 16,253,133 | | | | — | | | | 211 | | | | — | | | | — | | | | 1,712,449 | | | | 16,263,850 | | |
| Short Duration | | | 3,087,008 | | | | 4,863,512 | | | | — | | | | — | | | | — | | | | — | | | | — | | | | — | | | | 3,087,008 | | | | 4,863,512 | | |
| Strategic Income | | | 1,998,867 | | | | 557,000 | | | | — | | | | — | | | | — | | | | 724,810 | | | | — | | | | 119,014 | | | | 1,998,867 | | | | 1,400,824 | | |
80
As of October 31, 2009, the components of distributable earnings (accumulated losses) on a U.S. federal income tax basis were as follows:
| | | Undistributed
Ordinary
Income | | Undistributed
Tax-Exempt
Income | | Undistributed
Long-Term
Gain | | Unrealized
Appreciation
(Depreciation) | | Loss
Carryforwards
and Deferrals | | Total | |
| Core Bond | | $ | 543,865 | | | $ | — | | | $ | — | | | $ | (890,156 | ) | | $ | — | | | $ | (346,291 | ) | |
| High Income | | | 3,650,106 | | | | — | | | | — | | | | 42,035,149 | | | | (39,249,161 | ) | | | 6,436,094 | | |
| Municipal Intermediate Bond | | | — | | | | 111,095 | | | | — | | | | 544,297 | | | | (335,979 | ) | | | 319,413 | | |
| Municipal Money | | | 40,057 | | | | 18,748 | | | | — | | | | — | | | | — | | | | 58,805 | | |
| New York Municipal Money | | | — | | | | 33,956 | | | | — | | | | — | | | | (506,022 | ) | | | (472,066 | ) | |
| Short Duration | | | 305,789 | | | | — | | | | — | | | | (6,622,635 | ) | | | (16,595,063 | ) | | | (22,911,909 | ) | |
| Strategic Income | | | 2,288,984 | | | | — | | | | — | | | | 6,393,290 | | | | — | | | | 8,682,274 | | |
The differences between book basis and tax basis distributable earnings are attributable primarily to timing differences of distribution payments, timing differences of wash sales, partnership basis adjustments, mark to market on certain futures contract transactions, capital loss carryforwards, amortization of bond premium, organization expenses and delayed settlement compensation on bank loans.
To the extent each Fund's net realized capital gains, if any, can be offset by capital loss carryforwards, it is the policy of each Fund not to distribute such gains. As determined on October 31, 2009, the following Funds had unused capital loss carryforwards available for federal income tax purposes to offset net realized capital gains, if any, as follows:
| | | Expiring in: | |
| | | 2010 | | 2011 | | 2012 | | 2013 | | 2014 | | 2015 | | 2016 | | 2017 | |
| High Income | | $ | — | | | $ | — | | | $ | — | | | $ | — | | | $ | 3,893,592 | | | $ | — | | | $ | 35,355,569 | | | $ | — | | |
Municipal
Intermediate Bond | | | — | | | | — | | | | — | | | | — | | | | — | | | | — | | | | 335,979 | | | | — | | |
New York
Municipal Money | | | — | | | | — | | | | — | | | | — | | | | — | | | | — | | | | 138,731 | | | | 367,291 | | |
| Short Duration | | | — | | | | — | | | | 2,468,731 | | | | 3,168,736 | | | | 2,244,689 | | | | 643,625 | | | | — | | | | 8,069,282 | | |
During the year ended October 31, 2009, High Income and Municipal Intermediate Bond utilized capital loss carryforwards of $13,446,858 and $62,793, respectively. Short Duration had $456,883 of capital loss carryforwards expire during the year ended October 31, 2009.
6 Distributions to shareholders: Each Fund earns income, net of expenses, daily on its investments. It is the policy of each Fund to declare distributions from net investment income on each business day; such distributions are paid monthly. Prior to April 1, 2008, Strategic Income declared and paid distributions from net investment income quarterly. Distributions from net realized capital gains, if any, are generally distributed in December. Distributions to shareholders are recorded on the ex-date.
Prior to February 28, 2008, Strategic Income invested a portion of its assets in securities issued by real estate companies, including real estate investment trusts ("REITs"). The distributions received from REITs held by the Fund were generally comprised of income, capital gains, and return of REIT capital, but the REITs did not report this information to the Fund until the following calendar year. At October 31, 2008, the Fund estimated these amounts within the financial statements since the information was not available from the REITs until after the Fund's fiscal year-end. For the year ended October 31, 2008, the character of distributions paid to shareholders is disclosed within the Statements of Changes in Net Assets and was based on estimates made at that time. All
81
estimates were based upon REIT information sources available to the Fund together with actual IRS Forms 1099DIV received to date. As a result, the composition of the Fund's distributions as reported herein may have differed from the final composition determined after calendar year-end and reported to Fund shareholders on IRS Form 1099DIV.
7 Expense allocation: Certain expenses are applicable to multiple funds. Expenses directly attributable to a Fund are charged to that Fund. Expenses of the Trust that are not directly attributed to a Fund are allocated among the series of the Trust, on the basis of relative net assets, except where a more appropriate allocation of expenses to each of the series can otherwise be made fairly. Expenses borne by the complex of related investment companies, which includes open-end and closed-end investment companies for which Management serves as investment manager, that are not directly attributed to a Fund or the Trust are allocated among the Funds and the other investment companies in the complex or series thereof on the basis of relative net assets, except where a more appropriate allocation of expenses to each investment company in the complex or series thereof can otherwise be made fairly. Each Fund's expenses (other than those specific to each class) are allocated proportionally each day between the classes based upon the relative net assets of each class.
8 Security lending: A third party, eSecLending, serves as exclusive lending agent for each Fund. eSecLending, as agent, has assisted Core Bond, High Income and Short Duration in conducting a bidding process to try to identify a principal that would pay a guaranteed amount to each Fund in consideration of that Fund entering into an exclusive securities lending arrangement. During the fiscal year, no principal had an exclusive securities lending arrangement on any Fund; as such, no Fund is guaranteed any particular level of income.
Under the securities lending arrangements, each Fund receives cash collateral at the beginning of each transaction equal to at least 102% of the prior day's market value of the loaned securities (105% in the case of international securities). Each Fund may invest all the cash collateral in Neuberger Berman Securities Lending Quality Fund, LLC ("Quality Fund"), a fund managed by Neuberger Berman Fixed Income LLC (formerly known as Lehman Brothers Asset Management LLC) ("NBFI"), an affiliate of Management. Effective July 1, 2009, Dwight Asset Management Company LLC became the Sub-Adviser to the Quality Fund. The Quality Fund is not a money market fund that is registered under the 1940 Act and does not operate in accordance with all requirements of Rule 2a-7 under the 1940 Act. There is no assurance that the Quality Fund will maintain a $1.00 share price.
From November 1, 2008 to November 3, 2008, the Quality Fund's NAV was $0.99 per share, which could have affected the NAV of the Funds with securities loans outstanding on those days. For the period from November 4, 2008 to October 31, 2009, the Quality Fund's price per share was at least $1.00. The market value of each Fund's investments in the Quality Fund as of the fiscal year ended October 31, 2009, if any, is reflected in the Fund's Schedule of Investments. If it were necessary to liquidate assets in the Quality Fund to meet returns on outstanding securities loans at a time when the Quality Fund's price per share was less than $1.00, a Fund may not receive an amount from the Quality Fund that is equal in amount to the collateral the Fund would be required to return to the borrower of the securities and the Fund would be required to make up for this shortfall. In addition, as a result of recent reduced liquidity in the credit and fixed income markets, it may be difficult to dispose quickly of some securities in the Quality Fund at the price at which the Quality Fund is carrying them.
Net income from the applicable lending program represents any amounts received from a principal plus income earned on the cash collateral invested in Quality Fund or in other investments, if applicable, less cash collateral fees and other expenses associated with the loans. For the fiscal year ended October 31, 2009, the approximate amount of interest income earned from the Quality Fund and any amounts received from a principal; the approximate amount of fees and expenses paid on securities loaned; the approximate amount of net income received under the securities lending arrangements, which is reflected in the Statements of Operations under the caption "Income
82
from securities loaned—net"; and the approximate amount of interest income that was earned from the Quality Fund are as follows:
| | | Total Interest Income
Earned From the Quality
Fund and Amounts
Received from a Principal | | Fees and
Expenses
Paid on
Securities
Loaned | | Net Income
Received
under the
Securities
Lending
Arrangements | | Interest Income
Earned From the
Quality Fund | |
| Core Bond | | $ | — | | | $ | — | | | $ | — | | | $ | — | | |
| High Income | | | 44,193 | | | | 15,495 | | | | 28,698 | | | | 7,195 | | |
9 Repurchase agreements: Each Fund may enter into repurchase agreements with institutions that Management has determined are creditworthy. Each repurchase agreement is recorded at cost. Each Fund requires that the securities purchased in a repurchase agreement be transferred to the custodian in a manner sufficient to enable the Fund to assert a perfected security interest in those securities in the event of a default under the repurchase agreement. Each Fund monitors, on a daily basis, the value of the securities transferred to ensure that their value, including accrued interest, is greater than amounts owed to the Fund under each such repurchase agreement.
10 Dollar rolls: Core Bond, High Income, Short Duration, and Strategic Income may enter into dollar roll transactions with respect to mortgage-backed securities. In a dollar roll transaction, a Fund sells securities for delivery in the current month and simultaneously agrees to repurchase substantially similar (i.e., same type and coupon) securities on a specified future date from the same party. During the period before this repurchase, a Fund forgoes principal and interest payments on the securities. A Fund is compensated by the difference between the current sales price and the forward price for the future purchase (often referred to as the "drop"), as well as by the interest earned on the cash proceeds of the initial sale. Dollar rolls may increase fluctuations in a Fund's net asset value and may be viewed as a form of leverage. There is a risk that the counter party will be unable or unwilling to complete the transaction as scheduled, which may result in losses to a Fund.
11 Other: All net investment income and realized and unrealized capital gains and losses of each Fund are allocated, on the basis of relative net assets, pro rata among its respective classes.
12 Transactions with other funds managed by Neuberger Berman Management LLC.: Pursuant to an Exemptive Order issued by the Securities and Exchange Commission, the Funds may invest in a money market fund managed by Management or an affiliate. Through August 10, 2009, the Funds invested in Neuberger Berman Prime Money Fund ("Prime Money"), as approved by the Board. Prime Money sought to provide the highest available current income consistent with safety and liquidity. For any cash that the Funds invested in Prime Money, Management waived a portion of its management fee equal to the management fee it received from Prime Money on those assets (the "Arrangement"). For the year ended October 31, 2009, management fees waived under this Arrangement are reflected in the Statements of Operations under the caption "Management and administration fees waived." For the year ended October 31, 2009, income earned under this Arrangement is reflected in the Statements of Operations under the caption "Income from investments in affiliated issuers." For the year ended October 31, 2009, management fees waived and income earned under this Arrangement were as follows:
| | | Management
Fees Waived | | Income
Earned | |
| Core Bond | | $ | 2,666 | | | $ | 18,287 | | |
| High Income | | | 11,894 | | | | 55,790 | | |
| Short Duration | | | 1,728 | | | | 2,758 | | |
| Strategic Income | | | 2,397 | | | | 6,570 | | |
83
On August 10, 2009, the Funds ceased investing in Prime Money. On this date, the Funds' shares of Prime Money were redeemed in exchange for portfolio holdings of Prime Money, which were used to purchase Institutional Class shares of State Street Institutional Liquid Reserves Fund.
13 Foreign taxes: Foreign taxes withheld represent amounts withheld by foreign tax authorities, net of refunds recoverable.
14 Investments in foreign securities: Investing in foreign securities may involve certain sovereign and other risks, in addition to the credit and market risks normally associated with domestic securities. These additional risks include the possibility of adverse political and economic developments (including political instability, nationalization, expropriation, or confiscatory taxation) and the potentially adverse effects of unavailability of public information regarding issuers, less governmental supervision and regulation of financial markets, reduced liquidity of certain financial markets, and the lack of uniform accounting, auditing, and financial reporting standards or the application of standards that are different or less stringent than those applied in the United States. Foreign securities also may experience greater price volatility, higher rates of inflation, and delays in settlement.
15 Derivative instruments: During the period ending October 31, 2009, the Funds' use of derivatives was limited to financial futures contracts. The Funds adopted ASC 815 "Derivatives and Hedging"("ASC 815"), formerly known as FASB Statement of Financial Accounting Standards No. 161 "Disclosures about Derivative Instruments and Hedging Activities," effective December 1, 2008. The Funds have disclosed derivative transactions for the year ending October 31, 2009, although ASC 815 only requires disclosure for the six months ending October 31, 2009.
Financial futures contracts: Core Bond, High Income, Municipal Intermediate Bond, Short Duration, and Strategic Income may each buy and sell financial futures contracts to hedge against changes in securities prices resulting from changes in prevailing interest rates. At the time a Fund enters into a financial futures contract, it is required to deposit with the futures commission merchant a specified amount of cash or liquid securities, known as "initial margin," ranging upward from 1.1% of the value of the financial futures contract being traded. Each day, the futures contract is valued at the official settlement price of the board of trade or U.S. commodity exchange on which such futures contract is traded. Subsequent payments, known as "variation margin," to and from the broker are made on a daily basis, or as needed for Core Bond and Strategic Income, as the market price of the financial futures contract fluctuates. Daily variation margin adjustments, arising from this "mark to market," are recorded by the Funds as unrealized gains or losses.
Although some financial futures contracts by their terms call for actual delivery or acceptance of financial instruments, in most cases the contracts are closed out prior to delivery by offsetting purchases or sales of matching financial futures contracts. When the contracts are closed, a Fund recognizes a gain or loss. Risks of entering into futures contracts include the possibility there may be an illiquid market, possibly at a time of rapidly declining prices, and/or a change in the value of the contract may not correlate with changes in the value of the underlying securities. Futures have minimal counterparty risk to a Fund since the exchange's clearinghouse, as counterparty to all exchange traded futures, guarantees the futures against default.
For U.S. federal income tax purposes, the futures transactions undertaken by a Fund may cause that Fund to recognize gains or losses from marking contracts to market even though its positions have not been sold or terminated, may affect the character of the gains or losses recognized as long-term or short-term, and may affect the timing of some capital gains and losses realized by the Fund. Also, a Fund's losses on transactions involving futures contracts may be deferred rather than being taken into account currently in calculating such Fund's taxable income.
84
During the year ended October 31, 2009, High Income and Municipal Intermediate Bond did not enter into any financial futures contracts. During the year ended October 31, 2009, Core Bond, Short Duration and Strategic Income entered into financial futures contracts. At October 31, 2009, open positions in financial futures contracts were:
| Fund | | Expiration | | Open Contracts | | Position | | Unrealized
Appreciation
(Depreciation) | |
| Core Bond | | December 2009 | | 20 U.S. Treasury Notes, 10 Year | | Short | | $ | (14,063 | ) | |
| Short Duration | | December 2009 | | 45 U.S. Treasury Notes, 2 Year | | Long | | $ | 71,125 | | |
| Strategic Income | | December 2009 | | 25 U.S. Treasury Notes, 10 Year | | Long | | $ | (24,016 | ) | |
The contract amounts at period end are indicative of the volume throughout the period. At October 31, 2009, the Funds had deposited the following in segregated accounts to cover margin requirements on open futures contracts:
Core Bond: $200,000
Short Duration: $204,054 in Fannie Mae Whole Loan, 10.53%, due 11/2/09
Strategic Income: $200,000
At October 31, 2009, the Funds had the following derivatives (not designated as hedging instruments under ASC 815), for open contracts grouped by primary risk exposure:
Asset Derivatives
| | | Interest Rate
Risk | |
| Short Duration | |
| Futures Contracts(1) | | $ | 71,125 | | |
| Total Value | | $ | 71,125 | | |
Liability Derivatives
| | | Interest Rate
Risk | |
| Core Bond | |
| Futures Contracts(1) | | $ | (14,063 | ) | |
| Total Value | | $ | (14,063 | ) | |
| Strategic Income | |
| Futures Contracts(1) | | $ | (24,016 | ) | |
| Total Value | | $ | (24,016 | ) | |
(1) Statement of Assets and Liabilities location: Cumulative appreciation (depreciation) of futures contracts is shown in "Futures Contracts" above and is included in Net unrealized appreciation (depreciation) in value of investments within the Statements of Assets and Liabilities. The outstanding variation margin, if any, is reported within the Statements of Assets and Liabilities: Receivable/Payable for variation margin.
85
The impact of these derivative instruments on the Statements of Operations during the year ended October 31, 2009, was as follows:
Realized Gain (Loss)(1)
| | | Interest Rate
Risk | |
| Core Bond | |
| Futures Contracts | | $ | — | | |
| Total Realized Gain (Loss) | | $ | — | | |
| Short Duration | |
| Futures Contracts | | $ | 958,546 | | |
| Total Realized Gain (Loss) | | $ | 958,546 | | |
| Strategic Income | |
| Futures Contracts | | $ | — | | |
| Total Realized Gain (Loss) | | $ | — | | |
Change in Appreciation (Depreciation)(2)
| | | Interest Rate
Risk | |
| Core Bond | |
| Futures Contracts | | $ | (14,063 | ) | |
Total Change in
Appreciation (Depreciation) | | $ | (14,063 | ) | |
| Short Duration | |
| Futures Contracts | | $ | (223,644 | ) | |
Total Change in
Appreciation (Depreciation) | | $ | (223,644 | ) | |
| Strategic Income | |
| Futures Contracts | | $ | (24,016 | ) | |
Total Change in
Appreciation (Depreciation) | | $ | (24,016 | ) | |
(1) Statements of Operations location: Net realized gain (loss) on financial futures contracts.
(2) Statements of Operations location: Change in net unrealized appreciation (depreciation) in value of financial futures contracts.
Management has concluded that the Funds, except Core Bond, Short Duration and Strategic Income, did not hold any derivative instruments during the year ended October 31, 2009 that require additional disclosures pursuant to ASC 815.
16 Indemnifications: Like many other companies, the Trust's organizational documents provide that its officers and trustees are indemnified against certain liabilities arising out of the performance of their duties to the Trust. In addition, both in some of its principal service contracts and in the normal course of its business, the Trust enters into contracts that provide indemnifications to other parties for certain types of losses or liabilities. The Trust's maximum exposure under these arrangements is unknown as this could involve future claims against the Trust.
86
Note B—Management Fees, Administration Fees, Distribution Arrangements, and Other Transactions with Affiliates:
Each Fund retains Management as its investment manager under a Management Agreement. For such investment management services, each Fund (except High Income and Strategic Income) pays Management a fee at the annual rate of 0.25% of the first $500 million of that Fund's average daily net assets, 0.225% of the next $500 million, 0.20% of the next $500 million, 0.175% of the next $500 million, and 0.15% of average daily net assets in excess of $2 billion. High Income and Strategic Income each pay Management a fee for investment management services at the annual rates of 0.48% and 0.55%, respectively, of each Fund's average daily net assets. Management has voluntarily agreed to waive its management fee in the amount of 0.25% of the average daily net assets of Core Bond. Management may, at its sole discretion, modify or terminate this voluntary waiver without notice to the Fund. For the year ended October 31, 2009, such waived fees amounted to $181,182 for Core Bond.
Each Fund retains Management as its administrator under an Administration Agreement. Each Fund pays Management an administration fee at the annual rate of 0.06% of its average daily net assets under this agreement. In addition, each Fund's Investor Class pays Management an administration fee at the annual rate of 0.21% of its average daily net assets, each Fund's Institutional Class pays Management an administration fee at the annual rate of 0.09% of its average daily net assets, the Trust Class of Short Duration and Strategic Income pays Management an administration fee at the annual rate of 0.44% and 0.34%, respectively, of its average daily net assets, Class A and Class C of Core Bond, High Income and Strategic Income each pay Management an administration fee at the annual rate of 0.21% of its average daily net assets and Class R3 of High Income pays Management an administrative fee at the annual rate of 0.21% of its average daily net assets under this agreement. Additionally, Management retains State Street Bank and Trust Company ("State Street") as its sub-administrator under a Sub-Administration Agreement. Management pays State Street a fee for all services received under the agreement.
Management has contractually undertaken to reimburse the Fund's direct operating expenses (including fees payable to Management but excluding interest, taxes, brokerage commissions, and extraordinary expenses) ("Operating Expenses") which exceed the expense limitation as detailed in the following table. The Investor Classes of Core Bond, High Income, Municipal Intermediate Bond, Municipal Money, New York Municipal Money and Short Duration, the Institutional Classes of Core Bond, High Income and Strategic Income, the Trust Classes of Short Duration and Strategic Income, Class A and Class C of Core Bond, High Income and Strategic Income and Class R3 of High Income have each agreed to repay Management for their excess Operating Expenses previously reimbursed by Management, pursuant to a contractual expense limitation, so long as their annual Operating Expenses during that period do not exceed their respective expense limitations, and the repayments are made within three years after the year in which Management issued the reimbursement. During the year ended October 31, 2009, there were no reimbursements to Management under this agreement. At October 31, 2009, contingent liabilities to Management under the agreement were as follows:
| | | | | | | Expenses Deferred in
Fiscal Period Ending October 31, | |
| | | | | | | 2007 | | 2008 | | 2009 | |
| | | | | | | Subject to Repayment until October 31, | |
| Class | | Contractual
Expense
Limitation(1) | | Expiration | | 2010 | | 2011 | | 2012 | |
| Core Bond Investor Class | | | 0.85 | % | | 10/31/19 | | $ | 68,273 | | | $ | 62,629 | | | $ | 90,020 | | |
| Core Bond Institutional Class | | | 0.45 | % | | 10/31/19 | | | 54,868 | | | | 60,609 | | | | 81,405 | | |
| Core Bond Class A | | | 0.85 | % | | 10/31/19 | | | — | | | | 1,700 | (2) | | | 14,617 | | |
| Core Bond Class C | | | 1.60 | % | | 10/31/19 | | | — | | | | 1,695 | (2) | | | 3,790 | | |
| High Income Investor Class | | | 1.00 | % | | 10/31/12 | | | — | | | | — | | | | 93,652 | | |
| High Income Institutional Class | | | 0.75 | % | | 10/31/12 | | | — | | | | — | | | | 22,388 | (6) | |
87
| | | | | | | Expenses Deferred in
Fiscal Period Ending October 31, | |
| | | | | | | 2007 | | 2008 | | 2009 | |
| | | | | | | Subject to Repayment until October 31, | |
| Class | | Contractual
Expense
Limitation(1) | | Expiration | | 2010 | | 2011 | | 2012 | |
| High Income Class A | | | 1.12 | % | | 10/31/13 | | $ | — | | | $ | — | | | $ | 4,496 | (6) | |
| High Income Class C | | | 1.87 | % | | 10/31/13 | | | — | | | | — | | | | 693 | (6) | |
| High Income Class R3 | | | 1.37 | % | | 10/31/13 | | | — | | | | — | | | | 1,035 | (6) | |
| Municipal Intermediate Bond | |
| Investor Class | | | 0.65 | % | | 10/31/12 | | | 153,618 | | | | 170,458 | | | | 213,114 | | |
| Municipal Money Investor Class | | | 0.59 | %(5) | | 10/31/12 | | | 50,949 | | | | — | | | | 176,691 | | |
| New York Municipal Money Investor Class | | | 0.59 | %(3)(5) | | 10/31/12 | | | — | | | | — | | | | 191,176 | | |
| Short Duration Investor Class | | | 0.70 | % | | 10/31/12 | | | 204,360 | | | | 202,732 | | | | 247,213 | | |
| Short Duration Trust Class | | | 0.80 | % | | 10/31/12 | | | 54,550 | | | | 52,852 | | | | 62,762 | | |
| Strategic Income Institutional Class | | | 0.75 | %(4) | | 10/31/19 | | | 356,257 | | | | 372,887 | | | | 148,644 | | |
| Strategic Income Trust Class | | | 1.10 | % | | 10/31/12 | | | 3,394 | | | | 24,251 | | | | 50,305 | | |
| Strategic Income Class A | | | 1.15 | % | | 10/31/19 | | | — | | | | 6,744 | (2) | | | 198,132 | | |
| Strategic Income Class C | | | 1.85 | % | | 10/31/19 | | | — | | | | 6,026 | (2) | | | 78,520 | | |
(1) Expense limitation per annum of the respective class' average daily net assets.
(2) Period from December 20, 2007 to October 31, 2008.
(3) In addition to the contractual limitation above, beginning August 26, 2008, Management voluntarily agreed to waive certain expenses of the Investor Class of New York Municipal Money, so that its total annual Operating Expenses are limited to .55% of average daily net assets. For the year ended October 31, 2009, such voluntary waived fees amounted to $179,234.
(4) Prior to February 28, 2008, the expense limitation was .85%.
(5) In addition to the contractual and/or voluntary limitations previously listed, Management also voluntarily waived expenses as necessary to maintain a minimum yield for Municipal Money and New York Municipal Money. Management may, at its sole discretion, modify or terminate these voluntary waivers without notice to the Funds. For the year ended October 31, 2009, such waived fees amounted to $333,606 and $329,231 for Municipal Money and New York Municipal Money, respectively.
(6) Period from May 27, 2009 to October 31, 2009.
During the reporting period, the predecessor of Management, the investment manager of the Funds and Lehman Brothers Asset Management LLC, the sub-adviser of the Funds, were wholly owned subsidiaries of Lehman Brothers Holdings Inc. ("Lehman Brothers"), a publicly owned holding company. On September 15, 2008, Lehman Brothers filed a voluntary petition under Chapter 11 of the U.S. Bankruptcy Code. On December 3, 2008, NBSH Acquisition, LLC ("NBSH"), an entity organized by key members of Neuberger Berman's senior management, was selected as the successful bidder in the public auction to acquire a majority interest in Neuberger Berman's business and the fixed income and certain alternative asset management businesses of Lehman Brothers' Investment Management Division (together with Neuberger Berman, the "Acquired Businesses") (the "Acquisition"). On December 22, 2008, the bankruptcy court having jurisdiction over the Lehman Brothers matter approved the sale of the Acquired Businesses to NBSH (or its successor or assign), as the successful bidder.
88
The Acquisition closed on May 4, 2009. The Acquired Businesses are now indirectly owned by, among others, portfolio managers, Neuberger Berman's management team, and certain key members and senior professionals who are employed in various parts of the Neuberger Berman complex of companies, with a minority interest retained by Lehman Brothers and certain affiliates of Lehman Brothers.
The closing of the Acquisition resulted in an "assignment" of the Funds' Management Agreements and Sub-Advisory Agreements. Such an assignment, by law, automatically terminated those agreements. Accordingly, prior to the closing the Board, including the Trustees who are not "interested persons" of the Funds' investment manager and its affiliates or the Funds, considered and approved new Management Agreements and Sub-Advisory Agreements for the Funds. The new agreements, which are virtually identical to those previously in effect, were also approved by a vote of the Funds' shareholders.
These events have not had a material impact on the Funds or their operations. Management and NBFI continue to operate in the ordinary course of business as the investment manager and sub-adviser of the Funds.
NBFI, as the sub-adviser to High Income, Municipal Intermediate Bond, Municipal Money, Short Duration and Strategic Income, is retained by Management to furnish it with investment recommendations and research information without added cost to each Fund it sub-advises. NBFI, as sub-adviser to Core Bond and New York Municipal Money, is retained by Management to provide day-to-day investment management services and receives a monthly fee paid by Management. As investment manager, Management is responsible for overseeing the investment activities of NBFI. Several individuals who are officers and/or Trustees of the Trust are also employees of NBFI, Neuberger Berman LLC ("Neuberger") and/or Management.
Each Fund also has a distribution agreement with Management with respect to each class of shares. Management receives no compensation therefore and no commissions for sales or redemptions of shares of beneficial interest of each share class, except as described below for Class A and Class C shares, but receives fees from the Core Bond Investor Class and the Strategic Income Trust Class under their distribution plans (each a "Plan", collectively, the "Plans") pursuant to Rule 12b-1 under the 1940 Act.
For Core Bond's Investor Class, Class A, and Class C, High Income's Class A, Class C and Class R3 and Strategic Income's Trust Class, Class A, and Class C, Management acts as agent in arranging for the sale of class shares without commission and bears advertising and promotion expenses. The Board has adopted Plans with respect to these classes, pursuant to Rule 12b-1 under the 1940 Act. The Plans provide that, as compensation for administrative and other services provided to these classes, Management's activities and expenses related to the sale and distribution of these classes of shares, and ongoing services provided to investors in these classes, Management receives from each of these classes a fee at the annual rate of 0.25% of Core Bond Investor Class', Core Bond Class A's, High Income Class A's and Class R3's and Strategic Income Class A's average daily net assets, respectively; 0.10% of Strategic Income Trust Class' average daily net assets, and 1.00% of Core Bond Class C's, High Income Class C's and Strategic Income Class C's average daily net assets, respectively. Management receives this amount to provide distribution and shareholder servicing for these classes and pays a portion of it to institutions that provide such services. Those institutions may use the payments for, among other purposes, compensating employees engaged in sales and/or shareholder servicing. The amount of fees paid by each class during any year may be more or less than the cost of distribution and other services provided to that class. NASD rules limit the amount of annual distribution fees that may be paid by a mutual fund and impose a ceiling on the cumulative distribution fees paid. The Trust's Plans comply with those rules.
Class A shares of each Fund are generally sold with an initial sales charge of up to 4.25% and no contingent deferred sales charge ("CDSC"), except that a CDSC of 1.00% applies to certain redemptions made within 18 months following purchases of $1 million or more without an initial sales charge. Class C shares are sold with no initial sales charge and a 1.00% CDSC if shares are sold within one year after purchase.
89
For the year ended October 31, 2009, Management, acting as underwriter and broker-dealer, received net commissions from the sale of Class A and Class C shares and CDSCs from the redemptions of Class A and Class C shares as follows:
| | | Underwriter | | Broker-Dealer | |
| | | Net Commissions | | CDSC | | Net Commissions | | CDSC | |
| Core Bond Class A | | $ | 454 | | | $ | — | | | $ | — | | | $ | — | | |
| Core Bond Class C | | | — | | | | 272 | | | | — | | | | — | | |
| High Income Class A | | | 2,308 | | | | — | | | | — | | | | — | | |
| High Income Class C | | | — | | | | 291 | | | | — | | | | — | | |
| Strategic Income Class A | | | 22,128 | | | | — | | | | — | | | | — | | |
| Strategic Income Class C | | | — | | | | 4,040 | | | | — | | | | — | | |
For the year ended October 31, 2008, High Income recorded a capital contribution from Management in the amount of $383,334. This amount was paid in connection with a reallocation of expenses that are shared by the Fund and Management. This expense was paid to a third party that provides services to the Fund.
During the year ended October 31, 2009, Municipal Money and New York Municipal Money engaged in purchase and sale transactions with funds that have a common investment adviser (or affiliated investment adviser), common trustees/directors and/or common officers ("Interfund Transactions"). These Interfund Transactions complied with Rule 17a-7 under the 1940 Act and were as follows:
| | | Purchases | | Sales | |
| Municipal Money | | $ | 107,041,348 | | | $ | 68,473,349 | | |
| New York Municipal Money | | | 48,543,303 | | | | 79,117,011 | | |
Each Fund has an expense offset arrangement in connection with its custodian contract. For the year ended October 31, 2009, the impact of this arrangement was a reduction of expenses of $65, $1,449, $717, $4,498, $9,892, $94 and $65 for Core Bond, High Income, Municipal Intermediate Bond, Municipal Money, New York Municipal Money, Short Duration, and Strategic Income, respectively.
Note C—Securities Transactions:
Cost of purchases and proceeds of sales and maturities of long-term securities (excluding short-term securities and financial futures contracts) for the year ended October 31, 2009 were as follows:
| | | Purchases of
U.S. Government and
Agency Obligations | | Purchases excluding
U.S. Government and
Agency Obligations | | Sales and
Maturities of
U.S. Government and
Agency Obligations | | Sales and
Maturities excluding
U.S. Government and
Agency Obligations | |
| Core Bond | | $ | 275,541,178 | | | $ | 87,441,299 | | | $ | 255,158,282 | | | $ | 114,416,111 | | |
| High Income | | | — | | | | 760,217,026 | | | | — | | | | 512,053,746 | | |
Municipal
Intermediate Bond | | | — | | | | 133,428,015 | | | | — | | | | 68,640,373 | | |
| Short Duration | | | 15,966,247 | | | | 11,052,148 | | | | 1,366,290 | | | | 32,186,003 | | |
| Strategic Income | | | 145,821,328 | | | | 109,486,709 | | | | 102,907,991 | | | | 46,667,189 | | |
All securities transactions for Municipal Money and New York Municipal Money were short-term.
90
Note D—Fund Share Transactions:
Share activity for the years ended October 31, 2009 and October 31, 2008 were as follows:
| | | For the Year Ended October 31, 2009 | | For the Year Ended October 31, 2008 | |
| (000's omitted) | | Shares
Sold | | Shares Issued
on Reinvestment
of Dividends
and Distributions | | Shares
Redeemed | | Total | | Shares
Sold | | Shares Issued
on Reinvestment
of Dividends
and Distributions | | Shares
Redeemed | | Total | |
| Core Bond: | |
| Investor Class | | | 1,052 | | | | 118 | | | | (3,836 | ) | | | (2,666 | ) | | | 2,812 | | | | 155 | | | | (1,524 | ) | | | 1,443 | | |
| Institutional Class | | | 5,704 | | | | 150 | | | | (3,768 | ) | | | 2,086 | | | | 896 | | | | 221 | | | | (2,234 | ) | | | (1,117 | ) | |
| Class A | | | 2,013 | | | | 19 | | | | (227 | ) | | | 1,805 | | | | 15 | | | | 1 | | | | — | | | | 16 | (1) | |
| Class C | | | 82 | | | | 1 | | | | (18 | ) | | | 65 | | | | 16 | | | | 1 | | | | — | | | | 17 | (1) | |
| High Income: | |
| Investor Class | | | 51,650 | | | | 3,412 | | | | (32,540 | ) | | | 22,522 | | | | 13,297 | | | | 2,480 | | | | (30,588 | ) | | | (14,811 | ) | |
| Institutional Class(2) | | | 10,062 | | | | 49 | | | | (135 | ) | | | 9,976 | | | | — | | | | — | | | | — | | | | — | | |
| Class A(2) | | | 2,834 | | | | 26 | | | | (60 | ) | | | 2,800 | | | | — | | | | — | | | | — | | | | — | | |
| Class C(2) | | | 307 | | | | 1 | | | | (13 | ) | | | 295 | | | | — | | | | — | | | | — | | | | — | | |
| Class R3(2) | | | 9 | | | | — | | | | — | | | | 9 | | | | — | | | | — | | | | — | | | | — | | |
Municipal
Intermediate Bond: | |
| Investor Class | | | 6,539 | | | | 94 | | | | (816 | ) | | | 5,817 | | | | 579 | | | | 79 | | | | (730 | ) | | | (72 | ) | |
| Municipal Money: | |
| Investor Class | | | 524,114 | | | | 1,713 | | | | (604,750 | ) | | | (78,923 | ) | | | 4,555,916 | | | | 12,986 | | | | (5,045,062 | ) | | | (476,160 | ) | |
New York
Municipal Money: | |
| Investor Class | | | 466,801 | | | | 1,712 | | | | (545,986 | ) | | | (77,473 | ) | | | 2,999,266 | | | | 12,177 | | | | (3,333,188 | ) | | | (321,745 | ) | |
| Short Duration: | |
| Investor Class | | | 1,059 | | | | 334 | | | | (2,452 | ) | | | (1,059 | ) | | | 1,136 | | | | 455 | | | | (4,041 | ) | | | (2,450 | ) | |
| Trust Class | | | 349 | | | | 56 | | | | (541 | ) | | | (136 | ) | | | 285 | | | | 69 | | | | (634 | ) | | | (280 | ) | |
| Strategic Income: | |
| Institutional Class | | | 1,472 | | | | 38 | | | | (264 | ) | | | 1,246 | | | | 29 | | �� | | 85 | | | | (1,230 | ) | | | (1,116 | ) | |
| Trust Class | | | 709 | | | | 11 | | | | (128 | ) | | | 592 | | | | 39 | | | | 3 | | | | (24 | ) | | | 18 | | |
| Class A | | | 7,204 | | | | 55 | | | | (837 | ) | | | 6,422 | | | | 18 | | | | 1 | | | | — | | | | 19 | (1) | |
| Class C | | | 3,493 | | | | 12 | | | | (101 | ) | | | 3,404 | | | | 14 | | | | 1 | | | | (1 | ) | | | 14 | (1) | |
(1) Period from December 20, 2007 to October 31, 2008.
(2) Period from May 27, 2009 to October 31, 2009.
Note E—Lines of Credit:
During the fiscal year ended October 31, 2009, Core Bond, High Income, Municipal Money (as of September 18, 2009), New York Municipal Money (as of September 18, 2009), Short Duration and Strategic Income were participants in a single committed, unsecured $150,000,000 line of credit with State Street, to be used only for temporary or emergency purposes. Other investment companies managed by Management also participate in this line
91
of credit on the same terms. Interest is charged on borrowings under this line of credit at the higher of (a) the Federal Funds Rate plus 1.25% per annum or (b) the Overnight LIBOR Rate plus 1.25% per annum. Prior to September 18, 2009, interest was charged on borrowings under this line of credit at the Federal Funds Rate plus 0.50% per annum. A facility fee of 0.15% (prior to September 18, 2009, 0.09%) per annum of the available line of credit is charged, of which each Fund has agreed to pay its pro rata share, based on the ratio of its individual net assets to the net assets of all participants at the time the fee is due and payable. The fee is paid quarterly in arrears. Because several investment companies participate, there is no assurance that an individual Fund will have access to all or any part of the $150,000,000 at any particular time. There were no loans outstanding pursuant to this line of credit at October 31, 2009. During the fiscal year ended October 31, 2009, none of the Funds utilized this line of credit.
During the fiscal year ended October 31, 2009, Municipal Money and New York Municipal Money were participants in a single committed, unsecured $300,000,000 syndicated line of credit with The Bank of New York Mellon, as agent, to be used only for temporary or emergency purposes. This line of credit terminated as of April 30, 2009. Other investment companies managed by Management also participated in this line of credit on the same terms. Interest was charged on borrowings under this line of credit at the overnight Federal Funds Rate plus 0.375% per annum. A commitment fee of 0.085% per annum of the unused available line of credit was charged, of which each Fund agreed to pay its pro rata share, based on the ratio of its individual net assets to the net assets of all participants at the time the fee was due and payable. The fee was paid quarterly in arrears. In addition, a one time arrangement fee of $50,000 was charged in connect ion with the line of credit, of which each Fund agreed to pay its pro rata share, based on the ratio of its individual net assets to the net assets of all participants at the time the fee was due and payable. Because several investment companies participated, there was no assurance that an individual Fund would have access to all or any part of the $300,000,000 at any particular time. There were no loans outstanding pursuant to this line of credit at October 31, 2009. During the fiscal year ended October 31, 2009, neither of the Funds utilized this line of credit.
At October 31, 2009, Municipal Money and New York Municipal Money were participants in a single uncommitted, unsecured $150,000,000 line of credit with State Street, as lender, to be used only for temporary or emergency purposes. Other investment companies managed by Management also participate in this line of credit on the same terms. Interest is charged on borrowings under this line of credit at the higher of (a) the Federal Funds Rate plus 1.25% per annum or (b) the Overnight LIBOR Rate plus 1.25% per annum. Prior to May 22, 2009, interest was charged on borrowings under this line of credit at the Federal Funds Rate plus 0.375% per annum. Because several investment companies participate, there is no assurance that an individual Fund will have access to all or any part of the $150,000,000 at any particular time. There were no loans outstanding pursuant to this line of credit at October 31, 2009. During the fiscal year ended October 31, 2009, neither of the Funds utilized this line of credit.
Note F—Investments In Affiliates:
| | | Balance of
Shares Held
October 31,
2008 | | Gross
Purchases
and Additions | | Gross
Sales and
Reductions | | Balance of
Shares Held
October 31,
2009 | | Value
October 31,
2009 | | Income from
Investments
in Affiliated
Issuers Included
in Total Income | |
| Core Bond: | |
Neuberger Berman Prime
Money Fund Trust Class* | | | 1,337,111 | | | | 70,835,893 | | | | 72,173,004 | | | | — | | | $ | — | | | $ | 18,287 | | |
Neuberger Berman Securities
Lending Quality Fund, LLC** | | | — | | | | 1,085,616 | | | | 5,482 | | | | 1,080,134 | | | | 1,101,736 | | | | — | | |
| Total | | | | | | | | | | $ | 1,101,736 | | | $ | 18,287 | | |
92
| | | Balance of
Shares Held
October 31,
2008 | | Gross
Purchases
and Additions | | Gross
Sales and
Reductions | | Balance of
Shares Held
October 31,
2009 | | Value
October 31,
2009 | | Income from
Investments
in Affiliated
Issuers Included
in Total Income | |
| High Income: | |
Neuberger Berman Prime
Money Fund Trust Class* | | | 15,507,852 | | | | 309,910,770 | | | | 325,418,622 | | | | — | | | $ | — | | | $ | 55,790 | | |
Neuberger Berman Securities
Lending Quality Fund, LLC** | | | — | | | | 55,042,951 | | | | 42,148,237 | | | | 12,894,714 | | | | 13,152,608 | | | | 7,195 | | |
| Total | | | | | | | | | | | | | | | | | | $ | 13,152,608 | | | $ | 62,985 | | |
| Short Duration: | |
Neuberger Berman Prime
Money Fund Trust Class* | | | — | | | | 13,387,868 | | | | 13,387,868 | | | | — | | | $ | — | | | $ | 2,758 | | |
| Strategic Income: | |
Neuberger Berman Prime
Money Fund Trust Class* | | | — | | | | 45,439,722 | | | | 45,439,722 | | | | — | | | $ | — | | | $ | 6,570 | | |
* Prime Money was also managed by Management and may have been considered an affiliate since it had the same officers, Board members, and investment manager as the Fund and because, at times, the Fund may have owned 5% or more of the outstanding voting securities of Prime Money.
** Quality Fund, a fund managed by NBFI, an affiliate of Management, is used to invest cash the Funds receive as collateral for securities loaned as approved by the Board. Because all shares of Quality Fund are held by funds in the related investment management complex, Quality Fund may be considered an affiliate of the Funds.
Note G—Recent Accounting Pronouncement:
In accordance with the provision set forth in ASC 855 "Subsequent Events"("ASC 855"), formerly known as FAS 165, "Subsequent Events," Management has evaluated the possibility of subsequent events existing in the Funds' financial statements through December 17, 2009. Management has determined that there are no subsequent events that, in accordance with ASC 855, would need to be disclosed in the Funds' financial statements through this date.
Note H—U.S. Treasury Temporary Guarantee Program for Money Market Funds
Each of Municipal Money and New York Municipal Money participated in the Temporary Guarantee Program for Money Market Funds (the "Program") offered by the United States Department of the Treasury ("U.S. Treasury") and bore the expense of its participation. The Program terminated on September 18, 2009. The dollar amount each Fund has paid from November 1, 2008 through September 18, 2009 to participate in the Program is listed below under "Program Payment". The dollar amount each Fund expensed from November 1, 2008 through September 18,
93
2009, which is reflected in the Statements of Operations under the caption "U.S. Treasury Temporary Guarantee Program Fee", is listed below under "Program Fees Expensed November 1, 2008 to September 18, 2009".
| | | Program
Payment | | Program Fees Expensed
November 1, 2008 to
September 18, 2009 | |
| Municipal Money | | $ | 202,222 | | | $ | 202,222 | | |
| New York Municipal Money | | | 174,742 | | | | 174,742 | | |
Subject to certain conditions and limitations, in the event that a Fund's per share value fell below $0.995 and the Fund liquidated its holdings, the Program guaranteed shareholders of record at the close of business on September 19, 2008 ("Designated Shareholders") of that Fund $1.00 per share for the lesser of either the number of shares the Designated Shareholder held in the Fund at the close of business on September 19, 2008, or the number of shares the Designated Shareholder held in the Fund on the date the Fund's per share value fell below $0.995. The Program applied only to Designated Shareholders who maintained an account with the Fund from the close of business on September 19, 2008 through the date on which the Fund's per share value were to fall below $0.995. Designated Shareholders could purchase and redeem shares in their account during the period covered by the Program. However, the number of shares covered by the guarantee could not exceed the number of shares a Designated Shareholder held in the Fund at the close of business on September 19, 2008. Thus, to the extent the overall value of a shareholder's account with the Fund increased after September 19, 2008, the amount of the increase would not be covered by the guarantee.
The Program provided coverage for a period that was originally due to expire on April 30, 2009, unless extended by the Secretary of the U.S. Treasury. The Secretary of the U.S. Treasury extended the Program until September 18, 2009, and the Board of the Trust decided to continue each respective Fund's participation in the Program. For coverage for the period September 19, 2008 to April 30, 2009, each Fund paid 0.025% based on its net assets as of September 19, 2008. For continuing coverage for the extended period May 1, 2009 to September 18, 2009 (the "Extended Period"), each Fund paid an additional 0.015% based on its net assets as of September 19, 2008 which was expensed over the Extended Period. The Program terminated on September 18, 2009 and the Secretary of the U.S. Treasury does not have authority to extend the Program for any additional amount of time.
94
This page has been left blank intentionally
Financial Highlights
The following tables include selected data for a share outstanding throughout each period and other performance information derived from the Financial Statements.
| | | Net Asset
Value,
Beginning
of Year | | Net
Investment
Income (Loss) | | Net Gains or
Losses on
Securities
(both
realized and
unrealized) | | Total From
Investment
Operations | | Dividends
from Net
Investment
Income | | Distributions
from Net
Realized
Capital Gains | | Tax
Return of
Capital | | Total
Distributions | |
| Core Bond Fund | |
| Investor Class | |
| 10/31/2009 | | $ | 8.64 | | | $ | 0.40 | @ | | $ | 1.55 | | | $ | 1.95 | | | $ | (0.40 | ) | | $ | (0.00 | ) | | $ | — | | | $ | (0.40 | ) | |
| 10/31/2008 | | $ | 9.76 | | | $ | 0.39 | @ | | $ | (1.12 | ) | | $ | (0.73 | ) | | $ | (0.39 | ) | | $ | — | | | $ | — | | | $ | (0.39 | ) | |
| 10/31/2007 | | $ | 9.85 | | | $ | 0.44 | @ | | $ | (0.09 | ) | | $ | 0.35 | | | $ | (0.44 | ) | | $ | — | | | $ | — | | | $ | (0.44 | ) | |
| 10/31/2006 | | $ | 10.09 | | | $ | 0.41 | @ | | $ | 0.09 | | | $ | 0.50 | | | $ | (0.43 | ) | | $ | (0.31 | ) | | $ | — | | | $ | (0.74 | ) | |
Period from 10/1/2005 to
10/31/2005 | | $ | 10.21 | | | $ | 0.03 | @ | | $ | (0.12 | ) | | $ | (0.09 | ) | | $ | (0.03 | ) | | $ | — | | | $ | — | | | $ | (0.03 | ) | |
| 9/30/2005‡‡ | | $ | 10.51 | | | $ | 0.31 | @ | | $ | (0.04 | ) | | $ | 0.27 | | | $ | (0.31 | ) | | $ | (0.26 | ) | | $ | — | | | $ | (0.57 | ) | |
| Institutional Class | |
| 10/31/2009 | | $ | 8.65 | | | $ | 0.43 | @ | | $ | 1.57 | | | $ | 2.00 | | | $ | (0.44 | ) | | $ | (0.00 | ) | | $ | — | | | $ | (0.44 | ) | |
| 10/31/2008 | | $ | 9.77 | | | $ | 0.43 | @ | | $ | (1.12 | ) | | $ | (0.69 | ) | | $ | (0.43 | ) | | $ | — | | | $ | — | | | $ | (0.43 | ) | |
| 10/31/2007 | | $ | 9.86 | | | $ | 0.48 | @ | | $ | (0.09 | ) | | $ | 0.39 | | | $ | (0.48 | ) | | $ | — | | | $ | — | | | $ | (0.48 | ) | |
| 10/31/2006 | | $ | 10.11 | | | $ | 0.45 | @ | | $ | 0.08 | | | $ | 0.53 | | | $ | (0.47 | ) | | $ | (0.31 | ) | | $ | — | | | $ | (0.78 | ) | |
Period from 10/1/2005 to
10/31/2005 | | $ | 10.22 | | | $ | 0.03 | @ | | $ | (0.11 | ) | | $ | (0.08 | ) | | $ | (0.03 | ) | | $ | — | | | $ | — | | | $ | (0.03 | ) | |
| 9/30/2005‡‡ | | $ | 10.52 | | | $ | 0.33 | @ | | $ | (0.02 | ) | | $ | 0.31 | | | $ | (0.35 | ) | | $ | (0.26 | ) | | $ | — | | | $ | (0.61 | ) | |
| Class A | |
| 10/31/2009 | | $ | 8.64 | | | $ | 0.37 | @ | | $ | 1.57 | | | $ | 1.94 | | | $ | (0.40 | ) | | $ | (0.00 | ) | | $ | — | | | $ | (0.40 | ) | |
Period from 12/20/2007^ to
10/31/2008 | | $ | 9.77 | | | $ | 0.33 | @ | | $ | (1.13 | ) | | $ | (0.80 | ) | | $ | (0.33 | ) | | $ | — | | | $ | — | | | $ | (0.33 | ) | |
| Class C | |
| 10/31/2009 | | $ | 8.64 | | | $ | 0.32 | @ | | $ | 1.55 | | | $ | 1.87 | | | $ | (0.33 | ) | | $ | (0.00 | ) | | $ | — | | | $ | (0.33 | ) | |
Period from 12/20/2007^ to
10/31/2008 | | $ | 9.77 | | | $ | 0.26 | @ | | $ | (1.12 | ) | | $ | (0.86 | ) | | $ | (0.27 | ) | | $ | — | | | $ | — | | | $ | (0.27 | ) | |
| High Income Bond Fund | |
| Investor Class | |
| 10/31/2009 | | $ | 6.57 | | | $ | 0.74 | @ | | $ | 2.02 | | | $ | 2.76 | | | $ | (0.67 | ) | | $ | — | | | $ | — | | | $ | (0.67 | ) | |
| 10/31/2008 | | $ | 9.00 | | | $ | 0.66 | @ | | $ | (2.44 | ) | | $ | (1.78 | ) | | $ | (0.66 | ) | | $ | — | | | $ | — | | | $ | (0.66 | ) | |
| 10/31/2007 | | $ | 9.08 | | | $ | 0.68 | @ | | $ | (0.08 | ) | | $ | 0.60 | | | $ | (0.68 | ) | | $ | — | | | $ | — | | | $ | (0.68 | ) | |
| 10/31/2006 | | $ | 9.10 | | | $ | 0.59 | @ | | $ | (0.02 | ) | | $ | 0.57 | | | $ | (0.59 | ) | | $ | — | | | $ | — | | | $ | (0.59 | ) | |
| 10/31/2005 | | $ | 9.54 | | | $ | 0.55 | @ | | $ | (0.44 | ) | | $ | 0.11 | | | $ | (0.55 | ) | | $ | — | | | $ | — | | | $ | (0.55 | ) | |
See Notes to Financial Highlights
96
| | | Capital
Contributions | | Net Asset
Value, End of
Year | Total
Return†† | Net Assets,
End of Year
(in millions) | | Ratio of
Gross
Expenses
to Average
Net Assets# | | Ratio of Net
Expenses
to Average
Net Assets | | Ratio of Net
Investment
Income/
(Loss) to
Average
Net Assets | | Portfolio
Turnover
Rate | |
| Core Bond Fund | |
| Investor Class | |
| 10/31/2009 | | $ | — | | $ | 10.19 | | 23.10 | % | $ | 25.0 | | | | .86 | % | | | .86 | %‡ | | | 4.39 | % | | | 450 | % | |
| 10/31/2008 | | $ | — | | $ | 8.64 | | (7.72 | )% | $ | 44.2 | | | | .85 | % | | | .85 | %‡ | | | 4.08 | % | | | 430 | % | |
| 10/31/2007 | | $ | — | | $ | 9.76 | | 3.67 | % | $ | 35.9 | | | | .85 | % | | | .85 | %‡ | | | 4.51 | % | | | 404 | % | |
| 10/31/2006 | | $ | — | | $ | 9.85 | | 5.21 | % | $ | 33.9 | | | | .86 | % | | | .85 | %‡ | | | 4.22 | % | | | 399 | % | |
Period from 10/1/2005 to
10/31/2005 | | $ | — | | $ | 10.09 | | (.87 | )%** | $ | 31.7 | | | | .85 | %* | | .85 | %‡* | | 3.51 | %* | | | 34 | %** | |
| 9/30/2005‡‡ | | $ | — | | $ | 10.21 | | 2.64 | % | $ | 31.2 | | | | .86 | % | | | .85 | %‡ | | | 3.03 | % | | | 462 | % | |
| Institutional Class | |
| 10/31/2009 | | $ | — | | $ | 10.21 | | 23.70 | % | $ | 59.1 | | | | .45 | % | | | .45 | %‡ | | | 4.60 | % | | | 450 | % | |
| 10/31/2008 | | $ | — | | $ | 8.65 | | (7.34 | )% | $ | 32.1 | | | | .45 | % | | | .45 | %‡ | | | 4.48 | % | | | 430 | % | |
| 10/31/2007 | | $ | — | | $ | 9.77 | | 4.08 | % | $ | 47.2 | | | | .45 | % | | | .45 | %‡ | | | 4.91 | % | | | 404 | % | |
| 10/31/2006 | | $ | — | | $ | 9.86 | | 5.52 | % | $ | 44.5 | | | | .46 | % | | | .45 | %‡ | | | 4.60 | % | | | 399 | % | |
Period from 10/1/2005 to
10/31/2005 | | $ | — | | $ | 10.11 | | (.73 | )%** | $ | 47.5 | | | | .45 | %* | | .45 | %‡* | | 3.91 | %* | | | 34 | %** | |
| 9/30/2005‡‡ | | $ | — | | $ | 10.22 | | 3.05 | % | $ | 48.5 | | | | .45 | % | | | .45 | %‡ | | | 3.17 | % | | | 462 | % | |
| Class A | |
| 10/31/2009 | | $ | — | | $ | 10.18 | | 22.96 | % | $ | 18.5 | | | | .85 | % | | | .85 | %‡ | | | 3.81 | % | | | 450 | % | |
Period from 12/20/2007^ to
10/31/2008 | | $ | — | | $ | 8.64 | | (8.37 | )%** | $ | 0.1 | | | | .85 | %* | | .85 | %‡* | | 4.01 | %* | | | 430 | %**^^ | |
| Class C | |
| 10/31/2009 | | $ | — | | $ | 10.18 | | 22.04 | % | $ | 0.8 | | | | 1.61 | % | | | 1.61 | %‡ | | | 3.39 | % | | | 450 | % | |
Period from 12/20/2007^ to
10/31/2008 | | $ | — | | $ | 8.64 | | (8.98 | )%** | $ | 0.1 | | | | 1.60 | %* | | 1.60 | %‡* | | 3.24 | %* | | | 430 | %**^^ | |
| High Income Bond Fund | |
| Investor Class | |
| 10/31/2009 | | $ | — | | $ | 8.66 | | 44.38 | % | $ | 422.2 | | | | 1.00 | % | | | 1.00 | %‡ | | | 9.90 | % | | | 167 | % | |
| 10/31/2008 | | $ | 0.01 | | $ | 6.57 | | (20.86 | )% | $ | 172.3 | | | | .92 | % | | | .92 | %‡ | | | 7.96 | % | | | 115 | % | |
| 10/31/2007 | | $ | — | | $ | 9.00 | | 6.73 | % | $ | 369.2 | | | | .92 | % | | | .92 | %‡ | | | 7.41 | % | | | 153 | % | |
| 10/31/2006 | | $ | — | | $ | 9.08 | | 6.53 | % | $ | 588.3 | | | | .90 | % | | | .89 | %‡ | | | 6.52 | % | | | 136 | % | |
| 10/31/2005 | | $ | — | | $ | 9.10 | | 1.17 | % | $ | 779.7 | | | | .91 | % | | | .91 | % | | | 5.88 | % | | | 63 | % | |
97
Financial Highlights (cont'd)
| | | Net Asset
Value,
Beginning
of Year | | Net
Investment
Income (Loss) | | Net Gains or
Losses on
Securities
(both
realized and
unrealized) | | Total From
Investment
Operations | | Dividends
from Net
Investment
Income | | Distributions
from Net
Realized
Capital Gains | | Tax
Return of
Capital | | Total
Distributions | |
| Institutional Class | |
Period from 5/27/2009^ to
10/31/2009 | | $ | 7.51 | | | $ | 0.36 | @ | | $ | 1.14 | | | $ | 1.50 | | | $ | (0.33 | ) | | $ | — | | | $ | — | | | $ | (0.33 | ) | |
| Class A | |
Period from 5/27/2009^ to
10/31/2009 | | $ | 7.51 | | | $ | 0.33 | @ | | $ | 1.13 | | | $ | 1.46 | | | $ | (0.31 | ) | | $ | — | | | $ | — | | | $ | (0.31 | ) | |
| Class C | |
Period from 5/27/2009^ to
10/31/2009 | | $ | 7.51 | | | $ | 0.30 | @ | | $ | 1.14 | | | $ | 1.44 | | | $ | (0.28 | ) | | $ | — | | | $ | — | | | $ | (0.28 | ) | |
| Class R3 | |
Period from 5/27/2009^ to
10/31/2009 | | $ | 7.51 | | | $ | 0.33 | @ | | $ | 1.13 | | | $ | 1.46 | | | $ | (0.30 | ) | | $ | — | | | $ | — | | | $ | (0.30 | ) | |
| Municipal Intermediate Bond Fund | |
| Investor Class | |
| 10/31/2009 | | $ | 10.60 | | | $ | 0.35 | @ | | $ | 0.64 | | | $ | 0.99 | | | $ | (0.37 | ) | | $ | — | | | $ | — | | | $ | (0.37 | ) | |
| 10/31/2008 | | $ | 11.20 | | | $ | 0.41 | @ | | $ | (0.59 | ) | | $ | (0.18 | ) | | $ | (0.41 | ) | | $ | (0.01 | ) | | $ | — | | | $ | (0.42 | ) | |
| 10/31/2007 | | $ | 11.36 | | | $ | 0.41 | @ | | $ | (0.12 | ) | | $ | 0.29 | | | $ | (0.41 | ) | | $ | (0.04 | ) | | $ | — | | | $ | (0.45 | ) | |
| 10/31/2006 | | $ | 11.33 | | | $ | 0.40 | @ | | $ | 0.08 | | | $ | 0.48 | | | $ | (0.40 | ) | | $ | (0.05 | ) | | $ | — | | | $ | (0.45 | ) | |
| 10/31/2005 | | $ | 11.81 | | | $ | 0.40 | @ | | $ | (0.41 | ) | | $ | (0.01 | ) | | $ | (0.40 | ) | | $ | (0.07 | ) | | $ | — | | | $ | (0.47 | ) | |
| Municipal Money Fund | |
| Investor Class | |
| 10/31/2009 | | $ | 0.9999 | | | $ | 0.0040 | | | $ | 0.0000 | | | $ | 0.0040 | | | $ | (0.0040 | ) | | $ | (0.0000 | ) | | $ | — | | | $ | (0.0040 | ) | |
| 10/31/2008 | | $ | 0.9999 | | | $ | 0.0209 | | | $ | 0.0000 | | | $ | 0.0209 | | | $ | (0.0209 | ) | | $ | (0.0000 | ) | | $ | — | | | $ | (0.0209 | ) | |
| 10/31/2007 | | $ | 0.9998 | | | $ | 0.0313 | | | $ | 0.0001 | | | $ | 0.0314 | | | $ | (0.0313 | ) | | $ | (0.0000 | ) | | $ | — | | | $ | (0.0313 | ) | |
| 10/31/2006 | | $ | 0.9998 | | | $ | 0.0276 | | | $ | 0.0000 | | | $ | 0.0276 | | | $ | (0.0276 | ) | | $ | — | | | $ | — | | | $ | (0.0276 | ) | |
| 10/31/2005 | | $ | 0.9998 | | | $ | 0.0158 | | | $ | — | | | $ | 0.0158 | | | $ | (0.0158 | ) | | $ | — | | | $ | — | | | $ | (0.0158 | ) | |
| New York Municipal Money Fund | |
| Investor Class | |
| 10/31/2009 | | $ | 0.9997 | | | $ | 0.0036 | | | $ | (0.0013 | ) | | $ | 0.0023 | | | $ | (0.0036 | ) | | $ | — | | | $ | — | | | $ | (0.0036 | ) | |
| 10/31/2008 | | $ | 1.0000 | | | $ | 0.0216 | | | $ | (0.0003 | ) | | $ | 0.0213 | | | $ | (0.0216 | ) | | $ | (0.0000 | ) | | $ | — | | | $ | (0.0216 | ) | |
| 10/31/2007 | | $ | 1.0000 | | | $ | 0.0322 | | | $ | 0.0000 | | | $ | 0.0322 | | | $ | (0.0322 | ) | | $ | (0.0000 | ) | | $ | — | | | $ | (0.0322 | ) | |
Period from 12/19/2005^ to
10/31/2006 | | $ | 1.0000 | | | $ | 0.0249 | | | $ | 0.0000 | | | $ | 0.0249 | | | $ | (0.0249 | ) | | $ | — | | | $ | — | | | $ | (0.0249 | ) | |
See Notes to Financial Highlights
98
| | | Capital
Contributions | | Net Asset
Value, End of
Year | | Total
Return†† | | Net Assets,
End of Year
(in millions) | | Ratio of
Gross
Expenses
to Average
Net Assets# | | Ratio of Net
Expenses
to Average
Net Assets | | Ratio of Net
Investment
Income/
(Loss) to
Average
Net Assets | | Portfolio
Turnover
Rate | |
| Institutional Class | |
Period from 5/27/2009^ to
10/31/2009 | | $ | — | | | $ | 8.68 | | | | 20.23 | %** | | $ | 86.6 | | | | .75 | %* | | .75 | %‡* | 9.86 | %* | | | 167 | %^^ | |
| Class A | |
Period from 5/27/2009^ to
10/31/2009 | | $ | — | | | $ | 8.66 | | | | 19.69 | %** | | $ | 24.3 | | | | 1.12 | %* | | 1.12 | %‡* | 9.19 | %* | | | 167 | %^^ | |
| Class C | |
Period from 5/27/2009^ to
10/31/2009 | | $ | — | | | $ | 8.67 | | | | 19.43 | %** | | $ | 2.6 | | | | 1.87 | %* | | 1.87 | %‡* | 8.26 | %* | | | 167 | %^^ | |
| Class R3 | |
Period from 5/27/2009^ to
10/31/2009 | | $ | — | | | $ | 8.67 | | | | 19.76 | %** | | $ | 0.1 | | | | 1.37 | %* | | 1.37 | %‡* | 9.29 | %* | | | 167 | %^^ | |
| Municipal Intermediate Bond Fund | |
| Investor Class | |
| 10/31/2009 | | $ | — | | | $ | 11.22 | | | | 9.42 | % | | $ | 92.3 | | | | .65 | % | | | .65 | %‡ | | 3.15 | % | | | 146 | % | |
| 10/31/2008 | | $ | — | | | $ | 10.60 | | | | (1.74 | )% | | $ | 25.6 | | | | .66 | % | | | .64 | %‡ | | 3.65 | % | | | 39 | % | |
| 10/31/2007 | | $ | — | | | $ | 11.20 | | | | 2.61 | % | | $ | 27.8 | | | | .66 | % | | | .65 | %‡ | | 3.61 | % | | | 9 | % | |
| 10/31/2006 | | $ | — | | | $ | 11.36 | | | | 4.38 | % | | $ | 32.1 | | | | .66 | % | | | .65 | %‡ | | 3.56 | % | | | 28 | % | |
| 10/31/2005 | | $ | — | | | $ | 11.33 | | | | (.09 | )% | | $ | 33.7 | | | | .66 | % | | | .66 | %‡ | | 3.44 | % | | | 16 | % | |
| Municipal Money Fund | |
| Investor Class | |
| 10/31/2009 | | $ | — | | | $ | 0.9999 | | | | .40 | % | | $ | 316.5 | | | | .57 | % | | | .57 | %‡ | | .43 | % | | | n/a | | |
| 10/31/2008 | | $ | — | | | $ | 0.9999 | | | | 2.12 | % | | $ | 395.3 | | | | .59 | % | | | .58 | %§ | | 2.06 | % | | | n/a | | |
| 10/31/2007 | | $ | — | | | $ | 0.9999 | | | | 3.18 | % | | $ | 871.5 | | | | .59 | % | | | .59 | %‡ | | 3.13 | % | | | n/a | | |
| 10/31/2006 | | $ | — | | | $ | 0.9998 | | | | 2.80 | % | | $ | 773.2 | | | | .59 | % | | | .59 | %‡ | | 2.81 | % | | | n/a | | |
| 10/31/2005 | | $ | — | | | $ | 0.9998 | | | | 1.59 | % | | $ | 587.1 | | | | .60 | % | | | .60 | % | | 1.62 | % | | | n/a | | |
| New York Municipal Money Fund | |
| Investor Class | |
| 10/31/2009 | | $ | — | | | $ | 0.9984 | | | | .37 | % | | $ | 323.4 | | | | .52 | % | | | .52 | %a | | .38 | % | | | n/a | | |
| 10/31/2008 | | $ | — | | | $ | 0.9997 | | | | 2.19 | % | | $ | 401.2 | | | | .49 | % | | | .48 | %a | | 2.09 | % | | | n/a | | |
| 10/31/2007 | | $ | — | | | $ | 1.0000 | | | | 3.27 | % | | $ | 723.1 | | | | .48 | % | | | .46 | %a | | 3.22 | % | | | n/a | | |
Period from 12/19/2005^ to
10/31/2006 | | $ | — | | | $ | 1.0000 | | | | 2.51 | %** | | $ | 173.2 | | | | .55 | %* | | .54 | %a* | 2.94 | %* | | | n/a | | |
99
Financial Highlights (cont'd)
| | | Net Asset
Value,
Beginning
of Year | | Net
Investment
Income (Loss) | | Net Gains or
Losses on
Securities
(both
realized and
unrealized) | | Total From
Investment
Operations | | Dividends
from Net
Investment
Income | | Distributions
from Net
Realized
Capital Gains | | Tax
Return of
Capital | | Total
Distributions | |
| Short Duration Bond Fund | |
| Investor Class | |
| 10/31/2009 | | $ | 7.91 | | | $ | 0.35 | @ | | $ | (0.05 | ) | | $ | 0.30 | | | $ | (0.38 | ) | | $ | — | | | $ | — | | | $ | (0.38 | ) | |
| 10/31/2008 | | $ | 9.13 | | | $ | 0.41 | @ | | $ | (1.18 | ) | | $ | (0.77 | ) | | $ | (0.45 | ) | | $ | — | | | $ | — | | | $ | (0.45 | ) | |
| 10/31/2007 | | $ | 9.11 | | | $ | 0.41 | @ | | $ | 0.06 | | | $ | 0.47 | | | $ | (0.45 | ) | | $ | — | | | $ | — | | | $ | (0.45 | ) | |
| 10/31/2006 | | $ | 9.13 | | | $ | 0.35 | @ | | $ | 0.03 | | | $ | 0.38 | | | $ | (0.40 | ) | | $ | — | | | $ | — | | | $ | (0.40 | ) | |
| 10/31/2005 | | $ | 9.41 | | | $ | 0.25 | @ | | $ | (0.18 | ) | | $ | 0.07 | | | $ | (0.35 | ) | | $ | — | | | $ | — | | | $ | (0.35 | ) | |
| Trust Class | |
| 10/31/2009 | | $ | 7.54 | | | $ | 0.33 | @ | | $ | (0.06 | ) | | $ | 0.27 | | | $ | (0.35 | ) | | $ | — | | | $ | — | | | $ | (0.35 | ) | |
| 10/31/2008 | | $ | 8.70 | | | $ | 0.38 | @ | | $ | (1.12 | ) | | $ | (0.74 | ) | | $ | (0.42 | ) | | $ | — | | | $ | — | | | $ | (0.42 | ) | |
| 10/31/2007 | | $ | 8.68 | | | $ | 0.39 | @ | | $ | 0.05 | | | $ | 0.44 | | | $ | (0.42 | ) | | $ | — | | | $ | — | | | $ | (0.42 | ) | |
| 10/31/2006 | | $ | 8.70 | | | $ | 0.32 | @ | | $ | 0.03 | | | $ | 0.35 | | | $ | (0.37 | ) | | $ | — | | | $ | — | | | $ | (0.37 | ) | |
| 10/31/2005 | | $ | 8.97 | | | $ | 0.23 | @ | | $ | (0.17 | ) | | $ | 0.06 | | | $ | (0.33 | ) | | $ | — | | | $ | — | | | $ | (0.33 | ) | |
| Strategic Income Fund | |
| Institutional Class | |
| 10/31/2009 | | $ | 8.78 | | | $ | 0.45 | @ | | $ | 1.79 | | | $ | 2.24 | | | $ | (0.44 | ) | | $ | — | | | $ | — | | | $ | (0.44 | ) | |
| 10/31/2008 | | $ | 10.38 | | | $ | 0.44 | @ | | $ | (1.02 | ) | | $ | (0.58 | ) | | $ | (0.31 | )@ | | $ | (0.61 | )@ | | $ | (0.10 | )@ | $ | (1.02 | ) | |
| 10/31/2007 | | $ | 10.65 | | | $ | 0.43 | @ | | $ | 0.15 | | | $ | 0.58 | | | $ | (0.45 | ) | | $ | (0.40 | ) | | $ | — | | | $ | (0.85 | ) | |
| 10/31/2006 | | $ | 10.90 | | | $ | 0.38 | @ | | $ | 0.65 | | | $ | 1.03 | | | $ | (0.46 | ) | | $ | (0.82 | ) | | $ | — | | | $ | (1.28 | ) | |
| 10/31/2005 | | $ | 10.72 | | | $ | 0.37 | @ | | $ | 0.34 | | | $ | 0.71 | | | $ | (0.45 | ) | | $ | (0.08 | ) | | $ | — | | | $ | (0.53 | ) | |
| Trust Class | |
| 10/31/2009 | | $ | 8.77 | | | $ | 0.43 | @ | | $ | 1.78 | | | $ | 2.21 | | | $ | (0.40 | ) | | $ | — | | | $ | — | | | $ | (0.40 | ) | |
| 10/31/2008 | | $ | 10.38 | | | $ | 0.42 | @ | | $ | (1.05 | ) | | $ | (0.63 | ) | | $ | (0.27 | )@ | | $ | (0.61 | )@ | | $ | (0.10 | )@ | $ | (0.98 | ) | |
Period from 4/2/2007^ to
10/31/2007 | | $ | 10.39 | | | $ | 0.24 | @ | | $ | (0.02 | ) | | $ | 0.22 | | | $ | (0.23 | ) | | $ | — | | | $ | — | | | $ | (0.23 | ) | |
| Class A | |
| 10/31/2009 | | $ | 8.78 | | | $ | 0.43 | @ | | $ | 1.77 | | | $ | 2.20 | | | $ | (0.39 | ) | | $ | — | | | $ | — | | | $ | (0.39 | ) | |
Period from 12/20/2007^ to
10/31/2008 | | $ | 10.19 | | | $ | 0.36 | @ | | $ | (0.78 | ) | | $ | (0.42 | ) | | $ | (0.28 | )@ | | $ | (0.61 | )@ | | $ | (0.10 | )@ | $ | (0.99 | ) | |
| Class C | |
| 10/31/2009 | | $ | 8.78 | | | $ | 0.36 | @ | | $ | 1.76 | | | $ | 2.12 | | | $ | (0.32 | ) | | $ | — | | | $ | — | | | $ | (0.32 | ) | |
Period from 12/20/2007^ to
10/31/2008 | | $ | 10.19 | | | $ | 0.29 | @ | | $ | (0.77 | ) | | $ | (0.48 | ) | | $ | (0.22 | )@ | | $ | (0.61 | )@ | | $ | (0.10 | )@ | | $ | (0.93 | ) | |
See Notes to Financial Highlights
100
| | | Capital
Contributions | | Net Asset
Value, End of
Year | | Total
Return†† | | Net Assets,
End of Year
(in millions) | | Ratio of
Gross
Expenses
to Average
Net Assets# | | Ratio of Net
Expenses
to Average
Net Assets | | Ratio of Net
Investment
Income/
(Loss) to
Average
Net Assets | | Portfolio
Turnover
Rate | |
| Short Duration Bond Fund | |
| Investor Class | |
| 10/31/2009 | | $ | — | | | $ | 7.83 | | | | 4.18 | % | | $ | 52.6 | | | | .70 | % | | | .70 | %‡ | | | 4.73 | % | | | 48 | % | |
| 10/31/2008 | | $ | — | | | $ | 7.91 | | | | (8.70 | )% | | $ | 61.6 | | | | .70 | % | | | .70 | %‡ | | | 4.73 | % | | | 10 | % | |
| 10/31/2007 | | $ | — | | | $ | 9.13 | | | | 5.24 | % | | $ | 93.4 | | | | .70 | % | | | .70 | %‡ | | | 4.54 | % | | | 53 | % | |
| 10/31/2006 | | $ | — | | | $ | 9.11 | | | | 4.28 | % | | $ | 108.1 | | | | .71 | % | | | .70 | %‡ | | | 3.80 | % | | | 74 | % | |
| 10/31/2005 | | $ | — | | | $ | 9.13 | | | | .77 | % | | $ | 151.8 | | | | .71 | % | | | .70 | %‡ | | | 2.75 | % | | | 166 | % | |
| Trust Class | |
| 10/31/2009 | | $ | — | | | $ | 7.46 | | | | 4.02 | % | | $ | 8.1 | | | | .80 | % | | | .80 | %‡ | | | 4.62 | % | | | 48 | % | |
| 10/31/2008 | | $ | — | | | $ | 7.54 | | | | (8.76 | )% | | $ | 9.3 | | | | .80 | % | | | .80 | %‡ | | | 4.64 | % | | | 10 | % | |
| 10/31/2007 | | $ | — | | | $ | 8.70 | | | | 5.15 | % | | $ | 13.1 | | | | .80 | % | | | .80 | %‡ | | | 4.44 | % | | | 53 | % | |
| 10/31/2006 | | $ | — | | | $ | 8.68 | | | | 4.16 | % | | $ | 16.6 | | | | .81 | % | | | .80 | %‡ | | | 3.69 | % | | | 74 | % | |
| 10/31/2005 | | $ | — | | | $ | 8.70 | | | | .64 | % | | $ | 20.1 | | | | .81 | % | | | .81 | %‡ | | | 2.64 | % | | | 166 | % | |
| Strategic Income Fund | |
| Institutional Class | |
| 10/31/2009 | | $ | — | | | $ | 10.58 | | | | 25.97 | % | | $ | 18.7 | | | | .75 | % | | | .75 | %‡ | | | 4.59 | % | | | 322 | % | |
| 10/31/2008 | | $ | — | | | $ | 8.78 | | | | (6.09 | )% | | $ | 4.6 | | | | .84 | % | | | .83 | %‡ | | | 4.54 | % | | | 323 | % | |
| 10/31/2007 | | $ | — | | | $ | 10.38 | | | | 5.64 | % | | $ | 17.0 | | | | .86 | % | | | .85 | %‡ | | | 4.10 | % | | | 99 | % | |
| 10/31/2006 | | $ | — | | | $ | 10.65 | | | | 10.34 | % | | $ | 20.4 | | | | .86 | % | | | .85 | %‡ | | | 3.66 | % | | | 111 | % | |
| 10/31/2005 | | $ | — | | | $ | 10.90 | | | | 6.68 | % | | $ | 26.2 | | | | .86 | % | | | .85 | %‡ | | | 3.43 | % | | | 89 | % | |
| Trust Class | |
| 10/31/2009 | | $ | — | | | $ | 10.58 | | | | 25.66 | % | | $ | 6.7 | | | | 1.10 | % | | | 1.10 | %‡ | | | 4.32 | % | | | 322 | % | |
| 10/31/2008 | | $ | — | | | $ | 8.77 | | | | (6.54 | )% | | $ | 0.3 | | | | 1.15 | % | | | 1.14 | %‡ | | | 4.36 | % | | | 323 | % | |
Period from 4/2/2007^ to
10/31/2007 | | $ | — | | | $ | 10.38 | | | | 2.16 | %** | $ | 0.2 | | | | 1.11 | %* | | 1.10 | %‡* | | 3.92 | %* | | | 99 | %^^ | |
| Class A | |
| 10/31/2009 | | $ | — | | | $ | 10.59 | | | | 25.51 | % | | $ | 68.2 | | | | 1.15 | % | | | 1.15 | %‡ | | | 4.25 | % | | | 322 | % | |
Period from 12/20/2007^ to
10/31/2008 | | $ | — | | | $ | 8.78 | | | | (4.64 | )%** | $ | 0.2 | | | | 1.21 | %* | | 1.20 | %‡* | | 4.36 | %* | | | 323 | %^^ | |
| Class C | |
| 10/31/2009 | | $ | — | | | $ | 10.58 | | | | 24.47 | % | | $ | 36.2 | | | | 1.85 | % | | | 1.85 | %‡ | | | 3.53 | % | | | 322 | % | |
Period from 12/20/2007^ to
10/31/2008 | | $ | — | | | $ | 8.78 | | | | (5.22 | )%** | $ | 0.1 | | | | 1.91 | %* | | 1.90 | %‡* | | 3.56 | %* | | | 323 | %^^ | |
101
Notes to Financial Highlights Income Funds
†† Total return based on per share net asset value reflects the effects of changes in net asset value on the performance of each Fund during each fiscal period and assumes dividends and other distributions, if any, were reinvested. Results represent past performance and do not guarantee future results. Current returns may be lower or higher than the performance data quoted. Investment returns and principal may fluctuate and shares when redeemed may be worth more or less than original cost. For each Fund, total return would have been lower if Management had not reimbursed and/or waived certain expenses. For the year ended October 31, 2007, Management reimbursed Short Duration for losses incurred in connection with the disposition of foreign currency contracts, which had no impact on total return. For the year ended October 31, 2008, High Income recorded a capital contribution from Management in connection with a reallocation of expenses that are shared by the Fund and Management, which had a (.12)% impact on total return.
# The Fund is required to calculate an expense ratio without taking into consideration any expense reductions related to expense offset arrangements.
‡ After reimbursement of expenses and/or waiver of a portion of the investment management fee by Management. Had Management not undertaken such actions, the annualized ratios of net expenses to average daily net assets would have been:
| | | Year Ended October 31, | | Year Ended
September 30, | |
| | | 2009 | | 2008 | | 2007 | | 2006 | | 2005 | | 2005 | |
| Core Bond Fund Investor Class | | | 1.40 | % | | | 1.25 | % | | | 1.30 | % | | | 1.46 | % | | | 1.58 | %(3) | | | 1.05 | % | |
| Core Bond Fund Institutional Class | | | 0.94 | % | | | .83 | % | | | .83 | % | | | .91 | % | | | 1.05 | %(3) | | | .55 | % | |
| Core Bond Fund Class A | | | 1.36 | % | | | 2.73 | %(1) | | | — | | | | — | | | | — | | | | — | | |
| Core Bond Fund Class C | | | 2.68 | % | | | 3.43 | %(1) | | | — | | | | — | | | | — | | | | — | | |
| High Income Bond Fund Investor Class | | | 1.04 | % | | | .92 | % | | | .92 | % | | | .90 | % | | | — | | | | — | | |
| High Income Bond Fund Institutional Class | | | .91 | %(4) | | | — | | | | — | | | | — | | | | — | | | | — | | |
| High Income Bond Fund Class A | | | 1.27 | %(4) | | | — | | | | — | | | | — | | | | — | | | | — | | |
| High Income Bond Fund Class C | | | 2.02 | %(4) | | | — | | | | — | | | | — | | | | — | | | | — | | |
| High Income Bond Fund Class R3 | | | 5.53 | %(4) | | | — | | | | — | | | | — | | | | — | | | | — | | |
| Municipal Intermediate Bond Fund Investor Class | | | 1.12 | % | | | 1.24 | % | | | 1.17 | % | | | 1.19 | % | | | 1.10 | % | | | — | | |
| Municipal Money Fund Investor Class | | | .70 | % | | | — | | | | .59 | % | | | .61 | % | | | — | | | | — | | |
| Short Duration Bond Fund Investor Class | | | 1.18 | % | | | .95 | % | | | .90 | % | | | .80 | % | | | .80 | % | | | — | | |
| Short Duration Bond Fund Trust Class | | | 1.58 | % | | | 1.27 | % | | | 1.18 | % | | | 1.06 | % | | | 1.02 | % | | | — | | |
| Strategic Income Fund Institutional Class | | | 2.47 | % | | | 4.03 | % | | | 2.73 | % | | | 2.29 | % | | | 1.82 | % | | | — | | |
| Strategic Income Fund Trust Class | | | 3.00 | % | | | 9.14 | % | | | 4.81 | %(2) | | | — | | | | — | | | | — | | |
| Strategic Income Fund Class A | | | 1.93 | % | | | 7.52 | %(1) | | | — | | | | — | | | | — | | | | — | | |
| Strategic Income Fund Class C | | | 2.55 | % | | | 8.75 | %(1) | | | — | | | | — | | | | — | | | | — | | |
(1) Period from December 20, 2007 to October 31, 2008.
(2) Period from April 2, 2007 to October 31, 2007.
(3) Period from October 1, 2005 to October 31, 2005.
(4) Period from May 27, 2009 to October 31, 2009.
102
Notes to Financial Highlights Income Funds (cont'd)
§ After reimbursement of expenses previously paid by Management. Had Management not been reimbursed, the annualized ratio of net expenses to average daily net assets would have been:
| | | Year Ended
October 31,
2008 | |
| Municipal Money Fund Investor Class | | | .56 | % | |
a After utilization of the Line of Credit by New York Municipal Money, reimbursement of expenses and/or waiver of a portion of the investment management fee by Management. Had Management not undertaken such actions or had the Fund not utilized the Line of Credit, the annualized ratio of net expenses to average daily net assets would have been:
| | | Year Ended October 31, | |
| | | 2009 | | 2008 | | 2007 | | 2006 | |
| New York Municipal Money Fund Investor Class | | | .68 | % | | | .53 | % | | | .57 | % | | | .69 | %(1) | |
(1) Period from December 19, 2005 to October 31, 2006.
n/a Not applicable.
^ The date investment operations commenced.
* Annualized.
** Not annualized.
@ The per share amounts which are shown for the periods ended October 31, 2005 and thereafter (September 30, 2005 and thereafter for Core Bond) have been calculated based on the average number of shares outstanding during each fiscal period.
‡‡ Effective after the close of business on June 10, 2005, Management succeeded Ariel Capital Management, LLC, as the Fund's investment manager. The financial highlights for the year ended September 30, 2005 include the income and expenses attributable to the Ariel Premier Bond Fund for the period from October 1, 2004 through June 10, 2005, and the income and expenses of the Fund thereafter.
^^ Portfolio turnover is calculated at the Fund level. Percentage indicated was calculated for the year ended October 31, 2007 for Strategic Income, for the year ended October 31, 2008 for Core Bond and Strategic Income and for the year ended October 31, 2009 for High Income.
103
Report of Independent Registered Public Accounting Firm
To the Board of Trustees and Shareholders of
Neuberger Berman High Income Bond Fund
Neuberger Berman Municipal Intermediate Bond Fund
Neuberger Berman Municipal Money Fund
Neuberger Berman Short Duration Bond Fund
Neuberger Berman Strategic Income Fund
We have audited the accompanying statements of assets and liabilities, including the schedules of investments, of Neuberger Berman High Income Bond Fund, Neuberger Berman Municipal Intermediate Bond Fund (formerly, Neuberger Berman Municipal Securities Trust), Neuberger Berman Municipal Money Fund, Neuberger Berman Short Duration Bond Fund, and Neuberger Berman Strategic Income Fund, five of the series constituting the Neuberger Berman Income Funds (formerly, Lehman Brothers Income Funds) (the "Trust") as of October 31, 2009, and the related statements of operations for the year then ended, the statements of changes in net assets for each of the two years in the period then ended, and the financial highlights for each of the periods indicated therein. These financial statements and financial highlights are the responsibility of the Trust's management. Our responsibility is to express an opinion on these financial statements and financial highlights based on our audits.
We conducted our audits in accordance with the standards of the Public Company Accounting Oversight Board (United States). Those standards require that we plan and perform the audits to obtain reasonable assurance about whether the financial statements and financial highlights are free of material misstatement. We were not engaged to perform an audit of the Trust's internal control over financial reporting. Our audits included consideration of internal control over financial reporting as a basis for designing audit procedures that are appropriate in the circumstances, but not for the purpose of expressing an opinion on the effectiveness of the Trust's internal control over financial reporting. Accordingly, we express no such opinion. An audit also includes examining, on a test basis, evidence supporting the amounts and disclosures in the financial statements and financial highlights, assessing the accounting principles used and significant estimates made by management, and evaluating the overall financial statement presentation. Our procedures included confirmation of securities owned as of October 31, 2009 by correspondence with the custodian and brokers or by other appropriate auditing procedures where replies from brokers were not received. We believe that our audits provide a reasonable basis for our opinion.
In our opinion, the financial statements and financial highlights referred to above present fairly, in all material respects, the financial position of Neuberger Berman High Income Bond Fund, Neuberger Berman Municipal Intermediate Bond Fund, Neuberger Berman Municipal Money Fund, Neuberger Berman Short Duration Bond Fund, and Neuberger Berman Strategic Income Fund at October 31, 2009, the results of its operations for the year then ended, the changes in its net assets for each of the two years in the period then ended, and financial highlights for each of the periods indicated therein, in conformity with U.S. generally accepted accounting principles.
Boston, Massachusetts
December 17, 2009
104
Report of Independent Registered Public Accounting Firm
To the Board of Trustees
Neuberger Berman Income Funds and
Shareholders of
Neuberger Berman Core Bond Fund and
Neuberger Berman New York Municipal Money Fund
We have audited the accompanying statements of assets and liabilities of Neuberger Berman Core Bond Fund (formerly Lehman Brothers Core Bond Fund) and Neuberger Berman New York Municipal Money Fund (formerly Lehman Brothers New York Municipal Money Fund), each a series of the Neuberger Berman Income Funds (formerly Lehman Brothers Income Funds) (the "Trust"), including the schedules of investments, as of October 31, 2009, and for Neuberger Berman Core Bond Fund, the related statement of operations for the year then ended, the statements of changes in net assets for each of the two years in the period then ended, and the financial highlights for each of the four years in the period then ended, the period October 1, 2005 through October 31, 2005, and the year ended September 30, 2005, and for Neuberger Berman New York Municipal Money Fund, the related statement of operations for the year then ended, the statements of changes in net assets for each of the two years in the period then ended, and the financial highlights for each of the three years in the period then ended and for the period December 19, 2005 (commencement of operations) to October 31, 2006. These financial statements and financial highlights are the responsibility of the Trust's management. Our responsibility is to express an opinion on these financial statements and financial highlights based on our audits.
We conducted our audits in accordance with the standards of the Public Company Accounting Oversight Board (United States). Those standards require that we plan and perform the audit to obtain reasonable assurance about whether the financial statements and financial highlights are free of material misstatement. The Trust is not required to have, nor were we engaged to perform, an audit of its internal control over financial reporting. Our audits included consideration of internal control over financial reporting as a basis for designing audit procedures that are appropriate in the circumstances, but not for the purpose of expressing an opinion on the effectiveness of the Trust's internal control over financial reporting. Accordingly, we express no such opinion. An audit also includes examining, on a test basis, evidence supporting the amounts and disclosures in the financial statements, assessing the accounting principles used and significant estimates made by management, as well as evaluating the overall financial statement presentation. Our procedures included confirmation of securities owned as of October 31, 2009, by correspondence with the custodian and brokers or by other appropriate auditing procedures where replies from brokers were not received. We believe that our audits provide a reasonable basis for our opinion.
In our opinion, the financial statements and financial highlights referred to above present fairly, in all material respects, the financial position of Neuberger Berman Core Bond Fund and Neuberger Berman New York Municipal Money Fund as of October 31, 2009, the results of their operations, the changes in their net assets, and the financial highlights for the periods indicated above, in conformity with accounting principles generally accepted in the United States of America.

Philadelphia, Pennsylvania
December 17, 2009
105
Directory
Investment Manager, Administrator and Distributor
Neuberger Berman Management LLC
605 Third Avenue, 2nd Floor
New York, NY 10158-0180
800.877.9700 or 212.476.8800
Intermediary Support Services 800.366.6264
Sub-Adviser
Neuberger Berman Fixed Income LLC
200 South Wacker Drive
Suite 2100
Chicago, IL 60601
Custodian and Shareholder Servicing Agent
State Street Bank and Trust Company
2 Avenue de Lafayette
Boston, MA 02111
For Investor Class Shareholders Address correspondence to:
Neuberger Berman Funds
Boston Service Center
P.O. Box 8403
Boston, MA 02266-8403
800.877.9700 or 212.476.8800
For Class A, Class C and Class R3 Shareholders:
Please contact your investment provider
For Institutional Class and Trust Class Shareholders Address correspondence to:
Neuberger Berman Management LLC
605 Third Avenue, Mail Drop 2-7
New York, NY 10158-0180
Attn: Intermediary Support Services 800.366.6264
Legal Counsel
K&L Gates LLP
1601 K Street, NW
Washington, DC 20006
Independent Registered Public Accounting Firms
Ernst & Young LLP
200 Clarendon Street
Boston, MA 02116
Tait, Weller & Baker LLP
1818 Market Street
Suite 2400
Philadelphia, PA 19103
106
Trustee and Officer Information
The following tables set forth information concerning the trustees ("Trustees") and officers ("Officers") of the Trust. All persons named as Trustees and Officers also serve in similar capacities for other funds administered or managed by Management, NBFI and Neuberger. The Statement of Additional Information includes additional information about the Trustees and Officers and is available upon request, without charge, by calling (800) 877-9700.
Name, (Year of Birth),
and Address(1) | | Position and
Length of
Time Served(2) | | Principal Occupation(s)(3) | | Number of
Funds in Fund
Complex
Overseen by
Fund Trustee | | Other Directorships
Held Outside Fund
Complex by Fund
Trustee | |
| Independent Fund Trustees | |
|
| John Cannon (1930) | | Trustee since 1994 | | Consultant; formerly, Chairman, CDC Investment Advisers (registered investment adviser), 1993 to January 1999; formerly, President and Chief Executive Officer, AMA Investment Advisors, an affiliate of the American Medical Association. | | | 46 | | | Formerly, Independent Trustee or Director of three series of Oppenheimer Funds: Oppenheimer Limited Term New York Municipal Fund, Rochester Fund Municipals, and Oppenheimer Convertible Securities Fund (1992 to 2009). | |
|
| Faith Colish (1935) | | Trustee since 2000 | | Counsel, Carter Ledyard & Milburn LLP (law firm) since October 2002; formerly, Attorney-at-Law and President, Faith Colish, A Professional Corporation, 1980 to 2002. | | | 46 | | | Formerly, Director (1997 to 2003) and Advisory Director (2003 to 2006), ABA Retirement Funds (formerly, American Bar Retirement Association) (not-for-profit membership corporation). | |
|
| Martha C. Goss (1949) | | Trustee since 2007 | | President, Woodhill Enterprises Inc./Chase Hollow Associates LLC (personal investment vehicle), since 2006; Chief Operating and Financial Officer, Hopewell Holdings LLC/ Amwell Holdings, LLC (a holding company for a healthcare reinsurance company start-up), since 2003; formerly, Consultant, Resources Connection (temporary staffing), 2002 to 2006. | | | 46 | | | Director, Ocwen Financial Corporation (mortgage servicing), since 2005; Director, American Water (water utility), since 2003; Director, Channel Reinsurance (financial guaranty reinsurance), since 2006; Advisory Board Member, Attensity (software developer), since 2005; Director, Allianz Life of New York (insurance), since 2005; Director, Financial Women's Association of New York (not for profit association), since 2003; Trustee Emerita, Brown University, since 1998. | |
|
107
Name, (Year of Birth),
and Address(1) | | Position and
Length of
Time Served(2) | | Principal Occupation(s)(3) | | Number of
Funds in Fund
Complex
Overseen by
Fund Trustee | | Other Directorships
Held Outside Fund
Complex by Fund
Trustee | |
| | | | | | | | | | | | |
| C. Anne Harvey (1937) | | Trustee since 2000 | | President, C.A. Harvey Associates, since October 2001; formerly, Director, AARP, 1978 to December 2001. | | | 46 | | | Formerly, President, Board of Associates to The National Rehabilitation Hospital's Board of Directors, 2001 to 2002; formerly, Member, Individual Investors Advisory Committee to the New York Stock Exchange Board of Directors, 1998 to June 2002. | |
|
| Robert A. Kavesh (1927) | | Trustee since 1993 | | Retired; Marcus Nadler Professor Emeritus of Finance and Economics, New York University Stern School of Business; formerly, Executive Secretary-Treasurer, American Finance Association, 1961 to 1979. | | | 46 | | | Formerly, Director, The Caring Community (not-for-profit), 1997 to 2006; formerly, Director, DEL Laboratories, Inc. (cosmetics and pharmaceuticals), 1978 to 2004; formerly, Director, Apple Bank for Savings, 1979 to 1990; formerly, Director, Western Pacific Industries, Inc., 1972 to 1986 (public company). | |
|
| Michael M. Knetter (1960) | | Trustee since 2007 | | Dean, School of Business, University of Wisconsin - Madison; formerly, Professor of International Economics and Associate Dean, Amos Tuck School of Business - Dartmouth College, 1998 to 2002. | | | 46 | | | Trustee, Northwestern Mutual Series Fund, Inc., since February 2007; Director, Wausau Paper, since 2005; Director, Great Wolf Resorts, since 2004. | |
|
| Howard A. Mileaf (1937) | | Trustee since 2000 | | Retired; formerly, Vice President and General Counsel, WHX Corporation (holding company), 1993 to 2001. | | | 46 | | | Formerly, Director, Webfinancial Corporation (holding company), 2002 to 2008; formerly, Director WHX Corporation (holding company), January 2002 to June 2005; formerly, Director, State Theatre of New Jersey (not-for-profit theater), 2000 to 2005. | |
|
108
Name, (Year of Birth),
and Address(1) | | Position and
Length of
Time Served(2) | | Principal Occupation(s)(3) | | Number of
Funds in Fund
Complex
Overseen by
Fund Trustee | | Other Directorships
Held Outside Fund
Complex by Fund
Trustee | |
| | | | | | | | | | | |
| George W. Morriss (1947) | | Trustee since 2007 | | Retired; formerly, Executive Vice President and Chief Financial Officer, People's Bank, Connecticut (a financial services company), 1991 to 2001. | | | 46 | | | Manager, Old Mutual 2100 fund complex (consisting of six funds) since October 2006 for four funds and since February 2007 for two funds; formerly, Member NASDAQ Issuers' Affairs Committee, 1995 to 2003. | |
|
| Edward I. O'Brien (1928) | | Trustee since 2000 | | Retired; Formerly, Member, Investment Policy Committee, Edward Jones, 1993 to 2001; President, Securities Industry Association ("SIA") (securities industry's representative in government relations and regulatory matters at the federal and state levels), 1974 to 1992; Adviser to SIA, November 1992 to November 1993. | | | 46 | | | Formerly, Director, Legg Mason, Inc. (financial services holding company), 1993 to July 2008; formerly, Director, Boston Financial Group (real estate and tax shelters), 1993 to 1999. | |
|
| Cornelius T. Ryan (1931) | | Trustee since 2000 | | Founding General Partner, Oxford Partners and Oxford Bioscience Partners (venture capital investing) and President, Oxford Venture Corporation, since 1981. | | | 46 | | | None. | |
|
| Tom D. Seip (1950) | | Trustee since 2000; Chairman of the Board since 2008; Lead Independent Trustee from 2006 to 2008 | | General Partner, Seip Investments LP (a private investment partnership); formerly, President and CEO, Westaff, Inc. (temporary staffing), May 2001 to January 2002; formerly, Senior Executive at the Charles Schwab Corporation, 1983 to 1998, including Chief Executive Officer, Charles Schwab Investment Management, Inc., and Trustee, Schwab Family of Funds and Schwab Investments, 1997 to 1998, and Executive Vice President-Retail Brokerage, Charles Schwab & Co., Inc., 1994 to 1997. | | | 46 | | | Director, H&R Block, Inc. (financial services company), since May 2001; Chairman, Compensation Committee, H&R Block, Inc., since 2006; formerly, Director, Forward Management, Inc. (asset management company), 1999 to 2006. | |
|
109
Name, (Year of Birth),
and Address(1) | | Position and
Length of
Time Served(2) | | Principal Occupation(s)(3) | | Number of
Funds in Fund
Complex
Overseen by
Fund Trustee | | Other Directorships
Held Outside Fund
Complex by Fund
Trustee | |
| | | | | | | | | | | |
| Candace L. Straight (1947) | | Trustee since 1993 | | Private investor and consultant specializing in the insurance industry; formerly, Advisory Director, Securitas Capital LLC (a global private equity investment firm dedicated to making investments in the insurance sector), 1998 to December 2003. | | | 46 | | | Director, Montpelier Re (reinsurance company), since 2006; formerly, Director, National Atlantic Holdings Corporation (property and casualty insurance company), 2004 to 2008; formerly, Director, The Proformance Insurance Company (property and casualty insurance company), 2004 to 2008; formerly, Director, Providence Washington Insurance Company (property and casualty insurance company), December 1998 to March 2006; formerly, Director, Summit Global Partners (insurance brokerage firm), 2000 to 2005. | |
|
| Peter P. Trapp (1944) | | Trustee since 2000 | | Retired; formerly, Regional Manager for Mid-Southern Region, Ford Motor Credit Company, September 1997 to 2007; formerly, President, Ford Life Insurance Company, April 1995 to August 1997. | | | 46 | | | None. | |
|
110
Name, (Year of Birth),
and Address(1) | | Position and
Length of
Time Served(2) | | Principal Occupation(s)(3) | | Number of
Funds in Fund
Complex
Overseen by
Fund Trustee | | Other Directorships
Held Outside Fund
Complex by Fund
Trustee | |
| Fund Trustees who are "Interested Persons" | |
| |
| Joseph V. Amato* (1962) | | Trustee since 2009 | | President and Director, Neuberger Berman Group LLC, since 2009; President and Chief Executive Officer, Neuberger and Neuberger Berman Holdings LLC (including its predecessor, Neuberger Berman Inc.), since 2007; Chief Investment Officer, Neuberger, since 2009; Chief Executive Officer (Equities) and Managing Director, Management, since 2009; Managing Director, NBFI, since 2007; Board member of NBFI since 2006; formerly, Global Head of Asset Management of Lehman Brothers Holdings Inc.'s ("LBHI") Investment Management division, 2006 to 2009; formerly, member of LBHI's Investment Management Division's Executive Management Committee, 2006 to 2009; formerly, Managing Director, Lehman Brothers Inc. ("LBI"), 2006 to 2008; formerly, Chief Recruiting and Development Officer, LBI, 2005 to 2006; formerly, Global Head of LBI's Equity Sales and a Member of its Equities Division Executive Committee, 2003 to 2005. | | | 46 | | | Member of Board of Advisors, McDonough School of Business, Georgetown University, since 2001; Member of New York City Board of Advisors, Teach for America, since 2005; Trustee, Montclair Kimberley Academy (private school), since 2007. | |
|
| Robert Conti* (1956) | | Chief Executive Officer, President and Trustee since 2008; prior thereto, Executive Vice President in 2008 and Vice President 2000 to 2008 | | Managing Director, Neuberger, since 2007; formerly, Senior Vice President, Neuberger, 2003 to 2006; formerly, Vice President, Neuberger, 1999 to 2003; President and Chief Executive Officer, Management, since 2008; formerly, Senior Vice President, Management, 2000 to 2008. | | | 46 | | | Chairman of the Board, Staten Island Mental Health Society since 2008. | |
|
111
Name, (Year of Birth),
and Address(1) | | Position and
Length of
Time Served(2) | | Principal Occupation(s)(3) | | Number of
Funds in Fund
Complex
Overseen
by Trustee | | Other Directorships
Held Outside Fund
Complex by Fund
Trustee | |
| | | | | | | | | | | | |
| Jack L. Rivkin* (1940) | | Trustee since 2002; President from 2002 to 2008 | | Formerly, Executive Vice President and Chief Investment Officer, Neuberger Berman Holdings LLC (holding company), 2002 to August 2008 and 2003 to August 2008, respectively; formerly, Managing Director and Chief Investment Officer, Neuberger, December 2005 to August 2008 and 2003 to August 2008, respectively; formerly, Executive Vice President, Neuberger, December 2002 to 2005; formerly, Director and Chairman, Management, December 2002 to August 2008; formerly, Executive Vice President, Citigroup Investments, Inc., September 1995 to February 2002; formerly, Executive Vice President, Citigroup Inc., September 1995 to February 2002. | | | 46 | | | Director, Idealab (private company), since 2009; Director, Distributed World Power (private company), since 2009; Director, Dale Carnegie and Associates, Inc. (private company), since 1998; Director, Solbright, Inc. (private company), since 1997; formerly, Director, New York Society of Security Analysts (2006 to 2008). | |
|
(1) The business address of each listed person is 605 Third Avenue, New York, New York 10158.
(2) Pursuant to the Trust's Trust Instrument, each of these Fund Trustees shall hold office for life or until his or her successor is elected or the Trust terminates; except that (a) any Fund Trustee may resign by delivering a written resignation; (b) any Fund Trustee may be removed with or without cause at any time by a written instrument signed by at least two-thirds of the other Fund Trustees; (c) any Fund Trustee who requests to be retired, or who has become unable to serve, may be retired by a written instrument signed by a majority of the other Fund Trustees; and (d) any Fund Trustee may be removed at any shareholder meeting by a vote of at least two-thirds of the outstanding shares.
(3) Except as otherwise indicated, each individual has held the positions shown for at least the last five years.
* Indicates a Fund Trustee who is an "interested person" within the meaning of the 1940 Act. Mr. Amato and Mr. Conti are interested persons of the Trust by virtue of the fact that each is an officer of Management, Neuberger and/or their affiliates. Mr. Rivkin may be deemed an interested person of the Trust by virtue of the fact that, until August 2008, he was a director of Management and an officer of Neuberger.
112
Information about the Officers of the Trust
Name, (Year of Birth),
and Address(1) | | Position and
Length of Time
Served(2) | | Principal Occupation(s)(3) | |
| | | | | | |
| Andrew B. Allard (1961) | | Anti-Money Laundering Compliance Officer since 2002 | | Senior Vice President, Neuberger, since 2006; Deputy General Counsel, Neuberger, since 2004; formerly, Vice President, Neuberger, 2000 to 2005; formerly, Associate General Counsel, Neuberger, 1999 to 2004; Anti-Money Laundering Compliance Officer, nine registered investment companies for which Management acts as investment manager and administrator (six since 2002, two since 2003 and one since 2006). | |
|
| Claudia A. Brandon (1956) | | Executive Vice President since 2008 and Secretary since 1985 | | Senior Vice President, Neuberger, since 2007 and Employee since 1999; formerly, Vice President, Neuberger, 2002 to 2006; Senior Vice President, Management, since 2008 and Assistant Secretary since 2004; formerly, Vice President-Mutual Fund Board Relations, Management, 2000 to 2008; Executive Vice President, nine registered investment companies for which Management acts as investment manager and administrator (nine since 2008); Secretary, nine registered investment companies for which Management acts as investment manager and administrator (three since 1985, three since 2002, two since 2003 and one since 2006). | |
|
| Maxine L. Gerson (1950) | | Executive Vice President since 2008 and Chief Legal Officer since 2005 (only for purposes of sections 307 and 406 of the Sarbanes-Oxley Act of 2002) | | Senior Vice President, Neuberger, since 2002; Deputy General Counsel and Assistant Secretary, Neuberger, since 2001; Senior Vice President, Management, since 2006; Secretary and General Counsel, Management, since 2004; Executive Vice President, nine registered investment companies for which Management acts as investment manager and administrator (nine since 2008); Chief Legal Officer (only for purposes of sections 307 and 406 of the Sarbanes-Oxley Act of 2002), nine registered investment companies for which Management acts as investment manager and administrator (eight since 2005 and one since 2006). | |
|
| Sheila R. James (1965) | | Assistant Secretary since 2002 | | Vice President, Neuberger, since 2008 and Employee since 1999; formerly, Assistant Vice President, Neuberger, 2007; Assistant Secretary, nine registered investment companies for which Management acts as investment manager and administrator (six since 2002, two since 2003 and one since 2006). | |
|
| Brian Kerrane (1969) | | Vice President since 2008 | | Senior Vice President, Neuberger, since 2006; formerly, Vice President, Neuberger, 2002 to 2006; Vice President, Management, since 2008 and Employee since 1991; Vice President, nine registered investment companies for which Management acts as investment manager and administrator (nine since 2008). | |
|
| Kevin Lyons (1955) | | Assistant Secretary since 2003 | | Assistant Vice President, Neuberger, since 2008 and Employee since 1999; Assistant Secretary, nine registered investment companies for which Management acts as investment manager and administrator (eight since 2003 and one since 2006). | |
|
113
Name, (Year of Birth),
and Address(1) | | Position and
Length of Time
Served(2) | | Principal Occupation(s)(3) | |
| | | | | | |
| Owen F. McEntee, Jr. (1961) | | Vice President since 2008 | | Vice President, Neuberger, since 2006; Employee, Management, since 1992; Vice President, nine registered investment companies for which Management acts as investment manager and administrator (nine since 2008). | |
|
| John M. McGovern (1970) | | Treasurer and Principal Financial and Accounting Officer since 2005; prior thereto, Assistant Treasurer since 2002 | | Senior Vice President, Neuberger, since 2007; formerly, Vice President, Neuberger, 2004 to 2006; Employee, Management, since 1993; Treasurer and Principal Financial and Accounting Officer, nine registered investment companies for which Management acts as investment manager and administrator (eight since 2005 and one since 2006); formerly, Assistant Treasurer, eight registered investment companies for which Management acts as investment manager and administrator, 2002 to 2005. | |
|
| Andrew Provencher (1965) | | Vice President since 2008 | | Managing Director, Management, since 2008; Managing Director, Neuberger, since 2005; formerly, Senior Vice President, Neuberger, 2003 to 2005; formerly, Vice President, Neuberger, 1999 to 2003; Vice President, nine registered investment companies for which Management acts as investment manager and administrator (nine since 2008). | |
|
| Frank Rosato (1971) | | Assistant Treasurer since 2005 | | Vice President, Neuberger, since 2006; Employee, Management, since 1995; Assistant Treasurer, nine registered investment companies for which Management acts as investment manager and administrator (eight since 2005 and one since 2006). | |
|
| Neil S. Siegel (1967) | | Vice President since 2008 | | Managing Director, Management, since 2008; Managing Director, Neuberger, since 2006; formerly, Senior Vice President, Neuberger, 2004 to 2006; Vice President, nine registered investment companies for which Management acts as investment manager and administrator (nine since 2008); formerly, Head of Institutional Marketing, Morgan Stanley Investment Management, 1993 to 2004. | |
|
| Chamaine Williams (1971) | | Chief Compliance Officer since 2005 | | Senior Vice President, Neuberger, since 2007; Chief Compliance Officer, Management, since 2006; Chief Compliance Officer, nine registered investment companies for which Management acts as investment manager and administrator (eight since 2005 and one since 2006); formerly, Senior Vice President, Lehman Brothers Inc., 2007 to 2008; formerly, Vice President, Lehman Brothers Inc., 2003 to 2006; formerly, Chief Compliance Officer, Lehman Brothers Asset Management Inc., 2003 to 2007; formerly, Chief Compliance Officer, Lehman Brothers Alternative Investment Management LLC, 2003 to 2007; formerly, Vice President, UBS Global Asset Management (US) Inc. (formerly, Mitchell Hutchins Asset Management, a wholly-owned subsidiary of PaineWebber Inc.), 1997 to 2003. | |
|
(1) The business address of each listed person is 605 Third Avenue, New York, New York 10158.
(2) Pursuant to the By-Laws of the Trust, each officer elected by the Fund Trustees shall hold office until his or her successor shall have been elected and qualified or until his or her earlier death, inability to serve, or resignation. Officers serve at the pleasure of the Fund Trustees and may be removed at any time with or without cause.
(3) Except as otherwise indicated, each individual has held the positions shown for at least the last five years.
114
Proxy Voting Policies and Procedures
A description of the policies and procedures that the Trust uses to determine how to vote proxies relating to portfolio securities is available, without charge, by calling 1-800-877-9700 (toll-free) and on the website of the Securities and Exchange Commission, at www.sec.gov. Information regarding how the Trust voted proxies relating to portfolio securities during the most recent 12-month period ended June 30 is also available, without charge, by calling 1-800-877-9700 (toll-free), on the website of the Securities and Exchange Commission at www.sec.gov, and on Management's website at www.nb.com.
Quarterly Portfolio Schedule
The Trust files a complete schedule of portfolio holdings for each Fund with the Securities and Exchange Commission for the first and third quarters of each fiscal year on Form N-Q. The Trust's Forms N-Q are available on the Securities and Exchange Commission's website at www.sec.gov and may be reviewed and copied at the Securities and Exchange Commission's Public Reference Room in Washington, DC. Information on the operation of the Public Reference Room may be obtained by calling 1-800-SEC-0330. The information on Form N-Q is available upon request, without charge, by calling 1-800-877-9700 (toll-free).
Notice to Shareholders (Unaudited)
For High Income 0.04% of the dividends distributed during the fiscal year ended October 31, 2009 qualifies for the dividends received deduction for corporate shareholders.
Under most state tax laws, mutual fund dividends which are derived from direct investments in U.S. Government obligations are not taxable, as long as a Fund meets certain requirements. Some states require that a Fund must provide shareholders with a written notice, within 60 days of the close of a Fund's taxable year, designating the portion of the dividends which represents interest which those states consider to have been earned on U.S. Government obligations. The chart below shows the percentage of income derived from such investments for the twelve months ended October 31, 2009. This information should not be used to complete your tax returns.
| | | U.S. Treasury
Obligations | | Other Direct
U.S. Government
Obligations | | Other Indirect
U.S. Government
Obligations | | Repurchase
Agreements | |
| Core Bond | | | 3.8 | % | | | 0.3 | % | | | 20.3 | % | | | 0.0 | % | |
| High Income | | | 0.0 | | | | 0.0 | | | | 0.0 | | | | 0.0 | | |
| Short Duration | | | 5.4 | | | | 0.0 | | | | 8.3 | | | | 0.0 | | |
| Strategic Income | | | 5.2 | | | | 0.3 | | | | 10.9 | | | | 0.0 | | |
In January 2010, you will receive information to be used in filing your 2009 tax returns, which will include a notice of the exact tax status of all dividends paid to you by each Fund during calendar year 2009. Please consult your own tax advisor for details as to how this information should be reflected on your tax returns.
For the fiscal year ended October 31, 2009, High Income designates $13,590, or up to the maximum amount of such dividends allowable pursuant to the Internal Revenue Code, as qualified dividend income eligible for reduced tax rates. These lower rates range from 5% to 15% depending upon an individual's tax bracket. Complete information regarding the Funds' distributions during the calendar year 2009 will be reported in conjunction with Form 1099DIV.
For the fiscal period ended October 31, 2009, the percentages representing the portion of distributions from net investment income, which are exempt from federal tax, other than alternative minimum tax are as follows:
| Municipal Intermediate Bond | | | 98.83 | % | |
| Municipal Money | | | 98.93 | % | |
| New York Municipal Money | | | 100.00 | % | |
115
Investment manager: Neuberger Berman Management LLC
Sub-adviser: Neuberger Berman Fixed Income LLC
Neuberger Berman Management LLC
605 Third Avenue, 2nd Floor
New York, NY 10158-0180
Retail Services: 800.877.9700
Broker/Dealer and Institutional Services: 800.366.6264/888.556.9030
New York Municipal Money Fund Inquiries: 888.556.9030
Web site: www.nb.com
Statistics and projections in this report are derived from sources deemed to be reliable but cannot be regarded as a representation of future results of the Funds. This report is prepared for the general information of shareholders and is not an offer of shares of the Funds. Shares are sold only through the currently effective prospectus, which must precede or accompany this report.
H0648 12/09
Item 2. Code of Ethics
The Board of Trustees (“Board”) of Neuberger Berman Income Funds (“Registrant”) adopted a code of ethics that applies to the Registrant’s principal executive officer, principal financial officer, principal accounting officer or controller, or persons performing similar functions (“Code of Ethics”). For the period covered by this Form N-CSR, there were no amendments to the Code of Ethics and there were no waivers from the Code of Ethics granted to the Registrant’s principal executive officer, principal financial officer, principal accounting officer or controller, or persons performing similar functions.
A copy of the Code of Ethics is incorporated by reference to the Registrant’s Form N-CSR, Investment Company Act file number 811-03802 (filed on July 10, 2006). The Code of Ethics is also available, without charge, by calling 1-800-877-9700 (toll-free).
Item 3. Audit Committee Financial Expert
The Board has determined that the Registrant has two audit committee financial experts serving on its audit committee. The Registrant’s audit committee financial experts are Martha Goss and George Morriss. Ms. Goss and Mr. Morriss are independent trustees as defined by Form N-CSR.
Item 4. Principal Accountant Fees and Services
The financial information provided below is that of the Registrant, Neuberger Berman Income Funds. This N-CSR relates only to Neuberger Berman Core Bond Fund, Neuberger Berman High Income Bond Fund, Neuberger Berman Municipal Intermediate Bond Fund, Neuberger Berman Municipal Money Fund, Neuberger Berman New York Municipal Money Fund, Neuberger Berman Short Duration Bond Fund and Neuberger Berman Strategic Income Fund (collectively, the “Funds”). Tait, Weller & Baker LLP (“Tait Weller”) serves as independent registered public accounting firm to Neuberger Berman Core Bond Fund and Neuberger Berman New York Municipal Money Fund. Ernst & Young LLP (“E&Y”) serves as independent registered public accounting firm to all other series of the Registrant.
(a) Audit Fees
The aggregate fees billed for professional services rendered by E&Y for the audit of the annual financial statements or services that are normally provided by E&Y in connection with statutory and regulatory filings or engagements were $231,000 and $187,000 for the fiscal years ended 2008 and 2009, respectively.
The aggregate fees billed for professional services rendered by Tait Weller for the audit of the annual financial statements or services that are normally provided by Tait Weller in connection with statutory and regulatory filings or engagements were $71,400 and $37,500 for the fiscal years ended 2008 and 2009, respectively.
(b) Audit-Related Fees
The aggregate fees billed to the Registrant for assurance and related services by E&Y that are reasonably related to the performance of the audit of the Registrant’s financial statements and are not reported above in Audit Fees were $0 and $0 for the fiscal years ended 2008 and 2009, respectively.
The fees billed to other entities in the investment company complex for assurance and related services by E&Y that are reasonably related to the performance of the audit that the Audit Committee was
required to approve because the engagement related directly to the operations and financial reporting of the Registrant were $0 and $0 for the fiscal years ended 2008 and 2009 respectively.
The aggregate fees billed to the Registrant for assurance and related services by Tait Weller that are reasonably related to the performance of the audit of the Registrant’s financial statements and are not reported above in Audit Fees were $0 and $0 for the fiscal years ended 2008 and 2009, respectively.
The fees billed to other entities in the investment company complex for assurance and related services by Tait Weller that are reasonably related to the performance of the audit that the Audit Committee was required to approve because the engagement related directly to the operations and financial reporting of the Registrant were $0 and $0 for the fiscal years ended 2008 and 2009, respectively.
(c) Tax Fees
The aggregate fees billed to the Registrant for professional services rendered by E&Y for tax compliance, tax advice, and tax planning were $57,000 and $57,000 for the fiscal years ended 2008 and 2009, respectively. The nature of the services provided was tax compliance, tax advice and tax planning. The Audit Committee approved 0% and 0% of these services provided by E&Y for the fiscal years ended 2008 and 2009, respectively, pursuant to the waiver provisions of Rule 2-01(c)(7)(i)(C) of Regulation S-X.
The fees billed to other entities in the investment company complex for professional services rendered by E&Y for tax compliance, tax advice, and tax planning that the Audit Committee was required to approve because the engagement related directly to the operations and financial reporting of the Registrant were $0 and $0 for the fiscal years ended 2008 and 2009, respectively.
The aggregate fees billed to the Registrant for professional services rendered by Tait Weller for tax compliance, tax advice, and tax planning were $10,000 and $5,200 for the fiscal years ended 2008 and 2009, respectively. The nature of the services provided comprised tax compliance, tax advice and tax planning. The Audit Committee approved 0% and 0% of these services provided by Tait Weller for the fiscal years ended 2008 and 2009, respectively, pursuant to the waiver provisions of Rule 2-01(c)(7)(i)(C) of Regulation S-X.
The fees billed to other entities in the investment company complex for professional services rendered by Tait Weller for tax compliance, tax advice, and tax planning that the Audit Committee was required to approve because the engagement related directly to the operations and financial reporting of the Registrant were $0 and $0 for the fiscal years ended 2008 and 2009, respectively.
(d) All Other Fees
The aggregate fees billed to the Registrant for products and services provided by E&Y, other than services reported in Audit Fees, Audit-Related Fees, and Tax Fees were $0 and $0 for the fiscal years ended 2008 and 2009, respectively.
The fees billed to other entities in the investment company complex for products and services provided by E&Y, other than services reported in Audit Fees, Audit-Related Fees, and Tax Fees, that the Audit Committee was required to approve because the engagement related directly to the operations and financial reporting of the Registrant were $0 and $0 for the fiscal years ended 2008 and 2009, respectively.
The aggregate fees billed to the Registrant for products and services provided by Tait Weller, other than services reported in Audit Fees, Audit-Related Fees, and Tax Fees were $0 and $0 for the fiscal years ended 2008 and 2009, respectively.
The fees billed to other entities in the investment company complex for products and services provided by Tait Weller, other than services reported in Audit Fees, Audit-Related Fees, and Tax Fees, that the Audit Committee was required to approve because the engagement related directly to the operations and financial reporting of the Registrant were $0 and $0 for the fiscal years ended 2008 and 2009, respectively.
(e) Audit Committee’s Pre-Approval Policies and Procedures
(1) The Audit Committee’s pre-approval policies and procedures for the Registrant to engage an accountant to render audit and non-audit services delegate to each member of the Committee the power to pre-approve services between meetings of the Committee.
(2) None of the services described in paragraphs (b) through (d) above were approved by the Audit Committee pursuant to paragraph (c)(7)(i)(C) of Rule 2-01 of Regulation S-X.
(f) Hours Attributed to Other Persons
Not applicable.
(g) Non-Audit Fees
Non-audit fees billed by E&Y for services rendered to the Registrant were $57,000 and $57,000 for the fiscal years ended 2008 and 2009, respectively.
Non-audit fees billed by E&Y for services rendered to the Registrant’s investment adviser and any entity controlling, controlled by, or under common control with the adviser that provides ongoing services to the Registrant were $400,000 and $100,000 for the fiscal years ended 2008 and 2009, respectively.
Non-audit fees billed by Tait Weller for services rendered to the Registrant were $10,000 and $5,200 for the fiscal years ended 2008 and 2009, respectively.
Non-audit fees billed by Tait Weller for services rendered to the Registrant’s investment adviser and any entity controlling, controlled by, or under common control with the adviser that provides ongoing services to the Registrant were $0 and $0 for the fiscal years ended 2008 and 2009, respectively.
(h) The Audit Committee of the Board considered whether the provision of non-audit services rendered to the Registrant’s investment adviser and any entity controlling, controlled by, or under common control with the adviser that provides ongoing services to the Registrant that were not pre-approved by the Audit Committee because the engagement did not relate directly to the operations and financial reporting of the Registrant is compatible with maintaining E&Y’s and Tait Weller’s independence.
Item 5. Audit Committee of Listed Registrants
Not applicable to the Registrant.
Item 6. Schedule of Investments
The complete schedule of investments for each series is disclosed in the Registrant’s Annual Report, which is included as Item 1 of this Form N-CSR.
Item 7. Disclosure of Proxy Voting Policies and Procedures for Closed-End Management Investment Companies
Not applicable to the Registrant.
Item 8. Portfolio Managers of Closed-End Management Investment Companies.
Not applicable to the Registrant.
Item 9. Purchases of Equity Securities by Closed-End Management Investment Company and Affiliated Purchasers
Not applicable to the Registrant.
Item 10. Submission of Matters to a Vote of Security Holders
There were no changes to the procedures by which shareholders may recommend nominees to the Board.
Item 11. Controls and Procedures
| (a) | Based on an evaluation of the disclosure controls and procedures (as defined in Rule 30a-3(c) under the Investment Company Act of 1940, as amended (the “Act”)) as of a date within 90 days of the filing date of this document, the Chief Executive Officer and Treasurer and Principal Financial and Accounting Officer of the Registrant have concluded that such disclosure controls and procedures are effectively designed to ensure that information required to be disclosed by the Registrant on Form N-CSR and Form N-Q is accumulated and communicated to the Registrant’s management to allow timely decisions regarding required disclosure. |
| (b) | There were no significant changes in the Registrant’s internal controls over financial reporting (as defined in Rule 30a-3(d) under the Act) that occurred during the Registrant’s second fiscal quarter of the period covered by this report that have materially affected, or are reasonably likely to materially affect, the Registrant’s internal control over financial reporting. |
Item 12. Exhibits
| (a)(1) | A copy of the Code of Ethics is incorporated by reference to the Registrant’s Form N-CSR, Investment Company Act file number 811-3802 (filed July 10, 2006). |
| (a)(2) | The certifications required by Rule 30a-2(a) of the Act and Section 302 of the Sarbanes-Oxley Act of 2002 (“Sarbanes-Oxley Act”) are filed herewith. |
| (a)(3) | Not applicable to the Registrant. |
| (b) | The certifications required by Rule 30a-2(b) of the Act and Section 906 of the Sarbanes-Oxley Act are filed herewith. |
The certifications provided pursuant to Rule 30a-2(b) of the Act and Section 906 of the Sarbanes-Oxley Act are not deemed “filed” for purposes of Section 18 of the Securities Exchange Act of 1934, as amended (“Exchange Act”), or otherwise subject to the liability of that section. Such certifications will not be deemed to be incorporated by reference into any filing under the Securities Act of 1933, as amended, or the Exchange Act, except to the extent that the Registrant specifically incorporates them by reference.
SIGNATURES
Pursuant to the requirements of the Securities Exchange Act of 1934 and the Investment Company Act of 1940, the Registrant has duly caused this report to be signed on its behalf by the undersigned, thereunto duly authorized.
NEUBERGER BERMAN INCOME FUNDS
By: /s/ Robert Conti
Robert Conti
Chief Executive Officer
Date: December 24, 2009
Pursuant to the requirements of the Securities Exchange Act of 1934 and the Investment Company Act of 1940, this report has been signed below by the following persons on behalf of the Registrant and in the capacities and on the dates indicated.
By: /s/ Robert Conti
Robert Conti
Chief Executive Officer
Date: December 24, 2009
By: /s/ John M. McGovern
John M. McGovern
Treasurer and Principal Financial
and Accounting Officer
Date: December 24, 2009