As filed with the Securities and Exchange Commission on January 7, 2011
UNITED STATES
SECURITIES AND EXCHANGE COMMISSION
Washington, D.C. 20549
FORM N-CSR
CERTIFIED SHAREHOLDER REPORT OF
REGISTERED MANAGEMENT INVESTMENT COMPANIES
Investment Company Act file number: 811-3802
NEUBERGER BERMAN INCOME FUNDS
(Exact Name of the Registrant as Specified in Charter)
c/o Neuberger Berman Management LLC
605 Third Avenue, 2nd Floor
New York, New York 10158-0180
(Address of Principal Executive Offices – Zip Code)
Registrant's telephone number, including area code: (212) 476-8800
Robert Conti
Chief Executive Officer and President
c/o Neuberger Berman Management LLC
Neuberger Berman Income Funds
605 Third Avenue, 2nd Floor
New York, New York 10158-0180
Arthur C. Delibert, Esq.
K&L Gates LLP
1601 K Street, N.W.
Washington, D.C. 20006-1600
(Names and Addresses of agents for service)
Date of fiscal year end: October 31, 2010
Date of reporting period: October 31, 2010
Form N-CSR is to be used by management investment companies to file reports with the Commission not later than 10 days after the transmission to stockholders of any report that is required to be transmitted to stockholders under Rule 30e-1 under the Investment Company Act of 1940 (17 CFR 270.30e-1). The Commission may use the information provided on Form N-CSR in its regulatory, disclosure review, inspection and policymaking roles.
A registrant is required to disclose the information specified by Form N-CSR, and the Commission will make this information public. A registrant is not required to respond to the collection of information contained in Form N-CSR unless the Form displays a currently valid Office of Management and Budget (“OMB”) control number. Please direct comments concerning the accuracy of the information collection burden estimate and any suggestions for reducing the burden to the Secretary, Securities and Exchange Commission, 100 F Street, NE, Washington, DC 20549-0609. The OMB has reviewed this collection of information under the clearance requirements of 44 U.S.C. § 3507.
Item 1. Report to Shareholders
| | Neuberger Berman | | |
| | | | |
| | Investor Class Shares | | Class A Shares |
| | Institutional Class Shares | | Class C Shares |
| | Trust Class Shares | | Class R3 Shares |
| | | | |
| | | | |
| | Core Bond Fund Floating Rate Income Fund High Income Bond Fund | | Municipal Intermediate Bond Fund Short Duration Bond Fund Strategic Income Fund |
| | | | |
| | | | |
| | | | |
| | Annual Report October 31, 2010 | | |
| | Contents | |
| | | |
| | THE FUNDS | |
| | | |
| | President's Letter | 1 |
| | | |
| | PORTFOLIO COMMENTARY | |
| | | |
| | Core Bond Fund | 2 |
| | | |
| | Floating Rate Income Fund | 5 |
| | | |
| | High Income Bond Fund | 8 |
| | | |
| | Municipal Intermediate Bond Fund | 11 |
| | | |
| | Short Duration Bond Fund | 14 |
| | | |
| | Strategic Income Fund | 17 |
| | | |
| | FUND EXPENSE INFORMATION | 25 |
| | | |
| | SCHEDULE OF INVESTMENTS | |
| | | |
| | Core Bond Fund | 27 |
| | | |
| | Floating Rate Income Fund | 33 |
| | | |
| | High Income Bond Fund | 39 |
| | | |
| | Municipal Intermediate Bond Fund | 46 |
| | | |
| | Short Duration Bond Fund | 51 |
| | | |
| | Strategic Income Fund | 54 |
| | | |
| | FINANCIAL STATEMENTS | 84 |
The "Neuberger Berman" name and logo are registered service marks of Neuberger Berman Group LLC. "Neuberger Berman Management LLC" and the individual Fund names in this piece are either service marks or registered service marks of Neuberger Berman Management LLC. ©2010 Neuberger Berman Management LLC. All rights reserved.
| FINANCIAL HIGHLIGHTS (ALL CLASSES)/PER SHARE DATA |
| | | |
| | Core Bond Fund | 106 |
| | | |
| | Floating Rate Income Fund | 106 |
| | | |
| | High Income Bond Fund | 108 |
| | | |
| | Municipal Intermediate Bond Fund | 108 |
| | | |
| | Short Duration Bond Fund | 110 |
| | | |
| | Strategic Income Fund | 112 |
| | | |
| | Reports of Independent Registered Public Accounting Firms | 116 |
| | | |
| | Directory | 118 |
| | | |
| | Trustees and Officers | 119 |
| | | |
| | Proxy Voting Policies and Procedures | 128 |
| | | |
| | Quarterly Portfolio Schedule | 128 |
| | | |
| | Notice to Shareholders | 128 |
| | | |
| | Board Consideration of the Management and Sub-Advisory Agreements | 128 |
| | | |
The "Neuberger Berman" name and logo are registered service marks of Neuberger Berman Group LLC. "Neuberger Berman Management LLC" and the individual Fund names in this piece are either service marks or registered service marks of Neuberger Berman Management LLC. ©2010 Neuberger Berman Management LLC. All rights reserved.
President's Letter
Dear Fellow Shareholder,
The fixed income markets generally provided solid results in the fiscal year ended October 31, 2010. While there were periods of heightened volatility, they were largely offset by robust risk appetite, as investors looked to generate incremental income in the low-interest-rate environment. Against this backdrop, non-Treasury securities outperformed their Treasury counterparts. Also supporting non-Treasuries were the continued economic expansion, benign inflation and strengthening corporate balance sheets.
Our Fixed Income Funds were generally positioned to benefit from the outperformance of non-Treasuries. In particular, exposure to the areas of the market that had lagged the most during the credit crisis enhanced the Funds' results during the reporting period.
Looking ahead, while the lengthiest recession since the Great Depression has finally been declared over, the U.S. economy still faces a number of headwinds. These include continued elevated unemployment and a housing market that is struggling to regain its footing. Despite these challenges, it is our belief that the economy has enough momentum to avoid a double-dip recession. That said, we expect to see growth that is more modest than previous periods exiting a severe recession.
One factor that we believe will support the economy going forward is continued low interest rates. With economic growth moderating during the second half of the reporting period, the Federal Reserve kept the Federal Funds rate at a historically low range of 0% to 0.25%. In addition, during its September 2010 meeting, Federal Reserve Chairman Ben Bernanke indicated that the Fed was "prepared to provide additional accommodation if needed to support the economic recovery..." In November, after the reporting period had concluded, the Federal Reserve announced its intention to purchase $600 billion in Treasuries by the end of June 2011, in an attempt to keep longer-term rates low and support the economy. Whether this plan has its desired effect, of course, remains to be seen.
Against a backdrop of moderately positive economic growth and mild inflation, we believe that non-Treasuries could continue to generate solid results, and our Fixed Income Funds are positioned accordingly. In addition, it is our belief that demand for non-Treasuries will remain strong given the low yields offered by Treasury securities.
In conclusion, as the last few years have shown, the financial markets can experience periods of unsettling volatility. Given uncertainties surrounding the economy and the Federal Reserve's policies, we believe there is a chance that the financial markets will experience higher volatility going forward. Should such volatility occur, we urge shareholders to maintain a long-term perspective.
Thank you for your continued support and trust. We look forward to continue serving your investment needs in the years to come.
Sincerely,
Robert Conti
President and CEO
Neuberger Berman Mutual Funds
Core Bond Fund Commentary (Unaudited)
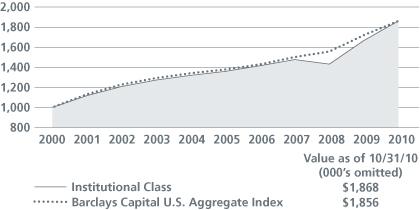
For the fiscal year ended October 31, 2010, Neuberger Berman Core Bond Fund posted a strong absolute return and outperformed its benchmark, the Barclays Capital U.S. Aggregate Index.
To a great extent, risk appetite was robust during the reporting period as investors were drawn to investments that offered relatively high yields in the low interest rate environment. Two notable exceptions occurred in late April and May, when concerns regarding the European sovereign debt crisis escalated, and again in August, as moderating economic data led to fears of a double-dip recession. However, these proved to be only temporary setbacks and risk aversion was quickly replaced by continued strong demand for non-Treasury fixed income securities. Also supporting non-Treasuries were strengthening corporate balance sheets and better-than-generally-expected corporate profits, continued low interest rates, benign inflation and indications that the Federal Reserve would introduce another round of quantitative easing (QE2) to support the economy. Against this backdrop, non-Treasuries generally outperformed equal-duration Treasuries during the reporting period.
Many of the best performing sectors in the investment grade fixed income market were those that offered the most attractive yields, including commercial mortgage-backed securities (CMBS) and investment grade bonds.
The Fund was well positioned for an environment that favored non-Treasuries. In particular, the Fund's overweight positions versus the benchmark in CMBS and investment-grade bonds enhanced results as their spreads (the difference in yield between Treasuries and other bond sectors) significantly narrowed during the 12-month reporting period. Within the investment grade sector, the Fund's industrial and financial bonds produced the best results.
Also contributing to performance was the Fund's yield curve positioning and an allocation to Treasury Inflation Protected Securities (TIPS). Throughout most of the period, the Fund had an overweight to the intermediate portion of the yield curve. This was beneficial to results as intermediate-term rates declined more than their short- and long-term counterparts. TIPS benefited from a decline in real (excluding inflation) yields and increasing expectations for higher inflation.
Modestly hampering absolute performance was the Fund's exposure to U.S. Treasuries and agency mortgage-backed securities, as lower yielding and higher quality bonds lagged the overall fixed income market during the period.
We made a number of adjustments to the portfolio during the reporting period, such as paring its investment-grade bond exposure to capture profits given the sector's strong results. The proceeds of those sales were used to increase the Fund's exposure to U.S. Treasury securities in October. This was done to broaden diversification and reduce overall risk exposure.
Looking ahead, we believe that the U.S. economy will avert a double-dip recession and that inflation will remain benign. However, we feel economic growth could be muted by historical standards coming out of a severe recession. In addition, the Federal Reserve has signaled that short-term interest rates could remain low "for an extended period" and in our view QE2 could keep longer-term rates relatively low as well. Against this backdrop, we believe that demand for non-Treasuries will remain strong. We feel the portfolio is well positioned for such an environment given our overweight to non-Treasuries as we seek to generate solid risk-adjusted returns.
Sincerely,
Thanos Bardas, David M. Brown, Andrew A. Johnson and Bradley C. Tank
Portfolio Co-Managers
Information about the principal risks of investing in the Fund is set forth in the prospectus and statement of additional information.
The composition, industries and holdings of the Fund are subject to change.
Core Bond Fund
| TICKER SYMBOLS |
| Investor Class | | NCRIX |
| Institutional Class | | NCRLX |
| Class A | | NCRAX |
| Class C | | NCRCX |
| PORTFOLIO BY TYPE OF SECURITY |
| (as a % of Total Net Assets) | |
| Asset-Backed | | | 13.1 | % | |
| Corporate Debt | | | 25.8 | | |
| Mortgage-Backed Securities | | | 30.1 | | |
| U.S. Treasury Securities | | | 45.5 | | |
| Short-Term Investments | | | 2.7 | �� | |
Liabilities, less cash, receivables and other assets | | | (17.2 | ) | |
| Total | | | 100.0 | | |
| PERFORMANCE HIGHLIGHTS3,10 |
| | | Average Annual Total Return Ended 10/31/2010 | |
| | | Inception Date | | 1 Year | | 5 Years | | 10 Years | | Life of Fund | |
| At NAV | | | | | | | | | | | | | | | | | | | |
| Investor Class | | 02/01/1997 | | | 10.03 | % | | | 6.39 | % | | | 6.01 | % | | | 5.81 | % | |
| Institutional Class | | 10/01/1995 | | | 10.45 | % | | | 6.81 | % | | | 6.45 | % | | | 6.21 | % | |
Class A15 | | 12/20/2007 | | | 10.04 | % | | | 6.53 | % | | | 6.30 | % | | | 6.11 | % | |
Class C15 | | 12/20/2007 | | | 9.31 | % | | | 6.09 | % | | | 6.08 | % | | | 5.97 | % | |
| With Sales Charge | | | | | | | | | | | | | | | | | | | |
Class A15 | | | | | 5.38 | % | | | 5.61 | % | | | 5.84 | % | | | 5.81 | % | |
Class C15 | | | | | 8.31 | % | | | 6.09 | % | | | 6.08 | % | | | 5.97 | % | |
| Index | | | | | | | | | | | | | | | | | | | |
Barclays Capital U.S. Aggregate Index13,14 | | | 8.01 | % | | | 6.45 | % | | | 6.38 | % | | | 6.41 | % | |
Performance data quoted represent past performance, which is no guarantee of future results. The investment return and principal value of an investment will fluctuate so that an investor's shares, when redeemed, may be worth more or less than their original cost. Results are shown on a "total return" basis and include reinvestment of all income dividends and distributions.
Current performance may be lower or higher than the performance data quoted. For performance data current to the most recent month end, please visit www.nb.com/performance.
For the period ended October 31, 2010, the 30-day SEC yield was 1.85%, 2.23%, 1.77% and 1.12% for Investor Class, Institutional Class, Class A and Class C shares, respectively.
As stated in the Fund's most recent prospectus, the total annual operating expense ratios for fiscal year 2009 were 1.17%, 0.72%, 1.13% and 2.45% for Investor Class, Institutional Class, Class A and Class C shares, respectively (prior to any fee waivers or expense reimbursements). The expense ratios net of waivers and/or reimbursements were 0.88%, 0.48%, 0.88% and 1.63% for Investor Class, Institutional Class, Class A and Class C shares, respectively. Neuberger Berman Management LLC has contractually agreed to limit certain expenses of the Fund through 10/31/2020 for Investor Class, Institutional Class, Class A and Class C shares.
Total Returns shown with a sales charge reflect the deduction of the current maximum initial sales charge of 4.25% for Class A shares and the applicable contingent deferred sales charges (CDSC) for Class C shares. The maximum CDSC for Class C shares is 1%, which is reduced to 0% after 1 year. The performance of the Fund's share classes will differ primarily due to different sales charge structures and class expenses. Please see the prospectus for more information about sales charge structures, if any, and class expenses for your share class.
Core Bond Fund
| COMPARISON OF A $1,000,000 INVESTMENT |
| (000's Omitted) |
 |
| |
This chart shows the value of a hypothetical $1,000,000 investment in the Fund over the past 10 fiscal years. The graph is based on the Institutional Class shares only; performance of other classes will vary due to differences in fee structures (see Performance Highlights chart on previous page). The result is compared with one or more benchmarks, which may include a broad-based market index and/or a narrower index. Please note that market indices have not been reduced to reflect any of the fees and costs of investing. All results include the reinvestment of income dividends and distributions. Neither the Fund's returns nor the market indices shown in the graph and table reflect the effect of taxes an investor would pay on Fund distributions or on the redemption of Fund shares. R esults represent past performance and do not indicate future results. Please see Endnotes and Glossary of Indices for additional information. |
Floating Rate Income Fund Commentary (Unaudited)
We are pleased to provide the first annual report for Neuberger Berman Floating Rate Income Fund, which was launched on December 29, 2009. As portfolio managers for the Fund, we seek to generate a high level of current income for shareholders while maintaining a focus on capital preservation. The Fund invests primarily in floating rate senior secured loans that we believe have the potential for attractive risk-adjusted returns. Central to our discipline is rigorous credit research, as we look for companies with historically stable cash flows, liquidity and a tangible asset base.
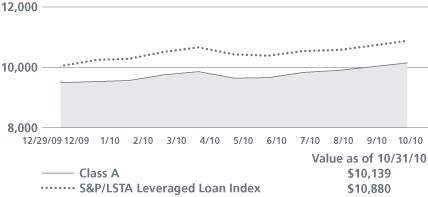
For the period from its inception through October 31, 2010, the Fund posted a solid absolute return but underperformed its benchmark, the S&P/LSTA Leveraged Loan Index.
While there were periods of volatility, most notably in late April and May given concerns regarding the European debt crisis, the floating rate bank loan market produced strong results during the reporting period. Supporting the market were generally strong demand from investors seeking incremental yields in the low interest rate environment and a contracting supply of floating rate bank loans. There was also a meaningful decline in floating rate loan defaults. During the reporting period, the default rate among the securities in the benchmark fell from approximately 9.6% to 2.3%. As was the case in 2009, lower-quality securities outperformed their higher-quality counterparts. Calendar year-to-date through October 31, 2010, the S&P/LSTA Leveraged Loan Index returned 8.41%, CCC-rated securities in the index gained 16.9% and BB-rated se curities rose 6.6%, respectively.
During the period, we increased the Fund's allocation to non-floating rate securities. We have the flexibility to allocate up to 20% of the portfolio to these securities and within this segment, we invested in fixed-rate senior secured bonds that offered higher yields than the floating rate loans offered by the same issuers. Given our focus on generating high current income, 17.7% of the Fund was held in fixed-rate securities at the end of the reporting period.
We also continued to actively participate in the new issuance market, emphasizing securities in the primary rather than the secondary bank loan market due to the former's higher current yields. In addition, we emphasized larger, highly liquid names that offered attractive yields in order to maintain a liquid portfolio.
Our higher-quality bias detracted from relative performance during the reporting period. Throughout the period, the Fund was underweighted in CCC-rated securities and overweighted in BB and B-rated issues versus the benchmark. We felt this positioning was appropriate given weak economic data and continued economic headwinds, such as elevated unemployment and ongoing strains in the housing market.
From a sector perspective, security selection in radio/TV, building and development, chemicals and aerospace and defense detracted the most from results. In contrast, our security selection in electronics, autos, financial and telecommunications added the most to positive performance.
Looking ahead, we have a positive outlook for the floating rate loan market. In our opinion, the supply/demand dynamics in the market will remain favorable. We expect to see a continued shrinking of the loan market. Moreover, given the likelihood of relatively low interest rates, we feel that demand for the segment will continue to be strong as investors search for higher yields. During the first 11 months of calendar year 2010, roughly $11.3 billion was invested in retail bank loan mutual funds. In contrast, $3.4 billion was invested in these mutual funds during all of 2009. We believe the economy will avert a double-dip recession. This, coupled with strengthening corporate balance sheets, could result in continued low default rates in 2011.
Sincerely,
Stephen J. Casey, Ann H. Benjamin, Thomas P. O'Reilly and Joseph P. Lynch
Portfolio Co-Managers
Information about the principal risks of investing in the Fund is set forth in the prospectus and statement of additional information.
The composition, industries and holdings of the Fund are subject to change.
Floating Rate Income Fund
| TICKER SYMBOLS |
| Institutional Class | | NFIIX | |
| Class A | | NFIAX | |
| Class C | | NFICX | |
| PORTFOLIO BY MATURITY DISTRIBUTION |
| (as a % of Total Investments) | |
| Less than One Year | | | 12.9 | % | |
| One to Five Years | | | 31.6 | | |
| Five to Ten Years | | | 52.7 | | |
| Ten Years or Greater | | | 2.8 | | |
| Total | | | 100.0 | | |
PERFORMANCE HIGHLIGHTS6 |
| | | Inception Date | | Cumulative Total Return Ended 10/31/2010 Life of Fund | |
| At NAV | | | | | | | |
Institutional Class17 | | 12/30/2009 | | | 6.24 | % | |
| Class A | | 12/29/2009 | | | 5.85 | % | |
Class C17 | | 12/30/2009 | | | 5.39 | % | |
| With Sales Charge | |
| Class A | | | | | 1.39 | % | |
Class C17 | | | | | 4.39 | % | |
| Index | |
S&P/LSTA Leveraged Loan Index13,14 | | | 8.80 | % | |
Performance data quoted represent past performance, which is no guarantee of future results. The investment return and principal value of an investment will fluctuate so that an investor's shares, when redeemed, may be worth more or less than their original cost. Results are shown on a "total return" basis and include reinvestment of all income dividends and distributions.
Current performance may be lower or higher than the performance data quoted. For performance data current to the most recent month end, please visit www.nb.com/performance.
For the period ended October 31, 2010, the 30-day SEC yield was 5.16%, 4.56% and 4.05% for Institutional Class, Class A and Class C shares, respectively.
As stated in the Fund's most recent prospectus, the total annual operating expense ratios for fiscal year 2009 were 1.38%, 1.75% and 2.50% for Institutional Class, Class A and Class C shares, respectively (prior to any fee waivers or expense reimbursements). The expense ratios net of waivers and/or reimbursements were 0.70%, 1.07% and 1.82% for Institutional Class, Class A and Class C, respectively. Neuberger Berman Management LLC has contractually agreed to limit certain expenses of the Fund through 10/31/2013 for Institutional Class, Class A and Class C.
Total Returns shown with a sales charge reflect the deduction of the current maximum initial sales charge of 4.25% for Class A shares and the applicable contingent deferred sales charges (CDSC) for Class C shares. The maximum CDSC for Class C shares is 1%, which is reduced to 0% after 1 year. The performance of the Fund's share classes will differ primarily due to different sales charge structures and class expenses. Please see the prospectus for more information about sales charge structures, if any, and class expenses for your share class.
Floating Rate Income Fund
| COMPARISON OF A $10,000 INVESTMENT (WITH SALES CHARGE) |
|
| |
This chart shows the value of a hypothetical $10,000 investment in the Fund over the past 10 fiscal years, or since the Fund's inception, if it has not operated for 10 years. The graph is based on the Class A shares only; performance of other classes will vary due to differences in fee structures (see Performance Highlights chart on previous page). The result is compared with one or more benchmarks, which may include a broad-based market index and/or a narrower index. Please note that market indices have not been reduced to reflect any of the fees and costs of investing. All results include the reinvestment of income dividends and distributions. Neither the Fund's returns nor the market indices shown in the graph and table reflect the effect of taxes an investor would pay on Fund distributions or on the redemption of Fund shares. Results represent past performance and do not indicate future results. Please see Endnotes and Glossary of Indices for additional information. |
High Income Bond Fund Commentary (Unaudited)
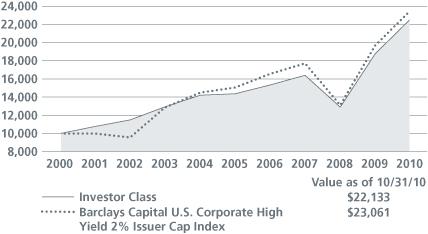
For the fiscal year ended October 31, 2010, Neuberger Berman High Income Bond Fund Investor Class posted a strong absolute return and modestly outperformed its benchmark, the Barclays Capital U.S. Corporate High Yield 2% Issuer Cap Index. (Please see Performance Highlights on next page for performance of all classes.)
To a great extent, the same factors that had triggered the high yield market rally that began in the spring of 2009 continued during the reporting period. These included the stabilizing economy, modest inflation, strengthening corporate balance sheets, better-than-expected profits and falling default rates. Aside from some temporary periods of volatility — triggered by the sovereign debt crisis in Europe and concerns regarding a possible double-dip recession — investor risk appetite was robust, further supporting high yield bond prices. All told, the Fund's benchmark posted positive returns during 11 of the 12 months covered by this report and gained 19.10% overall. The high yield market's gains were broad-based, as bonds rated CCC (a relatively low rating) and BB securities (rated higher) in the index returned 20.2% and 18.9% , respectively.
For the Fund, security selection in non-captive diversified finance, autos and media/non-cable were the largest positive contributors to relative performance. In contrast, an underweight in banking, along with security selection in retail and technology, were the largest detractors from relative results.
We made several adjustments to the portfolio during the reporting period, such as reducing the Fund's exposure to CCC-rated securities. This was accomplished through the sale of certain holdings that had appreciated and reached our target prices. In addition, a number of our holdings rated CCC were upgraded. Given these upgrades, the Fund's exposure to securities rated BB increased during the period. We also focused on buying higher-quality names in the new issue market, as we believed them to be attractively structured and priced. Elsewhere, given signs of moderating economic growth during the second half of the reporting period, we pared our exposure to more cyclical names and increased the Fund's weighting to certain defensive sectors.
Even with its outstanding results over the last two years, we continue to have a positive outlook for the high yield market. We believe that inflation will remain muted and that the U.S. economic recovery will continue, although growth rates could be muted by historical standards coming out of a severe recession. This type of environment has generally been historically positive for high yield bonds. In addition, the Federal Reserve has signaled that short-term interest rates could remain low "for an extended period" and we believe the additional quantitative easing announced in November could keep longer-term rates relatively low as well. Against this backdrop, we believe that demand for high yield bonds will remain strong. Other factors that could support the high yield market, if they continue, could be additional improvements in corpor ate earnings and declining high yield defaults. After peaking at 10.3% in 2009, default rates were approximately 2.4% at the end of the reporting period. We feel that defaults could decline further based on the gradually improving economy and the lack of potential default triggers within high yield issuers' balance sheets.
As always, we will continue to conduct extensive research on potential securities for the portfolio as we seek to generate consistently strong risk-adjusted returns.
Sincerely,
Ann H. Benjamin and Thomas P. O'Reilly
Portfolio Co-Managers
Information about the principal risks of investing in the Fund is set forth in the prospectus and statement of additional information.
The composition, industries and holdings of the Fund are subject to change.
High Income Bond Fund
| TICKER SYMBOLS |
| Investor Class | | NHINX | |
| Institutional Class | | NHILX | |
| Class A | | NHIAX | |
| Class C | | NHICX | |
| Class R3 | | NHIRX | |
| PORTFOLIO BY MATURITY DISTRIBUTION | |
| (as a % of Total Investments) | |
| Less than One Year | | | 2.2 | % | |
| One to Five Years | | | 23.9 | | |
| Five to Ten Years | | | 62.2 | | |
| Ten Years or Greater | | | 11.7 | | |
| Total | | | 100.0 | | |
PERFORMANCE HIGHLIGHTS2,9 |
| | | Average Annual Total Return Ended 10/31/2010 | |
| | | Inception Date | | 1 Year | | 5 Years | | 10 Years | | Life of Fund | |
| At NAV | | | | | | | | | | | | | | | | | | | |
| Investor Class | | 02/01/1992 | | | 19.71 | % | | | 9.23 | % | | | 8.27 | % | | | 8.28 | % | |
Institutional Class12 | | 05/27/2009 | | | 19.81 | % | | | 9.33 | % | | | 8.32 | % | | | 8.30 | % | |
Class A12 | | 05/27/2009 | | | 19.52 | % | | | 9.18 | % | | | 8.24 | % | | | 8.26 | % | |
Class C12 | | 05/27/2009 | | | 18.60 | % | | | 8.96 | % | | | 8.13 | % | | | 8.20 | % | |
Class R312 | | 05/27/2009 | | | 19.08 | % | | | 9.11 | % | | | 8.21 | % | | | 8.24 | % | |
| With Sales Charge | | | | | | | | | | | | | | | | | | | |
Class A12 | | | | | 14.49 | % | | | 8.23 | % | | | 7.77 | % | | | 8.01 | % | |
Class C12 | | | | | 17.60 | % | | | 8.96 | % | | | 8.13 | % | | | 8.20 | % | |
| Index | | | | | | | | | | | | | | | | | | | |
Barclays Capital U.S. Corporate High Yield 2% Issuer Cap Index13,14 | | | 19.10 | % | | | 9.13 | % | | | 8.71 | % | | | N/A | | |
Performance data quoted represent past performance, which is no guarantee of future results. The investment return and principal value of an investment will fluctuate so that an investor's shares, when redeemed, may be worth more or less than their original cost. Results are shown on a "total return" basis and include reinvestment of all income dividends and distributions.
Current performance may be lower or higher than the performance data quoted. For performance data current to the most recent month end, please visit www.nb.com/performance.
For the period ended October 31, 2010, the 30-day SEC Yield was 6.22%, 6.46%, 5.83%, 5.35% and 5.85% for Investor Class, Institutional Class, Class A, Class C and Class R3 shares, respectively.
As stated in the Fund's most recent prospectus, the total annual operating expense ratios for fiscal year 2009 were 1.06%, 0.93%, 1.29%, 2.04% and 5.55% for Investor Class, Institutional Class, Class A, Class C and Class R3 shares, respectively (prior to any fee waivers or expense reimbursements). The expense ratios net of waivers and/or reimbursements were 1.03%, 0.77%, 1.14%, 1.89% and 1.39% for Investor Class, Institutional Class, Class A, Class C and Class R3 shares, respectively. Neuberger Berman Management LLC has contractually agreed to limit certain expenses of the Fund through 10/31/2013 for Investor Class, Institutional Class, Class A, Class C and Class R3 shares.
Total Returns shown with a sales charge reflect the deduction of the current maximum initial sales charge of 4.25% for Class A shares and the applicable contingent deferred sales charges (CDSC) for Class C shares. The maximum CDSC for Class C shares is 1%, which is reduced to 0% after 1 year. The performance of the Fund's share classes will differ primarily due to different sales charge structures and class expenses. Please see the prospectus for more information about sales charge structures, if any, and class expenses for your share class.
High Income Bond Fund
| COMPARISON OF A $10,000 INVESTMENT |
| |
 |
| |
This chart shows the value of a hypothetical $10,000 investment in the Fund over the past 10 fiscal years. The graph is based on the Investor Class shares only; performance of other classes will vary due to differences in fee structures (see Performance Highlights chart on previous page). The result is compared with one or more benchmarks, which may include a broad-based market index and/or a narrower index. Please note that market indices have not been reduced to reflect any of the fees and costs of investing. All results include the reinvestment of income dividends and distributions. Neither the Fund's returns nor the market indices shown in the graph and table reflect the effect of taxes an investor would pay on Fund distributions or on the redemption of Fund shares. Results r epresent past performance and do not indicate future results. Please see Endnotes and Glossary of Indices for additional information. |
Municipal Intermediate Bond Fund Commentary (Unaudited)
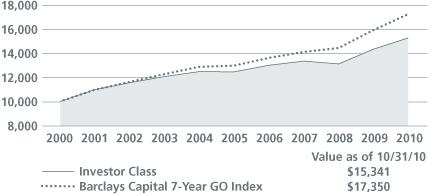
For the fiscal year ended October 31, 2010, Neuberger Berman Municipal Intermediate Bond Fund posted a positive return but lagged its benchmark, the Barclays Capital 7-Year General Obligation Index.
Even though numerous states and local municipalities continued to face budgetary challenges, the municipal bond market generated solid results during the reporting period. Investor demand for municipal securities was generally robust as they looked to generate additional yield given the relatively low interest rate environment. Also supporting the market were low inflation and the falling supply of traditional tax-exempt municipal bonds. This was due, in large part, to increased issuance of taxable Build America Bonds (BABs). In many cases, municipalities preferred to issue BABs because the federal government provides cash subsidy payments equal to 35% of the issuing municipality's interest costs.
The Fund's underperformance versus its benchmark was largely the result of its defensive positioning and higher quality bias. With investors looking for higher yields, lower-rated municipal bonds outperformed their higher-rated counterparts. To illustrate, the Barclays Capital BAA Municipal Bond Index gained 11.2% during the reporting period, while the Barclays Capital AAA Municipal Bond Index returned 5.9%. We believed a higher-quality portfolio was warranted given only a modestly improving economy, continued high unemployment and relatively weak tax revenues.
From a sector perspective, we emphasized higher quality revenue and general obligation bonds that tend to perform relatively well in difficult economic times. This was not rewarded, as what we consider lower-quality sectors, such as health care, produced stronger results during the reporting period.
Also detracting from performance was the Fund's yield curve positioning. Throughout the reporting period, we utilized a barbell approach (investing in shorter and longer maturities). In contrast, the benchmark is concentrated in the six- to eight-year portion of the curve, which was among the best-performing portions of the municipal yield curve.
We made a number of adjustments to the portfolio during the reporting period, such as increasing our allocation to single family housing municipal securities. We believe these federally-backed mortgage bonds are high quality, have minimal prepayment risk and are compellingly valued relative to their credit quality.
Looking ahead, we continue to have a positive long-term outlook for the municipal market. While the economy is growing at a modest pace, we do not expect it to fall back into a recession. We also believe that demand for municipal securities will remain strong. This demand could be driven by higher federal, state and local tax rates. In addition, the Federal Reserve has signaled that short-term interest rates could remain low "for an extended period" and we think additional quantitative easing could keep longer-term rates relatively low as well. This could be supportive of continued strong demand for municipal securities. Finally, the municipal market, in our opinion, remains attractively valued when compared to Treasury counterparts.
That is not to say that we will not experience periods of increased volatility in the municipal market. Based on the results of the mid-term elections, there could be less federal government support for financially challenged state and local governments. Less federal assistance, coupled with only a modestly improving economy and relatively weak tax revenues, could result in an increase in municipal bond downgrades. Against this backdrop, we believe that maintaining our defensive posture and what we consider a higher quality portfolio is appropriate. In addition, we believe that active management and thorough, in-house fundamental research on the underlying credit characteristics of our existing and potential holdings will be essential to produce consistently strong risk-adjusted returns.
Sincerely,
James L. Iselin and S. Blake Miller
Portfolio Co-Managers
Information about the principal risks of investing in the Fund is set forth in the prospectus and statement of additional information.
The composition, industries and holdings of the Fund are subject to change.
Municipal Intermediate Bond Fund
| TICKER SYMBOLS |
| Investor Class | | NMUIX | |
| Institutional Class | | NMNLX | |
| Class A | | NMNAX | |
| Class C | | NMNCX | |
| PORTFOLIO BY STATE AND TERRITORY |
| (as a % of Total Investments) | | | | | |
| Alaska | | | 0.5 | % | |
| Arizona | | | 3.9 | | |
| California | | | 12.2 | | |
| Colorado | | | 4.3 | | |
| District of Columbia | | | 2.5 | | |
| Florida | | | 2.5 | | |
| Georgia | | | 2.0 | | |
| Illinois | | | 10.6 | | |
| Indiana | | | 2.5 | | |
| Iowa | | | 1.2 | | |
| Kansas | | | 3.2 | | |
| Louisiana | | | 0.5 | | |
| Massachusetts | | | 6.0 | | |
| Michigan | | | 3.9 | | |
| Minnesota | | | 1.4 | | |
| Mississippi | | | 1.8 | | |
| Missouri | | | 1.8 | | |
| Nebraska | | | 1.5 | | |
| Nevada | | | 2.3 | | |
| New Jersey | | | 3.7 | | |
| New Mexico | | | 1.9 | | |
| New York | | | 8.7 | | |
| North Carolina | | | 0.9 | | |
| Ohio | | | 0.5 | | |
| Oregon | | | 1.1 | | |
| Pennsylvania | | | 1.4 | | |
| Puerto Rico | | | 2.0 | | |
| Rhode Island | | | 1.0 | | |
| South Carolina | | | 0.1 | | |
| South Dakota | | | 0.8 | | |
| Tennessee | | | 1.5 | | |
| Texas | | | 7.3 | | |
| Virginia | | | 1.4 | | |
| Washington | | | 1.8 | | |
| Wisconsin | | | 1.3 | | |
| Total | | | 100.0 | | |
PERFORMANCE HIGHLIGHTS1,7,8 |
| | | | |
| | | Average Annual Total Return Ended 10/31/2010 | |
| | | Inception Date | | 1 Year | | 5 Years | | 10 Years | | Life of Fund | |
| At NAV | | | | | | | | | | | | | | | | | | | |
| Investor Class | | 07/09/1987 | | | 6.56 | % | | | 4.18 | % | | | 4.37 | % | | | 5.24 | % | |
Institutional Class18 | | 06/21/2010 | | | 6.62 | % | | | 4.19 | % | | | 4.38 | % | | | 5.25 | % | |
Class A18 | | 06/21/2010 | | | 6.57 | % | | | 4.18 | % | | | 4.37 | % | | | 5.24 | % | |
Class C18 | | 06/21/2010 | | | 6.18 | % | | | 4.10 | % | | | 4.34 | % | | | 5.23 | % | |
| With Sales Charge | |
Class A18 | | | | | 2.04 | % | | | 3.28 | % | | | 3.92 | % | | | 5.05 | % | |
Class C18 | | | | | 5.18 | % | | | 4.10 | % | | | 4.34 | % | | | 5.23 | % | |
| Index | |
Barclays Capital 7-Year GO Index13,14 | | | 8.45 | % | | | 5.93 | % | | | 5.66 | % | | | 6.26 | % | |
Performance data quoted represent past performance, which is no guarantee of future results. The investment return and principal value of an investment will fluctuate so that an investor's shares, when redeemed, may be worth more or less than their original cost. Results are shown on a "total return" basis and include reinvestment of all income dividends and distributions.
Current performance may be lower or higher than the performance data quoted. For performance data current to the most recent month end, please visit www.nb.com/performance.
For the period ended October 31, 2010, the 30-day SEC Yield was 2.17%, 2.32%, 1.95% and 1.23% for Investor Class, Institutional Class, Class A and Class C shares, respectively. The tax-equivalent yield was 3.34%, 3.57%, 3.00% and 1.89% for Investor Class, Institutional Class, Class A and Class C shares, respectively, for an investor in the highest federal income tax bracket (35%).
As stated in the Fund's most recent prospectus, the total annual operating expense ratios for fiscal year 2009 were 1.12%, 0.58%, 0.95% and 1.70% for Investor Class, Institutional Class, Class A and Class C shares, respectively (prior to any fee waivers or expense reimbursements). The expense ratios net of waivers and/or reimbursements were 0.65%, 0.50%, 0.87% and 1.62% for the Investor Class, Institutional Class, Class A and Class C shares, respectively. Neuberger Berman Management LLC has contractually agreed to limit certain expenses of the Fund through 10/31/2013 for Investor Class, Institutional Class, Class A and Class C shares.
Total Returns shown with a sales charge reflect the deduction of the current maximum initial sales charge of 4.25% for Class A shares and the applicable contingent deferred sales charges (CDSC) for Class C shares. The maximum CDSC for Class C shares is 1%, which is reduced to 0% after 1 year. The performance of the Fund's share classes will differ primarily due to different sales charge structures and class expenses. Please see the prospectus for more information about sales charge structures, if any, and class expenses for your share class.
Municipal Intermediate Bond Fund
| COMPARISON OF A $10,000 INVESTMENT |
| |
 |
| |
This chart shows the value of a hypothetical $10,000 investment in the Fund over the past 10 fiscal years. The graph is based on the Investor Class shares only; performance of other classes will vary due to differences in fee structures (see Performance Highlights chart above). The result is compared with one or more benchmarks, which may include a broad-based market index and/or a narrower index. Please note that market indices have not been reduced to reflect any of the fees and costs of investing. All results include the reinvestment of income dividends and distributions. Neither the Fund's returns nor the market indices shown in the graph and table reflect the effect of taxes an investor would pay on Fund distributions or on the redemption of Fund shares. Results represent pa st performance and do not indicate future results. Please see Endnotes and Glossary of Indices for additional information. |
Short Duration Bond Fund Commentary (Unaudited)
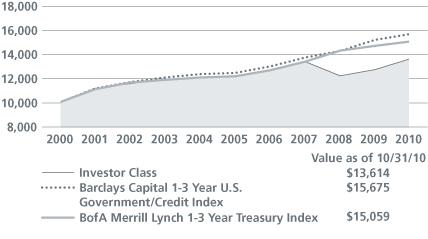
For the fiscal year ended October 31, 2010, Neuberger Berman Short Duration Bond Fund posted a positive return and outperformed its benchmark, the Barclays Capital 1-3 Year U.S. Government/Credit Index. The Fund also outperformed its previous benchmark, the BofA Merrill Lynch 1-3 Year Treasury Index, over the same period.
To a great extent, risk appetite was robust during the reporting period as investors were drawn to investments that offered relatively high yields in the low interest rate environment. Two notable exceptions occurred in late April and May, when concerns regarding the European sovereign debt crisis escalated, and again in August, as moderating economic data led to fears of a double-dip recession. However, these proved to be only temporary setbacks and risk aversion was quickly replaced by continued strong demand for non-Treasury fixed income securities. Also supporting non-Treasuries were strengthening corporate balance sheets and better-than-generally-expected corporate profits, continued low interest rates, benign inflation and indications that the Federal Reserve would introduce another round of quantitative easing (QE2) to support the economy. Against this backdrop, non-Treasuries generally outperformed equal-duration Treasuries during the reporting period.
The Fund was well positioned for an environment that favored non-Treasuries. In particular, the Fund's commercial mortgage-backed securities (CMBS), non-agency mortgage-backed securities, investment-grade bonds and asset-backed securities enhanced results as their spreads (the difference in yield between Treasuries and other bond sectors) significantly narrowed during the 12-month reporting period. Within the investment grade sector, the Fund's financial bonds produced the best results.
Detracting somewhat from results was the Fund's defensive duration positioning. When the reporting period began, the Fund's duration was marginally shorter than that of its benchmark. We adjusted duration even shorter in May as interest rates fell sharply, given that we did not believe they would move substantially lower. However, this positioning was not rewarded as short-term rates fell to historically low levels toward the end of the reporting period. During the period, we used Treasury futures to manage the Fund's duration positioning.
We made a number of adjustments to the Fund during the reporting period, such as opportunistically reducing its weighting in non-agency mortgage-backed securities to take advantage of strengthening prices. We also pared our exposure to investment grade financials and increased its position in BBB-rated industrial bonds, where, in our opinion, we found attractively valued opportunities. The portfolio's exposure to CMBS was also reduced given their strong results. In addition to selling certain CMBS securities, a number of the Fund's positions matured. We largely reinvested the proceeds in a combination of asset-backed securities and corporate bonds.
Looking ahead, we believe the U.S. economy will avert a double-dip recession and inflation will remain benign. However, we feel that economic growth could be muted by historical standards coming out of a severe recession. In addition, the Federal Reserve has signaled that short-term interest rates could remain low "for an extended period" and in our view QE2 could keep longer-term rates relatively low as well. Against this backdrop, we believe that demand for non-Treasuries will remain strong. We feel the portfolio is appropriately positioned for such an environment with our overweight versus the benchmark in non-Treasuries as we seek to generate solid risk-adjusted returns.
Sincerely,
Thomas Sontag, Michael Foster and Richard Grau
Portfolio Co-Managers
Information about the principal risks of investing in the Fund is set forth in the prospectus and statement of additional information.
The composition, industries and holdings of the Fund are subject to change.
Short Duration Bond Fund
| TICKER SYMBOLS |
| Investor Class | | NSBIX | |
| Trust Class | | NSBTX | |
| Institutional Class | | NSHLX | |
| Class A | | NSHAX | |
| Class C | | NSHCX | |
| PORTFOLIO BY TYPE OF SECURITY |
| (as a % of Total Net Assets) | |
| Asset-Backed | | | 8.3 | % | |
| Corporate Debt | | | 23.2 | | |
| U.S. Government Agency Securities | | | 4.0 | | |
| Mortgage-Backed Securities | | | 35.8 | | |
| U.S. Treasury Securities | | | 27.6 | | |
| Short-Term Investments | | | 2.4 | | |
Liabilities, less cash, receivables and other assets | | | (1.3 | ) | |
| Total | | | 100.0 | | |
PERFORMANCE HIGHLIGHTS5 |
| | | | |
| | | Average Annual Total Return Ended 10/31/2010 | |
| | | Inception Date | | 1 Year | | 5 Years | | 10 Years | | Life of Fund | |
| At NAV | | | | | | | | | | | | | | | | | | | |
| Investor Class | | 06/09/1986 | | | 7.08 | % | | | 2.25 | % | | | 3.13 | % | | | 4.99 | % | |
Trust Class16 | | 08/30/1993 | | | 7.01 | % | | | 2.15 | % | | | 3.02 | % | | | 4.93 | % | |
Institutional Class16 | | 06/21/2010 | | | 7.16 | % | | | 2.27 | % | | | 3.14 | % | | | 4.99 | % | |
Class A16 | | 06/21/2010 | | | 7.10 | % | | | 2.26 | % | | | 3.13 | % | | | 4.99 | % | |
Class C16 | | 06/21/2010 | | | 6.81 | % | | | 2.20 | % | | | 3.11 | % | | | 4.98 | % | |
| With Sales Charge | |
Class A16 | | | | | 2.55 | % | | | 1.37 | % | | | 2.69 | % | | | 4.80 | % | |
Class C16 | | | | | 5.81 | % | | | 2.20 | % | | | 3.11 | % | | | 4.98 | % | |
| Index | |
| Barclays Capital 1-3 Year | | | | | | | | | | | | | | | | | | | |
U.S. Government/Credit Index13,14 | | | | | 3.23 | % | | | 4.75 | % | | | 4.60 | % | | | 6.02 | % | |
BofA Merrill Lynch 1-3 Year Treasury Index13,14 | | 2.53 | % | | | 4.40 | % | | | 4.18 | % | | | 5.81 | % | |
Performance data quoted represent past performance, which is no guarantee of future results. The investment return and principal value of an investment will fluctuate so that an investor's shares, when redeemed, may be worth more or less than their original cost. Results are shown on a "total return" basis and include reinvestment of all income dividends and distributions.
Current performance may be lower or higher than the performance data quoted. For performance data current to the most recent month end, please visit www.nb.com/performance.
For the period ended October 31, 2010, the 30-day SEC Yield was 1.31%, 1.22%, 1.50%, 1.10% and 0.49% for Investor Class, Trust Class, Institutional Class, Class A and Class C shares, respectively.
As stated in the Fund's most recent prospectus, the total annual operating expense ratios for fiscal year 2009 were 1.19%, 1.59%, 0.70%, 1.07% and 1.82% for Investor Class, Trust Class, Institutional Class, Class A and Class C shares, respectively (prior to any fee waivers or expense reimbursements). The expense ratios net of waivers and/or reimbursements were 0.72%, 0.82%, 0.52%, 0.89% and 1.64% for Investor Class, Trust Class, Institutional Class, Class A and Class C shares, respectively. Neuberger Berman Management LLC has contractually agreed to limit certain expenses of the Fund through 10/31/2013 for Investor Class, Trust Class, Institutional Class, Class A and Class C shares.
Total Returns shown with a sales charge reflect the deduction of the current maximum initial sales charge of 4.25% for Class A shares and the applicable contingent deferred sales charges (CDSC) for Class C shares. The maximum CDSC for Class C shares is 1%, which is reduced to 0% after 1 year. The performance of the Fund's share classes will differ primarily due to different sales charge structures and class expenses. Please see the prospectus for more information about sales charge structures, if any, and class expenses for your share class.
The Fund's broad-based index used for comparison purposes has been changed from the BofA Merrill Lynch 1-3 Year Treasury Index to the Barclays Capital 1-3 Year U.S. Government/Credit Index because the new index more closely resembles the characteristics of the Fund's investments.
Short Duration Bond Fund
| COMPARISON OF A $10,000 INVESTMENT |
| |
 |
| |
This chart shows the value of a hypothetical $10,000 investment in the Fund over the past 10 fiscal years. The graph is based on the Investor Class shares only; performance of other classes will vary due to differences in fee structures (see Performance Highlights on previous page). The result is compared with one or more benchmarks, which may include a broad-based market index and/or a narrower index. Please note that market indices have not been reduced to reflect any of the fees and costs of investing. All results include the reinvestment of income dividends and distributions. Neither the Fund's returns nor the market indices shown in the graph and table reflect the effect of taxes an investor would pay on Fund distributions or on the redemption of Fund shares. Results represe nt past performance and do not indicate future results. Please see Endnotes and Glossary of Indices for additional information. |
Strategic Income Fund Commentary (Unaudited)
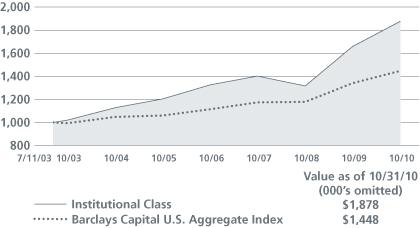
For the fiscal year ended October 31, 2010, Neuberger Berman Strategic Income Fund posted a positive absolute return and outperformed its benchmark, the Barclays Capital U.S. Aggregate Index.
To a great extent, risk appetite was robust during the reporting period as investors were drawn to investments that offered relatively high yields in the low interest rate environment. Two notable exceptions occurred in late April and May, when concerns regarding the European sovereign debt crisis escalated, and again in August, as moderating economic data led to fears of a double-dip recession. However, these proved to be only temporary setbacks and risk aversion was quickly replaced by continued strong demand for non-Treasury fixed income securities. Also supporting non-Treasuries were strengthening corporate balance sheets and better-than-expected corporate profits, continued low interest rates, benign inflation and indications that the Federal Reserve would introduce another round of quantitative easing (QE2) to support the economy. A gainst this backdrop, non-Treasuries generally outperformed equal-duration Treasuries during the reporting period.
Many of the best performing sectors in the fixed income market were those that offered the most attractive yields, including high yield bonds, emerging market debt, commercial mortgage-backed securities (CMBS), investment grade bonds and non-agency mortgage-backed securities.
The Fund was well positioned for an environment that favored non-Treasuries. In particular, the Fund's overweight positions versus the benchmark in CMBS, high yield bonds, emerging market debt and investment-grade bonds enhanced results as their spreads (the difference in yield between Treasuries and other bond sectors) significantly narrowed during the 12-month reporting period. Within the corporate bond market, the Fund's industrial and financial bonds produced the best results.
Also contributing to performance was the Fund's yield curve positioning and an allocation to Treasury Inflation Protected Securities (TIPS). Throughout most of the period, the Fund had an overweight to the intermediate portion of the yield curve. This was beneficial for results as intermediate-term rates declined more than their short- and long-term counterparts. TIPS benefited from a decline in real (excluding inflation) yields and increasing expectations for higher inflation.
Modestly detracting from performance was the Fund's exposure to U.S. Treasuries and agency mortgage-backed securities as lower yielding and higher quality bonds lagged the overall fixed income market during the period.
We made a number of adjustments to the portfolio during the reporting period, such as opportunistically increasing its exposure to high yield bonds. In contrast, we pared the Fund's exposure to TIPS.
Looking ahead, we believe that the U.S. economy will avert a double-dip recession and that inflation will remain benign. However, we feel economic growth could be muted by historical standards coming out of a severe recession. In addition, the Federal Reserve has signaled that short-term interest rates could remain low "for an extended period" and in our view QE2 could keep longer-term rates relatively low as well. Against this backdrop, we believe that demand for non-Treasuries will remain strong. We feel the portfolio is well positioned for such an environment given our overweight in non-Treasuries as we seek to generate solid risk-adjusted returns.
Sincerely,
Thanos Bardas, David M. Brown, Andrew A. Johnson and Bradley C. Tank
Portfolio Co-Managers
Information about the principal risks of investing in the Fund is set forth in the prospectus and statement of additional information.
The composition, industries and holdings of the Fund are subject to change.
Strategic Income Fund
| TICKER SYMBOLS |
| Institutional Class | | NSTLX | |
| Trust Class | | NSTTX | |
| Class A | | NSTAX | |
| Class C | | NSTCX | |
| PORTFOLIO BY TYPE OF SECURITY | |
| (as a % of Total Net Assets) | |
| Asset-Backed | | | 12.5 | % | |
| Corporate Debt | | | 41.8 | | |
| Bank Loans | | | 12.9 | | |
| Government Securities | | | 2.6 | | |
| Mortgage-Backed Securities | | | 15.0 | | |
| U.S. Treasury Securities | | | 20.9 | | |
| Short-Term Investments | | | 7.0 | | |
Liabilities, less cash, receivables and other assets | | | (12.7 | ) | |
| Total | | | 100.0 | | |
PERFORMANCE HIGHLIGHTS4 |
| | | Average Annual Total Return Ended 10/31/2010 | |
| | | Inception Date | | 1 Year | | 5 Years | | Life of Fund | |
| At NAV | |
| Institutional Class | | 07/11/2003 | | | 13.17 | % | | | 9.31 | % | | | 9.00 | % | |
Trust Class11 | | 04/02/2007 | | | 12.78 | % | | | 9.06 | % | | | 8.82 | % | |
Class A11 | | 12/20/2007 | | | 12.72 | % | | | 9.07 | % | | | 8.84 | % | |
Class C11 | | 12/20/2007 | | | 11.93 | % | | | 8.61 | % | | | 8.52 | % | |
| With Sales Charge | |
Class A11 | | | | | 7.93 | % | | | 8.13 | % | | | 8.19 | % | |
Class C11 | | | | | 10.93 | % | | | 8.61 | % | | | 8.52 | % | |
| Index | |
Barclays Capital U.S. Aggregate Index13,14 | | | 8.01 | % | | | 6.45 | % | | | 5.19 | % | |
Performance data quoted represent past performance, which is no guarantee of future results. The investment return and principal value of an investment will fluctuate so that an investor's shares, when redeemed, may be worth more or less than their original cost. Results are shown on a "total return" basis and include reinvestment of all income dividends and distributions.
Current performance may be lower or higher than the performance data quoted. For performance data current to the most recent month end, please visit www.nb.com/performance. Because the Fund had a different goal and strategy, which included managing assets by an asset allocation committee, prior to February 28, 2008, its performance during that time might have been different if current policies had been in effect.
For the period ended October 31, 2010, the 30-day SEC yield was 3.62%, 3.28%, 3.09% and 2.55% for Institutional Class, Trust Class, Class A and Class C shares, respectively.
As stated in the Fund's most recent prospectus, the total annual operating expense ratios for fiscal year 2009 were 2.51%, 3.03%, 1.96% and 2.58% for Institutional Class,Trust Class, Class A and Class C shares, respectively (prior to any fee waivers or expense reimbursements). The expense ratios net of waivers and/or reimbursements were 0.78%, 1.13%, 1.18% and 1.88% for Institutional Class, Trust Class, Class A and Class C shares, respectively. Neuberger Berman Management LLC has contractually agreed to limit certain expenses of the Fund through 10/31/2020 for Institutional Class, Class A and Class C shares, and 10/31/2013 for Trust Class shares.
Total Returns shown with a sales charge reflect the deduction of the current maximum initial sales charge of 4.25% for Class A shares and the applicable contingent deferred sales charges (CDSC) for Class C shares. The maximum CDSC for Class C shares is 1%, which is reduced to 0% after 1 year. The performance of the Fund's share classes will differ primarily due to different sales charge structures and class expenses. Please see the prospectus for more information about sales charge structures, if any, and class expenses for your share class.
Strategic Income Fund
| COMPARISON OF A $1,000,000 INVESTMENT |
| (000's Omitted) |
| |
 |
| |
This chart shows the value of a hypothetical $1,000,000 investment in the Fund over the past 10 fiscal years, or since the Fund's inception, if it has not operated for 10 years. The graph is based on the Institutional Class shares only; performance of other classes will vary due to differences in fee structures (see Average Annual Total Return above).The result is compared with one or more benchmarks, which may include a broad-based market index and/or a narrower index. Please note that market indices have not been reduced to reflect any of the fees and costs of investing. All results include the reinvestment of income dividends and distributions. Neither the Fund's returns nor the market indices shown in the graph and table reflect the effect of taxes an investor would pay on Fu nd distributions or on the redemption of Fund shares. Results represent past performance and do not indicate future results. Please see Endnotes and Glossary of Indices for additional information. |
Endnotes
| 1 | Neuberger Berman Management LLC ("Management") has contractually undertaken to forgo current payment of fees and/or reimburse Neuberger Berman Municipal Intermediate Bond Fund so that its total annual operating expenses (excluding interest, taxes, brokerage commissions, acquired fund fees and expenses, and extraordinary expenses, if any) ("Operating Expenses") are limited to 0.65%, 0.50%, 0.87% and 1.62% of average daily net assets for the Investor Class, Institutional Class, Class A and Class C, respectively. These undertakings last until October 31, 2013. Each class of the Fund has agreed to repay Management for fees and expenses forgone and/or its excess Operating Expenses previously reimbursed by Management, pursuant to the contractual expense limitation, so long as its annual Operating Expenses during the period do not exceed its abo ve-stated expense limitation, and the repayment is made within three years after the year in which Management issued the reimbursement or waived fees. Absent such forgone fees and/or reimbursements, the performance of each class of the Fund would have been lower. For the year ended October 31, 2010, there were no repayments of expenses to Management. |
| | |
| 2 | Management has contractually undertaken to forgo current payment of fees and/or reimburse Neuberger Berman High Income Bond Fund so that its total annual operating expenses (excluding interest, taxes, brokerage commissions, acquired fund fees and expenses, and extraordinary expenses, if any) ("Operating Expenses") are limited to 1.00%, 0.75%, 1.12%, 1.87% and 1.37% of average daily net assets for the Investor Class, Institutional Class, Class A, Class C and Class R3, respectively. These undertakings last until October 31, 2013. Each class of the Fund has agreed to repay Management for fees and expenses forgone and/or its excess Operating Expenses previously reimbursed by Management, pursuant to the contractual expense limitation, so long as its annual Operating Expenses during the period do not exceed its above-stated expense limitation, and the repayment is made within three years after the year in which Management issued the reimbursement or waived fees. Absent such forgone fees and/or reimbursements, the performance of each class of the Fund would have been lower. For the year ended October 31, 2010, the Investor Class of the Fund reimbursed Management $93,652. |
| | |
| 3 | Management has contractually undertaken to forgo current payment of fees and/or reimburse Neuberger Berman Core Bond Fund so that its total annual operating expenses (excluding interest, taxes, brokerage commissions, acquired fund fees and expenses, and extraordinary expenses, if any) ("Operating Expenses") are limited to 0.85%, 0.45%, 0.85% and 1.60% of average daily net assets for the Investor Class, Institutional Class, Class A and Class C, respectively. These undertakings last until October 31, 2020. Each class of the Fund has agreed to repay Management for fees and expenses forgone and/or its excess Operating Expenses previously reimbursed by Management, pursuant to the contractual expense limitation, so long as its annual Operating Expenses during the period do not exceed its above-stated expense limitation, and the repayment is mad e within three years after the year in which Management issued the reimbursement or waived fees. Absent such forgone fees and/or reimbursements, the performance of each class of the Fund would have been lower. For the year ended October 31, 2010, there were no repayments of expenses to Management. In addition, Management has voluntarily agreed to waive its management fee in the amount of 0.18% (0.25% prior to March 3, 2010 and 0.20% prior to March 1, 2006) of the Fund's average daily net assets. Management may, at its sole discretion, modify or terminate this voluntary waiver at any time without notice to the Fund. Absent such waiver, the performance of each class of the Fund would have been lower. |
| | |
| 4 | Management has contractually undertaken to forgo current payment of fees and/or reimburse Neuberger Berman Strategic Income Fund so that its total annual operating expenses (excluding interest, taxes, brokerage commissions, acquired fund fees and expenses, and extraordinary expenses, if any) ("Operating Expenses") are limited to 1.10%, 0.75% (effective March 1, 2008, and 0.85% through February 28, 2008), 1.15% and 1.85% of average daily net assets for the Trust Class, Institutional Class, Class A and Class C, respectively. These undertakings last until October 31, 2013 for the Trust Class and until October 31, 2020 for the Institutional Class, Class A and Class C. Each class of the Fund has agreed to repay Management for fees and expenses forgone and/or its excess Operating Expenses previously reimbursed by Management, pursuant to the con tractual expense limitation, so long as its annual |
| | Operating Expenses during the period do not exceed its above-stated expense limitation, and the repayment is made within three years after the year in which Management issued the reimbursement or waived fees. Absent such forgone fees and/or reimbursements, the performance of each class of the Fund would have been lower. For the year ended October 31, 2010, there were no repayments of expenses to Management. |
| | |
| 5 | Neuberger Berman Management LLC ("Management") has contractually undertaken to forgo current payment of fees and/or reimburse Short Duration Bond Fund so that the total annual operating expenses (excluding interest, taxes, brokerage commissions, acquired fund fees and expenses, and extraordinary expenses, if any) ("Operating Expenses") are limited to 0.70%, 0.50%, 0.80%, 0.87% and 1.62% for the Investor Class, Institutional Class, Trust Class, Class A and Class C, respectively. These undertakings last until October 31, 2013. Each class of the Fund has agreed to repay Management for fees and expenses forgone and/or its excess Operating Expenses previously reimbursed by Management, pursuant to the contractual expense limitation, so long as its annual Operating Expenses during the period do not exceed its above-stated expense limitation, and the repayment is made within three years after the year in which Management issued the reimbursement or waived fees. Absent such forgone fees and/or reimbursements, the performance of each class of the Fund would have been lower. For the year ended October 31, 2010, there were no repayments of expenses to Management. |
| | |
| 6 | Management has contractually undertaken to forgo current payment of fees and/or reimburse Neuberger Berman Floating Rate Income Fund so that its total annual operating expenses (excluding interest, taxes, brokerage commissions, acquired fund fees and expenses, and extraordinary expenses, if any) ("Operating Expenses") are limited to 0.70%, 1.07% and 1.82% of average daily net assets for the Institutional Class, Class A and Class C, respectively. These undertakings last until October 31, 2013. Each class of the Fund has agreed to repay Management for fees and expenses forgone and/or its excess Operating Expenses previously reimbursed by Management, pursuant to the contractual expense limitation, so long as its annual Operating Expenses during the period do not exceed its above-stated expense limitation, and the repayment is made within thr ee years after the year in which Management issued the reimbursement or waived fees. Absent such forgone fees and/or reimbursements, the performance of each class of the Fund would have been lower. For the year ended October 31, 2010, there were no repayments of expenses to Management. |
| | |
| 7 | Tax-equivalent effective yield is the taxable effective yield that an investor would have had to receive in order to realize the same level of yield after federal income taxes at the highest federal tax rate, currently 35%, assuming that all of a fund's income is exempt from federal income taxes. |
| | |
| 8 | A portion of the income may be a tax preference item for purposes of the federal alternative minimum tax for certain investors. |
| | |
| 9 | The Fund is the successor to Lipper High Income Bond Fund ("Lipper Fund"). The total return data for the periods prior to September 7, 2002, are those of Lipper Fund Premier Class. The performance information for Investor Class is that of Lipper Fund Premier Class for the period April 1, 1996, through September 6, 2002. The investment policies, objectives, guidelines and restrictions of the Fund are in all material respects the same as those of Lipper Fund. Returns would have been lower if the manager of Lipper Fund had not waived certain of its fees during the periods shown. |
| | |
| 10 | The Fund is the successor to Ariel Premier Bond Fund ("Ariel Bond Fund"). The total return data for the periods prior to June 13, 2005, are those of Ariel Bond Fund Institutional Class and Ariel Bond Fund Investor Class. The performance information for Institutional Class is that of Ariel Bond Fund Institutional Class for the period October 1, 1995 (date of inception) through June 10, 2005. The performance information for Investor Class is that of Ariel Bond Fund Institutional Class for the period October 1, 1995 through January 31, 1997 (the period prior to the class' commencement of operations), and that of Ariel Bond Fund Investor Class for the period February 1, 1997 (class' commencement of operations) through June 10, 2005. Ariel Bond Fund Institutional Class had lower expenses and typically higher returns than Ariel Bond Fund Invest or Class. The investment policies, guidelines and restrictions of the Fund are in all material respects the same as those of Ariel Bond Fund. Returns would have been lower if the manager of Ariel Bond Fund had not waived certain of its fees during the periods shown. |
| 11 | The Trust Class, Class A and Class C of Neuberger Berman Strategic Income Fund commenced operations on April 2, 2007, December 20, 2007 and December 20, 2007, respectively. The performance information for Trust Class, Class A and Class C prior to the class' commencement of operations is that of the Institutional Class of Neuberger Berman Strategic Income Fund. In making this translation, the performance information of the Institutional Class has been adjusted to reflect the appropriate sales charge applicable to Class A and Class C shares, but has not been adjusted to take into account differences in class specific Operating Expenses (such as 12b-1 fees). The Institutional Class has lower expenses and typically higher returns than Class A, Class C or Class R3. |
| | |
| 12 | The Institutional Class, Class A, Class C and Class R3 of Neuberger Berman High Income Bond Fund each commenced operations on May 27, 2009. The performance information for Institutional Class, Class A, Class C and Class R3 prior to the class' commencement of operations is that of the Investor Class of Neuberger Berman High Income Bond Fund. In making this translation, the performance information of the Investor Class has been adjusted to reflect the appropriate sales charge applicable to Class A and Class C shares, but has not been adjusted to take into account differences in class specific Operating Expenses (such as 12b-1 fees). The Investor Class has lower expenses and typically higher returns than Class A, Class C or Class R3. The Institutional Class has lower expenses and typically higher returns than Investor Class. |
| | |
| 13 | The date used to calculate Life of Fund performance for the index is the inception date of the oldest share class. |
| | |
| 14 | Please see "Glossary of Indices" starting on page 24 for a description of indices. Please note that indices do not take into account any fees and expenses or tax consequences of investing in the individual securities that they track, and that individuals cannot invest directly in any index. Data about the performance of these indices are prepared or obtained by Management and include reinvestment of all income dividends and distributions. The Fund may invest in securities not included in the described indices or may not invest in all securities included in the described indices. |
| | |
| 15 | Class A and Class C of Neuberger Berman Core Bond Fund each commenced operations on December 20, 2007. The performance information for Class A and Class C prior to the class' commencement of operations is that of the Institutional Class of Neuberger Berman Core Bond Fund. In making this translation, the performance information for the Institutional Class has been adjusted to reflect the appropriate sales charge applicable to Class A and Class C shares, but has not been adjusted to take into account differences in class specific Operating Expenses (such as Rule 12b-1 fees). The Institutional Class has lower expenses and typically higher returns than Class A or Class C. |
| | |
| 16 | For Neuberger Berman Short Duration Bond Fund, Life of Fund performance shown for the Trust Class, Institutional Class, Class A and Class C is that of the Fund's Investor Class from the inception date of the Investor Class to the inception date of each Class. The Trust Class of Short Duration Bond Fund commenced operations on August 30, 1993. The Institutional Class, Class A and Class C of Neuberger Berman Short Duration Bond Fund each commenced operations on June 21, 2010. The performance information for Trust Class, Institutional Class, Class A and Class C prior to the class' commencement of operations is that of the Investor Class of Neuberger Berman Short Duration Bond Fund. In making this translation, the performance information of the Investor Class has been adjusted to reflect the appropriate sales charge applicable to Class A and Class C shares, but has not been adjusted to take into account differences in class specific Operating Expenses (such as 12b-1 fees). The Investor Class has lower expenses and typically higher returns than Class A or Class C. The Institutional Class has lower expenses and typically higher returns than Investor Class. |
| | |
| 17 | The Institutional Class and Class C of Neuberger Berman Floating Rate Income Fund each commenced operations on December 30, 2009. The performance information for Institutional Class and Class C prior to the class' commencement of operations is that of Class A of Neuberger Berman Floating Rate Income Fund. In making this translation, the performance information (at NAV) of Class A has been adjusted to reflect the appropriate sales charge applicable to Class C shares, but has not been adjusted to take into account differences in class specific operating expenses (such as Rule 12b-1 fees). Class A has higher expenses and typically lower returns (at NAV) than Institutional Class. Class A has lower expenses and typically higher returns (at NAV) than Class C. |
| 18 | The Institutional Class, Class A and Class C of Neuberger Berman Municipal Intermediate Bond Fund each commenced operations on June 21, 2010. The performance information for Institutional Class, Class A and Class C prior to the class' commencement of operations is that of the Investor Class of Neuberger Berman Municipal Intermediate Bond Fund. In making this translation, the performance information of the Investor Class has been adjusted to reflect the appropriate sales charge applicable to Class A and Class C shares, but has not been adjusted to take into account differences in class specific Operating Expenses (such as 12b-1 fees). The Investor Class has lower expenses and typically higher returns than Class A and Class C. The Institutional Class has lower expenses and typically higher returns than Investor Class. |
| | |
Glossary of Indices
Barclays Capital 1-3 Year U.S. Government/Credit Index: | | An unmanaged index that includes all bonds in the U.S. Government/Credit Index with at least one to three years to maturity. The U.S. Government/Credit Index includes all securities in the Government and Credit Indices. The Government Index includes treasuries (i.e., public obligations of the U.S. Treasury that have remaining maturities of more than one year) and agencies (i.e., publicly issued debt of U.S. Government agencies, quasi-federal corporations, and corporate or foreign debt guaranteed by the U.S. Government). The Credit Index includes publicly issued U.S. corporate and foreign debentures and secured notes that meet specified maturity, liquidity, and quality requirements. All bonds in the index must meet the following additional criteria: must have at least one year to final maturity regardless of call features; must have at lea st $250 million par amount outstanding; must be rated investment-grade (Baa3/BBB- or higher) by at least two of the following ratings agencies: Standard & Poor's, Moody's Investors Services, Inc., and Fitch Inc.; must be fixed rate; must be dollar-denominated and non-convertible; and must be publicly issued. | |
| |
Barclays Capital 7-Year General Obligation Index: | | An unmanaged total return performance benchmark for the 7-year (6-8) maturity component of the Barclays Capital General Obligation ("G.O.") Index, which tracks the performance of the investment grade G.O. (state and local) tax-exempt bond market. | |
| |
| Barclays Capital U.S. Aggregate Index: | | An unmanaged index that represents the U.S. domestic investment grade bond market. It is comprised of the Barclays Capital Government/Corporate Bond Index, Mortgage-Backed Securities Index, and Asset-Backed Securities Index, including securities that are of investment-grade quality or better, have at least one year to maturity, and have an outstanding par value of at least $100 million. | |
| |
Barclays Capital U.S. Corporate High Yield 2% Issuer Cap Index: | | An unmanaged sub-index of the Barclays Capital U.S. Corporate High Yield Index (which includes all U.S. dollar-denominated, taxable, fixed rate, noninvestment grade debt), capped such that no single issuer accounts for more than 2% of the index weight. | |
| |
| S&P/LTSA Leverage Loan Index: | | A daily total return index that uses Loan Syndications and Trading Association (LSTA)/Loan Pricing Corporation (LPC) mark-to-market pricing to calculate market value change. On a real-time basis, the Index tracks the current outstanding balance and spread over LIBOR for fully funded term loans. The Index represents a broad cross section of leveraged loans syndicated in the United States, including dollar-denominated loans to overseas issuers. | |
| |
| BofA Merrill Lynch 1-3 Year Treasury Index: | | An unmanaged total return market value index consisting of all coupon-bearing U.S. Treasury publicly placed debt securities with maturities between 1 and 3 years. | |
| |
Please note that indices do not take into account any fees and expenses or any tax consequences of investing in the individual securities that they track and that individuals cannot invest directly in any index. Data about the performance of these indices or averages are prepared or obtained by Management and include reinvestment of all income dividends and distributions. The Funds may invest in securities not included in the above-described indices.
Information About Your Fund's Expenses
These tables are designed to provide information regarding costs related to your investments. All mutual funds incur operating expenses, which include management fees, fees for administrative services and costs of shareholder reports, among others. You may also incur transaction costs, such as sales charges (loads). The following examples are intended to help you understand your ongoing costs of investing in a fund, which are the operating expenses described above, and do not include transaction costs. The following examples are based on an investment of $1,000 made at the beginning of the six month period ended October 31, 2010 and held for the entire period. The table illustrates each fund's costs in two ways:
| Actual Expenses and Performance: | | The first section of the table provides information about actual account values and actual expenses in dollars, based on the fund's actual performance during the period. You may use the information in this line, together with the amount you invested, to estimate the expenses you paid over the period. Simply divide your account value by $1,000 (for example, an $8,600 account value divided by $1,000 = 8.6), then multiply the result by the number in the first section of the table under the heading entitled "Expenses Paid During the Period" to estimate the expenses you paid over the period. | |
| |
Hypothetical Example for Comparison Purposes: | | The second section of the table provides information about hypothetical account values and hypothetical expenses based on the fund's actual expense ratio and an assumed rate of return at 5% per year before expenses. This return is not the fund's actual return. The hypothetical account values and expenses may not be used to estimate the actual ending account balance or expenses you paid for the period. You may use this information to compare the ongoing costs of investing in these funds versus other funds. To do so, compare the expenses shown in this 5% hypothetical example with the 5% hypothetical examples that appear in the shareholder reports of other funds. | |
| |
Please note that the expenses in the tables are meant to highlight your ongoing costs only and do not reflect any transaction costs, such as sales charges (loads) or redemption fees. Therefore, the information under the heading "Hypothetical (5% annual return before expenses)" is useful in comparing ongoing costs only, and will not help you determine the relative total costs of owning different funds. In addition, if these transaction costs were included, your costs would have been higher.
Expense Information as of 10/31/10 (Unaudited)
| Neuberger Berman Income Funds | |
| | ACTUAL | | HYPOTHETICAL (5% ANNUAL RETURN BEFORE EXPENSES)(3) | |
| | | Beginning Account Value 5/1/10 | | Ending Account Value 10/31/10 | | Expenses Paid During the Period(1) 5/1/10 - 10/31/10 | | Expense Ratio | | Beginning Account Value 5/1/10 | | Ending Account Value 10/31/10 | | Expenses Paid During the Period(1) 5/1/10 - 10/31/10 | | Expense Ratio | |
Neuberger Berman Core Bond Fund | |
| Investor Class | $ | 1,000.00 | | | $ | 1,054.50 | | | $ | 4.40 | | | | .85 | % | | $ | 1,000.00 | | | $ | 1,020.92 | | | $ | 4.33 | | | | .85 | % | |
| Institutional Class | | $ | 1,000.00 | | | $ | 1,056.50 | | | $ | 2.33 | | | | .45 | % | | $ | 1,000.00 | | | $ | 1,022.94 | | | $ | 2.29 | | | | .45 | % | |
| Class A | | $ | 1,000.00 | | | $ | 1,054.50 | | | $ | 4.40 | | | | .85 | % | | $ | 1,000.00 | | | $ | 1,020.92 | | | $ | 4.33 | | | | .85 | % | |
| Class C | | $ | 1,000.00 | | | $ | 1,050.50 | | | $ | 8.27 | | | | 1.60 | % | | $ | 1,000.00 | | | $ | 1,017.14 | | | $ | 8.13 | | | | 1.60 | % | |
Neuberger Berman Floating Rate Income Fund | |
| Institutional Class | $ | 1,000.00 | | | $ | 1,032.60 | | | $ | 3.59 | | | | .70 | % | | $ | 1,000.00 | | | $ | 1,021.68 | | | $ | 3.57 | | | | .70 | % | |
| Class A | | $ | 1,000.00 | | | $ | 1,029.50 | | | $ | 5.47 | | | | 1.07 | % | | $ | 1,000.00 | | | $ | 1,019.81 | | | $ | 5.45 | | | | 1.07 | % | |
| Class C | | $ | 1,000.00 | | | $ | 1,026.80 | | | $ | 9.30 | | | | 1.82 | % | | $ | 1,000.00 | | | $ | 1,016.03 | | | $ | 9.25 | | | | 1.82 | % | |
Neuberger Berman High Income Bond Fund | |
| Investor Class | | $ | 1,000.00 | | | $ | 1,071.90 | | | $ | 5.01 | | | | .96 | % | | $ | 1,000.00 | | | $ | 1,020.37 | | | $ | 4.89 | | | | .96 | % | |
| Institutional Class | | $ | 1,000.00 | | | $ | 1,071.80 | | | $ | 3.92 | | | | .75 | % | | $ | 1,000.00 | | | $ | 1,021.42 | | | $ | 3.82 | | | | .75 | % | |
| Class A | | $ | 1,000.00 | | | $ | 1,069.90 | | | $ | 5.84 | | | | 1.12 | % | | $ | 1,000.00 | | | $ | 1,019.56 | | | $ | 5.70 | | | | 1.12 | % | |
| Class C | | $ | 1,000.00 | | | $ | 1,065.80 | | | $ | 9.74 | | | | 1.87 | % | | $ | 1,000.00 | | | $ | 1,015.78 | | | $ | 9.50 | | | | 1.87 | % | |
| Class R3 | | $ | 1,000.00 | | | $ | 1,068.60 | | | $ | 7.14 | | | | 1.37 | % | | $ | 1,000.00 | | | $ | 1,018.30 | | | $ | 6.97 | | | | 1.37 | % | |
Neuberger Berman Municipal Intermediate Bond Fund | |
| Investor Class | | $ | 1,000.00 | | | $ | 1,034.60 | | | $ | 3.33 | | | | .65 | % | | $ | 1,000.00 | | | $ | 1,021.93 | | | $ | 3.31 | | | | .65 | % | |
| Institutional Class | | $ | 1,000.00 | | | $ | 1,032.50 | (2) | | $ | 1.85 | | | | .50 | % | | $ | 1,000.00 | | | $ | 1,022.68 | | | $ | 2.55 | | | | .50 | % | |
| Class A | | $ | 1,000.00 | | | $ | 1,032.00 | (2) | | $ | 3.22 | | | | .87 | % | | $ | 1,000.00 | | | $ | 1,020.82 | | | $ | 4.43 | | | | .87 | % | |
| Class C | | $ | 1,000.00 | | | $ | 1,028.30 | (2) | | $ | 5.99 | | | | 1.62 | % | | $ | 1,000.00 | | | $ | 1,017.04 | | | $ | 8.24 | | | | 1.62 | % | |
Neuberger Berman Short Duration Bond Fund | |
| Investor Class | | $ | 1,000.00 | | | $ | 1,022.20 | | | $ | 3.57 | | | | .70 | % | | $ | 1,000.00 | | | $ | 1,021.68 | | | $ | 3.57 | | | | .70 | % | |
| Institutional Class | | $ | 1,000.00 | | | $ | 1,027.30 | (2) | | $ | 1.85 | | | | .50 | % | | $ | 1,000.00 | | | $ | 1,022.68 | | | $ | 2.55 | | | | .50 | % | |
| Trust Class | | $ | 1,000.00 | | | $ | 1,020.70 | | | $ | 4.07 | | | | .80 | % | | $ | 1,000.00 | | | $ | 1,021.17 | | | $ | 4.08 | | | | .80 | % | |
| Class A | | $ | 1,000.00 | | | $ | 1,026.70 | (2) | | $ | 3.21 | | | | .87 | % | | $ | 1,000.00 | | | $ | 1,020.82 | | | $ | 4.43 | | | | .87 | % | |
| Class C | | $ | 1,000.00 | | | $ | 1,023.90 | (2) | | $ | 5.97 | | | | 1.62 | % | | $ | 1,000.00 | | | $ | 1,017.04 | | | $ | 8.24 | | | | 1.62 | % | |
Neuberger Berman Strategic Income Fund | |
| Institutional Class | | $ | 1,000.00 | | | $ | 1,058.10 | | | $ | 3.89 | | | | .75 | % | | $ | 1,000.00 | | | $ | 1,021.42 | | | $ | 3.82 | | | | .75 | % | |
| Trust Class | | $ | 1,000.00 | | | $ | 1,056.30 | | | $ | 5.70 | | | | 1.10 | % | | $ | 1,000.00 | | | $ | 1,019.66 | | | $ | 5.60 | | | | 1.10 | % | |
| Class A | | $ | 1,000.00 | | | $ | 1,055.90 | | | $ | 5.96 | | | | 1.15 | % | | $ | 1,000.00 | | | $ | 1,019.41 | | | $ | 5.85 | | | | 1.15 | % | |
| Class C | | $ | 1,000.00 | | | $ | 1,052.20 | | | $ | 9.57 | | | | 1.85 | % | | $ | 1,000.00 | | | $ | 1,015.88 | | | $ | 9.40 | | | | 1.85 | % | |
| (1) | For each class, expenses are equal to the annualized expense ratio for the class, multiplied by the average account value over the period, multiplied by 184/365 (to reflect the one-half year period shown), unless otherwise indicated. |
| | |
| (2) | For each class, expenses are equal to the annualized expense ratio for the class, multiplied by the average account value over the period, multiplied by 133/365 (to reflect the period shown of June 21, 2010 to October 31, 2010). |
| | |
| (3) | Hypothetical 5% annual return before expenses is calculated by multiplying the number of days in the most recent period divided by 365. |
Schedule of Investments Neuberger Berman Core Bond Fund
| PRINCIPAL AMOUNT | | VALUE† | |
| | | | |
| (000's omitted) | | (000's omitted) | |
| | | | | | |
| U.S. Treasury Securities-Backed by the Full Faith and Credit of the U.S. Government (45.5%) | |
| $ | 15,000 | | | U.S. Treasury Bills, 0.01%, due 11/18/10 | | $ | 14,999 | | |
| | 10,000 | | | U.S. Treasury Bills, 0.05%, due 12/9/10 | | | 9,999 | | |
| | 3,000 | | | U.S. Treasury Bills, 0.09%, due 12/23/10 | | | 2,999 | | |
| | 5,000 | | | U.S. Treasury Bills, 0.09%, due 2/10/11 | | | 4,998 | | |
| | 5,000 | | | U.S. Treasury Bills, 0.16%, due 4/21/11 | | | 4,996 | | |
| | 1,365 | | | U.S. Treasury Bonds, 8.75%, due 5/15/20 | | | 2,087 | | |
| | 205 | | | U.S. Treasury Bonds, 6.88%, due 8/15/25 | | | 292 | | |
| | 2,305 | | | U.S. Treasury Bonds, 4.50%, due 2/15/36 | | | 2,524 | | |
| | 8,476 | | | U.S. Treasury Inflation Index Notes, 2.38%, due 1/15/17 | | | 9,713 | ØØ | |
| | 6,470 | | | U.S. Treasury Notes, 2.38%, due 10/31/14 | | | 6,859 | ØØ | |
| | 12,200 | | | U.S. Treasury Notes, 3.13%, due 1/31/17 | | | 13,258 | | |
| | 2,305 | | | U.S. Treasury Notes, 3.63%, due 8/15/19 | | | 2,528 | ØØ | |
| | | | | | | | | | |
| | Total U.S. Treasury Securities-Backed by the Full Faith and Credit of the U.S. Government (Cost $73,651) | | | 75,252 | | |
| | | | | | | | | | |
| Mortgage-Backed Securities (30.1%) | |
| | |
| Adjustable Rate Mortgages (1.4%) | |
| | 235 | | | Banc of America Funding Corp., Ser. 2005-F, Class 4A1, 3.15%, due 9/20/35 | | | 188 | µ | |
| | 306 | | | First Horizon Mortgage Pass-Through Trust, Ser. 2005-AR5, Class 2A1, 2.76%, due 11/25/35 | | | 268 | µ | |
| | 236 | | | GSR Mortgage Loan Trust, Ser. 2005-AR3, Class 6A1, 2.95%, due 5/25/35 | | | 199 | µ | |
| | 403 | | | GSR Mortgage Loan Trust, Ser. 2007-AR1, Class 2A1, 5.65%, due 3/25/47 | | | 312 | µ | |
| | 225 | | | HSI Asset Loan Obligation, Ser. 2007-AR1, Class 2A1, 5.95%, due 1/25/37 | | | 147 | µ | |
| | 49 | | | IndyMac INDX Mortgage Loan Trust, Ser. 2006-AR7, Class 3A1, 5.35%, due 5/25/36 | | | 28 | µ | |
| | 433 | | | IndyMac INDX Mortgage Loan Trust, Ser. 2006-AR11, Class 2A1, 5.09%, due 6/25/36 | | | 241 | µ | |
| | 590 | | | JP Morgan Mortgage Trust, Ser. 2005-A3, Class 7CA1, 2.91%, due 6/25/35 | | | 521 | µ | |
| | 257 | | | Residential Accredit Loans, Inc., Ser. 2005-QA10, Class A31, 3.86%, due 9/25/35 | | | 177 | µØØ | |
| | 339 | | | Residential Accredit Loans, Inc., Ser. 2006-QA1, Class A21, 5.83%, due 1/25/36 | | | 185 | µØØ | |
| | | | 2,266 | | |
| Fannie Mae (21.0%) | |
| | 5,681 | | | Pass-Through Certificates, 6.00%, due 11/1/15 – 6/1/38 | | | 6,178 | | |
| | 1,383 | | | Pass-Through Certificates, 5.00%, due 3/1/21 – 7/1/39 | | | 1,474 | | |
| | 94 | | | Pass-Through Certificates, 8.50%, due 4/1/34 | | | 109 | | |
| | 7,039 | | | Pass-Through Certificates, 5.50%, due 11/1/35 – 1/1/39 | | | 7,565 | | |
| | 910 | | | Pass-Through Certificates, 5.00%, TBA, 30 Year Maturity | | | 967 | Ø | |
| | 975 | | | Pass-Through Certificates, 6.00%, TBA, 30 Year Maturity | | | 1,059 | Ø | |
| | 16,235 | | | Pass-Through Certificates, 5.50%, TBA, 30 Year Maturity | | | 17,430 | Ø | |
| | | | 34,782 | | |
| Freddie Mac (7.7%) | |
| | 492 | | | Pass-Through Certificates, 5.00%, due 5/1/23 – 1/1/39 | | | 524 | | |
| | 54 | | | Pass-Through Certificates, 6.50%, due 11/1/25 | | | 60 | | |
| | 345 | | | Pass-Through Certificates, 5.31%, due 2/1/37 | | | 365 | µ | |
| | 835 | | | Pass-Through Certificates, 5.29%, due 4/1/37 | | | 888 | µ | |
| | 894 | | | Pass-Through Certificates, 5.50%, due 10/1/38 & 11/1/38 | | | 961 | | |
| | 8,260 | | | Pass-Through Certificates, 4.00%, TBA, 30 Year Maturity | | | 8,501 | Ø | |
| | 1,375 | | | Pass-Through Certificates, 5.50%, TBA, 30 Year Maturity | | | 1,473 | Ø | |
| | | | 12,772 | | |
| | Total Mortgage-Backed Securities (Cost $49,735) | | | 49,820 | | |
| See Notes to Schedule of Investments | 27 | |
| PRINCIPAL AMOUNT | | VALUE† | |
| | | | |
| (000's omitted) | | (000's omitted) | |
| | | | |
| Corporate Debt Securities (25.8%) | |
| | |
| Airlines (1.6%) | |
| $ | 530 | | | Continental Airlines, Inc., Pass-Through Certificates, Ser. A, 7.25%, due 11/10/19 | | $ | 588 | | |
| | 434 | | | Continental Airlines, Inc., Pass-Through Certificates, Ser. 2007-1, Class A, 5.98%, due 4/19/22 | | | 459 | | |
| | 505 | | | Delta Air Lines, Inc., Pass-Through Certificates, 6.20%, due 7/2/18 | | | 541 | | |
| | 890 | | | Delta Air Lines, Inc., Pass-Through Certificates, Ser. A, 7.75%, due 12/17/19 | | | 997 | | |
| | | | 2,585 | | |
| Banking (6.9%) | |
| | 690 | | | Bank of America Corp., Senior Unsecured Medium-Term Notes, Ser. L, 7.38%, due 5/15/14 | | | 782 | | |
| | 360 | | | Bank of America Corp., Senior Unsecured Notes, 4.50%, due 4/1/15 | | | 375 | | |
| | 595 | | | Bank of America Corp., Senior Unsecured Medium-Term Notes, Ser. L, 5.65%, due 5/1/18 | | | 626 | | |
| | 905 | | | Bank of Tokyo-Mitsubishi UFJ Ltd., Notes, 1.60%, due 9/11/13 | | | 914 | ñ | |
| | 520 | | | Citigroup, Inc., Senior Unsecured Notes, 6.13%, due 11/21/17 | | | 579 | | |
| | 350 | | | Citigroup, Inc., Senior Unsecured Notes, 8.13%, due 7/15/39 | | | 440 | | |
| | 685 | | | Goldman Sachs Group, Inc., Senior Unsecured Medium-Term Notes, 3.63%, due 8/1/12 | | | 714 | | |
| | 325 | | | Goldman Sachs Group, Inc., Senior Unsecured Medium-Term Notes, 6.00%, due 5/1/14 | | | 365 | | |
| | 580 | | | Goldman Sachs Group, Inc., Subordinated Notes, 6.75%, due 10/1/37 | | | 608 | | |
| | 590 | | | JP Morgan Chase & Co., Senior Unsecured Notes, 4.25%, due 10/15/20 | | | 594 | | |
| | 480 | | | JP Morgan Chase & Co., Senior Unsecured Notes, 5.50%, due 10/15/40 | | | 484 | | |
| | 315 | | | JP Morgan Chase Capital XV, Guaranteed Notes, 5.88%, due 3/15/35 | | | 302 | | |
| | 915 | | | Morgan Stanley, Senior Unsecured Notes, 3.45%, due 11/2/15 | | | 920 | Ø | |
| | 690 | | | Morgan Stanley, Senior Unsecured Medium-Term Notes, Ser. F, 6.63%, due 4/1/18 | | | 775 | | |
| | 1,540 | | | Morgan Stanley, Senior Unsecured Medium-Term Notes, Ser. F, 5.63%, due 9/23/19 | | | 1,617 | ØØ | |
| | 465 | | | Wachovia Corp., Senior Unsecured Medium-Term Notes, Ser. G, 5.50%, due 5/1/13 | | | 512 | ØØ | |
| | 685 | | | Wells Fargo & Co., Senior Notes, 3.63%, due 4/15/15 | | | 722 | | |
| | | | 11,329 | | |
| Beverages (0.5%) | |
| | 625 | | | Anheuser-Busch InBev Worldwide, Inc., Guaranteed Notes, 7.75%, due 1/15/19 | | | 808 | ñØØ | |
| | | | | | | | | | |
| Chemicals (0.4%) | |
| | 475 | | | The Dow Chemical Co., Senior Unsecured Notes, 8.55%, due 5/15/19 | | | 610 | | |
| | | | | | | | | | |
| Commercial Services (0.9%) | |
| | 885 | | | ERAC USA Finance Co., Guaranteed Notes, 6.38%, due 10/15/17 | | | 1,035 | ñØØ | |
| | 430 | | | ERAC USA Finance Co., Guaranteed Notes, 7.00%, due 10/15/37 | | | 476 | ñ | |
| | | | 1,511 | | |
| Diversified Capital Goods (0.2%) | |
| | 315 | | | Ingersoll-Rand Global Holding Co. Ltd., Guaranteed Notes, 6.00%, due 8/15/13 | | | 353 | | |
| | | | | | | | | | |
| Diversified Financial Services (2.7%) | |
| | 560 | | | American Express Credit Corp., Senior Unsecured Medium-Term Notes, Ser. C, 5.88%, due 5/2/13 | | | 616 | | |
| | 555 | | | American Express Credit Corp., Senior Unsecured Notes, 2.75%, due 9/15/15 | | | 560 | | |
| | 805 | | | American Honda Finance Corp., Senior Unsecured Notes, 3.50%, due 3/16/15 | | | 851 | ñØØ | |
| | 830 | | | General Electric Capital Corp., Senior Unsecured Notes, 5.90%, due 5/13/14 | | | 944 | | |
| | 730 | | | General Electric Capital Corp., Senior Unsecured Medium-Term Notes, Ser. A, 6.88%, due 1/10/39 | | | 839 | | |
| | 615 | | | Merrill Lynch & Co., Senior Unsecured Medium-Term Notes, Ser. C, 5.45%, due 2/5/13 | | | 654 | ØØ | |
| | | | 4,464 | | |
| See Notes to Schedule of Investments | 28 | |
| PRINCIPAL AMOUNT | | VALUE† | |
| | | | | | |
| (000's omitted) | | (000's omitted) | |
| | | | | | |
| Electric - Integrated (0.1%) | |
| $ | 235 | | | FirstEnergy Solutions Corp., Guaranteed Notes, 4.80%, due 2/15/15 | | $ | 254 | | |
Food (1.6%) | |
| | 1,400 | | | Grupo Bimbo SAB de CV, Guaranteed Notes, 4.88%, due 6/30/20 | | | 1,465 | ñØØ | |
| | 140 | | | Kraft Foods, Inc., Senior Unsecured Notes, 6.13%, due 2/1/18 | | | 165 | ØØ | |
| | 820 | | | Kraft Foods, Inc., Senior Unsecured Notes, 6.50%, due 2/9/40 | | | 940 | | |
| | | | 2,570 | | |
| Gas Distribution (0.5%) | |
| | 420 | | | Kinder Morgan Energy Partners L.P., Senior Unsecured Notes, 5.95%, due 2/15/18 | | | 480 | | |
| | 325 | | | Kinder Morgan Energy Partners L.P., Senior Unsecured Notes, 6.50%, due 9/1/39 | | | 345 | ØØ | |
| | | | 825 | | |
| Industrial (1.4%) | |
| | 335 | | | Husky Energy, Inc., Senior Unsecured Notes, 5.90%, due 6/15/14 | | | 374 | | |
| | 455 | | | Medco Health Solutions, Inc., Senior Unsecured Notes, 4.13%, due 9/15/20 | | | 459 | | |
| | 300 | | | Rio Tinto Finance (USA) Ltd., Guaranteed Notes, 5.20%, due 11/2/40 | | | 302 | | |
| | 675 | | | Vale Overseas Ltd., Guaranteed Notes, 4.63%, due 9/15/20 | | | 699 | | |
| | 490 | | | Weatherford Int'l Ltd., Guaranteed Notes, 5.13%, due 9/15/20 | | | 513 | | |
| | | | 2,347 | | |
| Insurance (1.3%) | |
| | 450 | | | Hartford Financial Services Group, Inc., Senior Unsecured Notes, 5.38%, due 3/15/17 | | | 468 | | |
| | 550 | | | Hartford Financial Services Group, Inc., Senior Unsecured Notes, 5.50%, due 3/30/20 | | | 562 | | |
| | 260 | | | Lincoln National Corp., Senior Unsecured Notes, 7.00%, due 6/15/40 | | | 285 | | |
| | 545 | | | Prudential Financial, Inc., Senior Unsecured Medium-Term Notes, Ser. D, 3.88%, due 1/14/15 | | | 575 | ØØ | |
| | 180 | | | Prudential Financial, Inc., Senior Unsecured Notes, 6.63%, due 6/21/40 | | | 198 | | |
| | | | 2,088 | | |
| Media (1.7%) | |
| | 650 | | | DirecTV Holdings LLC, Guaranteed Notes, 3.55%, due 3/15/15 | | | 683 | | |
| | 575 | | | DirecTV Holdings LLC, Guaranteed Notes, 6.00%, due 8/15/40 | | | 585 | | |
| | 285 | | | News America, Inc., Guaranteed Notes, 6.90%, due 8/15/39 | | | 330 | | |
| | 580 | | | Time Warner Cable, Inc., Guaranteed Notes, 8.75%, due 2/14/19 | | | 772 | ØØ | |
| | 430 | | | Time Warner, Inc., Guaranteed Notes, 6.10%, due 7/15/40 | | | 458 | | |
| | | | 2,828 | | |
| Media - Broadcast (0.8%) | |
| | 955 | | | NBC Universal, Inc., Senior Unsecured Notes, 4.38%, due 4/1/21 | | | 975 | ñ | |
| | 365 | | | NBC Universal, Inc., Senior Unsecured Notes, 5.95%, due 4/1/41 | | | 373 | ñ | |
| | | | 1,348 | | |
| Media - Cable (0.1%) | |
| | 220 | | | Comcast Corp., Guaranteed Notes, 6.40%, due 3/1/40 | | | 243 | | |
| | | | | | | | | | |
| Metals/Mining Excluding Steel (0.3%) | |
| | 530 | | | Southern Copper Corp., Senior Unsecured Notes, 6.75%, due 4/16/40 | | | 569 | | |
| See Notes to Schedule of Investments | 29 | |
| PRINCIPAL AMOUNT | | VALUE† | |
| | | | | | |
| (000's omitted) | | (000's omitted) | |
| | | | | | |
| Office/Business Equipment (0.1%) | |
| $ | 170 | | | Xerox Corp., Senior Unsecured Notes, 6.40%, due 3/15/16 | | $ | 201 | | |
Pharmaceuticals (0.1%) | |
| | 90 | | | Express Scripts, Inc., Guaranteed Notes, 5.25%, due 6/15/12 | | | 96 | | |
Pipelines (0.3%) | |
| | 425 | | | Plains All American Pipeline L.P., Guaranteed Notes, 4.25%, due 9/1/12 | | | 446 | ØØ | |
Real Estate (0.2%) | |
| | 330 | | | WEA Finance LLC, Guaranteed Notes, 7.50%, due 6/2/14 | | | 384 | ñØØ | |
REITs (0.4%) | |
| | 420 | | | Simon Property Group LP, Senior Unsecured Notes, 10.35%, due 4/1/19 | | | 594 | ØØ | |
Retail (0.3%) | |
| | 425 | | | CVS Pass-Through Trust, Pass-Through Certificates, 7.51%, due 1/10/32 | | | 496 | ñ | |
Specialty Retail (0.3%) | |
| | 420 | | | Home Depot, Inc., Senior Unsecured Notes, 5.88%, due 12/16/36 | | | 436 | | |
Steel Producers/Products (1.5%) | |
| | 1,070 | | | ArcelorMittal, Senior Unsecured Notes, 6.13%, due 6/1/18 | | | 1,170 | ØØ | |
| | 745 | | | ArcelorMittal, Senior Unsecured Notes, 9.85%, due 6/1/19 | | | 961 | | |
| | 405 | | | ArcelorMittal, Senior Unsecured Notes, 5.25%, due 8/5/20 | | | 410 | | |
| | | | 2,541 | | |
| Telecommunications (0.9%) | |
| | 465 | | | AT&T, Inc., Senior Unsecured Notes, 4.85%, due 2/15/14 | | | 516 | | |
| | 430 | | | Telecom Italia Capital SA, Guaranteed Unsecured Notes, 4.95%, due 9/30/14 | | | 465 | ØØ | |
| | 410 | | | Verizon New Jersey, Inc., Senior Unsecured Notes, Ser. A, 5.88%, due 1/17/12 | | | 433 | | |
| | | | 1,414 | | |
| Tobacco (0.7%) | |
| | 795 | | | Lorillard Tobacco Co., Guaranteed Notes, 8.13%, due 6/23/19 | | | 918 | ØØ | |
| | 285 | | | Lorillard Tobacco Co., Guaranteed Notes, 6.88%, due 5/1/20 | | | 306 | | |
| | | | 1,224 | | |
| Total Corporate Debt Securities (Cost $39,720) | | | 42,564 | | |
Asset-Backed Securities (13.1%) | |
| | 185 | | | Banc of America Commercial Mortgage, Inc., Ser. 2007-3, Class A4, 5.84%, due 6/10/49 | | | 193 | µ | |
| | 500 | | | Banc of America Commercial Mortgage, Inc., Ser. 2007-4, Class ASB, 5.71%, due 2/10/51 | | | 544 | | |
| | 12 | | | Banc of America Funding Corp., Ser. 2006-G, Class 2A2, 0.34%, due 7/20/36 | | | 12 | µ | |
| | 77 | | | Banc of America Funding Corp., Ser. 2006-G, Class 2A1, 0.48%, due 7/20/36 | | | 56 | µ | |
| | 1,000 | | | Bear Stearns Commercial Mortgage Securities, Ser. 2007-PW15, Class A4, 5.33%, due 2/11/44 | | | 1,041 | ØØ | |
| | 400 | | | Bear Stearns Commercial Mortgage Securities, Ser. 2007-PW17, Class A4, 5.69%, due 6/11/50 | | | 431 | | |
| | 330 | | | Carrington Mortgage Loan Trust, Ser. 2006-NC3, Class A3, 0.41%, due 8/25/36 | | | 166 | µ | |
| See Notes to Schedule of Investments | 30 | |
| (000's omitted) | | | | (000's omitted) | |
| | | | | | |
| $ | 24 | | | Chase Funding Mortgage Loan Asset-Backed Certificates, Ser. 2004-1, Class 2A2, 0.72%, | | $ | 22 | µ | |
| | | | | due 12/25/33 | | | | | |
| | 110 | | | Citigroup Mortgage Loan Trust, Inc., Ser. 2006-WFH1, Class M2, 0.63%, due 1/25/36 | | | 40 | µ | |
| | 1,050 | | | Commercial Mortgage Loan Trust, Ser. 2008-LS1, Class A4B, 6.21%, due 12/10/49 | | | 1,121 | µ | |
| | 500 | | | Commercial Mortgage Pass-Through Certificates, Ser. 2006-C8, Class A4, 5.31%, due 12/10/46 | | | 525 | | |
| | 144 | | | Countrywide Asset-Backed Certificates, Ser. 2005-IM2, Class A3, 0.53%, due 1/25/36 | | | 110 | µ | |
| | 75 | | | Countrywide Asset-Backed Certificates, Ser. 2006-BC1, Class 1A, 0.46%, due 4/25/36 | | | 66 | µ | |
| | 110 | | | Countrywide Asset-Backed Certificates, Ser. 2007-BC2, Class 2A1, 0.35%, due 6/25/37 | | | 107 | µ | |
| | 140 | | | Credit Suisse First Boston Mortgage Securities Corp., Ser. 2001-CK6, Class A3, 6.39%, due 8/15/36 | | | 145 | | |
| | 225 | | | Credit Suisse First Boston Mortgage Securities Corp., Ser. 2005-C4, Class A3, 5.12%, due 8/15/38 | | | 233 | | |
| | 139 | | | Credit Suisse Mortgage Capital Certificates, Ser. 2007-TF2A, Class A1, 0.44%, due 4/15/22 | | | 122 | ñµ | |
| | 80 | | | Credit Suisse Mortgage Capital Certificates, Ser. 2007-C3, Class A4, 5.91%, due 6/15/39 | | | 83 | µ | |
| | 1,200 | | | Credit Suisse Mortgage Capital Certificates, Ser. 2006-C4, Class A3, 5.47%, due 9/15/39 | | | 1,281 | ØØ | |
| | 45 | | | Credit Suisse Mortgage Capital Certificates, Ser. 2007-C4, Class A4, 6.00%, due 9/15/39 | | | 47 | µ | |
| | 100 | | | Credit Suisse Mortgage Capital Certificates, Ser. 2007-C1, Class A3, 5.38%, due 2/15/40 | | | 101 | | |
| | 130 | | | Credit Suisse Mortgage Capital Certificates, Ser. 2007-C5, Class A4, 5.70%, due 9/15/40 | | | 135 | | |
| | 250 | | | Credit Suisse Mortgage Capital Certificates, Ser. 2008-C1, Class A3, 6.42%, due 2/15/41 | | | 268 | µ | |
| | 38 | | | Credit-Based Asset Servicing and Securitization, Ser. 2005-CB5, Class AV2, 0.52%, due 8/25/35 | | | 36 | µ | |
| | 506 | | | Credit-Based Asset Servicing and Securitization, Ser. 2006-CB3, Class AV3, 0.43%, due 3/25/36 | | | 413 | µ | |
| | 66 | | | Credit-Based Asset Servicing and Securitization, Ser. 2006-CB6, Class A22, 0.35%, due 7/25/36 | | | 66 | µ | |
| | 750 | | | CW Capital Cobalt Ltd., Ser. 2007-C3, Class A4, 6.01%, due 5/15/46 | | | 790 | µ | |
| | 45 | | | Equifirst Mortgage Loan Trust, Ser. 2003-2, Class 3A3, 1.01%, due 9/25/33 | | | 41 | µ | |
| | 26 | | | Fannie Mae Grantor Trust, Ser. 2002-T5, Class A1, 0.50%, due 5/25/32 | | | 25 | µ | |
| | 98 | | | Fannie Mae Whole Loan, Ser. 2003-W5, Class A, 0.48%, due 4/25/33 | | | 93 | µ | |
| | 175 | | | Greenwich Capital Commercial Funding Corp., Ser. 2007-GG11, Class A4, 5.74%, due 12/10/49 | | | 185 | | |
| | 600 | | | GS Mortgage Securities Corp. II, Ser. 2006-GG6, Class A4, 5.55%, due 4/10/38 | | | 651 | | |
| | 400 | | | GS Mortgage Securities Corp. II, Ser. 2006-GG8, Class A4, 5.56%, due 11/10/39 | | | 432 | | |
| | 500 | | | GS Mortgage Securities Corp. II, Ser. 2007-GG10, Class A4, 6.00%, due 8/10/45 | | | 529 | µ | |
| | 78 | | | Household Home Equity Loan Trust, Ser. 2006-1, Class A1, 0.42%, due 1/20/36 | | | 71 | µ | |
| | 93 | | | Household Home Equity Loan Trust, Ser. 2006-2, Class A2, 0.44%, due 3/20/36 | | | 86 | µ | |
| | 170 | | | HSI Asset Securitization Corp. Trust, Ser. 2006-WMC1, Class A2, 0.36%, due 7/25/36 | | | 63 | µ | |
| | 134 | | | Impac Secured Assets Corp., Ser. 2006-3, Class A4, 0.35%, due 11/25/36 | | | 123 | µ | |
| | 795 | | | JP Morgan Chase Commercial Mortgage Securities Corp., Ser. 2006-LDP9, Class A3, 5.34%, due 5/15/47 | | | 837 | | |
| | 1,200 | | | JP Morgan Chase Commercial Mortgage Securities Corp., Ser. 2007-LDPX, Class A3, 5.42%, due 1/15/49 | | | 1,256 | | |
| | 2,380 | | | JP Morgan Chase Commercial Mortgage Securities Corp., Ser. 2007-CB19, Class A4, 5.93%, due 2/12/49 | | | 2,532 | µØØ | |
| | 1,270 | | | JP Morgan Chase Commercial Mortgage Securities Corp., Ser. 2007-LD11, Class A4, 6.00%, due 6/15/49 | | | 1,348 | µØØ | |
| | 555 | | | JP Morgan Chase Commercial Mortgage Securities Corp., Ser. 2007-CB20, Class ASB, 5.69%, due 2/12/51 | | | 609 | ØØ | |
| | 1,219 | | | JP Morgan Chase Commercial Mortgage Securities Corp., Ser. 2007-LD12, Class A4, 5.88%, due 2/15/51 | | | 1,303 | ØØ | |
| | 46 | | | JP Morgan Mortgage Acquisition Corp., Ser. 2006-CW2, Class AV3, 0.36%, due 8/25/36 | | | 46 | µ | |
| | 642 | | | Knollwood CDO Ltd., Ser. 2006-2A, Class A2J, 0.71%, due 7/13/46 | | | 0 | #µØØ | |
| | 10 | | | Merrill Lynch First Franklin Mortgage Loan, Ser. 2007-2, Class A2A, 0.37%, due 5/25/37 | | | 10 | µØØ | |
| | 700 | | | Merrill Lynch/Countrywide Commercial Mortgage Trust, Ser. 2007-5, Class A4, 5.38%, due 8/12/48 | | | 715 | ØØ | |
| | 1,400 | | | Merrill Lynch/Countrywide Commercial Mortgage Trust, Ser. 2007-7, Class A4, 5.81%, due 6/12/50 | | | 1,455 | µØØ | |
| | 42 | | | Morgan Stanley Capital I, Ser. 2004-WMC3, Class B3, 4.31%, due 1/25/35 | | | 2 | µØØ | |
| | 300 | | | Morgan Stanley Capital I, Ser. 2007-IQ16, Class A4, 5.81%, due 12/12/49 | | | 315 | ØØ | |
| | 54 | | | MSCC Heloc Trust, Ser. 2003-2, Class A, 0.52%, due 4/25/16 | | | 47 | µØØ | |
| | 183 | | | Nomura Asset Acceptance Corp., Ser. 2007-2, Class A1A, 0.38%, due 4/25/47 | | | 101 | µØØ | |
| | 146 | | | Opteum Mortgage Acceptance Corp., Ser. 2005-3, Class A1B, 0.52%, due 7/25/35 | | | 131 | µØØ | |
| | 405 | | | Option One Mortgage Loan Trust, Ser. 2006-2, Class 2A2, 0.36%, due 7/25/36 | | | 312 | µØØ | |
| See Notes to Schedule of Investments | 31 | |
| PRINCIPAL AMOUNT | | VALUE† | |
| | | | |
| (000's omitted) | | (000's omitted) | |
| | | | |
| $ | 150 | | | Residential Accredit Loans, Inc., Ser. 2006-QO7, Class 3A2, 0.46%, due 9/25/46 | | $ | 62 | µØØ | |
| | 13 | | | Residential Asset Mortgage Products, Inc., Ser. 2003-RS2, Class AII, 0.94%, due 3/25/33 | | | 8 | µØØ | |
| | 34 | | | Residential Asset Mortgage Products, Inc., Ser. 2003-RS3, Class AII, 0.98%, due 4/25/33 | | | 21 | µØØ | |
| | 9 | | | Saxon Asset Securities Trust, Ser. 2004-1, Class A, 0.80%, due 3/25/35 | | | 7 | µØØ | |
| | 115 | | | SLM Student Loan Trust, Ser. 2008-6, Class A1, 0.69%, due 10/27/14 | | | 116 | µØØ | |
| | 4 | | | Specialty Underwriting & Residential Finance, Ser. 2003-BC1, Class A, 0.94%, due 1/25/34 | | | 3 | µØØ | |
| | | | | | | | | | |
| | Total Asset-Backed Securities (Cost $20,985) | | | 21,689 | | |
| | | | | | | | | | |
| NUMBER OF SHARES | |
| | |
| Short-Term Investments (2.7%) | |
| | 4,395,141 | | | State Street Institutional Liquid Reserves Fund Institutional Class (Cost $4,395) | | | 4,395 | | |
| | | | | | | | | | |
| | Total Investments (117.2%) (Cost $188,486) | | | 193,720 | ## | |
| | | | | | | | | | |
| | Liabilities, less cash, receivables and other assets [(17.2%)] | | | (28,445 | ) | |
| | | | | | | | | | |
| | Total Net Assets (100.0%) | | $ | 165,275 | | |
| See Notes to Schedule of Investments | 32 | |
Schedule of Investments Neuberger Berman Floating Rate Income Fund
| PRINCIPAL AMOUNT | | VALUE† | |
| | | | | | |
| (000's omitted) | | (000's omitted) | |
| | | | | | |
Bank Loan Obligationsµ (80.7%) | |
| | | | |
| Aerospace & Defense (1.2%) | |
| $ | 496 | | | Booz Allen & Hamilton, Inc., Term Loan C, 6.00%, due 7/31/15 | | $ | 496 | | |
| | 496 | | | TASC, Inc., Term Loan B, 5.75%, due 12/18/15 | | | 500 | | |
| | | | 996 | | |
| All Telecom (8.3%) | |
| | 280 | | | Cincinnati Bell, Inc., Term Loan, 6.50%, due 6/12/17 | | | 282 | | |
| | 249 | | | Integra Telecom Holdings, Inc., Term Loan B, 9.25%, due 4/15/15 | | | 251 | | |
| | 800 | | | Knology, Inc., Term Loan B, 5.50%, due 10/17/16 | | | 802 | | |
| | 250 | | | Level 3 Financing, Inc., Term Loan A, 2.54%, due 3/13/14 | | | 233 | | |
| | 999 | | | NTELOS, Inc., Term Loan B, 5.75%, due 8/7/15 | | | 1,005 | | |
| | 1,130 | | | Sitel LLC, Term Loan B, due 1/30/14 | | | 1,022 | ¢^^ | |
| | 832 | | | Springboard Finance, LLC, Term Loan A, 7.00%, due 2/23/15 | | | 835 | | |
| | 1,500 | | | Transaction Network Services, Inc., Term Loan C, 6.00%, due 11/18/15 | | | 1,503 | | |
| | 1,050 | | | Yankee Cable Acquisition, LLC, Term Loan B1, 6.50%, due 8/26/16 | | | 1,040 | ¢^^ | |
| | | | 6,973 | | |
| Automotive (1.1%) | |
| | 925 | | | United Components, Inc., Term Loan B, 6.25%, due 3/23/17 | | | 930 | | |
Building & Development (2.0%) | |
| | 796 | | | Capital Automotive LP, Term Loan C, 2.76%, due 12/14/12 | | | 786 | | |
| | 711 | | | Custom Building Products, Inc., Term Loan B, 5.75%, due 3/19/15 | | | 709 | | |
| | 27 | | | Realogy Corp., Letter of Credit, 3.26%, due 10/10/13 | | | 24 | | |
| | 194 | | | Realogy Corp., Term Loan, 3.26%, due 10/10/13 | | | 178 | | |
| | | | 1,697 | | |
| Business Equipment & Services (3.1%) | |
| | 499 | | | Advantage Sales & Marketing LLC, Second Lien Term Loan, 8.50%, due 5/5/17 | | | 504 | | |
| | 790 | | | Brickman Group Holdings, Inc., Term Loan B, 7.25%, due 10/14/16 | | | 798 | ¢^^ | |
| | 227 | | | MSCI, Inc., Term Loan, 4.75%, due 6/1/16 | | | 228 | | |
| | 374 | | | Protection One Alarm Monitoring, Inc., Term Loan B, 6.00%, due 5/16/16 | | | 373 | | |
| | 750 | | | SourceCorp, Inc., Term Loan B, 5.76%, due 7/12/13 | | | 706 | | |
| | | | 2,609 | | |
| Cable & Satellite Television (1.3%) | |
| | 222 | | | Charter Communications Operating LLC, Term Loan, 7.25%, due 3/6/14 | | | 229 | | |
| | 833 | | | Midcontinent Communications, Term Loan B, 6.25%, due 12/31/16 | | | 835 | | |
| | | | 1,064 | | |
| Chemicals & Plastics (5.0%) | |
| | 870 | | | General Chemical Holding Co., Term Loan B, 6.75%, due 10/6/15 | | | 876 | ¢^^ | |
| | 333 | | | Lyondell Chemical Co., Term Loan, 5.50%, due 4/8/16 | | | 335 | | |
| | 397 | | | Momentive Performance Materials, Inc., Term Loan B, 2.56%, due 12/4/13 | | | 388 | | |
| | 685 | | | PQ Corp., Second Lien Term Loan, 6.76%, due 7/30/15 | | | 645 | ¢^^ | |
| | 402 | | | Rockwood Specialties Group, Inc., Term Loan H, 6.00%, due 5/15/14 | | | 403 | | |
| | 790 | | | Styron Corp., Term Loan B, 7.50%, due 6/17/16 | | | 803 | | |
| | 780 | | | Univar NV, Term Loan, 3.26%, due 10/10/14 | | | 775 | | |
| | | | 4,225 | | |
| See Notes to Schedule of Investments | 33 | |
| PRINCIPAL AMOUNT | | VALUE† | |
| | | | | | |
| (000's omitted) | | (000's omitted) | |
| | | | | | |
| Clothing/Textiles (0.8%) | |
| $ | 631 | | | Phillips-Van Heusen Corp., Term Loan B, 4.75%, due 5/6/16 | | $ | 635 | | |
| | | | | | | | | | |
| Conglomerates (3.6%) | |
| | 1,125 | | | Goodman Global, Inc., Term Loan B, due 10/28/16 | | | 1,139 | ¢^^ | |
| | 45 | | | Goodman Global, Inc., Term Loan B, due 10/30/17 | | | 46 | ¢^^ | |
| | 250 | | | Goodman Global, Inc., Term Loan B, 6.25%, due 2/13/14 | | | 250 | | |
| | 470 | | | JohnsonDiversey, Inc., Term Loan B, 5.50%, due 11/24/15 | | | 472 | | |
| | 1,125 | | | Pinafore LLC, Term Loan B, 6.75%, due 9/29/16 | | | 1,137 | | |
| | | | 3,044 | | |
| Containers & Glass Products (2.5%) | |
| | 365 | | | BWAY Holding Co., Term Loan B,5.50% – 6.00%, due 6/16/17 | | | 365 | | |
| | 932 | | | Graham Packaging Co. L.P., Term Loan C, 6.75%, due 4/5/14 | | | 939 | | |
| | 300 | | | Graham Packaging Co. L.P., Term Loan D, 6.00%, due 9/23/16 | | | 303 | | |
| | 34 | | | ICL Industrial Containers, Term Loan C, 6.00%, due 6/16/17 | | | 34 | | |
| | 500 | | | Reynolds Group Holdings, Inc., Term Loan D, due 5/5/16 | | | 504 | ^^†† | |
| | | | 2,145 | | |
| Drugs (1.6%) | |
| | 364 | | | Warner Chilcott Co. LLC, Term Loan A, 6.00%, due 10/30/14 | | | 362 | | |
| | 448 | | | Warner Chilcott Co. LLC, Term Loan B2, 6.25%, due 4/30/15 | | | 450 | | |
| | 39 | | | Warner Chilcott Co. LLC, Term Loan B4, 6.50%, due 2/22/16 | | | 40 | | |
| | 70 | | | Warner Chilcott Corp., Term Loan, 6.25%, due 4/30/15 | | | 70 | | |
| | 269 | | | Warner Chilcott Corp., Term Loan B1, 6.25%, due 4/30/15 | | | 270 | | |
| | 121 | | | Warner Chilcott Corp., Term Loan B3, 6.50%, due 2/22/16 | | | 122 | | |
| | | | 1,314 | | |
| Electric - Generation (1.1%) | |
| | 1,000 | | | TPF Generation Holdings LLC, Second Lien Term Loan C, 4.54%, due 12/15/14 | | | 914 | ¢^^ | |
Electronics/Electrical (6.6%) | |
| | 398 | | | Aspect Software, Inc., Term Loan B, 6.25%, due 4/19/16 | | | 399 | | |
| | 750 | | | AutoTrader.com, Inc., Term Loan B, 6.00%, due 6/14/16 | | | 752 | ¢^^ | |
| | 530 | | | Fidelity National Information Services, Inc., Term Loan B, 5.25%, due 7/18/16 | | | 537 | | |
| | 600 | | | Fifth Third Processing Solutions, Term Loan B, due 11/30/16 | | | 606 | ¢^^ | |
| | 150 | | | Fifth Third Processing Solutions, Term Loan, due 11/30/17 | | | 152 | ¢^^ | |
| | 1,122 | | | Interactive Data Corp., Term Loan B, 6.75%, due 1/27/17 | | | 1,141 | | |
| | 853 | | | Reynolds & Reynolds Co., Term Loan B, 5.25%, due 4/21/17 | | | 856 | | |
| | 374 | | | SkillSoft Corp., Term Loan B, 6.50%, due 5/26/17 | | | 377 | | |
| | 750 | | | Verint Systems, Inc., Term Loan B, 5.25%, due 5/25/14 | | | 741 | | |
| | | | 5,561 | | |
| Equipment Leasing (2.0%) | |
| | 141 | | | AIG/Delos Aircraft, Inc., Term Loan B2, 7.00%, due 3/17/16 | | | 144 | | |
| | 692 | | | AIG/International Lease Finance Corp., Term Loan B1, 6.75%, due 3/17/15 | | | 707 | | |
| | 800 | | | AWAS, First Lien Term Loan, 7.75%, due 6/10/16 | | | 817 | | |
| | | | 1,668 | | |
| Farming/Agriculture (0.8%) | |
| | 700 | | | WM Bolthouse Farms, Inc., First Lien Term Loan, 5.50%, due 2/11/16 | | | 702 | | |
| See Notes to Schedule of Investments | 34 | |
| PRINCIPAL AMOUNT | | VALUE† | |
| | | | | | |
| (000's omitted) | | (000's omitted) | |
| | | | |
| Financial Intermediaries (4.9%) | |
| $ | 833 | | | American General Finance Corp., Term Loan B, 7.25%, due 4/21/15 | | $ | 840 | | |
| | 380 | | | CB Richard Ellis Services, Term Loan B, 5.75%, due 12/20/13 | | | 380 | | |
| | 500 | | | CIT Group, Inc., Term Loan 3, 6.25%, due 8/11/15 | | | 508 | | |
| | 900 | | | FIG LLC, Term Loan B, 5.75%, due 9/30/15 | | | 906 | | |
| | 239 | | | First Data Corp., Term Loan B2, 3.01%, due 9/24/14 | | | 215 | | |
| | 498 | | | LPL Holdings, Inc., Term Loan, 5.25%, due 6/28/17 | | | 494 | | |
| | 829 | | | Ocwen Financial Corp., Term Loan, 9.00%, due 7/28/15 | | | 823 | | |
| | | | 4,166 | | |
| Food Products (3.3%) | |
| | 564 | | | Michael Foods, Inc., Term Loan B, 6.25%, due 6/29/16 | | | 573 | | |
| | 1,125 | | | NBTY, Inc., Term Loan B, 6.25%, due 10/2/17 | | | 1,139 | | |
| | 1,047 | | | Pinnacle Foods Holdings Corp., Term Loan D, 6.00%, due 4/2/14 | | | 1,058 | | |
| | | | 2,770 | | |
| Food Service (0.9%) | |
| | 770 | | | DineEquity, Inc., Term Loan B, 6.00%, due 10/19/17 | | | 776 | | |
| | | | | | | | | | |
| Food/Drug Retailers (1.5%) | |
| | 325 | | | Rite Aid Corp., Term Loan B, due 6/4/14 | | | 292 | ¢^^ | |
| | 993 | | | Rite Aid Corp., Term Loan 3, 6.00%, due 6/4/14 | | | 986 | | |
| | | | 1,278 | | |
| Health Care (7.8%) | |
| | 499 | | | Aurora Diagnostics LLC, Term Loan B, 6.25%, due 5/21/16 | | | 490 | | |
| | 500 | | | Grifols SA, Term Loan B, due 6/4/16 | | | 505 | ¢^^ | |
| | 750 | | | HCA, Inc., Term Loan A, 1.54%, due 11/19/12 | | | 736 | | |
| | 280 | | | IASIS Healthcare Corp., Term Loan, 5.54%, due 6/13/14 | | | 271 | | |
| | 594 | | | IMS Health, Inc., Term Loan B, 5.25%, due 2/26/16 | | | 599 | | |
| | 1,051 | | | Multiplan, Inc., Term Loan B, 6.50%, due 8/26/17 | | | 1,053 | | |
| | 927 | | | RehabCare Group, Inc., Term Loan B, 6.00%, due 11/24/15 | | | 931 | | |
| | 1,100 | | | Universal Health Services, Inc., Term Loan B, due 7/28/16 | | | 1,112 | ¢^^ | |
| | 900 | | | Valeant Pharmaceuticals Int'l, Term Loan B, due 9/27/16 | | | 909 | ¢^^ | |
| | | | 6,606 | | |
| Industrial Equipment (0.6%) | |
| | 250 | | | Generac Acquisition Corp., Term Loan B, 2.76% – 2.79%, due 11/11/13 | | | 237 | | |
| | 242 | | | Manitowoc Co., Inc., Term Loan B, 8.00%, due 11/6/14 | | | 243 | | |
| | | | 480 | | |
| Insurance (0.9%) | |
| | 747 | | | Sedgwick CMS Holdings, Inc., First Lien Term Loan, 5.50%, due 5/27/16 | | | 746 | ¢^^ | |
| | | | | | | | | | |
| Leisure Goods/Activities/Movies (2.6%) | |
| | 1,047 | | | Cedar Fair L.P., Term Loan B, 5.50%, due 12/15/16 | | | 1,062 | | |
| | 350 | | | Six Flags Theme Parks, Inc., Term Loan, due 12/31/16 | | | 361 | ¢^^ | |
| | 734 | | | Six Flags Theme Parks, Inc., Term Loan B, 6.00%, due 6/30/16 | | | 736 | | |
| | | | 2,159 | | |
| See Notes to Schedule of Investments | 35 | |
| PRINCIPAL AMOUNT | | VALUE† | |
| | | | | | |
| (000's omitted) | | (000's omitted) | |
| | | | | | |
| Lodging & Casinos (3.1%) | |
| $ | 900 | | | CityCenter Construction, Term Loan, due 6/30/12 | | $ | 870 | ¢^^ | |
| | 450 | | | Harrah's Operating Co., Inc., Term Loan B2, 3.29%, due 1/28/15 | | | 397 | | |
| | 497 | | | Harrah's Operating Co., Inc., Term Loan B4, 9.50%, due 10/31/16 | | | 517 | | |
| | 306 | | | VML US Finance LLC, Term Loan B, 4.78%, due 5/25/12 | | | 306 | ¢^^ | |
| | 529 | | | VML US Finance LLC, Term Loan B, 4.78%, due 5/27/13 | | | 529 | ¢^^ | |
| | | | 2,619 | | |
| Media - Broadcast (0.2%) | |
| | 221 | | | Univision Communications, Inc., Term Loan, 4.51%, due 3/31/17 | | | 209 | | |
| | | | | | | | | | |
| Nonferrous Metals/Minerals (1.4%) | |
| | 1,145 | | | Fairmount Minerals Ltd., Term Loan B, 6.25%, due 8/5/16 | | | 1,157 | | |
| | | | | | | | | | |
| Oil & Gas (1.2%) | |
| | 993 | | | MEG Energy Corp., Term Loan D, 6.00%, due 4/3/16 | | | 994 | | |
| | | | | | | | | | |
| Publishing (3.6%) | |
| | 246 | | | Cengage Learning Acquisitions, Inc., Term Loan, 2.54%, due 7/3/14 | | | 225 | | |
| | 499 | | | Cengage Learning Acquisitions, Inc., Term Loan 1, 7.50%, due 7/3/14 | | | 498 | | |
| | 229 | | | Dex Media East LLC, Term Loan, 2.79% – 2.80%, due 10/24/14 | | | 186 | | |
| | 432 | | | Dex Media West LLC, Term Loan, 7.00%, due 10/24/14 | | | 399 | | |
| | 919 | | | Postmedia Network, Inc., Term Loan, 9.00%, due 7/13/16 | | | 929 | | |
| | 798 | | | Quad Graphics, Inc., Term Loan B, 5.50%, due 4/14/16 | | | 793 | | |
| | | | 3,030 | | |
| Radio & Television (1.1%) | |
| | 250 | | | Clear Channel Communications, Inc., Term Loan B, 3.91%, due 1/28/16 | | | 198 | | |
| | 735 | | | Fox Acquisition Sub LLC, Term Loan, 7.50%, due 7/14/15 | | | 727 | | |
| | | | 925 | | |
| Retailers (except food & drug) (2.2%) | |
| | 398 | | | Bass Pro Group LLC, Term Loan, 5.00% – 5.75%, due 4/9/15 | | | 398 | | |
| | 750 | | | Michaels Stores, Inc., Term Loan B2, 4.81% – 5.00%, due 7/31/16 | | | 743 | ¢^^ | |
| | 23 | | | ServiceMaster Co., Term Loan DD, 2.76%, due 7/24/14 | | | 21 | | |
| | 227 | | | ServiceMaster Co., Term Loan, 2.76% – 2.80%, due 7/24/14 | | | 216 | | |
| | 475 | | | Toys 'R' Us-Delaware, Inc., Term Loan, 6.00%, due 9/1/16 | | | 477 | | |
| | | | 1,855 | | |
| Surface Transport (0.6%) | |
| | 451 | | | Hertz Corp., Term Loan B, 2.01%, due 12/21/12 | | | 447 | | |
| | 47 | | | Hertz Corp., Letter of Credit, .34%, due 12/21/12 | | | 46 | | |
| | | | 493 | | |
| Utilities (3.8%) | |
| | 925 | | | Bicent Power LLC, Term Loan B, 2.29%, due 6/30/14 | | | 802 | | |
| | 250 | | | FirstLight Power Resources, Second Lien Term Loan, 4.81%, due 5/1/14 | | | 229 | | |
| | 204 | | | Great Point Power, Term Loan DD, 5.50%, due 3/10/17 | | | 204 | | |
| | 517 | | | Longview Power LLC, Term Loan DD, due 2/28/14 | | | 443 | ¢^^ | |
| See Notes to Schedule of Investments | 36 | |
| PRINCIPAL AMOUNT | | VALUE† | |
| | | | |
| (000's omitted) | | (000's omitted) | |
| | | | |
| $ | 443 | | | Longview Power LLC, Term Loan B, due 2/28/14 | | $ | 381 | ¢^^ | |
| | 665 | | | New Development Holdings LLC, Term Loan, 7.00%, due 7/3/17 | | | 677 | | |
| | 460 | | | RRI Energy, Inc., Term Loan B, due 9/8/17 | | | 460 | ¢^^ | |
| | | | 3,196 | | |
| | Total Bank Loan Obligations (Cost $67,129) | | | 67,936 | | |
| | | | | | | | | | |
| Corporate Debt Securities (17.9%) | |
| | | | |
| AirTransport (1.3%) | |
| | 500 | | | Continental Airlines, Inc., Senior Secured Notes, 6.75%, due 9/15/15 | | | 521 | ñØØ | |
| | 240 | | | Continental Airlines, Inc., Pass-Through Certificates, Ser. 2009-1, Class A, 9.00%, due 7/8/16 | | | 278 | ØØ | |
| | 150 | | | Delta Air Lines, Inc., Pass-Through Certificates, Ser. 2001-1, Class B, 7.71%, due 9/18/11 | | | 154 | ØØ | |
| | 135 | | | Delta Air Lines, Inc., Senior Secured Notes, 9.50%, due 9/15/14 | | | 149 | ñ | |
| | | | 1,102 | | |
| Auto Loans (1.0%) | |
| | 250 | | | Ford Motor Credit Co. LLC, Senior Unsecured Notes, 8.00%, due 12/15/16 | | | 293 | ØØ | |
| | 480 | | | Ford Motor Credit Co. LLC, Senior Unsecured Notes, 6.63%, due 8/15/17 | | | 537 | ØØ | |
| | | | 830 | | |
| Banking (1.2%) | |
| | 275 | | | CIT Group, Inc., Senior Secured Notes, 7.00%, due 5/1/14 | | | 277 | ØØ | |
| | 750 | | | CIT Group, Inc., Senior Secured Notes, 7.00%, due 5/1/16 | | | 747 | ØØ | |
| | | | 1,024 | | |
| Chemicals (0.3%) | |
| | 250 | | | Momentive Performance Materials, Inc., Guaranteed Notes, 12.50%, due 6/15/14 | | | 286 | | |
| | | | | | | | | | |
| Consumer/Commercial/Lease Financing (0.6%) | |
| | 105 | | | Int'l Lease Finance Corp., Senior Secured Notes, 6.50%, due 9/1/14 | | | 113 | ñ | |
| | 250 | | | Int'l Lease Finance Corp., Senior Secured Notes, 6.75%, due 9/1/16 | | | 272 | ñ | |
| | 85 | | | Int'l Lease Finance Corp., Senior Secured Notes, 7.13%, due 9/1/18 | | | 94 | ñ | |
| | | | 479 | | |
| Department Stores (0.9%) | |
| | 745 | | | Sears Holdings Corp., Senior Secured Notes, 6.63%, due 10/15/18 | | | 743 | ñØØ | |
| | | | | | | | | | |
| Electric - Generation (3.6%) | |
| | 1,050 | | | Calpine Corp., Senior Secured Notes, 7.25%, due 10/15/17 | | | 1,092 | ñØØ | |
| | 400 | | | Dynegy-Roseton Danskammer, Pass-Through Certificates, Ser. B, 7.67%, due 11/8/16 | | | 372 | ØØ | |
| | 995 | | | Energy Future Holdings Corp., Senior Secured Notes, 10.00%, due 1/15/20 | | | 1,042 | ñØØ | |
| | 553 | | | Homer City Funding LLC, Senior Secured Notes, 8.14%, due 10/1/19 | | | 520 | ØØ | |
| | | | 3,026 | | |
| Electronics (1.3%) | |
| | 250 | | | NXP BV Funding LLC, Senior Secured Floating Rate Notes, 3.04%, due 10/15/13 | | | 238 | µ | |
| | 770 | | | NXP BV Funding LLC, Senior Secured Notes, 9.75%, due 8/1/18 | | | 840 | ñ | |
| | | | 1,078 | | |
| See Notes to Schedule of Investments | 37 | |
| PRINCIPAL AMOUNT | | VALUE† | |
| | | | | | |
| (000's omitted) | | (000's omitted) | |
| | | | | | |
| Gas Distribution (1.4%) | |
| $ | 905 | | | Energy Transfer Equity L.P., Guaranteed Notes, 7.50%, due 10/15/20 | | $ | 986 | ØØ | |
| | 250 | | | Sabine Pass LNG L.P., Senior Secured Notes, 7.50%, due 11/30/16 | | | 231 | ØØ | |
| | | | 1,217 | | |
| Health Care (0.7%) | |
| | 250 | | | HCA, Inc., Senior Secured Notes, 8.50%, due 4/15/19 | | | 281 | | |
| | 300 | | | HCA, Inc., Senior Secured Notes, 7.25%, due 9/15/20 | | | 328 | | |
| | | | 609 | | |
| Media - Broadcast (0.3%) | |
| | 245 | | | Univision Communications, Inc., Senior Secured Notes, 7.88%, due 11/1/20 | | | 257 | ñ | |
| | | | | | | | | | |
| Media - Cable (1.1%) | |
| | 500 | | | Echostar DBS Corp., Guaranteed Notes, 7.75%, due 5/31/15 | | | 544 | ØØ | |
| | 365 | | | Virgin Media Secured Finance PLC, Senior Secured Notes, 6.50%, due 1/15/18 | | | 392 | | |
| | | | 936 | | |
| Packaging (0.6%) | |
| | 505 | | | Reynolds Group Issuer, Inc., Senior Secured Notes, 7.13%, due 4/15/19 | | | 526 | ñ | |
| | | | | | | | | | |
| Specialty Retail (1.3%) | |
| | 1,025 | | | Toys "R: US-Delaware, Inc., Senior Secured Notes, 7.38%, due 9/1/16 | | | 1,067 | ñØØ | |
| | | | | | | | | | |
| Support - Services (0.5%) | |
| | 350 | | | RSC Equipment Rental, Inc., Senior Secured Notes, 10.00%, due 7/15/17 | | | 391 | ñØØ | |
| | | | | | | | | | |
| Telecom - Integrated/Services (0.9%) | |
| | 665 | | | PAETEC Holding Corp., Senior Secured Notes, 8.88%, due 6/30/17 | | | 717 | | |
| | | | | | | | | | |
| Telecom - Wireless (0.9%) | |
| | 700 | | | Cricket Communications, Inc., Senior Secured Notes, 7.75%, due 5/15/16 | | | 754 | ØØ | |
| | | | | Total Corporate Debt Securities (Cost $14,423) | | | 15,042 | | |
| | | | | | | | | | |
| NUMBER OF SHARES | |
| | |
| Short-Term Investments (14.3%) | |
| | 30 | | | State Street Institutional Government Money Market Fund Institutional Class | | | 0 | | |
| | 12,023,359 | | | State Street Institutional Liquid Reserves Fund Institutional Class | | | 12,023 | ØØ | |
| | | | | | | | | | |
| | Total Short-Term Investments (Cost $12,023) | | | 12,023 | | |
| | | | | | | | | | |
| | Total Investments (112.9%) (Cost $93,575) | | | 95,001 | ## | |
| | | | | | | | | | |
| | Liabilities, less cash, receivables and other assets [(12.9%)] | | | (10,869 | ) | |
| | | | | | | | | | |
| | Total Net Assets (100.0%) | | $ | 84,132 | | |
| See Notes to Schedule of Investments | 38 | |
| PRINCIPAL AMOUNT | | VALUE† | |
| | | | | | |
| (000's omitted) | | (000's omitted) | |
| | | | | | |
Bank Loan Obligationsµ (0.2%) | |
| | |
| Media - Broadcast (0.2%) | |
| $ | 1,609 | | | Univision Communications, Inc., Term Loan B, 4.51%, due 3/31/17 (Cost $1,400) | | $ | 1,523 | | |
| | | | | | | | | | |
| Corporate Debt Securities (96.1%) | |
| | |
| Aerospace/Defense (0.7%) | |
| | 2,500 | | | BE Aerospace, Inc., Senior Unsecured Notes, 8.50%, due 7/1/18 | | | 2,800 | | |
| | 3,270 | | | L-3 Communications Corp., Guaranteed Notes, Ser. B, 6.38%, due 10/15/15 | | | 3,368 | | |
| | | | 6,168 | | |
| Airlines (2.0%) | |
| | 7,520 | | | Continental Airlines, Inc., Senior Secured Notes, 6.75%, due 9/15/15 | | | 7,830 | ñ | |
| | 2,210 | | | Delta Air Lines, Inc., Senior Secured Notes, 9.50%, due 9/15/14 | | | 2,431 | ñ | |
| | 6,890 | | | United Airlines, Inc., Pass-Through Certificates, Ser. 2009-2, Class A, 9.75%, due 1/15/17 | | | 8,097 | | |
| | | | 18,358 | | |
| Auto Loans (2.9%) | |
| | 2,750 | | | Ford Motor Credit Co. LLC, Senior Unsecured Notes, 8.00%, due 12/15/16 | | | 3,219 | | |
| | 11,260 | | | Ford Motor Credit Co. LLC, Senior Unsecured Notes, 6.63%, due 8/15/17 | | | 12,594 | ØØ | |
| | 9,245 | | | Ford Motor Credit Co. LLC, Senior Unsecured Notes, 8.13%, due 1/15/20 | | | 11,305 | | |
| | | | 27,118 | | |
| Auto Parts & Equipment (0.2%) | |
| | 1,970 | | | Goodyear Tire & Rubber Co., Guaranteed Notes, 8.25%, due 8/15/20 | | | 2,098 | | |
| | | | | | | | | | |
| Automakers (1.5%) | |
| | 1,600 | | | Ford Holdings, Inc., Guaranteed Notes, 9.30%, due 3/1/30 | | | 2,000 | ØØ | |
| | 2,725 | | | Ford Motor Co., Senior Unsecured Notes, 7.45%, due 7/16/31 | | | 3,093 | | |
| | 2,233 | | | Ford Motor Co., Senior Unsecured Notes, 9.98%, due 2/15/47 | | | 2,783 | | |
| | 5,875 | | | Navistar Int'l Corp., Guaranteed Notes, 8.25%, due 11/1/21 | | | 6,440 | | |
| | | | 14,316 | | |
| Banking (6.7%) | |
| | 6,240 | | | Ally Financial, Inc., Subordinated Notes, 8.00%, due 12/31/18 | | | 6,458 | | |
| | 4,980 | | | Ally Financial, Inc., Guaranteed Notes, 8.00%, due 3/15/20 | | | 5,503 | ñ | |
| | 11,060 | | | Ally Financial, Inc., Guaranteed Notes, 8.00%, due 11/1/31 | | | 12,083 | | |
| | 5,305 | | | CIT Group, Inc., Senior Secured Notes, 7.00%, due 5/1/13 | | | 5,371 | | |
| | 8,390 | | | CIT Group, Inc., Senior Secured Notes, 7.00%, due 5/1/14 | | | 8,432 | | |
| | 9,763 | | | CIT Group, Inc., Senior Secured Notes, 7.00%, due 5/1/16 | | | 9,727 | | |
| | 15,053 | | | CIT Group, Inc., Senior Secured Notes, 7.00%, due 5/1/17 | | | 14,977 | | |
| | | | 62,551 | | |
| Beverages (0.3%) | |
| | 2,390 | | | Constellation Brands, Inc., Guaranteed Notes, 7.25%, due 9/1/16 | | | 2,629 | | |
| See Notes to Schedule of Investments | 39 | |
| PRINCIPAL AMOUNT | | VALUE† | |
| | | | | | |
| (000's omitted) | | | | (000's omitted) | |
| | | | | | |
| Building & Construction (0.3%) | |
| $ | 3,330 | | | Meritage Homes Corp., Guaranteed Notes, 7.15%, due 4/15/20 | | $ | 3,230 | | |
| | | | | | | | | | |
| Building Materials (1.8%) | |
| | 1,540 | | | Associated Materials LLC, Senior Secured Notes, 9.13%, due 11/1/17 | | | 1,617 | ñ | |
| | 4,325 | | | Masco Corp., Senior Unsecured Notes, 6.13%, due 10/3/16 | | | 4,428 | | |
| | 4,465 | | | Ply Gem Industries, Inc., Senior Secured Notes, 11.75%, due 6/15/13 | | | 4,794 | | |
| | 4,300 | | | USG Corp., Guaranteed Notes, 9.75%, due 8/1/14 | | | 4,494 | ñ | |
| | 1,215 | | | USG Corp., Senior Unsecured Notes, 6.30%, due 11/15/16 | | | 1,088 | | |
| | | | 16,421 | | |
| Chemicals (2.8%) | |
| | 3,360 | | | Ashland, Inc., Guaranteed Notes, 9.13%, due 6/1/17 | | | 3,872 | | |
| | 3,195 | | | CF Industries, Inc., Guaranteed Notes, 6.88%, due 5/1/18 | | | 3,642 | | |
| | 775 | | | CF Industries, Inc., Guaranteed Notes, 7.13%, due 5/1/20 | | | 899 | | |
| | 4,330 | | | Huntsman Int'l LLC, Guaranteed Notes, 5.50%, due 6/30/16 | | | 4,303 | | |
| | 4,610 | | | LBI Escrow Corp., Senior Secured Notes, 8.00%, due 11/1/17 | | | 5,048 | ñ | |
| | 1,261 | | | Momentive Performance Materials, Inc., Guaranteed Notes, 12.50%, due 6/15/14 | | | 1,441 | | |
| | 2,890 | | | Momentive Performance Materials, Inc., Guaranteed Notes, 11.50%, due 12/1/16 | | | 3,128 | | |
| | 3,940 | | | Momentive Performance Materials, Inc., Secured Notes, 9.00%, due 1/15/21 | | | 4,088 | ñØ | |
| | | | 26,421 | | |
| Consumer/Commercial/Lease Financing (2.4%) | |
| | 1,150 | | | American General Finance Corp., Senior Unsecured Medium-Term Notes, Ser. I, 5.85%, due 6/1/13 | | | 1,067 | | |
| | 1,850 | | | Int'l Lease Finance Corp., Senior Unsecured Notes, Ser. Q, 5.25%, due 1/10/13 | | | 1,866 | | |
| | 2,695 | | | Int'l Lease Finance Corp., Senior Unsecured Medium-Term Notes, 5.88%, due 5/1/13 | | | 2,745 | | |
| | 2,200 | | | Int'l Lease Finance Corp., Senior Unsecured Medium-Term Notes, Ser. R, 5.65%, due 6/1/14 | | | 2,200 | | |
| | 8,000 | | | Int'l Lease Finance Corp., Senior Unsecured Notes, 8.63%, due 9/15/15 | | | 9,000 | ñ | |
| | 2,885 | | | Int'l Lease Finance Corp., Senior Unsecured Notes, 8.75%, due 3/15/17 | | | 3,282 | ñ | |
| | 1,840 | | | Int'l Lease Finance Corp., Senior Unsecured Notes, 8.88%, due 9/1/17 | | | 2,102 | | |
| | | | 22,262 | | |
| Department Stores (0.5%) | |
| | 4,910 | | | Sears Holdings Corp., Senior Secured Notes, 6.63%, due 10/15/18 | | | 4,898 | ñ | |
| | | | | | | | | | |
| Electric - Generation (4.4%) | |
| | 8,435 | | | Calpine Corp., Senior Secured Notes, 7.25%, due 10/15/17 | | | 8,772 | ñ | |
| | 5,995 | | | Dynegy Holdings, Inc., Senior Unsecured Notes, 7.50%, due 6/1/15 | | | 4,646 | | |
| | 7,545 | | | Dynegy Holdings, Inc., Senior Unsecured Notes, 7.75%, due 6/1/19 | | | 5,150 | | |
| | 4,165 | | | Dynegy-Roseton Danskammer, Pass-Through Certificates, Ser. B, 7.67%, due 11/8/16 | | | 3,873 | | |
| | 2,835 | | | Edison Mission Energy, Senior Unsecured Notes, 7.20%, due 5/15/19 | | | 2,041 | | |
| | 7,858 | | | Edison Mission Energy, Senior Unsecured Notes, 7.63%, due 5/15/27 | | | 5,285 | | |
| | 4,791 | | | Energy Future Intermediate Holding Co. LLC, Senior Secured Notes, 10.00%, due 12/1/20 | | | 5,018 | | |
| | 2,180 | | | NRG Energy, Inc., Guaranteed Notes, 8.25%, due 9/1/20 | | | 2,311 | ñ | |
| | 4,360 | | | RRI Energy, Inc., Senior Unsecured Notes, 7.63%, due 6/15/14 | | | 4,393 | | |
| | | | 41,489 | | |
| Electric - Integrated (0.2%) | |
| | 1,690 | | | IPALCO Enterprises, Inc., Senior Secured Notes, 7.25%, due 4/1/16 | | | 1,842 | ñ | |
| See Notes to Schedule of Investments | 40 | |
| PRINCIPAL AMOUNT | | VALUE† | |
| | | | | | |
| (000's omitted) | | (000's omitted) | |
| | | | | | |
| Electronics (2.8%) | |
| $ | 4,930 | | | Advanced Micro Devices, Inc., Senior Unsecured Notes, 8.13%, due 12/15/17 | | $ | 5,325 | | |
| | 1,135 | | | Advanced Micro Devices, Inc., Senior Unsecured Notes, 7.75%, due 8/1/20 | | | 1,203 | ñ | |
| | 5,715 | | | Flextronics Int'l Ltd., Senior Subordinated Notes, 6.25%, due 11/15/14 | | | 5,822 | | |
| | 1,670 | | | Freescale Semiconductor, Inc., Guaranteed Notes, 10.13%, due 12/15/16 | | | 1,630 | | |
| | 3,490 | | | Freescale Semiconductor, Inc., Senior Secured Notes, 9.25%, due 4/15/18 | | | 3,734 | ñ | |
| | 1,290 | | | Freescale Semiconductor, Inc., Guaranteed Notes, 10.75%, due 8/1/20 | | | 1,338 | ñ | |
| | 6,570 | | | NXP BV Funding LLC, Senior Secured Notes, 9.75%, due 8/1/18 | | | 7,170 | ñ | |
| | | | 26,222 | | |
| Energy - Exploration & Production (5.0%) | |
| | 15,455 | | | ATP Oil & Gas Corp., Senior Secured Notes, 11.88%, due 5/1/15 | | | 14,103 | ñ | |
| | 5,525 | | | Chesapeake Energy Corp., Guaranteed Notes, 9.50%, due 2/15/15 | | | 6,409 | | |
| | 1,555 | | | Chesapeake Energy Corp., Guaranteed Notes, 6.63%, due 8/15/20 | | | 1,646 | | |
| | 2,345 | | | Cimarex Energy Co., Guaranteed Notes, 7.13%, due 5/1/17 | | | 2,486 | | |
| | 1,586 | | | Denbury Resources, Inc., Guaranteed Notes, 8.25%, due 2/15/20 | | | 1,768 | | |
| | 3,300 | | | Linn Energy LLC, Senior Unsecured Notes, 8.63%, due 4/15/20 | | | 3,564 | ñ | |
| | 4,445 | | | Linn Energy LLC, Guaranteed Notes, 7.75%, due 2/1/21 | | | 4,590 | ñ | |
| | 1,305 | | | Pioneer Natural Resources Co., Senior Guaranteed Notes, 5.88%, due 7/15/16 | | | 1,367 | | |
| | 1,980 | | | Quicksilver Resources, Inc., Guaranteed Notes, 11.75%, due 1/1/16 | | | 2,287 | | |
| | 8,300 | | | SandRidge Energy, Inc., Guaranteed Notes, 8.00%, due 6/1/18 | | | 8,300 | ñ | |
| | | | 46,520 | | |
| Food & Drug Retailers (1.5%) | |
| | 3,370 | | | Rite Aid Corp., Senior Secured Notes, 9.75%, due 6/12/16 | | | 3,656 | | |
| | 2,470 | | | Rite Aid Corp., Senior Secured Notes, 10.38%, due 7/15/16 | | | 2,628 | | |
| | 5,285 | | | Rite Aid Corp., Senior Secured Notes, 7.50%, due 3/1/17 | | | 5,093 | | |
| | 3,000 | | | SUPERVALU, Inc., Senior Unsecured Notes, 8.00%, due 5/1/16 | | | 3,049 | | |
| | | | 14,426 | | |
| Food - Wholesale (1.2%) | |
| | 2,395 | | | Del Monte Corp., Guaranteed Notes, 7.50%, due 10/15/19 | | | 2,629 | | |
| | 1,980 | | | Michael Foods, Inc., Senior Notes, 9.75%, due 7/15/18 | | | 2,158 | ñ | |
| | 5,745 | | | NBTY, Inc., Guaranteed Notes, 9.00%, due 10/1/18 | | | 6,104 | ñ | |
| | | | 10,891 | | |
| Forestry/Paper (0.6%) | |
| | 2,080 | | | Georgia-Pacific LLC, Guaranteed Notes, 8.25%, due 5/1/16 | | | 2,387 | ñ | |
| | 2,390 | | | PE Paper Escrow GmbH, Senior Secured Notes, 12.00%, due 8/1/14 | | | 2,772 | ñ | |
| | | | 5,159 | | |
| Gaming (4.2%) | |
| | 6,115 | | | FireKeepers Development Authority, Senior Secured Notes, 13.88%, due 5/1/15 | | | 7,170 | ñ | |
| | 2,950 | | | Harrah's Operating Co., Inc., Guaranteed Notes, 5.63%, due 6/1/15 | | | 2,198 | | |
| | 6,325 | | | Harrah's Operating Co., Inc., Guaranteed Notes, 10.75%, due 2/1/16 | | | 5,748 | | |
| | 1,920 | | | Harrah's Operating Co., Inc., Senior Secured Notes, 12.75%, due 4/15/18 | | | 1,901 | ñ | |
| | 1,840 | | | Marina District Finance Co., Inc., Senior Secured Notes, 9.50%, due 10/15/15 | | | 1,815 | ñ | |
| | 1,840 | | | MGM Mirage, Inc., Guaranteed Notes, 7.50%, due 6/1/16 | | | 1,637 | | |
| | 3,160 | | | MGM Mirage, Inc., Senior Secured Notes, 11.13%, due 11/15/17 | | | 3,634 | | |
| | 550 | | | MGM Mirage, Inc., Senior Unsecured Notes, 11.38%, due 3/1/18 | | | 570 | | |
| | 5,145 | | | MGM Mirage, Inc., Senior Secured Notes, 9.00%, due 3/15/20 | | | 5,627 | ñ | |
| See Notes to Schedule of Investments | 41 | |
| PRINCIPAL AMOUNT | | VALUE† | |
| | | | | | |
| (000's omitted) | | (000's omitted) | |
| | | | | | |
| $ | 6,491 | | | Pokagon Gaming Authority, Senior Notes, 10.38%, due 6/15/14 | | $ | 6,751 | ñ | |
| | 2,365 | | | San Pasqual Casino Development Group, Inc., Notes, 8.00%, due 9/15/13 | | | 2,294 | ñ | |
| | | | 39,345 | | |
| Gas Distribution (6.4%) | |
| | 400 | | | El Paso Corp., Senior Unsecured Notes, 7.00%, due 6/15/17 | | | 436 | | |
| | 5,150 | | | El Paso Energy Corp., Global Medium-Term Notes, 7.80%, due 8/1/31 | | | 5,510 | ØØ | |
| | 12,530 | | | Energy Transfer Equity L.P., Guaranteed Notes, 7.50%, due 10/15/20 | | | 13,658 | | |
| | 2,305 | | | Ferrellgas L.P., Senior Unsecured Notes, 6.75%, due 5/1/14 | | | 2,334 | | |
| | 3,500 | | | Ferrellgas Partners L.P., Senior Unsecured Notes, 6.75%, due 5/1/14 | | | 3,544 | | |
| | 3,355 | | | Ferrellgas Partners L.P., Senior Unsecured Notes, 9.13%, due 10/1/17 | | | 3,707 | | |
| | 950 | | | Inergy L.P., Guaranteed Notes, 8.75%, due 3/1/15 | | | 1,033 | | |
| | 2,580 | | | Inergy L.P., Guaranteed Notes, 8.25%, due 3/1/16 | | | 2,709 | | |
| | 2,100 | | | Inergy L.P., Guaranteed Notes, 7.00%, due 10/1/18 | | | 2,194 | ñ | |
| | 2,200 | | | Kinder Morgan Finance Co., Guaranteed Notes, 5.70%, due 1/5/16 | | | 2,269 | | |
| | 1,905 | | | MarkWest Energy Partners L.P., Guaranteed Notes, Ser. B, 6.88%, due 11/1/14 | | | 1,948 | | |
| | 5,140 | | | MarkWest Energy Partners L.P., Guaranteed Notes, Ser. B, 8.75%, due 4/15/18 | | | 5,641 | | |
| | 3,480 | | | Regency Energy Partners L.P., Guaranteed Notes, 6.88%, due 12/1/18 | | | 3,645 | | |
| | 12,510 | | | Sabine Pass LNG L.P., Senior Secured Notes, 7.50%, due 11/30/16 | | | 11,556 | | |
| | | | 60,184 | | |
| Health Care (2.4%) | |
| | 1,345 | | | Columbia Healthcare Corp., Senior Unsecured Notes, 7.50%, due 12/15/23 | | | 1,271 | | |
| | 1,985 | | | Columbia/HCA Corp., Senior Unsecured Notes, 7.69%, due 6/15/25 | | | 1,866 | | |
| | 1,370 | | | Columbia/HCA Corp., Senior Unsecured Notes, 7.05%, due 12/1/27 | | | 1,209 | | |
| | 5,085 | | | HCA, Inc., Secured Notes, 9.25%, due 11/15/16 | | | 5,504 | | |
| | 4,330 | | | HCA, Inc., Secured Notes, 9.63%, due 11/15/16 | | | 4,709 | | |
| | 7,135 | | | HCA, Inc., Senior Secured Notes, 8.50%, due 4/15/19 | | | 8,027 | | |
| | | | 22,586 | | |
| Health Facilities (2.3%) | |
| | 5,885 | | | Community Health Systems, Inc., Guaranteed Notes, 8.88%, due 7/15/15 | | | 6,297 | | |
| | 4,210 | | | Health Management Associates, Inc., Senior Secured Notes, 6.13%, due 4/15/16 | | | 4,336 | | |
| | 2,625 | | | LVB Acquisition, Inc., Guaranteed Notes, 10.38%, due 10/15/17 | | | 2,927 | | |
| | 1,090 | | | LVB Acquisition, Inc., Guaranteed Notes, 11.63%, due 10/15/17 | | | 1,228 | | |
| | 4,140 | | | National MENTOR Holdings, Inc., Guaranteed Notes, 11.25%, due 7/1/14 | | | 4,254 | | |
| | 2,290 | | | Tenet Healthcare Corp., Senior Secured Notes, 8.88%, due 7/1/19 | | | 2,576 | | |
| | | | 21,618 | | |
| Health Services (1.3%) | |
| | 1,045 | | | AMGH Merger Sub, Inc., Guaranteed Notes, 9.25%, due 11/1/18 | | | 1,082 | ñ | |
| | 1,965 | | | Omnicare, Inc., Guaranteed Notes, 6.88%, due 12/15/15 | | | 2,014 | | |
| | 700 | | | Service Corp. Int'l, Senior Unsecured Notes, 6.75%, due 4/1/15 | | | 737 | | |
| | 4,345 | | | Service Corp. Int'l, Senior Unsecured Notes, 7.50%, due 4/1/27 | | | 4,291 | | |
| | 3,860 | | | Warner Chilcott Co. LLC, Guaranteed Notes, 7.75%, due 9/15/18 | | | 4,014 | ñ | |
| | | | 12,138 | | |
| Hotels (1.1%) | |
| | 1,780 | | | Host Hotels & Resorts L.P., Guaranteed Notes, 6.88%, due 11/1/14 | | | 1,837 | | |
| | 1,225 | | | Host Hotels & Resorts L.P., Guaranteed Notes, Ser. O, 6.38%, due 3/15/15 | | | 1,256 | | |
| | 2,720 | | | Host Hotels & Resorts L.P., Guaranteed Notes, Ser. Q, 6.75%, due 6/1/16 | | | 2,825 | | |
| | 3,725 | | | Starwood Hotels & Resorts Worldwide, Inc., Senior Unsecured Notes, 6.75%, due 5/15/18 | | | 4,125 | | |
| | | | 10,043 | | |
| See Notes to Schedule of Investments | 42 | |
| PRINCIPAL AMOUNT | | VALUE† | |
| | | | | | |
| (000's omitted) | | (000's omitted) | |
| | | | | | |
| Investments & Misc. Financial Services (0.8%) | |
| $ | 7,230 | | | Icahn Enterprises L.P., Guaranteed Notes, 7.75%, due 1/15/16 | | $ | 7,429 | | |
| | | | | | | | | | |
| Leisure (0.9%) | |
| | 4,195 | | | Cedar Fair L.P., Guaranteed Notes, 9.13%, due 8/1/18 | | | 4,510 | ñ | |
| | 3,270 | | | Royal Caribbean Cruises Ltd., Senior Unsecured Notes, 7.00%, due 6/15/13 | | | 3,540 | | |
| | 335 | | | Royal Caribbean Cruises Ltd., Senior Unsecured Notes, 7.25%, due 6/15/16 | | | 365 | | |
| | | | 8,415 | | |
| Machinery (1.5%) | |
| | 7,830 | | | Case New Holland, Inc., Senior Notes, 7.88%, due 12/1/17 | | | 8,750 | ñ | |
| | 4,965 | | | The Manitowoc Co., Inc., Guaranteed Notes, 8.50%, due 11/1/20 | | | 5,182 | | |
| | | | 13,932 | | |
| Media - Broadcast (2.6%) | |
| | 5,925 | | | Clear Channel Communications, Inc., Senior Unsecured Notes, 5.75%, due 1/15/13 | | | 5,332 | | |
| | 3,075 | | | Sirius XM Radio, Inc., Guaranteed Notes, 8.75%, due 4/1/15 | | | 3,317 | ñ | |
| | 5,609 | | | Umbrella Acquisition, Inc., Guaranteed Notes, 9.75%, due 3/15/15 | | | 5,878 | ñ | |
| | 2,710 | | | Univision Communications, Inc., Senior Secured Notes, 7.88%, due 11/1/20 | | | 2,845 | ñ | |
| | 5 | | | XM Satellite Radio, Inc., Guaranteed Notes, 13.00%, due 8/1/13 | | | 6 | ñ | |
| | 6,895 | | | XM Satellite Radio, Inc., Senior Unsecured Notes, 7.63%, due 11/1/18 | | | 7,085 | ñ | |
| | | | 24,463 | | |
| Media - Cable (5.7%) | |
| | 5,350 | | | CCO Holdings LLC, Guaranteed Notes, 7.25%, due 10/30/17 | | | 5,524 | ñ | |
| | 2,890 | | | CCO Holdings LLC, Guaranteed Notes, 8.13%, due 4/30/20 | | | 3,121 | ñ | |
| | 7,240 | | | Cequel Communications Holdings I LLC, Senior Unsecured Notes, 8.63%, due 11/15/17 | | | 7,747 | ñ | |
| | 4,265 | | | CSC Holdings, Inc., Senior Unsecured Notes, 8.50%, due 6/15/15 | | | 4,697 | | |
| | 6,655 | | | DISH DBS Corp., Guaranteed Notes, 7.75%, due 5/31/15 | | | 7,246 | | |
| | 6,450 | | | DISH DBS Corp., Guaranteed Notes, 7.88%, due 9/1/19 | | | 7,071 | | |
| | 3,300 | | | Videotron Ltee, Guaranteed Senior Unsecured Notes, 6.88%, due 1/15/14 | | | 3,345 | | |
| | 3,615 | | | Videotron Ltee, Guaranteed Notes, 9.13%, due 4/15/18 | | | 4,071 | | |
| | 1,655 | | | Virgin Media Finance PLC, Guaranteed Notes, 9.13%, due 8/15/16 | | | 1,769 | | |
| | 6,775 | | | Virgin Media Finance PLC, Guaranteed Notes, Ser. 1, 9.50%, due 8/15/16 | | | 7,698 | | |
| | 550 | | | Virgin Media Finance PLC, Guaranteed Notes, 8.38%, due 10/15/19 | | | 613 | | |
| | | | 52,902 | | |
| Media - Services (1.3%) | |
| | 2,440 | | | Nielsen Finance LLC, Guaranteed Notes, 11.50%, due 5/1/16 | | | 2,806 | | |
| | 8,465 | | | WMG Acquisition Corp., Senior Secured Notes, 9.50%, due 6/15/16 | | | 9,121 | | |
| | | | 11,927 | | |
| Metals/Mining Excluding Steel (1.3%) | |
| | 5,930 | | | Arch Coal, Inc., Guaranteed Notes, 8.75%, due 8/1/16 | | | 6,656 | | |
| | 1,096 | | | Arch Western Finance LLC, Guaranteed Notes, 6.75%, due 7/1/13 | | | 1,107 | | |
| | 3,050 | | | FMG Resources (August 2006) Pty Ltd., Senior Notes, 7.00%, due 11/1/15 | | | 3,126 | ñ | |
| | 1,310 | | | Peabody Energy Corp., Guaranteed Notes, 7.38%, due 11/1/16 | | | 1,484 | | |
| | | | 12,373 | | |
| See Notes to Schedule of Investments | 43 | |
| PRINCIPAL AMOUNT | | VALUE† | |
| | | | | | |
| (000's omitted) | | (000's omitted) | |
| | | | | | |
| Multi - Line Insurance (0.9%) | |
| $ | 7,765 | | | American Int'l Group, Inc., Junior Subordinated Debentures, 8.18%, due 5/15/58 | | $ | 8,270 | µ | |
| | | | | | | | | | |
| Packaging (2.8%) | |
| | 2,550 | | | Ardagh Packaging Finance PLC, Senior Secured Notes, 7.38%, due 10/15/17 | | | 2,703 | ñ | |
| | 1,605 | | | Ardagh Packaging Finance PLC, Guaranteed Notes, 9.13%, due 10/15/20 | | | 1,701 | ñ | |
| | 1,295 | | | Ball Corp., Guaranteed Notes, 6.63%, due 3/15/18 | | | 1,344 | | |
| | 2,200 | | | Berry Plastics Corp., Secured Notes, 8.88%, due 9/15/14 | | | 2,239 | | |
| | 1,090 | | | Berry Plastics Corp., Senior Secured Notes, 8.88%, due 9/15/14 | | | 1,109 | | |
| | 8,285 | | | Berry Plastics Corp., Senior Secured Notes, 9.50%, due 5/15/18 | | | 8,119 | | |
| | 1,225 | | | Crown Americas LLC, Guaranteed Notes, 7.63%, due 5/15/17 | | | 1,335 | | |
| | 1,030 | | | Graham Packaging Co. L.P., Guaranteed Notes, 8.25%, due 10/1/18 | | | 1,066 | ñ | |
| | 2,170 | | | Reynolds Group Issuer, Inc., Senior Notes, 9.00%, due 4/15/19 | | | 2,254 | ñ | |
| | 3,735 | | | Reynolds Group Issuer, Inc., Senior Secured Notes, 7.13%, due 4/15/19 | | | 3,894 | ñ | |
| | | | 25,764 | | |
| Pharmaceuticals (0.6%) | |
| | 2,705 | | | Valeant Pharmaceuticals Int'l, Guaranteed Notes, 6.75%, due 10/1/17 | | | 2,823 | ñ | |
| | 2,470 | | | Valeant Pharmaceuticals Int'l, Guaranteed Notes, 7.00%, due 10/1/20 | | | 2,594 | ñ | |
| | | | 5,417 | | |
| Printing & Publishing (1.3%) | |
| | 4,295 | | | Cengage Learning Acquisitions, Inc., Senior Notes, 10.50%, due 1/15/15 | | | 4,445 | ñ | |
| | 3,410 | | | Gannett Co., Inc., Guaranteed Notes, 9.38%, due 11/15/17 | | | 3,828 | | |
| | 4,165 | | | Gannett Co., Inc., Guaranteed Notes, 7.13%, due 9/1/18 | | | 4,285 | ñ | |
| | | | 12,558 | | |
| REITs (0.8%) | |
| | 820 | | | Ventas Realty L.P., Guaranteed Notes, 6.50%, due 6/1/16 | | | 863 | | |
| | 5,425 | | | Ventas Realty L.P., Guaranteed Notes, Ser. 1, 6.50%, due 6/1/16 | | | 5,711 | | |
| | 965 | | | Ventas Realty L.P., Guaranteed Notes, 6.75%, due 4/1/17 | | | 998 | | |
| | | | 7,572 | | |
| Software/Services (3.8%) | |
| | 2,180 | | | Ceridian Corp., Guaranteed Notes, 11.25%, due 11/15/15 | | | 2,120 | | |
| | 9,330 | | | Ceridian Corp., Guaranteed Notes, 12.25%, due 11/15/15 | | | 9,073 | | |
| | 3,920 | | | Fidelity National Information Services, Inc., Guaranteed Notes, 7.63%, due 7/15/17 | | | 4,244 | ñ | |
| | 2,740 | | | Fidelity National Information Services, Inc., Guaranteed Notes, 7.88%, due 7/15/20 | | | 2,994 | ñ | |
| | 5,170 | | | Lender Processing Services, Inc., Guaranteed Notes, 8.13%, due 7/1/16 | | | 5,325 | | |
| | 1,194 | | | SunGard Data Systems, Inc., Guaranteed Notes, 9.13%, due 8/15/13 | | | 1,222 | | |
| | 2,810 | | | SunGard Data Systems, Inc., Guaranteed Notes, 10.63%, due 5/15/15 | | | 3,140 | | |
| | 6,665 | | | SunGard Data Systems, Inc., Guaranteed Notes, 10.25%, due 8/15/15 | | | 7,023 | | |
| | | | 35,141 | | |
| Specialty Retail (1.0%) | |
| | 7,845 | | | Toys "R" Us Property Co. I LLC, Guaranteed Notes, 10.75%, due 7/15/17 | | | 8,963 | | |
| | | | | | | | | | |
| Steel Producers/Products (1.1%) | |
| | 1,070 | | | Steel Dynamics, Inc., Guaranteed Notes, 6.75%, due 4/1/15 | | | 1,109 | | |
| | 1,665 | | | Steel Dynamics, Inc., Guaranteed Notes, 7.75%, due 4/15/16 | | | 1,778 | | |
| See Notes to Schedule of Investments | 44 | |
| PRINCIPAL AMOUNT | | VALUE† | |
| | | | | | |
| (000's omitted) | | (000's omitted) | |
| | | | | | |
| $ | 4,445 | | | Tube City IMS Corp., Guaranteed Notes, 9.75%, due 2/1/15 | | $ | 4,628 | | |
| | 3,330 | | | United States Steel Corp., Senior Unsecured Notes, 6.65%, due 6/1/37 | | | 2,955 | | |
| | | | 10,470 | | |
| Support - Services (2.2%) | |
| | 1,860 | | | Knowledge Learning Corp., Inc., Guaranteed Notes, 7.75%, due 2/1/15 | | | 1,869 | ñ | |
| | 2,390 | | | RSC Equipment Rental, Inc., Senior Unsecured Notes, 9.50%, due 12/1/14 | | | 2,494 | | |
| | 1,230 | | | RSC Equipment Rental, Inc., Guaranteed Notes, 10.25%, due 11/15/19 | | | 1,338 | | |
| | 2,430 | | | United Rentals N.A., Inc., Guaranteed Notes, 7.00%, due 2/15/14 | | | 2,479 | | |
| | 2,915 | | | United Rentals N.A., Inc., Guaranteed Notes, 10.88%, due 6/15/16 | | | 3,323 | | |
| | 3,005 | | | United Rentals N.A., Inc., Guaranteed Notes, 8.38%, due 9/15/20 | | | 3,050 | | |
| | 2,455 | | | West Corp., Guaranteed Notes, 11.00%, due 10/15/16 | | | 2,651 | | |
| | 3,245 | | | West Corp., Guaranteed Notes, 8.63%, due 10/1/18 | | | 3,367 | ñ | |
| | | | 20,571 | | |
| Telecom - Integrated/Services (8.4%) | |
| | 13,025 | | | Citizens Communications Corp., Senior Unsecured Notes, 9.00%, due 8/15/31 | | | 14,523 | | |
| | 1,915 | | | Dycom Investments, Inc., Guaranteed Notes, 8.13%, due 10/15/15 | | | 1,963 | | |
| | 5,360 | | | GCI, Inc., Senior Unsecured Notes, 8.63%, due 11/15/19 | | | 5,896 | | |
| | 5,355 | | | Integra Telecom Holdings, Inc., Senior Secured Notes, 10.75%, due 4/15/16 | | | 5,663 | ñ | |
| | 12,752 | | | Intelsat Bermuda Ltd., Guaranteed Notes, 11.50%, due 2/4/17 | | | 13,620 | ØØ | |
| | 1,655 | | | Intelsat Jackson Holdings Ltd., Guaranteed Notes, 8.50%, due 11/1/19 | | | 1,808 | ñ | |
| | 8,185 | | | Level 3 Financing, Inc., Guaranteed Notes, 9.25%, due 11/1/14 | | | 8,021 | | |
| | 5,680 | | | Level 3 Financing, Inc., Guaranteed Notes, 10.00%, due 2/1/18 | | | 5,439 | | |
| | 1,090 | | | PAETEC Holding Corp., Guaranteed Notes, 9.50%, due 7/15/15 | | | 1,153 | | |
| | 3,370 | | | PAETEC Holding Corp., Senior Secured Notes, 8.88%, due 6/30/17 | | | 3,631 | | |
| | 3,600 | | | Qwest Communications Int'l, Inc., Guaranteed Notes, 7.13%, due 4/1/18 | | | 3,825 | ñ | |
| | 5,350 | | | Qwest Corp., Senior Unsecured Notes, 8.38%, due 5/1/16 | | | 6,447 | | |
| | 1,585 | | | Windstream Corp., Guaranteed Notes, 8.13%, due 8/1/13 | | | 1,745 | | |
| | 4,310 | | | Windstream Corp., Guaranteed Notes, 8.63%, due 8/1/16 | | | 4,579 | | |
| | | | 78,313 | | |
| Telecom - Wireless (3.6%) | |
| | 9,985 | | | Clearwire Communications LLC, Senior Secured Notes, 12.00%, due 12/1/15 | | | 11,059 | ñ | |
| | 4,425 | | | Cricket Communications, Inc., Senior Secured Notes, 7.75%, due 5/15/16 | | | 4,768 | | |
| | 3,592 | | | MetroPCS Wireless, Inc., Guaranteed Notes, 9.25%, due 11/1/14 | | | 3,763 | | |
| | 14,700 | | | Sprint Capital Corp., Guaranteed Notes, 6.88%, due 11/15/28 | | | 13,854 | | |
| | | | 33,444 | | |
| | Total Corporate Debt Securities (Cost $834,183) | | | 896,857 | | |
| | | | | | | | | | |
| NUMBER OF SHARES | |
| | |
| Short-Term Investments (2.2%) | |
| | 20,336,655 | | | State Street Institutional Liquid Reserves Fund Institutional Class (Cost $20,337) | | | 20,337 | | |
| | | | | | | | | | |
| | Total Investments (98.5%) (Cost $855,920) | | | 918,717 | ## | |
| | | | | | | | | | |
| | Cash, receivables and other assets, less liabilities (1.5%) | | | 14,460 | | |
| | | | | | | | | | |
| | Total Net Assets (100.0%) | | $ | 933,177 | | |
| See Notes to Schedule of Investments | 45 | |
| PRINCIPAL AMOUNT | SECURITY@@ | | VALUE† | |
| | | | | | |
| (000's omitted) | | (000's omitted) | |
| | | | | | |
| Municipal Debt Securities (99.2%) | |
| Alaska (0.5%) | |
| | $ 500 | | | Anchorage G.O., Ser. 2008-A, 5.00%, due 8/1/20 | | $ | 570 | | |
| | | | | | | | | | |
| Arizona (3.9%) | |
| | 875 | | | Northern Arizona Univ. Cert. of Participation (Research Infrastructure Proj.), Ser. 2005, (AMBAC Insured), 4.00%, due 9/1/14 | | | 928 | | |
| | 2,000 | | | Pima Co. Cert. of Participation, Ser. 2009, 4.00%, due 6/1/12 | | | 2,081 | | |
| | 1,550 | | | Salt River Proj. Agricultural Imp. & Pwr. Dist. Elec. Sys. Ref. Rev., Ser. 2002-A, 5.25%, due 1/1/18 | | | 1,642 | | |
| | | | 4,651 | | |
| California (12.1%) | |
| | 450 | | | California Ind. G.O., Ser. 2009-B, 5.00%, due 7/1/20 | | | 514 | | |
| | 1,000 | | | California Pub. Works Board Lease Rev. Dept. of Mental Hlth. (Coalinga St. Hosp.), Ser. 2004-A, 5.50%, due 6/1/21 | | | 1,050 | | |
| | 2,000 | | | California St. G.O., Ser. 2010, 5.25%, due 3/1/30 | | | 2,112 | | |
| | 200 | | | California St. G.O. (Muni. Sec. Trust Receipts), Ser. 2001-SGA135, (AMBAC Insured), 0.31%, due 12/1/30 | | | 200 | ñµa | |
| | 850 | | | Folsom Spec. Tax Ref. (Comm. Facs. Dist. Number 2), Ser. 2010, 5.00%, due 12/1/19 | | | 902 | | |
| | 1,000 | | | Los Angeles Dept. of Wtr. & Pwr. Sys. Rev., Ser. 2009-B, 5.25%, due 7/1/23 | | | 1,157 | ØØ | |
| | 1,000 | | | Sacramento City Fin. Au. Ref. Rev. (Master Lease Prog. Facs.), Ser. 2006-E, (AMBAC Insured), 5.25%, due 12/1/24 | | | 1,066 | | |
| | 905 | | | San Diego Pub. Fac. Fin. Au. Lease Ref. Rev. (Ballpark), Ser. 2007-A, (AMBAC Insured), 5.25%, due 2/15/21 | | | 960 | ñ | |
| | 1,500 | | | San Diego Pub. Facs. Fin. Au. Sr. Swr. Ref. Rev., Ser. 2009-B, 5.00%, due 5/15/21 | | | 1,718 | | |
| | 630 | | | San Francisco City & Co. Redev. Agcy. Lease Rev. Cap. Appreciation (George R. Moscone Convention Ctr.), Ser. 1992, 0.00%, due 7/1/12 | | | 619 | | |
| | 1,500 | | | San Jose Redev. Agcy. Tax Allocation, Ser. 2005-A, (National Public Finance Guarantee Corp. Insured), 5.00%, due 8/1/19 | | | 1,581 | | |
| | 1,125 | | | Santa Clara Co. East Side Union High Sch. Dist. G.O. (Election 2008), Ser. 2010-B, (Assured Guaranty Insured), 5.00%, due 8/1/23 | | | 1,232 | | |
| | 1,300 | | | Walnut Pub. Fin. Au. Tax Allocation Rev. (Walnut Imp. Proj.), Ser. 2002, (AMBAC Insured), 5.38%, due 9/1/22 | | | 1,330 | ØØ | |
| | | | 14,441 | | |
| Colorado (4.3%) | |
| | 2,600 | | | Colorado Ed. & Cultural Facs. Au. Rev. (Nat'l Jewish Federal Board Prog.), Ser. 2009-C7, (LOC: U.S. Bank), 0.28%, due 3/1/39 | | | 2,600 | µß | |
| | 1,645 | | | Colorado Wtr. Res. & Pwr. Dev. Au. Clean Wtr. Rev., Ser. 2010-A, 4.00%, due 9/1/25 | | | 1,730 | | |
| | 730 | | | Denver City & Co. Cert. of Participation (Wastewater/ Rosyn Properties), Ser. 2010-B, 3.00%, due 12/1/16 | | | 767 | | |
| | | | 5,097 | | |
| District of Columbia (2.5%) | |
| | 950 | | | Dist. of Columbia Ref. Rev. (The American Univ.), Ser. 2008, (LOC: Bank of America), 0.30%, due 10/1/38 | | | 950 | µß | |
| | 1,865 | | | Dist. of Columbia Univ. Ref. Rev. (Georgetown Univ.), Ser. 2009-A, 5.00%, due 4/1/21 | | | 2,023 | ß | |
| | | | 2,973 | | |
| See Notes to Schedule of Investments | 46 | |
| PRINCIPAL AMOUNT | SECURITY@@ | | VALUE† | |
| | | | | | |
| (000's omitted) | | | | (000's omitted) | |
| | | | | | |
| Florida (2.5%) | |
| | $ 1,255 | | | Port St. Lucie Research Facs. Rev. (Oregon Hlth. and Science Univ. Vaccine and Gene | | $ | 1,326 | ß | |
| | | Therapy Institute Florida Corp. Proj.), Ser. 2010, 5.00%, due 5/1/22 | | | | | |
| | 1,580 | | | Port St. Lucie Research Facs. Rev. (Oregon Hlth. and Science Univ. Vaccine and Gene Therapy Institute Florida Corp. Proj.), Ser. 2010, 5.00%, due 5/1/23 | | | 1,654 | ß | |
| | | | 2,980 | | |
| Georgia (2.0%) | |
| | 1,000 | | | Gwinnett Co. Sch. Dist. G.O. Ref., Ser. 2010, 5.00%, due 2/1/25 | | | 1,217 | | |
| | 1,000 | | | Gwinnett Co. Sch. Dist. G.O. Ref., Ser. 2010, 5.00%, due 2/1/27 | | | 1,172 | | |
| | | | 2,389 | | |
| Illinois (10.4%) | |
| | 2,000 | | | Chicago G.O., Ser. 2010-A, 5.00%, due 12/1/15 | | | 2,295 | | |
| | 1,000 | | | Chicago O'Hare Int'l Arpt. Gen. Arpt. Third Lien Ref. Rev., Ser. 2005-B, (National Public Finance Guarantee Corp. Insured), 5.25%, due 1/1/17 | | | 1,135 | | |
| | 1,600 | | | Cook Co. Sch. Dist. Number 144 G.O. (Ltd. Sch.), Ser. 2010-A, (AGM Insured), 5.25%, due 12/1/27 | | | 1,680 | | |
| | 600 | | | Illinois Fin. Au. Rev. (Univ. of Chicago), Ser. 2007, 5.00%, due 7/1/22 | | | 664 | ß | |
| | 1,650 | | | Illinois St. (Build Illinois), Ser. 2010, 5.00%, due 6/15/17 | | | 1,888 | ØØ | |
| | 2,000 | | | Illinois St. G.O., Ser. 1997, (National Public Finance Guarantee Corp. Insured), 5.25%, due 7/1/22 | | | 2,005 | | |
| | 1,060 | | | Illinois St. G.O., Ser. 2007, (National Public Finance Guarantee Corp. Insured), 5.00%, due 4/1/20 | | | 1,127 | | |
| | 1,500 | | | Illinois St. G.O. Ref., Ser. 2010, (AGM Insured), 5.00%, due 1/1/15 | | | 1,646 | | |
| | | | 12,440 | | |
| Indiana (2.4%) | |
| | 940 | | | Indiana Muni. Pwr. Agcy. Pwr. Supply Sys. Ref. Rev., Ser. 2010-B, 5.00%, due 1/1/22 | | | 1,055 | | |
| | 1,615 | | | Indiana St. Fin. Au. Rev. (St. Revolving Fund Prog.), Ser. 2009-A1, 5.00%, due 2/1/21 | | | 1,856 | | |
| | | | 2,911 | | |
| Iowa (1.2%) | |
| | 1,345 | | | Iowa Fin. Au. Hlth. Care Fac. Rev. (Genesis Hlth. Sys.), Ser. 2010, 5.00%, due 7/1/13 | | | 1,476 | ß | |
| | | | | | | | | | |
| Kansas (3.2%) | |
| | 1,000 | | | Kansas St. Dev. Fin. Au. Hlth. Facs. Rev. (Hays Med. Ctr., Inc.), Ser. 2010-Q, 5.00%, due 5/15/35 | | | 981 | Ø | |
| | 1,740 | | | Kansas St. Dev. Fin. Au. Rev. (Dept. of Commerce Impact Prog.), Ser. 2009, 5.00%, due 6/1/16 | | | 2,009 | | |
| | 750 | | | Wichita Hosp. Rev. (Facs. Imp.), Ser. 2009-IIIA, 4.50%, due 11/15/12 | | | 795 | ß | |
| | | | 3,785 | | |
| Louisiana (0.5%) | |
| | 570 | | | Terrebonne Parish LA Hosp. Svc. Dist. Number 1 Hosp. Ref. Rev. (Gen. Med. Ctr. Proj.), Ser. 2010, 4.00%, due 4/1/15 | | | 595 | | |
| | | | | | | | | | |
| Massachusetts (5.9%) | |
| | 2,000 | | | Massachusetts Bay Trans. Au. Rev. (Assessment), Ser. 2006-A, 5.25%, due 7/1/30 | | | 2,393 | | |
| | 1,000 | | | Massachusetts Bay Trans. Au. Sr. Sales Tax Rev., Ser. 2005-B, (National Public Finance Guarantee Corp. Insured), 5.50%, due 7/1/24 | | | 1,233 | | |
| | 1,000 | | | Massachusetts Bay Trans. Au. Sr. Sales Tax Rev., Ser. 2006-A, 5.25%, due 7/1/34 | | | 1,170 | | |
| | 1,225 | | | Massachusetts St. HFA Hsg. Rev. (Single Family), Ser. 2009-144, 3.95%, due 6/1/18 | | | 1,252 | | |
| | 500 | | | Massachusetts St. Hlth. & Ed. Fac. Au. Rev. (Berklee College of Music), Ser. 2007-A, 5.00%, due 10/1/15 | | | 573 | ß | |
| | 440 | | | Massachusetts St. Turnpike Au. Western Turnpike Rev., Ser. 1997-A, (National Public Finance Guarantee Corp. Insured), 5.55%, due 1/1/17 | | | 442 | | |
| | | | 7,063 | | |
| See Notes to Schedule of Investments | 47 | |
| PRINCIPAL AMOUNT | SECURITY@@ | | VALUE† | |
| | | | | | |
| (000's omitted) | | | | (000's omitted) | |
| | | | | | |
| Michigan (3.8%) | |
| $ | 1,000 | | | Michigan St. Hsg. Dev. Au., Ser. 2009-B, 3.10%, due 6/1/11 | | $ | 1,004 | | |
| | 1,000 | | | Michigan St. Trunk Line Ref. Rev., Ser. 2009, 5.00%, due 11/1/19 | | | 1,162 | | |
| | 2,160 | | | Saginaw Valley St. Univ. Rev., Ser. 2010-A, 5.00%, due 7/1/13 | | | 2,350 | | |
| | | | 4,516 | | |
| Minnesota (1.4%) | |
| | 1,500 | | | Becker PCR (No. St. Pwr. Co.), Ser. 1992-A, 8.50%, due 3/1/19 | | | 1,702 | ß | |
| | | | | | | | | | |
| Mississippi (1.8%) | |
| | 1,045 | | | Mississippi Dev. Bank Spec. Oblig. (Dept. Corrections), Ser. 2010-D, 5.00%, due 8/1/22 | | | 1,151 | | |
| | 790 | | | Mississippi St. G.O. Ref., Ser. 2003-A, 5.25%, due 11/1/20 | | | 955 | | |
| | | | 2,106 | | |
| Missouri (1.8%) | |
| | 1,040 | | | Missouri St. Dev. Fin. Board Infrastructure Facs. Ref. Rev. Wtr. Sys., Ser. 2009-E, 4.00%, due 11/1/15 | | | 1,109 | | |
| | 1,000 | | | Missouri St. Hlth. & Ed. Fac. Au. Rev. (Children's Mercy Hosp.), Ser. 2009, 5.13%, due 5/15/24 | | | 1,057 | ß | |
| | | | 2,166 | | |
| Nebraska (1.5%) | |
| | 1,520 | | | Omaha Pub. Fac. Corp. Lease Rev. (Baseball Stadium Proj.), Ser. 2009, 5.00%, due 6/1/22 | | | 1,729 | | |
| | | | | | | | | | |
| Nevada (2.3%) | |
| | 1,345 | | | Clark Co. G.O. (Limited Tax Bond Bank), Ser. 2001, (National Public Finance Guarantee Corp. Insured), 5.50%, due 6/1/13 | | | 1,383 | | |
| | 450 | | | Las Vegas Convention & Visitors Au. Rev., Ser. 1999, (AMBAC Insured), 6.00%, due 7/1/11 | | | 451 | | |
| | 750 | | | Las Vegas Redev. Agcy. Tax Increment Rev., Ser. 2009-A, 7.50%, due 6/15/23 | | | 875 | | |
| | | | 2,709 | | |
| New Jersey (3.7%) | |
| | 790 | | | New Jersey St. Higher Ed. Assist. Au. Std. Loan Ref. Rev., Ser. 2010-1A, 4.75%, due 12/1/23 | | | 809 | | |
| | 1,000 | | | New Jersey St. Turnpike Au. Turnpike Rev., Ser. 2009-H, 5.00%, due 1/1/20 | | | 1,149 | | |
| | 1,000 | | | New Jersey Trans. Trust Fund Au. Trans. Sys. Rev., Ser. 2006-A, 5.25%, due 12/15/19 | | | 1,154 | | |
| | 1,255 | | | Newark G.O., Ser. 2010-A, 4.00%, due 10/1/21 | | | 1,286 | | |
| | | | 4,398 | | |
| New Mexico (1.9%) | |
| | 1,000 | | | Albuquerque Muni. Sch. Dist. Number 012 (Sch. Bldg.) G.O., Ser. 2008-B, 4.50%, due 8/1/19 | | | 1,110 | | |
| | 1,000 | | | New Mexico Fin. Au. St. Trans. Rev. Sr. Lien, Ser. 2004-A, (National Public Finance Guarantee Corp. Insured), 5.25%, due 6/15/21 Pre-Refunded 6/15/14 | | | 1,154 | | |
| | | | 2,264 | | |
| New York (8.6%) | |
| | 400 | | | Long Island Pwr. Au. Elec. Sys. Rev., Ser. 2006-F, (National Public Finance Guarantee Corp. Insured), 5.00%, due 5/1/19 | | | 446 | | |
| | 3,640 | | | New York St. Dorm. Au. Rev., Ser. 2002-B, 5.25%, due 11/15/23 Putable 5/15/12 | | | 3,878 | µ | |
| | 1,500 | | | New York St. Dorm. Au. Rev. Non St. Supported Debt (Mtge. United Hlth. Hosp.), Ser. 2009, (FHA Insured), 4.00%, due 8/1/14 | | | 1,598 | ß | |
| | 1,030 | | | New York St. Env. Fac. Corp. Spec. Oblig. Rev. Ref. (Riverbank St. Park), Ser. 1996, (AMBAC Insured), 6.25%, due 4/1/12 | | | 1,079 | | |
| See Notes to Schedule of Investments | 48 | |
| PRINCIPAL AMOUNT | SECURITY@@ | | VALUE† | |
| | | | | | |
| (000's omitted) | | | | (000's omitted) | |
| | | | | | |
| $ | 250 | | | New York St. Urban Dev. Corp. Ref. Rev. (Correctional Facs.), Ser. 1994-A, (AGM Insured), | | $ | 267 | | |
| | | 5.50%, due 1/1/14 | | | | | |
| | 750 | | | New York St. Urban Dev. Corp. Rev. (St. Personal Income Tax), Ser. 2009-A1, 5.00%, due 12/15/19 | | | 892 | | |
| | 2,000 | | | Port Au. New York & New Jersey Rev. (One Hundred Fifty-Third), Ser. 2008, 4.50%, due 7/15/27 | | | 2,113 | | |
| | | | 10,273 | | |
| North Carolina (0.9%) | |
| | 650 | | | North Carolina St. Cap. Imp. Ltd. Oblig. (Annual Appropriation), Ser. 2009-A, 5.00%, due 5/1/19 | | | 765 | | |
| | 295 | | | Western Carolina Univ. Research & Dev. Corp. Cert. of Participation (Western Carolina Univ. Std. Hsg.), Ser. 2008, (Assured Guaranty Insured), 5.25%, due 6/1/20 | | | 339 | ß | |
| | | | 1,104 | | |
| Ohio (0.5%) | |
| | 530 | | | North Olmsted G.O., Ser. 1996, (AMBAC Insured), 6.20%, due 12/1/11 | | | 546 | | |
| | | | | | | | | | |
| Oregon (1.1%) | |
| | 1,240 | | | Oregon St. Hsg. & Comm. Svc. Dept. Mtge. Rev. (Single Family Mtge. Prog.), Ser. 2005-D, 4.40%, due 7/1/19 | | | 1,273 | | |
| | | | | | | | | | |
| Pennsylvania (1.4%) | |
| | 1,285 | | | Pennsylvania HFA Single Family Mtge. Rev., Ser. 2010-109, 2.45%, due 4/1/16 | | | 1,283 | | |
| | 340 | | | Pennsylvania St. Pub. Sch. Bldg. Au. College Rev. (Montgomery Co. Comm. College), Ser. 2008, (AGM Insured), 5.00%, due 5/1/21 | | | 385 | ß | |
| | | | 1,668 | | |
| Puerto Rico (2.0%) | |
| | 500 | | | Puerto Rico Elec. Pwr. Au. Pwr. Rev., Ser. 2010-XX, 5.25%, due 7/1/35 | | | 513 | | |
| | 1,745 | | | Puerto Rico Elec. Pwr. Au. Pwr. Rev., Ser. 2010-XX, 5.25%, due 7/1/40 | | | 1,819 | | |
| | | | 2,332 | | |
| Rhode Island (1.0%) | |
| | 1,200 | | | Rhode Island St. Std. Loan Au. Std. Loan Rev. (Sr. Prog.), Ser. 2010-A, 4.40%, due 12/1/19 | | | 1,222 | | |
| | | | | | | | | | |
| South Carolina (0.1%) | |
| | 200 | | | Piedmont Muni. Pwr. Agcy. Elec. Rev. (Cap. Appreciation), Ser. 1988-A, (AMBAC Insured), 0.00%, due 1/1/13 | | | 168 | | |
| | | | | | | | | | |
| South Dakota (0.8%) | |
| | 1,000 | | | South Dakota St. Hlth. & Ed. Facs. Au. Rev. (Reg. Hlth.), Ser. 2010, 4.38%, due 9/1/24 | | | 1,004 | ß | |
| | | | | | | | | | |
| Tennessee (1.5%) | |
| | 1,600 | | | Metro. Nashville Arpt. Au. Ref. Rev. Impt., Ser. 2010-B, (AGM Insured), 4.00%, due 7/1/15 | | | 1,757 | | |
| | | | | | | | | | |
| Texas (7.2%) | |
| | 500 | | | Dallas Fort Worth Int'l Arpt. Ref. Rev., Ser. 2009-A, 5.00%, due 11/1/24 | | | 537 | | |
| | 750 | | | Fort Bend Independent Sch. Dist. Ref. G.O. (Sch. Bldg.), Ser. 2008, (PSF Insured), 5.00%, due 8/15/21 | | | 863 | | |
| | 1,000 | | | Grapevine Combination Tax & Tax Increment Reinvestment Zone Rev. Cert. of Oblig. G.O., Ser. 2000, (National Public Finance Guarantee Corp. Insured), 5.63%, due 8/15/15 | | | 1,003 | | |
| See Notes to Schedule of Investments | 49 | |
| PRINCIPAL AMOUNT | SECURITY@@ | | VALUE† | |
| | | | | | |
(000's omitted) | | | | (000's omitted) | |
| | $ 1,000 | | | Harris Co. Cultural Ed. Fac. Fin. Corp. Ref. Rev. (Methodist Hosp. Sys.), Ser. 2009-B1, | | $ | 1,067 | µß | |
| | | | | 5.00%, due 12/1/28 Putable 6/1/12 | | | | | |
| | 500 | | | Harris Co. Cultural Ed. Fac. Fin. Corp. Rev. (Methodist Hosp. Sys.), Ser. 2008-B, 5.25%, due 12/1/17 | | | 570 | ß | |
| | 825 | | | Houston Ref. G.O. (Pub. Imp.), Ser. 2009-A, 4.00%, due 3/1/16 | | | 925 | | |
| | 1,000 | | | Houston Wtr. & Swr. Sys. Jr. Lien Ref. Rev., Ser. 2001-B, (National Public Finance Guarantee Corp. Insured), 5.50%, due 12/1/24 | | | 1,277 | | |
| | 450 | | | Mesquite Independent Sch. Dist. G.O. (Sch. Bldg.), Ser. 2009, 5.00%, due 8/15/17 | | | 527 | | |
| | 590 | | | Mesquite Independent Sch. Dist. G.O. (Sch. Bldg.), Ser. 2009, 5.00%, due 8/15/18 | | | 696 | | |
| | 1,000 | | | Weatherford Independent Sch. Dist. G.O. (Sch. Bldg.), Ser. 2002-A, (PSF Insured), 5.00%, due 2/1/12 | | | 1,057 | | |
| | | | 8,522 | | |
| Virginia (1.4%) | |
| | 1,690 | | | Virginia St. Hsg. Dev. Au. Homeownership Mtge. Rev., Ser. 2010-B, 2.10%, due 9/1/15 | | | 1,688 | | |
| | | | | | | | | | |
| Washington (1.8%) | |
| | 2,000 | | | Energy Northwest Elec. Ref. Rev. (Proj. Number 1), Ser. 2002-B, (National Public Finance Guarantee Corp. Insured), 6.00%, due 7/1/17 | | | 2,169 | | |
| | | | | | | | | | |
| Wisconsin (1.3%) | |
| | 500 | | | Wisconsin St. G.O., Ser. 2002-C, (National Public Finance Guarantee Corp. Insured), 5.25%, due 5/1/14 Pre-Refunded 5/1/12 | | | 536 | | |
| | 1,000 | | | Wisconsin St. Hlth. & Ed. Fac. Au. Rev. (Marquette Univ.), Ser. 1998, (National Public Finance Guarantee Corp. Insured), 5.25%, due 6/1/13 | | | 1,003 | ß | |
| | | | 1,539 | | |
| | Total Investments (99.2%) (Cost $114,935) | | | 118,226 | ## | |
| | | | | | | | | | |
| | Cash, receivables and other assets, less liabilities (0.8%) | | | 910 | | |
| | | | | | | | | | |
| | Total Net Assets (100.0%) | | $ | 119,136 | | |
| See Notes to Schedule of Investments | 50 | |
| PRINCIPAL AMOUNT | | | VALUE† | |
| | | | | | |
| (000's omitted) | | | | (000's omitted) | |
| | | | | | |
| U.S. Treasury Securities-Backed by the Full Faith and Credit of the U.S. Government (27.6%) | |
| | $ 3,550 | | | U.S. Treasury Notes, 4.75%, due 3/31/11 | | $ | 3,617 | | |
| | 6,200 | | | U.S. Treasury Notes, 1.00%, due 9/30/11 | | | 6,242 | | |
| | 5,105 | | | U.S. Treasury Notes, 3.88%, due 10/31/12 | | | 5,468 | | |
| | 2,655 | | | U.S. Treasury Notes, 2.00%, due 11/30/13 | | | 2,774 | | |
| | | | | | | | | | |
| | Total U.S. Treasury Securities-Backed by the Full Faith and Credit of the U.S. Government (Cost $17,944) | | | 18,101 | | |
| | | | | | | | | | |
| U.S. Government Agency Securities (4.0%) | |
| | 1,325 | | | Citigroup Funding, Inc., Guaranteed FDIC Floating Rate Medium-Term Notes, 0.59%, due 3/30/12 | | | 1,334 | µ@ | |
| | 1,275 | | | Wells Fargo & Co., Guaranteed FDIC Floating Rate Notes, 0.51%, due 6/15/12 | | | 1,280 | µ@ | |
| | | | | | | | | | |
| | Total U.S. Government Agency Securities (Cost $2,600) | | | 2,614 | | |
| | | | | | | | | | |
| Mortgage-Backed Securities (35.8%) | |
| | | | |
| Adjustable Alt-A Mixed Balance (0.9%) | |
| | 808 | | | Countrywide Home Loan Mortgage Pass-Through Trust, Ser. 2006-HYB3, Class 1A1A, 3.18%, due 5/20/36 | | | 573 | µ | |
| | | | | | | | | | |
| Adjustable Alt-B Mixed Balance (0.8%) | |
| | 676 | | | Lehman XS Trust, Floating Rate, Ser. 2005-1, Class 2A1, 1.76%, due 7/25/35 | | | 506 | µ | |
| | | | | | | | | | |
| Adjustable Conforming Balance (1.8%) | |
| | 1,640 | | | Adjustable Rate Mortgage Trust, Ser. 2005-10, Class 4A1, 3.14%, due 1/25/36 | | | 1,190 | µ | |
| | | | | | | | | | |
| Adjustable Jumbo Balance (3.9%) | |
| | 1,589 | | | GMAC Mortgage Corp. Loan Trust, Ser. 2006-AR1, Class 1A1, 4.98%, due 4/19/36 | | | 1,289 | µ | |
| | 1,500 | | | Wells Fargo Mortgage Backed Securities Trust, Ser. 2005-AR16, Class 4A2, 2.89%, due 10/25/35 | | | 1,273 | µ | |
| | | 2,562 | | |
| Adjustable Mixed Balance (3.8%) | |
| | 1,126 | | | Credit Suisse First Boston Mortgage Securities Corp., Ser. 2004-AR4, Class 2A1, 2.84%, due 5/25/34 | | | 1,012 | µ | |
| | 1,589 | | | First Horizon Mortgage Pass-Through Trust, Ser. 2005-AR5, Class 2A1, 2.99%, due 11/25/35 | | | 1,394 | µ | |
| | 185 | | | Harborview Mortgage Loan Trust, Ser. 2004-4, Class 3A, 1.38%, due 6/19/34 | | | 122 | µ | |
| | | 2,528 | | |
| Commercial Mortgage-Backed (16.3%) | |
| | 1,825 | | | Bear Stearns Commercial Mortgage Securities, Inc., Ser. 2005-PWR8, Class AAB, 4.58%, due 6/11/41 | | | 1,907 | | |
| | 1,025 | | | Commercial Mortgage Pass-Through Certificates, Ser. 2003-LB1A, Class C, 4.23%, due 6/10/38 | | | 1,046 | | |
| | 1,500 | | | Credit Suisse Mortgage Capital Certificates, Ser. 2007-C2, Class A2, 5.45%, due 1/15/49 | | | 1,539 | | |
| | 600 | | | GE Capital Commercial Mortgage Corp., Ser. 2002-2A, Class A2, 4.97%, due 8/11/36 | | | 619 | | |
| | 1,133 | | | GMAC Commercial Mortgage Securities, Inc., Ser. 2004-C3, Class AAB, 4.70%, due 12/10/41 | | | 1,206 | | |
| | 188 | | | LB-UBS Commercial Mortgage Trust, Ser. 2006-C3, Class A1, 5.48%, due 3/15/32 | | | 189 | | |
| | 1,500 | | | LB-UBS Commercial Mortgage Trust, Ser. 2003-C1, Class C, 4.50%, due 12/15/36 | | | 1,542 | | |
| | 875 | | | LB-UBS Commercial Mortgage Trust, Ser. 2003-C7, Class C, 5.02%, due 7/15/37 | | | 923 | µ | |
| | 1,615 | | | Wachovia Bank Commercial Mortgage Trust, Ser. 2003-C6, Class D, 5.13%, due 8/15/35 | | | 1,681 | | |
| | | 10,652 | | |
| See Notes to Schedule of Investments | 51 | |
| PRINCIPAL AMOUNT | | VALUE† | |
| | | | | | |
| (000's omitted) | | (000's omitted) | |
| | | | | | |
| Mortgage-Backed Non-Agency (4.0%) | |
| $ | 692 | | | Countrywide Home Loans, Ser. 2005-R2, Class 2A4, 8.50%, due 6/25/35 | | $ | 631 | ñ | |
| | 1,612 | | | GSMPS Mortgage Loan Trust, Ser. 2005-RP2, Class 1A4, 8.50%, due 3/25/35 | | | 1,631 | ñ | |
| | 343 | | | GSMPS Mortgage Loan Trust, Ser. 2005-RP3, Class 1A4, 8.50%, due 9/25/35 | | | 333 | ñ | |
| | | 2,595 | | |
| Fannie Mae (1.3%) | |
| | 759 | | | Whole Loan, Ser. 2004-W8, Class PT, 11.01%, due 6/25/44 | | | 860 | µ | |
| Freddie Mac (3.0%) | |
| | 7 | | | ARM Certificates, 1.88%, due 1/1/17 | | | 7 | µ | |
| | 986 | | | Pass-Through Certificates, 8.00%, due 11/1/26 | | | 1,135 | | |
| | 715 | | | Pass-Through Certificates, 8.50%, due 10/1/30 | | | 837 | | |
| | | 1,979 | | |
| Government National Mortgage Association (0.0%) | |
| | 6 | | | Pass-Through Certificates, 7.00%, due 4/15/11 | | | 7 | | |
| | 7 | | | Pass-Through Certificates, 12.00%, due 12/15/12 & 3/15/14 | | | 7 | | |
| | | 14 | | |
| | Total Mortgage-Backed Securities (Cost $25,206) | | | 23,459 | | |
| | | | | | | | | | |
| Corporate Debt Securities (23.2%) | |
Banks (8.2%) | | | |
| | 750 | | | Bear Stearns Cos. LLC, Senior Unsecured Notes, 5.35%, due 2/1/12 | | | 792 | | |
| | 325 | | | Bear Stearns Cos. LLC, Senior Unsecured Medium-Term Notes, Ser. B, 6.95%, due 8/10/12 | | | 358 | | |
| | 1,150 | | | Citigroup, Inc., Senior Unsecured Notes, 6.00%, due 12/13/13 | | | 1,272 | | |
| | 1,000 | | | Goldman Sachs Group, Inc., Senior Unsecured Notes, 5.30%, due 2/14/12 | | | 1,053 | | |
| | 770 | | | Merrill Lynch & Co., Inc., Senior Unsecured Medium-Term Notes, Ser. C, 6.05%, due 8/15/12 | | | 821 | | |
| | 1,000 | | | Morgan Stanley, Senior Unsecured Global Medium-Term Notes, Ser. F, 5.75%, due 8/31/12 | | | 1,080 | | |
| | | 5,376 | | |
| Beverages (1.0%) | |
| | 575 | | | Anheuser-Busch Cos., Inc., Guaranteed Unsecured Notes, 4.95%, due 1/15/14 | | | 629 | | |
Diversified Financial Services (4.6%) | |
| | 945 | | | American Express Credit Corp., Senior Unsecured Medium-Term Notes, Ser. C, 5.88%, due 5/2/13 | | | 1,040 | | |
| | 380 | | | Caterpillar Financial Services Corp., Unsecured Medium-Term Notes, Ser. F, 4.70%, due 3/15/12 | | | 400 | | |
| | 175 | | | General Electric Capital Corp., Senior Unsecured Global Medium-Term Notes, 5.00%, due 4/10/12 | | | 185 | | |
| | 1,200 | | | General Electric Capital Corp., Senior Unsecured Notes, 5.90%, due 5/13/14 | | | 1,364 | | |
| | | 2,989 | | |
| Food (1.6%) | |
| | 965 | | | Kraft Foods, Inc., Senior Unsecured Notes, 6.25%, due 6/1/12 | | | 1,046 | | |
| See Notes to Schedule of Investments | 52 | |
| PRINCIPAL AMOUNT | | | VALUE† | |
| | | | | | |
| (000's omitted) | | | | (000's omitted) | |
| | | | | | |
| Media (3.1%) | |
| $ | 600 | | | Comcast Cable Communications LLC, Guaranteed Notes, 6.75%, due 1/30/11 | | $ | 609 | | |
| | 525 | | | NBC Universal, Inc., Senior Unsecured Notes, 2.10%, due 4/1/14 | | | 532 | ñ | |
| | 850 | | | Time Warner Cable, Inc., Guaranteed Notes, 5.40%, due 7/2/12 | | | 909 | | |
| | | 2,050 | | |
| Office/Business Equipment (1.0%) | |
| | 650 | | | Xerox Corp., Senior Unsecured Notes, 5.50%, due 5/15/12 | | | 690 | | |
| | | | | | | | | | |
| Oil & Gas (0.7%) | |
| | 425 | | | XTO Energy, Inc., Senior Unsecured Notes, 5.90%, due 8/1/12 | | | 464 | | |
| | | | | | | | | | |
| Retail (1.1%) | |
| | 625 | | | Home Depot, Inc., Senior Unsecured Notes, 5.25%, due 12/16/13 | | | 696 | | |
| | | | | | | | | | |
| Telecommunications (1.9%) | |
| | 560 | | | Telecom Italia Capital SA, Guaranteed Notes, 5.25%, due 11/15/13 | | | 609 | | |
| | 645 | | | Telefonica Emisiones SAU, Guaranteed Notes, 2.58%, due 4/26/13 | | | 662 | | |
| | | 1,271 | | |
| Total Corporate Debt Securities (Cost $14,897) | | | 15,211 | | |
Asset-Backed Securities (8.3%) | |
| | 400 | | | ACE Securities Corp. Home Equity Loan Trust, Ser. 2006-OP1, Class A2C, 0.41%, due 4/25/36 | | | 256 | µ | |
| | 676 | | | ACE Securities Corp. Home Equity Loan Trust, Ser. 2006-ASP5, Class A2B, 0.39%, due 10/25/36 | | | 507 | µ | |
| | 400 | | | Bear Stearns Asset Backed Securities Trust, Ser. 2006-HE9, Class 1A2, 0.41%, due 11/25/36 | | | 215 | µ | |
| | 528 | | | Carrington Mortgage Loan Trust, Ser. 2006-OPT1, Class A3, 0.44%, due 2/25/36 | | | 476 | µ | |
| | 850 | | | Carrington Mortgage Loan Trust, Ser. 2007-FRE1, Class A3, 0.52%, due 2/25/37 | | | 384 | µ | |
| | 450 | | | Countrywide Asset-Backed Certificates Trust, Ser. 2006-3, Class 2A2, 0.44%, due 6/25/36 | | | 391 | µ | |
| | 271 | | | Countrywide Asset-Backed Certificates Trust, Ser. 2006-5, Class 2A2, 0.44%, due 8/25/36 | | | 236 | µ | |
| | 488 | | | Countrywide Asset-Backed Certificates Trust, Ser. 2006-6, Class 2A2, 0.44%, due 9/25/36 | | | 405 | µ | |
| | 1,100 | | | Honda Auto Receivables Owner Trust, Ser. 2010-3, Class A3, 0.70%, due 4/21/14 | | | 1,100 | | |
| | 137 | | | Impac Secured Assets Corp., Ser. 2006-3, Class A4, 0.35%, due 11/25/36 | | | 126 | µ | |
| | 413 | | | Knollwood CDO Ltd., Ser. 2006-2A, Class A2J, 0.71%, due 7/13/46 | | | 0 | #µ | |
| | 427 | | | Residential Asset Mortgage Products, Inc., Ser. 2006-RS1, Class AI2, 0.49%, due 1/25/36 | | | 317 | µ | |
| | 1,100 | | | Soundview Home Equity Loan Trust, Ser. 2006-OPT3, Class 2A3, 0.43%, due 6/25/36 | | | 901 | µ | |
| | 159 | | | Structured Asset Investment Loan Trust, Ser. 2006-3, Class A4, 0.35%, due 6/25/36 | | | 158 | µ | |
| | | | | | | | | | |
| | Total Asset-Backed Securities (Cost $7,140) | | | 5,472 | | |
| | | | | | | | | | |
| NUMBER OF SHARES | |
| | |
| Short-Term Investments (2.4%) | |
| | 1,581,999 | | | State Street Institutional Liquid Reserves Fund Institutional Class (Cost $1,582) | | | 1,582 | | |
| | | | | | | | | | |
| | Total Investments (101.3%) (Cost $69,369) | | | 66,439 | ## | |
| | | | | | | | | | |
| | Liabilities, less cash, receivables and other assets [(1.3%)] | | | (849 | ) | |
| | | | | | | | | | |
| | Total Net Assets (100.0%) | | $ | 65,590 | | |
| See Notes to Schedule of Investments | 53 | |
| PRINCIPAL AMOUNT | | | VALUE† | |
| | | | | | |
| (000's omitted) | | | | (000's omitted) | |
| | | | | | |
Bank Loan Obligationsµ (12.9%) | |
| | | | |
| All Telecom (1.3%) | |
| $ | 255 | | | Asurion Corp., Term Loan, 6.76%, due 7/3/15 | | $ | 238 | | |
| | 263 | | | Cincinnati Bell, Inc., Term Loan, 6.50%, due 6/12/17 | | | 265 | | |
| | 299 | | | Integra Telecom Holdings, Inc., Term Loan B, 9.25%, due 4/15/15 | | | 301 | | |
| | 200 | | | Knology, Inc., Term Loan B, 5.50%, due 10/17/16 | | | 201 | | |
| | 300 | | | Level 3 Financing, Inc., Term Loan A, 2.54%, due 3/13/14 | | | 280 | | |
| | 499 | | | NTELOS Corp., Term Loan B, 5.75%, due 8/7/15 | | | 502 | | |
| | 730 | | | Sitel LLC, Term Loan B, due 1/30/14 | | | 661 | ¢^^ | |
| | 494 | | | Springboard Finance, LLC, Term Loan A, 7.00%, due 2/23/15 | | | 495 | | |
| | 1,000 | | | Transaction Network Services, Inc., Term Loan C, 6.00%, due 11/18/15 | | | 1,002 | | |
| | 1,050 | | | Yankee Cable Acquisition, LLC, Term Loan B1, 6.50%, due 8/26/16 | | | 1,039 | ¢^^ | |
| | | 4,984 | | |
Automotive (0.0%) | |
| | 125 | | | United Components, Inc., Term Loan B, 6.25%, due 3/23/17 | | | 126 | | |
| | | | | | | | | | |
| Building & Development (0.3%) | |
| | 259 | | | Capital Automotive LP, Term Loan C, 2.76%, due 12/14/12 | | | 255 | | |
| | 289 | | | Custom Building Products, Inc., Term Loan B, 5.75%, due 3/19/15 | | | 288 | | |
| | 54 | | | Realogy Corp., Letter of Credit, 3.26%, due 10/10/13 | | | 49 | | |
| | 393 | | | Realogy Corp., Term Loan, 3.26%, due 10/10/13 | | | 359 | | |
| | | 951 | | |
Business Equipment & Services (0.4%) | |
| | 600 | | | Advantage Sales & Marketing LLC, Second Lien Term Loan, 8.50%, due 5/5/17 | | | 606 | | |
| | 370 | | | Brickman Group Holdings, Inc., Term Loan B, 7.25%, due 10/14/16 | | | 374 | | |
| | 299 | | | MSCI, Inc., Term Loan, 4.75%, due 6/1/16 | | | 301 | | |
| | 299 | | | Protection One Alarm Monitoring, Inc., Term Loan B, 6.00%, due 5/16/16 | | | 298 | | |
| | | 1,579 | | |
Cable & Satellite Television (0.6%) | |
| | 886 | | | Charter Communications Operating LLC, Term Loan, due 3/6/14 | | | 917 | ¢^^ | |
| | 833 | | | Midcontinent Communications, Term Loan B, 6.25%, due 12/31/16 | | | 834 | | |
| | 493 | | | TWCC Holding Corp., Term Loan, 5.00%, due 9/14/15 | | | 495 | | |
| | | 2,246 | | |
Chemicals & Plastics (0.4%) | |
| | 255 | | | General Chemical Holding Co., Term Loan B, 6.75%, due 10/6/15 | | | 257 | | |
| | 299 | | | Lyondell Chemical Co., Term Loan, 5.50%, due 4/8/16 | | | 302 | | |
| | 499 | | | Momentive Performance Materials, Inc., Term Loan B, 2.56%, due 12/4/13 | | | 488 | | |
| | 300 | | | PQ Corp., Second Lien Term Loan, due 7/30/15 | | | 282 | ¢^^ | |
| | 245 | | | Univar NV, Term Loan, 3.26%, due 10/10/14 | | | 243 | | |
| | | 1,572 | | |
Clothing/Textiles (0.1%) | |
| | 500 | | | Phillips-Van Heusen Corp., Term Loan B, 4.75%, due 5/6/16 | | | 503 | | |
| See Notes to Schedule of Investments | 54 | |
| PRINCIPAL AMOUNT | | | VALUE† | |
| | | | | | |
| (000's omitted) | | | | (000's omitted) | |
| | | | | | |
| Conglomerates (0.4%) | |
| $ | 775 | | | Goodman Global, Inc., Term Loan, due 10/28/16 | | $ | 784 | ¢^^ | |
| | 30 | | | Goodman Global, Inc., Term Loan, due 10/30/17 | | | 31 | ¢^^ | |
| | 472 | | | JohnsonDiversy, Inc., Term Loan B, 5.50%, due 11/24/15 | | | 475 | | |
| | 375 | | | Pinafore LLC, Term Loan B, 6.75%, due 9/29/16 | | | 379 | | |
| | | 1,669 | | |
Containers & Glass Products (0.3%) | |
| | 456 | | | BWAY Holding Co., Term Loan B, 5.50% – 6.00%, due 6/16/17 | | | 457 | | |
| | 43 | | | BWAY Holding Co., Term Loan C, 5.50% – 6.00%, due 6/16/17 | | | 43 | | |
| | 200 | | | Graham Packaging Co. L.P., Term Loan D, 6.00%, due 9/23/16 | | | 202 | | |
| | 350 | | | Reynolds Group Holdings, Inc., Term Loan D, due 5/5/16 | | | 352 | ^^†† | |
| | | 1,054 | | |
Drugs (0.1%) | |
| | 98 | | | Warner Chilcott Co. LLC, Term Loan B4, 6.50%, due 2/22/16 | | | 99 | | |
| | 302 | | | Warner Chilcott Corp., Term Loan B3, 6.50%, due 2/22/16 | | | 304 | | |
| | | 403 | | |
Ecological Services & Equipment (0.2%) | |
| | 873 | | | EnergySolutions LLC, Term Loan, 6.25%, due 8/12/16 | | | 883 | | |
| | | | | | | | | | |
| Electric - Generation (0.2%) | |
| | 625 | | | TPF Generation Holdings LLC, Second Lien Term Loan C, 4.54%, due 12/15/14 | | | 571 | | |
| | | | | | | | | | |
| Electronics/Electrical (1.0%) | |
| | 499 | | | Aspect Software, Inc., Term Loan B, 6.25%, due 4/19/16 | | | 500 | | |
| | 500 | | | AutoTrader.com, Inc., Term Loan B, 6.00%, due 6/14/16 | | | 501 | | |
| | 530 | | | Fidelity National Information Services, Inc., Term Loan B, 5.25%, due 7/18/16 | | | 537 | | |
| | 400 | | | Fifth Third Processing Solutions, Term Loan B, due 11/1/16 | | | 404 | ¢^^ | |
| | 100 | | | Fifth Third Processing Solutions, Term Loan, due 11/1/17 | | | 101 | ¢^^ | |
| | 1,122 | | | Interactive Data Corp., Term Loan B, 6.75%, due 1/27/17 | | | 1,141 | | |
| | 284 | | | Reynolds & Reynolds Co., Term Loan B, 5.25%, due 4/21/17 | | | 286 | | |
| | 299 | | | SkillSoft Corp., Term Loan B, 6.50%, due 5/26/17 | | | 302 | | |
| | | 3,772 | | |
Farming/Agriculture (0.1%) | |
| | 299 | | | WM Bolthouse Farms, Inc., First Lien Term Loan, 5.50%, due 2/11/16 | | | 300 | | |
| | | | | | | | | | |
| Financial Intermediaries (1.0%) | |
| | 500 | | | American General Finance Corp., Term Loan B, 7.25%, due 4/21/15 | | | 504 | | |
| | 750 | | | CIT Group, Inc., Term Loan 3, 6.25%, due 8/11/15 | | | 762 | | |
| | 600 | | | FIG LLC, Term Loan B, 5.75%, due 9/30/15 | | | 604 | | |
| | 287 | | | First Data Corp., Term Loan B2, 3.01%, due 9/24/14 | | | 258 | | |
| | 499 | | | LPL Holdings, Inc., Term Loan, 5.25%, due 6/28/17 | | | 495 | | |
| | 1,073 | | | Ocwen Financial Corp., Term Loan, 9.00%, due 7/28/15 | | | 1,066 | | |
| | | 3,689 | | |
| See Notes to Schedule of Investments | 55 | |
| PRINCIPAL AMOUNT | | | VALUE† | |
| | | | | | |
| (000's omitted) | | | | (000's omitted) | |
| | | | | | |
| Food Products (0.7%) | |
| $ | 210 | | | Dole Food Co., Inc., Term Loan B, 5.00% – 5.50%, due 3/2/17 | | $ | 211 | | |
| | 522 | | | Dole Food Co., Inc., Term Loan C, 5.00% – 5.50%, due 3/2/17 | | | 524 | | |
| | 584 | | | Michael Foods, Inc., Term Loan B, 6.25%, due 6/29/16 | | | 594 | | |
| | 375 | | | NBTY, Inc., Term Loan B, 6.25%, due 10/2/17 | | | 380 | | |
| | 948 | | | Pinnacle Foods Holdings Corp., Term Loan D, 6.00%, due 4/2/14 | | | 957 | | |
| | | 2,666 | | |
Food Service (0.1%) | |
| | 360 | | | DineEquity, Inc., Term Loan B, 6.00%, due 10/19/17 | | | 363 | | |
| | | | | | | | | |
| Food/Drug Retailers (0.3%) | |
| | 225 | | | Rite Aid Corp., Term Loan B, due 6/4/14 | | | 202 | ¢^^ | |
| | 1,011 | | | Rite Aid Corp., Term Loan 3, 6.00%, due 6/4/14 | | | 1,004 | | |
| | | 1,206 | | |
Health Care (1.5%) | |
| | 499 | | | Aurora Diagnostics LLC, Term Loan B, 6.25%, due 5/21/16 | | | 490 | | |
| | 375 | | | Grifols SA, Term Loan B, due 6/4/16 | | | 379 | ¢^^ | |
| | 300 | | | HCA, Inc., Term Loan A, 1.54%, due 11/19/12 | | | 294 | | |
| | 245 | | | IASIS Healthcare Corp., Term Loan, 5.54%, due 6/13/14 | | | 237 | | |
| | 500 | | | IMS Health, Inc., Term Loan B, due 2/26/16 | | | 504 | ¢^^ | |
| | 941 | | | Multiplan, Inc., Term Loan B, 6.50%, due 8/26/17 | | | 943 | | |
| | 697 | | | RehabCare Group, Inc., Term Loan B, 6.00%, due 11/24/15 | | | 700 | | |
| | 494 | | | Rural/Metro Operating Co. LLC, Term Loan, 7.00%, due 12/9/14 | | | 495 | | |
| | 1,100 | | | Universal Health Services, Inc., Term Loan B, due 7/28/16 | | | 1,112 | ¢^^ | |
| | 275 | | | Valeant Pharmaceuticals Int'l, Term Loan B, due 9/27/16 | | | 278 | ¢^^ | |
| | | 5,432 | | |
Industrial Equipment (0.2%) | |
| | 300 | | | Generac Acquisition Corp., Term Loan B, 2.76% – 2.79%, due 11/11/13 | | | 285 | | |
| | 300 | | | Rental Services Corp., Term Loan, 3.80% – 4.04%, due 12/2/13 | | | 293 | | |
| | | 578 | | |
Insurance (0.1%) | |
| | 299 | | | Sedgwick CMS Holdings, Inc., First Lien Term Loan, 5.50%, due 5/27/16 | | | 299 | | |
| | | | | | | | | | |
| Leisure Goods/Activities/Movies (0.5%) | |
| | 1,047 | | | Cedar Fair L.P., Term Loan B, 5.50%, due 12/15/16 | | | 1,062 | | |
| | 484 | | | Six Flags Theme Parks, Inc., Term Loan B, 6.00%, due 6/30/16 | | | 485 | | |
| | 250 | | | Six Flags Theme Parks, Inc., Term Loan B, due 12/31/16 | | | 258 | ¢^^ | |
| | | 1,805 | | |
Lodging & Casinos (0.4%) | |
| | 600 | | | CityCenter Construction, Term Loan, due 6/30/12 | | | 580 | ¢^^ | |
| | 500 | | | Harrah's Operating Co., Inc., Term Loan B2, 3.29%, due 1/28/15 | | | 441 | | |
| | 299 | | | Harrah's Operating Co., Inc., Term Loan B4, 9.50%, due 10/31/16 | | | 311 | | |
| | 110 | | | VML US Finance, LLC, Term Loan B, due 5/25/12 | | | 110 | ¢^^ | |
| | 190 | | | VML US Finance, LLC, Term Loan B, due 5/27/13 | | | 190 | ¢^^ | |
| | | 1,632 | | |
| See Notes to Schedule of Investments | 56 | |
| PRINCIPAL AMOUNT | | | VALUE† | |
| | | | | | |
| (000's omitted) | | | | (000's omitted) | |
| | | | | | |
| Media - Broadcast (0.1%) | |
| $ | 293 | | | Univision Communications, Inc., Term Loan, 4.51%, due 3/31/17 | | $ | 277 | | |
| | | | | | | | | | |
| Nonferrous Metals/Minerals (0.2%) | |
| | 555 | | | Fairmount Minerals Ltd., Term Loan B, 6.25%, due 8/5/16 | | | 561 | | |
| | | | | | | | | | |
| Oil & Gas (0.3%) | |
| | 250 | | | Dresser, Inc., Term Loan, 6.11%, due 5/4/15 | | | 249 | | |
| | 798 | | | MEG Energy Corp., Term Loan D, 6.00%, due 4/3/16 | | | 799 | | |
| | | 1,048 | | |
Publishing (0.6%) | |
| | 499 | | | Cengage Learning Acquisitions, Inc., Term Loan, 2.54%, due 7/3/14 | | | 456 | | |
| | 285 | | | DEX Media East LLC, Term Loan, 2.79% – 2.80%, due 10/24/14 | | | 231 | | |
| | 472 | | | DEX Media West LLC, Term Loan, 7.00%, due 10/24/14 | | | 436 | | |
| | 446 | | | Postmedia Network, Inc., Term Loan, 9.00%, due 7/13/16 | | | 451 | | |
| | 748 | | | Quad Graphics, Inc., Term Loan B, 5.50%, due 4/14/16 | | | 744 | | |
| | | 2,318 | | |
Radio & Television (0.3%) | |
| | 300 | | | Clear Channel Communications, Inc., Term Loan B, 3.91%, due 1/28/16 | | | 238 | | |
| | 499 | | | Fox Acquisition Sub, LLC, Term Loan, 7.50%, due 7/14/15 | | | 493 | | |
| | 299 | | | Local TV on Satellite, LLC, Term Loan B, 2.29%, due 5/7/13 | | | 279 | | |
| | | 1,010 | | |
Retailers (except food & drug) (0.4%) | |
| | 499 | | | Bass Pro Group LLC, Term Loan, 5.00% – 5.75%, due 4/9/15 | | | 499 | | |
| | 300 | | | Michaels Stores, Inc., Term Loan B2, 4.81% – 5.00%, due 7/31/16 | | | 297 | | |
| | 272 | | | ServiceMaster Co., Term Loan, 2.76% – 2.80%, due 7/24/14 | | | 258 | | |
| | 27 | | | ServiceMaster Co., Term Loan DD, 2.76%, due 7/24/14 | | | 26 | | |
| | 425 | | | Toys "R' Us-Delaware, Inc., Term Loan, 6.00%, due 9/1/16 | | | 427 | | |
| | | 1,507 | | |
Surface Transport (0.1%) | |
| | 78 | | | Hertz Corp., Letter of Credit, 0.34%, due 12/21/12 | | | 77 | | |
| | 421 | | | Hertz Corp., Term Loan B, 2.01%, due 12/21/12 | | | 417 | | |
| | | 494 | | |
Utilities (0.7%) | |
| | 625 | | | Bicent Power LLC, Term Loan B, 2.29%, due 6/30/14 | | | 542 | | |
| | 295 | | | Longview Power LLC, Term Loan B, due 2/28/14 | | | 253 | ¢^^ | |
| | 345 | | | Longview Power LLC, Term Loan DD, due 2/28/14 | | | 296 | ¢^^ | |
| | 998 | | | New Development Holdings LLC, Term Loan, 7.00%, due 7/3/17 | | | 1,016 | | |
| | 340 | | | RRI Energy, Inc., Term Loan B, due 9/8/17 | | | 340 | ¢^^ | |
| | | 2,447 | | |
| Total Bank Loan Obligations (Cost $46,369) | | | 47,945 | | |
| See Notes to Schedule of Investments | 57 | |
| PRINCIPAL AMOUNT | | VALUE† | |
| | | | | | |
| (000's omitted) | | | | (000's omitted) | |
| | | | | | |
| U.S. Treasury Securities-Backed by the Full Faith and Credit of the U.S. Government (20.9%) | |
| $ | 6,000 | | | U.S. Treasury Bills, 0.01%, due 11/18/10 | | $ | 6,000 | ØØ | |
| | 20,000 | | | U.S. Treasury Bills, 0.05%, due 12/9/10 | | | 19,997 | | |
| | 1,500 | | | U.S. Treasury Bills, 0.09%, due 12/23/10 | | | 1,500 | | |
| | 8,000 | | | U.S. Treasury Bills, 0.09%, due 2/10/11 | | | 7,997 | | |
| | 15,000 | | | U.S. Treasury Bills, 0.16%, due 4/21/11 | | | 14,988 | | |
| | 1,360 | | | U.S. Treasury Bonds, 8.75%, due 5/15/20 | | | 2,079 | | |
| | 555 | | | U.S. Treasury Bonds, 6.88%, due 8/15/25 | | | 790 | | |
| | 2,875 | | | U.S. Treasury Bonds, 4.50%, due 2/15/36 | | | 3,148 | | |
| | 5,791 | | | U.S. Treasury Inflation Index Notes, 2.38%, due 1/15/25 | | | 6,905 | | |
| | 2,575 | | | U.S. Treasury Notes, 2.38%, due 10/31/14 | | | 2,730 | | |
| | 5,175 | | | U.S. Treasury Notes, 3.13%, due 1/31/17 | | | 5,624 | | |
| | 5,350 | | | U.S. Treasury Notes, 3.63%, due 8/15/19 | | | 5,868 | ØØ | |
| | | | | | | | | | |
| | Total U.S. Treasury Securities-Backed by the Full Faith and Credit of the U.S. Government (Cost $76,889) | | | 77,626 | | |
| | | | | | | | | | |
| Mortgage-Backed Securities (15.0%) | |
| | |
| Adjustable Rate Mortgages (0.3%) | |
| | 1,352 | | | Merrill Lynch Mortgage Investors Trust, Ser. 2006-A1, Class 1A1, 4.78%, due 3/25/36 | | | 861 | µ | |
| | 275 | | | WaMu Mortgage Pass-Through Certificates, Ser. 2006-AR10, Class 1A1, 5.87%, due 9/25/36 | | | 225 | µ | |
| | | 1,086 | | |
Fannie Mae (4.6%) | |
| | 750 | | | Pass-Through Certificates, 4.00%, due 10/1/39 – 10/1/40 | | | 774 | | |
| | 285 | | | Pass-Through Certificates, 5.00%, due 8/1/33 – 5/1/37 | | | 303 | ØØ | |
| | 3,860 | | | Pass-Through Certificates, 5.00%, TBA, 30 Year Maturity | | | 4,102 | Ø | |
| | 6,336 | | | Pass-Through Certificates, 5.50%, due 7/1/33 – 1/1/39 | | | 6,809 | ØØ | |
| | 647 | | | Pass-Through Certificates, 6.00%, due 9/1/33 & 7/1/38 | | | 703 | ØØ | |
| | 4,000 | | | Pass-Through Certificates, 6.00%, TBA, 30 Year Maturity | | | 4,342 | Ø | |
| | 3 | | | Pass-Through Certificates, 6.50%, due 9/1/32 | | | 3 | ØØ | |
| | 9 | | | Pass-Through Certificates, 7.00%, due 7/1/29 | | | 11 | ØØ | |
| | 2 | | | Pass-Through Certificates, 7.50%, due 12/1/32 | | | 3 | ØØ | |
| | | 17,050 | | |
Freddie Mac (10.1%) | |
| | 33,085 | | | Pass-Through Certificates, 4.00%, TBA, 30 Year Maturity | | | 34,052 | Ø | |
| | 9 | | | Pass-Through Certificates, 4.50%, due 8/1/18 | | | 9 | ØØ | |
| | 1,826 | | | Pass-Through Certificates, 5.00%, due 5/1/18 – 8/1/39 | | | 1,938 | ØØ | |
| | 1,012 | | | Pass-Through Certificates, 5.50%, due 9/1/17 – 11/1/38 | | | 1,089 | ØØ | |
| | 285 | | | Pass-Through Certificates, 5.50%, TBA, 30 Year Maturity | | | 305 | Ø | |
| | 28 | | | Pass-Through Certificates, 6.00%, due 4/1/17 – 12/1/33 | | | 30 | ØØ | |
| | 2 | | | Pass-Through Certificates, 6.50%, due 3/1/16 | | | 2 | ØØ | |
| | 2 | | | Pass-Through Certificates, 7.00%, due 6/1/32 | | | 3 | ØØ | |
| | | 37,428 | | |
Government National Mortgage Association (0.0%) | |
| | 4 | | | Pass-Through Certificates, 6.50%, due 7/15/32 | | | 5 | ØØ | |
| | 3 | | | Pass-Through Certificates, 7.00%, due 8/15/32 | | | 4 | ØØ | |
| | | 9 | | |
| Total Mortgage-Backed Securities (Cost $54,978) | | | 55,573 | | |
| See Notes to Schedule of Investments | 58 | |
| PRINCIPAL AMOUNT | | VALUE† | |
| | | | | | |
| (000's omitted) | | | | (000's omitted) | |
| | | | | | |
| Corporate Debt Securities (41.8%) | |
| | | | |
| Aerospace/Defense (0.1%) | |
| $ | 225 | | | BE Aerospace, Inc., Senior Unsecured Notes, 8.50%, due 7/1/18 | | $ | 252 | | |
| | | | | | | | | | |
| Airlines (1.5%) | | | |
| | 1,020 | | | Continental Airlines, Inc., Senior Secured Notes, 6.75%, due 9/15/15 | | | 1,062 | ñ | |
| | 470 | | | Continental Airlines, Inc., Pass-Through Certificates, Ser. 2009-2, Class A, 7.25%, due 11/10/19 | | | 522 | | |
| | 617 | | | Continental Airlines, Inc., Pass-Through Certificates, Ser. 2007-1, Class A, 5.98%, due 4/19/22 | | | 653 | ØØ | |
| | 300 | | | Delta Air Lines, Inc., Pass-Through Certificates, Ser. 2001-1, Class B, 7.71%, due 9/18/11 | | | 309 | | |
| | 175 | | | Delta Air Lines, Inc., Senior Secured Notes, 9.50%, due 9/15/14 | | | 193 | ñ | |
| | 520 | | | Delta Air Lines, Inc., Pass-Through Certificates, Ser. 2010-1, Class A, 6.20%, due 7/2/18 | | | 556 | ØØ | |
| | 1,136 | | | Delta Air Lines, Inc., Pass-Through Certificates, Ser. 2009-1, Class A, 7.75%, due 12/17/19 | | | 1,272 | ØØ | |
| | 406 | | | Delta Air Lines, Inc., Pass-Through Certificates, Ser. 2007-1, Class A, 6.82%, due 8/10/22 | | | 439 | ØØ | |
| | 381 | | | United Airlines, Inc., Pass-Through Certificates, Ser. 2009-2, Class A, 9.75%, due 1/15/17 | | | 447 | | |
| | | 5,453 | | |
Auto Loans (0.6%) | | | |
| | 1,050 | | | Ford Motor Credit Co. LLC, Senior Unsecured Notes, 6.63%, due 8/15/17 | | | 1,174 | | |
| | 822 | | | Ford Motor Credit Co. LLC, Senior Unsecured Notes, 8.13%, due 1/15/20 | | | 1,005 | | |
| | | 2,179 | | |
Auto Parts & Equipment (0.0%) | |
| | 130 | | | Goodyear Tire & Rubber Co., Guaranteed Notes, 8.25%, due 8/15/20 | | | 138 | | |
| | | | | | | | | | |
| Automakers (0.4%) | | | |
| | 240 | | | Ford Holdings, Inc., Guaranteed Notes, 9.30%, due 3/1/30 | | | 300 | | |
| | 435 | | | Ford Motor Co., Senior Unsecured Notes, 7.45%, due 7/16/31 | | | 494 | | |
| | 145 | | | Ford Motor Co., Senior Unsecured Notes, 9.98%, due 2/15/47 | | | 181 | | |
| | 595 | | | Navistar Int'l Corp., Guaranteed Notes, 8.25%, due 11/1/21 | | | 652 | | |
| | | 1,627 | | |
Banking (6.8%) | | | |
| | 280 | | | Ally Financial, Inc., Guaranteed Notes, Ser. 8, 6.75%, due 12/1/14 | | | 293 | | |
| | 245 | | | Ally Financial, Inc., Subordinated Notes, 8.00%, due 12/31/18 | | | 254 | | |
| | 780 | | | Ally Financial, Inc., Guaranteed Notes, 8.00%, due 11/1/31 | | | 852 | | |
| | 635 | | | Bank of America Corp., Senior Unsecured Medium-Term Notes, Ser. L, 7.38%, due 5/15/14 | | | 720 | ØØ | |
| | 300 | | | Bank of America Corp., Senior Unsecured Notes, 4.50%, due 4/1/15 | | | 312 | | |
| | 1,130 | | | Bank of Tokyo-Mitsubishi UFJ Ltd., Notes, 1.60%, due 9/11/13 | | | 1,141 | ñ | |
| | 775 | | | CIT Group, Inc., Senior Secured Notes, 7.00%, due 5/1/14 | | | 779 | | |
| | 785 | | | CIT Group, Inc., Senior Secured Notes, 7.00%, due 5/1/16 | | | 782 | | |
| | 919 | | | CIT Group, Inc., Senior Secured Notes, 7.00%, due 5/1/17 | | | 915 | ØØ | |
| | 1,650 | | | Citigroup, Inc., Senior Unsecured Notes, 6.13%, due 11/21/17 | | | 1,837 | ØØ | |
| | 255 | | | Citigroup, Inc., Senior Unsecured Notes, 6.88%, due 3/5/38 | | | 283 | | |
| | 620 | | | Citigroup, Inc., Senior Unsecured Notes, 8.13%, due 7/15/39 | | | 780 | | |
| | 420 | | | Deutsche Bank AG, Senior Unsecured Notes, 3.88%, due 8/18/14 | | | 451 | | |
| | 360 | | | Goldman Sachs Group, Inc., Senior Unsecured Global Medium-Term Notes, 3.63%, due 8/1/12 | | | 375 | | |
| | 100 | | | Goldman Sachs Group, Inc., Senior Unsecured Notes, 5.15%, due 1/15/14 | | | 109 | ØØ | |
| | 285 | | | Goldman Sachs Group, Inc., Senior Unsecured Medium-Term Notes, 6.00%, due 5/1/14 | | | 320 | ØØ | |
| | 790 | | | Goldman Sachs Group, Inc., Senior Unsecured Notes, 6.15%, due 4/1/18 | | | 885 | | |
| | 515 | | | Goldman Sachs Group, Inc., Subordinated Notes, 6.75%, due 10/1/37 | | | 540 | ØØ | |
| | 3,100 | | | JP Morgan Chase & Co., Senior Unsecured Notes, 4.25%, due 10/15/20 | | | 3,123 | | |
| | 1,295 | | | JP Morgan Chase & Co., Senior Unsecured Notes, 5.50%, due 10/15/40 | | | 1,305 | | |
| | 50 | | | JP Morgan Chase Capital XV, Guaranteed Notes, 5.88%, due 3/15/35 | | | 48 | ØØ | |
| | 885 | | | JP Morgan Chase Capital XVII, Guaranteed Notes, Ser. Q, 5.85%, due 8/1/35 | | | 838 | | |
| | 250 | | | Morgan Stanley, Subordinated Notes, 4.75%, due 4/1/14 | | | 261 | ØØ | |
| | 1,315 | | | Morgan Stanley, Senior Unsecured Notes, 3.45%, due 11/2/15 | | | 1,322 | Ø | |
| See Notes to Schedule of Investments | 59 | |
| PRINCIPAL AMOUNT | | VALUE† | |
| | | | | | |
| (000's omitted) | | (000's omitted) | |
| | | | | | |
| $ | 2,065 | | | Morgan Stanley, Senior Unsecured Global Medium-Term Notes, Ser. F, 6.63%, due 4/1/18 | | $ | 2,319 | | |
| | 3,260 | | | Morgan Stanley, Senior Unsecured Global Medium-Term Notes, Ser. F, 5.63%, due 9/23/19 | | | 3,423 | ØØ | |
| | 995 | | | Wells Fargo & Co., Senior Notes, 3.63%, due 4/15/15 | | | 1,048 | | |
| | | 25,315 | | |
Beverages (0.5%) | | | |
| | 1,275 | | | Anheuser-Busch InBev Worldwide, Inc., Guaranteed Notes, 7.75%, due 1/15/19 | | | 1,649 | ñØØ | |
| | 135 | | | Constellation Brands, Inc., Guaranteed Notes, 8.38%, due 12/15/14 | | | 152 | | |
| | 175 | | | Constellation Brands, Inc., Guaranteed Notes, 7.25%, due 9/1/16 | | | 192 | | |
| | | 1,993 | | |
Building & Construction (0.1%) | |
| | 270 | | | Meritage Homes Corp., Guaranteed Notes, 7.15%, due 4/15/20 | | | 262 | | |
Building Materials (0.3%) | |
| | 100 | | | Associated Materials LLC, Senior Secured Notes, 9.13%, due 11/1/17 | | | 105 | ñ | |
| | 410 | | | Masco Corp., Senior Unsecured Notes, 6.13%, due 10/3/16 | | | 420 | | |
| | 250 | | | Owens Corning, Inc., Guaranteed Notes, 9.00%, due 6/15/19 | | | 303 | | |
| | 270 | | | USG Corp., Guaranteed Notes, 9.75%, due 8/1/14 | | | 282 | ñ | |
| | | 1,110 | | |
Chemicals (1.6%) | | | |
| | 565 | | | Ashland, Inc., Guaranteed Notes, 9.13%, due 6/1/17 | | | 651 | | |
| | 215 | | | CF Industries, Inc., Guaranteed Notes, 6.88%, due 5/1/18 | | | 245 | | |
| | 220 | | | CF Industries, Inc., Guaranteed Notes, 7.13%, due 5/1/20 | | | 255 | | |
| | 585 | | | Huntsman Int'l LLC, Guaranteed Notes, 5.50%, due 6/30/16 | | | 581 | | |
| | 490 | | | LBI Escrow Corp., Senior Secured Notes, 8.00%, due 11/1/17 | | | 537 | ñ | |
| | 560 | | | Nalco Co., Senior Notes, 8.25%, due 5/15/17 | | | 624 | | |
| | 325 | | | The Dow Chemical Co., Senior Unsecured Notes, 5.90%, due 2/15/15 | | | 366 | | |
| | 1,940 | | | The Dow Chemical Co., Senior Unsecured Notes, 8.55%, due 5/15/19 | | | 2,492 | ØØ | |
| | | 5,751 | | |
Commercial Services (0.4%) | |
| | 905 | | | ERAC USA Finance Co., Guaranteed Notes, 6.38%, due 10/15/17 | | | 1,059 | ñ | |
| | 450 | | | ERAC USA Finance Co., Guaranteed Notes, 7.00%, due 10/15/37 | | | 498 | ñØØ | |
| | | 1,557 | | |
Consumer/Commercial/Lease Financing (0.4%) | |
| | 195 | | | Int'l Lease Finance Corp., Senior Unsecured Medium-Term Notes, Ser. Q, 5.25%, due 1/10/13 | | | 197 | | |
| | 190 | | | Int'l Lease Finance Corp., Senior Unsecured Notes, 5.88%, due 5/1/13 | | | 193 | | |
| | 770 | | | Int'l Lease Finance Corp., Senior Unsecured Medium-Term Notes, Ser. R, 5.65%, due 6/1/14 | | | 770 | | |
| | 95 | | | Int'l Lease Finance Corp., Senior Secured Notes, 6.50%, due 9/1/14 | | | 103 | ñ | |
| | 75 | | | Int'l Lease Finance Corp., Senior Secured Notes, 7.13%, due 9/1/18 | | | 82 | ñ | |
| | | 1,345 | | |
Department Stores (0.2%) | |
| | 800 | | | Sears Holdings Corp., Senior Secured Notes, 6.63%, due 10/15/18 | | | 798 | ñ | |
| | | | | | | | | | |
| Diversified Capital Goods (0.3%) | |
| | 1,105 | | | Ingersoll-Rand Global Holding Co. Ltd., Guaranteed Notes, 6.00%, due 8/15/13 | | | 1,240 | ØØ | |
| See Notes to Schedule of Investments | 60 | |
| PRINCIPAL AMOUNT | | VALUE† | |
| | | | | | |
| (000's omitted) | | (000's omitted) | |
| | | | | | |
| Diversified Financial Services (2.1%) | |
| $ | 650 | | | American Express Credit Corp., Senior Unsecured Medium-Term Notes, Ser. C, 5.88%, | | $ | 716 | ØØ | |
| | | | | due 5/2/13 | | | | | |
| | 290 | | | American Express Credit Corp., Senior Unsecured Medium-Term Notes, Ser. D, 5.13%, due 8/25/14 | | | 320 | | |
| | 700 | | | American Express Credit Corp., Senior Unsecured Notes, 2.75%, due 9/15/15 | | | 706 | | |
| | 675 | | | American Honda Finance Corp., Senior Unsecured Notes, 3.50%, due 3/16/15 | | | 713 | ñ | |
| | 535 | | | Ameriprise Financial, Inc., Senior Unsecured Notes, 5.30%, due 3/15/20 | | | 587 | | |
| | 150 | | | General Electric Capital Corp., Global Medium-Term Notes, Ser. A, 5.25%, due 10/19/12 | | | 162 | ØØ | |
| | 450 | | | General Electric Capital Corp., Senior Unsecured Notes, 5.90%, due 5/13/14 | | | 512 | ØØ | |
| | 755 | | | General Electric Capital Corp., Senior Unsecured Global Medium-Term Notes, Ser. A, 5.63%, due 5/1/18 | | | 844 | | |
| | 2,210 | | | General Electric Capital Corp., Senior Unsecured Notes, 4.38%, due 9/16/20 | | | 2,229 | | |
| | 495 | | | General Electric Capital Corp., Senior Unsecured Global Medium-Term Notes, Ser. A, 6.88%, due 1/10/39 | | | 569 | ØØ | |
| | 460 | | | Merrill Lynch & Co., Senior Unsecured Medium-Term Notes, Ser. C, 5.45%, due 2/5/13 | | | 490 | ØØ | |
| | 75 | | | Merrill Lynch & Co., Subordinated Notes, 6.11%, due 1/29/37 | | | 71 | ØØ | |
| | | 7,919 | | |
Electric - Generation (0.6%) | |
| | 830 | | | Calpine Corp., Senior Secured Notes, 7.25%, due 10/15/17 | | | 863 | ñ | |
| | 470 | | | Dynegy Holdings, Inc., Senior Unsecured Notes, 7.75%, due 6/1/19 | | | 321 | | |
| | 405 | | | Dynegy-Roseton Danskammer, Pass-Through Certificates, Ser. B, 7.67%, due 11/8/16 | | | 377 | | |
| | 95 | | | Edison Mission Energy, Senior Unsecured Notes, 7.20%, due 5/15/19 | | | 68 | | |
| | 235 | | | Edison Mission Energy, Senior Unsecured Notes, 7.63%, due 5/15/27 | | | 158 | | |
| | 135 | | | NRG Energy, Inc., Guaranteed Notes, 7.25%, due 2/1/14 | | | 138 | | |
| | 130 | | | NRG Energy, Inc., Guaranteed Notes, 8.25%, due 9/1/20 | | | 138 | ñ | |
| | 250 | | | RRI Energy, Inc., Senior Unsecured Notes, 7.63%, due 6/15/14 | | | 252 | | |
| | | 2,315 | | |
Electric - Integrated (0.1%) | |
| | 220 | | | FirstEnergy Solutions Corp., Guaranteed Notes, 4.80%, due 2/15/15 | | | 238 | | |
| | | | | | | | | | |
| Electronics (0.2%) | |
| | 235 | | | Advanced Micro Devices, Inc., Senior Unsecured Notes, 8.13%, due 12/15/17 | | | 254 | | |
| | 90 | | | Advanced Micro Devices, Inc., Senior Unsecured Notes, 7.75%, due 8/1/20 | | | 95 | ñ | |
| | 275 | | | Freescale Semiconductor, Inc., Senior Secured Notes, 9.25%, due 4/15/18 | | | 294 | ñ | |
| | 180 | | | NXP BV Funding LLC, Senior Secured Notes, 9.75%, due 8/1/18 | | | 197 | ñ | |
| | | 840 | | |
Energy (0.1%) | |
| | 290 | | | CMS Energy Corp., Senior Unsecured Notes, 4.25%, due 9/30/15 | | | 296 | | |
| | | | | | | | | | |
| Energy - Alternate Sources (0.1%) | |
| | 230 | | | PSALM Corp., Guaranteed Notes, 7.39%, due 12/2/24 | | | 285 | ñ | |
| | | | | | | | | | |
| Energy - Exploration & Production (1.3%) | |
| | 530 | | | ATP Oil & Gas Corp., Senior Secured Notes, 11.88%, due 5/1/15 | | | 484 | ñ | |
| | 50 | | | Chesapeake Energy Corp., Guaranteed Notes, 7.63%, due 7/15/13 | | | 55 | | |
| | 815 | | | Chesapeake Energy Corp., Guaranteed Notes, 9.50%, due 2/15/15 | | | 945 | | |
| | 125 | | | Chesapeake Energy Corp., Guaranteed Notes, 6.63%, due 8/15/20 | | | 132 | | |
| | 590 | | | Cimarex Energy Co., Guaranteed Notes, 7.13%, due 5/1/17 | | | 625 | | |
| | 264 | | | Denbury Resources, Inc., Guaranteed Notes, 8.25%, due 2/15/20 | | | 294 | | |
| See Notes to Schedule of Investments | 61 | |
| PRINCIPAL AMOUNT | | VALUE† | |
| | | | | | |
| (000's omitted) | | | | (000's omitted) | |
| | | | | | |
| $ | 290 | | | Forest Oil Corp., Guaranteed Notes, 7.25%, due 6/15/19 | | $ | 305 | | |
| | 280 | | | Linn Energy LLC, Senior Unsecured Notes, 8.63%, due 4/15/20 | | | 302 | ñ | |
| | 160 | | | Linn Energy LLC, Guaranteed Notes, 7.75%, due 2/1/21 | | | 165 | ñ | |
| | 540 | | | Newfield Exploration Co., Senior Subordinated Notes, 6.63%, due 4/15/16 | | | 562 | | |
| | 370 | | | Pioneer Natural Resources Co., Senior Guaranteed Notes, 5.88%, due 7/15/16 | | | 388 | | |
| | 190 | | | Quicksilver Resources, Inc., Guaranteed Notes, 11.75%, due 1/1/16 | | | 220 | | |
| | 525 | | | SandRidge Energy, Inc., Guaranteed Notes, 8.00%, due 6/1/18 | | | 525 | ñ | |
| | | 5,002 | | |
Food (1.3%) | |
| | 2,195 | | | Grupo Bimbo SAB de CV, Guaranteed Notes, 4.88%, due 6/30/20 | | | 2,297 | ñØØ | |
| | 315 | | | Kraft Foods, Inc., Senior Unsecured Notes, 6.75%, due 2/19/14 | | | 368 | ØØ | |
| | 75 | | | Kraft Foods, Inc., Senior Unsecured Notes, 6.13%, due 2/1/18 | | | 88 | | |
| | 1,915 | | | Kraft Foods, Inc., Senior Unsecured Notes, 6.50%, due 2/9/40 | | | 2,195 | ØØ | |
| | | 4,948 | | |
Food & Drug Retailers (0.2%) | |
| | 150 | | | Rite Aid Corp., Senior Secured Notes, 9.75%, due 6/12/16 | | | 163 | | |
| | 70 | | | Rite Aid Corp., Senior Secured Notes, 10.38%, due 7/15/16 | | | 74 | | |
| | 195 | | | SUPERVALU, Inc., Senior Unsecured Medium-Term Notes, 7.50%, due 11/15/14 | | | 197 | | |
| | 250 | | | SUPERVALU, Inc., Senior Unsecured Notes, 8.00%, due 5/1/16 | | | 254 | | |
| | | 688 | | |
Food - Wholesale (0.2%) | |
| | 255 | | | Del Monte Corp., Guaranteed Notes, 7.50%, due 10/15/19 | | | 280 | ØØ | |
| | 380 | | | NBTY, Inc., Guaranteed Notes, 9.00%, due 10/1/18 | | | 404 | ñ | |
| | | 684 | | |
Forestry/Paper (0.0%) | |
| | 150 | | | Georgia-Pacific LLC, Guaranteed Notes, 8.25%, due 5/1/16 | | | 172 | ñØØ | |
| | | | | | | | | | |
| Gaming (0.5%) | |
| | 465 | | | FireKeepers Development Authority, Senior Secured Notes, 13.88%, due 5/1/15 | | | 545 | ñ | |
| | 55 | | | Marina District Finance Co., Inc., Senior Secured Notes, 9.88%, due 8/15/18 | | | 54 | ñ | |
| | 365 | | | MGM Mirage, Inc., Senior Secured Notes, 11.13%, due 11/15/17 | | | 420 | ØØ | |
| | 95 | | | MGM Mirage, Inc., Senior Secured Notes, 9.00%, due 3/15/20 | | | 104 | ñ | |
| | 570 | | | Pokagon Gaming Authority, Senior Notes, 10.38%, due 6/15/14 | | | 593 | ñ | |
| | 175 | | | San Pasqual Casino Development Group, Inc., Notes, 8.00%, due 9/15/13 | | | 170 | ñ | |
| | | 1,886 | | |
Gas Distribution (2.2%) | |
| | 550 | | | AmeriGas Partners L.P., Senior Unsecured Notes, 7.13%, due 5/20/16 | | | 573 | | |
| | 340 | | | El Paso Corp., Senior Unsecured Medium-Term Notes, 8.25%, due 2/15/16 | | | 386 | | |
| | 240 | | | El Paso Corp., Senior Unsecured Notes, 7.00%, due 6/15/17 | | | 262 | | |
| | 265 | | | El Paso Energy Corp., Global Medium-Term Notes, 7.80%, due 8/1/31 | | | 284 | | |
| | 1,325 | | | Energy Transfer Equity L.P., Guaranteed Notes, 7.50%, due 10/15/20 | | | 1,444 | | |
| | 365 | | | Enterprise Products Operating LLC, Guaranteed Notes, Ser. G, 5.60%, due 10/15/14 | | | 412 | ØØ | |
| | 645 | | | Ferrellgas Partners L.P., Senior Unsecured Notes, 9.13%, due 10/1/17 | | | 713 | ØØ | |
| | 185 | | | Inergy L.P., Guaranteed Notes, 8.75%, due 3/1/15 | | | 201 | | |
| | 45 | | | Inergy L.P., Guaranteed Notes, 8.25%, due 3/1/16 | | | 47 | | |
| | 165 | | | Inergy L.P., Guaranteed Notes, 7.00%, due 10/1/18 | | | 173 | ñ | |
| | 1,115 | | | Kinder Morgan Energy Partners L.P., Senior Unsecured Notes, 5.95%, due 2/15/18 | | | 1,274 | ØØ | |
| | 460 | | | MarkWest Energy Partners L.P., Guaranteed Notes, Ser. B, 8.75%, due 4/15/18 | | | 505 | | |
| See Notes to Schedule of Investments | 62 | |
| PRINCIPAL AMOUNT | | VALUE† | |
| | | | | | |
| (000's omitted) | | (000's omitted) | |
| | | | | | |
| $ | 230 | | | Regency Energy Partners L.P., Guaranteed Notes, 6.88%, due 12/1/18 | | $ | 241 | | |
| | 1,625 | | | Sabine Pass LNG L.P., Senior Secured Notes, 7.50%, due 11/30/16 | | | 1,501 | | |
| | | 8,016 | | |
Health Care (0.5%) | |
| | 80 | | | Columbia Healthcare Corp., Senior Unsecured Notes, 7.50%, due 12/15/23 | | | 76 | | |
| | 620 | | | HCA, Inc., Secured Notes, 9.25%, due 11/15/16 | | | 671 | | |
| | 180 | | | HCA, Inc., Secured Notes, 9.63%, due 11/15/16 | | | 196 | | |
| | 755 | | | HCA, Inc., Senior Secured Notes, 8.50%, due 4/15/19 | | | 849 | | |
| | | 1,792 | | |
Health Facilities (0.4%) | |
| | 215 | | | Community Health Systems, Inc., Guaranteed Notes, 8.88%, due 7/15/15 | | | 230 | | |
| | 635 | | | Health Management Associates, Inc., Senior Secured Notes, 6.13%, due 4/15/16 | | | 654 | | |
| | 275 | | | LVB Acquisition, Inc., Guaranteed Notes, 10.38%, due 10/15/17 | | | 307 | | |
| | 360 | | | Tenet Healthcare Corp., Senior Secured Notes, 8.88%, due 7/1/19 | | | 405 | | |
| | | 1,596 | | |
Health Services (0.2%) | |
| | 135 | | | AMGH Merger Sub, Inc., Guaranteed Notes, 9.25%, due 11/1/18 | | | 140 | ñ | |
| | 160 | | | Omnicare, Inc., Guaranteed Notes, 6.88%, due 12/15/15 | | | 164 | | |
| | 230 | | | Service Corp. Int'l, Senior Unsecured Notes, 7.38%, due 10/1/14 | | | 251 | | |
| | 255 | | | Warner Chilcott Co. LLC, Guaranteed Notes, 7.75%, due 9/15/18 | | | 265 | ñ | |
| | | 820 | | |
Hotels (0.4%) | |
| | 117 | | | Host Hotels & Resorts L.P., Guaranteed Notes, 7.13%, due 11/1/13 | | | 119 | | |
| | 65 | | | Host Hotels & Resorts L.P., Guaranteed Notes, 6.88%, due 11/1/14 | | | 67 | | |
| | 75 | | | Host Hotels & Resorts L.P., Guaranteed Notes, Ser. O, 6.38%, due 3/15/15 | | | 77 | | |
| | 440 | | | Host Hotels & Resorts L.P., Guaranteed Notes, Ser. Q, 6.75%, due 6/1/16 | | | 457 | | |
| | 580 | | | Starwood Hotels & Resorts Worldwide, Inc., Senior Unsecured Notes, 6.75%, due 5/15/18 | | | 642 | ØØ | |
| | | 1,362 | | |
Industrial (2.5%) | |
| | 415 | | | Boston Scientific Corp., Senior Unsecured Notes, 4.50%, due 1/15/15 | | | 436 | | |
| | 425 | | | Corn Products Int'l, Inc., Senior Unsecured Notes, 4.63%, due 11/1/20 | | | 440 | | |
| | 535 | | | Corn Products Int'l, Inc., Senior Unsecured Notes, 6.63%, due 4/15/37 | | | 579 | | |
| | 460 | | | Hess Corp., Senior Unsecured Notes, 5.60%, due 2/15/41 | | | 470 | | |
| | 705 | | | Hospira, Inc., Senior Unsecured Notes, 5.60%, due 9/15/40 | | | 703 | | |
| | 1,305 | | | Husky Energy, Inc., Senior Unsecured Notes, 5.90%, due 6/15/14 | | | 1,460 | | |
| | 210 | | | Lamar Media Corp., Guaranteed Notes, 9.75%, due 4/1/14 | | | 243 | | |
| | 490 | | | Macy's Retail Holdings, Inc., Guaranteed Notes, 6.38%, due 3/15/37 | | | 481 | | |
| | 580 | | | Medco Health Solutions, Inc., Senior Unsecured Notes, 4.13%, due 9/15/20 | | | 585 | | |
| | 665 | | | Rio Tinto Finance (USA) Ltd., Guaranteed Notes, 5.20%, due 11/2/40 | | | 669 | | |
| | 275 | | | UPC Holding BV, Secured Notes, 9.88%, due 4/15/18 | | | 300 | ñ | |
| | 850 | | | Vale Overseas Ltd., Guaranteed Notes, 4.63%, due 9/15/20 | | | 880 | | |
| | 1,140 | | | Wal-Mart Stores, Inc., Senior Unsecured Notes, 5.00%, due 10/25/40 | | | 1,131 | | |
| | 975 | | | Weatherford Int'l Ltd., Guaranteed Notes, 5.13%, due 9/15/20 | | | 1,021 | | |
| | | 9,398 | | |
Industrial Equipment (0.1%) | |
| | 300 | | | RSC Equipment Rental, Inc., Senior Secured Notes, 10.00%, due 7/15/17 | | | 335 | ñ | |
| See Notes to Schedule of Investments | 63 | |
| PRINCIPAL AMOUNT | | VALUE† | |
| | | | | | |
| (000's omitted) | | (000's omitted) | |
| | | | | | |
| Insurance (0.6%) | |
| $ | 390 | | | Hartford Financial Services Group, Inc., Senior Unsecured Notes, 5.38%, due 3/15/17 | | $ | 405 | | |
| | 800 | | | Hartford Financial Services Group, Inc., Senior Unsecured Notes, 5.50%, due 3/30/20 | | | 818 | | |
| | 260 | | | Lincoln National Corp., Senior Unsecured Notes, 7.00%, due 6/15/40 | | | 285 | | |
| | 460 | | | Prudential Financial, Inc., Senior Unsecured Medium-Term Notes, Ser. D, 3.88%, due 1/14/15 | | | 486 | | |
| | 290 | | | Prudential Financial, Inc., Senior Unsecured Notes, 6.63%, due 6/21/40 | | | 319 | ØØ | |
| | | 2,313 | | |
Integrated Energy (0.1%) | |
| | 325 | | | Petrobras Int'l Finance Co., Guaranteed Notes, 5.75%, due 1/20/20 | | | 363 | | |
| | | | | | | | | | |
| Investments & Misc. Financial Services (0.1%) | |
| | 175 | | | Icahn Enterprises L.P., Guaranteed Notes, 7.75%, due 1/15/16 | | | 180 | | |
| | | | | | | | | | |
| Leisure (0.1%) | |
| | 355 | | | Cedar Fair L.P., Guaranteed Notes, 9.13%, due 8/1/18 | | | 381 | ñ | |
| | 20 | | | Royal Caribbean Cruises Ltd., Senior Unsecured Notes, 7.25%, due 6/15/16 | | | 22 | | |
| | | 403 | | |
Machinery (0.3%) | |
| | 530 | | | Case New Holland, Inc., Senior Notes, 7.88%, due 12/1/17 | | | 592 | ñØØ | |
| | 330 | | | The Manitowoc Co., Inc., Guaranteed Notes, 8.50%, due 11/1/20 | | | 345 | | |
| | | 937 | | |
Media (1.5%) | |
| | 1,080 | | | DirecTV Holdings LLC, Guaranteed Notes, 3.55%, due 3/15/15 | | | 1,134 | ØØ | |
| | 1,080 | | | DirecTV Holdings LLC, Guaranteed Notes, 6.00%, due 8/15/40 | | | 1,100 | | |
| | 1,600 | | | Time Warner Cable, Inc., Guaranteed Notes, 6.75%, due 7/1/18 | | | 1,920 | ØØ | |
| | 345 | | | Time Warner Cable, Inc., Guaranteed Notes, 8.75%, due 2/14/19 | | | 459 | | |
| | 900 | | | Time Warner, Inc., Guaranteed Notes, 6.10%, due 7/15/40 | | | 959 | ØØ | |
| | | 5,572 | | |
Media - Broadcast (1.0%) | |
| | 185 | | | Clear Channel Communications, Inc., Senior Unsecured Notes, 5.75%, due 1/15/13 | | | 167 | | |
| | 330 | | | NBC Universal, Inc., Senior Unsecured Notes, 5.15%, due 4/30/20 | | | 358 | ñ | |
| | 1,210 | | | NBC Universal, Inc., Senior Unsecured Notes, 4.38%, due 4/1/21 | | | 1,236 | ñ | |
| | 465 | | | NBC Universal, Inc., Senior Unsecured Notes, 5.95%, due 4/1/41 | | | 475 | ñ | |
| | 323 | | | Umbrella Acquisition, Inc., Guaranteed Notes, 9.75%, due 3/15/15 | | | 343 | ñ | |
| | 415 | | | Univision Communications, Inc., Senior Secured Notes, 7.88%, due 11/1/20 | | | 431 | ñ | |
| | 135 | | | XM Satellite Radio, Inc., Guaranteed Notes, 13.00%, due 8/1/13 | | | 161 | ñ | |
| | 340 | | | XM Satellite Radio, Inc., Senior Unsecured Notes, 7.63%, due 11/1/18 | | | 349 | ñ | |
| | | 3,520 | | |
Media - Cable (1.4%) | |
| | 350 | | | CCO Holdings LLC, Guaranteed Notes, 7.25%, due 10/30/17 | | | 361 | ñ | |
| | 245 | | | CCO Holdings LLC, Guaranteed Notes, 8.13%, due 4/30/20 | | | 265 | ñ | |
| | 470 | | | Cequel Communications Holdings I LLC, Senior Unsecured Notes, 8.63%, due 11/15/17 | | | 503 | ñ | |
| | 595 | | | Comcast Corp., Guaranteed Notes, 6.40%, due 3/1/40 | | | 656 | | |
| | 250 | | | CSC Holdings, Inc., Senior Unsecured Notes, 8.50%, due 6/15/15 | | | 275 | | |
| | 260 | | | DISH DBS Corp., Guaranteed Notes, 7.75%, due 5/31/15 | | | 283 | | |
| | 150 | | | DISH DBS Corp., Guaranteed Notes, 7.88%, due 9/1/19 | | | 164 | | |
| See Notes to Schedule of Investments | 64 | |
| PRINCIPAL AMOUNT | VALUE† | |
| | | | | |
| (000's omitted) | (000's omitted) | |
| | | | | | |
| $ | 465 | | | EchoStar DBS Corp., Guaranteed Notes, 7.00%, due 10/1/13 | | $ | 498 | | |
| | 480 | | | Videotron Ltee, Guaranteed Notes, 9.13%, due 4/15/18 | | | 541 | | |
| | 260 | | | Virgin Media Finance PLC, Guaranteed Notes, 9.13%, due 8/15/16 | | | 278 | | |
| | 375 | | | Virgin Media Finance PLC, Guaranteed Notes, Ser.1, 9.50%, due 8/15/16 | | | 426 | | |
| | 885 | | | Virgin Media Secured Finance PLC, Senior Secured Notes, 6.50%, due 1/15/18 | | | 949 | | |
| | | 5,199 | | |
Media - Services (0.2%) | |
| | 530 | | | WMG Acquisition Corp., Senior Secured Notes, 9.50%, due 6/15/16 | | | 571 | | |
| | | | | | | | | | |
| Metals/Mining Excluding Steel (0.4%) | |
| | 360 | | | Arch Coal, Inc., Guaranteed Notes, 8.75%, due 8/1/16 | | | 404 | | |
| | 185 | | | Arch Western Finance LLC, Guaranteed Notes, 6.75%, due 7/1/13 | | | 187 | ØØ | |
| | 200 | | | FMG Resources (August 2006) Pty Ltd., Senior Notes, 7.00%, due 11/1/15 | | | 205 | ñ | |
| | 120 | | | Peabody Energy Corp., Guaranteed Notes, 7.38%, due 11/1/16 | | | 136 | | |
| | 635 | | | Southern Copper Corp., Senior Unsecured Notes, 6.75%, due 4/16/40 | | | 682 | | |
| | | 1,614 | | |
Multi - Line Insurance (0.1%) | |
| | 305 | | | American Int'l Group, Inc., Junior Subordinated Debentures, 8.18%, due 5/15/58 | | | 325 | µ | |
| | | | | | | | | | |
| Office/Business Equipment (0.7%) | |
| | 315 | | | Xerox Corp., Senior Unsecured Notes, 5.50%, due 5/15/12 | | | 334 | ØØ | |
| | 1,450 | | | Xerox Corp., Senior Unsecured Notes, 6.40%, due 3/15/16 | | | 1,711 | ØØ | |
| | 530 | | | Xerox Corp., Senior Notes, 5.63%, due 12/15/19 | | | 594 | | |
| | | 2,639 | | |
Oil & Gas (0.4%) | |
| | 995 | | | Motiva Enterprises LLC, Notes, 5.75%, due 1/15/20 | | | 1,148 | ñ | |
| | 400 | | | Noble Holding Int'l Ltd., Guaranteed Notes, 4.90%, due 8/1/20 | | | 440 | | |
| | | 1,588 | | |
Oil Refining & Marketing (0.2%) | |
| | 460 | | | Valero Energy Corp., Senior Unsecured Notes, 6.13%, due 2/1/20 | | | 509 | | |
| | 370 | | | Valero Energy Corp., Guaranteed Notes, 6.63%, due 6/15/37 | | | 374 | | |
| | | 883 | | |
Packaging (0.4%) | |
| | 295 | | | Ardagh Packaging Finance PLC, Senior Secured Notes, 7.38%, due 10/15/17 | | | 313 | ñ | |
| | 450 | | | Ball Corp., Guaranteed Notes, 7.13%, due 9/1/16 | | | 490 | | |
| | 215 | | | Berry Plastics Corp., Senior Secured Notes, 9.50%, due 5/15/18 | | | 211 | | |
| | 150 | | | Crown Americas LLC, Guaranteed Notes, 7.63%, due 5/15/17 | | | 164 | | |
| | 135 | | | Owens-Brockway Glass Container, Inc., Guaranteed Notes, 7.38%, due 5/15/16 | | | 147 | | |
| | 245 | | | Reynolds Group Issuer, Inc., Senior Secured Notes, 7.13%, due 4/15/19 | | | 255 | ñ | |
| | | 1,580 | | |
Pharmaceuticals (0.3%) | |
| | 675 | | | Express Scripts, Inc., Guaranteed Notes, 5.25%, due 6/15/12 | | | 719 | ØØ | |
| | 175 | | | Valeant Pharmaceuticals Int'l, Guaranteed Notes, 6.75%, due 10/1/17 | | | 183 | ñ | |
| | 160 | | | Valeant Pharmaceuticals Int'l, Guaranteed Notes, 7.00%, due 10/1/20 | | | 168 | ñ | |
| | | | | | | 1,070 | | |
| See Notes to Schedule of Investments | 65 | |
| PRINCIPAL AMOUNT | | VALUE† | |
| | | | | | |
| (000's omitted) | | (000's omitted) | |
| | | | | | |
| Pipelines (0.1%) | | | |
| $ | 170 | | | Plains All American Pipeline L.P., Guaranteed Notes, 4.25%, due 9/1/12 | | $ | 178 | | |
| | | | | | | | | | |
| Printing & Publishing (0.2%) | |
| | 450 | | | Gannett Co., Inc., Guaranteed Notes, 9.38%, due 11/15/17 | | | 505 | | |
| | 195 | | | Gannett Co., Inc., Guaranteed Notes, 7.13%, due 9/1/18 | | | 201 | ñ | |
| | | 706 | | |
Real Estate (0.2%) | |
| | 660 | | | WEA Finance LLC, Guaranteed Notes, 7.50%, due 6/2/14 | | | 769 | ñØØ | |
| | | | | | | | | | |
| REITs (0.3%) | |
| | 330 | | | Simon Property Group L.P., Senior Unsecured Notes, 10.35%, due 4/1/19 | | | 466 | | |
| | 580 | | | Ventas Realty L.P., Guaranteed Notes. Ser. 1, 6.50%, due 6/1/16 | | | 611 | | |
| | 135 | | | Ventas Realty L.P., Guaranteed Notes, 6.75%, due 4/1/17 | | | 140 | | |
| | | 1,217 | | |
Retail (0.1%) | |
| | 425 | | | CVS Pass-Through Trust, Pass-Through Certificates, 7.51%, due 1/10/32 | | | 496 | ñ | |
| | | | | | | | | | |
| Software/Services (0.3%) | |
| | 375 | | | Fidelity National Information Services, Inc., Guaranteed Notes, 7.63%, due 7/15/17 | | | 406 | ñ | |
| | 215 | | | Fidelity National Information Services, Inc., Guaranteed Notes, 7.88%, due 7/15/20 | | | 235 | ñ | |
| | 275 | | | Lender Processing Services, Inc., Guaranteed Notes, 8.13%, due 7/1/16 | | | 283 | | |
| | 90 | | | SunGard Data Systems, Inc., Guaranteed Notes, 9.13%, due 8/15/13 | | | 92 | | |
| | 35 | | | SunGard Data Systems, Inc., Guaranteed Notes, 10.63%, due 5/15/15 | | | 39 | | |
| | | 1,055 | | |
Specialty Retail (0.5%) | |
| | 780 | | | Home Depot, Inc., Senior Unsecured Notes, 5.88%, due 12/16/36 | | | 810 | | |
| | 490 | | | Toys "R" Us Property Co. I LLC, Guaranteed Notes, 10.75%, due 7/15/17 | | | 560 | | |
| | 475 | | | Toys "R" Us-Delaware, Inc., Senior Secured Notes, 7.38%, due 9/1/16 | | | 495 | ñ | |
| | | 1,865 | | |
Steel Producers/Products (1.4%) | |
| | 1,410 | | | ArcelorMittal, Senior Unsecured Notes, 6.13%, due 6/1/18 | | | 1,542 | ØØ | |
| | 745 | | | ArcelorMittal, Senior Unsecured Notes, 9.85%, due 6/1/19 | | | 961 | ØØ | |
| | 1,560 | | | ArcelorMittal, Senior Unsecured Notes, 5.25%, due 8/5/20 | | | 1,579 | | |
| | 165 | | | Steel Dynamics, Inc., Guaranteed Notes, 6.75%, due 4/1/15 | | | 171 | | |
| | 285 | | | Steel Dynamics, Inc., Guaranteed Notes, 7.75%, due 4/15/16 | | | 304 | | |
| | 240 | | | Tube City IMS Corp., Guaranteed Notes, 9.75%, due 2/1/15 | | | 250 | | |
| | 345 | | | United States Steel Corp., Senior Unsecured Notes, 6.65%, due 6/1/37 | | | 306 | | |
| | | 5,113 | | |
Support - Services (0.3%) | |
| | 265 | | | Knowledge Learning Corp., Guaranteed Notes, 7.75%, due 2/1/15 | | | 266 | ñ | |
| | 110 | | | United Rentals N.A., Inc., Guaranteed Notes, 7.00%, due 2/15/14 | | | 112 | | |
| | 440 | | | United Rentals N.A., Inc., Guaranteed Notes, 10.88%, due 6/15/16 | | | 502 | | |
| | 135 | | | West Corp., Guaranteed Notes, 8.63%, due 10/1/18 | | | 140 | ñ | |
| | | 1,020 | | |
| See Notes to Schedule of Investments | 66 | |
| PRINCIPAL AMOUNT | | VALUE† | |
| | | | | | |
| (000's omitted) | | (000's omitted) | |
| | | | | | |
| Telecom - Integrated/Services (1.2%) | |
| $ | 395 | | | Citizens Communications Co., Senior Unsecured Notes, 9.00%, due 8/15/31 | | $ | 440 | | |
| | 135 | | | Citizens Utilities Co., Senior Unsecured Notes, 6.63%, due 3/15/15 | | | 144 | | |
| | 285 | | | Dycom Investments, Inc., Guaranteed Notes, 8.13%, due 10/15/15 | | | 292 | | |
| | 330 | | | GCI, Inc., Senior Unsecured Notes, 8.63%, due 11/15/19 | | | 363 | ØØ | |
| | 478 | | | Intelsat Bermuda Ltd., Guaranteed Notes, 11.50%, due 2/4/17 | | | 510 | | |
| | 135 | | | Intelsat Jackson Holdings Ltd., Guaranteed Notes, 8.50%, due 11/1/19 | | | 147 | ñ | |
| | 65 | | | Intelsat Subsidiary Holding Co., Ltd, Guaranteed Notes, Ser. B, 8.88%, due 1/15/15 | | | 67 | ñ | |
| | 550 | | | PAETEC Holding Corp., Senior Secured Notes, 8.88%, due 6/30/17 | | | 593 | ØØ | |
| | 235 | | | Qwest Communications Int'l, Inc., Guaranteed Notes, 7.13%, due 4/1/18 | | | 250 | ñ | |
| | 550 | | | Qwest Corp., Senior Unsecured Notes, 8.88%, due 3/15/12 | | | 604 | ØØ | |
| | 335 | | | Qwest Corp., Senior Unsecured Notes, 8.38%, due 5/1/16 | | | 404 | | |
| | 450 | | | Windstream Corp., Guaranteed Notes, 8.13%, due 8/1/13 | | | 495 | | |
| | 185 | | | Windstream Corp., Guaranteed Notes, 8.63%, due 8/1/16 | | | 197 | ØØ | |
| | | 4,506 | | |
Telecom - Wireless (0.8%) | |
| | 460 | | | CC Holdings GS V LLC/Crown Castle GS III Corp., Senior Secured Notes, 7.75%, due 5/1/17 | | | 516 | ñ | |
| | 120 | | | Clearwire Communications LLC, Senior Secured Notes, 12.00%, due 12/1/15 | | | 133 | ñ | |
| | 1,060 | | | Cricket Communications, Inc., Senior Secured Notes, 7.75%, due 5/15/16 | | | 1,142 | | |
| | 199 | | | MetroPCS Wireless, Inc., Guaranteed Notes, 9.25%, due 11/1/14 | | | 209 | | |
| | 995 | | | Sprint Capital Corp., Guaranteed Notes, 6.88%, due 11/15/28 | | | 938 | | |
| | | 2,938 | | |
Telecommunications (0.7%) | |
| | 825 | | | America Movil SAB de CV, Guaranteed Notes, 5.00%, due 3/30/20 | | | 902 | | |
| | 750 | | | AT&T, Inc., Senior Unsecured Notes, 4.85%, due 2/15/14 | | | 831 | | |
| | 360 | | | Telecom Italia Capital SA, Guaranteed Unsecured Notes, 4.95%, due 9/30/14 | | | 389 | | |
| | 370 | | | Verizon New Jersey, Inc., Senior Unsecured Notes, Ser. A, 5.88%, due 1/17/12 | | | 391 | | |
| | | 2,513 | | |
Tobacco (1.3%) | |
| | 2,105 | | | Altria Group, Inc., Guaranteed Notes, 9.70%, due 11/10/18 | | | 2,904 | ØØ | |
| | 1,510 | | | Lorillard Tobacco Co., Guaranteed Notes, 8.13%, due 6/23/19 | | | 1,745 | ØØ | |
| | 250 | | | Lorillard Tobacco Co., Guaranteed Notes, 6.88%, due 5/1/20 | | | 268 | | |
| | | 4,917 | | |
Transport - Rail (0.1%) | |
| | 405 | | | RZD Capital Ltd., Medium-Term Loan Participation Notes, 5.74%, due 4/3/17 | | | 427 | | |
| | | | | | | | | | |
| Utilities (0.3%) | |
| | 710 | | | Energy Future Holdings Corp., Senior Secured Notes, 10.00%, due 1/15/20 | | | 743 | ñ | |
| | 402 | | | Homer City Funding LLC, Senior Secured Notes, 8.14%, due 10/1/19 | | | 378 | | |
| | | 1,121 | | |
| Total Corporate Debt Securities (Cost $146,015) | | | 155,210 | | |
| | | | | | | | | | |
| Asset-Backed Securities (12.5%) | |
| | 839 | | | Banc of America Commercial Mortgage, Inc., Ser. 2006-3, Class A4, 5.89%, due 7/10/44 | | | 919 | | |
| | 600 | | | Banc of America Commercial Mortgage, Inc., Ser. 2006-6, Class A4, 5.36%, due 10/10/45 | | | 641 | | |
| | 730 | | | Banc of America Commercial Mortgage, Inc., Ser. 2006-4, Class A4, 5.63%, due 7/10/46 | | | 788 | | |
| | 700 | | | Banc of America Commercial Mortgage, Inc., Ser. 2006-5, Class A4, 5.41%, due 9/10/47 | | | 748 | | |
| | 435 | | | Banc of America Commercial Mortgage, Inc., Ser. 2007-1, Class A4, 5.45%, due 1/15/49 | | | 459 | | |
| See Notes to Schedule of Investments | 67 | |
| PRINCIPAL AMOUNT | | VALUE† | |
| | | | | | |
| (000's omitted) | | | | (000's omitted) | |
| | | | | | |
| $ | 1,750 | | | Banc of America Commercial Mortgage, Inc., Ser. 2007-3, Class A4, 5.66%, due 6/10/49 | | $ | 1,822 | µØØ | |
| | 2,500 | | | Bear Stearns Commercial Mortgage Securities, Ser. 2007-PW15, Class A4, 5.33%, due 2/11/44 | | | 2,603 | ØØ | |
| | 550 | | | Bear Stearns Commercial Mortgage Securities, Ser. 2007-PW17, Class A4, 5.69%, due 6/11/50 | | | 592 | | |
| | 1,280 | | | Citigroup Mortgage Loan Trust, Inc., Ser. 2006-AMC1, Class A2B, 0.16%, due 9/25/36 | | | 586 | µ | |
| | 1,160 | | | Citigroup/Deutsche Bank Commercial Mortgage Trust, Ser. 2007-CD5, Class A4, 5.89%, due 11/15/44 | | | 1,253 | ØØ | |
| | 2,000 | | | Citigroup/Deutsche Bank Commercial Mortgage Trust, Ser. 2007-CD4, Class A4, 5.32%, due 12/11/49 | | | 2,086 | ØØ | |
| | 2,000 | | | Commercial Mortgage Loan Trust, Ser. 2008-LS1, Class A4B, 6.01%, due 12/10/49 | | | 2,135 | µØ | |
| | 500 | | | Commercial Mortgage Pass-Through Certificates, Ser. 2006-C8, Class A4, 5.31%, due 12/10/46 | | | 525 | | |
| | 2,000 | | | Credit Suisse Mortgage Capital Certificates, Ser. 2007-C3, Class A4, 5.72%, due 6/15/39 | | | 2,075 | µ | |
| | 1,060 | | | Credit Suisse Mortgage Capital Certificates, Ser. 2006-C4, Class A3, 5.47%, due 9/15/39 | | | 1,132 | | |
| | 300 | | | Credit Suisse Mortgage Capital Certificates, Ser. 2007-C4, Class A4, 5.80%, due 9/15/39 | | | 311 | µØØ | |
| | 400 | | | Credit Suisse Mortgage Capital Certificates, Ser. 2006-C5, Class A3, 5.31%, due 12/15/39 | | | 421 | ØØ | |
| | 1,925 | | | CWCapital Cobalt Ltd., Ser. 2007-C3, Class A4, 5.82%, due 5/15/46 | | | 2,026 | µØØ | |
| | 718 | | | CWCapital Cobalt Ltd., Ser. 2007-C2, Class A2, 5.33%, due 4/15/47 | | | 748 | | |
| | 500 | | | CWCapital Cobalt Ltd., Ser. 2007-C2, Class A3, 5.48%, due 4/15/47 | | | 523 | | |
| | 335 | | | Greenwich Capital Commercial Funding Corp., Ser. 2007-GG9, Class A4, 5.44%, due 3/10/39 | | | 358 | | |
| | 1,000 | | | GS Mortgage Securities Corp. II, Ser. 2006-GG6, Class A4, 5.55%, due 4/10/38 | | | 1,085 | | |
| | 500 | | | GS Mortgage Securities Corp. II, Ser. 2005-GG4, Class A3, 4.61%, due 7/10/39 | | | 509 | ØØ | |
| | 700 | | | GS Mortgage Securities Corp. II, Ser. 2005-GG4, Class A4, 4.76%, due 7/10/39 | | | 731 | ØØ | |
| | 2,000 | | | GS Mortgage Securities Corp. II, Ser. 2007-GG10, Class A4, 5.81%, due 8/10/45 | | | 2,118 | µØØ | |
| | 400 | | | JP Morgan Chase Commercial Mortgage Securities Corp., Ser. 2006-LDP7, Class A4, 5.87%, due 4/15/45 | | | 444 | µ | |
| | 500 | | | JP Morgan Chase Commercial Mortgage Securities Corp., Ser. 2006-LDP9, Class A3, 5.34%, due 5/15/47 | | | 526 | | |
| | 1,725 | | | JP Morgan Chase Commercial Mortgage Securities Corp., Ser. 2007-CB18, Class A4, 5.44%, due 6/12/47 | | | 1,820 | ØØ | |
| | 2,500 | | | JP Morgan Chase Commercial Mortgage Securities Corp., Ser. 2007-CB19, Class A4, 5.74%, due 2/12/49 | | | 2,660 | µØØ | |
| | 1,790 | | | JP Morgan Chase Commercial Mortgage Securities Corp., Ser. 2007-LD11, Class A4, 5.82%, due 6/15/49 | | | 1,900 | µØØ | |
| | 1,610 | | | JP Morgan Chase Commercial Mortgage Securities Corp., Ser. 2007-CB20, Class A4, 5.79%, due 2/12/51 | | | 1,746 | ØØ | |
| | 2,200 | | | JP Morgan Chase Commercial Mortgage Securities Corp., Ser. 2007-LD12, Class A4, 5.88%, due 2/15/51 | | | 2,351 | ØØ | |
| �� | 915 | | | LB-UBS Commercial Mortgage Trust, Ser. 2007-C6, Class A4, 5.86%, due 7/15/40 | | | 973 | ØØ | |
| | 1,935 | | | Merrill Lynch/Countrywide Commercial Mortgage Trust, Ser. 2007-5, Class A4, 5.38%, due 8/12/48 | | | 1,978 | ØØ | |
| | 2,000 | | | Merrill Lynch/Countrywide Commercial Mortgage Trust, Ser. 2007-7, Class A4, 5.81%, due 6/12/50 | | | 2,079 | µØØ | |
| | 900 | | | Morgan Stanley Capital I, Ser. 2007-IQ16, Class A4, 5.81%, due 12/12/49 | | | 945 | ØØ | |
| | 837 | | | Morgan Stanley Home Equity Loan Trust, Ser. 2006-3, Class A3, 0.42%, due 4/25/36 | | | 546 | µ | |
| | 400 | | | Wachovia Bank Commercial Mortgage Trust, Ser. 2005-C19, Class A5, 4.66%, due 5/15/44 | | | 415 | | |
| | 250 | | | Wachovia Bank Commercial Mortgage Trust, Ser. 2007-C31, Class A4, 5.51%, due 4/15/47 | | | 259 | ØØ | |
| | 957 | | | Wells Fargo Home Equity Trust, Ser. 2006-3, Class A2, 0.41%, due 1/25/37 | | | 651 | µ | |
| | | | | | | | | | |
| | Total Asset-Backed Securities (Cost $39,536) | | | 46,487 | | |
| | | | | | | | | | |
| Government Securities (2.6%) | |
| | |
| Quasi - Sovereign (0.6%) | |
| | 422 | | | Banco Nacional de Desenvolvimento Economico e Social, Senior Unsecured Notes, 5.50%, due 7/12/20 | | | 456 | | |
| | 215 | | | Bank of China (Hong Kong) Ltd., Subordinated Notes, 5.55%, due 2/11/20 | | | 227 | | |
| | 165 | | | Empresa Nacional del Petroleo, Unsecured Notes, 5.25%, due 8/10/20 | | | 174 | | |
| | 175 | | | Intergas Finance BV, Senior Unsecured Notes, 6.38%, due 5/14/17 | | | 191 | | |
| | 110 | | | KazMunaiGaz Finance Sub BV, Guaranteed Global Medium-Term Notes, Ser. 2, 9.13%, due 7/2/18 | | | 132 | | |
| | 125 | | | Nak Naftogaz Ukraine, Gov't Guaranteed Notes, 9.50%, due 9/30/14 | | | 135 | | |
| | 210 | | | Petroleos de Venezuela SA, Guaranteed Notes, 5.25%, due 4/12/17 | | | 124 | | |
| | 110 | | | Petroleos de Venezuela SA, Guaranteed Notes, 5.38%, due 4/12/27 | | | 53 | | |
| See Notes to Schedule of Investments | 68 | |
| PRINCIPAL AMOUNT | | VALUE† | |
| | | | | | |
| (000's omitted) | | (000's omitted) | |
| | | | | | |
| $ | 335 | | | Petronas Capital Ltd., Guaranteed Notes, 5.25%, due 8/12/19 | | $ | 371 | | |
| | 114 | | | Republic of Croatia, Senior Unsecured Notes, 6.75%, due 11/5/19 | | | 130 | | |
| | | 1,993 | | |
| Sovereign (2.0%) | |
| | 348 | | | Federative Republic of Brazil, Senior Unsecured Notes, 4.88%, due 1/22/21 | | | 386 | | |
| | 265 | | | Lebanese Republic, Notes, 8.50%, due 1/19/16 | | | 307 | | |
| | 102 | | | Lebanese Republic, Unsubordinated Medium-Term Notes, 6.38%, due 3/9/20 | | | 106 | | |
| | 100 | | | Majapahit Holding BV, Guaranteed Notes, 7.25%, due 6/28/17 | | | 117 | | |
| | 130 | | | Majapahit Holding BV, Guaranteed Notes, 7.88%, due 6/29/37 | | | 162 | | |
| | 258 | | | Pemex Project Funding Master Trust, Guaranteed Notes, 5.75%, due 3/1/18 | | | 290 | | |
| | 120 | | | Pemex Project Funding Master Trust, Guaranteed Notes, 6.63%, due 6/15/38 | | | 134 | | |
| | 30 | | | Republic of Argentina, Senior Unsecured Notes, 8.75%, due 6/2/17 | | | 31 | | |
| | 231 | | | Republic of Argentina, Senior Unsecured Notes, 8.28%, due 12/31/33 | | | 219 | | |
| | 65 | | | Republic of Argentina, Unsubordinated Notes, Step-Up, 2.50%/5.25%, due 12/31/38 | | | 30 | ** | |
| | 55 | | | Republic of Bulgaria, Unsubordinated Notes, 8.25%, due 1/15/15 | | | 65 | | |
| | 100 | | | Republic of Chile, Senior Unsecured Notes, 3.88%, due 8/5/20 | | | 104 | | |
| | 210 | | | Republic of Colombia, Senior Unsecured Notes, 8.13%, due 5/21/24 | | | 287 | | |
| | 180 | | | Republic of Colombia, Unsecured Notes, 7.38%, due 1/27/17 | | | 224 | | |
| | 85 | | | Republic of El Salvador, Senior Unsecured Notes, 7.75%, due 1/24/23 | | | 99 | | |
| | 50 | | | Republic of El Salvador, Unsecured Notes, 7.65%, due 6/15/35 | | | 57 | | |
| | 17 | | | Republic of Hungary, Senior Unsecured Notes, 4.75%, due 2/3/15 | | | 18 | | |
| | 130 | | | Republic of Hungary, Senior Unsecured Notes, 6.25%, due 1/29/20 | | | 143 | | |
| | 105 | | | Republic of Indonesia, Senior Unsecured Notes, 7.25%, due 4/20/15 | | | 125 | | |
| | 249 | | | Republic of Indonesia, Senior Unsecured Notes, 5.88%, due 3/13/20 | | | 289 | | |
| | 150 | | | Republic of Lithuania, Senior Unsecured Notes, 7.38%, due 2/11/20 | | | 175 | | |
| | 55 | | | Republic of Panama, Senior Unsecured Notes, 7.25%, due 3/15/15 | | | 67 | | |
| | 100 | | | Republic of Panama, Senior Unsecured Notes, 5.20%, due 1/30/20 | | | 113 | | |
| | 162 | | | Republic of Panama, Senior Unsecured Notes, 6.70%, due 1/26/36 | | | 204 | | |
| | 255 | | | Republic of Peru, Senior Unsecured Notes, 7.35%, due 7/21/25 | | | 338 | | |
| | 43 | | | Republic of Peru, Senior Unsecured Notes, 8.75%, due 11/21/33 | | | 66 | | |
| | 400 | | | Republic of Philippines, Senior Unsecured Notes, 6.50%, due 1/20/20 | | | 480 | | |
| | 335 | | | Republic of Poland, Senior Unsecured Notes, 5.00%, due 10/19/15 | | | 372 | | |
| | 100 | | | Republic of South Africa, Senior Unsecured Notes, 6.50%, due 6/2/14 | | | 115 | | |
| | 175 | | | Republic of South Africa, Senior Unsecured Notes, 6.88%, due 5/27/19 | | | 216 | | |
| | 447 | | | Republic of Turkey, Senior Unsecured Notes, 7.00%, due 6/5/20 | | | 554 | | |
| | 100 | | | Republic of Turkey, Senior Unsecured Notes, 5.63%, due 3/30/21 | | | 112 | | |
| | 100 | | | Republic of Turkey, Senior Unsecured Notes, 7.38%, due 2/5/25 | | | 127 | | |
| | 222 | | | Republic of Uruguay, Senior Unsecured Notes, 6.88%, due 9/28/25 | | | 276 | | |
| | 13 | | | Republic of Uruguay, Unsecured Notes, 7.88%, due 1/15/33 | | | 18 | | |
| | 241 | | | Republic of Venezuela, Senior Unsecured Notes, 7.75%, due 10/13/19 | | | 164 | | |
| | 124 | | | Republic of Venezuela, Senior Unsecured Notes, 9.38%, due 1/13/34 | | | 83 | | |
| | 200 | | | RSHB Capital SA, Senior Secured Notes, 6.30%, due 5/15/17 | | | 211 | | |
| | 100 | | | Russian Federation Bond, Notes, 5.00%, due 4/29/20 | | | 104 | | |
| | 11 | | | Russian Federation Bond, Senior Unsecured Notes, 7.50%, due 3/31/30 | | | 13 | | |
| | 4 | | | Russian Federation Bond, Senior Unsecured Notes, 7.50%, due 3/31/30 | | | 4 | | |
| | 100 | | | Ukraine Government Bond, Senior Unsubordinated Notes, 6.58%, due 11/21/16 | | | 98 | | |
| | 308 | | | United Mexican States, Senior Unsecured Medium-Term Notes, Ser. A, 5.13%, due 1/15/20 | | | 346 | | |
| | | 7,449 | | |
| | Total Government Securities (Cost $9,376) | | | 9,442 | | |
| | | | | | | | | | |
| NUMBER OF SHARES | |
| | |
| Short-Term Investments (7.0%) | |
| | 26,118,169 | | | State Street Institutional Liquid Reserves Fund Institutional Class (Cost $26,118) | | | 26,118 | | |
| | | | | | | | | | |
| | Total Investments (112.7%) (Cost $399,281) | | | 418,401 | ## | |
| | | | | | | | | | |
| | Liabilities, less cash, receivables and other assets [(12.7%)] | | | (47,179 | ) | |
| | | | | | | | | | |
| | Total Net Assets (100.0%) | | $ | 371,222 | | |
| See Notes to Schedule of Investments | 69 | |
Notes to Schedule of Investments
| † | In accordance with Accounting Standards Codification ("ASC") 820 "Fair Value Measurements and Disclosures" ("ASC 820"), all investments held by each of Neuberger Berman Core Bond Fund ("Core Bond"), Neuberger Berman Floating Rate Income Fund ("Floating Rate Income"), Neuberger Berman High Income Bond Fund ("High Income"), Neuberger Berman Municipal Intermediate Bond Fund ("Municipal Intermediate Bond"), Neuberger Berman Short Duration Bond Fund ("Short Duration"), and Neuberger Berman Strategic Income Fund ("Strategic Income") (each individually a "Fund", and collectively the "Funds") are carried at the value that Neuberger Berman Management LLC ("Management") believes a fund would receive upon selling an investment in an orderly transaction to an independent buyer in the principal or most advantageous market for the investment under curr ent market conditions. Various inputs, including the volume and level of activity for the asset or liability in the market, are considered in valuing the Funds' investments, some of which are discussed below. Significant management judgment may be necessary to value investments in accordance with ASC 820. |
| | |
| | ASC 820 established a three-tier hierarchy of inputs to create a classification of value measurements for disclosure purposes. The three-tier hierarchy of inputs is summarized in the three broad Levels listed below. |
| | |
| | ● | Level 1 – quoted prices in active markets for identical investments |
| | |
| | ● | Level 2 – other significant observable inputs (including quoted prices for similar investments, interest rates, prepayment speeds, credit risk, amortized cost, etc.) |
| | |
| | ● | Level 3 – significant unobservable inputs (including a Fund's own assumptions in determining the fair value of investments) |
| | |
| | The inputs or methodology used for valuing an investment are not necessarily an indication of the risk associated with investing in those securities. |
| | |
| | The value of the Funds' investments in debt securities is determined by Management primarily by obtaining valuations from independent pricing services based on readily available bid quotations, or if quotations are not available, by methods which include various considerations based on security type (generally Level 2 inputs). In addition to the consideration of yields or prices of securities of comparable quality, coupon, maturity and type; indications as to values from dealers; and general market conditions, the following is a description of other Level 2 inputs and related valuation techniques used by an independent pricing service to value certain types of debt securities and short term investments of the Funds: |
| | |
| | Corporate Debt Securities. Inputs used to value corporate debt securities generally include relative credit information, observed market movements, sector news, spread to the U.S. Treasury market, and other market information which may include benchmark yields, reported trades, broker/dealer quotes, issuer spreads, benchmark securities, bids, offers, and reference data, such as market research publications, when available ("Other Market Information"). |
| | |
| | U.S. Treasury Securities. Inputs used to value U.S. Treasury securities generally include quotes from several inter-dealer brokers and Other Market Information. |
| | |
| | Asset-Backed Securities and Mortgage Backed Securities. Inputs used to value asset-backed securities and mortgage backed securities generally include models that consider a number of factors, which may include the following: prepayment speeds, cash flows, spread adjustments and Other Market Information. |
| | |
| | High Yield Securities. Inputs used to value high yield securities generally include a number of observations of equity and credit default swap curves related to the issuer and Other Market Information. |
| | |
| | Municipal Debt Securities. Inputs used to evaluate municipal debt securities include current trades, bid-wanted lists (which informs the market that a holder is interested in selling a position and that offers will be considered), offerings, general information on market movement, direction, trends, and specific data on specialty issues. |
| See Notes to Financial Statements | 70 | |
| Notes to Schedule of Investments (cont'd) |
| | Emerging Markets Debt. Inputs used to value emerging markets debt generally include dealer quotes, bond market activity, discounted cash flow models, and other relevant information such as credit spreads and benchmark curves. |
| | |
| | Inputs used by independent pricing services to value bank loan securities include multiple broker quotes (generally Level 2 inputs). Financial futures contracts are determined by obtaining valuations from independent pricing services at the settlement price at the market close. Management has developed a process to periodically review information provided by independent pricing services for all types of securities. Investments in State Street Institutional Government Money Market Fund Institutional Class and State Street Institutional Liquid Reserves Fund Institutional Class are valued using the respective fund's daily calculated NAV. For debt securities, if a valuation is not available from an independent pricing service, or if Management has reason to believe that the valuation received does not represent the amount a fund might reasonably expect to receive on a current sale in an orderly transaction, the Funds seek to obtain quotations from principal market makers (generally considered Level 3 inputs). If such quotations are not readily available, the security is valued using methods the Board of Trustees of Neuberger Berman Income Funds (the "Board") has approved on the belief that they reflect fair value. Numerous factors may be considered when determining the fair value of a security based on Level 2 or 3 inputs, including available analyst, media or other reports, trading in futures or ADRs and whether the issuer of the security being fair valued has other securities outstanding. These fair value prices are necessarily estimates, and there is no assurance that such a price will be at or close to the price at which the security is next quoted or next trades. The following is a summary, categorized by Level, of inputs used to value the Funds' investments as of October 31, 2010: |
Asset Valuation Inputs (000's omitted) | | | Level 1 | | Level 2 | | Level 3§ | | Total | |
Core Bond | |
| Investments: | |
U.S. Treasury Securities-Backed by the Full Faith and Credit of the U.S. Government | | | $— | | | | | | | | | | |
| Mortgage-Backed Securities | |
| Adjustable Rate Mortgages | | | — | | | 2,266 | | | — | | | 2,266 | |
| Fannie Mae | | | — | | | 34,782 | | | — | | | 34,782 | |
| Freddie Mac | | | — | | | 12,772 | | | — | | | 12,772 | |
| Total Mortgage-Backed Securities | | | — | | | 49,820 | | | — | | | 49,820 | |
| Corporate Debt Securities | |
| Airlines | | | — | | | — | | | 2,585 | | | 2,585 | |
| Banking | | | — | | | 11,329 | | | — | | | 11,329 | |
| Beverages | | | — | | | 808 | | | — | | | 808 | |
| Chemicals | | | — | | | 610 | | | — | | | 610 | |
| Commercial Services | | | — | | | 1,511 | | | — | | | 1,511 | |
| Diversified Capital Goods | | | — | | | 353 | | | — | | | 353 | |
| Diversified Financial Services | | | — | | | 4,464 | | | — | | | 4,464 | |
| Electric—Integrated | | | — | | | 254 | | | — | | | 254 | |
| See Notes to Financial Statements | 71 | |
Notes to Schedule of Investments (cont'd)
Asset Valuation Inputs (000's omitted) | | Level 1 | | Level 2 | | Level 3§ | | Total | |
| Food | | | | | | | | | | | | | |
| Gas Distribution | | | — | | | 825 | | | — | | | 825 | |
| Industrial | | | — | | | 2,347 | | | — | | | 2,347 | |
| Insurance | | | — | | | 2,088 | | | — | | | 2,088 | |
| Media | | | — | | | 2,828 | | | — | | | 2,828 | |
| Media—Broadcast | | | — | | | 1,348 | | | — | | | 1,348 | |
| Media—Cable | | | — | | | 243 | | | — | | | 243 | |
| Metals/Mining Excluding Steel | | | — | | | 569 | | | — | | | 569 | |
| Office/Business Equipment | | | — | | | 201 | | | — | | | 201 | |
| Pharmaceuticals | | | — | | | 96 | | | — | | | 96 | |
| Pipelines | | | — | | | 446 | | | — | | | 446 | |
| Real Estate | | | — | | | 384 | | | — | | | 384 | |
| REITs | | | — | | | 594 | | | — | | | 594 | |
| Retail | | | — | | | 496 | | | — | | | 496 | |
| Specialty Retail | | | — | | | 436 | | | — | | | 436 | |
| Steel Producers/Products | | | — | | | 2,541 | | | — | | | 2,541 | |
| Telecommunications | | | — | | | 1,414 | | | — | | | 1,414 | |
| Tobacco | | | — | | | 1,224 | | | — | | | 1,224 | |
| Total Corporate Debt Securities | | | — | | | 39,979 | | | 2,585 | | | 42,564 | |
| Asset-Backed Securities | | | — | | | 21,689 | | | 0 | | | 21,689 | |
| Short-Term Investments | | | — | | | 4,395 | | | — | | | 4,395 | |
| Total Investments | | | — | | | 191,135 | | | 2,585 | | | 193,720 | |
| Floating Rate Income | |
| Investments: | |
| Bank Loan Obligations | |
| Aerospace & Defense | | | — | | | 996 | | | — | | | 996 | |
| All Telecom | | | — | | | 6,973 | | | — | | | 6,973 | |
| Automotive | | | — | | | 930 | | | — | | | 930 | |
| Building & Development | | | — | | | 988 | | | 709 | | | 1,697 | |
| Business Equipment & Services | | | — | | | 1,732 | | | 877 | | | 2,609 | |
| Cable & Satellite Television | | | — | | | 1,064 | | | — | | | 1,064 | |
| Chemicals & Plastics | | | — | | | 4,225 | | | — | | | 4,225 | |
| Clothing/Textiles | | | — | | | 635 | | | — | | | 635 | |
| Conglomerates | | | — | | | 3,044 | | | — | | | 3,044 | |
| Containers & Glass Products | | | — | | | 2,145 | | | — | | | 2,145 | |
| Drugs | | | — | | | 1,314 | | | — | | | 1,314 | |
| Electric—Generation | | | — | | | 914 | | | — | | | 914 | |
| Electronics/Electrical | | | — | | | 5,561 | | | — | | | 5,561 | |
| Equipment Leasing | | | — | | | 1,668 | | | — | | | 1,668 | |
| Farming/Agriculture | | | — | | | 702 | | | — | | | 702 | |
| See Notes to Financial Statements | 72 | |
Notes to Schedule of Investments (cont'd)
Asset Valuation Inputs (000's omitted) | | Level 1 | | Level 2 | | Level 3§ | | Total | |
| Financial Intermediaries | | $ | — | | $ | 2,849 | | $ | 1,317 | | $ | 4,166 | |
| Food Products | | | — | | | 2,770 | | | — | | | 2,770 | |
| Food Service | | | — | | | 776 | | | — | | | 776 | |
| Food/Drug Retailers | | | — | | | 1,278 | | | — | | | 1,278 | |
| Health Care | | | — | | | 6,606 | | | — | | | 6,606 | |
| Industrial Equipment | | | — | | | 480 | | | — | | | 480 | |
| Insurance | | | — | | | 746 | | | — | | | 746 | |
| Leisure Goods/Activities/Movies | | | — | | | 2,159 | | | — | | | 2,159 | |
| Lodging & Casinos | | | — | | | 2,619 | | | — | | | 2,619 | |
| Media—Broadcast | | | — | | | 209 | | | — | | | 209 | |
| Nonferrous Metals/Minerals | | | — | | | 1,157 | | | — | | | 1,157 | |
| Oil & Gas | | | — | | | 994 | | | — | | | 994 | |
| Publishing | | | — | | | 3,030 | | | — | | | 3,030 | |
| Radio & Television | | | — | | | 925 | | | — | | | 925 | |
| Retailers (except food & drug) | | | — | | | 1,855 | | | — | | | 1,855 | |
| Surface Transport | | | — | | | 493 | | | — | | | 493 | |
| Utilities | | | — | | | 3,196 | | | — | | | 3,196 | |
| Total Bank Loan Obligations | | | | | | 65,033 | | | 2,903 | | | 67,936 | |
| Corporate Debt Securities | |
| AirTransport | | | — | | | 670 | | | 432 | | | 1,102 | |
| Auto Loans | | | — | | | 830 | | | — | | | 830 | |
| Banking | | | — | | | 1,024 | | | — | | | 1,024 | |
| Chemicals | | | — | | | 286 | | | — | | | 286 | |
| Consumer/Commercial/Lease Financing | | | — | | | 479 | | | — | | | 479 | |
| Department Stores | | | — | | | 743 | | | — | | | 743 | |
| Electric—Generation | | | — | | | 2,654 | | | 372 | | | 3,026 | |
| Electronics | | | — | | | 1,078 | | | — | | | 1,078 | |
| Gas Distribution | | | — | | | 1,217 | | | — | | | 1,217 | |
| Health Care | | | — | | | 609 | | | — | | | 609 | |
| Media—Broadcast | | | — | | | 257 | | | — | | | 257 | |
| Media—Cable | | | — | | | 936 | | | — | | | 936 | |
| Packaging | | | — | | | 526 | | | — | | | 526 | |
| Specialty Retail | | | — | | | 1,067 | | | — | | | 1,067 | |
| Support—Services | | | — | | | 391 | | | — | | | 391 | |
| Telecom—Integrated/Services | | | — | | | 717 | | | — | | | 717 | |
| Telecom—Wireless | | | — | | | 754 | | | — | | | 754 | |
| Total Corporate Debt Securities | | | — | | | 14,238 | | | 804 | | | 15,042 | |
| Short-Term Investments | | | — | | | 12,023 | | | — | | | 12,023 | |
| Total Investments | | | — | | | 91,294 | | | 3,707 | | | 95,001 | |
| See Notes to Financial Statements | 73 | |
Notes to Schedule of Investments (cont'd)
Asset Valuation Inputs (000's omitted) | | Level 1 | | Level 2 | | Level 3§ | | Total | |
High Income | |
Investments: | |
| Bank Loan Obligations | |
| Media—Broadcast | | | | | | | | | | | | | |
| Corporate Debt Securities | |
| Aerospace/Defense | | | — | | | 6,168 | | | — | | | 6,168 | |
| Airlines | | | — | | | 10,261 | | | 8,097 | | | 18,358 | |
| Auto Loans | | | — | | | 27,118 | | | — | | | 27,118 | |
| Auto Parts & Equipment | | | — | | | 2,098 | | | — | | | 2,098 | |
| Automakers | | | — | | | 14,316 | | | — | | | 14,316 | |
| Banking | | | — | | | 62,551 | | | — | | | 62,551 | |
| Beverages | | | — | | | 2,629 | | | — | | | 2,629 | |
| Building & Construction | | | — | | | 3,230 | | | — | | | 3,230 | |
| Building Materials | | | — | | | 16,421 | | | — | | | 16,421 | |
| Chemicals | | | — | | | 26,421 | | | — | | | 26,421 | |
| Consumer/Commercial/Lease Financing | | | — | | | 22,262 | | | — | | | 22,262 | |
| Department Stores | | | — | | | 4,898 | | | — | | | 4,898 | |
| Electric—Generation | | | — | | | 37,616 | | | 3,873 | | | 41,489 | |
| Electric—Integrated | | | — | | | 1,842 | | | — | | | 1,842 | |
| Electronics | | | — | | | 26,222 | | | — | | | 26,222 | |
| Energy—Exploration & Production | | | — | | | 46,520 | | | — | | | 46,520 | |
| Food & Drug Retailers | | | — | | | 14,426 | | | — | | | 14,426 | |
| Food—Wholesale | | | — | | | 10,891 | | | — | | | 10,891 | |
| Forestry/Paper | | | — | | | 5,159 | | | — | | | 5,159 | |
| Gaming | | | — | | | 39,345 | | | — | | | 39,345 | |
| Gas Distribution | | | — | | | 60,184 | | | — | | | 60,184 | |
| Health Care | | | — | | | 22,586 | | | — | | | 22,586 | |
| Health Facilities | | | — | | | 21,618 | | | — | | | 21,618 | |
| Health Services | | | — | | | 12,138 | | | — | | | 12,138 | |
| Hotels | | | — | | | 10,043 | | | — | | | 10,043 | |
| Investments & Misc. Financial Services | | | — | | | 7,429 | | | — | | | 7,429 | |
| Leisure | | | — | | | 8,415 | | | — | | | 8,415 | |
| Machinery | | | — | | | 13,932 | | | — | | | 13,932 | |
| Media—Broadcast | | | — | | | 24,463 | | | — | | | 24,463 | |
| Media—Cable | | | — | | | 52,902 | | | — | | | 52,902 | |
| Media—Services | | | — | | | 11,927 | | | — | | | 11,927 | |
| Metals/Mining Excluding Steel | | | — | | | 12,373 | | | — | | | 12,373 | |
| Multi—Line Insurance | | | — | | | 8,270 | | | — | | | 8,270 | |
| Packaging | | | — | | | 25,764 | | | — | | | 25,764 | |
| See Notes to Financial Statements | 74 | |
Notes to Schedule of Investments (cont'd)
Asset Valuation Inputs (000's omitted) | | Level 1 | | Level 2 | | Level 3§ | | Total | |
Pharmaceuticals | | | | | | | | | | | | | |
| Printing & Publishing | | | — | | | 12,558 | | | — | | | 12,558 | |
| REITs | | | — | | | 7,572 | | | — | | | 7,572 | |
| Software/Services | | | — | | | 35,141 | | | — | | | 35,141 | |
| Specialty Retail | | | — | | | 8,963 | | | — | | | 8,963 | |
| Steel Producers/Products | | | — | | | 10,470 | | | — | | | 10,470 | |
| Support—Services | | | — | | | 20,571 | | | — | | | 20,571 | |
| Telecom—Integrated/Services | | | — | | | 78,313 | | | — | | | 78,313 | |
| Telecom—Wireless | | | — | | | 33,444 | | | — | | | 33,444 | |
| Total Corporate Debt Securities | | | — | | | 884,887 | | | 11,970 | | | 896,857 | |
| Short-Term Investments | | | — | | | 20,337 | | | — | | | 20,337 | |
Total Investments | | | — | | | 906,747 | | | 11,970 | | | 918,717 | |
Municipal Intermediate Bond | |
Investments: | |
| Municipal Debt Securities^ | | | — | | | 118,226 | | | — | | | 118,226 | |
Total Investments | | | — | | | 118,226 | | | — | | | 118,226 | |
Short Duration | |
| Investments: | |
U.S. Treasury Securities-Backed by the Full Faith and Credit of the U.S. Government | | | — | | | 18,101 | | | — | | | 18,101 | |
| U.S. Government Agency Securities | | | — | | | 2,614 | | | — | | | 2,614 | |
| Mortgage-Backed Securities^ | | | — | | | 23,459 | | | — | | | 23,459 | |
| Corporate Debt Securities^ | | | — | | | 15,211 | | | — | | | 15,211 | |
| Asset-Backed Securities | | | — | | | 4,372 | | | 1,100 | | | 5,472 | |
| Short-Term Investments | | | — | | | 1,582 | | | — | | | 1,582 | |
Total Investments | | | — | | | 65,339 | | | 1,100 | | | 66,439 | |
Strategic Income | |
Investments: | |
| Bank Loan Obligations | |
| All Telecom | | | — | | | 4,984 | | | — | | | 4,984 | |
| Automotive | | | — | | | 126 | | | — | | | 126 | |
| Building & Development | | | — | | | 663 | | | 288 | | | 951 | |
| Business Equipment & Services | | | — | | | 675 | | | 904 | | | 1,579 | |
| Cable & Satellite Television | | | — | | | 2,246 | | | — | | | 2,246 | |
| Chemicals & Plastics | | | — | | | 1,572 | | | — | | | 1,572 | |
| Clothing/Textiles | | | — | | | 503 | | | — | | | 503 | |
| Conglomerates | | | — | | | 1,669 | | | — | | | 1,669 | |
| Containers & Glass Products | | | — | | | 1,054 | | | — | | | 1,054 | |
| Drugs | | | — | | | 403 | | | — | | | 403 | |
| See Notes to Financial Statements | 75 | |
Notes to Schedule of Investments (cont'd)
Asset Valuation Inputs (000's omitted) | | Level 1 | | Level 2 | | Level 3§ | | Total | |
| Ecological Services & Equipment | | | | | | | | | | | | | |
| Electric—Generation | | | — | | | 571 | | | — | | | 571 | |
| Electronics/Electrical | | | — | | | 3,772 | | | — | | | 3,772 | |
| Farming/Agriculture | | | — | | | 300 | | | — | | | 300 | |
| Financial Intermediaries | | | — | | | 2,128 | | | 1,561 | | | 3,689 | |
| Food Products | | | — | | | 2,666 | | | — | | | 2,666 | |
| Food Service | | | — | | | 363 | | | — | | | 363 | |
| Food/Drug Retailers | | | — | | | 1,206 | | | — | | | 1,206 | |
| Health Care | | | — | | | 5,432 | | | — | | | 5,432 | |
| Industrial Equipment | | | — | | | 578 | | | — | | | 578 | |
| Insurance | | | — | | | 299 | | | — | | | 299 | |
| Leisure Goods/Activities/Movies | | | — | | | 1,805 | | | — | | | 1,805 | |
| Lodging & Casinos | | | — | | | 1,632 | | | — | | | 1,632 | |
| Media—Broadcast | | | — | | | 277 | | | — | | | 277 | |
| Nonferrous Metals/Minerals | | | — | | | 561 | | | — | | | 561 | |
| Oil & Gas | | | — | | | 1,048 | | | — | | | 1,048 | |
| Publishing | | | — | | | 2,318 | | | — | | | 2,318 | |
| Radio & Television | | | — | | | 1,010 | | | — | | | 1,010 | |
| Retailers (except food & drug) | | | — | | | 1,507 | | | — | | | 1,507 | |
| Surface Transport | | | — | | | 494 | | | — | | | 494 | |
| Utilities | | | — | | | 2,447 | | | — | | | 2,447 | |
| Total Bank Loan Obligations | | | — | | | 45,192 | | | 2,753 | | | 47,945 | |
U.S. Treasury Securities-Backed by the Full Faith and Credit of the U.S. Government | | | — | | | 77,626 | | | — | | | 77,626 | |
| Mortgage-Backed Securities | |
| Adjustable Rate Mortgages | | | — | | | 1,086 | | | — | | | 1,086 | |
| Fannie Mae | | | — | | | 17,050 | | | — | | | 17,050 | |
| Freddie Mac | | | — | | | 37,428 | | | — | | | 37,428 | |
| Government National Mortgage Association | | | — | | | 9 | | | — | | | 9 | |
| Total Mortgage-Backed Securities | | | — | | | 55,573 | | | — | | | 55,573 | |
| Corporate Debt Securities | |
| Aerospace/Defense | | | — | | | 252 | | | — | | | 252 | |
| Airlines | | | — | | | 1,255 | | | 4,198 | | | 5,453 | |
| Auto Loans | | | — | | | 2,179 | | | — | | | 2,179 | |
| Auto Parts & Equipment | | | — | | | 138 | | | — | | | 138 | |
| Automakers | | | — | | | 1,627 | | | — | | | 1,627 | |
| Banking | | | — | | | 25,315 | | | — | | | 25,315 | |
| Beverages | | | — | | | 1,993 | | | — | | | 1,993 | |
| Building & Construction | | | — | | | 262 | | | — | | | 262 | |
| See Notes to Financial Statements | 76 | |
Notes to Schedule of Investments (cont'd)
Asset Valuation Inputs (000's omitted) | | Level 1 | | Level 2 | | Level 3§ | | Total | |
| Building Materials | | | | | | | | | | | | | |
| Chemicals | | | — | | | 5,751 | | | — | | | 5,751 | |
| Commercial Services | | | — | | | 1,557 | | | — | | | 1,557 | |
| Consumer/Commercial/Lease Financing | | | — | | | 1,345 | | | — | | | 1,345 | |
| Department Stores | | | — | | | 798 | | | — | | | 798 | |
| Diversified Capital Goods | | | — | | | 1,240 | | | — | | | 1,240 | |
| Diversified Financial Services | | | — | | | 7,919 | | | — | | | 7,919 | |
| Electric—Generation | | | — | | | 1,938 | | | 377 | | | 2,315 | |
| Electric—Integrated | | | — | | | 238 | | | — | | | 238 | |
| Electronics | | | — | | | 840 | | | — | | | 840 | |
| Energy | | | — | | | 296 | | | — | | | 296 | |
| Energy—Alternate Sources | | | — | | | 285 | | | — | | | 285 | |
| Energy—Exploration & Production | | | — | | | 5,002 | | | — | | | 5,002 | |
| Food | | | — | | | 4,948 | | | — | | | 4,948 | |
| Food & Drug Retailers | | | — | | | 688 | | | — | | | 688 | |
| Food—Wholesale | | | — | | | 684 | | | — | | | 684 | |
| Forestry/Paper | | | — | | | 172 | | | — | | | 172 | |
| Gaming | | | — | | | 1,886 | | | — | | | 1,886 | |
| Gas Distribution | | | — | | | 8,016 | | | — | | | 8,016 | |
| Health Care | | | — | | | 1,792 | | | — | | | 1,792 | |
| Health Facilities | | | — | | | 1,596 | | | — | | | 1,596 | |
| Health Services | | | — | | | 820 | | | — | | | 820 | |
| Hotels | | | — | | | 1,362 | | | — | | | 1,362 | |
| Industrial | | | — | | | 9,398 | | | — | | | 9,398 | |
| Industrial Equipment | | | — | | | 335 | | | — | | | 335 | |
| Insurance | | | — | | | 2,313 | | | — | | | 2,313 | |
| Integrated Energy | | | — | | | 363 | | | — | | | 363 | |
| Investments & Misc. Financial Services | | | — | | | 180 | | | — | | | 180 | |
| Leisure | | | — | | | 403 | | | — | | | 403 | |
| Machinery | | | — | | | 937 | | | — | | | 937 | |
| Media | | | — | | | 5,572 | | | — | | | 5,572 | |
| Media—Broadcast | | | — | | | 3,520 | | | — | | | 3,520 | |
| Media—Cable | | | — | | | 5,199 | | | — | | | 5,199 | |
| Media—Services | | | — | | | 571 | | | — | | | 571 | |
| Metals/Mining Excluding Steel | | | — | | | 1,614 | | | — | | | 1,614 | |
| Multi—Line Insurance | | | — | | | 325 | | | — | | | 325 | |
| Office/Business Equipment | | | — | | | 2,639 | | | — | | | 2,639 | |
| See Notes to Financial Statements | 77 | |
Notes to Schedule of Investments (cont'd)
Asset Valuation Inputs (000's omitted) | | Level 1 | | Level 2 | | Level 3§ | | Total | |
| Oil & Gas | | | | | | | | | | | | | |
| Oil Refining & Marketing | | | — | | | 883 | | | — | | | 883 | |
| Packaging | | | — | | | 1,580 | | | — | | | 1,580 | |
| Pharmaceuticals | | | — | | | 1,070 | | | — | | | 1,070 | |
| Pipelines | | | — | | | 178 | | | — | | | 178 | |
| Printing & Publishing | | | — | | | 706 | | | — | | | 706 | |
| Real Estate | | | — | | | 769 | | | — | | | 769 | |
| REITs | | | — | | | 1,217 | | | — | | | 1,217 | |
| Retail | | | — | | | 496 | | | — | | | 496 | |
| Software/Services | | | — | | | 1,055 | | | — | | | 1,055 | |
| Specialty Retail | | | — | | | 1,865 | | | — | | | 1,865 | |
| Steel Producers/Products | | | — | | | 5,113 | | | — | | | 5,113 | |
| Support-Services | | | — | | | 1,020 | | | — | | | 1,020 | |
| Telecom—Integrated/Services | | | — | | | 4,506 | | | — | | | 4,506 | |
| Telecom—Wireless | | | — | | | 2,938 | | | — | | | 2,938 | |
| Telecommunications | | | — | | | 2,513 | | | — | | | 2,513 | |
| Tobacco | | | — | | | 4,917 | | | — | | | 4,917 | |
| Transport—Rail | | | — | | | 427 | | | — | | | 427 | |
| Utilities | | | — | | | 1,121 | | | — | | | 1,121 | |
| Total Corporate Debt Securities | | | — | | | 150,635 | | | 4,575 | | | 155,210 | |
| Asset-Backed Securities | | | — | | | 46,487 | | | — | | | 46,487 | |
| Government Securities | |
| Quasi—Sovereign | | | — | | | 1,993 | | | — | | | 1,993 | |
| Sovereign | | | — | | | 7,449 | | | — | | | 7,449 | |
| Total Government Securities | | | — | | | 9,442 | | | — | | | 9,442 | |
| Short-Term Investments | | | — | | | 26,118 | | | — | | | 26,118 | |
Total Investments | | | — | | | 411,073 | | | 7,328 | | | 418,401 | |
^ The Schedule of Investments provides information on the industry or state categorization for the portfolio.
| See Notes to Financial Statements | 78 | |
Notes to Schedule of Investments (cont'd)
§ The following is a reconciliation between the beginning and ending balances of investments in which significant unobservable inputs (Level 3) were used in determining value:
| (000's omitted) | | Beginning balance, as of 11/1/09 | | Accrued discounts/ (premiums) | | Realized gain/loss and change in unrealized appreciation/ (depreciation) | | Net purchases/ (sales) | | Net transfers in and/or out of Level 3 | | Balance, as of 10/31/10 | | Net change in unrealized appreciation/ (depreciation) from investments still held as of 10/31/10 | |
Investments in Securities: | |
| Core Bond | |
| Corporate Debt Securities | |
| Industrial/Airlines | | | | | | | | | | | | | | | | | | | | | | |
| Asset-Backed Securities | | | 23 | | | — | | | (3) | | | (20) | | | — | | | 0 | | | 0 | |
Total | | | 1,278 | | | — | | | 197 | | | 1,110 | | | — | | | 2,585 | | | 200 | |
Floating Rate Income | |
| Bank Loan Obligations | |
| Building & Development | | | — | | | — | | | 3 | | | 706 | | | — | | | 709 | | | 3 | |
| Business Equipment & Services | | | — | | | — | | | 11 | | | 866 | | | — | | | 877 | | | 11 | |
| Financial Intermediaries | | | — | | | 2 | | | 14 | | | 1,301 | | | — | | | 1,317 | | | 10 | |
| Corporate Debt Securities | |
| AirTransport | | | — | | | — | | | 15 | | | 417 | | | — | | | 432 | | | 15 | |
| Electric—Generation | | | — | | | — | | | (10) | | | 382 | | | — | | | 372 | | | (10) | |
Total | | | — | | | 2 | | | 33 | | | 3,672 | | | — | | | 3,707 | | | 29 | |
High Income | |
| Corporate Debt Securities | |
| Airlines | | | 6,931 | | | — | | | 1,237 | | | (71) | | | — | | | 8,097 | | | 821 | |
| Electric—Generation | | | 1,010 | | | — | | | 380 | | | (9,154) | | | 11,637 | | | 3,873 | | | 127 | |
Total | | | 7,941 | | | — | | | 1,617 | | | (9,225) | | | 11,637 | | | 11,970 | | | 948 | |
Short Duration | |
| Asset-Backed Securities | | | 0 | | | — | | | — | | | 1,100 | | | — | | | 1,100 | | | — | |
Total | | | 0 | | | — | | | — | | | 1,100 | | | — | | | 1,100 | | | — | |
Strategic Income | |
| Bank Loan Obligations | |
| Building & Development | | | — | | | — | | | 1 | | | 287 | | | — | | | 288 | | | 1 | |
| Business Equipment & Services | | | — | | | — | | | 4 | | | 900 | | | — | | | 904 | | | 4 | |
| Financial Intermediaries | | | — | | | 3 | | | 8 | | | 1,550 | | | — | | | 1,561 | | | 7 | |
| See Notes to Financial Statements | 79 | |
Notes to Schedule of Investments (cont'd)
| (000's omitted) | | Beginning balance, as of 11/1/09 | | Accrued discounts/ (premiums) | | Realized gain/loss and change in unrealized appreciation/ (depreciation) | | Net purchases/ (sales) | | Net transfers in and/or out of Level 3 | | Balance, as of 10/31/10 | | Net change in unrealized appreciation/ (depreciation) from investments still held as of 10/31/10 | |
| Corporate Debt Securities | |
| Airlines | | | $1,559 | | | | | | | | | | | | | | | | | | | |
| Electric—Generation | | | — | | | — | | | 33 | | | (193) | | | 537 | | | 377 | | | (17) | |
| Food & Beverage | | | 442 | | | — | | | (4) | | | (438) | | | — | | | — | | | — | |
| Total | | | 2,001 | | | 3 | | | 430 | | | 4,357 | | | 537 | | | 7,328 | | | 313 | |
The Funds had no significant transfers between Levels 1 and 2 during the year ended October 31, 2010. During the year ended October 31, 2010, one security in High Income and Strategic Income transferred from Level 2 to Level 3 as a result of a decrease in the number of quotations that were readily available to the independent pricing service.
| Liability Valuation Inputs | |
The following is a summary, categorized by Level, of inputs used to value the Funds' derivatives as of October 31, 2010:
| (000's omitted) | | Level 1 | | Level 2 | | Level 3 | | Total | |
| Core Bond | |
| Futures Contracts | | | | | | | | | | | | | |
| Strategic Income | |
| Futures Contracts | | | (181) | | | — | | | — | | | (181) | |
| ## | At October 31, 2010, selected fund information on a U.S. federal income tax basis was as follows: |
| (000's omitted) | | Cost | | Gross Unrealized Appreciation | | Gross Unrealized Depreciation | | Net Unrealized Appreciation (Depreciation) | |
| Core Bond | | | | | | | | | | | | | |
| Floating Rate Income | | | 93,594 | | | 1,553 | | | 146 | | | 1,407 | |
| High Income | | | 857,204 | | | 61,820 | | | 307 | | | 61,513 | |
| Municipal Intermediate Bond | | | 114,935 | | | 3,485 | | | 194 | | | 3,291 | |
| Short Duration | | | 69,966 | | | 422 | | | 3,949 | | | (3,527) | |
| Strategic Income | | | 399,956 | | | 18,790 | | | 345 | | | 18,445 | |
| @@ | Approximately 44% of the municipal securities held by Municipal Intermediate Bond have credit enhancement features backing them. |
| | |
| ñ | Restricted security subject to restrictions on resale under federal securities laws. These securities may be resold in transactions exempt from registration, normally to qualified institutional buyers under Rule 144A under the Securities Act of 1933, as amended, and have been deemed by the investment manager to be liquid. At October 31, 2010, these securities amounted to approximately $7,899,000 or 4.8% of net assets for Core Bond, approximately |
| See Notes to Financial Statements | 80 | |
Notes to Schedule of Investments (cont'd)
| | $7,107,000 or 8.4% of net assets for Floating Rate Income, approximately $263,890,000 or 28.3% of net assets for High Income, approximately $1,160,000 or 1.0% of net assets for Municipal Intermediate Bond, approximately $3,127,000 or 4.8% of net assets for Short Duration, and approximately $29,713,000 or 8.0% of net assets for Strategic Income. |
| | |
| ß | Security is guaranteed by the corporate or non-profit obligor. |
| | |
| Ø | All or a portion of this security was purchased on a when-issued basis. At October 31, 2010, these securities amounted to $30,350,000 for Core Bond, $4,088,000 for High Income, $981,000 for Municipal Intermediate Bond and $45,191,000 for Strategic Income, respectively. |
| | |
| ¢ | All or a portion of this security was purchased on a delayed delivery basis. |
| | |
| †† | As of October 31, 2010, the value of unfunded loan commitments was approximately $504,000 for Floating Rate Income and $352,000 for Strategic Income pursuant to the following loan agreements: |
Floating Rate Income | |
| Borrower | | Principal Amount | | Value | |
| Reynolds Group Holdings, Inc., Term Loan D, due 5/5/16 | | | | | | | |
Strategic Income | |
| Borrower | | Principal Amount | | Value | |
| Reynolds Group Holdings, Inc., Term Loan D, due 5/5/16 | | | | | | | |
| ^^ | All or a portion of this security has not settled as of October 31, 2010 and thus does not have an interest rate in effect. Interest rates do not take effect until settlement. |
| | |
| ØØ | All or a portion of this security is segregated in connection with obligations for when-issued purchase commitments and/or financial futures contracts and/or delayed delivery purchase commitments. |
| | |
| µ | Floating rate securities are securities whose yields vary with a designated market index or market rate. These securities are shown at their current rates as of October 31, 2010 and their final maturity dates. |
| | |
| ** | Step Bond: Coupon rate is a fixed rate for an initial period then resets at a specific date and rate. |
| | |
| @ | This debt is guaranteed under the Federal Deposit Insurance Corporation's ("FDIC") Temporary Liquidity Guarantee Program and is backed by the full faith and credit of the United States. At October 31, 2010, these securities amounted to approximately $2,614,000 or 4.0% of net assets for Short Duration. |
| | |
| a | Security is subject to a guarantee provided by Societe Generale, backing 100% of the total principal. |
| | |
| # | Restricted security subject to restrictions on resale under federal securities laws. These securities may be resold in transactions exempt from registration, normally to qualified institutional buyers under Rule 144A under the Securities Act of 1933, as amended, and have been deemed by the investment manager to be illiquid and restricted. At October 31, 2010, these securities amounted to approximately $0 or 0.0% of net assets for Core Bond and approximately $0 or 0.0% of net assets for Short Duration. |
| See Notes to Financial Statements | 81 | |
Notes to Schedule of Investments (cont'd)
| (000's omitted) | | Restricted Security | | Acquisition Date | | Acquisition Cost | | Acquisition Cost Percentage of Net Assets as of Acquisition Date | | Value as of October 31, 2010 | | Fair Value Percentage of Net Assets as of October 31, 2010 | |
| Core Bond | | Knollwood CDO Ltd., Ser. 2006-2A, Class A2J, 0.71%, due 7/13/46 | | | 6/29/2006 | | | $642 | | | 0.9% | | | $0 | | | 0.0% | |
| Short Duration | | Knollwood CDO Ltd., Ser. 2006-2A, Class A2J, 0.71%, due 7/13/46 | | | 9/14/2007 | | | 227 | | | 0.2 | | | 0 | | | 0.0 | |
| See Notes to Financial Statements | 82 | |
This page has been left blank intentionally
Statements of Assets and Liabilities
Neuberger Berman Income Funds
(000's omitted except per share amounts)
| | | CORE BOND FUND | | FLOATING RATE INCOME FUND | | HIGH INCOME BOND FUND | |
| | | October 31, 2010 | | October 31, 2010 | | October 31, 2010 | |
| Assets | |
| Investments in securities, at value* (Notes A & F)—see Schedule of Investments: | |
| Unaffiliated issuers | | | | | | | | | | |
| Cash | | | 533 | | | 42 | | | 1,525 | |
| Deposits with brokers for futures contracts (Note A) | | | 306 | | | — | | | — | |
| Dividends and interest receivable | | | 1,111 | | | 556 | | | 20,687 | |
| Receivable for securities sold | | | 2,387 | | | 821 | | | 8,277 | |
| Receivable for Fund shares sold | | | 35 | | | 25 | | | 4,658 | |
| Receivable from Management—net (Note B) | | | 10 | | | 44 | | | — | |
| Prepaid expenses and other assets | | | 6 | | | 1 | | | 24 | |
| Total Assets | | | 198,108 | | | 96,490 | | | 953,888 | |
| Liabilities | |
| Distributions payable | | | 109 | | | 6 | | | 850 | |
| Payable for securities purchased | | | 32,444 | | | 12,074 | | | 14,632 | |
| Payable for Fund shares redeemed | | | 74 | | | 152 | | | 4,345 | |
| Payable to investment manager (Notes A & B) | | | 35 | | | 35 | | | 371 | |
| Payable to administrator—net (Note B) | | | — | | | — | | | 233 | |
| Payable for variation margin (Note A) | | | 89 | | | — | | | — | |
| Accrued expenses and other payables | | | 82 | | | 91 | | | 280 | |
| Total Liabilities | | | 32,833 | | | 12,358 | | | 20,711 | |
| Net Assets at value | | | | | | | | | | |
| Net Assets consist of: | |
| Paid-in capital | | | | | | | | | | |
| Undistributed net investment income (loss) | | | — | | | — | | | 544 | |
| Distributions in excess of net investment income | | | (109 | ) | | (3 | ) | | — | |
| Accumulated net realized gains (losses) on investments | | | 4,152 | | | 181 | | | 5,792 | |
| Net unrealized appreciation (depreciation) in value of investments | | | 5,145 | | | 1,426 | | | 62,797 | |
| Net Assets at value | | | | | | | | | | |
| Net Assets | |
| Investor Class | | | | | | | | | | |
| Institutional Class | | | 120,349 | | | 70,535 | | | 266,194 | |
| Trust Class | | | — | | | — | | | — | |
| Class A | | | 23,368 | | | 12,869 | | | 277,477 | |
| Class C | | | 2,919 | | | 728 | | | 25,480 | |
| Class R3 | | | — | | | — | | | 466 | |
| Shares Outstanding ($.001 par value; unlimited shares authorized) | |
| Investor Class | | | 1,716 | | | — | | | 38,314 | |
| Institutional Class | | | 11,058 | | | 6,936 | | | 28,009 | |
| Trust Class | | | — | | | — | | | — | |
| Class A | | | 2,154 | | | 1,265 | | | 29,234 | |
| Class C | | | 269 | | | 72 | | | 2,681 | |
| Class R3 | | | — | | | — | | | 49 | |
| Net Asset Value, offering and redemption price per share | |
| Investor Class | | | 10.86 | | | | | | | |
| Institutional Class | | | 10.88 | | | 10.17 | | | 9.50 | |
| Trust Class | | | — | | | — | | | — | |
| Class R3 | | | — | | | — | | | 9.49 | |
| Net Asset Value and redemption price per share | |
| Class A | | | | | | | | | | |
| Offering Price per share | |
| Class A‡ | | | | | | | | | | |
| Net Asset Value and offering price per share | |
| Class C^ | | | | | | | | | | |
| *Cost of Investments: | | | | | | | | | | |
‡ On single retail sales of less than $50,000. On sales of $50,000 or more or in certain other circumstances described in the Fund's prospectus, offering price is reduced.
^ Redemption price per share is equal to net asset value less any applicable contingent deferred sales charge.
| See Notes to Financial Statements | 84 | |
| | | MUNICIPAL INTERMEDIATE BOND FUND | | SHORT DURATION BOND FUND | | STRATEGIC INCOME FUND | |
| | | October 31, 2010 | | October 31, 2010 | | October 31, 2010 | |
| Assets | |
| Investments in securities, at value* (Notes A & F)—see Schedule of Investments: | |
| Unaffiliated issuers | | | | | | | | | | |
| Cash | | | 45 | | | — | | | 378 | |
| Deposits with brokers for futures contracts (Note A) | | | — | | | — | | | 678 | |
| Dividends and interest receivable | | | 1,639 | | | 489 | | | 3,392 | |
| Receivable for securities sold | | | 510 | | | 8 | | | 14,509 | |
| Receivable for Fund shares sold | | | 45 | | | 6 | | | 3,233 | |
| Receivable from Management—net (Note B) | | | 93 | | | 93 | | | — | |
| Prepaid expenses and other assets | | | 5 | | | 5 | | | 10 | |
| Total Assets | | | 120,563 | | | 67,040 | | | 440,601 | |
| Liabilities | |
| Distributions payable | | | 20 | | | 10 | | | 412 | |
| Payable for securities purchased | | | 995 | | | 1,264 | | | 68,150 | |
| Payable for Fund shares redeemed | | | 277 | | | 63 | | | 267 | |
| Payable to investment manager (Notes A & B) | | | 25 | | | 14 | | | 166 | |
| Payable to administrator—net (Note B) | | | — | | | — | | | 72 | |
| Payable for variation margin (Note A) | | | — | | | — | | | 181 | |
| Accrued expenses and other payables | | | 110 | | | 99 | | | 131 | |
| Total Liabilities | | | 1,427 | | | 1,450 | | | 69,379 | |
| Net Assets at value | | | | | | | | | | |
| Net Assets consist of: | |
| Paid-in capital | | | | | | | | | | |
| Undistributed net investment income (loss) | | | — | | | 203 | | | 305 | |
| Distributions in excess of net investment income | | | — | | | — | | | — | |
| Accumulated net realized gains (losses) on investments | | | 510 | | | (18,043 | ) | | 6,115 | |
| Net unrealized appreciation (depreciation) in value of investments | | | 3,291 | | | (2,930 | ) | | 18,939 | |
| Net Assets at value | | | | | | | | | | |
| Net Assets | |
| Investor Class | | | | | | | | | | |
| Institutional Class | | | 65 | | | 31 | | | 118,815 | |
| Trust Class | | | — | | | 9,388 | | | 16,270 | |
| Class A | | | 159 | | | 51 | | | 142,873 | |
| Class C | | | 64 | | | 31 | | | 93,264 | |
| Class R3 | | | — | | | — | | | — | |
| Shares Outstanding ($.001 par value; unlimited shares authorized) | |
| Investor Class | | | 10,252 | | | 6,929 | | | — | |
| Institutional Class | | | 6 | | | 4 | | | 10,583 | |
| Trust Class | | | — | | | 1,217 | | | 1,449 | |
| Class A | | | 14 | | | 7 | | | 12,716 | |
| Class C | | | 6 | | | 4 | | | 8,307 | |
| Class R3 | | | — | | | — | | | — | |
| Net Asset Value, offering and redemption price per share | |
| Investor Class | | | | | | | | | | |
| Institutional Class | | | 11.59 | | | 8.09 | | | 11.23 | |
| Trust Class | | | — | | | 7.71 | | | 11.23 | |
| Class R3 | | | — | | | — | | | — | |
| Net Asset Value and redemption price per share | |
| Class A | | | | | | | | | | |
| Offering Price per share | |
| Class A‡ | | | | | | | | | | |
| Net Asset Value and offering price per share | |
| Class C^ | | | | | | $7.72 | | | $11.23 | |
| *Cost of Investments: | | | $114,935 | | | $69,369 | | | $399,281 | |
Statements of Operations
Neuberger Berman Income Funds
(000's omitted)
| | | CORE BOND FUND | | FLOATING RATE INCOME FUND | | HIGH INCOME BOND FUND | |
| | | For the Year Ended October 31, 2010 | | For the Period from December 29, 2009 (Commencement of Operations) to October 31, 2010 | | For the Year Ended October 31, 2010 | |
| Investment Income: | |
| Income (Note A): | |
| Interest income—unaffiliated issuers | | | $4,918 | | | $2,337 | | | $59,338 | |
| Income from securities loaned—net (Note F) | | | — | | | — | | | 64 | |
| Total income | | | $4,918 | | | $2,337 | | | $59,402 | |
Expenses: | |
| Investment management fees (Note B) | | | 354 | | | 196 | | | 3,055 | |
| Administration fees (Note B) | | | 85 | | | 23 | | | 382 | |
| Administration fees (Note B): | |
| Investor Class | | | 41 | | | — | | | 795 | |
| Institutional Class | | | 90 | | | 30 | | | 150 | |
| Trust Class | | | — | | | — | | | — | |
| Class A | | | 41 | | | 10 | | | 169 | |
| Class C | | | 4 | | | 1 | | | 22 | |
| Class R3 | | | — | | | — | | | — | |
| Distribution fees (Note B): | |
| Investor Class | | | 49 | | | — | | | — | |
| Trust Class | | | — | | | — | | | — | |
| Class A | | | 49 | | | 12 | | | 200 | |
| Class C | | | 21 | | | 4 | | | 105 | |
| Class R3 | | | — | | | — | | | 1 | |
| Shareholder servicing agent fees: | |
| Investor Class | | | 24 | | | — | | | 223 | |
| Institutional Class | | | 13 | | | 5 | | | 15 | |
| Trust Class | | | — | | | — | | | — | |
| Class A | | | 4 | | | 2 | | | 29 | |
| Class C | | | 1 | | | 2 | | | 6 | |
| Class R3 | | | — | | | — | | | 1 | |
| Organization expense (Note A) | | | — | | | 103 | | | — | |
| Audit fees | | | 25 | | | 28 | | | 51 | |
| Custodian fees (Note B) | | | 122 | | | 107 | | | 214 | |
| Insurance expense | | | 8 | | | 1 | | | 34 | |
| Legal fees | | | 93 | | | 81 | | | 117 | |
| Registration and filing fees | | | 79 | | | 91 | | | 146 | |
| Reimbursement of expenses previously assumed by administrator (Note B) | | | — | | | — | | | 94 | |
| Shareholder reports | | | 24 | | | 29 | | | 127 | |
| Trustees' fees and expenses | | | 47 | | | 40 | | | 47 | |
| Miscellaneous | | | 13 | | | 4 | | | 67 | |
Total expenses | | | 1,187 | | | 769 | | | 6,050 | |
| See Notes to Financial Statements | 86 | |
| | | MUNICIPAL INTERMEDIATE BOND FUND | | SHORT DURATION BOND FUND | | STRATEGIC INCOME FUND | |
| | | For the Year Ended October 31, 2010 | | For the Year Ended October 31, 2010 | | For the Year Ended October 31, 2010 | |
| Investment Income: | |
| Income (Note A): | |
| Interest income—unaffiliated issuers | | | | | | $1,891 | | | $13,205 | |
| Income from securities loaned—net (Note F) | | | — | | | — | | | — | |
| Total income | | | $4,172 | | | $1,891 | | | $13,205 | |
Expenses: | |
| Investment management fees (Note B) | | | 277 | | | 163 | | | 1,295 | |
| Administration fees (Note B) | | | 66 | | | 39 | | | 141 | |
| Administration fees (Note B): | |
| Investor Class | | | 232 | | | 119 | | | — | |
| Institutional Class | | | — | | | — | | | 65 | |
| Trust Class | | | — | | | 39 | | | 37 | |
| Class A | | | — | | | — | | | 190 | |
| Class C | | | — | | | — | | | 130 | |
| Class R3 | | | — | | | — | | | — | |
| Distribution fees (Note B): | |
| Investor Class | | | — | | | — | | | — | |
| Trust Class | | | — | | | — | | | 11 | |
| Class A | | | — | | | — | | | 227 | |
| Class C | | | — | | | — | | | 617 | |
| Class R3 | | | — | | | — | | | — | |
| Shareholder servicing agent fees: | |
| Investor Class | | | 135 | | | 52 | | | — | |
| Institutional Class | | | 4 | | | 4 | | | 11 | |
| Trust Class | | | — | | | 5 | | | 6 | |
| Class A | | | 4 | | | 4 | | | 44 | |
| Class C | | | 4 | | | 4 | | | 25 | |
| Class R3 | | | — | | | — | | | — | |
| Organization expense (Note A) | | | — | | | — | | | — | |
| Audit fees | | | 50 | | | 52 | | | 50 | |
| Custodian fees (Note B) | | | 82 | | | 69 | | | 198 | |
| Insurance expense | | | 5 | | | 5 | | | 8 | |
| Legal fees | | | 129 | | | 143 | | | 98 | |
| Registration and filing fees | | | 68 | | | 82 | | | 99 | |
| Reimbursement of expenses previously assumed by administrator (Note B) | | | — | | | — | | | — | |
| Shareholder reports | | | 18 | | | 25 | | | 52 | |
| Trustees' fees and expenses | | | 47 | | | 47 | | | 47 | |
| Miscellaneous | | | 13 | | | 9 | | | 31 | |
| Total expenses | | | 1,134 | | | 861 | | | 3,382 | |
Statements of Operations (cont'd)
Neuberger Berman Income Funds (cont'd)
(000's omitted)
| | | CORE BOND FUND | | FLOATING RATE INCOME FUND | | HIGH INCOME BOND FUND | |
| | | For the Year Ended October 31, 2010 | | For the Period from December 29, 2009 (Commencement of Operations) to October 31, 2010 | | For the Year Ended October 31, 2010 | |
| Expenses reimbursed by Management (Note B) | | | (88) | | | (474) | | | (71) | |
| Management and administration fees waived (Notes A & B) | | | (282) | | | — | | | — | |
| Expenses reduced by custodian fee expense offset arrangement (Note B) | | | — | | | — | | | (1) | |
| Total net expenses | | | 817 | | | 295 | | | 5,978 | |
| Net investment income (loss) | | | | | | $2,042 | | | $53,424 | |
Realized and Unrealized Gain (Loss) on Investments (Note A) | |
Net realized gain (loss) on: | |
| Sales of investment securities of unaffiliated issuers | | | 4,584 | | | 180 | | | 46,242 | |
| Financial futures contracts | | | (319) | | | — | | | — | |
Change in net unrealized appreciation (depreciation) in value of: | |
| Unaffiliated investment securities | | | 6,132 | | | 1,426 | | | 19,561 | |
| Affiliated investment securities | | | (11) | | | — | | | — | |
| Financial futures contracts | | | (75) | | | — | | | — | |
| Net gain (loss) on investments | | | 10,311 | | | 1,606 | | | 65,803 | |
| Net increase (decrease) in net assets resulting from operations | | | $14,412 | | | $3,648 | | | $119,227 | |
| See Notes to Financial Statements | 88 | |
| | | MUNICIPAL INTERMEDIATE BOND FUND | | SHORT DURATION BOND FUND | | STRATEGIC INCOME FUND | |
| | | For the Year Ended October 31, 2010 | | For the Year Ended October 31, 2010 | | For the Year Ended October 31, 2010 | |
| Expenses reimbursed by Management (Note B) | | | (413) | | | (394) | | | (536) | |
| Management and administration fees waived (Notes A & B) | | | — | | | — | | | — | |
| Expenses reduced by custodian fee expense offset arrangement (Note B) | | | (1) | | | — | | | — | |
| Total net expenses | | | 720 | | | 467 | | | 2,846 | |
| Net investment income (loss) | | | | | | $1,424 | | | $10,359 | |
| Realized and Unrealized Gain (Loss) on Investments (Note A) | |
| Net realized gain (loss) on: | |
| Sales of investment securities of unaffiliated issuers | | | 846 | | | (588) | | | 7,688 | |
| Financial futures contracts | | | — | | | 286 | | | (907) | |
| Change in net unrealized appreciation (depreciation) in value of: | |
| Unaffiliated investment securities | | | 2,747 | | | 3,419 | | | 12,654 | |
| Affiliated investment securities | | | — | | | — | | | — | |
| Financial futures contracts | | | — | | | (71) | | | (157) | |
| Net gain (loss) on investments | | | 3,593 | | | 3,046 | | | 19,278 | |
| Net increase (decrease) in net assets resulting from operations | | | $7,045 | | | $4,470 | | | $29,637 | |
Statements of Changes in Net Assets
Neuberger Berman Income Funds
(000's omitted)
| | | CORE BOND FUND | | FLOATING RATE INCOME FUND | | HIGH INCOME BOND FUND | |
| | | Year Ended October 31, 2010 | | Year Ended October 31, 2009 | | Period from December 29, 2009 (Commencement of Operations) to October 31, 2010 | | Year Ended October 31, 2010 | | Year Ended October 31, 2009 | |
Increase (Decrease) in Net Assets: | |
| From Operations (Note A): | |
| Net investment income (loss) | | | | | | $3,216 | | | $2,042 | | | $53,424 | | | $31,495 | |
| Net realized gain (loss) on investments | | | 4,265 | | | 582 | | | 180 | | | 46,242 | | | 13,429 | |
| Change in net unrealized appreciation (depreciation) of investments | | | 6,046 | | | 11,672 | | | 1,426 | | | 19,561 | | | 85,767 | |
| Net increase (decrease) in net assets resulting from operations | | | 14,412 | | | 15,470 | | | 3,648 | | | 119,227 | | | 130,691 | |
Distributions to Shareholders From (Note A): | |
| Net investment income: | |
| Investor Class | | | (534) | | | (1,356) | | | — | | | (34,110) | | | (27,611) | |
| Institutional Class | | | (3,103) | | | (1,584) | | | (1,792) | | | (14,672) | | | (1,317) | |
| Trust Class | | | — | | | — | | | — | | | — | | | — | |
| Class A | | | (533) | | | (219) | | | (236) | | | (6,353) | | | (264) | |
| Class C | | | (40) | | | (15) | | | (16) | | | (756) | | | (36) | |
| Class R3 | | | — | | | — | | | — | | | (18) | | | (2) | |
| Net realized gain on investments: | |
| Investor Class | | | (112) | | | (17) | | | — | | | — | | | — | |
| Institutional Class | | | (375) | | | (18) | | | — | | | — | | | — | |
| Trust Class | | | — | | | — | | | — | | | — | | | — | |
| Class A | | | (82) | | | (3) | | | — | | | — | | | — | |
| Class C | | | (6) | | | — | | | — | | | — | | | — | |
| Total distributions to shareholders | | | (4,785) | | | (3,212) | | | (2,044) | | | (55,909) | | | (29,230) | |
From Fund Share Transactions (Note D): | |
| Proceeds from shares sold: | |
| Investor Class | | | 5,301 | | | 9,831 | | | — | | | 125,230 | | | 369,323 | |
| Institutional Class | | | 77,785 | | | 54,887 | | | 71,397 | | | 220,011 | | | 83,277 | |
| Trust Class | | | — | | | — | | | — | | | — | | | — | |
| Class A | | | 11,288 | | | 19,189 | | | 22,594 | | | 273,774 | | | 23,619 | |
| Class C | | | 2,330 | | | 755 | | | 993 | | | 22,494 | | | 2,531 | |
| Class R3 | | | — | | | — | | | — | | | 451 | | | 70 | |
| Proceeds from reinvestment of dividends and distributions: | |
| Investor Class | | | 566 | | | 1,080 | | | — | | | 32,109 | | | 25,779 | |
| Institutional Class | | | 2,377 | | | 1,390 | | | 1,772 | | | 7,404 | | | 415 | |
| Trust Class | | | — | | | — | | | — | | | — | | | — | |
| Class A | | | 522 | | | 188 | | | 222 | | | 5,735 | | | 222 | |
| Class C | | | 12 | | | 6 | | | 15 | | | 284 | | | 8 | |
| Class R3 | | | — | | | — | | | — | | | 10 | | | 2 | |
| Payments for shares redeemed: | |
| Investor Class | | | (13,317) | | | (35,233) | | | — | | | (250,124) | | | (241,645) | |
| Institutional Class | | | (25,994) | | | (35,023) | | | (3,921) | | | (64,330) | | | (1,123) | |
| Trust Class | | | — | | | — | | | — | | | — | | | — | |
| Class A | | | (8,290) | | | (2,242) | | | (10,244) | | | (37,637) | | | (495) | |
| Class C | | | (411) | | | (165) | | | (300) | | | (1,113) | | | (113) | |
| Class R3 | | | — | | | — | | | — | | | (109) | | | — | |
| Net increase (decrease) from Fund share transactions | | | 52,169 | | | 14,663 | | | 82,528 | | | 334,189 | | | 261,870 | |
Net Increase (Decrease) in Net Assets | | | 61,796 | | | 26,921 | | | 84,132 | | | 397,507 | | | 363,331 | |
Net Assets: | |
| Beginning of year | | | 103,479 | | | 76,558 | | | — | | | 535,670 | | | 172,339 | |
| End of year | | | | | | $103,479 | | | $84,132 | | | $933,177 | | | $535,670 | |
| Undistributed net investment income (loss) at end of year | | $— | | | $— | | | $— | | | $544 | | | $3,029 | |
| Distributions in excess of net investment income at end of year | | (109) | | | $— | | | $(3) | | | $— | | | $— | |
| See Notes to Financial Statements | 90 | |
| | | MUNICIPAL INTERMEDIATE BOND FUND | | SHORT DURATION BOND FUND | |
| | | Year Ended October 31, 2010 | | Year Ended October 31, 2009 | | Year Ended October 31, 2010 | | Year Ended October 31, 2009 | |
| Increase (Decrease) in Net Assets: | |
From Operations (Note A): | |
| Net investment income (loss) | | | | | | $1,438 | | | $1,424 | | | | $2,843 | | |
| Net realized gain (loss) on investments | | | 846 | | | 63 | | | (302) | | | | (7,877) | | |
| Change in net unrealized appreciation (depreciation) of investments | | | 2,747 | | | 1,443 | | | 3,348 | | | | 6,745 | | |
| Net increase (decrease) in net assets resulting from operations | | | 7,045 | | | 2,944 | | | 4,470 | | | | 1,711 | | |
Distributions to Shareholders From (Note A): | |
| Net investment income: | |
| Investor Class | | | (3,450) | | | (1,438) | | | (2,012) | | | | (2,678) | | |
| Institutional Class | | | (1) | | | — | | | (0) | | | | — | | |
| Trust Class | | | — | | | — | | | (303) | | | | (409) | | |
| Class A | | | (1) | | | — | | | (1) | | | | — | | |
| Class C | | | (0) | | | — | | | (0) | | | | — | | |
| Class R3 | | | — | | | — | | | — | | | | — | | |
| Net realized gain on investments: | |
| Investor Class | | | — | | | — | | | — | | | | — | | |
| Institutional Class | | | — | | | — | | | — | | | | — | | |
| Trust Class | | | — | | | — | | | — | | | | — | | |
| Class A | | | — | | | — | | | — | | | | — | | |
| Class C | | | — | | | — | | | — | | | | — | | |
| Total distributions to shareholders | | | (3,452) | | | (1,438) | | | (2,316) | | | | (3,087) | | |
From Fund Share Transactions (Note D): | |
| Proceeds from shares sold: | |
| Investor Class | | | 48,490 | | | 73,302 | | | 16,238 | | | | 7,877 | | |
| Institutional Class | | | 64 | | | — | | | 30 | | | | — | | |
| Trust Class | | | — | | | — | | | 3,180 | | | | 2,444 | | |
| Class A | | | 158 | | | — | | | 50 | | | | — | | |
| Class C | | | 64 | | | — | | | 30 | | | | — | | |
| Class R3 | | | — | | | — | | | — | | | | — | | |
| Proceeds from reinvestment of dividends and distributions: | |
| Investor Class | | | 3,207 | | | 1,044 | | | 1,844 | | | | 2,480 | | |
| Institutional Class | | | — | | | — | | | — | | | | — | | |
| Trust Class | | | — | | | — | | | 284 | | | | 400 | | |
| Class A | | | — | | | — | | | — | | | | — | | |
| Class C | | | — | | | — | | | 1 | | | | — | | |
| Class R3 | | | — | | | — | | | — | | | | — | | |
| Payments for shares redeemed: | |
| Investor Class | | | (28,773) | | | (9,084) | | | (16,495) | | | | (18,058) | | |
| Institutional Class | | | — | | | — | | | — | | | | — | | |
| Trust Class | | | — | | | — | | | (2,513) | | | | (3,795) | | |
| Class A | | | — | | | — | | | — | | | | — | | |
| Class C | | | — | | | — | | | — | | | | — | | |
| Class R3 | | | — | | | — | | | — | | | | — | | |
| Net increase (decrease) from Fund share transactions | | | 23,210 | | | 65,262 | | | 2,649 | | | | (8,652) | | |
Net Increase (Decrease) in Net Assets | | | 26,803 | | | 66,768 | | | 4,803 | | | | (10,028) | | |
Net Assets: | |
| Beginning of year | | | 92,333 | | | 25,565 | | | 60,787 | | | | 70,815 | | |
| End of year | | | $119,136 | | | $92,333 | | | $65,590 | | | | $60,787 | | |
| Undistributed net investment income (loss) at end of year | | | $— | | | $— | | | $203 | | | | $294 | | |
| Distributions in excess of net investment income at end of year | | | $— | | | $— | | | $— | | | | $— | | |
Statements of Changes in Net Assets (cont'd)
Neuberger Berman Income Funds (cont'd)
(000's omitted)
| | | STRATEGIC INCOME FUND | |
| | | Year Ended October 31, 2010 | | Year Ended October 31, 2009 | |
| Increase (Decrease) in Net Assets: | |
From Operations (Note A): | |
| Net investment income (loss) | | | $10,359 | | | $2,000 | |
| Net realized gain (loss) on investments | | | 6,781 | | | 2,090 | |
| Change in net unrealized appreciation (depreciation) of investments | | | 12,497 | | | 6,941 | |
| Net increase (decrease) in net assets resulting from operations | | | 29,637 | | | 11,031 | |
Distributions to Shareholders From (Note A): | |
| Net investment income: | |
| Investor Class | | | — | | | — | |
| Institutional Class | | | (3,651) | | | (397) | |
| Trust Class | | | (514) | | | (115) | |
| Class A | | | (4,179) | | | (1,089) | |
| Class C | | | (2,422) | | | (398) | |
| Class R3 | | | — | | | — | |
| Net realized gain on investments: | |
| Investor Class | | | — | | | — | |
| Institutional Class | | | (646) | | | — | |
| Trust Class | | | (97) | | | — | |
| Class A | | | (744) | | | — | |
| Class C | | | (534) | | | — | |
| Total distributions to shareholders | | | (12,787) | | | (1,999) | |
From Fund Share Transactions (Note D): | |
| Proceeds from shares sold: | |
| Investor Class | | | — | | | — | |
| Institutional Class | | | 111,374 | | | 14,705 | |
| Trust Class | | | 9,774 | | | 6,948 | |
| Class A | | | 110,619 | | | 70,930 | |
| Class C | | | 57,032 | | | 34,836 | |
| Class R3 | | | — | | | — | |
| Proceeds from reinvestment of dividends and distributions: | |
| Investor Class | | | — | | | — | |
| Institutional Class | | | 2,032 | | | 382 | |
| Trust Class | | | 600 | | | 112 | |
| Class A | | | 3,887 | | | 558 | |
| Class C | | | 1,206 | | | 129 | |
| Class R3 | | | — | | | — | |
| Payments for shares redeemed: | |
| Investor Class | | | — | | | — | |
| Institutional Class | | | (18,534) | | | (2,534) | |
| Trust Class | | | (1,519) | | | (1,227) | |
| Class A | | | (46,275) | | | (8,316) | |
| Class C | | | (5,567) | | | (1,021) | |
| Class R3 | | | — | | | — | |
| Net increase (decrease) from Fund share transactions | | | 224,629 | | | 115,502 | |
Net Increase (Decrease) in Net Assets | | | 241,479 | | | 124,534 | |
Net Assets: | |
| Beginning of year | | | 129,743 | | | 5,209 | |
| End of year | | | $371,222 | | | $129,743 | |
| Undistributed net investment income (loss) at end of year | | | $305 | | | $95 | |
| Distributions in excess of net investment income at end of year | | | $— | | | $— | |
| See Notes to Financial Statements | 92 | |
Notes to Financial Statements Income Funds
Note A—Summary of Significant Accounting Policies:
| 1 | General: The Funds are separate operating series of Neuberger Berman Income Funds, (the "Trust"), a Delaware statutory trust organized pursuant to an Amended and Restated Trust Instrument dated June 24, 2009. The Trust is registered as a diversified, open-end management investment company under the Investment Company Act of 1940, as amended (the "1940 Act"), and its shares are registered under the Securities Act of 1933, as amended (the "1933 Act"). Four Funds offer Investor Class shares, six offer Institutional Class shares, two offer Trust Class shares, six offer Class A shares, six offer Class C shares and one offers Class R3 shares. The Board may establish additional series or classes of shares without the approval of sh areholders. The assets of each Fund belong only to that Fund, and the liabilities of each Fund are borne solely by that Fund and no other. The preparation of financial statements in accordance with U.S. generally accepted accounting principles requires Management to make estimates and assumptions at the date of the financial statements. Actual results could differ from those estimates. |
| | |
| 2 | Portfolio valuation: Investment securities are valued as indicated in the notes following the Funds' Schedules of Investments. |
| | |
| 3 | Foreign currency translation: Core Bond, Floating Rate Income, High Income, Short Duration and Strategic Income may invest in foreign securities denominated in foreign currencies. The accounting records of the Funds are maintained in U.S. dollars. Foreign currency amounts are translated daily into U.S. dollars using the exchange rate as of 4:00 p.m., Eastern time, to determine the value of investments, other assets and liabilities. Purchase and sale prices of securities, and income and expenses, are translated into U.S. dollars at the prevailing rate of exchange on the respective dates of such transactions. Net unrealized foreign currency gain (loss), if any, arises from changes in the value of assets and liabilities, oth er than investments in securities, as a result of changes in exchange rates and is stated separately in the Statements of Operations. |
| | |
| 4 | Securities transactions and investment income: Securities transactions are recorded on trade date for financial reporting purposes. Dividend income is recorded on the ex-dividend date or, for certain foreign dividends, as soon as the Fund becomes aware of the dividends. Non-cash dividends included in dividend income, if any, are recorded at the fair market value of the securities received. Interest income, including accretion of discount (adjusted for original issue discount, where applicable) and amortization of premium, where applicable, is recorded on the accrual basis. Realized gains and losses from securities transactions (for each Fund) and foreign currency transactions (for Core Bond, Floating Rate Income, High Inc ome, Short Duration and Strategic Income), if any, are recorded on the basis of identified cost and stated separately in the Statements of Operations. Included in net realized gain (loss) on investments are proceeds from the settlements of class action litigation in which High Income, Short Duration and Strategic Income participated as a plaintiff. The amounts of such proceeds for the year ended October 31, 2010 were $162,208, $166,638 and $379 for High Income, Short Duration and Strategic Income, respectively. |
| | |
| 5 | Income tax information: Each Fund is treated as a separate entity for U.S. federal income tax purposes. It is the policy of each Fund, except Floating Rate Income, to continue to, and the intention of Floating Rate Income to qualify as a regulated investment company by complying with the requirements of Subchapter M of the Internal Revenue Code applicable to regulated investment companies and to distribute substantially all of its earnings to its shareholders. Therefore, no federal income or excise tax provision is required. The Funds have adopted the provisions of ASC 740 "Income Taxes" ("ASC 740"). ASC 740 sets forth a minimum threshold for financial statement recognition of the benefit of a tax position taken, or expected to be taken, in a tax return. The Funds recognize interest and penalties, if any, related to unrecognized tax benefits as an income tax expense in the Statements of Operations. The Funds are subject to examination by U.S. federal and state tax |
| | authorities for returns filed for the prior three fiscal years 2007 - 2009. As of October 31, 2010, the Funds did not have any unrecognized tax benefits. Income distributions and capital gain distributions are determined in accordance with income tax regulations, which may differ from U.S. generally accepted accounting principles. These differences are primarily due to differing treatments of income and gains on various investment securities held by each Fund, timing differences and differing characterization of distributions made by each Fund as a whole. The Funds may also utilize earnings and profits distributed to shareholders on redemption of shares as a part of the dividends paid deduction for income tax purposes. As determined on October 31, 2010, permanent differences resulting primarily from different book and tax accounting for amortization of bond premium, paydown gains and losses, non-deductible 12b-1 fees and contingent payment debt instrument income adjustments were reclassified at fiscal year-end. These reclassifications had no effect on net income, net asset value or net asset value per share of each Fund. The tax character of distributions paid during the years ended October 31, 2010 and October 31, 2009 was as follows: |
| | | Distributions Paid From: | |
| | | Taxable Income | | Tax-Exempt Income | | Long-Term Capital Gain | | Return of Capital | | Total | |
| | | 2010 | | 2009 | | 2010 | | 2009 | | 2010 | | 2009 | | 2010 | | 2009 | | 2010 | | 2009 | |
| Core Bond | | | | | $3,212,281 | | | | $— | | | | $— | | | | $— | | | | $— | | | | $— | | | | $— | | | | $4,784,336 | | | | $3,212,281 | | |
Floating Rate Income | 2,044,059 | (1) | | | — | | | | — | (1) | | | — | | | | — | (1) | | | — | | | | — | (1) | | | — | | | | 2,044,059 | (1) | | | — | | |
| High Income | 55,908,863 | | | | 29,230,047 | | | | — | | | | — | | | | — | | | | — | | | | — | | | | — | | | | 55,908,863 | | | | 29,230,047 | | |
Municipal Intermediate Bond | 798 | | | | 16,815 | | | | 3,450,922 | | | | 1,421,035 | | | | — | | | | — | | | | — | | | | — | | | | 3,451,720 | | | | 1,437,850 | | |
| Short Duration | | | 2,315,688 | | | | 3,087,008 | | | | — | | | | — | | | | — | | | | — | | | | — | | | | — | | | | 2,315,688 | | | | 3,087,008 | | |
| Strategic Income | | | 12,787,114 | | | | 1,998,867 | | | | — | | | | — | | | | — | | | | — | | | | — | | | | — | | | | 12,787,114 | | | | 1,998,867 | | |
| (1) | Period from December 29, 2009 (Commencement of Operations) to October 31, 2010. |
| | |
| | As of October 31, 2010, the components of distributable earnings (accumulated losses) on a U.S. federal income tax basis were as follows: |
| | Undistributed Ordinary Income | | Undistributed Tax-Exempt Income | | Undistributed Long-Term Gain | | Unrealized Appreciation (Depreciation) | | Loss Carryforwards and Deferrals | | Total | |
| Core Bond | | | | | $— | | | $282,709 | | | $5,161,466 | | | $— | | | $9,295,852 | | |
| Floating Rate Income | | 292,799 | | | — | | | — | | | 1,407,118 | | | — | | | 1,699,917 | | |
| High Income | | 1,393,997 | | | — | | | 7,075,803 | | | 61,512,727 | | | — | | | 69,982,527 | | |
| Municipal Intermediate Bond | | 24,294 | | | 20,192 | | | 486,102 | | | 3,290,900 | | | — | | | 3,821,488 | | |
| Short Duration | | 212,506 | | | — | | | — | | | (3,527,187 | ) | | (17,445,334 | ) | | (20,760,015 | ) | |
| Strategic Income | | 6,598,510 | | | — | | | 727,286 | | | 18,444,290 | | | — | | | 25,770,086 | | |
| | The differences between book basis and tax basis distributable earnings are attributable primarily to timing differences of distribution payments, delayed settlement compensation on bank loans, timing differences of wash sales, mark to market on certain futures contract transactions, organization expenses, capital loss carryforwards and amortization of bond premium. |
| | To the extent each Fund's net realized capital gains, if any, can be offset by capital loss carryforwards, it is the policy of each Fund not to distribute such gains. As determined on October 31, 2010, the following Funds had unused capital loss carryforwards available for federal income tax purposes to offset net realized capital gains, if any, as follows: |
| | | Expiring in: | |
| | | 2011 | | 2012 | | 2013 | | 2014 | | 2015 | | 2016 | | 2017 | | 2018 | |
| Short Duration | | | | | | | | | | | | | | | | | | | | | | | | | | | | | | | | | |
| | During the year ended October 31, 2010, High Income and Municipal Intermediate Bond utilized capital loss carryforwards of $39,249,160 and $335,979, respectively. |
| | |
| 6 | Distributions to shareholders: Each Fund earns income, net of expenses, daily on its investments. Ordinarily, distributions from net investment income are declared on each business day and paid monthly, and distributions from net realized capital gains, if any, are generally distributed once a year (usually in December). Distributions to shareholders are recorded on the ex-date. |
| | |
| 7 | Organization expenses: Costs incurred by Floating Rate Income in connection with its organization, which amount to $102,640, have been expensed as incurred. |
| | |
| 8 | Expense allocation: Certain expenses are applicable to multiple funds. Expenses directly attributable to a Fund are charged to that Fund. Expenses of the Trust that are not directly attributable to a particular series of the Trust (e.g., a Fund) are allocated among the series of the Trust, on the basis of relative net assets, except where a more appropriate allocation of expenses to each of the series can otherwise be made fairly. Expenses borne by the complex of related investment companies, which includes open-end and closed-end investment companies for which Management serves as investment manager, that are not directly attributable to a particular investment company in the complex (e.g., the Trust) or series thereof are allocated among the investment companies in the complex or series thereof, on the basis of relative net assets, except where a more appropriate allocation of expenses to each of the investment companies in the complex or series thereof can otherwise be made fairly. Each Fund's expenses (other than those specific to each class) are allocated proportionally each day between the classes based upon the relative net assets of each class. |
| | |
| 9 | Security lending: A third party, eSecLending, has assisted Core Bond, High Income and Short Duration in conducting a bidding process to try to identify a principal that would pay a guaranteed amount to each Fund in consideration of that Fund entering into an exclusive securities lending arrangement. During most of the fiscal year, eSecLending served as exclusive lending agent for each of these Funds. As a result of a bidding process on October 1, 2009, no principal had an exclusive securities lending arrangement with any Fund; as such, no Fund was guaranteed any particular level of income during the fiscal year. As of August 27, 2010, the Funds no longer participate in a security lending program. |
| | |
| | Under the securities lending arrangements, each Fund received cash collateral at the beginning of each transaction equal to at least 102% of the prior day's market value of the loaned securities (105% in the case of international securities). Each Fund invested all the cash collateral in Neuberger Berman Securities Lending Quality Fund, LLC ("Quality Fund"), a fund managed by Neuberger Berman Fixed Income LLC ("NBFI"), an affiliate of Management, and sub-advised by Dwight Asset Management Company LLC. Quality Fund was not a money market fund registered under the 1940 Act and did not operate in accordance with all requirements of Rule 2a-7 under the 1940 Act. Each Fund redeemed all of its investments in Quality Fund, if any, as of August 27, 2010. |
| | |
| | Net income from the applicable securities lending program represents any amounts received from a principal, plus income earned on the cash collateral invested in Quality Fund or in other investments, if applicable, less cash collateral fees and other expenses associated with the loans. Short Duration did not loan any securities during the fiscal year ended October 31, 2010. For Core Bond and High Income, for the fiscal year ended October 31, 2010, the amount of net income received under the securities lending arrangements, which is reflected in the Statements of |
| | Operations under the caption "Income from securities loaned — net", and the amount of interest income that was earned from Quality Fund are as follows: |
| | | Net Income Received under the Securities Lending Arrangements | | Interest Income Earned From the Quality Fund | |
| Core Bond | | | — | | | | | | |
High Income | | | 64,247 | | | | 18,216 | | |
| 10 | Repurchase agreements: Each Fund may enter into repurchase agreements with institutions that Management has determined are creditworthy. Each repurchase agreement is recorded at cost. Each Fund requires that the securities purchased in a repurchase agreement be transferred to the custodian in a manner sufficient to enable the Fund to assert a perfected security interest in those securities in the event of a default under the repurchase agreement. Each Fund monitors, on a daily basis, the value of the securities transferred to ensure that their value, including accrued interest, is greater than amounts owed to the Fund under each such repurchase agreement. |
| | |
| 11 | Dollar rolls: Core Bond, Floating Rate Income, High Income, Short Duration, and Strategic Income may enter into dollar roll transactions with respect to mortgage-backed securities. In a dollar roll transaction, a Fund sells securities for delivery in the current month and simultaneously agrees to repurchase substantially similar (i.e., same type and coupon) securities on a specified future date from the same party. During the period before this repurchase, a Fund forgoes principal and interest payments on the securities. A Fund is compensated by the difference between the current sales price and the forward price for the future purchase (often referred to as the "drop"), as well as by the interest earned on the cash proceeds of the initial sale. Dollar rolls may increase fluctuations in a Fund's net asset value and may be viewed as a form of leverage. There is a risk that the counter party will be unable or unwilling to complete the transaction as scheduled, which may result in losses to a Fund. |
| | |
| 12 | When-Issued/Delayed Delivery Securities: Each Fund may purchase securities with delivery or payment to occur at a later date beyond the normal settlement period. At the time a Fund enters into a commitment to purchase a security, the transaction is recorded and the value of the security is reflected in the net asset value. The price of such security and the date when the security will be delivered and paid for are fixed at the time the transaction is negotiated. The value of the security may vary with market fluctuations. No interest accrues to a Fund until payment takes place. At the time a Fund enters into this type of transaction it is required to segregate cash or other liquid assets at least equal to the amount of the c ommitment. Certain risks may arise upon entering into when-issued or delayed delivery securities from the potential inability of counterparties to meet the terms of their contracts or if the issuer does not issue the securities due to political, economic, or other factors. Additionally, losses may arise due to changes in the value of the underlying securities. |
| | |
| 13 | Foreign taxes: Foreign taxes withheld represent amounts withheld by foreign tax authorities, net of refunds recoverable. |
| | |
| 14 | Investments in foreign securities: Investing in foreign securities may involve certain sovereign and other risks, in addition to the credit and market risks normally associated with domestic securities. These additional risks include the possibility of adverse political and economic developments (including political instability, nationalization, expropriation, or confiscatory taxation) and the potentially adverse effects of unavailability of public information regarding issuers, less government supervision and regulation of financial markets, reduced liquidity of certain financial markets, and the lack of uniform accounting, auditing, and financial reporting standards or the application of standards that are different or les s stringent than those applied in the United States. Foreign securities also may experience greater price volatility, higher rates of inflation, and delays in settlement. |
| | |
| 15 | Derivative instruments: During the year ended October 31, 2010, the Funds' use of derivatives was limited to financial futures contracts. The Funds have adopted the provisions of ASC 815 "Derivatives and Hedging" ("ASC 815"). The disclosure requirements of ASC 815 distinguish between derivatives that qualify for hedge accounting and those |
| | |
| | that do not. Because investment companies value their derivatives at fair value and recognize changes in fair value through the Statements of Operations, they do not qualify for hedge accounting. Accordingly, even though a Fund's investments in derivatives may represent economic hedges, they are considered non-hedge transactions for purposes of this disclosure. Financial futures contracts: Each of Core Bond, Floating Rate Income, High Income, Municipal Intermediate Bond, Short Duration, and Strategic Income may buy and sell financial futures contracts to hedge against changes in securities prices resulting from changes in prevailing interest rates, and each of Core Bond and Strategic Income may also invest in financial futures contracts for investment purposes. At the time a Fund enters into a financial futures contract, it is required to deposit with the futures commission merchant a specified amount of cash or liquid securities, known as "initial margin," ranging upward from 1.1% of the value of the financial futures contract being traded. Each day, the futures contract is valued at the official settlement price of the board of trade or U.S. commodity exchange on which such futures contract is traded. Subsequent payments, known as "variation margin," to and from the broker are made on a daily basis, or as needed for Core Bond and Strategic Income, as the market price of the financial futures contract fluctuates. Daily variation margin adjustments, arising from this "mark to market," are recorded by the Funds as unrealized gains or losses. Although some financial futures contracts by their terms call for actual delivery or acceptance of financial instruments, in most cases the contracts are closed out prior to delivery by offsetting purchases or sales of matching financial futures contracts. When the contracts are closed, a Fund recognizes a gain or loss. Risks of entering into futures contracts include the possibility there may be an illiquid market, possibly at a time of rapidly declining prices, and/or a change in the value of the contract may not correlate with changes in the value of the underlying securities. Futures have minimal counterparty risk to a Fund because the exchange's clearinghouse, as counterparty to all exchange traded futures, guarantees the futures against default. For U.S. federal income tax purposes, the futures transactions undertaken by a Fund may cause that Fund to recognize gains or losses from marking contracts to market even though its positions have not been sold or terminated, may affect the character of the gains or losses recognized as long-term or short-term, and may affect the timing of some capital gains and losses realized by the Fund. Also, a Fund's losses on transactions involving futures contracts may be deferred rather than being taken into account currently in calculating such Fund's taxable income. During the year ended October 31, 2010, Floating Rate Income, High Income and Municipal Intermediate Bond did not enter into any financial futures contracts. During the year ended October 31, 2010, Core Bond, Short Duration and Strategic Income entered into financial futures contracts for economic hedging purposes, including as a maturity or duration management device. At October 31, 2010, open positions in financial futures contracts were: |
| Fund | | Expiration | | Open Contracts | | Position | | Unrealized Appreciation (Depreciation) | |
| Core Bond | | December 2010 | | 47 U.S. Treasury Notes, 10 Year | | Short | | | | | |
| Strategic Income | | December 2010 | | 102 U.S. Treasury Notes, 10 Year | | Short | | | $(193,64) | | |
| Strategic Income | | December 2010 | | 9 U.S. Treasury Notes, 30 Year | | Short | | | $12,375 | | |
| | During the year ended October 31, 2010, the average notional amount of financial futures contracts was: |
| | |
| Core Bond | | $ | (3,120,000) | | |
Strategic Income | | | (6,280,000) | | |
| | At October 31, 2010, the Funds had deposited the following in segregated accounts to cover margin requirements on open futures contracts: |
| | Core Bond: $305,674 Strategic Income: $678,155 |
| | At October 31, 2010, the Funds had the following derivatives (which did not qualify for as hedging instruments under ASC 815), grouped by primary risk exposure: |
| Liability Derivatives | |
| | Interest Rate Risk | |
| Core Bond | |
Futures Contracts(1) | $(89,227) | | |
| Total Value | $(89,227) | | |
Strategic Income | |
Futures Contracts(1) | $(181,266) | | |
| Total Value | $(181,266) | | |
| (1) | Reflected in the Statements of Assets and Liabilities; included under the caption "Net unrealized appreciation (depreciation) in value of investments," and is the cumulative appreciation (depreciation) of futures contracts as of October 31, 2010 as shown in "Futures Contracts" above. The outstanding variation margin as of October 31, 2010, if any, is reflected in the Statements of Assets and Liabilities under the caption "Receivable/Payable for variation margin." The impact of the use of these derivative instruments on the Statements of Operations during the year ended October 31, 2010, was as follows: |
Realized Gain (Loss)(1)
| | Interest Rate Risk | |
| Core Bond | |
| Futures Contracts | | | $(319,326) | | |
| Total Realized Gain (Loss) | | | $(319,326) | | |
Short Duration | |
| Futures Contracts | | | $285,603 | | |
| Total Realized Gain (Loss) | | | $285,603 | | |
Strategic Income | |
| Futures Contracts | | | $(906,845) | | |
| Total Realized Gain (Loss) | | | $(906,845) | | |
Change in Appreciation (Depreciation)(2)
| | Interest Rate Risk | |
| Core Bond | |
| Futures Contracts | | | | |
| Total Change in Appreciation (Depreciation) | | | | |
Short Duration | |
| Futures Contracts | | | | |
| Total Change in Appreciation (Depreciation) | | | | |
Strategic Income | |
| Futures Contracts | | | | |
| Total Change in Appreciation (Depreciation) | | | | |
| (1) | Reflected in the Statements of Operations under the caption "Net realized gain (loss) on financial futures contracts." |
| | |
| (2) | Reflected in the Statements of Operations under the caption "Change in net unrealized appreciation (depreciation) in value of financial futures contracts." Management has concluded that the Funds, except Core Bond, Short Duration and Strategic Income, did not hold any derivative instruments during the year ended October 31, 2010 that require additional disclosures pursuant to ASC 815. |
| | |
| 16 | Indemnifications: Like many other companies, the Trust's organizational documents provide that its officers and trustees are indemnified against certain liabilities arising out of the performance of their duties to the Trust. In addition, both in some of its principal service contracts and in the normal course of its business, the Trust enters into contracts that provide indemnifications to other parties for certain types of losses or liabilities. The Trust's maximum exposure under these arrangements is unknown as this could involve future claims against the Trust. |
| | |
| 17 | Other: All net investment income and realized and unrealized capital gains and losses of each Fund are allocated, on the basis of relative net assets, pro rata among its respective classes. |
Note B—Management Fees, Administration Fees, Distribution Arrangements, and Other Transactions with Affiliates:
| | Each Fund retains Management as its investment manager under a Management Agreement. For such investment management services, each Fund (except Floating Rate Income, High Income, and Strategic Income) pays Management a fee at the annual rate of 0.25% of the first $500 million of that Fund's average daily net assets, 0.225% of the next $500 million, 0.20% of the next $500 million, 0.175% of the next $500 million, and 0.15% of average daily net assets in excess of $2 billion. Floating Rate Income, High Income, and Strategic Income each pay Management a fee for investment management services at the annual rates of 0.50%, 0.48%, and 0.55%, respectively, of its average daily net assets. Management has voluntarily agreed to waive its management fee in the amount of 0.18% (0.25% prior t o March 3, 2010; 0.12% as of November 1, 2010) of the average daily net assets of Core Bond. Management may, at its sole discretion, modify or terminate this voluntary waiver without notice to the Fund. For the year ended October 31, 2010, such waived fees amounted to $282,072 for Core Bond. Each Fund retains Management as its administrator under an Administration Agreement. Each Fund pays Management an administration fee at the annual rate of 0.06% of its average daily net assets under this agreement. In addition, Investor Class of each Fund that offers that class pays Management an administration fee at the annual rate of 0.21% of its average daily net assets, Institutional Class of each Fund that offers that class pays Management |
| | an administration fee at the annual rate of 0.09% of its average daily net assets, Trust Class of each of Short Duration and Strategic Income pays Management an administration fee at the annual rate of 0.44% and 0.34%, respectively, of its average daily net assets, Class A and Class C of each Fund that offers that class pays Management an administration fee at the annual rate of 0.21% of its average daily net assets, and Class R3 of each Fund that offers that class pays Management an administration fee at the annual rate of 0.21% of its average daily net assets under this agreement. Additionally, Management retains State Street Bank and Trust Company ("State Street") as its sub-administrator under a Sub-Administration Agreement. Management pays State Street a fee for all services received under the agreement. Management has contractually agreed to forgo current payment of fees and/or reimburse certain expenses of the Investor Class, Institutional Class, Trust Class, Class A, Class C and Class R3 of each Fund that offers those classes so that the total annual operating expenses of those classes do not exceed the expense limitations as detailed in the following table. These undertakings apply to a Fund's direct expenses and do not cover interest, taxes, brokerage commissions, acquired fund fees and expenses, and extraordinary expenses, if any; consequently, net expenses may exceed the contractual expense limitations. Each Fund has agreed that each of its respective classes will repay Management for fees and expenses forgone or reimbursed for that class provided that repayment does not c ause the class' annual operating expenses to exceed its contractual expense limitation. Any such repayment must be made within three years after the year in which Management incurred the expense. During the year ended October 31, 2010, the Investor Class of High Income reimbursed Management $93,652 under its contractual expense limitation. At October 31, 2010, contingent liabilities to Management under the contractual expense limitations were as follows: |
| | | | | | | Expenses Deferred in Fiscal Period Ending October 31, | |
| | | | | | | 2008 | | 2009 | | 2010 | |
| | | | | | | Subject to Repayment until October 31, | |
| Class | | Contractual Expense Limitation(1) | | Expiration | | 2011 | | 2012 | | 2013 | |
| Core Bond Investor Class | | | 0.85 | % | | 10/31/20 | | | | | | | | | | | | | |
| Core Bond Institutional Class | | | 0.45 | % | | 10/31/20 | | | 60,609 | | | | 81,405 | | | | 54,638 | | |
| Core Bond Class A | | | 0.85 | % | | 10/31/20 | | | 1,700 | (2) | | | 14,617 | | | | 6,716 | | |
| Core Bond Class C | | | 1.60 | % | | 10/31/20 | | | 1,695 | (2) | | | 3,790 | | | | 957 | | |
| Floating Rate Income Institutional Class | | | 0.70 | % | | 10/31/13 | | | — | | | | — | | | | 410,835 | (6) | |
| Floating Rate Income Class A | | | 1.07 | % | | 10/31/13 | | | — | | | | — | | | | 57,005 | (5) | |
| Floating Rate Income Class C | | | 1.82 | % | | 10/31/13 | | | — | | | | — | | | | 6,128 | (6) | |
| High Income Investor Class | | | 1.00 | % | | 10/31/13 | | | — | | | | — | | | | — | | |
| High Income Institutional Class | | | 0.75 | % | | 10/31/13 | | | — | | | | 22,388 | (4) | | | 28,917 | | |
| High Income Class A | | | 1.12 | % | | 10/31/13 | | | — | | | | 4,496 | (4) | | | 34,122 | | |
| High Income Class C | | | 1.87 | % | | 10/31/13 | | | — | | | | 693 | (4) | | | 6,499 | | |
| High Income Class R3 | | | 1.37 | % | | 10/31/13 | | | — | | | | 1,035 | (4) | | | 800 | | |
Municipal Intermediate Bond Investor Class | | | 0.65 | % | | 10/31/13 | | | 170,458 | | | | 213,114 | | | | 402,491 | | |
Municipal Intermediate Bond Institutional Class | | | 0.50 | % | | 10/31/13 | | | — | | | | — | | | | 3,630 | (7) | |
| Municipal Intermediate Bond Class A | | | 0.87 | % | | 10/31/13 | | | — | | | | — | | | | 3,660 | (7) | |
| Municipal Intermediate Bond Class C | | | 1.62 | % | | 10/31/13 | | | — | | | | — | | | | 3,637 | (7) | |
| Short Duration Investor Class | | | 0.70 | % | | 10/31/13 | | | 202,732 | | | | 247,213 | | | | 322,782 | | |
| | | | | | | Expenses Deferred in Fiscal Period Ending October 31, | |
| | | | | | | 2008 | | 2009 | | 2010 | |
| | | | | | | Subject to Repayment until October 31, | |
| Class | | Contractual Expense Limitation(1) | | Expiration | | 2011 | | 2012 | | 2013 | |
| Short Duration Institutional Class | | | 0.50 | % | | 10/31/13 | | | | | | | $— | | | | $3,653 | (7) | |
| Short Duration Trust Class | | | 0.80 | % | | 10/31/13 | | | 52,852 | | | | 62,762 | | | | 59,964 | | |
| Short Duration Class A | | | 0.87 | % | | 10/31/13 | | | — | | | | — | | | | 3,698 | (7) | |
| Short Duration Class C | | | 1.62 | % | | 10/31/13 | | | — | | | | — | | | | 3,646 | (7) | |
| Strategic Income Institutional Class | | | 0.75 | %(3) | | 10/31/20 | | | 372,887 | | | | 148,644 | | | | 153,882 | | |
| Strategic Income Trust Class | | | 1.10 | % | | 10/31/13 | | | 24,251 | | | | 50,305 | | | | 28,331 | | |
| Strategic Income Class A | | | 1.15 | % | | 10/31/20 | | | 6,744 | (2) | | | 198,132 | | | | 196,672 | | |
| Strategic Income Class C | | | 1.85 | % | | 10/31/20 | | | 6,026 | (2) | | | 78,520 | | | | 157,265 | | |
| (1) | Expense limitation per annum of the respective class' average daily net assets. |
| | |
| (2) | Period from December 20, 2007 to October 31, 2008. |
| | |
| (3) | Prior to February 28, 2008, the expense limitation was .85%. |
| | |
| (4) | Period from May 27, 2009 to October 31, 2009. |
| | |
| (5) | Period from December 29, 2009 to October 31, 2010. |
| | |
| (6) | Period from December 30, 2009 to October 31, 2010. |
| | |
| (7) | Period from June 21, 2010 to October 31, 2010. On May 4, 2009, NBSH Acquisition, LLC ("NBSH"), an entity organized by key members of Neuberger Berman's senior management, acquired a majority interest in Neuberger Berman's business and the fixed income and certain alternative asset management businesses of Lehman Brothers Holdings Inc.'s ("LBHI") Investment Management Division (together with Neuberger Berman, the "Acquired Businesses") (the "Acquisition"). Prior to that date, the predecessor of Management and NBFI were wholly owned subsidiaries of LBHI. On September 15, 2008, LBHI filed a voluntary petition under Chapter 11 of the U.S. Bankruptcy Code, and on December 22, 2008, the bankruptcy court having jurisdiction over the LBHI matter approved the sale of the Acquired Businesses to NBSH (or its successor or assign), as the successful bidder in a public auction. The Acquired Businesses are now indirectly owned by, among others, portfolio managers, Neuberger Berman's management team, and certain key members and senior professionals who are employed in various parts of the Neuberger Berman complex of companies, with a minority interest retained by LBHI and certain affiliates of LBHI. The closing of the Acquisition resulted in an "assignment" of the Funds' Management Agreements and Sub-Advisory Agreements. Such an assignment, by law, automatically terminated those agreements. Accordingly, prior to the closing, the Board, including the Trustees who are not "interested persons" of the Funds' investment manager and its affiliates or the Funds, considered and approved a new Management Agreement and new Sub-Advisory Agreements for the Funds. The new agreements, which are virtually identical to those previously in effect, were also approved by a vote of the Funds' shareholders. These events have not had a material impact on the Funds or their operations. Management and NBFI continue to operate in the ordinary course of business as the investment manager and sub-adviser, respectively, of the Funds. NBFI, as the sub-adviser to High Income, Municipal Intermediate Bond, Short Duration, and Strategic Income, is retained by Management to furnish it with investment recommendations and research information without added cost to each Fund it sub-advises. NBFI, as sub-adviser to Core Bond and Floating Rate Income, is retained by Management to provide day-to-day investment management services and receives a monthly fee paid by |
| | Management. As investment manager, Management is responsible for overseeing the investment activities of NBFI. Several individuals who are officers and/or Trustees of the Trust are also employees of NBFI, Neuberger Berman LLC ("Neuberger") and/or Management. Each Fund also has a distribution agreement with Management with respect to each class of shares. Management acts as agent in arranging for the sale of class shares without sales commission or other compensation, except as described below for Class A and Class C shares, and bears advertising and promotion expenses. However, Management receives fees from Core Bond's Investor Class, Class A, and Class C, Floating Rate Income's Class A and Class C, High Income's Class A, Class C, and Class R3, Municipal Intermediate Bond's Class A and Class C, Short Duration's Class A and Class C and Strategic Income's Trust Class, Class A, and Class C, under their distribution plans (each a "Plan", collectively, the "Plans") pursuant to Rule 12b-1 under the 1940 Act. The Plans provide that, as compensation for administrative and other services provided to these classes, Management's activities and expenses related to the sale and distribution of these classes of shares, and ongoing services provided to investors in these classes, Management receives from each of these classes a fee at the annual rate of 0.25% of Core Bond Investor Class', Core Bond Class A's, Floating Rate Income Class A's, High Income Class A's, Municipal Intermediate Bond Class A's, Short Duration Class A's and Strategic Income Class A's average daily net assets, respectively; 0.10% of Strategic Income Trust Class' average daily net assets; 0.50% of High Income Class R3's average daily net assets; and 1.00% of Core Bond Class C's, Floating Rate Income Class C's, High Income Class C's, Municipal Intermediate Bond Class C's, Short Duration Class C's and Strategic Income Class C's average daily net assets, respectively. Management receives this amount to provide distribution and shareholder servicing for these classes and pays a portion of it to institutions that provide such services. Those institutions may use the payments for, among other purposes, compensating employees engaged in sales and/or shareholder servicing. The amount of fees paid by each class during any year may be more or less than the cost of distribution and other services provided to that class. NASD rules limit the amount of annual distribution fees that may be paid by a mutual fund and impose a ceiling on the cumulative distribution fees paid. The Trust's Plans comply with those rules. Class A shares of each Fund are generally sold with an initial sales charge of up to 4.25% and no contingent deferred sales charge ("CDSC"), except that a CDSC of 1.00% applies to certain redemptions made within 18 months following purchases of $1 million or more without an initial sales charge. Class C shares are sold with no initial sales charge and a 1.00% CDSC if shares are sold within one year after purchase. For the year ended October 31, 2010, Management, acting as underwriter and broker-dealer, received net commissions from the sale of Class A and Class C shares and CDSCs from the redemptions of Class A and Class C shares as follows: |
| | | Underwriter | | Broker-Dealer | |
| | | Net Commissions | | CDSC | | Net Commissions | | CDSC | |
| Core Bond Class A | | | $1,683 | | | | $— | | | | | | | | | | |
| Core Bond Class C | | | — | | | | 1,505 | | | | — | | | | — | | |
| Floating Rate Income Class A | | | 262 | | | | — | | | | — | | | | — | | |
| Floating Rate Income Class C | | | — | | | | 418 | | | | — | | | | — | | |
| High Income Class A | | | 28,754 | | | | 2 | | | | — | | | | — | | |
| High Income Class C | | | — | | | | 6,299 | | | | — | | | | — | | |
| Municipal Intermediate Bond Class A | | | — | | | | — | | | | — | | | | — | | |
| Municipal Intermediate Bond Class C | | | — | | | | — | | | | — | | | | — | | |
| Short Duration Class A | | | — | | | | — | | | | — | | | | — | | |
| Short Duration Class C | | | — | | | | — | | | | — | | | | — | | |
| Strategic Income Class A | | | 28,918 | | | | 11 | | | | — | | | | — | | |
| Strategic Income Class C | | | — | | | | 23,063 | | | | — | | | | — | | |
| | Each Fund has an expense offset arrangement in connection with its custodian contract. For the year ended October 31, 2010, the impact of this arrangement was a reduction of expenses of $98, $253, $812, $526, $75 and $263 for Core Bond, Floating Rate Income, High Income, Municipal Intermediate Bond, Short Duration, and Strategic Income, respectively. |
Note C—Securities Transactions:
| | Cost of purchases and proceeds of sales and maturities of long-term securities (excluding short-term securities and financial futures contracts) for the year ended October 31, 2010, were as follows: |
| | | Purchases of U.S. Government and Agency Obligations | | Purchases excluding U.S. Government and Agency Obligations | | Sales and Maturities of U.S. Government and Agency Obligations | | Sales and Maturities excluding U.S. Government and Agency Obligations | |
| Core Bond | | | | | | | $6,690,445 | | | | $430,096,230 | | | | $40,979,466 | | |
| Floating Rate Income | | | — | | | | 132,211,808 | | | | — | | | | 51,349,875 | | |
| High Income | | | — | | | | 1,226,174,128 | | | | — | | | | 900,407,161 | | |
| Municipal Intermediate Bond | | | — | | | | 134,812,422 | | | | — | | | | 110,929,045 | | |
| Short Duration | | | 24,925,622 | | | | 22,231,690 | | | | 23,533,161 | | | | 20,104,749 | | |
| Strategic Income | | | 373,729,692 | | | | 371,802,347 | | | | 326,497,920 | | | | 214,599,113 | | |
Note D—Fund Share Transactions:
Share activity for the years ended October 31, 2010 and October 31, 2009 was as follows:
| | | For the Year Ended October 31, 2010 | | For the Year Ended October 31, 2009 | |
| (000's omitted) | | Shares Sold | | Shares Issued on Reinvestment of Dividends and Distributions | | Shares Redeemed | | Total | | Shares Sold | | Shares Issued on Reinvestment of Dividends and Distributions | | Shares Redeemed | | Total | |
Core Bond: | |
| Investor Class | | | 511 | | | | 54 | | | | (1,301) | | | | (736) | | | | 1,052 | | | | 118 | | | | (3,836) | | | | (2,666) | | |
| Institutional Class | | | 7,486 | | | | 227 | | | | (2,450) | | | | 5,263 | | | | 5,704 | | | | 150 | | | | (3,768) | | | | 2,086 | | |
| Class A | | | 1,083 | | | | 50 | | | | (800) | | | | 333 | | | | 2,013 | | | | 19 | | | | (227) | | | | 1,805 | | |
| Class C | | | 225 | | | | 1 | | | | (39) | | | | 187 | | | | 82 | | | | 1 | | | | (18) | | | | 65 | | |
Floating Rate Income: | |
Institutional Class(2) | | | 7,149 | | | | 177 | | | | (390) | | | | 6,936 | | | | — | | | | — | | | | — | | | | — | | |
Class A(1) | | | 2,254 | | | | 22 | | | | (1,011) | | | | 1,265 | | | | — | | | | — | | | | — | | | | — | | |
Class C(2) | | | 100 | | | | 2 | | | | (30) | | | | 72 | | | | — | | | | — | | | | — | | | | — | | |
High Income: | |
| Investor Class | | | 13,963 | | | | 3,577 | | | | (27,976) | | | | (10,436) | | | | 51,650 | | | | 3,412 | | | | (32,540) | | | | 22,522 | | |
| Institutional Class | | | 24,328 | | | | 816 | | | | (7,111) | | | | 18,033 | | | | 10,062 | | | | 49 | | | | (135) | | | | 9,976 | (3) | |
| Class A | | | 29,897 | | | | 629 | | | | (4,092) | | | | 26,434 | | | | 2,834 | | | | 26 | | | | (60) | | | | 2,800 | (3) | |
| Class C | | | 2,477 | | | | 31 | | | | (122) | | | | 2,386 | | | | 307 | | | | 1 | | | | (13) | | | | 295 | (3) | |
| Class R3 | | | 51 | | | | 1 | | | | (12) | | | | 40 | | | | 9 | | | | — | | | | — | | | | 9 | (3) | |
| | | For the Year Ended October 31, 2010 | | For the Year Ended October 31, 2009 | |
| (000's omitted) | | Shares Sold | | Shares Issued on Reinvestment of Dividends and Distributions | | Shares Redeemed | | Total | | Shares Sold | | Shares Issued on Reinvestment of Dividends and Distributions | | Shares Redeemed | | Total | |
Municipal Intermediate Bond: | |
| Investor Class | | | 4,241 | | | | 280 | | | | (2,498) | | | | 2,023 | | | | 6,539 | | | | 94 | | | | (816) | | | | 5,817 | | |
Institutional Class(4) | | | 6 | | | | — | | | | — | | | | 6 | | | | — | | | | — | | | | — | | | | — | | |
Class A(4) | | | 14 | | | | — | | | | — | | | | 14 | | | | — | | | | — | | | | — | | | | — | | |
Class C(4) | | | 6 | | | | — | | | | — | | | | 6 | | | | — | | | | — | | | | — | | | | — | | |
Short Duration: | |
| Investor Class | | | 2,041 | | | | 232 | | | | (2,065) | | | | 208 | | | | 1,059 | | | | 334 | | | | (2,452) | | | | (1,059) | | |
Institutional Class(4) | | | 4 | | | | — | | | | — | | | | 4 | | | | — | | | | — | | | | — | | | | — | | |
| Trust Class | | | 419 | | | | 38 | | | | (331) | | | | 126 | | | | 349 | | | | 56 | | | | (541) | | | | (136) | | |
Class A(4) | | | 7 | | | | — | | | | — | | | | 7 | | | | — | | | | — | | | | — | | | | — | | |
Class C(4) | | | 4 | | | | — | | | | — | | | | 4 | | | | — | | | | — | | | | — | | | | — | | |
Strategic Income: | |
| Institutional Class | | | 10,340 | | | | 189 | | | | (1,714) | | | | 8,815 | | | | 1,472 | | | | 38 | | | | (264) | | | | 1,246 | | |
| Trust Class | | | 904 | | | | 56 | | | | (142) | | | | 818 | | | | 709 | | | | 11 | | | | (128) | | | | 592 | | |
| Class A | | | 10,236 | | | | 361 | | | | (4,322) | | | | 6,275 | | | | 7,204 | | | | 55 | | | | (837) | | | | 6,422 | | |
| Class C | | | 5,290 | | | | 112 | | | | (513) | | | | 4,889 | | | | 3,493 | | | | 12 | | | | (101) | | | | 3,404 | | |
(1) Period from December 29, 2009 (Commencement of Operations) to October 31, 2010.
(2) Period from December 30, 2009 (Commencement of Operations) to October 31, 2010.
(3) Period from May 27, 2009 (Commencement of Operations) to October 31, 2009.
(4) Period from June 21, 2010 (Commencement of Operations) to October 31, 2010.
Note E—Line of Credit:
| | During the fiscal year ended October 31, 2010, Core Bond, Floating Rate Income (added to the line of credit on March 25, 2010), High Income, Short Duration and Strategic Income were participants in a single committed, unsecured $200,000,000 ($150,000,000 prior to September 17, 2010) line of credit with State Street, to be used only or temporary or emergency purposes. Other investment companies managed by Management also participate in this line of credit on the same terms. Interest is charged on borrowings under this line of credit at the higher of (a) the Federal Funds Rate plus 1.25% per annum or (b) the Overnight LIBOR Rate plus 1.25% per annum. A facility fee of 0.125% (0.15% prior to September 17, 2010) per annum of the available line of credit is charged, of which each part icipating Fund has agreed to pay its pro rata share, based on the ratio of its individual net assets to the net assets of all participants at the time the fee is due and payable. The fee is paid quarterly in arrears. Because several mutual funds participate, there is no assurance that an individual Fund will have access to all or any part of the $200,000,000 ($150,000,000 prior to September 17, 2010) at any particular time. There were no loans outstanding pursuant to this line of credit at October 31, 2010. During the fiscal year ended October 31, 2010, none of the Funds utilized this line of credit. |
Note F—Investments In Affiliates:
| | | Balance of Shares Held October 31, 2009 | | Gross Purchases and Additions | | Gross Sales and Reductions | | Balance of Shares Held October 31, 2010 | | Value October 31, 2010 | | Income from Investments in Affiliated Issuers Included in Total Income | |
| Core Bond: | |
Neuberger Berman Securities Lending Quality Fund, LLC* | | | 1,080,134 | | | | 63,813 | | | | 1,143,947 | | | | — | | | | $— | | | | | | |
High Income: | |
Neuberger Berman Securities Lending Quality Fund, LLC* | | | 12,894,714 | | | | 133,930,526 | | | | 146,825,240 | | | | — | | | | $— | | | $ | | | |
| * | Quality Fund, a fund that was managed by NBFI, an affiliate of Management, was used to invest cash the Funds received as collateral for securities loaned as approved by the Board. Because all shares of Quality Fund were held by funds in the related investment management complex, Quality Fund may have been considered an affiliate of the Funds. |
Financial Highlights
The following tables include selected data for a share outstanding throughout each period and other performance information derived from the Financial Statements.
| | | Net Asset Value, Beginning of Year | | Net Investment Income (Loss)@ | | Net Gains or Losses on Securities (both realized and unrealized) | | Total From Investment Operations | | Dividends from Net Investment Income | | Distributions from Net Realized Capital Gains | | Tax Return of Capital | | Total Distributions | |
| Core Bond Fund | |
Investor Class | |
| 10/31/2010 | | $ | 10.19 | | | $ | 0.28 | | | $ | 0.72 | | | $ | 1.00 | | | $ | (0.28) | | | $ | (0.05) | | | $ | — | | | $ | (0.33) | | |
| 10/31/2009 | | $ | 8.64 | | | $ | 0.40 | | | $ | 1.55 | | | $ | 1.95 | | | $ | (0.40) | | | $ | (0.00) | | | $ | — | | | $ | (0.40) | | |
| 10/31/2008 | | $ | 9.76 | | | $ | 0.39 | | | $ | (1.12) | | | $ | (0.73) | | | $ | (0.39) | | | $ | — | | | $ | — | | | $ | (0.39) | | |
| 10/31/2007 | | $ | 9.85 | | | $ | 0.44 | | | $ | (0.09) | | | $ | 0.35 | | | $ | (0.44) | | | $ | — | | | $ | — | | | $ | (0.44) | | |
| 10/31/2006 | | $ | 10.09 | | | $ | 0.41 | | | $ | 0.09 | | | $ | 0.50 | | | $ | (0.43) | | | $ | (0.31) | | | $ | — | | | $ | (0.74) | | |
Institutional Class | |
| 10/31/2010 | | $ | 10.21 | | | $ | 0.32 | | | $ | 0.73 | | | $ | 1.05 | | | $ | (0.33) | | | $ | (0.05) | | | $ | — | | | $ | (0.38) | | |
| 10/31/2009 | | $ | 8.65 | | | $ | 0.43 | | | $ | 1.57 | | | $ | 2.00 | | | $ | (0.44) | | | $ | (0.00) | | | $ | — | | | $ | (0.44) | | |
| 10/31/2008 | | $ | 9.77 | | | $ | 0.43 | | | $ | (1.12) | | | $ | (0.69) | | | $ | (0.43) | | | $ | — | | | $ | — | | | $ | (0.43) | | |
| 10/31/2007 | | $ | 9.86 | | | $ | 0.48 | | | $ | (0.09) | | | $ | 0.39 | | | $ | (0.48) | | | $ | — | | | $ | — | | | $ | (0.48) | | |
| 10/31/2006 | | $ | 10.11 | | | $ | 0.45 | | | $ | 0.08 | | | $ | 0.53 | | | $ | (0.47) | | | $ | (0.31) | | | $ | — | | | $ | (0.78) | | |
Class A | |
10/31/2010 | | $ | 10.18 | | | $ | 0.28 | | | $ | 0.72 | | | $ | 1.00 | | | $ | (0.28) | | | $ | (0.05) | | | $ | — | | | $ | (0.33) | | |
| 10/31/2009 | | $ | 8.64 | | | $ | 0.37 | | | $ | 1.57 | | | $ | 1.94 | | | $ | (0.40) | | | $ | (0.00) | | | $ | — | | | $ | (0.40) | | |
Period from 12/20/2007^ to 10/31/2008 | | $ | 9.77 | | | $ | 0.33 | | | $ | (1.13) | | | $ | (0.80) | | | $ | (0.33) | | | $ | — | | | $ | — | | | $ | (0.33) | | |
Class C | |
10/31/2010 | | $ | 10.18 | | | $ | 0.19 | | | $ | 0.74 | | | $ | 0.93 | | | $ | (0.20) | | | $ | (0.05) | | | $ | — | | | $ | (0.25) | | |
| 10/31/2009 | | $ | 8.64 | | | $ | 0.32 | | | $ | 1.55 | | | $ | 1.87 | | | $ | (0.33) | | | $ | (0.00) | | | $ | — | | | $ | (0.33) | | |
Period from 12/20/2007^ to 10/31/2008 | | $ | 9.77 | | | $ | 0.26 | | | $ | (1.12) | | | $ | (0.86) | | | $ | (0.27) | | | $ | — | | | $ | — | | | $ | (0.27) | | |
Floating Rate Income Fund | |
| Institutional Class | |
Period from 12/30/2009^ to 10/31/2010 | | $ | 10.00 | | | $ | 0.44 | | | $ | 0.17 | | | $ | 0.61 | | | $ | (0.44) | | | $ | — | | | $ | — | | | $ | (0.44) | | |
Class A | |
Period from 12/29/2009^ to 10/31/2010 | | $ | 10.00 | | | $ | 0.41 | | | $ | 0.16 | | | $ | 0.57 | | | $ | (0.40) | | | $ | — | | | $ | — | | | $ | (0.40) | | |
| See Notes to Financial Highlights | 106 | |
| | | Capital Contributions | | Net Asset Value, End of Year | | Total Return†† | | Net Assets, End of Year (in millions) | | Ratio of Gross Expenses to Average Net Assets# | | Ratio of Net Expenses to Average Net Assets | | Ratio of Net Investment Income/ (Loss) to Average Net Assets | | Portfolio Turnover Rate | |
| Core Bond Fund | |
| Investor Class | |
10/31/2010 | | $ | — | | | $ | 10.86 | | | | 10.03 | % | | $ | 18.6 | | | | .85 | % | | | .85 | %‡ | | | 2.66 | % | | | 340 | % | |
| 10/31/2009 | | $ | — | | | $ | 10.19 | | | | 23.10 | % | | $ | 25.0 | | | | .86 | % | | | .86 | %‡ | | | 4.39 | % | | | 450 | % | |
| 10/31/2008 | | $ | — | | | $ | 8.64 | | | | (7.72 | )% | | $ | 44.2 | | | | .85 | % | | | .85 | %‡ | | | 4.08 | % | | | 430 | % | |
| 10/31/2007 | | $ | — | | | $ | 9.76 | | | | 3.67 | % | | $ | 35.9 | | | | .85 | % | | | .85 | %‡ | | | 4.51 | % | | | 404 | % | |
| 10/31/2006 | | $ | — | | | $ | 9.85 | | | | 5.21 | % | | $ | 33.9 | | | | .86 | % | | | .85 | %‡ | | | 4.22 | % | | | 399 | % | |
Institutional Class | |
| 10/31/2010 | | $ | — | | | $ | 10.88 | | | | 10.45 | % | | $ | 120.3 | | | | .45 | % | | | .45 | %‡ | | | 3.02 | % | | | 340 | % | |
| 10/31/2009 | | $ | — | | | $ | 10.21 | | | | 23.70 | % | | $ | 59.1 | | | | .45 | % | | | .45 | %‡ | | | 4.60 | % | | | 450 | % | |
| 10/31/2008 | | $ | — | | | $ | 8.65 | | | | (7.34 | )% | | $ | 32.1 | | | | .45 | % | | | .45 | %‡ | | | 4.48 | % | | | 430 | % | |
| 10/31/2007 | | $ | — | | | $ | 9.77 | | | | 4.08 | % | | $ | 47.2 | | | | .45 | % | | | .45 | %‡ | | | 4.91 | % | | | 404 | % | |
| 10/31/2006 | | $ | — | | | $ | 9.86 | | | | 5.52 | % | | $ | 44.5 | | | | .46 | % | | | .45 | %‡ | | | 4.60 | % | | | 399 | % | |
Class A | |
| 10/31/2010 | | $ | — | | | $ | 10.85 | | | | 10.04 | % | | $ | 23.4 | | | | .85 | % | | | .85 | %‡ | | | 2.64 | % | | | 340 | % | |
| 10/31/2009 | | $ | — | | | $ | 10.18 | | | | 22.96 | % | | $ | 18.5 | | | | .85 | % | | | .85 | %‡ | | | 3.81 | % | | | 450 | % | |
Period from 12/20/2007^ to 10/31/2008 | | $ | — | | | $ | 8.64 | | | | (8.37 | )%** | | $ | 0.1 | | | | .85 | %* | | | .85 | %‡* | | | 4.01 | %* | | | 430 | %^^ | |
Class C | |
| 10/31/2010 | | $ | — | | | $ | 10.86 | | | | 9.31 | % | | $ | 2.9 | | | | 1.60 | % | | | 1.60 | %‡ | | | 1.83 | % | | | 340 | % | |
| 10/31/2009 | | $ | — | | | $ | 10.18 | | | | 22.04 | % | | $ | 0.8 | | | | 1.61 | % | | | 1.61 | %‡ | | | 3.39 | % | | | 450 | % | |
Period from 12/20/2007^ to 10/31/2008 | | $ | — | | | $ | 8.64 | | | | (8.98 | )%** | | $ | 0.1 | | | | 1.60 | %* | | | 1.60 | %‡* | | | 3.24 | %* | | | 430 | %^^ | |
Floating Rate Income Fund | |
| Institutional Class | |
Period from 12/30/2009^ to 10/31/2010 | | $ | — | | | $ | 10.17 | | | | 6.24 | %** | | $ | 70.5 | | | | .70 | %* | | | .70 | %‡* | | | 5.28 | %* | | | 112 | %** | |
Class A | |
Period from 12/29/2009^ to 10/31/2010 | | $ | — | | | $ | 10.17 | | | | 5.85 | %** | | $ | 12.9 | | | | 1.07 | %* | | | 1.07 | %‡* | | | 4.87 | %* | | | 112 | %** | |
Financial Highlights (cont'd)
| | | Net Asset Value, Beginning of Year | | Net Investment Income (Loss)@ | | Net Gains or Losses on Securities (both realized and unrealized) | | Total From Investment Operations | | Dividends from Net Investment Income | | Distributions from Net Realized Capital Gains | | Tax Return of Capital | | Total Distributions | |
| Class C | |
Period from 12/30/2009^ to 10/31/2010 | | $ | 10.00 | | | $ | 0.35 | | | $ | 0.18 | | | $ | 0.53 | | | $ | (0.36 | ) | | $ | — | | | $ | — | | | $ | (0.36 | ) | |
High Income Bond Fund | |
Investor Class | |
| 10/31/2010 | | $ | 8.66 | | | $ | 0.76 | | | $ | 0.87 | | | $ | 1.63 | | | $ | (0.80 | ) | | $ | — | | | $ | — | | | $ | (0.80 | ) | |
| 10/31/2009 | | $ | 6.57 | | | $ | 0.74 | | | $ | 2.02 | | | $ | 2.76 | | | $ | (0.67 | ) | | $ | — | | | $ | — | | | $ | (0.67 | ) | |
| 10/31/2008 | | $ | 9.00 | | | $ | 0.66 | | | $ | (2.44 | ) | | $ | (1.78 | ) | | $ | (0.66 | ) | | $ | — | | | $ | — | | | $ | (0.66 | ) | |
| 10/31/2007 | | $ | 9.08 | | | $ | 0.68 | | | $ | (0.08 | ) | | $ | 0.60 | | | $ | (0.68 | ) | | $ | — | | | $ | — | | | $ | (0.68 | ) | |
| 10/31/2006 | | $ | 9.10 | | | $ | 0.59 | | | $ | (0.02 | ) | | $ | 0.57 | | | $ | (0.59 | ) | | $ | — | | | $ | — | | | $ | (0.59 | ) | |
Institutional Class | |
| 10/31/2010 | | $ | 8.68 | | | $ | 0.77 | | | $ | 0.87 | | | $ | 1.64 | | | $ | (0.82 | ) | | $ | — | | | $ | — | | | $ | (0.82 | ) | |
Period from 5/27/2009^ to
10/31/2009 | | $ | 7.51 | | | $ | 0.36 | | | $ | 1.14 | | | $ | 1.50 | | | $ | (0.33 | ) | | $ | — | | | $ | — | | | $ | (0.33 | ) | |
Class A | |
| 10/31/2010 | | $ | 8.66 | | | $ | 0.70 | | | $ | 0.91 | | | $ | 1.61 | | | $ | (0.78 | ) | | $ | — | | | $ | — | | | $ | (0.78 | ) | |
Period from 5/27/2009^ to 10/31/2009 | | $ | 7.51 | | | $ | 0.33 | | | $ | 1.13 | | | $ | 1.46 | | | $ | (0.31 | ) | | $ | — | | | $ | — | | | $ | (0.31 | ) | |
Class C | |
| 10/31/2010 | | $ | 8.67 | | | $ | 0.64 | | | $ | 0.91 | | | $ | 1.55 | | | $ | (0.72 | ) | | $ | — | | | $ | — | | | $ | (0.72 | ) | |
Period from 5/27/2009^ to 10/31/2009 | | $ | 7.51 | | | $ | 0.30 | | | $ | 1.14 | | | $ | 1.44 | | | $ | (0.28 | ) | | $ | — | | | $ | — | | | $ | (0.28 | ) | |
Class R3 | |
| 10/31/2010 | | $ | 8.67 | | | $ | 0.69 | | | $ | 0.89 | | | $ | 1.58 | | | $ | (0.76 | ) | | $ | — | | | $ | — | | | $ | (0.76 | ) | |
Period from 5/27/2009^ to 10/31/2009 | | $ | 7.51 | | | $ | 0.33 | | | $ | 1.13 | | | $ | 1.46 | | | $ | (0.30 | ) | | $ | — | | | $ | — | | | $ | (0.30 | ) | |
Municipal Intermediate Bond Fund | |
Investor Class | |
| 10/31/2010 | | $ | 11.22 | | | $ | 0.36 | | | $ | 0.37 | | | $ | 0.73 | | | $ | (0.36 | ) | | $ | — | | | $ | — | | | $ | (0.36 | ) | |
| 10/31/2009 | | $ | 10.60 | | | $ | 0.35 | | | $ | 0.64 | | | $ | 0.99 | | | $ | (0.37 | ) | | $ | — | | | $ | — | | | $ | (0.37 | ) | |
| 10/31/2008 | | $ | 11.20 | | | $ | 0.41 | | | $ | (0.59 | ) | | $ | (0.18 | ) | | $ | (0.41 | ) | | $ | (0.01 | ) | | $ | — | | | $ | (0.42 | ) | |
| 10/31/2007 | | $ | 11.36 | | | $ | 0.41 | | | $ | (0.12 | ) | | $ | 0.29 | | | $ | (0.41 | ) | | $ | (0.04 | ) | | $ | — | | | $ | (0.45 | ) | |
| 10/31/2006 | | $ | 11.33 | | | $ | 0.40 | | | $ | 0.08 | | | $ | 0.48 | | | $ | (0.40 | ) | | $ | (0.05 | ) | | $ | — | | | $ | (0.45 | ) | |
| See Notes to Financial Highlights | 108 | |
| | | Capital Contributions | | Net Asset Value, End of Year | | Total Return†† | | Net Assets, End of Year (in millions) | | Ratio of Gross Expenses to Average Net Assets# | | Ratio of Net Expenses to Average Net Assets | | Ratio of Net Investment Income/ (Loss) to Average Net Assets | | Portfolio Turnover Rate | |
| Class C | |
Period from 12/30/2009^ to 10/31/2010 | | $ | — | | | $ | 10.17 | | | | 5.39 | %** | | $ | 0.7 | | | | 1.82 | %* | | | 1.82 | %‡* | | | 4.23 | %* | | | 112 | %** | |
High Income Bond Fund | |
Investor Class | |
| 10/31/2010 | | $ | — | | | $ | 9.49 | | | | 19.71 | % | | $ | 363.6 | | | | .96 | % | | | .96 | %§ | | | 8.50 | % | | | 144 | % | |
| 10/31/2009 | | $ | — | | | $ | 8.66 | | | | 44.38 | % | | $ | 422.2 | | | | 1.00 | % | | | 1.00 | %‡ | | | 9.90 | % | | | 167 | % | |
| 10/31/2008 | | $ | 0.01 | | | $ | 6.57 | | | | (20.86 | )% | | $ | 172.3 | | | | .92 | % | | | .92 | %‡ | | | 7.96 | % | | | 115 | % | |
| 10/31/2007 | | $ | — | | | $ | 9.00 | | | | 6.73 | % | | $ | 369.2 | | | | .92 | % | | | .92 | %‡ | | | 7.41 | % | | | 153 | % | |
| 10/31/2006 | | $ | — | | | $ | 9.08 | | | | 6.53 | % | | $ | 588.3 | | | | .90 | % | | | .89 | %‡ | | | 6.52 | % | | | 136 | % | |
Institutional Class | |
| 10/31/2010 | | $ | — | | | $ | 9.50 | | | | 19.81 | % | | $ | 266.2 | | | | .75 | % | | | .75 | %‡ | | | 8.55 | % | | | 144 | % | |
Period from 5/27/2009^ to 10/31/2009 | | $ | — | | | $ | 8.68 | | | | 20.23 | %** | | $ | 86.6 | | | | .75 | %* | | | .75 | %‡* | | | 9.86 | %* | | | 167 | %^^ | |
Class A | |
| 10/31/2010 | | $ | — | | | $ | 9.49 | | | | 19.52 | % | | $ | 277.5 | | | | 1.12 | % | | | 1.12 | %‡ | | | 7.75 | % | | | 144 | % | |
Period from 5/27/2009^ to 10/31/2009 | | $ | — | | | $ | 8.66 | | | | 19.69 | %** | | $ | 24.3 | | | | 1.12 | %* | | | 1.12 | %‡* | | | 9.19 | %* | | | 167 | %^^ | |
Class C | |
| 10/31/2010 | | $ | — | | | $ | 9.50 | | | | 18.60 | % | | $ | 25.5 | | | | 1.87 | % | �� | | 1.87 | %‡ | | | 7.05 | % | | | 144 | % | |
Period from 5/27/2009^ to 10/31/2009 | | $ | — | | | $ | 8.67 | | | | 19.43 | %** | | $ | 2.6 | | | | 1.87 | %* | | | 1.87 | %‡* | | | 8.26 | %* | | | 167 | %^^ | |
Class R3 | |
| 10/31/2010 | | $ | — | | | $ | 9.49 | | | | 19.08 | % | | $ | 0.5 | | | | 1.37 | % | | | 1.37 | %‡ | | | 7.60 | % | | | 144 | % | |
Period from 5/27/2009^ to 10/31/2009 | | $ | — | | | $ | 8.67 | | | | 19.76 | %** | | $ | 0.1 | | | | 1.37 | %* | | | 1.37 | %‡* | | | 9.29 | %* | | | 167 | %^^ | |
Municipal Intermediate Bond Fund | |
Investor Class | |
| 10/31/2010 | | $ | — | | | $ | 11.59 | | | | 6.56 | % | | $ | 118.8 | | | | .65 | % | | | .65 | %‡ | | | 3.12 | % | | | 101 | % | |
| 10/31/2009 | | $ | — | | | $ | 11.22 | | | | 9.42 | % | | $ | 92.3 | | | | .65 | % | | | .65 | %‡ | | | 3.15 | % | | | 146 | % | |
| 10/31/2008 | | $ | — | | | $ | 10.60 | | | | (1.74 | )% | | $ | 25.6 | | | | .66 | % | | | .64 | %‡ | | | 3.65 | % | | | 39 | % | |
| 10/31/2007 | | $ | — | | | $ | 11.20 | | | | 2.61 | % | | $ | 27.8 | | | | .66 | % | | | .65 | %‡ | | | 3.61 | % | | | 9 | % | |
| 10/31/2006 | | $ | — | | | $ | 11.36 | | | | 4.38 | % | | $ | 32.1 | | | | .66 | % | | | .65 | %‡ | | | 3.56 | % | | | 28 | % | |
Financial Highlights (cont'd)
| | | Net Asset Value, Beginning of Year | | Net Investment Income (Loss)@ | | Net Gains or Losses on Securities (both realized and unrealized) | | Total From Investment Operations | | Dividends from Net Investment Income | | Distributions from Net Realized Capital Gains | | Tax Return of Capital | | Total Distributions | |
| Institutional Class | |
Period from 6/21/2010^ to 10/31/2010 | | $ | 11.36 | | | $ | 0.14 | | | $ | 0.23 | | | $ | 0.37 | | | $ | (0.14 | ) | | $ | — | | | $ | — | | | $ | (0.14 | ) | |
Class A | |
Period from 6/21/2010^ to 10/31/2010 | | $ | 11.36 | | | $ | 0.12 | | | $ | 0.24 | | | $ | 0.36 | | | $ | (0.12 | ) | | $ | — | | | $ | — | | | $ | (0.12 | ) | |
Class C | |
Period from 6/21/2010^ to 10/31/2010 | | $ | 11.36 | | | $ | 0.09 | | | $ | 0.23 | | | $ | 0.32 | | | $ | (0.09 | ) | | $ | — | | | $ | — | | | $ | (0.09 | ) | |
Short Duration Bond Fund | |
Investor Class | |
| 10/31/2010 | | $ | 7.83 | | | $ | 0.17 | | | $ | 0.38 | | | $ | 0.55 | | | $ | (0.29 | ) | | $ | — | | | $ | — | | | $ | (0.29 | ) | |
| 10/31/2009 | | $ | 7.91 | | | $ | 0.35 | | | $ | (0.05 | ) | | $ | 0.30 | | | $ | (0.38 | ) | | $ | — | | | $ | — | | | $ | (0.38 | ) | |
| 10/31/2008 | | $ | 9.13 | | | $ | 0.41 | | | $ | (1.18 | ) | | $ | (0.77 | ) | | $ | (0.45 | ) | | $ | — | | | $ | — | | | $ | (0.45 | ) | |
| 10/31/2007 | | $ | 9.11 | | | $ | 0.41 | | | $ | 0.06 | | | $ | 0.47 | | | $ | (0.45 | ) | | $ | — | | | $ | — | | | $ | (0.45 | ) | |
| 10/31/2006 | | $ | 9.13 | | | $ | 0.35 | | | $ | 0.03 | | | $ | 0.38 | | | $ | (0.40 | ) | | $ | — | | | $ | — | | | $ | (0.40 | ) | |
Institutional Class | |
Period from 6/21/2010^ to 10/31/2010 | | $ | 7.97 | | | $ | 0.06 | | | $ | 0.16 | | | $ | 0.22 | | | $ | (0.10 | ) | | $ | — | | | $ | — | | | $ | (0.10 | ) | |
Trust Class | |
| 10/31/2010 | | $ | 7.46 | | | $ | 0.16 | | | $ | 0.35 | | | $ | 0.51 | | | $ | (0.26 | ) | | $ | — | | | $ | — | | | $ | (0.26 | ) | |
| 10/31/2009 | | $ | 7.54 | | | $ | 0.33 | | | $ | (0.06 | ) | | $ | 0.27 | | | $ | (0.35 | ) | | $ | — | | | $ | — | | | $ | (0.35 | ) | |
| 10/31/2008 | | $ | 8.70 | | | $ | 0.38 | | | $ | (1.12 | ) | | $ | (0.74 | ) | | $ | (0.42 | ) | | $ | — | | | $ | — | | | $ | (0.42 | ) | |
| 10/31/2007 | | $ | 8.68 | | | $ | 0.39 | | | $ | 0.05 | | | $ | 0.44 | | | $ | (0.42 | ) | | $ | — | | | $ | — | | | $ | (0.42 | ) | |
| 10/31/2006 | | $ | 8.70 | | | $ | 0.32 | | | $ | 0.03 | | | $ | 0.35 | | | $ | (0.37 | ) | | $ | — | | | $ | — | | | $ | (0.37 | ) | |
Class A | |
Period from 6/21/2010^ to 10/31/2010 | | $ | 7.60 | | | $ | 0.05 | | | $ | 0.15 | | | $ | 0.20 | | | $ | (0.08 | ) | | $ | — | | | $ | — | | | $ | (0.08 | ) | |
Class C | |
Period from 6/21/2010^ to 10/31/2010 | | $ | 7.60 | | | $ | 0.03 | | | $ | 0.15 | | | $ | 0.18 | | | $ | (0.06 | ) | | $ | — | | | $ | — | | | $ | (0.06 | ) | |
| See Notes to Financial Highlights | 110 | |
| | | Capital Contributions | | Net Asset Value, End of Year | | Total Return†† | | Net Assets, End of Year (in millions) | | Ratio of Gross Expenses to Average Net Assets# | | Ratio of Net Expenses to Average Net Assets | | Ratio of Net Investment Income/ (Loss) to Average Net Assets | | Portfolio Turnover Rate | |
| Institutional Class | |
Period from 6/21/2010^ to 10/31/2010 | | $ | — | | | $ | 11.59 | | | | 3.25 | %** | | $ | 0.1 | | | | .50 | %* | | | .50 | %‡* | | | 3.30 | %* | | | 101 | %^^ | |
Class A | |
Period from 6/21/2010^ to 10/31/2010 | | $ | — | | | $ | 11.60 | | | | 3.20 | %** | | $ | 0.2 | | | | .87 | %* | | | .87 | %‡* | | | 3.00 | %* | | | 101 | %^^ | |
Class C | |
Period from 6/21/2010^ to 10/31/2010 | | $ | — | | | $ | 11.59 | | | | 2.83 | %** | | $ | 0.1 | | | | 1.62 | %* | | | 1.62 | %‡* | | | 2.14 | %* | | | 101 | %^^ | |
Short Duration Bond Fund | |
Investor Class | |
| 10/31/2010 | | $ | — | | | $ | 8.09 | | | | 7.08 | % | | $ | 56.1 | | | | .70 | % | | | .70 | %‡ | | | 2.19 | % | | | 69 | % | |
| 10/31/2009 | | $ | — | | | $ | 7.83 | | | | 4.18 | % | | $ | 52.6 | | | | .70 | % | | | .70 | %‡ | | | 4.73 | % | | | 48 | % | |
| 10/31/2008 | | $ | — | | | $ | 7.91 | | | | (8.70 | )% | | $ | 61.6 | | | | .70 | % | | | .70 | %‡ | | | 4.73 | % | | | 10 | % | |
| 10/31/2007 | | $ | — | | | $ | 9.13 | | | | 5.24 | % | | $ | 93.4 | | | | .70 | % | | | .70 | %‡ | | | 4.54 | % | | | 53 | % | |
| 10/31/2006 | | $ | — | | | $ | 9.11 | | | | 4.28 | % | | $ | 108.1 | | | | .71 | % | | | .70 | %‡ | | | 3.80 | % | | | 74 | % | |
Institutional Class | |
Period from 6/21/2010^ to 10/31/2010 | | $ | — | | | $ | 8.09 | | | | 2.73 | %** | | $ | 0.0 | | | | .50 | %* | | | .50 | %‡* | | | 2.16 | %* | | | 69 | %^^ | |
Trust Class | |
| 10/31/2010 | | $ | — | | | $ | 7.71 | | | | 7.01 | % | | $ | 9.4 | | | | .80 | % | | | .80 | %‡ | | | 2.09 | % | | | 69 | % | |
| 10/31/2009 | | $ | — | | | $ | 7.46 | | | | 4.02 | % | | $ | 8.1 | | | | .80 | % | | | .80 | %‡ | | | 4.62 | % | | | 48 | % | |
| 10/31/2008 | | $ | — | | | $ | 7.54 | | | | (8.76 | )% | | $ | 9.3 | | | | .80 | % | | | .80 | %‡ | | | 4.64 | % | | | 10 | % | |
| 10/31/2007 | | $ | — | | | $ | 8.70 | | | | 5.15 | % | | $ | 13.1 | | | | .80 | % | | | .80 | %‡ | | | 4.44 | % | | | 53 | % | |
| 10/31/2006 | | $ | — | | | $ | 8.68 | | | | 4.16 | % | | $ | 16.6 | | | | .81 | % | | | .80 | %‡ | | | 3.69 | % | | | 74 | % | |
Class A | |
Period from 6/21/2010^ to 10/31/2010 | | $ | — | | | $ | 7.72 | | | | 2.67 | %** | | $ | 0.1 | | | | .87 | %* | | | .87 | %‡* | | | 1.83 | %* | | | 69 | %^^ | |
Class C | |
Period from 6/21/2010^ to 10/31/2010 | | $ | — | | | $ | 7.72 | | | | 2.39 | %** | | $ | 0.0 | | | | 1.62 | %* | | | 1.62 | %‡* | | | 1.04 | %* | | | 69 | %^^ | |
Financial Highlights (cont'd)
| | | Net Asset Value, Beginning of Year | | Net Investment Income (Loss)@ | | Net Gains or Losses on Securities (both realized and unrealized) | | Total From Investment Operations | | Dividends from Net Investment Income | | Distributions from Net Realized Capital Gains | | Tax Return of Capital | | Total Distributions | |
| Strategic Income Fund | |
Institutional Class | |
| 10/31/2010 | | $ | 10.58 | | | $ | 0.53 | | | $ | 0.81 | | | $ | 1.34 | | | $ | (0.56 | ) | | $ | (0.13 | ) | | $ | — | | | $ | (0.69 | ) | |
| 10/31/2009 | | $ | 8.78 | | | $ | 0.45 | | | $ | 1.79 | | | $ | 2.24 | | | $ | (0.44 | ) | | $ | — | | | $ | — | | | $ | (0.44 | ) | |
| 10/31/2008 | | $ | 10.38 | | | $ | 0.44 | | | $ | (1.02 | ) | | $ | (0.58 | ) | | $ | (0.31 | )@ | | $ | (0.61 | )@ | | $ | (0.10 | )@ | | $ | (1.02 | ) | |
| 10/31/2007 | | $ | 10.65 | | | $ | 0.43 | | | $ | 0.15 | | | $ | 0.58 | | | $ | (0.45 | ) | | $ | (0.40 | ) | | $ | — | | | $ | (0.85 | ) | |
| 10/31/2006 | | $ | 10.90 | | | $ | 0.38 | | | $ | 0.65 | | | $ | 1.03 | | | $ | (0.46 | ) | | $ | (0.82 | ) | | $ | — | | | $ | (1.28 | ) | |
| Trust Class | |
| 10/31/2010 | | $ | 10.58 | | | $ | 0.49 | | | $ | 0.81 | | | $ | 1.30 | | | $ | (0.52 | ) | | $ | (0.13 | ) | | $ | — | | | $ | (0.65 | ) | |
| 10/31/2009 | | $ | 8.77 | | | $ | 0.43 | | | $ | 1.78 | | | $ | 2.21 | | | $ | (0.40 | ) | | $ | — | | | $ | — | | | $ | (0.40 | ) | |
| 10/31/2008 | | $ | 10.38 | | | $ | 0.42 | | | $ | (1.05 | ) | | $ | (0.63 | ) | | $ | (0.27 | )@ | | $ | (0.61 | )@ | | $ | (0.10 | )@ | | $ | (0.98 | ) | |
Period from 4/2/2007^ to 10/31/2007 | | $ | 10.39 | | | $ | 0.24 | | | $ | (0.02 | ) | | $ | 0.22 | | | $ | (0.23 | ) | | $ | — | | | $ | — | | | $ | (0.23 | ) | |
Class A | |
| 10/31/2010 | | $ | 10.59 | | | $ | 0.48 | | | $ | 0.81 | | | $ | 1.29 | | | $ | (0.51 | ) | | $ | (0.13 | ) | | $ | — | | | $ | (0.64 | ) | |
| 10/31/2009 | | $ | 8.78 | | | $ | 0.43 | | | $ | 1.77 | | | $ | 2.20 | | | $ | (0.39 | ) | | $ | — | | | $ | — | | | $ | (0.39 | ) | |
Period from 12/20/2007^ to 10/31/2008 | | $ | 10.19 | | | $ | 0.36 | | | $ | (0.78 | ) | | $ | (0.42 | ) | | $ | (0.28 | )@ | | $ | (0.61 | )@ | | $ | (0.10 | )@ | | $ | (0.99 | ) | |
Class C | |
| 10/31/2010 | | $ | 10.58 | | | $ | 0.41 | | | $ | 0.81 | | | $ | 1.22 | | | $ | (0.44 | ) | | $ | (0.13 | ) | | $ | — | | | $ | (0.57 | ) | |
| 10/31/2009 | | $ | 8.78 | | | $ | 0.36 | | | $ | 1.76 | | | $ | 2.12 | | | $ | (0.32 | ) | | $ | — | | | $ | — | | | $ | (0.32 | ) | |
Period from 12/20/2007^ to 10/31/2008 | | $ | 10.19 | | | $ | 0.29 | | | $ | (0.77 | ) | | $ | (0.48 | ) | | $ | (0.22 | )@ | | $ | (0.61 | )@ | | $ | (0.10 | )@ | | $ | (0.93 | ) | |
| See Notes to Financial Highlights | 112 | |
| | | Capital Contributions | | Net Asset Value, End of Year | | Total Return†† | | Net Assets, End of Year (in millions) | | Ratio of Gross Expenses to Average Net Assets# | | Ratio of Net Expenses to Average Net Assets | | Ratio of Net Investment Income/ (Loss) to Average Net Assets | | Portfolio Turnover Rate | |
| Strategic Income Fund | |
Institutional Class | |
| 10/31/2010 | | $ | — | | | $ | 11.23 | | | | 13.17 | % | | $ | 118.8 | | | | .75 | % | | | .75 | %‡ | | | 4.88 | % | | | 238 | % | |
| 10/31/2009 | | $ | — | | | $ | 10.58 | | | | 25.97 | % | | $ | 18.7 | | | | .75 | % | | | .75 | %‡ | | | 4.59 | % | | | 322 | % | |
| 10/31/2008 | | $ | — | | | $ | 8.78 | | | | (6.09 | )% | | $ | 4.6 | | | | .84 | % | | | .83 | %‡ | | | 4.54 | % | | | 323 | % | |
| 10/31/2007 | | $ | — | | | $ | 10.38 | | | | 5.64 | % | | $ | 17.0 | | | | .86 | % | | | .85 | %‡ | | | 4.10 | % | | | 99 | % | |
| 10/31/2006 | | $ | — | | | $ | 10.65 | | | | 10.34 | % | | $ | 20.4 | | | | .86 | % | | | .85 | %‡ | | | 3.66 | % | | | 111 | % | |
Trust Class | |
| 10/31/2010 | | $ | — | | | $ | 11.23 | | | | 12.78 | % | | $ | 16.3 | | | | 1.10 | % | | | 1.10 | %‡ | | | 4.56 | % | | | 238 | % | |
| 10/31/2009 | | $ | — | | | $ | 10.58 | | | | 25.66 | % | | $ | 6.7 | | | | 1.10 | % | | | 1.10 | %‡ | | | 4.32 | % | | | 322 | % | |
| 10/31/2008 | | $ | — | | | $ | 8.77 | | | | (6.54 | )% | | $ | 0.3 | | | | 1.15 | % | | | 1.14 | %‡ | | | 4.36 | % | | | 323 | % | |
Period from 4/2/2007^ to 10/31/2007 | | $ | — | | | $ | 10.38 | | | | 2.16 | %** | | $ | 0.2 | | | | 1.11 | %* | | | 1.10 | %‡* | | | 3.92 | %* | | | 99 | %^^ | |
Class A | |
| 10/31/2010 | | $ | — | | | $ | 11.24 | | | | 12.72 | % | | $ | 142.9 | | | | 1.15 | % | | | 1.15 | %‡ | | | 4.44 | % | | | 238 | % | |
| 10/31/2009 | | $ | — | | | $ | 10.59 | | | | 25.51 | % | | $ | 68.2 | | | | 1.15 | % | | | 1.15 | %‡ | | | 4.25 | % | | | 322 | % | |
Period from 12/20/2007^ to 10/31/2008 | | $ | — | | | $ | 8.78 | | | | (4.64 | )%** | | $ | 0.2 | | | | 1.21 | %* | | | 1.20 | %‡* | | | 4.36 | %* | | | 323 | %^^ | |
Class C | |
| 10/31/2010 | | $ | — | | | $ | 11.23 | | | | 11.93 | % | | $ | 93.3 | | | | 1.85 | % | | | 1.85 | %‡ | | | 3.75 | % | | | 238 | % | |
| 10/31/2009 | | $ | — | | | $ | 10.58 | | | | 24.47 | % | | $ | 36.2 | | | | 1.85 | % | | | 1.85 | %‡ | | | 3.53 | % | | | 322 | % | |
Period from 12/20/2007^ to 10/31/2008 | | $ | — | | | $ | 8.78 | | | | (5.22 | )%** | | $ | 0.1 | | | | 1.91 | %* | | | 1.90 | %‡* | | | 3.56 | %* | | | 323 | %^^ | |
Notes to Financial Highlights Income Funds
| †† | Total return based on per share NAV reflects the effects of changes in NAV on the performance of each Fund during each fiscal period and assumes income dividends and other distributions, if any, were reinvested, but does not reflect the effect of sales charges. Results represent past performance and do not guarantee future results. Current returns may be lower or higher than the performance data quoted. Investment returns and principal may fluctuate and shares when redeemed may be worth more or less than original cost. For each Fund, total return would have been lower if Management had not reimbursed and/or waived certain expenses. Total return would have been higher if Management had not recouped previously reimbursed expenses. For the year ended October 31, 2007, Management rei mbursed Short Duration for losses incurred in connection with the disposition of foreign currency contracts, which had no impact on total return. For the year ended October 31, 2008, High Income recorded a capital contribution from Management in connection with a reallocation of expenses that are shared by the Fund and Management, which had a (.12)% impact on total return. |
| | |
| # | The Fund is required to calculate an expense ratio without taking into consideration any expense reductions related to expense offset arrangements. |
| | |
| ‡ | After reimbursement of expenses and/or waiver of a portion of the investment management fee by Management. Had Management not undertaken such actions, the annualized ratios of net expenses to average daily net assets would have been: |
| | | Year Ended October 31, | |
| | | 2010 | | 2009 | | 2008 | | 2007 | | 2006 | |
| Core Bond Fund Investor Class | | | 1.19 | % | | | 1.40 | % | | | 1.25 | % | | | 1.30 | % | | | 1.46 | % | |
| Core Bond Fund Institutional Class | | | .70 | % | | | .94 | % | | | .83 | % | | | .83 | % | | | .91 | % | |
| Core Bond Fund Class A | | | 1.09 | % | | | 1.36 | % | | | 2.73 | %(1) | | | — | | | | — | �� | |
| Core Bond Fund Class C | | | 1.84 | % | | | 2.68 | % | | | 3.43 | %(1) | | | — | | | | — | | |
| Floating Rate Income Fund Institutional Class | | | 1.87 | %(5) | | | — | | | | — | | | | — | | | | — | | |
| Floating Rate Income Fund Class A | | | 2.21 | %(4) | | | — | | | | — | | | | — | | | | — | | |
| Floating Rate Income Fund Class C | | | 3.39 | %(5) | | | — | | | | — | | | | — | | | | — | | |
| High Income Bond Fund Investor Class | | | — | | | | 1.04 | % | | | .92 | % | | | .92 | % | | | .90 | % | |
| High Income Bond Fund Institutional Class | | | .77 | % | | | .91 | %(3) | | | — | | | | — | | | | — | | |
| High Income Bond Fund Class A | | | .1.16 | % | | | 1.27 | %(3) | | | — | | | | — | | | | — | | |
| High Income Bond Fund Class C | | | 1.93 | % | | | 2.02 | %(3) | | | — | | | | — | | | | — | | |
| High Income Bond Fund Class R3 | | | 1.72 | % | | | 5.53 | %(3) | | | — | | | | — | | | | — | | |
| Municipal Intermediate Bond Fund Investor Class | | | 1.01 | % | | | 1.12 | % | | | 1.24 | % | | | 1.17 | % | | | 1.19 | % | |
| Municipal Intermediate Bond Fund Institutional Class | | | 26.10 | %(6) | | | — | | | | — | | | | — | | | | — | | |
| Municipal Intermediate Bond Fund Class A | | | 23.88 | %(6) | | | — | | | | — | | | | — | | | | — | | |
| Municipal Intermediate Bond Fund Class C | | | 22.28 | %(6) | | | — | | | | — | | | | — | | | | — | | |
| Short Duration Bond Fund Investor Class | | | 1.27 | % | | | 1.18 | % | | | .95 | % | | | .90 | % | | | .80 | % | |
| Short Duration Bond Fund Institutional Class | | | 33.53 | %(6) | | | — | | | | — | | | | — | | | | — | | |
| Short Duration Bond Fund Trust Class | | | 1.48 | % | | | 1.58 | % | | | 1.27 | % | | | 1.18 | % | | | 1.06 | % | |
| Short Duration Bond Fund Class A | | | 26.42 | %(6) | | | — | | | | — | | | | — | | | | — | | |
| Short Duration Bond Fund Class C | | | 34.63 | %(6) | | | — | | | | — | | | | — | | | | — | | |
| Strategic Income Fund Institutional Class | | | .96 | % | | | 2.47 | % | | | 4.03 | % | | | 2.73 | % | | | 2.29 | % | |
| Strategic Income Fund Trust Class | | | 1.36 | % | | | 3.00 | % | | | 9.14 | % | | | 4.81 | %(2) | | | — | | |
| Strategic Income Fund Class A | | | 1.37 | % | | | 1.93 | % | | | 7.52 | %(1) | | | — | | | | — | | |
| Strategic Income Fund Class C | | | 2.10 | % | | | 2.55 | % | | | 8.75 | %(1) | | | — | | | | — | | |
Notes to Financial Highlights (cont'd)
| (1) | Period from December 20, 2007 to October 31, 2008. |
| | |
| (2) | Period from April 2, 2007 to October 31, 2007. |
| | |
| (3) | Period from May 27, 2009 to October 31, 2009. |
| | |
| (4) | Period from December 29, 2009 to October 31, 2010. Organization expense, which is an extraordinary non-recurring expense, is included in ratios on a non-annualized basis. |
| | |
| (5) | Period from December 30, 2009 to October 31, 2010. Organization expense, which is an extraordinary non-recurring expense, is included in ratios on a non-annualized basis. |
| | |
| (6) | Period from June 21, 2010 to October 31, 2010. |
| | |
| § | After reimbursement of expenses previously paid by Management. Had the Fund not made such reimbursements, the annualized ratios of net expenses to average daily net assets would have been: |
| | | Year Ended October 31, 2010 | |
| High Income Bond Fund Investor Class | .93% | |
| ^ | The date investment operations commenced. |
| | |
| @ | Calculated based on the average number of shares outstanding during each fiscal period. |
| | |
| * | |
| | |
| ** | Not annualized. |
| | |
| ^^ | Portfolio turnover is calculated at the Fund level. Percentage indicated was calculated for the year ended October 31, 2007 for Strategic Income (Trust Class), for the year ended October 31, 2008 for Core Bond and Strategic Income (Class A and C), for the year ended October 31, 2009 for High Income (Institutional Class, Class A, Class C and Class R3) and for the year ended October 31, 2010 for Municipal Intermediate Bond and Short Duration (Institutional Class, Class A and Class C). |
Report of Independent Registered Public Accounting Firm
To the Board of Trustees and Shareholders of
Neuberger Berman High Income Bond Fund
Neuberger Berman Municipal Intermediate Bond Fund
Neuberger Berman Short Duration Bond Fund
Neuberger Berman Strategic Income Fund
We have audited the accompanying statements of assets and liabilities, including the schedules of investments, of Neuberger Berman High Income Bond Fund, Neuberger Berman Municipal Intermediate Bond Fund, Neuberger Berman Short Duration Bond Fund, and Neuberger Berman Strategic Income Fund, four of the series constituting the Neuberger Berman Income Funds (the "Trust") as of October 31, 2010, and the related statements of operations for the year then ended, the statements of changes in net assets for each of the two years in the period then ended, and the financial highlights for each of the periods indicated therein. These financial statements and financial highlights are the responsibility of the Trust's management. Our responsibility is to express an opinion on these financial statements and financial highlights based on our audits.
We conducted our audits in accordance with the standards of the Public Company Accounting Oversight Board (United States). Those standards require that we plan and perform the audits to obtain reasonable assurance about whether the financial statements and financial highlights are free of material misstatement. We were not engaged to perform an audit of the Trust's internal control over financial reporting. Our audits included consideration of internal control over financial reporting as a basis for designing audit procedures that are appropriate in the circumstances, but not for the purpose of expressing an opinion on the effectiveness of the Trust's internal control over financial reporting. Accordingly, we express no such opinion. An audit also includes examining, on a test basis, evidence supporting the amounts and disclosures in the financial statements and financial highlights, assessing the accounting principles used and significant estimates made by management, and evaluating the overall financial statement presentation. Our procedures included confirmation of securities owned as of October 31, 2010 by correspondence with the custodian and brokers or by other appropriate auditing procedures where replies from brokers were not received. We believe that our audits provide a reasonable basis for our opinion.
In our opinion, the financial statements and financial highlights referred to above present fairly, in all material respects, the financial position of Neuberger Berman High Income Bond Fund, Neuberger Berman Municipal Intermediate Bond Fund, Neuberger Berman Short Duration Bond Fund, and Neuberger Berman Strategic Income Fund at October 31, 2010, the results of its operations for the year then ended, the changes in its net assets for each of the two years in the period then ended, and financial highlights for each of the periods indicated therein, in conformity with U.S. generally accepted accounting principles.
Boston, Massachusetts
December 17, 2010
Report of Independent Registered Public Accounting Firm
To the Board of Trustees and Shareholders
Neuberger Berman Income Funds
We have audited the accompanying statements of assets and liabilities of the Neuberger Berman Core Bond Fund and the Neuberger Berman Floating Rate Income Fund, each a series of the Neuberger Berman Income Funds (the "Trust"), including the schedules of investments, as of October 31, 2010, and the related statements of operations for the year then ended (with respect to Neuberger Berman Floating Rate Income Fund, the period December 29, 2009 to October 31, 2010), the statements of changes in net assets for each of the two years in the period then ended (with respect to Neuberger Berman Floating Rate Income Fund, the period December 29, 2009 to October 31, 2010), and the financial highlights for each of the five years in the period then ended (with respect to Neuberger Berman Floating Rate Income Fund, the period December 29, 2009 to Octob er 31, 2010). These financial statements and financial highlights are the responsibility of the Trust's management. Our responsibility is to express an opinion on these financial statements and financial highlights based on our audits.
We conducted our audits in accordance with the standards of the Public Company Accounting Oversight Board (United States). Those standards require that we plan and perform the audit to obtain reasonable assurance about whether the financial statements and financial highlights are free of material misstatement. The Trust is not required to have, nor were we engaged to perform, an audit of its internal control over financial reporting. Our audits included consideration of internal control over financial reporting as a basis for designing audit procedures that are appropriate in the circumstances, but not for the purpose of expressing an opinion on the effectiveness of the Trust's internal control over financial reporting. Accordingly, we express no such opinion. An audit also includes examining, on a test basis, evidence supporting the amou nts and disclosures in the financial statements, assessing the accounting principles used and significant estimates made by management, as well as evaluating the overall financial statement presentation. Our procedures included confirmation of securities owned as of October 31, 2010, by correspondence with the custodian and brokers or by other appropriate auditing procedures where replies from brokers were not received. We believe that our audits provide a reasonable basis for our opinion.
In our opinion, the financial statements and financial highlights referred to above present fairly, in all material respects, the financial position of the above mentioned series of the Neuberger Berman Income Funds, as of October 31, 2010, and the results of their operations, the changes in their net assets, and the financial highlights for the periods indicated above, in conformity with accounting principles generally accepted in the United States of America.
Philadelphia, Pennsylvania
December 17, 2010
Directory
| Investment Manager, Administrator and Distributor | | For Institutional Class and Trust Class Shareholders Address correspondence to: |
| Neuberger Berman Management LLC | | Neuberger Berman Management LLC |
| 605 Third Avenue, 2nd Floor | | 605 Third Avenue, Mail Drop 2-7 |
| New York, NY 10158-0180 | | New York, NY 10158-0180 |
| 800.877.9700 or 212.476.8800 | | Attn: Intermediary Support Services 800.366.6264 |
| Intermediary Support Services 800.366.6264 | | |
| | | Legal Counsel |
| Sub-Adviser | | K&L Gates LLP |
| Neuberger Berman Fixed Income LLC | | 1601 K Street, NW |
| 200 South Wacker Drive | | Washington, DC 20006 |
| Suite 2100 | | |
| Chicago, IL 60601 | | Independent Registered Public Accounting Firms |
| | | Ernst & Young LLP |
| Custodian and Shareholder Servicing Agent | | 200 Clarendon Street |
| State Street Bank and Trust Company | | Boston, MA 02116 |
| 2 Avenue de Lafayette | | |
| Boston, MA 02111 | | Tait, Weller & Baker LLP |
| | | 1818 Market Street |
| For Investor Class Shareholders Address correspondence to: | | |
| Neuberger Berman Funds | | Philadelphia, PA 19103 |
| Boston Service Center | | |
| P.O. Box 8403 | | |
| Boston, MA 02266-8403 | | |
| 800.877.9700 or 212.476.8800 | | |
| | | |
| For Class A, Class C and Class R3 Shareholders: | | |
| Please contact your investment provider | | |
Trustee and Officer Information
The following tables set forth information concerning the trustees ("Trustees") and officers ("Officers") of the Trust. All persons named as Trustees and Officers also serve in similar capacities for other funds administered or managed by Management, NBFI and Neuberger. The Statement of Additional Information includes additional information about the Trustees and Officers and is available upon request, without charge, by calling (800) 877-9700.
Information about the Board of Trustees
Name, (Year of Birth), and Address(1) | | Position and Length of Time Served(2) | | Principal Occupation(s)(3) | | Number of Funds in Fund Complex Overseen by Fund Trustee | | Other Directorships Held Outside Fund Complex by Fund Trustee | |
| Independent Fund Trustees | |
| |
| John Cannon (1930) | | Trustee since 1994 | | Consultant; formerly, Chairman, CDC Investment Advisers (registered investment adviser), 1993 to January 1999; formerly, President and Chief Executive Officer, AMA Investment Advisors, an affiliate of the American Medical Association. | | 43 | | Formerly, Independent Trustee or Director of three series of Oppenheimer Funds: Oppenheimer Limited Term New York Municipal Fund, Rochester Fund Municipals, and Oppenheimer Convertible Securities Fund, 1992 to 2009. | |
| |
| Faith Colish (1935) | | Trustee since 2000 | | Counsel, Carter Ledyard & Milburn LLP (law firm) since October 2002; formerly, Attorney-at-Law and President, Faith Colish, A Professional Corporation, 1980 to 2002. | | 43 | | Formerly, Director, 1997 to 2003, and Advisory Director, 2003 to 2006; ABA Retirement Funds (formerly, American Bar Retirement Association) (not-for-profit membership corporation). | |
| |
Name, (Year of Birth), and Address(1) | | Position and Length of Time Served(2) | | Principal Occupation(s)(3) | | Number of Funds in Fund Complex Overseen by Fund Trustee | | Other Directorships Held Outside Fund Complex by Fund Trustee | |
| Martha C. Goss (1949) | | Trustee since 2007 | | President, Woodhill Enterprises Inc./Chase Hollow Associates LLC (personal investment vehicle), since 2006; Chief Operating and Financial Officer, Hopewell Holdings LLC/ Amwell Holdings, LLC (a holding company for a healthcare reinsurance company start-up), since 2003; formerly, Consultant, Resources Connection (temporary staffing), 2002 to 2006. | | 43 | | Director, Ocwen Financial Corporation (mortgage servicing), since 2005; Director, American Water (water utility), since 2003; Director, Channel Reinsurance (financial guaranty reinsurance), since 2006; Director, Allianz Life of New York (insurance), since 2005; Director, Financial Women's Association of New York (not-for-profit association), since 2003; Trustee Emerita, Brown University, since 1998; formerly, Advisory Board Member, Attensity (software developer), 2005 to 2007; formerly, Director, Bank Leumi (commercial bank), 2005 to 2007; formerly, Director, Claire's Stores, Inc. (retailer), 2005 to 2007. | |
| |
| C. Anne Harvey (1937) | | Trustee since 2000 | | President, C.A. Harvey Associates, since October 2001; formerly, Director, AARP, 1978 to December 2001. | | 43 | | Formerly, President, Board of Associates to The National Rehabilitation Hospital's Board of Directors, 2001 to 2002; formerly, Member, Individual Investors Advisory Committee to the New York Stock Exchange Board of Directors, 1998 to 2002. | |
| |
| Robert A. Kavesh (1927) | | Trustee since 1993 | | Retired; Marcus Nadler Professor Emeritus of Finance and Economics, New York University Stern School of Business; formerly, Executive Secretary-Treasurer, American Finance Association, 1961 to 1979. | | 43 | | Formerly, Director, The Caring Community (not-for-profit), 1997 to 2006; formerly, Director, DEL Laboratories, Inc. (cosmetics and pharmaceuticals), 1978 to 2004; formerly, Director, Apple Bank for Savings, 1979 to 1990; formerly, Director, Western Pacific Industries, Inc., (public company), 1972 to 1986. | |
| |
Name, (Year of Birth), and Address(1) | | Position and Length of Time Served(2) | | Principal Occupation(s)(3) | | Number of Funds in Fund Complex Overseen by Fund Trustee | | Other Directorships Held Outside Fund Complex by Fund Trustee | |
| Michael M. Knetter (1960) | | Trustee since 2007 | | President and Chief Executive Officer, University of Wisconsin Foundation, October 2010 to Present; formerly, Dean, School of Business, University of Wisconsin—Madison; formerly, Professor of International Economics and Associate Dean, Amos Tuck School of Business—Dartmouth College, 1998 to 2002. | | 43 | | Director, American Family Insurance (a mutual company, not publicly traded), since March 2009; Trustee, Northwestern Mutual Series Fund, Inc., since February 2007; Director, Wausau Paper, since 2005; formerly, Director, Great Wolf Resorts, 2004 to 2009. | |
| |
| Howard A. Mileaf (1937) | | Trustee since 2000 | | Retired; formerly, Vice President and General Counsel, WHX Corporation (holding company), 1993 to 2001. | | 43 | | Formerly, Director, Webfinancial Corporation (holding company), 2002 to 2008; formerly, Director, WHX Corporation (holding company), 2002 to 2005; formerly, Director, State Theatre of New Jersey (not-for-profit theatre), 2000 to 2005. | |
| |
| George W. Morriss (1947) | | Trustee since 2007 | | Retired; formerly, Executive Vice President and Chief Financial Officer, People's Bank, Connecticut (a financial services company), 1991 to 2001. | | 43 | | Manager, Old Mutual Funds of Hedge Funds fund complex (consisting of six funds), since 2006 for four funds and since 2007 for two funds; formerly, Member NASDAQ Issuers' Affairs Committee, 1995 to 2003. | |
| |
| Edward I. O'Brien (1928) | | Trustee since 2000 | | Retired; formerly, Member, Investment Policy Committee, Edward Jones, 1993 to 2001; President, Securities Industry Association ("SIA") (securities industry's representative in government relations and regulatory matters at the federal and state levels), 1974 to 1992; Adviser to SIA, November 1992 to November 1993. | | 43 | | Formerly, Director, Legg Mason, Inc. (financial services holding company), 1993 to July 2008; formerly, Director, Boston Financial Group (real estate and tax shelters), 1993 to 1999. | |
| |
Name, (Year of Birth), and Address(1) | | Position and Length of Time Served(2) | | Principal Occupation(s)(3) | | Number of Funds in Fund Complex Overseen by Fund Trustee | | Other Directorships Held Outside Fund Complex by Fund Trustee | |
| Cornelius T. Ryan (1931) | | Trustee since 2000 | | General Partner and Adviser, TD2, TD3, and TOF1 Healthcare Venture Capital Partnerships; Founding General Partner, Oxford Partners and Oxford Bioscience Partners (venture capital investing) and President, Oxford Venture Corporation, since 1981. | | 43 | | Trustee, Norwalk Hospital Foundation, since 2000; Director, Supply Pro (privately held company), since 2008; formerly, Trustee, Norwalk Hospital, 1995 to 2004; formerly, President and Director, Randolph Computer Corp., 1966 to 1984; formerly, Director of numerous privately held portfolio companies of Oxford Partners and Oxford Bio Science Partners, 1981 to 2005. | |
| |
| Tom D. Seip (1950) | | Trustee since 2000; Chairman of the Board since 2008; Lead Independent Trustee from 2006 to 2008 | | General Partner, Seip Investments LP (a private investment partnership); formerly, President and CEO, Westaff, Inc. (temporary staffing), May 2001 to January 2002; formerly, Senior Executive, The Charles Schwab Corporation, 1983 to 1998, including Chief Executive Officer, Charles Schwab Investment Management, Inc.; Trustee, Schwab Family of Funds and Schwab Investments, 1997 to 1998; and Executive Vice President-Retail Brokerage, Charles Schwab & Co., Inc., 1994 to 1997. | | 43 | | Director, H&R Block, Inc. (financial services company), since May 2001; Chairman, Compensation Committee, H&R Block, Inc., since 2006; formerly, Director, Forward Management, Inc. (asset management company), 1999 to 2006. | |
| |
Name, (Year of Birth), and Address(1) | | Position and Length of Time Served(2) | | Principal Occupation(s)(3) | | Number of Funds in Fund Complex Overseen by Fund Trustee | | Other Directorships Held Outside Fund Complex by Fund Trustee | |
| Candace L. Straight (1947) | | Trustee since 1993 | | Private investor and consultant specializing in the insurance industry; formerly, Advisory Director, Securitas Capital LLC (a global private equity investment firm dedicated to making investments in the insurance sector), 1998 to December 2003. | | 43 | | Director, Montpelier Re Holdings Ltd. (reinsurance company), since 2006; formerly, Director, National Atlantic Holdings Corporation (property and casualty insurance company), 2004 to 2008; formerly, Director, The Proformance Insurance Company (property and casualty insurance company), 2004 to 2008; formerly, Director, Providence Washington Insurance Company (property and casualty insurance company), 1998 to 2006; formerly, Director, Summit Global Partners (insurance brokerage firm), 2000 to 2005. | |
| |
| Peter P. Trapp (1944) | | Trustee since 2000 | | Retired; formerly, Regional Manager for Mid-Southern Region, Ford Motor Credit Company, September 1997 to 2007; formerly, President, Ford Life Insurance Company, April 1995 to August 1997. | | 43 | | None. | |
| |
Name, (Year of Birth), and Address(1) | | Position and Length of Time Served(2) | | Principal Occupation(s)(3) | | Number of Funds in Fund Complex Overseen by Fund Trustee | | Other Directorships Held Outside Fund Complex by Fund Trustee | |
Fund Trustees who are "Interested Persons" | |
| |
| Joseph V. Amato* (1962) | | Trustee since 2009 | | President and Director, Neuberger Berman Group LLC, since 2009; President and Chief Executive Officer, Neuberger and Neuberger Berman Holdings LLC (including its predecessor, Neuberger Berman Inc.), since 2007; Chief Investment Officer, Neuberger, since 2009; Chief Investment Officer (Equities) and Managing Director, Management, since 2009; Managing Director, NBFI since 2007; Board member of NBFI since 2006; formerly, Global Head of Asset Management of LBHI Investment Management Division, 2006 to 2009; formerly, member of LBHI's Investment Management Division's Executive Management Committee, 2006 to 2009; formerly, Managing Director, Lehman Brothers Inc. ("LBI"), 2006 to 2008; formerly, Chief Recruiting and Development Officer, LBI, 2005 to 2006; formerly, Global Head of LBI's Equity Sales and a Member of its Equities Division Executive Committee, 2003 to 2005. | | 43 | | Member of Board of Advisors, McDonough School of Business, Georgetown University, since 2001; Member of New York City Board of Advisors, Teach for America, since 2005; Trustee, Montclair Kimberley Academy (private school), since 2007. | |
| |
| Robert Conti* (1956) | | Chief Executive Officer, President and Trustee since 2008; prior thereto, Executive Vice President in 2008 and Vice President 2000 to 2008 | | Managing Director, Neuberger, since 2007; formerly, Senior Vice President, Neuberger, 2003 to 2006; formerly, Vice President, Neuberger, 1999 to 2003; President and Chief Executive Officer, Management, since 2008; formerly, Senior Vice President, Management, 2000 to 2008. | | 43 | | Chairman of the Board, Staten Island Mental Health Society since 2008. | |
| |
Name, (Year of Birth), and Address(1) | | Position and Length of Time Served(2) | | Principal Occupation(s)(3) | | Number of Funds in Fund Complex Overseen by Fund Trustee | | Other Directorships Held Outside Fund Complex by Fund Trustee | |
| Jack L. Rivkin* (1940) | | Trustee since 2002; President from 2002 to 2008 | | Formerly, Executive Vice President and Chief Investment Officer, Neuberger Berman Holdings LLC (holding company), 2002 to August 2008 and 2003 to August 2008, respectively; formerly, Managing Director and Chief Investment Officer, Neuberger, December 2005 to August 2008 and 2003 to August 2008, respectively; formerly, Executive Vice President, Neuberger, December 2002 to 2005; formerly, Director and Chairman, Management, December 2002 to August 2008; formerly, Executive Vice President, Citigroup Investments, Inc., September 1995 to February 2002; formerly, Executive Vice President, Citigroup Inc., September 1995 to February 2002. | | 43 | | Director, Idealab (private company), since 2009; Director, Distributed World Power (private company), since 2009; Director, Dale Carnegie and Associates, Inc. (private company), since 1999; Director, Solbright, Inc. (private company), since 1998; Director, SA Agricultural Fund, since 2009; Chairman and Director, Essential Brands (consumer products) since 2008; formerly, Director, New York Society of Security Analysts, 2006 to 2008. | |
| |
| (1) | The business address of each listed person is 605 Third Avenue, New York, New York 10158. |
| | |
| (2) | Pursuant to the Trust's Trust Instrument, each of these Fund Trustees shall hold office for life or until his or her successor is elected or the Trust terminates; except that (a) any Fund Trustee may resign by delivering a written resignation; (b) any Fund Trustee may be removed with or without cause at any time by a written instrument signed by at least two-thirds of the other Fund Trustees; (c) any Fund Trustee who requests to be retired, or who has become unable to serve, may be retired by a written instrument signed by a majority of the other Fund Trustees; and (d) any Fund Trustee may be removed at any shareholder meeting by a vote of at least two-thirds of the outstanding shares. |
| | |
| (3) | Except as otherwise indicated, each individual has held the positions shown for at least the last five years. |
| | |
| * | Indicates a Fund Trustee who is an "interested person" within the meaning of the 1940 Act. Mr. Amato and Mr. Conti are interested persons of the Trust by virtue of the fact that each is an officer of Management, Neuberger and/or their affiliates. Mr. Rivkin may be deemed an interested person of the Trust by virtue of the fact that, until August 2008, he was a director of Management and an officer of Neuberger. |
Information about the Officers of the Trust
Name, (Year of Birth), and Address(1) | | Position and Length of Time Served(2) | | Principal Occupation(s)(3) | |
| Andrew B. Allard (1961) | | Anti-Money Laundering Compliance Officer since 2002 | | Senior Vice President, Neuberger, since 2006; Deputy General Counsel, Neuberger, since 2004; formerly, Vice President, Neuberger, 2000 to 2005; Anti-Money Laundering Compliance Officer, nine registered investment companies for which Management acts as investment manager and administrator (six since 2002, one since 2003, one since 2005 and one since 2006). | |
| |
| Claudia A. Brandon (1956) | | Executive Vice President since 2008 and Secretary since 1985 | | Senior Vice President, Neuberger, since 2007 and Employee since 1999; Senior Vice President, Management, since 2008 and Assistant Secretary since 2004; formerly, Vice President, Neuberger, 2002 to 2006; formerly, Vice President-Mutual Fund Board Relations, Management, 2000 to 2008; Executive Vice President, nine registered investment companies for which Management acts as investment manager and administrator (nine since 2008); Secretary, nine registered investment companies for which Management acts as investment manager and administrator (three since 1985, three since 2002, one since 2003, one since 2005 and one since 2006). | |
| |
| Maxine L. Gerson (1950) | | Executive Vice President since 2008 and Chief Legal Officer since 2005 (only for purposes of sections 307 and 406 of the Sarbanes-Oxley Act of 2002) | | Managing Director, Neuberger, since 2009, and Deputy General Counsel and Assistant Secretary Neuberger since 2001; Managing Director, Management, since 2009, and Secretary and General Counsel, Management, since 2004; formerly, Senior Vice President, Neuberger, 2002 to 2009; formerly, Senior Vice President, Management, 2006 to 2009; Executive Vice President, nine registered investment companies for which Management acts as investment manager and administrator (nine since 2008); Chief Legal Officer (only for purposes of sections 307 and 406 of the Sarbanes-Oxley Act of 2002), nine registered investment companies for which Management acts as investment manager and administrator (eight since 2005 and one since 2006). | |
| |
| Sheila R. James (1965) | | Assistant Secretary since 2002 | | Vice President, Neuberger, since 2008 and Employee since 1999; formerly, Assistant Vice President, Neuberger, 2007; Assistant Secretary, nine registered investment companies for which Management acts as investment manager and administrator (six since 2002, one since 2003, one since 2005 and one since 2006). | |
| |
| Brian Kerrane (1969) | | Vice President since 2008 | | Senior Vice President, Neuberger, since 2006; formerly, Vice President, Neuberger, 2002 to 2006; Vice President, Management, since 2008 and Employee since 1991; Vice President, nine registered investment companies for which Management acts as investment manager and administrator (nine since 2008). | |
| |
| Kevin Lyons (1955) | | Assistant Secretary since 2003 | | Assistant Vice President, Neuberger, since 2008 and Employee since 1999; Assistant Secretary, nine registered investment companies for which Management acts as investment manager and administrator (seven since 2003, one since 2005 and one since 2006). | |
| |
| Owen F. McEntee, Jr. (1961) | | Vice President since 2008 | | Vice President, Neuberger, since 2006; Employee, Management, since 1992; Vice President, nine registered investment companies for which Management acts as investment manager and administrator (nine since 2008). | |
| |
Name, (Year of Birth), and Address(1) | | Position and Length of Time Served(2) | | Principal Occupation(s)(3) | |
| John M. McGovern (1970) | | Treasurer and Principal Financial and Accounting Officer since 2005 | | Senior Vice President, Neuberger, since 2007; formerly, Vice President, Neuberger, 2004 to 2006; Employee, Management, since 1993; Treasurer and Principal Financial and Accounting Officer, nine registered investment companies for which Management acts as investment manager and administrator (eight since 2005 and one since 2006); formerly, Assistant Treasurer, eight registered investment companies for which Management acts as investment manager and administrator, 2002 to 2005. | |
| |
| Andrew Provencher (1965) | | Vice President since 2008 | | Managing Director, Management, since 2008; Managing Director, Neuberger, since 2005; formerly, Senior Vice President, Neuberger, 2003 to 2005; Vice President, nine registered investment companies for which Management acts as investment manager and administrator (nine since 2008). | |
| |
| Frank Rosato (1971) | | Assistant Treasurer since 2005 | | Vice President, Neuberger, since 2006; Employee, Management, since 1995; Assistant Treasurer, nine registered investment companies for which Management acts as investment manager and administrator (eight since 2005 and one since 2006). | |
| |
| Neil S. Siegel (1967) | | Vice President since 2008 | | Managing Director, Management, since 2008; Managing Director, Neuberger, since 2006; formerly, Senior Vice President, Neuberger, 2004 to 2006; Vice President, nine registered investment companies for which Management acts as investment manager and administrator (nine since 2008). | |
| |
| Chamaine Williams (1971) | | Chief Compliance Officer since 2005 | | Senior Vice President, Neuberger, since 2007; Chief Compliance Officer, Management, since 2006; Chief Compliance Officer, nine registered investment companies for which Management acts as investment manager and administrator (eight since 2005 and one since 2006); formerly, Senior Vice President, LBI, 2007 to 2008; formerly, Vice President, LBI, 2003 to 2006; formerly, Chief Compliance Officer, Lehman Brothers Asset Management Inc., 2003 to 2007; formerly, Chief Compliance Officer, Lehman Brothers Alternative Investment Management LLC, 2003 to 2007. | |
| |
| (1) | The business address of each listed person is 605 Third Avenue, New York, New York 10158. |
| | |
| (2) | Pursuant to the By-Laws of the Trust, each officer elected by the Fund Trustees shall hold office until his or her successor shall have been elected and qualified or until his or her earlier death, inability to serve, or resignation. Officers serve at the pleasure of the Fund Trustees and may be removed at any time with or without cause. |
| | |
| (3) | Except as otherwise indicated, each individual has held the positions shown for at least the last five years. |
| | |
| | |
Proxy Voting Policies and Procedures
A description of the policies and procedures that the Trust uses to determine how to vote proxies relating to portfolio securities is available, without charge, by calling 1-800-877-9700 (toll-free) and on the website of the Securities and Exchange Commission, at www.sec.gov. Information regarding how the Trust voted proxies relating to portfolio securities during the most recent 12-month period ended June 30 is also available, without charge, by calling 1-800-877-9700 (toll-free), on the website of the Securities and Exchange Commission at www.sec.gov, and on Management's website at www.nb.com.
Quarterly Portfolio Schedule
The Trust files a complete schedule of portfolio holdings for each Fund with the Securities and Exchange Commission for the first and third quarters of each fiscal year on Form N-Q. The Trust's Forms N-Q are available on the Securities and Exchange Commission's website at www.sec.gov and may be reviewed and copied at the Securities and Exchange Commission's Public Reference Room in Washington, DC. Information on the operation of the Public Reference Room may be obtained by calling 1-800-SEC-0330. The information on Form N-Q is available upon request, without charge, by calling 1-800-877-9700 (toll-free).
Notice to Shareholders (Unaudited)
Under most state tax laws, mutual fund dividends which are derived from direct investments in U.S. Government obligations are not taxable, as long as a Fund meets certain requirements. Some states require that a Fund must provide shareholders with a written notice, within 60 days of the close of a Fund's taxable year, designating the portion of the dividends which represents interest which those states consider to have been earned on U.S. Government obligations. The chart below shows the percentage of income derived from such investments for the twelve months ended October 31, 2010. This information should not be used to complete your tax returns.
| | | U.S. Treasury Obligations | | Other Direct U.S. Government Obligations | | Other Indirect U.S. Government Obligations | | Repurchase Agreements | |
| Core Bond | | | 10.8 | % | | | 0.0 | % | | | 17.1 | % | | | 0.0 | % | |
| Floating Rate Income | | | 0.0 | | | | 0.0 | | | | 0.0 | | | | 0.0 | | |
| High Income | | | 0.0 | | | | 0.0 | | | | 0.0 | | | | 0.0 | | |
| Short Duration | | | 24.2 | | | | 0.0 | | | | 9.4 | | | | 0.0 | | |
| Strategic Income | | | 3.7 | | | | 0.0 | | | | 4.8 | | | | 0.0 | | |
In January 2011, you will receive information to be used in filing your 2010 tax returns, which will include a notice of the exact tax status of all dividends paid to you by each Fund during calendar year 2010. Please consult your own tax advisor for details as to how this information should be reflected on your tax returns.
For the fiscal period ended October 31, 2010 the percentages representing the portion of distributions from net investment income, which are exempt from federal tax, other than alternative minimum tax are as follows:
| Municipal Intermediate Bond | | | 99.98 | % | |
Board Consideration of the Management and Sub-Advisory Agreements
At a meeting held on October 14, 2010, the Board of Trustees of Neuberger Berman Income Funds ("Board"), including the Trustees who are not "interested persons" of Neuberger Berman Management LLC ("Management") (including its affiliates) or Neuberger Berman Income Funds ("Independent Fund Trustees"), approved the continuance of the Management and Sub-Advisory Agreements ("Agreements") for each of Neuberger Berman Core Bond Fund, Neuberger
Berman High Income Bond Fund, Neuberger Berman Municipal Intermediate Bond Fund, Neuberger Berman Short Duration Bond Fund and Neuberger Berman Strategic Income Fund (each a "Fund").
In evaluating the Agreements, the Board, including the Independent Fund Trustees, reviewed materials furnished by Management and Neuberger Berman Fixed Income LLC ("NBFI") in response to questions submitted by counsel for the Independent Fund Trustees, and met with senior representatives of Management and NBFI regarding their personnel and operations. The Independent Fund Trustees were advised by counsel that is experienced in Investment Company Act of 1940 matters and that is independent of Management and NBFI. The Independent Fund Trustees received a memorandum from their independent counsel discussing the legal standards for their consideration of the proposed continuance of the Agreements. They met with such counsel separately from representatives of Management to discuss the annual contract review. The annual contract review extends over two regular meetings of the Board to ensure that Management and NBFI have time to respond to any questions the Independent Fund Trustees may have on their initial review of the report and that the Independent Fund Trustees have time to consider those responses. In addition, during this process, the Board held a separate meeting devoted primarily to reviewing and discussing Fund performance.
The Board considered the following factors, among others, in connection with its approval of the continuance of the Agreements: (1) the nature, extent, and quality of the services provided by Management and NBFI; (2) the performance of each Fund compared to a relevant market index and a peer group of investment companies; (3) the costs of the services provided and profits or losses realized by Management and its affiliates from their relationship with the Funds; (4) the extent to which economies of scale might be realized as each Fund grows; and (5) whether fee levels reflect any such potential economies of scale for the benefit of investors in each Fund. In their deliberations, the Board members did not identify any particular information that was all-important or controlling, and each Trustee may have attributed different weights to the various factors.
The Board evaluated the terms of the Agreements, the overall fairness of the Agreements to each Fund and whether the Agreements were in the best interests of each Fund and its shareholders.
With respect to the nature, extent and quality of the services provided, the Board considered the performance of each Fund and the experience and staffing of the portfolio management and investment research personnel of Management and NBFI who perform services for the Funds. The Board noted that Management also provides certain administrative services, including fund accounting and compliance oversight. The Board also considered Management's and NBFI's policies and practices regarding brokerage and the quality of brokerage execution obtained by Management. The Board's Portfolio Transactions and Pricing Committee from time to time reviewed the quality of the execution services that Management had provided. In addition, the Board noted the positive compliance history of Management and NBFI, as each firm has been free of significant reported compliance problems.
The Board considered the performance of each Fund relative to its benchmark and a peer group of investment companies pursuing broadly similar strategies. The Board also considered performance in relation to certain measures of the degree of investment risk undertaken by the portfolio manager(s). In the case of those Funds that had underperformed their peer groups and/or relevant market indices, the Board discussed with Management each Fund's performance and steps that Management had taken, or intended to take, to improve each Fund's performance. The Board also considered Management's resources and responsiveness with respect to the Funds that experienced lagging performance.
With respect to the overall fairness of the Agreements, the Board considered the fee structure for each Fund under the Agreements as compared to a peer group of comparable funds and any fall-out benefits likely to accrue to Management or NBFI or their affiliates from their relationship with each Fund. The Board also considered the profitability of Management and its affiliates from their association with the Funds.
The Board reviewed a comparison of each Fund's management fee and overall expense ratio to a peer group of broadly comparable funds. The Board considered the mean and median of the management fees and expense ratios of each peer group. Where a Fund's management fee was higher than the peer group mean and/or median, the Board considered whether specific portfolio management or administration needs contributed to the management fee. In addition, the Board considered the contractual limits on Fund expenses undertaken by Management for certain classes of each Fund. The
Board noted that Management incurred a loss on Neuberger Berman Core Bond Fund, Neuberger Berman High Income Bond Fund, Neuberger Berman Municipal Intermediate Bond Fund and Neuberger Berman Strategic Income Fund.
The Board considered whether there were other funds that were advised or sub-advised by Management or its affiliates or separate accounts managed by Management or its affiliates with similar investment objectives, policies and strategies as to certain of the Funds. The Board compared the fees charged to each Fund to the fees charged to any such funds and/or separate accounts. The Board considered the appropriateness and reasonableness of any differences between the fees charged to each Fund and any such funds and/or separate accounts and determined that the differences in fees were consistent with the management and other services provided.
The Board also evaluated any apparent or anticipated economies of scale in relation to the services Management provides to each Fund. The Board considered whether each Fund's fee structure provides for a reduction of payments resulting from the use of breakpoints and whether any such breakpoints are set at appropriate asset levels.
The Board also considered changes in management, staffing, resources and operations accompanying the separation of the Neuberger Berman entities from the Lehman Brothers Holdings Inc. bankruptcy estate.
In concluding that the benefits accruing to Management and its affiliates by virtue of their relationship to each Fund were reasonable in comparison with the costs of providing the investment advisory services and the benefits accruing to each Fund, the Board reviewed specific data as to Management's profit or loss on each Fund for a recent period and the trend in profit or loss over recent years. The Board also carefully examined Management's cost allocation methodology. The Board recognized that Management should be entitled to earn a reasonable level of profits for services it provides to the Funds and, based on its review, concluded that Management's level of profitability was not excessive.
Conclusions
In approving the Agreements, the Board concluded that the terms of each Agreement are fair and reasonable and that approval of the Agreements is in the best interests of each Fund and its shareholders. In reaching this determination, the Board considered that Management and NBFI could be expected to provide a high level of service to each Fund; that the performance of each Fund was satisfactory over time, or, in the case of underperforming Funds, that it retained confidence in Management's and NBFI's capabilities to manage the Funds; that each Fund's fee structure appeared to the Board to be reasonable given the nature and quality of services provided; and that the benefits accruing to Management and its affiliates by virtue of their relationship to the Funds were reasonable in comparison with the benefits accruing to each Fund.
Board Consideration of the Management and Sub-Advisory Agreements
At a meeting held on October 7, 2009, the Board of Trustees of Neuberger Berman Income Funds ("Board"), including the Trustees who are not "interested persons" of Neuberger Berman Management LLC ("Management") or Neuberger Berman Income Funds ("Independent Fund Trustees"), approved the Management and Sub-Advisory Agreements ("Agreements") for Neuberger Berman Floating Rate Income Fund (the "Fund").
In evaluating the Agreements, the Board, including the Independent Fund Trustees, reviewed materials furnished by Management and Neuberger Berman Fixed Income LLC ("NBFI") and met with senior representatives of Management and NBFI regarding their personnel and operations. The Independent Fund Trustees were advised by counsel that is experienced in Investment Company Act of 1940 matters and that is independent of Management and NBFI.
The Board considered the following factors, among others, in connection with its approval of the Agreements: (1) the nature, extent, and quality of the services to be provided by Management and NBFI; (2) the costs of the services to be provided; (3) the extent to which economies of scale might be realized as the Fund grows; and (4) whether fee levels reflect any such potential economies of scale for the benefit of investors in the Fund. In their deliberations, the Board members did not identify any particular information that was all-important or controlling, and each Trustee may have attributed different weights to the various factors.
The Board evaluated the terms of the Agreements, the overall fairness of the Agreements to the Fund and whether the Agreements were in the best interests of the Fund and its shareholders.
With respect to the nature, extent and quality of the services to be provided, the Board considered the experience and staffing of the portfolio management and investment research personnel who would perform services for the Fund. The Board noted that Management would also provide certain administrative services, including fund accounting and compliance oversight. The Board also considered Management's and NBFI's policies and practices regarding brokerage. In addition, the Board noted the positive compliance history of Management and NBFI, as each firm has been free of significant reported compliance problems.
With respect to the overall fairness of the Agreements, the Board considered the Fund's fee structure under the Agreements as compared to a peer group of comparable funds and any fall-out benefits likely to accrue to Management or NBFI or their affiliates from their relationship with the Fund. The Board reviewed a comparison of the Fund's management fee and overall expense ratio to a peer group of broadly comparable funds. In addition, the Board considered the contractual limit on Fund expenses undertaken by Management with regard to the Fund.
The Board also evaluated any anticipated economies of scale in relation to the services Management provides to the Fund. The Board considered whether the Fund's fee structure provides for a reduction of payments resulting from the use of breakpoints and whether those breakpoints are set at appropriate asset levels.
The Board also considered changes in management, staffing, resources and operations accompanying the separation of the Neuberger Berman entities from the Lehman Brothers Holdings Inc. bankruptcy estate.
Conclusions
In approving the Agreements, the Board concluded that the terms of each Agreement are fair and reasonable and that approval of the Agreements is in the best interests of the Fund and its shareholders. In reaching this determination, the Board considered that Management and NBFI could be expected to provide a high level of service to the Fund; that the Fund's fee structure appeared to the Board to be reasonable given the nature and quality of services expected to be provided; and that the expected benefits accruing to Management and its affiliates by virtue of their relationship to the Fund were reasonable in comparison with the expected costs of providing the investment advisory services and the expected benefits accruing to the Fund.
| | Investment manager: Neuberger Berman Management LLC Sub-adviser: Neuberger Berman Fixed Income LLC Neuberger Berman Management LLC 605 Third Avenue 2nd Floor New York, NY 10158-0180 Retail Services: 800.877.9700 Broker-Dealer and Institutional Services: 800.366.6264/888.556.9030 Web site: www.nb.com Statistics and projections in this report are derived from sources deemed to be reliable but cannot be regarded as a representation of future results of the Funds. This report is prepared for the general information of shareholders and is not an offer of shares of the Funds. Shares are sold only through the currently effective prospectus, which must precede or accompany this report. H0648 12/10 |
Item 2. Code of Ethics
The Board of Trustees (“Board”) of Neuberger Berman Income Funds (“Registrant”) adopted a code of ethics that applies to the Registrant’s principal executive officer, principal financial officer, principal accounting officer or controller, or persons performing similar functions (“Code of Ethics”). For the period covered by this Form N-CSR, there were no amendments to the Code of Ethics and there were no waivers from the Code of Ethics granted to the Registrant’s principal executive officer, principal financial officer, principal accounting officer or controller, or persons performing similar functions.
A copy of the Code of Ethics is incorporated by reference to the Registrant’s Form N-CSR, Investment Company Act file number 811-03802 (filed on July 10, 2006). The Code of Ethics is also available, without charge, by calling 1-800-877-9700 (toll-free).
Item 3. Audit Committee Financial Expert
The Board has determined that the Registrant has three audit committee financial experts serving on its audit committee. The Registrant’s audit committee financial experts are Martha Goss, George Morriss and Candace L. Straight. Ms. Goss, Mr. Morriss and Ms. Straight are independent trustees as defined by Form N-CSR.
Item 4. Principal Accountant Fees and Services
The financial information provided below is that of the Registrant, Neuberger Berman Income Funds. This N-CSR relates only to Neuberger Berman Core Bond Fund, Neuberger Berman Floating Rate Income Fund, Neuberger Berman High Income Bond Fund, Neuberger Berman Municipal Intermediate Bond Fund, Neuberger Berman Short Duration Bond Fund and Neuberger Berman Strategic Income Fund (collectively, the “Funds”). Tait, Weller & Baker LLP (“Tait Weller”) serves as independent registered public accounting firm to Neuberger Berman Core Bond Fund and Neuberger Berman Floating Rate Income Fund. Ernst & Young LLP (“E&Y”) serves as independent registered public accounting firm to all other series of the Registrant.
(a) Audit Fees
The aggregate fees billed for professional services rendered by E&Y for the audit of the annual financial statements or services that are normally provided by E&Y in connection with statutory and regulatory filings or engagements were $187,000 and $165,000 for the fiscal years ended 2009 and 2010, respectively.
The aggregate fees billed for professional services rendered by Tait Weller for the audit of the annual financial statements or services that are normally provided by Tait Weller in connection with statutory and regulatory filings or engagements were $37,500 and $46,900 for the fiscal years ended 2009 and 2010, respectively.
(b) Audit-Related Fees
The aggregate fees billed to the Registrant for assurance and related services by E&Y that are reasonably related to the performance of the audit of the Registrant’s financial statements and are not reported above in Audit Fees were $0 and $0 for the fiscal years ended 2009 and 2010, respectively.
The fees billed to other entities in the investment company complex for assurance and related services by E&Y that are reasonably related to the performance of the audit that the Audit Committee was
required to approve because the engagement related directly to the operations and financial reporting of the Registrant were $0 and $0 for the fiscal years ended 2009 and 2010, respectively.
The aggregate fees billed to the Registrant for assurance and related services by Tait Weller that are reasonably related to the performance of the audit of the Registrant’s financial statements and are not reported above in Audit Fees were $0 and $0 for the fiscal years ended 2009 and 2010, respectively.
The fees billed to other entities in the investment company complex for assurance and related services by Tait Weller that are reasonably related to the performance of the audit that the Audit Committee was required to approve because the engagement related directly to the operations and financial reporting of the Registrant were $0 and $0 for the fiscal years ended 2009 and 2010, respectively.
(c) Tax Fees
The aggregate fees billed to the Registrant for professional services rendered by E&Y for tax compliance, tax advice, and tax planning were $57,000 and $47,600 for the fiscal years ended 2009 and 2010, respectively. The nature of the services provided were tax compliance, tax advice and tax planning. The Audit Committee approved 0% and 0% of these services provided by E&Y for the fiscal years ended 2009 and 2010, respectively, pursuant to the waiver provisions of Rule 2-01(c)(7)(i)(C) of Regulation S-X.
The fees billed to other entities in the investment company complex for professional services rendered by E&Y for tax compliance, tax advice, and tax planning that the Audit Committee was required to approve because the engagement related directly to the operations and financial reporting of the Registrant were $0 and $0 for the fiscal years ended 2009 and 2010, respectively.
The aggregate fees billed to the Registrant for professional services rendered by Tait Weller for tax compliance, tax advice, and tax planning were $5,200 and $6,650 for the fiscal years ended 2009 and 2010, respectively. The nature of the services provided comprised tax compliance, tax advice and tax planning. The Audit Committee approved 0% and 0% of these services provided by Tait Weller for the fiscal years ended 2009 and 2010, respectively, pursuant to the waiver provisions of Rule 2-01(c)(7)(i)(C) of Regulation S-X.
The fees billed to other entities in the investment company complex for professional services rendered by Tait Weller for tax compliance, tax advice, and tax planning that the Audit Committee was required to approve because the engagement related directly to the operations and financial reporting of the Registrant were $0 and $0 for the fiscal years ended 2009 and 2010, respectively.
(d) All Other Fees
The aggregate fees billed to the Registrant for products and services provided by E&Y, other than services reported in Audit Fees, Audit-Related Fees, and Tax Fees were $0 and $0 for the fiscal years ended 2009 and 2010, respectively.
The fees billed to other entities in the investment company complex for products and services provided by E&Y, other than services reported in Audit Fees, Audit-Related Fees, and Tax Fees, that the Audit Committee was required to approve because the engagement related directly to the operations and financial reporting of the Registrant were $0 and $0 for the fiscal years ended 2009 and 2010, respectively.
The aggregate fees billed to the Registrant for products and services provided by Tait Weller, other than services reported in Audit Fees, Audit-Related Fees, and Tax Fees were $0 and $0 for the fiscal years ended 2009 and 2010, respectively.
The fees billed to other entities in the investment company complex for products and services provided by Tait Weller, other than services reported in Audit Fees, Audit-Related Fees, and Tax Fees, that the Audit Committee was required to approve because the engagement related directly to the operations and financial reporting of the Registrant were $0 and $0 for the fiscal years ended 2009 and 2010, respectively.
(e) Audit Committee’s Pre-Approval Policies and Procedures
(1) The Audit Committee’s pre-approval policies and procedures for the Registrant to engage an accountant to render audit and non-audit services delegate to each member of the Committee the power to pre-approve services between meetings of the Committee.
(2) None of the services described in paragraphs (b) through (d) above were approved by the Audit Committee pursuant to paragraph (c)(7)(i)(C) of Rule 2-01 of Regulation S-X.
(f) Hours Attributed to Other Persons
Not applicable.
(g) Non-Audit Fees
Non-audit fees billed by E&Y for services rendered to the Registrant were $57,000 and $47,600 for the fiscal years ended 2009 and 2010, respectively.
Non-audit fees billed by E&Y for services rendered to the Registrant’s investment adviser and any entity controlling, controlled by, or under common control with the adviser that provides ongoing services to the Registrant were $100,000 and $0 for the fiscal years ended 2009 and 2010, respectively.
Non-audit fees billed by Tait Weller for services rendered to the Registrant were $5,200 and $6,650 for the fiscal years ended 2009 and 2010, respectively.
Non-audit fees billed by Tait Weller for services rendered to the Registrant’s investment adviser and any entity controlling, controlled by, or under common control with the adviser that provides ongoing services to the Registrant were $0 and $0 for the fiscal years ended 2009 and 2010, respectively.
(h) The Audit Committee of the Board considered whether the provision of non-audit services rendered to the Registrant’s investment adviser and any entity controlling, controlled by, or under common control with the adviser that provides ongoing services to the Registrant that were not pre-approved by the Audit Committee because the engagement did not relate directly to the operations and financial reporting of the Registrant is compatible with maintaining E&Y’s and Tait Weller’s independence.
Item 5. Audit Committee of Listed Registrants
Not applicable to the Registrant.
Item 6. Schedule of Investments
The complete schedule of investments for each series is disclosed in the Registrant’s Annual Report, which is included as Item 1 of this Form N-CSR.
Item 7. Disclosure of Proxy Voting Policies and Procedures for Closed-End Management Investment Companies
Not applicable to the Registrant.
Item 8. Portfolio Managers of Closed-End Management Investment Companies.
Not applicable to the Registrant.
Item 9. Purchases of Equity Securities by Closed-End Management Investment Company and Affiliated Purchasers
Not applicable to the Registrant.
Item 10. Submission of Matters to a Vote of Security Holders
There were no changes to the procedures by which shareholders may recommend nominees to the Board.
Item 11. Controls and Procedures
| (a) | Based on an evaluation of the disclosure controls and procedures (as defined in Rule 30a-3(c) under the Investment Company Act of 1940, as amended (the “Act”)) as of a date within 90 days of the filing date of this document, the Chief Executive Officer and Treasurer and Principal Financial and Accounting Officer of the Registrant have concluded that such disclosure controls and procedures are effectively designed to ensure that information required to be disclosed by the Registrant on Form N-CSR and Form N-Q is accumulated and communicated to the Registrant’s management to allow timely decisions regarding required disclosure. |
| (b) | There were no significant changes in the Registrant’s internal controls over financial reporting (as defined in Rule 30a-3(d) under the Act) that occurred during the Registrant’s second fiscal quarter of the period covered by this report that have materially affected, or are reasonably likely to materially affect, the Registrant’s internal control over financial reporting. |
Item 12. Exhibits
| (a)(1) | A copy of the Code of Ethics is incorporated by reference to the Registrant’s Form N-CSR, Investment Company Act file number 811-3802 (filed July 10, 2006). |
| (a)(2) | The certifications required by Rule 30a-2(a) of the Act and Section 302 of the Sarbanes-Oxley Act of 2002 (“Sarbanes-Oxley Act”) are filed herewith. |
| (a)(3) | Not applicable to the Registrant. |
| (b) | The certifications required by Rule 30a-2(b) of the Act and Section 906 of the Sarbanes-Oxley Act are filed herewith. |
The certifications provided pursuant to Rule 30a-2(b) of the Act and Section 906 of the Sarbanes-Oxley Act are not deemed “filed” for purposes of Section 18 of the Securities Exchange Act of 1934, as amended (“Exchange Act”), or otherwise subject to the liability of that section. Such certifications will not be deemed to be incorporated by reference into any filing under the Securities Act of 1933, as amended, or the Exchange Act, except to the extent that the Registrant specifically incorporates them by reference.
SIGNATURES
Pursuant to the requirements of the Securities Exchange Act of 1934 and the Investment Company Act of 1940, the Registrant has duly caused this report to be signed on its behalf by the undersigned, thereunto duly authorized.
NEUBERGER BERMAN INCOME FUNDS
By: /s/ Robert Conti
Robert Conti
Chief Executive Officer
Date: December 29, 2010
Pursuant to the requirements of the Securities Exchange Act of 1934 and the Investment Company Act of 1940, this report has been signed below by the following persons on behalf of the Registrant and in the capacities and on the dates indicated.
By: /s/ Robert Conti
Robert Conti
Chief Executive Officer
Date: December 29, 2010
By: /s/ John M. McGovern
John M. McGovern
Treasurer and Principal Financial
and Accounting Officer
Date: December 29, 2010