As filed with the Securities and Exchange Commission on January 3, 2013
UNITED STATES
SECURITIES AND EXCHANGE COMMISSION
Washington, D.C. 20549
FORM N-CSR
CERTIFIED SHAREHOLDER REPORT OF
REGISTERED MANAGEMENT INVESTMENT COMPANIES
Investment Company Act file number: 811-03802
NEUBERGER BERMAN INCOME FUNDS
(Exact Name of the Registrant as Specified in Charter)
c/o Neuberger Berman Management LLC
605 Third Avenue, 2nd Floor
New York, New York 10158-0180
(Address of Principal Executive Offices – Zip Code)
Registrant's telephone number, including area code: (212) 476-8800
Robert Conti
Chief Executive Officer and President
Neuberger Berman Income Funds
c/o Neuberger Berman Management LLC
605 Third Avenue, 2nd Floor
New York, New York 10158-0180
Arthur C. Delibert, Esq.
K&L Gates LLP
1601 K Street, N.W.
Washington, D.C. 20006-1600
(Names and Addresses of agents for service)
Date of fiscal year end: October 31, 2012
Date of reporting period: October 31, 2012
Form N-CSR is to be used by management investment companies to file reports with the Commission not later than 10 days after the transmission to stockholders of any report that is required to be transmitted to stockholders under Rule 30e-1 under the Investment Company Act of 1940 (17 CFR 270.30e-1). The Commission may use the information provided on Form N-CSR in its regulatory, disclosure review, inspection and policymaking roles.
A registrant is required to disclose the information specified by Form N-CSR, and the Commission will make this information public. A registrant is not required to respond to the collection of information contained in Form N-CSR unless the Form displays a currently valid Office of Management and Budget (“OMB”) control number. Please direct comments concerning the accuracy of the information collection burden estimate and any suggestions for reducing the burden to the Secretary, Securities and Exchange Commission, 100 F Street, NE, Washington, DC 20549-0609. The OMB has reviewed this collection of information under the clearance requirements of 44 U.S.C. § 3507.
Item 1. Report to Shareholders.

Neuberger Berman
Income Funds
| Investor Class Shares | | Class A Shares |
| Trust Class Shares | | Class C Shares |
| Institutional Class Shares | | Class R3 Shares |
| | | |
| | | |
| | | |
| Core Bond Fund | | Municipal Intermediate Bond Fund |
| Floating Rate Income Fund | | Short Duration Bond Fund |
| High Income Bond Fund | | Short Duration High Income Fund |
| | | Strategic Income Fund |
Annual Report
October 31, 2012
| | Contents | |
| | THE FUNDS | |
| | President's Letter | 1 |
| | PORTFOLIO COMMENTARY | |
| | Core Bond Fund | 2 |
| | Floating Rate Income Fund | 5 |
| | High Income Bond Fund | 9 |
| | Municipal Intermediate Bond Fund | 12 |
| | Short Duration Bond Fund | 15 |
| | Short Duration High Income Fund | 18 |
| | Strategic Income Fund | 21 |
| | FUND EXPENSE INFORMATION | 28 |
| | SCHEDULE OF INVESTMENTS | |
| | Core Bond Fund | 30 |
| | Floating Rate Income Fund | 36 |
| | High Income Bond Fund | 43 |
| | Municipal Intermediate Bond Fund | 53 |
| | Short Duration Bond Fund | 59 |
| | Short Duration High Income Fund | 63 |
| | Strategic Income Fund | 69 |
| | FINANCIAL STATEMENTS | 102 |
The "Neuberger Berman" name and logo are registered service marks of Neuberger Berman Group LLC. "Neuberger Berman Management LLC" and the individual Fund names in this piece are either service marks or registered service marks of Neuberger Berman Management LLC. ©2012 Neuberger Berman Management LLC. All rights reserved.
| | FINANCIAL HIGHLIGHTS (ALL CLASSES)/PER SHARE DATA | |
| | Core Bond Fund | 126 |
| | Floating Rate Income Fund | 128 |
| | High Income Bond Fund | 128 |
| | Municipal Intermediate Bond Fund | 130 |
| | Short Duration Bond Fund | 132 |
| | Short Duration High Income Fund | 132 |
| | Strategic Income Fund | 134 |
| | Reports of Independent Registered Public Accounting Firms | 138 |
| | Directory | 140 |
| | Trustees and Officers | 141 |
| | Proxy Voting Policies and Procedures | 149 |
| | Quarterly Portfolio Schedule | 149 |
| | Notice to Shareholders | 149 |
| | Board Consideration of the Management and Sub-Advisory Agreements | 150 |
The "Neuberger Berman" name and logo are registered service marks of Neuberger Berman Group LLC. "Neuberger Berman Management LLC" and the individual Fund names in this piece are either service marks or registered service marks of Neuberger Berman Management LLC. ©2012 Neuberger Berman Management LLC. All rights reserved.
President's Letter
Dear Shareholder,
I am pleased to present this annual shareholder report for the Neuberger Berman Income Funds. This report includes the new Neuberger Berman Short Duration High Income Fund, which was launched on September 28, 2012.
Co-managed by Ann Benjamin, Thomas O'Reilly and Russ Covode, Neuberger Berman Short Duration High Income Fund largely invests in lower-quality, short-term fixed income securities and seeks to provide a high level of current income consistent with capital preservation. We believe the Fund demonstrates our continued interest in providing relevant strategies to our clients to help them achieve their long-term financial objectives.
Turning our attention to the fixed income market, while there were several periods of heightened risk aversion, investors who took on greater risk were generally rewarded over the 12 months ended October 31, 2012. Several global macro issues consumed the markets at times during the period. These included signs of weakening global growth, the European sovereign debt crisis and uncertainties surrounding the contentious November elections. Against this backdrop, on several occasions investors flocked to the safety of U.S. Treasury securities, driving their yields down to historical lows. Yet, these flights to quality were often quickly replaced with renewed risk appetite as investors sought out opportunities to generate higher yields amid the low interest rate environment.
During the reporting period as a whole, there was solid demand for non-Treasuries, especially the lower-rated, higher-yielding fixed income sectors, which generated the best returns. This backdrop was advantageous for many of our Fixed Income Funds, as they benefited from having overweights to non-Treasuries relative to their benchmarks.
Looking ahead, there are a number of unresolved issues facing investors. Perhaps first and foremost is the U.S. fiscal cliff and its potential impact on the economy. The ongoing European sovereign debt crisis and questions whether China can orchestrate a soft landing for its economy could also impact investor sentiment. Given these and other macro uncertainties, we think periods of elevated market volatility are likely. At the same time, we anticipate the Federal Reserve's vow to keep short-term interest rates in a historically low range until at least mid-2015 could lead to overall solid demand for non-Treasuries. We also think that overall demand for tax-free bonds will remain strong given their relatively attractive yields.
Thank you for your continued support and trust. We look forward to continue serving your investment needs in the years to come.
Sincerely,
ROBERT CONTI
PRESIDENT AND CEO
NEUBERGER BERMAN MUTUAL FUNDS
Core Bond Fund Commentary (Unaudited)
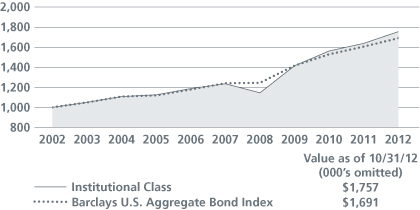
Neuberger Berman Core Bond Fund Institutional Class generated a 7.16% total return for the 12 months ended October 31, 2012 and outperformed its benchmark, the Barclays U.S. Aggregate Bond Index, which provided a 5.25% return for the period. (Performance for all share classes is provided in the table immediately following this letter.)
Shifting investor sentiment due to mixed economic data, the European sovereign debt crisis and uncertainties regarding future central bank policy resulted in occasions of increased market volatility during the reporting period. However, it appears that investors who took on greater risk were generally rewarded.
During the reporting period there were several setbacks in the non-Treasury market, however these proved to be only temporary in nature as demand was strong from investors looking to generate incremental yield. Also supporting non-Treasuries were actions taken by the Federal Reserve ("Fed") to stimulate the economy. Most prominent was the Fed's third round of quantitative easing ("QE3") that was initiated in September. The Fed's policy entails the open-ended purchase of agency mortgage-backed securities and an extension to keep the federal funds rate at a historically low level until at least mid-2015.
The Fund was rewarded for its overweight to non-Treasuries, as they outperformed equal-duration Treasuries during the period. In particular, an overweight to commercial mortgage-backed securities ("CMBS") benefited performance as their spreads (the difference in yield between Treasuries and other bond sectors) narrowed during the reporting period given generally robust investor demand. The Fund's investment grade corporate bonds also contributed to results. Within the sector, our medium- and lower-rated industrial bond exposure produced the strongest returns. An allocation to agency mortgage-backed securities ("MBS") was a positive for performance, as was our allocation to Treasury Inflation Protected Securities ("TIPS") given expectations for rising inflation tied to QE3. The Fund used short and long Treasury futures during the reporting period to assist in managing its duration positioning, which slightly detracted from results.
Several adjustments were made to the portfolio during the reporting period. In the last three months of the period we upgraded the quality of the investment grade corporate bond portion of the portfolio by reducing our exposures in banking, energy and chemicals. In contrast, we increased the Fund's allocation to less cyclical and more stable sectors such as cable/media, food and beverage, and tobacco. Elsewhere in the portfolio, during the reporting period we reduced our weighting in agency MBS given the strong performance at the end of the fiscal year, primarily due to QE3, and we increased our exposure to U.S. Treasuries.
Data released in recent months appear to us to be consistent with our forecast that the U.S. economy has enough momentum to continue expanding, albeit at a relatively modest pace. We also feel that core inflation will remain fairly well contained and allow the Fed to continue pursuing its highly accommodative monetary policy. In our view, the Fed's actions seem likely to drive investors to riskier assets in an attempt to boost their returns in the ultra-low interest rate environment. That being said, we anticipate seeing periods of volatility given the continuation of several unresolved global macro issues, as well as the uncertainties associated with post-November election policy and the fiscal cliff. However, we feel it remains prudent to maintain our broader overweight to the spread sectors as we believe it is the appropriate strategy for long-term investors.
Sincerely,
THANOS BARDAS, DAVID M. BROWN, ANDREW A. JOHNSON AND BRADLEY C. TANK
PORTFOLIO CO-MANAGERS
Information about the principal risks of investing in the Fund is set forth in the prospectus and statement of additional information.
The portfolio composition, industries and holdings of the Fund are subject to change.
Core Bond Fund (Unaudited)
| Investor Class | NCRIX |
| Institutional Class | NCRLX |
| Class A | NCRAX |
| Class C | NCRCX |
PORTFOLIO BY TYPE OF SECURITY |
| (as a % of Total Net Assets) | |
| Asset-Backed Securities | | | 0.3 | % | |
| Corporate Debt Securities | | | 24.6 | | |
| Mortgage-Backed Securities | | | 46.1 | | |
| U.S. Treasury Securities | | | 43.7 | | |
| Short-Term Investments | | | 8.5 | | |
Liabilities, less cash, receivables and other assets | | | (23.2 | ) | |
| Total | | | 100.0 | % | |
| | | Inception Date | Average Annual Total Return Ended 10/31/2012 | |
| | | 1 Year | | 5 Years | | 10 Years | | Life of Fund | |
| At NAV | | | | | | | | | | |
Investor Class3 | | 02/01/1997 | | 6.74 | % | | | 6.85 | % | | | 5.36 | % | | | 5.78 | % | |
Institutional Class3 | | 10/01/1995 | | 7.16 | % | | | 7.30 | % | | | 5.80 | % | | | 6.18 | % | |
Class A4 | | 12/20/2007 | | 6.75 | % | | | 6.82 | % | | | 5.56 | % | | | 6.04 | % | |
Class C4 | | 12/20/2007 | | 5.95 | % | | | 6.06 | % | | | 5.19 | % | | | 5.82 | % | |
| With Sales Charge | | | | | | | | | | |
Class A4 | | | | 2.20 | % | | | 5.90 | % | | | 5.11 | % | | | 5.77 | % | |
Class C4 | | | | 4.95 | % | | | 6.06 | % | | | 5.19 | % | | | 5.82 | % | |
| Index | |
Barclays U.S. Aggregate Bond Index1,14 | | | | 5.25 | % | | | 6.38 | % | | | 5.39 | % | | | 6.26 | % | |
The performance data quoted represent past performance and do not indicate future results. Current performance may be lower or higher than the performance data quoted. For more current performance data, please visit www.nb.com/performance.
The results shown in the table reflect the reinvestment of income dividends and other distributions, if any. The results do not reflect the effect of taxes a shareholder would pay on Fund distributions or on the redemption of Fund shares.
The investment return and principal value of an investment will fluctuate and shares, when redeemed, may be worth more or less than their original cost.
Returns would have been lower if Neuberger Berman Management LLC ("Management") had not reimbursed certain expenses and/or waived a portion of the investment management fees during certain of the periods shown. Repayment by a class (of expenses previously reimbursed and/or fees previously waived by Management) will decrease the class's returns. Please see Note B in the Notes to Financial Statements for specific information regarding expense reimbursement and/or fee waiver arrangements.
For the period ended October 31, 2012, the 30-day SEC yields were 1.38%, 1.78%, 1.32% and 0.63% for Investor Class, Institutional Class, Class A and Class C shares, respectively. Absent expense reimbursements and/or fee waivers, the 30-day SEC yields would have been 1.28%, 1.71%, 1.12% and 0.48% for Investor Class, Institutional Class, Class A and Class C shares, respectively.
Returns shown with a sales charge reflect the deduction of the current maximum initial sales charge of 4.25% for Class A shares and the applicable contingent deferred sales charges (CDSC) for Class C shares. The maximum CDSC for Class C shares is 1%, which is reduced to 0% after 1 year. The performance of the Fund's share classes will differ primarily due to different sales charge structures and class expenses. Please see the prospectus for more information about sales charge structures, if any, and class expenses for your share class.
Core Bond Fund (Unaudited)
COMPARISON OF A $1,000,000 INVESTMENT |
(000's omitted)
| This graph shows the change in value of a hypothetical $1,000,000 investment in the Fund over the past 10 fiscal years, or since the Fund's inception if it has not operated for 10 years. The graph is based on the Institutional Class shares only; the performance of the Fund's share classes will differ primarily due to different sales charge structures and class expenses (see Performance Highlights chart on previous page). The result is compared with benchmarks, which include a broad-based market index and may include a more narrowly based index. Market indices have not been reduced to reflect any of the fees and costs of investing. The results shown in the graph reflect the reinvestment of income dividends and other distributions, if any. The results do not reflect the effect of taxes a shareholder would pay on Fund distributions or on the redemption of Fund shares. Results represent past performance and do not indicate future results. |
Floating Rate Income Fund Commentary (Unaudited)
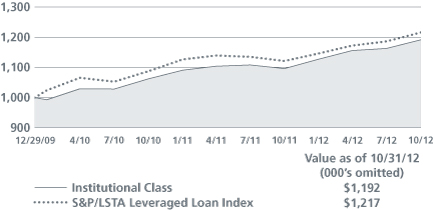
Neuberger Berman Floating Rate Income Fund Institutional Class generated an 8.73% total return for the 12 months ended October 31, 2012 and outperformed its benchmark, the S&P/LSTA Leveraged Loan Index, which provided an 8.48% return for the period. (Performance for all share classes is provided in the table immediately following this letter.)
The floating rate bank loan market generated strong results during the reporting period. Supporting the market were generally positive fundamentals, as corporate earnings were typically solid and balance sheets were often flush with cash. Sentiment for the floating rate bank loan market was also boosted by relatively low defaults. Against this backdrop, demand was mostly strong as investors looked to generate yield in what appears to be an extended period of extremely low interest rates. The new issuance market was robust during the reporting period, with the vast majority of issuance being the refinancing of existing loans to extend maturities and to take advantage of attractive rates. For the 12 months ended October 31, 2012, B-rated securities in the index gained 10.12%, whereas BB-rated and CCC-rated securities returned 6.60% and 9.93%, respectively.
The Fund continued to allocate a portion of its assets to non-floating rate securities. We have the flexibility to allocate up to 20% of the portfolio in these securities, usually fixed-rate senior secured bonds, as they can help the Fund generate incremental yield. The Fund's non-floating rate allocation fell from roughly 9% to 5% during the reporting period. We pared this allocation as floating rate loan yields became increasingly attractive on a relative basis.
We actively participated in the new issuance market by emphasizing securities in the primary rather than the secondary bank loan market due to the former's higher current yields. We also felt securities in the new issue market provided better opportunities on a risk-adjusted basis, as we identified loans to issuers that had appropriate capital structures and that had good operating momentum and relatively low leverage.
The Fund maintained its overweight to B-rated securities and underweight to BB-rated issues during the reporting period. We felt this was appropriate given what we perceived to be attractive valuations in the B-rated portion of the floating rate bank loan market. This positioning was beneficial to results as B-rated securities outperformed the index, while BB-rated securities lagged the index. While having an underweight to CCC-rated securities was not rewarded given their strong results, this was more than offset by strong security selection of CCC-rated securities.
From a sector perspective, security selection in utilities, health care and equipment leasing was the largest contributor to performance. In contrast, security selection in publishing and oil and gas detracted the most from results during the reporting period.
We continue to have a positive outlook for the floating rate bank loan market. In our view, fundamentals remain strong, as corporate balance sheets are typically flush with cash and the overall corporate earnings environment is positive. Furthermore, the default rate among the securities in the index has been well below its long term annual average of 4% and we believe this trend will continue in 2013. We also feel that the technical backdrop is supportive for the floating rate bank loan market. In our view, the Fed's actions seem likely to continue driving investors to riskier assets in an attempt to boost their returns in the ultra-low interest rate environment. That being said, there could be periods of volatility given the continuation of several unresolved global macro issues, as well as the uncertainties associated with the fiscal cliff. In
addition, given significant appreciation in the floating rate bank loan market, it's our belief that the vast majority of performance in 2013 will be driven by coupon payments.
Sincerely,
STEPHEN J. CASEY, ANN H. BENJAMIN, THOMAS P. O'REILLY AND JOSEPH P. LYNCH
PORTFOLIO CO-MANAGERS
Information about the principal risks of investing in the Fund is set forth in the prospectus and statement of additional information.
The portfolio composition, industries and holdings of the Fund are subject to change.
Floating Rate Income Fund (Unaudited)
| Institutional Class | | NFIIX |
| Class A | | NFIAX |
| Class C | | NFICX |
PORTFOLIO BY MATURITY DISTRIBUTION |
| (as a % of Total Investments) | |
| Less than One Year | | | 17.1 | % | |
| One to less than Five Years | | | 27.1 | | |
| Five to less than Ten Years | | | 55.2 | | |
| Ten Years or Greater | | | 0.6 | | |
| Total | | | 100.0 | % | |
| | | Inception Date | Average Annual Total Return Ended 10/31/2012 | |
| | | 1 Year | | Life of Fund | |
| At NAV | | | | | | |
Institutional Class5 | | 12/30/2009 | | 8.73 | % | | | 6.36 | % | |
| Class A | | 12/29/2009 | | 8.33 | % | | | 5.94 | % | |
Class C5 | | 12/30/2009 | | 7.51 | % | | | 5.22 | % | |
| With Sales Charge | | | | | | |
| Class A | | | | 3.72 | % | | | 4.35 | % | |
Class C5 | | | | 6.51 | % | | | 5.22 | % | |
| Index | | | | | | |
S&P/LSTA Leveraged Loan Index1,14 | | | | 8.48 | % | | | 7.15 | % | |
The performance data quoted represent past performance and do not indicate future results. Current performance may be lower or higher than the performance data quoted. For more current performance data, please visit www.nb.com/performance.
The results shown in the table reflect the reinvestment of income dividends and other distributions, if any. The results do not reflect the effect of taxes a shareholder would pay on Fund distributions or on the redemption of Fund shares.
The investment return and principal value of an investment will fluctuate and shares, when redeemed, may be worth more or less than their original cost.
Returns would have been lower if Neuberger Berman Management LLC ("Management") had not reimbursed certain expenses and/or waived a portion of the investment management fees during certain of the periods shown. Repayment by a class (of expenses previously reimbursed and/or fees previously waived by Management) will decrease the class's returns. Please see Note B in the Notes to Financial Statements for specific information regarding expense reimbursement and/or fee waiver arrangements.
For the period ended October 31, 2012, the 30-day SEC yields were 4.93%, 4.37% and 3.79% for Institutional Class, Class A and Class C shares, respectively. Absent expense reimbursements and/or fee waivers, the 30-day SEC yields would have been 4.70%, 4.12% and 3.54% for Institutional Class, Class A and Class C shares, respectively.
Returns shown with a sales charge reflect the deduction of the current maximum initial sales charge of 4.25% for Class A shares and the applicable contingent deferred sales charges (CDSC) for Class C shares. The maximum CDSC for Class C shares is 1%, which is reduced to 0% after 1 year. The performance of the Fund's share classes will differ primarily due to different sales charge structures and class expenses. Please see the prospectus for more information about sales charge structures, if any, and class expenses for your share class.
Floating Rate Income Fund (Unaudited)
COMPARISON OF A $1,000,000 INVESTMENT |
(000's omitted)
| This graph shows the change in value of a hypothetical $1,000,000 investment in the Fund over the past 10 fiscal years, or since the Fund's inception if it has not operated for 10 years. The graph is based on the Institutional Class shares only; the performance of the Fund's share classes will differ primarily due to different sales charge structures and class expenses (see Performance Highlights chart on previous page). The result is compared with benchmarks, which include a broad-based market index and may include a more narrowly based index. Market indices have not been reduced to reflect any of the fees and costs of investing. The results shown in the graph reflect the reinvestment of income dividends and other distributions, if any. The results do not reflect the effect of taxes a shareholder would pay on Fund distributions or on the redemption of Fund shares. Results represent past performance and do not indicate future results. |
High Income Bond Fund Commentary (Unaudited)
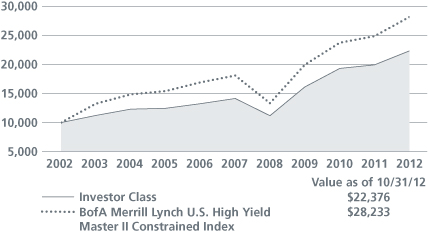
Neuberger Berman High Income Bond Fund Investor Class generated a 12.17% total return for the 12 months ended October 31, 2012 but lagged its benchmark, the BofA Merrill Lynch U.S. High Yield Master II Constrained Index, which provided a 13.15% return for the period. (Performance for all share classes is provided in the table immediately following this letter.)
The high yield market posted a strong return during the reporting period. Supporting the market were generally positive fundamentals as corporate earnings were typically solid and balance sheets were often flush with cash. Sentiment for the high yield market was also boosted by relatively low defaults. Against this backdrop, demand was mostly robust as investors looked to generate yield in what appears to be an extended period of extremely low interest rates. Overall, the high yield market outperformed equal-duration Treasuries and lower-quality securities performed better than their higher-rated counterparts. For the 12 months ended October 31, 2012, CCC-rated (a relatively low rating) securities in the benchmark and BB-rated (rated higher) securities returned 15.23% and 12.97%, respectively.
For the Fund, sector positioning detracted from relative performance during the reporting period. In particular, underweights in banking, real estate/homebuilders and insurance were negative for results. This was partially offset by our overweights in printing/publishing and media-broadcast, along with an underweight in aerospace/defense. On the upside, security selection in aggregate was beneficial for the Fund's performance relative to the index. The largest contributions came from our holdings in the telecommunications, technology/electronics and packaging sectors. These returns were somewhat mitigated by security selection in the utilities, chemicals and energy sectors.
The Fund's quality biases produced mixed results during the reporting period. While an overweight to BB-rated issues and a slight underweight to CCC-rated securities detracted from relative performance, this was offset by security selection in B-rated issues.
We made several adjustments to the portfolio during the reporting period. From a sector perspective, we increased the portfolio's exposures to energy, technology and health care. In contrast, the largest reductions in terms of sector allocations were in utilities, diversified financials and automotive. From a quality perspective, we added to the portfolio's allocation to B-rated issues.
We continue to have a positive outlook for the high yield market as, in our view, many of the factors supporting the market over the last 12 months remain in place. From a fundamentals perspective, we believe corporate balance sheets are generally solid and have substantial cash, and earnings remain respectable. We also believe the economy will continue expanding at a modest pace, which should keep inflation in check. Furthermore, many corporations have taken advantage of extremely low borrowing costs to extend their maturities at very favorable rates. We believe this will result in below-average high yield defaults in 2013.
In terms of market technicals, we anticipate ongoing robust supply. However, we feel that much of this will continue to be driven by refinancing activity. We anticipate that investor demand will remain strong given the low rate environment. That being said, we believe there could be periods of volatility given numerous macro issues, including the upcoming fiscal cliff and ongoing issues in Europe.
Sincerely,
ANN H. BENJAMIN, THOMAS P. O'REILLY AND RUSS COVODE
PORTFOLIO CO-MANAGERS
Information about the principal risks of investing in the Fund is set forth in the prospectus and statement of additional information.
The portfolio composition, industries and holdings of the Fund are subject to change.
High Income Bond Fund (Unaudited)
| Investor Class | NHINX |
| Institutional Class | NHILX |
| Class A | NHIAX |
| Class C | NHICX |
| Class R3 | NHIRX |
PORTFOLIO BY MATURITY DISTRIBUTION |
| (as a % of Total Investments) | |
| Less than One Year | | | 4.5 | % | |
| One to less than Five Years | | | 22.6 | | |
| Five to less than Ten Years | | | 67.8 | | |
| Ten Years or Greater | | | 5.1 | | |
| Total | | | 100.0 | % | |
| | | Inception Date | Average Annual Total Return Ended 10/31/2012 | |
| | | 1 Year | | 5 Years | | 10 Years | | Life of Fund | |
| At NAV | | | | | | | | | | |
Investor Class7 | | 02/01/1992 | | 12.17 | % | | | 9.60 | % | | | 8.39 | % | | | 8.20 | % | |
Institutional Class8 | | 05/27/2009 | | 12.44 | % | | | 9.78 | % | | | 8.48 | % | | | 8.25 | % | |
Class A8 | | 05/27/2009 | | 11.90 | % | | | 9.44 | % | | | 8.31 | % | | | 8.16 | % | |
Class C8 | | 05/27/2009 | | 11.15 | % | | | 8.91 | % | | | 8.05 | % | | | 8.04 | % | |
Class R38 | | 05/27/2009 | | 11.72 | % | | | 9.28 | % | | | 8.23 | % | | | 8.13 | % | |
| With Sales Charge | | | | | | | | | | | | | | | | | | |
Class A8 | | | | 7.16 | % | | | 8.49 | % | | | 7.84 | % | | | 7.94 | % | |
Class C8 | | | | 10.15 | % | | | 8.91 | % | | | 8.05 | % | | | 8.04 | % | |
| Index | | | | | | | | | | | | | | | | | | |
BofA Merrill Lynch U.S. High Yield Master II Constrained Index1,14 | | | | 13.15 | % | | | 9.28 | % | | | 10.94 | % | | | N/A | | |
The performance data quoted represent past performance and do not indicate future results. Current performance may be lower or higher than the performance data quoted. For more current performance data, please visit www.nb.com/performance.
The results shown in the table reflect the reinvestment of income dividends and other distributions, if any. The results do not reflect the effect of taxes a shareholder would pay on Fund distributions or on the redemption of Fund shares.
The investment return and principal value of an investment will fluctuate and shares, when redeemed, may be worth more or less than their original cost.
Returns would have been lower if Neuberger Berman Management LLC ("Management") had not reimbursed certain expenses and/or waived a portion of the investment management fees during certain of the periods shown. Repayment by a class (of expenses previously reimbursed and/or fees previously waived by Management) will decrease the class's returns. Please see Note B in the Notes to Financial Statements for specific information regarding expense reimbursement and/or fee waiver arrangements.
For the period ended October 31, 2012, the 30-day SEC yields were 4.79%, 4.94%, 4.36%, 3.80% and 4.31% for Investor Class, Institutional Class, Class A, Class C, and Class R3 shares, respectively.
Returns shown with a sales charge reflect the deduction of the current maximum initial sales charge of 4.25% for Class A shares and the applicable contingent deferred sales charges (CDSC) for Class C shares. The maximum CDSC for Class C shares is 1%, which is reduced to 0% after 1 year. The performance of the Fund's share classes will differ primarily due to different sales charge structures and class expenses. Please see the prospectus for more information about sales charge structures, if any, and class expenses for your share class.
High Income Bond Fund (Unaudited)
COMPARISON OF A $10,000 INVESTMENT |
This graph shows the change in value of a hypothetical $10,000 investment in the Fund over the past 10 fiscal years, or since the Fund's inception if it has not operated for 10 years. The graph is based on the Investor Class shares only; the performance of the Fund's share classes will differ primarily due to different sales charge structures and class expenses (see Performance Highlights chart on previous page). The result is compared with benchmarks, which include a broad-based market index and may include a more narrowly based index. Market indices have not been reduced to reflect any of the fees and costs of investing. The results shown in the graph reflect the reinvestment of income dividends and other distributions, if any. The results do not reflect the effect of taxes a shareholder would pay on Fund distributions or on the redemption of Fund shares. Results represent past performance and do not indicate future results. |
Municipal Intermediate Bond Fund Commentary (Unaudited)
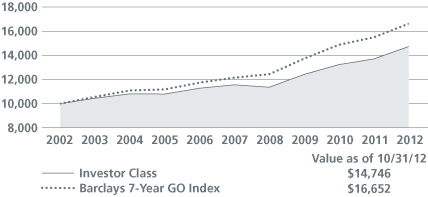
Neuberger Berman Municipal Intermediate Bond Fund Investor Class generated a 7.49% total return for the 12 months ended October 31, 2012 and outperformed its benchmark, the Barclays 7-Year General Obligation Index, which provided a 7.40% return for the period. (Performance for all share classes is provided in the table immediately following this letter.)
The municipal market posted a solid return during the reporting period. Supporting the market were rising tax revenues, low defaults and some meaningful progress in the fiscal position of numerous states. In addition, net new supply was low from a historical basis, whereas investor demand was typically strong. Looking at the municipal market more closely, lower-quality securities outperformed their higher-quality counterparts as investors looked to generate incremental yield in what appears to be an extended period of extremely low interest rates. In addition, longer-term securities outperformed shorter-term securities. The intermediate portion of the municipal curve produced mixed results over the 12-month period. However, intermediate-term municipal securities performed well overall, with the seven-year portion of the curve generating the best returns.
We tactically adjusted the Fund's duration several times during the reporting period. We started the period with a longer duration versus the index and then allowed it to drift shorter in the first quarter of 2012. This adjustment was made because we anticipated some weakness in the market due to its extended rally and given seasonal weakness that typically occurs during tax season. We then shifted to a longer duration and maintained this position for the remainder of the period. Overall, duration was a positive for performance. In terms of the Fund's yield curve positioning, we maintained a barbell approach (investing in shorter and longer maturities). In contrast, the Fund's benchmark is concentrated in the six- to eight-year portion of the curve. Given our underweight to the seven-year portion of the curve, the Fund's barbell approach detracted from relative results.
The Fund's higher-quality bias also detracted from performance, as lower-quality bonds outperformed. In particular, we sought to keep the overall average credit quality of the portfolio in the "AA" range and had only about a 7% allocation to BBB-rated municipal bonds. In contrast, security selection contributed positively to results during the reporting period. From a sector perspective, we emphasized higher-quality revenue and general obligation bonds that we felt would perform relatively well given the uncertain economic environment.
We have a generally positive outlook for the municipal market. In many ways, the opportunities and the challenges in the market are similar to what we faced heading into the reporting period. The municipal yield curve continues to be steep from a historical perspective and we believe supply should remain manageable. In addition, with the economy expanding at a modest pace, we feel the Federal Reserve will hold rates at their current ultra-low levels for the foreseeable future. As such, we believe demand for municipal securities will be solid, especially given their compelling valuations versus other higher-quality fixed income securities.
In terms of challenges, while we do not anticipate seeing wholesale defaults, we do see the potential for a level of defaults above historic norms, as well as an increase in downgrade activity. Other areas that warrant our attention include the fiscal cliff and potential legislation regarding the tax-exempt status of municipal bonds. It is our view that the fiscal cliff will be resolved sooner rather than later. In light of the growing deficit in the U.S., there could be discussions in Washington DC regarding municipal bonds, but we do not expect to see any meaningful changes to their tax-favored status. That being said, we could see periods of increased volatility in the municipal market in the coming months.
Sincerely,
JAMES L. ISELIN AND S. BLAKE MILLER
PORTFOLIO CO-MANAGERS
Information about the principal risks of investing in the Fund is set forth in the prospectus and statement of additional information.
The portfolio composition, industries and holdings of the Fund are subject to change.
Municipal Intermediate Bond Fund (Unaudited)
| Investor Class | NMUIX |
| Institutional Class | NMNLX |
| Class A | NMNAX |
| Class C | NMNCX |
PORTFOLIO BY STATE AND TERRITORY |
| (as a % of Total Investments) | |
| Arizona | | | 0.7 | % | |
| Arkansas | | | 2.1 | | |
| California | | | 10.6 | | |
| Colorado | | | 2.2 | | |
| Delaware | | | 0.1 | | |
| District of Columbia | | | 1.2 | | |
| Florida | | | 11.6 | | |
| Georgia | | | 0.9 | | |
| Illinois | | | 6.6 | | |
| Indiana | | | 4.7 | | |
| Iowa | | | 0.9 | | |
| Kansas | | | 1.0 | | |
| Louisiana | | | 2.0 | | |
| Maryland | | | 1.6 | | |
| Massachusetts | | | 4.0 | | |
| Michigan | | | 2.1 | | |
| Minnesota | | | 0.6 | | |
| Mississippi | | | 0.8 | | |
| Missouri | | | 1.0 | | |
| Nebraska | | | 0.9 | | |
| Nevada | | | 0.6 | | |
| New Jersey | | | 4.7 | | |
| New Mexico | | | 0.6 | | |
| New York | | | 8.4 | | |
| North Carolina | | | 0.8 | | |
| Ohio | | | 2.9 | | |
| Oregon | | | 0.8 | | |
| Pennsylvania | | | 2.7 | | |
| Puerto Rico | | | 1.5 | | |
| Rhode Island | | | 1.8 | | |
| South Carolina | | | 2.5 | | |
| Tennessee | | | 3.2 | | |
| Texas | | | 8.7 | | |
| Virginia | | | 3.5 | | |
| Washington | | | 1.7 | | |
| Total | | | 100.0 | % | |
| | | Inception Date | Average Annual Total Return Ended 10/31/2012 | |
| | | 1 Year | | 5 Years | | 10 Years | | Life of Fund | |
| At NAV | | | | | | | | | | |
| Investor Class | | 07/09/1987 | | 7.49 | % | | | 4.98 | % | | | 3.96 | % | | | 5.26 | % | |
Institutional Class11 | | 06/21/2010 | | 7.65 | % | | | 5.04 | % | | | 3.99 | % | | | 5.27 | % | |
Class A11 | | 06/21/2010 | | 7.16 | % | | | 4.85 | % | | | 3.90 | % | | | 5.24 | % | |
Class C11 | | 06/21/2010 | | 6.37 | % | | | 4.48 | % | | | 3.71 | % | | | 5.16 | % | |
| With Sales Charge | | | | | | | | | | |
Class A11 | | | | 2.64 | % | | | 3.95 | % | | | 3.45 | % | | | 5.06 | % | |
Class C11 | | | | 5.37 | % | | | 4.48 | % | | | 3.71 | % | | | 5.16 | % | |
| Index | | | | | | | | | | |
Barclays 7-Year GO Index1,14 | | | | 7.40 | % | | | 6.49 | % | | | 5.23 | % | | | 6.22 | % | |
The performance data quoted represent past performance and do not indicate future results. Current performance may be lower or higher than the performance data quoted. For more current performance data, please visit www.nb.com/performance.
The results shown in the table reflect the reinvestment of income dividends and other distributions, if any. The results do not reflect the effect of taxes a shareholder would pay on Fund distributions or on the redemption of Fund shares.
The investment return and principal value of an investment will fluctuate and shares, when redeemed, may be worth more or less than their original cost.
Returns would have been lower if Neuberger Berman Management LLC ("Management") had not reimbursed certain expenses and/or waived a portion of the investment management fees during certain of the periods shown. Repayment by a class (of expenses previously reimbursed and/or fees previously waived by Management) will decrease the class's returns. Please see Note B in the Notes to Financial Statements for specific information regarding expense reimbursement and/or fee waiver arrangements.
For the period ended October 31, 2012, the 30-day SEC yields were 1.31%, 1.46%, 1.04% and 0.36% for Investor Class, Institutional Class, Class A and Class C shares, respectively. The tax-equivalent yields were 2.02%, 2.25%, 1.60% and 0.55% for Investor Class, Institutional Class, Class A and Class C shares, respectively, for a shareholder in the highest federal income tax bracket (35%).9 Absent expense reimbursements and/or fee waivers, the 30-day SEC yields would have been 1.25%, 0.64% and 0.00% for Institutional Class, Class A and Class C shares, respectively. Absent repayment, the 30-day SEC yield would have been 1.90% for Investor Class shares.
Returns shown with a sales charge reflect the deduction of the current maximum initial sales charge of 4.25% for Class A shares and the applicable contingent deferred sales charges (CDSC) for Class C shares. The maximum CDSC for Class C shares is 1%, which is reduced to 0% after 1 year. The performance of the Fund's share classes will differ primarily due to different sales charge structures and class expenses. Please see the prospectus for more information about sales charge structures, if any, and class expenses for your share class.
Municipal Intermediate Bond Fund (Unaudited)
COMPARISON OF A $10,000 INVESTMENT |
This graph shows the change in value of a hypothetical $10,000 investment in the Fund over the past 10 fiscal years, or since the Fund's inception if it has not operated for 10 years. The graph is based on the Investor Class shares only; the performance of the Fund's share classes will differ primarily due to different sales charge structures and class expenses (see Performance Highlights chart on previous page). The result is compared with benchmarks, which include a broad-based market index and may include a more narrowly based index. Market indices have not been reduced to reflect any of the fees and costs of investing. The results shown in the graph reflect the reinvestment of income dividends and other distributions, if any. The results do not reflect the effect of taxes a shareholder would pay on Fund distributions or on the redemption of Fund shares. Results represent past performance and do not indicate future results. |
Short Duration Bond Fund Commentary (Unaudited)
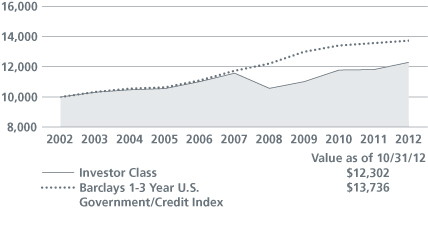
Neuberger Berman Short Duration Bond Fund Investor Class generated a 4.09% total return for the 12 months ended October 31, 2012 and outperformed its benchmark, the Barclays 1-3 Year U.S. Government/Credit Index, which provided a 1.15% return for the period. (Performance for all share classes is provided in the table immediately following this letter.)
Shifting investor sentiment due to mixed economic data, the European sovereign debt crisis and uncertainties regarding future central bank policy resulted in occasions of increased market volatility during the reporting period. However, investors who took on greater risk were generally rewarded.
During the reporting period there were several setbacks in the non-Treasury market, however these proved to be only temporary in nature as demand was strong from investors looking to generate incremental yield. Also supporting non-Treasuries were actions taken by the Federal Reserve ("Fed") to stimulate the economy. Most prominent was the Fed's third round of quantitative easing ("QE3") that was initiated in September 2012. Among the Fed's initiatives were an open-ended program to purchase agency mortgage-backed securities and an extension to keep the federal funds rate at a historically low level until at least mid-2015.
The Fund's overweight to non-Treasuries was the largest driver of its outperformance during the reporting period. The largest contributor to results was the Fund's exposure to non-agency mortgage-backed securities ("MBS"), followed by allocations to commercial mortgage-backed securities ("CMBS") and investment grade corporate bonds. Within the investment grade corporate bond market, our holdings in the financials and industrials subsectors were the most beneficial. Detracting slightly from results was the Fund's zero allocation to agency debt securities, as they outperformed equal-duration Treasuries. Elsewhere, the Fund's defensive yield curve positioning was rewarded, as short-term interest rates increased over the 12-month period.
There were several adjustments made to the portfolio from a sector perspective during the reporting period. We reduced our exposure to non-agency MBS to capture profits and pare the Fund's overall risk exposure. Our allocation to agency MBS was also reduced. In contrast, we increased the allocation to corporate bonds, primarily by taking advantage of opportunities in the new issue market. We also increased the Fund's allocation to fixed-rate asset-backed securities.
Data released in recent months appear to us to be consistent with our forecast that the U.S. economy has enough momentum to continue expanding, albeit at a relatively modest pace. We also feel that core inflation will remain fairly well contained and allow the Fed to continue pursuing its highly accommodative monetary policy. In our view, the Fed's actions seem likely to drive investors to riskier assets in an attempt to boost their returns in the ultra-low interest rate environment. That being said, we anticipate seeing periods of volatility given the continuation of several unresolved global macro issues, as well as the uncertainties associated with post-November election policy and the fiscal cliff. As a result, we have marginally reduced our exposure to the spread sectors given strong relative performance. However, we feel it remains prudent to maintain our broader overweight to the spread sectors as we believe it is the appropriate strategy for long-term investors.
Sincerely,
THOMAS SONTAG, MICHAEL FOSTER AND RICHARD GRAU
PORTFOLIO CO-MANAGERS
Information about the principal risks of investing in the Fund is set forth in the prospectus and statement of additional information.
The portfolio composition, industries and holdings of the Fund are subject to change.
Short Duration Bond Fund (Unaudited)
| Investor Class | NSBIX |
| Trust Class | NSBTX |
| Institutional Class | NSHLX |
| Class A | NSHAX |
| Class C | NSHCX |
PORTFOLIO BY TYPE OF SECURITY |
| (as a % of Total Net Assets) | |
| Asset-Backed Securities | | | 11.1 | % | |
| Corporate Debt Securities | | | 32.8 | | |
| Mortgage-Backed Securities | | | 24.8 | | |
| U.S. Treasury Securities | | | 27.0 | | |
| Short-Term Investments | | | 4.3 | | |
Liabilities, less cash, receivables and other assets | | | (0.0 | ) | |
| Total | | | 100.0 | % | |
| | | Inception Date | Average Annual Total Return Ended 10/31/2012 |
| | | 1 Year | | 5 Years | | 10 Years | | Life of Fund |
| At NAV | | | | | | | | | |
| Investor Class | | 06/09/1986 | | 4.09 | % | | | 1.22 | % | | | 2.09 | % | | | 4.77 | % |
Trust Class12 | | 08/30/1993 | | 4.08 | % | | | 1.14 | % | | | 2.00 | % | | | 4.71 | % |
Institutional Class12 | | 06/21/2010 | | 4.30 | % | | | 1.31 | % | | | 2.14 | % | | | 4.79 | % |
Class A12 | | 06/21/2010 | | 3.87 | % | | | 1.12 | % | | | 2.04 | % | | | 4.75 | % |
Class C12 | | 06/21/2010 | | 3.23 | % | | | 0.79 | % | | | 1.88 | % | | | 4.69 | % |
| With Sales Charge | | | | | | | | | |
Class A12 | | | | 1.31 | % | | | 0.61 | % | | | 1.78 | % | | | 4.65 | % |
Class C12 | | | | 2.23 | % | | | 0.79 | % | | | 1.88 | % | | | 4.69 | % |
| Index | | | | | | | | | |
Barclays 1-3 Year U.S. Government/Credit Index1,14 | | | | 1.15 | % | | | 3.20 | % | | | 3.23 | % | | | 5.64 | % |
The performance data quoted represent past performance and do not indicate future results. Current performance may be lower or higher than the performance data quoted. For more current performance data, please visit www.nb.com/performance.
The results shown in the table reflect the reinvestment of income dividends and other distributions, if any. The results do not reflect the effect of taxes a shareholder would pay on Fund distributions or on the redemption of Fund shares.
The investment return and principal value of an investment will fluctuate and shares, when redeemed, may be worth more or less than their original cost.
Returns would have been lower if Neuberger Berman Management LLC ("Management") had not reimbursed certain expenses and/or waived a portion of the investment management fees during certain of the periods shown. Repayment by a class (of expenses previously reimbursed and/or fees previously waived by Management) will decrease the class's returns. Please see Note B in the Notes to Financial Statements for specific information regarding expense reimbursement and/or fee waiver arrangements.
For the period ended October 31, 2012, the 30-day SEC yields were 0.57%, 0.47%, 0.77%, 0.39% and 0.00% for Investor Class, Trust Class, Institutional Class, Class A and Class C shares, respectively. Absent expense reimbursements and/or fee waivers, the 30-day SEC yields would have been 0.16%, 0.00%, 0.28%, 0.00% and 0.00% for Investor Class, Trust Class, Institutional Class, Class A and Class C shares, respectively.
Returns shown with a sales charge reflect the deduction of the current maximum initial sales charge of 2.50% for Class A shares and the applicable contingent deferred sales charges (CDSC) for Class C shares. The maximum CDSC for Class C shares is 1%, which is reduced to 0% after 1 year. The performance of the Fund's share classes will differ primarily due to different sales charge structures and class expenses. Please see the prospectus for more information about sales charge structures, if any, and class expenses for your share class.
Short Duration Bond Fund (Unaudited)
COMPARISON OF A $10,000 INVESTMENT |
This graph shows the change in value of a hypothetical $10,000 investment in the Fund over the past 10 fiscal years, or since the Fund's inception if it has not operated for 10 years. The graph is based on the Investor Class shares only; the performance of the Fund's share classes will differ primarily due to different sales charge structures and class expenses (see Performance Highlights chart on previous page). The result is compared with benchmarks, which include a broad-based market index and may include a more narrowly based index. Market indices have not been reduced to reflect any of the fees and costs of investing. The results shown in the graph reflect the reinvestment of income dividends and other distributions, if any. The results do not reflect the effect of taxes a shareholder would pay on Fund distributions or on the redemption of Fund shares. Results represent past performance and do not indicate future results. |
Short Duration High Income Fund Commentary (Unaudited)
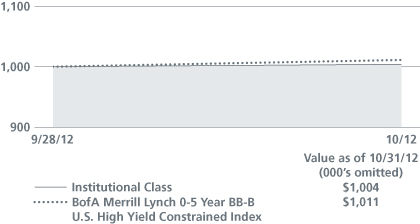
Neuberger Berman Short Duration High Income Fund, which was launched on September 28, 2012, seeks to deliver a high level of current income consistent with capital preservation. The Fund's assets are generally invested in below investment grade debt securities and floating rate senior secured loans from a broad range of issuers and industries. While the Fund can hold securities of any maturity, we seek to maintain a weighted average portfolio duration of three years or less. We look to manage credit risk and minimize interest rate risk through disciplined credit analysis and an emphasis on short-term and intermediate-term maturities. We also conduct thorough analysis on issuer cash flows, management and sources of repayment in an attempt to minimize the Fund's exposure to securities with deteriorating fundamentals and financials.
Neuberger Berman Short Duration High Income Fund Institutional Class generated a 0.38% total return from its inception on September 28, 2012 through October 31, 2012 but underperformed its benchmark, the BofA Merrill Lynch 0-5 Year BB-B U.S. High Yield Constrained Index, which provided a 1.08% return for the period. (Performance for all share classes is provided in the table immediately following this letter.)
During the short period since the Fund's inception, the high yield market posted a positive return. Supporting the market were generally positive fundamentals, as corporate earnings were typically solid and balance sheets were often flush with cash. Sentiment for the high yield market was also boosted by relatively low defaults, in our view. Against this backdrop, demand was solid as investors looked to generate yield in what appears to be an extended period of extremely low interest rates.
For the Fund, the sectors that were the most beneficial to performance during the reporting period were health care, energy and media-cable. In contrast, the chemicals, building materials and media-broadcast sectors detracted from the Fund's performance.
The Fund's quality biases were positive for performance during the reporting period. On average, approximately 94% of the portfolio was held in securities rated B and BB. This positioning was rewarded as the Fund's investments in both ratings categories outperformed securities rated CCC for the period.
We continue to have a positive outlook for the high yield market as, in our opinion, many of the factors supporting the market over the last 12 months remain in place. From a fundamentals perspective, we believe corporate balance sheets are generally solid and cash-rich, and earnings remain respectable. We also believe the economy will continue expanding at a modest pace, which should keep inflation in check. Furthermore, many corporations have taken advantage of extremely low borrowing costs to extend their maturities at very favorable rates. We believe this will result in below-average high yield defaults in 2013.
In terms of market technicals, we anticipate ongoing robust supply. However, we feel that much of this will continue to be driven by refinancing activity. Investor demand should remain strong, in our view, given the low interest rate environment. That being said, there could be periods of volatility given numerous macro issues, including the upcoming fiscal cliff and ongoing issues in Europe.
Sincerely,
ANN H. BENJAMIN, THOMAS P. O'REILLY AND RUSS COVODE
PORTFOLIO CO-MANAGERS
Information about the principal risks of investing in the Fund is set forth in the prospectus and statement of additional information.
The portfolio composition, industries and holdings of the Fund are subject to change.
Short Duration High Income Fund (Unaudited)
| Institutional Class | NHSIX |
| Class A | NHSAX |
| Class C | NHSCX |
PORTFOLIO BY MATURITY DISTRIBUTION |
| (as a % of Total Investments) | |
| Less than One Year | | | 13.8 | % | |
| One to less than Five Years | | | 47.2 | | |
| Five to less than Ten Years | | | 39.0 | | |
| Total | | | 100.0 | % | |
| | | Inception Date | | Cumulative Total Return Ended 10/31/2012 Life of Fund | |
| At NAV | | | | | |
| Institutional Class | | 09/28/2012 | | | 0.38 | % | |
| Class A | | 09/28/2012 | | | 0.36 | % | |
| Class C | | 09/28/2012 | | | 0.30 | % | |
| With Sales Charge | | | | | |
| Class A | | | | | -3.87 | % | |
| Class C | | | | | -0.70 | % | |
| Index | | | | | |
BofA Merrill Lynch 0-5 Year BB-B U.S. High Yield Constrained Index1,14 | | | | | 1.08 | % | |
The performance data quoted represent past performance and do not indicate future results. Current performance may be lower or higher than the performance data quoted. For more current performance data, please visit www.nb.com/performance.
The results shown in the table reflect the reinvestment of income dividends and other distributions, if any. The results do not reflect the effect of taxes a shareholder would pay on Fund distributions or on the redemption of Fund shares.
The investment return and principal value of an investment will fluctuate and shares, when redeemed, may be worth more or less than their original cost.
Returns would have been lower if Neuberger Berman Management LLC ("Management") had not reimbursed certain expenses and/or waived a portion of the investment management fees during certain of the periods shown. Repayment by a class (of expenses previously reimbursed and/or fees previously waived by Management) will decrease the class's returns. Please see Note B in the Notes to Financial Statements for specific information regarding expense reimbursement and/or fee waiver arrangements.
For the period ended October 31, 2012, the 30-day SEC yields were 2.73%, 2.41% and 1.68% for Institutional Class, Class A and Class C shares, respectively. Absent expense reimbursements and/or fee waivers, the 30-day SEC yields would have been 0.00%, 0.00% and 0.00% for Institutional Class, Class A and Class C shares, respectively.
Returns shown with a sales charge reflect the deduction of the current maximum initial sales charge of 4.25% for Class A shares and the applicable contingent deferred sales charges (CDSC) for Class C shares. The maximum CDSC for Class C shares is 1%, which is reduced to 0% after 1 year. The performance of the Fund's share classes will differ primarily due to different sales charge structures and class expenses. Please see the prospectus for more information about sales charge structures, if any, and class expenses for your share class.
Short Duration High Income Fund (Unaudited)
COMPARISON OF A $1,000,000 INVESTMENT |
This graph shows the change in value of a hypothetical $1,000,000 investment in the Fund over the past 10 fiscal years, or since the Fund's inception if it has not operated for 10 years. The graph is based on the Institutional Class shares only; the performance of the Fund's share classes will differ primarily due to different sales charge structures and class expenses (see Performance Highlights chart on previous page). The result is compared with benchmarks, which include a broad-based market index and may include a more narrowly based index. Market indices have not been reduced to reflect any of the fees and costs of investing. The results shown in the graph reflect the reinvestment of income dividends and other distributions, if any. The results do not reflect the effect of taxes a shareholder would pay on Fund distributions or on the redemption of Fund shares. Results represent past performance and do not indicate future results. |
Strategic Income Fund Commentary (Unaudited)
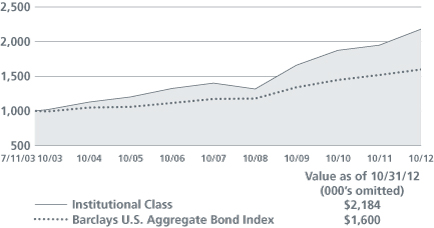
Neuberger Berman Strategic Income Fund Institutional Class generated an 11.85% total return for the 12 months ended October 31, 2012 and outperformed its benchmark, the Barclays U.S. Aggregate Bond Index, which provided a 5.25% return for the period. (Performance for all share classes is provided in the table immediately following this letter.)
Shifting investor sentiment due to mixed economic data, the European sovereign debt crisis and uncertainties regarding future central bank policy resulted in occasions of increased market volatility during the reporting period. However, it appears that investors who took on greater risk were generally rewarded.
During the reporting period there were several setbacks in the non-Treasury market, however these proved to be only temporary in nature as demand was strong from investors looking to generate incremental yield. Also supporting non-Treasuries were actions taken by the Federal Reserve ("Fed") to stimulate the economy. Most prominent was the Fed's third round of quantitative easing ("QE3") that was initiated in September. The Fed's policy entails the open-ended purchase of agency mortgage-backed securities and an extension to keep the federal funds rate at a historically low level until at least mid-2015.
The Fund was rewarded for its overweight to non-Treasuries, as they outperformed equal-duration Treasuries during the period. In particular, the Fund's overweights to non-agency mortgage-backed securities ("MBS"), commercial mortgage-backed securities ("CMBS") bank loans and high yield corporate bonds benefited performance as their spreads (the difference in yield between Treasuries and other bond sectors) narrowed during the reporting period given generally robust investor demand. Elsewhere, an allocation to Treasury Inflation Protected Securities ("TIPS") contributed to performance given expectations for rising inflation tied to QE3. Finally, the Fund's yield curve positioning was a slight positive for performance. The Fund used long and/or short Treasury and interest rate futures during the period to assist in managing its duration positioning, which slightly detracted from results.
Several adjustments were made to the portfolio during the reporting period. Early in the period we added global developed market sovereign bonds to the portfolio. Given the strong performance of non-Treasuries, in recent months we chose to realize some profits and reduce the Fund's overall risk exposure. As a result, we diversified the Fund's holdings in non-investment grade bonds by reducing exposure to high yield corporate bonds and increasing the allocation to bank loans and non-agency MBS. Elsewhere, we upgraded the quality of the investment grade corporate bond portion of the portfolio by reducing exposure to banking, energy and chemicals. In contrast, we increased the Fund's allocation to less cyclical and more stable sectors such as cable/media, food and beverage and tobacco. We reduced our weighting in agency MBS given the strong performance at the end of the fiscal year, primarily due to QE3, and we increased our exposure to U.S. Treasuries.
Data released in recent months appear to us to be consistent with our forecast that the U.S. economy has enough momentum to continue expanding, albeit at a relatively modest pace. We also feel that core inflation will remain fairly well contained and allow the Fed to continue pursuing its highly accommodative monetary policy. In our view, the Fed's actions seem likely to drive investors to riskier assets in an attempt to boost their returns in the ultra-low interest rate environment. That being said, we anticipate seeing periods of volatility given the continuation of several unresolved global macro issues, as well as the uncertainties associated with post-November election policy and the fiscal cliff. However, we feel it remains prudent to maintain our broader overweight to the spread sectors as we believe it is the appropriate strategy for long-term investors.
Sincerely,
THANOS BARDAS, DAVID M. BROWN, ANDREW A. JOHNSON AND BRADLEY C. TANK
PORTFOLIO CO-MANAGERS
Information about the principal risks of investing in the Fund is set forth in the prospectus and statement of additional information.
The portfolio composition, industries and holdings of the Fund are subject to change.
Strategic Income Fund (Unaudited)
| Trust Class | NSTTX |
| Institutional Class | NSTLX |
| Class A | NSTAX |
| Class C | NSTCX |
PORTFOLIO BY TYPE OF SECURITY |
| (as a % of Total Net Assets) | |
| Asset-Backed Securities | | | 6.2 | % | |
| Corporate Debt Securities | | | 36.8 | | |
| Bank Loan Obligations | | | 16.4 | | |
| Government Securities | | | 4.7 | | |
| Mortgage-Backed Securities | | | 41.8 | | |
| U.S. Treasury Securities | | | 11.7 | | |
| Short-Term Investments | | | 6.8 | | |
Liabilities, less cash, receivables and other assets | | | (24.4 | ) | |
| Total | | | 100.0 | % | |
| | | Inception | Average Annual Total Return Ended 10/31/2012 | |
| | | Date | 1 Year | | 5 Years | | Life of Fund | |
| At NAV | | | | | | | | |
Trust Class13 | | 04/02/2007 | | 11.46 | % | | | 8.87 | % | | | 8.53 | % | |
| Institutional Class | | 07/11/2003 | | 11.85 | % | | | 9.26 | % | | | 8.74 | % | |
Class A13 | | 12/20/2007 | | 11.39 | % | | | 8.84 | % | | | 8.52 | % | |
Class C13 | | 12/20/2007 | | 10.62 | % | | | 8.08 | % | | | 8.11 | % | |
| With Sales Charge | | | | | | | | |
Class A13 | | | | 6.64 | % | | | 7.90 | % | | | 8.02 | % | |
Class C13 | | | | 9.62 | % | | | 8.08 | % | | | 8.11 | % | |
| Index | | | | | | | | |
Barclays U.S. Aggregate Bond Index1,14 | | | | 5.25 | % | | | 6.38 | % | | | 5.17 | % | |
The performance data quoted represent past performance and do not indicate future results. Current performance may be lower or higher than the performance data quoted. For more current performance data, please visit www.nb.com/performance.
The results shown in the table reflect the reinvestment of income dividends and other distributions, if any. The results do not reflect the effect of taxes a shareholder would pay on Fund distributions or on the redemption of Fund shares.
The investment return and principal value of an investment will fluctuate and shares, when redeemed, may be worth more or less than their original cost.
Because the Fund had a different goal and strategy, which included managing assets by an asset allocation committee, prior to February 29, 2008, its performance during that time might have been different if current policies had been in effect.
Returns would have been lower if Neuberger Berman Management LLC ("Management") had not reimbursed certain expenses and/or waived a portion of the investment management fees during certain of the periods shown. Repayment by a class (of expenses previously reimbursed and/or fees previously waived by Management) will decrease the class's returns. Please see Note B in the Notes to Financial Statements for specific information regarding expense reimbursement and/or fee waiver arrangements.
For the period ended October 31, 2012, the 30-day SEC yields were 2.88%, 3.23%, 2.71% and 2.13% for Trust Class, Institutional Class, Class A and Class C shares, respectively. Absent expense reimbursements and/or fee waivers, the 30-day SEC yields would have been 2.77%, 3.12%, 2.59% and 2.00% for Trust Class, Institutional Class, Class A and Class C shares, respectively.
Returns shown with a sales charge reflect the deduction of the current maximum initial sales charge of 4.25% for Class A shares and the applicable contingent deferred sales charges (CDSC) for Class C shares. The maximum CDSC for Class C shares is 1%, which is reduced to 0% after 1 year. The performance of the Fund's share classes will differ primarily due to different sales charge structures and class expenses. Please see the prospectus for more information about sales charge structures, if any, and class expenses for your share class.
Strategic Income Fund (Unaudited)
COMPARISON OF A $1,000,000 INVESTMENT |
(000's omitted)
This graph shows the change in value of a hypothetical $1,000,000 investment in the Fund over the past 10 fiscal years, or since the Fund's inception if it has not operated for 10 years. The graph is based on the Institutional Class shares only; the performance of the Fund's share classes will differ primarily due to different sales charge structures and class expenses (see Performance Highlights chart on previous page). The result is compared with benchmarks, which include a broad-based market index and may include a more narrowly based index. Market indices have not been reduced to reflect any of the fees and costs of investing. The results shown in the graph reflect the reinvestment of income dividends and other distributions, if any. The results do not reflect the effect of taxes a shareholder would pay on Fund distributions or on the redemption of Fund shares. Results represent past performance and do not indicate future results. |
Endnotes (Unaudited)
| 1 | Please see "Glossary of Indices" on page 26 for a description of indices. Please note that indices do not take into account any fees, expenses or tax consequences of investing in the individual securities that they track, and that individuals cannot invest directly in any index. Data about the performance of an index is prepared or obtained by Neuberger Berman Management LLC ("Management") and reflects the reinvestment of income dividends and other distributions, if any. The Fund may invest in securities not included in a described index and/or may not invest in all securities included in a described index. |
| | |
| The performance information for periods prior to June 13, 2005, is that of the Fund's predecessor, Ariel Premier Bond Fund ("Ariel Fund"). The investment policies, guidelines and restrictions of the Fund are in all material respects equivalent to those of Ariel Fund. Returns would have been lower if Ariel Fund's manager had not waived certain of its fees during these periods. |
| | |
| The performance information for Institutional Class is that of Ariel Fund Institutional Class for the period October 1, 1995 (inception date) through June 10, 2005. The performance information for Investor Class is that of Ariel Fund Institutional Class for the period October 1, 1995 through January 31, 1997 (the period prior to the class' inception date), and that of Ariel Fund Investor Class for the period February 1, 1997 (class' inception date) through June 10, 2005. Ariel Fund Institutional Class had lower expenses and typically higher returns than Ariel Fund Investor Class. |
| | |
| The performance information for Class A and Class C prior to the classes' inception date is that of the Institutional Class of Neuberger Berman Core Bond Fund (please see Endnote 3). The performance information for the Institutional Class has been adjusted to reflect the appropriate sales charges applicable to Class A and Class C shares, but has not been adjusted to take into account differences in class specific operating expenses (such as 12b-1 fees).The Institutional Class has lower expenses and typically higher returns than Class A and Class C. |
| | |
| The performance information for Institutional Class and Class C prior to the classes' inception date is that of Class A of Neuberger Berman Floating Rate Income Fund. The performance information (at NAV) of Class A has been adjusted to reflect the appropriate sales charge applicable to Class C shares, but has not been adjusted to take into account differences in class specific operating expenses (such as 12b-1 fees). Class A has higher expenses and typically lower returns (at NAV) than Institutional Class. Class A has lower expenses and typically higher returns (at NAV) than Class C. |
| | |
| The performance information for the period April 1, 1996 through September 6, 2002, is that of the Fund's predecessor, Lipper High Income Bond Fund ("Lipper Fund"), and the performance information for the period February 1, 1992 through March 31, 1996, is that of Lipper Fund's predecessor partnership. The investment policies, objectives, guidelines and restrictions of the Fund are in all material respects equivalent to those of Lipper Fund, and the investment policies, objectives, guidelines and restrictions of Lipper Fund were in all material respects equivalent to those of its predecessor partnership. As mutual funds registered under the Investment Company Act of 1940 ("1940 Act"), the Fund is, and Lipper Fund was, subject to certain restrictions under the 1940 Act and the Internal Revenue Code ("Code") to which Lipper Fund's predecessor partnership was not subject. Had Lipper Fund's predecessor partnership been registered under the 1940 Act and been subject to the provisions of the 1940 Act and the Code, its investment performance may have been adversely affected. Returns would have been lower if Lipper Fund's manager had not waived certain of its fees during these periods. |
| | |
| The performance information for Investor Class is that of Lipper Fund Premier Class for the period April 1, 1996 through September 6, 2002, and that of Lipper Fund's predecessor partnership for the period February 1, 1992 (inception date) through March 31, 1996. |
| | |
| 8 | The performance information for Institutional Class, Class A, Class C and Class R3 prior to the classes' inception date is that of the Investor Class of Neuberger Berman High Income Bond Fund (please see Endnote 7). The performance information of the Investor Class has been adjusted to reflect the appropriate sales charges applicable |
| | to Class A and Class C shares, but has not been adjusted to take into account differences in class specific operating expenses (such as 12b-1 fees). The Investor Class has lower expenses and typically higher returns than Class A, Class C and Class R3. The Investor Class has higher expenses and typically lower returns than Institutional Class. |
| | |
| 9 | Tax-equivalent effective yield is the taxable effective yield that a shareholder would have had to receive in order to realize the same level of yield after federal income taxes at the highest federal tax rate, currently 35%, assuming that all of the Fund's income is exempt from federal income taxes. |
| | |
| 10 | A portion of the Fund's income may be a tax preference item for purposes of the federal alternative minimum tax for certain shareholders. |
| | |
| 11 | The performance information for Institutional Class, Class A and Class C prior to the classes' inception date is that of the Investor Class of Neuberger Berman Municipal Intermediate Bond Fund. The performance information of the Investor Class has been adjusted to reflect the appropriate sales charges applicable to Class A and Class C shares, but has not been adjusted to take into account differences in class specific operating expenses (such as 12b-1 fees). The Investor Class has lower expenses and typically higher returns than Class A and Class C. The Investor Class has higher expenses and typically lower returns than Institutional Class. |
| | |
| 12 | The performance information for Trust Class, Institutional Class, Class A and Class C prior to the classes' respective inception dates is that of the Investor Class of Neuberger Berman Short Duration Bond Fund. The performance information of the Investor Class has been adjusted to reflect the appropriate sales charges applicable to Class A and Class C shares, but has not been adjusted to take into account differences in class specific operating expenses (such as 12b-1 fees). The Investor Class has lower expenses and typically higher returns than Trust Class, Class A and Class C. The Investor Class has higher expenses and typically lower returns than Institutional Class. |
| | |
| 13 | The performance information for Trust Class, Class A and Class C prior to the classes' respective inception dates is that of the Institutional Class of Neuberger Berman Strategic Income Fund. The performance information of the Institutional Class has been adjusted to reflect the appropriate sales charges applicable to Class A and Class C shares, but has not been adjusted to take into account differences in class specific operating expenses (such as 12b-1 fees). The Institutional Class has lower expenses and typically higher returns than Trust Class, Class A and Class C. |
| | |
| 14 | The date used to calculate Life of Fund performance for the index is the inception date of the oldest share class. |
For more complete information on any of the Neuberger Berman Income Funds, call Neuberger Berman Management LLC at (800) 877-9700, or visit our website at www.nb.com.
Glossary of Indices (Unaudited)
Barclays 1-3 Year U.S. Government/Credit Index: | | An unmanaged index that includes all bonds in the U.S. Government/Credit Index with at least one to three years to maturity. The U.S. Government/Credit Index includes all securities in the Government and Credit Indices. The Government Index includes Treasuries (i.e., public obligations of the U.S. Treasury that have remaining maturities of more than one year) and agencies (i.e., publicly issued debt of U.S. Government agencies, quasi-federal corporations, and corporate or foreign debt guaranteed by the U.S. Government). The Credit Index includes publicly issued U.S. corporate and foreign debentures and secured notes that meet specified maturity, liquidity, and quality requirements. All bonds in the index must meet the following additional criteria: must have at least one year to final maturity regardless of call features; must have at least $250 million par amount outstanding; must be rated investment-grade (Baa3/BBB- or higher) by at least two of the following ratings agencies: Standard & Poor's, Moody's Investors Services, Inc., and Fitch, Inc.; must be fixed rate; must be dollar-denominated and non-convertible; and must be publicly issued. | |
| | | | |
Barclays 7-Year General Obligation Index: | | An unmanaged total return performance benchmark for the 7-year (6-8) maturity component of the Barclays General Obligation ("G.O.") Index, which tracks the performance of the investment-grade G.O. (state and local) tax-exempt bond market. | |
| | | | |
| Barclays U.S. Aggregate Bond Index: | | An unmanaged index that represents the U.S. domestic investment grade bond market. It is comprised of the Barclays Government/Corporate Bond Index, Mortgage-Backed Securities Index, and Asset-Backed Securities Index, including securities that are of investment-grade quality or better, have at least one year to maturity, and have an outstanding par value of at least $250 million. Asset-backed securities must have at least $500 million deal size and $25 million tranche size. For commercial mortgage-backed securities, the original transaction must have a minimum deal size of $500 million, and a minimum tranche size of $25 million; the current outstanding transaction size must be at least $300 million to remain in the index. | |
| | | | |
| S&P/ LSTA Leveraged Loan Index: | | A daily total return index that uses Loan Syndications and Trading Association (LSTA)/Loan Pricing Corporation (LPC) mark-to-market pricing to calculate market value change. On a real-time basis, the Index tracks the current outstanding balance and spread over LIBOR for fully funded term loans. The Index represents a broad cross section of leveraged loans syndicated in the United States, including dollar-denominated loans to overseas issuers. | |
| | | | |
BofA Merrill Lynch U.S. High Yield Master II Constrained Index: | | An unmanaged market value-weighted index of all domestic and Yankee high-yield bonds, including deferred interest bonds and payment-in-kind securities. Qualifying bonds must have at least one year remaining to maturity, a fixed coupon schedule and a minimum amount outstanding of $100 million. Qualifying bonds are capitalization weighted provided the total allocation to an individual issuer does not exceed 2%. | |
BofA Merrill Lynch 0-5 Year BB-B US High Yield Constrained Index: | | An unmanaged index that tracks the performance of short-term US dollar denominated below investment grade corporate debt publicly issued in the US domestic market. Qualifying securities must have less than five years remaining term to final maturity, be rated BB1 through B3, inclusive, based on an average of Moody's, S&P and Fitch, have a fixed coupon schedule and a minimum amount outstanding of $100 million. Original issue zero coupon bonds, 144a securities, both with and without registration rights, and pay-in-kind securities, including toggle notes, qualify for inclusion in the Index. Eurodollar bonds (USD bonds not issued in the US domestic market), taxable and tax-exempt US municipal, warrant-bearing, DRD-eligible and defaulted securities are excluded from the Index. Index constituents are capitalization-weighted, based on their current amount outstanding, provided the total allocation to an individual issuer does not exceed 2%. Issuers that exceed the limit are reduced to 2% and the face value of each of their bonds is adjusted on a pro-rata basis. Similarly, the face values of bonds of all other issuers that fall below the 2% cap are increased on a pro-rate basis. | |
Information About Your Fund's Expenses (Unaudited)
As a Fund shareholder, you incur two types of costs: (1) transaction costs, including sales charges (loads) on purchase payments or redemption proceeds (if applicable); and (2) ongoing costs, including management fees; distribution and/or service (12b-1) fees (if applicable); and other Fund expenses. This example is intended to help you understand your ongoing costs (in dollars) of investing in a Fund and compare these costs with the ongoing costs of investing in other mutual funds.
This table is designed to provide information regarding costs related to your investments. The following examples are based on an investment of $1,000 made at the beginning of the six month period ended October 31, 2012 and held for the entire period. The table illustrates each Fund's costs in two ways:
| Actual Expenses and Performance: | | The first section of the table provides information about actual account values and actual expenses in dollars, based on the Fund's actual performance during the period. You may use the information in this line, together with the amount you invested, to estimate the expenses you paid over the period. Simply divide your account value by $1,000 (for example, an $8,600 account value divided by $1,000 = 8.6), then multiply the result by the number in the first section of the table under the heading entitled "Expenses Paid During the Period" to estimate the expenses you paid over the period. | |
Hypothetical Example for Comparison Purposes: | | The second section of the table provides information about hypothetical account values and hypothetical expenses based on the Fund's actual expense ratio and an assumed rate of return at 5% per year before expenses. This return is not the Fund's actual return. The hypothetical account values and expenses may not be used to estimate the actual ending account balance or expenses you paid for the period. You may use this information to compare the ongoing costs of investing in a Fund versus other funds. To do so, compare the expenses shown in this 5% hypothetical example with the 5% hypothetical examples that appear in the shareholder reports of other funds. | |
Please note that the expenses in the table are meant to highlight your ongoing costs only and do not include any transaction costs, such as sales charges (loads) (if applicable). Therefore, the information under the heading "Hypothetical (5% annual return before expenses)" is useful in comparing ongoing costs only, and will not help you determine the relative total costs of owning different funds. In addition, if these transaction costs were included, your costs would have been higher.
Expense Information as of 10/31/12 (Unaudited)
| Neuberger Berman Income Funds |
| | ACTUAL | HYPOTHETICAL (5% ANNUAL RETURN BEFORE EXPENSES)(3) |
| | | Beginning Account Value 5/1/12 | Ending Account Value 10/31/12 | Expenses Paid During the Period(1) 5/1/12 - 10/31/12 | | Expense Ratio | | Beginning Account Value 5/1/12 | | Ending Account Value 10/31/12 | Expenses Paid During the Period(1) 5/1/12 - 10/31/12 | | Expense Ratio |
| Neuberger Berman Core Bond Fund |
| Investor Class | | $ 1,000.00 | $ 1,034.10 | $4.35 | | | | .85 | % | | $ 1,000.00 | | $1,020.86 | | | $4.32 | | | | .85 | % |
| Institutional Class | | $ 1,000.00 | $ 1,036.10 | $2.30 | | | | .45 | % | | $ 1,000.00 | | $1,022.87 | | | $2.29 | | | | .45 | % |
| Class A | | $ 1,000.00 | $ 1,033.10 | $4.34 | | | | .85 | % | | $ 1,000.00 | | $1,020.86 | | | $4.32 | | | | .85 | % |
| Class C | | $ 1,000.00 | $ 1,029.20 | $8.16 | | | | 1.60 | % | | $ 1,000.00 | | $1,017.09 | | | $8.11 | | | | 1.60 | % |
| | | | | | | | | | | | | | | | | | | | | | |
| Neuberger Berman Floating Rate Income Fund |
| Institutional Class | | $ 1,000.00 | $ 1,029.90 | $3.57 | | | | .70 | % | | $ 1,000.00 | | $1,021.62 | | | $3.56 | | | | .70 | % |
| Class A | | $ 1,000.00 | $ 1,027.90 | $5.45 | | | | 1.07 | % | | $ 1,000.00 | | $1,019.76 | | | $5.43 | | | | 1.07 | % |
| Class C | | $ 1,000.00 | $ 1,024.00 | $9.26 | | | | 1.82 | % | | $ 1,000.00 | | $1,015.99 | | | $9.22 | | | | 1.82 | % |
| | | | | | | | | | | | | | | | | | | | | | |
| Neuberger Berman High Income Bond Fund |
| Investor Class | | $ 1,000.00 | $ 1,056.50 | $4.34 | | | | .84 | % | | $ 1,000.00 | | $1,020.91 | | | $4.27 | | | | .84 | % |
| Institutional Class | | $ 1,000.00 | $ 1,058.40 | $3.62 | | | | .70 | % | | $ 1,000.00 | | $1,021.62 | | | $3.56 | | | | .70 | % |
| Class A | | $ 1,000.00 | $ 1,055.20 | $5.63 | | | | 1.09 | % | | $ 1,000.00 | | $1,019.66 | | | $5.53 | | | | 1.09 | % |
| Class C | | $ 1,000.00 | $ 1,052.40 | $9.44 | | | | 1.83 | % | | $ 1,000.00 | | $1,015.94 | | | $9.27 | | | | 1.83 | % |
| Class R3 | | $ 1,000.00 | $ 1,055.00 | $6.97 | | | | 1.35 | % | | $ 1,000.00 | | $1,018.35 | | | $6.85 | | | | 1.35 | % |
| | | | | | | | | | | | | | | | | | | | | | |
| Neuberger Berman Municipal Intermediate Bond Fund |
| Investor Class | | $ 1,000.00 | $ 1,026.10 | $3.31 | | | | .65 | % | | $ 1,000.00 | | $1,021.87 | | | $3.30 | | | | .65 | % |
| Institutional Class | | $ 1,000.00 | $ 1,026.90 | $2.55 | | | | .50 | % | | $ 1,000.00 | | $1,022.62 | | | $2.54 | | | | .50 | % |
| Class A | | $ 1,000.00 | $ 1,025.00 | $4.43 | | | | .87 | % | | $ 1,000.00 | | $1,020.76 | | | $4.42 | | | | .87 | % |
| Class C | | $ 1,000.00 | $ 1,021.10 | $8.23 | | | | 1.62 | % | | $ 1,000.00 | | $1,016.99 | | | $8.21 | | | | 1.62 | % |
| | | | | | | | | | | | | | | | | | | | | | |
| Neuberger Berman Short Duration Bond Fund |
| Investor Class | | $ 1,000.00 | $ 1,016.30 | $3.60 | | | | .71 | % | | $ 1,000.00 | | $1,021.57 | | | $3.61 | | | | .71 | % |
| Trust Class | | $ 1,000.00 | $ 1,017.40 | $4.11 | | | | .81 | % | | $ 1,000.00 | | $1,021.06 | | | $4.12 | | | | .81 | % |
| Institutional Class | | $ 1,000.00 | $ 1,018.60 | $2.59 | | | | .51 | % | | $ 1,000.00 | | $1,022.57 | | | $2.59 | | | | .51 | % |
| Class A | | $ 1,000.00 | $ 1,015.70 | $4.51 | | | | .89 | % | | $ 1,000.00 | | $1,020.66 | | | $4.52 | | | | .89 | % |
| Class C | | $ 1,000.00 | $ 1,013.20 | $8.25 | | | | 1.63 | % | | $ 1,000.00 | | $1,016.94 | | | $8.26 | | | | 1.63 | % |
| | | | | | | | | | | | | | | | | | | | | | |
| Neuberger Berman Short Duration High Income Fund |
| Institutional Class | | $ 1,000.00 | $ 1,003.80 | $0.66 | (2) | | | .71 | % | | $ 1,000.00 | | $1,021.57 | | | $3.61 | | | | .71 | % |
| Class A | | $ 1,000.00 | $ 1,003.60 | $0.95 | (2) | | | 1.02 | % | | $ 1,000.00 | | $1,020.01 | | | $5.18 | | | | 1.02 | % |
| Class C | | $ 1,000.00 | $ 1,003.00 | $1.49 | (2) | | | 1.60 | % | | $ 1,000.00 | | $1,017.09 | | | $8.11 | | | | 1.60 | % |
| | | | | | | | | | | | | | | | | | | | | | |
| Neuberger Berman Strategic Income Fund |
| Trust Class | | $ 1,000.00 | $ 1,062.70 | $5.70 | | | | 1.10 | % | | $ 1,000.00 | | $1,019.61 | | | $5.58 | | | | 1.10 | % |
| Institutional Class | | $ 1,000.00 | $ 1,064.50 | $3.89 | | | | .75 | % | | $ 1,000.00 | | $1,021.37 | | | $3.81 | | | | .75 | % |
| Class A | | $ 1,000.00 | $ 1,062.30 | $5.96 | | | | 1.15 | % | | $ 1,000.00 | | $1,019.36 | | | $5.84 | | | | 1.15 | % |
| Class C | | $ 1,000.00 | $ 1,058.70 | $9.57 | | | | 1.85 | % | | $ 1,000.00 | | $1,015.84 | | | $9.37 | | | | 1.85 | % |
| (1) | For each class, expenses are equal to the annualized expense ratio for the class, multiplied by the average account value over the period, multiplied by 184/366 (to reflect the one-half year period shown), unless otherwise indicated. |
| (2) | For each class, expenses are equal to the annualized expense ratio for the class, multiplied by the average account value over the period, multiplied by 34/366 (to reflect the period shown of September 28, 2012 (Commencement of Operations) to October 31, 2012). |
| (3) | Hypothetical 5% annual return before expenses is calculated by multiplying the number of days in the most recent period divided by 366. |
Schedule of Investments Neuberger Berman Core Bond Fund
| PRINCIPAL AMOUNT | | VALUE† |
| | | | |
| (000's omitted) | | (000's omitted)z |
| | | | |
| U.S. Treasury Securities-Backed by the Full Faith and Credit of the U.S. Government (43.7%) |
| $ | 7,440 | | U.S. Treasury Bonds, 6.88%, due 8/15/25 | | $ | 11,546 | ØØ |
| | 3,340 | | U.S. Treasury Bonds, 5.50%, due 8/15/28 | | | 4,765 | ØØ |
| | 2,505 | | U.S. Treasury Bonds, 4.50%, due 2/15/36 | | | 3,333 | ØØ |
| | 5,832 | | U.S. Treasury Inflation Index Bonds, 2.00%, due 1/15/26 | | | 7,738 | |
| | 666 | | U.S. Treasury Inflation Index Bonds, 3.88%, due 4/15/29 | | | 1,117 | |
| | 8,681 | | U.S. Treasury Inflation Index Notes, 2.38%, due 1/15/17 | | | 10,122 | ØØ |
| | 3,369 | | U.S. Treasury Inflation Index Notes, 1.13%, due 1/15/21 | | | 3,985 | ØØ |
| | 13,700 | | U.S. Treasury Notes, 0.50%, due 5/31/13 & 10/15/13 | | | 13,734 | |
| | 20,945 | | U.S. Treasury Notes, 0.38%, due 7/31/13 | | | 20,973 | |
| | 8,000 | | U.S. Treasury Notes, 0.13%, due 9/30/13 & 12/31/13 | | | 7,992 | |
| | 16,300 | | U.S. Treasury Notes, 0.25%, due 10/31/13 | | | 16,306 | |
| | 6,880 | | U.S. Treasury Notes, 2.38%, due 10/31/14 | | | 7,164 | |
| | 485 | | U.S. Treasury Notes, 1.00%, due 10/31/16 | | | 493 | |
| | 605 | | U.S. Treasury Notes, 3.25%, due 3/31/17 | | | 674 | |
| | 14,130 | | U.S. Treasury Notes, 3.63%, due 8/15/19 | | | 16,498 | ØØ |
| | | | | | |
| Total U.S. Treasury Securities-Backed by the Full Faith and Credit of the U.S. Government (Cost $123,589) | | 126,440 | |
| | | | | | |
| Mortgage-Backed Securities (46.1%) |
| |
| Collateralized Mortgage Obligations (0.7%) |
| | 189 | | Banc of America Funding Corp., Ser. 2005-F, Class 4A1, 3.08%, due 9/20/35 | | | 141 | µ |
| | 53 | | Banc of America Funding Corp., Ser. 2006-G, Class 2A1, 0.43%, due 7/20/36 | | | 45 | µ |
| | 94 | | Countrywide Asset-Backed Certificates, Ser. 2005-IM2, Class A3, 0.48%, due 1/25/36 | | | 85 | µ |
| | 247 | | First Horizon Mortgage Pass-Through Trust, Ser. 2005-AR5, Class 2A1, 2.71%, due 11/25/35 | | | 204 | µ |
| | 180 | | GSR Mortgage Loan Trust, Ser. 2005-AR3, Class 6A1, 3.01%, due 5/25/35 | | | 162 | µ |
| | 301 | | GSR Mortgage Loan Trust, Ser. 2007-AR1, Class 2A1, 2.82%, due 3/25/47 | | | 228 | µ |
| | 149 | | HSI Asset Loan Obligation, Ser. 2007-AR1, Class 2A1, 2.97%, due 1/25/37 | | | 98 | µ |
| | 35 | | IndyMac INDX Mortgage Loan Trust, Ser. 2006-AR7, Class 3A1, 2.94%, due 5/25/36 | | | 23 | µ |
| | 348 | | IndyMac INDX Mortgage Loan Trust, Ser. 2006-AR11, Class 2A1, 3.17%, due 6/25/36 | | | 225 | µ |
| | 477 | | JP Morgan Mortgage Trust, Ser. 2005-A3, Class 7CA1, 2.95%, due 6/25/35 | | | 421 | µ |
| | 149 | | Nomura Asset Acceptance Corp., Ser. 2007-2, Class A1A, 0.33%, due 4/25/47 | | | 74 | µ |
| | 62 | | Opteum Mortgage Acceptance Corp., Ser. 2005-3, Class A1B, 0.47%, due 7/25/35 | | | 61 | µ |
| | 227 | | Residential Accredit Loans, Inc., Ser. 2005-QA10, Class A31, 3.86%, due 9/25/35 | | | 164 | µ |
| | 274 | | Residential Accredit Loans, Inc., Ser. 2006-QA1, Class A21, 3.92%, due 1/25/36 | | | 195 | µ |
| | 103 | | Residential Accredit Loans, Inc., Ser. 2006-QO7, Class 3A2, 0.42%, due 9/25/46 | | | 55 | µ |
| | | | 2,181 | |
| Commercial Mortgage-Backed (12.2%) |
| | 390 | | Banc of America Commercial Mortgage, Inc., Ser. 2006-6, Class A4, 5.36%, due 10/10/45 | | | 449 | |
| | 500 | | Banc of America Commercial Mortgage, Inc., Ser. 2006-5, Class A4, 5.41%, due 9/10/47 | | | 569 | |
| | 1,025 | | Banc of America Commercial Mortgage, Inc., Ser. 2007-1, Class A4, 5.45%, due 1/15/49 | | | 1,188 | |
| | 725 | | Banc of America Commercial Mortgage, Inc., Ser. 2007-3, Class A4, 5.53%, due 6/10/49 | | | 842 | µØØ |
| | 490 | | Banc of America Commercial Mortgage, Inc., Ser. 2007-4, Class ASB, 5.71%, due 2/10/51 | | | 515 | |
| | 500 | | Bear Stearns Commercial Mortgage Securities, Ser. 2007-PW15, Class A4, 5.33%, due 2/11/44 | | | 557 | |
| | 400 | | Bear Stearns Commercial Mortgage Securities, Ser. 2007-PW17, Class A4, 5.69%, due 6/11/50 | | | 473 | |
| | 1,750 | | Citigroup/Deutsche Bank Commercial Mortgage Trust, Ser. 2007-CD4, Class A4, 5.32%, due 12/11/49 | | | 2,011 | ØØ |
| | 1,075 | | Commercial Mortgage Loan Trust, Ser. 2008-LS1, Class A4B, 6.00%, due 12/10/49 | | | 1,285 | µØØ |
| | 1,000 | | Commercial Mortgage Pass-Through Certificates, Ser. 2006-C8, Class A4, 5.31%, due 12/10/46 | | | 1,150 | ØØ |
| | 82 | | Credit Suisse Mortgage Capital Certificates, Ser. 2007-TF2A, Class A1, 0.39%, due 4/15/22 | | | 78 | ñµ |
| | 80 | | Credit Suisse Mortgage Capital Certificates, Ser. 2007-C3, Class A4, 5.68%, due 6/15/39 | | | 91 | µ |
| | 1,200 | | Credit Suisse Mortgage Capital Certificates, Ser. 2006-C4, Class A3, 5.47%, due 9/15/39 | | | 1,369 | ØØ |
See Notes to Schedule of Investments
Schedule of Investments Neuberger Berman Core Bond Fund (cont'd)
| PRINCIPAL AMOUNT | | VALUE† |
| | | | |
| (000's omitted) | | (000's omitted)z |
| | | | |
| $ | 520 | | Credit Suisse Mortgage Capital Certificates, Ser. 2007-C4, Class A4, 5.76%, due 9/15/39 | | $ | 598 | µØØ |
| | 100 | | Credit Suisse Mortgage Capital Certificates, Ser. 2007-C1, Class A3, 5.38%, due 2/15/40 | | | 111 | |
| | 1,000 | | Credit Suisse Mortgage Capital Certificates, Ser. 2007-C5, Class A4, 5.70%, due 9/15/40 | | | 1,153 | ØØ |
| | 250 | | Credit Suisse Mortgage Capital Certificates, Ser. 2008-C1, Class A3, 6.07%, due 2/15/41 | | | 292 | µ |
| | 1,500 | | CW Capital Cobalt Ltd., Ser. 2007-C3, Class A4, 5.80%, due 5/15/46 | | | 1,757 | µØØ |
| | 343 | | DBUBS Mortgage Trust, Ser. 20011-LC1A, Class A1, 3.74%, due 11/10/46 | | | 372 | ñ |
| | 850 | | Greenwich Capital Commercial Funding Corp., Ser. 2007-GG9, Class A4, 5.44%, due 3/10/39 | | | 979 | ØØ |
| | 2,050 | | Greenwich Capital Commercial Funding Corp., Ser. 2007-GG11, Class A4, 5.74%, due 12/10/49 | | | 2,411 | ØØ |
| | 550 | | GS Mortgage Securities Corp. II, Ser. 2006-GG8, Class A4, 5.56%, due 11/10/39 | | | 637 | ØØ |
| | 2,140 | | GS Mortgage Securities Corp. II, Ser. 2007-GG10, Class A4, 5.79%, due 8/10/45 | | | 2,458 | µØØ |
| | 1,100 | | JP Morgan Chase Commercial Mortgage Securities Corp., Ser. 2006-LDP9, Class A3, 5.34%, due 5/15/47 | | | 1,264 | ØØ |
| | 1,200 | | JP Morgan Chase Commercial Mortgage Securities Corp., Ser. 2007-CB18, Class A4, 5.44%, due 6/12/47 | | | 1,391 | ØØ |
| | 1,950 | | JP Morgan Chase Commercial Mortgage Securities Corp., Ser. 2007-LDPX, Class A3, 5.42%, due 1/15/49 | | | 2,258 | ØØ |
| | 1,380 | | JP Morgan Chase Commercial Mortgage Securities Corp., Ser. 2007-LD11, Class A4, 5.81%, due 6/15/49 | | | 1,616 | µØØ |
| | 507 | | JP Morgan Chase Commercial Mortgage Securities Corp., Ser. 2007-CB20, Class ASB, 5.69%, due 2/12/51 | | | 558 | |
| | 1,219 | | JP Morgan Chase Commercial Mortgage Securities Corp., Ser. 2007-LD12, Class A4, 5.88%, due 2/15/51 | | | 1,443 | ØØ |
| | 1,000 | | Merrill Lynch/Countrywide Commercial Mortgage Trust, Ser. 2007-5, Class A4, 5.38%, due 8/12/48 | | | 1,132 | ØØ |
| | 1,400 | | Merrill Lynch/Countrywide Commercial Mortgage Trust, Ser. 2007-7, Class A4, 5.73%, due 6/12/50 | | | 1,601 | µØØ |
| | 273 | | Morgan Stanley Capital I, Ser. 2007-IQ14, Class A2, 5.61%, due 4/15/49 | | | 282 | |
| | 300 | | Morgan Stanley Capital I, Ser. 2007-IQ16, Class A4, 5.81%, due 12/12/49 | | | 358 | |
| | 1,755 | | Wachovia Bank Commercial Mortgage Trust, Ser. 2007-C32, Class A3, 5.75%, due 6/15/49 | | | 2,017 | µØØ |
| | | | 35,265 | |
| Fannie Mae (13.3%) |
| | 22 | | Fannie Mae Grantor Trust, Ser. 2002-T5, Class A1, 0.45%, due 5/25/32 | | | 21 | µ |
| | 510 | | Pass-Through Certificates, 4.00%, due 12/1/41 | | | 547 | |
| | 2,184 | | Pass-Through Certificates, 4.50%, due 5/1/40 – 6/1/41 | | | 2,367 | |
| | 5,551 | | Pass-Through Certificates, 5.00%, due 3/1/21 – 8/1/38 | | | 6,071 | |
| | 3,994 | | Pass-Through Certificates, 5.50%, due 5/1/30 – 4/1/40 | | | 4,392 | |
| | 3,983 | | Pass-Through Certificates, 6.00%, due 11/1/15 – 11/1/38 | | | 4,438 | |
| | 71 | | Pass-Through Certificates, 8.50%, due 4/1/34 | | | 87 | |
| | 1,395 | | Pass-Through Certificates, 3.00%, TBA, 30 Year Maturity | | | 1,460 | Ø |
| | 5,255 | | Pass-Through Certificates, 3.50%, TBA, 30 Year Maturity | | | 5,597 | Ø |
| | 10,225 | | Pass-Through Certificates, 4.00%, TBA, 30 Year Maturity | | | 10,949 | Ø |
| | 2,375 | | Pass-Through Certificates, 5.50%, TBA, 30 Year Maturity | | | 2,604 | Ø |
| | | | 38,533 | |
| Freddie Mac (19.9%) |
| | 1,505 | | Federal Home Loan Bank, Bonds, 5.50%, due 7/15/36 | | | 2,093 | ØØ |
| | 242 | | Pass-Through Certificates, 2.56%, due 2/1/37 | | | 256 | µ |
| | 458 | | Pass-Through Certificates, 2.80%, due 4/1/37 | | | 491 | µ |
| | 2,113 | | Pass-Through Certificates, 4.00%, due 12/1/40 – 2/1/41 | | | 2,257 | |
| | 5,416 | | Pass-Through Certificates, 4.50%, due 1/1/38 – 7/1/41 | | | 5,818 | |
| | 1,149 | | Pass-Through Certificates, 5.00%, due 5/1/23 – 5/1/41 | | | 1,248 | |
| | 4,837 | | Pass-Through Certificates, 5.50%, due 5/1/35 – 11/1/38 | | | 5,264 | |
| | 121 | | Pass-Through Certificates, 6.00%, due 12/1/37 | | | 134 | |
See Notes to Schedule of Investments
Schedule of Investments Neuberger Berman Core Bond Fund (cont'd)
| PRINCIPAL AMOUNT | | VALUE† |
| | | | |
| (000's omitted) | | (000's omitted)z |
| | | | |
| $ | 20 | | Pass-Through Certificates, 6.50%, due 11/1/25 | | $ | 23 | |
| | 15,785 | | Pass-Through Certificates, 3.50%, TBA, 30 Year Maturity | | | 16,779 | Ø |
| | 21,725 | | Pass-Through Certificates, 4.00%, TBA, 30 Year Maturity | | | 23,175 | Ø |
| | | | 57,538 | |
| | | | Total Mortgage-Backed Securities (Cost $128,984) | | | 133,517 | |
| Corporate Debt Securities (24.6%) |
| |
| Aerospace & Defense (0.3%) |
| | 905 | | L-3 Communications Corp., Guaranteed Notes, 3.95%, due 11/15/16 | | | 984 | ØØ |
| | | | | | | | |
| Agriculture (1.0%) |
| | 555 | | Altria Group, Inc., Guaranteed Notes, 2.85%, due 8/9/22 | | | 556 | |
| | 420 | | Lorillard Tobacco Co., Guaranteed Notes, 2.30%, due 8/21/17 | | | 425 | |
| | 1,075 | | Lorillard Tobacco Co., Guaranteed Notes, 8.13%, due 6/23/19 | | | 1,383 | ØØ |
| | 495 | | Reynolds American, Inc., Guaranteed Notes, 3.25%, due 11/1/22 | | | 501 | |
| | | | 2,865 | |
| Airlines (0.2%) |
| | 630 | | Continental Airlines, Inc., Pass-Through Certificates, Ser. 2012-2, Class A, 4.00%, due 10/29/24 | | | 655 | |
| | | | | | | | |
| Banks (3.8%) |
| | 1,320 | | Bank of America Corp., Senior Notes, 1.50%, due 10/9/15 | | | 1,321 | |
| | 830 | | BB&T Corp., Senior Unsecured Global Medium-Term Notes, Ser. C, 1.60%, due 8/15/17 | | | 845 | |
| | 690 | | Citigroup, Inc., Senior Unsecured Notes, 2.65%, due 3/2/15 | | | 711 | ØØ |
| | 1,195 | | Goldman Sachs Group, Inc., Senior Notes, 3.30%, due 5/3/15 | | | 1,248 | ØØ |
| | 440 | | Goldman Sachs Group, Inc., Subordinated Notes, 6.75%, due 10/1/37 | | | 485 | |
| | 855 | | JPMorgan Chase & Co., Senior Unsecured Notes, 3.45%, due 3/1/16 | | | 910 | |
| | 1,395 | | JPMorgan Chase & Co., Senior Unsecured Notes, 2.00%, due 8/15/17 | | | 1,410 | |
| | 810 | | Morgan Stanley, Senior Unsecured Global Medium-Term Notes, Ser. F, 5.63%, due 9/23/19 | | | 899 | |
| | 370 | | UnionBanCal Corp., Senior Unsecured Notes, 3.50%, due 6/18/22 | | | 392 | |
| | 1,075 | | US Bancorp, Subordinated Medium-Term Notes, 2.95%, due 7/15/22 | | | 1,109 | ØØ |
| | 1,490 | | Wells Fargo & Co., Senior Notes, 1.50%, due 7/1/15 | | | 1,515 | ØØ |
| | | | 10,845 | |
| Beverages (2.0%) |
| | 925 | | Anheuser-Busch InBev Worldwide, Inc., Guaranteed Notes, 2.50%, due 7/15/22 | | | 941 | ØØ |
| | 350 | | Anheuser-Busch InBev Worldwide, Inc., Guaranteed Notes, 3.75%, due 7/15/42 | | | 361 | |
| | 500 | | Heineken NV, Senior Notes, 1.40%, due 10/1/17 | | | 502 | ñ |
| | 1,125 | | Heineken NV, Senior Unsecured Notes, 3.40%, due 4/1/22 | | | 1,202 | ñ |
| | 1,030 | | Pernod-Ricard SA, Senior Unsecured Notes, 2.95%, due 1/15/17 | | | 1,086 | ñØØ |
| | 615 | | Pernod-Ricard SA, Senior Unsecured Notes, 5.50%, due 1/15/42 | | | 742 | ñØØ |
| | 870 | | SABMiller Holdings, Inc., Guaranteed Notes, 3.75%, due 1/15/22 | | | 957 | ñØØ |
| | | | 5,791 | |
| Biotechnology (0.2%) |
| | 580 | | Celgene Corp., Senior Unsecured Notes, 1.90%, due 8/15/17 | | | 589 | |
See Notes to Schedule of Investments
Schedule of Investments Neuberger Berman Core Bond Fund (cont'd)
| PRINCIPAL AMOUNT | | VALUE† |
| | | | |
| (000's omitted) | | (000's omitted)z |
| | | | |
| Commercial Services (0.5%) |
| $ | 1,085 | | ERAC USA Finance LLC, Guaranteed Notes, 7.00%, due 10/15/37 | | $ | 1,414 | ñØØ |
| | | | | | | | |
| Computers (0.3%) |
| | 580 | | Hewlett-Packard Co., Senior Unsecured Notes, 2.60%, due 9/15/17 | | | 565 | |
| | 370 | | Hewlett-Packard Co., Senior Unsecured Notes, 4.65%, due 12/9/21 | | | 370 | ØØ |
| | | | 935 | |
| Diversified Financial Services (2.7%) |
| | 285 | | Ford Motor Credit Co. LLC, Senior Unsecured Notes, 3.00%, due 6/12/17 | | | 291 | |
| | 715 | | Ford Motor Credit Co. LLC, Senior Unsecured Notes, 4.25%, due 9/20/22 | | | 741 | |
| | 1,120 | | General Electric Capital Corp., Senior Unsecured Notes, 1.63%, due 7/2/15 | | | 1,139 | ØØ |
| | 1,250 | | General Electric Capital Corp., Senior Unsecured Medium-Term Notes, 2.30%, due 4/27/17 | | | 1,291 | ØØ |
| | 1,480 | | General Electric Capital Corp., Senior Unsecured Notes, 3.15%, due 9/7/22 | | | 1,506 | |
| | 775 | | Harley-Davidson Financial Services, Inc., Guaranteed Notes, 1.15%, due 9/15/15 | | | 779 | ñ |
| | 720 | | John Deere Capital Corp., Senior Notes, 1.70%, due 1/15/20 | | | 722 | |
| | 1,440 | | Toyota Motor Credit Corp., Senior Unsecured Medium-Term Notes, 1.25%, due 10/5/17 | | | 1,439 | |
| | | | 7,908 | |
| Electric (2.4%) |
| | 830 | | Dominion Resources, Inc., Senior Unsecured Notes, Ser. C, 4.05%, due 9/15/42 | | | 863 | |
| | 1,410 | | Duke Energy Corp., Senior Unsecured Notes, 1.63%, due 8/15/17 | | | 1,420 | |
| | 1,660 | | Exelon Generation Co., LLC, Senior Unsecured Notes, 4.00%, due 10/1/20 | | | 1,790 | ØØ |
| | 485 | | Georgia Power Co., Senior Unsecured Notes, 4.30%, due 3/15/42 | | | 531 | |
| | 895 | | Pacific Gas & Electric Co., Senior Unsecured Notes, 4.45%, due 4/15/42 | | | 995 | ØØ |
| | 880 | | PPL Capital Funding, Inc., Guaranteed Notes, 3.50%, due 12/1/22 | | | 904 | |
| | 460 | | Progress Energy, Inc., Senior Unsecured Notes, 3.15%, due 4/1/22 | | | 474 | |
| | | | 6,977 | |
| Electronics (0.2%) |
| | 695 | | Thermo Fisher Scientific, Inc., Senior Unsecured Notes, 1.85%, due 1/15/18 | | | 708 | |
| | | | | | | | |
| Food (0.3%) |
| | 675 | | Kraft Foods Group, Inc., Senior Unsecured Notes, 5.00%, due 6/4/42 | | | 788 | ñØØ |
| | | | | | | | |
| Healthcare - Services (0.3%) |
| | 240 | | UnitedHealth Group, Inc., Senior Unsecured Notes, 2.75%, due 2/15/23 | | | 246 | |
| | 660 | | WellPoint, Inc., Senior Unsecured Notes, 1.88%, due 1/15/18 | | | 669 | |
| | | | 915 | |
| Insurance (0.5%) |
| | 1,380 | | Prudential Financial, Inc., Junior Subordinated Notes, 5.88%, due 9/15/42 | | | 1,452 | µ |
| | | | | | | | |
| Iron - Steel (0.2%) |
| | 530 | | ArcelorMittal, Senior Unsecured Notes, 6.13%, due 6/1/18 | | | 528 | ØØ |
See Notes to Schedule of Investments
Schedule of Investments Neuberger Berman Core Bond Fund (cont'd)
| PRINCIPAL AMOUNT | | VALUE† |
| | | | | |
| (000's omitted) | | (000's omitted)z |
| | | | | |
| Media (2.2%) |
| $ | 1,260 | | DIRECTV Holdings LLC, Guaranteed Notes, 2.40%, due 3/15/17 | | $ | 1,298 | ØØ |
| | 120 | | DIRECTV Holdings LLC, Guaranteed Notes, 5.00%, due 3/1/21 | | | 137 | |
| | 575 | | DIRECTV Holdings LLC, Guaranteed Notes, 6.00%, due 8/15/40 | | | 661 | ØØ |
| | 565 | | NBCUniversal Media LLC, Senior Unsecured Notes, 6.40%, due 4/30/40 | | | 741 | ØØ |
| | 480 | | NBCUniversal Media LLC, Senior Unsecured Notes, 4.45%, due 1/15/43 | | | 496 | |
| | 1,080 | | Time Warner Cable, Inc., Guaranteed Notes, 8.75%, due 2/14/19 | | | 1,484 | ØØ |
| | 670 | | Time Warner Cable, Inc., Guaranteed Notes, 5.50%, due 9/1/41 | | | 782 | ØØ |
| | 555 | | Time Warner, Inc., Guaranteed Notes, 6.10%, due 7/15/40 | | | 708 | ØØ |
| | | | 6,307 | |
| Mining (0.8%) |
| | 785 | | Freeport-McMoRan Copper & Gold, Inc., Senior Unsecured Notes, 3.55%, due 3/1/22 | | | 799 | ØØ |
| | 840 | | Rio Tinto Finance USA PLC, Guaranteed Notes, 1.63%, due 8/21/17 | | | 844 | |
| | 600 | | Rio Tinto Finance USA PLC, Guaranteed Notes, 2.88%, due 8/21/22 | | | 605 | |
| | | | 2,248 | |
| Miscellaneous Manufacturers (0.4%) |
| | 510 | | General Electric Co., Senior Unsecured Notes, 2.70%, due 10/9/22 | | | 513 | |
| | 480 | | General Electric Co., Senior Unsecured Notes, 4.13%, due 10/9/42 | | | 503 | |
| | | | 1,016 | |
| Office - Business Equipment (0.2%) |
| | 480 | | Xerox Corp., Senior Unsecured Notes, 4.50%, due 5/15/21 | | | 508 | |
| | | | | | | | |
| Oil & Gas (1.1%) |
| | 1,020 | | Anadarko Petroleum Corp., Senior Unsecured Notes, 5.95%, due 9/15/16 | | | 1,185 | ØØ |
| | 555 | | Apache Corp., Senior Unsecured Notes, 4.75%, due 4/15/43 | | | 656 | |
| | 575 | | Marathon Oil Corp., Senior Unsecured Notes, 2.80%, due 11/1/22 | | | 580 | |
| | 655 | | Suncor, Inc., Senior Unsecured Notes, 6.50%, due 6/15/38 | | | 892 | |
| | | | 3,313 | |
| Pharmaceuticals (1.3%) |
| | 960 | | AstraZeneca PLC, Senior Unsecured Notes, 1.95%, due 9/18/19 | | | 983 | |
| | 1,500 | | Express Scripts Holding Co., Guaranteed Notes, 2.65%, due 2/15/17 | | | 1,566 | ñØØ |
| | 1,065 | | Takeda Pharmaceutical Co. Ltd., Senior Unsecured Notes, 1.63%, due 3/17/17 | | | 1,080 | ñØØ |
| | | | 3,629 | |
| Pipelines (0.3%) |
| | 755 | | Texas Eastern Transmission LP, Senior Unsecured Notes, 2.80%, due 10/15/22 | | | 759 | ñ |
| | | | | | | | |
| Retail (0.5%) |
| | 720 | | Target Corp., Senior Unsecured Notes, 4.00%, due 7/1/42 | | | 761 | ØØ |
| | 800 | | Walgreen Co., Senior Unsecured Notes, 3.10%, due 9/15/22 | | | 814 | |
| | | | 1,575 | |
See Notes to Schedule of Investments
Schedule of Investments Neuberger Berman Core Bond Fund (cont'd)
| PRINCIPAL AMOUNT | | VALUE† |
| | | | | |
| (000's omitted) | | (000's omitted)z |
| | | | | |
| Software (0.7%) |
| $ | 1,050 | | Oracle Corp., Senior Unsecured Notes, 1.20%, due 10/15/17 | | $ | 1,055 | |
| | 955 | | Oracle Corp., Senior Unsecured Notes, 2.50%, due 10/15/22 | | | 972 | |
| | | | 2,027 | |
| Telecommunications (1.7%) |
| | 500 | | America Movil SAB de CV, Senior Unsecured Notes, 3.13%, due 7/16/22 | | | 516 | ØØ |
| | 525 | | AT&T, Inc., Senior Unsecured Notes, 6.55%, due 2/15/39 | | | 724 | ØØ |
| | 1,795 | | Qwest Corp., Senior Unsecured Notes, 6.75%, due 12/1/21 | | | 2,147 | ØØ |
| | 575 | | SK Telecom Co. Ltd., Senior Unsecured Notes, 2.13%, due 5/1/18 | | | 574 | ñØ |
| | 1,015 | | Telefonaktiebolaget LM Ericsson, Senior Unsecured Notes, 4.13%, due 5/15/22 | | | 1,065 | |
| | | | 5,026 | |
| Transportation (0.5%) |
| | 410 | | CSX Corp., Senior Unsecured Notes, 4.10%, due 3/15/44 | | | 416 | |
| | 965 | | Norfolk Southern Corp., Senior Unsecured Notes, 3.95%, due 10/1/42 | | | 986 | |
| | | | 1,402 | |
| | | | Total Corporate Debt Securities (Cost $67,703) | | | 71,164 | |
| | | | | | | | |
| Asset-Backed Securities (0.3%) |
| | 330 | | Carrington Mortgage Loan Trust, Ser. 2006-NC3, Class A3, 0.36%, due 8/25/36 | | | 134 | µ |
| | 15 | | Chase Funding Mortgage Loan Asset-Backed Certificates, Ser. 2004-1, Class 2A2, 0.67%, due 12/25/33 | | | 14 | µ |
| | 110 | | Citigroup Mortgage Loan Trust, Inc., Ser. 2006-WFH1, Class M2, 0.58%, due 1/25/36 | | | 55 | µ |
| | 59 | | Countrywide Asset-Backed Certificates, Ser. 2006-BC1, Class 1A, 0.41%, due 4/25/36 | | | 47 | µ |
| | 18 | | Credit-Based Asset Servicing and Securitization, Ser. 2005-CB5, Class AV2, 0.47%, due 8/25/35 | | | 17 | µ |
| | 314 | | Credit-Based Asset Servicing and Securitization, Ser. 2006-CB3, Class AV3, 0.38%, due 3/25/36 | | | 206 | µ |
| | 36 | | Equifirst Mortgage Loan Trust, Ser. 2003-2, Class 3A3, 1.35%, due 9/25/33 | | | 33 | µ |
| | 50 | | Fannie Mae Whole Loan, Ser. 2003-W5, Class A, 0.43%, due 4/25/33 | | | 48 | µ |
| | 57 | | Household Home Equity Loan Trust, Ser. 2006-1, Class A1, 0.37%, due 1/20/36 | | | 55 | µ |
| | 66 | | Household Home Equity Loan Trust, Ser. 2006-2, Class A2, 0.39%, due 3/20/36 | | | 64 | µ |
| | 148 | | HSI Asset Securitization Corp. Trust, Ser. 2006-WMC1, Class A2, 0.31%, due 7/25/36 | | | 56 | µ |
| | 642 | | Knollwood CDO Ltd., Ser. 2006-2A, Class A2J, 0.76%, due 7/13/46 | | | 0 | #µ* |
| | 28 | | Morgan Stanley Capital I, Ser. 2004-WMC3, Class B3, 4.26%, due 1/25/35 | | | 1 | µ |
| | 227 | | Option One Mortgage Loan Trust, Ser. 2006-2, Class 2A2, 0.31%, due 7/25/36 | | | 125 | µ |
| | 10 | | Residential Asset Mortgage Products, Inc., Ser. 2003-RS2, Class AII, 0.89%, due 3/25/33 | | | 9 | µ |
| | 9 | | Saxon Asset Securities Trust, Ser. 2004-1, Class A, 0.75%, due 3/25/35 | | | 7 | µ |
| | 4 | | Specialty Underwriting & Residential Finance, Ser. 2003-BC1, Class A, 0.89%, due 1/25/34 | | | 3 | µ |
| | | | | | | | |
| | | | Total Asset-Backed Securities (Cost $2,123) | | | 874 | |
| | | | | | | | |
| NUMBER OF SHARES | | |
| | | | | |
| Short-Term Investments (8.5%) |
| | 24,699,711 | | State Street Institutional Liquid Reserves Fund Institutional Class (Cost $24,700) | | | 24,700 | |
| | | | | | | | |
| | | | Total Investments (123.2%) (Cost $347,099) | | | 356,695 | ## |
| | | | | | | | |
| | | | Liabilities, less cash, receivables and other assets [(23.2%)] | | | (67,188 | )± |
| | | | | | | | |
| | | | Total Net Assets (100.0%) | | $ | 289,507 | |
See Notes to Schedule of Investments
Schedule of Investments Neuberger Berman Floating Rate Income Fund
| PRINCIPAL AMOUNT | | VALUE† |
| | | | | |
| (000's omitted) | | (000's omitted)z |
| | | | | |
Bank Loan Obligationsµ (90.6%) |
| | | |
| Aerospace & Defense (0.8%) |
| $ | 1,050 | | Booz Allen Hamilton, Term Loan B, 4.50%, due 7/31/19 | | $ | 1,057 | |
| | 1,187 | | Sequa, Term Loan, 6.25%, due 12/3/14 | | | 1,188 | |
| | | | 2,245 | |
| Air Transport (0.4%) |
| | 1,082 | | Delta Air Lines, Term Loan, 5.50%, due 4/20/17 | | | 1,081 | |
| | | | | | | | |
| All Telecom (4.8%) |
| | 2,000 | | Cricket Communications, Inc., Term Loan, 4.75%, due 10/10/19 | | | 2,006 | |
| | 1,408 | | Crown Castle Operating Corp., Term Loan B, 4.00%, due 1/31/19 | | | 1,414 | ¢^^ |
| | 2,497 | | Intelsat Jackson Holdings, Term Loan B-1, 4.50%, due 4/2/18 | | | 2,512 | ¢^^ |
| | 2,973 | | Level 3 Financing Inc., Term Loan B2, due 8/1/19 | | | 2,986 | ¢^^ |
| | 1,600 | | Level 3 Financing Inc., Term Loan B, 5.25%, due 8/1/19 | | | 1,617 | |
| | 629 | | Metro PCS, Term Loan B-3, 4.00%, due 3/19/18 | | | 629 | |
| | 1,622 | | Syniverse Technologies, Term Loan, 5.00%, due 4/23/19 | | | 1,630 | |
| | 1,402 | | Windstream Corp., Term Loan B-3, 4.00%, due 8/8/19 | | | 1,409 | ¢^^ |
| | | | 14,203 | |
| Automotive (3.4%) |
| | 2,820 | | Allison Transmission, Term Loan B-3, 4.25%, due 8/23/19 | | | 2,832 | ¢^^ |
| | 2,470 | | Chrysler Automotive, Term Loan B, 6.00%, due 5/24/17 | | | 2,521 | ¢^^ |
| | 1,007 | | Federal Mogul, Term Loan B, due 12/29/14 | | | 942 | ¢^^ |
| | 514 | | Federal Mogul, Term Loan C, due 12/28/15 | | | 481 | ¢^^ |
| | 1,257 | | Goodyear Tire & Rubber Company, Second Lien Term Loan, 4.75%, due 4/30/19 | | | 1,264 | |
| | 1,884 | | Navistar International, Term Loan B, 7.00%, due 8/17/17 | | | 1,889 | |
| | | | 9,929 | |
| Building & Development (2.5%) |
| | 3,145 | | Capital Automotive LP, Term Loan B, 5.25%, due 3/11/17 | | | 3,161 | ¢^^ |
| | 1,216 | | Custom Building Products, Term Loan, 5.75%, due 3/19/15 | | | 1,215 | |
| | 1,047 | | Goodman Global Inc., First Lien Term Loan, 5.75%, due 10/28/16 | | | 1,047 | |
| | 1,833 | | Realogy Corporation, Term Loan, 4.46%, due 10/10/16 | | | 1,828 | ¢^^ |
| | 114 | | Realogy Corporation, Letter of Credit, 4.55%, due 10/10/16 | | | 114 | ¢^^ |
| | | | 7,365 | |
| Business Equipment & Services (8.4%) |
| | 2,110 | | Acosta Inc., Term Loan D, 5.00%, due 3/2/18 | | | 2,127 | ¢^^ |
| | 1,045 | | Advantage Sales & Marketing, Second Lien Term Loan, 9.25%, due 6/18/18 | | | 1,045 | |
| | 712 | | Brand Services, Inc., Term Loan, due 10/16/16 | | | 710 | ¢^^ |
| | 1,887 | | Brickman Group Holdings, Inc., Term Loan B-1, 5.50%, due 10/14/16 | | | 1,904 | |
| | 778 | | Brock Holdings III, First Lien Term Loan, 6.00%, due 3/16/17 | | | 779 | |
| | 967 | | Brock Holdings III, Second Lien Term Loan, 10.00%, due 3/16/18 | | | 972 | Ñ |
| | 2,626 | | Ceridian Corp., Term Loan, 5.96%, due 5/9/17 | | | 2,616 | ¢^^ |
| | 1,781 | | KAR Auction Services, Term Loan, 5.00%, due 5/19/17 | | | 1,789 | |
| | 935 | | Kronos, Term Loan B, due 10/31/19 | | | 940 | ¢^^ |
| | 1,635 | | Kronos, Second Lien Term Loan, due 4/30/20 | | | 1,643 | ¢^^ |
See Notes to Schedule of Investments
Schedule of Investments Neuberger Berman Floating Rate Income Fund (cont'd)
| PRINCIPAL AMOUNT | | VALUE† |
| | | | |
| (000's omitted) | | (000's omitted)z |
| | | | |
| $ | 1,850 | | McJunkin Corporation, Term Loan B, due 11/18/19 | | $ | 1,845 | Ѣ^^ |
| | 1,875 | | Monitronics, Term Loan, 5.50%, due 3/23/18 | | | 1,885 | |
| | 1,172 | | Protection One, Term Loan B-1, 5.75%, due 3/16/19 | | | 1,179 | |
| | 1,664 | | Quintiles Transnational Corp., Term Loan B, 5.00%, due 6/8/18 | | | 1,665 | |
| | 1,649 | | SymphonyIRI Group, Inc., Term Loan, 5.00%, due 12/1/17 | | | 1,646 | |
| | 1,820 | | West Corp., Term Loan B-6, 5.75%, due 6/30/18 | | | 1,845 | |
| | | | 24,590 | |
| Cable & Satellite Television (2.3%) |
| | 1,409 | | Cequel Communications, LLC, Term Loan, 4.00%, due 2/14/19 | | | 1,409 | ¢^^ |
| | 1,515 | | Charter Communications Operating LLC, Term Loan D, 4.00%, due 5/15/19 | | | 1,525 | |
| | 650 | | Rovi Corp., Term Loan B-2, 4.00%, due 3/31/19 | | | 637 | |
| | 1,235 | | UPC Distribution, Term Loan AB, 4.75%, due 12/31/17 | | | 1,236 | |
| | 1,913 | | Wave Division Holdings, Inc., Term Loan, 5.50%, due 9/30/19 | | | 1,934 | ¢^^ |
| | | | 6,741 | |
| Chemicals & Plastics (2.1%) |
| | 995 | | Hexion Specialty Chemicals, Term Loan C1B, due 5/5/15 | | | 988 | ¢^^ |
| | 429 | | Hexion Specialty Chemicals, Term Loan C2B, due 5/5/15 | | | 425 | ¢^^ |
| | 625 | | Ineos Holdings, Term Loan, 6.50%, due 5/4/18 | | | 633 | |
| | 7 | | Momentive Performance Materials, Term Loan B-1B, 3.50%, due 5/5/15 | | | 7 | |
| | 1,525 | | OM Group Inc., Term Loan B, 5.75%, due 8/2/17 | | | 1,533 | |
| | 622 | | Taminco Global Chemical, Term Loan B-1, 5.25%, due 2/15/19 | | | 627 | |
| | 663 | | Trinseo Materials OP SCA, Term Loan, 8.00%, due 8/2/17 | | | 633 | |
| | 1,278 | | Univar Inc., Term Loan B, 3.50% & 5.00%, due 6/30/17 | | | 1,263 | |
| | | | 6,109 | |
| Clothing - Textiles (0.5%) |
| | 1,470 | | Wolverine Worldwide, Term Loan B, due 10/9/19 | | | 1,477 | ¢^^ |
| | | | | | | | |
| Conglomerates (0.7%) |
| | 2,090 | | Wilsonart, LLC, Term Loan B, due 11/1/19 | | | 2,096 | ¢^^ |
| | | | | | | | |
| Containers & Glass Products (1.8%) |
| | 1,721 | | Exopack, Term Loan B, 6.50%, due 5/31/17 | | | 1,721 | Ñ |
| | 1,412 | | Reynolds Group, Term Loan, due 9/28/18 | | | 1,417 | ¢^^ |
| | 2,209 | | Sealed Air, Term Loan B, 4.75%, due 10/3/18 | | | 2,217 | |
| | | | 5,355 | |
| Cosmetics - Toiletries (0.5%) |
| | 479 | | Prestige Brands, Term Loan B, 5.25%, due 1/31/19 | | | 483 | |
| | 990 | | Yankee Candle Company, Term Loan, 5.25%, due 4/2/19 | | | 997 | |
| | | | 1,480 | |
| Drugs (1.2%) |
| | 2,293 | | Par Pharmaceutical Companies, Inc., Term Loan B, 5.00%, due 9/28/19 | | | 2,285 | |
| | 182 | | Warner Chilcott Company, Inc., Term Loan B-1, 4.25%, due 3/15/18 | | | 182 | ¢^^ |
See Notes to Schedule of Investments
Schedule of Investments Neuberger Berman Floating Rate Income Fund (cont'd)
| PRINCIPAL AMOUNT | | VALUE† |
| | | | | |
| (000's omitted) | | (000's omitted)z |
| | | | | |
| $ | 478 | | Warner Chilcott Company, Inc., Term Loan B-1, 4.25%, due 3/15/18 | | $ | 480 | ¢^^ |
| | 239 | | Warner Chilcott Company, Inc., Term Loan B-2, 4.25%, due 3/15/18 | | | 240 | ¢^^ |
| | 329 | | Warner Chilcott Company, Inc., Term Loan B-3, 4.25%, due 3/15/18 | | | 330 | ¢^^ |
| | | | 3,517 | |
| Ecological Services & Equipment (0.7%) |
| | 2,129 | | ADS Waste Holdings, Inc., Term Loan B, 5.25%, due 9/11/19 | | | 2,148 | ¢^^ |
| | | | | | | | |
| Electronics - Electrical (6.4%) |
| | 611 | | BOC Edwards, First Lien Term Loan, 5.50%, due 5/31/16 | | | 612 | |
| | 1,007 | | CommScope, Term Loan, 4.25%, due 1/14/18 | | | 1,012 | |
| | 1,356 | | Epicor Software Corp., Term Loan B, 5.00%, due 5/16/18 | | | 1,362 | |
| | 2,175 | | Freescale Semiconductor, Term Loan B-2, 6.00%, due 2/28/19 | | | 2,157 | |
| | 1,955 | | Genesys, Term Loan, 6.75%, due 1/31/19 | | | 1,975 | |
| | 2,953 | | Go Daddy, Term Loan B-1, 5.50%, due 12/17/18 | | | 2,932 | |
| | 655 | | Hyland Software, Term Loan B, due 10/31/19 | | | 653 | ¢^^ |
| | 2,763 | | NXP Funding, Term Loan A-2, 5.50%, due 3/3/17 | | | 2,815 | ¢^^ |
| | 1,700 | | NXP Funding, Term Loan B, 5.25%, due 3/19/19 | | | 1,717 | ¢^^ |
| | 631 | | Paradigm, First Lien Term Loan B, 6.50%, due 7/30/19 | | | 628 | |
| | 1,016 | | SkillSoft, Term Loan, 5.00%, due 5/26/17 | | | 1,024 | ¢^^ |
| | 1,874 | | Sophia LP, Term Loan, 6.25%, due 7/19/18 | | | 1,895 | |
| | | | 18,782 | |
| Equipment Leasing (1.6%) |
| | 963 | | AWAS Fin Lux 2012 SA, Term Loan B, 5.25%, due 6/10/16 | | | 971 | |
| | 1,627 | | AWAS Fin Lux 2012 SA, Term Loan, 4.75%, due 7/16/18 | | | 1,640 | Ñ |
| | 1,941 | | International Lease Finance Co., Term Loan, 5.00%, due 6/30/17 | | | 1,965 | |
| | | | 4,576 | |
| Financial Intermediaries (7.3%) |
| | 1,869 | | American Capital, Senior Secured Term Loan, 5.50%, due 8/22/16 | | | 1,881 | |
| | 3,421 | | CITCO, Term Loan, 5.50%, due 6/29/18 | | | 3,435 | ¢^^ |
| | 656 | | First Data Corporation, Term Loan B, 5.21%, due 9/24/18 | | | 641 | |
| | 770 | | First Data Corporation, Term Loan, due 3/26/18 | | | 733 | ¢^^ |
| | 1,634 | | First Data Corporation, Term Loan, 5.21%, due 3/24/17 | | | 1,605 | |
| | 922 | | HarbourVest Partners, Term Loan, 6.25%, due 12/19/16 | | | 920 | |
| | 1,376 | | Mondrian Investment, Term Loan, 5.50%, due 7/12/18 | | | 1,381 | |
| | 1,720 | | Nuveen Investments Inc., First Lien Term Loan, 7.25%, due 5/13/17 | | | 1,732 | |
| | 808 | | Nuveen Investments Inc., First Lien Term Loan, 5.86%, due 5/13/17 | | | 805 | |
| | 1,944 | | Ocwen Financial, Term Loan, 5.50%, due 9/1/16 | | | 1,949 | |
| | 2,022 | | Residential Capital, Term Loan A-1, 5.00%, due 11/18/13 | | | 2,026 | |
| | 605 | | Residential Capital, Term Loan A-2, 6.75%, due 11/18/13 | | | 612 | |
| | 623 | | Royalty Pharma, Term Loan, 4.00%, due 11/9/18 | | | 626 | Ñ |
| | 1,298 | | Springleaf, Term Loan, 5.50%, due 5/10/17 | | | 1,279 | |
| | 1,721 | | Walter Investments, First Lien Term Loan, 7.75%, due 6/30/16 | | | 1,730 | |
| | | | 21,355 | |
| Food & Drug Retailers (0.7%) |
| | 1,911 | | Rite Aid Corp., Term Loan 5, 4.50%, due 3/3/18 | | | 1,906 | |
See Notes to Schedule of Investments
Schedule of Investments Neuberger Berman Floating Rate Income Fund (cont'd)
| PRINCIPAL AMOUNT | | VALUE† |
| | | | |
| (000's omitted) | | (000's omitted)z |
| | | | |
| Food Products (1.5%) |
| $ | 2,601 | | Del Monte Corp., Term Loan, 4.50%, due 3/8/18 | | $ | 2,597 | |
| | 193 | | Pinnacle Foods Finance LLC, Term Loan F, 4.75%, due 10/17/18 | | | 193 | |
| | 1,686 | | Pinnacle Foods Finance LLC, Term Loan E, 4.75%, due 10/17/18 | | | 1,690 | ¢^^ |
| | | | 4,480 | |
| Food Service (1.4%) |
| | 1,808 | | OSI Restaurant Partners, Term Loan B, due 10/23/19 | | | 1,815 | ¢^^ |
| | 491 | | US Foodservice Inc., Term Loan, 5.75%, due 3/31/17 | | | 482 | |
| | 1,928 | | US Foodservice Inc., Term Loan, 5.75%, due 3/31/17 | | | 1,898 | |
| | | | 4,195 | |
| Health Care (9.6%) |
| | 857 | | Aurora Diagnostics, Term Loan B, 6.25%, due 5/26/16 | | | 855 | |
| | 3,284 | | Bausch & Lomb, Term Loan, 5.25%, due 5/17/19 | | | 3,318 | ¢^^ |
| | 1,920 | | CareStream Health Inc., Term Loan, 5.00%, due 2/25/17 | | | 1,897 | |
| | 2,062 | | DaVita, Inc., Term Loan B2, due 8/1/19 | | | 2,062 | ¢^^ |
| | 2,568 | | EMS, Term Loan, 5.25%, due 5/25/18 | | | 2,586 | ¢^^ |
| | 1,244 | | Grifols, Term Loan B, 4.50%, due 6/1/17 | | | 1,254 | ¢^^ |
| | 988 | | Health Management Associates Inc., Term Loan B, 4.50%, due 11/16/18 | | | 995 | |
| | 1,250 | | Hologic, Term Loan B, 4.50%, due 8/1/19 | | | 1,263 | |
| | 1,374 | | IASIS Healthcare Corporation, Term Loan B, 5.00%, due 5/3/18 | | | 1,376 | |
| | 1,876 | | Immucor, Term Loan B-1, 5.75%, due 8/19/18 | | | 1,890 | ¢^^ |
| | 1,069 | | IMS Health Incorporated, Term Loan B, due 8/26/17 | | | 1,075 | ¢^^ |
| | 2,045 | | Pharmaceutical Product Development, Inc., Term Loan, 6.25%, due 12/5/18 | | | 2,071 | |
| | 2,080 | | Sheridan Healthcare, Inc., First Lien Term Loan, 6.00%, due 6/29/18 | | | 2,092 | |
| | 2,478 | | United Surgical Partners, Term Loan B, 6.00%, due 4/3/19 | | | 2,498 | |
| | 2,760 | | Valeant Pharmaceuticals International, Inc., Term Loan B, due 2/13/19 | | | 2,768 | ¢^^ |
| | | | 28,000 | |
| Home Furnishings (1.2%) |
| | 3,473 | | AOT Bedding Super Holdings, LLC, Term Loan B, due 9/20/19 | | | 3,469 | ¢^^ |
| | | | | | | | |
| Industrial Equipment (2.8%) |
| | 521 | | Colfax, Term Loan B, 4.75%, due 9/12/18 | | | 526 | |
| | 1,851 | | Generac Power Systems Inc., Term Loan, 6.25%, due 5/30/18 | | | 1,888 | |
| | 2,513 | | Husky Injection Molding, Term Loan B, 5.75%, due 7/2/18 | | | 2,541 | |
| | 1,889 | | Rexnord Corp., Term Loan B, 4.50%, due 4/1/18 | | | 1,900 | ¢^^ |
| | 324 | | Terex Corp., Term Loan, due 4/28/17 | | | 326 | ¢^^ |
| | 931 | | Terex Corp., Term Loan, 4.50%, due 4/28/17 | | | 937 | |
| | | | 8,118 | |
| Insurance (0.2%) |
| | 566 | | Sedgwick Holdings Inc., Term Loan B, 5.00%, due 12/31/16 | | | 567 | |
| | | | | | | | |
| Leisure Goods - Activities - Movies (1.6%) |
| | 1,236 | | Bombardier Recreational Products Inc., Term Loan B-2, 4.47%, due 6/28/16 | | | 1,237 | ¢^^ |
| | 2,472 | | EMI Publishing, Term Loan B, 5.50%, due 6/29/18 | | | 2,503 | |
See Notes to Schedule of Investments
Schedule of Investments Neuberger Berman Floating Rate Income Fund (cont'd)
| PRINCIPAL AMOUNT | | VALUE† |
| | | | |
| (000's omitted) | | (000's omitted)z |
| | | | |
| $ | 970 | | Six Flags Theme Parks Inc., Term Loan B, 4.25%, due 12/20/18 | | $ | 975 | |
| | | | 4,715 | |
| Lodging & Casinos (4.5%) |
| | 1,872 | | Boyd Gaming Corporation, Term Loan, 6.00%, due 12/17/15 | | | 1,891 | |
| | 1,409 | | Cannery Casinos, Term Loan B, due 9/25/18 | | | 1,413 | ¢^^ |
| | 876 | | Cannery Casinos, Second Lien Term Loan, 10.00%, due 9/12/19 | | | 853 | |
| | 1,652 | | Mohegan Tribal Gaming Authority, Term Loan A, due 3/31/15 | | | 1,619 | ¢^^ |
| | 1,882 | | Peninsula Gaming, Term Loan B, due 5/16/17 | | | 1,902 | ¢^^ |
| | 740 | | Penn National Gaming, Term Loan B, 4.00%, due 7/14/18 | | | 743 | |
| | 1,864 | | Station Casinos, Term Loan B-2, 4.21%, due 6/17/16 | | | 1,777 | |
| | 3,028 | | Station Casinos, Term Loan B, 5.50%, due 9/7/19 | | | 3,033 | |
| | | | 13,231 | |
| Nonferrous Metals - Minerals (2.6%) |
| | 1,886 | | Arch Coal, Term Loan, 5.75%, due 5/16/18 | | | 1,901 | |
| | 1,302 | | Fairmount Minerals, Term Loan B, 5.25%, due 3/15/17 | | | 1,301 | |
| | 4,315 | | FMG Resources, Term Loan, due 10/18/17 | | | 4,292 | ¢^^ |
| | | | 7,494 | |
| Oil & Gas (3.5%) |
| | 333 | | Chesapeake Energy, Term Loan B, 8.50%, due 12/2/17 | | | 333 | |
| | 2,618 | | Everest Acquisition LLC, Term Loan B-1, 5.00%, due 5/24/18 | | | 2,632 | ¢^^ |
| | 295 | | Everest Acquisition LLC, Term Loan B2, due 4/1/19 | | | 294 | Ѣ^^ |
| | 2,231 | | Frac Tech, Term Loan, 8.50%, due 5/6/16 | | | 1,978 | |
| | 3,670 | | Plains Exploration & Production Company, Term Loan B, due 11/30/19 | | | 3,684 | ¢^^ |
| | 1,411 | | Samson Investment Company, Second Lien Term Loan, 6.00%, due 9/25/18 | | | 1,423 | |
| | | | 10,344 | |
| Publishing (1.4%) |
| | 2,830 | | Getty Images, Term Loan, due 10/18/19 | | | 2,836 | ¢^^ |
| | 1,602 | | IWCO Direct, Term Loan, 3.59%, due 8/7/14 | | | 1,231 | |
| | 167 | | IWCO Direct, Term Loan DD, 3.59%, due 8/7/14 | | | 128 | |
| | | | 4,195 | |
| Radio & Television (2.9%) |
| | 1,991 | | Clear Channel, Term Loan A, 3.61%, due 7/30/14 | | | 1,928 | ¢^^ |
| | 3,073 | | Cumulus Media, First Lien Term Loan, 5.75%, due 9/16/18 | | | 3,093 | ¢^^ |
| | 682 | | Formula One, Term Loan B2, due 4/30/19 | | | 686 | ¢^^ |
| | 1,398 | | FoxCo Acquisition, Term Loan, 5.50%, due 7/14/17 | | | 1,415 | ¢^^ |
| | 1,337 | | Univision Communications Inc., First Lien Term Loan, 4.46%, due 3/31/17 | | | 1,306 | |
| | | | 8,428 | |
| Retailers (except food & drug) (7.7%) |
| | 3,232 | | 99¢ Only Stores, Term Loan B-1, 5.25%, due 1/11/19 | | | 3,261 | ¢^^ |
| | 2,504 | | Amscan Holdings, Inc., Term Loan, 5.75%, due 7/27/19 | | | 2,525 | |
| | 1,322 | | Bass Pro Shops, Term Loan, 5.25%, due 6/13/17 | | | 1,333 | |
See Notes to Schedule of Investments
Schedule of Investments Neuberger Berman Floating Rate Income Fund (cont'd)
| PRINCIPAL AMOUNT | | VALUE† |
| | | | |
| (000's omitted) | | (000's omitted)z |
| | | | |
| $ | 653 | | BJ's Wholesale Club, First Lien Term Loan, 5.75%, due 9/26/19 | | $ | 659 | |
| | 1,820 | | David's Bridal, Term Loan, due 10/11/19 | | | 1,816 | ¢^^ |
| | 1,214 | | Leslie's Poolmart, Term Loan B, 5.25%, due 10/16/19 | | | 1,212 | †† |
| | 754 | | Lord & Taylor, Term Loan B, 4.50%, due 1/11/19 | | | 759 | |
| | 730 | | Michaels Stores Inc., Term Loan B-3, due 7/31/16 | | | 736 | ¢^^ |
| | 1,882 | | Michaels Stores Inc., Term Loan B-2, 4.94%, due 7/31/16 | | | 1,897 | |
| | 2,112 | | Neiman Marcus Group Inc., Term Loan, 4.75%, due 5/16/18 | | | 2,115 | |
| | 1,325 | | PETCO Animal Supply Inc., Term Loan, 4.50%, due 11/24/17 | | | 1,329 | |
| | 1,283 | | Pilot Travel Centers, Term Loan B, 4.25%, due 8/7/19 | | | 1,289 | |
| | 1,480 | | Toys R US Delaware Inc, Term Loan, 6.00%, due 9/1/16 | | | 1,474 | |
| | 1,985 | | Toys R US Delaware Inc, Term Loan B2, 5.25%, due 5/25/18 | | | 1,943 | ¢^^ |
| | | | 22,348 | |
| Steel (0.7%) |
| | 1,970 | | International Mill Services, Inc., Term Loan, 5.75%, due 3/20/19 | | | 1,990 | Ñ |
| | | | | | | | |
| Surface Transport (0.4%) |
| | 1,259 | | Avis Budget Car Rental, Term Loan C, 4.25%, due 3/15/19 | | | 1,265 | ¢^^ |
| | | | | | | | |
| Utilities (2.5%) |
| | 955 | | Calpine Corporation, Term Loan B3, due 9/30/19 | | | 956 | ¢^^ |
| | 990 | | Calpine Corporation, Term Loan, 4.50%, due 4/1/18 | | | 991 | ¢^^ |
| | 1,854 | | Essential Power, Term Loan, 5.50%, due 8/8/19 | | | 1,854 | Ñ |
| | 1,962 | | GenOn Energy, Term Loan, 6.50%, due 12/4/17 | | | 1,975 | |
| | 66 | | Longview Power, Letter of Credit, 0.23%, due 2/28/14 | | | 56 | |
| | 1,964 | | Longview Power, Term Loan, 7.25%, due 10/31/17 | | | 1,613 | |
| | | | 7,445 | |
| | | | Total Bank Loan Obligations (Cost $262,904) | | | 265,239 | |
| | | | | | | | |
| Corporate Debt Securities (5.9%) |
| |
| Airlines (0.2%) |
| | 510 | | Continental Airlines, Inc., Senior Secured Notes, 6.75%, due 9/15/15 | | | 534 | ñ |
| | | | | | | | |
| Chemicals (1.6%) |
| | 1,025 | | Hexion US Finance Corp., Senior Secured Notes, 6.63%, due 4/15/20 | | | 1,022 | |
| | 1,080 | | Momentive Performance Materials, Inc., Senior Secured Notes, 10.00%, due 10/15/20 | | | 1,037 | ñ |
| | 1,860 | | Momentive Performance Materials, Inc., Secured Notes, 9.00%, due 1/15/21 | | | 1,283 | ØØ |
| | 1,215 | | Momentive Performance Materials, Inc., Senior Secured Notes, 8.88%, due 10/15/20 | | | 1,191 | ñ |
| | | | 4,533 | |
| Consumer - Commercial Lease Financing (0.6%) |
| | 1,065 | | CIT Group, Inc., Senior Unsecured Notes, Ser. C, 5.25%, due 4/1/14 | | | 1,105 | ñ |
| | 680 | | CIT Group, Inc., Senior Unsecured Notes, 6.63%, due 4/1/18 | | | 758 | ñ |
| | | | 1,863 | |
See Notes to Schedule of Investments
Schedule of Investments Neuberger Berman Floating Rate Income Fund (cont'd)
| PRINCIPAL AMOUNT | | VALUE† |
| | | | |
| (000's omitted) | | (000's omitted)z |
| | | | |
| Electronics (0.3%) |
| $ | 685 | | Ceridian Corp., Senior Secured Notes, 8.88%, due 7/15/19 | | $ | 726 | ñ |
| | | | | | | | |
| Health Facilities (1.6%) |
| | 1,475 | | CHS/Community Health Systems, Inc., Senior Secured Notes, 5.13%, due 8/15/18 | | | 1,530 | |
| | 960 | | HCA, Inc., Senior Secured Notes, 5.88%, due 3/15/22 | | | 1,030 | |
| | 2,120 | | HCA, Inc., Senior Secured Notes, 4.75%, due 5/1/23 | | | 2,120 | |
| | | | 4,680 | |
| Media - Broadcast (0.3%) |
| | 995 | | Univision Communications, Inc., Senior Secured Notes, 6.88%, due 5/15/19 | | | 1,018 | ñØØ |
| | | | | | | | |
| Packaging (0.5%) |
| | 1,511 | | Reynolds Group Issuer, Inc., Senior Secured Notes, 5.75%, due 10/15/20 | | | 1,526 | ñ |
| | | | | | | | |
| Software - Services (0.8%) |
| | 1,490 | | First Data Corp., Senior Secured Notes, 7.38%, due 6/15/19 | | | 1,542 | ñ |
| | 840 | | First Data Corp., Senior Secured Notes, 6.75%, due 11/1/20 | | | 840 | ñ |
| | | | 2,382 | |
| | | | Total Corporate Debt Securities (Cost $17,258) | | | 17,262 | |
| | | | |
| NUMBER OF SHARES | | |
| | | | |
| Short-Term Investments (19.9%) |
| | 844,403 | | State Street Institutional Government Money Market Fund Institutional Class | | | 844 | |
| | 57,405,840 | | State Street Institutional Liquid Reserves Fund Institutional Class | | | 57,406 | ØØ |
| | | | | | | | |
| | | | Total Short-Term Investments (Cost $58,250) | | | 58,250 | |
| | | | | | | | |
| | | | Total Investments (116.4%) (Cost $338,412) | | | 340,751 | ## |
| | | | | | | | |
| | | | Liabilities, less cash, receivables and other assets [(16.4%)] | | | (48,074 | ) |
| | | | | | | | |
| | | | Total Net Assets (100.0%) | | $ | 292,677 | |
See Notes to Schedule of Investments
Schedule of Investments Neuberger Berman High Income Bond Fund
| PRINCIPAL AMOUNT | | VALUE† |
| | | | |
| (000's omitted) | | (000's omitted)z |
| | | | |
Bank Loan Obligationsµ (13.3%) |
| | |
| All Telecom (2.0%) |
| $ | 22,000 | | Crown Castle Operating Corp., Term Loan B, 4.00%, due 1/31/19 | | $ | 22,100 | |
| | 8,726 | | Intelsat Jackson Holdings, Term Loan B-1, 4.50%, due 4/2/18 | | | 8,779 | |
| | 9,289 | | Level 3 Financing, Inc., Term Loan B, 5.25%, due 8/1/19 | | | 9,388 | ¢^^ |
| | 9,651 | | Level 3 Financing, Inc., Term Loan B2, due 8/1/19 | | | 9,690 | ¢^^ |
| | 3,776 | | Syniverse Technologies, Term Loan, 5.00%, due 4/23/19 | | | 3,794 | |
| | 9,975 | | Windstream Corp., Term Loan B-3, due 8/8/19 | | | 10,021 | ¢^^ |
| | | | 63,772 | |
| Automotive (1.7%) |
| | 24,373 | | Chrysler Automotive, Term Loan B, 6.00%, due 5/24/17 | | | 24,877 | |
| | 13,294 | | Goodyear Tire & Rubber Company, Second Lien Term Loan, 4.75%, due 4/30/19 | | | 13,371 | |
| | 18,295 | | Navistar International, Term Loan B, 7.00%, due 8/15/17 | | | 18,341 | ¢^^ |
| | | | 56,589 | |
| Building & Development (0.7%) |
| | 21,630 | | Realogy Corporation, Term Loan, 4.46%, due 10/10/16 | | | 21,572 | |
| | | | | | | | |
| Business Equipment & Services (0.5%) |
| | 8,805 | | Ceridian Corp., Term Loan, 5.96%, due 5/9/17 | | | 8,772 | |
| | 7,216 | | Monitronics, Term Loan, 5.50%, due 3/23/18 | | | 7,253 | |
| | | | 16,025 | |
| Cable & Satellite Television (0.9%) |
| | 9,975 | | Cequel Communications, LLC, Term Loan, due 2/14/19 | | | 9,977 | ¢^^ |
| | 7,918 | | Charter Communications Operating LLC, Term Loan D, 4.00%, due 5/15/19 | | | 7,970 | |
| | 10,000 | | Wave Division Holdings, Inc., Term Loan, due 9/30/19 | | | 10,108 | ¢^^ |
| | | | 28,055 | |
| Ecological Services & Equipment (0.2%) |
| | 8,050 | | ADS Waste Holdings, Inc., Term Loan B, 5.25%, due 9/28/19 | | | 8,122 | ¢^^ |
| | | | | | | | |
| Electronics - Electrical (0.2%) |
| | 5,003 | | Sophia LP, Term Loan, 6.25%, due 7/19/18 | | | 5,061 | |
| | | | | | | | |
| Financial Intermediaries (1.2%) |
| | 12,033 | | First Data Corporation, Term Loan, 5.21%, due 3/24/17 | | | 11,822 | |
| | 25,947 | | Springleaf, Term Loan, 5.50%, due 5/10/17 | | | 25,577 | |
| | | | 37,399 | |
| Health Care (1.9%) |
| | 11,840 | | DaVita, Inc., Term Loan B2, due 8/1/19 | | | 11,840 | ¢^^ |
| | 8,042 | | EMS, Term Loan, 5.25%, due 5/25/18 | | | 8,098 | |
| | 11,125 | | HCA Inc., Term Loan B2, 3.61%, due 3/31/17 | | | 11,134 | |
See Notes to Schedule of Investments
Schedule of Investments Neuberger Berman High Income Bond Fund (cont'd)
| PRINCIPAL AMOUNT | | VALUE† |
| | | | |
| (000's omitted) | | (000's omitted)z |
| | | | |
| $ | 6,111 | | Hologic, Term Loan B, 4.50%, due 8/1/19 | | $ | 6,175 | |
| | 8,173 | | Pharmaceutical Product Development, Inc., Term Loan, 6.25%, due 12/5/18 | | | 8,278 | |
| | 10,699 | | United Surgical Partners, Term Loan B, 6.00%, due 4/3/19 | | | 10,788 | ¢^^ |
| | 6,060 | | Valeant Pharmaceuticals International, Inc., Term Loan B, due 9/12/19 | | | 6,071 | ¢^^ |
| | | | 62,384 | |
| Industrial Equipment (0.1%) |
| | 4,609 | | Generac Power Systems Inc., Term Loan, due 5/30/18 | | | 4,701 | ¢^^ |
| | | | | | | | |
| Lodging & Casinos (1.4%) |
| | 10,105 | | Ceasers Entertainment Operating Co., Term Loan B5, 4.46%, due 1/28/18 | | | 8,729 | |
| | 25,157 | | Graton Resort & Casino, Term Loan B, 9.00%, due 8/3/18 | | | 25,681 | |
| | 11,845 | | Station Casinos, Term Loan B-2, 4.21%, due 6/17/16 | | | 11,298 | |
| | | | 45,708 | |
| Nonferrous Metals - Minerals (0.9%) |
| | 5,965 | | Arch Coal, Term Loan, 5.75%, due 5/16/18 | | | 6,012 | |
| | 24,475 | | FMG Resources, Term Loan, due 10/18/17 | | | 24,340 | ¢^^ |
| | | | 30,352 | |
| Oil & Gas (0.1%) |
| | 3,906 | | Chesapeake Energy, Term Loan B, 8.50%, due 12/2/17 | | | 3,909 | |
| | | | | | | | |
| Publishing (0.2%) |
| | 7,902 | | Cengage Learning, Term Loan B1, 5.72%, due 7/31/17 | | | 7,168 | |
| | | | | | | | |
| Radio & Television (0.3%) |
| | 4,035 | | Clear Channel, Term Loan A, 3.61%, due 7/30/14 | | | 3,907 | |
| | 5,009 | | Univision Communications Inc., First Lien Term Loan, 4.46%, due 3/31/17 | | | 4,893 | |
| | | | 8,800 | |
| Retailers (except food & drug) (0.6%) |
| | 13,392 | | Amscan Holdings, Inc., Term Loan, 5.75%, due 7/27/19 | | | 13,506 | |
| | 7,140 | | Toys R US Delaware Inc., Term Loan B3, 5.25%, due 5/25/18 | | | 6,986 | ¢^^ |
| | | | 20,492 | |
| Utilities (0.4%) |
| | 11,999 | | Calpine Corporation, Term Loan, 4.50%, due 4/1/18 | | | 12,016 | |
| | | | | | | | |
| | | | Total Bank Loan Obligations (Cost $425,663) | | | 432,125 | |
See Notes to Schedule of Investments
Schedule of Investments Neuberger Berman High Income Bond Fund (cont'd)
| PRINCIPAL AMOUNT | | VALUE† |
| | | | |
| (000's omitted) | | (000's omitted)z |
| | | | |
| Corporate Debt Securities (83.3%) |
| | |
| Airlines (0.7%) |
| $ | 7,865 | | Continental Airlines, Inc., Senior Secured Notes, 6.75%, due 9/15/15 | | $ | 8,229 | ñØØ |
| | 8,926 | | United Airlines, Inc., Senior Secured Notes, 9.88%, due 8/1/13 | | | 9,104 | ñØØ |
| | 3,373 | | United Airlines, Inc., Pass-Through Certificates, Ser. 2009-2, Class A, 9.75%, due 1/15/17 | | | 3,904 | |
| | | | 21,237 | |
| Auto Loans (0.5%) |
| | 16,705 | | General Motors Financial Co., Inc., Guaranteed Notes, 4.75%, due 8/15/17 | | | 17,103 | ñ |
| | | | | | | | |
| Automakers (0.6%) |
| | 1,390 | | Chrysler Group LLC/CG Co-Issuer, Inc., Secured Notes, 8.00%, due 6/15/19 | | | 1,479 | |
| | 5,785 | | Ford Holdings, Inc., Guaranteed Notes, 9.30%, due 3/1/30 | | | 8,121 | |
| | 2,670 | | Ford Motor Co., Senior Unsecured Notes, 8.90%, due 1/15/32 | | | 3,541 | |
| | 3,734 | | Ford Motor Co., Senior Unsecured Notes, 9.98%, due 2/15/47 | | | 5,185 | |
| | | | 18,326 | |
| Banking (1.7%) |
| | 10,275 | | Ally Financial, Inc., Guaranteed Notes, 5.50%, due 2/15/17 | | | 10,872 | ØØ |
| | 13,230 | | Ally Financial, Inc., Guaranteed Notes, 6.25%, due 12/1/17 | | | 14,530 | ØØ |
| | 1,420 | | Ally Financial, Inc., Subordinated Notes, 8.00%, due 12/31/18 | | | 1,603 | |
| | 14,865 | | Ally Financial, Inc., Guaranteed Notes, 8.00%, due 3/15/20 | | | 17,728 | ØØ |
| | 5,515 | | Ally Financial, Inc., Guaranteed Notes, 7.50%, due 9/15/20 | | | 6,501 | |
| | 3,985 | | Ally Financial, Inc., Guaranteed Notes, 8.00%, due 11/1/31 | | | 4,742 | ØØ |
| | | | 55,976 | |
| Beverages (0.1%) |
| | 2,065 | | Constellation Brands, Inc., Guaranteed Notes, 7.25%, due 9/1/16 | | | 2,385 | |
| | | | | | | | |
| Building & Construction (0.8%) |
| | 2,265 | | Beazer Homes USA, Inc., Guaranteed Notes, 9.13%, due 5/15/19 | | | 2,378 | |
| | 8,010 | | D.R. Horton, Inc., Guaranteed Notes, 4.38%, due 9/15/22 | | | 8,030 | |
| | 12,590 | | Lennar Corp., Guaranteed Notes, 4.75%, due 12/15/17 | | | 13,125 | ñ |
| | 3,065 | | Standard Pacific Corp., Guaranteed Notes, 8.38%, due 1/15/21 | | | 3,556 | |
| | | | 27,089 | |
| Building Materials (1.3%) |
| | 4,910 | | Masco Corp., Senior Unsecured Notes, 6.13%, due 10/3/16 | | | 5,374 | |
| | 2,460 | | Ply Gem Industries, Inc., Senior Secured Notes, 8.25%, due 2/15/18 | | | 2,626 | |
| | 17,520 | | USG Corp., Senior Unsecured Notes, 9.75%, due 1/15/18 | | | 19,141 | ØØ |
| | 12,490 | | USG Corp., Guaranteed Notes, 8.38%, due 10/15/18 | | | 13,614 | ñ |
| | | | 40,755 | |
| Chemicals (3.1%) |
| | 5,025 | | Huntsman Int'l LLC, Guaranteed Notes, 8.63%, due 3/15/20 | | | 5,666 | |
| | 10,900 | | Huntsman Int'l LLC, Guaranteed Notes, 8.63%, due 3/15/21 | | | 12,399 | |
| | 21,605 | | LyondellBasell Industries NV, Senior Unsecured Notes, 5.00%, due 4/15/19 | | | 23,387 | ØØ |
See Notes to Schedule of Investments
Schedule of Investments Neuberger Berman High Income Bond Fund (cont'd)
| PRINCIPAL AMOUNT | | VALUE† |
| | | | |
| (000's omitted) | | (000's omitted)z |
| | | | |
| $ | 4,425 | | LyondellBasell Industries NV, Senior Unsecured Notes, 6.00%, due 11/15/21 | | $ | 5,116 | ØØ |
| | 10,685 | | Momentive Performance Materials, Inc., Senior Secured Notes, 10.00%, due 10/15/20 | | | 10,258 | ñØØ |
| | 37,914 | | Momentive Performance Materials, Inc., Secured Notes, 9.00%, due 1/15/21 | | | 26,161 | ØØ |
| | 18,520 | | MPM Escrow LLC/MPM Finance Escrow Corp., Senior Secured Notes, 8.88%, due 10/15/20 | | | 18,149 | ñ |
| | | | 101,136 | |
| Computer Hardware (0.3%) |
| | 8,110 | | Seagate HDD Cayman, Guaranteed Notes, 7.00%, due 11/1/21 | | | 8,475 | |
| | | | | | | | |
| Consumer - Commercial Lease Financing (4.1%) |
| | 1,165 | | CIT Group, Inc., Senior Unsecured Notes, 4.25%, due 8/15/17 | | | 1,195 | |
| | 19,190 | | CIT Group, Inc., Senior Unsecured Notes, 6.63%, due 4/1/18 | | | 21,397 | ñ |
| | 35,870 | | CIT Group, Inc., Senior Unsecured Notes, 5.50%, due 2/15/19 | | | 38,246 | ñ |
| | 11,195 | | Int'l Lease Finance Corp., Senior Unsecured Medium-Term Notes, Ser. R, 6.63%, due 11/15/13 | | | 11,699 | |
| | 14,245 | | Int'l Lease Finance Corp., Senior Secured Notes, 6.50%, due 9/1/14 | | | 15,313 | ñ |
| | 17,770 | | Int'l Lease Finance Corp., Senior Unsecured Notes, 8.63%, due 9/15/15 | | | 20,009 | |
| | 3,730 | | Int'l Lease Finance Corp., Senior Unsecured Notes, 8.75%, due 3/15/17 | | | 4,355 | |
| | 1,315 | | Int'l Lease Finance Corp., Senior Unsecured Notes, 5.88%, due 4/1/19 | | | 1,393 | |
| | 4,970 | | Int'l Lease Finance Corp., Senior Unsecured Notes, 6.25%, due 5/15/19 | | | 5,357 | |
| | 11,305 | | Int'l Lease Finance Corp., Senior Unsecured Notes, 8.63%, due 1/15/22 | | | 13,665 | |
| | | | 132,629 | |
| Consumer Products (0.1%) |
| | 3,000 | | Alphabet Holding Co., Inc., Senior Unsecured Notes, 7.75%, due 11/1/17 | | | 3,026 | ñc |
| | | | | | | | |
| Department Stores (1.1%) |
| | 38,034 | | Sears Holdings Corp., Secured Notes, 6.63%, due 10/15/18 | | | 35,562 | |
| | | | | | | | |
| Electric - Generation (2.0%) |
| | 5,805 | | Calpine Corp., Senior Secured Notes, 7.25%, due 10/15/17 | | | 6,153 | ñØØ |
| | 4,216 | | Calpine Corp., Senior Secured Notes, 7.88%, due 7/31/20 | | | 4,617 | ñØØ |
| | 16,100 | | NRG Energy, Inc., Guaranteed Notes, 8.50%, due 6/15/19 | | | 17,428 | |
| | 9,815 | | NRG Energy, Inc., Guaranteed Notes, 8.25%, due 9/1/20 | | | 10,821 | |
| | 22,895 | | NRG Energy, Inc., Guaranteed Notes, 7.88%, due 5/15/21 | | | 25,070 | |
| | | | 64,089 | |
| Electric - Integrated (0.8%) |
| | 6,650 | | CMS Energy Corp., Senior Unsecured Notes, 4.25%, due 9/30/15 | | | 7,074 | |
| | 270 | | CMS Energy Corp., Senior Unsecured Notes, 6.55%, due 7/17/17 | | | 320 | |
| | 185 | | CMS Energy Corp., Senior Unsecured Notes, 5.05%, due 2/15/18 | | | 209 | |
| | 13,535 | | IPALCO Enterprises, Inc., Senior Secured Notes, 7.25%, due 4/1/16 | | | 15,074 | ñ |
| | 3,545 | | IPALCO Enterprises, Inc., Senior Secured Notes, 5.00%, due 5/1/18 | | | 3,740 | |
| | | | 26,417 | |
| Electronics (2.1%) |
| | 6,270 | | Amkor Technology, Inc., Guaranteed Notes, 6.38%, due 10/1/22 | | | 5,815 | ñ |
| | 14,820 | | Ceridian Corp., Guaranteed Notes, 11.25%, due 11/15/15 | | | 14,450 | |
See Notes to Schedule of Investments
Schedule of Investments Neuberger Berman High Income Bond Fund (cont'd)
| PRINCIPAL AMOUNT | | VALUE† |
| | | | |
| (000's omitted) | | (000's omitted)z |
| | | | |
| $ | 29,635 | | Ceridian Corp., Guaranteed Notes, 12.25%, due 11/15/15 | | $ | 29,116 | c |
| | 9,610 | | Ceridian Corp., Senior Secured Notes, 8.88%, due 7/15/19 | | | 10,187 | ñ |
| | 8,060 | | Freescale Semiconductor, Inc., Senior Secured Notes, 9.25%, due 4/15/18 | | | 8,624 | ñ |
| | | | 68,192 | |
| Energy - Exploration & Production (10.6%) |
| | 14,220 | | Chesapeake Energy Corp., Guaranteed Notes, 9.50%, due 2/15/15 | | | 15,926 | |
| | 12,080 | | Chesapeake Energy Corp., Guaranteed Notes, 6.50%, due 8/15/17 | | | 12,820 | |
| | 1,570 | | Chesapeake Energy Corp., Guaranteed Notes, 6.88%, due 8/15/18 | | | 1,649 | |
| | 8,510 | | Chesapeake Energy Corp., Guaranteed Notes, 6.63%, due 8/15/20 | | | 8,936 | |
| | 14,703 | | Chesapeake Energy Corp., Guaranteed Notes, 6.13%, due 2/15/21 | | | 14,887 | |
| | 10,170 | | Cimarex Energy Co., Guaranteed Notes, 5.88%, due 5/1/22 | | | 10,856 | |
| | 10,080 | | Continental Resources, Inc., Guaranteed Notes, 5.00%, due 9/15/22 | | | 10,634 | ñ |
| | 2,285 | | EP Energy LLC/Everest Acquisition Finance, Inc., Guaranteed Notes, 7.75%, due 9/1/22 | | | 2,365 | ñ |
| | 34,206 | | Everest Acquisition LLC, Senior Unsecured Notes, 9.38%, due 5/1/20 | | | 37,798 | ñ |
| | 21,720 | | EXCO Resources, Inc., Guaranteed Notes, 7.50%, due 9/15/18 | | | 20,417 | |
| | 11,880 | | Forest Oil Corp., Guaranteed Notes, 7.50%, due 9/15/20 | | | 12,147 | ñ |
| | 18,285 | | Linn Energy LLC, Guaranteed Notes, 6.25%, due 11/1/19 | | | 18,285 | ñ |
| | 10,375 | | Linn Energy LLC, Guaranteed Notes, 8.63%, due 4/15/20 | | | 11,348 | |
| | 15,241 | | Linn Energy LLC, Guaranteed Notes, 7.75%, due 2/1/21 | | | 16,270 | |
| | 17,615 | | Newfield Exploration Co., Senior Unsecured Notes, 5.75%, due 1/30/22 | | | 19,024 | |
| | 4,760 | | Newfield Exploration Co., Senior Unsecured Notes, 5.63%, due 7/1/24 | | | 5,081 | |
| | 4,500 | | Plains Exploration & Production Co., Guaranteed Notes, 7.63%, due 6/1/18 | | | 4,770 | |
| | 3,230 | | Plains Exploration & Production Co., Guaranteed Notes, 6.13%, due 6/15/19 | | | 3,222 | |
| | 8,580 | | Plains Exploration & Production Co., Guaranteed Notes, 8.63%, due 10/15/19 | | | 9,459 | |
| | 12,630 | | Plains Exploration & Production Co., Guaranteed Notes, 6.50%, due 11/15/20 | | | 12,630 | |
| | 8,060 | | Plains Exploration & Production Co., Guaranteed Notes, 6.63%, due 5/1/21 | | | 8,060 | |
| | 19,540 | | Plains Exploration & Production Co., Guaranteed Notes, 6.75%, due 2/1/22 | | | 19,638 | |
| | 11,820 | | Plains Exploration & Production Co., Guaranteed Notes, 6.88%, due 2/15/23 | | | 11,805 | |
| | 2,210 | | Range Resources Corp., Guaranteed Notes, 8.00%, due 5/15/19 | | | 2,442 | |
| | 4,495 | | Range Resources Corp., Guaranteed Notes, 5.75%, due 6/1/21 | | | 4,810 | |
| | 2,910 | | Range Resources Corp., Guaranteed Notes, 5.00%, due 8/15/22 | | | 3,041 | |
| | 13,700 | | SandRidge Energy, Inc., Guaranteed Notes, 8.00%, due 6/1/18 | | | 14,385 | ñ |
| | 7,665 | | SandRidge Energy, Inc., Guaranteed Notes, 7.50%, due 2/15/23 | | | 7,933 | ñ |
| | 6,760 | | WPX Energy, Inc., Senior Unsecured Notes, 5.25%, due 1/15/17 | | | 7,216 | |
| | 14,760 | | WPX Energy, Inc., Senior Unsecured Notes, 6.00%, due 1/15/22 | | | 15,793 | |
| | | | 343,647 | |
| Food & Drug Retailers (0.7%) |
| | 3,935 | | Rite Aid Corp., Secured Notes, 7.50%, due 3/1/17 | | | 4,043 | |
| | 1,205 | | Rite Aid Corp., Guaranteed Notes, 9.50%, due 6/15/17 | | | 1,238 | |
| | 3,985 | | Rite Aid Corp., Secured Notes, 10.25%, due 10/15/19 | | | 4,553 | |
| | 11,124 | | Rite Aid Corp., Senior Secured Notes, 8.00%, due 8/15/20 | | | 12,782 | |
| | | | 22,616 | |
| Gaming (3.7%) |
| | 12,920 | | Boyd Acquisition Sub LLC/Boyd Acquisition Finance Corp., Guaranteed Notes, 8.38%, due 2/15/18 | | | 13,211 | ñ |
| | 3,580 | | Boyd Gaming Corp., Senior Subordinated Notes, 7.13%, due 2/1/16 | | | 3,499 | |
| | 7,645 | | CityCenter Holdings LLC, Senior Secured Notes, 7.63%, due 1/15/16 | | | 8,161 | |
| | 5,185 | | CityCenter Holdings LLC, Senior Secured Notes, 7.63%, due 1/15/16 | | | 5,522 | ñ |
| | 1,841 | | CityCenter Holdings LLC, Secured Notes, 10.75%, due 1/15/17 | | | 1,946 | c |
See Notes to Schedule of Investments
Schedule of Investments Neuberger Berman High Income Bond Fund (cont'd)
| PRINCIPAL AMOUNT | | VALUE† |
| | | | |
| (000's omitted) | | (000's omitted)z |
| | | | |
| $ | 9,865 | | Graton Economic Development Authority, Senior Secured Notes, 9.63%, due 9/1/19 | | $ | 10,494 | ñ |
| | 4,526 | | MGM Mirage, Inc., Senior Secured Notes, 10.38%, due 5/15/14 | | | 5,086 | |
| | 3,410 | | MGM Mirage, Inc., Guaranteed Notes, 7.50%, due 6/1/16 | | | 3,615 | |
| | 1,805 | | MGM Mirage, Inc., Senior Secured Notes, 9.00%, due 3/15/20 | | | 2,013 | |
| | 3,740 | | MGM Resorts Int'l, Guaranteed Notes, 6.75%, due 10/1/20 | | | 3,712 | ñ |
| | 35,585 | | MGM Resorts Int'l, Guaranteed Notes, 7.75%, due 3/15/22 | | | 36,786 | |
| | 3,325 | | Mohegan Tribal Gaming Authority, Secured Notes, 10.50%, due 12/15/16 | | | 3,134 | ñ |
| | 6,860 | | Mohegan Tribal Gaming Authority, Guaranteed Notes, 11.00%, due 9/15/18 | | | 5,085 | ñ |
| | 6,120 | | Pinnacle Entertainment, Inc., Guaranteed Notes, 7.75%, due 4/1/22 | | | 6,625 | |
| | 7,345 | | Seminole Indian Tribe of Florida, Notes, 7.75%, due 10/1/17 | | | 8,006 | ñ |
| | 3,057 | | Wynn Las Vegas LLC, 1st Mortgage, 7.75%, due 8/15/20 | | | 3,431 | |
| | | | 120,326 | |
| Gas Distribution (4.6%) |
| | 830 | | Access Midstream Partner L.P., Guaranteed Notes, 5.88%, due 4/15/21 | | | 863 | |
| | 14,905 | | Access Midstream Partner L.P., Guaranteed Notes, 6.13%, due 7/15/22 | | | 15,762 | |
| | 10,695 | | AmeriGas Finance LLC, Guaranteed Notes, 6.75%, due 5/20/20 | | | 11,497 | |
| | 14,299 | | AmeriGas Finance LLC, Guaranteed Notes, 7.00%, due 5/20/22 | | | 15,532 | |
| | 10,400 | | El Paso Corp., Senior Unsecured Notes, 7.00%, due 6/15/17 | | | 11,882 | |
| | 4,700 | | El Paso Corp., Senior Unsecured Notes, 7.25%, due 6/1/18 | | | 5,427 | |
| | 5,970 | | El Paso Corp., Senior Unsecured Global Medium-Term Notes, 7.75%, due 1/15/32 | | | 7,125 | |
| | 6,535 | | El Paso Energy Corp., Senior Unsecured Global Medium-Term Notes, 7.80%, due 8/1/31 | | | 7,778 | |
| | 16,665 | | Energy Transfer Equity L.P., Senior Secured Notes, 7.50%, due 10/15/20 | | | 18,956 | |
| | 11,870 | | Ferrellgas L.P., Senior Unsecured Notes, 9.13%, due 10/1/17 | | | 12,701 | |
| | 4,055 | | Kinder Morgan Finance Co., Guaranteed Notes, 5.70%, due 1/5/16 | | | 4,439 | |
| | 5,775 | | Kinder Morgan Finance Co., Senior Secured Notes, 6.00%, due 1/15/18 | | | 6,336 | ñ |
| | 6,160 | | MarkWest Energy Partners L.P., Guaranteed Notes, Ser. B, 8.75%, due 4/15/18 | | | 6,591 | |
| | 10,155 | | Regency Energy Partners L.P., Guaranteed Notes, 6.88%, due 12/1/18 | | | 10,917 | |
| | 6,201 | | Suburban Propane Partners L.P./Suburban Energy Finance Corp., Senior Unsecured Notes, 7.50%, due 10/1/18 | | | 6,666 | ñ |
| | 5,982 | | Suburban Propane Partners L.P./ Suburban Energy Finance Corp., Senior Unsecured Notes, 7.38%, due 8/1/21 | | | 6,401 | ñ |
| | | | | |
| | | | 148,873 | |
| | | | | |
| Health Facilities (4.8%) |
| | 19,490 | | CHS/Community Health Systems, Inc., Senior Secured Notes, 5.13%, due 8/15/18 | | | 20,221 | |
| | 1,345 | | Columbia Healthcare Corp., Senior Unsecured Notes, 7.50%, due 12/15/23 | | | 1,345 | |
| | 1,985 | | Columbia/HCA Corp., Senior Unsecured Notes, 7.69%, due 6/15/25 | | | 2,005 | |
| | 1,370 | | Columbia/HCA Corp., Senior Unsecured Notes, 7.05%, due 12/1/27 | | | 1,295 | |
| | 4,820 | | DaVita, Inc., Guaranteed Notes, 5.75%, due 8/15/22 | | | 5,037 | |
| | 22,155 | | HCA, Inc., Senior Secured Notes, 8.50%, due 4/15/19 | | | 24,897 | |
| | 1,615 | | HCA, Inc., Senior Secured Notes, 6.50%, due 2/15/20 | | | 1,785 | |
| | 7,490 | | HCA, Inc., Senior Secured Notes, 7.88%, due 2/15/20 | | | 8,370 | |
| | 17,415 | | HCA, Inc., Senior Secured Notes, 4.75%, due 5/1/23 | | | 17,415 | |
| | 13,195 | | OMEGA Healthcare Investors, Inc., Guaranteed Notes, 6.75%, due 10/15/22 | | | 14,382 | |
| | 8,070 | | OMEGA Healthcare Investors, Inc., Guaranteed Notes, 5.88%, due 3/15/24 | | | 8,594 | |
| | 3,590 | | Tenet Healthcare Corp., Senior Unsecured Notes, 9.25%, due 2/1/15 | | | 4,048 | |
| | 20,890 | | Tenet Healthcare Corp., Senior Secured Notes, 8.88%, due 7/1/19 | | | 23,344 | |
| | 4,755 | | Tenet Healthcare Corp., Senior Secured Notes, 4.75%, due 6/1/20 | | | 4,713 | ñ |
| | 12,420 | | United Surgical Partners Int'l, Inc., Guaranteed Notes, 9.00%, due 4/1/20 | | | 13,600 | |
| | 3,395 | | Universal Health Services, Inc., Senior Secured Notes, 7.13%, due 6/30/16 | | | 3,845 | |
| | | | 154,896 | |
See Notes to Schedule of Investments
Schedule of Investments Neuberger Berman High Income Bond Fund (cont'd)
| PRINCIPAL AMOUNT | | VALUE† |
| | | | |
| (000's omitted) | | (000's omitted)z |
| | | | |
| Hotels (0.5%) |
| $ | 12,475 | | Host Hotels & Resorts L.P., Unsubordinated Notes, Ser. W, 5.88%, due 6/15/19 | | $ | 13,722 | |
| | 1,400 | | Host Hotels & Resorts L.P., Senior Unsecured Notes, 6.00%, due 10/1/21 | | | 1,624 | |
| | | | 15,346 | |
| Investments & Misc. Financial Services (1.6%) |
| | 22,510 | | Icahn Enterprises L.P., Guaranteed Notes, 7.75%, due 1/15/16 | | | 23,523 | |
| | 19,265 | | Icahn Enterprises L.P., Guaranteed Notes, 8.00%, due 1/15/18 | | | 20,710 | ñ |
| | 5,815 | | Icahn Enterprises L.P., Guaranteed Notes, 8.00%, due 1/15/18 | | | 6,251 | |
| | | | 50,484 | |
| Leisure (0.2%) |
| | 7,095 | | Cedar Fair L.P., Guaranteed Notes, 9.13%, due 8/1/18 | | | 8,026 | |
| | | | | | | | |
| Machinery (1.4%) |
| | 14,385 | | Case New Holland, Inc., Guaranteed Notes, 7.88%, due 12/1/17 | | | 16,902 | |
| | 8,960 | | CNH Capital LLC, Senior Notes, 3.88%, due 11/1/15 | | | 9,184 | ñ |
| | 1,620 | | Terex Corp., Senior Subordinated Notes, 8.00%, due 11/15/17 | | | 1,691 | |
| | 5,355 | | Terex Corp., Guaranteed Notes, 6.50%, due 4/1/20 | | | 5,623 | |
| | 5,280 | | The Manitowoc Co., Inc., Guaranteed Notes, 9.50%, due 2/15/18 | | | 5,901 | |
| | 5,585 | | The Manitowoc Co., Inc., Guaranteed Notes, 8.50%, due 11/1/20 | | | 6,269 | |
| | | | 45,570 | |
| Media - Broadcast (2.5%) |
| | 4,560 | | AMC Networks, Inc., Guaranteed Notes, 7.75%, due 7/15/21 | | | 5,164 | |
| | 10,215 | | Clear Channel Communications, Inc., Senior Unsecured Notes, 5.50%, due 9/15/14 | | | 9,551 | |
| | 8,740 | | Clear Channel Communications, Inc., Guaranteed Notes, 10.75%, due 8/1/16 | | | 6,468 | |
| | 17,295 | | Cumulus Media Holdings, Inc., Guaranteed Notes, 7.75%, due 5/1/19 | | | 16,906 | |
| | 3,950 | | Sirius XM Radio, Inc., Guaranteed Notes, 8.75%, due 4/1/15 | | | 4,483 | ñ |
| | 13,671 | | Univision Communications, Inc., Senior Secured Notes, 6.88%, due 5/15/19 | | | 13,979 | ñ |
| | 14,360 | | Univision Communications, Inc., Guaranteed Notes, 8.50%, due 5/15/21 | | | 14,432 | ñ |
| | 8,700 | | XM Satellite Radio, Inc., Guaranteed Notes, 7.63%, due 11/1/18 | | | 9,613 | ñ |
| | | | 80,596 | |
| Media - Cable (4.1%) |
| | 9,405 | | CCO Holdings LLC, Guaranteed Notes, 7.25%, due 10/30/17 | | | 10,275 | |
| | 25 | | CCO Holdings LLC, Guaranteed Notes, 7.88%, due 4/30/18 | | | 27 | |
| | 9,015 | | CCO Holdings LLC, Guaranteed Notes, 7.00%, due 1/15/19 | | | 9,691 | |
| | 2,965 | | CCO Holdings LLC, Guaranteed Notes, 8.13%, due 4/30/20 | | | 3,336 | |
| | 2,215 | | Cequel Communications Escrow 1 LLC/Cequel Communications Escrow Capital Corp., Senior Unsecured Notes, 6.38%, due 9/15/20 | | | 2,243 | ñ |
| | 12,480 | | Cequel Communications Holdings I LLC/Cequel Capital Corp., Senior Unsecured Notes, 8.63%, due 11/15/17 | | | 13,353 | ñ |
| | 3,890 | | CSC Holdings LLC, Senior Unsecured Notes, 7.63%, due 7/15/18 | | | 4,503 | |
| | 13,705 | | CSC Holdings LLC, Senior Unsecured Notes, 6.75%, due 11/15/21 | | | 15,247 | ñ |
| | 3,615 | | DISH DBS Corp., Guaranteed Notes, 7.75%, due 5/31/15 | | | 4,067 | |
| | 4,510 | | DISH DBS Corp., Guaranteed Notes, 4.63%, due 7/15/17 | | | 4,651 | |
| | 28,224 | | DISH DBS Corp., Guaranteed Notes, 6.75%, due 6/1/21 | | | 31,434 | |
| | 19,425 | | DISH DBS Corp., Guaranteed Notes, 5.88%, due 7/15/22 | | | 20,396 | |
See Notes to Schedule of Investments
Schedule of Investments Neuberger Berman High Income Bond Fund (cont'd)
| PRINCIPAL AMOUNT | | VALUE† |
| | | | |
| (000's omitted) | | (000's omitted)z |
| | | | |
| $ | 3,745 | | EchoStar DBS Corp., Guaranteed Notes, 7.13%, due 2/1/16 | | $ | 4,185 | |
| | 9,475 | | EchoStar DBS Corp., Guaranteed Notes, 6.63%, due 10/1/14 | | | 10,280 | |
| | | | 133,688 | |
| Media - Services (1.2%) |
| | 4,845 | | Clear Channel Worldwide Holdings, Inc., Guaranteed Notes, Ser. B, 9.25%, due 12/15/17 | | | 5,196 | |
| | 3,595 | | Clear Channel Worldwide Holdings, Inc., Guaranteed Notes, Ser. B, 7.63%, due 3/15/20 | | | 3,424 | |
| | 23,530 | | WMG Acquisition Corp., Senior Secured Notes, 9.50%, due 6/15/16 | | | 25,913 | |
| | 425 | | WMG Acquisition Corp., Senior Secured Notes, 9.50%, due 6/15/16 | | | 467 | |
| | 2,735 | | WMG Acquisition Corp., Senior Secured Notes, 6.00%, due 1/15/21 | | | 2,742 | ñØ |
| | | | 37,742 | |
| Medical Products (0.8%) |
| | 7,525 | | Fresenius Medical Care US Finance II, Inc., Guaranteed Notes, 5.63%, due 7/31/19 | | | 7,920 | ñ |
| | 2,635 | | Fresenius Medical Care US Finance II, Inc., Guaranteed Notes, 5.88%, due 1/31/22 | | | 2,803 | ñ |
| | 9,315 | | Fresenius Medical Care US Finance, Inc., Guaranteed Notes, 6.50%, due 9/15/18 | | | 10,433 | ñ |
| | 5,085 | | Hologic, Inc., Guaranteed Notes, 6.25%, due 8/1/20 | | | 5,390 | ñ |
| | | | 26,546 | |
| Metals - Mining Excluding Steel (2.4%) |
| | 4,780 | | Arch Coal, Inc., Guaranteed Notes, 7.25%, due 10/1/20 | | | 4,230 | |
| | 3,790 | | Arch Coal, Inc., Guaranteed Notes, 7.25%, due 6/15/21 | | | 3,344 | |
| | 15,470 | | FMG Resources (August 2006) Pty Ltd., Guaranteed Notes, 7.00%, due 11/1/15 | | | 15,625 | ñ |
| | 19,680 | | FMG Resources (August 2006) Pty Ltd., Senior Unsecured Notes, 6.00%, due 4/1/17 | | | 18,893 | ñ |
| | 17,415 | | FMG Resources (August 2006) Pty Ltd., Senior Unsecured Notes, 6.88%, due 4/1/22 | | | 16,370 | ñ |
| | 10,085 | | FMG Resources (August 2006) Pty Ltd., Guaranteed Notes, 8.25%, due 11/1/19 | | | 10,085 | ñ |
| | 8,500 | | Peabody Energy Corp., Guaranteed Notes, 6.00%, due 11/15/18 | | | 8,819 | |
| | | | 77,366 | |
| Packaging (4.6%) |
| | 11,546 | | Berry Plastics Corp., Secured Notes, 9.50%, due 5/15/18 | | | 12,556 | |
| | 45,040 | | Berry Plastics Corp., Secured Notes, 9.75%, due 1/15/21 | | | 51,120 | |
| | 5,520 | | Crown Americas LLC, Guaranteed Notes, 7.63%, due 5/15/17 | | | 5,865 | |
| | 6,148 | | Owens-Brockway Glass Container, Inc., Guaranteed Notes, 7.38%, due 5/15/16 | | | 7,040 | |
| | 25,090 | | Reynolds Group Issuer, Inc., Guaranteed Notes, 9.88%, due 8/15/19 | | | 26,282 | |
| | 18,070 | | Reynolds Group Issuer, Inc., Senior Secured Notes, 7.88%, due 8/15/19 | | | 19,606 | ØØ |
| | 17,940 | | Reynolds Group Issuer, Inc., Senior Secured Notes, 5.75%, due 10/15/20 | | | 18,119 | ñ |
| | 7,560 | | Reynolds Group Issuer, Inc., Senior Secured Notes, 6.88%, due 2/15/21 | | | 8,033 | |
| | | | 148,621 | |
| Pharmaceuticals (1.7%) |
| | 6,370 | | Endo Pharmaceuticals Holdings, Inc., Guaranteed Notes, 7.00%, due 7/15/19 | | | 6,880 | |
| | 4,445 | | Jaguar Holding Co., Senior Notes, 9.38%, due 10/15/17 | | | 4,512 | ñc |
| | 7,860 | | Jaguar Holding Co., Senior Unsecured Notes, 9.50%, due 12/1/19 | | | 8,783 | ñ |
| | 9,390 | | Valeant Pharmaceuticals Int'l, Guaranteed Notes, 6.75%, due 10/1/17 | | | 10,071 | ñ |
| | 2,995 | | Valeant Pharmaceuticals Int'l, Senior Notes, 6.38%, due 10/15/20 | | | 3,152 | ñ |
| | 20,210 | | VPI Escrow Corp., Guaranteed Notes, 6.38%, due 10/15/20 | | | 21,271 | ñ |
| | | | 54,669 | |
See Notes to Schedule of Investments
Schedule of Investments Neuberger Berman High Income Bond Fund (cont'd)
| PRINCIPAL AMOUNT | | VALUE† |
| | | | |
| (000's omitted) | | (000's omitted)z |
| | | | |
| Printing & Publishing (3.6%) |
| $ | 9,920 | | Cengage Learning Acquisitions, Inc., Senior Secured Notes, 11.50%, due 4/15/20 | | $ | 10,639 | ñ |
| | 3,590 | | Gannett Co., Inc., Guaranteed Notes, 9.38%, due 11/15/17 | | | 3,994 | |
| | 20,180 | | Gannett Co., Inc., Guaranteed Notes, 7.13%, due 9/1/18 | | | 22,021 | |
| | 5,905 | | R. R. Donnelley & Sons Co., Senior Unsecured Notes, 8.60%, due 8/15/16 | | | 6,436 | |
| | 18,130 | | R. R. Donnelley & Sons Co., Senior Unsecured Notes, 7.25%, due 5/15/18 | | | 18,017 | |
| | 35,100 | | R. R. Donnelley & Sons Co., Senior Unsecured Notes, 8.25%, due 3/15/19 | | | 36,153 | |
| | 20,230 | | R. R. Donnelley & Sons Co., Senior Unsecured Notes, 7.63%, due 6/15/20 | | | 19,927 | |
| | | | 117,187 | |
| Real Estate Dev. & Mgt. (0.3%) |
| | 9,520 | | Realogy Corp., Senior Secured Notes, 7.63%, due 1/15/20 | | | 10,686 | ñ |
| | | | | | | | |
| Software - Services (2.7%) |
| | 4,942 | | Fidelity National Information Services, Inc., Guaranteed Notes, 7.63%, due 7/15/17 | | | 5,393 | |
| | 5,290 | | Fidelity National Information Services, Inc., Guaranteed Notes, 7.88%, due 7/15/20 | | | 5,912 | |
| | 21,485 | | First Data Corp., Guaranteed Notes, 11.25%, due 3/31/16 | | | 21,002 | |
| | 7,420 | | First Data Corp., Senior Secured Notes, 7.38%, due 6/15/19 | | | 7,680 | ñØØ |
| | 7,155 | | First Data Corp., Senior Secured Notes, 6.75%, due 11/1/20 | | | 7,155 | ñ |
| | 11,060 | | Sophia, L.P., Guaranteed Notes, 9.75%, due 1/15/19 | | | 11,820 | ñ |
| | 3,845 | | SunGard Data Systems, Inc., Guaranteed Notes, 7.38%, due 11/15/18 | | | 4,138 | |
| | 14,965 | | SunGard Data Systems, Inc., Guaranteed Notes, 6.63%, due 11/1/19 | | | 15,096 | ñØ |
| | 3,805 | | SunGard Data Systems, Inc., Guaranteed Notes, 7.63%, due 11/15/20 | | | 4,133 | ØØ |
| | 4,000 | | Syniverse Holdings, Inc., Guaranteed Notes, 9.13%, due 1/15/19 | | | 4,260 | |
| | | | 86,589 | |
| Specialty Retail (1.6%) |
| | 2,939 | | Limited Brands, Inc., Guaranteed Notes, 8.50%, due 6/15/19 | | | 3,560 | |
| | 5,295 | | PC Merger Sub, Inc., Senior Notes, 8.88%, due 8/1/20 | | | 5,626 | ñ |
| | 21,500 | | Toys "R" Us Property Co. I LLC, Guaranteed Notes, 10.75%, due 7/15/17 | | | 23,247 | |
| | 18,550 | | Toys "R" Us Property Co. II LLC, Senior Secured Notes, 8.50%, due 12/1/17 | | | 19,918 | |
| | | | 52,351 | |
| Steel Producers - Products (1.0%) |
| | 7,515 | | ArcelorMittal, Senior Unsecured Notes, 6.13%, due 6/1/18 | | | 7,490 | |
| | 23,944 | | ArcelorMittal, Senior Unsecured Notes, 5.50%, due 8/5/20 | | | 23,093 | |
| | 2,700 | | ArcelorMittal, Senior Unsecured Notes, 5.75%, due 3/1/21 | | | 2,607 | |
| | | | 33,190 | |
| Support - Services (1.7%) |
| | 1,660 | | ADS Waste Holdings, Inc., Senior Notes, 8.25%, due 10/1/20 | | | 1,718 | ñ |
| | 5,885 | | HDTFS, Inc., Guaranteed Notes, 5.88%, due 10/15/20 | | | 5,944 | ñ |
| | 6,570 | | Iron Mountain, Inc., Guaranteed Notes, 7.75%, due 10/1/19 | | | 7,408 | |
| | 10,795 | | Iron Mountain, Inc., Senior Subordinated Notes, 5.75%, due 8/15/24 | | | 10,768 | |
| | 7,010 | | Knowledge Learning Corp., Inc., Guaranteed Notes, 7.75%, due 2/1/15 | | | 6,169 | ñ |
| | 8,260 | | RSC Equipment Rental, Inc., Senior Unsecured Notes, 8.25%, due 2/1/21 | | | 9,127 | |
| | 3,490 | | UR Merger Sub Corp., Guaranteed Notes, 10.88%, due 6/15/16 | | | 3,887 | |
| | 7,825 | | UR Merger Sub Corp., Secured Notes, 5.75%, due 7/15/18 | | | 8,412 | ñ |
| | | | | |
| | | | 53,433 | |
See Notes to Schedule of Investments
Schedule of Investments Neuberger Berman High Income Bond Fund (cont'd)
| PRINCIPAL AMOUNT | | VALUE† |
| | | | |
| (000's omitted) | | (000's omitted)z |
| | | | |
| Telecom - Integrated Services (4.8%) |
| $ | 3,442 | | CenturyLink, Inc., Senior Unsecured Notes, Ser. N, 6.00%, due 4/1/17 | | $ | 3,818 | |
| | 1,610 | | CenturyLink, Inc., Senior Unsecured Notes, Ser. S, 6.45%, due 6/15/21 | | | 1,765 | |
| | 8,605 | | CenturyLink, Inc., Senior Unsecured Notes, Ser. T, 5.80%, due 3/15/22 | | | 9,057 | |
| | 15,560 | | Citizens Communications Co., Senior Unsecured Notes, 9.00%, due 8/15/31 | | | 16,610 | |
| | 2,760 | | Frontier Communications Corp., Senior Unsecured Notes, 9.25%, due 7/1/21 | | | 3,264 | |
| | 8,070 | | Integra Telecom Holdings, Inc., Senior Secured Notes, 10.75%, due 4/15/16 | | | 8,231 | ñ |
| | 10,415 | | Intelsat Bermuda Ltd., Guaranteed Notes, 11.50%, due 2/4/17 | | | 10,962 | c |
| | 2,340 | | Intelsat Jackson Holdings SA, Guaranteed Notes, 8.50%, due 11/1/19 | | | 2,627 | |
| | 2,830 | | Level 3 Communications, Inc., Senior Unsecured Notes, 8.88%, due 6/1/19 | | | 2,972 | ñ |
| | 10,085 | | Level 3 Financing, Inc., Guaranteed Notes, 8.13%, due 7/1/19 | | | 10,766 | |
| | 8,405 | | Level 3 Financing, Inc., Guaranteed Notes, 8.63%, due 7/15/20 | | | 9,161 | |
| | 3,370 | | PAETEC Holding Corp., Senior Secured Notes, 8.88%, due 6/30/17 | | | 3,631 | |
| | 1,390 | | PAETEC Holding Corp., Guaranteed Notes, 9.88%, due 12/1/18 | | | 1,588 | |
| | 3,600 | | Qwest Communications Int'l, Inc., Guaranteed Notes, 7.13%, due 4/1/18 | | | 3,803 | |
| | 4,060 | | Qwest Corp., Senior Unsecured Notes, 6.75%, due 12/1/21 | | | 4,856 | |
| | 8,630 | | U.S. West Communications Group, Senior Unsecured Notes, 6.88%, due 9/15/33 | | | 8,673 | |
| | 1,585 | | Windstream Corp., Guaranteed Notes, 8.13%, due 8/1/13 | | | 1,654 | |
| | 30,350 | | Windstream Corp., Guaranteed Notes, 7.88%, due 11/1/17 | | | 33,802 | |
| | 3,000 | | Windstream Corp., Guaranteed Notes, 8.13%, due 9/1/18 | | | 3,248 | |
| | 335 | | Windstream Corp., Guaranteed Notes, 7.00%, due 3/15/19 | | | 343 | |
| | 12,290 | | Windstream Corp., Guaranteed Notes, 7.50%, due 6/1/22 | | | 13,027 | |
| | | | | |
| | | | 153,858 | |
| | | | | |
| Telecom - Wireless (2.9%) |
| | 7,100 | | CC Holdings GS V LLC/Crown Castle GS III Corp., Senior Secured Notes, 7.75%, due 5/1/17 | | | 7,562 | ñ |
| | 8,255 | | MetroPCS Wireless, Inc., Guaranteed Notes, 6.63%, due 11/15/20 | | | 8,874 | |
| | 4,495 | | SBA Telecommunications, Inc., Guaranteed Notes, 5.75%, due 7/15/20 | | | 4,675 | ñ |
| | 17,885 | | Sprint Capital Corp., Guaranteed Notes, 6.88%, due 11/15/28 | | | 18,287 | |
| | 15,840 | | Sprint Capital Corp., Guaranteed Notes, 8.75%, due 3/15/32 | | | 18,691 | |
| | 7,270 | | Sprint Nextel Corp., Guaranteed Notes, 9.00%, due 11/15/18 | | | 8,978 | ñ |
| | 7,024 | | Sprint Nextel Corp., Guaranteed Notes, 7.00%, due 3/1/20 | | | 8,148 | ñ |
| | 2,770 | | Wind Acquisition Finance SA, Senior Secured Notes, 7.25%, due 2/15/18 | | | 2,701 | ñ |
| | 17,025 | | Wind Acquisition Finance SA, Senior Secured Notes, 7.25%, due 2/15/18 | | | 16,514 | ñ |
| | | | 94,430 | |
| | | | Total Corporate Debt Securities (Cost $2,566,205) | | | 2,693,133 | |
| | | | | | | | |
| NUMBER OF SHARES | | |
| | | | |
| Short-Term Investments (4.3%) |
| | 137,664,047 | | State Street Institutional Liquid Reserves Fund Institutional Class (Cost $137,664) | | | 137,664 | |
| | | | | | | | |
| | | | Total Investments (100.9%) (Cost $3,129,532) | | | 3,262,922 | ## |
| | | | | | | | |
| | | | Liabilities, less cash, receivables and other assets [(0.9%)] | | | (29,031 | ) |
| | | | | | | | |
| | | | Total Net Assets (100.0%) | | $ | 3,233,891 | |
See Notes to Schedule of Investments
Schedule of Investments Neuberger Berman Municipal Intermediate Bond Fund
| PRINCIPAL AMOUNT | SECURITY | | VALUE† |
| | | | |
| (000's omitted) | | (000's omitted)z |
| | | | |
| Municipal Debt Securities (101.7%) |
| | |
| Arizona (0.7%) |
| $ | 1,000 | | Phoenix Civic Imp. Corp. Wastewater Sys. Jr. Lien Ref. Rev., Ser. 2011, 2.00%, due 7/1/18 | | $ | 1,030 | |
| | | | | | | | |
| Arkansas (2.2%) |
| | 1,605 | | Arkansas St. Dev. Fin. Au. St. Park Fac. Ref. Rev. (Mt. Magazine Proj.), Ser. 2012, (AGM Insured), 3.00%, due 1/1/22 | | | 1,665 | |
| | 1,470 | | Springdale Sales & Use Rev., Ser. 2012, 3.00%, due 11/1/21 | | | 1,564 | Ø |
| | | | 3,229 | |
| California (10.7%) |
| | 675 | | Acalanes Union High Sch. Dist. G.O. Ref. Rev., Ser. 2012, 4.00%, due 8/1/22 | | | 796 | |
| | 1,400 | | California St. Poll. Ctrl. Fin. Au. Env. Imp. Rev. (Air Prods. & Chemicals, Inc.), Ser. 1997-B, 0.24%, due 3/1/42 | | | 1,400 | µß |
| | 1,000 | | California Pub. Works Board Lease Rev. Dept. of Mental Hlth. (Coalinga St. Hosp.), Ser. 2004-A, 5.50%, due 6/1/21 | | | 1,074 | |
| | 1,000 | | California St. G.O., Ser. 2010, 5.25%, due 3/1/30 | | | 1,149 | |
| | 795 | | Inglewood Pub. Fin. Au. Lease Ref. Rev., Ser. 2012, 5.00%, due 8/1/16 | | | 844 | |
| | 1,500 | | Irvine Imp. Bond Act 1915 Ltd. Oblig. (Spec. Assessment Dist. Number 12-1), Ser. 2012, 3.00%, due 9/2/16 | | | 1,583 | |
| | 400 | | JPMorgan Chase Putters/Drivers Trust Var. Sts. Rev., Ser. 2012-4059, (LOC: JPMorgan Chase Bank, N.A.), 0.23%, due 5/1/13 | | | 400 | ñµ |
| | 1,190 | | Mesa Cons. Wtr. Dist. Cert. of Participation, Ser. 2010, 5.00%, due 3/15/22 | | | 1,440 | |
| | 705 | | Oakland G.O. Ref., Ser. 2012, 5.00%, due 1/15/20 | | | 843 | |
| | 900 | | Sacramento City Fin. Au. Ref. Rev. (Master Lease Prog. Facs.), Ser. 2006-E, (AMBAC Insured), 5.25%, due 12/1/24 | | | 1,075 | |
| | 905 | | San Diego Pub. Fac. Fin. Au. Lease Ref. Rev. (Ballpark), Ser. 2007-A, (AMBAC Insured), 5.25%, due 2/15/21 | | | 1,013 | |
| | 1,500 | | San Francisco City & Co. Pub. Utils. Commission Wtr. Ref. Rev., Ser. 2011-D, 5.00%, due 11/1/24 | | | 1,830 | |
| | 740 | | San Marcos Unified Sch. Dist. G.O. (Election 2010), Ser. 2012-B, 0.00%, due 8/1/26 | | | 412 | |
| | 645 | | San Marcos Unified Sch. Dist. G.O. (Election 2010), Ser. 2012-B, 0.00%, due 8/1/27 | | | 340 | |
| | 1,000 | | Santa Barbara Unified Sch. Dist. G.O. (Election 2010), Ser. 2012-C, 0.00%, due 8/1/37 | | | 645 | |
| | 1,000 | | Turlock Irrigation Dist. Ref. Rev. (First Priority), Ser. 2011, 5.00%, due 1/1/19 | | | 1,190 | |
| | | | 16,034 | |
| Colorado (2.2%) |
| | 1,000 | | Colorado St. Ed. & Cultural Facs. Au. Rev. (Nat'l Jewish Federation), Ser. 2007-D3, (LOC: JPMorgan Chase Bank, N.A.), 0.23%, due 12/1/37 | | | 1,000 | µß |
| | 730 | | Denver City & Co. Cert. of Participation (Wastewater/Rosyn Properties), Ser. 2010-B, 3.00%, due 12/1/16 | | | 784 | |
| | 475 | | No. Colorado Wtr. Conservancy Dist. Cert. of Participation, Ser. 2012, 4.00%, due 7/1/18 | | | 539 | |
| | 450 | | No. Colorado Wtr. Conservancy Dist. Cert. of Participation, Ser. 2012, 4.00%, due 7/1/19 | | | 513 | |
| | 475 | | No. Colorado Wtr. Conservancy Dist. Cert. of Participation, Ser. 2012, 3.00%, due 7/1/20 | | | 506 | |
| | | | | |
| | | | 3,342 | |
| Delaware (0.1%) |
| | 195 | | Univ. of Delaware Rev., Ser. 2004-B, (LOC: Bank of America), 0.27%, due 11/1/34 | | | 195 | µØØ |
See Notes to Schedule of Investments
Schedule of Investments Neuberger Berman Municipal Intermediate Bond Fund (cont'd)
| PRINCIPAL AMOUNT | SECURITY | | VALUE† |
| | | | |
| (000's omitted) | | (000's omitted)z |
| | | | |
| District of Columbia (1.2%) |
| $ | 1,000 | | Dist. of Columbia Rev. (Assoc. of American Med. College), Ser. 2011-B, 5.00%, due 10/1/22 | | $ | 1,176 | ß |
| | 505 | | Dist. of Columbia Rev. (Friendship Pub. Charter Sch.), Ser. 2012, 2.15%, due 6/1/15 | | | 505 | ß |
| | 165 | | Dist. of Columbia Univ. Ref. Rev. (Georgetown Univ.), Ser. 2009-A, 5.00%, due 4/1/21 | | | 192 | ß |
| | | | 1,873 | |
| Florida (11.8%) |
| | 1,000 | | CityPlace Comm. Dev. Dist. Spec. Assessment Ref. Rev., Ser. 2012, 5.00%, due 5/1/26 | | | 1,139 | |
| | 2,300 | | Collier Co. Gas Tax Ref. Rev., Ser. 2012, 5.00%, due 6/1/16 | | | 2,596 | |
| | 1,300 | | Eclipse Funding Trust Var. Sts. Rev. (Solar Eclipse Miami-Dade Co.), Ser. 2007-0045, (LOC: U.S. Bank), 0.23%, due 4/1/37 | | | 1,300 | µ |
| | 1,495 | | Florida St. Muni. Loan Council Rev., Ser. 2012, (AGM Insured), 4.00%, due 5/1/19 | | | 1,678 | Ø |
| | 1,420 | | Gulf Breeze Rev. (Local Gov't), Ser. 1985, 1.70%, due 12/1/20 Putable 12/1/2017 | | | 1,419 | µ |
| | 1,000 | | Miami-Dade Co. Sch. Board Cert. of Participation, Ser. 2012-A, 5.00%, due 8/1/22 | | | 1,170 | |
| | 1,000 | | Orange Co. Sch. Board Cert. of Participation, Ser. 2012-A, 5.00%, due 8/1/19 | | | 1,194 | |
| | 1,000 | | Palm Beach Co. G.O. Ref. (Rec. & Cultural Facs.), Ser. 2010, 5.00%, due 7/1/20 | | | 1,247 | |
| | 750 | | Palm Beach Co. Solid Waste Au. Rev., Ser. 2002-B, (AMBAC Insured), 0.00%, due 10/1/15 | | | 722 | |
| | 1,255 | | Port St. Lucie Research Facs. Rev. (Oregon Hlth. and Science Univ. Vaccine and Gene Therapy Institute Florida Corp. Proj.), Ser. 2010, 5.00%, due 5/1/22 | | | 1,416 | ß |
| | 1,580 | | Port St. Lucie Research Facs. Rev. (Oregon Hlth. and Science Univ. Vaccine and Gene Therapy Institute Florida Corp. Proj.), Ser. 2010, 5.00%, due 5/1/23 | | | 1,761 | ß |
| | 2,000 | | Space Coast Infrastructure Agcy. Imp. Rev. (I-95 Brevard Co. DBF Proj.), Ser. 2012, 4.00%, due 6/15/17 | | | 2,160 | |
| | | | 17,802 | |
| Georgia (0.9%) |
| | 1,000 | | Gwinnett Co. Sch. Dist. G.O. Ref., Ser. 2010, 5.00%, due 2/1/25 | | | 1,323 | |
| | |
| Illinois (6.7%) |
| | 2,000 | | Chicago G.O., Ser. 2010-A, 5.00%, due 12/1/15 | | | 2,253 | |
| | 1,000 | | Chicago O'Hare Int'l Arpt. Gen. Arpt. Third Lien Ref. Rev., Ser. 2005-B, (National Public Finance Guarantee Corp. Insured), 5.25%, due 1/1/17 | | | 1,163 | |
| | 1,165 | | Chicago Park Dist. G.O., Ser. 2011-C, 5.00%, due 1/1/24 | | | 1,417 | |
| | 1,400 | | Cook Co. Sch. Dist. Number 144 Prairie Hills G.O. (Ltd. Sch.), Ser. 2010-A, (AGM Insured), 5.25%, due 12/1/27 Pre-Refunded 12/1/2020 | | | 1,820 | |
| | 200 | | Cook Co. Sch. Dist. Number 144 Prairie Hills G.O. (Ltd. Sch.), Ser. 2010-A, (AGM Insured), 5.25%, due 12/1/27 | | | 223 | |
| | 1,000 | | Cook Co. Sch. Dist. Number 83 G.O. (Ref. Sch.), Ser. 2011-D, 5.13%, due 12/1/30 | | | 1,141 | |
| | 750 | | Dekalb Kane Lasalle Cos. Comm. College Dist. Number 523 G.O., Ser. 2011-B, 0.00%, due 2/1/25 | | | 467 | |
| | 1,500 | | Illinois St. G.O. Ref., Ser. 2010, (AGM Insured), 5.00%, due 1/1/15 | | | 1,627 | |
| | | | 10,111 | |
| Indiana (4.8%) |
| | 1,000 | | Boone Co. Hosp. Assoc. Lease Rev., Ser. 2005, (National Public Finance Guarantee Corp. Insured), 5.25%, due 7/10/17 | | | 1,112 | |
| | 1,000 | | Eclipse Funding Trust Var. Sts. (Solar Eclipse), Ser. 2007-0052, (LOC: U.S. Bank), 0.23%, due 7/15/26 | | | 1,000 | ñµ |
| | 500 | | Indiana Fin. Au. Midwestern Disaster Relief Rev. (Ohio Valley Elec. Corp. Proj.), Ser. 2012-A, 5.00%, due 6/1/32 | | | 538 | ß |
| | 940 | | Indiana St. Muni. Pwr. Agcy. Ref. Rev., Ser. 2010-B, 5.00%, due 1/1/22 | | | 1,125 | |
| | 1,280 | | Indiana St. Muni. Pwr. Agcy. Rev., Ser. 2011-A, 5.00%, due 1/1/18 | | | 1,527 | |
| | 1,615 | | Indiana St. Fin. Au. Rev. (St. Revolving Fund Prog.), Ser. 2009-A1, 5.00%, due 2/1/21 | | | 1,938 | |
| | | | | |
| | | | 7,240 | |
See Notes to Schedule of Investments
Schedule of Investments Neuberger Berman Municipal Intermediate Bond Fund (cont'd)
| PRINCIPAL AMOUNT | SECURITY | | VALUE† |
| | | | |
| (000's omitted) | | (000's omitted)z |
| | | | |
| Iowa (0.9%) |
| $ | 1,345 | | Iowa Fin. Au. Hlth. Care Fac. Rev. (Genesis Hlth. Sys.), Ser. 2010, 5.00%, due 7/1/13 | | $ | 1,381 | ß |
| | | | | | | | |
| | | | | | | | |
| Kansas (1.0%) |
| | 720 | | Olathe Hlth. Facs. Rev. (Med. Ctr.), Ser. 2012-A, 3.00%, due 9/1/16 | | | 756 | ß |
| | 750 | | Wichita Hosp. Rev. (Facs. Imp.), Ser. 2009-IIIA, 4.50%, due 11/15/12 | | | 751 | ß |
| | | | 1,507 | |
| Louisiana (2.0%) |
| | 1,280 | | Louisiana St. Local Gov't Env. Facs. & Comm. Dev. Au. Rev. (Plaquemines Proj.), Ser. 2012, (AGM Insured), 4.00%, due 9/1/21 | | | 1,429 | |
| | 100 | | Louisiana St. Pub. Facs. Au. Rev. (Air Prods. & Chemicals, Inc.), Ser. 2008-C, 0.21%, due 12/1/43 | | | 100 | µß |
| | 795 | | Monroe Sales & Use Tax Ref. Rev., Ser. 2012, 4.00%, due 7/1/23 | | | 860 | |
| | 570 | | Terrebonne Parish LA Hosp. Svc. Dist. Number 1 Hosp. Ref. Rev. (Gen. Med. Ctr. Proj.), Ser. 2010, 4.00%, due 4/1/15 | | | 602 | |
| | | | 2,991 | |
| Maryland (1.6%) |
| | 1,000 | | Maryland St. G.O. (St. & Local Facs. Loan), Ser. 2012-B, 3.00%, due 3/15/23 | | | 1,075 | |
| | 1,250 | | Maryland St. G.O., Ser. 2011-B, 4.00%, due 3/15/25 | | | 1,400 | |
| | | | 2,475 | |
| Massachusetts (4.1%) |
| | 2,000 | | Massachusetts Bay Trans. Au. Rev. (Assessment), Ser. 2006-A, 5.25%, due 7/1/30 | | | 2,656 | |
| | 950 | | Massachusetts Bay Trans. Au. Sr. Sales Tax Rev., Ser. 2006-A, 5.25%, due 7/1/34 | | | 1,252 | |
| | 600 | | Massachusetts St. HFA Hsg. Rev. (Single Family), Ser. 2009-144, 3.95%, due 6/1/18 | | | 652 | |
| | 500 | | Massachusetts St. Hlth. & Ed. Fac. Au. Rev. (Berklee College of Music), Ser. 2007-A, 5.00%, due 10/1/15 | | | 557 | ß |
| | 1,000 | | Massachusetts St. Hlth. & Ed. Fac. Au. Rev. (Northeastern Univ.), Ser. 2008-T3, 2.70%, due 10/1/37 Putable 2/20/14 | | | 1,024 | µß |
| | | | 6,141 | |
| Michigan (2.2%) |
| | 350 | | Forest Hills Pub. Sch. G.O. Ref., Ser. 2005, (AGM Insured), 5.00%, due 5/1/21 | | | 382 | |
| | 2,075 | | Michigan St. Hosp. Fin. Au. Rev. (Ascension Healthcare Group), Ser. 1999-B4, 0.90%, due 11/15/33 Putable 3/16/2015 | | | 2,076 | µßØØ |
| | 800 | | Univ. of Michigan Rev., Ser. 2012-B, (LOC: Northern Trust Co.), 0.20%, due 4/1/42 | | | 800 | µ |
| | | | 3,258 | |
| Minnesota (0.6%) |
| | 755 | | Willmar G.O. Ref. (Rice Mem. Hosp. Proj.), Ser. 2012-A, 5.00%, due 2/1/19 | | | 919 | |
| | | | | | | | |
| Mississippi (0.8%) |
| | 1,045 | | Mississippi Dev. Bank Spec. Oblig. (Dept. Corrections), Ser. 2010-D, 5.00%, due 8/1/22 | | | 1,231 | |
See Notes to Schedule of Investments
Schedule of Investments Neuberger Berman Municipal Intermediate Bond Fund (cont'd)
| PRINCIPAL AMOUNT | SECURITY | | VALUE† |
| | | | |
| (000's omitted) | | (000's omitted)z |
| | | | |
| Missouri (1.0%) |
| $ | 750 | | Missouri St. Dev. Fin. Board Infrastructure Facs. Rev. (St. Joseph Swr. Sys. Imp.), Ser. 2012-C, 3.25%, due 11/1/24 | | $ | 742 | Ø |
| | 750 | | Missouri St. Hlth. & Ed. Fac. Au. Rev. (Children's Mercy Hosp.), Ser. 2009, 5.13%, due 5/15/24 | | | 827 | ß |
| | | | 1,569 | |
| Nebraska (1.0%) |
| | 1,220 | | Omaha Pub. Fac. Corp. Lease Rev. (Baseball Stadium Proj.), Ser. 2009, 5.00%, due 6/1/22 | | | 1,437 | |
| | | | | | | | |
| Nevada (0.6%) |
| | 750 | | Las Vegas Redev. Agcy. Tax Increment Rev., Ser. 2009-A, 7.50%, due 6/15/23 | | | 863 | |
| | | | | | | | |
| New Jersey (4.7%) |
| | 305 | | Harrison G.O., Ser. 2012-A, 5.00%, due 4/15/18 | | | 344 | |
| | 365 | | Harrison G.O., Ser. 2012-A, 4.25%, due 4/15/19 | | | 396 | |
| | 365 | | Harrison G.O., Ser. 2012-A, 4.25%, due 4/15/20 | | | 394 | |
| | 240 | | Harrison G.O., Ser. 2012-A, 4.25%, due 4/15/21 | | | 257 | |
| | 755 | | Morristown Parking Au. Rev., Ser. 2011, 4.00%, due 8/1/18 | | | 846 | |
| | 1,000 | | New Jersey Econ. Dev. Au. Rev. (Sch. Fac. Construction), Ser. 2010-DD1, 5.00%, due 12/15/18 | | | 1,198 | |
| | 2,000 | | New Jersey Trans. Trust Fund Au., Ser. 2006-A, (National Public Finance Guarantee Corp. Insured), 5.25%, due 12/15/21 | | | 2,469 | |
| | 1,000 | | New Jersey St. Trans. Trust Fund Au. Trans. Sys. Rev., Ser. 2006-A, 5.25%, due 12/15/19 | | | 1,229 | |
| | | | 7,133 | |
| New Mexico (0.6%) |
| | 750 | | Albuquerque Muni. Sch. Dist. Number 012 (Sch. Bldg.) G.O., Ser. 2008-B, 4.50%, due 8/1/19 | | | 842 | |
| | | | | | | | |
| New York (8.6%) |
| | 400 | | Long Island Pwr. Au. Elec. Sys. Rev., Ser. 2006-F, (National Public Finance Guarantee Corp. Insured), 5.00%, due 5/1/19 | | | 462 | |
| | 1,850 | | New York G.O., Ser. 2011-I1, 5.00%, due 8/1/18 | | | 2,249 | |
| | 1,000 | | New York St. Dorm. Au. (St. Personal Income Tax), Ser. 2011-C, 4.00%, due 3/15/19 | | | 1,172 | |
| | 1,500 | | New York St. Dorm. Au. Rev. (St. Personal Income Tax), Ser. 2012-D, 3.00%, due 2/15/21 | | | 1,650 | |
| | 1,690 | | New York St. Local Gov't Assist Corp., Ser. 1993-E, (AGM Insured), 6.00%, due 4/1/14 | | | 1,773 | |
| | 100 | | New York St. Urban Dev. Corp. Ref. Rev. (Correctional Facs.), Ser. 1994-A, (AGM Insured), 5.50%, due 1/1/14 | | | 103 | |
| | 750 | | New York St. Urban Dev. Corp. Rev. (St. Personal Income Tax), Ser. 2009-A1, 5.00%, due 12/15/19 | | | 917 | |
| | 1,000 | | New York St. Urban Dev. Corp. Rev. (St. Personal Income Tax), Ser. 2010-A, 5.00%, due 3/15/19 | | | 1,233 | |
| | 2,000 | | Port Au. New York & New Jersey Rev. (One Hundred Fifty-Third), Ser. 2008, 4.50%, due 7/15/27 | | | 2,204 | ØØ |
| | 1,000 | | Suffolk Co. Wtr. Au. Ref. Rev., Ser. 2012, 4.00%, due 6/1/24 | | | 1,147 | |
| | | | 12,910 | |
| North Carolina (0.8%) |
| | 650 | | North Carolina St. Cap. Imp. Ltd. Oblig. (Annual Appropriation), Ser. 2009-A, 5.00%, due 5/1/19 | | | 811 | |
| | 295 | | Western Carolina Univ. Research & Dev. Corp. Cert. of Participation (Western Carolina Univ. Std. Hsg.), Ser. 2008, (Assured Guaranty Insured), 5.25%, due 6/1/20 | | | 348 | ß |
| | | | 1,159 | |
See Notes to Schedule of Investments
Schedule of Investments Neuberger Berman Municipal Intermediate Bond Fund (cont'd)
| PRINCIPAL AMOUNT | SECURITY | | VALUE† |
| | | | |
| (000's omitted) | | (000's omitted)z |
| | | | |
| Ohio (3.0%) |
| $ | 2,000 | | Kent St. Univ. Rev. Gen. Receipts, Ser. 2012-A, 3.50%, due 5/1/27 | | $ | 2,045 | |
| | 1,000 | | Ohio St. Adult Correctional Cap. Fac. Ref. Rev. (Lease Appropriation Bldg. Fund), Ser. 2012-A, 5.00%, due 4/1/21 | | | 1,204 | |
| | 1,000 | | Ohio St. G.O. (Infrastructure Imp.), Ser. 2011-B, 5.00%, due 8/1/19 | | | 1,239 | |
| | | | 4,488 | |
| Oregon (0.8%) |
| | 400 | | Oregon St. G.O. (Veterans Welfare), Ser. 2006-86, (LOC: U.S. Bank), 0.23%, due 6/1/40 | | | 400 | µ |
| | 750 | | Oregon St. Hsg. & Comm. Svc. Dept. Mtge. Rev. (Single Family Mtge. Prog.), Ser. 2005-D, 4.40%, due 7/1/19 | | | 794 | |
| | | | 1,194 | |
| Pennsylvania (2.8%) |
| | 710 | | Indiana Co. Ind. Dev. Au. Rev. (Std. Cooperative Assoc., Inc.), Ser. 2012, 3.35%, due 5/1/24 | | | 715 | ß |
| | 1,000 | | Norristown Area Sch. Dist. Cert. of Participation (Installment Purchase), Ser. 2012, 4.50%, due 4/1/27 | | | 1,038 | |
| | 1,285 | | Pennsylvania St. HFA Single Family Mtge. Rev., Ser. 2010-109, 2.45%, due 4/1/16 | | | 1,337 | |
| | 340 | | Pennsylvania St. Pub. Sch. Bldg. Au. College Rev. (Montgomery Co. Comm. College), Ser. 2008, (AGM Insured), 5.00%, due 5/1/21 | | | 390 | ß |
| | 650 | | Pennsylvania St. Turnpike Commission Rev., Ser. 2011-B, 5.00%, due 12/1/14 | | | 705 | ØØ |
| | | | 4,185 | |
| Puerto Rico (1.5%) |
| | 1,745 | | Puerto Rico Elec. Pwr. Au. Pwr. Rev., Ser. 2010-XX, 5.25%, due 7/1/40 | | | 1,774 | |
| | 500 | | Puerto Rico Ind. Tourist Ed. Med. & Env. Ctrl. Fac. Fin. Au. Ref. Rev. (Int'l American Univ. Proj.), Ser. 2012, 4.00%, due 10/1/14 | | | 523 | ß |
| | | | 2,297 | |
| Rhode Island (1.9%) |
| | 1,420 | | Cranston G.O., Ser. 2012-B, 3.00%, due 7/1/16 | | | 1,488 | |
| | 1,200 | | Rhode Island St. Std. Loan Au. Std. Loan Rev. (Sr. Prog.), Ser. 2010-A, 4.40%, due 12/1/19 | | | 1,303 | |
| | | | 2,791 | |
| South Carolina (2.5%) |
| | 870 | | Charleston Co. G.O. (Cap. Imp. Plan), Ser. 2011, 5.00%, due 11/1/18 | | | 1,084 | |
| | 2,335 | | South Carolina St. Pub. Svc. Au. Ref. Rev. (Santee Cooperative), Ser. 2012-A, 4.00%, due 12/1/20 | | | 2,729 | ØØ |
| | | | 3,813 | |
| Tennessee (3.3%) |
| | 1,750 | | Memphis Ref. G.O. (Gen. Imp.), Ser. 2011, 5.00%, due 5/1/24 | | | 2,140 | |
| | 1,000 | | Metro. Gov't Nashville & Davidson Co. Hlth. & Ed. Fac. Board, Ser. 2012, 5.00%, due 11/1/26 | | | 1,111 | ß |
| | 1,600 | | Metro. Nashville Arpt. Au. Ref. Rev. Imp., Ser. 2010-B, (AGM Insured), 4.00%, due 7/1/15 | | | 1,710 | |
| | | | 4,961 | |
| Texas (8.9%) |
| | 1,000 | | Alamo Comm. College Dist. G.O. (Maintenance Tax Notes), Ser. 2011, 4.00%, due 2/15/20 | | | 1,171 | |
| | 750 | | Brownsville G.O., Ser. 2011-A, 4.00%, due 2/15/18 | | | 843 | |
See Notes to Schedule of Investments
Schedule of Investments Neuberger Berman Municipal Intermediate Bond Fund (cont'd)
| PRINCIPAL AMOUNT | SECURITY | | VALUE† |
| | | | |
| (000's omitted) | | (000's omitted)z |
| | | | |
| $ | 705 | | Brownsville G.O., Ser. 2011-A, 4.00%, due 2/15/20 | | $ | 800 | |
| | 1,085 | | Dallas Co. Sch. G.O. (Pub. Prop. Fin. Contractual Oblig.), Ser. 2012-A, 4.00%, due 12/1/18 | | | 1,255 | |
| | 460 | | Dallas Fort Worth Int'l Arpt. Ref. Rev., Ser. 2009-A, 5.00%, due 11/1/24 | | | 507 | |
| | 420 | | El Paso Independent Sch. Dist. Ref. G.O., Ser. 2011, (PSF Insured), 4.00%, due 8/15/26 | | | 465 | |
| | 750 | | Fort Bend Independent Sch. Dist. Ref. G.O. (Sch. Bldg.), Ser. 2008, (PSF Insured), 5.00%, due 8/15/21 | | | 900 | |
| | 1,000 | | Grapevine Combination Tax & Tax Increment Reinvestment Zone Rev. Cert. of Oblig. G.O., Ser. 2000, (National Public Finance Guarantee Corp. Insured), 5.63%, due 8/15/15 | | | 1,003 | |
| | 225 | | Harris Co. Cultural Ed. Fac. Fin. Corp. Rev. (Methodist Hosp. Sys.), Ser. 2008-B, 5.25%, due 12/1/17 | | | 264 | ß |
| | 1,110 | | Houston Hotel Occupancy Tax & Spec. Ref. Rev. (Convention & Entertainment Facs.), Ser. 2012, 5.00%, due 9/1/28 | | | 1,141 | |
| | 1,000 | | Houston Wtr. & Swr. Sys. Jr. Lien Ref. Rev., Ser. 2001-B, (National Public Finance Guarantee Corp. Insured), 5.50%, due 12/1/24 | | | 1,343 | |
| | 915 | | Lone Star College Sys. G.O., Ser. 2011, 3.00%, due 2/15/19 | | | 1,010 | |
| | 375 | | Texas A&M Univ. Perm. Univ. Fund Rev., Ser. 2011, 3.00%, due 7/1/17 | | | 414 | |
| | 555 | | Texas A&M Univ. Perm. Univ. Fund Rev., Ser. 2011, 3.00%, due 7/1/18 | | | 619 | |
| | 750 | | Texas A&M Univ. Perm. Univ. Fund Rev., Ser. 2011, 4.00%, due 7/1/19 | | | 885 | |
| | 415 | | Texas St. Technical College Sys. Rev. Ref. & Imp., Ser. 2011, 5.00%, due 8/1/17 | | | 471 | |
| | 245 | | Texas St. Technical College Sys. Rev. Ref. & Imp., Ser. 2011, 5.00%, due 8/1/18 | | | 281 | |
| | | | 13,372 | |
| Virginia (3.5%) |
| | 1,200 | | Newport News Ref. G.O., Ser. 2011-B, 4.00%, due 7/1/19 | | | 1,408 | |
| | 2,000 | | Virginia Commonwealth Trans. Board Rev. (Cap. Proj.), Ser. 2011, 4.00%, due 5/15/29 | | | 2,198 | |
| | 1,690 | | Virginia St. Hsg. Dev. Au. Homeownership Mtge. Rev., Ser. 2010-B, 2.10%, due 9/1/15 | | | 1,709 | |
| | | | 5,315 | |
| Washington (1.7%) |
| | 1,385 | | Energy Northwest Elec. Ref. Rev. (Proj. Number 3), Ser. 2010-A, 5.00%, due 7/1/18 | | | 1,692 | ß |
| | 795 | | Washington St. Ref. G.O. (Var. Purp.), Ser. 2010-R-2011B, 4.00%, due 7/1/26 | | | 878 | |
| | | | 2,570 | |
| | | | Total Investments (101.7%) (Cost $144,905) | | | 152,981 | ## |
| | | | | | | | |
| | | | Liabilities, less cash, receivables and other assets [(1.7%)] | | | (2,532 | ) |
| | | | | | | | |
| | | | Total Net Assets (100.0%) | | $ | 150,449 | |
See Notes to Schedule of Investments
Schedule of Investments Neuberger Berman Short Duration Bond Fund
| PRINCIPAL AMOUNT | | VALUE† |
| | | | |
| (000's omitted) | | (000's omitted)z |
| | | | |
| U.S. Treasury Securities-Backed by the Full Faith and Credit of the U.S. Government (27.0%) |
| $ | 1,500 | | U.S. Treasury Notes, 1.13%, due 12/15/12 | | $ | 1,502 | |
| | 3,375 | | U.S. Treasury Notes, 0.38%, due 7/31/13 | | | 3,379 | |
| | 8,070 | | U.S. Treasury Notes, 2.13%, due 11/30/14 | | | 8,373 | |
| | 3,620 | | U.S. Treasury Notes, 1.25%, due 8/31/15 | | | 3,709 | |
| | 2,110 | | U.S. Treasury Notes, 0.25%, due 9/15/15 | | | 2,103 | |
| | Total U.S. Treasury Securities-Backed by the Full Faith and Credit of the U.S. Government (Cost $19,162) | | | 19,066 | |
| |
| Mortgage-Backed Securities (24.8%) |
| |
| Adjustable Mixed Balance (2.9%) |
| | 906 | | Credit Suisse First Boston Mortgage Securities Corp., Ser. 2004-AR4, Class 2A1, 2.96%, due 5/25/34 | | | 860 | µ |
| | 1,283 | | First Horizon Mortgage Pass-Through Trust, Ser. 2005-AR5, Class 2A1, 2.71%, due 11/25/35 | | | 1,060 | µ |
| | 142 | | Harborview Mortgage Loan Trust, Ser. 2004-4, Class 3A, 1.34%, due 6/19/34 | | | 132 | µ |
| | | | 2,052 | |
| Commercial Mortgage-Backed (15.3%) |
| | 704 | | Bear Stearns Commercial Mortgage Securities, Inc., Ser. 2005-PWR8, Class AAB, 4.58%, due 6/11/41 | | | 707 | |
| | 576 | | Citigroup Commercial Mortgage Trust, Ser. 2006-C4, Class A2, 5.73%, due 3/15/49 | | | 592 | µ |
| | 131 | | Citigroup/Deutsche Bank Commercial Mortgage Trust, Ser. 2006-CD2, Class AAB, 5.33%, due 1/15/46 | | | 135 | µ |
| | 1,025 | | Commercial Mortgage Pass-Through Certificates, Ser. 2003-LB1A, Class C, 4.23%, due 6/10/38 | | | 1,032 | |
| | 71 | | Credit Suisse Mortgage Capital Certificates, Ser. 2007-C2, Class A2, 5.45%, due 1/15/49 | | | 71 | |
| | 763 | | GMAC Commercial Mortgage Securities, Inc., Ser. 2004-C3, Class AAB, 4.70%, due 12/10/41 | | | 787 | |
| | 965 | | JP Morgan Chase Commercial Mortgage Securities Corp., Ser. 2011-C3, Class A1, 1.87%, due 2/15/46 | | | 982 | ñ |
| | 1,500 | | LB-UBS Commercial Mortgage Trust, Ser. 2003-C1, Class C, 4.50%, due 12/15/36 | | | 1,514 | |
| | 875 | | LB-UBS Commercial Mortgage Trust, Ser. 2003-C7, Class C, 5.00%, due 7/15/37 | | | 904 | µ |
| | 565 | | Morgan Stanley Capital I, Ser. 2011-C1, Class A1, 2.60%, due 9/15/47 | | | 582 | ñ |
| | 1,061 | | Morgan Stanley Capital I, Ser. 2011-C3, Class A1, 2.18%, due 7/15/49 | | | 1,092 | |
| | 1,615 | | Wachovia Bank Commercial Mortgage Trust, Ser. 2003-C6, Class D, 5.13%, due 8/15/35 | | | 1,652 | |
| | 103 | | Wachovia Bank Commercial Mortgage Trust, Ser. 2005-C22, Class A3, 5.31%, due 12/15/44 | | | 103 | µ |
| | 648 | | WF-RBS Commercial Mortgage Trust, Ser. 2011-C2, Class A1, 2.50%, due 2/15/44 | | | 665 | ñ |
| | | | 10,818 | |
| Mortgage-Backed Non-Agency (3.2%) |
| | 546 | | Countrywide Home Loans, Ser. 2005-R2, Class 2A4, 8.50%, due 6/25/35 | | | 565 | ñ |
| | 1,308 | | GSMPS Mortgage Loan Trust, Ser. 2005-RP2, Class 1A4, 8.50%, due 3/25/35 | | | 1,362 | ñ |
| | 285 | | GSMPS Mortgage Loan Trust, Ser. 2005-RP3, Class 1A4, 8.50%, due 9/25/35 | | | 305 | ñ |
| | | | 2,232 | |
| Fannie Mae (1.7%) |
| | 1,070 | | Pass-Through Certificates, 4.50%, due 4/1/39 | | | 1,155 | |
See Notes to Schedule of Investments
Schedule of Investments Neuberger Berman Short Duration Bond Fund (cont'd)
| PRINCIPAL AMOUNT | | VALUE† |
| | | | |
| (000's omitted) | | (000's omitted)z |
| | | | |
| Freddie Mac (1.7%) |
| $ | 4 | | ARM Certificates, 1.63%, due 1/1/17 | | $ | 4 | µ |
| | 1,139 | | Pass-Through Certificates, 4.50%, due 11/1/39 | | | 1,220 | |
| | | | 1,224 | |
| Government National Mortgage Association (0.0%) |
| | 3 | | Pass-Through Certificates, 12.00%, due 3/15/14 | | | 3 | |
| | | | | | | | |
| | | | Total Mortgage-Backed Securities (Cost $17,892) | | | 17,484 | |
| |
| Corporate Debt Securities (32.8%) |
| |
| Aerospace & Defense (0.2%) |
| | 115 | | United Technologies Corp., Senior Unsecured Notes, 1.20%, due 6/1/15 | | | 117 | |
| | | | | | | | |
| Auto Manufacturers (0.9%) |
| | 590 | | Daimler Finance N.A. LLC, Guaranteed Notes, 1.65%, due 4/10/15 | | | 598 | ñ |
| | | | | | | | |
| Banks (8.5%) |
| | 835 | | Citigroup, Inc., Senior Unsecured Notes, 2.65%, due 3/2/15 | | | 861 | |
| | 1,670 | | JPMorgan Chase & Co., Senior Unsecured Medium-Term Notes, 1.88%, due 3/20/15 | | | 1,702 | |
| | 745 | | Morgan Stanley, Senior Unsecured Global Medium-Term Notes, 6.00%, due 5/13/14 | | | 791 | |
| | 1,265 | | Wells Fargo & Co., Senior Notes, 1.50%, due 7/1/15 | | | 1,286 | |
| | 555 | | Westpac Banking Corp., Senior Unsecured Notes, 1.85%, due 12/9/13 | | | 563 | |
| | 820 | | Westpac Banking Corp., Senior Unsecured Notes, 1.13%, due 9/25/15 | | | 826 | |
| | | | 6,029 | |
| Beverages (1.6%) |
| | 575 | | Anheuser-Busch Cos., LLC, Guaranteed Unsecured Notes, 4.95%, due 1/15/14 | | | 605 | |
| | 325 | | Anheuser-Busch InBev Worldwide, Inc., Guaranteed Notes, 1.50%, due 7/14/14 | | | 331 | |
| | 110 | | Anheuser-Busch InBev Worldwide, Inc., Guaranteed Notes, 0.80%, due 7/15/15 | | | 110 | |
| | 80 | | Heineken NV, Senior Notes, 0.80%, due 10/1/15 | | | 80 | ñ |
| | | | 1,126 | |
| Commercial Services (0.7%) |
| | 405 | | ERAC USA Finance Co., Guaranteed Notes, 2.25%, due 1/10/14 | | | 410 | ñ |
| | 90 | | ERAC USA Finance LLC, Guaranteed Notes, 1.40%, due 4/15/16 | | | 91 | ñ |
| | | | 501 | |
| Computers (2.0%) |
| | 1,400 | | IBM Corp., Senior Unsecured Notes, 0.88%, due 10/31/14 | | | 1,412 | |
| | | | | | | | |
| Diversified Financial Services (7.8%) |
| | 945 | | American Express Credit Corp., Senior Unsecured Medium-Term Notes, Ser. C, 5.88%, due 5/2/13 | | | 970 | |
| | 540 | | American Honda Finance Corp., Unsecured Notes, 1.00%, due 8/11/15 | | | 541 | ñ |
| | 510 | | Caterpillar Financial Services Corp., Senior Unsecured Notes, 1.65%, due 4/1/14 | | | 518 | |
| | 280 | | Caterpillar Financial Services Corp., Senior Unsecured Medium-Term Notes, 1.13%, due 12/15/14 | | | 283 | |
| | 1,200 | | General Electric Capital Corp., Senior Unsecured Notes, 5.90%, due 5/13/14 | | | 1,295 | |
See Notes to Schedule of Investments
Schedule of Investments Neuberger Berman Short Duration Bond Fund (cont'd)
| PRINCIPAL AMOUNT | | VALUE† |
| | | | |
| (000's omitted) | | (000's omitted)z |
| | | | |
| $ | 455 | | General Electric Capital Corp., Senior Unsecured Notes, 2.15%, due 1/9/15 | | $ | 468 | |
| | 415 | | Harley-Davidson Financial Services, Inc., Guaranteed Notes, 1.15%, due 9/15/15 | | | 417 | ñ |
| | 490 | | John Deere Capital Corp., Senior Unsecured Notes, 0.88%, due 4/17/15 | | | 494 | |
| | 525 | | Toyota Motor Credit Corp., Senior Unsecured Medium-Term Notes, 1.00%, due 2/17/15 | | | 529 | |
| | | | 5,515 | |
| Food (0.2%) |
| | 170 | | Kraft Foods Group, Inc., Senior Unsecured Notes, 1.63%, due 6/4/15 | | | 174 | ñ |
| | | | | | | | |
| Insurance (0.8%) |
| | 545 | | Berkshire Hathaway Finance Corp., Guaranteed Notes, 1.50%, due 1/10/14 | | | 552 | |
| | | | | | | | |
| Media (3.4%) |
| | 750 | | DIRECTV Holdings LLC, Guaranteed Notes, 4.75%, due 10/1/14 | | | 805 | |
| | 800 | | NBC Universal Media LLC, Senior Unsecured Notes, 2.10%, due 4/1/14 | | | 816 | |
| | 750 | | Time Warner Cable, Inc., Guaranteed Notes, 3.50%, due 2/1/15 | | | 797 | |
| | | | 2,418 | |
| Mining (1.3%) |
| | 360 | | BHP Billiton Finance USA Ltd., Guaranteed Notes, 1.13%, due 11/21/14 | | | 364 | |
| | 530 | | Freeport-McMoRan Copper & Gold, Inc., Senior Unsecured Notes, 1.40%, due 2/13/15 | | | 535 | |
| | | | 899 | |
| Oil & Gas (1.2%) |
| | 665 | | BP Capital Markets PLC, Guaranteed Notes, 1.70%, due 12/5/14 | | | 680 | |
| | 190 | | Marathon Oil Corp., Senior Unsecured Notes, 0.90%, due 11/1/15 | | | 191 | |
| | | | 871 | |
| Pharmaceuticals (0.6%) |
| | 415 | | Express Scripts Holding Co., Guaranteed Notes, 2.10%, due 2/12/15 | | | 425 | ñ |
| | | | | | | | |
| Pipelines (0.7%) |
| | 215 | | Enterprise Products Operating LLC, Guaranteed Notes, 1.25%, due 8/13/15 | | | 217 | |
| | 240 | | TransCanada PipeLines Ltd., Senior Unsecured Notes, 0.88%, due 3/2/15 | | | 243 | |
| | | | 460 | |
| Retail (0.9%) |
| | 625 | | Home Depot, Inc., Senior Unsecured Notes, 5.25%, due 12/16/13 | | | 659 | |
| | | | | | | | |
| Telecommunications (2.0%) |
| | 570 | | AT&T, Inc., Senior Unsecured Notes, 0.88%, due 2/13/15 | | | 575 | |
| | 810 | | Verizon Communications, Inc., Senior Unsecured Notes, 1.95%, due 3/28/14 | | | 827 | |
| | | | 1,402 | |
| | | | Total Corporate Debt Securities (Cost $22,689) | | | 23,158 | |
See Notes to Schedule of Investments
Schedule of Investments Neuberger Berman Short Duration Bond Fund (cont'd)
| PRINCIPAL AMOUNT | | VALUE† |
| | | | |
| (000's omitted) | | (000's omitted)z |
| | | | |
| Asset-Backed Securities (11.1%) |
| $ | 340 | | ACE Securities Corp. Home Equity Loan Trust, Ser. 2006-OP1, Class A2C, 0.36%, due 4/25/36 | | $ | 246 | µ |
| | 367 | | Ally Auto Receivables Trust, Ser. 2010-4, Class A3, 0.91%, due 11/17/14 | | | 368 | |
| | 594 | | Ally Auto Receivables Trust, Ser. 2011-1, Class A3, 1.38%, due 1/15/15 | | | 597 | |
| | 850 | | Carrington Mortgage Loan Trust, Ser. 2007-FRE1, Class A3, 0.47%, due 2/25/37 | | | 393 | µ |
| | 1,266 | | Ford Credit Auto Owner Trust, Ser. 2011-A, Class A3, 0.97%, due 1/15/15 | | | 1,270 | |
| | 1,234 | | Hyundai Auto Receivables Trust, Ser. 2011-A, Class A3, 1.16%, due 4/15/15 | | | 1,239 | |
| | 413 | | Knollwood CDO Ltd., Ser. 2006-2A, Class A2J, 0.76%, due 7/13/46 | | | 0 | #µ* |
| | 1,125 | | Mercedes-Benz Auto Receivables Trust, Ser. 2012-1, Class A2, 0.37%, due 3/16/15 | | | 1,125 | |
| | 450 | | Mercedes-Benz Auto Receivables Trust, Ser. 2011-1, Class A3, 0.85%, due 3/16/15 | | | 452 | |
| | 1,400 | | Nissan Auto Receivables Owner Trust, Ser. 2012-B, Class A2, 0.39%, due 4/15/15 | | | 1,400 | |
| | 888 | | Soundview Home Equity Loan Trust, Ser. 2006-OPT3, Class 2A3, 0.38%, due 6/25/36 | | | 704 | µ |
| | | | | | | | |
| | | | Total Asset-Backed Securities (Cost $8,704) | | | 7,794 | |
| | | | | | | | |
| NUMBER OF SHARES |
| |
| Short-Term Investments (4.3%) |
| | 3,062,958 | | State Street Institutional Liquid Reserves Fund Institutional Class (Cost $3,063) | | | 3,063 | |
| | | | | | | | |
| | | | Total Investments (100.0%) (Cost $71,510) | | | 70,565 | ## |
| | | | | | | | |
| | | | Liabilities, less cash, receivables and other assets [(0.0%)] | | | (30 | ) |
| | | | | | | | |
| | | | Total Net Assets (100.0%) | | $ | 70,535 | |
See Notes to Schedule of Investments
Schedule of Investments Neuberger Berman Short Duration High Income Fund
| PRINCIPAL AMOUNT | | VALUE† |
| | | | |
| (000's omitted) | | (000's omitted)z |
| | | | |
Bank Loan Obligationsµ (14.5%) |
| | |
| Air Transport (1.0%) |
| $ | 255 | | Delta Air Lines, Term Loan, due 4/20/17 | | $ | 255 | ¢^^ |
| | | | | | | | |
| All Telecom (1.6%) |
| | 145 | | Cricket Communications, Inc., Term Loan, 4.75%, due 10/10/19 | | | 145 | |
| | 250 | | Intelsat Jackson Holdings, Term Loan B-1, due 4/2/18 | | | 252 | ¢^^ |
| | | | 397 | |
| Automotive (1.0%) |
| | 250 | | Navistar International, Term Loan B, due 8/17/17 | | | 250 | ¢^^ |
| | | | | | | | |
| Building & Development (1.0%) |
| | 250 | | Realogy Corporation, Term Loan, due 10/10/16 | | | 249 | ¢^^ |
| | | | | | | | |
| Business Equipment & Services (1.0%) |
| | 240 | | Kronos, Term Loan B, due 10/31/19 | | | 241 | ¢^^ |
| | | | | | | | |
| Financial Intermediaries (2.0%) |
| | 255 | | First Data Corporation, Term Loan, due 3/24/17 | | | 251 | ¢^^ |
| | 250 | | Springleaf, Term Loan, due 5/10/17 | | | 246 | ¢^^ |
| | | | 497 | |
| Health Care (1.0%) |
| | 255 | | CareStream Health Inc., Term Loan, due 2/25/17 | | | 252 | ¢^^ |
| | | | | | | | |
| Leisure Goods - Activities - Movies (1.1%) |
| | 265 | | WMG Acquisition Corp., Term Loan, due 10/25/18 | | | 266 | Ѣ^^ |
| | | | | | | | |
| Nonferrous Metals - Minerals (1.5%) |
| | 390 | | FMG Resources, Term Loan, due 10/18/17 | | | 388 | ¢^^ |
| | | | | | | | |
| Publishing (1.2%) |
| | 315 | | Getty Images, Term Loan B, due 10/18/19 | | | 316 | ¢^^ |
| | | | | | | | |
| Radio & Television (1.0%) |
| | 250 | | Univision Communications, Inc., First Lien Term Loan, 4.47%, due 3/31/17 | | | 244 | |
| | | | | | | | |
| Surface Transport (1.1%) |
| | 285 | | Hertz Corp., Term Loan, due 3/11/18 | | | 284 | ¢^^ |
| | | | | | | | |
| | | | Total Bank Loan Obligations (Cost $3,635) | | | 3,639 | |
See Notes to Schedule of Investments
Schedule of Investments Neuberger Berman Short Duration High Income Fund (cont'd)
| PRINCIPAL AMOUNT | | VALUE† |
| | | | |
| (000's omitted) | | (000's omitted)z |
| | | | |
| Corporate Debt Securities (83.6%) |
| | |
| Airlines (1.2%) |
| $ | 125 | | Continental Airlines, Inc., Senior Secured Notes, 6.75%, due 9/15/15 | | $ | 131 | ñ |
| | 175 | | United Airlines, Inc., Senior Secured Notes, 9.88%, due 8/1/13 | | | 178 | ñ |
| | | | 309 | |
| Auto Loans (0.6%) |
| | 150 | | General Motors Financial Co., Inc., Guaranteed Notes, 4.75%, due 8/15/17 | | | 154 | ñ |
| | | | | | | | |
| Banking (2.6%) |
| | 620 | | Ally Financial, Inc., Guaranteed Notes, 4.63%, due 6/26/15 | | | 644 | ØØ |
| | | | | | | | |
| Beverages (0.6%) |
| | 125 | | Constellation Brands, Inc., Guaranteed Notes, 7.25%, due 5/15/17 | | | 147 | |
| | | | | | | | |
| Building & Construction (1.8%) |
| | 200 | | Lennar Corp., Guaranteed Notes, 4.75%, due 12/15/17 | | | 209 | ñ |
| | 75 | | Shea Homes L.P., Senior Secured Notes, 8.63%, due 5/15/19 | | | 83 | |
| | 125 | | Standard Pacific Corp., Guaranteed Notes, 10.75%, due 9/15/16 | | | 155 | |
| | | | 447 | |
| Building Materials (0.8%) |
| | 175 | | USG Corp., Guaranteed Notes, 9.75%, due 8/1/14 | | | 192 | ñ |
| | | | | | | | |
| Chemicals (1.3%) |
| | 125 | | Huntsman Int'l LLC, Guaranteed Notes, 8.63%, due 3/15/20 | | | 141 | |
| | 200 | | MPM Escrow LLC/MPM Finance Escrow Corp., Senior Secured Notes, 8.88%, due 10/15/20 | | | 196 | ñ |
| | | | 337 | |
| Computer Hardware (0.8%) |
| | 175 | | Seagate HDD Cayman, Guaranteed Notes, 7.75%, due 12/15/18 | | | 190 | |
| | | | | | | | |
| Consumer - Commercial Lease Financing (5.3%) |
| | 520 | | CIT Group, Inc., Senior Unsecured Notes, 5.00%, due 5/15/17 | | | 548 | ØØ |
| | 325 | | Int'l Lease Finance Corp., Senior Unsecured Medium-Term Notes, Ser. R, 5.65%, due 6/1/14 | | | 341 | |
| | 400 | | Int'l Lease Finance Corp., Senior Unsecured Notes, 8.63%, due 9/15/15 | | | 450 | |
| | | | 1,339 | |
| Department Stores (0.5%) |
| | 125 | | Sears Holdings Corp., Secured Notes, 6.63%, due 10/15/18 | | | 117 | |
See Notes to Schedule of Investments
Schedule of Investments Neuberger Berman Short Duration High Income Fund (cont'd)
| PRINCIPAL AMOUNT | | VALUE† |
| | | | |
| (000's omitted) | | (000's omitted)z |
| | | | |
| Electric - Generation (2.3%) |
| $ | 400 | | NRG Energy, Inc., Guaranteed Notes, 8.50%, due 6/15/19 | | $ | 433 | |
| | 125 | | RRI Energy, Inc., Senior Unsecured Notes, 7.63%, due 6/15/14 | | | 134 | |
| | | | 567 | |
| Electronics (2.2%) |
| | 365 | | Ceridian Corp., Guaranteed Notes, 11.25%, due 11/15/15 | | | 356 | |
| | 175 | | Freescale Semiconductor, Inc., Senior Secured Notes, 9.25%, due 4/15/18 | | | 187 | ñ |
| | | | 543 | |
| Energy - Exploration & Production (8.0%) |
| | 250 | | Chesapeake Energy Corp., Guaranteed Notes, 6.88%, due 8/15/18 | | | 262 | |
| | 300 | | Denbury Resources, Inc., Guaranteed Notes, 8.25%, due 2/15/20 | | | 340 | |
| | 125 | | Everest Acquisition LLC/Everest Acquisition Finance, Inc., Senior Secured Notes, 6.88%, due 5/1/19 | | | 135 | ñ |
| | 75 | | EXCO Resources, Inc., Guaranteed Notes, 7.50%, due 9/15/18 | | | 70 | |
| | 275 | | Linn Energy LLC, Guaranteed Notes, 8.63%, due 4/15/20 | | | 301 | |
| | 250 | | Plains Exploration & Production Co., Guaranteed Notes, 8.63%, due 10/15/19 | | | 276 | |
| | 220 | | Plains Exploration & Production Co., Guaranteed Notes, 6.50%, due 11/15/20 | | | 220 | |
| | 250 | | SandRidge Energy, Inc., Guaranteed Notes, 9.88%, due 5/15/16 | | | 271 | |
| | 125 | | WPX Energy, Inc., Senior Unsecured Notes, 5.25%, due 1/15/17 | | | 133 | |
| | | | 2,008 | |
| Food & Drug Retailers (1.9%) |
| | 200 | | New Albertsons, Inc., Unsecured Notes, 7.25%, due 5/1/13 | | | 200 | |
| | 250 | | Rite Aid Corp., Senior Secured Notes, 9.75%, due 6/12/16 | | | 273 | |
| | | | 473 | |
| Gaming (5.4%) |
| | 350 | | CityCenter Holdings LLC, Senior Secured Notes, 7.63%, due 1/15/16 | | | 373 | |
| | 125 | | MGM Mirage, Inc., Guaranteed Notes, 7.50%, due 6/1/16 | | | 132 | |
| | 250 | | MGM Mirage, Inc., Senior Secured Notes, 9.00%, due 3/15/20 | | | 279 | |
| | 225 | | Pinnacle Entertainment, Inc., Guaranteed Notes, 8.63%, due 8/1/17 | | | 243 | |
| | 175 | | Seminole Indian Tribe of Florida, Notes, 7.75%, due 10/1/17 | | | 191 | ñ |
| | 125 | | Wynn Las Vegas LLC, 1st Mortgage, 7.88%, due 11/1/17 | | | 137 | |
| | | | 1,355 | |
| Gas Distribution (2.7%) |
| | 200 | | El Paso Corp., Senior Unsecured Notes, 6.88%, due 6/15/14 | | | 215 | |
| | 225 | | Ferrellgas L.P., Senior Unsecured Notes, 9.13%, due 10/1/17 | | | 241 | |
| | 81 | | Kinder Morgan Finance Co., Guaranteed Notes, 5.70%, due 1/5/16 | | | 89 | |
| | 125 | | Suburban Propane Partners L.P./Suburban Energy Finance Corp., Senior Unsecured Notes, 7.50%, due 10/1/18 | | | 134 | ñ |
| | | | 679 | |
See Notes to Schedule of Investments
Schedule of Investments Neuberger Berman Short Duration High Income Fund (cont'd)
| PRINCIPAL AMOUNT | | VALUE† |
| | | | |
| (000's omitted) | | (000's omitted)z |
| | | | |
| Health Facilities (4.6%) |
| $ | 200 | | CHS/Community Health Systems, Inc., Senior Secured Notes, 5.13%, due 8/15/18 | | $ | 208 | |
| | 295 | | HCA, Inc., Senior Secured Notes, 8.50%, due 4/15/19 | | | 332 | ØØ |
| | 265 | | Omega Healthcare Investors, Inc., Guaranteed Notes, 7.50%, due 2/15/20 | | | 291 | |
| | 300 | | Tenet Healthcare Corp., Senior Unsecured Notes, 9.25%, due 2/1/15 | | | 338 | |
| | | | 1,169 | |
| Hotels (0.8%) |
| | 175 | | Host Hotels & Resorts L.P., Guaranteed Notes, 6.00%, due 11/1/20 | | | 195 | |
| | | | | | | | |
| Investments & Misc. Financial Services (2.2%) |
| | 525 | | Icahn Enterprises L.P., Guaranteed Notes, 8.00%, due 1/15/18 | | | 564 | |
| | | | | | | | |
| Leisure (1.2%) |
| | 275 | | Cedar Fair L.P., Guaranteed Notes, 9.13%, due 8/1/18 | | | 311 | |
| | | | | | | | |
| Machinery (1.7%) |
| | 70 | | CNH Capital LLC, Senior Notes, 3.88%, due 11/1/15 | | | 72 | ñ |
| | 200 | | CNH Capital LLC, Guaranteed Notes, 6.25%, due 11/1/16 | | | 216 | ñ |
| | 125 | | The Manitowoc Co., Inc., Guaranteed Notes, 9.50%, due 2/15/18 | | | 139 | |
| | | | 427 | |
| Media - Broadcast (1.5%) |
| | 70 | | Clear Channel Communications, Inc., Senior Unsecured Notes, 5.50%, due 9/15/14 | | | 66 | |
| | 275 | | Sirius XM Radio, Inc., Guaranteed Notes, 8.75%, due 4/1/15 | | | 312 | ñ |
| | | | 378 | |
| Media - Cable (5.0%) |
| | 400 | | CCO Holdings LLC, Guaranteed Notes, 7.25%, due 10/30/17 | | | 437 | ØØ |
| | 35 | | Cequel Communications Escrow 1 LLC/Cequel Communications Escrow Capital Corp., Senior Unsecured Notes, 6.38%, due 9/15/20 | | | 35 | ñ |
| | 200 | | CSC Holdings, Inc., Senior Unsecured Notes, 7.88%, due 2/15/18 | | | 232 | |
| | 500 | | EchoStar DBS Corp., Guaranteed Notes, 7.13%, due 2/1/16 | | | 559 | |
| | | | 1,263 | |
| Media - Services (4.3%) |
| | 250 | | Clear Channel Worldwide Holdings, Inc., Guaranteed Notes, Ser. B, 9.25%, due 12/15/17 | | | 268 | |
| | 350 | | Lamar Media Corp., Guaranteed Notes, 7.88%, due 4/15/18 | | | 385 | |
| | 375 | | WMG Acquisition Corp., Senior Secured Notes, 9.50%, due 6/15/16 | | | 413 | |
| | 15 | | WMG Acquisition Corp., Senior Secured Notes, 6.00%, due 1/15/21 | | | 15 | ñØ |
| | | | 1,081 | |
| Medical Products (0.6%) |
| | 125 | | Fresenius Medical Care US Finance, Inc., Guaranteed Notes, 6.88%, due 7/15/17 | | | 143 | |
See Notes to Schedule of Investments
Schedule of Investments Neuberger Berman Short Duration High Income Fund (cont'd)
| PRINCIPAL AMOUNT | | VALUE† |
| | | | |
| (000's omitted) | | (000's omitted)z |
| | | | |
| Metals - Mining Excluding Steel (2.3%) |
| $ | 300 | | FMG Resources (August 2006) Pty Ltd., Guaranteed Notes, 7.00%, due 11/1/15 | | $ | 303 | ñ |
| | 250 | | Peabody Energy Corp., Guaranteed Notes, 7.38%, due 11/1/16 | | | 286 | |
| | | | 589 | |
| Packaging (1.7%) |
| | 225 | | Berry Plastics Corp., Secured Notes, 9.50%, due 5/15/18 | | | 245 | |
| | 50 | | Owens-Brockway Glass Container, Inc., Guaranteed Notes, 7.38%, due 5/15/16 | | | 57 | |
| | 125 | | Reynolds Group Issuer, Inc., Senior Secured Notes, 7.88%, due 8/15/19 | | | 136 | |
| | | | 438 | |
| Pharmaceuticals (2.2%) |
| | 225 | | Mylan, Inc., Guaranteed Notes, 7.63%, due 7/15/17 | | | 251 | ñ |
| | 300 | | Valeant Pharmaceuticals Int'l, Guaranteed Notes, 6.50%, due 7/15/16 | | | 316 | ñ |
| | | | 567 | |
| Printing & Publishing (3.1%) |
| | 250 | | Gannett Co., Inc., Guaranteed Notes, 6.38%, due 9/1/15 | | | 276 | |
| | 125 | | R. R. Donnelley & Sons Co., Senior Unsecured Notes, 5.50%, due 5/15/15 | | | 129 | |
| | 350 | | R. R. Donnelley & Sons Co., Senior Unsecured Notes, 8.60%, due 8/15/16 | | | 382 | ØØ |
| | | | 787 | |
| Software - Services (2.4%) |
| | 225 | | Fidelity National Information Services, Inc., Guaranteed Notes, 7.88%, due 7/15/20 | | | 252 | |
| | 200 | | First Data Corp., Senior Secured Notes, 7.38%, due 6/15/19 | | | 207 | ñ |
| | 140 | | SunGard Data Systems, Inc., Guaranteed Notes, 6.63%, due 11/1/19 | | | 141 | ñØ |
| | | | 600 | |
| Specialty Retail (2.3%) |
| | 125 | | Sally Holdings LLC/Sally Capital, Inc., Guaranteed Notes, 6.88%, due 11/15/19 | | | 139 | |
| | 55 | | Toys "R" Us Property Co. I LLC, Guaranteed Notes, 10.75%, due 7/15/17 | | | 59 | |
| | 350 | | Toys "R" Us Property Co. II LLC, Senior Secured Notes, 8.50%, due 12/1/17 | | | 376 | |
| | | | 574 | |
| Steel Producers - Products (1.9%) |
| | 125 | | ArcelorMittal, Senior Unsecured Notes, 4.00%, due 8/5/15 | | | 126 | |
| | 275 | | ArcelorMittal, Senior Unsecured Notes, 4.75%, due 2/25/17 | | | 270 | |
| | 75 | | Steel Dynamics, Inc., Guaranteed Notes, 6.13%, due 8/15/19 | | | 78 | ñ |
| | | | 474 | |
| Support - Services (0.9%) |
| | 75 | | Hertz Corp., Guaranteed Notes, 7.50%, due 10/15/18 | | | 81 | |
| | 125 | | Iron Mountain, Inc., Guaranteed Notes, 7.75%, due 10/1/19 | | | 141 | |
| | | | 222 | |
See Notes to Schedule of Investments
Schedule of Investments Neuberger Berman Short Duration High Income Fund (cont'd)
| PRINCIPAL AMOUNT | | VALUE† |
| | | | |
| (000's omitted) | | (000's omitted)z |
| | | | |
| Telecom - Integrated Services (5.4%) |
| $ | 275 | | Citizens Utilities Co., Senior Unsecured Notes, 6.63%, due 3/15/15 | | $ | 298 | |
| | 60 | | Integra Telecom Holdings, Inc., Senior Secured Notes, 10.75%, due 4/15/16 | | | 61 | ñ |
| | 60 | | Intelsat Bermuda Ltd., Guaranteed Notes, 11.50%, due 2/4/17 | | | 63 | c |
| | 275 | | Level 3 Financing, Inc., Guaranteed Notes, 10.00%, due 2/1/18 | | | 307 | |
| | 175 | | tw telecom holdings, inc., Guaranteed Notes, 8.00%, due 3/1/18 | | | 193 | |
| | 400 | | Windstream Corp., Guaranteed Notes, 7.88%, due 11/1/17 | | | 445 | ØØ |
| | | | 1,367 | |
| Telecom - Wireless (1.5%) |
| | 60 | | Clearwire Communications LLC, Senior Secured Notes, 12.00%, due 12/1/15 | | | 64 | ñ |
| | 125 | | Sprint Nextel Corp., Senior Unsecured Notes, 6.00%, due 12/1/16 | | | 134 | |
| | 110 | | Telesat Canada/Telesat LLC, Senior Unsecured Notes, 6.00%, due 5/15/17 | | | 115 | ñ |
| | 65 | | Wind Acquisition Finance SA, Senior Secured Notes, 7.25%, due 2/15/18 | | | 63 | ñ |
| | | | 376 | |
| | | | Total Corporate Debt Securities (Cost $21,089) | | | 21,026 | |
| | | | | | | | |
| NUMBER OF SHARES |
| |
| Short-Term Investments (14.0%) |
| | 3,517,296 | | State Street Institutional Liquid Reserves Fund Institutional Class (Cost $3,517) | | | 3,517 | |
| | | | | | | | |
| | | | Total Investments (112.1%) (Cost $28,241) | | | 28,182 | ## |
| | | | | | | | |
| | | | Liabilities, less cash, receivables and other assets [(12.1%)] | | | (3,036 | ) |
| | | | | | | | |
| | | | Total Net Assets (100.0%) | | $ | 25,146 | |
See Notes to Schedule of Investments
Schedule of Investments Neuberger Berman Strategic Income Fund
| PRINCIPAL AMOUNT | | VALUE† |
| | | | |
| (000's omitted) | | (000's omitted)z |
| | | | |
Bank Loan Obligationsµ (16.4%) |
| | |
| Aerospace & Defense (0.1%) |
| $ | 640 | | Booz Allen Hamilton, Term Loan B, 4.50%, due 7/31/19 | | $ | 644 | |
| | 258 | | Sequa, Term Loan, 6.25%, due 12/3/14 | | | 258 | |
| | | | 902 | |
| Air Transport (0.1%) |
| | 657 | | Delta Air Lines, Term Loan, 5.50%, due 4/20/17 | | | 656 | |
| | | | | | | | |
| All Telecom (0.8%) |
| | 867 | | Crown Castle Operating Corp., Term Loan B, 4.00%, due 1/31/19 | | | 871 | ¢^^ |
| | 1,694 | | Intelsat Jackson Holdings, Term Loan B-1, 4.50%, due 4/2/18 | | | 1,704 | ¢^^ |
| | 1,020 | | Level 3 Financing Inc., Term Loan B, 5.25%, due 8/1/19 | | | 1,031 | |
| | 1,831 | | Level 3 Financing Inc., Term Loan B2, due 8/1/19 | | | 1,839 | ¢^^ |
| | 368 | | Metro PCS, Term Loan B-3, 4.00%, due 3/19/18 | | | 368 | |
| | 692 | | SBA Communications Inc., Term Loan B, 3.75%, due 9/28/19 | | | 695 | |
| | 956 | | Syniverse Technologies, Term Loan, 5.00%, due 4/23/19 | | | 960 | |
| | 863 | | Windstream Corp., Term Loan B-3, 4.00%, due 8/8/19 | | | 867 | ¢^^ |
| | | | 8,335 | |
| Automotive (0.6%) |
| | 1,930 | | Allison Transmission, Term Loan B-3, 4.25%, due 8/23/19 | | | 1,938 | ¢^^ |
| | 1,676 | | Chrysler Automotive, Term Loan B, 6.00%, due 5/24/17 | | | 1,710 | ¢^^ |
| | 627 | | Federal Mogul, Term Loan B, due 12/29/14 | | | 587 | ¢^^ |
| | 320 | | Federal Mogul, Term Loan C, due 12/28/15 | | | 300 | ¢^^ |
| | 855 | | Goodyear Tire & Rubber Company, Second Lien Term Loan, 4.75%, due 4/30/19 | | | 860 | |
| | 1,144 | | Navistar International, Term Loan B, 7.00%, due 8/17/17 | | | 1,147 | |
| | | | 6,542 | |
| Building & Development (0.4%) |
| | 1,847 | | Capital Automotive LP, Term Loan B, 5.25%, due 3/11/17 | | | 1,856 | ¢^^ |
| | 742 | | Custom Building Products, Term Loan, 5.75%, due 3/19/15 | | | 741 | |
| | 721 | | Goodman Global Inc., First Lien Term Loan, 5.75%, due 10/28/16 | | | 721 | |
| | 1,236 | | Realogy Corporation, Term Loan, 4.46%, due 10/10/16 | | | 1,233 | ¢^^ |
| | 85 | | Realogy Corporation, Letter of Credit, 4.55%, due 10/10/16 | | | 85 | ¢^^ |
| | | | 4,636 | |
| Business Equipment & Services (1.3%) |
| | 1,300 | | Acosta Inc., Term Loan D, 5.00%, due 3/2/18 | | | 1,310 | ¢^^ |
| | 495 | | Advantage Sales & Marketing, Second Lien Term Loan, 9.25%, due 6/18/18 | | | 495 | |
| | 423 | | Brand Services, Inc., Term Loan, due 10/16/16 | | | 422 | ¢^^ |
| | 1,282 | | Brickman Group Holdings Inc., Term Loan B-1, 5.50%, due 10/14/16 | | | 1,294 | |
| | 382 | | Brock Holdings III, First Lien Term Loan, 6.00%, due 3/16/17 | | | 383 | |
| | 475 | | Brock Holdings III, Second Lien Term Loan, 10.00%, due 3/16/18 | | | 477 | Ñ |
| | 1,567 | | Ceridian Corp., Term Loan, 5.96%, due 5/9/17 | | | 1,561 | ¢^^ |
| | 958 | | KAR Auction Services, Term Loan, 5.00%, due 5/19/17 | | | 963 | |
| | 595 | | Kronos, Term Loan B, due 10/31/19 | | | 598 | ¢^^ |
| | 1,035 | | Kronos, Second Lien Term Loan B, due 4/30/20 | | | 1,040 | ¢^^ |
| | 1,155 | | McJunkin Corporation, Term Loan B, due 11/8/19 | | | 1,152 | Ѣ^^ |
| | 1,272 | | Monitronics, Term Loan, 5.50%, due 3/23/18 | | | 1,279 | |
| | 683 | | Protection One, Term Loan B-1, 5.75%, due 3/16/19 | | | 687 | |
See Notes to Schedule of Investments
Schedule of Investments Neuberger Berman Strategic Income Fund (cont'd)
| PRINCIPAL AMOUNT | | VALUE† |
| | | | |
| (000's omitted) | | (000's omitted)z |
| | | | |
| $ | 861 | | Quintiles Transnational Corp., Term Loan B, 5.00%, due 6/8/18 | | $ | 861 | |
| | 558 | | SymphonyIRI Group, Inc., Term Loan, 5.00%, due 12/1/17 | | | 557 | |
| | 783 | | West Corp., Term Loan B-6, 5.75%, due 6/30/18 | | | 794 | |
| | | | 13,873 | |
| Cable & Satellite Television (0.6%) |
| | 867 | | Cequel Communications, LLC, Term Loan, 4.00%, due 2/14/19 | | | 868 | ¢^^ |
| | 885 | | Charter Communications Operating LLC, Term Loan D, 4.00%, due 5/15/19 | | | 890 | |
| | 2,755 | | Rovi Corp., Term Loan B-2, 4.00%, due 3/31/19 | | | 2,696 | |
| | 722 | | UPC Distribution, Term Loan AB, 4.75%, due 12/31/17 | | | 722 | |
| | 1,161 | | Wave Division Holdings, Inc., Term Loan, 5.50%, due 9/30/19 | | | 1,174 | ¢^^ |
| | | | 6,350 | |
| Chemicals & Plastics (0.4%) |
| | 610 | | Hexion Specialty Chemicals, Term Loan C-1B, due 5/5/15 | | | 605 | ¢^^ |
| | 262 | | Hexion Specialty Chemicals, Term Loan C-2B, due 5/5/15 | | | 260 | ¢^^ |
| | 366 | | Ineos Holdings, Term Loan, 6.50%, due 5/4/18 | | | 371 | |
| | 393 | | Momentive Performance Materials, Term Loan B-1B, 3.50%, due 5/5/15 | | | 390 | |
| | 639 | | OM Group Inc., Term Loan B, 5.75%, due 8/2/17 | | | 642 | |
| | 363 | | Taminco Global Chemical, Term Loan B-1, 5.25%, due 2/15/19 | | | 366 | |
| | 388 | | Trinseo Materials OP SCA, Term Loan, 8.00%, due 8/2/17 | | | 370 | |
| | 426 | | Univar Inc., Term Loan B, 3.50%, due 6/30/17 | | | 421 | |
| | 371 | | Univar Inc., Term Loan B, 5.00%, due 6/30/17 | | | 367 | |
| | | | 3,792 | |
| Clothing - Textiles (0.2%) |
| | 1,590 | | Wolverine Worldwide, Term Loan B, due 10/9/19 | | | 1,598 | ¢^^ |
| | | | | | | | |
| Conglomerates (0.1%) |
| | | | | | | | |
| | 1,305 | | Wilsonart, LLC, Term Loan B, due 11/1/19 | | | 1,309 | ¢^^ |
| | | | | | | | |
| Containers & Glass Products (0.3%) |
| | 1,028 | | Exopack, Term Loan B, 6.50%, due 5/31/17 | | | 1,028 | Ñ |
| | 870 | | Reynolds Group, Term Loan, 4.75%, due 9/28/18 | | | 873 | ¢^^ |
| | 802 | | Sealed Air, Term Loan B, 4.75%, due 10/3/18 | | | 805 | |
| | | | 2,706 | |
| Cosmetics - Toiletries (0.1%) |
| | 233 | | Prestige Brands, Term Loan B, 5.25%, due 1/31/19 | | | 235 | |
| | 542 | | Yankee Candle Company, Term Loan, 5.25%, due 4/2/19 | | | 546 | |
| | | | 781 | |
| Drugs (0.3%) |
| | 1,933 | | Par Pharmaceutical Companies, Inc., Term Loan B, 5.00%, due 9/28/19 | | | 1,927 | |
| | 109 | | Warner Chilcott Company, Inc., Term Loan B-1, 4.25%, due 3/15/18 | | | 109 | ¢^^ |
| | 286 | | Warner Chilcott Company, Inc., Term Loan B-1, 4.25%, due 3/15/18 | | | 287 | ¢^^ |
| | 143 | | Warner Chilcott Company, Inc., Term Loan B-2, 4.25%, due 3/15/18 | | | 143 | ¢^^ |
| | 197 | | Warner Chilcott Company, Inc., Term Loan B-3, 4.25%, due 3/15/18 | | | 197 | ¢^^ |
| | | | 2,663 | |
See Notes to Schedule of Investments
Schedule of Investments Neuberger Berman Strategic Income Fund (cont'd)
| PRINCIPAL AMOUNT | | VALUE† |
| | | | |
| (000's omitted) | | (000's omitted)z |
| | | | |
| Ecological Services & Equipment (0.2%) |
| $ | 1,315 | | ADS Waste Holdings, Inc., Term Loan B, 5.25%, due 9/28/19 | | $ | 1,327 | ¢^^ |
| | 1,125 | | Progressive Waste Solutions, Ltd., Term Loan B, due 10/24/19 | | | 1,133 | ¢^^ |
| | | | 2,460 | |
| Electronics - Electrical (1.2%) |
| | 358 | | BOC Edwards, First Lien Term Loan, 5.50%, due 5/31/16 | | | 359 | |
| | 1,181 | | CommScope, Term Loan, 4.25%, due 1/14/18 | | | 1,187 | |
| | 772 | | Epicor Software Corp., Term Loan B, 5.00%, due 5/16/18 | | | 775 | |
| | 1,476 | | Freescale Semiconductor, Term Loan B-2, 6.00%, due 2/28/19 | | | 1,463 | |
| | 1,199 | | Genesys, Term Loan, 6.75%, due 1/31/19 | | | 1,211 | |
| | 1,718 | | Go Daddy, Term Loan B-1, 5.50%, due 12/17/18 | | | 1,706 | |
| | 410 | | Hyland Software, Term Loan B, due 10/31/19 | | | 409 | ¢^^ |
| | 2,041 | | NXP Funding, Term Loan A-2, 5.50%, due 3/3/17 | | | 2,079 | ¢^^ |
| | 949 | | NXP Funding, Term Loan B, 5.25%, due 3/19/19 | | | 958 | ¢^^ |
| | 369 | | Paradigm, First Lien Term Loan B, 6.50%, due 7/30/19 | | | 367 | |
| | 600 | | SkillSoft, Term Loan, 5.00%, due 5/26/17 | | | 604 | ¢^^ |
| | 1,143 | | Sophia LP, Term Loan, 6.25%, due 7/19/18 | | | 1,156 | |
| | | | 12,274 | |
| Equipment Leasing (0.3%) |
| | 515 | | AWAS Fin Lux 2012 SA, Term Loan B, 5.25%, due 6/10/16 | | | 519 | |
| | 1,006 | | AWAS Fin Lux 2012 SA, Term Loan, 4.75%, due 7/16/18 | | | 1,014 | Ñ |
| | 1,480 | | International Lease Finance Co., Term Loan, 5.00%, due 6/30/17 | | | 1,498 | |
| | | | 3,031 | |
| Financial Intermediaries (1.3%) |
| | 1,094 | | American Capital, Senior Secured Term Loan, 5.50%, due 8/22/16 | | | 1,101 | |
| | 2,172 | | CITCO, Term Loan, 5.50%, due 6/29/18 | | | 2,181 | ¢^^ |
| | 1,160 | | First Data Corporation, Term Loan, 5.21%, due 3/24/17 | | | 1,139 | |
| | 480 | | First Data Corporation, Term Loan, due 3/26/18 | | | 457 | ¢^^ |
| | 585 | | First Data Corporation, Term Loan B, 5.21%, due 9/24/18 | | | 572 | |
| | 651 | | HarbourVest Partners, Term Loan, 6.25%, due 12/19/16 | | | 650 | |
| | 686 | | Mondrian Investment, Term Loan, 5.50%, due 7/12/18 | | | 689 | |
| | 1,275 | | Nuveen Investments Inc., First Lien Term Loan, 7.25%, due 5/13/17 | | | 1,284 | |
| | 344 | | Nuveen Investments Inc., First Lien Term Loan, 5.86%, due 5/13/17 | | | 343 | |
| | 1,266 | | Ocwen Financial, Term Loan, 5.50%, due 9/1/16 | | | 1,269 | |
| | 1,276 | | Residential Capital, Term Loan A-1, 5.00%, due 11/18/13 | | | 1,278 | |
| | 385 | | Residential Capital, Term Loan A-2, 6.75%, due 11/18/13 | | | 389 | |
| | 379 | | Royalty Pharma, Term Loan, 4.00%, due 11/9/18 | | | 381 | Ñ |
| | 830 | | Springleaf, Term Loan, 5.50%, due 5/10/17 | | | 818 | |
| | 774 | | Walter Investments, First Lien Term Loan, 7.75%, due 6/30/16 | | | 777 | |
| | | | 13,328 | |
| Food & Drug Retailers (0.1%) |
| | 1,298 | | Rite Aid Corp., Term Loan 5, 4.50%, due 3/3/18 | | | 1,294 | |
| | | | | | | | |
| Food Products (0.3%) |
| | 1,579 | | Del Monte Corp., Term Loan, 4.50%, due 3/8/18 | | | 1,576 | |
| | 1,094 | | Pinnacle Foods Finance LLC, Term Loan E, 4.75%, due 10/17/18 | | | 1,096 | |
| | | | 2,672 | |
See Notes to Schedule of Investments
Schedule of Investments Neuberger Berman Strategic Income Fund (cont'd)
| PRINCIPAL AMOUNT | | VALUE† |
| | | | |
| (000's omitted) | | (000's omitted)z |
| | | | |
| Food Service (0.2%) |
| $ | 1,127 | | OSI Restaurant Partners, Term Loan B, due 10/23/19 | | $ | 1,131 | ¢^^ |
| | 248 | | US Foodservice Inc., Term Loan, 5.75%, due 3/31/17 | | | 244 | |
| | 1,289 | | US Foodservice Inc., Term Loan, 5.75%, due 3/31/17 | | | 1,269 | |
| | | | 2,644 | |
| Health Care (1.7%) |
| | 280 | | Aurora Diagnostics, Term Loan B, 6.25%, due 5/26/16 | | | 280 | |
| | 2,091 | | Bausch & Lomb, Term Loan, 5.25%, due 5/17/19 | | | 2,113 | ¢^^ |
| | 1,309 | | CareStream Health Inc., Term Loan, 5.00%, due 2/25/17 | | | 1,293 | |
| | 1,967 | | DaVita, Inc., Term Loan B2, due 8/1/19 | | | 1,967 | ¢^^ |
| | 1,621 | | EMS, Term Loan, 5.25%, due 5/25/18 | | | 1,632 | ¢^^ |
| | 849 | | Grifols, Term Loan B, 4.50%, due 6/1/17 | | | 856 | ¢^^ |
| | 690 | | Health Management Associates Inc., Term Loan B, 4.50%, due 11/16/18 | | | 695 | |
| | 845 | | Hologic, Term Loan B, 4.50%, due 8/1/19 | | | 854 | |
| | 830 | | IASIS Healthcare Corporation, Term Loan B, 5.00%, due 5/3/18 | | | 831 | |
| | 1,273 | | Immucor, Term Loan B-1, 5.75%, due 8/19/18 | | | 1,282 | ¢^^ |
| | 634 | | IMS Health Incorporated, Term Loan B, due 8/26/17 | | | 637 | ¢^^ |
| | 1,117 | | Pharmaceutical Product Development, Inc., Term Loan, 6.25%, due 12/5/18 | | | 1,131 | |
| | 1,267 | | Sheridan Healthcare, Inc., First Lien Term Loan, 6.00%, due 6/29/18 | | | 1,274 | |
| | 1,496 | | United Surgical Partners, Term Loan B, 6.00%, due 4/3/19 | | | 1,509 | |
| | 374 | | Universal Health, Term Loan B-1, due 11/15/16 | | | 375 | ¢^^ |
| | 1,630 | | Valeant Pharmaceuticals International, Inc., Term Loan B, due 2/13/19 | | | 1,635 | ¢^^ |
| | | | 18,364 | |
| Home Furnishings (0.2%) |
| | 2,208 | | AOT Bedding Super Holdings, LLC, Term Loan B, due 9/20/19 | | | 2,206 | ¢^^ |
| | | | | | | | |
| Industrial Equipment (0.7%) |
| | 635 | | Colfax, Term Loan B, 4.75%, due 9/12/18 | | | 641 | |
| | 1,257 | | Generac Power Systems Inc., Term Loan, 6.25%, due 5/30/18 | | | 1,282 | |
| | 1,302 | | Goodyear Engineered Products, Term Loan B, 1.99%, due 7/31/14 | | | 1,290 | |
| | 186 | | Goodyear Engineered Products, Term Loan B DD, 2.50%, due 7/31/14 | | | 185 | |
| | 1,705 | | Husky Injection Molding, Term Loan B, 5.75%, due 7/2/18 | | | 1,724 | |
| | 1,283 | | Rexnord Corp., Term Loan B, 4.50%, due 4/1/18 | | | 1,291 | ¢^^ |
| | 808 | | Terex Corp., Term Loan, 4.50%, due 4/28/17 | | | 813 | ¢^^ |
| | | | 7,226 | |
| Insurance (0.0%) |
| | 298 | | Sedgwick Holdings Inc., Term Loan B, 5.00%, due 12/31/16 | | | 299 | |
| | | | | | | | |
| Leisure Goods - Activities - Movies (0.3%) |
| | 790 | | Bombardier Recreational Products, Inc., Term Loan B-2, 4.47%, due 6/28/16 | | | 791 | ¢^^ |
| | 1,538 | | EMI Publishing, Term Loan B, 5.50%, due 6/29/18 | | | 1,557 | |
| | 800 | | Six Flags Theme Parks Inc., Term Loan B, 4.25%, due 12/20/18 | | | 804 | |
| | | | 3,152 | |
See Notes to Schedule of Investments
Schedule of Investments Neuberger Berman Strategic Income Fund (cont'd)
| PRINCIPAL AMOUNT | | VALUE† |
| | | | |
| (000's omitted) | | (000's omitted)z |
| | | | |
| Lodging & Casinos (0.9%) |
| $ | 1,195 | | Boyd Gaming Corporation, Term Loan, 6.00%, due 12/17/15 | | $ | 1,206 | |
| | 868 | | Cannery Casinos, Term Loan B, due 9/25/18 | | | 871 | ¢^^ |
| | 551 | | Cannery Casinos, Second Lien Term Loan, 10.00%, due 9/12/19 | | | 536 | |
| | 1,034 | | Mohegan Tribal Gaming Authority, Term Loan A, due 3/31/15 | | | 1,013 | ¢^^ |
| | 1,220 | | Peninsula Gaming, Term Loan B, due 5/16/17 | | | 1,233 | ¢^^ |
| | 1,125 | | Penn National Gaming, Term Loan B, due 7/14/18 | | | 1,129 | ¢^^ |
| | 434 | | Station Casinos, Term Loan B-1, 3.21%, due 6/17/16 | | | 422 | |
| | 1,187 | | Station Casinos, Term Loan B-2, 4.21%, due 6/17/16 | | | 1,132 | |
| | 1,933 | | Station Casinos, Term Loan B, 5.50%, due 9/7/19 | | | 1,937 | |
| | | | 9,479 | |
| Nonferrous Metals - Minerals (0.4%) |
| | 1,277 | | Arch Coal, Term Loan, 5.75%, due 5/16/18 | | | 1,287 | |
| | 790 | | Fairmount Minerals, Term Loan B, 5.25%, due 3/15/17 | | | 790 | |
| | 2,635 | | FMG Resources, Term Loan, due 10/18/17 | | | 2,620 | ¢^^ |
| | | | 4,697 | |
| Oil & Gas (0.6%) |
| | 200 | | Chesapeake Energy, Term Loan B, 8.50%, due 12/2/17 | | | 200 | |
| | 1,736 | | Everest Acquisition LLC, Term Loan B-1, 5.00%, due 5/24/18 | | | 1,745 | ¢^^ |
| | 100 | | Everest Acquisition LLC, Term Loan B2, due 4/1/19 | | | 100 | Ѣ^^ |
| | 1,376 | | Frac Tech, Term Loan, 8.50%, due 5/6/16 | | | 1,219 | |
| | 2,290 | | Plains Exploration & Production Company, Term Loan B, due 11/30/19 | | | 2,299 | ¢^^ |
| | 897 | | Samson Investment Company, Second Lien Term Loan, 6.00%, due 9/25/18 | | | 905 | |
| | | | 6,468 | |
| Publishing (0.2%) |
| | 1,175 | | Getty Images, Term Loan, due 10/18/19 | | | 1,178 | ¢^^ |
| | 952 | | IWCO Direct, Term Loan, 3.59%, due 8/7/14 | | | 731 | |
| | 99 | | IWCO Direct, Term Loan DD, 3.59%, due 8/7/14 | | | 76 | |
| | | | 1,985 | |
| Radio & Television (0.5%) |
| | 1,277 | | Clear Channel, Term Loan A, 3.61%, due 7/30/14 | | | 1,237 | ¢^^ |
| | 1,893 | | Cumulus Media, First Lien Term Loan, 5.75%, due 9/16/18 | | | 1,905 | ¢^^ |
| | 475 | | Formula One, Term Loan B2, 4.75%, due 4/30/19 | | | 478 | |
| | 862 | | FoxCo Acquisition, Term Loan, 5.50%, due 7/14/17 | | | 872 | ¢^^ |
| | 1,097 | | Univision Communications Inc., First Lien Term Loan, 4.46%, due 3/31/17 | | | 1,072 | |
| | | | 5,564 | |
| Retailers (except food & drug) (1.4%) |
| | 2,153 | | 99¢ Only Stores, Term Loan B-1, 5.25%, due 1/11/19 | | | 2,173 | ¢^^ |
| | 1,699 | | Amscan Holdings, Inc., Term Loan, 5.75%, due 7/27/19 | | | 1,714 | |
| | 529 | | Bass Pro Shops, Term Loan, 5.25%, due 6/13/17 | | | 534 | |
| | 243 | | Bass Pro Shops, Term Loan B2, 5.25%, due 6/13/17 | | | 245 | |
| | 415 | | BJ's Wholesale Club, First Lien Term Loan, 5.75%, due 9/26/19 | | | 419 | |
| | 1,120 | | David's Bridal, Term Loan, due 10/11/19 | | | 1,117 | ¢^^ |
| | 746 | | Leslie's Poolmart, Term Loan B, 5.25%, due 10/16/19 | | | 745 | †† |
| | 510 | | Lord & Taylor, Term Loan B, 4.50%, due 1/11/19 | | | 513 | |
| | 977 | | Michaels Stores Inc., Term Loan B-2, 4.94%, due 7/31/16 | | | 985 | |
See Notes to Schedule of Investments
Schedule of Investments Neuberger Berman Strategic Income Fund (cont'd)
| PRINCIPAL AMOUNT | | VALUE† |
| | | | |
| (000's omitted) | | (000's omitted)z |
| | | | |
| $ | 756 | | Michaels Stores Inc., Term Loan B-3, 4.94%, due 7/31/16 | | $ | 762 | ¢^^ |
| | 1,299 | | Neiman Marcus Group Inc., Term Loan, 4.75%, due 5/16/18 | | | 1,301 | |
| | 619 | | PETCO Animal Supply Inc., Term Loan, 4.50%, due 11/24/17 | | | 621 | |
| | 779 | | Pilot Travel Centers, Term Loan B, 4.25%, due 8/7/19 | | | 783 | |
| | 1,112 | | Toys R US Delaware Inc., Term Loan, 6.00%, due 9/1/16 | | | 1,107 | |
| | 1,189 | | Toys R US Delaware Inc., Term Loan B-2, 5.25%, due 5/25/18 | | | 1,164 | ¢^^ |
| | | | 14,183 | |
| Steel (0.1%) |
| | 1,099 | | International Mill Services, Inc., Term Loan, 5.75%, due 3/20/19 | | | 1,110 | Ñ |
| | | | | | | | |
| Surface Transport (0.1%) |
| | 814 | | Avis Budget Car Rental, Term Loan C, 4.25%, due 3/15/19 | | | 818 | ¢^^ |
| | | | | | | | |
| Utilities (0.4%) |
| | 924 | | Calpine Corporation, Term Loan, 4.50%, due 4/1/18 | | | 926 | ¢^^ |
| | 263 | | Calpine Corporation, Term Loan, 4.50%, due 4/1/18 | | | 263 | |
| | 19 | | Calpine Corporation, Term Loan B3, due 9/30/19 | | | 19 | ¢^^ |
| | 1,086 | | Essential Power, Term Loan, 5.50%, due 8/8/19 | | | 1,086 | Ñ |
| | 1,360 | | GenOn Energy, Term Loan, 6.50%, due 12/4/17 | | | 1,369 | |
| | 13 | | Longview Power, Letter of Credit, 0.23%, due 2/28/14 | | | 11 | |
| | 915 | | Longview Power, Term Loan, 7.25%, due 10/31/17 | | | 752 | |
| | | | 4,426 | |
| | | | Total Bank Loan Obligations (Cost $170,445) | | | 171,823 | |
| | | | | | | | |
| U.S. Treasury Securities-Backed by the Full Faith and Credit of the U.S. Government (11.7%) |
| | 11,185 | | U.S. Treasury Bonds, 6.88%, due 8/15/25 | | | 17,358 | ØØ |
| | 6,765 | | U.S. Treasury Bonds, 5.50%, due 8/15/28 | | | 9,651 | ØØ |
| | 1,805 | | U.S. Treasury Bonds, 4.50%, due 2/15/36 | | | 2,402 | ØØ |
| | 21,568 | | U.S. Treasury Inflation Index Bonds, 2.00%, due 1/15/26 | | | 28,618 | |
| | 4,337 | | U.S. Treasury Inflation Index Bonds, 3.88%, due 4/15/29 | | | 7,281 | |
| | 9,696 | | U.S. Treasury Inflation Index Notes, 2.38% & 2.38%, due 1/15/17 & 1/15/25 | | | 11,988 | |
| | 10,103 | | U.S. Treasury Inflation Index Notes, 1.13%, due 1/15/21 | | | 11,948 | |
| | 3,275 | | U.S. Treasury Notes, 0.38%, due 7/31/13 | | | 3,279 | ØØ |
| | 20,300 | | U.S. Treasury Notes, 2.38%, due 10/31/14 | | | 21,137 | ØØ |
| | 1,525 | | U.S. Treasury Notes, 3.25%, due 3/31/17 | | | 1,700 | |
| | 5,785 | | U.S. Treasury Notes, 3.63%, due 8/15/19 | | | 6,755 | |
| | | | | | | | |
| | | | Total U.S. Treasury Securities-Backed by the Full Faith and Credit of the U.S. Government (Cost $119,719) | | | 122,117 | |
| | | | | | | | |
| Mortgage-Backed Securities (41.8%) |
| | |
| Collateralized Mortgage Obligations (0.7%) |
| | 1,717 | | Banc of America Funding Corp., Ser. 2006-G, Class 2A1, 0.43%, due 7/20/36 | | | 1,448 | µ |
| | 518 | | Credit Suisse First Boston Mortgage Securities Corp., Ser. 2004-AR4, Class 2A1, 2.96%, due 5/25/34 | | | 492 | µ |
| | 1,210 | | JP Morgan Alternative Loan Trust, Ser. 2006-A5, Class 1A1, 0.37%, due 10/25/36 | | | 736 | µ |
| | 1,514 | | JP Morgan Mortgage Acquisition Corp., Ser. 2007-HE1, Class AF1, 0.31%, due 3/25/47 | | | 1,049 | µ |
| | 2,802 | | JP Morgan Mortgage Trust, Ser. 2005-A3, Class 6A5, 3.04%, due 6/25/35 | | | 2,572 | µ |
| | 1,242 | | MortgageIT Trust, Ser. 2005-3, Class A1, 0.51%, due 8/25/35 | | | 1,089 | µ |
| | 215 | | WaMu Mortgage Pass-Through Certificates, Ser. 2006-AR10, Class 1A1, 2.73%, due 9/25/36 | | | 170 | µ |
| | | | 7,556 | |
See Notes to Schedule of Investments
Schedule of Investments Neuberger Berman Strategic Income Fund (cont'd)
| PRINCIPAL AMOUNT | | VALUE† |
| | | | |
| (000's omitted) | | (000's omitted)z |
| | | | |
| Commercial Mortgage-Backed (12.1%) |
| $ | 1,884 | | Banc of America Commercial Mortgage, Inc., Ser. 2006-3, Class A4, 5.89%, due 7/10/44 | | $ | 2,157 | µØØ |
| | 3,000 | | Banc of America Commercial Mortgage, Inc., Ser. 2006-6, Class A4, 5.36%, due 10/10/45 | | | 3,452 | ØØ |
| | 3,415 | | Banc of America Commercial Mortgage, Inc., Ser. 2006-5, Class A4, 5.41%, due 9/10/47 | | | 3,890 | ØØ |
| | 2,335 | | Banc of America Commercial Mortgage, Inc., Ser. 2007-1, Class A4, 5.45%, due 1/15/49 | | | 2,708 | ØØ |
| | 3,000 | | Banc of America Commercial Mortgage, Inc., Ser. 2007-3, Class A4, 5.53%, due 6/10/49 | | | 3,482 | µØØ |
| | 2,025 | | Bear Stearns Commercial Mortgage Securities, Ser. 2007-PW15, Class A4, 5.33%, due 2/11/44 | | | 2,257 | ØØ |
| | 550 | | Bear Stearns Commercial Mortgage Securities, Ser. 2007-PW17, Class A4, 5.69%, due 6/11/50 | | | 650 | ØØ |
| | 1,159 | | Citigroup/Deutsche Bank Commercial Mortgage Trust, Ser. 2007-CD5, Class A4, 5.89%, due 11/15/44 | | | 1,377 | ØØ |
| | 4,730 | | Citigroup/Deutsche Bank Commercial Mortgage Trust, Ser. 2007-CD4, Class A4, 5.32%, due 12/11/49 | | | 5,436 | ØØ |
| | 3,100 | | Commercial Mortgage Loan Trust, Ser. 2008-LS1, Class A4B, 6.00%, due 12/10/49 | | | 3,704 | µØØ |
| | 500 | | Commercial Mortgage Pass-Through Certificates, Ser. 2006-C8, Class A4, 5.31%, due 12/10/46 | | | 575 | ØØ |
| | 1,490 | | Credit Suisse Commercial Mortgage Trust, Ser. 2006-C1, Class A4, 5.41%, due 2/15/39 | | | 1,691 | µ |
| | 2,068 | | Credit Suisse Mortgage Capital Certificates, Ser. 2006-C3, Class A3, 5.80%, due 6/15/38 | | | 2,377 | µØØ |
| | 2,000 | | Credit Suisse Mortgage Capital Certificates, Ser. 2007-C3, Class A4, 5.68%, due 6/15/39 | | | 2,274 | µØØ |
| | 1,500 | | Credit Suisse Mortgage Capital Certificates, Ser. 2006-C4, Class A3, 5.47%, due 9/15/39 | | | 1,711 | ØØ |
| | 2,000 | | Credit Suisse Mortgage Capital Certificates, Ser. 2007-C4, Class A4, 5.76%, due 9/15/39 | | | 2,299 | µØØ |
| | 400 | | Credit Suisse Mortgage Capital Certificates, Ser. 2006-C5, Class A3, 5.31%, due 12/15/39 | | | 456 | ØØ |
| | 715 | | Credit Suisse Mortgage Capital Certificates, Ser. 2007-C5, Class A4, 5.70%, due 9/15/40 | | | 824 | ØØ |
| | 3,574 | | CW Capital Cobalt Ltd., Ser. 2007-C3, Class A4, 5.80%, due 5/15/46 | | | 4,187 | µØØ |
| | 500 | | CW Capital Cobalt Ltd., Ser. 2007-C2, Class A3, 5.48%, due 4/15/47 | | | 576 | ØØ |
| | 1,925 | | CW Capital Cobalt Ltd., Ser. 2006-C1, Class A4, 5.22%, due 8/15/48 | | | 2,159 | ØØ |
| | 941 | | DBUBS Mortgage Trust, Ser. 2011-LC1A, Class A1, 3.74%, due 11/10/46 | | | 1,021 | ñ |
| | 4,055 | | Greenwich Capital Commercial Funding Corp., Ser. 2007-GG9, Class A4, 5.44%, due 3/10/39 | | | 4,671 | ØØ |
| | 4,000 | | Greenwich Capital Commercial Funding Corp., Ser. 2007-GG11, Class A4, 5.74%, due 12/10/49 | | | 4,705 | ØØ |
| | 1,000 | | GS Mortgage Securities Corp. II, Ser. 2006-GG6, Class A4, 5.55%, due 4/10/38 | | | 1,132 | ØØ |
| | 111 | | GS Mortgage Securities Corp. II, Ser. 2005-GG4, Class A3, 4.61%, due 7/10/39 | | | 111 | |
| | 700 | | GS Mortgage Securities Corp. II, Ser. 2005-GG4, Class A4, 4.76%, due 7/10/39 | | | 753 | ØØ |
| | 765 | | GS Mortgage Securities Corp. II, Ser. 2006-GG8, Class A4, 5.56%, due 11/10/39 | | | 886 | |
| | 5,800 | | GS Mortgage Securities Corp. II, Ser. 2007-GG10, Class A4, 5.79%, due 8/10/45 | | | 6,661 | µØØ |
| | 3,150 | | Home Equity Mortgage Trust, Ser. 2004-5, Class M2, 1.81%, due 2/25/35 | | | 2,366 | µØØ |
| | 1,000 | | JP Morgan Chase Commercial Mortgage Securities Corp., Ser. 2006-CB15, Class A4, 5.81%, due 6/12/43 | | | 1,151 | ØØ |
| | 3,915 | | JP Morgan Chase Commercial Mortgage Securities Corp., Ser. 2006-LDP9, Class A3, 5.34%, due 5/15/47 | | | 4,501 | ØØ |
| | 3,250 | | JP Morgan Chase Commercial Mortgage Securities Corp., Ser. 2007-CB18, Class A4, 5.44%, due 6/12/47 | | | 3,767 | ØØ |
| | 3,000 | | JP Morgan Chase Commercial Mortgage Securities Corp., Ser. 2007-LDPX, Class A3, 5.42%, due 1/15/49 | | | 3,474 | ØØ |
| | 4,000 | | JP Morgan Chase Commercial Mortgage Securities Corp., Ser. 2007-CB19, Class A4, 5.73%, due 2/12/49 | | | 4,715 | µØØ |
| | 3,000 | | JP Morgan Chase Commercial Mortgage Securities Corp., Ser. 2007-LD11, Class A4, 5.81%, due 6/15/49 | | | 3,513 | µØØ |
| | 1,610 | | JP Morgan Chase Commercial Mortgage Securities Corp., Ser. 2007-CB20, Class A4, 5.79%, due 2/12/51 | | | 1,925 | ØØ |
| | 1,684 | | JP Morgan Chase Commercial Mortgage Securities Corp., Ser. 2007-CB20, Class A3, 5.82%, due 2/12/51 | | | 1,758 | ØØ |
| | 3,450 | | JP Morgan Chase Commercial Mortgage Securities Corp., Ser. 2007-LD12, Class A4, 5.88%, due 2/15/51 | | | 4,083 | ØØ |
| | 839 | | LB-UBS Commercial Mortgage Trust, Ser. 2007-C6, Class A4, 5.86%, due 7/15/40 | | | 997 | |
| | 3,088 | | Merrill Lynch/Countrywide Commercial Mortgage Trust, Ser. 2007-5, Class A4, 5.38%, due 8/12/48 | | | 3,496 | ØØ |
See Notes to Schedule of Investments
Schedule of Investments Neuberger Berman Strategic Income Fund (cont'd)
| PRINCIPAL AMOUNT | | VALUE† |
| | | | |
| (000's omitted) | | (000's omitted)z |
| | | | |
| $ | 3,500 | | Merrill Lynch/Countrywide Commercial Mortgage Trust, Ser. 2006-4, Class A3, 5.17%, due 12/12/49 | | $ | 3,988 | |
| | 2,300 | | Merrill Lynch/Countrywide Commercial Mortgage Trust, Ser. 2007-7, Class A4, 5.73%, due 6/12/50 | | | 2,630 | µØØ |
| | 2,142 | | Morgan Stanley Capital I, Ser. 2005-WMC1, Class M2, 0.95%, due 1/25/35 | | | 1,931 | µØØ |
| | 2,650 | | Morgan Stanley Capital I, Ser. 2007-IQ16, Class A4, 5.81%, due 12/12/49 | | | 3,163 | ØØ |
| | 747 | | Wachovia Bank Commercial Mortgage Trust, Ser. 2006-C23, Class A4, 5.42%, due 1/15/45 | | | 835 | µØØ |
| | 1,500 | | Wachovia Bank Commercial Mortgage Trust, Ser. 2007-C34, Class A3, 5.68%, due 5/15/46 | | | 1,761 | ØØ |
| | 3,968 | | Wachovia Bank Commercial Mortgage Trust, Ser. 2007-C31, Class A4, 5.51%, due 4/15/47 | | | 4,585 | ØØ |
| | 3,265 | | Wachovia Bank Commercial Mortgage Trust, Ser. 2007-C32, Class A3, 5.75%, due 6/15/49 | | | 3,752 | µØØ |
| | | | 126,573 | |
| Fannie Mae (10.8%) |
| | 7,868 | | Pass-Through Certificates, 5.00%, due 8/1/33 – 7/1/40 | | | 8,594 | |
| | 2,742 | | Pass-Through Certificates, 5.50%, due 7/1/33 – 1/1/39 | | | 3,010 | |
| | 1,971 | | Pass-Through Certificates, 6.00%, due 9/1/33 – 9/1/40 | | | 2,196 | |
| | 2 | | Pass-Through Certificates, 6.50%, due 9/1/32 | | | 3 | |
| | 6 | | Pass-Through Certificates, 7.00%, due 7/1/29 | | | 7 | |
| | 2 | | Pass-Through Certificates, 7.50%, due 12/1/32 | | | 2 | |
| | 1,974 | | Pass-Through Certificates, 4.00%, due 10/1/39 – 12/1/41 | | | 2,118 | |
| | 1,747 | | Pass-Through Certificates, 4.50%, due 5/1/41 – 11/1/41 | | | 1,893 | |
| | 4,940 | | Pass-Through Certificates, 3.00%, TBA, 30 Year Maturity | | | 5,168 | Ø |
| | 27,420 | | Pass-Through Certificates, 3.50%, TBA, 30 Year Maturity | | | 29,207 | Ø |
| | 45,345 | | Pass-Through Certificates, 4.00%, TBA, 30 Year Maturity | | | 48,555 | Ø |
| | 7,325 | | Pass-Through Certificates, 5.00%, TBA, 30 Year Maturity | | | 7,991 | Ø |
| | 4,000 | | Pass-Through Certificates, 5.50%, TBA, 30 Year Maturity | | | 4,386 | Ø |
| | | | 113,130 | |
| Freddie Mac (18.2%) |
| | 3,825 | | Federal Home Loan Bank, Bonds, 5.50%, due 7/15/36 | | | 5,320 | ØØ |
| | 17,436 | | Pass-Through Certificates, 4.50%, due 8/1/18 – 10/1/41 | | | 18,776 | ØØ |
| | 1,729 | | Pass-Through Certificates, 5.00%, due 5/1/18 – 8/1/39 | | | 1,874 | |
| | 8,296 | | Pass-Through Certificates, 5.50%, due 9/1/17 – 5/1/40 | | | 9,036 | ØØ |
| | 65 | | Pass-Through Certificates, 6.00%, due 4/1/17 – 9/1/38 | | | 72 | |
| | 1 | | Pass-Through Certificates, 6.50%, due 3/1/16 | | | 1 | |
| | 1 | | Pass-Through Certificates, 7.00%, due 6/1/32 | | | 1 | |
| | 24,067 | | Pass-Through Certificates, 4.00%, due 9/1/39 – 1/1/41 | | | 25,769 | ØØ |
| | 66,610 | | Pass-Through Certificates, 3.50%, TBA, 30 Year Maturity | | | 70,804 | Ø |
| | 55,535 | | Pass-Through Certificates, 4.00%, TBA, 30 Year Maturity | | | 59,242 | Ø |
| | | | 190,895 | |
| Government National Mortgage Association (0.0%) |
| | 2 | | Pass-Through Certificates, 6.50%, due 7/15/32 | | | 3 | |
| | 2 | | Pass-Through Certificates, 7.00%, due 8/15/32 | | | 3 | |
| | | | 6 | |
| | | | Total Mortgage-Backed Securities (Cost $421,828) | | | 438,160 | |
| | | | | | | | |
| Corporate Debt Securities (36.8%) |
| | |
| Aerospace & Defense (0.5%) |
| | 327 | | AWAS Aviation Capital Ltd., Senior Secured Notes, 7.00%, due 10/17/16 | | | 349 | ñ |
| | 4,360 | | L-3 Communications Corp., Guaranteed Notes, 3.95%, due 11/15/16 | | | 4,739 | ØØ |
| | | | 5,088 | |
See Notes to Schedule of Investments
Schedule of Investments Neuberger Berman Strategic Income Fund (cont'd)
| PRINCIPAL AMOUNT | | VALUE† |
| | | | |
| (000's omitted) | | (000's omitted)z |
| | | | |
| Agriculture (1.9%) |
| $ | 3,870 | | Altria Group, Inc., Guaranteed Notes, 2.85%, due 8/9/22 | | $ | 3,881 | ØØ |
| | 5,570 | | Lorillard Tobacco Co., Guaranteed Notes, 2.30%, due 8/21/17 | | | 5,635 | ØØ |
| | 3,080 | | Lorillard Tobacco Co., Guaranteed Notes, 8.13%, due 6/23/19 | | | 3,962 | ØØ |
| | 6,815 | | Reynolds American, Inc., Guaranteed Notes, 4.75%, due 11/1/42 | | | 6,942 | |
| | | | 20,420 | |
| Airlines (0.6%) |
| | 280 | | Continental Airlines, Inc., Senior Secured Notes, 6.75%, due 9/15/15 | | | 293 | ñØØ |
| | 5,005 | | Continental Airlines, Inc., Pass-Through Certificates, Ser. 2012-2, Class A, 4.00%, due 10/29/24 | | | 5,205 | |
| | 529 | | United Airlines, Inc., Senior Secured Notes, 9.88%, due 8/1/13 | | | 540 | ñØØ |
| | | | 6,038 | |
| Auto Loans (0.1%) |
| | 100 | | Ford Motor Credit Co. LLC, Senior Unsecured Notes, 6.63%, due 8/15/17 | | | 117 | ØØ |
| | 520 | | General Motors Financial Co., Inc., Guaranteed Notes, 4.75%, due 8/15/17 | | | 532 | ñØØ |
| | | | 649 | |
| Automakers (0.2%) |
| | 375 | | Chrysler Group LLC/CG Co-Issuer, Inc., Secured Notes, 8.00%, due 6/15/19 | | | 399 | ØØ |
| | 240 | | Ford Holdings, Inc., Guaranteed Notes, 9.30%, due 3/1/30 | | | 337 | ØØ |
| | 805 | | Ford Motor Co., Senior Unsecured Notes, 7.45%, due 7/16/31 | | | 1,018 | ØØ |
| | 145 | | Ford Motor Co., Senior Unsecured Notes, 9.98%, due 2/15/47 | | | 201 | ØØ |
| | | | 1,955 | |
| Banks (5.3%) |
| | 1,085 | | Ally Financial, Inc., Guaranteed Notes, 5.50%, due 2/15/17 | | | 1,148 | |
| | 1,175 | | Ally Financial, Inc., Guaranteed Notes, 6.25%, due 12/1/17 | | | 1,290 | ØØ |
| | 550 | | Ally Financial, Inc., Guaranteed Notes, 8.00%, due 3/15/20 | | | 656 | ØØ |
| | 4,390 | | Bank of America Corp., Senior Notes, 1.50%, due 10/9/15 | | | 4,395 | ØØ |
| | 1,975 | | Citigroup, Inc., Senior Unsecured Notes, 2.65%, due 3/2/15 | | | 2,036 | ØØ |
| | 1,650 | | Citigroup, Inc., Senior Unsecured Notes, 6.13%, due 11/21/17 | | | 1,957 | ØØ |
| | 3,585 | | Goldman Sachs Group, Inc., Senior Notes, 3.30%, due 5/3/15 | | | 3,744 | ØØ |
| | 2,430 | | Goldman Sachs Group, Inc., Senior Unsecured Notes, 5.75%, due 1/24/22 | | | 2,821 | ØØ |
| | 1,195 | | Goldman Sachs Group, Inc., Subordinated Notes, 6.75%, due 10/1/37 | | | 1,316 | ØØ |
| | 2,445 | | JPMorgan Chase & Co., Senior Unsecured Notes, 3.45%, due 3/1/16 | | | 2,602 | |
| | 4,350 | | JPMorgan Chase & Co., Senior Unsecured Notes, 2.00%, due 8/15/17 | | | 4,397 | ØØ |
| | 8,010 | | Morgan Stanley, Senior Unsecured Global Medium-Term Notes, Ser. F, 5.63%, due 9/23/19 | | | 8,895 | ØØ |
| | 2,005 | | Morgan Stanley, Senior Unsecured Notes, 6.38%, due 7/24/42 | | | 2,304 | ØØ |
| | 7,660 | | Societe Generale SA, Guaranteed Notes, 2.75%, due 10/12/17 | | | 7,718 | |
| | 8,475 | | Swedbank AB, Senior Unsecured Notes, 2.13%, due 9/29/17 | | | 8,558 | ñØØ |
| | 1,225 | | UnionBanCal Corp., Senior Unsecured Notes, 3.50%, due 6/18/22 | | | 1,298 | ØØ |
| | | | 55,135 | |
See Notes to Schedule of Investments
Schedule of Investments Neuberger Berman Strategic Income Fund (cont'd)
| PRINCIPAL AMOUNT | | VALUE† |
| | | | |
| (000's omitted) | | (000's omitted)z |
| | | | |
| Beverages (0.8%) |
| $ | 380 | | Constellation Brands, Inc., Guaranteed Notes, 7.25%, due 9/1/16 | | $ | 439 | ØØ |
| | 215 | | Constellation Brands, Inc., Guaranteed Notes, 7.25%, due 5/15/17 | | | 253 | ØØ |
| | 3,875 | | Pernod-Ricard SA, Senior Unsecured Notes, 2.95%, due 1/15/17 | | | 4,087 | ñØØ |
| | 2,660 | | Pernod-Ricard SA, Senior Unsecured Notes, 5.50%, due 1/15/42 | | | 3,211 | ñØØ |
| | | | 7,990 | |
| Building & Construction (0.1%) |
| | 345 | | Lennar Corp., Guaranteed Notes, 4.75%, due 12/15/17 | | | 360 | ñØØ |
| | 190 | | Shea Homes L.P., Senior Secured Notes, 8.63%, due 5/15/19 | | | 211 | ØØ |
| | 350 | | Standard Pacific Corp., Guaranteed Notes, 8.38%, due 5/15/18 | | | 408 | ØØ |
| | | | 979 | |
| Building Materials (0.7%) |
| | 530 | | Masco Corp., Senior Unsecured Notes, 6.13%, due 10/3/16 | | | 580 | ØØ |
| | 6,270 | | Owens Corning, Inc., Guaranteed Notes, 4.20%, due 12/15/22 | | | 6,337 | |
| | 830 | | USG Corp., Guaranteed Notes, 8.38%, due 10/15/18 | | | 905 | ñØØ |
| | | | 7,822 | |
| Chemicals (0.5%) |
| | 1,100 | | Hexion US Finance Corp., Senior Secured Notes, 6.63%, due 4/15/20 | | | 1,097 | ØØ |
| | 330 | | Huntsman Int'l LLC, Guaranteed Notes, 8.63%, due 3/15/20 | | | 372 | ØØ |
| | 425 | | Huntsman Int'l LLC, Guaranteed Notes, 8.63%, due 3/15/21 | | | 484 | ØØ |
| | 1,010 | | LyondellBasell Industries NV, Senior Unsecured Notes, 5.00%, due 4/15/19 | | | 1,093 | ØØ |
| | 170 | | LyondellBasell Industries NV, Senior Unsecured Notes, 6.00%, due 11/15/21 | | | 197 | ØØ |
| | 650 | | Momentive Performance Materials, Inc., Senior Secured Notes, 10.00%, due 10/15/20 | | | 624 | ñØØ |
| | 890 | | Momentive Performance Materials, Inc., Secured Notes, 9.00%, due 1/15/21 | | | 614 | ØØ |
| | 745 | | MPM Escrow LLC/MPM Finance Escrow Corp., Senior Secured Notes, 8.88%, due 10/15/20 | | | 730 | ñ |
| | | | 5,211 | |
| Commercial Services (1.2%) |
| | 9,430 | | ERAC USA Finance LLC, Guaranteed Notes, 3.30%, due 10/15/22 | | | 9,521 | ñØØ |
| | 1,955 | | ERAC USA Finance LLC, Guaranteed Notes, 7.00%, due 10/15/37 | | | 2,548 | ñØØ |
| | | | 12,069 | |
| Computer Hardware (0.1%) |
| | 260 | | Seagate HDD Cayman, Guaranteed Notes, 6.88%, due 5/1/20 | | | 271 | |
| | 270 | | Seagate HDD Cayman, Guaranteed Notes, 7.00%, due 11/1/21 | | | 282 | ØØ |
| | | | 553 | |
| Computers (0.5%) |
| | 2,300 | | Hewlett-Packard Co., Senior Unsecured Notes, 2.60%, due 9/15/17 | | | 2,240 | ØØ |
| | 3,475 | | Hewlett-Packard Co., Senior Unsecured Notes, 4.65%, due 12/9/21 | | | 3,478 | ØØ |
| | | | 5,718 | |
See Notes to Schedule of Investments
Schedule of Investments Neuberger Berman Strategic Income Fund (cont'd)
| PRINCIPAL AMOUNT | | VALUE† |
| | | | |
| (000's omitted) | | (000's omitted)z |
| | | | |
| Consumer - Commercial Lease Financing (0.6%) |
| $ | 650 | | CIT Group, Inc., Senior Unsecured Notes, Ser. C, 5.25%, due 4/1/14 | | $ | 674 | ñØØ |
| | 585 | | CIT Group, Inc., Senior Unsecured Notes, 5.00%, due 5/15/17 | | | 616 | ØØ |
| | 1,225 | | CIT Group, Inc., Senior Unsecured Notes, 4.25%, due 8/15/17 | | | 1,256 | ØØ |
| | 75 | | CIT Group, Inc., Senior Unsecured Notes, 5.25%, due 3/15/18 | | | 80 | ØØ |
| | 310 | | CIT Group, Inc., Senior Unsecured Notes, 6.63%, due 4/1/18 | | | 346 | ñØØ |
| | 435 | | CIT Group, Inc., Senior Unsecured Notes, 5.50%, due 2/15/19 | | | 464 | ñØØ |
| | 755 | | Int'l Lease Finance Corp., Senior Unsecured Medium-Term Notes, Ser. R, 5.65%, due 6/1/14 | | | 792 | ØØ |
| | 1,140 | | Int'l Lease Finance Corp., Senior Unsecured Notes, 8.63%, due 9/15/15 | | | 1,284 | ØØ |
| | 535 | | Int'l Lease Finance Corp., Senior Unsecured Notes, 8.75%, due 3/15/17 | | | 625 | ØØ |
| | 355 | | Int'l Lease Finance Corp., Senior Unsecured Notes, 6.25%, due 5/15/19 | | | 382 | ØØ |
| | | | 6,519 | |
| Department Stores (0.1%) |
| | 630 | | Sears Holdings Corp., Secured Notes, 6.63%, due 10/15/18 | | | 589 | ØØ |
| | | | | | | | |
| Diversified Financial Services (2.2%) |
| | 2,520 | | Ford Motor Credit Co. LLC, Senior Unsecured Notes, 3.00%, due 6/12/17 | | | 2,577 | ØØ |
| | 4,760 | | Ford Motor Credit Co. LLC, Senior Unsecured Notes, 4.25%, due 9/20/22 | | | 4,932 | ØØ |
| | 3,460 | | General Electric Capital Corp., Senior Unsecured Notes, 1.63%, due 7/2/15 | | | 3,519 | ØØ |
| | 2,930 | | General Electric Capital Corp., Senior Unsecured Medium-Term Notes, 2.30%, due 4/27/17 | | | 3,027 | ØØ |
| | 4,705 | | General Electric Capital Corp., Junior Subordinated Notes, Ser. B, 6.25%, due 12/15/49 | | | 5,129 | µØØ |
| | 2,615 | | Harley-Davidson Financial Services, Inc., Guaranteed Notes, 1.15%, due 9/15/15 | | | 2,628 | ñØØ |
| | 720 | | PSALM Corp., Senior Unsecured Notes, 7.39%, due 12/2/24 | | | 1,010 | |
| | | | 22,822 | |
| Electric (1.3%) |
| | 2,860 | | Dominion Resources, Inc., Senior Unsecured Notes, Ser. C, 4.05%, due 9/15/42 | | | 2,974 | ØØ |
| | 1,775 | | Duke Energy Corp., Senior Unsecured Notes, 1.63%, due 8/15/17 | | | 1,788 | ØØ |
| | 6,110 | | Exelon Generation Co., LLC, Senior Unsecured Notes, 4.00%, due 10/1/20 | | | 6,588 | ØØ |
| | 2,780 | | Pacific Gas & Electric Co., Senior Unsecured Notes, 3.75%, due 8/15/42 | | | 2,768 | ØØ |
| | | | 14,118 | |
| Electric - Generation (0.3%) |
| | 942 | | Calpine Corp., Senior Secured Notes, 7.25%, due 10/15/17 | | | 999 | ñØØ |
| | 1,000 | | NRG Energy, Inc., Guaranteed Notes, 7.63%, due 1/15/18 | | | 1,092 | ØØ |
| | 1,385 | | NRG Energy, Inc., Guaranteed Notes, 7.88%, due 5/15/21 | | | 1,517 | ØØ |
| | | | 3,608 | |
| Electric - Integrated (0.2%) |
| | 545 | | IPALCO Enterprises, Inc., Senior Secured Notes, 7.25%, due 4/1/16 | | | 607 | ñØØ |
| | 960 | | IPALCO Enterprises, Inc., Senior Secured Notes, 5.00%, due 5/1/18 | | | 1,013 | ØØ |
| | | | 1,620 | |
| Electronics (0.1%) |
| | 940 | | Ceridian Corp., Senior Secured Notes, 8.88%, due 7/15/19 | | | 996 | ñØØ |
| | 225 | | Freescale Semiconductor, Inc., Senior Secured Notes, 9.25%, due 4/15/18 | | | 241 | ñØØ |
| | 180 | | NXP BV Funding LLC, Senior Secured Notes, 9.75%, due 8/1/18 | | | 210 | ñØØ |
| | | | | |
| | | | 1,447 | |
See Notes to Schedule of Investments
Schedule of Investments Neuberger Berman Strategic Income Fund (cont'd)
| PRINCIPAL AMOUNT | | VALUE† |
| | | | |
| (000's omitted) | | (000's omitted)z |
| | | | |
| Energy - Exploration & Production (1.1%) |
| $ | 50 | | Chesapeake Energy Corp., Guaranteed Notes, 7.63%, due 7/15/13 | | $ | 52 | ØØ |
| | 400 | | Chesapeake Energy Corp., Guaranteed Notes, 9.50%, due 2/15/15 | | | 448 | ØØ |
| | 40 | | Chesapeake Energy Corp., Guaranteed Notes, 6.50%, due 8/15/17 | | | 42 | ØØ |
| | 1,130 | | Chesapeake Energy Corp., Guaranteed Notes, 6.88%, due 8/15/18 | | | 1,187 | ØØ |
| | 15 | | Chesapeake Energy Corp., Guaranteed Notes, 6.63%, due 8/15/20 | | | 16 | ØØ |
| | 565 | | Chesapeake Energy Corp., Guaranteed Notes, 6.13%, due 2/15/21 | | | 572 | ØØ |
| | 520 | | Cimarex Energy Co., Guaranteed Notes, 5.88%, due 5/1/22 | | | 555 | ØØ |
| | 560 | | Continental Resources, Inc., Guaranteed Notes, 5.00%, due 9/15/22 | | | 591 | ñØØ |
| | 115 | | Everest Acquisition LLC/Everest Acquisition Finance, Inc., Senior Secured Notes, 6.88%, due 5/1/19 | | | 124 | ñØØ |
| | 1,180 | | Everest Acquisition LLC/Everest Acquisition Finance, Inc., Senior Unsecured Notes, 9.38%, due 5/1/20 | | | 1,304 | ñØØ |
| | 85 | | Everest Acquisition LLC/Everest Acquisition Finance, Inc., Guaranteed Notes, 7.75%, due 9/1/22 | | | 88 | ñØØ |
| | 510 | | EXCO Resources, Inc., Guaranteed Notes, 7.50%, due 9/15/18 | | | 479 | ØØ |
| | 300 | | Forest Oil Corp., Guaranteed Notes, 7.50%, due 9/15/20 | | | 307 | ñØØ |
| | 595 | | Linn Energy LLC, Guaranteed Notes, 8.63%, due 4/15/20 | | | 651 | ØØ |
| | 453 | | Linn Energy LLC, Guaranteed Notes, 7.75%, due 2/1/21 | | | 484 | ØØ |
| | 625 | | Newfield Exploration Co., Senior Unsecured Notes, 5.75%, due 1/30/22 | | | 675 | ØØ |
| | 210 | | Newfield Exploration Co., Senior Unsecured Notes, 5.63%, due 7/1/24 | | | 224 | ØØ |
| | 390 | | Plains Exploration & Production Co., Guaranteed Notes, 7.63%, due 6/1/18 | | | 413 | ØØ |
| | 470 | | Plains Exploration & Production Co., Guaranteed Notes, 6.50%, due 11/15/20 | | | 470 | |
| | 345 | | Plains Exploration & Production Co., Guaranteed Notes, 6.63%, due 5/1/21 | | | 345 | ØØ |
| | 360 | | Plains Exploration & Production Co., Guaranteed Notes, 6.75%, due 2/1/22 | | | 362 | ØØ |
| | 500 | | Plains Exploration & Production Co., Guaranteed Notes, 6.88%, due 2/15/23 | | | 499 | |
| | 195 | | Range Resources Corp., Guaranteed Notes, 5.75%, due 6/1/21 | | | 209 | ØØ |
| | 115 | | Range Resources Corp., Guaranteed Notes, 5.00%, due 8/15/22 | | | 120 | ØØ |
| | 345 | | SandRidge Energy, Inc., Guaranteed Notes, 8.00%, due 6/1/18 | | | 362 | ñØØ |
| | 430 | | SandRidge Energy, Inc., Guaranteed Notes, 7.50%, due 3/15/21 | | | 447 | ØØ |
| | 330 | | SandRidge Energy, Inc., Guaranteed Notes, 8.13%, due 10/15/22 | | | 355 | ñØØ |
| | 415 | | WPX Energy, Inc., Senior Unsecured Notes, 5.25%, due 1/15/17 | | | 443 | ØØ |
| | | | 11,824 | |
| Food (0.2%) | |
| | 2,005 | | Kraft Foods Group, Inc., Senior Unsecured Notes, 5.00%, due 6/4/42 | | | 2,342 | ñØØ |
| | | | | | | | |
| Food & Drug Retailers (0.1%) |
| | 655 | | Rite Aid Corp., Senior Secured Notes, 9.75%, due 6/12/16 | | | 714 | ØØ |
| | | | | | | | |
| Gaming (0.6%) | |
| | 905 | | CityCenter Holdings LLC, Senior Secured Notes, 7.63%, due 1/15/16 | | | 966 | ØØ |
| | 150 | | CityCenter Holdings LLC, Senior Secured Notes, 7.63%, due 1/15/16 | | | 160 | ñØØ |
| | 790 | | Graton Economic Development Authority, Senior Secured Notes, 9.63%, due 9/1/19 | | | 840 | ñØØ |
| | 635 | | MGM Mirage, Inc., Senior Secured Notes, 11.13%, due 11/15/17 | | | 700 | ØØ |
| | 315 | | MGM Mirage, Inc., Senior Secured Notes, 9.00%, due 3/15/20 | | | 351 | ØØ |
| | 325 | | MGM Resorts Int'l, Guaranteed Notes, 6.75%, due 10/1/20 | | | 323 | ñØØ |
| | 1,210 | | MGM Resorts Int'l, Guaranteed Notes, 7.75%, due 3/15/22 | | | 1,251 | ØØ |
| | 510 | | Pinnacle Entertainment, Inc., Guaranteed Notes, 7.75%, due 4/1/22 | | | 552 | ØØ |
| | 460 | | Seminole Indian Tribe of Florida, Notes, 7.75%, due 10/1/17 | | | 502 | ñØØ |
| | 378 | | Wynn Las Vegas LLC, 1st Mortgage, 7.75%, due 8/15/20 | | | 424 | ØØ |
| | | | 6,069 | |
See Notes to Schedule of Investments
Schedule of Investments Neuberger Berman Strategic Income Fund (cont'd)
| PRINCIPAL AMOUNT | VALUE† |
| | | | |
| (000's omitted) | (000's omitted)z |
| | | | |
| Gas Distribution (0.7%) |
| $ | 220 | | AmeriGas Finance LLC, Guaranteed Notes, 6.75%, due 5/20/20 | | $ | 237 | ØØ |
| | 665 | | AmeriGas Finance LLC, Guaranteed Notes, 7.00%, due 5/20/22 | | | 722 | ØØ |
| | 645 | | Chesapeake Midstream Partners L.P., Guaranteed Notes, 6.13%, due 7/15/22 | | | 682 | ØØ |
| | 310 | | El Paso Corp., Senior Unsecured Notes, 7.00%, due 6/15/17 | | | 354 | ØØ |
| | 90 | | El Paso Corp., Senior Unsecured Global Medium-Term Notes, 7.75%, due 1/15/32 | | | 107 | ØØ |
| | 700 | | El Paso Energy Corp., Senior Unsecured Global Medium-Term Notes, 7.80%, due 8/1/31 | | | 833 | ØØ |
| | 960 | | Energy Transfer Equity L.P., Senior Secured Notes, 7.50%, due 10/15/20 | | | 1,092 | ØØ |
| | 350 | | Ferrellgas L.P., Senior Unsecured Notes, 9.13%, due 10/1/17 | | | 375 | ØØ |
| | 815 | | Kinder Morgan Finance Co., Guaranteed Notes, 5.70%, due 1/5/16 | | | 892 | ØØ |
| | 755 | | MarkWest Energy Partners L.P., Guaranteed Notes, Ser. B, 8.75%, due 4/15/18 | | | 808 | ØØ |
| | 455 | | Regency Energy Partners L.P., Guaranteed Notes, 6.88%, due 12/1/18 | | | 489 | ØØ |
| | 295 | | Suburban Propane Partners L.P., Senior Unsecured Notes, 7.50%, due 10/1/18 | | | 317 | ñØØ |
| | | | 6,908 | |
| Health Facilities (1.0%) |
| | 80 | | CHS/Columbia Healthcare Corp., Senior Unsecured Notes, 7.50%, due 12/15/23 | | | 80 | ØØ |
| | 1,590 | | Community Health Systems, Inc., Senior Secured Notes, 5.13%, due 8/15/18 | | | 1,650 | ØØ |
| | 360 | | DaVita, Inc., Guaranteed Notes, 5.75%, due 8/15/22 | | | 376 | ØØ |
| | 1,935 | | HCA, Inc., Senior Secured Notes, 8.50%, due 4/15/19 | | | 2,174 | ØØ |
| | 725 | | HCA, Inc., Senior Secured Notes, 5.88%, due 3/15/22 | | | 778 | ØØ |
| | 1,345 | | HCA, Inc., Senior Secured Notes, 4.75%, due 5/1/23 | | | 1,345 | |
| | 1,045 | | OMEGA Healthcare Investors, Inc., Guaranteed Notes, 6.75%, due 10/15/22 | | | 1,139 | ØØ |
| | 560 | | OMEGA Healthcare Investors, Inc., Guaranteed Notes, 5.88%, due 3/15/24 | | | 596 | ØØ |
| | 690 | | Tenet Healthcare Corp., Senior Secured Notes, 6.25%, due 11/1/18 | | | 747 | ØØ |
| | 140 | | Tenet Healthcare Corp., Senior Secured Notes, 8.88%, due 7/1/19 | | | 156 | ØØ |
| | 1,295 | | Tenet Healthcare Corp., Senior Secured Notes, 4.75%, due 6/1/20 | | | 1,284 | ñ |
| | | | 10,325 | |
| Healthcare - Services (0.5%) |
| | 5,065 | | UnitedHealth Group, Inc., Senior Unsecured Notes, 3.95%, due 10/15/42 | | | 5,132 | |
| | | | | | | | |
| Hotels (0.1%) |
| | 405 | | Host Hotels & Resorts L.P., Unsubordinated Notes, Ser. W, 5.88%, due 6/15/19 | | | 445 | ØØ |
| | 220 | | Host Hotels & Resorts L.P., Senior Unsecured Notes, 6.00%, due 10/1/21 | | | 255 | ØØ |
| | 520 | | Host Hotels & Resorts L.P., Senior Unsecured Notes, 5.25%, due 3/15/22 | | | 575 | |
| | | | 1,275 | |
| Insurance (0.6%) |
| | 6,460 | | Prudential Financial, Inc., Junior Subordinated Notes, 5.88%, due 9/15/42 | | | 6,799 | µØØ |
| | | | | | | | |
| Investments & Misc. Financial Services (0.2%) |
| | 830 | | Icahn Enterprises L.P., Guaranteed Notes, 7.75%, due 1/15/16 | | | 867 | ØØ |
| | 820 | | Icahn Enterprises L.P., Guaranteed Notes, 8.00%, due 1/15/18 | | | 881 | ØØ |
| | 235 | | Icahn Enterprises L.P., Guaranteed Notes, 8.00%, due 1/15/18 | | | 253 | ñØØ |
| | | | 2,001 | |
| Leisure (0.1%) |
| | 275 | | Cedar Fair L.P., Guaranteed Notes, 9.13%, due 8/1/18 | | | 311 | ØØ |
| | 635 | | Royal Caribbean Cruises Ltd., Senior Unsecured Notes, 7.25%, due 6/15/16 | | | 718 | ØØ |
| | | | 1,029 | |
See Notes to Schedule of Investments
Schedule of Investments Neuberger Berman Strategic Income Fund (cont'd)
| PRINCIPAL AMOUNT | | VALUE† |
| | | | |
| (000's omitted) | | (000's omitted)z |
| | | | |
| Machinery (0.2%) |
| $ | 1,355 | | Case New Holland, Inc., Guaranteed Notes, 7.88%, due 12/1/17 | | $ | 1,592 | ØØ |
| | 320 | | CNH Capital LLC, Senior Notes, 3.88%, due 11/1/15 | | | 328 | ñ |
| | 345 | | Terex Corp., Guaranteed Notes, 6.50%, due 4/1/20 | | | 362 | ØØ |
| | 245 | | The Manitowoc Co., Inc., Guaranteed Notes, 8.50%, due 11/1/20 | | | 275 | ØØ |
| | | | 2,557 | |
| Media (1.9%) |
| | 3,300 | | DirecTV Holdings LLC, Guaranteed Notes, 6.00%, due 8/15/40 | | | 3,796 | ØØ |
| | 1,675 | | NBCUniversal Media LLC, Senior Unsecured Notes, 2.88%, due 1/15/23 | | | 1,688 | ØØ |
| | 1,505 | | NBCUniversal Media LLC, Senior Unsecured Notes, 6.40%, due 4/30/40 | | | 1,972 | ØØ |
| | 1,585 | | NBCUniversal Media LLC, Senior Unsecured Notes, 4.45%, due 1/15/43 | | | 1,638 | ØØ |
| | 1,820 | | Time Warner Cable, Inc., Guaranteed Notes, 6.75%, due 7/1/18 | | | 2,304 | ØØ |
| | 2,845 | | Time Warner Cable, Inc., Guaranteed Notes, 8.75%, due 2/14/19 | | | 3,910 | ØØ |
| | 1,815 | | Time Warner Cable, Inc., Guaranteed Notes, 5.50%, due 9/1/41 | | | 2,118 | ØØ |
| | 1,365 | | Time Warner, Inc., Guaranteed Notes, 6.10%, due 7/15/40 | | | 1,741 | ØØ |
| | 815 | | Time Warner, Inc., Guaranteed Notes, 5.38%, due 10/15/41 | | | 957 | ØØ |
| | | | 20,124 | |
| Media - Broadcast (0.3%) |
| | 140 | | AMC Networks, Inc., Guaranteed Notes, 7.75%, due 7/15/21 | | | 159 | ØØ |
| | 1,380 | | Univision Communications, Inc., Senior Secured Notes, 6.88%, due 5/15/19 | | | 1,411 | ñØØ |
| | 1,100 | | XM Satellite Radio, Inc., Guaranteed Notes, 7.63%, due 11/1/18 | | | 1,215 | ñØØ |
| | | | 2,785 | |
| Media - Cable (0.8%) |
| | 1,080 | | CCO Holdings LLC, Guaranteed Notes, 7.25%, due 10/30/17 | | | 1,180 | ØØ |
| | 60 | | CCO Holdings LLC, Guaranteed Notes, 7.00%, due 1/15/19 | | | 65 | ØØ |
| | 585 | | CCO Holdings LLC, Guaranteed Notes, 8.13%, due 4/30/20 | | | 658 | ØØ |
| | 55 | | Cequel Communications Escrow I LLC, Senior Unsecured Notes, 6.38%, due 9/15/20 | | | 56 | ñ |
| | 840 | | Cequel Communications Holdings I LLC, Senior Unsecured Notes, 8.63%, due 11/15/17 | | | 899 | ñØØ |
| | 695 | | CSC Holdings LLC, Senior Unsecured Notes, 7.63%, due 7/15/18 | | | 804 | ØØ |
| | 820 | | CSC Holdings LLC, Senior Unsecured Notes, 6.75%, due 11/15/21 | | | 912 | ñØØ |
| | 270 | | DISH DBS Corp., Guaranteed Notes, 4.63%, due 7/15/17 | | | 278 | |
| | 500 | | DISH DBS Corp., Guaranteed Notes, 7.88%, due 9/1/19 | | | 586 | ØØ |
| | 90 | | DISH DBS Corp., Guaranteed Notes, 6.75%, due 6/1/21 | | | 100 | ØØ |
| | 1,080 | | DISH DBS Corp., Guaranteed Notes, 5.88%, due 7/15/22 | | | 1,134 | |
| | 150 | | EchoStar DBS Corp., Guaranteed Notes, 7.13%, due 2/1/16 | | | 168 | ØØ |
| | 525 | | UPC Holding BV, Secured Notes, 9.88%, due 4/15/18 | | | 589 | ñØØ |
| | 555 | | Videotron Ltee, Guaranteed Notes, 9.13%, due 4/15/18 | | | 599 | ØØ |
| | 530 | | Virgin Media Finance PLC, Guaranteed Notes, 5.25%, due 2/15/22 | | | 554 | ØØ |
| | | | 8,582 | |
| Media - Services (0.2%) |
| | 1,070 | | Clear Channel Worldwide Holdings, Inc., Guaranteed Notes, Ser. B, 9.25%, due 12/15/17 | | | 1,148 | ØØ |
| | 765 | | WMG Acquisition Corp., Senior Secured Notes, 9.50%, due 6/15/16 | | | 842 | |
| | 25 | | WMG Acquisition Corp., Senior Secured Notes, 9.50%, due 6/15/16 | | | 28 | |
| | 100 | | WMG Acquisition Corp., Senior Secured Notes, 6.00%, due 1/15/21 | | | 100 | ñØ |
| | | | 2,118 | |
See Notes to Schedule of Investments
Schedule of Investments Neuberger Berman Strategic Income Fund (cont'd)
| PRINCIPAL AMOUNT | | VALUE† |
| | | | |
| (000's omitted) | | (000's omitted)z |
| | | | |
| Medical Products (0.2%) |
| $ | 300 | | Biomet, Inc., Guaranteed Notes, 6.50%, due 8/1/20 | | $ | 310 | ñ |
| | 395 | | Fresenius Medical Care US Finance, Inc., Guaranteed Notes, 6.50%, due 9/15/18 | | | 442 | ñØØ |
| | 315 | | Fresenius Medical Care US Finance, Inc., Guaranteed Notes, 5.63%, due 7/31/19 | | | 331 | ñØØ |
| | 110 | | Fresenius Medical Care US Finance, Inc., Guaranteed Notes, 5.88%, due 1/31/22 | | | 117 | ñØØ |
| | 350 | | Hologic, Inc., Guaranteed Notes, 6.25%, due 8/1/20 | | | 371 | ñØØ |
| | 485 | | LVB Acquisition, Inc., Guaranteed Notes, 10.00%, due 10/15/17 | | | 512 | ØØ |
| | | | 2,083 | |
| Metals - Mining Excluding Steel (0.2%) |
| | 320 | | FMG Resources (August 2006) Pty Ltd., Guaranteed Notes, 7.00%, due 11/1/15 | | | 323 | ñØØ |
| | 565 | | FMG Resources (August 2006) Pty Ltd., Senior Unsecured Notes, 6.00%, due 4/1/17 | | | 543 | ñØØ |
| | 400 | | Peabody Energy Corp., Guaranteed Notes, 7.38%, due 11/1/16 | | | 458 | ØØ |
| | 780 | | Peabody Energy Corp., Guaranteed Notes, 6.00%, due 11/15/18 | | | 809 | |
| | | | 2,133 | |
| Mining (0.8%) |
| | 4,070 | | Freeport-McMoRan Copper & Gold, Inc., Senior Unsecured Notes, 3.55%, due 3/1/22 | | | 4,144 | ØØ |
| | 2,640 | | Rio Tinto Finance USA PLC, Guaranteed Notes, 1.63%, due 8/21/17 | | | 2,652 | ØØ |
| | 1,930 | | Vale Overseas Ltd., Guaranteed Notes, 4.38%, due 1/11/22 | | | 2,055 | ØØ |
| | | | 8,851 | |
| Miscellaneous Manufacturers (0.8%) |
| | 1,695 | | General Electric Co., Senior Unsecured Notes, 2.70%, due 10/9/22 | | | 1,704 | |
| | 1,600 | | General Electric Co., Senior Unsecured Notes, 4.13%, due 10/9/42 | | | 1,677 | |
| | 5,120 | | Smiths Group PLC, Guaranteed Notes, 3.63%, due 10/12/22 | | | 5,222 | ñ |
| | | | 8,603 | |
| Office - Business Equipment (0.4%) |
| | 4,065 | | Xerox Corp., Senior Unsecured Notes, 4.50%, due 5/15/21 | | | 4,299 | ØØ |
| | | | | | | | |
| Oil & Gas (0.7%) |
| | 5,110 | | Anadarko Petroleum Corp., Senior Unsecured Notes, 5.95%, due 9/15/16 | | | 5,936 | ØØ |
| | 270 | | Pemex Project Funding Master Trust, Guaranteed Notes, 5.75%, due 3/1/18 | | | 314 | |
| | 600 | | Pemex Project Funding Master Trust, Guaranteed Notes, 6.63%, due 6/15/38 | | | 750 | |
| | | | 7,000 | |
| Oil, Gas & Consumable Fuels (0.5%) |
| | 4,845 | | Encana Corp., Senior Unsecured Notes, 3.90%, due 11/15/21 | | | 5,225 | ØØ |
| | | | | | | | |
| Packaging (0.4%) |
| | 570 | | Crown Americas LLC, Guaranteed Notes, 7.63%, due 5/15/17 | | | 606 | ØØ |
| | 580 | | Owens-Brockway Glass Container, Inc., Guaranteed Notes, 7.38%, due 5/15/16 | | | 664 | ØØ |
| | 475 | | Reynolds Group Issuer, Inc., Senior Secured Notes, 7.13%, due 4/15/19 | | | 506 | ØØ |
| | 225 | | Reynolds Group Issuer, Inc., Senior Secured Notes, 7.88%, due 8/15/19 | | | 244 | ØØ |
| | 1,439 | | Reynolds Group Issuer, Inc., Senior Secured Notes, 5.75%, due 10/15/20 | | | 1,453 | ñØØ |
| | 450 | | Reynolds Group Issuer, Inc., Senior Secured Notes, 6.88%, due 2/15/21 | | | 478 | ØØ |
| | | | 3,951 | |
See Notes to Schedule of Investments
Schedule of Investments Neuberger Berman Strategic Income Fund (cont'd)
| PRINCIPAL AMOUNT | | VALUE† |
| | | | |
| (000's omitted) | | (000's omitted)z |
| | | | |
| Pharmaceuticals (0.8%) |
| $ | 665 | | Endo Pharmaceuticals Holdings, Inc., Guaranteed Notes, 7.00%, due 7/15/19 | | $ | 718 | ØØ |
| | 4,165 | | Express Scripts Holding, Co., Guaranteed Notes, 2.65%, due 2/15/17 | | | 4,348 | ñØØ |
| | 280 | | Jaguar Holding Co., Senior Unsecured Notes, 9.50%, due 12/1/19 | | | 313 | ñØØ |
| | 380 | | Mylan, Inc., Guaranteed Notes, 7.63%, due 7/15/17 | | | 424 | ñØØ |
| | 405 | | Mylan, Inc., Guaranteed Notes, 7.88%, due 7/15/20 | | | 457 | ñØØ |
| | 355 | | Valeant Pharmaceuticals Int'l, Guaranteed Notes, 6.50%, due 7/15/16 | | | 374 | ñØØ |
| | 295 | | Valeant Pharmaceuticals Int'l, Guaranteed Notes, 6.75%, due 10/1/17 | | | 316 | ñØØ |
| | 195 | | Valeant Pharmaceuticals Int'l, Guaranteed Notes, 6.88%, due 12/1/18 | | | 208 | ñØØ |
| | 105 | | Valeant Pharmaceuticals Int'l, Senior Notes, 6.38%, due 10/15/20 | | | 110 | ñØØ |
| | 720 | | VPI Escrow Corp., Guaranteed Notes, 6.38%, due 10/15/20 | | | 758 | ñØØ |
| | | | 8,026 | |
| Pipelines (0.2%) |
| | 1,640 | | Kinder Morgan Energy Partners L.P., Senior Unsecured Notes, 6.50%, due 9/1/39 | | | 2,092 | ØØ |
| | | | | | | | |
| Printing & Publishing (0.4%) |
| | 670 | | Gannett Co., Inc., Guaranteed Notes, 9.38%, due 11/15/17 | | | 746 | ØØ |
| | 1,020 | | Gannett Co., Inc., Guaranteed Notes, 7.13%, due 9/1/18 | | | 1,113 | ØØ |
| | 165 | | R.R. Donnelley & Sons Co., Senior Unsecured Notes, 8.60%, due 8/15/16 | | | 180 | ØØ |
| | 1,400 | | R.R. Donnelley & Sons Co., Senior Unsecured Notes, 7.25%, due 5/15/18 | | | 1,391 | ØØ |
| | 675 | | R.R. Donnelley & Sons Co., Senior Unsecured Notes, 8.25%, due 3/15/19 | | | 695 | ØØ |
| | | | 4,125 | |
| Real Estate (0.5%) |
| | 5,420 | | WEA Finance LLC/WT Finance Aust Pty. Ltd., Guaranteed Notes, 3.38%, due 10/3/22 | | | 5,493 | ñØØ |
| | | | | | | | |
| Real Estate Investment Trusts (0.7%) |
| | 4,315 | | Entertainment Properties Trust, Guaranteed Notes, 5.75%, due 8/15/22 | | | 4,522 | ØØ |
| | 2,300 | | Ventas Realty LP/Ventas Capital Corp., Guaranteed Notes, 4.00%, due 4/30/19 | | | 2,484 | ØØ |
| | | | 7,006 | |
| Retail (0.4%) |
| | 3,655 | | Walgreen Co., Senior Unsecured Notes, 3.10%, due 9/15/22 | | | 3,722 | ØØ |
| | | | | | | | |
| Software - Services (0.2%) |
| | 225 | | Fidelity National Information Services, Inc., Guaranteed Notes, 7.63%, due 7/15/17 | | | 246 | ØØ |
| | 160 | | Fidelity National Information Services, Inc., Guaranteed Notes, 7.88%, due 7/15/20 | | | 179 | ØØ |
| | 1,240 | | First Data Corp., Senior Secured Notes, 7.38%, due 6/15/19 | | | 1,283 | ñØØ |
| | 780 | | First Data Corp., Senior Secured Notes, 6.75%, due 11/1/20 | | | 780 | ñØØ |
| | | | 2,488 | |
| Specialty Retail (0.2%) |
| | 840 | | Sally Holdings LLC, Guaranteed Notes, 5.75%, due 6/1/22 | | | 898 | ØØ |
| | 760 | | Toys "R" Us Property Co. I LLC, Guaranteed Notes, 10.75%, due 7/15/17 | | | 822 | ØØ |
| | 450 | | Toys "R" Us Property Co. II LLC, Senior Secured Notes, 8.50%, due 12/1/17 | | | 483 | ØØ |
| | | | 2,203 | |
See Notes to Schedule of Investments
Schedule of Investments Neuberger Berman Strategic Income Fund (cont'd)
| PRINCIPAL AMOUNT | | VALUE† |
| | | | |
| (000's omitted) | | (000's omitted)z |
| | | | |
| Steel Producers - Products (0.4%) |
| $ | 110 | | ArcelorMittal, Senior Unsecured Notes, 4.75%, due 2/25/17 | | $ | 108 | ØØ |
| | 2,940 | | ArcelorMittal, Senior Unsecured Notes, 6.13%, due 6/1/18 | | | 2,930 | ØØ |
| | 325 | | ArcelorMittal, Senior Unsecured Notes, 5.50%, due 8/5/20 | | | 314 | ØØ |
| | 310 | | ArcelorMittal, Senior Unsecured Notes, 5.75%, due 3/1/21 | | | 299 | |
| | 140 | | ArcelorMittal, Senior Unsecured Notes, 6.50%, due 2/25/22 | | | 138 | ØØ |
| | 540 | | Steel Dynamics, Inc., Guaranteed Notes, 6.13%, due 8/15/19 | | | 564 | ñØØ |
| | | | 4,353 | |
| Support - Services (0.2%) |
| | 145 | | HDTFS, Inc., Guaranteed Notes, 5.88%, due 10/15/20 | | | 146 | ñ |
| | 615 | | Iron Mountain, Inc., Guaranteed Notes, 7.75%, due 10/1/19 | | | 693 | ØØ |
| | 265 | | Knowledge Learning Corp., Guaranteed Notes, 7.75%, due 2/1/15 | | | 233 | ñØØ |
| | 295 | | United Rentals NA, Inc., Guaranteed Notes, 10.88%, due 6/15/16 | | | 329 | ØØ |
| | 340 | | UR Financing Escrow Corp., Secured Notes, 5.75%, due 7/15/18 | | | 366 | ñØØ |
| | | | 1,767 | |
| Telecom - Integrated Services (1.4%) |
| | 560 | | CenturyLink, Inc., Senior Unsecured Notes, Ser. T, 5.80%, due 3/15/22 | | | 589 | ØØ |
| | 175 | | Citizens Communications Co., Senior Unsecured Notes, 6.25%, due 1/15/13 | | | 176 | ØØ |
| | 35 | | Citizens Communications Co., Senior Unsecured Notes, 9.00%, due 8/15/31 | | | 37 | ØØ |
| | 135 | | Frontier Communications Corp., Senior Unsecured Notes, 7.88%, due 4/15/15 | | | 151 | ØØ |
| | 595 | | Frontier Communications Corp., Senior Unsecured Notes, 8.25%, due 4/15/17 | | | 686 | ØØ |
| | 490 | | Intelsat Jackson Holdings SA, Guaranteed Notes, 8.50%, due 11/1/19 | | | 550 | ØØ |
| | 153 | | PAETEC Holding Corp., Senior Secured Notes, 8.88%, due 6/30/17 | | | 165 | ØØ |
| | 260 | | Qwest Capital Funding, Inc., Guaranteed Notes, 6.88%, due 7/15/28 | | | 267 | ØØ |
| | 1,345 | | Qwest Communications Int'l, Inc., Guaranteed Notes, 7.13%, due 4/1/18 | | | 1,421 | ØØ |
| | 6,050 | | Qwest Corp., Senior Unsecured Notes, 6.75%, due 12/1/21 | | | 7,236 | ØØ |
| | 850 | | tw telecom holdings, Inc., Guaranteed Notes, 5.38%, due 10/1/22 | | | 873 | ñØØ |
| | 330 | | U.S. West Communications Group, Senior Unsecured Notes, 6.88%, due 9/15/33 | | | 332 | ØØ |
| | 125 | | Windstream Corp., Guaranteed Notes, 8.13%, due 8/1/13 | | | 131 | ØØ |
| | 1,205 | | Windstream Corp., Guaranteed Notes, 7.75%, due 10/15/20 | | | 1,298 | ØØ |
| | 600 | | Windstream Corp., Guaranteed Notes, 7.75%, due 10/1/21 | | | 649 | ØØ |
| | 300 | | Windstream Corp., Guaranteed Notes, 7.50%, due 6/1/22 | | | 318 | ØØ |
| | | | 14,879 | |
| Telecom - Wireless (0.4%) |
| | 165 | | SBA Telecommunications, Inc., Guaranteed Notes, 5.75%, due 7/15/20 | | | 171 | ñØØ |
| | 945 | | Sprint Capital Corp., Guaranteed Notes, 6.90%, due 5/1/19 | | | 1,028 | ØØ |
| | 385 | | Sprint Capital Corp., Guaranteed Notes, 6.88%, due 11/15/28 | | | 394 | ØØ |
| | 960 | | Sprint Nextel Corp., Senior Unsecured Notes, 6.00%, due 12/1/16 | | | 1,032 | ØØ |
| | 580 | | Sprint Nextel Corp., Guaranteed Notes, 7.00%, due 3/1/20 | | | 673 | ñØØ |
| | 945 | | Telesat Canada/Telesat LLC, Senior Unsecured Notes, 6.00%, due 5/15/17 | | | 985 | ñ |
| | | | 4,283 | |
| Telecommunications (1.0%) |
| | 4,830 | | SK Telecom Co. Ltd., Senior Unsecured Notes, 2.13%, due 5/1/18 | | | 4,820 | ñØ |
| | 5,055 | | Telefonaktiebolaget LM Ericsson, Senior Unsecured Notes, 4.13%, due 5/15/22 | | | 5,307 | ØØ |
| | | | 10,127 | |
See Notes to Schedule of Investments
Schedule of Investments Neuberger Berman Strategic Income Fund (cont'd)
| PRINCIPAL AMOUNT | | VALUE† |
| | | | |
| (000's omitted) | | (000's omitted)z |
| | | | |
| Transportation (0.1%) |
| $ | 1,390 | | CSX Corp., Senior Unsecured Notes, 4.10%, due 3/15/44 | | $ | 1,409 | ØØ |
| | | | | | | | |
| | | | Total Corporate Debt Securities (Cost $366,519) | | | 385,052 | |
| | | | | | | | |
| Asset-Backed Securities (6.2%) |
| | 2,980 | | Accredited Mortgage Loan Trust, Ser. 2005-3, Class M1, 0.66%, due 9/25/35 | | | 2,336 | µ |
| | 3,480 | | Accredited Mortgage Loan Trust, Ser. 2005-4, Class A2D, 0.53%, due 12/25/35 | | | 3,167 | µ |
| | 1,894 | | ACE Securities Corp., Ser. 2007-ASP2, Class A2D, 0.49%, due 6/25/37 | | | 1,084 | µØØ |
| | 4,750 | | Aegis Asset Backed Securities Trust, Ser. 2005-1, Class M3, 0.76%, due 3/25/35 | | | 3,602 | µ |
| | 1,131 | | Asset Backed Securities Corp. Home Equity, Ser. 2004-HE5, Class M2, 2.09%, due 8/25/34 | | | 840 | µ |
| | 3,521 | | Asset Backed Securities Corp. Home Equity, Ser. 2006-HE1, Class A3, 0.41%, due 1/25/36 | | | 3,143 | µ |
| | 1,320 | | Bear Stearns Asset Backed Securities Trust, Ser. 2006-HE1, Class 2M1, 0.62%, due 2/25/36 | | | 1,032 | µ |
| | 3,958 | | Carrington Mortgage Loan Trust, Ser. 2005-NC3, Class M2, 0.67%, due 6/25/35 | | | 2,866 | µ |
| | 6,000 | | Carrington Mortgage Loan Trust, Ser. 2006-RFC1, Class A3, 0.36%, due 5/25/36 | | | 4,894 | µ |
| | 3,312 | | Carrington Mortgage Loan Trust, Ser. 2006-NC4, Class A5, 0.27%, due 10/25/36 | | | 2,350 | µ |
| | 2,500 | | Citigroup Mortgage Loan Trust, Inc., Ser. 2005-HE2, Class M1, 0.96%, due 5/25/35 | | | 1,993 | ñµ |
| | 1,101 | | Citigroup Mortgage Loan Trust, Inc., Ser. 2006-AMC1, Class A2B, 0.37%, due 9/25/36 | | | 530 | µ |
| | 2,110 | | Credit-Based Asset Servicing and Securitization, Ser. 2006-CB3, Class AV3, 0.38%, due 3/25/36 | | | 1,384 | µ |
| | 1,905 | | First Franklin Mortgage Loan Asset Backed Certificates, Ser. 2004-FFH4, Class M5, 1.79%, due 1/25/35 | | | 1,637 | µ |
| | 3,300 | | First Franklin Mortgage Loan Asset Backed Certificates, Ser. 2005-FF5, Class M2, 0.70%, due 3/25/35 | | | 2,711 | µ |
| | 1,116 | | Fremont Home Loan Trust, Ser. 2004-2, Class M2, 1.14%, due 7/25/34 | | | 985 | µ |
| | 7,843 | | Morgan Stanley Home Equity Loan Trust, Ser. 2006-2, Class A4, 0.49%, due 2/25/36 | | | 5,077 | µ |
| | 602 | | Morgan Stanley Home Equity Loan Trust, Ser. 2006-3, Class A3, 0.37%, due 4/25/36 | | | 373 | µ |
| | 3,190 | | Nationstar Home Equity Loan Trust, Ser. 2007-A, Class AV3, 0.36%, due 3/25/37 | | | 2,850 | µ |
| | 3,692 | | New Century Home Equity Loan Trust, Ser. 2004-3, Class M2, 1.19%, due 11/25/34 | | | 3,375 | µ |
| | 3,500 | | Newcastle Mortgage Securities Trust, Ser. 2006-1, Class A4, 0.49%, due 3/25/36 | | | 3,088 | µØØ |
| | 2,170 | | Park Place Securities, Inc., Ser. 2004-WHQ2, Class M3, 0.90%, due 2/25/35 | | | 1,656 | µ |
| | 1,334 | | Residential Asset Mortgage Products, Inc., Ser. 2003-RS2, Class AII, 0.89%, due 3/25/33 | | | 1,118 | µ |
| | 1,886 | | Residential Asset Mortgage Products, Inc., Ser. 2006-RS1, Class AI2, 0.44%, due 1/25/36 | | | 1,677 | µ |
| | 1,397 | | Saxon Asset Securities Trust, Ser. 2004-2, Class MV1, 1.08%, due 8/25/35 | | | 1,037 | µ |
| | 1,240 | | Soundview Home Equity Loan Trust, Ser. 2006-3, Class A3, 0.37%, due 11/25/36 | | | 855 | µ |
| | 3,490 | | Structured Asset Investment Loan Trust, Ser. 2004-8, Class M1, 1.11%, due 9/25/34 | | | 2,584 | µ |
| | 4,255 | | Structured Asset Securities Corp., Ser. 2005-NC2, Class M3, 0.64%, due 5/25/35 | | | 3,296 | µ |
| | 1,905 | | Structured Asset Securities Corp., Ser. 2006-NC1, Class A4, 0.36%, due 5/25/36 | | | 1,592 | µØØ |
| | 2,157 | | Wells Fargo Home Equity Trust, Ser. 2006-3, Class A2, 0.36%, due 1/25/37 | | | 1,801 | µØØ |
| | | | | | | | |
| | | | Total Asset-Backed Securities (Cost $56,421) | | | 64,933 | |
| | | | | | | | |
| Government Securities (4.7%) |
| |
| Quasi - Sovereign (1.1%) |
| | 1,200 | | Banco Nacional de Desenvolvimento Economico e Social, Senior Unsecured Notes, 5.50%, due 7/12/20 | | | 1,437 | |
| | 760 | | Bank of China Hong Kong, Subordinated Notes, 5.55%, due 2/11/20 | | | 866 | |
| | 200 | | Empresa Nacional del Petroleo, Senior Unsecured Notes, 5.25%, due 8/10/20 | | | 224 | |
| | 600 | | Export Credit Bank of Turkey, Senior Unsecured Notes, 5.88%, due 4/24/19 | | | 656 | |
| | 500 | | Intergas Finance BV, Senior Unsecured Notes, 6.38%, due 5/14/17 | | | 569 | |
| | 150 | | KazMunayGaz National Co., Senior Unsecured Global Medium-Term Notes, Ser. 2, 9.13%, due 7/2/18 | | | 196 | |
| | 250 | | KazMunayGaz National Co., Senior Unsecured Notes, 11.75%, due 1/23/15 | | | 300 | |
| | 250 | | KazMunayGaz National Co., Senior Unsecured Notes, 6.38%, due 4/9/21 | | | 295 | |
| | 200 | | Majapahit Holding BV, Senior Unsecured Notes, 7.25%, due 6/28/17 | | | 238 | |
| | 550 | | Majapahit Holding BV, Senior Unsecured Notes, 7.75%, due 1/20/20 | | | 692 | |
| | 370 | | Majapahit Holding BV, Senior Unsecured Notes, 7.88%, due 6/29/37 | | | 507 | |
| | 1,300 | | Nak Naftogaz Ukraine, Unsecured Notes, 9.50%, due 9/30/14 | | | 1,324 | |
See Notes to Schedule of Investments
Schedule of Investments Neuberger Berman Strategic Income Fund (cont'd)
| PRINCIPAL AMOUNT | | VALUE† |
| | | | |
| (000's omitted) | | (000's omitted)z |
| | | | |
| $ | 330 | | Pemex Project Funding Master Trust, Guaranteed Notes, 6.63%, due 6/15/35 | | $ | 412 | |
| | 1,280 | | Petroleos de Venezuela SA, Senior Unsecured Notes, 5.25%, due 4/12/17 | | | 1,011 | |
| | 850 | | Petroleos de Venezuela SA, Senior Unsecured Notes, 12.75%, due 2/17/22 | | | 873 | |
| | 750 | | Power Sector Assets & Liabilities Management Corp., Senior Unsecured Notes, 6.88%, due 11/2/16 | | | 887 | |
| | 600 | | Russian Agricultural Bank OJSC Via RSHB Capital SA, Senior Unsecured Medium-Term Notes, 6.30%, due 5/15/17 | | | 665 | |
| | 100 | | Russian Agricultural Bank OJSC Via RSHB Capital SA, Senior Unsecured Notes, 7.13%, due 1/14/14 | | | 106 | |
| | 200 | | Russian Agricultural Bank OJSC Via RSHB Capital SA, Senior Unsecured Notes, 7.75%, due 5/29/18 | | | 238 | |
| | 400 | | Russian Agricultural Bank OJSC Via RSHB Capital SA, Subordinated Notes, 6.00%, due 6/3/21 | | | 418 | |
| | | | 11,914 | |
| Sovereign (3.6%) |
| | 100 | | Arab Republic of Egypt, Senior Unsecured Notes, 6.88%, due 4/30/40 | | | 100 | |
| AUD | 6,025 | | Australian Government Bond, Senior Unsecured Notes, 5.25%, due 3/15/19 | | | 7,145 | a |
| CAD | 5,090 | | Canadian Government Bond, Unsecured Notes, 1.50%, due 3/1/17 | | | 5,136 | a |
| | 200 | | Dominican Republic, Senior Unsecured Notes, 7.50%, due 5/6/21 | | | 235 | |
| | 100 | | Federative Republic of Brazil, Senior Unsecured Notes, 7.88%, due 3/7/15 | | | 117 | |
| | 150 | | Federative Republic of Brazil, Senior Unsecured Notes, 5.63%, due 1/7/41 | | | 192 | |
| | 100 | | Gabonese Republic, Bonds, 8.20%, due 12/12/17 | | | 121 | |
| | 180 | | Ivory Coast Government International Bond, Senior Unsecured Notes, 3.75%, due 12/31/32 | | | 162 | |
| JPY | 138,180 | | Japanese Government Cpi Linked Bond, Senior Unsecured Notes, 1.40%, due 6/10/18 | | | 1,914 | a |
| | 430 | | Lebanese Republic, Unsubordinated Global Medium-Term Notes, 6.38%, due 3/9/20 | | | 447 | |
| | 100 | | Lithuania Government International Bond, Senior Unsecured Notes, 5.13%, due 9/14/17 | | | 112 | |
| NZD | 5,890 | | New Zealand Government Bond, Senior Unsecured Notes, 6.00%, due 12/15/17 | | | 5,573 | a |
| NZD | 1,760 | | New Zealand Government Bond, Senior Unsecured Notes, 5.50%, due 4/15/23 | | | 1,698 | a |
| | 260 | | Republic of Argentina, Senior Unsecured Notes, 8.75%, due 6/2/17 | | | 221 | |
| | 1,053 | | Republic of Argentina, Senior Unsecured Notes, 8.28%, due 12/31/33 | | | 685 | |
| | 800 | | Republic of Argentina, Senior Unsecured Notes, 2.50%, due 12/31/38 | | | 260 | |
| | 280 | | Republic of Bulgaria, Senior Unsecured Notes, 8.25%, due 1/15/15 | | | 322 | |
| | 150 | | Republic of Colombia, Senior Unsecured Notes, 8.25%, due 12/22/14 | | | 173 | |
| | 50 | | Republic of Colombia, Senior Unsecured Notes, 8.13%, due 5/21/24 | | | 75 | |
| | 100 | | Republic of Colombia, Senior Unsecured Notes, 6.13%, due 1/18/41 | | | 137 | |
| | 530 | | Republic of Croatia, Senior Unsecured Notes, 6.75%, due 11/5/19 | | | 608 | |
| | 250 | | Republic of El Salvador, Senior Unsecured Notes, 7.38%, due 12/1/19 | | | 294 | |
| | 200 | | Republic of El Salvador, Senior Unsecured Notes, 7.65%, due 6/15/35 | | | 232 | |
| | 100 | | Republic of Ghana, Senior Unsecured Notes, 8.50%, due 10/4/17 | | | 116 | |
| | 1,110 | | Republic of Hungary, Senior Unsecured Notes, 6.25%, due 1/29/20 | | | 1,230 | |
| | 350 | | Republic of Hungary, Senior Unsecured Notes, 7.63%, due 3/29/41 | | | 416 | |
| | 550 | | Republic of Lithuania, Senior Unsecured Notes, 7.38%, due 2/11/20 | | | 698 | |
| | 400 | | Republic of Panama, Senior Unsecured Notes, 5.20%, due 1/30/20 | | | 484 | |
| | 380 | | Republic of Panama, Senior Unsecured Notes, 7.13%, due 1/29/26 | | | 545 | |
| | 200 | | Republic of Panama, Senior Unsecured Notes, 6.70%, due 1/26/36 | | | 285 | |
| | 310 | | Republic of Peru, Senior Unsecured Notes, 8.38%, due 5/3/16 | | | 384 | |
| | 300 | | Republic of Philippines, Senior Unsecured Notes, 8.38%, due 6/17/19 | | | 414 | |
| | 170 | | Republic of Philippines, Senior Unsecured Notes, 6.38%, due 10/23/34 | | | 236 | |
| | 100 | | Republic of Poland, Senior Unsecured Notes, 5.25%, due 1/15/14 | | | 105 | |
| | 500 | | Republic of Poland, Senior Unsecured Notes, 6.38%, due 7/15/19 | | | 622 | |
| | 300 | | Republic of Poland, Senior Unsecured Notes, 5.13%, due 4/21/21 | | | 353 | |
| | 400 | | Republic of Sri Lanka, Senior Unsecured Notes, 6.25%, due 10/4/20 | | | 448 | |
| | 200 | | Republic of Turkey, Senior Unsecured Notes, 9.50%, due 1/15/14 | | | 218 | |
| | 400 | | Republic of Turkey, Senior Unsecured Notes, 7.00%, due 6/5/20 | | | 499 | |
| | 380 | | Republic of Turkey, Senior Unsecured Notes, 7.38%, due 2/5/25 | | | 497 | |
| | 220 | | Republic of Turkey, Senior Unsecured Notes, 6.88%, due 3/17/36 | | | 283 | |
| | 170 | | Republic of Turkey, Senior Unsecured Notes, 7.25%, due 3/5/38 | | | 230 | |
See Notes to Schedule of Investments
Schedule of Investments Neuberger Berman Strategic Income Fund (cont'd)
| PRINCIPAL AMOUNT | | VALUE† |
| | | | |
| (000's omitted) | (000's omitted)z |
| | | | |
| $ | 160 | | Republic of Uruguay, Unsecured Notes, 8.00%, due 11/18/22 | | $ | 231 | |
| | 450 | | Republic of Venezuela, Senior Unsecured Notes, 9.38%, due 1/13/34 | | | 399 | |
| | 200 | | Russian Federation Bond, Senior Unsecured Notes, 5.00%, due 4/29/20 | | | 232 | |
| | 283 | | Russian Federation Bond, Senior Unsecured Notes, 7.50%, due 3/31/30 | | | 358 | |
| | 4 | | Russian Federation Bond, Senior Unsecured Notes, 7.50%, due 3/31/30 | | | 5 | |
| | 450 | | Socialist Republic of Vietnam, Bonds, 6.75%, due 1/29/20 | | | 525 | |
| | 1,200 | | Ukraine Government Bond, Senior Unsecured Notes, 6.58%, due 11/21/16 | | | 1,187 | |
| | 400 | | Ukraine Government International Bond, Senior Unsecured Notes, 7.95%, due 2/23/21 | | | 424 | |
| | 200 | | United Mexican States, Senior Unsecured Notes, Ser. A, 5.13%, due 1/15/20 | | | 239 | |
| | | | 37,622 | |
| | Total Government Securities (Cost $47,708) | | | 49,536 | |
| | | | | | | | |
| NUMBER OF SHARES | | |
| | | | |
| Short-Term Investments (6.8%) |
| | 70,874,218 | | State Street Institutional Liquid Reserves Fund Institutional Class (Cost $70,874) | | | 70,874 | ØØ |
| | | | | | | | |
| | Total Investments (124.4%) (Cost $1,253,514) | | | 1,302,495 | ## |
| | | | | | | | |
| | Liabilities, less cash, receivables and other assets [(24.4%)] | | | (255,773 | )± |
| | | | | | | | |
| | Total Net Assets (100.0%) | | $ | 1,046,722 | |
See Notes to Schedule of Investments
Notes to Schedule of Investments
| † | In accordance with Accounting Standards Codification ("ASC") 820 "Fair Value Measurements and Disclosures" ("ASC 820"), all investments held by each of Neuberger Berman Core Bond Fund ("Core Bond"), Neuberger Berman Floating Rate Income Fund ("Floating Rate Income"), Neuberger Berman High Income Bond Fund ("High Income"), Neuberger Berman Municipal Intermediate Bond Fund ("Municipal Intermediate Bond"), Neuberger Berman Short Duration Bond Fund ("Short Duration"), Neuberger Berman Short Duration High Income Fund ("Short Duration High Income") and Neuberger Berman Strategic Income Fund ("Strategic Income") (each individually a "Fund," and collectively, the "Funds") are carried at the value that Neuberger Berman Management LLC ("Management") believes a fund would receive upon selling an investment in an orderly transaction to an independent buyer in the principal or most advantageous market for the investment under current market conditions. Various inputs, including the volume and level of activity for the asset or liability in the market, are considered in valuing the Funds' investments, some of which are discussed below. Significant management judgment may be necessary to value investments in accordance with ASC 820. |
| | |
| | ASC 820 established a three-tier hierarchy of inputs to create a classification of value measurements for disclosure purposes. The three-tier hierarchy of inputs is summarized in the three broad Levels listed below. |
| | |
| | ● | Level 1 – quoted prices in active markets for identical investments |
| | | |
| | ● | Level 2 – other significant observable inputs (including quoted prices for similar investments, interest rates, prepayment speeds, credit risk, amortized cost, etc.) |
| | | |
| | ● | Level 3 – significant unobservable inputs (including a Fund's own assumptions in determining the fair value of investments) |
| | |
| | The inputs or methodology used for valuing an investment are not necessarily an indication of the risk associated with investing in those securities. |
| | |
| | The value of the Funds' investments in debt securities is determined by Management primarily by obtaining valuations from independent pricing services based on readily available bid quotations, or if quotations are not available, by methods which include various considerations based on security type (generally Level 2 inputs). In addition to the consideration of yields or prices of securities of comparable quality, coupon, maturity and type; indications as to values from dealers; and general market conditions, the following is a description of other Level 2 inputs and related valuation techniques used by an independent pricing service to value certain types of debt securities of the Funds: |
| | | |
| | | Corporate Debt Securities. Inputs used to value corporate debt securities generally include relative credit information, observed market movements, sector news, spread to the U.S. Treasury market, and other market information which may include benchmark yields, reported trades, broker-dealer quotes, issuer spreads, benchmark securities, bids, offers, and reference data, such as market research publications, when available ("Other Market Information"). |
| | | |
| | | U.S. Treasury Securities. Inputs used to value U.S. Treasury securities generally include quotes from several inter-dealer brokers and Other Market Information. |
| | | |
| | | Asset-Backed Securities and Mortgage-Backed Securities. Inputs used to value asset-backed securities and mortgage-backed securities generally include models that consider a number of factors, which may include the following: prepayment speeds, cash flows, spread adjustments and Other Market Information. |
| | | |
| | | High Yield Securities. Inputs used to value high yield securities generally include a number of observations of equity and credit default swap curves related to the issuer and Other Market Information. |
| | | |
| | | Municipal Debt Securities. Inputs used to value municipal debt securities include current trades, bid-wanted lists (which informs the market that a holder is interested in selling a position and that offers will be |
See Notes to Financial Statements
Notes to Schedule of Investments (cont'd)
| | | considered), offerings, general information on market movement, direction, trends, and specific data on specialty issues. |
| | | |
| | | Emerging Markets Debt, Sovereign Debt and Quasi-Sovereign Debt. Inputs used to value emerging markets debt, sovereign debt and quasi-sovereign debt generally include dealer quotes, bond market activity, discounted cash flow models, and other relevant information such as credit spreads, benchmark curves and Other Market Information. |
| | | |
| | The value of bank loan securities is determined by obtaining broker quotes from independent pricing services (generally Level 2 or Level 3 inputs depending on the number of quotes available). |
| | |
| | The value of financial futures contracts is determined by obtaining valuations from independent pricing services at the settlement price at the market close (Level 1 inputs). |
| | |
| | Management has developed a process to periodically review information provided by independent pricing services for all types of securities. |
| | |
| | Investments in State Street Institutional Government Money Market Fund Institutional Class and State Street Institutional Liquid Reserves Fund Institutional Class are valued using the respective fund's daily calculated net asset value per share (Level 2 inputs). |
| | |
| | If a valuation is not available from an independent pricing service, or if Management has reason to believe that the valuation received does not represent the amount a Fund might reasonably expect to receive on a current sale in an orderly transaction, the applicable Fund seeks to obtain quotations from principal market makers (generally considered Level 3 inputs). If such quotations are not readily available, the security is valued using methods the Neuberger Berman Income Funds' Board of Trustees (the "Board") has approved on the belief that they reflect fair value. Numerous factors may be considered when determining the fair value of a security based on Level 2 or 3 inputs, including available analyst, media or other reports, trading in futures or ADRs and whether the issuer of the security being fair valued has other securities outstanding. |
| | |
| | Fair value prices are necessarily estimates, and there is no assurance that such a price will be at or close to the price at which the security is next quoted or next trades. |
| | |
| | The following is a summary, categorized by Level, of inputs used to value the Funds' investments as of October 31, 2012: |
Asset Valuation Inputs (000's omitted) | | Level 1 | | Level 2 | | Level 3§ | | Total |
| | | | | | | | | |
| Core Bond |
| Investments: |
U.S. Treasury Securities-Backed by the Full Faith and Credit of the U.S. Government | | | $— | | | | $126,440 | | | | $— | | | | $126,440 | |
| Mortgage-Backed Securities^ | | | — | | | | 133,517 | | | | — | | | | 133,517 | |
| Corporate Debt Securities |
| Aerospace & Defense | | | — | | | | 984 | | | | — | | | | 984 | |
| Agriculture | | | — | | | | 2,865 | | | | — | | | | 2,865 | |
| Airlines | | | — | | | | — | | | | 655 | | | | 655 | |
| Banks | | | — | | | | 10,845 | | | | — | | | | 10,845 | |
| Beverages | | | — | | | | 5,791 | | | | — | | | | 5,791 | |
| Biotechnology | | | — | | | | 589 | | | | — | | | | 589 | |
See Notes to Financial Statements
Notes to Schedule of Investments (cont'd)
Asset Valuation Inputs (000's omitted) | | Level 1 | | Level 2 | | Level 3§ | | Total |
| Commercial Services | | | $— | | | | $1,414 | | | | $— | | | | $1,414 | |
| Computers | | | — | | | | 935 | | | | — | | | | 935 | |
| Diversified Financial Services | | | — | | | | 7,908 | | | | — | | | | 7,908 | |
| Electric | | | — | | | | 6,977 | | | | — | | | | 6,977 | |
| Electronics | | | — | | | | 708 | | | | — | | | | 708 | |
| Food | | | — | | | | 788 | | | | — | | | | 788 | |
| Healthcare—Services | | | — | | | | 915 | | | | — | | | | 915 | |
| Insurance | | | — | | | | 1,452 | | | | — | | | | 1,452 | |
| Iron—Steel | | | | | | | 528 | | | | | | | | 528 | |
| Media | | | — | | | | 6,307 | | | | — | | | | 6,307 | |
| Mining | | | — | | | | 2,248 | | | | — | | | | 2,248 | |
| Miscellaneous Manufacturers | | | — | | | | 1,016 | | | | — | | | | 1,016 | |
| Office—Business Equipment | | | — | | | | 508 | | | | — | | | | 508 | |
| Oil & Gas | | | — | | | | 3,313 | | | | — | | | | 3,313 | |
| Pharmaceuticals | | | — | | | | 3,629 | | | | — | | | | 3,629 | |
| Pipelines | | | — | | | | 759 | | | | — | | | | 759 | |
| Retail | | | — | | | | 1,575 | | | | — | | | | 1,575 | |
| Software | | | — | | | | 2,027 | | | | — | | | | 2,027 | |
| Telecommunications | | | — | | | | 5,026 | | | | — | | | | 5,026 | |
| Transportation | | | — | | | | 1,402 | | | | — | | | | 1,402 | |
| Total Corporate Debt Securities | | | — | | | | 70,509 | | | | 655 | | | | 71,164 | |
| Asset-Backed Securities | | | — | | | | 874 | | | | 0 | | | | 874 | |
| Short-Term Investments | | | — | | | | 24,700 | | | | — | | | | 24,700 | |
| Total Investments | | | — | | | | 356,040 | | | | 655 | | | | 356,695 | |
| Floating Rate Income |
| Investments: |
| Bank Loan Obligations |
| Aerospace & Defense | | | — | | | | 2,245 | | | | — | | | | 2,245 | |
| Air Transport | | | — | | | | 1,081 | | | | — | | | | 1,081 | |
| All Telecom | | | — | | | | 14,203 | | | | — | | | | 14,203 | |
| Automotive | | | — | | | | 9,929 | | | | — | | | | 9,929 | |
| Building & Development | | | — | | | | 7,365 | | | | — | | | | 7,365 | |
| Business Equipment & Services | | | — | | | | 21,773 | | | | 2,817 | | | | 24,590 | |
| Cable & Satellite Television | | | — | | | | 6,741 | | | | — | | | | 6,741 | |
| Chemicals & Plastics | | | — | | | | 6,109 | | | | — | | | | 6,109 | |
| Clothing—Textiles | | | — | | | | 1,477 | | | | — | | | | 1,477 | |
| Conglomerates | | | — | | | | 2,096 | | | | — | | | | 2,096 | |
| Containers & Glass Products | | | — | | | | 3,634 | | | | 1,721 | | | | 5,355 | |
| Cosmetics—Toiletries | | | — | | | | 1,480 | | | | — | | | | 1,480 | |
See Notes to Financial Statements
Notes to Schedule of Investments (cont'd)
Asset Valuation Inputs (000's omitted) | | Level 1 | | Level 2 | | Level 3§ | | Total |
| Drugs | | | $— | | | | $3,517 | | | | $— | | | | $3,517 | |
| Ecological Services & Equipment | | | — | | | | 2,148 | | | | — | | | | 2,148 | |
| Electronics—Electrical | | | — | | | | 18,782 | | | | — | | | | 18,782 | |
| Equipment Leasing | | | — | | | | 2,936 | | | | 1,640 | | | | 4,576 | |
| Financial Intermediaries | | | — | | | | 20,729 | | | | 626 | | | | 21,355 | |
| Food & Drug Retailers | | | — | | | | 1,906 | | | | — | | | | 1,906 | |
| Food Products | | | — | | | | 4,480 | | | | — | | | | 4,480 | |
| Food Service | | | — | | | | 4,195 | | | | — | | | | 4,195 | |
| Health Care | | | — | | | | 28,000 | | | | — | | | | 28,000 | |
| Home Furnishings | | | — | | | | 3,469 | | | | — | | | | 3,469 | |
| Industrial Equipment | | | — | | | | 8,118 | | | | — | | | | 8,118 | |
| Insurance | | | — | | | | 567 | | | | — | | | | 567 | |
| Leisure Goods—Activities—Movies | | | — | | | | 4,715 | | | | — | | | | 4,715 | |
| Lodging & Casinos | | | — | | | | 13,231 | | | | — | | | | 13,231 | |
| Nonferrous Metals—Minerals | | | — | | | | 7,494 | | | | — | | | | 7,494 | |
| Oil & Gas | | | — | | | | 10,050 | | | | 294 | | | | 10,344 | |
| Publishing | | | — | | | | 4,195 | | | | — | | | | 4,195 | |
| Radio & Television | | | — | | | | 8,428 | | | | — | | | | 8,428 | |
| Retailers (except food & drug) | | | — | | | | 22,348 | | | | — | | | | 22,348 | |
| Steel | | | — | | | | — | | | | 1,990 | | | | 1,990 | |
| Surface Transport | | | — | | | | 1,265 | | | | — | | | | 1,265 | |
| Utilities | | | — | | | | 5,591 | | | | 1,854 | | | | 7,445 | |
| Total Bank Loan Obligations | | | — | | | | 254,297 | | | | 10,942 | | | | 265,239 | |
| Corporate Debt Securities^ | | | — | | | | 17,262 | | | | — | | | | 17,262 | |
| Short-Term Investments | | | — | | | | 58,250 | | | | — | | | | 58,250 | |
| Total Investments | | | — | | | | 329,809 | | | | 10,942 | | | | 340,751 | |
| High Income |
| Investments: |
| Bank Loan Obligations^ | | | — | | | | 432,125 | | | | — | | | | 432,125 | |
| Corporate Debt Securities |
| Airlines | | | — | | | | 17,333 | | | | 3,904 | | | | 21,237 | |
| Auto Loans | | | — | | | | 17,103 | | | | — | | | | 17,103 | |
| Automakers | | | — | | | | 18,326 | | | | — | | | | 18,326 | |
| Banking | | | — | | | | 55,976 | | | | — | | | | 55,976 | |
| Beverages | | | — | | | | 2,385 | | | | — | | | | 2,385 | |
| Building & Construction | | | — | | | | 27,089 | | | | — | | | | 27,089 | |
| Building Materials | | | — | | | | 40,755 | | | | — | | | | 40,755 | |
| Chemicals | | | — | | | | 101,136 | | | | — | | | | 101,136 | |
| Computer Hardware | | | — | | | | 8,475 | | | | — | | | | 8,475 | |
See Notes to Financial Statements
Notes to Schedule of Investments (cont'd)
Asset Valuation Inputs (000's omitted) | | Level 1 | | Level 2 | | Level 3§ | | Total |
| Consumer—Commercial Lease Financing | | | $— | | | | $132,629 | | | | $— | | | | $132,629 | |
| Consumer Products | | | — | | | | 3,026 | | | | — | | | | 3,026 | |
| Department Stores | | | — | | | | 35,562 | | | | — | | | | 35,562 | |
| Electric—Generation | | | — | | | | 64,089 | | | | — | | | | 64,089 | |
| Electric—Integrated | | | — | | | | 26,417 | | | | — | | | | 26,417 | |
| Electronics | | | — | | | | 68,192 | | | | — | | | | 68,192 | |
| Energy—Exploration & Production | | | — | | | | 343,647 | | | | — | | | | 343,647 | |
| Food & Drug Retailers | | | — | | | | 22,616 | | | | — | | | | 22,616 | |
| Gaming | | | — | | | | 120,326 | | | | — | | | | 120,326 | |
| Gas Distribution | | | — | | | | 148,873 | | | | — | | | | 148,873 | |
| Health Facilities | | | — | | | | 154,896 | | | | — | | | | 154,896 | |
| Hotels | | | — | | | | 15,346 | | | | — | | | | 15,346 | |
| Investments & Misc. Financial Services | | | — | | | | 50,484 | | | | — | | | | 50,484 | |
| Leisure | | | — | | | | 8,026 | | | | — | | | | 8,026 | |
| Machinery | | | — | | | | 45,570 | | | | — | | | | 45,570 | |
| Media—Broadcast | | | — | | | | 80,596 | | | | — | | | | 80,596 | |
| Media—Cable | | | — | | | | 133,688 | | | | — | | | | 133,688 | |
| Media—Services | | | — | | | | 37,742 | | | | — | | | | 37,742 | |
| Medical Products | | | — | | | | 26,546 | | | | — | | | | 26,546 | |
| Metals—Mining Excluding Steel | | | — | | | | 77,366 | | | | — | | | | 77,366 | |
| Packaging | | | — | | | | 148,621 | | | | — | | | | 148,621 | |
| Pharmaceuticals | | | — | | | | 54,669 | | | | — | | | | 54,669 | |
| Printing & Publishing | | | — | | | | 117,187 | | | | — | | | | 117,187 | |
| Real Estate Dev. & Mgt. | | | — | | | | 10,686 | | | | — | | | | 10,686 | |
| Software—Services | | | — | | | | 86,589 | | | | — | | | | 86,589 | |
| Specialty Retail | | | — | | | | 52,351 | | | | — | | | | 52,351 | |
| Steel Producers—Products | | | — | | | | 33,190 | | | | — | | | | 33,190 | |
| Support—Services | | | — | | | | 53,433 | | | | — | | | | 53,433 | |
| Telecom—Integrated Services | | | — | | | | 153,858 | | | | — | | | | 153,858 | |
| Telecom—Wireless | | | — | | | | 94,430 | | | | — | | | | 94,430 | |
| Total Corporate Debt Securities | | | — | | | | 2,689,229 | | | | 3,904 | | | | 2,693,133 | |
| Short-Term Investments | | | — | | | | 137,664 | | | | — | | | | 137,664 | |
| Total Investments | | | — | | | | 3,259,018 | | | | 3,904 | | | | 3,262,922 | |
| Municipal Intermediate Bond |
| Investments: |
| Municipal Debt Securities^ | | | — | | | | 152,981 | | | | — | | | | 152,981 | |
| Total Investments | | | — | | | | 152,981 | | | | — | | | | 152,981 | |
See Notes to Financial Statements
Notes to Schedule of Investments (cont'd)
Asset Valuation Inputs (000's omitted) | | Level 1 | | Level 2 | | Level 3§ | | Total |
| | | | | | | | | |
| Short Duration |
| Investments: |
U.S. Treasury Securities-Backed by the Full Faith and Credit of the U.S. Government | | | $— | | | | $19,066 | | | | $— | | | | $19,066 | |
| Mortgage-Backed Securities^ | | | — | | | | 17,484 | | | | — | | | | 17,484 | |
| Corporate Debt Securities^ | | | — | | | | 23,158 | | | | — | | | | 23,158 | |
| Asset-Backed Securities | | | — | | | | 7,794 | | | | 0 | | | | 7,794 | |
| Short-Term Investments | | | — | | | | 3,063 | | | | — | | | | 3,063 | |
| Total Investments | | | — | | | | 70,565 | | | | 0 | | | | 70,565 | |
| Short Duration High Income |
| Investments: |
| Bank Loans Obligations |
| Air Transport | | | — | | | | 255 | | | | — | | | | 255 | |
| All Telecom | | | — | | | | 397 | | | | — | | | | 397 | |
| Automotive | | | — | | | | 250 | | | | — | | | | 250 | |
| Building & Development | | | — | | | | 249 | | | | — | | | | 249 | |
| Business Equipment & Services | | | — | | | | 241 | | | | — | | | | 241 | |
| Financial Intermediaries | | | — | | | | 497 | | | | — | | | | 497 | |
| Health Care | | | — | | | | 252 | | | | — | | | | 252 | |
| Leisure Goods—Activities—Movies | | | — | | | | — | | | | 266 | | | | 266 | |
| Nonferrous Metals—Minerals | | | — | | | | 388 | | | | — | | | | 388 | |
| Publishing | | | — | | | | 316 | | | | — | | | | 316 | |
| Radio & Television | | | — | | | | 244 | | | | — | | | | 244 | |
| Surface Transport | | | — | | | | 284 | | | | — | | | | 284 | |
| Total Bank Loan Obligations | | | — | | | | 3,373 | | | | 266 | | | | 3,639 | |
| Corporate Debt Securities^ | | | — | | | | 21,026 | | | | — | | | | 21,026 | |
| Short-Term Investments | | | — | | | | 3,517 | | | | — | | | | 3,517 | |
| Total Investments | | | — | | | | 27,916 | | | | 266 | | | | 28,182 | |
| Strategic Income |
| Investments: |
| Bank Loan Obligations |
| Aerospace & Defense | | | — | | | | 902 | | | | — | | | | 902 | |
| Air Transport | | | — | | | | 656 | | | | — | | | | 656 | |
| All Telecom | | | — | | | | 8,335 | | | | — | | | | 8,335 | |
| Automotive | | | — | | | | 6,542 | | | | — | | | | 6,542 | |
| Building & Development | | | — | | | | 4,636 | | | | — | | | | 4,636 | |
| Business Equipment & Services | | | — | | | | 12,244 | | | | 1,629 | | | | 13,873 | |
| Cable & Satellite Television | | | — | | | | 6,350 | | | | — | | | | 6,350 | |
| Chemicals & Plastics | | | — | | | | 3,792 | | | | — | | | | 3,792 | |
See Notes to Financial Statements
Notes to Schedule of Investments (cont'd)
Asset Valuation Inputs (000's omitted) | | Level 1 | | Level 2 | | Level 3§ | | Total |
| Clothing—Textiles | | | | | | | $1,598 | | | | $— | | | | $1,598 | |
| Conglomerates | | | — | | | | 1,309 | | | | — | | | | 1,309 | |
| Containers & Glass Products | | | — | | | | 1,678 | | | | 1,028 | | | | 2,706 | |
| Cosmetics—Toiletries | | | — | | | | 781 | | | | — | | | | 781 | |
| Drugs | | | — | | | | 2,663 | | | | — | | | | 2,663 | |
| Ecological Services & Equipment | | | — | | | | 2,460 | | | | — | | | | 2,460 | |
| Electronics—Electrical | | | — | | | | 12,274 | | | | — | | | | 12,274 | |
| Equipment Leasing | | | — | | | | 2,017 | | | | 1,014 | | | | 3,031 | |
| Financial Intermediaries | | | — | | | | 12,947 | | | | 381 | | | | 13,328 | |
| Food & Drug Retailers | | | — | | | | 1,294 | | | | — | | | | 1,294 | |
| Food Products | | | — | | | | 2,672 | | | | — | | | | 2,672 | |
| Food Service | | | — | | | | 2,644 | | | | — | | | | 2,644 | |
| Health Care | | | — | | | | 18,364 | | | | — | | | | 18,364 | |
| Home Furnishings | | | — | | | | 2,206 | | | | — | | | | 2,206 | |
| Industrial Equipment | | | — | | | | 7,226 | | | | — | | | | 7,226 | |
| Insurance | | | — | | | | 299 | | | | — | | | | 299 | |
| Leisure Goods—Activities—Movies | | | — | | | | 3,152 | | | | — | | | | 3,152 | |
| Lodging & Casinos | | | — | | | | 9,479 | | | | — | | | | 9,479 | |
| Nonferrous Metals—Minerals | | | — | | | | 4,697 | | | | — | | | | 4,697 | |
| Oil & Gas | | | — | | | | 6,368 | | | | 100 | | | | 6,468 | |
| Publishing | | | — | | | | 1,985 | | | | — | | | | 1,985 | |
| Radio & Television | | | — | | | | 5,564 | | | | — | | | | 5,564 | |
| Retailers (except food & drug) | | | — | | | | 14,183 | | | | — | | | | 14,183 | |
| Steel | | | — | | | | — | | | | 1,110 | | | | 1,110 | |
| Surface Transport | | | — | | | | 818 | | | | — | | | | 818 | |
| Utilities | | | — | | | | 3,340 | | | | 1,086 | | | | 4,426 | |
| Total Bank Loan Obligations | | | — | | | | 165,475 | | | | 6,348 | | | | 171,823 | |
U.S. Treasury Securities-Backed by the Full Faith and Credit of the U.S. Government | | | — | | | | 122,117 | | | | — | | | | 122,117 | |
| Mortgage-Backed Securities^ | | | — | | | | 438,160 | | | | — | | | | 438,160 | |
| Corporate Debt Securities |
| Aerospace & Defense | | | — | | | | 5,088 | | | | — | | | | 5,088 | |
| Agriculture | | | — | | | | 20,420 | | | | — | | | | 20,420 | |
| Airlines | | | — | | | | 833 | | | | 5,205 | | | | 6,038 | |
| Auto Loans | | | — | | | | 649 | | | | — | | | | 649 | |
| Automakers | | | — | | | | 1,955 | | | | — | | | | 1,955 | |
| Banks | | | — | | | | 55,135 | | | | — | | | | 55,135 | |
| Beverages | | | — | | | | 7,990 | | | | — | | | | 7,990 | |
See Notes to Financial Statements
Notes to Schedule of Investments (cont'd)
Asset Valuation Inputs (000's omitted) | | Level 1 | | Level 2 | | Level 3§ | | Total |
| Building & Construction | | | $— | | | | $979 | | | | $— | | | | $979 | |
| Building Materials | | | — | | | | 7,822 | | | | — | | | | 7,822 | |
| Chemicals | | | — | | | | 5,211 | | | | — | | | | 5,211 | |
| Commercial Services | | | — | | | | 12,069 | | | | — | | | | 12,069 | |
| Computer Hardware | | | — | | | | 553 | | | | — | | | | 553 | |
| Computers | | | — | | | | 5,718 | | | | — | | | | 5,718 | |
| Consumer—Commercial Lease Financing | | | — | | | | 6,519 | | | | — | | | | 6,519 | |
| Department Stores | | | — | | | | 589 | | | | — | | | | 589 | |
| Diversified Financial Services | | | — | | | | 22,822 | | | | — | | | | 22,822 | |
| Electric | | | — | | | | 14,118 | | | | — | | | | 14,118 | |
| Electric—Generation | | | — | | | | 3,608 | | | | — | | | | 3,608 | |
| Electric—Integrated | | | — | | | | 1,620 | | | | — | | | | 1,620 | |
| Electronics | | | — | | | | 1,447 | | | | — | | | | 1,447 | |
| Energy—Exploration & Production | | | — | | | | 11,824 | | | | — | | | | 11,824 | |
| Food | | | — | | | | 2,342 | | | | — | | | | 2,342 | |
| Food & Drug Retailers | | | — | | | | 714 | | | | — | | | | 714 | |
| Gaming | | | — | | | | 6,069 | | | | — | | | | 6,069 | |
| Gas Distribution | | | — | | | | 6,908 | | | | — | | | | 6,908 | |
| Health Facilities | | | — | | | | 10,325 | | | | — | | | | 10,325 | |
| Healthcare—Services | | | — | | | | 5,132 | | | | — | | | | 5,132 | |
| Hotels | | | — | | | | 1,275 | | | | — | | | | 1,275 | |
| Insurance | | | — | | | | 6,799 | | | | — | | | | 6,799 | |
| Investments & Misc. Financial Services | | | — | | | | 2,001 | | | | — | | | | 2,001 | |
| Leisure | | | — | | | | 1,029 | | | | — | | | | 1,029 | |
| Machinery | | | — | | | | 2,557 | | | | — | | | | 2,557 | |
| Media | | | — | | | | 20,124 | | | | — | | | | 20,124 | |
| Media—Broadcast | | | — | | | | 2,785 | | | | — | | | | 2,785 | |
| Media—Cable | | | — | | | | 8,582 | | | | — | | | | 8,582 | |
| Media—Services | | | — | | | | 2,118 | | | | — | | | | 2,118 | |
| Medical Products | | | — | | | | 2,083 | | | | — | | | | 2,083 | |
| Metals—Mining Excluding Steel | | | — | | | | 2,133 | | | | — | | | | 2,133 | |
| Mining | | | — | | | | 8,851 | | | | — | | | | 8,851 | |
| Miscellaneous Manufacturers | | | — | | | | 8,603 | | | | — | | | | 8,603 | |
| Office—Business Equipment | | | — | | | | 4,299 | | | | — | | | | 4,299 | |
| Oil & Gas | | | — | | | | 7,000 | | | | — | | | | 7,000 | |
| Oil, Gas & Consumable Fuels | | | — | | | | 5,225 | | | | — | | | | 5,225 | |
| Packaging | | | — | | | | 3,951 | | | | — | | | | 3,951 | |
| Pharmaceuticals | | | — | | | | 8,026 | | | | — | | | | 8,026 | |
| Pipelines | | | — | | | | 2,092 | | | | — | | | | 2,092 | |
See Notes to Financial Statements
Notes to Schedule of Investments (cont'd)
Asset Valuation Inputs (000's omitted) | | Level 1 | | Level 2 | | Level 3§ | | Total |
| Printing & Publishing | | | $— | | | | $4,125 | | | | $— | | | | $4,125 | |
| Real Estate | | | — | | | | 5,493 | | | | — | | | | 5,493 | |
| Real Estate Investment Trusts | | | — | | | | 7,006 | | | | — | | | | 7,006 | |
| Retail | | | — | | | | 3,722 | | | | — | | | | 3,722 | |
| Software—Services | | | — | | | | 2,488 | | | | — | | | | 2,488 | |
| Specialty Retail | | | — | | | | 2,203 | | | | — | | | | 2,203 | |
| Steel Producers—Products | | | — | | | | 4,353 | | | | — | | | | 4,353 | |
| Support—Services | | | — | | | | 1,767 | | | | — | | | | 1,767 | �� |
| Telecom—Integrated Services | | | — | | | | 14,879 | | | | — | | | | 14,879 | |
| Telecom—Wireless | | | — | | | | 4,283 | | | | — | | | | 4,283 | |
| Telecommunications | | | — | | | | 10,127 | | | | — | | | | 10,127 | |
| Transportation | | | — | | | | 1,409 | | | | — | | | | 1,409 | |
| Total Corporate Debt Securities | | | — | | | | 379,847 | | | | 5,205 | | | | 385,052 | |
| Asset-Backed Securities | | | — | | | | 64,933 | | | | — | | | | 64,933 | |
| Government Securities^ | | | — | | | | 49,536 | | | | — | | | | 49,536 | |
| Short-Term Investments | | | — | | | | 70,874 | | | | — | | | | 70,874 | |
| Total Investments | | | — | | | | 1,290,942 | | | | 11,553 | | | | 1,302,495 | |
| ^ | The Schedule of Investments provides information on the industry or state categorization for the portfolio. |
| § | The following is a reconciliation between the beginning and ending balances of investments in which significant unobservable inputs (Level 3) were used in determining value: |
| (000's omitted) | | Beginning balance, as of 11/1/11 | | Accrued discounts/ (premiums) | | Realized gain/loss | | Change in unrealized appreciation/ (depreciation) | | Purchases | | Sales | | Transfers in to Level 3 | | Transfers out of Level 3 | | Balance, as of 10/31/12 | | Net change in unrealized appreciation/ (depreciation) from investments still held as of 10/31/12 |
| Investments in Securities: |
| |
| Core Bond |
| |
| Corporate Debt Securities |
| Airlines | | | $3,025 | | | | $— | | | | $208 | | | | $(45 | ) | | | $1,971 | | | | $(4,504 | ) | | | $— | | | | $— | | | | $655 | | | | $25 | |
Asset-Backed Securitiesz | | | 0 | | | | — | | | | — | | | | — | | | | — | | | | — | | | | — | | | | — | | | | 0 | | | | — | |
| Total | | | 3,025 | | | | — | | | | 208 | | | | (45 | ) | | | 1,971 | | | | (4,504 | ) | | | — | | | | — | | | | 655 | | | | 25 | |
| Floating Rate Income |
| Bank Loan Obligations |
| Aerospace & Defense | | | 660 | | | | — | | | | — | | | | — | | | | — | | | | — | | | | — | | | | (660 | ) | | | — | | | | — | |
| All Telecom | | | 1,093 | | | | 1 | | | | — | | | | (43 | ) | | | — | | | | (1,051 | ) | | | — | | | | — | | | | — | | | | — | |
| Automotive | | | 1,298 | | | | — | | | | — | | | | (9 | ) | | | — | | | | (1,289 | ) | | | — | | | | — | | | | — | | | | — | |
See Notes to Financial Statements
Notes to Schedule of Investments (cont'd)
| (000's omitted) | | Beginning balance, as of 11/1/11 | | Accrued discounts/ (premiums) | | Realized gain/loss | | Change in unrealized appreciation/ (depreciation) | | Purchases | | Sales | | Transfers in to Level 3 | | Transfers out of Level 3 | | Balance, as of 10/31/12 | | Net change in unrealized appreciation/ (depreciation) from investments still held as of 10/31/12 |
| Building & Development | | | $581 | | | | $— | | | | $— | | | | $— | | | | $— | | | | $— | | | | $— | | | | $(581 | ) | | | $— | | | | $— | |
Business Equipment & Services | | | — | | | | 2 | | | | — | | | | 35 | | | | 1,831 | | | | — | | | | 949 | | | | — | | | | 2,817 | | | | 35 | |
Containers & Glass Products | | | 2,757 | | | | 1 | | | | (22 | ) | | | 50 | | | | — | | | | (1,065 | ) | | | — | | | | — | | | | 1,721 | | | | 50 | |
| Electronics—Electrical | | | 727 | | | | — | | | | — | | | | (8 | ) | | | — | | | | (719 | ) | | | — | | | | — | | | | — | | | | — | |
| Equipment Leasing | | | — | | | | — | | | | — | | | | 26 | | | | 1,629 | | | | (15 | ) | | | — | | | | — | | | | 1,640 | | | | 26 | |
| Financial Intermediaries | | | 3,944 | | | | — | | | | — | | | | (29 | ) | | | 617 | | | | (2,795 | ) | | | — | | | | (1,111 | ) | | | 626 | | | | 12 | |
| Home Furnishings | | | 1,747 | | | | — | | | | — | | | | 55 | | | | — | | | | (1,802 | ) | | | — | | | | — | | | | — | | | | — | |
Leisure Goods— Activities—Movies | | | 1,246 | | | | — | | | | — | | | | 29 | | | | — | | | | (1,275 | ) | | | — | | | | — | | | | — | | | | — | |
| Oil & Gas | | | — | | | | — | | | | — | | | | — | | | | 294 | | | | — | | | | — | | | | — | | | | 294 | | | | — | |
| Publishing | | | 1,680 | | | | — | | | | — | | | | — | | | | — | | | | — | | | | — | | | | (1,680 | ) | | | — | | | | — | |
| Steel | | | — | | | | 2 | | | | — | | | | 38 | | | | 1,960 | | | | (10 | ) | | | — | | | | — | | | | 1,990 | | | | 38 | |
| Utilities | | | — | | | | 1 | | | | 17 | | | | 27 | | | | 2,945 | | | | (1,136 | ) | | | — | | | | — | | | | 1,854 | | | | 27 | |
| Total | | | 15,733 | | | | 7 | | | | (5 | ) | | | 171 | | | | 9,276 | | | | (11,157 | ) | | | 949 | | | | (4,032 | ) | | | 10,942 | | | | 188 | |
| High Income |
| Corporate Debt Securities |
| Airlines | | | 4,063 | | | | — | | | | (30 | ) | | | 260 | | | | — | | | | (389 | ) | | | — | | | | — | | | | 3,904 | | | | 260 | |
| Total | | | 4,063 | | | | — | | | | (30 | ) | | | 260 | | | | — | | | | (389 | ) | | | — | | | | — | | | | 3,904 | | | | 260 | |
| Short Duration |
Asset-Backed Securitiesz | | | 0 | | | | — | | | | — | | | | — | | | | — | | | | — | | | | — | | | | — | | | | 0 | | | | — | |
| Total | | | 0 | | | | — | | | | — | | | | — | | | | — | | | | — | | | | — | | | | — | | | | 0 | | | | — | |
| Short Duration High Income |
| Bank Loan Obligations |
Leisure Goods— Activities—Movies | | | — | | | | — | | | | — | | | | 3 | | | | 263 | | | | — | | | | — | | | | — | | | | 266 | | | | 3 | |
| Total | | | — | | | | — | | | | — | | | | 3 | | | | 263 | | | | — | | | | — | | | | — | | | | 266 | | | | 3 | |
| Strategic Income |
| Bank Loan Obligations |
| Aerospace & Defense | | | 260 | | | | — | | | | — | | | | — | | | | — | | | | — | | | | — | | | | (260 | ) | | | — | | | | — | |
| All Telecom | | | 706 | | | | — | | | | — | | | | (27 | ) | | | — | | | | (679 | ) | | | — | | | | — | | | | — | | | | — | |
| Automotive | | | 441 | | | | — | | | | — | | | | (3 | ) | | | — | | | | (438 | ) | | | — | | | | — | | | | — | | | | — | |
| Building & Development | | | 236 | | | | — | | | | — | | | | — | | | | — | | | | — | | | | — | | | | (236 | ) | | | — | | | | — | |
Business Equipment & Services | | | — | | | | 1 | | | | — | | | | 19 | | | | 1,143 | | | | — | | | | 466 | | | | — | | | | 1,629 | | | | 19 | |
See Notes to Financial Statements
Notes to Schedule of Investments (cont'd)
| (000's omitted) | | Beginning balance, as of 11/1/11 | | Accrued discounts/ (premiums) | | Realized gain/loss | | Change in unrealized appreciation/ (depreciation) | | Purchases | | Sales | | Transfers in to Level 3 | | Transfers out of Level 3 | | Balance, as of 10/31/12 | | Net change in unrealized appreciation/ (depreciation) from investments still held as of 10/31/12 |
Containers & Glass Products | | | $723 | | | | $1 | | | | $— | | | | $14 | | | | $1,034 | | | | $(744 | ) | | | $— | | | | $— | | | | $1,028 | | | | $3 | |
| Electronics—Electrical | | | 494 | | | | — | | | | — | | | | (12 | ) | | | — | | | | (482 | ) | | | — | | | | — | | | | — | | | | — | |
| Equipment Leasing | | | — | | | | 1 | | | | — | | | | 15 | | | | 1,008 | | | | (10 | ) | | | — | | | | — | | | | 1,014 | | | | 15 | |
| Financial Intermediaries | | | 2,183 | | | | 1 | | | | — | | | | (12 | ) | | | 375 | | | | (1,381 | ) | | | — | | | | (785 | ) | | | 381 | | | | 7 | |
| Home Furnishing | | | 307 | | | | — | | | | — | | | �� | 8 | | | | — | | | | (315 | ) | | | — | | | | — | | | | — | | | | — | |
Leisure Goods— Activities—Movies | | | 612 | | | | — | | | | — | | | | 14 | | | | — | | | | (626 | ) | | | — | | | | — | | | | — | | | | — | |
| Oil & Gas | | | — | | | | — | | | | — | | | | — | | | | 100 | | | | — | | | | — | | | | — | | | | 100 | | | | — | |
| Publishing | | | 998 | | | | — | | | | — | | | | — | | | | — | | | | — | | | | — | | | | (998 | ) | | | — | | | | — | |
| Steel | | | — | | | | 1 | | | | — | | | | 21 | | | | 1,094 | | | | (6 | ) | | | — | | | | — | | | | 1,110 | | | | 21 | |
| Utilities | | | — | | | | — | | | | 10 | | | | 16 | | | | 1,724 | | | | (664 | ) | | | — | | | | — | | | | 1,086 | | | | 16 | |
| Corporate Debt Securities |
| Airlines | | | 5,637 | | | | — | | | | 572 | | | | (68 | ) | | | 9,462 | | | | (10,398 | ) | | | — | | | | — | | | | 5,205 | | | | 171 | |
| Electric—Generation | | | 61 | | | | — | | | | — | | | | 1 | | | | — | | | | (62 | ) | | | — | | | | — | | | | — | | | | — | |
| Total | | | 12,658 | | | | 5 | | | | 582 | | | | (14 | ) | | | 15,940 | | | | (15,805 | ) | | | 466 | | | | (2,279 | ) | | | 11,553 | | | | 252 | |
The Funds had no transfers between Levels 1 and 2 during the year ended October 31, 2012. As of October 31, 2012, five securities in Floating Rate Income and six securities in Strategic Income transferred from Level 3 to Level 2 as a result of an increase in the number of observable quotations that were readily available to the independent pricing service. As of October 31, 2012, one security in Floating Rate Income and one security in Strategic Income transferred from Level 2 to Level 3 as a result of a decrease in the number of observable quotations that were readily available to the independent pricing service.
Liability Valuation Inputs
The following is a summary, categorized by Level, of inputs used to value the Funds' derivatives as of October 31, 2012:
| (000's omitted) | | Level 1 | | Level 2 | | Level 3 | | Total |
| | | | | | | | | |
| Core Bond |
| Futures contracts | | | $(81 | ) | | | $— | | | | $— | | | | $(81 | ) |
| Strategic Income |
| Futures contracts | | | $(455 | ) | | | $— | | | | $— | | | | $(455 | ) |
See Notes to Financial Statements
Notes to Schedule of Investments (cont'd)
| ## | At October 31, 2012, selected fund information on a U.S. federal income tax basis was as follows: |
| (000's omitted) | | Cost | | Gross Unrealized Appreciation | | Gross Unrealized Depreciation | | Net Unrealized Appreciation (Depreciation) |
| Core Bond | | | $347,448 | | | $11,674 | | | $2,427 | | | $9,247 |
| Floating Rate Income | | | 338,548 | | | 3,498 | | | 1,295 | | | 2,203 |
| High Income | | | 3,131,190 | | | 143,452 | | | 11,720 | | | 131,732 |
| Municipal Intermediate Bond | | | 144,924 | | | 8,083 | | | 26 | | | 8,057 |
| Short Duration | | | 71,887 | | | 381 | | | 1,703 | | | (1,322 ) |
| Short Duration High Income | | | 28,247 | | | 56 | | | 121 | | | (65 ) |
| Strategic Income | | | 1,256,483 | | | 48,960 | | | 2,948 | | | 46,012 |
| ñ | Securities were purchased under Rule 144A of the Securities Act of 1933, as amended (the "1933 Act"), or are private placements and, unless registered under the 1933 Act or exempted from registration, may only be sold to qualified institutional investors. These securities have been deemed by the investment manager to be liquid. At October 31, 2012, these securities amounted to approximately $11,899,000 or 4.1% of net assets for Core Bond, approximately $10,277,000 or 3.5% of net assets for Floating Rate Income, approximately $805,000,000 or 24.9% of net assets for High Income, approximately $1,400,000 or 0.9% of net assets for Municipal Intermediate Bond, approximately $7,197,000 or 10.2% of net assets for Short Duration, approximately $3,956,000 or 15.7% of net assets for Short Duration High Income and approximately $89,906,000 or 8.6% of net assets for Strategic Income. |
| Ñ | These securities have been deemed by the investment manager to be illiquid. At October 31, 2012, these securities amounted to approximately $10,942,000 or 3.7% of net assets for Floating Rate Income, approximately $266,000 or 1.1% of net assets for Short Duration High Income and approximately $6,348,000 or 0.6% of net assets for Strategic Income. |
| Ø | All or a portion of this security was purchased on a when-issued basis. At October 31, 2012, these securities amounted to $61,138,000 for Core Bond, $17,838,000 for High Income, $3,984,000 for Municipal Intermediate Bond, $156,000 for Short Duration High Income and $230,273,000 for Strategic Income. |
| ß | Security is guaranteed by the corporate or non-profit obligor. |
| * | Security did not produce income during the last twelve months. |
| ¢ | All or a portion of this security was purchased on a delayed delivery basis. |
| †† | As of October 31, 2012, the value of unfunded loan commitments was approximately $97,000 for Floating Rate Income and $60,000 for Strategic Income pursuant to the following loan agreements: |
| Floating Rate Income | |
| Borrower | | Principal Amount | | Value | |
| Leslie's Poolmart, Term Loan B, 5.25%, due 10/16/19 | | | $97,000 | | | | $97,000 | | |
| Strategic Income | |
| Borrower | | Principal Amount | | Value | |
| Leslie's Poolmart, Term Loan B, 5.25%, due 10/16/19 | | | $60,000 | | | | $60,000 | | |
See Notes to Financial Statements
Notes to Schedule of Investments (cont'd)
| ^^ | All or a portion of this security has not settled as of October 31, 2012 and thus may not have an interest rate in effect. Interest rates do not take effect until settlement. |
| ØØ | All or a portion of this security is segregated in connection with obligations for when-issued security purchase commitments and/or financial futures contracts and/or delayed delivery purchase commitments. |
| µ | Floating rate securities are securities whose yields vary with a designated market index or market rate. These securities are shown at their current rates as of October 31, 2012, and their final maturities. |
| c | Payment-in-kind security for which part of the income earned may be paid as additional principal. |
| # | Restricted security subject to restrictions on resale. Securities were purchased under Rule 144A of the 1933 Act or are private placements and, unless registered under the 1933 Act or exempted from registration, may only be sold to qualified institutional investors. These securities have been deemed by the investment manager to be illiquid. |
| | At October 31, 2012, these securities amounted to approximately $0 or 0.0% of net assets for Core Bond and approximately $0 or 0.0% of net assets for Short Duration. |
| (000's omitted) | Restricted Security | Acquisition Date | | Acquisition Cost | | Acquisition Cost Percentage of Net Assets as of Acquisition Date | | Value as of October 31, 2012 | | Fair Value Percentage of Net Assets as of October 31, 2012 |
| Core Bond | Knollwood CDO Ltd., Ser. 2006-2A, Class A2J, 0.76%, due 7/13/46 | 6/29/2006 | | | $642 | | | 0.9% | | | $0 | | | 0.0 | % |
| Short Duration | Knollwood CDO Ltd., Ser. 2006-2A, Class A2J, 0.76%, due 7/13/46 | 9/14/2007 | | | 227 | | | 0.2 | | | 0 | | | 0.0 | |
| a | Principal amount is stated in the currency in which the security is denominated. |
| z | A zero balance may reflect actual amounts rounding to less than $1,000. |
| ± | See Note A-13 in the Notes to Financial Statements for the Funds' open derivatives at October 31, 2012. |
See Notes to Financial Statements
Statements of Assets and Liabilities
Neuberger Berman Income Funds
(000's omitted except per share amounts)
| | | CORE BOND FUND | | FLOATING RATE INCOME FUND | | HIGH INCOME BOND FUND | | MUNICIPAL INTERMEDIATE BOND FUND |
| | | October 31, 2012 | | October 31, 2012 | | October 31, 2012 | | October 31, 2012 |
| Assets |
| Investments in securities, at value* (Note A)—see Schedule of Investments: |
| Unaffiliated issuers | | | $356,695 | | | | $340,751 | | | | $3,262,922 | | | | $152,981 | |
| Cash | | | — | | | | 2,355 | | | | 17,231 | | | | 27 | |
| Foreign currency | | | — | | | | — | | | | — | | | | — | |
| Deposits with brokers for futures contracts (Note A) | | | 253 | | | | — | | | | — | | | | — | |
| Dividends and interest receivable | | | 1,225 | | | | 943 | | | | 51,809 | | | | 1,690 | |
| Receivable for securities sold | | | 7,464 | | | | 27,806 | | | | 32,564 | | | | 5 | |
| Receivable for Fund shares sold | | | 239 | | | | 2,093 | | | | 7,133 | | | | 92 | |
| Receivable from Management—net (Note B) | | | — | | | | — | | | | — | | | | — | |
| Prepaid expenses and other assets | | | 39 | | | | 34 | | | | 171 | | | | 28 | |
| Total Assets | | | 365,915 | | | | 373,982 | | | | 3,371,830 | | | | 154,823 | |
| Liabilities |
| Distributions payable | | | 99 | | | | 178 | | | | 3,439 | | | | 37 | |
| Due to custodian | | | 9,303 | | | | — | | | | — | | | | — | |
| Payable for securities purchased | | | 66,467 | | | | 80,628 | | | | 127,696 | | | | 3,990 | |
| Payable for Fund shares redeemed | | | 267 | | | | 265 | | | | 4,493 | | | | 221 | |
| Payable to investment manager (Note B) | | | 62 | | | | 122 | | | | 1,301 | | | | 32 | |
| Payable to administrator—net (Note B) | | | 27 | | | | 4 | | | | 666 | | | | 10 | |
| Payable for variation margin (Note A) | | | 81 | | | | — | | | | — | | | | — | |
| Payable for organization expense (Note A) | | | — | | | | — | | | | — | | | | — | |
| Accrued expenses and other payables | | | 102 | | | | 108 | | | | 344 | | | | 84 | |
| Total Liabilities | | | 76,408 | | | | 81,305 | | | | 137,939 | | | | 4,374 | |
| Net Assets | | | $289,507 | | | | $292,677 | | | | $3,233,891 | | | | $150,449 | |
| Net Assets consist of: |
| Paid-in capital | | | $273,653 | | | | $291,362 | | | | $3,064,258 | | | | $141,411 | |
| Undistributed net investment income (loss) | | | — | | | | — | | | | 263 | | | | — | |
| Distributions in excess of net investment income | | | (99 | ) | | | (108 | ) | | | — | | | | — | |
| Accumulated net realized gains (losses) on investments | | | 6,438 | | | | (916 | ) | | | 35,980 | | | | 962 | |
| Net unrealized appreciation (depreciation) in value of investments | | | 9,515 | | | | 2,339 | | | | 133,390 | | | | 8,076 | |
| Net Assets | | | $289,507 | | | | $292,677 | | | | $3,233,891 | | | | $150,449 | |
| Net Assets |
| Investor Class | | | $16,270 | | | | $— | | | | $340,457 | | | | $20,833 | |
| Trust Class | | | — | | | | — | | | | — | | | | — | |
| Institutional Class | | | 218,940 | | | | 241,459 | | | | 2,306,090 | | | | 124,697 | |
| Class A | | | 47,325 | | | | 36,787 | | | | 505,271 | | | | 3,416 | |
| Class C | | | 6,972 | | | | 14,431 | | | | 72,325 | | | | 1,503 | |
| Class R3 | | | — | | | | — | | | | 9,748 | | | | — | |
| Shares Outstanding ($.001 par value; unlimited shares authorized) |
| Investor Class | | | 1,474 | | | | — | | | | 35,984 | | | | 1,726 | |
| Trust Class | | | — | | | | — | | | | — | | | | — | |
| Institutional Class | | | 19,801 | | | | 23,621 | | | | 243,356 | | | | 10,340 | |
| Class A | | | 4,294 | | | | 3,599 | | | | 53,392 | | | | 283 | |
| Class C | | | 632 | | | | 1,412 | | | | 7,632 | | | | 125 | |
| Class R3 | | | — | | | | — | | | | 1,030 | | | | — | |
| Net Asset Value, offering and redemption price per share |
| Investor Class | | | $11.04 | | | | $— | | | | $9.46 | | | | $12.07 | |
| Trust Class | | | — | | | | — | | | | — | | | | — | |
| Institutional Class | | | 11.06 | | | | 10.22 | | | | 9.48 | | | | 12.06 | |
| Class R3 | | | — | | | | — | | | | 9.47 | | | | — | |
| Net Asset Value and redemption price per share |
| Class A | | | $11.02 | | | | $10.22 | | | | $9.46 | | | | $12.06 | |
| Offering Price per share |
| Class A‡ | | | $11.51 | | | | $10.67 | | | | $9.88 | | | | $12.60 | |
| Net Asset Value and offering price per share |
| Class C^ | | | $11.03 | | | | $10.22 | | | | $9.48 | | | | $12.06 | |
| *Cost of Investments | | | $347,099 | | | | $338,412 | | | | $3,129,532 | | | | $144,905 | |
| Total cost of foreign currency | | | $— | | | | $— | | | | $— | | | | $— | |
| ‡ | On single retail sales of less than $50,000. On sales of $50,000 or more or in certain other circumstances described in the Fund's prospectus, offering price is reduced. |
| ^ | Redemption price per share is equal to net asset value less any applicable contingent deferred sales charge. |
See Notes to Financial Statements
| | | SHORT DURATION BOND FUND | | SHORT DURATION HIGH INCOME FUND | | STRATEGIC INCOME FUND |
| | | October 31, 2012 | | October 31, 2012 | | October 31, 2012 |
| Assets |
| Investments in securities, at value* (Note A)—see Schedule of Investments: |
| Unaffiliated issuers | | | $70,565 | | | $ | 28,182 | | | | $1,302,495 | |
| Cash | | | — | | | | 209 | | | | 145 | |
| Foreign currency | | | — | | | | — | | | | 879 | |
| Deposits with brokers for futures contracts (Note A) | | | — | | | | — | | | | 1,559 | |
| Dividends and interest receivable | | | 317 | | | | 390 | | | | 6,556 | |
| Receivable for securities sold | | | 141 | | | | 1,977 | | | | 8,502 | |
| Receivable for Fund shares sold | | | 100 | | | | 10,000 | | | | 11,355 | |
| Receivable from Management—net (Note B) | | | 10 | | | | 57 | | | | — | |
| Prepaid expenses and other assets | | | 35 | | | | 57 | | | | 72 | |
| Total Assets | | | 71,168 | | | | 40,872 | | | | 1,331,563 | |
| Liabilities |
| Distributions payable | | | 6 | | | | — | | | | 862 | |
| Due to custodian | | | — | | | | — | | | | — | |
| Payable for securities purchased | | | 488 | | | | 5,568 | | | | 281,493 | |
| Payable for Fund shares redeemed | | | 37 | | | | 10,079 | | | | 1,056 | |
| Payable to investment manager (Note B) | | | 15 | | | | 10 | | | | 473 | |
| Payable to administrator—net (Note B) | | | — | | | | — | | | | 301 | |
| Payable for variation margin (Note A) | | | — | | | | — | | | | 455 | |
| Payable for organization expense (Note A) | | | — | | | | 1 | | | | — | |
| Accrued expenses and other payables | | | 87 | | | | 68 | | | | 201 | |
| Total Liabilities | | | 633 | | | | 15,726 | | | | 284,841 | |
| Net Assets | | | $70,535 | | | | $25,146 | | | | $1,046,722 | |
| Net Assets consist of: |
| Paid-in capital | | | $89,457 | | | | $25,130 | | | | $977,663 | |
| Undistributed net investment income (loss) | | | 158 | | | | — | | | | 1,832 | |
| Distributions in excess of net investment income | | | — | | | | — | | | | — | |
| Accumulated net realized gains (losses) on investments | | | (18,135 | ) | | | 75 | | | | 18,697 | |
| Net unrealized appreciation (depreciation) in value of investments | | | (945 | ) | | | (59 | ) | | | 48,530 | |
| Net Assets | | | $70,535 | | | | $25,146 | | | | $1,046,722 | |
| Net Assets |
| Investor Class | | | $38,786 | | | | $— | | | | $— | |
| Trust Class | | | 5,552 | | | | — | | | | 26,555 | |
| Institutional Class | | | 22,176 | | | | 25,049 | | | | 526,256 | |
| Class A | | | 2,340 | | | | 67 | | | | 309,121 | |
| Class C | | | 1,681 | | | | 30 | | | | 184,790 | |
| Class R3 | | | — | | | | — | | | | — | |
| Shares Outstanding ($.001 par value; unlimited shares authorized) |
| Investor Class | | | 4,834 | | | | — | | | | — | |
| Trust Class | | | 726 | | | | — | | | | 2,276 | |
| Institutional Class | | | 2,766 | | | | 2,503 | | | | 45,101 | |
| Class A | | | 306 | | | | 7 | | | | 26,470 | |
| Class C | | | 220 | | | | 3 | | | | 15,835 | |
| Class R3 | | | — | | | | — | | | | — | |
| Net Asset Value, offering and redemption price per share |
| Investor Class | | | $8.02 | | | | $— | | | | $— | |
| Trust Class | | | 7.65 | | | | — | | | | 11.67 | |
| Institutional Class | | | 8.02 | | | | 10.01 | | | | 11.67 | |
| Class R3 | | | — | | | | — | | | | — | |
| Net Asset Value and redemption price per share |
| Class A | | | $7.64 | | | | $10.01 | | | | $11.68 | |
| Offering Price per share |
| Class A‡ | | | $7.84 | | | | $10.45 | | | | $12.20 | |
| Net Asset Value and offering price per share |
| Class C^ | | | $7.65 | | | | $10.01 | | | | $11.67 | |
| *Cost of Investments | | | $71,510 | | | | $28,241 | | | | $1,253,514 | |
| Total cost of foreign currency | | | $— | | | | $— | | | | $874 | |
Statements of Operations
Neuberger Berman Income Funds
(000's omitted)
| | | CORE BOND FUND | | FLOATING RATE INCOME FUND | | HIGH INCOME BOND FUND | | MUNICIPAL INTERMEDIATE BOND FUND |
| | | For the Year Ended October 31, 2012 | | For the Year Ended October 31, 2012 | | For the Year Ended October 31, 2012 | | For the Year Ended October 31, 2012 |
| Investment Income: |
| Income (Note A): |
| Interest income—unaffiliated issuers | | | $6,406 | | | | $13,071 | | | | $193,836 | | | | $4,215 | |
| | | | | | | | | | | | | | | | | |
| Expenses: |
| Investment management fees (Note B) | | | 636 | | | | 1,097 | | | | 13,078 | | | | 342 | |
| Administration fees (Note B) | | | 152 | | | | 132 | | | | 1,635 | | | | 82 | |
| Administration fees (Note B): |
| Investor Class | | | 34 | | | | — | | | | 681 | | | | 88 | |
| Trust Class | | | — | | | | — | | | | — | | | | — | |
| Institutional Class | | | 176 | | | | 164 | | | | 1,747 | | | | 83 | |
| Class A | | | 71 | | | | 57 | | | | 827 | | | | 4 | |
| Class C | | | 18 | | | | 20 | | | | 124 | | | | 2 | |
| Class R3 | | | — | | | | — | | | | 13 | | | | — | |
| Distribution fees (Note B): |
| Investor Class | | | 41 | | | | — | | | | — | | | | — | |
| Trust Class | | | — | | | | — | | | | — | | | | — | |
| Class A | | | 84 | | | | 68 | | | | 985 | | | | 4 | |
| Class C | | | 85 | | | | 94 | | | | 590 | | | | 11 | |
| Class R3 | | | — | | | | — | | | | 31 | | | | — | |
| Shareholder servicing agent fees: |
| Investor Class | | | 21 | | | | — | | | | 124 | | | | 29 | |
| Trust Class | | | — | | | | — | | | | — | | | | — | |
| Institutional Class | | | 17 | | | | 16 | | | | 225 | | | | 9 | |
| Class A | | | 14 | | | | 6 | | | | 124 | | | | 2 | |
| Class C | | | 3 | | | | 3 | | | | 21 | | | | 2 | |
| Class R3 | | | — | | | | — | | | | 2 | | | | — | |
| Organization expense (Note A) | | | — | | | | — | | | | — | | | | — | |
| Audit fees | | | 27 | | | | 30 | | | | 56 | | | | 53 | |
| Custodian fees (Note A) | | | 157 | | | | 251 | | | | 506 | | | | 108 | |
| Insurance expense | | | 12 | | | | 13 | | | | 101 | | | | 7 | |
| Legal fees | | | 99 | | | | 100 | | | | 96 | | | | 98 | |
| Registration and filing fees | | | 56 | | | | 60 | | | | 237 | | | | 47 | |
| Reimbursement of expenses previously assumed by Management (Note B) | | | — | | | | — | | | | 9 | | | | — | |
| Shareholder reports | | | 38 | | | | 20 | | | | 264 | | | | 15 | |
| Trustees' fees and expenses | | | 53 | | | | 53 | | | | 55 | | | | 53 | |
| Miscellaneous | | | 20 | | | | 20 | | | | 138 | | | | 10 | |
| Total expenses | | | 1,814 | | | | 2,204 | | | | 21,669 | | | | 1,049 | |
See Notes to Financial Statements
| | | SHORT DURATION BOND FUND | | SHORT DURATION HIGH INCOME FUND | | STRATEGIC INCOME FUND |
| | | For the Year Ended October 31, 2012 | | Period from September 28, 2012 (Commencement of Operations) to October 31, 2012 | | For the Year Ended October 31, 2012 |
| Investment Income: |
| Income (Note A): |
| Interest income—unaffiliated issuers | | | $1,427 | | | | $87 | | | | $33,013 | |
| | | | | | | | | | | | | |
| Expenses: |
| Investment management fees (Note B) | | | 163 | | | | 10 | | | | 4,159 | |
| Administration fees (Note B) | | | 39 | | | | 2 | | | | 454 | |
| Administration fees (Note B): |
| Investor Class | | | 88 | | | | — | | | | — | |
| Trust Class | | | 26 | | | | — | | | | 75 | |
| Institutional Class | | | 14 | | | | 2 | | | | 306 | |
| Class A | | | 2 | | | | — | | | | 513 | |
| Class C | | | 3 | | | | — | | | | 316 | |
| Class R3 | | | — | | | | — | | | | — | |
| Distribution fees (Note B): |
| Investor Class | | | — | | | | — | | | | — | |
| Trust Class | | | — | | | | — | | | | 22 | |
| Class A | | | 2 | | | | — | | | | 610 | |
| Class C | | | 12 | | | | — | | | | 1,503 | |
| Class R3 | | | — | | | | — | | | | — | |
| Shareholder servicing agent fees: |
| Investor Class | | | 36 | | | | — | | | | — | |
| Trust Class | | | 1 | | | | — | | | | 5 | |
| Institutional Class | | | 2 | | | | — | | | | 41 | |
| Class A | | | 1 | | | | — | | | | 110 | |
| Class C | | | — | | | | — | | | | 40 | |
| Class R3 | | | — | | | | — | | | | — | |
| Organization expense (Note A) | | | — | | | | 112 | | | | — | |
| Audit fees | | | 58 | | | | 32 | | | | 60 | |
| Custodian fees (Note A) | | | 81 | | | | 9 | | | | 442 | |
| Insurance expense | | | 4 | | | | — | | | | 33 | |
| Legal fees | | | 92 | | | | 12 | | | | 105 | |
| Registration and filing fees | | | 56 | | | | 1 | | | | 97 | |
| Reimbursement of expenses previously assumed by Management (Note B) | | | — | | | | — | | | | — | |
| Shareholder reports | | | 15 | | | | 15 | | | | 85 | |
| Trustees' fees and expenses | | | 53 | | | | — | | | | 53 | |
| Miscellaneous | | | 9 | | | | 1 | | | | 55 | |
| Total expenses | | | 757 | | | | 196 | | | | 9,084 | |
Statements of Operations (cont'd)
Neuberger Berman Income Funds (cont'd)
(000's omitted)
| | | CORE BOND FUND | | FLOATING RATE INCOME FUND | | HIGH INCOME BOND FUND | | MUNICIPAL INTERMEDIATE BOND FUND |
| | | For the Year Ended October 31, 2012 | | For the Year Ended October 31, 2012 | | For the Year Ended October 31, 2012 | | For the Year Ended October 31, 2012 |
| Expenses reimbursed by Management (Note B) | | | (214 | ) | | | (454 | ) | | | — | | | | (282 | ) |
| Management fees waived (Note B) | | | (153 | ) | | | — | | | | — | | | | — | |
| Expenses reduced by custodian fee expense offset arrangement (Note A) | | | — | | | | — | | | | (2 | ) | | | (1 | ) |
| Total net expenses | | | 1,447 | | | | 1,750 | | | | 21,667 | | | | 766 | |
| Net investment income (loss) | | | $4,959 | | | | $11,321 | | | | $172,169 | | | | $3,449 | |
| Realized and Unrealized Gain (Loss) on Investments (Note A) |
| Net realized gain (loss) on: |
| Sales of investment securities of unaffiliated issuers | | | 8,358 | | | | 660 | | | | 37,595 | | | | 964 | |
| Financial futures contracts | | | (611 | ) | | | — | | | | — | | | | — | |
| Foreign currency | | | — | | | | — | | | | — | | | | — | |
| Change in net unrealized appreciation (depreciation) in value of: |
| Unaffiliated investment securities | | | 4,534 | | | | 5,876 | | | | 107,173 | | | | 5,272 | |
| Financial futures contracts | | | (8 | ) | | | — | | | | — | | | | — | |
| Foreign currency | | | — | | | | — | | | | — | | | | — | |
| Net gain (loss) on investments | | | 12,273 | | | | 6,536 | | | | 144,768 | | | | 6,236 | |
| Net increase (decrease) in net assets resulting from operations | | | $17,232 | | | | $17,857 | | | | $316,937 | | | | $9,685 | |
See Notes to Financial Statements
| | | SHORT DURATION BOND FUND | | SHORT DURATION HIGH INCOME FUND | | STRATEGIC INCOME FUND |
| | | For the Year Ended October 31, 2012 | | Period from September 28, 2012 (Commencement of Operations) to October 31, 2012 | | For the Year Ended October 31, 2012 |
| Expenses reimbursed by Management (Note B) | | | (309 | ) | | | (180 | ) | | | (695 | ) |
| Management fees waived (Note B) | | | — | | | | — | | | | — | |
| Expenses reduced by custodian fee expense offset arrangement (Note A) | | | — | | | | — | | | | — | |
| Total net expenses | | | 448 | | | | 16 | | | | 8,389 | |
| Net investment income (loss) | | | $979 | | | | $71 | | | | $24,624 | |
| Realized and Unrealized Gain (Loss) on Investments (Note A) |
| Net realized gain (loss) on: |
| Sales of investment securities of unaffiliated issuers | | | (957 | ) | | | 75 | | | | 25,131 | |
| Financial futures contracts | | | — | | | | — | | | | (1,985 | ) |
| Foreign currency | | | — | | | | — | | | | (1 | ) |
| Change in net unrealized appreciation (depreciation) in value of: |
| Unaffiliated investment securities | | | 2,587 | | | | (59 | ) | | | 37,404 | |
| Financial futures contracts | | | — | | | | — | | | | (210 | ) |
| Foreign currency | | | — | | | | — | | | | 4 | |
| Net gain (loss) on investments | | | 1,630 | | | | 16 | | | | 60,343 | |
| Net increase (decrease) in net assets resulting from operations | | | $2,609 | | | | $87 | | | | $84,967 | |
Statements of Changes in Net Assets
Neuberger Berman Income Funds
(000's omitted)
| | | CORE BOND FUND | | FLOATING RATE INCOME FUND | | HIGH INCOME BOND FUND |
| | | Year Ended October 31, 2012 | | Year Ended October 31, 2011 | | Year Ended October 31, 2012 | | Year Ended October 31, 2011 | | Year Ended October 31, 2012 | | Year Ended October 31, 2011 |
| Increase (Decrease) in Net Assets: |
| From Operations (Note A): |
| Net investment income (loss) | | | $4,959 | | | | $4,812 | | | | $11,321 | | | | $8,943 | | | | $172,169 | | | | $77,653 | |
| Net realized gain (loss) on investments | | | 7,747 | | | | 4,986 | | | | 660 | | | | (1,575 | ) | | | 37,595 | | | | 19,176 | |
Change in net unrealized appreciation (depreciation) of investments | | | 4,526 | | | | (156 | ) | | | 5,876 | | | | (4,963 | ) | | | 107,173 | | | | (36,580 | ) |
Net increase (decrease) in net assets resulting from operations | | | 17,232 | | | | 9,642 | | | | 17,857 | | | | 2,405 | | | | 316,937 | | | | 60,249 | |
| Distributions to Shareholders From (Note A): |
| Net investment income: |
| Investor Class | | | (273 | ) | | | (384 | ) | | | — | | | | — | | | | (20,435 | ) | | | (24,417 | ) |
| Trust Class | | | — | | | | — | | | | — | | | | — | | | | — | | | | — | |
| Institutional Class | | | (4,043 | ) | | | (4,198 | ) | | | (9,613 | ) | | | (7,813 | ) | | | (124,640 | ) | | | (30,477 | ) |
| Class A | | | (537 | ) | | | (575 | ) | | | (1,324 | ) | | | (1,029 | ) | | | (23,703 | ) | | | (20,717 | ) |
| Class C | | | (72 | ) | | | (48 | ) | | | (388 | ) | | | (202 | ) | | | (3,100 | ) | | | (2,133 | ) |
| Class R3 | | | — | | | | — | | | | — | | | | — | | | | (360 | ) | | | (121 | ) |
| Net realized gain on investments: |
| Investor Class | | | (402 | ) | | | (452 | ) | | | — | | | | — | | | | (2,732 | ) | | | (2,737 | ) |
| Trust Class | | | — | | | | — | | | | — | | | | — | | | | — | | | | — | |
| Institutional Class | | | (4,669 | ) | | | (3,055 | ) | | | — | | | | (146 | ) | | | (13,495 | ) | | | (1,959 | ) |
| Class A | | | (714 | ) | | | (557 | ) | | | — | | | | (34 | ) | | | (2,809 | ) | | | (2,165 | ) |
| Class C | | | (157 | ) | | | (72 | ) | | | — | | | | (2 | ) | | | (434 | ) | | | (217 | ) |
| Class R3 | | | — | | | | — | | | | — | | | | — | | | | (29 | ) | | | (6 | ) |
| Total distributions to shareholders | | | (10,867 | ) | | | (9,341 | ) | | | (11,325 | ) | | | (9,226 | ) | | | (191,737 | ) | | | (84,949 | ) |
| From Fund Share Transactions (Note D): |
| Proceeds from shares sold: |
| Investor Class | | | 3,488 | | | | 3,710 | | | | — | | | | — | | | | 87,461 | | | | 98,046 | |
| Trust Class | | | — | | | | — | | | | — | | | | — | | | | — | | | | — | |
| Institutional Class | | | 67,757 | | | | 93,813 | | | | 119,417 | | | | 163,642 | | | | 1,383,112 | | | | 1,381,475 | |
| Class A | | | 35,547 | | | | 16,487 | | | | 17,827 | | | | 33,327 | | | | 275,080 | | | | 251,066 | |
| Class C | | | 9,546 | | | | 3,075 | | | | 9,419 | | | | 8,557 | | | | 36,975 | | | | 28,303 | |
| Class R3 | | | — | | | | — | | | | — | | | | — | | | | 7,723 | | | | 3,955 | |
Proceeds from reinvestment of dividends and distributions: |
| Investor Class | | | 655 | | | | 817 | | | | — | | | | — | | | | 21,678 | | | | 25,509 | |
| Trust Class | | | — | | | | — | | | | — | | | | — | | | | — | | | | — | |
| Institutional Class | | | 7,245 | | | | 5,762 | | | | 8,930 | | | | 7,459 | | | | 94,585 | | | | 21,942 | |
| Class A | | | 1,169 | | | | 983 | | | | 926 | | | | 829 | | | | 22,873 | | | | 20,290 | |
| Class C | | | 85 | | | | 35 | | | | 175 | | | | 110 | | | | 2,019 | | | | 1,238 | |
| Class R3 | | | — | | | | — | | | | — | | | | — | | | | 282 | | | | 54 | |
| Payments for shares redeemed: |
| Investor Class | | | (3,928 | ) | | | (7,283 | ) | | | — | | | | — | | | | (92,592 | ) | | | (161,131 | ) |
| Trust Class | | | — | | | | — | | | | — | | | | — | | | | — | | | | — | |
| Institutional Class | | | (41,708 | ) | | | (39,744 | ) | | | (73,816 | ) | | | (54,379 | ) | | | (776,274 | ) | | | (164,748 | ) |
| Class A | | | (16,628 | ) | | | (14,386 | ) | | | (5,453 | ) | | | (23,557 | ) | | | (151,755 | ) | | | (191,315 | ) |
| Class C | | | (7,345 | ) | | | (1,586 | ) | | | (3,208 | ) | | | (1,371 | ) | | | (16,273 | ) | | | (6,374 | ) |
| Class R3 | | | — | | | | — | | | | — | | | | — | | | | (1,577 | ) | | | (1,413 | ) |
| Net increase (decrease) from Fund share transactions | | | 55,883 | | | | 61,683 | | | | 74,217 | | | | 134,617 | | | | 893,317 | | | | 1,306,897 | |
| Net Increase (Decrease) in Net Assets | | | 62,248 | | | | 61,984 | | | | 80,749 | | | | 127,796 | | | | 1,018,517 | | | | 1,282,197 | |
| Net Assets: |
| Beginning of year | | | 227,259 | | | | 165,275 | | | | 211,928 | | | | 84,132 | | | | 2,215,374 | | | | 933,177 | |
| End of year | | | $289,507 | | | | $227,259 | | | | $292,677 | | | | $211,928 | | | | $3,233,891 | | | | $2,215,374 | |
Undistributed net investment income (loss) at end of year | | | $— | | | | $— | | | | $— | | | | $— | | | | $263 | | | | $332 | |
Distributions in excess of net investment income at end of year | | | $(99 | ) | | | $(135 | ) | | | $(108 | ) | | | $(104 | ) | | | $— | | | | $— | |
See Notes to Financial Statements
| | | MUNICIPAL INTERMEDIATE BOND FUND | | SHORT DURATION BOND FUND |
| | | Year Ended October 31, 2012 | | Year Ended October 31, 2011 | | Year Ended October 31, 2012 | | Year Ended October 31, 2011 |
| Increase (Decrease) in Net Assets: |
| From Operations (Note A): |
| Net investment income (loss) | | | $3,449 | | | | $3,577 | | | | $979 | | | | $1,283 | |
| Net realized gain (loss) on investments | | | 964 | | | | 817 | | | | (957 | ) | | | (548 | ) |
Change in net unrealized appreciation (depreciation) of investments | | | 5,272 | | | | (487 | ) | | | 2,587 | | | | (602 | ) |
Net increase (decrease) in net assets resulting from operations | | | 9,685 | | | | 3,907 | | | | 2,609 | | | | 133 | |
| Distributions to Shareholders From (Note A): |
| Net investment income: |
| Investor Class | | | (1,061 | ) | | | (3,437 | ) | | | (947 | ) | | | (1,351 | ) |
| Trust Class | | | — | | | | — | | | | (127 | ) | | | (198 | ) |
| Institutional Class | | | (2,334 | ) | | | (132 | ) | | | (374 | ) | | | (314 | ) |
| Class A | | | (38 | ) | | | (5 | ) | | | (16 | ) | | | (12 | ) |
| Class C | | | (16 | ) | | | (3 | ) | | | (16 | ) | | | (8 | ) |
| Class R3 | | | — | | | | — | | | | — | | | | — | |
| Net realized gain on investments: |
| Investor Class | | | (765 | ) | | | (510 | ) | | | — | | | | — | |
| Trust Class | | | — | | | | — | | | | — | | | | — | |
| Institutional Class | | | (46 | ) | | | (1 | ) | | | — | | | | — | |
| Class A | | | (1 | ) | | | (1 | ) | | | — | | | | — | |
| Class C | | | (5 | ) | | | (0 | ) | | | — | | | | — | |
| Class R3 | | | — | | | | — | | | | — | | | | — | |
| Total distributions to shareholders | | | (4,266 | ) | | | (4,089 | ) | | | (1,480 | ) | | | (1,883 | ) |
| From Fund Share Transactions (Note D): |
| Proceeds from shares sold: |
| Investor Class | | | 8,368 | | | | 28,033 | | | | 3,431 | | | | 5,109 | |
| Trust Class | | | — | | | | — | | | | 920 | | | | 1,687 | |
| Institutional Class | | | 124,889 | | | | 8,068 | | | | 17,490 | | | | 18,728 | |
| Class A | | | 3,475 | | | | 298 | | | | 2,227 | | | | 4,833 | |
| Class C | | | 1,065 | | | | 550 | | | | 1,375 | | | | 1,468 | |
| Class R3 | | | — | | | | — | | | | — | | | | — | |
Proceeds from reinvestment of dividends and distributions: |
| Investor Class | | | 1,681 | | | | 3,692 | | | | 888 | | | | 1,262 | |
| Trust Class | | | — | | | | — | | | | 126 | | | | 191 | |
| Institutional Class | | | 2,192 | | | | 85 | | | | 358 | | | | 306 | |
| Class A | | | 32 | | | | 4 | | | | 13 | | | | 3 | |
| Class C | | | 9 | | | | 2 | | | | 7 | | | | 5 | |
| Class R3 | | | — | | | | — | | | | — | | | | — | |
| Payments for shares redeemed: |
| Investor Class | | | (109,723 | ) | | | (33,779 | ) | | | (10,394 | ) | | | (17,075 | ) |
| Trust Class | | | — | | | | — | | | | (1,985 | ) | | | (4,684 | ) |
| Institutional Class | | | (10,339 | ) | | | (1,697 | ) | | | (13,811 | ) | | | (909 | ) |
| Class A | | | (309 | ) | | | (292 | ) | | | (91 | ) | | | (4,700 | ) |
| Class C | | | (227 | ) | | | (1 | ) | | | (699 | ) | | | (513 | ) |
| Class R3 | | | — | | | | — | | | | — | | | | — | |
| Net increase (decrease) from Fund share transactions | | | 21,113 | | | | 4,963 | | | | (145 | ) | | | 5,711 | |
| Net Increase (Decrease) in Net Assets | | | 26,532 | | | | 4,781 | | | | 984 | | | | 3,961 | |
| Net Assets: |
| Beginning of year | | | 123,917 | | | | 119,136 | | | | 69,551 | | | | 65,590 | |
| End of year | | | $150,449 | | | | $123,917 | | | | $70,535 | | | | $69,551 | |
Undistributed net investment income (loss) at end of year | | | $— | | | | $— | | | | $158 | | | | $172 | |
Distributions in excess of net investment income at end of year | | | $— | | | | $— | | | | $— | | | | $— | |
Statements of Changes in Net Assets (cont'd)
Neuberger Berman Income Funds (cont'd)
(000's omitted)
| | | SHORT DURATION HIGH INCOME FUND | | STRATEGIC INCOME FUND |
| | | Period from September 28, 2012 (Commencement of Operations) to October 31, 2012 | | Year Ended October 31, 2012 | | Year Ended October 31, 2011 |
| Increase (Decrease) in Net Assets: |
| From Operations (Note A): |
| Net investment income (loss) | | | $71 | | | | $24,624 | | | | $16,358 | |
| Net realized gain (loss) on investments | | | 75 | | | | 23,145 | | | | 7,128 | |
| Change in net unrealized appreciation (depreciation) of investments | | | (59 | ) | | | 37,198 | | | | (7,607 | ) |
| Net increase (decrease) in net assets resulting from operations | | | 87 | | | | 84,967 | | | | 15,879 | |
| Distributions to Shareholders From (Note A): |
| Net investment income: |
| Investor Class | | | — | | | | — | | | | — | |
| Trust Class | | | — | | | | (801 | ) | | | (730 | ) |
| Institutional Class | | | (71 | ) | | | (13,396 | ) | | | (6,572 | ) |
| Class A | | | (0 | ) | | | (8,730 | ) | | | (6,438 | ) |
| Class C | | | (0 | ) | | | (4,324 | ) | | | (3,285 | ) |
| Class R3 | | | — | | | | — | | | | — | |
| Net realized gain on investments: |
| Investor Class | | | — | | | | — | | | | — | |
| Trust Class | | | — | | | | (212 | ) | | | (291 | ) |
| Institutional Class | | | — | | | | (2,545 | ) | | | (2,080 | ) |
| Class A | | | — | | | | (2,165 | ) | | | (2,545 | ) |
| Class C | | | — | | | | (1,374 | ) | | | (1,658 | ) |
| Class R3 | | | — | | | | — | | | | — | |
| Total distributions to shareholders | | | (71 | ) | | | (33,547 | ) | | | (23,599 | ) |
| From Fund Share Transactions (Note D): |
| Proceeds from shares sold: |
| Investor Class | | | — | | | | — | | | | — | |
| Trust Class | | | — | | | | 10,465 | | | | 10,834 | |
| Institutional Class | | | 35,040 | | | | 374,157 | | | | 150,456 | |
| Class A | | | 67 | | | | 174,063 | | | | 119,810 | |
| Class C | | | 30 | | | | 75,610 | | | | 47,139 | |
| Class R3 | | | — | | | | — | | | | — | |
| Proceeds from reinvestment of dividends and distributions: |
| Investor Class | | | — | | | | — | | | | — | |
| Trust Class | | | — | | | | 990 | | | | 984 | |
| Institutional Class | | | 71 | | | | 10,004 | | | | 4,741 | |
| Class A | | | — | | | | 9,064 | | | | 7,397 | |
| Class C | | | — | | | | 3,060 | | | | 2,397 | |
| Class R3 | | | — | | | | — | | | | — | |
| Payments for shares redeemed: |
| Investor Class | | | — | | | | — | | | | — | |
| Trust Class | | | — | | | | (5,762 | ) | | | (8,278 | ) |
| Institutional Class | | | (10,078 | ) | | | (92,839 | ) | | | (60,889 | ) |
| Class A | | | — | | | | (86,202 | ) | | | (70,771 | ) |
| Class C | | | — | | | | (24,726 | ) | | | (19,904 | ) |
| Class R3 | | | — | | | | — | | | | — | |
| Net increase (decrease) from Fund share transactions | | | 25,130 | | | | 447,884 | | | | 183,916 | |
| Net Increase (Decrease) in Net Assets | | | 25,146 | | | | 499,304 | | | | 176,196 | |
| Net Assets: |
| Beginning of year | | | — | | | | 547,418 | | | | 371,222 | |
| End of year | | | $25,146 | | | | $1,046,722 | | | | $547,418 | |
| Undistributed net investment income (loss) at end of year | | | $— | | | | $1,832 | | | | $875 | |
| Distributions in excess of net investment income at end of year | | | $— | | | | $— | | | | $— | |
See Notes to Financial Statements
This page has been left blank intentionally
Notes to Financial Statements Income Funds
Note A—Summary of Significant Accounting Policies:
| 1 | | General: Neuberger Berman Income Funds (the "Trust") is a Delaware statutory trust organized pursuant to an Amended and Restated Trust Instrument dated June 24, 2009. The Trust is registered as an open-end management investment company under the Investment Company Act of 1940, as amended (the "1940 Act"), and its shares are registered under the 1933 Act. Each Fund is a separate operating series of the Trust and is diversified. Four Funds offer Investor Class shares, two offer Trust Class shares, seven offer Institutional Class shares, seven offer Class A shares, seven offer Class C shares and one offers Class R3 shares. Short Duration High Income had no operations until September 28, 2012 other than matters relating to its organization and registration of shares under the 1933 Act. The Board may establish additional series or classes of shares without the approval of shareholders. |
| | | |
| | | The assets of each Fund belong only to that Fund, and the liabilities of each Fund are borne solely by that Fund and no other. |
| | | |
| | | The preparation of financial statements in accordance with U.S. generally accepted accounting principles ("GAAP") requires Management to make estimates and assumptions at the date of the financial statements. Actual results could differ from those estimates. |
| | | |
| 2 | | Portfolio valuation: Investment securities are valued as indicated in the notes following the Funds' Schedule of Investments. |
| | | |
| 3 | | Foreign currency translation: Core Bond, Floating Rate Income, High Income, Short Duration, Short Duration High Income and Strategic Income may invest in foreign securities denominated in foreign currencies. The accounting records of the Funds are maintained in U.S. dollars. Foreign currency amounts are translated into U.S. dollars using the exchange rate as of 4:00 p.m., Eastern time, to determine the value of investments, other assets and liabilities. Purchase and sale prices of securities, and income and expenses, are translated into U.S. dollars at the prevailing rate of exchange on the respective dates of such transactions. Net unrealized foreign currency gain (loss), if any, arises from changes in the value of assets and liabilities, other than investments in securities, as a result of changes in exchange rates and is stated separately in the Statements of Operations. |
| | | |
| 4 | | Securities transactions and investment income: Securities transactions are recorded on trade date for financial reporting purposes. Dividend income is recorded on the ex-dividend date or, for certain foreign dividends, as soon as the Fund becomes aware of the dividends. Non-cash dividends included in dividend income, if any, are recorded at the fair market value of the securities received. Interest income, including accretion of discount (adjusted for original issue discount, where applicable) and amortization of premium, where applicable, is recorded on the accrual basis. Realized gains and losses from securities transactions (for each Fund) and foreign currency transactions (for Core Bond, Floating Rate Income, High Income, Short Duration, Short Duration High Income and Strategic Income), if any, are recorded on the basis of identified cost and stated separately in the Statements of Operations. Included in net realized gain (loss) on investments are proceeds from the settlements of class action litigation in which Core Bond, High Income, Short Duration and Strategic Income participated as class members. The amounts of such proceeds for the year ended October 31, 2012 were $53, $811,229, $8,210 and $6,065 for Core Bond, High Income, Short Duration and Strategic Income, respectively. |
| | | |
| 5 | | Income tax information: Each Fund is treated as a separate entity for U.S. federal income tax purposes. It is the policy of each Fund, except Short Duration High Income, to continue to, and the intention of Short Duration High Income to, qualify as a regulated investment company by complying with the requirements of the U.S. Internal Revenue Code applicable to regulated investment companies and to distribute substantially all of its earnings to its shareholders. To the extent a Fund distributes substantially all of its earnings to shareholders, no federal income or excise tax provision is required. |
| | | |
| | | The Funds have adopted the provisions of ASC 740 "Income Taxes" ("ASC 740"). ASC 740 sets forth a minimum threshold for financial statement recognition of a tax position taken, or expected to be taken, in a tax return. The Funds recognize interest and penalties, if any, related to unrecognized tax positions as an income tax expense in the Statements |
| | of Operations. The Funds are subject to examination by U.S. federal and state tax authorities for returns filed for the prior three fiscal years 2009 - 2011. As of October 31, 2012, the Funds did not have any unrecognized tax positions. |
| | |
| | Income distributions and capital gain distributions are determined in accordance with income tax regulations, which may differ from GAAP. These differences are primarily due to differing treatments of income and gains on various investment securities held by each Fund, timing differences and differing characterization of distributions made by each Fund as a whole. The Funds may also utilize earnings and profits distributed to shareholders on redemption of their shares as a part of the dividends paid deduction for income tax purposes. |
| | |
| | As determined on October 31, 2012, permanent differences resulting primarily from different book and tax accounting were reclassified at year end. Such differences may be attributed to one or more of the following: amortization of bond premium, non-deductible 12b-1 fees, tax treatment of deflation adjustments on U.S. Treasury Inflation Protected Bonds, capital loss carryforwards expiring, paydown gains and losses, foreign currency gains and losses and distribution redesignations. These reclassifications had no effect on net income, net asset value ("NAV") or NAV per share of each Fund. For the year ended October 31, 2012, the Funds recorded the following permanent reclassifications: |
| | | Paid-in Capital | | Undistributed Net Investment Income (Loss) | | Accumulated Net Realized Gains (Losses) on Investments | |
| Core Bond | | | $— | | | | $2,524 | | | | $(2,524 | ) | |
| Floating Rate Income | | | (1 | ) | | | — | | | | 1 | | |
| High Income | | | 1 | | | | — | | | | (1 | ) | |
| Municipal Intermediate Bond | | | — | | | | — | | | | — | | |
| Short Duration | | | (2,468,731 | ) | | | 486,680 | | | | 1,982,051 | | |
| Short Duration High Income | | | (40 | ) | | | 40 | | | | — | | |
| Strategic Income | | | — | | | | 3,584,345 | | | | (3,584,345 | ) | |
| | For tax purposes, short-term gains are considered ordinary income. |
| | The tax character of distributions paid during the years ended October 31, 2012 and October 31, 2011 was as follows: |
| | | Distributions Paid From: |
| | | Taxable Income | | Tax-Exempt Income | | Long-Term Capital Gain | | Return of Capital | | Total |
| | | 2012 | | 2011 | | 2012 | | 2011 | | 2012 | | 2011 | | 2012 | | 2011 | | 2012 | | 2011 |
| Core Bond | | | $9,598,829 | | | | $9,057,417 | | | | $— | | | | $— | | | | $1,267,893 | | | | $283,730 | | | | $— | | | | $— | | | | $10,866,722 | | | | $9,341,147 | |
Floating Rate Income | | | 11,325,064 | | | | 9,226,504 | | | | — | | | | — | | | | — | | | | — | | | | — | | | | — | | | | 11,325,064 | | | | 9,226,504 | |
High Income | | | 175,342,574 | | | | 77,865,786 | | | | — | | | | — | | | | 16,394,086 | | | | 7,083,769 | | | | — | | | | — | | | | 191,736,660 | | | | 84,949,555 | |
Municipal Intermediate Bond | | | 237,224 | | | | 40,358 | | | | 3,448,763 | | | | 3,561,892 | | | | 580,339 | | | | 486,576 | | | | — | | | | — | | | | 4,266,326 | | | | 4,088,826 | |
Short Duration | | | 1,479,347 | | | | 1,882,953 | | | | — | | | | — | | | | — | | | | — | | | | — | | | | — | | | | 1,479,347 | | | | 1,882,953 | |
Short Duration High Income | | | 71,279 | (1) | | | — | | | | — | (1) | | | — | | | | — | (1) | | | — | | | | — | (1) | | | — | | | | 71,279 | (1) | | | — | |
Strategic Income | | | 30,907,548 | | | | 22,870,889 | | | | — | | | | — | | | | 2,639,229 | | | | 727,415 | | | | — | | | | — | | | | 33,546,777 | | | | 23,598,304 | |
| (1) | Period from September 28, 2012 (Commencement of Operations) to October 31, 2012. |
As of October 31, 2012, the components of distributable earnings (accumulated losses) on a U.S. federal income tax basis were as follows:
| | | Undistributed Ordinary Income | | Undistributed Tax-Exempt Income | | Undistributed Long-Term Gain | | Unrealized Appreciation (Depreciation) | | Loss Carryforwards and Deferrals | | Other Temporary Differences | | Total |
| Core Bond | | | $4,520,655 | | | | $— | | | | $2,185,554 | | | | $9,246,905 | | | | $— | | | | $(99,383 | ) | | | $15,853,731 | |
Floating Rate Income | | | 253,052 | | | | — | | | | — | | | | 2,202,996 | | | | (886,739 | ) | | | (254,727 | ) | | | 1,314,582 | |
| High Income | | | 38,084,670 | | | | — | | | | 3,255,046 | | | | 131,732,122 | | | | — | | | | (3,439,254 | ) | | | 169,632,584 | |
Municipal Intermediate Bond | | | 762,203 | | | | 36,259 | | | | 218,863 | | | | 8,057,599 | | | | — | | | | (36,419 | ) | | | 9,038,505 | |
| Short Duration | | | 162,942 | | | | — | | | | — | | | | (1,321,832 | ) | | | (17,758,332 | ) | | | (5,504 | ) | | | (18,922,726 | ) |
Short Duration High Income | | | 85,423 | | | | — | | | | — | | | | (64,894 | ) | | | — | | | | (3,992 | ) | | | 16,537 | |
Strategic Income | | | 21,103,288 | | | | — | | | | 3,071,502 | | | | 45,746,308 | | | | — | | | | (862,159 | ) | | | 69,058,939 | |
The differences between book basis and tax basis distributable earnings are primarily due to: timing differences of distribution payments, delayed settlement compensation on bank loans, timing differences of wash sales, mark to market on certain futures contract transactions, organization expenses, capital loss carryforwards, current year straddle losses deferred and amortization of bond premium.
To the extent each Fund's net realized capital gains, if any, can be offset by capital loss carryforwards, it is the policy of each Fund not to distribute such gains. The Regulated Investment Company ("RIC") Modernization Act of 2010 (the "Act") became effective for the Funds on November 1, 2011. The Act modernizes several of the federal income and excise tax provisions related to RICs. Among the changes made are changes to the capital loss carryforward rules allowing for RICs to carry forward capital losses indefinitely and to retain the character of capital loss carryforwards as short-term or long-term ("Post-Enactment"). Rules in effect previously limited the carryforward period to eight years and all carryforwards were considered short-term in character ("Pre-Enactment"). As determined at October 31, 2012, the following Funds had unused capital loss carryforwards available for federal income tax purposes to offset net realized capital gains, if any, as follows:
| | | Pre-Enactment | |
| | | Expiring in: | |
| | | 2013 | | 2014 | | 2015 | | 2016 | | 2017 | | 2018 | | 2019 | |
| | | | | | | | | | | | | | | | | | | | | | | | | | | | | | |
| Floating Rate Income | | | $— | | | | $— | | | | $— | | | | $— | | | | $— | | | | $— | | | | $886,739 | | |
| Short Duration | | | 3,168,736 | | | | 2,244,689 | | | | 643,625 | | | | — | | | | 8,069,282 | | | | 850,271 | | | | 1,276,932 | | |
| | | Post-Enactment (No Expiration Date) |
| | | Long-Term | | Short-Term |
| Short Duration | | | $1,420,063 | | | | $84,734 | |
Post-Enactment capital loss carryforwards must be fully used before Pre-Enactment capital loss carryforwards; therefore, under certain circumstances, Pre-Enactment capital loss carryforwards available as of the report date may expire unused.
During the year ended October 31, 2012, Floating Rate Income utilized capital loss carryforwards of $637,174. During the year ended October 31, 2012, Short Duration had capital loss carryforwards expire during the year of $2,468,731.
| 6 | | Distributions to shareholders: Each Fund earns income, net of expenses, daily on its investments. Ordinarily, distributions from net investment income are declared on each business day and paid monthly, and distributions from net realized capital gains, if any, are generally distributed once a year (usually in December). Distributions to shareholders are recorded on the ex-date. |
| | | |
| 7 | | Organization expenses: Costs incurred by Short Duration High Income in connection with its organization, which amounted to $112,257, have been expensed as incurred. |
| | | |
| 8 | | Expense allocation: Certain expenses are applicable to multiple funds. Expenses directly attributable to a Fund are charged to that Fund. Expenses of the Trust that are not directly attributable to a particular series of the Trust (e.g., a Fund) are allocated among the series of the Trust, on the basis of relative net assets, except where a more appropriate allocation of expenses to each of the series can otherwise be made fairly. Expenses borne by the complex of related investment companies, which includes open-end and closed-end investment companies for which Management serves as investment manager, that are not directly attributable to a particular investment company in the complex (e.g., the Trust) or series thereof are allocated among the investment companies in the complex or series thereof, on the basis of relative net assets, except where a more appropriate allocation of expenses to each of the investment companies in the complex or series thereof can otherwise be made fairly. Each Fund's expenses (other than those specific to each class) are allocated proportionally each day among the classes based upon the relative net assets of each class. |
| | | |
| 9 | | Dollar rolls: Core Bond, Floating Rate Income, High Income, Short Duration, Short Duration High Income and Strategic Income may enter into dollar roll transactions with respect to mortgage-backed securities. In a dollar roll transaction, a Fund sells securities for delivery in the current month and simultaneously agrees to repurchase substantially similar (i.e., same type and coupon) securities on a specified future date from the same party. During the period before this repurchase, a Fund forgoes principal and interest payments on the securities. A Fund is compensated by the difference between the current sales price and the forward price for the future purchase (often referred to as the "drop"), as well as by the interest earned on the cash proceeds of the initial sale. Dollar rolls may increase fluctuations in a Fund's NAV and may be viewed as a form of leverage. There is a risk that the counterparty will be unable or unwilling to complete the transaction as scheduled, which may result in losses to a Fund. |
| | | |
| 10 | | When-Issued/Delayed Delivery Securities: Each Fund may purchase securities with delivery or payment to occur at a later date beyond the normal settlement period. At the time a Fund enters into a commitment to purchase a security, the transaction is recorded and the value of the security is reflected in the NAV. The price of such security and the date when the security will be delivered and paid for are fixed at the time the transaction is negotiated. The value of the security may vary with market fluctuations. No interest accrues to a Fund until payment takes place. At the time a Fund enters into this type of transaction it is required to segregate cash or other liquid assets at least equal to the amount of the commitment. When-issued and delayed delivery transactions can have a leverage-like effect on a Fund, which can increase fluctuations in the Fund's share price. Certain risks may arise upon entering into when-issued or delayed delivery securities from the potential inability of counterparties to meet the terms of their contracts or if the issuer does not issue the securities due to political, economic, or other factors. Additionally, losses may arise due to changes in the value of the underlying securities. |
| | | |
| 11 | | Foreign taxes: Foreign taxes withheld represent amounts withheld by foreign tax authorities, net of refunds recoverable. |
| | | |
| 12 | | Investments in foreign securities: Investing in foreign securities may involve certain sovereign and other risks, in addition to the credit and market risks normally associated with domestic securities. These additional risks include the possibility of adverse political and economic developments (including political instability, nationalization, expropriation, or confiscatory taxation) and the potentially adverse effects of unavailability of public information regarding issuers, less governmental supervision and regulation of financial markets, reduced liquidity of certain financial markets, and the lack of uniform accounting, auditing, and financial reporting standards or the application of standards that are different or less stringent than those applied in the United States. Foreign securities also may experience greater price volatility, higher rates of inflation, and delays in settlement. |
| 13 | Derivative instruments: During the year ended October 31, 2012, certain of the Funds' use of derivatives, as described below, was limited to financial futures contracts. The Funds have adopted the provisions of ASC 815 "Derivatives and Hedging" ("ASC 815"). The disclosure requirements of ASC 815 distinguish between derivatives that qualify for hedge accounting and those that do not. Because investment companies value their derivatives at fair value and recognize changes in fair value through the Statements of Operations, they do not qualify for hedge accounting. Accordingly, even though a Fund's investments in derivatives may represent economic hedges, they are considered non-hedge transactions for purposes of this disclosure. |
| | |
| | Financial futures contracts: During the year ended October 31, 2012, Floating Rate Income, High Income, Municipal Intermediate Bond, Short Duration and Short Duration High Income did not enter into any financial futures contracts. During the year ended October 31, 2012, Core Bond and Strategic Income entered into financial futures contracts for economic hedging purposes, including as a maturity or duration management device. |
| | |
| | At the time a Fund enters into a financial futures contract, it is required to deposit with the futures commission merchant a specified amount of cash or liquid securities, known as "initial margin," which is a percentage of the value of the financial futures contract being traded that is set by the exchange upon which the futures contract is traded. Each day, the futures contract is valued at the official settlement price of the board of trade or U.S. commodity exchange on which such futures contract is traded. Subsequent payments, known as "variation margin," to and from the broker are made on a daily basis, or as needed, as the market price of the financial futures contract fluctuates. Daily variation margin adjustments, arising from this "mark to market," are recorded by a Fund as unrealized gains or losses. |
| | |
| | Although some financial futures contracts by their terms call for actual delivery or acquisition of the underlying securities or currency, in most cases the contracts are closed out prior to delivery by offsetting purchases or sales of matching financial futures contracts. When the contracts are closed, a Fund recognizes a gain or loss. Risks of entering into futures contracts include the possibility there may be an illiquid market, possibly at a time of rapidly declining prices, and/or a change in the value of the contract may not correlate with changes in the value of the underlying securities. Futures executed on regulated futures exchanges have minimal counterparty risk to a fund because the exchange's clearinghouse assumes the position of the counterparty in each transaction. Thus, a Fund is exposed to risk only in connection with the clearinghouse and not in connection with the original counterparty to the transaction. |
| | |
| | For U.S. federal income tax purposes, the futures transactions undertaken by a Fund may cause that Fund to recognize gains or losses from marking contracts to market even though its positions have not been sold or terminated, may affect the character of the gains or losses recognized as long-term or short-term, and may affect the timing of some capital gains and losses realized by the Fund. Also, a Fund's losses on transactions involving futures contracts may be deferred rather than being taken into account currently in calculating such Fund's taxable income. |
| | |
| | At October 31, 2012, open positions in financial futures contracts were: |
| Fund | Expiration | Open Contracts | Position | | Unrealized Appreciation (Depreciation) |
| | | | | | |
| Core Bond | December 2012 | 211 U.S. Treasury Notes, 5 Year | Short | | | $(19,359 | ) |
| Core Bond | December 2012 | 123 U.S. Treasury Notes, 10 Year | Short | | | (54,851 | ) |
| Core Bond | December 2012 | 33 U.S. Treasury Notes, 2 Year | Long | | | (3,093 | ) |
| Core Bond | December 2015 | 29 Euribor Interest Rate, 3 Month | Long | | | (2,572 | ) |
| Core Bond | December 2015 | 22 Eurodollar, 90 Day | Long | | | (412 | ) |
| Total | | | | | | $(80,287 | ) |
| Strategic Income | December 2012 | 537 U.S. Treasury Notes, 5 Year | Short | | | $(49,277 | ) |
| Strategic Income | December 2012 | 488 U.S. Treasury Notes, 10 Year | Short | | | (108,929 | ) |
| Fund | Expiration | Open Contracts | Position | | Unrealized Appreciation (Depreciation) |
| | | | | | |
| Strategic Income | December 2012 | 35 U.S. Treasury Bond, Ultra Long | Short | | | $(17,500 | ) |
| Strategic Income | December 2012 | 65 Australian Dollar | Short | | | (120,710 | ) |
| Strategic Income | December 2012 | 25 Canadian Dollar | Short | | | 31,600 | |
| Strategic Income | December 2012 | 12 Japanese Yen | Short | | | 32,625 | |
| Strategic Income | December 2012 | 74 New Zealand Dollar | Short | | | (205,720 | ) |
| Strategic Income | December 2012 | 105 U.S. Treasury Notes, 2 Year | Long | | | (9,840 | ) |
| Strategic Income | September 2013 | 4 New Zealand Bank Bill, 90 Day | Long | | | 2,001 | |
| Strategic Income | December 2013 | 50 Canada Bankers Acceptance, 3 Month | Long | | | 14,568 | |
| Strategic Income | December 2015 | 156 Eurodollar, 90 Day | Long | | | (13,687 | ) |
| Strategic Income | December 2015 | 118 Euribor Interest Rate, 3 Month | Long | | | (10,628 | ) |
| Total | | | | | | $(455,497 | ) |
During the year ended October 31, 2012, the average notional value of financial futures contracts was:
| | | Long Positions | | Short Positions |
| Core Bond | | | $4,999,222 | | | | $(30,027,570 | ) |
| Strategic Income | | | $26,658,761 | | | | $(97,811,860 | ) |
At October 31, 2012, the notional value of financial futures contracts was:
| | | Long Positions | | Short Positions |
| Core Bond | | | $22,020,201 | | | | $(42,579,594 | ) |
| Strategic Income | | | $115,232,180 | | | | $(154,584,711 | ) |
At October 31, 2012, the Funds had deposited the following in segregated accounts to cover margin requirements on open futures contracts:
| Core Bond | | | $252,735 | |
| Strategic Income | | | $1,559,407 | |
At October 31, 2012, the Funds had the following derivatives (which did not qualify as hedging instruments under ASC 815), grouped by primary risk exposure:
Liability Derivatives
| | Statements of Assets and Liabilities Location | | Interest Rate Risk | | Currency Risk | | Total |
| Core Bond |
| Futures Contracts | | | | $(80,287 | ) | | | $— | | | | $(80,287 | ) |
| Total Value | | | | $(80,287 | ) | | | $— | | | | $(80,287 | ) |
| | Payable for variation margin(1) | | | | | | |
| Strategic Income |
| Futures Contracts | | | | $(193,292 | ) | | | $(262,205 | ) | | | $(455,497 | ) |
| Total Value | | | | $(193,292 | ) | | | $(262,205 | ) | | | $(455,497 | ) |
| (1) | "Futures Contracts" reflects the cumulative appreciation (depreciation) of futures contracts as of October 31, 2012, which is reflected in the Statements of Assets and Liabilities under the caption "Net unrealized appreciation |
| | (depreciation) in value of investments." The outstanding variation margin as of October 31, 2012, if any, is reflected in the Statements of Assets and Liabilities under the caption "Payable for variation margin." The impact of the use of these derivative instruments on the Statements of Operations during the year ended October 31, 2012, was as follows: |
Realized Gain (Loss)
| | Statements of Operations Location | | Interest Rate Risk | | Currency Risk | | Total |
| Core Bond |
| Futures Contracts | | | | $(610,672 | ) | | | $— | | | | $(610,672 | ) |
Total Realized Gain (Loss) Strategic Income | Net realized gain (loss) on: financial futures contracts | | | $(610,672 | ) | | | $— | | | | $(610,672 | ) |
| Futures Contracts | | | | $(2,138,869 | ) | | | $154,164 | | | | $(1,984,705 | ) |
| Total Realized Gain (Loss) | | | | $(2,138,869 | ) | | | $154,164 | | | | $(1,984,705 | ) |
| Change in Appreciation (Depreciation) | |
| | Statements of Operations Location | | Interest Rate Risk | | Currency Risk | | Total |
| Core Bond |
| Futures Contracts | | | | $(7,381 | ) | | | $— | | | | $(7,381 | ) |
Total Change in Appreciation (Depreciation) | Change in net unrealized appreciation | | | $(7,381 | ) | | | $— | | | | $(7,381 | ) |
| Strategic Income | (depreciation) in | | | | | | |
| Futures Contracts | value of: | | | $51,521 | | | | $(262,205 | ) | | | $(210,684 | ) |
Total Change in Appreciation (Depreciation) | financial futures contracts | | | $51,521 | | | | $(262,205 | ) | | | $(210,684 | ) |
| | | Management has concluded that the Funds, except Core Bond and Strategic Income, did not hold any derivative instruments during the year ended October 31, 2012 that require additional disclosures pursuant to ASC 815. |
| | | |
| 14 | | Indemnifications: Like many other companies, the Trust's organizational documents provide that its officers and trustees are indemnified against certain liabilities arising out of the performance of their duties to the Trust. In addition, both in some of its principal service contracts and in the normal course of its business, the Trust enters into contracts that provide indemnifications to other parties for certain types of losses or liabilities. The Trust's maximum exposure under these arrangements is unknown as this could involve future claims against the Trust. |
| | | |
| 15 | | Expense offset arrangement: Each Fund has an expense offset arrangement in connection with its custodian contract. For the year ended October 31, 2012, the impact of this arrangement was a reduction of expenses of $30, $300, $1,995, $540, $34, $0 and $341 for Core Bond, Floating Rate Income, High Income, Municipal Intermediate Bond, Short Duration, Short Duration High Income and Strategic Income, respectively. |
| 16 | | Other: All net investment income and realized and unrealized capital gains and losses of each Fund are allocated, on the basis of relative net assets, pro rata among its respective classes. |
Note B—Management Fees, Administration Fees, Distribution Arrangements, and Other Transactions with Affiliates:
| | | Each Fund retains Management as its investment manager under a Management Agreement. For such investment management services, Core Bond, Municipal Intermediate Bond and Short Duration each pays Management a fee at the annual rate of 0.25% of the first $500 million of that Fund's average daily net assets, 0.225% of the next $500 million, 0.20% of the next $500 million, 0.175% of the next $500 million, and 0.15% of average daily net assets in excess of $2 billion. Accordingly, for the year ended October 31, 2012, the fee pursuant to the Management Agreement was equivalent to an annual effective rate of 0.25%, 0.25% and 0.25% of Core Bond's, Municipal Intermediate Bond's and Short Duration's average daily net assets, respectively. For such investment management services, Floating Rate Income, High Income, Short Duration High Income and Strategic Income each pays Management a fee at the annual rate of 0.50%, 0.48%, 0.45%, and 0.55%, respectively, of its average daily net assets. Management had voluntarily agreed to waive its management fee in the amount of 0.06% of the average daily net assets of Core Bond. Effective November 1, 2012, Management terminated the voluntary waiver for Core Bond. For the year ended October 31, 2012, such waived fees amounted to $152,544 for Core Bond. Accordingly, for the year ended October 31, 2012, the management fee pursuant to the Management Agreement was equivalent to an annual effective net rate of 0.19% of Core Bond's average daily net assets. |
| | | Each Fund retains Management as its administrator under an Administration Agreement. Each Fund pays Management an administration fee at the annual rate of 0.06% of its average daily net assets under this agreement. In addition, Investor Class, Class A, Class C and Class R3 of each Fund that offers those classes pays Management an administration fee at the annual rate of 0.21% of its average daily net assets, Trust Class of each of Short Duration and Strategic Income pays Management an administration fee at the annual rate of 0.44% and 0.34%, respectively, of its average daily net assets and Institutional Class of each Fund that offers that class pays Management an administration fee at the annual rate of 0.09% of its average daily net assets, under this agreement. Additionally, Management retains State Street Bank and Trust Company ("State Street") as its sub-administrator under a Sub-Administration Agreement. Management pays State Street a fee for all services received under the agreement. |
| | | Management has contractually agreed to waive current payment of fees and/or reimburse certain expenses of the Investor Class, Trust Class, Institutional Class, Class A, Class C and Class R3 of each Fund that offers those classes so that the total annual operating expenses of those classes do not exceed the expense limitations as detailed in the following table. These undertakings apply to a Fund's direct expenses and exclude interest, taxes, brokerage commissions, acquired fund fees and expenses, extraordinary expenses and dividend expense on short sales, if any; consequently, net expenses may exceed the contractual expense limitations. Each Fund has agreed that each of its respective classes will repay Management for fees and expenses waived or reimbursed for that class provided that repayment does not cause that class's annual operating expenses to exceed its contractual expense limitation in place at the time the fees were waived or reimbursed. Any such repayment must be made within three years after the year in which Management incurred the expense. |
| | | During the year ended October 31, 2012, Class C of High Income and Class R3 of High Income reimbursed Management $7,723 and $1,578, respectively, under its contractual expense limitation. |
At October 31, 2012, contingent liabilities to Management under the contractual expense limitations were as follows:
| | | | | | Expenses Reimbursed in Fiscal Period Ending, October 31, |
| | | | | | 2010 | | 2011 | | 2012 |
| | | | | | Subject to Repayment until October 31, |
| Class | | Contractual Expense Limitation(1) | Expiration | | 2013 | | 2014 | | 2015 |
| Core Bond Investor Class | | | 0.85 | % | 10/31/21 | | | $25,560 | | | | $29,269 | | | | $27,514 | |
| Core Bond Institutional Class | | | 0.45 | % | 10/31/21 | | | 54,638 | | | | 134,496 | | | | 154,024 | |
| Core Bond Class A | | | 0.85 | % | 10/31/21 | | | 6,716 | | | | 16,514 | | | | 26,508 | |
| Core Bond Class C | | | 1.60 | % | 10/31/21 | | | 957 | | | | 2,434 | | | | 6,318 | |
| Floating Rate Income Institutional Class | | | 0.70 | % | 10/31/15 | | | 410,835 | (3) | | | 358,055 | | | | 374,906 | |
| Floating Rate Income Class A | | | 1.07 | % | 10/31/21 | | | 57,005 | (2) | | | 54,980 | | | | 58,121 | |
| Floating Rate Income Class C | | | 1.82 | % | 10/31/21 | | | 6,128 | (3) | | | 11,494 | | | | 21,016 | |
| High Income Investor Class | | | 1.00 | % | 10/31/15 | | | — | | | | — | | | | — | |
| High Income Institutional Class | | | 0.75 | % | 10/31/15 | | | — | | | | — | | | | — | |
| High Income Class A | | | 1.12 | % | 10/31/15 | | | — | | | | — | | | | — | |
| High Income Class C | | | 1.87 | % | 10/31/15 | | | — | | | | — | | | | — | |
| High Income Class R3 | | | 1.37 | % | 10/31/15 | | | — | | | | — | | | | — | |
| Municipal Intermediate Bond Investor Class | | | 0.65 | % | 10/31/15 | | | 402,491 | | | | 364,558 | | | | 93,905 | |
Municipal Intermediate Bond Institutional Class | | | 0.50 | % | 10/31/15 | | | 3,630 | (4) | | | 11,099 | | | | 179,948 | |
| Municipal Intermediate Bond Class A | | | 0.87 | % | 10/31/15 | | | 3,660 | (4) | | | 1,607 | | | | 4,964 | |
| Municipal Intermediate Bond Class C | | | 1.62 | % | 10/31/15 | | | 3,637 | (4) | | | 1,310 | | | | 3,645 | |
| Short Duration Investor Class | | | 0.70 | % | 10/31/15 | | | 322,782 | | | | 256,301 | | | | 194,144 | |
| Short Duration Trust Class | | | 0.80 | % | 10/31/15 | | | 59,964 | | | | 43,741 | | | | 31,215 | |
| Short Duration Institutional Class | | | 0.50 | % | 10/31/15 | | | 3,653 | (4) | | | 55,445 | | | | 72,550 | |
| Short Duration Class A | | | 0.87 | % | 10/31/15 | | | 3,698 | (4) | | | 2,715 | | | | 4,577 | |
| Short Duration Class C | | | 1.62 | % | 10/31/15 | | | 3,646 | (4) | | | 2,242 | | | | 6,131 | |
Short Duration High Income Institutional Class | | | 0.75 | %(6) | 10/31/15 | | | — | | | | — | | | | 177,932 | (5) |
| Short Duration High Income Class A | | | 1.12 | %(6) | 10/31/15 | | | — | | | | — | | | | 382 | (5) |
| Short Duration High Income Class C | | | 1.87 | %(6) | 10/31/15 | | | — | | | | — | | | | 242 | (5) |
| Strategic Income Trust Class | | | 1.10 | % | 10/31/15 | | | 28,331 | | | | 28,723 | | | | 21,192 | |
| Strategic Income Institutional Class | | | 0.75 | % | 10/31/21 | | | 153,882 | | | | 219,304 | | | | 285,110 | |
| Strategic Income Class A | | | 1.15 | % | 10/31/21 | | | 196,672 | | | | 259,854 | | | | 211,303 | |
| Strategic Income Class C | | | 1.85 | % | 10/31/21 | | | 157,265 | | | | 184,718 | | | | 176,962 | |
| (1) | Expense limitation per annum of the respective class's average daily net assets. |
| (2) | Period from December 29, 2009 to October 31, 2010. |
| (3) | Period from December 30, 2009 to October 31, 2010. |
| (4) | Period from June 21, 2010 to October 31, 2010. |
| (5) | Period from September 28, 2012 to October 31, 2012. |
| (6) | In addition, Management voluntarily waived expenses as necessary to maintain a minimum yield from September 28, 2012 (Commencement of Operations) to October 2, 2012. For the period ended October 31, 2012, voluntary reimbursements for the Institutional Class, Class A and Class C of Short Duration High Income amounted to $935, $5 and $8, respectively. These amounts are not subject to recovery by Management. This undertaking was in addition to the contractual undertakings as stated above. |
| | Management and Neuberger Berman Fixed Income LLC ("NBFI") are indirect subsidiaries of Neuberger Berman Group LLC (("NBG") and together with its consolidated subsidiaries ("NB Group")). NBSH Acquisition, LLC ("NBSH"), which is owned by portfolio managers, members of the NB Group management team and certain of NB Group's key employees and senior professionals, owns, as of September 30, 2012, approximately 57% of NBG's common units, and Lehman Brothers Holdings Inc. ("LBHI") and certain of its subsidiaries (collectively the "LBHI Parties") own the remaining 43% of such common units. Pursuant to agreements among NBG, NBSH and the LBHI Parties, NBG is entitled to acquire the remaining Class A common units through a process that is expected to end in 2017. In April 2012, NBG exercised its option (the "Redemption Agreement Option") to redeem during 2012 certain of its Class A common units held by the LBHI Parties equal to 10% of NBG's aggregate common units issued and outstanding as of March 16, 2012. The final payment for such Class A common units is due within thirty (30) days of December 31, 2012. |
| | NBFI, as the sub-adviser to High Income, Municipal Intermediate Bond, Short Duration and Strategic Income, is retained by Management to furnish it with investment recommendations and research information without added cost to each Fund it sub-advises. NBFI, as the sub-adviser to Core Bond, Floating Rate Income and Short Duration High Income, is retained by Management to provide day-to-day investment management services and receives a monthly fee paid by Management. As investment manager, Management is responsible for overseeing the investment activities of NBFI. Several individuals who are officers and/or Trustees of the Trust are also employees of NBFI, Neuberger Berman LLC ("Neuberger") and/or Management. |
| | Each Fund also has a distribution agreement with Management with respect to each class of shares. Management acts as agent in arranging for the sale of class shares without sales commission or other compensation, except as described below for Class A and Class C shares, and bears advertising and promotion expenses. |
| | However, Management receives fees from Core Bond's Investor Class, Strategic Income's Trust Class, High Income's Class R3, and each Fund's Class A and Class C under their distribution plans (each a "Plan", collectively, the "Plans") pursuant to Rule 12b-1 under the 1940 Act. The Plans provide that, as compensation for administrative and other services provided to these classes, Management's activities and expenses related to the sale and distribution of these classes of shares, and ongoing services provided to investors in these classes, Management receives from each of these respective classes a fee at the annual rate of 0.25% of Core Bond Investor Class', Core Bond Class A's, Floating Rate Income Class A's, High Income Class A's, Municipal Intermediate Bond Class A's, Short Duration Class A's, Short Duration High Income Class A's and Strategic Income Class A's average daily net assets; 0.10% of Strategic Income Trust Class' average daily net assets; 0.50% of High Income Class R3's average daily net assets; and 1.00% of Core Bond Class C's, Floating Rate Income Class C's, High Income Class C's, Municipal Intermediate Bond Class C's, Short Duration Class C's, Short Duration High Income Class C's and Strategic Income Class C's average daily net assets. Management receives this amount to provide distribution and shareholder servicing for these classes and pays a portion of it to institutions that provide such services. Those institutions may use the payments for, among other purposes, compensating employees engaged in sales and/or shareholder servicing. The amount of fees paid by each class during any year may be more or less than the cost of distribution and other services provided to that class. FINRA rules limit the amount of annual distribution fees that may be paid by a mutual fund and impose a ceiling on the cumulative distribution fees paid. The Trust's Plans comply with those rules. |
| | Class A shares of each Fund (except Short Duration) are generally sold with an initial sales charge of up to 4.25%. Class A shares of Short Duration are generally sold with an initial sales charge of up to 2.50% (4.25% prior to June 15, 2011). Class A shares of each Fund are generally sold with no contingent deferred sales charge ("CDSC"), except that a CDSC of 1.00% applies to certain redemptions made within 18 months following purchases of |
| | $1 million or more without an initial sales charge. Class C shares of each Fund are sold with no initial sales charge and a 1.00% CDSC if shares are sold within one year after purchase. |
| | For the year ended October 31, 2012, Management, acting as underwriter and broker-dealer, received net initial sales charges from the purchase of Class A shares and CDSCs from the redemption of Class A and Class C shares as follows: |
| | | Underwriter | | Broker-Dealer |
| | | Net Initial Sales Charges | | CDSC | | Net Initial Sales Charges | | CDSC |
| | | | | | | | | |
| Core Bond Class A | | | $2,208 | | | | $3,212 | | | | $— | | | | $— | |
| Core Bond Class C | | | — | | | | 3,164 | | | | — | | | | — | |
| Floating Rate Income Class A | | | 4,295 | | | | — | | | | — | | | | — | |
| Floating Rate Income Class C | | | — | | | | 8,979 | | | | — | | | | — | |
| High Income Class A | | | 34,791 | | | | — | | | | — | | | | — | |
| High Income Class C | | | — | | | | 15,529 | | | | — | | | | — | |
| Municipal Intermediate Bond Class A | | | 2,100 | | | | — | | | | — | | | | — | |
| Municipal Intermediate Bond Class C | | | — | | | | 215 | | | | — | | | | — | |
| Short Duration Class A | | | 416 | | | | — | | | | — | | | | — | |
| Short Duration Class C | | | — | | | | 2,107 | | | | — | | | | — | |
| Short Duration High Income Class A | | | — | | | | — | | | | — | | | | — | |
| Short Duration High Income Class C | | | — | | | | — | | | | — | | | | — | |
| Strategic Income Class A | | | 26,093 | | | | 6,180 | | | | — | | | | — | |
| Strategic Income Class C | | | — | | | | 33,456 | | | | — | | | | — | |
Note C—Securities Transactions:
| | Cost of purchases and proceeds of sales and maturities of long-term securities (excluding financial futures contracts) for the year ended October 31, 2012, were as follows: |
| | | Purchases of U.S. Government and Agency Obligations | | Purchases excluding U.S. Government and Agency Obligations | | Sales and Maturities of U.S. Government and Agency Obligations | | Sales and Maturities excluding U.S. Government and Agency Obligations |
| | | | | | | | | |
| Core Bond | | | $810,580,329 | | | | $165,007,530 | | | | $754,408,981 | | | | $151,243,821 | |
| Floating Rate Income | | | — | | | | 307,370,071 | | | | — | | | | 238,108,796 | |
| High Income | | | — | | | | 3,070,721,144 | | | | — | | | | 2,132,684,590 | |
| Municipal Intermediate Bond | | | — | | | | 98,609,479 | | | | — | | | | 74,044,069 | |
| Short Duration | | | 25,545,081 | | | | 20,373,313 | | | | 21,493,381 | | | | 28,058,818 | |
| Short Duration High Income | | | — | | | | 31,794,976 | | | | — | | | | 7,499,800 | |
| Strategic Income | | | 2,379,406,255 | | | | 1,054,917,057 | | | | 2,140,768,116 | | | | 695,120,917 | |
Note D—Fund Share Transactions:
| | Share activity for the years ended October 31, 2012 and October 31, 2011 was as follows: |
| | | For the Year Ended October 31, 2012 | | | For the Year Ended October 31, 2011 | |
| (000's omitted) | | Shares Sold | | Shares Issued on Reinvestment of Dividends and Distributions | | Shares Redeemed | | Total | | | Shares Sold | | Shares Issued on Reinvestment of Dividends and Distributions | | Shares Redeemed | | Total | |
| Core Bond: | | | | | | | |
| Investor Class | | | 324 | | | | 61 | | | | (363 | ) | | | 22 | | | | | 348 | | | | 78 | | | | (690 | ) | | | (264 | ) | |
| Institutional Class | | | 6,241 | | | | 677 | | | | (3,852 | ) | | | 3,066 | | | | | 8,872 | | | | 546 | | | | (3,741 | ) | | | 5,677 | | |
| Class A | | | 3,279 | | | | 109 | | | | (1,539 | ) | | | 1,849 | | | | | 1,550 | | | | 93 | | | | (1,352 | ) | | | 291 | | |
| Class C | | | 885 | | | | 8 | | | | (671 | ) | | | 222 | | | | | 288 | | | | 3 | | | | (150 | ) | | | 141 | | |
Floating Rate Income: | | | | | | | |
| Institutional Class | | | 11,780 | | | | 886 | | | | (7,359 | ) | | | 5,307 | | | | | 16,115 | | | | 742 | | | | (5,479 | ) | | | 11,378 | | |
| Class A | | | 1,760 | | | | 92 | | | | (541 | ) | | | 1,311 | | | | | 3,265 | | | | 82 | | | | (2,324 | ) | | | 1,023 | | |
| Class C | | | 932 | | | | 17 | | | | (319 | ) | | | 630 | | | | | 838 | | | | 11 | | | | (139 | ) | | | 710 | | |
| High Income: | | | | | | | |
| Investor Class | | | 9,593 | | | | 2,373 | | | | (10,115 | ) | | | 1,851 | | | | | 10,533 | | | | 2,735 | | | | (17,449 | ) | | | (4,181 | ) | |
| Institutional Class | | | 150,548 | | | | 10,305 | | | | (84,435 | ) | | | 76,418 | | | | | 154,507 | | | | 2,365 | | | | (17,943 | ) | | | 138,929 | | |
| Class A | | | 29,869 | | | | 2,498 | | | | (16,668 | ) | | | 15,699 | | | | | 26,927 | | | | 2,180 | | | | (20,648 | ) | | | 8,459 | | |
| Class C | | | 4,013 | | | | 221 | | | | (1,766 | ) | | | 2,468 | | | | | 3,036 | | | | 133 | | | | (686 | ) | | | 2,483 | | |
| Class R3 | | | 841 | | | | 31 | | | | (172 | ) | | | 700 | | | | | 428 | | | | 6 | | | | (153 | ) | | | 281 | | |
Municipal Intermediate Bond: | | | | | | | |
| Investor Class | | | 708 | | | | 143 | | | | (9,175 | ) | | | (8,324 | ) | | | | 2,480 | | | | 327 | | | | (3,009 | ) | | | (202 | ) | |
| Institutional Class | | | 10,438 | | | | 183 | | | | (866 | ) | | | 9,755 | | | | | 723 | | | | 7 | | | | (151 | ) | | | 579 | | |
| Class A | | | 292 | | | | 3 | | | | (26 | ) | | | 269 | | | | | 26 | | | | — | | | | (26 | ) | | | — | | |
| Class C | | | 90 | | | | 1 | | | | (19 | ) | | | 72 | | | | | 47 | | | | — | | | | — | | | | 47 | | |
| Short Duration: | | | | | | | |
| Investor Class | | | 431 | | | | 112 | | | | (1,308 | ) | | | (765 | ) | | | | 642 | | | | 158 | | | | (2,130 | ) | | | (1,330 | ) | |
| Trust Class | | | 121 | | | | 17 | | | | (262 | ) | | | (124 | ) | | | | 221 | | | | 25 | | | | (613 | ) | | | (367 | ) | |
| Institutional Class | | | 2,194 | | | | 45 | | | | (1,744 | ) | | | 495 | | | | | 2,343 | | | | 38 | | | | (114 | ) | | | 2,267 | | |
| Class A | | | 293 | | | | 2 | | | | (12 | ) | | | 283 | | | | | 632 | | | | — | | | | (616 | ) | | | 16 | | |
| Class C | | | 181 | | | | 1 | | | | (92 | ) | | | 90 | | | | | 193 | | | | 1 | | | | (68 | ) | | | 126 | | |
Short Duration High Income: | | | | | | | |
Institutional Class(1) | | | 3,503 | | | | 7 | | | | (1,007 | ) | | | 2,503 | | | | | — | | | | — | | | | — | | | | — | | |
Class A(1) | | | 7 | | | | — | | | | — | | | | 7 | | | | | — | | | | — | | | | — | | | | — | | |
Class C(1) | | | 3 | | | | — | | | | — | | | | 3 | | | | | — | | | | — | | | | — | | | | — | | |
| Strategic Income: | | | | | | | |
| Trust Class | | | 936 | | | | 89 | | | | (520 | ) | | | 505 | | | | | 990 | | | | 90 | | | | (758 | ) | | | 322 | | |
| Institutional Class | | | 33,284 | | | | 894 | | | | (8,282 | ) | | | 25,896 | | | | | 13,750 | | | | 434 | | | | (5,562 | ) | | | 8,622 | | |
| Class A | | | 15,491 | | | | 814 | | | | (7,673 | ) | | | 8,632 | | | | | 10,912 | | | | 677 | | | | (6,467 | ) | | | 5,122 | | |
| Class C | | | 6,746 | | | | 275 | | | | (2,201 | ) | | | 4,820 | | | | | 4,307 | | | | 219 | | | | (1,818 | ) | | | 2,708 | | |
| (1) | Period from September 28, 2012 to October 31, 2012. |
Note E—Line of Credit:
At October 31, 2012, each Fund (except Short Duration High Income) was a participant in a single committed, unsecured $200,000,000 line of credit with State Street, to be used only for temporary or emergency purposes. Other investment companies managed by Management also participate in this line of credit on the same terms. Interest is charged on borrowings under this line of credit at the higher of (a) the Federal Funds Rate plus 1.25% per annum or (b) the Overnight LIBOR Rate plus 1.25% per annum. A commitment fee of 0.10% per annum of the available line of credit is charged, of which each participating Fund has agreed to pay its pro rata share, based on the ratio of its individual net assets to the net assets of all participants at the time the fee is due and payable. The fee is paid quarterly in arrears. Because several mutual funds participate, there is no assurance that an individual Fund will have access to all or any part of the $200,000,000 at any particular time. There were no loans outstanding pursuant to this line of credit at October 31, 2012. During the twelve months ended October 31, 2012, none of the Funds utilized this line of credit.
Note F—Recent Accounting Pronouncement:
In December 2011, the Financial Accounting Standards Board issued Accounting Standards Update 2011-11 Disclosures about Offsetting Assets and Liabilities ("ASU 2011-11"). Effective for annual reporting periods beginning on or after January 1, 2013 and interim periods within those annual periods, ASU 2011-11 is intended to enhance disclosure requirements on the offsetting of financial assets and liabilities. At this time, Management is evaluating the implications of ASU 2011-11 and its impact on the financial statements.
This page has been left blank intentionally
Financial Highlights
The following tables include selected data for a share outstanding throughout each period and other performance information derived from the Financial Statements. Per share amounts that round to less than $0.01 or $(0.01) per share are presented as $0.00 or $(0.00), respectively. Net Asset amounts with a zero balance may reflect actual amounts rounding to less than $0.1 million.
| | | Net Asset Value, Beginning of Year | | Net Investment Income (Loss)@ | | Net Gains or Losses on Securities (both realized and unrealized) | | Total From Investment Operations | | Dividends from Net Investment Income | | Distributions from Net Realized Capital Gains | | Tax Return of Capital | | Total Distributions |
| Core Bond Fund |
| |
| Investor Class |
| 10/31/2012 | | $ | 10.79 | | | $ | 0.18 | | | $ | 0.52 | | | $ | 0.70 | | | $ | (0.18 | ) | | $ | (0.27 | ) | | $ | — | | | $ | (0.45 | ) |
| 10/31/2011 | | $ | 10.86 | | | $ | 0.23 | | | $ | 0.22 | | | $ | 0.45 | | | $ | (0.25 | ) | | $ | (0.27 | ) | | $ | — | | | $ | (0.52 | ) |
| 10/31/2010 | | $ | 10.19 | | | $ | 0.28 | | | $ | 0.72 | | | $ | 1.00 | | | $ | (0.28 | ) | | $ | (0.05 | ) | | $ | — | | | $ | (0.33 | ) |
| 10/31/2009 | | $ | 8.64 | | | $ | 0.40 | | | $ | 1.55 | | | $ | 1.95 | | | $ | (0.40 | ) | | $ | (0.00 | ) | | $ | — | | | $ | (0.40 | ) |
| 10/31/2008 | | $ | 9.76 | | | $ | 0.39 | | | $ | (1.12 | ) | | $ | (0.73 | ) | | $ | (0.39 | ) | | $ | — | | | $ | — | | | $ | (0.39 | ) |
| |
| Institutional Class |
| 10/31/2012 | | $ | 10.81 | | | $ | 0.22 | | | $ | 0.53 | | | $ | 0.75 | | | $ | (0.23 | ) | | $ | (0.27 | ) | | $ | — | | | $ | (0.50 | ) |
| 10/31/2011 | | $ | 10.88 | | | $ | 0.28 | | | $ | 0.22 | | | $ | 0.50 | | | $ | (0.30 | ) | | $ | (0.27 | ) | | $ | — | | | $ | (0.57 | ) |
| 10/31/2010 | | $ | 10.21 | | | $ | 0.32 | | | $ | 0.73 | | | $ | 1.05 | | | $ | (0.33 | ) | | $ | (0.05 | ) | | $ | — | | | $ | (0.38 | ) |
| 10/31/2009 | | $ | 8.65 | | | $ | 0.43 | | | $ | 1.57 | | | $ | 2.00 | | | $ | (0.44 | ) | | $ | (0.00 | ) | | $ | — | | | $ | (0.44 | ) |
| 10/31/2008 | | $ | 9.77 | | | $ | 0.43 | | | $ | (1.12 | ) | | $ | (0.69 | ) | | $ | (0.43 | ) | | $ | — | | | $ | — | | | $ | (0.43 | ) |
| |
| Class A |
| 10/31/2012 | | $ | 10.77 | | | $ | 0.17 | | | $ | 0.53 | | | $ | 0.70 | | | $ | (0.18 | ) | | $ | (0.27 | ) | | $ | — | | | $ | (0.45 | ) |
| 10/31/2011 | | $ | 10.85 | | | $ | 0.23 | | | $ | 0.21 | | | $ | 0.44 | | | $ | (0.25 | ) | | $ | (0.27 | ) | | $ | — | | | $ | (0.52 | ) |
| 10/31/2010 | | $ | 10.18 | | | $ | 0.28 | | | $ | 0.72 | | | $ | 1.00 | | | $ | (0.28 | ) | | $ | (0.05 | ) | | $ | — | | | $ | (0.33 | ) |
| 10/31/2009 | | $ | 8.64 | | | $ | 0.37 | | | $ | 1.57 | | | $ | 1.94 | | | $ | (0.40 | ) | | $ | (0.00 | ) | | $ | — | | | $ | (0.40 | ) |
Period from 12/20/2007^ to 10/31/2008 | | $ | 9.77 | | | $ | 0.33 | | | $ | (1.13 | ) | | $ | (0.80 | ) | | $ | (0.33 | ) | | $ | — | | | $ | — | | | $ | (0.33 | ) |
| |
| Class C |
| 10/31/2012 | | $ | 10.78 | | | $ | 0.09 | | | $ | 0.53 | | | $ | 0.62 | | | $ | (0.10 | ) | | $ | (0.27 | ) | | $ | — | | | $ | (0.37 | ) |
| 10/31/2011 | | $ | 10.86 | | | $ | 0.15 | | | $ | 0.21 | | | $ | 0.36 | | | $ | (0.17 | ) | | $ | (0.27 | ) | | $ | — | | | $ | (0.44 | ) |
| 10/31/2010 | | $ | 10.18 | | | $ | 0.19 | | | $ | 0.74 | | | $ | 0.93 | | | $ | (0.20 | ) | | $ | (0.05 | ) | | $ | — | | | $ | (0.25 | ) |
| 10/31/2009 | | $ | 8.64 | | | $ | 0.32 | | | $ | 1.55 | | | $ | 1.87 | | | $ | (0.33 | ) | | $ | (0.00 | ) | | $ | — | | | $ | (0.33 | ) |
Period from 12/20/2007^ to 10/31/2008 | | $ | 9.77 | | | $ | 0.26 | | | $ | (1.12 | ) | | $ | (0.86 | ) | | $ | (0.27 | ) | | $ | — | | | $ | — | | | $ | (0.27 | ) |
See Notes to Financial Highlights
| | | Capital Contributions | | Net Asset Value, End of Year | | Total Return†† | | Net Assets, End of Year (in millions) | | Ratio of Gross Expenses to Average Net Assets# | | Ratio of Net Expenses to Average Net Assets‡ | Ratio of Net Investment Income/ (Loss) to Average Net Assets | Portfolio Turnover Rate |
| Core Bond Fund |
| |
| Investor Class |
| 10/31/2012 | | $ | — | | | $ | 11.04 | | | | 6.74 | % | | $ | 16.3 | | | | 1.08 | % | | | .85 | % | 1.69 | % | 360 | %a |
| 10/31/2011 | | $ | — | | | $ | 10.79 | | | | 4.41 | % | | $ | 15.7 | | | | 1.12 | % | | | .85 | % | 2.18 | % | 379 | %a |
| 10/31/2010 | | $ | — | | | $ | 10.86 | | | | 10.03 | % | | $ | 18.6 | | | | 1.19 | % | | | .85 | % | 2.66 | % | 340 | %a |
| 10/31/2009 | | $ | — | | | $ | 10.19 | | | | 23.10 | % | | $ | 25.0 | | | | 1.40 | % | | | .86 | % | 4.39 | % | 450 | %a |
| 10/31/2008 | | $ | — | | | $ | 8.64 | | | | (7.72 | )% | | $ | 44.2 | | | | 1.25 | % | | | .85 | % | 4.08 | % | 430 | %a |
| |
| Institutional Class |
| 10/31/2012 | | $ | — | | | $ | 11.06 | | | | 7.16 | % | | $ | 218.9 | | | | .59 | % | | | .45 | % | 2.08 | % | 360 | %a |
| 10/31/2011 | | $ | — | | | $ | 10.81 | | | | 4.82 | % | | $ | 180.8 | | | | .62 | % | | | .45 | % | 2.58 | % | 379 | %a |
| 10/31/2010 | | $ | — | | | $ | 10.88 | | | | 10.45 | % | | $ | 120.3 | | | | .70 | % | | | .45 | % | 3.02 | % | 340 | %a |
| 10/31/2009 | | $ | — | | | $ | 10.21 | | | | 23.70 | % | | $ | 59.1 | | | | .94 | % | | | .45 | % | 4.60 | % | 450 | %a |
| 10/31/2008 | | $ | — | | | $ | 8.65 | | | | (7.34 | )% | | $ | 32.1 | | | | .83 | % | | | .45 | % | 4.48 | % | 430 | %a |
| |
Class A |
| 10/31/2012 | | $ | — | | | $ | 11.02 | | | | 6.75 | % | | $ | 47.3 | | | | .99 | % | | | .85 | % | 1.61 | % | 360 | %a |
| 10/31/2011 | | $ | — | | | $ | 10.77 | | | | 4.32 | % | | $ | 26.3 | | | | 1.01 | % | | | .85 | % | 2.18 | % | 379 | %a |
| 10/31/2010 | | $ | — | | | $ | 10.85 | | | | 10.04 | % | | $ | 23.4 | | | | 1.09 | % | | | .85 | % | 2.64 | % | 340 | %a |
| 10/31/2009 | | $ | — | | | $ | 10.18 | | | | 22.96 | % | | $ | 18.5 | | | | 1.36 | % | | | .85 | % | 3.81 | % | 450 | %a |
Period from 12/20/2007^ to 10/31/2008 | | $ | — | | | $ | 8.64 | | | | (8.37 | )%** | | $ | 0.1 | | | | 2.73 | %* | | | .85 | %* | 4.01 | %* | 430 | %^^a |
| |
| Class C |
| 10/31/2012 | | $ | — | | | $ | 11.03 | | | | 5.95 | % | | $ | 7.0 | | | | 1.74 | % | | | 1.60 | % | .86 | % | 360 | %a |
| 10/31/2011 | | $ | — | | | $ | 10.78 | | | | 3.54 | % | | $ | 4.4 | | | | 1.77 | % | | | 1.60 | % | 1.43 | % | 379 | %a |
| 10/31/2010 | | $ | — | | | $ | 10.86 | | | | 9.31 | % | | $ | 2.9 | | | | 1.84 | % | | | 1.60 | % | 1.83 | % | 340 | %a |
| 10/31/2009 | | $ | — | | | $ | 10.18 | | | | 22.04 | % | | $ | 0.8 | | | | 2.68 | % | | | 1.61 | % | 3.39 | % | 450 | %a |
Period from 12/20/2007^ to 10/31/2008 | | $ | — | | | $ | 8.64 | | | | (8.98 | )%** | | $ | 0.1 | | | | 3.43 | %* | | | 1.60 | %* | 3.24 | %* | 430 | %^^a |
Financial Highlights (cont'd)
| | | Net Asset Value, Beginning of Year | | Net Investment Income (Loss)@ | | Net Gains or Losses on Securities (both realized and unrealized) | | Total From Investment Operations | | Dividends from Net Investment Income | | Distributions from Net Realized Capital Gains | | Tax Return of Capital | | Total Distributions |
| Floating Rate Income Fund |
| |
| Institutional Class |
| 10/31/2012 | | $ | 9.91 | | | $ | 0.53 | | | $ | 0.31 | | | $ | 0.84 | | | $ | (0.53 | ) | | $ | — | | | $ | — | | | $ | (0.53 | ) |
| 10/31/2011 | | $ | 10.17 | | | $ | 0.54 | | | $ | (0.22 | ) | | $ | 0.32 | | | $ | (0.56 | ) | | $ | (0.02 | ) | | $ | — | | | $ | (0.58 | ) |
Period from 12/30/2009^ to 10/31/2010 | | $ | 10.00 | | | $ | 0.44 | | | $ | 0.17 | | | $ | 0.61 | | | $ | (0.44 | ) | | $ | — | | | $ | — | | | $ | (0.44 | ) |
| | | | | | | | | | | | | | | | | | | | | | | | | | | | | | | | | |
| Class A |
| 10/31/2012 | | $ | 9.91 | | | $ | 0.49 | | | $ | 0.32 | | | $ | 0.81 | | | $ | (0.50 | ) | | $ | — | | | $ | — | | | $ | (0.50 | ) |
| 10/31/2011 | | $ | 10.17 | | | $ | 0.50 | | | $ | (0.22 | ) | | $ | 0.28 | | | $ | (0.52 | ) | | $ | (0.02 | ) | | $ | — | | | $ | (0.54 | ) |
Period from 12/29/2009^ to 10/31/2010 | | $ | 10.00 | | | $ | 0.41 | | | $ | 0.16 | | | $ | 0.57 | | | $ | (0.40 | ) | | $ | — | | | $ | — | | | $ | (0.40 | ) |
| | | | | | | | | | | | | | | | | | | | | | | | | | | | | | | | | |
| Class C |
| 10/31/2012 | | $ | 9.91 | | | $ | 0.41 | | | $ | 0.32 | | | $ | 0.73 | | | $ | (0.42 | ) | | $ | — | | | $ | — | | | $ | (0.42 | ) |
| 10/31/2011 | | $ | 10.17 | | | $ | 0.42 | | | $ | (0.22 | ) | | $ | 0.20 | | | $ | (0.44 | ) | | $ | (0.02 | ) | | $ | — | | | $ | (0.46 | ) |
Period from 12/30/2009^ to 10/31/2010 | | $ | 10.00 | | | $ | 0.35 | | | $ | 0.18 | | | $ | 0.53 | | | $ | (0.36 | ) | | $ | — | | | $ | — | | | $ | (0.36 | ) |
| | | | | | | | | | | | | | | | | | | | | | | | | | | | | | | | | |
| High Income Bond Fund |
| |
| Investor Class |
| 10/31/2012 | | $ | 9.06 | | | $ | 0.58 | | | $ | 0.48 | | | $ | 1.06 | | | $ | (0.58 | ) | | $ | (0.08 | ) | | $ | — | | | $ | (0.66 | ) |
| 10/31/2011 | | $ | 9.49 | | | $ | 0.65 | | | $ | (0.36 | ) | | $ | 0.29 | | | $ | (0.65 | ) | | $ | (0.07 | ) | | $ | — | | | $ | (0.72 | ) |
| 10/31/2010 | | $ | 8.66 | | | $ | 0.76 | | | $ | 0.87 | | | $ | 1.63 | | | $ | (0.80 | ) | | $ | — | | | $ | — | | | $ | (0.80 | ) |
| 10/31/2009 | | $ | 6.57 | | | $ | 0.74 | | | $ | 2.02 | | | $ | 2.76 | | | $ | (0.67 | ) | | $ | — | | | $ | — | | | $ | (0.67 | ) |
| 10/31/2008 | | $ | 9.00 | | | $ | 0.66 | | | $ | (2.44 | ) | | $ | (1.78 | ) | | $ | (0.66 | ) | | $ | — | | | $ | — | | | $ | (0.66 | ) |
| | | | | | | | | | | | | | | | | | | | | | | | | | | | | | | | | |
| Institutional Class |
| 10/31/2012 | | $ | 9.07 | | | $ | 0.59 | | | $ | 0.49 | | | $ | 1.08 | | | $ | (0.59 | ) | | $ | (0.08 | ) | | $ | — | | | $ | (0.67 | ) |
| 10/31/2011 | | $ | 9.50 | | | $ | 0.64 | | | $ | (0.34 | ) | | $ | 0.30 | | | $ | (0.66 | ) | | $ | (0.07 | ) | | $ | — | | | $ | (0.73 | ) |
| 10/31/2010 | | $ | 8.68 | | | $ | 0.77 | | | $ | 0.87 | | | $ | 1.64 | | | $ | (0.82 | ) | | $ | — | | | $ | — | | | $ | (0.82 | ) |
Period from 5/27/2009^ to 10/31/2009 | | $ | 7.51 | | | $ | 0.36 | | | $ | 1.14 | | | $ | 1.50 | | | $ | (0.33 | ) | | $ | — | | | $ | — | | | $ | (0.33 | ) |
| | | | | | | | | | | | | | | | | | | | | | | | | | | | | | | | | |
| Class A |
| 10/31/2012 | | $ | 9.06 | | | $ | 0.55 | | | $ | 0.49 | | | $ | 1.04 | | | $ | (0.56 | ) | | $ | (0.08 | ) | | $ | — | | | $ | (0.64 | ) |
| 10/31/2011 | | $ | 9.49 | | | $ | 0.62 | | | $ | (0.36 | ) | | $ | 0.26 | | | $ | (0.62 | ) | | $ | (0.07 | ) | | $ | — | | | $ | (0.69 | ) |
| 10/31/2010 | | $ | 8.66 | | | $ | 0.70 | | | $ | 0.91 | | | $ | 1.61 | | | $ | (0.78 | ) | | $ | — | | | $ | — | | | $ | (0.78 | ) |
Period from 5/27/2009^ to 10/31/2009 | | $ | 7.51 | | | $ | 0.33 | | | $ | 1.13 | | | $ | 1.46 | | | $ | (0.31 | ) | | $ | — | | | $ | — | | | $ | (0.31 | ) |
See Notes to Financial Highlights
| | | Capital Contributions | | Net Asset Value, End of Year | | Total Return†† | | Net Assets, End of Year (in millions) | | Ratio of Gross Expenses to Average Net Assets# | | Ratio of Net Expenses to Average Net Assets‡ | | Ratio of Net Investment Income/ (Loss) to Average Net Assets | | Portfolio Turnover Rate | |
| Floating Rate Income Fund | |
| | |
| Institutional Class | |
| 10/31/2012 | | $ | — | | | $ | 10.22 | | | | 8.73 | % | | $ | 241.5 | | | | .91 | % | | | .70 | % | | | 5.26 | % | | | 112 | % | |
| 10/31/2011 | | $ | — | | | $ | 9.91 | | | | 3.16 | % | | $ | 181.5 | | | | .95 | % | | | .70 | % | | | 5.39 | % | | | 147 | % | |
Period from 12/30/2009^ to 10/31/2010 | | $ | — | | | $ | 10.17 | | | | 6.24 | %** | | $ | 70.5 | | | | 1.87 | %* | | | .70 | %* | | | 5.28 | %* | | | 112 | %** | |
| | | | | | | | | | | | | | | | | | | | | | | | | | | | | | | | | | |
| Class A | |
| 10/31/2012 | | $ | — | | | $ | 10.22 | | | | 8.33 | % | | $ | 36.8 | | | | 1.29 | % | | | 1.07 | % | | | 4.87 | % | | | 112 | % | |
| 10/31/2011 | | $ | — | | | $ | 9.91 | | | | 2.77 | % | | $ | 22.7 | | | | 1.34 | % | | | 1.07 | % | | | 5.00 | % | | | 147 | % | |
Period from 12/29/2009^ to 10/31/2010 | | $ | — | | | $ | 10.17 | | | | 5.85 | %** | | $ | 12.9 | | | | 2.21 | %* | | | 1.07 | %* | | | 4.87 | %* | | | 112 | %** | |
| | | | | | | | | | | | | | | | | | | | | | | | | | | | | | | | | | |
| Class C | |
| 10/31/2012 | | $ | — | | | $ | 10.22 | | | | 7.51 | % | | $ | 14.4 | | | | 2.05 | % | | | 1.82 | % | | | 4.10 | % | | | 112 | % | |
| 10/31/2011 | | $ | — | | | $ | 9.91 | | | | 1.98 | % | | $ | 7.8 | | | | 2.06 | % | | | 1.82 | % | | | 4.22 | % | | | 147 | % | |
Period from 12/30/2009^ to 10/31/2010 | | $ | — | | | $ | 10.17 | | | | 5.39 | %** | | $ | 0.7 | | | | 3.39 | %* | | | 1.82 | %* | | | 4.23 | %* | | | 112 | %** | |
| | | | | | | | | | | | | | | | | | | | | | | | | | | | | | | | | | |
| High Income Bond Fund | |
| | |
| Investor Class | |
| 10/31/2012 | | $ | — | | | $ | 9.46 | | | | 12.17 | % | | $ | 340.5 | �� | | | .84 | % | | | .84 | % | | | 6.29 | % | | | 82 | % | |
| 10/31/2011 | | $ | — | | | $ | 9.06 | | | | 3.09 | % | | $ | 309.2 | | | | .86 | % | | | .86 | % | | | 6.92 | % | | | 88 | % | |
| 10/31/2010 | | $ | — | | | $ | 9.49 | | | | 19.71 | % | | $ | 363.6 | | | | .96 | % | | | .96 | %§ | | | 8.50 | % | | | 144 | % | |
| 10/31/2009 | | $ | — | | | $ | 8.66 | | | | 44.38 | % | | $ | 422.2 | | | | 1.04 | % | | | 1.00 | % | | | 9.90 | % | | | 167 | % | |
| 10/31/2008 | | $ | 0.01 | | | $ | 6.57 | | | | (20.86 | )% | | $ | 172.3 | | | | .92 | % | | | .92 | % | | | 7.96 | % | | | 115 | % | |
| | | | | | | | | | | | | | | | | | | | | | | | | | | | | | | | | | |
Institutional Class | |
| 10/31/2012 | | $ | — | | | $ | 9.48 | | | | 12.44 | % | | $ | 2,306.1 | | | | .70 | % | | | .70 | % | | | 6.42 | % | | | 82 | % | |
| 10/31/2011 | | $ | — | | | $ | 9.07 | | | | 3.23 | % | | $ | 1,514.7 | | | | .73 | % | | | .73 | %§ | | | 6.93 | % | | | 88 | % | |
| 10/31/2010 | | $ | — | | | $ | 9.50 | | | | 19.81 | % | | $ | 266.2 | | | | .77 | % | | | .75 | % | | | 8.55 | % | | | 144 | % | |
Period from 5/27/2009^ to 10/31/2009 | | $ | — | | | $ | 8.68 | | | | 20.23 | %** | | $ | 86.6 | | | | .91 | %* | | | .75 | %* | | | 9.86 | %* | | | 167 | %^^ | |
| | | | | | | | | | | | | | | | | | | | | | | | | | | | | | | | | | |
Class A | |
| 10/31/2012 | | $ | — | | | $ | 9.46 | | | | 11.90 | % | | $ | 505.3 | | | | 1.08 | % | | | 1.08 | % | | | 6.01 | % | | | 82 | % | |
| 10/31/2011 | | $ | — | | | $ | 9.06 | | | | 2.83 | % | | $ | 341.6 | | | | 1.12 | % | | | 1.12 | %§ | | | 6.64 | % | | | 88 | % | |
| 10/31/2010 | | $ | — | | | $ | 9.49 | | | | 19.52 | % | | $ | 277.5 | | | | 1.16 | % | | | 1.12 | % | | | 7.75 | % | | | 144 | % | |
Period from 5/27/2009^ to 10/31/2009 | | $ | — | | | $ | 8.66 | | | | 19.69 | %** | | $ | 24.3 | | | | 1.27 | %* | | | 1.12 | %* | | | 9.19 | %* | | | 167 | %^^ | |
Financial Highlights (cont'd)
| | | Net Asset Value, Beginning of Year | | Net Investment Income (Loss)@ | | Net Gains or Losses on Securities (both realized and unrealized) | | Total From Investment Operations | | Dividends from Net Investment Income | | Distributions from Net Realized Capital Gains | | Tax Return of Capital | | Total Distributions |
| Class C |
| 10/31/2012 | | $ | 9.07 | | | $ | 0.48 | | | $ | 0.50 | | | $ | 0.98 | | | $ | (0.49 | ) | | $ | (0.08 | ) | | $ | — | | | $ | (0.57 | ) |
| 10/31/2011 | | $ | 9.50 | | | $ | 0.54 | | | $ | (0.35 | ) | | $ | 0.19 | | | $ | (0.55 | ) | | $ | (0.07 | ) | | $ | — | | | $ | (0.62 | ) |
| 10/31/2010 | | $ | 8.67 | | | $ | 0.64 | | | $ | 0.91 | | | $ | 1.55 | | | $ | (0.72 | ) | | $ | — | | | $ | — | | | $ | (0.72 | ) |
Period from 5/27/2009^ to 10/31/2009 | | $ | 7.51 | | | $ | 0.30 | | | $ | 1.14 | | | $ | 1.44 | | | $ | (0.28 | ) | | $ | — | | | $ | — | | | $ | (0.28 | ) |
| | | | | | | | | | | | | | | | | | | | | | | | | | | | | | | | | |
| Class R3 |
| 10/31/2012 | | $ | 9.06 | | | $ | 0.53 | | | $ | 0.49 | | | $ | 1.02 | | | $ | (0.53 | ) | | $ | (0.08 | ) | | $ | — | | | $ | (0.61 | ) |
| 10/31/2011 | | $ | 9.49 | | | $ | 0.59 | | | $ | (0.35 | ) | | $ | 0.24 | | | $ | (0.60 | ) | | $ | (0.07 | ) | | $ | — | | | $ | (0.67 | ) |
| 10/31/2010 | | $ | 8.67 | | | $ | 0.69 | | | $ | 0.89 | | | $ | 1.58 | | | $ | (0.76 | ) | | $ | — | | | $ | — | | | $ | (0.76 | ) |
Period from 5/27/2009^ to 10/31/2009 | | $ | 7.51 | | | $ | 0.33 | | | $ | 1.13 | | | $ | 1.46 | | | $ | (0.30 | ) | | $ | — | | | $ | — | | | $ | (0.30 | ) |
| | | | | | | | | | | | | | | | | | | | | | | | | | | | | | | | | |
| Municipal Intermediate Bond Fund |
| |
| Investor Class |
| 10/31/2012 | | $ | 11.58 | | | $ | 0.30 | | | $ | 0.56 | | | $ | 0.86 | | | $ | (0.29 | ) | | $ | (0.08 | ) | | $ | — | | | $ | (0.37 | ) |
| 10/31/2011 | | $ | 11.59 | | | $ | 0.35 | | | $ | 0.04 | | | $ | 0.39 | | | $ | (0.35 | ) | | $ | (0.05 | ) | | $ | — | | | $ | (0.40 | ) |
| 10/31/2010 | | $ | 11.22 | | | $ | 0.36 | | | $ | 0.37 | | | $ | 0.73 | | | $ | (0.36 | ) | | $ | — | | | $ | — | | | $ | (0.36 | ) |
| 10/31/2009 | | $ | 10.60 | | | $ | 0.35 | | | $ | 0.64 | | | $ | 0.99 | | | $ | (0.37 | ) | | $ | — | | | $ | — | | | $ | (0.37 | ) |
| 10/31/2008 | | $ | 11.20 | | | $ | 0.41 | | | $ | (0.59 | ) | | $ | (0.18 | ) | | $ | (0.41 | ) | | $ | (0.01 | ) | | $ | — | | | $ | (0.42 | ) |
| | | | | | | | | | | | | | | | | | | | | | | | | | | | | | | | | |
| Institutional Class |
| 10/31/2012 | | $ | 11.57 | | | $ | 0.30 | | | $ | 0.58 | | | $ | 0.88 | | | $ | (0.31 | ) | | $ | (0.08 | ) | | $ | — | | | $ | (0.39 | ) |
| 10/31/2011 | | $ | 11.59 | | | $ | 0.36 | | | $ | 0.04 | | | $ | 0.40 | | | $ | (0.37 | ) | | $ | (0.05 | ) | | $ | — | | | $ | (0.42 | ) |
Period from 6/21/2010^ to 10/31/2010 | | $ | 11.36 | | | $ | 0.14 | | | $ | 0.23 | | | $ | 0.37 | | | $ | (0.14 | ) | | $ | — | | | $ | — | | | $ | (0.14 | ) |
| | | | | | | | | | | | | | | | | | | | | | | | | | | | | | | | | |
| Class A |
| 10/31/2012 | | $ | 11.58 | | | $ | 0.25 | | | $ | 0.57 | | | $ | 0.82 | | | $ | (0.26 | ) | | $ | (0.08 | ) | | $ | — | | | $ | (0.34 | ) |
| 10/31/2011 | | $ | 11.60 | | | $ | 0.33 | | | $ | 0.03 | | | $ | 0.36 | | | $ | (0.33 | ) | | $ | (0.05 | ) | | $ | — | | | $ | (0.38 | ) |
Period from 6/21/2010^ to 10/31/2010 | | $ | 11.36 | | | $ | 0.12 | | | $ | 0.24 | | | $ | 0.36 | | | $ | (0.12 | ) | | $ | — | | | $ | — | | | $ | (0.12 | ) |
| | | | | | | | | | | | | | | | | | | | | | | | | | | | | | | | | |
| Class C |
| 10/31/2012 | | $ | 11.58 | | | $ | 0.17 | | | $ | 0.56 | | | $ | 0.73 | | | $ | (0.17 | ) | | $ | (0.08 | ) | | $ | — | | | $ | (0.25 | ) |
| 10/31/2011 | | $ | 11.59 | | | $ | 0.23 | | | $ | 0.05 | | | $ | 0.28 | | | $ | (0.24 | ) | | $ | (0.05 | ) | | $ | — | | | $ | (0.29 | ) |
Period from 6/21/2010^ to 10/31/2010 | | $ | 11.36 | | | $ | 0.09 | | | $ | 0.23 | | | $ | 0.32 | | | $ | (0.09 | ) | | $ | — | | | $ | — | | | $ | (0.09 | ) |
See Notes to Financial Highlights
| | | Capital Contributions | | Net Asset Value, End of Year | | Total Return†† | | Net Assets, End of Year (in millions) | | Ratio of Gross Expenses to Average Net Assets# | | Ratio of Net Expenses to Average Net Assets‡ | | Ratio of Net Investment Income/ (Loss) to Average Net Assets | | Portfolio Turnover Rate | |
| Class C | |
| 10/31/2012 | | $ | — | | | $ | 9.48 | | | | 11.15 | % | | $ | 72.3 | | | | 1.85 | % | | | 1.85 | %§ | | | 5.25 | % | | | 82 | % | |
| 10/31/2011 | | $ | — | | | $ | 9.07 | | | | 2.06 | % | | $ | 46.9 | | | | 1.87 | % | | | 1.87 | % | | | 5.82 | % | | | 88 | % | |
| 10/31/2010 | | $ | — | | | $ | 9.50 | | | | 18.60 | % | | $ | 25.5 | | | | 1.93 | % | | | 1.87 | % | | | 7.05 | % | | | 144 | % | |
Period from 5/27/2009^ to 10/31/2009 | | $ | — | | | $ | 8.67 | | | | 19.43 | %** | | $ | 2.6 | | | | 2.02 | %* | | | 1.87 | %* | | | 8.26 | %* | | | 167 | %^^ | |
| | | | | | | | | | | | | | | | | | | | | | | | | | | | | | | | | | |
| Class R3 | |
| 10/31/2012 | | $ | — | | | $ | 9.47 | | | | 11.72 | % | | $ | 9.7 | | | | 1.35 | % | | | 1.35 | %§ | | | 5.73 | % | | | 82 | % | |
| 10/31/2011 | | $ | — | | | $ | 9.06 | | | | 2.58 | % | | $ | 3.0 | | | | 1.37 | % | | | 1.37 | %§ | | | 6.32 | % | | | 88 | % | |
| 10/31/2010 | | $ | — | | | $ | 9.49 | | | | 19.08 | % | | $ | 0.5 | | | | 1.72 | % | | | 1.37 | % | | | 7.60 | % | | | 144 | % | |
Period from 5/27/2009^ to 10/31/2009 | | $ | — | | | $ | 8.67 | | | | 19.76 | %** | | $ | 0.1 | | | | 5.53 | %* | | | 1.37 | %* | | | 9.29 | %* | | | 167 | %^^ | |
| | | | | | | | | | | | | | | | | | | | | | | | | | | | | | | | | | |
| Municipal Intermediate Bond Fund | |
| | |
| Investor Class | |
| 10/31/2012 | | $ | — | | | $ | 12.07 | | | | 7.49 | % | | $ | 20.8 | | | | .88 | % | | | .65 | % | | | 2.55 | % | | | 54 | % | |
| 10/31/2011 | | $ | — | | | $ | 11.58 | | | | 3.53 | % | | $ | 116.4 | | | | .98 | % | | | .65 | % | | | 3.10 | % | | | 79 | % | |
| 10/31/2010 | | $ | — | | | $ | 11.59 | | | | 6.56 | % | | $ | 118.8 | | | | 1.01 | % | | | .65 | % | | | 3.12 | % | | | 101 | % | |
| 10/31/2009 | | $ | — | | | $ | 11.22 | | | | 9.42 | % | | $ | 92.3 | | | | 1.12 | % | | | .65 | % | | | 3.15 | % | | | 146 | % | |
| 10/31/2008 | | $ | — | | | $ | 10.60 | | | | (1.74 | )% | | $ | 25.6 | | | | 1.24 | % | | | .64 | % | | | 3.65 | % | | | 39 | % | |
| | | | | | | | | | | | | | | | | | | | | | | | | | | | | | | | | | |
| Institutional Class | |
| 10/31/2012 | | $ | — | | | $ | 12.06 | | | | 7.65 | % | | $ | 124.7 | | | | .70 | % | | | .50 | % | | | 2.53 | % | | | 54 | % | |
| 10/31/2011 | | $ | — | | | $ | 11.57 | | | | 3.60 | % | | $ | 6.8 | | | | .77 | % | | | .50 | % | | | 3.19 | % | | | 79 | % | |
Period from 6/21/2010^ to 10/31/2010 | | $ | — | | | $ | 11.59 | | | | 3.25 | %** | | $ | 0.1 | | | | 26.10 | %* | | | .50 | %* | | | 3.30 | %* | | | 101 | %^^ | |
| | | | | | | | | | | | | | | | | | | | | | | | | | | | | | | | | | |
| Class A | |
| 10/31/2012 | | $ | — | | | $ | 12.06 | | | | 7.16 | % | | $ | 3.4 | | | | 1.15 | % | | | .87 | % | | | 2.11 | % | | | 54 | % | |
| 10/31/2011 | | $ | — | | | $ | 11.58 | | | | 3.22 | % | | $ | 0.2 | | | | 1.87 | % | | | .87 | % | | | 2.91 | % | | | 79 | % | |
Period from 6/21/2010^ to 10/31/2010 | | $ | — | | | $ | 11.60 | | | | 3.20 | %** | | $ | 0.2 | | | | 23.88 | %* | | | .87 | %* | | | 3.00 | %* | | | 101 | %^^ | |
| | | | | | | | | | | | | | | | | | | | | | | | | | | | | | | | | | |
| Class C | |
| 10/31/2012 | | $ | — | | | $ | 12.06 | | | | 6.37 | % | | $ | 1.5 | | | | 1.95 | % | | | 1.62 | % | | | 1.44 | % | | | 54 | % | |
| 10/31/2011 | | $ | — | | | $ | 11.58 | | | | 2.54 | % | | $ | 0.6 | | | | 2.39 | % | | | 1.62 | % | | | 1.99 | % | | | 79 | % | |
Period from 6/21/2010^ to 10/31/2010 | | $ | — | | | $ | 11.59 | | | | 2.83 | %** | | $ | 0.1 | | | | 22.28 | %* | | | 1.62 | %* | | | 2.14 | %* | | | 101 | %^^ | |
Financial Highlights (cont'd)
| | | Net Asset Value, Beginning of Year | | Net Investment Income (Loss)@ | | Net Gains or Losses on Securities (both realized and unrealized) | | Total From Investment Operations | | Dividends from Net Investment Income | | Distributions from Net Realized Capital Gains | | Tax Return of Capital | | Total Distributions | |
| Short Duration Bond Fund | |
| | |
| Investor Class | |
| 10/31/2012 | | $ | 7.88 | | | $ | 0.12 | | | $ | 0.20 | | | $ | 0.32 | | | $ | (0.18 | ) | | $ | — | | | $ | — | | | $ | (0.18 | ) | |
| 10/31/2011 | | $ | 8.09 | | | $ | 0.15 | | | $ | (0.13 | ) | | $ | 0.02 | | | $ | (0.23 | ) | | $ | — | | | $ | — | | | $ | (0.23 | ) | |
| 10/31/2010 | | $ | 7.83 | | | $ | 0.17 | | | $ | 0.38 | | | $ | 0.55 | | | $ | (0.29 | ) | | $ | — | | | $ | — | | | $ | (0.29 | ) | |
| 10/31/2009 | | $ | 7.91 | | | $ | 0.35 | | | $ | (0.05 | ) | | $ | 0.30 | | | $ | (0.38 | ) | | $ | — | | | $ | — | | | $ | (0.38 | ) | |
| 10/31/2008 | | $ | 9.13 | | | $ | 0.41 | | | $ | (1.18 | ) | | $ | (0.77 | ) | | $ | (0.45 | ) | | $ | — | | | $ | — | | | $ | (0.45 | ) | |
| | | | | | | | | | | | | | | | | | | | | | | | | | | | | | | | | | |
| Trust Class | |
| 10/31/2012 | | $ | 7.51 | | | $ | 0.11 | | | $ | 0.19 | | | $ | 0.30 | | | $ | (0.16 | ) | | $ | — | | | $ | — | | | $ | (0.16 | ) | |
| 10/31/2011 | | $ | 7.71 | | | $ | 0.14 | | | $ | (0.13 | ) | | $ | 0.01 | | | $ | (0.21 | ) | | $ | — | | | $ | — | | | $ | (0.21 | ) | |
| 10/31/2010 | | $ | 7.46 | | | $ | 0.16 | | | $ | 0.35 | | | $ | 0.51 | | | $ | (0.26 | ) | | $ | — | | | $ | — | | | $ | (0.26 | ) | |
| 10/31/2009 | | $ | 7.54 | | | $ | 0.33 | | | $ | (0.06 | ) | | $ | 0.27 | | | $ | (0.35 | ) | | $ | — | | | $ | — | | | $ | (0.35 | ) | |
| 10/31/2008 | | $ | 8.70 | | | $ | 0.38 | | | $ | (1.12 | ) | | $ | (0.74 | ) | | $ | (0.42 | ) | | $ | — | | | $ | — | | | $ | (0.42 | ) | |
| | | | | | | | | | | | | | | | | | | | | | | | | | | | | | | | | | |
| Institutional Class | |
| 10/31/2012 | | $ | 7.88 | | | $ | 0.13 | | | $ | 0.20 | | | $ | 0.33 | | | $ | (0.19 | ) | | $ | — | | | $ | — | | | $ | (0.19 | ) | |
| 10/31/2011 | | $ | 8.09 | | | $ | 0.17 | | | $ | (0.14 | ) | | $ | 0.03 | | | $ | (0.24 | ) | | $ | — | | | $ | — | | | $ | (0.24 | ) | |
Period from 6/21/2010^ to 10/31/2010 | | $ | 7.97 | | | $ | 0.06 | | | $ | 0.16 | | | $ | 0.22 | | | $ | (0.10 | ) | | $ | — | | | $ | — | | | $ | (0.10 | ) | |
| | | | | | | | | | | | | | | | | | | | | | | | | | | | | | | | | | |
| Class A | |
| 10/31/2012 | | $ | 7.51 | | | $ | 0.08 | | | $ | 0.21 | | | $ | 0.29 | | | $ | (0.16 | ) | | $ | — | | | $ | — | | | $ | (0.16 | ) | |
| 10/31/2011 | | $ | 7.72 | | | $ | 0.13 | | | $ | (0.14 | ) | | $ | (0.01 | ) | | $ | (0.20 | ) | | $ | — | | | $ | — | | | $ | (0.20 | ) | |
Period from 6/21/2010^ to 10/31/2010 | | $ | 7.60 | | | $ | 0.05 | | | $ | 0.15 | | | $ | 0.20 | | | $ | (0.08 | ) | | $ | — | | | $ | — | | | $ | (0.08 | ) | |
| | | | | | | | | | | | | | | | | | | | | | | | | | | | | | | | | | |
| Class C | |
| 10/31/2012 | | $ | 7.51 | | | $ | 0.04 | | | $ | 0.20 | | | $ | 0.24 | | | $ | (0.10 | ) | | $ | — | | | $ | — | | | $ | (0.10 | ) | |
| 10/31/2011 | | $ | 7.72 | | | $ | 0.07 | | | $ | (0.13 | ) | | $ | (0.06 | ) | | $ | (0.15 | ) | | $ | — | | | $ | — | | | $ | (0.15 | ) | |
Period from 6/21/2010^ to 10/31/2010 | | $ | 7.60 | | | $ | 0.03 | | | $ | 0.15 | | | $ | 0.18 | | | $ | (0.06 | ) | | $ | — | | | $ | — | | | $ | (0.06 | ) | |
| | | | | | | | | | | | | | | | | | | | | | | | | | | | | | | | | | |
| Short Duration High Income Fund | |
| | |
| Institutional Class | |
Period from 9/28/2012^ to 10/31/2012 | | $ | 10.00 | | | $ | 0.03 | | | $ | 0.01 | | | $ | 0.04 | | | $ | (0.03 | ) | | $ | — | | | $ | — | | | $ | (0.03 | ) | |
See Notes to Financial Highlights
| | | Capital Contributions | | Net Asset Value, End of Year | | Total Return†† | | Net Assets, End of Year (in millions) | | Ratio of Gross Expenses to Average Net Assets# | | Ratio of Net Expenses to Average Net Assets‡ | | Ratio of Net Investment Income/ (Loss) to Average Net Assets | | Portfolio Turnover Rate | |
| Short Duration Bond Fund | |
| | |
| Investor Class | |
| 10/31/2012 | | $ | — | | | $ | 8.02 | | | | 4.09 | % | | $ | 38.8 | | | | 1.17 | % | | | .70 | % | | | 1.50 | % | | | 74 | % | |
| 10/31/2011 | | $ | — | | | $ | 7.88 | | | | .20 | % | | $ | 44.1 | | | | 1.25 | % | | | .71 | % | | | 1.93 | % | | | 84 | % | |
| 10/31/2010 | | $ | — | | | $ | 8.09 | | | | 7.08 | % | | $ | 56.1 | | | | 1.27 | % | | | .70 | % | | | 2.19 | % | | | 69 | % | |
| 10/31/2009 | | $ | — | | | $ | 7.83 | | | | 4.18 | % | | $ | 52.6 | | | | 1.18 | % | | | .70 | % | | | 4.73 | % | | | 48 | % | |
| 10/31/2008 | | $ | — | | | $ | 7.91 | | | | (8.70 | )% | | $ | 61.6 | | | | .95 | % | | | .70 | % | | | 4.73 | % | | | 10 | % | |
| | | | | | | | | | | | | | | | | | | | | | | | | | | | | | | | | | |
| Trust Class | |
| 10/31/2012 | | $ | — | | | $ | 7.65 | | | | 4.08 | % | | $ | 5.6 | | | | 1.34 | % | | | .80 | % | | | 1.40 | % | | | 74 | % | |
| 10/31/2011 | | $ | — | | | $ | 7.51 | | | | .10 | % | | $ | 6.4 | | | | 1.41 | % | | | .80 | % | | | 1.83 | % | | | 84 | % | |
| 10/31/2010 | | $ | — | | | $ | 7.71 | | | | 7.01 | % | | $ | 9.4 | | | | 1.48 | % | | | .80 | % | | | 2.09 | % | | | 69 | % | |
| 10/31/2009 | | $ | — | | | $ | 7.46 | | | | 4.02 | % | | $ | 8.1 | | | | 1.58 | % | | | .80 | % | | | 4.62 | % | | | 48 | % | |
| 10/31/2008 | | $ | — | | | $ | 7.54 | | | | (8.76 | )% | | $ | 9.3 | | | | 1.27 | % | | | .80 | % | | | 4.64 | % | | | 10 | % | |
| | | | | | | | | | | | | | | | | | | | | | | | | | | | | | | | | | |
| Institutional Class | |
| 10/31/2012 | | $ | — | | | $ | 8.02 | | | | 4.30 | % | | $ | 22.2 | | | | .98 | % | | | .51 | % | | | 1.65 | % | | | 74 | % | |
| 10/31/2011 | | $ | — | | | $ | 7.88 | | | | .40 | % | | $ | 17.9 | | | | 1.03 | % | | | .51 | % | | | 2.09 | % | | | 84 | % | |
Period from 6/21/2010^ to 10/31/2010 | | $ | — | | | $ | 8.09 | | | | 2.73 | %** | | $ | 0.0 | | | | 33.53 | %* | | | .50 | %* | | | 2.16 | %* | | | 69 | %^^ | |
| | | | | | | | | | | | | | | | | | | | | | | | | | | | | | | | | | |
| Class A | |
| 10/31/2012 | | $ | — | | | $ | 7.64 | | | | 3.87 | % | | $ | 2.3 | | | | 1.41 | % | | | .88 | % | | | 1.07 | % | | | 74 | % | |
| 10/31/2011 | | $ | — | | | $ | 7.51 | | | | (.10 | )% | | $ | 0.2 | | | | 1.50 | % | | | .87 | % | | | 1.75 | % | | | 84 | % | |
Period from 6/21/2010^ to 10/31/2010 | | $ | — | | | $ | 7.72 | | | | 2.67 | %** | | $ | 0.1 | | | | 26.42 | %* | | | .87 | %* | | | 1.83 | %* | | | 69 | %^^ | |
| | | | | | | | | | | | | | | | | | | | | | | | | | | | | | | | | | |
| Class C | |
| 10/31/2012 | | $ | — | | | $ | 7.65 | | | | 3.23 | % | | $ | 1.7 | | | | 2.12 | % | | | 1.63 | % | | | .51 | % | | | 74 | % | |
| 10/31/2011 | | $ | — | | | $ | 7.51 | | | | (.84 | )% | | $ | 1.0 | | | | 2.17 | % | | | 1.62 | % | | | .97 | % | | | 84 | % | |
Period from 6/21/2010^ to 10/31/2010 | | $ | — | | | $ | 7.72 | | | | 2.39 | %** | | $ | 0.0 | | | | 34.63 | %* | | | 1.62 | %* | | | 1.04 | %* | | | 69 | %^^ | |
| | | | | | | | | | | | | | | | | | | | | | | | | | | | | | | | | | |
| Short Duration High Income Fund | |
| | |
| Institutional Class | |
Period from 9/28/2012^ to 10/31/2012 | | $ | — | | | $ | 10.01 | | | | .38 | %** | | $ | 25.0 | | | | 4.24 | %*ø | | | .71 | %*ø | | | 3.24 | %*ø | | | 35 | %** | |
Financial Highlights (cont'd)
| | | Net Asset Value, Beginning of Year | | Net Investment Income (Loss)@ | | Net Gains or Losses on Securities (both realized and unrealized) | | Total From Investment Operations | | Dividends from Net Investment Income | | Distributions from Net Realized Capital Gains | | Tax Return of Capital | | Total Distributions | |
| Class A | |
Period from 9/28/2012^ to 10/31/2012 | | $ | 10.00 | | | $ | 0.03 | | | $ | 0.01 | | | $ | 0.04 | | | $ | (0.03 | ) | | $ | — | | | $ | — | | | $ | (0.03 | ) | |
| Class C | |
Period from 9/28/2012^ to 10/31/2012 | | $ | 10.00 | | | $ | 0.02 | | | $ | 0.01 | | | $ | 0.03 | | | $ | (0.02 | ) | | $ | — | | | $ | — | | | $ | (0.02 | ) | |
| | |
| Strategic Income Fund | |
| | |
| Trust Class | |
| 10/31/2012 | | $ | 10.98 | | | $ | 0.37 | | | $ | 0.85 | | | $ | 1.22 | | | $ | (0.41 | ) | | $ | (0.12 | ) | | $ | — | | | $ | (0.53 | ) | |
| 10/31/2011 | | $ | 11.23 | | | $ | 0.42 | | | $ | (0.04 | ) | | $ | 0.38 | | | $ | (0.44 | ) | | $ | (0.19 | ) | | $ | — | | | $ | (0.63 | ) | |
| 10/31/2010 | | $ | 10.58 | | | $ | 0.49 | | | $ | 0.81 | | | $ | 1.30 | | | $ | (0.52 | ) | | $ | (0.13 | ) | | $ | — | | | $ | (0.65 | ) | |
| 10/31/2009 | | $ | 8.77 | | | $ | 0.43 | | | $ | 1.78 | | | $ | 2.21 | | | $ | (0.40 | ) | | $ | — | | | $ | — | | | $ | (0.40 | ) | |
| 10/31/2008 | | $ | 10.38 | | | $ | 0.42 | | | $ | (1.05 | ) | | $ | (0.63 | ) | | $ | (0.27 | )@ | | $ | (0.61 | )@ | | $ | (0.10 | )@ | | $ | (0.98 | ) | |
| | | | | | | | | | | | | | | | | | | | | | | | | | | | | | | | | | |
| Institutional Class | |
| 10/31/2012 | | $ | 10.98 | | | $ | 0.41 | | | $ | 0.85 | | | $ | 1.26 | | | $ | (0.45 | ) | | $ | (0.12 | ) | | $ | — | | | $ | (0.57 | ) | |
| 10/31/2011 | | $ | 11.23 | | | $ | 0.46 | | | $ | (0.04 | ) | | $ | 0.42 | | | $ | (0.48 | ) | | $ | (0.19 | ) | | $ | — | | | $ | (0.67 | ) | |
| 10/31/2010 | | $ | 10.58 | | | $ | 0.53 | | | $ | 0.81 | | | $ | 1.34 | | | $ | (0.56 | ) | | $ | (0.13 | ) | | $ | — | | | $ | (0.69 | ) | |
| 10/31/2009 | | $ | 8.78 | | | $ | 0.45 | | | $ | 1.79 | | | $ | 2.24 | | | $ | (0.44 | ) | | $ | — | | | $ | — | | | $ | (0.44 | ) | |
| 10/31/2008 | | $ | 10.38 | | | $ | 0.44 | | | $ | (1.02 | ) | | $ | (0.58 | ) | | $ | (0.31 | )@ | | $ | (0.61 | )@ | | $ | (0.10 | )@ | | $ | (1.02 | ) | |
| | | | | | | | | | | | | | | | | | | | | | | | | | | | | | | | | | |
| Class A | |
| 10/31/2012 | | $ | 10.99 | | | $ | 0.36 | | | $ | 0.86 | | | $ | 1.22 | | | $ | (0.41 | ) | | $ | (0.12 | ) | | $ | — | | | $ | (0.53 | ) | |
| 10/31/2011 | | $ | 11.24 | | | $ | 0.42 | | | $ | (0.04 | ) | | $ | 0.38 | | | $ | (0.44 | ) | | $ | (0.19 | ) | | $ | — | | | $ | (0.63 | ) | |
| 10/31/2010 | | $ | 10.59 | | | $ | 0.48 | | | $ | 0.81 | | | $ | 1.29 | | | $ | (0.51 | ) | | $ | (0.13 | ) | | $ | — | | | $ | (0.64 | ) | |
| 10/31/2009 | | $ | 8.78 | | | $ | 0.43 | | | $ | 1.77 | | | $ | 2.20 | | | $ | (0.39 | ) | | $ | — | | | $ | — | | | $ | (0.39 | ) | |
Period from 12/20/2007^ to 10/31/2008 | | $ | 10.19 | | | $ | 0.36 | | | $ | (0.78 | ) | | $ | (0.42 | ) | | $ | (0.28 | )@ | | $ | (0.61 | )@ | | $ | (0.10 | )@ | | $ | (0.99 | ) | |
| | | | | | | | | | | | | | | | | | | | | | | | | | | | | | | | | | |
| Class C | |
| 10/31/2012 | | $ | 10.98 | | | $ | 0.28 | | | $ | 0.86 | | | $ | 1.14 | | | $ | (0.33 | ) | | $ | (0.12 | ) | | $ | — | | | $ | (0.45 | ) | |
| 10/31/2011 | | $ | 11.23 | | | $ | 0.34 | | | $ | (0.04 | ) | | $ | 0.30 | | | $ | (0.36 | ) | | $ | (0.19 | ) | | $ | — | | | $ | (0.55 | ) | |
| 10/31/2010 | | $ | 10.58 | | | $ | 0.41 | | | $ | 0.81 | | | $ | 1.22 | | | $ | (0.44 | ) | | $ | (0.13 | ) | | $ | — | | | $ | (0.57 | ) | |
| 10/31/2009 | | $ | 8.78 | | | $ | 0.36 | | | $ | 1.76 | | | $ | 2.12 | | | $ | (0.32 | ) | | $ | — | | | $ | — | | | $ | (0.32 | ) | |
Period from 12/20/2007^ to 10/31/2008 | | $ | 10.19 | | | $ | 0.29 | | | $ | (0.77 | ) | | $ | (0.48 | ) | | $ | (0.22 | )@ | | $ | (0.61 | )@ | | $ | (0.10 | )@ | | $ | (0.93 | ) | |
See Notes to Financial Highlights
| | | Capital Contributions | | Net Asset Value, End of Year | | Total Return†† | | Net Assets, End of Year (in millions) | | Ratio of Gross Expenses to Average Net Assets# | | Ratio of Net Expenses to Average Net Assets‡ | | Ratio of Net Investment Income/ (Loss) to Average Net Assets | | Portfolio Turnover Rate | |
| Class A | |
Period from 9/28/2012^ to 10/31/2012 | | $ | — | | | $ | 10.01 | | | | .36 | %** | | $ | 0.1 | | | | 4.79 | %*ø | | | 1.02 | %*ø | | | 3.18 | %*ø | | | 35 | %** | |
| Class C | |
Period from 9/28/2012^ to 10/31/2012 | | $ | — | | | $ | 10.01 | | | | .30 | %** | | $ | 0.0 | | | | 5.89 | %*ø | | | 1.60 | %*ø | | | 2.13 | %*ø | | | 35 | %** | |
| | |
| Strategic Income Fund | |
| | |
| Trust Class | |
| 10/31/2012 | | $ | — | | | $ | 11.67 | | | | 11.46 | % | | $ | 26.6 | | | | 1.20 | % | | | 1.10 | % | | | 3.28 | % | | | 329 | %a | |
| 10/31/2011 | | $ | — | | | $ | 10.98 | | | | 3.60 | % | | $ | 19.4 | | | | 1.26 | % | | | 1.10 | % | | | 3.86 | % | | | 265 | %a | |
| 10/31/2010 | | $ | — | | | $ | 11.23 | | | | 12.78 | % | | $ | 16.3 | | | | 1.36 | % | | | 1.10 | % | | | 4.56 | % | | | 238 | %a | |
| 10/31/2009 | | $ | — | | | $ | 10.58 | | | | 25.66 | % | | $ | 6.7 | | | | 3.00 | % | | | 1.10 | % | | | 4.32 | % | | | 322 | %a | |
| 10/31/2008 | | $ | — | | | $ | 8.77 | | | | (6.54 | )% | | $ | 0.3 | | | | 9.14 | % | | | 1.14 | % | | | 4.36 | % | | | 323 | %a | |
| | | | | | | | | | | | | | | | | | | | | | | | | | | | | | | | | | |
| Institutional Class | |
| 10/31/2012 | | $ | — | | | $ | 11.67 | | | | 11.85 | % | | $ | 526.3 | | | | .84 | % | | | .75 | % | | | 3.61 | % | | | 329 | %a | |
| 10/31/2011 | | $ | — | | | $ | 10.98 | | | | 3.96 | % | | $ | 210.8 | | | | .90 | % | | | .75 | % | | | 4.20 | % | | | 265 | %a | |
| 10/31/2010 | | $ | — | | | $ | 11.23 | | | | 13.17 | % | | $ | 118.8 | | | | .96 | % | | | .75 | % | | | 4.88 | % | | | 238 | %a | |
| 10/31/2009 | | $ | — | | | $ | 10.58 | | | | 25.97 | % | | $ | 18.7 | | | | 2.47 | % | | | .75 | % | | | 4.59 | % | | | 322 | %a | |
| 10/31/2008 | | $ | — | | | $ | 8.78 | | | | (6.09 | )% | | $ | 4.6 | | | | 4.03 | % | | | .83 | % | | | 4.54 | % | | | 323 | %a | |
| | | | | | | | | | | | | | | | | | | | | | | | | | | | | | | | | | |
| Class A | |
| 10/31/2012 | | $ | — | | | $ | 11.68 | | | | 11.39 | % | | $ | 309.1 | | | | 1.24 | % | | | 1.15 | % | | | 3.22 | % | | | 329 | %a | |
| 10/31/2011 | | $ | — | | | $ | 10.99 | | | | 3.55 | % | | $ | 196.0 | | | | 1.31 | % | | | 1.15 | % | | | 3.79 | % | | | 265 | %a | |
| 10/31/2010 | | $ | — | | | $ | 11.24 | | | | 12.72 | % | | $ | 142.9 | | | | 1.37 | % | | | 1.15 | % | | | 4.44 | % | | | 238 | %a | |
| 10/31/2009 | | $ | — | | | $ | 10.59 | | | | 25.51 | % | | $ | 68.2 | | | | 1.93 | % | | | 1.15 | % | | | 4.25 | % | | | 322 | %a | |
Period from 12/20/2007^ to 10/31/2008 | | $ | — | | | $ | 8.78 | | | | (4.64 | )%** | | $ | 0.2 | | | | 7.52 | %* | | | 1.20 | %* | | | 4.36 | %* | | | 323 | %^^a | |
| | | | | | | | | | | | | | | | | | | | | | | | | | | | | | | | | | |
| Class C | |
| 10/31/2012 | | $ | — | | | $ | 11.67 | | | | 10.62 | % | | $ | 184.8 | | | | 1.97 | % | | | 1.85 | % | | | 2.52 | % | | | 329 | %a | |
| 10/31/2011 | | $ | — | | | $ | 10.98 | | | | 2.83 | % | | $ | 120.9 | | | | 2.03 | % | | | 1.85 | % | | | 3.09 | % | | | 265 | %a | |
| 10/31/2010 | | $ | — | | | $ | 11.23 | | | | 11.93 | % | | $ | 93.3 | | | | 2.10 | % | | | 1.85 | % | | | 3.75 | % | | | 238 | %a | |
| 10/31/2009 | | $ | — | | | $ | 10.58 | | | | 24.47 | % | | $ | 36.2 | | | | 2.55 | % | | | 1.85 | % | | | 3.53 | % | | | 322 | %a | |
Period from 12/20/2007^ to 10/31/2008 | | $ | — | | | $ | 8.78 | | | | (5.22 | )%** | | $ | 0.1 | | | | 8.75 | %* | | | 1.90 | %* | | | 3.56 | %* | | | 323 | %^^a | |
Notes to Financial Highlights Income Funds
| †† | Total return based on per share NAV reflects the effects of changes in NAV on the performance of each Fund during each fiscal period and assumes income dividends and other distributions, if any, were reinvested, but does not reflect the effect of sales charges. Results represent past performance and do not indicate future results. Current returns may be lower or higher than the performance data quoted. Investment returns and principal may fluctuate and shares when redeemed may be worth more or less than original cost. For each Fund, total return would have been lower if Management had not reimbursed and/or waived certain expenses. Total return would have been higher if Management had not recouped previously reimbursed expenses. For the year ended October 31, 2008, High Income recorded a capital contribution from Management in connection with a reallocation of expenses that are shared by the Fund and Management, which had a (.12)% impact on total return. The class action proceeds listed in Note A-4 had no impact on total return. |
| # | Represents the annualized ratios of net expenses to average daily net assets if Management had not reimbursed certain expenses and/or waived a portion of the investment management fee. |
| ‡ | After reimbursement of expenses and/or waiver of a portion of the investment management fee by Management. The Fund is required to calculate an expense ratio without taking into consideration any expense reductions related to expense offset arrangements. Had the Fund not received expense reductions related to expense offset arrangements, the annualized ratios of net expenses to average daily net assets would have been: |
| | | Year Ended October 31, | |
| | | 2012 | | 2011 | | 2010 | | 2009 | | 2008 | |
| Core Bond Fund Investor Class | | | .85 | % | | | .85 | % | | | .85 | % | | | .86 | % | | | .85 | % | |
| Core Bond Fund Institutional Class | | | .45 | % | | | .45 | % | | | .45 | % | | | .45 | % | | | .45 | % | |
| Core Bond Fund Class A | | | .85 | % | | | .85 | % | | | .85 | % | | | .85 | % | | | .85 | %(1) | |
| Core Bond Fund Class C | | | 1.60 | % | | | 1.60 | % | | | 1.60 | % | | | 1.61 | % | | | 1.60 | %(1) | |
| Floating Rate Income Fund Institutional Class | | | .70 | % | | | .70 | % | | | .70 | %(4) | | | — | | | | — | | |
| Floating Rate Income Fund Class A | | | 1.07 | % | | | 1.07 | % | | | 1.07 | %(3) | | | — | | | | — | | |
| Floating Rate Income Fund Class C | | | 1.82 | % | | | 1.82 | % | | | 1.82 | %(4) | | | — | | | | — | | |
| High Income Bond Fund Investor Class | | | .84 | % | | | .86 | % | | | .96 | % | | | 1.00 | % | | | .92 | % | |
| High Income Bond Fund Institutional Class | | | .70 | % | | | .73 | % | | | .75 | % | | | .75 | %(2) | | | — | | |
| High Income Bond Fund Class A | | | 1.08 | % | | | 1.12 | % | | | 1.12 | % | | | 1.12 | %(2) | | | — | | |
| High Income Bond Fund Class C | | | 1.85 | % | | | 1.87 | % | | | 1.87 | % | | | 1.87 | %(2) | | | — | | |
| High Income Bond Fund Class R3 | | | 1.35 | % | | | 1.37 | % | | | 1.37 | % | | | 1.37 | %(2) | | | — | | |
| Municipal Intermediate Bond Fund Investor Class | | | .65 | % | | | .65 | % | | | .65 | % | | | .65 | % | | | .66 | % | |
| Municipal Intermediate Bond Fund Institutional Class | | | .50 | % | | | .50 | % | | | .50 | %(5) | | | — | | | | — | | |
| Municipal Intermediate Bond Fund Class A | | | .87 | % | | | .87 | % | | | .87 | %(5) | | | — | | | | — | | |
| Municipal Intermediate Bond Fund Class C | | | 1.62 | % | | | 1.62 | % | | | 1.62 | %(5) | | | — | | | | — | | |
| Short Duration Bond Fund Investor Class | | | .70 | % | | | .71 | % | | | .70 | % | | | .70 | % | | | .70 | % | |
| Short Duration Bond Fund Trust Class | | | .80 | % | | | .80 | % | | | .80 | % | | | .80 | % | | | .80 | % | |
| Short Duration Bond Fund Institutional Class | | | .51 | % | | | .51 | % | | | .50 | %(5) | | | — | | | | — | | |
| Short Duration Bond Fund Class A | | | .88 | % | | | .87 | % | | | .87 | %(5) | | | — | | | | — | | |
| Short Duration Bond Fund Class C | | | 1.63 | % | | | 1.62 | % | | | 1.62 | %(5) | | | — | | | | — | | |
| Short Duration High Income Fund Institutional Class | | | .71 | %(6) | | | — | | | | — | | | | — | | | | — | | |
| Short Duration High Income Fund Class A | | | 1.02 | %(6) | | | — | | | | — | | | | — | | | | — | | |
| Short Duration High Income Fund Class B | | | 1.60 | %(6) | | | — | | | | — | | | | — | | | | — | | |
Notes to Financial Highlights (cont'd)
| | | Year Ended October 31, | |
| | | 2012 | | 2011 | | 2010 | | 2009 | | 2008 | |
| Strategic Income Fund Trust Class | | | 1.10 | % | | | 1.10 | % | | | 1.10 | % | | | 1.10 | % | | | 1.15 | % | |
| Strategic Income Fund Institutional Class | | | .75 | % | | | .75 | % | | | .75 | % | | | .75 | % | | | .84 | % | |
| Strategic Income Fund Class A | | | 1.15 | % | | | 1.15 | % | | | 1.15 | % | | | 1.15 | % | | | 1.21 | %(1) | |
| Strategic Income Fund Class C | | | 1.85 | % | | | 1.85 | % | | | 1.85 | % | | | 1.85 | % | | | 1.91 | %(1) | |
| | (1) | Period from December 20, 2007 to October 31, 2008. |
| | | |
| | (2) | Period from May 27, 2009 to October 31, 2009. |
| | | |
| | (3) | Period from December 29, 2009 to October 31, 2010. Organization expense, which is a non-recurring expense, is included in ratios on a non-annualized basis. |
| | | |
| | (4) | Period from December 30, 2009 to October 31, 2010. Organization expense, which is a non-recurring expense, is included in ratios on a non-annualized basis. |
| | | |
| | (5) | Period from June 21, 2010 to October 31, 2010. |
| | | |
| | (6) | Period from September 28, 2012 to October 31, 2012. Organization expense, which is a non-recurring expense, is included in ratios on a non-annualized basis. |
| § | After reimbursement of expenses previously paid by Management. Had the Fund not made such reimbursements, the annualized ratios of net expenses to average daily net assets would have been: |
| | | Year Ended October 31, | |
| | | 2012 | | 2011 | | 2010 | |
| High Income Bond Fund Investor Class | | | — | | | | — | | | | .93 | % | |
| High Income Bond Fund Institutional Class | | | — | | | | .72 | % | | | — | | |
| High Income Bond Fund Class A | | | — | | | | 1.11 | % | | | — | | |
| High Income Bond Fund Class C | | | 1.84 | % | | | — | | | | — | | |
| High Income Bond Fund Class R3 | | | 1.33 | % | | | 1.36 | % | | | — | | |
| ^ | The date investment operations commenced. |
| @ | Calculated based on the average number of shares outstanding during each fiscal period. |
| ^^ | Portfolio turnover is calculated at the Fund level. Percentage indicated was calculated for the year ended October 31, 2008 for Core Bond and Strategic Income (Class A and C), for the year ended October 31, 2009 for High Income (Institutional Class, Class A, Class C and Class R3) and for the year ended October 31, 2010 for Municipal Intermediate Bond and Short Duration (Institutional Class, Class A and Class C). |
| a | The portfolio turnover rates not including mortgage dollar roll transactions were 162%, 115%, 112%, 238% and 104% for the years ended October 31, 2012, 2011, 2010, 2009 and 2008 for Core Bond and 157%, 122%, 152%, 182%, and 145% for years ended October 31, 2012, 2011, 2010, 2009 and 2008 for Strategic Income, respectively. |
| ø | Organization expense, which is a non-recurring expense, is included in these ratios on a non-annualized basis. |
Report of Independent Registered Public Accounting Firm
To the Board of Trustees and Shareholders of
Neuberger Berman High Income Bond Fund
Neuberger Berman Municipal Intermediate Bond Fund
Neuberger Berman Short Duration Bond Fund
Neuberger Berman Strategic Income Fund
We have audited the accompanying statements of assets and liabilities of Neuberger Berman High Income Bond Fund, Neuberger Berman Municipal Intermediate Bond Fund, Neuberger Berman Short Duration Bond Fund, and Neuberger Berman Strategic Income Fund, four of the series constituting the Neuberger Berman Income Funds (the "Trust"), including the schedules of investments, as of October 31, 2012, and the related statements of operations for the year then ended, the statements of changes in net assets for each of the two years in the period then ended, and the financial highlights for each of the periods indicated therein. These financial statements and financial highlights are the responsibility of the Trust's management. Our responsibility is to express an opinion on these financial statements and financial highlights based on our audits.
We conducted our audits in accordance with the standards of the Public Company Accounting Oversight Board (United States). Those standards require that we plan and perform the audits to obtain reasonable assurance about whether the financial statements and financial highlights are free of material misstatement. We were not engaged to perform an audit of the Trust's internal control over financial reporting. Our audits included consideration of internal control over financial reporting as a basis for designing audit procedures that are appropriate in the circumstances, but not for the purpose of expressing an opinion on the effectiveness of the Trust's internal control over financial reporting. Accordingly, we express no such opinion. An audit also includes examining, on a test basis, evidence supporting the amounts and disclosures in the financial statements and financial highlights, assessing the accounting principles used and significant estimates made by management, and evaluating the overall financial statement presentation. Our procedures included confirmation of securities owned as of October 31, 2012 by correspondence with the custodian and others or by other appropriate auditing procedures where replies from others were not received. We believe that our audits provide a reasonable basis for our opinion.
In our opinion, the financial statements and financial highlights referred to above present fairly, in all material respects, the financial position of Neuberger Berman High Income Bond Fund, Neuberger Berman Municipal Intermediate Bond Fund, Neuberger Berman Short Duration Bond Fund, and Neuberger Berman Strategic Income Fund as of October 31, 2012, the results of their operations for the year then ended, the changes in their net assets for each of the two years in the period then ended, and the financial highlights for each of the periods indicated therein, in conformity with U.S. generally accepted accounting principles.
Boston, Massachusetts
December 21, 2012
Report of Independent Registered Public Accounting Firm
To the Board of Trustees and Shareholders
Neuberger Berman Income Funds
We have audited the accompanying statements of assets and liabilities of the Neuberger Berman Core Bond Fund, the Neuberger Berman Floating Rate Income Fund and the Neuberger Berman Short Duration High Income Fund, each a series of the Neuberger Berman Income Funds (the "Trust"), including the schedules of investments, as of October 31, 2012, and the related statements of operations for the year then ended, the statements of changes in net assets for each of the two years in the period then ended (with respect to Neuberger Berman Short Duration High Income Fund, for the period September 28, 2012 to October 31, 2012 ), and the financial highlights for each of the five years in the period then ended (with respect to Neuberger Berman Floating Rate Income Fund, for the two years in the period then ended and for the period December 29, 2009 to October 31, 2010, and with respect to Neuberger Berman Short Duration High Income Fund, for the period September 28, 2012 to October 31, 2012). These financial statements and financial highlights are the responsibility of the Trust's management. Our responsibility is to express an opinion on these financial statements and financial highlights based on our audits.
We conducted our audits in accordance with the standards of the Public Company Accounting Oversight Board (United States). Those standards require that we plan and perform the audit to obtain reasonable assurance about whether the financial statements and financial highlights are free of material misstatement. The Trust is not required to have, nor were we engaged to perform, an audit of its internal control over financial reporting. Our audits included consideration of internal control over financial reporting as a basis for designing audit procedures that are appropriate in the circumstances, but not for the purpose of expressing an opinion on the effectiveness of the Trust's internal control over financial reporting. Accordingly, we express no such opinion. An audit also includes examining, on a test basis, evidence supporting the amounts and disclosures in the financial statements and financial highlights, assessing the accounting principles used and significant estimates made by management, as well as evaluating the overall financial statement presentation. Our procedures included confirmation of securities owned as of October 31, 2012, by correspondence with the custodian and brokers or by other appropriate auditing procedures where replies from brokers were not received. We believe that our audits provide a reasonable basis for our opinion.
In our opinion, the financial statements and financial highlights referred to above present fairly, in all material respects, the financial position of the above mentioned series of the Neuberger Berman Income Funds, as of October 31, 2012, and the results of their operations, the changes in their net assets, and the financial highlights for the periods indicated above, in conformity with accounting principles generally accepted in the United States of America.
Philadelphia, Pennsylvania
December 21, 2012
Directory
| | Investment Manager, Administrator and Distributor Neuberger Berman Management LLC 605 Third Avenue, 2nd Floor New York, NY 10158-0180 800.877.9700 or 212.476.8800 Intermediary Support Services 800.366.6264 | | For Trust Class and Institutional Class Shareholders Address correspondence to: Neuberger Berman Management LLC 605 Third Avenue, Mail Drop 2-7 New York, NY 10158-0180 Attn: Intermediary Support Services 800.366.6264 |
| | | | |
| | Sub-Adviser Neuberger Berman Fixed Income LLC 190 South LaSalle Street Chicago, IL 60603 | | Legal Counsel K&L Gates LLP 1601 K Street, NW Washington, DC 20006 |
| | | | |
| | Custodian and Shareholder Servicing Agent State Street Bank and Trust Company 2 Avenue de Lafayette Boston, MA 02111 | | Independent Registered Public Accounting Firms Ernst & Young LLP 200 Clarendon Street Boston, MA 02116 |
| | | | |
| | For Investor Class Shareholders Address correspondence to: Neuberger Berman Funds Boston Service Center P.O. Box 8403 Boston, MA 02266-8403 800.877.9700 or 212.476.8800 | | Tait, Weller & Baker LLP 1818 Market Street Suite 2400 Philadelphia, PA 19103 |
| | | | |
| | For Class A, Class C and Class R3 Shareholders: Please contact your investment provider | | |
Trustees and Officers
The following tables set forth information concerning the trustees ("Trustees") and officers ("Officers") of each of the Funds. All persons named as Trustees and Officers also serve in similar capacities for other funds administered or managed by Management and NBFI. Each Fund's Statement of Additional Information includes additional information about the Trustees as of the time of the Fund's most recent public offering and is available upon request, without charge, by calling (800) 877-9700.
Information about the Board of Trustees
Name, (Year of Birth), and Address(1) | | Position(s) and Length of Time Served(2) | | Principal Occupation(s)(3) | | Number of Funds in Fund Complex Overseen by Fund Trustee | | Other Directorships Held Outside Fund Complex by Fund Trustee(3) | |
| | | | | | | | | | |
| Independent Fund Trustees | |
| | |
| Faith Colish (1935) | | Trustee since 2000 | | Counsel, Carter Ledyard & Milburn LLP (law firm) since October 2002; formerly, Attorney-at-Law and President, Faith Colish, A Professional Corporation, 1980 to 2002. | | | 50 | | | Formerly, Director, 1997 to 2003, and Advisory Director, 2003 to 2006, ABA Retirement Funds (formerly, American Bar Retirement Association) (not-for-profit membership corporation). | |
| Martha C. Goss (1949) | | Trustee since 2007 | | President, Woodhill Enterprises Inc./Chase Hollow Associates LLC (personal investment vehicle), since 2006; Chief Operating and Financial Officer, Hopewell Holdings LLC/ Amwell Holdings, LLC (a holding company for investments in the healthcare sector), since 2003; formerly, Consultant, Resources Connection (temporary staffing), 2002 to 2006. | | | 50 | | | Director, American Water (water utility), since 2003; Director, Channel Reinsurance (financial guaranty reinsurance), 2006 to 2010; Director, Allianz Life of New York (insurance), since 2005; Director, Financial Women's Association of New York (not-for-profit association), since 2003; Trustee Emerita, Brown University, since 1998; formerly, Director, Ocwen Financial Corporation (mortgage servicing), 2005 to 2010; formerly, Advisory Board Member, Attensity (software developer), 2005 to 2007; formerly, Director, Bank Leumi (commercial bank), 2005 to 2007; formerly, Director, Claire's Stores, Inc. (retailer), 2005 to 2007. | |
Name, (Year of Birth), and Address(1) | | Position(s) and Length of Time Served(2) | | Principal Occupation(s)(3) | | Number of Funds in Fund Complex Overseen by Fund Trustee | | Other Directorships Held Outside Fund Complex by Fund Trustee(3) | |
| | | | | | | | | | |
| Michael M. Knetter (1960) | | Trustee since 2007 | | President and Chief Executive Officer, University of Wisconsin Foundation, since October 2010; formerly, Dean, School of Business, University of Wisconsin — Madison; formerly, Professor of International Economics and Associate Dean, Amos Tuck School of Business — Dartmouth College, 1998 to 2002. | | | 50 | | | Director, American Family Insurance (a mutual company, not publicly traded), since March 2009; formerly, Trustee, Northwestern Mutual Series Fund, Inc., 2007 to 2010; formerly, Director, Wausau Paper, 2005 to 2011; formerly, Director, Great Wolf Resorts, 2004 to 2009. | |
| Howard A. Mileaf (1937) | | Trustee since 2000 | | Retired; formerly, Vice President and General Counsel, WHX Corporation (holding company), 1993 to 2001. | | | 50 | | | Formerly, Director, Webfinancial Corporation (holding company), 2002 to 2008; formerly, Director, WHX Corporation (holding company), 2002 to 2005; formerly, Director, State Theatre of New Jersey (not-for-profit theatre), 2000 to 2005. | |
| George W. Morriss (1947) | | Trustee since 2007 | | Adjunct Faculty Member, Columbia University School of International Policy and Administration, since October 2012; formerly, Executive Vice President and Chief Financial Officer, People's Bank, Connecticut (a financial services company), 1991 to 2001. | | | 50 | | | Formerly, Manager, Larch Lane Multi-Strategy Fund complex (which consisted of three funds), 2006 to 2011; formerly, Member, NASDAQ Issuers' Affairs Committee, 1995 to 2003. | |
Name, (Year of Birth), and Address(1) | | Position(s) and Length of Time Served(2) | | Principal Occupation(s)(3) | | Number of Funds in Fund Complex Overseen by Fund Trustee | | Other Directorships Held Outside Fund Complex by Fund Trustee(3) | |
| | | | | | | | | | |
| Jack L. Rivkin (1940) | | Trustee since 2002; President from 2002 to 2008 | | Formerly, Executive Vice President and Chief Investment Officer, Neuberger Berman Holdings LLC (holding company), 2002 to August 2008 and 2003 to August 2008, respectively; formerly, Managing Director and Chief Investment Officer, Neuberger, December 2005 to August 2008 and 2003 to August 2008, respectively; formerly, Executive Vice President, Neuberger, December 2002 to 2005; formerly, Director and Chairman, Management, December 2002 to August 2008; formerly, Executive Vice President, Citigroup Investments, Inc., September 1995 to February 2002; formerly, Executive Vice President, Citigroup Inc., September 1995 to February 2002. | | | 50 | | | Director, Idealab (private company), since 2009; Director, Distributed World Power (private company), since 2009; Director, Dale Carnegie and Associates, Inc. (private company), since 1999; Director, Solbright, Inc. (private company), since 1998; Director, SA Agricultural Fund, since 2009; Chairman and Director, Essential Brands (consumer products) since 2008; formerly, Director, New York Society of Security Analysts, 2006 to 2008. | |
| Tom D. Seip (1950) | | Trustee since 2000; Chairman of the Board since 2008; Lead Independent Trustee from 2006 to 2008 | | General Partner, Ridgefield Farm LLC (a private investment vehicle); formerly, President and CEO, Westaff, Inc. (temporary staffing), May 2001 to January 2002; formerly, Senior Executive, The Charles Schwab Corporation, 1983 to 1998, including Chief Executive Officer, Charles Schwab Investment Management, Inc.; Trustee, Schwab Family of Funds and Schwab Investments, 1997 to 1998; and Executive Vice President-Retail Brokerage, Charles Schwab & Co., Inc., 1994 to 1997. | | | 50 | | | Director, H&R Block, Inc. (financial services company), since May 2001; Chairman, Governance and Nominating Committee, H&R Block, Inc., since 2011; formerly, Chairman, Compensation Committee, H&R Block, Inc., 2006 to 2010; formerly, Director, Forward Management, Inc. (asset management company), 1999 to 2006. | |
Name, (Year of Birth), and Address(1) | | Position(s) and Length of Time Served(2) | | Principal Occupation(s)(3) | | Number of Funds in Fund Complex Overseen by Fund Trustee | | Other Directorships Held Outside Fund Complex by Fund Trustee(3) | |
| | | | | | | | | | |
| Candace L. Straight (1947) | | Trustee since 1993 | | Private investor and consultant specializing in the insurance industry; formerly, Advisory Director, Securitas Capital LLC (a global private equity investment firm dedicated to making investments in the insurance sector), 1998 to December 2003. | | | 50 | | | Public Member, Board of Governors and Board of Trustees, Rutgers University, since 2011; Director, Montpelier Re Holdings Ltd. (reinsurance company), since 2006; formerly, Director, National Atlantic Holdings Corporation (property and casualty insurance company), 2004 to 2008; formerly, Director, The Proformance Insurance Company (property and casualty insurance company), 2004 to 2008; formerly, Director, Providence Washington Insurance Company (property and casualty insurance company), 1998 to 2006; formerly, Director, Summit Global Partners (insurance brokerage firm), 2000 to 2005. | |
| Peter P. Trapp (1944) | | Trustee since 2000 | | Retired; formerly, Regional Manager for Mid-Southern Region, Ford Motor Credit Company, September 1997 to 2007; formerly, President, Ford Life Insurance Company, April 1995 to August 1997. | | | 50 | | | None. | |
Name, (Year of Birth), and Address(1) | | Position(s) and Length of Time Served(2) | | Principal Occupation(s)(3) | | Number of Funds in Fund Complex Overseen by Fund Trustee | | Other Directorships Held Outside Fund Complex by Fund Trustee(3) | |
| | |
| Fund Trustees who are "Interested Persons" | |
| | | | | | | | | | | | |
| Joseph V. Amato* (1962) | | Trustee since 2009 | | President and Director, NBG since 2009; President and Chief Executive Officer, Neuberger and Neuberger Berman Holdings LLC (including its predecessor, Neuberger Berman Inc.), since 2007; Chief Investment Officer, Neuberger, since 2009; Chief Investment Officer (Equities) and Managing Director, Management, since 2009; Managing Director, NBFI, since 2007; Board member of NBFI since 2006; formerly, Global Head of Asset Management of Lehman Brothers Holdings Inc.'s ("LBHI") Investment Management Division, 2006 to 2009; formerly, member of LBHI's Investment Management Division's Executive Management Committee, 2006 to 2009; formerly, Managing Director, Lehman Brothers Inc. ("LBI"), 2006 to 2008; formerly, Chief Recruiting and Development Officer, LBI, 2005 to 2006; formerly, Global Head of LBI's Equity Sales and a Member of its Equities Division Executive Committee, 2003 to 2005. | | | 50 | | | Member of Board of Advisors, McDonough School of Business, Georgetown University, since 2001; Member of New York City Board of Advisors, Teach for America, since 2005; Trustee, Montclair Kimberley Academy (private school), since 2007. | |
Name, (Year of Birth), and Address(1) | | Position(s) and Length of Time Served(2) | | Principal Occupation(s)(3) | | Number of Funds in Fund Complex Overseen by Fund Trustee | | Other Directorships Held Outside Fund Complex by Fund Trustee(3) | |
| | | | | | | | | | |
| Robert Conti* (1956) | | Chief Executive Officer, President and Trustee since 2008; prior thereto, Executive Vice President in 2008 and Vice President from 2000 to 2008 | | Managing Director, Neuberger, since 2007; formerly, Senior Vice President, Neuberger, 2003 to 2006; formerly, Vice President, Neuberger, 1999 to 2003; President and Chief Executive Officer, Management, since 2008; formerly, Senior Vice President, Management, 2000 to 2008; Managing Director, NBFI, since 2009. | | | 50 | | | Director, Staten Island Mental Health Society, since 2008; formerly, Chairman of the Board, Staten Island Mental Health Society, 2008 to 2011. | |
| (1) | The business address of each listed person is 605 Third Avenue, New York, New York 10158. |
| (2) | Pursuant to the Trust's Trust Instrument, each of these Fund Trustees shall hold office for life or until his or her successor is elected or the Trust terminates; except that (a) any Fund Trustee may resign by delivering a written resignation; (b) any Fund Trustee may be removed with or without cause at any time by a written instrument signed by at least two-thirds of the other Fund Trustees; (c) any Fund Trustee who requests to be retired, or who has become unable to serve, may be retired by a written instrument signed by a majority of the other Fund Trustees; and (d) any Fund Trustee may be removed at any shareholder meeting by a vote of at least two-thirds of the outstanding shares. |
| (3) | Except as otherwise indicated, each individual has held the positions shown for at least the last five years. |
| * | Indicates a Fund Trustee who is an "interested person" within the meaning of the 1940 Act. Mr. Amato and Mr. Conti are interested persons of the Trust by virtue of the fact that each is an officer of Management and/or its affiliates. |
Information about the Officers of the Trust
Name, (Year of Birth), and Address(1) | | Position(s) and Length of Time Served(2) | | Principal Occupation(s)(3) | |
| | | | | | |
| Andrew B. Allard (1961) | | Anti-Money Laundering Compliance Officer since 2002 | | Senior Vice President, Neuberger, since 2006 and Employee since 1999; Deputy General Counsel, Neuberger, since 2004; formerly, Vice President, Neuberger, 2000 to 2005; formerly, Employee, Management, 1994 to 1999; Anti-Money Laundering Compliance Officer, nine registered investment companies for which Management acts as investment manager and administrator (six since 2002, one since 2003, one since 2005 and one since 2006). | |
| Claudia A. Brandon (1956) | | Executive Vice President since 2008 and Secretary since 1985 | | Senior Vice President, Neuberger, since 2007 and Employee since 1999; Senior Vice President, Management, since 2008 and Assistant Secretary since 2004; formerly, Vice President, Neuberger, 2002 to 2006; formerly, Vice President-Mutual Fund Board Relations, Management, 2000 to 2008; formerly, Vice President, Management, 1986 to 1999 and Employee 1984 to 1999; Executive Vice President, nine registered investment companies for which Management acts as investment manager and administrator (nine since 2008); Secretary, nine registered investment companies for which Management acts as investment manager and administrator (three since 1985, three since 2002, one since 2003, one since 2005 and one since 2006). | |
| Anthony DiBernardo (1979) | | Assistant Treasurer since 2011 | | Vice President, Neuberger, since 2009; Employee, Management, since 2003; Assistant Treasurer, nine registered investment companies for which Management acts as investment manager and administrator (nine since 2011). | |
| Maxine L. Gerson (1950) | | Executive Vice President since 2008 and Chief Legal Officer since 2005 (only for purposes of sections 307 and 406 of the Sarbanes-Oxley Act of 2002) | | Managing Director, Neuberger, since 2009, and Deputy General Counsel and Assistant Secretary, Neuberger, since 2001; Managing Director, Management, since 2009, and Secretary and General Counsel, Management, since 2004; formerly, Senior Vice President, Neuberger, 2002 to 2009; formerly, Senior Vice President, Management, 2006 to 2009; Executive Vice President, nine registered investment companies for which Management acts as investment manager and administrator (nine since 2008); Chief Legal Officer (only for purposes of sections 307 and 406 of the Sarbanes-Oxley Act of 2002), nine registered investment companies for which Management acts as investment manager and administrator (eight since 2005 and one since 2006). | |
| Sheila R. James (1965) | | Assistant Secretary since 2002 | | Vice President, Neuberger, since 2008 and Employee since 1999; formerly, Assistant Vice President, Neuberger, 2007; formerly, Employee, Management, 1991 to 1999; Assistant Secretary, nine registered investment companies for which Management acts as investment manager and administrator (six since 2002, one since 2003, one since 2005 and one since 2006). | |
| Brian Kerrane (1969) | | Vice President since 2008 | | Senior Vice President, Neuberger, since 2006; formerly, Vice President, Neuberger, 2002 to 2006; Vice President, Management, since 2008 and Employee since 1991; Vice President, nine registered investment companies for which Management acts as investment manager and administrator (nine since 2008). | |
Name, (Year of Birth), and Address(1) | | Position(s) and Length of Time Served(2) | | Principal Occupation(s)(3) | |
| | | | | | |
| Kevin Lyons (1955) | | Assistant Secretary since 2003 | | Assistant Vice President, Neuberger, since 2008 and Employee since 1999; formerly, Employee, Management 1993 to 1999; Assistant Secretary, nine registered investment companies for which Management acts as investment manager and administrator (seven since 2003, one since 2005 and one since 2006). | |
| Owen F. McEntee, Jr. (1961) | | Vice President since 2008 | | Vice President, Neuberger, since 2006; Employee, Management, since 1992; Vice President, nine registered investment companies for which Management acts as investment manager and administrator (nine since 2008). | |
| John M. McGovern (1970) | | Treasurer and Principal Financial and Accounting Officer since 2005 | | Senior Vice President, Neuberger, since 2007; formerly, Vice President, Neuberger, 2004 to 2006; Employee, Management, since 1993; Treasurer and Principal Financial and Accounting Officer, nine registered investment companies for which Management acts as investment manager and administrator (eight since 2005 and one since 2006); formerly, Assistant Treasurer, eight registered investment companies for which Management acts as investment manager and administrator, 2002 to 2005. | |
| Frank Rosato (1971) | | Assistant Treasurer since 2005 | | Vice President, Neuberger, since 2006; Employee, Management, since 1995; Assistant Treasurer, nine registered investment companies for which Management acts as investment manager and administrator (eight since 2005 and one since 2006). | |
| Neil S. Siegel (1967) | | Vice President since 2008 | | Managing Director, Management, since 2008; Managing Director, Neuberger, since 2006; formerly, Senior Vice President, Neuberger, 2004 to 2006; Vice President, nine registered investment companies for which Management acts as investment manager and administrator (nine since 2008). | |
| Chamaine Williams (1971) | | Chief Compliance Officer since 2005 | | Senior Vice President, Neuberger, since 2007; Chief Compliance Officer, Management, since 2006; Chief Compliance Officer, nine registered investment companies for which Management acts as investment manager and administrator (eight since 2005 and one since 2006); formerly, Senior Vice President, LBI, 2007 to 2008; formerly, Vice President, LBI, 2003 to 2006; formerly, Chief Compliance Officer, Lehman Brothers Asset Management Inc., 2003 to 2007; formerly, Chief Compliance Officer, Lehman Brothers Alternative Investment Management LLC, 2003 to 2007. | |
| (1) | The business address of each listed person is 605 Third Avenue, New York, New York 10158. |
| (2) | Pursuant to the By-Laws of the Trust, each officer elected by the Fund Trustees shall hold office until his or her successor shall have been elected and qualified or until his or her earlier death, inability to serve, or resignation. Officers serve at the pleasure of the Fund Trustees and may be removed at any time with or without cause. |
| (3) | Except as otherwise indicated, each individual has held the positions shown for at least the last five years. |
Proxy Voting Policies and Procedures
A description of the policies and procedures that the Trust uses to determine how to vote proxies relating to portfolio securities is available, without charge, by calling 1-800-877-9700 (toll-free) and on the website of the Securities and Exchange Commission, at www.sec.gov. Information regarding how the Trust voted proxies relating to portfolio securities during the most recent 12-month period ended June 30 is also available, without charge, by calling 1-800-877-9700 (toll-free), on the website of the Securities and Exchange Commission at www.sec.gov, and on Management's website at www.nb.com.
Quarterly Portfolio Schedule
The Trust files a complete schedule of portfolio holdings for each Fund with the Securities and Exchange Commission for the first and third quarters of each fiscal year on Form N-Q. The Trust's Forms N-Q are available on the Securities and Exchange Commission's website at www.sec.gov and may be reviewed and copied at the Securities and Exchange Commission's Public Reference Room in Washington, DC. Information on the operation of the Public Reference Room may be obtained by calling 1-800-SEC-0330. The information on Form N-Q is available upon request, without charge, by calling 1-800-877-9700 (toll-free).
Notice to Shareholders
Under most state tax laws, mutual fund dividends which are derived from direct investments in U.S. Government obligations are not taxable, as long as a Fund meets certain requirements. Some states require that a Fund must provide shareholders with a written notice, within 60 days of the close of a Fund's taxable year, designating the portion of the dividends which represents interest which those states consider to have been earned on U.S. Government obligations. The chart below shows the percentage of income derived from such investments for the twelve months ended October 31, 2012. This information should not be used to complete your tax returns.
| | | U.S. Treasury Obligations | | Other Direct U.S. Government Obligations | | Other Indirect U.S. Government Obligations | | Repurchase Agreements |
| | | | | | | | | |
| Core Bond | | | 7.0 | % | | | 0.6 | % | | | 18.0 | % | | | 0.0 | % |
| Floating Rate Income | | | 0.0 | | | | 0.0 | | | | 0.0 | | | | 0.0 | |
| High Income | | | 0.0 | | | | 0.0 | | | | 0.0 | | | | 0.0 | |
| Short Duration | | | 8.0 | | | | 0.0 | | | | 9.6 | | | | 0.0 | |
| Short Duration High Income | | | 0.0 | | | | 0.0 | | | | 0.0 | | | | 0.0 | |
| Strategic Income | | | 3.4 | | | | 0.6 | | | | 7.7 | | | | 0.0 | |
For the fiscal period ended October 31, 2012 the percentages representing the portion of distributions from net investment income, which are exempt from federal tax, other than alternative minimum tax are as follows:
| Municipal Intermediate Bond | | | 100.00 | % |
For the fiscal period ended October 31, 2012, the maximum amount of ordinary income distribution that is designated as qualified interest income, pursuant to the American Jobs Creation Act of 2004, is as follows:
| | | Ordinary Income | | Short-Term Capital Gains |
| | | | | |
| Core Bond | | $ | 7,074,531 | | | $ | 3,481,909 | |
| High Income | | | 182,226,627 | | | | 3,104,940 | |
| Strategic Income | | | 30,027,805 | | | | 3,656,374 | |
In January 2013, you will receive information to be used in filing your 2012 tax returns, which will include a notice of the exact tax status of all dividends paid to you by each Fund during calendar year 2012. Please consult your own tax advisor for details as to how this information should be reflected on your tax returns.
Core Bond, High Income, Municipal Intermediate Bond and Strategic Income designate $1,267,893, $16,394,086, $580,339 and $2,639,229, respectively, as a capital gain distribution.
Board Consideration of the Management and Sub-Advisory Agreements
At a meeting held on October 25, 2012, the Board of Trustees of Neuberger Berman Income Funds ("Board"), including the Trustees who are not "interested persons" of Management (including its affiliates) or Neuberger Berman Income Funds ("Independent Fund Trustees"), approved the continuance of the Management and Sub-Advisory Agreements ("Agreements") for each of Neuberger Berman Core Bond Fund, Neuberger Berman High Income Bond Fund, Neuberger Berman Floating Rate Income Fund, Neuberger Berman Municipal Intermediate Bond Fund, Neuberger Berman Short Duration Bond Fund and Neuberger Berman Strategic Income Fund (each a "Fund").
In evaluating the Agreements, the Board, including the Independent Fund Trustees, reviewed materials furnished by Management in response to questions submitted by counsel for the Independent Fund Trustees, and met with senior representatives of Management regarding their personnel, operations and financial conditions as they relate to the Funds. The Independent Fund Trustees were advised by counsel that is experienced in Investment Company Act of 1940 matters and that is independent of Management. The Independent Fund Trustees received a memorandum from independent counsel discussing the legal standards for their consideration of the proposed continuance of the Agreements. They met with such counsel separately from representatives of Management to discuss the annual contract review. The annual contract review extends over three regular meetings of the Board to ensure that Management and Neuberger Berman Fixed Income LLC ("NBFI") have time to respond to any questions the Independent Fund Trustees may have on their initial review of the report and that the Independent Fund Trustees have time to consider those responses. One of those meetings was devoted primarily to reviewing and discussing Fund performance.
The Board considered the following factors, among others, in connection with its approval of the continuance of the Agreements: (1) the nature, extent, and quality of the services provided by Management and NBFI; (2) the performance of each Fund compared to a relevant market index and a peer group of investment companies; (3) the costs of the services provided and profits or losses realized by Management and its affiliates from their relationship with the Funds; (4) the extent to which economies of scale might be realized as each Fund grows; and (5) whether fee levels reflect any such potential economies of scale for the benefit of investors in each Fund. In their deliberations, the Board members did not identify any particular information that was all-important or controlling, and each Trustee may have attributed different weights to the various factors.
The Board evaluated the terms of the Agreements, the overall fairness of the Agreements to each Fund and whether the Agreements were in the best interests of each Fund and its shareholders.
With respect to the nature, extent and quality of the services provided, the Board considered the performance of each Fund and the experience and staffing of the portfolio management personnel of Management and NBFI who perform services for the Funds. The Board noted that Management also provides certain administrative services, including fund accounting and compliance oversight. The Board also considered Management's and NBFI's policies and practices regarding brokerage and allocation of portfolio transactions by Management. The Board's Portfolio Transactions and Pricing Committee from time to time reviewed the quality of the execution services that Management had provided. In addition, the Board noted the positive compliance history of Management and NBFI, as each firm has been free of significant reported compliance problems. As in past years, the Board also considered the manner in which Management addressed various non-routine matters that arose during the year, some of them a result of developments in the broader fund industry or the regulations governing it.
The Board considered the performance of each Fund relative to its benchmark and the average performance of composite peer groups of investment companies pursuing broadly similar strategies. The Board also reviewed during the period
performance in relation to certain measures of the degree of investment risk undertaken by the portfolio managers. In the case of those Funds that had underperformed their peer groups and/or relevant market indices, the Board discussed with Management each Fund's performance and steps that Management had taken, or intended to take, to improve performance. The Board also considered Management's resources and responsiveness with respect to the Funds that experienced lagging performance.
With respect to the overall fairness of the Agreements, the Board considered the fee structure for each Fund under the Agreements as compared to a peer group of comparable funds and any fall-out benefits likely to accrue to Management or NBFI or their affiliates from their relationship with each Fund. The Board also considered the profitability of Management and its affiliates from their association with the Funds.
The Board reviewed a comparison of each Fund's management fee and overall expense ratio to a peer group of broadly comparable funds. The Board considered the mean and median of the management fees and expense ratios of each peer group. Where a Fund's management fee was higher than the peer group mean and/or median, the Board considered whether specific portfolio management or administration needs contributed to the management fee. In addition, the Board considered the contractual limit on expenses of certain classes of each Fund and the voluntary waiver of a portion of the management fee by Management for Neuberger Berman Core Bond Fund. The Board noted that Management incurred a loss on certain of the Funds during the review period. The Board considered whether there were other funds that were advised or sub-advised by Management or its affiliates or separate accounts managed by Management or its affiliates with investment objectives, policies and strategies that were similar to those of any of the Funds. The Board compared the fees charged to each Fund to the fees charged to any such funds and/or separate accounts. The Board considered the appropriateness and reasonableness of any differences between the fees charged to each Fund and any such funds and/or separate accounts and determined that the differences in fees were consistent with the management and other services provided. The Board also evaluated any apparent or anticipated economies of scale in relation to the services Management provides to each Fund. The Board considered whether each Fund's fee structure provides for a reduction of payments resulting from the use of breakpoints and whether any such breakpoints are set at appropriate asset levels. In concluding that the benefits accruing to Management and its affiliates by virtue of their relationship to each Fund were reasonable in comparison with the costs of providing the investment advisory and other services and the benefits accruing to each Fund, the Board reviewed specific data as to Management's profit or loss on each Fund for a recent period. The Board also carefully examined Management's cost allocation methodology. The Board recognized that Management should be entitled to earn a reasonable level of profits for services it provides to the Funds and, based on its review, concluded that Management's level of profitability was not excessive.
Conclusions
In approving the Agreements, the Board concluded that the terms of each Agreement are fair and reasonable to each Fund and that approval of the Agreements is in the best interests of each Fund and its shareholders. In reaching this determination, the Board considered that Management and NBFI could be expected to provide a high level of service to each Fund; that the performance of each Fund was satisfactory over time, or, in the case of underperforming Funds, that it retained confidence in Management's and NBFI's capabilities to manage the Funds; that each Fund's fee structure appeared to the Board to be reasonable given the nature and quality of services provided; and that the benefits accruing to Management and its affiliates by virtue of their relationship to the Funds were reasonable in comparison with the benefits accruing to each Fund.
Board Consideration of the Management and Sub-Advisory Agreements
At a meeting held on April 19, 2012, the Board of Trustees of Neuberger Berman Income Funds ("Board"), including the Trustees who are not "interested persons" of Management (including its affiliates) or Neuberger Berman Income Funds ("Independent Fund Trustees"), approved the Management and Sub-Advisory Agreements ("Agreements") for Neuberger Berman Short Duration High Income Fund (the "Fund").
In evaluating the Agreements, the Board, including the Independent Fund Trustees, reviewed materials furnished by Management and met with senior representatives of Management regarding their personnel, operations and financial conditions as they relate to the Fund. The Independent Fund Trustees were advised by counsel that is experienced in Investment Company Act of 1940 matters and that is independent of Management.
The Board evaluated the terms of the Agreements, the overall fairness of the Agreements to the Fund and whether the Agreements were in the best interests of the Fund and its shareholders. The Board considered the following factors, among others, in connection with its approval of the Agreements: (1) the nature, extent, and quality of the services to be provided by Management and Neuberger Berman Fixed Income LLC ("NBFI"); (2) the expected costs of the services to be provided; (3) the extent to which economies of scale might be realized as the Fund grows; and (4) whether fee levels reflect any such potential economies of scale for the benefit of investors in the Fund. In their deliberations, the Board members did not identify any particular information that was all-important or controlling, and each Trustee may have attributed different weights to the various factors.
With respect to the nature, extent and quality of the services provided, the Board considered the experience and staffing of the portfolio management personnel of Management and NBFI who perform services for the Fund. The Board noted that Management also provides certain administrative services, including fund accounting and compliance oversight. The Board also considered Management's and Neuberger's policies and practices regarding brokerage and allocation of portfolio transactions for the Fund. In addition, the Board noted the positive compliance history of Management and NBFI, as each firm has been free of significant compliance problems. The Board also considered the manner in which Management addressed various non-routine matters that have arisen from time to time, some of them a result of developments in the broader fund industry or the regulations governing it.
With respect to the overall fairness of the Agreements, the Board considered the fee structure for the Fund under the Agreements as compared to a peer group of comparable funds and any fall-out benefits likely to accrue to Management or NBFI or their affiliates from their relationship with the Fund.
The Board reviewed a comparison of the Fund's management fee and overall expense ratio to a peer group of broadly comparable funds. In addition, the Board considered the contractual limits on the Fund's expenses undertaken by Management for the Fund. The Board also evaluated any anticipated economies of scale in relation to the services Management provides to the Fund, noting that it may be too soon to have a sense about economies at the start up phase of a fund.
Conclusions
In approving the Agreements, the Board concluded that the terms of each Agreement are fair and reasonable to the Fund and that approval of the Agreements is in the best interests of the Fund and its shareholders. In reaching this determination, the Board considered that Management and NBFI could be expected to provide a high level of service to the Fund; that the Fund's fee structure appeared to the Board to be reasonable given the nature and quality of services expected to be provided; and that the expected benefits accruing to Management and its affiliates by virtue of their relationship to the Fund were reasonable in comparison with the expected costs of providing the investment advisory services and the expected benefits accruing to the Fund.
This page has been left blank intentionally
This page has been left blank intentionally
| | Investment manager: Neuberger Berman Management LLC Sub-adviser: Neuberger Berman Fixed Income LLC Neuberger Berman Management LLC 605 Third Avenue 2nd Floor New York, NY 10158-0180 Retail Services: 800.877.9700 Broker-Dealer and Institutional Services: 800.366.6264/888.556.9030 Web site: www.nb.com Statistics and projections in this report are derived from sources deemed to be reliable but cannot be regarded as a representation of future results of the Funds. This report is prepared for the general information of shareholders and is not an offer of shares of the Funds. Shares are sold only through the currently effective prospectus, which must precede or accompany this report. H0648 12/12 |
Item 2. Code of Ethics.
The Board of Trustees (“Board”) of Neuberger Berman Income Funds (“Registrant”) adopted a code of ethics that applies to the Registrant’s principal executive officer, principal financial officer, principal accounting officer or controller, or persons performing similar functions (“Code of Ethics”). For the period covered by this Form N-CSR, there were no amendments to the Code of Ethics and there were no waivers from the Code of Ethics granted to the Registrant’s principal executive officer, principal financial officer, principal accounting officer or controller, or persons performing similar functions.
A copy of the Code of Ethics is incorporated by reference to Neuberger Berman Equity Funds’ Form N-CSRS, Investment Company Act file number 811-00582 (filed May 4, 2012). The Code of Ethics is also available, without charge, by calling 1-800-877-9700 (toll-free).
Item 3. Audit Committee Financial Expert.
The Board has determined that the Registrant has three audit committee financial experts serving on its audit committee. The Registrant’s audit committee financial experts are Martha Goss, George Morriss and Candace Straight. Ms. Goss, Mr. Morriss and Ms. Straight are independent trustees as defined by Form N-CSR.
Item 4. Principal Accountant Fees and Services.
The financial information provided below is that of the Registrant, Neuberger Berman Income Funds. This N-CSR relates only to Neuberger Berman Core Bond Fund, Neuberger Berman Floating Rate Income Fund, Neuberger Berman High Income Bond Fund, Neuberger Berman Municipal Intermediate Bond Fund, Neuberger Berman Short Duration Bond Fund, Neuberger Berman Short Duration High Income Fund and Neuberger Berman Strategic Income Fund (collectively, the “Funds”). Tait, Weller & Baker LLP (“Tait Weller”) serves as independent registered public accounting firm to Neuberger Berman Core Bond Fund, Neuberger Berman Floating Rate Income Fund and Neuberger Berman Short Duration High Income Fund. Ernst & Young LLP (“E&Y”) serves as independent registered public accounting firm to all other series of the Registrant.
(a) Audit Fees
The aggregate fees billed for professional services rendered by E&Y for the audit of the annual financial statements or services that are normally provided by E&Y in connection with statutory and regulatory filings or engagements were $161,450 and $185,950 for the fiscal years ended 2011 and 2012, respectively.
The aggregate fees billed for professional services rendered by Tait Weller for the audit of the annual financial statements or services that are normally provided by Tait Weller in connection with statutory and regulatory filings or engagements were $47,650 and $77,300 for the fiscal years ended 2011 and 2012, respectively.
(b) Audit-Related Fees
The aggregate fees billed to the Registrant for assurance and related services by E&Y that are reasonably related to the performance of the audit of the Registrant’s financial statements and are not reported above in Audit Fees were $0 and $0 for the fiscal years ended 2011 and 2012, respectively. The Audit Committee approved 0% and 0% of these services provided by E&Y for the fiscal years ended 2011 and 2012, respectively, pursuant to the waiver provisions of Rule 2-01(c)(7)(i)(C) of Regulation S-X.
The fees billed to other entities in the investment company complex for assurance and related services by E&Y that are reasonably related to the performance of the audit that the Audit Committee was required to approve because the engagement related directly to the operations and financial reporting of the Registrant were $0 and $0 for the fiscal years ended 2011 and 2012, respectively. The Audit Committee approved 0% and 0% of these services provided by E&Y for the fiscal years ended 2011 and 2012, respectively, pursuant to the waiver provisions of Rule 2-01(c)(7)(i)(C) of Regulation S-X.
The aggregate fees billed to the Registrant for assurance and related services by Tait Weller that are reasonably related to the performance of the audit of the Registrant’s financial statements and are not reported above in Audit Fees were $0 and $0 for the fiscal years ended 2011 and 2012, respectively. The Audit Committee approved 0% and 0% of these services provided by Tait Weller for the fiscal years ended 2011 and 2012, respectively, pursuant to the waiver provisions of Rule 2-01(c)(7)(i)(C) of Regulation S-X.
The fees billed to other entities in the investment company complex for assurance and related services by Tait Weller that are reasonably related to the performance of the audit that the Audit Committee was required to approve because the engagement related directly to the operations and financial reporting of the Registrant were $0 and $0 for the fiscal years ended 2011 and 2012, respectively. The Audit Committee approved 0% and 0% of these services provided by Tait Weller for the fiscal years ended 2011 and 2012, respectively, pursuant to the waiver provisions of Rule 2-01(c)(7)(i)(C) of Regulation S-X.
(c) Tax Fees
The aggregate fees billed to the Registrant for professional services rendered by E&Y for tax compliance, tax advice, and tax planning were $39,200 and $41,600 for the fiscal years ended 2011 and 2012, respectively. The nature of the services provided were tax compliance, tax advice, and tax planning. The Audit Committee approved 0% and 0% of these services provided by E&Y for the fiscal years ended 2011 and 2012, respectively, pursuant to the waiver provisions of Rule 2-01(c)(7)(i)(C) of Regulation S-X.
The fees billed to other entities in the investment company complex for professional services rendered by E&Y for tax compliance, tax advice, and tax planning that the Audit Committee was required to approve because the engagement related directly to the operations and financial reporting of the Registrant were $0 and $0 for the fiscal years ended 2011 and 2012, respectively. The Audit Committee approved 0% and 0% of these services provided by E&Y for the fiscal years ended 2011 and 2012, respectively, pursuant to the waiver provisions of Rule 2-01(c)(7)(i)(C) of Regulation S-X.
The aggregate fees billed to the Registrant for professional services rendered by Tait Weller for tax compliance, tax advice, and tax planning were $7,050 and $12,000 for the fiscal years ended 2011 and 2012, respectively. The nature of the services provided were tax compliance, tax advice and tax planning. The Audit Committee approved 0% and 0% of these services provided by Tait Weller for the fiscal years ended 2011 and 2012, respectively, pursuant to the waiver provisions of Rule 2-01(c)(7)(i)(C) of Regulation S-X.
The fees billed to other entities in the investment company complex for professional services rendered by Tait Weller for tax compliance, tax advice, and tax planning that the Audit Committee was required
to approve because the engagement related directly to the operations and financial reporting of the Registrant were $0 and $0 for the fiscal years ended 2011 and 2012, respectively. The Audit Committee approved 0% and 0% of these services provided by Tait Weller for the fiscal years ended 2011 and 2012, respectively, pursuant to the waiver provisions of Rule 2-01(c)(7)(i)(C) of Regulation S-X.
(d) All Other Fees
The aggregate fees billed to the Registrant for products and services provided by E&Y, other than services reported in Audit Fees, Audit-Related Fees, and Tax Fees were $0 and $0 for the fiscal years ended 2011 and 2012, respectively. The Audit Committee approved 0% and 0% of these services provided by E&Y for the fiscal years ended 2011 and 2012, respectively, pursuant to the waiver provisions of Rule 2-01(c)(7)(i)(C) of Regulation S-X.
The fees billed to other entities in the investment company complex for products and services provided by E&Y, other than services reported in Audit Fees, Audit-Related Fees, and Tax Fees, that the Audit Committee was required to approve because the engagement related directly to the operations and financial reporting of the Registrant were $0 and $0 for the fiscal years ended 2011 and 2012, respectively. The Audit Committee approved 0% and 0% of these services provided by E&Y for the fiscal years ended 2011 and 2012, respectively, pursuant to the waiver provisions of Rule 2-01(c)(7)(i)(C) of Regulation S-X.
The aggregate fees billed to the Registrant for products and services provided by Tait Weller, other than services reported in Audit Fees, Audit-Related Fees, and Tax Fees were $0 and $0 for the fiscal years ended 2011 and 2012, respectively. The Audit Committee approved 0% and 0% of these services provided by Tait Weller for the fiscal years ended 2011 and 2012, respectively, pursuant to the waiver provisions of Rule 2-01(c)(7)(i)(C) of Regulation S-X.
The fees billed to other entities in the investment company complex for products and services provided by Tait Weller, other than services reported in Audit Fees, Audit-Related Fees, and Tax Fees, that the Audit Committee was required to approve because the engagement related directly to the operations and financial reporting of the Registrant were $0 and $0 for the fiscal years ended 2011 and 2012, respectively. The Audit Committee approved 0% and 0% of these services provided by Tait Weller for the fiscal years ended 2011 and 2012, respectively, pursuant to the waiver provisions of Rule 2-01(c)(7)(i)(C) of Regulation S-X.
(e) Audit Committee’s Pre-Approval Policies and Procedures
(1) The Audit Committee’s pre-approval policies and procedures for the Registrant to engage an accountant to render audit and non-audit services delegate to each member of the Committee the power to pre-approve services between meetings of the Committee.
(2) None of the services described in paragraphs (b) through (d) above were approved by the Audit Committee pursuant to paragraph (c)(7)(i)(C) of Rule 2-01 of Regulation S-X.
(f) Hours Attributed to Other Persons
Not applicable.
(g) Non-Audit Fees
Non-audit fees billed by E&Y for services rendered to the Registrant were $39,200 and $41,600 for the fiscal years ended 2011 and 2012, respectively.
Non-audit fees billed by E&Y for services rendered to the Registrant’s investment adviser and any entity controlling, controlled by, or under common control with the adviser that provides ongoing services to the Registrant were $0 and $0 for the fiscal years ended 2011 and 2012, respectively.
Non-audit fees billed by Tait Weller for services rendered to the Registrant were $7,050 and $12,000 for the fiscal years ended 2011 and 2012, respectively.
Non-audit fees billed by Tait Weller for services rendered to the Registrant’s investment adviser and any entity controlling, controlled by, or under common control with the adviser that provides ongoing services to the Registrant were $0 and $0 for the fiscal years ended 2011 and 2012, respectively.
(h) The Audit Committee of the Board considered whether the provision of non-audit services rendered to the Registrant’s investment adviser and any entity controlling, controlled by, or under common control with the adviser that provides ongoing services to the Registrant that were not pre-approved by the Audit Committee because the engagement did not relate directly to the operations and financial reporting of the Registrant is compatible with maintaining E&Y’s and Tait Weller’s independence.
Item 5. Audit Committee of Listed Registrants.
Not applicable to the Registrant.
Item 6. Schedule of Investments.
The complete schedule of investments for each series is disclosed in the Registrant’s Annual Report, which is included as Item 1 of this Form N-CSR.
Item 7. Disclosure of Proxy Voting Policies and Procedures for Closed-End Management Investment Companies.
Not applicable to the Registrant.
Item 8. Portfolio Managers of Closed-End Management Investment Companies.
Not applicable to the Registrant.
Item 9. Purchases of Equity Securities by Closed-End Management Investment Company and Affiliated Purchasers.
Not applicable to the Registrant.
Item 10. Submission of Matters to a Vote of Security Holders.
There were no changes to the procedures by which shareholders may recommend nominees to the Board.
Item 11. Controls and Procedures.
| (a) | Based on an evaluation of the disclosure controls and procedures (as defined in Rule 30a-3(c) under the Investment Company Act of 1940, as amended (the “Act”)) as of a date within 90 days of the filing date of this document, the Chief Executive Officer and Treasurer and |
| | Principal Financial and Accounting Officer of the Registrant have concluded that such disclosure controls and procedures are effectively designed to ensure that information required to be disclosed by the Registrant on Form N-CSR and Form N-Q is accumulated and communicated to the Registrant’s management to allow timely decisions regarding required disclosure. |
| | |
| (b) | There were no significant changes in the Registrant’s internal controls over financial reporting (as defined in Rule 30a-3(d) under the Act) that occurred during the Registrant’s second fiscal quarter of the period covered by this report that have materially affected, or are reasonably likely to materially affect, the Registrant’s internal control over financial reporting. |
| | |
| Item 12. Exhibits. |
| |
| (a)(1) | A copy of the Code of Ethics is incorporated by reference to Neuberger Berman Equity Funds’ Form N-CSRS, Investment Company Act file number 811-00582 (filed May 4, 2012). |
| | |
| (a)(2) | The certifications required by Rule 30a-2(a) of the Act and Section 302 of the Sarbanes-Oxley Act of 2002 (“Sarbanes-Oxley Act”) are filed herewith. |
| | |
| (a)(3) | Not applicable to the Registrant. |
| | |
| (b) | The certifications required by Rule 30a-2(b) of the Act and Section 906 of the Sarbanes-Oxley Act are filed herewith. |
The certifications provided pursuant to Rule 30a-2(b) of the Act and Section 906 of the Sarbanes-Oxley Act are not deemed “filed” for purposes of Section 18 of the Securities Exchange Act of 1934, as amended (“Exchange Act”), or otherwise subject to the liability of that section. Such certifications will not be deemed to be incorporated by reference into any filing under the Securities Act of 1933, as amended, or the Exchange Act, except to the extent that the Registrant specifically incorporates them by reference.
SIGNATURES
Pursuant to the requirements of the Securities Exchange Act of 1934 and the Investment Company Act of 1940, the Registrant has duly caused this report to be signed on its behalf by the undersigned, thereunto duly authorized.
NEUBERGER BERMAN INCOME FUNDS
By: | /s/ Robert Conti | |
| | Robert Conti | |
| | Chief Executive Officer | |
| | | |
Date: | January 3, 2013 | |
| | | |
| | | |
Pursuant to the requirements of the Securities Exchange Act of 1934 and the Investment Company Act of 1940, this report has been signed below by the following persons on behalf of the Registrant and in the capacities and on the dates indicated. |
| | | |
| | | |
| | | |
By: | /s/ Robert Conti | |
| | Robert Conti | |
| | Chief Executive Officer | |
| | | |
Date: | January 3, 2013 | |
| | | |
By: | /s/ John M. McGovern | |
| | John M. McGovern | |
| | Treasurer and Principal Financial | |
| | and Accounting Officer | |
| | | |
Date: | January 3, 2013 | |