As filed with the Securities and Exchange Commission on January 6, 2014
UNITED STATES
SECURITIES AND EXCHANGE COMMISSION
Washington, D.C. 20549
FORM N-CSR
CERTIFIED SHAREHOLDER REPORT OF
REGISTERED MANAGEMENT INVESTMENT COMPANIES
Investment Company Act file number: 811-03802
NEUBERGER BERMAN INCOME FUNDS
(Exact Name of the Registrant as Specified in Charter)
c/o Neuberger Berman Management LLC
605 Third Avenue, 2nd Floor
New York, New York 10158-0180
(Address of Principal Executive Offices – Zip Code)
Registrant's telephone number, including area code: (212) 476-8800
Robert Conti
Chief Executive Officer and President
Neuberger Berman Income Funds
c/o Neuberger Berman Management LLC
605 Third Avenue, 2nd Floor
New York, New York 10158-0180
Arthur C. Delibert, Esq.
K&L Gates LLP
1601 K Street, N.W.
Washington, D.C. 20006-1600
(Names and Addresses of agents for service)
Date of fiscal year end: October 31, 2013
Date of reporting period: October 31, 2013
Form N-CSR is to be used by management investment companies to file reports with the Commission not later than 10 days after the transmission to stockholders of any report that is required to be transmitted to stockholders under Rule 30e-1 under the Investment Company Act of 1940 (17 CFR 270.30e-1). The Commission may use the information provided on Form N-CSR in its regulatory, disclosure review, inspection and policymaking roles.
A registrant is required to disclose the information specified by Form N-CSR, and the Commission will make this information public. A registrant is not required to respond to the collection of information contained in Form N-CSR unless the Form displays a currently valid Office of Management and Budget (“OMB”) control number. Please direct comments concerning the accuracy of the information collection burden estimate and any suggestions for reducing the burden to the Secretary, Securities and Exchange Commission, 100 F Street, NE, Washington, DC 20549-0609. The
OMB has reviewed this collection of information under the clearance requirements of 44 U.S.C. § 3507.
Item 1. Report to Shareholders.

Neuberger Berman
Income Funds
Investor Class Shares
Trust Class Shares
Institutional Class Shares
Core Bond Fund
Floating Rate Income Fund
High Income Bond Fund
Municipal Intermediate Bond Fund
Class A Shares
Class C Shares
Class R3 Shares
Class R6 Shares
New York Municipal Income Fund
Short Duration Bond Fund
Short Duration High Income Fund
Strategic Income Fund
Annual Report
October 31, 2013
Contents
THE FUNDS
PORTFOLIO COMMENTARY
Core Bond Fund | | | 2 | | |
Floating Rate Income Fund | | | 5 | | |
High Income Bond Fund | | | 9 | | |
Municipal Intermediate Bond Fund | | | 12 | | |
New York Municipal Income Fund | | | 15 | | |
Short Duration Bond Fund | | | 18 | | |
Short Duration High Income Fund | | | 21 | | |
Strategic Income Fund | | | 24 | | |
FUND EXPENSE INFORMATION | | | 31 | | |
SCHEDULE OF INVESTMENTS
Core Bond Fund | | | 33 | | |
Floating Rate Income Fund | | | 39 | | |
High Income Bond Fund | | | 47 | | |
Municipal Intermediate Bond Fund | | | 57 | | |
New York Municipal Income Fund | | | 63 | | |
Short Duration Bond Fund | | | 65 | | |
Short Duration High Income Fund | | | 69 | | |
Strategic Income Fund | | | 77 | | |
FINANCIAL STATEMENTS | | | 104 | | |
The "Neuberger Berman" name and logo are registered service marks of Neuberger Berman Group LLC. "Neuberger Berman Management LLC" and the individual Fund names in this piece are either service marks or registered service marks of Neuberger Berman Management LLC. ©2013 Neuberger Berman Management LLC. All rights reserved.
FINANCIAL HIGHLIGHTS (ALL CLASSES)/PER SHARE DATA
Core Bond Fund | | | 140 | | |
Floating Rate Income Fund | | | 140 | | |
High Income Bond Fund | | | 142 | | |
Municipal Intermediate Bond Fund | | | 144 | | |
New York Municipal Income Fund | | | 146 | | |
Short Duration Bond Fund | | | 146 | | |
Short Duration High Income Fund | | | 148 | | |
Strategic Income Fund | | | 148 | | |
Reports of Independent Registered Public Accounting Firms | | | 153 | | |
Directory | | | 155 | | |
Trustees and Officers | | | 156 | | |
Proxy Voting Policies and Procedures | | | 163 | | |
Quarterly Portfolio Schedule | | | 163 | | |
Notice to Shareholders | | | 163 | | |
Board Consideration of the Management and Sub-Advisory Agreements | | | 164 | | |
The "Neuberger Berman" name and logo are registered service marks of Neuberger Berman Group LLC. "Neuberger Berman Management LLC" and the individual Fund names in this piece are either service marks or registered service marks of Neuberger Berman Management LLC. ©2013 Neuberger Berman Management LLC. All rights reserved.
Dear Shareholder,
I am pleased to present this annual shareholder report for the Neuberger Berman Income Funds.
The U.S. fixed income market could be broken down into two distinct periods over the 12 months ended October 31, 2013. For the first half, long-term yields declined as the U.S. Federal Reserve (the Fed) maintained its highly accommodative monetary policy given continued elevated unemployment. Yields were also pushed down on several occasions as a number of issues, including the fiscal cliff and the European sovereign debt crisis, caused investors to turn to the safety of U.S. Treasury securities. Against this backdrop, most non-Treasury securities generally rose modestly.
The second half of the period was dominated by expectations of shifting Fed monetary policy. This was triggered by Fed Chairman Bernanke's comments that the central bank may begin tapering its asset purchase program before the end of the year. This caused yields to rise sharply and negatively impacted the fixed income market. The Fed surprised the market, however, at its September 18 meeting when it announced its decision to delay the taper. Yields then fell from their early September peak and many non-Treasury securities recouped a portion of their losses from the summer. All told, the return of the overall bond market, as measured by the Barclays U.S. Aggregate Bond Index, declined 1.08% during the 12-month reporting period.
Despite the market's weakness, there were several pockets of opportunity, namely higher yielding non-Treasuries. These securities were supported by overall solid demand from investors looking to generate higher yields. This backdrop was typically beneficial for a number of our taxable fixed income funds, as they were overweighted to non-Treasuries relative to their respective benchmarks during the period.
Looking ahead, we feel the U.S. economic expansion could accelerate somewhat in 2014. However, we think the Fed is likely to maintain its accommodative monetary policy longer than most people expect. In addition, we believe economic growth and inflation trends suggest that longer-term Treasury yields are near fair value. In our view, this could lead to a modestly better backdrop for non-Treasuries in the coming year. Still, we anticipate volatility will continue if monetary policy slowly moves from accommodation to normalization.
We believe our fixed income funds are well positioned given our outlook, as they currently maintain overweight positions in non-Treasuries relative to their benchmarks. We are also of the opinion that overall demand for tax-free bonds could improve. We will continue to actively manage our fixed income funds and adjust their portfolios as we feel appropriate given changing economic and investment conditions.
Thank you for your continued support and trust. We look forward to continue serving your investment needs in the years to come.
Sincerely,

ROBERT CONTI
PRESIDENT AND CEO
NEUBERGER BERMAN MUTUAL FUNDS
1
Core Bond Fund Commentary (Unaudited)
Neuberger Berman Core Bond Fund Institutional Class generated a -1.71% total return for the 12 months ended October 31, 2013 and underperformed its benchmark, the Barclays U.S. Aggregate Bond Index, which provided a -1.08% return for the period. (Performance for all share classes is provided in the table immediately following this letter.)
The fixed income market was volatile at times during the reporting period. This was triggered by a number of factors, including uncertainties regarding the fiscal cliff and sequestration, mixed economic data, expectations for shifting U.S. Federal Reserve (the Fed) monetary policy and the partial government shutdown. While interest rates moved higher during the period, they declined from their early September 2013 peak. This occurred as the Fed surprised the market by choosing to delay tapering its asset purchase program, which was announced at its September 18 meeting. While the overall fixed income market posted a modest decline during the 12-month period, there were several areas of strength. In particular, lower-quality securities, including high yield bonds and floating rate bank loans, generated strong results given generally robust investor demand.
Detracting from results during the reporting period was the Fund's allocation to Treasury Inflation-Protected Securities. They underperformed the index as longer-term rates moved higher and expectations for future inflation were relatively muted. Duration and yield curve positioning were also negative for results. This was largely due to our tactical positioning on the curve. In contrast, the Fund's allocation to investment grade corporate bonds was beneficial. It was our exposure to medium and lower rated industrials that contributed the most to performance. Elsewhere, allocations to commercial mortgage-backed securities and non-agency mortgage-backed securities were additive for results. The Fund used long and short Treasury futures during the period to assist in managing its duration positioning, which contributed modestly to results.
There were no significant changes to the portfolio during the reporting period.
We believe the timing and magnitude of any asset purchase tapering by the Fed will be data dependent. Given the drag on the economy from the partial government shutdown, continued high unemployment and fiscal policy uncertainties, we would not be surprised to see the Fed maintain its asset purchase program until 2014. From an economic perspective, we feel growth in the U.S. could modestly improve in 2014 and inflation may be relatively well contained. It is our belief this would be a positive backdrop for the spread sectors (i.e., those segments of the bond market where investors seek greater yield by undertaking the additional risks of investing in corporate or other securities not backed by the U.S. Treasury). That being said, we anticipate volatility will persist as the Fed's monetary policy eventually transitions from accommodation to normalization. While it could be several years before the Fed moves to raise the federal funds rate, this would likely be priced into the market beforehand. We anticipate maintaining our long-held strategy of overweighting the spread sectors as we feel it is appropriate for long-term investors.
Sincerely,


THANOS BARDAS, DAVID M. BROWN, ANDREW A. JOHNSON, THOMAS J. MARTHALER AND BRADLEY C. TANK
PORTFOLIO CO-MANAGERS
Information about the principal risks of investing in the Fund is set forth in the prospectus and statement of additional information.
The portfolio composition, industries and holdings of the Fund are subject to change.
The opinions expressed are those of the Fund's portfolio managers. The opinions are as of the date of this report and are subject to change without notice.
2
Core Bond Fund (Unaudited)
TICKER SYMBOLS
Investor Class | | NCRIX | |
Institutional Class | | NCRLX | |
Class A | | NCRAX | |
Class C | | NCRCX | |
PORTFOLIO BY TYPE OF SECURITY
(as a % of Total Net Assets) | |
Asset-Backed Securities | | | 0.4 | % | |
Corporate Debt Securities | | | 27.6 | | |
Government Securities | | | 0.2 | | |
Mortgage-Backed Securities | | | 49.8 | | |
U.S. Government Agency Securities | | | 2.6 | | |
U.S. Treasury Securities | | | 23.0 | | |
Short-Term Investments | | | 16.6 | | |
Liabilities, less cash, receivables and
other assets | | | (20.2 | ) | |
Total | | | 100.0 | % | |
PERFORMANCE HIGHLIGHTS2
| | | Inception | | Average Annual Total Return
Ended 10/31/2013 | |
| | | Date | | 1 Year | | 5 Years | | 10 Years | | Life of Fund | |
At NAV | | | | | | | | | | | |
| Investor Class3 | | 02/01/1997 | | | -2.11 | % | | | 8.12 | % | | | 4.67 | % | | | 5.33 | % | |
| Institutional Class3 | | 10/01/1995 | | | -1.71 | % | | | 8.57 | % | | | 5.10 | % | | | 5.73 | % | |
| Class A4 | | 12/20/2007 | | | -2.03 | % | | | 8.10 | % | | | 4.83 | % | | | 5.58 | % | |
| Class C4 | | 12/20/2007 | | | -2.76 | % | | | 7.31 | % | | | 4.38 | % | | | 5.33 | % | |
With Sales Charge | |
| Class A4 | | | | | -6.20 | % | | | 7.17 | % | | | 4.38 | % | | | 5.33 | % | |
| Class C4 | | | | | -3.69 | % | | | 7.31 | % | | | 4.38 | % | | | 5.33 | % | |
Index | |
| Barclays U.S. Aggregate Bond Index1,14 | | | | | -1.08 | % | | | 6.09 | % | | | 4.78 | % | | | 5.84 | % | |
The performance data quoted represent past performance and do not indicate future results. Current performance may be lower or higher than the performance data quoted. For more current performance data, please visit www.nb.com/performance.
The results shown in the table reflect the reinvestment of income dividends and other distributions, if any. The results do not reflect the effect of taxes a shareholder would pay on Fund distributions or on the redemption of Fund shares.
The investment return and principal value of an investment will fluctuate and shares, when redeemed, may be worth more or less than their original cost.
Returns would have been lower if Neuberger Berman Management LLC ("Management") had not reimbursed certain expenses and/or waived a portion of the investment management fees during certain of the periods shown. Repayment by a class (of expenses previously reimbursed and/or fees previously waived by Management) will decrease the class's returns. Please see Note B in the Notes to Financial Statements for specific information regarding expense reimbursement and/or fee waiver arrangements.
For the period ended October 31, 2013, the 30-day SEC yields were 2.07%, 2.47%, 1.98% and 1.33% for Investor Class, Institutional Class, Class A and Class C shares, respectively. Absent expense reimbursements and/or fee waivers, the 30-day SEC yields would have been 1.95%, 2.27%, 1.96% and 1.21% for Investor Class, Institutional Class, Class A and Class C shares, respectively.
As stated in the Fund's most recent prospectus, the total annual operating expense ratios for fiscal year 2012 were 1.10%, 0.61%, 1.01% and 1.75% for Investor Class, Institutional Class, Class A and Class C shares, respectively (before expense reimbursements and/or fee waivers, if any). The expense ratios were 0.87%, 0.47%, 0.87% and 1.62% for Investor Class, Institutional Class, Class A and Class C shares, respectively, after expense reimbursements and/or fee waivers.
Returns shown with a sales charge reflect the deduction of the current maximum initial sales charge of 4.25% for Class A shares and the applicable contingent deferred sales charges (CDSC) for Class C shares. The maximum CDSC for Class C shares is 1%, which is reduced to 0% after 1 year. The performance of the Fund's share classes will differ primarily due to different sales charge structures and class expenses. Please see the prospectus for more information about sales charge structures, if any, and class expenses for your share class.
3
Core Bond Fund (Unaudited)
COMPARISON OF A $1,000,000 INVESTMENT
(000's omitted)
This graph shows the change in value of a hypothetical $1,000,000 investment in the Fund over the past 10 fiscal years, or since the Fund's inception if it has not operated for 10 years. The graph is based on the Institutional Class shares only; the performance of the Fund's share classes will differ primarily due to different sales charge structures and class expenses (see Performance Highlights chart on previous page). The result is compared with benchmarks, which include a broad-based market index and may include a more narrowly based index. Market indices have not been reduced to reflect any of the fees and costs of investing. The results shown in the graph reflect the reinvestment of income dividends and other distributions, if any. The results do not reflect the effect of taxes a shareholder would pay on Fund distributions or on the redemption of Fund shares. Results represent past performance and do not indicate future results.
4
Floating Rate Income Fund Commentary (Unaudited)
Neuberger Berman Floating Rate Income Fund Institutional Class generated a 4.96% total return for the 12 months ended October 31, 2013 but underperformed its benchmark, the S&P/LSTA Leveraged Loan Index, which provided a 5.43% return for the period. (Performance for all share classes is provided in the table immediately following this letter.)
The floating rate bank loan market generated solid results during the reporting period. Supporting the market were generally positive fundamentals as corporate balance sheets were often cash-rich and defaults were low. Given the overall positive backdrop, demand was robust overall as investors looked to generate incremental yield. The new issuance market remained strong during the period, largely driven by refinancing activity as issuers took advantage of relatively low interest rates and extended their maturity profiles. For the 12 months ended October 31, 2013, securities rated B and higher in the index gained on average 5.33%, whereas BB-rated and CCC and lower-rated securities returned an average 4.05% and 12.51%, respectively.
The Fund continued to allocate a portion of its assets in non-floating rate securities. We have the flexibility to allocate up to 20% of the portfolio in these securities, usually fixed-rate senior secured bonds, as they can help the Fund generate incremental yield. The Fund's non-floating rate allocation began the period at approximately 6% and ended the period at approximately 6.5%. This relatively low allocation is indicative of the fact that floating rate loan yields were relatively more attractive versus their non-floating rate counterparts.
We continued to actively participate in the new issuance market by emphasizing securities in the primary versus the secondary bank loan market due to the former's higher current yields. We also felt securities in the new issue market provided better opportunities on a total return basis. Throughout the period, we emphasized loans in the primary market from issuers that had appropriate capital structures with positive operating momentum and relatively low leverage.
The Fund's quality biases detracted from performance during the reporting period. In particular, our underweight to securities rated CCC and below was not rewarded given their strong returns. This more than offset the Fund's allocations to securities rated B and higher. During the period, we increased the Fund's exposure to securities rated BB and higher, while reducing its allocation to B-rated securities. This adjustment was made as the yields available for both quality categories moved closer. As such, we felt it was appropriate to reduce the Fund's risk exposure by cutting back its allocation to B-rated securities.
From a sector perspective, security selection in chemicals and plastics, financial intermediaries, and cable & satellite television were the largest contributors to performance. In contrast, security selection in radio and television and printing/publishing, along with an underweight in utilities, detracted the most from results during the reporting period.
We maintain our overall positive outlook for the floating rate bank loan market. Supporting the market, in our view, are overall solid fundamentals and corporate earnings that allow most issuers to generate free cash flow. In addition, defaults remain significantly below their long-term annual average of 4% and we anticipate this trend will continue in 2014. Even though Fed tapering of its asset purchase program appears to be on hold for now, when the central bank ultimately begins
5
to pare its asset purchase program it will be largely due to strengthening economic conditions. In our view, such a backdrop would be supportive for the overall floating rate bank loan market. While periods of volatility could occur at times due to uncertainties surrounding future monetary and fiscal policy, we feel that demand for floating rate securities could be solid in the coming months.
Sincerely,


ANN H. BENJAMIN, THOMAS P. O'REILLY, JOSEPH P. LYNCH AND STEPHEN CASEY
PORTFOLIO CO-MANAGERS
Information about the principal risks of investing in the Fund is set forth in the prospectus and statement of additional information.
The portfolio composition, industries and holdings of the Fund are subject to change.
The opinions expressed are those of the Fund's portfolio managers. The opinions are as of the date of this report and are subject to change without notice.
6
Floating Rate Income Fund (Unaudited)
TICKER SYMBOLS
Institutional Class | | NFIIX | |
Class A | | NFIAX | |
Class C | | NFICX | |
PORTFOLIO BY MATURITY DISTRIBUTION
(as a % of Total Investments) | |
Less than One Year | | | 6.5 | % | |
One to less than Five Years | | | 32.8 | | |
Five to less than Ten Years | | | 60.5 | | |
Ten Years or Greater | | | 0.2 | | |
Total | | | 100.0 | % | |
PERFORMANCE HIGHLIGHTS
| | | Inception | | Average Annual Total Return
Ended 10/31/2013 | |
| | | Date | | 1 Year | | Life of Fund | |
At NAV | |
| Institutional Class5 | | 12/30/2009 | | | 4.96 | % | | | 5.99 | % | |
Class A | | 12/29/2009 | | | 4.57 | % | | | 5.58 | % | |
| Class C5 | | 12/30/2009 | | | 3.78 | % | | | 4.84 | % | |
With Sales Charge | |
Class A | | | | | 0.16 | % | | | 4.41 | % | |
| Class C5 | | | | | 2.78 | % | | | 4.84 | % | |
Index | |
| S&P/LSTA Leveraged Loan Index1,14 | | | | | 5.43 | % | | | 6.70 | % | |
The performance data quoted represent past performance and do not indicate future results. Current performance may be lower or higher than the performance data quoted. For more current performance data, please visit www.nb.com/performance.
The results shown in the table reflect the reinvestment of income dividends and other distributions, if any. The results do not reflect the effect of taxes a shareholder would pay on Fund distributions or on the redemption of Fund shares.
The investment return and principal value of an investment will fluctuate and shares, when redeemed, may be worth more or less than their original cost.
Returns would have been lower if Neuberger Berman Management LLC ("Management") had not reimbursed certain expenses and/or waived a portion of the investment management fees during certain of the periods shown. Repayment by a class (of expenses previously reimbursed and/or fees previously waived by Management) will decrease the class's returns. Please see Note B in the Notes to Financial Statements for specific information regarding expense reimbursement and/or fee waiver arrangements.
For the period ended October 31, 2013, the 30-day SEC yields were 3.75%, 3.22% and 2.62% for Institutional Class, Class A and Class C shares, respectively. Absent expense reimbursements and/or fee waivers, the 30-day SEC yields would have been 3.66%, 3.14% and 2.52% for Institutional Class, Class A and Class C shares, respectively.
As stated in the Fund's most recent prospectus, the total annual operating expense ratios for fiscal year 2012 were 0.92%, 1.30% and 2.06% for Institutional Class, Class A and Class C shares, respectively (before expense reimbursements and/or fee waivers, if any). The expense ratios were 0.72%, 1.09% and 1.84% for Institutional Class, Class A and Class C shares, respectively, after expense reimbursements and/or fee waivers.
Returns shown with a sales charge reflect the deduction of the current maximum initial sales charge of 4.25% for Class A shares and the applicable contingent deferred sales charges (CDSC) for Class C shares. The maximum CDSC for Class C shares is 1%, which is reduced to 0% after 1 year. The performance of the Fund's share classes will differ primarily due to different sales charge structures and class expenses. Please see the prospectus for more information about sales charge structures, if any, and class expenses for your share class.
7
Floating Rate Income Fund (Unaudited)
COMPARISON OF A $1,000,000 INVESTMENT
(000's omitted)
This graph shows the change in value of a hypothetical $1,000,000 investment in the Fund over the past 10 fiscal years, or since the Fund's inception if it has not operated for 10 years. The graph is based on the Institutional Class shares only; the performance of the Fund's share classes will differ primarily due to different sales charge structures and class expenses (see Performance Highlights chart on previous page). The result is compared with benchmarks, which include a broad-based market index and may include a more narrowly based index. Market indices have not been reduced to reflect any of the fees and costs of investing. The results shown in the graph reflect the reinvestment of income dividends and other distributions, if any. The results do not reflect the effect of taxes a shareholder would pay on Fund distributions or on the redemption of Fund shares. Results represent past performance and do not indicate future results.
8
High Income Bond Fund Commentary (Unaudited)
Neuberger Berman High Income Bond Fund Investor Class generated a 9.10% total return for the 12 months ended October 31, 2013 and outperformed its benchmark, the BofA Merrill Lynch U.S. High Yield Master II Constrained Index, which provided an 8.82% return for the period. (Performance for all share classes is provided in the table immediately following this letter.)
The fixed income market was volatile at times during the reporting period. We believe this was triggered by a number of factors, including uncertainties regarding the fiscal cliff and sequestration, mixed economic data, expectations for shifting U.S. Federal Reserve (Fed) monetary policy and the partial government shutdown. While interest rates moved higher during the period, they declined from their early September 2013 peak. This occurred as the Fed surprised the market by choosing to delay tapering its asset purchase program, which was announced at its September 18 meeting. While the overall fixed income market posted a modest decline during the 12-month period, there were several areas of strength. In particular, high yield bonds generated strong results given generally robust investor demand. For the period, CCC-rated and lower (a relatively low rating) securities in the benchmark and BB-rated (rated higher) securities returned 14.39% and 6.37%, respectively.
Security selection in the aggregate was beneficial for the Fund's performance relative to the index. The largest contributions to performance came from our holdings in the gaming, chemicals and printing & publishing sectors. This was somewhat mitigated by security selection in diversified financial services, healthcare and food and drug retailers.
Sector positioning, overall, detracted from relative performance during the reporting period. In particular, overweights in printing & publishing and media/cable, along with an underweight in banking, were negative for results. This was partially offset by our overweights in technology & electronics and media-broadcast, along with underweights in real estate/home builders.
The Fund's quality biases produced mixed results during the reporting period. Security selection and our allocation to bonds rated CCC and lower were beneficial for performance. The Fund's allocation to bonds rated BB and higher detracted from results, but this was more than offset by strong security selection. Elsewhere, we remained moderately underweighted to B-rated bonds.
We made several adjustments to the portfolio during the reporting period. We reduced the Fund's allocation to bonds rated BB and higher, moving from an overweight to an underweight position. Our exposure to B-rated bonds was modestly increased, but we remained underweighted versus the index. The Fund's allocation to bonds rated CCC and lower was increased, moving from an underweight to an overweight position. Elsewhere, we reduced the Fund's out-of-index allocation to bank loans from approximately 13.2% to approximately 4.8% of the portfolio. This was done as we found the bank loan market to be less attractive from a valuation perspective versus high yield bonds.
We continue to have a positive outlook for the high yield market. Even though Fed tapering of its asset purchase program appears to be on hold for now, when the central bank ultimately begins to pare its asset purchases we believe it will be largely due to strengthening economic conditions. In our view, such a backdrop would be supportive for the overall high yield market. In addition, in our opinion, high yield fundamentals remain solid and we anticipate defaults will continue to be significantly lower than their historical average. While periods of volatility could occur at times due to uncertainties surrounding future monetary and fiscal policy, we feel that demand for high yield securities could be solid in the coming months.
Sincerely,


ANN H. BENJAMIN, THOMAS P. O'REILLY AND RUSS COVODE
PORTFOLIO CO-MANAGERS
Information about the principal risks of investing in the Fund is set forth in the prospectus and statement of additional information.
The portfolio composition, industries and holdings of the Fund are subject to change.
The opinions expressed are those of the Fund's portfolio managers. The opinions are as of the date of this report and are subject to change without notice.
9
High Income Bond Fund (Unaudited)
TICKER SYMBOLS
Investor Class | | NHINX | |
Institutional Class | | NHILX | |
Class A | | NHIAX | |
Class C | | NHICX | |
Class R3 | | NHIRX | |
Class R6 | | NRHIX | |
PORTFOLIO BY MATURITY DISTRIBUTION
(as a % of Total Investments) | |
Less than One Year | | | 3.6 | % | |
One to less than Five Years | | | 23.1 | | |
Five to less than Ten Years | | | 69.5 | | |
Ten Years or Greater | | | 3.8 | | |
Total | | | 100.0 | % | |
PERFORMANCE HIGHLIGHTS6
| | | Inception | | Average Annual Total Return
Ended 10/31/2013 | |
| | | Date | | 1 Year | | 5 Years | | 10 Years | | Life of Fund | |
At NAV | | | | | | | | | | | |
| Investor Class7 | | 02/01/1992 | | | 9.10 | % | | | 16.87 | % | | | 8.09 | % | | | 8.24 | % | |
| Institutional Class8 | | 05/27/2009 | | | 9.14 | % | | | 17.07 | % | | | 8.18 | % | | | 8.29 | % | |
| Class A8 | | 05/27/2009 | | | 8.83 | % | | | 16.64 | % | | | 7.98 | % | | | 8.19 | % | |
| Class C8 | | 05/27/2009 | | | 7.91 | % | | | 15.88 | % | | | 7.63 | % | | | 8.03 | % | |
| Class R38 | | 05/27/2009 | | | 8.46 | % | | | 16.39 | % | | | 7.87 | % | | | 8.14 | % | |
| Class R68 | | 03/15/2013 | | | 9.13 | % | | | 16.88 | % | | | 8.09 | % | | | 8.25 | % | |
With Sales Charge | |
| Class A8 | | | | | 4.20 | % | | | 15.63 | % | | | 7.51 | % | | | 7.98 | % | |
| Class C8 | | | | | 6.91 | % | | | 15.88 | % | | | 7.63 | % | | | 8.03 | % | |
Index | |
BofA Merrill Lynch U.S. High Yield
Master II Constrained Index1,14 | | | | | 8.82 | % | | | 18.11 | % | | | 8.75 | % | | | N/A | | |
The performance data quoted represent past performance and do not indicate future results. Current performance may be lower or higher than the performance data quoted. For more current performance data, please visit www.nb.com/performance.
The results shown in the table reflect the reinvestment of income dividends and other distributions, if any. The results do not reflect the effect of taxes a shareholder would pay on Fund distributions or on the redemption of Fund shares.
The investment return and principal value of an investment will fluctuate and shares, when redeemed, may be worth more or less than their original cost.
Returns would have been lower if Neuberger Berman Management LLC ("Management") had not reimbursed certain expenses and/or waived a portion of the investment management fees during certain of the periods shown. Repayment by a class (of expenses previously reimbursed and/or fees previously waived by Management) will decrease the class's returns. Please see Note B in the Notes to Financial Statements for specific information regarding expense reimbursement and/or fee waiver arrangements.
For the period ended October 31, 2013, the 30-day SEC yields were 4.62%, 4.73%, 4.20%, 3.65%, 4.14% and 4.83% for Investor Class, Institutional Class, Class A, Class C, Class R3 and Class R6 shares, respectively.
As stated in the Fund's most recent prospectus, the total annual operating expense ratios for fiscal year 2012 (estimated for 2013 for Class R6) were 0.85%, 0.70%, 1.09%, 1.86%,1.36% and 0.61% for Investor Class, Institutional Class, Class A, Class C, Class R3 and Class R6 shares, respectively (before expense reimbursements and/or fee waivers, if any). The total annual operating expense ratio for each of Class C and Class R3 includes the class's repayment of expenses previously reimbursed and/or fees previously waived by Management.
Returns shown with a sales charge reflect the deduction of the current maximum initial sales charge of 4.25% for Class A shares and the applicable contingent deferred sales charges (CDSC) for Class C shares. The maximum CDSC for Class C shares is 1%, which is reduced to 0% after 1 year. The performance of the Fund's share classes will differ primarily due to different sales charge structures and class expenses. Please see the prospectus for more information about sales charge structures, if any, and class expenses for your share class.
10
High Income Bond Fund (Unaudited)
COMPARISON OF A $10,000 INVESTMENT
This graph shows the change in value of a hypothetical $10,000 investment in the Fund over the past 10 fiscal years, or since the Fund's inception if it has not operated for 10 years. The graph is based on the Investor Class shares only; the performance of the Fund's share classes will differ primarily due to different sales charge structures and class expenses (see Performance Highlights chart on previous page). The result is compared with benchmarks, which include a broad-based market index and may include a more narrowly based index. Market indices have not been reduced to reflect any of the fees and costs of investing. The results shown in the graph reflect the reinvestment of income dividends and other distributions, if any. The results do not reflect the effect of taxes a shareholder would pay on Fund distributions or on the redemption of Fund shares. Results represent past performance and do not indicate future results.
11
Municipal Intermediate Bond Fund Commentary (Unaudited)
Neuberger Berman Municipal Intermediate Bond Fund Investor Class generated a -1.30% total return for the 12 months ended October 31, 2013 and underperformed its benchmark, the Barclays 7-Year General Obligation Index, which provided a -0.51% return for the period. (Performance for all share classes is provided in the table immediately following this letter.)
The municipal market was volatile at times during the reporting period. This was triggered by a number of factors, including uncertainties surrounding the tax-favored status of municipal bonds amid the fiscal cliff negotiations, expectations for shifting U.S. Federal Reserve (the Fed) monetary policy and rising Treasury yields. Investor sentiment was also challenged given concerns regarding the potential fallout from Detroit's bankruptcy. However, the municipal market rallied sharply following the Fed's decision to not begin tapering its asset purchases, which was announced at its September 18 meeting. All told, the overall municipal market posted a negative return for the 12 month period.
We tactically adjusted the Fund's average duration during the reporting period. We started the period with a long average duration versus the index and then allowed it to drift somewhat shorter in the first quarter of 2013 given expected weakness during tax season. We then extended the Fund's duration post tax season and maintained this position until the summer, when we somewhat shortened its average duration again. Overall, having a duration that was longer than the index detracted from performance as interest rates moved higher. In terms of the Fund's yield curve positioning, we maintained a barbell approach (investing in shorter and longer maturities). In contrast, the Fund's benchmark is concentrated in the intermediate range (six- to eight-year portion of the curve). Yield curve positioning was a negative for performance given our overweight in the 10-year range and an underweight to the seven-year portion of the curve relative to the benchmark.
The Fund maintained a higher-quality bias, which produced mixed results. Having a small allocation to lower-rated BBB municipal bonds was a positive for performance. A modest underweight to Puerto Rico bonds was also beneficial, as they generated weak results. However, having no exposure to the tobacco sector was a drag on performance.
From a security selection perspective, we opportunistically purchased a number of attractively valued municipal bonds during the summer sell-off. This was additive to results as the municipal market rallied in September and October 2013.
We have a fairly positive outlook for the municipal market. The municipal yield curve is steep from a historical perspective. In addition, as the economy has been gaining some traction, we believe the trend of rising state tax revenues could remain in place, helping to strengthen state balance sheets. If the real estate market continues to show further improvement, local tax revenues, which have been challenged, could increase as well. We are also cautiously optimistic for the technical backdrop. Retail demand for municipal securities was weak during the second half of the reporting period. Given higher tax rates and attractive valuations versus equal-duration Treasuries, we're anticipating somewhat better demand for this high quality asset class going forward. At the same time, we estimate supply will moderate in 2014 given less refinancing activity, a major driver of new municipal issuance in recent years.
Despite these positives, there are several risks. News about Detroit's bankruptcy, credit issues in Puerto Rico and the anticipation of other municipal downgrades could negatively impact retail demand and put pressure on the market. While we anticipate the Fed will remain largely accommodative and not rush the taper of its asset purchases, in our opinion it's reasonable to assume that rates will move moderately higher in 2014. This, too, could be a headwind for the municipal market.
Sincerely,


JAMES L. ISELIN AND S. BLAKE MILLER
PORTFOLIO CO-MANAGERS
Information about the principal risks of investing in the Fund is set forth in the prospectus and statement of additional information.
The portfolio composition, industries and holdings of the Fund are subject to change.
The opinions expressed are those of the Fund's portfolio managers. The opinions are as of the date of this report and are subject to change without notice.
12
Municipal Intermediate Bond Fund (Unaudited)
TICKER SYMBOLS
Investor Class | | NMUIX | |
Institutional Class | | NMNLX | |
Class A | | NMNAX | |
Class C | | NMNCX | |
PORTFOLIO BY STATE AND TERRITORY
(as a % of Total Net Assets) | |
Arizona | | | 1.2 | % | |
Arkansas | | | 2.1 | | |
California | | | 9.7 | | |
Colorado | | | 2.3 | | |
District of Columbia | | | 2.0 | | |
Florida | | | 10.1 | | |
Georgia | | | 3.0 | | |
Illinois | | | 7.6 | | |
Indiana | | | 5.2 | | |
Kansas | | | 0.5 | | |
Louisiana | | | 2.3 | | |
Maryland | | | 0.6 | | |
Massachusetts | | | 1.2 | | |
Michigan | | | 2.6 | | |
Minnesota | | | 0.6 | | |
Mississippi | | | 2.5 | | |
Missouri | | | 0.4 | | |
Nebraska | | | 0.3 | | |
Nevada | | | 0.5 | | |
New Jersey | | | 7.2 | | |
New Mexico | | | 0.5 | | |
New York | | | 6.9 | | |
North Carolina | | | 1.7 | | |
Ohio | | | 2.3 | | |
Oregon | | | 0.4 | | |
Pennsylvania | | | 3.0 | | |
Puerto Rico | | | 0.9 | | |
Rhode Island | | | 2.4 | | |
South Carolina | | | 4.0 | | |
Tennessee | | | 3.0 | | |
Texas | | | 9.4 | | |
Utah | | | 0.8 | | |
Virginia | | | 3.2 | | |
Washington | | | 0.5 | | |
Liabilities, less cash, receivables and
other assets | | | (0.9 | ) | |
Total | | | 100.0 | % | |
PERFORMANCE HIGHLIGHTS10
| | | Inception | | Average Annual Total Return
Ended 10/31/2013 | |
| | | Date | | 1 Year | | 5 Years | | 10 Years | | Life of Fund | |
At NAV | | | | | | | | | | | |
Investor Class | | 07/09/1987 | | | -1.30 | % | | | 5.07 | % | | | 3.37 | % | | | 5.00 | % | |
| Institutional Class11 | | 06/21/2010 | | | -1.15 | % | | | 5.16 | % | | | 3.41 | % | | | 5.02 | % | |
| Class A11 | | 06/21/2010 | | | -1.52 | % | | | 4.90 | % | | | 3.28 | % | | | 4.97 | % | |
| Class C11 | | 06/21/2010 | | | -2.25 | % | | | 4.37 | % | | | 3.02 | % | | | 4.87 | % | |
With Sales Charge | |
| Class A11 | | | | | -5.74 | % | | | 3.99 | % | | | 2.84 | % | | | 4.80 | % | |
| Class C11 | | | | | -3.21 | % | | | 4.37 | % | | | 3.02 | % | | | 4.87 | % | |
Index | |
| Barclays 7-Year GO Index1,14 | | | | | -0.51 | % | | | 5.89 | % | | | 4.60 | % | | | 5.95 | % | |
The performance data quoted represent past performance and do not indicate future results. Current performance may be lower or higher than the performance data quoted. For more current performance data, please visit www.nb.com/performance.
The results shown in the table reflect the reinvestment of income dividends and other distributions, if any. The results do not reflect the effect of taxes a shareholder would pay on Fund distributions or on the redemption of Fund shares.
The investment return and principal value of an investment will fluctuate and shares, when redeemed, may be worth more or less than their original cost.
Returns would have been lower if Neuberger Berman Management LLC ("Management") had not reimbursed certain expenses and/or waived a portion of the investment management fees during certain of the periods shown. Repayment by a class (of expenses previously reimbursed and/or fees previously waived by Management) will decrease the class's returns. Please see Note B in the Notes to Financial Statements for specific information regarding expense reimbursement and/or fee waiver arrangements.
For the period ended October 31, 2013, the 30-day SEC yields were 2.01%, 2.16%, 1.72% and 1.05% for Investor Class, Institutional Class, Class A and Class C shares, respectively. The tax-equivalent yields were 3.55%, 3.82%, 3.04% and 1.86% for Investor Class, Institutional Class, Class A and Class C shares, respectively, for a shareholder in the highest federal income tax bracket (39.6% plus 3.8% Medicare contribution tax).9Absent expense reimbursements and/or fee waivers, the 30-day SEC yields would have been 1.88%, 2.02%, 1.52% and 0.64% for Investor Class, Institutional Class, Class A and Class C shares, respectively.
As stated in the Fund's most recent prospectus, the total annual operating expense ratios for fiscal year 2012 were 0.88%, 0.70%, 1.15% and 1.95% for Investor Class, Institutional Class, Class A and Class C shares, respectively (before expense reimbursements and/or fee waivers, if any). The expense ratios were 0.65%, 0.50%, 0.87% and 1.62% for Investor Class, Institutional Class, Class A and Class C shares, respectively, after expense reimbursements and/or fee waivers.
Returns shown with a sales charge reflect the deduction of the current maximum initial sales charge of 4.25% for Class A shares and the applicable contingent deferred sales charges (CDSC) for Class C shares. The maximum CDSC for Class C shares is 1%, which is reduced to 0% after 1 year. The performance of the Fund's share classes will differ primarily due to different sales charge structures and class expenses. Please see the prospectus for more information about sales charge structures, if any, and class expenses for your share class.
13
Municipal Intermediate Bond Fund (Unaudited)
COMPARISON OF A $10,000 INVESTMENT
This graph shows the change in value of a hypothetical $10,000 investment in the Fund over the past 10 fiscal years, or since the Fund's inception if it has not operated for 10 years. The graph is based on the Investor Class shares only; the performance of the Fund's share classes will differ primarily due to different sales charge structures and class expenses (see Performance Highlights chart on previous page). The result is compared with benchmarks, which include a broad-based market index and may include a more narrowly based index. Market indices have not been reduced to reflect any of the fees and costs of investing. The results shown in the graph reflect the reinvestment of income dividends and other distributions, if any. The results do not reflect the effect of taxes a shareholder would pay on Fund distributions or on the redemption of Fund shares. Results represent past performance and do not indicate future results.
14
New York Municipal Income Fund Commentary (Unaudited)
Neuberger Berman New York Municipal Income Fund Institutional Class generated a -1.64% total return for the period from its inception on March 11, 2013 through October 31, 2013. In contrast, its benchmark, the Barclays 7-Year General Obligation Index, provided a -0.49% return for the period.
The municipal market was volatile at times during the reporting period. This was triggered by a number of factors, including uncertainties surrounding their tax-favored status amid the fiscal cliff negotiations, expectations for shifting U.S. Federal Reserve (the Fed) monetary policy and rising Treasury yields. Investor sentiment was also challenged given concerns regarding the potential fallout from Detroit's bankruptcy. However, the municipal market rallied sharply following the Fed's decision to not begin tapering its asset purchases, which was announced at its September 18 meeting. All told, the overall municipal market posted a negative return for the 12 months ended October 31, 2013.
We extended the Fund's average duration during the reporting period and, overall, were modestly longer in average duration than the benchmark. This detracted from performance as rates moved higher. In terms of the Fund's yield curve positioning, we maintained a barbell approach (investing in shorter and longer maturities). In contrast, the Fund's benchmark is concentrated in the intermediate range (six- to eight-year portion of the curve). Yield curve positioning was a negative for performance given our overweight in the 10-year range and an underweight to the seven-year portion of the curve relative to the benchmark.
The Fund's positioning from a quality perspective was similar to that of the benchmark and, as such, did not significantly impact its relative performance. Security selection, overall, was slightly additive to results versus the index. Whereas the Fund generally holds securities issued by the state of New York, the index contains securities from across the country. As a result, allocation by state had a detrimental impact on results as New York municipal securities underperformed the index.
We opportunistically purchased a number of attractively valued municipal bonds during the summer sell-off. This was additive for results as the municipal market rallied in September and October.
We have a fairly positive outlook for the municipal market. The municipal yield curve is steep from a historical perspective. In addition, as the economy has been gaining some traction, we believe the trend of rising state tax revenues could remain in place, helping to strengthen state balance sheets. If the real estate market continues to show further improvement, local tax revenues, which have been challenged, could increase as well. We are also cautiously optimistic for the technical backdrop. Retail demand for municipal securities was weak during the second half of the reporting period. Given higher tax rates and attractive valuations versus equal-duration Treasuries, we're anticipating somewhat better demand for this high quality asset class going forward. At the same time, we estimate supply will moderate in 2014 given less refinancing activity, a major driver of new municipal issuance in recent years.
Despite these positives, there are several risks. News about Detroit's bankruptcy, credit issues in Puerto Rico and the anticipation of other municipal downgrades could negatively impact retail demand and put pressure on the market. While we anticipate the Fed will remain largely accommodative and not rush the taper of its asset purchases, in our opinion it's reasonable to assume that rates will move moderately higher in 2014. This, too, could be a headwind for the municipal market.
Sincerely,


JAMES L. ISELIN AND S. BLAKE MILLER
PORTFOLIO CO-MANAGERS
Information about the principal risks of investing in the Fund is set forth in the prospectus and statement of additional information.
The portfolio composition, industries and holdings of the Fund are subject to change.
The opinions expressed are those of the Fund's portfolio managers. The opinions are as of the date of this report and are subject to change without notice.
15
New York Municipal Income Fund (Unaudited)
TICKER SYMBOLS
Institutional Class | | NMIIX | |
PORTFOLIO BY STATE AND TERRITORY
(as a % of Total Net Assets) | |
New York | | | 97.8 | % | |
Puerto Rico | | | 0.8 | | |
Cash, receivables and other assets,
less liabilities | | | 1.4 | | |
Total | | | 100.0 | % | |
PERFORMANCE HIGHLIGHTS10
| | | Inception
Date | | Cumulative Total Return
Ended 10/31/2013
Life of Fund | |
At NAV | | | | | |
Institutional Class | | 03/11/201316 | | | -1.64 | % | |
Index | | | | | |
| Barclays 7-Year GO Index1,14 | | | | | -0.49 | % | |
The performance data quoted represent past performance and do not indicate future results. Current performance may be lower or higher than the performance data quoted. For more current performance data, please visit www.nb.com/performance.
The results shown in the table reflect the reinvestment of income dividends and other distributions, if any. The results do not reflect the effect of taxes a shareholder would pay on Fund distributions or on the redemption of Fund shares.
The investment return and principal value of an investment will fluctuate and shares, when redeemed, may be worth more or less than their original cost.
Returns would have been lower if Neuberger Berman Management LLC ("Management") had not reimbursed certain expenses and/or waived a portion of the investment management fees during the period shown. Repayment by a class (of expenses previously reimbursed and/or fees previously waived by Management) will decrease the class's returns. Please see Note B in the Notes to Financial Statements for specific information regarding expense reimbursement and/or fee waiver arrangements.
For the period ended October 31, 2013, the 30-day SEC yield was 2.52% for Institutional Class. The tax-equivalent yield was 4.45% for Institutional Class for a shareholder in the highest federal income tax bracket (39.6% plus 3.8% Medicare contribution tax).9
As stated in the Fund's most recent prospectus, the estimated total annual operating expense ratio for fiscal year 2013 was 0.87% for Institutional Class shares (before expense reimbursements and/or fee waivers, if any).
16
New York Municipal Income Fund (Unaudited)
COMPARISON OF A $1,000,000 INVESTMENT
(000's omitted)
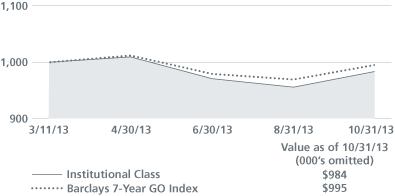
This graph shows the change in value of a hypothetical $1,000,000 investment in the Fund over the past 10 fiscal years, or since the Fund's inception if it has not operated for 10 years. The result is compared with benchmarks, which include a broad-based market index and may include a more narrowly based index. Market indices have not been reduced to reflect any of the fees and costs of investing. The results shown in the graph reflect the reinvestment of income dividends and other distributions, if any. The results do not reflect the effect of taxes a shareholder would pay on Fund distributions or on the redemption of Fund shares. Results represent past performance and do not indicate future results.
17
Short Duration Bond Fund Commentary (Unaudited)
Neuberger Berman Short Duration Bond Fund Investor Class generated a 1.03% total return for the 12 months ended October 31, 2013 and outperformed its benchmark, the Barclays 1-3 Year U.S. Government/Credit Index, which provided a 0.77% return for the period. (Performance for all share classes is provided in the table immediately following this letter.)
The fixed income market was volatile at times during the reporting period. This was triggered by a number of factors, including uncertainties regarding the fiscal cliff and sequestration, mixed economic data, expectations for shifting U.S. Federal Reserve (the Fed) monetary policy and the partial government shutdown. While interest rates moved higher during the period, they declined from their early September 2013 peak. This occurred as the Fed surprised the market by choosing to delay tapering its asset purchase program, which was announced at its September 18 meeting. While the overall fixed income market posted a modest decline for the 12 months ended October 31, 2013, there were several areas of strength. In particular, lower-quality securities, including high yield bonds and floating rate bank loans, generated strong results given generally robust investor demand.
The Fund's overweight to non-Treasuries was the main driver of its outperformance during the reporting period. The largest contributors to results were the Fund's exposures to non-agency mortgage-backed securities (MBS), asset-backed securities (ABS) and commercial mortgage-backed securities (CMBS). The Fund's allocation to investment grade corporate bonds was also beneficial, albeit to a lesser extent. Modestly detracting from results was the Fund's yield curve positioning.
There were several adjustments made to the portfolio from a sector perspective. We reduced the Fund's allocation to Treasuries and increased the exposures to investment grade corporate bonds, lower coupon 15-year agency MBS, CMBS and floating rate ABS. Within the investment grade corporate bond market, we actively participated in the new issue market, initiating new positions and extending positions in currently owned companies we find attractive. We also proactively adjusted the Fund's investment grade corporate bond exposure in an attempt to minimize event risk, namely merger and acquisition activity.
The Fund utilized Treasury futures during the second half of the reporting period to help manage its duration and yield curve positioning. They did not meaningfully impact performance.
We believe the timing and magnitude of the Fed's asset purchase tapering will be data dependent. Given the drag on the economy from the partial government shutdown, continued high unemployment and fiscal policy uncertainties, we would not be surprised to see the Fed maintain its asset purchase program until 2014. From an economic perspective, we feel growth in the U.S. could modestly improve in 2014 and inflation may be relatively well contained. It is our belief that this would be a positive backdrop for the spread sectors (i.e., those segments of the bond market where investors seek greater yield by undertaking the additional risks of investing in corporate or other securities not backed by the U.S. Treasury). That being said, we anticipate volatility will persist as the Fed's monetary policy eventually transitions from accommodation to normalization. While it could be several years before the Fed moves to raise the federal funds rate, this would likely be priced into the market beforehand. We anticipate maintaining our long-held strategy of overweighting the spread sectors as we feel it is appropriate for long-term investors.
Sincerely,


THOMAS SONTAG, MICHAEL FOSTER AND RICHARD GRAU
PORTFOLIO CO-MANAGERS
Information about the principal risks of investing in the Fund is set forth in the prospectus and statement of additional information.
The portfolio composition, industries and holdings of the Fund are subject to change.
The opinions expressed are those of the Fund's portfolio managers. The opinions are as of the date of this report and are subject to change without notice.
18
Short Duration Bond Fund (Unaudited)
TICKER SYMBOLS
Investor Class | | NSBIX | |
Trust Class | | NSBTX | |
Institutional Class | | NSHLX | |
Class A | | NSHAX | |
Class C | | NSHCX | |
PORTFOLIO BY TYPE OF SECURITY
(as a % of Total Net Assets) | |
Asset-Backed Securities | | | 11.6 | % | |
Corporate Debt Securities | | | 42.8 | | |
Mortgage-Backed Securities | | | 32.6 | | |
U.S. Treasury Securities | | | 11.2 | | |
Short-Term Investments | | | 3.8 | | |
Liabilities, less cash, receivables and
other assets | | | (2.0 | ) | |
Total | | | 100.0 | % | |
PERFORMANCE HIGHLIGHTS15
| | | Inception | | Average Annual Total Return
Ended 10/31/2013 | |
| | | Date | | 1 Year | | 5 Years | | 10 Years | | Life of Fund | |
At NAV | | | | | | | | | | | |
Investor Class | | 06/09/1986 | | | 1.03 | % | | | 3.29 | % | | | 1.87 | % | | | 4.63 | % | |
| Trust Class12 | | 08/30/1993 | | | 0.77 | % | | | 3.17 | % | | | 1.77 | % | | | 4.56 | % | |
| Institutional Class12 | | 06/21/2010 | | | 1.11 | % | | | 3.40 | % | | | 1.93 | % | | | 4.65 | % | |
| Class A12 | | 06/21/2010 | | | 0.83 | % | | | 3.14 | % | | | 1.80 | % | | | 4.61 | % | |
| Class C12 | | 06/21/2010 | | | 0.08 | % | | | 2.65 | % | | | 1.56 | % | | | 4.51 | % | |
With Sales Charge | |
| Class A12 | | | | | -1.74 | % | | | 2.62 | % | | | 1.55 | % | | | 4.51 | % | |
| Class C12 | | | | | -0.91 | % | | | 2.65 | % | | | 1.56 | % | | | 4.51 | % | |
Index | |
Barclays 1-3 Year
U.S. Government/ Credit Index1,14 | | | | 0.77 | % | | | 2.51 | % | | | 2.97 | % | | | 5.46 | % | |
The performance data quoted represent past performance and do not indicate future results. Current performance may be lower or higher than the performance data quoted. For more current performance data, please visit www.nb.com/performance.
The results shown in the table reflect the reinvestment of income dividends and other distributions, if any. The results do not reflect the effect of taxes a shareholder would pay on Fund distributions or on the redemption of Fund shares.
The investment return and principal value of an investment will fluctuate and shares, when redeemed, may be worth more or less than their original cost.
Returns would have been lower if Neuberger Berman Management LLC ("Management") had not reimbursed certain expenses and/or waived a portion of the investment management fees during certain of the periods shown. Repayment by a class (of expenses previously reimbursed and/or fees previously waived by Management) will decrease the class's returns. Please see Note B in the Notes to Financial Statements for specific information regarding expense reimbursement and/or fee waiver arrangements.
For the period ended October 31, 2013, the 30-day SEC yields were 0.80%, 0.70%, 1.00%, 0.62% and 0.00% for Investor Class, Trust Class, Institutional Class, Class A and Class C shares, respectively. Absent expense reimbursements and/or fee waivers, the 30-day SEC yields would have been 0.49%, 0.24%, 0.59%, 0.22% and 0.00% for Investor Class, Trust Class, Institutional Class, Class A and Class C shares, respectively.
As stated in the Fund's most recent prospectus, the total annual operating expense ratios for fiscal year 2012 were 1.18%, 1.34%, 0.98%, 1.41% and 2.13% for Investor Class, Trust Class, Institutional Class, Class A and Class C shares, respectively (before expense reimbursements and/or fee waivers, if any). The expense ratios were 0.71%, 0.81%, 0.51%, 0.89% and 1.63% for Investor Class, Trust Class, Institutional Class, Class A and Class C shares, respectively, after expense reimbursements and/or fee waivers.
Returns shown with a sales charge reflect the deduction of the current maximum initial sales charge of 2.50% for Class A shares and the applicable contingent deferred sales charges (CDSC) for Class C shares. The maximum CDSC for Class C shares is 1%, which is reduced to 0% after 1 year. The performance of the Fund's share classes will differ primarily due to different sales charge structures and class expenses. Please see the prospectus for more information about sales charge structures, if any, and class expenses for your share class.
19
Short Duration Bond Fund (Unaudited)
COMPARISON OF A $10,000 INVESTMENT
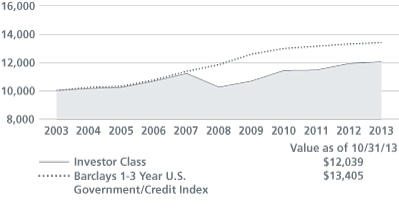
This graph shows the change in value of a hypothetical $10,000 investment in the Fund over the past 10 fiscal years, or since the Fund's inception if it has not operated for 10 years. The graph is based on the Investor Class shares only; the performance of the Fund's share classes will differ primarily due to different sales charge structures and class expenses (see Performance Highlights chart on previous page). The result is compared with benchmarks, which include a broad-based market index and may include a more narrowly based index. Market indices have not been reduced to reflect any of the fees and costs of investing. The results shown in the graph reflect the reinvestment of income dividends and other distributions, if any. The results do not reflect the effect of taxes a shareholder would pay on Fund distributions or on the redemption of Fund shares. Results represent past performance and do not indicate future results.
20
Short Duration High Income Fund Commentary (Unaudited)
Neuberger Berman Short Duration High Income Fund Institutional Class generated a 6.51% total return for the 12 months ended October 31, 2013, but lagged its benchmark, the BofA Merrill Lynch 0-5 Year BB-B U.S. High Yield Constrained Index, which provided a 7.79% return for the period. (Performance for all share classes is provided in the table immediately following this letter.)
The fixed income market was volatile at times during the reporting period. This was triggered by a number of factors, including uncertainties regarding the fiscal cliff and sequestration, mixed economic data, expectations for shifting U.S. Federal Reserve (the Fed) monetary policy and the partial government shutdown. While interest rates moved higher during the period, they declined from their early September 2013 peak. This occurred as the Fed surprised the market by choosing to delay tapering its asset purchase program, which was announced at its September 18 meeting. While the overall fixed income market posted a modest decline for the 12 months ended October 31, 2013, there were several areas of strength. In particular, high yield bonds generated strong results given generally robust investor demand.
For the Fund, the sectors that were the most beneficial to absolute performance during the reporting period were energy, telecommunications and healthcare. While no sectors detracted from absolute performance, those adding the least value were aerospace & defense, hotel, and food, beverage and tobacco.
From a quality perspective, approximately 92% of the portfolio was held in securities rated B and higher at the end of the reporting period. If we had allocated a larger portion of the portfolio to securities rated CCC we would have further enhanced the Fund's absolute performance, as this portion of the market outperformed both B- and BB-rated securities.
We continue to have a positive outlook for the high yield market. Even though Fed tapering appears to be on hold for now, when the central bank ultimately begins to pare its asset purchase program, we believe it will be largely due to strengthening economic conditions. In our view, such a backdrop would be supportive for the overall high yield market. In addition, high yield fundamentals remain solid and we anticipate defaults will continue to be significantly lower than their historical average. While periods of volatility could occur at times due to uncertainties surrounding future monetary and fiscal policy, we feel that demand for high yield securities could be solid in the coming months.
Sincerely,


ANN H. BENJAMIN, THOMAS P. O'REILLY AND RUSS COVODE
PORTFOLIO CO-MANAGERS
Information about the principal risks of investing in the Fund is set forth in the prospectus and statement of additional information.
The portfolio composition, industries and holdings of the Fund are subject to change.
The opinions expressed are those of the Fund's portfolio managers. The opinions are as of the date of this report and are subject to change without notice.
21
Short Duration High Income Fund (Unaudited)
TICKER SYMBOLS
Institutional Class | | NHSIX | |
Class A | | NHSAX | |
Class C | | NHSCX | |
PORTFOLIO BY MATURITY DISTRIBUTION
(as a % of Total Investments) | |
Less than One Year | | | 1.1 | % | |
One to less than Five Years | | | 61.8 | | |
Five to less than Ten Years | | | 37.1 | | |
Total | | | 100.0 | % | |
PERFORMANCE HIGHLIGHTS
| | | Inception | | Average Annual Total Return
Ended 10/31/2013 | |
| | | Date | | 1 Year | | Life of Fund | |
At NAV | |
Institutional Class | | 09/28/2012 | | | 6.51 | % | | | 6.31 | % | |
Class A | | 09/28/2012 | | | 6.21 | % | | | 6.02 | % | |
Class C | | 09/28/2012 | | | 5.43 | % | | | 5.24 | % | |
With Sales Charge | |
Class A | | | | | 1.74 | % | | | 1.92 | % | |
Class C | | | | | 4.43 | % | | | 5.24 | % | |
Index | | | | | | | |
BofA Merrill Lynch 0-5 Year BB-B
U.S. High Yield Constrained Index1,14 | | | | | 7.79 | % | | | 8.16 | % | |
The performance data quoted represent past performance and do not indicate future results. Current performance may be lower or higher than the performance data quoted. For more current performance data, please visit www.nb.com/performance.
The results shown in the table reflect the reinvestment of income dividends and other distributions, if any. The results do not reflect the effect of taxes a shareholder would pay on Fund distributions or on the redemption of Fund shares.
The investment return and principal value of an investment will fluctuate and shares, when redeemed, may be worth more or less than their original cost.
Returns would have been lower if Neuberger Berman Management LLC ("Management") had not reimbursed certain expenses and/or waived a portion of the investment management fees during certain of the periods shown. Repayment by a class (of expenses previously reimbursed and/or fees previously waived by Management) will decrease the class's returns. Please see Note B in the Notes to Financial Statements for specific information regarding expense reimbursement and/or fee waiver arrangements.
For the period ended October 31, 2013, the 30-day SEC yields were 3.18%, 2.68% and 2.08% for Institutional Class, Class A and Class C shares, respectively. Absent repayment, the 30-day SEC yield would have been 3.25% for Institutional Class shares. Absent expense reimbursements and/or fee waivers, the 30-day SEC yields would have been 2.64% and 2.01% for Class A and Class C shares, respectively.
As stated in the Fund's most recent prospectus, the estimated total annual operating expense ratios for fiscal year 2013 were 1.20%, 1.57% and 2.32% for Institutional Class, Class A and Class C shares, respectively (before expense reimbursements and/or fee waivers, if any). The expense ratios were 0.75%, 1.12% and 1.87% for Institutional Class, Class A and Class C shares, respectively, after expense reimbursements and/or fee waivers.
Returns shown with a sales charge reflect the deduction of the current maximum initial sales charge of 4.25% for Class A shares and the applicable contingent deferred sales charges (CDSC) for Class C shares. The maximum CDSC for Class C shares is 1%, which is reduced to 0% after 1 year. The performance of the Fund's share classes will differ primarily due to different sales charge structures and class expenses. Please see the prospectus for more information about sales charge structures, if any, and class expenses for your share class.
22
Short Duration High Income Fund (Unaudited)
COMPARISON OF A $1,000,000 INVESTMENT
(000's omitted)
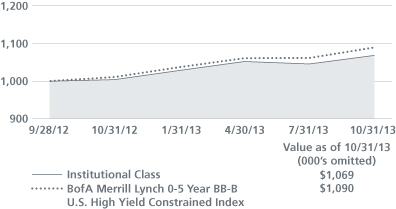
This graph shows the change in value of a hypothetical $1,000,000 investment in the Fund over the past 10 fiscal years, or since the Fund's inception if it has not operated for 10 years. The graph is based on the Institutional Class shares only; the performance of the Fund's share classes will differ primarily due to different sales charge structures and class expenses (see Performance Highlights chart on previous page). The result is compared with benchmarks, which include a broad-based market index and may include a more narrowly based index. Market indices have not been reduced to reflect any of the fees and costs of investing. The results shown in the graph reflect the reinvestment of income dividends and other distributions, if any. The results do not reflect the effect of taxes a shareholder would pay on Fund distributions or on the redemption of Fund shares. Results represent past performance and do not indicate future results.
23
Strategic Income Fund Commentary (Unaudited)
Neuberger Berman Strategic Income Fund Institutional Class generated a 1.52% total return for the 12 months ended October 31, 2013 and outperformed its benchmark, the Barclays U.S. Aggregate Bond Index, which provided a -1.08% return for the period. (Performance for all share classes is provided in the table immediately following this letter.)
The fixed income market was volatile at times during the reporting period. This was triggered by a number of factors, including uncertainties regarding the fiscal cliff and sequestration, mixed economic data, expectations for shifting U.S. Federal Reserve (the Fed) monetary policy and the partial government shutdown. While interest rates moved higher during the period, they declined from their early September 2013 peak. This occurred as the Fed surprised the market by choosing to delay tapering its asset purchase program, which was announced at its September 18 meeting. While the overall fixed income market posted a modest decline for the 12 months ended October 31, 2013, there were several areas of strength. In particular, lower-quality securities, including high yield bonds and floating rate bank loans, generated strong results given generally robust investor demand.
Contributing to the Fund's performance during the reporting period were its allocations to high yield corporate bonds, bank loans, investment grade corporate bonds, commercial mortgage-backed securities (CMBS) and non-agency mortgage-backed securities (MBS). They were all supported by overall solid investor demand. Duration and yield curve positioning were also positive for results. This was largely due to our tactical positioning on the curve. The Fund used long and short Treasury futures during the reporting period to assist in managing its duration positioning, which contributed modestly to results. Detracting from results was the Fund's allocation to Treasury Inflation-Protected Securities (TIPS). They underperformed the index as longer term rates moved higher and expectations for future inflation were relatively muted.
There were several adjustments made to the portfolio during the reporting period. We increased the Fund's high yield corporate bond exposure and pared our allocation to bank loans, the latter of which is relatively higher in the capital structure. We also increased our exposure to emerging market debt as valuations became more attractive. Elsewhere, we selectively reduced the Fund's duration over the 12-month period.
We believe the timing and magnitude of the Fed's asset purchase tapering will be data dependent. Given the drag on the economy from the partial government shutdown, continued high unemployment and fiscal policy uncertainties, we would not be surprised to see the Fed maintain its asset purchase program until 2014. From an economic perspective, we feel growth in the U.S. could modestly improve in 2014 and inflation could be relatively well contained. It is our belief this would be a positive backdrop for the spread sectors (i.e., those segments of the bond market where investors seek greater yield by undertaking the additional risks of investing in corporate or other securities not backed by the U.S. Treasury). That being said, we anticipate volatility will persist as the Fed's monetary policy eventually transitions from accommodation to normalization. While it could be several years before the Fed moves to raise the federal funds rate, this would likely be priced into the market beforehand. We anticipate maintaining our long-held strategy of overweighting the spread sectors as we feel it is appropriate for long-term investors.
Sincerely,


THANOS BARDAS, DAVID M. BROWN, ANDREW A. JOHNSON, THOMAS J. MARTHALER AND BRADLEY C. TANK
PORTFOLIO CO-MANAGERS
Information about the principal risks of investing in the Fund is set forth in the prospectus and statement of additional information.
The portfolio composition, industries and holdings of the Fund are subject to change.
The opinions expressed are those of the Fund's portfolio managers. The opinions are as of the date of this report and are subject to change without notice.
24
Strategic Income Fund (Unaudited)
TICKER SYMBOLS
Trust Class | | NSTTX | |
Institutional Class | | NSTLX | |
Class A | | NSTAX | |
Class C | | NSTCX | |
Class R6 | | NRSIX | |
PORTFOLIO BY TYPE OF SECURITY
(as a % of Total Net Assets) | |
Asset-Backed Securities | | | 11.0 | % | |
Corporate Debt Securities | | | 41.5 | | |
Bank Loan Obligations | | | 14.5 | | |
Government Securities | | | 2.5 | | |
Mortgage-Backed Securities | | | 41.7 | | |
U.S. Government Agency Securities | | | 0.3 | | |
U.S. Treasury Securities | | | 6.8 | | |
Mutual Funds | | | 6.7 | | |
Short-Term Investments | | | 5.0 | | |
Liabilities, less cash, receivables and
other assets | | | (30.0 | ) | |
Total | | | 100.0 | % | |
PERFORMANCE HIGHLIGHTS17
| | | Inception | | Average Annual Total Return
Ended 10/31/2013 | |
| | | Date | | 1 Year | | 5 Years | | 10 Years | | Life of Fund | |
At NAV | | | | | | | | | | | |
| Trust Class13 | | 04/02/2007 | | | 1.07 | % | | | 10.59 | % | | | 7.83 | % | | | 7.78 | % | |
Institutional Class | | 07/11/2003 | | | 1.52 | % | | | 10.97 | % | | | 8.08 | % | | | 8.02 | % | |
| Class A13 | | 12/20/2007 | | | 1.02 | % | | | 10.51 | % | | | 7.82 | % | | | 7.77 | % | |
| Class C13 | | 12/20/2007 | | | 0.40 | % | | | 9.74 | % | | | 7.37 | % | | | 7.34 | % | |
| Class R613 | | 03/15/2013 | | | 1.47 | % | | | 10.96 | % | | | 8.07 | % | | | 8.02 | % | |
With Sales Charge | |
| Class A13 | | | | | -3.28 | % | | | 9.56 | % | | | 7.35 | % | | | 7.32 | % | |
| Class C13 | | | | | -0.55 | % | | | 9.74 | % | | | 7.37 | % | | | 7.34 | % | |
Index | |
| Barclays U.S. Aggregate Bond Index1,14 | | | | | -1.08 | % | | | 6.09 | % | | | 4.78 | % | | | 4.55 | % | |
The performance data quoted represent past performance and do not indicate future results. Current performance may be lower or higher than the performance data quoted. For more current performance data, please visit www.nb.com/performance.
The results shown in the table reflect the reinvestment of income dividends and other distributions, if any. The results do not reflect the effect of taxes a shareholder would pay on Fund distributions or on the redemption of Fund shares.
The investment return and principal value of an investment will fluctuate and shares, when redeemed, may be worth more or less than their original cost.
Returns would have been lower if Neuberger Berman Management LLC ("Management") had not reimbursed certain expenses and/or waived a portion of the investment management fees during certain of the periods shown. Repayment by a class (of expenses previously reimbursed and/or fees previously waived by Management) will decrease the class's returns. Please see Note B in the Notes to Financial Statements for specific information regarding expense reimbursement and/or fee waiver arrangements.
For the period ended October 31, 2013, the 30-day SEC yields were 2.86%, 3.21%, 2.69%, 2.12% and 3.26% for Trust Class, Institutional Class, Class A, Class C and Class R6 shares, respectively. Absent expense reimbursements and/or fee waivers, the 30-day SEC yields would have been 2.78%, 3.13%, 2.66%, 2.02% and 3.18% for Trust Class, Institutional Class, Class A, Class C and Class R6 shares, respectively.
As stated in the Fund's most recent prospectus, the total annual operating expense ratios for fiscal year 2012 (estimated for 2013 for Class R6) were 1.21%, 0.84%, 1.25%, 1.98% and 0.75% for Trust Class, Institutional Class, Class A, Class C and Class R6 shares, respectively (before expense reimbursements and/or fee waivers, if any). The expense ratios were 1.11%, 0.76%, 1.16%, 1.86% and 0.68% for Trust Class, Institutional Class, Class A, Class C and Class R6 shares, respectively, after expense reimbursements and/or fee waivers.
Returns shown with a sales charge reflect the deduction of the current maximum initial sales charge of 4.25% for Class A shares and the applicable contingent deferred sales charges (CDSC) for Class C shares. The maximum CDSC for Class C shares is 1%, which is reduced to 0% after 1 year. The performance of the Fund's share classes will differ primarily due to different sales charge structures and class expenses. Please see the prospectus for more information about sales charge structures, if any, and class expenses for your share class.
25
Strategic Income Fund (Unaudited)
COMPARISON OF A $1,000,000 INVESTMENT
(000's omitted)
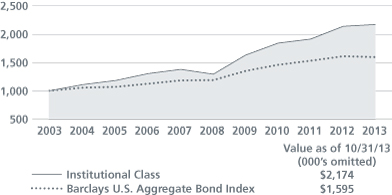
This graph shows the change in value of a hypothetical $1,000,000 investment in the Fund over the past 10 fiscal years, or since the Fund's inception if it has not operated for 10 years. The graph is based on the Institutional Class shares only; the performance of the Fund's share classes will differ primarily due to different sales charge structures and class expenses (see Performance Highlights chart on previous page). The result is compared with benchmarks, which include a broad-based market index and may include a more narrowly based index. Market indices have not been reduced to reflect any of the fees and costs of investing. The results shown in the graph reflect the reinvestment of income dividends and other distributions, if any. The results do not reflect the effect of taxes a shareholder would pay on Fund distributions or on the redemption of Fund shares. Results represent past performance and do not indicate future results.
26
1 Please see "Glossary of Indices" on page 29 for a description of indices. Please note that indices do not take into account any fees, expenses or tax consequences of investing in the individual securities that they track, and that individuals cannot invest directly in any index. Data about the performance of an index is prepared or obtained by Neuberger Berman Management LLC ("Management") and reflects the reinvestment of income dividends and other distributions, if any. The Fund may invest in securities not included in a described index and may not invest in all securities included in a described index.
2 The performance information for periods prior to June 13, 2005, is that of the Fund's predecessor, Ariel Premier Bond Fund ("Ariel Fund"). The investment policies, guidelines and restrictions of the Fund are in all material respects equivalent to those of Ariel Fund. Returns would have been lower if Ariel Fund's manager had not waived certain of its fees during these periods.
3 The performance information for Institutional Class is that of Ariel Fund Institutional Class for the period October 1, 1995 (inception date) through June 10, 2005. The performance information for Investor Class is that of Ariel Fund Institutional Class for the period October 1, 1995 through January 31, 1997 (the period prior to the Investor Class' inception date), and that of Ariel Fund Investor Class for the period February 1, 1997 through June 10, 2005. Ariel Fund Institutional Class had lower expenses and typically higher returns than Ariel Fund Investor Class.
4 The performance information for Class A and Class C prior to the classes' inception date is that of the Institutional Class of Neuberger Berman Core Bond Fund (please see Endnote 3). The performance information for the Institutional Class has been adjusted to reflect the appropriate sales charges applicable to Class A and Class C shares, but has not been adjusted to take into account differences in class specific operating expenses (such as 12b-1 fees).The Institutional Class has lower expenses and typically higher returns than Class A and Class C.
5 The performance information for Institutional Class and Class C prior to the classes' inception date is that of Class A of Neuberger Berman Floating Rate Income Fund. The performance information (at NAV) of Class A has been adjusted to reflect the appropriate sales charge applicable to Class C shares, but has not been adjusted to take into account differences in class specific operating expenses (such as 12b-1 fees). Class A has higher expenses and typically lower returns (at NAV) than Institutional Class. Class A has lower expenses and typically higher returns (at NAV) than Class C.
6 The performance information for the period April 1, 1996 through September 6, 2002, is that of the Fund's predecessor, Lipper High Income Bond Fund ("Lipper Fund"), and the performance information for the period February 1, 1992 through March 31, 1996, is that of Lipper Fund's predecessor partnership. The investment policies, objectives, guidelines and restrictions of the Fund are in all material respects equivalent to those of Lipper Fund, and the investment policies, objectives, guidelines and restrictions of Lipper Fund were in all material respects equivalent to those of its predecessor partnership. As mutual funds registered under the Investment Company Act of 1940, as amended ("1940 Act"), the Fund is, and Lipper Fund was, subject to certain restrictions under the 1940 Act and the Internal Revenue Code of 1986, as amended ("Code"), to which Lipper Fund's predecessor partnership was not subject. Had Lipper Fund's predecessor partnership been registered under the 1940 Act and been subject to the provisions of the 1940 Act and the Code, its investment performance may have been adversely affected. Returns would have been lower if Lipper Fund's manager had not waived certain of its fees during these periods.
7 The performance information for Investor Class is that of Lipper Fund Premier Class for the period April 1, 1996 through September 6, 2002, and that of Lipper Fund's predecessor partnership for the period February 1, 1992 (inception date) through March 31, 1996.
8 The performance information for Institutional Class, Class A, Class C, Class R3 and Class R6 prior to the classes' respective inception dates is that of the Investor Class of Neuberger Berman High Income Bond Fund (please see
27
Endnote 7). The performance information of the Investor Class has been adjusted to reflect the appropriate sales charges applicable to Class A and Class C shares, but has not been adjusted to take into account differences in class specific operating expenses (such as 12b-1 fees). The Investor Class has lower expenses and typically higher returns than Class A, Class C and Class R3. The Investor Class has higher expenses and typically lower returns than Institutional Class and Class R6.
9 Tax-equivalent effective yield is the taxable effective yield that a shareholder would have had to receive in order to realize the same level of yield after federal income taxes at the highest federal tax rate, currently 39.6% plus the 3.8% Medicare contribution tax, assuming that all of the Fund's income is exempt from federal income taxes.
10 A portion of the Fund's income may be a tax preference item for purposes of the federal alternative minimum tax for certain shareholders.
11 The performance information for Institutional Class, Class A and Class C prior to the classes' inception date is that of the Investor Class of Neuberger Berman Municipal Intermediate Bond Fund. The performance information of the Investor Class has been adjusted to reflect the appropriate sales charges applicable to Class A and Class C shares, but has not been adjusted to take into account differences in class specific operating expenses (such as 12b-1 fees). The Investor Class has lower expenses and typically higher returns than Class A and Class C. The Investor Class has higher expenses and typically lower returns than Institutional Class.
12 The performance information for Trust Class, Institutional Class, Class A and Class C prior to the classes' respective inception dates is that of the Investor Class of Neuberger Berman Short Duration Bond Fund. The performance information of the Investor Class has been adjusted to reflect the appropriate sales charges applicable to Class A and Class C shares, but has not been adjusted to take into account differences in class specific operating expenses (such as 12b-1 fees). The Investor Class has lower expenses and typically higher returns than Trust Class, Class A and Class C. The Investor Class has higher expenses and typically lower returns than Institutional Class.
13 The performance information for Trust Class, Class A, Class C and Class R6 prior to the classes' respective inception dates is that of the Institutional Class of Neuberger Berman Strategic Income Fund. The performance information of the Institutional Class has been adjusted to reflect the appropriate sales charges applicable to Class A and Class C shares, but has not been adjusted to take into account differences in class specific operating expenses (such as 12b-1 fees). The Institutional Class has lower expenses and typically higher returns than Trust Class, Class A and Class C. The Institutional Class has higher expenses and typically lower returns than Class R6.
14 The date used to calculate Life of Fund performance for the index is the inception date of the oldest share class.
15 The investments for the Fund are managed by the same portfolio manager(s) who manage(s) one or more other registered funds that have names, investment objectives and investment styles that are similar to those of the Fund. You should be aware that the Fund is likely to differ from the other mutual fund(s) in size, cash flow pattern and tax matters. Accordingly, the holdings and performance of the Fund can be expected to vary from those of the other mutual fund(s).
16 This date reflects when Management first became the investment manager to the Fund.
17 The Fund had a different goal and strategy, which included managing assets by an asset allocation committee, prior to February 29, 2008. Its performance during that time might have been different if current policies had been in effect.
For more complete information on any of the Neuberger Berman Income Funds, call Neuberger Berman Management LLC at (800) 877-9700, or visit our website at www.nb.com.
28
Barclays 1-3 Year U.S. Government/Credit Index: | | An unmanaged index that includes all bonds in the U.S. Government/Credit Index with at least one to three years to maturity. The U.S. Government/Credit Index includes all securities in the Government and Credit Indices. The Government Index includes Treasuries (i.e., public obligations of the U.S. Treasury that have remaining maturities of more than one year) and agencies (i.e., publicly issued debt of U.S. Government agencies, quasi-federal corporations, and corporate or foreign debt guaranteed by the U.S. Government). The Credit Index includes publicly issued U.S. corporate and foreign debentures and secured notes that meet specified maturity, liquidity, and quality requirements. All bonds in the index must meet the following additional criteria: must have at least one year to final maturity regardless of call features; must have at least $250 million par amount outstanding; must be rated investment-grade (Baa3/BBB- or h igher) by at least two of the following ratings agencies: Standard & Poor's, Moody's Investors Services, Inc., and Fitch, Inc.; must be fixed rate; must be dollar-denominated and non-convertible; and must be publicly issued. | |
Barclays 7-Year General Obligation Index: | | An unmanaged total return performance benchmark for the 7-year (6-8) maturity component of the Barclays General Obligation ("G.O.") Index, which tracks the performance of the investment-grade G.O. (state and local) tax exempt bond market. | |
Barclays U.S. Aggregate Bond Index: | | An unmanaged index that represents the U.S. domestic investment grade bond market. It is comprised of the Barclays Government/Corporate Bond Index, Mortgage-Backed Securities Index, and Asset-Backed Securities Index, including securities that are of investment-grade quality or better, have at least one year to maturity, and have an outstanding par value of at least $250 million. Asset backed securities must have at least $500 million deal size and $25 million tranche size. For commercial mortgage-backed securities, the original transaction must have a minimum deal size of $500 million, and a minimum tranche size of $25 million; the current outstanding transaction size must be at least $300 million to remain in the index. | |
S&P/LSTA Leveraged Loan Index: | | A daily total return index that uses Loan Syndications and Trading Association (LSTA)/Loan Pricing Corporation (LPC) mark-to-market pricing to calculate market value change. On a real-time basis, the Index tracks the current outstanding balance and spread over LIBOR for fully funded term loans. The Index represents a broad cross section of leveraged loans syndicated in the United States, including dollar-denominated loans to overseas issuers. | |
BofA Merrill Lynch U.S. High Yield Master II Constrained Index: | | An unmanaged market value-weighted index of all domestic and Yankee high yield bonds, including deferred interest bonds and payment-in-kind securities. Qualifying bonds must have at least one year remaining to maturity, a fixed coupon schedule and a minimum amount outstanding of $100 million. Qualifying bonds are capitalization weighted provided the total allocation to an individual issuer does not exceed 2%. | |
29
BofA Merrill Lynch 0-5 Year BB-B U.S. High Yield Constrained Index: | | An unmanaged index that tracks the performance of short-term U.S. dollar denominated below investment grade corporate debt publicly issued in the U.S. domestic market. Qualifying securities must have less than five years remaining term to final maturity, be rated BB1 through B3, inclusive, based on an average of Moody's, S&P and Fitch, have a fixed coupon schedule and a minimum amount outstanding of $100 million. Original issue zero coupon bonds, 144a securities, both with and without registration rights, and pay-in-kind securities, including toggle notes, qualify for inclusion in the Index. Eurodollar bonds (USD bonds not issued in the U.S. domestic market), taxable and tax-exempt U.S. municipal, warrant-bearing, DRD-eligible and defaulted securities are excluded from the Index. Index constituents are capitalization-weighted, based on their current amount outstanding, provided the total allocation to an individual issuer does not exceed 2%. Issuers that exceed the limit are reduced to 2% and the face value of each of their bonds is adjusted on a pro-rata basis. Similarly, the face values of bonds of all other issuers that fall below the 2% cap are increased on a pro-rata basis. | |
30
Information About Your Fund's Expenses (Unaudited)
As a Fund shareholder, you incur two types of costs: (1) transaction costs, including sales charges (loads) on purchase payments or redemption proceeds (if applicable); and (2) ongoing costs, including management fees, distribution and/or service (12b-1) fees (if applicable), and other Fund expenses. This example is intended to help you understand your ongoing costs (in U.S. dollars) of investing in a Fund and compare these costs with the ongoing costs of investing in other mutual funds.
This table is designed to provide information regarding costs related to your investments. The following examples are based on an investment of $1,000 made at the beginning of the six month period ended October 31, 2013 and held for the entire period. The table illustrates each Fund's costs in two ways:
Actual Expenses and Performance: | | The first section of the table provides information about actual account values and actual expenses in dollars, based on the Fund's actual performance during the period. You may use the information in this line, together with the amount you invested, to estimate the expenses you paid over the period. Simply divide your account value by $1,000 (for example, an $8,600 account value divided by $1,000 = 8.6), then multiply the result by the number in the first section of the table under the heading entitled "Expenses Paid During the Period" to estimate the expenses you paid over the period. | |
Hypothetical Example for
Comparison Purposes: | | The second section of the table provides information about hypothetical account values and hypothetical expenses based on the Fund's actual expense ratio and an assumed rate of return at 5% per year before expenses. This return is not the Fund's actual return. The hypothetical account values and expenses may not be used to estimate the actual ending account balance or expenses you paid for the period. You may use this information to compare the ongoing costs of investing in a Fund versus other funds. To do so, compare the expenses shown in this 5% hypothetical example with the 5% hypothetical examples that appear in the shareholder reports of other funds. | |
Please note that the expenses in the table are meant to highlight your ongoing costs only and do not include any transaction costs, such as sales charges (loads) (if applicable). Therefore, the information under the heading "Hypothetical (5% annual return before expenses)" is useful in comparing ongoing costs only, and will not help you determine the relative total costs of owning different funds. In addition, if these transaction costs were included, your costs would have been higher.
31
Expense Information as of 10/31/13 (Unaudited)
Neuberger Berman Income Funds | |
| | | ACTUAL | | HYPOTHETICAL (5% ANNUAL RETURN BEFORE EXPENSES)(2) | |
| | | Beginning
Account
Value
5/1/13 | | Ending
Account
Value
10/31/13 | | Expenses Paid
During the
Period(1)
5/1/13 - 10/31/13 | | Expense
Ratio | | Beginning
Account
Value
5/1/13 | | Ending
Account
Value
10/31/13 | | Expenses Paid
During the
Period(1)
5/1/13 - 10/31/13 | | Expense
Ratio | |
Neuberger Berman Core Bond Fund | |
Investor Class | | $ | 1,000.00 | | | $ | 972.90 | | | $ | 4.23 | | | | .85 | % | | $ | 1,000.00 | | | $ | 1,020.92 | | | $ | 4.33 | | | | .85 | % | |
Institutional Class | | $ | 1,000.00 | | | $ | 975.00 | | | $ | 2.24 | | | | .45 | % | | $ | 1,000.00 | | | $ | 1,022.94 | | | $ | 2.29 | | | | .45 | % | |
Class A | | $ | 1,000.00 | | | $ | 973.80 | | | $ | 4.23 | | | | .85 | % | | $ | 1,000.00 | | | $ | 1,020.92 | | | $ | 4.33 | | | | .85 | % | |
Class C | | $ | 1,000.00 | | | $ | 969.30 | | | $ | 7.94 | | | | 1.60 | % | | $ | 1,000.00 | | | $ | 1,017.14 | | | $ | 8.13 | | | | 1.60 | % | |
Neuberger Berman Floating Rate Income Fund | |
Institutional Class | | $ | 1,000.00 | | | $ | 1,012.60 | | | $ | 3.55 | | | | .70 | % | | $ | 1,000.00 | | | $ | 1,021.68 | | | $ | 3.57 | | | | .70 | % | |
Class A | | $ | 1,000.00 | | | $ | 1,010.70 | | | $ | 5.42 | | | | 1.07 | % | | $ | 1,000.00 | | | $ | 1,019.81 | | | $ | 5.45 | | | | 1.07 | % | |
Class C | | $ | 1,000.00 | | | $ | 1,006.90 | | | $ | 9.21 | | | | 1.82 | % | | $ | 1,000.00 | | | $ | 1,016.03 | | | $ | 9.25 | | | | 1.82 | % | |
Neuberger Berman High Income Bond Fund | |
Investor Class | | $ | 1,000.00 | | | $ | 1,017.40 | | | $ | 4.22 | | | | .83 | % | | $ | 1,000.00 | | | $ | 1,021.02 | | | $ | 4.23 | | | | .83 | % | |
Institutional Class | | $ | 1,000.00 | | | $ | 1,017.10 | | | $ | 3.51 | | | | .69 | % | | $ | 1,000.00 | | | $ | 1,021.73 | | | $ | 3.52 | | | | .69 | % | |
Class A | | $ | 1,000.00 | | | $ | 1,016.10 | | | $ | 5.54 | | | | 1.09 | % | | $ | 1,000.00 | | | $ | 1,019.71 | | | $ | 5.55 | | | | 1.09 | % | |
Class C | | $ | 1,000.00 | | | $ | 1,011.30 | | | $ | 9.23 | | | | 1.82 | % | | $ | 1,000.00 | | | $ | 1,016.03 | | | $ | 9.25 | | | | 1.82 | % | |
Class R3 | | $ | 1,000.00 | | | $ | 1,013.90 | | | $ | 6.70 | | | | 1.32 | % | | $ | 1,000.00 | | | $ | 1,018.55 | | | $ | 6.72 | | | | 1.32 | % | |
Class R6 | | $ | 1,000.00 | | | $ | 1,018.50 | | | $ | 3.15 | | | | .62 | % | | $ | 1,000.00 | | | $ | 1,022.08 | | | $ | 3.16 | | | | .62 | % | |
Neuberger Berman Municipal Intermediate Bond Fund | |
Investor Class | | $ | 1,000.00 | | | $ | 971.80 | | | $ | 3.23 | | | | .65 | % | | $ | 1,000.00 | | | $ | 1,021.93 | | | $ | 3.31 | | | | .65 | % | |
Institutional Class | | $ | 1,000.00 | | | $ | 972.50 | | | $ | 2.49 | | | | .50 | % | | $ | 1,000.00 | | | $ | 1,022.68 | | | $ | 2.55 | | | | .50 | % | |
Class A | | $ | 1,000.00 | | | $ | 970.70 | | | $ | 4.32 | | | | .87 | % | | $ | 1,000.00 | | | $ | 1,020.82 | | | $ | 4.43 | | | | .87 | % | |
Class C | | $ | 1,000.00 | | | $ | 967.00 | | | $ | 8.03 | | | | 1.62 | % | | $ | 1,000.00 | | | $ | 1,017.04 | | | $ | 8.24 | | | | 1.62 | % | |
Neuberger Berman New York Municipal Income Fund | |
Institutional Class | | $ | 1,000.00 | | | $ | 974.30 | | | $ | 4.13 | | | | .83 | % | | $ | 1,000.00 | | | $ | 1,021.02 | | | $ | 4.23 | | | | .83 | % | |
Neuberger Berman Short Duration Bond Fund | |
Investor Class | | $ | 1,000.00 | | | $ | 1,000.20 | | | $ | 3.53 | | | | .70 | % | | $ | 1,000.00 | | | $ | 1,021.68 | | | $ | 3.57 | | | | .70 | % | |
Trust Class | | $ | 1,000.00 | | | $ | 999.30 | | | $ | 4.03 | | | | .80 | % | | $ | 1,000.00 | | | $ | 1,021.17 | | | $ | 4.08 | | | | .80 | % | |
Institutional Class | | $ | 1,000.00 | | | $ | 1,001.20 | | | $ | 2.52 | | | | .50 | % | | $ | 1,000.00 | | | $ | 1,022.68 | | | $ | 2.55 | | | | .50 | % | |
Class A | | $ | 1,000.00 | | | $ | 998.90 | | | $ | 4.38 | | | | .87 | % | | $ | 1,000.00 | | | $ | 1,020.82 | | | $ | 4.43 | | | | .87 | % | |
Class C | | $ | 1,000.00 | | | $ | 996.50 | | | $ | 8.15 | | | | 1.62 | % | | $ | 1,000.00 | | | $ | 1,017.04 | | | $ | 8.24 | | | | 1.62 | % | |
Neuberger Berman Short Duration High Income Fund | |
Institutional Class | | $ | 1,000.00 | | | $ | 1,015.60 | | | $ | 3.81 | | | | .75 | % | | $ | 1,000.00 | | | $ | 1,021.42 | | | $ | 3.82 | | | | .75 | % | |
Class A | | $ | 1,000.00 | | | $ | 1,014.60 | | | $ | 5.69 | | | | 1.12 | % | | $ | 1,000.00 | | | $ | 1,019.56 | | | $ | 5.70 | | | | 1.12 | % | |
Class C | | $ | 1,000.00 | | | $ | 1,010.90 | | | $ | 9.48 | | | | 1.87 | % | | $ | 1,000.00 | | | $ | 1,015.78 | | | $ | 9.50 | | | | 1.87 | % | |
Neuberger Berman Strategic Income Fund | |
Trust Class | | $ | 1,000.00 | | | $ | 981.60 | | | $ | 5.49 | | | | 1.10 | % | | $ | 1,000.00 | | | $ | 1,019.66 | | | $ | 5.60 | | | | 1.10 | % | |
Institutional Class | | $ | 1,000.00 | | | $ | 984.20 | | | $ | 3.75 | | | | .75 | % | | $ | 1,000.00 | | | $ | 1,021.42 | | | $ | 3.82 | | | | .75 | % | |
Class A | | $ | 1,000.00 | | | $ | 981.30 | | | $ | 5.74 | | | | 1.15 | % | | $ | 1,000.00 | | | $ | 1,019.41 | | | $ | 5.85 | | | | 1.15 | % | |
Class C | | $ | 1,000.00 | | | $ | 978.70 | | | $ | 9.23 | | | | 1.85 | % | | $ | 1,000.00 | | | $ | 1,015.88 | | | $ | 9.40 | | | | 1.85 | % | |
Class R6 | | $ | 1,000.00 | | | $ | 983.70 | | | $ | 3.40 | | | | .68 | % | | $ | 1,000.00 | | | $ | 1,021.78 | | | $ | 3.47 | | | | .68 | % | |
(1) For each class, expenses are equal to the annualized expense ratio for the class, multiplied by the average account value over the period, multiplied by 184/365 (to reflect the one-half year period shown), unless otherwise indicated.
(2) Hypothetical 5% annual return before expenses is calculated by multiplying the number of days in the most recent period divided by 365.
32
Schedule of Investments Neuberger Berman Core Bond Fund
PRINCIPAL AMOUNT | | | | VALUE† | |
(000's omitted) | | | | (000's omitted)z | |
U.S. Treasury Securities-Backed by the Full Faith and Credit of the U.S. Government (23.0%) | | | |
$ | 8,675 | | | U.S. Treasury Bonds, 6.25%, due 8/15/23 | | $ | 11,532 | ØØ | |
| | 7,305 | | | U.S. Treasury Bonds, 5.50%, due 8/15/28 | | | 9,407 | ØØ | |
| | 1,580 | | | U.S. Treasury Bonds, 4.50%, due 2/15/36 | | | 1,843 | | |
| | 5,304 | | | U.S. Treasury Inflation Index Bonds, 0.50%, due 4/15/15 | | | 5,411 | | |
| | 4,460 | | | U.S. Treasury Inflation Index Bonds, 2.00%, due 1/15/26 | | | 5,154 | | |
| | 676 | | | U.S. Treasury Inflation Index Bonds, 3.88%, due 4/15/29 | | | 970 | | |
| | 8,886 | | | U.S. Treasury Inflation Index Notes, 0.13%, due 4/15/17 | | | 9,187 | | |
| | 5,190 | | | U.S. Treasury Notes, 3.63%, due 8/15/19 | | | 5,782 | ØØ | |
| | | | | Total U.S. Treasury Securities-Backed by the Full Faith and Credit of the
U.S. Government (Cost $50,266) | | | 49,286 | | |
U.S. Government Agency Securities (2.6%) | | | |
| | 720 | | | Federal Farm Credit Bank, Bonds, 1.46%, due 11/19/19 | | | 684 | ØØ | |
| | 1,505 | | | Federal Home Loan Bank, Bonds, 5.50%, due 7/15/36 | | | 1,800 | ØØ | |
| | 470 | | | Federal National Mortgage Association, Notes, 1.50%, due 10/23/19 | | | 451 | | |
| | 1,610 | | | Federal National Mortgage Association, Notes, 1.55%, due 10/29/19 | | | 1,563 | | |
| | 1,200 | | | Federal National Mortgage Association, Notes, 1.60%, due 12/24/20 | | | 1,104 | ØØ | |
| | | | | Total U.S. Government Agency Securities (Cost $5,926) | | | 5,602 | | |
Mortgage-Backed Securities (49.8%) | | | |
Collateralized Mortgage Obligations (0.9%) | | | |
| | 163 | | | Banc of America Funding Corp., Ser. 2005-F, Class 4A1, 2.74%, due 9/20/35 | | | 142 | µ | |
| | 43 | | | Banc of America Funding Corp., Ser. 2006-G, Class 2A1, 0.39%, due 7/20/36 | | | 39 | µ | |
| | 79 | | | Countrywide Asset-Backed Certificates, Ser. 2005-IM2, Class A3, 0.44%, due 1/25/36 | | | 74 | µ | |
| | 22 | | | Fannie Mae Grantor Trust, Ser. 2002-T5, Class A1, 0.41%, due 5/25/32 | | | 21 | µ | |
| | 229 | | | First Horizon Mortgage Pass-Through Trust, Ser. 2005-AR5, Class 2A1, 2.61%, due 11/25/35 | | | 213 | µ | |
| | 151 | | | GSR Mortgage Loan Trust, Ser. 2005-AR3, Class 6A1, 2.86%, due 5/25/35 | | | 137 | µ | |
| | 260 | | | GSR Mortgage Loan Trust, Ser. 2007-AR1, Class 2A1, 2.74%, due 3/25/47 | | | 215 | µ | |
| | 127 | | | HSI Asset Loan Obligation, Ser. 2007-AR1, Class 2A1, 2.74%, due 1/25/37 | | | 96 | µ | |
| | 31 | | | IndyMac INDX Mortgage Loan Trust, Ser. 2006-AR7, Class 3A1, 2.72%, due 5/25/36 | | | 23 | µ | |
| | 307 | | | IndyMac INDX Mortgage Loan Trust, Ser. 2006-AR11, Class 2A1, 2.95%, due 6/25/36 | | | 228 | µ | |
| | 426 | | | JP Morgan Mortgage Trust, Ser. 2005-A3, Class 7CA1, 2.74%, due 6/25/35 | | | 407 | µ | |
| | 128 | | | Nomura Asset Acceptance Corp., Ser. 2007-2, Class A1A, 0.29%, due 4/25/47 | | | 78 | µ | |
| | 22 | | | Opteum Mortgage Acceptance Corp., Ser. 2005-3, Class A1B, 0.43%, due 7/25/35 | | | 22 | µ | |
| | 245 | | | Residential Accredit Loans, Inc., Ser. 2006-QA1, Class A21, 3.77%, due 1/25/36 | | | 181 | µ | |
| | 79 | | | Residential Accredit Loans, Inc., Ser. 2006-QO7, Class 3A2, 0.38%, due 9/25/46 | | | 48 | µ | |
| | | | 1,924 | | |
Commercial Mortgage-Backed (11.6%) | | | |
| | 390 | | | Banc of America Commercial Mortgage, Inc., Ser. 2006-6, Class A4, 5.36%, due 10/10/45 | | | 424 | | |
| | 500 | | | Banc of America Commercial Mortgage, Inc., Ser. 2006-5, Class A4, 5.41%, due 9/10/47 | | | 549 | ØØ | |
| | 420 | | | Banc of America Commercial Mortgage, Inc., Ser. 2007-4, Class ASB, 5.71%, due 2/10/51 | | | 430 | | |
| | 500 | | | Bear Stearns Commercial Mortgage Securities, Ser. 2007-PW15, Class A4, 5.33%, due 2/11/44 | | | 549 | ØØ | |
| | 400 | | | Bear Stearns Commercial Mortgage Securities, Ser. 2007-PW17, Class A4, 5.69%, due 6/11/50 | | | 452 | | |
| | 3,622 | | | Citigroup Commercial Mortgage Trust, Ser. 2013-GC15, Class XA, 1.31%, due 9/10/46 | | | 279 | µ | |
| | 1,075 | | | Commercial Mortgage Loan Trust, Ser. 2008-LS1, Class A4B, 6.00%, due 12/10/49 | | | 1,212 | µØØ | |
| | 3,933 | | | Commercial Mortgage Trust, Ser. 2012-CR2, Class XA, 1.95%, due 8/15/45 | | | 449 | µØØ | |
| | 80 | | | Credit Suisse Mortgage Capital Certificates, Ser. 2007-TF2A, Class A1, 0.35%, due 4/15/22 | | | 79 | ñµ | |
| | 65 | | | Credit Suisse Mortgage Capital Certificates, Ser. 2007-C3, Class A4, 5.68%, due 6/15/39 | | | 72 | µ | |
| | 188 | | | Credit Suisse Mortgage Capital Certificates, Ser. 2006-C4, Class A3, 5.47%, due 9/15/39 | | | 205 | | |
| | 520 | | | Credit Suisse Mortgage Capital Certificates, Ser. 2007-C4, Class A4, 5.76%, due 9/15/39 | | | 578 | µØØ | |
| | 97 | | | Credit Suisse Mortgage Capital Certificates, Ser. 2007-C1, Class A3, 5.38%, due 2/15/40 | | | 106 | | |
See Notes to Schedule of Investments
33
Schedule of Investments Neuberger Berman Core Bond Fund (cont'd)
PRINCIPAL AMOUNT | | | | VALUE† | |
(000's omitted) | | | | (000's omitted)z | |
$ | 1,000 | | | Credit Suisse Mortgage Capital Certificates, Ser. 2007-C5, Class A4, 5.70%, due 9/15/40 | | $ | 1,117 | ØØ | |
| | 250 | | | Credit Suisse Mortgage Capital Certificates, Ser. 2008-C1, Class A3, 6.04%, due 2/15/41 | | | 285 | µ | |
| | 850 | | | Greenwich Capital Commercial Funding Corp., Ser. 2007-GG9, Class A4, 5.44%, due 3/10/39 | | | 941 | ØØ | |
| | 550 | | | GS Mortgage Securities Corp. II, Ser. 2006-GG8, Class A4, 5.56%, due 11/10/39 | | | 607 | ØØ | |
| | 1,500 | | | GS Mortgage Securities Corp. II, Ser. 2007-GG10, Class A4, 5.80%, due 8/10/45 | | | 1,663 | µ | |
| | 3,417 | | | GS Mortgage Securities Trust, Ser. 2012-GC6, Class XA, 2.17%, due 1/10/45 | | | 423 | ñµ | |
| 1,100 | | | JP Morgan Chase Commercial Mortgage Securities Corp., Ser. 2006-LDP9, Class A3, 5.34%,
due 5/15/47 | | | 1,210 | ØØ | |
| 1,200 | | | JP Morgan Chase Commercial Mortgage Securities Corp., Ser. 2007-CB18, Class A4, 5.44%,
due 6/12/47 | | | 1,329 | ØØ | |
| 1,950 | | | JP Morgan Chase Commercial Mortgage Securities Corp., Ser. 2007-LDPX, Class A3, 5.42%,
due 1/15/49 | | | 2,162 | ØØ | |
| 630 | | | JP Morgan Chase Commercial Mortgage Securities Corp., Ser. 2007-LD11, Class A4, 5.81%,
due 6/15/49 | | | 711 | µ | |
| 1,219 | | | JP Morgan Chase Commercial Mortgage Securities Corp., Ser. 2007-LD12, Class A4, 5.88%,
due 2/15/51 | | | 1,379 | ØØ | |
| 500 | | | Merrill Lynch/Countrywide Commercial Mortgage Trust, Ser. 2007-5, Class A4, 5.38%,
due 8/12/48 | | | 548 | ØØ | |
| 1,400 | | | Merrill Lynch/Countrywide Commercial Mortgage Trust, Ser. 2007-7, Class A4, 5.74%,
due 6/12/50 | | | 1,563 | µØØ | |
| 4,347 | | | Morgan Stanley Bank of America Merrill Lynch Trust, Ser. 2013-C7, Class XA, 1.75%,
due 2/15/46 | | | 445 | µØØ | |
| 3,484 | | | Morgan Stanley Bank of America Merrill Lynch Trust, Ser. 2013-C9, Class XA, 1.47%,
due 5/15/46 | | | 289 | µ | |
| | 170 | | | Morgan Stanley Capital I, Ser. 2007-IQ14, Class A2, 5.61%, due 4/15/49 | | | 172 | | |
| | 2,972 | | | UBS-Barclays Commercial Mortgage Trust, Ser. 2012-C4, Class XA, 1.88%, due 12/10/45 | | | 346 | ñµ | |
| | 4,959 | | | UBS-Barclays Commercial Mortgage Trust, Ser. 2013-C5, Class XA, 1.16%, due 3/10/46 | | | 371 | ñµ | |
| | 1,867 | | | UBS-Barclays Commercial Mortgage Trust, Ser. 2012-C3, Class XA, 2.18%, due 8/10/49 | | | 237 | ñµ | |
| | 1,755 | | | Wachovia Bank Commercial Mortgage Trust, Ser. 2007-C32, Class A3, 5.73%, due 6/15/49 | | | 1,954 | µØØ | |
| | 7,460 | | | WF-RBS Commercial Mortgage Trust, Ser. 2013-C11, Class XA, 1.52%, due 3/15/45 | | | 640 | ñµØØ | |
| | 2,949 | | | WF-RBS Commercial Mortgage Trust, Ser. 2012-C9, Class XA, 2.26%, due 11/15/45 | | | 379 | ñµ | |
| | 3,671 | | | WF-RBS Commercial Mortgage Trust, Ser. 2013-C14, Class XA, 0.94%, due 6/15/46 | | | 224 | µ | |
| | 5,966 | | | WF-RBS Commercial Mortgage Trust, Ser. 2013-C12, Class XA, 1.52%, due 3/15/48 | | | 556 | ñµØØ | |
| | | | 24,935 | | |
Fannie Mae (22.5%) | | | |
| | 3,107 | | | Pass-Through Certificates, 3.50%, due 12/1/41 – 10/1/43 | | | 3,191 | | |
| | 4,025 | | | Pass-Through Certificates, 4.00%, due 2/1/41 – 2/1/43 | | | 4,246 | ØØ | |
| | 4,578 | | | Pass-Through Certificates, 4.50%, due 11/1/39 – 4/1/42 | | | 4,901 | Ø,ØØ | |
| | 2,755 | | | Pass-Through Certificates, 5.00%, due 3/1/21 – 8/1/38 | | | 2,992 | ØØ | |
| | 1,903 | | | Pass-Through Certificates, 5.50%, due 5/1/30 – 4/1/40 | | | 2,075 | | |
| | 2,271 | | | Pass-Through Certificates, 6.00%, due 11/1/15 – 11/1/38 | | | 2,486 | | |
| | 55 | | | Pass-Through Certificates, 8.50%, due 4/1/34 | | | 62 | | |
| | 2,750 | | | Pass-Through Certificates, 3.00%, TBA, 30 Year Maturity | | | 2,711 | Ø | |
| | 10,235 | | | Pass-Through Certificates, 3.50%, TBA, 30 Year Maturity | | | 10,494 | Ø | |
| | 10,390 | | | Pass-Through Certificates, 4.00%, TBA, 30 Year Maturity | | | 10,944 | Ø | |
| | 3,050 | | | Pass-Through Certificates, 4.50%, TBA, 30 Year Maturity | | | 3,265 | Ø | |
| | 780 | | | Pass-Through Certificates, 5.00%, TBA, 30 Year Maturity | | | 848 | Ø | |
| | | | 48,215 | | |
Freddie Mac (14.8%) | | | |
| | 299 | | | Pass-Through Certificates, 2.50%, due 4/1/37 | | | 319 | µ | |
| | 201 | | | Pass-Through Certificates, 2.62%, due 2/1/37 | | | 215 | µ | |
| | 2,974 | | | Pass-Through Certificates, 3.50%, due 8/1/42 – 8/1/43 | | | 3,043 | | |
See Notes to Schedule of Investments
34
Schedule of Investments Neuberger Berman Core Bond Fund (cont'd)
PRINCIPAL AMOUNT | | | | VALUE† | |
(000's omitted) | | | | (000's omitted)z | |
$ | 5,028 | | | Pass-Through Certificates, 4.00%, due 9/1/40 – 6/1/42 | | $ | 5,279 | ØØ | |
| | 3,495 | | | Pass-Through Certificates, 4.50%, due 1/1/38 – 7/1/41 | | | 3,730 | ØØ | |
| | 644 | | | Pass-Through Certificates, 5.00%, due 5/1/23 – 5/1/41 | | | 697 | | |
| | 2,260 | | | Pass-Through Certificates, 5.50%, due 5/1/35 – 11/1/38 | | | 2,443 | ØØ | |
| | 62 | | | Pass-Through Certificates, 6.00%, due 12/1/37 | | | 67 | | |
| | 17 | | | Pass-Through Certificates, 6.50%, due 11/1/25 | | | 19 | | |
| | 8,120 | | | Pass-Through Certificates, 3.50%, TBA, 30 Year Maturity | | | 8,298 | Ø | |
| | 7,225 | | | Pass-Through Certificates, 4.00%, TBA, 30 Year Maturity | | | 7,582 | Ø | |
| | | | 31,692 | | |
| | | | | Total Mortgage-Backed Securities (Cost $104,973) | | | 106,766 | | |
Corporate Debt Securities (27.6%) | | | |
Aerospace & Defense (0.8%) | | | |
| | 905 | | | L-3 Communications Corp., Guaranteed Notes, 3.95%, due 11/15/16 | | | 965 | ØØ | |
| | 865 | | | Northrop Grumman Corp., Senior Unsecured Notes, 1.75%, due 6/1/18 | | | 852 | ØØ | |
| | | | 1,817 | | |
Agriculture (0.3%) | | | |
| | 585 | | | Altria Group, Inc., Guaranteed Notes, 5.38%, due 1/31/44 | | | 591 | | |
Airlines (1.2%) | | | |
| | 1,055 | | | American Airlines, Inc., Equipment Trust, Ser. 2013-2, Class A, 4.95%, due 1/15/23 | | | 1,087 | ñ | |
| | 665 | | | American Airlines, Inc., Equipment Trust, Ser. 2013-1, Class A, 4.00%, due 7/15/25 | | | 632 | ñØØ | |
| | 430 | | | Continental Airlines, Inc., Pass-Through Certificates, Ser. 2012-02, Class A, 4.00%, due 10/29/24 | | | 417 | ØØ | |
| | 490 | | | US Airways, Pass Through Certificates, Ser. 2013-1, Class A, 3.95%, due 11/15/25 | | | 465 | ØØ | |
| | | | 2,601 | | |
Banks (7.3%) | | | |
| | 825 | | | ABN AMRO Bank NV, Senior Unsecured Notes, 2.50%, due 10/30/18 | | | 825 | ñ | |
| | 995 | | | Bank of America Corp., Senior Unsecured Notes, 1.50%, due 10/9/15 | | | 1,003 | ØØ | |
| | 705 | | | Bank of America Corp., Senior Unsecured Notes, 2.00%, due 1/11/18 | | | 703 | ØØ | |
| | 715 | | | Bank of America Corp., Senior Unsecured Notes, 2.60%, due 1/15/19 | | | 720 | | |
| | 375 | | | Bank of America Corp., Senior Unsecured Medium-Term Notes, 3.30%, due 1/11/23 | | | 360 | ØØ | |
| | 690 | | | Citigroup, Inc., Senior Unsecured Notes, 2.65%, due 3/2/15 | | | 705 | ØØ | |
| | 770 | | | Citigroup, Inc., Senior Unsecured Notes, 2.50%, due 9/26/18 | | | 776 | | |
| | 865 | | | Citigroup, Inc., Senior Unsecured Notes, 3.88%, due 10/25/23 | | | 865 | | |
| | 1,195 | | | Goldman Sachs Group, Inc., Senior Unsecured Notes, 3.30%, due 5/3/15 | | | 1,237 | ØØ | |
| | 730 | | | Goldman Sachs Group, Inc., Senior Unsecured Notes, 2.90%, due 7/19/18 | | | 745 | | |
| | 570 | | | Goldman Sachs Group, Inc., Senior Unsecured Notes, 3.63%, due 1/22/23 | | | 556 | ØØ | |
| | 540 | | | Huntington National Bank, Senior Unsecured Notes, 1.35%, due 8/2/16 | | | 541 | | |
| | 855 | | | JPMorgan Chase & Co., Senior Unsecured Notes, 3.45%, due 3/1/16 | | | 901 | ØØ | |
| | 400 | | | JPMorgan Chase & Co., Senior Unsecured Notes, 2.00%, due 8/15/17 | | | 405 | ØØ | |
| | 935 | | | JPMorgan Chase & Co., Senior Unsecured Notes, 1.63%, due 5/15/18 | | | 918 | ØØ | |
| | 800 | | | Morgan Stanley, Senior Unsecured Notes, 1.75%, due 2/25/16 | | | 808 | ØØ | |
| | 1,845 | | | Morgan Stanley, Senior Unsecured Notes, 2.13%, due 4/25/18 | | | 1,834 | ØØ | |
| | 1,380 | | | Wells Fargo & Co., Senior Unsecured Notes, 1.25%, due 7/20/16 | | | 1,388 | | |
| | 460 | | | Wells Fargo & Co., Subordinated Notes, 5.38%, due 11/2/43 | | | 465 | | |
| | | | 15,755 | | |
See Notes to Schedule of Investments
35
Schedule of Investments Neuberger Berman Core Bond Fund (cont'd)
PRINCIPAL AMOUNT | | | | VALUE† | |
(000's omitted) | | | | (000's omitted)z | |
Beverages (1.0%) | | | |
$ | 300 | | | Anheuser-Busch InBev Worldwide, Inc., Guaranteed Notes, 3.75%, due 7/15/42 | | $ | 265 | ØØ | |
| | 945 | | | Coca-Cola Co., Senior Unsecured Notes, 3.20%, due 11/1/23 | | | 940 | | |
| | 500 | | | Fomento Economico Mexicano SAB de CV, Senior Unsecured Notes, 4.38%, due 5/10/43 | | | 423 | ØØ | |
| | 470 | | | SABMiller Holdings, Inc., Guaranteed Notes, 2.20%, due 8/1/18 | | | 470 | ñ | |
| | | | 2,098 | | |
Commercial Services (0.4%) | | | |
| | 735 | | | ERAC USA Finance LLC, Guaranteed Notes, 2.80%, due 11/1/18 | | | 745 | ñ | |
Computers (0.2%) | | | |
| | 355 | | | Hewlett-Packard Co., Senior Unsecured Notes, 4.65%, due 12/9/21 | | | 359 | ØØ | |
Diversified Financial Services (3.2%) | | | |
| | 1,475 | | | Ford Motor Credit Co. LLC, Senior Unsecured Notes, 1.70%, due 5/9/16 | | | 1,488 | ØØ | |
| | 285 | | | Ford Motor Credit Co. LLC, Senior Unsecured Notes, 3.00%, due 6/12/17 | | | 297 | ØØ | |
| | 390 | | | General Electric Capital Corp., Senior Secured Notes, 1.00%, due 12/11/15 | | | 392 | ØØ | |
| | 1,025 | | | General Electric Capital Corp., Senior Unsecured Medium-Term Notes, 2.30%, due 4/27/17 | | | 1,056 | ØØ | |
| | 1,000 | | | General Electric Capital Corp., Senior Unsecured Global Medium-Term Notes, 3.15%, due 9/7/22 | | | 979 | ØØ | |
| | 595 | | | Hyundai Capital America, Senior Unsecured Notes, 1.88%, due 8/9/16 | | | 600 | ñ | |
| | 620 | | | Jefferies Group LLC, Senior Unsecured Notes, 5.13%, due 4/13/18 | | | 668 | ØØ | |
| | 1,450 | | | Nomura Holdings, Inc., Senior Unsecured Medium-Term Notes, 2.00%, due 9/13/16 | | | 1,460 | ØØ | |
| | | | 6,940 | | |
Electric (1.4%) | | | |
| | 650 | | | Dominion Resources, Inc., Senior Unsecured Notes, Ser. C, 4.05%, due 9/15/42 | | | 568 | ØØ | |
| | 1,365 | | | Exelon Generation Co., LLC, Senior Unsecured Notes, 4.00%, due 10/1/20 | | | 1,374 | ØØ | |
| | 450 | | | Georgia Power Co., Senior Unsecured Notes, 4.30%, due 3/15/42 | | | 413 | ØØ | |
| | 385 | | | Southern California Edison Co., 1st Mortgage, Ser. 13-A, 3.90%, due 3/15/43 | | | 349 | ØØ | |
| | 305 | | | Southern Co., Senior Unsecured Notes, 2.45%, due 9/1/18 | | | 310 | | |
| | | | 3,014 | | |
Food (0.2%) | | | |
| | 515 | | | WM Wrigley Jr. Co., Senior Unsecured Notes, 3.38%, due 10/21/20 | | | 526 | ñ | |
Healthcare - Products (0.2%) | | | |
| | 495 | | | Boston Scientific Corp., Senior Unsecured Notes, 2.65%, due 10/1/18 | | | 499 | | |
Healthcare - Services (0.1%) | | | |
| | 280 | | | Aetna, Inc., Senior Unsecured Notes, 4.13%, due 11/15/42 | | | 250 | ØØ | |
Insurance (1.6%) | | | |
| | 655 | | | Allstate Corp., Subordinated Notes, 5.75%, due 8/15/53 | | | 670 | µ | |
| | 490 | | | Berkshire Hathaway Finance Corp., Guaranteed Notes, 4.30%, due 5/15/43 | | | 456 | ØØ | |
| | 440 | | | ING US, Inc., Senior Unsecured Notes, 5.70%, due 7/15/43 | | | 465 | ñ | |
| | 1,180 | | | Prudential Financial, Inc., Junior Subordinated Notes, 5.88%, due 9/15/42 | | | 1,198 | µØØ | |
| | 670 | | | Prudential Financial, Inc., Junior Subordinated Notes, 5.20%, due 3/15/44 | | | 650 | µØØ | |
| | | | 3,439 | | |
See Notes to Schedule of Investments
36
Schedule of Investments Neuberger Berman Core Bond Fund (cont'd)
PRINCIPAL AMOUNT | | | | VALUE† | |
(000's omitted) | | | | (000's omitted)z | |
Media (1.1%) | | | |
$ | 465 | | | NBCUniversal Media LLC, Guaranteed Notes, 6.40%, due 4/30/40 | | $ | 562 | ØØ | |
| | 255 | | | News America, Inc., Guaranteed Notes, 4.00%, due 10/1/23 | | | 259 | ñ | |
| | 445 | | | Time Warner, Inc., Guaranteed Notes, 6.10%, due 7/15/40 | | | 491 | ØØ | |
| | 990 | | | Viacom, Inc., Senior Unsecured Notes, 5.85%, due 9/1/43 | | | 1,051 | | |
| | | | 2,363 | | |
Mining (1.2%) | | | |
| | 395 | | | Barrick Gold Corp., Senior Unsecured Notes, 4.10%, due 5/1/23 | | | 358 | | |
| | 630 | | | BHP Billiton Finance USA Ltd., Guaranteed Notes, 3.85%, due 9/30/23 | | | 639 | | |
| | 765 | | | Freeport-McMoRan Copper & Gold, Inc., Guaranteed Notes, 3.88%, due 3/15/23 | | | 724 | | |
| | 375 | | | Freeport-McMoRan Copper & Gold, Inc., Guaranteed Notes, 5.45%, due 3/15/43 | | | 351 | | |
| | 415 | | | Rio Tinto Finance USA PLC, Guaranteed Notes, 1.38%, due 6/17/16 | | | 417 | | |
| | | | 2,489 | | |
Oil & Gas (1.4%) | | | |
| | 770 | | | Anadarko Petroleum Corp., Senior Unsecured Notes, 5.95%, due 9/15/16 | | | 870 | ØØ | |
| | 275 | | | BP Capital Markets PLC, Guaranteed Notes, 2.75%, due 5/10/23 | | | 257 | ØØ | |
| | 545 | | | Marathon Petroleum Corp., Senior Unsecured Notes, 5.13%, due 3/1/21 | | | 597 | | |
| | 775 | | | Petrobras Global Finance BV, Guaranteed Notes, 3.00%, due 1/15/19 | | | 737 | ØØ | |
| | 395 | | | Petrobras Global Finance BV, Guaranteed Notes, 4.38%, due 5/20/23 | | | 365 | ØØ | |
| | 160 | | | Suncor Energy, Inc., Senior Unsecured Notes, 6.50%, due 6/15/38 | | | 190 | ØØ | |
| | | | 3,016 | | |
Pharmaceuticals (0.7%) | | | |
| | 265 | | | AbbVie, Inc., Senior Unsecured Notes, 4.40%, due 11/6/42 | | | 250 | | |
| | 1,250 | | | Express Scripts Holding Co., Guaranteed Notes, 2.65%, due 2/15/17 | | | 1,297 | ØØ | |
| | | | 1,547 | | |
Pipelines (1.1%) | | | |
| | 665 | | | Energy Transfer Partners LP, Senior Unsecured Notes, 6.50%, due 2/1/42 | | | 728 | ØØ | |
| | 270 | | | Enterprise Products Operating LLC, Guaranteed Notes, 4.85%, due 3/15/44 | | | 259 | ØØ | |
| | 830 | | | Kinder Morgan Energy Partners LP, Senior Unsecured Notes, 2.65%, due 2/1/19 | | | 832 | | |
| | 510 | | | TransCanada PipeLines Ltd., Senior Unsecured Notes, 3.75%, due 10/16/23 | | | 513 | | |
| | | | 2,332 | | |
Real Estate Investment Trusts (1.5%) | | | |
| | 525 | | | American Tower Corp., Senior Unsecured Notes, 3.40%, due 2/15/19 | | | 531 | | |
| | 445 | | | Corporate Office Properties LP, Guaranteed Notes, 5.25%, due 2/15/24 | | | 465 | | |
| | 850 | | | EPR Properties, Guaranteed Notes, 5.25%, due 7/15/23 | | | 849 | | |
| | 375 | | | Health Care REIT, Inc., Senior Unsecured Notes, 2.25%, due 3/15/18 | | | 374 | ØØ | |
| | 1,105 | | | Ventas Realty LP/Ventas Capital Corp., Guaranteed Notes, 2.00%, due 2/15/18 | | | 1,091 | ØØ | |
| | | | 3,310 | | |
Retail (0.6%) | | | |
| | 355 | | | Home Depot, Inc., Senior Unsecured Notes, 4.20%, due 4/1/43 | | | 331 | ØØ | |
| | 400 | | | Wal-Mart Stores, Inc., Senior Unsecured Notes, 2.55%, due 4/11/23 | | | 375 | ØØ | |
| | 535 | | | Wal-Mart Stores, Inc., Senior Unsecured Notes, 4.00%, due 4/11/43 | | | 482 | ØØ | |
| | | | 1,188 | | |
See Notes to Schedule of Investments
37
Schedule of Investments Neuberger Berman Core Bond Fund (cont'd)
PRINCIPAL AMOUNT | | | | VALUE† | |
(000's omitted) | | | | (000's omitted)z | |
Telecommunications (2.1%) | | | |
$ | 1,465 | | | Qwest Corp., Senior Unsecured Notes, 6.75%, due 12/1/21 | | $ | 1,598 | ØØ | |
| | 1,495 | | | Verizon Communications, Inc., Senior Unsecured Notes, 5.15%, due 9/15/23 | | | 1,622 | | |
| | 1,030 | | | Verizon Communications, Inc., Senior Unsecured Notes, 6.55%, due 9/15/43 | | | 1,194 | | |
| | | | 4,414 | | |
| | | | | Total Corporate Debt Securities (Cost $58,993) | | | 59,293 | | |
Asset-Backed Securities (0.4%) | | | |
| 15 | | | Chase Funding Mortgage Loan Asset-Backed Certificates, Ser. 2004-1, Class 2A2, 0.63%,
due 12/25/33 | | | 14 | µ | |
| | 110 | | | Citigroup Mortgage Loan Trust, Inc., Ser. 2006-WFH1, Class M2, 0.54%, due 1/25/36 | | | 91 | µ | |
| | 407 | | | Countrywide Asset-Backed Certificates, Ser. 2006-BC1, Class 1A, 0.37%, due 4/25/36 | | | 355 | µ | |
| | 11 | | | Credit-Based Asset Servicing and Securitization, Ser. 2005-CB5, Class AV2, 0.43%, due 8/25/35 | | | 11 | µ | |
| | 36 | | | Fannie Mae Whole Loan, Ser. 2003-W5, Class A, 0.39%, due 4/25/33 | | | 35 | µ | |
| | 46 | | | Household Home Equity Loan Trust, Ser. 2006-1, Class A1, 0.33%, due 1/20/36 | | | 44 | µ | |
| | 53 | | | Household Home Equity Loan Trust, Ser. 2006-2, Class A2, 0.35%, due 3/20/36 | | | 51 | µ | |
| | 140 | | | HSI Asset Securitization Corp., Ser. 2006-WMC1, Class A2, 0.27%, due 7/25/36 | | | 53 | µ | |
| | 143 | | | Option One Mortgage Loan Trust, Ser. 2006-2, Class 2A2, 0.27%, due 7/25/36 | | | 87 | µ | |
| | 9 | | | Residential Asset Mortgage Products, Inc., Ser. 2003-RS2, Class AII, 0.85%, due 3/25/33 | | | 8 | µ | |
| | 9 | | | Saxon Asset Securities Trust, Ser. 2004-1, Class A, 0.71%, due 3/25/35 | | | 7 | µ | |
| | 4 | | | Specialty Underwriting & Residential Finance, Ser. 2003-BC1, Class A, 0.85%, due 1/25/34 | | | 4 | µ | |
| | | | | Total Asset-Backed Securities (Cost $923) | | | 760 | | |
Government Securities (0.2%) | | | |
Sovereign (0.2%) | | | |
| 365 | | | Mexico Government International Bond, Senior Unsecured Notes, 4.00%,
due 10/2/23 (Cost $363) | | | 371 | | |
NUMBER OF SHARES | | | | | |
Short-Term Investments (16.6%) | | | |
| | 35,712,059 | | | State Street Institutional Liquid Reserves Fund Institutional Class (Cost $35,712) | | | 35,712 | ØØ | |
| | | | | Total Investments (120.2%) (Cost $257,156) | | | 257,790 | ## | |
| | | | | Liabilities, less cash, receivables and other assets [(20.2%)] | | | (43,240 | )± | |
| | | | | Total Net Assets (100.0%) | | $ | 214,550 | | |
See Notes to Schedule of Investments
38
Schedule of Investments Neuberger Berman Floating Rate Income Fund
PRINCIPAL AMOUNT | | | | VALUE† | |
(000's omitted) | | | | (000's omitted)z | |
| Bank Loan Obligationsµ(90.3%) | | | |
Aerospace & Defense (0.8%) | | | |
$ | 2,873 | | | Silver II/Hamilton Sundstrand Corporation, Term Loan, 4.00%, due 12/13/19 | | $ | 2,870 | | |
| | 1,536 | | | Transdigm Inc., Term Loan C, 3.75%, due 2/28/20 | | | 1,537 | | |
| | | | 4,407 | | |
Air Transport (2.1%) | | | |
| | 4,933 | | | American Airlines Inc., Term Loan B, 4.75%, due 6/27/19 | | | 4,958 | | |
| | 2,800 | | | Delta Air Lines, Term Loan, due 4/20/17 | | | 2,813 | ¢^^ | |
| | 2,659 | | | United Air Lines, Inc., Term Loan B, 4.00%, due 4/1/19 | | | 2,671 | | |
| | 1,248 | | | US Airways, Term Loan B1, 4.25%, due 5/23/19 | | | 1,248 | | |
| | | | 11,690 | | |
All Telecom (5.1%) | | | |
| | 2,274 | | | Arris Group, Term Loan B, 3.50%, due 4/17/20 | | | 2,266 | | |
| | 3,573 | | | Cricket Communications, Inc., Term Loan C, 4.75%, due 3/8/20 | | | 3,588 | | |
| | 1,512 | | | Integra Telecom, Term Loan B, 5.25%, due 2/22/19 | | | 1,529 | | |
| | 770 | | | Integra Telecom, Second Lien Term Loan, 9.75%, due 2/21/20 | | | 791 | | |
| | 5,093 | | | Intelsat Jackson HLDG, Term Loan B-1, 4.25%, due 4/2/18 | | | 5,117 | | |
| | 510 | | | Level 3 Financing Inc., Term Loan B-III, 4.00%, due 8/1/19 | | | 512 | | |
| | 7,650 | | | Level 3 Financing Inc., Term Loan B, 4.00%, due 1/15/20 | | | 7,682 | | |
| | 1,561 | | | Syniverse Technologies, Term Loan, 4.00%, due 4/23/19 | | | 1,564 | | |
| | 2,933 | | | Syniverse Technologies, Term Loan B, 4.00%, due 4/23/19 | | | 2,939 | | |
| | 1,388 | | | Windstream Corp., Term Loan B-3, 4.00%, due 8/8/19 | | | 1,392 | | |
| | 1,228 | | | Windstream Corp., Term Loan B-4, 3.50%, due 1/23/20 | | | 1,229 | | |
| | | | 28,609 | | |
Automotive (2.7%) | | | |
| | 2,792 | | | Allison Transmission, Term Loan B-3, 3.75%, due 8/23/19 | | | 2,809 | | |
| | 2,445 | | | Chrysler Automotive, Term Loan B, 4.25%, due 5/24/17 | | | 2,466 | | |
| | 3,847 | | | Goodyear Engineered Products, Term Loan, 5.25%, due 9/8/17 | | | 3,820 | | |
| | 1,257 | | | Goodyear Tire & Rubber Company, Second Lien Term Loan, 4.75%, due 4/30/19 | | | 1,271 | | |
| | 1,809 | | | Navistar, Inc., Term Loan B, 5.75%, due 8/17/17 | | | 1,843 | | |
| | 2,488 | | | TI Group Automotive, Term Loan, 5.50%, due 3/28/19 | | | 2,518 | Ñ | |
| | | | 14,727 | | |
Building & Development (2.1%) | | | |
| | 3,080 | | | American Builders & Co., Inc., Term Loan B, 3.50%, due 4/16/20 | | | 3,082 | | |
| | 2,335 | | | Capital Automotive LP, Term Loan B-1, 4.00%, due 4/10/19 | | | 2,347 | | |
| | 605 | | | CPG International Inc., Term Loan, 4.75%, due 9/30/20 | | | 606 | | |
| | 5,683 | | | Realogy Corporation, Term Loan B, 4.50%, due 3/5/20 | | | 5,738 | | |
| | | | 11,773 | | |
Business Equipment & Services (7.0%) | | | |
| | 4,217 | | | Acosta Inc., Term Loan B, 4.25%, due 3/2/18 | | | 4,229 | ¢^^ | |
| | 1,881 | | | Advantage Sales & Marketing, First Lien Term Loan, 4.25%, due 12/18/17 | | | 1,897 | Ñ | |
| | 1,286 | | | Advantage Sales & Marketing, Second Lien Term Loan, 8.25%, due 6/17/18 | | | 1,297 | | |
| | 4,730 | | | BMC Software, Term Loan, 5.00%, due 9/10/20 | | | 4,775 | | |
See Notes to Schedule of Investments
39
Schedule of Investments Neuberger Berman Floating Rate Income Fund (cont'd)
PRINCIPAL AMOUNT | | | | VALUE† | |
(000's omitted) | | | | (000's omitted)z | |
$ | 280 | | | BMC Software, Term Loan, 5.00%, due 3/21/19 | | $ | 283 | | |
| | 1,690 | | | Brock Holdings III, First Lien Term Loan, 6.00%, due 3/16/17 | | | 1,692 | | |
| | 967 | | | Brock Holdings III, Second Lien Term Loan, 10.00%, due 3/16/18 | | | 978 | | |
| | 1,558 | | | Kronos, First Lien Term Loan, 4.50%, due 10/30/19 | | | 1,564 | | |
| | 1,575 | | | Kronos, Second Lien Term Loan, 9.75%, due 4/30/20 | | | 1,622 | | |
| | 2,105 | | | Minimax Viking, Term Loan B1, 4.50%, due 8/14/20 | | | 2,114 | | |
| | 1,105 | | | Mitchell International, Inc., Term Loan B, 4.50%, due 10/12/20 | | | 1,112 | | |
| | 1,090 | | | Mitchell International, Inc., Second Lien Term Loan, due 9/17/21 | | | 1,105 | ¢^^ | |
| | 2,966 | | | Monitronics, Term Loan B, 4.25%, due 3/23/18 | | | 2,987 | | |
| | 2,043 | | | Protection One, Term Loan B, 4.25%, due 3/20/19 | | | 2,043 | | |
| | 1,634 | | | Quintiles Transnational, Term Loan B-2, 4.00%, due 6/8/18 | | | 1,640 | | |
| | 2,788 | | | Servicemaster Company, Term Loan C, 4.25%, due 1/31/17 | | | 2,739 | | |
| | 3,366 | | | SunGard Data Systems, Term Loan E, 4.00%, due 3/8/20 | | | 3,389 | | |
| | 1,432 | | | SymphonyIRI Group, Inc., Term Loan B, 4.75%, due 9/30/20 | | | 1,437 | ¢^^ | |
| | 1,776 | | | West Corporation, Term Loan B-8, 3.75%, due 6/30/18 | | | 1,780 | | |
| | | | 38,683 | | |
Cable & Satellite Television (0.7%) | | | |
| | 378 | | | Cequel Communications, LLC, Term Loan, 3.50%, due 2/14/19 | | | 378 | | |
| | 1,240 | | | Charter Communications Operating LLC, Term Loan F, 3.00%, due 4/10/13 | | | 1,226 | | |
| | 2,245 | | | UPC Financing Partnership, Term Loan AF, 4.00%, due 1/31/21 | | | 2,257 | | |
| | | | 3,861 | | |
Chemicals & Plastics (3.5%) | | | |
| | 2,099 | | | Dupont Performance Coatings, Term Loan B, 4.75%, due 2/1/20 | | | 2,120 | | |
| | 1,725 | | | Huntsman International LLC, Term Loan B, due 10/15/20 | | | 1,727 | ¢^^ | |
| | 2,831 | | | Ineos Holdings, First Lien Term Loan, 4.00%, due 5/4/18 | | | 2,839 | | |
| | 3,701 | | | MacDermid Inc., First Lien Term Loan B, 4.00%, due 6/7/20 | | | 3,712 | | |
| | 1,875 | | | OXEA FIN/CY SCA, First Lien Term Loan B-2, 4.25%, due 1/15/20 | | | 1,878 | | |
| | 3,480 | | | PQ Corporation, Term Loan, 4.50%, due 8/7/17 | | | 3,504 | | |
| | 1,593 | | | Taminco Global Chemical, Term Loan B-2, 4.25%, due 2/15/19 | | | 1,601 | | |
| | 2,213 | | | Univar Inc., Term Loan B, 5.00%, due 6/30/17 | | | 2,175 | | |
| | | | 19,556 | | |
Conglomerates (0.8%) | | | |
| | 2,665 | | | Gardner Denver, Term Loan, 4.25%, due 7/30/20 | | | 2,665 | | |
| | 1,624 | | | Spectrum Brands, Inc., Term Loan, 4.50%, due 12/17/19 | | | 1,629 | | |
| | | | 4,294 | | |
Containers & Glass Products (2.6%) | | | |
| | 1,300 | | | Berlin Packaging, First Lien Term Loan, 4.75%, due 4/2/19 | | | 1,307 | | |
| | 1,534 | | | Berlin Packaging, Second Lien Term Loan, 8.75%, due 4/2/20 | | | 1,546 | | |
| | 2,557 | | | Berry Plastics, Term Loan D, 3.50%, due 2/8/20 | | | 2,547 | | |
| | 624 | | | Exopack, Term Loan B, 5.00%, due 5/31/17 | | | 633 | | |
| | 2,150 | | | Pact Group, Term Loan, 3.75%, due 5/29/20 | | | 2,129 | | |
| | 4,264 | | | Reynolds Group, Term Loan, 4.75%, due 9/28/18 | | | 4,297 | | |
| | 2,014 | | | Sealed Air Corporation, Term Loan B-1, 4.00%, due 10/3/18 | | | 2,025 | | |
| | | | 14,484 | | |
See Notes to Schedule of Investments
40
Schedule of Investments Neuberger Berman Floating Rate Income Fund (cont'd)
PRINCIPAL AMOUNT | | | | VALUE† | |
(000's omitted) | | | | (000's omitted)z | |
Drugs (1.5%) | | | |
$ | 2,998 | | | Par Pharmaceutical Companies, Inc., Term Loan B-1, 4.25%, due 9/30/19 | | $ | 3,007 | | |
| | 3,257 | | | Valeant Pharmaceuticals, Term Loan B, 3.75%, due 2/13/19 | | | 3,283 | | |
| | 1,950 | | | Valeant Pharmaceuticals, Term Loan B, 4.50%, due 8/5/20 | | | 1,974 | | |
| | | | 8,264 | | |
Ecological Services & Equipment (0.4%) | | | |
| | 2,366 | | | ADS Waste Holdings, Inc., Term Loan B, 4.25%, due 10/9/19 | | | 2,378 | | |
Electronics - Electrical (5.4%) | | | |
| | 4,143 | | | BOC Edwards, First Lien Term Loan, 4.75%, due 3/26/20 | | | 4,145 | | |
| | 6,300 | | | Ceridian Corp., Term Loan, 4.42%, due 5/9/17 | | | 6,330 | | |
| | 5,223 | | | Datatel-Sophia LP, Term Loan B, 4.50%, due 7/19/18 | | | 5,267 | ¢^^ | |
| | 1,343 | | | Epicor Software Corp., Term Loan B, 4.50%, due 5/16/18 | | | 1,351 | | |
| | 2,159 | | | Freescale Semiconductor, Term Loan B-4, 5.00%, due 3/1/20 | | | 2,177 | | |
| | 120 | | | Freescale Semiconductor, Term Loan B5, 5.00%, due 1/15/21 | | | 121 | | |
| | 4,662 | | | Go Daddy, Term Loan B-2, 4.25%, due 12/17/18 | | | 4,674 | | |
| | 1,881 | | | Riverbed Technology, Term Loan, 4.00%, due 12/18/19 | | | 1,890 | | |
| | 1,360 | | | SkillSoft, Term Loan, 5.00%, due 5/26/17 | | | 1,362 | | |
| | 2,522 | | | Verint Systems Inc., Term Loan, 4.00%, due 9/6/19 | | | 2,530 | | |
| | | | 29,847 | | |
Equipment Leasing (1.6%) | | | |
| | 1,996 | | | AWAS Fin Lux 2012 SA, Term Loan, 3.50%, due 6/10/16 | | | 1,998 | | |
| | 1,538 | | | AWAS Fin Lux 2012 SA, Term Loan, 3.50%, due 7/16/18 | | | 1,538 | | |
| | 5,561 | | | International Lease Finance Co., Term Loan, 3.50%, due 6/30/17 | | | 5,559 | | |
| | | | 9,095 | | |
Financial Intermediaries (9.8%) | | | |
| | 1,668 | | | American Capital, Term Loan B, 4.00%, due 8/22/16 | | | 1,672 | | |
| | 4,711 | | | CITCO, Term Loan, 4.25%, due 6/29/18 | | | 4,711 | | |
| | 4,364 | | | First Data Corporation, Term Loan, 4.17%, due 3/24/17 | | | 4,368 | | |
| | 2,520 | | | First Data Corporation, Term Loan, 4.17%, due 3/23/18 | | | 2,521 | ¢^^ | |
| | 3,061 | | | First Data Corporation, Term Loan B, 4.17%, due 9/24/18 | | | 3,064 | | |
| | 1,835 | | | Guggenheim Partners, Term Loan, 4.25%, due 7/22/20 | | | 1,843 | | |
| | 1,840 | | | Harbourvest Partners L.P., Term Loan, 4.75%, due 11/21/17 | | | 1,845 | Ñ | |
| | 3,506 | | | Home Loan Servicing Solutions, Term Loan, 4.50%, due 6/26/20 | | | 3,524 | Ñ | |
| | 3,109 | | | Mondrian Investment, Term Loan B-1, 4.00%, due 3/9/20 | | | 3,119 | | |
| | 4,255 | | | MoneyGram International, Term Loan, 4.25%, due 3/27/20 | | | 4,267 | | |
| | 3,593 | | | Nuveen Inv., First Lien Term Loan B, 4.17%, due 5/13/17 | | | 3,570 | | |
| | 2,085 | | | Nuveen Inv., Second Lien Term Loan B, 6.50%, due 2/28/19 | | | 2,043 | | |
| | 5,269 | | | Ocwen Financial, Term Loan, 5.00%, due 2/15/18 | | | 5,333 | | |
| | 2,820 | | | Springleaf, Term Loan, 4.75%, due 9/30/19 | | | 2,847 | | |
| | 2,839 | | | TCW Group, Term Loan, 4.00%, due 2/6/20 | | | 2,839 | | |
| | 6,688 | | | Walter Investment Mgmt., Term Loan B, 5.75%, due 11/28/17 | | | 6,745 | | |
| | | | 54,311 | | |
Food & Drug Retailers (1.1%) | | | |
| | 4,542 | | | Rite Aid Corp., Term Loan 6, 4.00%, due 2/21/20 | | | 4,564 | | |
| | 1,435 | | | Rite Aid Corp., Term Loan 2, 4.88%, due 6/21/21 | | | 1,445 | | |
| | | | 6,009 | | |
See Notes to Schedule of Investments
41
Schedule of Investments Neuberger Berman Floating Rate Income Fund (cont'd)
PRINCIPAL AMOUNT | | | | VALUE† | |
(000's omitted) | | | | (000's omitted)z | |
Food Products (2.5%) | | | |
$ | 4,218 | | | Del Monte Corp., Term Loan, 4.00%, due 3/8/18 | | $ | 4,218 | | |
| | 5,052 | | | HJ Heinz Company, Term Loan B-2, 3.50%, due 6/5/20 | | | 5,087 | | |
| | 4,571 | | | Pinnacle Foods Finance LLC, Term Loan G, 3.25%, due 4/29/20 | | | 4,564 | | |
| | | | 13,869 | | |
Food Service (2.8%) | | | |
| | 4,650 | | | Aramark Corporation, Term Loan D, 4.00%, due 9/9/19 | | | 4,660 | | |
| | 6,665 | | | US Foodservice Inc., Term Loan, 4.50%, due 3/31/19 | | | 6,682 | | |
| | 4,443 | | | Weight Watchers International, Term Loan B-2, 3.75%, due 4/2/20 | | | 4,079 | | |
| | | | 15,421 | | |
Health Care (5.5%) | | | |
| | 3,287 | | | Biomet, Inc., Term Loan B-2, 3.67%, due 7/25/17 | | | 3,308 | | |
| | 2,047 | | | DaVita, Inc., Term Loan B-2, 4.00%, due 11/1/19 | | | 2,058 | | |
| | 3,057 | | | dj Orthopedics LLC, Term Loan B, 4.75%, due 9/15/17 | | | 3,086 | | |
| | 2,512 | | | EMS-Emergency Medical Services, Term Loan, 4.00%, due 5/25/18 | | | 2,521 | | |
| | 2,613 | | | IASIS Healthcare Corporation, Term Loan B-2, 4.50%, due 5/3/18 | | | 2,630 | ¢^^ | |
| | 3,501 | | | Immucor, Term Loan B-2, 5.00%, due 8/19/18 | | | 3,517 | | |
| | 1,472 | | | IMS Health Incorporated, Term Loan B-1, 3.75%, due 9/1/17 | | | 1,479 | | |
| | 2,668 | | | Kindred Healthcare, Term Loan B-1, 4.25%, due 6/1/18 | | | 2,664 | | |
| | 821 | | | Multiplan, Inc., Term Loan B-1, 4.00%, due 8/26/17 | | | 826 | | |
| | 2,197 | | | Pharmaceutical Product Development, Inc., Term Loan, 4.25%, due 12/5/18 | | | 2,216 | | |
| | 2,059 | | | Sheridan Healthcare, First Lien Term Loan, 4.50%, due 6/29/18 | | | 2,068 | | |
| | 2,453 | | | United Surgical Partners International, Inc., Term Loan B, 4.75%, due 4/3/19 | | | 2,460 | | |
| | 1,985 | | | VWR International, Inc., Term Loan B-1, 4.17%, due 4/3/17 | | | 1,991 | | |
| | | | 30,824 | | |
Home Furnishings (0.6%) | | | |
| | 2,143 | | | AOT Bedding Super Holdings, LLC, Term Loan, 5.00%, due 10/1/19 | | | 2,154 | | |
| | 1,161 | | | Jarden Corporation, Term Loan B1, 2.92%, due 9/30/20 | | | 1,161 | | |
| | | | 3,315 | | |
Industrial Equipment (1.5%) | | | |
| | 1,616 | | | Generac Power Systems Inc., Term Loan B, 3.50%, due 5/31/20 | | | 1,609 | | |
| | 2,411 | | | Husky Injection Molding, Term Loan, 4.25%, due 6/30/18 | | | 2,424 | | |
| | 4,290 | | | Rexnord Corp., Term Loan B, 4.00%, due 8/21/20 | | | 4,292 | | |
| | | | 8,325 | | |
Insurance (1.0%) | | | |
| | 3,990 | | | Sedgwick Holdings Inc., First Lien Term Loan B, 4.25%, due 6/12/18 | | | 4,012 | | |
| | 1,570 | | | Sedgwick Holdings Inc., Second Lien Term Loan B, 8.00%, due 12/12/18 | | | 1,596 | | |
| | | | 5,608 | | |
Leisure Goods - Activities - Movies (4.6%) | | | |
| | 5,400 | | | Activision Blizzard Inc., Term Loan, 3.25%, due 10/12/20 | | | 5,417 | | |
| | 2,210 | | | Bombardier Recreational Products Inc., Term Loan B, 4.00%, due 1/30/19 | | | 2,219 | | |
| | 669 | | | Digital Cinema Implementation, Term Loan, 3.25%, due 5/17/21 | | | 666 | Ñ | |
See Notes to Schedule of Investments
42
Schedule of Investments Neuberger Berman Floating Rate Income Fund (cont'd)
PRINCIPAL AMOUNT | | | | VALUE† | |
(000's omitted) | | | | (000's omitted)z | |
$ | 3,120 | | | Emerald Expositions Holdings, Term Loan, 5.50%, due 6/17/20 | | $ | 3,147 | Ñ | |
| | 3,817 | | | EMI Publishing, Term Loan B, 4.25%, due 6/29/18 | | | 3,836 | | |
| | 2,060 | | | Live Nation Entertainment, Inc., Term Loan B-1, 3.50%, due 8/17/20 | | | 2,065 | | |
| | 4,140 | | | Scientific Games Corp., Term Loan, 4.25%, due 10/18/20 | | | 4,140 | | |
| | 4,000 | | | Warner Music Group, Term Loan B, 3.75%, due 7/1/20 | | | 4,001 | | |
| | | | 25,491 | | |
Lodging & Casinos (6.6%) | | | |
| | 2,060 | | | Boyd Gaming Corporation, Term Loan B, 4.00%, due 8/14/20 | | | 2,056 | | |
| | 1,060 | | | Cannery Casinos, First Lien Term Loan, 6.00%, due 10/2/18 | | | 1,059 | | |
| | 1,156 | | | Cannery Casinos, Second Lien Term Loan, 10.00%, due 10/2/19 | | | 1,072 | | |
| | 1,750 | | | Centaur Acquisition, LLC, First Lien Term Loan, 5.25%, due 2/20/19 | | | 1,768 | | |
| | 1,980 | | | Centaur Acquisition, LLC, Second Lien Term Loan, 8.75%, due 2/20/20 | | | 2,001 | | |
| | 4,075 | | | CityCenter, Term Loan B, 5.00%, due 10/16/20 | | | 4,107 | | |
| | 1,440 | | | Four Seasons Holdings Inc., First Lien Term Loan, 4.25%, due 6/27/20 | | | 1,451 | | |
| | 640 | | | Four Seasons Holdings Inc., Second Lien Term Loan, 6.25%, due 12/27/20 | | | 656 | Ñ | |
| | 6,570 | | | Hilton Worldwide, Term Loan, 4.00%, due 10/26/20 | | | 6,606 | | |
| | 1,635 | | | Mohegan Tribal Gaming, Term Loan A, 7.75%, due 3/31/15 | | | 1,635 | | |
| | 2,154 | | | Peninsula Gaming, Term Loan B, 4.25%, due 11/20/17 | | | 2,159 | | |
| | 2,425 | | | Pinnacle Entertainment, Term Loan B-2, 3.75%, due 8/13/20 | | | 2,427 | | |
| | 2,500 | | | SHINGLE SPRINGS, Term Loan B, 6.25%, due 8/29/19 | | | 2,493 | | |
| | 7,270 | | | Station Casinos, Term Loan B, 5.00%, due 3/2/20 | | | 7,336 | ¢^^ | |
| | | | 36,826 | | |
Nonferrous Metals - Minerals (2.0%) | | | |
| | 1,413 | | | Alpha Natural Resources, Term Loan B, 3.50%, due 5/22/20 | | | 1,347 | | |
| | 3,729 | | | Arch Coal, Term Loan, 5.75%, due 5/16/18 | | | 3,613 | ¢^^ | |
| | 4,883 | | | Peabody Energy Corp., Term Loan, 4.25%, due 9/24/20 | | | 4,867 | | |
| | 1,540 | | | Walter Energy, Term Loan A, 5.74%, due 4/1/16 | | | 1,514 | | |
| | | | 11,341 | | |
Oil & Gas (2.1%) | | | |
| | 1,745 | | | Everest Acquisition LLC, Term Loan B-3, 3.50%, due 5/24/18 | | | 1,745 | | |
| | 111 | | | Everest Acquisition LLC, Term Loan B-2, 4.50%, due 4/30/19 | | | 111 | Ñ | |
| | 3,684 | | | EXCO Resources Inc., Term Loan, 5.00%, due 8/19/19 | | | 3,684 | Ñ | |
| | 1,845 | | | Fieldwood Energy, Term Loan, 3.88%, due 9/28/18 | | | 1,861 | | |
| | 2,035 | | | NFR Energy, Second Lien Term Loan, 8.75%, due 12/31/18 | | | 2,043 | | |
| | 2,411 | | | Samson Investment Company, Second Lien Term Loan, 6.00%, due 9/25/18 | | | 2,428 | | |
| | | | 11,872 | | |
Publishing (1.2%) | | | |
| | 3,455 | | | Springer Science + Business Media S.A., Term Loan B2, 5.00%, due 8/14/20 | | | 3,454 | ¢^^ | |
| | 3,459 | | | Tribune Company, Term Loan B, 4.00%, due 12/31/19 | | | 3,457 | | |
| | | | 6,911 | | |
Radio & Television (5.3%) | | | |
| | 5,870 | | | Clear Channel, Term Loan D, 6.92%, due 1/30/19 | | | 5,577 | ¢^^ | |
| | 3,273 | | | Cumulus Media, First Lien Term Loan, 4.50%, due 9/17/18 | | | 3,292 | | |
| | 1,177 | | | Cumulus Media, Second Lien Term Loan, 7.50%, due 9/16/19 | | | 1,202 | | |
See Notes to Schedule of Investments
43
Schedule of Investments Neuberger Berman Floating Rate Income Fund (cont'd)
PRINCIPAL AMOUNT | | | | VALUE† | |
(000's omitted) | | | | (000's omitted)z | |
$ | 3,660 | | | Formula One, Term Loan B, 4.50%, due 4/30/19 | | $ | 3,697 | | |
| | 1,328 | | | FoxCo Acquisition, Term Loan, 5.50%, due 7/14/17 | | | 1,330 | | |
| | 4,195 | | | Nine Entertainment, Term Loan B, 3.25%, due 2/5/20 | | | 4,176 | | |
| | 5,733 | | | Univision Communications Inc., Term Loan, 4.00%, due 3/1/20 | | | 5,733 | ¢^^ | |
| | 1,542 | | | Univision Communications Inc., First Lien Term Loan, 4.50%, due 3/1/20 | | | 1,550 | | |
| | 800 | | | Univision Communications Inc., First Lien Term Loan, 4.50%, due 3/1/20 | | | 804 | | |
| | 2,215 | | | Weather Channel (TWCC), Second Lien Term Loan, 7.00%, due 6/26/20 | | | 2,269 | | |
| | | | 29,630 | | |
Retailers (except food & drug) (3.5%) | | | |
| | 3,187 | | | 99¢ Only Stores, Term Loan B, 4.50%, due 1/14/19 | | | 3,206 | | |
| | 1,886 | | | David's Bridal, Term Loan, 5.00%, due 10/11/19 | | | 1,889 | | |
| | 3,080 | | | Hudson's Bay Company, Term Loan B, due 10/7/20 | | | 3,120 | ¢^^ | |
| | 4,771 | | | Michaels Stores Inc., Term Loan B, 3.75%, due 1/28/20 | | | 4,787 | | |
| | 1,640 | | | Neiman Marcus Group Inc., Term Loan, 5.00%, due 10/25/20 | | | 1,651 | | |
| | 3,715 | | | Sears Holding Corp., Term Loan, 5.50%, due 6/30/18 | | | 3,726 | | |
| | 1,026 | | | Toys R US Delaware Inc., Term Loan, 6.00%, due 9/1/16 | | | 957 | | |
| | 127 | | | Toys R US Delaware Inc., Term Loan B-2, 5.25%, due 5/25/18 | | | 115 | | |
| | | | 19,451 | | |
Steel (0.9%) | | | |
| | 2,327 | | | FMG Resources, Term Loan, 5.25%, due 10/18/17 | | | 2,330 | | |
| | 1,832 | | | McJunkin Red Man Corporation, Term Loan, 6.00%, due 11/8/19 | | | 1,841 | | |
| | 990 | | | TMS International, Term Loan B, 4.50%, due 10/16/20 | | | 992 | | |
| | | | 5,163 | | |
Surface Transport (0.1%) | | | |
| | 796 | | | Avis Budget Car Rental, Term Loan B, 3.00%, due 3/15/19 | | | 794 | | |
Utilities (2.9%) | | | |
| | 2,613 | | | Calpine Construction, Term Loan B-1, 3.00%, due 5/3/20 | | | 2,578 | | |
| | 2,830 | | | Calpine Corp., First Lien Term Loan, due 10/22/20 | | | 2,840 | ¢^^ | |
| | 2,638 | | | Dynegy Holdings Inc., Term Loan B-2, 4.00%, due 4/23/20 | | | 2,639 | | |
| | 2,618 | | | Equipower Resources, First Lien Term Loan C, 4.25%, due 12/31/19 | | | 2,630 | | |
| | 3,185 | | | Essential Power, Term Loan, 4.25%, due 8/8/19 | | | 3,169 | Ñ | |
| | 2,342 | | | La Frontera Generation, Term Loan, 4.50%, due 9/30/20 | | | 2,360 | | |
| | | | 16,216 | | |
| | | | | Total Bank Loan Obligations (Cost $499,786) | | | 503,045 | | |
Corporate Debt Securities (6.4%) | | | |
Airlines (0.1%) | | | |
| | 510 | | | Continental Airlines, Inc., Senior Secured Notes, 6.75%, due 9/15/15 | | | 525 | ñØØ | |
Chemicals (0.8%) | | | |
| | 3,215 | | | Hexion US Finance Corp., Senior Secured Notes, 6.63%, due 4/15/20 | | | 3,263 | ØØ | |
| | 1,215 | | | Momentive Performance Materials, Inc., Senior Secured Notes, 8.88%, due 10/15/20 | | | 1,285 | ØØ | |
| | | | 4,548 | | |
See Notes to Schedule of Investments
44
Schedule of Investments Neuberger Berman Floating Rate Income Fund (cont'd)
PRINCIPAL AMOUNT | | | | VALUE† | |
(000's omitted) | | | | (000's omitted)z | |
Consumer - Commercial Lease Financing (0.3%) | | | |
$ | 1,065 | | | CIT Group, Inc., Senior Unsecured Notes, Ser. C, 5.25%, due 4/1/14 | | $ | 1,082 | ñØØ | |
| | 680 | | | CIT Group, Inc., Senior Unsecured Notes, 6.63%, due 4/1/18 | | | 771 | ñØØ | |
| | | | 1,853 | | |
Department Stores (0.1%) | | | |
| | 815 | | | Sears Holdings Corp., Secured Notes, 6.63%, due 10/15/18 | | | 768 | ØØ | |
Electric - Generation (0.3%) | | | |
| | 585 | | | Calpine Corp., Senior Secured Notes, 6.00%, due 1/15/22 | | | 607 | ñ | |
| | 1,000 | | | Calpine Corp., Senior Secured Notes, 5.88%, due 1/15/24 | | | 1,002 | ñ | |
| | | | 1,609 | | |
Electronics (0.6%) | | | |
| | 685 | | | Ceridian Corp., Senior Secured Notes, 8.88%, due 7/15/19 | | | 793 | ñØØ | |
| | 1,384 | | | Freescale Semiconductor, Inc., Senior Secured Notes, 5.00%, due 5/15/21 | | | 1,346 | ñØØ | |
| | 1,000 | | | Freescale Semiconductor, Inc., Senior Secured Notes, 6.00%, due 1/15/22 | | | 1,011 | ñØ | |
| | | | 3,150 | | |
Health Facilities (1.3%) | | | |
| | 1,475 | | | CHS/Community Health Systems, Inc., Senior Secured Notes, 5.13%, due 8/15/18 | | | 1,534 | ØØ | |
| | 1,815 | | | HCA, Inc., Senior Secured Notes, 5.88%, due 3/15/22 | | | 1,910 | ØØ | |
| | 2,450 | | | Tenet Healthcare Corp., Senior Secured Notes, 4.75%, due 6/1/20 | | | 2,432 | | |
| | 1,535 | | | Tenet Healthcare Corp., Senior Secured Notes, 6.00%, due 10/1/20 | | | 1,623 | ñ | |
| | | | 7,499 | | |
Media - Broadcast (0.2%) | | | |
| | 995 | | | Univision Communications, Inc., Senior Secured Notes, 6.88%, due 5/15/19 | | | 1,072 | ñØØ | |
Media - Cable (0.9%) | | | |
| | 2,160 | | | Unitymedia Hessen GmbH & Co. KG, Senior Secured Notes, 5.50%, due 1/15/23 | | | 2,133 | ñØØ | |
| | 2,705 | | | Virgin Media Secured Finance PLC, Senior Secured Notes, 5.38%, due 4/15/21 | | | 2,719 | ñØØ | |
| | | | 4,852 | | |
Packaging (0.7%) | | | |
| | 3,991 | | | Reynolds Group Issuer, Inc., Senior Secured Notes, 5.75%, due 10/15/20 | | | 4,121 | ØØ | |
Software - Services (0.5%) | | | |
| | 1,490 | | | First Data Corp., Senior Secured Notes, 7.38%, due 6/15/19 | | | 1,604 | ñØØ | |
| | 840 | | | First Data Corp., Senior Secured Notes, 6.75%, due 11/1/20 | | | 889 | ñØØ | |
| | | | 2,493 | | |
Support - Services (0.6%) | | | |
| | 3,545 | | | APX Group, Inc., Senior Secured Notes, 6.38%, due 12/1/19 | | | 3,532 | | |
| | | | | Total Corporate Debt Securities (Cost $35,066) | | | 36,022 | | |
See Notes to Schedule of Investments
45
Schedule of Investments Neuberger Berman Floating Rate Income Fund (cont'd)
NUMBER OF SHARES | | | | VALUE† | |
| | | | | (000's omitted)z | |
Short-Term Investments (5.3%) | | | |
| | 34 | | | State Street Institutional Government Money Market Fund Institutional Class | | $ | 0 | | |
| | 29,381,186 | | | State Street Institutional Liquid Reserves Fund Institutional Class | | | 29,381 | ØØ | |
| | | | | Total Short-Term Investments (Cost $29,381) | | | 29,381 | | |
| | | | | Total Investments (102.0%) (Cost $564,233) | | | 568,448 | ## | |
| | | | | Liabilities, less cash, receivables and other assets [(2.0%)] | | | (11,288 | ) | |
| | | | | Total Net Assets (100.0%) | | $ | 557,160 | | |
See Notes to Schedule of Investments
46
Schedule of Investments Neuberger Berman High Income Bond Fund
PRINCIPAL AMOUNT | | | | VALUE† | |
(000's omitted) | | | | (000's omitted)z | |
| Bank Loan Obligationsµ(4.8%) | | | |
All Telecom (0.3%) | | | |
$ | 6,174 | | | Integra Telecom, Term Loan B, 5.25%, due 2/22/19 | | $ | 6,241 | | |
| | 4,810 | | | Level 3 Financing Inc., Term Loan B, 4.00%, due 1/15/20 | | | 4,830 | | |
| | | | 11,071 | | |
Automotive (0.2%) | | | |
| | 5,261 | | | Navistar, Inc., Term Loan B, 5.75%, due 8/17/17 | | | 5,359 | | |
Building & Development (0.3%) | | | |
| | 10,388 | | | Realogy Corporation, Term Loan B, 4.50%, due 3/5/20 | | | 10,489 | | |
Chemicals & Plastics (0.2%) | | | |
| | 5,547 | | | Dupont Performance Coatings, Term Loan B, 4.75%, due 2/1/20 | | | 5,602 | | |
Containers & Glass Products (0.2%) | | | |
| | 5,034 | | | Berry Plastics, Term Loan D, 3.50%, due 2/8/20 | | | 5,014 | | |
Electronics - Electrical (0.2%) | | | |
| | 4,747 | | | Datatel-Sophia LP, Term Loan B, 4.50%, due 7/19/18 | | | 4,787 | | |
Financial Intermediaries (0.2%) | | | |
| | 6,636 | | | First Data Corporation, Term Loan, 4.17%, due 3/24/17 | | | 6,641 | | |
Health Care (0.4%) | | | |
| | 13,028 | | | United Surgical Partners International, Inc., Term Loan B, 4.75%, due 4/3/19 | | | 13,067 | | |
Leisure Goods - Activities - Movies (0.3%) | | | |
| | 9,480 | | | Scientific Games Corp., Term Loan, 4.25%, due 10/18/20 | | | 9,480 | | |
Lodging & Casinos (1.2%) | | | |
| | 15,552 | | | Graton Resort & Casino, First Lien Term Loan B, 9.00%, due 8/22/18 | | | 16,330 | Ñ | |
| | 24,134 | | | Hilton Worldwide, Term Loan, 4.00%, due 10/26/20 | | | 24,267 | | |
| | | | 40,597 | | |
Nonferrous Metals - Minerals (0.4%) | | | |
| | 12,826 | | | Peabody Energy Corp., Term Loan, 4.25%, due 9/24/20 | | | 12,783 | ¢^^ | |
Oil & Gas (0.5%) | | | |
| | 16,489 | | | Chesapeake Energy, Term Loan B, 5.75%, due 12/2/17 | | | 16,839 | | |
See Notes to Schedule of Investments
47
Schedule of Investments Neuberger Berman High Income Bond Fund (cont'd)
PRINCIPAL AMOUNT | | | | VALUE† | |
(000's omitted) | | | | (000's omitted)z | |
Radio & Television (0.4%) | | | |
$ | 8,005 | | | Clear Channel, First Lien Term Loan B, 3.82%, due 1/29/16 | | $ | 7,759 | ¢^^ | |
| | 5,846 | | | Univision Communications Inc., Term Loan, 4.00%, due 3/1/20 | | | 5,847 | | |
| | | | 13,606 | | |
| | | | | Total Bank Loan Obligations (Cost $152,036) | | | 155,335 | | |
Corporate Debt Securities (90.4%) | | | |
Airlines (0.5%) | | | |
| | 5,930 | | | American Airlines, Inc., Equipment Trust, Ser. 2013-2, Class A, 4.95%, due 1/15/23 | | | 6,108 | ñ | |
| | 7,865 | | | Continental Airlines, Inc., Senior Secured Notes, 6.75%, due 9/15/15 | | | 8,101 | ñ | |
| | 2,787 | | | United Airlines, Inc., Pass-Through Certificates, Ser. 2009-2, Class A, 9.75%, due 1/15/17 | | | 3,198 | | |
| | | | 17,407 | | |
Auto Loans (0.7%) | | | |
| | 2,640 | | | General Motors Financial Co., Inc., Guaranteed Notes, 2.75%, due 5/15/16 | | | 2,660 | ñ | |
| | 16,705 | | | General Motors Financial Co., Inc., Guaranteed Notes, 4.75%, due 8/15/17 | | | 17,666 | ñ | |
| | 3,985 | | | General Motors Financial Co., Inc., Guaranteed Notes, 3.25%, due 5/15/18 | | | 3,970 | ñ | |
| | | | 24,296 | | |
Auto Parts & Equipment (0.4%) | | | |
| | 12,725 | | | Goodyear Tire & Rubber Co., Guaranteed Notes, 6.50%, due 3/1/21 | | | 13,457 | | |
Automakers (0.7%) | | | |
| | 2,395 | | | Chrysler Group LLC/CG Co-Issuer, Inc., Secured Notes, 8.00%, due 6/15/19 | | | 2,652 | | |
| | 2,670 | | | Ford Motor Co., Senior Unsecured Notes, 8.90%, due 1/15/32 | | | 3,449 | | |
| | 4,714 | | | Ford Motor Co., Senior Unsecured Notes, 9.98%, due 2/15/47 | | | 6,581 | | |
| | 9,910 | | | Navistar Int'l Corp., Guaranteed Notes, 8.25%, due 11/1/21 | | | 10,121 | | |
| | | | 22,803 | | |
Banking (1.6%) | | | |
| | 13,200 | | | Ally Financial, Inc., Guaranteed Notes, 3.50%, due 7/18/16 | | | 13,530 | | |
| | 12,080 | | | Ally Financial, Inc., Guaranteed Notes, 6.25%, due 12/1/17 | | | 13,379 | ØØ | |
| | 20,640 | | | Ally Financial, Inc., Guaranteed Notes, 8.00%, due 3/15/20 | | | 24,510 | | |
| | | | 51,419 | | |
Building & Construction (1.2%) | | | |
| | 4,565 | | | D.R. Horton, Inc., Guaranteed Notes, 4.38%, due 9/15/22 | | | 4,325 | | |
| | 11,665 | | | D.R. Horton, Inc., Guaranteed Notes, 5.75%, due 8/15/23 | | | 12,103 | | |
| | 7,525 | | | Lennar Corp., Guaranteed Notes, 4.75%, due 12/15/17 | | | 7,901 | | |
| | 4,130 | | | Ryland Group, Inc., Guaranteed Notes, 5.38%, due 10/1/22 | | | 4,006 | | |
| | 3,065 | | | Standard Pacific Corp., Guaranteed Notes, 8.38%, due 1/15/21 | | | 3,517 | | |
| 8,215 | | | Taylor Morrison Communities, Inc./Monarch Communities, Inc., Guaranteed Notes, 5.25%,
due 4/15/21 | | | 8,010 | ñ | |
| | | | 39,862 | | |
See Notes to Schedule of Investments
48
Schedule of Investments Neuberger Berman High Income Bond Fund (cont'd)
PRINCIPAL AMOUNT | | | | VALUE† | |
(000's omitted) | | | | (000's omitted)z | |
Building Materials (1.3%) | | | |
$ | 1,975 | | | Associated Materials LLC/AMH New Finance, Inc., Senior Secured Notes, 9.13%, due 11/1/17 | | $ | 2,106 | | |
| | 4,910 | | | Masco Corp., Senior Unsecured Notes, 6.13%, due 10/3/16 | | | 5,474 | | |
| | 17,520 | | | USG Corp., Senior Unsecured Notes, 9.75%, due 1/15/18 | | | 20,586 | ØØ | |
| | 12,490 | | | USG Corp., Guaranteed Notes, 8.38%, due 10/15/18 | | | 13,583 | ñ | |
| | | | 41,749 | | |
Chemicals (2.8%) | | | |
| | 5,645 | | | Huntsman Int'l LLC, Guaranteed Notes, 8.63%, due 3/15/20 | | | 6,252 | | |
| | 4,065 | | | Huntsman Int'l LLC, Guaranteed Notes, 4.88%, due 11/15/20 | | | 4,045 | | |
| | 11,235 | | | Huntsman Int'l LLC, Guaranteed Notes, 8.63%, due 3/15/21 | | | 12,611 | | |
| | 3,895 | | | INEOS Finance PLC, Senior Secured Notes, 8.38%, due 2/15/19 | | | 4,343 | ñ | |
| | 3,055 | | | INEOS Group Holdings SA, Guaranteed Notes, 6.13%, due 8/15/18 | | | 3,085 | ñ | |
| | 5,210 | | | Momentive Performance Materials, Inc., Senior Secured Notes, 8.88%, due 10/15/20 | | | 5,509 | | |
| | 33,983 | | | Momentive Performance Materials, Inc., Secured Notes, 9.00%, due 1/15/21 | | | 30,075 | ØØ | |
| | 19,985 | | | PQ Corp., Secured Notes, 8.75%, due 5/1/18 | | | 21,634 | ñ | |
| | 4,525 | | | US Coatings Acquisition, Inc., Guaranteed Notes, 7.38%, due 5/1/21 | | | 4,808 | ñ | |
| | | | 92,362 | | |
Computer Hardware (0.3%) | | | |
| | 10,100 | | | Seagate HDD Cayman, Guaranteed Notes, 7.00%, due 11/1/21 | | | 11,161 | | |
Consumer - Commercial Lease Financing (4.5%) | | | |
| | 13,665 | | | CIT Group, Inc., Senior Unsecured Notes, 4.25%, due 8/15/17 | | | 14,331 | | |
| | 2,150 | | | CIT Group, Inc., Senior Unsecured Notes, 5.25%, due 3/15/18 | | | 2,325 | | |
| | 2,990 | | | CIT Group, Inc., Senior Unsecured Notes, 6.63%, due 4/1/18 | | | 3,390 | ñ | |
| | 34,720 | | | CIT Group, Inc., Senior Unsecured Notes, 5.50%, due 2/15/19 | | | 37,584 | ñ | |
| | 5,980 | | | Int'l Lease Finance Corp., Senior Unsecured Notes, 8.63%, due 9/15/15 | | | 6,653 | | |
| | 5,000 | | | Int'l Lease Finance Corp., Senior Unsecured Notes, 5.75%, due 5/15/16 | | | 5,344 | | |
| | 6,330 | | | Int'l Lease Finance Corp., Senior Unsecured Notes, 8.75%, due 3/15/17 | | | 7,438 | | |
| | 8,205 | | | Int'l Lease Finance Corp., Senior Unsecured Notes, 8.88%, due 9/1/17 | | | 9,733 | | |
| | 12,090 | | | Int'l Lease Finance Corp., Senior Unsecured Notes, 3.88%, due 4/15/18 | | | 12,120 | | |
| | 2,415 | | | Int'l Lease Finance Corp., Senior Secured Notes, 7.13%, due 9/1/18 | | | 2,780 | ñ | |
| | 10,525 | | | Int'l Lease Finance Corp., Senior Unsecured Notes, 6.25%, due 5/15/19 | | | 11,472 | | |
| | 17,515 | | | Int'l Lease Finance Corp., Senior Unsecured Notes, 8.63%, due 1/15/22 | | | 21,193 | | |
| | 10,345 | | | SLM Corp., Unsecured Medium-Term Notes, 5.50%, due 1/15/19 | | | 10,743 | | |
| | | | 145,106 | | |
Department Stores (1.1%) | | | |
| | 37,666 | | | Sears Holdings Corp., Secured Notes, 6.63%, due 10/15/18 | | | 35,500 | | |
Electric - Generation (3.0%) | | | |
| | 13,735 | | | Calpine Corp., Senior Secured Notes, 7.88%, due 7/31/20 | | | 15,006 | ñ | |
| | 3,105 | | | Calpine Corp., Senior Secured Notes, 6.00%, due 1/15/22 | | | 3,222 | ñ | |
| | 1,750 | | | Calpine Corp., Senior Secured Notes, 5.88%, due 1/15/24 | | | 1,754 | ñ | |
| | 3,550 | | | NRG Energy, Inc., Guaranteed Notes, 7.63%, due 1/15/18 | | | 4,029 | | |
| | 15,845 | | | NRG Energy, Inc., Guaranteed Notes, 7.63%, due 5/15/19 | | | 16,875 | | |
| | 8,800 | | | NRG Energy, Inc., Guaranteed Notes, 8.50%, due 6/15/19 | | | 9,482 | | |
| | 17,551 | | | NRG Energy, Inc., Guaranteed Notes, 8.25%, due 9/1/20 | | | 19,569 | | |
| | 22,895 | | | NRG Energy, Inc., Guaranteed Notes, 7.88%, due 5/15/21 | | | 25,299 | | |
See Notes to Schedule of Investments
49
Schedule of Investments Neuberger Berman High Income Bond Fund (cont'd)
PRINCIPAL AMOUNT | | | | VALUE† | |
(000's omitted) | | | | (000's omitted)z | |
$ | 2,615 | | | NRG Energy, Inc., Guaranteed Notes, 6.63%, due 3/15/23 | | $ | 2,703 | | |
| | | | 97,939 | | |
Electric - Integrated (0.2%) | | | |
| | 2,300 | | | IPALCO Enterprises, Inc., Senior Secured Notes, 7.25%, due 4/1/16 | | | 2,530 | ñ | |
| | 4,045 | | | IPALCO Enterprises, Inc., Senior Secured Notes, 5.00%, due 5/1/18 | | | 4,227 | | |
| | | | 6,757 | | |
Electronics (2.0%) | | | |
| | 6,170 | | | Amkor Technology, Inc., Guaranteed Notes, 7.38%, due 5/1/18 | | | 6,532 | | |
| | 11,910 | | | Amkor Technology, Inc., Senior Unsecured Notes, 6.38%, due 10/1/22 | | | 11,731 | | |
| | 6,850 | | | Ceridian Corp., Guaranteed Notes, 11.25%, due 11/15/15 | | | 6,893 | | |
| | 5,324 | | | Ceridian Corp., Guaranteed Notes, 12.25%, due 11/15/15 | | | 5,357 | c | |
| | 6,270 | | | Ceridian Corp., Senior Secured Notes, 8.88%, due 7/15/19 | | | 7,258 | ñ | |
| | 4,435 | | | Flextronics Int'l Ltd., Guaranteed Notes, 5.00%, due 2/15/23 | | | 4,424 | | |
| | 8,504 | | | Freescale Semiconductor, Inc., Senior Secured Notes, 9.25%, due 4/15/18 | | | 9,195 | ñ | |
| | 7,390 | | | Freescale Semiconductor, Inc., Guaranteed Notes, 8.05%, due 2/1/20 | | | 7,963 | | |
| | 6,055 | | | Freescale Semiconductor, Inc., Senior Secured Notes, 6.00%, due 1/15/22 | | | 6,123 | ñØ | |
| | | | 65,476 | | |
Energy - Exploration & Production (9.7%) | | | |
| | 4,210 | | | Antero Resources Finance Corp., Guaranteed Notes, 5.38%, due 11/1/21 | | | 4,278 | ñØ | |
| | 12,580 | | | Chesapeake Energy Corp., Guaranteed Notes, 6.50%, due 8/15/17 | | | 14,090 | | |
| | 10,780 | | | Chesapeake Energy Corp., Guaranteed Notes, 6.63%, due 8/15/20 | | | 12,154 | | |
| | 1,950 | | | Chesapeake Energy Corp., Guaranteed Notes, 6.13%, due 2/15/21 | | | 2,130 | | |
| | 5,330 | | | Cimarex Energy Co., Guaranteed Notes, 5.88%, due 5/1/22 | | | 5,676 | | |
| | 7,350 | | | Concho Resources, Inc., Guaranteed Notes, 5.50%, due 4/1/23 | | | 7,626 | | |
| | 7,055 | | | Denbury Resources, Inc., Guaranteed Notes, 8.25%, due 2/15/20 | | | 7,761 | | |
| | 36,271 | | | EP Energy LLC/EP Energy Finance, Inc., Senior Unsecured Notes, 9.38%, due 5/1/20 | | | 41,893 | | |
| | 2,285 | | | EP Energy LLC/Everest Acquisition Finance, Inc., Guaranteed Notes, 7.75%, due 9/1/22 | | | 2,571 | | |
| | 31,002 | | | EXCO Resources, Inc., Guaranteed Notes, 7.50%, due 9/15/18 | | | 29,994 | ØØ | |
| | 33,600 | | | Linn Energy LLC, Guaranteed Notes, 7.00%, due 11/1/19 | | | 33,516 | ñ | |
| | 10,375 | | | Linn Energy LLC, Guaranteed Notes, 8.63%, due 4/15/20 | | | 11,049 | | |
| | 19,061 | | | Linn Energy LLC, Guaranteed Notes, 7.75%, due 2/1/21 | | | 19,681 | | |
| | 26,843 | | | Newfield Exploration Co., Senior Unsecured Notes, 5.75%, due 1/30/22 | | | 28,185 | | |
| | 10,010 | | | Newfield Exploration Co., Senior Unsecured Notes, 5.63%, due 7/1/24 | | | 10,210 | | |
| | 4,945 | | | Range Resources Corp., Guaranteed Notes, 5.75%, due 6/1/21 | | | 5,266 | | |
| | 2,458 | | | Range Resources Corp., Guaranteed Notes, 5.00%, due 8/15/22 | | | 2,455 | | |
| | 10,990 | | | Rosetta Resources, Inc., Guaranteed Notes, 5.63%, due 5/1/21 | | | 11,100 | | |
| | 12,485 | | | SandRidge Energy, Inc., Guaranteed Notes, 7.50%, due 3/15/21 | | | 13,234 | | |
| | 23,455 | | | SandRidge Energy, Inc., Guaranteed Notes, 8.13%, due 10/15/22 | | | 24,980 | | |
| | 12,205 | | | SandRidge Energy, Inc., Guaranteed Notes, 7.50%, due 2/15/23 | | | 12,663 | | |
| | 7,275 | | | Whiting Petroleum Corp., Guaranteed Notes, 5.00%, due 3/15/19 | | | 7,566 | | |
| | 6,915 | | | WPX Energy, Inc., Senior Unsecured Notes, 6.00%, due 1/15/22 | | | 7,261 | | |
| | | | 315,339 | | |
Food & Drug Retailers (0.8%) | | | |
| | 3,985 | | | Rite Aid Corp., Secured Notes, 10.25%, due 10/15/19 | | | 4,478 | | |
| | 6,195 | | | Rite Aid Corp., Guaranteed Notes, 9.25%, due 3/15/20 | | | 7,155 | | |
| | 11,624 | | | Rite Aid Corp., Senior Secured Notes, 8.00%, due 8/15/20 | | | 13,034 | | |
| | | | 24,667 | | |
See Notes to Schedule of Investments
50
Schedule of Investments Neuberger Berman High Income Bond Fund (cont'd)
PRINCIPAL AMOUNT | | | | VALUE† | |
(000's omitted) | | | | (000's omitted)z | |
Food - Wholesale (0.1%) | | | |
$ | 2,984 | | | US Foods, Inc., Guaranteed Notes, 8.50%, due 6/30/19 | | $ | 3,200 | | |
Gaming (4.5%) | | | |
| | 4,518 | | | Ameristar Casinos, Inc., Guaranteed Notes, 7.50%, due 4/15/21 | | | 4,958 | | |
| | 12,830 | | | CityCenter Holdings LLC, Senior Secured Notes, 7.63%, due 1/15/16 | | | 13,491 | | |
| | 2,580 | | | GLP Capital L.P./GLP Financing II, Inc., Guaranteed Notes, 4.38%, due 11/1/18 | | | 2,632 | ñØ | |
| | 5,955 | | | GLP Capital L.P./GLP Financing II, Inc., Guaranteed Notes, 4.88%, due 11/1/20 | | | 6,000 | ñ | |
| | 5,255 | | | GLP Capital L.P./GLP Financing II, Inc., Guaranteed Notes, 5.38%, due 11/1/23 | | | 5,307 | ñ | |
| | 9,865 | | | Graton Economic Development Authority, Senior Secured Notes, 9.63%, due 9/1/19 | | | 11,024 | ñ | |
| | 3,410 | | | MGM Resorts Int'l, Guaranteed Notes, 7.63%, due 1/15/17 | | | 3,879 | | |
| | 4,750 | | | MGM Resorts Int'l, Guaranteed Notes, 7.75%, due 3/15/22 | | | 5,379 | | |
| | 4,075 | | | Mohegan Tribal Gaming Authority, Secured Notes, 11.50%, due 11/1/17 | | | 4,564 | ñ | |
| | 6,390 | | | Mohegan Tribal Gaming Authority, Guaranteed Notes, 11.00%, due 9/15/18 | | | 6,406 | ñ | |
| | 11,350 | | | Mohegan Tribal Gaming Authority, Senior Unsecured Notes, 9.75%, due 9/1/21 | | | 12,230 | ñ | |
| | 12,055 | | | Peninsula Gaming LLC, Guaranteed Notes, 8.38%, due 2/15/18 | | | 13,140 | ñ | |
| | 10,465 | | | Pinnacle Entertainment, Inc., Guaranteed Notes, 7.75%, due 4/1/22 | | | 11,446 | | |
| | 5,635 | | | PNK Finance Corp., Guaranteed Notes, 6.38%, due 8/1/21 | | | 5,917 | ñ | |
| | 7,345 | | | Seminole Indian Tribe of Florida, Senior Secured Notes, 7.75%, due 10/1/17 | | | 7,795 | ñ | |
| | 19,710 | | | Station Casinos LLC, Guaranteed Notes, 7.50%, due 3/1/21 | | | 21,139 | | |
| | 8,987 | | | Wynn Las Vegas LLC, Unsecured Notes, 7.75%, due 8/15/20 | | | 10,133 | | |
| | | | 145,440 | | |
Gas Distribution (3.8%) | | | |
| | 3,475 | | | Access Midstream Partners L.P., Guaranteed Notes, 5.88%, due 4/15/21 | | | 3,727 | | |
| | 7,040 | | | Access Midstream Partners L.P., Guaranteed Notes, 6.13%, due 7/15/22 | | | 7,550 | | |
| | 6,890 | | | Access Midstream Partners L.P., Guaranteed Notes, 4.88%, due 5/15/23 | | | 6,856 | | |
| | 13,885 | | | AmeriGas Finance LLC, Guaranteed Notes, 6.75%, due 5/20/20 | | | 15,135 | | |
| | 17,491 | | | AmeriGas Finance LLC, Guaranteed Notes, 7.00%, due 5/20/22 | | | 18,890 | | |
| | 6,535 | | | El Paso Corp., Senior Secured Global Medium-Term Notes, 7.80%, due 8/1/31 | | | 6,744 | | |
| | 7,760 | | | Energy Transfer Equity L.P., Senior Secured Notes, 7.50%, due 10/15/20 | | | 8,963 | | |
| | 13,775 | | | Ferrellgas L.P., Senior Unsecured Notes, 9.13%, due 10/1/17 | | | 14,477 | | |
| | 11,375 | | | Ferrellgas L.P./Ferrellgas Finance Corp., Senior Unsecured Notes, 6.75%, due 1/15/22 | | | 11,602 | ñØ | |
| | 12,890 | | | Regency Energy Partners L.P., Guaranteed Notes, 6.88%, due 12/1/18 | | | 13,921 | | |
| | 2,325 | | | Regency Energy Partners L.P., Guaranteed Notes, 4.50%, due 11/1/23 | | | 2,151 | ñ | |
| 2,440 | | | Regency Energy Partners L.P./Regency Energy Finance Corp., Guaranteed Notes, 5.50%,
due 4/15/23 | | | 2,434 | | |
| 6,201 | | | Suburban Propane Partners L.P./Suburban Energy Finance Corp., Senior Unsecured Notes,
7.50%, due 10/1/18 | | | 6,658 | | |
| 4,397 | | | Suburban Propane Partners L.P./Suburban Energy Finance Corp., Senior Unsecured Notes,
7.38%, due 8/1/21 | | | 4,738 | | |
| | | | 123,846 | | |
Health Facilities (5.1%) | | | |
| | 4,670 | | | CHS/Community Health Systems, Inc., Senior Secured Notes, 5.13%, due 8/15/18 | | | 4,857 | | |
| | 3,150 | | | CHS/Community Health Systems, Inc., Guaranteed Notes, 8.00%, due 11/15/19 | | | 3,414 | | |
| | 1,590 | | | Columbia Healthcare Corp., Senior Unsecured Notes, 7.50%, due 12/15/23 | | | 1,693 | | |
| | 8,400 | | | Columbia/HCA Corp., Senior Unsecured Notes, 7.69%, due 6/15/25 | | | 8,841 | | |
| | 1,370 | | | Columbia/HCA Corp., Senior Unsecured Notes, 7.05%, due 12/1/27 | | | 1,339 | | |
| | 4,910 | | | DaVita HealthCare Partners, Inc., Guaranteed Notes, 5.75%, due 8/15/22 | | | 5,039 | | |
| | 5,050 | | | HCA Holdings, Inc., Senior Unsecured Notes, 6.25%, due 2/15/21 | | | 5,302 | | |
| | 2,395 | | | HCA, Inc., Senior Secured Notes, 7.88%, due 2/15/20 | | | 2,599 | | |
| | 24,890 | | | IASIS Healthcare LLC/IASIS Capital Corp., Guaranteed Notes, 8.38%, due 5/15/19 | | | 26,383 | | |
See Notes to Schedule of Investments
51
Schedule of Investments Neuberger Berman High Income Bond Fund (cont'd)
PRINCIPAL AMOUNT | | | | VALUE† | |
(000's omitted) | | | | (000's omitted)z | |
$ | 8,080 | | | OMEGA Healthcare Investors, Inc., Guaranteed Notes, 7.50%, due 2/15/20 | | $ | 8,848 | | |
| | 15,575 | | | OMEGA Healthcare Investors, Inc., Guaranteed Notes, 6.75%, due 10/15/22 | | | 17,055 | | |
| | 9,625 | | | Tenet Healthcare Corp., Senior Secured Notes, 6.25%, due 11/1/18 | | | 10,539 | | |
| | 9,530 | | | Tenet Healthcare Corp., Senior Unsecured Notes, 6.75%, due 2/1/20 | | | 9,863 | | |
| | 7,820 | | | Tenet Healthcare Corp., Senior Secured Notes, 6.00%, due 10/1/20 | | | 8,270 | ñ | |
| | 6,915 | | | Tenet Healthcare Corp., Senior Secured Notes, 4.50%, due 4/1/21 | | | 6,708 | | |
| | 4,550 | | | Tenet Healthcare Corp., Senior Secured Notes, 4.38%, due 10/1/21 | | | 4,368 | ñ | |
| | 21,610 | | | Tenet Healthcare Corp., Senior Unsecured Notes, 8.13%, due 4/1/22 | | | 23,663 | ñ | |
| | 4,000 | | | Tenet Healthcare Corp., Senior Unsecured Notes, 6.88%, due 11/15/31 | | | 3,520 | | |
| | 12,420 | | | United Surgical Partners Int'l, Inc., Guaranteed Notes, 9.00%, due 4/1/20 | | | 13,910 | | |
| | | | 166,211 | | |
Health Services (0.2%) | | | |
| | 1,620 | | | Emergency Medical Services Corp., Guaranteed Notes, 8.13%, due 6/1/19 | | | 1,760 | | |
| | 5,410 | | | Healthcare Technology Intermediate, Inc., Senior Unsecured Notes, 7.38%, due 9/1/18 | | | 5,592 | ñc | |
| | | | 7,352 | | |
Investments & Misc. Financial Services (0.7%) | | | |
| | 20,670 | | | Icahn Enterprises L.P., Guaranteed Notes, 8.00%, due 1/15/18 | | | 21,678 | | |
Leisure (0.4%) | | | |
| | 7,620 | | | Cedar Fair L.P., Guaranteed Notes, 9.13%, due 8/1/18 | | | 8,344 | | |
| | 5,845 | | | Cedar Fair L.P., Guaranteed Notes, 5.25%, due 3/15/21 | | | 5,757 | ñ | |
| | | | 14,101 | | |
Machinery (1.6%) | | | |
| | 14,885 | | | Case New Holland, Inc., Guaranteed Notes, 7.88%, due 12/1/17 | | | 17,620 | | |
| | 8,960 | | | CNH Capital LLC, Guaranteed Notes, 3.88%, due 11/1/15 | | | 9,240 | | |
| | 5,335 | | | Terex Corp., Guaranteed Notes, 6.50%, due 4/1/20 | | | 5,709 | | |
| | 6,095 | | | Terex Corp., Guaranteed Notes, 6.00%, due 5/15/21 | | | 6,369 | | |
| | 5,280 | | | The Manitowoc Co., Inc., Guaranteed Notes, 9.50%, due 2/15/18 | | | 5,636 | | |
| | 7,340 | | | The Manitowoc Co., Inc., Guaranteed Notes, 8.50%, due 11/1/20 | | | 8,331 | | |
| | | | 52,905 | | |
Managed Care (0.3%) | | | |
| | 9,355 | | | MPH Intermediate Holding Co. 2, Senior Unsecured Notes, 8.38%, due 8/1/18 | | | 9,718 | ñc | |
Media - Broadcast (3.1%) | | | |
| | 6,351 | | | AMC Networks, Inc., Guaranteed Notes, 7.75%, due 7/15/21 | | | 7,145 | | |
| | 9,314 | | | AMC Networks, Inc., Guaranteed Notes, 4.75%, due 12/15/22 | | | 9,011 | | |
| | 6,750 | | | Clear Channel Communications, Inc., Senior Secured Notes, 9.00%, due 12/15/19 | | | 6,851 | | |
| | 27,493 | | | Clear Channel Communications, Inc., Senior Secured Notes, 11.25%, due 3/1/21 | | | 29,521 | | |
| | 17,195 | | | Cumulus Media Holdings, Inc., Guaranteed Notes, 7.75%, due 5/1/19 | | | 18,141 | ØØ | |
| | 8,745 | | | Sirius XM Radio, Inc., Guaranteed Notes, 5.75%, due 8/1/21 | | | 8,920 | ñ | |
| | 13,671 | | | Univision Communications, Inc., Senior Secured Notes, 6.88%, due 5/15/19 | | | 14,730 | ñ | |
| | 2,275 | | | Univision Communications, Inc., Senior Secured Notes, 7.88%, due 11/1/20 | | | 2,525 | ñ | |
| | 3,095 | | | Univision Communications, Inc., Senior Secured Notes, 6.75%, due 9/15/22 | | | 3,374 | ñ | |
| | | | 100,218 | | |
See Notes to Schedule of Investments
52
Schedule of Investments Neuberger Berman High Income Bond Fund (cont'd)
PRINCIPAL AMOUNT | | | | VALUE† | |
(000's omitted) | | | | (000's omitted)z | |
Media - Cable (4.3%) | | | |
$ | 7,725 | | | CCO Holdings LLC, Guaranteed Notes, 7.25%, due 10/30/17 | | $ | 8,169 | | |
| | 8,750 | | | CCO Holdings LLC, Guaranteed Notes, 7.00%, due 1/15/19 | | | 9,275 | | |
| 16,092 | | | Cequel Communications Escrow I LLC/Cequel Communications Escrow Capital Corp.,
Senior Unsecured Notes, 6.38%, due 9/15/20 | | | 16,695 | ñ | |
| 7,720 | | | Cequel Communications Escrow I LLC/Cequel Communications Escrow Capital Corp.,
Senior Unsecured Notes, 5.13%, due 12/15/21 | | | 7,488 | ñ | |
| | 5,075 | | | CSC Holdings LLC, Senior Unsecured Notes, 7.63%, due 7/15/18 | | | 5,849 | | |
| | 17,090 | | | DISH DBS Corp., Guaranteed Notes, 4.25%, due 4/1/18 | | | 17,346 | | |
| | 14,040 | | | DISH DBS Corp., Guaranteed Notes, 5.13%, due 5/1/20 | | | 14,216 | | |
| | 17,459 | | | DISH DBS Corp., Guaranteed Notes, 6.75%, due 6/1/21 | | | 18,899 | | |
| | 7,090 | | | DISH DBS Corp., Guaranteed Notes, 5.88%, due 7/15/22 | | | 7,258 | | |
| | 5,880 | | | DISH DBS Corp., Guaranteed Notes, 5.00%, due 3/15/23 | | | 5,623 | | |
| | 5,725 | | | Lynx I Corp., Senior Secured Notes, 5.38%, due 4/15/21 | | | 5,754 | ñ | |
| | 9,060 | | | UPCB Finance III Ltd., Senior Secured Notes, 6.63%, due 7/1/20 | | | 9,672 | ñ | |
| | 12,711 | | | Virgin Media Finance PLC, Guaranteed Notes, 8.38%, due 10/15/19 | | | 13,871 | | |
| | | | 140,115 | | |
Media - Services (1.0%) | | | |
| | 14,945 | | | Clear Channel Worldwide Holdings, Inc., Guaranteed Notes, Ser. B, 7.63%, due 3/15/20 | | | 15,954 | | |
| | 4,150 | | | Clear Channel Worldwide Holdings, Inc., Guaranteed Notes, Ser. A, 6.50%, due 11/15/22 | | | 4,316 | | |
| | 11,215 | | | Clear Channel Worldwide Holdings, Inc., Guaranteed Notes, Ser. B, 6.50%, due 11/15/22 | | | 11,775 | | |
| | 1,956 | | | WMG Acquisition Corp., Senior Secured Notes, 6.00%, due 1/15/21 | | | 2,054 | ñ | |
| | | | 34,099 | | |
Medical Products (1.0%) | | | |
| | 4,445 | | | Biomet, Inc., Guaranteed Notes, 6.50%, due 8/1/20 | | | 4,723 | | |
| | 1,945 | | | DJO Finance LLC/DJO Finance Corp., Guaranteed Notes, 7.75%, due 4/15/18 | | | 1,964 | | |
| | 3,420 | | | DJO Finance LLC/DJO Finance Corp., Guaranteed Notes, 9.88%, due 4/15/18 | | | 3,668 | | |
| | 4,525 | | | Fresenius Medical Care US Finance II, Inc., Guaranteed Notes, 5.63%, due 7/31/19 | | | 4,842 | ñ | |
| | 9,815 | | | Fresenius Medical Care US Finance, Inc., Guaranteed Notes, 6.50%, due 9/15/18 | | | 11,017 | ñ | |
| | 5,085 | | | Hologic, Inc., Guaranteed Notes, 6.25%, due 8/1/20 | | | 5,403 | | |
| | | | 31,617 | | |
Metals - Mining Excluding Steel (2.3%) | | | |
| | 11,165 | | | Alpha Natural Resources, Inc., Guaranteed Notes, 9.75%, due 4/15/18 | | | 11,500 | | |
| | 9,643 | | | Alpha Natural Resources, Inc., Guaranteed Notes, 6.00%, due 6/1/19 | | | 8,293 | | |
| | 10,115 | | | Alpha Natural Resources, Inc., Guaranteed Notes, 6.25%, due 6/1/21 | | | 8,573 | | |
| | 2,180 | | | Arch Coal, Inc., Guaranteed Notes, 8.75%, due 8/1/16 | | | 2,180 | | |
| | 8,040 | | | Arch Coal, Inc., Guaranteed Notes, 9.88%, due 6/15/19 | | | 6,834 | | |
| | 1,784 | | | Arch Coal, Inc., Guaranteed Notes, 7.25%, due 10/1/20 | | | 1,358 | | |
| | 10,515 | | | Arch Coal, Inc., Guaranteed Notes, 7.25%, due 6/15/21 | | | 8,018 | | |
| | 6,595 | | | FMG Resources (August 2006) Pty Ltd., Guaranteed Notes, 7.00%, due 11/1/15 | | | 6,842 | ñ | |
| | 5,225 | | | FMG Resources (August 2006) Pty Ltd., Guaranteed Notes, 8.25%, due 11/1/19 | | | 5,800 | ñ | |
| | 7,965 | | | Peabody Energy Corp., Guaranteed Notes, 6.00%, due 11/15/18 | | | 8,403 | | |
| | 3,235 | | | Walter Energy, Inc., Senior Secured Notes, 9.50%, due 10/15/19 | | | 3,413 | ñ | |
| | 3,395 | | | Walter Energy, Inc., Guaranteed Notes, 8.50%, due 4/15/21 | | | 2,877 | ñ | |
| | | | 74,091 | | |
See Notes to Schedule of Investments
53
Schedule of Investments Neuberger Berman High Income Bond Fund (cont'd)
PRINCIPAL AMOUNT | | | | VALUE† | |
(000's omitted) | | | | (000's omitted)z | |
Packaging (4.4%) | | | |
$ | 45,040 | | | Berry Plastics Corp., Secured Notes, 9.75%, due 1/15/21 | | $ | 52,922 | | |
| | 6,648 | | | Owens-Brockway Glass Container, Inc., Guaranteed Notes, 7.38%, due 5/15/16 | | | 7,487 | | |
| | 1,545 | | | Reynolds Group Issuer, Inc., Guaranteed Notes, 8.50%, due 5/15/18 | | | 1,638 | | |
| | 15,330 | | | Reynolds Group Issuer, Inc., Guaranteed Notes, 9.00%, due 4/15/19 | | | 16,403 | | |
| | 28,100 | | | Reynolds Group Issuer, Inc., Guaranteed Notes, 9.88%, due 8/15/19 | | | 31,086 | | |
| | 18,570 | | | Reynolds Group Issuer, Inc., Senior Secured Notes, 7.88%, due 8/15/19 | | | 20,520 | ØØ | |
| | 4,545 | | | Reynolds Group Issuer, Inc., Guaranteed Notes, 8.25%, due 2/15/21 | | | 4,727 | | |
| | 7,560 | | | Reynolds Group Issuer, Inc., Senior Secured Notes, 6.88%, due 2/15/21 | | | 8,202 | | |
| | | | 142,985 | | |
Pharmaceuticals (2.7%) | | | |
| | 6,370 | | | Endo Health Solutions, Inc., Guaranteed Notes, 7.00%, due 7/15/19 | | | 6,800 | | |
| | 4,445 | | | Jaguar Holding Co., Senior Unsecured Notes, 9.38%, due 10/15/17 | | | 4,712 | ñc | |
| | 9,995 | | | Jaguar Holding Co. II/Jaguar Merger Sub., Inc., Senior Unsecured Notes, 9.50%, due 12/1/19 | | | 11,219 | ñ | |
| | 3,965 | | | Valeant Pharmaceuticals Int'l, Guaranteed Notes, 6.50%, due 7/15/16 | | | 4,104 | ñ | |
| | 6,290 | | | Valeant Pharmaceuticals Int'l, Guaranteed Notes, 6.75%, due 10/1/17 | | | 6,762 | ñ | |
| | 6,386 | | | Valeant Pharmaceuticals Int'l, Guaranteed Notes, 6.88%, due 12/1/18 | | | 6,825 | ñ | |
| | 38,897 | | | Valeant Pharmaceuticals Int'l, Guaranteed Notes, 6.38%, due 10/15/20 | | | 41,522 | ñ | |
| | 6,370 | | | Valeant Pharmaceuticals Int'l, Senior Unsecured Notes, 6.75%, due 8/15/18 | | | 6,975 | ñ | |
| | | | 88,919 | | |
Printing & Publishing (3.7%) | | | |
| | 3,590 | | | Gannett Co., Inc., Guaranteed Notes, 9.38%, due 11/15/17 | | | 3,774 | | |
| | 21,955 | | | Gannett Co., Inc., Guaranteed Notes, 7.13%, due 9/1/18 | | | 23,602 | | |
| | 17,485 | | | Gannett Co., Inc., Guaranteed Notes, 5.13%, due 10/15/19 | | | 18,097 | ñ | |
| | 4,540 | | | Gannett Co., Inc., Guaranteed Notes, 5.13%, due 7/15/20 | | | 4,642 | ñ | |
| | 3,965 | | | R. R. Donnelley & Sons Co., Senior Unsecured Notes, 7.25%, due 5/15/18 | | | 4,471 | | |
| | 29,035 | | | R. R. Donnelley & Sons Co., Senior Unsecured Notes, 8.25%, due 3/15/19 | | | 33,390 | | |
| | 17,115 | | | R. R. Donnelley & Sons Co., Senior Unsecured Notes, 7.63%, due 6/15/20 | | | 18,912 | | |
| | 10,620 | | | R. R. Donnelley & Sons Co., Senior Unsecured Notes, 7.88%, due 3/15/21 | | | 11,841 | | |
| | 2,110 | | | R. R. Donnelley & Sons Co., Senior Unsecured Notes, 7.00%, due 2/15/22 | | | 2,237 | | |
| | | | 120,966 | | |
Real Estate Dev. & Mgt. (0.2%) | | | |
| | 5,310 | | | Realogy Group LLC, Senior Secured Notes, 7.63%, due 1/15/20 | | | 5,921 | ñ | |
Software - Services (4.4%) | | | |
| | 6,935 | | | Activision Blizzard, Inc., Guaranteed Notes, 5.63%, due 9/15/21 | | | 7,178 | ñ | |
| | 9,060 | | | First Data Corp., Senior Secured Notes, 7.38%, due 6/15/19 | | | 9,751 | ñ | |
| | 7,655 | | | First Data Corp., Senior Secured Notes, 6.75%, due 11/1/20 | | | 8,105 | ñ | |
| | 20,575 | | | First Data Corp., Guaranteed Notes, 11.25%, due 1/15/21 | | | 22,607 | ñ | |
| | 21,947 | | | First Data Corp., Guaranteed Notes, 12.63%, due 1/15/21 | | | 25,321 | | |
| | 10,895 | | | First Data Corp., Guaranteed Notes, 10.63%, due 6/15/21 | | | 11,698 | ñ | |
| | 6,640 | | | First Data Corp., Guaranteed Notes, 11.75%, due 8/15/21 | | | 6,756 | ñØ | |
| | 18,805 | | | Sophia, L.P., Guaranteed Notes, 9.75%, due 1/15/19 | | | 20,497 | ñ | |
| | 3,845 | | | SunGard Data Systems, Inc., Guaranteed Notes, 7.38%, due 11/15/18 | | | 4,076 | | |
| | 18,105 | | | SunGard Data Systems, Inc., Guaranteed Notes, 6.63%, due 11/1/19 | | | 18,920 | | |
| | 3,805 | | | SunGard Data Systems, Inc., Guaranteed Notes, 7.63%, due 11/15/20 | | | 4,143 | ØØ | |
| | 5,580 | | | Syniverse Holdings, Inc., Guaranteed Notes, 9.13%, due 1/15/19 | | | 6,040 | | |
| | | | 145,092 | | |
See Notes to Schedule of Investments
54
Schedule of Investments Neuberger Berman High Income Bond Fund (cont'd)
PRINCIPAL AMOUNT | | | | VALUE† | |
(000's omitted) | | | | (000's omitted)z | |
Specialty Retail (0.7%) | | | |
$ | 3,133 | | | L Brands, Inc., Guaranteed Notes, 8.50%, due 6/15/19 | | $ | 3,771 | | |
| | 6,455 | | | L Brands, Inc., Guaranteed Notes, 5.63%, due 10/15/23 | | | 6,600 | | |
| 7,410 | | | Michaels FinCo Holdings LLC / Michaels FinCo, Inc., Senior Unsecured Notes, 7.50%,
due 8/1/18 | | | 7,651 | ñc | |
| | 5,295 | | | Party City Holdings, Inc., Guaranteed Notes, 8.88%, due 8/1/20 | | | 5,785 | ñ | |
| | | | 23,807 | | |
Steel Producers - Products (1.1%) | | | |
| | 8,015 | | | ArcelorMittal, Senior Unsecured Notes, 6.13%, due 6/1/18 | | | 8,696 | | |
| | 22,614 | | | ArcelorMittal, Senior Unsecured Notes, 5.75%, due 8/5/20 | | | 23,858 | | |
| | 2,410 | | | ArcelorMittal, Senior Unsecured Notes, 7.50%, due 10/15/39 | | | 2,380 | | |
| | | | 34,934 | | |
Support - Services (2.5%) | | | |
| | 5,885 | | | Hertz Corp., Guaranteed Notes, 5.88%, due 10/15/20 | | | 6,194 | | |
| | 8,560 | | | Iron Mountain, Inc., Guaranteed Notes, 7.75%, due 10/1/19 | | | 9,512 | | |
| | 2,603 | | | Iron Mountain, Inc., Senior Subordinated Notes, 8.38%, due 8/15/21 | | | 2,811 | | |
| | 8,480 | | | Iron Mountain, Inc., Guaranteed Notes, 5.75%, due 8/15/24 | | | 8,098 | | |
| | 7,010 | | | Knowledge Learning Corp., Guaranteed Notes, 7.75%, due 2/1/15 | | | 6,905 | ñ | |
| | 18,650 | | | ServiceMaster Co., Guaranteed Notes, 8.00%, due 2/15/20 | | | 19,116 | | |
| | 13,945 | | | ServiceMaster Co., Guaranteed Notes, 7.00%, due 8/15/20 | | | 13,736 | | |
| | 5,860 | | | United Rental N.A., Inc., Guaranteed Notes, 7.38%, due 5/15/20 | | | 6,534 | | |
| | 8,660 | | | United Rental N.A., Inc., Senior Unsecured Notes, 8.25%, due 2/1/21 | | | 9,808 | | |
| | | | 82,714 | | |
Telecom - Integrated Services (7.3%) | | | |
| | 3,942 | | | CenturyLink, Inc., Senior Unsecured Notes, Ser. N, 6.00%, due 4/1/17 | | | 4,316 | | |
| | 10,000 | | | CenturyLink, Inc., Senior Unsecured Notes, Ser. V, 5.63%, due 4/1/20 | | | 10,163 | | |
| | 3,065 | | | CenturyLink, Inc., Senior Unsecured Notes, Ser. S, 6.45%, due 6/15/21 | | | 3,188 | | |
| | 19,602 | | | Citizens Communications Co., Senior Unsecured Notes, 9.00%, due 8/15/31 | | | 20,288 | ØØ | |
| | 5,380 | | | Frontier Communications Corp., Senior Unsecured Notes, 7.63%, due 4/15/24 | | | 5,676 | | |
| | 7,365 | | | Hughes Satellite Systems Corp., Senior Secured Notes, 6.50%, due 6/15/19 | | | 7,899 | | |
| | 8,360 | | | Intelsat Jackson Holdings SA, Guaranteed Notes, 8.50%, due 11/1/19 | | | 9,175 | | |
| | 15,885 | | | Intelsat Jackson Holdings SA, Guaranteed Notes, 5.50%, due 8/1/23 | | | 15,329 | ñ | |
| | 8,835 | | | Intelsat Luxembourg SA, Guaranteed Notes, 7.75%, due 6/1/21 | | | 9,321 | ñ | |
| | 5,920 | | | Intelsat Luxembourg SA, Guaranteed Notes, 8.13%, due 6/1/23 | | | 6,260 | ñ | |
| | 2,830 | | | Level 3 Communications, Inc., Senior Unsecured Notes, 8.88%, due 6/1/19 | | | 3,088 | | |
| | 9,500 | | | Level 3 Financing, Inc., Guaranteed Notes, 10.00%, due 2/1/18 | | | 10,153 | | |
| | 2,910 | | | Level 3 Financing, Inc., Guaranteed Notes, 9.38%, due 4/1/19 | | | 3,252 | | |
| | 16,205 | | | Level 3 Financing, Inc., Guaranteed Notes, 8.13%, due 7/1/19 | | | 17,866 | | |
| | 16,445 | | | Level 3 Financing, Inc., Guaranteed Notes, 8.63%, due 7/15/20 | | | 18,624 | | |
| | 2,655 | | | Level 3 Financing, Inc., Guaranteed Notes, 6.13%, due 1/15/21 | | | 2,701 | ñØ | |
| | 3,600 | | | Qwest Communications Int'l, Inc., Guaranteed Notes, 7.13%, due 4/1/18 | | | 3,735 | | |
| | 8,630 | | | Qwest Corp., Senior Unsecured Notes, 6.88%, due 9/15/33 | | | 8,371 | | |
| | 10,580 | | | tw telecom holdings, Inc., Senior Unsecured Notes, 5.38%, due 10/1/22 | | | 10,554 | ñ | |
| | 35,830 | | | Windstream Corp., Guaranteed Notes, 7.88%, due 11/1/17 | | | 40,981 | | |
| | 4,625 | | | Windstream Corp., Guaranteed Notes, 7.75%, due 10/15/20 | | | 4,960 | | |
| | 4,075 | | | Windstream Corp., Guaranteed Notes, 7.75%, due 10/1/21 | | | 4,350 | ñ | |
| | 12,290 | | | Windstream Corp., Guaranteed Notes, 7.50%, due 6/1/22 | | | 12,874 | | |
| | 6,131 | | | Windstream Corp., Guaranteed Notes, 6.38%, due 8/1/23 | | | 5,947 | | |
| | | | 239,071 | | |
See Notes to Schedule of Investments
55
Schedule of Investments Neuberger Berman High Income Bond Fund (cont'd)
PRINCIPAL AMOUNT | | | | VALUE† | |
(000's omitted) | | | | (000's omitted)z | |
Telecom - Wireless (4.2%) | | | |
$ | 6,840 | | | MetroPCS Wireless, Inc., Guaranteed Notes, 6.25%, due 4/1/21 | | $ | 7,156 | ñ | |
| | 3,900 | | | MetroPCS Wireless, Inc., Guaranteed Notes, 6.63%, due 4/1/23 | | | 4,080 | ñ | |
| | 3,910 | | | SBA Telecommunications, Inc., Guaranteed Notes, 5.75%, due 7/15/20 | | | 4,066 | | |
| | 14,930 | | | Sprint Capital Corp., Guaranteed Notes, 6.88%, due 11/15/28 | | | 14,184 | | |
| | 11,735 | | | Sprint Capital Corp., Guaranteed Notes, 8.75%, due 3/15/32 | | | 12,703 | | |
| | 23,055 | | | Sprint Corp., Guaranteed Notes, 7.25%, due 9/15/21 | | | 24,842 | ñ | |
| | 15,330 | | | Sprint Corp., Guaranteed Notes, 7.88%, due 9/15/23 | | | 16,633 | ñ | |
| | 7,270 | | | Sprint Nextel Corp., Guaranteed Notes, 9.00%, due 11/15/18 | | | 8,815 | ñ | |
| | 3,135 | | | Sprint Nextel Corp., Senior Unsecured Notes, 7.00%, due 8/15/20 | | | 3,362 | | |
| | 8,170 | | | T-Mobile USA, Inc., Guaranteed Notes, 6.46%, due 4/28/19 | | | 8,660 | | |
| | 10,325 | | | T-Mobile USA, Inc., Guaranteed Notes, 6.54%, due 4/28/20 | | | 10,945 | | |
| | 10,210 | | | T-Mobile USA, Inc., Guaranteed Notes, 6.63%, due 4/28/21 | | | 10,797 | | |
| | 3,680 | | | T-Mobile USA, Inc., Guaranteed Notes, 6.73%, due 4/28/22 | | | 3,887 | | |
| | 5,125 | | | T-Mobile USA, Inc., Guaranteed Notes, 6.84%, due 4/28/23 | | | 5,420 | | |
| | | | 135,550 | | |
| | | | | Total Corporate Debt Securities (Cost $2,811,395) | | | 2,949,850 | | |
NUMBER OF SHARES | | | | | |
Short-Term Investments (3.5%) | | | |
| | 114,884,315 | | | State Street Institutional Liquid Reserves Fund Institutional Class (Cost $114,884) | | | 114,884 | | |
| | | | | Total Investments (98.7%) (Cost $3,078,315) | | | 3,220,069 | ## | |
| | | | | Cash, receivables and other assets, less liabilities (1.3%) | | | 42,472 | | |
| | | | | Total Net Assets (100.0%) | | $ | 3,262,541 | | |
See Notes to Schedule of Investments
56
Schedule of Investments Neuberger Berman Municipal Intermediate Bond Fund
PRINCIPAL AMOUNT | | SECURITY | | VALUE† | |
(000's omitted) | | | | (000's omitted)z | |
Municipal Notes (100.9%) | | | |
Arizona (1.2%) | | | |
$ | 705 | | | Arizona St. Cert. of Participation Ref. (Dept. Administration), Ser. 2013-B, 5.00%, due 10/1/21 | | $ | 804 | | |
| | 1,000 | | | Phoenix Civic Imp. Corp. Wastewater Sys. Jr. Lien Ref. Rev., Ser. 2011, 2.00%, due 7/1/18 | | | 1,022 | | |
| | | | 1,826 | | |
Arkansas (2.1%) | | | |
| | 1,145 | | | Springdale Sales & Use Rev., Ser. 2012, 3.00%, due 11/1/21 | | | 1,170 | | |
| | 2,000 | | | Springdale Sales & Use Rev., Ser. 2013, 5.00%, due 7/1/22 | | | 2,180 | | |
| | | | 3,350 | | |
California (9.7%) | | | |
| | 675 | | | Acalanes Union High Sch. Dist. G.O. Ref. Rev., Ser. 2012, 4.00%, due 8/1/22 | | | 754 | | |
| | 2,000 | | | California G.O. Ref., Ser. 2013, 5.00%, due 11/1/25 | | | 2,276 | Ø | |
| 2,055 | | | California Statewide Communities Dev. Au. PCR (So. California Edison Co.), Ser. 2006, 1.90%,
due 4/1/28 Putable 4/1/20 | | | 1,998 | µß | |
| | 795 | | | Inglewood Pub. Fin. Au. Lease Ref. Rev., Ser. 2012, 5.00%, due 8/1/16 | | | 819 | | |
| 1,500 | | | Irvine Imp. Bond Act 1915 Ltd. Oblig. (Spec. Assessment Dist. Number 12-1), Ser. 2012, 3.00%,
due 9/2/16 | | | 1,560 | | |
| | 200 | | | Mountain View-Whisman Sch. Dist. G.O. (Election 2012), Ser. 2013-A, 4.00%, due 9/1/27 | | | 207 | | |
| | 300 | | | Mountain View-Whisman Sch. Dist. G.O. (Election 2012), Ser. 2013-A, 4.00%, due 9/1/28 | | | 307 | | |
| | 705 | | | Oakland G.O. Ref., Ser. 2012, 5.00%, due 1/15/20 | | | 804 | | |
| | 500 | | | Orange Co. Trans. Au. Toll Road Sr. Lien Rev. (91 Express Lanes), Ser. 2013, 5.00%, due 8/15/21 | | | 588 | | |
| | 625 | | | Oxnard Harbor Dist. Rev., Ser. 2011-B, 4.50%, due 8/1/24 | | | 627 | | |
| 900 | | | Sacramento City Fin. Au. Ref. Rev. (Master Lease Prog. Facs.), Ser. 2006-E, (AMBAC Insured), 5.25%,
due 12/1/24 | | | 1,008 | | |
| 705 | | | San Diego Pub. Fac. Fin. Au. Lease Ref. Rev. (Ballpark), Ser. 2007-A, (AMBAC Insured), 5.25%,
due 2/15/21 | | | 762 | ñ | |
| | 1,500 | | | San Francisco City & Co. Pub. Utils. Commission Wtr. Ref. Rev., Ser. 2011-D, 5.00%, due 11/1/24 | | | 1,731 | | |
| | 740 | | | San Marcos Unified Sch. Dist. G.O. Cap. Appreciation (Election 2010), Ser. 2012-B, 0.00%, due 8/1/26 | | | 427 | | |
| | 645 | | | San Marcos Unified Sch. Dist. G.O. Cap. Appreciation (Election 2010), Ser. 2012-B, 0.00%, due 8/1/27 | | | 350 | | |
| 440 | | | Santa Maria Bonita Sch. Dist. Cert. of Participation (New Sch. Construction Proj.), Ser. 2013,
(BAM Insured), 2.63%, due 6/1/21 | | | 433 | | |
| | 1,000 | | | St. Helena Unified Sch. Dist. G.O. Cap. Appreciation (Election 2012), Ser. 2013-A, 0.00%, due 8/1/27 | | | 643 | b | |
| | | | 15,294 | | |
Colorado (2.3%) | | | |
| | 1,000 | | | Commerce City No. Infrastructure Gen. Imp. Dist. G.O., Ser. 2013, (AGM Insured), 5.00%, due 12/1/24 | | | 1,131 | | |
| | 730 | | | Denver City & Co. Cert. of Participation (Wastewater/Rosyn Properties), Ser. 2010-B, 3.00%, due 12/1/16 | | | 772 | ØØ | |
| | 275 | | | No. Colorado Wtr. Conservancy Dist. Cert. of Participation, Ser. 2012, 4.00%, due 7/1/18 | | | 302 | | |
| | 450 | | | No. Colorado Wtr. Conservancy Dist. Cert. of Participation, Ser. 2012, 4.00%, due 7/1/19 | | | 492 | | |
| | 475 | | | No. Colorado Wtr. Conservancy Dist. Cert. of Participation, Ser. 2012, 3.00%, due 7/1/20 | | | 485 | | |
| | 500 | | | Westminster Cert. of Participation Ref., Ser. 2013, 4.00%, due 12/1/25 | | | 516 | | |
| | | | 3,698 | | |
District of Columbia (2.0%) | | | |
| | 355 | | | Dist. of Columbia Rev. (Assoc. of American Med. College), Ser. 2011-A, 4.00%, due 10/1/19 | | | 384 | ß | |
| | 460 | | | Dist. of Columbia Rev. (Assoc. of American Med. College), Ser. 2011-A, 5.00%, due 10/1/21 | | | 521 | ß | |
| | 350 | | | Dist. of Columbia Rev. (Assoc. of American Med. College), Ser. 2011-A, 5.00%, due 10/1/22 | | | 396 | ß | |
| | 1,000 | | | Dist. of Columbia Rev. (Assoc. of American Med. College), Ser. 2011-B, 5.00%, due 10/1/22 | | | 1,123 | ß | |
See Notes to Schedule of Investments
57
Schedule of Investments Neuberger Berman Municipal Intermediate Bond Fund (cont'd)
PRINCIPAL AMOUNT | | SECURITY | | VALUE† | |
(000's omitted) | | | | (000's omitted)z | |
$ | 505 | | | Dist. of Columbia Rev. (Friendship Pub. Charter Sch.), Ser. 2012, 2.15%, due 6/1/15 | | $ | 499 | ß | |
| | 165 | | | Dist. of Columbia Univ. Ref. Rev. (Georgetown Univ.), Ser. 2009-A, 5.00%, due 4/1/21 | | | 182 | ß | |
| | | | 3,105 | | |
Florida (10.1%) | | | |
| | 1,000 | | | CityPlace Comm. Dev. Dist. Spec. Assessment Ref. Rev., Ser. 2012, 5.00%, due 5/1/26 | | | 1,075 | | |
| | 2,300 | | | Collier Co. Gas Tax Ref. Rev., Ser. 2012, 5.00%, due 6/1/16 | | | 2,511 | ØØ | |
| | 1,495 | | | Florida St. Muni. Loan Council Rev., Ser. 2012, (AGM Insured), 4.00%, due 5/1/19 | | | 1,627 | ØØ | |
| | 1,420 | | | Gulf Breeze Rev. (Local Gov't), Ser. 1985, 1.70%, due 12/1/20 Putable 12/1/17 | | | 1,442 | µØØ | |
| | 900 | | | JEA Elec. Sys. Rev., Ser. 2013-A, 5.00%, due 10/1/29 | | | 966 | | |
| | 1,000 | | | Miami-Dade Co. Sch. Board Cert. of Participation, Ser. 2012-A, 5.00%, due 8/1/22 | | | 1,141 | | |
| | 1,000 | | | Palm Beach Co. G.O. Ref. (Rec. & Cultural Facs.), Ser. 2010, 5.00%, due 7/1/20 | | | 1,192 | | |
| | 750 | | | Palm Beach Co. Solid Waste Au. Rev., Ser. 2002-B, (AMBAC Insured), 0.00%, due 10/1/15 | | | 733 | | |
| | 1,255 | | | Port St. Lucie Research Facs. Rev. (Oregon Hlth. and Science Univ. Vaccine and Gene
Therapy Institute Florida Corp. Proj.), Ser. 2010, 5.00%, due 5/1/22 | | | 1,350
| ß | |
| | 1,580 | | | Port St. Lucie Research Facs. Rev. (Oregon Hlth. and Science Univ. Vaccine and Gene
Therapy Institute Florida Corp. Proj.), Ser. 2010, 5.00%, due 5/1/23 | | | 1,682
| ß | |
| | 2,000 | | | Space Coast Infrastructure Agcy. Imp. Rev. (I-95 Brevard Co. DBF Proj.), Ser. 2012, 4.00%, due 6/15/17 | | | 2,117 | ØØ | |
| | | | 15,836 | | |
Georgia (3.0%) | | | |
| | 1,000 | | | Bartow Co. Dev. Au. Rev. (GA Pwr. Co. Plant Bowen), Ser. 1997, 2.38%, due 9/1/29 Putable 8/10/17 | | | 1,005 | µß | |
| 1,645 | | | Bulloch Co. Dev. Au. Std. Hsg. Rev. Ref. (Georgia So. Univ. Hsg. Foundation One LLC),
Ser. 2012, (AGM Insured), 5.00%, due 8/1/22 | | | 1,860 | ß | |
| | 510 | | | Georgia St. G.O. Ref., Ser. 2013-C, 4.00%, due 10/1/22 | | | 577 | | |
| | 1,000 | | | Gwinnett Co. Sch. Dist. G.O. Ref., Ser. 2010, 5.00%, due 2/1/25 | | | 1,215 | | |
| | | | 4,657 | | |
Illinois (7.6%) | | | |
| | 2,000 | | | Chicago G.O., Ser. 2010-A, 5.00%, due 12/1/15 | | | 2,135 | | |
| 1,000 | | | Chicago O'Hare Int'l Arpt. Gen. Arpt. Third Lien Ref. Rev., Ser. 2005-B, (National Public Finance
Guarantee Corp. Insured), 5.25%, due 1/1/17 | | | 1,134 | | |
| | 1,165 | | | Chicago Park Dist. G.O., Ser. 2011-C, 5.00%, due 1/1/24 | | | 1,257 | | |
| 1,400 | | | Cook Co. Sch. Dist. Number 144 Prairie Hills G.O. (Ltd. Sch.), Ser. 2010-A, (AGM Insured), 5.25%,
due 12/1/27 Pre-Refunded 12/1/20 | | | 1,714 | | |
| 200 | | | Cook Co. Sch. Dist. Number 144 Prairie Hills G.O. (Ltd. Sch.), Ser. 2010-A, (AGM Insured), 5.25%,
due 12/1/27 | | | 209 | | |
| | 1,000 | | | Cook Co. Sch. Dist. Number 83 G.O. (Mannheim), Ser. 2013-C, 5.35%, due 12/1/29 | | | 1,018 | | |
| | 1,195 | | | Cook Co. Sch. Dist. Number 83 G.O. (Mannheim), Ser. 2013-C, 5.63%, due 12/1/32 | | | 1,215 | | |
| | 1,000 | | | Cook Co. Sch. Dist. Number 83 G.O. (Ref. Sch.), Ser. 2011-D, 5.13%, due 12/1/30 Pre-Refunded 12/1/21 | | | 1,219 | | |
| 750 | | | Dekalb Kane LaSalle Cos. Comm. College Dist. Number 523 G.O. Cap. Appreciation,
Ser. 2011-B, 0.00%, due 2/1/25 | | | 444 | | |
| | 1,500 | | | Illinois St. G.O. Ref., Ser. 2010, (AGM Insured), 5.00%, due 1/1/15 | | | 1,570 | | |
| | | | 11,915 | | |
Indiana (5.2%) | | | |
| 1,000 | | | Boone Co. Hosp. Assoc. Lease Rev., Ser. 2005, (National Public Finance Guarantee Corp. Insured),
5.25%, due 7/10/17 | | | 1,069 | | |
| | 500 | | | Indiana Fin. Au. Midwestern Disaster Relief Rev. (Ohio Valley Elec. Corp. Proj.), Ser. 2012-A, 5.00%,
due 6/1/32 | | | 471
| ß | |
| 2,225 | | | Indiana St. Fin. Au. Env. Rev. (So. Indiana Gas & Elec. Co.), Ser. 2013-E, 1.95%,
due 5/1/37 Putable 9/14/17 | | | 2,249 | µß | |
See Notes to Schedule of Investments
58
Schedule of Investments Neuberger Berman Municipal Intermediate Bond Fund (cont'd)
PRINCIPAL AMOUNT | | SECURITY | | VALUE† | |
(000's omitted) | | | | (000's omitted)z | |
$ | 1,615 | | | Indiana St. Fin. Au. Rev. (St. Revolving Fund Prog.), Ser. 2009-A1, 5.00%, due 2/1/21 | | $ | 1,874 | | |
| | 940 | | | Indiana St. Muni. Pwr. Agcy. Ref. Rev., Ser. 2010-B, 5.00%, due 1/1/22 | | | 1,074 | | |
| | 1,280 | | | Indiana St. Muni. Pwr. Agcy. Rev., Ser. 2011-A, 5.00%, due 1/1/18 | | | 1,481 | | |
| | | | 8,218 | | |
Kansas (0.5%) | | | |
| | 720 | | | Olathe Hlth. Facs. Rev. (Med. Ctr.), Ser. 2012-A, 3.00%, due 9/1/16 | | | 758 | ß | |
Louisiana (2.3%) | | | |
| 1,280 | | | Louisiana St. Local Gov't Env. Facs. & Comm. Dev. Au. Rev. (Plaquemines Proj.), Ser. 2012,
(AGM Insured), 4.00%, due 9/1/21 | | | 1,362 | | |
| 800 | | | Louisiana St. Pub. Facs. Au. Rev. (Air Prods. & Chemicals, Inc. Proj.), Ser. 2008-C, 0.05%,
due 12/1/43 | | | 800 | µß | |
| | 795 | | | Monroe Sales & Use Tax Ref. Rev., Ser. 2012, 4.00%, due 7/1/23 | | | 823 | | |
| 570 | | | Terrebonne Parish LA Hosp. Svc. Dist. Number 1 Hosp. Ref. Rev. (Gen. Med. Ctr. Proj.),
Ser. 2010, 4.00%, due 4/1/15 | | | 596 | | |
| | | | 3,581 | | |
Maryland (0.6%) | | | |
| | 1,000 | | | Maryland St. G.O. (St. & Local Facs. Loan), Ser. 2012-B, 3.00%, due 3/15/23 | | | 1,028 | | |
Massachusetts (1.2%) | | | |
| | 260 | | | Massachusetts Bay Trans. Au. Sr. Sales Tax Rev., Ser. 2006-A, 5.25%, due 7/1/34 | | | 290 | | |
| 500 | | | Massachusetts St. Hlth. & Ed. Fac. Au. Rev. (Berklee College of Music), Ser. 2007-A, 5.00%,
due 10/1/15 | | | 540 | ß | |
| 995 | | | Massachusetts St. Hlth. & Ed. Fac. Au. Rev. (Northeastern Univ.), Ser. 2008-T3, 2.70%,
due 10/1/37 Putable 2/20/14 | | | 1,001 | µß | |
| | | | 1,831 | | |
Michigan (2.6%) | | | |
| | 350 | | | Forest Hills Pub. Schs. G.O. Ref., Ser. 2005, (AGM Insured), 5.00%, due 5/1/21 | | | 369 | | |
| 1,300 | | | L'Anse Creuse Pub. Sch. G.O. (Sch. Bldg. & Site), Ser. 2008, (LOC: JPMorgan Chase Bank N.A.),
0.12%, due 5/1/35 | | | 1,300 | µ | |
| 1,500 | | | Lakewood Pub. Schs. G.O. (Putters), Ser. 2008-2624Z, (LOC: JPMorgan Chase Bank N.A.),
0.09%, due 5/1/29 | | | 1,500 | µ | |
| 900 | | | Michigan St. Hosp. Fin. Au. Rev. (Ascension Hlth. Credit Group), Ser. 2010-F4, 1.95%,
due 11/15/47 Putable 4/1/20 | | | 859 | µß | |
| | | | 4,028 | | |
Minnesota (0.6%) | | | |
| | 755 | | | Willmar G.O. Ref. (Rice Mem. Hosp. Proj.), Ser. 2012-A, 5.00%, due 2/1/19 | | | 886 | | |
Mississippi (2.5%) | | | |
| | 1,330 | | | Lamar Co. Sch. Dist. Ref. G.O., Ser. 2013, 2.63%, due 6/1/19 | | | 1,378 | | |
| | 1,045 | | | Mississippi Dev. Bank Spec. Oblig. (Dept. Corrections), Ser. 2010-D, 5.00%, due 8/1/22 | | | 1,167 | | |
| | 1,250 | | | Mississippi Dev. Bank Spec. Oblig. (Madison Co. Hwy. Proj.), Ser. 2013-C, 5.00%, due 1/1/27 | | | 1,396 | | |
| | | | 3,941 | | |
See Notes to Schedule of Investments
59
Schedule of Investments Neuberger Berman Municipal Intermediate Bond Fund (cont'd)
PRINCIPAL AMOUNT | | SECURITY | | VALUE† | |
(000's omitted) | | | | (000's omitted)z | |
Missouri (0.4%) | | | |
$ | 750 | | | Missouri St. Dev. Fin. Board Infrastructure Facs. Rev. (St. Joseph Swr. Sys. Imp.), Ser. 2012-C, 3.25%,
due 11/1/24 | | $ | 691
| | |
Nebraska (0.3%) | | | |
| | 370 | | | Omaha Pub. Fac. Corp. Lease Rev. (Baseball Stadium Proj.), Ser. 2009, 5.00%, due 6/1/22 | | | 421 | | |
Nevada (0.5%) | | | |
| | 750 | | | Las Vegas Redev. Agcy. Tax Increment Rev., Ser. 2009-A, 7.50%, due 6/15/23 | | | 811 | | |
New Jersey (7.2%) | | | |
| | 305 | | | Harrison G.O., Ser. 2012-A, 5.00%, due 4/15/18 | | | 345 | | |
| | 625 | | | Hudson Co. Correctional Fac. Cert. of Participation, Ser. 2013, (AGM Insured), 3.00%, due 12/1/21 | | | 618 | | |
| | 900 | | | Jersey City G.O. Ref., Ser. 2012, (AGM Insured), 4.00%, due 9/1/19 | | | 977 | | |
| | 755 | | | Morristown Parking Au. Rev., Ser. 2011, 4.00%, due 8/1/18 | | | 820 | | |
| | 1,000 | | | New Jersey Econ. Dev. Au. Rev. (Sch. Fac. Construction), Ser. 2010-DD1, 5.00%, due 12/15/18 | | | 1,172 | | |
| 2,000 | | | New Jersey Hlth. Care Fac. Fin. Au. Dept. Human Svc. Rev. (Greystone Park Psychiatric Hosp. Proj.),
Ser. 2013-B, 5.00%, due 9/15/20 | | | 2,282 | | |
| | 1,000 | | | New Jersey St. Trans. Trust Fund Au. Trans. Sys. Rev., Ser. 2006-A, 5.25%, due 12/15/19 | | | 1,180 | | |
| 2,000 | | | New Jersey Trans. Trust Fund Au., Ser. 2006-A, (National Public Finance Guarantee Corp. Insured),
5.25%, due 12/15/21 | | | 2,344 | | |
| | 360 | | | Union Co. Imp. Au. Rev. (Correctional Fac. Proj.), Ser. 2013, 3.00%, due 6/15/20 | | | 375 | | |
| | 370 | | | Union Co. Imp. Au. Rev. (Correctional Fac. Proj.), Ser. 2013, 3.00%, due 6/15/21 | | | 379 | | |
| | 375 | | | Union Co. Imp. Au. Rev. (Correctional Fac. Proj.), Ser. 2013, 4.00%, due 6/15/22 | | | 407 | | |
| | 395 | | | Union Co. Imp. Au. Rev. (Correctional Fac. Proj.), Ser. 2013, 4.00%, due 6/15/23 | | | 426 | | |
| | | | 11,325 | | |
New Mexico (0.5%) | | | |
| | 750 | | | Albuquerque Muni. Sch. Dist. Number 012 (Sch. Bldg.) G.O., Ser. 2008-B, 4.50%, due 8/1/19 | | | 811 | | |
New York (6.9%) | | | |
| | 1,630 | | | Albany Co. G.O., Ser. 2012-B, 4.00%, due 11/1/22 | | | 1,769 | | |
| | 1,850 | | | New York G.O., Ser. 2011-I1, 5.00%, due 8/1/18 | | | 2,176 | ØØ | |
| | 1,500 | | | New York St. Dorm. Au. Rev. (St. Personal Income Tax), Ser. 2012-D, 3.00%, due 2/15/21 | | | 1,579 | | |
| | 2,000 | | | New York St. Dorm. Au. Rev. Non St. Supported Debt (Univ. Facs.), Ser. 2013-A, 5.00%, due 7/1/28 | | | 2,187 | | |
| | 1,000 | | | New York St. Dorm. Au. Sales Tax Rev., Ser. 2013-A, 5.00%, due 3/15/28 | | | 1,115 | | |
| 50 | | | New York St. Urban Dev. Corp. Ref. Rev. (Correctional Facs.), Ser. 1994-A, (AGM Insured), 5.50%,
due 1/1/14 | | | 50 | | |
| | 750 | | | New York St. Urban Dev. Corp. Rev. (St. Personal Income Tax), Ser. 2009-A1, 5.00%, due 12/15/19 | | | 885 | | |
| | 1,000 | | | Port Au. New York & New Jersey Rev. (One Hundred Fifty-Third), Ser. 2008, 4.50%, due 7/15/27 | | | 1,062 | | |
| | | | 10,823 | | |
North Carolina (1.7%) | | | |
| | 1,500 | | | North Carolina Muni. Pwr. Agcy. Number 1 Rev. (Catawba Elec.), Ser. 2012-A, 3.00%, due 1/1/16 | | | 1,580 | | |
| | 650 | | | North Carolina St. Cap. Imp. Ltd. Oblig. (Annual Appropriation), Ser. 2009-A, 5.00%, due 5/1/19 | | | 768 | | |
| 295 | | | Western Carolina Univ. Research & Dev. Corp. Cert. of Participation (Western Carolina Univ. Std. Hsg.),
Ser. 2008, (Assured Guaranty Insured), 5.25%, due 6/1/20 | | | 331 | ß | |
| | | | 2,679 | | |
See Notes to Schedule of Investments
60
Schedule of Investments Neuberger Berman Municipal Intermediate Bond Fund (cont'd)
PRINCIPAL AMOUNT | | SECURITY | | VALUE† | |
(000's omitted) | | | | (000's omitted)z | |
Ohio (2.3%) | | | |
$ | 2,000 | | | Kent St. Univ. Rev. Gen. Receipts, Ser. 2012-A, 3.50%, due 5/1/27 | | $ | 1,894 | | |
| | 450 | | | Lorain G.O., Ser. 2013, (AGM Insured), 3.63%, due 12/1/25 | | | 442 | | |
| | 900 | | | Lorain G.O., Ser. 2013, (AGM Insured), 3.88%, due 12/1/27 | | | 878 | | |
| | 400 | | | Lorain G.O., Ser. 2013, (AGM Insured), 4.00%, due 12/1/29 | | | 387 | | |
| | | | 3,601 | | |
Oregon (0.4%) | | | |
| 595 | | | Oregon St. Hsg. & Comm. Svc. Dept. Mtge. Rev. (Single Family Mtge. Prog.), Ser. 2005-D, 4.40%,
due 7/1/19 | | | 608 | | |
Pennsylvania (3.0%) | | | |
| | 1,000 | | | Norristown Area Sch. Dist. Cert. of Participation (Installment Purchase), Ser. 2012, 4.50%, due 4/1/27 | | | 969 | | |
| | 1,285 | | | Pennsylvania St. HFA Single Family Mtge. Rev., Ser. 2010-109, 2.45%, due 4/1/16 | | | 1,316 | | |
| 340 | | | Pennsylvania St. Pub. Sch. Bldg. Au. College Rev. (Montgomery Co. Comm. College), Ser. 2008,
(AGM Insured), 5.00%, due 5/1/21 | | | 375 | ß | |
| | 1,870 | | | Philadelphia G.O. Ref., Ser. 2007-A, (AGM Insured), 5.00%, due 8/1/18 | | | 2,093 | | |
| | | | 4,753 | | |
Puerto Rico (0.9%) | | | |
| | 500 | | | Puerto Rico Elec. Pwr. Au. Rev., Ser. 2010-XX, 5.25%, due 7/1/27 | | | 378 | | |
| 500 | | | Puerto Rico Ind. Tourist Ed. Med. & Env. Ctrl. Fac. Fin. Au. Ref. Rev. (Int'l American Univ. Proj.),
Ser. 2012, 4.00%, due 10/1/14 | | | 507 | ß | |
| | 600 | | | Puerto Rico Pub. Bldg. Au. Rev. (Unrefunded Bal. Gov't Fac.), Ser. 2002-C, 5.75%, due 7/1/20 | | | 500 | | |
| | | | 1,385 | | |
Rhode Island (2.4%) | | | |
| | 1,250 | | | Cranston G.O., Ser. 2012-B, 3.00%, due 7/1/16 | | | 1,293 | | |
| 1,125 | | | Rhode Island St. Hlth. & Ed. Bldg. Corp. Rev. (Providence Pub. Sch. Prog.), Ser. 2013-A, 5.00%,
due 5/15/22 | | | 1,238 | ßØ | |
| | 1,200 | | | Rhode Island St. Std. Loan Au. Std. Loan Rev. (Sr. Prog.), Ser. 2010-A, 4.40%, due 12/1/19 | | | 1,268 | | |
| | | | 3,799 | | |
South Carolina (4.0%) | | | |
| | 870 | | | Charleston Co. G.O. (Cap. Imp. Plan), Ser. 2011, 5.00%, due 11/1/18 | | | 1,033 | | |
| | 1,140 | | | Rock Hill Ltd. Oblig. Rev. (Hosp. Fee Pledge), Ser. 2013, 5.00%, due 4/1/22 | | | 1,305 | | |
| | 1,195 | | | Rock Hill Ltd. Oblig. Rev. (Hosp. Fee Pledge), Ser. 2013, 5.00%, due 4/1/23 | | | 1,362 | | |
| | 2,335 | | | South Carolina St. Pub. Svc. Au. Ref. Rev. (Santee Cooperative), Ser. 2012-A, 4.00%, due 12/1/20 | | | 2,607 | ØØ | |
| | | | 6,307 | | |
Tennessee (3.0%) | | | |
| | 1,750 | | | Memphis Ref. G.O. (Gen. Imp.), Ser. 2011, 5.00%, due 5/1/24 | | | 2,020 | | |
| | 1,000 | | | Metro. Gov't Nashville & Davidson Co. Hlth. & Ed. Fac. Board, Ser. 2012, 5.00%, due 11/1/26 | | | 1,027 | ß | |
| | 1,600 | | | Metro. Nashville Arpt. Au. Ref. Rev. Imp., Ser. 2010-B, (AGM Insured), 4.00%, due 7/1/15 | | | 1,676 | | |
| | | | 4,723 | | |
See Notes to Schedule of Investments
61
Schedule of Investments Neuberger Berman Municipal Intermediate Bond Fund (cont'd)
PRINCIPAL AMOUNT | | SECURITY | | VALUE† | |
(000's omitted) | | | | (000's omitted)z | |
Texas (9.4%) | | | |
$ | 1,000 | | | Alamo Comm. College Dist. G.O. (Maintenance Tax Notes), Ser. 2011, 4.00%, due 2/15/20 | | $ | 1,124 | | |
| | 750 | | | Brownsville G.O., Ser. 2011-A, 4.00%, due 2/15/18 | | | 833 | | |
| | 705 | | | Brownsville G.O., Ser. 2011-A, 4.00%, due 2/15/20 | | | 779 | | |
| | 1,085 | | | Dallas Co. Sch. G.O. (Pub. Prop. Fin. Contractual Oblig.), Ser. 2012-A, 4.00%, due 12/1/18 | | | 1,219 | | |
| | 460 | | | Dallas Fort Worth Int'l Arpt. Ref. Rev., Ser. 2009-A, 5.00%, due 11/1/24 | | | 492 | | |
| | 420 | | | El Paso Independent Sch. Dist. Ref. G.O., Ser. 2011, 4.00%, due 8/15/26 | | | 438 | | |
| 250 | | | Grapevine Combination Tax & Tax Increment Reinvestment Zone Rev. Cert. of Oblig. G.O.,
Ser. 2000, (National Public Finance Guarantee Corp. Insured), 5.63%, due 8/15/15 | | | 251 | | |
| | 500 | | | Gulf Coast Waste Disp. Au. Rev. (Bayport Area Sys.), Ser. 2013, (AGM Insured), 3.00%, due 10/1/25 | | | 447 | | |
| | 500 | | | Gulf Coast Waste Disp. Au. Rev. (Bayport Area Sys.), Ser. 2013, (AGM Insured), 3.00%, due 10/1/26 | | | 434 | | |
| | 225 | | | Harris Co. Cultural Ed. Fac. Fin. Corp. Rev. (Methodist Hosp. Sys.), Ser. 2008-B, 5.25%, due 12/1/17 | | | 261 | ß | |
| 300 | | | Harris-Montgomery Cos. Muni. Utils. (Dist. Number 386) G.O., Ser. 2012, (AGM Insured), 3.00%,
due 9/1/24 | | | 276 | | |
| 1,110 | | | Houston Hotel Occupancy Tax & Spec. Ref. Rev. (Convention & Entertainment Facs.), Ser. 2012,
5.00%, due 9/1/28 | | | 1,112 | | |
| 1,000 | | | Houston Wtr. & Swr. Sys. Jr. Lien Ref. Rev., Ser. 2001-B, (National Public Finance
Guarantee Corp. Insured), 5.50%, due 12/1/24 | | | 1,262 | | |
| | 2,000 | | | La Joya Independent Sch. Dist. Ref. G.O., Ser. 2013, 5.00%, due 2/15/33 | | | 2,223 | | |
| | 800 | | | Port of Port Arthur Navigation Dist. Rev. (Motiva Enterprises Proj.), Ser. 2010-A, 0.09%, due 4/1/40 | | | 800 | µß | |
| | 375 | | | Texas A&M Univ. Perm. Univ. Fund Rev., Ser. 2011, 3.00%, due 7/1/17 | | | 405 | | |
| | 555 | | | Texas A&M Univ. Perm. Univ. Fund Rev., Ser. 2011, 3.00%, due 7/1/18 | | | 602 | | |
| | 1,000 | | | Texas Pub. Fin. Au. Rev. (So. Univ. Fin. Sys.), Ser. 2013, (BAM Insured), 5.00%, due 11/1/20 | | | 1,105 | | |
| | 415 | | | Texas St. Technical College Sys. Rev. Ref. & Imp., Ser. 2011, 5.00%, due 8/1/17 | | | 467 | | |
| | 245 | | | Texas St. Technical College Sys. Rev. Ref. & Imp., Ser. 2011, 5.00%, due 8/1/18 | | | 279 | | |
| | | | 14,809 | | |
Utah (0.8%) | | | |
| 200 | | | Murray City Hosp. Rev. (IHC Hlth. Svcs., Inc.), Ser. 2005-C, (LOC: Northern Trust Co.), 0.08%,
due 5/15/37 | | | 200 | µß | |
| | 1,000 | | | Weber Co. Spec. Assessment (Summit Mountain Assessment Area), Ser. 2013, 5.50%, due 1/15/28 | | | 1,088 | | |
| | | | 1,288 | | |
Virginia (3.2%) | | | |
| | 1,200 | | | Newport News Ref. G.O., Ser. 2011-B, 4.00%, due 7/1/19 | | | 1,348 | | |
| | 2,000 | | | Virginia Commonwealth Trans. Board Rev. (Cap. Proj.), Ser. 2011, 4.00%, due 5/15/29 | | | 2,018 | | |
| | 1,690 | | | Virginia St. Hsg. Dev. Au. Homeownership Mtge. Rev., Ser. 2010-B, 2.10%, due 9/1/15 | | | 1,723 | | |
| | | | 5,089 | | |
Washington (0.5%) | | | |
| | 795 | | | Washington St. Ref. G.O. (Var. Purp.), Ser. 2010-R-2011B, 4.00%, due 7/1/26 | | | 832 | | |
| | | | | Total Investments (100.9%) (Cost $157,310) | | | 158,707 | ## | |
| | | | | Liabilities, less cash, receivables and other assets [(0.9%)] | | | (1,421 | ) | |
| | | | | Total Net Assets (100.0%) | | $ | 157,286 | | |
See Notes to Schedule of Investments
62
Schedule of Investments Neuberger Berman New York Municipal Income Fund
PRINCIPAL AMOUNT | | SECURITY | | VALUE† | |
(000's omitted) | | | | (000's omitted)z | |
Municipal Notes (98.6%) | | | |
New York (97.8%) | | | |
$ | 1,425 | | | Addison Central Sch. Dist. Ref. G.O., Ser. 2012, 5.00%, due 6/1/19 | | $ | 1,658 | | |
| | 2,000 | | | Brookhaven G.O. (Pub. Imp.), Ser. 2013-A, 3.00%, due 9/15/27 | | | 1,853 | | |
| | 1,360 | | | Cayuga Co. G.O., Ser. 2013-A, (BAM Insured), 2.50%, due 2/1/23 | | | 1,287 | | |
| | 1,380 | | | Cayuga Co. G.O., Ser. 2013-A, (BAM Insured), 2.75%, due 2/1/26 | | | 1,239 | | |
| | 385 | | | East Moriches Union Free Sch. Dist. Ref. G.O., Ser. 2012, (AGM Insured), 3.00%, due 7/1/19 | | | 403 | | |
| 2,000 | | | Erie Co. IDA Sch. Fac. Rev. (City Sch. Dist. Buffalo Proj.), Ser. 2007-A, (AGM Insured), 5.75%,
due 5/1/25 | | | 2,225 | | |
| 295 | | | Genesee Valley Central Sch. Dist. Ref. G.O. (Sch. Dist. at Angelica-Belmont), Ser. 2012,
(AGM Insured), 4.00%, due 6/15/15 | | | 309 | | |
| | 1,000 | | | Hudson Yards Infrastructure Corp. Rev., Ser. 2011-A, 5.75%, due 2/15/47 | | | 1,058 | | |
| | 750 | | | Ithaca Ref. G.O., Ser. 2012-A, 3.00%, due 1/15/16 | | | 783 | | |
| | 250 | | | Ithaca Ref. G.O., Ser. 2012-B, 3.00%, due 8/1/15 | | | 260 | | |
| | 1,310 | | | Jamestown City Sch. Dist. Ref. G.O., Ser. 2012, 4.00%, due 11/1/19 | | | 1,439 | | |
| | 335 | | | Johnson City Central Sch. Dist. Ref. G.O., Ser. 2012, (AGM Insured), 5.00%, due 6/15/22 | | | 381 | | |
| | 400 | | | Johnson City Central Sch. Dist. Ref. G.O., Ser. 2012, (AGM Insured), 5.00%, due 6/15/26 | | | 442 | | |
| | 500 | | | Long Island Pwr. Au. Rev., Ser. 2008-A, 6.00%, due 5/1/33 | | | 559 | | |
| | 1,500 | | | Metropolitan Trans. Au. Rev., Ser. 2008-C, 6.50%, due 11/15/28 | | | 1,779 | | |
| | 1,250 | | | Metropolitan Trans. Au. Rev., Ser. 2013-A, 5.00%, due 11/15/27 | | | 1,361 | | |
| | 400 | | | Monroe Co. Ind. Dev. Corp. Rev. (Nazareth College of Rochester Proj.), Ser. 2013-A, 4.13%, due 10/1/27 | | | 361 | ß | |
| | 350 | | | New Rochelle Ref. G.O., Ser. 2013-A, 4.00%, due 3/15/17 | | | 384 | | |
| | 475 | | | New Rochelle Ref. G.O., Ser. 2013-A, 4.00%, due 3/15/18 | | | 528 | | |
| | 350 | | | New Rochelle Ref. G.O., Ser. 2013-A, 4.00%, due 3/15/19 | | | 392 | | |
| | 480 | | | New Rochelle Ref. G.O., Ser. 2013-A, 4.00%, due 3/15/20 | | | 534 | | |
| | 165 | | | New York City Hsg. Dev. Corp. Rev., Ser. 2008-M, 4.40%, due 5/1/14 | | | 167 | | |
| | 330 | | | New York City Hsg. Dev. Corp. Rev., Ser. 2008-M, 4.45%, due 11/1/14 | | | 339 | | |
| | 340 | | | New York City Hsg. Dev. Corp. Rev., Ser. 2008-M, 4.60%, due 5/1/15 | | | 355 | | |
| | 1,000 | | | New York City Hsg. Dev. Corp. Rev., Ser. 2008-M, 6.75%, due 11/1/33 | | | 1,125 | | |
| | 1,125 | | | New York City Muni. Wtr. Fin. Au. Wtr. & Swr. Sys. Rev., Ser. 2012-GG, 5.00%, due 6/15/17 | | | 1,227 | | |
| 325 | | | New York City Trust for Cultural Resources Rev. (Juilliard Sch.), Ser. 2009-B, 1.35%,
due 1/1/36 Putable 8/1/17 | | | 328 | µß | |
| | 1,120 | | | New York St. Bridge Au. Rev., Ser. 2012, 4.00%, due 1/1/22 | | | 1,241 | | |
| 3,540 | | | New York St. Dorm. Au. Rev. (Spec. Active Sch. Dist. Prog.), Ser. 1995, (National Public Finance
Guarantee Corp. Insured), 6.00%, due 7/1/19 | | | 3,553 | | |
| 1,140 | | | New York St. Dorm. Au. Rev. (Upstate Comm. Colleges), Ser. 2004, (National Public Finance
Guarantee Corp. Insured), 5.25%, due 7/1/15 | | | 1,177 | | |
| 130 | | | New York St. Dorm. Au. Rev. Non St. Supported Debt (Catholic Hlth. Sys. Oblig. Group), Ser. 2012-A,
2.00%, due 7/1/14 | | | 130 | ß | |
| 300 | | | New York St. Dorm. Au. Rev. Non St. Supported Debt (Catholic Hlth. Sys. Oblig. Group), Ser. 2012-A,
3.00%, due 7/1/16 | | | 302 | ß | |
| 745 | | | New York St. Dorm. Au. Rev. Non St. Supported Debt (Culinary Institute of America), Ser. 2013,
4.50%, due 7/1/24 | | | 774 | ß | |
| 500 | | | New York St. Dorm. Au. Rev. Non St. Supported Debt (Hosp. Spec. Surgery), Ser. 2009, (FHA Insured),
6.00%, due 8/15/38 | | | 560 | ß | |
| 500 | | | New York St. Dorm. Au. Rev. Non St. Supported Debt (Mem. Sloan-Kettering), Ser. 2012-1,
5.00%, due 7/1/20 | | | 587 | ß | |
| 1,150 | | | New York St. Dorm. Au. Rev. Non St. Supported Debt (Mem. Sloan-Kettering), Ser. 2012-1,
4.00%, due 7/1/22 | | | 1,264 | ß | |
| 2,000 | | | New York St. Dorm. Au. Rev. Non St. Supported Debt (Muni. Hlth. Fac. Lease), Ser. 2001,
5.00%, due 1/15/18 | | | 2,296 | | |
| 150 | | | New York St. Dorm. Au. Rev. Non St. Supported Debt (North Shore-Long Island Jewish Oblig. Group),
Ser. 2009-B, 4.25%, due 5/1/39 | | | 139 | ß | |
| 200 | | | New York St. Dorm. Au. Rev. Non St. Supported Debt (North Shore-Long Island Jewish Oblig. Group),
Ser. 2011-A, 5.00%, due 5/1/22 | | | 226 | ß | |
See Notes to Schedule of Investments
63
Schedule of Investments Neuberger Berman New York Municipal Income Fund (cont'd)
PRINCIPAL AMOUNT | | SECURITY | | VALUE† | |
(000's omitted) | | | | (000's omitted)z | |
$ | 100 | | | New York St. Dorm. Au. Rev. Non St. Supported Debt (St. Lawrence Lewis), Ser. 2007,
(AGM Insured), 4.00%, due 8/15/18 | | $ | 107
| ß | |
| 110 | | | New York St. Dorm. Au. Rev. Non St. Supported Debt (St. Lawrence Lewis), Ser. 2007,
(AGM Insured), 4.13%, due 8/15/20 | | | 115 | ß | |
| 100 | | | New York St. Dorm. Au. Rev. Non St. Supported Debt (St. Lawrence Lewis), Ser. 2007,
(AGM Insured), 4.25%, due 8/15/21 | | | 105 | ß | |
| | 500 | | | New York St. Dorm. Au. Rev. Non St. Supported Debt (Univ. Facs.), Ser. 2013-A, 5.00%, due 7/1/28 | | | 547 | | |
| 2,305 | | | New York St. Dorm. Au. Rev. Non St. Supported Debt (Univ. Rochester), Ser. 2007-A1,
5.00%, due 7/1/19 | | | 2,557 | ß | |
| 3,000 | | | New York St. Dorm. Au. Rev. St. Personal Income Tax Rev. Ref. (Gen. Purp. Bonds), Ser. 2012-A,
5.00%, due 12/15/29 | | | 3,309 | | |
| 1,500 | | | New York St. Dorm. Au. Rev. St. Supported Debt (City Univ. Cons. 5th), Ser. 2008-E, 6.13%,
due 1/1/31 | | | 1,678 | | |
| | 1,000 | | | New York St. Dorm. Au. Rev. St. Supported Debt (Dept. Ed.), Ser. 2006-A, 5.00%, due 7/1/18 | | | 1,096 | | |
| 2,500 | | | New York St. Dorm. Au. Rev. St. Supported Debt (Mental. Hlth. Svcs. Fac. Imp.), Ser. 2005-A,
(AMBAC Insured), 5.00%, due 2/15/19 | | | 2,626 | | |
| 1,500 | | | New York St. Dorm. Au. Rev. St. Supported Debt (Mental. Hlth. Svcs. Fac. Imp.), Ser. 2008-F,
6.25%, due 2/15/31 | | | 1,678 | | |
| | 2,000 | | | New York St. Dorm. Au. Sales Tax Rev., Ser. 2013-A, 5.00%, due 3/15/28 | | | 2,229 | | |
| 500 | | | New York St. Env. Fac. Corp. Solid Waste Disp. Rev. (Waste Management, Inc. Proj.), Ser. 2004-A,
2.75%, due 7/1/17 | | | 504 | ß | |
| 1,500 | | | New York St. Env. Facs. Corp. (St. Clean Wtr. & Drinking Rev. Revolving Fund Muni. Wtr. Fin. Auth. Proj.),
Ser. 2012-D, 5.00%, due 6/15/24 | | | 1,762 | | |
| | 1,000 | | | New York St. Env. Facs. Corp. Rev. (United Wtr. New Rochelle), Ser. 2010-A, 4.88%, due 9/1/40 | | | 982 | ß | |
| | 2,000 | | | New York St. G.O., Ser. 2008-E-1, 6.25%, due 10/15/28 | | | 2,344 | | |
| | 905 | | | New York St. G.O., Ser. 2013-G, 5.00%, due 8/1/21 | | | 1,065 | | |
| | 350 | | | North Syracuse Central Sch. Dist. Ref. G.O., Ser. 2012-B, 5.00%, due 6/15/19 | | | 405 | | |
| | 300 | | | North Syracuse Central Sch. Dist. Ref. G.O., Ser. 2012-B, 5.00%, due 6/15/21 | | | 350 | | |
| | 1,000 | | | Oneida Co. Ref. G.O. (Pub. Imp.), Ser. 2013, 5.00%, due 4/1/20 | | | 1,155 | | |
| | 735 | | | Orange Co. Funding Corp. Rev. (Mount St. Mary College), Ser. 2012-B, 4.00%, due 7/1/23 | | | 765 | ß | |
| | 695 | | | Orange Co. Funding Corp. Rev. (Mount St. Mary College), Ser. 2012-B, 4.00%, due 7/1/24 | | | 715 | ß | |
| | 500 | | | Smithtown Central Sch. Dist. Ref. G.O., Ser. 2013, 5.00%, due 10/15/21 | | | 590 | | |
| | 670 | | | Smithtown Central Sch. Dist. Ref. G.O., Ser. 2013, 5.00%, due 10/15/23 | | | 798 | | |
| | 1,000 | | | St. Lawrence Co. IDA Civic Dev. Corp. Rev. (St. Lawrence Univ. Proj.), Ser. 2012, 5.00%, due 7/1/26 | | | 1,114 | ß | |
| 310 | | | Triborough Bridge & Tunnel Au. Rev. Ref., Ser. 2002, (National Public Finance
Guarantee Corp. Insured), 5.25%, due 11/15/22 | | | 311 | | |
| 1,205 | | | Triborough Bridge & Tunnel Au. Rev. Ref., Ser. 2002, (National Public Finance
Guarantee Corp. Insured), 5.25%, due 11/15/23 | | | 1,209 | | |
| | 1,500 | | | Triborough Bridge & Tunnel Au. Rev. Ref., Ser. 2013-A, 5.00%, due 11/15/27 | | | 1,658 | | |
| | | | 66,799 | | |
Puerto Rico (0.8%) | | | |
| | 700 | | | Puerto Rico Elec. Pwr. Au. Rev., Ser. 2010-XX, 5.25%, due 7/1/27 | | | 528 | | |
| | | | | Total Investments (98.6%) (Cost $66,509) | | | 67,327 | ## | |
| | | | | Cash, receivables and other assets, less liabilities (1.4%) | | | 947 | | |
| | | | | Total Net Assets (100.0%) | | $ | 68,274 | | |
See Notes to Schedule of Investments
64
Schedule of Investments Neuberger Berman Short Duration Bond Fund
PRINCIPAL AMOUNT | | | | VALUE† | |
(000's omitted) | | | | (000's omitted)z | |
U.S. Treasury Securities-Backed by the Full Faith and Credit of the U.S. Government (11.2%) | | | |
$ | 1,275 | | | U.S. Treasury Notes, 0.25%, due 11/30/14 | | $ | 1,276 | | |
| | 1,965 | | | U.S. Treasury Notes, 0.63%, due 8/15/16 | | | 1,970 | | |
| | 2,400 | | | U.S. Treasury Notes, 0.88%, due 9/15/16 | | | 2,422 | | |
| | 1,400 | | | U.S. Treasury Notes, 0.50%, due 10/15/16 | | | 1,403 | | |
| | | | | Total U.S. Treasury Securities-Backed by the Full Faith and Credit of the
U.S. Government (Cost $7,051) | | | 7,071 | | |
Mortgage-Backed Securities (32.6%) | | | |
Adjustable Mixed Balance (3.1%) | | | |
| 779 | | | Credit Suisse First Boston Mortgage Securities Corp., Ser. 2004-AR4, Class 2A1, 2.62%,
due 5/25/34 | | | 771 | µ | |
| | 1,192 | | | First Horizon Mortgage Pass-Through Trust, Ser. 2005-AR5, Class 2A1, 2.61%, due 11/25/35 | | | 1,109 | µ | |
| | 108 | | | Harborview Mortgage Loan Trust, Ser. 2004-4, Class 3A, 1.30%, due 6/19/34 | | | 102 | µ | |
| | | | 1,982 | | |
Commercial Mortgage-Backed (17.1%) | | | |
| | 450 | | | Banc of America Commercial Mortgage, Inc., Ser. 2005-2, Class A5, 4.86%, due 7/10/43 | | | 471 | | |
| | 690 | | | Citigroup Commercial Mortgage Trust, Ser. 2013-GC15, Class A1, 1.38%, due 9/10/46 | | | 696 | | |
| 85 | | | Citigroup/Deutsche Bank Commercial Mortgage Trust, Ser. 2006-CD2, Class AAB,
5.33%, due 1/15/46 | | | 86 | µ | |
| | 1,025 | | | Commercial Mortgage Pass-Through Certificates, Ser. 2003-LB1A, Class C, 4.23%, due 6/10/38 | | | 1,025 | | |
| | 637 | | | Credit Suisse Commercial Mortgage Trust, Ser. 2006-C3, Class A3, 5.79%, due 6/15/38 | | | 697 | µ | |
| | 54 | | | Credit Suisse Commercial Mortgage Trust, Ser. 2007-C2, Class A2, 5.45%, due 1/15/49 | | | 54 | | |
| | 555 | | | GMAC Commercial Mortgage Securities, Inc., Ser. 2004-C3, Class AAB, 4.70%, due 12/10/41 | | | 558 | | |
| | 1,500 | | | GS Mortgage Securities Trust, Ser. 2006-GG6, Class A4, 5.55%, due 4/10/38 | | | 1,625 | | |
| 477 | | | JP Morgan Chase Commercial Mortgage Securities Corp., Ser. 2011-C3, Class A1,
1.87%, due 2/15/46 | | | 479 | ñ | |
| 1,726 | | | Morgan Stanley Bank of America Merrill Lynch Trust, Ser. 2013-C10, Class A1,
1.39%, due 7/15/46 | | | 1,734 | | |
| | 409 | | | Morgan Stanley Capital I Trust, Ser. 2011-C1, Class A1, 2.60%, due 9/15/47 | | | 416 | ñ | |
| | 71 | | | Morgan Stanley Capital I Trust, Ser. 2011-C3, Class A1, 2.18%, due 7/15/49 | | | 71 | | |
| | 1,060 | | | Wachovia Bank Commercial Mortgage Trust, Ser. 2005-C20, Class A7, 5.12%, due 7/15/42 | | | 1,123 | | |
| | 9 | | | Wachovia Bank Commercial Mortgage Trust, Ser. 2005-C22, Class A3, 5.31%, due 12/15/44 | | | 9 | µ | |
| | 1,247 | | | Wachovia Bank Commercial Mortgage Trust, Ser. 2006-C23, Class A4, 5.42%, due 1/15/45 | | | 1,336 | | |
| | 436 | | | WF-RBS Commercial Mortgage Trust, Ser. 2011-C2, Class A1, 2.50%, due 2/15/44 | | | 442 | ñ | |
| | | | 10,822 | | |
Mortgage-Backed Non-Agency (3.1%) | | | |
| | 437 | | | Countrywide Home Loans, Ser. 2005-R2, Class 2A4, 8.50%, due 6/25/35 | | | 467 | ñ | |
| | 1,172 | | | GSMPS Mortgage Loan Trust, Ser. 2005-RP2, Class 1A4, 8.50%, due 3/25/35 | | | 1,260 | ñ | |
| | 244 | | | GSMPS Mortgage Loan Trust, Ser. 2005-RP3, Class 1A4, 8.50%, due 9/25/35 | | | 260 | ñ | |
| | | | 1,987 | | |
Fannie Mae (4.7%) | | | |
| | 902 | | | Pass-Through Certificates, 3.50%, due 10/1/25 | | | 953 | | |
| | 1,415 | | | Pass-Through Certificates, 3.00%, due 9/1/27 | | | 1,471 | | |
| | 486 | | | Pass-Through Certificates, 4.50%, due 4/1/39 | | | 519 | | |
| | | | 2,943 | | |
See Notes to Schedule of Investments
65
Schedule of Investments Neuberger Berman Short Duration Bond Fund (cont'd)
PRINCIPAL AMOUNT | | | | VALUE† | |
(000's omitted) | | | | (000's omitted)z | |
Freddie Mac (4.6%) | | | |
$ | 2 | | | ARM Certificates, 1.75%, due 1/1/17 | | $ | 2 | µ | |
| | 886 | | | Pass-Through Certificates, 3.50%, due 5/1/26 | | | 932 | | |
| | 1,201 | | | Pass-Through Certificates, 3.00%, due 1/1/27 | | | 1,245 | | |
| | 714 | | | Pass-Through Certificates, 4.50%, due 11/1/39 | | | 762 | | |
| | | | 2,941 | | |
| | | | | Total Mortgage-Backed Securities (Cost $20,906) | | | 20,675 | | |
Corporate Debt Securities (42.8%) | | | |
Auto Manufacturers (1.8%) | | | |
| | 590 | | | Daimler Finance N.A. LLC, Guaranteed Notes, 1.65%, due 4/10/15 | | | 597 | ñ | |
| | 525 | | | Toyota Motor Credit Corp., Senior Unsecured Medium-Term Notes, 1.00%, due 2/17/15 | | | 529 | | |
| | | | 1,126 | | |
Banks (14.3%) | | | |
| | 305 | | | American Express Centurion Bank, Senior Unsecured Notes, 0.88%, due 11/13/15 | | | 306 | | |
| | 360 | | | Bank of America Corp., Senior Unsecured Medium-Term Notes, 3.63%, due 3/17/16 | | | 380 | | |
| | 835 | | | Citigroup, Inc., Senior Unsecured Notes, 2.65%, due 3/2/15 | | | 854 | | |
| | 395 | | | Goldman Sachs Group, Inc., Senior Unsecured Medium-Term Notes, 1.60%, due 11/23/15 | | | 399 | | |
| | 1,670 | | | JPMorgan Chase & Co., Senior Unsecured Medium-Term Notes, 1.88%, due 3/20/15 | | | 1,697 | | |
| | 745 | | | Morgan Stanley, Senior Unsecured Global Medium-Term Notes, 6.00%, due 5/13/14 | | | 766 | | |
| | 155 | | | Morgan Stanley, Senior Unsecured Notes, 1.75%, due 2/25/16 | | | 156 | | |
| | 1,330 | | | Royal Bank of Canada, Senior Unsecured Global Medium-Term Notes, 1.45%, due 10/30/14 | | | 1,345 | | |
| | 470 | | | Sumitomo Mitsui Banking Corp., Bank Guaranteed Notes, 0.90%, due 1/18/16 | | | 469 | | |
| | 1,265 | | | Wells Fargo & Co., Senior Unsecured Notes, 1.50%, due 7/1/15 | | | 1,283 | | |
| | 555 | | | Westpac Banking Corp., Senior Unsecured Notes, 1.85%, due 12/9/13 | | | 556 | | |
| | 820 | | | Westpac Banking Corp., Senior Unsecured Notes, 1.13%, due 9/25/15 | | | 828 | | |
| | | | 9,039 | | |
Beverages (2.3%) | | | |
| | 1,390 | | | Anheuser-Busch InBev Finance, Inc., Guaranteed Notes, 0.80%, due 1/15/16 | | | 1,392 | | |
| | 80 | | | Heineken NV, Senior Unsecured Notes, 0.80%, due 10/1/15 | | | 80 | ñ | |
| | | | 1,472 | | |
Commercial Services (0.8%) | | | |
| | 405 | | | ERAC USA Finance LLC, Guaranteed Notes, 2.25%, due 1/10/14 | | | 406 | ñ | |
| | 90 | | | ERAC USA Finance LLC, Guaranteed Notes, 1.40%, due 4/15/16 | | | 90 | ñ | |
| | | | 496 | | |
Computers (2.9%) | | | |
| | 425 | | | Hewlett-Packard Co., Senior Unsecured Notes, 2.20%, due 12/1/15 | | | 432 | | |
| | 1,400 | | | IBM Corp., Senior Unsecured Notes, 0.88%, due 10/31/14 | | | 1,408 | | |
| | | | 1,840 | | |
Diversified Financial Services (5.1%) | | | |
| | 540 | | | American Honda Finance Corp., Unsecured Notes, 1.00%, due 8/11/15 | | | 543 | ñ | |
| | 405 | | | General Electric Capital Corp., Senior Unsecured Notes, 5.90%, due 5/13/14 | | | 417 | | |
| | 455 | | | General Electric Capital Corp., Senior Unsecured Notes, 2.15%, due 1/9/15 | | | 464 | | |
See Notes to Schedule of Investments
66
Schedule of Investments Neuberger Berman Short Duration Bond Fund (cont'd)
PRINCIPAL AMOUNT | | | | VALUE† | |
(000's omitted) | | | | (000's omitted)z | |
$ | 530 | | | General Electric Capital Corp., Senior Unsecured Medium-Term Notes, 1.00%, due 1/8/16 | | $ | 532 | | |
| | 390 | | | General Electric Capital Corp., Senior Unsecured Global Medium-Term Notes, 1.50%, due 7/12/16 | | | 395 | | |
| | 415 | | | Harley-Davidson Financial Services, Inc., Guaranteed Notes, 1.15%, due 9/15/15 | | | 416 | ñ | |
| | 490 | | | John Deere Capital Corp., Senior Unsecured Notes, 0.88%, due 4/17/15 | | | 493 | | |
| | | | 3,260 | | |
Food (0.6%) | | | |
| | 170 | | | Kraft Foods Group, Inc., Senior Unsecured Notes, 1.63%, due 6/4/15 | | | 173 | | |
| | 215 | | | WM Wrigley Jr. Co., Senior Unsecured Notes, 1.40%, due 10/21/16 | | | 216 | ñ | |
| | | | 389 | | |
Insurance (0.4%) | | | |
| | 250 | | | Berkshire Hathaway Finance Corp., Guaranteed Notes, 0.95%, due 8/15/16 | | | 251 | | |
Internet (0.6%) | | | |
| | 405 | | | Amazon.com, Inc., Senior Unsecured Notes, 0.65%, due 11/27/15 | | | 404 | | |
Machinery - Construction & Mining (1.3%) | | | |
| | 510 | | | Caterpillar Financial Services Corp., Senior Unsecured Medium-Term Notes, 1.65%, due 4/1/14 | | | 513 | | |
| | 280 | | | Caterpillar Financial Services Corp., Senior Unsecured Medium-Term Notes, 1.13%, due 12/15/14 | | | 282 | | |
| | | | 795 | | |
Media (2.9%) | | | |
| | 995 | | | DIRECTV Holdings LLC, Guaranteed Notes, 4.75%, due 10/1/14 | | | 1,032 | | |
| | 800 | | | NBC Universal Media LLC, Guaranteed Notes, 2.10%, due 4/1/14 | | | 805 | | |
| | | | 1,837 | | |
Mining (0.9%) | | | |
| | 360 | | | BHP Billiton Finance USA Ltd., Guaranteed Notes, 1.13%, due 11/21/14 | | | 363 | | |
| | 240 | | | Rio Tinto Finance USA PLC, Guaranteed Notes, 1.38%, due 6/17/16 | | | 242 | | |
| | | | 605 | | |
Oil & Gas (1.7%) | | | |
| | 665 | | | BP Capital Markets PLC, Guaranteed Notes, 1.70%, due 12/5/14 | | | 674 | | |
| | 200 | | | CNOOC Finance 2013 Ltd., Guaranteed Notes, 1.13%, due 5/9/16 | | | 199 | | |
| | 190 | | | Marathon Oil Corp., Senior Unsecured Notes, 0.90%, due 11/1/15 | | | 190 | | |
| | | | 1,063 | | |
Pharmaceuticals (4.3%) | | | |
| | 1,050 | | | AbbVie, Inc., Senior Unsecured Notes, 1.20%, due 11/6/15 | | | 1,058 | | |
| | 415 | | | Express Scripts Holding Co., Guaranteed Notes, 2.10%, due 2/12/15 | | | 422 | | |
| | 165 | | | McKesson Corp., Senior Unsecured Notes, 0.95%, due 12/4/15 | | | 165 | | |
| | 300 | | | Mylan, Inc., Guaranteed Notes, 1.80%, due 6/24/16 | | | 302 | ñ | |
| | 675 | | | Novartis Capital Corp., Guaranteed Notes, 2.90%, due 4/24/15 | | | 700 | | |
| | 75 | | | Zoetis, Inc., Senior Unsecured Notes, 1.15%, due 2/1/16 | | | 75 | | |
| | | | 2,722 | | |
See Notes to Schedule of Investments
67
Schedule of Investments Neuberger Berman Short Duration Bond Fund (cont'd)
PRINCIPAL AMOUNT | | | | VALUE† | |
(000's omitted) | | | | (000's omitted)z | |
Pipelines (0.7%) | | | |
$ | 215 | | | Enterprise Products Operating LLC, Guaranteed Notes, 1.25%, due 8/13/15 | | $ | 216 | | |
| | 240 | | | TransCanada PipeLines Ltd., Senior Unsecured Notes, 0.88%, due 3/2/15 | | | 241 | | |
| | | | 457 | | |
Real Estate Investment Trusts (0.3%) | | | |
| | 185 | | | Ventas Realty L.P., Guaranteed Notes, 1.55%, due 9/26/16 | | | 186 | | |
Retail (1.0%) | | | |
| | 625 | | | Home Depot, Inc., Senior Unsecured Notes, 5.25%, due 12/16/13 | | | 628 | | |
Telecommunications (0.9%) | | | |
| | 525 | | | Verizon Communications, Inc., Senior Unsecured Notes, 2.50%, due 9/15/16 | | | 545 | | |
| | | | | Total Corporate Debt Securities (Cost $26,833) | | | 27,115 | | |
Asset-Backed Securities (11.6%) | | | |
| | 2,075 | | | American Express Credit Account Master Trust, Ser. 2012-4, Class A, 0.41%, due 5/15/20 | | | 2,064 | µ | |
| | 1,200 | | | Citibank Credit Card Issuance Trust, Ser. 2013-A1, Class A1, 0.27%, due 4/24/17 | | | 1,199 | µ | |
| | 128 | | | Hyundai Auto Receivables Trust, Ser. 2011-A, Class A3, 1.16%, due 4/15/15 | | | 128 | | |
| | 474 | | | Mercedes-Benz Auto Receivables Trust, Ser. 2012-1, Class A2, 0.37%, due 3/16/15 | | | 474 | | |
| | 109 | | | Mercedes-Benz Auto Receivables Trust, Ser. 2011-1, Class A3, 0.85%, due 3/16/15 | | | 109 | | |
| | 213 | | | Nelnet Student Loan Trust, Ser. 2006-1, Class A4, 0.35%, due 11/23/22 | | | 212 | µ | |
| | 619 | | | Nissan Auto Receivables Owner Trust, Ser. 2012-B, Class A2, 0.39%, due 4/15/15 | | | 619 | | |
| | 591 | | | SLM Student Loan Trust, Ser. 2004-5, Class A4, 0.39%, due 1/25/21 | | | 591 | µ | |
| | 1,273 | | | SLM Student Loan Trust, Ser. 2006-5, Class A4, 0.32%, due 4/25/23 | | | 1,268 | µ | |
| | 793 | | | Soundview Home Equity Loan Trust, Ser. 2006-OPT3, Class 2A3, 0.34%, due 6/25/36 | | | 704 | µ | |
| | | | | Total Asset-Backed Securities (Cost $7,456) | | | 7,368 | | |
NUMBER OF SHARES | | | | | |
Short-Term Investments (3.8%) | | | |
| | 2,401,540 | | | State Street Institutional Liquid Reserves Fund Institutional Class (Cost $2,402) | | | 2,402 | | |
| | | | | Total Investments (102.0%) (Cost $64,648) | | | 64,631 | ## | |
| | | | | Liabilities, less cash, receivables and other assets [(2.0%)] | | | (1,268 | ) | |
| | | | | Total Net Assets (100.0%) | | $ | 63,363 | | |
See Notes to Schedule of Investments
68
Schedule of Investments Neuberger Berman Short Duration High Income Fund
PRINCIPAL AMOUNT | | | | VALUE† | |
(000's omitted) | | | | (000's omitted)z | |
| Bank Loan Obligationsµ(10.1%) | | | |
Air Transport (0.2%) | | | |
$ | 252 | | | Delta Air Lines, Term Loan, 4.25%, due 4/20/17 | | $ | 254 | | |
All Telecom (1.0%) | | | |
| | 144 | | | Cricket Communications, Inc., Term Loan B, 4.75%, due 10/10/19 | | | 144 | | |
| | 409 | | | Cricket Communications, Inc., Term Loan C, 4.75%, due 3/8/20 | | | 411 | | |
| | 199 | | | Integra Telecom, Term Loan B, 5.25%, due 2/22/19 | | | 201 | | |
| | 255 | | | Level 3 Financing Inc., Term Loan B, 4.00%, due 1/15/20 | | | 256 | | |
| | | | 1,012 | | |
Automotive (0.6%) | | | |
| | 189 | | | Chrysler Automotive, Term Loan B, 4.25%, due 5/24/17 | | | 191 | | |
| | 399 | | | Navistar, Inc., Term Loan B, 5.75%, due 8/17/17 | | | 407 | | |
| | | | 598 | | |
Building & Development (0.6%) | | | |
| | 602 | | | Realogy Corporation, Term Loan B, 4.50%, due 3/5/20 | | | 608 | | |
Business Equipment & Services (0.6%) | | | |
| | 601 | | | Kronos, First Lien Term Loan, 4.50%, due 10/30/19 | | | 604 | | |
Chemicals & Plastics (0.5%) | | | |
| | 199 | | | Dupont Performance Coatings, Term Loan B, 4.75%, due 2/1/20 | | | 201 | | |
| | 268 | | | PQ Corporation, Term Loan, 4.50%, due 8/7/17 | | | 270 | | |
| | | | 471 | | |
Electronics - Electrical (0.4%) | | | |
| | 400 | | | Ceridian Corp., Term Loan, 4.42%, due 5/9/17 | | | 402 | | |
Financial Intermediaries (0.8%) | | | |
| | 255 | | | First Data Corporation, Term Loan, 4.17%, due 3/24/17 | | | 255 | | |
| | 620 | | | First Data Corporation, Term Loan, 4.17%, due 3/23/18 | | | 620 | | |
| | | | 875 | | |
Food & Drug Retailers (0.4%) | | | |
| | 380 | | | Rite Aid Corp., Term Loan 6, 4.00%, due 2/21/20 | | | 383 | | |
| | 55 | | | Rite Aid Corp., Term Loan 2, 4.88%, due 6/21/21 | | | 56 | | |
| | | | 439 | | |
Leisure Goods - Activities - Movies (0.8%) | | | |
| | 600 | | | Scientific Games Corp., Term Loan, 4.25%, due 10/18/20 | | | 600 | | |
| | 265 | | | Warner Music Group, Term Loan B, 3.75%, due 7/1/20 | | | 265 | | |
| | | | 865 | | |
See Notes to Schedule of Investments
69
Schedule of Investments Neuberger Berman Short Duration High Income Fund (cont'd)
PRINCIPAL AMOUNT | | | | VALUE† | |
(000's omitted) | | | | (000's omitted)z | |
Lodging & Casinos (2.2%) | | | |
$ | 402 | | | Centaur Acquisition, LLC, Second Lien Term Loan, 8.75%, due 2/20/20 | | $ | 406 | | |
| | 625 | | | CityCenter, Term Loan B, 5.00%, due 10/16/20 | | | 630 | | |
| | 635 | | | Hilton Worldwide, Term Loan, 4.00%, due 10/26/20 | | | 639 | | |
| | 617 | | | Station Casinos, Term Loan B, 5.00%, due 3/2/20 | | | 622 | | |
| | | | 2,297 | | |
Nonferrous Metals - Minerals (0.5%) | | | |
| | 353 | | | Alpha Natural Resources, Term Loan B, 3.50%, due 5/22/20 | | | 337 | | |
| | 233 | | | Peabody Energy Corp., Term Loan, 4.25%, due 9/24/20 | | | 232 | | |
| | | | 569 | | |
Oil & Gas (0.8%) | | | |
| | 825 | | | Chesapeake Energy, Term Loan B, 5.75%, due 12/2/17 | | | 843 | | |
Radio & Television (0.4%) | | | |
| | 206 | | | Cumulus Media, First Lien Term Loan, 4.50%, due 9/17/18 | | | 207 | | |
| | 204 | | | Univision Communications Inc., Term Loan, 4.00%, due 3/1/20 | | | 204 | | |
| | | | 411 | | |
Retailers (except food & drug) (0.3%) | | | |
| | 290 | | | Sears Holding Corp., Term Loan, 5.50%, due 6/30/18 | | | 291 | | |
| | | | | Total Bank Loan Obligations (Cost $10,502) | | | 10,539 | | |
Corporate Debt Securities (87.4%) | | | |
Aerospace & Defense (0.2%) | | | |
| | 195 | | | Bombardier, Inc., Senior Notes, 4.25%, due 1/15/16 | | | 203 | ñ | |
Airlines (1.1%) | | | |
| | 845 | | | Continental Airlines, Inc., Senior Secured Notes, 6.75%, due 9/15/15 | | | 871 | ñ | |
| | 221 | | | United Airlines, Inc., Pass-Through Certificates, Ser. 2009-2, Class A, 9.75%, due 1/15/17 | | | 253 | | |
| | | | 1,124 | | |
Auto Loans (1.1%) | | | |
| | 235 | | | General Motors Financial Co., Inc., Guaranteed Notes, 2.75%, due 5/15/16 | | | 237 | ñ | |
| | 705 | | | General Motors Financial Co., Inc., Guaranteed Notes, 4.75%, due 8/15/17 | | | 746 | ñ | |
| | 140 | | | General Motors Financial Co., Inc., Guaranteed Notes, 3.25%, due 5/15/18 | | | 139 | ñ | |
| | | | 1,122 | | |
Auto Parts & Equipment (0.4%) | | | |
| | 390 | | | Goodyear Tire & Rubber Co., Guaranteed Notes, 6.50%, due 3/1/21 | | | 412 | | |
Banking (3.0%) | | | |
| | 620 | | | Ally Financial, Inc., Guaranteed Notes, 4.63%, due 6/26/15 | | | 647 | | |
| | 795 | | | Ally Financial, Inc., Guaranteed Notes, 3.13%, due 1/15/16 | | | 809 | | |
See Notes to Schedule of Investments
70
Schedule of Investments Neuberger Berman Short Duration High Income Fund (cont'd)
PRINCIPAL AMOUNT | | | | VALUE† | |
(000's omitted) | | | | (000's omitted)z | |
$ | 1,180 | | | Ally Financial, Inc., Guaranteed Notes, 5.50%, due 2/15/17 | | $ | 1,275 | | |
| | 400 | | | Ally Financial, Inc., Guaranteed Notes, 4.75%, due 9/10/18 | | | 416 | | |
| | | | 3,147 | | |
Beverages (0.5%) | | | |
| | 25 | | | Constellation Brands, Inc., Guaranteed Notes, 7.25%, due 9/1/16 | | | 28 | | |
| | 425 | | | Constellation Brands, Inc., Guaranteed Notes, 7.25%, due 5/15/17 | | | 495 | | |
| | | | 523 | | |
Building & Construction (2.6%) | | | |
| | 260 | | | D.R. Horton, Inc., Guaranteed Notes, 3.63%, due 2/15/18 | | | 262 | | |
| | 65 | | | Lennar Corp., Guaranteed Notes, Ser. B, 5.60%, due 5/31/15 | | | 69 | | |
| | 1,215 | | | Lennar Corp., Guaranteed Notes, 4.75%, due 12/15/17 | | | 1,276 | | |
| | 120 | | | Ryland Group, Inc., Guaranteed Notes, 8.40%, due 5/15/17 | | | 140 | | |
| | 505 | | | Shea Homes L.P., Senior Secured Notes, 8.63%, due 5/15/19 | | | 559 | | |
| | 280 | | | Standard Pacific Corp., Guaranteed Notes, 10.75%, due 9/15/16 | | | 339 | | |
| | 80 | | | Standard Pacific Corp., Guaranteed Notes, 8.38%, due 5/15/18 | | | 93 | | |
| | | | 2,738 | | |
Building Materials (1.6%) | | | |
| | 220 | | | Masco Corp., Senior Unsecured Notes, 6.13%, due 10/3/16 | | | 245 | | |
| | 175 | | | USG Corp., Guaranteed Notes, 9.75%, due 8/1/14 | | | 186 | ñ | |
| | 230 | | | USG Corp., Senior Unsecured Notes, 6.30%, due 11/15/16 | | | 246 | | |
| | 925 | | | USG Corp., Guaranteed Notes, 8.38%, due 10/15/18 | | | 1,006 | ñ | |
| | | | 1,683 | | |
Chemicals (1.5%) | | | |
| | 150 | | | Ashland, Inc., Senior Unsecured Notes, 3.00%, due 3/15/16 | | | 153 | | |
| | 515 | | | Huntsman Int'l LLC, Guaranteed Notes, 8.63%, due 3/15/20 | | | 570 | | |
| | 450 | | | Momentive Performance Materials, Inc., Senior Secured Notes, 8.88%, due 10/15/20 | | | 476 | | |
| | 350 | | | PQ Corp., Secured Notes, 8.75%, due 5/1/18 | | | 379 | ñ | |
| | | | 1,578 | | |
Computer Hardware (0.3%) | | | |
| | 310 | | | Seagate HDD Cayman, Guaranteed Notes, 3.75%, due 11/15/18 | | | 310 | ñ | |
Consumer - Commercial Lease Financing (5.9%) | | | |
| | 644 | | | AWAS Aviation Capital Ltd., Senior Secured Notes, 7.00%, due 10/17/16 | | | 669 | ñ | |
| | 80 | | | CIT Group, Inc., Senior Unsecured Notes, 4.75%, due 2/15/15 | | | 83 | ñ | |
| | 1,220 | | | CIT Group, Inc., Senior Unsecured Notes, 5.00%, due 5/15/17 | | | 1,311 | | |
| | 960 | | | CIT Group, Inc., Senior Unsecured Notes, 4.25%, due 8/15/17 | | | 1,007 | | |
| | 325 | | | Int'l Lease Finance Corp., Senior Unsecured Medium-Term Notes, Ser. R, 5.65%, due 6/1/14 | | | 333 | | |
| | 900 | | | Int'l Lease Finance Corp., Senior Unsecured Notes, 8.63%, due 9/15/15 | | | 1,001 | | |
| | 250 | | | Int'l Lease Finance Corp., Senior Secured Notes, 6.75%, due 9/1/16 | | | 278 | ñ | |
| | 1,015 | | | Int'l Lease Finance Corp., Senior Unsecured Notes, 8.75%, due 3/15/17 | | | 1,193 | | |
| | 275 | | | SLM Corp., Unsecured Medium-Term Notes, 5.50%, due 1/15/19 | | | 286 | | |
| | | | 6,161 | | |
See Notes to Schedule of Investments
71
Schedule of Investments Neuberger Berman Short Duration High Income Fund (cont'd)
PRINCIPAL AMOUNT | | | | VALUE† | |
(000's omitted) | | | | (000's omitted)z | |
Department Stores (0.8%) | | | |
$ | 830 | | | Sears Holdings Corp., Secured Notes, 6.63%, due 10/15/18 | | $ | 782 | | |
Electric - Generation (3.0%) | | | |
| | 1,066 | | | Calpine Corp., Senior Secured Notes, 7.88%, due 7/31/20 | | | 1,165 | ñ | |
| | 1,425 | | | NRG Energy, Inc., Guaranteed Notes, 7.63%, due 1/15/18 | | | 1,617 | | |
| | 350 | | | NRG Energy, Inc., Guaranteed Notes, 8.50%, due 6/15/19 | | | 377 | | |
| | | | 3,159 | | |
Electric - Integrated (0.4%) | | | |
| | 365 | | | IPALCO Enterprises, Inc., Senior Secured Notes, 7.25%, due 4/1/16 | | | 402 | ñ | |
Electronics (1.9%) | | | |
| | 375 | | | Amkor Technology, Inc., Guaranteed Notes, 7.38%, due 5/1/18 | | | 397 | | |
| | 365 | | | Ceridian Corp., Guaranteed Notes, 11.25%, due 11/15/15 | | | 367 | | |
| | 200 | | | Ceridian Corp., Senior Secured Notes, 8.88%, due 7/15/19 | | | 232 | ñ | |
| | 730 | | | Freescale Semiconductor, Inc., Senior Secured Notes, 9.25%, due 4/15/18 | | | 789 | ñ | |
| | 230 | | | NXP BV Funding LLC, Guaranteed Notes, 3.50%, due 9/15/16 | | | 236 | ñ | |
| | | | 2,021 | | |
Energy - Exploration & Production (7.4%) | | | |
| | 765 | | | Chesapeake Energy Corp., Guaranteed Notes, 3.25%, due 3/15/16 | | | 775 | | |
| | 935 | | | Chesapeake Energy Corp., Guaranteed Notes, 6.50%, due 8/15/17 | | | 1,047 | | |
| | 1,040 | | | Denbury Resources, Inc., Guaranteed Notes, 8.25%, due 2/15/20 | | | 1,144 | | |
| | 710 | | | EP Energy LLC/EP Energy Finance, Inc., Senior Unsecured Notes, 9.38%, due 5/1/20 | | | 820 | | |
| | 125 | | | EP Energy LLC/Everest Acquisition Finance, Inc., Senior Secured Notes, 6.88%, due 5/1/19 | | | 134 | | |
| | 585 | | | EXCO Resources, Inc., Guaranteed Notes, 7.50%, due 9/15/18 | | | 566 | | |
| | 1,785 | | | Linn Energy LLC, Guaranteed Notes, 8.63%, due 4/15/20 | | | 1,901 | | |
| | 740 | | | SandRidge Energy, Inc., Guaranteed Notes, 8.75%, due 1/15/20 | | | 799 | | |
| | 235 | | | Whiting Petroleum Corp., Guaranteed Notes, 5.00%, due 3/15/19 | | | 245 | | |
| | 280 | | | WPX Energy, Inc., Senior Unsecured Notes, 5.25%, due 1/15/17 | | | 299 | | |
| | | | 7,730 | | |
Food & Drug Retailers (0.8%) | | | |
| | 755 | | | Rite Aid Corp., Senior Secured Notes, 8.00%, due 8/15/20 | | | 847 | | |
Gaming (3.9%) | | | |
| | 635 | | | CityCenter Holdings LLC, Senior Secured Notes, 7.63%, due 1/15/16 | | | 668 | | |
| | 370 | | | GLP Capital L.P./GLP Financing II, Inc., Guaranteed Notes, 4.38%, due 11/1/18 | | | 377 | ñ | |
| | 150 | | | GLP Capital L.P./GLP Financing II, Inc., Guaranteed Notes, 4.88%, due 11/1/20 | | | 151 | ñ | |
| | 1,130 | | | MGM Mirage, Inc., Guaranteed Notes, 7.50%, due 6/1/16 | | | 1,269 | | |
| | 385 | | | MGM Resorts Int'l, Guaranteed Notes, 7.63%, due 1/15/17 | | | 438 | | |
| | 70 | | | Mohegan Tribal Gaming Authority, Secured Notes, 11.50%, due 11/1/17 | | | 78 | ñ | |
| | 225 | | | Peninsula Gaming LLC, Guaranteed Notes, 8.38%, due 2/15/18 | | | 245 | ñ | |
| | 225 | | | Seminole Indian Tribe of Florida, Senior Secured Notes, 7.75%, due 10/1/17 | | | 239 | ñ | |
| | 225 | | | Station Casinos LLC, Guaranteed Notes, 7.50%, due 3/1/21 | | | 241 | | |
| | 315 | | | Wynn Las Vegas LLC, Unsecured Notes, 7.75%, due 8/15/20 | | | 355 | | |
| | | | 4,061 | | |
See Notes to Schedule of Investments
72
Schedule of Investments Neuberger Berman Short Duration High Income Fund (cont'd)
PRINCIPAL AMOUNT | | | | VALUE† | |
(000's omitted) | | | | (000's omitted)z | |
Gas Distribution (3.4%) | | | |
$ | 755 | | | AmeriGas Partners L.P./AmeriGas Finance Corp., Senior Unsecured Notes, 6.25%, due 8/20/19 | | $ | 808 | | |
| | 525 | | | El Paso Corp., Senior Secured Notes, 7.00%, due 6/15/17 | | | 593 | | |
| | 380 | | | Ferrellgas L.P., Senior Unsecured Notes, 9.13%, due 10/1/17 | | | 399 | | |
| | 81 | | | Kinder Morgan Finance Co., Senior Secured Notes, 5.70%, due 1/5/16 | | | 87 | | |
| | 320 | | | Regency Energy Partners L.P., Guaranteed Notes, 6.88%, due 12/1/18 | | | 346 | | |
| | 295 | | | Southern Star Central Corp., Senior Unsecured Notes, 6.75%, due 3/1/16 | | | 299 | | |
| | 935 | | | Suburban Propane Partners L.P./Suburban Energy Finance Corp.,
Senior Unsecured Notes, 7.50%, due 10/1/18 | | | 1,004
| | |
| | | | 3,536 | | |
Health Facilities (4.5%) | | | |
| | 450 | | | CHS/Community Health Systems, Inc., Senior Secured Notes, 5.13%, due 8/15/18 | | | 468 | | |
| | 350 | | | CHS/Community Health Systems, Inc., Guaranteed Notes, 8.00%, due 11/15/19 | | | 379 | | |
| | 210 | | | DaVita HealthCare Partners, Inc., Guaranteed Notes, 6.63%, due 11/1/20 | | | 224 | | |
| | 980 | | | HCA, Inc., Senior Secured Notes, 8.50%, due 4/15/19 | | | 1,052 | | |
| | 480 | | | IASIS Healthcare LLC/IASIS Capital Corp., Guaranteed Notes, 8.38%, due 5/15/19 | | | 509 | | |
| | 1,000 | | | OMEGA Healthcare Investors, Inc., Guaranteed Notes, 7.50%, due 2/15/20 | | | 1,095 | | |
| | 465 | | | Tenet Healthcare Corp., Senior Secured Notes, 6.25%, due 11/1/18 | | | 509 | | |
| | 260 | | | Tenet Healthcare Corp., Senior Secured Notes, 6.00%, due 10/1/20 | | | 275 | ñ | |
| | 180 | | | United Surgical Partners Int'l, Inc., Guaranteed Notes, 9.00%, due 4/1/20 | | | 202 | | |
| | | | 4,713 | | |
Health Services (1.2%) | | | |
| | 465 | | | Emergency Medical Services Corp., Guaranteed Notes, 8.13%, due 6/1/19 | | | 505 | | |
| | 110 | | | Healthcare Technology Intermediate, Inc., Senior Unsecured Notes, 7.38%, due 9/1/18 | | | 114 | ñc | |
| | 203 | | | Service Corp. Int'l, Senior Unsecured Notes, 6.75%, due 4/1/15 | | | 216 | | |
| | 387 | | | Service Corp. Int'l, Senior Unsecured Notes, 6.75%, due 4/1/16 | | | 423 | | |
| | | | 1,258 | | |
Investments & Misc. Financial Services (1.9%) | | | |
| | 1,920 | | | Icahn Enterprises L.P., Guaranteed Notes, 8.00%, due 1/15/18 | | | 2,014 | | |
Leisure (1.3%) | | | |
| | 895 | | | Cedar Fair L.P., Guaranteed Notes, 9.13%, due 8/1/18 | | | 980 | | |
| | 360 | | | Royal Caribbean Cruises Ltd., Senior Unsecured Notes, 7.25%, due 6/15/16 | | | 406 | | |
| | | | 1,386 | | |
Machinery (1.6%) | | | |
| | 875 | | | Case New Holland, Inc., Guaranteed Notes, 7.88%, due 12/1/17 | | | 1,036 | | |
| | 70 | | | CNH Capital LLC, Guaranteed Notes, 3.88%, due 11/1/15 | | | 72 | | |
| | 200 | | | CNH Capital LLC, Guaranteed Notes, 6.25%, due 11/1/16 | | | 219 | | |
| | 355 | | | The Manitowoc Co., Inc., Guaranteed Notes, 9.50%, due 2/15/18 | | | 379 | | |
| | | | 1,706 | | |
Managed Care (0.4%) | | | |
| | 360 | | | MPH Intermediate Holding Co. 2, Senior Unsecured Notes, 8.38%, due 8/1/18 | | | 374 | ñc | |
See Notes to Schedule of Investments
73
Schedule of Investments Neuberger Berman Short Duration High Income Fund (cont'd)
PRINCIPAL AMOUNT | | | | VALUE† | |
(000's omitted) | | | | (000's omitted)z | |
Media - Broadcast (0.9%) | | | |
$ | 415 | | | Clear Channel Communications, Inc., Senior Unsecured Notes, 5.50%, due 9/15/14 | | $ | 409 | | |
| | 440 | | | Univision Communications, Inc., Senior Secured Notes, 6.88%, due 5/15/19 | | | 474 | ñ | |
| | | | 883 | | |
Media - Cable (5.9%) | | | |
| | 400 | | | CCO Holdings LLC, Guaranteed Notes, 7.25%, due 10/30/17 | | | 423 | | |
| | 365 | | | CCO Holdings LLC, Guaranteed Notes, 8.13%, due 4/30/20 | | | 399 | | |
| | 885 | | | CCO Holdings LLC, Guaranteed Notes, 7.38%, due 6/1/20 | | | 967 | | |
| | 895 | | | CSC Holdings, Inc., Senior Unsecured Notes, 7.88%, due 2/15/18 | | | 1,036 | | |
| | 520 | | | DISH DBS Corp., Guaranteed Notes, 4.25%, due 4/1/18 | | | 528 | | |
| | 1,650 | | | EchoStar DBS Corp., Guaranteed Notes, 7.13%, due 2/1/16 | | | 1,823 | | |
| | 130 | | | UPC Holding BV, Secured Notes, 9.88%, due 4/15/18 | | | 141 | ñ | |
| | 445 | | | UPCB Finance III Ltd., Senior Secured Notes, 6.63%, due 7/1/20 | | | 475 | ñ | |
| | 305 | | | Virgin Media Finance PLC, Guaranteed Notes, 8.38%, due 10/15/19 | | | 333 | | |
| | | | 6,125 | | |
Media - Services (1.0%) | | | |
| | 245 | | | Clear Channel Worldwide Holdings, Inc., Guaranteed Notes, Ser. B, 7.63%, due 3/15/20 | | | 261 | | |
| | 170 | | | Lamar Media Corp., Guaranteed Notes, 9.75%, due 4/1/14 | | | 176 | | |
| | 565 | | | Lamar Media Corp., Guaranteed Notes, 7.88%, due 4/15/18 | | | 602 | | |
| | | | 1,039 | | |
Medical Products (0.9%) | | | |
| | 575 | | | Fresenius Medical Care US Finance, Inc., Guaranteed Notes, 6.88%, due 7/15/17 | | | 650 | | |
| | 210 | | | Fresenius Medical Care US Finance, Inc., Guaranteed Notes, 6.50%, due 9/15/18 | | | 235 | ñ | |
| | | | 885 | | |
Metals - Mining Excluding Steel (2.5%) | | | |
| | 1,325 | | | FMG Resources (August 2006) Pty Ltd., Guaranteed Notes, 7.00%, due 11/1/15 | | | 1,375 | ñ | |
| | 880 | | | Peabody Energy Corp., Guaranteed Notes, 7.38%, due 11/1/16 | | | 990 | | |
| | 190 | | | Walter Energy, Inc., Senior Secured Notes, 9.50%, due 10/15/19 | | | 200 | ñ | |
| | | | 2,565 | | |
Packaging (2.3%) | | | |
| | 355 | | | Berry Plastics Corp., Secured Notes, 9.50%, due 5/15/18 | | | 385 | | |
| | 250 | | | Reynolds Group Issuer, Inc., Senior Secured Notes, 7.13%, due 4/15/19 | | | 267 | | |
| | 1,620 | | | Reynolds Group Issuer, Inc., Senior Secured Notes, 7.88%, due 8/15/19 | | | 1,790 | | |
| | | | 2,442 | | |
Pharmaceuticals (2.7%) | | | |
| | 245 | | | Endo Pharmaceuticals Holdings, Inc., Guaranteed Notes, 7.00%, due 7/15/19 | | | 262 | | |
| | 440 | | | Jaguar Holding Co. II/Jaguar Merger Sub, Inc., Senior Unsecured Notes, 9.50%, due 12/1/19 | | | 494 | ñ | |
| | 300 | | | Valeant Pharmaceuticals Int'l, Guaranteed Notes, 6.50%, due 7/15/16 | | | 311 | ñ | |
| | 460 | | | Valeant Pharmaceuticals Int'l, Guaranteed Notes, 6.75%, due 10/1/17 | | | 494 | ñ | |
| | 915 | | | Valeant Pharmaceuticals Int'l, Guaranteed Notes, 6.88%, due 12/1/18 | | | 978 | ñ | |
| | 245 | | | Valeant Pharmaceuticals Int'l, Senior Unsecured Notes, 6.75%, due 8/15/18 | | | 268 | ñ | |
| | | | 2,807 | | |
See Notes to Schedule of Investments
74
Schedule of Investments Neuberger Berman Short Duration High Income Fund (cont'd)
PRINCIPAL AMOUNT | | | | VALUE† | |
(000's omitted) | | | | (000's omitted)z | |
Printing & Publishing (3.0%) | | | |
$ | 250 | | | Gannett Co., Inc., Guaranteed Notes, 6.38%, due 9/1/15 | | $ | 271 | | |
| | 615 | | | Gannett Co., Inc., Guaranteed Notes, 7.13%, due 9/1/18 | | | 661 | | |
| | 215 | | | Gannett Co., Inc., Guaranteed Notes, 5.13%, due 10/15/19 | | | 222 | ñ | |
| | 1,455 | | | R. R. Donnelley & Sons Co., Senior Unsecured Notes, 8.60%, due 8/15/16 | | | 1,691 | | |
| | 264 | | | R. R. Donnelley & Sons Co., Senior Unsecured Notes, 7.25%, due 5/15/18 | | | 298 | | |
| | | | 3,143 | | |
Software - Services (1.9%) | | | |
| | 795 | | | First Data Corp., Senior Secured Notes, 7.38%, due 6/15/19 | | | 856 | ñ | |
| | 410 | | | Sophia, L.P., Guaranteed Notes, 9.75%, due 1/15/19 | | | 447 | ñ | |
| | 310 | | | SunGard Data Systems, Inc., Guaranteed Notes, 7.38%, due 11/15/18 | | | 328 | | |
| | 331 | | | Syniverse Holdings, Inc., Guaranteed Notes, 9.13%, due 1/15/19 | | | 358 | | |
| | | | 1,989 | | |
Specialty Retail (0.8%) | | | |
| | 50 | | | Limited Brands, Inc., Senior Unsecured Notes, 6.90%, due 7/15/17 | | | 57 | | |
| | 295 | | | Michaels FinCo Holdings LLC / Michaels FinCo, Inc., Senior Unsecured Notes, 7.50%, due 8/1/18 | | | 305 | ñc | |
| | 430 | | | Sally Holdings LLC/Sally Capital, Inc., Guaranteed Notes, 6.88%, due 11/15/19 | | | 475 | | |
| | | | 837 | | |
Steel Producers - Products (2.3%) | | | |
| | 805 | | | ArcelorMittal, Senior Unsecured Notes, 4.25%, due 2/25/15 | | | 829 | | |
| | 365 | | | ArcelorMittal, Senior Unsecured Notes, 4.25%, due 8/5/15 | | | 377 | | |
| | 925 | | | ArcelorMittal, Senior Unsecured Notes, 5.00%, due 2/25/17 | | | 977 | | |
| | 185 | | | Steel Dynamics, Inc., Guaranteed Notes, 6.13%, due 8/15/19 | | | 201 | | |
| | | | 2,384 | | |
Support - Services (2.2%) | | | |
| | 575 | | | Avis Budget Car Rental LLC/Avis Budget Finance, Inc., Guaranteed Notes, 4.88%, due 11/15/17 | | | 599 | | |
| | 370 | | | Hertz Corp., Guaranteed Notes, 7.50%, due 10/15/18 | | | 401 | | |
| | 670 | | | Iron Mountain, Inc., Guaranteed Notes, 7.75%, due 10/1/19 | | | 745 | | |
| | 55 | | | Knowledge Learning Corp., Inc., Guaranteed Notes, 7.75%, due 2/1/15 | | | 54 | ñ | |
| | 445 | | | ServiceMaster Co., Guaranteed Notes, 8.00%, due 2/15/20 | | | 456 | | |
| | | | 2,255 | | |
Telecom - Integrated Services (7.2%) | | | |
| | 660 | | | Frontier Communications Corp., Senior Unsecured Notes, 8.25%, due 4/15/17 | | | 763 | | |
| | 970 | | | Intelsat Jackson Holdings SA, Guaranteed Notes, 8.50%, due 11/1/19 | | | 1,065 | | |
| | 195 | | | Intelsat Luxembourg SA, Guaranteed Notes, 6.75%, due 6/1/18 | | | 205 | ñ | |
| | 620 | | | Level 3 Financing, Inc., Guaranteed Notes, 10.00%, due 2/1/18 | | | 663 | | |
| | 415 | | | Level 3 Financing, Inc., Guaranteed Notes, 9.38%, due 4/1/19 | | | 464 | | |
| | 655 | | | Level 3 Financing, Inc., Guaranteed Notes, 8.13%, due 7/1/19 | | | 722 | | |
| | 638 | | | Qwest Communications Int'l, Inc., Guaranteed Notes, 7.13%, due 4/1/18 | | | 662 | | |
| | 685 | | | Telesat Canada/Telesat LLC, Senior Unsecured Notes, 6.00%, due 5/15/17 | | | 716 | ñ | |
| | 1,985 | | | Windstream Corp., Guaranteed Notes, 7.88%, due 11/1/17 | | | 2,270 | | |
| | | | 7,530 | | |
See Notes to Schedule of Investments
75
Schedule of Investments Neuberger Berman Short Duration High Income Fund (cont'd)
PRINCIPAL AMOUNT | | | | VALUE† | |
(000's omitted) | | | | (000's omitted)z | |
Telecom - Wireless (3.1%) | | | |
$ | 60 | | | Clearwire Communications LLC, Senior Secured Notes, 12.00%, due 12/1/15 | | $ | 62 | ñ | |
| | 675 | | | Sprint Nextel Corp., Senior Unsecured Notes, 8.38%, due 8/15/17 | | | 781 | | |
| | 1,140 | | | Sprint Nextel Corp., Senior Unsecured Notes, 6.00%, due 12/1/16 | | | 1,233 | | |
| | 185 | | | T-Mobile USA, Inc., Senior Unsecured Notes, 5.25%, due 9/1/18 | | | 192 | ñ | |
| | 945 | | | T-Mobile USA, Inc., Guaranteed Notes, 6.46%, due 4/28/19 | | | 1,002 | | |
| | | | 3,270 | | |
| | | | | Total Corporate Debt Securities (Cost $90,803) | | | 91,144 | | |
Convertible Bonds (0.6%) | | | |
| | 645 | | | Alpha Appalachia Holdings, Inc., Guaranteed Notes, 3.25%, due 8/1/15 (Cost $628) | | | 613 | | |
NUMBER OF SHARES | | | | | |
Short-Term Investments (0.0%) | | | |
| | 38,910 | | | State Street Institutional Liquid Reserves Fund Institutional Class (Cost $39) | | | 39 | | |
| | | | | Total Investments (98.1%) (Cost $101,972) | | | 102,335 | ## | |
| | | | | Cash, receivables and other assets, less liabilities (1.9%) | | | 2,008 | | |
| | | | | Total Net Assets (100.0%) | | $ | 104,343 | | |
See Notes to Schedule of Investments
76
Schedule of Investments Neuberger Berman Strategic Income Fund
PRINCIPAL AMOUNT | | | | VALUE† | |
(000's omitted) | | | | (000's omitted)z | |
| Bank Loan Obligationsµ(14.5%) | | | |
Aerospace & Defense (0.1%) | | | |
$ | 1,053 | | | Silver II/Hamilton Sundstrand Corporation, Term Loan, 4.00%, due 12/13/19 | | $ | 1,052 | ØØ | |
| | 618 | | | Transdigm Inc., Term Loan C, 3.75%, due 2/28/20 | | | 618 | ØØ | |
| | | | 1,670 | | |
Air Transport (0.3%) | | | |
| | 1,875 | | | American Airlines Inc., Term Loan B, 4.75%, due 6/27/19 | | | 1,885 | ØØ | |
| | 1,742 | | | United Air Lines, Inc., Term Loan B, 4.00%, due 4/1/19 | | | 1,750 | ØØ | |
| | | | 3,635 | | |
All Telecom (0.8%) | | | |
| | 909 | | | Arris Group, Term Loan B, 3.50%, due 4/17/20 | | | 906 | ØØ | |
| | 1,477 | | | Cricket Communications, Inc., Term Loan C, 4.75%, due 3/8/20 | | | 1,484 | ØØ | |
| | 973 | | | Integra Telecom, Term Loan B, 5.25%, due 2/22/19 | | | 983 | ØØ | |
| | 1,121 | | | Intelsat Jackson HLDG, Term Loan B-1, 4.25%, due 4/2/18 | | | 1,126 | ØØ | |
| | 1,780 | | | Level 3 Financing Inc., Term Loan B-III, 4.00%, due 8/1/19 | | | 1,787 | ØØ | |
| | 1,330 | | | Level 3 Financing Inc., Term Loan B, 4.00%, due 1/15/20 | | | 1,336 | ØØ | |
| | 1,155 | | | Syniverse Technologies, Term Loan B, 4.00%, due 4/23/19 | | | 1,157 | ØØ | |
| | 995 | | | Windstream Corp., Term Loan B-4, 3.50%, due 1/23/20 | | | 997 | ØØ | |
| | | | 9,776 | | |
Automotive (0.6%) | | | |
| | 1,318 | | | Allison Transmission, Term Loan B-3, 3.75%, due 8/23/19 | | | 1,326 | ØØ | |
| | 1,140 | | | Chrysler Automotive, Term Loan B, 4.25%, due 5/24/17 | | | 1,150 | ØØ | |
| | 1,965 | | | Goodyear Engineered Products, Term Loan, 5.25%, due 9/8/17 | | | 1,951 | ØØ | |
| | 979 | | | Goodyear Tire & Rubber Company, Second Lien Term Loan, 4.75%, due 4/30/19 | | | 990 | ØØ | |
| | 2,683 | | | TI Group Automotive, Term Loan, 5.50%, due 3/28/19 | | | 2,716 | Ñ | |
| | | | 8,133 | | |
Building & Development (0.6%) | | | |
| | 780 | | | American Builders & Co., Inc., Term Loan B, 3.50%, due 4/16/20 | | | 781 | ØØ | |
| | 1,539 | | | Capital Automotive LP, Term Loan B-1, 4.00%, due 4/10/19 | | | 1,547 | ØØ | |
| | 940 | | | Capital Automotive LP, Second Lien Term Loan, 6.00%, due 4/30/20 | | | 967 | ØØ | |
| | 3,773 | | | Realogy Corporation, Term Loan B, 4.50%, due 3/5/20 | | | 3,810 | ØØ | |
| | | | 7,105 | | |
Business Equipment & Services (1.1%) | | | |
| | 1,606 | | | Acosta Inc., Term Loan B, 4.25%, due 3/2/18 | | | 1,610 | ¢^^ØØ | |
| | 484 | | | Advantage Sales & Marketing, First Lien Term Loan, 4.25%, due 12/18/17 | | | 488 | ÑØØ | |
| | 105 | | | BMC Software, Term Loan, 5.00%, due 9/10/20 | | | 106 | ØØ | |
| | 1,780 | | | BMC Software, Term Loan, 5.00%, due 9/10/20 | | | 1,797 | ØØ | |
| | 998 | | | KAR Auction Services, Inc., Term Loan, 3.75%, due 5/19/17 | | | 1,001 | ØØ | |
| | 997 | | | Kronos, First Lien Term Loan, 4.50%, due 10/30/19 | | | 1,001 | ØØ | |
| | 795 | | | Minimax Viking, Term Loan B1, 4.50%, due 8/14/20 | | | 798 | ØØ | |
| | 420 | | | Mitchell International, Inc., Term Loan B, 4.50%, due 10/12/20 | | | 423 | ØØ | |
| | 415 | | | Mitchell International, Inc., Second Lien Term Loan, due 9/17/21 | | | 421 | ¢^^ | |
| | 991 | | | Monitronics, Term Loan B, 4.25%, due 3/23/18 | | | 998 | ØØ | |
| | 780 | | | Protection One, Term Loan B, 4.25%, due 3/21/19 | | | 780 | ØØ | |
| | 1,005 | | | Servicemaster Company, Term Loan C, 4.25%, due 1/31/17 | | | 987 | ØØ | |
See Notes to Schedule of Investments
77
Schedule of Investments Neuberger Berman Strategic Income Fund (cont'd)
PRINCIPAL AMOUNT | | | | VALUE† | |
(000's omitted) | | | | (000's omitted)z | |
$ | 1,382 | | | SunGard Data Systems, Term Loan E, 4.00%, due 3/8/20 | | $ | 1,391 | ØØ | |
| | 547 | | | SymphonyIRI Group, Inc., Term Loan B, 4.75%, due 9/30/20 | | | 549 | ¢^^ØØ | |
| | 1,294 | | | West Corporation, Term Loan B-8, 3.75%, due 6/30/18 | | | 1,297 | ØØ | |
| | | | 13,647 | | |
Chemicals & Plastics (0.6%) | | | |
| | 891 | | | Dupont Performance Coatings, Term Loan B, 4.75%, due 2/1/20 | | | 900 | ØØ | |
| | 655 | | | Huntsman International LLC, Term Loan B, due 10/15/20 | | | 656 | ¢^^ | |
| | 1,381 | | | Ineos Holdings, First Lien Term Loan, 4.00%, due 5/4/18 | | | 1,385 | ØØ | |
| | 1,727 | | | MacDermid Inc., First Lien Term Loan B, 4.00%, due 6/7/20 | | | 1,732 | ØØ | |
| | 877 | | | OXEA FIN/CY SCA, First Lien Term Loan B-2, 4.25%, due 1/15/20 | | | 878 | ØØ | |
| | 1,912 | | | PQ Corporation, Term Loan, 4.50%, due 8/7/17 | | | 1,926 | ØØ | |
| | 944 | | | Univar Inc., Term Loan B, 5.00%, due 6/30/17 | | | 928 | ØØ | |
| | | | 8,405 | | |
Conglomerates (0.1%) | | | |
| | 1,035 | | | Gardner Denver, Term Loan, 4.25%, due 7/30/20 | | | 1,035 | ØØ | |
| | 704 | | | Spectrum Brands, Inc., Term Loan, 4.50%, due 12/17/19 | | | 706 | ØØ | |
| | | | 1,741 | | |
Containers & Glass Products (0.6%) | | | |
| | 1,206 | | | Berlin Packaging, First Lien Term Loan, 4.75%, due 4/2/19 | | | 1,213 | ØØ | |
| | 570 | | | Berlin Packaging, Second Lien Term Loan, 8.75%, due 4/2/20 | | | 574 | ØØ | |
| | 1,075 | | | Berry Plastics, Term Loan D, 3.50%, due 2/8/20 | | | 1,070 | ØØ | |
| | 1,021 | | | Pact Group, Term Loan, 3.75%, due 5/29/20 | | | 1,012 | ØØ | |
| | 2,987 | | | Reynolds Group, Term Loan, 4.75%, due 9/28/18 | | | 3,010 | ØØ | |
| | 883 | | | Sealed Air Corporation, Term Loan B-1, 4.00%, due 10/3/18 | | | 888 | ØØ | |
| | | | 7,767 | | |
Drugs (0.2%) | | | |
| | 1,322 | | | Par Pharmaceutical Companies, Inc., Term Loan B-1, 4.25%, due 9/30/19 | | | 1,326 | ØØ | |
| | 1,609 | | | Valeant Pharmaceuticals, Term Loan B, 3.75%, due 2/13/19 | | | 1,622 | ØØ | |
| | | | 2,948 | | |
Ecological Services & Equipment (0.1%) | | | |
| | 1,047 | | | ADS Waste Holdings, Inc., Term Loan B, 4.25%, due 10/9/19 | | | 1,052 | ØØ | |
Electronics - Electrical (0.9%) | | | |
| | 1,583 | | | BOC Edwards, First Lien Term Loan, 4.75%, due 3/26/20 | | | 1,584 | ØØ | |
| | 2,343 | | | Ceridian Corp., Term Loan, 4.42%, due 5/9/17 | | | 2,354 | ØØ | |
| | 2,005 | | | Datatel-Sophia LP, Term Loan B, 4.50%, due 7/19/18 | | | 2,022 | ¢^^ØØ | |
| | 764 | | | Epicor Software Corp., Term Loan B, 4.50%, due 5/16/18 | | | 768 | ØØ | |
| | 1,015 | | | Freescale Semiconductor, Term Loan B-4, 5.00%, due 3/1/20 | | | 1,023 | ØØ | |
| | 115 | | | Freescale Semiconductor, Term Loan B5, 5.00%, due 1/15/21 | | | 116 | ØØ | |
| | 1,762 | | | Go Daddy, Term Loan B-2, 4.25%, due 12/17/18 | | | 1,767 | ØØ | |
| | 818 | | | Riverbed Technology, Term Loan, 4.00%, due 12/18/19 | | | 822 | ØØ | |
| | 1,643 | | | Verint Systems Inc., Term Loan, 4.00%, due 9/6/19 | | | 1,648 | ØØ | |
| | | | 12,104 | | |
See Notes to Schedule of Investments
78
Schedule of Investments Neuberger Berman Strategic Income Fund (cont'd)
PRINCIPAL AMOUNT | | | | VALUE† | |
(000's omitted) | | | | (000's omitted)z | |
Equipment Leasing (0.3%) | | | |
$ | 1,407 | | | AWAS Fin Lux 2012 SA, Term Loan, 3.50%, due 7/16/18 | | $ | 1,407 | ØØ | |
| | 2,235 | | | International Lease Finance Co., Term Loan, 3.50%, due 6/30/17 | | | 2,234 | ØØ | |
| | | | 3,641 | | |
Financial Intermediaries (1.5%) | | | |
| | 744 | | | American Capital, Term Loan B, 4.00%, due 8/22/16 | | | 746 | ØØ | |
| | 1,951 | | | CITCO, Term Loan, 4.25%, due 6/29/18 | | | 1,951 | ØØ | |
| | 2,780 | | | First Data Corporation, Term Loan, 4.17%, due 3/24/17 | | | 2,782 | ØØ | |
| | 30 | | | First Data Corporation, Term Loan, due 3/23/18 | | | 30 | ¢^^ | |
| | 1,530 | | | First Data Corporation, Term Loan, 4.17%, due 9/24/18 | | | 1,531 | ØØ | |
| | 715 | | | Guggenheim Partners, Term Loan, 4.25%, due 7/22/20 | | | 718 | ØØ | |
| | 1,350 | | | Mondrian Investment, Term Loan B-1, 4.00%, due 3/9/20 | | | 1,355 | ØØ | |
| | 2,320 | | | MoneyGram International, Term Loan, 4.25%, due 3/27/20 | | | 2,326 | ØØ | |
| | 1,841 | | | Nuveen Inv., First Lien Term Loan B, 4.17%, due 5/13/17 | | | 1,830 | ¢^^ØØ | |
| | 290 | | | Nuveen Inv., Second Lien Term Loan B, 6.50%, due 2/28/19 | | | 284 | ØØ | |
| | 2,144 | | | Ocwen Financial, Term Loan, 5.00%, due 2/15/18 | | | 2,170 | ØØ | |
| | 1,085 | | | Springleaf, Term Loan, 4.75%, due 9/30/19 | | | 1,095 | ØØ | |
| | 1,212 | | | TCW Group, Term Loan, 4.00%, due 2/6/20 | | | 1,212 | ØØ | |
| | 1,097 | | | Walter Investment Mgmt., Term Loan B, 5.75%, due 11/28/17 | | | 1,107 | ØØ | |
| | | | 19,137 | | |
Food & Drug Retailers (0.2%) | | | |
| | 2,769 | | | Rite Aid Corp., Term Loan 6, 4.00%, due 2/21/20 | | | 2,782 | ØØ | |
Food Products (0.3%) | | | |
| | 930 | | | Del Monte Corp., Term Loan, 4.00%, due 3/8/18 | | | 930 | ØØ | |
| | 1,675 | | | HJ Heinz Company, Term Loan B-2, 3.50%, due 6/5/20 | | | 1,686 | ØØ | |
| | 1,791 | | | Pinnacle Foods Finance LLC, Term Loan G, 3.25%, due 4/29/20 | | | 1,789 | ØØ | |
| | | | 4,405 | | |
Food Service (0.4%) | | | |
| | 1,097 | | | Aramark Corporation, Term Loan D, 4.00%, due 9/9/19 | | | 1,099 | ØØ | |
| | 2,971 | | | US Foodservice Inc., Term Loan, 4.50%, due 3/31/19 | | | 2,979 | ØØ | |
| | 1,726 | | | Weight Watchers International, Term Loan B-2, 3.75%, due 4/2/20 | | | 1,585 | ØØ | |
| | | | 5,663 | | |
Health Care (0.7%) | | | |
| | 1,257 | | | Biomet, Inc., Term Loan B-2, 3.67%, due 7/25/17 | | | 1,265 | ØØ | |
| | 1,345 | | | DaVita, Inc., Term Loan B-2, 4.00%, due 11/1/19 | | | 1,353 | ØØ | |
| | 1,107 | | | EMS-Emergency Medical Services, Term Loan, 4.00%, due 5/25/18 | | | 1,111 | ØØ | |
| | 973 | | | IASIS Healthcare Corporation, Term Loan B-2, 4.50%, due 5/3/18 | | | 979 | ¢^^ØØ | |
| | 1,771 | | | Immucor, Term Loan B-2, 5.00%, due 8/19/18 | | | 1,779 | ØØ | |
| | 979 | | | Pharmaceutical Product Development, Inc., Term Loan, 4.25%, due 12/5/18 | | | 987 | ØØ | |
| | 865 | | | Sheridan Healthcare, First Lien Term Loan, 4.50%, due 6/29/18 | | | 869 | ØØ | |
| | 1,024 | | | United Surgical Partners International, Inc., Term Loan B, 4.75%, due 4/3/19 | | | 1,027 | ØØ | |
| | | | 9,370 | | |
See Notes to Schedule of Investments
79
Schedule of Investments Neuberger Berman Strategic Income Fund (cont'd)
PRINCIPAL AMOUNT | | | | VALUE† | |
(000's omitted) | | | | (000's omitted)z | |
Home Furnishings (0.1%) | | | |
$ | 931 | | | AOT Bedding Super Holdings, LLC, Term Loan, 5.00%, due 10/1/19 | | $ | 936 | ØØ | |
| | 439 | | | Jarden Corporation, Term Loan B1, 2.92%, due 9/30/20 | | | 439 | ØØ | |
| | | | 1,375 | | |
Industrial Equipment (0.2%) | | | |
| | 1,129 | | | Husky Injection Molding, Term Loan, 4.25%, due 6/30/18 | | | 1,135 | ØØ | |
| | 1,635 | | | Rexnord Corp., Term Loan B, 4.00%, due 8/21/20 | | | 1,636 | ØØ | |
| | | | 2,771 | | |
Insurance (0.1%) | | | |
| | 898 | | | Sedgwick Holdings Inc., First Lien Term Loan B, 4.25%, due 6/12/18 | | | 903 | ØØ | |
| | 215 | | | Sedgwick Holdings Inc., Second Lien Term Loan B, 8.00%, due 12/12/18 | | | 218 | ØØ | |
| | | | 1,121 | | |
Leisure Goods - Activities - Movies (0.7%) | | | |
| | 2,060 | | | Activision Blizzard Inc., Term Loan, 3.25%, due 10/12/20 | | | 2,066 | ØØ | |
| | 923 | | | Bombardier Recreational Products Inc., Term Loan B, 4.00%, due 1/30/19 | | | 927 | ØØ | |
| | 1,188 | | | Emerald Expositions Holdings, Term Loan, 5.50%, due 6/17/20 | | | 1,199 | Ñ | |
| | 2,020 | | | EMI Publishing, Term Loan B, 4.25%, due 6/29/18 | | | 2,029 | ØØ | |
| | 765 | | | Live Nation Entertainment, Inc., Term Loan B-1, 3.50%, due 8/17/20 | | | 767 | ØØ | |
| | 1,966 | | | Scientific Games Corp., Term Loan, due 10/18/20 | | | 1,966 | ¢^^ | |
| | | | 8,954 | | |
Lodging & Casinos (1.2%) | | | |
| | 775 | | | Boyd Gaming Corporation, Term Loan B, 4.00%, due 8/14/20 | | | 774 | ØØ | |
| | 395 | | | Cannery Casinos, First Lien Term Loan, 6.00%, due 10/2/18 | | | 395 | ØØ | |
| | 505 | | | Cannery Casinos, Second Lien Term Loan, 10.00%, due 10/2/19 | | | 468 | ØØ | |
| | 1,730 | | | Centaur Acquisition, LLC, Second Lien Term Loan, 8.75%, due 2/20/20 | | | 1,749 | ØØ | |
| | 1,540 | | | CityCenter, Term Loan B, 5.00%, due 10/16/20 | | | 1,552 | ØØ | |
| | 570 | | | Four Seasons Holdings Inc., First Lien Term Loan, 4.25%, due 6/27/20 | | | 574 | ØØ | |
| | 255 | | | Four Seasons Holdings Inc., Second Lien Term Loan, 6.25%, due 12/27/20 | | | 261 | Ñ | |
| | 2,505 | | | Hilton Worldwide, Term Loan, due 10/26/20 | | | 2,519 | ¢^^ | |
| | 963 | | | Peninsula Gaming, Term Loan B, 4.25%, due 11/20/17 | | | 965 | ØØ | |
| | 901 | | | Pinnacle Entertainment, Term Loan B-2, 3.75%, due 8/13/20 | | | 901 | ØØ | |
| | 930 | | | SHINGLE SPRINGS, Term Loan B, 6.25%, due 8/29/19 | | | 927 | ØØ | |
| | 4,347 | | | Station Casinos, Term Loan B, 5.00%, due 3/2/20 | | | 4,387 | ØØ | |
| | | | 15,472 | | |
Nonferrous Metals - Minerals (0.3%) | | | |
| | 504 | | | Alpha Natural Resources, Term Loan B, 3.50%, due 5/22/20 | | | 480 | ØØ | |
| | 993 | | | Arch Coal, Term Loan, 5.75%, due 5/16/18 | | | 963 | ØØ | |
| | 1,866 | | | Peabody Energy Corp., Term Loan, 4.25%, due 9/24/20 | | | 1,860 | ØØ | |
| | 600 | | | Walter Energy, Term Loan A, 5.74%, due 4/1/16 | | | 590 | ØØ | |
| | | | 3,893 | | |
Oil & Gas (0.4%) | | | |
| | 801 | | | Everest Acquisition LLC, Term Loan B-3, 3.50%, due 5/24/18 | | | 801 | ØØ | |
| | 1,380 | | | EXCO Resources Inc., Term Loan, 5.00%, due 8/19/19 | | | 1,380 | Ñ | |
See Notes to Schedule of Investments
80
Schedule of Investments Neuberger Berman Strategic Income Fund (cont'd)
PRINCIPAL AMOUNT | | | | VALUE† | |
(000's omitted) | | | | (000's omitted)z | |
$ | 710 | | | Fieldwood Energy, Term Loan, 3.88%, due 9/28/18 | | $ | 716 | ØØ | |
| | 1,049 | | | NFR Energy, Second Lien Term Loan, 8.75%, due 12/31/18 | | | 1,053 | ØØ | |
| | 972 | | | Samson Investment Company, Second Lien Term Loan, 6.00%, due 9/25/18 | | | 979 | ØØ | |
| | | | 4,929 | | |
Publishing (0.2%) | | | |
| | 1,324 | | | Springer Science+Business Media S.A., Term Loan B2, 5.00%, due 8/14/20 | | | 1,323 | ¢^^ØØ | |
| | 999 | | | Tribune Company, Term Loan B, 4.00%, due 12/31/19 | | | 999 | ØØ | |
| | | | 2,322 | | |
Radio & Television (0.8%) | | | |
| | 2,210 | | | Clear Channel, Term Loan D, 6.92%, due 1/30/19 | | | 2,100 | ¢^^ØØ | |
| | 1,437 | | | Cumulus Media, First Lien Term Loan, 4.50%, due 9/17/18 | | | 1,446 | ØØ | |
| | 974 | | | Formula One, Term Loan B, 4.50%, due 4/30/19 | | | 983 | ØØ | |
| | 660 | | | Nine Entertainment, Term Loan B, 3.75%, due 2/5/20 | | | 658 | Ñ | |
| | 10 | | | Univision Communications Inc., First Lien Term Loan, 4.50%, due 3/1/20 | | | 10 | ØØ | |
| | 2,430 | | | Univision Communications Inc., First Lien Term Loan, 4.50%, due 3/1/20 | | | 2,442 | ØØ | |
| | 1,694 | | | Univision Communications Inc., Term Loan, 4.00%, due 3/1/20 | | | 1,694 | ØØ | |
| | 983 | | | Weather Channel (TWCC), Second Lien Term Loan, 7.00%, due 6/26/20 | | | 1,007 | ØØ | |
| | | | 10,340 | | |
Retailers (except food & drug) (0.5%) | | | |
| | 1,465 | | | 99¢ Only Stores, Term Loan B, 4.50%, due 1/14/19 | | | 1,474 | ØØ | |
| | 718 | | | David's Bridal, Term Loan, 5.00%, due 10/11/19 | | | 719 | ØØ | |
| | 1,175 | | | Hudson's Bay Company, Term Loan B, 4.75%, due 10/7/20 | | | 1,190 | ¢^^ | |
| | 1,981 | | | Michaels Stores Inc., Term Loan B, 3.75%, due 1/28/20 | | | 1,988 | ØØ | |
| | 1,415 | | | Sears Holding Corp., Term Loan, 5.50%, due 6/30/18 | | | 1,419 | ØØ | |
| | | | 6,790 | | |
Steel (0.1%) | | | |
| | 1,040 | | | FMG Resources, Term Loan, 5.25%, due 10/18/17 | | | 1,042 | ØØ | |
Utilities (0.5%) | | | |
| | 876 | | | Calpine Construction, Term Loan B-1, 3.00%, due 5/3/20 | | | 864 | ØØ | |
| | 353 | | | Calpine Corp., Term Loan B-1, 4.00%, due 4/1/18 | | | 354 | ØØ | |
| | 1,106 | | | Calpine Corp., Term Loan, 4.00%, due 10/9/19 | | | 1,112 | ØØ | |
| | 982 | | | Dynegy Holdings Inc., Term Loan B-2, 4.00%, due 4/23/20 | | | 983 | ØØ | |
| | 938 | | | Equipower Resources, First Lien Term Loan C, 4.25%, due 12/31/19 | | | 942 | ØØ | |
| | 1,509 | | | Essential Power, Term Loan, 4.25%, due 8/8/19 | | | 1,501 | Ñ | |
| | 1,145 | | | La Frontera Generation, Term Loan, 4.50%, due 9/30/20 | | | 1,154 | ØØ | |
| | | | 6,910 | | |
| | | | | Total Bank Loan Obligations (Cost $187,838) | | | 188,900 | | |
U.S. Treasury Securities-Backed by the Full Faith and Credit of the U.S. Government (6.8%) | | | |
| | 3,160 | | | U.S. Treasury Bonds, 0.88%, due 2/28/17 | | | 3,175 | | |
| | 13,505 | | | U.S. Treasury Bonds, 6.25%, due 8/15/23 | | | 17,953 | ØØ | |
| | 6,745 | | | U.S. Treasury Bonds, 4.50%, due 2/15/36 | | | 7,867 | | |
| | 25,251 | | | U.S. Treasury Inflation Index Bonds, 2.00%, due 1/15/26 | | | 29,179 | ØØ | |
See Notes to Schedule of Investments
81
Schedule of Investments Neuberger Berman Strategic Income Fund (cont'd)
PRINCIPAL AMOUNT | | | | VALUE† | |
(000's omitted) | | | | (000's omitted)z | |
$ | 6,786 | | | U.S. Treasury Inflation Index Bonds, 3.88%, due 4/15/29 | | $ | 9,744 | ØØ | |
| | 17,419 | | | U.S. Treasury Inflation Index Notes, 2.38%, due 1/15/25 | | | 20,819 | ØØ | |
| | | | | Total U.S. Treasury Securities-Backed by the Full Faith and Credit of the
U.S. Government (Cost $94,383) | | | 88,737 | | |
U.S. Government Agency Securities (0.3%) | | | |
| | 3,825 | | | Federal Home Loan Bank, Bonds, 5.50%, due 7/15/36 (Cost $4,960) | | | 4,575 | ØØ | |
Mortgage-Backed Securities (41.7%) | | | |
Collateralized Mortgage Obligations (0.5%) | | | |
| | 1,386 | | | Banc of America Funding Corp., Ser. 2006-G, Class 2A1, 0.39%, due 7/20/36 | | | 1,258 | µØØ | |
| | 446 | | | Credit Suisse First Boston Mortgage Securities Corp., Ser. 2004-AR4, Class 2A1,
2.62%, due 5/25/34 | | | 441
| µØØ | |
| | 1,079 | | | JP Morgan Alternative Loan Trust, Ser. 2006-A5, Class 1A1, 0.33%, due 10/25/36 | | | 803 | µØØ | |
| | 1,126 | | | MortgageIT Trust, Ser. 2005-3, Class A1, 0.47%, due 8/25/35 | | | 1,064 | µØØ | |
| | 3,260 | | | Residential Accredit Loans, Inc., Ser. 2006-QS9, Class 2A1, 7.00%, due 7/25/36 | | | 2,184 | ØØ | |
| | 190 | | | WaMu Mortgage Pass-Through Certificates, Ser. 2006-AR10, Class 1A1, 2.37%, due 9/25/36 | | | 166 | µØØ | |
| | | | 5,916 | | |
Commercial Mortgage-Backed (10.3%) | | | |
| | 1,884 | | | Banc of America Commercial Mortgage, Inc., Ser. 2006-3, Class A4, 5.89%, due 7/10/44 | | | 2,065 | ØØ | |
| | 3,780 | | | Banc of America Commercial Mortgage, Inc., Ser. 2006-6, Class A4, 5.36%, due 10/10/45 | | | 4,109 | ØØ | |
| | 200 | | | Banc of America Commercial Mortgage, Inc., Ser. 2006-4, Class A4, 5.63%, due 7/10/46 | | | 219 | ØØ | |
| | 3,415 | | | Banc of America Commercial Mortgage, Inc., Ser. 2006-5, Class A4, 5.41%, due 9/10/47 | | | 3,753 | ØØ | |
| | 2,025 | | | Bear Stearns Commercial Mortgage Securities, Ser. 2007-PW15, Class A4, 5.33%, due 2/11/44 | | | 2,224 | ØØ | |
| | 550 | | | Bear Stearns Commercial Mortgage Securities, Ser. 2007-PW17, Class A4, 5.69%, due 6/11/50 | | | 622 | ØØ | |
| | 16,160 | | | Citigroup Commercial Mortgage Trust, Ser. 2013-GC15, Class XA, 1.31%, due 9/10/46 | | | 1,245 | µØØ | |
| | 3,500 | | | Commercial Mortgage Loan Trust, Ser. 2008-LS1, Class A4B, 6.00%, due 12/10/49 | | | 3,945 | µØØ | |
| 31,110 | | | Commercial Mortgage Pass-Through Certificates, Ser. 2013-LC6, Class XB, 0.36%,
due 1/10/46 | | | 970 | ñµØØ | |
| 750 | | | Commercial Mortgage Pass-Through Certificates, Ser. 2006-C8, Class A4, 5.31%,
due 12/10/46 | | | 823 | ØØ | |
| | 14,749 | | | Commercial Mortgage Trust, Ser. 2012-CR2, Class XA, 1.95%, due 8/15/45 | | | 1,683 | µØØ | |
| | 46,374 | | | Commercial Mortgage Trust, Ser. 2013-LC6, Class XA, 1.80%, due 1/10/46 | | | 4,621 | µØØ | |
| | 34,000 | | | Commercial Mortgage Trust, Ser. 2013-CR6, Class XB, 0.64%, due 3/10/46 | | | 1,625 | µØØ | |
| | 1,630 | | | Credit Suisse Mortgage Capital Certificates, Ser. 2007-C3, Class A4, 5.68%, due 6/15/39 | | | 1,794 | µØØ | |
| | 2,000 | | | Credit Suisse Mortgage Capital Certificates, Ser. 2007-C4, Class A4, 5.76%, due 9/15/39 | | | 2,222 | µØØ | |
| | 1,385 | | | Credit Suisse Mortgage Capital Certificates, Ser. 2006-C5, Class A3, 5.31%, due 12/15/39 | | | 1,511 | ØØ | |
| | 715 | | | Credit Suisse Mortgage Capital Certificates, Ser. 2007-C5, Class A4, 5.70%, due 9/15/40 | | | 798 | ØØ | |
| | 499 | | | CW Capital Cobalt Ltd., Ser. 2007-C2, Class A3, 5.48%, due 4/15/47 | | | 556 | ØØ | |
| | 3,000 | | | CW Capital Cobalt Ltd., Ser. 2006-C1, Class A4, 5.22%, due 8/15/48 | | | 3,252 | ØØ | |
| | 902 | | | DBUBS Mortgage Trust, Ser. 2011-LC1A, Class A1, 3.74%, due 11/10/46 | | | 948 | ñØØ | |
| 4,055 | | | Greenwich Capital Commercial Funding Corp., Ser. 2007-GG9, Class A4, 5.44%,
due 3/10/39 | | | 4,491 | ØØ | |
| 4,000 | | | Greenwich Capital Commercial Funding Corp., Ser. 2007-GG11, Class A4, 5.74%,
due 12/10/49 | | | 4,508 | ØØ | |
| | 700 | | | GS Mortgage Securities Corp. II, Ser. 2005-GG4, Class A4, 4.76%, due 7/10/39 | | | 730 | ØØ | |
| | 14,644 | | | GS Mortgage Securities Trust, Ser. 2012-GC6, Class XA, 2.17%, due 1/10/45 | | | 1,813 | ñµØØ | |
| | 7,500 | | | GS Mortgage Securities Trust, Ser. 2007-GG10, Class A4, 5.80%, due 8/10/45 | | | 8,317 | µØØ | |
| 1,298 | | | JP Morgan Chase Commercial Mortgage Securities Corp., Ser. 2006-CB15, Class A4,
5.81%, due 6/12/43 | | | 1,415 | ØØ | |
| 1,000 | | | JP Morgan Chase Commercial Mortgage Securities Corp., Ser. 2006-CB17, Class A4,
5.43%, due 12/12/43 | | | 1,092 | ØØ | |
See Notes to Schedule of Investments
82
Schedule of Investments Neuberger Berman Strategic Income Fund (cont'd)
PRINCIPAL AMOUNT | | | | VALUE† | |
(000's omitted) | | | | (000's omitted)z | |
$ | 3,475 | | | JP Morgan Chase Commercial Mortgage Securities Corp., Ser. 2007-CB18, Class A4,
5.44%, due 6/12/47 | | $ | 3,849
| ØØ | |
| 3,715 | | | JP Morgan Chase Commercial Mortgage Securities Corp., Ser. 2007-LDPX, Class A3,
5.42%, due 1/15/49 | | | 4,118 | ØØ | |
| 6,000 | | | JP Morgan Chase Commercial Mortgage Securities Corp., Ser. 2007-CB19, Class A4,
5.71%, due 2/12/49 | | | 6,723 | µØØ | |
| 1,000 | | | JP Morgan Chase Commercial Mortgage Securities Corp., Ser. 2007-LD11, Class A4,
5.81%, due 6/15/49 | | | 1,128 | µØØ | |
| 1,610 | | | JP Morgan Chase Commercial Mortgage Securities Corp., Ser. 2007-CB20, Class A4,
5.79%, due 2/12/51 | | | 1,823 | ØØ | |
| 5,195 | | | JP Morgan Chase Commercial Mortgage Securities Corp., Ser. 2007-LD12, Class A4,
5.88%, due 2/15/51 | | | 5,878 | ØØ | |
| | 5,023 | | | LB-UBS Commercial Mortgage Trust, Ser. 2007-C1, Class A4, 5.42%, due 2/15/40 | | | 5,579 | ØØ | |
| 2,243 | | | Merrill Lynch/Countrywide Commercial Mortgage Trust, Ser. 2007-5, Class A4, 5.38%,
due 8/12/48 | | | 2,458 | ØØ | |
| 6,500 | | | Merrill Lynch/Countrywide Commercial Mortgage Trust, Ser. 2006-4, Class A3, 5.17%,
due 12/12/49 | | | 7,069 | ØØ | |
| 2,729 | | | Merrill Lynch/Countrywide Commercial Mortgage Trust, Ser. 2007-7, Class A4, 5.74%,
due 6/12/50 | | | 3,047 | µØØ | |
| 17,035 | | | Morgan Stanley/Bank of America/Merrill Lynch Trust, Ser. 2013-C7, Class XA, 1.75%,
due 2/15/46 | | | 1,744 | µØØ | |
| 18,915 | | | Morgan Stanley/Bank of America/Merrill Lynch Trust, Ser. 2013-C9, Class XA, 1.47%,
due 5/15/46 | | | 1,567 | µØØ | |
| | 21,795 | | | UBS-Barclays Commercial Mortgage Trust, Ser. 2012-C4, Class XA, 1.88%, due 12/10/45 | | | 2,541 | ñµØØ | |
| | 24,795 | | | UBS-Barclays Commercial Mortgage Trust, Ser. 2013-C5, Class XA, 1.16%, due 3/10/46 | | | 1,856 | ñµØØ | |
| | 26,033 | | | UBS-Barclays Commercial Mortgage Trust, Ser. 2012-C3, Class XA, 2.18%, due 8/10/49 | | | 3,304 | ñµØØ | |
| | 1,500 | | | Wachovia Bank Commercial Mortgage Trust, Ser. 2007-C30, Class A5, 5.34%, due 12/15/43 | | | 1,665 | ØØ | |
| | 3,692 | | | Wachovia Bank Commercial Mortgage Trust, Ser. 2006-C23, Class A4, 5.42%, due 1/15/45 | | | 3,954 | ØØ | |
| | 5,630 | | | Wachovia Bank Commercial Mortgage Trust, Ser. 2007-C32, Class A3, 5.73%, due 6/15/49 | | | 6,269 | µØØ | |
| | 32,496 | | | WF-RBS Commercial Mortgage Trust, Ser. 2013-C11, Class XA, 1.52%, due 3/15/45 | | | 2,788 | ñµØØ | |
| | 12,778 | | | WF-RBS Commercial Mortgage Trust, Ser. 2012-C9, Class XA, 2.26%, due 11/15/45 | | | 1,643 | ñµØØ | |
| | 102,868 | | | WF-RBS Commercial Mortgage Trust, Ser. 2013-C14, Class XB, 0.16%, due 6/15/46 | | | 1,671 | µØØ | |
| | 21,778 | | | WF-RBS Commercial Mortgage Trust, Ser. 2013-C14, Class XA, 0.94%, due 6/15/46 | | | 1,327 | µØØ | |
| | 11,931 | | | WF-RBS Commercial Mortgage Trust, Ser. 2013-C12, Class XA, 1.52%, due 3/15/48 | | | 1,111 | ñµØØ | |
| | | | 134,463 | | |
Fannie Mae (21.9%) | | | |
| | 1,262 | | | Pass-Through Certificates, 5.50%, due 7/1/33 – 1/1/39 | | | 1,374 | ØØ | |
| | 291 | | | Pass-Through Certificates, 6.00%, due 9/1/33 – 9/1/40 | | | 322 | ØØ | |
| | 2 | | | Pass-Through Certificates, 6.50%, due 9/1/32 | | | 2 | | |
| | 5 | | | Pass-Through Certificates, 7.00%, due 7/1/29 | | | 6 | | |
| | 1 | | | Pass-Through Certificates, 7.50%, due 12/1/32 | | | 1 | | |
| | 25 | | | Pass-Through Certificates, 5.00%, due 6/1/40 & 7/1/40 | | | 27 | | |
| | 61,880 | | | Pass-Through Certificates, 3.50%, TBA, 30 Year Maturity | | | 63,446 | Ø | |
| | 120,890 | | | Pass-Through Certificates, 4.00%, TBA, 30 Year Maturity | | | 127,331 | Ø | |
| | 86,570 | | | Pass-Through Certificates, 4.50%, TBA, 30 Year Maturity | | | 92,670 | Ø | |
| | | | 285,179 | | |
Freddie Mac (9.0%) | | | |
| | 3 | | | Pass-Through Certificates, 4.50%, due 8/1/18 | | | 3 | | |
| | 441 | | | Pass-Through Certificates, 5.00%, due 5/1/18 – 8/1/39 | | | 475 | ØØ | |
| | 532 | | | Pass-Through Certificates, 5.50%, due 9/1/17 – 4/1/36 | | | 577 | ØØ | |
| | 2 | | | Pass-Through Certificates, 6.00%, due 4/1/17 | | | 2 | | |
| | 0 | | | Pass-Through Certificates, 6.50%, due 3/1/16 | | | 0 | | |
| | 1 | | | Pass-Through Certificates, 7.00%, due 6/1/32 | | | 1 | | |
| | 35,940 | | | Pass-Through Certificates, 3.50%, TBA, 30 Year Maturity | | | 36,726 | Ø | |
See Notes to Schedule of Investments
83
Schedule of Investments Neuberger Berman Strategic Income Fund (cont'd)
PRINCIPAL AMOUNT | | | | VALUE† �� | |
(000's omitted) | | | | (000's omitted)z | |
$ | 63,485 | | | Pass-Through Certificates, 4.00%, TBA, 30 Year Maturity | | $ | 66,620 | Ø | |
| | 12,425 | | | Pass-Through Certificates, 4.50%, TBA, 30 Year Maturity | | | 13,266 | Ø | |
| | | | 117,670 | | |
Government National Mortgage Association (0.0%) | | | |
| | 2 | | | Pass-Through Certificates, 6.50%, due 7/15/32 | | | 2 | | |
| | 2 | | | Pass-Through Certificates, 7.00%, due 8/15/32 | | | 2 | | |
| | | | 4 | | |
| | | | | Total Mortgage-Backed Securities (Cost $539,480) | | | 543,232 | | |
Corporate Debt Securities (41.5%) | | | |
Aerospace & Defense (0.4%) | | | |
| | 330 | | | Bombardier, Inc., Senior Notes, 4.25%, due 1/15/16 | | | 344 | ñØØ | |
| | 5,205 | | | L-3 Communications Corp., Guaranteed Notes, 3.95%, due 11/15/16 | | | 5,551 | ØØ | |
| | | | 5,895 | | |
Agriculture (0.3%) | | | |
| | 3,615 | | | Altria Group, Inc., Guaranteed Notes, 5.38%, due 1/31/44 | | | 3,655 | | |
Airlines (1.9%) | | | |
| | 2,610 | | | Air Canada, Pass-Through Certificates, Ser. 2013-1, Class A, 4.13%, due 5/15/25 | | | 2,496 | ñØØ | |
| | 6,770 | | | American Airlines, Inc., Equipment Trust, Ser. 2013-2, Class A, 4.95%, due 1/15/23 | | | 6,973 | ñØØ | |
| 5,005 | | | Continental Airlines, Inc., Pass-Through Certificates, Ser. 2013-1, Class A, 4.00%,
due 10/29/24 | | | 4,855 | ØØ | |
| | 394 | | | United Airlines, Inc., Pass-Through Certificates, Ser. 2007-1, Class A, 6.64%, due 7/2/22 | | | 414 | ØØ | |
| | 5,855 | | | US Airways Group, Inc., Pass-Through Certificates, Ser. 2012-2, Class A, 4.63%, due 6/3/25 | | | 5,767 | ØØ | |
| 4,140 | | | Virgin Australia Holdings Ltd., Pass-Through Certificates, Ser. 2013-1, Class A, 5.00%,
due 10/23/23 | | | 4,243 | ñØØ | |
| | | | 24,748 | | |
Auto Loans (0.1%) | | | |
| | 620 | | | General Motors Financial Co., Inc., Guaranteed Notes, 2.75%, due 5/15/16 | | | 625 | ñØØ | |
| | 915 | | | General Motors Financial Co., Inc., Guaranteed Notes, 4.75%, due 8/15/17 | | | 967 | ñØØ | |
| | | | 1,592 | | |
Auto Parts & Equipment (0.1%) | | | |
| | 1,605 | | | Goodyear Tire & Rubber Co., Guaranteed Notes, 6.50%, due 3/1/21 | | | 1,697 | ØØ | |
Automakers (0.1%) | | | |
| | 1,265 | | | Chrysler Group LLC/CG Co-Issuer, Inc., Secured Notes, 8.00%, due 6/15/19 | | | 1,401 | ØØ | |
Banking (0.8%) | | | |
| | 1,085 | | | Ally Financial, Inc., Guaranteed Notes, 5.50%, due 2/15/17 | | | 1,172 | ØØ | |
| | 2,445 | | | Ally Financial, Inc., Guaranteed Notes, 6.25%, due 12/1/17 | | | 2,708 | ØØ | |
| | 740 | | | Ally Financial, Inc., Guaranteed Notes, 8.00%, due 3/15/20 | | | 878 | ØØ | |
| | 4,990 | | | Commerzbank AG, Subordinated Notes, 8.13%, due 9/19/23 | | | 5,327 | ñØØ | |
| | | | 10,085 | | |
See Notes to Schedule of Investments
84
Schedule of Investments Neuberger Berman Strategic Income Fund (cont'd)
PRINCIPAL AMOUNT | | | | VALUE† | |
(000's omitted) | | | | (000's omitted)z | |
Banks (5.6%) | | | |
$ | 7,785 | | �� | Bank of America Corp., Senior Unsecured Notes, 1.50%, due 10/9/15 | | $ | 7,852 | ØØ | |
| | 3,615 | | | Bank of America Corp., Senior Unsecured Notes, 2.00%, due 1/11/18 | | | 3,604 | ØØ | |
| | 9,695 | | | Bank of America Corp., Junior Subordinated Notes, Ser. U, 5.20%, due 12/31/49 | | | 8,798 | µØØ | |
| | 3,585 | | | Goldman Sachs Group, Inc., Senior Unsecured Notes, 3.30%, due 5/3/15 | | | 3,710 | ØØ | |
| | 3,725 | | | Goldman Sachs Group, Inc., Global Senior Unsecured Notes, 2.38%, due 1/22/18 | | | 3,745 | ØØ | |
| | 4,395 | | | Goldman Sachs Group, Inc., Senior Unsecured Notes, 2.90%, due 7/19/18 | | | 4,487 | ØØ | |
| | 5,600 | | | Goldman Sachs Group, Inc., Senior Unsecured Notes, 5.75%, due 1/24/22 | | | 6,348 | ØØ | |
| | 11,800 | | | JPMorgan Chase & Co., Junior Subordinated Notes, Ser. R, 6.00%, due 12/31/49 | | | 11,417 | µØØ | |
| | 11,050 | | | Morgan Stanley, Senior Unsecured Medium-Term Notes, Ser. F, 5.63%, due 9/23/19 | | | 12,605 | ØØ | |
| | 3,335 | | | Morgan Stanley, Subordinated Notes, 4.88%, due 11/1/22 | | | 3,432 | ØØ | |
| | 7,395 | | | Santander UK PLC, Subordinated Notes, 5.00%, due 11/7/23 | | | 7,371 | ñØ | |
| | | | 73,369 | | |
Beverages (0.1%) | | | |
| | 350 | | | Constellation Brands, Inc., Guaranteed Notes, 7.25%, due 5/15/17 | | | 407 | ØØ | |
| | 840 | | | Constellation Brands, Inc., Guaranteed Notes, 6.00%, due 5/1/22 | | | 916 | | |
| | | | 1,323 | | |
Building & Construction (0.3%) | | | |
| | 450 | | | D.R. Horton, Inc., Guaranteed Notes, 4.38%, due 9/15/22 | | | 427 | | |
| | 590 | | | D.R. Horton, Inc., Guaranteed Notes, 5.75%, due 8/15/23 | | | 612 | ØØ | |
| | 1,415 | | | Lennar Corp., Guaranteed Notes, 4.75%, due 12/15/17 | | | 1,486 | ØØ | |
| | 440 | | | Shea Homes L.P., Senior Secured Notes, 8.63%, due 5/15/19 | | | 487 | ØØ | |
| | 825 | | | Standard Pacific Corp., Guaranteed Notes, 8.38%, due 5/15/18 | | | 957 | ØØ | |
| | | | 3,969 | | |
Building Materials (0.1%) | | | |
| | 830 | | | USG Corp., Guaranteed Notes, 8.38%, due 10/15/18 | | | 902 | ñØØ | |
| | 428 | | | USG Corp., Guaranteed Notes, 7.88%, due 3/30/20 | | | 471 | ñØØ | |
| | | | 1,373 | | |
Chemicals (0.3%) | | | |
| | 1,460 | | | Ashland, Inc., Senior Unsecured Notes, 3.88%, due 4/15/18 | | | 1,467 | ØØ | |
| | 915 | | | Hexion US Finance Corp., Senior Secured Notes, 6.63%, due 4/15/20 | | | 929 | ØØ | |
| | 330 | | | Huntsman Int'l LLC, Guaranteed Notes, 8.63%, due 3/15/20 | | | 366 | ØØ | |
| | 695 | | | Huntsman Int'l LLC, Guaranteed Notes, 8.63%, due 3/15/21 | | | 780 | ØØ | |
| | | | 3,542 | | |
Computer Hardware (0.1%) | | | |
| | 705 | | | Seagate HDD Cayman, Guaranteed Notes, 7.00%, due 11/1/21 | | | 779 | ØØ | |
Computers (0.4%) | | | |
| | 5,285 | | | Hewlett-Packard Co., Senior Unsecured Notes, 4.65%, due 12/9/21 | | | 5,349 | ØØ | |
Consumer - Commercial Lease Financing (0.9%) | | | |
| | 431 | | | AWAS Aviation Capital Ltd., Senior Secured Notes, 7.00%, due 10/17/16 | | | 447 | ñØØ | |
| | 585 | | | CIT Group, Inc., Senior Unsecured Notes, 5.00%, due 5/15/17 | | | 629 | ØØ | |
See Notes to Schedule of Investments
85
Schedule of Investments Neuberger Berman Strategic Income Fund (cont'd)
PRINCIPAL AMOUNT | | | | VALUE† | |
(000's omitted) | | | | (000's omitted)z | |
$ | 2,345 | | | CIT Group, Inc., Senior Unsecured Notes, 4.25%, due 8/15/17 | | $ | 2,459 | ØØ | |
| | 75 | | | CIT Group, Inc., Senior Unsecured Notes, 5.25%, due 3/15/18 | | | 81 | ØØ | |
| | 700 | | | CIT Group, Inc., Senior Unsecured Notes, 6.63%, due 4/1/18 | | | 794 | ñØØ | |
| | 435 | | | CIT Group, Inc., Senior Unsecured Notes, 5.50%, due 2/15/19 | | | 471 | ñØØ | |
| | 1,160 | | | Int'l Lease Finance Corp., Senior Unsecured Notes, 8.75%, due 3/15/17 | | | 1,363 | ØØ | |
| | 1,015 | | | Int'l Lease Finance Corp., Senior Unsecured Notes, 8.88%, due 9/1/17 | | | 1,204 | | |
| | 545 | | | Int'l Lease Finance Corp., Senior Unsecured Notes, 5.88%, due 4/1/19 | | | 586 | ØØ | |
| | 1,295 | | | Int'l Lease Finance Corp., Senior Unsecured Notes, 6.25%, due 5/15/19 | | | 1,412 | ØØ | |
| | 1,180 | | | SLM Corp., Unsecured Medium-Term Notes, 5.50%, due 1/15/19 | | | 1,225 | ØØ | |
| | 1,265 | | | SLM Corp., Senior Unsecured Medium-Term Notes, 8.00%, due 3/25/20 | | | 1,445 | | |
| | | | 12,116 | | |
Department Stores (0.1%) | | | |
| | 840 | | | Sears Holdings Corp., Secured Notes, 6.63%, due 10/15/18 | | | 792 | ØØ | |
Diversified Financial Services (2.1%) | | | |
| | 4,485 | | | Ford Motor Credit Co. LLC, Senior Unsecured Notes, 3.00%, due 6/12/17 | | | 4,667 | ØØ | |
| | 8,275 | | | General Electric Capital Corp., Junior Subordinated Notes, Ser. B, 6.25%, due 12/31/49 | | | 8,627 | µØØ | |
| | 4,540 | | | General Electric Capital Corp., Junior Subordinated Notes, Ser. C, 5.25%, due 12/31/49 | | | 4,336 | µØØ | |
| | 8,020 | | | Jefferies Group, Inc., Senior Unsecured Notes, 5.13%, due 1/20/23 | | | 8,127 | ØØ | |
| | 1,445 | | | Nomura Holdings, Inc., Senior Unsecured Medium-Term Notes, 2.00%, due 9/13/16 | | | 1,455 | ØØ | |
| | | | 27,212 | | |
Electric (1.4%) | | | |
| | 8,610 | | | Comision Federal de Electricidad, Senior Unsecured Notes, 4.88%, due 1/15/24 | | | 8,729 | ñ | |
| | 9,375 | | | Exelon Generation Co., LLC, Senior Unsecured Notes, 4.00%, due 10/1/20 | | | 9,437 | ØØ | |
| | | | 18,166 | | |
Electric - Generation (0.5%) | | | |
| | 920 | | | Calpine Corp., Senior Secured Notes, 7.50%, due 2/15/21 | | | 994 | ñØØ | |
| | 1,160 | | | Calpine Corp., Senior Secured Notes, 6.00%, due 1/15/22 | | | 1,203 | ñ | |
| | 95 | | | Calpine Corp., Senior Secured Notes, 5.88%, due 1/15/24 | | | 95 | ñ | |
| | 1,000 | | | NRG Energy, Inc., Guaranteed Notes, 7.63%, due 1/15/18 | | | 1,135 | ØØ | |
| | 2,805 | | | NRG Energy, Inc., Guaranteed Notes, 7.88%, due 5/15/21 | | | 3,100 | ØØ | |
| | | | 6,527 | | |
Electric - Integrated (0.1%) | | | |
| | 130 | | | IPALCO Enterprises, Inc., Senior Secured Notes, 7.25%, due 4/1/16 | | | 143 | ñØØ | |
| | 1,575 | | | IPALCO Enterprises, Inc., Senior Secured Notes, 5.00%, due 5/1/18 | | | 1,646 | ØØ | |
| | | | 1,789 | | |
Electronics (0.2%) | | | |
| | 290 | | | Amkor Technology, Inc., Senior Unsecured Notes, 6.38%, due 10/1/22 | | | 286 | ØØ | |
| | 860 | | | Ceridian Corp., Senior Secured Notes, 8.88%, due 7/15/19 | | | 995 | ñØØ | |
| | 605 | | | Flextronics Int'l Ltd., Guaranteed Notes, 4.63%, due 2/15/20 | | | 607 | ØØ | |
| | 345 | | | Flextronics Int'l Ltd., Guaranteed Notes, 5.00%, due 2/15/23 | | | 344 | ØØ | |
| | 237 | | | Freescale Semiconductor, Inc., Senior Secured Notes, 9.25%, due 4/15/18 | | | 256 | ñØØ | |
| | 245 | | | Freescale Semiconductor, Inc., Senior Secured Notes, 6.00%, due 1/15/22 | | | 248 | ñØ | |
| | | | 2,736 | | |
See Notes to Schedule of Investments
86
Schedule of Investments Neuberger Berman Strategic Income Fund (cont'd)
PRINCIPAL AMOUNT | | | | VALUE† | |
(000's omitted) | | | | (000's omitted)z | |
Energy - Exploration & Production (1.7%) | | | |
$ | 245 | | | Antero Resources Finance Corp., Guaranteed Notes, 5.38%, due 11/1/21 | | $ | 249 | ñØ | |
| | 400 | | | Chesapeake Energy Corp., Guaranteed Notes, 9.50%, due 2/15/15 | | | 439 | ØØ | |
| | 1,290 | | | Chesapeake Energy Corp., Guaranteed Notes, 6.50%, due 8/15/17 | | | 1,445 | ØØ | |
| | 925 | | | Chesapeake Energy Corp., Guaranteed Notes, 6.13%, due 2/15/21 | | | 1,011 | ØØ | |
| | 200 | | | Chesapeake Energy Corp., Guaranteed Notes, 5.75%, due 3/15/23 | | | 212 | ØØ | |
| | 910 | | | Cimarex Energy Co., Guaranteed Notes, 5.88%, due 5/1/22 | | | 969 | ØØ | |
| | 390 | | | Concho Resources, Inc., Guaranteed Notes, 5.50%, due 4/1/23 | | | 405 | ØØ | |
| | 1,360 | | | Continental Resources, Inc., Guaranteed Notes, 5.00%, due 9/15/22 | | | 1,416 | ØØ | |
| | 1,445 | | | Denbury Resources, Inc., Guaranteed Notes, 4.63%, due 7/15/23 | | | 1,333 | ØØ | |
| | 615 | | | EP Energy LLC/Everest Acquisition Finance, Inc., Senior Secured Notes, 6.88%, due 5/1/19 | | | 661 | ØØ | |
| | 85 | | | EP Energy LLC/Everest Acquisition Finance, Inc., Guaranteed Notes, 7.75%, due 9/1/22 | | | 96 | ØØ | |
| | 1,655 | | | Everest Acquisition LLC/EP Energy Finance, Inc., Senior Unsecured Notes, 9.38%, due 5/1/20 | | | 1,912 | ØØ | |
| | 470 | | | EXCO Resources, Inc., Guaranteed Notes, 7.50%, due 9/15/18 | | | 455 | ØØ | |
| | 345 | | | Linn Energy LLC, Guaranteed Notes, 7.00%, due 11/1/19 | | | 344 | ñØØ | |
| | 2,710 | | | Linn Energy LLC, Guaranteed Notes, 8.63%, due 4/15/20 | | | 2,886 | ØØ | |
| | 983 | | | Linn Energy LLC, Guaranteed Notes, 7.75%, due 2/1/21 | | | 1,015 | ØØ | |
| | 1,410 | | | Newfield Exploration Co., Senior Unsecured Notes, 5.75%, due 1/30/22 | | | 1,480 | ØØ | |
| | 195 | | | Range Resources Corp., Guaranteed Notes, 5.75%, due 6/1/21 | | | 208 | ØØ | |
| | 1,140 | | | Range Resources Corp., Guaranteed Notes, 5.00%, due 8/15/22 | | | 1,139 | ØØ | |
| | 320 | | | Rosetta Resources, Inc., Guaranteed Notes, 5.63%, due 5/1/21 | | | 323 | ØØ | |
| | 1,325 | | | SandRidge Energy, Inc., Guaranteed Notes, 7.50%, due 3/15/21 | | | 1,404 | ØØ | |
| | 1,380 | | | SandRidge Energy, Inc., Guaranteed Notes, 8.13%, due 10/15/22 | | | 1,470 | ØØ | |
| | 460 | | | Whiting Petroleum Corp., Guaranteed Notes, 5.00%, due 3/15/19 | | | 478 | ØØ | |
| | 920 | | | WPX Energy, Inc., Senior Unsecured Notes, 5.25%, due 1/15/17 | | | 982 | ØØ | |
| | | | 22,332 | | |
Food (0.6%) | | | |
| | 7,170 | | | WM Wrigley Jr. Co., Senior Unsecured Notes, 2.00%, due 10/20/17 | | | 7,231 | ñØØ | |
Food & Drug Retailers (0.1%) | | | |
| | 835 | | | Rite Aid Corp., Senior Secured Notes, 8.00%, due 8/15/20 | | | 936 | ØØ | |
Food - Wholesale (0.0%) | | | |
| | 350 | | | Hawk Acquisition Sub., Inc., Secured Notes, 4.25%, due 10/15/20 | | | 339 | ñØØ | |
Gaming (0.6%) | | | |
| | 850 | | | Ameristar Casinos, Inc., Guaranteed Notes, 7.50%, due 4/15/21 | | | 933 | ØØ | |
| | 265 | | | GLP Capital L.P./GLP Financing II, Inc., Guaranteed Notes, 4.38%, due 11/1/18 | | | 270 | ñ | |
| | 400 | | | GLP Capital L.P./GLP Financing II, Inc., Guaranteed Notes, 4.88%, due 11/1/20 | | | 403 | ñ | |
| | 355 | | | GLP Capital L.P./GLP Financing II, Inc., Guaranteed Notes, 5.38%, due 11/1/23 | | | 359 | ñ | |
| | 1,295 | | | Graton Economic Development Authority, Senior Secured Notes, 9.63%, due 9/1/19 | | | 1,447 | ñØØ | |
| | 845 | | | MGM Resorts Int'l, Guaranteed Notes, 7.75%, due 3/15/22 | | | 957 | ØØ | |
| | 750 | | | Pinnacle Entertainment, Inc., Guaranteed Notes, 7.75%, due 4/1/22 | | | 820 | ØØ | |
| | 335 | | | PNK Finance Corp., Guaranteed Notes, 6.38%, due 8/1/21 | | | 352 | ñØØ | |
| | 755 | | | Seminole Indian Tribe of Florida, Senior Secured Notes, 7.75%, due 10/1/17 | | | 801 | ñØØ | |
| | 838 | | | Wynn Las Vegas LLC, Unsecured Notes, 7.75%, due 8/15/20 | | | 945 | ØØ | |
| | | | 7,287 | | |
Gas Distribution (0.9%) | | | |
| | 145 | | | Access Midstream Partners L.P., Guaranteed Notes, 5.88%, due 4/15/21 | | | 156 | ØØ | |
| | 1,175 | | | Access Midstream Partners L.P., Guaranteed Notes, 6.13%, due 7/15/22 | | | 1,260 | ØØ | |
| | 240 | | | Access Midstream Partners L.P., Guaranteed Notes, 4.88%, due 5/15/23 | | | 239 | ØØ | |
See Notes to Schedule of Investments
87
Schedule of Investments Neuberger Berman Strategic Income Fund (cont'd)
PRINCIPAL AMOUNT | | | | VALUE† | |
(000's omitted) | | | | (000's omitted)z | |
$ | 660 | | | AmeriGas Finance LLC, Guaranteed Notes, 6.75%, due 5/20/20 | | $ | 719 | ØØ | |
| | 1,557 | | | AmeriGas Finance LLC, Guaranteed Notes, 7.00%, due 5/20/22 | | | 1,682 | ØØ | |
| | 700 | | | El Paso Corp., Senior Secured Global Medium-Term Notes, 7.80%, due 8/1/31 | | | 722 | ØØ | |
| | 1,705 | | | Energy Transfer Equity L.P., Senior Secured Notes, 7.50%, due 10/15/20 | | | 1,969 | ØØ | |
| | 575 | | | Ferrellgas L.P., Senior Unsecured Notes, 9.13%, due 10/1/17 | | | 604 | | |
| | 490 | | | Ferrellgas L.P., Senior Unsecured Notes, 6.75%, due 1/15/22 | | | 500 | ñØ | |
| | 815 | | | Kinder Morgan Finance Co., Senior Secured Notes, 5.70%, due 1/5/16 | | | 879 | ØØ | |
| | 730 | | | MarkWest Energy Partners L.P., Guaranteed Notes, 6.25%, due 6/15/22 | | | 792 | ØØ | |
| | 805 | | | Regency Energy Partners L.P., Guaranteed Notes, 6.88%, due 12/1/18 | | | 870 | ØØ | |
| | 1,320 | | | Suburban Propane Partners L.P., Senior Unsecured Notes, 7.50%, due 10/1/18 | | | 1,417 | ØØ | |
| | | | 11,809 | | |
Health Facilities (0.9%) | | | |
| | 1,210 | | | CHS/Community Health Systems, Inc., Senior Secured Notes, 5.13%, due 8/15/18 | | | 1,258 | ØØ | |
| | 960 | | | CHS/Community Health Systems, Inc., Guaranteed Notes, 8.00%, due 11/15/19 | | | 1,040 | ØØ | |
| | 80 | | | Columbia Healthcare Corp., Senior Unsecured Notes, 7.50%, due 12/15/23 | | | 85 | ØØ | |
| | 1,830 | | | DaVita, Inc., Guaranteed Notes, 5.75%, due 8/15/22 | | | 1,878 | ØØ | |
| | 390 | | | HCA Holdings, Inc., Senior Unsecured Notes, 6.25%, due 2/15/21 | | | 410 | ØØ | |
| | 955 | | | HCA, Inc., Guaranteed Notes, 7.50%, due 2/15/22 | | | 1,073 | ØØ | |
| | 755 | | | HCA, Inc., Senior Secured Notes, 5.88%, due 3/15/22 | | | 795 | ØØ | |
| | 1,045 | | | OMEGA Healthcare Investors, Inc., Guaranteed Notes, 6.75%, due 10/15/22 | | | 1,144 | ØØ | |
| | 560 | | | OMEGA Healthcare Investors, Inc., Guaranteed Notes, 5.88%, due 3/15/24 | | | 574 | ØØ | |
| | 1,520 | | | Tenet Healthcare Corp., Senior Secured Notes, 6.25%, due 11/1/18 | | | 1,664 | ØØ | |
| | 320 | | | Tenet Healthcare Corp., Senior Secured Notes, 4.75%, due 6/1/20 | | | 318 | ØØ | |
| | 495 | | | Tenet Healthcare Corp., Senior Secured Notes, 6.00%, due 10/1/20 | | | 524 | ñØØ | |
| | 505 | | | Tenet Healthcare Corp., Senior Secured Notes, 4.50%, due 4/1/21 | | | 490 | ØØ | |
| | 180 | | | Tenet Healthcare Corp., Senior Secured Notes, 4.38%, due 10/1/21 | | | 173 | ñØØ | |
| | | | 11,426 | | |
Health Services (0.2%) | | | |
| | 2,060 | | | Service Corp. Int'l, Senior Unsecured Notes, 5.38%, due 1/15/22 | | | 2,081 | ñØØ | |
Insurance (2.3%) | | | |
| | 3,960 | | | Allstate Corp, Subordinated Notes, 5.75%, due 8/15/53 | | | 4,049 | µØØ | |
| | 8,290 | | | ING US, Inc., Guaranteed Notes, 5.65%, due 5/15/53 | | | 7,884 | µØØ | |
| | 11,035 | | | Prudential Financial, Inc., Junior Subordinated Notes, 5.88%, due 9/15/42 | | | 11,200 | µØØ | |
| | 6,645 | | | Wilton Re Finance LLC, Guaranteed Notes, 5.88%, due 3/30/33 | | | 6,612 | ñµØØ | |
| | | | 29,745 | | |
Investments & Misc. Financial Services (0.2%) | | | |
| | 830 | | | Icahn Enterprises L.P., Guaranteed Notes, 7.75%, due 1/15/16 | | | 855 | ØØ | |
| | 2,190 | | | Icahn Enterprises L.P., Guaranteed Notes, 8.00%, due 1/15/18 | | | 2,297 | ØØ | |
| | | | 3,152 | | |
Iron - Steel (1.6%) | | | |
| | 14,420 | | | Glencore Funding LLC, Guaranteed Notes, 1.70%, due 5/27/16 | | | 14,359 | ñØØ | |
| | 6,285 | | | Samarco Mineracao SA, Senior Unsecured Notes, 5.75%, due 10/24/23 | | | 6,285 | ñ | |
| | | | 20,644 | | |
See Notes to Schedule of Investments
88
Schedule of Investments Neuberger Berman Strategic Income Fund (cont'd)
PRINCIPAL AMOUNT | | | | VALUE† | |
(000's omitted) | | | | (000's omitted)z | |
Leisure (0.2%) | | | |
$ | 450 | | | Cedar Fair L.P., Guaranteed Notes, 9.13%, due 8/1/18 | | $ | 493 | ØØ | |
| | 735 | | | Cedar Fair L.P., Guaranteed Notes, 5.25%, due 3/15/21 | | | 724 | ñØØ | |
| | 1,040 | | | Royal Caribbean Cruises Ltd., Senior Unsecured Notes, 7.25%, due 6/15/16 | | | 1,172 | ØØ | |
| | | | 2,389 | | |
Machinery (0.2%) | | | |
| | 1,915 | | | Case New Holland, Inc., Guaranteed Notes, 7.88%, due 12/1/17 | | | 2,267 | ØØ | |
| | 295 | | | Terex Corp., Guaranteed Notes, 6.50%, due 4/1/20 | | | 315 | ØØ | |
| | 215 | | | Terex Corp., Guaranteed Notes, 6.00%, due 5/15/21 | | | 225 | ØØ | |
| | 400 | | | The Manitowoc Co., Inc., Guaranteed Notes, 8.50%, due 11/1/20 | | | 454 | ØØ | |
| | | | 3,261 | | |
Media (0.6%) | | | |
| | 3,300 | | | DirecTV Holdings LLC, Guaranteed Notes, 6.00%, due 8/15/40 | | | 3,248 | ØØ | |
| | 1,220 | | | Time Warner, Inc., Guaranteed Notes, 6.10%, due 7/15/40 | | | 1,345 | ØØ | |
| | 3,525 | | | Viacom, Inc., Senior Unsecured Notes, 5.85%, due 9/1/43 | | | 3,741 | ØØ | |
| | | | 8,334 | | |
Media - Broadcast (0.3%) | | | |
| | 420 | | | AMC Networks, Inc., Guaranteed Notes, 7.75%, due 7/15/21 | | | 473 | ØØ | |
| | 1,465 | | | Sirius XM Radio, Inc., Senior Unsecured Notes, 4.25%, due 5/15/20 | | | 1,397 | ñØØ | |
| | 1,475 | | | Univision Communications, Inc., Senior Secured Notes, 6.88%, due 5/15/19 | | | 1,589 | ñØØ | |
| | | | 3,459 | | |
Media - Cable (0.6%) | | | |
| | 1,080 | | | CCO Holdings LLC, Guaranteed Notes, 7.25%, due 10/30/17 | | | 1,142 | ØØ | |
| | 60 | | | CCO Holdings LLC, Guaranteed Notes, 7.00%, due 1/15/19 | | | 64 | ØØ | |
| | 155 | | | CCO Holdings LLC, Guaranteed Notes, 8.13%, due 4/30/20 | | | 170 | ØØ | |
| 230 | | | Cequel Communications Escrow I LLC/Cequel Communications Escrow Capital Corp.,
Senior Unsecured Notes, 6.38%, due 9/15/20 | | | 239 | ñØØ | |
| 240 | | | Cequel Communications Escrow I LLC/Cequel Communications Escrow Capital Corp.,
Senior Unsecured Notes, 5.13%, due 12/15/21 | | | 233 | ñØØ | |
| | 835 | | | DISH DBS Corp., Guaranteed Notes, 4.25%, due 4/1/18 | | | 847 | ØØ | |
| | 710 | | | DISH DBS Corp., Guaranteed Notes, 7.88%, due 9/1/19 | | | 825 | ØØ | |
| | 1,490 | | | DISH DBS Corp., Guaranteed Notes, 5.13%, due 5/1/20 | | | 1,509 | ØØ | |
| | 420 | | | DISH DBS Corp., Guaranteed Notes, 5.88%, due 7/15/22 | | | 430 | ØØ | |
| | 150 | | | EchoStar DBS Corp., Guaranteed Notes, 7.13%, due 2/1/16 | | | 166 | ØØ | |
| | 685 | | | UPC Holding BV, Secured Notes, 9.88%, due 4/15/18 | | | 741 | ñØØ | |
| | 825 | | | UPCB Finance III Ltd., Senior Secured Notes, 6.63%, due 7/1/20 | | | 881 | ñØØ | |
| | 530 | | | Virgin Media Finance PLC, Guaranteed Notes, 5.25%, due 2/15/22 | | | 461 | ØØ | |
| | 640 | | | Virgin Media Secured Finance PLC, Senior Secured Notes, 5.38%, due 4/15/21 | | | 643 | ñØØ | |
| | | | 8,351 | | |
Media - Services (0.2%) | | | |
| | 310 | | | Clear Channel Worldwide Holdings, Inc., Guaranteed Notes, Ser. A, 6.50%, due 11/15/22 | | | 322 | ØØ | |
| | 1,475 | | | Clear Channel Worldwide Holdings, Inc., Guaranteed Notes, Ser. B, 6.50%, due 11/15/22 | | | 1,549 | ØØ | |
| | 195 | | | Nielsen Co. Luxembourg SARL, Guaranteed Notes, 5.50%, due 10/1/21 | | | 200 | ñØØ | |
| | 270 | | | WMG Acquisition Corp., Senior Secured Notes, 6.00%, due 1/15/21 | | | 284 | ñØØ | |
| | | | 2,355 | | |
See Notes to Schedule of Investments
89
Schedule of Investments Neuberger Berman Strategic Income Fund (cont'd)
PRINCIPAL AMOUNT | | | | VALUE† | |
(000's omitted) | | | | (000's omitted)z | |
Medical Products (0.2%) | | | |
$ | 950 | | | Biomet, Inc., Guaranteed Notes, 6.50%, due 8/1/20 | | $ | 1,009 | ØØ | |
| | 315 | | | Fresenius Medical Care US Finance II, Inc., Guaranteed Notes, 5.63%, due 7/31/19 | | | 337 | ñØØ | |
| | 110 | | | Fresenius Medical Care US Finance II, Inc., Guaranteed Notes, 5.88%, due 1/31/22 | | | 117 | ñØØ | |
| | 870 | | | Hologic, Inc., Guaranteed Notes, 6.25%, due 8/1/20 | | | 924 | ØØ | |
| | | | 2,387 | | |
Metals - Mining Excluding Steel (0.3%) | | | |
| | 440 | | | Alpha Natural Resources, Inc., Guaranteed Notes, 9.75%, due 4/15/18 | | | 453 | ØØ | |
| | 1,085 | | | Alpha Natural Resources, Inc., Guaranteed Notes, 6.25%, due 6/1/21 | | | 920 | ØØ | |
| | 1,260 | | | FMG Resources (August 2006) Pty Ltd., Guaranteed Notes, 7.00%, due 11/1/15 | | | 1,307 | ñØØ | |
| | 400 | | | Peabody Energy Corp., Guaranteed Notes, 7.38%, due 11/1/16 | | | 450 | ØØ | |
| | 1,210 | | | Peabody Energy Corp., Guaranteed Notes, 6.00%, due 11/15/18 | | | 1,277 | ØØ | |
| | | | 4,407 | | |
Mining (0.6%) | | | |
| | 3,895 | | | Barrick Gold Corp., Senior Unsecured Notes, 2.50%, due 5/1/18 | | | 3,798 | ØØ | |
| | 4,080 | | | Barrick Gold Corp., Senior Unsecured Notes, 4.10%, due 5/1/23 | | | 3,699 | ØØ | |
| | | | 7,497 | | |
Oil & Gas (1.7%) | | | |
| | 5,955 | | | Anadarko Petroleum Corp., Senior Unsecured Notes, 5.95%, due 9/15/16 | | | 6,727 | ØØ | |
| | 6,825 | | | Marathon Petroleum Corp., Senior Unsecured Notes, 5.13%, due 3/1/21 | | | 7,481 | ØØ | |
| | 4,485 | | | Petrobras Global Finance BV, Guaranteed Notes, 3.00%, due 1/15/19 | | | 4,266 | ØØ | |
| | 4,260 | | | Petrobras Global Finance BV, Guaranteed Notes, 4.38%, due 5/20/23 | | | 3,935 | ØØ | |
| | | | 22,409 | | |
Packaging (0.3%) | | | |
| | 465 | | | Ball Corp., Guaranteed Notes, 5.00%, due 3/15/22 | | | 469 | ØØ | |
| | 1,970 | | | Reynolds Group Issuer, Inc., Senior Secured Notes, 7.13%, due 4/15/19 | | | 2,103 | ØØ | |
| | 225 | | | Reynolds Group Issuer, Inc., Senior Secured Notes, 7.88%, due 8/15/19 | | | 249 | ØØ | |
| | 465 | | | Reynolds Group Issuer, Inc., Senior Secured Notes, 5.75%, due 10/15/20 | | | 480 | ØØ | |
| | 735 | | | Reynolds Group Issuer, Inc., Senior Secured Notes, 6.88%, due 2/15/21 | | | 797 | ØØ | |
| | | | 4,098 | | |
Packing & Containers (0.4%) | | | |
| | 5,080 | | | Packaging Corp. of America, Senior Unsecured Notes, 4.50%, due 11/1/23 | | | 5,222 | ØØ | |
Pharmaceuticals (0.4%) | | | |
| | 1,225 | | | Jaguar Holding Co., Senior Unsecured Notes, 9.50%, due 12/1/19 | | | 1,375 | ñØØ | |
| | 355 | | | Valeant Pharmaceuticals Int'l, Guaranteed Notes, 6.50%, due 7/15/16 | | | 367 | ñØØ | |
| | 715 | | | Valeant Pharmaceuticals Int'l, Guaranteed Notes, 6.75%, due 10/1/17 | | | 769 | ñØØ | |
| | 730 | | | Valeant Pharmaceuticals Int'l, Guaranteed Notes, 6.88%, due 12/1/18 | | | 780 | ñØØ | |
| | 1,870 | | | Valeant Pharmaceuticals Int'l, Guaranteed Notes, 6.38%, due 10/15/20 | | | 1,996 | ñØØ | |
| | 305 | | | Valeant Pharmaceuticals Int'l, Senior Unsecured Notes, 6.75%, due 8/15/18 | | | 334 | ñØØ | |
| | | | 5,621 | | |
See Notes to Schedule of Investments
90
Schedule of Investments Neuberger Berman Strategic Income Fund (cont'd)
PRINCIPAL AMOUNT | | | | VALUE† | |
(000's omitted) | | | | (000's omitted)z | |
Pipelines (1.1%) | | | |
$ | 4,990 | | | Energy Transfer Partners L.P., Senior Unsecured Notes, 6.50%, due 2/1/42 | | $ | 5,461 | ØØ | |
| | 5,545 | | | Kinder Morgan Energy Partners L.P., Senior Unsecured Notes, 2.65%, due 2/1/19 | | | 5,562 | | |
| | 2,965 | | | Kinder Morgan Energy Partners L.P., Senior Unsecured Notes, 6.50%, due 9/1/39 | | | 3,331 | ØØ | |
| | | | 14,354 | | |
Printing & Publishing (0.6%) | | | |
| | 670 | | | Gannett Co., Inc., Guaranteed Notes, 9.38%, due 11/15/17 | | | 704 | ØØ | |
| | 1,760 | | | Gannett Co., Inc., Guaranteed Notes, 7.13%, due 9/1/18 | | | 1,892 | ØØ | |
| | 840 | | | Gannett Co., Inc., Guaranteed Notes, 5.13%, due 10/15/19 | | | 869 | ñØØ | |
| | 165 | | | R.R. Donnelley & Sons Co., Senior Unsecured Notes, 8.60%, due 8/15/16 | | | 192 | ØØ | |
| | 665 | | | R.R. Donnelley & Sons Co., Senior Unsecured Notes, 7.25%, due 5/15/18 | | | 750 | ØØ | |
| | 1,605 | | | R.R. Donnelley & Sons Co., Senior Unsecured Notes, 8.25%, due 3/15/19 | | | 1,846 | ØØ | |
| | 330 | | | R.R. Donnelley & Sons Co., Senior Unsecured Notes, 7.63%, due 6/15/20 | | | 365 | ØØ | |
| | 305 | | | R.R. Donnelley & Sons Co., Senior Unsecured Notes, 7.88%, due 3/15/21 | | | 340 | ØØ | |
| | 350 | | | R.R. Donnelley & Sons Co., Senior Unsecured Notes, 7.00%, due 2/15/22 | | | 371 | ØØ | |
| | | | 7,329 | | |
Real Estate Investment Trusts (2.8%) | | | |
| | 4,765 | | | Alexandria Real Estate Equities, Inc., Guaranteed Notes, 3.90%, due 6/15/23 | | | 4,580 | ØØ | |
| | 6,785 | | | American Tower Corp., Senior Unsecured Notes, 3.40%, due 2/15/19 | | | 6,867 | ØØ | |
| | 7,075 | | | Entertainment Properties Trust, Guaranteed Notes, 5.75%, due 8/15/22 | | | 7,341 | ØØ | |
| | 8,515 | | | Health Care REIT, Inc., Senior Unsecured Notes, 5.25%, due 1/15/22 | | | 9,222 | ØØ | |
| | 840 | | | Host Hotels & Resorts L.P., Guaranteed Notes, 6.00%, due 11/1/20 | | | 916 | ØØ | |
| | 1,385 | | | Host Hotels & Resorts L.P., Senior Unsecured Notes, 6.00%, due 10/1/21 | | | 1,533 | ØØ | |
| | 6,020 | | | Weingarten Realty Investors, Senior Unsecured Notes, 4.45%, due 1/15/24 | | | 6,082 | ØØ | |
| | | | 36,541 | | |
Software - Services (0.2%) | | | |
| | 1,035 | | | Activision Blizzard, Inc., Guaranteed Notes, 5.63%, due 9/15/21 | | | 1,071 | ñØØ | |
| | 300 | | | First Data Corp., Senior Secured Notes, 7.38%, due 6/15/19 | | | 323 | ñØØ | |
| | 1,000 | | | First Data Corp., Senior Secured Notes, 6.75%, due 11/1/20 | | | 1,059 | ñØØ | |
| | | | 2,453 | | |
Specialty Retail (0.1%) | | | |
| | 380 | | | L Brands, Inc., Guaranteed Notes, 5.63%, due 10/15/23 | | | 388 | ØØ | |
| | 170 | | | Limited Brands, Inc., Senior Unsecured Notes, 6.90%, due 7/15/17 | | | 194 | ØØ | |
| | 1,375 | | | Sally Holdings LLC, Guaranteed Notes, 5.75%, due 6/1/22 | | | 1,427 | ØØ | |
| | | | 2,009 | | |
Steel Producers - Products (0.7%) | | | |
| | 110 | | | ArcelorMittal, Senior Unsecured Notes, 5.00%, due 2/25/17 | | | 116 | ØØ | |
| | 4,685 | | | ArcelorMittal, Senior Unsecured Notes, 6.13%, due 6/1/18 | | | 5,083 | ØØ | |
| | 605 | | | ArcelorMittal, Senior Unsecured Notes, 5.75%, due 8/5/20 | | | 638 | ØØ | |
| | 930 | | | ArcelorMittal, Senior Unsecured Notes, 6.00%, due 3/1/21 | | | 975 | ØØ | |
| | 140 | | | ArcelorMittal, Senior Unsecured Notes, 6.75%, due 2/25/22 | | | 152 | ØØ | |
| | 345 | | | ArcelorMittal, Senior Unsecured Notes, 7.50%, due 10/15/39 | | | 341 | ØØ | |
| | 1,065 | | | Steel Dynamics, Inc., Guaranteed Notes, 6.13%, due 8/15/19 | | | 1,156 | ØØ | |
| | 300 | | | Steel Dynamics, Inc., Guaranteed Notes, 5.25%, due 4/15/23 | | | 297 | ñØØ | |
| | | | 8,758 | | |
See Notes to Schedule of Investments
91
Schedule of Investments Neuberger Berman Strategic Income Fund (cont'd)
PRINCIPAL AMOUNT | | | | VALUE† | |
(000's omitted) | | | | (000's omitted)z | |
Support - Services (0.3%) | | | |
$ | 345 | | | ADT Corp., Senior Unsecured Notes, 6.25%, due 10/15/21 | | $ | 366 | ñØØ | |
| | 575 | | | Hertz Corp., Guaranteed Notes, 4.25%, due 4/1/18 | | | 576 | ñØØ | |
| | 145 | | | Hertz Corp., Guaranteed Notes, 5.88%, due 10/15/20 | | | 153 | ØØ | |
| | 1,120 | | | Iron Mountain, Inc., Guaranteed Notes, 7.75%, due 10/1/19 | | | 1,245 | ØØ | |
| | 265 | | | Knowledge Learning Corp., Guaranteed Notes, 7.75%, due 2/1/15 | | | 261 | ñØØ | |
| | 670 | | | United Rentals N.A., Inc., Secured Notes, 5.75%, due 7/15/18 | | | 718 | ØØ | |
| | | | 3,319 | | |
Telecom - Integrated Services (2.0%) | | | |
| | 920 | | | CenturyLink, Inc., Senior Unsecured Notes, Ser. V, 5.63%, due 4/1/20 | | | 935 | ØØ | |
| | 560 | | | CenturyLink, Inc., Senior Unsecured Notes, Ser. T, 5.80%, due 3/15/22 | | | 554 | ØØ | |
| | 35 | | | Citizens Communications Co., Senior Unsecured Notes, 9.00%, due 8/15/31 | | | 36 | ØØ | |
| | 1,235 | | | Frontier Communications Corp., Senior Unsecured Notes, 9.25%, due 7/1/21 | | | 1,456 | ØØ | |
| | 380 | | | Frontier Communications Corp., Senior Unsecured Notes, 7.63%, due 4/15/24 | | | 401 | ØØ | |
| | 435 | | | Hughes Satellite Systems Corp., Senior Secured Notes, 6.50%, due 6/15/19 | | | 467 | ØØ | |
| | 1,300 | | | Intelsat Jackson Holdings SA, Guaranteed Notes, 8.50%, due 11/1/19 | | | 1,427 | ØØ | |
| | 1,345 | | | Qwest Communications Int'l, Inc., Guaranteed Notes, 7.13%, due 4/1/18 | | | 1,395 | ØØ | |
| | 10,940 | | | Qwest Corp., Senior Unsecured Notes, 6.75%, due 12/1/21 | | | 11,934 | ØØ | |
| | 555 | | | Telesat Canada/Telesat LLC, Senior Unsecured Notes, 6.00%, due 5/15/17 | | | 580 | ñØØ | |
| | 1,395 | | | tw telecom holdings, Inc., Guaranteed Notes, 5.38%, due 10/1/22 | | | 1,391 | ØØ | |
| | 780 | | | tw telecom holdings, Inc., Senior Unsecured Notes, 5.38%, due 10/1/22 | | | 778 | ñØØ | |
| | 630 | | | U.S. West Communications Group, Senior Unsecured Notes, 6.88%, due 9/15/33 | | | 611 | ØØ | |
| | 2,880 | | | Windstream Corp., Guaranteed Notes, 7.75%, due 10/15/20 | | | 3,089 | ØØ | |
| | 760 | | | Windstream Corp., Guaranteed Notes, 7.75%, due 10/1/21 | | | 811 | ØØ | |
| | 165 | | | Windstream Corp., Guaranteed Notes, 6.38%, due 8/1/23 | | | 160 | ØØ | |
| | | | 26,025 | | |
Telecom - Wireless (0.9%) | | | |
| | 460 | | | MetroPCS Wireless, Inc., Guaranteed Notes, 6.25%, due 4/1/21 | | | 481 | ñØØ | |
| | 920 | | | SBA Telecommunications, Inc., Guaranteed Notes, 5.75%, due 7/15/20 | | | 957 | ØØ | |
| | 2,100 | | | Sprint Capital Corp., Guaranteed Notes, 6.90%, due 5/1/19 | | | 2,263 | ØØ | |
| | 480 | | | Sprint Capital Corp., Guaranteed Notes, 6.88%, due 11/15/28 | | | 456 | ØØ | |
| | 1,580 | | | Sprint Corp., Guaranteed Notes, 7.25%, due 9/15/21 | | | 1,702 | ñØØ | |
| | 590 | | | Sprint Corp., Guaranteed Notes, 7.88%, due 9/15/23 | | | 640 | ñØØ | |
| | 1,570 | | | Sprint Nextel Corp., Senior Unsecured Notes, 6.00%, due 12/1/16 | | | 1,698 | ØØ | |
| | 175 | | | T-Mobile USA, Inc., Senior Unsecured Notes, 5.25%, due 9/1/18 | | | 182 | ñØØ | |
| | 480 | | | T-Mobile USA, Inc., Guaranteed Notes, 6.46%, due 4/28/19 | | | 509 | ØØ | |
| | 895 | | | T-Mobile USA, Inc., Guaranteed Notes, 6.54%, due 4/28/20 | | | 949 | ØØ | |
| | 600 | | | T-Mobile USA, Inc., Guaranteed Notes, 6.63%, due 4/28/21 | | | 634 | ØØ | |
| | 510 | | | T-Mobile USA, Inc., Guaranteed Notes, 6.73%, due 4/28/22 | | | 539 | ØØ | |
| | 300 | | | T-Mobile USA, Inc., Guaranteed Notes, 6.84%, due 4/28/23 | | | 317 | ØØ | |
| | | | 11,327 | | |
Telecommunications (1.8%) | | | |
| | 13,690 | | | Verizon Communications, Inc., Senior Unsecured Notes, 3.65%, due 9/14/18 | | | 14,556 | ØØ | |
| | 7,735 | | | Verizon Communications, Inc., Senior Unsecured Notes, 6.55%, due 9/15/43 | | | 8,969 | ØØ | |
| | | | 23,525 | | |
| | | | | Total Corporate Debt Securities (Cost $533,402) | | | 540,527 | | |
See Notes to Schedule of Investments
92
Schedule of Investments Neuberger Berman Strategic Income Fund (cont'd)
PRINCIPAL AMOUNT | | | | VALUE† | |
(000's omitted) | | | | (000's omitted)z | |
Asset-Backed Securities (11.0%) | | | |
$ | 2,980 | | | Accredited Mortgage Loan Trust, Ser. 2005-3, Class M1, 0.62%, due 9/25/35 | | $ | 2,725 | µØØ | |
| | 3,382 | | | Accredited Mortgage Loan Trust, Ser. 2005-4, Class A2D, 0.49%, due 12/25/35 | | | 3,171 | µØØ | |
| | 6,965 | | | Aegis Asset Backed Securities Trust, Ser. 2005-1, Class M3, 0.72%, due 3/25/35 | | | 6,093 | µØØ | |
| | 922 | | | Ameriquest Mortgage Securities, Inc., Ser. 2003-9, Class M2, 2.07%, due 9/25/33 | | | 867 | µØØ | |
| | 3,388 | | | Argent Securities, Inc., Ser. 2003-W3, Class M1, 1.30%, due 9/25/33 | | | 3,274 | µØØ | |
| | 7,540 | | | Argent Securities, Inc., Ser. 2004-W10, Class M1, 1.07%, due 10/25/34 | | | 6,872 | µØØ | |
| | 950 | | | Asset Backed Securities Corp. Home Equity, Ser. 2004-HE5, Class M2, 2.05%, due 8/25/34 | | | 838 | µØØ | |
| | 2,893 | | | Asset Backed Securities Corp. Home Equity, Ser. 2006-HE1, Class A3, 0.37%, due 1/25/36 | | | 2,738 | µØØ | |
| | 4,100 | | | Bear Stearns Asset Backed Securities I Trust, Ser. 2005-TC1, Class M1, 0.61%, due 5/25/35 | | | 3,642 | µØØ | |
| | 1,320 | | | Bear Stearns Asset Backed Securities Trust, Ser. 2006-HE1, Class 2M1, 0.58%, due 2/25/36 | | | 1,144 | µØØ | |
| | 1,568 | | | Bear Stearns Asset Backed Securities Trust, Ser. 2006-2, Class M1, 0.59%, due 7/25/36 | | | 1,455 | µ | |
| | 3,958 | | | Carrington Mortgage Loan Trust, Ser. 2005-NC3, Class M2, 0.63%, due 6/25/35 | | | 3,504 | µØØ | |
| | 7,136 | | | Carrington Mortgage Loan Trust, Ser. 2006-RFC1, Class A3, 0.32%, due 5/25/36 | | | 6,457 | µØØ | |
| | 2,586 | | | Carrington Mortgage Loan Trust, Ser. 2006-NC4, Class A5, 0.23%, due 10/25/36 | | | 2,169 | µØØ | |
| | 2,500 | | | Citigroup Mortgage Loan Trust, Inc., Ser. 2005-HE2, Class M1, 0.92%, due 5/25/35 | | | 2,368 | ñµØØ | |
| | 1,930 | | | Citigroup Mortgage Loan Trust, Inc., Ser. 2006-WFH1, Class M2, 0.54%, due 1/25/36 | | | 1,600 | µØØ | |
| | 1,009 | | | Citigroup Mortgage Loan Trust, Inc., Ser. 2006-AMC1, Class A2B, 0.33%, due 9/25/36 | | | 492 | µØØ | |
| | 6,459 | | | EquiFirst Mortgage Loan Trust, Ser. 2003-2, Class 1A1, 1.30%, due 9/25/33 | | | 6,315 | µØØ | |
| | 5,640 | | | Fieldstone Mortgage Investment Trust, Ser. 2005-1, Class M5, 1.30%, due 3/25/35 | | | 4,398 | µ | |
| 6,298 | | | First Franklin Mortgage Loan Asset Backed Certificates, Ser. 2005-FF1, Class M1, 0.91%,
due 12/25/34 | | | 5,859 | µØØ | |
| 1,905 | | | First Franklin Mortgage Loan Asset Backed Certificates, Ser. 2004-FFH4, Class M5, 1.75%,
due 1/25/35 | | | 1,798 | µØØ | |
| 3,300 | | | First Franklin Mortgage Loan Asset Backed Certificates, Ser. 2005-FF5, Class M2, 0.66%,
due 3/25/35 | | | 3,006 | µØØ | |
| | 2,497 | | | Home Equity Mortgage Trust, Ser. 2004-5, Class M2, 1.77%, due 2/25/35 | | | 2,252 | µØØ | |
| | 1,460 | | | JP Morgan Mortgage Acquisition Corp., Ser. 2006-ACC1, Class A5, 0.41%, due 5/25/36 | | | 1,187 | µØØ | |
| | 1,127 | | | JP Morgan Mortgage Acquisition Corp., Ser. 2007-HE1, Class AF1, 0.27%, due 3/25/47 | | | 799 | µØØ | |
| | 1,771 | | | Morgan Stanley Capital I, Ser. 2005-WMC1, Class M2, 0.91%, due 1/25/35 | | | 1,689 | µØØ | |
| | 8,318 | | | Morgan Stanley Home Equity Loan Trust, Ser. 2006-2, Class A4, 0.45%, due 2/25/36 | | | 7,212 | µØØ | |
| | 3,032 | | | New Century Home Equity Loan Trust, Ser. 2004-3, Class M2, 1.15%, due 11/25/34 | | | 2,841 | µØØ | |
| | 3,500 | | | Newcastle Mortgage Securities Trust, Ser. 2006-1, Class A4, 0.45%, due 3/25/36 | | | 3,284 | µØØ | |
| | 6,350 | | | Park Place Securities, Inc., Ser. 2004-WWF1, Class M4, 1.82%, due 12/25/34 | | | 5,586 | µØØ | |
| | 9,335 | | | Park Place Securities, Inc., Ser. 2004-WHQ2, Class M3, 1.21%, due 2/25/35 | | | 8,526 | µØØ | |
| | 1,158 | | | Residential Asset Mortgage Products, Inc., Ser. 2003-RS2, Class AII, 0.85%, due 3/25/33 | | | 1,012 | µØØ | |
| | 1,378 | | | Residential Asset Mortgage Products, Inc., Ser. 2006-RS1, Class AI2, 0.40%, due 1/25/36 | | | 1,278 | µØØ | |
| | 3,280 | | | Residential Asset Mortgage Products, Inc., Ser. 2006-RZ1, Class M1, 0.57%, due 3/25/36 | | | 2,883 | µØØ | |
| | 1,290 | | | Saxon Asset Securities Trust, Ser. 2004-2, Class MV1, 1.04%, due 8/25/35 | | | 1,199 | µØØ | |
| | 7,665 | | | Soundview Home Equity Loan Trust, Ser. 2005-OPT2, Class M1, 0.68%, due 8/25/35 | | | 6,460 | µØØ | |
| | 1,054 | | | Soundview Home Equity Loan Trust, Ser. 2006-3, Class A3, 0.33%, due 11/25/36 | | | 796 | µØØ | |
| | 11,599 | | | Structured Asset Investment Loan Trust, Ser. 2004-6, Class A3, 0.97%, due 7/25/34 | | | 10,837 | µØØ | |
| | 3,490 | | | Structured Asset Investment Loan Trust, Ser. 2004-8, Class M1, 1.07%, due 9/25/34 | | | 3,292 | µØØ | |
| | 4,990 | | | Structured Asset Investment Loan Trust, Ser. 2005-3, Class M2, 0.83%, due 4/25/35 | | | 4,307 | µØØ | |
| | 4,255 | | | Structured Asset Securities Corp., Ser. 2005-NC2, Class M3, 0.60%, due 5/25/35 | | | 3,958 | µØØ | |
| | 1,565 | | | Structured Asset Securities Corp., Ser. 2006-NC1, Class A4, 0.32%, due 5/25/36 | | | 1,416 | µØØ | |
| | 2,350 | | | Structured Asset Securities Corp., Ser. 2006-BC5, Class A4, 0.34%, due 12/25/36 | | | 1,664 | µØØ | |
| | | | | Total Asset-Backed Securities (Cost $127,995) | | | 143,263 | | |
Government Securities (2.5%) | | | |
Sovereign (2.5%) | | | |
AUD | 6,750 | | | Australian Government Bond, Senior Unsecured Notes, 5.25%, due 3/15/19 | | | 6,955 | a | |
AUD | 2,955 | | | Australian Government Bond, Senior Unsecured Notes, 5.50%, due 4/21/23 | | | 3,133 | a | |
EUR | 4,550 | | | Italy Buoni Poliennali Del Tesoro, Bonds, 4.00%, due 2/1/37 | | | 5,621 | a | |
NZD | 9,000 | | | New Zealand Government Bond, Senior Unsecured Notes, 6.00%, due 12/15/17 | | | 8,035 | a | |
NZD | 2,100 | | | New Zealand Government Bond, Senior Unsecured Notes, 5.50%, due 4/15/23 | | | 1,858 | a | |
NZD | 9,150 | | | New Zealand Government Bond, Senior Unsecured Notes, 2.00%, due 9/20/25 | | | 7,203 | a | |
| | | | | Total Government Securities (Cost $34,431) | | | 32,805 | | |
See Notes to Schedule of Investments
93
Schedule of Investments Neuberger Berman Strategic Income Fund (cont'd)
NUMBER OF SHARES | | | | VALUE† | |
| | | | | (000's omitted)z | |
Mutual Funds (6.7%) | | | |
| | 8,529,643 | | | Neuberger Berman Emerging Markets Income Fund Institutional Class (Cost $85,303) | | $ | 86,975 | | |
Short-Term Investments (5.0%) | | | |
| | 65,723,130 | | | State Street Institutional Liquid Reserves Fund Institutional Class (Cost $65,723) | | | 65,723 | ØØ | |
| | | | | Total Investments (130.0%) (Cost $1,673,515) | | | 1,694,737 | ## | |
| | | | | Liabilities, less cash, receivables and other assets [(30.0%)] | | | (390,904 | )± | |
| | | | | Total Net Assets (100.0%) | | $ | 1,303,833 | | |
See Notes to Schedule of Investments
94
Notes to Schedule of Investments
† In accordance with Accounting Standards Codification ("ASC") 820 "Fair Value Measurements and Disclosures" ("ASC 820"), all investments held by each of Neuberger Berman Core Bond Fund ("Core Bond"), Neuberger Berman Floating Rate Income Fund ("Floating Rate Income"), Neuberger Berman High Income Bond Fund ("High Income"), Neuberger Berman Municipal Intermediate Bond Fund ("Municipal Intermediate Bond"), Neuberger Berman New York Municipal Income Fund ("New York Municipal Income"), Neuberger Berman Short Duration Bond Fund ("Short Duration"), Neuberger Berman Short Duration High Income Fund ("Short Duration High Income") and Neuberger Berman Strategic Income Fund ("Strategic Income") (each individually a "Fund," and collectively, the "Funds") are carried at the value that Neuberger Berman Management LLC ("Management") believes a Fund would receive upon selling an investment in an orderly transaction to an independent buyer in the principal or most advantageous market for the investment under current market conditions. Various inputs, including the volume and level of activity for the asset or liability in the market, are considered in valuing the Funds' investments, some of which are discussed below. Significant management judgment may be necessary to value investments in accordance with ASC 820.
ASC 820 established a three-tier hierarchy of inputs to create a classification of value measurements for disclosure purposes. The three-tier hierarchy of inputs is summarized in the three broad Levels listed below.
• Level 1 – quoted prices in active markets for identical investments
• Level 2 – other significant observable inputs (including quoted prices for similar investments, interest rates, prepayment speeds, credit risk, amortized cost, etc.)
• Level 3 – significant unobservable inputs (including a Fund's own assumptions in determining the fair value of investments)
The inputs or methodology used for valuing an investment are not necessarily an indication of the risk associated with investing in those securities.
The value of the Funds' investments in debt securities is determined by Management primarily by obtaining valuations from independent pricing services based on readily available bid quotations, or if quotations are not available, by methods which include various considerations based on security type (generally Level 2 inputs). In addition to the consideration of yields or prices of securities of comparable quality, coupon, maturity and type; indications as to values from dealers; and general market conditions, the following is a description of other Level 2 inputs and related valuation techniques used by an independent pricing service to value certain types of debt securities of the Funds:
Corporate Debt Securities. Inputs used to value corporate debt securities generally include relative credit information, observed market movements, sector news, spread to the U.S. Treasury market, and other market information which may include benchmark yields, reported trades, broker-dealer quotes, issuer spreads, benchmark securities, bids, offers, and reference data, such as market research publications, when available ("Other Market Information").
Convertible Bonds. Inputs used to value convertible bonds generally include underlying stock data, dealer quotes, conversion premiums, listed bond and preferred stock prices and other market information, which may include benchmark curves, trade execution data, and sensitivity analysis, when available.
U.S. Treasury Securities. Inputs used to value U.S. Treasury securities generally include quotes from several inter-dealer brokers and Other Market Information.
U.S. Government Agency Securities. Inputs used to value U.S. Government Agency securities generally include obtaining benchmark quotes and Other Market Information.
See Notes to Financial Statements
95
Notes to Schedule of Investments (cont'd)
Asset-Backed Securities and Mortgage-Backed Securities. Inputs used to value asset-backed securities and mortgage-backed securities generally include models that consider a number of factors, which may include the following: prepayment speeds, cash flows, spread adjustments and Other Market Information.
High Yield Securities. Inputs used to value high yield securities generally include a number of observations of equity and credit default swap curves related to the issuer and Other Market Information.
Municipal Debt Securities. Inputs used to value municipal debt securities include current trades, bid-wanted lists (which informs the market that a holder is interested in selling a position and that offers will be considered), offerings, general information on market movement, direction, trends, and specific data on specialty issues.
Emerging Markets Debt, Sovereign Debt and Quasi-Sovereign Debt. Inputs used to value emerging markets debt, sovereign debt and quasi-sovereign debt generally include dealer quotes, bond market activity, discounted cash flow models, and other relevant information such as credit spreads, benchmark curves and Other Market Information.
The value of bank loan securities is determined by Management primarily by obtaining valuations from independent pricing services based on broker quotes (generally Level 2 or Level 3 inputs depending on the number of quotes available).
The value of financial futures contracts is determined by obtaining valuations from independent pricing services at the settlement price at the market close (Level 1 inputs).
Management has developed a process to periodically review information provided by independent pricing services for all types of securities.
Investments in investment companies are valued using the respective fund's daily calculated net asset value per share (Level 2 inputs).
If a valuation is not available from an independent pricing service, or if Management has reason to believe that the valuation received does not represent the amount a Fund might reasonably expect to receive on a current sale in an orderly transaction, the applicable Fund seeks to obtain quotations from principal market makers (generally considered Level 3 inputs). If such quotations are not readily available, the security is valued using methods the Neuberger Berman Income Funds' Board of Trustees (the "Board") has approved on the belief that they reflect fair value. Numerous factors may be considered when determining the fair value of a security based on Level 2 or 3 inputs, including available analyst, media or other reports, trading in futures or American Depositary Receipts ("ADRs") and whether the issuer of the security being fair valued has other securities outstanding.
The Board has approved the use of Interactive Data Pricing and Reference Data, Inc. ("Interactive") to evaluate the prices of foreign income securities as of the close of the New York Stock Exchange (the "NYSE"). Interactive utilizes benchmark spread and yield curves and evaluates available market activity from the local close to the close of the NYSE (Level 2 inputs) to assist in determining prices for certain foreign income securities. In the absence of precise information about the market values of these foreign securities as of the close of the NYSE, the Board has determined on the basis of available data that prices evaluated in this way are likely to be closer to the prices the Fund could realize on a current sale than are the prices of those securities established at the close of the foreign markets in which the securities primarily trade.
Fair value prices are necessarily estimates, and there is no assurance that such a price will be at or close to the price at which the security is next quoted or next trades.
See Notes to Financial Statements
96
Notes to Schedule of Investments (cont'd)
The following is a summary, categorized by Level, of inputs used to value the Funds' investments as of October 31, 2013:
Asset Valuation Inputs
(000's omitted) | | Level 1 | | Level 2 | | Level 3§ | | Total | |
Core Bond | |
Investments: | |
U.S. Treasury Securities-Backed by the Full Faith and
Credit of the U.S. Government | | $ | — | | | $ | 49,286 | | | $ | — | | | $ | 49,286 | | |
U.S. Government Agency Securities | | | — | | | | 5,602 | | | | — | | | | 5,602 | | |
Mortgage-Backed Securities^ | | | — | | | | 106,766 | | | | — | | | | 106,766 | | |
Corporate Debt Securities | |
Airlines | | | — | | | | — | | | | 2,601 | | | | 2,601 | | |
Other Corporate Debt Securities^ | | | — | | | | 56,692 | | | | — | | | | 56,692 | | |
Total Corporate Debt Securities | | | — | | | | 56,692 | | | | 2,601 | | | | 59,293 | | |
Asset-Backed Securities | | | — | | | | 760 | | | | — | | | | 760 | | |
Government Securities^ | | | — | | | | 371 | | | | — | | | | 371 | | |
Short-Term Investments | | | — | | | | 35,712 | | | | — | | | | 35,712 | | |
Total Investments | | | — | | | | 255,189 | | | | 2,601 | | | | 257,790 | | |
Floating Rate Income | |
Investments: | |
Bank Loan Obligations | |
Automotive | | | — | | | | 12,209 | | | | 2,518 | | | | 14,727 | | |
Business Equipment & Services | | | — | | | | 36,786 | | | | 1,897 | | | | 38,683 | | |
Financial Intermediaries | | | — | | | | 48,942 | | | | 5,369 | | | | 54,311 | | |
Leisure Goods—Activities—Movies | | | — | | | | 21,678 | | | | 3,813 | | | | 25,491 | | |
Lodging & Casinos | | | — | | | | 36,170 | | | | 656 | | | | 36,826 | | |
Oil & Gas | | | — | | | | 8,077 | | | | 3,795 | | | | 11,872 | | |
Utilities | | | — | | | | 13,047 | | | | 3,169 | | | | 16,216 | | |
Other Bank Loan Obligations^ | | | — | | | | 304,919 | | | | — | | | | 304,919 | | |
Total Bank Loan Obligations | | | — | | | | 481,828 | | | | 21,217 | | | | 503,045 | | |
Corporate Debt Securities^ | | | — | | | | 36,022 | | | | — | | | | 36,022 | | |
Short-Term Investments | | | — | | | | 29,381 | | | | — | | | | 29,381 | | |
Total Investments | | | — | | | | 547,231 | | | | 21,217 | | | | 568,448 | | |
High Income | |
Investments: | |
Bank Loan Obligations | |
Lodging & Casinos | | | — | | | | 24,267 | | | | 16,330 | | | | 40,597 | | |
Other Bank Loan Obligations^ | | | — | | | | 114,738 | | | | — | | | | 114,738 | | |
Total Bank Loan Obligations | | | — | | | | 139,005 | | | | 16,330 | | | | 155,335 | | |
See Notes to Financial Statements
97
Notes to Schedule of Investments (cont'd)
Asset Valuation Inputs
(000's omitted) | | Level 1 | | Level 2 | | Level 3§ | | Total | |
Corporate Debt Securities | |
Airlines | | $ | — | | | $ | 8,101 | | | $ | 9,306 | | | $ | 17,407 | | |
Other Corporate Debt Securities^ | | | — | | | | 2,932,443 | | | | — | | | | 2,932,443 | | |
Total Corporate Debt Securities | | | — | | | | 2,940,544 | | | | 9,306 | | | | 2,949,850 | | |
Short-Term Investments | | | — | | | | 114,884 | | | | — | | | | 114,884 | | |
Total Investments | | | — | | | | 3,194,433 | | | | 25,636 | | | | 3,220,069 | | |
Municipal Intermediate Bond | |
Investments: | |
Municipal Notes^ | | | — | | | | 158,707 | | | | — | | | | 158,707 | | |
Total Investments | | | — | | | | 158,707 | | | | — | | | | 158,707 | | |
New York Municipal Income | |
Investments: | |
Municipal Notes^ | | | — | | | | 67,327 | | | | — | | | | 67,327 | | |
Total Investments | | | — | | | | 67,327 | | | | — | | | | 67,327 | | |
Short Duration | |
Investments: | |
U.S. Treasury Securities-Backed by the Full Faith and
Credit of the U.S. Government | | | — | | | | 7,071 | | | | — | | | | 7,071 | | |
Mortgage-Backed Securities^ | | | — | | | | 20,675 | | | | — | | | | 20,675 | | |
Corporate Debt Securities^ | | | — | | | | 27,115 | | | | — | | | | 27,115 | | |
Asset-Backed Securities | | | — | | | | 7,368 | | | | — | | | | 7,368 | | |
Short-Term Investments | | | — | | | | 2,402 | | | | — | | | | 2,402 | | |
Total Investments | | | — | | | | 64,631 | | | | — | | | | 64,631 | | |
Short Duration High Income | |
Investments: | |
Bank Loan Obligations^ | | | — | | | | 10,539 | | | | — | | | | 10,539 | | |
Corporate Debt Securities | |
Airlines | | | — | | | | 871 | | | | 253 | | | | 1,124 | | |
Other Corporate Debt Securities^ | | | — | | | | 90,020 | | | | — | | | | 90,020 | | |
Total Corporate Debt Securities | | | — | | | | 90,891 | | | | 253 | | | | 91,144 | | |
Convertible Bonds | | | — | | | | 613 | | | | — | | | | 613 | | |
Short-Term Investments | | | — | | | | 39 | | | | — | | | | 39 | | |
Total Investments | | | — | | | | 102,082 | | | | 253 | | | | 102,335 | | |
Strategic Income | |
Investments: | |
Bank Loan Obligations | |
Automotive | | | — | | | | 5,417 | | | | 2,716 | | | | 8,133 | | |
Business Equipment & Services | | | — | | | | 13,159 | | | | 488 | | | | 13,647 | | |
Leisure Goods—Activities—Movies | | | — | | | | 7,755 | | | | 1,199 | | | | 8,954 | | |
See Notes to Financial Statements
98
Notes to Schedule of Investments (cont'd)
Asset Valuation Inputs
(000's omitted) | | Level 1 | | Level 2 | | Level 3§ | | Total | |
Lodging & Casinos | | $ | — | | | $ | 15,211 | | | $ | 261 | | | $ | 15,472 | | |
Oil & Gas | | | — | | | | 3,549 | | | | 1,380 | | | | 4,929 | | |
Radio & Television | | | — | | | | 9,682 | | | | 658 | | | | 10,340 | | |
Utilities | | | — | | | | 5,409 | | | | 1,501 | | | | 6,910 | | |
Other Bank Loan Obligations^ | | | — | | | | 120,515 | | | | — | | | | 120,515 | | |
Total Bank Loan Obligations | | | — | | | | 180,697 | | | | 8,203 | | | | 188,900 | | |
U.S. Treasury Securities-Backed by the Full Faith and
Credit of the U.S. Government | | | — | | | | 88,737 | | | | — | | | | 88,737 | | |
U.S. Government Agency Securities | | | — | | | | 4,575 | | | | — | | | | 4,575 | | |
Mortgage-Backed Securities | |
Commercial Mortgage-Backed | | | — | | | | 133,493 | | | | 970 | | | | 134,463 | | |
Other Mortgage-Backed Securities^ | | | — | | | | 408,769 | | | | — | | | | 408,769 | | |
Total Mortgage-Backed Securities | | | — | | | | 542,262 | | | | 970 | | | | 543,232 | | |
Corporate Debt Securities | |
Airlines | | | — | | | | 4,243 | | | | 20,505 | | | | 24,748 | | |
Other Corporate Debt Securities^ | | | — | | | | 515,779 | | | | — | | | | 515,779 | | |
Total Corporate Debt Securities | | | — | | | | 520,022 | | | | 20,505 | | | | 540,527 | | |
Asset-Backed Securities | | | — | | | | 143,263 | | | | — | | | | 143,263 | | |
Government Securities^ | | | — | | | | 32,805 | | | | — | | | | 32,805 | | |
Mutual Funds | | | — | | | | 86,975 | | | | — | | | | 86,975 | | |
Short-Term Investments | | | — | | | | 65,723 | | | | — | | | | 65,723 | | |
Total Investments | | | — | | | | 1,665,059 | | | | 29,678 | | | | 1,694,737 | | |
^ The Schedule of Investments provides information on the industry or state categorization for the portfolio.
§ The following is a reconciliation between the beginning and ending balances of investments in which significant unobservable inputs (Level 3) were used in determining value:
(000's omitted) | | Beginning
balance, as
of 11/1/12 | | Accrued
discounts/
(premiums) | | Realized
gain/(loss) | | Change
in unrealized
appreciation/
(depreciation) | | Purchases | | Sales | | Transfers
in to
Level 3 | | Transfers
out of
Level 3 | | Balance,
as of
10/31/13 | | Net change
in unrealized
appreciation/
(depreciation)
from
investments
still held as of
10/31/13 | |
Investments in
Securities: | |
Core Bond | |
Corporate Debt Securities | |
Airlines | | $ | 655 | | | $ | — | | | $ | (7 | ) | | $ | (67 | ) | | $ | 2,213 | | | $ | (193 | ) | | $ | — | | | $ | — | | | $ | 2,601 | | | $ | (67 | ) | |
Asset-Backed Securitiesz | | | 0 | | | | — | | | | (642 | ) | | | 642 | | | | — | | | | (0 | ) | | | — | | | | — | | | | — | | | | — | | |
Total | | | 655 | | | | — | | | | (649 | ) | | | 575 | | | | 2,213 | | | | (193 | ) | | | — | | | | — | | | | 2,601 | | | | (67 | ) | |
See Notes to Financial Statements
99
Notes to Schedule of Investments (cont'd)
(000's omitted) | | Beginning
balance, as
of 11/1/12 | | Accrued
discounts/
(premiums) | | Realized
gain/(loss) | | Change
in unrealized
appreciation/
(depreciation) | | Purchases | | Sales | | Transfers
in to
Level 3 | | Transfers
out of
Level 3 | | Balance,
as of
10/31/13 | | Net change
in unrealized
appreciation/
(depreciation)
from
investments
still held as of
10/31/13 | |
Floating Rate Income | |
Bank Loan Obligations | |
Automotive | | $ | — | | | $ | 3 | | | $ | — | | | $ | 53 | | | $ | 2,475 | | | $ | (13 | ) | | $ | — | | | $ | — | | | $ | 2,518 | | | $ | 53 | | |
Business Equipment &
Services | | | 972 | | | | (2 | ) | | | — | | | | 1 | | | | 1,907 | | | | (9 | ) | | | — | | | | (972 | ) | | | 1,897 | | | | 1 | | |
Containers & Glass
Products | | | 1,721 | | | | — | | | | — | | | | — | | | | — | | | | — | | | | — | | | | (1,721 | ) | | | — | | | | — | | |
Equipment Leasing | | | 1,640 | | | | — | | | | — | | | | — | | | | — | | | | — | | | | — | | | | (1,640 | ) | | | — | | | | — | | |
Financial Intermediaries | | | 626 | | | | 4 | | | | 20 | | | | 66 | | | | 5,701 | | | | (1,048 | ) | | | — | | | | — | | | | 5,369 | | | | 80 | | |
Leisure Goods—
Activities—Movies | | | — | | | | 1 | | | | — | | | | 29 | | | | 4,889 | | | | (1,106 | ) | | | — | | | | — | | | | 3,813 | | | | 29 | | |
Lodging & Casinos | | | — | | | | — | | | | — | | | | 22 | | | | 634 | | | | — | | | | — | | | | — | | | | 656 | | | | 22 | | |
Oil & Gas | | | 294 | | | | 1 | | | | 5 | | | | 37 | | | | 4,373 | | | | (621 | ) | | | — | | | | (294 | ) | | | 3,795 | | | | 37 | | |
Steel | | | 3,835 | | | | — | | | | 10 | | | | (37 | ) | | | 421 | | | | (2,384 | ) | | | — | | | | (1,845 | ) | | | — | | | | — | | |
Utilities | | | 1,854 | | | | 3 | | | | 19 | | | | (20 | ) | | | 3,201 | | | | (1,888 | ) | | | — | | | | — | | | | 3,169 | | | | (20 | ) | |
Total | | | 10,942 | | | | 10 | | | | 54 | | | | 151 | | | | 23,601 | | | | (7,069 | ) | | | — | | | | (6,472 | ) | | | 21,217 | | | | 202 | | |
High Income | |
Bank Loan Obligations | |
Lodging & Casinos | | | — | | | | 48 | | | | 466 | | | | 196 | | | | — | | | | (10,061 | ) | | | 25,681 | | | | — | | | | 16,330 | | | | 196 | | |
Corporate Debt Securities | |
Airlines | | | 3,904 | | | | — | | | | (22 | ) | | | 97 | | | | 6,890 | | | | (1,563 | ) | | | — | | | | — | | | | 9,306 | | | | 97 | | |
Total | | | 3,904 | | | | 48 | | | | 444 | | | | 293 | | | | 6,890 | | | | (11,624 | ) | | | 25,681 | | | | — | | | | 25,636 | | | | 293 | | |
Short Duration | |
Asset-Backed Securitiesz | | | 0 | | | | — | | | | (227 | ) | | | 227 | | | | — | | | | (0 | ) | | | — | | | | — | | | | — | | | | — | | |
Total | | | 0 | | | | — | | | | (227 | ) | | | 227 | | | | — | | | | (0 | ) | | | — | | | | — | | | | — | | | | — | | |
Short Duration High Income | |
Bank Loan Obligations | |
Leisure Goods—
Activities—Movies | | | 266 | | | | — | | | | — | | | | — | | | | — | | | | — | | | | — | | | | (266 | ) | | | — | | | | — | | |
Corporate Debt Securities | |
Airlines | | | — | | | | — | | | | — | | | | (1 | ) | | | 254 | | | | — | | | | — | | | | — | | | | 253 | | | | (1 | ) | |
Total | | | 266 | | | | — | | | | — | | | | (1 | ) | | | 254 | | | | — | | | | — | | | | (266 | ) | | | 253 | | | | (1 | ) | |
Strategic Income | |
Bank Loan Obligations | |
Automotive | | | — | | | | 3 | | | | 19 | | | | 58 | | | | 3,881 | | | | (1,245 | ) | | | — | | | | — | | | | 2,716 | | | | 58 | | |
See Notes to Financial Statements
100
Notes to Schedule of Investments (cont'd)
(000's omitted) | | Beginning
balance, as
of 11/1/12 | | Accrued
discounts/
(premiums) | | Realized
gain/(loss) | | Change
in unrealized
appreciation/
(depreciation) | | Purchases | | Sales | | Transfers
in to
Level 3 | | Transfers
out of
Level 3 | | Balance,
as of
10/31/13 | | Net change
in unrealized
appreciation/
(depreciation)
from
investments
still held as of
10/31/13 | |
Business Equipment &
Services | | $ | 1,629 | | | $ | — | | | $ | (10 | ) | | $ | (3 | ) | | $ | 1,634 | | | $ | (1,133 | ) | | $ | — | | | $ | (1,629 | ) | | $ | 488 | | | $ | (3 | ) | |
Containers &
Glass Products | | | 1,028 | | | | — | | | | — | | | | — | | | | — | | | | — | | | | — | | | | (1,028 | ) | | | — | | | | — | | |
Equipment Leasing | | | 1,014 | | | | — | | | | — | | | | — | | | | — | | | | — | | | | — | | | | (1,014 | ) | | | — | | | | — | | |
Financial Intermediaries | | | 381 | | | | — | | | | 11 | | | | (9 | ) | | | — | | | | (383 | ) | | | — | | | | — | | | | — | | | | — | | |
Leisure Goods—
Activities—Movies | | | — | | | | — | | | | 2 | | | | 16 | | | | 1,582 | | | | (401 | ) | | | — | | | | — | | | | 1,199 | | | | 16 | | |
Lodging & Casinos | | | — | | | | — | | | | — | | | | 9 | | | | 252 | | | | — | | | | — | | | | — | | | | 261 | | | | 9 | | |
Oil & Gas | | | 100 | | | | — | | | | 2 | | | | 13 | | | | 1,520 | | | | (155 | ) | | | — | | | | (100 | ) | | | 1,380 | | | | 13 | | |
Radio & Television | | | — | | | | — | | | | — | | | | — | | | | 658 | | | | — | | | | — | | | | — | | | | 658 | | | | — | | |
Steel | | | 1,110 | | | | — | | | | 2 | | | | (19 | ) | | | 435 | | | | (1,528 | ) | | | — | | | | — | | | | — | | | | — | | |
Utilities | | | 1,086 | | | | 2 | | | | 11 | | | | (10 | ) | | | 2,089 | | | | (1,677 | ) | | | — | | | | — | | | | 1,501 | | | | (10 | ) | |
Mortgage-Backed Securities | |
Commercial Mortgage-
Backed | | | — | | | | — | | | | — | | | | (130 | ) | | | 1,100 | | | | — | | | | — | | | | — | | | | 970 | | | | (130 | ) | |
Corporate Debt Securities | |
Airlines | | | 5,205 | | | | — | | | | (80 | ) | | | (370 | ) | | | 18,330 | | | | (2,580 | ) | | | — | | | | — | | | | 20,505 | | | | (370 | ) | |
Total | | | 11,553 | | | | 5 | | | | (43 | ) | | | (445 | ) | | | 31,481 | | | | (9,102 | ) | | | — | | | | (3,771 | ) | | | 29,678 | | | | (417 | ) | |
Securities categorized as Level 3 are valued based on a single quotation obtained from a dealer. The Funds do not have access to unobservable inputs and therefore cannot disclose such inputs used in formulating such quotation.
As of the period ending October 31, 2013, certain securities were transferred from one level to another based on beginning of period market values as of October 31, 2012. As of October 31, 2013, five securities in Floating Rate Income, one security in Short Duration High Income and five securities in Strategic Income transferred from Level 3 to Level 2 as a result of an increase in the number of observable inputs that were readily available to the independent pricing service. As of October 31, 2013, one security in High Income transferred from Level 2 to Level 3 as a result of a decrease in the number of observable inputs that were readily available to the independent pricing service. As of the period ending October 31, 2013, the Funds had no transfers between Levels 1 and 2.
See Notes to Financial Statements
101
Notes to Schedule of Investments (cont'd)
The following is a summary, categorized by Level, of inputs used to value the Funds' derivatives as of October 31, 2013:
(000's omitted) | | Level 1 | | Level 2 | | Level 3 | | Total | |
Core Bond | |
Futures contracts (unrealized appreciation) | | $ | — | | | $ | — | | | $ | — | | | $ | — | | |
Strategic Income | |
Futures contracts (unrealized appreciation) | | $ | 292 | | | $ | — | | | $ | — | | | $ | 292 | | |
Liability Valuation Inputs | |
The following is a summary, categorized by Level, of inputs used to value the Funds' derivatives as of October 31, 2013:
(000's omitted) | | Level 1 | | Level 2 | | Level 3 | | Total | |
Core Bond | |
Futures contracts (unrealized depreciation) | | $ | (985 | ) | | $ | — | | | $ | — | | | $ | (985 | ) | |
Strategic Income | |
Futures contracts (unrealized depreciation) | | $ | (12,738 | ) | | $ | — | | | $ | — | | | $ | (12,738 | ) | |
## At October 31, 2013, selected fund information on a U.S. federal income tax basis was as follows:
(000's omitted) | | Cost | | Gross
Unrealized
Appreciation | | Gross
Unrealized
Depreciation | | Net
Unrealized
Appreciation
(Depreciation) | |
Core Bond | | $ | 258,192 | | | $ | 3,172 | | | $ | 3,574 | | | $ | (402 | ) | |
Floating Rate Income | | | 564,429 | | | | 4,982 | | | | 963 | | | | 4,019 | | |
High Income | | | 3,079,834 | | | | 149,714 | | | | 9,479 | | | | 140,235 | | |
Municipal Intermediate Bond | | | 157,310 | | | | 3,826 | | | | 2,429 | | | | 1,397 | | |
New York Municipal Income | | | 66,509 | | | | 2,294 | | | | 1,476 | | | | 818 | | |
Short Duration | | | 64,950 | | | | 261 | | | | 580 | | | | (319 | ) | |
Short Duration High Income | | | 101,973 | | | | 863 | | | | 501 | | | | 362 | | |
Strategic Income | | | 1,676,742 | | | | 38,188 | | | | 20,193 | | | | 17,995 | | |
ñ Securities were purchased under Rule 144A of the Securities Act of 1933, as amended (the "1933 Act"), or are private placements and, unless registered under the 1933 Act or exempted from registration, may only be sold to qualified institutional investors. These securities have been deemed by the investment manager to be liquid. At October 31, 2013, these securities amounted to approximately $8,640,000 or 4.0% of net assets for Core Bond, approximately $17,177,000 or 3.1% of net assets for Floating Rate Income, approximately $800,496,000 or 24.5% of net assets for High Income, approximately $762,000 or 0.5% of net assets for Municipal Intermediate Bond, approximately $5,974,000 or 9.4% of net assets for Short Duration, approximately $18,288,000 or 17.5% of net assets for Short Duration High Income and approximately $129,263,000 or 9.9% of net assets for Strategic Income.
Ñ These securities have been deemed by the investment manager to be illiquid. At October 31, 2013, these securities amounted to approximately $21,217,000 or 3.8% of net assets for Floating Rate Income, $16,330,000 or 0.5% of net assets for High Income and approximately $8,203,000 or 0.6% of net assets for Strategic Income.
See Notes to Financial Statements
102
Notes to Schedule of Investments (cont'd)
Ø All or a portion of this security was purchased on a when-issued basis. At October 31, 2013, these securities amounted to $44,325,000 for Core Bond, $1,011,000 for Floating Rate Income, $30,733,000 for High Income, $3,514,000 for Municipal Intermediate Bond and $408,427,000 for Strategic Income. For TBA (to be announced) securities, the maturity date was not known at the time of investment.
ß Security is guaranteed by the corporate or non-profit obligor.
¢ All or a portion of this security was purchased on a delayed delivery basis.
^^ All or a portion of this security has not settled as of October 31, 2013 and thus may not have an interest rate in effect. Interest rates do not take effect until settlement.
ØØ All or a portion of this security is segregated in connection with obligations for when-issued security purchase commitments and/or financial futures contracts and/or delayed delivery purchase commitments.
µ Floating rate securities are securities whose yields vary with a designated index or market rate. These securities are shown at their current rates as of October 31, 2013, and their final maturities.
c Payment-in-kind security for which part of the income earned may be paid as additional principal.
a Principal amount is stated in the currency in which the security is denominated.
AUD = Australian Dollar
EUR = Euro Dollar
NZD = New Zealand Dollar
b Currently a zero coupon security; will convert to 4.00% on August 1, 2023.
z A zero balance may reflect actual amounts rounding to less than $1,000.
± See Note A-12 in the Notes to Financial Statements for the Funds' open derivatives at October 31, 2013.
See Notes to Financial Statements
103
Statements of Assets and Liabilities
Neuberger Berman Income Funds
(000's omitted except per share amounts)
| | | CORE BOND
FUND | | FLOATING
RATE INCOME
FUND | | HIGH INCOME
BOND FUND | | MUNICIPAL
INTERMEDIATE
BOND FUND | |
| | | October 31,
2013 | | October 31,
2013 | | October 31,
2013 | | October 31,
2013 | |
Assets | |
Investments in securities, at value* (Note A)—see Schedule of Investments: | |
Unaffiliated issuers | | $ | 257,790 | | | $ | 568,448 | | | $ | 3,220,069 | | | $ | 158,707 | | |
Affiliated issuers | | | — | | | | — | | | | — | | | | — | | |
| | | | 257,790 | | | | 568,448 | | | | 3,220,069 | | | | 158,707 | | |
Cash | | | — | | | | 1,586 | | | | 5,681 | | | | 249 | | |
Foreign currency | | | — | | | | — | | | | — | | | | — | | |
Deposits with brokers for futures contracts (Note A) | | | 561 | | | | — | | | | — | | | | — | | |
Dividends and interest receivable | | | 1,061 | | | | 1,843 | | | | 54,797 | | | | 1,752 | | |
Receivable for securities sold | | | 8,571 | | | | 10,295 | | | | 29,634 | | | | — | | |
Receivable for Fund shares sold | | | 127 | | | | 1,617 | | | | 7,042 | | | | 585 | | |
Receivable from Management—net (Note B) | | | — | | | | — | | | | — | | | | — | | |
Receivable for variation margin (Note A) | | | 6 | | | | — | | | | — | | | | — | | |
Prepaid expenses and other assets | | | 29 | | | | 36 | | | | 149 | | | | 23 | | |
Total Assets | | | 268,145 | | | | 583,825 | | | | 3,317,372 | | | | 161,316 | | |
Liabilities | |
Distributions payable | | | 76 | | | | 337 | | | | 3,114 | | | | 57 | | |
Payable for securities purchased | | | 53,138 | | | | 24,003 | | | | 43,669 | | | | 3,458 | | |
Payable for Fund shares redeemed | | | 234 | | | | 1,888 | | | | 5,782 | | | | 383 | | |
Payable to investment manager—net (Notes A & B) | | | 45 | | | | 233 | | | | 1,310 | | | | 33 | | |
Payable to administrator—net (Note B) | | | 15 | | | | 107 | | | | 595 | | | | 6 | | |
Payable to trustees | | | 3 | | | | 3 | | | | 3 | | | | 3 | | |
Accrued expenses and other payables | | | 84 | | | | 94 | | | | 358 | | | | 90 | | |
Total Liabilities | | | 53,595 | | | | 26,665 | | | | 54,831 | | | | 4,030 | | |
Net Assets | | $ | 214,550 | | | $ | 557,160 | | | $ | 3,262,541 | | | $ | 157,286 | | |
Net Assets consist of: | |
Paid-in capital | | $ | 215,041 | | | $ | 554,211 | | | $ | 3,042,340 | | | $ | 154,929 | | |
Undistributed net investment income (loss) | | | — | | | | — | | | | 183 | | | | — | | |
Distributions in excess of net investment income | | | (76 | ) | | | (250 | ) | | | — | | | | — | | |
Accumulated net realized gains (losses) on investments | | | (63 | ) | | | (1,016 | ) | | | 78,264 | | | | 960 | | |
Net unrealized appreciation (depreciation) in value of investments | | | (352 | ) | | | 4,215 | | | | 141,754 | | | | 1,397 | | |
Net Assets | | $ | 214,550 | | | $ | 557,160 | | | $ | 3,262,541 | | | $ | 157,286 | | |
Net Assets | |
Investor Class | | $ | 13,539 | | | $ | — | | | $ | 311,481 | | | $ | 18,823 | | |
Trust Class | | | — | | | | — | | | | — | | | | — | | |
Institutional Class | | | 165,867 | | | | 430,668 | | | | 1,949,590 | | | | 131,965 | | |
Class A | | | 30,143 | | | | 74,674 | | | | 395,620 | | | | 4,973 | | |
Class C | | | 5,001 | | | | 51,818 | | | | 60,004 | | | | 1,525 | | |
Class R3 | | | — | | | | — | | | | 10,873 | | | | — | | |
Class R6 | | | — | | | | — | | | | 534,973 | | | | — | | |
Shares Outstanding ($.001 par value; unlimited shares authorized) | |
Investor Class | | | 1,308 | | | | — | | | | 32,350 | | | | 1,626 | | |
Trust Class | | | — | | | | — | | | | — | | | | — | | |
Institutional Class | | | 15,991 | | | | 41,868 | | | | 202,163 | | | | 11,406 | | |
Class A | | | 2,916 | | | | 7,260 | | | | 41,085 | | | | 430 | | |
Class C | | | 483 | | | | 5,037 | | | | 6,222 | | | | 132 | | |
Class R3 | | | — | | | | — | | | | 1,129 | | | | — | | |
Class R6 | | | — | | | | — | | | | 55,471 | | | | — | | |
Net Asset Value, offering and redemption price per share | |
Investor Class | | $ | 10.35 | | | $ | — | | | $ | 9.63 | | | $ | 11.58 | | |
Trust Class | | | — | | | | — | | | | — | | | | — | | |
Institutional Class | | | 10.37 | | | | 10.29 | | | | 9.64 | | | | 11.57 | | |
Class R3 | | | — | | | | — | | | | 9.63 | | | | — | | |
Class R6 | | | — | | | | — | | | | 9.64 | | | | — | | |
Net Asset Value and redemption price per share | |
Class A | | $ | 10.34 | | | $ | 10.29 | | | $ | 9.63 | | | $ | 11.57 | | |
Offering Price per share | |
Class A‡ | | $ | 10.80 | | | $ | 10.75 | | | $ | 10.06 | | | $ | 12.08 | | |
Net Asset Value and offering price per share | |
Class C^ | | $ | 10.35 | | | $ | 10.29 | | | $ | 9.64 | | | $ | 11.57 | | |
See Notes to Financial Statements
104
| | | NEW YORK
MUNICIPAL
INCOME FUND | | SHORT
DURATION
BOND FUND | | SHORT
DURATION
HIGH INCOME
FUND | | STRATEGIC
INCOME FUND | |
| | | October 31,
2013 | | October 31,
2013 | | October 31,
2013 | | October 31,
2013 | |
Assets | |
Investments in securities, at value* (Note A)—see Schedule of Investments: | |
Unaffiliated issuers | | $ | 67,327 | | | $ | 64,631 | | | $ | 102,335 | | | $ | 1,607,762 | | |
Affiliated issuers | | | — | | | | — | | | | — | | | | 86,975 | | |
| | | | 67,327 | | | | 64,631 | | | | 102,335 | | | | 1,694,737 | | |
Cash | | | 15 | | | | — | | | | 2 | | | | 2,095 | | |
Foreign currency | | | — | | | | — | | | | — | | | | 3,731 | | |
Deposits with brokers for futures contracts (Note A) | | | — | | | | — | | | | — | | | | 7,735 | | |
Dividends and interest receivable | | | 930 | | | | 203 | | | | 1,581 | | | | 9,387 | | |
Receivable for securities sold | | | 91 | | | | — | | | | 1,297 | | | | 106,179 | | |
Receivable for Fund shares sold | | | 3 | | | | 79 | | | | 18 | | | | 1,753 | | |
Receivable from Management—net (Note B) | | | — | | | | 3 | | | | — | | | | — | | |
Receivable for variation margin (Note A) | | | — | | | | — | | | | — | | | | 144 | | |
Prepaid expenses and other assets | | | 17 | | | | 27 | | | | 17 | | | | 72 | | |
Total Assets | | | 68,383 | | | | 64,943 | | | | 105,250 | | | | 1,825,833 | | |
Liabilities | |
Distributions payable | | | 21 | | | | 11 | | | | — | | | | 858 | | |
Payable for securities purchased | | | — | | | | 1,402 | | | | 713 | | | | 511,738 | | |
Payable for Fund shares redeemed | | | 6 | | | | 59 | | | | 65 | | | | 8,200 | | |
Payable to investment manager—net (Notes A & B) | | | 14 | | | | 13 | | | | 39 | | | | 578 | | |
Payable to administrator—net (Note B) | | | 9 | | | | — | | | | 19 | | | | 386 | | |
Payable to trustees | | | 3 | | | | 3 | | | | 3 | | | | 3 | | |
Accrued expenses and other payables | | | 56 | | | | 92 | | | | 68 | | | | 237 | | |
Total Liabilities | | | 109 | | | | 1,580 | | | | 907 | | | | 522,000 | | |
Net Assets | | $ | 68,274 | | | $ | 63,363 | | | $ | 104,343 | | | $ | 1,303,833 | | |
Net Assets consist of: | |
Paid-in capital | | $ | 67,309 | | | $ | 79,481 | | | $ | 103,846 | | | $ | 1,291,395 | | |
Undistributed net investment income (loss) | | | 12 | | | | 152 | | | | — | | | | 1,773 | | |
Distributions in excess of net investment income | | | — | | | | — | | | | (3 | ) | | | — | | |
Accumulated net realized gains (losses) on investments | | | 135 | | | | (16,253 | ) | | | 137 | | | | 1,851 | | |
Net unrealized appreciation (depreciation) in value of investments | | | 818 | | | | (17 | ) | | | 363 | | | | 8,814 | | |
Net Assets | | $ | 68,274 | | | $ | 63,363 | | | $ | 104,343 | | | $ | 1,303,833 | | |
Net Assets | |
Investor Class | | $ | — | | | $ | 32,824 | | | $ | — | | | $ | — | | |
Trust Class | | | — | | | | 3,962 | | | | — | | | | 43,792 | | |
Institutional Class | | | 68,274 | | | | 18,068 | | | | 102,937 | | | | 739,085 | | |
Class A | | | — | | | | 6,300 | | | | 1,178 | | | | 311,773 | | |
Class C | | | — | | | | 2,209 | | | | 228 | | | | 191,706 | | |
Class R3 | | | — | | | | — | | | | — | | | | — | | |
Class R6 | | | — | | | | — | | | | — | | | | 17,477 | | |
Shares Outstanding ($.001 par value; unlimited shares authorized) | |
Investor Class | | | — | | | | 4,113 | | | | — | | | | — | | |
Trust Class | | | — | | | | 521 | | | | — | | | | 3,916 | | |
Institutional Class | | | 3,984 | | | | 2,266 | | | | 10,108 | | | | 66,074 | | |
Class A | | | — | | | | 829 | | | | 116 | | | | 27,850 | | |
Class C | | | — | | | | 290 | | | | 22 | | | | 17,139 | | |
Class R3 | | | — | | | | — | | | | — | | | | — | | |
Class R6 | | | — | | | | — | | | | — | | | | 1,563 | | |
Net Asset Value, offering and redemption price per share | |
Investor Class | | $ | — | | | $ | 7.98 | | | $ | — | | | $ | — | | |
Trust Class | | | — | | | | 7.60 | | | | — | | | | 11.18 | | |
Institutional Class | | | 17.14 | | | | 7.97 | | | | 10.18 | | | | 11.19 | | |
Class R3 | | | — | | | | — | | | | — | | | | — | | |
Class R6 | | | — | | | | — | | | | — | | | | 11.18 | | |
Net Asset Value and redemption price per share | |
Class A | | $ | — | | | $ | 7.60 | | | $ | 10.19 | | | $ | 11.19 | | |
Offering Price per share | |
Class A‡ | | $ | — | | | $ | 7.79 | | | $ | 10.64 | | | $ | 11.69 | | |
Net Asset Value and offering price per share | |
Class C^ | | $ | — | | | $ | 7.61 | | | $ | 10.19 | | | $ | 11.19 | | |
105
Statements of Assets and Liabilities (cont'd)
Neuberger Berman Income Funds (cont'd)
(000's omitted except per share amounts)
| | CORE BOND
FUND | | FLOATING
RATE INCOME
FUND | | HIGH INCOME
BOND FUND | | MUNICIPAL
INTERMEDIATE
BOND FUND | |
| | | October 31,
2013 | | October 31,
2013 | | October 31,
2013 | | October 31,
2013 | |
*Cost of Investments: | |
Unaffiliated issuers | | $ | 257,156 | | | $ | 564,233 | | | $ | 3,078,315 | | | $ | 157,310 | | |
Affiliated issuers | | | — | | | | — | | | | — | | | | — | | |
Total cost of investments | | $ | 257,156 | | | $ | 564,233 | | | $ | 3,078,315 | | | $ | 157,310 | | |
Total cost of foreign currency | | $ | — | | | $ | — | | | $ | — | | | $ | — | | |
‡ On single retail sales of less than $50,000. On sales of $50,000 or more or in certain other circumstances described in the Fund's prospectus, offering price is reduced.
^ Redemption price per share is equal to net asset value less any applicable contingent deferred sales charge.
See Notes to Financial Statements
106
| | | NEW YORK
MUNICIPAL
INCOME FUND | | SHORT
DURATION
BOND FUND | | SHORT
DURATION
HIGH INCOME
FUND | | STRATEGIC
INCOME FUND | |
| | | October 31,
2013 | | October 31,
2013 | | October 31,
2013 | | October 31,
2013 | |
*Cost of Investments: | |
Unaffiliated issuers | | $ | 66,509 | | | $ | 64,648 | | | $ | 101,972 | | | $ | 1,588,212 | | |
Affiliated issuers | | | — | | | | — | | | | — | | | | 85,303 | | |
Total cost of investments | | $ | 66,509 | | | $ | 64,648 | | | $ | 101,972 | | | $ | 1,673,515 | | |
Total cost of foreign currency | | $ | — | | | $ | — | | | $ | — | | | $ | 3,698 | | |
107
Neuberger Berman Income Funds
(000's omitted)
| | | CORE BOND
FUND | | FLOATING RATE
INCOME FUND | | HIGH INCOME
BOND FUND | | MUNICIPAL
INTERMEDIATE
BOND FUND | |
| | | For the
Year Ended
October 31,
2013 | | For the
Year Ended
October 31,
2013 | | For the
Year Ended
October 31,
2013 | | For the
Year Ended
October 31,
2013 | |
Investment Income: | |
Income (Note A): | |
Interest and other income—unaffiliated issuers | | $ | 5,802 | | | $ | 21,014 | | | $ | 220,429 | | | $ | 4,452 | | |
Dividend income—affiliated issuers (Note I) | | | — | | | | — | | | | — | | | | — | | |
Foreign taxes withheld | | | — | | | | — | | | | — | | | | — | | |
Total income | | $ | 5,802 | | | $ | 21,014 | | | $ | 220,429 | | | $ | 4,452 | | |
Expenses: | |
Investment management fees (Note B) | | | 616 | | | | 2,210 | | | | 15,958 | | | | 392 | | |
Administration fees (Note B) | | | 148 | | | | 265 | | | | 1,995 | | | | 94 | | |
Administration fees (Note B): | |
Investor Class | | | 31 | | | | — | | | | 682 | | | | 42 | | |
Trust Class | | | — | | | | — | | | | — | | | | — | | |
Institutional Class | | | 172 | | | | 316 | | | | 2,004 | | | | 117 | | |
Class A | | | 71 | | | | 123 | | | | 1,008 | | | | 11 | | |
Class C | | | 13 | | | | 69 | | | | 140 | | | | 4 | | |
Class R3 | | | — | | | | — | | | | 22 | | | | — | | |
Class R6 | | | — | | | | — | | | | 43 | | | | — | | |
Distribution fees (Note B): | |
Investor Class | | | 37 | | | | — | | | | — | | | | — | | |
Trust Class | | | — | | | | — | | | | — | | | | — | | |
Class A | | | 84 | | | | 146 | | | | 1,200 | | | | 13 | | |
Class C | | | 62 | | | | 330 | | | | 668 | | | | 15 | | |
Class R3 | | | — | | | | — | | | | 52 | | | | — | | |
Shareholder servicing agent fees: | |
Investor Class | | | 18 | | | | — | | | | 116 | | | | 10 | | |
Trust Class | | | — | | | | — | | | | — | | | | — | | |
Institutional Class | | | 17 | | | | 30 | | | | 270 | | | | 11 | | |
Class A | | | 23 | | | | 10 | | | | 169 | | | | 2 | | |
Class C | | | 2 | | | | 6 | | | | 18 | | | | 1 | | |
Class R3 | | | — | | | | — | | | | 2 | | | | — | | |
Class R6 | | | — | | | | — | | | | 17 | | | | — | | |
Builder Class (Note B) | | | — | | | | — | | | | — | | | | — | | |
Premier Class (Note B) | | | — | | | | — | | | | — | | | | — | | |
Audit fees | | | 28 | | | | 31 | | | | 63 | | | | 55 | | |
Custodian and accounting fees | | | 154 | | | | 326 | | | | 595 | | | | 121 | | |
Insurance expense | | | 10 | | | | 13 | | | | 144 | | | | 6 | | |
Legal fees | | | 94 | | | | 93 | | | | 113 | | | | 91 | | |
Registration and filing fees | | | 80 | | | | 89 | | | | 351 | | | | 67 | | |
Registration and filing fees—Builder Class | | | — | | | | — | | | | — | | | | — | | |
Registration and filing fees—Premier Class | | | — | | | | — | | | | — | | | | — | | |
Shareholder reports | | | 49 | | | | 27 | | | | 280 | | | | 15 | | |
Trustees' fees and expenses | | | 45 | | | | 45 | | | | 45 | | | | 45 | | |
Miscellaneous | | | 33 | | | | 28 | | | | 151 | | | | 11 | | |
Fund accounting fees (Note B) | | | — | | | | — | | | | — | | | | — | | |
Compliance service fees (Note B) | | | — | | | | — | | | | — | | | | — | | |
Total expenses | | | 1,787 | | | | 4,157 | | | | 26,106 | | | | 1,123 | | |
See Notes to Financial Statements
108
| | | NEW YORK MUNICIPAL
INCOME FUND | | SHORT
DURATION
BOND FUND | | SHORT
DURATION
HIGH INCOME
FUND | | STRATEGIC
INCOME FUND | |
| | | For the
Period
March 1, 2013
to
October 31, 2013 | | For the
Year Ended
February 28,
2013 | | For the
Year Ended
October 31,
2013 | | For the
Year Ended
October 31,
2013 | | For the
Year Ended
October 31,
2013 | |
Investment Income: | |
Income (Note A): | |
Interest and other income—unaffiliated issuers | | $ | 1,692 | | | $ | 2,248 | | | $ | 929 | | | $ | 3,075 | | | $ | 54,875 | | |
Dividend income—affiliated issuers (Note I) | | | — | | | | — | | | | — | | | | — | | | | 302 | | |
Foreign taxes withheld | | | — | | | | — | | | | — | | | | — | | | | (3 | ) | |
Total income | | $ | 1,692 | | | $ | 2,248 | | | $ | 929 | | | $ | 3,075 | | | $ | 55,174 | | |
Expenses: | |
Investment management fees (Note B) | | | 124 | | | | 324 | | | | 169 | | | | 282 | | | | 7,043 | | |
Administration fees (Note B) | | | 32 | | | | 81 | | | | 41 | | | | 38 | | | | 769 | | |
Administration fees (Note B): | |
Investor Class | | | — | | | | — | | | | 74 | | | | — | | | | — | | |
Trust Class | | | — | | | | — | | | | 20 | | | | — | | | | 120 | | |
Institutional Class | | | 42 | | | | — | | | | 20 | | | | 56 | | | | 622 | | |
Class A | | | — | | | | — | | | | 8 | | | | 1 | | | | 722 | | |
Class C | | | — | | | | — | | | | 4 | | | | — | | | | 431 | | |
Class R3 | | | — | | | | — | | | | — | | | | — | | | | — | | |
Class R6 | | | — | | | | — | | | | — | | | | — | | | | 1 | | |
Distribution fees (Note B): | |
Investor Class | | | — | | | | — | | | | — | | | | — | | | | — | | |
Trust Class | | | — | | | | — | | | | — | | | | — | | | | 35 | | |
Class A | | | — | | | | — | | | | 10 | | | | 2 | | | | 860 | | |
Class C | | | — | | | | — | | | | 17 | | | | 1 | | | | 2,052 | | |
Class R3 | | | — | | | | — | | | | — | | | | — | | | | — | | |
Shareholder servicing agent fees: | |
Investor Class | | | — | | | | — | | | | 33 | | | | — | | | | — | | |
Trust Class | | | — | | | | — | | | | 1 | | | | — | | | | 8 | | |
Institutional Class | | | 31 | | | | — | | | | 2 | | | | 6 | | | | 78 | | |
Class A | | | — | | | | — | | | | 1 | | | | 2 | | | | 131 | | |
Class C | | | — | | | | — | | | | — | | | | 2 | | | | 44 | | |
Class R3 | | | — | | | | — | | | | — | | | | — | | | | — | | |
Class R6 | | | — | | | | — | | | | — | | | | — | | | | 2 | | |
Builder Class (Note B) | | | — | | | | 39 | | | | — | | | | — | | | | — | | |
Premier Class (Note B) | | | 1 | | | | 18 | | | | — | | | | — | | | | — | | |
Audit fees | | | 24 | | | | 29 | | | | 59 | | | | 33 | | | | 69 | | |
Custodian and accounting fees | | | 29 | | | | 33 | | | | 85 | | | | 96 | | | | 546 | | |
Insurance expense | | | 2 | | | | 12 | | | | 2 | | | | 1 | | | | 45 | | |
Legal fees | | | 75 | | | | 59 | | | | 92 | | | | 87 | | | | 168 | | |
Registration and filing fees | | | 13 | | | | 7 | | | | 85 | | | | 86 | | | | 207 | | |
Registration and filing fees—Builder Class | | | — | | | | 14 | | | | — | | | | — | | | | — | | |
Registration and filing fees—Premier Class | | | — | | | | 7 | | | | — | | | | — | | | | — | | |
Shareholder reports | | | 12 | | | | 41 | | | | 15 | | | | 3 | | | | 126 | | |
Trustees' fees and expenses | | | 23 | | | | 63 | | | | 45 | | | | 45 | | | | 45 | | |
Miscellaneous | | | 9 | | | | 15 | | | | 8 | | | | 2 | | | | 92 | | |
Fund accounting fees (Note B) | | | — | | | | 44 | | | | — | | | | — | | | | — | | |
Compliance service fees (Note B) | | | — | | | | 36 | | | | — | | | | — | | | | — | | |
Total expenses | | | 417 | | | | 822 | | | | 791 | | | | 743 | | | | 14,216 | | |
109
Statements of Operations (cont'd)
Neuberger Berman Income Funds (cont'd)
(000's omitted)
| | CORE BOND
FUND | | FLOATING RATE
INCOME FUND | | HIGH INCOME
BOND FUND | | MUNICIPAL
INTERMEDIATE
BOND FUND | |
| | | For the
Year Ended
October 31,
2013 | | For the
Year Ended
October 31,
2013 | | For the
Year Ended
October 31,
2013 | | For the
Year Ended
October 31,
2013 | |
Expenses reimbursed by Management (Note B) | | | (405 | ) | | | (465 | ) | | | — | | | | (270 | ) | |
Management fees waived (Note B) | | | — | | | | — | | | | — | | | | — | | |
Expenses reduced by custodian fee expense offset arrangement (Note A) | | | — | | | | — | | | | (1 | ) | | | — | | |
Total net expenses | | | 1,382 | | | | 3,692 | | | | 26,105 | | | | 853 | | |
Net investment income (loss) | | $ | 4,420 | | | $ | 17,322 | | | $ | 194,324 | | | $ | 3,599 | | |
Realized and Unrealized Gain (Loss) on Investments (Note A) | |
Net realized gain (loss) on: | |
Sales of investment securities of unaffiliated issuers | | | (1,076 | ) | | | (100 | ) | | | 79,684 | | | | 979 | | |
Financial futures contracts | | | 1,800 | | | | — | | | | — | | | | — | | |
Foreign currency | | | 1 | | | | — | | | | — | | | | — | | |
Change in net unrealized appreciation (depreciation) in value of: | |
Unaffiliated investment securities | | | (8,962 | ) | | | 1,876 | | | | 8,364 | | | | (6,679 | ) | |
Affiliated investment securities | | | — | | | | — | | | | — | | | | — | | |
Financial futures contracts | | | (905 | ) | | | — | | | | — | | | | — | | |
Foreign currency | | | — | | | | — | | | | — | | | | — | | |
Net gain (loss) on investments | | | (9,142 | ) | | | 1,776 | | | | 88,048 | | | | (5,700 | ) | |
Net increase (decrease) in net assets resulting from operations | | $ | (4,722 | ) | | $ | 19,098 | | | $ | 282,372 | | | $ | (2,101 | ) | |
See Notes to Financial Statements
110
| | | NEW YORK MUNICIPAL
INCOME FUND | | SHORT
DURATION
BOND FUND | | SHORT
DURATION
HIGH INCOME
FUND | | STRATEGIC
INCOME FUND | |
| | | For the
Period
March 1, 2013
to
October 31, 2013 | | For the
Year Ended
February 28,
2013 | | For the
Year Ended
October 31,
2013 | | For the
Year Ended
October 31,
2013 | | For the
Year Ended
October 31,
2013 | |
Expenses reimbursed by Management (Note B) | | | — | | | | — | | | | (332 | ) | | | (270 | ) | | | (828 | ) | |
Management fees waived (Note B) | | | — | | | | — | | | | — | | | | — | | | | (42 | ) | |
Expenses reduced by custodian fee expense offset arrangement (Note A) | | | — | | | | — | | | | — | | | | — | | | | — | | |
Total net expenses | | | 417 | | | | 822 | | | | 459 | | | | 473 | | | | 13,346 | | |
Net investment income (loss) | | $ | 1,275 | | | $ | 1,426 | | | $ | 470 | | | $ | 2,602 | | | $ | 41,828 | | |
Realized and Unrealized Gain (Loss) on Investments (Note A) | |
Net realized gain (loss) on: | |
Sales of investment securities of unaffiliated issuers | | | 164 | | | | 3 | | | | (715 | ) | | | 149 | | | | (6,697 | ) | |
Financial futures contracts | | | — | | | | — | | | | 1 | | | | — | | | | 13,531 | | |
Foreign currency | | | — | | | | — | | | | — | | | | — | | | | (117 | ) | |
Change in net unrealized appreciation (depreciation) in value of: | |
Unaffiliated investment securities | | | (2,978 | ) | | | — | | | | 928 | | | | 422 | | | | (29,431 | ) | |
Affiliated investment securities | | | — | | | | 187 | | | | — | | | | — | | | | 1,672 | | |
Financial futures contracts | | | — | | | | — | | | | — | | | | — | | | | (11,991 | ) | |
Foreign currency | | | — | | | | — | | | | — | | | | — | | | | 34 | | |
Net gain (loss) on investments | | | (2,814 | ) | | | 190 | | | | 214 | | | | 571 | | | | (32,999 | ) | |
Net increase (decrease) in net assets resulting from operations | | $ | (1,539 | ) | | $ | 1,616 | | | $ | 684 | | | $ | 3,173 | | | $ | 8,829 | | |
111
Statements of Changes in Net Assets
Neuberger Berman Income Funds
(000's omitted)
| | | CORE BOND FUND | | FLOATING RATE INCOME FUND | |
| | | Year Ended
October 31,
2013 | | Year Ended
October 31,
2012 | | Year Ended
October 31,
2013 | | Year Ended
October 31,
2012 | |
Increase (Decrease) in Net Assets: | |
From Operations (Note A): | |
Net investment income (loss) | | $ | 4,420 | | | $ | 4,959 | | | $ | 17,322 | | | $ | 11,321 | | |
Net realized gain (loss) on investments | | | 725 | | | | 7,747 | | | | (100 | ) | | | 660 | | |
Change in net unrealized appreciation
(depreciation) of investments | | | (9,867 | ) | | | 4,526 | | | | 1,876 | | | | 5,876 | | |
Net increase (decrease) in net assets resulting
from operations | | | (4,722 | ) | | | 17,232 | | | | 19,098 | | | | 17,857 | | |
Distributions to Shareholders From (Note A): | |
Net investment income: | |
Investor Class | | | (226 | ) | | | (273 | ) | | | — | | | | — | | |
Trust Class | | | — | | | | — | | | | — | | | | — | | |
Institutional Class | | | (3,673 | ) | | | (4,043 | ) | | | (14,360 | ) | | | (9,613 | ) | |
Class A | | | (507 | ) | | | (537 | ) | | | (2,154 | ) | | | (1,324 | ) | |
Class C | | | (48 | ) | | | (72 | ) | | | (950 | ) | | | (388 | ) | |
Class R3 | | | — | | | | — | | | | — | | | | — | | |
Class R6 | | | — | | | | — | | | | — | | | | — | | |
Builder Class | | | — | | | | — | | | | — | | | | — | | |
Premier Class | | | — | | | | — | | | | — | | | | — | | |
Net realized gain on investments: | |
Investor Class | | | (414 | ) | | | (402 | ) | | | — | | | | — | | |
Trust Class | | | — | | | | — | | | | — | | | | — | | |
Institutional Class | | | (5,453 | ) | | | (4,669 | ) | | | — | | | | — | | |
Class A | | | (1,118 | ) | | | (714 | ) | | | — | | | | — | | |
Class C | | | (184 | ) | | | (157 | ) | | | — | | | | — | | |
Class R3 | | | — | | | | — | | | | — | | | | — | | |
Tax return of capital: | |
Investor Class | | | (23 | ) | | | — | | | | — | | | | — | | |
Institutional Class | | | (297 | ) | | | — | | | | — | | | | — | | |
Class A | | | (52 | ) | | | — | | | | — | | | | — | | |
Class C | | | (10 | ) | | | — | | | | — | | | | — | | |
Total distributions to shareholders | | | (12,005 | ) | | | (10,867 | ) | | | (17,464 | ) | | | (11,325 | ) | |
From Fund Share Transactions (Note D): | |
Proceeds from shares sold: | |
Investor Class | | | 1,674 | | | | 3,488 | | | | — | | | | — | | |
Trust Class | | | — | | | | — | | | | — | | | | — | | |
Institutional Class | | | 33,946 | | | | 67,757 | | | | 323,861 | | | | 119,417 | | |
Class A | | | 20,143 | | | | 35,547 | | | | 59,730 | | | | 17,827 | | |
Class C | | | 1,462 | | | | 9,546 | | | | 41,592 | | | | 9,419 | | |
Class R3 | | | — | | | | — | | | | — | | | | — | | |
Class R6 | | | — | | | | — | | | | — | | | | — | | |
Builder Class | | | — | | | | — | | | | — | | | | — | | |
Premier Class | | | — | | | | — | | | | — | | | | — | | |
Proceeds from reinvestment of dividends and
distributions: | |
Investor Class | | | 636 | | | | 655 | | | | — | | | | — | | |
Trust Class | | | — | | | | — | | | | — | | | | — | | |
Institutional Class | | | 8,309 | | | | 7,245 | | | | 12,305 | | | | 8,930 | | |
Class A | | | 1,558 | | | | 1,169 | | | | 1,658 | | | | 926 | | |
Class C | | | 95 | | | | 85 | | | | 471 | | | | 175 | | |
Class R3 | | | — | | | | — | | | | — | | | | — | | |
Class R6 | | | — | | | | — | | | | — | | | | — | | |
Builder Class | | | — | | | | — | | | | — | | | | — | | |
Premier Class | | | — | | | | — | | | | — | | | | — | | |
Payments for shares redeemed: | |
Investor Class | | | (4,053 | ) | | | (3,928 | ) | | | — | | | | — | | |
Trust Class | | | — | | | | — | | | | — | | | | — | | |
Institutional Class | | | (82,428 | ) | | | (41,708 | ) | | | (148,267 | ) | | | (73,816 | ) | |
Class A | | | (36,476 | ) | | | (16,628 | ) | | | (23,724 | ) | | | (5,453 | ) | |
Class C | | | (3,096 | ) | | | (7,345 | ) | | | (4,777 | ) | | | (3,208 | ) | |
Class R3 | | | — | | | | — | | | | — | | | | — | | |
Class R6 | | | — | | | | — | | | | — | | | | — | | |
Builder Class | | | — | | | | — | | | | — | | | | — | | |
Premier Class | | | — | | | | — | | | | — | | | | — | | |
See Notes to Financial Statements
112
| | | HIGH INCOME BOND FUND | | MUNICIPAL INTERMEDIATE
BOND FUND | |
| | | Year Ended
October 31,
2013 | | Year Ended
October 31,
2012 | | Year Ended
October 31,
2013 | | Year Ended
October 31,
2012 | |
Increase (Decrease) in Net Assets: | |
From Operations (Note A): | |
Net investment income (loss) | | $ | 194,324 | | | $ | 172,169 | | | $ | 3,599 | | | $ | 3,449 | | |
Net realized gain (loss) on investments | | | 79,684 | | | | 37,595 | | | | 979 | | | | 964 | | |
Change in net unrealized appreciation
(depreciation) of investments | | | 8,364 | | | | 107,173 | | | | (6,679 | ) | | | 5,272 | | |
Net increase (decrease) in net assets resulting
from operations | | | 282,372 | | | | 316,937 | | | | (2,101 | ) | | | 9,685 | | |
Distributions to Shareholders From (Note A): | |
Net investment income: | |
Investor Class | | | (18,833 | ) | | | (20,435 | ) | | | (439 | ) | | | (1,061 | ) | |
Trust Class | | | — | | | | — | | | | — | | | | — | | |
Institutional Class | | | (132,245 | ) | | | (124,640 | ) | | | (3,038 | ) | | | (2,334 | ) | |
Class A | | | (26,671 | ) | | | (23,703 | ) | | | (103 | ) | | | (38 | ) | |
Class C | | | (3,219 | ) | | | (3,100 | ) | | | (19 | ) | | | (16 | ) | |
Class R3 | | | (555 | ) | | | (360 | ) | | | — | | | | — | | |
Class R6 | | | (12,881 | ) | | | — | | | | — | | | | — | | |
Builder Class | | | — | | | | — | | | | — | | | | — | | |
Premier Class | | | — | | | | — | | | | — | | | | — | | |
Net realized gain on investments: | |
Investor Class | | | (3,851 | ) | | | (2,732 | ) | | | (134 | ) | | | (765 | ) | |
Trust Class | | | — | | | | — | | | | — | | | | — | | |
Institutional Class | | | (26,761 | ) | | | (13,495 | ) | | | (813 | ) | | | (46 | ) | |
Class A | | | (5,861 | ) | | | (2,809 | ) | | | (24 | ) | | | (1 | ) | |
Class C | | | (823 | ) | | | (434 | ) | | | (10 | ) | | | (5 | ) | |
Class R3 | | | (104 | ) | | | (29 | ) | | | — | | | | — | | |
Tax return of capital: | |
Investor Class | | | — | | | | — | | | | — | | | | — | | |
Institutional Class | | | — | | | | — | | | | — | | | | — | | |
Class A | | | — | | | | — | | | | — | | | | — | | |
Class C | | | — | | | | — | | | | — | | | | — | | |
Total distributions to shareholders | | | (231,804 | ) | | | (191,737 | ) | | | (4,580 | ) | | | (4,266 | ) | |
From Fund Share Transactions (Note D): | |
Proceeds from shares sold: | |
Investor Class | | | 65,445 | | | | 87,461 | | | | 797 | | | | 8,368 | | |
Trust Class | | | — | | | | — | | | | — | | | | — | | |
Institutional Class | | | 1,118,289 | | | | 1,383,112 | | | | 31,383 | | | | 124,889 | | |
Class A | | | 249,096 | | | | 275,080 | | | | 3,503 | | | | 3,475 | | |
Class C | | | 12,430 | | | | 36,975 | | | | 891 | | | | 1,065 | | |
Class R3 | | | 7,550 | | | | 7,723 | | | | — | | | | — | | |
Class R6 | | | 555,474 | | | | — | | | | — | | | | — | | |
Builder Class | | | — | | | | — | | | | — | | | | — | | |
Premier Class | | | — | | | | — | | | | — | | | | — | | |
Proceeds from reinvestment of dividends and
distributions: | |
Investor Class | | | 21,315 | | | | 21,678 | | | | 470 | | | | 1,681 | | |
Trust Class | | | — | | | | — | | | | — | | | | — | | |
Institutional Class | | | 117,445 | | | | 94,585 | | | | 3,329 | | | | 2,192 | | |
Class A | | | 28,440 | | | | 22,873 | | | | 81 | | | | 32 | | |
Class C | | | 2,376 | | | | 2,019 | | | | 15 | | | | 9 | | |
Class R3 | | | 529 | | | | 282 | | | | — | | | | — | | |
Class R6 | | | 12,881 | | | | — | | | | — | | | | — | | |
Builder Class | | | — | | | | — | | | | — | | | | — | | |
Premier Class | | | — | | | | — | | | | — | | | | — | | |
Payments for shares redeemed: | |
Investor Class | | | (121,476 | ) | | | (92,592 | ) | | | (2,423 | ) | | | (109,723 | ) | |
Trust Class | | | — | | | | — | | | | — | | | | — | | |
Institutional Class | | | (1,630,943 | ) | | | (776,274 | ) | | | (21,958 | ) | | | (10,339 | ) | |
Class A | | | (393,392 | ) | | | (151,755 | ) | | | (1,754 | ) | | | (309 | ) | |
Class C | | | (28,173 | ) | | | (16,273 | ) | | | (816 | ) | | | (227 | ) | |
Class R3 | | | (7,102 | ) | | | (1,577 | ) | | | — | | | | — | | |
Class R6 | | | (32,102 | ) | | | — | | | | — | | | | — | | |
Builder Class | | | — | | | | — | | | | — | | | | — | | |
Premier Class | | | — | | | | — | | | | — | | | | — | | |
113
Statements of Changes in Net Assets (cont'd)
Neuberger Berman Income Funds (cont'd)
(000's omitted)
| | CORE BOND FUND | | FLOATING RATE INCOME FUND | |
| | | Year Ended
October 31,
2013 | | Year Ended
October 31,
2012 | | Year Ended
October 31,
2013 | | Year Ended
October 31,
2012 | |
Proceeds from shares issued in connection with the
Reorganization (Note F): | |
Institutional Class | | | — | | | | — | | | | — | | | | — | | |
Builder Class | | | — | | | | — | | | | — | | | | — | | |
Premier Class | | | — | | | | — | | | | — | | | | — | | |
Net increase (decrease) from Fund share transactions | | | (58,230 | ) | | | 55,883 | | | | 262,849 | | | | 74,217 | | |
Net Increase (Decrease) in Net Assets | | | (74,957 | ) | | | 62,248 | | | | 264,483 | | | | 80,749 | | |
Net Assets: | |
Beginning of year | | | 289,507 | | | | 227,259 | | | | 292,677 | | | | 211,928 | | |
End of year | | $ | 214,550 | | | $ | 289,507 | | | $ | 557,160 | | | $ | 292,677 | | |
Undistributed net investment income (loss) at end of year | | $ | — | | | $ | — | | | $ | — | | | $ | — | | |
Distributions in excess of net investment income at
end of year | | $ | (76 | ) | | $ | (99 | ) | | $ | (250 | ) | | $ | (108 | ) | |
See Notes to Financial Statements
114
| | | HIGH INCOME BOND FUND | | MUNICIPAL INTERMEDIATE
BOND FUND | |
| | | Year Ended
October 31,
2013 | | Year Ended
October 31,
2012 | | Year Ended
October 31,
2013 | | Year Ended
October 31,
2012 | |
Proceeds from shares issued in connection with the
Reorganization (Note F): | |
Institutional Class | | | — | | | | — | | | | — | | | | — | | |
Builder Class | | | — | | | | — | | | | — | | | | — | | |
Premier Class | | | — | | | | — | | | | — | | | | — | | |
Net increase (decrease) from Fund share transactions | | | (21,918 | ) | | | 893,317 | | | | 13,518 | | | | 21,113 | | |
Net Increase (Decrease) in Net Assets | | | 28,650 | | | | 1,018,517 | | | | 6,837 | | | | 26,532 | | |
Net Assets: | |
Beginning of year | | | 3,233,891 | | | | 2,215,374 | | | | 150,449 | | | | 123,917 | | |
End of year | | $ | 3,262,541 | | | $ | 3,233,891 | | | $ | 157,286 | | | $ | 150,449 | | |
Undistributed net investment income (loss) at end of year | | $ | 183 | | | $ | 263 | | | $ | — | | | $ | — | | |
Distributions in excess of net investment income at
end of year | | $ | — | | | $ | — | | | $ | — | | | $ | — | | |
115
Statements of Changes in Net Assets (cont'd)
Neuberger Berman Income Funds (cont'd)
(000's omitted)
| | | NEW YORK MUNICIPAL
INCOME FUND | | SHORT DURATION BOND FUND | |
| | | Period from
March 1, 2013
to
October 31,
2013 | | Year Ended
February 28,
2013 | | Year Ended
February 29,
2012
(see Note A-1) | | Year Ended
October 31,
2013 | | Year Ended
October 31,
2012 | |
Increase (Decrease) in Net Assets: | |
From Operations (Note A): | |
Net investment income (loss) | | $ | 1,275 | | | $ | 1,426 | | | $ | 1,664 | | | $ | 470 | | | $ | 979 | | |
Net realized gain (loss) on investments | | | 164 | | | | 3 | | | | 1 | | | | (714 | ) | | | (957 | ) | |
Change in net unrealized appreciation (depreciation) of investments | | | (2,978 | ) | | | 187 | | | | 1,649 | | | | 928 | | | | 2,587 | | |
Net increase (decrease) in net assets resulting from operations | | | (1,539 | ) | | | 1,616 | | | | 3,314 | | | | 684 | | | | 2,609 | | |
Distributions to Shareholders From (Note A): | |
Net investment income: | |
Investor Class | | | | | | | | | | | — | | | | (541 | ) | | | (947 | ) | |
Trust Class | | | — | | | | — | | | | — | | | | (65 | ) | | | (127 | ) | |
Institutional Class | | | — | | | | — | | | | — | | | | (378 | ) | | | (374 | ) | |
Class A | | | (1,237 | ) | | | — | | | | — | | | | (55 | ) | | | (16 | ) | |
Class C | | | — | | | | — | | | | — | | | | (10 | ) | | | (16 | ) | |
Class R3 | | | — | | | | — | | | | — | | | | — | | | | — | | |
Class R6 | | | — | | | | — | | | | — | | | | — | | | | — | | |
Builder Class | | | (17 | ) | | | (632 | ) | | | (751 | ) | | | — | | | | — | | |
Premier Class | | | (21 | ) | | | (792 | ) | | | (911 | ) | | | — | | | | — | | |
Net realized gain on investments: | |
Investor Class | | | — | | | | — | | | | — | | | | — | | | | — | | |
Trust Class | | | — | | | | — | | | | — | | | | — | | | | — | | |
Institutional Class | | | — | | | | — | | | | — | | | | — | | | | — | | |
Class A | | | — | | | | — | | | | — | | | | — | | | | — | | |
Class C | | | — | | | | — | | | | — | | | | — | | | | — | | |
Class R3 | | | — | | | | — | | | | — | | | | — | | | | — | | |
Tax return of capital: | |
Investor Class | | | — | | | | — | | | | — | | | | — | | | | — | | |
Institutional Class | | | — | | | | — | | | | — | | | | — | | | | — | | |
Class A | | | — | | | | — | | | | — | | | | — | | | | — | | |
Class C | | | — | | | | — | | | | — | | | | — | | | | — | | |
Total distributions to shareholders | | | (1,275 | ) | | | (1,424 | ) | | | (1,662 | ) | | | (1,049 | ) | | | (1,480 | ) | |
From Fund Share Transactions (Note D): | |
Proceeds from shares sold: | |
Investor Class | | | — | | | | — | | | | — | | | | 2,717 | | | | 3,431 | | |
Trust Class | | | — | | | | — | | | | — | | | | 1,062 | | | | 920 | | |
Institutional Class | | | 281 | | | | — | | | | — | | | | 12,276 | | | | 17,490 | | |
Class A | | | — | | | | — | | | | — | | | | 6,304 | | | | 2,227 | | |
Class C | | | — | | | | — | | | | — | | | | 2,198 | | | | 1,375 | | |
Class R3 | | | — | | | | — | | | | — | | | | — | | | | — | | |
Class R6 | | | — | | | | — | | | | — | | | | — | | | | — | | |
Builder Class | | | 38 | | | | 1,303 | | | | 747 | | | | — | | | | — | | |
Premier Class | | | 6 | | | | 2,176 | | | | 1,197 | | | | — | | | | — | | |
Proceeds from reinvestment of dividends and distributions: | |
Investor Class | | | — | | | | — | | | | — | | | | 505 | | | | 888 | | |
Trust Class | | | — | | | | — | | | | — | | | | 64 | | | | 126 | | |
Institutional Class | | | 1,133 | | | | — | | | | — | | | | 339 | | | | 358 | | |
Class A | | | — | | | | — | | | | — | | | | 33 | | | | 13 | | |
Class C | | | — | | | | — | | | | — | | | | 4 | | | | 7 | | |
Class R3 | | | — | | | | — | | | | — | | | | — | | | | — | | |
Class R6 | | | — | | | | — | | | | — | | | | — | | | | — | | |
Builder Class | | | — | | | | 589 | | | | 698 | | | | — | | | | — | | |
Premier Class | | | — | | | | 628 | | | | 756 | | | | — | | | | — | | |
Payments for shares redeemed: | |
Investor Class | | | — | | | | — | | | | — | | | | (8,994 | ) | | | (10,394 | ) | |
Trust Class | | | — | | | | — | | | | — | | | | (2,691 | ) | | | (1,985 | ) | |
Institutional Class | | | (7,248 | ) | | | — | | | | — | | | | (16,596 | ) | | | (13,811 | ) | |
Class A | | | — | | | | — | | | | — | | | | (2,360 | ) | | | (91 | ) | |
Class C | | | — | | | | — | | | | — | | | | (1,668 | ) | | | (699 | ) | |
Class R3 | | | — | | | | — | | | | — | | | | — | | | | — | | |
Class R6 | | | — | | | | — | | | | — | | | | — | | | | — | | |
Builder Class | | | (177 | ) | | | (3,422 | ) | | | (2,738 | ) | | | — | | | | — | | |
Premier Class | | | — | | | | (6,619 | ) | | | (2,546 | ) | | | — | | | | — | | |
See Notes to Financial Statements
116
| | | SHORT DURATION
HIGH INCOME FUND | | STRATEGIC INCOME FUND | |
| | | Year Ended
October 31,
2013 | | Period from
September 28, 2012
(Commencement
of Operations) to
October 31,
2012 | | Year Ended
October 31,
2013 | | Year Ended
October 31,
2012 | |
Increase (Decrease) in Net Assets: | |
From Operations (Note A): | |
Net investment income (loss) | | $ | 2,602 | | | $ | 71 | | | $ | 41,828 | | | $ | 24,624 | | |
Net realized gain (loss) on investments | | | 149 | | | | 75 | | | | 6,717 | | | | 23,145 | | |
Change in net unrealized appreciation (depreciation) of investments | | | 422 | | | | (59 | ) | | | (39,716 | ) | | | 37,198 | | |
Net increase (decrease) in net assets resulting from operations | | | 3,173 | | | | 87 | | | | 8,829 | | | | 84,967 | | |
Distributions to Shareholders From (Note A): | |
Net investment income: | |
Investor Class | | | — | | | | — | | | | — | | | | — | | |
Trust Class | | | — | | | | — | | | | (1,195 | ) | | | (801 | ) | |
Institutional Class | | | (2,579 | ) | | | (71 | ) | | | (25,805 | ) | | | (13,396 | ) | |
Class A | | | (23 | ) | | | (0 | ) | | | (11,456 | ) | | | (8,730 | ) | |
Class C | | | (3 | ) | | | (0 | ) | | | (5,421 | ) | | | (4,324 | ) | |
Class R3 | | | — | | | | — | | | | — | | | | — | | |
Class R6 | | | — | | | | — | | | | (174 | ) | | | — | | |
Builder Class | | | — | | | | — | | | | — | | | | — | | |
Premier Class | | | — | | | | — | | | | — | | | | — | | |
Net realized gain on investments: | |
Investor Class | | | — | | | | — | | | | — | | | | — | | |
Trust Class | | | — | | | | — | | | | (551 | ) | | | (212 | ) | |
Institutional Class | | | (87 | ) | | | — | | | | (10,764 | ) | | | (2,545 | ) | |
Class A | | | (0 | ) | | | — | | | | (6,268 | ) | | | (2,165 | ) | |
Class C | | | (0 | ) | | | — | | | | (3,816 | ) | | | (1,374 | ) | |
Class R3 | | | — | | | | — | | | | — | | | | — | | |
Tax return of capital: | |
Investor Class | | | — | | | | — | | | | — | | | | — | | |
Institutional Class | | | — | | | | — | | | | — | | | | — | | |
Class A | | | — | | | | — | | | | — | | | | — | | |
Class C | | | — | | | | — | | | | — | | | | — | | |
Total distributions to shareholders | | | (2,692 | ) | | | (71 | ) | | | (65,450 | ) | | | (33,547 | ) | |
From Fund Share Transactions (Note D): | |
Proceeds from shares sold: | |
Investor Class | | | — | | | | — | | | | — | | | | — | | |
Trust Class | | | — | | | | — | | | | 30,105 | | | | 10,465 | | |
Institutional Class | | | 78,635 | | | | 35,040 | | | | 548,706 | | | | 374,157 | | |
Class A | | | 1,559 | | | | 67 | | | | 245,524 | | | | 174,063 | | |
Class C | | | 291 | | | | 30 | | | | 74,250 | | | | 75,610 | | |
Class R3 | | | — | | | | — | | | | — | | | | — | | |
Class R6 | | | — | | | | — | | | | 17,511 | | | | — | | |
Builder Class | | | — | | | | — | | | | — | | | | — | | |
Premier Class | | | — | | | | — | | | | — | | | | — | | |
Proceeds from reinvestment of dividends and distributions: | |
Investor Class | | | — | | | | — | | | | — | | | | — | | |
Trust Class | | | — | | | | — | | | | 1,718 | | | | 990 | | |
Institutional Class | | | 2,665 | | | | 71 | | | | 25,773 | | | | 10,004 | | |
Class A | | | 22 | | | | — | | | | 14,465 | | | | 9,064 | | |
Class C | | | 3 | | | | — | | | | 5,527 | | | | 3,060 | | |
Class R3 | | | — | | | | — | | | | — | | | | — | | |
Class R6 | | | — | | | | — | | | | 174 | | | | — | | |
Builder Class | | | — | | | | — | | | | — | | | | — | | |
Premier Class | | | — | | | | — | | | | — | | | | — | | |
Payments for shares redeemed: | |
Investor Class | | | — | | | | — | | | | — | | | | — | | |
Trust Class | | | — | | | | — | | | | (13,234 | ) | | | (5,762 | ) | |
Institutional Class | | | (3,876 | ) | | | (10,078 | ) | | | (331,445 | ) | | | (92,839 | ) | |
Class A | | | (483 | ) | | | — | | | | (241,790 | ) | | | (86,202 | ) | |
Class C | | | (100 | ) | | | — | | | | (63,503 | ) | | | (24,726 | ) | |
Class R3 | | | — | | | | — | | | | — | | | | — | | |
Class R6 | | | — | | | | — | | | | (49 | ) | | | — | | |
Builder Class | | | — | | | | — | | | | — | | | | — | | |
Premier Class | | | — | | | | — | | | | — | | | | — | | |
117
Statements of Changes in Net Assets (cont'd)
Neuberger Berman Income Funds (cont'd)
(000's omitted)
| | | NEW YORK MUNICIPAL
INCOME FUND | | SHORT DURATION BOND FUND | |
| | | Period from
March 1, 2013
to
October 31,
2013 | | Year Ended
February 28,
2013 | | Year Ended
February 29,
2012
(see Note A-1) | | Year Ended
October 31,
2013 | | Year Ended
October 31,
2012 | |
Proceeds from shares issued in connection with the Reorganization (Note F): | |
Institutional Class | | | 76,649 | | | | — | | | | — | | | | — | | | | — | | |
Builder Class | | | (35,911 | ) | | | — | | | | — | | | | — | | | | — | | |
Premier Class | | | (40,738 | ) | | | — | | | | — | | | | — | | | | — | | |
Net increase (decrease) from Fund share transactions | | | (5,967 | ) | | | (5,345 | ) | | | (1,886 | ) | | | (6,807 | ) | | | (145 | ) | |
Net Increase (Decrease) in Net Assets | | | (8,781 | ) | | | (5,153 | ) | | | (234 | ) | | | (7,172 | ) | | | 984 | | |
Net Assets: | |
Beginning of year | | | 77,055 | | | | 82,208 | | | | 82,442 | | | | 70,535 | | | | 69,551 | | |
End of year | | $ | 68,274 | | | $ | 77,055 | | | $ | 82,208 | | | $ | 63,363 | | | $ | 70,535 | | |
Undistributed net investment income (loss) at end of year | | $ | 12 | | | $ | 16 | | | $ | 14 | | | $ | 152 | | | $ | 158 | | |
Distributions in excess of net investment income at end of year | | $ | — | | | $ | — | | | $ | — | | | $ | — | | | $ | — | | |
See Notes to Financial Statements
118
| | | SHORT DURATION
HIGH INCOME FUND | | STRATEGIC INCOME FUND | |
| | | Year Ended
October 31,
2013 | | Period from
September 28, 2012
(Commencement
of Operations) to
October 31,
2012 | | Year Ended
October 31,
2013 | | Year Ended
October 31,
2012 | |
Proceeds from shares issued in connection with the Reorganization (Note F): | |
Institutional Class | | | — | | | | — | | | | — | | | | — | | |
Builder Class | | | — | | | | — | | | | — | | | | — | | |
Premier Class | | | — | | | | — | | | | — | | | | — | | |
Net increase (decrease) from Fund share transactions | | | 78,716 | | | | 25,130 | | | | 313,732 | | | | 447,884 | | |
Net Increase (Decrease) in Net Assets | | | 79,197 | | | | 25,146 | | | | 257,111 | | | | 499,304 | | |
Net Assets: | |
Beginning of year | | | 25,146 | | | | — | | | | 1,046,722 | | | | 547,418 | | |
End of year | | $ | 104,343 | | | $ | 25,146 | | | $ | 1,303,833 | | | $ | 1,046,722 | | |
Undistributed net investment income (loss) at end of year | | $ | — | | | $ | — | | | $ | 1,773 | | | $ | 1,832 | | |
Distributions in excess of net investment income at end of year | | $ | (3 | ) | | $ | — | | | $ | — | | | $ | — | | |
119
Notes to Financial Statements Income Funds
Note A—Summary of Significant Accounting Policies:
1 General: Neuberger Berman Income Funds (the "Trust") is a Delaware statutory trust organized pursuant to an Amended and Restated Trust Instrument dated June 24, 2009. The Trust is registered as an open-end management investment company under the Investment Company Act of 1940, as amended (the "1940 Act"), and its shares are registered under the 1933 Act. Each Fund is a separate operating series of the Trust and is diversified. Four Funds offer Investor Class shares, two offer Trust Class shares, eight offer Institutional Class shares, seven offer Class A shares, seven offer Class C shares, one offers Class R3 shares and two offer Class R6 shares. Short Duration High Income had no operations until September 28, 2012 other than matters relating to its organization and registration of its shares under the 1933 Act. New York Municipal Income had no operations until March 11, 2013, other than matters relating to its organization and registration of its shares as a series of the Trust under the 1933 Act. New York Municipal Income was the successor to The Empire Builder Tax Free Bond Fund (the "Predecessor Fund") pursuant to a reorganization that took place prior to March 11, 2013. The financial information prior to March 11, 2013, for the Institutional Class of New York Municipal Income is that of the Builder Class of the Predecessor Fund (see Notes F and H for more information). The Board may establish additional series or classes of shares without the approval of shareholders.
A zero balance, if any, reflects an actual amount rounding to less than $1,000.
The assets of each Fund belong only to that Fund, and the liabilities of each Fund are borne solely by that Fund and no other.
The preparation of financial statements in accordance with U.S. generally accepted accounting principles ("GAAP") requires Management to make estimates and assumptions at the date of the financial statements. Actual results could differ from those estimates.
2 Portfolio valuation: Investment securities are valued as indicated in the notes following the Funds' Schedule of Investments.
3 Foreign currency translation: Core Bond, Floating Rate Income, High Income, Short Duration, Short Duration High Income and Strategic Income may invest in foreign securities denominated in foreign currencies. The accounting records of the Funds are maintained in U.S. dollars. Foreign currency amounts are translated into U.S. dollars using the exchange rate as of 4:00 p.m., Eastern time, to determine the value of investments, other assets and liabilities. Purchase and sale prices of securities, and income and expenses, are translated into U.S. dollars at the prevailing rate of exchange on the respective dates of such transactions. Net unrealized foreign currency gain (loss), if any, arises from changes in the value of assets and liabilities, other than investments in securities, as a result of changes in exchange rates and is stated separately in the Statements of Operations.
4 Securities transactions and investment income: Securities transactions are recorded on trade date for financial reporting purposes. Dividend income is recorded on the ex-dividend date or, for certain foreign dividends, as soon as the Fund becomes aware of the dividends. Non-cash dividends included in dividend income, if any, are recorded at the fair market value of the securities received. Interest income, including accretion of discount (adjusted for original issue discount, where applicable) and amortization of premium, where applicable, is recorded on the accrual basis. Realized gains and losses from securities transactions (for each Fund) and foreign currency transactions (for Core Bond, Floating Rate Income, High Income, Short Duration, Short Duration High Income and Strategic Income), if any, are recorded on the basis of identified cost and stated separately in the Statements of Operations. Included in net realized gain (loss) on investments are proceeds from the settlements of class action litigation in which Core Bond, High Income and Strategic Income participated as class members. The amounts of such proceeds for the year ended October 31, 2013 were $159,599, $24,959 and $670 for Core Bond, High Income and Strategic Income, respectively.
120
5 Income tax information:Each Fund is treated as a separate entity for U.S. federal income tax purposes. It is the policy of each Fund to continue to qualify for treatment as a regulated investment company by complying with the requirements of the U.S. Internal Revenue Code applicable to regulated investment companies and to distribute substantially all of its net investment income and net realized capital gains to its shareholders. To the extent a Fund distributes substantially all of its net investment income and net realized capital gains to shareholders, no federal income or excise tax provision is required.
The Funds have adopted the provisions of ASC 740 "Income Taxes" ("ASC 740"). ASC 740 sets forth a minimum threshold for financial statement recognition of a tax position taken, or expected to be taken, in a tax return. The Funds recognize interest and penalties, if any, related to unrecognized tax positions as an income tax expense in the Statements of Operations. The Funds are subject to examination by U.S. federal and state tax authorities for returns filed for the prior three fiscal years 2010 - 2012 (February 28, 2011 - February 28, 2013 for New York Municipal Income). As of October 31, 2013, the Funds did not have any unrecognized tax positions.
Income distributions and capital gain distributions are determined in accordance with income tax regulations, which may differ from GAAP. These differences are primarily due to differing treatments of income and gains on various investment securities held by each Fund, timing differences and differing characterization of distributions made by each Fund. The Funds may also utilize earnings and profits distributed to shareholders on redemption of their shares as a part of the dividends-paid deduction for income tax purposes.
As determined on October 31, 2013, permanent differences resulting primarily from different book and tax accounting were reclassified at year end. Such differences may be attributed to one or more of the following: amortization of bond premium, non-deductible 12b-1 fees, tax treatment of deflation adjustments on U.S. Treasury Inflation Protected Bonds, capital loss carryforwards expiring, paydown gains and losses, foreign currency gains and losses, return of capital distributions, and distribution redesignations. These reclassifications had no effect on net income, net asset value ("NAV") or NAV per share of each Fund. For the year ended October 31, 2013, the Funds recorded the following permanent reclassifications:
| | | Paid-in Capital | | Undistributed
Net Investment
Income (Loss) | | Accumulated Net
Realized Gains
(Losses) on
Investments | |
Core Bond | | $ | — | | | $ | 57,164 | | | $ | (57,164 | ) | |
Floating Rate Income | | | — | | | | — | | | | — | | |
High Income | | | — | | | | — | | | | — | | |
Municipal Intermediate Bond | | | — | | | | — | | | | — | | |
| New York Municipal Income(1) | | | 18,682 | | | | (3,713 | ) | | | (14,969 | ) | |
Short Duration | | | (3,168,737 | ) | | | 573,293 | | | | 2,595,444 | | |
Short Duration High Income | | | — | | | | — | | | | — | | |
Strategic Income | | | — | | | | 2,164,578 | | | | (2,164,578 | ) | |
(1) For the period March 1, 2013 to October 31, 2013.
121
For tax purposes, distributions of short-term gains are taxable to shareholders as ordinary income.
The tax character of distributions paid during the years ended October 31, 2013 and October 31, 2012, except for New York Municipal Income (see footnotes 2, 3 and 4), was as follows:
| | | Distributions Paid From: | |
| | | Taxable Income | | Tax-Exempt Income | | Long-Term
Capital Gain | | Return of
Capital | | Total | |
| | | 2013 | | 2012 | | 2013 | | 2012 | | 2013 | | 2012 | | 2013 | | 2012 | | 2013 | | 2012 | |
Core Bond | | $ | 8,973,868 | | | $ | 9,598,829 | | | $ | — | | | $ | — | | | $ | 2,649,482 | | | $ | 1,267,893 | | | $ | 381,734 | | | $ | — | | | $ | 12,005,084 | | | $ | 10,866,722 | | |
Floating
Rate
Income | | | 17,464,260 | | | | 11,325,064 | | | | — | | | | — | | | | — | | | | — | | | | — | | | | — | | | | 17,464,260 | | | | 11,325,064 | | |
High
Income | | | 228,534,877 | | | | 175,342,574 | | | | — | | | | — | | | | 3,268,594 | | | | 16,394,086 | | | | — | | | | — | | | | 231,803,471 | | | | 191,736,660 | | |
Municipal
Intermediate
Bond | | | 762,533 | | | | 237,224 | | | | 3,598,216 | | | | 3,448,763 | | | | 219,147 | | | | 580,339 | | | | — | | | | — | | | | 4,579,896 | | | | 4,266,326 | | |
New York
Municipal
Income | | | 1,039 | (4) | | | — | (2)(3) | | | 1,273,671 | (4) | | | 1,423,654 | (2)(3) | | | — | (4) | | | — | (2)(3) | | | — | (4) | | | — | (2)(3) | | | 1,274,710 | (4) | | | 1,423,654 | (2)(3) | |
Short
Duration | | | 1,049,318 | | | | 1,479,347 | | | | — | | | | — | | | | — | | | | — | | | | — | | | | — | | | | 1,049,318 | | | | 1,479,347 | | |
Short
Duration
High
Income | | | 2,691,944 | | | | 71,279 | (1) | | | — | | | | — | (1) | | | — | | | | — | (1) | | | — | | | | — | (1) | | | 2,691,944 | | | | 71,279 | (1) | |
Strategic
Income | | | 62,378,683 | | | | 30,907,548 | | | | — | | | | — | | | | 3,071,502 | | | | 2,639,229 | | | | — | | | | — | | | | 65,450,185 | | | | 33,546,777 | | |
(1) Period from September 28, 2012 (Commencement of Operations) to October 31, 2012.
(2) Year ended February 28, 2013.
(3) Year ended February 29, 2012. Distributions paid from tax-exempt income was $1,662,562.
(4) Period from March 1, 2013 to October 31, 2013.
As of October 31, 2013, the components of distributable earnings (accumulated losses) on a U.S. federal income tax basis were as follows:
| | | Undistributed
Ordinary
Income | | Undistributed
Tax-Exempt
Income | | Undistributed
Long-Term
Gain | | Unrealized
Appreciation
(Depreciation) | | Loss
Carryforwards
and Deferrals | | Other
Temporary
Differences | | Total | |
Core Bond | | $ | — | | | $ | — | | | $ | — | | | $ | (415,438 | ) | | $ | — | | | $ | (76,382 | ) | | $ | (491,820 | ) | |
Floating Rate
Income | | | 172,622 | | | | — | | | | — | | | | 4,019,533 | | | | (835,287 | ) | | | (407,592 | ) | | | 2,949,276 | | |
High Income | | | 32,474,151 | | | | — | | | | 50,606,349 | | | | 140,234,642 | | | | — | | | | (3,113,914 | ) | | | 220,201,228 | | |
Municipal
Intermediate
Bond | | | — | | | | 57,227 | | | | 960,102 | | | | 1,397,024 | | | | — | | | | (57,387 | ) | | | 2,356,966 | | |
122
| | | Undistributed
Ordinary
Income | | Undistributed
Tax-Exempt
Income | | Undistributed
Long-Term
Gain | | Unrealized
Appreciation
(Depreciation) | | Loss
Carryforwards
and Deferrals | | Other
Temporary
Differences | | Total | |
New York
Municipal
Income | | $ | — | | | $ | 32,608 | | | $ | 135,591 | | | $ | 818,116 | | | $ | — | | | $ | (20,701 | ) | | $ | 965,614 | | |
Short Duration | | | 162,906 | | | | — | | | | — | | | | (319,305 | ) | | | (15,950,521 | ) | | | (10,865 | ) | | | (16,117,785 | ) | |
Short Duration
High Income | | | 138,471 | | | | — | | | | — | | | | 361,603 | | | | — | | | | (3,724 | ) | | | 496,350 | | |
Strategic
Income | | | 2,633,684 | | | | — | | | | — | | | | 17,698,149 | | | | (7,036,290 | ) | | | (857,660 | ) | | | 12,437,883 | | |
The differences between book basis and tax basis distributable earnings are primarily due to: timing differences of distribution payments, delayed settlement compensation on bank loans, timing differences of wash sales, mark to market on certain futures contract transactions, organizational expenses, capital loss carryforwards, deferral of current year straddle losses, tax treatment of deflation adjustments on U.S. Treasury Inflation Protected Bonds and amortization of bond premium/discount.
To the extent each Fund's net realized capital gains, if any, can be offset by capital loss carryforwards, it is the policy of each Fund not to distribute such gains. The Regulated Investment Company ("RIC") Modernization Act of 2010 (the "Act") became effective for the Funds on November 1, 2011 (March 1, 2011 for New York Municipal Income and September 28, 2012 (Commencement of Operations) for Short Duration High Income). The Act modernizes several of the federal income and excise tax provisions related to RICs. Among the changes made are changes to the capital loss carryforward rules allowing for RICs to carry forward capital losses indefinitely and to retain the character of capital loss carryforwards as short-term or long-term ("Post-Enactment"). Rules in effect previously limited the carryforward period to eight years and all carryforwards were considere d short-term in character ("Pre- Enactment"). As determined at October 31, 2013, the following Funds had unused capital loss carryforwards available for federal income tax purposes to offset net realized capital gains, if any, as follows:
| | | Pre-Enactment | | | |
| | | Expiring in: | | | |
| | 2014 | | 2015 | | 2016 | | 2017 | | 2018 | | 2019 | |
Floating Rate Income | | $ | — | | | $ | — | | | $ | — | | | $ | — | | | $ | — | | | $ | 835,287 | | |
Short Duration | | | 2,244,689 | | | | 643,625 | | | | — | | | | 8,069,282 | | | | 850,271 | | | | 1,276,932 | | |
| | | Post-Enactment (No Expiration Date) | |
| | | Long-Term | | Short-Term | |
Short Duration | | $ | 2,661,055 | | | $ | 204,667 | | |
Strategic Income | | | — | | | | 7,036,290 | | |
Post-Enactment capital loss carryforwards must be fully used before Pre-Enactment capital loss carryforwards; therefore, under certain circumstances, Pre-Enactment capital loss carryforwards available as of the report date may expire unused.
During the year ended October 31, 2013, Floating Rate Income utilized capital loss carryforwards of $51,452. During the period ended October 31, 2013, New York Municipal Income utilized capital loss carryforwards of $28,934. During the year ended October 31, 2013, Short Duration had capital loss carryforwards expire of $3,168,736.
6 Distributions to shareholders: Each Fund earns income, net of expenses, daily on its investments. Ordinarily, distributions from net investment income are declared on each business day and paid monthly, and distributions
123
from net realized capital gains, if any, are generally distributed once a year (usually in December). Distributions to shareholders are recorded on the ex-date.
7 Expense allocation: Certain expenses are applicable to multiple funds. Expenses directly attributable to a Fund are charged to that Fund. Expenses of the Trust that are not directly attributable to a particular series of the Trust (e.g., a Fund) are allocated among the series of the Trust, on the basis of relative net assets, except where a more appropriate allocation of expenses to each of the series can otherwise be made fairly. Expenses borne by the complex of related investment companies, which includes open-end and closed-end investment companies for which Management serves as investment manager, that are not directly attributable to a particular investment company in the complex (e.g., the Trust) or series thereof are allocated among the investment companies in the complex or series thereof, on the basis of relative net assets, except where a more appropriate allocation of expenses to each of the investment companies in the complex or series thereof can otherwise be made fairly. Each Fund's expenses (other than those specific to each class) are allocated proportionally each day among the classes based upon the relative net assets of each class.
8 Dollar rolls: Core Bond, Floating Rate Income, High Income, Short Duration, Short Duration High Income and Strategic Income may enter into dollar roll transactions with respect to mortgage-backed securities. In a dollar roll transaction, a Fund sells securities for delivery in the current month and simultaneously agrees to repurchase substantially similar (i.e., same type and coupon) securities on a specified future date from the same party. During the period before this repurchase, a Fund forgoes principal and interest payments on the securities. A Fund is compensated by the difference between the current sales price and the forward price for the future purchase (often referred to as the "drop"), as well as by the interest earned on the cash proceeds of the initial sale. Dollar rolls may increase fluctuations in a Fund's NAV and may be viewed as a form of leverage. There is a risk that the counterparty will be unable or unwilling to complete the transaction as scheduled, which may result in losses to a Fund.
9 When-Issued/delayed delivery securities: Each Fund may purchase securities with delivery or payment to occur at a later date beyond the normal settlement period. At the time a Fund enters into a commitment to purchase a security, the transaction is recorded and the value of the security is reflected in the NAV. The price of such security and the date when the security will be delivered and paid for are fixed at the time the transaction is negotiated. The value of the security may vary with market fluctuations. No interest accrues to a Fund until payment takes place. At the time a Fund enters into this type of transaction it is required to segregate cash or other liquid assets at least equal to the amount of the commitment. When-issued and delayed delivery transactions can have a leverage-like effect on a Fund, which can increase fluctuations in the Fund's share price. Certain risks may arise upon entering into when-issued or delayed delivery securities from the potential inability of counterparties to meet the terms of their contracts or if the issuer does not issue the securities due to political, economic, or other factors. Additionally, losses may arise due to changes in the value of the underlying securities.
10 Foreign taxes: Foreign taxes withheld represent amounts withheld by foreign tax authorities, net of refunds recoverable.
11 Investments in foreign securities: Investing in foreign securities may involve certain sovereign and other risks, in addition to the credit and market risks normally associated with domestic securities. These additional risks include the possibility of adverse political and economic developments (including political instability, nationalization, expropriation, or confiscatory taxation) and the potentially adverse effects of unavailability of public information regarding issuers, less governmental supervision and regulation of financial markets, reduced liquidity of certain financial markets, and the lack of uniform accounting, auditing, and financial reporting standards or the application of standards that are different or less stringent than those applied in the United States. Foreign securities also may experience greater price volatility, higher rates of inflation, and delays in settlement.
12 Derivative instruments: During the year ended October 31, 2013, certain of the Funds' use of derivatives, as described below, was limited to financial futures contracts. The Funds have adopted the provisions of ASC 815 "Derivatives and Hedging" ("ASC 815"). The disclosure requirements of ASC 815 distinguish between derivatives that qualify for hedge accounting and those that do not. Because investment companies value their derivatives at
124
fair value and recognize changes in fair value through the Statements of Operations, they do not qualify for hedge accounting. Accordingly, even though a Fund's investments in derivatives may represent economic hedges, they are considered non-hedge transactions for purposes of this disclosure.
Financial futures contracts: During the year ended October 31, 2013, Floating Rate Income, High Income, Municipal Intermediate Bond, New York Municipal Income and Short Duration High Income did not enter into any financial futures contracts. During the year ended October 31, 2013, Core Bond, Short Duration and Strategic Income entered into financial futures contracts for economic hedging purposes, including as a maturity or duration management device.
At the time a Fund enters into a financial futures contract, it is required to deposit with the futures commission merchant a specified amount of cash or liquid securities, known as "initial margin," which is a percentage of the value of the financial futures contract being traded that is set by the exchange upon which the futures contract is traded. Each day, the futures contract is valued at the official settlement price of the board of trade or U.S. commodity exchange on which such futures contract is traded. Subsequent payments, known as "variation margin," to and from the broker are made on a daily basis, or as needed, as the market price of the financial futures contract fluctuates. Daily variation margin adjustments, arising from this "mark to market," are recorded by a Fund as unrealized gains or losses.
Although some financial futures contracts by their terms call for actual delivery or acquisition of the underlying securities or currency, in most cases the contracts are closed out prior to delivery by offsetting purchases or sales of matching financial futures contracts. When the contracts are closed, a Fund recognizes a gain or loss. Risks of entering into futures contracts include the possibility there may be an illiquid market, possibly at a time of rapidly declining prices, and/or a change in the value of the contract may not correlate with changes in the value of the underlying securities. Futures executed on regulated futures exchanges have minimal counterparty risk to a fund because the exchange's clearinghouse assumes the position of the counterparty in each transaction. Thus, a Fund is exposed to risk only in connection with the clearinghouse and n ot in connection with the original counterparty to the transaction.
For U.S. federal income tax purposes, the futures transactions undertaken by a Fund may cause that Fund to recognize gains or losses from marking contracts to market even though its positions have not been sold or terminated, may affect the character of the gains or losses recognized as long-term or short-term, and may affect the timing of some capital gains and losses realized by the Fund. Also, a Fund's losses on transactions involving futures contracts may be deferred rather than being taken into account currently in calculating such Fund's taxable income.
At October 31, 2013, open positions in financial futures contracts were:
Fund | | Expiration | | Open Contracts | | Position | | Unrealized
Appreciation
(Depreciation) | |
Core Bond | | December 2013 | | 46 U.S. Treasury Note, 2 Year | | Short | | $ | (37,089 | ) | |
Core Bond | | December 2013 | | 18 U.S. Treasury Bond, 30 Year | | Short | | | (77,553 | ) | |
Core Bond | | December 2013 | | 20 U.S. Treasury Bond, Ultra Long | | Short | | | (114,687 | ) | |
Core Bond | | December 2013 | | 76 U.S. Treasury Note, 10 Year | | Short | | | (184,619 | ) | |
Core Bond | | December 2013 | | 291 U.S. Treasury Note, 5 Year | | Short | | | (519,060 | ) | |
Core Bond | | June 2014 | | 15 New Zealand Bank Bill, 90 Day | | Long | | | (9,682 | ) | |
Core Bond | | September 2015 | | 23 Canada Bankers Acceptance, 3 Month | | Long | | | (3,938 | ) | |
Core Bond | | December 2016 | | 38 Euribor Interest Rate, 3 Month | | Long | | | (29,052 | ) | |
Core Bond | | December 2016 | | 48 Sterling Interest Rate, 3 Month | | Long | | | (3,536 | ) | |
Core Bond | | December 2016 | | 48 Eurodollar, 90 Day | | Long | | | (6,215 | ) | |
Total | | | | | | | | $ | (985,431 | ) | |
125
Fund | | Expiration | | Open Contracts | | Position | | Unrealized
Appreciation
(Depreciation) | |
Strategic Income | | December 2013 | | 134 Mini Japanese, 10 Year | | Short | | $ | (263,349 | ) | |
Strategic Income | | December 2013 | | 193 U.S. Treasury Note, 2 Year | | Short | | | (155,612 | ) | |
Strategic Income | | December 2013 | | 110 Australian Dollar | | Short | | | (181,832 | ) | |
Strategic Income | | December 2013 | | 39 Euro Currency | | Short | | | (156,144 | ) | |
Strategic Income | | December 2013 | | 86 Euro-Buxl | | Short | | | (370,021 | ) | |
Strategic Income | | December 2013 | | 207 New Zealand Dollar | | Short | | | (450,183 | ) | |
Strategic Income | | December 2013 | | 211 U.S. Treasury Bond, Ultra Long | | Short | | | (1,130,989 | ) | |
Strategic Income | | December 2013 | | 1,830 U.S. Treasury Note, 10 Year | | Short | | | (5,025,019 | ) | |
Strategic Income | | December 2013 | | 2,707 U.S. Treasury Note, 5 Year | | Short | | | (4,730,887 | ) | |
Strategic Income | | December 2013 | | 65 U.S. Treasury Bond, 30 Year | | Long | | | 124,904 | | |
Strategic Income | | June 2014 | | 87 New Zealand Bank Bill, 90 Day | | Long | | | (56,157 | ) | |
Strategic Income | | September 2015 | | 467 Canada Bankers Acceptance, 3 Month | | Long | | | 166,993 | | |
Strategic Income | | December 2016 | | 221 Euribor Interest Rate, 3 Month | | Long | | | (167,589 | ) | |
Strategic Income | | December 2016 | | 290 Sterling Interest Rate, 3 Month | | Long | | | (21,366 | ) | |
Strategic Income | | December 2016 | | 287 Eurodollar, 90 Day | | Long | | | (28,931 | ) | |
Total | | | | | | | | $ | (12,446,182 | ) | |
During the year ended October 31, 2013, the average notional value of financial futures contracts was:
| | | Long Positions | | Short Positions | |
Core Bond | | $ | 25,490,610 | | | $ | (66,131,399 | ) | |
Short Duration | | $ | — | | | $ | (84,736 | ) | |
Strategic Income | | $ | 212,042,377 | | | $ | (349,568,577 | ) | |
At October 31, 2013, the notional value of financial futures contracts was:
| | | Long Positions | | Short Positions | |
Core Bond | | $ | 51,622,803 | | | $ | (60,538,281 | ) | |
Short Duration | | $ | — | | | $ | — | | |
Strategic Income | | $ | 391,315,391 | | | $ | (703,960,482 | ) | |
At October 31, 2013, the Funds had deposited the following in segregated accounts to cover margin requirements on open futures contracts:
Core Bond | | $ | 561,201 | | |
Short Duration | | $ | — | | |
Strategic Income | | $ | 7,735,238 | | |
126
At October 31, 2013, the Funds had the following derivatives (which did not qualify as hedging instruments under ASC 815), grouped by primary risk exposure:
Asset Derivatives
| | | Statements of
Assets and
Liabilities Location | | Interest Rate
Risk | | Currency
Risk | | Total | |
Core Bond | |
Futures Contracts | | | | | | $ | — | | | $ | — | | | $ | — | | |
Total Value | | Receivable/Payable
for variation margin(1) | | $ | —
| | | $ | —
| | | $ | —
| | |
| | Statements of
Assets and
Liabilities Location | | Interest Rate
Risk | | Currency
Risk | | Total | |
Strategic Income | |
Futures Contracts | | | | $ | 291,897 | | | $ | — | | | $ | 291,897 | | |
Total Value | | | | $ | 291,897 | | | $ | — | | | $ | 291,897 | | |
Liability Derivatives | |
| | | Statements of
Assets and
Liabilities Location | | Interest Rate
Risk | | Currency
Risk | | Total | |
Core Bond | |
Futures Contracts | | | | | | $ | (985,431 | ) | | $ | — | | | $ | (985,431 | ) | |
Total Value | | Receivable/Payable
for variation margin(1) | | $ | (985,431
| ) | | $ | —
| | | $ | (985,431
| ) | |
Strategic Income | |
Futures Contracts | | | | $ | (11,949,920 | ) | | $ | (788,159 | ) | | $ | (12,738,079 | ) | |
Total Value | | | | $ | (11,949,920 | ) | | $ | (788,159 | ) | | $ | (12,738,079 | ) | |
(1) "Futures Contracts" reflects the cumulative appreciation (depreciation) of futures contracts as of October 31, 2013, which is reflected in the Statements of Assets and Liabilities under the caption "Net unrealized appreciation (depreciation) in value of investments." The outstanding variation margin as of October 31, 2013, if any, is reflected in the Statements of Assets and Liabilities under the caption "Receivable/Payable for variation margin."
127
The impact of the use of these derivative instruments on the Statements of Operations during the year ended October 31, 2013, was as follows:
Realized Gain (Loss)
| | | Statements of
Operations
Location | | Interest Rate
Risk | | Currency
Risk | | Total | |
Core Bond | |
Futures Contracts | | | | $ | 1,800,278 | | | $ | — | | | $ | 1,800,278 | | |
Total Realized Gain (Loss) | | Net realized gain
(loss) on:
financial futures
contracts | | $ | 1,800,278 | | | $ | — | | | $ | 1,800,278 | | |
Short Duration | |
Futures Contracts | | | | $ | 1,231 | | | $ | — | | | $ | 1,231 | | |
Total Realized Gain (Loss) | | | | $ | 1,231 | | | $ | — | | | $ | 1,231 | | |
Strategic Income | |
Futures Contracts | | | | $ | 12,615,790 | | | $ | 914,965 | | | $ | 13,530,755 | | |
Total Realized Gain (Loss) | | | | $ | 12,615,790 | | | $ | 914,965 | | | $ | 13,530,755 | | |
Change in Appreciation (Depreciation) | |
| | | Statements of
Operations
Location | | Interest Rate
Risk | | Currency
Risk | | Total | |
Core Bond | |
Futures Contracts | | | | $ | (905,209 | ) | | $ | — | | | $ | (905,209 | ) | |
Total Change in
Appreciation
(Depreciation) | | Change in
net unrealized appreciation | | | $(905,209) | | | | $— | | | | $(905,209) | | |
Strategic Income | | (depreciation) in | | | | | | | | | | | | | |
Futures Contracts | | value of: | | $ | (11,464,731 | ) | | $ | (525,954 | ) | | $ | (11,990,685 | ) | |
Total Change in
Appreciation
(Depreciation) | | financial futures contracts
| | $ | (11,464,731 | ) | | $ | (525,954 | ) | | $ | (11,990,685 | ) | |
Management has concluded that the Funds, except Core Bond, Short Duration and Strategic Income, did not hold any derivative instruments during the year ended October 31, 2013 that require additional disclosures pursuant to ASC 815.
13 Indemnifications: Like many other companies, the Trust's organizational documents provide that its officers and trustees are indemnified against certain liabilities arising out of the performance of their duties to the Trust. In addition, both in some of its principal service contracts and in the normal course of its business, the Trust enters into contracts that provide indemnifications to other parties for certain types of losses or liabilities. The Trust's maximum exposure under these arrangements is unknown as this could involve future claims against the Trust.
14 Transactions with other funds managed by Neuberger Berman Management LLC: Neuberger Berman Income Funds and Management have obtained an exemptive order from the Securities and Exchange Commission ("SEC")
128
that permits the Funds to invest in both affiliated and unaffiliated investment companies, including exchange-traded funds, in excess of the limits in Section 12(d)(1)(A) of the 1940 Act, as amended, subject to the terms and conditions of such order. Through October 31, 2013, Strategic Income invested in the Neuberger Berman Emerging Markets Income Fund (an "Underlying Fund") (see Note I).
For Strategic Income's investment in the Underlying Fund, Management waived a portion of its management fee equal to the management fee it received from the Underlying Fund on those assets (the "Arrangement"). For the fiscal period ended October 31, 2013, management fees waived under this Arrangement are reflected in the Statements of Operations under the caption "Investment management fees waived." For the fiscal period ended October 31, 2013, income earned under this Arrangement on Strategic Income's investments is reflected in the Statements of Operations under the caption "Dividend income-affiliated issuers." For the fiscal period ended October 31, 2013, management fees waived and income earned under this Arrangement on Strategic Income's investments in the Underlying Fund were as follows:
| | Management Fees Waived | | Income Earned | |
Strategic Income | | $ | 41,563 | | | $ | 302,356 | | |
15 Expense offset arrangement: Prior to January 1, 2013, each Fund (prior to August 2, 2010 for New York Municipal Income) had an expense offset arrangement in connection with its custodian contract. For the year ended October 31, 2013, the impact of this arrangement was a reduction of expenses of $43, $220, $1,349, $83, $39, $15 and $260 for Core Bond, Floating Rate Income, High Income, Municipal Intermediate Bond, Short Duration, Short Duration High Income and Strategic Income, respectively.
16 Other: All net investment income and realized and unrealized capital gains and losses of each Fund are allocated, on the basis of relative net assets, pro rata among its respective classes.
Note B—Management Fees, Administration Fees, Distribution Arrangements, and Other Transactions with Affiliates:
Each Fund retains Management as its investment manager under a Management Agreement. For such investment management services, Core Bond, Municipal Intermediate Bond, New York Municipal Income (as of March 11, 2013) and Short Duration each pays Management a fee at the annual rate of 0.25% of the first $500 million of that Fund's average daily net assets, 0.225% of the next $500 million, 0.20% of the next $500 million, 0.175% of the next $500 million, and 0.15% of average daily net assets in excess of $2 billion. Accordingly, for the period ended October 31, 2013, the fee pursuant to the Management Agreement was equivalent to an annual effective rate of 0.25%, 0.25% , 0.25% and 0.25% of Core Bond's, Municipal Intermediate Bond's, New York Municipal Income's and Short Duration's average daily net assets, respectively. For such investment management services, Floating Rate Income, High Income, Short Duration High Income and Strategic Income each pays Management a fee at the annual rate of 0.50%, 0.48%, 0.45%, and 0.55%, respectively, of its average daily net assets.
Prior to March 11, 2013, New York Municipal Income's Predecessor Fund retained Glickenhaus & Co. (the "prior Adviser") to act as investment adviser pursuant to an Investment Advisory Agreement. As compensation for its advisory services, the prior Adviser received a fee, accrued daily and paid monthly, at an annual rate of 0.40% of the first $100 million of average daily net assets and 0.3333% of such assets in excess of $100 million. The prior Adviser had agreed to a reduction of its advisory fees to the extent that the Predecessor Fund's total expenses, including the advisory fees, exceeded 1.50% per annum of the Predecessor Fund's average daily net assets. For the period prior to March 11, 2013, there was no reduction of advisory fees pursuant to this agreement.
Each Fund retains Management as its administrator under an Administration Agreement. Each Fund pays Management an administration fee at the annual rate of 0.06% of its average daily net assets under this agreement. In addition, Investor Class, Class A, Class C and Class R3 of each Fund that offers those classes pays Management
129
an administration fee at the annual rate of 0.21% of its average daily net assets, Trust Class of each of Short Duration and Strategic Income pays Management an administration fee at the annual rate of 0.44% and 0.34%, respectively, of its average daily net assets, Institutional Class of each Fund (as of March 11, 2013 for New York Municipal Income) that offers that class pays Management an administration fee at the annual rate of 0.09% of its average daily net assets and Class R6 of each of High Income and Strategic Income pays Management an administrative fee at the annual rate of 0.02% of its average daily net assets, under this agreement. Additionally, Management retains State Street Bank and Trust Company ("State Street") as its sub-administrator under a Sub-Administration Agreement. Management pays State Street a fee for all services received under the agreement.
Prior to March 11, 2013, New York Municipal Income's Predecessor Fund retained Ultimus Fund Solutions, LLC ("Ultimus") as its administrator under an Administration Agreement. For the performance of these administrative services, the Predecessor Fund paid Ultimus a fee at the annual rate of 0.10% of the average value of its daily net assets up to $250 million, 0.075% of such assets from $250 million to $500 million and 0.05% of such assets in excess of $500 million, provided, however, that the minimum fee was $5,000 per month.
Prior to March 11, 2013, under the terms of a Fund Accounting Agreement with New York Municipal Income's Predecessor Fund, Ultimus provided the Fund with accounting and pricing services. For calculating daily net asset value per share and maintaining such books and records as was necessary to enable Ultimus to perform its duties, the Predecessor Fund paid Ultimus a base fee of $3,000 per month, plus an asset-based fee at the annual rate of 0.01% of the average value of its daily net assets up to $500 million and 0.005% of such assets in excess of $500 million.
Prior to March 11, 2013, under the terms of a Transfer Agent and Shareholder Services Agreement with New York Municipal Income's Predecessor Fund, Ultimus served as transfer agent and shareholder services agent for the Predecessor Fund.
Prior to March 11, 2013, under the terms of a Compliance Consulting Agreement between New York Municipal Income's Predecessor Fund and Ultimus (the "Compliance Agreement"), Ultimus made available an individual to serve as the Predecessor Fund's Chief Compliance Officer ("CCO"). Under the Compliance Agreement, Ultimus also provided infrastructure and support in implementing the written policies and procedures comprising the Predecessor Fund's compliance program, including supporting services to the CCO.
Management has contractually agreed to waive current payment of fees and/or reimburse certain expenses of the Investor Class, Trust Class, Institutional Class, Class A, Class C, Class R3 and Class R6 of each Fund that offers those classes so that the total annual operating expenses of those classes do not exceed the expense limitations as detailed in the following table. These undertakings apply to a Fund's direct expenses and exclude interest, taxes, brokerage commissions, acquired fund fees and expenses, extraordinary expenses and dividend expenses on short sales, if any; consequently, net expenses may exceed the contractual expense limitations. Each Fund has agreed that each of its respective classes will repay Management for fees and expenses waived or reimbursed for that class provided that repayment does not cause that class's annual operating expenses to exceed its contractual expense limitation in place at the time the fees were waived or reimbursed. Any such repayment must be made within three years after the year in which Management incurred the expense.
During the period ended October 31, 2013, there was no repayment to Management under these agreements.
130
At October 31, 2013, contingent liabilities to Management under the agreements were as follows:
| | | | | | | Expenses Reimbursed in Fiscal Period
Ending, October 31, | |
| | | | | | | 2011 | | 2012 | | 2013 | |
| | | | | | | Subject to Repayment until October 31, | |
Class | | Contractual
Expense
Limitation(1) | | Expiration | | 2014 | | 2015 | | 2016 | |
Core Bond Investor Class | | | 0.85 | % | | 10/31/21 | | $ | 29,269 | | | $ | 27,514 | | | $ | 35,806 | | |
Core Bond Institutional Class | | | 0.45 | % | | 10/31/21 | | | 134,496 | | | | 154,024 | | | | 298,036 | | |
Core Bond Class A | | | 0.85 | % | | 10/31/21 | | | 16,514 | | | | 26,508 | | | | 61,747 | | |
Core Bond Class C | | | 1.60 | % | | 10/31/21 | | | 2,434 | | | | 6,318 | | | | 9,196 | | |
Floating Rate Income Institutional Class | | | 0.70 | % | | 10/31/16 | | | 358,055 | | | | 374,906 | | | | 367,105 | | |
Floating Rate Income Class A | | | 1.07 | % | | 10/31/21 | | | 54,980 | | | | 58,121 | | | | 63,435 | | |
Floating Rate Income Class C | | | 1.82 | % | | 10/31/21 | | | 11,494 | | | | 21,016 | | | | 34,681 | | |
High Income Investor Class | | | 1.00 | % | | 10/31/16 | | | — | | | | — | | | | — | | |
High Income Institutional Class | | | 0.75 | % | | 10/31/16 | | | — | | | | — | | | | — | | |
High Income Class A | | | 1.12 | % | | 10/31/16 | | | — | | | | — | | | | — | | |
High Income Class C | | | 1.87 | % | | 10/31/16 | | | — | | | | — | | | | — | | |
High Income Class R3 | | | 1.37 | % | | 10/31/16 | | | — | | | | — | | | | — | | |
High Income Class R6 | | | 0.68 | % | | 10/31/16 | | | — | | | | — | | | | — | (4) | |
Municipal Intermediate Bond
Investor Class | | | 0.65 | % | | 10/31/16 | | | 364,558 | | | | 93,905 | | | | 36,412 | | |
Municipal Intermediate Bond
Institutional Class | | | 0.50 | % | | 10/31/16 | | | 11,099 | | | | 179,948 | | | | 220,175 | | |
Municipal Intermediate Bond Class A | | | 0.87 | % | | 10/31/16 | | | 1,607 | | | | 4,964 | | | | 9,915 | | |
Municipal Intermediate Bond Class C | | | 1.62 | % | | 10/31/16 | | | 1,310 | | | | 3,645 | | | | 3,722 | | |
New York Municipal Income
Institutional Class | | | 1.00 | % | | 10/31/15 | | | — | | | | — | | | | — | (5) | |
Short Duration Investor Class | | | 0.70 | % | | 10/31/16 | | | 256,301 | | | | 194,144 | | | | 172,377 | | |
Short Duration Trust Class | | | 0.80 | % | | 10/31/16 | | | 43,741 | | | | 31,215 | | | | 25,172 | | |
Short Duration Institutional Class | | | 0.50 | % | | 10/31/16 | | | 55,445 | | | | 72,550 | | | | 105,939 | | |
Short Duration Class A | | | 0.87 | % | | 10/31/16 | | | 2,715 | | | | 4,577 | | | | 19,994 | | |
Short Duration Class C | | | 1.62 | % | | 10/31/16 | | | 2,242 | | | | 6,131 | | | | 8,495 | | |
Short Duration High Income
Institutional Class | | | 0.75 | %(3) | | 10/31/16 | | | — | | | | 177,932 | (2) | | | 264,663 | | |
Short Duration High Income Class A | | | 1.12 | %(3) | | 10/31/16 | | | — | | | | 382 | (2) | | | 3,831 | | |
Short Duration High Income Class C | | | 1.87 | %(3) | | 10/31/16 | | | — | | | | 242 | (2) | | | 1,999 | | |
Strategic Income Trust Class | | | 1.10 | % | | 10/31/16 | | | 28,723 | | | | 21,192 | | | | 25,620 | | |
Strategic Income Institutional Class | | | 0.75 | % | | 10/31/21 | | | 219,304 | | | | 285,110 | | | | 418,813 | | |
Strategic Income Class A | | | 1.15 | % | | 10/31/21 | | | 259,854 | | | | 211,303 | | | | 194,057 | | |
Strategic Income Class C | | | 1.85 | % | | 10/31/21 | | | 184,718 | | | | 176,962 | | | | 185,562 | | |
Strategic Income Class R6 | | | 0.68 | % | | 10/31/16 | | | — | | | | — | | | | 4,189 | (4) | |
(1) Expense limitation per annum of the respective class's average daily net assets.
(2) Period from September 28, 2012 to October 31, 2012.
131
(3) In addition, Management voluntarily waived expenses as necessary to maintain a minimum yield from September 28, 2012 (Commencement of Operations) to October 2, 2012. For the period ended October 31, 2012, voluntary reimbursements for the Institutional Class, Class A and Class C of Short Duration High Income amounted to $935, $5 and $8, respectively. These amounts are not subject to recovery by Management. This undertaking was in addition to the contractual undertakings as stated above.
(4) Period from March 15, 2013 to October 31, 2013.
(5) Period from March 11, 2013 to October 31, 2013.
Neuberger Berman Fixed Income LLC ("NBFI"), as the sub-adviser to High Income, Municipal Intermediate Bond, Short Duration and Strategic Income, is retained by Management to furnish it with investment recommendations and research information without added cost to each Fund it sub-advises. NBFI, as the sub-adviser to Core Bond, Floating Rate Income, New York Municipal Income and Short Duration High Income, is retained by Management to provide day-to-day investment management services and receives a monthly fee paid by Management. As investment manager, Management is responsible for overseeing the investment activities of NBFI. Several individuals who are officers and/or Trustees of the Trust are also employees of NBFI, Neuberger Berman LLC ("Neuberger") and/or Management.
Management and NBFI are indirect subsidiaries of Neuberger Berman Group LLC (("NBG") and together with its consolidated subsidiaries ("NB Group")). NBSH Acquisition, LLC ("NBSH" and together with NBG, the "NB Parties"), which is owned by portfolio managers, members of the NB Group management team and certain of NB Group's key employees, senior professionals, and certain of their permitted transferees, owns, as of September 30, 2013, approximately 76% of NBG's equity, and Lehman Brothers Holdings Inc. ("LBHI") and certain of its subsidiaries (collectively the "LBHI Parties") own the remaining 24% of such equity. Pursuant to agreements among the NB Parties and the LBHI Parties, as well as the issuance of NBSH equity to employees with respect to their previously made equity elections relating to 2013 compensation, it is expected that NBSH will own 81% of NBG's equity as of January 1, 2014. NBG has the opportunity to continue to redeem the remaining NBG equity held by the LBHI Parties through a process that is expected to end in 2016.
Prior to March 11, 2013, certain officers and Trustees of New York Municipal Income's Predecessor Fund were affiliated with the prior Adviser or Ultimus. Except as disclosed above in connection with the Compliance Agreement, such officers and Trustees received no compensation from the Fund for serving in their respective roles. Each of the four non-interested Trustees who served on the Fund's Board were paid a retainer of $2,600 per quarter and an additional $900 fee for each Board meeting attended, plus reimbursement for certain expenses. The non-interested Trustees who served on committees of the Board received an additional fee of $750 for attendance at each committee meeting held on a day other than a regular quarterly Board meeting. Prior to March 6, 2012, the quarterly retainer paid to each Trustee was $2,100.
Each Fund also has a distribution agreement with Management with respect to each class of shares. Management acts as agent in arranging for the sale of class shares without sales commission or other compensation, except as described below for Class A and Class C shares, and bears advertising and promotion expenses.
However, Management receives fees from Core Bond's Investor Class, Strategic Income's Trust Class, High Income's Class R3, and each Fund's Class A and Class C under their distribution plans (each a "Plan", collectively, the "Plans") pursuant to Rule 12b-1 under the 1940 Act. The Plans provide that, as compensation for administrative and other services provided to these classes, Management's activities and expenses related to the sale and distribution of these classes of shares, and ongoing services provided to investors in these classes, Management receives from each of these respective classes a fee at the annual rate of 0.25% of Core Bond Investor Class', Core Bond Class A's, Floating Rate Income Class A's, High Income Class A's, Municipal Intermediate Bond Class A's, Short Duration Class A's, Short Duration High Income Class A's and Strategic Income Class A's average daily net assets; 0.10% of Strategic Income Trust Class' average daily net assets; 0.50% of High Income Class R3's average daily net assets; and 1.00% of Core Bond Class C's, Floating Rate Income Class C's, High Income Class C's, Municipal Intermediate Bond Class C's, Short Duration Class C's, Short Duration High Income Class C's and
132
Strategic Income Class C's average daily net assets. Management receives this amount to provide distribution and shareholder servicing for these classes and pays a portion of it to institutions that provide such services. Those institutions may use the payments for, among other purposes, compensating employees engaged in sales and/or shareholder servicing. The amount of fees paid by each class during any year may be more or less than the cost of distribution and other services provided to that class. FINRA rules limit the amount of annual distribution fees that may be paid by a mutual fund and impose a ceiling on the cumulative distribution fees paid. The Trust's Plans comply with those rules.
Class A shares of each Fund (except Short Duration) are generally sold with an initial sales charge of up to 4.25%. Class A shares of Short Duration are generally sold with an initial sales charge of up to 2.50% (4.25% prior to June 15, 2011). Class A shares of each Fund are generally sold with no contingent deferred sales charge ("CDSC"), except that a CDSC of 1.00% applies to certain redemptions made within 18 months following purchases of $1 million or more without an initial sales charge. Class C shares of each Fund are sold with no initial sales charge and a 1.00% CDSC if shares are sold within one year after purchase.
For the year ended October 31, 2013, Management, acting as underwriter and broker-dealer, received net initial sales charges from the purchase of Class A shares and CDSCs from the redemption of Class A and Class C shares as follows:
| | Underwriter | | Broker-Dealer | |
| | Net Initial
Sales Charges | | CDSC | | Net Initial
Sales Charges | | CDSC | |
Core Bond Class A | | $ | 481 | | | $ | 1,941 | | | $ | — | | | $ | — | | |
Core Bond Class C | | | — | | | | 1,547 | | | | — | | | | — | | |
Floating Rate Income Class A | | | 13,444 | | | | 6,000 | | | | — | | | | — | | |
Floating Rate Income Class C | | | — | | | | 7,160 | | | | — | | | | — | | |
High Income Class A | | | 12,375 | | | | 37,724 | | | | — | | | | — | | |
High Income Class C | | | — | | | | 19,611 | | | | — | | | | — | | |
Municipal Intermediate Bond Class A | | | 927 | | | | — | | | | — | | | | — | | |
Municipal Intermediate Bond Class C | | | — | | | | 316 | | | | — | | | | — | | |
Short Duration Class A | | | 380 | | | | — | | | | — | | | | — | | |
Short Duration Class C | | | — | | | | 1,270 | | | | — | | | | — | | |
Short Duration High Income Class A | | | — | | | | — | | | | — | | | | — | | |
Short Duration High Income Class C | | | — | | | | — | | | | — | | | | — | | |
Strategic Income Class A | | | 30,246 | | | | 38,538 | | | | — | | | | — | | |
Strategic Income Class C | | | — | | | | 65,152 | | | | — | | | | — | | |
133
Note C—Securities Transactions:
Cost of purchases and proceeds of sales and maturities of long-term securities (excluding financial futures contracts) for the year ended October 31, 2013, were as follows:
| | | Purchases of
U.S. Government and
Agency Obligations | | Purchases excluding
U.S. Government and
Agency Obligations | | Sales and
Maturities of
U.S. Government and
Agency Obligations | | Sales and
Maturities excluding
U.S. Government and
Agency Obligations | |
Core Bond | | $ | 835,239,033 | | | $ | 102,889,922 | | | $ | 880,416,225 | | | $ | 120,816,625 | | |
Floating Rate Income | | | — | | | | 587,195,009 | | | | — | | | | 332,893,509 | | |
High Income | | | — | | | | 2,541,468,351 | | | | — | | | | 2,646,365,198 | | |
Municipal Intermediate Bond | | | — | | | | 102,392,215 | | | | — | | | | 89,213,862 | | |
| New York Municipal Income(1) | | | — | | | | 39,853,520 | | | | — | | | | 36,555,042 | | |
Short Duration | | | 28,332,036 | | | | 26,961,987 | | | | 31,730,955 | | | | 23,613,385 | | |
Short Duration High Income | | | — | | | | 109,090,970 | | | | — | | | | 30,902,867 | | |
Strategic Income | | | 4,638,415,427 | | | | 1,701,446,957 | | | | 4,549,192,337 | | | | 1,358,242,917 | | |
(1) Period from March 1, 2013 to October 31, 2013.
Note D—Fund Share Transactions:
Share activity for the years ended October 31, 2013 and October 31, 2012 was as follows:
| | | For the Year Ended October 31, 2013 | | For the Year Ended October 31, 2012 | |
(000's omitted) | | Shares
Sold | | Shares
Issued on
Reinvestment
of Dividends
and
Distributions | | Shares
Issued in
Connection
with
Reorganization
(Note F) | | Shares
Redeemed | | Total | | Shares
Sold | | Shares
Issued on
Reinvestment
of Dividends
and
Distributions | | Shares
Redeemed | | Total | |
Core Bond: | |
Investor Class | | | 157 | | | | 60 | | | | — | | | | (383 | ) | | | (166 | ) | | | 324 | | | | 61 | | | | (363 | ) | | | 22 | | |
Institutional Class | | | 3,187 | | | | 779 | | | | — | | | | (7,776 | ) | | | (3,810 | ) | | | 6,241 | | | | 677 | | | | (3,852 | ) | | | 3,066 | | |
Class A | | | 1,939 | | | | 146 | | | | — | | | | (3,463 | ) | | | (1,378 | ) | | | 3,279 | | | | 109 | | | | (1,539 | ) | | | 1,849 | | |
Class C | | | 136 | | | | 9 | | | | — | | | | (294 | ) | | | (149 | ) | | | 885 | | | | 8 | | | | (671 | ) | | | 222 | | |
Floating Rate
Income: | |
Institutional Class | | | 31,489 | | | | 1,197 | | | | — | | | | (14,439 | ) | | | 18,247 | | | | 11,780 | | | | 886 | | | | (7,359 | ) | | | 5,307 | | |
Class A | | | 5,807 | | | | 162 | | | | — | | | | (2,308 | ) | | | 3,661 | | | | 1,760 | | | | 92 | | | | (541 | ) | | | 1,311 | | |
Class C | | | 4,045 | | | | 45 | | | | — | | | | (465 | ) | | | 3,625 | | | | 932 | | | | 17 | | | | (319 | ) | | | 630 | | |
High Income: | |
Investor Class | | | 6,896 | �� | | | 2,244 | | | | — | | | | (12,774 | ) | | | (3,634 | ) | | | 9,593 | | | | 2,373 | | | | (10,115 | ) | | | 1,851 | | |
Institutional Class | | | 117,061 | | | | 12,338 | | | | — | | | | (170,592 | ) | | | (41,193 | ) | | | 150,548 | | | | 10,305 | | | | (84,435 | ) | | | 76,418 | | |
Class A | | | 26,246 | | | | 2,992 | | | | — | | | | (41,545 | ) | | | (12,307 | ) | | | 29,869 | | | | 2,498 | | | | (16,668 | ) | | | 15,699 | | |
Class C | | | 1,304 | | | | 250 | | | | — | | | | (2,964 | ) | | | (1,410 | ) | | | 4,013 | | | | 221 | | | | (1,766 | ) | | | 2,468 | | |
Class R3 | | | 792 | | | | 56 | | | | — | | | | (749 | ) | | | 99 | | | | 841 | | | | 31 | | | | (172 | ) | | | 700 | | |
| Class R6(4) | | | 57,516 | | | | 1,362 | | | | — | | | | (3,407 | ) | | | 55,471 | | | | — | | | | — | | | | — | | | | — | | |
134
| | | For the Year Ended October 31, 2013 | | For the Year Ended October 31, 2012 | |
(000's omitted) | | Shares
Sold | | Shares
Issued on
Reinvestment
of Dividends
and
Distributions | | Shares
Issued in
Connection
with
Reorganization
(Note F) | | Shares
Redeemed | | Total | | Shares
Sold | | Shares
Issued on
Reinvestment
of Dividends
and
Distributions | | Shares
Redeemed | | Total | |
Municipal
Intermediate Bond: | |
Investor Class | | | 68 | | | | 40 | | | | — | | | | (208 | ) | | | (100 | ) | | | 708 | | | | 143 | | | | (9,175 | ) | | | (8,324 | ) | |
Institutional Class | | | 2,649 | | | | 282 | | | | — | | | | (1,865 | ) | | | 1,066 | | | | 10,438 | | | | 183 | | | | (866 | ) | | | 9,755 | | |
Class A | | | 293 | | | | 7 | | | | — | | | | (153 | ) | | | 147 | | | | 292 | | | | 3 | | | | (26 | ) | | | 269 | | |
Class C | | | 76 | | | | 1 | | | | — | | �� | | (70 | ) | | | 7 | | | | 90 | | | | 1 | | | | (19 | ) | | | 72 | | |
New York
Municipal Income: | |
Institutional Class | | | 16 | (2) | | | 65 | (2) | | | 4,323 | (2) | | | (420 | )(2) | | | 3,984 | (2) | | | — | | | | — | | | | — | | | | — | | |
Builder Class | | | 2 | (1) | | | — | (1) | | | (2,025 | ) | | | (10 | )(1) | | | (2,033 | ) | | | 73 | (3) | | | 33 | (3) | | | (192 | )(3) | | | (86 | )(3) | |
Premier Class | | | 0 | z(1) | | | — | (1) | | | (2,297 | ) | | | — | (1) | | | (2,297 | ) | | | 123 | (3) | | | 35 | (3) | | | (372 | )(3) | | | (214 | )(3) | |
Short Duration: | |
Investor Class | | | 339 | | | | 63 | | | | — | | | | (1,123 | ) | | | (721 | ) | | | 431 | | | | 112 | | | | (1,308 | ) | | | (765 | ) | |
Trust Class | | | 139 | | | | 9 | | | | — | | | | (353 | ) | | | (205 | ) | | | 121 | | | | 17 | | | | (262 | ) | | | (124 | ) | |
Institutional Class | | | 1,533 | | | | 42 | | | | — | | | | (2,075 | ) | | | (500 | ) | | | 2,194 | | | | 45 | | | | (1,744 | ) | | | 495 | | |
Class A | | | 827 | | | | 4 | | | | — | | | | (308 | ) | | | 523 | | | | 293 | | | | 2 | | | | (12 | ) | | | 283 | | |
Class C | | | 288 | | | | 1 | | | | — | | | | (219 | ) | | | 70 | | | | 181 | | | | 1 | | | | (92 | ) | | | 90 | | |
Short Duration
High Income: | |
Institutional Class | | | 7,723 | | | | 265 | | | | — | | | | (383 | ) | | | 7,605 | | | | 3,503 | | | | 7 | | | | (1,007 | ) | | | 2,503 | (5) | |
Class A | | | 155 | | | | 2 | | | | — | | | | (48 | ) | | | 109 | | | | 7 | | | | — | | | | — | | | | 7 | (5) | |
Class C | | | 29 | | | | 0 | z | | | — | | | | (10 | ) | | | 19 | | | | 3 | | | | — | | | | — | | | | 3 | (5) | |
Strategic Income: | |
Trust Class | | | 2,661 | | | | 152 | | | | — | | | | (1,173 | ) | | | 1,640 | | | | 936 | | | | 89 | | | | (520 | ) | | | 505 | | |
Institutional Class | | | 48,230 | | | | 2,275 | | | | — | | | | (29,532 | ) | | | 20,973 | | | | 33,284 | | | | 894 | | | | (8,282 | ) | | | 25,896 | | |
Class A | | | 21,565 | | | | 1,272 | | | | — | | | | (21,457 | ) | | | 1,380 | | | | 15,491 | | | | 814 | | | | (7,673 | ) | | | 8,632 | | |
Class C | | | 6,480 | | | | 486 | | | | — | | | | (5,662 | ) | | | 1,304 | | | | 6,746 | | | | 275 | | | | (2,201 | ) | | | 4,820 | | |
| Class R6(4) | | | 1,552 | | | | 16 | | | | — | | | | (5 | ) | | | 1,563 | | | | — | | | | — | | | | — | | | | — | | |
(1) For the period March 1, 2013 to March 8, 2013. Shares redeemed for Builder Class and Premier Class includes approximately 2,025,000 and 2,297,000 shares, respectively, which were converted to Institutional Class shares of New York Municipal Income on March 11, 2013 in connection with the reorganization (see Note F).
(2) Approximately 4,323,000 Institutional Class shares were issued in connection with conversion of approximately 2,025,000 Builder Class shares and 2,297,000 Premier Class shares (See Note F).
135
(3) Share activity for the year ended February 28, 2013 for the Predecessor Fund of New York Municipal Income. Share activity for the year ended February 29, 2012 for the Predecessor Fund of New York Municipal Income was as follows:
| | | For the Year Ended February 29, 2012 | |
(000's omitted) | | Shares
Sold | | Shares Issued
on Reinvestment
of Dividends
and Distributions | | Shares
Redeemed | | Total | |
New York Municipal Income: | |
Builder Class | | | 42 | | | | 40 | | | | (156 | ) | | | (74 | ) | |
Premier Class | | | 68 | | | | 43 | | | | (145 | ) | | | (34 | ) | |
(4) Period from March 15, 2013 to October 31, 2013.
(5) Period from September 28, 2012 (Commencement of Operations) to October 31, 2012.
z A zero balance, if any, reflects an actual amount rounding to less than 1,000.
Note E—Line of Credit:
At October 31, 2013, the Funds were participants in a single committed, unsecured $300,000,000 line of credit with State Street, to be used only for temporary or emergency purposes. Other investment companies managed by Management also participate in this line of credit on the same terms. Interest is charged on borrowings under this line of credit at the higher of (a) the Federal Funds Rate plus 1.25% per annum or (b) the Overnight LIBOR Rate plus 1.25% per annum. A commitment fee of 0.10% per annum of the unused portion of the available line of credit is charged, of which each participating Fund has agreed to pay its pro rata share, based on the ratio of its individual net assets to the net assets of all participants at the time the fee is due and payable. The fee is paid quarterly in arrears. Because several mutual funds participate, there is no assurance that an individual Fund will have access to all or any part of the $300,000,000 at any particular time. There were no loans outstanding pursuant to this line of credit at October 31, 2013. During the year ended October 31, 2013, none of the Funds utilized this line of credit.
At October 31, 2013, the Funds were participants in a single uncommitted, unsecured $100,000,000 line of credit with State Street, to be used only for temporary or emergency purposes. Other investment companies managed by Management also participate in this line of credit on the same terms. Interest is charged on borrowings under this line of credit at a variable rate per annum as determined and quoted by State Street at the time a Fund requests a loan. Because several mutual funds participate, there is no assurance that an individual Fund will have access to all or any part of the $100,000,000 at any particular time. There were no loans outstanding pursuant to this line of credit at October 31, 2013. During September (inception of line of credit) and October 2013, none of the Funds utilized this line of credit.
Note F—Reorganization of New York Municipal Income:
After the close of business on March 8, 2013, all the net assets and liabilities of the Predecessor Fund, a Massachusetts business trust, were reorganized into New York Municipal Income. The Predecessor Fund was registered as a non-diversified, open-end management investment company under the 1940 Act. The reorganization was performed pursuant to a plan of reorganization approved by the Predecessor Fund's shareholders on February 22, 2013.
The reorganization was accomplished by a tax-free exchange of 2,025,214 shares of the Institutional Class of New York Municipal Income (valued at $35,911,391) for 2,025,214 shares of the Builder Class of the Predecessor Fund
136
and 2,297,401 shares of the Institutional Class of New York Municipal Income (valued at $40,737,640) for 2,297,171 shares of the Premier Class of the Predecessor Fund outstanding on March 8, 2013. The Predecessor Fund's aggregate net assets at that date ($76,649,031 including $13,966 of undistributed net realized loss and $3,523,309 of net unrealized appreciation) were combined with those of the New York Municipal Income. The aggregate net assets of New York Municipal Income and the Predecessor Fund immediately after the reorganization were $76,649,031.
Note G—Change in Fiscal Year End:
The Board of Trustees adopted a change in New York Municipal Income's fiscal year end to October 31. This change was effective beginning with this fiscal period, beginning March 1, 2013 for New York Municipal Income.
Note H—Change in Independent Auditors:
On March 5, 2013, PricewaterhouseCoopers LLP ("PricewaterhouseCoopers") was replaced as independent auditor of the Predecessor Fund, and Tait, Weller & Baker LLP ("Tait Weller") was selected as the Predecessor Fund's new independent auditor. The Predecessor Fund's selection of Tait Weller as its independent auditor was recommended and approved by the Predecessor Fund's audit committee and was ratified by the Predecessor Fund's Board of Trustees.
PricewaterhouseCoopers reports on the Predecessor Fund's financial statements for the prior two fiscal years did not contain an adverse opinion or a disclaimer of opinion, and were not qualified or modified as to uncertainty, audit scope or accounting principles. During such fiscal years, and through the date of PricewaterhouseCoopers' replacement, there were no disagreements between the Predecessor Fund and PricewaterhouseCoopers on any matter of accounting principles or practices, financial statement disclosure, or auditing scope or procedures, which disagreements, if not resolved to the satisfaction of PricewaterhouseCoopers, would have caused it to make reference to the subject matter of the disagreements in connection with its reports on the financial statements for such years. Prior to March 5, 2013, Tait Weller was not contacted during the prior two fiscal years regarding the application of accounting principles to any particular financial matter.
Note I—Investments in Affiliates(1):
| | | Balance of
Shares Held
October 31,
2012 | | Gross
Purchases
and Additions | | Gross
Sales and
Reductions | | Balance of
Shares Held
October 31,
2013 | | Value
October 31,
2013 | | Income from
Investments
in Affiliated
Issuers | | Net Realized
Gain (Loss)
from
Investments
in Affiliated
Issuers | |
Strategic Income: | |
Neuberger Berman
Emerging Markets
Income Fund
Institutional Class | | | — | | | | 8,529,643 | | | | — | | | | 8,529,643 | | | $ | 86,975,036 | | | $ | 302,356 | | | $ | — | | |
(1) Affiliated issuers, as defined in the 1940 Act.
Note J—Recent Accounting Pronouncements:
In December 2011, the Financial Accounting Standards Board ("FASB") issued Accounting Standards Update 2011-11 Disclosures about Offsetting Assets and Liabilities ("ASU 2011-11"). Effective for annual reporting periods
137
beginning on or after January 1, 2013 and interim periods within those annual periods, ASU 2011-11 is intended to enhance disclosure requirements on the offsetting of financial assets and liabilities. At this time, Management is evaluating the implications of ASU 2011-11 and its impact on the Funds' financial statements. In June 2013, FASB issued Accounting Standards Update 2013-08 Financial Services — Investment Companies (Topic 946) — Amendments to the Scope, Measurement, and Disclosure Requirements ("ASU 2013-08"). Effective for interim and annual reporting periods in fiscal years that begin after December 15, 2013, ASU 2013-08 sets forth a methodology for determining whether an entity should be characterized as an investment company and prescribes fair value accounting for an investment company's non-controlling ownership interest in another investment company. FASB has determined that a fund registered under the 1940 Act automatically meets ASU 2013-08's criteria for an investment company. Although still evaluating the potential impact of ASU 2013-08 on the Funds' financial statements, Management expects that the impact will be limited to additional financial statement disclosures.
138
This page has been left blank intentionally
The following tables include selected data for a share outstanding throughout each period and other performance information
derived from the Financial Statements. Per share amounts that round to less than $.01 or $(0.01) per share are presented as $0.00
or $(0.00), respectively. Ratios that round to less than 0.00% or (0.00%) per share are presented as 0.00% or (0.00%), respectively.
Net Asset amounts with a zero balance may reflect actual amounts rounding to less than $0.1 million. A "—" indicates that the
line item was not applicable in the corresponding period.
| | | Net Asset
Value,
Beginning
of Year | | Net
Investment
Income (Loss) | | Net Gains or
Losses on
Securities
(both
realized and
unrealized) | | Total From
Investment
Operations | | Dividends
from Net
Investment
Income | | Distributions
from Net
Realized
Capital Gains | | Tax
Return of
Capital | | Total
Distributions | |
Core Bond Fund | |
Investor Class | |
10/31/2013 | | $ | 11.04 | | | $ | 0.16 | @ | | $ | (0.39 | ) | | $ | (0.23 | ) | | $ | (0.16 | ) | | $ | (0.28 | ) | | $ | (0.02 | ) | | $ | (0.46 | ) | |
10/31/2012 | | $ | 10.79 | | | $ | 0.18 | @ | | $ | 0.52 | | | $ | 0.70 | | | $ | (0.18 | ) | | $ | (0.27 | ) | | $ | — | | | $ | (0.45 | ) | |
10/31/2011 | | $ | 10.86 | | | $ | 0.23 | @ | | $ | 0.22 | | | $ | 0.45 | | | $ | (0.25 | ) | | $ | (0.27 | ) | | $ | — | | | $ | (0.52 | ) | |
10/31/2010 | | $ | 10.19 | | | $ | 0.28 | @ | | $ | 0.72 | | | $ | 1.00 | | | $ | (0.28 | ) | | $ | (0.05 | ) | | $ | — | | | $ | (0.33 | ) | |
10/31/2009 | | $ | 8.64 | | | $ | 0.40 | @ | | $ | 1.55 | | | $ | 1.95 | | | $ | (0.40 | ) | | $ | (0.00 | ) | | $ | — | | | $ | (0.40 | ) | |
Institutional Class | |
10/31/2013 | | $ | 11.06 | | | $ | 0.20 | @ | | $ | (0.39 | ) | | $ | (0.19 | ) | | $ | (0.20 | ) | | $ | (0.28 | ) | | $ | (0.02 | ) | | $ | (0.50 | ) | |
10/31/2012 | | $ | 10.81 | | | $ | 0.22 | @ | | $ | 0.53 | | | $ | 0.75 | | | $ | (0.23 | ) | | $ | (0.27 | ) | | $ | — | | | $ | (0.50 | ) | |
10/31/2011 | | $ | 10.88 | | | $ | 0.28 | @ | | $ | 0.22 | | | $ | 0.50 | | | $ | (0.30 | ) | | $ | (0.27 | ) | | $ | — | | | $ | (0.57 | ) | |
10/31/2010 | | $ | 10.21 | | | $ | 0.32 | @ | | $ | 0.73 | | | $ | 1.05 | | | $ | (0.33 | ) | | $ | (0.05 | ) | | $ | — | | | $ | (0.38 | ) | |
10/31/2009 | | $ | 8.65 | | | $ | 0.43 | @ | | $ | 1.57 | | | $ | 2.00 | | | $ | (0.44 | ) | | $ | (0.00 | ) | | $ | — | | | $ | (0.44 | ) | |
Class A | |
10/31/2013 | | $ | 11.02 | | | $ | 0.16 | @ | | $ | (0.38 | ) | | $ | (0.22 | ) | | $ | (0.16 | ) | | $ | (0.28 | ) | | $ | (0.02 | ) | | $ | (0.46 | ) | |
10/31/2012 | | $ | 10.77 | | | $ | 0.17 | @ | | $ | 0.53 | | | $ | 0.70 | | | $ | (0.18 | ) | | $ | (0.27 | ) | | $ | — | | | $ | (0.45 | ) | |
10/31/2011 | | $ | 10.85 | | | $ | 0.23 | @ | | $ | 0.21 | | | $ | 0.44 | | | $ | (0.25 | ) | | $ | (0.27 | ) | | $ | — | | | $ | (0.52 | ) | |
10/31/2010 | | $ | 10.18 | | | $ | 0.28 | @ | | $ | 0.72 | | | $ | 1.00 | | | $ | (0.28 | ) | | $ | (0.05 | ) | | $ | — | | | $ | (0.33 | ) | |
10/31/2009 | | $ | 8.64 | | | $ | 0.37 | @ | | $ | 1.57 | | | $ | 1.94 | | | $ | (0.40 | ) | | $ | (0.00 | ) | | $ | — | | | $ | (0.40 | ) | |
Class C | |
10/31/2013 | | $ | 11.03 | | | $ | 0.08 | @ | | $ | (0.38 | ) | | $ | (0.30 | ) | | $ | (0.08 | ) | | $ | (0.28 | ) | | $ | (0.02 | ) | | $ | (0.38 | ) | |
10/31/2012 | | $ | 10.78 | | | $ | 0.09 | @ | | $ | 0.53 | | | $ | 0.62 | | | $ | (0.10 | ) | | $ | (0.27 | ) | | $ | — | | | $ | (0.37 | ) | |
10/31/2011 | | $ | 10.86 | | | $ | 0.15 | @ | | $ | 0.21 | | | $ | 0.36 | | | $ | (0.17 | ) | | $ | (0.27 | ) | | $ | — | | | $ | (0.44 | ) | |
10/31/2010 | | $ | 10.18 | | | $ | 0.19 | @ | | $ | 0.74 | | | $ | 0.93 | | | $ | (0.20 | ) | | $ | (0.05 | ) | | $ | — | | | $ | (0.25 | ) | |
10/31/2009 | | $ | 8.64 | | | $ | 0.32 | @ | | $ | 1.55 | | | $ | 1.87 | | | $ | (0.33 | ) | | $ | (0.00 | ) | | $ | — | | | $ | (0.33 | ) | |
Floating Rate Income Fund | |
Institutional Class | |
10/31/2013 | | $ | 10.22 | | | $ | 0.42 | @ | | $ | 0.08 | | | $ | 0.50 | | | $ | (0.43 | ) | | $ | — | | | $ | — | | | $ | (0.43 | ) | |
10/31/2012 | | $ | 9.91 | | | $ | 0.53 | @ | | $ | 0.31 | | | $ | 0.84 | | | $ | (0.53 | ) | | $ | — | | | $ | — | | | $ | (0.53 | ) | |
10/31/2011 | | $ | 10.17 | | | $ | 0.54 | @ | | $ | (0.22 | ) | | $ | 0.32 | | | $ | (0.56 | ) | | $ | (0.02 | ) | | $ | — | | | $ | (0.58 | ) | |
Period from 12/30/2009^ to
10/31/2010 | | $ | 10.00 | | | $ | 0.44 | @ | | $ | 0.17 | | | $ | 0.61 | | | $ | (0.44 | ) | | $ | — | | | $ | — | | | $ | (0.44 | ) | |
See Notes to Financial Highlights
140
| | Net Asset
Value, End of
Year | | Total
Return†† | | Net Assets,
End of Year
(in millions) | | Ratio of
Gross
Expenses
to Average
Net Assets## | | Ratio of Net
Expenses
to Average
Net Assets‡ | | Ratio of Net
Investment
Income/
(Loss) to
Average
Net Assets | | Portfolio
Turnover
Rate | |
Core Bond Fund | |
Investor Class | |
10/31/2013 | | $ | 10.35 | | | | (2.11 | )% | | $ | 13.5 | | | | 1.10 | % | | | .85 | % | | | 1.51 | % | | | 346 | %a | |
10/31/2012 | | $ | 11.04 | | | | 6.74 | % | | $ | 16.3 | | | | 1.08 | % | | | .85 | % | | | 1.69 | % | | | 360 | %a | |
10/31/2011 | | $ | 10.79 | | | | 4.41 | % | | $ | 15.7 | | | | 1.12 | % | | | .85 | % | | | 2.18 | % | | | 379 | %a | |
10/31/2010 | | $ | 10.86 | | | | 10.03 | % | | $ | 18.6 | | | | 1.19 | % | | | .85 | % | | | 2.66 | % | | | 340 | %a | |
10/31/2009 | | $ | 10.19 | | | | 23.10 | % | | $ | 25.0 | | | | 1.40 | % | | | .86 | % | | | 4.39 | % | | | 450 | %a | |
Institutional Class | |
10/31/2013 | | $ | 10.37 | | | | (1.71 | )% | | $ | 165.9 | | | | .61 | % | | | .45 | % | | | 1.90 | % | | | 346 | %a | |
10/31/2012 | | $ | 11.06 | | | | 7.16 | % | | $ | 218.9 | | | | .59 | % | | | .45 | % | | | 2.08 | % | | | 360 | %a | |
10/31/2011 | | $ | 10.81 | | | | 4.82 | % | | $ | 180.8 | | | | .62 | % | | | .45 | % | | | 2.58 | % | | | 379 | %a | |
10/31/2010 | | $ | 10.88 | | | | 10.45 | % | | $ | 120.3 | | | | .70 | % | | | .45 | % | | | 3.02 | % | | | 340 | %a | |
10/31/2009 | | $ | 10.21 | | | | 23.70 | % | | $ | 59.1 | | | | .94 | % | | | .45 | % | | | 4.60 | % | | | 450 | %a | |
Class A | |
10/31/2013 | | $ | 10.34 | | | | (2.03 | )% | | $ | 30.1 | | | | 1.04 | % | | | .85 | % | | | 1.49 | % | | | 346 | %a | |
10/31/2012 | | $ | 11.02 | | | | 6.75 | % | | $ | 47.3 | | | | .99 | % | | | .85 | % | | | 1.61 | % | | | 360 | %a | |
10/31/2011 | | $ | 10.77 | | | | 4.32 | % | | $ | 26.3 | | | | 1.01 | % | | | .85 | % | | | 2.18 | % | | | 379 | %a | |
10/31/2010 | | $ | 10.85 | | | | 10.04 | % | | $ | 23.4 | | | | 1.09 | % | | | .85 | % | | | 2.64 | % | | | 340 | %a | |
10/31/2009 | | $ | 10.18 | | | | 22.96 | % | | $ | 18.5 | | | | 1.36 | % | | | .85 | % | | | 3.81 | % | | | 450 | %a | |
Class C | |
10/31/2013 | | $ | 10.35 | | | | (2.76 | )% | | $ | 5.0 | | | | 1.75 | % | | | 1.60 | % | | | .75 | % | | | 346 | %a | |
10/31/2012 | | $ | 11.03 | | | | 5.95 | % | | $ | 7.0 | | | | 1.74 | % | | | 1.60 | % | | | .86 | % | | | 360 | %a | |
10/31/2011 | | $ | 10.78 | | | | 3.54 | % | | $ | 4.4 | | | | 1.77 | % | | | 1.60 | % | | | 1.43 | % | | | 379 | %a | |
10/31/2010 | | $ | 10.86 | | | | 9.31 | % | | $ | 2.9 | | | | 1.84 | % | | | 1.60 | % | | | 1.83 | % | | | 340 | %a | |
10/31/2009 | | $ | 10.18 | | | | 22.04 | % | | $ | 0.8 | | | | 2.68 | % | | | 1.61 | % | | | 3.39 | % | | | 450 | %a | |
Floating Rate Income Fund | |
Institutional Class | |
10/31/2013 | | $ | 10.29 | | | | 4.96 | % | | $ | 430.7 | | | | .81 | % | | | .70 | % | | | 4.06 | % | | | 78 | % | |
10/31/2012 | | $ | 10.22 | | | | 8.73 | % | | $ | 241.5 | | | | .91 | % | | | .70 | % | | | 5.26 | % | | | 112 | % | |
10/31/2011 | | $ | 9.91 | | | | 3.16 | % | | $ | 181.5 | | | | .95 | % | | | .70 | % | | | 5.39 | % | | | 147 | % | |
Period from 12/30/2009^ to
10/31/2010 | | $ | 10.17 | | | | 6.24 | %** | | $ | 70.5 | | | | 1.87 | %* | | | .70 | %* | | | 5.28 | %* | | | 112 | %** | |
141
Financial Highlights (cont'd)
| | | Net Asset
Value,
Beginning
of Year | | Net
Investment
Income (Loss) | | Net Gains or
Losses on
Securities
(both
realized and
unrealized) | | Total From
Investment
Operations | | Dividends
from Net
Investment
Income | | Distributions
from Net
Realized
Capital Gains | | Tax
Return of
Capital | | Total
Distributions | |
Class A | |
10/31/2013 | | $ | 10.22 | | | $ | 0.38 | @ | | $ | 0.08 | | | $ | 0.46 | | | $ | (0.39 | ) | | $ | — | | | $ | — | | | $ | (0.39 | ) | |
10/31/2012 | | $ | 9.91 | | | $ | 0.49 | @ | | $ | 0.32 | | | $ | 0.81 | | | $ | (0.50 | ) | | $ | — | | | $ | — | | | $ | (0.50 | ) | |
10/31/2011 | | $ | 10.17 | | | $ | 0.50 | @ | | $ | (0.22 | ) | | $ | 0.28 | | | $ | (0.52 | ) | | $ | (0.02 | ) | | $ | — | | | $ | (0.54 | ) | |
Period from 12/29/2009^ to
10/31/2010 | | $ | 10.00 | | | $ | 0.41 | @ | | $ | 0.16 | | | $ | 0.57 | | | $ | (0.40 | ) | | $ | — | | | $ | — | | | $ | (0.40 | ) | |
Class C | |
10/31/2013 | | $ | 10.22 | | | $ | 0.29 | @ | | $ | 0.09 | | | $ | 0.38 | | | $ | (0.31 | ) | | $ | — | | | $ | — | | | $ | (0.31 | ) | |
10/31/2012 | | $ | 9.91 | | | $ | 0.41 | @ | | $ | 0.32 | | | $ | 0.73 | | | $ | (0.42 | ) | | $ | — | | | $ | — | | | $ | (0.42 | ) | |
10/31/2011 | | $ | 10.17 | | | $ | 0.42 | @ | | $ | (0.22 | ) | | $ | 0.20 | | | $ | (0.44 | ) | | $ | (0.02 | ) | | $ | — | | | $ | (0.46 | ) | |
Period from 12/30/2009^ to
10/31/2010 | | $ | 10.00 | | | $ | 0.35 | @ | | $ | 0.18 | | | $ | 0.53 | | | $ | (0.36 | ) | | $ | — | | | $ | — | | | $ | (0.36 | ) | |
High Income Bond Fund | |
Investor Class | |
10/31/2013 | | $ | 9.46 | | | $ | 0.55 | @ | | $ | 0.28 | | | $ | 0.83 | | | $ | (0.55 | ) | | $ | (0.11 | ) | | $ | — | | | $ | (0.66 | ) | |
10/31/2012 | | $ | 9.06 | | | $ | 0.58 | @ | | $ | 0.48 | | | $ | 1.06 | | | $ | (0.58 | ) | | $ | (0.08 | ) | | $ | — | | | $ | (0.66 | ) | |
10/31/2011 | | $ | 9.49 | | | $ | 0.65 | @ | | $ | (0.36 | ) | | $ | 0.29 | | | $ | (0.65 | ) | | $ | (0.07 | ) | | $ | — | | | $ | (0.72 | ) | |
10/31/2010 | | $ | 8.66 | | | $ | 0.76 | @ | | $ | 0.87 | | | $ | 1.63 | | | $ | (0.80 | ) | | $ | — | | | $ | — | | | $ | (0.80 | ) | |
10/31/2009 | | $ | 6.57 | | | $ | 0.74 | @ | | $ | 2.02 | | | $ | 2.76 | | | $ | (0.67 | ) | | $ | — | | | $ | — | | | $ | (0.67 | ) | |
Institutional Class | |
10/31/2013 | | $ | 9.48 | | | $ | 0.57 | @ | | $ | 0.27 | | | $ | 0.84 | | | $ | (0.57 | ) | | $ | (0.11 | ) | | $ | — | | | $ | (0.68 | ) | |
10/31/2012 | | $ | 9.07 | | | $ | 0.59 | @ | | $ | 0.49 | | | $ | 1.08 | | | $ | (0.59 | ) | | $ | (0.08 | ) | | $ | — | | | $ | (0.67 | ) | |
10/31/2011 | | $ | 9.50 | | | $ | 0.64 | @ | | $ | (0.34 | ) | | $ | 0.30 | | | $ | (0.66 | ) | | $ | (0.07 | ) | | $ | — | | | $ | (0.73 | ) | |
10/31/2010 | | $ | 8.68 | | | $ | 0.77 | @ | | $ | 0.87 | | | $ | 1.64 | | | $ | (0.82 | ) | | $ | — | | | $ | — | | | $ | (0.82 | ) | |
Period from 5/27/2009^ to
10/31/2009 | | $ | 7.51 | | | $ | 0.36 | @ | | $ | 1.14 | | | $ | 1.50 | | | $ | (0.33 | ) | | $ | — | | | $ | — | | | $ | (0.33 | ) | |
Class A | |
10/31/2013 | | $ | 9.46 | | | $ | 0.53 | @ | | $ | 0.28 | | | $ | 0.81 | | | $ | (0.53 | ) | | $ | (0.11 | ) | | $ | — | | | $ | (0.64 | ) | |
10/31/2012 | | $ | 9.06 | | | $ | 0.55 | @ | | $ | 0.49 | | | $ | 1.04 | | | $ | (0.56 | ) | | $ | (0.08 | ) | | $ | — | | | $ | (0.64 | ) | |
10/31/2011 | | $ | 9.49 | | | $ | 0.62 | @ | | $ | (0.36 | ) | | $ | 0.26 | | | $ | (0.62 | ) | | $ | (0.07 | ) | | $ | — | | | $ | (0.69 | ) | |
10/31/2010 | | $ | 8.66 | | | $ | 0.70 | @ | | $ | 0.91 | | | $ | 1.61 | | | $ | (0.78 | ) | | $ | — | | | $ | — | | | $ | (0.78 | ) | |
Period from 5/27/2009^ to
10/31/2009 | | $ | 7.51 | | | $ | 0.33 | @ | | $ | 1.13 | | | $ | 1.46 | | | $ | (0.31 | ) | | $ | — | | | $ | — | | | $ | (0.31 | ) | |
See Notes to Financial Highlights
142
| | Net Asset
Value, End of
Year | | Total
Return†† | | Net Assets,
End of Year
(in millions) | | Ratio of
Gross
Expenses
to Average
Net Assets## | | Ratio of Net
Expenses
to Average
Net Assets‡ | | Ratio of Net
Investment
Income/
(Loss) to
Average
Net Assets | | Portfolio
Turnover
Rate | |
Class A | |
10/31/2013 | | $ | 10.29 | | | | 4.57 | % | | $ | 74.7 | | | | 1.18 | % | | | 1.07 | % | | | 3.66 | % | | | 78 | % | |
10/31/2012 | | $ | 10.22 | | | | 8.33 | % | | $ | 36.8 | | | | 1.29 | % | | | 1.07 | % | | | 4.87 | % | | | 112 | % | |
10/31/2011 | | $ | 9.91 | | | | 2.77 | % | | $ | 22.7 | | | | 1.34 | % | | | 1.07 | % | | | 5.00 | % | | | 147 | % | |
Period from 12/29/2009^ to
10/31/2010 | | $ | 10.17 | | | | 5.85 | %** | | $ | 12.9 | | | | 2.21 | %* | | | 1.07 | %* | | | 4.87 | %* | | | 112 | %** | |
Class C | |
10/31/2013 | | $ | 10.29 | | | | 3.78 | % | | $ | 51.8 | | | | 1.93 | % | | | 1.82 | % | | | 2.85 | % | | | 78 | % | |
10/31/2012 | | $ | 10.22 | | | | 7.51 | % | | $ | 14.4 | | | | 2.05 | % | | | 1.82 | % | | | 4.10 | % | | | 112 | % | |
10/31/2011 | | $ | 9.91 | | | | 1.98 | % | | $ | 7.8 | | | | 2.06 | % | | | 1.82 | % | | | 4.22 | % | | | 147 | % | |
Period from 12/30/2009^ to
10/31/2010 | | $ | 10.17 | | | | 5.39 | %** | | $ | 0.7 | | | | 3.39 | %* | | | 1.82 | %* | | | 4.23 | %* | | | 112 | %** | |
High Income Bond Fund | |
Investor Class | |
10/31/2013 | | $ | 9.63 | | | | 9.10 | % | | $ | 311.5 | | | | .84 | % | | | .84 | % | | | 5.80 | % | | | 80 | % | |
10/31/2012 | | $ | 9.46 | | | | 12.17 | % | | $ | 340.5 | | | | .84 | % | | | .84 | % | | | 6.29 | % | | | 82 | % | |
10/31/2011 | | $ | 9.06 | | | | 3.09 | % | | $ | 309.2 | | | | .86 | % | | | .86 | % | | | 6.92 | % | | | 88 | % | |
10/31/2010 | | $ | 9.49 | | | | 19.71 | % | | $ | 363.6 | | | | .96 | % | | | .96 | %§ | | | 8.50 | % | | | 144 | % | |
10/31/2009 | | $ | 8.66 | | | | 44.38 | % | | $ | 422.2 | | | | 1.04 | % | | | 1.00 | % | | | 9.90 | % | | | 167 | % | |
Institutional Class | |
10/31/2013 | | $ | 9.64 | | | | 9.14 | % | | $ | 1,949.6 | | | | .69 | % | | | .69 | % | | | 5.94 | % | | | 80 | % | |
10/31/2012 | | $ | 9.48 | | | | 12.44 | % | | $ | 2,306.1 | | | | .70 | % | | | .70 | % | | | 6.42 | % | | | 82 | % | |
10/31/2011 | | $ | 9.07 | | | | 3.23 | % | | $ | 1,514.7 | | | | .73 | % | | | .73 | %§ | | | 6.93 | % | | | 88 | % | |
10/31/2010 | | $ | 9.50 | | | | 19.81 | % | | $ | 266.2 | | | | .77 | % | | | .75 | % | | | 8.55 | % | | | 144 | % | |
Period from 5/27/2009^ to
10/31/2009 | | $ | 8.68 | | | | 20.23 | %** | | $ | 86.6 | | | | .91 | %* | | | .75 | %* | | | 9.86 | %* | | | 167 | %^^ | |
Class A | |
10/31/2013 | | $ | 9.63 | | | | 8.83 | % | | $ | 395.6 | | | | 1.09 | % | | | 1.09 | % | | | 5.56 | % | | | 80 | % | |
10/31/2012 | | $ | 9.46 | | | | 11.90 | % | | $ | 505.3 | | | | 1.08 | % | | | 1.08 | % | | | 6.01 | % | | | 82 | % | |
10/31/2011 | | $ | 9.06 | | | | 2.83 | % | | $ | 341.6 | | | | 1.12 | % | | | 1.12 | %§ | | | 6.64 | % | | | 88 | % | |
10/31/2010 | | $ | 9.49 | | | | 19.52 | % | | $ | 277.5 | | | | 1.16 | % | | | 1.12 | % | | | 7.75 | % | | | 144 | % | |
Period from 5/27/2009^ to
10/31/2009 | | $ | 8.66 | | | | 19.69 | %** | | $ | 24.3 | | | | 1.27 | %* | | | 1.12 | %* | | | 9.19 | %* | | | 167 | %^^ | |
143
Financial Highlights (cont'd)
| | | Net Asset
Value,
Beginning
of Year | | Net
Investment
Income (Loss) | | Net Gains or
Losses on
Securities
(both
realized and
unrealized) | | Total From
Investment
Operations | | Dividends
from Net
Investment
Income | | Distributions
from Net
Realized
Capital Gains | | Tax
Return of
Capital | | Total
Distributions | |
Class C | |
10/31/2013 | | $ | 9.48 | | | $ | 0.46 | @ | | $ | 0.27 | | | $ | 0.73 | | | $ | (0.46 | ) | | $ | (0.11 | ) | | $ | — | | | $ | (0.57 | ) | |
10/31/2012 | | $ | 9.07 | | | $ | 0.48 | @ | | $ | 0.50 | | | $ | 0.98 | | | $ | (0.49 | ) | | $ | (0.08 | ) | | $ | — | | | $ | (0.57 | ) | |
10/31/2011 | | $ | 9.50 | | | $ | 0.54 | @ | | $ | (0.35 | ) | | $ | 0.19 | | | $ | (0.55 | ) | | $ | (0.07 | ) | | $ | — | | | $ | (0.62 | ) | |
10/31/2010 | | $ | 8.67 | | | $ | 0.64 | @ | | $ | 0.91 | | | $ | 1.55 | | | $ | (0.72 | ) | | $ | — | | | $ | — | | | $ | (0.72 | ) | |
Period from 5/27/2009^ to
10/31/2009 | | $ | 7.51 | | | $ | 0.30 | @ | | $ | 1.14 | | | $ | 1.44 | | | $ | (0.28 | ) | | $ | — | | | $ | — | | | $ | (0.28 | ) | |
Class R3 | |
10/31/2013 | | $ | 9.47 | | | $ | 0.50 | @ | | $ | 0.28 | | | $ | 0.78 | | | $ | (0.51 | ) | | $ | (0.11 | ) | | $ | — | | | $ | (0.62 | ) | |
10/31/2012 | | $ | 9.06 | | | $ | 0.53 | @ | | $ | 0.49 | | | $ | 1.02 | | | $ | (0.53 | ) | | $ | (0.08 | ) | | $ | — | | | $ | (0.61 | ) | |
10/31/2011 | | $ | 9.49 | | | $ | 0.59 | @ | | $ | (0.35 | ) | | $ | 0.24 | | | $ | (0.60 | ) | | $ | (0.07 | ) | | $ | — | | | $ | (0.67 | ) | |
10/31/2010 | | $ | 8.67 | | | $ | 0.69 | @ | | $ | 0.89 | | | $ | 1.58 | | | $ | (0.76 | ) | | $ | — | | | $ | — | | | $ | (0.76 | ) | |
Period from 5/27/2009^ to
10/31/2009 | | $ | 7.51 | | | $ | 0.33 | @ | | $ | 1.13 | | | $ | 1.46 | | | $ | (0.30 | ) | | $ | — | | | $ | — | | | $ | (0.30 | ) | |
Class R6 | |
Period from 3/15/2013^ to
10/31/2013 | | $ | 9.59 | | | $ | 0.36 | @ | | $ | 0.05 | | | $ | 0.41 | | | $ | (0.36 | ) | | $ | — | | | $ | — | | | $ | (0.36 | ) | |
Municipal Intermediate Bond Fund | |
Investor Class | |
10/31/2013 | | $ | 12.07 | | | $ | 0.26 | @ | | $ | (0.41 | ) | | $ | (0.15 | ) | | $ | (0.26 | ) | | $ | (0.08 | ) | | $ | — | | | $ | (0.34 | ) | |
10/31/2012 | | $ | 11.58 | | | $ | 0.30 | @ | | $ | 0.56 | | | $ | 0.86 | | | $ | (0.29 | ) | | $ | (0.08 | ) | | $ | — | | | $ | (0.37 | ) | |
10/31/2011 | | $ | 11.59 | | | $ | 0.35 | @ | | $ | 0.04 | | | $ | 0.39 | | | $ | (0.35 | ) | | $ | (0.05 | ) | | $ | — | | | $ | (0.40 | ) | |
10/31/2010 | | $ | 11.22 | | | $ | 0.36 | @ | | $ | 0.37 | | | $ | 0.73 | | | $ | (0.36 | ) | | $ | — | | | $ | — | | | $ | (0.36 | ) | |
10/31/2009 | | $ | 10.60 | | | $ | 0.35 | @ | | $ | 0.64 | | | $ | 0.99 | | | $ | (0.37 | ) | | $ | — | | | $ | — | | | $ | (0.37 | ) | |
Institutional Class | |
10/31/2013 | | $ | 12.06 | | | $ | 0.27 | @ | | $ | (0.41 | ) | | $ | (0.14 | ) | | $ | (0.27 | ) | | $ | (0.08 | ) | | $ | — | | | $ | (0.35 | ) | |
10/31/2012 | | $ | 11.57 | | | $ | 0.30 | @ | | $ | 0.58 | | | $ | 0.88 | | | $ | (0.31 | ) | | $ | (0.08 | ) | | $ | — | | | $ | (0.39 | ) | |
10/31/2011 | | $ | 11.59 | | | $ | 0.36 | @ | | $ | 0.04 | | | $ | 0.40 | | | $ | (0.37 | ) | | $ | (0.05 | ) | | $ | — | | | $ | (0.42 | ) | |
Period from 6/21/2010^ to
10/31/2010 | | $ | 11.36 | | | $ | 0.14 | @ | | $ | 0.23 | | | $ | 0.37 | | | $ | (0.14 | ) | | $ | — | | | $ | — | | | $ | (0.14 | ) | |
Class A | |
10/31/2013 | | $ | 12.06 | | | $ | 0.23 | @ | | $ | (0.41 | ) | | $ | (0.18 | ) | | $ | (0.23 | ) | | $ | (0.08 | ) | | $ | — | | | $ | (0.31 | ) | |
10/31/2012 | | $ | 11.58 | | | $ | 0.25 | @ | | $ | 0.57 | | | $ | 0.82 | | | $ | (0.26 | ) | | $ | (0.08 | ) | | $ | — | | | $ | (0.34 | ) | |
10/31/2011 | | $ | 11.60 | | | $ | 0.33 | @ | | $ | 0.03 | | | $ | 0.36 | | | $ | (0.33 | ) | | $ | (0.05 | ) | | $ | — | | | $ | (0.38 | ) | |
Period from 6/21/2010^ to
10/31/2010 | | $ | 11.36 | | | $ | 0.12 | @ | | $ | 0.24 | | | $ | 0.36 | | | $ | (0.12 | ) | | $ | — | | | $ | — | | | $ | (0.12 | ) | |
See Notes to Financial Highlights
144
| | Net Asset
Value, End of
Year | | Total
Return†† | | Net Assets,
End of Year
(in millions) | | Ratio of
Gross
Expenses
to Average
Net Assets## | | Ratio of Net
Expenses
to Average
Net Assets‡ | | Ratio of Net
Investment
Income/
(Loss) to
Average
Net Assets | | Portfolio
Turnover
Rate | |
Class C | |
10/31/2013 | | $ | 9.64 | | | | 7.91 | % | | $ | 60.0 | | | | 1.83 | % | | | 1.83 | % | | | 4.82 | % | | | 80 | % | |
10/31/2012 | | $ | 9.48 | | | | 11.15 | % | | $ | 72.3 | | | | 1.85 | % | | | 1.85 | %§ | | | 5.25 | % | | | 82 | % | |
10/31/2011 | | $ | 9.07 | | | | 2.06 | % | | $ | 46.9 | | | | 1.87 | % | | | 1.87 | % | | | 5.82 | % | | | 88 | % | |
10/31/2010 | | $ | 9.50 | | | | 18.60 | % | | $ | 25.5 | | | | 1.93 | % | | | 1.87 | % | | | 7.05 | % | | | 144 | % | |
Period from 5/27/2009^ to
10/31/2009 | | $ | 8.67 | | | | 19.43 | %** | | $ | 2.6 | | | | 2.02 | %* | | | 1.87 | %* | | | 8.26 | %* | | | 167 | %^^ | |
Class R3 | |
10/31/2013 | | $ | 9.63 | | | | 8.46 | % | | $ | 10.9 | | | | 1.32 | % | | | 1.32 | % | | | 5.30 | % | | | 80 | % | |
10/31/2012 | | $ | 9.47 | | | | 11.72 | % | | $ | 9.7 | | | | 1.35 | % | | | 1.35 | %§ | | | 5.73 | % | | | 82 | % | |
10/31/2011 | | $ | 9.06 | | | | 2.58 | % | | $ | 3.0 | | | | 1.37 | % | | | 1.37 | %§ | | | 6.32 | % | | | 88 | % | |
10/31/2010 | | $ | 9.49 | | | | 19.08 | % | | $ | 0.5 | | | | 1.72 | % | | | 1.37 | % | | | 7.60 | % | | | 144 | % | |
Period from 5/27/2009^ to
10/31/2009 | | $ | 8.67 | | | | 19.76 | %** | | $ | 0.1 | | | | 5.53 | %* | | | 1.37 | %* | | | 9.29 | %* | | | 167 | %^^ | |
Class R6 | |
Period from 3/15/2013^ to
10/31/2013 | | $ | 9.64 | | | | 4.34 | %** | | $ | 535.0 | | | | .62 | %* | | | .62 | %* | | | 5.95 | %* | | | 80 | %^^ | |
Municipal Intermediate Bond Fund | |
Investor Class | |
10/31/2013 | | $ | 11.58 | | | | (1.30 | )% | | $ | 18.8 | | | | .83 | % | | | .65 | % | | | 2.18 | % | | | 57 | % | |
10/31/2012 | | $ | 12.07 | | | | 7.49 | % | | $ | 20.8 | | | | .88 | % | | | .65 | % | | | 2.55 | % | | | 54 | % | |
10/31/2011 | | $ | 11.58 | | | | 3.53 | % | | $ | 116.4 | | | | .98 | % | | | .65 | % | | | 3.10 | % | | | 79 | % | |
10/31/2010 | | $ | 11.59 | | | | 6.56 | % | | $ | 118.8 | | | | 1.01 | % | | | .65 | % | | | 3.12 | % | | | 101 | % | |
10/31/2009 | | $ | 11.22 | | | | 9.42 | % | | $ | 92.3 | | | | 1.12 | % | | | .65 | % | | | 3.15 | % | | | 146 | % | |
Institutional Class | |
10/31/2013 | | $ | 11.57 | | | | (1.15 | )% | | $ | 132.0 | | | | .67 | % | | | .50 | % | | | 2.34 | % | | | 57 | % | |
10/31/2012 | | $ | 12.06 | | | | 7.65 | % | | $ | 124.7 | | | | .70 | % | | | .50 | % | | | 2.53 | % | | | 54 | % | |
10/31/2011 | | $ | 11.57 | | | | 3.60 | % | | $ | 6.8 | | | | .77 | % | | | .50 | % | | | 3.19 | % | | | 79 | % | |
Period from 6/21/2010^ to
10/31/2010 | | $ | 11.59 | | | | 3.25 | %** | | $ | 0.1 | | | | 26.10 | %* | | | .50 | %* | | | 3.30 | %* | | | 101 | %^^ | |
Class A | |
10/31/2013 | | $ | 11.57 | | | | (1.52 | )% | | $ | 5.0 | | | | 1.06 | % | | | .87 | % | | | 1.96 | % | | | 57 | % | |
10/31/2012 | | $ | 12.06 | | | | 7.16 | % | | $ | 3.4 | | | | 1.15 | % | | | .87 | % | | | 2.11 | % | | | 54 | % | |
10/31/2011 | | $ | 11.58 | | | | 3.22 | % | | $ | 0.2 | | | | 1.87 | % | | | .87 | % | | | 2.91 | % | | | 79 | % | |
Period from 6/21/2010^ to
10/31/2010 | | $ | 11.60 | | | | 3.20 | %** | | $ | 0.2 | | | | 23.88 | %* | | | .87 | %* | | | 3.00 | %* | | | 101 | %^^ | |
145
Financial Highlights (cont'd)
| | | Net Asset
Value,
Beginning
of Year | | Net
Investment
Income (Loss) | | Net Gains or
Losses on
Securities
(both
realized and
unrealized) | | Total From
Investment
Operations | | Dividends
from Net
Investment
Income | | Distributions
from Net
Realized
Capital Gains | | Tax
Return of
Capital | | Total
Distributions | |
Class C | |
10/31/2013 | | $ | 12.06 | | | $ | 0.14 | @ | | $ | (0.41 | ) | | $ | (0.27 | ) | | $ | (0.14 | ) | | $ | (0.08 | ) | | $ | — | | | $ | (0.22 | ) | |
10/31/2012 | | $ | 11.58 | | | $ | 0.17 | @ | | $ | 0.56 | | | $ | 0.73 | | | $ | (0.17 | ) | | $ | (0.08 | ) | | $ | — | | | $ | (0.25 | ) | |
10/31/2011 | | $ | 11.59 | | | $ | 0.23 | @ | | $ | 0.05 | | | $ | 0.28 | | | $ | (0.24 | ) | | $ | (0.05 | ) | | $ | — | | | $ | (0.29 | ) | |
Period from 6/21/2010^ to
10/31/2010 | | $ | 11.36 | | | $ | 0.09 | @ | | $ | 0.23 | | | $ | 0.32 | | | $ | (0.09 | ) | | $ | — | | | $ | — | | | $ | (0.09 | ) | |
New York Municipal Income Fund | |
| Institutional ClassØØ | |
Period from 3/1/2013ß to
10/31/2013 | | $ | 17.80 | | | $ | 0.31 | @ | | $ | (0.66 | ) | | $ | (0.35 | ) | | $ | (0.31 | ) | | $ | — | | | $ | — | | | $ | (0.31 | ) | |
2/28/2013 | | $ | 17.75 | | | $ | 0.31 | | | $ | 0.05 | | | $ | 0.36 | | | $ | (0.31 | ) | | $ | — | | | $ | — | | | $ | (0.31 | ) | |
2/29/2012 | | $ | 17.40 | | | $ | 0.35 | | | $ | 0.35 | | | $ | 0.70 | | | $ | (0.35 | ) | | $ | — | | | $ | — | | | $ | (0.35 | ) | |
2/28/2011 | | $ | 17.60 | | | $ | 0.37 | | | $ | (0.17 | ) | | $ | 0.20 | | | $ | (0.37 | ) | | $ | (0.03 | ) | | $ | — | | | $ | (0.40 | ) | |
2/28/2010 | | $ | 17.34 | | | $ | 0.40 | | | $ | 0.28 | | | $ | 0.68 | | | $ | (0.40 | ) | | $ | (0.02 | ) | | $ | — | | | $ | (0.42 | ) | |
2/28/2009 | | $ | 16.97 | | | $ | 0.47 | | | $ | 0.37 | | | $ | 0.84 | | | $ | (0.47 | ) | | $ | — | | | $ | — | | | $ | (0.47 | ) | |
Short Duration Bond Fund | |
Investor Class | |
10/31/2013 | | $ | 8.02 | | | $ | 0.05 | @ | | $ | 0.03 | | | $ | 0.08 | | | $ | (0.12 | ) | | $ | — | | | $ | — | | | $ | (0.12 | ) | |
10/31/2012 | | $ | 7.88 | | | $ | 0.12 | @ | | $ | 0.20 | | | $ | 0.32 | | | $ | (0.18 | ) | | $ | — | | | $ | — | | | $ | (0.18 | ) | |
10/31/2011 | | $ | 8.09 | | | $ | 0.15 | @ | | $ | (0.13 | ) | | $ | 0.02 | | | $ | (0.23 | ) | | $ | — | | | $ | — | | | $ | (0.23 | ) | |
10/31/2010 | | $ | 7.83 | | | $ | 0.17 | @ | | $ | 0.38 | | | $ | 0.55 | | | $ | (0.29 | ) | | $ | — | | | $ | — | | | $ | (0.29 | ) | |
10/31/2009 | | $ | 7.91 | | | $ | 0.35 | @ | | $ | (0.05 | ) | | $ | 0.30 | | | $ | (0.38 | ) | | $ | — | | | $ | — | | | $ | (0.38 | ) | |
Trust Class | |
10/31/2013 | | $ | 7.65 | | | $ | 0.04 | @ | | $ | 0.02 | | | $ | 0.06 | | | $ | (0.11 | ) | | $ | — | | | $ | — | | | $ | (0.11 | ) | |
10/31/2012 | | $ | 7.51 | | | $ | 0.11 | @ | | $ | 0.19 | | | $ | 0.30 | | | $ | (0.16 | ) | | $ | — | | | $ | — | | | $ | (0.16 | ) | |
10/31/2011 | | $ | 7.71 | | | $ | 0.14 | @ | | $ | (0.13 | ) | | $ | 0.01 | | | $ | (0.21 | ) | | $ | — | | | $ | — | | | $ | (0.21 | ) | |
10/31/2010 | | $ | 7.46 | | | $ | 0.16 | @ | | $ | 0.35 | | | $ | 0.51 | | | $ | (0.26 | ) | | $ | — | | | $ | — | | | $ | (0.26 | ) | |
10/31/2009 | | $ | 7.54 | | | $ | 0.33 | @ | | $ | (0.06 | ) | | $ | 0.27 | | | $ | (0.35 | ) | | $ | — | | | $ | — | | | $ | (0.35 | ) | |
Institutional Class | |
10/31/2013 | | $ | 8.02 | | | $ | 0.07 | @ | | $ | 0.02 | | | $ | 0.09 | | | $ | (0.14 | ) | | $ | — | | | $ | — | | | $ | (0.14 | ) | |
10/31/2012 | | $ | 7.88 | | | $ | 0.13 | @ | | $ | 0.20 | | | $ | 0.33 | | | $ | (0.19 | ) | | $ | — | | | $ | — | | | $ | (0.19 | ) | |
10/31/2011 | | $ | 8.09 | | | $ | 0.17 | @ | | $ | (0.14 | ) | | $ | 0.03 | | | $ | (0.24 | ) | | $ | — | | | $ | — | | | $ | (0.24 | ) | |
Period from 6/21/2010^ to
10/31/2010 | | $ | 7.97 | | | $ | 0.06 | @ | | $ | 0.16 | | | $ | 0.22 | | | $ | (0.10 | ) | | $ | — | | | $ | — | | | $ | (0.10 | ) | |
See Notes to Financial Highlights
146
| | | Net Asset
Value, End of
Year | | Total
Return†† | | Net Assets,
End of Year
(in millions) | | Ratio of
Gross
Expenses
to Average
Net Assets## | | Ratio of Net
Expenses
to Average
Net Assets‡ | | Ratio of Net
Investment
Income/
(Loss) to
Average
Net Assets | | Portfolio
Turnover
Rate | |
Class C | |
10/31/2013 | | $ | 11.57 | | | | (2.25 | )% | | $ | 1.5 | | | | 1.86 | % | | | 1.62 | % | | | 1.21 | % | | | 57 | % | |
10/31/2012 | | $ | 12.06 | | | | 6.37 | % | | $ | 1.5 | | | | 1.95 | % | | | 1.62 | % | | | 1.44 | % | | | 54 | % | |
10/31/2011 | | $ | 11.58 | | | | 2.54 | % | | $ | 0.6 | | | | 2.39 | % | | | 1.62 | % | | | 1.99 | % | | | 79 | % | |
Period from 6/21/2010^ to
10/31/2010 | | $ | 11.59 | | | | 2.83 | %** | | $ | 0.1 | | | | 22.28 | %* | | | 1.62 | %* | | | 2.14 | %* | | | 101 | %^^ | |
New York Municipal Income Fund | |
| Institutional ClassØØ | |
Period from 3/1/2013ß to
10/31/2013 | | $ | 17.14 | | | | (1.98 | )%** | | $ | 68.3 | | | | .86 | %* | | | .86 | %* | | | 2.64 | %* | | | 52 | %** | |
2/28/2013 | | $ | 17.80 | | | | 2.01 | % | | $ | 36.2 | | | | 1.06 | % | | | 1.06 | % | | | 1.71 | % | | | 28 | % | |
2/29/2012 | | $ | 17.75 | | | | 4.05 | % | | $ | 37.6 | | | | 1.07 | % | | | 1.07 | % | | | 1.99 | % | | | 19 | % | |
2/28/2011 | | $ | 17.40 | | | | 1.08 | % | | $ | 38.2 | | | | 1.16 | % | | | 1.16 | % | | | 2.07 | % | | | 25 | % | |
2/28/2010 | | $ | 17.60 | | | | 3.97 | % | | $ | 40.0 | | | | 1.41 | % | | | 1.41 | % | | | 2.28 | % | | | 18 | % | |
2/28/2009 | | $ | 17.34 | | | | 5.01 | % | | $ | 40.3 | | | | 1.31 | % | | | 1.31 | % | | | 2.74 | % | | | 75 | % | |
Short Duration Bond Fund | |
Investor Class | |
10/31/2013 | | $ | 7.98 | | | | 1.03 | % | | $ | 32.8 | | | | 1.19 | % | | | .70 | % | | | .67 | % | | | 86 | % | |
10/31/2012 | | $ | 8.02 | | | | 4.09 | % | | $ | 38.8 | | | | 1.17 | % | | | .70 | % | | | 1.50 | % | | | 74 | % | |
10/31/2011 | | $ | 7.88 | | | | .20 | % | | $ | 44.1 | | | | 1.25 | % | | | .71 | % | | | 1.93 | % | | | 84 | % | |
10/31/2010 | | $ | 8.09 | | | | 7.08 | % | | $ | 56.1 | | | | 1.27 | % | | | .70 | % | | | 2.19 | % | | | 69 | % | |
10/31/2009 | | $ | 7.83 | | | | 4.18 | % | | $ | 52.6 | | | | 1.18 | % | | | .70 | % | | | 4.73 | % | | | 48 | % | |
Trust Class | |
10/31/2013 | | $ | 7.60 | | | | .77 | % | | $ | 4.0 | | | | 1.35 | % | | | .80 | % | | | .57 | % | | | 86 | % | |
10/31/2012 | | $ | 7.65 | | | | 4.08 | % | | $ | 5.6 | | | | 1.34 | % | | | .80 | % | | | 1.40 | % | | | 74 | % | |
10/31/2011 | | $ | 7.51 | | | | .10 | % | | $ | 6.4 | | | | 1.41 | % | | | .80 | % | | | 1.83 | % | | | 84 | % | |
10/31/2010 | | $ | 7.71 | | | | 7.01 | % | | $ | 9.4 | | | | 1.48 | % | | | .80 | % | | | 2.09 | % | | | 69 | % | |
10/31/2009 | | $ | 7.46 | | | | 4.02 | % | | $ | 8.1 | | | | 1.58 | % | | | .80 | % | | | 4.62 | % | | | 48 | % | |
Institutional Class | |
10/31/2013 | | $ | 7.97 | | | | 1.11 | % | | $ | 18.1 | | | | .98 | % | | | .50 | % | | | .87 | % | | | 86 | % | |
10/31/2012 | | $ | 8.02 | | | | 4.30 | % | | $ | 22.2 | | | | .98 | % | | | .51 | % | | | 1.65 | % | | | 74 | % | |
10/31/2011 | | $ | 7.88 | | | | .40 | % | | $ | 17.9 | | | | 1.03 | % | | | .51 | % | | | 2.09 | % | | | 84 | % | |
Period from 6/21/2010^ to
10/31/2010 | | $ | 8.09 | | | | 2.73 | %** | | $ | 0.0 | | | | 33.53 | %* | | | .50 | %* | | | 2.16 | %* | | | 69 | %^^ | |
147
Financial Highlights (cont'd)
| | | Net Asset
Value,
Beginning
of Year | | Net
Investment
Income (Loss) | | Net Gains or
Losses on
Securities
(both
realized and
unrealized) | | Total From
Investment
Operations | | Dividends
from Net
Investment
Income | | Distributions
from Net
Realized
Capital Gains | | Tax
Return of
Capital | | Total
Distributions | |
Class A | |
10/31/2013 | | $ | 7.64 | | | $ | 0.04 | @ | | $ | 0.02 | | | $ | 0.06 | | | $ | (0.10 | ) | | $ | — | | | $ | — | | | $ | (0.10 | ) | |
10/31/2012 | | $ | 7.51 | | | $ | 0.08 | @ | | $ | 0.21 | | | $ | 0.29 | | | $ | (0.16 | ) | | $ | — | | | $ | — | | | $ | (0.16 | ) | |
10/31/2011 | | $ | 7.72 | | | $ | 0.13 | @ | | $ | (0.14 | ) | | $ | (0.01 | ) | | $ | (0.20 | ) | | $ | — | | | $ | — | | | $ | (0.20 | ) | |
Period from 6/21/2010^ to
10/31/2010 | | $ | 7.60 | | | $ | 0.05 | @ | | $ | 0.15 | | | $ | 0.20 | | | $ | (0.08 | ) | | $ | — | | | $ | — | | | $ | (0.08 | ) | |
Class C | |
10/31/2013 | | $ | 7.65 | | | $ | (0.02 | )@ | | $ | 0.03 | | | $ | 0.01 | | | $ | (0.05 | ) | | $ | — | | | $ | — | | | $ | (0.05 | ) | |
10/31/2012 | | $ | 7.51 | | | $ | 0.04 | @ | | $ | 0.20 | | | $ | 0.24 | | | $ | (0.10 | ) | | $ | — | | | $ | — | | | $ | (0.10 | ) | |
10/31/2011 | | $ | 7.72 | | | $ | 0.07 | @ | | $ | (0.13 | ) | | $ | (0.06 | ) | | $ | (0.15 | ) | | $ | — | | | $ | — | | | $ | (0.15 | ) | |
Period from 6/21/2010^ to
10/31/2010 | | $ | 7.60 | | | $ | 0.03 | @ | | $ | 0.15 | | | $ | 0.18 | | | $ | (0.06 | ) | | $ | — | | | $ | — | | | $ | (0.06 | ) | |
Short Duration High Income Fund | |
Institutional Class | |
10/31/2013 | | $ | 10.01 | | | $ | 0.42 | @ | | $ | 0.22 | | | $ | 0.64 | | | $ | (0.44 | ) | | $ | (0.03 | ) | | $ | — | | | $ | (0.47 | ) | |
Period from 9/28/2012^ to
10/31/2012 | | $ | 10.00 | | | $ | 0.03 | @ | | $ | 0.01 | | | $ | 0.04 | | | $ | (0.03 | ) | | $ | — | | | $ | — | | | $ | (0.03 | ) | |
Class A | |
10/31/2013 | | $ | 10.01 | | | $ | 0.37 | @ | | $ | 0.24 | | | $ | 0.61 | | | $ | (0.40 | ) | | $ | (0.03 | ) | | $ | — | | | $ | (0.43 | ) | |
Period from 9/28/2012^ to
10/31/2012 | | $ | 10.00 | | | $ | 0.03 | @ | | $ | 0.01 | | | $ | 0.04 | | | $ | (0.03 | ) | | $ | — | | | $ | — | | | $ | (0.03 | ) | |
Class C | |
10/31/2013 | | $ | 10.01 | | | $ | 0.30 | @ | | $ | 0.24 | | | $ | 0.54 | | | $ | (0.33 | ) | | $ | (0.03 | ) | | $ | — | | | $ | (0.36 | ) | |
Period from 9/28/2012^ to
10/31/2012 | | $ | 10.00 | | | $ | 0.02 | @ | | $ | 0.01 | | | $ | 0.03 | | | $ | (0.02 | ) | | $ | — | | | $ | — | | | $ | (0.02 | ) | |
Strategic Income Fund | |
Trust Class | |
10/31/2013 | | $ | 11.67 | | | $ | 0.36 | @ | | $ | (0.23 | ) | | $ | 0.13 | | | $ | (0.39 | ) | | $ | (0.23 | ) | | $ | — | | | $ | (0.62 | ) | |
10/31/2012 | | $ | 10.98 | | | $ | 0.37 | @ | | $ | 0.85 | | | $ | 1.22 | | | $ | (0.41 | ) | | $ | (0.12 | ) | | $ | — | | | $ | (0.53 | ) | |
10/31/2011 | | $ | 11.23 | | | $ | 0.42 | @ | | $ | (0.04 | ) | | $ | 0.38 | | | $ | (0.44 | ) | | $ | (0.19 | ) | | $ | — | | | $ | (0.63 | ) | |
10/31/2010 | | $ | 10.58 | | | $ | 0.49 | @ | | $ | 0.81 | | | $ | 1.30 | | | $ | (0.52 | ) | | $ | (0.13 | ) | | $ | — | | | $ | (0.65 | ) | |
10/31/2009 | | $ | 8.77 | | | $ | 0.43 | @ | | $ | 1.78 | | | $ | 2.21 | | | $ | (0.40 | ) | | $ | — | | | $ | — | | | $ | (0.40 | ) | |
See Notes to Financial Highlights
148
| | | Net Asset
Value, End of
Year | | Total
Return†† | | Net Assets,
End of Year
(in millions) | | Ratio of
Gross
Expenses
to Average
Net Assets## | | Ratio of Net
Expenses
to Average
Net Assets‡ | | Ratio of Net
Investment
Income/
(Loss) to
Average
Net Assets | | Portfolio
Turnover
Rate | |
Class A | |
10/31/2013 | | $ | 7.60 | | | | .83 | % | | $ | 6.3 | | | | 1.37 | % | | | .87 | % | | | .50 | % | | | 86 | % | |
10/31/2012 | | $ | 7.64 | | | | 3.87 | % | | $ | 2.3 | | | | 1.41 | % | | | .88 | % | | | 1.07 | % | | | 74 | % | |
10/31/2011 | | $ | 7.51 | | | | (.10 | )% | | $ | 0.2 | | | | 1.50 | % | | | .87 | % | | | 1.75 | % | | | 84 | % | |
Period from 6/21/2010^ to
10/31/2010 | | $ | 7.72 | | | | 2.67 | %** | | $ | 0.1 | | | | 26.42 | %* | | | .87 | %* | | | 1.83 | %* | | | 69 | %^^ | |
Class C | |
10/31/2013 | | $ | 7.61 | | | | .08 | % | | $ | 2.2 | | | | 2.13 | % | | | 1.62 | % | | | (.24 | )% | | | 86 | % | |
10/31/2012 | | $ | 7.65 | | | | 3.23 | % | | $ | 1.7 | | | | 2.12 | % | | | 1.63 | % | | | .51 | % | | | 74 | % | |
10/31/2011 | | $ | 7.51 | | | | (.84 | )% | | $ | 1.0 | | | | 2.17 | % | | | 1.62 | % | | | .97 | % | | | 84 | % | |
Period from 6/21/2010^ to
10/31/2010 | | $ | 7.72 | | | | 2.39 | %** | | $ | 0.0 | | | | 34.63 | %* | | | 1.62 | %* | | | 1.04 | %* | | | 69 | %^^ | |
Short Duration High Income Fund | |
Institutional Class | |
10/31/2013 | | $ | 10.18 | | | | 6.51 | % | | $ | 102.9 | | | | 1.18 | % | | | .75 | % | | | 4.16 | % | | | 53 | % | |
Period from 9/28/2012^ to
10/31/2012 | | $ | 10.01 | | | | .38 | %** | | $ | 25.0 | | | | 4.24 | %*Ø | | | .71 | %*Ø | | | 3.24 | %*Ø | | | 35 | %** | |
Class A | |
10/31/2013 | | $ | 10.19 | | | | 6.21 | % | | $ | 1.2 | | | | 1.74 | % | | | 1.12 | % | | | 3.73 | % | | | 53 | % | |
Period from 9/28/2012^ to
10/31/2012 | | $ | 10.01 | | | | .36 | %** | | $ | 0.1 | | | | 4.79 | %*Ø | | | 1.02 | %*Ø | | | 3.18 | %*Ø | | | 35 | %** | |
Class C | |
10/31/2013 | | $ | 10.19 | | | | 5.43 | % | | $ | 0.2 | | | | 3.80 | % | | | 1.87 | % | | | 3.03 | % | | | 53 | % | |
Period from 9/28/2012^ to
10/31/2012 | | $ | 10.01 | | | | .30 | %** | | $ | 0.0 | | | | 5.89 | %*Ø | | | 1.60 | %*Ø | | | 2.13 | %*Ø | | | 35 | %** | |
Strategic Income Fund | |
Trust Class | |
10/31/2013 | | $ | 11.18 | | | | 1.07 | % | | $ | 43.8 | | | | 1.18 | % | | | 1.10 | % | | | 3.22 | % | | | 384 | %a | |
10/31/2012 | | $ | 11.67 | | | | 11.46 | % | | $ | 26.6 | | | | 1.20 | % | | | 1.10 | % | | | 3.28 | % | | | 329 | %a | |
10/31/2011 | | $ | 10.98 | | | | 3.60 | % | | $ | 19.4 | | | | 1.26 | % | | | 1.10 | % | | | 3.86 | % | | | 265 | %a | |
10/31/2010 | | $ | 11.23 | | | | 12.78 | % | | $ | 16.3 | | | | 1.36 | % | | | 1.10 | % | | | 4.56 | % | | | 238 | %a | |
10/31/2009 | | $ | 10.58 | | | | 25.66 | % | | $ | 6.7 | | | | 3.00 | % | | | 1.10 | % | | | 4.32 | % | | | 322 | %a | |
149
Financial Highlights (cont'd)
| | Net Asset
Value,
Beginning
of Year | | Net
Investment
Income (Loss) | | Net Gains or
Losses on
Securities
(both
realized and
unrealized) | | Total From
Investment
Operations | | Dividends
from Net
Investment
Income | | Distributions
from Net
Realized
Capital Gains | | Tax
Return of
Capital | | Total
Distributions | |
Institutional Class | |
10/31/2013 | | $ | 11.67 | | | $ | 0.40 | @ | | $ | (0.22 | ) | | $ | 0.18 | | | $ | (0.43 | ) | | $ | (0.23 | ) | | $ | — | | | $ | (0.66 | ) | |
10/31/2012 | | $ | 10.98 | | | $ | 0.41 | @ | | $ | 0.85 | | | $ | 1.26 | | | $ | (0.45 | ) | | $ | (0.12 | ) | | $ | — | | | $ | (0.57 | ) | |
10/31/2011 | | $ | 11.23 | | | $ | 0.46 | @ | | $ | (0.04 | ) | | $ | 0.42 | | | $ | (0.48 | ) | | $ | (0.19 | ) | | $ | — | | | $ | (0.67 | ) | |
10/31/2010 | | $ | 10.58 | | | $ | 0.53 | @ | | $ | 0.81 | | | $ | 1.34 | | | $ | (0.56 | ) | | $ | (0.13 | ) | | $ | — | | | $ | (0.69 | ) | |
10/31/2009 | | $ | 8.78 | | | $ | 0.45 | @ | | $ | 1.79 | | | $ | 2.24 | | | $ | (0.44 | ) | | $ | — | | | $ | — | | | $ | (0.44 | ) | |
Class A | |
10/31/2013 | | $ | 11.68 | | | $ | 0.36 | @ | | $ | (0.24 | ) | | $ | 0.12 | | | $ | (0.38 | ) | | $ | (0.23 | ) | | $ | — | | | $ | (0.61 | ) | |
10/31/2012 | | $ | 10.99 | | | $ | 0.36 | @ | | $ | 0.86 | | | $ | 1.22 | | | $ | (0.41 | ) | | $ | (0.12 | ) | | $ | — | | | $ | (0.53 | ) | |
10/31/2011 | | $ | 11.24 | | | $ | 0.42 | @ | | $ | (0.04 | ) | | $ | 0.38 | | | $ | (0.44 | ) | | $ | (0.19 | ) | | $ | — | | | $ | (0.63 | ) | |
10/31/2010 | | $ | 10.59 | | | $ | 0.48 | @ | | $ | 0.81 | | | $ | 1.29 | | | $ | (0.51 | ) | | $ | (0.13 | ) | | $ | — | | | $ | (0.64 | ) | |
10/31/2009 | | $ | 8.78 | | | $ | 0.43 | @ | | $ | 1.77 | | | $ | 2.20 | | | $ | (0.39 | ) | | $ | — | | | $ | — | | | $ | (0.39 | ) | |
Class C | |
10/31/2013 | | $ | 11.67 | | | $ | 0.28 | @ | | $ | (0.23 | ) | | $ | 0.05 | | | $ | (0.30 | ) | | $ | (0.23 | ) | | $ | — | | | $ | (0.53 | ) | |
10/31/2012 | | $ | 10.98 | | | $ | 0.28 | @ | | $ | 0.86 | | | $ | 1.14 | | | $ | (0.33 | ) | | $ | (0.12 | ) | | $ | — | | | $ | (0.45 | ) | |
10/31/2011 | | $ | 11.23 | | | $ | 0.34 | @ | | $ | (0.04 | ) | | $ | 0.30 | | | $ | (0.36 | ) | | $ | (0.19 | ) | | $ | — | | | $ | (0.55 | ) | |
10/31/2010 | | $ | 10.58 | | | $ | 0.41 | @ | | $ | 0.81 | | | $ | 1.22 | | | $ | (0.44 | ) | | $ | (0.13 | ) | | $ | — | | | $ | (0.57 | ) | |
10/31/2009 | | $ | 8.78 | | | $ | 0.36 | @ | | $ | 1.76 | | | $ | 2.12 | | | $ | (0.32 | ) | | $ | — | | | $ | — | | | $ | (0.32 | ) | |
Class R6 | |
Period from 3/15/2013^ to
10/31/2013 | | $ | 11.44 | | | $ | 0.26 | @ | | $ | (0.25 | ) | | $ | 0.01 | | | $ | (0.27 | ) | | $ | — | | | $ | — | | | $ | (0.27 | ) | |
See Notes to Financial Highlights
150
| | | Capital
Contributions | | Net Asset
Value, End of
Year | | Total
Return†† | | Net Assets,
End of Year
(in millions) | | Ratio of
Gross
Expenses
to Average
Net Assets## | | Ratio of Net
Expenses
to Average
Net Assets‡ | | Ratio of Net
Investment
Income/
(Loss) to
Average
Net Assets | | Portfolio
Turnover
Rate | |
Institutional Class | |
10/31/2013 | | $ | — | | | $ | 11.19 | | | | 1.52 | % | | $ | 739.1 | | | | .81 | % | | | .75 | % | | | 3.57 | % | | | 384 | %a | |
10/31/2012 | | $ | — | | | $ | 11.67 | | | | 11.85 | % | | $ | 526.3 | | | | .84 | % | | | .75 | % | | | 3.61 | % | | | 329 | %a | |
10/31/2011 | | $ | — | | | $ | 10.98 | | | | 3.96 | % | | $ | 210.8 | | | | .90 | % | | | .75 | % | | | 4.20 | % | | | 265 | %a | |
10/31/2010 | | $ | — | | | $ | 11.23 | | | | 13.17 | % | | $ | 118.8 | | | | .96 | % | | | .75 | % | | | 4.88 | % | | | 238 | %a | |
10/31/2009 | | $ | — | | | $ | 10.58 | | | | 25.97 | % | | $ | 18.7 | | | | 2.47 | % | | | .75 | % | | | 4.59 | % | | | 322 | %a | |
Class A | |
10/31/2013 | | $ | — | | | $ | 11.19 | | | | 1.02 | % | | $ | 311.8 | | | | 1.21 | % | | | 1.15 | % | | | 3.14 | % | | | 384 | %a | |
10/31/2012 | | $ | — | | | $ | 11.68 | | | | 11.39 | % | | $ | 309.1 | | | | 1.24 | % | | | 1.15 | % | | | 3.22 | % | | | 329 | %a | |
10/31/2011 | | $ | — | | | $ | 10.99 | | | | 3.55 | % | | $ | 196.0 | | | | 1.31 | % | | | 1.15 | % | | | 3.79 | % | | | 265 | %a | |
10/31/2010 | | $ | — | | | $ | 11.24 | | | | 12.72 | % | | $ | 142.9 | | | | 1.37 | % | | | 1.15 | % | | | 4.44 | % | | | 238 | %a | |
10/31/2009 | | $ | — | | | $ | 10.59 | | | | 25.51 | % | | $ | 68.2 | | | | 1.93 | % | | | 1.15 | % | | | 4.25 | % | | | 322 | %a | |
Class C | |
10/31/2013 | | $ | — | | | $ | 11.19 | | | | .40 | % | | $ | 191.7 | | | | 1.94 | % | | | 1.85 | % | | | 2.45 | % | | | 384 | %a | |
10/31/2012 | | $ | — | | | $ | 11.67 | | | | 10.62 | % | | $ | 184.8 | | | | 1.97 | % | | | 1.85 | % | | | 2.52 | % | | | 329 | %a | |
10/31/2011 | | $ | — | | | $ | 10.98 | | | | 2.83 | % | | $ | 120.9 | | | | 2.03 | % | | | 1.85 | % | | | 3.09 | % | | | 265 | %a | |
10/31/2010 | | $ | — | | | $ | 11.23 | | | | 11.93 | % | | $ | 93.3 | | | | 2.10 | % | | | 1.85 | % | | | 3.75 | % | | | 238 | %a | |
10/31/2009 | | $ | — | | | $ | 10.58 | | | | 24.47 | % | | $ | 36.2 | | | | 2.55 | % | | | 1.85 | % | | | 3.53 | % | | | 322 | %a | |
Class R6 | |
Period from 3/15/2013^ to
10/31/2013 | | $ | — | | | $ | 11.18 | | | | .09 | %** | | $ | 17.5 | | | | .77 | %* | | | .68 | %* | | | 3.70 | %* | | | 384 | %^^a | |
151
Notes to Financial Highlights Income Funds
†† Total return based on per share NAV reflects the effects of changes in NAV on the performance of each Fund during each fiscal period. Returns assume income dividends and other distributions, if any, were reinvested, but do not reflect the effect of sales charges. Results represent past performance and do not indicate future results. Current returns may be lower or higher than the performance data quoted. Investment returns and principal may fluctuate and shares when redeemed may be worth more or less than original cost. Total return would have been lower if Management had not reimbursed and/or waived certain expenses. Total return would have been higher if Management had not recouped previously reimbursed expenses. The class action proceeds listed in Note A-4 had no impact on total return.
## Represents the annualized ratios of net expenses to average daily net assets if Management had not reimbursed certain expenses and/or waived a portion of the investment management fee.
‡ Prior to January 1, 2013, each Fund had an expense offset arrangement in connection with its custodian contract. The impact of expense reductions related to expense offset arrangements, if any, was less than .01%.
§ After repayment of expenses previously reimbursed and/or fees previously waived by Management, as applicable. Had the Fund not made such repayments, the annualized ratios of net expenses to average daily net assets would have been:
| | | Year Ended October 31, | |
| | | 2013 | | 2012 | | 2011 | | 2010 | |
High Income Bond Fund Investor Class | | | — | | | | — | | | | — | | | | .93 | % | |
High Income Bond Fund Institutional Class | | | — | | | | — | | | | .72 | % | | | — | | |
High Income Bond Fund Class A | | | — | | | | — | | | | 1.11 | % | | | — | | |
High Income Bond Fund Class C | | | — | | | | 1.84 | % | | | — | | | | — | | |
High Income Bond Fund Class R3 | | | — | | | | 1.33 | % | | | 1.36 | % | | | — | | |
^ The date investment operations commenced.
* Annualized.
** Not annualized.
@ Calculated based on the average number of shares outstanding during each fiscal period.
^^ Portfolio turnover is calculated at the Fund level. Percentage indicated was calculated for the year ended October 31, 2009 for High Income (Institutional Class, Class A, Class C and Class R3), for the year ended October 31, 2010 for Municipal Intermediate Bond and Short Duration (Institutional Class, Class A and Class C), and for the year ended October 31, 2013 for High Income and Strategic Income (Class R6).
a The portfolio turnover rates not including mortgage dollar roll transactions were 139%, 162%, 115%, 112% and 238% for the years ended October 31, 2013, 2012, 2011, 2010 and 2009 for Core Bond and 161%, 157%, 122%, 152%, and 182% for the years ended October 31, 2013, 2012, 2011, 2010 and 2009 for Strategic Income, respectively.
ø Organization expense, which is a non-recurring expense, is included in these ratios on a non-annualized basis.
øø Effective after the close of business on March 8, 2013, Management succeeded Glickenhaus & Co., as the Fund's investment manager. The financial highlights for the period ended October 31, 2013 include the income and expenses attributable to the Empire Builder Tax Free Bond Fund prior to March 11, 2013, and the income and expenses of New York Municipal Income, thereafter.
ß Start of fiscal year due to change in fiscal year end. See Note G in Notes to Financial Statements for more information.
152
Report of Independent Registered Public Accounting Firm
To the Board of Trustees and Shareholders of:
Neuberger Berman High Income Bond Fund
Neuberger Berman Municipal Intermediate Bond Fund
Neuberger Berman Short Duration Bond Fund
Neuberger Berman Strategic Income Fund
We have audited the accompanying statements of assets and liabilities of Neuberger Berman High Income Bond Fund, Neuberger Berman Municipal Intermediate Bond Fund, Neuberger Berman Short Duration Bond Fund and Neuberger Berman Strategic Income Fund, four of the series constituting Neuberger Berman Income Funds (the "Funds"), including the schedules of investments, as of October 31, 2013, and the related statements of operations for the year then ended, the statements of changes in net assets for each of the two years in the period then ended, and the financial highlights for each of the periods indicated therein. These financial statements and financial highlights are the responsibility of the Funds' management. Our responsibility is to express an opinion on these financial statements and financial highlights based on our audits.
We conducted our audits in accordance with the standards of the Public Company Accounting Oversight Board (United States). Those standards require that we plan and perform the audit to obtain reasonable assurance about whether the financial statements and financial highlights are free of material misstatement. We were not engaged to perform an audit of the Funds' internal control over financial reporting. Our audits included consideration of internal control over financial reporting as a basis for designing audit procedures that are appropriate in the circumstances, but not for the purpose of expressing an opinion on the effectiveness of the Funds' internal control over financial reporting. Accordingly, we express no such opinion. An audit also includes examining, on a test basis, evidence supporting the amounts and disclosures in the financial statements and financial highlights, assessing the accounting principles used and significant estimates made by management, and evaluating the overall financial statement presentation. Our procedures included confirmation of securities owned as of October 31, 2013, by correspondence with the custodian and others or by other appropriate auditing procedures where replies from others were not received. We believe that our audits provide a reasonable basis for our opinion.
In our opinion, the financial statements and financial highlights referred to above present fairly, in all material respects, the financial position of Neuberger Berman High Income Bond Fund, Neuberger Berman Municipal Intermediate Bond Fund, Neuberger Berman Short Duration Bond Fund and Neuberger Berman Strategic Income Fund as of October 31, 2013, the results of their operations for the year ended, the changes in their net assets for each of the two years in the period then ended, and the financial highlights for each of the periods indicated therein, in conformity with U.S. generally accepted accounting principles.

Boston, Massachusetts
December 20, 2013
153
Report of Independent Registered Public Accounting Firm
To the Board of Trustees and Shareholders
Neuberger Berman Income Funds
We have audited the accompanying statements of assets and liabilities of the Neuberger Berman Core Bond Fund, the Neuberger Berman Floating Rate Income Fund, the Neuberger Berman New York Municipal Income Fund, and the Neuberger Berman Short Duration High Income Fund, each a series of the Neuberger Berman Income Funds (the "Trust"), including the schedules of investments, as of October 31, 2013, and the related statements of operations for the year then ended (with respect to Neuberger Berman New York Municipal Income Fund, for the period March 1, 2013 to October 31, 2013 and for the year ended February 28, 2013), the statements of changes in net assets for each of the two years in the period then ended (with respect to Neuberger Berman New York Municipal Income Fund, for the period March 1, 2013 to October 31, 2013, and for the year ended February 28, 2013, and with respect to Neuberger Berman Short Duration High Income Fund, for the year then ended and for the period September 28, 2012 to October 31, 2012), and the financial highlights for each of the five years in the period then ended (with respect to Neuberger Berman Floating Rate Income Fund, for each of the three years in the period then ended and for the period December 29, 2009 to October 31, 2010, with respect to Neuberger Berman New York Municipal Income Fund, for the period March 1, 2013 to October 31, 2013 and for the year ended February 28, 2013, and with respect to Neuberger Berman Short Duration High Income Fund, for the year then ended and for the period September 28, 2012 to October 31, 2012). These financial statements and financial highlights are the responsibility of the Trust's management. Our responsibility is to express an opinion on these financial statements and financial highlights based on our audits. With respect to Neuberger Berman New York Municipal Income Fund, the statement of changes in net assets for the year ended February 29, 2012 and the financial highlights for each of the four years in the period then ended were audited by other auditors, whose report dated April 16, 2012, expressed an unqualified opinion on such statements and financial highlights.
We conducted our audits in accordance with the standards of the Public Company Accounting Oversight Board (United States). Those standards require that we plan and perform the audits to obtain reasonable assurance about whether the financial statements and financial highlights are free of material misstatement. The Trust is not required to have, nor were we engaged to perform, an audit of its internal control over financial reporting. Our audits included consideration of internal control over financial reporting as a basis for designing audit procedures that are appropriate in the circumstances, but not for the purpose of expressing an opinion on the effectiveness of the Trust's internal control over financial reporting. Accordingly, we express no such opinion. An audit also includes examining, on a test basis, evidence supporting the amounts and disclosures in the financial statements, assessing the accounting principles used and significant estimates made by management, as well as evaluating the overall financial statement presentation. Our procedures included confirmation of securities owned as of October 31, 2013, by correspondence with the custodian and others or by other appropriate auditing procedures where replies from others were not received. We believe that our audits provide a reasonable basis for our opinion.
In our opinion, the financial statements and financial highlights referred to above present fairly, in all material respects, the financial position of the above mentioned series of the Neuberger Berman Income Funds, as of October 31, 2013, and the results of their operations, the changes in their net assets, and the financial highlights for the periods indicated above, in conformity with accounting principles generally accepted in the United States of America.

Philadelphia, Pennsylvania
December 17, 2013
154
Investment Manager, Administrator and Distributor
Neuberger Berman Management LLC
605 Third Avenue, 2nd Floor
New York, NY 10158-0180
800.877.9700 or 212.476.8800
Intermediary Client Services 800.366.6264
Sub-Adviser
Neuberger Berman Fixed Income LLC
190 South LaSalle Street
Chicago, IL 60603
Custodian and Shareholder Servicing Agent
State Street Bank and Trust Company
2 Avenue de Lafayette
Boston, MA 02111
For Investor Class Shareholders Address correspondence to:
Neuberger Berman Funds
Boston Service Center
P.O. Box 8403
Boston, MA 02266-8403
800.877.9700 or 212.476.8800
For Class A, Class C, Class R3 and Class R6 Shareholders:
Please contact your investment provider
For Trust Class and Institutional Class Shareholders Address correspondence to:
Neuberger Berman Management LLC
605 Third Avenue, Mail Drop 2-7
New York, NY 10158-0180
Attn: Intermediary Client Services 800.366.6264
Legal Counsel
K&L Gates LLP
1601 K Street, NW
Washington, DC 20006
Independent Registered Public Accounting Firms
Ernst & Young LLP
200 Clarendon Street
Boston, MA 02116
Tait, Weller & Baker LLP
1818 Market Street
Suite 2400
Philadelphia, PA 19103
155
The following tables set forth information concerning the trustees ("Trustees") and officers ("Officers") of each of the Funds. All persons named as Trustees and Officers also serve in similar capacities for other funds administered or managed by Management and NBFI. Each Fund's Statement of Additional Information includes additional information about the Trustees as of the date of the Fund's most recent public offering documents and is available upon request, without charge, by calling (800) 877-9700.
Information about the Board of Trustees
Name, (Year of Birth),
and Address(1) | | Position(s)
and Length of
Time Served(2) | | Principal Occupation(s)(3) | | Number of
Funds in Fund
Complex
Overseen
by Trustee | | Other Directorships
Held Outside Fund
Complex by Trustee(3) | |
Independent Trustees | |
Faith Colish (1935) | | Trustee since 2000 | | Counsel, Carter Ledyard & Milburn LLP (law firm) since October 2002; formerly, Attorney-at-Law and President, Faith Colish, A Professional Corporation, 1980 to 2002. | | | 54 | | | Formerly, Director, 1997 to 2003, and Advisory Director, 2003 to 2006, ABA Retirement Funds (formerly, American Bar Retirement Association) (not-for-profit membership corporation). | |
Martha C. Goss (1949) | | Trustee since 2007 | | President, Woodhill Enterprises Inc./Chase Hollow Associates LLC (personal investment vehicle), since 2006; formerly, Consultant, Resources Global Professionals (temporary staffing), 2002 to 2006. | | | 54 | | | Director, American Water (water utility), since 2003; Director, Allianz Life of New York (insurance), since 2005; Director, Berger Group Holdings, Inc. (engineering consulting firm), since 2013; Director, Financial Women's Association of New York (not-for-profit association), since 2003; Trustee Emerita, Brown University, since 1998; Director, Museum of American Finance (not-for-profit), since 2013; formerly, Non-Executive Chair and Director, Channel Reinsurance (financial guaranty reinsurance), 2006 to 2010; formerly, Director, Ocwen Financial Corporation (mortgage servicing), 2005 to 2010; formerly, Director, Claire's Stores, Inc. (retailer), 2005 to 2007; formerly, Director, Parsons Brinckerhoff Inc. (engineering consulting firm), 2007 to 2010; formerly Director, Bank Leumi (commercial bank), 2005 to 2007; formerly Advisory Board Member, Attensity (software developer), 2005 to 2007. | |
156
Name, (Year of Birth),
and Address(1) | | Position(s)
and Length of
Time Served(2) | | Principal Occupation(s)(3) | | Number of
Funds in Fund
Complex
Overseen
by Trustee | | Other Directorships
Held Outside Fund
Complex by Trustee(3) | |
Michael M. Knetter (1960) | | Trustee since 2007 | | President and Chief Executive Officer, University of Wisconsin Foundation, since October 2010; formerly, Dean, School of Business, University of Wisconsin — Madison; formerly, Professor of International Economics and Associate Dean, Amos Tuck School of Business — Dartmouth College, 1998 to 2002. | | | 54 | | | Director, American Family Insurance (a mutual company, not publicly traded), since March 2009; formerly, Trustee, Northwestern Mutual Series Fund, Inc., 2007 to 2010; formerly, Director, Wausau Paper, 2005 to 2011; formerly, Director, Great Wolf Resorts, 2004 to 2009. | |
Howard A. Mileaf (1937) | | Trustee since 2000 | | Retired; formerly, Vice President and General Counsel, WHX Corporation (holding company), 1993 to 2001. | | | 54 | | | Formerly, Director, Webfinancial Corporation (holding company), 2002 to 2008; formerly, Director, WHX Corporation (holding company), 2002 to 2005; formerly, Director, State Theatre of New Jersey (not-for-profit theatre), 2000 to 2005. | |
George W. Morriss (1947) | | Trustee since 2007 | | Adjunct Professor, Columbia University School of International and Public Affairs, since October 2012; formerly, Executive Vice President and Chief Financial Officer, People's Bank, Connecticut (a financial services company), 1991 to 2001. | | | 54 | | | Director and Treasurer, National Association of Corporate Directors, Connecticut Chapter, since 2013; Trustee, Steben Alternative Investment Funds, Steben Select Multi-Strategy Fund, and Steben Select Multi-Strategy Master Fund, since 2013; formerly, Manager, Larch Lane Multi-Strategy Fund complex (which consisted of three funds), 2006 to 2011; formerly, Member, NASDAQ Issuers' Affairs Committee, 1995 to 2003. | |
157
Name, (Year of Birth),
and Address(1) | | Position(s)
and Length of
Time Served(2) | | Principal Occupation(s)(3) | | Number of
Funds in Fund
Complex
Overseen
by Trustee | | Other Directorships
Held Outside Fund
Complex by Trustee(3) | |
Tom D. Seip (1950) | | Trustee since 2000; Chairman of the Board since 2008; Lead Independent Trustee from 2006 to 2008 | | General Partner, Ridgefield Farm LLC (a private investment vehicle); formerly, President and CEO, Westaff, Inc. (temporary staffing), May 2001 to January 2002; formerly, Senior Executive, The Charles Schwab Corporation, 1983 to 1998, including Chief Executive Officer, Charles Schwab Investment Management, Inc.; Trustee, Schwab Family of Funds and Schwab Investments, 1997 to 1998; and Executive Vice President-Retail Brokerage, Charles Schwab & Co., Inc., 1994 to 1997. | | | 54 | | | Director, H&R Block, Inc. (financial services company), since May 2001; Chairman, Governance and Nominating Committee, H&R Block, Inc., since 2011; formerly, Chairman, Compensation Committee, H&R Block, Inc., 2006 to 2010; formerly, Director, Forward Management, Inc. (asset management company), 1999 to 2006. | |
Candace L. Straight (1947) | | Trustee since 1993 | | Private investor and consultant specializing in the insurance industry; formerly, Advisory Director, Securitas Capital LLC (a global private equity investment firm dedicated to making investments in the insurance sector), 1998 to December 2003. | | | 54 | | | Public Member, Board of Governors and Board of Trustees, Rutgers University, since 2011; Director, Montpelier Re Holdings Ltd. (reinsurance company), since 2006; formerly, Director, National Atlantic Holdings Corporation (property and casualty insurance company), 2004 to 2008; formerly, Director, The Proformance Insurance Company (property and casualty insurance company), 2004 to 2008; formerly, Director, Providence Washington Insurance Company (property and casualty insurance company), 1998 to 2006; formerly, Director, Summit Global Partners (insurance brokerage firm), 2000 to 2005. | |
Peter P. Trapp (1944) | | Trustee since 2000 | | Retired; formerly, Regional Manager for Mid-Southern Region, Ford Motor Credit Company, September 1997 to 2007; formerly, President, Ford Life Insurance Company, April 1995 to August 1997. | | | 54 | | | None. | |
158
Name, (Year of Birth),
and Address(1) | | Position(s)
and Length of
Time Served(2) | | Principal Occupation(s)(3) | | Number of
Funds in Fund
Complex
Overseen
by Trustee | | Other Directorships
Held Outside Fund
Complex by Trustee(3) | |
Trustees who are "Interested Persons" | |
Joseph V. Amato* (1962) | | Trustee since 2009 | | President and Director, Neuberger Group LLC, since 2009; President and Chief Executive Officer, Neuberger and Neuberger Berman Holdings LLC (including its predecessor, Neuberger Berman Inc.), since 2007; Chief Investment Officer (Equities) and Managing Director, Management, since 2009; Managing Director, NBFI, since 2007; Board member of NBFI since 2006; formerly, Global Head of Asset Management of Lehman Brothers Holdings Inc.'s ("LBHI") Investment Management Division, 2006 to 2009; formerly, member of LBHI's Investment Management Division's Executive Management Committee, 2006 to 2009; formerly, Managing Director, Lehman Brothers Inc. ("LBI"), 2006 to 2008; formerly, Chief Recruiting and Development Officer, LBI, 2005 to 2006; formerly, Global Head of LBI's Equity Sales and a Member of its Equities Division Executive Committee, 2003 to 2005. | | | 54 | | | Member of Board of Advisors, McDonough School of Business, Georgetown University, since 2001; Member of New York City Board of Advisors, Teach for America, since 2005; Trustee, Montclair Kimberley Academy (private school), since 2007; Member of Board of Regents, Georgetown University, since 2013. | |
Robert Conti* (1956) | | Chief Executive Officer, President and Trustee since 2008; prior thereto, Executive Vice President in 2008 and Vice President from 2000 to 2008 | | Managing Director, Neuberger, since 2007; Managing Director, NBFI, since 2009; formerly, Senior Vice President, Neuberger, 2003 to 2006; formerly, Vice President, Neuberger, 1999 to 2003; President and Chief Executive Officer, Management, since 2008; formerly, Senior Vice President, Management, 2000 to 2008. | | | 54 | | | Director, Staten Island Mental Health Society, since 1994; formerly, Chairman of the Board, Staten Island Mental Health Society, 2008 to 2011. | |
159
(1) The business address of each listed person is 605 Third Avenue, New York, New York 10158.
(2) Pursuant to the Trust's Trust Instrument, each of these Trustees shall hold office for life or until his or her successor is elected or the Trust terminates; except that (a) any Trustee may resign by delivering a written resignation; (b) any Trustee may be removed with or without cause at any time by a written instrument signed by at least two-thirds of the other Trustees; (c) any Trustee who requests to be retired, or who has become unable to serve, may be retired by a written instrument signed by a majority of the other Trustees; and (d) any Trustee may be removed at any shareholder meeting by a vote of at least two-thirds of the outstanding shares.
(3) Except as otherwise indicated, each individual has held the positions shown for at least the last five years.
* Indicates a Trustee who is an "interested person" within the meaning of the 1940 Act. Mr. Amato and Mr. Conti are interested persons of the Trust because each is an officer of Management and/or its affiliates.
160
Information about the Officers of the Trust
Name, (Year of Birth),
and Address(1) | | Position(s)
and Length of
Time Served(2) | | Principal Occupation(s)(3) | |
Andrew B. Allard (1961) | | Chief Legal Officer since 2013 (only for purposes of sections 307 and 406 of the Sarbanes-Oxley Act of 2002) and Anti-Money Laundering Compliance Officer since 2002 | | General Counsel and Senior Vice President, Management, since 2013; Senior Vice President, Neuberger, since 2006 and Employee since 1999; Deputy General Counsel, Neuberger, since 2004; formerly, Vice President, Neuberger, 2000 to 2005; formerly, Employee, Management, 1994 to 1999; Chief Legal Officer since 2013 (only for purposes of sections 307 and 406 of the Sarbanes-Oxley Act of 2002) ten registered investment companies for which Management acts as investment manager and administrator (ten since 2013); Anti-Money Laundering Compliance Officer, ten registered investment companies for which Management acts as investment manager and administrator (six since 2002, one since 2003, one since 2005, one since 2006 and one since 2013). | |
Claudia A. Brandon (1956) | | Executive Vice President since 2008 and Secretary since 1985 | | Senior Vice President, Neuberger, since 2007 and Employee since 1999; Senior Vice President, Management, since 2008 and Assistant Secretary since 2004; formerly, Vice President, Neuberger, 2002 to 2006; formerly, Vice President-Mutual Fund Board Relations, Management, 2000 to 2008; formerly, Vice President, Management, 1986 to 1999 and Employee 1984 to 1999; Executive Vice President, ten registered investment companies for which Management acts as investment manager and administrator (nine since 2008 and one since 2013); Secretary, ten registered investment companies for which Management acts as investment manager and administrator (three since 1985, three since 2002, one since 2003, one since 2005, one since 2006 and one since 2013). | |
Agnes Diaz (1971) | | Vice President since 2013 | | Vice President, ten registered investment companies for which Management acts as investment manager and administrator (ten since 2013). | |
Anthony DiBernardo (1979) | | Assistant Treasurer since 2011 | | Vice President, Neuberger, since 2009; Employee, Management, since 2003; Assistant Treasurer, ten registered investment companies for which Management acts as investment manager and administrator (nine since 2011 and one since 2013). | |
Sheila R. James (1965) | | Assistant Secretary since 2002 | | Vice President, Neuberger, since 2008 and Employee since 1999; formerly, Assistant Vice President, Neuberger, 2007; formerly, Employee, Management, 1991 to 1999; Assistant Secretary, ten registered investment companies for which Management acts as investment manager and administrator (six since 2002, one since 2003, one since 2005, one since 2006 and one since 2013). | |
Brian Kerrane (1969) | | Vice President since 2008 | | Senior Vice President, Neuberger, since 2008 and Employee since 1991; formerly, Vice President, Neuberger, 2002 to 2008; Vice President, ten registered investment companies for which Management acts as investment manager and administrator (nine since 2008 and one since 2013). | |
161
Name, (Year of Birth),
and Address(1) | | Position(s)
and Length of
Time Served(2) | | Principal Occupation(s)(3) | |
Kevin Lyons (1955) | | Assistant Secretary since 2003 | | Assistant Vice President, Neuberger, since 2008 and Employee since 1999; formerly, Employee, Management, 1993 to 1999; Assistant Secretary, ten registered investment companies for which Management acts as investment manager and administrator (seven since 2003, one since 2005, one since 2006 and one since 2013). | |
Owen F. McEntee, Jr. (1961) | | Vice President since 2008 | | Vice President, Neuberger, since 2006; Employee, Management, since 1992; Vice President, ten registered investment companies for which Management acts as investment manager and administrator (nine since 2008 and one since 2013). | |
John M. McGovern (1970) | | Treasurer and Principal Financial and Accounting Officer since 2005 | | Senior Vice President, Neuberger, since 2007; formerly, Vice President, Neuberger, 2004 to 2006; Employee, Management, since 1993; Treasurer and Principal Financial and Accounting Officer, ten registered investment companies for which Management acts as investment manager and administrator (eight since 2005, one since 2006 and one since 2013); formerly, Assistant Treasurer, eight registered investment companies for which Management acts as investment manager and administrator, 2002 to 2005. | |
Frank Rosato (1971) | | Assistant Treasurer since 2005 | | Vice President, Neuberger, since 2006; Employee, Management, since 1995; Assistant Treasurer, ten registered investment companies for which Management acts as investment manager and administrator (eight since 2005, one since 2006 and one since 2013). | |
Neil S. Siegel (1967) | | Vice President since 2008 | | Managing Director, Management, since 2008; Managing Director, Neuberger, since 2006; Managing Director, NBFI, since 2011; formerly, Senior Vice President, Neuberger, 2004 to 2006; Vice President, ten registered investment companies for which Management acts as investment manager and administrator (nine since 2008 and one since 2013). | |
Chamaine Williams (1971) | | Chief Compliance Officer since 2005 | | Senior Vice President, Neuberger, since 2007; Chief Compliance Officer, Management, since 2006; Chief Compliance Officer, ten registered investment companies for which Management acts as investment manager and administrator (eight since 2005, one since 2006 and one since 2013); formerly, Senior Vice President, LBI, 2007 to 2008; formerly, Vice President, LBI, 2003 to 2006; formerly, Chief Compliance Officer, Lehman Brothers Asset Management Inc., 2003 to 2007; formerly, Chief Compliance Officer, Lehman Brothers Alternative Investment Management LLC, 2003 to 2007. | |
(1) The business address of each listed person is 605 Third Avenue, New York, New York 10158.
(2) Pursuant to the By-Laws of the Trust, each officer elected by the Trustees shall hold office until his or her successor shall have been elected and qualified or until his or her earlier death, inability to serve, or resignation. Officers serve at the pleasure of the Trustees and may be removed at any time with or without cause.
(3) Except as otherwise indicated, each individual has held the positions shown for at least the last five years.
162
Proxy Voting Policies and Procedures
A description of the policies and procedures that the Trust uses to determine how to vote proxies relating to portfolio securities is available, without charge, by calling 800-877-9700 (toll-free) and on the website of the Securities and Exchange Commission at www.sec.gov. Information regarding how the Trust voted proxies relating to portfolio securities during the most recent 12-month period ended June 30 is also available, without charge, by calling 800-877-9700 (toll-free), on the website of the Securities and Exchange Commission at www.sec.gov, and on Management's website at www.nb.com.
Quarterly Portfolio Schedule
The Trust files a complete schedule of portfolio holdings for each Fund with the Securities and Exchange Commission for the first and third quarters of each fiscal year on Form N-Q. The Trust's Forms N-Q are available on the Securities and Exchange Commission's website at www.sec.gov and may be reviewed and copied at the Securities and Exchange Commission's Public Reference Room in Washington, DC. Information on the operation of the Public Reference Room may be obtained by calling 800-SEC-0330. The information on Form N-Q is available upon request, without charge, by calling 800-877-9700 (toll-free).
Notice to Shareholders
Under most state tax laws, mutual fund dividends which are derived from direct investments in U.S. Government obligations are not taxable, as long as a Fund meets certain requirements. Some states require that a Fund must provide shareholders with a written notice, within 60 days of the close of a Fund's taxable year, designating the portion of the dividends which represents interest which those states consider to have been earned on U.S. Government obligations. The chart below shows the percentage of income derived from such investments for the twelve months ended October 31, 2013. This information should not be used to complete your tax returns.
| | U.S. Treasury
Obligations | | Other Direct
U.S. Government
Obligations | | Other Indirect
U.S. Government
Obligations | | Repurchase
Agreements | |
Core Bond | | | 5.7 | % | | | 0.7 | % | | | 11.7 | % | | | 0.0 | % | |
Floating Rate Income | | | 0.0 | | | | 0.0 | | | | 0.0 | | | | 0.0 | | |
High Income | | | 0.0 | | | | 0.0 | | | | 0.0 | | | | 0.0 | | |
Short Duration | | | 7.7 | | | | 0.0 | | | | 10.0 | | | | 0.0 | | |
Short Duration High Income | | | 0.0 | | | | 0.0 | | | | 0.0 | | | | 0.0 | | |
Strategic Income | | | 3.0 | | | | 0.3 | | | | 2.1 | | | | 0.0 | | |
For the fiscal period ended October 31, 2013, the percentages representing the portion of distributions from net investment income that is exempt from federal tax, other than alternative minimum tax, are as follows:
Municipal Intermediate Bond | | | 100.00 | % | |
New York Municipal Income | | | 99.92 | % | |
For the fiscal period ended October 31, 2013, the maximum amount of ordinary income distribution that is designated as qualified interest income, pursuant to the American Jobs Creation Act of 2004, is as follows:
| | Ordinary
Income | | Short-Term
Capital Gains | |
Core Bond | | $ | 6,397,475 | | | $ | 4,522,199 | | |
High Income | | | 207,809,421 | | | | 34,131,006 | | |
Strategic Income | | | 46,556,026 | | | | 18,331,313 | | |
163
In January 2014, you will receive information to be used in filing your 2013 tax returns, which will include a notice of the exact tax status of all dividends paid to you by each Fund during calendar year 2013. Please consult your own tax advisor for details as to how this information should be reflected on your tax returns.
Core Bond, High Income, Municipal Intermediate Bond and Strategic Income designate $2,649,482, $3,268,594, $219,147 and $3,071,502, respectively, as a capital gain distribution.
For the fiscal year ended October 31, 2013, Strategic Income makes the following designation, or up to the maximum amount of such dividends allowable pursuant to the Internal Revenue Code, as qualified dividend income eligible for reduced tax rates. Complete information regarding each Fund's distributions during the calendar year 2013 will be reported in conjunction with Form 1099-DIV.
| Fund | | Qualified
Dividend Income | |
Strategic Income | | $ | 302,356 | | |
Board Consideration of the Management and Sub-Advisory Agreements
On an annual basis, the Board of Trustees ("Board") of Neuberger Berman Income Funds ("Trust"), including the Trustees who are not "interested persons" of Management (including its affiliates) or the Trust ("Independent Fund Trustees"), considers whether to continue the Management and Sub-Advisory Agreements ("Agreements") with respect to each Fund. At a meeting held on October 22-23, 2013, the Board, including the Independent Fund Trustees, approved the continuation of the Agreements for each of Neuberger Berman Core Bond Fund, Neuberger Berman Floating Rate Income Fund, Neuberger Berman High Income Bond Fund, Neuberger Berman Municipal Intermediate Bond Fund, Neuberger Berman Short Duration Bond Fund, Neuberger Berman Short Duration High Income Fund, and Neuberger Berman Strategic Income Fund (each a "Fund").
In evaluating the Agreements, the Board, including the Independent Fund Trustees, reviewed extensive materials provided by Management in response to questions submitted by the Board and counsel for the Independent Fund Trustees, and met with senior representatives of Management regarding its personnel, operations and financial condition as they relate to the Funds. The annual contract review extends over at least two regular meetings of the Board to ensure that Management and NBFI have time to respond to any questions the Independent Fund Trustees may have on their initial review of the materials and that the Independent Fund Trustees have time to consider those responses.
In connection with its deliberations, the Board also considered the broad range of information relevant to the annual contract review that is provided to the Board (including its various standing committees) at meetings throughout the year, including investment performance reports and related portfolio information for each Fund, as well as periodic reports on, among other matters, pricing and valuation; brokerage and execution; and compliance, shareholder and other services provided by Management, NBFI and their affiliates. To assist the Board in its deliberations regarding the annual contract review, the Board has established a Contract Review Committee comprised of Independent Fund Trustees, as well as other committees that focus throughout the year on specific areas relevant to the annual contract review, such as Fund performance or compliance matters.
Throughout the process, the Independent Fund Trustees were advised by counsel that is experienced in Investment Company Act of 1940 matters and that is independent of Management. The Independent Fund Trustees received from independent counsel a memorandum discussing the legal standards for their consideration of the proposed continuation of the Agreements. During the course of the year and during their deliberations regarding the annual contract review, the Independent Fund Trustees met with such counsel separately from representatives of Management and NBFI.
In connection with its approval of the continuation of the Agreements, the Board evaluated the terms of the Agreements, the overall fairness of the Agreements to each Fund and whether the Agreements were in the best interests of each Fund and its shareholders. The Board considered all factors it deemed relevant with respect to each Fund, including the following factors: (1) the nature, extent, and quality of the services provided by Management and NBFI; (2) the investment performance of each Fund compared to a relevant market index and a peer group of investment companies;
164
(3) the costs of the services provided and the profit or loss realized by Management and its affiliates from their relationship with each Fund; (4) the extent to which economies of scale might be realized as each Fund grows; and (5) whether fee levels reflect any such potential economies of scale for the benefit of investors in each Fund. While each Trustee may have attributed different weights to the various factors, the Board's determination to approve the continuation of the Agreements was based on a comprehensive consideration of all information provided to the Board throughout the year and specifically in connection with the annual contract review. The Board members did not identify any particular information or factor that was all-important or controlling. The Board focused on the overall costs and benefits of the Agreements relating to each Fund and, through the Funds, their shareholders.
With respect to the nature, extent and quality of the services provided, the Board considered the investment philosophy and decision-making processes of Management and NBFI, and the qualifications, experience and capabilities of and the resources available to the portfolio management personnel of Management and NBFI who perform services for the Funds. The Board noted that Management also provides certain administrative services, including fund accounting and compliance oversight. The Board also considered Management's and NBFI's policies and practices regarding brokerage and allocation of portfolio transactions and reviewed the quality of the execution services that Management had provided. The Board also considered that Management's responsibilities include daily management of investment, operational, enterprise, legal, regulatory and compliance risks as they relate to the Funds, and considered information regarding Management's process for managing risk. In addition, the Board noted the positive compliance history of Management and NBFI, as each firm has been free of significant reported compliance problems. The Board also considered the general structure of the portfolio manager compensation program and whether this structure provides appropriate incentives to act in the best interests of the Funds. As in past years, the Board also considered the manner in which Management addressed various non-routine matters that arose during the year, some of them a result of developments in the broader fund industry or the regulations governing it. In addition, the Board considered actions taken by Management and NBFI in response to recent market conditions, including actions taken in response to changes in market volatility, and considered the overall performance of Management and NBFI in this context.
With respect to investment performance, the Board considered information regarding each Fund's short-, intermediate- and long-term performance, as applicable, on both an absolute basis and relative to a relevant market index (or benchmark) and the average performance of a composite peer group (as constructed by an independent organization) of investment companies pursuing broadly similar strategies. The Board also reviewed performance in relation to certain measures of the degree of investment risk undertaken by the portfolio managers. The Board factored into its evaluation of the Funds' performance the limitations inherent in the methodology for constructing peer groups and determining which investment companies should be included in which peer groups. In the case of those Funds that had underperformed their relevant market indices and/or peer groups, the Board discussed with Management each Fund's performance and steps that Management had taken, or intended to take, to improve performance. The Board also considered Management's responsiveness with respect to the Funds that experienced lagging performance. In this regard, the Board noted that performance, especially short-term performance, is only one of the factors that it deems relevant to its consideration of a Fund's Agreements and that, after considering all relevant factors, it may be appropriate to approve the continuation of the Agreements notwithstanding a Fund's underperformance.
With respect to the overall fairness of the Agreements, the Board considered the fee structure for each Fund under the Agreements as compared to a peer group of comparable funds and any fall-out benefits likely to accrue to Management or NBFI or their affiliates from their relationship with each Fund. The Board also considered the profitability of Management and its affiliates from their association with the Funds.
The Board reviewed a comparison of each Fund's management fee and overall expense ratio to a peer group of broadly comparable funds (in the case of Neuberger Berman Short Duration High Income Fund, this comparison was done prior to the Fund's inception). The Board noted that the comparative management fee analysis includes, in each Fund's management fee, the separate administrative fee paid to Management, but it was not clear whether this was the case for all funds in the peer group. The Board considered the mean and median of the management fees and expense ratios of each peer group. Where a Fund's management fee was higher than the peer group mean and/or median, the Board considered whether specific portfolio management or administration needs contributed to the management fee. In addition, the
165
Board considered the contractual limit on expenses of certain classes of each Fund. The Board noted that Management incurred a loss on certain of the Funds during the review period. The Board also considered whether there were other funds that were advised or sub-advised by Management or its affiliates or separate accounts managed by Management or its affiliates with investment objectives, policies and strategies that were similar to those of any of the Funds. The Board compared the fees charged to each Fund to the fees charged to any such funds and/or separate accounts. The Board considered the appropriateness and reasonableness of any differences between the fees charged to each Fund and any such funds and/or separate accounts, including any breakpoints, and determined that any differences in fees and fee structures were consistent with the management and other services provided. The Board also evaluated any apparent or anticipated economies of scale in relation to the services Management provides to each Fund. The Board considered whether each Fund's fee structure provides for a reduction of payments resulting from the use of breakpoints and whether any such breakpoints are set at appropriate asset levels. In concluding that the benefits accruing to Management and its affiliates by virtue of their relationship to each Fund were reasonable in light of the costs of providing the investment advisory and other services and the benefits accruing to each Fund, the Board reviewed specific data as to Management's profit or loss on each Fund for a recent period. The Board also carefully examined Management's cost allocation methodology. The Board recognized that Management should be entitled to earn a reasonable level of profits for services it provides to the Funds and, based on its review, concluded that Management's reported level of profitability was reasonable.
Conclusions
In approving the Agreements, the Board concluded that the terms of each Agreement are fair and reasonable to each Fund and that approval of the Agreements is in the best interests of each Fund and its shareholders. In reaching this determination, the Board considered that Management and NBFI could be expected to provide a high level of service to each Fund; that the performance of each Fund was satisfactory over time, or, in the case of underperforming Funds, that it retained confidence in Management's and NBFI's capabilities to manage the Funds; that each Fund's fee structure appeared to the Board to be reasonable given the nature, extent and quality of services provided; and that the benefits accruing to Management and its affiliates by virtue of their relationship to the Funds were reasonable in light of the costs of providing the investment advisory and other services and the benefits accruing to each Fund. The Board's conclusions may be based in part on its consideration of materials prepared in connection with the Agreements in prior years and on the Board's ongoing regular review of Fund performance and operations throughout the year, in addition to material prepared specifically for the most recent annual review of the Agreements.
166
Investment manager: Neuberger Berman Management LLC
Sub-adviser: Neuberger Berman Fixed Income LLC
Neuberger Berman Management LLC
605 Third Avenue 2nd Floor
New York, NY 10158-0180
Retail Services: 800.877.9700
Broker-Dealer and Institutional Services: 800.366.6264/888.556.9030
Web site: www.nb.com
Statistics and projections in this report are derived from sources deemed to be reliable but cannot be regarded as a representation of future results of the Funds. This report is prepared for the general information of shareholders and is not an offer of shares of the Funds. Shares are sold only through the currently effective prospectus, which must precede or accompany this report.
H0648 12/13

Neuberger Berman
Income Funds
Institutional Class Shares
Class A Shares
Class C Shares
Emerging Markets Income Fund
Annual Report
October 31, 2013
Contents
PRESIDENT'S LETTER | | | 1 | | |
PORTFOLIO COMMENTARY | | | 2 | | |
FUND EXPENSE INFORMATION | | | 8 | | |
SCHEDULE OF INVESTMENTS | | | 10 | | |
FINANCIAL STATEMENTS | | | 23 | | |
FINANCIAL HIGHLIGHTS (ALL CLASSES)/
PER SHARE DATA | | | 39 | | |
Report of Independent Registered Public Accounting Firm | | | 42 | | |
Directory | | | 43 | | |
Trustees and Officers | | | 44 | | |
Proxy Voting Policies and Procedures | | | 52 | | |
Quarterly Portfolio Schedule | | | 52 | | |
Board Consideration of the Management and Sub-Advisory Agreements | | | 53 | | |
The "Neuberger Berman" name and logo are registered service marks of Neuberger Berman Group LLC. "Neuberger Berman Management LLC" and the individual Fund names in this piece are either service marks or registered service marks of Neuberger Berman Management LLC. ©2013 Neuberger Berman Management LLC. All rights reserved.
Dear Shareholder,
I am pleased to present the first annual report for Neuberger Berman Emerging Markets Income Fund, covering the period from inception on September 27, 2013 through October 31, 2013. In my opinion, the Fund represents an important new addition to our fixed income offerings.
Emerging markets economies have enjoyed real momentum over the past decade. While developed economies have struggled with the burdens of debt and slow growth, emerging markets have generally enjoyed strong GDP growth. Over time, many have achieved lower levels of government debt than developed counterparts, and have generated superior current account balances and deep currency reserves. We believe attractive demographics and growing middle classes are among the economic forces that are supporting their long-term growth.
Emerging markets debt (EMD) has come to reflect the current reality — and potential — of these economies. EMD now represents an investable universe of some $3.5 trillion dollars. Credit quality has steadily improved, so that a portion of the EMD marketplace is now investment grade. Given the sheer variety of countries, currencies, issuers and yield fundamentals, the asset class, in our view, offers broad diversification potential. And with investors' tendency to "discount" emerging issuers, we have found that EMD generally has provided more attractive yields than comparable developed market bonds.
To capitalize on this opportunity, the Emerging Markets Income Fund takes a flexible, research-driven approach, investing in a full spectrum of emerging corporate and sovereign/quasi-sovereign debt securities, all denominated in local and developed market currencies. It employs both top-down and bottom-up methodologies to gauge macroeconomic risks while identifying what we believe are sound credits that provide favorable risk/return dynamics.
The Fund is managed by Rob Drijkoningen and Gorky Urquieta, the co-heads of Neuberger Berman's EMD team, along with five other portfolio managers. Rob and Gorky have been managing EMD strategies since the mid-1990s and each has roughly two decades of investment experience. They lead a seasoned team of over 20 dedicated EMD professionals, who are located in three sites globally, giving them access to local knowledge and research, as well as regional trading. (You can read more about their process and current market view on page 2.)
Many U.S. investors tend to focus their bond portfolios on domestic issuers. However, the increasingly global nature of our economy suggests that a broader approach — encompassing more diverse assets and markets — may open up new opportunities for those seeking better yields and differentiated returns. In my opinion, the new Emerging Markets Income Fund helps to serve this crucial purpose.
Thank you for your confidence in Neuberger Berman. We will work hard to maintain your confidence in the months and years to come.
Sincerely,

ROBERT CONTI
PRESIDENT AND CEO
NEUBERGER BERMAN MUTUAL FUNDS
1
Emerging Markets Income Fund Commentary (Unaudited)
Neuberger Berman Emerging Markets Income Fund Institutional Class generated a 2.36% total return during the period since its inception on September 27, 2013 through October 31, 2013 and outperformed its blended benchmark, which is composed of 50% JPMorgan Government Bond Index (GBI) — Emerging Markets Global Diversified, 25% JPMorgan Emerging Markets Bond Index (EMBI) — Global Diversified and 25% JPMorgan Corporate Emerging Markets Bond Index (CEMBI) — Diversified, which provided a 2.21% return for the period. (Performance for all share classes is provided in the table immediately following this letter.)
In our opinion performance of emerging markets debt (EMD) since May 2013 has been driven by two main factors: (1) disappointing economic growth in emerging markets (EM) and recovery signals in developed economies, and (2) rising U.S. Treasury yields on the back of the prospect of reduced asset purchases by the U.S. Federal Reserve (Fed), creating competition for capital and making external financing more expensive for EM countries. These factors ignited large outflows from the asset class to levels not seen since 2008. While some pick up in EM growth data had created occasional periods of stability, the theme of higher U.S. yields prevailed. Countries that have been relying heavily on capital flows to finance their current account deficits suffered the most, with damage concentrated on five large EM countries that the markets came to label as the "Fragile Five": Brazil, Turkey, South Africa, Indonesia and India. The policy makers responded in most cases by instituting several measures (such as hiking interest rates), but these were not convincing enough to substantially improve market sentiment. The Fragile Five also face general elections in 2014—an added risk element that may limit flexibility of policy responses.
While EMD performed negatively since May, with a short break in August, October has been a month of relief for the asset class. Risk appetite for EMD has improved since the second half of September after the Fed announced a delay in tapering its asset purchase program, which alleviated immediate concerns of a further tightening in liquidity conditions on emerging markets as well as pressure on EM local currencies. Against this backdrop, both hard and local currency yields tightened in October.
Since inception, the majority of outperformance versus the benchmark came from the portfolio's local currency allocation, while performance of the hard currency component was neutral. In the local currency space, the main contributor was Indonesian bonds, while Turkey and Hungary were the main detractors. Main contributors to the performance in hard currency came from our positions in Mexico, Brazil and Indonesia, while Chile and South Africa detracted from performance. The Fund's use of interest rate swaps and forward foreign currency contracts contributed modestly to results.
During the period we maintained an overall neutral spread duration in the hard currency sub-asset class. Some of our main investment-grade positions are in Brazil, Mexico, Indonesia and Kazakhstan. In the high yield space, our larger positions are in countries with idiosyncratic stories, such as Iraq, Ivory Coast and Bolivia. In October, we generally increased risk in the high yield space. We bought a position in Belarus, added to Bolivia on better macro numbers, initiated a position in Mongolia after improvements in foreign investment law and expectations of a government deal with Rio Tinto (a British-Australian metal and mining company). We also grabbed exposure in Belize as we consider its restructured debt to be manageable with attractive carry (cost difference between financing a position in an instrument and the yield).
In the corporate space, one of our largest holdings from a country perspective was in Brazil, where valuations offered in light of the negative sentiment were compelling. We also overweighted both Peru and China across various sectors, including financial, metals and mining, and real estate. The Middle East and Korea have been our highest conviction underweights as valuations remain very tight. Overall, we are concerned about spreads going forward, and accordingly are taking a slightly defensive posture.
In the local currency space we maintained an overweight duration in Latin America and CEEMEA (Central and Eastern Europe, Middle East and Africa) and an underweight in Asia. In the foreign exchange market (FX), we mainly focused on relative value with a focus on having defensive positions in countries that we believe are vulnerable to flow dynamics. We
2
established a small overall long in FX, mainly in currencies that we think are likely to benefit most from an improving economic outlook in the U.S. and Europe.
From a tactical perspective, we remained fully invested but neutral on hard versus local currency; we preferred sovereigns to corporates and implemented this strategy through an underweight in spread duration in corporates versus sovereigns. The overall duration profile remained neutral in the dollar and long in the local currency space.
We are constructive on EMD due to what we view as favorable valuation, technical factors and improving EMD fundamentals. Recent recovery in developed markets, in particular in Europe, stronger EM exports and global manufacturing data have, in our view, created a positive fundamental backdrop for the asset class in the coming months. However, we believe global market conditions have become less supportive as monetary policy normalization in the U.S. remains a serious risk to the asset class. We anticipate EMD will likely remain volatile until U.S. interest rates stabilize on tapering clarity and the market becomes more comfortable that cyclically EM countries are in an upswing.
Our strategy in this environment is to focus on relative value, while keeping directional risk close to neutral. We will continue to use hedges tactically when needed to reduce the potential impact on the portfolio from higher U.S. interest rates. We are focusing on countries we anticipate will benefit most from the uptick in global growth. We also favor countries with strong external balances and/or those that have strong idiosyncratic factors.
Sincerely,


ROB DRIJKONINGEN, GORKY URQUIETA, BART VAN DER MADE, RAOUL LUTTIK,
JENNIFER GORGOLL, VERA KARTSEVA AND NISH POPAT
PORTFOLIO CO-MANAGERS
Information about the principal risks of investing in the Fund is set forth in the prospectus and statement of additional information.
The portfolio composition, industries and holdings of the Fund are subject to change.
The opinions expressed are those of the Fund's portfolio managers. The opinions are as of the date of this report and are subject to change without notice.
3
Emerging Markets Income Fund Commentary (Unaudited)
TICKER SYMBOLS
Institutional Class | | NERIX | |
Class A | | NERAX | |
Class C | | NERCX | |
PORTFOLIO BY TYPE OF SECURITY
(as a % of Total Net Assets) | |
Corporate Debt Securities | | | 30.1 | % | |
Government Securities | | | 65.6 | | |
Short-Term Investments | | | 2.5 | | |
Cash, receivables and other assets, less
liabilities | | | 1.8 | | |
Total | | | 100.0 | % | |
PERFORMANCE HIGHLIGHTS
| | | Inception
Date | | Cumulative Total Return
Ended 10/31/2013
Life of Fund | |
At NAV | | | | | |
Institutional Class | | 09/27/2013 | | | 2.36 | % | |
Class A | | 09/27/2013 | | | 2.32 | % | |
Class C | | 09/27/2013 | | | 2.26 | % | |
With Sales Charge | | | | | |
Class A | | | | | | | -1.99 | % | |
Class C | | | | | | | 1.26 | % | |
Index | | | | | |
| Blended Benchmark*1,2 | | | | | 2.21 | % | |
* Blended benchmark is composed of 50% JPMorgan GBI — Emerging Markets Global Diversified, 25% JPMorgan EMBI — Global Diversified, and 25% JPMorgan CEMBI — Diversified, and is rebalanced monthly.
The performance data quoted represent past performance and do not indicate future results. Current performance may be lower or higher than the performance data quoted. For more current performance data, please visit www.nb.com/performance.
The results shown in the table reflect the reinvestment of income dividends and other distributions, if any. The results do not reflect the effect of taxes a shareholder would pay on Fund distributions or on the redemption of Fund shares.
The investment return and principal value of an investment will fluctuate and shares, when redeemed, may be worth more or less than their original cost.
Returns would have been lower if Neuberger Berman Management LLC ("Management") had not reimbursed certain expenses and/or waived a portion of the investment management fees during the period shown. Repayment by a class (of expenses previously reimbursed and/or fees previously waived by Management) will decrease the class's returns. Please see Note B in the Notes to Financial Statements for specific information regarding expense reimbursement and/or fee waiver arrangements.
For the period ended October 31, 2013, the 30-day SEC yields were 4.62%, 4.18%, and 3.43% for Institutional Class, Class A and Class C shares, respectively. Absent expense reimbursements and/or fee waivers, the 30-day SEC yields would have been 3.93%, 0% and 0% for Institutional Class, Class A and Class C shares, respectively.
As stated in the Fund's most recent prospectus, the estimated total annual operating expense ratios for fiscal year 2013 were 1.57%, 1.94% and 2.69% for Institutional Class, Class A and Class C shares, respectively (before expense reimbursements and/or fee waivers, if any). The expense ratios were 0.91%, 1.28% and 2.03% for Institutional Class, Class A and Class C shares, respectively, after expense reimbursements and/or fee waivers.
Returns shown with a sales charge reflect the deduction of the current maximum initial sales charge of 4.25% for Class A shares and the applicable contingent deferred sales charges (CDSC) for Class C shares. The maximum CDSC for Class C shares is 1%, which is reduced to 0% after 1 year. The performance of the Fund's share classes will differ primarily due to different sales charge structures and class expenses. Please see the prospectus for more information about sales charge structures, if any, and class expenses for your share class.
4
Emerging Markets Income Fund (Unaudited)
COMPARISON OF A $1,000,000 INVESTMENT
(000's omitted)
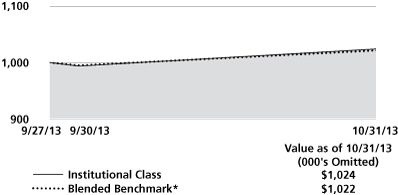
This graph shows the change in value of a hypothetical $1,000,000 investment in the Fund over the past 10 fiscal years, or since the Fund's inception if it has not operated for 10 years. The graph is based on the Institutional Class shares only; the performance of the Fund's share classes will differ primarily due to different sales charge structures and class expenses (see Performance Highlights chart on previous page). The result is compared with benchmarks, which include a broad-based market index and may include a more narrowly based index. Market indices have not been reduced to reflect any of the fees and costs of investing. The results shown in the graph reflect the reinvestment of income dividends and other distributions, if any. The results do not reflect the effect of taxes a shareholder would pay on Fund distributions or on the redemption of Fund shares. Results represent past performance and do not indicate future results.
* Blended benchmark is composed of 50% JPMorgan GBI — Emerging Markets Global Diversified, 25% JPMorgan EMBI — Global Diversified, and 25% JPMorgan CEMBI — Diversified, and is rebalanced monthly.
5
1 Please see "Glossary of Indices" on page 7 for a description of indices. Please note that indices do not take into account any fees, expenses or tax consequences of investing in the individual securities that they track, and that individuals cannot invest directly in any index. Data about the performance of an index is prepared or obtained by Neuberger Berman Management LLC ("Management") and reflects the reinvestment of income dividends and other distributions, if any. The Fund may invest in securities not included in a described index and may not invest in all securities included in a described index.
2 The date used to calculate Life of Fund performance for the index is September 27, 2013.
For more complete information on any of the Neuberger Berman Income Funds, call Management at (800) 877-9700, or visit our website at www.nb.com.
6
Blended benchmark is composed of 50% JPMorgan GBI — Emerging Markets Global Diversified, 25% JPMorgan EMBI — Global Diversified, and 25% JPMorgan CEMBI — Diversified, and is rebalanced monthly.
JPMorgan Government Bond Index (GBI) — Emerging Markets Global Diversified | | An unmanaged comprehensive emerging market debt benchmark that tracks the performance of local currency government bonds issued by Emerging Market governments, including Emerging Market countries from Asia, Europe, Latin America and the Middle East/Africa. The Global version of the index is an investable benchmark that includes only countries that are accessible by most of the international investor base, while countries with explicit capital controls are excluded. The Diversified version of the index is market capitalization weighted, with a maximum weight to a country capped at 10%. The excess is redistributed to those countries that have a weight of less than 10%. The index includes only fixed coupon instruments that meet specific liquidity criteria and have a maturity of greater than 13 months. | |
JPMorgan Emerging Markets Bond Index (EMBI) — Global Diversified | | An unmanaged benchmark that tracks the performance of US-dollar denominated debt instruments issued by Emerging Market sovereign and quasi-sovereign entities (Brady bonds, loans and Eurobonds), including Emerging Market countries from Asia, Europe, Latin America and the Middle East/Africa. The Global version of the index captures a broad, comprehensive universe of Emerging Market issues. The Diversified version of the index is market capitalization weighted and limits the weights of those index countries with larger debt stocks by including only specified portions of those countries' eligible current face amounts of debt outstanding. The index includes both fixed and floating rate instruments, as well as capitalizing/amortizing bonds or loans denominated in US dollars, that meet specific liquidity criteria and have at least US$500 million current face amount outstanding. Only instruments with at least 2.5 years until maturity are included. Once added, an instrument may remain in the index until 1 year before it matures. | |
JPMorgan Corporate Emerging Markets Bond Index (CEMBI) — Diversified | | An unmanaged liquid global benchmark that tracks the performance of US-dollar denominated corporate emerging market bonds, including Emerging Market countries from Asia, Europe, Latin America and the Middle East/Africa. The Diversified version of the index is market capitalization weighted and limits the weights of those index countries with larger corporate debt stocks by including only specified portions of those countries' eligible current face amounts of debt outstanding. The index includes fixed coupon instruments issued by corporate entities from index-eligible countries. Instruments must have at least US$500 million current face amount outstanding. Only instruments with at least 5 years until maturity are included. Once added, an instrument may remain in the index until 36 months before it matures. | |
7
Information About Your Fund's Expenses (Unaudited)
As a Fund shareholder, you incur two types of costs: (1) transaction costs, including sales charges (loads) on purchase payments or redemption proceeds (if applicable); and (2) ongoing costs, including management fees, distribution and/or service (12b-1) fees (if applicable), and other Fund expenses. This example is intended to help you understand your ongoing costs (in U.S. dollars) of investing in the Fund and compare these costs with the ongoing costs of investing in other mutual funds.
This table is designed to provide information regarding costs related to your investments. The following examples are based on an investment of $1,000 made at the beginning of the period ended October 31, 2013 (as indicated) and held for the entire period. The table illustrates the Fund's costs in two ways:
Actual Expenses and Performance: | | The first section of the table provides information about actual account values and actual expenses in dollars, based on the Fund's actual performance during the period. You may use the information in this line, together with the amount you invested, to estimate the expenses you paid over the period. Simply divide your account value by $1,000 (for example, an $8,600 account value divided by $1,000 = 8.6), then multiply the result by the number in the first section of the table under the heading entitled "Expenses Paid During the Period" to estimate the expenses you paid over the period. | |
Hypothetical Example for
Comparison Purposes: | | The second section of the table provides information about hypothetical account values and hypothetical expenses based on the Fund's actual expense ratio and an assumed rate of return at 5% per year before expenses. This return is not the Fund's actual return. The hypothetical account values and expenses may not be used to estimate the actual ending account balance or expenses you paid for the period. You may use this information to compare the ongoing costs of investing in the Fund versus other funds. To do so, compare the expenses shown in this 5% hypothetical example with the 5% hypothetical examples that appear in the shareholder reports of other funds. | |
Please note that the expenses in the table are meant to highlight your ongoing costs only and do not include any transaction costs, such as sales charges (loads) (if applicable). Therefore, the information under the heading "Hypothetical (5% annual return before expenses)" is useful in comparing ongoing costs only, and will not help you determine the relative total costs of owning different funds. In addition, if these transaction costs were included, your costs would have been higher.
8
Expense Information as of 10/31/2013 (Unaudited)
Neuberger Berman Income Funds | |
| | | ACTUAL | | HYPOTHETICAL (5% ANNUAL RETURN BEFORE EXPENSES)(2) | |
| | | Beginning
Account
Value
9/27/13 | | Ending
Account
Value
10/31/13 | | Expenses Paid
During the
Period(1)
9/27/13 - 10/31/13 | | Expense
Ratio | | Beginning
Account
Value
5/1/13 | | Ending
Account
Value
10/31/13 | | Expenses Paid
During the
Period(1)
5/1/13 - 10/31/13 | | Expense
Ratio | |
Neuberger Berman Emerging Markets Income Fund | |
Institutional Class | | $ | 1,000.00 | | | $ | 1,023.60 | | | $ | 0.78 | | | | 0.80 | % | | $ | 1,000.00 | | | $ | 1,021.17 | | | $ | 4.08 | | | | 0.80 | % | |
Class A | | $ | 1,000.00 | | | $ | 1,023.20 | | | $ | 1.10 | | | | 1.13 | % | | $ | 1,000.00 | | | $ | 1,019.51 | | | $ | 5.75 | | | | 1.13 | % | |
Class C | | $ | 1,000.00 | | | $ | 1,022.60 | | | $ | 1.74 | | | | 1.79 | % | | $ | 1,000.00 | | | $ | 1,016.18 | | | $ | 9.10 | | | | 1.79 | % | |
(1) For each class, expenses are equal to the annualized expense ratio for the class, multiplied by the average account value over the period, multiplied by 35/365 (to reflect the period shown of September 27, 2013 (Commencement of Operations) to October 31, 2013), unless otherwise indicated.
(2) Hypothetical 5% annual return before expenses is calculated by multiplying the number of days in the most recent period divided by 365.
9
Schedule of Investments Neuberger Berman Emerging Markets Income Fund
| PRINCIPAL AMOUNTa | | | | VALUE† | |
(000's omitted) | | | | (000's omitted)z | |
Corporate Debt Securities (30.1%) | | | |
Australia (0.2%) | | | |
$ | 200 | | | CNOOC Curtis Funding No. 1 Pty Ltd., Guaranteed Notes, 4.50%, due 10/3/23 | | $ | 205 | ñ | |
Austria (0.2%) | | | |
| | 200 | | | JBS Investments GmbH, Guaranteed Notes, 7.75%, due 10/28/20 | | | 205 | ñ | |
Bermuda (0.7%) | | | |
| | 190 | | | BW Group Ltd., Senior Secured Notes, 6.63%, due 6/28/17 | | | 196 | ñ | |
| | 200 | | | China Resources Gas Group Ltd., Senior Unsecured Notes, 4.50%, due 4/5/22 | | | 200 | ñ | |
| | 200 | | | GeoPark Latin America Ltd. Agencia en Chile, Senior Secured Notes, 7.50%, due 2/11/20 | | | 204 | ñ | |
| | | | 600 | | |
Brazil (1.9%) | | | |
| | 385 | | | Banco Bradesco SA, Senior Unsecured Notes, 4.50%, due 1/12/17 | | | 404 | | |
| | 215 | | | Cielo SA, Guaranteed Notes, 3.75%, due 11/16/22 | | | 193 | ñ | |
| | 100 | | | Cosan Overseas Ltd., Guaranteed Notes, 8.25%, due 12/31/49 | | | 103 | | |
| | 350 | | | Hypermarcas SA, Senior Unsecured Notes, 6.50%, due 4/20/21 | | | 367 | | |
| | 210 | | | Itau Unibanco Holding SA, Subordinated Notes, 5.65%, due 3/19/22 | | | 208 | ñ | |
| | 205 | | | Itau Unibanco Holding SA, Subordinated Notes, 5.50%, due 8/6/22 | | | 202 | | |
| | 200 | | | Samarco Mineracao SA, Senior Unsecured Notes, 5.75%, due 10/24/23 | | | 200 | ñ | |
| | | | 1,677 | | |
British Virgin Islands (2.1%) | | | |
| | 205 | | | CNOOC Finance 2011 Ltd., Guaranteed Notes, 4.25%, due 1/26/21 | | | 211 | | |
| | 220 | | | PCCW-HKT Capital No. 5 Ltd., Guaranteed Notes, 3.75%, due 3/8/23 | | | 203 | | |
| | 800 | | | Sinopec Group Overseas Development 2013 Ltd., Guaranteed Notes, 4.38%, due 10/17/23 | | | 802 | ñØØ | |
| | 200 | | | Skysea Int'l Capital Management, Guaranteed Euro Medium-Term Notes, 4.88%, due 12/7/21 | | | 210 | | |
| | 400 | | | Talent Yield Investments Ltd., Guaranteed Notes, 4.50%, due 4/25/22 | | | 403 | ñ | |
| | | | 1,829 | | |
Canada (0.6%) | | | |
| | 310 | | | Pacific Rubiales Energy Corp., Guaranteed Notes, 7.25%, due 12/12/21 | | | 341 | ñ | |
| | 200 | | | PTTEP Canada Int'l Finance Ltd., Guaranteed Notes, 5.69%, due 4/5/21 | | | 219 | ñ | |
| | | | 560 | | |
Chile (0.4%) | | | |
| | 340 | | | Banco de Credito e Inversiones, Senior Unsecured Notes, 3.00%, due 9/13/17 | | | 338 | | |
China (4.8%) | | | |
| | 205 | | | Braskem Finance Ltd., Guaranteed Notes, 5.75%, due 4/15/21 | | | 210 | | |
| | 400 | | | Cementos Progreso Trust, Guaranteed Notes, 7.13%, due 11/6/23 | | | 403 | ñ | |
| | 190 | | | China Overseas Finance Cayman II Ltd., Guaranteed Notes, 5.50%, due 11/10/20 | | | 201 | | |
| | 340 | | | China Overseas Finance Cayman IV Ltd., Guaranteed Notes, 4.88%, due 2/15/17 | | | 363 | | |
| | 305 | | | China State Construction Finance Cayman I Ltd., Guaranteed Notes, 3.13%, due 4/2/18 | | | 292 | | |
| | 200 | | | Country Garden Holdings Co., Ltd., Guaranteed Notes, 11.13%, due 2/23/18 | | | 223 | ñ | |
See Notes to Schedule of Investments
10
Schedule of Investments Neuberger Berman Emerging Markets Income Fund (cont'd)
| PRINCIPAL AMOUNTa | | | | VALUE† | |
(000's omitted) | | | | (000's omitted)z | |
$ | 200 | | | Country Garden Holdings Co., Ltd., Guaranteed Notes, 7.50%, due 1/10/23 | | $ | 199 | ñ | |
| | 310 | | | Fibria Overseas Finance Ltd., Guaranteed Notes, 6.75%, due 3/3/21 | | | 339 | ñ | |
| | 220 | | | Hutchison Whampoa International 10 Ltd., Guaranteed Notes, 6.00%, due 12/31/49 | | | 232 | ñµ | |
| | 205 | | | Kuwait Projects Co., Guaranteed Euro Medium-Term Notes, 9.38%, due 7/15/20 | | | 246 | ØØ | |
| | 200 | | | Longfor Properties Co., Ltd., Guaranteed Euro Medium-Term Notes, 6.88%, due 10/18/19 | | | 202 | | |
| | 120 | | | Odebrecht Finance Ltd., Guaranteed Notes, 7.50%, due 12/31/49 | | | 120 | ñ | |
| | 235 | | | Sadia Overseas Ltd., Guaranteed Notes, 7.25%, due 1/28/20 | | | 266 | ñ | |
| | 230 | | | Shimao Property Holdings Ltd., Guaranteed Notes, 9.65%, due 8/3/17 | | | 248 | | |
| | 200 | | | Sun Hung Kai Properties Capital Market Ltd., Guaranteed Euro Medium-Term Notes, 4.50%,
due 2/14/22 | | | 203 | | |
| | 270 | | | Tingyi Cayman Islands Holding Corp., Senior Unsecured Notes, 3.88%, due 6/20/17 | | | 282 | | |
| | 100 | | | Vale Overseas Ltd., Guaranteed Notes, 8.25%, due 1/17/34 | | | 117 | | |
| | | | 4,146 | | |
Columbia (1.0%) | | | |
| | 400 | | | Banco de Bogota SA, Senior Unsecured Notes, 5.00%, due 1/15/17 | | | 421 | ñ | |
| | 420 | | | Bancolombia SA, Senior Unsecured Notes, 5.95%, due 6/3/21 | | | 444 | | |
| | | | 865 | | |
Hong Kong (0.6%) | | | |
| | 215 | | | Bank of China Hong Kong Ltd., Subordinated Notes, 5.55%, due 2/11/20 | | | 235 | | |
| | 310 | | | Yuexiu Property Co., Ltd., Senior Unsecured Notes, 3.25%, due 1/24/18 | | | 292 | | |
| | | | 527 | | |
India (0.6%) | | | |
| | 320 | | | ICICI Bank Ltd., Senior Unsecured Notes, 4.70%, due 2/21/18 | | | 325 | ñ | |
| | 225 | | | NTPC Ltd., Senior Unsecured Euro Medium-Term Notes, 5.63%, due 7/14/21 | | | 229 | | |
| | | | 554 | | |
Indonesia (1.2%) | | | |
| | 150 | | | Adaro Indonesia PT, Guaranteed Notes, 7.63%, due 10/22/19 | | | 158 | ñ | |
| | 280 | | | Berau Coal Energy Tbk PT, Senior Secured Notes, 7.25%, due 3/13/17 | | | 269 | ñ | |
| | 750 | | | Pertamina Persero PT, Senior Unsecured Notes, 5.63%, due 5/20/43 | | | 630 | ñ | |
| | | | 1,057 | | |
Ireland (1.1%) | | | |
| | 200 | | | Credit Bank of Moscow via CBOM Finance PLC, Subordinated Notes, 8.70%, due 11/13/18 | | | 196 | | |
| | 200 | | | EDC Finance Ltd., Guaranteed Notes, 4.88%, due 4/17/20 | | | 199 | | |
| | 271 | | | Vimpel Communications via VIP Finance Ireland Ltd. OJSC, Senior Unsecured Notes, 9.13%,
due 4/30/18 | | | 316 | ñ | |
| | 200 | | | Vnesheconombank via VEB Finance PLC, Senior Unsecured Notes, 5.38%, due 2/13/17 | | | 214 | ñ | |
| | | | 925 | | |
Jersey (0.3%) | | | |
| | 210 | | | Burgan Finance No. 1 Jersey Ltd., Bank Guaranteed Notes, 7.88%, due 9/29/20 | | | 230 | | |
See Notes to Schedule of Investments
11
Schedule of Investments Neuberger Berman Emerging Markets Income Fund (cont'd)
| PRINCIPAL AMOUNTa | | | | VALUE† | |
(000's omitted) | | | | (000's omitted)z | |
Kazakhstan (2.1%) | | | |
$ | 265 | | | Halyk Savings Bank of Kazakhstan JSC, Senior Unsecured Notes, 7.25%, due 5/3/17 | | $ | 284 | ñ | |
| | 1,200 | | | KazMunayGas National Co., JSC, Senior Unsecured Notes, 6.38%, due 4/9/21 | | | 1,335 | ñØØ | |
| | 200 | | | Zhaikmunai LLP, Guaranteed Notes, 7.13%, due 11/13/19 | | | 213 | ñ | |
| | | | 1,832 | | |
Korea (0.4%) | | | |
| | 340 | | | Industrial Bank of Korea, Senior Unsecured Notes, 2.38%, due 7/17/17 | | | 344 | | |
Luxembourg (3.0%) | | | |
| | 243 | | | Evraz Group SA, Senior Unsecured Notes, 7.40%, due 4/24/17 | | | 252 | ñ | |
| | 200 | | | Millicom International Cellular SA, Senior Unsecured Notes, 6.63%, due 10/15/21 | | | 206 | ñ | |
| | 200 | | | Minerva Luxembourg SA, Guaranteed Notes, 7.75%, due 1/31/23 | | | 194 | ñ | |
| | 210 | | | Offshore Drilling Holding SA, Senior Secured Notes, 8.38%, due 9/20/20 | | | 223 | ñ | |
| | 376 | | | Sberbank of Russia Via SB Capital SA, Senior Unsecured Notes, 4.95%, due 2/7/17 | | | 399 | ñØØ | |
| | 276 | | | Severstal OAO via Steel Capital SA, Senior Unsecured Notes, 6.25%, due 7/26/16 | | | 294 | | |
| | 200 | | | Sistema JSFC via Sistema Int'l Funding SA, Senior Unsecured Notes, 6.95%, due 5/17/19 | | | 213 | ñ | |
| | 766 | | | VTB Bank OJSC Via VTB Capital SA, Senior Unsecured Notes, 6.00%, due 4/12/17 | | | 816 | ñØØ | |
| | | | 2,597 | | |
Mexico (2.1%) | | | |
| | 125 | | | America Movil SAB de CV, Guaranteed Notes, 6.38%, due 3/1/35 | | | 137 | | |
| | 210 | | | BBVA Bancomer SA, Subordinated Notes, 6.50%, due 3/10/21 | | | 227 | ñ | |
| | 185 | | | BBVA Bancomer SA, Subordinated Notes, 6.75%, due 9/30/22 | | | 201 | | |
| | 375 | | | Comision Federal de Electricidad, Senior Unsecured Notes, 4.88%, due 1/15/24 | | | 380 | | |
| | 290 | | | Petroleos Mexicanos, Guaranteed Notes, 5.50%, due 1/21/21 | | | 316 | | |
| | 500 | | | Petroleos Mexicanos, Guaranteed Notes, 6.50%, due 6/2/41 | | | 533 | ØØ | |
| | | 1,794 | | |
Netherlands (1.5%) | | | |
| | 215 | | | Indo Energy Finance BV, Senior Secured Notes, 7.00%, due 5/7/18 | | | 225 | | |
| | 210 | | | Indosat Palapa Co., BV, Guaranteed Notes, 7.38%, due 7/29/20 | | | 226 | ñ | |
| | 400 | | | Intergas Finance BV, Guaranteed Notes, 6.38%, due 5/14/17 | | | 439 | ñ | |
| | 215 | | | Listrindo Capital BV, Guaranteed Notes, 6.95%, due 2/21/19 | | | 225 | ñ | |
| | 200 | | | VimpelCom Holdings BV, Guaranteed Notes, 7.50%, due 3/1/22 | | | 214 | ñ | |
| | | 1,329 | | |
Peru (1.2%) | | | |
| | 190 | | | Banco de Credito del Peru, Senior Unsecured Notes, 4.25%, due 4/1/23 | | | 181 | ñ | |
| | 410 | | | Banco de Credito del Peru/Panama, Senior Unsecured Notes, 5.38%, due 9/16/20 | | | 434 | ñ | |
| | 190 | | | BBVA Banco Continental SA, Senior Unsecured Notes, 5.00%, due 8/26/22 | | | 194 | | |
| | 200 | | | Corp. Financiera de Desarrollo SA, Senior Unsecured Notes, 4.75%, due 2/8/22 | | | 201 | | |
| | | | 1,010 | | |
Philippines (0.2%) | | | |
| | 140 | | | Power Sector Assets & Liabilities Management Corp., Guaranteed Notes, 7.39%, due 12/2/24 | | | 176 | ñ | |
See Notes to Schedule of Investments
12
Schedule of Investments Neuberger Berman Emerging Markets Income Fund (cont'd)
| PRINCIPAL AMOUNTa | | | | VALUE† | |
(000's omitted) | | | | (000's omitted)z | |
Singapore (0.4%) | | | |
$ | 350 | | | United Overseas Bank Ltd., Subordinated Euro Medium-Term Notes, 2.88%, due 10/17/22 | | $ | 351 | µ | |
South Africa (0.4%) | | | |
| | 300 | | | Eskom Holdings SOC Ltd., Senior Unsecured Notes, 6.75%, due 8/6/23 | | | 310 | ñ | |
Spain (0.1%) | | | |
| | 100 | | | Cemex Espana Luxembourg, Senior Secured Notes, 9.25%, due 5/12/20 | | | 109 | ñ | |
Turkey (1.1%) | | | |
| | 787 | | | Finansbank AS, Senior Unsecured Notes, 5.50%, due 5/11/16 | | | 795 | ñ | |
| | 200 | | | Turkiye Vakiflar Bankasi Tao, Senior Unsecured Notes, 5.00%, due 10/31/18 | | | 199 | ñ | |
| | | | 994 | | |
United Arab Emirates (0.1%) | | | |
| | 120 | | | DP World Ltd., Senior Unsecured Notes, 6.85%, due 7/2/37 | | | 125 | ñ | |
United Kingdom (0.2%) | | | |
| | 190 | | | Vedanta Resources PLC, Senior Unsecured Notes, 9.50%, due 7/18/18 | | | 211 | ñ | |
United States (1.3%) | | | |
| | 400 | | | Cemex Finance LLC, Senior Secured Notes, 9.38%, due 10/12/22 | | | 449 | ñ | |
| | 210 | | | Gerdau Holdings, Inc., Guaranteed Notes, 7.00%, due 1/20/20 | | | 230 | | |
| | 250 | | | Reliance Holdings USA, Inc., Guaranteed Notes, 4.50%, due 10/19/20 | | | 253 | ñ | |
| | 205 | | | Southern Copper Corp., Senior Unsecured Notes, 7.50%, due 7/27/35 | | | 218 | | |
| | | | 1,150 | | |
Venezuela (0.3%) | | | |
| | 240 | | | Corp. Andina de Fomento, Senior Unsecured Notes, 4.38%, due 6/15/22 | | | 243 | | |
| | | | | Total Corporate Debt Securities (Cost $25,872) | | | 26,293 | | |
Government Securities (65.6%) | | | |
Armenia (0.3%) | | | |
| | 300 | | | Republic of Armenia, Senior Unsecured Notes, 6.00%, due 9/30/20 | | | 295 | ñ | |
Bahrain (0.3%) | | | |
| | 250 | | | Bahrain Government International Bond, Senior Unsecured Notes, 6.13%, due 8/1/23 | | | 260 | ñ | |
Belarus (0.2%) | | | |
| | 200 | | | Republic of Belarus, Senior Unsecured Notes, 8.95%, due 1/26/18 | | | 199 | | |
See Notes to Schedule of Investments
13
Schedule of Investments Neuberger Berman Emerging Markets Income Fund (cont'd)
| PRINCIPAL AMOUNTa | | | | VALUE† | |
(000's omitted) | | | | (000's omitted)z | |
Belize (0.4%) | | | |
$ | 600
| | | Belize Government International Bond, Senior Unsecured Notes,
Step-Up 5.00%/6.77%, due 2/20/38 | | $ | 369 | ** | |
Bermuda (0.4%) | | | |
| | 350 | | | Bermuda Government International Bond, Senior Unsecured Notes, 4.85%, due 2/6/24 | | | 348 | ñ | |
Bolivia (1.4%) | | | |
| | 1,200 | | | Bolivian Government International Bond, Senior Unsecured Notes, 5.95%, due 8/22/23 | | | 1,209 | ñ | |
Brazil (5.5%) | | | |
BRL | 11,500 | | | Brazil Letras do Tesouro Nacional, Bills, due 1/1/17 | | | 3,651 | ØØ | |
BRL | 300 | | | Brazil Notas do Tesouro Nacional Series B, Bills, 6.00%, due 8/15/22 | | | 323 | | |
| | 670 | | | Brazilian Government International Bond, Senior Unsecured Notes, 7.13%, due 1/20/37 | | | 804 | ØØ | |
| | | | 4,778 | | |
Columbia (5.0%) | | | |
| | 550 | | | Colombia Government International Bond, Senior Unsecured Notes, 7.38%, due 9/18/37 | | | 710 | ØØ | |
COP | 5,500,000 | | | Colombian TES, Notes, Ser. B, 5.00%, due 11/21/18 | | | 2,813 | ØØ | |
COP | 1,614,517 | | | Colombian TES, Bonds, 3.50%, due 3/10/21 | | | 841 | | |
| | | | 4,364 | | |
Croatia (0.9%) | | | |
| | 700 | | | Croatia Government International Bond, Senior Unsecured Notes, 6.25%, due 4/27/17 | | | 747 | ØØ | |
Czech Republic (0.8%) | | | |
CZK | 14,000 | | | Czech Republic Government Bond, Bonds, 1.50%, due 10/29/19 | | | 732 | | |
Dominican Republic (0.3%) | | | |
| | 240 | | | Dominican Republic International Bond, Unsecured Notes, 6.60%, due 1/28/24 | | | 248 | ñ | |
Hungary (3.3%) | | | |
HUF | 127,000 | | | Hungary Government Bond, Bonds, 7.00%, due 6/24/22 | | | 644 | | |
HUF | 271,210 | | | Hungary Government Bond, Bonds, 6.75%, due 10/22/28 | | | 1,325 | | |
| | 200 | | | MFB Magyar Fejlesztesi Bank Zrt, Guaranteed Notes, 6.25%, due 10/21/20 | | | 205 | ñ | |
| | 650 | | | Hungary Government International Bond, Senior Unsecured Notes, 7.63%, due 3/29/41 | | | 732 | | |
| | | | 2,906 | | |
Indonesia (5.4%) | | | |
| | 500 | | | Indonesia Government International Bond, Senior Unsecured Notes, 11.63%, due 3/4/19 | | | 684 | ñ | |
| | 150 | | | Indonesia Government International Bond, Senior Unsecured Notes, 7.75%, due 1/17/38 | | | 183 | ñ | |
IDR | 30,000,000 | | | Indonesia Treasury Bond, Senior Unsecured Notes, 8.38%, due 3/15/24 | | | 2,820 | | |
IDR | 11,141,000 | | | Indonesia Treasury Bond, Senior Unsecured Notes, 8.38%, due 3/15/34 | | | 1,013 | | |
| | | | 4,700 | | |
See Notes to Schedule of Investments
14
Schedule of Investments Neuberger Berman Emerging Markets Income Fund (cont'd)
| PRINCIPAL AMOUNTa | | | | VALUE† | |
(000's omitted) | | | | (000's omitted)z | |
Iraq (1.2%) | | | |
$ | 1,200 | | | Republic of Iraq, Unsecured Notes, 5.80%, due 1/15/28 | | $ | 1,044 | ñØØ | |
Ivory Coast (0.8%) | | | |
| | 800 | | | Ivory Coast Government International Bond, Senior Unsecured Notes, 5.75%, due 12/31/32 | | | 720 | ñ | |
Malaysia (1.6%) | | | |
MYR | 3,350 | | | Malaysia Government Bond, Senior Unsecured Notes, 3.26%, due 3/1/18 | | | 1,058 | ØØ | |
MYR | 1,000 | | | Malaysia Government Bond, Senior Unsecured Notes, 3.48%, due 3/15/23 | | | 313 | | |
| | | | 1,371 | | |
Mexico (5.0%) | | | |
MXN | 23,000 | | | Mexican Bonos, Bonds, Ser. M, 6.50%, due 6/9/22 | | | 1,830 | ØØ | |
MXN | 19,000 | | | Mexican Bonos, Bonds, Ser. M, 8.00%, due 12/7/23 | | | 1,663 | ØØ | |
| | 700 | | | Mexico Government International Bond, Senior Unsecured Medium-Term Notes, Ser. A,
6.75%, due 9/27/34 | | | 857 | ØØ | |
| | | | 4,350 | | |
Mongolia (1.1%) | | | |
| | 500 | | | Development Bank of Mongolia LLC, Government Guaranteed Notes, 5.75%, due 3/21/17 | | | 482 | | |
| | 500 | | | Mongolia Government International Bond, Senior Unsecured Notes, 4.13%, due 1/5/18 | | | 468 | | |
| | | | 950 | | |
Morocco (0.5%) | | | |
| | 500 | | | Morocco Government International Bond, Senior Unsecured Notes, 4.25%, due 12/11/22 | | | 470 | ñ | |
Nigeria (2.3%) | | | |
NGN | 170,000 | | | Nigeria Government Bond, Bonds, 15.10%, due 4/27/17 | | | 1,151 | | |
NGN | 120,000 | | | Nigeria Government Bond, Bonds, 16.00%, due 6/29/19 | | | 866 | ØØ | |
| | | | 2,017 | | |
Panama (0.4%) | | | |
| | 300 | | | Panama Government International Bond, Senior Unsecured Notes, 6.70%, due 1/26/36 | | | 355 | | |
Peru (1.4%) | | | |
PEN | 1,400 | | | Peruvian Government International Bond, Senior Unsecured Notes, 6.95%, due 8/12/31 | | | 544 | | |
| | 450 | | | Peruvian Government International Bond, Senior Unsecured Notes, 8.75%, due 11/21/33 | | | 656 | ØØ | |
| | | | 1,200 | | |
Philippines (1.1%) | | | |
PHP | 12,000 | | | Philippine Government International Bond, Senior Unsecured Notes, 3.90%, due 11/26/22 | | | 292 | | |
| | 400 | | | Philippine Government International Bond, Senior Unsecured Notes, 10.63%, due 3/16/25 | | | 632 | | |
| | | | 924 | | |
See Notes to Schedule of Investments
15
Schedule of Investments Neuberger Berman Emerging Markets Income Fund (cont'd)
| PRINCIPAL AMOUNTa | | | | VALUE† | |
(000's omitted) | | | | (000's omitted)z | |
Poland (3.2%) | | | |
PLN | 4,600 | | | Poland Government Bond, Bonds, 5.50%, due 10/25/19 | | $ | 1,635 | | |
PLN | 3,250 | | | Poland Government Bond, Bonds, 5.75%, due 9/23/22 | | | 1,181 | | |
| | | | 2,816 | | |
Romania (0.6%) | | | |
RON | 1,500 | | | Romania Government Bond, Bonds, 5.75%, due 1/27/16 | | | 478 | | |
RON | 250 | | | Romania Government Bond, Bonds, 5.85%, due 4/26/23 | | | 82 | | |
| | | | 560 | | |
Russia (7.8%) | | | |
RUB | 108,500 | | | Russian Federal Bond — OFZ, Bonds, 7.40%, due 6/14/17 | | | 3,480 | ØØ | |
RUB | 45,000 | | | Russian Federal Bond — OFZ, Bonds, 7.00%, due 1/25/23 | | | 1,396 | | |
RUB | 9,500 | | | Russian Federal Bond — OFZ, Bonds, 7.00%, due 8/16/23 | | | 293 | | |
RUB | 36,000 | | | Russian Federal Bond — OFZ, Bonds, 8.15%, due 2/3/27 | | | 1,190 | | |
| | 358 | | | Russian Foreign Bond — Eurobond, Senior Unsecured Notes, 7.50%, due 3/31/30 | | | 425 | ñ | |
| | | | 6,784 | | |
Serbia (0.3%) | | | |
| | 240 | | | Republic of Serbia, Senior Unsecured Notes, 7.25%, due 9/28/21 | | | 250 | | |
South Africa (3.5%) | | | |
ZAR | 16,500 | | | South Africa Government Bond, Bonds, 7.25%, due 1/15/20 | | | 1,647 | ØØ | |
ZAR | 6,000 | | | South Africa Government Bond, Bonds, 7.75%, due 2/28/23 | | | 602 | | |
ZAR | 3,700 | | | South Africa Government Bond, Bonds, 7.00%, due 2/28/31 | | | 313 | | |
| | 550 | | | South Africa Government International Bond, Senior Unsecured Notes, 4.67%, due 1/17/24 | | | 542 | | |
| | | | 3,104 | | |
Thailand (3.7%) | | | |
THB | 70,000 | | | Thailand Government Bond, Senior Unsecured Notes, 3.25%, due 6/16/17 | | | 2,256 | ØØ | |
THB | 30,000 | | | Thailand Government Bond, Senior Unsecured Notes, 3.63%, due 6/16/23 | | | 944 | | |
| | | | 3,200 | | |
Turkey (6.0%) | | | |
| | 350 | | | Export Credit Bank of Turkey, Senior Unsecured Notes, 5.88%, due 4/24/19 | | | 366 | ñ | |
| | 200 | | | Hazine Mustesarligi Varlik Kiralama AS, Bonds, 4.56%, due 10/10/18 | | | 204 | ñ | |
TRY | 5,500 | | | Turkey Government Bond, Bonds, 6.30%, due 2/14/18 | | | 2,586 | ØØ | |
TRY | 1,400 | | | Turkey Government Bond, Bonds, 8.30%, due 6/20/18 | | | 703 | | |
TRY | 1,400 | | | Turkey Government Bond, Bonds, 7.10%, due 3/8/23 | | | 635 | | |
| | 660 | | | Turkey Government International Bond, Senior Unsecured Notes, 6.75%, due 5/30/40 | | | 719 | | |
| | | | 5,213 | | |
See Notes to Schedule of Investments
16
Schedule of Investments Neuberger Berman Emerging Markets Income Fund (cont'd)
| PRINCIPAL AMOUNTa | | | | VALUE† | |
(000's omitted) | | | | (000's omitted)z | |
Venezuela (0.9%) | | | |
$ | 250 | | | Venezuela Government International Bond, Senior Unsecured Notes, 9.38%, due 1/13/34 | | $ | 199 | | |
| | 600 | | | Venezuela Government International Bond, Senior Unsecured Notes, 12.75%, due 8/23/22 | | | 604 | ØØ | |
| | | | 803 | | |
| | | | | Total Government Securities (Cost $56,478) | | | 57,286 | | |
NUMBER OF SHARES | | | | | |
Short-Term Investments (2.5%) | | | |
| | 2,159,789 | | | State Street Institutional Government Money Market Fund Institutional Class (Cost $2,160) | | | 2,160 | ØØ | |
| | | | | Total Investments (98.2%) (Cost $84,510) | | | 85,739 | ## | |
| | | | | Cash, receivables and other assets, less liabilities (1.8%) | | | 1,612 | ± | |
| | | | | Total Net Assets (100.0%) | | $ | 87,351 | | |
See Notes to Schedule of Investments
17
SUMMARY SCHEDULE OF INVESTMENTS BY INDUSTRY NEUBERGER BERMAN EMERGING MARKETS INCOME FUND
Industry | | Investments at
Value†
(000's omitted) | | Percentage of
Net Assets | |
Sovereign | | $ | 57,286 | | | | 65.6 | % | |
Banks | | | 7,852 | | | | 9.0 | % | |
Oil & Gas | | | 5,485 | | | | 6.3 | % | |
Real Estate | | | 1,931 | | | | 2.2 | % | |
Telecommunications | | | 1,302 | | | | 1.5 | % | |
Electric | | | 1,144 | | | | 1.3 | % | |
Iron — Steel | | | 1,093 | | | | 1.3 | % | |
Food | | | 1,050 | | | | 1.2 | % | |
Gas | | | 1,042 | | | | 1.2 | % | |
Diversified Financial Services | | | 993 | | | | 1.1 | % | |
Coal | | | 652 | | | | 0.8 | % | |
Building Materials | | | 558 | | | | 0.6 | % | |
Holding Companies — Diversified | | | 478 | | | | 0.5 | % | |
Mining | | | 429 | | | | 0.5 | % | |
Engineering & Construction | | | 412 | | | | 0.5 | % | |
Pharmaceuticals | | | 367 | | | | 0.4 | % | |
Forest Products & Paper | | | 339 | | | | 0.4 | % | |
Commercial Services | | | 318 | | | | 0.4 | % | |
Multi-National | | | 243 | | | | 0.3 | % | |
Chemicals | | | 210 | | | | 0.2 | % | |
Oil & Gas Services | | | 199 | | | | 0.2 | % | |
Transportation | | | 196 | | | | 0.2 | % | |
Short-Term Investments and Other Assets—Net | | | 3,772 | | | | 4.3 | % | |
| | | $ | 87,351 | | | | 100.0 | % | |
See Notes to Schedule of Investments
18
Notes to Schedule of Investments
† In accordance with Accounting Standards Codification ("ASC") 820 "Fair Value Measurements and Disclosures" ("ASC 820"), all investments held by Neuberger Berman Emerging Markets Income Fund (the "Fund") are carried at the value that Neuberger Berman Management LLC ("Management") believes the Fund would receive upon selling an investment in an orderly transaction to an independent buyer in the principal or most advantageous market for the investment under current market conditions. Various inputs, including the volume and level of activity for the asset or liability in the market, are considered in valuing the Fund's investments, some of which are discussed below. Significant management judgment may be necessary to value investments in accordance with ASC 820.
ASC 820 established a three-tier hierarchy of inputs to create a classification of value measurements for disclosure purposes. The three-tier hierarchy of inputs is summarized in the three broad Levels listed below.
• Level 1 – quoted prices in active markets for identical investments
• Level 2 – other significant observable inputs (including quoted prices for similar investments, interest rates, prepayment speeds, credit risk, amortized cost, etc.)
• Level 3 – significant unobservable inputs (including a Fund's own assumptions in determining the fair value of investments)
The inputs or methodology used for valuing an investment are not necessarily an indication of the risk associated with investing in those securities.
The value of the Fund's investments in debt securities is determined by Management primarily by obtaining valuations from independent pricing services based on readily available bid quotations, or if quotations are not available, by methods which include various considerations based on security type (generally Level 2 inputs). In addition to the consideration of yields or prices of securities of comparable quality, coupon, maturity and type; indications as to values from dealers; and general market conditions, the following is a description of other Level 2 inputs and related valuation techniques used by an independent pricing service to value certain types of debt securities of the Fund:
Corporate Debt Securities. Inputs used to value corporate debt securities generally include relative credit information, observed market movements, sector news, spread to the U.S. Treasury market, and other market information which may include benchmark yields, reported trades, broker-dealer quotes, issuer spreads, benchmark securities, bids, offers, and reference data, such as market research publications, when available ("Other Market Information").
Emerging Markets Debt, Sovereign Debt and Quasi-Sovereign Debt. Inputs used to value emerging markets debt, sovereign debt and quasi-sovereign debt generally include dealer quotes, bond market activity, discounted cash flow models, and other relevant information such as credit spreads, benchmark curves and Other Market Information.
The value of forward foreign currency contracts is determined by obtaining valuations from an independent pricing service based on actual traded currency rates on an independent pricing service's network, along with other traded and quoted currency rates provided to the pricing service by leading market participants (Level 2 inputs).
The value of the Fund's investments in interest rate swap contracts is determined by Management primarily by obtaining valuations from independent pricing services based on references to the underlying rates including the overnight index swap rate and London Interbank Offered Rate ("LIBOR") forward rate to produce the daily settlement price (generally Level 2 inputs).
See Notes to Schedule of Investments
19
Notes to Schedule of Investments (cont'd)
Management has developed a process to periodically review information provided by independent pricing services for all types of securities.
Investments in investment companies are valued using the respective fund's daily calculated net asset value per share (Level 2 inputs).
If a valuation is not available from an independent pricing service, or if Management has reason to believe that the valuation received does not represent the amount the Fund might reasonably expect to receive on a current sale in an orderly transaction, the Fund seeks to obtain quotations from principal market makers (generally considered Level 3 inputs). If such quotations are not readily available, the security is valued using methods the Neuberger Berman Income Fund's Board of Trustees (the "Board") has approved on the belief that they reflect fair value. Numerous factors may be considered when determining the fair value of a security based on Level 2 or 3 inputs, including available analyst, media or other reports, trading in futures or American Depositary Receipts ("ADRs") and whether the issuer of the security being fair valued has other securities outstanding.
The Board has approved the use of Interactive Data Pricing and Reference Data, Inc. ("Interactive") to evaluate the prices of foreign income securities as of the close of the New York Stock Exchange (the "NYSE"). Interactive utilizes benchmark spread and yield curves and evaluates available market activity from the local close to the close of the NYSE (Level 2 inputs) to assist in determining prices for certain foreign income securities. In the absence of precise information about the market values of these foreign securities as of the close of the NYSE, the Board has determined on the basis of available data that prices evaluated in this way are likely to be closer to the prices the Fund could realize on a current sale than are the prices of those securities established at the close of the foreign markets in which the securities primarily trade.
Fair value prices are necessarily estimates, and there is no assurance that such a price will be at or close to the price at which the security is next quoted or next trades.
The following is a summary, categorized by Level, of inputs used to value the Fund's investments as of October 31, 2013:
Asset Valuation Inputs
(000's omitted) | | Level 1 | | Level 2 | | Level 3 | | Total | |
Investments: | |
Corporate Debt Securities^ | | $ | — | | | $ | 26,293 | | | $ | — | | | $ | 26,293 | | |
Government Securities^ | | | — | | | | 57,286 | | | | — | | | | 57,286 | | |
Short-Term Investments | | | — | | | | 2,160 | | | | — | | | | 2,160 | | |
Total Investments | | | — | | | | 85,739 | | | | — | | | | 85,739 | | |
^ The Schedule of Investments and Summary Schedule of Investments by Industry provide information on the country and industry categorization for the portfolio.
The Fund had no transfers between Levels 1 and 2 during the period ended October 31, 2013.
The following is a summary, categorized by Level, of inputs used to value the Fund's derivatives as of October 31, 2013:
(000's omitted) | | Level 1 | | Level 2 | | Level 3 | | Total | |
Forward contracts (unrealized appreciation) | | $ | — | | | $ | 468 | | | $ | — | | | $ | 468 | | |
Interest rate swaps | | | — | | | | 32 | | | | — | | | | 32 | | |
Total | | | — | | | | 500 | | | | — | | | | 500 | | |
See Notes to Schedule of Investments
20
Notes to Schedule of Investments (cont'd)
Liability Valuation Inputs
The following is a summary, categorized by Level, of inputs used to value the Fund's derivatives as of October 31, 2013:
(000's omitted) | | Level 1 | | Level 2 | | Level 3 | | Total | |
Forward contracts (unrealized depreciation) | | $ | — | | | $ | (243 | ) | | $ | — | | | $ | (243 | ) | |
Interest rate swaps | | | — | | | | (31 | ) | | | — | | | | (31 | ) | |
Total | | | — | | | | (274 | ) | | | — | | | | (274 | ) | |
## At October 31, 2013, the cost of investments for U.S. federal income tax purposes was approximately $84,510,000. Gross unrealized appreciation of investments was approximately $2,047,000 and gross unrealized depreciation of investments was approximately $818,000, resulting in net unrealized appreciation of approximately $1,229,000 based on cost for U.S. federal income tax purposes.
ñ Securities were purchased under Rule 144A of the Securities Act of 1933, as amended (the "1933 Act"), or are private placements and, unless registered under the 1933 Act or exempted from registration, may only be sold to qualified institutional investors. These securities have been deemed by the investment manager to be liquid. At October 31, 2013, these securities amounted to approximately $23,465,000 or 26.9% of net assets for the Fund.
ØØ All or a portion of this security is segregated in connection with obligations for forward contracts and/or interest rate swaps.
µ Floating rate securities are securities whose yields vary with a designated index or market rate. These securities are shown at their current rates as of October 31, 2013, and their final maturities.
a Principal amount is stated in the currency in which the security is denominated.
BRL = Brazilian Real
COP = Colombian Peso
CZK = Czech Koruna
HUF = Hungarian Forint
IDR = Indonesian Rupiah
MXN = Mexican Peso
MYR = Malaysian Ringgit
NGN = Nigerian Naira
PEN = Peruvian Nuevo Sol
PHP = Philippine Peso
PLN = Polish Zloty
RON = Romanian Leu
RUB = Russian Ruble
THB = Thai Baht
TRY = Turkish Lira
ZAR = South African Rand
See Notes to Schedule of Investments
21
Notes to Schedule of Investments (cont'd)
z A zero balance may reflect actual amounts rounding to less than $1,000.
± See Note A-13 in the Notes to Financial Statements for the Fund's open derivatives at October 31, 2013.
** Step Bond: Coupon rate is a fixed rate for an initial period, then resets at a specific date and rate.
See Notes to Schedule of Investments
22
Statement of Assets and Liabilities
Neuberger Berman Income Funds
(000's omitted except per share amounts)
| | | EMERGING
MARKETS
INCOME FUND | |
| | | October 31,
2013 | |
Assets | |
Investments in securities, at value * (Note A)—see Schedule of Investments: | |
Unaffiliated issuers | | $ | 85,739 | | |
Cash | | | 2,346 | | |
Dividends and interest receivable | | | 1,202 | | |
Receivable for securities sold | | | 2,168 | | |
Receivable from Management-net (Note B) | | | 43 | | |
Receivable for open forward foreign currency contracts (Note A) | | | 468 | | |
Interest rate swaps, at value (Note A) | | | 1 | | |
Total Assets | | | 91,967 | | |
Liabilities | |
Payable for open forward foreign currency contracts (Note C) | | | 243 | | |
Due to custodian | | | 7 | | |
Payable for securities purchased | | | 4,083 | | |
Payable to investment manager-net (Note B) | | | 40 | | |
Payable to trustees | | | 3 | | |
Payable for offering costs | | | 180 | | |
Accrued expenses and other payables | | | 60 | | |
Total Liabilities | | | 4,616 | | |
Net Assets | | $ | 87,351 | | |
Net Assets consist of: | |
Paid-in capital | | $ | 85,674 | | |
Undistributed net investment income (loss) | | | 142 | | |
Accumulated net realized gains (losses) on investments | | | 76 | | |
Net unrealized appreciation (depreciation) in value of investments | | | 1,459 | | |
Net Assets | | $ | 87,351 | | |
Net Assets | |
Institutional Class | | $ | 87,249 | | |
Class A | | | 51 | | |
Class C | | | 51 | | |
Shares Outstanding ($.001 par value; unlimited shares authorized) | |
Institutional Class | | | 8,556 | | |
Class A | | | 5 | | |
Class C | | | 5 | | |
Net Asset Value, offering and redemption price per share | |
Institutional Class | | $ | 10.20 | | |
Net Asset Value and redemption price per share | |
Class A | | $ | 10.20 | | |
Offering Price per share | |
Class A‡ | | $ | 10.65 | | |
Net Asset Value and offering price per share | |
Class C^ | | $ | 10.20 | | |
*Cost of Investments: | | | |
Unaffiliated issuers | | $ | 84,510 | | |
‡ On single retail sales of less than $50,000. On sales of $50,000 or more or in certain other circumstances described in the Fund's prospectus, offering price is reduced.
^ Redemption price per share is equal to net asset value less any applicable contingent deferred sales charge.
See Notes to Financial Statements
23
Neuberger Berman Income Funds
(000's omitted)
| | EMERGING
MARKETS
INCOME FUND | |
| | Period from
September 27, 2013
(Commencement of
Operations) to
October 31,
2013 | |
Investment Income: | |
Income (Note A): | |
Interest and other income-unaffiliated issuers | | $ | 396 | | |
Foreign taxes withheld | | | (32 | ) | |
Total income | | $ | 364 | | |
Expenses: | |
Investment management fees (Note B) | | | 45 | | |
Administration fees (Note B) | | | 5 | | |
Administration fees (Note B): | |
Institutional Class | | | 7 | | |
Class A | | | — | | |
Class C | | | — | | |
Distribution fees (Note B): | |
Class A | | | — | | |
Class C | | | — | | |
Shareholder servicing agent fees: | |
Institutional Class | | | 2 | | |
Class A | | | 2 | | |
Class C | | | 2 | | |
Organization expense (Note A) | | | 180 | | |
Audit fees | | | 29 | | |
Custodian and accounting fees | | | 14 | | |
Legal fees | | | 4 | | |
Registration and filing fees | | | 1 | | |
Shareholder reports | | | 8 | | |
Trustees' fees and expenses | | | 2 | | |
Miscellaneous | | | 1 | | |
Total expenses | | | 302 | | |
Expenses reimbursed by Management (Note B) | | | (228 | ) | |
Management fees waived (Note B) | | | (8 | ) | |
Total net expenses | | | 66 | | |
Net investment income (loss) | | $ | 298 | | |
Realized and Unrealized Gain (Loss) on Investments (Note A): | |
Net realized gain (loss) on: | |
Sales of investment securities of unaffiliated issuers | | | 135 | | |
Foreign currency | | | 88 | | |
Net unrealized appreciation (depreciation) in value of: | |
Unaffiliated investment securities | | | 1,229 | | |
Forward foreign currency contracts | | | 225 | | |
Foreign currency | | | 4 | | |
Interest rate swap contracts | | | 1 | | |
Net gain (loss) on investments | | | 1,682 | | |
Net increase (decrease) in net assets resulting from operations | | $ | 1,980 | | |
See Notes to Financial Statements
24
Statement of Changes in Net Assets
Neuberger Berman Income Funds
(000's omitted)
| | | EMERGING
MARKETS
INCOME FUND | |
| | | Period from
September 27, 2013
(Commencement of
Operations) to
October 31,
2013 | |
Increase (Decrease) in Net Assets: | |
From Operations (Note A): | |
Net investment income (loss) | | $ | 298 | | |
Net realized gain (loss) on investments | | | 223 | | |
Net unrealized appreciation (depreciation) of investments | | | 1,459 | | |
Net increase (decrease) in net assets resulting from operations | | | 1,980 | | |
Distributions to Shareholders From (Note A): | |
Net investment income: | |
Institutional Class | | | (303 | ) | |
Class A | | | (0 | ) | |
Class C | | | (0 | ) | |
Total distributions to shareholders | | | (303 | ) | |
From Fund Share Transactions (Note D): | |
Proceeds from shares sold: | |
Institutional Class | | | 85,271 | | |
Class A | | | 50 | | |
Class C | | | 50 | | |
Proceeds from reinvestment of dividends and distributions: | |
Institutional Class | | | 303 | | |
Class A | | | — | | |
Class C | | | — | | |
Net increase (decrease) from Fund share transactions | | | 85,674 | | |
Net Increase (Decrease) in Net Assets | | | 87,351 | | |
Net Assets: | |
Beginning of period | | | — | | |
End of period | | $ | 87,351 | | |
Undistributed net investment income (loss) at end of period | | $ | 142 | | |
See Notes to Financial Statements
25
Notes to Financial Statements Emerging Markets Income Fund
Note A—Summary of Significant Accounting Policies:
1 General: Neuberger Berman Income Funds (the "Trust") is a Delaware statutory trust organized pursuant to an Amended and Restated Trust Instrument dated June 24, 2009. The Trust is registered as an open-end management investment company under the Investment Company Act of 1940, as amended (the "1940 Act"), and its shares are registered under the 1933 Act. The Fund is a separate operating series of the Trust and is non-diversified. The Fund offers Institutional Class shares, Class A shares and Class C shares. The Fund had no operations until September 27, 2013, other than matters relating to its organization and registration of shares under the 1933 Act. The Board may establish additional series or classes of shares without the approval of shareholders.
A zero balance, if any, reflects an actual amount rounding to less than $1,000.
The assets of the Fund belong only to the Fund, and the liabilities of the Fund are borne solely by the Fund and no other.
The preparation of financial statements in accordance with U.S. generally accepted accounting principles ("GAAP") requires Management to make estimates and assumptions at the date of the financial statements. Actual results could differ from those estimates.
2 Portfolio valuation: Investment securities are valued as indicated in the notes following the Fund's Schedule of Investments.
3 Foreign currency translation: The Fund may invest in foreign securities denominated in foreign currencies. The accounting records of the Fund are maintained in U.S. dollars. Foreign currency amounts are translated into U.S. dollars using the exchange rate as of 4:00 p.m., Eastern time, to determine the value of investments, other assets and liabilities. Purchase and sale prices of securities, and income and expenses, are translated into U.S. dollars at the prevailing rate of exchange on the respective dates of such transactions. Net unrealized foreign currency gain (loss), if any, arises from changes in the value of assets and liabilities, other than investments in securities, as a result of changes in exchange rates and is stated separately in the Statement of Operations.
4 Securities transactions and investment income: Securities transactions are recorded on the trade date for financial reporting purposes. Dividend income is recorded on the ex-dividend date or, for certain foreign dividends, as soon as the Fund becomes aware of the dividends. Non-cash dividends included in dividend income, if any, are recorded at the fair market value of the securities received. Interest income, including accretion of discount (adjusted for original issue discount, where applicable) and amortization of premium, where applicable, is recorded on the accrual basis. Realized gains and losses from securities transactions and foreign currency transactions, if any, are recorded on the basis of identified cost and stated separately in the Statement of Operations.
5 Income tax information: It is the intention of the Fund to qualify for treatment as a regulated investment company by complying with the requirements of the U.S. Internal Revenue Code applicable to regulated investment companies and to distribute substantially all of its net investment income and net realized capital gains to its shareholders. To the extent the Fund distributes substantially all of its net investment income and net realized capital gains to shareholders, no federal income or excise tax provision is required.
The Fund has adopted the provisions of ASC 740 "Income Taxes" ("ASC 740"). ASC 740 sets forth a minimum threshold for financial statement recognition of a tax position taken, or expected to be taken, in a tax return. The Fund recognizes interest and penalties, if any, related to unrecognized tax positions as an income tax expense in the Statement of Operations. As of October 31, 2013, the Fund did not have any unrecognized tax positions.
Income distributions and capital gain distributions are determined in accordance with income tax regulations, which may differ from GAAP. These differences are primarily due to differing treatments of income and gains on
26
various investment securities held by the Fund, timing differences and differing characterization of distributions made by the Fund. The Fund may also utilize earnings and profits distributed to shareholders on redemption of their shares as a part of the dividends-paid deduction for income tax purposes.
As determined on October 31, 2013, permanent differences resulting primarily from different book and tax accounting were reclassified at the end of the period. Such differences may be attributed to one or more of the following: non-deductible 12b-1 fees, and foreign currency gains and losses. These reclassifications had no effect on net income, net asset value ("NAV") or NAV per share of the Fund. For the period ended October 31, 2013, the Fund recorded the following permanent reclassifications:
| Paid-in Capital | | Undistributed
Net Investment
Income (Loss) | | Accumulated Net
Realized Gains
(Losses) on
Investments | |
| $ | (61 | ) | | $ | 147,221 | | | $ | (147,160 | ) | |
For tax purposes, distributions of short-term gains are taxable to shareholders as ordinary income.
The tax character of distributions paid during the period ended October 31, 2013 was as follows:
| | | Distributions Paid From: | |
| | Ordinary Income | | Long-Term
Capital Gain | | Return of
Capital | | Total | |
| | | 2013 | | 2013 | | 2013 | | 2013 | |
| | | | | $ | 302,935 | (1) | | $ | — | | | $ | — | | | $ | 302,935 | (1) | |
(1) Period from September 27, 2013 (Commencement of Operations) to October 31, 2013.
As of October 31, 2013, the components of distributable earnings (accumulated losses) on a U.S. federal income tax basis were as follows:
Undistributed
Ordinary
Income | | Undistributed
Tax-Exempt
Income | | Undistributed
Long-Term
Gain | | Unrealized
Appreciation
(Depreciation) | | Loss
Carryforwards
and Deferrals | | Other
Temporary
Differences | | Total | |
| $ | 424,712 | | | $ | — | | | $ | 73,855 | | | $ | 1,231,818 | | | $ | — | | | $ | (52,815 | ) | | $ | 1,677,570 | | |
The differences between book basis and tax basis distributable earnings are primarily due to: organization expenses, deferral of current year straddle losses, and mark to market on certain swap contract transactions and forward foreign currency contracts.
To the extent the Fund's net realized capital gains, if any, can be offset by capital loss carryforwards, it is the policy of the Fund not to distribute such gains. For taxable years beginning after December 22, 2010, the capital loss carryforward rules allow for regulated investment companies to carry forward capital losses indefinitely and to retain the character of capital loss carryforwards as short-term or long-term. As determined at October 31, 2013, the Fund had unused capital loss carryforwards available for federal income tax purposes to offset net realized capital gains, if any, as follows:
| Long-Term | | Short-Term | |
| $ | — | | | $ | — | | |
6 Distributions to shareholders: The Fund earns income, net of expenses, daily on its investments. Ordinarily, distributions from net investment income are declared on each business day and paid monthly, and distributions from net realized capital gains, if any, are generally distributed once a year (usually in December). Distributions to shareholders are recorded on the ex-date.
27
7 Organization expenses: Costs incurred by the Fund in connection with its organization, which amounted to $179,895 and are reflected in Organization expense in the Statement of Operations, have been expensed as incurred.
8 Expense allocation: Certain expenses are applicable to multiple funds. Expenses directly attributable to the Fund are charged to the Fund. Expenses of the Trust that are not directly attributable to a particular series of the Trust (e.g., the Fund) are allocated among the series of the Trust, on the basis of relative net assets, except where a more appropriate allocation of expenses to each of the series can otherwise be made fairly. Expenses borne by the complex of related investment companies, which includes open-end and closed-end investment companies for which Management serves as investment manager, that are not directly attributable to a particular investment company in the complex (e.g., the Trust) or series thereof are allocated among the investment companies in the complex or series thereof, on the basis of relative net assets, except where a more appropriate allocation of expenses to each of the investment companies in the complex or series thereof can otherwise be made fairly. The Fund's expenses (other than those specific to each class) are allocated proportionally each day among the classes based upon the relative net assets of each class.
9 Dollar rolls: The Fund may enter into dollar roll transactions with respect to mortgage-backed securities. In a dollar roll transaction, the Fund sells securities for delivery in the current month and simultaneously agrees to repurchase substantially similar (i.e., same type and coupon) securities on a specified future date from the same party. During the period before this repurchase, the Fund forgoes principal and interest payments on the securities. The Fund is compensated by the difference between the current sales price and the forward price for the future purchase (often referred to as the "drop"), as well as by the interest earned on the cash proceeds of the initial sale. Dollar rolls may increase fluctuations in the Fund's NAV and may be viewed as a form of leverage. There is a risk that the counterparty will be unable or unwilling to complete the transaction as scheduled, which may result in losses to the Fund.
10 When-issued/Delayed delivery securities: The Fund may purchase securities with delivery or payment to occur at a later date beyond the normal settlement period. At the time the Fund enters into a commitment to purchase a security, the transaction is recorded and the value of the security is reflected in the NAV. The price of such security and the date when the security will be delivered and paid for are fixed at the time the transaction is negotiated. The value of the security may vary with market fluctuations. No interest accrues to the Fund until payment takes place. At the time the Fund enters into this type of transaction it is required to segregate cash or other liquid assets at least equal to the amount of the commitment. When-issued and delayed delivery transactions can have a leverage-like effect on the Fund, which can increase fluctuations in the Fund's share price. Certain risks may arise upon entering into when-issued or delayed delivery securities from the potential inability of counterparties to meet the terms of their contracts or if the issuer does not issue the securities due to political, economic, or other factors. Additionally, losses may arise due to changes in the value of the underlying securities.
11 Foreign taxes: Foreign taxes, if any, withheld represent amounts withheld by foreign tax authorities, net of refunds recoverable.
12 Investments in foreign securities: Investing in foreign securities may involve certain sovereign and other risks, in addition to the credit and market risks normally associated with domestic securities. These additional risks include the possibility of adverse political and economic developments (including political instability, nationalization, expropriation, or confiscatory taxation) and the potentially adverse effects of unavailability of public information regarding issuers, less governmental supervision and regulation of financial markets, reduced liquidity of certain financial markets, and the lack of uniform accounting, auditing, and financial reporting standards or the application of standards that are different or less stringent than those applied in the United States. Foreign securities also may experience greater price volatility, higher rates of inflation, and delays in settlement.
13 Derivative instruments: During the period ended October 31, 2013, the Fund's use of derivatives, as described below, was limited to interest rate swaps and forward foreign currency contracts. The Fund has adopted the provisions of ASC 815 "Derivatives and Hedging" ("ASC 815"). The disclosure requirements of ASC 815
28
distinguish between derivatives that qualify for hedge accounting and those that do not. Because investment companies value their derivatives at fair value and recognize changes in fair value through the Statement of Operations, they do not qualify for hedge accounting. Accordingly, even though the Fund's investments in derivatives may represent economic hedges, they are considered non-hedge transactions for purposes of this disclosure.
Interest rate swaps: The Fund entered into interest rate swap transactions, with institutions that Management has determined are creditworthy, to manage or adjust interest rate risk of the Fund, to take advantage of the portfolio managers' views on interest rates and market pricing of future monetary policy, to obtain liquidity in portions of the curve where bonds are illiquid or do not exist, and to generate alpha by obtaining leveraged rate positions. Under the terms of the interest rate swap contracts, the Fund agrees to pay the swap counterparty a fixed-rate payment in exchange for the counterparty's paying the Fund a variable-rate payment. The fixed-rate and variable-rate payment flows are netted against each other, with the difference being paid by one party to the other on a monthly or quarterly basis. The Fund segregates cash or liquid securities having a value at least equal to the Fund's net payment obligations under any swap transaction, marked to market daily. There is no guarantee that these swap transactions will be successful in reducing or limiting risk.
Risks may arise if the counterparty to a swap contract fails to comply with the terms of its contract. The loss incurred by the failure of a counterparty is generally limited to the net interest payment to be received by the Fund and/or the termination value at the end of the contract. Additionally, risks may arise if there is no liquid market for these agreements or from movements in interest rates unanticipated by Management.
Periodic expected interim net interest payments or receipts on the swaps are recorded as an adjustment to unrealized gains/losses, along with the fair value of the future periodic payment or receivable streams on the swaps. The unrealized gains/losses associated with the periodic interim net interest payments or receipts are reclassified to realized gains/losses in conjunction with the actual net payment or receipt of such amounts. The reclassifications do not impact the Fund's total net assets or its total net increase (decrease) in net assets resulting from operations. At October 31, 2013, the Fund had outstanding interest rate swap contracts as follows:
Swap
Counterparty | | Notional
Amount(1) | | Termination
Date | | Fixed-rate
Payments
Made
by the Fund | | Variable-rate
Payments
Received
by the Fund | | Accrued Net
Interest
Receivable
(Payable) | | Unrealized
Appreciation
(Depreciation) | | Total Fair
Value | |
JP Morgan
Chase
Bank, N.A. | | $ | 200,000,000 | | | October 4, 2015 | | | 3.62 | % | | | 3.55% | (4) | | $ | (15 | ) | | $ | (457 | ) | | $ | (472 | ) | |
JP Morgan
Chase
Bank, N.A. | | | 7,500,000 | | | October 4, 2015 | | | 1.30 | % | | | 1.00% | (2) | | | (453 | ) | | | (5,674 | ) | | | (6,127 | ) | |
JP Morgan
Chase
Bank, N.A. | | | 5,297,881 | | | January 5, 2016 | | | 11.02 | % | | | 9.32% | (5) | | | 2,935 | | | | (5,756 | ) | | | (2,821 | ) | |
JP Morgan
Chase
Bank, N.A. | | | 40,000,000 | | | October 5, 2017 | | | 6.21 | % | | | 3.79% | (8) | | | — | | | | 2,483 | | | | 2,483 | | |
JP Morgan
Chase
Bank, N.A. | | | 30,000,000 | | | September 27, 2018 | | | 5.25 | % | | | 4.03% | (6) | | | 2,278 | | | | (4,968 | ) | | | (2,690 | ) | |
JP Morgan
Chase
Bank, N.A. | | | 3,150,000 | | | October 4, 2018 | | | 2.40 | % | | | 1.00% | (2) | | | 957 | | | | 10,145 | | | | 11,102 | | |
29
Swap
Counterparty | | Notional
Amount(1) | | Termination
Date | | Fixed-rate
Payments
Made
by the Fund | | Variable-rate
Payments
Received
by the Fund | | Accrued Net
Interest
Receivable
(Payable) | | Unrealized
Appreciation
(Depreciation) | | Total Fair
Value | |
JP Morgan
Chase
Bank, N.A. | | $ | 7,800,000 | | | October 2, 2023 | | | 8.08 | % | | | 5.14% | (3) | | $ | 1,739 | | | $ | 7,957 | | | $ | 9,696 | | |
Goldman Sachs
International | | | 8,000,000 | | | October 12, 2023 | | | 6.18 | % | | | 3.98% | (7) | | | 265 | | | | (18,786 | ) | | | (18,521 | ) | |
JP Morgan
Chase
Bank, N.A. | | | 6,400,000 | | | October 2, 2028 | | | 8.53 | % | | | 5.14% | (3) | | | 1,649 | | | | 6,670 | | | | 8,319 | | |
| | | | | | | | | | $ | 9,355 | | | $ | (8,386 | ) | | $ | 969 | | |
(1) The notional amount at period end is indicative of the volume throughout the period.
(2) 3 Month Tel Aviv Interbank Offer Rate (TELBOR) at October 2, 2013.
(3) 3 Month Johannesburg Interbank Agreed Rate (JIBAR) at October 3, 2013.
(4) 6 Month Budapest Interbank Offer Rate (BUBOR) at October 2, 2013.
(5) 1 Day Overnight Brazil CETIP Interbank Deposit Rate.
(6) 28 Day Mexican Interbank Equilibrium Interest Rate (TIIE) at October 1, 2013.
(7) 28 Day Mexican Interbank Equilibrium Interest Rate (TIIE) at October 24, 2013.
(8) 28 Day Mexican Interbank Equilibrium Interest Rate (TIIE).
Forward foreign currency contracts: During the period ended October 31, 2013, the Fund entered into forward foreign currency contracts ("forward contracts") to manage or adjust currency views and currency exposure of the Fund, to generate alpha by applying FX leverage, and to gain exposure to new and difficult to access markets.
A forward contract is an agreement between two parties to buy or sell a specific currency for another at a set price on a future date, which is individually negotiated and privately traded by currency traders and their customers in the interbank market. The market value of a forward contract fluctuates with changes in forward currency exchange rates. Forward contracts are marked to market daily, and the change in value is recorded by the Fund as an unrealized gain or loss. At the consummation of a forward contract to purchase or sell currency, a Fund may either exchange the currencies specified at the maturity of a forward contract or enter into a closing transaction involving the purchase or sale of an offsetting forward contract. Closing transactions with respect to forward contracts are usually performed with the counterparty to the original forward contract. The gain or loss arising from the difference between the US dollar cost of the original contract and the value of the foreign currency in US dollars upon closing a contract is included in "Net realized gain (loss) from forward foreign currency contracts" in the Statement of Operations. These contracts may involve market risk in excess of the unrealized gain or loss reflected in the Statement of Assets and Liabilities. In addition, the Fund could be exposed to risk if the counterparties are unable to meet the terms of the contracts or if the value of the currency changes unfavorably to the US dollar.
30
At October 31, 2013, open forward contracts were as follows:
| Contracts Received | | In Exchange For | | Counterparty | | Settlement
Date | | Value | | Net
Unrealized
Appreciation
(Depreciation) | |
| 1,300,089 | | | Brazilian Real | | $ | 575,897 | | | US Dollar | | Goldman Sachs
International | | 12/02/13 | | $ | 576,431 | | | $ | 534 | | |
| 13,150,000 | | | Yuan Renminbi | | | 2,147,114 | | | US Dollar | | Goldman Sachs
International | | 04/22/14 | | | 2,147,050 | | | | (64 | ) | |
| 932,795 | | | Euro Currency | | | 1,261,373 | | | Czech Koruna | | JP Morgan Chase
Bank, N.A. | | 11/07/13 | | | 1,266,511 | | | | 5,138 | | |
| 124,472 | | | Euro Currency | | | 169,255 | | | US Dollar | | Goldman Sachs
International | | 12/02/13 | | | 169,012 | | | | (243 | ) | |
| 539,336 | | | Euro Currency | | | 732,068 | | | Czech Koruna | | Goldman Sachs
International | | 11/07/13 | | | 732,289 | | | | 221 | | |
| 2,015,580 | | | Euro Currency | | | 2,733,521 | | | US Dollar | | Goldman Sachs
International | | 11/05/13 | | | 2,736,659 | | | | 3,138 | | |
| 1,848,497 | | | Euro Currency | | | 2,545,691 | | | Hungarian Forint | | JP Morgan Chase
Bank, N.A. | | 11/04/13 | | | 2,509,795 | | | | (35,896 | ) | |
| 380,115 | | | Euro Currency | | | 519,165 | | | US Dollar | | Goldman Sachs
International | | 12/04/13 | | | 516,135 | | | | (3,030 | ) | |
| 543,740,470 | | | Hungarian Forint | | | 2,464,258 | | | Euro Currency | | JP Morgan Chase
Bank, N.A. | | 11/04/13 | | | 2,497,424 | | | | 33,166 | | |
| 18,567,876 | | | Hungarian Forint | | | 84,804 | | | US Dollar | | Goldman Sachs
International | | 11/04/13 | | | 85,283 | | | | 479 | | |
| 465,140,470 | | | Hungarian Forint | | | 2,192,100 | | | Euro Currency | | JP Morgan Chase
Bank, N.A. | | 01/24/14 | | | 2,125,628 | | | | (66,472 | ) | |
| 32,794,611 | | | Hungarian Forint | | | 154,160 | | | Euro Currency | | Goldman Sachs
International | | 01/24/14 | | | 149,867 | | | | (4,293 | ) | |
| 7,700,000,000 | | | Indonesian Rupiah | | | 699,364 | | | US Dollar | | Goldman Sachs
International | | 12/02/13 | | | 679,898 | | | | (19,466 | ) | |
| 53,000,000 | | | Indian Rupee | | | 826,962 | | | US Dollar | | Goldman Sachs
International | | 12/11/13 | | | 855,232 | | | | 28,270 | | |
| 1,800,000,000 | | | South Korean Won | | | 1,666,975 | | | US Dollar | | JP Morgan Chase
Bank, N.A. | | 12/11/13 | | | 1,692,368 | | | | 25,393 | | |
| 13,579,376 | | | Mexican Peso | | | 1,027,421 | | | US Dollar | | JP Morgan Chase
Bank, N.A. | | 11/19/13 | | | 1,039,547 | | | | 12,126 | | |
| 11,747,355 | | | Mexican Peso | | | 892,049 | | | US Dollar | | Goldman Sachs
International | | 11/19/13 | | | 899,300 | | | | 7,251 | | |
| 16,500,000 | | | Mexican Peso | | | 1,260,039 | | | US Dollar | | Goldman Sachs
International | | 12/16/13 | | | 1,260,473 | | | | 434 | | |
| 9,150,000 | | | Malaysian Ringgit | | | 2,795,173 | | | US Dollar | | JP Morgan Chase
Bank, N.A. | | 11/26/13 | | | 2,895,145 | | | | 99,972 | | |
| 300,000 | | | Malaysian Ringgit | | | 94,937 | | | US Dollar | | Goldman Sachs
International | | 11/26/13 | | | 94,923 | | | | (14 | ) | |
| 2,941,805 | | | Peruvian Nuevo Sol | | | 1,052,515 | | | US Dollar | | JP Morgan Chase
Bank, N.A. | | 11/12/13 | | | 1,059,894 | | | | 7,379 | | |
| 12,344,571 | | | Polish Zloty | | | 3,953,668 | | | Euro Currency | | JP Morgan Chase
Bank, N.A. | | 11/18/13 | | | 4,004,233 | | | | 50,565 | | |
31
| Contracts Received | | In Exchange For | | Counterparty | | Settlement
Date | | Value | | Net
Unrealized
Appreciation
(Depreciation) | |
| 1,278,727 | | | Romanian Leu | | $ | 387,640 | | | Euro Currency | | JP Morgan Chase
Bank, N.A. | | 12/02/13 | | $ | 390,893 | | | $ | 3,253 | | |
| 20,852,435 | | | Russian Ruble | | | 637,684 | | | US Dollar | | JP Morgan Chase
Bank, N.A. | | 11/20/13 | | | 648,495 | | | | 10,811 | | |
| 3,000,000 | | | Russian Ruble | | | 92,365 | | | US Dollar | | Goldman Sachs
International | | 11/20/13 | | | 93,298 | | | | 933 | | |
| 4,221,536 | | | Turkish Lira | | | 2,107,544 | | | US Dollar | | JP Morgan Chase
Bank, N.A. | | 11/05/13 | | | 2,113,271 | | | | 5,727 | | |
| 2,385,177 | | | Turkish Lira | | | 1,179,927 | | | US Dollar | | JP Morgan Chase
Bank, N.A. | | 01/28/14 | | | 1,176,937 | | | | (2,990 | ) | |
| 11,778,081 | | | South African Rand | | | 1,157,341 | | | US Dollar | | JP Morgan Chase
Bank, N.A. | | 12/02/13 | | | 1,168,612 | | | | 11,271 | | |
Total | | | | | | | | | | | | | | $ | 173,593 | | |
| Contracts Delivered | | In Exchange For | | Counterparty | | Settlement
Date | | Value | | Net
Unrealized
Appreciation
(Depreciation) | |
| 178,688,286 | | | Chilean Peso | | $ | 351,265 | | | US Dollar | | JP Morgan Chase
Bank, N.A. | | 11/27/13 | | $ | 347,636 | | | $ | 3,629 | | |
| 1,094,398,979 | | | Colombian Peso | | | 568,519 | | | US Dollar | | Goldman Sachs
International | | 12/02/13 | | | 576,888 | | | | (8,369 | ) | |
| 1,760,000,000 | | | Colombian Peso | | | 928,588 | | | US Dollar | | Goldman Sachs
International | | 12/02/13 | | | 927,744 | | | | 844 | | |
| 24,000,000 | | | Czech Koruna | | | 1,261,373 | | | Euro Currency | | JP Morgan Chase
Bank, N.A. | | 11/07/13 | | | 1,262,945 | | | | (1,572 | ) | |
| 13,781,251 | | | Czech Koruna | | | 732,068 | | | Euro Currency | | Goldman Sachs
International | | 11/07/13 | | | 725,207 | | | | 6,861 | | |
| 450,000 | | | Euro Currency | | | 607,519 | | | US Dollar | | JP Morgan Chase
Bank, N.A. | | 11/05/13 | | | 610,989 | | | | (3,470 | ) | |
| 285,732 | | | Euro Currency | | | 387,640 | | | Romanian Leu | | JP Morgan Chase
Bank, N.A. | | 12/02/13 | | | 387,977 | | | | (337 | ) | |
| 1,820,113 | | | Euro Currency | | | 2,464,258 | | | Hungarian Forint | | JP Morgan Chase
Bank, N.A. | | 11/04/13 | | | 2,471,257 | | | | (6,999 | ) | |
| 86,485 | | | Euro Currency | | | 117,580 | | | US Dollar | | Goldman Sachs
International | | 12/02/13 | | | 117,432 | | | | 148 | | |
| 2,919,062 | | | Euro Currency | | | 3,953,668 | | | Polish Zloty | | JP Morgan Chase
Bank, N.A. | | 11/18/13 | | | 3,963,477 | | | | (9,809 | ) | |
| 1,573,222 | | | Euro Currency | | | 2,192,100 | | | Hungarian Forint | | JP Morgan Chase
Bank, N.A. | | 01/24/14 | | | 2,136,299 | | | | 55,801 | | |
| 1,565,580 | | | Euro Currency | | | 2,129,227 | | | US Dollar | | Goldman Sachs
International | | 11/05/13 | | | 2,125,670 | | | | 3,557 | | |
| 111,283 | | | Euro Currency | | | 154,160 | | | Hungarian Forint | | Goldman Sachs
International | | 01/24/14 | | | 151,113 | | | | 3,047 | | |
| 18,567,876 | | | Hungarian Forint | | | 87,697 | | | US Dollar | | Goldman Sachs
International | | 11/04/13 | | | 85,284 | | | | 2,414 | | |
| 543,740,470 | | | Hungarian Forint | | | 2,545,691 | | | Euro Currency | | JP Morgan Chase
Bank, N.A. | | 11/04/13 | | | 2,497,423 | | | | 48,267 | | |
32
| Contracts Delivered | | In Exchange For | | Counterparty | | Settlement
Date | | Value | | Net
Unrealized
Appreciation
(Depreciation) | |
| 13,449,195,050 | | | Indonesian Rupiah | | $ | 1,143,639 | | | US Dollar | | Goldman Sachs
International | | 12/02/13 | | $ | 1,187,542 | | | $ | (43,903 | ) | |
| 5,914,596 | | | Israeli Shekel | | | 1,669,024 | | | US Dollar | | JP Morgan Chase
Bank, N.A. | | 12/02/13 | | | 1,676,462 | | | | (7,438 | ) | |
| 11,300,000 | | | Mexican Peso | | | 860,559 | | | US Dollar | | JP Morgan Chase
Bank, N.A. | | 11/19/13 | | | 865,054 | | | | (4,495 | ) | |
| 15,700,000 | | | Mexican Peso) | | | 1,208,023 | | | US Dollar | | JP Morgan Chase
Bank, N.A. | | 12/16/13 | | | 1,199,360 | | | | 8,663 | | |
| 45,000,000 | | | Russian Ruble | | | 1,380,622 | | | US Dollar | | Goldman Sachs
International | | 11/20/13 | | | 1,399,466 | | | | (18,844 | ) | |
| 26,300,000 | | | Russian Ruble | | | 821,618 | | | US Dollar | | JP Morgan Chase
Bank, N.A. | | 11/20/13 | | | 817,910 | | | | 3,708 | | |
| 11,200,000 | | | Russian Ruble | | | 348,096 | | | US Dollar | | JP Morgan Chase
Bank, N.A. | | 11/20/13 | | | 348,499 | | | | (403 | ) | |
| 27,500,000 | | | Thai Baht | | | 876,494 | | | US Dollar | | Goldman Sachs
International | | 12/04/13 | | | 881,869 | | | | (5,375 | ) | |
| 6,569,266 | | | Turkish Lira | | | 3,307,465 | | | US Dollar | | JP Morgan Chase
Bank, N.A. | | 01/28/14 | | | 3,288,529 | | | | 18,936 | | |
| 3,330,824 | | | Turkish Lira | | | 1,649,732 | | | US Dollar | | JP Morgan Chase
Bank, N.A. | | 01/28/14 | | | 1,643,555 | | | | 6,177 | | |
Total | | | | | | | | | | | | | | $ | 51,038 | | |
During the period from September 27, 2013 (commencement of operations) to October 31, 2013, the Fund entered into 53 forward contracts that had a total base value of $67,628,309.
At October 31, 2013, the Fund had the following derivatives (which did not qualify as hedging instruments under ASC 815), grouped by primary risk exposure:
Asset Derivatives | |
Derivative Type | | Statement of
Assets and
Liabilities Location | | Interest
Rate Risk | | Currency Risk | | Total | |
Swap contracts | | Interest rate swaps, at value(1) | | $ | 31,600 | | | $ | — | | | $ | 31,600 | | |
| Forward contracts | | Receivable for open forward
foreign currency contracts | | | — | | | | 468,113 | | | | 468,113 | | |
Total Value—Assets | | | | $ | 31,600 | | | $ | 468,113 | | | $ | 499,713 | | |
Liability Derivatives | |
Derivative Type | | Statement of
Assets and
Liabilities Location | | Interest
Rate Risk | | Currency Risk | | Total | |
Swap contracts | | Interest rate swaps, at value(1) | | $ | (30,631 | ) | | $ | — | | | $ | (30,631 | ) | |
| Forward contracts | | Payable for open forward
foreign currency contracts | | | — | | | | (243,482 | ) | | | (243,482 | ) | |
Total Value—Liabilities | | | | $ | (30,631 | ) | | $ | (243,482 | ) | | $ | (274,113 | ) | |
(1) "Swap contracts" reflects the appreciation (depreciation) of the interest rate swap contracts plus accrued interest as of October 31, 2013, which is reflected in the Statement of Assets and Liabilities under the caption "Interest rate swaps, at value."
33
The impact of the use of these derivative instruments on the Statement of Operations during the period ended October 31, 2013, was as follows:
Realized Gain (Loss) | |
Derivative Type | | Statement of
Operations Location | | Interest
Rate Risk | | Currency Risk | | Total | |
Swap contracts | | Net realized gain (loss) on:
interest rate swap contracts | | $ | — | | | $ | — | | | $ | — | | |
Forward contracts | | Net realized gain (loss) on:
forward foreign
currency contracts | | | — | | | | — | | | | — | | |
Total Realized Gain (Loss) | | | | $ | — | | | $ | — | | | $ | — | | |
Change in Appreciation (Depreciation) | |
Derivative Type | | Statement of
Operations Location | | Interest
Rate Risk | | Currency Risk | | Total | |
Swap contracts | | Net unrealized
appreciation (depreciation) in
value of: interest rate
swap contracts | | $ | 969 | | | $ | — | | | $ | 969 | | |
Forward contracts | | Net unrealized
appreciation (depreciation) in
value of: forward foreign
currency contracts | | | — | | | | 224,631 | | | | 224,631 | | |
Total Change in Appreciation (Depreciation) | | | | $ | 969 | | | $ | 224,631 | | | $ | 225,600 | | |
During the current reporting period, the Fund adopted the provisions of Accounting Standards Update 2011-11 Disclosures about Offsetting Assets and Liabilities ("ASU 2011-11"). ASU 2011-11 is intended to enhance disclosure requirements on the offsetting of financial assets and liabilities. Pursuant to ASU 2011-11, an entity is required to disclose both gross and net information for assets and liabilities related to derivatives, repurchase and reverse repurchase agreements, and securities lending and securities borrowing transactions that are eligible for offset or subject to an enforceable master netting or similar agreement. The Fund's derivative assets and liabilities at fair value by type are reported gross in the Statement of Assets and Liabilities. The following tables present the Fund's derivative assets and liabilities by counterparty, net of amounts a vailable for offset under a master netting agreement and net of the related collateral received by the Fund for assets and pledged by the Fund for liabilities as of October 31, 2013.
Description | | Gross Amounts of
Recognized Assets | | Gross Amounts
Offset in the
Statement of
Assets and
Liabilities | | Net Amounts of Assets Presented in the
Statement of Assets and Liabilities | |
Swap contracts | | $ | 31,600 | | | $ | — | | | $ | 31,600 | | |
Forward contracts | | | 468,113 | | | | — | | | | 468,113 | | |
Total | | $ | 499,713 | | | $ | — | | | $ | 499,713 | | |
34
| | | Gross Amounts Not Offset in the Statement of Assets and Liabilities | |
Counterparty | | Net Amounts of
Assets Presented in
the Statement of
Asset and Liabilities | | Financial
Instruments | | Cash Collateral
Received(a) | | Net Amount(b) | |
Goldman Sachs International | | $ | 58,131 | | | $ | (58,131 | ) | | $ | — | | | $ | — | | |
JP Morgan Chase Bank, N.A. | | | 441,582 | | | | (151,991 | ) | | | — | | | | 289,591 | | |
Total | | $ | 499,713 | | | $ | (210,122 | ) | | $ | — | | | $ | 289,591 | | |
Description | | Gross Amounts of
Recognized Liabilities | | Gross Amounts
Offset in the
Statement of
Assets and
Liabilities | | Net Amounts of Liabilities Presented in the
Statement of Assets and Liabilities | |
Swap contracts | | $ | (30,631 | ) | | $ | — | | | $ | (30,631 | ) | |
Forward contracts | | | (243,482 | ) | | | — | | | | (243,482 | ) | |
Total | | $ | (274,113 | ) | | $ | — | | | $ | (274,113 | ) | |
| | | Gross Amounts Not Offset in the Statement of Assets and Liabilities | |
Counterparty | | Net Amounts of
Liabilities Presented in
the Statement of
Asset and Liabilities | | Financial
Instruments | | Cash Collateral
Pledged(a) | | Net Amount(c) | |
Goldman Sachs International | | $ | (122,122 | ) | | $ | 58,131 | | | $ | — | | | $ | (63,991 | ) | |
JP Morgan Chase Bank, N.A. | | | (151,991 | ) | | | 151,991 | | | | — | | | | — | | |
Total | | $ | (274,113 | ) | | $ | 210,122 | | | $ | — | | | $ | (63,991 | ) | |
(a) Collateral received (or pledged) is limited to an amount not to exceed 100% of the net amount of assets (or liabilities) in the tables presented above, for each respective counterparty.
(b) Net Amount represents amounts subject to loss as of October 31, 2013, in the event of a counterparty failure.
(c) Net Amount represents amounts under-collateralized by the Fund to each counterparty as of October 31, 2013.
14 Indemnifications: Like many other companies, the Trust's organizational documents provide that its officers and trustees are indemnified against certain liabilities arising out of the performance of their duties to the Trust. In addition, both in some of its principal service contracts and in the normal course of its business, the Trust enters into contracts that provide indemnifications to other parties for certain types of losses or liabilities. The Trust's maximum exposure under these arrangements is unknown as this could involve future claims against the Trust.
15 Other: All net investment income and realized and unrealized capital gains and losses of the Fund are allocated, on the basis of relative net assets, pro rata among its respective classes.
Note B—Management Fees, Administration Fees, Distribution Arrangements, and Other Transactions with Affiliates:
The Fund retains Management as its investment manager under a Management Agreement. For such investment management services, the Fund pays Management a fee at the annual rate of 0.55% of the Fund's average daily net assets.
The Fund retains Management as its administrator under an Administration Agreement. The Fund pays Management an administration fee at the annual rate of 0.06% of its average daily net assets under this agreement. In addition, Institutional Class pays Management an administration fee at the annual rate of 0.09% of its average
35
daily net assets and Class A and Class C each pays Management an administration fee at the annual rate of 0.21% of its average daily net assets, under this agreement. Additionally, Management retains State Street Bank and Trust Company ("State Street") as its sub-administrator under a Sub-Administration Agreement. Management pays State Street a fee for all services received under the agreement.
Management has contractually agreed to waive current payment of fees and/or reimburse certain expenses of the Institutional Class, Class A and Class C of the Fund so that the total annual operating expenses of those classes do not exceed the expense limitations as detailed in the following table. These undertakings apply to the Fund's direct expenses and exclude interest, taxes, brokerage commissions, acquired fund fees and expenses, extraordinary expenses and dividend and interest expenses on short sales, if any; consequently, net expenses may exceed the contractual expense limitations. The Fund has agreed that each of its respective classes will repay Management for fees and expenses waived or reimbursed for that class provided that repayment does not cause that class's annual operating expenses to exceed its contractual expense limitation in place at the t ime the fees were waived or reimbursed. Any such repayment must be made within three years after the year in which Management incurred the expense.
During the period ended October 31, 2013, there was no repayment to Management under this agreement.
At October 31, 2013, contingent liabilities to Management under the agreement were as follows:
| | | | | | | Expenses Reimbursed in Fiscal Period
Ending, October 31, 2013(2) | |
Class | | Contractual
Expense
Limitation(1) | | Expiration | | Subject to Repayment
until October 31, 2016 | |
Institutional Class | | | 0.90 | %(3) | | 10/31/16 | | $ | 223,521 | | |
Class A | | | 1.27 | %(3) | | 10/31/16 | | | 2,100 | | |
Class C | | | 2.02 | %(3) | | 10/31/16 | | | 2,090 | | |
(1) Expense limitation per annum of the respective class's average daily net assets.
(2) Period from September 27, 2013 to October 31, 2013.
(3) In addition, Management voluntarily waived expenses as necessary to maintain a minimum yield from September 27, 2013 (Commencement of Operations) to September 30, 2013. For the period ended October 31, 2013, voluntary reimbursements for the Institutional Class, Class A and Class C amounted to $8,376, $7 and $11, respectively. These amounts are not subject to recovery by Management. This undertaking was in addition to the contractual undertakings as stated above.
Neuberger Berman Fixed Income LLC ("NBFI"), as the sub-adviser to the Fund, is retained by Management to provide day-to-day investment management services and receives a monthly fee paid by Management. As investment manager, Management is responsible for overseeing the investment activities of NBFI. Several individuals who are officers and/or Trustees of the Trust are also employees of NBFI, Neuberger Berman LLC ("Neuberger") and/or Management.
Management and NBFI are indirect subsidiaries of Neuberger Berman Group LLC (("NBG") and together with its consolidated subsidiaries ("NB Group")). NBSH Acquisition, LLC ("NBSH" and together with NBG, the "NB Parties"), which is owned by portfolio managers, members of the NB Group management team and certain of NB Group's key employees, senior professionals, and certain of their permitted transferees, owns, as of September 30, 2013, approximately 76% of NBG's equity, and Lehman Brothers Holdings Inc. ("LBHI") and certain of its subsidiaries (collectively the "LBHI Parties") own the remaining 24% of such equity. Pursuant to agreements among the NB Parties and the LBHI Parties, as well as the issuance of NBSH equity to employees with respect to their previously made equity elections relating to 2013 compensation, it is expected that NBSH will own 81% of NBG's equity as of January 1, 2014. NBG has the opportunity to continue to redeem the remaining NBG equity held by the LBHI Parties through a process that is expected to end in 2016.
36
The Fund also has a distribution agreement with Management with respect to each class of shares. Management acts as agent in arranging for the sale of class shares without sales commission or other compensation, except as described below for Class A and Class C shares, and bears advertising and promotion expenses.
However, Management receives fees from Class A and Class C under their distribution plans (each a "Plan", collectively, the "Plans") pursuant to Rule 12b-1 under the 1940 Act. The Plans provide that, as compensation for administrative and other services provided to these classes, Management's activities and expenses related to the sale and distribution of these classes of shares, and ongoing services provided to investors in these classes, Management receives from each of these respective classes a fee at the annual rate of 0.25% of Class A's and 1.00% of Class C's average daily net assets. Management receives this amount to provide distribution and shareholder servicing for these classes and pays a portion of it to institutions that provide such services. Those institutions may use the payments for, among other purposes, compensating employees engaged in sales and/or shareholder servicing. The amount of fees paid by each class during any year may be more or less than the cost of distribution and other services provided to that class. FINRA rules limit the amount of annual distribution fees that may be paid by a mutual fund and impose a ceiling on the cumulative distribution fees paid. The Trust's Plans comply with those rules.
Class A shares are generally sold with an initial sales charge of up to 4.25%. Class A shares of the Fund are generally sold with no contingent deferred sales charge ("CDSC"), except that a CDSC of 1.00% applies to certain redemptions made within 18 months following purchases of $1 million or more without an initial sales charge. Class C shares of the Fund are sold with no initial sales charge and a 1.00% CDSC if shares are sold within one year after purchase.
For the period ended October 31, 2013, Management, acting as underwriter and broker-dealer, received net initial sales charges from the purchase of Class A shares and CDSCs from the redemption of Class A and Class C shares as follows:
| | | Underwriter | | Broker-Dealer | |
| | | Net Initial
Sales Charges | | CDSC | | Net Initial
Sales Charges | | CDSC | |
Class A | | $ | — | | | $ | — | | | $ | — | | | $ | — | | |
Class C | | | — | | | | — | | | | — | | | | — | | |
Note C—Securities Transactions:
During the period ended October 31, 2013, there were purchases and sales of long-term securities (excluding interest rate swaps and forward contracts) of $86,549,749 and $4,353,512, respectively.
Note D—Fund Share Transactions:
Share activity for the period ended October 31, 2013(1) was as follows:
(000's omitted) | | Shares
Sold | | Shares Issued
on Reinvestment
of Dividends
and Distributions | | Shares
Redeemed | | Total | |
Institutional Class | | | 8,526 | | | | 30 | | | | — | | | | 8,556 | | |
Class A | | | 5 | | | | — | | | | — | | | | 5 | | |
Class C | | | 5 | | | | — | | | | — | | | | 5 | | |
(1) Period from September 27, 2013 (Commencement of Operations) to October 31, 2013.
37
At October 31, 2013, the Neuberger Berman Strategic Income Fund, which is also managed by Management, held 99.69% of the outstanding shares of the Fund.
Note E—Subsequent Event:
Effective December 1, 2013, NB Management engaged Neuberger Berman Europe Limited ("NBEL") as a new sub-adviser for the Fund.
Note F—Recent Accounting Pronouncement:
In June 2013, FASB issued Accounting Standards Update 2013-08 Financial Services — Investment Companies (Topic 946) — Amendments to the Scope, Measurement, and Disclosure Requirements ("ASU 2013-08"). Effective for interim and annual reporting periods in fiscal years that begin after December 15, 2013, ASU 2013-08 sets forth a methodology for determining whether an entity should be characterized as an investment company and prescribes fair value accounting for an investment company's non-controlling ownership interest in another investment company. FASB has determined that a fund registered under the 1940 Act automatically meets ASU 2013-08's criteria for an investment company. Although still evaluating the potential impact of ASU 2013-08 on the Fund's financial statements, Management expects that the impact will be limited to additional financial s tatement disclosures.
38
The following table includes selected data for a share outstanding throughout each period and other performance information
derived from the Financial Statements. Per share amounts that round to less than $.01 or $(0.01) per share are presented as
$0.00 or $(0.00), respectively. Ratios that round to less than 0.00% or (0.00%) per share are presented as 0.00% or (0.00%),
respectively. Net Asset amounts with a zero balance may reflect actual amounts rounding to less than $0.1 million. A "—"
indicates that the line item was not applicable in the corresponding period.
| | Net Asset
Value,
Beginning
of Year | | Net
Investment
Income (Loss)@ | | Net Gains or
Losses on
Securities
(both
realized and
unrealized) | | Total From
Investment
Operations | | Dividends
from Net
Investment
Income | | Distributions
from Net
Realized
Capital Gains | | Total
Distributions | |
Emerging Markets Income Fund | |
Institutional Class | |
Period from 9/27/2013^ to
10/31/2013 | | $ | 10.00 | | | $ | 0.04 | | | $ | 0.20 | | | $ | 0.24 | | | $ | (0.04 | ) | | $ | — | | | $ | (0.04 | ) | |
Class A | |
Period from 9/27/2013^ to
10/31/2013 | | $ | 10.00 | | | $ | 0.03 | | | $ | 0.20 | | | $ | 0.23 | | | $ | (0.03 | ) | | $ | — | | | $ | (0.03 | ) | |
Class C | |
Period from 9/27/2013^ to
10/31/2013 | | $ | 10.00 | | | $ | 0.03 | | | $ | 0.20 | | | $ | 0.23 | | | $ | (0.03 | ) | | $ | — | | | $ | (0.03 | ) | |
See Notes to Financial Highlights
39
| | | Net Asset
Value, End of
Year | | Total
Return†† | | Net Assets,
End of Year
(in millions) | | Ratio of
Gross
Expenses
to Average
Net Assets#‡ | | Ratio of Net
Expenses
to Average
Net Assets‡ | | Ratio of Net
Investment
Income/
(Loss) to
Average Net
Assets‡ | | Portfolio
Turnover
Rate | |
Emerging Markets Income Fund | |
Institutional Class | |
Period from 9/27/2013^ to
10/31/2013 | | $ | 10.20 | | | | 2.36 | %** | | $ | 87.2 | | | | 1.64 | %* | | | .80 | %* | | | 3.60 | %* | | | 5 | %** | |
Class A | |
Period from 9/27/2013^ to
10/31/2013 | | $ | 10.20 | | | | 2.32 | %** | | $ | 0.0 | | | | 42.54 | %* | | | 1.13 | %* | | | 3.28 | %* | | | 5 | %** | |
Class C | |
Period from 9/27/2013^ to
10/31/2013 | | $ | 10.20 | | | | 2.26 | %** | | $ | 0.0 | | | | 43.10 | %* | | | 1.79 | %* | | | 2.60 | %* | | | 5 | %** | |
40
Notes to Financial Highlights
†† Total return based on per share NAV reflects the effects of changes in NAV on the performance of the Fund during the fiscal period and assumes income dividends and other distributions, if any, were reinvested, but does not reflect the effect of sales charges. Results represent past performance and do not indicate future results. Current returns may be lower or higher than the performance data quoted. Investment returns and principal may fluctuate and shares when redeemed may be worth more or less than original cost. Total return would have been lower if Management had not reimbursed and/or waived certain expenses.
^ The date investment operations commenced.
‡ Organization expense, which is a non-recurring expense, is included in these ratios on a non-annualized basis.
@ Calculated based on the average number of shares outstanding during the fiscal period.
* Annualized.
** Not annualized.
# Represents the annualized ratios of net expenses to average daily net assets if Management had not reimbursed certain expenses and/or waived a portion of the investment management fee.
41
Report of Independent Registered Public Accounting Firm
To the Board of Trustees of Neuberger Berman Income Funds and Shareholders
Neuberger Berman Emerging Markets Income Fund
We have audited the accompanying statement of assets and liabilities of Neuberger Berman Emerging Markets Income Fund ("Fund"), one of the series comprising Neuberger Berman Income Funds, including the schedule of investments, as of October 31, 2013, and the related statement of operations, the statement of changes in net assets, and the financial highlights for the period from September 27, 2013 (commencement of operations) to October 31, 2013. These financial statements and financial highlights are the responsibility of the Fund's management. Our responsibility is to express an opinion on these financial statements and financial highlights based on our audit.
We conducted our audit in accordance with the standards of the Public Company Accounting Oversight Board (United States). Those standards require that we plan and perform the audit to obtain reasonable assurance about whether the financial statements and financial highlights are free of material misstatement. We were not engaged to perform an audit of the Fund's internal control over financial reporting. Our audit included consideration of internal control over financial reporting as a basis for designing audit procedures that are appropriate in the circumstances, but not for the purpose of expressing an opinion on the effectiveness of the Fund's internal control over financial reporting. Accordingly, we express no such opinion. An audit also includes examining, on a test basis, evidence supporting the amounts and disclosures in the financial statements and financial highlights, assessing the accounting principles used and significant estimates made by management, and evaluating the overall financial statement presentation. Our procedures included confirmation of securities owned as of October 31, 2013, by correspondence with the custodian and others or by other appropriate auditing procedures where replies from others were not received. We believe that our audit provides a reasonable basis for our opinion.
In our opinion, the financial statements and financial highlights referred to above present fairly, in all material respects, the financial position of Neuberger Berman Emerging Markets Income Fund at October 31, 2013, the results of its operations, the changes in its net assets, and the financial highlights for the period from September 27, 2013 (commencement of operations) to October 31, 2013, in conformity with U.S. generally accepted accounting principles.

Boston, Massachusetts
December 27, 2013
42
Investment Manager, Administrator and Distributor
Neuberger Berman Management LLC
605 Third Avenue, 2nd Floor
New York, NY 10158-0180
800.877.9700 or 212.476.8800
Intermediary Client Services 800.366.6264
Sub-Advisers
Neuberger Berman Fixed Income LLC
190 South LaSalle Street
Chicago, IL 60603
Neuberger Berman Europe Limited
Lansdowne House
57 Berkeley Square
London, United Kingdom W1J 6ER
Custodian and Shareholder Servicing Agent
State Street Bank and Trust Company
2 Avenue de Lafayette
Boston, MA 02111
For Investor Class Shareholders Address correspondence to:
Neuberger Berman Funds
Boston Service Center
P.O. Box 8403
Boston, MA 02266-8403
800.877.9700 or 212.476.8800
For Class A and Class C Shareholders:
Please contact your investment provider
Institutional Class Shareholders Address correspondence to:
Neuberger Berman Management LLC
605 Third Avenue, Mail Drop 2-7
New York, NY 10158-0180
Attn: Intermediary Client Services 800.366.6264
Legal Counsel
K&L Gates LLP
1601 K Street, NW
Washington, DC 20006
Independent Registered Public Accounting Firm
Ernst & Young LLP
200 Clarendon Street
Boston, MA 02116
43
The following tables set forth information concerning the trustees ("Trustees") and officers ("Officers") of the Fund. All persons named as Trustees and Officers also serve in similar capacities for other funds administered or managed by Management and NBFI. The Fund's Statement of Additional Information includes additional information about the Trustees as of the date of the Fund's most recent public offering documents and is available upon request, without charge, by calling (800) 877-9700.
Information about the Board of Trustees
Name, (Year of Birth),
and Address(1) | | Position(s)
and Length of
Time Served(2) | | Principal Occupation(s)(3) | | Number of
Funds in
Fund Complex
Overseen by
Trustee | | Other Directorships Held
Outside Fund Complex by
Trustee(3) | |
Independent Trustees | |
Faith Colish (1935) | | Trustee since 2000 | | Counsel, Carter Ledyard & Milburn LLP (law firm) since October 2002; formerly, Attorney-at-Law and President, Faith Colish, A Professional Corporation, 1980 to 2002. | | | 54 | | | Formerly, Director, 1997 to 2003, and Advisory Director, 2003 to 2006, ABA Retirement Funds (formerly, American Bar Retirement Association) (not-for-profit membership corporation). | |
44
Name, (Year of Birth),
and Address(1) | | Position(s)
and Length of
Time Served(2) | | Principal Occupation(s)(3) | | Number of
Funds in
Fund Complex
Overseen by
Trustee | | Other Directorships Held
Outside Fund Complex by
Trustee(3) | |
Martha C. Goss (1949) | | Trustee since 2007 | | President, Woodhill Enterprises Inc./Chase Hollow Associates LLC (personal investment vehicle), since 2006; formerly, Consultant, Resources Global Professionals (temporary staffing), 2002 to 2006. | | | 54 | | | Director, American Water (water utility), since 2003; Director, Allianz Life of New York (insurance), since 2005; Director, Berger Group Holdings, Inc. (engineering consulting firm), since 2013; Director, Financial Women's Association of New York (not-for-profit association), since 2003; Trustee Emerita, Brown University, since 1998; Director, Museum of American Finance (not-for-profit), since 2013; formerly, Non-Executive Chair and Director, Channel Reinsurance (financial guaranty reinsurance), 2006 to 2010; formerly, Director, Ocwen Financial Corporation (mortgage servicing), 2005 to 2010; formerly, Director, Claire's Stores, Inc. (retailer), 2005 to 2007; formerly, Director, Parsons Brinckerhoff Inc. (engineering consulting firm), 2007 to 2010; formerly Director, Bank Leumi (commercial bank), 2005 to 2007; formerly Advisory Board Member, Attensity (software developer), 2005 to 2007. | |
45
Name, (Year of Birth),
and Address(1) | | Position(s)
and Length of
Time Served(2) | | Principal Occupation(s)(3) | | Number of
Funds in
Fund Complex
Overseen by
Trustee | | Other Directorships Held
Outside Fund Complex by
Trustee(3) | |
Michael M. Knetter (1960) | | Trustee since 2007 | | President and Chief Executive Officer, University of Wisconsin Foundation, since October 2010; formerly, Dean, School of Business, University of Wisconsin — Madison; formerly, Professor of International Economics and Associate Dean, Amos Tuck School of Business — Dartmouth College, 1998 to 2002. | | | 54 | | | Director, American Family Insurance (a mutual company, not publicly traded), since March 2009; formerly, Trustee, Northwestern Mutual Series Fund, Inc., 2007 to 2010; formerly, Director, Wausau Paper, 2005 to 2011; formerly, Director, Great Wolf Resorts, 2004 to 2009. | |
Howard A. Mileaf (1937) | | Trustee since 2000 | | Retired; formerly, Vice President and General Counsel, WHX Corporation (holding company), 1993 to 2001. | | | 54 | | | Formerly, Director, Webfinancial Corporation (holding company), 2002 to 2008; formerly, Director, WHX Corporation (holding company), 2002 to 2005; formerly, Director, State Theatre of New Jersey (not-for-profit theatre), 2000 to 2005. | |
George W. Morriss (1947) | | Trustee since 2007 | | Adjunct Professor, Columbia University School of International and Public Affairs, since October 2012; formerly, Executive Vice President and Chief Financial Officer, People's Bank, Connecticut (a financial services company), 1991 to 2001. | | | 54 | | | Director and Treasurer, National Association of Corporate Directors, Connecticut Chapter, since 2013; Trustee, Steben Alternative Investment Funds, Steben Select Multi-Strategy Fund, and Steben Select Multi-Strategy Master Fund, since 2013; formerly, Manager, Larch Lane Multi-Strategy Fund complex (which consisted of three funds), 2006 to 2011; formerly, Member, NASDAQ Issuers' Affairs Committee, 1995 to 2003. | |
46
Name, (Year of Birth),
and Address(1) | | Position(s)
and Length of
Time Served(2) | | Principal Occupation(s)(3) | | Number of
Funds in
Fund Complex
Overseen by
Trustee | | Other Directorships Held
Outside Fund Complex by
Trustee(3) | |
Tom D. Seip (1950) | | Trustee since 2000; Chairman of the Board since 2008; Lead Independent Trustee from 2006 to 2008 | | General Partner, Ridgefield Farm LLC (a private investment vehicle); formerly, President and CEO, Westaff, Inc. (temporary staffing), May 2001 to January 2002; formerly, Senior Executive, The Charles Schwab Corporation, 1983 to 1998, including Chief Executive Officer, Charles Schwab Investment Management, Inc.; Trustee, Schwab Family of Funds and Schwab Investments, 1997 to 1998; and Executive Vice President-Retail Brokerage, Charles Schwab & Co., Inc., 1994 to 1997. | | | 54 | | | Director, H&R Block, Inc. (financial services company), since May 2001; Chairman, Governance and Nominating Committee, H&R Block, Inc., since 2011; formerly, Chairman, Compensation Committee, H&R Block, Inc., 2006 to 2010; formerly, Director, Forward Management, Inc. (asset management company), 1999 to 2006. | |
Candace L. Straight (1947) | | Trustee since 1993 | | Private investor and consultant specializing in the insurance industry; formerly, Advisory Director, Securitas Capital LLC (a global private equity investment firm dedicated to making investments in the insurance sector), 1998 to December 2003. | | | 54 | | | Public Member, Board of Governors and Board of Trustees, Rutgers University, since 2011; Director, Montpelier Re Holdings Ltd. (reinsurance company), since 2006; formerly, Director, National Atlantic Holdings Corporation (property and casualty insurance company), 2004 to 2008; formerly, Director, The Proformance Insurance Company (property and casualty insurance company), 2004 to 2008; formerly, Director, Providence Washington Insurance Company (property and casualty insurance company), 1998 to 2006; formerly, Director, Summit Global Partners (insurance brokerage firm), 2000 to 2005. | |
47
Name, (Year of Birth),
and Address(1) | | Position(s)
and Length of
Time Served(2) | | Principal Occupation(s)(3) | | Number of
Funds in
Fund Complex
Overseen by
Trustee | | Other Directorships Held
Outside Fund Complex by
Trustee(3) | |
Peter P. Trapp (1944) | | Trustee since 2000 | | Retired; formerly, Regional Manager for Mid-Southern Region, Ford Motor Credit Company, September 1997 to 2007; formerly, President, Ford Life Insurance Company, April 1995 to August 1997. | | | 54 | | | None. | |
Trustees who are "Interested Persons" | |
Joseph V. Amato* (1962) | | Trustee since 2009 | | President and Director, Neuberger Group LLC, since 2009; President and Chief Executive Officer, Neuberger and Neuberger Berman Holdings LLC (including its predecessor, Neuberger Berman Inc.), since 2007; Chief Investment Officer (Equities) and Managing Director, Management, since 2009; Managing Director, NBFI, since 2007; Board member of NBFI since 2006; formerly, Global Head of Asset Management of Lehman Brothers Holdings Inc.'s ("LBHI") Investment Management Division, 2006 to 2009; formerly, member of LBHI's Investment Management Division's Executive Management Committee, 2006 to 2009; formerly, Managing Director, Lehman Brothers Inc. ("LBI"), 2006 to 2008; formerly, Chief Recruiting and Development Officer, LBI, 2005 to 2006; formerly, Global Head of LBI's Equity Sales and a Member of its Equities Division Executive Committee, 2003 to 2005. | | | 54 | | | Member of Board of Advisors, McDonough School of Business, Georgetown University, since 2001; Member of New York City Board of Advisors, Teach for America, since 2005; Trustee, Montclair Kimberley Academy (private school), since 2007; Member of Board of Regents, Georgetown University, since 2013. | |
48
Name, (Year of Birth),
and Address(1) | | Position(s)
and Length of
Time Served(2) | | Principal Occupation(s)(3) | | Number of
Funds in
Fund Complex
Overseen by
Trustee | | Other Directorships Held
Outside Fund Complex by
Trustee(3) | |
Robert Conti* (1956) | | Chief Executive Officer, President and Trustee since 2008; prior thereto, Executive Vice President in 2008 and Vice President from 2000 to 2008 | | Managing Director, Neuberger, since 2007; Managing Director, NBFI, since 2009; formerly, Senior Vice President, Neuberger, 2003 to 2006; formerly, Vice President, Neuberger, 1999 to 2003; President and Chief Executive Officer, Management, since 2008; formerly, Senior Vice President, Management, 2000 to 2008. | | | 54 | | | Director, Staten Island Mental Health Society, since 1994; formerly, Chairman of the Board, Staten Island Mental Health Society, 2008 to 2011. | |
(1) The business address of each listed person is 605 Third Avenue, New York, New York 10158.
(2) Pursuant to the Trust's Trust Instrument, each of these Trustees shall hold office for life or until his or her successor is elected or the Trust terminates; except that (a) any Trustee may resign by delivering a written resignation; (b) any Trustee may be removed with or without cause at any time by a written instrument signed by at least two-thirds of the other Trustees; (c) any Trustee who requests to be retired, or who has become unable to serve, may be retired by a written instrument signed by a majority of the other Trustees; and (d) any Trustee may be removed at any shareholder meeting by a vote of at least two-thirds of the outstanding shares.
(3) Except as otherwise indicated, each individual has held the positions shown for at least the last five years.
* Indicates a Trustee who is an "interested person" within the meaning of the 1940 Act. Mr. Amato and Mr. Conti are interested persons of the Trust because each is an officer of Management and/or its affiliates.
49
Information about the Officers of the Trust
Name, (Year of Birth),
and Address(1) | | Position(s)
and Length of
Time Served(2) | | Principal Occupation(s)(3) | |
Andrew B. Allard (1961) | | Chief Legal Officer since 2013 (only for purposes of sections 307 and 406 of the Sarbanes-Oxley Act of 2002) and Anti-Money Laundering Compliance Officer since 2002 | | General Counsel and Senior Vice President, Management, since 2013; Senior Vice President, Neuberger, since 2006 and Employee since 1999; Deputy General Counsel, Neuberger, since 2004; formerly, Vice President, Neuberger, 2000 to 2005; formerly, Employee, Management, 1994 to 1999; Chief Legal Officer since 2013 (only for purposes of sections 307 and 406 of the Sarbanes-Oxley Act of 2002) ten registered investment companies for which Management acts as investment manager and administrator (ten since 2013); Anti-Money Laundering Compliance Officer, ten registered investment companies for which Management acts as investment manager and administrator (six since 2002, one since 2003, one since 2005, one since 2006 and one since 2013). | |
Claudia A. Brandon (1956) | | Executive Vice President since 2008 and Secretary since 1985 | | Senior Vice President, Neuberger, since 2007 and Employee since 1999; Senior Vice President, Management, since 2008 and Assistant Secretary since 2004; formerly, Vice President, Neuberger, 2002 to 2006; formerly, Vice President-Mutual Fund Board Relations, Management, 2000 to 2008; formerly, Vice President, Management, 1986 to 1999 and Employee 1984 to 1999; Executive Vice President, ten registered investment companies for which Management acts as investment manager and administrator (nine since 2008 and one since 2013); Secretary, ten registered investment companies for which Management acts as investment manager and administrator (three since 1985, three since 2002, one since 2003, one since 2005, one since 2006 and one since 2013). | |
Agnes Diaz (1971) | | Vice President since 2013 | | Vice President, ten registered investment companies for which Management acts as investment manager and administrator (ten since 2013). | |
Anthony DiBernardo (1979) | | Assistant Treasurer since 2011 | | Vice President, Neuberger, since 2009; Employee, Management, since 2003; Assistant Treasurer, ten registered investment companies for which Management acts as investment manager and administrator (nine since 2011 and one since 2013). | |
Sheila R. James (1965) | | Assistant Secretary since 2002 | | Vice President, Neuberger, since 2008 and Employee since 1999; formerly, Assistant Vice President, Neuberger, 2007; formerly, Employee, Management, 1991 to 1999; Assistant Secretary, ten registered investment companies for which Management acts as investment manager and administrator (six since 2002, one since 2003, one since 2005, one since 2006 and one since 2013). | |
Brian Kerrane (1969) | | Vice President since 2008 | | Senior Vice President, Neuberger, since 2008 and Employee since 1991; formerly, Vice President, Neuberger, 2002 to 2008; Vice President, ten registered investment companies for which Management acts as investment manager and administrator (nine since 2008 and one since 2013). | |
50
Name, (Year of Birth),
and Address(1) | | Position(s)
and Length of
Time Served(2) | | Principal Occupation(s)(3) | |
Kevin Lyons (1955) | | Assistant Secretary since 2003 | | Assistant Vice President, Neuberger, since 2008 and Employee since 1999; formerly, Employee, Management, 1993 to 1999; Assistant Secretary, ten registered investment companies for which Management acts as investment manager and administrator (seven since 2003, one since 2005, one since 2006 and one since 2013). | |
Owen F. McEntee, Jr. (1961) | | Vice President since 2008 | | Vice President, Neuberger, since 2006; Employee, Management, since 1992; Vice President, ten registered investment companies for which Management acts as investment manager and administrator (nine since 2008 and one since 2013). | |
John M. McGovern (1970) | | Treasurer and Principal Financial and Accounting Officer since 2005 | | Senior Vice President, Neuberger, since 2007; formerly, Vice President, Neuberger, 2004 to 2006; Employee, Management, since 1993; Treasurer and Principal Financial and Accounting Officer, ten registered investment companies for which Management acts as investment manager and administrator (eight since 2005, one since 2006 and one since 2013); formerly, Assistant Treasurer, eight registered investment companies for which Management acts as investment manager and administrator, 2002 to 2005. | |
Frank Rosato (1971) | | Assistant Treasurer since 2005 | | Vice President, Neuberger, since 2006; Employee, Management, since 1995; Assistant Treasurer, ten registered investment companies for which Management acts as investment manager and administrator (eight since 2005, one since 2006 and one since 2013). | |
Neil S. Siegel (1967) | | Vice President since 2008 | | Managing Director, Management, since 2008; Managing Director, Neuberger, since 2006; Managing Director, NBFI, since 2011; formerly, Senior Vice President, Neuberger, 2004 to 2006; Vice President, ten registered investment companies for which Management acts as investment manager and administrator (nine since 2008 and one since 2013). | |
Chamaine Williams (1971) | | Chief Compliance Officer since 2005 | | Senior Vice President, Neuberger, since 2007; Chief Compliance Officer, Management, since 2006; Chief Compliance Officer, ten registered investment companies for which Management acts as investment manager and administrator (eight since 2005, one since 2006 and one since 2013); formerly, Senior Vice President, LBI, 2007 to 2008; formerly, Vice President, LBI, 2003 to 2006; formerly, Chief Compliance Officer, Lehman Brothers Asset Management Inc., 2003 to 2007; formerly, Chief Compliance Officer, Lehman Brothers Alternative Investment Management LLC, 2003 to 2007. | |
(1) The business address of each listed person is 605 Third Avenue, New York, New York 10158.
(2) Pursuant to the By-Laws of the Trust, each officer elected by the Trustees shall hold office until his or her successor shall have been elected and qualified or until his or her earlier death, inability to serve, or resignation. Officers serve at the pleasure of the Trustees and may be removed at any time with or without cause.
(3) Except as otherwise indicated, each individual has held the positions shown for at least the last five years.
51
Proxy Voting Policies and Procedures
A description of the policies and procedures that the Trust uses to determine how to vote proxies relating to portfolio securities is available, without charge, by calling 800-877-9700 (toll-free) and on the website of the Securities and Exchange Commission at www.sec.gov. Information regarding how the Trust voted proxies relating to portfolio securities during the most recent 12-month period ended June 30 is also available, without charge, by calling 800-877-9700 (toll-free), on the website of the Securities and Exchange Commission at www.sec.gov, and on Management's website at www.nb.com.
Quarterly Portfolio Schedule
The Trust files a complete schedule of portfolio holdings for the Fund with the Securities and Exchange Commission for the first and third quarters of each fiscal year on Form N-Q. The Trust's Forms N-Q are available on the Securities and Exchange Commission's website at www.sec.gov and may be reviewed and copied at the Securities and Exchange Commission's Public Reference Room in Washington, DC. Information on the operation of the Public Reference Room may be obtained by calling 800-SEC-0330. The information on Form N-Q is available upon request, without charge, by calling 800-877-9700 (toll-free).
52
Board Consideration of the Management and Sub-Advisory Agreements
At meetings held on April 23-24, 2013 and October 22-23, 2013, the Board of Trustees ("Board") of Neuberger Berman Income Funds ("Trust"), including the Trustees who are not "interested persons" of Neuberger Berman Management LLC ("Management") (including its affiliates) or the Trust ("Independent Fund Trustees"), approved the management agreement with Management (the "Management Agreement") and the separate sub-advisory agreements between Management and each of Neuberger Berman Fixed Income LLC ("NBFI") and Neuberger Berman Europe Limited ("NBEL") (each a "Sub-Advisory Agreement" and collectively with the Management Agreement, the "Agreements") for Neuberger Berman Emerging Markets Income Fund (the "Fund").
In evaluating the Agreements, the Board, including the Independent Fund Trustees, reviewed extensive materials provided by Management and NBEL, and met with senior representatives of Management and NBEL regarding their personnel, operations and financial conditions as they relate to the Fund.
To assist the Board in its deliberations regarding the contract review, the Board has established a Contract Review Committee comprised of Independent Fund Trustees, as well as other committees that focus on specific areas relevant to the contract review.
The Independent Fund Trustees were advised by counsel that is experienced in Investment Company Act of 1940 matters and that is independent of Management. The Independent Trustees received from independent counsel a memorandum discussing the legal standards for their consideration of the Agreements. During the course of their deliberations regarding the contract review, the Independent Fund Trustees met with such counsel separately from representatives of Management, NBFI and NBEL.
In connection with its approval of the Agreements, the Board evaluated the terms of the Agreements, the overall fairness of the Agreements to the Fund and whether the Agreements were in the best interests of the Fund and its shareholders. The Board considered all factors it deemed relevant with respect to the Fund, including the following factors: (1) the nature, extent, and quality of the services to be provided by Management, NBFI and NBEL; (2) the expected costs of the services to be provided; (3) the extent to which economies of scale might be realized as the Fund grows; and (4) whether proposed fee levels reflect any such potential economies of scale for the benefit of investors in the Fund. While each Trustee may have attributed different weights to the various factors, the Board's determination to approve the Agreements was based on a comprehensive consideration of all information provided to the Board, and the Board members did not identify any particular information or factor that was all-important or controlling. The Board focused on the overall costs and benefits of the Agreements relating to the Fund and, through the Fund, its shareholders.
With respect to the nature, extent and quality of the services to be provided, the Board considered the investment philosophy and decision-making processes of Management, NBFI and NBEL, and the qualifications, experience and capabilities of and the resources available to the portfolio management personnel of Management, NBFI and NBEL who would perform services for the Fund. The Board noted that Management also would provide certain administrative services, including fund accounting and compliance oversight. The Board also considered Management's, NBFI's and NBEL's policies and practices regarding brokerage and allocation of portfolio transactions. The Board also considered that Management's responsibilities include daily management of investment, operational, enterprise, legal, regulatory and compliance risks as they relate to the Fund, and considered information regarding Management's process for managing risk. In addition, the Board considered the scope and depth of the compliance programs of Management, NBFI and NBEL. The Board also considered the nature of the markets in which the Fund would invest and whether those factors suggested need for special research, trading, valuation and/or compliance measures. The Board also considered the manner in which Management addressed various non-routine matters that have arisen from time to time, some of them a result of developments in the broader fund industry or the regulations governing it.
The Board also noted the performance, over various periods, of other accounts that were managed by Management or its affiliates with investment objectives, policies and strategies that were similar to those of the Fund.
With respect to the overall fairness of the Agreements, the Board considered the fee structure proposed for the Fund under the Agreements as compared to a peer group of comparable funds and any fall-out benefits likely to accrue to
53
Management, NBFI, NBEL or their affiliates from their relationship with the Fund. The Board reviewed a comparison of the Fund's proposed management fee and overall expense ratio to a peer group of broadly comparable funds. The Board noted that the comparative management fee analysis includes, in the Fund's management fee, the separate administrative fee proposed to be paid to Management, but it was not clear whether this was the case for all funds in the peer group. The Board considered the mean and median of the management fees and overall expense ratios of the peer group. Where the Fund's proposed management fee was higher than the peer group mean and/or median for some classes, the Board considered whether specific portfolio management or administration needs contributed to the management fee. In addition, the Board considered the proposed contractual limit on expenses of each class of the Fund. The Board also considered whether there were other accounts that were managed by Management or its affiliates with investment objectives, policies and strategies that were similar to those of the Fund. The Board compared the fees proposed to be charged to the Fund to the fees charged to any such accounts. The Board considered the appropriateness and reasonableness of any differences between the fees proposed to be charged to the Fund and any such accounts and determined that any differences in fees and fee structures were consistent with the management and other services provided. The Board also considered whether it would be appropriate to evaluate any anticipated economies of scale in relation to the services Management would provide to the Fund, noting that it may be too soon to anticipate the economies at the start-up phase of a fund. The Board concluded that the benefits expected to accrue to Management and its affiliates by virtue of their relationship to the Fund were reasonable in light of the costs of providing the investment advisory and other services and the benefits expected to accrue to the Fund.
Conclusions
In approving the Agreements, the Board concluded that the terms of each Agreement are fair and reasonable to the Fund and that approval of the Agreements is in the best interests of the Fund and its shareholders. In reaching this determination, the Board considered that Management, NBFI and NBEL could be expected to provide a high level of service to the Fund; that the Fund's proposed fee structure appeared to the Board to be reasonable given the nature, extent and quality of services expected to be provided; and that the benefits expected to accrue to Management and its affiliates by virtue of their relationship to the Fund were reasonable in light of the costs of providing the investment advisory and other services and the benefits expected to accrue to the Fund.
54
This page has been left blank intentionally
Investment manager: Neuberger Berman Management LLC
Sub-advisers: Neuberger Berman Fixed Income LLC
Neuberger Berman Europe Limited
Neuberger Berman Management LLC
605 Third Avenue 2nd Floor
New York, NY 10158-0180
Retail Services: 800.877.9700
Broker-Dealer and Institutional Services: 800.366.6264/888.556.9030
Web site: www.nb.com
Statistics and projections in this report are derived from sources deemed to be reliable but cannot be regarded as a representation of future results of the Fund. This report is prepared for the general information of shareholders and is not an offer of shares of the Fund. Shares are sold only through the currently effective prospectus, which must precede or accompany this report.
N0287 12/13
Item 2. Code of Ethics.
The Board of Trustees (“Board”) of Neuberger Berman Income Funds (“Registrant”) adopted a code of ethics that applies to the Registrant’s principal executive officer, principal financial officer, principal accounting officer or controller, or persons performing similar functions (“Code of Ethics”). For the period covered by this Form N-CSR, there were no amendments to the Code of Ethics and there were no waivers from the Code of Ethics granted to the Registrant’s principal executive officer, principal financial officer, principal accounting officer or controller, or persons performing similar functions.
A copy of the Code of Ethics is incorporated by reference to Neuberger Berman Equity Funds’ Form N-CSRS, Investment Company Act file number 811-00582 (filed May 6, 2013). The Code of Ethics is also available, without charge, by calling 1-800-877-9700 (toll-free).
Item 3. Audit Committee Financial Expert.
The Board has determined that the Registrant has three audit committee financial experts serving on its audit committee. The Registrant’s audit committee financial experts are Martha C. Goss, George W. Morriss and Candace L. Straight. Ms. Goss, Mr. Morriss and Ms. Straight are independent trustees as defined by Form N-CSR.
Item 4. Principal Accountant Fees and Services.
Ernst & Young LLP (“E&Y”) serves as independent registered public accounting firm to Neuberger Berman Emerging Markets Income Fund, Neuberger Berman High Income Bond Fund, Neuberger Berman Municipal Intermediate Bond Fund, Neuberger Berman Short Duration Bond Fund and Neuberger Berman Strategic Income Fund. Neuberger Berman Emerging Markets Income Fund, Neuberger Berman High Income Bond Fund, Neuberger Berman Municipal Intermediate Bond Fund, Neuberger Berman Short Duration Bond Fund and Neuberger Berman Strategic Income Fund commenced operations on September 27, 2013, February 1, 1992, July 9, 1987, June 9, 1986, and July 11, 2003, respectively.
Tait, Weller & Baker LLP (“Tait Weller”) serves as independent registered public accounting firm to Neuberger Berman Core Bond Fund, Neuberger Berman Floating Rate Income Fund, Neuberger Berman New York Municipal Income Fund and Neuberger Berman Short Duration High Income Fund. Neuberger Berman Core Bond Fund, Neuberger Berman Floating Rate Income Fund, Neuberger Berman New York Municipal Income Fund and Neuberger Berman Short Duration High Income Fund commenced operations on October 1, 1995, December 29, 2009, March 11, 2013 and September 28, 2012, respectively.
(a) Audit Fees
The aggregate fees billed for professional services rendered by E&Y for the audit of the annual financial statements or services that are normally provided by E&Y in connection with statutory and regulatory filings or engagements were $185,950 and $212,550 for the fiscal years ended 2012 and 2013, respectively.
The aggregate fees billed for professional services rendered by Tait Weller for the audit of the annual financial statements or services that are normally provided by Tait Weller in connection with statutory and regulatory filings or engagements were $77,300 and $99,500 for the fiscal years ended 2012 and 2013, respectively.
(b) Audit-Related Fees
The aggregate fees billed to the Registrant for assurance and related services by E&Y that are reasonably related to the performance of the audit of the Registrant’s financial statements and are not reported above in Audit Fees were $0 and $0 for the fiscal years ended 2012 and 2013, respectively. The Audit Committee approved 0% and 0% of these services provided by E&Y for the fiscal years ended 2012 and 2013, respectively, pursuant to the waiver provisions of Rule 2-01(c)(7)(i)(C) of Regulation S-X.
The fees billed to other entities in the investment company complex for assurance and related services by E&Y that are reasonably related to the performance of the audit that the Audit Committee was required to approve because the engagement related directly to the operations and financial reporting of the Registrant were $0 and $0 for the fiscal years ended 2012 and 2013, respectively. The Audit Committee approved 0% and 0% of these services provided by E&Y for the fiscal years ended 2012 and 2013, respectively, pursuant to the waiver provisions of Rule 2-01(c)(7)(i)(C) of Regulation S-X.
The aggregate fees billed to the Registrant for assurance and related services by Tait Weller that are reasonably related to the performance of the audit of the Registrant’s financial statements and are not reported above in Audit Fees were $0 and $0 for the fiscal years ended 2012 and 2013, respectively. The Audit Committee approved 0% and 0% of these services provided by Tait Weller for the fiscal years ended 2012 and 2013, respectively, pursuant to the waiver provisions of Rule 2-01(c)(7)(i)(C) of Regulation S-X.
The fees billed to other entities in the investment company complex for assurance and related services by Tait Weller that are reasonably related to the performance of the audit that the Audit Committee was required to approve because the engagement related directly to the operations and financial reporting of the Registrant were $0 and $0 for the fiscal years ended 2012 and 2013, respectively. The Audit Committee approved 0% and 0% of these services provided by Tait Weller for the fiscal years ended 2012 and 2013, respectively, pursuant to the waiver provisions of Rule 2-01(c)(7)(i)(C) of Regulation S-X.
(c) Tax Fees
The aggregate fees billed to the Registrant for professional services rendered by E&Y for tax compliance, tax advice, and tax planning were $41,600 and $55,300 for the fiscal years ended 2012 and 2013, respectively. The nature of the services provided includes preparation of the Federal and State tax extensions and tax returns, review of annual excise tax calculations, and preparation of form 8613, in addition to guidance with the identification of Passive Foreign Investment Companies ("PFICS"), assistance with determination of various foreign withholding taxes, and assistance with Internal Revenue Code and tax regulation requirements for fund investments. The Audit Committee approved 0% and 0% of these services provided by E&Y for the fiscal years ended 2012 and 2013, respectively, pursuant to the waiver provisions of Rule 2-01(c)(7)(i)(C) of Regulation S-X.
The fees billed to other entities in the investment company complex for professional services rendered by E&Y for tax compliance, tax advice, and tax planning that the Audit Committee was required to approve because the engagement related directly to the operations and financial reporting of the Registrant were $0 and $0 for the fiscal years ended 2012 and 2013, respectively. The Audit Committee approved 0% and 0% of these services provided by E&Y for the fiscal years ended 2012 and 2013, respectively, pursuant to the waiver provisions of Rule 2-01(c)(7)(i)(C) of Regulation S-X.
The aggregate fees billed to the Registrant for professional services rendered by Tait Weller for tax compliance, tax advice, and tax planning were $12,000 and $16,250 for the fiscal years ended 2012
and 2013, respectively. The nature of the services provided includes preparation of the Federal and State tax extensions and tax returns, review of annual excise tax calculations, and preparation of form 8613, in addition to guidance with the identification of Passive Foreign Investment Companies ("PFICS"), assistance with determination of various foreign withholding taxes, and assistance with Internal Revenue Code and tax regulation requirements for fund investments. The Audit Committee approved 0% and 0% of these services provided by Tait Weller for the fiscal years ended 2012 and 2013, respectively, pursuant to the waiver provisions of Rule 2-01(c)(7)(i)(C) of Regulation S-X.
The fees billed to other entities in the investment company complex for professional services rendered by Tait Weller for tax compliance, tax advice, and tax planning that the Audit Committee was required to approve because the engagement related directly to the operations and financial reporting of the Registrant were $0 and $0 for the fiscal years ended 2012 and 2013, respectively. The Audit Committee approved 0% and 0% of these services provided by Tait Weller for the fiscal years ended 2012 and 2013, respectively, pursuant to the waiver provisions of Rule 2-01(c)(7)(i)(C) of Regulation S-X.
(d) All Other Fees
The aggregate fees billed to the Registrant for products and services provided by E&Y, other than services reported in Audit Fees, Audit-Related Fees, and Tax Fees were $0 and $0 for the fiscal years ended 2012 and 2013, respectively. The Audit Committee approved 0% and 0% of these services provided by E&Y for the fiscal years ended 2012 and 2013, respectively, pursuant to the waiver provisions of Rule 2-01(c)(7)(i)(C) of Regulation S-X.
The fees billed to other entities in the investment company complex for products and services provided by E&Y, other than services reported in Audit Fees, Audit-Related Fees, and Tax Fees, that the Audit Committee was required to approve because the engagement related directly to the operations and financial reporting of the Registrant were $0 and $0 for the fiscal years ended 2012 and 2013, respectively. The Audit Committee approved 0% and 0% of these services provided by E&Y for the fiscal years ended 2012 and 2013, respectively, pursuant to the waiver provisions of Rule 2-01(c)(7)(i)(C) of Regulation S-X.
The aggregate fees billed to the Registrant for products and services provided by Tait Weller, other than services reported in Audit Fees, Audit-Related Fees, and Tax Fees were $0 and $0 for the fiscal years ended 2012 and 2013, respectively. The Audit Committee approved 0% and 0% of these services provided by Tait Weller for the fiscal years ended 2012 and 2013, respectively, pursuant to the waiver provisions of Rule 2-01(c)(7)(i)(C) of Regulation S-X.
The fees billed to other entities in the investment company complex for products and services provided by Tait Weller, other than services reported in Audit Fees, Audit-Related Fees, and Tax Fees, that the Audit Committee was required to approve because the engagement related directly to the operations and financial reporting of the Registrant were $0 and $0 for the fiscal years ended 2012 and 2013, respectively. The Audit Committee approved 0% and 0% of these services provided by Tait Weller for the fiscal years ended 2012 and 2013, respectively, pursuant to the waiver provisions of Rule 2-01(c)(7)(i)(C) of Regulation S-X.
(e) Audit Committee’s Pre-Approval Policies and Procedures
(1) The Audit Committee’s pre-approval policies and procedures for the Registrant to engage an accountant to render audit and non-audit services delegate to each member of the Committee the power to pre-approve services between meetings of the Committee.
(2) None of the services described in paragraphs (b) through (d) above were approved by the Audit Committee pursuant to paragraph (c)(7)(i)(C) of Rule 2-01 of Regulation S-X.
(f) Hours Attributed to Other Persons
Not applicable.
(g) Non-Audit Fees
Non-audit fees billed by E&Y for services rendered to the Registrant were $41,600 and $55,300 for the fiscal years ended 2012 and 2013, respectively.
Non-audit fees billed by E&Y for services rendered to the Registrant’s investment adviser and any entity controlling, controlled by, or under common control with the adviser that provides ongoing services to the Registrant were $0 and $0 for the fiscal years ended 2012 and 2013, respectively.
Non-audit fees billed by Tait Weller for services rendered to the Registrant were $12,000 and $16,250 for the fiscal years ended 2012 and 2013, respectively.
Non-audit fees billed by Tait Weller for services rendered to the Registrant’s investment adviser and any entity controlling, controlled by, or under common control with the adviser that provides ongoing services to the Registrant were $0 and $0 for the fiscal years ended 2012 and 2013, respectively.
(h) The Audit Committee of the Board considered whether the provision of non-audit services rendered to the Registrant’s investment adviser and any entity controlling, controlled by, or under common control with the adviser that provides ongoing services to the Registrant that were not pre-approved by the Audit Committee because the engagement did not relate directly to the operations and financial reporting of the Registrant is compatible with maintaining E&Y’s and Tait Weller’s independence.
Item 5. Audit Committee of Listed Registrants.
Not applicable to the Registrant.
Item 6. Schedule of Investments.
The complete schedule of investments for each series is disclosed in the Registrant’s Annual Report, which is included as Item 1 of this Form N-CSR.
Item 7. Disclosure of Proxy Voting Policies and Procedures for Closed-End Management Investment Companies.
Not applicable to the Registrant.
Item 8. Portfolio Managers of Closed-End Management Investment Companies.
Not applicable to the Registrant.
Item 9. Purchases of Equity Securities by Closed-End Management Investment Company and Affiliated Purchasers.
Not applicable to the Registrant.
Item 10. Submission of Matters to a Vote of Security Holders.
There were no changes to the procedures by which shareholders may recommend nominees to the Board.
Item 11. Controls and Procedures.
| (a) | Based on an evaluation of the disclosure controls and procedures (as defined in Rule 30a-3(c) under the Investment Company Act of 1940, as amended (the “Act”)) as of a date within 90 days of the filing date of this document, the Chief Executive Officer and Treasurer and Principal Financial and Accounting Officer of the Registrant have concluded that such disclosure controls and procedures are effectively designed to ensure that information required to be disclosed by the Registrant on Form N-CSR and Form N-Q is accumulated and communicated to the Registrant’s management to allow timely decisions regarding required disclosure. |
| | |
| (b) | There were no significant changes in the Registrant’s internal controls over financial reporting (as defined in Rule 30a-3(d) under the Act) that occurred during the Registrant’s second fiscal quarter of the period covered by this report that have materially affected, or are reasonably likely to materially affect, the Registrant’s internal control over financial reporting. |
Item 12. Exhibits.
| (a)(1) | A copy of the Code of Ethics is incorporated by reference to Neuberger Berman Equity Funds’ Form N-CSRS, Investment Company Act file number 811-00582 (filed May 6, 2013). |
| | |
| (a)(2) | The certifications required by Rule 30a-2(a) of the Act and Section 302 of the Sarbanes-Oxley Act of 2002 (“Sarbanes-Oxley Act”) are filed herewith. |
| | |
| (a)(3) | Not applicable to the Registrant. |
| | |
| (b) | The certifications required by Rule 30a-2(b) of the Act and Section 906 of the Sarbanes-Oxley Act are filed herewith. |
The certifications provided pursuant to Rule 30a-2(b) of the Act and Section 906 of the Sarbanes-Oxley Act are not deemed “filed” for purposes of Section 18 of the Securities Exchange Act of 1934, as amended (“Exchange Act”), or otherwise subject to the liability of that section. Such certifications will not be deemed to be incorporated by reference into any filing under the Securities Act of 1933, as amended, or the Exchange Act, except to the extent that the Registrant specifically incorporates them by reference.
SIGNATURES
Pursuant to the requirements of the Securities Exchange Act of 1934 and the Investment Company Act of 1940, the Registrant has duly caused this report to be signed on its behalf by the undersigned, thereunto duly authorized.
NEUBERGER BERMAN INCOME FUNDS
By: /s/ Robert Conti |
| | Robert Conti |
| | Chief Executive Officer |
Date: January 6, 2014
Pursuant to the requirements of the Securities Exchange Act of 1934 and the Investment Company Act of 1940, this report has been signed below by the following persons on behalf of the Registrant and in the capacities and on the dates indicated.
|
| | Robert Conti |
| | Chief Executive Officer |
Date: January 6, 2014
|
| | John M. McGovern |
| | Treasurer and Principal Financial |
| | and Accounting Officer |
Date: January 6, 2014