As filed with the Securities and Exchange Commission on January 4, 2018
UNITED STATES
SECURITIES AND EXCHANGE COMMISSION
Washington, D.C. 20549
FORM N-CSR
CERTIFIED SHAREHOLDER REPORT OF
REGISTERED MANAGEMENT INVESTMENT COMPANIES
Investment Company Act file number: 811-03802
NEUBERGER BERMAN INCOME FUNDS
(Exact name of registrant as specified in charter)
c/o Neuberger Berman Investment Advisers LLC
1290 Avenue of the Americas
New York, New York 10104-0002
(Address of principal executive offices – Zip Code)
Registrant's telephone number, including area code: (212) 476-8800
Robert Conti
Chief Executive Officer and President
Neuberger Berman Income Funds
c/o Neuberger Berman Investment Advisers LLC
1290 Avenue of the Americas
New York, New York 10104-0002
Arthur C. Delibert, Esq.
K&L Gates LLP
1601 K Street, N.W.
Washington, D.C. 20006-1600
(Names and addresses of agents for service)
Date of fiscal year end: October 31
Date of reporting period: October 31, 2017
Form N-CSR is to be used by management investment companies to file reports with the Commission not later than 10 days after the transmission to stockholders of any report that is required to be transmitted to stockholders under Rule 30e-1 under the Investment Company Act of 1940, as amended (“Act”) (17 CFR 270.30e-1). The Commission may use the information provided on Form N-CSR in its regulatory, disclosure review, inspection, and policymaking roles.
A registrant is required to disclose the information specified by Form N-CSR, and the Commission will make this information public. A registrant is not required to respond to the collection of information contained in Form N-CSR unless the Form displays a currently valid Office of Management and Budget (“OMB”) control number. Please direct comments concerning the accuracy of the information collection burden estimate and any suggestions for reducing the burden to Secretary, Securities and Exchange Commission, 100 F Street, NE, Washington, DC 20549-0609. The OMB has reviewed this collection of information under the clearance requirements of 44 U.S.C. § 3507.
Item 1. Report to Shareholders.
Following is a copy of the annual report transmitted to shareholders pursuant to Rule 30e-1 under the Act.

Neuberger Berman
Income Funds
Investor Class Shares
Trust Class Shares
Institutional Class Shares
Core Bond Fund
Core Plus Fund
Emerging Markets Debt Fund
Floating Rate Income Fund
High Income Bond Fund
Municipal High Income Fund
Class A Shares
Class C Shares
Class R3 Shares
Class R6 Shares
Municipal Intermediate Bond Fund
New York Municipal Income Fund
Short Duration Bond Fund
Short Duration High Income Fund
Strategic Income Fund
Unconstrained Bond Fund
Annual Report
October 31, 2017
Contents
THE FUNDS
PORTFOLIO COMMENTARY
Core Bond Fund | | | 2 | | |
Core Plus Fund | | | 5 | | |
Emerging Markets Debt Fund | | | 8 | | |
Floating Rate Income Fund | | | 12 | | |
High Income Bond Fund | | | 15 | | |
Municipal High Income Fund | | | 18 | | |
Municipal Intermediate Bond Fund | | | 21 | | |
New York Municipal Income Fund | | | 24 | | |
Short Duration Bond Fund | | | 27 | | |
Short Duration High Income Fund | | | 30 | | |
Strategic Income Fund | | | 33 | | |
Unconstrained Bond Fund | | | 36 | | |
FUND EXPENSE INFORMATION | | | 44 | | |
SCHEDULE OF INVESTMENTS
Core Bond Fund | | | 47 | | |
Core Plus Fund | | | 57 | | |
Emerging Markets Debt Fund | | | 65 | | |
Positions by Industry | | | 82 | | |
Floating Rate Income Fund | | | 94 | | |
High Income Bond Fund | | | 110 | | |
Municipal High Income Fund | | | 126 | | |
Municipal Intermediate Bond Fund | | | 134 | | |
New York Municipal Income Fund | | | 142 | | |
Short Duration Bond Fund | | | 145 | | |
Short Duration High Income Fund | | | 151 | | |
Strategic Income Fund | | | 164 | | |
Unconstrained Bond Fund | | | 199 | | |
FINANCIAL STATEMENTS | | | 218 | | |
FINANCIAL HIGHLIGHTS (ALL CLASSES)/PER SHARE DATA
Core Bond Fund | | | 264 | | |
Core Plus Fund | | | 264 | | |
Emerging Markets Debt Fund | | | 266 | | |
Floating Rate Income Fund | | | 268 | | |
High Income Bond Fund | | | 268 | | |
Municipal High Income Fund | | | 270 | | |
Municipal Intermediate Bond Fund | | | 272 | | |
New York Municipal Income Fund | | | 274 | | |
Short Duration Bond Fund | | | 274 | | |
Short Duration High Income Fund | | | 276 | | |
Strategic Income Fund | | | 278 | | |
Unconstrained Bond Fund | | | 280 | | |
Reports of Independent Registered Public Accounting Firms | | | 284 | | |
Directory | | | 286 | | |
Trustees and Officers | | | 287 | | |
Proxy Voting Policies and Procedures | | | 296 | | |
Quarterly Portfolio Schedule | | | 296 | | |
Board Consideration of the Management and Sub-Advisory Agreements | | | 296 | | |
Notice to Shareholders | | | 302 | | |
The "Neuberger Berman" name and logo and "Neuberger Berman Investment Advisers LLC" name are registered service marks of Neuberger Berman Group LLC. The individual Fund names in this piece are either service marks or registered service marks of Neuberger Berman Investment Advisers LLC, an affiliate of Neuberger Berman BD LLC, distributor, member FINRA. @2017 Neuberger Berman BD LLC, distributor. All rights reserved.
Dear Shareholder,
I am pleased to present this annual shareholder report for the Neuberger Berman Income Funds.
The U.S. economy, as measured by gross domestic product (GDP), continued to expand and the pace accelerated as the 12-month reporting period progressed. Against this backdrop, the U.S. Federal Reserve (Fed) raised interest rates on three occasions during the reporting period, with another rate hike possible before the end of December. Additionally, in a well telegraphed move, the Fed began reducing its balance sheet in October 2017. Elsewhere, growth outside the U.S. largely improved, although inflation remained relatively tame. Meanwhile, central banks outside the U.S. largely maintained their accommodative monetary policies.
After selling off following the U.S. election in November 2016, the U.S. government bond market stabilized and started to rebound in March 2017. This turnaround was triggered by a number of factors, including tempered expectations for fiscal stimulus in the U.S. and several geopolitical events that led to flights to quality.
All told, the Bloomberg Barclays U.S. Aggregate Bond Index gained 0.90% during the 12 months ended October 31, 2017. Investment grade corporate bonds produced positive excess returns relative to equal-duration Treasuries during the period, while securitized sectors generated mixed results. Investors who took on more risk were typically rewarded, as high yield bonds, bank loans and emerging market debt outperformed. For example, the ICE BofAML U.S. High Yield Constrained Index returned 9.14% during the reporting period.
The synchronous global expansion and buoyant markets have so far been able to withstand a number of crucial questions. Looking ahead, how will extreme levels of monetary policy accommodation eventually be unwound? What are the prospects for the reflationary, pro-growth elements of President Trump's agenda? When will a long forecasted increase in U.S. government bond yields materialize? What is the impact of wildcards such as North Korea or an unusually destructive hurricane season? As unsettling as it may be, we don't anticipate complete clarity on these questions in the near term, and we do think there may be some unexpected answers — including that the global economic upturn may nevertheless continue.
We believe the fundamentals for corporate credit, the securitized sectors and the municipal market remain supportive, although valuations have become less attractive. In terms of U.S. government bonds, we anticipate yields for U.S. Treasuries and other developed market sovereigns will drift higher in 2018. Pursuant to our long-term investment philosophy, we will actively manage our fixed income funds and adjust their portfolios given the evolving economic and investment backdrop.
Thank you for your continued support and trust. We look forward to continue serving your investment needs in the years to come.
Sincerely,

ROBERT CONTI
PRESIDENT AND CEO
NEUBERGER BERMAN MUTUAL FUNDS
1
Core Bond Fund Commentary (Unaudited)
Neuberger Berman Core Bond Fund Institutional Class generated a 0.95% total return for the 12 months ended October 31, 2017 and outperformed its benchmark, the Bloomberg Barclays U.S. Aggregate Bond Index, which provided a 0.90% total return for the same period. (Performance for all share classes is provided in the table immediately following this letter.)
The overall U.S. fixed income market generated a modest gain during the reporting period. Both short- and longer-term Treasury yields rose over the 12 months ended October 31, 2017. In general, short-term yields moved higher as the U.S. Federal Reserve (Fed) raised interest rates three times over the reporting period. The Fed also began reducing its balance sheet in October 2017. Meanwhile, longer-term Treasury yields fluctuated given changing expectations for economic growth in the U.S., uncertainties surrounding future fiscal policy, and a number of geopolitical events.
The Fund's allocation to non-agency mortgage-backed securities (MBS) benefited performance. A solid housing market led to ongoing improvement in mortgage creditworthiness, and a shrinking pool of existing securities was met by increasing investor demand. Security selection within investment grade corporate bonds also contributed to results. Corporate credit continued to benefit from solid investor risk appetite and supportive fundamentals. An allocation to U.S. Treasury Inflation-Protected Securities was beneficial as inflation expectations accelerated following the November 2016 U.S. elections. Conversely, the Fund's overall duration positioning and exposures to global sovereign bonds were both detractors from performance.
The Fund's use of futures contracts detracted from performance during the reporting period.
There were several adjustments made to the portfolio during the reporting period. Although we ended the 12 month period higher than we began it, we tactically adjusted the Fund's duration, first increasing duration following the November 2016 U.S. election sell-off and then subsequently reducing duration. Over the period, we decreased holdings in U.S. Treasuries. We initially increased the Fund's allocation to investment grade corporate bonds then later pared this allocation as valuations became less attractive after a strong rally. Within securitized sectors, we increased the Fund's holdings of asset-backed securities and, to lesser extents, commercial MBS and non-agency MBS.
Looking ahead, the long-awaited sell-off in government bond yields may continue to prove elusive. Investors seem to doubt whether the Fed will hike rates meaningfully and seem to expect the Fed's balance sheet exit may be a non-event. Compare today's mindset to the "taper tantrum" of 2013 when former Fed Chair Bernanke's mere mention of a potential future tapering of asset purchases sparked a major sell-off and volatility spike. As of the period end, the Fed actually started reducing holdings — which is arguably more significant than tapering — and it anticipates to continue hiking rates. Nevertheless, Treasury yields and interest rate volatility remain stubbornly low. We believe there's certainly a chance it plays out calmly and predictably, but the bond market's current stance may prove to be overly complacent. We believe reducing central bank balance sheet holdings — quantitative tightening — should add to volatility in fixed income markets just as adding to central bank balance sheets — quantitative easing — had previously reduced volatility.
Sincerely,
THANOS BARDAS, DAVID M. BROWN, ANDREW A. JOHNSON, THOMAS J. MARTHALER AND BRADLEY C. TANK
PORTFOLIO MANAGERS
Information about principal risks of investing in the Fund is set forth in the prospectus and statement of additional information.
The portfolio composition, industries and holdings of the Fund are subject to change without notice.
The opinions expressed are those of the Fund's portfolio managers. The opinions are as of the date of this report and are subject to change without notice.
2
Core Bond Fund (Unaudited)
TICKER SYMBOLS
Investor Class | | NCRIX | |
Institutional Class | | NCRLX | |
Class A | | NCRAX | |
Class C | | NCRCX | |
PORTFOLIO BY TYPE OF SECURITY
(as a % of Total Net Assets) | |
Asset-Backed Securities | | | 11.9 | % | |
Corporate Bonds | | | 26.9 | | |
Developed Markets Ex- U.S. | | | 1.3 | | |
Foreign Government Security | | | 0.8 | | |
Mortgage-Backed Securities | | | 33.8 | | |
U.S. Government Agency Securities | | | 2.1 | | |
U.S. Treasury Obligations | | | 30.9 | | |
Short-Term Investment | | | 1.8 | | |
Liabilities Less Other Assets | | | (9.5 | )* | |
Total | | | 100.0 | % | |
* Includes the impact of the Fund's open positions in derivatives, if any.
PERFORMANCE HIGHLIGHTS2,18
| | | Inception | | Average Annual Total Return
Ended 10/31/2017 | |
| | | Date | | 1 Year | | 5 Years | | 10 Years | | Life of Fund | |
At NAV | | | | | | | | | | | | | | | | | | | | | |
| Investor Class3 | | 02/01/1997 | | | 0.54 | % | | | 1.50 | % | | | 4.14 | % | | | 4.79 | % | |
| Institutional Class3 | | 10/01/1995 | | | 0.95 | % | | | 1.92 | % | | | 4.58 | % | | | 5.20 | % | |
| Class A4 | | 12/20/2007 | | | 0.54 | % | | | 1.51 | % | | | 4.14 | % | | | 5.00 | % | |
| Class C4 | | 12/20/2007 | | | -0.21 | % | | | 0.76 | % | | | 3.38 | % | | | 4.65 | % | |
With Sales Charge | | | | | | | | | | | | | | | | | | | |
| Class A4 | | | | | | | -3.76 | % | | | 0.63 | % | | | 3.68 | % | | | 4.79 | % | |
| Class C4 | | | | | | | -1.19 | % | | | 0.76 | % | | | 3.38 | % | | | 4.65 | % | |
Index | | | | | | | | | | | | | | | | | | | | | |
Bloomberg Barclays U.S. Aggregate
Bond Index1,14 | | | | | | | 0.90 | % | | | 2.04 | % | | | 4.19 | % | | | 5.29 | % | |
The performance data quoted represent past performance and do not indicate future results. Current performance may be lower or higher than the performance data quoted. For performance data current to the most recent month-end, please visit www.nb.com/performance.
The results shown in the table reflect the reinvestment of income dividends and other distributions, if any. The results do not reflect the effect of taxes a shareholder would pay on Fund distributions or on the redemption of Fund shares.
The investment return and principal value of an investment will fluctuate and shares, when redeemed, may be worth more or less than their original cost.
Returns would have been lower if Neuberger Berman Investment Advisers LLC ("Management") had not reimbursed certain expenses and/or waived a portion of the investment management fees during certain of the periods shown. Repayment by a class (of expenses previously reimbursed and/or fees previously waived by Management) will decrease the class's returns. Please see Note B in the Notes to Financial Statements for specific information regarding expense reimbursement and/or fee waiver arrangements.
For the period ended October 31, 2017, the 30-day SEC yields were 2.14%, 2.54%, 2.14% and 1.40% for Investor Class, Institutional Class, Class A and Class C shares, respectively. Absent expense reimbursements and/or fee waivers, the 30-day SEC yields would have been 2.04%, 2.57%, 2.20% and 1.46% for Investor Class, Institutional Class, Class A and Class C shares, respectively.
As stated in the Fund's most recent prospectus, the total annual operating expense ratios for fiscal year 2016 were 1.15%, 0.60%, 0.98% and 1.72% for Investor Class, Institutional Class, Class A and Class C shares, respectively (before expense reimbursements and/or fee waivers, if any). The expense ratios were 0.86%, 0.46%, 0.86% and 1.61% for Investor Class, Institutional Class, Class A and Class C shares, respectively, after expense reimbursements and/or fee waivers. The expense ratios for the annual period ended October 31, 2017 can be found in the Financial Highlights section of this report.
Returns shown with a sales charge reflect the deduction of the current maximum initial sales charge of 4.25% for Class A shares and the contingent deferred sales charge (CDSC) for Class C shares. The CDSC for Class C shares is 1%, which is reduced to 0% after 1 year. The performance of the Fund's share classes will differ primarily due to different sales charge structures and class expenses. Please see the prospectus for more information about sales charge structures, if any, and class expenses for your share class.
3
Core Bond Fund (Unaudited)
COMPARISON OF A $1,000,000 INVESTMENT
(000's omitted)
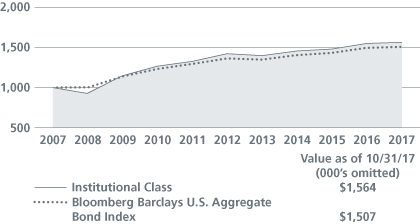
This graph shows the change in value of a hypothetical $1,000,000 investment in the Fund over the past 10 fiscal years, or since the Fund's inception if it has not operated for 10 years. The graph is based on the Institutional Class shares only; the performance of the Fund's share classes will differ primarily due to different sales charge structures and class expenses (see Performance Highlights chart on previous page). The result is compared with benchmarks, which include a broad-based market index and may include a more narrowly based index. Market indices have not been reduced to reflect any of the fees and costs of investing. The results shown in the graph reflect the reinvestment of income dividends and other distributions, if any. The results do not reflect the effect of taxes a shareholder would pay on Fund distributions or on the redemption of Fund shares. Results represent past performance and do not indicate future results.
4
Core Plus Fund Commentary (Unaudited)
Neuberger Berman Core Plus Fund Institutional Class generated a 0.63% total return from its inception on July 18, 2017 through October 31, 2017 (the "reporting period") and underperformed its benchmark, the Bloomberg Barclays U.S. Aggregate Bond Index, which provided a 0.72% total return for the same period. (Performance for all share classes is provided in the table immediately following this letter.)
The overall U.S. fixed income market, as measured by the Bloomberg Barclays U.S. Aggregate Bond Index, generated a modest gain during 2017. Both short- and longer-term Treasury yields rose during the reporting period. In general, short-term yields moved higher in anticipation of further U.S. Federal Reserve (Fed) interest rate hikes. In addition, the Fed began reducing its balance sheet in October 2017. Meanwhile, longer-term Treasury yields fluctuated given changing expectations for economic growth in the U.S., uncertainties surrounding future fiscal policy, and a number of geopolitical events.
The Fund's security selection within investment grade corporate bonds contributed to results as did an allocation to high yield corporates. After widening in early August, credit spreads subsequently recovered due to higher oil prices, diminished geopolitical risk and supportive corporate earnings. Allocations to hard currency emerging markets debt were also beneficial as the sector has seen ongoing investor inflows and improving fundamentals. Elsewhere, the Fund's duration positioning, particularly an overweight in U.S. interest rate sensitivity, detracted from performance as yields moved higher. Additionally, exposure to Italian sovereign yields was modestly unfavorable.
The Fund's aggregate use of futures and swap contracts detracted from performance during the reporting period.
The Fund was launched during the reporting period. We initiated a neutral weight in investment grade corporate bonds and an overweight in high yield corporates as well as hard currency emerging markets debt. To a lesser extent, the Fund also established overweight positions in asset-backed securities and credit risk transfer securities (collateralized mortgage obligations). Counterbalancing these allocations, the Fund has greater interest rate sensitivity than the benchmark and an overweight to agency mortgage-backed securities, both of which we believe may serve as a ballast in a risk-off market for credit.
Looking ahead, the long-awaited sell-off in government bond yields may continue to prove elusive. Investors seem to doubt whether the Fed will hike rates meaningfully and seem to expect the Fed's balance sheet exit may be a non-event. Compare today's mindset to the "taper tantrum" of 2013 when former Fed Chair Bernanke's mere mention of a potential future tapering of asset purchases sparked a major sell-off and volatility spike. As of the period end, the Fed actually started to reduce holdings — which is arguably more significant than tapering — and anticipates to continue hiking rates. Nevertheless, Treasury yields and interest rate volatility remain stubbornly low. We believe there's certainly a chance it plays out calmly and predictably, but the bond market's current stance may prove to be overly complacent. We believe reducing central bank balance sheet holdings — quantitative tightening — should add to volatility in fixed income markets just as adding to central bank balance sheets — quantitative easing — had previously reduced volatility.
Sincerely,
THANOS BARDAS, ASHOK BHATIA, DAVID M. BROWN, ANDREW A. JOHNSON, NATHAN KUSH,
THOMAS J. MARTHALER AND BRADLEY C. TANK
PORTFOLIO MANAGERS
Information about principal risks of investing in the Fund is set forth in the prospectus and statement of additional information.
The portfolio composition, industries and holdings of the Fund are subject to change without notice.
The opinions expressed are those of the Fund's portfolio managers. The opinions are as of the date of this report and are subject to change without notice.
5
Core Plus Fund (Unaudited)
TICKER SYMBOLS
Institutional Class | | NCPIX | |
Class A | | NCPAX | |
Class C | | NCPCX | |
Class R6 | | NCPRX | |
PORTFOLIO BY TYPE OF SECURITY
(as a % of Total Net Assets) | |
Asset-Backed Securities | | | 7.4 | % | |
Corporate Bonds | | | 31.1 | | |
Foreign Government Securities | | | 8.9 | | |
Mortgage-Backed Securities | | | 38.4 | | |
U.S. Treasury Obligations | | | 31.6 | | |
Short-Term Investment | | | 0.4 | | |
Liabilities Less Other Assets | | | (17.8 | )* | |
Total | | | 100.0 | % | |
* Includes the impact of the Fund's open positions in derivatives, if any.
PERFORMANCE HIGHLIGHTS
| | | Inception
Date | | Cumulative Total Return
Ended 10/31/2017
Life of Fund | |
At NAV | | | | | |
Institutional Class | | 07/18/2017 | | | 0.63 | % | |
Class A | | 07/18/2017 | | | 0.52 | % | |
Class C | | 07/18/2017 | | | 0.31 | % | |
Class R6 | | 07/18/2017 | | | 0.65 | % | |
With Sales Charge | | | | | |
Class A | | | | | -3.71 | % | |
Class C | | | | | -0.69 | % | |
Index | | | | | |
Bloomberg Barclays U.S. Aggregate
Bond Index1,14 | | | | | 0.72 | % | |
The performance data quoted represent past performance and do not indicate future results. Current performance may be lower or higher than the performance data quoted. For performance data current to the most recent month-end, please visit www.nb.com/performance.
The results shown in the table reflect the reinvestment of income dividends and other distributions, if any. The results do not reflect the effect of taxes a shareholder would pay on Fund distributions or on the redemption of Fund shares.
The investment return and principal value of an investment will fluctuate and shares, when redeemed, may be worth more or less than their original cost.
Returns would have been lower if Neuberger Berman Investment Advisers LLC ("Management") had not reimbursed certain expenses and/or waived a portion of the investment management fees during certain of the periods shown. Repayment by a class (of expenses previously reimbursed and/or fees previously waived by Management) will decrease the class's returns. Please see Note B in the Notes to Financial Statements for specific information regarding expense reimbursement and/or fee waiver arrangements.
For the period ended October 31, 2017, the 30-day SEC yields were 2.73%, 2.36%, 1.61% and 2.80% for Institutional Class, Class A, Class C and Class R6 shares, respectively. Absent expense reimbursements and/or fee waivers, the 30-day SEC yields would have been -2.94%, -3.35%, -4.08% and -2.88% for Institutional Class, Class A, Class C and Class R6 shares, respectively. A negative 30-day SEC yield results when a fund's accrued expenses exceed its income for the relevant period. Please note, in such instances the 30-day SEC yield may not equal the Fund's actual rate of income earned and distributed by the Fund and, therefore, a per share distribution may still be paid to shareholders.
As stated in the Fund's most recent prospectus, the estimated total annual operating expense ratios for fiscal year 2017 are 1.30%, 1.67%, 2.42% and 1.23% for Institutional Class, Class A, Class C and Class R6 shares, respectively (before expense reimbursements and/or fee waivers, if any). The estimated total annual operating expense ratios for the current fiscal year are 0.46%, 0.83%, 1.58% and 0.39% for Institutional Class, Class A, Class C and Class R6 shares, respectively, after expense reimbursements and/or fee waivers. The expense ratios for the annual period ended October 31, 2017 can be found in the Financial Highlights section of this report.
Returns shown with a sales charge reflect the deduction of the current maximum initial sales charge of 4.25% for Class A shares and the contingent deferred sales charge (CDSC) for Class C shares. The CDSC for Class C shares is 1%, which is reduced to 0% after 1 year. The performance of the Fund's share classes will differ primarily due to different sales charge structures and class expenses. Please see the prospectus for more information about sales charge structures, if any, and class expenses for your share class.
6
Core Plus Fund (Unaudited)
COMPARISON OF A $1,000,000 INVESTMENT
(000's omitted)
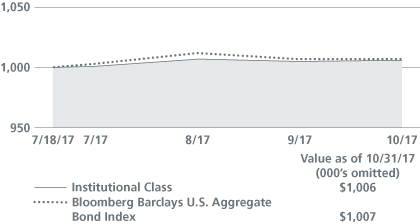
This graph shows the change in value of a hypothetical $1,000,000 investment in the Fund over the past 10 fiscal years, or since the Fund's inception if it has not operated for 10 years. The graph is based on the Institutional Class shares only; the performance of the Fund's share classes will differ primarily due to different sales charge structures and class expenses (see Performance Highlights chart on previous page). The result is compared with benchmarks, which include a broad-based market index and may include a more narrowly based index. Market indices have not been reduced to reflect any of the fees and costs of investing. The results shown in the graph reflect the reinvestment of income dividends and other distributions, if any. The results do not reflect the effect of taxes a shareholder would pay on Fund distributions or on the redemption of Fund shares. Results represent past performance and do not indicate future results.
7
Emerging Markets Debt Fund Commentary (Unaudited)
Neuberger Berman Emerging Markets Debt Fund Institutional Class generated a 6.77% total return for the 12 months ended October 31, 2017 and outperformed its benchmark, a custom blend consisting of 25% J.P. Morgan Emerging Markets Bond Index — Global Diversified, 25% J.P. Morgan Corporate Emerging Markets Bond Index — Diversified and 50% J.P. Morgan Government Bond Index — Emerging Markets Global Diversified, which provided a 5.75% total return for the same period. (Performance for all share classes is provided in the table immediately following this letter.)
Emerging markets (EM) experienced a turbulent start to the period, with markets selling-off sharply after the November 2016 U.S. elections followed by a recovery that extended through the end of the reporting period. Global economic activity surprised on the upside while inflation slowed, creating a "goldilocks" environment for EM debt and leading to a continuation of strong inflows. The recovery of commodity prices supported commodity producing and exporting economies. Further, reported Chinese growth remained at the higher end of our expectations, in spite of government measures to slow down credit growth. Additionally, exports from EM ex-China improved, reflecting healthier global demand. Finally, absent any indications of overheating in developed markets, core global monetary policy was expected to turn less accommodative only slowly. This, along with the historically low EM inflation, allowed EM central banks to cut rates and support further growth.
The Fund's positive performance was driven by country allocation and bottom-up security selection across the underlying sleeves in the portfolio. The tactical asset allocation detracted from performance, however the Fund's duration hedging was positive, making the top-down positioning positive for the reporting period. Tactically, we started with an overweight in local currency funded by an underweight in corporates, and a neutral position in hard currency. We moved to cash after the November 2016 U.S. elections and rotated from local to hard currency as EM faced uncertainty surrounding the new U.S. Administration's trade rhetoric. As the sentiment improved, supported by attractive valuations, we added to the EM foreign currencies (EMFX) overlay in EM high yielders. As EM growth continued to recover, we added back to the foreign currency (FX) overlay and moved to an overweight in local currency, while maintaining the overweight to hard currency and underweight to corporates.
In hard currency, the significant contributors to performance were security selection in Argentina, Malaysia and Indonesia, an underweight position in the Philippines, and overweights in Argentina and frontier countries including Mongolia, Iraq and Ghana. The underweight exposure to Hungary and Zambia detracted from performance as well as security selection in Venezuela. In the corporate space we benefitted from overweights in Argentina and Brazil and underweights in low beta countries, such as Hong Kong, Singapore, Israel and Korea, as the market rallied. Security selection in India was also positive though this was offset somewhat by security selection in Brazil and Colombia. By sector, positions in metals & mining, consumer, and utilities were positive, while oil & gas created a drag on relative performance. In local currency, local rates positioning drove outperformance. Key contributors were Central and Eastern Europe, the Middle East and Africa, and positions in Russia and the Czech Republic, while Hungary detracted from the Fund's performance. In Latin America, rates position in Colombia was positive, but was offset by exposure in Brazil. A new rates position in Sri Lanka was also additive, while the contribution from FX was negative in the reporting period. FX exposure to Russia, Colombia, Korea and Taiwan detracted from the EMFX returns. This was mitigated by positive returns from Czech Republic, Brazil and Mexico.
The Fund's aggregate use of futures, forward foreign currency and swap contracts contributed positively to performance during the reporting period.
In our view, the fundamental outlook for EM continues to be positive. We think external vulnerabilities have receded considerably and several countries have lately been in a position of rebuilding FX reserves and easing monetary policy. Both export growth data and domestic macro indicators such as retail sales have been showing strength across the EM world.
8
Corporates and consumers, China aside, have deleveraged and adjusted to lower commodity prices. Absent any indications of overheating in developed markets, core global monetary policy is expected to gradually move tighter only slowly, allowing EM central banks to cut rates and support growth further. We believe this, along with historically low EM inflation, if they continue, should be supportive of lower bond yields and EM currencies.
Sincerely,
ROB DRIJKONINGEN, GORKY URQUIETA, BART VAN DER MADE, RAOUL LUTTIK,
JENNIFER GORGOLL, VERA KARTSEVA AND NISH POPAT
PORTFOLIO CO-MANAGERS
Information about principal risks of investing in the Fund is set forth in the prospectus and statement of additional information.
The portfolio composition, industries and holdings of the Fund are subject to change without notice.
The opinions expressed are those of the Fund's portfolio managers. The opinions are as of the date of this report and are subject to change without notice.
9
Emerging Markets Debt Fund (Unaudited)
TICKER SYMBOLS
Institutional Class | | NERIX | |
Class A | | NERAX | |
Class C | | NERCX | |
PERFORMANCE HIGHLIGHTS
| | | Inception | | Average Annual Total Return
Ended 10/31/2017 | |
| | | Date | | 1 Year | | Life of Fund | |
At NAV | | | | | | | |
Institutional Class | | 09/27/2013 | | | 6.77 | % | | | 2.99 | % | |
Class A | | 09/27/2013 | | | 6.26 | % | | | 2.58 | % | |
Class C | | 09/27/2013 | | | 5.47 | % | | | 1.82 | % | |
With Sales Charge | | | | | | | |
Class A | | | | | 1.69 | % | | | 1.51 | % | |
Class C | | | | | 4.47 | % | | | 1.82 | % | |
Index | | | | | | | |
| Blended Benchmark*1,14 | | | | | 5.75 | % | | | 2.88 | % | |
* Blended benchmark is composed of 50% J.P. Morgan Government Bond Index (GBI) — Emerging Markets Global Diversified, 25% J.P. Morgan Emerging Markets Bond Index (EMBI) — Global Diversified, and 25% J.P. Morgan Corporate Emerging Markets Bond Index (CEMBI) — Diversified, and is rebalanced monthly.
The performance data quoted represent past performance and do not indicate future results. Current performance may be lower or higher than the performance data quoted. For performance data current to the most recent month-end, please visit www.nb.com/performance.
The results shown in the table reflect the reinvestment of income dividends and other distributions, if any. The results do not reflect the effect of taxes a shareholder would pay on Fund distributions or on the redemption of Fund shares.
The investment return and principal value of an investment will fluctuate and shares, when redeemed, may be worth more or less than their original cost.
Returns would have been lower if Neuberger Berman Investment Advisers LLC ("Management") had not reimbursed certain expenses and/or waived a portion of the investment management fees during certain of the periods shown. Repayment by a class (of expenses previously reimbursed and/or fees previously waived by Management) will decrease the class's returns. Please see Note B in the Notes to Financial Statements for specific information regarding expense reimbursement and/or fee waiver arrangements.
For the period ended October 31, 2017, the 30-day SEC yields were 5.38%, 5.01% and 4.24% for Institutional Class, Class A and Class C shares, respectively. Absent expense reimbursements and/or fee waivers, the 30-day SEC yields would have been 5.35%, 4.84% and 4.24% for Institutional Class, Class A and Class C shares, respectively.
As stated in the Fund's most recent prospectus, the total annual operating expense ratios for fiscal year 2016 were 1.21%, 1.74% and 2.37% for Institutional Class, Class A and Class C shares, respectively (before expense reimbursements and/or fee waivers, if any). The expense ratios were 0.79%, 1.16% and 1.91% for Institutional Class, Class A and Class C shares, respectively, after expense reimbursements and/or fee waivers. The expense ratios for the annual period ended October 31, 2017 can be found in the Financial Highlights section of this report.
Returns shown with a sales charge reflect the deduction of the current maximum initial sales charge of 4.25% for Class A shares and the contingent deferred sales charge (CDSC) for Class C shares. The CDSC for Class C shares is 1%, which is reduced to 0% after 1 year. The performance of the Fund's share classes will differ primarily due to different sales charge structures and class expenses. Please see the prospectus for more information about sales charge structures, if any, and class expenses for your share class.
10
Emerging Markets Debt Fund (Unaudited)
COMPARISON OF A $1,000,000 INVESTMENT
(000's omitted)
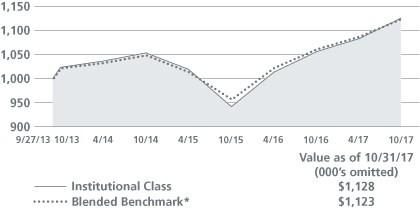
This graph shows the change in value of a hypothetical $1,000,000 investment in the Fund over the past 10 fiscal years, or since the Fund's inception if it has not operated for 10 years. The graph is based on the Institutional Class shares only; the performance of the Fund's share classes will differ primarily due to different sales charge structures and class expenses (see Performance Highlights chart on previous page). The result is compared with benchmarks, which include a broad-based market index and may include a more narrowly based index. Market indices have not been reduced to reflect any of the fees and costs of investing. The results shown in the graph reflect the reinvestment of income dividends and other distributions, if any. The results do not reflect the effect of taxes a shareholder would pay on Fund distributions or on the redemption of Fund shares. Results represent past performance and do not indicate future results.
* Blended benchmark is composed of 50% J.P. Morgan Government Bond Index (GBI) — Emerging Markets Global Diversified, 25% J.P. Morgan Emerging Markets Bond Index (EMBI) — Global Diversified, and 25% J.P. Morgan Corporate Emerging Markets Bond Index (CEMBI) — Diversified, and is rebalanced monthly.
11
Floating Rate Income Fund Commentary (Unaudited)
Neuberger Berman Floating Rate Income Fund Institutional Class generated a 4.14% total return for the 12 months ended October 31, 2017 and underperformed its benchmark, the S&P/LSTA Leveraged Loan Index, which provided a 5.06% total return for the same period. (Performance for all share classes is provided in the table immediately following this letter.)
The senior floating rate bank loan market posted positive results during the reporting period. Supporting the asset class were generally solid fundamentals, relatively low defaults and indications from the U.S. Federal Reserve that it would continue to take a measured approach in terms of raising interest rates. For the 12 months ended October 31, 2017, securities rated B in the S&P/LSTA Leveraged Loan Index returned 5.13%, whereas BB rated and CCC rated securities returned 3.97% and 15.22%, respectively.
The Fund tactically adjusted its position in non-floating rate securities during the reporting period. We have the flexibility to allocate up to 20% of the portfolio in these securities, usually fixed-rate senior bonds. Relative value between floating rate loans and bonds fluctuated during the reporting period given the increase in volatility. Against this backdrop, the Fund's non-floating rate allocation ended the reporting period at approximately 7.9%.
In terms of the Fund's quality biases, an underweight to CCC rated issues and security selection within B rated issues detracted from performance. Conversely, security selection of BB rated issues contributed to performance.
From a sector perspective, security selection within oil & gas, business equipment & services, and electronics-electrical detracted the most from performance during the reporting period. In contrast, security selection within retailers, financial intermediaries, and drugs were the largest contributors to performance.
We continue to believe that the floating rate loan market is compensating investors for default risk. We think defaults may have peaked in 2016 and could remain below 2% in both 2017 and 2018 as revenue and leverage ratios improve. While volatility has failed to emerge in the non-investment grade space, as it has in most risk markets, we believe the potential remains for a spike in volatility over the balance of the year given ongoing policy uncertainty in the U.S., various geopolitical flashpoints, and the possibility that the improvement in global economic growth could wane.
Sincerely,
THOMAS P. O'REILLY, JOSEPH P. LYNCH, STEPHEN J. CASEY AND DANIEL DOYLE
PORTFOLIO MANAGERS
Information about principal risks of investing in the Fund is set forth in the prospectus and statement of additional information.
The portfolio composition, industries and holdings of the Fund are subject to change without notice.
The opinions expressed are those of the Fund's portfolio managers. The opinions are as of the date of this report and are subject to change without notice.
The loan ratings noted above represent segments of the S&P/LSTA Leveraged Loan Index, which are determined based on the ratings issued by Standard & Poor's.
12
Floating Rate Income Fund (Unaudited)
TICKER SYMBOLS
Institutional Class | | NFIIX | |
Class A | | NFIAX | |
Class C | | NFICX | |
PORTFOLIO BY MATURITY DISTRIBUTION
(as a % of Total Investments*) | |
One to less than Five Years | | | 36.1 | % | |
Five to less than Ten Years | | | 62.7 | | |
Ten Years or Greater | | | 1.2 | | |
Total | | | 100.0 | % | |
* Does not include Short-Term Investments or the impact of the Fund's open positions in derivatives, if any.
PERFORMANCE HIGHLIGHTS
| | | Inception | | Average Annual Total Return
Ended 10/31/2017 | |
| | | Date | | 1 Year | | 5 Years | | Life of Fund | |
At NAV | | | | | | | | | |
| Institutional Class5 | | 12/30/2009 | | | 4.14 | % | | | 3.41 | % | | | 4.47 | % | |
Class A | | 12/29/2009 | | | 3.76 | % | | | 3.03 | % | | | 4.07 | % | |
| Class C5 | | 12/30/2009 | | | 2.99 | % | | | 2.26 | % | | | 3.32 | % | |
With Sales Charge | | | | | | | | | |
Class A | | | | | -0.66 | % | | | 2.15 | % | | | 3.51 | % | |
| Class C5 | | | | | 1.99 | % | | | 2.26 | % | | | 3.32 | % | |
Index | | | | | | | | | |
| S&P/LSTA Leveraged Loan Index1,14 | | | | | 5.06 | % | | | 4.15 | % | | | 5.23 | % | |
The performance data quoted represent past performance and do not indicate future results. Current performance may be lower or higher than the performance data quoted. For performance data current to the most recent month-end, please visit www.nb.com/performance.
The results shown in the table reflect the reinvestment of income dividends and other distributions, if any. The results do not reflect the effect of taxes a shareholder would pay on Fund distributions or on the redemption of Fund shares.
The investment return and principal value of an investment will fluctuate and shares, when redeemed, may be worth more or less than their original cost.
Returns would have been lower if Neuberger Berman Investment Advisers LLC ("Management") had not reimbursed certain expenses and/or waived a portion of the investment management fees during certain of the periods shown. Repayment by a class (of expenses previously reimbursed and/or fees previously waived by Management) will decrease the class's returns. Please see Note B in the Notes to Financial Statements for specific information regarding expense reimbursement and/or fee waiver arrangements.
For the period ended October 31, 2017, the 30-day SEC yields were 3.79%, 3.42% and 2.68% for Institutional Class, Class A and Class C shares, respectively. Absent expense reimbursements and/or fee waivers, the 30-day SEC yields would have been 3.41% and 2.67% for Class A and Class C shares, respectively.
As stated in the Fund's most recent prospectus, the total annual operating expense ratios for fiscal year 2016 were 0.92%, 1.32% and 2.05% for Institutional Class, Class A and Class C shares, respectively (before expense reimbursements and/or fee waivers, if any). The expense ratios were 0.71%, 1.08% and 1.83% for Institutional Class, Class A and Class C shares, respectively, after expense reimbursements and/or fee waivers. The expense ratios for the annual period ended October 31, 2017 can be found in the Financial Highlights section of this report.
Returns shown with a sales charge reflect the deduction of the current maximum initial sales charge of 4.25% for Class A shares and the contingent deferred sales charge (CDSC) for Class C shares. The CDSC for Class C shares is 1%, which is reduced to 0% after 1 year. The performance of the Fund's share classes will differ primarily due to different sales charge structures and class expenses. Please see the prospectus for more information about sales charge structures, if any, and class expenses for your share class.
13
Floating Rate Income Fund (Unaudited)
COMPARISON OF A $1,000,000 INVESTMENT
(000's omitted)
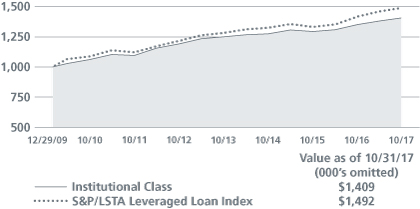
This graph shows the change in value of a hypothetical $1,000,000 investment in the Fund over the past 10 fiscal years, or since the Fund's inception if it has not operated for 10 years. The graph is based on the Institutional Class shares only; the performance of the Fund's share classes will differ primarily due to different sales charge structures and class expenses (see Performance Highlights chart on previous page). The result is compared with benchmarks, which include a broad-based market index and may include a more narrowly based index. Market indices have not been reduced to reflect any of the fees and costs of investing. The results shown in the graph reflect the reinvestment of income dividends and other distributions, if any. The results do not reflect the effect of taxes a shareholder would pay on Fund distributions or on the redemption of Fund shares. Results represent past performance and do not indicate future results.
14
High Income Bond Fund Commentary (Unaudited)
Neuberger Berman High Income Bond Fund Investor Class generated a 6.84% total return for the 12 months ended October 31, 2017 and underperformed its benchmark, the ICE BofAML U.S. High Yield Constrained Index, which provided a 9.14% total return for the same period. (Performance for all share classes is provided in the table immediately following this letter.)
The overall high yield market, as measured by the ICE BofAML U.S. High Yield Constrained Index, generated strong results during the reporting period. After a weak start in November 2016, the high yield market rallied over nine of the last 11 months of the reporting period. This was driven by a number of factors, including overall strong corporate earnings, low defaults, improving global growth, and rising oil prices. Against this backdrop, investor demand was generally robust as investors looked to generate incremental yield in the low interest rate environment. Within the benchmark index, securities rated CCC and lower (relatively lower ratings) and securities rated BB (a higher rating) returned 13.72% and 7.78%, respectively.*
From a sector perspective, an underweight to energy, as well as security selection within support services and banking detracted the most from performance. In contrast, security selection within utilities, an underweight to super retail and security selection within gaming contributed the most to results.
In terms of the Fund's quality biases, security selection within BB and B rated securities was negative for its performance, as was our underweight to CCC rated securities.
We made several adjustments to the portfolio during the reporting period. The Fund's allocation to BBB and BB rated securities was reduced. We also increased our allocation to B rated bonds, reducing our underweight to slightly above 1% from 6%. From a sector perspective, the Fund increased its allocation to diversified financial services securities, while reducing its gas distribution and health care exposure.
Looking ahead, it is widely anticipated that the U.S. Federal Reserve (Fed) will raise interest rates again following its mid-December meeting, which would be the third hike of 2017. All in all, we believe the Fed's measured approach to policy normalization represents a constructive scenario for high yield bonds, which historically have performed well during rising-rate environments. We continue to believe that the high yield market is compensating investors for default risk. We anticipate high yield defaults will remain below historical averages for the remainder of 2017 and 2018 if the U.S. economic expansion continues. While volatility has failed to emerge in the non-investment grade space, as it has in most risk markets, the potential remains for a spike in volatility over the balance of the year given ongoing policy uncertainty in the U.S., various geopolitical flashpoints, and the possibility that the improvement in global economic growth could wane. We don't believe lower-quality high yield securities at current levels are compensating investors for these risks, which is one of the reasons why we increased our allocation to B rated bonds as noted above.
Sincerely,
THOMAS P. O'REILLY, RUSS COVODE, DANIEL DOYLE, AND PATRICK FLYNN
PORTFOLIO CO-MANAGERS
* The performance of certain rated bonds within the benchmark, as noted above, represent issues that are rated Ba1/BB+ through Ba3/BB- and CCC+/Caa1 or lower, based on an average of Moody's, S&P and Fitch, as calculated by ICE BofAML.
Information about principal risks of investing in the Fund is set forth in the prospectus and statement of additional information.
The portfolio composition, industries and holdings of the Fund are subject to change without notice.
The opinions expressed are those of the Fund's portfolio managers. The opinions are as of the date of this report and are subject to change without notice.
15
High Income Bond Fund (Unaudited)
TICKER SYMBOLS
Investor Class | | NHINX | |
Institutional Class | | NHILX | |
Class A | | NHIAX | |
Class C | | NHICX | |
Class R3 | | NHIRX | |
Class R6 | | NRHIX | |
PORTFOLIO BY MATURITY DISTRIBUTION
(as a % of Total Investments*) | |
Less than One Year | | | 3.2 | % | |
One to less than Five Years | | | 32.5 | | |
Five to less than Ten Years | | | 57.0 | | |
Ten Years or Greater | | | 7.3 | | |
Total | | | 100.0 | % | |
* Does not include Short-Term Investments or the impact of the Fund's open positions in derivatives, if any.
PERFORMANCE HIGHLIGHTS6,19
| | | Inception | | Average Annual Total Return
Ended 10/31/2017 | |
| | | Date | | 1 Year | | 5 Years | | 10 Years | | Life of Fund | |
At NAV | | | | | | | | | | | |
| Investor Class7 | | 02/01/1992 | | | 6.84 | % | | | 5.01 | % | | | 7.28 | % | | | 7.58 | % | |
| Institutional Class8 | | 05/27/2009 | | | 6.82 | % | | | 5.13 | % | | | 7.43 | % | | | 7.63 | % | |
| Class A8 | | 05/27/2009 | | | 6.49 | % | | | 4.73 | % | | | 7.06 | % | | | 7.49 | % | |
| Class C8 | | 05/27/2009 | | | 5.77 | % | | | 3.98 | % | | | 6.42 | % | | | 7.24 | % | |
| Class R38 | | 05/27/2009 | | | 6.20 | % | | | 4.47 | % | | | 6.85 | % | | | 7.41 | % | |
| Class R68 | | 03/15/2013 | | | 7.03 | % | | | 5.22 | % | | | 7.39 | % | | | 7.62 | % | |
With Sales Charge | |
| Class A8 | | | | | 1.91 | % | | | 3.83 | % | | | 6.60 | % | | | 7.31 | % | |
| Class C8 | | | | | 4.77 | % | | | 3.98 | % | | | 6.42 | % | | | 7.24 | % | |
Index | |
ICE BofAML U.S. High Yield
Constrained Index^1,14 | | | | | 9.14 | % | | | 6.30 | % | | | 7.78 | % | | | N/A | | |
^ Effective October 20, 2017, the BofA Merrill Lynch U.S. High Yield Master II Constrained Index changed its name to the ICE BofAML U.S. High Yield Constrained Index.
The performance data quoted represent past performance and do not indicate future results. Current performance may be lower or higher than the performance data quoted. For performance data current to the most recent month-end, please visit www.nb.com/performance.
The results shown in the table reflect the reinvestment of income dividends and other distributions, if any. The results do not reflect the effect of taxes a shareholder would pay on Fund distributions or on the redemption of Fund shares.
The investment return and principal value of an investment will fluctuate and shares, when redeemed, may be worth more or less than their original cost.
Returns would have been lower if Neuberger Berman Investment Advisers LLC ("Management") had not reimbursed certain expenses and/or waived a portion of the investment management fees during certain of the periods shown. Repayment by a class (of expenses previously reimbursed and/or fees previously waived by Management) will decrease the class's returns. Please see Note B in the Notes to Financial Statements for specific information regarding expense reimbursement and/or fee waiver arrangements.
For the period ended October 31, 2017, the 30-day SEC yields were 4.39%, 4.53%, 4.03%, 3.41%, 3.89% and 4.62% for Investor Class, Institutional Class, Class A, Class C, Class R3 and Class R6 shares, respectively. Absent expense reimbursement and/or fee waiver, the 30-day SEC yield would have been 3.88% for Class A shares.
As stated in the Fund's most recent prospectus, the total annual operating expense ratios for fiscal year 2016 were 0.85%, 0.71%, 1.08%, 1.82%, 1.41% and 0.62% for Investor Class, Institutional Class, Class A, Class C, Class R3 and Class R6 shares, respectively (before expense reimbursements and/or fee waivers, if any). The expense ratio was 1.38% for Class R3 after expense reimbursements and/or fee waivers. The expense ratios for the annual period ended October 31, 2017 can be found in the Financial Highlights section of this report.
Returns shown with a sales charge reflect the deduction of the current maximum initial sales charge of 4.25% for Class A shares and the contingent deferred sales charge (CDSC) for Class C shares. The CDSC for Class C shares is 1%, which is reduced to 0% after 1 year. The performance of the Fund's share classes will differ primarily due to different sales charge structures and class expenses. Please see the prospectus for more information about sales charge structures, if any, and class expenses for your share class.
16
High Income Bond Fund (Unaudited)
COMPARISON OF A $10,000 INVESTMENT

This graph shows the change in value of a hypothetical $10,000 investment in the Fund over the past 10 fiscal years, or since the Fund's inception if it has not operated for 10 years. The graph is based on the Investor Class shares only; the performance of the Fund's share classes will differ primarily due to different sales charge structures and class expenses (see Performance Highlights chart on previous page). The result is compared with benchmarks, which include a broad-based market index and may include a more narrowly based index. Market indices have not been reduced to reflect any of the fees and costs of investing. The results shown in the graph reflect the reinvestment of income dividends and other distributions, if any. The results do not reflect the effect of taxes a shareholder would pay on Fund distributions or on the redemption of Fund shares. Results represent past performance and do not indicate future results.
17
Municipal High Income Fund Commentary (Unaudited)
Neuberger Berman Municipal High Income Fund Institutional Class generated a 2.24% total return for the 12 months ended October 31, 2017 and underperformed its benchmark, a custom blend consisting of 65% Bloomberg Barclays Municipal Bond Index and 35% Bloomberg Barclays Municipal High Yield Index, which provided a 2.48% total return for the same period. (Performance for all share classes is provided in the table immediately following this letter.)
The municipal bond market outperformed the taxable bond market during the reporting period. Municipal securities were supported by generally positive fundamentals, solid demand, and more moderate supply than a year earlier. Both short- and longer-term Treasury yields rose over the 12 months ended October 31, 2017. Short-term yields generally moved higher as the U.S. Federal Reserve (Fed) raised interest rates three times over the reporting period and began reducing its balance sheet in October 2017. Meanwhile, longer-term Treasury yields fluctuated given changing expectations for economic growth in the U.S., uncertainties surrounding future fiscal policy and a number of geopolitical events. All told, the Bloomberg Barclays Municipal Bond Index gained 2.19% for the 12 months ended October 31, 2017, whereas the overall taxable bond market, as measured by the Bloomberg Barclays U.S. Aggregate Bond Index, returned 0.90%.
We tactically adjusted the Fund's duration during the reporting period. Having a duration that was longer than the Fund's benchmark initially detracted from results as rates moved sharply higher in December 2016. Duration positioning then benefited results as rates subsequently declined. As the reporting period progressed, we moved to reduce the Fund's duration. Overall, duration positioning was a headwind for results.
The Fund's credit biases were beneficial for results. In particular, having an overweight to securities rated BBB and below was additive for returns as they outperformed their higher rated counterparts. From a sector perspective, an underweight to tobacco securitization bonds detracted from performance. In addition, having no allocation to securities issued by Puerto Rico contributed to results. On the downside, our small diversified exposure to the Virgin Islands detracted from performance as they were negatively impacted by Hurricane Maria.
Given the slow but steady economic growth backdrop and subdued but stable level of inflation, we see no reason to doubt the Fed's intention of taking a measured approach to future monetary policy tightening. That being said, changes in fiscal policy or potential volatility caused by the withdrawal of monetary accommodation might cause adjustments to that forecast. Specific to the municipal bond market, technicals continue to look promising for the remainder of the year, in our opinion. As was characteristic of most of 2017, we believe reduced new issue supply should provide a firm bid for municipal product. We will keep a close eye on both tax reform and infrastructure investment legislation, but we believe that several months may pass before any legislation becomes a reality. We continue to execute on our research based, bottom-up investment process in the effort to find attractive buying opportunities for our investors.
Sincerely,
JAMES L. ISELIN, S. BLAKE MILLER AND ERIC J. PELIO
PORTFOLIO MANAGERS
Information about principal risks of investing in the Fund is set forth in the prospectus and statement of additional information.
The portfolio composition, industries and holdings of the Fund are subject to change without notice.
The opinions expressed are those of the Fund's portfolio managers. The opinions are as of the date of this report and are subject to change without notice.
The bond ratings noted above represent segments of the Bloomberg Barclays Municipal Bond Index and Bloomberg Barclays Municipal High Yield Index, which are determined based on the average ratings issued by Standard & Poor's, Moody's and Fitch.
18
Municipal High Income Fund (Unaudited)
TICKER SYMBOLS
Institutional Class | | NMHIX | |
Class A | | NMHAX | |
Class C | | NMHCX | |
PORTFOLIO BY STATE AND TERRITORY
(as a % of Total Net Assets) | |
Alabama | | | 1.0 | % | |
Alaska | | | 3.7 | | |
American Samoa | | | 0.2 | | |
Arizona | | | 5.3 | | |
California | | | 7.5 | | |
Colorado | | | 3.4 | | |
Connecticut | | | 1.0 | | |
District of Columbia | | | 0.5 | | |
Florida | | | 5.3 | | |
Georgia | | | 1.0 | | |
Hawaii | | | 0.8 | | |
Illinois | | | 9.3 | | |
Indiana | | | 0.8 | | |
Iowa | | | 0.9 | | |
Kansas | | | 0.3 | | |
Kentucky | | | 1.5 | | |
Louisiana | | | 1.7 | | |
Maine | | | 0.7 | | |
Massachusetts | | | 1.2 | | |
Michigan | | | 4.0 | | |
Minnesota | | | 0.8 | | |
Mississippi | | | 2.7 | | |
Missouri | | | 1.6 | | |
Nevada | | | 0.5 | | |
New Jersey | | | 7.1 | | |
New Mexico | | | 0.5 | | |
New York | | | 2.9 | | |
North Carolina | | | 0.7 | | |
North Dakota | | | 1.1 | | |
Ohio | | | 1.9 | | |
Oregon | | | 0.5 | | |
Pennsylvania | | | 5.1 | | |
Rhode Island | | | 2.9 | | |
South Carolina | | | 0.6 | | |
Tennessee | | | 0.7 | | |
Texas | | | 7.8 | | |
Utah | | | 0.5 | | |
Vermont | | | 1.4 | | |
Virgin Islands | | | 0.4 | | |
Virginia | | | 0.6 | | |
Washington | | | 1.1 | | |
West Virginia | | | 0.9 | | |
Wisconsin | | | 5.6 | | |
Other Assets Less Liabilities | | | 2.0 | * | |
Total | | | 100.0 | % | |
* Includes the impact of the Fund's open positions in derivatives, if any.
PERFORMANCE HIGHLIGHTS10
| | | Inception | | Average Annual Total Return
Ended 10/31/2017 | |
| | | Date | | 1 Year | | Life of Fund | |
At NAV | | | | | | | |
Institutional Class | | 06/22/2015 | | | 2.24 | % | | | 4.74 | % | |
Class A | | 06/22/2015 | | | 1.87 | % | | | 4.36 | % | |
Class C | | 06/22/2015 | | | 1.20 | % | | | 3.63 | % | |
With Sales Charge | | | | | | | |
Class A | | | | | -2.44 | % | | | 2.47 | % | |
Class C | | | | | 0.23 | % | | | 3.63 | % | |
Index | |
| Blended Benchmark*1,14 | | | | | 2.48 | % | | | 4.03 | % | |
* Blended benchmark is composed of 65% Bloomberg Barclays Municipal Bond Index and 35% Bloomberg Barclays Municipal High Yield Index and is rebalanced monthly.
The performance data quoted represent past performance and do not indicate future results. Current performance may be lower or higher than the performance data quoted. For performance data current to the most recent month-end, please visit www.nb.com/performance.
The results shown in the table reflect the reinvestment of income dividends and other distributions, if any. The results do not reflect the effect of taxes a shareholder would pay on Fund distributions or on the redemption of Fund shares.
The investment return and principal value of an investment will fluctuate and shares, when redeemed, may be worth more or less than their original cost.
Returns would have been lower if Neuberger Berman Investment Advisers LLC ("Management") had not reimbursed certain expenses and/or waived a portion of the investment management fees during certain of the periods shown. Repayment by a class (of expenses previously reimbursed and/or fees previously waived by Management) will decrease the class's returns. Please see Note B in the Notes to Financial Statements for specific information regarding expense reimbursement and/or fee waiver arrangements.
For the period ended October 31, 2017, the 30-day SEC yields were 3.10%, 2.72% and 1.98% for Institutional Class, Class A and Class C shares, respectively. The tax-equivalent yields were 5.48%, 4.81% and 3.50% for Institutional Class, Class A and Class C shares, respectively, for a shareholder in the highest federal income tax bracket (39.6% plus 3.8% Medicare contribution tax).9 Absent expense reimbursements and/or fee waivers, the 30-day SEC yields would have been 2.97%, 2.51% and 1.85% for Institutional Class, Class A and Class C shares, respectively.
As stated in the Fund's most recent prospectus, the total annual operating expense ratios for fiscal year 2016 were 0.93%, 1.47% and 2.15% for Institutional Class, Class A and Class C shares, respectively (before expense reimbursements and/or fee waivers, if any). The expense ratios were 0.50%, 0.87% and 1.62% for Institutional Class, Class A and Class C shares, respectively, after expense reimbursements and/or fee waivers. The expense ratios for the annual period ended October 31, 2017 can be found in the Financial Highlights section of this report.
Returns shown with a sales charge reflect the deduction of the current maximum initial sales charge of 4.25% for Class A shares and the contingent deferred sales charge (CDSC) for Class C shares. The CDSC for Class C shares is 1%, which is reduced to 0% after 1 year. The performance of the Fund's share classes will differ primarily due to different sales charge structures and class expenses. Please see the prospectus for more information about sales charge structures, if any, and class expenses for your share class.
19
Municipal High Income Fund (Unaudited)
COMPARISON OF A $1,000,000 INVESTMENT
(000's omitted)
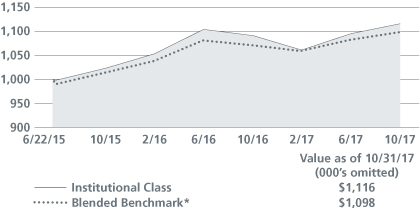
This graph shows the change in value of a hypothetical $1,000,000 investment in the Fund over the past 10 fiscal years, or since the Fund's inception if it has not operated for 10 years. The graph is based on the Institutional Class shares only; the performance of the Fund's share classes will differ primarily due to different sales charge structures and class expenses (see Performance Highlights chart on previous page). The result is compared with benchmarks, which include a broad-based market index and may include a more narrowly based index. Market indices have not been reduced to reflect any of the fees and costs of investing. The results shown in the graph reflect the reinvestment of income dividends and other distributions, if any. The results do not reflect the effect of taxes a shareholder would pay on Fund distributions or on the redemption of Fund shares. Results represent past performance and do not indicate future results.
* Blended benchmark is composed of 65% Bloomberg Barclays Municipal Bond Index and 35% Bloomberg Barclays Municipal High Yield Index and is rebalanced monthly.
20
Municipal Intermediate Bond Fund Commentary (Unaudited)
Neuberger Berman Municipal Intermediate Bond Fund Investor Class generated a 1.28% total return for the 12 months ended October 31, 2017 and underperformed its benchmark, the Bloomberg Barclays 7-Year G.O. Index, which provided a 1.50% total return for the same period. (Performance for all share classes is provided in the table immediately following this letter.)
The municipal bond market outperformed the taxable bond market during the reporting period. Municipal securities were supported by generally positive fundamentals, solid demand, and more moderate supply than a year earlier. Both short- and longer-term Treasury yields rose over the 12 months ended October 31, 2017. Short-term yields generally moved higher as the U.S. Federal Reserve (Fed) raised interest rates three times over the reporting period and began reducing its balance sheet in October 2017. Meanwhile, longer-term Treasury yields fluctuated given changing expectations for economic growth in the U.S., uncertainties surrounding future fiscal policy, and a number of geopolitical events. All told, the Bloomberg Barclays Municipal Bond Index gained 2.19% for the 12 months ended October 31, 2017, whereas the overall taxable bond market, as measured by the Bloomberg Barclays U.S. Aggregate Bond Index, returned 0.90%.
Throughout the reporting period, the Fund maintained a barbell approach (investing in shorter and longer maturities). In contrast, the Fund's benchmark, the Bloomberg Barclays 7-Year G.O. Index, is concentrated in the six- to eight-year portion of the curve. This positioning modestly detracted from results as the five- to seven-year portion of the municipal curve outperformed over the 12-month period as a whole.
The Fund's credit biases were additive for results. In particular, having overweights to BBB rated and A rated securities benefited results as lower rated issues outperformed their higher rated counterparts. From a sector perspective, an overweight to revenue bonds added to results as they largely outperformed general obligation bonds.
A number of changes were made to the Fund during the reporting period. We tactically adjusted the Fund's duration, initially allowing it to drift shorter in anticipation of increased volatility, higher rates, and seasonal headwinds. As the period progressed, we increased the Fund's duration and ended the period slightly longer than the benchmark. Elsewhere, we opportunistically purchased certain lesser grade securities, which was beneficial for performance.
Given the slow but steady economic growth backdrop and subdued but stable level of inflation, we see no reason to doubt the Fed's intention of taking a measured approach to future monetary policy tightening. That being said, changes in fiscal policy or potential volatility caused by the withdrawal of monetary accommodation might cause adjustments to that forecast. Specific to the municipal bond market, technicals continue to look promising for the remainder of the year, in our opinion. As was characteristic of most of 2017, we believe reduced new issue supply should provide a firm bid for municipal product. We will keep a close eye on both tax reform and infrastructure investment legislation, but we believe that several months may pass before any legislation becomes a reality. We continue to execute on our research based, bottom-up investment process in the effort to find attractive buying opportunities for our investors.
Sincerely,
JAMES L. ISELIN AND S. BLAKE MILLER
PORTFOLIO MANAGERS
Information about principal risks of investing in the Fund is set forth in the prospectus and statement of additional information.
The portfolio composition, industries and holdings of the Fund are subject to change without notice.
The opinions expressed are those of the Fund's portfolio managers. The opinions are as of the date of this report and are subject to change without notice.
The bond ratings noted above represent segments of the Bloomberg Barclays 7-Year G.O. Index, which are determined based on the average ratings issued by Standard & Poor's, Moody's and Fitch.
21
Municipal Intermediate Bond Fund (Unaudited)
TICKER SYMBOLS
Investor Class | | NMUIX | |
Institutional Class | | NMNLX | |
Class A | | NMNAX | |
Class C | | NMNCX | |
PORTFOLIO BY STATE AND TERRITORY
(as a % of Total Net Assets) | |
Alabama | | | 0.1 | % | |
Alaska | | | 3.4 | | |
Arizona | | | 0.8 | | |
Arkansas | | | 0.3 | | |
California | | | 10.2 | | |
Colorado | | | 0.8 | | |
Connecticut | | | 1.4 | | |
District of Columbia | | | 0.4 | | |
Florida | | | 5.9 | | |
Georgia | | | 2.6 | | |
Illinois | | | 5.4 | | |
Indiana | | | 3.6 | | |
Iowa | | | 0.6 | | |
Kentucky | | | 1.6 | | |
Louisiana | | | 0.5 | | |
Maryland | | | 3.8 | | |
Massachusetts | | | 1.1 | | |
Michigan | | | 0.9 | | |
Minnesota | | | 2.5 | | |
Mississippi | | | 3.3 | | |
Nevada | | | 0.4 | | |
New Jersey | | | 6.5 | | |
New York | | | 10.4 | | |
North Carolina | | | 4.0 | | |
Ohio | | | 1.2 | | |
Oklahoma | | | 1.4 | | |
Pennsylvania | | | 9.5 | | |
Rhode Island | | | 1.5 | | |
South Carolina | | | 1.6 | | |
Tennessee | | | 0.5 | | |
Texas | | | 10.2 | | |
Utah | | | 0.8 | | |
Vermont | | | 0.3 | | |
Virginia | | | 1.9 | | |
Washington | | | 3.7 | | |
Wisconsin | | | 0.7 | | |
Liabilities Less Other Assets | | | (3.8 | )* | |
Total | | | 100.0 | % | |
* Includes the impact of the Fund's open positions in derivatives, if any.
PERFORMANCE HIGHLIGHTS10
| | | Inception | | Average Annual Total Return
Ended 10/31/2017 | |
| | | Date | | 1 Year | | 5 Years | | 10 Years | | Life of Fund | |
At NAV | | | | | | | | | | | |
Investor Class | | 07/09/1987 | | | 1.28 | % | | | 2.14 | % | | | 3.55 | % | | | 4.74 | % | |
| Institutional Class11 | | 06/21/2010 | | | 1.43 | % | | | 2.30 | % | | | 3.66 | % | | | 4.78 | % | |
| Class A11 | | 06/21/2010 | | | 0.96 | % | | | 1.90 | % | | | 3.37 | % | | | 4.68 | % | |
| Class C11 | | 06/21/2010 | | | 0.30 | % | | | 1.16 | % | | | 2.81 | % | | | 4.49 | % | |
With Sales Charge | |
| Class A11 | | | | | -3.32 | % | | | 1.01 | % | | | 2.92 | % | | | 4.53 | % | |
| Class C11 | | | | | -0.69 | % | | | 1.16 | % | | | 2.81 | % | | | 4.49 | % | |
Index | |
Bloomberg Barclays
7-Year G.O. Index1,14 | | | | | 1.50 | % | | | 2.31 | % | | | 4.38 | % | | | 5.56 | % | |
The performance data quoted represent past performance and do not indicate future results. Current performance may be lower or higher than the performance data quoted. For performance data current to the most recent month-end, please visit www.nb.com/performance.
The results shown in the table reflect the reinvestment of income dividends and other distributions, if any. The results do not reflect the effect of taxes a shareholder would pay on Fund distributions or on the redemption of Fund shares.
The investment return and principal value of an investment will fluctuate and shares, when redeemed, may be worth more or less than their original cost.
Returns would have been lower if Neuberger Berman Investment Advisers LLC ("Management") had not reimbursed certain expenses and/or waived a portion of the investment management fees during certain of the periods shown. Repayment by a class (of expenses previously reimbursed and/or fees previously waived by Management) will decrease the class's returns. Please see Note B in the Notes to Financial Statements for specific information regarding expense reimbursement and/or fee waiver arrangements.
For the period ended October 31, 2017, the 30-day SEC yields were 1.37%, 1.52%, 1.15% and 0.41% for Investor Class, Institutional Class, Class A and Class C shares, respectively. The tax-equivalent yields were 2.42%, 2.69%, 2.03% and 0.72% for Investor Class, Institutional Class, Class A and Class C shares, respectively, for a shareholder in the highest federal income tax bracket (39.6% plus 3.8% Medicare contribution tax).9 Absent repayments, the 30-day SEC yields would have been 1.50%, 1.68%, 1.31% and 0.56% for Investor Class, Institutional Class, Class A and Class C shares, respectively.
As stated in the Fund's most recent prospectus, the total annual operating expense ratios for fiscal year 2016 were 0.84%, 0.65%, 1.03% and 1.78% for Investor Class, Institutional Class, Class A and Class C shares, respectively (before expense reimbursements and/or fee waivers, if any). The expense ratios were 0.65%, 0.50%, 0.87% and 1.62% for Investor Class, Institutional Class, Class A and Class C shares, respectively, after expense reimbursements and/or fee waivers. The expense ratios for the annual period ended October 31, 2017 can be found in the Financial Highlights section of this report.
Returns shown with a sales charge reflect the deduction of the current maximum initial sales charge of 4.25% for Class A shares and the contingent deferred sales charge (CDSC) for Class C shares. The CDSC for Class C shares is 1%, which is reduced to 0% after 1 year. The performance of the Fund's share classes will differ primarily due to different sales charge structures and class expenses. Please see the prospectus for more information about sales charge structures, if any, and class expenses for your share class.
22
Municipal Intermediate Bond Fund (Unaudited)
COMPARISON OF A $10,000 INVESTMENT
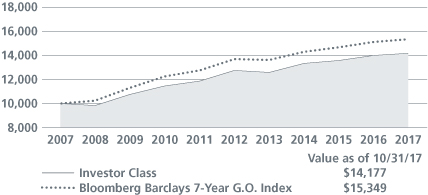
This graph shows the change in value of a hypothetical $10,000 investment in the Fund over the past 10 fiscal years, or since the Fund's inception if it has not operated for 10 years. The graph is based on the Investor Class shares only; the performance of the Fund's share classes will differ primarily due to different sales charge structures and class expenses (see Performance Highlights chart on previous page). The result is compared with benchmarks, which include a broad-based market index and may include a more narrowly based index. Market indices have not been reduced to reflect any of the fees and costs of investing. The results shown in the graph reflect the reinvestment of income dividends and other distributions, if any. The results do not reflect the effect of taxes a shareholder would pay on Fund distributions or on the redemption of Fund shares. Results represent past performance and do not indicate future results.
23
New York Municipal Income Fund Commentary (Unaudited)
Neuberger Berman New York Municipal Income Fund Institutional Class generated a 0.84% total return for the 12 months ended October 31, 2017 and underperformed its benchmark, the Bloomberg Barclays 7-Year G.O. Index, which provided a 1.50% total return for the same period.
The municipal bond market outperformed the taxable bond market during the reporting period. Municipal securities were supported by generally positive fundamentals, solid demand, and more moderate supply than a year earlier. Both short- and longer-term Treasury yields rose over the 12 months ended October 31, 2017. Short-term yields generally moved higher as the U.S. Federal Reserve (Fed) raised interest rates three times over the period and began reducing its balance sheet in October 2017. Meanwhile, longer-term Treasury yields fluctuated given changing expectations for economic growth in the U.S., uncertainties surrounding future fiscal policy, and a number of geopolitical events. All told, the Bloomberg Barclays Municipal Bond Index gained 2.19% for the 12 months ended October 31, 2017, whereas the overall taxable bond market, as measured by the Bloomberg Barclays U.S. Aggregate Bond Index, returned 0.90%.
Throughout the reporting period, the Fund maintained a barbell approach (investing in shorter and longer maturities). In contrast, the Fund's benchmark, the Bloomberg Barclays 7-Year G.O. Index, is concentrated in the six- to eight-year portion of the curve. This positioning modestly detracted from results as the five- to seven- year portion of the municipal curve outperformed over the 12-month period as a whole.
The Fund's credit biases were additive to results. In particular, having overweights to BBB rated and A rated securities benefited results as lower rated issues outperformed their higher rated counterparts. From a sector perspective, an overweight to revenue bonds added to results as they largely outperformed general obligation bonds.
A number of changes were made to the Fund during the reporting period. We tactically adjusted the Fund's duration, initially allowing it to drift shorter in anticipation of increased volatility, higher rates, and seasonal headwinds. As the period progressed we increased the Fund's duration and ended the period slightly longer than the benchmark. Elsewhere, we opportunistically purchased certain lesser grade securities, which was beneficial for performance.
Given the slow but steady economic growth backdrop and subdued but stable level of inflation, we see no reason to doubt the Fed's intention of taking a measured approach to future monetary policy tightening. That being said, changes in fiscal policy or potential volatility caused by the withdrawal of monetary accommodation might cause adjustments to that forecast. Specific to the municipal bond market, technicals continue to look promising for the remainder of the year, in our opinion. As was characteristic of most of 2017, we believe reduced new issue supply should provide a firm bid for municipal product. We will keep a close eye on both tax reform and infrastructure investment legislation, but we believe that several months may pass before any legislation becomes a reality. We continue to execute on our research based, bottom-up investment process in the effort to find attractive buying opportunities for our investors.
Sincerely,
JAMES L. ISELIN AND S. BLAKE MILLER
PORTFOLIO MANAGERS
Information about principal risks of investing in the Fund is set forth in the prospectus and statement of additional information.
The portfolio composition, industries and holdings of the Fund are subject to change without notice.
The opinions expressed are those of the Fund's portfolio managers. The opinions are as of the date of this report and are subject to change without notice.
The bond ratings noted above represent segments of the Bloomberg Barclays 7-Year G.O. Index, which are determined based on the average ratings issued by Standard & Poor's, Moody's and Fitch.
24
New York Municipal Income Fund (Unaudited)
TICKER SYMBOLS
Institutional Class | | NMIIX | |
PORTFOLIO BY STATE AND TERRITORY
(as a % of Total Net Assets) | |
New York | | | 98.9 | % | |
Other Assets Less Liabilities | | | 1.1 | * | |
Total | | | 100.0 | % | |
* Includes the impact of the Fund's open positions in derivatives, if any.
PERFORMANCE HIGHLIGHTS10
| | | Inception | | Average Annual Total Return
Ended 10/31/2017 | |
| | | Date | | 1 Year | | Life of Fund | |
At NAV | |
Institutional Class | | 03/11/201316 | | | 0.84 | % | | | 2.27 | % | |
Index | |
Bloomberg Barclays
7-Year G.O. Index1,14 | | | | | 1.50 | % | | | 2.49 | % | |
The performance data quoted represent past performance and do not indicate future results. Current performance may be lower or higher than the performance data quoted. For performance data current to the most recent month-end, please visit www.nb.com/performance.
The results shown in the table reflect the reinvestment of income dividends and other distributions, if any. The results do not reflect the effect of taxes a shareholder would pay on Fund distributions or on the redemption of Fund shares.
The investment return and principal value of an investment will fluctuate and shares, when redeemed, may be worth more or less than their original cost.
Returns would have been lower if Neuberger Berman Investment Advisers LLC ("Management") had not reimbursed certain expenses and/or waived a portion of the investment management fees during certain of the periods shown. Repayment by a class (of expenses previously reimbursed and/or fees previously waived by Management) will decrease the class's returns. Please see Note B in the Notes to Financial Statements for specific information regarding expense reimbursement and/or fee waiver arrangements.
For the period ended October 31, 2017, the 30-day SEC yield was 1.04% for Institutional Class. The tax-equivalent yield was 1.84% for Institutional Class for a shareholder in the highest federal income tax bracket (39.6% plus 3.8% Medicare contribution tax).9
As stated in the Fund's most recent prospectus, the total annual operating expense ratio for fiscal year 2016 was 0.96% for Institutional Class shares (before expense reimbursements and/or fee waivers, if any). The expense ratios for the annual period ended October 31, 2017 can be found in the Financial Highlights section of this report.
25
New York Municipal Income Fund (Unaudited)
COMPARISON OF A $1,000,000 INVESTMENT
(000's omitted)
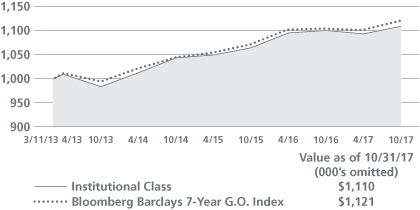
This graph shows the change in value of a hypothetical $1,000,000 investment in the Fund over the past 10 fiscal years, or since the Fund's inception if it has not operated for 10 years. The result is compared with benchmarks, which include a broad-based market index and may include a more narrowly based index. Market indices have not been reduced to reflect any of the fees and costs of investing. The results shown in the graph reflect the reinvestment of income dividends and other distributions, if any. The results do not reflect the effect of taxes a shareholder would pay on Fund distributions or on the redemption of Fund shares. Results represent past performance and do not indicate future results.
26
Short Duration Bond Fund Commentary (Unaudited)
Neuberger Berman Short Duration Bond Fund Investor Class generated a 0.41% total return for the 12 months ended October 31, 2017 and underperformed its benchmark, the Bloomberg Barclays 1-3 Year U.S. Government/Credit Bond Index, which provided a 0.67% total return for the same period. (Performance for all share classes is provided in the table immediately following this letter.)
The overall U.S. taxable fixed income market, as measured by the Bloomberg Barclays U.S. Aggregate Bond Index, generated a modest gain during the reporting period. Both short-and longer-term Treasury yields rose over the 12 months ended October 31, 2017. Short-term yields generally moved higher as the U.S. Federal Reserve (Fed) raised interest rates three times over the period and began reducing its balance sheet in October 2017. Meanwhile, longer-term Treasury yields fluctuated given changing expectations for economic growth in the U.S., uncertainties surrounding future fiscal policy, and a number of geopolitical events.
The primary detractor from the Fund's relative performance during the reporting period was its lack of exposure to agency debt. While we felt the sector was richly valued, it outperformed equal duration Treasuries. Yield curve positioning was also a headwind for results. In particular, having an overweight to the three- to five-year area of the yield curve was not rewarded as it lagged the two-year and less portion of the curve. On the upside, the Fund's overweight to investment grade credit was positive for results. Credit spreads tightened over the period amid strong investor demand. Elsewhere, allocations to commercial mortgage-backed securities (CMBS) and asset-backed securities (ABS) were additive for performance.
The Fund's use of futures contracts contributed positively to performance during the reporting period.
We maintained the Fund's overall positioning over the reporting period, with an overweight to non-Treasury securities and underweights to Treasuries, agency debt, and non-corporate securities. We tactically adjusted the Fund's duration but remained defensively positioned overall. The Fund ended the period roughly one-tenth of a year shorter than its benchmark. From a sector positioning perspective, we reduced our allocations to Treasuries and ABS, while increasing our weightings in CMBS and both fixed and floating rate investment grade credit.
Looking ahead, the market appears to think the long-awaited sell-off in government bond yields may continue to prove elusive. Investors seem to doubt whether the Fed will hike rates meaningfully and seem to expect the Fed's balance sheet exit may be a non-event. Compare today's mindset to the "taper tantrum" of 2013 when former Fed Chair Bernanke's mere mention of a potential future tapering of asset purchases sparked a major sell-off and volatility spike. Now, the Fed has actually started reducing holdings — which is arguably more significant than tapering — and anticipates to continue hiking rates. Nevertheless, Treasury yields and interest rate volatility remain stubbornly low. There's certainly a chance it plays out calmly and predictably, but the bond market's current stance may prove to be overly complacent. We believe reducing central bank balance sheet holdings — quantitative tightening — should add to volatility in fixed income markets just as adding to central bank balance sheets — quantitative easing — had previously reduced volatility.
Sincerely,
THOMAS SONTAG, MICHAEL FOSTER AND MATTHEW MCGINNIS
PORTFOLIO MANAGERS
Information about principal risks of investing in the Fund is set forth in the prospectus and statement of additional information.
The portfolio composition, industries and holdings of the Fund are subject to change without notice.
The opinions expressed are those of the Fund's portfolio managers. The opinions are as of the date of this report and are subject to change without notice.
27
Short Duration Bond Fund (Unaudited)
TICKER SYMBOLS
Investor Class | | NSBIX | |
Trust Class | | NSBTX | |
Institutional Class | | NSHLX | |
Class A | | NSHAX | |
Class C | | NSHCX | |
PORTFOLIO BY TYPE OF SECURITY
(as a % of Total Net Assets) | |
Asset-Backed Securities | | | 13.0 | % | |
Corporate Bonds | | | 54.8 | | |
Mortgage-Backed Securities | | | 27.4 | | |
Short-Term Investments | | | 8.2 | | |
Liabilities Less Other Assets | | | (3.4 | )* | |
Total | | | 100.0 | % | |
* Includes the impact of the Fund's open positions in derivatives, if any.
PERFORMANCE HIGHLIGHTS15
| | | Inception | | Average Annual Total Return
Ended 10/31/2017 | |
| | | Date | | 1 Year | | 5 Years | | 10 Years | | Life of Fund | |
At NAV | | | | | | | | | | | |
Investor Class | | 06/09/1986 | | | 0.41 | % | | | 0.68 | % | | | 0.95 | % | | | 4.11 | % | |
| Trust Class12 | | 08/30/1993 | | | 0.40 | % | | | 0.57 | % | | | 0.86 | % | | | 4.04 | % | |
| Institutional Class12 | | 06/21/2010 | | | 0.74 | % | | | 0.88 | % | | | 1.10 | % | | | 4.16 | % | |
| Class A12 | | 06/21/2010 | | | 0.20 | % | | | 0.50 | % | | | 0.81 | % | | | 4.06 | % | |
| Class C12 | | 06/21/2010 | | | -0.55 | % | | | -0.27 | % | | | 0.26 | % | | | 3.88 | % | |
With Sales Charge | |
| Class A12 | | | | | -2.28 | % | | | -0.01 | % | | | 0.56 | % | | | 3.98 | % | |
| Class C12 | | | | | -1.54 | % | | | -0.27 | % | | | 0.26 | % | | | 3.88 | % | |
Index | | | | | | | | | | | |
Bloomberg Barclays 1-3 Year
U.S. Government/Credit Bond Index1,14 | | | | | 0.67 | % | | | 0.90 | % | | | 2.05 | % | | | 4.87 | % | |
The performance data quoted represent past performance and do not indicate future results. Current performance may be lower or higher than the performance data quoted. For performance data current to the most recent month-end, please visit www.nb.com/performance.
The results shown in the table reflect the reinvestment of income dividends and other distributions, if any. The results do not reflect the effect of taxes a shareholder would pay on Fund distributions or on the redemption of Fund shares.
The investment return and principal value of an investment will fluctuate and shares, when redeemed, may be worth more or less than their original cost.
Returns would have been lower if Neuberger Berman Investment Advisers LLC ("Management") had not reimbursed certain expenses and/or waived a portion of the investment management fees during certain of the periods shown. Repayment by a class (of expenses previously reimbursed and/or fees previously waived by Management) will decrease the class's returns. Please see Note B in the Notes to Financial Statements for specific information regarding expense reimbursement and/or fee waiver arrangements.
For the period ended October 31, 2017, the 30-day SEC yields were 1.15%, 1.05%, 1.34%, 0.98% and 0.24% for Investor Class, Trust Class, Institutional Class, Class A and Class C shares, respectively. Absent expense reimbursements and/or fee waivers, the 30-day SEC yields would have been 1.00%, 0.89%, 1.21%, 0.84% and 0.09% for Investor Class, Trust Class, Institutional Class, Class A and Class C shares, respectively.
As stated in the Fund's most recent prospectus, the total annual operating expense ratios for fiscal year 2016 were 1.22%, 1.37%, 0.99%, 1.37% and 2.11% for Investor Class, Trust Class, Institutional Class, Class A and Class C shares, respectively (before expense reimbursements and/or fee waivers, if any). The expense ratios were 0.71%, 0.81%, 0.51%, 0.88% and 1.63% for Investor Class, Trust Class, Institutional Class, Class A and Class C shares, respectively, after expense reimbursements and/or fee waivers. The expense ratios for the annual period ended October 31, 2017 can be found in the Financial Highlights section of this report.
Returns shown with a sales charge reflect the deduction of the current maximum initial sales charge of 2.50% for Class A shares and the contingent deferred sales charge (CDSC) for Class C shares. The CDSC for Class C shares is 1%, which is reduced to 0% after 1 year. The performance of the Fund's share classes will differ primarily due to different sales charge structures and class expenses. Please see the prospectus for more information about sales charge structures, if any, and class expenses for your share class.
28
Short Duration Bond Fund (Unaudited)
COMPARISON OF A $10,000 INVESTMENT
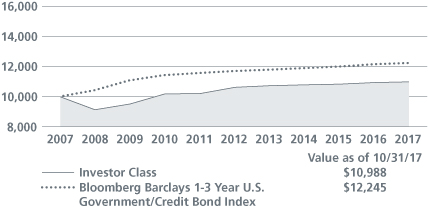
This graph shows the change in value of a hypothetical $10,000 investment in the Fund over the past 10 fiscal years, or since the Fund's inception if it has not operated for 10 years. The graph is based on the Investor Class shares only; the performance of the Fund's share classes will differ primarily due to different sales charge structures and class expenses (see Performance Highlights chart on previous page). The result is compared with benchmarks, which include a broad-based market index and may include a more narrowly based index. Market indices have not been reduced to reflect any of the fees and costs of investing. The results shown in the graph reflect the reinvestment of income dividends and other distributions, if any. The results do not reflect the effect of taxes a shareholder would pay on Fund distributions or on the redemption of Fund shares. Results represent past performance and do not indicate future results.
29
Short Duration High Income Fund Commentary (Unaudited)
Neuberger Berman Short Duration High Income Fund Institutional Class generated a 4.94% total return for the 12 months ended October 31, 2017 and underperformed its benchmark, the ICE BofAML 0-5 Year BB-B U.S. High Yield Constrained Index, which provided a 6.44% total return for the same period. (Performance for all share classes is provided in the table immediately following this letter.)
The overall high yield market, as measured by the ICE BofAML U.S. High Yield Constrained Index, generated strong results during the reporting period. After a weak start in November 2016, the high yield market rallied over nine of the last 11 months of the reporting period. This was driven by a number of factors, including overall strong corporate earnings, low defaults, improving global growth, and rising oil prices. Against this backdrop, investor demand was generally robust as investors looked to generate incremental yield in the low interest rate environment.
The sectors that contributed the least to absolute performance during the reporting period were food & drug retail, environmental, and aerospace/defense. The sectors that were the most beneficial to absolute performance during the reporting period were health care, telecommunications, and utilities. From a quality perspective, approximately 97% of the portfolio, as of the end of the reporting period, was held in securities rated B and higher and in cash. This positioning was additive to the Fund's absolute performance.
During the reporting period, the Fund increased its allocations to diversified financial services, media-cable, and energy securities, while reducing its allocations to real estate & homebuilders and super retail.
Looking ahead, it is widely anticipated that the U.S. Federal Reserve (Fed) will raise interest rates again following its mid-December meeting, which would be the third hike of 2017. All in all, the Fed's measured approach to policy normalization represents a constructive scenario for high yield bonds, which historically have performed well during rising-rate environments. We continue to believe that the high yield market is compensating investors for default risk. We anticipate high yield defaults will remain below historical averages for the remainder of 2017 and 2018 if the U.S. economic expansion continues. While volatility has failed to emerge in the non-investment grade space, as it has in most risk markets, the potential remains for a spike in volatility over the balance of the year given ongoing policy uncertainty in the U.S., various geopolitical flashpoints and the possibility that the improvement in global economic growth could wane. We don't believe lower-quality high yield securities at current levels are compensating investors for these risks, which is one of the reasons for the Fund's allocation to higher-quality securities as noted above.
Sincerely,
THOMAS P. O'REILLY, RUSS COVODE, DANIEL DOYLE, AND PATRICK FLYNN
PORTFOLIO CO-MANAGERS
Information about principal risks of investing in the Fund is set forth in the prospectus and statement of additional information.
The portfolio composition, industries and holdings of the Fund are subject to change without notice.
The opinions expressed are those of the Fund's portfolio managers. The opinions are as of the date of this report and are subject to change without notice.
30
Short Duration High Income Fund (Unaudited)
TICKER SYMBOLS
Institutional Class | | NHSIX | |
Class A | | NHSAX | |
Class C | | NHSCX | |
PORTFOLIO BY TYPE OF SECURITY
(as a % of Total Net Assets) | |
Loan Assignments | | | 5.3 | % | |
Corporate Bonds | | | 92.4 | | |
Short-Term Investment | | | 1.3 | | |
Other Assets Less Liabilities | | | 1.0 | * | |
Total | | | 100.0 | % | |
* Includes the impact of the Fund's open positions in derivatives, if any.
PERFORMANCE HIGHLIGHTS
| | | Inception | | Average Annual Total Return
Ended 10/31/2017 | |
| | | Date | | 1 Year | | 5 Years | | Life of Fund | |
At NAV | | | | | | | | | |
Institutional Class | | 09/28/2012 | | | 4.94 | % | | | 3.77 | % | | | 3.77 | % | |
Class A | | 09/28/2012 | | | 4.55 | % | | | 3.40 | % | | | 3.41 | % | |
Class C | | 09/28/2012 | | | 3.78 | % | | | 2.62 | % | | | 2.63 | % | |
With Sales Charge | | | | | | | | | |
Class A | | | | | 0.11 | % | | | 2.52 | % | | | 2.54 | % | |
Class C | | | | | 2.78 | % | | | 2.62 | % | | | 2.63 | % | |
Index | | | | | | | | | |
ICE BofAML 0-5 Year BB-B
U.S. High Yield Constrained Index^1,14 | | | | | 6.44% | | | | 4.87% | | | | 4.99% | | |
^ Effective October 20, 2017, the BofA Merrill Lynch 0-5 Year BB-B U.S. High Yield Constrained Index changed its name to the ICE BofAML 0-5 Year BB-B U.S. High Yield Constrained Index.
The performance data quoted represent past performance and do not indicate future results. Current performance may be lower or higher than the performance data quoted. For performance data current to the most recent month-end, please visit www.nb.com/performance.
The results shown in the table reflect the reinvestment of income dividends and other distributions, if any. The results do not reflect the effect of taxes a shareholder would pay on Fund distributions or on the redemption of Fund shares.
The investment return and principal value of an investment will fluctuate and shares, when redeemed, may be worth more or less than their original cost.
Returns would have been lower if Neuberger Berman Investment Advisers LLC ("Management") had not reimbursed certain expenses and/or waived a portion of the investment management fees during certain of the periods shown. Repayment by a class (of expenses previously reimbursed and/or fees previously waived by Management) will decrease the class's returns. Please see Note B in the Notes to Financial Statements for specific information regarding expense reimbursement and/or fee waiver arrangements.
For the period ended October 31, 2017, the 30-day SEC yields were 3.34%, 2.97% and 2.22% for Institutional Class, Class A and Class C shares, respectively. Absent expense reimbursements and/or fee waivers, the 30-day SEC yields would have been 3.24%, 2.86% and 2.12% for Institutional Class, Class A and Class C shares, respectively.
As stated in the Fund's most recent prospectus, the total annual operating expense ratios for fiscal year 2016 were 0.87%, 1.31% and 2.05% for Institutional Class, Class A and Class C shares, respectively (before expense reimbursements and/or fee waivers, if any). The expense ratios were 0.76%, 1.13% and 1.88% for Institutional Class, Class A and Class C shares, respectively, after expense reimbursements and/or fee waivers. The expense ratios for the annual period ended October 31, 2017 can be found in the Financial Highlights section of this report.
Returns shown with a sales charge reflect the deduction of the current maximum initial sales charge of 4.25% for Class A shares and the contingent deferred sales charge (CDSC) for Class C shares. The CDSC for Class C shares is 1%, which is reduced to 0% after 1 year. The performance of the Fund's share classes will differ primarily due to different sales charge structures and class expenses. Please see the prospectus for more information about sales charge structures, if any, and class expenses for your share class.
31
Short Duration High Income Fund (Unaudited)
COMPARISON OF A $1,000,000 INVESTMENT
(000's omitted)

This graph shows the change in value of a hypothetical $1,000,000 investment in the Fund over the past 10 fiscal years, or since the Fund's inception if it has not operated for 10 years. The graph is based on the Institutional Class shares only; the performance of the Fund's share classes will differ primarily due to different sales charge structures and class expenses (see Performance Highlights chart on previous page). The result is compared with benchmarks, which include a broad-based market index and may include a more narrowly based index. Market indices have not been reduced to reflect any of the fees and costs of investing. The results shown in the graph reflect the reinvestment of income dividends and other distributions, if any. The results do not reflect the effect of taxes a shareholder would pay on Fund distributions or on the redemption of Fund shares. Results represent past performance and do not indicate future results.
32
Strategic Income Fund Commentary (Unaudited)
Neuberger Berman Strategic Income Fund Institutional Class generated a 4.45% total return for the 12 months ended October 31, 2017 and outperformed its benchmark, the Bloomberg Barclays U.S. Aggregate Bond Index, which provided a 0.90% total return for the same period. (Performance for all share classes is provided in the table immediately following this letter.)
The overall U.S. taxable fixed income market, as measured by the Bloomberg Barclays U.S. Aggregate Bond Index, generated a modest gain during the reporting period. Treasury yields moved sharply higher following the November 2016 U.S. elections, due to expectations for improving growth and higher inflation. Also impacting the U.S. fixed income market were three Federal Reserve (Fed) interest rate hikes during the reporting period. However, Treasury yields declined from their peak in mid-March 2017, as investors tempered their policy optimism following the Administration's health care bill setback. Overseas, the European Central Bank left policy rates unchanged while reducing their asset purchase program, with further tapering planned in 2018. Meanwhile, the Bank of Japan maintained highly accommodative monetary policies. Finally, the U.S. dollar depreciated given shifting expectations for growth and monetary/fiscal policy. Investors' search for yield continued over the period, helping high yield corporate bonds and emerging markets (EM) debt to produce solid results.
The Fund's allocation to non-agency mortgage-backed securities (MBS) benefited performance. A solid housing market led to ongoing improvement in mortgage creditworthiness, and a shrinking pool of existing securities was met by increasing investor demand. The Fund's allocations to high yield and investment grade corporate bonds contributed to results amid solid investor risk appetite and supportive fundamentals. Security selection within investment grade corporate bonds also contributed to performance. The Fund's overall underweight duration positioning benefited the portfolio during the reporting period as yields moved higher. Allocations to U.S. Treasury Inflation-Protected Securities (TIPS) were beneficial as inflation expectations accelerated following the November 2016 U.S. elections. Elsewhere, the Fund's positioning in global sovereigns was a modest drag on performance.
The Fund's aggregate use of futures and swap contracts detracted from performance during the reporting period.
There were several adjustments made to the portfolio during the reporting period. We tactically adjusted the Fund's duration, first increasing duration following the November 2016 U.S. elections sell-off and then subsequently reducing duration. We moderately increased the Fund's allocation to EM debt and bank loans, as we believed valuations were attractive relative to other fixed income subsectors. Elsewhere, we decreased the Fund's allocations to investment grade corporate bonds, high yield corporate bonds, non-agency MBS, TIPS, and global sovereign bonds.
Looking ahead, the market appears to think the long-awaited sell-off in government bond yields may continue to prove elusive. Investors seem to doubt whether the Fed will hike rates meaningfully and seem to expect the Fed's balance sheet exit may be a non-event. Compare today's mindset to the "taper tantrum" of 2013 when former Fed Chair Bernanke's mere mention of a potential future tapering of asset purchases sparked a major sell-off and volatility spike. Now, the Fed has actually started reducing holdings — which is arguably more significant than tapering — and anticipates to continue hiking rates. Nevertheless, Treasury yields and interest rate volatility remain stubbornly low. There's certainly a chance it plays out calmly and predictably, but the bond market's current stance may prove to be overly complacent. We believe reducing central bank balance sheet holdings — quantitative tightening — should add to volatility in fixed income markets just as adding to central bank balance sheets — quantitative easing — had previously reduced volatility.
Sincerely,
THANOS BARDAS, DAVID M. BROWN, ANDREW A. JOHNSON, THOMAS J. MARTHALER AND BRADLEY C. TANK
PORTFOLIO MANAGERS
Information about principal risks of investing in the Fund is set forth in the prospectus and statement of additional information.
The portfolio composition, industries and holdings of the Fund are subject to change without notice.
The opinions expressed are those of the Fund's portfolio managers. The opinions are as of the date of this report and are subject to change without notice.
33
Strategic Income Fund (Unaudited)
TICKER SYMBOLS
Trust Class | | NSTTX | |
Institutional Class | | NSTLX | |
Class A | | NSTAX | |
Class C | | NSTCX | |
Class R6 | | NRSIX | |
PORTFOLIO BY TYPE OF SECURITY
(as a % of Total Net Assets) | |
Asset-Backed Securities | | | 12.1 | % | |
Corporate Bonds | | | 38.6 | | |
Developed Markets Ex- U.S. | | | 1.3 | | |
Foreign Government Securities | | | 4.0 | | |
Investment Companies | | | 3.7 | | |
Loan Assignments | | | 5.8 | | |
Mortgage-Backed Securities | | | 27.1 | | |
U.S. Treasury Obligations | | | 30.2 | | |
Short-Term Investment | | | 1.1 | | |
Liabilities Less Other Assets | | | (23.9 | )* | |
Total | | | 100.0 | % | |
* Includes the impact of the Fund's open positions in derivatives, if any.
PERFORMANCE HIGHLIGHTS17
| | | Inception | | Average Annual Total Return
Ended 10/31/2017 | |
| | | Date | | 1 Year | | 5 Years | | 10 Years | | Life of Fund | |
At NAV | | | | | | | | | | | |
| Trust Class13 | | 04/02/2007 | | | 4.09 | % | | | 2.96 | % | | | 5.88 | % | | | 6.55 | % | |
Institutional Class | | 07/11/2003 | | | 4.45 | % | | | 3.34 | % | | | 6.26 | % | | | 6.82 | % | |
| Class A13 | | 12/20/2007 | | | 4.03 | % | | | 2.93 | % | | | 5.85 | % | | | 6.53 | % | |
| Class C13 | | 12/20/2007 | | | 3.31 | % | | | 2.20 | % | | | 5.10 | % | | | 6.01 | % | |
| Class R613 | | 03/15/2013 | | | 4.52 | % | | | 3.39 | % | | | 6.28 | % | | | 6.84 | % | |
With Sales Charge | | | | | | | | | | | |
| Class A13 | | | | | -0.37 | % | | | 2.04 | % | | | 5.39 | % | | | 6.21 | % | |
| Class C13 | | | | | 2.31 | % | | | 2.20 | % | | | 5.10 | % | | | 6.01 | % | |
Index | | | | | | | | | |
Bloomberg Barclays
U.S. Aggregate Bond Index1,14 | | | | | 0.90 | % | | | 2.04 | % | | | 4.19 | % | | | 4.07 | % | |
The performance data quoted represent past performance and do not indicate future results. Current performance may be lower or higher than the performance data quoted. For performance data current to the most recent month-end, please visit www.nb.com/performance.
The results shown in the table reflect the reinvestment of income dividends and other distributions, if any. The results do not reflect the effect of taxes a shareholder would pay on Fund distributions or on the redemption of Fund shares.
The investment return and principal value of an investment will fluctuate and shares, when redeemed, may be worth more or less than their original cost.
Returns would have been lower if Neuberger Berman Investment Advisers LLC ("Management") had not reimbursed certain expenses and/or waived a portion of the investment management fees during certain of the periods shown. Repayment by a class (of expenses previously reimbursed and/or fees previously waived by Management) will decrease the class's returns. Please see Note B in the Notes to Financial Statements for specific information regarding expense reimbursement and/or fee waiver arrangements.
For the period ended October 31, 2017, the 30-day SEC yields were 2.91%, 3.26%, 2.86%, 2.17% and 3.33% for Trust Class, Institutional Class, Class A, Class C and Class R6 shares, respectively. Absent expense reimbursements and/or fee waivers, the 30-day SEC yields would have been 2.90% and 2.16%for Trust Class and Class C shares, respectively. Absent repayments, the 30-day SEC yields would have been 3.28%, 2.90% and 3.35% for Institutional Class, Class A and Class R6 shares, respectively.
As stated in the Fund's most recent prospectus, the total annual operating expense ratios for fiscal year 2016 were 1.00%, 0.64%, 1.04%, 1.77% and 0.57% for Trust Class, Institutional Class, Class A, Class C and Class R6 shares, respectively (before expense reimbursements and/or fee waivers, if any). The expense ratios were 0.94%, 0.59%, 0.99%, 1.69% and 0.52% for Trust Class, Institutional Class, Class A, Class C and Class R6 shares, respectively, after expense reimbursements and/or fee waivers. The expense ratios for the annual period ended October 31, 2017 can be found in the Financial Highlights section of this report.
Returns shown with a sales charge reflect the deduction of the current maximum initial sales charge of 4.25% for Class A shares and the contingent deferred sales charge (CDSC) for Class C shares. The CDSC for Class C shares is 1%, which is reduced to 0% after 1 year. The performance of the Fund's share classes will differ primarily due to different sales charge structures and class expenses. Please see the prospectus for more information about sales charge structures, if any, and class expenses for your share class.
34
Strategic Income Fund (Unaudited)
COMPARISON OF A $1,000,000 INVESTMENT
(000's omitted)
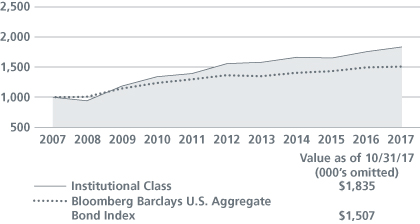
This graph shows the change in value of a hypothetical $1,000,000 investment in the Fund over the past 10 fiscal years, or since the Fund's inception if it has not operated for 10 years. The graph is based on the Institutional Class shares only; the performance of the Fund's share classes will differ primarily due to different sales charge structures and class expenses (see Performance Highlights chart on previous page). The result is compared with benchmarks, which include a broad-based market index and may include a more narrowly based index. Market indices have not been reduced to reflect any of the fees and costs of investing. The results shown in the graph reflect the reinvestment of income dividends and other distributions, if any. The results do not reflect the effect of taxes a shareholder would pay on Fund distributions or on the redemption of Fund shares. Results represent past performance and do not indicate future results.
35
Unconstrained Bond Fund Commentary (Unaudited)
Neuberger Berman Unconstrained Bond Fund Institutional Class generated a 4.05% total return for the 12 months ended October 31, 2017. In contrast, its benchmark, the ICE BofAML 3-Month U.S. Treasury Bill Index, provided a 0.72% total return for the same period. (Performance for all share classes is provided in the table immediately following this letter.)
The global fixed income market, as measured by the Bloomberg Barclays Global Aggregate Index, gained 1.18% during the reporting period. In the U.S., Treasury yields moved sharply higher following the November 2016 U.S. elections, due to expectations for improving growth and higher inflation. Also impacting the U.S. fixed income market were three U.S. Federal Reserve (Fed) interest rate hikes during the reporting period. However, Treasury yields declined from their peak in mid-March 2017, as investors tempered their policy optimism following the Administration's health care bill setback. Overseas, the European Central Bank left interest rates unchanged while reducing their asset purchase program, with further tapering planned in 2018. Meanwhile, the Bank of Japan maintained highly accommodative monetary policies. Finally, the U.S. dollar depreciated given shifting expectations for growth and monetary/fiscal policy. Investors' search for yield continued over the period, helping high yield corporate bonds and emerging markets (EM) debt to produce solid results.
The Fund's duration positioning benefited its performance, particularly within U.S. interest rates. An allocation to Treasury Inflation-Protected Securities was also beneficial. Allocations to non-agency mortgage-backed securities (MBS) and investment grade corporate bonds contributed to results. In addition, our currency positioning was additive. Our bearish positioning in pan-European high yield detracted from performance.
There were several adjustments made to the portfolio during the reporting period. We began the reporting period long U.S. interest rates but have recently reversed the position to be net short. We added holdings in collateralized loan obligations and credit risk transfer securities (collateralized mortgage obligations). Also, we initially increased the Fund's allocations to high yield and investment grade corporate bonds as spreads widened early in the period, then pared these allocations subsequent to their strong rebound. Elsewhere, we decreased the Fund's allocations to non-agency MBS and curtailed short positions in (EM) debt.
The Fund's aggregate use of futures, forward foreign currency, and swap contracts detracted from performance during the reporting period.
Looking ahead, the market appears to think the long-awaited sell-off in government bond yields may continue to prove elusive. Investors seem to doubt whether the Fed will hike rates meaningfully and seem to expect the Fed's balance sheet exit may be a non-event. Compare today's mindset to the "taper tantrum" of 2013 when former Fed Chair Bernanke's mere mention of a potential future tapering of asset purchases sparked a major sell-off and volatility spike. Now, the Fed has actually started reducing holdings — which is arguably more significant than tapering — and anticipates continuing hiking rates. We believe the European Central Bank will eventually follow suit. Nevertheless, global sovereign yields and interest rate volatility remain stubbornly low. There's certainly a chance it plays out calmly and predictably, but the bond market's current stance may prove to be overly complacent. We believe reducing global central bank balance sheet holdings — quantitative tightening — should add to volatility in fixed income markets just as adding to central bank balance sheets — quantitative easing — had previously reduced volatility.
Sincerely,
THANOS BARDAS, DAVID M. BROWN, ANDREW A. JOHNSON, NATHAN KUSH, THOMAS J. MARTHALER, JON JONSSON AND
UGO LANCIONI
PORTFOLIO MANAGERS
Information about principal risks of investing in the Fund is set forth in the prospectus and statement of additional information.
The portfolio composition, industries and holdings of the Fund are subject to change without notice.
The opinions expressed are those of the Fund's portfolio managers. The opinions are as of the date of this report and are subject to change without notice.
36
Unconstrained Bond Fund (Unaudited)
TICKER SYMBOLS
Institutional Class | | NUBIX | |
Class A | | NUBAX | |
Class C | | NUBCX | |
Class R6 | | NRUBX | |
PORTFOLIO BY TYPE OF SECURITY
(as a % of Total Net Assets) | |
Asset-Backed Securities | | | 10.4 | % | |
Corporate Bonds | | | 39.5 | | |
Foreign Government Securities | | | 16.2 | | |
Mortgage-Backed Securities | | | 7.0 | | |
U.S. Treasury Obligations | | | 21.0 | | |
Short-Term Investment | | | 3.7 | | |
Other Assets Less Liabilities | | | 2.2 | * | |
Total | | | 100.0 | % | |
* Includes the impact of the Fund's open positions in derivatives, if any.
PERFORMANCE HIGHLIGHTS
| | | Inception | | Average Annual Total Return
Ended 10/31/2017 | |
| | | Date | | 1 Year | | Life of Fund | |
At NAV | | | | | | | |
Institutional Class | | 02/13/2014 | | | 4.05 | % | | | 0.90 | % | |
Class A | | 02/13/2014 | | | 3.78 | % | | | 0.53 | % | |
Class C | | 02/13/2014 | | | 3.02 | % | | | -0.19 | % | |
Class R6 | | 02/13/2014 | | | 4.12 | % | | | 1.00 | % | |
With Sales Charge | | | | | | | |
Class A | | | | | -0.66 | % | | | -0.63 | % | |
Class C | | | | | 2.02 | % | | | -0.19 | % | |
Index | | | | | | | |
ICE BofAML 3-Month
U.S. Treasury Bill Index^1,14 | | | | | 0.72 | % | | | 0.29 | % | |
^ Effective October 20, 2017, the BofA Merrill Lynch 3-Month U.S. Treasury Bill Index changed its name to the ICE BofAML 3-Month U.S. Treasury Bill Index.
The performance data quoted represent past performance and do not indicate future results. Current performance may be lower or higher than the performance data quoted. For performance data current to the most recent month-end, please visit www.nb.com/performance.
The results shown in the table reflect the reinvestment of income dividends and other distributions, if any. The results do not reflect the effect of taxes a shareholder would pay on Fund distributions or on the redemption of Fund shares.
The investment return and principal value of an investment will fluctuate and shares, when redeemed, may be worth more or less than their original cost.
Returns would have been lower if Neuberger Berman Investment Advisers LLC ("Management") had not reimbursed certain expenses and/or waived a portion of the investment management fees during certain of the periods shown. Repayment by a class (of expenses previously reimbursed and/or fees previously waived by Management) will decrease the class's returns. Please see Note B in the Notes to Financial Statements for specific information regarding expense reimbursement and/or fee waiver arrangements.
For the period ended October 31, 2017, the 30-day SEC yields were 2.30%, 1.93%, 1.19% and 2.37% for Institutional Class, Class A, Class C and Class R6 shares, respectively. Absent expense reimbursement and/or fee waiver, the 30-day SEC yield would have been 1.85% for Institutional Class shares. Absent repayments, the 30-day SEC yields would have been 2.29%, 1.29% and 2.56% for Class A, Class C and Class R6 shares, respectively.
As stated in the Fund's most recent prospectus, the total annual operating expense ratios for fiscal year 2016 were 1.27%, 1.64%, 2.42% and 1.16% for Institutional Class, Class A, Class C and Class R6 shares, respectively (before expense reimbursements and/or fee waivers, if any). The expense ratios were 0.69%, 1.06%, 1.81% and 0.62% for Institutional Class, Class A, Class C and Class R6 shares, respectively, after expense reimbursements and/or fee waivers. The expense ratios for the annual period ended October 31, 2017 can be found in the Financial Highlights section of this report.
Returns shown with a sales charge reflect the deduction of the current maximum initial sales charge of 4.25% for Class A shares and the contingent deferred sales charge (CDSC) for Class C shares. The CDSC for Class C shares is 1%, which is reduced to 0% after 1 year. The performance of the Fund's share classes will differ primarily due to different sales charge structures and class expenses. Please see the prospectus for more information about sales charge structures, if any, and class expenses for your share class.
37
Unconstrained Bond Fund (Unaudited)
COMPARISON OF A $1,000,000 INVESTMENT
(000's omitted)

This graph shows the change in value of a hypothetical $1,000,000 investment in the Fund over the past 10 fiscal years, or since the Fund's inception if it has not operated for 10 years. The graph is based on the Institutional Class shares only; the performance of the Fund's share classes will differ primarily due to different sales charge structures and class expenses (see Performance Highlights chart on previous page). The result is compared with benchmarks, which include a broad-based market index and may include a more narrowly based index. Market indices have not been reduced to reflect any of the fees and costs of investing. The results shown in the graph reflect the reinvestment of income dividends and other distributions, if any. The results do not reflect the effect of taxes a shareholder would pay on Fund distributions or on the redemption of Fund shares. Results represent past performance and do not indicate future results.
38
1 Please see "Glossary of Indices" on page 42 for a description of indices. Please note that individuals cannot invest directly in any index. The indices described in this report do not take into account any fees, expenses or tax consequences of investing in the individual securities that they track. Data about the performance of an index are prepared or obtained by Neuberger Berman Investment Advisers LLC* ("Management") and reflect the reinvestment of income dividends and other distributions, if any. The Fund may invest in securities not included in a described index and generally does not invest in all securities included in a described index.
2 The performance information for periods prior to June 13, 2005, is that of the Fund's predecessor, Ariel Premier Bond Fund ("Ariel Fund"). The investment policies, guidelines and restrictions of the Fund are in all material respects equivalent to those of Ariel Fund. Returns would have been lower if Ariel Fund's manager had not waived certain of its fees during these periods.
3 The performance information for Institutional Class is that of Ariel Fund Institutional Class for the period October 1, 1995 (inception date) through June 10, 2005. The performance information for Investor Class is that of Ariel Fund Institutional Class for the period October 1, 1995 through January 31, 1997 (the period prior to the Investor Class' inception date), and that of Ariel Fund Investor Class for the period February 1, 1997 through June 10, 2005. Ariel Fund Institutional Class had lower expenses and typically higher returns than Ariel Fund Investor Class.
4 The performance information for Class A and Class C prior to the classes' inception date is that of the Institutional Class of Neuberger Berman Core Bond Fund (please see Endnote 3). The performance information for the Institutional Class has been adjusted to reflect the appropriate sales charges applicable to Class A and Class C shares, but has not been adjusted to take into account differences in class specific operating expenses (such as 12b-1 fees). The Institutional Class has lower expenses and typically higher returns than Class A and Class C.
5 The performance information for Institutional Class and Class C prior to the classes' inception date is that of Class A of Neuberger Berman Floating Rate Income Fund. The performance information (at NAV) of Class A has been adjusted to reflect the appropriate sales charge applicable to Class C shares, but has not been adjusted to take into account differences in class specific operating expenses (such as 12b-1 fees). Class A has higher expenses and typically lower returns (at NAV) than Institutional Class. Class A has lower expenses and typically higher returns (at NAV) than Class C.
6 The performance information for the period April 1, 1996 through September 6, 2002, is that of the Fund's predecessor, Lipper High Income Bond Fund ("Lipper Fund"), and the performance information for the period February 1, 1992 through March 31, 1996, is that of Lipper Fund's predecessor partnership. The investment policies, objectives, guidelines and restrictions of the Fund are in all material respects equivalent to those of Lipper Fund, and the investment policies, objectives, guidelines and restrictions of Lipper Fund were in all material respects equivalent to those of its predecessor partnership. As mutual funds registered under the Investment Company Act of 1940, as amended ("1940 Act"), the Fund is, and Lipper Fund was, subject to certain restrictions under the 1940 Act and the Internal Revenue Code of 1986, as amended ("Code"), to which Lipper Fund's predecessor partnership was not subject. Had Lipper Fund's predecessor partnership been registered under the 1940 Act and been subject to the provisions of the 1940 Act and the Code, its investment performance may have been adversely affected. Returns would have been lower if Lipper Fund's manager had not waived certain of its fees during these periods.
7 The performance information for Investor Class is that of Lipper Fund Premier Class for the period April 1, 1996 through September 6, 2002, and that of Lipper Fund's predecessor partnership for the period February 1, 1992 (inception date) through March 31, 1996 (please see Endnote 6).
39
8 The performance information for Institutional Class, Class A, Class C, Class R3 and Class R6 prior to the classes' respective inception dates is that of the Investor Class of Neuberger Berman High Income Bond Fund (please see Endnote 7). The performance information of the Investor Class has been adjusted to reflect the appropriate sales charges applicable to Class A and Class C shares, but has not been adjusted to take into account differences in class specific operating expenses (such as 12b-1 fees). The Investor Class has lower expenses and typically higher returns than Class A, Class C and Class R3. The Investor Class has higher expenses and typically lower returns than Institutional Class and Class R6.
9 Tax-equivalent effective yield is the taxable effective yield that a shareholder would have had to receive in order to realize the same level of yield after federal income taxes at the highest federal tax rate, currently 39.6% plus the 3.8% Medicare contribution tax, assuming that all of the Fund's income is exempt from federal income taxes.
10 A portion of the Fund's income may be a tax preference item for purposes of the federal alternative minimum tax for certain shareholders.
11 The performance information for Institutional Class, Class A and Class C prior to the classes' inception date is that of the Investor Class of Neuberger Berman Municipal Intermediate Bond Fund. The performance information of the Investor Class has been adjusted to reflect the appropriate sales charges applicable to Class A and Class C shares, but has not been adjusted to take into account differences in class specific operating expenses (such as 12b-1 fees). The Investor Class has lower expenses and typically higher returns than Class A and Class C. The Investor Class has higher expenses and typically lower returns than Institutional Class.
12 The performance information for Trust Class, Institutional Class, Class A and Class C prior to the classes' respective inception dates is that of the Investor Class of Neuberger Berman Short Duration Bond Fund. The performance information of the Investor Class has been adjusted to reflect the appropriate sales charges applicable to Class A and Class C shares, but has not been adjusted to take into account differences in class specific operating expenses (such as 12b-1 fees). The Investor Class has lower expenses and typically higher returns than Trust Class, Class A and Class C. The Investor Class has higher expenses and typically lower returns than Institutional Class.
13 The performance information for Trust Class, Class A, Class C and Class R6 prior to the classes' respective inception dates is that of the Institutional Class of Neuberger Berman Strategic Income Fund. The performance information of the Institutional Class has been adjusted to reflect the appropriate sales charges applicable to Class A and Class C shares, but has not been adjusted to take into account differences in class specific operating expenses (such as 12b-1 fees). The Institutional Class has lower expenses and typically higher returns than Trust Class, Class A and Class C. The Institutional Class has higher expenses and typically lower returns than Class R6.
14 The date used to calculate Life of Fund performance for the index is the inception date of the oldest share class.
15 The investments for the Fund are managed by the same portfolio manager(s) who manage(s) one or more other registered funds that have names, investment objectives and investment styles that are similar to those of the Fund. You should be aware that the Fund is likely to differ from the other mutual fund(s) in size, cash flow pattern and tax matters. Accordingly, the holdings and performance of the Fund can be expected to vary from those of the other mutual fund(s).
16 This date reflects when Management first became the investment manager to the Fund.
17 The Fund had a different goal, to maximize income without undue risk to principal, and investment strategy, which included managing assets by an asset allocation committee, prior to February 28, 2008. Its performance prior to that date might have been different if the current goal and investment strategy had been in effect.
18 The Fund had a different goal, to maximize total return through a combination of income and capital appreciation, and investment strategy, which did not include investments in derivatives and non-U.S. dollar denominated securities, prior to February 28, 2008. Its performance prior to that date might have been different if the current goal and investment strategy had been in effect.
40
19 The Fund's policies limited its ability to invest in bonds rated below "B" prior to July 6, 2006. Its performance prior to that date might have been different if current policies had been in effect.
* On January 1, 2016, Neuberger Berman Management LLC ("NBM") and Neuberger Berman LLC ("Neuberger Berman") transferred to Neuberger Berman Fixed Income LLC ("NBFI") their rights and obligations pertaining to all services they provided to any Fund under any investment management, investment sub-advisory, and/or administration agreement, as applicable (the "Agreements"). Following such transfer, NBFI was renamed Neuberger Berman Investment Advisers LLC ("NBIA" or "Management"). Following the consolidation, the investment professionals of NBM who provided services to any Fund under the Agreements continue to provide the same services, except that they provide those services in their new capacities as investment professionals of NBIA. Further, the consolidation did not result in any change in the investment processes employed by any Fund, the nature or level of services provided to any Fund, or the fees any Fund pays under its Agreements.
On July 1, 2016, NBM was reorganized into Neuberger Berman (the "Reorganization"). Upon the completion of the Reorganization, Neuberger Berman assumed all rights and obligations pertaining to all services NBM provided to any Fund under any distribution agreement or distribution and services agreement (the "Agreements") or plan adopted pursuant to Rule 12b-1 under the Investment Company Act of 1940, as amended, (the "Plans"). Accordingly, after the Reorganization, Neuberger Berman became each Fund's distributor and the services previously provided by NBM under the Agreements and Plans are provided by Neuberger Berman.
Following the Reorganization, the employees of NBM provide the same services to each Fund under the Agreements and Plans, except that they provide those services in their capacities as employees of Neuberger Berman. Further, the Reorganization did not result in any change in the nature or level of services provided to each Fund, or the fees, if any, each Fund pays under the Agreements or the Plans.
On January 1, 2017, the Funds' distributor, Neuberger Berman, changed its name to Neuberger Berman BD LLC.
For more complete information on any of the Neuberger Berman Income Funds, call us at (800) 877-9700, or visit our website at www.nb.com.
41
Bloomberg Barclays 7-Year General Obligation (G.O.) Index: | | The index is the 7-year (6-8 years to maturity) component of the Bloomberg Barclays G.O. Index. The Bloomberg Barclays G.O. Index measures the investment grade, U.S. dollar-denominated, long-term, tax-exempt state and local general obligation bond market. | |
Bloomberg Barclays U.S. Aggregate Bond Index: | | The index measures the investment grade, U.S. dollar-denominated, fixed-rate, taxable bond market and includes Treasuries, government-related and corporate securities, mortgage-backed securities (MBS) (agency fixed-rate and hybrid adjustable rate mortgage (ARM) pass-throughs), asset-backed securities (ABS), and commercial mortgage-backed securities (CMBS) (agency and nonagency). | |
Bloomberg Barclays 1-3 Year U.S. Government/Credit Bond Index: | | The index is the 1-3 year component of the Bloomberg Barclays U.S. Government/Credit Index. The Bloomberg Barclays U.S. Government/Credit Index is the non-securitized component of the Bloomberg Barclays U.S. Aggregate Bond Index and includes Treasuries and government-related (agency, sovereign, supranational, and local authority debt) and corporate securities. | |
Blended benchmark is composed of 65% Bloomberg Barclays Municipal Bond Index and 35% Bloomberg Barclays Municipal High Yield Index:
Bloomberg Barclays Municipal Bond Index: | | The Index is a rules-based, market-value-weighted index engineered for the long-term tax-exempt bond market. To be included in the index, bonds must be rated investment-grade (Baa3/BBB- or higher) by at least two of the following ratings agencies: Moody's, S&P, Fitch. If only two of the three agencies rate the security, the lower rating is used to determine index eligibility. If only one of the three agencies rates a security, the rating must be investment-grade. They must have an outstanding par value of at least $7 million and be issued as part of a transaction of at least $75 million. The bonds must be fixed rate, have a dated date after December 31, 1990, and must be at least one year from their maturity date. Remarketed issues, taxable municipal bonds, bonds with floating rates, and derivatives, are excluded from the benchmark. | |
Bloomberg Barclays Municipal High Yield Index: | | The index measures the performance of the high yield municipal bond market. To be included in the index, bonds must be rated non-investment-grade (Ba1/BB- or lower) by at least two of the following ratings agencies: Moody's, S&P, Fitch. If only two of the three agencies rate the security, the lower rating is used to determine index eligibility. If only one of the three agencies rates a security, the rating must be non-investment-grade. They must have an outstanding par value of at least $7 million and be issued as part of a transaction of at least $75 million. The bonds must be fixed rate, have a dated date after December 31, 1990, and must be at least one year from their maturity date. Remarketed issues, taxable municipal bonds, bonds with floating rates, and derivatives, are excluded from the benchmark. | |
42
Blended benchmark is composed of 50% J.P. Morgan GBI — Emerging Markets Global Diversified, 25% J.P. Morgan EMBI — Global Diversified, and 25% J.P. Morgan CEMBI — Diversified, and is rebalanced monthly.
J.P. Morgan Corporate Emerging Markets Bond Index (CEMBI) — Diversified: | | The index tracks the performance of U.S. dollar-denominated corporate emerging market bonds, including emerging market countries from Asia, Europe, Latin America and the Middle East/Africa. The Diversified version of the index is market capitalization-weighted and limits the weights of those index countries with larger corporate debt stocks by including only specified portions of those countries' eligible current face amounts of debt outstanding. | |
J.P. Morgan Emerging Markets Bond Index (EMBI) — Global Diversified: | | The index tracks the performance of U.S. dollar-denominated debt instruments issued by emerging market sovereign and quasi-sovereign entities (Brady bonds, loans and Eurobonds), including emerging market countries from Asia, Europe, Latin America and the Middle East/Africa. The Global version of the index captures a broad, comprehensive universe of emerging market issues. The Diversified version of the index is market capitalization-weighted and limits the weights of those index countries with larger debt stocks by including only specified portions of those countries' eligible current face amounts of debt outstanding. | |
J.P. Morgan Government Bond Index (GBI) — Emerging Markets Global Diversified: | | The index tracks the performance of local currency denominated bonds issued by emerging market governments, including emerging market countries from Asia, Europe, Latin America and the Middle East/Africa. The Global version of the index includes only countries that are accessible by most of the international investor base, while countries with explicit capital controls are excluded. The Diversified version of the index is market capitalization-weighted, with a maximum weight to a country capped at 10%. | |
ICE BofAML U.S. High Yield Constrained Index: | | The index tracks the performance of U.S. dollar-denominated below investment grade corporate debt publicly issued in the U.S. domestic market. In addition to meeting other criteria, qualifying securities must have a below investment grade rating (based on an average of Moody's, S&P and Fitch ratings), and have risk exposure to countries that are members of the FX-G10, Western Europe or territories of the U.S. and Western Europe. Securities in legal default are excluded from the index. Index constituents are capitalization-weighted, provided the total allocation to an individual issuer does not exceed 2%. | |
ICE BofAML 3-Month U.S. Treasury Bill Index: | | The index is comprised of a single issue purchased at the beginning of the month and held for a full month. At the end of the month that issue is sold and rolled into a newly selected issue. The issue selected at each month-end rebalancing is the outstanding Treasury Bill that matures closest to, but not beyond, three months from the rebalancing date. | |
ICE BofAML 0-5 Year BB-B U.S. High Yield Constrained Index: | | The index tracks the performance of short-term U.S. dollar-denominated below investment grade corporate debt publicly issued in the U.S. domestic market. In addition to meeting other criteria, qualifying securities must have less than five years remaining term to final maturity, be rated BB1 through B3, inclusive (based on an average of Moody's, S&P and Fitch ratings), and have risk exposure to countries that are members of the FX-G10, Western Europe or territories of the U.S. and Western Europe. Index constituents are capitalization-weighted, provided the total allocation to an individual issuer does not exceed 2%. | |
S&P/LSTA Leveraged Loan Index: | | The index measures the performance of the U.S. leveraged loan market based upon real-time market weightings, spreads and interest payments. Loan Syndications and Trading Association (LSTA)/Loan Pricing Corporation (LPC) mark-to-market pricing is used to price each loan in the index. | |
43
Information About Your Fund's Expenses (Unaudited)
As a Fund shareholder, you incur two types of costs: (1) transaction costs, including sales charges (loads) on purchase payments or redemption proceeds (if applicable); and (2) ongoing costs, including management fees, distribution and/or service (12b-1) fees (if applicable), and other Fund expenses. This example is intended to help you understand your ongoing costs (in U.S. dollars) of investing in a Fund and compare these costs with the ongoing costs of investing in other mutual funds.
This table is designed to provide information regarding costs related to your investments. The following examples are based on an investment of $1,000 made at the beginning of the six month period ended October 31, 2017 and held for the entire period. The table illustrates each Fund's costs in two ways:
Actual Expenses and Performance: | | The first section of the table provides information about actual account values and actual expenses in dollars, based on the Fund's actual performance during the period indicated. You may use the information in this line, together with the amount you invested, to estimate the expenses you paid over the period. Simply divide your account value by $1,000 (for example, an $8,600 account value divided by $1,000 = 8.6), then multiply the result by the number in the first section of the table under the heading entitled "Expenses Paid During the Period" to estimate the expenses you paid over the period. | |
Hypothetical Example for
Comparison Purposes: | | The second section of the table provides information about hypothetical account values and hypothetical expenses based on the Fund's actual expense ratio and an assumed rate of return at 5% per year before expenses. This return is not the Fund's actual return. The hypothetical account values and expenses may not be used to estimate the actual ending account balance or expenses you paid for the period. You may use this information to compare the ongoing costs of investing in a Fund versus other funds. To do so, compare the expenses shown in this 5% hypothetical example with the 5% hypothetical examples that appear in the shareholder reports of other funds. | |
Please note that the expenses in the table are meant to highlight your ongoing costs only and do not include any transaction costs, such as sales charges (loads) (if applicable). Therefore, the information under the heading "Hypothetical (5% annual return before expenses)" is useful in comparing ongoing costs only, and will not help you determine the relative total costs of owning different funds. In addition, if these transaction costs were included, your costs would have been higher.
44
Expense Example (Unaudited)
Neuberger Berman Income Funds | |
| | | ACTUAL | | HYPOTHETICAL (5% ANNUAL RETURN BEFORE EXPENSES) | |
| | | Beginning
Account
Value
5/1/17 | | Ending
Account
Value
10/31/17 | | Expenses Paid
During the
Period(1)
5/1/17 - 10/31/17 | | Expense
Ratio | | Beginning
Account
Value
5/1/17 | | Ending
Account
Value
10/31/17 | | Expenses Paid
During the
Period(2)
5/1/17 - 10/31/17 | | Expense
Ratio | |
Core Bond Fund | |
Investor Class | | $ | 1,000.00 | | | $ | 1,011.80 | | | $ | 4.36 | | | | 0.86 | % | | $ | 1,000.00 | | | $ | 1,020.87 | | | $ | 4.38 | | | | 0.86 | % | |
Institutional Class | | $ | 1,000.00 | | | $ | 1,014.80 | | | $ | 2.34 | | | | 0.46 | % | | $ | 1,000.00 | | | $ | 1,022.89 | | | $ | 2.35 | | | | 0.46 | % | |
Class A | | $ | 1,000.00 | | | $ | 1,012.70 | | | $ | 4.36 | | | | 0.86 | % | | $ | 1,000.00 | | | $ | 1,020.87 | | | $ | 4.38 | | | | 0.86 | % | |
Class C | | $ | 1,000.00 | | | $ | 1,007.90 | | | $ | 8.15 | | | | 1.61 | % | | $ | 1,000.00 | | | $ | 1,017.09 | | | $ | 8.19 | | | | 1.61 | % | |
Core Plus Fund | |
Institutional Class | | $ | 1,000.00 | | | $ | 1,006.30 | | | $ | 1.31 | (3) | | | 0.45 | % | | $ | 1,000.00 | | | $ | 1,022.94 | | | $ | 2.29 | | | | 0.45 | % | |
Class A | | $ | 1,000.00 | | | $ | 1,005.20 | | | $ | 2.36 | (3) | | | 0.81 | % | | $ | 1,000.00 | | | $ | 1,021.12 | | | $ | 4.13 | | | | 0.81 | % | |
Class C | | $ | 1,000.00 | | | $ | 1,003.10 | | | $ | 4.54 | (3) | | | 1.56 | % | | $ | 1,000.00 | | | $ | 1,017.34 | | | $ | 7.93 | | | | 1.56 | % | |
Class R6 | | $ | 1,000.00 | | | $ | 1,006.50 | | | $ | 1.11 | (3) | | | 0.38 | % | | $ | 1,000.00 | | | $ | 1,023.29 | | | $ | 1.94 | | | | 0.38 | % | |
Emerging Markets Debt Fund | |
Institutional Class | | $ | 1,000.00 | | | $ | 1,040.30 | | | $ | 4.01 | | | | 0.78 | % | | $ | 1,000.00 | | | $ | 1,021.27 | | | $ | 3.97 | | | | 0.78 | % | |
Class A | | $ | 1,000.00 | | | $ | 1,037.20 | | | $ | 5.91 | | | | 1.15 | % | | $ | 1,000.00 | | | $ | 1,019.41 | | | $ | 5.85 | | | | 1.15 | % | |
Class C | | $ | 1,000.00 | | | $ | 1,033.30 | | | $ | 9.12 | | | | 1.78 | % | | $ | 1,000.00 | | | $ | 1,016.23 | | | $ | 9.05 | | | | 1.78 | % | |
Floating Rate Income Fund | |
Institutional Class | | $ | 1,000.00 | | | $ | 1,019.30 | | | $ | 3.61 | | | | 0.71 | % | | $ | 1,000.00 | | | $ | 1,021.63 | | | $ | 3.62 | | | | 0.71 | % | |
Class A | | $ | 1,000.00 | | | $ | 1,017.40 | | | $ | 5.49 | | | | 1.08 | % | | $ | 1,000.00 | | | $ | 1,019.76 | | | $ | 5.50 | | | | 1.08 | % | |
Class C | | $ | 1,000.00 | | | $ | 1,013.60 | | | $ | 9.29 | | | | 1.83 | % | | $ | 1,000.00 | | | $ | 1,015.98 | | | $ | 9.30 | | | | 1.83 | % | |
High Income Bond Fund | |
Investor Class | | $ | 1,000.00 | | | $ | 1,024.20 | | | $ | 4.29 | | | | 0.84 | %(4) | | $ | 1,000.00 | | | $ | 1,020.97 | | | $ | 4.28 | | | | 0.84 | %(4) | |
Institutional Class | | $ | 1,000.00 | | | $ | 1,024.90 | | | $ | 3.57 | | | | 0.70 | %(4) | | $ | 1,000.00 | | | $ | 1,021.68 | | | $ | 3.57 | | | | 0.70 | %(4) | |
Class A | | $ | 1,000.00 | | | $ | 1,023.60 | | | $ | 5.97 | | | | 1.17 | %(4) | | $ | 1,000.00 | | | $ | 1,019.31 | | | $ | 5.96 | | | | 1.17 | %(4) | |
Class C | | $ | 1,000.00 | | | $ | 1,020.40 | | | $ | 9.22 | | | | 1.81 | %(4) | | $ | 1,000.00 | | | $ | 1,016.08 | | | $ | 9.20 | | | | 1.81 | %(4) | |
Class R3 | | $ | 1,000.00 | | | $ | 1,022.70 | | | $ | 6.93 | | | | 1.36 | %(4) | | $ | 1,000.00 | | | $ | 1,018.35 | | | $ | 6.92 | | | | 1.36 | %(4) | |
Class R6 | | $ | 1,000.00 | | | $ | 1,026.50 | | | $ | 3.12 | | | | 0.61 | %(4) | | $ | 1,000.00 | | | $ | 1,022.13 | | | $ | 3.11 | | | | 0.61 | %(4) | |
Municipal High Income Fund | |
Institutional Class | | $ | 1,000.00 | | | $ | 1,035.80 | | | $ | 2.57 | | | | 0.50 | % | | $ | 1,000.00 | | | $ | 1,022.68 | | | $ | 2.55 | | | | 0.50 | % | |
Class A | | $ | 1,000.00 | | | $ | 1,034.90 | | | $ | 4.46 | | | | 0.87 | % | | $ | 1,000.00 | | | $ | 1,020.82 | | | $ | 4.43 | | | | 0.87 | % | |
Class C | | $ | 1,000.00 | | | $ | 1,031.00 | | | $ | 8.29 | | | | 1.62 | % | | $ | 1,000.00 | | | $ | 1,017.04 | | | $ | 8.24 | | | | 1.62 | % | |
Municipal Intermediate Bond Fund | |
Investor Class | | $ | 1,000.00 | | | $ | 1,018.70 | | | $ | 3.31 | | | | 0.65 | % | | $ | 1,000.00 | | | $ | 1,021.93 | | | $ | 3.31 | | | | 0.65 | % | |
Institutional Class | | $ | 1,000.00 | | | $ | 1,019.50 | | | $ | 2.55 | | | | 0.50 | % | | $ | 1,000.00 | | | $ | 1,022.68 | | | $ | 2.55 | | | | 0.50 | % | |
Class A | | $ | 1,000.00 | | | $ | 1,017.60 | | | $ | 4.42 | | | | 0.87 | % | | $ | 1,000.00 | | | $ | 1,020.82 | | | $ | 4.43 | | | | 0.87 | % | |
Class C | | $ | 1,000.00 | | | $ | 1,013.80 | | | $ | 8.22 | | | | 1.62 | % | | $ | 1,000.00 | | | $ | 1,017.04 | | | $ | 8.24 | | | | 1.62 | % | |
New York Municipal Income Fund | |
Institutional Class | | $ | 1,000.00 | | | $ | 1,015.00 | | | $ | 4.47 | | | | 0.88 | %(4) | | $ | 1,000.00 | | | $ | 1,020.77 | | | $ | 4.48 | | | | 0.88 | %(4) | |
Short Duration Bond Fund | |
Investor Class | | $ | 1,000.00 | | | $ | 1,003.10 | | | $ | 3.53 | | | | 0.70 | % | | $ | 1,000.00 | | | $ | 1,021.68 | | | $ | 3.57 | | | | 0.70 | % | |
Trust Class | | $ | 1,000.00 | | | $ | 1,003.80 | | | $ | 4.04 | | | | 0.80 | % | | $ | 1,000.00 | | | $ | 1,021.17 | | | $ | 4.08 | | | | 0.80 | % | |
Institutional Class | | $ | 1,000.00 | | | $ | 1,005.40 | | | $ | 2.53 | | | | 0.50 | % | | $ | 1,000.00 | | | $ | 1,022.68 | | | $ | 2.55 | | | | 0.50 | % | |
Class A | | $ | 1,000.00 | | | $ | 1,002.10 | | | $ | 4.39 | | | | 0.87 | % | | $ | 1,000.00 | | | $ | 1,020.82 | | | $ | 4.43 | | | | 0.87 | % | |
Class C | | $ | 1,000.00 | | | $ | 998.30 | | | $ | 8.16 | | | | 1.62 | % | | $ | 1,000.00 | | | $ | 1,017.04 | | | $ | 8.24 | | | | 1.62 | % | |
Short Duration High Income Fund | |
Institutional Class | | $ | 1,000.00 | | | $ | 1,019.20 | | | $ | 3.82 | | | | 0.75 | % | | $ | 1,000.00 | | | $ | 1,021.42 | | | $ | 3.82 | | | | 0.75 | % | |
Class A | | $ | 1,000.00 | | | $ | 1,017.30 | | | $ | 5.69 | | | | 1.12 | % | | $ | 1,000.00 | | | $ | 1,019.56 | | | $ | 5.70 | | | | 1.12 | % | |
Class C | | $ | 1,000.00 | | | $ | 1,013.50 | | | $ | 9.49 | | | | 1.87 | % | | $ | 1,000.00 | | | $ | 1,015.78 | | | $ | 9.50 | | | | 1.87 | % | |
45
Neuberger Berman Income Funds | |
| | | ACTUAL | | HYPOTHETICAL (5% ANNUAL RETURN BEFORE EXPENSES) | |
| | | Beginning
Account
Value
5/1/17 | | Ending
Account
Value
10/31/17 | | Expenses Paid
During the
Period(1)
5/1/17 - 10/31/17 | | Expense
Ratio | | Beginning
Account
Value
5/1/17 | | Ending
Account
Value
10/31/17 | | Expenses Paid
During the
Period(2)
5/1/17 - 10/31/17 | | Expense
Ratio | |
Strategic Income Fund | |
Trust Class | | $ | 1,000.00 | | | $ | 1,025.00 | | | $ | 4.75 | | | | 0.93 | % | | $ | 1,000.00 | | | $ | 1,020.52 | | | $ | 4.74 | | | | 0.93 | % | |
Institutional Class | | $ | 1,000.00 | | | $ | 1,027.70 | | | $ | 2.96 | | | | 0.58 | % | | $ | 1,000.00 | | | $ | 1,022.28 | | | $ | 2.96 | | | | 0.58 | % | |
Class A | | $ | 1,000.00 | | | $ | 1,025.60 | | | $ | 5.00 | | | | 0.98 | % | | $ | 1,000.00 | | | $ | 1,020.27 | | | $ | 4.99 | | | | 0.98 | % | |
Class C | | $ | 1,000.00 | | | $ | 1,021.10 | | | $ | 8.56 | | | | 1.68 | % | | $ | 1,000.00 | | | $ | 1,016.74 | | | $ | 8.54 | | | | 1.68 | % | |
Class R6 | | $ | 1,000.00 | | | $ | 1,028.10 | | | $ | 2.61 | | | | 0.51 | % | | $ | 1,000.00 | | | $ | 1,022.63 | | | $ | 2.60 | | | | 0.51 | % | |
Unconstrained Bond Fund | |
Institutional Class | | $ | 1,000.00 | | | $ | 1,021.80 | | | $ | 3.47 | | | | 0.68 | % | | $ | 1,000.00 | | | $ | 1,021.78 | | | $ | 3.47 | | | | 0.68 | % | |
Class A | | $ | 1,000.00 | | | $ | 1,021.10 | | | $ | 5.40 | | | | 1.06 | % | | $ | 1,000.00 | | | $ | 1,019.86 | | | $ | 5.40 | | | | 1.06 | % | |
Class C | | $ | 1,000.00 | | | $ | 1,017.30 | | | $ | 9.20 | | | | 1.81 | % | | $ | 1,000.00 | | | $ | 1,016.08 | | | $ | 9.20 | | | | 1.81 | % | |
Class R6 | | $ | 1,000.00 | | | $ | 1,022.20 | | | $ | 3.16 | | | | 0.62 | % | | $ | 1,000.00 | | | $ | 1,022.08 | | | $ | 3.16 | | | | 0.62 | % | |
(1) For each class, expenses are equal to the annualized expense ratio for the class, multiplied by the average account value over the period, multiplied by 184/365 (to reflect the one-half year period shown), unless otherwise indicated.
(2) Hypothetical expenses are equal to the annualized expense ratios for each class, multiplied by the average account value over the period (assuming a 5% annual return), multiplied by 184/365 (to reflect the one-half year period shown).
(3) For each class, expenses are equal to the annualized expense ratio for the class, multiplied by the average account value over the period, multiplied by 106/365 (to reflect the period shown of July18, 2017 (Commencement of Operations) to October 31, 2017).
(4) Custodian Out-of-Pocket Expenses Refunded, as listed in Note G of the Notes to Financial Statements, is non-recurring. See Notes to Financial Highlights for the annualized ratio of net expenses to average daily net assets for the year ended October 31, 2107, had the Funds not received the refund as listed in Note G of the Notes to Financial Statements.
46
Schedule of Investments Core Bond Fund October 31, 2017
| PRINCIPAL AMOUNT(a) | | | | VALUE | |
(000's omitted) | | | | (000's omitted) | |
U.S. Treasury Obligations 30.9% | | | |
$ | 1,850 | | | U.S. Treasury Bill, 0.83%, due 5/24/18 | | $ | 1,837 | (b)(c) | |
| | 7,390 | | | U.S. Treasury Bond, 3.88%, due 8/15/40 | | | 8,759 | | |
| | | | | U.S. Treasury Inflation-Indexed Bonds | | | | | |
| | 10,619 | | | 0.25%, due 1/15/25 | | | 10,501 | (d) | |
| | 8,318 | | | 2.00%, due 1/15/26 | | | 9,334 | (d) | |
| | 3,985 | | | 2.50%, due 1/15/29 | | | 4,801 | (d) | |
| | 6,421 | | | 3.88%, due 4/15/29 | | | 8,709 | (d) | |
| | 1,175 | | | 0.63%, due 2/15/43 | | | 1,099 | (d) | |
| | | | | U.S. Treasury Notes | | | | | |
| | 11,275 | | | 1.50%, due 8/31/18 – 2/28/23 | | | 11,183 | | |
| | 35,000 | | | 1.38%, due 11/30/18 – 4/30/20 | | | 34,777 | | |
| | 5,000 | | | 0.88%, due 5/15/19 | | | 4,948 | | |
| | 1,755 | | | 3.63%, due 8/15/19 | | | 1,818 | | |
| | 9,535 | | | 2.75%, due 2/15/24 | | | 9,857 | | |
| | 8,390 | | | 1.63%, due 2/15/26 | | | 7,949 | | |
| | | | | Total U.S. Treasury Obligations (Cost $115,364) | | | 115,572 | | |
U.S. Government Agency Securities 2.1% | | | |
| | 1,745 | | | Federal Home Loan Bank, 5.50%, due 7/15/36 | | | 2,362 | | |
| | 1,200 | | | Federal National Mortgage Association, 1.60%, due 12/24/20 | | | 1,187 | | |
| | 2,455 | | | Residual Funding Corp., 0.00%, due 4/15/30 | | | 1,703 | (e) | |
| | | | | Tennessee Valley Authority | | | | | |
| | 840 | | | 7.13%, due 5/1/30 | | | 1,218 | | |
| | 930 | | | 5.88%, due 4/1/36 | | | 1,285 | | |
| | | | | Total U.S. Government Agency Securities (Cost $7,631) | | | 7,755 | | |
Mortgage-Backed Securities 33.8% | | | |
| Collateralized Mortgage Obligations 0.0%(f) | | | |
| | 10 | | | Fannie Mae Grantor Trust, Ser. 2002-T5, Class A1, 1 month USD LIBOR + 0.12%, (1.48%),
due 5/25/32 | | | 10
| (g) | |
Commercial Mortgage-Backed 4.9% | | | |
| | 1,918 | | | CGMS Commercial Mortgage Trust, Ser. 2017-B1, Class A1, 2.01%, due 8/15/50 | | | 1,909 | | |
| | | | | Citigroup Commercial Mortgage Trust | | | | | |
| | 4,849 | | | Ser. 2014-GC25, Class XA, 1.04%, due 10/10/47 | | | 278 | (h)(i) | |
| | 2,591 | | | Ser. 2015-GC27, Class XA, 1.42%, due 2/10/48 | | | 201 | (h)(i) | |
| | 550 | | | Ser. 2015-P1, Class A5, 3.72%, due 9/15/48 | | | 580 | | |
| | 450 | | | Ser. 2016-GC36, Class A5, 3.62%, due 2/10/49 | | | 469 | | |
| | 725 | | | Ser. 2017-C4, Class A4, 3.47%, due 10/12/50 | | | 747 | | |
| | 6,776 | | | Commercial Mortgage Loan Trust, Ser. 2014-CR17, Class XA, 1.13%, due 5/10/47 | | | 324 | (h)(i) | |
| | | | | Commercial Mortgage Trust | | | | | |
| | 6,916 | | | Ser. 2014-CR16, Class XA, 1.18%, due 4/10/47 | | | 323 | (h)(i) | |
| | 4,395 | | | Ser. 2014-LC15, Class XA, 1.33%, due 4/10/47 | | | 226 | (h)(i) | |
| | 3,910 | | | Ser. 2014-UBS3, Class XA, 1.31%, due 6/10/47 | | | 215 | (h)(i) | |
| | 4,855 | | | Ser. 2014-UBS6, Class XA, 1.02%, due 12/10/47 | | | 236 | (h)(i) | |
| | 335 | | | Ser. 2015-LC21, Class A4, 3.71%, due 7/10/48 | | | 352 | | |
| | 549 | | | Ser. 2017-COR2, Class A1, 2.11%, due 9/10/50 | | | 547 | | |
| | 26 | | | Credit Suisse Mortgage Capital Certificates, Ser. 2008-C1, Class A3, 6.31%, due 2/15/41 | | | 26 | (h) | |
| | | | | CSAIL Commercial Mortgage Trust | | | | | |
| | 353 | | | Ser. 2016-C7, Class A5, 3.50%, due 11/15/49 | | | 365 | | |
| | 612 | | | Ser. 2017-CX9, Class A1, 2.02%, due 9/15/50 | | | 610 | | |
See Notes to Financial Statements
47
Schedule of Investments Core Bond Fund (cont'd)
| PRINCIPAL AMOUNT(a) | | | | VALUE | |
(000's omitted) | | | | (000's omitted) | |
| | | | | GS Mortgage Securities Trust | | | | | |
$ | 11,742 | | | Ser. 2014-GC18, Class XA, 1.12%, due 1/10/47 | | $ | 565 | (h)(i) | |
| | 335 | | | Ser. 2015-GC32, Class A4, 3.76%, due 7/10/48 | | | 354 | | |
| | 442 | | | Ser. 2015-GC34, Class AAB, 3.28%, due 10/10/48 | | | 456 | | |
| | 355 | | | JPMBB Commercial Mortgage Securities Trust, Ser. 2016-C1, Class A5, 3.58%, due 3/15/49 | | | 369 | | |
| | | | | Morgan Stanley Bank of America Merrill Lynch Trust | | | | | |
| | 4,609 | | | Ser. 2014-C16, Class XA, 1.17%, due 6/15/47 | | | 225 | (h)(i) | |
| | 710 | | | Ser. 2015-C24, Class A4, 3.73%, due 5/15/48 | | | 747 | | |
| | 620 | | | Ser. 2017-C34, Class A1, 2.11%, due 11/15/52 | | | 619 | | |
| | | | | UBS Commercial Mortgage Trust | | | | | |
| | 1,243 | | | Ser. 2017-C2, Class A1, 2.01%, due 8/15/50 | | | 1,236 | | |
| | 500 | | | Ser. 2017-C2, Class A4, 3.49%, due 7/15/27 | | | 517 | | |
| | 750 | | | Ser. 2017-C4, Class A1, 2.13%, due 10/15/50 | | | 749 | | |
| | | | | Wells Fargo Commercial Mortgage Trust | | | | | |
| | 500 | | | Ser. 2015-C29, Class A4, 3.64%, due 6/15/48 | | | 524 | | |
| | 225 | | | Ser. 2016-LC24, Class A4, 2.94%, due 10/15/49 | | | 223 | | |
| | 950 | | | Ser. 2016-NXS6, Class A4, 2.92%, due 11/15/49 | | | 943 | | |
| | 776 | | | Ser. 2017-C39, Class A1, 1.98%, due 9/15/50 | | | 772 | | |
| | 580 | | | Ser. 2017-39, Class A5, 3.42%, due 9/15/50 | | | 597 | | |
| | 500 | | | Ser. 2015-C30, Class A4, 3.66%, due 9/15/58 | | | 525 | | |
| | 445 | | | Ser. 2016-LC25, Class A4, 3.64%, due 12/15/59 | | | 465 | | |
| | | | | WF-RBS Commercial Mortgage Trust | | | | | |
| | 6,384 | | | Ser. 2014-C25, Class XA, 0.93%, due 11/15/47 | | | 298 | (h)(i) | |
| | 15,338 | | | Ser. 2014-C22, Class XA, 0.92%, due 9/15/57 | | | 679 | (h)(i) | |
| | | | 18,271 | | |
Fannie Mae 14.8% | | | |
| | | | | Pass-Through Certificates | | | | | |
| | 9,733 | | | 3.00%, due 9/1/27 – 2/1/47 | | | 9,822 | | |
| | 8,986 | | | 3.50%, due 1/1/27 – 7/1/47 | | | 9,271 | | |
| | 13,562 | | | 4.00%, due 1/1/41 – 8/1/47 | | | 14,274 | | |
| | 4,345 | | | 4.50%, due 9/1/23 – 1/1/47 | | | 4,662 | | |
| | 2,500 | | | 5.00%, due 3/1/21 – 10/1/41 | | | 2,725 | | |
| | 2,302 | | | 5.50%, due 11/1/22 – 3/1/41 | | | 2,551 | | |
| | 793 | | | 6.00%, due 3/1/33 – 11/1/38 | | | 892 | | |
| | 1,015 | | | 3.00%, TBA, 15 Year Maturity | | | 1,040 | (j) | |
| | 5,220 | | | 3.50%, TBA, 30 Year Maturity | | | 5,365 | (j) | |
| | 4,600 | | | 4.00%, TBA, 30 Year Maturity | | | 4,827 | (j) | |
| | | | 55,429 | | |
Freddie Mac 10.5% | | | |
| | | | | Pass-Through Certificates | | | | | |
| | 4,870 | | | 3.00%, due 2/1/32 – 4/1/47 | | | 4,890 | (k) | |
| | 5,728 | | | 3.50%, due 7/1/42 – 10/1/47 | | | 5,904 | (k) | |
| | 9,516 | | | 4.00%, due 11/1/40 – 8/1/47 | | | 9,992 | | |
| | 2,403 | | | 4.50%, due 6/1/39 – 5/1/47 | | | 2,573 | | |
| | 1,026 | | | 5.00%, due 5/1/23 – 5/1/41 | | | 1,113 | | |
| | 805 | | | 5.50%, due 12/1/22 – 11/1/38 | | | 894 | | |
| | 14 | | | 6.00%, due 12/1/37 | | | 16 | | |
| | 4 | | | 6.50%, due 11/1/25 | | | 4 | | |
| | 2,165 | | | 3.00%, TBA, 15 Year Maturity | | | 2,218 | (j) | |
| | 6,500 | | | 3.50%, TBA, 30 Year Maturity | | | 6,681 | (j) | |
| | 4,925 | | | 4.00%, TBA, 30 Year Maturity | | | 5,168 | (j) | |
| | | | 39,453 | | |
See Notes to Financial Statements
48
Schedule of Investments Core Bond Fund (cont'd)
| PRINCIPAL AMOUNT(a) | | | | VALUE | |
(000's omitted) | | | | (000's omitted) | |
Ginnie Mae 3.6% | | | |
| | | | | Pass-Through Certificates | | | | | |
$ | 1,412 | | | 3.00%, due 3/20/45 – 2/20/47 | | $ | 1,429 | | |
| | 2,533 | | | 3.50%, due 1/20/43 – 8/20/47 | | | 2,634 | | |
| | 2,197 | | | 4.00%, due 11/20/44 – 7/20/47 | | | 2,314 | | |
| | 5,495 | | | 3.50%, TBA, 30 Year Maturity | | | 5,699 | (j) | |
| | 1,280 | | | 4.50%, TBA, 30 Year Maturity | | | 1,356 | (j) | |
| | | | 13,432 | | |
| | | | | Total Mortgage-Backed Securities (Cost $128,325) | | | 126,595 | | |
Corporate Bonds 26.9% | | | |
Aerospace & Defense 0.3% | | | |
| | 1,060 | | | Northrop Grumman Corp., 2.55%, due 10/15/22 | | | 1,061 | | |
Agriculture 0.6% | | | |
| | 2,035 | | | BAT Capital Corp., 4.54%, due 8/15/47 | | | 2,075 | (l) | |
Airlines 0.5% | | | |
| | | | | American Airlines, Inc. | | | | | |
| | 1,617 | | | Ser. 2016-2, Class A, 3.65%, due 6/15/28 | | | 1,655 | (m) | |
| | 380 | | | Ser. 2016-2, Class AA, 3.20%, due 6/15/28 | | | 380 | | |
| | | | 2,035 | | |
Auto Manufacturers 0.7% | | | |
| | | | | General Motors Financial Co., Inc. | | | | | |
| | 1,275 | | | 3.15%, due 6/30/22 | | | 1,288 | | |
| | 840 | | | 4.30%, due 7/13/25 | | | 870 | | |
| | 520 | | | 4.35%, due 1/17/27 | | | 535 | | |
| | | | 2,693 | | |
Banks 7.1% | | | |
| | 2,000 | | | Banco Santander SA, 3.80%, due 2/23/28 | | | 1,997 | | |
| | 1,170 | | | Bank of America Corp., 4.45%, due 3/3/26 | | | 1,244 | (m) | |
| | 2,015 | | | Barclays PLC, 3.68%, due 1/10/23 | | | 2,058 | (m) | |
| | 1,865 | | | Capital One N.A., 2.35%, due 1/31/20 | | | 1,868 | (m) | |
| | 1,910 | | | Citibank N.A., 2.00%, due 3/20/19 | | | 1,913 | | |
| | 1,280 | | | Citigroup, Inc., 2.70%, due 3/30/21 | | | 1,291 | (m) | |
| | | | | Goldman Sachs Group, Inc. | | | | | |
| | 1,425 | | | 3 month USD LIBOR + 1.51%, (3.69%), due 6/5/28 | | | 1,438 | (g) | |
| | 1,030 | | | 3 month USD LIBOR + 1.37%, (4.02%), due 10/31/38 | | | 1,037 | (g) | |
| | 1,100 | | | 5.15%, due 5/22/45 | | | 1,252 | (m) | |
| | 1,200 | | | Huntington National Bank, 2.50%, due 8/7/22 | | | 1,191 | | |
| | | | | JPMorgan Chase & Co. | | | | | |
| | 1,720 | | | 3 month USD LIBOR + 1.16%, (3.22%), due 3/1/25 | | | 1,738 | (g) | |
| | 1,465 | | | 3 month USD LIBOR + 1.38%, (3.54%), due 5/1/28 | | | 1,482 | (g)(m) | |
| | 685 | | | 3 month USD LIBOR + 1.46%, (4.03%), due 7/24/48 | | | 698 | (g) | |
| | | | | Morgan Stanley | | | | | |
| | 1,035 | | | 2.50%, due 4/21/21 | | | 1,037 | (m) | |
| | 1,095 | | | 2.75%, due 5/19/22 | | | 1,097 | | |
| | 740 | | | 3.88%, due 1/27/26 | | | 772 | | |
| | 1,400 | | | 3.63%, due 1/20/27 | | | 1,425 | (m) | |
See Notes to Financial Statements
49
Schedule of Investments Core Bond Fund (cont'd)
| PRINCIPAL AMOUNT(a) | | | | VALUE | |
(000's omitted) | | | | (000's omitted) | |
$ | 905 | | | PNC Bank N.A., 1.70%, due 12/7/18 | | $ | 905 | | |
| | 2,000 | | | Westpac Banking Corp., 5 Year USD ICE Swap + 2.89%, (5.00%), due 12/31/99 | | | 2,009 | (g) | |
| | | | 26,452 | | |
Beverages 0.2% | | | |
| | 660 | | | Anheuser-Busch InBev Finance, Inc., 4.70%, due 2/1/36 | | | 726 | | |
Biotechnology 0.2% | | | |
| | 660 | | | Gilead Sciences, Inc., 4.60%, due 9/1/35 | | | 734 | | |
Commercial Services 0.8% | | | |
| | 3,160 | | | Ecolab, Inc., 2.38%, due 8/10/22 | | | 3,144 | | |
Computers 2.5% | | | |
| | | | | Apple, Inc. | | | | | |
| | 1,540 | | | 2.30%, due 5/11/22 | | | 1,540 | (m) | |
| | 1,620 | | | 3.20%, due 5/11/27 | | | 1,645 | (m) | |
| | 1,155 | | | 4.65%, due 2/23/46 | | | 1,313 | | |
| | | | | Diamond 1 Finance Corp./Diamond 2 Finance Corp. | | | | | |
| | 2,240 | | | 4.42%, due 6/15/21 | | | 2,355 | (l)(m) | |
| | 960 | | | 6.02%, due 6/15/26 | | | 1,072 | (l) | |
| | 1,210 | | | HP Enterprise Co., 4.90%, due 10/15/25 | | | 1,286 | (m) | |
| | | | 9,211 | | |
Electric 1.2% | | | |
| | 1,405 | | | Duke Energy Corp., 1.80%, due 9/1/21 | | | 1,377 | (m) | |
| | 1,520 | | | Enel Finance Int'l NV, 3.50%, due 4/6/28 | | | 1,494 | (l) | |
| | 865 | | | Exelon Corp., 4.45%, due 4/15/46 | | | 916 | | |
| | 690 | | | Georgia Power Co., 3.25%, due 3/30/27 | | | 692 | | |
| | | | 4,479 | | |
Healthcare-Products 0.6% | | | |
| | | | | Abbott Laboratories | | | | | |
| | 1,410 | | | 2.35%, due 11/22/19 | | | 1,418 | (m) | |
| | 895 | | | 4.90%, due 11/30/46 | | | 1,003 | | |
| | | | 2,421 | | |
Iron - Steel 0.8% | | | |
| | 2,635 | | | Vale Overseas Ltd., 6.25%, due 8/10/26 | | | 3,036 | | |
Media 2.2% | | | |
| | 550 | | | 21st Century Fox America, Inc., 3.38%, due 11/15/26 | | | 553 | | |
| | | | | Charter Communications Operating LLC/Charter Communications Operating Capital | | | | | |
| | 1,450 | | | 3.58%, due 7/23/20 | | | 1,489 | (m) | |
| | 2,215 | | | 4.91%, due 7/23/25 | | | 2,356 | (m) | |
| | 865 | | | 6.48%, due 10/23/45 | | | 997 | (m) | |
| | 1,230 | | | 5.38%, due 5/1/47 | | | 1,244 | (l)(m) | |
| | 760 | | | Discovery Communications LLC, 5.20%, due 9/20/47 | | | 774 | | |
| | 1,145 | | | Viacom, Inc., 4.38%, due 3/15/43 | | | 972 | | |
| | | | 8,385 | | |
See Notes to Financial Statements
50
Schedule of Investments Core Bond Fund (cont'd)
| PRINCIPAL AMOUNT(a) | | | | VALUE | |
(000's omitted) | | | | (000's omitted) | |
Multi-National 0.6% | | | |
$ | 2,370 | | | Corporacion Andina de Fomento, 2.75%, due 1/6/23 | | $ | 2,365 | | |
Oil & Gas 1.1% | | | |
| | 1,440 | | | Concho Resources, Inc., 3.75%, due 10/1/27 | | | 1,456 | | |
| | 1,650 | | | Hess Corp., 4.30%, due 4/1/27 | | | 1,662 | (m) | |
| | 940 | | | Noble Energy, Inc., 5.05%, due 11/15/44 | | | 987 | | |
| | | | 4,105 | | |
Pharmaceuticals 1.7% | | | |
| | | | | AbbVie, Inc. | | | | | |
| | 1,215 | | | 2.50%, due 5/14/20 | | | 1,225 | (m) | |
| | 620 | | | 4.70%, due 5/14/45 | | | 672 | | |
| | 1,390 | | | AstraZeneca PLC, 2.38%, due 6/12/22 | | | 1,380 | | |
| | 1,240 | | | Eli Lilly & Co., 3.10%, due 5/15/27 | | | 1,252 | (m) | |
| | 1,685 | | | Shire Acquisitions Investments Ireland DAC, 1.90%, due 9/23/19 | | | 1,678 | (m) | |
| | | | 6,207 | | |
Pipelines 0.8% | | | |
| | 900 | | | Energy Transfer L.P., 6.50%, due 2/1/42 | | | 1,027 | (m) | |
| | 650 | | | Energy Transfer Partners L.P., 4.15%, due 10/1/20 | | | 678 | | |
| | 355 | | | Kinder Morgan, Inc., 5.55%, due 6/1/45 | | | 386 | | |
| | 905 | | | ONEOK, Inc., 4.00%, due 7/13/27 | | | 921 | | |
| | | | 3,012 | | |
Real Estate Investment Trusts 0.9% | | | |
| | 1,135 | | | Corporate Office Properties L.P., 3.60%, due 5/15/23 | | | 1,145 | (m) | |
| | 1,195 | | | EPR Properties, 4.50%, due 6/1/27 | | | 1,215 | | |
| | 970 | | | Healthcare Trust of America Holdings L.P., 3.75%, due 7/1/27 | | | 970 | | |
| | | | 3,330 | | |
Semiconductors 1.3% | | | |
| | | | | Broadcom Corp./Broadcom Cayman Finance Ltd. | | | | | |
| | 1,425 | | | 2.38%, due 1/15/20 | | | 1,433 | (l) | |
| | 2,180 | | | 3.88%, due 1/15/27 | | | 2,243 | (l) | |
| | 1,300 | | | QUALCOMM, Inc., 4.30%, due 5/20/47 | | | 1,312 | | |
| | | | 4,988 | | |
Software 0.5% | | | |
| | 865 | | | Microsoft Corp., 3.70%, due 8/8/46 | | | 870 | | |
| | 790 | | | Oracle Corp., 4.00%, due 7/15/46 | | | 818 | | |
| | | | 1,688 | | |
See Notes to Financial Statements
51
Schedule of Investments Core Bond Fund (cont'd)
| PRINCIPAL AMOUNT(a) | | | | VALUE | |
(000's omitted) | | | | (000's omitted) | |
Telecommunications 2.3% | | | |
| | | | | AT&T, Inc. | | | | | |
$ | 1,185 | | | 3.90%, due 8/14/27 | | $ | 1,180 | | |
| | 1,865 | | | 5.25%, due 3/1/37 | | | 1,951 | (m) | |
| | 1,155 | | | 4.75%, due 5/15/46 | | | 1,088 | (m) | |
| | 1,175 | | | Telefonica Emisiones SAU, 5.21%, due 3/8/47 | | | 1,293 | | |
| | | | | Verizon Communications, Inc. | | | | | |
| | 2,580 | | | 4.27%, due 1/15/36 | | | 2,537 | (m) | |
| | 820 | | | 4.13%, due 8/15/46 | | | 743 | | |
| | | | 8,792 | | |
| | | | | Total Corporate Bonds (Cost $99,167) | | | 100,939 | | |
Asset-Backed Securities 11.9% | | | |
| | 1,400 | | | Aames Mortgage Investment Trust, Ser. 2006-1, Class A4, 1 month USD LIBOR + 0.56%, (1.80%),
due 4/25/36 | | | 1,382
| (g) | |
| | 1,350 | | | ACE Securities Corp. Home Equity Loan Trust, Ser. 2005-HE3, Class M3,
1 month USD LIBOR + 0.71%, (1.94%), due 5/25/35 | | | 1,339
| (g) | |
| | 860 | | | Ally Auto Receivables Trust, Ser. 2017-3, Class A2, 1.53%, due 3/16/20 | | | 859 | | |
| | 4,180 | | | American Express Credit Account Master Trust, Ser. 2013-1, Class A,
1 month USD LIBOR + 0.42%, (1.66%), due 2/16/21 | | | 4,192
| (g) | |
| | 530 | | | Ameriquest Mortgage Securities, Inc., Ser. 2005-R7, Class M2,
1 month USD LIBOR + 0.50%, (1.74%), due 9/25/35 | | | 531
| (g) | |
| | | | | Asset Backed Funding Corp. Asset Backed Certificates | | | | | |
| | 212 | | | Ser. 2003-OPT1, Class A3, 1 month USD LIBOR + 0.68%, (1.92%), due 4/25/33 | | | 205 | (g) | |
| | 1,160 | | | Ser. 2004-OPT3, Class A4, 1 month USD LIBOR + 0.78%, (2.02%), due 11/25/33 | | | 1,148 | (g) | |
| | 960 | | | BA Credit Card Trust, Ser. 2015-A2, Class A, 1.36%, due 9/15/20 | | | 959 | | |
| | 6,740 | | | Capital One Multi-Asset Execution Trust, Ser. 2017-A1, Class A1, 2.00%, due 1/17/23 | | | 6,750 | | |
| | 1,100 | | | Centex Home Equity Loan Trust, Ser. 2005-D, Class M3, 1 month USD LIBOR + 0.48%, (1.72%),
due 10/25/35 | | | 1,101
| (g) | |
| | 15 | | | Chase Funding Mortgage Loan Asset-Backed Certificates, Ser. 2004-1, Class 2A2,
1 month USD LIBOR + 0.46%, (1.70%), due 12/25/33 | | | 15
| (g) | |
| | 440 | | | Chase Issuance Trust, Ser. 2015-A5, Class A5, 1.36%, due 4/15/20 | | | 440 | | |
| | 6,540 | | | Citibank Credit Card Issuance Trust, Ser. 2016-A1, Class A1, 1.75%, due 11/19/21 | | | 6,518 | | |
| | 67 | | | Citigroup Mortgage Loan Trust, Inc., Ser. 2006-WFH1, Class M2,
1 month USD LIBOR + 0.37%, (1.61%), due 1/25/36 | | | 68
| (g) | |
| | | | | Countrywide Asset-Backed Certificates | | | | | |
| | 250 | | | Ser. 2004-5, Class 1A, 1 month USD LIBOR + 0.50%, (1.74%), due 10/25/34 | | | 246 | (g) | |
| | 680 | | | Ser. 2005-15, Class 2AV3, 1 month USD LIBOR + 0.37%, (1.61%), due 4/25/36 | | | 662 | (g) | |
| | 16 | | | Fannie Mae Whole Loan, Ser. 2003-W5, Class A, 1 month USD LIBOR + 0.11%, (1.35%),
due 4/25/33 | | | 15
| (g) | |
| | 775 | | | First Franklin Mortgage Loan Trust, Ser. 2005-FF3, Class M5, 1 month USD LIBOR + 0.98%,
(2.21%), due 4/25/35 | | | 770
| (g) | |
| | 1,970 | | | Freddie Mac Multifamily, Ser. 2017-KT01, Class A, 1 month USD LIBOR + 0.32%, (1.56%),
due 2/25/20 | | | 1,974
| (g) | |
| | 2,022 | | | Home Equity Asset Trust, Ser. 2003-5, Class A1, 1 month USD LIBOR + 0.58%, (1.82%),
due 12/25/33 | | | 1,935
| (g) | |
| | 1,410 | | | IndyMac Residential Asset-Backed Trust, Ser. 2005-D, Class AII4, 1 month USD LIBOR + 0.35%,
(1.59%), due 3/25/36 | | | 1,405
| (g) | |
| | 813 | | | Morgan Stanley ABS Capital I, Inc. Trust, Ser. 2004-NC1, Class M1, 1 month USD LIBOR + 1.05%,
(2.29%), due 12/27/33 | | | 815
| (g) | |
| | 573 | | | Morgan Stanley ABS Capital I, Inc., Trust, Ser. 2003-HE1, Class M1, 1 month USD LIBOR + 1.20%,
(2.44%), due 5/25/33 | | | 568
| (g) | |
| | | | | Navient Student Loan Trust | | | | | |
| | 767 | | | Ser. 2016-6A, Class A1, 1 month USD LIBOR + 0.48%, (1.72%), due 3/25/66 | | | 768 | (g)(l) | |
| | 1,012 | | | Ser. 2017-3A, Class A1, 1 month USD LIBOR + 0.30%, (1.54%), due 7/26/66 | | | 1,013 | (g)(l) | |
See Notes to Financial Statements
52
Schedule of Investments Core Bond Fund (cont'd)
| PRINCIPAL AMOUNT(a) | | | | VALUE | |
(000's omitted) | | | | (000's omitted) | |
$ | 768 | | | Ser. 2017-1A, Class A1, 1 month USD LIBOR + 0.40%, (1.64%), due 7/26/66 | | $ | 769 | (g)(l) | |
| | 1,756 | | | Ser. 2017-4A, Class A1, 1 month USD LIBOR + 0.24%, (1.48%), due 9/27/66 | | | 1,756 | (g)(l) | |
| | 464 | | | Popular ABS Mortgage Pass-Through Trust, Ser. 2005-2, Class AV1B, 1 month
USD LIBOR + 0.26%, (1.50%), due 4/25/35 | | | 452
| (g) | |
| | 1,350 | | | Residential Asset Securities Corp., Ser. 2005-KS12, Class M2, 1 month USD LIBOR + 0.46%,
(1.70%), due 1/25/36 | | | 1,343
| (g) | |
| | | | | Residential Asset Mortgage Products, Inc. | | | | | |
| | 5 | | | Ser. 2003-RS2, Class AII, 1 month USD LIBOR + 0.68%, (1.92%), due 3/25/33 | | | 5 | (g) | |
| | 750 | | | Ser. 2005-RS4, Class M3, 1 month USD LIBOR + 0.48%, (1.72%), due 4/25/35 | | | 742 | (g) | |
| | 9 | | | Saxon Asset Securities Trust, Ser. 2004-1, Class A, 1 month USD LIBOR + 0.54%, (1.78%),
due 3/25/35 | | | 9
| (g) | |
| | 900 | | | Soundview Home Equity Loan Trust, Ser. 2005-OPT3, Class M1, 1 month USD LIBOR + 0.47%,
(1.71%), due 11/25/35 | | | 883
| (g) | |
| | 4 | | | Specialty Underwriting & Residential Finance, Ser. 2003-BC1, Class A,
1 month USD LIBOR + 0.68%, (1.92%), due 1/25/34 | | | 4
| (g) | |
| | 1,470 | | | Toyota Auto Receivables Owner Trust, Ser. 2017-B, Class A2A, 1.46% due 1/15/20, 1.46%,
due 1/15/20 | | | 1,468
| | |
| | 1,350 | | | Verizon Owner Trust, Ser. 2016-2A, Class A, 1.68%, due 5/20/21 | | | 1,345 | (l) | |
| | | | | Total Asset-Backed Securities (Cost $43,097) | | | 44,454 | | |
Foreign Government Security 0.8% | | | |
ZAR | 64,945 | | | South Africa Government Bond, Ser. R214, 6.50%, due 2/28/41 (Cost $4,163) | | | 3,119 | (m) | |
Developed Markets Ex- U.S. 1.3% | | | |
Diversified Financial Services 0.3% | | | |
$ | 1,210 | | | CPPIB Capital, Inc., 2.75%, due 11/2/27 | | | 1,213 | (l) | |
Regional (state/province) 1.0% | | | |
| | 1,800 | | | Province of New Brunswick Canada, 2.75%, due 6/15/18 | | | 1,812 | | |
| | 1,875 | | | Province of Ontario Canada, 1.20%, due 2/14/18 | | | 1,873 | | |
| | | | 3,685 | | |
| | | | | Total Developed Markets Ex- U.S. (Cost $4,895) | | | 4,898 | | |
NUMBER OF SHARES | | | | | |
Short-Term Investment 1.8% | | | |
Investment Company 1.8% | | | |
| | 6,897,169 | | | State Street Institutional U.S. Government Money Market Fund Premier Class, 0.96%
(Cost $6,897) | | | 6,897
| (m)(n) | |
| | | | | Total Investments 109.5% (Cost $409,539) | | | 410,229 | | |
| | | | | Liabilities Less Other Assets (9.5)% | | | (35,584 | )(o) | |
| | | | | Net Assets 100.0% | | $ | 374,645 | | |
See Notes to Financial Statements
53
Schedule of Investments Core Bond Fund (cont'd)
(a) Principal amount is stated in the currency in which the security is denominated.
ZAR = South African Rand
(b) Rate shown was the discount rate at the date of purchase.
(c) All or a portion of the security is pledged as collateral for futures.
(d) Index-linked bond whose principal amount adjusts according to a government retail price index.
(e) Principal only security. This security entitles the holder to receive principal payments from an underlying pool of assets or on the security itself.
(f) Represents less than 0.05% of net assets.
(g) Variable or floating rate security. The interest rate shown was the current rate as of October 31, 2017 and changes periodically.
Benchmarks for Variable / Floating Rates:
LIBOR (USD) = London Interbank Offered Rate
(h) Weighted average coupon that changes/updates periodically. Rate shown is the rate at October 31, 2017.
(i) Interest only security. These securities represent the right to receive the monthly interest payments on an underlying pool of mortgages. Payments of principal on the pool reduce the value of the "interest only" holding.
(j) TBA (To Be Announced) Securities are purchased/sold on a forward commitment basis with an approximate principal amount and no defined maturity date. The actual principal and maturity date will be determined upon settlement when the specific mortgage pools are assigned. Total value of all such securities (excluding forward sales contracts, if any) at October 31, 2017 amounted to approximately $32,354,000, which represents 8.6% of net assets of the Fund.
(k) When-issued security. Total value of all such securities at October 31, 2017 amounted to approximately $216,000, which represents 0.1% of net assets of the Fund.
(l) Securities were purchased under Rule 144A of the Securities Act of 1933, as amended (the "1933 Act"), or are otherwise restricted and, unless registered under the 1933 Act or exempted from registration, may only be sold to qualified institutional investors or may have other restrictions on resale. At October 31, 2017, these securities amounted to approximately $18,780,000, which represents 5.0% of net assets of the Fund. These securities have been deemed by the investment manager to be liquid.
(m) All or a portion of this security is segregated in connection with obligations for to be announced securities, futures and/or when-issued securities with a total value of approximately $50,239,000.
(n) Represents 7-day effective yield as of October 31, 2017.
(o) Includes the impact of the Fund's open positions in derivatives at October 31, 2017.
See Notes to Financial Statements
54
Schedule of Investments Core Bond Fund (cont'd)
Derivative Instruments
Futures contracts ("futures")
At October 31, 2017, open positions in futures for the Fund were as follows:
Long Futures:
Expiration
Date | | Number of
Contracts | | Open Contracts | | Notional
Amount | | Value and
Unrealized
Appreciation/
(Depreciation) | |
12/2017 | | | 62 | | | Brazilian Real | | $ | 1,883,560 | | | $ | 444 | | |
12/2017 | | | 147 | | | Mexican Peso | | | 3,807,300 | | | | (117,565 | ) | |
12/2017 | | | 54 | | | New Zealand Dollar | | | 3,691,440 | | | | (75,273 | ) | |
12/2017 | | | 16 | | | South African Rand | | | 560,800 | | | | (561 | ) | |
12/2017 | | | 82 | | | U.S. Treasury Note, 5 Year | | | 9,609,375 | | | | (85,718 | ) | |
12/2017 | | | 139 | | | U.S. Treasury Note, 10 Year | | | 17,366,313 | | | | (108,438 | ) | |
12/2017 | | | 68 | | | U.S. Treasury Note, 10 Year Ultra | | | 9,106,688 | | | | (72,449 | ) | |
12/2017 | | | 4 | | | U.S. Treasury Ultra Long Bond | | | 659,125 | | | | (11,150 | ) | |
Total Long Positions | | | | | | $ | 46,684,601 | | | $ | (470,710 | ) | |
Short Futures:
Expiration
Date | | Number of
Contracts | | Open Contracts | | Notional
Amount | | Value and
Unrealized
Appreciation/
(Depreciation) | |
12/2017 | | | 48 | | | Canadian Dollar | | $ | (3,723,600 | ) | | $ | 50,362 | | |
12/2017 | | | 26 | | | Euro | | | (3,796,325 | ) | | | 72,455 | | |
12/2017 | | | 25 | | | Euro-Bobl Bond, 5 Year | | | (3,837,597 | ) | | | (15,496 | ) | |
12/2017 | | | 114 | | | Euro-Bund | | | (21,612,035 | ) | | | (163,601 | ) | |
12/2017 | | | 29 | | | Euro-Buxl Bond, 30 Year | | | (5,611,639 | ) | | | (23,718 | ) | |
12/2017 | | | 52 | | | United Kingdom Long Gilt Bond | | | (8,586,702 | ) | | | 4,401 | | |
12/2017 | | | 11 | | | U.S. Treasury Ultra Long Bond | | | (1,677,156 | ) | | | 27,049 | | |
Total Short Positions | | | | | | $ | (48,845,054 | ) | | $ | (48,548 | ) | |
Total Futures | | | | | | | | $ | (519,258 | ) | |
At October 31, 2017, the Fund had securities pledged in the amount of $1,588,644 to cover collateral requirements on open futures.
For the year ended October 31, 2017, the average notional value of futures for the Fund was $32,110,261 for long positions and $(46,983,663) for short positions.
See Notes to Financial Statements
55
Schedule of Investments Core Bond Fund (cont'd)
The following is a summary, categorized by Level (see Note A of Notes to Financial Statements), of inputs used to value the Fund's investments as of October 31, 2017:
Asset Valuation Inputs
(000's omitted) | | Level 1 | | Level 2 | | Level 3 | | Total | |
Investments: | |
U.S. Treasury Obligations | | $ | — | | | $ | 115,572 | | | $ | — | | | $ | 115,572 | | |
U.S. Government Agency Securities | | | — | | | | 7,755 | | | | — | | | | 7,755 | | |
| Mortgage-Backed Securities(a) | | | — | | | | 126,595 | | | | — | | | | 126,595 | | |
| Corporate Bonds(a) | | | — | | | | 100,939 | | | | — | | | | 100,939 | | |
Asset-Backed Securities | | | — | | | | 44,454 | | | | — | | | | 44,454 | | |
Foreign Government Security | | | — | | | | 3,119 | | | | — | | | | 3,119 | | |
| Developed Markets Ex- U.S.(a) | | | — | | | | 4,898 | | | | — | | | | 4,898 | | |
Short-Term Investment | | | — | | | | 6,897 | | | | — | | | | 6,897 | | |
Total Investments | | $ | — | | | $ | 410,229 | | | $ | — | | | $ | 410,229 | | |
(a) The Schedule of Investments provides information on the industry or sector categorization for the portfolio.
As of the year ended October 31, 2017, no securities were transferred from one level (as of October 31, 2016) to another.
The following is a summary, categorized by Level (see Note A of Notes to Financial Statements), of inputs used to value the Fund's derivatives as of October 31, 2017:
Other Financial Instruments
(000's omitted) | | Level 1 | | Level 2 | | Level 3 | | Total | |
| Futures(a) | |
Assets | | $ | 155 | | | $ | — | | | $ | — | | | $ | 155 | | |
Liabilities | | | (674 | ) | | | — | | | | — | | | | (674 | ) | |
Total | | $ | (519 | ) | | $ | — | | | $ | — | | | $ | (519 | ) | |
(a) Futures are reported at the cumulative unrealized appreciation/(depreciation) of the instrument.
See Notes to Financial Statements
56
Schedule of Investments Core Plus Fund October 31, 2017
| PRINCIPAL AMOUNT(a) | | | | VALUE | |
(000's omitted) | | | | (000's omitted) | |
U.S. Treasury Obligations 31.6% | | | |
$ | 100 | | | U.S. Treasury Bill, 0.86%, due 5/24/18 | | $ | 99 | (b)(c) | |
| | 125 | | | U.S. Treasury Bond, 3.88%, due 8/15/40 | | | 148 | | |
| | | | | U.S. Treasury Inflation-Indexed Bonds | | | | | |
| | 366 | | | 3.88%, due 4/15/29 | | | 496 | (d) | |
| | 21 | | | 0.63%, due 2/15/43 | | | 20 | (d) | |
| | | | | U.S. Treasury Notes | | | | | |
| | 590 | | | 1.50%, due 8/31/18 – 3/31/23 | | | 583 | | |
| | 250 | | | 1.38%, due 11/30/18 | | | 250 | | |
| | 1,150 | | | 2.75%, due 2/15/24 | | | 1,189 | | |
| | 385 | | | 1.63%, due 2/15/26 | | | 365 | | |
| | | | | Total U.S. Treasury Obligations (Cost $3,170) | | | 3,150 | | |
Mortgage-Backed Securities 38.4% | | | |
Collateralized Mortgage Obligations 3.9% | | | |
| | | | | Fannie Mae Connecticut Avenue Securities | | | | | |
| | 100 | | | Ser. 2017-C05, Class 1M2, 1 month USD LIBOR + 2.20%, (3.44%), due 1/25/30 | | | 99 | (e) | |
| | 20 | | | Ser. 2017-C06, Class 1M2, 1 month USD LIBOR + 2.65%, (3.89%), due 2/25/30 | | | 20 | (f)(e) | |
| | 20 | | | Ser. 2017-C06, Class 2M2, 1 month USD LIBOR + 2.80%, (4.04%), due 2/25/30 | | | 21 | (f)(e) | |
| | 250 | | | Freddie Mac Structured Agency Credit Risk Debt Notes, Ser. 2017-HQA2, Class M2,
1 month USD LIBOR + 2.65%, (3.89%), due 12/25/29 | | | 253
| (e) | |
| | | | 393 | | |
Fannie Mae 9.9% | | | |
| | | | | Pass-Through Certificates | | | | | |
| | 340 | | | 3.50%, due 1/1/46 – 8/1/47 | | | 349 | | |
| | 306 | | | 4.00%, due 7/1/46 – 7/1/47 | | | 321 | | |
| | 90 | | | 3.50%, TBA, 30 Year Maturity | | | 93 | (g) | |
| | 210 | | | 4.00%, TBA, 30 Year Maturity | | | 220 | (g) | |
| | | | 983 | | |
Freddie Mac 24.6% | | | |
| | | | | Pass-Through Certificates | | | | | |
| | 563 | | | 3.00%, due 1/1/29 – 4/1/47 | | | 571 | | |
| | 349 | | | 4.00%, due 3/1/46 – 6/1/47 | | | 366 | | |
| | 100 | | | 3.00%, TBA, 15 Year Maturity | | | 102 | (g) | |
| | 875 | | | 3.50%, TBA, 30 Year Maturity | | | 899 | (g) | |
| | 495 | | | 4.00%, TBA, 30 Year Maturity | | | 520 | (g) | |
| | | | 2,458 | | |
| | | | | Total Mortgage-Backed Securities (Cost $3,842) | | | 3,834 | | |
Corporate Bonds 31.1% | | | |
Aerospace & Defense 0.3% | | | |
| | 25 | | | Northrop Grumman Corp., 2.55%, due 10/15/22 | | | 25 | | |
Agriculture 0.6% | | | |
| | 55 | | | BAT Capital Corp., 4.54%, due 8/15/47 | | | 56 | (h) | |
See Notes to Financial Statements
57
Schedule of Investments Core Plus Fund (cont'd)
| PRINCIPAL AMOUNT(a) | | | | VALUE | |
(000's omitted) | | | | (000's omitted) | |
Auto Manufacturers 2.5% | | | |
$ | 100 | | | Ford Motor Credit Co. LLC, 3.66%, due 9/8/24 | | $ | 101 | (i) | |
| | 40 | | | General Motors Co., 6.75%, due 4/1/46 | | | 49 | | |
| | 100 | | | General Motors Financial Co., Inc., 3.15%, due 6/30/22 | | | 101 | (i) | |
| | | | 251 | | |
Banks 9.3% | | | |
| | 100 | | | Bank of America Corp., 4.20%, due 8/26/24 | | | 106 | (i) | |
| | 100 | | | Citigroup, Inc., 4.40%, due 6/10/25 | | | 106 | (i) | |
| | 50 | | | Goldman Sachs Group, Inc., 4.25%, due 10/21/25 | | | 52 | (i) | |
| | 100 | | | HSBC Holdings PLC, 1 month USD LIBOR + 3.75%, (6.00%), due 12/31/99 | | | 106 | (e)(i) | |
| | 90 | | | Morgan Stanley, 5.00%, due 11/24/25 | | | 99 | (i) | |
| | 100 | | | Royal Bank of Scotland Group PLC, 3 month USD LIBOR + 1.48%, (3.50%), due 5/15/23 | | | 101 | (e) | |
| | 80 | | | SunTrust Banks, Inc., Ser. G, 3 month USD LIBOR + 3.10%, (5.05%), due 12/31/99 | | | 82 | (e)(i) | |
| | 200 | | | UBS Group AG, 5 Year USD Swap + 4.59%, (6.88)%, due 12/29/49 | | | 224 | (e)(j) | |
| | 55 | | | Westpac Banking Corp., 5 Year USD ICE Swap + 2.89%, (5.00%), due 12/31/99 | | | 55 | (e) | |
| | | | 931 | | |
Computers 3.1% | | | |
| | 185 | | | Diamond 1 Finance Corp./Diamond 2 Finance Corp., 5.45%, due 6/15/23 | | | 203 | (h)(i) | |
| | 100 | | | HP Enterprise Co., 4.90%, due 10/15/25 | | | 106 | (i) | |
| | | | 309 | | |
Diversified Financial Services 1.0% | | | |
| | 100 | | | Discover Financial Services, 4.10%, due 2/9/27 | | | 102 | (i) | |
Iron - Steel 1.0% | | | |
| | 90 | | | Vale Overseas Ltd., 6.25%, due 8/10/26 | | | 104 | (i) | |
Media 4.9% | | | |
| | 15 | | | 21st Century Fox America, Inc., 3.38%, due 11/15/26 | | | 15 | | |
| | 185 |
| | Charter Communications Operating LLC/Charter Communications Operating Capital, 4.91%,
due 7/23/25 | | | 197
| (i) | |
| | | | | Discovery Communications LLC | | | | | |
| | 100 | | | 4.90%, due 3/11/26 | | | 107 | (i) | |
| | 20 | | | 5.20%, due 9/20/47 | | | 20 | | |
| | | | | Viacom, Inc. | | | | | |
| | 55 | | | 4.38%, due 3/15/43 | | | 47 | | |
| | 100 | | | 3 month USD LIBOR + 3.90%, (5.88%), due 2/28/57 | | | 99 | (e)(i) | |
| | | | 485 | | |
Mining 1.1% | | | |
| | 100 | | | Glencore Funding LLC, 4.63%, due 4/29/24 | | | 107 | (h)(i) | |
Oil & Gas 3.0% | | | |
| | 40 | | | Concho Resources, Inc., 3.75%, due 10/1/27 | | | 41 | | |
| | 100 | | | Hess Corp., 4.30%, due 4/1/27 | | | 101 | (i) | |
| | 60 | | | Noble Energy, Inc., 3.85%, due 1/15/28 | | | 60 | | |
| | 100 | | | Petroleos Mexicanos, 4.63%, due 9/21/23 | | | 102 | (i) | |
| | | | 304 | | |
See Notes to Financial Statements
58
Schedule of Investments Core Plus Fund (cont'd)
| PRINCIPAL AMOUNT(a) | | | | VALUE | |
(000's omitted) | | | | (000's omitted) | |
Pipelines 3.2% | | | |
$ | 50 | | | Energy Transfer Partners L.P., 6.50%, due 2/1/42 | | $ | 57 | (i) | |
| | 100 | | | Enterprise Products Operating LLC, Ser. E, 3 month USD LIBOR + 3.03%, (5.25%), due 8/16/77 | | | 103 | (e) | |
| | 50 | | | Kinder Morgan Energy Partners L.P., 5.50%, due 3/1/44 | | | 53 | (i) | |
| | 100 | | | MPLX L.P., 4.88%, due 12/1/24 | | | 108 | (i) | |
| | | | 321 | | |
Semiconductors 0.6% | | | |
| | 60 | | | Broadcom Corp./Broadcom Cayman Finance Ltd., 3.88%, due 1/15/27 | | | 62 | (h) | |
Telecommunications 0.5% | | | |
| | 50 | | | Verizon Communications, Inc., 4.13%, due 3/16/27 | | | 52 | (i) | |
| | | | | Total Corporate Bonds (Cost $3,084) | | | 3,109 | | |
Asset-Backed Securities 7.4% | | | |
| | 50 | | | Ally Auto Receivables Trust, Ser. 2017-3, Class A2, 1.53%, due 3/16/20 | | | 50 | | |
| | 150 |
| | Capital One Multi-Asset Execution Trust, Ser. 2014-A4, Class A4,
1 month USD LIBOR + 0.36%, (1.60%), due 6/15/22 | | | 151
| (e) | |
| | 150 | | | Chase Issuance Trust, Ser. 2015-A5, Class A5, 1.36%, due 4/15/20 | | | 150 | (i) | |
| | 100 | | | Citibank Credit Card Issuance Trust, Ser. 2017-A3, Class A3, 1.92%, due 4/7/22 | | | 100 | (i) | |
| | 100 |
| | Morgan Stanley Home Equity Loan Trust, Ser. 2005-1, Class M4,
1 month USD LIBOR + 1.05%, (2.29%), due 12/25/34 | | | 99
| (e) | |
| | 91 |
| | Navient Student Loan Trust, Ser. 2017-4A, Class A1,
1 month USD LIBOR + 0.24%, (1.48%), due 9/27/66 | | | 91
| (e)(h) | |
| | 100 | | | Verizon Owner Trust, Ser. 2016-2A, Class A, 1.68%, due 5/20/21 | | | 99 | (h)(i) | |
| | | | | Total Asset-Backed Securities (Cost $740) | | | 740 | | |
Foreign Government Securities 8.9% | | | |
| | 20 | | | Bolivian Government International Bond, 4.50%, due 3/20/28 | | | 19 | (h) | |
| | | | | Brazilian Government International Bond | | | | | |
| | 25 | | | 2.63%, due 1/5/23 | | | 24 | | |
| | 20 | | | 6.00%, due 4/7/26 | | | 22 | | |
| | 15 | | | 5.63%, due 2/21/47 | | | 15 | | |
| | | | | Colombia Government International Bond | | | | | |
| | 20 | | | 4.00%, due 2/26/24 | | | 21 | | |
| | 10 | | | 3.88%, due 4/25/27 | | | 10 | | |
| | 10 | | | 5.00%, due 6/15/45 | | | 10 | | |
| | | | | Dominican Republic International Bond | | | | | |
| | 20 | | | 5.88%, due 4/18/24 | | | 22 | (h) | |
| | 15 | | | 6.88%, due 1/29/26 | | | 17 | (h) | |
| | 10 | | | 6.85%, due 1/27/45 | | | 11 | (h) | |
| | 20 | | | Guatemala Government Bond, 4.38%, due 6/5/27 | | | 20 | (h) | |
| | 20 | | | Hungary Government International Bond, 7.63%, due 3/29/41 | | | 31 | | |
| | | | | Indonesia Government International Bond | | | | | |
| | 40 | | | 3.70%, due 1/8/22 | | | 42 | (h) | |
| | 10 | | | 4.35%, due 1/8/27 | | | 11 | (h) | |
| | 40 | | | Kazakhstan Government International Bond, 5.13%, due 7/21/25 | | | 44 | (h) | |
| | | | | Mexico Government International Bond | | | | | |
| | 20 | | | 4.15%, due 3/28/27 | | | 21 | | |
| | 20 | | | 4.35%, due 1/15/47 | | | 19 | | |
| | | | | Morocco Government International Bond | | | | | |
| | 20 | | | 4.25%, due 12/11/22 | | | 21 | (h) | |
See Notes to Financial Statements
59
Schedule of Investments Core Plus Fund (cont'd)
| PRINCIPAL AMOUNT(a) | | | | VALUE | |
(000's omitted) | | | | (000's omitted) | |
$ | 10 | | | 5.50%, due 12/11/42 | | $ | 11 | (h) | |
| | 25 | | | Namibia International Bonds, 5.25%, due 10/29/25 | | | 25 | (h) | |
| | | | | Oman Government International Bond | | | | | |
| | 20 | | | 3.88%, due 3/8/22 | | | 20 | (h) | |
| | 10 | | | 5.38%, due 3/8/27 | | | 10 | (h) | |
| | 10 | | | 6.50%, due 3/8/47 | | | 10 | (h) | |
| | | | | Panama Government International Bond | | | | | |
| | 20 | | | 3.75%, due 3/16/25 | | | 21 | | |
| | 10 | | | 3.88%, due 3/17/28 | | | 10 | | |
| | 10 | | | 4.50%, due 5/15/47 | | | 11 | | |
| | 20 | | | Paraguay Government International Bond, 4.70%, due 3/27/27 | | | 21 | (h) | |
| | | | | Qatar Government International Bond | | | | | |
| | 20 | | | 2.38%, due 6/2/21 | | | 20 | (h) | |
| | 10 | | | 3.25%, due 6/2/26 | | | 10 | (h) | |
| | 10 | | | 4.63%, due 6/2/46 | | | 10 | (h) | |
| | 10 | | | Republic of South Africa Government International Bond, 4.30%, due 10/12/28 | | | 9 | | |
| | 15 | | | Romanian Government International Bond, 6.13%, due 1/22/44 | | | 19 | (h) | |
| | | | | Saudi Government International Bond | | | | | |
| | 20 | | | 2.38%, due 10/26/21 | | | 20 | (h) | |
| | 10 | | | 3.25%, due 10/26/26 | | | 10 | (h) | |
| | 10 | | | 4.50%, due 10/26/46 | | | 10 | (h) | |
| | 25 | | | Serbia International Bond, 4.88%, due 2/25/20 | | | 26 | (h) | |
| | | | | South Africa Government International Bond | | | | | |
| | 20 | | | 4.88%, due 4/14/26 | | | 20 | | |
ZAR | 1,740 | | | Ser. R214, 6.50%, due 2/28/41 | | | 84 | | |
$ | 10 | | | 5.00%, due 10/12/46 | | | 9 | | |
| | 30 | | | Trinidad & Tobago Government International Bond, 4.50%, due 8/4/26 | | | 30 | (h) | |
| | | | | Turkey Government International Bond | | | | | |
| | 20 | | | 6.25%, due 9/26/22 | | | 22 | | |
| | 20 | | | 6.00%, due 3/25/27 | | | 21 | | |
| | 10 | | | 5.75%, due 5/11/47 | | | 10 | | |
| | | | | Uruguay Government International Bond | | | | | |
| | 20 | | | 4.38%, due 10/27/27 | | | 22 | | |
| | 20 | | | 5.10%, due 6/18/50 | | | 21 | | |
| | | | | Total Foreign Government Securities (Cost $897) | | | 892 | | |
NUMBER OF SHARES | | | | | |
Short-Term Investment 0.4% | | | |
Investment Company 0.4% | | | |
| 35,072 | | | State Street Institutional U.S. Government Money Market Fund Premier Class, 0.96%
(Cost $35) | | | 35 | (i)(k) | |
| | | | | Total Investments 117.8% (Cost $11,768) | | | 11,760 | | |
| | | | | Liabilities Less Other Assets (17.8)% | | | (1,779 | )(l) | |
| | | | | Net Assets 100.0% | | $ | 9,981 | | |
See Notes to Financial Statements
60
Schedule of Investments Core Plus Fund (cont'd)
(a) Principal amount is stated in the currency in which the security is denominated.
ZAR = South African Rand
(b) Rate shown was the discount rate at the date of purchase.
(c) All or a portion of the security is pledged as collateral for futures.
(d) Index-linked bond whose principal amount adjusts according to a government retail price index.
(e) Variable or floating rate security. The interest rate shown was the current rate as of October 31, 2017 and changes periodically.
Benchmarks for Variable / Floating Rates:
LIBOR (USD) = London Interbank Offered Rate
(f) Weighted average coupon that changes/updates periodically. Rate shown is the rate at October 31, 2017.
(g) TBA (To Be Announced) Securities are purchased/sold on a forward commitment basis with an approximate principal amount and no defined maturity date. The actual principal and maturity date will be determined upon settlement when the specific mortgage pools are assigned. Total value of all such securities (excluding forward sales contracts, if any) at October 31, 2017 amounted to approximately $1,834,000, which represents 18.4% of net assets of the Fund.
(h) Securities were purchased under Rule 144A of the 1933 Act, as amended (the "1933 Act"), or are otherwise restricted and, unless registered under the 1933 Act or exempted from registration, may only be sold to qualified institutional investors or may have other restrictions on resale. At October 31, 2017, these securities amounted to approximately $1,077,000, which represents 10.8% of net assets of the Fund. These securities have been deemed by the investment manager to be liquid.
(i) All or a portion of this security is segregated in connection with obligations for to be announced securities and futures with a total value of approximately $2,636,000.
(j) Security exempt from registration pursuant to Regulation S under the Securities Act of 1933. Regulation S applies to securities offerings that are made outside of the United States and do not involve direct selling efforts in the United States and as such may have restrictions on resale. Total value of all such securities at October 31, 2017 amounted to approximately $224,000, which represents 2.2% of net assets of the Fund.
(k) Represents 7-day effective yield as of October 31, 2017.
(l) Includes the impact of the Fund's open positions in derivatives at October 31, 2017.
See Notes to Financial Statements
61
Schedule of Investments Core Plus Fund (cont'd)
Derivative Instruments
Futures contracts ("futures")
At October 31, 2017, open positions in futures for the Fund were as follows:
Long Futures:
Expiration
Date | | Number of
Contracts | | Open Contracts | | Notional
Amount | | Value and
Unrealized
Appreciation/
(Depreciation) | |
11/2017 | | | 2 | | | Brazilian Real | | $ | 60,760 | | | $ | 14 | | |
12/2017 | | | 4 | | | Mexican Peso | | | 103,600 | | | | (3,607 | ) | |
12/2017 | | | 1 | | | New Zealand Dollar | | | 68,360 | | | | (2,788 | ) | |
12/2017 | | | 1 | | | South African Rand | | | 35,050 | | | | (35 | ) | |
12/2017 | | | 10 | | | U.S. Treasury Note, 10 Year | | | 1,249,375 | | | | (13,274 | ) | |
12/2017 | | | 1 | | | U.S. Treasury Long Bond | | | 152,469 | | | | (3,004 | ) | |
Total Long Positions | | | | | | | | $ | 1,669,614 | | | $ | (22,694 | ) | |
Short Futures:
Expiration
Date | | Number of
Contracts | | Open Contracts | | Notional
Amount | | Value and
Unrealized
Appreciation/
(Depreciation) | |
12/2017 | | | 1 | | | Canadian Dollar | | $ | (77,575 | ) | | $ | 2,152 | | |
12/2017 | | | 1 | | | Euro | | | (146,013 | ) | | | 1,502 | | |
12/2017 | | | 3 | | | Euro-Bund | | | (568,738 | ) | | | (4,327 | ) | |
12/2017 | | | 1 | | | Euro-Buxl Bond, 30 Year | | | (193,505 | ) | | | (818 | ) | |
12/2017 | | | 2 | | | United Kingdom Long Gilt Bond | | | (330,258 | ) | | | 101 | | |
Total Short Positions | | | | | | | | | | $ | (1,316,089 | ) | | $ | (1,390 | ) | |
Total Futures | | | | | | | | | | | | | | $ | (24,084 | ) | |
At October 31, 2017, the Fund had securities pledged in the amount of $99,290 to cover collateral requirements on open futures.
For the period ended October 31, 2017, the average notional value of futures for the Fund was $1,428,490 for long positions and $(1,229,841) for short positions.
See Notes to Financial Statements
62
Schedule of Investments Core Plus Fund (cont'd)
Credit default swap contracts ("credit default swaps")
At October 31, 2017, the Fund had outstanding credit default swaps as follows:
Centrally Cleared Credit Default Swaps — Sell Protection
Clearinghouse | | Reference
Entity | | Notional
Amount | | Financing
Rate
Received
by the Fund | | Maturity
Date | | Upfront
Payments/
(Receipts) | | Unrealized
Appreciation/
(Depreciation) | | Accrued
Net
Interest
Receivable/
(Payable) | | Value | |
ICE Clear
Credit LLC | | Credit Default Swap
CDX North American
High Yield Index,
Ser.28 V.1 | | $ | 455,400 | | | | 5.00 | %(a) | | 6/20/2022 | | $ | 34,727 | | | $ | 6,435 | | | $ | 4,710 | | | $ | 45,872 | | |
ICE Clear
Credit LLC | | CDX Emerging Markets
Index, Ser.27 V.1 | | | 210,000 | | | | 1.00 | %(a) | | 6/20/2022 | | | (8,840 | ) | | | 3,222 | | | | 1,183 | | | | (4,435 | ) | |
| | | Total | | | | | | | | $ | 25,887 | | | $ | 9,657 | | | $ | 5,893 | | | $ | 41,437 | | |
(a) Payment frequency — quarterly.
At October 31, 2017, the Fund had $46,345 deposited in a segregated account to cover margin requirements for centrally cleared swaps.
For the period ended October 31, 2017, the average notional value of credit default swaps for the Fund was $(698,127) for sell protection.
The following is a summary, categorized by Level (see Note A of Notes to Financial Statements), of inputs used to value the Fund's investments as of October 31, 2017:
Asset Valuation Inputs
(000's omitted) | | Level 1 | | Level 2 | | Level 3 | | Total | |
Investments: | |
U.S. Treasury Obligations | | $ | — | | | $ | 3,150 | | | $ | — | | | $ | 3,150 | | |
| Mortgage-Backed Securities(a) | | | — | | | | 3,834 | | | | — | | | | 3,834 | | |
| Corporate Bonds(a) | | | — | | | | 3,109 | | | | — | | | | 3,109 | | |
Asset-Backed Securities | | | — | | | | 740 | | | | — | | | | 740 | | |
Foreign Government Securities | | | — | | | | 892 | | | | — | | | | 892 | | |
Short-Term Investment | | | — | | | | 35 | | | | — | | | | 35 | | |
Total Investments | | $ | — | | | $ | 11,760 | | | $ | — | | | $ | 11,760 | | |
(a) The Schedule of Investments provides information on the industry or sector categorization for the portfolio.
As of the period ended October 31, 2017, no securities were transferred from one level (as of July 18, 2017 (Commencement of Operations)) to another.
See Notes to Financial Statements
63
Schedule of Investments Core Plus Fund (cont'd)
The following is a summary, categorized by Level (see Note A of Notes to Financial Statements), of inputs used to value the Fund's derivatives as of October 31, 2017:
Other Financial Instruments
(000's omitted) | | Level 1 | | Level 2 | | Level 3 | | Total | |
| Futures(a) | |
Assets | | $ | 4 | | | $ | — | | | $ | — | | | $ | 4 | | |
Liabilities | | | (28 | ) | | | — | | | | — | | | | (28 | ) | |
Swaps | |
Assets | | | — | | | | 45 | | | | — | | | | 45 | | |
Liabilities | | | — | | | | (4 | ) | | | — | | | | (4 | ) | |
Total | | $ | (24 | ) | | $ | 41 | | | $ | — | | | $ | 17 | | |
(a) Futures are reported at the cumulative unrealized appreciation/(depreciation) of the instrument.
See Notes to Financial Statements
64
Schedule of Investments Emerging Markets Debt Fund October 31, 2017
| PRINCIPAL AMOUNT(a) | | | | VALUE | |
(000's omitted) | | | | (000's omitted) | |
Corporate Bonds 26.4% | | | |
Argentina 1.2% | | | |
| | | | | Aeropuertos Argentina 2000 SA | | | | | |
$ | 150 | | | 6.88%, due 2/1/27 | | $ | 162 | (b) | |
| | 400 | | | 6.88%, due 2/1/27 | | | 431 | (c) | |
| | 192 | | | Capex SA, 6.88%, due 5/15/24 | | | 200 | (b) | |
| | 400 | | | Genneia SA, 8.75%, due 1/20/22 | | | 444 | (c) | |
| | | | | Pampa Energia SA | | | | | |
| | 257 | | | 7.38%, due 7/21/23 | | | 281 | (b) | |
| | 300 | | | 7.50%, due 1/24/27 | | | 327 | (b) | |
| | 524 | | | 7.50%, due 1/24/27 | | | 572 | (c) | |
| | | | | YPF SA | | | | | |
| | 83 | | | BADLARPP Index + 4.00%, (25.46%), due 7/7/20 | | | 80 | (c)(d) | |
| | 200 | | | 8.75%, due 4/4/24 | | | 232 | (c) | |
| | 300 | | | 8.50%, due 7/28/25 | | | 349 | (c) | |
| | | | 3,078 | | |
Austria 0.2% | | | |
| | 600 | | | JBS Investments GmbH, 7.75%, due 10/28/20 | | | 612 | (c) | |
Azerbaijan 0.6% | | | |
| | | | | Southern Gas Corridor CJSC | | | | | |
| | 200 | | | 6.88%, due 3/24/26 | | | 226 | (c) | |
| | 206 | | | 6.88%, due 3/24/26 | | | 233 | (b) | |
| | 1,000 | | | 6.88%, due 3/24/26 | | | 1,130 | (c) | |
| | | | 1,589 | | |
Bahrain 0.1% | | | |
| | 250 | | | Oil and Gas Holding Co. BSCC, 7.50%, due 10/25/27 | | | 259 | (b) | |
Belarus 0.1% | | | |
| | 200 | | | Eurotorg LLC Via Bonitron DAC, 8.75%, due 10/30/22 | | | 202 | (b) | |
Brazil 3.6% | | | |
| | | | | Banco do Brasil SA | | | | | |
| | 284 | | | 4.63%, due 1/15/25 | | | 284 | (b) | |
| | 400 | | | 10 year CMT + 6.36%, (9.00%), due 6/29/49 | | | 439 | (c)(d) | |
| | 200 | | | Banco Nacional de Desenvolvimento Economico e Social, 4.75%, due 5/9/24 | | | 202 | (b) | |
| | 411 | | | Cosan Luxembourg SA, 7.00%, due 1/20/27 | | | 446 | (c) | |
| | 170 | | | CSN Islands XI Corp., 6.88%, due 9/21/19 | | | 156 | (c) | |
| | 980 | | | CSN Resources SA, 6.50%, due 7/21/20 | | | 906 | (c) | |
| | 200 | | | Fibria Overseas Finance Ltd., 5.50%, due 1/17/27 | | | 214 | | |
| | | | | GTL Trade Finance, Inc. | | | | | |
| | 200 | | | 5.89%, due 4/29/24 | | | 216 | (c) | |
| | 200 | | | 7.25%, due 4/16/44 | | | 219 | (c) | |
| | 200 | | | Itau Unibanco Holding SA, 5.65%, due 3/19/22 | | | 212 | (c) | |
| | | | | Marfrig Holdings Europe BV | | | | | |
| | 200 | | | 8.00%, due 6/8/23 | | | 209 | (b) | |
| | 850 | | | 8.00%, due 6/8/23 | | | 888 | (c) | |
See Notes to Financial Statements
65
Schedule of Investments Emerging Markets Debt Fund (cont'd)
| PRINCIPAL AMOUNT(a) | | | | VALUE | |
(000's omitted) | | | | (000's omitted) | |
| | | | | Minerva Luxembourg SA | | | | | |
$ | 200 | | | 6.50%, due 9/20/26 | | $ | 207 | (c) | |
| | 254 | | | 6.50%, due 9/20/26 | | | 263 | (b) | |
| | | | | Petrobras Global Finance BV | | | | | |
| | 616 | | | 7.38%, due 1/17/27 | | | 684 | (e) | |
| | 686 | | | 6.00%, due 1/27/28 | | | 694 | (b) | |
| | 200 | | | 6.88%, due 1/20/40 | | | 204 | | |
| | 200 | | | Rumo Luxembourg Sarl, 7.38%, due 2/9/24 | | | 218 | (b) | |
| | 400 | | | Suzano Austria GmbH, 7.00%, due 3/16/47 | | | 447 | (b) | |
| | 400 | | | Ultrapar Int'l SA, 5.25%, due 10/6/26 | | | 410 | (c) | |
| | | | | Vale Overseas Ltd. | | | | | |
| | 117 | | | 8.25%, due 1/17/34 | | | 151 | | |
| | 75 | | | 6.88%, due 11/21/36 | | | 90 | | |
| | | | | VM Holding SA Co. | | | | | |
| | 594 | | | 5.38%, due 5/4/27 | | | 629 | (b)(e) | |
| | 400 | | | 5.38%, due 5/4/27 | | | 423 | (c) | |
| | 200 | | | Votorantim Cimentos SA, 7.25%, due 4/5/41 | | | 214 | (c) | |
| | | | 9,025 | | |
| Canada 0.0%(f) | | | |
| | 20 | | | Nexen, Inc., 5.88%, due 3/10/35 | | | 24 | | |
Chile 1.0% | | | |
| | 422 | | | Banco de Credito e Inversiones, 3.50%, due 10/12/27 | | | 412 | (b) | |
| | 299 | | | Celeo Redes Operacion Chile SA, 5.20%, due 6/22/47 | | | 304 | (b) | |
| | 200 | | | Celulosa Arauco y Constitucion SA, 5.50%, due 11/2/47 | | | 201 | (b)(g) | |
| | 390 | | | Cencosud SA, 4.38%, due 7/17/27 | | | 389 | (b) | |
| | 200 | | | Colbun SA, 3.95%, due 10/11/27 | | | 200 | (b) | |
| | 200 | | | Empresa Electrica Guacolda SA, 4.56%, due 4/30/25 | | | 195 | (c) | |
| | 160 | | | Enel Americas SA, 4.00%, due 10/25/26 | | | 163 | | |
| | 389 | | | Geopark Ltd., 6.50%, due 9/21/24 | | | 399 | (b) | |
| | 263 | | | SACI Falabella, 3.75%, due 10/30/27 | | | 256 | (b) | |
| | | | 2,519 | | |
China 2.8% | | | |
| | 300 | | | Bluestar Finance Holdings Ltd., 3.50%, due 9/30/21 | | | 302 | (c) | |
| | 200 | | | Chalieco Hong Kong Corp. Ltd., 3 Year CMT + 2.75%, (5.70%), due 12/29/49 | | | 207 | (c)(d) | |
| | 400 | | | China Construction Bank Corp., 5 Year CMT + 2.43%, (3.88%), due 5/13/25 | | | 407 | (c)(d) | |
| | | | | China Evergrande Group, | | | | | |
| | 600 | | | 8.25%, due 3/23/22 | | | 631 | (c)(e) | |
| | 200 | | | 8.75%, due 6/28/25 | | | 208 | (c) | |
| | 200 | | | China Overseas Finance Cayman VI Ltd., 6.45%, due 6/11/34 | | | 246 | (c) | |
| | 200 | | | China Reinsurance Finance Corp. Ltd., 3.38%, due 3/9/22 | | | 199 | (c) | |
| | 300 | | | China SCE Property Holdings Ltd., 5.88%, due 3/10/22 | | | 300 | (c) | |
| | 200 | | | CNOOC Finance 2015 USA LLC, 3.50%, due 5/5/25 | | | 204 | | |
| | 200 | | | CNRC Capitale Ltd., 5 Year CMT + 6.08%, (3.90%), due 12/31/99 | | | 202 | (c)(d) | |
| | 300 | | | Franshion Brilliant Ltd., 5 Year USD Swap + 3.86% (5.75%), due 12/29/49 | | | 312 | (c)(d) | |
| | 400 | | | Golden Eagle Retail Group Ltd., 4.63%, due 5/21/23 | | | 380 | (c) | |
| | 200 | | | Health and Happiness H&H International Holdings Ltd., 7.25%, due 6/21/21 | | | 210 | (c) | |
| | 200 | | | HeSteel Hong Kong Co. Ltd., 4.25%, due 4/7/20 | | | 202 | (c) | |
| | 200 | | | Huarong Finance 2017 Co. Ltd., 5 Year CMT + 6.98% (4.00%), due 12/31/99 | | | 200 | (c)(h)(d) | |
| | | | | Huarong Finance II Co. Ltd. | | | | | |
| | 400 | | | 4.50%, due 1/16/20 | | | 412 | (c) | |
| | 200 | | | 4.25%, due 11/7/27 | | | 200 | (c)(h) | |
See Notes to Financial Statements
66
Schedule of Investments Emerging Markets Debt Fund (cont'd)
| PRINCIPAL AMOUNT(a) | | | | VALUE | |
(000's omitted) | | | | (000's omitted) | |
| | | | | Proven Honour Capital Ltd. | | | | | |
$ | 400 | | | 4.13%, due 5/19/25 | | $ | 416 | (c)(e) | |
| | 250 | | | 4.13%, due 5/6/26 | | | 259 | (c) | |
| | 200 | | | Shimao Property Holdings Ltd., 8.38%, due 2/10/22 | | | 221 | (c) | |
| | 300 | | | Shui On Development Holding Ltd., 5 Year CMT + 7.63%, (6.40%), due 12/31/99 | | | 311 | (c)(d) | |
| | 312 | | | Sinopec Group Overseas Development 2017 Ltd., 3.25%, due 9/13/27 | | | 311 | (b) | |
| | 300 | | | Sunac China Holdings Ltd., 6.88%, due 8/8/20 | | | 300 | (c) | |
| | 400 | | | Wisdom Glory Group Ltd., 3 Year CMT + 8.67%, (5.25%), due 12/31/99 | | | 403 | (c)(d) | |
| | | 7,043 | | |
Colombia 1.5% | | | |
| | 400 | | | Banco de Bogota SA, 5.38%, due 2/19/23 | | | 422 | (c)(e) | |
| | 304 | | | Bancolombia SA, 5 Year CMT + 2.93% (4.88%), due 10/18/27 | | | 304 | (d) | |
| | | | | Ecopetrol SA | | | | | |
| | 300 | | | 7.38%, due 9/18/43 | | | 348 | | |
| | 149 | | | 5.88%, due 5/28/45 | | | 148 | | |
| | | | | Empresas Publicas de Medellin ESP | | | | | |
COP | 1,278,000 | | | 8.38%, due 2/1/21 | | | 434 | (c)(e) | |
COP | 807,000 | | | 7.63%, due 9/10/24 | | | 265 | (b) | |
COP | 1,600,000 | | | 8.38%, due 11/8/27 | | | 526 | (b)(h) | |
COP | 437,000 | | | Financiera de Desarrollo Territorial SA Findeter, 7.88%, due 8/12/24 | | | 145 | (b) | |
$ | 300 | | | Grupo Aval Ltd., 4.75%, due 9/26/22 | | | 306 | (c) | |
| | | | | Millicom Int'l Cellular SA | | | | | |
| | 400 | | | 6.00%, due 3/15/25 | | | 422 | (c)(e) | |
| | 389 | | | 5.13%, due 1/15/28 | | | 391 | (b) | |
| | 100 | | | SUAM Finance B.V., 4.88%, due 4/17/24 | | | 107 | (c) | |
| | | 3,818 | | |
Guatemala 0.4% | | | |
| | 200 | | | Cementos Progreso Trust, 7.13%, due 11/6/23 | | | 213 | (b) | |
| | 250 | | | Central American Bottling Corp., 5.75%, due 1/31/27 | | | 264 | (b) | |
| | 600 | | | Comcel Trust via Comunicaciones Celulares SA, 6.88%, due 2/6/24 | | | 633 | (c) | |
| | | | 1,110 | | |
Hong Kong 1.4% | | | |
| | 600 | | | Bank of East Asia Ltd, 5 Year CMT + 3.83%, (5.50%), due 12/29/49 | | | 619 | (c)(d)(e) | |
| | 300 | | | China Cinda Finance 2017 I Ltd., 4.10%, due 3/9/24 | | | 309 | (c) | |
| | 200 | | | CLP Power HK Finance Ltd., 6 month USD LIBOR + 2.30%, (4.25%), due 5/29/49 | | | 205 | (c)(d) | |
| | 200 | | | Fita Int'l Ltd., 7.00%, due 2/10/20 | | | 217 | | |
| | 200 | | | HLP Finance Ltd., 4.45%, due 4/16/21 | | | 209 | (c) | |
| | 400 | | | Melco Resorts Finance Ltd., 4.88%, due 6/6/25 | | | 404 | (b) | |
| | 300 | | | PCPD Capital Ltd., 4.75%, due 3/9/22 | | | 306 | (c) | |
| | | | | Studio City Co. Ltd. | | | | | |
| | 400 | | | 7.25%, due 11/30/21 | | | 428 | (b)(e) | |
| | 650 | | | 7.25%, due 11/30/21 | | | 696 | (c) | |
| | | | 3,393 | | |
See Notes to Financial Statements
67
Schedule of Investments Emerging Markets Debt Fund (cont'd)
| PRINCIPAL AMOUNT(a) | | | | VALUE | |
(000's omitted) | | | | (000's omitted) | |
India 1.8% | | | |
$ | 200 | | | ABJA Investment Co. Pte Ltd., 5.95%, due 7/31/24 | | $ | 214 | (c) | |
| | 350 | | | Adani Ports & Special Economic Zone Ltd., 3.95%, due 1/19/22 | | | 360 | (c) | |
| | 200 | | | Azure Power Energy Ltd., 5.50%, due 11/3/22 | | | 207 | (b) | |
| | | | | Bharti Airtel Int'l Netherlands BV | | | | | |
| | 300 | | | 5.13%, due 3/11/23 | | | 321 | (c) | |
| | 250 | | | 5.35%, due 5/20/24 | | | 270 | (b) | |
| | 212 | | | Greenko Dutch BV, 4.88%, due 7/24/22 | | | 216 | (b) | |
| | 800 | | | IDBI Bank Ltd./DIFC Dubai, 4.25%, due 11/30/20 | | | 813 | (c) | |
| | | | | JSW Steel Ltd. | | | | | |
| | 400 | | | 4.75%, due 11/12/19 | | | 408 | (c) | |
| | 200 | | | 5.25%, due 4/13/22 | | | 206 | (c) | |
| | 200 | | | Jubilant Pharma Ltd., 4.88%, due 10/6/21 | | | 203 | (c) | |
| | 250 | | | Reliance Industries Ltd., 4.88%, due 2/10/45 | | | 271 | (b) | |
| | | | | Vedanta Resources PLC | | | | | |
| | 200 | | | 8.25%, due 6/7/21 | | | 224 | (c) | |
| | 200 | | | 6.38%, due 7/30/22 | | | 209 | (b) | |
| | 200 | | | 6.38%, due 7/30/22 | | | 209 | (c) | |
| | 200 | | | 7.13%, due 5/31/23 | | | 216 | (c) | |
| | | 4,347 | | |
Indonesia 0.6% | | | |
| | 400 | | | Indo Energy Finance II BV, 6.38%, due 1/24/23 | | | 406 | (c) | |
| | 200 | | | Minejesa Capital BV, 5.63%, due 8/10/37 | | | 213 | (b) | |
| | 350 | | | Pertamina Persero PT, 5.63%, due 5/20/43 | | | 383 | (b) | |
| | 450 | | | Perusahaan Gas Negara Persero Tbk, 5.13%, due 5/16/24 | | | 488 | (c)(e) | |
| | | 1,490 | | |
Israel 0.2% | | | |
| | 200 | | | Israel Electric Corp. Ltd., 5.00%, due 11/12/24 | | | 215 | (b)(c) | |
| | | | | Teva Pharmaceutical Finance Netherlands III BV | | | | | |
| | 200 | | | 2.80%, due 7/21/23 | | | 184 | | |
| | 200 | | | 3.15%, due 10/1/26 | | | 177 | | |
| | | | 576 | | |
Jamaica 0.4% | | | |
| | 300 | | | Digicel Group Ltd., 7.13%, due 4/1/22 | | | 283 | (c) | |
| | 600 | | | Digicel Ltd., 6.00%, due 4/15/21 | | | 590 | (c)(e) | |
| | | | 873 | | |
Kazakhstan 1.3% | | | |
| | 200 | | | Halyk Savings Bank of Kazakhstan JSC, 7.25%, due 1/28/21 | | | 220 | (c) | |
| | 400 | | | Kazkommertsbank JSC, 5.50%, due 12/21/22 | | | 397 | (c) | |
| | | | | KazMunayGas National Co. JSC | | | | | |
| | 200 | | | 9.13%, due 7/2/18 | | | 209 | (c) | |
| | 600 | | | 7.00%, due 5/5/20 | | | 654 | (b) | |
| | 200 | | | 6.38%, due 4/9/21 | | | 219 | (c) | |
| | 400 | | | 4.75%, due 4/19/27 | | | 409 | (c) | |
| | 635 | | | 4.75%, due 4/19/27 | | | 649 | (b)(e) | |
| | 200 | | | 5.75%, due 4/19/47 | | | 201 | (b) | |
| | 250 | | | Nostrum Oil & Gas Finance BV, 8.00%, due 7/25/22 | | | 260 | (b) | |
| | | | 3,218 | | |
See Notes to Financial Statements
68
Schedule of Investments Emerging Markets Debt Fund (cont'd)
| PRINCIPAL AMOUNT(a) | | | | VALUE | |
(000's omitted) | | | | (000's omitted) | |
Korea 0.6% | | | |
$ | 450 | | | Kyobo Life Insurance Co. Ltd., 5 year CMT + 2.09%, (3.95%), due 7/24/47 | | $ | 457 | (b)(d) | |
| | 200 | | | Shinhan Bank, 3.88%, due 3/24/26 | | | 204 | (b) | |
| | | | | Woori Bank | | | | | |
| | 200 | | | 4.75%, due 4/30/24 | | | 210 | (c) | |
| | 200 | | | 4.75%, due 4/30/24 | | | 209 | (b) | |
| | 400 | | | 5 Year CMT + 3.31%, (4.50%), due 12/29/49 | | | 399 | (b)(d) | |
| | | 1,479 | | |
Kuwait 0.3% | | | |
| | 400 | | | Kuwait Projects Co. SPC Ltd., 4.50%, due 2/23/27 | | | 402 | (c) | |
| | 400 | | | NBK Tier 1 Financing Ltd., 6 year USD Swap + 4.12%, (5.75%), due 12/29/49 | | | 416 | (c)(d)(e) | |
| | | | 818 | | |
Macau 0.1% | | | |
| | 200 | | | Wynn Macau Ltd., 4.88%, due 10/1/24 | | | 204 | (b) | |
Malaysia 0.1% | | | |
| | 200 | | | Gohl Capital Ltd., 4.25%, due 1/24/27 | | | 207 | (c) | |
Mauritius 0.1% | | | |
| | 318 | | | Liquid Telecommunications Financing PLC, 8.50%, due 7/13/22 | | | 339 | (b) | |
Mexico 2.7% | | | |
| | 200 | | | Alfa SAB de CV, 6.88%, due 3/25/44 | | | 219 | (c) | |
| | 300 | | | Banco Inbursa SA Institucion de Banca Multiple, 4.38%, due 4/11/27 | | | 298 | (c) | |
| 200 | | | Banco Santander Mexico SA Institucion de Banca Multiple Grupo Financiero Santander,
5 Year CMT + 4.58%, (5.95%), due 1/30/24 | | | 209 | (c)(d) | |
MXN | 6,480 | | | Comision Federal de Electricidad, Ser. 14-2, 7.35%, due 11/25/25 | | | 315 | | |
$ | 403 | | | Cydsa SAB de CV, 6.25%, due 10/4/27 | | | 399 | (b) | |
| | 500 | | | Elementia SAB de CV, 5.50%, due 1/15/25 | | | 515 | (c)(e) | |
| | 232 | | | Fermaca Enterprises S de RL de CV, 6.38%, due 3/30/38 | | | 253 | (c) | |
| | 200 | | | Grupo Televisa SAB, 6.13%, due 1/31/46 | | | 232 | | |
| | | | | Mexichem SAB de CV | | | | | |
| | 200 | | | 6.75%, due 9/19/42 | | | 228 | (c) | |
| | 200 | | | 5.88%, due 9/17/44 | | | 207 | (c) | |
| | 409 | | | Mexico City Airport Trust, 5.50%, due 7/31/47 | | | 405 | (b) | |
| | | | | Petroleos Mexicanos | | | | | |
| | 130 | | | 4.63%, due 9/21/23 | | | 133 | | |
MXN | 10,910 | | | 7.19%, due 9/12/24 | | | 510 | (c) | |
$ | 41 | | | 6.88%, due 8/4/26 | | | 46 | | |
MXN | 13,713 | | | Ser. 14-2, 7.47%, due 11/12/26 | | | 635 | | |
$ | 250 | | | 6.50%, due 3/13/27 | | | 273 | (c) | |
| | 900 | | | 6.50%, due 6/2/41 | | | 911 | (e) | |
| | 130 | | | 5.50%, due 6/27/44 | | | 117 | | |
| | 92 | | | 6.75%, due 9/21/47 | | | 95 | (b) | |
| | 300 | | | PLA Administradora Industrial S de RL de CV, 5.25%, due 11/10/22 | | | 315 | (c) | |
See Notes to Financial Statements
69
Schedule of Investments Emerging Markets Debt Fund (cont'd)
| PRINCIPAL AMOUNT(a) | | | | VALUE | |
(000's omitted) | | | | (000's omitted) | |
$ | 200 | | | Sigma Alimentos SA de CV, 4.13%, due 5/2/26 | | $ | 200 | (b) | |
| | 200 | | | Trust F/1401, 5.25%, due 12/15/24 | | | 213 | (c) | |
| | | | 6,728 | | |
Morocco 0.2% | | | |
| | 350 | | | Office Cherifien des Phosphates SA, 5.63%, due 4/25/24 | | | 376 | (b) | |
Nigeria 0.2% | | | |
| | 400 | | | Zenith Bank PLC, 7.38%, due 5/30/22 | | | 414 | (c) | |
Panama 0.2% | | | |
| | 400 | | | C&W Senior Financing Designated Activity Co., 6.88%, due 9/15/27 | | | 418 | (b) | |
Peru 0.9% | | | |
| | 199 | | | Abengoa Transmision Sur SA, 6.88%, due 4/30/43 | | | 219 | (b) | |
| | 100 | | | BBVA Banco Continental SA, 5 Year CMT + 2.75%, (5.25%), due 9/22/29 | | | 108 | (c)(d) | |
| | 525 | | | Fenix Power Peru SA, 4.32%, due 9/20/27 | | | 526 | (b) | |
PEN | 843 | | | Fondo MIVIVIENDA SA, 7.00%, due 2/14/24 | | | 272 | (b) | |
$ | 200 | | | Orazul Energy Egenor S en C por A, 5.63%, due 4/28/27 | | | 197 | (b) | |
| | 200 | | | Petroleos del Peru SA, 4.75%, due 6/19/32 | | | 204 | (b) | |
| | 250 | | | Southern Copper Corp., 6.75%, due 4/16/40 | | | 313 | | |
| | 312 | | | Union Andina de Cementos SAA, 5.88%, due 10/30/21 | | | 328 | (b) | |
| | | | 2,167 | | |
| Qatar 0.0%(f) | | | |
| | 100 | | | Nakilat, Inc., 6.07%, due 12/31/33 | | | 117 | (c) | |
Russia 0.7% | | | |
| | 319 | | | Credit Bank of Moscow Via CBOM Finance PLC, 5.88%, due 11/7/21 | | | 330 | (b) | |
| | 200 | | | Evraz Group SA, 8.25%, due 1/28/21 | | | 226 | (c) | |
| | 300 | | | GTH Finance BV, 7.25%, due 4/26/23 | | | 340 | (c) | |
| | 200 | | | Sberbank of Russia Via SB Capital SA, 5.13%, due 10/29/22 | | | 209 | (c) | |
| | 205 | | | SCF Capital Ltd., 5.38%, due 6/16/23 | | | 213 | (b) | |
| | 300 | | | Vnesheconombank Via VEB Finance PLC, 6.80%, due 11/22/25 | | | 341 | (c) | |
| | | 1,659 | | |
Singapore 0.5% | | | |
| | 400 | | | BOC Aviation Ltd., 3.88%, due 4/27/26 | | | 414 | (c) | |
| | | | | Oversea-Chinese Banking Corp. Ltd. | | | | | |
| | 350 | | | 5 Year USD Swap + 2.28%, (3.15%), due 3/11/23 | | | 351 | (c)(d) | |
| | 200 | | | 4.25%, due 6/19/24 | | | 209 | (c) | |
| | 250 | | | Parkway Pantai Ltd., 5 Year CMT + 4.43%, (4.25%), due 12/31/99 | | | 255 | (c)(d) | |
| | | | 1,229 | | |
See Notes to Financial Statements
70
Schedule of Investments Emerging Markets Debt Fund (cont'd)
| PRINCIPAL AMOUNT(a) | | | | VALUE | |
(000's omitted) | | | | (000's omitted) | |
South Africa 0.5% | | | |
$ | 400 | | | Eskom Holdings SOC Ltd., 7.13%, due 2/11/25 | | $ | 410 | (b)(e) | |
| | 200 | | | Gold Fields Orogen Holdings BVI Ltd., 4.88%, due 10/7/20 | | | 205 | (c) | |
| | 200 | | | Myriad Int'l Holdings BV, 5.50%, due 7/21/25 | | | 217 | (b) | |
| | 280 | | | Stillwater Mining Co., 7.13%, due 6/27/25 | | | 287 | (b) | |
| | | | 1,119 | | |
Supranational 0.1% | | | |
| | 205 | | | Banque Ouest Africaine de Developpement, 5.00%, due 7/27/27 | | | 213 | (b) | |
Thailand 0.3% | | | |
| | 200 | | | Krung Thai Bank PCL, 5 Year CMT + 3.54%, (5.20%), due 12/26/24 | | | 208 | (c)(d) | |
| | 200 | | | PTT PCL, 4.50%, due 10/25/42 | | | 203 | (c) | |
| | 200 | | | Thai Oil PCL, 3.63%, due 1/23/23 | | | 206 | (c) | |
| | | | 617 | | |
Turkey 0.9% | | | |
| | 200 | | | Akbank TAS, 5.13%, due 3/31/25 | | | 194 | (b) | |
| | 200 | | | Alternatifbank AS, 5 Year USD Swap + 7.83%, (8.75%), due 4/16/26 | | | 209 | (c)(d) | |
| | 200 | | | Finansbank AS, 4.88%, due 5/19/22 | | | 197 | (c) | |
| | | | | TC Ziraat Bankasi AS | | | | | |
| | 200 | | | 4.25%, due 7/3/19 | | | 200 | (c) | |
| | 200 | | | 5.13%, due 5/3/22 | | | 199 | (b) | |
| | 200 | | | 5.13%, due 9/29/23 | | | 196 | (b) | |
| | 300 | | | Turkiye Garanti Bankasi AS, 5 Year USD Swap + 4.22%, (6.13%), due 5/24/27 | | | 296 | (b)(d) | |
| | 200 | | | Turkiye Halk Bankasi AS, 5.00%, due 7/13/21 | | | 195 | (b) | |
| | 215 | | | Turkiye Is Bankasi, 6.13%, due 4/25/24 | | | 214 | (b) | |
| | 200 | | | Turkiye Sinai Kalkinma Bankasi AS, 5.38%, due 10/30/19 | | | 204 | (c) | |
| | 200 | | | Yapi ve Kredi Bankasi AS, 5.85%, due 6/21/24 | | | 197 | (b) | |
| | | | 2,301 | | |
United Arab Emirates 0.4% | | | |
| | | | | Abu Dhabi Crude Oil Pipeline LLC | | | | | |
| | 285 | | | 3.65%, due 11/2/29 | | | 285 | (b)(g) | |
| | 283 | | | 4.60%, due 11/2/47 | | | 289 | (b)(g) | |
| | 200 | | | ADCB Finance Cayman Ltd., 4.50%, due 3/6/23 | | | 210 | (c) | |
| | 200 | | | Topaz Marine SA, 9.13%, due 7/26/22 | | | 202 | (b) | |
| | | | | | | | 986 | | |
Venezuela 0.4% | | | |
| | | | | Petroleos de Venezuela SA | | | | | |
| | 600 | | | 6.00%, due 5/16/24 | | | 166 | (c) | |
| | 1,335 | | | 6.00%, due 11/15/26 | | | 367 | (c) | |
| | 650 | | | 5.38%, due 4/12/27 | | | 188 | (c) | |
| | 785 | | | 5.38%, due 4/12/27 | | | 227 | (c) | |
| | | | 948 | | |
| | | | | Total Corporate Bonds (Cost $64,655) | | | 65,515 | | |
See Notes to Financial Statements
71
Schedule of Investments Emerging Markets Debt Fund (cont'd)
| PRINCIPAL AMOUNT(a) | | | | VALUE | |
(000's omitted) | | | | (000's omitted) | |
Foreign Government Securities 68.4% | | | |
Argentina 3.5% | | | |
ARS | 1,471 | | | Argentina Bonar Bonds, BADLARPP Index + 2.00%, (23.74%), due 4/3/22 | | $ | 88 | (d) | |
ARS | 1,963 | | | Argentina Treasury Bond BONCER, 2.50%, due 7/22/21 | | | 135 | | |
$ | 313 | | | Argentine Bonad Bonds, 2.40%, due 3/18/18 | | | 309 | | |
| | | | | Argentine Bonos del Tesoro | | | | | |
ARS | $699 | | | 22.75%, due 3/5/18 | | | 41 | | |
ARS | 8,534 | | | 21.20%, due 9/19/18 | | | 486 | | |
ARS | 5,210 | | | 18.20%, due 10/3/21 | | | 305 | | |
| | | | | Argentine Republic Government International Bond | | | | | |
EUR | 522 | | | 5.00%, due 1/15/27 | | | 613 | (c) | |
EUR | 2,288 | | | 7.82%, due 12/31/33 | | | 3,061 | | |
$ | 519 | | | 8.28%, due 12/31/33 | | | 595 | | |
EUR | 3,224 | | | 2.26%, due 12/31/38 | | | 2,668 | (j) | |
EUR | 256 | | | 2.26%, due 12/31/38 | | | 208 | (j) | |
ARS | 2,845 | | | City of Buenos Aires Argentina, BADLARPP Index + 3.25%, (24.98%), due 3/29/24 | | | 159 | (d) | |
EUR | 108 | | | Provincia de Buenos Aires, 5.38%, due 1/20/23 | | | 132 | (b) | |
| | | | 8,800 | | |
Azerbaijan 0.9% | | | |
| | | | | State Oil Co. of the Azerbaijan Republic | | | | | |
$ | 1,900 | | | 4.75%, due 3/13/23 | | | 1,907 | (c) | |
| | 200 | | | 6.95%, due 3/18/30 | | | 220 | (c) | |
| | 180 | | | 6.95%, due 3/18/30 | | | 198 | (c) | |
| | | | 2,325 | | |
Bahrain 0.2% | | | |
| | | | | Bahrain Government International Bond | | | | | |
| | 200 | | | 7.00%, due 10/12/28 | | | 206 | (c) | |
| | 283 | | | 6.75%, due 9/20/29 | | | 281 | (c) | |
| | | | 487 | | |
Belize 0.1% | | | |
| | 311 | | | Belize Government International Bond, 4.94%, due 2/20/34 | | | 193 | (c) | |
Bermuda 0.4% | | | |
| | | | | Bermuda Government International Bond | | | | | |
| | 700 | | | 4.85%, due 2/6/24 | | | 762 | (c)(e) | |
| | 200 | | | 3.72%, due 1/25/27 | | | 201 | (c) | |
| | | | 963 | | |
Brazil 3.8% | | | |
BRL | 1,425 | | | Brazil Letras do Tesouro Nacional, 12.38% – 15.19%, due 1/1/19 | | | 402 | (k) | |
$ | 400 | | | Brazil Minas SPE via State of Minas Gerais, 5.33%, due 2/15/28 | | | 407 | (c) | |
| | | | | Brazil Notas do Tesouro Nacional | | | | | |
BRL | 14,322 | | | Ser. F, 10.00%, due 1/1/21 | | | 4,491 | | |
BRL | 2,000 | | | Ser. B, 6.00%, due 8/15/22 | | | 1,955 | | |
BRL | 1,536 | | | Ser. F, 10.00%, due 1/1/23 | | | 478 | | |
BRL | 840 | | | Ser. F, 10.00%, due 1/1/27 | | | 259 | | |
See Notes to Financial Statements
72
Schedule of Investments Emerging Markets Debt Fund (cont'd)
| PRINCIPAL AMOUNT(a) | | | | VALUE | |
(000's omitted) | | | | (000's omitted) | |
| | | | | Brazilian Government International Bond | | | | | |
$ | 295 | | | 4.63%, due 1/13/28 | | $ | 293 | | |
| | 670 | | | 5.63%, due 1/7/41 | | | 679 | | |
| | 640 | | | 5.00%, due 1/27/45 | | | 592 | | |
| | | | 9,556 | | |
Chile 0.4% | | | |
| | | | | Bonos de la Tesoreria de la Republica en pesos | | | | | |
CLP | 205,000 | | | 5.00%, due 3/1/35 | | | 331 | | |
CLP | 295,000 | | | 6.00%, due 1/1/43 | | | 534 | (g) | |
| | | | 865 | | |
Colombia 3.0% | | | |
| | | | | Colombia Government International Bond | | | | | |
COP | $423,000 | | | 4.38%, due 3/21/23 | | | 131 | | |
$ | 446 | | | 3.88%, due 4/25/27 | | | 449 | | |
COP | 921,000 | | | 9.85%, due 6/28/27 | | | 380 | | |
$ | 330 | | | 6.13%, due 1/18/41 | | | 388 | | |
| | 310 | | | 5.63%, due 2/26/44 | | | 345 | | |
| | 210 | | | 5.00%, due 6/15/45 | | | 216 | | |
| | | | | Colombian TES | | | | | |
COP | 9,155,500 | | | Ser. B, 7.00%, due 5/4/22 | | | 3,130 | (e) | |
COP | 1,923,200 | | | Ser. B, 10.00%, due 7/24/24 | | | 757 | | |
COP | 785,800 | | | Ser. B, 7.50%, due 8/26/26 | | | 273 | | |
COP | 799,700 | | | Ser. B, 6.00%, due 4/28/28 | | | 249 | | |
COP | 1,579,200 | | | Ser. B, 7.75%, due 9/18/30 | | | 563 | | |
COP | 1,524,800 | | | Ser. B, 7.00%, due 6/30/32 | | | 501 | | |
| | | | 7,382 | | |
Costa Rica 0.2% | | | |
$ | 520 | | | Costa Rica Government International Bond, 7.00%, due 4/4/44 | | | 542 | (c)(e) | |
Cote D'Ivoire 0.8% | | | |
| | | | | Ivory Coast Government International Bond | | | | | |
EUR | 172 | | | 5.13%, due 6/15/25 | | | 212 | (c) | |
$ | 1,771 | | | 5.75%, due 12/31/32 | | | 1,738 | (c)(e) | |
| | | | 1,950 | | |
Croatia 0.8% | | | |
| | | | | Croatia Government International Bond | | | | | |
EUR | 1,195 | | | 3.00%, due 3/11/25 | | | 1,486 | (c) | |
EUR | 360 | | | 3.00%, due 3/20/27 | | | 439 | (c) | |
| | | | 1,925 | | |
Dominican Republic 0.4% | | | |
DOP | 5,800 | | | Dominican Republic Bond, 10.50%, due 4/7/23 | | | 128 | (c)(l) | |
| | | | | Dominican Republic International Bond | | | | | |
DOP | 2,040 | | | 11.00%, due 1/5/18 | | | 43 | (c)(l)(m) | |
DOP | 1,200 | | | 15.95%, due 6/4/21 | | | 30 | (c)(l) | |
See Notes to Financial Statements
73
Schedule of Investments Emerging Markets Debt Fund (cont'd)
| PRINCIPAL AMOUNT(a) | | | | VALUE | �� |
(000's omitted) | | | | (000's omitted) | |
DOP | 10,330 | | | 11.00%, due 7/30/21 | | $ | 227 | (b)(l) | |
DOP | 3,600 | | | 10.38%, due 3/4/22 | | | 79 | (c)(l) | |
DOP | 6,100 | | | 11.50%, due 5/10/24 | | | 140 | (c)(l) | |
$ | 123 | | | 7.45%, due 4/30/44 | | | 146 | (b)(l) | |
| | 236 | | | 7.45%, due 4/30/44 | | | 280 | (c)(l) | |
| | | | 1,073 | | |
Ecuador 0.3% | | | |
| | | | | Ecuador Government International Bond | | | | | |
| | 300 | | | 7.95%, due 6/20/24 | | | 303 | (c) | |
| | 200 | | | 9.63%, due 6/2/27 | | | 215 | (c) | |
| | 200 | | | 8.88%, due 10/23/27 | | | 205 | (c) | |
| | | | 723 | | |
Egypt 1.4% | | | |
| | | | | Egypt Government International Bond | | | | | |
| | 200 | | | 6.13%, due 1/31/22 | | | 208 | (c) | |
| | 224 | | | 5.88%, due 6/11/25 | | | 229 | (b) | |
| | 200 | | | 7.50%, due 1/31/27 | | | 222 | (c) | |
| | 800 | | | 8.50%, due 1/31/47 | | | 905 | (c) | |
| | | | | Egypt Treasury Bill | | | | | |
EGP | 15,000 | | | Ser. 364D, 0.83%, due 11/14/17 | | | 846 | (k) | |
EGP | 2,975 | | | Ser. 364D, 5.58%, due 1/9/18 | | | 163 | (k) | |
EGP | 3,600 | | | Ser. 364D, 7.00%, due 2/6/18 | | | 195 | (k) | |
EGP | 10,000 | | | Ser. 364D, 12.71%, due 7/10/18 | | | 505 | (k) | |
EGP | 5,500 | | | Ser. 364D, 16.93%, due 10/2/18 | | | 268 | (k) | |
| | | | 3,541 | | |
El Salvador 0.7% | | | |
| | | | | El Salvador Government International Bond | | | | | |
$ | 1,125 | | | 6.38%, due 1/18/27 | | | 1,120 | (c) | |
| | 67 | | | 8.63%, due 2/28/29 | | | 76 | (c) | |
| | 100 | | | 7.65%, due 6/15/35 | | | 104 | (c) | |
| | 450 | | | 7.63%, due 2/1/41 | | | 469 | (c) | |
| | | | 1,769 | | |
Ghana 0.6% | | | |
| | | | | Ghana Government Bond | | | | | |
GHS | 388 | | | 24.50%, due 4/22/19 | | | 95 | | |
GHS | 194 | | | 24.00%, due 9/9/19 | | | 48 | | |
GHS | 1,066 | | | 24.75%, due 7/19/21 | | | 287 | | |
| | | | | Ghana Government International Bond | | | | | |
$ | 600 | | | 10.75%, due 10/14/30 | | | 799 | (c)(e) | |
| | 200 | | | 10.75%, due 10/14/30 | | | 266 | (c)(e) | |
| | | | 1,495 | | |
Hungary 2.0% | | | |
| | | | | Hungary Government Bond | | | | | |
HUF | 396,700 | | | 1.75%, due 10/26/22 | | | 1,525 | | |
HUF | 329,620 | | | 3.00%, due 6/26/24 | | | 1,326 | | |
See Notes to Financial Statements
74
Schedule of Investments Emerging Markets Debt Fund (cont'd)
| PRINCIPAL AMOUNT(a) | | | | VALUE | |
(000's omitted) | | | | (000's omitted) | |
HUF | 85,000 | | | 2.75%, due 12/22/26 | | $ | 328 | | |
HUF | 106,880 | | | 3.00%, due 10/27/27 | | | 419 | | |
| | | | | Hungary Government International Bond | | | | | |
$ | 200 | | | 5.38%, due 2/21/23 | | | 224 | | |
EUR | 356 | | | 1.75%, due 10/10/27 | | | 422 | (c) | |
$ | 460 | | | 7.63%, due 3/29/41 | | | 709 | (e) | |
| | | | 4,953 | | |
Indonesia 6.1% | | | |
| | | | | Indonesia Government International Bond | | | | | |
EUR | $233 | | | 2.15%, due 7/18/24 | | | 281 | (c) | |
EUR | 380 | | | 3.38%, due 7/30/25 | | | 493 | (c) | |
EUR | 1,920 | | | 3.75%, due 6/14/28 | | | 2,537 | (c) | |
$ | 550 | | | 8.50%, due 10/12/35 | | | 822 | (c)(e) | |
| | 200 | | | 5.25%, due 1/17/42 | | | 224 | (c) | |
| | | | | Indonesia Treasury Bond | | | | | |
IDR | 3,500,000 | | | 7.88%, due 4/15/19 | | | 266 | | |
IDR | 22,400,000 | | | 8.38%, due 3/15/24 | | | 1,789 | (e) | |
IDR | 31,500,000 | | | 7.00%, due 5/15/27 | | | 2,361 | | |
IDR | 9,975,000 | | | 9.00%, due 3/15/29 | | | 837 | (e) | |
IDR | 11,204,000 | | | 8.75%, due 5/15/31 | | | 927 | (e) | |
IDR | 11,500,000 | | | 7.50%, due 8/15/32 | | | 864 | | |
IDR | 11,044,000 | | | 8.38%, due 3/15/34 | | | 882 | (e) | |
IDR | 29,683,000 | | | 8.25%, due 5/15/36 | | | 2,381 | (e) | |
IDR | 6,500,000 | | | 7.50%, due 5/15/38 | | | 488 | | |
| | | | 15,152 | | |
Jamaica 0.1% | | | |
$ | 200 | | | Jamaica Government International Bond, 6.75%, due 4/28/28 | | | 232 | | |
Jordan 0.2% | | | |
| | | | | Jordan Government International Bond | | | | | |
| | 200 | | | 6.13%, due 1/29/26 | | | 207 | (c) | |
| | 200 | | | 7.38%, due 10/10/47 | | | 209 | (c) | |
| | | | 416 | | |
Kazakhstan 0.1% | | | |
| | 250 | | | Kazakhstan Government International Bond, 5.13%, due 7/21/25 | | | 278 | (c) | |
Korea 0.1% | | | |
| | 258 | | | Korea Housing Finance Corp., 3.00%, due 10/31/22 | | | 258 | (b) | |
Malaysia 2.2% | | | |
| | 1,000 | | | 1MDB Global Investments Ltd., 4.40%, due 3/9/23 | | | 959 | (c)(e) | |
| | | | | Malaysia Government Bond | | | | | |
MYR | 880 | | | 3.49%, due 3/31/20 | | | 208 | | |
MYR | 400 | | | 4.05%, due 9/30/21 | | | 96 | | |
MYR | 500 | | | 3.80%, due 9/30/22 | | | 118 | | |
MYR | 5,500 | | | 3.80%, due 8/17/23 | | | 1,290 | | |
See Notes to Financial Statements
75
Schedule of Investments Emerging Markets Debt Fund (cont'd)
| PRINCIPAL AMOUNT(a) | | | | VALUE | |
(000's omitted) | | | | (000's omitted) | |
MYR | 2,300 | | | 4.18%, due 7/15/24 | | $ | 549 | (e) | |
MYR | 3,300 | | | 4.06%, due 9/30/24 | | | 784 | | |
MYR | 1,500 | | | 3.96%, due 9/15/25 | | | 349 | | |
MYR | 500 | | | 3.90%, due 11/16/27 | | | 118 | | |
MYR | 1,835 | | | 4.23%, due 6/30/31 | | | 423 | | |
MYR | 350 | | | 4.94%, due 9/30/43 | | | 82 | | |
MYR | 2,000 | | | Malaysia Government Investment Issue, 4.07%, due 9/30/26 | | | 466 | | |
| | | | 5,442 | | |
Mexico 5.6% | | | |
| | | | | Mexican Bonos | | | | | |
MXN | 139,585 | | | Ser. M, 6.50%, due 6/9/22 | | | 7,122 | | |
MXN | 56,310 | | | Ser. M20, 10.00%, due 12/5/24 | | | 3,406 | | |
MXN | 21,055 | | | Ser. M20, 7.50%, due 6/3/27 | | | 1,114 | | |
MXN | 4,188 | | | Ser. M20, 8.50%, due 5/31/29 | | | 238 | | |
MXN | 1,278 | | | Ser. M20, 8.50%, due 5/31/29 | | | 73 | | |
MXN | 3,473 | | | Ser. M, 7.75%, due 5/29/31 | | | 187 | | |
MXN | 3,634 | | | Ser. M30, 8.50%, due 11/18/38 | | | 209 | | |
MXN | 4,460 | | | Ser. M, 7.75%, due 11/13/42 | | | 238 | | |
$ | 1,340 | | | Mexico Government International Bond, 5.75%, due 10/12/10 | | | 1,400 | | |
| | | | 13,987 | | |
Mongolia 0.3% | | | |
| | | | | Mongolia Government International Bond | | | | | |
| | 400 | | | 10.88%, due 4/6/21 | | | 470 | (c) | |
| | 200 | | | 8.75%, due 3/9/24 | | | 229 | (c) | |
| | 42 | | | 8.75%, due 3/9/24 | | | 48 | (c) | |
| | | | 747 | | |
Morocco 0.4% | | | |
EUR | 740 | | | Morocco Government International Bond, 3.50%, due 6/19/24 | | | 960 | (c) | |
Nigeria 1.0% | | | |
| | | | | Nigeria Government International Bond | | | | | |
$ | 860 | | | 5.63%, due 6/27/22 | | | 880 | | |
| | 600 | | | 7.88%, due 2/16/32 | | | 659 | (c) | |
| | | | | Nigeria Treasury Bill | | | | | |
NGN | 135,981 | | | Ser. 364D, 18.98%, due 4/5/18 | | | 349 | (k) | |
NGN | 230,000 | | | Ser. 364D, 11.16%, due 8/2/18 | | | 555 | (k)(m) | |
| | | | 2,443 | | |
Oman 0.2% | | | |
$ | 450 | | | Oman Government International Bond, 4.75%, due 6/15/26 | | | 444 | (c) | |
Peru 2.1% | | | |
PEN | 1,347 | | | Peru Government Bond, 6.15%, due 8/12/32 | | | 433 | (b)(c) | |
| | | | | Peruvian Government International Bond | | | | | |
PEN | 1,641 | | | 5.70%, due 8/12/24 | | | 535 | (b) | |
PEN | 1,156 | | | 5.70%, due 8/12/24 | | | 377 | (c) | |
See Notes to Financial Statements
76
Schedule of Investments Emerging Markets Debt Fund (cont'd)
| PRINCIPAL AMOUNT(a) | | | | VALUE | |
(000's omitted) | | | | (000's omitted) | |
PEN | 4,649 | | | 8.20%, due 8/12/26 | | $ | 1,753 | (c) | |
PEN | 622 | | | 6.35%, due 8/12/28 | | | 206 | (b) | |
EUR | 1,344 | | | 3.75%, due 3/1/30 | | | 1,895 | | |
PEN | 371 | | | 6.95%, due 8/12/31 | | | 128 | (c) | |
| | | | 5,327 | | |
Philippines 0.1% | | | |
PHP | 12,000 | | | Philippine Government International Bond, 3.90%, due 11/26/22 | | | 231 | | |
Poland 3.4% | | | |
| | | | | Poland Government Bond | | | | | |
PLN | 5,850 | | | 1.75%, due 7/25/21 | | | 1,571 | | |
PLN | 1,861 | | | 5.75%, due 9/23/22 | | | 583 | | |
PLN | 1,299 | | | 4.00%, due 10/25/23 | | | 378 | | |
PLN | 4,272 | | | 3.25%, due 7/25/25 | | | 1,173 | | |
PLN | 3,543 | | | 2.50%, due 7/25/26 | | | 909 | | |
PLN | 15,255 | | | 2.50%, due 7/25/27 | | | 3,868 | (e) | |
| | | | 8,482 | | |
Romania 1.0% | | | |
| | | | | Romania Government Bond | | | | | |
RON | 1,250 | | | 3.50%, due 12/19/22 | | | 317 | | |
RON | 1,250 | | | 4.75%, due 2/24/25 | | | 329 | | |
RON | 4,660 | | | 5.80%, due 7/26/27 | | | 1,312 | | |
EUR | 330 | | | Romanian Government International Bond, 3.88%, due 10/29/35 | | | 415 | (c) | |
| | | | 2,373 | | |
Russia 6.2% | | | |
| | | | | Russian Federal Bond–OFZ | | | | | |
RUB | 118,964 | | | 6.70%, due 5/15/19 | | | 2,016 | | |
RUB | 209,852 | | | 6.80%, due 12/11/19 | | | 3,554 | (e) | |
RUB | 10,000 | | | 7.60%, due 4/14/21 | | | 173 | | |
RUB | 12,342 | | | 7.60%, due 7/20/22 | | | 213 | | |
RUB | 43,851 | | | 7.00%, due 1/25/23 | | | 740 | | |
RUB | 424,762 | | | 7.75%, due 9/16/26 | | | 7,389 | (e) | |
RUB | 8,857 | | | 7.70%, due 3/23/33 | | | 152 | | |
| | | | | Russian Foreign Bond–Eurobond | | | | | |
$ | 400 | | | 4.25%, due 6/23/27 | | | 408 | (c) | |
| | 800 | | | 5.25%, due 6/23/47 | | | 819 | (c) | |
| | | | 15,464 | | |
Saudi Arabia 0.4% | | | |
| | | | | Saudi Government International Bond | | | | | |
| | 215 | | | 2.88%, due 3/4/23 | | | 214 | (c) | |
| | 307 | | | 3.63%, due 3/4/28 | | | 304 | (c) | |
| | 500 | | | 4.63%, due 10/4/47 | | | 512 | (c) | |
| | | | 1,030 | | |
See Notes to Financial Statements
77
Schedule of Investments Emerging Markets Debt Fund (cont'd)
| PRINCIPAL AMOUNT(a) | | | | VALUE | |
(000's omitted) | | | | (000's omitted) | |
Serbia 0.7% | | | |
| | | | | Serbia International Bond | | | | | |
$ | 200 | | | 4.88%, due 2/25/20 | | $ | 208 | (c) | |
| | 475 | | | 4.88%, due 2/25/20 | | | 495 | (c) | |
| | 200 | | | 7.25%, due 9/28/21 | | | 230 | (c) | |
| | 720 | | | 7.25%, due 9/28/21 | | | 828 | (c)(e) | |
| | | | 1,761 | | |
South Africa 4.0% | | | |
| | | | | Republic of South Africa Government Bond | | | | | |
ZAR | 11,766 | | | 7.75%, due 2/28/23 | | | 809 | | |
ZAR | 1,040 | | | 10.50%, due 12/21/26 | | | 80 | | |
ZAR | 15,309 | | | 10.50%, due 12/21/26 | | | 1,173 | | |
ZAR | 7,751 | | | 8.00%, due 1/31/30 | | | 485 | | |
ZAR | 9,018 | | | 8.25%, due 3/31/32 | | | 560 | | |
ZAR | 20,031 | | | 8.50%, due 1/31/37 | | | 1,233 | | |
ZAR | 27,724 | | | 9.00%, due 1/31/40 | | | 1,764 | | |
ZAR | 32,422 | | | 8.75%, due 1/31/44 | | | 1,992 | | |
ZAR | 23,204 | | | 8.75%, due 2/28/48 | | | 1,430 | | |
| | | | | Republic of South Africa Government International Bond | | | | | |
$ | 207 | | | 4.30%, due 10/12/28 | | | 191 | | |
| | 223 | | | 5.65%, due 9/27/47 | | | 214 | | |
| | | | 9,931 | | |
Sri Lanka 1.6% | | | |
| | | | | Sri Lanka Government Bonds | | | | | |
LKR | 150,000 | | | Ser. A, 11.50%, due 12/15/21 | | | 1,025 | | |
LKR | 79,000 | | | 11.00%, due 6/1/26 | | | 530 | | |
LKR | 62,000 | | | Ser. A, 11.50%, due 8/1/26 | | | 428 | | |
LKR | 59,000 | | | Ser. A, 11.75%, due 6/15/27 | | | 414 | | |
| | | | | Sri Lanka Government International Bond | | | | | |
$ | 961 | | | 6.85%, due 11/3/25 | | | 1,066 | (c)(e) | |
| | 200 | | | 6.83%, due 7/18/26 | | | 222 | (c) | |
| | 200 | | | 6.20%, due 5/11/27 | | | 213 | (c) | |
| | | | 3,898 | | |
Thailand 3.5% | | | |
| | | | | Thailand Government Bond | | | | | |
THB | 24,828 | | | 3.88%, due 6/13/19 | | | 776 | | |
THB | 59,000 | | | 3.65%, due 12/17/21 | | | 1,913 | | |
THB | 13,000 | | | 1.88%, due 6/17/22 | | | 392 | | |
THB | 24,100 | | | 3.63%, due 6/16/23 | | | 790 | | |
THB | 35,457 | | | 3.85%, due 12/12/25 | | | 1,190 | | |
THB | 50,500 | | | 2.13%, due 12/17/26 | | | 1,491 | | |
THB | 4,400 | | | 4.88%, due 6/22/29 | | | 164 | | |
THB | 45,000 | | | 3.65%, due 6/20/31 | | | 1,491 | | |
THB | 14,500 | | | 3.40%, due 6/17/36 | | | 470 | | |
| | | | 8,677 | | |
Tunisia 0.1% | | | |
EUR | 100 | | | Banque Centrale de Tunisie International Bond, 5.63%, due 2/17/24 | | | 124 | (c) | |
See Notes to Financial Statements
78
Schedule of Investments Emerging Markets Debt Fund (cont'd)
| PRINCIPAL AMOUNT(a) | | | | VALUE | |
(000's omitted) | | | | (000's omitted) | |
Turkey 6.5% | | | |
| | | | | Export Credit Bank of Turkey | | | | | |
$ | 200 | | | 5.38%, due 2/8/21 | | $ | 205 | (b) | |
| | 200 | | | 5.38%, due 10/24/23 | | | 201 | (b) | |
| | 200 | | | Hazine Mustesarligi Varlik Kiralama AS, 5.00%, due 4/6/23 | | | 204 | (c) | |
| | | | | Turkey Government Bond | | | | | |
TRY | 5,550 | | | 7.40%, due 2/5/20 | | | 1,323 | | |
TRY | 3,459 | | | 9.40%, due 7/8/20 | | | 853 | (e) | |
TRY | 600 | | | 10.70%, due 2/17/21 | | | 151 | | |
TRY | 35,522 | | | 9.20%, due 9/22/21 | | | 8,568 | (e) | |
TRY | 5,000 | | | 11.00%, due 3/2/22 | | | 1,276 | | |
TRY | 2,343 | | | 3.00%, due 8/2/23 | | | 627 | | |
TRY | 1,729 | | | 10.60%, due 2/11/26 | | | 429 | | |
TRY | 1,877 | | | 10.50%, due 8/11/27 | | | 466 | | |
| | | | | Turkey Government International Bond | | | | | |
EUR | 395 | | | 3.25%, due 6/14/25 | | | 460 | | |
$ | 280 | | | 4.25%, due 4/14/26 | | | 264 | | |
| | 250 | | | 4.88%, due 10/9/26 | | | 244 | | |
| | 620 | | | 6.00%, due 3/25/27 | | | 653 | | |
| | 200 | | | 5.75%, due 5/11/47 | | | 191 | | |
| | | | 16,115 | | |
Ukraine 2.4% | | | |
| | | | | Ukraine Government International Bond | | | | | |
| | 271 | | | 7.75%, due 9/1/20 | | | 289 | (b) | |
| | 100 | | | 7.75%, due 9/1/21 | | | 107 | (b) | |
| | 500 | | | 7.75%, due 9/1/21 | | | 534 | (c) | |
| | 100 | | | 7.75%, due 9/1/23 | | | 106 | (c) | |
| | 300 | | | 7.75%, due 9/1/25 | | | 312 | (c) | |
| | 500 | | | 7.75%, due 9/1/26 | | | 517 | (c) | |
| | 200 | | | 7.75%, due 9/1/26 | | | 206 | (c) | |
| | 2,660 | | | 7.75%, due 9/1/27 | | | 2,741 | (c)(e) | |
| | 666 | | | 7.38%, due 9/25/32 | | | 657 | (c) | |
| | 286 | | | IGDCUKR Index (0.00%), due 5/31/40 | | | 163 | (b)(d) | |
| | 170 | | | IGDCUKR Index (0.00%), due 5/31/40 | | | 97 | (c)(d) | |
| | 310 | | | Ukreximbank Via Biz Finance PLC, 9.63%, due 4/27/22 | | | 334 | (b) | |
| | | | 6,063 | | |
Uruguay 0.5% | | | |
| | 1,000 | | | Uruguay Government International Bond, 5.10%, due 6/18/50 | | | 1,072 | | |
UYU | 5,577 | | | Uruguay Monetary Regulation Bill, 0.58%, due 11/8/17 | | | 191 | (k) | |
| | | | 1,263 | | |
| Venezuela 0.0%(f) | | | |
$ | 40 | | | Venezuela Government International Bond, 8.25%, due 10/13/24 | | | 14 | (c) | |
See Notes to Financial Statements
79
Schedule of Investments Emerging Markets Debt Fund (cont'd)
| PRINCIPAL AMOUNT(a) | | | | VALUE | |
(000's omitted) | | | | (000's omitted) | |
Zambia 0.2% | | | |
| | | | | Zambia Government International Bond | | | | | |
$ | 280 | | | 8.50%, due 4/14/24 | | $ | 300 | (c) | |
| | 220 | | | 8.97%, due 7/30/27 | | | 239 | (c) | |
| | | | 539 | | |
| | | | | Total Foreign Government Securities (Cost $168,633) | | | 170,193 | | |
NUMBER OF SHARES | | | | | |
Short-Term Investment 4.3% | | | |
Investment Company 4.3% | | | |
| | 10,626,492 |
| | State Street Institutional U.S. Government Money Market Fund Premier Class, 0.96%
(Cost $10,626) | | | 10,626
| (e)(n) | |
| | | | | Total Investments 99.1% (Cost $243,914) | | | 246,334 | | |
| | | | | Other Assets Less Liabilities 0.9% | | | 2,228 | (i) | |
| | | | | Net Assets 100.0% | | $ | 248,562 | | |
(a) Principal amount is stated in the currency in which the security is denominated.
ARS = Argentine Peso
BRL = Brazilian Real
CLP = Chilean Peso
COP = Colombian Peso
DOP = Dominican Peso
EGP = Egyptian Pound
EUR = Euro
GHS = Ghanaian Cedi
HUF = Hungarian Forint
IDR = Indonesian Rupiah
LKR = Sri Lanka Rupee
MXN = Mexican Peso
MYR = Malaysian Ringgit
NGN = Nigeria Naira
PEN = Peruvian Nuevo Sol
PHP = Philippine Peso
PLN = Polish Zloty
RON = New Romanian Leu
RUB = Russian Ruble
THB = Thai Baht
TRY = Turkish Lira
UYU = Uruguayan Peso
ZAR = South African Rand
(b) Securities were purchased under Rule 144A of the Securities Act of 1933, as amended (the "1933 Act"), or are otherwise restricted and, unless registered under the 1933 Act or exempted from registration, may only be sold to qualified institutional investors or may have other restrictions on resale. At October 31, 2017, these securities amounted to approximately $26,319,000, which represents 10.6% of net assets of the Fund. Securities denoted with a (b) but without a (l) have been deemed by the investment manager to be liquid.
(c) Security exempt from registration pursuant to Regulation S under the Securities Act of 1933. Regulation S applies to securities offerings that are made outside of the United States and do not involve direct selling efforts in the United States and as such may have restrictions on resale. Total value of all such securities at October 31, 2017, amounted to approximately $75,977,000, which represents 30.6% of net assets of the Fund.
(d) Variable or floating rate security — The interest rate shown was the current rate as of October 31, 2017 and changes periodically.
See Notes to Financial Statements
80
Schedule of Investments Emerging Markets Debt Fund (cont'd)
Benchmarks for Variable / Floating Rates:
LIBOR (USD) = London Interbank Offered Rate
BADLARRPP = Argentina Deposit Rates Badlar Private Banks
CMT = Constant Maturity Treasury
IGDCUKR = IMF Ukraine GDP Constant Price
(e) All or a portion of this security is segregated in connection for when-issued securities, futures, forward foreign currency contracts and/or swaps with a total value of approximately $53,787,000.
(f) Represents less than 0.05% of net assets.
(g) When-issued security. Total value of all such securities at October 31, 2017 amounted to approximately $920,000, which represents 0.4% of net assets of the Fund.
(h) Security fair valued as of October 31, 2017 in accordance with procedures approved by the Board of Trustees. Total value of all such securities at October 31, 2017 amounted to approximately $926,000, which represents approximately 0.4% of net assets of the Fund.
(i) Includes the impact of the Fund's open positions in derivatives at October 31, 2017.
(j) Step Bond. Coupon rate is a fixed rate for an initial period that either resets at a specific date or may reset in the future contingent upon a predetermined trigger. The interest rate shown was the current rate as of October 31, 2017.
(k) Rate shown was the discount rate at the date of purchase.
(l) Illiquid security.
(m) Value determined using significant unobservable inputs.
(n) Represents 7-day effective yield as of October 31, 2017.
See Notes to Financial Statements
81
Schedule of Investments Emerging Markets Debt Fund (cont'd)
POSITIONS BY INDUSTRY
Industry | | Investments at
Value
(000's omitted) | | Percentage of
Net Assets | |
Foreign Government* | | $ | 167,046 | | | | 67.2 | % | |
Oil & Gas | | | 14,394 | | | | 5.8 | % | |
Banks | | | 11,728 | | | | 4.7 | % | |
Electric | | | 6,211 | | | | 2.5 | % | |
Telecommunications | | | 4,682 | | | | 1.9 | % | |
Real Estate | | | 3,455 | | | | 1.4 | % | |
Iron — Steel | | | 2,994 | | | | 1.2 | % | |
Food | | | 2,768 | | | | 1.1 | % | |
Mining | | | 2,715 | | | | 1.1 | % | |
Pipelines | | | 2,416 | | | | 1.0 | % | |
Diversified Financial Services | | | 2,317 | | | | 1.0 | % | |
Lodging | | | 1,939 | | | | 0.8 | % | |
Chemicals | | | 1,714 | | | | 0.7 | % | |
Engineering & Construction | | | 1,611 | | | | 0.6 | % | |
Forest Products & Paper | | | 862 | | | | 0.3 | % | |
Retail | | | 838 | | | | 0.3 | % | |
Building Materials | | | 755 | | | | 0.3 | % | |
Insurance | | | 656 | | | | 0.3 | % | |
Transportation | | | 633 | | | | 0.3 | % | |
Gas | | | 605 | | | | 0.2 | % | |
Pharmaceuticals | | | 564 | | | | 0.2 | % | |
Regional(state/province) | | | 539 | | | | 0.1 | % | |
Real Estate Investment Trusts | | | 528 | | | | 0.2 | % | |
Metal Fabricate — Hardware | | | 515 | | | | 0.2 | % | |
Media | | | 449 | | | | 0.2 | % | |
Energy — Alternate Sources | | | 423 | | | | 0.2 | % | |
Investment Companies | | | 412 | | | | 0.2 | % | |
Commercial Services | | | 360 | | | | 0.1 | % | |
Beverages | | | 264 | | | | 0.1 | % | |
Oil & Gas Services | | | 259 | | | | 0.1 | % | |
Healthcare — Services | | | 255 | | | | 0.1 | % | |
Holding Companies — Diversified | | | 219 | | | | 0.1 | % | |
Multi-National | | | 213 | | | | 0.1 | % | |
Household Products — Wares | | | 210 | | | | 0.1 | % | |
Municipal | | | 159 | | | | 0.1 | % | |
Short-Term Investment and Other Assets — Net | | | 12,854 | | | | 5.2 | % | |
| | | $ | 248,562 | | | | 100.0 | % | |
*Each foreign government is deemed its own industry. This represents the aggregate of all foreign governments.
See Notes to Financial Statements
82
Schedule of Investments Emerging Markets Debt Fund (cont'd)
Derivative Instruments
Futures contracts ("futures")
At October 31, 2017, open positions in futures for the Fund were as follows:
Long Futures:
Expiration
Date | | Number of
Contracts | | Open Contracts | | Notional
Amount | | Value and
Unrealized
Appreciation/
(Depreciation) | |
12/2017 | | | 60 | | | U.S. Treasury Note, 10 Year | | $ | 7,496,250 | | | $ | (74,322 | ) | |
12/2017 | | | 3 | | | U.S. Treasury Ultra Long Bond | | | 494,344 | | | | (4,860 | ) | |
Total Long Positions | | | | | | $ | (7,990,594 | ) | | $ | (79,182 | ) | |
Short Futures:
Expiration
Date | | Number of
Contracts | | Open Contracts | | Notional
Amount | | Value and
Unrealized
Appreciation/
(Depreciation) | |
12/2017 | | | 54 | | | Euro-Bund | | $ | (10,237,280 | ) | | $ | (58,425 | ) | |
12/2017 | | | 14 | | | Euro-Buxl | | | (2,709,067 | ) | | | 3,235 | | |
12/2017 | | | 25 | | | U.S. Treasury Note, 5 Year | | | (2,929,688 | ) | | | 25,996 | | |
12/2017 | | | 82 | | | U.S. Treasury Note, 10 Year | | | (10,244,875 | ) | | | 77,866 | | |
12/2017 | | | 6 | | | U.S. Treasury Ultra Long Bond | | | (914,813 | ) | | | 16,490 | | |
3/2018 | | | 7 | | | Euro-Bund | | | (1,323,630 | ) | | | (2,786 | ) | |
Total Short Positions | | | | | | $ | (28,359,353 | ) | | $ | 62,376 | | |
Total Futures | | | | | | | | $ | (16,806 | ) | |
At October 31, 2017, the Fund had $437,502 deposited in a segregated account to cover margin requirements on open futures.
For the year ended October 31, 2017, the average notional value of futures for the Fund was $6,642,250 for long positions and $(14,896,973) for short positions.
See Notes to Financial Statements
83
Schedule of Investments Emerging Markets Debt Fund (cont'd)
Forward foreign currency ("forward contracts")
At October 31, 2017, open forward contracts for the Fund were as follows:
| Currency Purchased | | Currency Sold | | Counterparty | | Settlement
Date | | Net
Unrealized
Appreciation/
(Depreciation) | |
| | 6,300,000 | | | ARS | | | 350,389 | | | USD | | JPMorgan Chase Bank N.A. | | 11/16/2017 | | $ | 3,419 | | |
| | 7,108,099 | | | ARS | | | 398,213 | | | USD | | JPMorgan Chase Bank N.A. | | 11/16/2017 | | | 978 | | |
| | 162,800 | | | USD | | | 520,000 | | | BRL | | Citibank, N.A. | | 12/14/2017 | | | 4,669 | | |
| | 273,317 | | | USD | | | 172,487,465 | | | CLP | | Citibank, N.A. | | 11/2/2017 | | | 2,302 | | |
| | 66,468,798 | | | CLP | | | 103,908 | | | USD | | Citibank, N.A. | | 11/2/2017 | | | 529 | | |
| | 56,197,395 | | | CLP | | | 88,009 | | | USD | | Citibank, N.A. | | 11/2/2017 | | | 289 | | |
| | 172,487,465 | | | CLP | | | 270,998 | | | USD | | Citibank, N.A. | | 11/2/2017 | | | 17 | | |
| | 600,504 | | | USD | | | 377,957,451 | | | CLP | | JPMorgan Chase Bank N.A. | | 11/2/2017 | | | 6,652 | | |
| | 36,691,983 | | | CLP | | | 56,663 | | | USD | | JPMorgan Chase Bank N.A. | | 11/2/2017 | | | 988 | | |
| | 38,475,442 | | | CLP | | | 59,826 | | | USD | | JPMorgan Chase Bank N.A. | | 11/2/2017 | | | 627 | | |
| | 377,957,451 | | | CLP | | | 593,815 | | | USD | | JPMorgan Chase Bank N.A. | | 11/2/2017 | | | 37 | | |
| | 1,332,174,914 | | | CLP | | | 2,044,310 | | | USD | | Standard Chartered Bank | | 11/2/2017 | | | 48,823 | | |
| | 930,346 | | | USD | | | 578,209,900 | | | CLP | | Standard Chartered Bank | | 11/2/2017 | | | 21,854 | | |
| | 1,271,478,598 | | | CLP | | | 1,997,641 | | | USD | | Standard Chartered Bank | | 11/2/2017 | | | 126 | | |
| | 578,209,900 | | | CLP | | | 908,435 | | | USD | | Standard Chartered Bank | | 11/2/2017 | | | 57 | | |
| | 1,271,478,598 | | | CLP | | | 1,993,444 | | | USD | | Standard Chartered Bank | | 1/31/2018 | | | 1,925 | | |
| | 1,373,043 | | | CNY | | | 194,441 | | | USD | | Citibank, N.A. | | 11/14/2017 | | | 12,486 | | |
| | 3,751,755 | | | CNY | | | 523,842 | | | USD | | Goldman Sachs International | | 11/14/2017 | | | 41,573 | | |
| | 2,188,741 | | | EUR | | | 56,498,953 | | | CZK | | Citibank, N.A. | | 12/11/2017 | | | 15,289 | | |
| | 998,352 | | | EUR | | | 25,656,743 | | | CZK | | Goldman Sachs International | | 12/11/2017 | | | 1,780 | | |
| | 1,109,179 | | | EUR | | | 28,507,910 | | | CZK | | Citibank, N.A. | | 12/20/2017 | | | 2,457 | | |
| | 1,149,574 | | | EUR | | | 29,552,766 | | | CZK | | JPMorgan Chase Bank N.A. | | 12/20/2017 | | | 2,847 | | |
| | 1,144,929 | | | EUR | | | 30,575,340 | | | CZK | | Goldman Sachs International | | 9/27/2018 | | | 50,396 | | |
| | 1,105,446 | | | EUR | | | 29,341,852 | | | CZK | | Goldman Sachs International | | 12/20/2018 | | | 38,004 | | |
| | 431,730 | | | EUR | | | 11,531,503 | | | CZK | | Goldman Sachs International | | 12/20/2018 | | | 18,185 | | |
| | 118,192 | | | EUR | | | 3,150,395 | | | CZK | | Goldman Sachs International | | 12/20/2018 | | | 4,677 | | |
| | 1,284,486 | | | USD | | | 1,087,640 | | | EUR | | Citibank, N.A. | | 11/3/2017 | | | 17,484 | | |
| | 521,176 | | | USD | | | 439,436 | | | EUR | | Citibank, N.A. | | 11/3/2017 | | | 9,273 | | |
| | 1,273,517 | | | USD | | | 1,086,770 | | | EUR | | Citibank, N.A. | | 11/3/2017 | | | 7,529 | | |
| | 414,560 | | | USD | | | 351,758 | | | EUR | | Citibank, N.A. | | 11/3/2017 | | | 4,794 | | |
| | 391,655 | | | USD | | | 332,830 | | | EUR | | Citibank, N.A. | | 11/3/2017 | | | 3,939 | | |
| | 658,079 | | | USD | | | 553,654 | | | EUR | | Goldman Sachs International | | 11/3/2017 | | | 13,123 | | |
| | 532,805 | | | USD | | | 450,000 | | | EUR | | Goldman Sachs International | | 11/3/2017 | | | 8,596 | | |
| | 6,885,802 | | | USD | | | 5,800,000 | | | EUR | | JPMorgan Chase Bank N.A. | | 11/3/2017 | | | 129,327 | | |
| | 1,154,280 | | | USD | | | 978,706 | | | EUR | | JPMorgan Chase Bank N.A. | | 11/3/2017 | | | 14,176 | | |
| | 1,170,571 | | | USD | | | 995,671 | | | EUR | | JPMorgan Chase Bank N.A. | | 11/3/2017 | | | 10,704 | | |
| | 511,041 | | | USD | | | 431,390 | | | EUR | | JPMorgan Chase Bank N.A. | | 11/3/2017 | | | 8,511 | | |
| | 319,412 | | | USD | | | 272,247 | | | EUR | | JPMorgan Chase Bank N.A. | | 11/3/2017 | | | 2,269 | | |
| | 327,062 | | | EUR | | | 380,499 | | | USD | | JPMorgan Chase Bank N.A. | | 11/3/2017 | | | 499 | | |
| | 402,343 | | | USD | | | 343,233 | | | EUR | | Standard Chartered Bank | | 11/3/2017 | | | 2,508 | | |
| | 8,188,607 | | | EUR | | | 9,537,570 | | | USD | | Standard Chartered Bank | | 12/5/2017 | | | 17,380 | | |
| | 394,484 | | | EUR | | | 447,721 | | | USD | | JPMorgan Chase Bank N.A. | | 12/20/2017 | | | 13,058 | | |
| | 8,092,244 | | | USD | | | 6,860,000 | | | EUR | | Standard Chartered Bank | | 1/4/2018 | | | 71,353 | | |
| | 339,646,981 | | | HUF | | | 1,096,147 | | | EUR | | Goldman Sachs International | | 11/16/2017 | | | 6,510 | | |
See Notes to Financial Statements
84
Schedule of Investments Emerging Markets Debt Fund (cont'd)
| Currency Purchased | | Currency Sold | | Counterparty | | Settlement
Date | | Net
Unrealized
Appreciation/
(Depreciation) | |
| | 379,661,014 | | | HUF | | | 1,229,442 | | | EUR | | Citibank, N.A. | | 12/13/2017 | | $ | 12,570 | | |
| | 339,666,554 | | | HUF | | | 1,094,382 | | | EUR | | JPMorgan Chase Bank N.A. | | 12/13/2017 | | | 4,770 | | |
| | 269,069,261 | | | HUF | | | 872,313 | | | EUR | | Goldman Sachs International | | 1/12/2018 | | | 10,330 | | |
| | 774,197 | | | EUR | | | 241,304,129 | | | HUF | | Goldman Sachs International | | 1/12/2018 | | | 213 | | |
| | 89,101 | | | USD | | | 1,208,119,571 | | | IDR | | Standard Chartered Bank | | 11/28/2017 | | | 215 | | |
| | 12,500,000 | | | INR | | | 191,433 | | | USD | | Goldman Sachs International | | 11/8/2017 | | | 1,672 | | |
| | 4,062,127 | | | ILS | | | 1,126,804 | | | USD | | Goldman Sachs International | | 11/3/2017 | | | 26,832 | | |
| | 1,154,422 | | | USD | | | 4,062,127 | | | ILS | | Goldman Sachs International | | 11/3/2017 | | | 786 | | |
| | 925,139,173 | | | KRW | | | 820,428 | | | USD | | Goldman Sachs International | | 12/19/2017 | | | 7,161 | | |
| | 6,200,000 | | | MYR | | | 1,457,692 | | | USD | | Standard Chartered Bank | | 12/8/2017 | | | 9,076 | | |
| | 836,905 | | | USD | | | 14,992,936 | | | MXN | | Citibank, N.A. | | 11/9/2017 | | | 55,707 | | |
| | 1,184,144 | | | USD | | | 21,205,494 | | | MXN | | Goldman Sachs International | | 11/9/2017 | | | 79,244 | | |
| | 994,372 | | | USD | | | 17,727,372 | | | MXN | | Goldman Sachs International | | 11/9/2017 | | | 70,698 | | |
| | 691,015 | | | USD | | | 12,354,316 | | | MXN | | Goldman Sachs International | | 11/9/2017 | | | 47,301 | | |
| | 1,245,365 | | | USD | | | 22,484,107 | | | MXN | | JPMorgan Chase Bank N.A. | | 11/9/2017 | | | 73,844 | | |
| | 9,394,079 | | | MXN | | | 486,693 | | | USD | | Goldman Sachs International | | 12/11/2017 | | | 50 | | |
| | 1,480,766 | | | USD | | | 28,119,579 | | | MXN | | JPMorgan Chase Bank N.A. | | 12/11/2017 | | | 23,784 | | |
| | 173,182 | | | USD | | | 3,248,621 | | | MXN | | JPMorgan Chase Bank N.A. | | 12/11/2017 | | | 4,859 | | |
| | 1,054,861 | | | USD | | | 20,294,695 | | | MXN | | JPMorgan Chase Bank N.A. | | 12/11/2017 | | | 3,316 | | |
| | 607,132 | | | PEN | | | 186,271 | | | USD | | Citibank, N.A. | | 11/17/2017 | | | 381 | | |
| | 966,486 | | | PEN | | | 295,507 | | | USD | | JPMorgan Chase Bank N.A. | | 11/17/2017 | | | 1,622 | | |
| | 649,474 | | | PEN | | | 198,951 | | | USD | | JPMorgan Chase Bank N.A. | | 11/17/2017 | | | 719 | | |
| | 831,863 | | | PLN | | | 196,069 | | | EUR | | JPMorgan Chase Bank N.A. | | 11/17/2017 | | | 40 | | |
| | 1,397,487 | | | EUR | | | 5,983,469 | | | PLN | | Citibank, N.A. | | 11/3/2017 | | | 15,887 | | |
| | 502,455 | | | EUR | | | 2,148,124 | | | PLN | | Citibank, N.A. | | 11/3/2017 | | | 4,838 | | |
| | 376,216 | | | EUR | | | 1,607,139 | | | PLN | | Citibank, N.A. | | 11/3/2017 | | | 3,271 | | |
| | 322,148 | | | EUR | | | 1,371,604 | | | PLN | | Citibank, N.A. | | 11/3/2017 | | | 1,546 | | |
| | 205,154 | | | EUR | | | 879,427 | | | PLN | | JPMorgan Chase Bank N.A. | | 11/3/2017 | | | 2,618 | | |
| | 2,199,616 | | | EUR | | | 9,460,777 | | | PLN | | Citibank, N.A. | | 11/17/2017 | | | 34,848 | | |
| | 146,474 | | | EUR | | | 629,269 | | | PLN | | JPMorgan Chase Bank N.A. | | 11/17/2017 | | | 2,120 | | |
| | 194,075 | | | EUR | | | 831,045 | | | PLN | | JPMorgan Chase Bank N.A. | | 11/17/2017 | | | 2,060 | | |
| | 144,935 | | | EUR | | | 622,421 | | | PLN | | JPMorgan Chase Bank N.A. | | 11/17/2017 | | | 2,033 | | |
| | 1,726,787 | | | EUR | | | 7,378,746 | | | PLN | | Standard Chartered Bank | | 1/25/2018 | | | 6,777 | | |
| | 299,779 | | | USD | | | 17,315,343 | | | RUS | | Goldman Sachs International | | 11/22/2017 | | | 4,169 | | |
| | 462,892 | | | USD | | | 27,000,000 | | | RUS | | Goldman Sachs International | | 11/22/2017 | | | 1,944 | | |
| | 80,000,000 | | | RUS | | | 1,331,336 | | | USD | | JPMorgan Chase Bank N.A. | | 11/22/2017 | | | 34,434 | | |
| | 1,284,451 | | | USD | | | 74,793,586 | | | RUS | | JPMorgan Chase Bank N.A. | | 11/22/2017 | | | 7,565 | | |
| | 842,202 | | | USD | | | 49,163,556 | | | RUS | | JPMorgan Chase Bank N.A. | | 11/22/2017 | | | 2,876 | | |
| | 1,277,732 | | | USD | | | 74,785,680 | | | RUS | | JPMorgan Chase Bank N.A. | | 11/22/2017 | | | 982 | | |
| | 197,567 | | | USD | | | 265,878 | | | SGD | | JPMorgan Chase Bank N.A. | | 11/15/2017 | | | 2,502 | | |
| | 526,521 | | | USD | | | 717,061 | | | SGD | | JPMorgan Chase Bank N.A. | | 11/15/2017 | | | 438 | | |
| | 526,477 | | | USD | | | 717,061 | | | SGD | | JPMorgan Chase Bank N.A. | | 11/15/2017 | | | 393 | | |
| | 221,895 | | | USD | | | 300,000 | | | SGD | | Citibank, N.A. | | 12/5/2017 | | | 1,756 | | |
| | 812,719 | | | USD | | | 1,102,794 | | | SGD | | Goldman Sachs International | | 12/5/2017 | | | 3,491 | | |
| | 22,900,000 | | | THB | | | 686,238 | | | USD | | JPMorgan Chase Bank N.A. | | 11/30/2017 | | | 3,139 | | |
| | 7,645,154 | | | THB | | | 229,271 | | | USD | | JPMorgan Chase Bank N.A. | | 11/30/2017 | | | 877 | | |
| | 43,166,835 | | | THB | | | 1,295,620 | | | USD | | Standard Chartered Bank | | 11/30/2017 | | | 3,865 | | |
See Notes to Financial Statements
85
Schedule of Investments Emerging Markets Debt Fund (cont'd)
| Currency Purchased | | Currency Sold | | Counterparty | | Settlement
Date | | Net
Unrealized
Appreciation/
(Depreciation) | |
| | 25,003,499 | | | THB | | | 747,936 | | | USD | | Goldman Sachs International | | 12/6/2017 | | $ | 4,782 | | |
| | 1,010,794 | | | USD | | | 3,739,622 | | | TRY | | Goldman Sachs International | | 12/12/2017 | | | 36,769 | | |
| | 679,264 | | | TRY | | | 176,763 | | | USD | | Goldman Sachs International | | 12/12/2017 | | | 159 | | |
| | 2,257,735 | | | USD | | | 8,478,032 | | | TRY | | JPMorgan Chase Bank N.A. | | 12/12/2017 | | | 49,540 | | |
| | 355,213 | | | USD | | | 1,327,173 | | | TRY | | Standard Chartered Bank | | 12/12/2017 | | | 9,536 | | |
| | 284,548 | | | USD | | | 1,060,478 | | | TRY | | Standard Chartered Bank | | 12/12/2017 | | | 8,335 | | |
| | 164,992 | | | USD | | | 2,211,128 | | | ZAR | | Citibank, N.A. | | 11/24/2017 | | | 9,202 | | |
| | 1,286,141 | | | USD | | | 17,477,328 | | | ZAR | | Goldman Sachs International | | 11/24/2017 | | | 54,739 | | |
| | 1,212,258 | | | USD | | | 16,786,412 | | | ZAR | | Goldman Sachs International | | 11/24/2017 | | | 29,537 | | |
| | 179,812 | | | USD | | | 2,483,085 | | | ZAR | | Goldman Sachs International | | 11/24/2017 | | | 4,861 | | |
| | 640,499 | | | USD | | | 8,939,601 | | | ZAR | | Standard Chartered Bank | | 11/24/2017 | | | 10,641 | | |
| | 7,543,762 | | | ZAR | | | 519,191 | | | USD | | JPMorgan Chase Bank N.A. | | 1/29/2018 | | | 6,509 | | |
| | 32,943 | | | USD | | | 472,712 | | | ZAR | | JPMorgan Chase Bank N.A. | | 1/29/2018 | | | 1 | | |
| | 637,600 | | | USD | | | 9,057,532 | | | ZAR | | Standard Chartered Bank | | 1/29/2018 | | | 6,410 | | |
| | | | | | | | | | | | $ | 1,432,659 | | |
| | 658,884 | | | USD | | | 11,971,927 | | | ARS | | Citibank, N.A. | | 11/16/2017 | | | (13,460 | ) | |
| | 5,386,421 | | | ARS | | | 303,803 | | | USD | | JPMorgan Chase Bank N.A. | | 11/16/2017 | | | (1,301 | ) | |
| | 630,066 | | | BRL | | | 196,668 | | | USD | | Citibank, N.A. | | 1/10/2018 | | | (5,670 | ) | |
| | 4,173,935 | | | BRL | | | 1,316,450 | | | USD | | Citibank, N.A. | | 1/10/2018 | | | (51,160 | ) | |
| | 8,129,687 | | | BRL | | | 2,534,192 | | | USD | | Citibank, N.A. | | 1/10/2018 | | | (69,753 | ) | |
| | 6,234,777 | | | BRL | | | 1,965,876 | | | USD | | JPMorgan Chase Bank N.A. | | 1/10/2018 | | | (75,862 | ) | |
| | 687,201 | | | BRL | | | 217,200 | | | USD | | Standard Chartered Bank | | 1/10/2018 | | | (8,881 | ) | |
| | 2,579,012 | | | BRL | | | 802,545 | | | USD | | JPMorgan Chase Bank N.A. | | 1/24/2018 | | | (22,137 | ) | |
| | 88,293 | | | USD | | | 56,197,395 | | | CLP | | Citibank, N.A. | | 11/2/2017 | | | (6 | ) | |
| | 104,430 | | | USD | | | 66,468,798 | | | CLP | | Citibank, N.A. | | 11/2/2017 | | | (7 | ) | |
| | 156,491 | | | USD | | | 99,604,638 | | | CLP | | Goldman Sachs International | | 11/2/2017 | | | (10 | ) | |
| | 99,604,638 | | | CLP | | | 159,866 | | | USD | | Goldman Sachs International | | 11/2/2017 | | | (3,365 | ) | |
| | 57,647 | | | USD | | | 36,691,983 | | | CLP | | JPMorgan Chase Bank N.A. | | 11/2/2017 | | | (4 | ) | |
| | 60,449 | | | USD | | | 38,475,442 | | | CLP | | JPMorgan Chase Bank N.A. | | 11/2/2017 | | | (4 | ) | |
| | 1,210,577 | | | USD | | | 770,520,244 | | | CLP | | JPMorgan Chase Bank N.A. | | 11/2/2017 | | | (76 | ) | |
| | 770,520,244 | | | CLP | | | 1,228,038 | | | USD | | JPMorgan Chase Bank N.A. | | 11/2/2017 | | | (17,385 | ) | |
| | 2,093,002 | | | USD | | | 1,332,174,914 | | | CLP | | Standard Chartered Bank | | 11/2/2017 | | | (132 | ) | |
| | 1,996,042 | | | USD | | | 1,271,478,598 | | | CLP | | Standard Chartered Bank | | 11/2/2017 | | | (1,725 | ) | |
| | 325,654,745 | | | CLP | | | 512,439 | | | USD | | Goldman Sachs International | | 1/31/2018 | | | (1,379 | ) | |
| | 188,227 | | | USD | | | 120,021,229 | | | CLP | | JPMorgan Chase Bank N.A. | | 1/31/2018 | | | (125 | ) | |
| | 738,497 | | | USD | | | 5,124,798 | | | CNY | | Citibank, N.A. | | 11/14/2017 | | | (33,845 | ) | |
| | 3,972,698,004 | | | COP | | | 1,346,198 | | | USD | | Citibank, N.A. | | 11/20/2017 | | | (42,464 | ) | |
| | 478,395,490 | | | COP | | | 163,126 | | | USD | | Goldman Sachs International | | 11/20/2017 | | | (6,130 | ) | |
| | 570,000,000 | | | COP | | | 194,606 | | | USD | | JPMorgan Chase Bank N.A. | | 11/20/2017 | | | (7,547 | ) | |
| | 21,762 | | | EUR | | | 558,115 | | | CZK | | JPMorgan Chase Bank N.A. | | 12/20/2017 | | | (6 | ) | |
| | 380,488 | | | EUR | | | 448,185 | | | USD | | Citibank, N.A. | | 11/3/2017 | | | (4,951 | ) | |
| | 437,315 | | | EUR | | | 515,251 | | | USD | | Citibank, N.A. | | 11/3/2017 | | | (5,818 | ) | |
| | 564,647 | | | EUR | | | 664,296 | | | USD | | Citibank, N.A. | | 11/3/2017 | | | (6,534 | ) | |
| | 588,076 | | | EUR | | | 692,542 | | | USD | | Citibank, N.A. | | 11/3/2017 | | | (7,487 | ) | |
| | 1,013,785 | | | EUR | | | 1,197,731 | | | USD | | Citibank, N.A. | | 11/3/2017 | | | (16,763 | ) | |
| | 152,025 | | | EUR | | | 178,514 | | | USD | | Goldman Sachs International | | 11/3/2017 | | | (1,419 | ) | |
| | 220,814 | | | EUR | | | 260,827 | | | USD | | Goldman Sachs International | | 11/3/2017 | | | (3,599 | ) | |
See Notes to Financial Statements
86
Schedule of Investments Emerging Markets Debt Fund (cont'd)
| Currency Purchased | | Currency Sold | | Counterparty | | Settlement
Date | | Net
Unrealized
Appreciation/
(Depreciation) | |
| | 907,104 | | | EUR | | | 1,062,652 | | | USD | | Goldman Sachs International | | 11/3/2017 | | $ | (5,958 | ) | |
| | 494,727 | | | EUR | | | 579,590 | | | USD | | JPMorgan Chase Bank N.A. | | 11/3/2017 | | | (3,278 | ) | |
| | 500,000 | | | EUR | | | 587,919 | | | USD | | JPMorgan Chase Bank N.A. | | 11/3/2017 | | | (5,464 | ) | |
| | 8,579,011 | | | EUR | | | 10,232,856 | | | USD | | JPMorgan Chase Bank N.A. | | 11/3/2017 | | | (239,084 | ) | |
| | 9,521,627 | | | USD | | | 8,188,607 | | | EUR | | Standard Chartered Bank | | 11/3/2017 | | | (17,359 | ) | |
| | 4,611,017 | | | PLN | | | 1,082,599 | | | EUR | | JPMorgan Chase Bank N.A. | | 11/3/2017 | | | (5,650 | ) | |
| | 7,378,746 | | | PLN | | | 1,734,247 | | | EUR | | Standard Chartered Bank | | 11/3/2017 | | | (6,915 | ) | |
| | 910,797 | | | PLN | | | 212,558 | | | EUR | | Citibank, N.A. | | 11/17/2017 | | | (2,423 | ) | |
| | 1,269,213 | | | PLN | | | 293,904 | | | EUR | | Goldman Sachs International | | 11/17/2017 | | | (6,057 | ) | |
| | 1,300,000 | | | PLN | | | 300,438 | | | EUR | | Goldman Sachs International | | 11/17/2017 | | | (6,899 | ) | |
| | 4,613,847 | | | PLN | | | 1,082,857 | | | EUR | | JPMorgan Chase Bank N.A. | | 11/17/2017 | | | (5,169 | ) | |
| | 453,240 | | | RON | | | 97,794 | | | EUR | | JPMorgan Chase Bank N.A. | | 2/20/2018 | | | (13 | ) | |
| | 12,352,638 | | | CZK | | | 474,008 | | | EUR | | JPMorgan Chase Bank N.A. | | 9/27/2018 | | | (6,746 | ) | |
| | 44,023,750 | | | CZK | | | 1,689,647 | | | EUR | | Goldman Sachs International | | 12/20/2018 | | | (19,866 | ) | |
| | 2,221,363 | | | EUR | | | 674,245,054 | | | HUF | | Citibank, N.A. | | 11/16/2017 | | | (65,801 | ) | |
| | 178,118 | | | EUR | | | 54,469,447 | | | HUF | | Goldman Sachs International | | 11/16/2017 | | | (3,757 | ) | |
| | 145,008 | | | EUR | | | 43,895,677 | | | HUF | | Goldman Sachs International | | 11/16/2017 | | | (4,738 | ) | |
| | 2,876,520 | | | EUR | | | 881,446,120 | | | HUF | | Standard Chartered Bank | | 12/13/2017 | | | (55,065 | ) | |
| | 171,252 | | | EUR | | | 52,903,149 | | | HUF | | Goldman Sachs International | | 1/12/2018 | | | (1,729 | ) | |
| | 32,584 | | | EUR | | | 10,152,703 | | | HUF | | JPMorgan Chase Bank N.A. | | 1/12/2018 | | | (3 | ) | |
| | 158,239 | | | USD | | | 2,151,572,990 | | | IDR | | Goldman Sachs International | | 11/28/2017 | | | (61 | ) | |
| | 9,199,155,910 | | | IDR | | | 679,808 | | | USD | | JPMorgan Chase Bank N.A. | | 11/28/2017 | | | (2,989 | ) | |
| | 10,934,218,184 | | | IDR | | | 821,368 | | | USD | | Standard Chartered Bank | | 11/28/2017 | | | (16,894 | ) | |
| | 72,600,000 | | | INR | | | 1,129,961 | | | USD | | Citibank, N.A. | | 11/8/2017 | | | (8,407 | ) | |
| | 1,299,644 | | | USD | | | 84,788,766 | | | INR | | Citibank, N.A. | | 11/8/2017 | | | (10,207 | ) | |
| | 1,224,134 | | | USD | | | 5,200,000 | | | MYR | | Standard Chartered Bank | | 12/8/2017 | | | (6,058 | ) | |
| | 2,196,270 | | | MYR | | | 520,566 | | | USD | | Citibank, N.A. | | 12/18/2017 | | | (1,131 | ) | |
| | 457,014 | | | USD | | | 1,933,854 | | | MYR | | JPMorgan Chase Bank N.A. | | 12/18/2017 | | | (358 | ) | |
| | 6,689,775 | | | MYR | | | 1,596,986 | | | USD | | Goldman Sachs International | | 12/19/2017 | | | (14,847 | ) | |
| | 1,855,385 | | | MYR | | | 438,937 | | | USD | | Citibank, N.A. | | 1/19/2018 | | | (482 | ) | |
| | 2,368,344 | | | MXN | | | 131,795 | | | USD | | Citibank, N.A. | | 11/9/2017 | | | (8,394 | ) | |
| | 1,754,313 | | | MXN | | | 98,049 | | | USD | | Goldman Sachs International | | 11/9/2017 | | | (6,642 | ) | |
| | 2,652,280 | | | MXN | | | 148,269 | | | USD | | Goldman Sachs International | | 11/9/2017 | | | (10,074 | ) | |
| | 4,138,139 | | | MXN | | | 226,901 | | | USD | | Goldman Sachs International | | 11/9/2017 | | | (11,286 | ) | |
| | 8,577,861 | | | MXN | | | 475,135 | | | USD | | Goldman Sachs International | | 11/9/2017 | | | (28,190 | ) | |
| | 41,963,641 | | | MXN | | | 2,305,059 | | | USD | | Goldman Sachs International | | 11/9/2017 | | | (118,569 | ) | |
| | 3,311,570 | | | MXN | | | 180,064 | | | USD | | JPMorgan Chase Bank N.A. | | 11/9/2017 | | | (7,516 | ) | |
| | 6,231,912 | | | MXN | | | 345,897 | | | USD | | JPMorgan Chase Bank N.A. | | 11/9/2017 | | | (21,187 | ) | |
| | 14,784,845 | | | MXN | | | 828,793 | | | USD | | Goldman Sachs International | | 11/15/2017 | | | (59,256 | ) | |
| | 24,606,522 | | | MXN | | | 1,285,541 | | | USD | | Goldman Sachs International | | 12/11/2017 | | | (10,584 | ) | |
| | 4,344,420 | | | MXN | | | 229,930 | | | USD | | JPMorgan Chase Bank N.A. | | 12/11/2017 | | | (4,829 | ) | |
| | 916,457 | | | PEN | | | 282,412 | | | USD | | Goldman Sachs International | | 11/17/2017 | | | (663 | ) | |
| | 2,176,026 | | | PEN | | | 669,959 | | | USD | | JPMorgan Chase Bank N.A. | | 11/17/2017 | | | (978 | ) | |
| | 8,700,000 | | | PHP | | | 169,614 | | | USD | | JPMorgan Chase Bank N.A. | | 12/8/2017 | | | (1,782 | ) | |
| | 1,642,519 | | | EUR | | | 7,590,135 | | | RON | | Goldman Sachs International | | 2/20/2018 | | | (5,429 | ) | |
| | 10,500,000 | | | RUS | | | 180,594 | | | USD | | Goldman Sachs International | | 11/22/2017 | | | (1,336 | ) | |
| | 13,264,177 | | | RUS | | | 227,989 | | | USD | | Goldman Sachs International | | 11/22/2017 | | | (1,541 | ) | |
| | 21,000,000 | | | RUS | | | 360,632 | | | USD | | Goldman Sachs International | | 11/22/2017 | | | (2,117 | ) | |
See Notes to Financial Statements
87
Schedule of Investments Emerging Markets Debt Fund (cont'd)
Currency Purchased | | Currency Sold | | Counterparty | | Settlement
Date | | Net
Unrealized
Appreciation/
(Depreciation) | |
| 14,147,610 | | | RUS | | | 244,701 | | | USD | | Goldman Sachs International | | 11/22/2017 | | $ | (3,171 | ) | |
| 333,027 | | | USD | | | 20,000,000 | | | RUS | | Goldman Sachs International | | 11/22/2017 | | | (8,415 | ) | |
| 4,812,070 | | | USD | | | 288,753,095 | | | RUS | | Goldman Sachs International | | 11/22/2017 | | | (117,560 | ) | |
| 300,722 | | | USD | | | 17,619,327 | | | RUS | | JPMorgan Chase Bank N.A. | | 11/22/2017 | | | (77 | ) | |
| 366,361 | | | USD | | | 21,487,044 | | | RUS | | JPMorgan Chase Bank N.A. | | 11/22/2017 | | | (469 | ) | |
| 75,704,673 | | | RUS | | | 1,293,213 | | | USD | | JPMorgan Chase Bank N.A. | | 11/22/2017 | | | (773 | ) | |
| 82,000,000 | | | RUS | | | 1,411,603 | | | USD | | JPMorgan Chase Bank N.A. | | 11/22/2017 | | | (11,688 | ) | |
| 75,847,588 | | | RUS | | | 1,317,370 | | | USD | | JPMorgan Chase Bank N.A. | | 11/22/2017 | | | (22,490 | ) | |
| 8,226,851 | | | RUS | | | 141,743 | | | USD | | Standard Chartered Bank | | 11/22/2017 | | | (1,293 | ) | |
| 1,700,000 | | | SGD | | | 1,261,964 | | | USD | | JPMorgan Chase Bank N.A. | | 11/15/2017 | | | (14,732 | ) | |
| 2,794 | | | SGD | | | 2,077 | | | USD | | JPMorgan Chase Bank N.A. | | 12/5/2017 | | | (27 | ) | |
| 1,400,000 | | | SGD | | | 1,039,709 | | | USD | | Standard Chartered Bank | | 12/5/2017 | | | (12,393 | ) | |
| 1,231,182 | | | USD | | | 41,300,000 | | | THB | | Goldman Sachs International | | 11/30/2017 | | | (12,105 | ) | |
| 15,911,860 | | | THB | | | 481,375 | | | USD | | Citibank, N.A. | | 1/19/2018 | | | (2,237 | ) | |
| 132,570 | | | USD | | | 4,407,129 | | | THB | | JPMorgan Chase Bank N.A. | | 1/19/2018 | | | (137 | ) | |
| 15,911,859 | | | THB | | | 480,860 | | | USD | | JPMorgan Chase Bank N.A. | | 1/19/2018 | | | (1,721 | ) | |
| 2,544,414 | | | TRY | | | 678,176 | | | USD | | Citibank, N.A. | | 12/12/2017 | | | (15,456 | ) | |
| 3,110,736 | | | TRY | | | 833,415 | | | USD | | Goldman Sachs International | | 12/12/2017 | | | (23,190 | ) | |
| 756,392 | | | TRY | | | 203,251 | | | USD | | JPMorgan Chase Bank N.A. | | 12/12/2017 | | | (6,240 | ) | |
| 1,382,066 | | | TRY | | | 363,456 | | | USD | | Standard Chartered Bank | | 12/12/2017 | | | (3,482 | ) | |
| 1,254,927 | | | USD | | | 4,922,691 | | | TRY | | Goldman Sachs International | | 1/11/2018 | | | (16,160 | ) | |
| 2,350,480 | | | ZAR | | | 173,258 | | | USD | | Goldman Sachs International | | 11/24/2017 | | | (7,650 | ) | |
| 3,154,654 | | | ZAR | | | 237,052 | | | USD | | Goldman Sachs International | | 11/24/2017 | | | (14,785 | ) | |
| 17,411,620 | | | ZAR | | | 1,282,419 | | | USD | | Goldman Sachs International | | 11/24/2017 | | | (55,647 | ) | |
| 3,204,541 | | | ZAR | | | 235,400 | | | USD | | JPMorgan Chase Bank N.A. | | 11/24/2017 | | | (9,617 | ) | |
| 379,256 | | | ZAR | | | 28,378 | | | USD | | Standard Chartered Bank | | 11/24/2017 | | | (1,656 | ) | |
| 8,643,090 | | | ZAR | | | 648,106 | | | USD | | Standard Chartered Bank | | 11/24/2017 | | | (39,139 | ) | |
| | | | | | | | | | | | $ | (1,635,096 | ) | |
Total | | | | | | | | | | $ | (202,437 | ) | |
ARS = Argentine Peso(a)
BRL = Brazilian Real(a)
CLP = Chilean Peso(a)
CNY = Chinese Yuan Renminbi(a)
COP = Colombian Peso(a)
CZK = Czech Koruny
EUR = Euro
HUF = Hungarian Forint
IDR = Indonesian Rupiah(a)
ILS = Israeli Shekel
INR = Indian Rupee(a)
KRW = South Korean Won(a)
MYR = Malaysian Ringgit(a)
MXN = Mexican Peso
PEN = Peruvian Nuevo Sol
PHP = Philippine Peso(a)
PLN = Polish Zloty
RON = Romanian Leu
RUS = Russian Rubles(a)
SGD = Singapore Dollar
THB = Thai Baht
TRY = Turkish Lira
ZAR = South African Rand
(a) Non-deliverable forward contracts.
For the year ended October 31, 2017, the Fund's investments in forward contracts had an average notional value of $172,303,343.
See Notes to Financial Statements
88
Schedule of Investments Emerging Markets Debt Fund (cont'd)
Cross currency swap contracts ("cross currency swaps")
At October 31, 2017, the Fund had outstanding cross currency swaps as follows:
Counterparty | | Notional
Amount(c) | | Fund
Pays/
Receives
Floating
Rate | | Floating Rate
Index | | Annual
Fixed-Rate | | Maturity
Date | | Unrealized
Appreciation/
(Depreciation) | | Accrued Net
Interest
Receivable/
(Payable) | | Value | |
Goldman Sachs
International | | RUB | 253,488,047
| | | Receive
| | 3-month LIBOR(a)
| | | 6.88
| %(b) | | 5/29/2019
| | $ | 4,954
| | | $ | —
| | | $ | 4,954
| | |
JPMorgan
Chase Bank N.A. | | TRY | 16,000,000
| | | Pay
| | 3-month LIBOR(a)
| | | 12.06
| %(b) | | 1/29/2019
| | | (33,864
| ) | | | —
| | | | (33,864
| ) | |
Total | | | | | | | | | | | | $ | (28,910 | ) | | $ | — | | | $ | (28,910 | ) | |
(a) Payment frequency — quarterly.
(b) Payment frequency — annually.
(c) Notional amount represents the value (including any fees or commissions) of the positions when they were established and is stated in the currency in which the contract is denominated.
RUB = Russian Ruble
TRY = Turkish Lira
Interest rate swap contracts ("interest rate swaps")
At October 31, 2017, the Fund had outstanding centrally cleared interest rate swaps as follows:
| Clearinghouse | | Notional
Amount(f) | | Fund
Pays/
Receives
Floating
Rate | | Floating Rate Index | | Annual
Fixed-Rate | | Maturity
Date | | Unrealized
Appreciation/
(Depreciation) | | Accrued Net
Interest
Receivable/
(Payable) | | Value | |
CME Group, Inc.
| | MXN | 3,500,000
| | | Pay
| | 28-day Mexican Interbank
Equilibrium Interest Rate (TIIE)(b) | | | 7.71
| %(b) | | 1/21/2022
| | $ | 3,264
| | | $ | (20
| ) | | $ | 3,244
| | |
CME Group, Inc.
| | MXN | 15,505,918
| | | Pay
| | 28-day Mexican Interbank
Equilibrium Interest Rate (TIIE)(b) | | | 7.58
| %(b) | | 1/28/2022
| | | 10,613
| | | | 81
| | | | 10,694
| | |
CME Group, Inc.
| | MXN | 12,211,377
| | | Pay
| | 28-day Mexican Interbank
Equilibrium Interest Rate (TIIE)(b) | | | 6.75
| %(b) | | 6/23/2022
| | | (12,268
| ) | | | (149
| ) | | | (12,417
| ) | |
CME Group, Inc.
| | MXN | 34,769,500
| | | Pay
| | 28-day Mexican Interbank
Equilibrium Interest Rate (TIIE)(b) | | | 6.71
| %(b) | | 7/7/2022
| | | (37,830
| ) | | | 307
| | | | (37,523
| ) | |
CME Group, Inc.
| | MXN | 14,000,000
| | | Pay
| | 28-day Mexican Interbank
Equilibrium Interest Rate (TIIE)(b) | | | 7.61
| %(b) | | 3/7/2024
| | | 11,973
| | | | 27
| | | | 12,000
| | |
CME Group, Inc.
| | MXN | 19,000,000
| | | Pay
| | 28-day Mexican Interbank
Equilibrium Interest Rate (TIIE)(b) | | | 7.35
| %(b) | | 3/20/2024
| | | 3,053
| | | | (17
| ) | | | 3,036
| | |
CME Group, Inc.
| | MXN | 1,800,000
| | | Pay
| | 28-day Mexican Interbank
Equilibrium Interest Rate (TIIE)(b) | | | 7.72
| %(b) | | 12/3/2026
| | | 1,935
| | | | 11
| | | | 1,946
| | |
CME Group, Inc.
| | MXN | 3,300,000
| | | Pay
| | 28-day Mexican Interbank
Equilibrium Interest Rate (TIIE)(b) | | | 8.16
| %(b) | | 12/28/2026
| | | 8,677
| | | | 60
| | | | 8,737
| | |
CME Group, Inc.
| | MXN | 9,380,123
| | | Pay
| | 28-day Mexican Interbank
Equilibrium Interest Rate (TIIE)(b) | | | 7.92
| %(b) | | 1/22/2027
| | | 16,587
| | | | 137
| | | | 16,724
| | |
CME Group, Inc.
| | MXN | 6,685,611
| | | Pay
| | 28-day Mexican Interbank
Equilibrium Interest Rate (TIIE)(b) | | | 7.51
| %(b) | | 4/20/2027
| | | 1,857
| | | | 19
| | | | 1,876
| | |
LCH.Clearnet
Limited | | PLN | 5,256,500
| | | Pay
| | 6-month Poland Warsaw
Interbank Offer Rate (WIBOR)(d) | | | 2.51
| %(e) | | 1/10/2022
| | | 4,465
| | | | 19,817
| | | | 24,282
| | |
LCH.Clearnet
Limited | | PLN | 1,250,000
| | | Pay
| | 6-month Poland Warsaw
Interbank Offer Rate (WIBOR)(d) | | | 2.33
| %(e) | | 4/6/2022
| | | (1,885
| ) | | | 4,057
| | | | 2,172
| | |
See Notes to Financial Statements
89
Schedule of Investments Emerging Markets Debt Fund (cont'd)
| Clearinghouse | | Notional
Amount(f) | | Fund
Pays/
Receives
Floating
Rate | | Floating Rate Index | | Annual
Fixed-Rate | | Maturity
Date | | Unrealized
Appreciation/
(Depreciation) | | Accrued Net
Interest
Receivable/
(Payable) | | Value | |
LCH.Clearnet
Limited | | PLN | 1,600,000
| | | Receive
| | 6-month Poland Warsaw
Interbank Offer Rate (WIBOR)(d) | | | 2.76
| %(e) | | 7/3/2017
| | $ | 8,854
| | | $ | (1,391
| ) | | $ | 7,463
| | |
LCH.Clearnet
Limited | | PLN | 5,200,000
| | | Receive
| | 6-month Poland Warsaw
Interbank Offer Rate (WIBOR)(d) | | | 3.01
| %(e) | | 10/26/2027
| | | 1,116
| | | | (281
| ) | | | 835
| | |
| Total | | | | | | | | | | | | | | | | | | | | | | $ | 20,411 | | | $ | 22,658 | | | $ | 43,069 | | |
The Fund had $236,800 deposited in a segregated account to cover collateral requirements on centrally cleared interest rate swaps.
At October 31, 2017, the Fund had outstanding over-the-counter ("OTC") interest rate swaps as follows:
Counterparty | | Notional
Amount(f) | | Fund
Pays/
Receives
Floating
Rate | | Floating Rate Index | | Annual
Fixed-Rate | | Maturity
Date | | Unrealized
Appreciation/
(Depreciation) | | Accrued Net
Interest
Receivable/
(Payable) | | Value | |
Goldman Sachs
International | | BRL | 3,811,089
| | | Pay
| | 1-day Overnight Brazil (CETIP)(a)
| | | 11.81
| %(a) | | 1/2/2018
| | $ | (24,263
| ) | | $ | (156
| ) | | $ | (24,419
| ) | |
Goldman Sachs
International | | BRL | 12,431,344
| | | Pay
| | 1-day Overnight Brazil (CETIP)(a)
| | | 12.86
| %(a) | | 1/2/2018
| | | 40,346
| | | | 5,733
| | | | 46,079
| | |
Goldman Sachs
International | | BRL | 1,152,498
| | | Pay
| | 1-day Overnight Brazil (CETIP)(a)
| | | 9.73
| %(a) | | 1/2/2020
| | | 10,321
| | | | 373
| | | | 10,694
| | |
Goldman Sachs
International | | BRL | 3,622,798
| | | Pay
| | 1-day Overnight Brazil (CETIP)(a)
| | | 12.73
| %(a) | | 1/4/2021
| | | 164,606
| | | | (4,232
| ) | | | 160,374
| | |
Goldman Sachs
International | | BRL | 1,000,000
| | | Pay
| | 1-day Overnight Brazil (CETIP)(a)
| | | 11.99
| %(a) | | 1/2/2023
| | | 46,149
| | | | (7,281
| ) | | | 38,868
| | |
JPMorgan Chase
Bank N.A. | | BRL | 7,778,457
| | | Pay
| | 1-day Overnight Brazil (CETIP)(a)
| | | 8.87
| %(a) | | 1/4/2021
| | | (13,360
| ) | | | 2,424
| | | | (10,936
| ) | |
JPMorgan Chase
Bank N.A. | | BRL | 1,332,786
| | | Pay
| | 1-day Overnight Brazil (CETIP)(a)
| | | 8.66
| %(a) | | 1/4/2021
| | | (4,834
| ) | | | 212
| | | | (4,622
| ) | |
JPMorgan Chase
Bank N.A. | | BRL | 1,614,106
| | | Pay
| | 1-day Overnight Brazil (CETIP)(a)
| | | 9.28
| %(a) | | 1/4/2021
| | | 3,131
| | | | 806
| | | | 3,937
| | |
JPMorgan Chase
Bank N.A. | | BRL | 930,916
| | | Pay
| | 1-day Overnight Brazil (CETIP)(a)
| | | 9.61
| %(a) | | 1/2/2020
| | | 7,616
| | | | (106
| ) | | | 7,510
| | |
JPMorgan Chase
Bank N.A. | | BRL | 1,984,200
| | | Pay
| | 1-day Overnight Brazil (CETIP)(a)
| | | 9.07
| %(a) | | 1/2/2020
| | | 9,285
| | | | (654
| ) | | | 8,631
| | |
JPMorgan Chase
Bank N.A. | | BRL | 1,063,932
| | | Pay
| | 1-day Overnight Brazil (CETIP)(a)
| | | 11.46
| %(a) | | 1/2/2020
| | | 22,408
| | | | 1,829
| | | | 24,237
| | |
JPMorgan Chase
Bank N.A. | | BRL | 31,354
| | | Pay
| | 1-day Overnight Brazil (CETIP)(a)
| | | 10.23
| %(a) | | 1/4/2021
| | | 343
| | | | 40
| | | | 383
| | |
JPMorgan Chase
Bank N.A. | | BRL | 2,071,383
| | | Pay
| | 1-day Overnight Brazil (CETIP)(a)
| | | 9.20
| %(a) | | 1/4/2021
| | | 2,524
| | | | 962
| | | | 3,486
| | |
JPMorgan Chase
Bank N.A. | | BRL | 489,151
| | | Pay
| | 1-day Overnight Brazil (CETIP)(a)
| | | 10.04
| %(a) | | 1/4/2021
| | | 4,443
| | | | 520
| | | | 4,963
| | |
Goldman Sachs
International | | CLP | 630,267,484
| | | Pay
| | Sinacofi Chile Interbank
Rate Avg (CLICP)(d) | | | 3.45
| %(d) | | 10/25/2022
| | | 320
| | | | 157
| | | | 477
| | |
JPMorgan Chase
Bank N.A. | | CLP | 231,188,535
| | | Pay
| | Sinacofi Chile Interbank
Rate Avg (CLICP)(d) | | | 3.43
| %(d) | | 5/10/2022
| | | 1,419
| | | | 1,633
| | | | 3,052
| | |
JPMorgan Chase
Bank N.A. | | CLP | 260,000,000
| | | Pay
| | Sinacofi Chile Interbank
Rate Avg (CLICP)(d) | | | 3.41
| %(d) | | 7/11/2022
| | | 556
| | | | 1,167
| | | | 1,723
| | |
JPMorgan Chase
Bank N.A. | | CLP | 256,265,113
| | | Pay
| | Sinacofi Chile Interbank
Rate Avg (CLICP)(d) | | | 4.06
| %(d) | | 6/2/2027
| | | 1,134
| | | | 403
| | | | 1,537
| | |
Goldman Sachs
International | | COP | 1,717,651,141
| | | Pay
| | 1-day Colombia Overnight
Interbank Reference Rate (IBRCOL)(c) | | | 5.44
| %(c) | | 9/7/2022
| | | 2,338
| | | | 311
| | | | 2,649
| | |
Goldman Sachs
International | | COP | 4,347,854,926
| | | Pay
| | 1-day Colombia Overnight
Interbank Reference Rate (IBRCOL)(c) | | | 5.36
| %(c) | | 9/26/2022
| | | 225
| | | | 404
| | | | 629
| | |
Citibank, N.A. | | COP | 2,000,000,000
| | | Pay
| | 1-day Colombia Overnight
Interbank Reference Rate (IBRCOL)(c) | | | 5.57
| %(c) | | 8/25/2022
| | | 6,505
| | | | 565
| | | | 7,070
| | |
Goldman Sachs
International | | COP | 270,032,867
| | | Pay
| | 1-day Colombia Overnight
Interbank Reference Rate (IBRCOL)(c) | | | 5.36
| %(c) | | 5/23/2022
| | | 248
| | | | 42
| | | | 290
| | |
See Notes to Financial Statements
90
Schedule of Investments Emerging Markets Debt Fund (cont'd)
Counterparty | | Notional
Amount(f) | | Fund
Pays/
Receives
Floating
Rate | | Floating Rate Index | | Annual
Fixed-Rate | | Maturity
Date | | Unrealized
Appreciation/
(Depreciation) | | Accrued Net
Interest
Receivable/
(Payable) | | Value | |
JPMorgan Chase
Bank N.A. | | COP | 4,347,854,900
| | | Pay
| | 1-day Colombia Overnight
Interbank Reference Rate (IBRCOL)(c) | | | 5.38
| %(c) | | 9/25/2022
| | $ | 1,473
| | | $ | 444
| | | $ | 1,917
| | |
JPMorgan Chase
Bank N.A. | | COP | 996,329,313
| | | Pay
| | 1-day Colombia Overnight
Interbank Reference Rate (IBRCOL)(c) | | | 5.30
| %(c) | | 10/23/2022
| | | (1,016
| ) | | | 19
| | | | (997
| ) | |
JPMorgan Chase
Bank N.A. | | COP | 1,124,229,971
| | | Pay
| | 1-day Colombia Overnight
Interbank Reference Rate (IBRCOL)(a) | | | 6.96
| %(c) | | 11/14/2017
| | | 243
| | | | 263
| | | | 506
| | |
Citibank, N.A. | | CZK | 34,781,263
| | | Receive
| | 6M Prague Interbank
Offer Rate (PRIBOR)(d) | | | 1.17
| %(e) | | 9/8/2022
| | | 25,404
| | | | (1,537
| ) | | | 23,867
| | |
Goldman Sachs
International | | CZK | 5,500,000
| | | Receive
| | 6-month Prague Interbank
Offer Rate (PRIBOR)(d) | | | 0.87
| %(e) | | 3/9/2022
| | | 6,388
| | | | (1,180
| ) | | | 5,208
| | |
Goldman Sachs
International | | CZK | 26,000,000
| | | Receive
| | 6-month Prague Interbank
Offer Rate (PRIBOR)(d) | | | 1.18
| %(e) | | 6/30/2027
| | | 62,273
| | | | (3,276
| ) | | | 58,997
| | |
JPMorgan Chase
Bank N.A. | | CZK | 5,000,000
| | | Receive
| | 6-month Prague Interbank
Offer Rate (PRIBOR)(d) | | | 0.73
| %(e) | | 2/10/2022
| | | 7,117
| | | | (876
| ) | | | 6,241
| | |
JPMorgan Chase
Bank, N.A. | | CZK | 95,000,000
| | | Receive
| | 6-month Prague Interbank
Offer Rate (PRIBOR)(d) | | | 0.54
| %(e) | | 2/16/2020
| | | 67,488
| | | | (13,122
| ) | | | 54,366
| | |
Goldman Sachs
International | | HUF | 500,000,000
| | | Pay
| | 6-month Budapest Interbank
Offer Rate (BUBOR)(d) | | | 0.84
| %(e) | | 9/21/2022
| | | 416
| | | | 1,443
| | | | 1,859
| | |
Goldman Sachs
International | | HUF | 2,200,000,000
| | | Receive
| | 3-month Budapest Interbank
Offer Rate (BUBOR)(c) | | | 0.65
| %(e) | | 4/11/2019
| | | (42,707
| ) | | | —
| | | | (42,707
| ) | |
Goldman Sachs
International | | HUF | 359,014,464
| | | Receive
| | 6-month Budapest Interbank
Offer Rate (BUBOR)(d) | | | 1.27
| %(e) | | 1/10/2022
| | | (34,521
| ) | | | (4,479
| ) | | | (39,000
| ) | |
Goldman Sachs
International | | HUF | 520,000,000
| | | Pay
| | 6-month Budapest Interbank
Offer Rate (BUBOR)(d) | | | 4.07
| %(e) | | 4/11/2027
| | | 76,805
| | | | —
| | | | 76,805
| | |
JPMorgan Chase
Bank, N.A. | | HUF | 250,000,000
| | | Pay
| | 6-month Budapest Interbank
Offer Rate (BUBOR)(d) | | | 2.46
| %(e) | | 5/16/2027
| | | 39,893
| | | | 9,671
| | | | 49,564
| | |
JPMorgan Chase
Bank, N.A. | | HUF | 600,000,000
| | | Receive
| | 6-month Budapest Interbank
Offer Rate (BUBOR)(d) | | | 0.85
| %(e) | | 10/10/2019
| | | (28,553
| ) | | | (1,064
| ) | | | (29,617
| ) | |
JPMorgan Chase
Bank, N.A. | | HUF | 382,000,000
| | | Receive
| | 6-month Budapest Interbank
Offer Rate (BUPOR)(d) | | | 0.69
| %(e) | | 4/20/2020
| | | (14,825
| ) | | | (5,245
| ) | | | (20,070
| ) | |
JPMorgan Chase
Bank, N.A. | | HUF | 128,246,450
| | | Receive
| | 6-month Budapest Interbank
Offer Rate (BUBOR)(d) | | | 1.38
| %(e) | | 6/17/2021
| | | (15,091
| ) | | | (2,084
| ) | | | (17,175
| ) | |
JPMorgan Chase
Bank, N.A. | | HUF | 45,000,000
| | | Receive
| | 6-month Budapest Interbank
Offer Rate (BUBOR)(d) | | | 1.30
| %(e) | | 4/6/2022
| | | (4,426
| ) | | | (1,235
| ) | | | (5,661
| ) | |
Goldman Sachs
International | | KRW | 8,000,000,000
| | | Pay
| | 3-month Certificate of
Deposit Rate (KWCDC)(c) | | | 1.32
| %(c) | | 11/4/2018
| | | (32,797
| ) | | | (2,822
| ) | | | (35,619
| ) | |
Goldman Sachs
International | | KRW | 3,000,000,000
| | | Receive
| | 3-month Certificate of
Deposit Rate (KWCDC)(c) | | | 1.39
| %(c) | | 11/4/2021
| | | 76,571
| | | | 134
| | | | 76,705
| | |
Goldman Sachs
International | | MXN | 9,000,000
| | | Pay
| | 28-day Mexican Interbank
Equilibrium Interest Rate (TIIE)(b) | | | 5.37
| %(b) | | 3/17/2021
| | | (26,630
| ) | | | (741
| ) | | | (27,371
| ) | |
Goldman Sachs
International | | MXN | 28,033,731
| | | Pay
| | 28-day Mexican Interbank
Equilibrium Interest Rate (TIIE)(b) | | | 5.90
| %(b) | | 9/12/2022
| | | (80,063
| ) | | | (967
| ) | | | (81,030
| ) | |
Goldman Sachs
International | | MXN | 10,713,184
| | | Pay
| | 28-day Mexican Interbank
Equilibrium Interest Rate (TIIE)(b) | | | 6.21
| %(b) | | 12/8/2025
| | | (40,035
| ) | | | (165
| ) | | | (40,200
| ) | |
Goldman Sachs
International | | MXN | 9,462,643
| | | Pay
| | 28-day Mexican Interbank
Equilibrium Interest Rate (TIIE)(b) | | | 6.17
| %(b) | | 3/5/2026
| | | (37,488
| ) | | | (100
| ) | | | (37,588
| ) | |
Goldman Sachs
International | | MXN | 5,000,000
| | | Pay
| | 28-day Mexican Interbank
Equilibrium Interest Rate (TIIE)(b) | | | 6.38
| %(b) | | 9/17/2026
| | | (17,081
| ) | | | (51
| ) | | | (17,132
| ) | |
JPMorgan Chase
Bank, N.A. | | MXN | 7,500,000
| | | Pay
| | 28-day Mexican Interbank
Equilibrium Interest Rate (TIIE)(b) | | | 6.13
| %(b) | | 6/18/2026
| | | (31,441
| ) | | | 22,224
| | | | (9,217
| ) | |
Standard
Chartered Bank | | MYR | 12,300,000
| | | Receive
| | 3-month Malaysia Bumiputra
Bank Rate (KLIBOR)(c) | | | 3.88
| %(c) | | 10/24/2022
| | | 297
| | | | (248
| ) | | | 49
| | |
Goldman Sachs
International | | THB | 290,000,000
| | | Receive
| | 6-month Thailand
Fixing Rate (BOFX6M)(d) | | | 1.33
| %(d) | | 9/15/2019
| | | 11,755
| | | | (4,007
| ) | | | 7,748
| | |
Goldman Sachs
International | | ZAR | 31,000,000
| | | Receive
| | 3-month Johannesburg
Interbank Agreed Rate (JIBAR)(c) | | | 7.54
| %(c) | | 7/6/2022
| | | 18,203
| | | | (882
| ) | | | 17,321
| | |
Total | | | | | | | | | | | | $ | 269,112 | | | $ | (4,731 | ) | | $ | 264,381 | | |
See Notes to Financial Statements
91
Schedule of Investments Emerging Markets Debt Fund (cont'd)
(a) Payment frequency — upon termination.
(b) Payment frequency — monthly.
(c) Payment frequency — quarterly.
(d) Payment frequency — semi-annually.
(e) Payment frequency — annually.
(f) Notional amount represents the value (including any fees or commissions) of the positions when they were established and is stated in the currency in which the contract is denominated.
BRL = Brazilian Real
CLP = Chilean Peso
COP = Colombian Peso
CZK = Czech Republic Koruna
HUF = Hungarian Forint
KRW = South Korean Won
MXN = Mexican Peso
MYR = Malaysian Ringgit
THB = Thai Baht
ZAR = South African Rand
For the year ended October 31, 2017, the average notional value of interest rate swaps and cross currency swaps for the Fund was $38,048,772 when the Fund paid the fixed rate and $32,974,995 when the Fund received the fixed rate.
At October 31, 2017, the Fund had cash collateral of $120,000 and $70,000 deposited in a segregated account for Citibank, N.A. and JPMorgan Chase Bank, N.A. respectively, to cover collateral requirements on OTC derivatives.
The following is a summary, categorized by Level (see Note A of Notes to Financial Statements), of inputs used to value the Fund's investments as of October 31, 2017:
Asset Valuation Inputs
(000's omitted) | | Level 1 | | Level 2 | | Level 3(b) | | Total | |
Investments: | |
| Corporate Bonds(a) | | $ | — | | | $ | 65,515 | | | $ | — | | | $ | 65,515 | | |
Foreign Government Securities | |
Dominican Republic | | | — | | | | 1,030 | | | | 43 | | | | 1,073 | | |
Nigeria | | | — | | | | 1,888 | | | | 555 | | | | 2,443 | | |
Other Foreign Government Securities(a) | | | — | | | | 166,677 | | | | — | | | | 166,677 | | |
Total Foreign Government Securities | | | — | | | | 169,595 | | | | 598 | | | | 170,193 | | |
Short-Term Investment | | | — | | | | 10,626 | | | | — | | | | 10,626 | | |
Total Investments | | $ | — | | | $ | 245,736 | | | $ | 598 | | | $ | 246,334 | | |
(a) The Schedule of Investments provides a geographic categorization as well as a Positions by Industry summary.
See Notes to Financial Statements
92
Schedule of Investments Emerging Markets Debt Fund (cont'd)
(b) The following is a reconciliation between the beginning and ending balances of investments in which unobservable inputs (Level 3) were used in determining value:
| | | Beginning
balance, as
of 11/1/2016 | | Accrued
discounts/
(premiums) | | Realized
gain/(loss) | | Change in
unrealized
appreciation/
(depreciation) | | Purchases | | Sales | | Transfers
into
Level 3 | | Transfers
out of
Level 3 | | Balance,
as of
10/31/2017 | | Net change
in unrealized
appreciation/
(depreciation)
from
investments
still held as of
10/31/2017 | |
Investments in
Securities: | |
| Foreign Government Securities(c) | |
Dominican Republic | | $ | 45 | | | $ | — | | | $ | — | | | $ | (2 | ) | | $ | — | | | $ | — | | | $ | — | | | $ | — | | | $ | 43 | | | $ | (2 | ) | |
Nigeria | | | — | | | | 25 | | | | — | | | | 15 | | | | 515 | | | | — | | | | — | | | | — | | | | 555 | | | | 15 | | |
Total | | $ | 45 | | | $ | 25 | | | $ | — | | | $ | 13 | | | $ | 515 | | | $ | — | | | $ | — | | | $ | — | | | $ | 598 | | | $ | 13 | | |
(c) Securities categorized as Level 3 were valued based on a single quotation obtained from a dealer. The Fund does not have access to unobservable inputs and therefore cannot disclose such inputs used in formulating such quotation.
As of the year ended October 31, 2017, no securities were transferred from one level (as of October 31, 2016) to another.
The following is a summary, categorized by Level (see Note A of Notes to Financial Statements), of inputs used to value the Fund's derivatives as of October 31, 2017:
Other Financial Instruments
(000's omitted) | | Level 1 | | Level 2 | | Level 3 | | Total | |
| Futures(a) | |
Assets | | $ | 123 | | | $ | — | | | $ | — | | | $ | 123 | | |
Liabilities | | | (140 | ) | | | — | | | | — | | | | (140 | ) | |
| Forward Contracts(a) | |
Assets | | | — | | | | 1,433 | | | | — | | | | 1,433 | | |
Liabilities | | | — | | | | (1,635 | ) | | | — | | | | (1,635 | ) | |
Swaps | |
Assets | | | — | | | | 806 | | | | — | | | | 806 | | |
Liabilities | | | — | | | | (527 | ) | | | — | | | | (527 | ) | |
Total | | $ | (17 | ) | | $ | 77 | | | $ | — | | | $ | 60 | | |
(a) Futures and forward contracts are reported at the cumulative unrealized appreciation/(depreciation) of the instrument.
See Notes to Financial Statements
93
Schedule of Investments Floating Rate Income Fund October 31, 2017
NUMBER OF SHARES | | | | VALUE | |
(000's omitted) | | | | (000's omitted) | |
Common Stock 0.1% | | | |
Business Equipment & Services 0.1% | | | |
| | 22 | | | Brock Holdings III, Inc. (Cost $403) | | $ | 436 | (a)(b) | |
PRINCIPAL AMOUNT | | | | | |
| Loan Assignments(c) 89.1% | | | |
Aerospace & Defense 0.7% | | | |
| | | | | Transdigm Inc. | | | | | |
$ | 1,072 | | | First Lien Term Loan D, 3 month USD LIBOR + 3.00%, (4.33%), due 6/4/21 | | | 1,078 | | |
| | 371 | | | Term Loan E1, 3 month USD LIBOR + 3.00%, (4.27%), due 5/14/22 | | | 373 | | |
| | 1,218 | | | First Lien Term Loan F, 3 month USD LIBOR + 3.00%, (4.27%), due 6/9/23 | | | 1,223 | | |
| | | | 2,674 | | |
Air Transport 0.6% | | | |
| | | | | American Airlines Inc. | | | | | |
| | 584 | | | First Lien Term Loan B, 3 month USD LIBOR + 2.00%, (3.24%), due 6/27/20 | | | 585 | | |
| | 1,173 | | | First Lien Term Loan, 3 month USD LIBOR + 2.50%, (3.74%), due 4/28/23 | | | 1,175 | | |
| | 541 | | | United Air Lines, Inc., First Lien Term Loan B, 3 month USD LIBOR + 2.25%, (3.63%), due 4/1/24 | | | 544 | | |
| | | | 2,304 | | |
All Telecom 7.9% | | | |
| | 3,725 | | | Centurylink, First Lien Term Loan B, 3 month USD LIBOR + 1.38%, (2.75%), due 1/31/25 | | | 3,675 | | |
| | 1,172 | | | Communications Sales and Leasing Inc., First Lien Term Loan, 3 month USD LIBOR + 3.00%,
(4.24%), due 10/24/22 | | | 1,124
| | |
| | 1,474 | | | Consolidated Communications Inc., First Lien Term Loan B, 3 month USD LIBOR + 3.00%,
(4.25%), due 10/5/23 | | | 1,450
| | |
| | | | | Frontier Communications Corp. | | | | | |
| | 320 | | | First Lien Term Loan A, 3 month USD LIBOR + 2.50%, (4.00%), due 3/31/21 | | | 306 | | |
| | 2,260 | | | First Lien Term Loan B, 3 month USD LIBOR + 3.75%, (4.99%), due 6/1/24 | | | 2,149 | | |
| | 397 | | | GTT Communications, Inc., Term Loan, 3 month USD LIBOR + 3.25%, (4.50%), due 1/9/24 | | | 399 | | |
| | 5,539 | | | Intelsat Jackson HLDG, First Lien Term Loan B2, 3 month USD LIBOR + 2.75%,
(4.07%), due 6/30/19 | | | 5,520
| | |
| | 1,485 | | | Level 3 Financing, Inc., First Lien Term Loan B, 3 month USD LIBOR + 2.25%, (3.49%),
due 2/22/24 | | | 1,490
| | |
| | | | | Lumos Networks | | | | | |
| | 344 | | | First Lien Term Loan B, 3 month USD LIBOR + 3.25%, (4.50%), due 10/26/24 | | | 345 | | |
| | 337 | | | First Lien Term Loan B, 3 month USD LIBOR + 3.25%, (3.50%), due 10/27/24 | | | 337 | | |
| | 389 | | | Neustar, First Lien Term Loan B2, 3 month USD LIBOR + 3.75%, (5.06%), due 8/8/24 | | | 393 | | |
| | 1,264 | | | RCN Grande, First Lien Term Loan, 3 month USD LIBOR + 3.00%, (4.24%), due 2/1/24 | | | 1,249 | | |
| | 634 | | | SBA Communications, First Lien Term Loan B1, 3 month USD LIBOR + 2.25%, (3.50%),
due 3/24/21 | | | 636
| | |
| | 3,000 | | | Sprint Communications, Inc., First Lien Term Loan B, 3 month USD LIBOR + 2.50%, (3.75%),
due 2/2/24 | | | 3,010
| | |
| | 214 | | | Switch, First Lien Term Loan B, 3 month USD LIBOR + 2.75%, (3.99%), due 6/27/24 | | | 217 | | |
| | | | | Syniverse Technologies | | | | | |
| | 2,390 | | | First Lien Term Loan, 3 month USD LIBOR + 3.00%, (4.33%), due 4/23/19 | | | 2,325 | | |
| | 405 | | | First Lien Term Loan, 3 month USD LIBOR + 3.00%, (4.33%), due 4/23/19 | | | 393 | | |
| | 1,035 | | | Telesat, First Lien Term Loan B, 3 month USD LIBOR + 3.00%, (4.32%), due 11/17/23 | | | 1,041 | | |
| | 615 | | | Windstream, First Lien Term Loan B6, 3 month USD LIBOR + 4.00%, (5.24%), due 3/16/21 | | | 575 | | |
See Notes to Financial Statements
94
Schedule of Investments Floating Rate Income Fund (cont'd)
PRINCIPAL AMOUNT | | | | VALUE | |
(000's omitted) | | | | (000's omitted) | |
$ | 819 | | | Zayo Group, First Lien Term Loan B2, 3 month USD LIBOR + 2.25%, (3.49%), due 1/19/24 | | $ | 822 | | |
| | 2,085 | | | Ziggo Secured, First Lien Term Loan E, 3 month USD LIBOR + 2.50%, (3.74%), due 4/23/25 | | | 2,090 | | |
| | | | 29,546 | | |
Automotive 1.3% | | | |
| | | | | ABRA Auto | | | | | |
| | 945 | | | Term Loan, 3 month USD LIBOR + 3.00%, (4.32%), due 9/17/21 | | | 951 | | |
| | 700 | | | Second Lien Term Loan, 3 month USD LIBOR + 7.25%, (8.60%), due 9/17/22 | | | 701 | | |
| | 154 | | | Belron, First Lien Term Loan B, 3 month USD LIBOR + 2.50%, (2.50%), due 11/15/24 | | | 155 | | |
| | 737 | | | Caliber Collision, First Lien Term Loan, 3 month USD LIBOR + 3.00%, (4.24%), due 2/1/24 | | | 743 | | |
| 601 | | | Cooper Standard Automotive Inc., First Lien Term Loan B, 3 month USD LIBOR + 2.25%,
(3.58%), due 11/2/23 | | | 604 | | |
| | 485 | | | Dealer Tire LLC, First Lien Term Loan B, 3 month USD LIBOR + 3.75%, (5.13%), due 12/22/21 | | | 489 | | |
| 1,155 | | | Midas Intermediate, First Lien Term Loan B, 3 month USD LIBOR + 2.75%, (4.07%),
due 8/18/21 | | | 1,158 | | |
| | | | 4,801 | | |
Building & Development 3.3% | | | |
| | 1,751 | | | American Builders & Co. Inc., First Lien Term Loan B, 3 month USD LIBOR + 2.50%,
(3.74%), due 10/31/23 | | | 1,761
| | |
| | | | | Beacon Roofing Supply | | | | | |
| | 886 | | | First Lien Term Loan B, 3 month USD LIBOR + 2.75%, (3.99%), due 10/1/22 | | | 891 | | |
| | 535 | | | First Lien Term Loan B, 3 month USD LIBOR + 2.25%, due 1/2/25 | | | 538 | (d)(e) | |
| | | | | Capital Automotive LP | | | | | |
| | 1,591 | | | First Lien Term Loan B, 3 month USD LIBOR + 3.00%, (4.25%), due 3/24/24 | | | 1,593 | | |
| | 1,014 | | | Second Lien Term Loan, 3 month USD LIBOR + 6.00%, (7.24%), due 3/24/25 | | | 1,039 | (a) | |
| | 1,852 | | | DTZ, First Lien Term Loan B, 3 month USD LIBOR + 3.25%, (4.59%), due 11/4/21 | | | 1,862 | | |
| | 249 | | | Forterra, First Lien Term Loan, 3 month USD LIBOR + 3.00%, (4.24%), due 10/25/23 | | | 208 | | |
| 1,111 | | | HD Supply Waterworks, First Lien Term Loan B, 3 month USD LIBOR + 3.00%, (4.46%),
due 8/1/24 | | | 1,118 | | |
| 192 | | | HD Supply, Inc., First Lien Term Loan B4, 3 month USD LIBOR + 2.50%, (3.83%),
due 10/17/23 | | | 194 | | |
| | 1,154 | | | Jeld Wen, Inc., First Lien Term Loan B, 3 month USD LIBOR + 3.00%, (4.33%), due 7/1/22 | | | 1,163 | | |
| | 417 | | | Mueller Water Products Inc., First Lien Term Loan B, 3 month USD LIBOR + 2.50%, (3.77%),
due 11/25/21 | | | 419
| | |
| | 330 | | | Ply Gem Industries, Inc., First Lien Term Loan B, 3 month USD LIBOR + 3.00%, (4.33%),
due 1/30/21 | | | 333
| | |
| | 705 | | | Quikrete, Term Loan B, 3 month USD LIBOR + 2.75%, (3.99%), due 11/15/23 | | | 708 | | |
| | 560 | | | Realogy Group, First Lien Term Loan B, 3 month USD LIBOR + 2.25%, (3.58%), due 7/20/22 | | | 563 | | |
| | | | 12,390 | | |
Business Equipment & Services 10.7% | | | |
| | 2,597 | | | Acosta Inc., First Lien Term Loan B1, 3 month USD LIBOR + 3.25%, (4.49%), due 9/26/21 | | | 2,285 | | |
| | | | | Advantage Sales and Marketing | | | | | |
| | 1,967 | | | First Lien Term Loan, 3 month USD LIBOR + 3.25%, (4.63%), due 7/25/21 | | | 1,859 | | |
| | 354 | | | First Lien Term Loan B, 3 month USD LIBOR + 3.25%, (4.63%), due 7/25/21 | | | 335 | | |
| | 640 | | | Second Lien Term Loan, 3 month USD LIBOR + 6.50%, (7.87%), due 7/25/22 | | | 533 | | |
| | 393 | | | Alixpartners, First Lien Term Loan B, 3 month USD LIBOR + 3.00%, (4.08%), due 4/4/24 | | | 395 | | |
| | | | | Brickman Group Holdings Inc. | | | | | |
| | 1,207 | | | Term Loan, 3 month USD LIBOR + 3.00%, (4.31%), due 12/18/20 | | | 1,214 | | |
| | 95 | | | Second Lien Term Loan, 3 month USD LIBOR + 6.50%, (7.74%), due 12/18/21 | | | 95 | | |
| | 584 | | | CCC Information Services Inc., First Lien Term Loan B, 3 month USD LIBOR + 3.00%,
(4.25%), due 4/29/24 | | | 586
| | |
See Notes to Financial Statements
95
Schedule of Investments Floating Rate Income Fund (cont'd)
PRINCIPAL AMOUNT | | | | VALUE | |
(000's omitted) | | | | (000's omitted) | |
$ | 397 | | | Ceridian Corp., First Lien Term Loan B2, 3 month USD LIBOR + 3.50%, (4.74%), due 9/15/20 | | $ | 397 | | |
| | 990 | | | Change Healthcare Holdings, First Lien Term Loan B, 3 month USD LIBOR + 2.75%,
(3.99%), due 3/1/24 | | | 995
| | |
| | 1,171 | | | Convergeone, First Lien Term Loan B, 3 month USD LIBOR + 4.75%, (6.09%), due 6/20/24 | | | 1,172 | | |
| | 1,915 | | | CPA Global, First Lien Term Loan B, 3 month USD LIBOR + 3.50%, (4.68%), due 12/3/20 | | | 1,919 | | |
| | 1,411 | | | CSC Serviceworks, First Lien Term Loan B, 3 month USD LIBOR + 3.75%, (4.99%),
due 11/14/22 | | | 1,421
| | |
| | 1,380 | | | Element Materials, First Lien Term Loan B, 3 month USD LIBOR + 3.50%, (4.83%), due 6/2/24 | | | 1,397 | | |
| 984 | | | Endurance International, First Lien Term Loan, 3 month USD LIBOR + 4.00%, (5.32%),
due 2/9/23 | | | 994 | | |
| | 153 | | | Equinix, Inc., First Lien Term Loan B, 3 month USD LIBOR + 2.00%, (3.33%), due 1/9/23 | | | 154 | | |
| | 4,226 | | | First Data Corporation, First Lien Term Loan, 3 month USD LIBOR + 2.25%, (3.49%),
due 7/10/22 | | | 4,236
| | |
| | 668 | | | FleetCor Technologies, First Lien Term Loan B, 3 month USD LIBOR + 2.00%, (3.24%),
due 8/2/24 | | | 670
| | |
| | 1,934 | | | Garda World Security, Term Loan, 3 month USD LIBOR + 4.00%, (5.31%), due 5/3/24 | | | 1,950 | | |
| | 1,573 | | | Genesys, First Lien Term Loan B, 3 month USD LIBOR + 3.75%, (5.08%), due 12/1/23 | | | 1,583 | | |
| | 288 | | | Global Payments, First Lien Term Loan B, 3 month USD LIBOR + 2.00%, (3.24%), due 5/2/23 | | | 289 | | |
| | | | | Kronos | | | | | |
| | 923 | | | First Lien Term Loan B, 3 month USD LIBOR + 3.50%, (4.81%), due 11/1/23 | | | 929 | | |
| | 230 | | | Second Lien Term Loan, 3 month USD LIBOR + 8.25%, (9.56%), due 11/1/24 | | | 237 | | |
| | | | | Mitchell International, Inc. | | | | | |
| | 2,777 | | | First Lien Term Loan, 3 month USD LIBOR + 3.50%, (4.88%), due 10/11/20 | | | 2,803 | | |
| | 375 | | | Second Lien Term Loan, 3 month USD LIBOR + 7.50%, (8.88%), due 10/11/21 | | | 377 | | |
| | 591 | | | On Assignment, First Lien Term Loan B, 3 month USD LIBOR + 2.00%, (3.24%), due 6/5/22 | | | 594 | | |
| | 1,933 | | | Presidio, First Lien Term Loan, 3 month USD LIBOR + 3.50%, (4.58%), due 2/2/22 | | | 1,947 | | |
| | 1,785 | | | Protection One, First Lien Term Loan B, 3 month USD LIBOR + 2.75%, (3.99%), due 5/2/22 | | | 1,799 | | |
| | 985 | | | Servicemaster Company, First Lien Term Loan B, 3 month USD LIBOR + 2.50%, (3.74%),
due 11/8/23 | | | 989
| | |
| | 1,435 | | | Solera, First Lien Term Loan B, 3 month USD LIBOR + 3.25%, (4.49%), due 3/3/23 | | | 1,445 | | |
| | 983 | | | Tempo Acquisition LLC, First Lien Term Loan B, 3 month USD LIBOR + 3.00%, (4.24%),
due 4/20/24 | | | 985
| | |
| 702 | | | TRANS UNION LLC, First Lien Term Loan B2, 3 month USD LIBOR + 2.00%, (3.24%),
due 4/9/23 | | | 705 | | |
| | 549 | | | Vantiv, First Lien Term Loan B, 3 month USD LIBOR + 2.00%, (3.74%), due 10/14/23 | | | 553 | | |
| | 1,450 | | | West, First Lien Term Loan, 3 month USD LIBOR + 4.00%, (5.24%), due 10/3/24 | | | 1,453 | | |
| | 798 | | | Wex, First Lien Term Loan B, 3 month USD LIBOR + 2.75%, (3.99%), due 7/1/23 | | | 807 | | |
| | | | 40,102 | | |
Cable & Satellite Television 3.4% | | | |
| | 979 | | | Cablevision Systems Corp., First Lien Term Loan B, 3 month USD LIBOR + 2.25%, (3.48%),
due 7/17/25 | | | 977
| | |
| | 1,667 | | | Cequel Communications, LLC, First Lien Term Loan B, 3 month USD LIBOR + 2.25%,
(3.48%), due 7/14/25 | | | 1,664
| | |
| | 2,319 | | | Charter Communications Operating LLC, First Lien Term Loan I, 3 month USD
LIBOR + 2.25%, (3.50%), due 1/15/24 | | | 2,336
| | |
| 677 | | | Mediacom Illinois LLC, First Lien Term Loan K, 3 month USD LIBOR + 2.25%, (3.46%),
due 2/19/24 | | | 678 | | |
| | | | | Numericable | | | | | |
| | 1,463 | | | First Lien Term Loan B11, 3 month USD LIBOR + 2.75%, (4.13%), due 7/31/25 | | | 1,460 | | |
| | 605 | | | First Lien Term Loan B12, 3 month USD LIBOR + 3.00%, due 1/6/26 | | | 605 | (d)(e) | |
| | 1,035 | | | Telenet, First Lien Term Loan AI, 3 month USD LIBOR + 2.75%, (3.99%), due 6/30/25 | | | 1,039 | | |
| | 660 | | | Unity Media, First Lien Term Loan B, 3 month USD LIBOR + 2.25%, (3.49%), due 9/30/25 | | | 660 | | |
| | 990 | | | UPC Financing Partnership, First Lien Term Loan AR, 3 month USD LIBOR + 2.50%,
(3.73%), due 1/15/26 | | | 993
| | |
See Notes to Financial Statements
96
Schedule of Investments Floating Rate Income Fund (cont'd)
PRINCIPAL AMOUNT | | | | VALUE | |
(000's omitted) | | | | (000's omitted) | |
$ | 850 | | | Virgin Media, First Lien Term Loan I, 3 month USD LIBOR + 2.75%, (3.99%), due 1/31/25 | | $ | 853 | | |
| | 1,540 | | | Wide Open West, First Lien Term Loan B, 3 month USD LIBOR + 3.25%, (4.49%), due 8/19/23 | | | 1,542 | | |
| | | | 12,807 | | |
Chemicals & Plastics 2.7% | | | |
| | | | | Allnex | | | | | |
| | 258 | | | First Lien Term Loan B3, 3 month USD LIBOR + 3.25%, (4.56%), due 9/13/23 | | | 259 | | |
| | 342 | | | First Lien Term Loan B2, 3 month USD LIBOR + 3.25%, (4.56%), due 9/13/23 | | | 344 | | |
| | 386 | | | Diversey, First Lien Term Loan, 3 month USD LIBOR + 3.00%, (4.32%), due 9/6/24 | | | 387 | | |
| | 628 | | | Dupont Performance Coatings, First Lien Term Loan, 3 month USD LIBOR + 2.00%,
(3.33%), due 6/1/24 | | | 632
| | |
| | 1,112 | | | HB Fuller, First Lien Term Loan B, 3 month USD LIBOR + 2.25%, (3.49%), due 10/11/24 | | | 1,118 | | |
| | | | | Ineos Finance PLC | | | | | |
| | 951 | | | First Lien Term Loan B, 3 month USD LIBOR + 2.75%, (3.94%), due 3/31/22 | | | 951 | | |
| | 1,515 | | | First Lien Term Loan B, 3 month USD LIBOR + 2.00%, (2.25%), due 3/31/24 | | | 1,516 | | |
| | 313 | | | First Lien Term Loan B, 3 month USD LIBOR + 2.75%, (3.94%), due 3/31/24 | | | 313 | | |
| | 1,055 | | | KIK Custom Products, Inc., First Lien Term Loan B, 3 month USD LIBOR + 4.50%, (5.74%),
due 8/26/22 | | | 1,066
| | |
| | 380 | | | Pq Corp., First Lien Term Loan B, 3 month USD LIBOR + 3.25%, (4.63%), due 11/4/22 | | | 385 | | |
| | | | | Solenis | | | | | |
| | 997 | | | First Lien Term Loan, 3 month USD LIBOR + 3.25%, (4.57%), due 7/31/21 | | | 1,001 | | |
| | 408 | | | Second Lien Term Loan, 3 month USD LIBOR + 6.75%, (8.07%), due 7/31/22 | | | 402 | | |
| | 1,609 | | | Univar USA, Inc., First Lien Term Loan B, 3 month USD LIBOR + 2.75%, (3.99%), due 7/1/22 | | | 1,617 | | |
| | | | 9,991 | | |
Conglomerates 0.1% | | | |
| | 269 | | | Penn Engineering, First Lien Term Loan B, 3 month USD LIBOR + 2.75%, (3.99%), due 6/27/24 | | | 271 | | |
Containers & Glass Products 3.7% | | | |
| | | | | Berlin Packaging | | | | | |
| | 2,737 | | | First Lien Term Loan B, 3 month USD LIBOR + 3.25%, (4.53%), due 10/1/21 | | | 2,756 | | |
| | 525 | | | Second Lien Term Loan, 3 month USD LIBOR + 6.75%, (7.99%), due 10/1/22 | | | 530 | | |
| | | | | Berry Plastics | | | | | |
| | 867 | | | First Lien Term Loan M, 3 month USD LIBOR + 2.25%, (3.49%), due 10/1/22 | | | 870 | | |
| | 1,164 | | | First Lien Term Loan N, 3 month USD LIBOR + 2.25%, (3.49%), due 1/19/24 | | | 1,168 | | |
| | 1,062 | | | BWAY Corporation, First Lien Term Loan, 3 month USD LIBOR + 3.25%, (4.59%), due 4/3/24 | | | 1,069 | | |
| | 600 | | | Consolidated Container, First Lien Term Loan B, 3 month USD LIBOR + 3.50%, (4.74%),
due 5/9/24 | | | 604
| | |
| | 859 | | | Fort Dearborn Co., First Lien Term Loan B, 3 month USD LIBOR + 4.00%, (5.33%),
due 10/19/23 | | | 862
| (a) | |
| | 685 | | | Proampac, First Lien Term Loan, 3 month USD LIBOR + 4.00%, (5.30%), due 11/20/23 | | | 691 | | |
| | 1,471 | | | Reynolds Group, First Lien Term Loan, 3 month USD LIBOR + 3.00%, (3.99%), due 2/5/23 | | | 1,479 | | |
| | 2,682 | | | SIG Combibloc Group, First Lien Term Loan B, 3 month USD LIBOR + 3.00%, (4.24%),
due 3/12/22 | | | 2,700
| | |
| | 580 | | | Tekni-Plex Inc., First Lien Term Loan, 3 month USD LIBOR + 3.25%, (4.53%), due 10/4/24 | | | 584 | | |
| | 564 | | | Tricorbraun, First Lien Term Loan, 3 month USD LIBOR + 3.75%, (5.06%), due 10/30/23 | | | 567 | | |
| | | | 13,880 | | |
Cosmetics - Toiletries 0.2% | | | |
| 868 | | | Prestige Brands, Inc., First Lien Term Loan B4, 3 month USD LIBOR + 2.75%, (3.99%),
due 1/26/24 | | | 873 | | |
See Notes to Financial Statements
97
Schedule of Investments Floating Rate Income Fund (cont'd)
PRINCIPAL AMOUNT | | | | VALUE | |
(000's omitted) | | | | (000's omitted) | |
Drugs 3.6% | | | |
$ | 4,030 | | | Endo Pharma, First Lien Term Loan B, 3 month USD LIBOR + 4.25%, (5.50%), due 4/27/24 | | $ | 4,083 | | |
| | 4,052 | | | Pharmaceutical Product Development, Inc., First Lien Term Loan, 3 month USD
LIBOR + 2.75%, (4.04%), due 8/18/22 | | | 4,073
| | |
| | 600 | | | Pharmaceutical Technologies & Services, First Lien Term Loan B, 3 month USD
LIBOR + 2.25%, due 5/20/24 | | | 605
| (d)(e) | |
| 4,444 | | | Valeant Pharmaceuticals, First Lien Term Loan BF3, 3 month USD LIBOR + 4.75%, (5.99%),
due 4/1/22 | | | 4,541 | | |
| | | | 13,302 | | |
Ecological Services & Equipment 0.5% | | | |
| | 1,288 |
| | ADS Waste Holdings, Inc., First Lien Term Loan B, 3 month USD LIBOR + 2.75%, (3.95%),
due 11/10/23 | | | 1,299
| | |
| | 520 |
| | Waste Industries USA Inc., First Lien Term Loan B, 3 month USD LIBOR + 3.00%, (4.24%),
due 9/20/24 | | | 524
| | |
| | | | 1,823 | | |
Electronics - Electrical 8.2% | | | |
| | | | | Applied Systems | | | | | |
| | 1,220 | | | First Lien Term Loan B, 3 month USD LIBOR + 3.25%, (4.57%), due 9/18/24 | | | 1,235 | | |
| | 500 | | | Second Lien Term Loan, 3 month USD LIBOR + 7.00%, (8.32%), due 9/18/25 | | | 515 | | |
| | 2,077 | | | Avast Software BV, First Lien Term Loan B, 3 month USD LIBOR + 3.25%, (4.58%),
due 9/30/23 | | | 2,087
| | |
| | 1,466 | | | BMC Software, First Lien Term Loan, 3 month USD LIBOR + 4.00%, (5.24%), due 9/10/22 | | | 1,476 | | |
| | 465 | | | CommScope, First Lien Term Loan B, 3 month USD LIBOR + 2.00%, (3.37%), due 12/29/22 | | | 467 | | |
| | 1,011 | | | CPI ACQUISITION INC., First Lien Term Loan, 3 month USD LIBOR + 4.50%, (5.96%),
due 8/17/22 | | | 724
| | |
| | 3,959 | | | Datatel-Sophia LP, First Lien Term Loan B, 3 month USD LIBOR + 3.25%, (4.58%), due 9/30/22 | | | 3,952 | | |
| | 2,395 | | | Dell, First Lien Term Loan B, 3 month USD LIBOR + 2.00%, due 9/7/23 | | | 2,400 | (d)(e) | |
| | 1,265 | | | Go Daddy, First Lien Term Loan B, 3 month USD LIBOR + 2.50%, (3.72%), due 2/15/24 | | | 1,272 | | |
| | | | | Hyland Software, Inc. | | | | | |
| | 806 | | | First Lien Term Loan, 3 month USD LIBOR + 3.25%, (4.49%), due 7/1/22 | | | 814 | | |
| | 135 | | | Second Lien Term Loan, 3 month USD LIBOR + 7.00%, (8.24%), due 7/7/25 | | | 138 | | |
| | 450 | | | IFS, First Lien Term Loan B, 3 month USD LIBOR + 3.75%, due 7/25/24 | | | 449 | (d)(e) | |
| | 1,607 | | | Infor Global Solutions Ltd., First Lien Term Loan, 3 month USD LIBOR + 2.75%, (4.08%),
due 2/1/22 | | | 1,609
| | |
| | | | | Mcafee | | | | | |
| | 1,050 | | | First Lien Term Loan B, 3 month USD LIBOR + 4.50%, (5.83%), due 9/26/24 | | | 1,056 | | |
| | 460 | | | Second Lien Term Loan B, 3 month USD LIBOR + 8.50%, (9.83%), due 9/26/25 | | | 467 | | |
| | 407 | | | MKS Instruments, Inc., First Lien Term Loan B, 3 month USD LIBOR + 2.25%, (3.49%),
due 4/29/23 | | | 409
| | |
| | 404 | | | Oberthur Technologies, First Lien Term Loan B1, 3 month USD LIBOR + 3.75%, (5.08%),
due 12/15/23 | | | 396
| | |
| | 935 | | | On Semiconductor, First Lien Term Loan B, 3 month USD LIBOR + 2.25%, (3.49%), due 3/31/23 | | | 939 | | |
| | | | | Optiv, Inc. | | | | | |
| | 1,846 | | | First Lien Term Loan, 3 month USD LIBOR + 3.25%, (4.56%), due 2/1/24 | | | 1,738 | | |
| | 425 | | | Second Lien Term Loan, 3 month USD LIBOR + 7.25%, (8.56%), due 2/1/25 | | | 391 | | |
| 1,438 | | | Rackspace Hosting, Inc., First Lien Term Loan B, 3 month USD LIBOR + 3.00%, (4.31%),
due 11/3/23 | | | 1,437 | | |
| | 1,602 | | | Riverbed Technology, First Lien Term Loan B, 3 month USD LIBOR + 3.25%, (4.50%),
due 4/24/22 | | | 1,533
| | |
| | 476 | | | Sensata Technologies, First Lien Term Loan B1, 3 month USD LIBOR + 2.25%, (3.49%),
due 10/14/21 | | | 478
| | |
See Notes to Financial Statements
98
Schedule of Investments Floating Rate Income Fund (cont'd)
PRINCIPAL AMOUNT | | | | VALUE | |
(000's omitted) | | | | (000's omitted) | |
| | | | | SkillSoft | | | | | |
$ | 597 | | | First Lien Term Loan, 3 month USD LIBOR + 4.75%, (5.99%), due 4/28/21 | | $ | 573 | | |
| | 647 | | | Second Lien Term Loan, 3 month USD LIBOR + 8.25%, (9.49%), due 4/28/22 | | | 546 | | |
| | 1,614 | | | Vertafore, First Lien Term Loan, 3 month USD LIBOR + 3.25%, (4.49%), due 6/17/23 | | | 1,624 | | |
| | 891 | | | Western Digital Corp., First Lien Term Loan, 3 month USD LIBOR + 2.75%, (3.99%),
due 4/29/23 | | | 894
| | |
| | 921 | | | Zebra Technologies, First Lien Term Loan B, 3 month USD LIBOR + 2.00%, (3.37%),
due 10/27/21 | | | 926
| | |
| | | | 30,545 | | |
Equipment Leasing 1.0% | | | |
| | 760 | | | Aercap, First Lien Term Loan B, 3 month USD LIBOR + 2.00%, (3.33%), due 10/30/22 | | | 766 | | |
| | 2,833 | | | Avolon, First Lien Term Loan B2, 3 month USD LIBOR + 2.75%, (3.49%), due 4/3/22 | | | 2,854 | | |
| | | | 3,620 | | |
Financial Intermediaries 2.0% | | | |
| | 574 | | | Americold, First Lien Term Loan B, 3 month USD LIBOR + 3.75%, (4.99%), due 12/1/22 | | | 581 | (a) | |
| | 1,657 | | | CITCO, First Lien Term Loan, 3 month USD LIBOR + 3.00%, (4.24%), due 4/3/22 | | | 1,670 | | |
| | 565 | | | Fortress Investment Group, First Lien Term Loan B, 3 month USD LIBOR + 1.38%, (2.75%),
due 7/14/22 | | | 573
| | |
| | 1,720 | | | Grosvenor Capital Management Holdings, LLP, First Lien Term Loan B, 3 month USD
LIBOR + 3.00%, (4.24%), due 8/18/23 | | | 1,724
| | |
| | 685 | | | Guggenheim Partners, First Lien Term Loan B, 3 month USD LIBOR + 2.75%, (3.99%),
due 7/22/23 | | | 688
| | |
| | 362 | | | Lender Processing Services, First Lien Term Loan B, 3 month USD LIBOR + 2.25%, (3.50%),
due 5/27/22 | | | 365
| (a) | |
| | 564 | | | Royalty Pharma AG, First Lien Term Loan B6, 3 month USD LIBOR + 2.00%, (3.33%),
due 3/27/23 | | | 566
| | |
| | 708 | | | SAM Finance, First Lien Term Loan B, 3 month USD LIBOR + 3.25%, (4.57%), due 12/17/20 | | | 711 | | |
| | 438 | | | Walter Investment Mgmt, First Lien Term Loan, 3 month USD LIBOR + 3.75%, (4.99%),
due 12/18/20 | | | 412
| | |
| | | | 7,290 | | |
Food & Drug Retailers 2.0% | | | |
| | | | | Albertsons LLC | | | | | |
| | 787 | | | First Lien Term Loan B4, 3 month USD LIBOR + 2.75%, (3.99%), due 8/25/21 | | | 763 | | |
| | 1,807 | | | First Lien Term Loan B5, 3 month USD LIBOR + 3.00%, (4.33%), due 12/21/22 | | | 1,748 | | |
| | 1,105 | | | First Lien Term Loan B6, 3 month USD LIBOR + 3.00%, (4.32%), due 6/22/23 | | | 1,070 | | |
| | 1,500 | | | General Nutrition Centers, First Lien Term Loan, 3 month USD LIBOR + 2.50%, (3.75%),
due 3/4/19 | | | 1,423
| | |
| | 2,589 | | | Rite Aid Corp., Second Lien Term Loan 2, 3 month USD LIBOR + 3.88%, (5.21%), due 6/21/21 | | | 2,593 | | |
| | | | 7,597 | | |
Food Products 1.0% | | | |
| | 515 | | | B&G Foods Inc., First Lien Term Loan B, 3 month USD LIBOR + 2.25%, (3.49%), due 11/2/22 | | | 518 | | |
| | 576 | | | DE Master Blenders 1753 NV, First Lien Term Loan B, 3 month USD LIBOR + 2.25%, (3.56%),
due 7/2/22 | | | 581
| | |
| | 988 | | | Del Monte Foods, First Lien Term Loan, 3 month USD LIBOR + 3.25%, (4.57%), due 2/18/21 | | | 842 | | |
| | 340 | | | Nomad Foods Europe Midco Ltd., First Lien Term Loan B, 3 month USD LIBOR + 2.75%,
(3.99%), due 4/20/24 | | | 342
| | |
See Notes to Financial Statements
99
Schedule of Investments Floating Rate Income Fund (cont'd)
PRINCIPAL AMOUNT | | | | VALUE | |
(000's omitted) | | | | (000's omitted) | |
$ | 519
| | | Pinnacle Foods Finance, First Lien Term Loan B, 3 month USD LIBOR + 2.00%, (3.23%),
due 2/2/24 | | $ | 521
| | |
| | 958 | | | Post Holdings, First Lien Term Loan B, 3 month USD LIBOR + 2.25%, (3.49%), due 5/24/24 | | | 962 | | |
| | | | 3,766 | | |
Food Service 1.4% | | | |
| | 1,357 | | | Burger King Corporation, First Lien Term Loan B, 3 month USD LIBOR + 2.25%, (3.52%),
due 2/17/24 | | | 1,359
| | |
| 1,044 | | | Manitowoc Foodservice, First Lien Term Loan B, 3 month USD LIBOR + 3.00%, (3.99%),
due 3/3/23 | | | 1,052 | | |
| | 1,609 | | | US Foods, First Lien Term Loan B, 3 month USD LIBOR + 2.75%, (4.00%), due 6/27/23 | | | 1,622 | | |
| | 337 | | | Weight Watchers International Inc., Term Loan, 3 month USD LIBOR + 3.25%, (4.58%),
due 4/2/20 | | | 333
| | |
| | 984 | | | Yum Brands, Inc., First Lien Term Loan B, 3 month USD LIBOR + 2.00%, (3.24%), due 6/16/23 | | | 990 | | |
| | | | 5,356 | | |
Health Care 6.0% | | | |
| | 1,985 | | | Acadia Healthcare Co., First Lien Term Loan B2, 3 month USD LIBOR + 2.75%, (3.99%),
due 2/16/23 | | | 1,994
| | |
| | | | | Air Medical Group Holding | | | | | |
| | 1,212 | | | First Lien Term Loan B, 3 month USD LIBOR + 3.25%, (4.49%), due 4/28/22 | | | 1,210 | | |
| | 534 | | | First Lien Term Loan B1, 3 month USD LIBOR + 4.00%, (5.24%), due 4/28/22 | | | 536 | | |
| | 30 | | | First Lien Term Loan B, 3 month USD LIBOR + 4.25%, due 9/26/24 | | | 30 | (d)(e) | |
| | | | | CHS/Community Health | | | | | |
| | 462 | | | First Lien Term Loan G1, 3 month USD LIBOR + 2.75%, (4.07%), due 12/31/19 | | | 450 | | |
| | 1,909 | | | First Lien Term Loan H1, 3 month USD LIBOR + 3.00%, (4.32%), due 1/27/21 | | | 1,845 | | |
| | 1,436 | | | Concentra Operating Company, First Lien Term Loan 1, 3 month USD LIBOR + 3.00%,
(4.32%), due 6/1/22 | | | 1,440
| | |
| | 985 | | | Convatec Inc., First Lien Term Loan B, 3 month USD LIBOR + 2.50%, (3.58%), due 10/26/23 | | | 986 | | |
| | 956 | | | Davita Inc., First Lien Term Loan B, 3 month USD LIBOR + 2.75%, (3.99%), due 6/24/21 | | | 964 | | |
| | 2,064 | | | Envision Healthcare, First Lien Term Loan B, 3 month USD LIBOR + 3.00%, (4.25%),
due 12/1/23 | | | 2,072
| | |
| | 1,179 | | | Grifols SA, First Lien Term Loan B, 3 month USD LIBOR + 2.25%, (3.45%), due 1/19/25 | | | 1,183 | | |
| | 498 | | | IMS Health Incorporated, First Lien Term Loan B, 3 month USD LIBOR + 2.25%, (3.33%),
due 3/7/24 | | | 501
| | |
| | 881 | | | INC Research, First Lien Term Loan B, 3 month USD LIBOR + 2.25%, (3.49%), due 8/1/24 | | | 886 | | |
| | 1,628 | | | Mallinckrodt International, First Lien Term Loan B, 3 month USD LIBOR + 2.75%, (4.08%),
due 9/24/24 | | | 1,631
| | |
| 244 | | | Mediware Information System, First Lien Term Loan B, 3 month USD LIBOR + 3.75%,
(4.99%), due 2/9/24 | | | 245 | | |
| | 2,281 | | | Multiplan, Inc., First Lien Term Loan B, 3 month USD LIBOR + 3.00%, (4.33%), due 6/7/23 | | | 2,302 | | |
| 1,056 | | | National Mentor, Inc., First Lien Term Loan B, 3 month USD LIBOR + 3.00%, (4.33%),
due 1/31/21 | | | 1,064 | | |
| | 558 | | | Surgery Partners, First Lien Term Loan, 3 month USD LIBOR + 3.25%, (4.50%), due 9/3/24 | | | 553 | | |
| | 2,489 | | | Team Health, Inc., First Lien Term Loan B, 3 month USD LIBOR + 2.75%, (3.99%), due 2/6/24 | | | 2,467 | (a) | |
| | | | 22,359 | | |
Industrial Equipment 4.4% | | | |
| | | | | Crosby Worldwide | | | | | |
| | 2,489 | | | First Lien Term Loan, 3 month USD LIBOR + 3.00%, (4.31%), due 11/22/20 | | | 2,357 | | |
| | 520 | | | Second Lien Term Loan, 3 month USD LIBOR + 6.00%, (7.31%), due 11/22/21 | | | 434 | | |
| | 2,109 | | | Doosan Infracore, First Lien Term Loan B, 3 month USD LIBOR + 2.75%, (4.08%), due 5/19/24 | | | 2,124 | | |
See Notes to Financial Statements
100
Schedule of Investments Floating Rate Income Fund (cont'd)
PRINCIPAL AMOUNT | | | | VALUE | |
(000's omitted) | | | | (000's omitted) | |
$ | 1,419 | | | Filtration Group, First Lien Term Loan, 3 month USD LIBOR + 3.00%, (4.38%), due 11/21/20 | | $ | 1,429 | | |
| | 365 | | | Gardner Denver, First Lien Term Loan B, 3 month USD LIBOR + 2.75%, (4.08%), due 7/30/24 | | | 367 | | |
| | 776 | | | Gates Global LLC, First Lien Term Loan B, 3 month USD LIBOR + 3.25%, (4.58%), due 3/31/24 | | | 781 | | |
| | 520 | | | Generac Power Systems Inc., First Lien Term Loan B, 3 month USD LIBOR + 2.25%, (3.59%),
due 5/31/23 | | | 521
| | |
| | 447 | | | Harsco, First Lien Term Loan B, 3 month USD LIBOR + 5.00%, (6.25%), due 11/2/23 | | | 449 | | |
| | 1,364 | | | Husky Injection Molding, First Lien Term Loan B, 3 month USD LIBOR + 3.25%, (4.49%),
due 6/30/21 | | | 1,374
| | |
| | 444 | | | Hyster-Yale Group, First Lien Term Loan B, 3 month USD LIBOR + 4.00%, (5.24%), due 5/30/23 | | | 449 | (a) | |
| | 2,407 | | | Milacron LLC, First Lien Term Loan B, 3 month USD LIBOR + 3.00%, (4.24%), due 9/24/23 | | | 2,413 | (a) | |
| | 746 | | | Minimax Viking, First Lien Term Loan B, 3 month USD LIBOR + 2.75%, (3.99%), due 8/16/23 | | | 752 | | |
| | 1,995 | | | Rexnord Corp., First Lien Term Loan B, 3 month USD LIBOR + 2.75%, (4.09%), due 8/21/23 | | | 2,006 | | |
| | 1,032 | | | Signode Industrial, First Lien Term Loan B, 3 month USD LIBOR + 2.75%, (4.04%), due 5/1/21 | | | 1,042 | (a) | |
| | | | 16,498 | | |
Insurance 0.6% | | | |
| | | | | Sedgwick Holdings Inc. | | | | | |
| | 1,554 | | | First Lien Term Loan, 3 month USD LIBOR + 2.75%, (3.99%), due 2/28/21 | | | 1,560 | | |
| | 158 | | | First Lien Term Loan B, 3 month USD LIBOR + 3.25%, (4.58%), due 2/28/21 | | | 159 | | |
| | 120 | | | Second Lien Term Loan, 3 month USD LIBOR + 5.75%, (6.99%), due 2/28/22 | | | 121 | | |
| | 285 | | | Second Lien Term Loan, 3 month USD LIBOR + 5.75%, (7.07%), due 2/28/22 | | | 289 | | |
| | | | 2,129 | | |
Leisure Goods - Activities - Movies 3.0% | | | |
| | 495 | | | Amc Entertainment, First Lien Term Loan B, 3 month USD LIBOR + 2.25%, (3.49%),
due 12/15/22 | | | 495
| | |
| | 516 | | | Bright Horizons, First Lien Term Loan B, 3 month USD LIBOR + 2.25%, (3.49%), due 11/3/23 | | | 519 | | |
| | 671 | | | Clubcorp, First Lien Term Loan B, 3 month USD LIBOR + 3.25%, (4.59%), due 8/15/24 | | | 673 | | |
| | 2,875 | | | Formula One, First Lien Term Loan B, 3 month USD LIBOR + 3.25%, (4.24%), due 2/1/24 | | | 2,896 | | |
| | 785 | | | Match Group Inc., First Lien Term Loan B, 3 month USD LIBOR + 2.50%, (3.81%),
due 11/16/22 | | | 794
| (a) | |
| | 2,693 | | | Nielsen Business Media, First Lien Term Loan B, 3 month USD LIBOR + 3.00%, (4.33%),
due 5/22/24 | | | 2,724
| (a) | |
| | 326 | | | Regal Cinemas Corporation, First Lien Term Loan, 3 month USD LIBOR + 2.00%, (3.24%),
due 4/1/22 | | | 326
| | |
| | 1,850 | | | Seaworld, First Lien Term Loan B5, 3 month USD LIBOR + 3.00%, (4.33%), due 3/31/24 | | | 1,816 | (d)(e) | |
| | 995 | | | Warner Music, First Lien Term Loan, 3 month USD LIBOR + 2.50%, (3.74%), due 11/1/23 | | | 999 | | |
| | | | 11,242 | | |
Lodging & Casinos 6.5% | | | |
| | 530 | | | Aristocrat Leisure, First Lien Term Loan, 3 month USD LIBOR + 2.25%, (3.36%), due 10/20/21 | | | 533 | | |
| | 299 | | | Belmond, First Lien Term Loan B, 3 month USD LIBOR + 2.75%, (4.07%), due 7/3/24 | | | 300 | | |
| | 1,396 | | | Boyd Gaming Corporation, First Lien Term Loan B, 3 month USD LIBOR + 2.50%, (3.70%),
due 9/15/23 | | | 1,404
| | |
| | 920 | | | Caesars Entertainment, First Lien Term Loan B, 3 month USD LIBOR + 2.50%, (3.74%),
due 10/6/24 | | | 921
| | |
| | 1,095 | | | Caesars Resort Collection, First Lien Term Loan B, 3 month USD LIBOR + 2.75%, due 9/28/24 | | | 1,102 | (d)(e) | |
| | 1,521 | | | CityCenter, First Lien Term Loan B, 3 month USD LIBOR + 2.50%, (3.74%), due 4/18/24 | | | 1,527 | | |
| | 2,065 | | | Cowlitz Tribal Gaming, First Lien Term Loan B, 3 month USD LIBOR + 10.50%, (11.74%),
due 12/6/21 | | | 2,313
| (a)(f) | |
| | 569 | | | Eldorado Resorts, First Lien Term Loan B, 3 month USD LIBOR + 2.25%, (3.50%), due 4/17/24 | | | 569 | | |
| | 1,164 | | | Extended Stay, First Lien Term Loan B, 3 month USD LIBOR + 2.50%, (3.74%), due 8/30/23 | | | 1,171 | | |
See Notes to Financial Statements
101
Schedule of Investments Floating Rate Income Fund (cont'd)
PRINCIPAL AMOUNT | | | | VALUE | |
(000's omitted) | | | | (000's omitted) | |
$ | 1,035
| | | Four Seasons Holdings Inc., First Lien Term Loan B, 3 month USD LIBOR + 2.50%, (3.74%),
due 11/30/23 | | $ | 1,041
| | |
| | | | | Golden Entertainment | | | | | |
| | 1,299 | | | First Lien Term Loan B, 3 month USD LIBOR + 3.00%, (4.24%), due 8/15/24 | | | 1,300 | | |
| | 550 | | | Second Lien Term Loan, 3 month USD LIBOR + 7.00%, due 8/15/25 | | | 554 | (d)(e) | |
| | 897 | | | Hilton Worldwide, First Lien Term Loan B2, 3 month USD LIBOR + 2.00%, (3.23%),
due 10/25/23 | | | 902
| | |
| | 900 | | | MGM Growth Properties, First Lien Term Loan B, 3 month USD LIBOR + 2.25%, (3.49%),
due 4/25/23 | | | 905
| | |
| | | | | Mohegan Tribal Gaming | | | | | |
| | 304 | | | First Lien Term Loan A, 3 month USD LIBOR + 3.75%, (4.99%), due 10/13/21 | | | 306 | | |
| | 1,734 | | | First Lien Term Loan B, 3 month USD LIBOR + 4.00%, (5.24%), due 10/13/23 | | | 1,752 | | |
| | 527 | | | Penn National Gaming, First Lien Term Loan B, 3 month USD LIBOR + 2.50%, (3.74%),
due 1/19/24 | | | 531
| | |
| 2,682 | | | Scientific Games Corp., First Lien Term Loan B4, 3 month USD LIBOR + 3.25%, (4.52%),
due 8/14/24 | | | 2,712 | | |
| | 1,903 | | | Station Casinos, First Lien Term Loan B, 3 month USD LIBOR + 2.50%, (3.74%), due 6/8/23 | | | 1,908 | | |
| | 2,594 | | | Twin Rivers Casino, First Lien Term Loan B, 3 month USD LIBOR + 3.50%, (4.83%),
due 7/10/20 | | | 2,618
| | |
| | | | 24,369 | | |
Oil & Gas 1.7% | | | |
| | 374 | | | Chesapeake Energy Corp., First Lien Term Loan, 3 month USD LIBOR + 7.50%, (8.81%),
due 8/23/21 | | | 401
| | |
| | 1,007 | | | EagleClaw, First Lien Term Loan, 3 month USD LIBOR + 4.25%, (5.52%), due 6/6/24 | | | 1,018 | | |
| | 1,807 | | | Energy Transfer Equity, First Lien Term Loan B, 3 month USD LIBOR + 2.00%, (3.24%),
due 2/2/24 | | | 1,803
| | |
| | 650 | | | Gavilan Resources, Second Lien Term Loan, 3 month USD LIBOR + 6.00%, (7.24%), due 3/1/24 | | | 629 | | |
| | 1,420 | | | Rover, First Lien Term Loan B, 3 month USD LIBOR + 4.00%, due 9/20/24 | | | 1,435 | (d)(e) | |
| | 875 | | | Traverse Midstream, First Lien Term Loan B, 3 month USD LIBOR + 4.00%, (5.33%),
due 9/22/24 | | | 886
| | |
| | | | 6,172 | | |
Publishing 0.5% | | | |
| | 1,045 | | | Harland Clark Holdings Corp., First Lien Term Loan B6, 3 month USD LIBOR + 5.50%,
(6.83%), due 2/9/22 | | | 1,045
| | |
| | 891 | | | Nielsen Finance LLC, First Lien Term Loan B4, 3 month USD LIBOR + 2.00%, (3.24%),
due 10/4/23 | | | 894
| | |
| | | | 1,939 | | |
Radio & Television 2.2% | | | |
| | 1,702 | | | Cumulus Media, First Lien Term Loan B, 3 month USD LIBOR + 3.25%, (4.50%), due 12/23/20 | | | 1,477 | | |
| | 491 | | | Gray Television Inc., First Lien Term Loan B, 3 month USD LIBOR + 2.50%, (3.72%), due 2/7/24 | | | 495 | | |
| | 1,529 | | | iHeartCommunications Inc., First Lien Term Loan D, 3 month USD LIBOR + 6.75%, (8.08%),
due 1/30/19 | | | 1,143
| | |
| | 243 | | | Lions Gate, First Lien Term Loan B, 3 month USD LIBOR + 3.00%, (4.24%), due 12/8/23 | | | 245 | | |
| | 157 | | | Mission Broadcasting, First Lien Term Loan, 3 month USD LIBOR + 2.50%, (3.74%),
due 1/17/24 | | | 157
| | |
| | 1,247 | | | Nexstar Broadcasting, First Lien Term Loan B, 3 month USD LIBOR + 2.50%, (3.73%),
due 1/17/24 | | | 1,253
| | |
See Notes to Financial Statements
102
Schedule of Investments Floating Rate Income Fund (cont'd)
PRINCIPAL AMOUNT | | | | VALUE | |
(000's omitted) | | | | (000's omitted) | |
$ | 893
| | | Sinclair Broadcasting, First Lien Term Loan B2, 3 month USD LIBOR + 2.25%, (3.50%),
due 1/3/24 | | $ | 895
| | |
| | 2,583 | | | Univision Communications Inc., First Lien Term Loan C5, 3 month USD LIBOR + 2.75%,
(3.99%), due 3/15/24 | | | 2,573
| | |
| | | | 8,238 | | |
Retailers (except food & drug) 2.5% | | | |
| | 1,772 | | | 99¢ Only Stores, First Lien Term Loan B2, 3 month USD LIBOR + 3.50%, (4.83%), due 1/11/19 | | | 1,660 | | |
| | 2,130 | | | Bass Pro Shops, First Lien Term Loan B, 3 month USD LIBOR + 5.00%, (6.24%), due 9/25/24 | | | 2,066 | (d)(e) | |
| | | | | BJS Wholesale Club Inc. | | | | | |
| | 1,614 | | | First Lien Term Loan B, 3 month USD LIBOR + 3.75%, (4.99%), due 1/27/24 | | | 1,572 | | |
| | 455 | | | Second Lien Term Loan, 3 month USD LIBOR + 7.50%, (8.74%), due 1/27/25 | | | 439 | | |
| | 172 | | | Jo-Ann Stores, First Lien Term Loan B, 3 month USD LIBOR + 5.00%, (6.55%), due 10/21/23 | | | 165 | | |
| | 1,152 | | | PetSmart, Inc., First Lien Term Loan B, 3 month USD LIBOR + 3.00%, (4.24%), due 3/10/22 | | | 982 | | |
| | | | | Sally Beauty | | | | | |
| | 370 | | | First Lien Term Loan B1, 3 month USD LIBOR + 2.50%, (3.75%), due 6/22/24 | | | 370 | | |
| | 555 | | | First Lien Term Loan B2, 3 month USD LIBOR + 0.00%, (4.50%), due 6/22/24 | | | 554 | | |
| | 1,833 | | | Staples, First Lien Term Loan, 3 month USD LIBOR + 4.00%, (5.31%), due 8/14/24 | | | 1,723 | | |
| | | | 9,531 | | |
Steel 0.8% | | | |
| 1,655 | | | McJunkin Red Man Corporation, First Lien Term Loan B, 3 month USD LIBOR + 3.50%,
(4.74%), due 9/14/24 | | | 1,676 | (a) | |
| | 1,390 | | | TMS International, First Lien Term Loan B, 3 month USD LIBOR + 3.00%, (4.31%), due 8/9/24 | | | 1,393 | (a) | |
| | | | 3,069 | | |
Surface Transport 0.8% | | | |
| | 1,242 | | | Avis Budget Car Rental, First Lien Term Loan B, 3 month USD LIBOR + 2.00%, (3.34%),
due 3/15/22 | | | 1,241
| | |
| | 741 | | | Hertz Corporation, First Lien Term Loan B, 3 month USD LIBOR + 2.75%, (4.00%),
due 6/30/23 | | | 740
| | |
| | | | | Kenan Advantage Group | | | | | |
| | 143 | | | First Lien Term Loan B2, 3 month USD LIBOR + 3.00%, (4.20%), due 7/29/22 | | | 144 | | |
| | 1,024 | | | First Lien Term Loan B1, 3 month USD LIBOR + 3.00%, (4.24%), due 7/29/22 | | | 1,028 | | |
| | | | 3,153 | | |
Utilities 5.8% | | | |
| | | | | Calpine Construction | | | | | |
| | 454 | | | First Lien Term Loan B1, 3 month USD LIBOR + 2.25%, (3.50%), due 5/3/20 | | | 454 | | |
| | 775 | | | First Lien Term Loan B2, 3 month USD LIBOR + 2.50%, (3.75%), due 1/31/22 | | | 775 | | |
| | | | | Calpine Corp. | | | | | |
| | 119 | | | First Lien Term Loan B6, 3 month USD LIBOR + 2.75%, (4.09%), due 1/15/23 | | | 119 | | |
| | 1,310 | | | First Lien Term Loan B7, 3 month USD LIBOR + 2.75%, (4.09%), due 5/31/23 | | | 1,315 | | |
| | 307 | | | First Lien Term Loan B5, 3 month USD LIBOR + 2.75%, (4.09%), due 1/16/24 | | | 308 | | |
| | 3,099 | | | Dynegy Holdings Inc., First Lien Term Loan C, 3 month USD LIBOR + 3.25%, (4.49%),
due 2/7/24 | | | 3,116
| | |
| | 2,060 | | | Energy Future Intermediate Holding Co. LLC, First Lien Term Loan, 3 month USD
LIBOR + 3.00%, (4.24%), due 6/28/18 | | | 2,073
| | |
| 1,020 | | | Helix Gen Funding LLC, First Lien Term Loan B, 3 month USD LIBOR + 3.75%, (5.08%),
due 6/2/24 | | | 1,030 | | |
| | 1,581 | | | Nautilus Power LLC, First Lien Term Loan B, 3 month USD LIBOR + 4.50%, (5.74%), due 5/16/24 | | | 1,585 | | |
See Notes to Financial Statements
103
Schedule of Investments Floating Rate Income Fund (cont'd)
PRINCIPAL AMOUNT | | | | VALUE | |
(000's omitted) | | | | (000's omitted) | |
$ | 882 | | | NRG Energy Inc., First Lien Term Loan B, 3 month USD LIBOR + 2.25%, (3.58%), due 6/30/23 | | $ | 885 | | |
| | | | | RJS Power Holdings LLC | | | | | |
| | 972 | | | First Lien Term Loan B1, 3 month USD LIBOR + 4.00%, (5.24%), due 7/6/23 | | | 968 | | |
| | 1,512 | | | First Lien Term Loan B2, 3 month USD LIBOR + 4.00%, (5.24%), due 4/6/24 | | | 1,506 | | |
| | | | | Texas Competitive | | | | | |
| | 3,385 | | | First Lien Term Loan B, 3 month USD LIBOR + 2.75%, (4.01%), due 8/4/23 | | | 3,394 | | |
| | 778 | | | First Lien Term Loan C, 3 month USD LIBOR + 2.75%, (4.08%), due 8/4/23 | | | 780 | | |
| | 258 | | | First Lien Term Loan B2, 3 month USD LIBOR + 3.25%, (4.01%), due 12/14/23 | | | 260 | | |
| | 2,971 | | | TPF II, First Lien Term Loan B, 3 month USD LIBOR + 4.00%, (4.99%), due 10/2/23 | | | 2,993 | | |
| | | | 21,561 | | |
| | | | | Total Loan Assignments (Cost $333,740) | | | 333,198 | | |
Corporate Bonds 5.6% | | | |
Business Equipment & Services 0.1% | | | |
| | 252 | | | Brock Holdings Notes 2022, 15.00%, due 10/24/22 | | | 252 | (a)(b) | |
Cable & Satellite Television 0.2% | | | |
| | 360 | | | CSC Holdings LLC, 6.75%, due 11/15/21 | | | 397 | (g) | |
| | 400 | | | Numericable-SFR SA, 6.00%, due 5/15/22 | | | 417 | (g)(h) | |
| | | | 814 | | |
Chemicals 0.1% | | | |
| | 370 | | | PQ Corp., 6.75%, due 11/15/22 | | | 400 | (g)(h) | |
Electric - Generation 0.3% | | | |
| | 585 | | | Dynegy, Inc., 7.63%, due 11/1/24 | | | 639 | | |
| | 390 | | | NRG Energy, Inc., 6.25%, due 7/15/22 | | | 410 | (g) | |
| | | | 1,049 | | |
Electric - Integrated 0.1% | | | |
| | 255 | | | PPL Energy Supply LLC, 4.60%, due 12/15/21 | | | 232 | | |
Energy - Exploration & Production 0.3% | | | |
| | 360 | | | Chesapeake Energy Corp., 8.00%, due 12/15/22 | | | 387 | (h) | |
| | 1,200 | | | EP Energy LLC/Everest Acquisition Finance, Inc., 8.00%, due 2/15/25 | | | 888 | (g)(h) | |
| | | | 1,275 | | |
Gaming 0.1% | | | |
| | 295 | | | Int'l Game Technology PLC, 5.63%, due 2/15/20 | | | 313 | (h) | |
Gas Distribution 0.5% | | | |
| | | | | Cheniere Corpus Christi Holdings LLC | | | | | |
| | 380 | | | 5.88%, due 3/31/25 | | | 411 | (g) | |
| | 420 | | | 5.13%, due 6/30/27 | | | 433 | (g)(h) | |
| | 480 | | | Energy Transfer Equity L.P., 4.25%, due 3/15/23 | | | 488 | | |
| | 325 | | | Sabine Pass Liquefaction LLC, 5.63%, due 2/1/21 | | | 353 | | |
| | 370 | | | Targa Resources Partners L.P./Targa Resources Partners Finance Corp., 4.25%, due 11/15/23 | | | 368 | | |
| | | | 2,053 | | |
See Notes to Financial Statements
104
Schedule of Investments Floating Rate Income Fund (cont'd)
PRINCIPAL AMOUNT | | | | VALUE | |
(000's omitted) | | | | (000's omitted) | |
Health Facilities 0.4% | | | |
$ | 570 | | | MPT Operating Partnership L.P./MPT Finance Corp., 5.00%, due 10/15/27 | | $ | 586 | | |
| | 579 | | | Tenet Healthcare Corp., 4.63%, due 7/15/24 | | | 570 | (h) | |
| | 390 | | | THC Escrow Corp., 7.00%, due 8/1/25 | | | 357 | (h) | |
| | | | 1,513 | | |
Lodging & Casinos 0.2% | | | |
| | | | | Scientific Games Int'l, Inc. | | | | | |
| | 375 | | | 7.00%, due 1/1/22 | | | 397 | (i) | |
| | 410 | | | 5.00%, due 10/15/25 | | | 416 | (h) | |
| | | | 813 | | |
Oil Field Equipment & Services 0.1% | | | |
| | 340 | | | Precision Drilling Corp., 7.75%, due 12/15/23 | | | 348 | | |
Packaging 0.6% | | | |
| | 765 | | | Ardagh Packaging Finance PLC/Ardagh Holdings USA, Inc., 4.25%, due 9/15/22 | | | 788 | (g)(h) | |
| | 880 | | | BWAY Holding Co., 5.50%, due 4/15/24 | | | 916 | (g)(h) | |
| | 475 | | | Reynolds Group Issuer, Inc., 3 month USD LIBOR + 3.50%, (4.86%), due 7/15/21 | | | 485 | (c)(g)(h) | |
| | | | 2,189 | | |
Pharmaceuticals 1.0% | | | |
| | 870 | | | Endo Dac/Endo Finance LLC/Endo Finco, Inc., 5.88%, due 10/15/24 | | | 911 | (g)(h) | |
| | | | | Valeant Pharmaceuticals Int'l, Inc. | | | | | |
| | 1,045 | | | 6.50%, due 3/15/22 | | | 1,109 | (g)(h) | |
| | 1,055 | | | 7.00%, due 3/15/24 | | | 1,142 | (g)(h) | |
| | 445 | | | 5.50%, due 11/1/25 | | | 455 | (h) | |
| | | | 3,617 | | |
Printing & Publishing 0.1% | | | |
| | 365 | | | Harland Clarke Holdings Corp., 8.38%, due 8/15/22 | | | 385 | (h) | |
Restaurants 0.2% | | | |
| | 615 | | | 1011778 BC ULC/New Red Finance, Inc., 5.00%, due 10/15/25 | | | 624 | (h) | |
Steel Producers - Products 0.3% | | | |
| | 950 | | | Big River Steel LLC/BRS Finance Corp., 7.25%, due 9/1/25 | | | 1,019 | (h) | |
Support - Services 0.2% | | | |
| | 630 | | | Hertz Corp., 7.63%, due 6/1/22 | | | 657 | (g)(h) | |
Telecom - Wireless 0.8% | | | |
| | 880 | | | Sprint Spectrum Co., LLC, 3.36%, due 9/20/21 | | | 893 | (g)(h) | |
| | 2,320 | | | Wind Tre SpA, 5.00%, due 1/20/26 | | | 2,335 | (h)(j) | |
| | | | 3,228 | | |
| �� | | | | Total Corporate Bonds (Cost $20,449) | | | 20,781 | | |
See Notes to Financial Statements
105
Schedule of Investments Floating Rate Income Fund (cont'd)
PRINCIPAL AMOUNT | | | | VALUE | |
(000's omitted) | | | | (000's omitted) | |
Asset-Backed Securities 2.2% | | | |
$ | 285 | | | ALM VII Ltd., Ser. 2012-7A, Class DR, 3 month USD LIBOR + 7.10%, (8.46%), due 10/15/28 | | $ | 291 | (c)(h) | |
| | 390 | | | Apidos CLO, Ser. 2015-22A, Class D, 3 month USD LIBOR + 6.00%, (7.36%), due 10/20/27 | | | 395 | (c)(h) | |
| | 500 | | | Ares XLIII CLO Ltd., Ser. 2017-43A, Class E, 3 month USD LIBOR + 6.47%, (7.83%),
due 10/15/29 | | | 504
| (c)(g)(h) | |
| | 285 | | | California Street CLO IX L.P., Ser. 2012-9A, Class ER, 3 month USD LIBOR + 7.18%, (8.54%),
due 10/16/28 | | | 292
| (c)(h) | |
| | 385 | | | Highbridge Loan Management Ltd., Ser. 2015-7A, Class E, 3 month USD LIBOR + 5.75%,
(7.07%), due 11/15/26 | | | 384
| (c)(h) | |
| | 270 | | | LCM Ltd. Partnership, Ser. 19A, Class E2, 3 month USD LIBOR + 5.70%, (7.06%), due 7/15/27 | | | 273 | (c)(h) | |
| | 385 | | | Magnetite CLO Ltd., Ser. 2015-15A, Class E, 3 month USD LIBOR + 6.45%, (7.82%),
due 10/25/27 | | | 390
| (c)(h) | |
| | | | | Palmer Square CLO Ltd. | | | | | |
| | 1,000 | | | Ser. 2013-2A, Class DR, 3 month USD LIBOR + 6.10%, (7.45%), due 10/17/27 | | | 1,007 | (c)(g)(h) | |
| | 1,000 | | | Ser. 2015-1A, Class DR, 3 month USD LIBOR + 6.20%, (7.52%), due 5/21/29 | | | 1,010 | (c)(g)(h) | |
| | 335 | | | Riserva CLO Ltd., Ser. 2016-3A, Class E, 3 month USD LIBOR + 6.75%, (8.10%), due 10/18/28 | | | 342 | (c)(h) | |
| | 500 | | | Symphony CLO XIV Ltd., Ser. 2014-14A, Class E, 3 month USD LIBOR + 4.60%, (5.96%),
due 7/14/26 | | | 492
| (c)(g)(h) | |
| | 685 | | | TCI-Flatiron CLO Ltd., Ser. 2016-1A, Class E, 3 month USD LIBOR + 7.25%, (8.60%),
due 7/17/28 | | | 694
| (c)(g)(h) | |
| | 250 | | | TIAA CLO Ltd., Ser. 2017-1A, Class E, 3 month USD LIBOR + 5.85%, (7.21%), due 4/20/29 | | | 242 | (c)(h) | |
| | 1,000 | | | TRESTLES CLO Ltd., Ser. 2017-1A, Class D, 3 month USD LIBOR + 6.68%, (7.98%), due 7/25/29 | | | 1,007 | (c)(h) | |
| | 405 | | | Voya CLO Ltd., Ser. 2015-3A, Class D2, 3 month USD LIBOR + 5.45%, (6.81%), due 10/20/27 | | | 405 | (c)(h) | |
| 445 | | | Webster Park CLO Ltd., Ser. 2015-1A, Class D, 3 month USD LIBOR + 6.10%, (7.41%),
due 1/20/27 | | | 450 | (c)(h) | |
| | | | | Total Asset-Backed Securities (Cost $7,698) | | | 8,178 | | |
NUMBER OF SHARES | | | | | |
Short-Term Investment 3.0% | | | |
Investment Company 3.0% | | | |
| | 11,380,435 | | | State Street Institutional U.S. Government Money Market Fund Premier Class, 0.96%
(Cost $11,381) | | | 11,381
| (g)(k) | |
| | | | | Total Investments 100.0% (Cost $373,671) | | | 373,974 | | |
| | | | | Liabilities Less Other Assets 0.0%(m) | | | (114 | )(l) | |
| | | | | Net Assets 100.0% | | $ | 373,860 | | |
(a) Value determined using significant unobservable inputs.
(b) Security fair valued as of October 31, 2017 in accordance with procedures approved by the Board of Trustees (the "Board"). Total value of all such securities at October 31, 2017 amounted to approximately $688,000, which represents 0.2% of net assets of the Fund.
(c) Variable or floating rate security. The interest rate shown was the current rate as of October 31, 2017 and changes periodically.
Benchmarks for Variable / Floating Rates:
LIBOR (USD) = London Interbank Offered Rate
(d) All or a portion of this security has not settled as of October 31, 2017 and thus may not have an interest rate in effect. Interest rates do not take effect until settlement.
See Notes to Financial Statements
106
Schedule of Investments Floating Rate Income Fund (cont'd)
(e) All or a portion of this security was purchased on a delayed delivery basis.
(f) Illiquid security.
(g) All or a portion of this security is segregated in connection with obligations for when-issued securities and/or delayed delivery securities with a total value of approximately $25,092,000.
(h) Securities were purchased under Rule 144A of the Securities Act of 1933, as amended (the "1933 Act"), or are otherwise restricted and, unless registered under the 1933 Act or exempted from registration, may only be sold to qualified institutional investors or may have other restrictions on resale. At October 31, 2017, these securities amounted to approximately $24,078,000, which represents 6.4% of net asset of the Fund. Securities denoted with (h) but without (f) have been deemed by the investment manager to be liquid.
(i) Security exempt from registration pursuant to Regulation S under the Securities Act of 1933. Regulation S applies to securities offerings that are made outside of the United States and do not involve direct selling efforts in the United States and as such may have restrictions on resale. Total value of all such securities at October 31, 2017 amounted to approximately $397,000, which represents 0.1% of net assets of the Fund.
(j) When-issued security. Total value of all such securities at October 31, 2017 amounted to approximately $2,335,000, which represents 0.6% of net assets of the Fund.
(k) The rate shown is the annualized seven day yield at period-end.
(l) As of October 31, 2017, the value of unfunded loan commitments was approximately $57,000 for the Fund (see Note A of Notes to Financial Statements).
(m) Represents less than 0.05% of net assets.
The following is a summary, categorized by Level (see Note A of Notes to Financial Statements), of inputs used to value the Fund's investments as of October 31, 2017:
Asset Valuation Inputs
(000's omitted) | | Level 1 | | Level 2 | | Level 3(b) | | Total | |
Investments: | |
| Common Stock(a) | | $ | — | | | $ | — | | | $ | 436 | | | $ | 436 | | |
Loan Assignments | |
Building & Development | | | — | | | | 11,351 | | | | 1,039 | | | | 12,390 | | |
Containers & Glass Products | | | — | | | | 13,018 | | | | 862 | | | | 13,880 | | |
Financial Intermediaries | | | — | | | | 6,344 | | | | 946 | | | | 7,290 | | |
Health Care | | | — | | | | 19,892 | | | | 2,467 | | | | 22,359 | | |
Industrial Equipment | | | — | | | | 12,594 | | | | 3,904 | | | | 16,498 | | |
Leisure Goods—Activities—Movies | | | — | | | | 7,724 | | | | 3,518 | | | | 11,242 | | |
Lodging & Casinos | | | — | | | | 22,056 | | | | 2,313 | | | | 24,369 | | |
Steel | | | — | | | | — | | | | 3,069 | | | | 3,069 | | |
| Other Loan Assignments(a) | | | — | | | | 222,101 | | | | — | | | | 222,101 | | |
Total Loan Assignments | | | — | | | | 315,080 | | | | 18,118 | | | | 333,198 | | |
Corporate Bonds | |
Business Equipment & Services | | | — | | | | — | | | | 252 | | | | 252 | | |
| Other Corporate Bonds(a) | | | — | | | | 20,529 | | | | — | | | | 20,529 | | |
Total Corporate Bonds | | | — | | | | 20,529 | | | | 252 | | | | 20,781 | | |
Asset-Backed Securities | | | — | | | | 8,178 | | | | — | | | | 8,178 | | |
Short-Term Investment | | | — | | | | 11,381 | | | | — | | | | 11,381 | | |
Total Investments | | $ | — | | | $ | 355,168 | | | $ | 18,806 | | | $ | 373,974 | | |
See Notes to Financial Statements
107
Schedule of Investments Floating Rate Income Fund (cont'd)
(a) The Schedule of Investments provides information on the industry or sector categorization for the portfolio.
(000's omitted) | | Beginning
balance, as
of 11/1/2016 | | Accrued
discounts/
(premiums) | | Realized
gain/(loss) | | Change
in unrealized
appreciation/
(depreciation) | | Purchases | | Sales | | Transfers
into
Level 3 | | Transfers
out of
Level 3 | | Balance,
as of
10/31/2017 | | Net change
in unrealized
appreciation/
(depreciation)
from
investments
still held as of
10/31/2017 | |
Investments in
Securities: | |
| Common Stock(c) | |
Business
Equipment &
Services | | $ | — | | | $ | — | | | $ | — | | | $ | 33 | | | $ | 403 | | | $ | — | | | $ | — | | | $ | — | | | $ | 436 | | | $ | 33 | | |
| Loan Assignments(d) | |
Automotive | | | 1,141 | | | | — | | | | — | | | | — | | | | — | | | | — | | | | — | | | | (1,141 | ) | | | — | | | | — | | |
Building &
Development | | | 635 | | | | 1 | | | | 0 | (e) | | | 35 | | | | 1,019 | | | | (16 | ) | | | — | | | | (635 | ) | | | 1,039 | | | | 35 | | |
Containers &
Glass Products | | | 1,226 | | | | — | | | | (2 | ) | | | (11 | ) | | | 371 | | | | (1,477 | ) | | | 755 | | | | — | | | | 862 | | | | (2 | ) | |
Electronics—
Electrical | | | 433 | | | | — | | | | — | | | | — | | | | — | | | | — | | | | — | | | | (433 | ) | | | — | | | | — | | |
Financial
Intermediaries | | | — | | | | — | | | | (0 | )(e) | | | (4 | ) | | | 732 | | | | (14 | ) | | | 232 | | | | — | | | | 946 | | | | (4 | ) | |
Health Care | | | — | | | | — | | | | 0 | (e) | | | (15 | ) | | | 2,493 | | | | (11 | ) | | | — | | | | — | | | | 2,467 | | | | (15 | ) | |
Industrial
Equipment | | | — | | | | 1 | | | | (1 | ) | | | 30 | | | | 3,505 | | | | (162 | ) | | | 531 | | | | — | | | | 3,904 | | | | 30 | | |
Leisure Goods—
Activities—
Movies | | | 686 | | | | — | | | | 2 | | | | 47 | | | | 3,702 | | | | (233 | ) | | | — | | | | (686 | ) | | | 3,518 | | | | 47 | | |
Lodging &
Casinos | | | — | | | | 7 | | | | — | | | | 75 | | | | 901 | | | | — | | | | 1,330 | | | | — | | | | 2,313 | | | | 75 | | |
Steel | | | 489 | | | | 1 | | | | 3 | | | | 37 | | | | 3,360 | | | | (821 | ) | | | — | | | | — | | | | 3,069 | | | | 33 | | |
| Corporate Bonds(c) | |
Business
Equipment &
Services | | | — | | | | — | | | | — | | | | — | | | | 252 | | | | — | | | | — | | | | — | | | | 252 | | | | — | | |
Total | | $ | 4,610 | | | $ | 10 | | | $ | 2 | | | $ | 227 | | | $ | 16,738 | | | $ | (2,734 | ) | | $ | 2,848 | | | $ | (2,895 | ) | | $ | 18,806 | | | $ | 232 | | |
(c) As of the year ended October 31, 2017, these securites were valued using methods the Board has approved in the good-faith belief that the resulting valuation will reflect the fair value of the security. These investments did not have a material impact on the Fund's net assets and, therefore, disclosure of unobservable inputs used in formulating valuations is not presented.
See Notes to Financial Statements
108
Schedule of Investments Floating Rate Income Fund (cont'd)
(d) Securities categorized as Level 3 are valued based on a single quotation obtained from a dealer. The Fund does not have access to unobservable inputs and therefore cannot disclose such inputs used in formulating such quotation.
(e) Amount less than one thousand.
As of the year ended October 31, 2017, certain securities were transferred from one level (as of October 31, 2016) to another. Based on beginning of period market values as of November 1, 2016, approximately $2,895,000 was transferred from Level 3 to Level 2. Also, approximately $2,848,000 was transferred from Level 2 to Level 3. Transfers of loan assignments into or out of Level 3 were primarily due to the pricing methodology using a single broker quote (Level 3) or a single observable input (Level 3) by the independent pricing service. As of the year ended October 31, 2017, the Fund had no transfers between Levels 1 and 2.
See Notes to Financial Statements
109
Schedule of Investments High Income Bond Fund October 31, 2017
PRINCIPAL AMOUNT | | | | VALUE | |
(000's omitted) | | | | (000's omitted) | |
| Loan Assignments(a) 6.1% | | | |
All Telecom 0.2% | | | |
$ | 6,600 | | | Centurylink, First Lien Term Loan B,
3 month USD LIBOR + 1.38%, (2.75%), due 1/31/25 | | $ | 6,512
| | |
Business Equipment & Services 1.4% | | | |
| | 18,253 | | | Advantage Sales and Marketing, Second Lien Term Loan, 3 month USD LIBOR + 6.50%,
(7.87%), due 7/25/22 | | | 15,208
| | |
| | 17,468 | | | First Data Corporation, First Lien Term Loan, 3 month USD LIBOR + 2.25%, (3.49%),
due 7/10/22 | | | 17,509
| | |
| | 5,157 | | | Presidio, First Lien Term Loan, 3 month USD LIBOR + 3.50%, (4.58%), due 2/2/22 | | | 5,192 | | |
| | 7,082 | | | Servicemaster Company, First Lien Term Loan B, 3 month USD LIBOR + 2.50%, (3.74%),
due 11/8/23 | | | 7,113
| | |
| | | | 45,022 | | |
Cable & Satellite Television 0.4% | | | |
| | 4,864 | | | Cablevision Systems Corp., First Lien Term Loan B, 3 month USD LIBOR + 2.25%, (3.48%),
due 7/17/25 | | | 4,856
| | |
| | 8,679 | | | Wide Open West, First Lien Term Loan B, 3 month USD LIBOR + 3.25%, (4.49%),
due 8/19/23 | | | 8,690
| | |
| | | | 13,546 | | |
Containers & Glass Products 0.5% | | | |
| | 16,118 | | | Reynolds Group, First Lien Term Loan, 3 month USD LIBOR + 3.00%, (3.99%), due 2/5/23 | | | 16,209 | | |
Drugs 0.1% | | | |
| | 3,866 | | | Pharmaceutical Product Development, Inc., First Lien Term Loan, 3 month USD LIBOR + 2.75%,
(4.04%), due 8/18/22 | | | 3,887
| | |
Electronics - Electrical 0.3% | | | |
| | 7,180 | | | Mcafee, First Lien Term Loan B, 3 month USD LIBOR + 4.50%, (5.83%), due 9/26/24 | | | 7,224 | | |
| | 2,844 | | | Rackspace Hosting, Inc., First Lien Term Loan B, 3 month USD LIBOR + 3.00%, (4.31%),
due 11/3/23 | | | 2,842
| | |
| | | | 10,066 | | |
Equipment Leasing 0.2% | | | |
| | 5,731 | | | Avolon, First Lien Term Loan B2, 3 month USD LIBOR + 2.75%, (3.49%), due 4/3/22 | | | 5,773 | | |
Food & Drug Retailers 0.3% | | | |
| | 9,440 | | | General Nutrition Centers, First Lien Term Loan, 3 month USD LIBOR + 2.50%, (3.75%),
due 3/4/19 | | | 8,958
| | |
Health Care 0.7% | | | |
| | 8,557 | | | Envision Healthcare, First Lien Term Loan B, 3 month USD LIBOR + 3.00%, (4.25%),
due 12/1/23 | | | 8,589
| | |
| | 2,745 | | | Multiplan, Inc., First Lien Term Loan B, 3 month USD LIBOR + 3.00%, (4.33%), due 6/7/23 | | | 2,771 | | |
| | 11,900 | | | Team Health, Inc., First Lien Term Loan B, 3 month USD LIBOR + 2.75%, (3.99%),
due 2/6/24 | | | 11,796
| (b) | |
| | | | 23,156 | | |
See Notes to Financial Statements
110
Schedule of Investments High Income Bond Fund (cont'd)
PRINCIPAL AMOUNT | | | | VALUE | |
(000's omitted) | | | | (000's omitted) | |
Leisure Goods - Activities - Movies 0.2% | | | |
$ | 3,070 | | | Match Group Inc., First Lien Term Loan B, 3 month USD LIBOR + 2.50%, (3.81%),
due 11/16/22 | | $ | 3,104
| (b) | |
| | 4,089 | | | Seaworld, First Lien Term Loan B5, 3 month USD LIBOR + 3.00%, (4.33%), due 3/31/24 | | | 4,013 | | |
| | | | 7,117 | | |
Lodging & Casinos 0.6% | | | |
| | 11,520 | | | Cowlitz Tribal Gaming, First Lien Term Loan B, 3 month USD LIBOR + 10.50%, (11.74%),
due 12/6/21 | | | 12,902
| (b)(c) | |
| | 6,920 | | | Extended Stay, First Lien Term Loan B, 3 month USD LIBOR + 2.50%, (3.74%), due 8/30/23 | | | 6,960 | | |
| | | | 19,862 | | |
Publishing 0.2% | | | |
| | 4,625 | | | Harland Clark Holdings Corp., First Lien Term Loan B6, 3 month USD LIBOR + 5.50%,
(6.83%), due 2/9/22 | | | 4,624
| | |
Radio & Television 0.4% | | | |
| | 2,528 | | | Sinclair Broadcasting, First Lien Term Loan B2, 3 month USD LIBOR + 2.25%, (3.50%),
due 1/3/24 | | | 2,534
| | |
| | 9,954 | | | Univision Communications Inc., First Lien Term Loan C5, 3 month USD LIBOR + 2.75%,
(3.99%), due 3/15/24 | | | 9,916
| | |
| | | | 12,450 | | |
Retailers (except food & drug) 0.3% | | | |
| | 3,345 | | | Bass Pro Shops, First Lien Term Loan B, 3 month USD LIBOR + 5.00%, (6.24%),
due 9/25/24 | | | 3,245
| | |
| | 6,463 | | | BJS Wholesale Club Inc., First Lien Term Loan B, 3 month USD LIBOR + 3.75%, (4.99%),
due 1/27/24 | | | 6,293
| | |
| | | | 9,538 | | |
Utilities 0.3% | | | |
| | 8,075 | | | Calpine Corp., First Lien Term Loan B6, 3 month USD LIBOR + 2.75%, (4.09%),
due 1/15/23 | | | 8,111
| | |
| | 2,744 | | | Texas Competitive, First Lien Term Loan B2, 3 month USD LIBOR + 3.25%, (4.01%),
due 12/14/23 | | | 2,763
| | |
| | | | 10,874 | | |
| | | | | Total Loan Assignments (Cost $197,832) | | | 197,594 | | |
Corporate Bonds 89.4% | | | |
Advertising 1.5% | | | |
| | | | | Lamar Media Corp. | | | | | |
| | 1,320 | | | 5.00%, due 5/1/23 | | | 1,363 | | |
| | 3,685 | | | 5.75%, due 2/1/26 | | | 3,975 | | |
| | 12,930 | | | MDC Partners, Inc., 6.50%, due 5/1/24 | | | 13,189 | (d) | |
| | | | | Nielsen Finance LLC/Nielsen Finance Co. | | | | | |
| | 8,955 | | | 4.50%, due 10/1/20 | | | 9,078 | | |
| | 20,000 | | | 5.00%, due 4/15/22 | | | 20,598 | (d) | |
See Notes to Financial Statements
111
Schedule of Investments High Income Bond Fund (cont'd)
PRINCIPAL AMOUNT | | | | VALUE | |
(000's omitted) | | | | (000's omitted) | |
$ | 1,170 | | | Outfront Media Capital LLC/Outfront Media Capital Corp., 5.88%, due 3/15/25 | | $ | 1,239 | | |
| | | | 49,442 | | |
Auto Parts & Equipment 0.6% | | | |
| | 7,915 | | | IHO Verwaltungs GmbH, 4.50% Cash/5.25% PIK, due 9/15/23 | | | 8,162 | (d)(e) | |
| | 9,595 | | | ZF N.A. Capital, Inc., 4.00%, due 4/29/20 | | | 9,907 | (d) | |
| | | | 18,069 | | |
Banking 2.6% | | | |
| | | | | Ally Financial, Inc. | | | | | |
| | 13,955 | | | 6.25%, due 12/1/17 | | | 13,997 | | |
| | 22,975 | | | 3.60%, due 5/21/18 | | | 23,119 | | |
| | 6,295 | | | 3.25%, due 11/5/18 | | | 6,342 | | |
| | 24,840 | | | 8.00%, due 3/15/20 | | | 27,914 | | |
| | | | | CIT Group, Inc. | | | | | |
| | 1,948 | | | 5.50%, due 2/15/19 | | | 2,038 | (d) | |
| | 10,155 | | | 3.88%, due 2/19/19 | | | 10,307 | | |
| | | | 83,717 | | |
Brokerage 0.3% | | | |
| | 9,010 | | | LPL Holdings, Inc., 5.75%, due 9/15/25 | | | 9,370 | (d) | |
Building & Construction 1.9% | | | |
| | 4,945 | | | CalAtlantic Group, Inc., 5.25%, due 6/1/26 | | | 5,266 | | |
| | | | | Lennar Corp. | | | | | |
| | 11,305 | | | 4.75%, due 12/15/17 | | | 11,311 | | |
| | 6,690 | | | 4.75%, due 11/15/22 | | | 7,066 | | |
| | 8,115 | | | 4.88%, due 12/15/23 | | | 8,582 | | |
| | 2,330 | | | 4.75%, due 5/30/25 | | | 2,441 | | |
| | 3,192 | | | Meritage Homes Corp., 6.00%, due 6/1/25 | | | 3,431 | | |
| | 6,375 | | | PulteGroup, Inc., 4.25%, due 3/1/21 | | | 6,638 | | |
| | 3,565 | | | Ryland Group, Inc., 5.38%, due 10/1/22 | | | 3,886 | | |
| | 3,065 | | | Standard Pacific Corp., 8.38%, due 1/15/21 | | | 3,567 | | |
| | 5,023 | | | Taylor Morrison Communities, Inc./Taylor Morrison Holdings II, Inc., 5.63%, due 3/1/24 | | | 5,243 | (d) | |
| | 4,735 | | | Toll Brothers Finance Corp., 4.38%, due 4/15/23 | | | 4,948 | | |
| | | | 62,379 | | |
Building Materials 0.3% | | | |
| | 3,890 | | | HD Supply, Inc., 5.75%, due 4/15/24 | | | 4,196 | (d) | |
| | 4,050 | | | USG Corp., 5.50%, due 3/1/25 | | | 4,344 | (d) | |
| | | | 8,540 | | |
Cable & Satellite Television 8.0% | | | |
| | | | | Altice Luxembourg SA | | | | | |
| | 10,220 | | | 7.75%, due 5/15/22 | | | 10,820 | (d) | |
| | 6,520 | | | 7.63%, due 2/15/25 | | | 7,074 | (d) | |
| | 6,035 | | | Altice US Finance I Corp., 5.50%, due 5/15/26 | | | 6,276 | (d) | |
| | 4,640 | | | Altice US Finance II Corp., 7.75%, due 7/15/25 | | | 5,069 | (d) | |
See Notes to Financial Statements
112
Schedule of Investments High Income Bond Fund (cont'd)
PRINCIPAL AMOUNT | | | | VALUE | |
(000's omitted) | | | | (000's omitted) | |
| | | | | CCO Holdings LLC/CCO Holdings Capital Corp. | | | | | |
$ | 12,100 | | | 5.25%, due 9/30/22 | | $ | 12,463 | | |
| | 16,670 | | | 5.13%, due 5/1/23 | | | 17,378 | (d) | |
| | 17,645 | | | 5.75%, due 2/15/26 | | | 18,445 | (d) | |
| | 6,045 | | | 5.13%, due 5/1/27 | | | 6,098 | (d) | |
| | 8,785 | | | 5.88%, due 5/1/27 | | | 9,200 | (d) | |
| | 15,280 | | | 5.00%, due 2/1/28 | | | 15,165 | (d) | |
| | | | | Cequel Communications Holdings I LLC/Cequel Capital Corp. | | | | | |
| | 5,901 | | | 6.38%, due 9/15/20 | | | 6,020 | (d) | |
| | 11,632 | | | 5.13%, due 12/15/21 | | | 11,836 | (d) | |
| | | | | CSC Holdings LLC | | | | | |
| | 17,078 | | | 10.88%, due 10/15/25 | | | 20,921 | (d) | |
| | 3,085 | | | 5.50%, due 4/15/27 | | | 3,178 | (d) | |
| | 6,715 | | | CSC Holdings, Inc., 7.63%, due 7/15/18 | | | 6,916 | | |
| | | | | DISH DBS Corp. | | | | | |
| | 3,009 | | | 6.75%, due 6/1/21 | | | 3,159 | | |
| | 10,665 | | | 5.88%, due 11/15/24 | | | 10,678 | | |
| | 3,760 | | | 7.75%, due 7/1/26 | | | 4,113 | | |
| | | | | Numericable-SFR SA | | | | | |
| | 28,170 | | | 6.00%, due 5/15/22 | | | 29,367 | (d) | |
| | 15,170 | | | 7.38%, due 5/1/26 | | | 16,308 | (d) | |
| | 5,900 | | | Unitymedia Hessen GmbH & Co. KG/Unitymedia NRW GmbH, 5.00%, due 1/15/25 | | | 6,151 | (d) | |
| | 3,365 | | | UPCB Finance IV Ltd., 5.38%, due 1/15/25 | | | 3,441 | (d) | |
| | 2,890 | | | Virgin Media Finance PLC, 6.00%, due 10/15/24 | | | 3,027 | (d) | |
| | 11,105 | | | Virgin Media Secured Finance PLC, 5.50%, due 8/15/26 | | | 11,619 | (d) | |
| | 14,940 | | | Ziggo Secured Finance B.V., 5.50%, due 1/15/27 | | | 15,239 | (d) | |
| | | | 259,961 | | |
Chemicals 1.5% | | | |
| | 5,020 | | | CF Industries, Inc., 5.38%, due 3/15/44 | | | 4,819 | | |
| | | | | Momentive Performance Materials, Inc. | | | | | |
| | 4,775 | | | 8.88%, due 10/15/20 | | | 1 | (b)(c)(f)(g) | |
| | 4,775 | | | 3.88%, due 10/24/21 | | | 4,967 | | |
| | | | | NOVA Chemicals Corp. | | | | | |
| | 3,715 | | | 5.25%, due 8/1/23 | | | 3,831 | (d) | |
| | 12,600 | | | 4.88%, due 6/1/24 | | | 12,836 | (d) | |
| | 8,835 | | | 5.00%, due 5/1/25 | | | 8,945 | (d) | |
| | 9,005 | | | 5.25%, due 6/1/27 | | | 9,163 | (d) | |
| | | | | WR Grace & Co-Conn | | | | | |
| | 2,430 | | | 5.13%, due 10/1/21 | | | 2,612 | (d) | |
| | 1,555 | | | 5.63%, due 10/1/24 | | | 1,701 | (d) | |
| | | | 48,875 | | |
Consumer - Commercial Lease Financing 5.6% | | | |
| | | | | Aircastle Ltd. | | | | | |
| | 9,230 | | | 4.63%, due 12/15/18 | | | 9,461 | | |
| | 2,140 | | | 6.25%, due 12/1/19 | | | 2,290 | | |
| | 17,335 | | | 5.13%, due 3/15/21 | | | 18,397 | | |
| | 3,385 | | | 5.50%, due 2/15/22 | | | 3,639 | | |
| | 4,740 | | | 5.00%, due 4/1/23 | | | 5,012 | | |
| | | | | Navient Corp. | | | | | |
| | 3,715 | | | 5.50%, due 1/15/19 | | | 3,831 | | |
| | 24,220 | | | 4.88%, due 6/17/19 | | | 24,916 | | |
| | 5,145 | | | 8.00%, due 3/25/20 | | | 5,672 | | |
See Notes to Financial Statements
113
Schedule of Investments High Income Bond Fund (cont'd)
PRINCIPAL AMOUNT | | | | VALUE | |
(000's omitted) | | | | (000's omitted) | |
$ | 4,660 | | | 5.88%, due 3/25/21 | | $ | 4,899 | | |
| | 3,115 | | | 6.63%, due 7/26/21 | | | 3,337 | | |
| | 11,410 | | | 5.88%, due 10/25/24 | | | 11,581 | | |
| | 2,640 | | | 6.75%, due 6/25/25 | | | 2,761 | | |
| | 12,750 | | | OneMain Financial Holdings LLC, 7.25%, due 12/15/21 | | | 13,260 | (d) | |
| | | | | Park Aerospace Holdings Ltd. | | | | | |
| | 20,115 | | | 5.25%, due 8/15/22 | | | 20,920 | (d) | |
| | 17,540 | | | 5.50%, due 2/15/24 | | | 18,198 | (d) | |
| | 12,070 | | | SLM Corp., 6.13%, due 3/25/24 | | | 12,387 | | |
| | | | | Springleaf Finance Corp. | | | | | |
| | 4,185 | | | 8.25%, due 12/15/20 | | | 4,718 | | |
| | 6,025 | | | 7.75%, due 10/1/21 | | | 6,771 | | |
| | 9,110 | | | 6.13%, due 5/15/22 | | | 9,611 | | |
| | | | 181,661 | | |
Discount Stores 0.2% | | | |
| | 7,235 | | | Dollar Tree, Inc., 5.75%, due 3/1/23 | | | 7,606 | | |
Electric - Generation 3.9% | | | |
| | | | | Calpine Corp. | | | | | |
| | 10,220 | | | 6.00%, due 1/15/22 | | | 10,552 | (d) | |
| | 26,190 | | | 5.38%, due 1/15/23 | | | 25,470 | | |
| | | | | Dynegy, Inc. | | | | | |
| | 9,810 | | | 5.88%, due 6/1/23 | | | 10,129 | | |
| | 12,065 | | | 7.63%, due 11/1/24 | | | 13,181 | | |
| | 2,880 | | | 8.00%, due 1/15/25 | | | 3,150 | (d) | |
| | 9,465 | | | 8.13%, due 1/30/26 | | | 10,506 | (d) | |
| | | | | NRG Energy, Inc. | | | | | |
| | 5,160 | | | 6.25%, due 7/15/22 | | | 5,418 | | |
| | 5,885 | | | 6.63%, due 3/15/23 | | | 6,091 | | |
| | 15,735 | | | 7.25%, due 5/15/26 | | | 17,053 | | |
| | 22,235 | | | 6.63%, due 1/15/27 | | | 23,680 | | |
| | | | 125,230 | | |
Electric - Integrated 0.9% | | | |
| | 17,650 | | | PPL Energy Supply LLC, 4.60%, due 12/15/21 | | | 16,061 | | |
| | | | | Talen Energy Supply LLC | | | | | |
| | 8,710 | | | 9.50%, due 7/15/22 | | | 8,971 | (d) | |
| | 5,460 | | | 6.50%, due 6/1/25 | | | 4,737 | | |
| | | | 29,769 | | |
Electronics 1.3% | | | |
| | 11,915 | | | Amkor Technology, Inc., 6.38%, due 10/1/22 | | | 12,287 | | |
| | 3,630 | | | Flex Ltd., 5.00%, due 2/15/23 | | | 3,940 | | |
| | | | | Micron Technology, Inc. | | | | | |
| | 4,960 | | | 5.25%, due 8/1/23 | | | 5,192 | (d) | |
| | 3,390 | | | 5.50%, due 2/1/25 | | | 3,602 | | |
| | 2,925 | | | 5.63%, due 1/15/26 | | | 3,108 | (d) | |
| | 5,800 | | | NXP BV/NXP Funding LLC, 4.13%, due 6/1/21 | | | 6,061 | (d) | |
| | 6,615 | | | Sensata Technologies UK Financing Co. PLC, 6.25%, due 2/15/26 | | | 7,260 | (d) | |
| | 1,173 | | | Zebra Technologies Corp., 7.25%, due 10/15/22 | | | 1,239 | | |
| | | | 42,689 | | |
See Notes to Financial Statements
114
Schedule of Investments High Income Bond Fund (cont'd)
PRINCIPAL AMOUNT | | | | VALUE | |
(000's omitted) | | | | (000's omitted) | |
Energy - Exploration & Production 6.1% | | | |
$ | | | | Antero Resources Corp. | | | | | |
| | 7,540 | | | 5.38%, due 11/1/21 | | $ | 7,738 | | |
| | 9,360 | | | 5.13%, due 12/1/22 | | | 9,617 | | |
| | 365 | | | 5.00%, due 3/1/25 | | | 371 | | |
| | 8,580 | | | Ascent Resources Utica Holdings LLC/ARU Finance Corp., 10.00%, due 4/1/22 | | | 9,309 | (d) | |
| | | | | Bill Barrett Corp. | | | | | |
| | 7,113 | | | 7.00%, due 10/15/22 | | | 6,900 | | |
| | 1,255 | | | 8.75%, due 6/15/25 | | | 1,233 | | |
| | | | | Chesapeake Energy Corp. | | | | | |
| | 4,760 | | | 6.13%, due 2/15/21 | | | 4,796 | | |
| | 4,025 | | | 5.38%, due 6/15/21 | | | 3,874 | | |
| | 10,605 | | | 5.50%, due 9/15/26 | | | 9,392 | (d) | |
| | 10,350 | | | 8.00%, due 6/15/27 | | | 10,052 | (d) | |
| | | | | Continental Resources, Inc. | | | | | |
| | 2,578 | | | 4.50%, due 4/15/23 | | | 2,610 | | |
| | 8,190 | | | 3.80%, due 6/1/24 | | | 7,955 | | |
| | 3,560 | | | 4.90%, due 6/1/44 | | | 3,315 | | |
| | | | | EP Energy LLC/Everest Acquisition Finance, Inc. | | | | | |
| | 20,250 | | | 9.38%, due 5/1/20 | | | 17,004 | | |
| | 6,489 | | | 7.75%, due 9/1/22 | | | 3,991 | | |
| | 22,050 | | | 6.38%, due 6/15/23 | | | 13,120 | | |
| | 6,720 | | | Extraction Oil & Gas Holdings LLC/Extraction Finance Corp., 7.88%, due 7/15/21 | | | 7,123 | (d) | |
| | 5,415 | | | Newfield Exploration Co., 5.38%, due 1/1/26 | | | 5,753 | | |
| | | | | Oasis Petroleum, Inc. | | | | | |
| | 4,475 | | | 6.50%, due 11/1/21 | | | 4,553 | | |
| | 5,175 | | | 6.88%, due 3/15/22 | | | 5,317 | | |
| | 3,540 | | | PDC Energy, Inc., 6.13%, due 9/15/24 | | | 3,695 | | |
| | | | | Range Resources Corp. | | | | | |
| | 7,055 | | | 5.00%, due 8/15/22 | | | 6,967 | | |
| | 7,365 | | | 5.00%, due 3/15/23 | | | 7,291 | | |
| | | | | Sanchez Energy Corp. | | | | | |
| | 2,645 | | | 7.75%, due 6/15/21 | | | 2,460 | | |
| | 12,160 | | | 6.13%, due 1/15/23 | | | 10,154 | | |
| | | | | SM Energy Co. | | | | | |
| | 6,735 | | | 6.13%, due 11/15/22 | | | 6,769 | | |
| | 3,880 | | | 5.00%, due 1/15/24 | | | 3,705 | | |
| | | | | Whiting Petroleum Corp. | | | | | |
| | 7,600 | | | 5.75%, due 3/15/21 | | | 7,657 | | |
| | 8,285 | | | 6.25%, due 4/1/23 | | | 8,264 | | |
| | 6,460 | | | WPX Energy, Inc., 5.25%, due 9/15/24 | | | 6,484 | | |
| | | | 197,469 | | |
Food & Drug Retail 0.8% | | | |
| | | | | Albertsons Cos. LLC/Safeway, Inc./New Albertson's, Inc./Albertson's LLC | | | | | |
| | 16,250 | | | 6.63%, due 6/15/24 | | | 15,275 | | |
| | 13,175 | | | 5.75%, due 3/15/25 | | | 11,594 | | |
| | | | 26,869 | | |
Food - Wholesale 0.6% | | | |
| | | | | Post Holdings, Inc. | | | | | |
| | 7,955 | | | 6.00%, due 12/15/22 | | | 8,333 | (d) | |
| | 4,140 | | | 5.50%, due 3/1/25 | | | 4,306 | (d) | |
| | 5,225 | | | 5.75%, due 3/1/27 | | | 5,427 | (d) | |
| | | | 18,066 | | |
See Notes to Financial Statements
115
Schedule of Investments High Income Bond Fund (cont'd)
PRINCIPAL AMOUNT | | | | VALUE | |
(000's omitted) | | | | (000's omitted) | |
Gaming 2.1% | | | |
| | | | | Boyd Gaming Corp. | | | | | |
$ | 7,400 | | | 6.88%, due 5/15/23 | | $ | 7,946 | | |
| | 7,055 | | | 6.38%, due 4/1/26 | | | 7,743 | | |
| | | | | GLP Capital L.P./GLP Financing II, Inc. | | | | | |
| | 16,815 | | | 4.88%, due 11/1/20 | | | 17,780 | | |
| | 6,265 | | | 5.38%, due 11/1/23 | | | 6,813 | | |
| | 3,950 | | | Int'l Game Technology PLC, 5.63%, due 2/15/20 | | | 4,194 | (d) | |
| | | | | MGM Resorts Int'l | | | | | |
| | 8,485 | | | 8.63%, due 2/1/19 | | | 9,089 | | |
| | 3,360 | | | 6.63%, due 12/15/21 | | | 3,755 | | |
| | 5,405 | | | Scientific Games Int'l, Inc., 10.00%, due 12/1/22 | | | 5,972 | | |
| | 5,860 | | | Wynn Las Vegas LLC/Wynn Las Vegas Capital Corp., 5.50%, due 3/1/25 | | | 6,153 | (d) | |
| | | | 69,445 | | |
Gas Distribution 5.7% | | | |
| | 7,565 | | | Antero Midstream Partners L.P./Antero Midstream Finance Corp., 5.38%, due 9/15/24 | | | 7,887 | | |
| | | | | Cheniere Corpus Christi Holdings LLC | | | | | |
| | 6,690 | | | 5.88%, due 3/31/25 | | | 7,242 | | |
| | 3,490 | | | 5.13%, due 6/30/27 | | | 3,599 | (d) | |
| | 15,280 | | | Cheniere Energy Partners L.P., 5.25%, due 10/1/25 | | | 15,738 | (d) | |
| | | | | Crestwood Midstream Partners L.P./Crestwood Midstream Finance Corp. | | | | | |
| | 4,355 | | | 6.25%, due 4/1/23 | | | 4,529 | | |
| | 3,075 | | | 5.75%, due 4/1/25 | | | 3,156 | | |
| | | | | DCP Midstream LLC | | | | | |
| | 2,490 | | | 9.75%, due 3/15/19 | | | 2,714 | (d) | |
| | 7,460 | | | 6.75%, due 9/15/37 | | | 8,019 | (d) | |
| | 7,210 | | | 3 month USD LIBOR + 3.85%, (5.85%), due 5/21/43 | | | 6,859 | (a)(d) | |
| | | | | DCP Midstream Operating L.P. | | | | | |
| | 4,685 | | | 2.50%, due 12/1/17 | | | 4,685 | | |
| | 4,400 | | | 5.60%, due 4/1/44 | | | 4,202 | | |
| | | | | Duke Energy Corp. | | | | | |
| | 2,360 | | | 8.13%, due 8/16/30 | | | 2,785 | | |
| | 4,400 | | | 6.45%, due 11/3/36 | | | 4,653 | (d) | |
| | | | | Energy Transfer Equity L.P. | | | | | |
| | 6,540 | | | 7.50%, due 10/15/20 | | | 7,357 | | |
| | 4,605 | | | 5.88%, due 1/15/24 | | | 4,996 | | |
| | 1,750 | | | Ferrellgas L.P./Ferrellgas Finance Corp., 6.75%, due 6/15/23 | | | 1,627 | | |
| | | | | NuStar Logistics L.P. | | | | | |
| | 4,615 | | | 4.80%, due 9/1/20 | | | 4,794 | | |
| | 1,500 | | | 6.75%, due 2/1/21 | | | 1,628 | | |
| | 1,600 | | | 4.75%, due 2/1/22 | | | 1,630 | | |
| | | | | Rockies Express Pipeline LLC | | | | | |
| | 8,351 | | | 5.63%, due 4/15/20 | | | 8,852 | (d) | |
| | 2,005 | | | 7.50%, due 7/15/38 | | | 2,316 | (d) | |
| | 2,025 | | | 6.88%, due 4/15/40 | | | 2,258 | (d) | |
| | 2,830 | | | SemGroup Corp., 7.25%, due 3/15/26 | | | 2,901 | (d) | |
| | 17,690 | | | SemGroup Corp./Rose Rock Finance Corp., 5.63%, due 11/15/23 | | | 17,292 | | |
| | 11,020 | | | Summit Midstream Holdings LLC/Summit Midstream Finance Corp., 5.75%, due 4/15/25 | | | 11,240 | | |
| | | | | Targa Resources Partners L.P./Targa Resources Partners Finance Corp. | | | | | |
| | 4,770 | | | 4.25%, due 11/15/23 | | | 4,746 | | |
| | 7,110 | | | 6.75%, due 3/15/24 | | | 7,661 | | |
| | 5,290 | | | 5.13%, due 2/1/25 | | | 5,449 | | |
| | 1,625 | | | 5.38%, due 2/1/27 | | | 1,686 | | |
| | 7,730 | | | 5.00%, due 1/15/28 | | | 7,778 | (d) | |
See Notes to Financial Statements
116
Schedule of Investments High Income Bond Fund (cont'd)
PRINCIPAL AMOUNT | | | | VALUE | |
(000's omitted) | | | | (000's omitted) | |
$ | 1,525 | | | Tesoro Logistics L.P./Tesoro Logistics Finance Corp., 6.13%, due 10/15/21 | | $ | 1,575 | | |
| | | | | Williams Cos., Inc. | | | | | |
| | 4,255 | | | Ser. A, 7.50%, due 1/15/31 | | | 5,165 | | |
| | 6,075 | | | 5.75%, due 6/24/44 | | | 6,439 | | |
| | | | 183,458 | | |
Health Facilities 5.8% | | | |
| | | | | CHS/Community Health Systems, Inc. | | | | | |
| | 2,966 | | | 8.00%, due 11/15/19 | | | 2,825 | | |
| | 1,745 | | | 7.13%, due 7/15/20 | | | 1,514 | | |
| | 9,525 | | | 6.88%, due 2/1/22 | | | 6,965 | | |
| | | | | Columbia/HCA Corp. | | | | | |
| | 7,620 | | | 7.69%, due 6/15/25 | | | 8,649 | | |
| | 535 | | | 7.05%, due 12/1/27 | | | 591 | | |
| | | | | HCA, Inc. | | | | | |
| | 4,635 | | | 6.50%, due 2/15/20 | | | 4,994 | | |
| | 5,050 | | | 5.88%, due 3/15/22 | | | 5,530 | | |
| | 10,345 | | | 4.75%, due 5/1/23 | | | 10,823 | | |
| | 12,410 | | | 5.00%, due 3/15/24 | | | 13,058 | | |
| | 3,305 | | | 5.38%, due 2/1/25 | | | 3,399 | | |
| | 9,385 | | | 5.25%, due 4/15/25 | | | 9,995 | | |
| | 5,045 | | | LifePoint Health, Inc., 5.88%, due 12/1/23 | | | 5,185 | | |
| | | | | MPT Operating Partnership L.P./MPT Finance Corp. | | | | | |
| | 10,495 | | | 6.38%, due 3/1/24 | | | 11,348 | | |
| | 13,253 | | | 5.50%, due 5/1/24 | | | 14,032 | | |
| | 10,875 | | | 5.25%, due 8/1/26 | | | 11,323 | | |
| | 13,875 | | | 5.00%, due 10/15/27 | | | 14,256 | | |
| | 12,960 | | | Sabra Health Care L.P./Sabra Capital Corp., 5.50%, due 2/1/21 | | | 13,365 | | |
| | | | | Tenet Healthcare Corp. | | | | | |
| | 8,885 | | | 7.50%, due 1/1/22 | | | 9,351 | (d) | |
| | 11,525 | | | 8.13%, due 4/1/22 | | | 11,539 | | |
| | 13,325 | | | 6.75%, due 6/15/23 | | | 12,509 | | |
| | 13,826 | | | 4.63%, due 7/15/24 | | | 13,601 | (d) | |
| | 2,328 | | | 6.88%, due 11/15/31 | | | 1,967 | | |
| | 2,190 | | | THC Escrow Corp., 7.00%, due 8/1/25 | | | 2,007 | (d) | |
| | | | 188,826 | | |
Health Services 1.6% | | | |
| | | | | DaVita HealthCare Partners, Inc. | | | | | |
| | 11,585 | | | 5.13%, due 7/15/24 | | | 11,614 | | |
| | 5,885 | | | 5.00%, due 5/1/25 | | | 5,797 | | |
| | 10,730 | | | DaVita, Inc., 5.75%, due 8/15/22 | | | 11,065 | | |
| | 5,950 | | | IMS Health, Inc., 5.00%, due 10/15/26 | | | 6,322 | (d) | |
| | | | | Service Corp. Int'l | | | | | |
| | 7,125 | | | 5.38%, due 1/15/22 | | | 7,321 | | |
| | 9,025 | | | 5.38%, due 5/15/24 | | | 9,521 | | |
| | | | 51,640 | | |
Hotels 0.5% | | | |
| | 14,238 | | | ESH Hospitality, Inc., 5.25%, due 5/1/25 | | | 14,719 | (d) | |
See Notes to Financial Statements
117
Schedule of Investments High Income Bond Fund (cont'd)
PRINCIPAL AMOUNT | | | | VALUE | |
(000's omitted) | | | | (000's omitted) | |
Investments & Misc. Financial Services 1.0% | | | |
$ | 12,575 | | | Icahn Enterprises L.P./Icahn Enterprises Finance Corp., 4.88%, due 3/15/19 | | $ | 12,638 | | |
| | | | | MSCI, Inc. | | | | | |
| | 9,605 | | | 5.25%, due 11/15/24 | | | 10,157 | (d) | |
| | 10,195 | | | 5.75%, due 8/15/25 | | | 11,011 | (d) | |
| | | | 33,806 | | |
Machinery 0.8% | | | |
| | | | | CNH Industrial Capital LLC | | | | | |
| | 3,360 | | | 3.38%, due 7/15/19 | | | 3,415 | | |
| | 3,620 | | | 4.88%, due 4/1/21 | | | 3,855 | | |
| | 5,475 | | | 4.38%, due 4/5/22 | | | 5,811 | | |
| | 5,900 | | | CNH Industrial NV, 4.50%, due 8/15/23 | | | 6,239 | | |
| | 5,310 | | | Manitowoc Foodservice, Inc., 9.50%, due 2/15/24 | | | 6,073 | | |
| | | | 25,393 | | |
Managed Care 0.3% | | | |
| | 3,065 | | | Centene Corp., 4.75%, due 5/15/22 | | | 3,211 | | |
| | 6,360 | | | MPH Acquisition Holdings LLC, 7.13%, due 6/1/24 | | | 6,845 | (d) | |
| | | | 10,056 | | |
Media Content 2.6% | | | |
| | | | | Gannett Co., Inc. | | | | | |
| | 6,630 | | | 5.13%, due 10/15/19 | | | 6,729 | | |
| | 1,030 | | | 5.13%, due 7/15/20 | | | 1,056 | | |
| | | | | Gray Television, Inc. | | | | | |
| | 5,215 | | | 5.13%, due 10/15/24 | | | 5,200 | (d) | |
| | 2,655 | | | 5.88%, due 7/15/26 | | | 2,721 | (d) | |
| | | | | Netflix, Inc. | | | | | |
| | 7,960 | | | 5.50%, due 2/15/22 | | | 8,566 | | |
| | 4,875 | | | 4.38%, due 11/15/26 | | | 4,778 | (d) | |
| | 2,795 | | | 4.88%, due 4/15/28 | | | 2,778 | (d) | |
| | | | | Sinclair Television Group, Inc. | | | | | |
| | 3,160 | | | 5.38%, due 4/1/21 | | | 3,243 | | |
| | 5,410 | | | 5.13%, due 2/15/27 | | | 5,146 | (d) | |
| | | | | Sirius XM Radio, Inc. | | | | | |
| | 1,140 | | | 4.63%, due 5/15/23 | | | 1,169 | (d) | |
| | 9,103 | | | 6.00%, due 7/15/24 | | | 9,717 | (d) | |
| | 10,195 | | | 5.38%, due 7/15/26 | | | 10,743 | (d) | |
| | 7,970 | | | 5.00%, due 8/1/27 | | | 8,040 | (d) | |
| | | | | Univision Communications, Inc. | | | | | |
| | 1,760 | | | 6.75%, due 9/15/22 | | | 1,824 | (d) | |
| | 12,925 | | | 5.13%, due 5/15/23 | | | 13,087 | (d) | |
| | | | 84,797 | | |
Medical Products 0.6% | | | |
| | | | | Fresenius Medical Care US Finance II, Inc. | | | | | |
| | 9,775 | | | 6.50%, due 9/15/18 | | | 10,153 | (d) | |
| | 2,825 | | | 5.88%, due 1/31/22 | | | 3,154 | (d) | |
See Notes to Financial Statements
118
Schedule of Investments High Income Bond Fund (cont'd)
PRINCIPAL AMOUNT | | | | VALUE | |
(000's omitted) | | | | (000's omitted) | |
| | | | | Hologic, Inc. | | | | | |
$ | 3,765 | | | 5.25%, due 7/15/22 | | $ | 3,930 | (d) | |
| | 2,105 | | | 4.38%, due 10/15/25 | | | 2,139 | (d) | |
| | | | 19,376 | | |
Metals - Mining Excluding Steel 3.7% | | | |
| | 2,405 | | | Alcoa, Inc., 5.13%, due 10/1/24 | | | 2,581 | | |
| | | | | First Quantum Minerals Ltd. | | | | | |
| | 7,035 | | | 7.00%, due 2/15/21 | | | 7,299 | (d) | |
| | 9,215 | | | 7.25%, due 5/15/22 | | | 9,630 | (d) | |
| | | | | FMG Resources (August 2006) Pty Ltd. | | | | | |
| | 12,830 | | | 9.75%, due 3/1/22 | | | 14,337 | (d) | |
| | 4,310 | | | 4.75%, due 5/15/22 | | | 4,402 | (d) | |
| | 2,580 | | | 5.13%, due 5/15/24 | | | 2,654 | (d) | |
| | | | | Freeport-McMoRan, Inc. | | | | | |
| | 7,220 | | | 2.38%, due 3/15/18 | | | 7,220 | | |
| | 1,815 | | | 4.00%, due 11/14/21 | | | 1,829 | | |
| | 3,260 | | | 3.55%, due 3/1/22 | | | 3,227 | | |
| | 12,170 | | | 3.88%, due 3/15/23 | | | 12,003 | | |
| | 15,355 | | | 5.40%, due 11/14/34 | | | 14,971 | | |
| | 10,080 | | | 5.45%, due 3/15/43 | | | 9,475 | | |
| | 5,725 | | | Hudbay Minerals, Inc., 7.63%, due 1/15/25 | | | 6,312 | (d) | |
| | 7,180 | | | Novelis Corp., 5.88%, due 9/30/26 | | | 7,400 | (d) | |
| | | | | Teck Resources Ltd. | | | | | |
| | 4,145 | | | 4.75%, due 1/15/22 | | | 4,373 | | |
| | 11,215 | | | 6.25%, due 7/15/41 | | | 12,809 | | |
| | | | 120,522 | | |
Oil Field Equipment & Services 0.4% | | | |
| | | | | Precision Drilling Corp. | | | | | |
| | 5,970 | | | 6.50%, due 12/15/21 | | | 6,030 | | |
| | 7,590 | | | 5.25%, due 11/15/24 | | | 7,096 | | |
| | | | 13,126 | | |
Packaging 2.0% | | | |
| | | | | Ardagh Packaging Finance PLC/Ardagh Holdings USA, Inc. | | | | | |
| | 3,285 | | | 4.25%, due 9/15/22 | | | 3,384 | (d) | |
| | 12,035 | | | 6.00%, due 2/15/25 | | | 12,772 | (d) | |
| | | | | Ball Corp. | | | | | |
| | 3,010 | | | 4.38%, due 12/15/20 | | | 3,161 | | |
| | 8,730 | | | 5.00%, due 3/15/22 | | | 9,428 | | |
| | 8,040 | | | Berry Plastics Corp., 5.13%, due 7/15/23 | | | 8,442 | | |
| | 6,175 | | | BWAY Holding Co., 5.50%, due 4/15/24 | | | 6,430 | (d) | |
| | | | | Reynolds Group Issuer, Inc. | | | | | |
| | 1,555 | | | 5.75%, due 10/15/20 | | | 1,582 | | |
| | 3,808 | | | 6.88%, due 2/15/21 | | | 3,908 | | |
| | 12,055 | | | 5.13%, due 7/15/23 | | | 12,552 | (d) | |
| | 3,985 | | | Sealed Air Corp., 5.50%, due 9/15/25 | | | 4,393 | (d) | |
| | | | 66,052 | | |
See Notes to Financial Statements
119
Schedule of Investments High Income Bond Fund (cont'd)
PRINCIPAL AMOUNT | | | | VALUE | |
(000's omitted) | | | | (000's omitted) | |
Personal & Household Products 0.6% | | | |
$ | 11,245 | | | Energizer Holdings, Inc., 4.70%, due 5/24/22 | | $ | 11,948 | | |
| | 3,670 | | | Kronos Acquisition Holdings, Inc., 9.00%, due 8/15/23 | | | 3,536 | (d) | |
| | 4,195 | | | Spectrum Brands, Inc., 5.75%, due 7/15/25 | | | 4,456 | | |
| | | | 19,940 | | |
Pharmaceuticals 1.7% | | | |
| | 9,075 | | | Endo Finance LLC & Endo Finco, Inc., 5.38%, due 1/15/23 | | | 7,305 | (d) | |
| | | | | Endo Ltd./Endo Finance LLC/Endo Finco, Inc. | | | | | |
| | 3,770 | | | 6.00%, due 7/15/23 | | | 3,054 | (d) | |
| | 5,105 | | | 6.00%, due 2/1/25 | | | 4,059 | (d) | |
| | 4,530 | | | Jaguar Holding Co. II/Pharmaceutical Product Development LLC, 6.38%, due 8/1/23 | | | 4,728 | (d) | |
| | 4,310 | | | Mallinckrodt Int'l Finance SA/Mallinckrodt CB LLC, 5.50%, due 4/15/25 | | | 3,868 | (d) | |
| | | | | Valeant Pharmaceuticals Int'l, Inc. | | | | | |
| | 21,560 | | | 5.50%, due 3/1/23 | | | 18,110 | (d) | |
| | 13,460 | | | 5.88%, due 5/15/23 | | | 11,357 | (d) | |
| | 3,705 | | | 5.50%, due 11/1/25 | | | 3,784 | (d) | |
| | | | 56,265 | | |
Printing & Publishing 1.2% | | | |
| | 8,039 | | | Harland Clarke Holdings Corp., 8.38%, due 8/15/22 | | | 8,471 | (d) | |
| | | | | R.R. Donnelley & Sons Co. | | | | | |
| | 10,312 | | | 7.63%, due 6/15/20 | | | 11,227 | | |
| | 13,120 | | | 7.88%, due 3/15/21 | | | 13,841 | | |
| | 2,708 | | | 6.50%, due 11/15/23 | | | 2,600 | | |
| | 4,330 | | | 6.00%, due 4/1/24 | | | 4,038 | | |
| | | | 40,177 | | |
Real Estate Dev. & Mgt. 0.1% | | | |
| | 4,405 | | | Realogy Group LLC/Realogy Co-Issuer Corp., 4.50%, due 4/15/19 | | | 4,504 | (d) | |
Recreation & Travel 0.4% | | | |
| | 2,170 | | | Cedar Fair L.P./Canada's Wonderland Co./Magnum Management Corp., 5.38%, due 4/15/27 | | | 2,292 | (d) | |
| | 10,245 | | | NCL Corp. Ltd., 4.75%, due 12/15/21 | | | 10,629 | (d) | |
| | | | 12,921 | | |
Restaurants 0.8% | | | |
| | | | | 1011778 BC ULC/New Red Finance, Inc. | | | | | |
| | 4,231 | | | 4.63%, due 1/15/22 | | | 4,330 | (d) | |
| | 6,460 | | | 4.25%, due 5/15/24 | | | 6,506 | (d) | |
| | 4,715 | | | 5.00%, due 10/15/25 | | | 4,786 | (d) | |
| | 9,700 | | | KFC Holding Co./Pizza Hut Holdings LLC/Taco Bell of America LLC, 5.25%, due 6/1/26 | | | 10,308 | (d) | |
| | | | 25,930 | | |
Software - Services 2.5% | | | |
| | | | | First Data Corp. | | | | | |
| | 8,765 | | | 7.00%, due 12/1/23 | | | 9,379 | (d) | |
| | 11,135 | | | 5.00%, due 1/15/24 | | | 11,567 | (d) | |
See Notes to Financial Statements
120
Schedule of Investments High Income Bond Fund (cont'd)
PRINCIPAL AMOUNT | | | | VALUE | |
(000's omitted) | | | | (000's omitted) | |
$ | 9,815 | | | Infor Software Parent LLC/Infor Software Parent, Inc., 7.13% Cash/7.88% PIK, due 5/1/21 | | $ | 10,085 | (d)(e) | |
| | 6,100 | | | j2 Cloud Services LLC/j2 Global Co-Obligor, Inc., 6.00%, due 7/15/25 | | | 6,420 | (d) | |
| | | | | Nuance Communications, Inc. | | | | | |
| | 3,324 | | | 5.38%, due 8/15/20 | | | 3,369 | (d) | |
| | 12,880 | | | 6.00%, due 7/1/24 | | | 13,898 | | |
| | 9,540 | | | Open Text Corp., 5.88%, due 6/1/26 | | | 10,339 | (d) | |
| | 11,190 | | | Rackspace Hosting, Inc., 8.63%, due 11/15/24 | | | 11,784 | (d) | |
| | 5,255 | | | Symantec Corp., 5.00%, due 4/15/25 | | | 5,491 | (d) | |
| | | | 82,332 | | |
Specialty Retail 0.8% | | | |
| | 3,485 | | | Hanesbrands, Inc., 4.88%, due 5/15/26 | | | 3,590 | (d) | |
| | 5,445 | | | Liberty Media Corp., 8.50%, due 7/15/29 | | | 6,071 | | |
| | 6,555 | | | Penske Automotive Group, Inc., 3.75%, due 8/15/20 | | | 6,686 | | |
| | 4,645 | | | PetSmart, Inc., 5.88%, due 6/1/25 | | | 4,041 | (d) | |
| | 3,820 | | | QVC, Inc., 5.45%, due 8/15/34 | | | 3,802 | | |
| | | | 24,190 | | |
Steel Producers - Products 0.3% | | | |
| | 3,751 | | | Big River Steel LLC/BRS Finance Corp., 7.25%, due 9/1/25 | | | 4,023 | (d) | |
| | 4,400 | | | Steel Dynamics, Inc., 5.50%, due 10/1/24 | | | 4,712 | | |
| | | | 8,735 | | |
Support - Services 3.6% | | | |
| | 10,175 | | | ADT Corp., 4.88%, due 7/15/32 | | | 9,628 | (d) | |
| | 21,580 | | | Anna Merger Sub, Inc., 7.75%, due 10/1/22 | | | 15,025 | (d) | |
| | 6,040 | | | Aramark Services, Inc., 5.13%, due 1/15/24 | | | 6,387 | | |
| | 4,285 | | | Avis Budget Car Rental LLC/Avis Budget Finance, Inc., 5.25%, due 3/15/25 | | | 4,189 | (d) | |
| | | | | Hertz Corp. | | | | | |
| | 1,540 | | | 6.75%, due 4/15/19 | | | 1,544 | | |
| | 1,650 | | | 5.88%, due 10/15/20 | | | 1,639 | | |
| | 24,475 | | | 5.50%, due 10/15/24 | | | 22,028 | (d) | |
| | 14,738 | | | IHS Markit Ltd., 5.00%, due 11/1/22 | | | 15,843 | (d) | |
| | 2,205 | | | Iron Mountain U.S. Holdings, Inc., 5.38%, due 6/1/26 | | | 2,304 | (d) | |
| | | | | Iron Mountain, Inc. | | | | | |
| | 9,380 | | | 6.00%, due 8/15/23 | | | 9,873 | | |
| | 12,449 | | | 5.75%, due 8/15/24 | | | 12,760 | | |
| | 10,290 | | | Olympus Merger Sub, Inc., 8.50%, due 10/15/25 | | | 10,065 | (d) | |
| | | | | United Rental N.A., Inc. | | | | | |
| | 1,545 | | | 4.63%, due 7/15/23 | | | 1,616 | | |
| | 5,090 | | | 5.75%, due 11/15/24 | | | 5,395 | | |
| | | | 118,296 | | |
Technology Hardware & Equipment 2.6% | | | |
| | | | | CDW LLC/CDW Finance Corp. | | | | | |
| | 6,230 | | | 5.00%, due 9/1/23 | | | 6,503 | | |
| | 2,885 | | | 5.00%, due 9/1/25 | | | 3,018 | | |
| | 7,060 | | | CommScope Technologies LLC, 6.00%, due 6/15/25 | | | 7,448 | (d) | |
| | | | | Diamond 1 Finance Corp./Diamond 2 Finance Corp. | | | | | |
| | 10,915 | | | 5.88%, due 6/15/21 | | | 11,431 | (d) | |
| | 11,920 | | | 6.02%, due 6/15/26 | | | 13,306 | (d) | |
See Notes to Financial Statements
121
Schedule of Investments High Income Bond Fund (cont'd)
PRINCIPAL AMOUNT | | | | VALUE | |
(000's omitted) | | | | (000's omitted) | |
$ | 18,475 | | | EMC Corp., 1.88%, due 6/1/18 | | $ | 18,428 | | |
| | 5,960 | | | Project Homestake Merger Corp., 8.88%, due 3/1/23 | | | 5,334 | (d) | |
| | 15,145 | | | Western Digital Corp., 10.50%, due 4/1/24 | | | 17,773 | | |
| | | | 83,241 | | |
Telecom - Satellite 0.7% | | | |
| | 5,844 | | | Hughes Satellite Systems Corp., 6.50%, due 6/15/19 | | | 6,201 | | |
| | | | | Intelsat Jackson Holdings SA | | | | | |
| | 1,625 | | | 7.50%, due 4/1/21 | | | 1,540 | | |
| | 12,860 | | | 5.50%, due 8/1/23 | | | 10,979 | | |
| | 5,277 | | | Intelsat Luxembourg SA, 8.13%, due 6/1/23 | | | 3,219 | | |
| | | | 21,939 | | |
Telecom - Wireless 3.5% | | | |
| | | | | Sprint Corp. | | | | | |
| | 17,585 | | | 7.88%, due 9/15/23 | | | 19,651 | | |
| | 27,845 | | | 7.13%, due 6/15/24 | | | 30,099 | | |
| | | | | Sprint Nextel Corp. | | | | | |
| | 3,405 | | | 9.00%, due 11/15/18 | | | 3,609 | (d) | |
| | 5,120 | | | 6.00%, due 11/15/22 | | | 5,376 | | |
| | | | | T-Mobile USA, Inc. | | | | | |
| | 11,880 | | | 6.13%, due 1/15/22 | | | 12,355 | | |
| | 10,365 | | | 6.00%, due 3/1/23 | | | 10,922 | | |
| | | | | Wind Acquisition Finance SA | | | | | |
| | 8,915 | | | 4.75%, due 7/15/20 | | | 9,021 | (d) | |
| | 9,905 | | | 7.38%, due 4/23/21 | | | 10,290 | (d) | |
| | 12,480 | | | Wind Tre SpA, 5.00%, due 1/20/26 | | | 12,561 | (d)(h) | |
| | | | 113,884 | | |
Telecom - Wireline Integrated & Services 6.3% | | | |
| | | | | CenturyLink, Inc. | | | | | |
| | 6,175 | | | Ser. S, 6.45%, due 6/15/21 | | | 6,515 | | |
| | 3,495 | | | Ser. W, 6.75%, due 12/1/23 | | | 3,636 | | |
| | 21,537 | | | Citizens Communications Co., 9.00%, due 8/15/31 | | | 16,799 | | |
| | | | | Communications Sales & Leasing, Inc./CSL Capital LLC | | | | | |
| | 4,800 | | | 6.00%, due 4/15/23 | | | 4,806 | (d) | |
| | 4,710 | | | 8.25%, due 10/15/23 | | | 4,522 | | |
| | 6,060 | | | 7.13%, due 12/15/24 | | | 5,590 | (d) | |
| | 33,035 | | | Embarq Corp., 8.00%, due 6/1/36 | | | 33,324 | | |
| | 5,350 | | | Equinix, Inc., 5.88%, due 1/15/26 | | | 5,798 | | |
| | | | | Frontier Communications Corp. | | | | | |
| | 3,200 | | | 8.13%, due 10/1/18 | | | 3,259 | | |
| | 2,304 | | | 6.25%, due 9/15/21 | | | 1,901 | | |
| | 3,195 | | | 7.13%, due 1/15/23 | | | 2,453 | | |
| | 5,145 | | | 7.63%, due 4/15/24 | | | 3,936 | | |
| | 43,600 | | | 11.00%, due 9/15/25 | | | 36,896 | | |
| | | | | Level 3 Financing, Inc. | | | | | |
| | 9,220 | | | 5.38%, due 8/15/22 | | | 9,499 | | |
| | 8,320 | | | 5.13%, due 5/1/23 | | | 8,518 | | |
| | 3,655 | | | 5.38%, due 1/15/24 | | | 3,797 | | |
| | 9,475 | | | SoftBank Group Corp., 4.50%, due 4/15/20 | | | 9,786 | (d) | |
| | 8,975 | | | Telecom Italia Capital SA, 6.00%, due 9/30/34 | | | 10,055 | | |
| | 12,554 | | | U.S. West Communications Group, 6.88%, due 9/15/33 | | | 12,325 | | |
See Notes to Financial Statements
122
Schedule of Investments High Income Bond Fund (cont'd)
PRINCIPAL AMOUNT | | | | VALUE | |
(000's omitted) | | | | (000's omitted) | |
| | | | | Zayo Group LLC/Zayo Capital, Inc. | | | | | |
$ | 3,230 | | | 6.00%, due 4/1/23 | | $ | 3,396 | | |
| | 2,480 | | | 6.38%, due 5/15/25 | | | 2,669 | | |
| | 14,220 | | | 5.75%, due 1/15/27 | | | 14,984 | (d) | |
| | | | 204,464 | | |
Theaters & Entertainment 1.1% | | | |
| | | | | AMC Entertainment Holdings, Inc. | | | | | |
| | 9,160 | | | 5.75%, due 6/15/25 | | | 8,908 | | |
| | 15,540 | | | 6.13%, due 5/15/27 | | | 15,385 | | |
| | 10,871 | | | Regal Entertainment Group, 5.75%, due 3/15/22 | | | 11,251 | | |
| | | | 35,544 | | |
| | | | | Total Corporate Bonds (Cost $2,791,320) | | | 2,903,290 | | |
Asset-Backed Securities 0.5% | | | |
| | 1,250 | | | Ares XLV CLO Ltd., Ser. 2017-45A, Class E, 3 month USD LIBOR + 6.10%, (7.46%),
due 10/15/30 | | | 1,249
| (a)(d) | |
| | 2,100 | | | Assurant CLO I Ltd., Ser. 2017-1A, Class E, 3 month USD LIBOR + 6.46%, (0.00%),
due 10/20/29 | | | 2,053
| (a)(d)(h) | |
| | 1,000 | | | Babson CLO Ltd., Ser. 2015-2A, Class ER, 3 month USD LIBOR + 6.45%, (7.81%),
due 10/20/30 | | | 980
| (a)(d) | |
| | 2,000 | | | Benefit Street Partners CLO XII Ltd., Ser. 2017-12A, Class D,
3 month USD LIBOR + 6.41%, (7.76%), due 10/15/30 | | | 1,966
| (a)(d) | |
| | 3,500 | | | Dewolf Park CLO Ltd., Ser. 2017-1A, Class E, 3 month USD LIBOR + 6.20%, (7.45%),
due 10/15/30 | | | 3,521
| (a)(d) | |
| | 1,600 | | | Dryden 54 Senior Loan Fund, Ser. 2017-54A, Class E, 3 month USD LIBOR + 6.20%,
(7.55%), due 10/19/29 | | | 1,600
| (a)(d) | |
| | 1,200 | | | Gilbert Park CLO Ltd., Ser. 2017-1A, Class E, 3 month USD LIBOR + 6.40%, (7.76%),
due 10/15/30 | | | 1,200
| (a)(d) | |
| | 1,000 | | | HPS Investment Partners, Ser. 2013-2A, Class DR, 3 month USD LIBOR + 6.60%, (7.96%),
due 10/20/29 | | | 1,000
| (a)(d) | |
| | 1,250 | | | Marble Point CLO X Ltd., Ser. 2017-1A, Class E, 3 month USD LIBOR + 6.40%, (7.76%),
due 10/15/30 | | | 1,214
| (a)(d) | |
| | 2,750 | | | Milos CLO Ltd., Ser. 2017-1A, Class E, 3 month USD LIBOR + 6.30%, (7.66%),
due 10/20/30 | | | 2,680
| (a)(d) | |
| | | | | Total Asset-Backed Securities (Cost $17,323) | | | 17,463 | | |
NUMBER OF SHARES | | | | | |
Exchange Traded Fund 1.2% | | | |
| | 432 | | | iShares iBoxx $ High Yield Corporate Bond ETF (Cost $38,212) | | | 38,219 | | |
Short-Term Investment 2.5% | | | |
Investment Company 2.5% | | | |
| | 82,286,006 | | | State Street Institutional U.S. Government Money Market Fund Premier Class, 0.96%
(Cost $82,286) | | | 82,286
| (i)(j) | |
| | | | | Total Investments 99.7% (Cost $3,126,973) | | | 3,238,852 | | |
| | | | | Other Assets Less Liabilities 0.3% | | | 9,111 | | |
| | | | | Net Assets 100.0% | | $ | 3,247,963 | | |
See Notes to Financial Statements
123
Schedule of Investments High Income Bond Fund (cont'd)
(a) Variable or floating rate security. The interest rate shown was the current rate as of October 31, 2017 and changes periodically.
Benchmarks for Variable / Floating Rates:
LIBOR (USD) = London Interbank Offered Rate
(b) Value determined using significant unobservable inputs.
(c) Illiquid security.
(d) Securities were purchased under Rule 144A of the Securities Act of 1933, as amended (the "1933 Act"), or are otherwise restricted and, unless registered under the 1933 Act or exempted from registration, may only be sold to qualified institutional investors or may have other restrictions on resale. At October 31, 2017, these securities amounted to approximately $1,222,504,000, which represent 37.6% of net assets of the Fund. Securities denoted with (d) but without (c) have been deemed by the investment manager to be liquid.
(e) Payment-in-kind (PIK) security.
(f) Security fair valued as of October 31, 2017 in accordance with procedures approved by the Board of Trustees (the "Board"). Total value of all such securities at October 31, 2017 amounted to approximately $1,000, which represents 0.0% of net assets of the Fund.
(g) Defaulted Security.
(h) When-issued security. Total value of all such securities at October 31, 2017 amounted to approximately $14,614,000, which represents 0.4% of net assets of the Fund.
(i) All or a portion of this security is segregated in connection with obligations for when-issued securities with a total value of approximately $82,286,000.
(j) Represents 7-day effective yield as of October 31, 2017.
The following is a summary, categorized by Level (see Note A of Notes to Financial Statements), of inputs used to value the Fund's investments as of October 31, 2017:
Asset Valuation Inputs | | Level 1 | | Level 2 | | Level 3(b) | | Total | |
Investments: | |
Loan Assignments | |
Health Care | | $ | — | | | $ | 11,360 | | | $ | 11,796 | | | $ | 23,156 | | |
Leisure Goods—Activities—Movies | | | — | | | | 4,013 | | | | 3,104 | | | | 7,117 | | |
Lodging & Casinos | | | — | | | | 6,960 | | | | 12,902 | | | | 19,862 | | |
| Other Loan Assignments(a) | | | — | | | | 147,459 | | | | — | | | | 147,459 | | |
Total Loan Assignments | | | — | | | | 169,792 | | | | 27,802 | | | | 197,594 | | |
Corporate Bonds | |
Chemicals | | | — | | | | 48,874 | | | | 1 | | | | 48,875 | | |
| Other Corporate Bonds(a) | | | — | | | | 2,854,415 | | | | — | | | | 2,854,415 | | |
Total Corporate Bonds | | | — | | | | 2,903,289 | | | | 1 | | | | 2,903,290 | | |
Asset-Backed Securities | | | — | | | | 17,463 | | | | — | | | | 17,463 | | |
Exchange Traded Fund | | | 38,219 | | | | — | | | | — | | | | 38,219 | | |
Short-Term Investment | | | — | | | | 82,286 | | | | — | | | | 82,286 | | |
Total Investments | | $ | 38,219 | | | $ | 3,172,830 | | | $ | 27,803 | | | $ | 3,238,852 | | |
See Notes to Financial Statements
124
Schedule of Investments High Income Bond Fund (cont'd)
(a) The Schedule of Investments provides information on the industry or sector categorization for the portfolio.
(b) The following is a reconciliation between the beginning and ending balances of investments in which unobservable inputs (Level 3) were used in determining value:
| | | Beginning
balance, as
of 11/1/2016 | | Accrued
discounts/
(premiums) | | Realized
gain/(loss) | | Change
in unrealized
appreciation/
(depreciation) | | Purchases | | Sales | | Transfers
into
Level 3 | | Transfers
out of
Level 3 | | Balance
as of
10/31/2017 | | Net change
in unrealized
appreciation/
(depreciation)
from
investments
still held as of
10/31/2017 | |
Investments in
Securities: | |
| Loan Assignments(c) | |
Health Care | | $ | — | | | $ | 2 | | | $ | 0 | (e) | | $ | (77 | ) | | $ | 11,930 | | | $ | (59 | ) | | $ | — | | | $ | — | | | $ | 11,796 | | | $ | (77 | ) | |
Leisure Goods—
Activities—
Movies | | | — | | | | 1 | | | | — | | | | 48 | | | | 3,055 | | | | — | | | | — | | | | — | | | | 3,104 | | | | 48 | | |
Lodging &
Casinos | | | — | | | | 66 | | | | — | | | | 625 | | | | — | | | | — | | | | 12,211 | | | | — | | | | 12,902 | | | | 625 | | |
Radio &
Television | | | 7,604 | | | | — | | | | — | | | | — | | | | — | | | | — | | | | — | | | | (7,604 | ) | | | — | | | | — | | |
| Corporate Bonds(d) | |
Chemicals | | | — | | | | — | | | | — | | | | — | | | | — | | | | — | | | | 1 | | | | — | | | | 1 | | | | — | | |
Total | | $ | 7,604 | | | $ | 69 | | | $ | 0 | (e) | | $ | 596 | | | $ | 14,985 | | | $ | (59 | ) | | $ | 12,212 | | | $ | (7,604 | ) | | $ | 27,803 | | | $ | 596 | | |
(c) Securities categorized as Level 3 were valued using a single quotation obtained from a dealer. The Fund does not have access to unobservable inputs and therefore cannot disclose such inputs used in formulating such quotation.
(d) Securities categorized as Level 3 were valued using methods the Board has approved in the good-faith belief that the resulting valuation will reflect the fair value of these securities.
(e) Amount less than one thousand.
As of the year ended October 31, 2017, certain securities were transferred from one level (as of October 31, 2016) to another. Based on beginning of period market values as of November 1, 2016, approximately $7,604,000 was transferred from Level 3 to Level 2. Also, approximately $12,212,000 was transferred from Level 2 to Level 3. Transfers of loan assignments and corporate bonds into or out of Level 3 were primarily due to the pricing methodology using methods the Board has approved in the good-faith belief that the resulting valuation will reflect the fair value of these securities (Level 3) or a single observable input (Level 3) by the independent pricing service. As of the year ended October 31, 2017, the Fund had no transfers between Levels 1 and 2.
See Notes to Financial Statements
125
Schedule of Investments Municipal High Income Fund October 31, 2017
PRINCIPAL AMOUNT | | | | VALUE | |
(000's omitted) | | | | (000's omitted) | |
Municipal Notes 98.0% | | | |
Alabama 1.0% | | | |
$ | 300
| | | Birmingham Spec. Care Facs. Fin. Au. Rev. (Methodist Home for The Aging), Ser. 2016-2015-1, 5.75%,
due 6/1/45 | | $ | 326
| | |
| | 500 | | | Phenix City IDB Env. Imp. Rev. Ref. (Meadwestvaco Coated Board Proj.), Ser. 2012-A, 4.13%, due 5/15/35 | | | 504 | | |
| | 175 | | | Taylor-Ryan Impt. Dist. Rev. Ref., Ser. 2005, (LOC: Synovus Bank), 1.07%, due 11/1/35 | | | 175 | (a) | |
| | | | 1,005 | | |
Alaska 3.7% | | | |
| | 3,150 | | | Valdez Marine Term. Ref. Rev. (Exxon Pipeline Co. Proj.), Ser. 1993, 0.90%, due 12/1/33 | | | 3,150 | (a)(b) | |
| | 400 | | | Valdez Marine Term. Rev. Ref. (Exxon Pipeline Co. Proj.), Ser. 1993-C, 0.90%, due 12/1/33 | | | 400 | (a) | |
| | | | 3,550 | | |
American Samoa 0.2% | | | |
| | 200 | | | American Samoa Econ. Dev. Au. Gen. Rev. Ref., Ser. 2015-A, 6.25%, due 9/1/29 | | | 200 | | |
Arizona 5.3% | | | |
| 500 | | | Maricopa Co. Ind. Dev. Au. Ed. Ref. Rev. (Paradise Sch. Proj. Paragon Management, Inc.), Ser. 2016,
5.00%, due 7/1/36 | | | 518 | (c) | |
| 800 | | | Maricopa Co. Ind. Dev. Au. Solid Waste Disp. Rev. (Waste Management, Inc. Proj.), Ser. 2001,
3.38%, due 12/1/31 Putable 6/3/24 | | | 824 | (a) | |
| 1,230 | | | Maricopa Co. Ind. Dev. Au. Sr. Living Fac. Ref. Rev. (Christian Care Retirement Apts. Inc. Proj.),
Ser. 2016-A, 5.00%, due 1/1/25 | | | 1,451 | (b) | |
| 500 | | | Maricopa Co. Ind. Dev. Au. Sr. Living Fac. Rev. (Christian Care Surprise, Inc. Proj.), Ser. 2016, 5.00%,
due 1/1/26 | | | 500 | (c)(d) | |
| | 250 | | | Navajo Nation Ref. Rev., Ser. 2015-A, 5.00%, due 12/1/25 | | | 270 | (c) | |
| | 500 | | | Phoenix Ind. Dev. Au. Ed. Ref. Rev. (Great Hearts Academies), Ser. 2016-A, 5.00%, due 7/1/46 | | | 532 | | |
| | 600 | | | Phoenix Ind. Dev. Au. Rev. (Deer Valley Veterans Assisted Living Proj.), Ser. 2016-A, 5.13%, due 7/1/36 | | | 607 | | |
| 500 | | | Pima Co. Ind. Dev. Au. Ed. Ref. Rev. (American Leadership Academy Proj.), Ser. 2015, 5.38%,
due 6/15/35 | | | 486 | (c) | |
| | | | 5,188 | | |
California 7.5% | | | |
| 250 | | | California Muni. Fin. Au. Charter Sch. Lease Rev. (Santa Rosa Academy Proj.), Ser. 2015, 5.13%,
due 7/1/35 | | | 261 | (c) | |
| 500 | | | California Muni. Fin. Au. Charter Sch. Rev. (John Adams Academics Proj.), Ser. 2015-A, 4.50%,
due 10/1/25 | | | 536 | | |
| 500 | | | California Muni. Fin. Au. Charter Sch. Rev. (Palmdale Aerospace Academy Proj.), Ser. 2016, 5.00%,
due 7/1/31 | | | 516 | (c) | |
| | 400 | | | California Muni. Fin. Au. Rev. (Baptist Univ.), Ser. 2015-A, 5.00%, due 11/1/30 | | | 434 | (c) | |
| | 1,130 | | | California St. Dept. of Veterans Affairs Home Purchase Ref. Rev., Ser. 2016-A, 2.85%, due 12/1/27 | | | 1,112 | (b) | |
| | 200 | | | California St. G.O. Ref., Ser. 2015, 5.00%, due 8/1/29 | | | 240 | | |
| 500 | | | California St. Poll. Ctrl. Fin. Au. Solid Waste Disp. Rev. (Aemerge Redpak Svcs. So. California LLC Proj.),
Ser. 2016, 7.00%, due 12/1/27 | | | 491 | (c)(d) | |
| 500 | | | California St. Sch. Fin. Au. Charter Sch. Rev. (Downtown College Prep-Oblig. Group),
Ser. 2016, 4.75%, due 6/1/36 | | | 513 | (c) | |
| | 600 | | | California St. Sch. Fin. Au. Charter Sch. Rev. (Rocketship Ed.), Ser. 2016-A, 5.00%, due 6/1/31 | | | 616 | (c) | |
| | 400 | | | California Statewide CDA Rev. Ref. (Lancer Ed. Std. Hsg. Proj.), Ser. 2016-A, 5.00%, due 6/1/36 | | | 418 | (c) | |
| | | | | California Statewide CDA Spec. Tax Rev. Ref. (Comm. Facs. Dist. Number 2007-01 Orinda Wilder Proj.) | | | | | |
| | 130 | | | Ser. 2015, 4.25%, due 9/1/21 | | | 141 | | |
| | 145 | | | Ser. 2015, 4.50%, due 9/1/25 | | | 163 | | |
See Notes to Financial Statements
126
Schedule of Investments Municipal High Income Fund (cont'd)
PRINCIPAL AMOUNT | | | | VALUE | |
(000's omitted) | | | | (000's omitted) | |
$ | 400 | | | Del Mar Race Track Au. Ref. Rev., Ser. 2015, 5.00%, due 10/1/38 | | $ | 401 | | |
| 900 | | | Irvine Unified Sch. Dist. Spec. Tax (Comm. Facs. Dist. # 09-1), (LOC: U.S. Bank),
Ser. 2014, 0.82%, due 9/1/54 | | | 900 | (a) | |
| | 500 | | | Palomar Hlth. Ref. Rev., Ser. 2016, 5.00%, due 11/1/36 | | | 552 | | |
| | | | 7,294 | | |
Colorado 3.4% | | | |
| | 500 | | | Crystal Crossing Metro. Dist. Ref. G.O., Ser. 2016, 4.50%, due 12/1/26 | | | 500 | | |
| | 1,000 | | | Denver Convention Ctr. Hotel Au. Ref. Rev., Ser. 2016, 5.00%, due 12/1/27 | | | 1,180 | (b) | |
| | 500 | | | Littleton Village Metro. Dist. Number 2 Ref. G.O., Ser. 2015, 5.38%, due 12/1/45 | | | 503 | | |
| | | | | Park Creek Metro. Dist. Ref. Tax Allocation Rev. (Sr. Ltd. Prop. Tax Supported) | | | | | |
| | 250 | | | Ser. 2015-A, 5.00%, due 12/1/34 | | | 276 | | |
| | 250 | | | Ser. 2015-A, 5.00%, due 12/1/35 | | | 275 | | |
| | 500 | | | Ser. 2015-A, 5.00%, due 12/1/45 | | | 542 | | |
| | | | 3,276 | | |
Connecticut 1.0% | | | |
| | 465 | | | Hartford Co. Metro. Dist. G.O., Ser. 2016-C, (AGM Insured), 5.00%, due 11/1/27 | | | 551 | | |
| | 395 | | | Mohegan Tribe of Indians Gaming Au. Ref. Rev. (Priority Dist.), Ser. 2015-C, 4.75%, due 2/1/20 | | | 402 | (c) | |
| | | | 953 | | |
District of Columbia 0.5% | | | |
| | 500 | | | Dist. of Columbia Rev. (Howard Univ.), Ser. 2011-A, 6.25%, due 10/1/23 | | | 527 | | |
Florida 5.3% | | | |
| | 400 | | | Cap. Trust Agcy. Rev. (Tuscan Garden Palm Coast Proj.), Ser. 2017-A, 7.00%, due 10/1/49 | | | 389 | (c)(d) | |
| | 650 | | | Florida Dev. Fin. Corp. Ed. Facs. Rev. Ref. (Pepin Academies, Inc.), Ser. 2016-A, 5.00%, due 7/1/36 | | | 626 | | |
| 450 | | | Florida St. Dev. Fin. Corp. Ed. Facs. Rev. (Renaissance Charter Sch., Inc. Proj.),
Ser. 2015-A, 6.00%, due 6/15/35 | | | 471 | (c) | |
| | 500 | | | Florida St. Dev. Fin. Corp. Sr. Living Rev. (Tuscan Isle Obligated Group), Ser. 2015-A, 7.00%, due 6/1/45 | | | 405 | (c) | |
| | 470 | | | Florida St. Hsg. Fin. Corp. Rev., Ser. 2015-1, 3.75%, due 7/1/35 | | | 488 | | |
| 400 | | | Greater Orlando Aviation Au. Arpt. Facs. Spec. Purp. Rev. (Jetblue Airways Corp. Proj.),
Ser. 2013, 5.00%, due 11/15/36 | | | 417 | | |
| 525 | | | Lee Co. Ind. Dev. Au. Rev. (Cypress Cove Hlth. Park, Inc. Memory Care Proj.),
Ser. 2014, 4.50%, due 10/1/32 | | | 527 | | |
| | 400 | | | Martin Co. PCR Ref. (Florida Pwr. & Lt. Co. Proj.), Ser. 2000, 0.96%, due 7/15/22 | | | 400 | (a) | |
| | 1,400 | | | St. Lucie Co. Solid Waste Disp. Rev. Ref. (Florida Pwr. & Lt. Co. Proj.), Ser. 2003, 0.98%, due 5/1/24 | | | 1,400 | (a)(b) | |
| | | | 5,123 | | |
Georgia 1.0% | | | |
| 750 | | | Cobb Co. Dev. Au. Sr. Living Ref. Rev. (Provident Village Creekside Proj.), Ser. 2016-A, 6.00%,
due 7/1/36 | | | 692 | (c)(d) | |
| | 300 | | | Greene Co. Dev. Au. Swr. Fac. Rev., Ser. 2015, 6.13%, due 1/1/25 | | | 304 | (c)(d) | |
| | | | 996 | | |
See Notes to Financial Statements
127
Schedule of Investments Municipal High Income Fund (cont'd)
PRINCIPAL AMOUNT | | | | VALUE | |
(000's omitted) | | | | (000's omitted) | |
Hawaii 0.8% | | | |
| | | | | Hawaii St. Dept. of Budget & Fin. Spec. Purp. Rev. Ref. | | | | | |
$ | 250 | | | Ser. 2015, 5.00%, due 1/1/35 | | $ | 254 | (c) | |
| | 500 | | | Ser. 2015, 5.00%, due 1/1/45 | | | 501 | (c) | |
| | | | 755 | | |
Illinois 9.3% | | | |
| | | | | Chicago G.O. | | | | | |
| | 250 | | | Ser. 2002-2002B, 5.13%, due 1/1/27 | | | 274 | | |
| | 1,000 | | | Ser. 2009-C, 5.00%, due 1/1/27 | | | 1,021 | | |
| | | | | Chicago O'Hare Int'l Arpt. Rev. Ref. | | | | | |
| | 200 | | | Ser. 2015-A, 5.00%, due 1/1/28 | | | 231 | | |
| | 100 | | | Ser. 2015-A, 5.00%, due 1/1/34 | | | 112 | | |
| | | | | Chicago Ref. G.O. | | | | | |
| | 500 | | | Ser. 2002-B, 5.25%, due 1/1/28 | | | 549 | | |
| | 1,000 | | | Ser. 2012-C, 5.00%, due 1/1/20 | | | 1,047 | | |
| | 500 | | | Ser. 2012-C, 5.00%, due 1/1/24 | | | 535 | | |
| | 475 | | | Chicago Transit Au. Sales Tax Receipts Rev., Ser. 2010-A, 5.00%, due 12/1/17 | | | 476 | | |
| | 155 | | | Chicago Wastewater Rev. (Second Lien Proj.), Ser. 2014, 5.00%, due 11/1/27 | | | 176 | | |
| | 500 | | | Chicago Wastewater Transmission Rev. Ref. (Second Lien), Ser. 2008-C, 5.00%, due 1/1/39 | | | 540 | | |
| | 400 | | | Illinois Fin. Au. Charter Sch. Rev. (Intrinsic Sch.-Belmont Sch. Proj.), Ser. 2015-A, 5.75%, due 12/1/35 | | | 410 | (c) | |
| | 425 | | | Illinois Fin. Au. Rev. Ref. (Rosalind Franklin Univ. of Medicine & Science), Ser. 2017-A, 5.00%, due 8/1/47 | | | 465 | | |
| | | | | Illinois St. G.O. | | | | | |
| | 225 | | | Ser. 2006, 5.50%, due 1/1/30 | | | 250 | | |
| | 250 | | | Ser. 2009, 5.25%, due 4/1/28 | | | 252 | | |
| | 40 | | | Ser. 2013, 5.00%, due 7/1/23 | | | 43 | | |
| | 450 | | | Ser. 2014, 5.00%, due 2/1/39 | | | 466 | | |
| | | | | Illinois St. G.O. Ref. | | | | | |
| | 750 | | | Ser. 2016, 5.00%, due 2/1/24 | | | 818 | | |
| | 635 | | | Ser. 2016, 5.00%, due 2/1/26 | | | 692 | | |
| | 620 | | | Illinois St. Sales Tax Rev., Ser. 1992-P, 6.50%, due 6/15/22 | | | 691 | | |
| | | | 9,048 | | |
Indiana 0.8% | | | |
| | 725 | | | Indianapolis Econ. Dev. Rev. Ref. (Brookhaven Co. Line Apts. Proj.), Ser. 2013-A, 6.25%, due 7/1/43 | | | 754 | | |
Iowa 0.9% | | | |
| | 400 | | | Iowa Higher Ed. Loan Au. Ref. Rev. (Wartburg College Proj.), Ser. 2015, 5.00%, due 10/1/32 | | | 403 | | |
| | 500 | | | People's Mem. Hosp. Buchanan Co. Hosp. Rev., Ser. 2016, 1.50%, due 12/1/18 | | | 500 | | |
| | | | 903 | | |
Kansas 0.3% | | | |
| | 300 | | | Wichita City Sales Tax. Spec. Oblig. Rev. Ref. (Greenwich Star Bond), Ser. 2017-K-96, 4.20%, due 9/1/27 | | | 297 | | |
Kentucky 1.5% | | | |
| 405 | | | Kentucky Econ. Dev. Fin. Au. (Sr. Next Generation Information Hwy. Proj.),
Ser. 2015-A, 4.00%, due 7/1/29 | | | 423 | | |
| 500 | | | Kentucky Econ. Dev. Fin. Au. Rev. Ref. (Owensboro Hlth., Inc. Obligated Group), Ser. 2017-A,
(AGM Insured), 4.00%, due 6/1/37 | | | 510 | | |
| | 475 | | | Ohio Co. PCR Ref. (Big Rivers Elec. Corp. Proj.), Ser. 2010-A, 6.00%, due 7/15/31 | | | 484 | | |
| | | | 1,417 | | |
See Notes to Financial Statements
128
Schedule of Investments Municipal High Income Fund (cont'd)
PRINCIPAL AMOUNT | | | | VALUE | |
(000's omitted) | | | | (000's omitted) | |
Louisiana 1.7% | | | |
$ | 400
| | | Louisiana Local Govt. Env. Facs. & Comm. Dev. Au. Rev. Ref. (Westside Habilitation Ctr. Proj.),
Ser. 2017-A, 5.75%, due 2/1/32 | | $ | 400
| (c) | |
| | 500 | | | New Orleans Aviation Board Rev. (Gen. Arpt. Terminal), Ser. 2017-B, 5.00%, due 1/1/26 | | | 598 | | |
| | 555 | | | New Orleans Swr. Svc. Rev. (Swr. Rev.), Ser. 2015, 5.00%, due 6/1/40 | | | 622 | | |
| | | | 1,620 | | |
Maine 0.7% | | | |
| 445 | | | Maine St. Ed. Loan Au. Std. Loan Rev. (Supplemental Ed. Loan), Ser. 2014-A-1,
(AGM Insured), 4.00%, due 12/1/20 | | | 471 | | |
| 200 | | | Maine St. Fin. Au. Solid Waste Disp. Rev. (Casella Waste Sys. Proj.), Ser. 2015, 5.13%,
due 8/1/35 Putable 8/1/25 | | | 204 | (a)(c) | |
| | | | 675 | | |
Massachusetts 1.2% | | | |
| | 1,000 | | | Massachusetts St. Ed. Fin. Au. Rev. (Ed. Loan Rev.), Ser. 2014, 5.00%, due 1/1/27 | | | 1,119 | | |
Michigan 4.0% | | | |
| | 1,000 | | | Michigan St. Fin. Au. Rev. Ref. (Std. Loan), Ser. 2014-25-A, 5.00%, due 11/1/20 | | | 1,091 | | |
| | | | | Michigan St. Hsg. Dev. Au. Rev. | | | | | |
| | 250 | | | Ser. 2016-A, 3.35%, due 12/1/31 | | | 251 | | |
| | 1,000 | | | Ser. 2016-C, 2.15%, due 6/1/23 | | | 992 | | |
| | 400 | | | Summit Academy Pub. Sch. Academy Ref. Rev., Ser. 2005, 6.38%, due 11/1/35 | | | 400 | | |
| | 1,000 | | | Warren Cons. Sch. Dist. Ref. G.O., Ser. 2016-A, 5.00%, due 5/1/27 | | | 1,190 | | |
| | | | 3,924 | | |
Minnesota 0.8% | | | |
| 500 |
| | St. Paul Hsg. & Redev. Au. Charter Sch. Lease Rev. (Academia Cesar Chavez Sch. Proj.),
Ser. 2015-A, 5.25%, due 7/1/50 | | | 503 | | |
| 300 |
| | St. Paul Hsg. & Redev. Au. Charter Sch. Lease Rev. (Twin Cities Academy Proj.),
Ser. 2015-A, 5.00%, due 7/1/35 | | | 306 | | |
| | | | 809 | | |
Mississippi 2.7% | | | |
| | 1,300 | | | Jackson Co. Port Fac. Rev. Ref. (Chevron USA, Inc. Proj.), Ser. 1993, 0.90%, due 6/1/23 | | | 1,300 | (a) | |
| 1,300 |
| | Mississippi St. Bus. Fin. Corp. Solid Waste Disp. Rev. Ref. (Gulf Pwr. Co. Proj.),
Ser. 2012, 0.99%, due 11/1/42 | | | 1,300 | (a) | |
| | | | 2,600 | | |
Missouri 1.6% | | | |
| 500 |
| | Kansas City Ind. Dev. Au. Sr. Living Facs. Ref. Rev. (Kansas City United Methodist
Retirement Home, Inc.), Ser. 2016, 6.00%, due 11/15/46 | | | 490 | (c) | |
| | | | | St. Louis Co. Ind. Dev. Au. Ref. Rev. (Nazareth Living Ctr. Proj.) | | | | | |
| | 255 | | | Ser. 2015-A, 5.00%, due 8/15/30 | | | 260 | | |
| | 390 | | | Ser. 2015-A, 5.00%, due 8/15/35 | | | 394 | | |
| | 355 | | | Ser. 2015-A, 5.13%, due 8/15/45 | | | 361 | | |
| | | | 1,505 | | |
See Notes to Financial Statements
129
Schedule of Investments Municipal High Income Fund (cont'd)
PRINCIPAL AMOUNT | | | | VALUE | |
(000's omitted) | | | | (000's omitted) | |
Nevada 0.5% | | | |
$ | 500
| | | Director of the St. of Nevada Dept. of Bus. & Ind. Rev. (Somerset Academy),
Ser. 2015-A, 5.13%, due 12/15/45 | | $ | 511
| (c) | |
New Jersey 7.1% | | | |
| | | | | Atlantic City G.O. Ref. | | | | | |
| | 200 | | | Ser. 2017-A, (BAM Insured), 5.00%, due 3/1/26 | | | 234 | | |
| | 200 | | | Ser. 2017-A, (BAM Insured), 5.00%, due 3/1/32 | | | 229 | | |
| | 200 | | | Ser. 2017-A, (BAM Insured), 5.00%, due 3/1/42 | | | 226 | | |
| | 200 | | | Essex Co. Imp. Au. Solid Waste Disp. Rev. (Covanta Energy Proj.), Ser. 2015, 5.25%, due 7/1/45 | | | 203 | (c) | |
| | | | | New Jersey Econ. Dev. Au. Ref. Rev. (Sch. Facs. Construction) | | | | | |
| | 975 | | | Ser. 2005-K, (AMBAC Insured), 5.25%, due 12/15/20 | | | 1,066 | | |
| | 500 | | | Ser. 2014-PP, 5.00%, due 6/15/19 | | | 528 | | |
| | 250 | | | New Jersey Ed. Fac. Au. Ref. Rev. (College of New Jersey), Ser. 2016-F, 4.00%, due 7/1/35 | | | 258 | | |
| | 250 | | | New Jersey Higher Ed. Assist. Au. Rev. (Std. Loan Rev.), Ser. 2017-1A, 5.00%, due 12/1/25 | | | 288 | | |
| | 500 | | | New Jersey Hlth. Care Facs. Fin. Au. Rev. Ref. (Princeton Hlth. Care Sys.), Ser. 2016-A, 5.00%, due 7/1/39 | | | 560 | | |
| | 720 | | | New Jersey Trans. Trust Fund Au. Rev., Ser. 2003-B-4, 5.25%, due 12/15/19 | | | 768 | | |
| | | | | New Jersey Trans. Trust Fund Au. Rev. (Federal Hwy. Reimbursement Notes) | | | | | |
| | 600 | | | Ser. 2016-A-1, 5.00%, due 6/15/19 | | | 628 | | |
| | 750 | | | Ser. 2016-A-2, 5.00%, due 6/15/21 | | | 767 | | |
| | 500 | | | Salem Co. Poll. Ctrl. Fin. Au. Rev. (Chambers Proj.), Ser. 2014-A, 5.00%, due 12/1/23 | | | 543 | | |
| | 575 | | | Tobacco Settlement Fin. Corp. Rev., Ser. 2007-1A, 5.00%, due 6/1/41 | | | 552 | | |
| | | | 6,850 | | |
New Mexico 0.5% | | | |
| 500 |
| | Winrock Town Ctr. Tax Increment Dev. Dist. Number 1 Tax Allocation Sr., Lien Rev.
(Gross Receipts Tax Increment Bonds), Ser. 2015, 5.25%, due 5/1/25 | | | 508 | (c)(d) | |
New York 2.9% | | | |
| | 200 | | | Build NYC Res. Corp. Rev., Ser. 2014, 5.25%, due 11/1/34 | | | 210 | | |
| 400 |
| | New York St. Dorm. Au. Rev. Non St. Supported Debt (St. Josephs College),
Ser. 2010, 5.25%, due 7/1/25 | | | 401 | | |
| 900 |
| | New York St. Dorm. Au. Rev. Ref. Non St. Supported Debt (Orange Reg. Med. Ctr.),
Ser. 2017, 5.00%, due 12/1/22 | | | 1,002 | (c) | |
| 500 |
| | New York St. Trans. Dev. Corp. Spec. Fac. Rev. (American Airlines, Inc.,
John F Kennedy Int'l Arpt. Proj.), Ser. 2016, 5.00%, due 8/1/31 | | | 534 | | |
| 250 |
| | Niagara Area Dev. Corp. Solid Waste Disp. Fac. Rev. Ref. (Covanta Energy Proj.),
Ser. 2012-A, 5.25%, due 11/1/42 | | | 250 | (c) | |
| | 400 | | | Westchester Co. Local Dev. Corp. Rev. Ref. (Wartburg Sr. Hsg. Proj.), Ser. 2015-A, 5.00%, due 6/1/30 | | | 400 | (c) | |
| | | | 2,797 | | |
North Carolina 0.7% | | | |
| 250 |
| | North Carolina Med. Care Commission Hlth. Care Fac. First Mtge. Rev.
(Lutheran Svcs. for Aging, Inc.), Ser. 2012-A, 5.00%, due 3/1/37 | | | 262 | | |
| 345 |
| | North Carolina Med. Care Commission Retirement Facs. Ref. Rev.
(United Methodist Retirement Homes), Ser. 2016-A, 5.00%, due 10/1/35 | | | 382 | | |
| | | | 644 | | |
North Dakota 1.1% | | | |
| | 1,020 | | | Williston Sales Tax Rev., Ser. 2011-B, 2.75%, due 5/1/19 | | | 1,015 | | |
See Notes to Financial Statements
130
Schedule of Investments Municipal High Income Fund (cont'd)
PRINCIPAL AMOUNT | | | | VALUE | |
(000's omitted) | | | | (000's omitted) | |
Ohio 1.9% | | | |
$ | 2,000
| | | Buckeye Tobacco Settlement Fin. Au. Asset-Backed Sr. Rev. (Turbo), Ser. 2007-A-2, 5.88%,
due 6/1/47 | | $ | 1,876
| (b) | |
Oregon 0.5% | | | |
| | 490 | | | Western Generation Agcy. Rev. (Wauna Cogeneration Proj.), Ser. 2006-A, 5.00%, due 1/1/21 | | | 491 | | |
Pennsylvania 5.1% | | | |
| 1,000 |
| | Bucks Co. Ind. Dev. Au. Solid Waste Rev. (Waste Management, Inc. Proj.),
Ser. 2002, 1.50%, due 12/1/22 Putable 2/1/18 | | | 1,000 | (a) | |
| | | | | Lancaster Co. Hosp. Au. Rev. (Brethren Village Proj.) | | | | | |
| | 250 | | | Ser. 2015, 5.25%, due 7/1/35 | | | 271 | | |
| | 150 | | | Ser. 2015, 5.50%, due 7/1/45 | | | 164 | | |
| | 150 | | | Latrobe Ind. Dev. Au. (St. Vincent College Proj.), Ser. 2013, 5.00%, due 5/1/43 | | | 161 | | |
| | | | | Luzerne Co. G. O. Ref. | | | | | |
| | 750 | | | Ser. 2017-A, (AGM Insured), 5.00%, due 12/15/29 | | | 869 | (e) | |
| | 300 | | | Ser. 2017-B, (AGM Insured), 5.00%, due 12/15/27 | | | 353 | (e) | |
| | | | | Pennsylvania Econ. Dev. Fin. Au. Rev. (Bridges Finco LP) | | | | | |
| | 750 | | | Ser. 2015, 5.00%, due 6/30/18 | | | 767 | | |
| | 750 | | | Ser. 2016-C, 5.00%, due 12/31/38 | | | 842 | | |
| | 500 | | | Pennsylvania St. Turnpike Commission Turnpike Rev., Subser. 2017-B-1, 5.25%, due 6/1/47 | | | 563 | | |
| | | | 4,990 | | |
Rhode Island 2.9% | | | |
| | | | | Rhode Island St. Hsg. & Mtge. Fin. Corp. Ref. Rev. | | | | | |
| | 255 | | | Ser. 2016-1-C, 2.75%, due 4/1/25 | | | 260 | | |
| | 275 | | | Ser. 2016-1-C, 2.85%, due 10/1/25 | | | 281 | | |
| | 280 | | | Ser. 2016-1-C, 2.95%, due 4/1/26 | | | 286 | | |
| | 185 | | | Ser. 2016-1-C, 3.00%, due 10/1/26 | | | 189 | | |
| 380 | | | Rhode Island St. Hsg. & Mtge. Fin. Corp. Ref. Rev. (Homeownership Opportunity),
Ser. 2016-67-C, 3.25%, due 4/1/30 | | | 368 | | |
| | | | | Rhode Island St. Std. Loan Au. Std. Loan Rev. (Sr. Prog.) | | | | | |
| | 665 | | | Ser. 2013-A, 3.25%, due 12/1/22 | | | 681 | | |
| | 675 | | | Ser. 2017-A, 5.00%, due 12/1/24 | | | 768 | | |
| | | | 2,833 | | |
South Carolina 0.6% | | | |
| | 500 | | | Lancaster Co. Assessment Rev. Ref. (Walnut Creek Imp. Dist.), Ser. 2016-A-1, 5.00%, due 12/1/31 | | | 550 | | |
Tennessee 0.7% | | | |
| | 800 | | | Bristol IDB Sales Tax Rev., Ser. 2016-B, 0.00%, due 12/1/21 | | | 673 | (c) | |
Texas 7.8% | | | |
| | 750 | | | Anson Ed. Facs. Corp. Ed. Rev. (Arlington Classics Academy), Ser. 2016-A, 5.00%, due 8/15/45 | | | 787 | | |
| | 500 | | | Deaf Smith Co. Hosp. Dist. G.O. Ref., Ser. 2017, 4.00%, due 3/1/40 | | | 500 | | |
| | 400 | | | Fort Bend Co. Ind. Dev. Corp. Rev. (NRG Energy, Inc.), Ser. 2012-A, 4.75%, due 5/1/38 | | | 408 | | |
| | 400 | | | Houston Arpt. Sys. Rev., Ser. 2015-B-1, 5.00%, due 7/15/30 | | | 438 | | |
| 400 |
| | Lower Neches Valley Au. Ind. Dev. Corp. Rev. Ref. (Exxon Mobil Proj.), Ser. 2001-A, 0.90%,
due 11/1/29 | | | 400 | (a) | |
| | 400 |
| | Mesquite Hlth. Fac. Dev. Corp. Ref. Rev. (Christian Care Centers, Inc. Proj.), Ser. 2016, 5.00%,
due 2/15/35 | | | 425
| | |
| | 750 | | | Mission Econ. Dev. Corp. Rev. (Sr. Lien-Natgasoline Proj.), Ser. 2016-B, 5.75%, due 10/1/31 | | | 782 | (c) | |
See Notes to Financial Statements
131
Schedule of Investments Municipal High Income Fund (cont'd)
PRINCIPAL AMOUNT | | | | VALUE | |
(000's omitted) | | | | (000's omitted) | |
$ | 300
| | | Mission Econ. Dev. Corp. Wtr. Supply Rev. (Green Bond-Env. Wtr. Minerals Proj.),
Ser. 2015, 7.75%, due 1/1/45 | | $ | 256
| (c)(d) | |
| 750 |
| | New Hope Cultural Ed. Facs. Fin. Corp. Retirement Fac. Rev. Ref. (Carillon Life Care Comm. Proj.),
Ser. 2016, 5.00%, due 7/1/36 | | | 771 | | |
| 500 |
| | New Hope Cultural Ed. Facs. Fin. Corp. Sr. Living Rev. (Cardinal Bay, Inc. Village On
The Park Carriage), Ser. 2016-C, 5.75%, due 7/1/51 | | | 531 | | |
| 500 |
| | New Hope Cultural Ed. Facs. Fin. Corp. Std. Hsg. Rev. (NCCD-College Sta. Properties LLC),
Ser. 2015-A, 5.00%, due 7/1/47 | | | 491 | | |
| 400 |
| | Tarrant Co. Cultural Ed. Fac. Rev. (Buckingham Sr. Living Comm. Proj.),
Ser. 2015-B-1, 4.50%, due 11/15/21 | | | 400 | | |
| 500 |
| | Texas St. Private Activity Bond Surface Trans. Corp. Rev. (Sr. Lien-Blueridge Trans. Group LLC),
Ser. 2016, 5.00%, due 12/31/40 | | | 547 | | |
| | 750 | | | Texas St. Trans. Commission Turnpike Sys. Rev. Ref., Ser. 2015-C, 5.00%, due 8/15/34 | | | 839 | | |
| | | | 7,575 | | |
Utah 0.5% | | | |
| | 500 | | | Utah Charter Sch. Fin. Au. Rev. (Spectrum Academy Proj.), Ser. 2015, 6.00%, due 4/15/45 | | | 526 | (c) | |
Vermont 1.4% | | | |
| | | | | Vermont Std. Assist. Corp. Ed. Loan Rev. | | | | | |
| | 955 | | | Ser. 2013-A, 3.90%, due 6/15/22 | | | 1,005 | | |
| | 365 | | | Ser. 2015-A, 4.13%, due 6/15/28 | | | 374 | | |
| | | | 1,379 | | |
Virgin Islands 0.4% | | | |
| | 200 | | | Virgin Islands Pub. Fin. Au. Rev., Ser. 2014-A, 5.00%, due 10/1/29 | | | 124 | | |
| | 430 | | | Virgin Islands Pub. Fin. Au. Rev. (Matching Fund Loan-Diageo), Ser. 2009-A, 6.75%, due 10/1/37 | | | 286 | | |
| | | | 410 | | |
Virginia 0.6% | | | |
| | 400 | | | Embrey Mill Comm. Dev Au. Spec. Assessment Rev., Ser. 2015, 5.30%, due 3/1/35 | | | 390 | (c) | |
| 200 |
| | Virginia College Bldg. Au. Ed. Facs. Rev. (Green Bonds-Marymount Univ. Proj.),
Ser. 2015-B, 5.25%, due 7/1/35 | | | 215 | (c) | |
| | | | 605 | | |
Washington 1.1% | | | |
| 500 |
| | Washington St. Econ. Dev. Fin. Au. Env. Facs. Rev. (Columbia Pulp I LLC Proj.),
Ser. 2017-A, 7.50%, due 1/1/32 | | | 553 | (c) | |
| 500 |
| | Washington St. Hsg. Fin. Commission Rev. Ref. (Beyview Manor Homes),
Ser. 2016-A, 5.00%, due 7/1/46 | | | 508 | (c) | |
| | | | 1,061 | | |
West Virginia 0.9% | | | |
| 915 |
| | West Virginia Econ. Dev. Au. Energy Rev. Ref. (Morgantown Energy Assoc. Proj.),
Ser. 2016, 2.88%, due 12/15/26 | | | 893 | | |
See Notes to Financial Statements
132
Schedule of Investments Municipal High Income Fund (cont'd)
PRINCIPAL AMOUNT | | | | VALUE | |
(000's omitted) | | | | (000's omitted) | |
Wisconsin 5.6% | | | |
$ | 400 | | | Pub. Fin. Au. Ed. Rev. (Pine Lake Preparatory), Ser. 2015, 4.95%, due 3/1/30 | | $ | 419 | (c) | |
| | 300 | | | Pub. Fin. Au. Ed. Rev. (Research Triangle High Sch. Proj.), Ser. 2015, 5.38%, due 7/1/35 | | | 303 | (c) | |
| | 750 | | | Pub. Fin. Au. Exempt Facs. Ref. Rev. (Celanese Proj.), Ser. 2016-C, 4.30%, due 11/1/30 | | | 769 | | |
| | 1,000 | | | Pub. Fin. Au. Lease Dev. Rev. (Central Dist. Dev. Proj.), Ser. 2016, 5.00%, due 3/1/32 | | | 1,147 | | |
| 250 |
| | Pub. Fin. Au. Multi-Family Hsg. Mtge. Rev. (Trinity Affordable Section 8 Assisted Apts. Proj.),
Ser. 2015-A, 4.50%, due 7/1/33 | | | 249 | | |
| 750 |
| | Pub. Fin. Au. Multi-Family Hsg. Rev. (Estates Crystal Bay & Woodhaven Park Apts. Proj.),
Ser. 2016-A, 4.00%, due 12/1/36 | | | 739 | | |
| 460 |
| | Pub. Fin. Au. Multi-Family Hsg. Rev. (FFAH North Carolina & Missouri Portfolio),
Ser. 2015-A, 3.00%, due 12/1/21 | | | 464 | | |
| 950 |
| | Pub. Fin. Au. Multi-Family Hsg. Rev. (FFAH North Carolina & Missouri Portfolio),
Ser. 2015-A, 4.75%, due 12/1/35 | | | 969 | | |
| | 400 | | | Pub. Fin. Au. Rev. (Goodwill Industries of So. Nevada Proj.), Ser. 2015-A, 5.50%, due 12/1/35 | | | 348 | (d)(f) | |
| | | | 5,407 | | |
| | | | | Total Investments 98.0% (Cost $94,556) | | | 95,132 | | |
| | | | | Other Assets Less Liabilities 2.0% | | | 1,934 | | |
| | | | | Net Assets 100.0% | | $ | 97,066 | | |
(a) Weighted average coupon that changes/updates periodically. Rate shown is the rate at October 31, 2017.
(b) All or a portion of this security is segregated in connection with obligations for when-issued securities with a total value of approximately $10,169,000.
(c) Securities were purchased under Rule 144A of the Securities Act of 1933, as amended (the "1933 Act"), or are otherwise restricted and, unless registered under the 1933 Act or exempted from registration, may only be sold to qualified institutional investors or may have other restrictions on resale. At October 31, 2017, these securities amounted to approximately $17,444,000, which represents 18.0% of net assets of the Fund. Securities denoted with (c) but without (d) have been deemed by the investment manager to be liquid.
(d) Illiquid security.
(e) When-issued security. Total value of all such securities at October 31, 2017 amounted to approximately $1,222,000, which represents 1.3% of net assets of the Fund.
The following is a summary, categorized by Level (see Note A of Notes to Financial Statements), of inputs used to value the Fund's investments as of October 31, 2017:
(f) Defaulted security.
Asset Valuation Inputs
(000's omitted) | | Level 1 | | Level 2 | | Level 3 | | Total | |
Investments: | |
| Municipal Notes(a) | | $ | — | | | $ | 95,132 | | | $ | — | | | $ | 95,132 | | |
Total Investments | | $ | — | | | $ | 95,132 | | | $ | — | | | $ | 95,132 | | |
(a) The Schedule of Investments provides a categorization by state for the portfolio.
As of the year ended October 31, 2017, no securities were transferred from one level (as of October 31, 2016) to another.
See Notes to Financial Statements
133
Schedule of Investments Municipal Intermediate Bond Fund October 31, 2017
PRINCIPAL AMOUNT | | | | VALUE | |
(000's omitted) | | | | (000's omitted) | |
Municipal Notes 103.8% | | | |
Alabama 0.1% | | | |
$ | 210 | | | Taylor-Ryan Imp. Dist. Rev. Ref., Ser. 2005, (LOC: Synovus Bank), 1.07%, due 11/1/35 | | $ | 210 | (a) | |
Alaska 3.4% | | | |
| | 2,100 | | | Alaska St. Hsg. Fin. Corp. Ref. Rev. (Cap. Proj. Bonds II), Ser. 2014-D, 5.00%, due 12/1/25 | | | 2,477 | | |
| | 3,035 | | | Valdez Marine Term. Rev. (Exxon Pipeline Co. Proj.), Ser. 1993-A, 0.90%, due 12/1/33 | | | 3,035 | (a)(b) | |
| | 2,195 | | | Valdez Marine Term. Rev. Ref. (Exxon Pipeline Co. Proj.), Ser. 1993-C, 0.90%, due 12/1/33 | | | 2,195 | (a) | |
| | | | 7,707 | | |
Arizona 0.8% | | | |
| 500 |
| | Maricopa Co. Ind. Dev. Au. Rev. (Banner Hlth. Obligated Group), Ser. 2017-C, 5.00%, due 1/1/48
Putable 10/18/24 | | | 598 | (a) | |
| 950 |
| | Maricopa Co. Ind. Dev. Au. Sr. Living Fac. Rev. Ref. (Christian Care Retirement Apts., Inc. Proj.),
Ser. 2016-A, 5.00%, due 1/1/24 | | | 1,108 | | |
| | | | 1,706 | | |
Arkansas 0.3% | | | |
| | 610 | | | Fort Smith Wtr. & Swr. Rev. Ref., Ser. 2016, (BAM Insured), 5.00%, due 10/1/25 | | | 717 | | |
California 10.2% | | | |
| | | | | California G.O. Ref. | | | | | |
| | 350 | | | Ser. 2013, 5.00%, due 11/1/25 | | | 413 | | |
| | 875 | | | Ser. 2015, 5.00%, due 8/1/26 | | | 1,061 | (b) | |
| | 2,150 | | | Ser. 2017, 5.00%, due 8/1/24 | | | 2,593 | | |
| | | | | California Pub. Works Board Lease Rev. Ref. | | | | | |
| | 1,000 | | | Ser. 2017-B, 5.00%, due 10/1/24 | | | 1,206 | | |
| | 2,000 | | | Ser. 2017-B, 5.00%, due 10/1/26 | | | 2,465 | | |
| 2,055 |
| | California Statewide Communities Dev. Au. PCR (So. California Edison Co.), Ser. 2006, 1.90%,
due 4/1/28 Putable 4/1/20 | | | 2,080 | (a) | |
| | | | | California Statewide Communities Dev. Au. Rev. (Henry Mayo Newhall Mem. Hosp.) | | | | | |
| | 400 | | | Ser. 2014-A, (AGM Insured), 5.00%, due 10/1/27 | | | 460 | | |
| | 250 | | | Ser. 2014-A, (AGM Insured), 5.00%, due 10/1/28 | | | 287 | | |
| 1,665 |
| | Contra Costa Co. Redev. Agcy. Successor Agcy. Tax Allocation Ref., Ser. 2017-A,
(BAM Insured), 5.00%, due 8/1/32 | | | 1,987 | | |
| | | | | Fresno Joint Pwr. Fin. Au. Lease Rev. Ref. (Master Lease Proj.) | | | | | |
| | 1,300 | | | Ser. 2017-A, (AGM Insured), 5.00%, due 4/1/27 | | | 1,581 | | |
| | 500 | | | Ser. 2017-A, (AGM Insured), 5.00%, due 4/1/32 | | | 587 | | |
| | 560 | | | Placer Co. Wtr. Agcy. Cert. of Participation Ref. Rev., Ser. 2016, 4.00%, due 7/1/30 | | | 629 | | |
| 900 |
| | Sacramento City Fin. Au. Ref. Rev. (Master Lease Prog. Facs.), Ser. 2006-E,
(AMBAC Insured), 5.25%, due 12/1/24 | | | 1,102 | | |
| | | | | San Joaquin Co. Trans. Au. Rev. Ref. | | | | | |
| | 825 | | | Ser. 2017, 5.00%, due 3/1/31 | | | 1,000 | | |
| | 2,705 | | | Ser. 2017, 5.00%, due 3/1/37 | | | 3,186 | | |
| | | | | San Marcos Unified Sch. Dist. G.O. Cap. Appreciation (Election 2010) | | | | | |
| | 740 | | | Ser. 2012-B, 0.00%, due 8/1/26 | | | 598 | | |
| | 645 | | | Ser. 2012-B, 0.00%, due 8/1/27 | | | 501 | | |
| 900 |
| | Santa Margarita Wtr. Dist. Spec. Sales Tax Ref. (Comm. Facs. Dist. #99-1 Talega),
Ser. 2017-A, (BAM Insured), 5.00%, due 9/1/29 | | | 1,098 | | |
| | | | 22,834 | | |
See Notes to Financial Statements
134
Schedule of Investments Municipal Intermediate Bond Fund (cont'd)
PRINCIPAL AMOUNT | | | | VALUE | |
(000's omitted) | | | | (000's omitted) | |
Colorado 0.8% | |
$ | 945 | | | Colorado St. Ed. & Cultural Facs. Au. Rev. Ref. (Alexander Dawson Sch. Proj.), | | $ | 1,114 | | |
| | Ser. 2016, 5.00%, due 5/15/25 | | | |
| | 500 | | | Westminster Cert. of Participation Ref., Ser. 2013, 4.00%, due 12/1/25 | | | 555 | | |
| | | | 1,669 | | |
Connecticut 1.4% | |
| | 2,000 | | | Connecticut St. Hlth. & Ed. Facs. Au. Rev. (Yale Univ.), Ser. 1997-T-2, 1.65%, due 7/1/29 Putable 2/3/20 | | | 2,019 | (a) | |
| | 1,000 | | | Hartford Co. Metro. Dist. G.O., Ser. 2016-C, (AGM Insured), 5.00%, due 11/1/27 | | | 1,185 | | |
| | | | 3,204 | | |
District of Columbia 0.4% | |
| | | | | Dist. of Columbia Rev. (Assoc. of American Med. College) | | | | | |
| | 460 | | | Ser. 2011-A, 5.00%, due 10/1/21 | | | 516 | | |
| | 350 | | | Ser. 2011-A, 5.00%, due 10/1/22 | | | 400 | | |
| | | | 916 | | |
Florida 5.9% | |
| | 700 | | | Cape Coral Spec. Obligation Ref. Rev., Ser. 2015, 4.00%, due 10/1/30 | | | 759 | | |
| | 1,000 | | | CityPlace Comm. Dev. Dist. Spec. Assessment Ref. Rev., Ser. 2012, 5.00%, due 5/1/26 | | | 1,127 | | |
| | 1,345 | | | Florida St. Muni. Loan Council Rev., Ser. 2012, (AGM Insured), 4.00%, due 5/1/19 | | | 1,398 | | |
| | 1,420 | | | Gulf Breeze Rev. (Local Gov't), Ser. 1985, 1.70%, due 12/1/20 Putable 12/1/17 | | | 1,421 | (a) | |
| | 900 | | | JEA Elec. Sys. Rev., Ser. 2013-A, 5.00%, due 10/1/29 | | | 1,022 | | |
| | 2,000 | | | Miami-Dade Co. G.O. Ref., Ser. 2015-B, 4.00%, due 7/1/32 | | | 2,153 | | |
| | 1,000 | | | Palm Beach Co. Public Impt. Ref. Rev., Ser. 2016, 5.00%, due 5/1/29 | | | 1,205 | | |
| | | Port St. Lucie Research Facs. Rev. (Oregon Hlth. and Science Univ. Vaccine and Gene Therapy
Institute Florida Corp. Proj.) | | | | | |
| | 1,155 | | | Ser. 2010, 5.00%, due 5/1/22 | | | 1,217 | | |
| | 1,580 | | | Ser. 2010, 5.00%, due 5/1/23 | | | 1,664 | | |
| | 1,185 | | | Sunshine St. Governmental Fin. Commission Rev., Ser. 2013-B-1, 5.00%, due 9/1/20 | | | 1,304 | | |
| | | | 13,270 | | |
Georgia 2.6% | |
| 1,645 |
| | Bulloch Co. Dev. Au. Std. Hsg. Rev. Ref. (Georgia So. Univ. Hsg. Foundation One LLC),
Ser. 2012, (AGM Insured), 5.00%, due 8/1/22 | | | 1,886 | | |
| | 1,000 | | | Forsyth Co. G.O. Ref., Ser. 2015-B, 5.00%, due 3/1/27 | | | 1,209 | | |
| | 1,000 | | | Gwinnett Co. Sch. Dist. G.O. Ref., Ser. 2010, 5.00%, due 2/1/25 | | | 1,220 | | |
| 500 |
| | Monroe Co. Dev. Au. PCR Rev. (Georgia Pwr. Co. Plant-Scherer), Ser. 1995-1, 2.00%,
due 7/1/25 Putable 6/13/19 | | | 501 | (a) | |
| | | | | Private Colleges & Univ. Au. Rev. (Savannah College of Art & Design, Inc.) | | | | | |
| | 290 | | | Ser. 2014, 5.00%, due 4/1/22 | | | 324 | | |
| | 540 | | | Ser. 2014, 5.00%, due 4/1/25 | | | 615 | | |
| | | | 5,755 | | |
Illinois 5.4% | |
| 1,400 |
| | Cook Co. Sch. Dist. Number 144 Prairie Hills G.O. (Ltd. Sch.), Ser. 2010-A,
(AGM Insured), 5.25%, due 12/1/27 Pre-Refunded 12/1/20 | | | 1,564 | | |
| | 1,000 | | | Cook Co. Sch. Dist. Number 83 G.O. (Ref. Sch.), Ser. 2011-D, 5.13%, due 12/1/30 Pre-Refunded 12/1/21 | | | 1,145 | | |
| | 750 | | | Dekalb Kane LaSalle Cos. Comm. College Dist. Number 523 G.O., Ser. 2011-B, 0.00%, due 2/1/25 | | | 550 | | |
See Notes to Financial Statements
135
Schedule of Investments Municipal Intermediate Bond Fund (cont'd)
PRINCIPAL AMOUNT | | | | VALUE | |
(000's omitted) | | | | (000's omitted) | |
| | | | | Illinois St. G.O. | | | | | |
$ | 1,000 | | | Ser. 2013, 5.50%, due 7/1/25 | | $ | 1,099 | (b) | |
| | 2,500 | | | Ser. 2014, 5.25%, due 2/1/30 | | | 2,676 | | |
| | | | | Illinois St. G.O. Ref. | | | | | |
| | 1,125 | | | Ser. 2010, 5.00%, due 1/1/20 | | | 1,185 | (b) | |
| | 1,000 | | | Ser. 2012, 5.00%, due 8/1/21 | | | 1,076 | | |
| | | | | So. Illinois Univ. Cert. of Participation (Cap. Imp. Proj.) | | | | | |
| | 500 | | | Ser. 2014-A1, (BAM Insured), 4.00%, due 2/15/26 | | | 526 | | |
| | 500 | | | Ser. 2014-A1, (BAM Insured), 5.00%, due 2/15/27 | | | 550 | | |
| | | | | Springfield G.O. | | | | | |
| | 950 | | | Ser. 2014, 4.25%, due 12/1/27 | | | 1,033 | | |
| | 665 | | | Ser. 2014, 5.00%, due 12/1/28 | | | 753 | | |
| | | | 12,157 | | |
Indiana 3.6% | | | |
| 500 |
| | Indiana Fin. Au. Midwestern Disaster Relief Rev. (Ohio Valley Elec. Corp. Proj.),
Ser. 2012-A, 5.00%, due 6/1/32 | | | 506 | | |
| 720 |
| | Indiana Hlth. Fac. Fin. Au. Rev. (Ascension Hlth. Sub. Credit), Ser. 2005-A-1, 2.80%,
due 11/1/27 Putable 8/1/19 | | | 736 | (a) | |
| 1,615 |
| | Indiana St. Fin. Au. Rev. (St. Revolving Fund Prog.), Ser. 2009-A1, 5.00%,
due 2/1/21 Pre-Refunded 2/1/19 | | | 1,692 | | |
| | | | | Indiana St. Muni. Pwr. Agcy. Ref. Rev. | | | | | |
| | 940 | | | Ser. 2010-B, 5.00%, due 1/1/22 | | | 1,046 | | |
| | 500 | | | Ser. 2016-C, 5.00%, due 1/1/27 | | | 606 | | |
| | 2,100 | | | Lafayette Sch. Corp. G.O., Ser. 2016, 4.00%, due 1/15/19 | | | 2,170 | | |
| 1,200 |
| | Rockport PCR Ref. Rev. (Indiana Michigan Pwr. Co. Proj.), Ser. 2009-A, 1.75%,
due 6/1/25 Putable 6/1/18 | | | 1,202 | (a) | |
| | | | 7,958 | | |
Iowa 0.6% | | | |
| | 300 | | | Iowa St. Fin. Au. Poll. Ctrl. Facs. Rev. Ref. (Midamerican Energy Co.), Ser. 2008-B, 0.93%, due 5/1/23 | | | 300 | (a) | |
| | | | | Iowa St. Fin. Au. Single Family Mtge. Rev. (Non Ace-Mtge.-Backed Sec. Prog.) | | | | | |
| | 500 | | | Ser. 2017-C, (GNMA/FNMA/FHLMC Insured), 2.15%, due 7/1/25 | | | 493 | | |
| | 640 | | | Ser. 2017-C, (GNMA/FNMA/FHLMC Insured), 2.30%, due 1/1/26 | | | 632 | | |
| | | | 1,425 | | |
Kentucky 1.6% | | | |
| | 2,000 | | | Carroll Co. PCR Rev. ref. (KY Utils. Co. Proj.), Ser. 2016-A, 1.05%, due 9/1/42 Putable 9/1/2019 | | | 1,981 | (a) | |
| | 1,470 | | | Laurel Co. Judicial Ctr. Pub. Properties Corp. Ref. Rev. (Justice Center Proj.), Ser. 2015, 4.00%, due 3/1/24 | | | 1,623 | | |
| | | | 3,604 | | |
Louisiana 0.5% | | | |
| | 395 | | | Monroe Sales & Use Tax Ref. Rev., Ser. 2012, 4.00%, due 7/1/23 | | | 423 | | |
| | 500 | | | New Orleans Swr. Svc. Ref. Rev., Ser. 2014, 5.00%, due 6/1/23 | | | 580 | | |
| | | | 1,003 | | |
See Notes to Financial Statements
136
Schedule of Investments Municipal Intermediate Bond Fund (cont'd)
PRINCIPAL AMOUNT | | | | VALUE | |
(000's omitted) | | | | (000's omitted) | |
Maryland 3.8% | | | |
$ | 2,500 | | | Maryland St. Dept. of Trans. Ref. Rev. Ref., Ser. 2016, 4.00%, due 9/1/25 | | $ | 2,880 | | |
| | 2,635 | | | Maryland St. G.O., Ser. 2017-A, 5.00%, due 3/15/29 | | | 3,261 | | |
| | 2,000 | | | Montgomery Co. G.O., Ser. 2014-A, 5.00%, due 11/1/24 | | | 2,430 | | |
| | | | 8,571 | | |
Massachusetts 1.1% | | | |
| 600 |
| | Boston Wtr. & Swr. Commission Rev., Ser. 1993-A, (National Public Finance
Guarantee Corp. Insured), 5.25%, due 11/1/19 | | | 634 | | |
| | 260 | | | Massachusetts Bay Trans. Au. Sr. Sales Tax Rev., Ser. 2006-A, 5.25%, due 7/1/34 | | | 341 | | |
| | 1,150 | | | Massachusetts St. Sch. Bldg. Au. Sales Tax Rev., Ser. 2016-B, 5.00%, due 11/15/26 | | | 1,421 | | |
| | | | 2,396 | | |
Michigan 0.9% | | | |
| | 2,000 | | | Michigan St. Hsg. Dev. Au. Rev., Ser. 2016-B, 2.30%, due 6/1/25 | | | 1,977 | | |
Minnesota 2.5% | | | |
| | 550 | | | Minnesota St. G.O., Ser. 2015-A, 5.00%, due 8/1/29 | | | 663 | | |
| | 1,080 | | | Rochester G.O. (Lodging Tax), Ser. 2015-A, 5.00%, due 2/1/23 | | | 1,273 | | |
| 1,800 |
| | Rochester Hlth. Care Facs. Rev. (Mayo Clinic), Ser. 2008-B, (LOC: Northern Trust Co.), 0.87%,
due 11/15/38 | | | 1,800 | (a) | |
| 1,000 |
| | St. Paul Hsg. & Redev. Au. Hlth. Care Rev. Ref. (Fairview Hlth. Svcs. Obligated Group),
Ser. 2017-A, 4.00%, due 11/15/43 | | | 1,041 | | |
| | 755 | | | Willmar G.O. Ref. (Rice Mem. Hosp. Proj.), Ser. 2012-A, 5.00%, due 2/1/19 | | | 791 | | |
| | | | 5,568 | | |
Mississippi 3.3% | | | |
| | 3,200 | | | Jackson Co. Port Fac. Rev. Ref. (Chevron, U.S.A., Inc. Proj.), Ser. 1993, 0.90%, due 6/1/23 | | | 3,200 | (a) | |
| | | | | Mississippi Dev. Bank Spec. Oblig. | | | | | |
| | 530 | | | Ser. 2010-D, 5.00%, due 8/1/22 Pre-Refunded 8/1/2020 | | | 583 | | |
| | 515 | | | Ser. 2010-D, 5.00%, due 8/1/22 | | | 558 | | |
| | 1,250 | | | Mississippi Dev. Bank Spec. Oblig. (Madison Co. Hwy. Proj.), Ser. 2013-C, 5.00%, due 1/1/27 | | | 1,516 | | |
| | 1,325 | | | Mississippi St. G.O. Ref., Ser. 2015-C, 5.00%, due 10/1/26 | | | 1,608 | | |
| | | | 7,465 | | |
Nevada 0.4% | | | |
| | 750 | | | Las Vegas Redev. Agcy. Tax Increment Rev., Ser. 2009-A, 7.50%, due 6/15/23 Pre-Refunded 6/15/19 | | | 826 | | |
New Jersey 6.5% | | | |
| | 500 | | | Atlantic City G.O., Ser. 2017-B, (AGM Insured), 5.00%, due 3/1/37 | | | 566 | | |
| | 150 | | | Jersey City G.O. Ref., Ser. 2012, (AGM Insured), 4.00%, due 9/1/19 | | | 158 | | |
| | 1,000 | | | New Jersey Econ. Dev. Au. Rev., Ser. 2017-DDD, 5.00%, due 6/15/42 | | | 1,068 | | |
| | 1,000 | | | New Jersey Econ. Dev. Au. Rev. (Sch. Fac. Construction), Ser. 2010-DD1, 5.00%, due 12/15/18 | | | 1,034 | | |
| 900 |
| | New Jersey Hlth. Care Fac. Fin. Au. Dept. Human Svc. Rev. (Greystone Park Psychiatric Hosp. Proj.),
Ser. 2013-B, 5.00%, due 9/15/20 | | | 970 | | |
| | 1,430 | | | New Jersey Hlth. Care Fac. Fin. Au. Rev. (Inspira Hlth. Obligated Group), Ser. 2017-A, 5.00%, due 7/1/29 | | | 1,699 | | |
| 2,000 |
| | New Jersey St. Hsg. & Mtge. Fin. Agcy. (Aspen Riverpark Apts. Proj.), Ser. 2016-N, 1.20%,
due 10/1/19 Putable 7/1/2018 | | | 1,995 | (a) | |
| | 1,000 | | | New Jersey St. Trans. Trust Fund Au. Trans. Sys. Rev., Ser. 2006-A, 5.25%, due 12/15/19 | | | 1,066 | | |
See Notes to Financial Statements
137
Schedule of Investments Municipal Intermediate Bond Fund (cont'd)
PRINCIPAL AMOUNT | | | | VALUE | |
(000's omitted) | | | | (000's omitted) | |
$ | 1,000 | | | New Jersey Trans. Trust Fund Au. Rev. (Federal Hwy. Reimbursement Notes), Ser. 2016-A-1, 5.00%, | | $ | 1,047 | | |
| | | | | due 6/15/19 | | | |
| 3,750 |
| | Tender Option Bond Trust Receipts/Certs. Var. Sts. (Floaters), Ser. 2017-XF0553,
(LOC: JP Morgan Chase), 1.12%, due 6/1/25 | | | 3,750 | (a)(c) | |
| | | | | Union Co. Imp. Au. Rev. (Correctional Fac. Proj.) | | | | | |
| | 360 | | | Ser. 2013, 3.00%, due 6/15/20 | | | 376 | | |
| | 370 | | | Ser. 2013, 3.00%, due 6/15/21 | | | 391 | | |
| | 295 | | | Ser. 2013, 4.00%, due 6/15/23 | | | 332 | | |
| | | | 14,452 | | |
New York 10.4% | | | |
| 390 |
| | Albany Cap. Res. Corp. Ref. Rev. (Albany College of Pharmacy & Hlth. Sciences),
Ser. 2014-A, 5.00%, due 12/1/26 | | | 447 | | |
| | 650 | | | Albany Co. G.O., Ser. 2012-B, 4.00%, due 11/1/22 | | | 700 | | |
| | 1,140 | | | Hempstead Town Local Dev. Corp. Rev. Ref. (Molloy College Proj.), Ser. 2017, 5.00%, due 7/1/29 | | | 1,330 | | |
| | | | | Long Beach, G.O. | | | | | |
| | 485 | | | Ser. 2014-A, (BAM Insured), 4.00%, due 11/15/21 | | | 527 | | |
| | 500 | | | Ser. 2014-A, (BAM Insured), 4.00%, due 11/15/22 | | | 550 | | |
| | 520 | | | Ser. 2014-A, (BAM Insured), 4.00%, due 11/15/23 | | | 577 | | |
| | 1,000 | | | Metropolitan Trans. Au. Rev. Ref., Ser. 2016-A2, 4.00%, due 11/15/17 | | | 1,001 | | |
| | 1,000 | | | MTA Hudson Rail Yards Trust Oblig. Rev., Ser. 2016-A, 5.00%, due 11/15/46 | | | 1,064 | | |
| | 1,850 | | | New York City G.O., Ser. 2011-I1, 5.00%, due 8/1/18 | | | 1,904 | | |
| | 1,170 | | | New York City Transitional Fin. Au. Ref. Rev. (Future Tax Secured), Ser. 2015-C, 5.00%, due 11/1/18 | | | 1,216 | | |
| | | | | New York City Transitional Fin. Au. Rev. (Future Tax Secured) | | | | | |
| | 1,950 | | | Subser. 2016-A-1, 4.00%, due 5/1/31 | | | 2,137 | | |
| | 3,200 | | | Subser. 2017-F-1, 5.00%, due 5/1/30 | | | 3,894 | | |
| | 800 | | | New York St. Dorm. Au. Personal Income Tax Rev., Ser. 2014-C, 5.00%, due 3/15/25 | | | 953 | | |
| | 625 | | | New York St. Dorm. Au. Personal Income Tax Rev. Ref., Ser. 2015-E, 5.00%, due 3/15/26 | | | 761 | | |
| 1,170 |
| | New York St. Dorm. Au. Rev. Non St. Supported Debt (Sch. Dist. Bldg. Fin. Prog.),
Ser. 2017-B, 4.00%, due 10/1/21 | | | 1,282 | | |
| | 1,000 | | | New York St. Dorm. Au. Sales Tax Rev., Ser. 2013-A, 5.00%, due 3/15/28 | | | 1,170 | | |
| 750 |
| | New York St. Urban Dev. Corp. Rev. (St. Personal Income Tax), Ser. 2009-A1, 5.00%,
due 12/15/19 Pre-Refunded 12/15/18 | | | 783 | | |
| | 775 | | | Niagara Falls G.O. Ref., Ser. 2016, 4.00%, due 5/15/19 | | | 803 | | |
| | 1,000 | | | Oneida Co. G.O., Ser. 2016, (BAM Insured), 2.00%, due 5/15/19 | | | 1,013 | | |
| | 1,000 | | | Utils. Debt Securitization Au. Rev., Ser. 2013-TE, 5.00%, due 12/15/28 | | | 1,179 | | |
| | | | 23,291 | | |
North Carolina 4.0% | | | |
| | 600 | | | Greensboro Enterprise Sys. Rev. Ref., Ser. 2015, 5.00%, due 6/1/20 | | | 659 | | |
| | | | | North Carolina Med. Care Commission Hosp. Rev. (Moses Cone Hlth. Sys.) | | | | | |
| | 4,540 | | | Ser. 2001-A, (LOC: Harris Trust & Savings Bank), 0.90%, due 10/1/35 | | | 4,540 | (a) | |
| | 350 | | | Ser. 2001-B, (LOC: Bank of Montreal), 0.87%, due 10/1/35 | | | 350 | (a) | |
| | 650 | | | North Carolina St. Cap. Imp. Ltd. Oblig. (Annual Appropriation), Ser. 2009-A, 5.00%, due 5/1/19 | | | 687 | | |
| | 2,000 | | | Wake Co. Ltd. Oblig. Ref. Rev., Ser. 2016-A, 5.00%, due 12/1/28 | | | 2,445 | (b) | |
| 295 |
| | Western Carolina Univ. Research & Dev. Corp. Cert. of Participation (Western Carolina Univ. Std. Hsg.),
Ser. 2008, (Assured Guaranty Insured), 5.25%, due 6/1/20 Pre-Refunded 6/1/18 | | | 302 | | |
| | | | 8,983 | | |
Ohio 1.2% | | | |
| | 155 | | | Lorain G.O., Ser. 2013, (AGM Insured), 3.88%, due 12/1/27 | | | 162 | | |
| | 2,150 | | | Ohio St. Wtr. Dev. Au. Wtr. Poll. Ctrl. Rev., Ser. 2017-A, 5.00%, due 12/1/31 | | | 2,609 | | |
| | | | 2,771 | | |
See Notes to Financial Statements
138
Schedule of Investments Municipal Intermediate Bond Fund (cont'd)
PRINCIPAL AMOUNT | | | | VALUE | |
(000's omitted) | | | | (000's omitted) | |
Oklahoma 1.4% | | | |
$ | 1,000 | | | Cleveland Co. Ed. Facs. Au. Lease Rev. (Moore Pub. Sch. Proj.), Ser. 2016, 5.00%, due 6/1/19 | | $ | 1,056 | | |
| | 675 | | | Cleveland Co. Ed. Facs. Au. Lease Rev. Ref. (Noble Pub. Sch. Proj.), Ser. 2017, 5.00%, due 9/1/31 | | | 789 | | |
| | 1,350 | | | Tulsa Co. Independent Sch. Dist. No. 9 Union Board of Ed. G.O., Ser. 2016, 1.50%, due 4/1/19 | | | 1,357 | | |
| | | | 3,202 | | |
Pennsylvania 9.5% | | | |
| | | | | Berks Co. Ind. Dev. Au. Hlth. Sys. Rev. Ref. (Tower Hlth. Proj.) | | | | | |
| | 2,000 | | | Ser. 2017, 5.00%, due 11/1/28 | | | 2,384 | | |
| | 1,000 | | | Ser. 2017, 5.00%, due 11/1/29 | | | 1,181 | | |
| | | | | Lackawanna Co. Ind. Dev. Au. Rev. Ref. (Univ. of Scranton) | | | | | |
| | 940 | | | Ser. 2017, 5.00%, due 11/1/28 | | | 1,118 | (d) | |
| | 600 | | | Ser. 2017, 5.00%, due 11/1/29 | | | 708 | (d) | |
| | 500 | | | Ser. 2017, 5.00%, due 11/1/30 | | | 586 | (d) | |
| | | | | Luzerne Co. G. O. Ref. | | | | | |
| | 500 | | | Ser. 2017-A, (AGM Insured), 5.00%, due 12/15/25 | | | 581 | (d) | |
| | 500 | | | Ser. 2017-A, (AGM Insured), 5.00%, due 12/15/26 | | | 585 | (d) | |
| | 400 | | | Ser. 2017-A, (AGM Insured), 5.00%, due 12/15/27 | | | 471 | (d) | |
| | 300 | | | Ser. 2017-B, (AGM Insured), 5.00%, due 12/15/25 | | | 348 | (d) | |
| | 270 | | | Ser. 2017-B, (AGM Insured), 5.00%, due 12/15/26 | | | 316 | (d) | |
| | | | | Luzerne Co. Ind. Dev. Au. Lease Rev. Ref. Gtd. | | | | | |
| | 550 | | | Ser. 2017, (AGM Insured), 5.00%, due 12/15/25 | | | 634 | (d) | |
| | 525 | | | Ser. 2017, (AGM Insured), 5.00%, due 12/15/26 | | | 601 | (d) | |
| | 1,000 | | | Ser. 2017, (AGM Insured), 5.00%, due 12/15/27 | | | 1,138 | (d) | |
| | 1,000 | | | Pennsylvania St. G.O., Ser. 2015, 5.00%, due 3/15/29 | | | 1,162 | | |
| | 225 | | | Pennsylvania St. Ref. G.O., Ser. 2016, 5.00%, due 9/15/26 | | | 271 | | |
| | 2,065 | | | Pennsylvania St. Turnpike Commission Rev. Ref., Ser. 2016, 5.00%, due 6/1/27 | | | 2,421 | (b) | |
| | 1,405 | | | Philadelphia G.O. Ref., Ser. 2007-A, (AGM Insured), 5.00%, due 8/1/18 | | | 1,409 | | |
| | 3,950 | | | Philadelphia Wtr. & Wastewater Rev., Ser. 2017-A, 5.00%, due 10/1/47 | | | 4,524 | | |
| | 750 | | | Southeastern Trans. Au. Rev. Ref., Ser. 2017, 5.00%, due 3/1/28 | | | 923 | | |
| | | | 21,361 | | |
Rhode Island 1.5% | | | |
| | 500 | | | Providence Redev. Agcy. Ref. Rev., Ser. 2015-A, 5.00%, due 4/1/22 | | | 556 | | |
| | | | | Rhode Island St. Hlth. & Ed. Bldg. Corp. Pub. Sch. Rev. Ref. | | | | | |
| | 500 | | | Ser. 2017-A, (AGM Insured), 5.00%, due 5/15/24 | | | 586 | | |
| | 400 | | | Ser. 2017-A, (AGM Insured), 5.00%, due 5/15/25 | | | 473 | | |
| 625 |
| | Rhode Island St. Hlth. & Ed. Bldg. Corp. Rev. (Providence Pub. Sch. Prog.),
Ser. 2013-A, 5.00%, due 5/15/22 | | | 711 | | |
| 870 |
| | Rhode Island St. Providence Plantation Lease Cert. of Participation (Pastore Ctr. Energy
Conservation Proj.), Ser. 2014-A, 5.00%, due 11/1/18 | | | 903 | | |
| | 200 | | | Rhode Island St. Std. Loan Au. Std. Loan Rev. (Sr. Prog.), Ser. 2010-A, 4.40%, due 12/1/19 | | | 200 | | |
| | | | 3,429 | | |
South Carolina 1.6% | | | |
| | 870 | | | Charleston Co. G.O. (Cap. Imp. Plan), Ser. 2011, 5.00%, due 11/1/18 | | | 904 | (b) | |
| | | | | South Carolina St. Pub. Svc. Au. Oblig. Rev. Ref. | | | | | |
| | 2,000 | | | Ser. 2014-C, 5.00%, due 12/1/28 | | | 2,311 | | |
| | 370 | | | Ser. 2016-B, 5.00%, due 12/1/35 | | | 419 | | |
| | | | 3,634 | | |
See Notes to Financial Statements
139
Schedule of Investments Municipal Intermediate Bond Fund (cont'd)
PRINCIPAL AMOUNT | | | | VALUE | |
(000's omitted) | | | | (000's omitted) | |
Tennessee 0.5% | | | |
$ | 1,000 | | | Metro. Gov't Nashville & Davidson Co. Hlth. & Ed. Fac. Board (Belmont Univ.), | | $ | 1,096 | | |
| | | | | Ser. 2012, 5.00%, due 11/1/26 | | | |
Texas 10.2% | | | |
| | 750 | | | Brownsville G.O., Ser. 2011-A, 4.00%, due 2/15/18 | | | 756 | | |
| | 400 | | | Gulf Coast Waste Disp. Au. Rev. (Bayport Area Sys.), Ser. 2013, (AGM Insured), 3.00%, due 10/1/26 | | | 415 | | |
| | 225 | | | Harris Co. Cultural Ed. Fac. Fin. Corp. Rev. (Methodist Hosp. Sys.), Ser. 2008-B, 5.25%, due 12/1/17 | | | 226 | | |
| 1,000 |
| | Houston Wtr. & Swr. Sys. Jr. Lien Ref. Rev., Ser. 2001-B, (National Public Finance
Guarantee Corp. Insured), 5.50%, due 12/1/24 | | | 1,217 | | |
| | 2,050 | | | Humble Independent Sch. Dist. Ref. G.O. (Sch. Bldg.), Ser. 2015-A, 4.00%, due 2/15/28 | | | 2,299 | | |
| | 1,250 | | | La Joya Independent Sch. Dist. Ref. G.O., Ser. 2013, 5.00%, due 2/15/33 | | | 1,508 | | |
| | 1,250 | | | Laredo Independent Sch. Dist. G.O. (Sch. Bldg.), Ser. 2013, 5.00%, due 8/1/27 | | | 1,443 | | |
| | 100 | | | Lower Neches Valley Au. Ind. Dev. Corp. Rev. Ref. (Exxon Mobil Proj.), Ser. 2001-A, 0.90%, due 11/1/29 | | | 100 | (a) | |
| | 590 | | | McKinney G.O., Ser. 2014, 5.00%, due 8/15/24 | | | 711 | | |
| | | | | Midlothian Ref. G.O. | | | | | |
| | 1,400 | | | Ser. 2016, 2.00%, due 8/15/18 | | | 1,409 | | |
| | 1,430 | | | Ser. 2016, 2.00%, due 8/15/19 | | | 1,448 | | |
| | | | | New Hope Cultural Ed. Facs. Fin. Corp. Std. Hsg. Rev. (Collegiate Hsg. College Sta. I LLC) | | | | | |
| | 160 | | | Ser. 2014-A, (AGM Insured), 4.00%, due 4/1/20 | | | 168 | | |
| | 200 | | | Ser. 2014-A, (AGM Insured), 4.00%, due 4/1/21 | | | 214 | | |
| | 200 | | | Ser. 2014-A, (AGM Insured), 4.00%, due 4/1/22 | | | 217 | | |
| | 225 | | | Ser. 2014-A, (AGM Insured), 4.00%, due 4/1/23 | | | 246 | | |
| | 220 | | | Ser. 2014-A, (AGM Insured), 4.00%, due 4/1/24 | | | 242 | | |
| | 2,000 | | | North Tollway Au. First Tier Rev. Ref., Ser. 2017-A, 5.00%, due 1/1/43 | | | 2,316 | (d) | |
| 4,500 |
| | Tender Option Bond Trust Receipts/Certs. Var. Sts. (Floaters), Ser. 2017-XM0531,
(LOC: JP Morgan Chase), 1.09%, due 3/1/23 | | | 4,500 | (a)(c) | |
| | 555 | | | Texas A&M Univ. Perm. Univ. Fund Rev., Ser. 2011, 3.00%, due 7/1/18 | | | 562 | | |
| | 1,000 | | | Texas Pub. Fin. Au. Rev. (So. Univ. Fin. Sys.), Ser. 2013, (BAM Insured), 5.00%, due 11/1/20 | | | 1,101 | | |
| | 245 | | | Texas St. Technical College Sys. Rev. Ref. & Imp., Ser. 2011, 5.00%, due 8/1/18 | | | 252 | | |
| | 1,250 | | | Texas Wtr. Dev. Board Rev., Ser. 2017-A, 4.00%, due 10/15/32 | | | 1,383 | | |
| | | | 22,733 | | |
Utah 0.8% | | | |
| | 445 | | | Salt Lake Co. Hosp. Rev. (IHC Hlth. Svcs. Inc.), Ser. 2001, (AMBAC Insured), 5.13%, due 2/15/33 | | | 516 | | |
| | 1,000 | | | Weber Co. Spec. Assessment (Summit Mountain Assessment Area), Ser. 2013, 5.50%, due 1/15/28 | | | 1,150 | | |
| | | | 1,666 | | |
Vermont 0.3% | | | |
| | 685 | | | Burlington Elec. Sys. Rev., Ser. 2014-A, (AGM Insured), 3.63%, due 7/1/29 | | | 715 | | |
Virginia 1.9% | | | |
| | 2,000 | | | Henrico Co. Wtr. & Swr. Ref. Rev., Ser. 2016, 5.00%, due 5/1/27 | | | 2,454 | | |
| | 1,700 | | | Virginia Commonwealth Trans. Board Rev. (Cap. Proj.), Ser. 2011, 4.00%, due 5/15/29 | | | 1,825 | | |
| | | | 4,279 | | |
Washington 3.7% | | | |
| | | | | Kent Ref. G.O. | | | | | |
| | 900 | | | Ser. 2016, 4.00%, due 12/1/29 | | | 1,005 | | |
| | 1,000 | | | Ser. 2016, 4.00%, due 12/1/30 | | | 1,103 | | |
See Notes to Financial Statements
140
Schedule of Investments Municipal Intermediate Bond Fund (cont'd)
PRINCIPAL AMOUNT | | | | VALUE | |
(000's omitted) | | | | (000's omitted) | |
$ | 1,055 | | | King Co. Ref. G.O., Ser. 2015-E, 5.00%, due 12/1/27 | | $ | 1,282 | | |
| | | | | North Thurston Pub. Sch. G.O. | | | |
| | 215 | | | Ser. 2016, 4.00%, due 12/1/28 | | | 242 | | |
| | 250 | | | Ser. 2016, 4.00%, due 12/1/29 | | | 279 | | |
| | 375 | | | Ser. 2016, 4.00%, due 12/1/30 | | | 414 | | |
| | 1,230 | | | Seattle Ref. G.O., Ser. 2016-A, 4.00%, due 4/1/29 | | | 1,388 | | |
| | 190 | | | Washington St. G.O., Ser. 1993-B, 5.50%, due 5/1/18 | | | 194 | | |
| | 320 | | | Washington St. Ref. G.O., Ser. 2016-B, 5.00%, due 7/1/26 | | | 391 | | |
| | | | | Whitman Co. Sch. Dist. No. 267 Pullman G.O. | | | | | |
| | 800 | | | Ser. 2016, 4.00%, due 12/1/29 | | | 893 | | |
| | 975 | | | Ser. 2016, 4.00%, due 12/1/30 | | | 1,076 | | |
| | | | 8,267 | | |
Wisconsin 0.7% | | | |
| | 470 | | | Pub. Fin. Au. Lease Dev. Rev. (Central Dist. Dev. Proj.), Ser. 2016, 5.00%, due 3/1/32 | | | 539 | | |
| 1,000 |
| | Wisconsin St. Hlth. & Ed. Facs. Au. Rev. Ref. (Ascension Health Credit Group), Ser. 2016-A, 4.00%,
due 11/15/39 | | | 1,037 | | |
| | | | 1,576 | | |
| | | | | Total Investments 103.8% (Cost $228,360) | | | 232,393 | | |
| | | | | Liabilities Less Other Assets (3.8)% | | | (8,549 | ) | |
| | | | | Net Assets 100.0% | | $ | 223,844 | | |
(a) Weighted average coupon that changes/updates periodically. Rate shown is the rate at October 31, 2017.
(b) All or a portion of this security is segregated in connection with obligations for when-issued securities with a total value of approximately $11,481,000.
(c) Securities were purchased under Rule 144A of the Securities Act of 1933, as amended (the "1933 Act"), or are otherwise restricted and, unless registered under the 1933 Act or exempted from registration, may only be sold to qualified institutional investors or may have other restrictions on resale. At October 31, 2017, these securities amounted to approximately $8,250,000, which represents 3.7% of net assets of the Fund. These securities have been deemed by the investment manager to be liquid.
(d) When-issued security. Total value of all such securities at October 31, 2017 amounted to approximately $9,402,000, which represents 4.2% of net assets of the Fund.
The following is a summary, categorized by Level (see Note A of Notes to Financial Statements), of inputs used to value the Fund's investments as of October 31, 2017:
Asset Valuation Inputs
(000's omitted) | | Level 1 | | Level 2 | | Level 3 | | Total | |
Investments: | |
| Municipal Notes(a) | | $ | — | | | $ | 232,393 | | | $ | — | | | $ | 232,393 | | |
Total Investments | | $ | — | | | $ | 232,393 | | | $ | — | | | $ | 232,393 | | |
(a) The Schedule of Investments provides a categorization by state for the portfolio.
As of the year ended October 31, 2017, no securities were transferred from one level (as of October 31, 2016) to another.
See Notes to Financial Statements
141
Schedule of Investments New York Municipal Income Fund October 31, 2017
PRINCIPAL AMOUNT | | | | VALUE | |
(000's omitted) | | | | (000's omitted) | |
Municipal Notes 98.9% | | | |
New York 98.9% | | | |
| | | | | Albany Cap. Res. Corp. Ref. Rev. (Albany College of Pharmacy & Hlth. Sciences) | | | | | |
$ | 250 | | | Ser. 2014-A, 4.00%, due 12/1/20 | | $ | 265 | | |
| | 100 | | | Ser. 2014-A, 4.00%, due 12/1/21 | | | 107 | | |
| | 225 | | | Ser. 2014-A, 4.00%, due 12/1/22 | | | 244 | | |
| | 175 | | | Ser. 2014-A, 5.00%, due 12/1/23 | | | 200 | | |
| | 250 | | | Buffalo & Fort Erie Pub. Bridge Au. Rev., Ser. 2017, 5.00%, due 1/1/47 | | | 286 | | |
| | 250 | | | Buffalo, G.O., Ser. 2016-A, 5.00%, due 4/1/28 | | | 304 | | |
| | | | | Build NYC Res. Corp. Ref. Rev. | | | | | |
| | 425 | | | Ser. 2015, 5.00%, due 6/1/22 | | | 489 | | |
| | 475 | | | Ser. 2015, 5.00%, due 6/1/24 | | | 565 | | |
| | 225 | | | Build NYC Res. Corp. Ref. Rev. (City Univ. - Queens College), Ser. 2014-A, 5.00%, due 6/1/25 | | | 268 | | |
| | 750 | | | Build NYC Res. Corp. Ref. Rev. (Manhattan College Proj.), Ser. 2017, 5.00%, due 8/1/47 | | | 852 | | |
| | | | | Build NYC Res. Corp. Ref. Rev. (Packer Collegiate Institute Proj.) | | | | | |
| | 100 | | | Ser. 2015, 5.00%, due 6/1/21 | | | 112 | | |
| | 200 | | | Ser. 2015, 5.00%, due 6/1/22 | | | 229 | | |
| | 50 | | | Ser. 2015, 4.00%, due 6/1/24 | | | 56 | | |
| | 175 | | | Ser. 2015, 4.00%, due 6/1/25 | | | 197 | | |
| | | | | Dutchess Co. Local Dev. Corp. Rev. | | | | | |
| | 225 | | | Ser. 2014-A, 5.00%, due 7/1/21 | | | 252 | | |
| | 150 | | | Ser. 2014-A, 5.00%, due 7/1/22 | | | 171 | | |
| | 135 | | | Ser. 2014-A, 4.00%, due 7/1/23 | | | 150 | | |
| | 115 | | | Ser. 2014-A, 5.00%, due 7/1/25 | | | 135 | | |
| | | | | Erie Co. IDA Sch. Fac. Ref. Rev. (City Sch. Dist. Buffalo Proj.) | | | | | |
| | 680 | | | Ser. 2015-A, 5.00%, due 5/1/27 | | | 825 | | |
| | 600 | | | Ser. 2016-A, 5.00%, due 5/1/29 | | | 730 | | |
| | 1,000 | | | Hempstead Town G.O., Ser. 2017, (AGM Insured), 4.00%, due 4/1/25 | | | 1,139 | | |
| | | | | Hempstead Town Local Dev. Corp. Rev. (Molloy College Proj.) | | | | | |
| | 300 | | | Ser. 2014, 5.00%, due 7/1/18 | | | 307 | | |
| | 575 | | | Ser. 2014, 5.00%, due 7/1/19 | | | 606 | | |
| | 605 | | | Ser. 2014, 5.00%, due 7/1/20 | | | 654 | | |
| | | | | Hudson Yards Infrastructure Corp. Rev. | | | | | |
| | 450 | | | Ser. 2011-A, 5.75%, due 2/15/47 Pre-Refunded 2/15/21 | | | 514 | | |
| | 300 | | | Ser. 2011-A, 5.75%, due 2/15/47 | | | 335 | | |
| | 500 | | | Long Island Pwr. Au. Rev., Ser. 2008-A, 6.00%, due 5/1/33 Pre-Refunded 5/1/19 | | | 536 | | |
| | 1,000 | | | Metropolitan Trans. Au. Dedicated Tax Fund Ref. Rev., Ser. 2016-A, 5.25%, due 11/15/27 | | | 1,255 | | |
| | | | | Metropolitan Trans. Au. Rev. | | | | | |
| | 1,120 | | | Ser. 2008-C, 6.50%, due 11/15/28 Pre-Refunded 11/15/18 | | | 1,183 | | |
| | 90 | | | Ser. 2008-C, 6.50%, due 11/15/28 Pre-Refunded 11/15/18 | | | 95 | | |
| | 290 | | | Ser. 2008-C, 6.50%, due 11/15/28 | | | 306 | | |
| | 750 | | | Middletown City G.O., Ser. 2017-B, 2.00%, due 9/20/18 | | | 757 | | |
| 400 |
| | Monroe Co. Ind. Dev. Corp. Rev. (Nazareth College of Rochester Proj.),
Ser. 2013-A, 4.13%, due 10/1/27 | | | 429 | | |
| | | | | Monroe Co. Ind. Dev. Corp. Rev. (St. John Fisher College) | | | | | |
| | 100 | | | Ser. 2014-A, 4.00%, due 6/1/18 | | | 102 | | |
| | 115 | | | Ser. 2014-A, 5.00%, due 6/1/20 | | | 125 | | |
| | 50 | | | Ser. 2014-A, 5.00%, due 6/1/22 | | | 57 | | |
| | 100 | | | Ser. 2014-A, 5.00%, due 6/1/23 | | | 116 | | |
| | 450 | | | Monroe Co. Ind. Dev. Corp. Rev. Ref. (Highland Hosp. Rochester Proj.), Ser. 2015, 5.00%, due 7/1/22 | | | 518 | | |
| 300 |
| | Monroe Co. Ind. Dev. Corp. Rev. Ref. (Monroe Comm. College), Ser. 2014,
(AGM Insured), 5.00%, due 1/15/26 | | | 343 | | |
| | 500 | | | MTA Hudson Rail Yards Trust Oblig. Rev., Ser. 2016-A, 5.00%, due 11/15/46 | | | 532 | | |
| | | | | Nassau Co. Local Econ. Assist. Corp. Rev. (Catholic Hlth. Svcs. of Long Island Obligated Group Proj.) | | | | | |
| | 415 | | | Ser. 2014, 4.00%, due 7/1/18 | | | 422 | | |
| | 300 | | | Ser. 2014, 5.00%, due 7/1/27 | | | 345 | | |
See Notes to Financial Statements
142
Schedule of Investments New York Municipal Income Fund (cont'd)
PRINCIPAL AMOUNT | | | | VALUE | |
(000's omitted) | | | | (000's omitted) | |
| | | | | New Rochelle Ref. G.O. | | | | | |
$ | 475 | | | Ser. 2013-A, 4.00%, due 3/15/18 | | $ | 480 | | |
| | 350 | | | Ser. 2013-A, 4.00%, due 3/15/19 | | | 364 | | |
| | 1,000 | | | New York City Hsg. Dev. Corp. Rev., Ser. 2008-M, 6.75%, due 11/1/33 | | | 1,051 | | |
| 675 |
| | New York City Muni. Wtr. Fin. Au. Wtr. & Swr. Sys. Rev., Ser. 2007-BB-1,
(LOC: Bank of Tokyo), 0.87%, due 6/15/36 | | | 675 | (a) | |
| | | | | New York City Transitional Fin. Au. Rev. (Future Tax Secured-Fiscal) | | | | | |
| | 355 | | | Subser. 2016-A-1, 4.00%, due 5/1/30 | | | 394 | | |
| | 750 | | | Subser. 2016-A-1, 4.00%, due 5/1/31 | | | 822 | | |
| | 1,100 | | | Subser. 2016-A-1, 5.00%, due 5/1/33 | | | 1,303 | | |
| 350 |
| | New York Convention Center Dev. Corp. Rev. Ref. (Hotel Unit Fee Secured),
Ser. 2015, 5.00%, due 11/15/22 | | | 407 | | |
| | 505 | | | New York G.O. Ref., Ser. 2017-A, 5.00%, due 8/1/26 | | | 622 | | |
| | 1,120 | | | New York St. Bridge Au. Rev., Ser. 2012, 4.00%, due 1/1/22 | | | 1,237 | | |
| | 150 | | | New York St. Dorm. Au. Ref. Rev. (St. Personal Income Tax), Ser. 2016-D, 5.00%, due 2/15/27 | | | 184 | | |
| 500 |
| | New York St. Dorm. Au. Ref. Rev. Non St. Supported Debt (Pratt Institute),
Ser. 2015-A, 3.63%, due 7/1/36 | | | 506 | | |
| 745 |
| | New York St. Dorm. Au. Rev. Non St. Supported Debt (Culinary Institute of America),
Ser. 2013, 4.50%, due 7/1/24 | | | 827 | | |
| | 500 | | | New York St. Dorm. Au. Rev. Non St. Supported Debt (Fordham Univ.), Ser. 2014, 5.00%, due 7/1/22 | | | 576 | | |
| | | | | New York St. Dorm. Au. Rev. Non St. Supported Debt (Mem. Sloan-Kettering) | | | | | |
| | 500 | | | Ser. 2012-1, 5.00%, due 7/1/20 | | | 549 | | |
| | 1,150 | | | Ser. 2012-1, 4.00%, due 7/1/22 | | | 1,265 | | |
| 200 |
| | New York St. Dorm. Au. Rev. Non St. Supported Debt (North Shore-Long Island Jewish Oblig. Group),
Ser. 2011-A, 5.00%, due 5/1/22 Pre-Refunded 5/1/21 | | | 225 | | |
| 300 |
| | New York St. Dorm. Au. Rev. Non St. Supported Debt (Sch. Dist. Bldg. Fin. Prog.),
Ser. 2017-C, (AGM Insured), 5.00%, due 10/1/27 | | | 371 | | |
| | | | | New York St. Dorm. Au. Rev. Non St. Supported Debt (Sch. Dist. Fin. Prog.) | | | | | |
| | 275 | | | Ser. 2014-A, (AGM Insured), 5.00%, due 10/1/23 | | | 327 | | |
| | 2,000 | | | Ser. 2014-A, (AGM Insured), 5.00%, due 10/1/24 | | | 2,418 | | |
| 500 |
| | New York St. Dorm. Au. Rev. Non St. Supported Debt Ref. (NYU Dorm. Facs.),
Ser. 2015-B, 5.00%, due 7/1/26 | | | 606 | | |
| 1,050 |
| | New York St. Dorm. Au. Rev. Ref. Non St. Supported Debt (Univ. Facs.),
Ser. 2017-A, 5.00%, due 7/1/30 | | | 1,272 | | |
| | 500 | | | New York St. Dorm. Au. Rev. St. Supported Debt (City Univ. Cons. 5th), Ser. 2008-E, 6.13%, due 1/1/31 | | | 529 | | |
| 1,500 |
| | New York St. Dorm. Au. Rev. St. Supported Debt (Mental Hlth. Svcs. Facs. Imp.),
Ser. 2008-F, 6.25%, due 2/15/31 | | | 1,561 | | |
| | 500 | | | New York St. Dorm. Au. Rev. St. Supported Debt (New York Univ.), Ser. 2016-A, 4.00%, due 7/1/41 | | | 529 | | |
| | 2,000 | | | New York St. Dorm. Au. Sales Tax Rev., Ser. 2013-A, 5.00%, due 3/15/28 | | | 2,340 | | |
| 490 |
| | New York St. Energy Research & Dev. Au. Pollution Ctrl. Ref. Rev.
(New York Elec. & Gas Corp. Proj.), Ser. 1994, 2.00%, due 2/1/29 Putable 5/1/20 | | | 495 | (a) | |
| 1,450 |
| | New York St. Env. Facs. Corp. (St. Clean Wtr. & Drinking Rev.
Revolving Fund Muni. Wtr. Fin. Auth. Proj.), Ser. 2012-D, 5.00%, due 6/15/24 | | | 1,678 | | |
| | | | | New York St. G.O. | | | | | |
| | 1,915 | | | Ser. 2008, 6.25%, due 10/15/28 Pre-Refunded 10/15/18 | | | 2,010 | | |
| | 300 | | | Ser. 2016-B-1, 5.00%, due 12/1/29 | | | 364 | | |
| | 85 | | | New York St. G.O. (Unrefunded), Ser. 2008, 6.25%, due 10/15/28 | | | 89 | | |
| | 750 | | | New York St. HFA Rev. (Affordable Hsg.), Ser. 2015-G, (SONYMA Insured), 1.35%, due 5/1/19 | | | 750 | | |
| | | | | New York St. Urban Dev. Corp. Rev. Ref. (Personal Income Tax) | | | | | |
| | 500 | | | Ser. 2016-A, 5.00%, due 3/15/28 | | | 606 | | |
| | 1,000 | | | Ser. 2017-B, 5.00%, due 3/15/30 | | | 1,212 | | |
| | 165 | | | Niagara Falls Pub. Wtr. Au. Wtr. & Swr. Sys. Rev. Ref., Ser. 2016-A, 5.00%, due 7/15/25 | | | 197 | | |
| | 650 | | | Niagara Falls Ref. G.O., Ser. 2016, 4.00%, due 5/15/19 | | | 673 | | |
| | 710 | | | Onondaga Civic Dev. Corp. Ref. Rev., Ser. 2015, 5.00%, due 10/1/21 | | | 777 | | |
| | | | | Orange Co. Funding Corp. Rev. (Mount St. Mary College) | | | | | |
| | 735 | | | Ser. 2012-B, 4.00%, due 7/1/23 | | | 795 | | |
| | 695 | | | Ser. 2012-B, 4.00%, due 7/1/24 | | | 748 | | |
See Notes to Financial Statements
143
Schedule of Investments New York Municipal Income Fund (cont'd)
PRINCIPAL AMOUNT | | | | VALUE | |
(000's omitted) | | | | (000's omitted) | |
$ | 1,500
| | | Port Au. New York & New Jersey Cons. Bonds Rev. Ref. (Two Hundred -Third),
Ser. 2017, 5.00%, due 4/15/57 | | $ | 1,699
| | |
| | 350 | | | Rockland Co. G.O. (Pub. Imp.), Ser. 2014-C, (AGM Insured), 4.00%, due 5/1/21 | | | 377 | | |
| | 1,500 | | | Sales Tax Asset Receivable Corp. Ref. Rev. (Fiscal 2015), Ser. 2014-A, 4.00%, due 10/15/23 | | | 1,708 | | |
| | 170 | | | Smithtown Central Sch. Dist. Ref. G.O., Ser. 2013, 5.00%, due 10/15/23 | | | 203 | | |
| | | | | Suffolk Co. G.O. (Pub. Imp.) | | | | | |
| | 500 | | | Ser. 2014-A, (AGM Insured), 3.00%, due 6/15/19 | | | 514 | | |
| | 80 | | | Ser. 2014-A, (AGM Insured), 3.00%, due 6/15/24 | | | 84 | | |
| | 500 | | | Triborough Bridge & Tunnel Au. Rev., Ser. 2017-A, 5.00%, due 11/15/25 | | | 614 | | |
| | | | | Triborough Bridge & Tunnel Au. Rev. Ref. | | | | | |
| | 1,500 | | | Ser. 2013-A, 5.00%, due 11/15/27 | | | 1,760 | | |
| | 320 | | | Ser. 2016-A, 5.00%, due 11/15/46 | | | 372 | | |
| | 500 | | | Ser. 2017-B, 5.00%, due 11/15/30 | | | 611 | | |
| | 300 | | | Subser. 2005-B-2, (LOC: Wells Fargo Bank N.A.), 0.88%, due 1/1/32 | | | 300 | (a) | |
| | 500 | | | TSASC Inc. Rev. Ref., Ser. 2017, 5.00%, due 6/1/28 | | | 586 | | |
| | 950 | | | Utility Debt Securitization Au. Rev., Ser. 2013-TE, 5.00%, due 12/15/28 | | | 1,120 | | |
| | | | | Total Investments 98.9% (Cost $57,191) | | | 58,895 | | |
| | | | | Other Assets Less Liabilities 1.1% | | | 650 | | |
| | | | | Net Assets 100.0% | | $ | 59,545 | | |
(a) Weighted average coupon that changes/updates periodically. Rate shown is the rate at October 31, 2017.
The following is a summary, categorized by Level (see Note A of Notes to Financial Statements), of inputs used to value the Fund's investments as of October 31, 2017:
Asset Valuation Inputs
(000's omitted) | | Level 1 | | Level 2 | | Level 3 | | Total | |
Investments: | |
| Municipal Notes(a) | | $ | — | | | $ | 58,895 | | | $ | — | | | $ | 58,895 | | |
Total Investments | | $ | — | | | $ | 58,895 | | | $ | — | | | $ | 58,895 | | |
(a) The Schedule of Investments provides a categorization by state for the portfolio.
As of the year ended October 31, 2017, no securities were transferred from one level (as of October 31, 2016) to another.
See Notes to Financial Statements
144
Schedule of Investments Short Duration Bond Fund October 31, 2017
PRINCIPAL AMOUNT | | | | VALUE | |
(000's omitted) | | | | (000's omitted) | |
Mortgage-Backed Securities 27.4% | | | |
Collateralized Mortgage Obligations 0.1% | | | |
$ | 78 | | | Harborview Mortgage Loan Trust, Ser. 2004-4, Class 3A, 1 month USD LIBOR + 1.13%, (2.36%),
due 6/19/34 | | $ | 76
| (a) | |
Commercial Mortgage-Backed 24.8% | | | |
| | 892 | | | Banc of America Commercial Mortgage Trust, Ser. 2017-BNK3, Class A1, 1.96%, due 2/15/50 | | | 888 | | |
| | 653 | | | BBCMS Mortgage Trust, Ser. 2017-C1, Class A1, 2.01%, due 2/15/50 | | | 652 | | |
| | | | | CD Mortgage Trust | | | | | |
| | 743 | | | Ser. 2016-CD1, Class A1, 1.44%, due 8/10/49 | | | 734 | | |
| | 447 | | | Ser. 2017-CD3, Class A1, 1.97%, due 2/10/50 | | | 445 | | |
| | 2,190 | | | Ser. 2017-CD5, Class A1, 2.03%, due 8/15/50 | | | 2,179 | | |
| | | | | Citigroup Commercial Mortgage Trust | | | | | |
| | 736 | | | Ser. 2016-C2, Class A1, 1.50%, due 8/10/49 | | | 726 | | |
| | 1,208 | | | Ser. 2016-P6, Class A1, 1.88%, due 12/10/49 | | | 1,200 | | |
| | | | | Commercial Mortgage Pass-Through Certificates | | | | | |
| | 2,194 | | | Ser. 2012-CR5, Class ASB, 2.39%, due 12/10/45 | | | 2,203 | | |
| | 588 | | | Ser. 2014-LC15, Class A1, 1.26%, due 4/10/47 | | | 586 | | |
| | 115 | | | Ser. 2014-CR16, Class A1, 1.45%, due 4/10/47 | | | 114 | | |
| | 279 | | | Ser. 2014-UBS3, Class A1, 1.40%, due 6/10/47 | | | 278 | | |
| | 328 | | | Ser. 2014-UBS4, Class A1, 1.31%, due 8/10/47 | | | 327 | | |
| | 101 | | | Ser. 2014-UBS5, Class A1, 1.37%, due 9/10/47 | | | 101 | | |
| | 309 | | | Ser. 2015-CR25, Class A1, 1.74%, due 8/10/48 | | | 308 | | |
| | 628 | | | Ser. 2016-CR28, Class A1, 1.77%, due 2/10/49 | | | 626 | | |
| | 380 | | | Ser. 2015-PC1, Class A1, 1.67%, due 7/10/50 | | | 380 | | |
| | 1,551 | | | CSAIL Commercial Mortgage Trust, Ser. 2015-C2, Class A1, 1.45%, due 6/15/57 | | | 1,542 | | |
| | 672 | | | DBJPM Mortgage Trust, Ser. 2016-C3, Class A1, 1.50%, due 9/10/49 | | | 665 | | |
| | 262 | | | GS Mortgage Securities Trust, Ser. 2015-GS1, Class A1, 1.94%, due 11/10/48 | | | 262 | | |
| | 1,869 | | | Ladder Capital Commercial Mortgage Securities LLC, Ser. 2017-LC26, Class A1, 1.98%, due 7/12/50 | | | 1,860 | (b) | |
| | | | | Morgan Stanley Bank of America Merrill Lynch Trust | | | | | |
| | 574 | | | Ser. 2016-C28, Class A1, 1.53%, due 1/15/49 | | | 567 | | |
| | 894 | | | Ser. 2017-C33, Class A1, 2.03%, due 5/15/50 | | | 891 | | |
| | 529 | | | SG Commercial Mortgage Securities Trust, Ser. 2016-C5, Class A1, 1.35%, due 10/10/48 | | | 522 | | |
| | 2,187 | | | UBS Commercial Mortgage Trust, Ser. 2017-C2, Class A1, 2.01%, due 8/15/50 | | | 2,176 | | |
| | | | | Wells Fargo Commercial Mortgage Trust | | | | | |
| | 265 | | | Ser. 2015-P2, Class A1, 1.97%, due 12/15/48 | | | 265 | | |
| | 1,128 | | | Ser. 2016-NXS6, Class A1, 1.42%, due 11/15/49 | | | 1,115 | | |
| | 982 | | | Ser. 2017-C39, Class A1, 1.98%, due 9/15/50 | | | 977 | | |
| | 795 | | | Ser. 2016-NXS5, Class A1, 1.56%, due 1/15/59 | | | 790 | | |
| | 889 | | | Ser. 2016-C32, Class A1, 1.58%, due 1/15/59 | | | 883 | | |
| | | | | WF-RBS Commercial Mortgage Trust | | | | | |
| | 548 | | | Ser. 2014-C21, Class A1, 1.41%, due 8/15/47 | | | 546 | | |
| | 738 | | | Ser. 2014-C24, Class A1, 1.39%, due 11/15/47 | | | 734 | | |
| | | | 25,542 | | |
Fannie Mae 1.4% | | | |
| | | | | Pass-Through Certificates | | | | | |
| | 320 | | | 3.50%, due 10/1/25 | | | 333 | | |
| | 658 | | | 3.00%, due 9/1/27 | | | 675 | | |
| | 435 | | | 4.50%, due 4/1/39 – 5/1/44 | | | 465 | | |
| | | | 1,473 | | |
See Notes to Financial Statements
145
Schedule of Investments Short Duration Bond Fund (cont'd)
PRINCIPAL AMOUNT | | | | VALUE | |
(000's omitted) | | | | (000's omitted) | |
Freddie Mac 1.1% | | | |
| | | | | Pass-Through Certificates | | | | | |
$ | 356 | | | 3.50%, due 5/1/26 | | $ | 371 | | |
| | 471 | | | 3.00%, due 1/1/27 | | | 482 | | |
| | 278 | | | 4.50%, due 11/1/39 | | | 297 | | |
| | | | 1,150 | | |
| | | | | Total Mortgage-Backed Securities (Cost $28,424) | | | 28,241 | | |
Corporate Bonds 54.8% | | | |
Aerospace & Defense 1.3% | | | |
| | 980 | | | Northrop Grumman Corp., 2.08%, due 10/15/20 | | | 980 | | |
| | 400 | | | Rockwell Collins, Inc., 1.95%, due 7/15/19 | | | 400 | | |
| | | | 1,380 | | |
Agriculture 1.2% | | | |
| | 1,285 | | | BAT Capital Corp., 2.30%, due 8/14/20 | | | 1,285 | (b) | |
Auto Manufacturers 3.6% | | | |
| | 390 | | | Daimler Finance N.A. LLC, 1.50%, due 7/5/19 | | | 387 | (b) | |
| | | | | Ford Motor Credit Co. LLC | | | | | |
| | 880 | | | 3 month USD LIBOR + 0.94%, (2.29%), due 1/9/18 | | | 881 | (a) | |
| | 1,200 | | | 2.02%, due 5/3/19 | | | 1,198 | | |
| | 1,245 | | | General Motors Financial Co., Inc., 2.40%, due 5/9/19 | | | 1,250 | | |
| | | | 3,716 | | |
Banks 18.8% | | | |
| | | | | Bank of America Corp. | | | | | |
| | 915 | | | Ser. L, 2.60%, due 1/15/19 | | | 921 | | |
| | 1,675 | | | 5.63%, due 7/1/20 | | | 1,817 | | |
| | 1,115 | | | Capital One Financial Corp., 2.50%, due 5/12/20 | | | 1,119 | | |
| | 885 | | | Capital One N.A., 2.35%, due 8/17/18 | | | 888 | | |
| | 2,175 | | | Citigroup, Inc., 8.50%, due 5/22/19 | | | 2,386 | | |
| | 2,065 | | | Goldman Sachs Group, Inc, 2.60%, due 4/23/20 | | | 2,080 | | |
| | 2,130 | | | JPMorgan Chase & Co., 2.25%, due 1/23/20 | | | 2,140 | | |
| | 2,230 | | | Morgan Stanley, 2.45%, due 2/1/19 | | | 2,242 | | |
| | 230 | | | MUFG Americas Holdings Corp., 1.63%, due 2/9/18 | | | 230 | | |
| | 875 | | | National Australia Bank Ltd., 1.38%, due 7/12/19 | | | 867 | | |
| | 845 | | | U.S. Bank N.A., 1.45%, due 1/29/18 | | | 845 | | |
| | 2,145 | | | Wells Fargo & Co., Ser. N, 2.15%, due 1/30/20 | | | 2,150 | | |
| | 1,715 | | | Westpac Banking Corp., 2.15%, due 3/6/20 | | | 1,718 | | |
| | | | 19,403 | | |
Beverages 1.3% | | | |
| | 1,290 | | | Anheuser-Busch InBev Finance, Inc., 1.90%, due 2/1/19 | | | 1,291 | | |
Biotechnology 1.4% | | | |
| | 1,440 | | | Gilead Sciences, Inc., 3 month USD LIBOR + 0.17%, (1.50%), due 9/20/18 | | | 1,441 | (a) | |
See Notes to Financial Statements
146
Schedule of Investments Short Duration Bond Fund (cont'd)
PRINCIPAL AMOUNT | | | | VALUE | |
(000's omitted) | | | | (000's omitted) | |
Computers 0.3% | | | |
$ | 350 | | | Diamond 1 Finance Corp./Diamond 2 Finance Corp., 3.48%, due 6/1/19 | | $ | 356 | (b) | |
Diversified Financial Services 2.5% | | | |
| | 675 | | | AIG Global Funding, 2.15%, due 7/2/20 | | | 675 | (b) | |
| | 1,895 | | | American Express Co., 2.20%, due 10/30/20 | | | 1,891 | | |
| | | | 2,566 | | |
Electric 3.6% | | | |
| | 1,100 | | | Dominion Energy, Inc., 2.58%, due 7/1/20 | | | 1,106 | | |
| | 240 | | | Dominion Resources, Inc., Ser. B, 1.60%, due 8/15/19 | | | 239 | | |
| | 1,060 | | | Pennsylvania Electric Co., 5.20%, due 4/1/20 | | | 1,128 | | |
| | 160 | | | Southern Co., 1.55%, due 7/1/18 | | | 160 | | |
| | 1,125 | | | Southern Power Co., 1.85%, due 12/1/17 | | | 1,125 | | |
| | | | 3,758 | | |
Food 0.6% | | | |
| | 640 | | | Tyson Foods, Inc., 3 month USD LIBOR + 0.45%, (1.77%), due 5/30/19 | | | 641 | (a) | |
Household Products - Wares 1.0% | | | |
| | 990 | | | Reckitt Benckiser Treasury Services PLC, 2.13%, due 9/21/18 | | | 993 | (b) | |
Media 3.8% | | | |
| 500 |
| | Charter Communications Operating LLC/Charter Communications Operating Capital, 3.58%,
due 7/23/20 | | | 513 | | |
| | 1,250 | | | Comcast Corp., 6.30%, due 11/15/17 | | | 1,252 | | |
| | 585 | | | Discovery Communications LLC, 2.20%, due 9/20/19 | | | 586 | | |
| | 1,000 | | | NBCUniversal Enterprise, Inc., 3 month USD LIBOR + 0.69%, (2.04%), due 4/15/18 | | | 1,003 | (a)(b) | |
| | 540 | | | Thomson Reuters Corp., 4.70%, due 10/15/19 | | | 565 | | |
| | | | 3,919 | | |
Oil & Gas 2.9% | | | |
| | 585 | | | BP AMI Leasing, Inc., 5.52%, due 5/8/19 | | | 616 | (b) | |
| | | | | BP Capital Markets PLC | | | | | |
| | 350 | | | 1.68%, due 5/3/19 | | | 349 | | |
| | 915 | | | 2.52%, due 1/15/20 | | | 927 | | |
| | 1,045 | | | Canadian Natural Resources Ltd., 1.75%, due 1/15/18 | | | 1,045 | | |
| | | | 2,937 | | |
Pharmaceuticals 2.2% | | | |
| | | | | AbbVie, Inc. | | | | | |
| | 205 | | | 1.80%, due 5/14/18 | | | 205 | | |
| | 1,010 | | | 2.50%, due 5/14/20 | | | 1,018 | | |
| | 380 | | | Mylan NV, 2.50%, due 6/7/19 | | | 381 | | |
| | 640 | | | Shire Acquisitions Investments Ireland DAC, 1.90%, due 9/23/19 | | | 638 | | |
| | | | 2,242 | | |
See Notes to Financial Statements
147
Schedule of Investments Short Duration Bond Fund (cont'd)
PRINCIPAL AMOUNT | | | | VALUE | |
(000's omitted) | | | | (000's omitted) | |
Pipelines 2.3% | | | |
$ | 785 | | | El Paso Pipeline, 6.50%, due 4/1/20 | | $ | 857 | | |
| | 145 | | | Enterprise Products Operating LLC, 1.65%, due 5/7/18 | | | 145 | | |
| | 1,335 | | | Kinder Morgan Finance Co. LLC, 6.00%, due 1/15/18 | | | 1,346 | (b) | |
| | | | 2,348 | | |
REITs 2.3% | | | |
| | 2,375 | | | Simon Property Group L.P., 1.50%, due 2/1/18 | | | 2,375 | (b) | |
Retail 0.8% | | | |
| | 830 | | | CVS Health Corp., 1.90%, due 7/20/18 | | | 831 | | |
Semiconductors 0.3% | | | |
| | 290 | | | QUALCOMM, Inc., 2.10%, due 5/20/20 | | | 291 | | |
Telecommunications 4.6% | | | |
| | 1,750 | | | AT&T, Inc., 5.20%, due 3/15/20 | | | 1,878 | | |
| | 1,000 | | | Cisco Systems, Inc., 3 month USD LIBOR + 0.31%, (1.63%), due 6/15/18 | | | 1,002 | (a) | |
| | 1,790 | | | Verizon Communications, Inc., 4.50%, due 9/15/20 | | | 1,910 | | |
| | | | 4,790 | | |
| | | | | Total Corporate Bonds (Cost $56,571) | | | 56,563 | | |
Asset-Backed Securities 13.0% | | | |
| | 158 | | | Ally Auto Receivables Trust, Ser. 2014-2, Class A3, 1.25%, due 4/15/19 | | | 158 | | |
| | 620 | | | Canadian Pacer Auto Receivables Trust, Ser. 2017-1A, Class A2A, 1.77%, due 12/19/19 | | | 620 | (b) | |
| | | | | Capital One Multi-Asset Execution Trust | | | | | |
| | 1,200 | | | Ser. 2016-A3, Class A3, 1.34%, due 4/15/22 | | | 1,191 | | |
| | 1,030 | | | Ser. 2014-A4, Class A4, 1 month USD LIBOR + 0.36%, (1.60%), due 6/15/22 | | | 1,035 | (a) | |
| | | | | Chase Issuance Trust | | | | | |
| | 1,000 | | | Ser. 2013-A7, Class A, 1 month USD LIBOR + 0.43%, (1.67%), due 9/15/20 | | | 1,003 | (a) | |
| | 1,050 | | | Ser. 2016-A5, Class A5, 1.27%, due 7/15/21 | | | 1,043 | | |
| | | | | Citibank Credit Card Issuance Trust | | | | | |
| | 1,100 | | | Ser. 2013-A2, Class A2, 1 month USD LIBOR + 0.28%, (1.52%), due 5/26/20 | | | 1,102 | (a) | |
| | 1,000 | | | Ser. 2013-A4, Class A4, 1 month USD LIBOR + 0.42%, (1.66%), due 7/24/20 | | | 1,003 | (a) | |
| | 1,110 | | | Ser. 2016-A1, Class A1, 1.75%, due 11/19/21 | | | 1,106 | | |
| | 870 | | | Ford Credit Auto Owner Trust, Ser. 2017-A, Class A3, 1.67%, due 6/15/21 | | | 867 | | |
| | 1,350 | | | GM Financial Consumer Automobile Receivables Trust, Ser. 2017-3A, Class A2A, 1.71%, due 9/16/20 | | | 1,349 | (b) | |
| | 406 | | | Honda Auto Receivables Owner Trust, Ser. 2015-2, Class A3, 1.04%, due 2/21/19 | | | 405 | | |
| | 600 | | | Nissan Auto Receivables Owner Trust, Ser. 2016-C, Class A3, 1.18%, due 1/15/21 | | | 595 | | |
| | | | | Toyota Auto Receivables Owner Trust | | | | | |
| | 206 | | | Ser. 2015-A, Class A3, 1.12%, due 2/15/19 | | | 206 | | |
| | 1,030 | | | Ser. 2016-D, Class A3, 1.23%, due 10/15/20 | | | 1,023 | | |
| | 675 | | | Verizon Owner Trust, Ser. 2016-1A, Class A, 1.42%, due 1/20/21 | | | 672 | (b) | |
| | | | | Total Asset-Backed Securities (Cost $13,410) | | | 13,378 | | |
See Notes to Financial Statements
148
Schedule of Investments Short Duration Bond Fund (cont'd)
PRINCIPAL AMOUNT | | | | VALUE | |
(000's omitted) | | | | (000's omitted) | |
Short-Term Investments 8.2% | | | |
Commercial Paper 1.3% | | | |
$ | 1,300 | | | Energy Transfer Partners LP, 2.02%, due 11/14/17 | | $ | 1,299 | (b)(c) | |
NUMBER OF SHARES | | | | | |
Investment Company 6.9% | | | |
| | 7,147,828 | | | State Street Institutional U.S. Government Money Market Fund Premier Class, 0.96% | | | 7,148 | (d)(e) | |
| | | | | Total Short-Term Investments (Cost $8,447) | | | 8,447 | | |
| | | | | Total Investments 103.4% (Cost $106,852) | | | 106,629 | | |
| | | | | Liabilities Less Other Assets (3.4)% | | | (3,464 | )(f) | |
| | | | | Net Assets 100.0% | | $ | 103,165 | | |
(a) Variable or floating rate security. The interest rate shown was the current rate as of October 31, 2017 and changes periodically.
Benchmarks for Variable / Floating Rates:
LIBOR (USD) = London Interbank Offered Rate
(b) Securities were purchased under Rule 144A of the Securities Act of 1933, as amended (the "1933 Act"), or are otherwise restricted and, unless registered under the 1933 Act or exempted from registration, may only be sold to qualified institutional investors or may have other restrictions on resale. At October 31, 2017, these securities amounted to approximately $14,836,000, which represents 14.4% of net assets of the Fund. These securities have been deemed by the investment manager to be liquid.
(c) Rate shown was the discount rate at the date of purchase.
(d) All or a portion of this security is segregated in connection with obligations for futures with a total value of approximately $7,148,000.
(e) Represents 7-day effective yield as of October 31, 2017.
(f) Includes the impact of the Fund's open positions in derivatives at October 31, 2017.
Derivative Instruments
Futures contracts ("futures")
At October 31, 2017, open positions in futures for the Fund were as follows:
Long Futures
Expiration Date | | Number of
Contracts | | Open Contracts | | Notional
Amount | | Value and
Unrealized
Appreciation/
(Depreciation) | |
12/2017 | | | 70 | | | U.S. Treasury Note, 2 Year | | $ | 15,075,156 | | | $ | (68,977 | ) | |
Total Futures | | | | | | $ | 15,075,156 | | | $ | (68,977 | ) | |
See Notes to Financial Statements
149
Schedule of Investments Short Duration Bond Fund (cont'd)
At October 31, 2017, the Fund had $29,260 deposited in a segregated account to cover margin requirements on open futures.
For the year ended October 31, 2017, the average notional value of futures for the Fund was $9,701,236 for long positions.
The following is a summary, categorized by Level (see Note A of Notes to Financial Statements), of inputs used to value the Fund's investments as of October 31, 2017:
Asset Valuation Inputs
(000's omitted) | | Level 1 | | Level 2 | | Level 3 | | Total | |
Investments: | |
| Mortgage-Backed Securities(a) | | $ | — | | | $ | 28,241 | | | $ | — | | | $ | 28,241 | | |
| Corporate Bonds(a) | | | — | | | | 56,563 | | | | — | | | | 56,563 | | |
Asset-Backed Securities | | | — | | | | 13,378 | | | | — | | | | 13,378 | | |
| Short-Term Investments(a) | | | — | | | | 8,447 | | | | — | | | | 8,447 | | |
Total Investments | | $ | — | | | $ | 106,629 | | | $ | — | | | $ | 106,629 | | |
(a) The Schedule of Investments provides information on the industry or sector categorization for the portfolio.
As of the year ended October 31, 2017, no securities were transferred from one level (as of October 31, 2016) to another.
The following is a summary, categorized by Level (see Note A of Notes to Financial Statements), of inputs used to value the Fund's derivatives as of October 31, 2017:
Other Financial Instruments
(000's omitted) | | Level 1 | | Level 2 | | Level 3 | | Total | |
| Futures(a) | |
Liabilities | | $ | (69 | ) | | $ | — | | | $ | — | | | $ | (69 | ) | |
Total | | $ | (69 | ) | | $ | — | | | $ | — | | | $ | (69 | ) | |
(a) Futures are reported at the cumulative unrealized appreciation/(depreciation) of the instrument.
See Notes to Financial Statements
150
Schedule of Investments Short Duration High Income Fund October 31, 2017
PRINCIPAL AMOUNT | | | | VALUE | |
(000's omitted) | | | | (000's omitted) | |
| Loan Assignments(a) 5.3% | | | |
All Telecom 0.1% | | | |
$ | 145 | | | Level 3 Financing, Inc., First Lien Term Loan B, 3 month USD LIBOR + 2.25%, (3.49%), due 2/22/24 | | $ | 146 | | |
Building & Development 0.2% | | | |
| | 112 | | | Jeld Wen, Inc., First Lien Term Loan B, 3 month USD LIBOR + 3.00%, (4.33%), due 7/1/22 | | | 112 | | |
| | 91 | | | Realogy Group, First Lien Term Loan B, 3 month USD LIBOR + 2.25%, (3.58%), due 7/20/22 | | | 92 | | |
| | | | 204 | | |
Business Equipment & Services 0.8% | | | |
| | | | | Advantage Sales and Marketing | | | | | |
| | 174 | | | First Lien Term Loan, 3 month USD LIBOR + 3.25%, (4.63%), due 7/25/21 | | | 165 | | |
| | 25 | | | First Lien Term Loan B, 3 month USD LIBOR + 3.25%, (4.63%), due 7/25/21 | | | 24 | | |
| | 140 | | | Second Lien Term Loan, 3 month USD LIBOR + 6.50%, (7.87%), due 7/25/22 | | | 117 | | |
| | 37 | | | ConvergeOne, First Lien Term Loan B, 3 month USD LIBOR + 4.75%, (6.09%), due 6/20/24 | | | 37 | | |
| | 278 | | | Servicemaster Company, First Lien Term Loan B, 3 month USD LIBOR + 2.50%, (3.74%), due 11/8/23 | | | 279 | | |
| | 265 | | | West, First Lien Term Loan, 3 month USD LIBOR + 4.00%, (5.24%), due 10/3/24 | | | 265 | (b)(c) | |
| | | | 887 | | |
Cable & Satellite Television 0.1% | | | |
| 129 | | | Cablevision Systems Corp., First Lien Term Loan B, 3 month USD LIBOR + 2.25%, (3.48%),
due 7/17/25 | | | 129 | | |
Containers & Glass Products 0.1% | | | |
| | 174 | | | SIG Combibloc Group, First Lien Term Loan B, 3 month USD LIBOR + 3.00%, (4.24%), due 3/12/22 | | | 175 | | |
Drugs 0.2% | | | |
| 210 | | | Pharmaceutical Product Development, Inc., First Lien Term Loan, 3 month USD LIBOR + 2.75%,
(4.04%), due 8/18/22 | | | 211 | | |
Electronics - Electrical 0.4% | | | |
| | 200 | | | Mcafee, First Lien Term Loan B, 3 month USD LIBOR + 4.50%, (5.83%), due 9/26/24 | | | 201 | | |
| | 239 | | | Rackspace Hosting, Inc., First Lien Term Loan B, 3 month USD LIBOR + 3.00%, (4.31%), due 11/3/23 | | | 239 | | |
| | | | 440 | | |
Equipment Leasing 0.3% | | | |
| | 294 | | | Avolon, First Lien Term Loan B2, 3 month USD LIBOR + 2.75%, (3.49%), due 4/3/22 | | | 296 | | |
Food & Drug Retailers 0.2% | | | |
| | 271 | | | General Nutrition Centers, First Lien Term Loan, 3 month USD LIBOR + 2.50%, (3.75%), due 3/4/19 | | | 257 | | |
Health Care 0.8% | | | |
| | 100 | | | Air Medical Group Holding, First Lien Term Loan B, 3 month USD LIBOR + 4.25%, (5.25%), | | | 100
due 9/26/24 | (b)(c) | |
| | 228 | | | Envision Healthcare, First Lien Term Loan B, 3 month USD LIBOR + 3.00%, (4.25%), due 12/1/23 | | | 229 | | |
| | 298 | | | Multiplan, Inc., First Lien Term Loan B, 3 month USD LIBOR + 3.00%, (4.33%), due 6/7/23 | | | 301 | | |
| | 303 | | | Team Health, Inc., First Lien Term Loan B, 3 month USD LIBOR + 2.75%, (3.99%), due 2/6/24 | | | 301 | (d) | |
| | | | 931 | | |
See Notes to Financial Statements
151
Schedule of Investments Short Duration High Income Fund (cont'd)
PRINCIPAL AMOUNT | | | | VALUE | |
(000's omitted) | | | | (000's omitted) | |
Leisure Goods - Activities - Movies 0.1% | | | |
$ | 159 | | | Match Group Inc., First Lien Term Loan B, 3 month USD LIBOR + 2.50%, (3.81%), due 11/16/22 | | $ | 161 | (d) | |
Lodging & Casinos 0.7% | | | |
| 265 | | | Cowlitz Tribal Gaming, First Lien Term Loan B, 3 month USD LIBOR + 10.50%, (11.74%),
due 12/6/21 | | | 297 | (d)(e) | |
| | 352 | | | Station Casinos, First Lien Term Loan B, 3 month USD LIBOR + 2.50%, (3.74%), due 6/8/23 | | | 353 | | |
| | 170 | | | Twin Rivers Casino, First Lien Term Loan B, 3 month USD LIBOR + 3.50%, (4.83%), due 7/10/20 | | | 171 | | |
| | | | 821 | | |
Publishing 0.1% | | | |
| 110 | | | Harland Clark Holdings Corp., First Lien Term Loan B6, 3 month USD LIBOR + 5.50%, (6.83%),
due 2/9/22 | | | 110 | | |
Radio & Television 0.2% | | | |
| 277 | | | Univision Communications Inc., First Lien Term Loan C5, 3 month USD LIBOR + 2.75%, (3.99%),
due 3/15/24 | | | 276 | | |
Retailers (except food & drug) 0.6% | | | |
| | 240 | | | Bass Pro Shops, First Lien Term Loan B, 3 month USD LIBOR + 5.00%, (6.24%), due 9/25/24 | | | 233 | | |
| 428 | | | BJS Wholesale Club Inc., First Lien Term Loan B, 3 month USD LIBOR + 3.75%, (4.99%),
due 1/27/24 | | | 417 | | |
| | | | 650 | | |
Steel 0.2% | | | |
| | 280 | | | Big River Steel, First Lien Term Loan B, 3 month USD LIBOR + 5.00%, (6.33%), due 8/15/23 | | | 285 | (d) | |
Utilities 0.2% | | | |
| | 216 | | | Calpine Corp., First Lien Term Loan B6, 3 month USD LIBOR + 2.75%, (4.09%), due 1/15/23 | | | 216 | | |
| | 74 | | | Texas Competitive, First Lien Term Loan B2, 3 month USD LIBOR + 3.25%, (4.01%), due 12/14/23 | | | 75 | | |
| | | | 291 | | |
| | | | | Total Loan Assignments (Cost $6,249) | | | 6,270 | | |
Corporate Bonds 92.4% | | | |
Advertising 2.7% | | | |
| | | | | Lamar Media Corp. | | | | | |
| | 115 | | | 5.88%, due 2/1/22 | | | 118 | | |
| | 330 | | | 5.00%, due 5/1/23 | | | 341 | | |
| | 590 | | | MDC Partners, Inc., 6.50%, due 5/1/24 | | | 602 | (f) | |
| | 830 | | | Nielsen Co. Luxembourg S.a.r.l, 5.50%, due 10/1/21 | | | 855 | (f) | |
| | | | | Nielsen Finance LLC/Nielsen Finance Co. | | | | | |
| | 420 | | | 4.50%, due 10/1/20 | | | 426 | | |
| | 615 | | | 5.00%, due 4/15/22 | | | 633 | (f) | |
| | 170 | | | Outfront Media Capital LLC/Outfront Media Capital Corp., 5.63%, due 2/15/24 | | | 179 | | |
| | | | 3,154 | | |
See Notes to Financial Statements
152
Schedule of Investments Short Duration High Income Fund (cont'd)
PRINCIPAL AMOUNT | | | | VALUE | |
(000's omitted) | | | | (000's omitted) | |
Auto Parts & Equipment 0.4% | | | |
$ | 220 | | | IHO Verwaltungs GmbH, 4.13% Cash/4.88% PIK, due 9/15/21 | | $ | 224 | (f)(g) | |
| | 260 | | | ZF N.A. Capital, Inc., 4.00%, due 4/29/20 | | | 269 | (f) | |
| | | | 493 | | |
Banking 2.3% | | | |
| | | | | Ally Financial, Inc. | | | | | |
| | 350 | | | 3.60%, due 5/21/18 | | | 352 | | |
| | 145 | | | 3.25%, due 11/5/18 | | | 146 | | |
| | 150 | | | 8.00%, due 3/15/20 | | | 168 | | |
| | 575 | | | 7.50%, due 9/15/20 | | | 648 | | |
| | 685 | | | 4.25%, due 4/15/21 | | | 712 | | |
| | | | | CIT Group, Inc. | | | | | |
| | 395 | | | 3.88%, due 2/19/19 | | | 401 | | |
| | 270 | | | 5.38%, due 5/15/20 | | | 290 | | |
| | | | 2,717 | | |
Building & Construction 3.9% | | | |
| | 105 | | | D.R. Horton, Inc., 3.63%, due 2/15/18 | | | 105 | | |
| | | | | Lennar Corp. | | | | | |
| | 465 | | | 4.50%, due 11/15/19 | | | 482 | | |
| | 670 | | | 4.75%, due 4/1/21 | | | 702 | | |
| | 310 | | | 4.13%, due 1/15/22 | | | 320 | | |
| | 295 | | | Meritage Homes Corp., 7.15%, due 4/15/20 | | | 324 | | |
| | 165 | | | PulteGroup, Inc., 4.25%, due 3/1/21 | | | 172 | | |
| | | | | Ryland Group, Inc. | | | | | |
| | 420 | | | 6.63%, due 5/1/20 | | | 462 | | |
| | 110 | | | 5.38%, due 10/1/22 | | | 120 | | |
| | 445 | | | Standard Pacific Corp., 8.38%, due 5/15/18 | | | 459 | | |
| | | | | Taylor Morrison Communities, Inc./Taylor Morrison Holdings II, Inc. | | | | | |
| | 445 | | | 5.25%, due 4/15/21 | | | 454 | (f) | |
| | 185 | | | 5.88%, due 4/15/23 | | | 198 | (f) | |
| | 530 | | | Toll Brothers Finance Corp., 5.88%, due 2/15/22 | | | 588 | | |
| | 170 | | | TRI Pointe Group, Inc., 4.88%, due 7/1/21 | | | 178 | | |
| | | | 4,564 | | |
Building Materials 0.3% | | | |
| | 170 | | | Beacon Roofing Supply, Inc., 6.38%, due 10/1/23 | | | 183 | | |
| | 110 | | | HD Supply, Inc., 5.75%, due 4/15/24 | | | 119 | (f) | |
| | 55 | | | Vulcan Materials Co., 7.50%, due 6/15/21 | | | 64 | | |
| | | | 366 | | |
Cable & Satellite Television 7.4% | | | |
| | 200 | | | Altice Luxembourg SA, 7.75%, due 5/15/22 | | | 212 | (f) | |
| | 575 | | | Altice U.S. Finance I Corp., 5.38%, due 7/15/23 | | | 599 | (f) | |
| | 235 | | | Cable One, Inc., 5.75%, due 6/15/22 | | | 246 | (f) | |
| | | | | CCO Holdings LLC/CCO Holdings Capital Corp. | | | | | |
| | 1,120 | | | 5.13%, due 2/15/23 | | | 1,156 | | |
| | 340 | | | 4.00%, due 3/1/23 | | | 345 | (f) | |
| | 285 | | | 5.75%, due 1/15/24 | | | 296 | | |
| | 310 | | | 5.88%, due 4/1/24 | | | 330 | (f) | |
See Notes to Financial Statements
153
Schedule of Investments Short Duration High Income Fund (cont'd)
PRINCIPAL AMOUNT | | | | VALUE | |
(000's omitted) | | | | (000's omitted) | |
| | | | | CSC Holdings LLC | | | | | |
$ | 220 | | | 7.88%, due 2/15/18 | | $ | 223 | | |
| | 565 | | | 6.75%, due 11/15/21 | | | 623 | | |
| | 910 | | | 10.13%, due 1/15/23 | | | 1,042 | (f) | |
| | | | | DISH DBS Corp. | | | | | |
| | 135 | | | 5.13%, due 5/1/20 | | | 138 | | |
| | 405 | | | 6.75%, due 6/1/21 | | | 425 | | |
| | 325 | | | Lynx II Corp., 6.38%, due 4/15/23 | | | 339 | (f) | |
| | | | | Numericable-SFR SA | | | | | |
| | 1,400 | | | 6.00%, due 5/15/22 | | | 1,460 | (f) | |
| | 1,270 | | | 6.25%, due 5/15/24 | | | 1,330 | (f) | |
| | | | 8,764 | | |
Chemicals 1.9% | | | |
| | 360 | | | Huntsman Int'l LLC, 4.88%, due 11/15/20 | | | 378 | | |
| | | | | NOVA Chemicals Corp. | | | | | |
| | 830 | | | 5.25%, due 8/1/23 | | | 856 | (f) | |
| | 320 | | | 4.88%, due 6/1/24 | | | 326 | (f) | |
| | 615 | | | WR Grace & Co-Conn, 5.13%, due 10/1/21 | | | 661 | (f) | |
| | | | 2,221 | | |
Consumer - Commercial Lease Financing 7.6% | | | |
| | | | | Aircastle Ltd. | | | | | |
| | 1,065 | | | 4.63%, due 12/15/18 | | | 1,092 | | |
| | 505 | | | 7.63%, due 4/15/20 | | | 559 | | |
| | | | | Navient Corp. | | | | | |
| | 735 | | | 5.50%, due 1/15/19 | | | 758 | | |
| | 775 | | | 4.88%, due 6/17/19 | | | 797 | | |
| | 435 | | | OneMain Financial Holdings LLC, 7.25%, due 12/15/21 | | | 453 | (f) | |
| | | | | Park Aerospace Holdings Ltd. | | | | | |
| | 665 | | | 5.25%, due 8/15/22 | | | 692 | (f) | |
| | 215 | | | 4.50%, due 3/15/23 | | | 215 | (f) | |
| | 670 | | | 5.50%, due 2/15/24 | | | 695 | (f) | |
| | 1,050 | | | SLM Corp., 7.25%, due 1/25/22 | | | 1,139 | | |
| | | | | Springleaf Finance Corp. | | | | | |
| | 175 | | | 8.25%, due 12/15/20 | | | 197 | | |
| | 1,895 | | | 7.75%, due 10/1/21 | | | 2,130 | | |
| | 225 | | | 6.13%, due 5/15/22 | | | 237 | | |
| | | | 8,964 | | |
Discount Stores 0.3% | | | |
| | 340 | | | Dollar Tree, Inc., 5.25%, due 3/1/20 | | | 348 | | |
Diversified Capital Goods 0.2% | | | |
| | 195 | | | Anixter, Inc., 5.13%, due 10/1/21 | | | 208 | | |
Electric - Generation 2.9% | | | |
| | | | | Calpine Corp. | | | | | |
| | 850 | | | 6.00%, due 1/15/22 | | | 878 | (f) | |
| | 380 | | | 5.88%, due 1/15/24 | | | 393 | (f) | |
See Notes to Financial Statements
154
Schedule of Investments Short Duration High Income Fund (cont'd)
PRINCIPAL AMOUNT | | | | VALUE | |
(000's omitted) | | | | (000's omitted) | |
| | | | | Dynegy, Inc. | | | | | |
$ | 291 | | | 6.75%, due 11/1/19 | | $ | 301 | | |
| | 390 | | | 7.38%, due 11/1/22 | | | 418 | | |
| | | | | NRG Energy, Inc. | | | | | |
| | 1,035 | | | 6.25%, due 7/15/22 | | | 1,087 | | |
| | 285 | | | 6.25%, due 5/1/24 | | | 302 | | |
| | | | 3,379 | | |
Electric - Integrated 0.7% | | | |
| | 245 | | | IPALCO Enterprises, Inc., 3.45%, due 7/15/20 | | | 248 | | |
| | 350 | | | PPL Energy Supply LLC, 4.60%, due 12/15/21 | | | 318 | | |
| | 220 | | | RJS Power Holdings LLC, 4.63%, due 7/15/19 | | | 223 | (f) | |
| | 55 | | | Talen Energy Supply LLC, 9.50%, due 7/15/22 | | | 57 | (f) | |
| | | | 846 | | |
Electronics 0.5% | | | |
| | 337 | | | Amkor Technology, Inc., 6.63%, due 6/1/21 | | | 344 | | |
| | 280 | | | NXP BV/NXP Funding LLC, 4.13%, due 6/1/21 | | | 292 | (f) | |
| | | | 636 | | |
Energy - Exploration & Production 4.7% | | | |
| | | | | Antero Resources Corp. | | | | | |
| | 575 | | | 5.38%, due 11/1/21 | | | 590 | | |
| | 120 | | | 5.13%, due 12/1/22 | | | 123 | | |
| | 445 | | | Ascent Resources Utica Holdings LLC/ARU Finance Corp., 10.00%, due 4/1/22 | | | 483 | (f) | |
| | 305 | | | Bill Barrett Corp., 7.00%, due 10/15/22 | | | 296 | | |
| | | | | Chesapeake Energy Corp. | | | | | |
| | 145 | | | 6.63%, due 8/15/20 | | | 149 | | |
| | 140 | | | 6.88%, due 11/15/20 | | | 145 | | |
| | 500 | | | EP Energy LLC/Everest Acquisition Finance, Inc., 9.38%, due 5/1/20 | | | 420 | | |
| | 145 | | | Extraction Oil & Gas Holdings LLC/Extraction Finance Corp., 7.88%, due 7/15/21 | | | 154 | (f) | |
| | 290 | | | Laredo Petroleum, Inc., 5.63%, due 1/15/22 | | | 295 | | |
| | 280 | | | Newfield Exploration Co., 5.75%, due 1/30/22 | | | 301 | | |
| | | | | Oasis Petroleum, Inc. | | | | | |
| | 305 | | | 6.50%, due 11/1/21 | | | 310 | | |
| | 125 | | | 6.88%, due 1/15/23 | | | 128 | | |
| | 115 | | | PDC Energy, Inc., 7.75%, due 10/15/22 | | | 120 | | |
| | 575 | | | Range Resources Corp., 5.75%, due 6/1/21 | | | 592 | | |
| | 265 | | | Sanchez Energy Corp., 7.75%, due 6/15/21 | | | 246 | | |
| | | | | SM Energy Co. | | | | | |
| | 255 | | | 6.50%, due 11/15/21 | | | 258 | | |
| | 20 | | | 6.13%, due 11/15/22 | | | 20 | | |
| | | | | Whiting Petroleum Corp. | | | | | |
| | 425 | | | 5.00%, due 3/15/19 | | | 429 | | |
| | 185 | | | 5.75%, due 3/15/21 | | | 186 | | |
| | 335 | | | WPX Energy, Inc., 7.50%, due 8/1/20 | | | 363 | | |
| | | | 5,608 | | |
Food & Drug Retail 0.4% | | | |
| | 500 | | | Albertsons Cos. LLC/Safeway, Inc./New Albertson's, Inc./Albertson's LLC, 6.63%, due 6/15/24 | | | 470 | | |
See Notes to Financial Statements
155
Schedule of Investments Short Duration High Income Fund (cont'd)
PRINCIPAL AMOUNT | | | | VALUE | |
(000's omitted) | | | | (000's omitted) | |
Food - Wholesale 0.2% | | | |
$ | 280 | | | Post Holdings, Inc., 6.00%, due 12/15/22 | | $ | 293 | (f) | |
Gaming 3.1% | | | |
| | 570 | | | Boyd Gaming Corp., 6.88%, due 5/15/23 | | | 612 | | |
| | | | | GLP Capital L.P./GLP Financing II, Inc. | | | | | |
| | 560 | | | 4.38%, due 11/1/18 | | | 564 | | |
| | 530 | | | 4.88%, due 11/1/20 | | | 561 | | |
| | 430 | | | 4.38%, due 4/15/21 | | | 449 | | |
| | 200 | | | Int'l Game Technology PLC, 5.63%, due 2/15/20 | | | 212 | (f) | |
| | | | | MGM Resorts Int'l | | | | | |
| | 500 | | | 8.63%, due 2/1/19 | | | 536 | | |
| | 95 | | | 6.63%, due 12/15/21 | | | 106 | | |
| | 505 | | | 7.75%, due 3/15/22 | | | 587 | | |
| | | | 3,627 | | |
Gas Distribution 5.7% | | | |
| | 85 | | | Antero Midstream Partners L.P./Antero Midstream Finance Corp., 5.38%, due 9/15/24 | | | 89 | | |
| | | | | DCP Midstream LLC | | | | | |
| | 440 | | | 9.75%, due 3/15/19 | | | 480 | (f) | |
| | 270 | | | 5.35%, due 3/15/20 | | | 281 | (f) | |
| | 570 | | | 4.75%, due 9/30/21 | | | 587 | (f) | |
| | 745 | | | Energy Transfer Equity L.P., 7.50%, due 10/15/20 | | | 838 | | |
| | | | | NuStar Logistics L.P. | | | | | |
| | 270 | | | 6.75%, due 2/1/21 | | | 293 | | |
| | 175 | | | 4.75%, due 2/1/22 | | | 178 | | |
| | 225 | | | ONEOK, Inc., 4.25%, due 2/1/22 | | | 234 | | |
| | | | | Rockies Express Pipeline LLC | | | | | |
| | 440 | | | 6.00%, due 1/15/19 | | | 455 | (f) | |
| | 150 | | | 5.63%, due 4/15/20 | | | 159 | (f) | |
| | 195 | | | Sabine Pass Liquefaction LLC, 5.63%, due 2/1/21 | | | 212 | | |
| | 285 | | | SemGroup Corp./Rose Rock Finance Corp., 5.63%, due 7/15/22 | | | 281 | | |
| | 410 | | | Summit Midstream Holdings LLC/Summit Midstream Finance Corp., 5.50%, due 8/15/22 | | | 415 | | |
| | | | | Targa Resources Partners L.P./Targa Resources Partners Finance Corp. | | | | | |
| | 580 | | | 5.25%, due 5/1/23 | | | 597 | | |
| | 280 | | | 6.75%, due 3/15/24 | | | 302 | | |
| | | | | Williams Cos., Inc. | | | | | |
| | 865 | | | 7.88%, due 9/1/21 | | | 1,016 | | |
| | 285 | | | 3.70%, due 1/15/23 | | | 287 | | |
| | | | 6,704 | | |
Health Facilities 6.8% | | | |
| | | | | Acadia Healthcare Co., Inc. | | | | | |
| | 285 | | | 5.13%, due 7/1/22 | | | 291 | | |
| | 180 | | | 6.50%, due 3/1/24 | | | 190 | | |
| | 315 | | | Amsurg Corp., 5.63%, due 7/15/22 | | | 320 | | |
| | | | | CHS/Community Health Systems, Inc. | | | | | |
| | 125 | | | 8.00%, due 11/15/19 | | | 119 | | |
| | 235 | | | 6.88%, due 2/1/22 | | | 172 | | |
| | 275 | | | Envision Healthcare Corp., 6.25%, due 12/1/24 | | | 286 | (f) | |
| | | | | HCA, Inc. | | | | | |
| | 1,005 | | | 6.50%, due 2/15/20 | | | 1,083 | | |
| | 1,215 | | | 5.88%, due 3/15/22 | | | 1,330 | | |
See Notes to Financial Statements
156
Schedule of Investments Short Duration High Income Fund (cont'd)
PRINCIPAL AMOUNT | | | | VALUE | |
(000's omitted) | | | | (000's omitted) | |
$ | 310 | | | LifePoint Health, Inc., 5.88%, due 12/1/23 | | $ | 318 | | |
| | 260 | | | LifePoint Hospitals, Inc., 5.50%, due 12/1/21 | | | 265 | | |
| | | | | MPT Operating Partnership L.P./MPT Finance Corp. | | | | | |
| | 640 | | | 6.38%, due 3/1/24 | | | 692 | | |
| | 590 | | | 5.50%, due 5/1/24 | | | 625 | | |
| | 685 | | | Sabra Health Care L.P./Sabra Capital Corp., 5.50%, due 2/1/21 | | | 706 | | |
| | | | | Tenet Healthcare Corp. | | | | | |
| | 235 | | | 4.50%, due 4/1/21 | | | 237 | | |
| | 670 | | | 7.50%, due 1/1/22 | | | 705 | (f) | |
| | 333 | | | 4.63%, due 7/15/24 | | | 328 | (f) | |
| | | | | Universal Health Services, Inc. | | | | | |
| | 90 | | | 3.75%, due 8/1/19 | | | 92 | (f) | |
| | 280 | | | 4.75%, due 8/1/22 | | | 289 | (f) | |
| | | | 8,048 | | |
Health Services 1.9% | | | |
| | 300 | | | DaVita HealthCare Partners, Inc., 5.13%, due 7/15/24 | | | 301 | | |
| | 645 | | | DaVita, Inc., 5.75%, due 8/15/22 | | | 665 | | |
| | 160 | | | inVentiv Group Holdings, Inc./inVentiv Health, Inc./inVentiv Health Clinical, Inc., 7.50%, due 10/1/24 | | | 176 | (f) | |
| | 285 | | | Quintiles IMS, Inc., 4.88%, due 5/15/23 | | | 296 | (f) | |
| | 775 | | | Service Corp. Int'l, 4.50%, due 11/15/20 | | | 783 | | |
| | | | 2,221 | | |
Investments & Misc. Financial Services 0.1% | | | |
| | 130 | | | MSCI, Inc., 5.25%, due 11/15/24 | | | 137 | (f) | |
Machinery 0.6% | | | |
| | | | | CNH Industrial Capital LLC | | | | | |
| | 535 | | | 3.38%, due 7/15/19 | | | 544 | | |
| | 135 | | | 4.38%, due 4/5/22 | | | 143 | | |
| | 75 | | | Oshkosh Corp., 5.38%, due 3/1/22 | | | 78 | | |
| | | | 765 | | |
Managed Care 0.3% | | | |
| �� | | | | Centene Corp. | | | | | |
| | 175 | | | 4.75%, due 5/15/22 | | | 183 | | |
| | 170 | | | 6.13%, due 2/15/24 | | | 183 | | |
| | | | 366 | | |
Media Content 3.2% | | | |
| | | | | Gannett Co., Inc. | | | | | |
| | 91 | | | 5.13%, due 10/15/19 | | | 92 | | |
| | 430 | | | 5.13%, due 7/15/20 | | | 441 | | |
| | 295 | | | Gray Television, Inc., 5.13%, due 10/15/24 | | | 294 | (f) | |
| | 445 | | | Netflix, Inc., 5.38%, due 2/1/21 | | | 476 | | |
| | 110 | | | Nexstar Broadcasting, Inc., 6.13%, due 2/15/22 | | | 114 | (f) | |
| | 405 | | | Sinclair Television Group, Inc., 5.63%, due 8/1/24 | | | 411 | (f) | |
| | | | | Sirius XM Radio, Inc. | | | | | |
| | 845 | | | 3.88%, due 8/1/22 | | | 861 | (f) | |
| | 275 | | | 4.63%, due 5/15/23 | | | 282 | (f) | |
See Notes to Financial Statements
157
Schedule of Investments Short Duration High Income Fund (cont'd)
PRINCIPAL AMOUNT | | | | VALUE | |
(000's omitted) | | | | (000's omitted) | |
| | | | | Univision Communications, Inc. | | | | | |
$ | 199 | | | 6.75%, due 9/15/22 | | $ | 206 | (f) | |
| | 590 | | | 5.13%, due 5/15/23 | | | 598 | (f) | |
| | | | 3,775 | | |
Medical Products 0.7% | | | |
| | 795 | | | Hologic, Inc., 5.25%, due 7/15/22 | | | 830 | (f) | |
Metals - Mining Excluding Steel 3.8% | | | |
| | 320 | | | Anglo American Capital PLC, 4.45%, due 9/27/20 | | | 336 | (f) | |
| | 555 | | | First Quantum Minerals Ltd., 7.00%, due 2/15/21 | | | 576 | (f) | |
| | | | | FMG Resources (August 2006) Pty Ltd. | | | | | |
| | 245 | | | 9.75%, due 3/1/22 | | | 274 | (f) | |
| | 85 | | | 4.75%, due 5/15/22 | | | 87 | (f) | |
| | 90 | | | 5.13%, due 5/15/24 | | | 93 | (f) | |
| | | | | Freeport-McMoRan, Inc. | | | | | |
| | 100 | | | 2.38%, due 3/15/18 | | | 100 | | |
| | 320 | | | 3.10%, due 3/15/20 | | | 320 | | |
| | 175 | | | 6.50%, due 11/15/20 | | | 178 | | |
| | 275 | | | 6.75%, due 2/1/22 | | | 286 | | |
| | 1,500 | | | 3.55%, due 3/1/22 | | | 1,485 | | |
| | 220 | | | Hudbay Minerals, Inc., 7.25%, due 1/15/23 | | | 237 | (f) | |
| | 175 | | | Novelis Corp., 6.25%, due 8/15/24 | | | 185 | (f) | |
| | 290 | | | Teck Resources Ltd., 4.75%, due 1/15/22 | | | 306 | | |
| | | | 4,463 | | |
Oil Field Equipment & Services 0.3% | | | |
| | 345 | | | Precision Drilling Corp., 7.75%, due 12/15/23 | | | 354 | | |
Packaging 4.3% | | | |
| | | | | Ardagh Packaging Finance PLC/Ardagh Holdings USA, Inc. | | | | | |
| | 455 | | | 4.25%, due 9/15/22 | | | 469 | (f) | |
| | 200 | | | 4.63%, due 5/15/23 | | | 205 | (f) | |
| | 250 | | | Ball Corp., 5.00%, due 3/15/22 | | | 270 | | |
| | | | | Berry Plastics Corp. | | | | | |
| | 310 | | | 5.50%, due 5/15/22 | | | 322 | | |
| | 230 | | | 6.00%, due 10/15/22 | | | 244 | | |
| | 490 | | | 5.13%, due 7/15/23 | | | 514 | | |
| | 570 | | | BWAY Holding Co., 5.50%, due 4/15/24 | | | 593 | (f) | |
| | 320 | | | Graphic Packaging Int'l, Inc., 4.75%, due 4/15/21 | | | 338 | | |
| | | | | Reynolds Group Issuer, Inc. | | | | | |
| | 470 | | | 5.75%, due 10/15/20 | | | 478 | | |
| | 680 | | | 3 month USD LIBOR + 3.50%, (4.86%), due 7/15/21 | | | 694 | (a)(f) | |
| | 740 | | | 5.13%, due 7/15/23 | | | 771 | (f) | |
| | 202 | | | Silgan Holdings, Inc., 5.00%, due 4/1/20 | | | 204 | | |
| | | | 5,102 | | |
Personal & Household Products 0.5% | | | |
| | 335 | | | Energizer Holdings, Inc., 4.70%, due 5/19/21 | | | 354 | | |
| | 115 | | | Kronos Acquisition Holdings, Inc., 9.00%, due 8/15/23 | | | 111 | (f) | |
| | 80 | | | Spectrum Brands, Inc., 6.13%, due 12/15/24 | | | 85 | | |
| | | | 550 | | |
See Notes to Financial Statements
158
Schedule of Investments Short Duration High Income Fund (cont'd)
PRINCIPAL AMOUNT | | | | VALUE | |
(000's omitted) | | | | (000's omitted) | |
Pharmaceuticals 1.5% | | | |
$ | 315 | | | Endo Finance LLC, 5.75%, due 1/15/22 | | $ | 276 | (f) | |
| | 410 | | | Endo Finance LLC & Endo Finco, Inc., 7.25%, due 1/15/22 | | | 377 | (f) | |
| | 225 | | | Mallinckrodt Int'l Finance SA, 3.50%, due 4/15/18 | | | 225 | | |
| | 90 | | | Mallinckrodt Int'l Finance SA/Mallinckrodt CB LLC, 4.88%, due 4/15/20 | | | 90 | (f) | |
| | 575 | | | Valeant Pharmaceuticals Int'l, Inc., 6.50%, due 3/15/22 | | | 610 | (f) | |
| | 233 | | | VPI Escrow Corp., 6.38%, due 10/15/20 | | | 231 | (f) | |
| | | | 1,809 | | |
Printing & Publishing 1.9% | | | |
| | | | | Harland Clarke Holdings Corp. | | | | | |
| | 325 | | | 6.88%, due 3/1/20 | | | 335 | (f) | |
| | 320 | | | 8.38%, due 8/15/22 | | | 337 | (f) | |
| | | | | R.R. Donnelley & Sons Co. | | | | | |
| | 255 | | | 7.63%, due 6/15/20 | | | 278 | | |
| | 1,285 | | | 7.88%, due 3/15/21 | | | 1,356 | | |
| | | | 2,306 | | |
Real Estate Dev. & Mgt. 0.3% | | | |
| | 360 | | | Realogy Group LLC/Realogy Co-Issuer Corp., 4.50%, due 4/15/19 | | | 368 | (f) | |
Recreation & Travel 2.1% | | | |
| | 195 | | | Cedar Fair L.P./Canada's Wonderland Co./Magnum Management Corp., 5.38%, due 6/1/24 | | | 205 | | |
| | 1,900 | | | NCL Corp. Ltd., 4.75%, due 12/15/21 | | | 1,971 | (f) | |
| | 295 | | | Six Flags Entertainment Corp., 4.88%, due 7/31/24 | | | 304 | (f) | |
| | | | 2,480 | | |
Restaurants 0.8% | | | |
| | | | | 1011778 BC ULC/New Red Finance, Inc. | | | | | |
| | 195 | | | 4.63%, due 1/15/22 | | | 200 | (f) | |
| | 180 | | | 4.25%, due 5/15/24 | | | 181 | (f) | |
| | 340 | | | KFC Holding Co./Pizza Hut Holdings LLC/Taco Bell of America LLC, 5.00%, due 6/1/24 | | | 359 | (f) | |
| | 200 | | | Yum! Brands, Inc., 3.88%, due 11/1/20 | | | 206 | | |
| | | | 946 | | |
Software - Services 3.0% | | | |
| | | | | First Data Corp. | | | | | |
| | 560 | | | 5.38%, due 8/15/23 | | | 582 | (f) | |
| | 335 | | | 7.00%, due 12/1/23 | | | 359 | (f) | |
| | 225 | | | 5.00%, due 1/15/24 | | | 234 | (f) | |
| | | | | Nuance Communications, Inc. | | | | | |
| | 610 | | | 5.38%, due 8/15/20 | | | 618 | (f) | |
| | 625 | | | 6.00%, due 7/1/24 | | | 674 | | |
| | 550 | | | Open Text Corp., 5.63%, due 1/15/23 | | | 575 | (f) | |
| | 330 | | | Rackspace Hosting, Inc., 8.63%, due 11/15/24 | | | 348 | (f) | |
| | 195 | | | Symantec Corp., 3.95%, due 6/15/22 | | | 201 | | |
| | | | 3,591 | | |
See Notes to Financial Statements
159
Schedule of Investments Short Duration High Income Fund (cont'd)
PRINCIPAL AMOUNT | | | | VALUE | |
(000's omitted) | | | | (000's omitted) | |
Specialty Retail 1.1% | | | |
$ | 205 | | | Limited Brands, Inc., 8.50%, due 6/15/19 | | $ | 224 | | |
| | | | | Penske Automotive Group, Inc. | | | | | |
| | 50 | | | 3.75%, due 8/15/20 | | | 51 | | |
| | 270 | | | 5.75%, due 10/1/22 | | | 279 | | |
| | 795 | | | QVC, Inc., 3.13%, due 4/1/19 | | | 804 | | |
| | | | 1,358 | | |
Steel Producers - Products 0.5% | | | |
| | 590 | | | ArcelorMittal, 5.13%, due 6/1/20 | | | 627 | | |
Support - Services 2.5% | | | |
| | 285 | | | AECOM Technology Corp., 5.75%, due 10/15/22 | | | 297 | | |
| | 415 | | | Anna Merger Sub, Inc., 7.75%, due 10/1/22 | | | 289 | (f) | |
| | 385 | | | Aramark Services, Inc., 5.13%, due 1/15/24 | | | 407 | | |
| | 300 | | | Avis Budget Car Rental LLC/Avis Budget Finance, Inc., 5.13%, due 6/1/22 | | | 301 | (f) | |
| | | | | Hertz Corp. | | | | | |
| | 500 | | | 5.88%, due 10/15/20 | | | 497 | | |
| | 240 | | | 7.38%, due 1/15/21 | | | 241 | | |
| | 275 | | | 7.63%, due 6/1/22 | | | 287 | (f) | |
| | 55 | | | 6.25%, due 10/15/22 | | | 53 | | |
| | 100 | | | IHS Markit Ltd., 5.00%, due 11/1/22 | | | 108 | (f) | |
| | 275 | | | Iron Mountain, Inc., 4.38%, due 6/1/21 | | | 283 | (f) | |
| | 170 | | | United Rental N.A., Inc., 5.75%, due 11/15/24 | | | 180 | | |
| | | | 2,943 | | |
Technology Hardware & Equipment 2.4% | | | |
| | 275 | | | CDW LLC/CDW Finance Corp., 5.00%, due 9/1/23 | | | 287 | | |
| | 215 | | | CommScope, Inc., 5.50%, due 6/15/24 | | | 224 | (f) | |
| | | | | Diamond 1 Finance Corp./Diamond 2 Finance Corp. | | | | | |
| | 825 | | | 5.88%, due 6/15/21 | | | 864 | (f) | |
| | 260 | | | 7.13%, due 6/15/24 | | | 287 | (f) | |
| | 500 | | | EMC Corp., 1.88%, due 6/1/18 | | | 499 | | |
| | 175 | | | Project Homestake Merger Corp., 8.88%, due 3/1/23 | | | 157 | (f) | |
| | 425 | | | Western Digital Corp., 7.38%, due 4/1/23 | | | 465 | (f) | |
| | | | 2,783 | | |
Telecom - Satellite 0.6% | | | |
| | 708 | | | Hughes Satellite Systems Corp., 6.50%, due 6/15/19 | | | 751 | | |
Telecom - Wireless 2.0% | | | |
| | 550 | | | Sprint Capital Corp., 6.90%, due 5/1/19 | | | 580 | | |
| | 825 | | | Sprint Corp., 7.25%, due 9/15/21 | | | 899 | | |
| | 215 | | | Sprint Nextel Corp., 6.00%, due 11/15/22 | | | 226 | | |
| | | | | T-Mobile USA, Inc. | | | | | |
| | 330 | | | 6.13%, due 1/15/22 | | | 343 | | |
| | 335 | | | 4.00%, due 4/15/22 | | | 347 | | |
| | | | 2,395 | | |
See Notes to Financial Statements
160
Schedule of Investments Short Duration High Income Fund (cont'd)
PRINCIPAL AMOUNT | | | | VALUE | |
(000's omitted) | | | | (000's omitted) | |
Telecom - Wireline Integrated & Services 4.6% | | | |
$ | 650 | | | CenturyLink, Inc., Ser. V, 5.63%, due 4/1/20 | | $ | 678 | | |
| | | | | Communications Sales & Leasing, Inc./CSL Capital LLC | | | | | |
| | 275 | | | 6.00%, due 4/15/23 | | | 275 | (f) | |
| | 230 | | | 8.25%, due 10/15/23 | | | 221 | | |
| | 125 | | | Equinix, Inc., 5.38%, due 1/1/22 | | | 131 | | |
| | | | | Frontier Communications Corp. | | | | | |
| | 535 | | | 7.13%, due 3/15/19 | | | 538 | | |
| | 360 | | | 8.50%, due 4/15/20 | | | 356 | | |
| | 155 | | | 8.88%, due 9/15/20 | | | 151 | | |
| | 400 | | | 9.25%, due 7/1/21 | | | 357 | | |
| | | | | Level 3 Financing, Inc. | | | | | |
| | 540 | | | 6.13%, due 1/15/21 | | | 551 | | |
| | 590 | | | 5.63%, due 2/1/23 | | | 609 | | |
| | 175 | | | 5.38%, due 1/15/24 | | | 182 | | |
| | 200 | | | Qwest Corp., 6.75%, due 12/1/21 | | | 221 | | |
| | 285 | | | SoftBank Group Corp., 4.50%, due 4/15/20 | | | 294 | (f) | |
| | | | | Telecom Italia Capital SA | | | | | |
| | 115 | | | 7.00%, due 6/4/18 | | | 118 | | |
| | 125 | | | 7.18%, due 6/18/19 | | | 135 | | |
| | 555 | | | Zayo Group LLC/Zayo Capital, Inc., 6.00%, due 4/1/23 | | | 583 | | |
| | | | 5,400 | | |
Theaters & Entertainment 1.4% | | | |
| | 680 | | | AMC Entertainment Holdings, Inc., 5.88%, due 2/15/22 | | | 690 | | |
| | | | | Regal Entertainment Group | | | | | |
| | 800 | | | 5.75%, due 3/15/22 | | | 828 | | |
| | 140 | | | 5.75%, due 6/15/23 | | | 146 | | |
| | | | 1,664 | | |
| | | | | Total Corporate Bonds (Cost $108,018) | | | 109,394 | | |
NUMBER OF SHARES | | | | | |
Short-Term Investment 1.3% | | | |
Investment Company 1.3% | | | |
| 1,557,736 | | | State Street Institutional U.S. Government Money Market Fund Premier Class, 0.96%
(Cost $1,558) | | | 1,558 | (h)(i) | |
| | | | | Total Investments 99.0% (Cost $115,825) | | | 117,222 | | |
| | | | | Other Assets Less Liabilities 1.0% | | | 1,176 | | |
| | | | | Net Assets 100.0% | | $ | 118,398 | | |
(a) Variable or floating rate security. The interest rate shown was the current rate as of October 31, 2017 and changes periodically.
(b) All or a portion of this security was purchased on a delayed delivery basis.
(c) All or a portion of this security had not settled as of October 31, 2017 and thus may not have an interest rate in effect. Interest rates do not take effect until settlement.
(d) Value determined using significant unobservable inputs.
See Notes to Financial Statements
161
Schedule of Investments Short Duration High Income Fund (cont'd)
(e) Illiquid security.
(f) Securities were purchased under Rule 144A of the Securities Act of 1933, as amended (the "1933 Act"), or are otherwise restricted and, unless registered under the 1933 Act or exempted from registration, may only be sold to qualified institutional investors or may have other restrictions on resale. At October 31, 2017, these securities amounted to $40,827,000, which represents 34.5% of net assets of the Fund. Securities denoted with (f) but without (e) have been deemed by the investment manager to be liquid.
(g) Payment-in-kind (PIK) security.
(h) All or a portion of this security is segregated in connection with obligations for delayed delivery securities with a total value of approximately $1,558,000.
(i) Represents 7-day effective yield as of October 31, 2017.
The following is a summary, categorized by Level (see Note A of Notes to Financial Statements), of inputs used to value the Fund's investments as of October 31, 2017:
Asset Valuation Inputs
(000's omitted) | | Level 1 | | Level 2 | | Level 3(b) | | Total | |
Investments: | |
Loan Assignments | |
Health Care | | $ | — | | | $ | 630 | | | $ | 301 | | | $ | 931 | | |
Leisure Goods—Activities—Movies | | | — | | | | — | | | | 161 | | | | 161 | | |
Lodging & Casinos | | | — | | | | 524 | | | | 297 | | | | 821 | | |
Steel | | | — | | | | — | | | | 285 | | | | 285 | | |
| Other Loan Assignments(a) | | | — | | | | 4,072 | | | | — | | | | 4,072 | | |
Total Loan Assignments | | | — | | | | 5,226 | | | | 1,044 | | | | 6,270 | | |
| Corporate Bonds(a) | | | — | | | | 109,394 | | | | — | | | | 109,394 | | |
Short-Term Investment | | | — | | | | 1,558 | | | | — | | | | 1,558 | | |
Total Investments | | $ | — | | | $ | 116,178 | | | $ | 1,044 | | | $ | 117,222 | | |
(a) The Schedule of Investments provides information on the industry or sector categorization for the portfolio.
See Notes to Financial Statements
162
Schedule of Investments Short Duration High Income Fund (cont'd)
(b) The following is a reconciliation between the beginning and ending balances of investments in which unobservable inputs (Level 3) were used in determining value:
(000's omitted) | | Beginning
balance, as
of 11/1/2016 | | Accrued
discounts/
(premiums) | | Realized
gain/(loss) | | Change
in unrealized
appreciation/
(depreciation) | | Purchases | | Sales | | Transfers
into
Level 3 | | Transfers
out of
Level 3 | | Balance,
as of
10/31/2017 | | Net change
in unrealized
appreciation/
(depreciation)
from
investments
still held as of
10/31/2017 | |
Investments
in Securities: | |
Loan
Assignments(c) | |
Business
Equipment &
Services | | $ | 95 | | | $ | — | | | $ | (0 | )(d) | | $ | (1 | ) | | $ | — | | | $ | (94 | ) | | $ | — | | | $ | — | | | $ | — | | | $ | — | | |
Health Care | | | — | | | | — | | | | (0 | )(d) | | | (1 | ) | | | 433 | | | | (131 | ) | | | — | | | | — | | | | 301 | | | | (1 | ) | |
Leisure
Goods—
Activities—
Movies | | | — | | | | — | | | | — | | | | 4 | | | | 157 | | | | — | | | | — | | | | — | | | | 161 | | | | 4 | | |
Lodging &
Casinos | | | — | | | | (3 | ) | | | — | | | | 9 | | | | 291 | | | | — | | | | — | | | | — | | | | 297 | | | | 9 | | |
Steel | | | — | | | | — | | | | — | | | | 8 | | | | 277 | | | | — | | | | — | | | | — | | | | 285 | | | | 8 | | |
Total | | $ | 95 | | | $ | (3 | ) | | $ | (0 | )(d) | | $ | 19 | | | $ | 1,158 | | | $ | (225 | ) | | $ | — | | | $ | — | | | $ | 1,044 | | | $ | 20 | | |
(c) This security categorized as Level 3 is valued based on a single quotation obtained from a dealer. The Fund does not have access to unobservable inputs and therefore cannot disclose such inputs used in formulating such quotation.
(d) Amount less than one thousand.
As of the year ended October 31, 2017, no securities were transferred from one level (as of October 31, 2016) to another.
See Notes to Financial Statements
163
Schedule of Investments Strategic Income Fund October 31, 2017
| PRINCIPAL AMOUNT(a) | | | | VALUE | |
(000's omitted) | | | | (000's omitted) | |
| Loan Assignments(b) 5.8% | | | |
| Aerospace & Defense 0.0%(c) | | | |
| | | | | Transdigm Inc. | | | | | |
$ | 661 | | | First Lien Term Loan D, 3 month USD LIBOR + 3.00%, (4.33%), due 6/4/21 | | $ | 665 | | |
| | 84 | | | First Lien Term Loan F, 3 month USD LIBOR + 3.00%, (4.27%), due 6/9/23 | | | 85 | | |
| | | | 750 | | |
Air Transport 0.1% | | | |
| | | | | American Airlines Inc. | | | | | |
| | 134 | | | First Lien Term Loan B, 3 month USD LIBOR + 2.00%, (3.24%), due 6/27/20 | | | 134 | | |
| | 708 | | | First Lien Term Loan B, 3 month USD LIBOR + 2.00%, (3.24%), due 10/10/21 | | | 709 | | |
| | 355 | | | First Lien Term Loan B, 3 month USD LIBOR + 2.50%, (3.74%), due 12/14/23 | | | 356 | | |
| | 288 | | | United Airlines, First Lien Term Loan B, 3 month USD LIBOR + 2.25%, (3.63%), due 4/1/24 | | | 290 | | |
| | | | 1,489 | | |
All Telecom 0.6% | | | |
| | 1,815 | | | Centurylink, First Lien Term Loan B, 3 month USD LIBOR + 1.38%, (2.75%), due 1/31/25 | | | 1,791 | | |
| 800 | | | Communications Sales and Leasing Inc., First Lien Term Loan, 3 month USD LIBOR + 3.00%,
(4.24%), due 10/24/22 | | | 768 | | |
| 488 | | | Consolidated Communications Inc., First Lien Term Loan B, 3 month USD LIBOR + 3.00%,
(4.25%), due 10/5/23 | | | 480 | | |
| | | | | Frontier Communications Corp. | | | | | |
| | 866 | | | First Lien Term Loan A, 3 month USD LIBOR + 2.50%, (4.00%), due 3/31/21 | | | 829 | | |
| | 858 | | | First Lien Term Loan B, 3 month USD LIBOR + 3.75%, (4.99%), due 6/1/24 | | | 815 | | |
| | 863 | | | GTT Communications, Inc., Term Loan, 3 month USD LIBOR + 3.25%, (4.50%), due 1/9/24 | | | 868 | | |
| 3,259 | | | Intelsat Jackson HLDG, First Lien Term Loan B2, 3 month USD LIBOR + 2.75%, (4.07%),
due 6/30/19 | | | 3,248 | | |
| 520 | | | Level 3 Financing, Inc., First Lien Term Loan B, 3 month USD LIBOR + 2.25%, (3.49%),
due 2/22/24 | | | 522 | | |
| | | | | Lumos Networks | | | | | |
| | 157 | | | First Lien Term Loan B, 3 month USD LIBOR + 3.25%, (4.50%), due 10/26/24 | | | 158 | | |
| | 154 | | | First Lien Term Loan B, 3 month USD LIBOR + 3.25%, (3.50%), due 10/27/24 | | | 154 | | |
| | 136 | | | Neustar, First Lien Term Loan B2, 3 month USD LIBOR + 3.75%, (5.06%), due 8/8/24 | | | 137 | | |
| 399 | | | Premiere Global Services, Inc., First Lien Term Loan, 3 month USD LIBOR + 6.50%, (7.78%),
due 12/8/21 | | | 379 | | |
| | 418 | | | RCN Grande, First Lien Term Loan, 3 month USD LIBOR + 3.00%, (4.24%), due 2/1/24 | | | 413 | | |
| | | | | SBA Communications | | | | | |
| | 168 | | | First Lien Term Loan B1, 3 month USD LIBOR + 2.25%, (3.50%), due 3/24/21 | | | 168 | | |
| | 669 | | | First Lien Term Loan B2, 3 month USD LIBOR + 2.25%, (3.50%), due 6/10/22 | | | 671 | | |
| 925 | | | Sprint Communications, Inc., First Lien Term Loan B, 3 month USD LIBOR + 2.50%, (3.75%),
due 2/2/24 | | | 928 | | |
| | 85 | | | Switch, First Lien Term Loan B, 3 month USD LIBOR + 2.75%, (3.99%), due 6/27/24 | | | 86 | | |
| | | | | Syniverse Technologies | | | | | |
| | 340 | | | First Lien Term Loan, 3 month USD LIBOR + 3.00%, (4.33%), due 4/23/19 | | | 330 | | |
| | 954 | | | First Lien Term Loan, 3 month USD LIBOR + 3.00%, (4.33%), due 4/23/19 | | | 928 | | |
| | 557 | | | Telesat, First Lien Term Loan B, 3 month USD LIBOR + 3.00%, (4.32%), due 11/17/23 | | | 560 | | |
| | 268 | | | Zayo Group, First Lien Term Loan B2, 3 month USD LIBOR + 2.25%, (3.49%), due 1/19/24 | | | 269 | | |
| | 700 | | | Ziggo, First Lien Term Loan E, 3 month USD LIBOR + 2.50%, (3.74%), due 4/23/25 | | | 702 | | |
| | | | 15,204 | | |
See Notes to Financial Statements
164
Schedule of Investments Strategic Income Fund (cont'd)
| PRINCIPAL AMOUNT(a) | | | | VALUE | |
(000's omitted) | | | | (000's omitted) | |
| Automotive 0.0%(c) | | | |
$ | 382 | | | ABRA, First Lien Term Loan, 3 month USD LIBOR + 3.00%, (4.32%), due 9/17/21 | | $ | 385 | | |
| | 69 | | | Belron, First Lien Term Loan B, 3 month USD LIBOR + 2.50%, (2.50%), due 11/15/24 | | | 69 | | |
| | 297 | | | Caliber Collision, First Lien Term Loan, 3 month USD LIBOR + 3.00%, (4.24%), due 2/1/24 | | | 299 | | |
| 158 | | | Cooper Standard Automotive Inc., First Lien Term Loan B, 3 month USD LIBOR + 2.25%,
(3.58%), due 11/2/23 | | | 159 | | |
| 308 | | | Midas Intermediate Holdings Co., First Lien Term Loan B, 3 month USD LIBOR + 2.75%,
(4.07%), due 8/18/21 | | | 309 | | |
| | | | 1,221 | | |
Building & Development 0.2% | | | |
| 383 | | | American Builders & Co., Inc., First Lien Term Loan B, 3 month USD LIBOR + 2.50%,
(3.74%), due 10/31/23 | | | 385 | | |
| | 240 | | | Beacon Roofing Supply, First Lien Term Loan B, 3 month USD LIBOR + 2.25%, (2.25%),
due 1/2/25 | | | 242
| (d)(e) | |
| | | | | Capital Automotive LP | | | | | |
| | 498 | | | First Lien Term Loan B, 3 month USD LIBOR + 3.00%, (4.25%), due 3/24/24 | | | 499 | | |
| | 315 | | | Second Lien Term Loan, 3 month USD LIBOR + 6.00%, (7.24%), due 3/24/25 | | | 323 | (f) | |
| | 1,123 | | | DTZ, First Lien Term Loan B, 3 month USD LIBOR + 3.25%, (4.59%), due 11/4/21 | | | 1,129 | | |
| 439 | | | HD Supply Waterworks, First Lien Term Loan B, 3 month USD LIBOR + 3.00%, (4.46%),
due 8/1/24 | | | 442 | | |
| | 82 | | | HDS Supply, First Lien Term Loan B4, 3 month USD LIBOR + 2.50%, (3.83%), due 10/17/23 | | | 82 | | |
| | 270 | | | Jeld-Wen, Inc., First Lien Term Loan B, 3 month USD LIBOR + 3.00%, (4.33%), due 7/1/22 | | | 272 | | |
| | 615 | | | Mueller Water, First Lien Term Loan B, 3 month USD LIBOR + 2.50%, (3.77%), due 11/25/21 | | | 619 | | |
| | 238 | | | Quikrete, Term Loan B, 3 month USD LIBOR + 2.75%, (3.99%), due 11/15/23 | | | 239 | | |
| | 1,067 | | | Realogy Group, First Lien Term Loan B, 3 month USD LIBOR + 2.25%, (3.58%), due 7/20/22 | | | 1,073 | | |
| | | | 5,305 | | |
Business Equipment & Services 0.7% | | | |
| | 1,320 | | | Acosta Inc., First Lien Term Loan B1, 3 month USD LIBOR + 3.25%, (4.49%), due 9/26/21 | | | 1,162 | | |
| | | | | Advantage Sales and Marketing | | | | | |
| | 1,129 | | | First Lien Term Loan, 3 month USD LIBOR + 3.25%, (4.63%), due 7/25/21 | | | 1,067 | | |
| | 245 | | | Second Lien Term Loan, 3 month USD LIBOR + 6.50%, (7.87%), due 7/25/22 | | | 204 | | |
| | 124 | | | Alixpartners, First Lien Term Loan B, 3 month USD LIBOR + 3.00%, (4.08%), due 4/4/24 | | | 125 | | |
| | | | | Brickman Group Holdings Inc. | | | | | |
| | 939 | | | Term Loan, 3 month USD LIBOR + 3.00%, (4.31%), due 12/18/20 | | | 944 | | |
| | 37 | | | Second Lien Term Loan, 3 month USD LIBOR + 6.50%, (7.74%), due 12/18/21 | | | 38 | | |
| | 220 | | | CBS Outdoor, First Lien Term Loan B, 3 month USD LIBOR + 2.25%, (3.49%), due 3/10/24 | | | 222 | | |
| 185 | | | CCC Information Services Inc., First Lien Term Loan B, 3 month USD LIBOR + 3.00%,
(4.25%), due 4/29/24 | | | 185 | | |
| | 1,159 | | | Ceridian Corp., First Lien Term Loan B2, 3 month USD LIBOR + 3.50%, (4.74%), due 9/15/20 | | | 1,159 | | |
| 338 | | | Change Healthcare Holdings, First Lien Term Loan B, 3 month USD LIBOR + 2.75%, (3.99%),
due 3/1/24 | | | 340 | | |
| | 463 | | | Convergeone, First Lien Term Loan B, 3 month USD LIBOR + 4.75%, (6.09%), due 6/20/24 | | | 463 | | |
| | 836 | | | CPA Global, First Lien Term Loan B, 3 month USD LIBOR + 3.50%, (4.68%), due 12/3/20 | | | 838 | | |
| | 569 | | | CSC Serviceworks, First Lien Term Loan B, 3 month USD LIBOR + 3.75%, (4.99%), due 11/14/22 | | | 572 | | |
| | 145 | | | Digicert Holdings, First Lien Term Loan B2, 3 month USD LIBOR + 4.75%, (5.75%), due 9/15/24 | | | 147 | (d)(e) | |
| 394 | | | Endurance International, First Lien Term Loan, 3 month USD LIBOR + 4.00%, (5.32%),
due 2/9/23 | | | 398 | | |
| | 1,467 | | | First Data Corporation, First Lien Term Loan, 3 month USD LIBOR + 2.50%, (3.74%), due 4/20/24 | | | 1,473 | | |
| | 746 | | | Garda World Security, Term Loan, 3 month USD LIBOR + 4.00%, (5.31%), due 5/3/24 | | | 751 | | |
| | 214 | | | Gartner, First Lien Term Loan B, 3 month USD LIBOR + 2.00%, (3.24%), due 4/5/24 | | | 216 | (f) | |
| | 786 | | | Genesys, First Lien Term Loan B, 3 month USD LIBOR + 3.75%, (5.08%), due 12/1/23 | | | 791 | | |
| | 839 | | | Kronos, First Lien Term Loan B, 3 month USD LIBOR + 3.50%, (4.81%), due 11/1/23 | | | 844 | | |
See Notes to Financial Statements
165
Schedule of Investments Strategic Income Fund (cont'd)
| PRINCIPAL AMOUNT(a) | | | | VALUE | |
(000's omitted) | | | | (000's omitted) | |
$ | 1,117 | | | Mitchell International, Inc., First Lien Term Loan, 3 month USD LIBOR + 3.50%, (4.88%),
due 10/11/20 | | $ | 1,127
| | |
| | 250 | | | On Assignment, First Lien Term Loan B, 3 month USD LIBOR + 2.00%, (3.24%), due 6/5/22 | | | 251 | | |
| | 516 | | | Presidio, First Lien Term Loan, 3 month USD LIBOR + 3.50%, (4.58%), due 2/2/22 | | | 519 | | |
| | 670 | | | Protection One, First Lien Term Loan B, 3 month USD LIBOR + 2.75%, (3.99%), due 5/2/22 | | | 676 | | |
| 1,120 | | | Servicemaster Company, First Lien Term Loan B, 3 month USD LIBOR + 2.50%, (3.74%),
due 11/8/23 | | | 1,125 | | |
| | 795 | | | Solera, First Lien Term Loan B, 3 month USD LIBOR + 3.25%, (4.49%), due 3/3/23 | | | 801 | | |
| | 1,197 | | | Tempo Acquisition, First Lien Term Loan B, 3 month USD LIBOR + 3.00%, (4.24%), due 4/20/24 | | | 1,200 | | |
| | 492 | | | TRANS UNION LLC, First Lien Term Loan B2, 3 month USD LIBOR + 2.00%, (3.24%), due 4/9/23 | | | 494 | | |
| | 204 | | | Vantiv, First Lien Term Loan B, 3 month USD LIBOR + 2.00%, (3.74%), due 10/14/23 | | | 206 | | |
| | 635 | | | West, First Lien Term Loan, 3 month USD LIBOR + 4.00%, (5.24%), due 10/3/24 | | | 636 | | |
| | 188 | | | Wex, First Lien Term Loan B, 3 month USD LIBOR + 2.75%, (3.99%), due 7/1/23 | | | 190 | | |
| | | | 19,164 | | |
Cable & Satellite Television 0.3% | | | |
| | 282 | | | Atlantic Broadband, First Lien Term Loan B, 3 month USD LIBOR + 2.38%, (2.38%), due 8/11/24 | | | 282 | (d)(e) | |
| 992 | | | Cablevision Systems Corp., First Lien Term Loan B, 3 month USD LIBOR + 2.25%, (3.48%),
due 7/17/25 | | | 991 | | |
| 517 | | | Cequel Communications, LLC, First Lien Term Loan B, 3 month USD LIBOR + 2.25%,
(3.48%), due 7/14/25 | | | 516 | | |
| | | | | Charter Communications Operating LLC | | | | | |
| | 448 | | | First Lien Term Loan F, 3 month USD LIBOR + 2.00%, (3.25%), due 1/3/21 | | | 450 | | |
| | 925 | | | First Lien Term Loan I, 3 month USD LIBOR + 2.25%, (3.50%), due 1/15/24 | | | 931 | | |
| 229 | | | Mediacom Illinois LLC, First Lien Term Loan K, 3 month USD LIBOR + 2.25%, (3.46%),
due 2/19/24 | | | 229 | | |
| | | | | Numericable | | | | | |
| | 925 | | | First Lien Term Loan B11, 3 month USD LIBOR + 2.75%, (4.13%), due 7/31/25 | | | 923 | | |
| | 175 | | | First Lien Term Loan B12, 3 month USD LIBOR + 3.00%, (3.00%), due 1/6/26 | | | 175 | (d)(e) | |
| | 635 | | | Telenet, First Lien Term Loan AI, 3 month USD LIBOR + 2.75%, (3.99%), due 6/30/25 | | | 637 | | |
| | 475 | | | Unity Media, First Lien Term Loan B, 3 month USD LIBOR + 2.25%, (3.49%), due 9/30/25 | | | 475 | | |
| 440 | | | UPC Financing Partnership, First Lien Term Loan AR, 3 month USD LIBOR + 2.50%, (3.73%),
due 1/15/26 | | | 441 | | |
| | 280 | | | Virgin Media, First Lien Term Loan I, 3 month USD LIBOR + 2.75%, (3.99%), due 1/31/25 | | | 281 | | |
| | 1,669 | | | Wide Open West, First Lien Term Loan B, 3 month USD LIBOR + 3.25%, (4.49%), due 8/19/23 | | | 1,672 | | |
| | | | 8,003 | | |
Chemicals & Plastics 0.2% | | | |
| | | | | Allnex | | | | | |
| | 184 | | | First Lien Term Loan B2, 3 month USD LIBOR + 3.25%, (4.56%), due 9/13/23 | | | 185 | | |
| | 139 | | | First Lien Term Loan B3, 3 month USD LIBOR + 3.25%, (4.56%), due 9/13/23 | | | 140 | | |
| 429 | | | Axalta Coating Systems, First Lien Term Loan, 3 month USD LIBOR + 2.00%, (3.33%),
due 6/1/24 | | | 431 | | |
| | 153 | | | Diversey, First Lien Term Loan, 3 month USD LIBOR + 3.00%, (4.32%), due 9/6/24 | | | 154 | | |
| | 491 | | | HB Fuller, First Lien Term Loan B, 3 month USD LIBOR + 2.25%, (3.49%), due 10/11/24 | | | 494 | | |
| | | | | Ineos Finance PLC | | | | | |
| | 374 | | | First Lien Term Loan B, 3 month USD LIBOR + 2.75%, (3.94%), due 3/31/22 | | | 374 | | |
| | 680 | | | First Lien Term Loan B, 3 month USD LIBOR + 2.00%, (2.25%), due 3/31/24 | | | 680 | | |
| | 69 | | | First Lien Term Loan B, 3 month USD LIBOR + 2.75%, (3.94%), due 3/31/24 | | | 70 | | |
| 405 | | | KIK Custom Products Inc., First Lien Term Loan B, 3 month USD LIBOR + 4.50%, (5.74%),
due 8/26/22 | | | 409 | | |
| | | | | Solenis | | | | | |
| | 1,114 | | | First Lien Term Loan, 3 month USD LIBOR + 3.25%, (4.57%), due 7/31/21 | | | 1,119 | | |
| | 125 | | | Second Lien Term Loan, 3 month USD LIBOR + 6.75%, (8.07%), due 7/31/22 | | | 123 | | |
See Notes to Financial Statements
166
Schedule of Investments Strategic Income Fund (cont'd)
| PRINCIPAL AMOUNT(a) | | | | VALUE | |
(000's omitted) | | | | (000's omitted) | |
$ | 535 | | | Univar Inc., First Lien Term Loan B, 3 month USD LIBOR + 2.75%, (3.99%), due 7/1/22 | | $ | 537 | | |
| | | | 4,716 | | |
| Conglomerates 0.0%(c) | | | |
| | 105 | | | Penn Engineering, First Lien Term Loan B, 3 month USD LIBOR + 2.75%, (3.99%), due 6/27/24 | | | 105 | | |
| 267 | | | Spectrum Brands, Inc., First Lien Term Loan B, 3 month USD LIBOR + 2.00%, (3.29%),
due 6/23/22 | | | 269 | | |
| | | | 374 | | |
Containers & Glass Products 0.3% | | | |
| | | | | Berlin Packaging | | | | | |
| | 1,182 | | | First Lien Term Loan B, 3 month USD LIBOR + 3.25%, (4.53%), due 10/1/21 | | | 1,190 | | |
| | 240 | | | Second Lien Term Loan, 3 month USD LIBOR + 6.75%, (7.99%), due 10/1/22 | | | 242 | | |
| | | | | Berry Plastics | | | | | |
| | 193 | | | First Lien Term Loan K, 3 month USD LIBOR + 2.25%, (3.49%), due 2/8/20 | | | 194 | | |
| | 368 | | | First Lien Term Loan L, 3 month USD LIBOR + 2.25%, (3.49%), due 1/6/21 | | | 369 | | |
| | 741 | | | First Lien Term Loan M, 3 month USD LIBOR + 2.25%, (3.49%), due 10/1/22 | | | 744 | | |
| | 803 | | | BWAY Corporation, First Lien Term Loan, 3 month USD LIBOR + 3.25%, (4.59%), due 4/3/24 | | | 808 | | |
| 240 | | | Consolidated Container, First Lien Term Loan B, 3 month USD LIBOR + 3.50%, (4.74%),
due 5/9/24 | | | 242 | | |
| 443 | | | Fort Dearborn Co., First Lien Term Loan B, 3 month USD LIBOR + 4.00%, (5.33%),
due 10/19/23 | | | 445 | (f) | |
| | 1,593 | | | Reynolds Group, First Lien Term Loan, 3 month USD LIBOR + 3.00%, (3.99%), due 2/5/23 | | | 1,602 | | |
| 781 | | | SIG Combibloc Group, First Lien Term Loan B, 3 month USD LIBOR + 3.00%, (4.24%),
due 3/12/22 | | | 786 | | |
| | 260 | | | Tekni-Plex Inc., First Lien Term Loan, 3 month USD LIBOR + 3.25%, (4.53%), due 10/4/24 | | | 262 | | |
| | | | 6,884 | | |
| Cosmetics - Toiletries 0.0%(c) | | | |
| 295 | | | Prestige Brands, Inc., First Lien Term Loan B4, 3 month USD LIBOR + 2.75%, (3.99%),
due 1/26/24 | | | 297 | | |
Drugs 0.3% | | | |
| | 3,177 | | | Endo Pharma, First Lien Term Loan B, 3 month USD LIBOR + 4.25%, (5.50%), due 4/27/24 | | | 3,218 | | |
| 1,590 | | | Pharmaceutical Product Development, Inc., First Lien Term Loan,
3 month USD LIBOR + 2.75%, (4.04%), due 8/18/22 | | | 1,599 | | |
| 265 | | | Catalent Pharma Solutions, First Lien Term Loan B, 3 month USD LIBOR + 2.25%, (3.75%),
due 5/20/24 | | | 267 | (d)(e) | |
| 2,574 | | | Valeant Pharmaceuticals, First Lien Term Loan BF3, 3 month USD LIBOR + 4.75%, (5.99%),
due 4/1/22 | | | 2,630 | | |
| | | | 7,714 | | |
| Ecological Services & Equipment 0.0%(c) | | | |
| 825 | | | ADS Waste Holdings, Inc., First Lien Term Loan B, 3 month USD LIBOR + 2.75%, (3.95%),
due 11/10/23 | | | 831 | | |
| 220 | | | Waste Industries USA, Inc., First Lien Term Loan B, 3 month USD LIBOR + 3.00%, (4.24%),
due 9/20/24 | | | 222 | | |
| | | | 1,053 | | |
See Notes to Financial Statements
167
Schedule of Investments Strategic Income Fund (cont'd)
| PRINCIPAL AMOUNT(a) | | | | VALUE | |
(000's omitted) | | | | (000's omitted) | |
Electronics - Electrical 0.5% | | | |
$ | 510 | | | Applied Systems, First Lien Term Loan B, 3 month USD LIBOR + 3.25%, (4.57%), due 9/18/24 | | $ | 516 | | |
| | 1,164 | | | Avast Software, First Lien Term Loan B, 3 month USD LIBOR + 3.25%, (4.58%), due 9/30/23 | | | 1,170 | | |
| | 1,422 | | | BMC Software, First Lien Term Loan, 3 month USD LIBOR + 4.00%, (5.24%), due 9/10/22 | | | 1,431 | | |
| | 177 | | | CommScope, First Lien Term Loan B, 3 month USD LIBOR + 2.00%, (3.37%), due 12/29/22 | | | 178 | | |
| 640 | | | CPI ACQUISITION INC., First Lien Term Loan, 3 month USD LIBOR + 4.50%, (5.96%),
due 8/17/22 | | | 458 | | |
| | 1,065 | | | Dell, First Lien Term Loan B, 3 month USD LIBOR + 2.00%, (2.75%), due 9/7/23 | | | 1,067 | (d)(e) | |
| | 434 | | | Go Daddy, First Lien Term Loan B, 3 month USD LIBOR + 2.50%, (3.72%), due 2/15/24 | | | 436 | | |
| | | | | Hyland Software, Inc. | | | | | |
| | 309 | | | First Lien Term Loan, 3 month USD LIBOR + 3.25%, (4.49%), due 7/1/22 | | | 312 | | |
| | 55 | | | Second Lien Term Loan, 3 month USD LIBOR + 7.00%, (8.24%), due 7/7/25 | | | 56 | | |
| | 200 | | | IFS, First Lien Term Loan B, 3 month USD LIBOR + 3.75%, (4.50%), due 7/25/24 | | | 200 | (d)(e) | |
| 791 | | | Infor Global Solutions Ltd., First Lien Term Loan, 3 month USD LIBOR + 2.75%, (4.08%),
due 2/1/22 | | | 792 | | |
| | | | | Mcafee | | | | | |
| | 460 | | | First Lien Term Loan B, 3 month USD LIBOR + 4.50%, (5.83%), due 9/26/24 | | | 463 | | |
| | 200 | | | Second Lien Term Loan, 3 month USD LIBOR + 8.50%, (9.83%), due 9/26/25 | | | 203 | | |
| 164 | | | MKS Instruments, Inc., First Lien Term Loan B, 3 month USD LIBOR + 2.25%, (3.49%),
due 4/29/23 | | | 165 | | |
| 309 | | | On Semiconductor, First Lien Term Loan B, 3 month USD LIBOR + 2.25%, (3.49%),
due 3/31/23 | | | 311 | | |
| | | | | Optiv Security, Inc. | | | | | |
| | 776 | | | First Lien Term Loan, 3 month USD LIBOR + 3.25%, (4.56%), due 2/1/24 | | | 731 | | |
| | 160 | | | Second Lien Term Loan, 3 month USD LIBOR + 7.25%, (8.56%), due 2/1/25 | | | 147 | | |
| | 351 | | | Peak 10, First Lien Term Loan, 3 month USD LIBOR + 3.50%, (4.81%), due 7/21/24 | | | 353 | | |
| 802 | | | Rackspace Hosting Inc., First Lien Term Loan B, 3 month USD LIBOR + 3.00%, (4.31%),
due 11/3/23 | | | 801 | | |
| 1,594 | | | Riverbed Technology, First Lien Term Loan B, 3 month USD LIBOR + 3.25%, (4.50%),
due 4/24/22 | | | 1,525 | | |
| | 2,241 | | | Sophia LP, First Lien Term Loan B, 3 month USD LIBOR + 3.25%, (4.58%), due 9/30/22 | | | 2,236 | | |
| | 391 | | | Vertafore, First Lien Term Loan, 3 month USD LIBOR + 3.25%, (4.49%), due 6/17/23 | | | 394 | | |
| | | | 13,945 | | |
| Equipment Leasing 0.0%(c) | | | |
| 645 | | | AER /Int'l Lease Finance Corp., First Lien Term Loan B, 3 month USD LIBOR + 2.00%,
(3.33%), due 10/30/22 | | | 650 | | |
| | 618 | | | Avolon, First Lien Term Loan B2, 3 month USD LIBOR + 2.75%, (3.49%), due 4/3/22 | | | 623 | | |
| | | | 1,273 | | |
Financial Intermediaries 0.1% | | | |
| | 497 | | | Americold, First Lien Term Loan B, 3 month USD LIBOR + 3.75%, (4.99%), due 12/1/22 | | | 503 | (f) | |
| | 517 | | | CITCO, First Lien Term Loan, 3 month USD LIBOR + 3.00%, (4.24%), due 4/3/22 | | | 522 | | |
| 215 | | | Fortress Investment Group, First Lien Term Loan B, 3 month USD LIBOR + 1.38%, (2.75%),
due 7/14/22 | | | 218 | | |
| 1,124 | | | Grosvenor Capital Management Holdings, LLP, First Lien Term Loan B, 3 month
USD LIBOR + 3.00%, (4.24%), due 8/18/23 | | | 1,126 | | |
| 118 | | | Guggenheim Partners, First Lien Term Loan B, 3 month USD LIBOR + 2.75%, (3.99%),
due 7/22/23 | | | 118 | | |
| | 283 | | | Harbourvest Partners, First Lien Term Loan, 3 month USD LIBOR + 2.50%, (3.86%), due 2/4/21 | | | 283 | | |
| | 531 | | | Royalty Pharma, First Lien Term Loan B6, 3 month USD LIBOR + 2.00%, (3.33%), due 3/27/23 | | | 533 | | |
| | 236 | | | SAM Finance, First Lien Term Loan B, 3 month USD LIBOR + 3.25%, (4.57%), due 12/17/20 | | | 237 | | |
| | | | 3,540 | | |
See Notes to Financial Statements
168
Schedule of Investments Strategic Income Fund (cont'd)
| PRINCIPAL AMOUNT(a) | | | | VALUE | |
(000's omitted) | | | | (000's omitted) | |
Food & Drug Retailers 0.1% | | | |
| | | | | Albertsons LLC | | | | | |
$ | 57 | | | First Lien Term Loan B4, 3 month USD LIBOR + 2.75%, (3.99%), due 8/25/21 | | $ | 55 | | |
| | 613 | | | First Lien Term Loan B5, 3 month USD LIBOR + 3.00%, (4.33%), due 12/21/22 | | | 593 | | |
| | 549 | | | First Lien Term Loan B6, 3 month USD LIBOR + 3.00%, (4.32%), due 6/22/23 | | | 531 | | |
| 1,136 | | | General Nutrition Centers, First Lien Term Loan, 3 month USD LIBOR + 2.50%, (3.75%),
due 3/4/19 | | | 1,078 | | |
| | 1,600 | | | Rite Aid Corp., Second Lien Term Loan 2, 3 month USD LIBOR + 3.88%, (5.21%), due 6/21/21 | | | 1,603 | | |
| | | | 3,860 | | |
Food Products 0.1% | | | |
| | 520 | | | B&G Foods Inc., First Lien Term Loan B, 3 month USD LIBOR + 2.25%, (3.49%), due 11/2/22 | | | 523 | | |
| 311 | | | DE Master Blenders 1753 NV, First Lien Term Loan B1, 3 month USD LIBOR + 2.25%,
(3.56%), due 7/2/22 | | | 313 | | |
| | 299 | | | Del Monte Foods, First Lien Term Loan, 3 month USD LIBOR + 3.25%, (4.57%), due 2/18/21 | | | 255 | | |
| 800 | | | Nomad Foods Europe Midco Ltd., First Lien Term Loan B, 3 month USD LIBOR + 2.75%,
(3.99%), due 4/20/24 | | | 803 | | |
| | 369 | | | Post Holdings, First Lien Term Loan B, 3 month USD LIBOR + 2.25%, (3.49%), due 5/24/24 | | | 371 | | |
| | | | 2,265 | | |
Food Service 0.1% | | | |
| 169 | | | Aramark Corporation, First Lien Term Loan B, 3 month USD LIBOR + 2.00%, (3.24%),
due 3/2/24 | | | 170 | | |
| 522 | | | Burger King Corporation, First Lien Term Loan B, 3 month USD LIBOR + 2.25%, (3.52%),
due 2/17/24 | | | 522 | | |
| 443 | | | Manitowoc Foodservice, First Lien Term Loan B, 3 month USD LIBOR + 3.00%, (3.99%),
due 3/3/23 | | | 447 | | |
| | 534 | | | US Foods, First Lien Term Loan B, 3 month USD LIBOR + 2.75%, (4.00%), due 6/27/23 | | | 538 | | |
| 149 | | | Weight Watchers International Inc., Term Loan, 3 month USD LIBOR + 3.25%, (4.58%),
due 4/2/20 | | | 147 | | |
| | 535 | | | Yum Brands, Inc., First Lien Term Loan B, 3 month USD LIBOR + 2.00%, (3.24%), due 6/16/23 | | | 538 | | |
| | | | 2,362 | | |
Health Care 0.4% | | | |
| 796 | | | Acadia Healthcare Co., First Lien Term Loan B2, 3 month USD LIBOR + 2.75%, (3.99%),
due 2/16/23 | | | 800 | | |
| | | | | Air Medical Group Holding | | | | | |
| | 563 | | | First Lien Term Loan B, 3 month USD LIBOR + 3.25%, (4.49%), due 4/28/22 | | | 562 | | |
| | 110 | | | First Lien Term Loan B1, 3 month USD LIBOR + 4.00%, (5.24%), due 4/28/22 | | | 110 | | |
| | 105 | | | First Lien Term Loan B, 3 month USD LIBOR + 4.25%, (5.25%), due 9/26/24 | | | 105 | (d)(e) | |
| | | | | CHS/Community Health | | | | | |
| | 726 | | | First Lien Term Loan G1, 3 month USD LIBOR + 2.75%, (4.07%), due 12/31/19 | | | 708 | | |
| | 554 | | | First Lien Term Loan H1, 3 month USD LIBOR + 3.00%, (4.32%), due 1/27/21 | | | 536 | | |
| 817 | | | Concentra Operating Company, First Lien Term Loan 1, 3 month USD LIBOR + 3.00%,
(4.32%), due 6/1/22 | | | 820 | | |
| 1,677 | | | Envision Healthcare, First Lien Term Loan B, 3 month USD LIBOR + 3.00%, (4.25%),
due 12/1/23 | | | 1,684 | | |
| | 975 | | | Grifols SA, First Lien Term Loan B, 3 month USD LIBOR + 2.25%, (3.45%), due 1/19/25 | | | 978 | | |
| | | | | HCA Inc. | | | | | |
| | 390 | | | First Lien Term Loan B9, 3 month USD LIBOR + 2.00%, (3.24%), due 3/18/23 | | | 392 | | |
| | 476 | | | First Lien Term Loan B8, 3 month USD LIBOR + 2.25%, (3.49%), due 2/15/24 | | | 479 | | |
| | 349 | | | INC Research, First Lien Term Loan B, 3 month USD LIBOR + 2.25%, (3.49%), due 8/1/24 | | | 350 | | |
See Notes to Financial Statements
169
Schedule of Investments Strategic Income Fund (cont'd)
| PRINCIPAL AMOUNT(a) | | | | VALUE | |
(000's omitted) | | | | (000's omitted) | |
$ | 1,056 | | | Mallinckrodt International, First Lien Term Loan B, 3 month USD LIBOR + 2.75%, (4.08%),
due 9/24/24 | | $ | 1,058
| | |
| 100 | | | Mediware Information System, First Lien Term Loan B, 3 month USD LIBOR + 3.75%,
(4.99%), due 2/9/24 | | | 100 | | |
| | 708 | | | Multiplan, Inc., First Lien Term Loan B, 3 month USD LIBOR + 3.00%, (4.33%), due 6/7/23 | | | 715 | | |
| 559 | | | National Mentor, Inc., First Lien Term Loan B, 3 month USD LIBOR + 3.00%, (4.33%),
due 1/31/21 | | | 563 | | |
| | 193 | | | Quintiles Ims Health, First Lien Term Loan B, 3 month USD LIBOR + 2.25%, (3.33%), due 3/7/24 | | | 195 | | |
| | 224 | | | Surgery Partners, First Lien Term Loan, 3 month USD LIBOR + 3.25%, (4.50%), due 9/3/24 | | | 222 | | |
| | 1,214 | | | Team Health, Inc., First Lien Term Loan B, 3 month USD LIBOR + 2.75%, (3.99%), due 2/6/24 | | | 1,203 | (f) | |
| | | | 11,580 | | |
Industrial Equipment 0.2% | | | |
| | | | | Crosby Worldwide | | | | | |
| | 968 | | | First Lien Term Loan, 3 month USD LIBOR + 3.00%, (4.31%), due 11/22/20 | | | 917 | | |
| | 55 | | | Second Lien Term Loan, 3 month USD LIBOR + 6.00%, (7.31%), due 11/22/21 | | | 46 | | |
| | 806 | | | Doosan Infracore, First Lien Term Loan B, 3 month USD LIBOR + 2.75%, (4.08%), due 5/19/24 | | | 811 | | |
| | 1,189 | | | Filtration Group, First Lien Term Loan, 3 month USD LIBOR + 3.00%, (4.38%), due 11/21/20 | | | 1,197 | | |
| | 154 | | | Gardner Denver, First Lien Term Loan B, 3 month USD LIBOR + 2.75%, (4.08%), due 7/30/24 | | | 155 | | |
| | 244 | | | Gates Global LLC, First Lien Term Loan B, 3 month USD LIBOR + 3.25%, (4.58%), due 3/31/24 | | | 245 | | |
| | 104 | | | Harsco, First Lien Term Loan B, 3 month USD LIBOR + 5.00%, (6.25%), due 11/2/23 | | | 105 | | |
| 1,010 | | | Husky Injection Molding, First Lien Term Loan B, 3 month USD LIBOR + 3.25%, (4.49%),
due 6/30/21 | | | 1,017 | | |
| | 168 | | | Hyster-Yale Group, First Lien Term Loan B, 3 month USD LIBOR + 4.00%, (5.24%), due 5/30/23 | | | 170 | (f) | |
| | 809 | | | Milacron LLC, First Lien Term Loan B, 3 month USD LIBOR + 3.00%, (4.24%), due 9/24/23 | | | 811 | (f) | |
| | 589 | | | Rexnord Corp., First Lien Term Loan B, 3 month USD LIBOR + 2.75%, (4.09%), due 8/21/23 | | | 593 | | |
| | 488 | | | Signode Industrial, First Lien Term Loan B, 3 month USD LIBOR + 2.75%, (4.04%), due 5/1/21 | | | 493 | (f) | |
| | | | 6,560 | | |
Insurance 0.1% | | | |
| | | | | Sedgwick Holdings Inc. | | | | | |
| | 1,126 | | | First Lien Term Loan, 3 month USD LIBOR + 2.75%, (3.99%), due 2/28/21 | | | 1,131 | | |
| | 130 | | | Second Lien Term Loan, 3 month USD LIBOR + 5.75%, (6.99%), due 2/28/22 | | | 131 | | |
| | 110 | | | Second Lien Term Loan, 3 month USD LIBOR + 5.75%, (7.07%), due 2/28/22 | | | 112 | | |
| | | | 1,374 | | |
Leisure Goods - Activities - Movies 0.2% | | | |
| 537 | | | AMC Entertainment, First Lien Term Loan B, 3 month USD LIBOR + 2.25%, (3.49%),
due 12/15/22 | | | 537 | | |
| | 315 | | | Bright Horizons, First Lien Term Loan B, 3 month USD LIBOR + 2.25%, (3.49%), due 11/3/23 | | | 317 | | |
| | 282 | | | Clubcorp, First Lien Term Loan B, 3 month USD LIBOR + 3.25%, (4.59%), due 8/15/24 | | | 283 | | |
| | 1,365 | | | Formula One, First Lien Term Loan B, 3 month USD LIBOR + 3.25%, (4.24%), due 2/1/24 | | | 1,375 | | |
| | 329 | | | Match, First Lien Term Loan B, 3 month USD LIBOR + 2.50%, (3.81%), due 11/16/22 | | | 332 | (f) | |
| 1,027 | | | Nielsen Business Media, First Lien Term Loan B, 3 month USD LIBOR + 3.00%, (4.33%),
due 5/22/24 | | | 1,039 | (f) | |
| 269 | | | Regal Cinemas Corporation, First Lien Term Loan, 3 month USD LIBOR + 2.00%, (3.24%),
due 4/1/22 | | | 269 | | |
| | 780 | | | Seaworld, First Lien Term Loan B5, 3 month USD LIBOR + 3.00%, (4.33%), due 3/31/24 | | | 765 | (d)(e) | |
| 380 | | | Warner Music Group, First Lien Term Loan, 3 month USD LIBOR + 2.50%, (3.74%),
due 11/1/23 | | | 382 | | |
| | | | 5,299 | | |
See Notes to Financial Statements
170
Schedule of Investments Strategic Income Fund (cont'd)
| PRINCIPAL AMOUNT(a) | | | | VALUE | |
(000's omitted) | | | | (000's omitted) | |
Lodging & Casinos 0.3% | | | |
$ | 155 | | | Aristocrat Leisure, First Lien Term Loan, 3 month USD LIBOR + 2.25%, (3.36%), due 10/20/21 | | $ | 156 | | |
| | 120 | | | Belmond, First Lien Term Loan B, 3 month USD LIBOR + 2.75%, (4.07%), due 7/3/24 | | | 120 | | |
| 438 | | | Boyd Gaming Corporation, First Lien Term Loan B, 3 month USD LIBOR + 2.50%, (3.70%),
due 9/15/23 | | | 440 | | |
| 285 | | | Caesars Entertainment, First Lien Term Loan B, 3 month USD LIBOR + 2.50%, (3.74%),
due 10/6/24 | | | 285 | | |
| 490 | | | Caesars Resort Collection, First Lien Term Loan, 3 month USD LIBOR + 2.75%, (2.75%),
due 9/28/24 | | | 493 | (d)(e) | |
| | 474 | | | CityCenter, First Lien Term Loan B, 3 month USD LIBOR + 2.50%, (3.74%), due 4/18/24 | | | 476 | | |
| | 508 | | | Eldorado Resorts, First Lien Term Loan B, 3 month USD LIBOR + 2.25%, (3.50%), due 4/17/24 | | | 509 | | |
| 267 | | | ESH Hospitality, Inc., First Lien Term Loan B, 3 month USD LIBOR + 2.50%, (3.74%),
due 8/30/23 | | | 269 | | |
| 322 | | | Four Seasons Holdings Inc., First Lien Term Loan B, 3 month USD LIBOR + 2.50%, (3.74%),
due 11/30/23 | | | 325 | | |
| | | | | Golden Entertainment | | | | | |
| | 546 | | | First Lien Term Loan B, 3 month USD LIBOR + 3.00%, (4.24%), due 8/15/24 | | | 546 | | |
| | 232 | | | Second Lien Term Loan, 3 month USD LIBOR + 7.00%, (7.75%), due 8/15/25 | | | 234 | (d)(e) | |
| 547 | | | Hilton Worldwide, First Lien Term Loan B2, 3 month USD LIBOR + 2.00%, (3.23%),
due 10/25/23 | | | 550 | | |
| 398 | | | MGM Growth Properties, First Lien Term Loan B, 3 month USD LIBOR + 2.25%, (3.49%),
due 4/25/23 | | | 400 | | |
| | | | | Mohegan Tribal Gaming | | | | | |
| | 240 | | | First Lien Term Loan A, 3 month USD LIBOR + 3.75%, (4.99%), due 10/13/21 | | | 241 | | |
| | 535 | | | First Lien Term Loan B, 3 month USD LIBOR + 4.00%, (5.24%), due 10/13/23 | | | 541 | | |
| 1,223 | | | Scientific Games Corp., First Lien Term Loan B4, 3 month USD LIBOR + 3.25%, (4.52%),
due 8/14/24 | | | 1,237 | | |
| | 199 | | | Sky Bet, First Lien Term Loan, 3 month USD LIBOR + 3.50%, (4.83%), due 7/24/24 | | | 200 | | |
| | 523 | | | Station Casinos, First Lien Term Loan B, 3 month USD LIBOR + 2.50%, (3.74%), due 6/8/23 | | | 524 | | |
| | 686 | | | Twin Rivers Casino, First Lien Term Loan B, 3 month USD LIBOR + 3.50%, (4.83%), due 7/10/20 | | | 692 | | |
| | | | 8,238 | | |
Oil & Gas 0.1% | | | |
| | 450 | | | Chesapeake Energy, First Lien Term Loan, 3 month USD LIBOR + 7.50%, (8.81%), due 8/23/21 | | | 482 | | |
| | 404 | | | EagleClaw, First Lien Term Loan, 3 month USD LIBOR + 4.25%, (5.52%), due 6/6/24 | | | 408 | | |
| 606 | | | Energy Transfer Equity LP, First Lien Term Loan B, 3 month USD LIBOR + 2.00%, (3.24%),
due 2/2/24 | | | 605 | | |
| | 225 | | | Gavilan Resources, Second Lien Term Loan, 3 month USD LIBOR + 6.00%, (7.24%), due 3/1/24 | | | 218 | | |
| | 595 | | | Rover, First Lien Term Loan B, 3 month USD LIBOR + 4.00%, (5.00%) due 9/20/24 | | | 601 | (d)(e) | |
| 370 | | | Traverse Midstream, First Lien Term Loan B, 3 month USD LIBOR + 4.00%, (5.33%),
due 9/22/24 | | | 375 | | |
| | | | 2,689 | | |
| Publishing 0.0%(c) | | | |
| 400 | | | Harland Clark Holdings Corp., First Lien Term Loan B6, 3 month USD LIBOR + 5.50%,
(6.83%), due 2/9/22 | | | 400 | | |
| | 303 | | | Nielsen, First Lien Term Loan B4, 3 month USD LIBOR + 2.00%, (3.24%), due 10/4/23 | | | 304 | | |
| | 258 | | | Tribune Company, First Lien Term Loan B, 3 month USD LIBOR + 3.00%, (4.24%), due 1/27/24 | | | 258 | | |
| | | | 962 | | |
Radio & Television 0.1% | | | |
| | 455 | | | Cumulus Media, First Lien Term Loan B, 3 month USD LIBOR + 3.25%, (4.50%), due 12/23/20 | | | 395 | | |
| | 169 | | | Gray Television, Inc., First Lien Term Loan B, 3 month USD LIBOR + 2.50%, (3.72%), due 2/7/24 | | | 170 | | |
See Notes to Financial Statements
171
Schedule of Investments Strategic Income Fund (cont'd)
| PRINCIPAL AMOUNT(a) | | | | VALUE | |
(000's omitted) | | | | (000's omitted) | |
$ | 355 | | | iHeartCommunications Inc., First Lien Term Loan D, 3 month USD LIBOR + 6.75%, (8.08%),
due 1/30/19 | | $ | 265
| | |
| | 46 | | | Lions Gate, First Lien Term Loan B, 3 month USD LIBOR + 3.00%, (4.24%), due 12/8/23 | | | 47 | | |
| 34 | | | Mission Broadcasting, First Lien Term Loan, 3 month USD LIBOR + 2.50%, (3.74%),
due 1/17/24 | | | 34 | | |
| 267 | | | Nexstar Broadcasting, First Lien Term Loan B, 3 month USD LIBOR + 2.50%, (3.73%),
due 1/17/24 | | | 269 | | |
| 442 | | | Sinclair Broadcasting, First Lien Term Loan B2, 3 month USD LIBOR + 2.25%, (3.50%),
due 1/3/24 | | | 443 | | |
| 764 | | | Univision Communications Inc., First Lien Term Loan C5, 3 month USD LIBOR + 2.75%,
(3.99%), due 3/15/24 | | | 761 | | |
| | | | 2,384 | | |
Retailers (except food & drug) 0.2% | | | |
| | 940 | | | Bass Pro Shops, First Lien Term Loan B, 3 month USD LIBOR + 5.00%, (6.24%), due 9/25/24 | | | 912 | (d)(e) | |
| | | | | BJS Wholesale Club Inc. | | | | | |
| | 1,283 | | | First Lien Term Loan B, 3 month USD LIBOR + 3.75%, (4.99%), due 1/27/24 | | | 1,250 | | |
| | 185 | | | Second Lien Term Loan, 3 month USD LIBOR + 7.50%, (8.74%), due 1/27/25 | | | 178 | | |
| | 246 | | | CDW LLC, First Lien Term Loan B, 3 month USD LIBOR + 2.00%, (3.34%), due 8/17/23 | | | 247 | | |
| | 70 | | | Jo-Ann Stores, First Lien Term Loan B, 3 month USD LIBOR + 5.00%, (6.55%), due 10/21/23 | | | 67 | | |
| | 423 | | | PetSmart Inc., First Lien Term Loan B, 3 month USD LIBOR + 3.00%, (4.24%), due 3/10/22 | | | 361 | | |
| | | | | Sally Beauty | | | | | |
| | 145 | | | First Lien Term Loan B1, 3 month USD LIBOR + 2.50%, (3.75%), due 6/22/24 | | | 145 | | |
| | 225 | | | First Lien Term Loan B2, 4.50%, due 6/22/24 | | | 224 | (x) | |
| | 770 | | | Staples, First Lien Term Loan, 3 month USD LIBOR + 4.00%, (5.31%), due 8/14/24 | | | 724 | | |
| | | | 4,108 | | |
Steel 0.1% | | | |
| | 277 | | | Big River Steel, First Lien Term Loan B, 3 month USD LIBOR + 5.00%, (6.33%), due 8/15/23 | | | 282 | (f) | |
| 695 | | | McJunkin Red Man Corporation, First Lien Term Loan B, 3 month USD LIBOR + 3.50%,
(4.74%), due 9/14/24 | | | 704 | (f) | |
| | 580 | | | TMS International, First Lien Term Loan B, 3 month USD LIBOR + 3.00%, (4.31%), due 8/9/24 | | | 581 | (f) | |
| | | | 1,567 | | |
Surface Transport 0.1% | | | |
| 280 | | | Avis Budget Car Rental, First Lien Term Loan B, 3 month USD LIBOR + 2.00%, (3.34%),
due 3/15/22 | | | 280 | | |
| 1,682 | | | Hertz Corporation, First Lien Term Loan B, 3 month USD LIBOR + 2.75%, (4.00%),
due 6/30/23 | | | 1,678 | | |
| | | | | Kenan Advantage Group | | | | | |
| | 822 | | | First Lien Term Loan B1, 3 month USD LIBOR + 3.00%, (4.24%), due 7/29/22 | | | 826 | | |
| | 250 | | | First Lien Term Loan B2, 3 month USD LIBOR + 3.00%, (4.20%), due 7/29/22 | | | 251 | | |
| | | | 3,035 | | |
Utilities 0.4% | | | |
| 1,128 | | | Calpine Construction, First Lien Term Loan B2, 3 month USD LIBOR + 2.50%, (3.75%),
due 1/31/22 | | | 1,129 | | |
| | | | | Calpine Corp. | | | | | |
| | 237 | | | First Lien Term Loan B7, 3 month USD LIBOR + 2.75%, (4.09%), due 5/31/23 | | | 238 | | |
| | 405 | | | First Lien Term Loan B5, 3 month USD LIBOR + 2.75%, (4.09%), due 1/16/24 | | | 407 | | |
See Notes to Financial Statements
172
Schedule of Investments Strategic Income Fund (cont'd)
| PRINCIPAL AMOUNT(a) | | | | VALUE | |
(000's omitted) | | | | (000's omitted) | |
$ | 1,385 | | | Dynegy Holdings Inc., First Lien Term Loan C, 3 month USD LIBOR + 3.25%, (4.49%),
due 2/7/24 | | $ | 1,393
| | |
| | 825 | | | Energy Future, First Lien Term Loan, 3 month USD LIBOR + 3.00%, (4.24%), due 6/28/18 | | | 830 | | |
| | 385 | | | HELIX Generation, First Lien Term Loan B, 3 month USD LIBOR + 3.75%, (5.08%), due 6/2/24 | | | 389 | | |
| 818 | | | Nautilus Power LLC, First Lien Term Loan B, 3 month USD LIBOR + 4.50%, (5.74%),
due 5/16/24 | | | 820 | | |
| | 617 | | | NRG Energy Inc., First Lien Term Loan B, 3 month USD LIBOR + 2.25%, (3.58%), due 6/30/23 | | | 619 | | |
| | | | | RJS Power | | | | | |
| | 536 | | | First Lien Term Loan B1, 3 month USD LIBOR + 4.00%, (5.24%), due 7/6/23 | | | 534 | | |
| | 666 | | | First Lien Term Loan B2, 3 month USD LIBOR + 4.00%, (5.24%), due 4/6/24 | | | 663 | | |
| | | | | Texas Competitive | | | | | |
| | 1,177 | | | First Lien Term Loan B, 3 month USD LIBOR + 2.75%, (4.01%), due 8/4/23 | | | 1,180 | | |
| | 271 | | | First Lien Term Loan C, 3 month USD LIBOR + 2.75%, (4.08%), due 8/4/23 | | | 271 | | |
| | 402 | | | First Lien Term Loan B2, 3 month USD LIBOR + 3.25%, (4.01%), due 12/14/23 | | | 405 | | |
| | 1,977 | | | TPF II, First Lien Term Loan B, 3 month USD LIBOR + 4.00%, (4.99%), due 10/2/23 | | | 1,991 | | |
| | | | 10,869 | | |
| | | | | Total Loan Assignments (Cost $158,228) | | | 158,084 | | |
U.S. Treasury Obligations 30.2% | | | |
| | 16,600 | | | U.S. Treasury Bill, 0.82%, due 5/24/18 | | | 16,482 | (g)(h) | |
| | | | | U.S. Treasury Bonds | | | | | |
| | 2,625 | | | 4.50%, due 2/15/36 | | | 3,360 | | |
| | 7,890 | | | 3.88%, due 8/15/40 | | | 9,351 | | |
| | | | | U.S. Treasury Inflation-Indexed Bonds | | | | | |
| | 38,573 | | | 0.25%, due 1/15/25 | | | 38,143 | (i) | |
| | 51,337 | | | 2.00%, due 1/15/26 | | | 57,609 | (i) | |
| | 36,321 | | | 2.50%, due 1/15/29 | | | 43,761 | (i) | |
| | 62,616 | | | 3.88%, due 4/15/29 | | | 84,924 | (i) | |
| | 13,977 | | | 0.63%, due 2/15/43 | | | 13,078 | (i) | |
| | | | | U.S. Treasury Notes | | | | | |
| | 93,497 | | | 1.50%, due 8/31/18 – 2/28/23 | | | 92,668 | | |
| | 55,000 | | | 1.00%, due 9/15/18 | | | 54,772 | | |
| | 141,919 | | | 1.38%, due 9/30/18 – 4/30/20 | | | 141,702 | | |
| | 129,580 | | | 0.88%, due 10/15/18 – 5/15/19 | | | 128,716 | | |
| | 12,960 | | | 2.13%, due 12/31/21 | | | 13,063 | | |
| | 60,930 | | | 2.75%, due 2/15/24 | | | 62,989 | | |
| | 61,850 | | | 1.63%, due 2/15/26 | | | 58,601 | | |
| | | | | Total U.S. Treasury Obligations (Cost $824,469) | | | 819,219 | | |
Mortgage-Backed Securities 27.1% | | | |
Collateralized Mortgage Obligations 2.5% | | | |
| | | | | Fannie Mae Connecticut Avenue Securities | | | | | |
| | 20,303 | | | Ser. 2017-C02, Class 2M2, 1 month USD LIBOR + 3.65%, (4.89%), due 9/25/29 | | | 21,622 | (b) | |
| | 9,475 | | | Ser. 2017-C03, Class 1M2, 1 month USD LIBOR + 3.00%, (4.24%), due 10/25/29 | | | 9,803 | (b) | |
| | 5,668 | | | Ser. 2017-C04, Class 2M2, 1 month USD LIBOR + 2.85%, (4.09%), due 11/25/29 | | | 5,792 | (b) | |
| | 4,790 | | | Ser. 2017-C06, Class 1M2, 1 month USD LIBOR + 2.65%, (3.89%), due 2/25/30 | | | 4,859 | (b) | |
| | 6,240 | | | Ser. 2017-C06, Class 2M2, 1 month USD LIBOR + 2.80%, (4.04%), due 2/25/30 | | | 6,360 | (b) | |
| | | | | Freddie Mac Structured Agency Credit Risk Debt Notes | | | | | |
| | 9,020 | | | Ser. 2017-DNA2, Class M2, 1 month USD LIBOR + 3.45%, (4.69%), due 10/25/29 | | | 9,585 | (b) | |
| | 8,095 | | | Ser. 2017-HQA2, Class M2, 1 month USD LIBOR + 2.65%, (3.89%), due 12/25/29 | | | 8,182 | (b) | |
| | | | | JP Morgan Alternative Loan Trust | | | | | |
| | 642 | | | Ser. 2006-A5, Class 1A1, 1 month USD LIBOR + 0.16%, (1.40%), due 10/25/36 | | | 610 | (b) | |
| | 2,619 | | | Ser. 2007-A2, Class 12A3, 1 month USD LIBOR + 0.19%, (1.43%), due 6/25/37 | | | 2,616 | (b) | |
| | | | 69,429 | | |
See Notes to Financial Statements
173
Schedule of Investments Strategic Income Fund (cont'd)
| PRINCIPAL AMOUNT(a) | | | | VALUE | |
(000's omitted) | | | | (000's omitted) | |
Commercial Mortgage-Backed 1.2% | | | |
| | | | | Citigroup Commercial Mortgage Trust | | | | | |
$ | 48,511 | | | Ser. 2014-GC25, Class XA, 1.04%, due 10/10/47 | | $ | 2,784 | (j)(k) | |
| | 32,347 | | | Ser. 2015-GC27, Class XA, 1.42%, due 2/10/48 | | | 2,510 | (j)(k) | |
| | 13,828 | | | Ser. 2015-GC29, Class XA, 1.16%, due 4/10/48 | | | 822 | (j)(k) | |
| | 38,338 | | | Commercial Mortgage Loan Trust, Ser. 2014-CR17, Class XA, 1.13%, due 5/10/47 | | | 1,831 | (j)(k) | |
| | 31,110 | | | Commercial Mortgage Pass-Through Certificates, Ser. 2013-LC6, Class XB, 0.34%, due 1/10/46 | | | 599 | (j)(k)(l) | |
| | | | | Commercial Mortgage Trust | | | | | |
| | 34,000 | | | Ser. 2013-CR6, Class XB, 0.59%, due 3/10/46 | | | 897 | (j)(k) | |
| | 42,518 | | | Ser. 2014-CR16, Class XA, 1.18%, due 4/10/47 | | | 1,987 | (j)(k) | |
| | 52,927 | | | Ser. 2014-UBS3, Class XA, 1.31%, due 6/10/47 | | | 2,914 | (j)(k) | |
| | 56,685 | | | Ser. 2014-UBS6, Class XA, 1.02%, due 12/10/47 | | | 2,759 | (j)(k) | |
| | 38,855 | | | CSAIL Commercial Mortgage Trust, Ser. 2015-C2, Class XA, 0.86%, due 6/15/57 | | | 1,790 | (j)(k) | |
| | | | | GS Mortgage Securities Trust | | | | | |
| | 73,329 | | | Ser. 2014-GC18, Class XA, 1.12%, due 1/10/47 | | | 3,531 | (j)(k) | |
| | 57,498 | | | Ser. 2015-GC30, Class XA, 0.89%, due 5/10/50 | | | 2,568 | (j)(k) | |
| | | | | WF-RBS Commercial Mortgage Trust | | | | | |
| | 9,982 | | | Ser. 2011-C2, Class XA, 0.82%, due 2/15/44 | | | 208 | (j)(k)(l) | |
| | 102,868 | | | Ser. 2013-C14, Class XB, 0.15%, due 6/15/46 | | | 1,001 | (j)(k) | |
| | 43,716 | | | Ser. 2014-C21, Class XA, 1.13%, due 8/15/47 | | | 2,325 | (j)(k) | |
| | 62,465 | | | Ser. 2014-C25, Class XA, 0.93%, due 11/15/47 | | | 2,919 | (j)(k) | |
| | 9,146 | | | Ser. 2014-C22, Class XA, 0.92%, due 9/15/57 | | | 405 | (j)(k) | |
| | | | 31,850 | | |
Fannie Mae 10.3% | | | |
| | | | | Pass-Through Certificates | | | | | |
| | 8 | | | 5.00%, due 6/1/40 – 7/1/40 | | | 9 | | |
| | 96 | | | 6.00%, due 9/1/33 – 9/1/40 | | | 108 | | |
| | 1 | | | 6.50%, due 9/1/32 | | | 1 | | |
| | 1 | | | 7.50%, due 12/1/32 | | | 1 | | |
| | 26,215 | | | 3.00%, TBA, 15 Year Maturity | | | 26,854 | (n) | |
| | 19,670 | | | 3.00%, TBA, 30 Year Maturity | | | 19,678 | (n) | |
| | 79,970 | | | 3.50%, TBA, 30 Year Maturity | | | 82,188 | (n) | |
| | 144,460 | | | 4.00%, TBA, 30 Year Maturity | | | 151,581 | (n) | |
| | | | 280,420 | | |
Freddie Mac 11.0% | | | |
| | | | | Pass-Through Certificates | | | | | |
| | 0 | (m) | | 4.50%, due 8/1/18 | | | 0 | (m) | |
| | 7 | | | 5.00%, due 5/1/18 – 12/1/28 | | | 8 | | |
| | 38,525 | | | 3.00%, TBA, 15 Year Maturity | | | 39,465 | (n) | |
| | 19,865 | | | 3.00%, TBA, 30 Year Maturity | | | 19,879 | (n) | |
| | 9,850 | | | 3.50%, TBA, 15 Year Maturity | | | 10,249 | (n) | |
| | 93,885 | | | 3.50%, TBA, 30 Year Maturity | | | 96,500 | (n) | |
| | 125,495 | | | 4.00%, TBA, 30 Year Maturity | | | 131,696 | (n) | |
| | | | 297,797 | | |
Ginnie Mae 2.1% | | | |
| | | | | Pass-Through Certificates | | | | | |
| | 1 | | | 6.50%, due 7/15/32 | | | 1 | | |
| | 1 | | | 7.00%, due 8/15/32 | | | 1 | | |
See Notes to Financial Statements
174
Schedule of Investments Strategic Income Fund (cont'd)
| PRINCIPAL AMOUNT(a) | | | | VALUE | |
(000's omitted) | | | | (000's omitted) | |
$ | 27,075 | | | 3.50%, TBA, 30 Year Maturity | | $ | 28,083 | (n) | |
| | 28,214 | | | 4.50%, TBA, 30 Year Maturity | | | 29,898 | (n) | |
| | | | 57,983 | | |
| | | | | Total Mortgage-Backed Securities (Cost $749,077) | | | 737,479 | | |
Corporate Bonds 38.6% | | | |
Advertising 0.2% | | | |
| | | | | Lamar Media Corp. | | | | | |
| | 160 | | | 5.00%, due 5/1/23 | | | 165 | | |
| | 355 | | | 5.75%, due 2/1/26 | | | 383 | | |
| | 1,475 | | | MDC Partners, Inc., 6.50%, due 5/1/24 | | | 1,504 | (l)(o) | |
| | | | | Nielsen Finance LLC | | | | | |
| | 420 | | | 4.50%, due 10/1/20 | | | 426 | | |
| | 3,080 | | | 5.00%, due 4/15/22 | | | 3,172 | (l)(o) | |
| | 145 | | | Outfront Media Capital LLC/Outfront Media Capital Corp., 5.88%, due 3/15/25 | | | 154 | | |
| | | | 5,804 | | |
Aerospace & Defense 0.3% | | | |
| | 7,250 | | | Northrop Grumman Corp., 2.55%, due 10/15/22 | | | 7,258 | | |
Agriculture 0.5% | | | |
| | 14,295 | | | BAT Capital Corp., 4.54%, due 8/15/47 | | | 14,575 | (l)(o) | |
Airlines 0.3% | | | |
| | 7,599 | | | American Airlines, Inc., Ser. 2014-1, Class B, 4.38%, due 10/1/22 | | | 7,814 | (o) | |
Auto Manufacturers 1.7% | | | |
| | 30,020 | | | Ford Motor Credit Co. LLC, 2.98%, due 8/3/22 | | | 30,102 | (o) | |
| | | | | General Motors Financial Co., Inc. | | | | | |
| | 6,710 | | | 3.20%, due 7/6/21 | | | 6,846 | (o) | |
| | 9,330 | | | 4.00%, due 10/6/26 | | | 9,408 | (o) | |
| | | | 46,356 | | |
Auto Parts & Equipment 0.1% | | | |
| | 890 | | | IHO Verwaltungs GmbH, 4.50% Cash/5.25% PIK, due 9/15/23 | | | 918 | (l)(p) | |
| | 1,265 | | | ZF N.A. Capital, Inc., 4.00%, due 4/29/20 | | | 1,306 | (l) | |
| | | | 2,224 | | |
Banking 0.4% | | | |
| | | | | Ally Financial, Inc. | | | | | |
| | 2,890 | | | 6.25%, due 12/1/17 | | | 2,899 | (o) | |
| | 1,715 | | | 3.60%, due 5/21/18 | | | 1,726 | (o) | |
| | 2,470 | | | 3.25%, due 11/5/18 | | | 2,488 | (o) | |
| | 2,760 | | | 8.00%, due 3/15/20 | | | 3,101 | (o) | |
| | | | | CIT Group, Inc. | | | | | |
| | 188 | | | 5.50%, due 2/15/19 | | | 197 | (l) | |
| | 1,145 | | | 3.88%, due 2/19/19 | | | 1,162 | (o) | |
| | | | 11,573 | | |
See Notes to Financial Statements
175
Schedule of Investments Strategic Income Fund (cont'd)
| PRINCIPAL AMOUNT(a) | | | | VALUE | |
(000's omitted) | | | | (000's omitted) | |
Banks 5.7% | | | |
$ | 14,400 | | | Banco Santander SA, 3.80%, due 2/23/28 | | $ | 14,378 | | |
| | 9,145 | | | Bank of America Corp., Ser. L, 3.95%, due 4/21/25 | | | 9,430 | (o) | |
| | 14,320 | | | Barclays PLC, 4.34%, due 1/10/28 | | | 14,866 | (o) | |
| | 12,525 | | | Capital One N.A., 2.35%, due 1/31/20 | | | 12,545 | (o) | |
| | | | | Goldman Sachs Group, Inc. | | | | | |
| | 10,190 | | | 3 month USD LIBOR + 1.51%, (3.69%), due 6/5/28 | | | 10,282 | (b) | |
| | 7,370 | | | 3 month USD LIBOR + 1.37%, (4.02%), due 10/31/38 | | | 7,419 | (b) | |
| | 7,795 | | | 5.15%, due 5/22/45 | | | 8,873 | (o) | |
| | 14,440 | | | HSBC Holdings PLC, 5 Year USD ICE Swap + 3.75%, (6.00%), due 12/31/99 | | | 15,342 | (b) | |
| | 10,265 | | | JPMorgan Chase & Co., 3 month USD LIBOR + 1.38%, (3.54%), due 5/1/28 | | | 10,383 | (b)(o) | |
| | | | | Morgan Stanley | | | | | |
| | 24,090 | | | 3 month USD LIBOR + 1.34%, (3.59%), due 7/22/28 | | | 24,275 | (b)(o) | |
| | 5,015 | | | Ser. H, 3 month USD LIBOR + 3.61%, (5.45%), due 12/31/49 | | | 5,201 | (b)(o) | |
| | 6,930 | | | SunTrust Banks, Inc., Ser. G, 3 month USD LIBOR + 3.10%, (5.05%), due 12/31/99 | | | 7,107 | (b)(o) | |
| | 14,020 | | | Westpac Banking Corp., 5 Year USD ICE Swap + 2.89%, (5.00%), due 12/31/99 | | | 14,086 | (b) | |
| | | | 154,187 | | |
Beverages 0.2% | | | |
| | 4,675 | | | Anheuser-Busch InBev Finance, Inc., 4.70%, due 2/1/36 | | | 5,140 | (o) | |
Biotechnology 0.2% | | | |
| | 4,675 | | | Gilead Sciences, Inc., 4.60%, due 9/1/35 | | | 5,200 | | |
| Brokerage 0.0%(c) | | | |
| | 1,090 | | | LPL Holdings, Inc., 5.75%, due 9/15/25 | | | 1,134 | (l) | |
Building & Construction 0.4% | | | |
| | 525 | | | CalAtlantic Group, Inc., 5.25%, due 6/1/26 | | | 559 | | |
| | | | | Lennar Corp. | | | | | |
| | 1,935 | | | 4.75%, due 12/15/17 | | | 1,936 | (o) | |
| | 890 | | | 4.75%, due 11/15/22 | | | 940 | (o) | |
| | 955 | | | 4.88%, due 12/15/23 | | | 1,010 | (o) | |
| | 260 | | | 4.75%, due 5/30/25 | | | 272 | | |
| | 385 | | | Meritage Homes Corp., 6.00%, due 6/1/25 | | | 414 | | |
| | 805 | | | PulteGroup, Inc., 4.25%, due 3/1/21 | | | 838 | | |
| | 560 | | | Ryland Group, Inc., 5.38%, due 10/1/22 | | | 611 | | |
| | | | | Standard Pacific Corp. | | | | | |
| | 515 | | | 8.38%, due 5/15/18 | | | 532 | | |
| | 420 | | | 8.38%, due 1/15/21 | | | 489 | | |
| | 595 | | | Taylor Morrison Communities, Inc./Taylor Morrison Holdings II, Inc., 5.63%, due 3/1/24 | | | 621 | (l)(o) | |
| | | | | Toll Brothers Finance Corp. | | | | | |
| | 1,545 | | | 4.00%, due 12/31/18 | | | 1,568 | (o) | |
| | 465 | | | 4.38%, due 4/15/23 | | | 486 | | |
| | | | 10,276 | | |
Building Materials 0.1% | | | |
| | 1,015 | | | HD Supply, Inc., 5.75%, due 4/15/24 | | | 1,095 | (l) | |
| | 470 | | | USG Corp., 5.50%, due 3/1/25 | | | 504 | (l) | |
| | | | 1,599 | | |
See Notes to Financial Statements
176
Schedule of Investments Strategic Income Fund (cont'd)
| PRINCIPAL AMOUNT(a) | | | | VALUE | |
(000's omitted) | | | | (000's omitted) | |
Cable & Satellite Television 1.3% | | | |
| | | | | Altice Luxembourg SA | | | | | |
$ | 1,145 | | | 7.75%, due 5/15/22 | | $ | 1,212 | (l)(o) | |
| | 900 | | | 7.63%, due 2/15/25 | | | 977 | (l)(o) | |
| | | | | Altice US Finance I Corp. | | | | | |
| | 545 | | | 5.38%, due 7/15/23 | | | 568 | (l)(o) | |
| | 810 | | | 5.50%, due 5/15/26 | | | 842 | (l)(o) | |
| | 565 | | | Altice US Finance II Corp., 7.75%, due 7/15/25 | | | 617 | (l)(o) | |
| | | | | CCO Holdings LLC/CCO Holdings Capital Corp. | | | | | |
| | 1,440 | | | 5.25%, due 9/30/22 | | | 1,483 | (o) | |
| | 2,615 | | | 5.13%, due 5/1/23 | | | 2,726 | (l)(o) | |
| | 2,205 | | | 5.75%, due 2/15/26 | | | 2,305 | (l)(o) | |
| | 730 | | | 5.13%, due 5/1/27 | | | 736 | (l) | |
| | 1,090 | | | 5.88%, due 5/1/27 | | | 1,141 | (l)(o) | |
| | 1,860 | | | 5.00%, due 2/1/28 | | | 1,846 | (l) | |
| | | | | Cequel Communications Holdings I LLC/Cequel Capital Corp. | | | | | |
| | 940 | | | 6.38%, due 9/15/20 | | | 959 | (l)(o) | |
| | 1,205 | | | 5.13%, due 12/15/21 | | | 1,226 | (l)(o) | |
| | | | | CSC Holdings LLC | | | | | |
| | 2,086 | | | 10.88%, due 10/15/25 | | | 2,555 | (l)(o) | |
| | 390 | | | 5.50%, due 4/15/27 | | | 402 | (l) | |
| | 1,190 | | | CSC Holdings, Inc., 7.63%, due 7/15/18 | | | 1,226 | (o) | |
| | | | | DISH DBS Corp. | | | | | |
| | 545 | | | 4.25%, due 4/1/18 | | | 549 | | |
| | 355 | | | 6.75%, due 6/1/21 | | | 373 | | |
| | 1,300 | | | 5.88%, due 11/15/24 | | | 1,302 | (o) | |
| | 455 | | | 7.75%, due 7/1/26 | | | 498 | | |
| | | | | Numericable-SFR SA | | | | | |
| | 3,385 | | | 6.00%, due 5/15/22 | | | 3,529 | (l)(o) | |
| | 780 | | | 6.25%, due 5/15/24 | | | 817 | (l) | |
| | 1,820 | | | 7.38%, due 5/1/26 | | | 1,957 | (l)(o) | |
| | 740 | | | Unitymedia Hessen GmbH & Co. KG/Unitymedia NRW GmbH, 5.00%, due 1/15/25 | | | 771 | (l) | |
| | 545 | | | UPCB Finance IV Ltd., 5.38%, due 1/15/25 | | | 557 | (l) | |
| | | | | Virgin Media Finance PLC | | | | | |
| | 530 | | | 5.25%, due 2/15/22 | | | 509 | | |
| | 365 | | | 6.00%, due 10/15/24 | | | 382 | (l) | |
| | 1,330 | | | Virgin Media Secured Finance PLC, 5.50%, due 8/15/26 | | | 1,392 | (l)(o) | |
| | 1,780 | | | Ziggo Secured Finance BV, 5.50%, due 1/15/27 | | | 1,816 | (l)(o) | |
| | | | 35,273 | | |
Chemicals 0.2% | | | |
| | 535 | | | CF Industries, Inc., 5.38%, due 3/15/44 | | | 514 | | |
| | | | | Momentive Performance Materials, Inc. | | | | | |
| | 425 | | | 8.88%, due 10/15/20 | | | 0 | (f)(m)(q)(r)(s) | |
| | 425 | | | 3.88%, due 10/24/21 | | | 442 | | |
| | | | | NOVA Chemicals Corp. | | | | | |
| | 450 | | | 5.25%, due 8/1/23 | | | 464 | (l) | |
| | 1,510 | | | 4.88%, due 6/1/24 | | | 1,539 | (l) | |
| | 1,185 | | | 5.00%, due 5/1/25 | | | 1,200 | (l)(o) | |
| | 1,040 | | | 5.25%, due 6/1/27 | | | 1,058 | (l) | |
| | | | | WR Grace & Co-Conn | | | | | |
| | 295 | | | 5.13%, due 10/1/21 | | | 317 | (l) | |
| | 195 | | | 5.63%, due 10/1/24 | | | 213 | (l) | |
| | | | 5,747 | | |
See Notes to Financial Statements
177
Schedule of Investments Strategic Income Fund (cont'd)
| PRINCIPAL AMOUNT(a) | | | | VALUE | |
(000's omitted) | | | | (000's omitted) | |
Computers 2.0% | | | |
| | | | | Apple, Inc. | | | | | |
$ | 13,140 | | | 2.30%, due 5/11/22 | | $ | 13,143 | (o) | |
| | 8,195 | | | 4.65%, due 2/23/46 | | | 9,318 | (o) | |
| | | | | Diamond 1 Finance Corp./Diamond 2 Finance Corp. | | | | | |
| | 10,075 | | | 4.42%, due 6/15/21 | | | 10,592 | (l)(o) | |
| | 12,285 | | | 5.45%, due 6/15/23 | | | 13,459 | (l)(o) | |
| | 6,660 | | | HP Enterprise Co., 4.90%, due 10/15/25 | | | 7,081 | (o) | |
| | | | 53,593 | | |
Consumer - Commercial Lease Financing 0.9% | | | |
| | | | | Aircastle Ltd. | | | | | |
| | 1,755 | | | 4.63%, due 12/15/18 | | | 1,799 | (o) | |
| | 1,065 | | | 6.25%, due 12/1/19 | | | 1,140 | (o) | |
| | 510 | | | 5.13%, due 3/15/21 | | | 541 | (o) | |
| | 645 | | | 5.50%, due 2/15/22 | | | 693 | (o) | |
| | 490 | | | 5.00%, due 4/1/23 | | | 518 | (o) | |
| | | | | Navient Corp. | | | | | |
| | 505 | | | 5.50%, due 1/15/19 | | | 521 | | |
| | 2,980 | | | 4.88%, due 6/17/19 | | | 3,066 | (o) | |
| | 625 | | | 8.00%, due 3/25/20 | | | 689 | | |
| | 570 | | | 5.88%, due 3/25/21 | | | 599 | | |
| | 380 | | | 6.63%, due 7/26/21 | | | 407 | | |
| | 1,365 | | | 5.88%, due 10/25/24 | | | 1,385 | | |
| | 325 | | | 6.75%, due 6/25/25 | | | 340 | | |
| | 1,485 | | | OneMain Financial Holdings LLC, 7.25%, due 12/15/21 | | | 1,544 | (l) | |
| | | | | Park Aerospace Holdings Ltd. | | | | | |
| | 3,425 | | | 5.25%, due 8/15/22 | | | 3,562 | (l)(o) | |
| | 2,165 | | | 5.50%, due 2/15/24 | | | 2,246 | (l)(o) | |
| | | | | SLM Corp. | | | | | |
| | 500 | | | Ser. A, 8.45%, due 6/15/18 | | | 519 | | |
| | 1,445 | | | 6.13%, due 3/25/24 | | | 1,483 | | |
| | | | | Springleaf Finance Corp. | | | | | |
| | 510 | | | 8.25%, due 12/15/20 | | | 575 | | |
| | 735 | | | 7.75%, due 10/1/21 | | | 826 | | |
| | 1,065 | | | 6.13%, due 5/15/22 | | | 1,124 | | |
| | | | 23,577 | | |
Discount Stores 0.1% | | | |
| | | | | Dollar Tree, Inc. | | | | | |
| | 780 | | | 5.25%, due 3/1/20 | | | 798 | (o) | |
| | 905 | | | 5.75%, due 3/1/23 | | | 951 | (o) | |
| | | | 1,749 | | |
Electric 0.4% | | | |
| | 10,745 | | | Enel Finance Int'l NV, 3.50%, due 4/6/28 | | | 10,558 | (l) | |
Electric - Generation 0.6% | | | |
| | | | | Calpine Corp. | | | | | |
| | 1,725 | | | 6.00%, due 1/15/22 | | | 1,781 | (l)(o) | |
| | 3,390 | | | 5.38%, due 1/15/23 | | | 3,297 | (o) | |
See Notes to Financial Statements
178
Schedule of Investments Strategic Income Fund (cont'd)
| PRINCIPAL AMOUNT(a) | | | | VALUE | |
(000's omitted) | | | | (000's omitted) | |
| | | | | Dynegy, Inc. | | | | | |
$ | 1,015 | | | 5.88%, due 6/1/23 | | $ | 1,048 | | |
| | 1,485 | | | 7.63%, due 11/1/24 | | | 1,622 | | |
| | 355 | | | 8.00%, due 1/15/25 | | | 388 | (l) | |
| | 1,140 | | | 8.13%, due 1/30/26 | | | 1,265 | (l) | |
| | | | | NRG Energy, Inc. | | | | | |
| | 605 | | | 6.25%, due 7/15/22 | | | 635 | | |
| | 405 | | | 6.63%, due 3/15/23 | | | 419 | | |
| | 1,930 | | | 7.25%, due 5/15/26 | | | 2,092 | (o) | |
| | 2,730 | | | 6.63%, due 1/15/27 | | | 2,908 | (o) | |
| | | | 15,455 | | |
Electric - Integrated 0.1% | | | |
| | 2,145 | | | PPL Energy Supply LLC, 4.60%, due 12/15/21 | | | 1,952 | (o) | |
| | | | | Talen Energy Supply LLC | | | | | |
| | 1,065 | | | 9.50%, due 7/15/22 | | | 1,097 | (l) | |
| | 645 | | | 6.50%, due 6/1/25 | | | 559 | | |
| | | | 3,608 | | |
Electronics 0.2% | | | |
| | 1,435 | | | Amkor Technology, Inc., 6.38%, due 10/1/22 | | | 1,480 | (o) | |
| | 415 | | | Flex Ltd., 5.00%, due 2/15/23 | | | 450 | | |
| | | | | Micron Technology, Inc. | | | | | |
| | 600 | | | 5.25%, due 8/1/23 | | | 628 | (l) | |
| | 445 | | | 5.50%, due 2/1/25 | | | 473 | | |
| | 365 | | | 5.63%, due 1/15/26 | | | 388 | (l) | |
| | 665 | | | NXP BV/NXP Funding LLC, 4.13%, due 6/1/21 | | | 695 | (l)(o) | |
| | 770 | | | Sensata Technologies UK Financing Co. PLC, 6.25%, due 2/15/26 | | | 845 | (l)(o) | |
| | 136 | | | Zebra Technologies Corp., 7.25%, due 10/15/22 | | | 144 | | |
| | | | 5,103 | | |
Energy - Exploration & Production 0.9% | | | |
| | | | | Antero Resources Corp. | | | | | |
| | 1,060 | | | 5.38%, due 11/1/21 | | | 1,088 | (o) | |
| | 1,080 | | | 5.13%, due 12/1/22 | | | 1,110 | (o) | |
| | 45 | | | 5.00%, due 3/1/25 | | | 46 | (o) | |
| | 1,000 | | | Ascent Resources Utica Holdings LLC/ARU Finance Corp., 10.00%, due 4/1/22 | | | 1,085 | (l)(o) | |
| | 877 | | | Bill Barrett Corp., 7.00%, due 10/15/22 | | | 851 | (o) | |
| | | | | Chesapeake Energy Corp. | | | | | |
| | 655 | | | 6.13%, due 2/15/21 | | | 660 | | |
| | 515 | | | 5.38%, due 6/15/21 | | | 496 | | |
| | 790 | | | 8.00%, due 1/15/25 | | | 790 | (l)(o) | |
| | 1,260 | | | 8.00%, due 6/15/27 | | | 1,224 | (l) | |
| | | | | Continental Resources, Inc. | | | | | |
| | 455 | | | 4.50%, due 4/15/23 | | | 461 | | |
| | 1,045 | | | 3.80%, due 6/1/24 | | | 1,015 | (o) | |
| | 490 | | | 4.90%, due 6/1/44 | | | 456 | | |
| | | | | EP Energy LLC/Everest Acquisition Finance, Inc. | | | | | |
| | 2,270 | | | 9.38%, due 5/1/20 | | | 1,906 | (o) | |
| | 745 | | | 7.75%, due 9/1/22 | | | 458 | | |
| | 2,710 | | | 6.38%, due 6/15/23 | | | 1,612 | (o) | |
| | 780 | | | Extraction Oil & Gas Holdings LLC/Extraction Finance Corp., 7.88%, due 7/15/21 | | | 827 | (l) | |
| | 705 | | | Newfield Exploration Co., 5.38%, due 1/1/26 | | | 749 | (o) | |
See Notes to Financial Statements
179
Schedule of Investments Strategic Income Fund (cont'd)
| PRINCIPAL AMOUNT(a) | | | | VALUE | |
(000's omitted) | | | | (000's omitted) | |
| | | | | Oasis Petroleum, Inc. | | | | | |
$ | 525 | | | 6.50%, due 11/1/21 | | $ | 534 | | |
| | 665 | | | 6.88%, due 3/15/22 | | | 683 | (o) | |
| | 400 | | | PDC Energy, Inc., 6.13%, due 9/15/24 | | | 418 | | |
| | | | | Range Resources Corp. | | | | | |
| | 80 | | | 5.00%, due 8/15/22 | | | 79 | | |
| | 1,750 | | | 5.00%, due 3/15/23 | | | 1,733 | | |
| | | | | Sanchez Energy Corp. | | | | | |
| | 325 | | | 7.75%, due 6/15/21 | | | 302 | | |
| | 1,515 | | | 6.13%, due 1/15/23 | | | 1,265 | (o) | |
| | | | | SM Energy Co. | | | | | |
| | 855 | | | 6.13%, due 11/15/22 | | | 859 | | |
| | 570 | | | 5.00%, due 1/15/24 | | | 544 | | |
| | | | | Whiting Petroleum Corp. | | | | | |
| | 965 | | | 5.75%, due 3/15/21 | | | 972 | (o) | |
| | 1,035 | | | 6.25%, due 4/1/23 | | | 1,032 | (o) | |
| | 795 | | | WPX Energy, Inc., 5.25%, due 9/15/24 | | | 798 | (o) | |
| | | | 24,053 | | |
| Exploration & Productions 0.0%(c) | | | |
| | 140 | | | Bill Barrett Corp., 8.75%, due 6/15/25 | | | 138 | | |
Food & Drug Retail 0.1% | | | |
| | | | | Albertsons Cos LLC/Safeway, Inc./New Albertson's, Inc./Albertson's LLC | | | | | |
| | 1,970 | | | 6.63%, due 6/15/24 | | | 1,852 | | |
| | 1,595 | | | 5.75%, due 3/15/25 | | | 1,404 | (o) | |
| | 490 | | | Tesco PLC, 5.50%, due 11/15/17 | | | 490 | (l) | |
| | | | 3,746 | | |
Food - Wholesale 0.1% | | | |
| | | | | Post Holdings, Inc. | | | | | |
| | 925 | | | 6.00%, due 12/15/22 | | | 969 | (l)(o) | |
| | 520 | | | 5.50%, due 3/1/25 | | | 541 | (l) | |
| | 635 | | | 5.75%, due 3/1/27 | | | 659 | (l) | |
| | | | 2,169 | | |
Gaming 0.4% | | | |
| | | | | Boyd Gaming Corp. | | | | | |
| | 895 | | | 6.88%, due 5/15/23 | | | 961 | | |
| | 1,020 | | | 6.38%, due 4/1/26 | | | 1,119 | (o) | |
| | 430 | | | Eldorado Resorts, Inc., 7.00%, due 8/1/23 | | | 464 | | |
| | | | | GLP Capital L.P./GLP Financing II, Inc. | | | | | |
| | 950 | | | 4.38%, due 11/1/18 | | | 957 | (o) | |
| | 1,765 | | | 4.88%, due 11/1/20 | | | 1,866 | (o) | |
| | 1,095 | | | 5.38%, due 11/1/23 | | | 1,191 | (o) | |
| | 545 | | | Int'l Game Technology PLC, 5.63%, due 2/15/20 | | | 579 | (l) | |
| | | | | MGM Resorts Int'l | | | | | |
| | 1,205 | | | 8.63%, due 2/1/19 | | | 1,291 | (o) | |
| | 405 | | | 6.63%, due 12/15/21 | | | 453 | | |
| | 695 | | | Scientific Games Int'l, Inc., 10.00%, due 12/1/22 | | | 768 | (o) | |
| | 1,235 | | | Wynn Las Vegas LLC/Wynn Las Vegas Capital Corp., 5.50%, due 3/1/25 | | | 1,297 | (l)(o) | |
| | | | 10,946 | | |
See Notes to Financial Statements
180
Schedule of Investments Strategic Income Fund (cont'd)
| PRINCIPAL AMOUNT(a) | | | | VALUE | |
(000's omitted) | | | | (000's omitted) | |
Gas Distribution 0.9% | | | |
$ | 955 | | | Antero Midstream Partners LP/Antero Midstream Finance Corp., 5.38%, due 9/15/24 | | $ | 996 | (o) | |
| | | | | Cheniere Corpus Christi Holdings LLC | | | | | |
| | 850 | | | 5.88%, due 3/31/25 | | | 920 | | |
| | 450 | | | 5.13%, due 6/30/27 | | | 464 | (l) | |
| | 1,845 | | | Cheniere Energy Partners L.P., 5.25%, due 10/1/25 | | | 1,900 | (l) | |
| | | | | Crestwood Midstream Partners L.P./Crestwood Midstream Finance Corp. | | | | | |
| | 455 | | | 6.25%, due 4/1/23 | | | 473 | | |
| | 345 | | | 5.75%, due 4/1/25 | | | 354 | | |
| | | | | DCP Midstream LLC | | | | | |
| | 295 | | | 9.75%, due 3/15/19 | | | 322 | (l) | |
| | 910 | | | 6.75%, due 9/15/37 | | | 978 | (l)(o) | |
| | 905 | | | 3 month USD LIBOR + 3.85%, (5.85%), due 5/21/43 | | | 861 | (b)(l)(o) | |
| | | | | DCP Midstream Operating L.P. | | | | | |
| | 1,005 | | | 2.50%, due 12/1/17 | | | 1,005 | (o) | |
| | 495 | | | 5.60%, due 4/1/44 | | | 473 | | |
| | | | | Duke Energy Corp. | | | | | |
| | 170 | | | 8.13%, due 8/16/30 | | | 201 | | |
| | 500 | | | 6.45%, due 11/3/36 | | | 529 | (l) | |
| | | | | Energy Transfer Equity L.P. | | | | | |
| | 1,020 | | | 7.50%, due 10/15/20 | | | 1,147 | (o) | |
| | 605 | | | 5.88%, due 1/15/24 | | | 656 | | |
| | 235 | | | Ferrellgas L.P./Ferrellgas Finance Corp., 6.75%, due 6/15/23 | | | 219 | (o) | |
| | | | | NuStar Logistics L.P. | | | | | |
| | 565 | | | 4.80%, due 9/1/20 | | | 587 | | |
| | 175 | | | 6.75%, due 2/1/21 | | | 190 | | |
| | 190 | | | 4.75%, due 2/1/22 | | | 194 | | |
| | | | | Rockies Express Pipeline LLC | | | | | |
| | 515 | | | 6.85%, due 7/15/18 | | | 529 | (l) | |
| | 1,250 | | | 5.63%, due 4/15/20 | | | 1,325 | (l)(o) | |
| | 245 | | | 7.50%, due 7/15/38 | | | 283 | (l) | |
| | 245 | | | 6.88%, due 4/15/40 | | | 273 | (l) | |
| | 340 | | | SemGroup Corp., 7.25%, due 3/15/26 | | | 348 | (l) | |
| | 1,790 | | | SemGroup Corp./Rose Rock Finance Corp., 5.63%, due 11/15/23 | | | 1,750 | (o) | |
| | 1,400 | | | Summit Midstream Holdings LLC/Summit Midstream Finance Corp., 5.75%, due 4/15/25 | | | 1,428 | (o) | |
| | | | | Targa Resources Partners L.P./Targa Resources Partners Finance Corp. | | | | | |
| | 590 | | | 4.25%, due 11/15/23 | | | 587 | | |
| | 875 | | | 6.75%, due 3/15/24 | | | 943 | (o) | |
| | 670 | | | 5.13%, due 2/1/25 | | | 690 | | |
| | 195 | | | 5.38%, due 2/1/27 | | | 202 | | |
| | 940 | | | 5.00%, due 1/15/28 | | | 946 | (l) | |
| | 185 | | | Tesoro Logistics L.P./Tesoro Logistics Finance Corp., 6.13%, due 10/15/21 | | | 191 | | |
| | | | | Williams Cos., Inc. | | | | | |
| | 525 | | | Ser. A, 7.50%, due 1/15/31 | | | 637 | | |
| | 735 | | | 5.75%, due 6/24/44 | | | 779 | (o) | |
| | | | 23,380 | | |
Health Facilities 0.8% | | | |
| | | | | CHS/Community Health Systems, Inc. | | | | | |
| | 359 | | | 8.00%, due 11/15/19 | | | 342 | | |
| | 220 | | | 7.13%, due 7/15/20 | | | 191 | | |
| | 1,140 | | | 6.88%, due 2/1/22 | | | 834 | | |
| | 80 | | | Columbia Healthcare Corp., 7.50%, due 12/15/23 | | | 92 | | |
| | 935 | | | Columbia/HCA Corp., 7.69%, due 6/15/25 | | | 1,061 | (o) | |
See Notes to Financial Statements
181
Schedule of Investments Strategic Income Fund (cont'd)
| PRINCIPAL AMOUNT(a) | | | | VALUE | |
(000's omitted) | | | | (000's omitted) | |
| | | | | HCA, Inc. | | | | | |
$ | 540 | | | 6.50%, due 2/15/20 | | $ | 582 | | |
| | 605 | | | 5.88%, due 3/15/22 | | | 662 | | |
| | 1,290 | | | 4.75%, due 5/1/23 | | | 1,350 | (o) | |
| | 1,895 | | | 5.00%, due 3/15/24 | | | 1,994 | (o) | |
| | 375 | | | 5.38%, due 2/1/25 | | | 386 | | |
| | 1,130 | | | 5.25%, due 4/15/25 | | | 1,203 | (o) | |
| | 535 | | | LifePoint Health, Inc., 5.88%, due 12/1/23 | | | 550 | | |
| | | | | MPT Operating Partnership L.P./MPT Finance Corp. | | | | | |
| | 710 | | | 6.38%, due 3/1/24 | | | 768 | (o) | |
| | 1,505 | | | 5.50%, due 5/1/24 | | | 1,593 | (o) | |
| | 1,340 | | | 5.25%, due 8/1/26 | | | 1,395 | (o) | |
| | 1,675 | | | 5.00%, due 10/15/27 | | | 1,721 | | |
| | 1,550 | | | Sabra Health Care L.P./Sabra Capital Corp., 5.50%, due 2/1/21 | | | 1,598 | (o) | |
| | | | | Tenet Healthcare Corp. | | | | | |
| | 1,130 | | | 7.50%, due 1/1/22 | | | 1,189 | (l)(o) | |
| | 1,400 | | | 8.13%, due 4/1/22 | | | 1,402 | | |
| | 1,625 | | | 6.75%, due 6/15/23 | | | 1,525 | | |
| | 1,667 | | | 4.63%, due 7/15/24 | | | 1,640 | (l) | |
| | 285 | | | 6.88%, due 11/15/31 | | | 241 | | |
| | 265 | | | THC Escrow Corp., 7.00%, due 8/1/25 | | | 243 | (l) | |
| | | | 22,562 | | |
Health Services 0.2% | | | |
| | | | | DaVita HealthCare Partners, Inc. | | | | | |
| | 1,400 | | | 5.13%, due 7/15/24 | | | 1,403 | | |
| | 720 | | | 5.00%, due 5/1/25 | | | 709 | | |
| | 1,285 | | | DaVita, Inc., 5.75%, due 8/15/22 | | | 1,325 | (o) | |
| | 705 | | | IMS Health, Inc., 5.00%, due 10/15/26 | | | 749 | (l) | |
| | | | | Service Corp. Int'l | | | | | |
| | 400 | | | 7.63%, due 10/1/18 | | | 420 | | |
| | 685 | | | 5.38%, due 1/15/22 | | | 704 | | |
| | 1,065 | | | 5.38%, due 5/15/24 | | | 1,124 | (o) | |
| | | | 6,434 | | |
Healthcare - Products 0.2% | | | |
| | 5,910 | | | Abbott Laboratories, 4.90%, due 11/30/46 | | | 6,621 | (o) | |
Hotels 0.1% | | | |
| | 2,270 | | | ESH Hospitality, Inc., 5.25%, due 5/1/25 | | | 2,347 | (l)(o) | |
| | 965 | | | Hilton Worldwide Finance LLC/Hilton Worldwide Finance Corp., 4.63%, due 4/1/25 | | | 995 | | |
| | | | 3,342 | | |
Investments & Misc. Financial Services 0.1% | | | |
| | 1,465 | | | Icahn Enterprises L.P./Icahn Enterprises Finance Corp., 4.88%, due 3/15/19 | | | 1,472 | (o) | |
| | | | | MSCI, Inc. | | | | | |
| | 1,600 | | | 5.25%, due 11/15/24 | | | 1,692 | (l)(o) | |
| | 870 | | | 5.75%, due 8/15/25 | | | 940 | (l)(o) | |
| | | | 4,104 | | |
See Notes to Financial Statements
182
Schedule of Investments Strategic Income Fund (cont'd)
| PRINCIPAL AMOUNT(a) | | | | VALUE | |
(000's omitted) | | | | (000's omitted) | |
Iron - Steel 0.8% | | | |
$ | 18,450 | | | Vale Overseas Ltd., 6.25%, due 8/10/26 | | $ | 21,255 | | |
Machinery 0.1% | | | |
| | | | | CNH Industrial Capital LLC | | | | | |
| | 400 | | | 3.38%, due 7/15/19 | | | 407 | (o) | |
| | 510 | | | 4.88%, due 4/1/21 | | | 543 | | |
| | 640 | | | 4.38%, due 4/5/22 | | | 679 | | |
| | 525 | | | CNH Industrial NV, 4.50%, due 8/15/23 | | | 555 | | |
| | 565 | | | Manitowoc Foodservice, Inc., 9.50%, due 2/15/24 | | | 646 | | |
| | | | 2,830 | | |
| Managed Care 0.0%(c) | | | |
| | 375 | | | Centene Corp., 4.75%, due 5/15/22 | | | 393 | | |
| | 860 | | | MPH Acquisition Holdings LLC, 7.13%, due 6/1/24 | | | 925 | (l)(o) | |
| | | | 1,318 | | |
Media 2.3% | | | |
| | 3,765 | | | 21st Century Fox America, Inc., 3.38%, due 11/15/26 | | | 3,787 | | |
| | | | | Charter Communications Operating LLC/Charter Communications Operating Capital | | | | | |
| | 12,760 | | | 4.91%, due 7/23/25 | | | 13,574 | (o) | |
| | 11,010 | | | 6.48%, due 10/23/45 | | | 12,693 | (o) | |
| | 9,225 | | | 5.38%, due 5/1/47 | | | 9,333 | (l)(o) | |
| | 5,525 | | | Discovery Communications LLC, 5.20%, due 9/20/47 | | | 5,628 | | |
| | | | | Viacom, Inc. | | | | | |
| | 12,400 | | | 4.38%, due 3/15/43 | | | 10,520 | (o) | |
| | 6,950 | | | 3 month USD LIBOR + 3.90%, (5.88%), due 2/28/57 | | | 6,882 | (b)(o) | |
| | | | 62,417 | | |
Media Content 0.4% | | | |
| | | | | Gannett Co., Inc. | | | | | |
| | 448 | | | 5.13%, due 10/15/19 | | | 455 | | |
| | 820 | | | 5.13%, due 7/15/20 | | | 840 | | |
| | | | | Gray Television, Inc. | | | | | |
| | 660 | | | 5.13%, due 10/15/24 | | | 658 | (l) | |
| | 280 | | | 5.88%, due 7/15/26 | | | 287 | (l) | |
| | | | | Netflix, Inc. | | | | | |
| | 1,230 | | | 5.50%, due 2/15/22 | | | 1,324 | (o) | |
| | 480 | | | 4.38%, due 11/15/26 | | | 470 | (l) | |
| | 345 | | | 4.88%, due 4/15/28 | | | 343 | (l) | |
| | | | | Sinclair Television Group, Inc. | | | | | |
| | 705 | | | 5.38%, due 4/1/21 | | | 723 | | |
| | 630 | | | 5.13%, due 2/15/27 | | | 599 | (l) | |
| | | | | Sirius XM Radio, Inc. | | | | | |
| | 155 | | | 4.63%, due 5/15/23 | | | 159 | (l) | |
| | 1,705 | | | 6.00%, due 7/15/24 | | | 1,820 | (l)(o) | |
| | 1,275 | | | 5.38%, due 7/15/26 | | | 1,344 | (l)(o) | |
| | 990 | | | 5.00%, due 8/1/27 | | | 999 | (l) | |
| | | | | Univision Communications, Inc. | | | | | |
| | 176 | | | 6.75%, due 9/15/22 | | | 182 | (l) | |
| | 1,985 | | | 5.13%, due 5/15/23 | | | 2,010 | (l)(o) | |
| | | | 12,213 | | |
See Notes to Financial Statements
183
Schedule of Investments Strategic Income Fund (cont'd)
| PRINCIPAL AMOUNT(a) | | | | VALUE | |
(000's omitted) | | | | (000's omitted) | |
Medical Products 0.1% | | | |
| | | | | Fresenius Medical Care US Finance II, Inc. | | | | | |
$ | 1,105 | | | 6.50%, due 9/15/18 | | $ | 1,148 | (l)(o) | |
| | 540 | | | 5.88%, due 1/31/22 | | | 603 | (l) | |
| | | | | Hologic, Inc. | | | | | |
| | 830 | | | 5.25%, due 7/15/22 | | | 866 | (l) | |
| | 255 | | | 4.38%, due 10/15/25 | | | 259 | (l) | |
| | | | 2,876 | | |
Metals - Mining Excluding Steel 0.6% | | | |
| | 290 | | | Alcoa, Inc., 5.13%, due 10/1/24 | | | 311 | (o) | |
| | | | | First Quantum Minerals Ltd. | | | | | |
| | 935 | | | 7.00%, due 2/15/21 | | | 970 | (l)(o) | |
| | 1,100 | | | 7.25%, due 5/15/22 | | | 1,150 | (l)(o) | |
| | | | | FMG Resources (August 2006) Pty Ltd. | | | | | |
| | 1,465 | | | 9.75%, due 3/1/22 | | | 1,637 | (l)(o) | |
| | 500 | | | 4.75%, due 5/15/22 | | | 511 | (l) | |
| | 315 | | | 5.13%, due 5/15/24 | | | 324 | (l) | |
| | | | | Freeport-McMoRan, Inc. | | | | | |
| | 920 | | | 2.38%, due 3/15/18 | | | 920 | (o) | |
| | 845 | | | 4.00%, due 11/14/21 | | | 851 | | |
| | 400 | | | 3.55%, due 3/1/22 | | | 396 | | |
| | 1,535 | | | 3.88%, due 3/15/23 | | | 1,514 | (o) | |
| | 1,840 | | | 5.40%, due 11/14/34 | | | 1,794 | (o) | |
| | 1,185 | | | 5.45%, due 3/15/43 | | | 1,114 | | |
| | 725 | | | Hudbay Minerals, Inc., 7.63%, due 1/15/25 | | | 799 | (l)(o) | |
| | 870 | | | Novelis Corp., 5.88%, due 9/30/26 | | | 897 | (l)(o) | |
| | | | | Teck Resources Ltd. | | | | | |
| | 445 | | | 4.75%, due 1/15/22 | | | 469 | | |
| | 1,360 | | | 6.25%, due 7/15/41 | | | 1,553 | (o) | |
| | | | 15,210 | | |
Mining 0.1% | | | |
| | 3,000 | | | Glencore Funding LLC, 3.88%, due 10/27/27 | | | 2,976 | (l) | |
Miscellaneous Manufacturer 0.3% | | | |
| | 7,745 | | | General Electric Co., Ser. D, 3 month USD LIBOR + 3.33%, (5.00%), due 12/29/49 | | | 8,062 | (b)(o) | |
Multi-National 2.5% | | | |
| | | | | IFC Discount Notes | | | | | |
| | 24,000 | | | 0.26%, due 12/15/17 | | | 23,969 | (g)(o) | |
| | 30,000 | | | 0.94%, due 1/18/18 | | | 29,927 | (g) | |
| | 15,000 | | | Inter-American Development Bank, 1.25%, due 1/16/18 | | | 15,000 | | |
| | | | 68,896 | | |
Oil & Gas 2.8% | | | |
| | | | | Canadian Natural Resources Ltd. | | | | | |
| | 12,085 | | | 2.95%, due 1/15/23 | | | 12,150 | | |
| | 7,150 | | | 6.25%, due 3/15/38 | | | 8,834 | | |
| | 10,235 | | | Concho Resources, Inc., 3.75%, due 10/1/27 | | | 10,345 | | |
| | 12,610 | | | Hess Corp., 4.30%, due 4/1/27 | | | 12,700 | (o) | |
See Notes to Financial Statements
184
Schedule of Investments Strategic Income Fund (cont'd)
| PRINCIPAL AMOUNT(a) | | | | VALUE | |
(000's omitted) | | | | (000's omitted) | |
| | | | | Noble Energy, Inc. | | | | | |
$ | 15,690 | | | 3.85%, due 1/15/28 | | $ | 15,749 | (o) | |
| | 8,080 | | | 5.25%, due 11/15/43 | | | 8,624 | (o) | |
| | 8,265 | | | Petroleos Mexicanos, 6.50%, due 3/13/27 | | | 9,020 | (l) | |
| | | | 77,422 | | |
Oil Field Equipment & Services 0.1% | | | |
| | | | | Precision Drilling Corp. | | | | | |
| | 695 | | | 6.50%, due 12/15/21 | | | 702 | (o) | |
| | 960 | | | 5.25%, due 11/15/24 | | | 898 | (o) | |
| | | | 1,600 | | |
Packaging 0.4% | | | |
| | | | | Ardagh Packaging Finance PLC/Ardagh Holdings USA, Inc. | | | | | |
| | 400 | | | 4.25%, due 9/15/22 | | | 412 | (l)(o) | |
| | 1,350 | | | 6.00%, due 2/15/25 | | | 1,433 | (l)(o) | |
| | | | | Ball Corp. | | | | | |
| | 540 | | | 4.38%, due 12/15/20 | | | 567 | | |
| | 735 | | | 5.00%, due 3/15/22 | | | 794 | | |
| | 850 | | | Berry Plastics Corp., 5.13%, due 7/15/23 | | | 892 | | |
| | 720 | | | BWAY Holding Co., 5.50%, due 4/15/24 | | | 750 | (l) | |
| | | | | Reynolds Group Issuer, Inc. | | | | | |
| | 2,360 | | | 5.75%, due 10/15/20 | | | 2,401 | (o) | |
| | 444 | | | 6.88%, due 2/15/21 | | | 456 | | |
| | 1,410 | | | 5.13%, due 7/15/23 | | | 1,468 | (l)(o) | |
| | 480 | | | Sealed Air Corp., 5.50%, due 9/15/25 | | | 529 | (l) | |
| | | | 9,702 | | |
Personal & Household Products 0.1% | | | |
| | 1,330 | | | Energizer Holdings, Inc., 4.70%, due 5/24/22 | | | 1,413 | (o) | |
| | 475 | | | Kronos Acquisition Holdings, Inc., 9.00%, due 8/15/23 | | | 458 | (l) | |
| | 410 | | | Spectrum Brands, Inc., 5.75%, due 7/15/25 | | | 435 | | |
| | | | 2,306 | | |
Pharmaceuticals 0.5% | | | |
| | 5,655 | | | AbbVie, Inc., 4.45%, due 5/14/46 | | | 5,944 | (o) | |
| | 940 | | | Endo Finance LLC & Endo Finco, Inc., 5.38%, due 1/15/23 | | | 757 | (l)(o) | |
| | | | | Endo Ltd./Endo Finance LLC/Endo Finco, Inc. | | | | | |
| | 740 | | | 6.00%, due 7/15/23 | | | 599 | (l) | |
| | 465 | | | 6.00%, due 2/1/25 | | | 370 | (l) | |
| | 590 | | | Jaguar Holding Co. II/Pharmaceutical Product Development LLC, 6.38%, due 8/1/23 | | | 616 | (l) | |
| | 425 | | | Mallinckrodt Int'l Finance SA/Mallinckrodt CB LLC, 5.50%, due 4/15/25 | | | 381 | (l) | |
| | | | | Valeant Pharmaceuticals Int'l, Inc. | | | | | |
| | 1,220 | | | 5.50%, due 3/1/23 | | | 1,025 | (l)(o) | |
| | 3,465 | | | 5.88%, due 5/15/23 | | | 2,924 | (l)(o) | |
| | 450 | | | 5.50%, due 11/1/25 | | | 459 | (l) | |
| | | | 13,075 | | |
See Notes to Financial Statements
185
Schedule of Investments Strategic Income Fund (cont'd)
| PRINCIPAL AMOUNT(a) | | | | VALUE | |
(000's omitted) | | | | (000's omitted) | |
Pipelines 0.9% | | | |
| | | | | Energy Transfer Partners L.P. | | | | | |
$ | 3,000 | | | 4.20%, due 4/15/27 | | $ | 3,035 | | |
| | 5,715 | | | 6.50%, due 2/1/42 | | | 6,522 | (o) | |
| | 8,230 | | | Kinder Morgan, Inc., 5.55%, due 6/1/45 | | | 8,939 | (o) | |
| | 4,905 | | | MPLX LP, 4.13%, due 3/1/27 | | | 5,046 | | |
| | | | 23,542 | | |
Printing & Publishing 0.2% | | | |
| | 1,405 | | | Harland Clarke Holdings Corp., 8.38%, due 8/15/22 | | | 1,481 | (l) | |
| | | | | R.R. Donnelley & Sons Co. | | | | | |
| | 1,454 | | | 7.63%, due 6/15/20 | | | 1,583 | | |
| | 700 | | | 7.88%, due 3/15/21 | | | 738 | | |
| | 535 | | | 6.50%, due 11/15/23 | | | 514 | | |
| | 662 | | | 6.00%, due 4/1/24 | | | 617 | | |
| | | | 4,933 | | |
| Real Estate Dev. & Mgt. 0.0%(c) | | | |
| | 535 | | | Realogy Group LLC/Realogy Co-Issuer Corp., 4.50%, due 4/15/19 | | | 547 | (l) | |
Real Estate Investment Trusts 0.2% | | | |
| | 6,235 | | | Entertainment Properties Trust, 5.75%, due 8/15/22 | | | 6,871 | (o) | |
Recreation & Travel 0.1% | | | |
| | 255 | | | Cedar Fair L.P./Canada's Wonderland Co./Magnum Management Corp., 5.38%, due 4/15/27 | | | 269 | (l) | |
| | 1,145 | | | NCL Corp. Ltd., 4.75%, due 12/15/21 | | | 1,188 | (l)(o) | |
| | | | 1,457 | | |
Restaurants 0.1% | | | |
| | | | | 1011778 BC ULC/New Red Finance, Inc. | | | | | |
| | 740 | | | 4.63%, due 1/15/22 | | | 757 | (l)(o) | |
| | 1,390 | | | 4.25%, due 5/15/24 | | | 1,400 | (l) | |
| | 570 | | | 5.00%, due 10/15/25 | | | 579 | (l) | |
| | 1,180 | | | KFC Holding Co./Pizza Hut Holdings LLC/Taco Bell of America LLC, 5.25%, due 6/1/26 | | | 1,254 | (l) | |
| | | | 3,990 | | |
Semiconductors 0.6% | | | |
| | 15,485 | | | Broadcom Corp./Broadcom Cayman Finance Ltd., 3.88%, due 1/15/27 | | | 15,930 | (l) | |
Software 0.3% | | | |
| | 7,635 | | | Microsoft Corp., 4.50%, due 2/6/57 | | | 8,589 | (o) | |
Software - Services 0.5% | | | |
| | | | | First Data Corp. | | | | | |
| | 1,005 | | | 7.00%, due 12/1/23 | | | 1,075 | (l)(o) | |
| | 3,265 | | | 5.00%, due 1/15/24 | | | 3,392 | (l)(o) | |
| | 1,110 | | | Infor Software Parent LLC/Infor Software Parent, Inc., 7.13% Cash/7.88% PIK, due 5/1/21 | | | 1,141 | (l)(o)(p) | |
| | 730 | | | j2 Cloud Services LLC/j2 Global Co-Obligor, Inc., 6.00%, due 7/15/25 | | | 768 | (l) | |
| | 535 | | | Match Group, Inc., 6.75%, due 12/15/22 | | | 552 | | |
See Notes to Financial Statements
186
Schedule of Investments Strategic Income Fund (cont'd)
| PRINCIPAL AMOUNT(a) | | | | VALUE | |
(000's omitted) | | | | (000's omitted) | |
| | | | | Nuance Communications, Inc. | | | | | |
$ | 346 | | | 5.38%, due 8/15/20 | | $ | 351 | (l) | |
| | 1,580 | | | 6.00%, due 7/1/24 | | | 1,705 | | |
| | 1,305 | | | Open Text Corp., 5.88%, due 6/1/26 | | | 1,414 | (l)(o) | |
| | 1,380 | | | Rackspace Hosting, Inc., 8.63%, due 11/15/24 | | | 1,453 | (l)(o) | |
| | 625 | | | Symantec Corp., 5.00%, due 4/15/25 | | | 653 | (l) | |
| | | | 12,504 | | |
Specialty Retail 0.1% | | | |
| | 420 | | | Hanesbrands, Inc., 4.88%, due 5/15/26 | | | 433 | (l)(o) | |
| | 685 | | | Liberty Media Corp., 8.50%, due 7/15/29 | | | 764 | (o) | |
| | 580 | | | PetSmart, Inc., 5.88%, due 6/1/25 | | | 504 | (l) | |
| | | | | QVC, Inc. | | | | | |
| | 735 | | | 3.13%, due 4/1/19 | | | 744 | (o) | |
| | 460 | | | 5.45%, due 8/15/34 | | | 458 | | |
| | | | 2,903 | | |
| Steel Producers - Products 0.0%(c) | | | |
| | 455 | | | Big River Steel LLC/BRS Finance Corp., 7.25%, due 9/1/25 | | | 488 | (l) | |
Support - Services 0.6% | | | |
| | 1,225 | | | ADT Corp., 4.88%, due 7/15/32 | | | 1,159 | (l)(o) | |
| | 340 | | | Aegis Merger Sub, Inc., 10.25%, due 2/15/23 | | | 372 | (l) | |
| | 2,625 | | | Anna Merger Sub, Inc., 7.75%, due 10/1/22 | | | 1,828 | (l)(o) | |
| | 805 | | | Aramark Services, Inc., 5.13%, due 1/15/24 | | | 851 | (o) | |
| | 510 | | | Avis Budget Car Rental LLC/Avis Budget Finance, Inc., 5.25%, due 3/15/25 | | | 499 | (l) | |
| | | | | Hertz Corp. | | | | | |
| | 185 | | | 6.75%, due 4/15/19 | | | 185 | | |
| | 200 | | | 5.88%, due 10/15/20 | | | 199 | | |
| | 190 | | | 7.63%, due 6/1/22 | | | 198 | (l) | |
| | 2,825 | | | 5.50%, due 10/15/24 | | | 2,542 | (l)(o) | |
| | 1,815 | | | IHS Markit Ltd., 5.00%, due 11/1/22 | | | 1,951 | (l)(o) | |
| | 275 | | | Iron Mountain U.S. Holdings, Inc., 5.38%, due 6/1/26 | | | 287 | (l) | |
| | | | | Iron Mountain, Inc. | | | | | |
| | 1,465 | | | 6.00%, due 8/15/23 | | | 1,542 | (o) | |
| | 2,080 | | | 5.75%, due 8/15/24 | | | 2,132 | (o) | |
| | 1,255 | | | Olympus Merger Sub, Inc., 8.50%, due 10/15/25 | | | 1,228 | (l) | |
| | 560 | | | ServiceMaster Co. LLC, 5.13%, due 11/15/24 | | | 577 | (l) | |
| | | | | United Rental N.A., Inc. | | | | | |
| | 190 | | | 4.63%, due 7/15/23 | | | 199 | | |
| | 580 | | | 5.75%, due 11/15/24 | | | 615 | | |
| | | | 16,364 | | |
Tech Hardware & Equipment 0.6% | | | |
| | | | | CDW LLC/CDW Finance Corp. | | | | | |
| | 760 | | | 5.00%, due 9/1/23 | | | 793 | | |
| | 390 | | | 5.00%, due 9/1/25 | | | 408 | | |
| | 850 | | | CommScope Technologies Finance LLC, 6.00%, due 6/15/25 | | | 897 | (l) | |
| | | | | Diamond 1 Finance Corp./Diamond 2 Finance Corp. | | | | | |
| | 1,355 | | | 5.88%, due 6/15/21 | | | 1,419 | (l)(o) | |
| | 6,370 | | | 6.02%, due 6/15/26 | | | 7,111 | (l)(o) | |
| | 2,290 | | | EMC Corp., 1.88%, due 6/1/18 | | | 2,284 | (o) | |
See Notes to Financial Statements
187
Schedule of Investments Strategic Income Fund (cont'd)
| PRINCIPAL AMOUNT(a) | | | | VALUE | |
(000's omitted) | | | | (000's omitted) | |
$ | 695 | | | Project Homestake Merger Corp., 8.88%, due 3/1/23 | | $ | 622 | (l) | |
| | 1,780 | | | Western Digital Corp., 10.50%, due 4/1/24 | | | 2,089 | (o) | |
| | | | 15,623 | | |
Telecom - Satellite 0.1% | | | |
| | 551 | | | Hughes Satellite Systems Corp., 6.50%, due 6/15/19 | | | 585 | | |
| | | | | Intelsat Jackson Holdings SA | | | | | |
| �� | 205 | | | 7.50%, due 4/1/21 | | | 194 | | |
| | 1,585 | | | 5.50%, due 8/1/23 | | | 1,353 | | |
| | 636 | | | Intelsat Luxembourg SA, 8.13%, due 6/1/23 | | | 388 | | |
| | | | 2,520 | | |
Telecom - Wireless 0.5% | | | |
| | | | | Sprint Corp. | | | | | |
| | 2,055 | | | 7.88%, due 9/15/23 | | | 2,296 | (o) | |
| | 3,505 | | | 7.13%, due 6/15/24 | | | 3,789 | (o) | |
| | | | | Sprint Nextel Corp. | | | | | |
| | 575 | | | 9.00%, due 11/15/18 | | | 609 | (l) | |
| | 595 | | | 6.00%, due 11/15/22 | | | 625 | | |
| | | | | T-Mobile USA, Inc. | | | | | |
| | 1,105 | | | 6.13%, due 1/15/22 | | | 1,149 | (o) | |
| | 1,645 | | | 6.00%, due 3/1/23 | | | 1,733 | (o) | |
| | | | | Wind Acquisition Finance SA | | | | | |
| | 1,310 | | | 4.75%, due 7/15/20 | | | 1,326 | (l)(o) | |
| | 975 | | | 7.38%, due 4/23/21 | | | 1,013 | (l) | |
| | 1,530 | | | Wind Tre SpA, 5.00%, due 1/20/26 | | | 1,540 | (l)(t) | |
| | | | 14,080 | | |
Telecom - Wireline Integrated & Services 1.0% | | | |
| | | | | CenturyLink, Inc. | | | | | |
| | 750 | | | Ser. S, 6.45%, due 6/15/21 | | | 791 | (o) | |
| | 415 | | | Ser. W, 6.75%, due 12/1/23 | | | 432 | | |
| | 2,695 | | | Citizens Communications Co., 9.00%, due 8/15/31 | | | 2,102 | (o) | |
| | | | | Communications Sales & Leasing, Inc./CSL Capital LLC | | | | | |
| | 590 | | | 6.00%, due 4/15/23 | | | 591 | (l) | |
| | 605 | | | 8.25%, due 10/15/23 | | | 581 | | |
| | 740 | | | 7.13%, due 12/15/24 | | | 683 | (l) | |
| | 4,015 | | | Embarq Corp., 8.00%, due 6/1/36 | | | 4,050 | (o) | |
| | 660 | | | Equinix, Inc., 5.88%, due 1/15/26 | | | 715 | | |
| | | | | Frontier Communications Corp. | | | | | |
| | 360 | | | 8.13%, due 10/1/18 | | | 367 | (o) | |
| | 290 | | | 6.25%, due 9/15/21 | | | 239 | | |
| | 410 | | | 7.13%, due 1/15/23 | | | 315 | | |
| | 440 | | | 7.63%, due 4/15/24 | | | 337 | | |
| | 5,590 | | | 11.00%, due 9/15/25 | | | 4,730 | (o) | |
| | | | | Level 3 Financing, Inc. | | | | | |
| | 1,495 | | | 5.38%, due 8/15/22 | | | 1,540 | (o) | |
| | 960 | | | 5.13%, due 5/1/23 | | | 983 | (o) | |
| | 720 | | | 5.38%, due 1/15/24 | | | 748 | (o) | |
| | 1,120 | | | SoftBank Group Corp., 4.50%, due 4/15/20 | | | 1,157 | (l)(o) | |
| | 1,080 | | | Telecom Italia Capital SA, 6.00%, due 9/30/34 | | | 1,210 | (o) | |
| | 1,835 | | | U.S. West Communications Group, 6.88%, due 9/15/33 | | | 1,801 | (o) | |
See Notes to Financial Statements
188
Schedule of Investments Strategic Income Fund (cont'd)
| PRINCIPAL AMOUNT(a) | | | | VALUE | |
(000's omitted) | | | | (000's omitted) | |
| | | | | Zayo Group LLC/Zayo Capital, Inc. | | | | | |
$ | 385 | | | 6.00%, due 4/1/23 | | $ | 405 | | |
| | 305 | | | 6.38%, due 5/15/25 | | | 328 | | |
| | 1,765 | | | 5.75%, due 1/15/27 | | | 1,860 | (l)(o) | |
| | | | 25,965 | | |
Telecommunications 1.8% | | | |
| | | | | AT&T, Inc. | | | | | |
| | 8,085 | | | 3.90%, due 8/14/27 | | | 8,048 | (o) | |
| | 8,355 | | | 4.75%, due 5/15/46 | | | 7,871 | (o) | |
| | 13,890 | | | 5.45%, due 3/1/47 | | | 14,497 | (o) | |
| | | | | Verizon Communications, Inc. | | | | | |
| | 7,020 | | | 4.27%, due 1/15/36 | | | 6,904 | | |
| | 5,250 | | | 4.13%, due 8/15/46 | | | 4,757 | (o) | |
| | 8,049 | | | 4.67%, due 3/15/55 | | | 7,643 | (o) | |
| | | | 49,720 | | |
Theaters & Entertainment 0.2% | | | |
| | | | | AMC Entertainment Holdings, Inc. | | | | | |
| | 1,215 | | | 5.75%, due 6/15/25 | | | 1,181 | (o) | |
| | 1,740 | | | 6.13%, due 5/15/27 | | | 1,723 | (o) | |
| | 1,315 | | | Regal Entertainment Group, 5.75%, due 3/15/22 | | | 1,361 | (o) | |
| | | | 4,265 | | |
| | | | | Total Corporate Bonds (Cost $1,014,649) | | | 1,047,747 | | |
Asset-Backed Securities 12.1% | | | |
| 5,263 | | | Aames Mortgage Investment Trust, Ser. 2005-4, Class M3, 1 month USD LIBOR + 0.78%,
(2.02%), due 10/25/35 | | | 4,866 | (b) | |
| | | | | Accredited Mortgage Loan Trust | | | | | |
| | 1,305 | | | Ser. 2005-4, Class A2D, 1 month USD LIBOR + 0.32%, (1.56%), due 12/25/35 | | | 1,301 | (b) | |
| | 4,965 | | | Ser. 2006-1, Class A4, 1 month USD LIBOR + 0.28%, (1.52%), due 4/25/36 | | | 4,845 | (b) | |
| 8,754 | | | Aegis Asset Backed Securities Trust, Ser. 2005-3, Class M2, 1 month USD LIBOR + 0.48%,
(1.72%), due 8/25/35 | | | 8,635 | (b) | |
| | 5,510 | | | Ally Auto Receivables Trust, Ser. 2017-3, Class A2, 1.53%, due 3/16/20 | | | 5,507 | | |
| | | | | Ameriquest Mortgage Securities, Inc. | | | | | |
| | 6,400 | | | Ser. 2005-R5, Class M4, 1 month USD LIBOR + 0.95%, (2.18%), due 7/25/35 | | | 6,312 | (b) | |
| | 3,960 | | | Ser. 2005-R7, Class M2, 1 month USD LIBOR + 0.50%, (1.74%), due 9/25/35 | | | 3,971 | (b) | |
| | 3,555 | | | Ser. 2005-R8, Class M3, 1 month USD LIBOR + 0.51%, (1.75%), due 10/25/35 | | | 3,470 | (b) | |
| 2,000 | | | ARES XLV CLO Ltd., Ser. 2017-45A, Class E, 3 month USD LIBOR + 0.61%, (7.46%),
due 10/15/30 | | | 1,998 | (b)(l) | |
| | | | | Argent Securities, Inc. | | | | | |
| | 620 | | | Ser. 2003-W3, Class M1, 1 month USD LIBOR + 1.13%, (2.36%), due 9/25/33 | | | 560 | (b) | |
| | 4,144 | | | Ser. 2004-W10, Class M1, 1 month USD LIBOR + 0.90%, (2.14%), due 10/25/34 | | | 4,036 | (b) | |
| | 8,150 | | | Ser. 2005-W2, Class M1, 1 month USD LIBOR + 0.49%, (1.73%), due 10/25/35 | | | 8,112 | (b) | |
| | | | | Asset Backed Securities Corp. Home Equity | | | | | |
| | 532 | | | Ser. 2004-HE5, Class M2, 1 month USD LIBOR + 1.88%, (3.11%), due 8/25/34 | | | 526 | (b) | |
| | 916 | | | Ser. 2006-HE1, Class A3, 1 month USD LIBOR + 0.20%, (1.44%), due 1/25/36 | | | 909 | (b) | |
| 2,900 | | | ASSURANT CLO I Ltd., Ser. 2017-1A, Class E, 3 month USD LIBOR + 6.46%, (0.00%),
due 10/20/29 | | | 2,835 | (b)(l)(t) | |
| 1,300 | | | Babson CLO Ltd., Ser. 2015-2A, Class ER, 3 month USD LIBOR + 6.45%, (7.81%),
due 10/20/30 | | | 1,274 | (b)(l) | |
See Notes to Financial Statements
189
Schedule of Investments Strategic Income Fund (cont'd)
| PRINCIPAL AMOUNT(a) | | | | VALUE | |
(000's omitted) | | | | (000's omitted) | |
| | | | | Bear Stearns Asset Backed Securities I Trust | | | | | |
$ | 1,812 | | | Ser. 2005-TC1, Class M1, 1 month USD LIBOR + 0.66%, (1.90%), due 5/25/35 | | $ | 1,817 | (b) | |
| | 6,730 | | | Ser. 2005-AQ2, Class M1, 1 month USD LIBOR + 0.49%, (1.73%), due 9/25/35 | | | 6,653 | (b) | |
| | 2,797 | | | Ser. 2006-HE1, Class 1M3, 1 month USD LIBOR + 0.46%, (1.70%), due 12/25/35 | | | 2,454 | (b) | |
| | | | | Bear Stearns Asset Backed Securities Trust | | | | | |
| | 1,611 | | | Ser. 2004-SD3, Class M2, 1 month USD LIBOR + 1.88%, (3.11%), due 9/25/34 | | | 1,590 | (b) | |
| | 522 | | | Ser. 2006-HE1, Class 2M1, 1 month USD LIBOR + 0.41%, (1.65%), due 2/25/36 | | | 521 | (b) | |
| | 7,265 | | | Ser. 2006-SD2, Class M2, 1 month USD LIBOR + 0.80%, (2.04%), due 6/25/36 | | | 6,702 | (b) | |
| 3,000 | | | Benefit Street Partners Clo XII Ltd., Ser. 2017-12A, Class D, 3 month USD LIBOR + 6.41%,
(7.76%), due 10/15/30 | | | 2,950 | (b)(l) | |
| | | | | Capital One Multi-Asset Execution Trust | | | | | |
| | 5,440 | | | Ser. 2015-A1, Class A1, 1.39%, due 1/15/21 | | | 5,439 | | |
| | 3,530 | | | Ser. 2016-A1, Class A1, 1 month USD LIBOR + 0.45%, (1.69%), due 2/15/22 | | | 3,549 | (b) | |
| | 26,850 | | | Ser. 2014-A4, Class A4, 1 month USD LIBOR + 0.36%, (1.60%), due 6/15/22 | | | 26,980 | (b) | |
| | | | | Carrington Mortgage Loan Trust | | | | | |
| | 1,050 | | | Ser. 2005-OPT2, Class M4, 1 month USD LIBOR + 0.98%, (2.21%), due 5/25/35 | | | 1,060 | (b) | |
| | 2,185 | | | Ser. 2005-NC3, Class M2, 1 month USD LIBOR + 0.46%, (1.70%), due 6/25/35 | | | 2,193 | (b) | |
| | 11,410 | | | Ser. 2005-NC5, Class M1, 1 month USD LIBOR + 0.48%, (1.72%), due 10/25/35 | | | 11,205 | (b) | |
| | 8,605 | | | Ser. 2006-NC1, Class A4, 1 month USD LIBOR + 0.31%, (1.55%), due 1/25/36 | | | 8,277 | (b) | |
| | 12,000 | | | Ser. 2006-RFC1, Class A4, 1 month USD LIBOR + 0.24%, (1.48%), due 5/25/36 | | | 11,746 | (b) | |
| | | | | Citigroup Mortgage Loan Trust, Inc. | | | | | |
| | 274 | | | Ser. 2005-HE2, Class M1, 1 month USD LIBOR + 0.75%, (1.99%), due 5/25/35 | | | 274 | (b)(l) | |
| | 1,185 | | | Ser. 2006-WFH1, Class M2, 1 month USD LIBOR + 0.37%, (1.61%), due 1/25/36 | | | 1,186 | (b) | |
| | 657 | | | Ser. 2006-AMC1, Class A2B, 1 month USD LIBOR + 0.16%, (1.40%), due 9/25/36 | | | 539 | (b) | |
| 4,460 | | | Countrywide Asset-Backed Certificates, Ser. 2005-15, Class M1,
1 month USD LIBOR + 0.45%, (1.69%), due 3/25/36 | | | 4,214 | (b) | |
| 2,350 | | | Dryden 54 Senior Loan Fund, Ser. 2017-54A, Class E, 3 month USD LIBOR + 6.20%,
(7.55%), due 10/19/29 | | | 2,350 | (b)(l) | |
| | | | | Ellington Loan Acquisition Trust | | | | | |
| | 2,980 | | | Ser. 2007-2, Class A2C, 1 month USD LIBOR + 1.10%, (2.34%), due 5/25/37 | | | 2,889 | (b)(l) | |
| | 5,496 | | | Ser. 2007-1, Class A2C, 1 month USD LIBOR + 1.25%, (2.49%), due 5/25/37 | | | 5,552 | (b)(l) | |
| 3,247 | | | EquiFirst Mortgage Loan Trust, Ser. 2003-2, Class 1A1, 1 month USD LIBOR + 1.13%,
(2.36%), due 9/25/33 | | | 3,191 | (b) | |
| 5,000 | | | FBR Securitization Trust, Ser. 2005-2, Class M2, 1 month USD LIBOR + 0.75%, (1.99%),
due 9/25/35 | | | 5,007 | (b) | |
| 4,007 | | | Fieldstone Mortgage Investment Trust, Ser. 2005-1, Class M5, 1 month USD LIBOR + 1.13%,
(2.36%), due 3/25/35 | | | 3,925 | (b) | |
| | | | | First Franklin Mortgage Loan Asset Backed Certificates | | | | | |
| | 1,933 | | | Ser. 2005-FF1, Class M1, 1 month USD LIBOR + 0.74%, (1.97%), due 12/25/34 | | | 1,953 | (b) | |
| | 1,645 | | | Ser. 2004-FFH4, Class M5, 1 month USD LIBOR + 1.58%, (2.81%), due 1/25/35 | | | 1,658 | (b) | |
| | 7,154 | | | Ser. 2005-FF3, Class M5, 1 month USD LIBOR + 0.98%, (2.21%), due 4/25/35 | | | 7,106 | (b) | |
| | 1,417 | | | Ser. 2005-FF5, Class M2, 1 month USD LIBOR + 0.74%, (1.97%), due 5/25/35 | | | 1,421 | (b) | |
| | 700 | | | Flatiron Clo Ltd., Ser. 2017-1A, Class E, 3 month USD LIBOR + 6.00%, (7.45%), due 5/15/30 | | | 687 | (b)(l) | |
| 1,600 | | | Gilbert Park CLO Ltd., Ser. 2017-1A, Class E, 3 month USD LIBOR + 6.40%, (7.76%),
due 10/15/30 | | | 1,600 | (b)(l) | |
| | 3,425 | | | GSAMP Trust, Ser. 2006-HE1, Class M1, 1 month USD LIBOR + 0.39%, (1.63%), due 1/25/36 | | | 3,381 | (b) | |
| 1,000 | | | Highbridge Loan Management Ltd., Ser. 2013-2A, Class DR, 3 month USD LIBOR + 6.60%,
(7.96%), due 10/20/29 | | | 1,000 | (b)(l) | |
| 1,114 | | | Home Equity Mortgage Trust, Ser. 2004-5, Class M2, 1 month USD LIBOR + 1.60%,
(2.84%), due 2/25/35 | | | 1,111 | (b) | |
| 3,775 | | | HSI Asset Securitization Corp. Trust, Ser. 2006-OPT1, Class M1,
1 month USD LIBOR + 0.36%, (1.60%), due 12/25/35 | | | 3,731 | (b) | |
| 5,190 | | | IndyMac Residential Asset-Backed Trust, Ser. 2005-A, Class M6,
1 month USD LIBOR + 1.25%, (2.48%), due 3/25/35 | | | 4,905 | (b) | |
See Notes to Financial Statements
190
Schedule of Investments Strategic Income Fund (cont'd)
| PRINCIPAL AMOUNT(a) | | | | VALUE | |
(000's omitted) | | | | (000's omitted) | |
| | | | | JP Morgan Mortgage Acquisition Corp. | | | | | |
$ | 1,767 | | | Ser. 2005-OPT2, Class M2, 1 month USD LIBOR + 0.45%, (1.69%), due 12/25/35 | | $ | 1,762 | (b) | |
| | 11,998 | | | Ser. 2005-OPT2, Class M3, 1 month USD LIBOR + 0.48%, (1.72%), due 12/25/35 | | | 11,376 | (b) | |
| | 5,071 | | | Ser. 2006-ACC1, Class A5, 1 month USD LIBOR + 0.24%, (1.48%), due 5/25/36 | | | 5,069 | (b) | |
| | 5,360 | | | Ser. 2007-CH1, Class MV2, 1 month USD LIBOR + 0.28%, (1.52%), due 11/25/36 | | | 5,301 | (b) | |
| | 556 | | | Ser. 2007-HE1, Class AF1, 1 month USD LIBOR + 0.10%, (1.34%), due 3/25/47 | | | 370 | (b) | |
| 3,497 | | | JP Morgan Mortgage Acquisition Trust, Ser. 2006-CH1, Class M1,
1 month USD LIBOR + 0.22%, (1.46%), due 7/25/36 | | | 3,447 | (b) | |
| 6,005 | | | Morgan Stanley Home Equity Loan Trust, Ser. 2006-2, Class A4,
1 month USD LIBOR + 0.28%, (1.52%), due 2/25/36 | | | 5,964 | (b) | |
| 4,503 | | | Navient Student Loan Trust, Ser. 2016-6A, Class A1, 1 month USD LIBOR + 0.48%,
(1.72%), due 3/25/66 | | | 4,511 | (b)(l) | |
| | | | | Newcastle Mortgage Securities Trust | | | | | |
| | 392 | | | Ser. 2006-1, Class A4, 1 month USD LIBOR + 0.28%, (1.52%), due 3/25/36 | | | 392 | (b) | |
| | 9,476 | | | Ser. 2006-1, Class M2, 1 month USD LIBOR + 0.37%, (1.61%), due 3/25/36 | | | 9,370 | (b) | |
| | 3,000 | | | OCP CLO Ltd., Ser. 2015-8A, Class CR, 3 month USD LIBOR + 2.80%, (0.00%), due 4/17/27 | | | 3,006 | (b)(l) | |
| | | | | Park Place Securities, Inc. | | | | | |
| | 6,350 | | | Ser. 2004-WWF1, Class M4, 1 month USD LIBOR + 1.65%, (2.89%), due 12/25/34 | | | 6,375 | (b) | |
| | 9,335 | | | Ser. 2004-WHQ2, Class M3, 1 month USD LIBOR + 1.04%, (2.27%), due 2/25/35 | | | 9,398 | (b) | |
| | 880 | | | Prosper Marketplace Issuance Trust, Ser. 2017-2A, Class A, 2.41%, due 9/15/23 | | | 882 | (l) | |
| | | | | Residential Asset Mortgage Products, Inc. | | | | | |
| | 628 | | | Ser. 2003-RS2, Class AII, 1 month USD LIBOR + 0.68%, (1.92%), due 3/25/33 | | | 610 | (b) | |
| | 2,250 | | | Ser. 2005-RS4, Class M3, 1 month USD LIBOR + 0.48%, (1.72%), due 4/25/35 | | | 2,226 | (b) | |
| | 2,000 | | | Ser. 2005-RZ2, Class M4, 1 month USD LIBOR + 0.56%, (1.80%), due 5/25/35 | | | 1,988 | (b) | |
| | 5,531 | | | Ser. 2005-EFC4, Class M4, 1 month USD LIBOR + 0.59%, (1.83%), due 9/25/35 | | | 5,445 | (b) | |
| | 7,375 | | | Ser. 2006-RZ1, Class M3, 1 month USD LIBOR + 0.45%, (1.69%), due 3/25/36 | | | 6,750 | (b) | |
| 1,151 | | | Saxon Asset Securities Trust, Ser. 2004-2, Class MV1, 1 month USD LIBOR + 0.87%,
(2.11%), due 8/25/35 | | | 1,141 | (b) | |
| 520 | | | Securitized Asset Backed Receivables LLC Trust, Ser. 2004-DO1, Class M1,
1 month USD LIBOR + 0.98%, (2.21%), due 7/25/34 | | | 508 | (b) | |
| 3,200 | | | SoFi Professional Loan Program LLC, Ser. 2017-E, Class A1, 1 month USD LIBOR + 0.50%,
(1.74%), due 11/26/40 | | | 3,202 | (b)(l) | |
| 6,700 | | | Soundview Home Equity Loan Trust, Ser. 2005-OPT3, Class M1,
1 month USD LIBOR + 0.47%, (1.71%), due 11/25/35 | | | 6,570 | (b) | |
| 400 | | | Structured Asset Investment Loan Trust, Ser. 2005-4, Class M3,
1 month USD LIBOR + 0.72%, (1.96%), due 5/25/35 | | | 401 | (b) | |
| | | | | Structured Asset Securities Corp. | | | | | |
| | 2,238 | | | Ser. 2005-NC2, Class M3, 1 month USD LIBOR + 0.43%, (1.67%), due 5/25/35 | | | 2,242 | (b) | |
| | 7,780 | | | Ser. 2005-WF4, Class M4, 1 month USD LIBOR + 0.58%, (1.82%), due 11/25/35 | | | 7,823 | (b) | |
| | 344 | | | Ser. 2006-AM1, Class A4, 1 month USD LIBOR + 0.16%, (1.40%), due 4/25/36 | | | 342 | (b) | |
| | 525 | | | Ser. 2006-NC1, Class A4, 1 month USD LIBOR + 0.15%, (1.39%), due 5/25/36 | | | 523 | (b) | |
| | 9,400 | | | Toyota Auto Receivables Owner Trust, Ser. 2017-B, Class A2A, 1.46%, due 1/15/20 | | | 9,390 | | |
| 1,200 | | | TRESTLES CLO Ltd., Ser. 2017-1A, Class D, 3 month USD LIBOR + 6.68%, (7.98%),
due 7/25/29 | | | 1,209 | (b)(l) | |
| | | | | Total Asset-Backed Securities (Cost $289,499) | | | 327,566 | | |
Foreign Government Securities 4.0% | | | |
| | 2,100 | | | Bolivian Government International Bond, 4.50%, due 3/20/28 | | | 2,042 | (l) | |
| | | | | Brazilian Government International Bond | | | | | |
| | 2,600 | | | 2.63%, due 1/5/23 | | | 2,514 | | |
| | 2,100 | | | 6.00%, due 4/7/26 | | | 2,330 | | |
| | 1,500 | | | 5.63%, due 2/21/47 | | | 1,529 | | |
| | | | | Colombia Government International Bond | | | | | |
| | 2,100 | | | 4.00%, due 2/26/24 | | | 2,186 | | |
| | 1,000 | | | 3.88%, due 4/25/27 | | | 1,007 | | |
| | 1,000 | | | 5.00%, due 6/15/45 | | | 1,029 | | |
See Notes to Financial Statements
191
Schedule of Investments Strategic Income Fund (cont'd)
| PRINCIPAL AMOUNT(a) | | | | VALUE | |
(000's omitted) | | | | (000's omitted) | |
| | | | | Dominican Republic International Bond | | | | | |
$ | 2,100 | | | 5.88%, due 4/18/24 | | $ | 2,286 | (l) | |
| | 1,500 | | | 6.88%, due 1/29/26 | | | 1,714 | (l) | |
| | 1,000 | | | 6.85%, due 1/27/45 | | | 1,115 | (l) | |
| | 2,100 | | | Guatemala Government Bond, 4.38%, due 6/5/27 | | | 2,090 | (l) | |
| | 2,100 | | | Hungary Government International Bond, 7.63%, due 3/29/41 | | | 3,237 | | |
| | | | | Indonesia Government International Bond | | | | | |
| | 4,100 | | | 3.70%, due 1/8/22 | | | 4,256 | (l) | |
| | 1,000 | | | 4.35%, due 1/8/27 | | | 1,061 | (l) | |
| | 4,100 | | | Kazakhstan Government International Bond, 5.13%, due 7/21/25 | | | 4,557 | (l) | |
| | | | | Mexico Government International Bond | | | | | |
| | 2,100 | | | 4.15%, due 3/28/27 | | | 2,183 | | |
| | 2,100 | | | 4.35%, due 1/15/47 | | | 1,975 | | |
| | | | | Morocco Government International Bond | | | | | |
| | 2,100 | | | 4.25%, due 12/11/22 | | | 2,204 | (l) | |
| | 1,000 | | | 5.50%, due 12/11/42 | | | 1,116 | (l) | |
| | 2,600 | | | Namibia International Bonds, 5.25%, due 10/29/25 | | | 2,641 | (l) | |
| | | | | Oman Government International Bond | | | | | |
| | 2,100 | | | 3.88%, due 3/8/22 | | | 2,118 | (l) | |
| | 1,000 | | | 5.38%, due 3/8/27 | | | 1,026 | (l) | |
| | 1,000 | | | 6.50%, due 3/8/47 | | | 1,029 | (l) | |
| | | | | Panama Government International Bond | | | | | |
| | 2,100 | | | 3.75%, due 3/16/25 | | | 2,193 | | |
| | 1,000 | | | 3.88%, due 3/17/28 | | | 1,045 | | |
| | 1,000 | | | 4.50%, due 5/15/47 | | | 1,056 | | |
| | 2,100 | | | Paraguay Government International Bond, 4.70%, due 3/27/27 | | | 2,205 | (l) | |
| | | | | Qatar Government International Bond | | | | | |
| | 2,100 | | | 2.38%, due 6/2/21 | | | 2,054 | (l) | |
| | 1,000 | | | 3.25%, due 6/2/26 | | | 977 | (l) | |
| | 1,000 | | | 4.63%, due 6/2/46 | | | 1,028 | (l) | |
| | 1,800 | | | Romanian Government International Bond, 6.13%, due 1/22/44 | | | 2,283 | (l) | |
| | | | | Saudi Government International Bond | | | | | |
| | 2,100 | | | 2.38%, due 10/26/21 | | | 2,064 | (l) | |
| | 1,000 | | | 3.25%, due 10/26/26 | | | 983 | (l) | |
| | 1,000 | | | 4.50%, due 10/26/46 | | | 1,002 | (l) | |
| | 2,600 | | | Serbia International Bond, 4.88%, due 2/25/20 | | | 2,708 | (l) | |
ZAR | 517,715 | | | South Africa Government Bond, Ser. R214, 6.50%, due 2/28/41 | | | 24,863 | (o) | |
| | | | | South Africa Government International Bond | | | | | |
$ | 2,100 | | | 4.88%, due 4/14/26 | | | 2,087 | | |
| | 1,000 | | | 4.30%, due 10/12/28 | | | 925 | | |
| | 1,000 | | | 5.00%, due 10/12/46 | | | 890 | | |
| | 3,100 | | | Trinidad & Tobago Government International Bond, 4.50%, due 8/4/26 | | | 3,123 | (l) | |
| | | | | Turkey Government International Bond | | | | | |
| | 2,100 | | | 6.25%, due 9/26/22 | | | 2,279 | | |
| | 2,100 | | | 6.00%, due 3/25/27 | | | 2,212 | | |
| | 1,000 | | | 5.75%, due 5/11/47 | | | 953 | | |
| | | | | Uruguay Government International Bond | | | | | |
| | 2,000 | | | 4.38%, due 10/27/27 | | | 2,162 | | |
| | 2,000 | | | 5.10%, due 6/18/50 | | | 2,145 | | |
| | | | | Total Foreign Government Securities (Cost $118,554) | | | 108,482 | | |
Developed Markets Ex- U.S. 1.3% | | | |
Regional(state/province) 0.4% | | | |
| | 10,220 | | | Province of Ontario Canada, 3.00%, due 7/16/18 | | | 10,318 | | |
See Notes to Financial Statements
192
Schedule of Investments Strategic Income Fund (cont'd)
| PRINCIPAL AMOUNT(a) | | | | VALUE | |
(000's omitted) | | | | (000's omitted) | |
Sovereign 0.9% | | | |
$ | 23,730 | | | Province of New Brunswick Canada, 2.75%, due 6/15/18 | | $ | 23,890 | | |
| | | | | Total Developed Markets Ex- U.S. (Cost $34,345) | | | 34,208 | | |
NUMBER OF SHARES | | | | | |
Investment Companies 3.7% | | | |
| | 9,086,791 | | | Neuberger Berman Emerging Markets Debt Fund Institutional Class | | | 81,963 | (u) | |
| | 2,571,929 | | | Neuberger Berman Short Duration Bond Fund Institutional Class | | | 20,035 | (u) | |
| | | | | Total Investment Companies (Cost $100,591) | | | 101,998 | | |
Short-Term Investment 1.1% | | | |
Investment Company 1.1% | | | |
| 30,452,534 | | | State Street Institutional U.S. Government Money Market Fund Premier Class, 0.96%
(Cost $30,453) | | | 30,453 | (o)(v) | |
| | | | | Total Investments 123.9% (Cost $3,319,865) | | | 3,365,236 | | |
| | | | | Liabilities Less Other Assets (23.9)% | | | (649,882 | )(w) | |
| | | | | Net Assets 100.0% | | $ | 2,715,354 | | |
(a) Principal amount is stated in the currency in which the security is denominated.
ZAR = South African Rand
(b) Variable or floating rate security. The interest rate shown was the current rate as of October 31, 2017 and changes periodically.
Benchmarks for Variable / Floating Rates:
LIBOR (USD) = London Interbank Offered Rate
(c) Represents less than 0.05% of net assets.
(d) All or a portion of this security was purchased on a delayed delivery basis.
(e) All or a portion of this security had not settled as of October 31, 2017 and thus may not have an interest rate in effect. Interest rates do not take effect until settlement.
(f) Value determined using significant unobservable inputs.
(g) Rate shown was the discount rate at the date of purchase.
(h) All or a portion of the security is pledged as collateral for futures.
(i) Index-linked bond whose principal amount adjusts according to a government retail price index.
(j) Weighted average coupon that changes/updates periodically. Rate shown is the rate at October 31, 2017.
(k) Interest only security. These securities represent the right to receive the monthly interest payments on an underlying pool of mortgages. Payments of principal on the pool reduce the value of the "interest only" holding.
(l) Securities were purchased under Rule 144A of the Securities Act of 1933, as amended (the "1933 Act"), or are otherwise restricted and, unless registered under the 1933 Act or exempted from registration, may only be sold to qualified institutional investors or may have other restrictions on resale. At October 31, 2017, these securities amounted to approximately $335,941,000, which represents 12.4% of net assets of the Fund. Securities denoted with (l) but without (q) have been deemed by the investment manager to be liquid.
See Notes to Financial Statements
193
Schedule of Investments Strategic Income Fund (cont'd)
(m) Amount less than one thousand.
(n) TBA (To Be Announced) Securities are purchased/sold on a forward commitment basis with an approximate principal amount and no defined maturity date. The actual principal and maturity date will be determined upon settlement when the specific mortgage pools are assigned. Total value of all such securities (excluding forward sales contracts, if any) at October 31, 2017 amounted to approximately $636,071,000, which represents 23.4% of net assets of the Fund.
(o) All or a portion of this security is segregated in connection with obligations for to be announced securities, when-issued securities, futures, swaps and/or delayed delivery securities with a total value of approximately $655,755,000.
(p) Payment-in-kind (PIK) security.
(q) Illiquid security.
(r) Defaulted Security
(s) Security fair valued as of October 31, 2017 in accordance with procedures approved by the Board of Trustees. Total value of all such securities at October 31, 2017 amounted to approximately $0, which represents 0.0% of net assets of the Fund.
(t) When-issued security. Total value of all such securities at October 31, 2017 amounted to approximately $4,375,000, which represents 0.2% of net assets of the Fund.
(u) Affiliated company as defined under the Investment Company Act of 1940 (see Note F of Notes to Financial Statements).
(v) Represents 7-day effective yield as of October 31, 2017.
(w) Includes the impact of the Fund's open positions in derivatives at October 31, 2017.
(x) Fixed coupon
Derivative Instruments
Futures contracts ("futures")
At October 31, 2017, open positions in futures for the Fund were as follows:
Futures contracts ("futures")
Long Futures:
Expiration Date | | Number of
Contracts | | Open Contracts | | Notional
Amount | | Value and
Unrealized
Appreciation/
(Depreciation) | |
12/2017 | | | 400 | | | Brazilian Real | | $ | 12,152,000 | | | $ | (90,056 | ) | |
12/2017 | | | 4 | | | Australian Dollar | | | 306,080 | | | | (14,049 | ) | |
12/2017 | | | 1,009 | | | Mexican Peso | | | 26,133,100 | | | | (1,556,595 | ) | |
12/2017 | | | 355 | | | New Zealand Dollar | | | 24,267,800 | | | | (988,285 | ) | |
12/2017 | | | 21 | | | Pound Sterling | | | 1,745,756 | | | | 42,571 | | |
12/2017 | | | 26 | | | South African Rand | | | 911,300 | | | | (911 | ) | |
12/2017 | | | 281 | | | U.S. Treasury Note, 10 Year Ultra | | | 35,107,438 | | | | (66,710 | ) | |
12/2017 | | | 278 | | | U.S. Treasury Long Bond | | | 42,386,313 | | | | (776,323 | ) | |
12/2017 | | | 23 | | | U.S. Treasury Ultra Long Bond | | | 3,789,969 | | | | (64,114 | ) | |
Total Long Positions | | | | | | $ | 146,799,756 | | | $ | (3,514,472 | ) | |
See Notes to Financial Statements
194
Schedule of Investments Strategic Income Fund (cont'd)
Short Futures:
Expiration Date | | Number of
Contracts | | Open Contracts | | Notional
Amount | | Value and
Unrealized
Appreciation/
(Depreciation) | |
12/2017 | | | 315 | | | Canadian Dollar | | $ | (24,436,125 | ) | | $ | 639,173 | | |
12/2017 | | | 196 | | | Euro | | | (28,618,450 | ) | | | 659,740 | | |
12/2017 | | | 143 | | | Euro-Bobl | | | (21,951,053 | ) | | | (101,810 | ) | |
12/2017 | | | 695 | | | Euro-Bund | | | (131,757,583 | ) | | | (1,344,858 | ) | |
12/2017 | | | 308 | | | Euro-Buxl Bond, 30 Year | | | (59,599,478 | ) | | | (1,033,699 | ) | |
12/2017 | | | 246 | | | U.S. Treasury Note, 10 Year Ultra | | | (32,944,781 | ) | | | 126,993 | | |
12/2017 | | | 572 | | | United Kindgom Long Gilt Bond | | | (94,453,725 | ) | | | (18,872 | ) | |
Total Short Positions | | | | | | $ | (393,761,195 | ) | | $ | (1,073,333 | ) | |
Total Futures | | | | | | | | $ | (4,587,805 | ) | |
At October 31, 2017, the Fund had securities pledged in the amount of $14,387,157 to cover collateral requirements on open futures.
For the year ended October 31, 2017, the average notional value of futures for the Fund was $246,710,991 for long positions and $(529,317,901) for short positions.
Credit default swap contracts ("credit default swaps")
At October 31, 2017, the Fund had outstanding centrally cleared credit default swaps as follows:
Centrally Cleared Credit Default Swaps — Sell Protection
Clearinghouse | | Reference
Entity | | Notional
Amount | | Financing
Rate
Paid by
the Fund | | Maturity
Date | | Upfront
Payments/
(Receipts) | | Unrealized
Appreciation/
(Depreciation) | | Accrued
Net
Interest
Receivable/
(Payable) | | Value | |
ICE Clear Credit LLC
| | CDX North American
High Yield Index,
Ser. 28 V.1 | | $ | 82,665,000 | | | | 5.00 | %(a) | | 6/20/2022 | | $ | 5,571,176 | | | $ | 1,900,665 | | | $ | 433,901 | | | $ | 7,905,742 | | |
(a) Payment frequency-quarterly.
For the year ended October 31, 2017, the average notional value of credit default swaps for the Fund was $79,675,573 for buy protection and $(100,988,129) for sell protection.
At October 31, 2017, the Fund had $3,564,308 deposited in a segregated account to cover margin requirements for centrally cleared credit default swaps.
See Notes to Financial Statements
195
Schedule of Investments Strategic Income Fund (cont'd)
The following is a summary, categorized by Level (see Note A of Notes to Financial Statements), of inputs used to value the Fund's investments as of October 31, 2017:
Asset Valuation Inputs
(000's omitted) | | Level 1 | | Level 2 | | Level 3(b) | | Total | |
Investments: | |
Loan Assignments | |
Building & Development | | $ | — | | | $ | 4,982 | | | $ | 323 | | | $ | 5,305 | | |
Business Equipment & Services | | | | | 18,948 | | | | 216 | | | | 19,164 | | |
Containers & Glass Products | | | — | | | | 6,439 | | | | 445 | | | | 6,884 | | |
Financial Intermediaries | | | — | | | | 3,037 | | | | 503 | | | | 3,540 | | |
Health Care | | | — | | | | 10,377 | | | | 1,203 | | | | 11,580 | | |
Industrial Equipment | | | — | | | | 5,086 | | | | 1,474 | | | | 6,560 | | |
Leisure Goods—Activities—Movies | | | — | | | | 3,928 | | | | 1,371 | | | | 5,299 | | |
Steel | | | — | | | | — | | | | 1,567 | | | | 1,567 | | |
| Other Loan Assignments(a) | | | — | | | | 98,185 | | | | — | | | | 98,185 | | |
Total Loan Assignments | | | — | | | | 150,982 | | | | 7,102 | | | | 158,084 | | |
U.S. Treasury Obligations | | | — | | | | 819,219 | | | | — | | | | 819,219 | | |
| Mortgage-Backed Securities(a) | | | — | | | | 737,479 | | | | — | | | | 737,479 | | |
| Corporate Bonds(a) | | | — | | | | 1,047,747 | | | | — | | | | 1,047,747 | | |
Asset-Backed Securities | | | — | | | | 327,566 | | | | — | | | | 327,566 | | |
| Foreign Government Securities(a) | | | — | | | | 108,482 | | | | — | | | | 108,482 | | |
Developed Markets Ex- U.S. | | | — | | | | 34,208 | | | | — | | | | 34,208 | | |
Investment Companies | | | — | | | | 101,998 | | | | — | | | | 101,998 | | |
Short-Term Investment | | | — | | | | 30,453 | | | | — | | | | 30,453 | | |
Total Investments | | $ | — | | | $ | 3,358,134 | | | $ | 7,102 | | | $ | 3,365,236 | | |
(a) The Schedule of Investments provides information on the industry or sector categorization for the portfolio.
(b) The following is a reconciliation between the beginning and ending balances of investments in which unobservable inputs (Level 3) were used in determining value:
(000's omitted) | | Beginning
balance, as
of 11/1/2016 | | Accrued
discounts/
(premiums) | | Realized
gain/(loss) | | Change
in unrealized
appreciation/
(depreciation) | | Purchases | | Sales | | Transfers
into
Level 3 | | Transfers
out of
Level 3 | | Balance,
as of
10/31/2017 | | Net change
in unrealized
appreciation/
(depreciation)
from
investments
still held as of
10/31/2017 | |
Investments in
Securities: | |
| Loan Assignments(c) | |
Building &
Development | | $ | — | | | $ | 0 | (d) | | $ | 0 | (d) | | $ | 11 | | | $ | 317 | | | $ | (5 | ) | | $ | — | | | $ | — | | | $ | 323 | | | $ | 11 | | |
See Notes to Financial Statements
196
Schedule of Investments Strategic Income Fund (cont'd)
(000's omitted) | | Beginning
balance, as
of 11/1/2016 | | Accrued
discounts/
(premiums) | | Realized
gain/(loss) | | Change
in unrealized
appreciation/
(depreciation) | | Purchases | | Sales | | Transfers
into
Level 3 | | Transfers
out of
Level 3 | | Balance,
as of
10/31/2017 | | Net change
in unrealized
appreciation/
(depreciation)
from
investments
still held as of
10/31/2017 | |
Business
Equipment &
Services | | $ | — | | | $ | 0 | (d) | | $ | 0 | (d) | | $ | 2 | | | $ | 215 | | | $ | (1 | ) | | $ | — | | | $ | — | | | $ | 216 | | | $ | 2 | | |
Containers &
Glass Products | | | 386 | | | | 0 | (d) | | | 0 | (d) | | | (4 | ) | | | 308 | | | | (245 | ) | | | — | | | | — | | | | 445 | | | | (2 | ) | |
Financial
Intermediaries | | | 337 | | | | — | | | | — | | | | 6 | | | | 500 | | | | (3 | ) | | | — | | | | (337 | ) | | | 503 | | | | 6 | | |
Health Care | | | — | | | | 0 | (d) | | | 0 | (d) | | | (7 | ) | | | 1,216 | | | | (6 | ) | | | — | | | | — | | | | 1,203 | | | | (7 | ) | |
Industrial
Equipment | | | — | | | | 0 | (d) | | | (0 | )(d) | | | 9 | | | | 1,540 | | | | (75 | ) | | | — | | | | — | | | | 1,474 | | | | 9 | | |
Leisure
Goods—
Activities—
Movies | | | — | | | | 0 | (d) | | | 1 | | | | 18 | | | | 1,445 | | | | (93 | ) | | | — | | | | — | | | | 1,371 | | | | 18 | | |
Radio &
Television | | | 170 | | | | — | | | | (1 | ) | | | — | | | | — | | | | (169 | ) | | | — | | | | — | | | | — | | | | — | | |
Steel | | | — | | | | 0 | (d) | | | — | | | | 22 | | | | 1,545 | | | | — | | | | — | | | | — | | | | 1,567 | | | | 22 | | |
Total | | $ | 893 | | | $ | 0 | (d) | | $ | 0 | (d) | | $ | 57 | | | $ | 7,086 | | | $ | (597 | ) | | $ | — | | | $ | (337 | ) | | $ | 7,102 | | | $ | 59 | | |
(c) Securities categorized as Level 3 are valued based on a single quotation obtained from a dealer. The Fund does not have access to unobservable inputs and therefore cannot disclose such inputs used in formulating such quotation.
(d) Amount less than one thousand.
As of the year ended October 31, 2017, certain securities were transferred from one level (as of October 31, 2016) to another. Based on beginning of period market values as of November 1, 2016, approximately $337,000 was transferred from Level 3 to Level 2. There were no transfers from Level 2 to Level 3. Transfers of loan assignments and corporate bonds into or out of Level 3 were primarily due to the pricing methodology using methods the Board has approved in the good-faith belief that the resulting valuation will reflect the fair value of these securities (Level 3) or a single observable input (Level 3) by the independent pricing service. As of the year ended October 31, 2017, the Fund had no transfers between Levels 1 and 2.
See Notes to Financial Statements
197
Schedule of Investments Strategic Income Fund (cont'd)
The following is a summary, categorized by Level (see Note A of Notes to Financial Statements), of inputs used to value the Fund's derivatives as of October 31, 2017:
Other Financial Instruments
(000's omitted) | | Level 1 | | Level 2 | | Level 3 | | Total | |
| Futures(a) | |
Assets | | $ | 1,468 | | | $ | — | | | $ | — | | | $ | 1,468 | | |
Liabilities | | | (6,056 | ) | | | — | | | | — | | | | (6,056 | ) | |
Swaps | |
Assets | | | — | | | | 7,906 | | | | — | | | | 7,906 | | |
Total | | $ | (4,588 | ) | | $ | 7,906 | | | $ | — | | | $ | 3,318 | | |
(a) Futures are reported at the cumulative unrealized appreciation/(depreciation) of the instrument.
See Notes to Financial Statements
198
Schedule of Investments Unconstrained Bond Fund October 31, 2017
| PRINCIPAL AMOUNT(a) | | | | VALUE | |
(000's omitted) | | | | (000's omitted) | |
U.S. Treasury Obligations 21.0% | | | |
$ | 1,550 | | | U.S. Treasury Bill, 0.83%, due 5/24/18 | | $ | 1,539 | (b)(c) | |
| | | | | U.S. Treasury Inflation-Indexed Bonds | | | | | |
| | 4,948 | | | 0.38%, due 7/15/23 | | | 5,001 | (d) | |
| | 1,689 | | | 0.25%, due 1/15/25 | | | 1,671 | (d) | |
| | 5,300 | | | 2.00%, due 1/15/26 | | | 5,947 | (d) | |
| | 2,397 | | | 3.88%, due 4/15/29 | | | 3,251 | (d) | |
| | | | | U.S. Treasury Notes | | | | | |
| | 530 | | | 2.75%, due 2/15/24 | | | 548 | | |
| | 2,995 | | | 1.63%, due 2/15/26 | | | 2,837 | | |
| | | | | Total U.S. Treasury Obligations (Cost $20,792) | | | 20,794 | | |
Mortgage-Backed Securities 7.0% | | | |
Collateralized Mortgage Obligations 5.5% | | | |
| | | | | Fannie Mae Connecticut Avenue Securities | | | | | |
| | 575 | | | Ser. 2017-C02, Class 2M2, 1 month USD LIBOR + 3.65%, (4.89%), due 9/25/29 | | | 612 | (e) | |
| | 635 | | | Ser. 2017-C03, Class 1M2, 1 month USD LIBOR + 3.00%, (4.24%), due 10/25/29 | | | 657 | (e) | |
| | 631 | | | Ser. 2017-C04, Class 2M2, 1 month USD LIBOR + 2.85%, (4.09%), due 11/25/29 | | | 645 | (e) | |
| | 715 | | | Ser. 2017-C05, Class 1M2, 1 month USD LIBOR + 2.20%, (3.44%), due 1/25/30 | | | 710 | (e) | |
| | 620 | | | Ser. 2017-C06, Class 1M2, 1 month USD LIBOR + 2.65%, (3.89%), due 2/25/30 | | | 629 | (e) | |
| | 640 | | | Ser. 2017-C06, Class 2M2, 1 month USD LIBOR + 2.85%, (4.04%), due 2/25/30 | | | 652 | (e) | |
| | | | | Freddie Mac Structured Agency Credit Risk Debt Notes | | | | | |
| | 600 | | | Ser. 2017-DNA2, Class M2, 1 month USD LIBOR + 3.45%, (4.69%), due 10/25/29 | | | 638 | (e) | |
| | 600 | | | Ser. 2017-HQA2, Class M2, 1 month USD LIBOR + 2.65%, (3.89%), due 12/25/29 | | | 606 | (e) | |
| | 321 | | | RAAC, Ser. 2004-SP3, Class MII1, 1 month USD LIBOR + 0.65%, (1.89%), due 9/25/34 | | | 302 | (e) | |
| | | | 5,451 | | |
Commercial Mortgage-Backed 0.3% | | | |
| | 978 | | | Citigroup Commercial Mortgage Trust, Ser. 2015-GC27, Class XA, 1.42%, due 2/10/48 | | | 76 | (f)(g) | |
| | | | | Commercial Mortgage Trust | | | | | |
| | 830 | | | Ser. 2014-CR16, Class XA, 1.18%, due 4/10/47 | | | 39 | (f)(g) | |
| | 953 | | | Ser. 2014-LC15, Class XA, 1.33%, due 4/10/47 | | | 49 | (f)(g) | |
| | 835 |
| | Morgan Stanley Bank of America Merrill Lynch Trust, Ser. 2014-C16, Class XA, 1.17%,
due 6/15/47 | | | 41
| (f)(g) | |
| | 1,121 | | | WF-RBS Commercial Mortgage Trust, Ser. 2014-LC14, Class XA, 2.05%, due 3/15/47 | | | 58 | (f)(g) | |
| | | | 263 | | |
Fannie Mae 0.5% | | | |
| | 470 | | | Pass-Through Certificates, 4.00%, TBA, 30 Year Maturity | | | 493 | (h) | |
Freddie Mac 0.7% | | | |
| | | | | Pass-Through Certificates | | | | | |
| | 385 | | | 3.50%, TBA, 30 Year Maturity | | | 396 | (h) | |
| | 330 | | | 4.00%, TBA, 30 Year Maturity | | | 346 | (h) | |
| | | | 742 | | |
| | | | | Total Mortgage-Backed Securities (Cost $6,975) | | | 6,949 | | |
See Notes to Financial Statements
199
Schedule of Investments Unconstrained Bond Fund (cont'd)
| PRINCIPAL AMOUNT(a) | | | | VALUE | |
(000's omitted) | | | | (000's omitted) | |
Corporate Bonds 39.5% | | | |
Aerospace & Defense 0.3% | | | |
| | | | | Leonardo-Finmeccanica SpA | | | | | |
EUR | 200 | | | 4.50%, due 1/19/21 | | $ | 264 | | |
EUR | 50 | | | 5.25%, due 1/21/22 | | | 70 | | |
| | | | 334 | | |
Airlines 0.2% | | | |
$ | 196 | | | American Airlines, Inc., 4.38%, due 10/1/22 | | | 201 | | |
Apparel 0.4% | | | |
EUR | 200 | | | Hanesbrands Finance Luxembourg SCA, 3.50%, due 6/15/24 | | | 252 | (i) | |
EUR | 100 | | | Levi Strauss & Co., 3.38%, due 3/15/27 | | | 122 | | |
| | | | 374 | | |
Auto Manufacturers 1.3% | | | |
EUR | 200 | | | Fiat Chrysler Finance Europe, 4.75%, due 7/15/22 | | | 268 | (i) | |
EUR | 33 | | | GIE PSA Tresorerie, 6.00%, due 9/19/33 | | | 50 | | |
EUR | 800 | | | Volkswagen Int'l Finance NV, 7 year EUR Swap + 2.20%, (2.50%), due 12/29/49 | | | 958 | (e)(i) | |
| | | | 1,276 | | |
Auto Parts & Equipment 0.9% | | | |
EUR | 100 | | | Grupo-Antolin Irausa SA, 3.25%, due 4/30/24 | | | 122 | (i) | |
EUR | 150 | | | LKQ Italia Bondco SpA, 3.88%, due 4/1/24 | | | 193 | (i) | |
EUR | 300 | | | Schaeffler Finance BV, 3.50%, due 5/15/22 | | | 357 | (i) | |
EUR | 200 | | | ZF N.A. Capital, Inc., 2.75%, due 4/27/23 | | | 252 | (i) | |
| | | | 924 | | |
Banks 6.1% | | | |
GBP | 100 | | | Barclays PLC, 3.25%, due 2/12/27 | | | 138 | (i) | |
GBP | 200 | | | CYBG PLC, 6 month GBP LIBOR + 2.29%, (3.13%), due 6/22/25 | | | 270 | (e)(i) | |
GBP | 400 | | | Deutsche Bank AG, 1.88%, due 2/28/20 | | | 534 | (i) | |
$ | 405 | | | Fifth Third Bancorp, Ser. J, 3 month USD LIBOR + 3.13%, (4.90%), due 12/29/49 | | | 411 | (e) | |
| | | | | Goldman Sachs Group, Inc. | | | | | |
EUR | 300 | | | 1.38%, due 5/15/24 | | | 358 | (i) | |
$ | 380 | | | Ser. L, 3 month USD LIBOR + 3.88%, (5.70%), due 12/31/49 | | | 392 | (e) | |
| | 715 | | | HSBC Holdings PLC, 5 year USD ICE Swap + 3.75%, (6.00%), due 12/31/99 | | | 760 | (e) | |
EUR | 750 | | | Lloyds Banking Group PLC, 1.00%, due 11/9/23 | | | 887 | (i) | |
$ | 400 | | | Morgan Stanley, Ser. H, 3 month USD LIBOR + 3.61%, (5.45%), due 12/31/49 | | | 415 | (e) | |
| | | | | Royal Bank of Scotland Group PLC | | | | | |
EUR | 100 | | | 3 month Euribor + 2.04%, (2.00%), due 3/8/23 | | | 122 | (e)(i) | |
EUR | 500 | | | 5 year EUR Swap + 2.65%, (3.63%), due 3/25/24 | | | 603 | (e)(i) | |
$ | 200 | | | TC Ziraat Bankasi AS, 5.13%, due 5/3/22 | | | 199 | (i) | |
GBP | 100 | | | TSB Banking Group PLC, 3 month GBP LIBOR + 3.43%, (5.75%), due 5/6/26 | | | 145 | (e) | |
EUR | 741 | | | Wells Fargo & Co., 1.00%, due 2/2/27 | | | 847 | (i) | |
| | | | 6,081 | | |
See Notes to Financial Statements
200
Schedule of Investments Unconstrained Bond Fund (cont'd)
| PRINCIPAL AMOUNT(a) | | | | VALUE | |
(000's omitted) | | | | (000's omitted) | |
Building Materials 0.5% | | | |
EUR | 100 | | | CEMEX Finance LLC, 4.63%, due 6/15/24 | | $ | 128 | (i) | |
EUR | 100 | | | Cemex SAB de CV, 4.38%, due 3/5/23 | | | 124 | (i) | |
EUR | 190 | | | Wienerberger AG, 5 Year EUR Swap + 5.95%, (5.00%), due 12/29/49 | | | 239 | (e) | |
| | | | 491 | | |
Chemicals 1.0% | | | |
EUR | 100 | | | Arkema SA, 5 year EUR Swap + 4.35%, (4.75%), due 10/29/49 | | | 128 | (e)(i) | |
EUR | 120 | | | Axalta Coating Systems Dutch Holding B BV, 3.75%, due 1/15/25 | | | 150 | (i) | |
EUR | 100 | | | Axalta Coating Systems LLC, 4.25%, due 8/15/24 | | | 125 | (i) | |
EUR | 250 | | | Ineos Group Holdings SA, 5.38%, due 8/1/24 | | | 316 | (i) | |
EUR | 200 | | | Solvay Finance SA, 5 year EUR Swap + 5.22%, (5.87%), due 12/29/49 | | | 281 | (e)(i) | |
| | | | 1,000 | | |
Commercial Services 0.9% | | | |
EUR | 100 | | | Avis Budget Finance PLC, 4.50%, due 5/15/25 | | | 119 | (i) | |
EUR | 200 | | | Hertz Holdings Netherlands BV, 4.13%, due 10/15/21 | | | 235 | (i) | |
EUR | 200 | | | La Financiere Atalian SAS, 4.00%, due 5/15/24 | | | 247 | (i) | |
EUR | 200 | | | Loxam SAS, 6.00%, due 4/15/25 | | | 258 | (i) | |
| | | | 859 | | |
Computers 0.9% | | | |
$ | 510 | | | Diamond 1 Finance Corp./Diamond 2 Finance Corp., 5.45%, due 6/15/23 | | | 559 | (j) | |
| | 290 | | | HP Enterprise Co., 4.90%, due 10/15/25 | | | 308 | | |
| | | | 867 | | |
Distribution - Wholesale 0.2% | | | |
EUR | 100 | | | Rexel SA, 2.63%, due 6/15/24 | | | 120 | (i) | |
EUR | 100 | | | VWR Funding, Inc., 4.63%, due 4/15/22 | | | 121 | (i) | |
| | | | 241 | | |
Electric 3.0% | | | |
GBP | 200 | | | Drax Finco PLC, 4.25%, due 5/1/22 | | | 275 | (i) | |
EUR | 100 | | | EDP - Energias de Portugal SA, 5 year EUR Swap + 5.04%, (5.38%), due 9/16/75 | | | 130 | (e)(i) | |
EUR | 100 | | | EnBW Energie Baden-Wuerttemberg AG, 5 year EUR Swap + 2.34%, (3.63%), due 4/2/76 | | | 125 | (e)(i) | |
EUR | 100 | | | Enel SpA, 5 year EUR Swap + 3.65%, (5.00%), due 1/15/75 | | | 127 | (e)(i) | |
$ | 200 | | | Eskom Holdings SOC Ltd., 7.13%, due 2/11/25 | | | 205 | (i) | |
GBP | 200 | | | Iberdrola Finanzas SA, 7.38%, due 1/29/24 | | | 348 | | |
GBP | 680 | | | innogy Finance BV, 5.63%, due 12/6/23 | | | 1,092 | (i) | |
GBP | 500 | | | SSE PLC, 5 year GBP Swap + 2.75%, (3.63%), due 9/16/77 | | | 681 | (e)(i) | |
| | | | 2,983 | | |
Electrical Components & Equipment 0.2% | | | |
| | | | | Belden, Inc. | | | | | |
EUR | 6 | | | 5.50%, due 4/15/23 | | | 7 | (i) | |
EUR | 200 | | | 3.38%, due 7/15/27 | | | 238 | (i) | |
| | | | 245 | | |
See Notes to Financial Statements
201
Schedule of Investments Unconstrained Bond Fund (cont'd)
| PRINCIPAL AMOUNT(a) | | | | VALUE | |
(000's omitted) | | | | (000's omitted) | |
Engineering & Construction 0.1% | | | |
EUR | 100 | | | SPIE SA, 3.13%, due 3/22/24 | | $ | 122 | (i) | |
Entertainment 0.7% | | | |
GBP | 100 | | | AMC Entertainment Holdings, Inc., 6.38%, due 11/15/24 | | | 137 | | |
EUR | 200 | | | Int'l Game Technology PLC, 4.75%, due 2/15/23 | | | 263 | (i) | |
EUR | 150 | | | Merlin Entertainments PLC, 2.75%, due 3/15/22 | | | 183 | (i) | |
EUR | 100 | | | WMG Acquisition Corp., 4.13%, due 11/1/24 | | | 123 | (i) | |
| | | | 706 | | |
Food 1.3% | | | |
EUR | 200 | | | Casino Guichard Perrachon SA, 4.50%, due 3/7/24 | | | 263 | (i) | |
EUR | 350 | | | Nomad Foods Bondco PLC, 3.25%, due 5/15/24 | | | 420 | (i) | |
| | | | | Tesco PLC | | | | | |
GBP | 100 | | | 6.13%, due 2/24/22 | | | 154 | | |
GBP | 315 | | | 5.50%, due 1/13/33 | | | 483 | | |
| | | | 1,320 | | |
Food Service 0.2% | | | |
EUR | 200 | | | Aramark Int'l Finance Sarl, 3.13%, due 4/1/25 | | | 243 | (i) | |
Gas 0.4% | | | |
GBP | 200 | | | Centrica PLC, 6.40%, due 9/4/26 | | | 345 | | |
Healthcare - Services 0.1% | | | |
GBP | 100 | | | Voyage Care BondCo PLC, 5.88%, due 5/1/23 | | | 135 | (i) | |
Holding Companies - Diversified 0.2% | | | |
GBP | 100 | | | Co-operative Group Holdings 2011 Ltd., 7.50%, due 7/8/26 | | | 163 | (i) | |
Household Products - Wares 0.3% | | | |
EUR | 200 | | | Spectrum Brands, Inc., 4.00%, due 10/1/26 | | | 247 | (i) | |
Insurance 1.2% | | | |
$ | 215 | | | MetLife, Inc., Ser. C, 3 month USD LIBOR + 3.58%, (5.25%), due 12/29/49 | | | 225 | (e) | |
GBP | 650 | | | Phoenix Group Holdings, 5.75%, due 7/7/21 | | | 967 | (i) | |
| | | | 1,192 | | |
Internet 0.4% | | | |
EUR | 100 | | | Netflix, Inc., 3.63%, due 5/15/27 | | | 120 | (i) | |
EUR | 200 | | | United Group BV, 4.88%, due 7/1/24 | | | 246 | (i) | |
| | | | 366 | | |
See Notes to Financial Statements
202
Schedule of Investments Unconstrained Bond Fund (cont'd)
| PRINCIPAL AMOUNT(a) | | | | VALUE | |
(000's omitted) | | | | (000's omitted) | |
Iron - Steel 0.7% | | | |
EUR | 100 | | | ArcelorMittal, 3.13%, due 1/14/22 | | $ | 129 | (i) | |
EUR | 150 | | | thyssenkrupp AG, 2.75%, due 3/8/21 | | | 187 | (i) | |
$ | 325 | | | Vale Overseas Ltd., 6.25%, due 8/10/26 | | | 374 | | |
| | | | 690 | | |
Leisure Time 0.1% | | | |
EUR | 100 | | | Cirsa Funding Luxembourg SA, 5.88%, due 5/15/23 | | | 123 | (i) | |
Lodging 0.1% | | | |
EUR | 100 | | | Accor SA, 5 year EUR Swap + 3.65%, (4.13%), due 6/30/49 | | | 125 | (e)(i) | |
Machinery - Construction & Mining 0.4% | | | |
EUR | 300 | | | NEW Areva Holding SA, 3.13%, due 3/20/23 | | | 367 | (i) | |
Media 4.6% | | | |
EUR | 200 | | | Altice Financing SA, 5.25%, due 2/15/23 | | | 245 | (i) | |
EUR | 300 | | | Altice Luxembourg SA, 6.25%, due 2/15/25 | | | 386 | (i) | |
$ | 745
| | | Charter Communications Operating LLC/Charter Communications Operating Capital,
4.91%, due 7/23/25 | | | 792
| | |
| | | | | Discovery Communications LLC | | | | | |
EUR | 215 | | | 1.90%, due 3/19/27 | | | 250 | | |
$ | 635 | | | 3.95%, due 3/20/28 | | | 630 | | |
EUR | 275 | | | LGE HoldCo VI BV, 7.13%, due 5/15/24 | | | 361 | (i) | |
EUR | 300 | | | Numericable-SFR SA, 5.63%, due 5/15/24 | | | 380 | (i) | |
EUR | 150 | | | Telenet Finance V Luxembourg SCA, 6.75%, due 8/15/24 | | | 189 | (i) | |
EUR | 220 | | | Unitymedia Hessen GmbH & Co. KG/Unitymedia NRW GmbH, 6.25%, due 1/15/29 | | | 292 | (i) | |
EUR | 100 | | | UPCB Finance IV Ltd., 4.00%, due 1/15/27 | | | 124 | (i) | |
$ | 245 | | | Viacom, Inc., 4.38%, due 3/15/43 | | | 208 | | |
| | | | | Virgin Media Secured Finance PLC | | | | | |
GBP | 100 | | | 5.13%, due 1/15/25 | | | 140 | (i) | |
GBP | 100 | | | 4.88%, due 1/15/27 | | | 138 | (i) | |
GBP | 100 | | | 6.25%, due 3/28/29 | | | 145 | (i) | |
EUR | 100 | | | Ziggo Bond Finance BV, 4.63%, due 1/15/25 | | | 124 | (i) | |
EUR | 100 | | | Ziggo Secured Finance BV, 3.75%, due 1/15/25 | | | 123 | (i) | |
| | | | 4,527 | | |
Miscellaneous Manufacturers 0.3% | | | |
EUR | 200 | | | Colfax Corp., 3.25%, due 5/15/25 | | | 247 | (i) | |
Multi-National 0.2% | | | |
$ | 200 | | | Banque Ouest Africaine de Developpement, 5.50%, due 5/6/21 | | | 213 | (i) | |
Oil & Gas 3.0% | | | |
| | 450 | | | Canadian Natural Resources Ltd., 3.85%, due 6/1/27 | | | 459 | | |
EUR | 450 | | | Gazprom OAO Via Gaz Capital SA, 4.36%, due 3/21/25 | | | 596 | (i) | |
$ | 255 | | | Hess Corp., 4.30%, due 4/1/27 | | | 257 | | |
| | 300 | | | KazMunayGas National Co. JSC, 7.00%, due 5/5/20 | | | 327 | (i) | |
See Notes to Financial Statements
203
Schedule of Investments Unconstrained Bond Fund (cont'd)
| PRINCIPAL AMOUNT(a) | | | | VALUE | |
(000's omitted) | | | | (000's omitted) | |
| | | | | Petrobras Global Finance BV | | | | | |
EUR | 200 | | | 5.88%, due 3/7/22 | | $ | 270 | | |
GBP | 150 | | | 6.25%, due 12/14/26 | | | 215 | | |
$ | 50 | | | 7.38%, due 1/17/27 | | | 56 | | |
| | | | | Petroleos de Venezuela SA | | | | | |
| | 128 | | | 6.00%, due 11/15/26 | | | 35 | (i) | |
| | 362 | | | 5.38%, due 4/12/27 | | | 105 | (i) | |
| | 200 | | | Petroleos Mexicanos, 6.50%, due 6/2/41 | | | 203 | | |
EUR | 350 | | | TOTAL SA, 5 year EUR Swap + 1.86%, (2.25%), due 12/29/49 | | | 427 | (e)(i) | |
| | | | 2,950 | | |
Packaging & Containers 1.2% | | | |
EUR | 150 | | | ARD Finance SA, 6.63%Cash/17.38% PIK, due 9/15/23 | | | 188 | (k) | |
EUR | 100 | | | Ardagh Packaging Finance PLC, 6.75%, due 5/15/24 | | | 130 | (i) | |
EUR | 300 | | | Horizon Holdings I SAS, 7.25%, due 8/1/23 | | | 372 | (i) | |
EUR | 100 | | | OI European Group BV, 6.75%, due 9/15/20 | | | 138 | (i) | |
EUR | 100 | | | Sealed Air Corp., 4.50%, due 9/15/23 | | | 134 | (i) | |
EUR | 110 | | | SIG Combibloc Holdings SCA, 7.75%, due 2/15/23 | | | 135 | (i) | |
EUR | 100 | | | Silgan Holdings, Inc., 3.25%, due 3/15/25 | | | 122 | (i) | |
| | | | 1,219 | | |
Pharmaceuticals 0.5% | | | |
EUR | 300 | | | Catalent Pharma Solutions, Inc., 4.75%, due 12/15/24 | | | 377 | (i) | |
EUR | 100 | | | Grifols SA, 3.20%, due 5/1/25 | | | 119 | (i) | |
| | | | 496 | | |
Pipelines 1.5% | | | |
$ | 200 | | | Abu Dhabi Crude Oil Pipeline LLC, 4.60%, due 11/2/47 | | | 204 | (j)(l) | |
| | 375 | | | Energy Transfer Partners L.P., 4.20%, due 4/15/27 | | | 379 | | |
| | 260 | | | MPLX LP, 4.13%, due 3/1/27 | | | 268 | | |
| | 530 | | | Southern Gas Corridor CJSC, 6.88%, due 3/24/26 | | | 599 | (i) | |
| | | | 1,450 | | |
Real Estate Investment Trust 0.9% | | | |
| | 305 | | | EPR Properties, 4.50%, due 4/1/25 | | | 314 | | |
GBP | 200 | | | Iron Mountain Europe PLC, 6.13%, due 9/15/22 | | | 278 | (i) | |
| | | | | MPT Operating Partnership LP/MPT Finance Corp. | | | | | |
EUR | 100 | | | 4.00%, due 8/19/22 | | | 129 | | |
EUR | 100 | | | 3.33%, due 3/24/25 | | | 123 | | |
| | | | 844 | | |
Retail 1.1% | | | |
GBP | 550 | | | Next PLC, 4.38%, due 10/2/26 | | | 805 | (i) | |
EUR | 100 | | | PVH Corp., 3.63%, due 7/15/24 | | | 129 | (i) | |
GBP | 100 | | | Stonegate Pub Co. Financing PLC, 4.88%, due 3/15/22 | | | 134 | (i) | |
| | | | 1,068 | | |
See Notes to Financial Statements
204
Schedule of Investments Unconstrained Bond Fund (cont'd)
| PRINCIPAL AMOUNT(a) | | | | VALUE | |
(000's omitted) | | | | (000's omitted) | |
Software 0.2% | | | |
EUR | 200 | | | Quintiles IMS, Inc., 3.25%, due 3/15/25 | | $ | 241 | (i) | |
Telecommunications 3.5% | | | |
$ | 375 | | | AT&T, Inc., 4.13%, due 2/17/26 | | | 384 | | |
EUR | 200 | | | Cellnex Telecom SA, 2.88%, due 4/18/25 | | | 248 | (i) | |
GBP | 200 | | | Koninklijke KPN NV, 5 year GBP Swap + 5.51%, (6.88%), due 3/14/73 | | | 292 | (e)(i) | |
EUR | 100 | | | Matterhorn Telecom Holding SA, 4.88%, due 5/1/23 | | | 120 | (i) | |
EUR | 100 | | | Matterhorn Telecom SA, 3.88%, due 5/1/22 | | | 120 | (i) | |
EUR | 35 | | | Olivetti Finance SA, 7.75%, due 1/24/33 | | | 64 | | |
EUR | 100 | | | SES SA, 5 year EUR Swap + 5.40% (5.63%), due 12/29/49 | | | 131 | (e)(i) | |
EUR | 200 | | | SoftBank Group Corp., 4.00%, due 7/30/22 | | | 255 | (i) | |
GBP | 200 | | | TalkTalk Telecom Group PLC, 5.38%, due 1/15/22 | | | 276 | (i) | |
EUR | 200 | | | TDC A/S, 5 year EUR Swap + 3.11% (3.50%), due 2/26/15 | | | 244 | (e)(i) | |
| | | | | Telecom Italia SpA | | | | | |
EUR | 50 | | | 5.25%, due 2/10/22 | | | 70 | (i) | |
EUR | 450 | | | 3.63%, due 1/19/24 | | | 597 | (i) | |
| | | | | Telefonica Europe BV | | | | | |
EUR | 100 | | | 10 year EUR Swap + 4.30%, (5.88%), due 3/31/49 | | | 137 | (e)(i) | |
EUR | 100 | | | 8 year EUR Swap + 5.59% (7.63%), due 9/29/49 | | | 142 | (e)(i) | |
GBP | 100 | | | 5 year GBP Swap + 4.46%, (6.75%), due 11/29/49 | | | 147 | (e)(i) | |
| | | | | Verizon Communications, Inc. | | | | | |
EUR | 100 | | | 1.38%, due 11/2/28 | | | 115 | | |
EUR | 100 | | | 1.88%, due 10/26/29 | | | 118 | | |
| | | | 3,460 | | |
Water 0.4% | | | |
GBP | 150 | | | Anglian Water Osprey Financing PLC, 5.00%, due 4/30/23 | | | 216 | (i) | |
GBP | 150 | | | Thames Water Utilities Cayman Finance Ltd., 1.88%, due 1/24/24 | | | 195 | (i) | |
| | | | 411 | | |
| | | | | Total Corporate Bonds (Cost $37,557) | | | 39,146 | | |
Asset-Backed Securities 10.4% | | | |
$ | 330
| | | Aames Mortgage Investment Trust, Ser. 2005-4, Class M3, 1 month USD LIBOR + 0.78%,
(2.02%), due 10/25/35 | | | 305
| (e) | |
| | 144 |
| | Accredited Mortgage Loan Trust, Ser. 2006-1, Class A4, 1 month USD LIBOR + 0.28%,
(1.52%), due 4/25/36 | | | 140
| (e) | |
| | 250 | | | Ares XLV CLO Ltd., Ser. 2017-45A, Class E, 3 month USD LIBOR + 6.10% (7.46%),
due 10/15/30 | | | 250
| (e)(j) | |
| | 150 |
| | Argent Securities, Inc., Ser. 2005-W2, Class M1, 1 month USD LIBOR + 0.49%, (1.73%),
due 10/25/35 | | | 149
| (d) | |
| | 300 | | | Assurant CLO I Ltd., Ser. 2017-1A, Class E, 3 month USD LIBOR + 6.46% (0.00%),
due 10/20/29 | | | 293
| (e)(j)(l) | |
| | | | | Bear Stearns Asset Backed Securities Trust | | | | | |
| | 229 | | | Ser. 2004-SD3, Class M2, 1 month USD LIBOR + 1.88%, (3.11%), due 9/25/34 | | | 227 | (e) | |
| | 483 | | | Ser. 2005-SD2, Class 1M2, 1 month USD LIBOR + 1.00%, (2.24%), due 3/25/35 | | | 478 | (e) | |
| | 250 | | | Benefit Street Partners CLO XII Ltd., Ser. 2017-12A, Class D, 3 month USD LIBOR + 6.41%
(7.76%), due 10/15/30 | | | 246
| (e)(j) | |
| | 325 |
| | Carrington Mortgage Loan Trust, Ser. 2006-RFC1, Class A4, 1 month USD LIBOR + 0.24%,
(1.48%), due 5/25/36 | | | 318
| (e) | |
| | 500 | | | Dewolf Park CLO Ltd., Ser. 2017-1A, Class E, 3 month USD LIBOR + 6.20% (7.45%),
due 10/15/30 | | | 503
| (e)(j) | |
| | 250 | | | Dryden 54 Senior Loan Fund, Ser. 2017-54A, Class E, 3 month USD LIBOR + 6.20% (7.55%),
due 10/19/29 | | | 250
| (e)(j) | |
| | 240 |
| | Ellington Loan Acquisition Trust, Ser. 2007-2, Class A2C, 1 month USD LIBOR + 1.10%,
(2.34%), due 5/25/37 | | | 233
| (e)(j) | |
See Notes to Financial Statements
205
Schedule of Investments Unconstrained Bond Fund (cont'd)
| PRINCIPAL AMOUNT(a) | | | | VALUE | |
(000's omitted) | | | | (000's omitted) | |
$ | 285
| | | First Franklin Mortgage Loan Trust, Ser. 2005-FF3, Class M5, 1 month USD LIBOR + 0.98%,
(2.21%), due 4/25/35 | | $ | 283
| (e) | |
| | 300 | | | Flatiron CLO Ltd., Ser. 2017-1A, Class E, 3 month USD LIBOR + 6.00%, (7.45%), due 5/15/30 | | | 295 | (e)(j) | |
| | 250 | | | Gilbert Park CLO Ltd., Ser. 2017-1A, Class E, 3 month USD LIBOR + 6.40% (7.76%), due 10/15/30 | | | 250 | (e)(j) | |
| | 192 |
| | GSAA Home Equity Trust, Ser. 2005-10, Class M4, 1 month USD LIBOR + 0.65%, (1.89%),
due 6/25/35 | | | 185
| (e) | |
| | 140 |
| | Home Equity Mortgage Loan Asset-Backed Trust, Ser. 2005-A, Class M6, 1 month USD
LIBOR + 1.25%, (2.48%), due 3/25/35 | | | 132
| (e) | |
| | 250 | | | Milos CLO Ltd., Ser. 2017-1A, Class E, 3 month USD LIBOR + 6.30% (7.66%), due 10/20/30 | | | 244 | (e)(j) | |
| | 101 |
| | Morgan Stanley Dean Witter Capital I, Ser. 2002-AM2, Class M1, 1 month USD
LIBOR + 1.13%, (2.36%), due 5/25/32 | | | 101
| (e) | |
| | 330 |
| | Newcastle Mortgage Securities Trust, Ser. 2006-1, Class M2, 1 month USD LIBOR + 0.37%,
(1.61%), due 3/25/36 | | | 326
| (e) | |
| | 62 |
| | Park Place Securities, Inc., Ser. 2004-WHQ1, Class M4, 1 month USD LIBOR + 1.73%,
(2.96%), due 9/25/34 | | | 62
| (e) | |
| | 136 |
| | Popular Mortgage Pass-Through Trust, Ser. 2005-5, Class MV1, 1 month USD LIBOR + 0.44%,
(1.68%), due 11/25/35 | | | 136
| (e) | |
| | | | | Renaissance Home Equity Loan Trust | | | | | |
| | 1,205 | | | Ser. 2005-1, Class AV3, 1 month USD LIBOR + 0.33%, (1.57%), due 5/25/35 | | | 1,099 | (e) | |
| | 210 | | | Ser. 2005-2, Class AV3, 1 month USD LIBOR + 0.37%, (1.61%), due 8/25/35 | | | 200 | (e) | |
| | | | | Residential Asset Mortgage Products, Inc. | | | | | |
| | 650 | | | Ser. 2006-EFC4, Class M4, 1 month USD LIBOR + 0.59%, (1.83%), due 9/25/35 | | | 640 | (e) | |
| | 1,710 | | | Ser. 2005-RZ4, Class M3, 1 month USD LIBOR + 0.52%, (1.76%), due 11/25/35 | | | 1,637 | (e) | |
| | 144 |
| | Securitized Asset Backed Receivables LLC Trust, Ser. 2004-DO1, Class M1, 1 month USD
LIBOR + 0.98%, (2.21%), due 7/25/34 | | | 140
| (e) | |
| | 130 |
| | Soundview Home Equity Loan Trust, Ser. 2005-OPT3, Class M1, 1 month USD LIBOR + 0.47%,
(1.71%), due 11/25/35 | | | 128
| (e) | |
| | | | | Structured Asset Securities Corp. | | | | | |
| | 185 | | | Ser. 2005-WF4, Class M4, 1 month USD LIBOR + 0.58%, (1.82%), due 11/25/35 | | | 186 | (e) | |
| | 82 | | | Ser. 2006-AM1, Class A4, 1 month USD LIBOR + 0.16%, (1.40%), due 4/25/36 | | | 81 | (e) | |
| | 580 |
| | Trafigura Securitisation Finance PLC, Ser. 2017-1A, Class B, 1 month USD LIBOR + 1.70%,
(2.94%), due 12/15/20 | | | 583
| (e)(j) | |
| | 250 |
| | TRESTLES CLO Ltd., Ser. 2017-1A, Class D, 3 month USD LIBOR + 6.68%, (7.98%),
due 7/25/29 | | | 252
| (e)(j) | |
| | | | | Total Asset-Backed Securities (Cost $9,495) | | | 10,352 | | |
Foreign Government Securities 16.2% | | | |
| | | | | Argentine Republic Government International Bond | | | | | |
EUR | 138 | | | 7.82%, due 12/31/33 | | | 184 | | |
EUR | 780 | | | 2.26%, due 12/31/38 | | | 645 | (m) | |
$ | 80 | | | Belize Government International Bond, 4.94%, due 2/20/34 | | | 50 | (i) | |
| | 270 | | | Brazil Minas SPE via State of Minas Gerais, 5.33%, due 2/15/28 | | | 275 | (i) | |
| | 160 | | | Brazilian Government International Bond, 5.63%, due 1/7/41 | | | 162 | | |
| | | | | Bundesrepublik Deutschland | | | | | |
EUR | 2,275 | | | 0.25%, due 2/15/27 | | | 2,641 | (i) | |
EUR | 30 | | | 5.50%, due 1/4/31 | | | 57 | (i) | |
CAD | 6,220 | | | Canadian Government Bond, 0.50%, due 3/1/22 | | | 4,603 | | |
$ | 200 | | | Colombia Government International Bond, 5.00%, due 6/15/45 | | | 206 | | |
EUR | 220 | | | Croatia Government International Bond, 3.00%, due 3/20/27 | | | 268 | (i) | |
$ | 200 | | | Egypt Government International Bond, 8.50%, due 1/31/47 | | | 226 | (i) | |
| | | | | El Salvador Government International Bond | | | | | |
| | 50 | | | 5.88%, due 1/30/25 | | | 49 | (i) | |
| | 250 | | | 6.38%, due 1/18/27 | | | 249 | (i) | |
| | 200 | | | Ghana Government International Bond, 10.75%, due 10/14/30 | | | 266 | (i) | |
See Notes to Financial Statements
206
Schedule of Investments Unconstrained Bond Fund (cont'd)
| PRINCIPAL AMOUNT(a) | | | | VALUE | |
(000's omitted) | | | | (000's omitted) | |
| | | | | Hungary Government International Bond | | | | | |
$ | 200 | | | 5.38%, due 2/21/23 | | $ | 224 | | |
EUR | 79 | | | 1.75%, due 10/10/27 | | | 94 | (i) | |
EUR | 500 | | | Indonesia Government International Bond, 3.75%, due 6/14/28 | | | 661 | (i) | |
$ | 289 | | | Ivory Coast Government International Bond, 5.75%, due 12/31/32 | | | 284 | (i) | |
| | 200 | | | Kazakhstan Government International Bond, 6.50%, due 7/21/45 | | | 250 | (i) | |
| | 200 | | | Mexico Government International Bond, 5.75%, due 10/12/10 | | | 209 | | |
| | 270 | | | Nigeria Government International Bond, 7.88%, due 2/16/32 | | | 297 | (i) | |
EUR | 300 | | | Peruvian Government International Bond, 3.75%, due 3/1/30 | | | 423 | | |
EUR | 60 | | | Romanian Government International Bond, 3.88%, due 10/29/35 | | | 75 | (i) | |
| | | | | Russian Foreign Bond - Eurobond | | | | | |
$ | 200 | | | 4.88%, due 9/16/23 | | | 217 | (i) | |
| | 200 | | | 4.25%, due 6/23/27 | | | 204 | (i) | |
| | 200 | | | Saudi Government International Bond, 3.63%, due 3/4/28 | | | 198 | (i) | |
ZAR | 21,920 | | | South Africa Government International Bond, Ser. R214, 6.50%, due 2/28/41 | | | 1,053 | | |
$ | 200 | | | Sri Lanka Government International Bond, 6.20%, due 5/11/27 | | | 213 | (i) | |
| | 300 | | | State Oil Co. of the Azerbaijan Republic, 6.95%, due 3/18/30 | | | 329 | (i) | |
| | | | | Turkey Government International Bond | | | | | |
| | 200 | | | 5.63%, due 3/30/21 | | | 211 | | |
| | 200 | | | 4.88%, due 10/9/26 | | | 195 | | |
| | | | | Ukraine Government International Bond | | | | | |
| | 100 | | | 7.75%, due 9/1/20 | | | 107 | (i) | |
| | 200 | | | 7.75%, due 9/1/22 | | | 214 | (i) | |
| | 200 | | | 7.75%, due 9/1/25 | | | 208 | (i) | |
| | 100 | | | IMF Ukraine GDP Index, (0.00%), due 5/31/40 | | | 57 | (e)(i) | |
| | 190 | | | Uruguay Government International Bond, 5.10%, due 6/18/50 | | | 204 | | |
| | 200 | | | Zambia Government International Bond, 8.50%, due 4/14/24 | | | 214 | (i) | |
| | | | | Total Foreign Government Securities (Cost $15,912) | | | 16,022 | | |
NUMBER OF SHARES | | | | | |
Short-Term Investment 3.7% | | | |
Investment Company 3.7% | | | |
| 3,639,872 | | | State Street Institutional U.S. Government Money Market Fund Premier Class, 0.96%
(Cost $3,640) | | | 3,640 | (n)(o) | |
| | | | | Total Investments 97.8% (Cost $94,371) | | | 96,903 | | |
| | | | | Other Assets Less Liabilities 2.2% | | | 2,178 | (p) | |
| | | | | Net Assets 100.0% | | $ | 99,081 | | |
(a) Principal amount is stated in the currency in which the security is denominated.
CAD = Canadian Dollar
EUR = Euro
GBP = Pound Sterling
(b) Rate shown was the discount rate at the date of purchase.
(c) All or a portion of the security is pledged as collateral for futures.
(d) Index-linked bond whose principal amount adjusts according to a government retail price index.
See Notes to Financial Statements
207
Schedule of Investments Unconstrained Bond Fund (cont'd)
(e) Variable or floating rate security. The interest rate shown was the current rate as of October 31, 2017 and changes periodically.
Benchmarks for Variable / Floating Rates:
LIBOR (USD) = London Interbank Offered Rate
(f) Weighted average coupon that changes/updates periodically. Rate shown is the rate at October 31, 2017.
(g) Interest only security. These securities represent the right to receive the monthly interest payments on an underlying pool of mortgages. Payments of principal on the pool reduce the value of the "interest only" holding.
(h) TBA (To Be Announced) Securities are purchased/sold on a forward commitment basis with an approximate principal amount and no defined maturity date. The actual principal and maturity date will be determined upon settlement when the specific mortgage pools are assigned. Total value of all such securities (excluding forward sales contracts, if any) at October 31, 2017, amounted to approximately $1,235,000, which represents 1.2% of net assets of the Fund.
(i) Security exempt from registration pursuant to Regulation S under the Securities Act of 1933. Regulation S applies to securities offerings that are made outside of the United States and do not involve direct selling efforts in the United States and as such may have restrictions on resale. Total value of all such securities at October 31, 2017, amounted to approximately $35,221,000, which represents 35.5% of net assets of the Fund.
(j) Securities were purchased under Rule 144A of the Securities Act of 1933, as amended (the "1933 Act"), or are otherwise restricted and, unless registered under the 1933 Act or exempted from registration, may only be sold to qualified institutional investors or may have other restrictions on resale. At October 31, 2017, these securities amounted to approximately $4,162,000, which represents 4.2% of net assets of the Fund. These securities have been deemed by the investment manager to be liquid.
(k) Payment-in-kind (PIK) security.
(l) When-issued security. Total value of all such securities at 10/31/2017 amounted to approximately $497,000, which represents 0.5% of net assets for the Fund.
(m) Step Bond. Coupon rate is a fixed rate for an initial period that either resets at a specific date or may reset in the future contingent upon a predetermined trigger. The interest rate shown was the current rate as of October 31, 2017.
(n) Rate represents 7-day effective yield as of October 31, 2017.
(o) All or a portion of this security is segregated in connection with obligations for delayed delivery securities, to be announced securities, when-issued securities, futures, forward foreign currency contracts and/or swaps with a total value of approximately $3,640,000.
(p) Includes the impact of the Fund's open positions in derivatives at October 31, 2017.
See Notes to Financial Statements
208
Schedule of Investments Unconstrained Bond Fund (cont'd)
Derivative Instruments
Futures contracts ("futures")
At October 31, 2017, open positions in futures for the Fund were as follows:
Long Futures:
Expiration Date | | Number of
Contracts | | Open Contracts | | Notional
Amount | | Value and
Unrealized
Appreciation/
(Depreciation) | |
12/2017 | | | 64 | | | Euro-Bund | | $ | 12,133,072 | | | $ | 62,085 | | |
12/2017 | | | 299 | | | Euro, 90 day | | | 73,621,275 | | | | (79,591 | ) | |
12/2017 | | | 69 | | | U.S. Treasury Ultra Long Bond | | | 11,369,906 | | | | (195,145 | ) | |
12/2018 | | | 151 | | | Pound Sterling, 90 day | | | 24,845,719 | | | | (12,887 | ) | |
Total Long Positions | | | | | | $ | 121,969,972 | | | $ | (225,538 | ) | |
Short Futures:
Expiration Date | | Number of
Contracts | | Open Contracts | | Notional
Amount | | Value and
Unrealized
Appreciation/
(Depreciation) | |
12/2017 | | | 26 | | | Euro-Bobl | | $ | (3,991,101 | ) | | $ | (16,116 | ) | |
12/2017 | | | 51 | | | Euro-Bund | | | (9,668,542 | ) | | | (74,746 | ) | |
12/2017 | | | 54 | | | Euro-Buxl Bond, 30 Year | | | (10,449,259 | ) | | | (51,479 | ) | |
12/2017 | | | 57 | | | Euro-OAT | | | (10,454,781 | ) | | | (116,667 | ) | |
12/2017 | | | 358 | | | U.S. Treasury Note, 10 Year | | | (44,727,625 | ) | | | 546,876 | | |
12/2017 | | | 116 | | | U.S. Treasury Note, 10 Year Ultra | | | (15,534,938 | ) | | | 198,906 | | |
12/2017 | | | 12 | | | U.S. Treasury Ultra Long Bond | | | (1,829,625 | ) | | | 30,145 | | |
12/2017 | | | 16 | | | U.S. Ultra Bond | | | (2,636,500 | ) | | | 78,940 | | |
12/2017 | | | 151 | | | Pound Sterling, 90 day | | | (24,934,713 | ) | | | 3,407 | | |
12/2017 | | | 31 | | | United Kingdom Long Gilt Bond | | | (5,118,996 | ) | | | 86,558 | | |
12/2017 | | | 15 | | | U.S. Treasury Note, 5 Year | | | (1,757,813 | ) | | | 15,507 | | |
12/2018 | | | 299 | | | Euro, 90 day | | | (73,311,063 | ) | | | 249,309 | | |
Total Short Positions | | | | | | $ | (204,414,956 | ) | | $ | 950,640 | | |
Total Futures | | | | | | | | | | $ | 725,102 | | |
At October 31, 2017, the Fund had securities pledged in the amount of $1,434,741 to cover collateral requirements on open futures.
For the year ended October 31, 2017, the average notional value of futures for the Fund was $44,860,190 for long positions and $(97,583,963) for short positions.
See Notes to Financial Statements
209
Schedule of Investments Unconstrained Bond Fund (cont'd)
Forward foreign currency contracts ("forward contracts")
At October 31, 2017, open forward contracts for the Fund were as follows:
| Currency Purchased | | Currency Sold | | Counterparty | | Settlement
Date | | Net
Unrealized
Appreciation/
(Depreciation) | |
| | 2,392,895 | | | USD | | | 3,043,002 | | | AUD | | Goldman Sachs International | | 1/24/2018 | | $ | 65,662 | | |
| | 877,364 | | | USD | | | 1,146,556 | | | AUD | | Goldman Sachs International | | 1/24/2018 | | | 499 | | |
| | 284,997 | | | USD | | | 371,018 | | | AUD | | JPMorgan Chase Bank N.A. | | 1/24/2018 | | | 1,250 | | |
| | 78,308 | | | USD | | | 99,640 | | | AUD | | Societe Generale | | 1/24/2018 | | | 2,105 | | |
| | 5,865,992 | | | USD | | | 7,456,880 | | | AUD | | State Street Bank and Trust Company | | 1/24/2018 | | | 163,104 | | |
| | 1,287,307 | | | USD | | | 1,638,316 | | | AUD | | State Street Bank and Trust Company | | 1/24/2018 | | | 34,352 | | |
| | 197,768 | | | USD | | | 252,045 | | | AUD | | State Street Bank and Trust Company | | 1/24/2018 | | | 5,009 | | |
| | 225,884 | | | USD | | | 289,068 | | | AUD | | State Street Bank and Trust Company | | 1/24/2018 | | | 4,809 | | |
| | 380,956 | | | USD | | | 494,928 | | | AUD | | State Street Bank and Trust Company | | 1/24/2018 | | | 2,444 | | |
| | 1,714,025 | | | AUD | | | 1,309,498 | | | USD | | State Street Bank and Trust Company | | 1/24/2018 | | | 1,358 | | |
| | 1,593,940 | | | USD | | | 1,996,824 | | | CAD | | Citibank, N.A. | | 1/24/2018 | | | 44,761 | | |
| | 2,479,768 | | | USD | | | 3,105,860 | | | CAD | | Goldman Sachs International | | 1/24/2018 | | | 70,176 | | |
| | 1,037,338 | | | USD | | | 1,294,467 | | | CAD | | Goldman Sachs International | | 1/24/2018 | | | 33,063 | | |
| | 179,856 | | | USD | | | 230,876 | | | CAD | | JPMorgan Chase Bank N.A. | | 1/24/2018 | | | 738 | | |
| | 110,894 | | | USD | | | 142,116 | | | CAD | | JPMorgan Chase Bank N.A. | | 1/24/2018 | | | 637 | | |
| | 11,658,186 | | | USD | | | 14,549,883 | | | CAD | | Royal Bank of Canada | | 1/24/2018 | | | 370,078 | | |
| | 536,553 | | | USD | | | 669,639 | | | CAD | | Royal Bank of Canada | | 1/24/2018 | | | 17,032 | | |
| | 36,451 | | | USD | | | 45,677 | | | CAD | | Societe Generale | | 1/24/2018 | | | 1,014 | | |
| | 4,875,402 | | | USD | | | 6,088,719 | | | CAD | | State Street Bank and Trust Company | | 1/24/2018 | | | 151,644 | | |
| | 583,024 | | | USD | | | 564,892 | | | CHF | | Citibank, N.A. | | 1/24/2018 | | | 13,449 | | |
| | 342,771 | | | USD | | | 332,186 | | | CHF | | Goldman Sachs International | | 1/24/2018 | | | 7,831 | | |
| | 394,389 | | | USD | | | 390,307 | | | CHF | | JPMorgan Chase Bank N.A. | | 1/24/2018 | | | 845 | | |
| | 2,882,455 | | | USD | | | 2,813,997 | | | CHF | | Royal Bank of Canada | | 1/24/2018 | | | 45,129 | | |
| | 8,576,807 | | | USD | | | 8,312,255 | | | CHF | | Societe Generale | | 1/24/2018 | | | 195,641 | | |
| | 467,896 | | | USD | | | 455,923 | | | CHF | | State Street Bank and Trust Company | | 1/24/2018 | | | 8,193 | | |
| | 246,827 | | | USD | | | 240,664 | | | CHF | | State Street Bank and Trust Company | | 1/24/2018 | | | 4,167 | | |
| | 47,261 | | | USD | | | 1,027,186 | | | CZK | | State Street Bank and Trust Company | | 1/24/2018 | | | 386 | | |
| | 1,277,772 | | | USD | | | 1,076,000 | | | EUR | | Citibank, N.A. | | 1/24/2018 | | | 18,213 | | |
| | 71,588 | | | USD | | | 60,284 | | | EUR | | Citibank, N.A. | | 1/24/2018 | | | 1,020 | | |
| | 4,141,688 | | | USD | | | 3,487,972 | | | EUR | | Goldman Sachs International | | 1/24/2018 | | | 58,691 | | |
| | 2,842,077 | | | USD | | | 2,393,489 | | | EUR | | Goldman Sachs International | | 1/24/2018 | | | 40,275 | | |
| | 636,529 | | | EUR | | | 740,961 | | | USD | | Goldman Sachs International | | 1/24/2018 | | | 4,155 | | |
| | 1,721,509 | | | EUR | | | 2,013,181 | | | USD | | Goldman Sachs International | | 1/24/2018 | | | 2,006 | | |
| | 113,989 | | | EUR | | | 133,287 | | | USD | | Goldman Sachs International | | 1/24/2018 | | | 147 | | |
| | 4,997,281 | | | USD | | | 4,211,322 | | | EUR | | Royal Bank of Canada | | 1/24/2018 | | | 67,536 | | |
| | 680,577 | | | USD | | | 573,538 | | | EUR | | Royal Bank of Canada | | 1/24/2018 | | | 9,198 | | |
| | 439,088 | | | USD | | | 370,029 | | | EUR | | Royal Bank of Canada | | 1/24/2018 | | | 5,934 | | |
| | 377,503 | | | USD | | | 318,130 | | | EUR | | Royal Bank of Canada | | 1/24/2018 | | | 5,102 | | |
| | 148,240 | | | USD | | | 124,925 | | | EUR | | Royal Bank of Canada | | 1/24/2018 | | | 2,003 | | |
| | 2,941,853 | | | USD | | | 2,478,623 | | | EUR | | Societe Generale | | 1/24/2018 | | | 40,394 | | |
| | 671,580 | | | USD | | | 565,832 | | | EUR | | Societe Generale | | 1/24/2018 | | | 9,221 | | |
| | 543,242 | | | USD | | | 457,702 | | | EUR | | Societe Generale | | 1/24/2018 | | | 7,459 | | |
| | 188,491 | | | USD | | | 159,618 | | | EUR | | Societe Generale | | 1/24/2018 | | | 1,644 | | |
| | 24,851 | | | USD | | | 20,932 | | | EUR | | Societe Generale | | 1/24/2018 | | | 348 | | |
See Notes to Financial Statements
210
Schedule of Investments Unconstrained Bond Fund (cont'd)
| Currency Purchased | | Currency Sold | | Counterparty | | Settlement
Date | | Net
Unrealized
Appreciation/
(Depreciation) | |
| | 12,393,642 | | | USD | | | 10,451,317 | | | EUR | | State Street Bank and Trust Company | | 1/24/2018 | | $ | 159,401 | | |
| | 6,746,429 | | | USD | | | 5,689,132 | | | EUR | | State Street Bank and Trust Company | | 1/24/2018 | | | 86,769 | | |
| | 1,238,371 | | | USD | | | 1,046,876 | | | EUR | | State Street Bank and Trust Company | | 1/24/2018 | | | 12,905 | | |
| | 692,355 | | | USD | | | 586,786 | | | EUR | | State Street Bank and Trust Company | | 1/24/2018 | | | 5,467 | | |
| | 402,912 | | | USD | | | 341,257 | | | EUR | | State Street Bank and Trust Company | | 1/24/2018 | | | 3,439 | | |
| | 148,031 | | | USD | | | 124,601 | | | EUR | | State Street Bank and Trust Company | | 1/24/2018 | | | 2,174 | | |
| | 58,628 | | | USD | | | 49,440 | | | EUR | | State Street Bank and Trust Company | | 1/24/2018 | | | 754 | | |
| | 30,680 | | | USD | | | 23,000 | | | GBP | | Citibank, N.A. | | 1/24/2018 | | | 51 | | |
| | 2,274,171 | | | GBP | | | 3,027,558 | | | USD | | Goldman Sachs International | | 1/24/2018 | | | 958 | | |
| | 464,252 | | | GBP | | | 611,107 | | | USD | | JPMorgan Chase Bank N.A. | | 1/24/2018 | | | 7,138 | | |
| | 89,443 | | | GBP | | | 118,557 | | | USD | | JPMorgan Chase Bank N.A. | | 1/24/2018 | | | 555 | | |
| | 1,246,575 | | | GBP | | | 1,646,788 | | | USD | | Royal Bank of Canada | | 1/24/2018 | | | 13,277 | | |
| | 743,064 | | | USD | | | 557,770 | | | GBP | | Societe Generale | | 1/24/2018 | | | 281 | | |
| | 485,501 | | | USD | | | 364,434 | | | GBP | | Societe Generale | | 1/24/2018 | | | 184 | | |
| | 738,370 | | | GBP | | | 978,997 | | | USD | | State Street Bank and Trust Company | | 1/24/2018 | | | 4,291 | | |
| | 1,924,558 | | | USD | | | 1,442,513 | | | GBP | | State Street Bank and Trust Company | | 1/24/2018 | | | 3,562 | | |
| | 905,041 | | | USD | | | 678,355 | | | GBP | | State Street Bank and Trust Company | | 1/24/2018 | | | 1,675 | | |
| | 569,983 | | | USD | | | 427,219 | | | GBP | | State Street Bank and Trust Company | | 1/24/2018 | | | 1,055 | | |
| | 80,181 | | | USD | | | 60,098 | | | GBP | | State Street Bank and Trust Company | | 1/24/2018 | | | 148 | | |
| | 210,691 | | | USD | | | 23,772,320 | | | JPY | | JPMorgan Chase Bank N.A. | | 1/24/2018 | | | 718 | | |
| | 16,114,279 | | | JPY | | | 142,180 | | | USD | | JPMorgan Chase Bank N.A. | | 1/24/2018 | | | 153 | | |
| | 2,477,451 | | | USD | | | 275,597,827 | | | JPY | | Societe Generale | | 1/24/2018 | | | 43,176 | | |
| | 1,726,176 | | | USD | | | 192,047,414 | | | JPY | | State Street Bank and Trust Company | | 1/24/2018 | | | 29,877 | | |
| | 739,610,741 | | | KRW | | | 656,562 | | | USD | | State Street Bank and Trust Company | | 1/24/2018 | | | 5,230 | | |
| | 859,705 | | | USD | | | 16,611,217 | | | MXN | | Goldman Sachs International | | 1/24/2018 | | | 5,328 | | |
| | 209,371 | | | USD | | | 4,045,461 | | | MXN | | Goldman Sachs International | | 1/24/2018 | | | 1,298 | | |
| | 208,776 | | | USD | | | 4,036,479 | | | MXN | | Societe Generale | | 1/24/2018 | | | 1,165 | | |
| | 775,996 | | | USD | | | 14,993,183 | | | MXN | | State Street Bank and Trust Company | | 1/24/2018 | | | 4,841 | | |
| | 687,706 | | | USD | | | 13,287,303 | | | MXN | | State Street Bank and Trust Company | | 1/24/2018 | | | 4,291 | | |
| | 481,383 | | | USD | | | 670,441 | | | NZD | | Citibank, N.A. | | 1/24/2018 | | | 23,247 | | |
| | 27,346 | | | USD | | | 38,088 | | | NZD | | Goldman Sachs International | | 1/24/2018 | | | 1,319 | | |
| | 139,499 | | | USD | | | 204,020 | | | NZD | | Goldman Sachs International | | 1/24/2018 | | | 84 | | |
| | 83,578 | | | USD | | | 122,253 | | | NZD | | JPMorgan Chase Bank N.A. | | 1/24/2018 | | | 38 | | |
| | 1,368,596 | | | USD | | | 1,964,680 | | | NZD | | Royal Bank of Canada | | 1/24/2018 | | | 26,059 | | |
| | 110,190 | | | USD | | | 158,182 | | | NZD | | Royal Bank of Canada | | 1/24/2018 | | | 2,098 | | |
| | 5,442,105 | | | USD | | | 7,587,999 | | | NZD | | Societe Generale | | 1/24/2018 | | | 256,951 | | |
| | 95,943 | | | USD | | | 133,774 | | | NZD | | Societe Generale | | 1/24/2018 | | | 4,530 | | |
| | 1,967,435 | | | USD | | | 2,743,637 | | | NZD | | State Street Bank and Trust Company | | 1/24/2018 | | | 92,608 | | |
| | 120,718 | | | USD | | | 168,185 | | | NZD | | State Street Bank and Trust Company | | 1/24/2018 | | | 5,791 | | |
| | 683,478 | | | USD | | | 994,179 | | | NZD | | State Street Bank and Trust Company | | 1/24/2018 | | | 4,120 | | |
| | 157,869 | | | USD | | | 1,242,634 | | | NOK | | Citibank, N.A. | | 1/24/2018 | | | 5,402 | | |
| | 2,269,649 | | | USD | | | 17,853,736 | | | NOK | | Goldman Sachs International | | 1/24/2018 | | | 79,051 | | |
| | 1,116,473 | | | USD | | | 8,910,461 | | | NOK | | Goldman Sachs International | | 1/24/2018 | | | 23,187 | | |
| | 13,468,859 | | | NOK | | | 1,649,970 | | | USD | | Goldman Sachs International | | 1/24/2018 | | | 2,617 | | |
| | 8,129,465 | | | NOK | | | 996,778 | | | USD | | Goldman Sachs International | | 1/24/2018 | | | 682 | | |
| | 1,085,188 | | | USD | | | 8,557,971 | | | NOK | | State Street Bank and Trust Company | | 1/24/2018 | | | 35,152 | | |
| | 86,546 | | | USD | | | 698,061 | | | SEK | | Goldman Sachs International | | 1/24/2018 | | | 2,717 | | |
See Notes to Financial Statements
211
Schedule of Investments Unconstrained Bond Fund (cont'd)
| Currency Purchased | | Currency Sold | | Counterparty | | Settlement
Date | | Net
Unrealized
Appreciation/
(Depreciation) | |
| | 58,613 | | | USD | | | 472,703 | | | SEK | | Goldman Sachs International | | 1/24/2018 | | $ | 1,847 | | |
| | 271,807 | | | USD | | | 2,254,522 | | | SEK | | Goldman Sachs International | | 1/24/2018 | | | 1,066 | | |
| | 809,777 | | | USD | | | 6,740,392 | | | SEK | | Goldman Sachs International | | 1/24/2018 | | | 337 | | |
| | 263,856 | | | USD | | | 2,154,198 | | | SEK | | JPMorgan Chase Bank N.A. | | 1/24/2018 | | | 5,162 | | |
| | 3,079,394 | | | USD | | | 24,853,945 | | | SEK | | Societe Generale | | 1/24/2018 | | | 94,733 | | |
| | 1,946 | | | USD | | | 15,705 | | | SEK | | Societe Generale | | 1/24/2018 | | | 60 | | |
| | 942,729 | | | USD | | | 7,620,314 | | | SEK | | State Street Bank and Trust Company | | 1/24/2018 | | | 27,620 | | |
| | 254,020 | | | USD | | | 2,066,593 | | | SEK | | State Street Bank and Trust Company | | 1/24/2018 | | | 5,847 | | |
| | 2,233,992 | | | USD | | | 31,044,447 | | | ZAR | | Royal Bank of Canada | | 1/24/2018 | | | 68,831 | | |
| | 72,088 | | | USD | | | 977,017 | | | ZAR | | State Street Bank and Trust Company | | 1/24/2018 | | | 3,947 | | |
| | | | | | | | | | | | $ | 2,693,986 | | |
| | 828,006 | | | AUD | | | 651,011 | | | USD | | Citibank, N.A. | | 1/24/2018 | | | (17,767 | ) | |
| | 47,114 | | | AUD | | | 37,049 | | | USD | | Goldman Sachs International | | 1/24/2018 | | | (1,017 | ) | |
| | 145,544 | | | AUD | | | 114,450 | | | USD | | Goldman Sachs International | | 1/24/2018 | | | (3,141 | ) | |
| | 1,033,980 | | | AUD | | | 806,802 | | | USD | | Goldman Sachs International | | 1/24/2018 | | | (16,033 | ) | |
| | 45,830 | | | AUD | | | 35,933 | | | USD | | Royal Bank of Canada | | 1/24/2018 | | | (883 | ) | |
| | 271,812 | | | AUD | | | 213,115 | | | USD | | Royal Bank of Canada | | 1/24/2018 | | | (5,238 | ) | |
| | 797,251 | | | AUD | | | 626,565 | | | USD | | Societe Generale | | 1/24/2018 | | | (16,842 | ) | |
| | 162,265 | | | AUD | | | 127,647 | | | USD | | State Street Bank and Trust Company | | 1/24/2018 | | | (3,549 | ) | |
| | 391,339 | | | CAD | | | 304,378 | | | USD | | Goldman Sachs International | | 1/24/2018 | | | (769 | ) | |
| | 1,359,029 | | | CAD | | | 1,073,617 | | | USD | | Goldman Sachs International | | 1/24/2018 | | | (19,253 | ) | |
| | 846,175 | | | CAD | | | 678,003 | | | USD | | Royal Bank of Canada | | 1/24/2018 | | | (21,523 | ) | |
| | 17,255,286 | | | CAD | | | 13,769,969 | | | USD | | Societe Generale | | 1/24/2018 | | | (382,951 | ) | |
| | 340,658 | | | CAD | | | 272,213 | | | USD | | State Street Bank and Trust Company | | 1/24/2018 | | | (7,923 | ) | |
| | 1,813,088 | | | CAD | | | 1,449,265 | | | USD | | State Street Bank and Trust Company | | 1/24/2018 | | | (42,632 | ) | |
| | 6,715,736 | | | CAD | | | 5,377,472 | | | USD | | State Street Bank and Trust Company | | 1/24/2018 | | | (167,261 | ) | |
| | 794,203 | | | CHF | | | 803,020 | | | USD | | Goldman Sachs International | | 1/24/2018 | | | (2,234 | ) | |
| | 5,796,143 | | | CHF | | | 5,978,795 | | | USD | | State Street Bank and Trust Company | | 1/24/2018 | | | (134,602 | ) | |
| | 438,864 | | | USD | | | 435,638 | | | CHF | | JPMorgan Chase Bank N.A. | | 1/24/2018 | | | (386 | ) | |
| | 1,007,217 | | | CZK | | | 46,501 | | | USD | | Goldman Sachs International | | 1/24/2018 | | | (537 | ) | |
| | 366,285 | | | EUR | | | 434,971 | | | USD | | Citibank, N.A. | | 1/24/2018 | | | (6,200 | ) | |
| | 72,881 | | | EUR | | | 85,325 | | | USD | | Goldman Sachs International | | 1/24/2018 | | | (11 | ) | |
| | 26,565 | | | USD | | | 22,719 | | | EUR | | Goldman Sachs International | | 1/24/2018 | | | (29 | ) | |
| | 871,022 | | | USD | | | 745,170 | | | EUR | | Goldman Sachs International | | 1/24/2018 | | | (1,269 | ) | |
| | 723,232 | | | USD | | | 619,119 | | | EUR | | Goldman Sachs International | | 1/24/2018 | | | (1,505 | ) | |
| | 368,912 | | | EUR | | | 438,244 | | | USD | | Goldman Sachs International | | 1/24/2018 | | | (6,398 | ) | |
| | 638,553 | | | EUR | | | 758,231 | | | USD | | Goldman Sachs International | | 1/24/2018 | | | (10,745 | ) | |
| | 3,195,202 | | | EUR | | | 3,794,047 | | | USD | | Goldman Sachs International | | 1/24/2018 | | | (53,765 | ) | |
| | 128,287 | | | EUR | | | 151,096 | | | USD | | JPMorgan Chase Bank N.A. | | 1/24/2018 | | | (925 | ) | |
| | 248,509 | | | EUR | | | 293,899 | | | USD | | JPMorgan Chase Bank N.A. | | 1/24/2018 | | | (2,996 | ) | |
| | 61,801 | | | EUR | | | 73,052 | | | USD | | Societe Generale | | 1/24/2018 | | | (708 | ) | |
| | 85,724 | | | EUR | | | 101,774 | | | USD | | Societe Generale | | 1/24/2018 | | | (1,426 | ) | |
| | 1,181,087 | | | USD | | | 1,010,461 | | | EUR | | State Street Bank and Trust Company | | 1/24/2018 | | | (1,751 | ) | |
| | 677,763 | | | EUR | | | 803,721 | | | USD | | State Street Bank and Trust Company | | 1/24/2018 | | | (10,337 | ) | |
| | 988,927 | | | GBP | | | 1,319,130 | | | USD | | Citibank, N.A. | | 1/24/2018 | | | (2,175 | ) | |
| | 1,691,711 | | | USD | | | 1,270,740 | | | GBP | | Goldman Sachs International | | 1/24/2018 | | | (535 | ) | |
See Notes to Financial Statements
212
Schedule of Investments Unconstrained Bond Fund (cont'd)
| Currency Purchased | | Currency Sold | | Counterparty | | Settlement
Date | | Net
Unrealized
Appreciation/
(Depreciation) | |
| | 1,866,452 | | | USD | | | 1,401,998 | | | GBP | | Goldman Sachs International | | 1/24/2018 | | $ | (590 | ) | |
| | 265,671 | | | GBP | | | 354,540 | | | USD | | Goldman Sachs International | | 1/24/2018 | | | (745 | ) | |
| | 161,997 | | | USD | | | 123,352 | | | GBP | | Goldman Sachs International | | 1/24/2018 | | | (2,271 | ) | |
| | 1,609,745 | | | USD | | | 1,219,140 | | | GBP | | Goldman Sachs International | | 1/24/2018 | | | (13,785 | ) | |
| | 219,059 | | | USD | | | 165,822 | | | GBP | | Royal Bank of Canada | | 1/24/2018 | | | (1,766 | ) | |
| | 3,445,985 | | | USD | | | 2,608,520 | | | GBP | | Royal Bank of Canada | | 1/24/2018 | | | (27,783 | ) | |
| | 53,034 | | | GBP | | | 70,652 | | | USD | | Societe Generale | | 1/24/2018 | | | (27 | ) | |
| | 60,277 | | | USD | | | 45,299 | | | GBP | | Societe Generale | | 1/24/2018 | | | (48 | ) | |
| | 27,437 | | | USD | | | 20,757 | | | GBP | | Societe Generale | | 1/24/2018 | | | (205 | ) | |
| | 129,523 | | | USD | | | 98,021 | | | GBP | | State Street Bank and Trust Company | | 1/24/2018 | | | (1,012 | ) | |
| | 46,744,889 | | | JPY | | | 420,292 | | | USD | | Citibank, N.A. | | 1/24/2018 | | | (7,408 | ) | |
| | 4,169,417 | | | JPY | | | 37,486 | | | USD | | Goldman Sachs International | | 1/24/2018 | | | (658 | ) | |
| | 764,102 | | | USD | | | 86,608,412 | | | JPY | | Goldman Sachs International | | 1/24/2018 | | | (885 | ) | |
| | 51,897,880 | | | JPY | | | 460,526 | | | USD | | Goldman Sachs International | | 1/24/2018 | | | (2,128 | ) | |
| | 35,116,274 | | | JPY | | | 315,900 | | | USD | | Goldman Sachs International | | 1/24/2018 | | | (5,728 | ) | |
| | 228,791,665 | | | JPY | | | 2,056,980 | | | USD | | Goldman Sachs International | | 1/24/2018 | | | (36,129 | ) | |
| | 110,362,059 | | | JPY | | | 978,608 | | | USD | | Royal Bank of Canada | | 1/24/2018 | | | (3,812 | ) | |
| | 571,615,000 | | | JPY | | | 5,068,655 | | | USD | | Royal Bank of Canada | | 1/24/2018 | | | (19,746 | ) | |
| | 76,098,071 | | | JPY | | | 684,074 | | | USD | | Societe Generale | | 1/24/2018 | | | (11,922 | ) | |
| | 258,108 | | | USD | | | 29,259,108 | | | JPY | | State Street Bank and Trust Company | | 1/24/2018 | | | (329 | ) | |
| | 599,777 | | | USD | | | 68,166,493 | | | JPY | | State Street Bank and Trust Company | | 1/24/2018 | | | (2,317 | ) | |
| | 1,433,800 | | | USD | | | 162,796,553 | | | JPY | | State Street Bank and Trust Company | | 1/24/2018 | | | (4,134 | ) | |
| | 53,557,835 | | | JPY | | | 477,845 | | | USD | | State Street Bank and Trust Company | | 1/24/2018 | | | (4,784 | ) | |
| | 139,195,935 | | | JPY | | | 1,251,132 | | | USD | | State Street Bank and Trust Company | | 1/24/2018 | | | (21,655 | ) | |
| | 482,211 | | | USD | | | 544,536,857 | | | KRW | | Goldman Sachs International | | 1/24/2018 | | | (5,032 | ) | |
| | 2,631,601 | | | USD | | | 2,971,734,992 | | | KRW | | Goldman Sachs International | | 1/24/2018 | | | (27,463 | ) | |
| | 63,734 | | | USD | | | 72,171,930 | | | KRW | | Royal Bank of Canada | | 1/24/2018 | | | (845 | ) | |
| | 167,880 | | | USD | | | 190,106,833 | | | KRW | | Royal Bank of Canada | | 1/24/2018 | | | (2,225 | ) | |
| | 314,306 | | | USD | | | 354,062,201 | | | KRW | | State Street Bank and Trust Company | | 1/24/2018 | | | (2,504 | ) | |
| | 495,832 | | | USD | | | 559,794,636 | | | KRW | | State Street Bank and Trust Company | | 1/24/2018 | | | (5,063 | ) | |
| | 14,998,911 | | | MXN | | | 776,261 | | | USD | | Goldman Sachs International | | 1/24/2018 | | | (4,811 | ) | |
| | 12,960,932 | | | MXN | | | 675,158 | | | USD | | Royal Bank of Canada | | 1/24/2018 | | | (8,529 | ) | |
| | 17,332,764 | | | MXN | | | 902,894 | | | USD | | Royal Bank of Canada | | 1/24/2018 | | | (11,405 | ) | |
| | 7,686,764 | | | MXN | | | 397,841 | | | USD | | State Street Bank and Trust Company | | 1/24/2018 | | | (2,482 | ) | |
| | 1,579,433 | | | NZD | | | 1,088,125 | | | USD | | Goldman Sachs International | | 1/24/2018 | | | (8,841 | ) | |
| | 1,283,280 | | | NZD | | | 892,257 | | | USD | | Goldman Sachs International | | 1/24/2018 | | | (15,345 | ) | |
| | 2,477,629 | | | NZD | | | 1,762,657 | | | USD | | Goldman Sachs International | | 1/24/2018 | | | (69,604 | ) | |
| | 2,429,586 | | | NZD | | | 1,744,346 | | | USD | | Goldman Sachs International | | 1/24/2018 | | | (84,122 | ) | |
| | 5,802,532 | | | NZD | | | 4,042,044 | | | USD | | Royal Bank of Canada | | 1/24/2018 | | | (76,964 | ) | |
| | 2,427,553 | | | NZD | | | 1,741,039 | | | USD | | Societe Generale | | 1/24/2018 | | | (82,204 | ) | |
| | 672,694 | | | NZD | | | 470,206 | | | USD | | State Street Bank and Trust Company | | 1/24/2018 | | | (10,530 | ) | |
| | 1,906,525 | | | NZD | | | 1,368,446 | | | USD | | State Street Bank and Trust Company | | 1/24/2018 | | | (65,649 | ) | |
| | 3,041,846 | | | NOK | | | 374,355 | | | USD | | Goldman Sachs International | | 1/24/2018 | | | (1,130 | ) | |
| | 4,652,864 | | | NOK | | | 585,084 | | | USD | | Goldman Sachs International | | 1/24/2018 | | | (14,192 | ) | |
| | 1,708,444 | | | NOK | | | 210,727 | | | USD | | JPMorgan Chase Bank N.A. | | 1/24/2018 | | | (1,106 | ) | |
| | 14,795,932 | | | NOK | | | 1,859,218 | | | USD | | Royal Bank of Canada | | 1/24/2018 | | | (43,803 | ) | |
| | 27,419,673 | | | NOK | | | 3,480,703 | | | USD | | Societe Generale | | 1/24/2018 | | | (116,395 | ) | |
See Notes to Financial Statements
213
Schedule of Investments Unconstrained Bond Fund (cont'd)
Currency Purchased | | Currency Sold | | Counterparty | | Settlement
Date | | Net
Unrealized
Appreciation/
(Depreciation) | |
| 1,112,603 | | | NOK | | | 140,027 | | | USD | | State Street Bank and Trust Company | | 1/24/2018 | | $ | (3,514 | ) | |
| 12,514,422 | | | NOK | | | 1,589,193 | | | USD | | State Street Bank and Trust Company | | 1/24/2018 | | | (53,713 | ) | |
| 1,912,332 | | | SEK | | | 236,895 | | | USD | | Citibank, N.A. | | 1/24/2018 | | | (7,246 | ) | |
| 6,366,919 | | | SEK | | | 765,709 | | | USD | | Goldman Sachs International | | 1/24/2018 | | | (1,118 | ) | |
| 1,664,126 | | | SEK | | | 206,344 | | | USD | | Goldman Sachs International | | 1/24/2018 | | | (6,503 | ) | |
| 343,270 | | | SEK | | | 42,280 | | | USD | | Royal Bank of Canada | | 1/24/2018 | | | (1,057 | ) | |
| 23,322,412 | | | SEK | | | 2,872,590 | | | USD | | Royal Bank of Canada | | 1/24/2018 | | | (71,847 | ) | |
| 347,384 | | | SEK | | | 42,976 | | | USD | | State Street Bank and Trust Company | | 1/24/2018 | | | (1,259 | ) | |
| 2,737,937 | | | SEK | | | 335,560 | | | USD | | State Street Bank and Trust Company | | 1/24/2018 | | | (6,767 | ) | |
| 3,251,465 | | | SEK | | | 400,777 | | | USD | | State Street Bank and Trust Company | | 1/24/2018 | | | (10,315 | ) | |
| 10,942,142 | | | SEK | | | 1,337,382 | | | USD | | State Street Bank and Trust Company | | 1/24/2018 | | | (23,362 | ) | |
| 554,070 | | | ZAR | | | 41,123 | | | USD | | Goldman Sachs International | | 1/24/2018 | | | (2,480 | ) | |
| 15,261,590 | | | ZAR | | | 1,098,241 | | | USD | | Royal Bank of Canada | | 1/24/2018 | | | (33,838 | ) | |
| 103,661 | | | ZAR | | | 7,648 | | | USD | | State Street Bank and Trust Company | | 1/24/2018 | | | (419 | ) | |
| | | | | | | | | | | | $ | (1,998,865 | ) | |
Total | | | | | | | | | | $ | 695,121 | | |
AUD = Australian Dollar
CAD = Canadian Dollar
CHF = Swiss Franc
CZK = Czech Koruny
EUR = Euro
GBP = Pound Sterling
JPY = Japanese Yen
KRW = South Korean Won(a)
MXN= Mexican Peso
NOK = Norwegian Krone
NZD = New Zealand Dollar
SEK = Swedish Krona
ZAR = South African Rand
(a) Non-deliverable forward contracts.
For the year ended October 31, 2017, the Fund's investments in forward contracts had an average notional value of $253,075,577.
Credit default swap contracts ("credit default swaps")
At October 31, 2017, the Fund had outstanding credit default swaps as follows:
Centrally Cleared Credit Default Swaps — Buy Protection
Clearinghouse | | Reference
Entity | | Notional
Amount(a) | | Financing
Rate Paid
by the
Fund | | Maturity
Date | | Upfront
Payments/
(Receipts) | | Unrealized
Appreciation/
(Depreciation) | | Accrued
Net
Interest
Receivable/
(Payable) | | Value | |
ICE Clear
Credit LLC | | iTRAXX Europe
Crossover S28 | | EUR | 10,000,000 | | | | 5.00 | %(b) | | 12/20/2022 | | $ | (1,339,085 | ) | | $ | (175,604 | ) | | $ | (68,608 | ) | | $ | (1,583,297 | ) | |
ICE Clear
Credit LLC | | CDX Emerging
Markets Index,
Ser.28 V.1 | | $ | 17,200,000 | | | | 1.00 | %(b) | | 12/20/2022 | | | 729,070 | | | | (131,026 | ) | | | (11,925 | ) | | | 586,119 | | |
| | | Total | | | | | | | | | | | | | | $ | (610,015 | ) | | $ | (306,630 | ) | | $ | (80,533 | ) | | $ | (997,178 | ) | |
See Notes to Financial Statements
214
Schedule of Investments Unconstrained Bond Fund (cont'd)
(a) Notional amount represents the value (including any fees or commissions) of the positions when they were established and is stated in the currency in which the contract is denominated.
EUR = Euro
(b) Payment frequency-quarterly.
For the year ended October 31, 2017, the average notional value of credit default swaps for the Fund was $14,998,082 for buy protection.
Interest rate swap contracts ("interest rate swaps")
At October 31, 2017, the Fund had outstanding centrally cleared interest rate swaps as follows:
| Clearinghouse | | Notional
Amount(a) | | Fund
Pays/
Receives
Floating
Rate | | Floating Rate
Index | | Annual
Fixed-Rate | | Maturity
Date | | Unrealized
Appreciation/
(Depreciation) | | Upfront
Payments/
Receipts | | Accrued
Net
Interest
Receivable/
(Payable) | | Value | |
LCH.Clearnet
Limited | | SEK | 85,000,000 | | | Receive | | 3-month Stockholm
Interbank Offer Rate
(STIBOR)(b) | | | (0.17 | %)(c) | | 12/22/2019 | | $ | (9,974 | ) | | $ | — | | | $ | 9,520 | | | $ | (454 | ) | |
LCH.Clearnet
Limited | | SEK | 30,000,000 | | | Receive | | 3-month Stockholm
Interbank Offer Rate
(STIBOR)(b) | | | (0.01 | %)(c) | | 7/18/2020 | | | (8,510 | ) | | | 98 | | | | (604 | ) | | | (9,016 | ) | |
LCH.Clearnet
Limited | | SEK | 27,000,000 | | | Receive | | 3-month Stockholm
Interbank Offer Rate
(STIBOR)(b) | | | (0.01 | %)(c) | | 8/28/2020 | | | (7,699 | ) | | | 92 | | | | (2,657 | ) | | | (10,264 | ) | |
| | | Total | | | | | | | | | | $ | (26,183 | ) | | $ | 190 | | | $ | 6,259 | | | $ | (19,734 | ) | |
(a) Notional amount represents the value (including any fees or commissions) of the positions when they were established and is stated in the currency in which the contract is denominated.
SEK = Swedish Krona
(b) Payment frequency-quarterly.
(c) Payment frequency-annually.
For the year ended October 31, 2017, the average notional value of interest rate swaps for the Fund was $11,757,275 when the Fund paid the fixed rate.
See Notes to Financial Statements
215
Schedule of Investments Unconstrained Bond Fund (cont'd)
At October 31, 2017, the Fund received cash collateral of $915,842 for centrally cleared swaps and $620,000 for OTC swaps, respectively.
The following is a summary, categorized by Level (see Note A of Notes to Financial Statements), of inputs used to value the Fund's investments as of October 31, 2017:
Asset Valuation Inputs
(000's omitted) | | Level 1 | | Level 2 | | Level 3 | | Total | |
Investments: | |
U.S. Treasury Obligations | | $ | — | | | $ | 20,794 | | | $ | — | | | $ | 20,794 | | |
| Mortgage-Backed Securities(a) | | | — | | | | 6,949 | | | | — | | | | 6,949 | | |
| Corporate Bonds(a) | | | — | | | | 39,146 | | | | — | | | | 39,146 | | |
Asset-Backed Securities | | | — | | | | 10,352 | | | | — | | | | 10,352 | | |
Foreign Government Securities | | | — | | | | 16,022 | | | | — | | | | 16,022 | | |
Short-Term Investment | | | — | | | | 3,640 | | | | — | | | | 3,640 | | |
Total Investments | | $ | — | | | $ | 96,903 | | | $ | — | | | $ | 96,903 | | |
(a) The Schedule of Investments provides information on the industry or sector categorization for the portfolio.
As of the year ended October 31, 2017, no securities were transferred from one level (as of October 31, 2016) to another.
The following is a summary, categorized by Level (see Note A of Notes to Financial Statements), of inputs used to value the Fund's derivatives as of October 31, 2017:
Other Financial Instruments
(000's omitted) | | Level 1 | | Level 2 | | Level 3 | | Total | |
| Futures(a) | |
Assets | | $ | 1,272 | | | $ | — | | | $ | — | | | $ | 1,272 | | |
Liabilities | | | (547 | ) | | | — | | | | — | | | | (547 | ) | |
Forward Contracts(a) | |
Assets | | | — | | | | 2,694 | | | | — | | | | 2,694 | | |
Liabilities | | | — | | | | (1,999 | ) | | | — | | | | (1,999 | ) | |
Swaps | |
Assets | | | — | | | | 586 | | | | — | | | | 586 | | |
Liabilities | | | — | | | | (1,603 | ) | | | — | | | | (1,603 | ) | |
Total | | $ | 725 | | | $ | (322 | ) | | $ | — | | | $ | 403 | | |
(a) Futures and forward contracts are reported at the cumulative unrealized appreciation/(depreciation) of the instrument.
See Notes to Financial Statements
216
This page has been left blank intentionally
Statements of Assets and Liabilities
Neuberger Berman Income Funds
(000's omitted except per share amounts)
| | | CORE BOND
FUND | | CORE PLUS
FUND | | EMERGING
MARKETS
DEBT FUND | | FLOATING
RATE INCOME
FUND | | HIGH INCOME
BOND FUND | | MUNICIPAL
HIGH INCOME
FUND | |
| | | October 31,
2017 | | October 31,
2017 | | October 31,
2017 | | October 31,
2017 | | October 31,
2017 | | October 31,
2017 | |
Assets | |
Investments in securities, at value*
(Notes A & F)—see Schedule of Investments: | |
| Unaffiliated issuers(a) | | $ | 410,229 | | | $ | 11,760 | | | $ | 246,334 | | | $ | 373,974 | | | $ | 3,238,852 | | | $ | 95,132 | | |
| Affiliated issuers(b) | | | — | | | | — | | | | — | | | | — | | | | — | | | | — | | |
| | | | 410,229 | | | | 11,760 | | | | 246,334 | | | | 373,974 | | | | 3,238,852 | | | | 95,132 | | |
Cash | | | — | | | | — | | | | 456 | | | | 1,947 | | | | — | | | | 1,610 | | |
| Foreign currency(c) | | | — | | | | — | | | | 363 | | | | — | | | | — | | | | — | | |
Cash collateral segregated for futures contracts (Note A) | | | — | | | | — | | | | 438 | | | | — | | | | — | | | | — | | |
| Cash collateral segregated for swap contracts(d)(e) (Note A) | | | — | | | | 46 | | | | — | | | | — | | | | — | | | | — | | |
Cash collateral segregated for forward foreign currency
contracts (Note A) | | | — | | | | — | | | | 190 | | | | — | | | | — | | | | — | | |
Dividends and interest receivable | | | 1,917 | | | | 64 | | | | 3,712 | | | | 1,083 | | | | 46,551 | | | | 1,305 | | |
Receivable for securities sold | | | 7,173 | | | | 191 | | | | 1,542 | | | | 4,368 | | | | 13,190 | | | | 2,018 | | |
Receivable for Fund shares sold | | | 228 | | | | — | | | | 9 | | | | 9,218 | | | | 12,922 | | | | 250 | | |
Receivable from Management—net (Note B) | | | — | | | | 47 | | | | — | | | | — | | | | — | | | | — | | |
Receivable for variation margin on futures contracts (Note A) | | | — | | | | — | | | | 89 | | | | — | | | | — | | | | — | | |
Receivable for variation margin on centrally cleared
swap contracts(d)(e) | | | — | | | | 7 | | | | 59 | | | | — | | | | — | | | | — | | |
| OTC swap contracts, at value(f) (Note A) | | | — | | | | — | | | | 713 | | | | — | | | | — | | | | — | | |
Receivable for forward foreign currency contracts (Note A) | | | — | | | | — | | | | 1,433 | | | | — | | | | — | | | | — | | |
Prepaid expenses and other assets | | | 54 | | | | 69 | | | | 42 | | | | 28 | | | | 183 | | | | 19 | | |
Total Assets | | | 419,601 | | | | 12,184 | | | | 255,380 | | | | 390,618 | | | | 3,311,698 | | | | 100,334 | | |
Liabilities | |
OTC swap contracts, at value (Note A) | | | — | | | | — | | | | 477 | | | | — | | | | — | | | | — | | |
Cash collateral segregated for swaps contracts due to
broker(d)(e) (Note A) | | | — | | | | — | | | | 353 | | | | — | | | | — | | | | — | | |
Payable to investment manager—net (Notes A & B) | | | 80 | | | | 2 | | | | 116 | | | | 156 | | | | 1,325 | | | | 32 | | |
Due to custodian | | | — | | | | 1 | | | | — | | | | — | | | | 1,987 | | | | — | | |
Payable for securities purchased | | | 43,950 | | | | 2,032 | | | | 3,827 | | | | 15,723 | | | | 51,494 | | | | 2,948 | | |
Payable for Fund shares redeemed | | | 529 | | | | 21 | | | | 66 | | | | 473 | | | | 3,465 | | | | 196 | | |
Payable to administrator—net (Note B) | | | 69 | | | | — | | | | 25 | | | | 68 | | | | 381 | | | | 1 | | |
Payable to trustees | | | 2 | | | | 2 | | | | 2 | | | | 2 | | | | 2 | | | | 2 | | |
Payable for organization costs | | | — | | | | 27 | | | | — | | | | — | | | | — | | | | — | | |
Payable for variation margin on futures contracts (Note A) | | | 18 | | | | 1 | | | | — | | | | — | | | | — | | | | — | | |
Payable for forward foreign currency contracts (Note A) | | | — | | | | — | | | | 1,635 | | | | — | | | | — | | | | — | | |
Distributions payable | | | 160 | | | | 7 | | | | 39 | | | | 116 | | | | 4,415 | | | | — | | |
Accrued capital gains taxes | | | — | | | | — | | | | 75 | | | | — | | | | — | | | | — | | |
Accrued expenses and other payables | | | 148 | | | | 110 | | | | 203 | | | | 220 | | | | 666 | | | | 89 | | |
Total Liabilities | | | 44,956 | | | | 2,203 | | | | 6,818 | | | | 16,758 | | | | 63,735 | | | | 3,268 | | |
Unfunded Loan Commitments (Note A) | |
Net Assets | | $ | 374,645 | | | $ | 9,981 | | | $ | 248,562 | | | $ | 373,860 | | | $ | 3,247,963 | | | $ | 97,066 | | |
Net Assets consist of: | |
Paid-in capital | | $ | 378,039 | | | $ | 10,011 | | | $ | 253,083 | | | $ | 390,593 | | | $ | 3,262,818 | | | $ | 98,125 | | |
Undistributed net investment income (loss) | | | — | | | | — | | | | — | | | | — | | | | 149 | | | | — | | |
Distributions in excess of net investment income | | | (159 | ) | | | (4 | ) | | | (96 | ) | | | (154 | ) | | | — | | | | — | | |
Accumulated net realized gains (losses) on investments | | | (3,398 | ) | | | (10 | ) | | | (6,770 | ) | | | (16,883 | ) | | | (126,883 | ) | | | (1,635 | ) | |
Net unrealized appreciation (depreciation) in value of investments | | | 163 | | | | (16 | ) | | | 2,345 | | | | 304 | | | | 111,879 | | | | 576 | | |
Net Assets | | $ | 374,645 | | | $ | 9,981 | | | $ | 248,562 | | | $ | 373,860 | | | $ | 3,247,963 | | | $ | 97,066 | | |
Net Assets | |
Investor Class | | $ | 10,954 | | | $ | — | | | $ | — | | | $ | — | | | $ | 112,680 | | | $ | — | | |
Trust Class | | | — | | | | — | | | | — | | | | �� | | | | — | | | | — | | |
Institutional Class | | | 337,954 | | | | 7,575 | | | | 247,655 | | | | 335,820 | | | | 1,519,387 | | | | 96,083 | | |
Class A | | | 22,443 | | | | 213 | | | | 369 | | | | 17,403 | | | | 76,832 | | | | 260 | | |
Class C | | | 3,294 | | | | 199 | | | | 538 | | | | 20,637 | | | | 23,612 | | | | 723 | | |
Class R3 | | | — | | | | — | | | | — | | | | — | | | | 12,334 | | | | — | | |
Class R6 | | | — | | | | 1,994 | | | | — | | | | — | | | | 1,503,118 | | | | — | | |
See Notes to Financial Statements
218
| | | MUNICIPAL
INTERMEDIATE
BOND FUND | | NEW YORK
MUNICIPAL
INCOME FUND | | SHORT
DURATION
BOND FUND | | SHORT
DURATION
HIGH INCOME
FUND | | STRATEGIC
INCOME FUND | |
| | | October 31,
2017 | | October 31,
2017 | | October 31,
2017 | | October 31,
2017 | | October 31,
2017 | |
Assets | |
Investments in securities, at value*
(Notes A & F)—see Schedule of Investments: | |
| Unaffiliated issuers(a) | | $ | 232,393 | | | $ | 58,895 | | | $ | 106,629 | | | $ | 117,222 | | | $ | 3,263,238 | | |
| Affiliated issuers(b) | | | — | | | | — | | | | — | | | | — | | | | 101,998 | | |
| | | | 232,393 | | | | 58,895 | | | | 106,629 | | | | 117,222 | | | | 3,365,236 | | |
Cash | | | — | | | | 56 | | | | — | | | | 4 | | | | 390 | | |
| Foreign currency(c) | | | — | | | | — | | | | — | | | | — | | | | 2 | | |
Cash collateral segregated for futures contracts (Note A) | | | — | | | | — | | | | 29 | | | | — | | | | — | | |
| Cash collateral segregated for swap contracts(d)(e) (Note A) | | | — | | | | — | | | | — | | | | — | | | | 3,564 | | |
Cash collateral segregated for forward foreign currency
contracts (Note A) | | | — | | | | — | | | | — | | | | — | | | | — | | |
Dividends and interest receivable | | | 2,373 | | | | 770 | | | | 507 | | | | 1,579 | | | | 18,779 | | |
Receivable for securities sold | | | 5,419 | | | | 399 | | | | — | | | | 255 | | | | 28,046 | | |
Receivable for Fund shares sold | | | 48 | | | | — | | | | 610 | | | | 63 | | | | 4,590 | | |
Receivable from Management—net (Note B) | | | — | | | | — | | | | — | | | | — | | | | — | | |
Receivable for variation margin on futures contracts (Note A) | | | — | | | | — | | | | 21 | | | | — | | | | 15 | | |
Receivable for variation margin on centrally cleared
swap contracts(d)(e) | | | — | | | | — | | | | — | | | | — | | | | 2,540 | | |
| OTC swap contracts, at value(f) (Note A) | | | — | | | | — | | | | — | | | | — | | | | — | | |
Receivable for forward foreign currency contracts (Note A) | | | — | | | | — | | | | — | | | | — | | | | — | | |
Prepaid expenses and other assets | | | 29 | | | | 7 | | | | 38 | | | | 25 | | | | 102 | | |
Total Assets | | | 240,262 | | | | 60,127 | | | | 107,834 | | | | 119,148 | | | | 3,423,264 | | |
Liabilities | |
OTC swap contracts, at value (Note A) | | | — | | | | — | | | | — | | | | — | | | | — | | |
Cash collateral segregated for swaps contracts due to
broker(d)(e) (Note A) | | | — | | | | — | | | | — | | | | — | | | | — | | |
Payable to investment manager—net (Notes A & B) | | | 47 | | | | 13 | | | | 22 | | | | 46 | | | | 866 | | |
Due to custodian | | | 3,415 | | | | — | | | | — | | | | — | | | | — | | |
Payable for securities purchased | | | 12,411 | | | | 399 | | | | 3,972 | | | | 532 | | | | 700,968 | | |
Payable for Fund shares redeemed | | | 292 | | | | 54 | | | | 531 | | | | 35 | | | | 3,523 | | |
Payable to administrator—net (Note B) | | | 64 | | | | 8 | | | | 6 | | | | 7 | | | | 565 | | |
Payable to trustees | | | 2 | | | | 2 | | | | 2 | | | | 2 | | | | 2 | | |
Payable for organization costs | | | — | | | | — | | | | — | | | | — | | | | — | | |
Payable for variation margin on futures contracts (Note A) | | | — | | | | — | | | | — | | | | — | | | | — | | |
Payable for forward foreign currency contracts (Note A) | | | — | | | | — | | | | — | | | | — | | | | — | | |
Distributions payable | | | 61 | | | | 11 | | | | 4 | | | | — | | | | 1,504 | | |
Accrued capital gains taxes | | | — | | | | — | | | | — | | | | — | | | | — | | |
Accrued expenses and other payables | | | 126 | | | | 95 | | | | 132 | | | | 128 | | | | 482 | | |
Total Liabilities | | | 16,418 | | | | 582 | | | | 4,669 | | | | 750 | | | | 707,910 | | |
Unfunded Loan Commitments (Note A) | |
Net Assets | | $ | 223,844 | | | $ | 59,545 | | | $ | 103,165 | | | $ | 118,398 | | | $ | 2,715,354 | | |
Net Assets consist of: | |
Paid-in capital | | $ | 219,033 | | | $ | 57,731 | | | $ | 110,209 | | | $ | 131,143 | | | $ | 2,713,775 | | |
Undistributed net investment income (loss) | | | — | | | | 12 | | | | 156 | | | | — | | | | — | | |
Distributions in excess of net investment income | | | — | | | | — | | | | — | | | | (1 | ) | | | (3,838 | ) | |
Accumulated net realized gains (losses) on investments | | | 778 | | | | 98 | | | | (6,909 | ) | | | (14,141 | ) | | | (37,608 | ) | |
Net unrealized appreciation (depreciation) in value of investments | | | 4,033 | | | | 1,704 | | | | (291 | ) | | | 1,397 | | | | 43,025 | | |
Net Assets | | $ | 223,844 | | | $ | 59,545 | | | $ | 103,165 | | | $ | 118,398 | | | $ | 2,715,354 | | |
Net Assets | |
Investor Class | | $ | 13,764 | | | $ | — | | | $ | 24,024 | | | $ | — | | | $ | — | | |
Trust Class | | | — | | | | — | | | | 2,287 | | | | — | | | | 20,041 | | |
Institutional Class | | | 200,145 | | | | 59,545 | | | | 72,780 | | | | 114,716 | | | | 2,041,022 | | |
Class A | | | 6,738 | | | | — | | | | 2,499 | | | | 2,567 | | | | 193,058 | | |
Class C | | | 3,197 | | | | — | | | | 1,575 | | | | 1,115 | | | | 150,225 | | |
Class R3 | | | — | | | | — | | | | — | | | | — | | | | — | | |
Class R6 | | | — | | | | — | | | | — | | | | — | | | | 311,008 | | |
219
Statements of Assets and Liabilities (cont'd)
Neuberger Berman Income Funds (cont'd)
(000's omitted except per share amounts)
| | | CORE BOND
FUND | | CORE PLUS
FUND | | EMERGING
MARKETS
DEBT FUND | | FLOATING
RATE INCOME
FUND | | HIGH INCOME
BOND FUND | | MUNICIPAL
HIGH INCOME
FUND | |
| | | October 31,
2017 | | October 31,
2017 | | October 31,
2017 | | October 31,
2017 | | October 31,
2017 | | October 31,
2017 | |
Shares Outstanding ($.001 par value;
unlimited shares authorized) | |
Investor Class | | | 1,062 | | | | — | | | | — | | | | — | | | | 12,819 | | | | — | | |
Trust Class | | | — | | | | — | | | | — | | | | — | | | | — | | | | — | | |
Institutional Class | | | 32,699 | | | | 760 | | | | 27,468 | | | | 33,781 | | | | 172,585 | | | | 9,417 | | |
Class A | | | 2,179 | | | | 21 | | | | 41 | | | | 1,751 | | | | 8,744 | | | | 26 | | |
Class C | | | 319 | | | | 20 | | | | 60 | | | | 2,076 | | | | 2,682 | | | | 71 | | |
Class R3 | | | — | | | | — | | | | — | | | | — | | | | 1,402 | | | | — | | |
Class R6 | | | — | | | | 200 | | | | — | | | | — | | | | 170,693 | | | | — | | |
Net Asset Value, offering and redemption price per share | |
Investor Class | | $ | 10.31 | | | $ | — | | | $ | — | | | $ | — | | | $ | 8.79 | | | $ | — | | |
Trust Class | | | — | | | | — | | | | — | | | | — | | | | — | | | | — | | |
Institutional Class | | | 10.34 | | | | 9.97 | | | | 9.02 | | | | 9.94 | | | | 8.80 | | | | 10.20 | | |
Class R3 | | | — | | | | — | | | | — | | | | — | | | | 8.80 | | | | — | | |
Class R6 | | | — | | | | 9.97 | | | | — | | | | — | | | | 8.81 | | | | — | | |
Net Asset Value and redemption price per share | |
Class A | | $ | 10.30 | | | $ | 9.97 | | | $ | 9.01 | | | $ | 9.94 | | | $ | 8.79 | | | $ | 10.20 | | |
Offering Price per share | |
Class A‡ | | $ | 10.76 | | | $ | 10.41 | | | $ | 9.41 | | | $ | 10.38 | | | $ | 9.18 | | | $ | 10.65 | | |
Net Asset Value and offering price per share | |
Class C^ | | $ | 10.31 | | | $ | 9.97 | | | $ | 9.01 | | | $ | 9.94 | | | $ | 8.81 | | | $ | 10.21 | | |
*Cost of Investments: | |
(a) Unaffiliated issuers | | $ | 409,539 | | | $ | 11,768 | | | $ | 243,914 | | | $ | 373,671 | | | $ | 3,126,973 | | | $ | 94,556 | | |
(b) Affiliated issuers | | | — | | | | — | | | | — | | | | — | | | | — | | | | — | | |
Total cost of investments | | $ | 409,539 | | | $ | 11,768 | | | $ | 243,914 | | | $ | 373,671 | | | $ | 3,126,973 | | | $ | 94,556 | | |
(c) Total cost of foreign currency | | $ | — | | | $ | — | | | $ | 365 | | | $ | — | | | $ | — | | | $ | — | | |
(d) Unamortized upfront receipts on centrally cleared
swap contracts | | $ | — | | | $ | 9 | | | $ | — | | | $ | — | | | $ | — | | | $ | — | | |
(e) Unamortized upfront payments on centrally cleared
swap contracts | | $ | — | | | $ | 35 | | | $ | — | | | $ | — | | | $ | — | | | $ | — | | |
‡ On single retail sales of less than $50,000. On sales of $50,000 or more or in certain other circumstances described in the Fund's prospectus, offering price is reduced.
^ Redemption price per share is equal to net asset value less any applicable contingent deferred sales charge.
See Notes to Financial Statements
220
| | | MUNICIPAL
INTERMEDIATE
BOND FUND | | NEW YORK
MUNICIPAL
INCOME FUND | | SHORT
DURATION
BOND FUND | | SHORT
DURATION
HIGH INCOME
FUND | | STRATEGIC
INCOME FUND | |
| | | October 31,
2017 | | October 31,
2017 | | October 31,
2017 | | October 31,
2017 | | October 31,
2017 | |
Shares Outstanding ($.001 par value;
unlimited shares authorized) | |
Investor Class | | | 1,166 | | | | — | | | | 3,083 | | | | — | | | | — | | |
Trust Class | | | — | | | | — | | | | 308 | | | | — | | | | 1,797 | | |
Institutional Class | | | 16,963 | | | | 3,438 | | | | 9,347 | | | | 11,760 | | | | 182,950 | | |
Class A | | | 571 | | | | — | | | | 337 | | | | 263 | | | | 17,291 | | |
Class C | | | 271 | | | | — | | | | 212 | | | | 114 | | | | 13,467 | | |
Class R3 | | | — | | | | — | | | | — | | | | — | | | | — | | |
Class R6 | | | — | | | | — | | | | — | | | | — | | | | 27,899 | | |
Net Asset Value, offering and redemption price per share | |
Investor Class | | $ | 11.81 | | | $ | — | | | $ | 7.79 | | | $ | — | | | $ | — | | |
Trust Class | | | — | | | | — | | | | 7.43 | | | | — | | | | 11.15 | | |
Institutional Class | | | 11.80 | | | | 17.32 | | | | 7.79 | | | | 9.75 | | | | 11.16 | | |
Class R3 | | | — | | | | — | | | | — | | | | — | | | | — | | |
Class R6 | | | — | | | | — | | | | — | | | | — | | | | 11.15 | | |
Net Asset Value and redemption price per share | |
Class A | | $ | 11.79 | | | $ | — | | | $ | 7.42 | | | $ | 9.76 | | | $ | 11.17 | | |
Offering Price per share | |
Class A‡ | | $ | 12.31 | | | $ | — | | | $ | 7.61 | | | $ | 10.19 | | | $ | 11.67 | | |
Net Asset Value and offering price per share | |
Class C^ | | $ | 11.80 | | | $ | — | | | $ | 7.42 | | | $ | 9.75 | | | $ | 11.15 | | |
*Cost of Investments: | |
(a) Unaffiliated issuers | | $ | 228,360 | | | $ | 57,191 | | | $ | 106,852 | | | $ | 115,825 | | | $ | 3,219,274 | | |
(b) Affiliated issuers | | | — | | | | — | | | | — | | | | — | | | | 100,591 | | |
Total cost of investments | | $ | 228,360 | | | $ | 57,191 | | | $ | 106,852 | | | $ | 115,825 | | | $ | 3,319,865 | | |
(c) Total cost of foreign currency | | $ | — | | | $ | — | | | $ | — | | | $ | — | | | $ | 2 | | |
(d) Unamortized upfront receipts on centrally cleared
swap contracts | | $ | — | | | $ | — | | | $ | — | | | $ | — | | | $ | — | | |
(e) Unamortized upfront payments on centrally cleared
swap contracts | | $ | — | | | $ | — | | | $ | — | | | $ | — | | | $ | 5,571 | | |
221
Statements of Assets and Liabilities (cont'd)
Neuberger Berman Income Funds
(000's omitted except per share amounts)
| | | UNCONSTRAINED
BOND FUND | |
| | | October 31, 2017 | |
Assets | |
Investments in securities, at value* (Notes A & F)—see Schedule of Investments: | |
| Unaffiliated issuers(a) | | $ | 96,903 | | |
| Affiliated issuers(b) | | | — | | |
| | | | 96,903 | | |
Cash | | | 616 | | |
| Foreign currency(c) | | | 1,257 | | |
Cash collateral segregated for futures contracts (Note A) | | | — | | |
| Cash collateral segregated for swap contracts (Note A)(d)(e) | | | — | | |
Cash collateral segregated for forward foreign currency contracts (Note A) | | | — | | |
Dividends and interest receivable | | | 862 | | |
Receivable for securities sold | | | 172 | | |
Receivable for Fund shares sold | | | — | | |
Receivable from Management—net (Note B) | | | — | | |
Receivable for variation margin on futures contracts (Note A) | | | — | | |
| Receivable for variation margin on centrally cleared swap contracts(d)(e) | | | 2,032 | | |
OTC swap contracts, at value (Note A) | | | — | | |
Receivable for forward foreign currency contracts (Note A) | | | 2,694 | | |
Prepaid expenses and other assets | | | 14 | | |
Total Assets | | | 104,550 | | |
Liabilities | |
| Cash collateral segregated for swap contracts due to broker(d)(e) (Note A) | | | 1,536 | | |
Payable to investment manager—net (Notes A & B) | | | 38 | | |
Due to custodian | | | — | | |
Payable for securities purchased | | | 1,730 | | |
Payable for Fund shares redeemed | | | 2 | | |
Payable to administrator—net (Note B) | | | — | | |
Payable to trustees | | | 2 | | |
Payable for organization costs | | | — | | |
Payable for variation margin on futures contracts (Note A) | | | 2 | | |
Payable for forward foreign currency contracts (Note A) | | | 1,999 | | |
Distributions payable | | | 1 | | |
Accrued capital gains taxes | | | — | | |
Accrued expenses and other payables | | | 159 | | |
Total Liabilities | | | 5,469 | | |
Unfunded Loan Commitments (Note A) | |
Net Assets | | $ | 99,081 | | |
Net Assets consist of: | |
Paid-in capital | | $ | 107,697 | | |
Undistributed net investment income (loss) | | | 358 | | |
Distributions in excess of net investment income | | | — | | |
Accumulated net realized gains (losses) on investments | | | (12,536 | ) | |
Net unrealized appreciation (depreciation) in value of investments | | | 3,562 | | |
Net Assets | | $ | 99,081 | | |
See Notes to Financial Statements
222
Statements of Assets and Liabilities (cont'd)
Neuberger Berman Income Funds (cont'd)
(000's omitted except per share amounts)
| | | UNCONSTRAINED
BOND FUND | |
| | | October 31, 2017 | |
Net Assets | |
Investor Class | | $ | — | | |
Trust Class | | | — | | |
Institutional Class | | | 45,808 | | |
Class A | | | 453 | | |
Class C | | | 36 | | |
Class R3 | | | — | | |
Class R6 | | | 52,784 | | |
Shares Outstanding ($.001 par value; unlimited shares authorized) | |
Investor Class | | | — | | |
Trust Class | | | — | | |
Institutional Class | | | 4,867 | | |
Class A | | | 48 | | |
Class C | | | 4 | | |
Class R3 | | | — | | |
Class R6 | | | 5,603 | | |
Net Asset Value, offering and redemption price per share | |
Investor Class | | $ | — | | |
Trust Class | | | — | | |
Institutional Class | | | 9.41 | | |
Class R3 | | | — | | |
Class R6 | | | 9.42 | | |
Net Asset Value and redemption price per share | |
Class A | | $ | 9.41 | | |
Offering Price per share | |
Class A‡ | | $ | 9.83 | | |
Net Asset Value and offering price per share | |
Class C^ | | $ | 9.42 | | |
*Cost of Investments: | |
(a) Unaffiliated issuers | | $ | 94,371 | | |
(b) Affiliated issuers | | | — | | |
Total cost of investments | | $ | 94,371 | | |
(c) Total cost of foreign currency | | $ | 1,245 | | |
(d) Unamortized upfront receipts on centrally cleared swap contracts | | $ | 1,339 | | |
(e) Unamortized upfront payments on centrally cleared swap contracts | | $ | 729 | | |
‡ On single retail sales of less than $50,000. On sales of $50,000 or more or in certain other circumstances described in the Fund's prospectus, offering price is reduced.
^ Redemption price per share is equal to net asset value less any applicable contingent deferred sales charge.
See Notes to Financial Statements
223
Neuberger Berman Income Funds
(000's omitted)
| | | CORE BOND
FUND | | CORE PLUS
FUND | | EMERGING
MARKETS
DEBT FUND | | FLOATING
RATE INCOME
FUND | | HIGH INCOME
BOND FUND | | MUNICIPAL
HIGH INCOME
FUND | |
| | | For the
Year Ended
October 31,
2017 | | Period from
July 18, 2017
(Commencement
of Operations) to
October 31,
2017 | | For the
Year Ended
October 31,
2017 | | For the
Year Ended
October 31,
2017 | | For the
Year Ended
October 31,
2017 | | For the
Year Ended
October 31,
2017 | |
Investment Income: | |
Income (Note A): | |
Interest income—unaffiliated issuers | | $ | 10,136 | | | $ | 86 | | | $ | 10,554 | | | $ | 16,497 | | | $ | 222,876 | | | $ | 3,893 | | |
Dividend income—unaffiliated issuers | | | — | | | | — | | | | — | | | | — | | | | 539 | | | | — | | |
Dividend income—affiliated issuers (Note F) | | | — | | | | — | | | | — | | | | — | | | | — | | | | — | | |
Foreign taxes withheld (Note A) | | | — | | | | — | | | | (129 | ) | | | — | | | | — | | | | — | | |
Total income | | $ | 10,136 | | | $ | 86 | | | $ | 10,425 | | | $ | 16,497 | | | $ | 223,415 | | | $ | 3,893 | | |
Expenses: | |
Investment management fees (Note B) | | | 896 | | | | 7 | | | | 921 | | | | 1,887 | | | | 17,337 | | | | 386 | | |
Administration fees (Note B) | | | 140 | | | | — | | | | 55 | | | | 149 | | | | 1,516 | | | | 39 | | |
Administration fees (Note B): | |
Investor Class | | | 25 | | | | — | | | | — | | | | — | | | | 278 | | | | — | | |
Trust Class | | | — | | | | — | | | | — | | | | — | | | | — | | | | — | | |
Institutional Class | | | 355 | | | | 3 | | | | 195 | | | | 371 | | | | 2,712 | | | | 105 | | |
Class A | | | 55 | | | | — | | | | 1 | | | | 47 | | | | 182 | | | | 1 | | |
Class C | | | 9 | | | | — | | | | 1 | | | | 52 | | | | 62 | | | | 1 | | |
Class R3 | | | — | | | | — | | | | — | | | | — | | | | 26 | | | | — | | |
Class R6 | | | — | | | | — | | | | — | | | | — | | | | 351 | | | | — | | |
Distribution fees (Note B): | |
Investor Class | | | 28 | | | | — | | | | — | | | | — | | | | — | | | | — | | |
Trust Class | | | — | | | | — | | | | — | | | | — | | | | — | | | | — | | |
Class A | | | 59 | | | | — | | | | 1 | | | | 52 | | | | 198 | | | | 1 | | |
Class C | | | 38 | | | | 1 | | | | 2 | | | | 227 | | | | 274 | | | | 3 | | |
Class R3 | | | — | | | | — | | | | — | | | | — | | | | 56 | | | | — | | |
Shareholder servicing agent fees: | |
Investor Class | | | 23 | | | | — | | | | — | | | | — | | | | 50 | | | | — | | |
Trust Class | | | — | | | | — | | | | — | | | | — | | | | — | | | | — | | |
Institutional Class | | | 5 | | | | — | | | | 1 | | | | 3 | | | | 500 | | | | — | | |
Class A | | | 2 | | | | — | | | | — | | | | 3 | | | | 67 | | | | 1 | | |
Class C | | | — | | | | — | | | | — | | | | 1 | | | | 3 | | | | — | | |
Class R3 | | | — | | | | — | | | | — | | | | — | | | | 5 | | | | — | | |
Class R6 | | | — | | | | — | | | | — | | | | — | | | | 2 | | | | — | | |
Organization expense (Note A) | | | — | | | | 89 | | | | — | | | | — | | | | — | | | | — | | |
Audit fees | | | 33 | | | | 25 | | | | 62 | | | | 37 | | | | 66 | | | | 32 | | |
Custodian and accounting fees | | | 192 | | | | 38 | | | | 291 | | | | 389 | | | | 621 | | | | 79 | | |
Insurance expense | | | 12 | | | | — | | | | 5 | | | | 11 | | | | 132 | | | | 3 | | |
Legal fees | | | 80 | | | | 40 | | | | 74 | | | | 74 | | | | 91 | | | | 74 | | |
Registration and filing fees | | | 105 | | | | 3 | | | | 54 | | | | 54 | | | | 316 | | | | 58 | | |
Repayment to Management of expenses previously
assumed by Management (Note B) | | | — | | | | — | | | | — | | | | — | | | | 2 | | | | — | | |
Shareholder reports | | | 41 | | | | 3 | | | | — | | | | 20 | | | | 316 | | | | 4 | | |
Trustees' fees and expenses | | | 45 | | | | 13 | | | | 45 | | | | 45 | | | | 59 | | | | 44 | | |
Interest expense | | | 13 | | | | — | | | | — | | | | — | | | | — | | | | 1 | | |
Miscellaneous | | | 20 | | | | 3 | | | | 6 | | | | 25 | | | | 236 | | | | 7 | | |
Total expenses | | | 2,176 | | | | 225 | | | | 1,714 | | | | 3,447 | | | | 25,458 | | | | 839 | | |
See Notes to Financial Statements
224
| | | MUNICIPAL
INTERMEDIATE
BOND FUND | | NEW YORK
MUNICIPAL
INCOME FUND | | SHORT
DURATION
BOND FUND | | SHORT
DURATION
HIGH INCOME
FUND | | STRATEGIC
INCOME FUND | |
| | | For the
Year Ended
October 31,
2017 | | For the
Year Ended
October 31,
2017 | | For the
Year Ended
October 31,
2017 | | For the
Year Ended
October 31,
2017 | | For the
Year Ended
October 31,
2017 | |
Investment Income: | |
Income (Note A): | |
Interest income—unaffiliated issuers | | $ | 5,503 | | | $ | 1,899 | | | $ | 1,496 | | | $ | 5,670 | | | $ | 85,877 | | |
Dividend income—unaffiliated issuers | | | — | | | | — | | | | — | | | | — | | | | 2,455 | | |
Dividend income—affiliated issuers (Note F) | | | — | | | | — | | | | — | | | | — | | | | 3,858 | | |
Foreign taxes withheld (Note A) | | | — | | | | — | | | | — | | | | (2 | ) | | | — | | |
Total income | | $ | 5,503 | | | $ | 1,899 | | | $ | 1,496 | | | $ | 5,668 | | | $ | 92,190 | | |
Expenses: | |
Investment management fees (Note B) | | | 529 | | | | 150 | | | | 235 | | | | 514 | | | | 9,570 | | |
Administration fees (Note B) | | | 82 | | | | 90 | | | | 35 | | | | 44 | | | | 879 | | |
Administration fees (Note B): | |
Investor Class | | | 33 | | | | — | | | | 58 | | | | — | | | | — | | |
Trust Class | | | — | | | | — | | | | 11 | | | | — | | | | 90 | | |
Institutional Class | | | 210 | | | | — | | | | 70 | | | | 123 | | | | 1,911 | | |
Class A | | | 12 | | | | — | | | | 8 | | | | 7 | | | | 505 | | |
Class C | | | 8 | | | | — | | | | 4 | | | | 2 | | | | 373 | | |
Class R3 | | | — | | | | — | | | | — | | | | — | | | | — | | |
Class R6 | | | — | | | | — | | | | — | | | | — | | | | 98 | | |
Distribution fees (Note B): | |
Investor Class | | | — | | | | — | | | | — | | | | — | | | | — | | |
Trust Class | | | — | | | | — | | | | — | | | | — | | | | 25 | | |
Class A | | | 13 | | | | — | | | | 9 | | | | 7 | | | | 554 | | |
Class C | | | 35 | | | | — | | | | 19 | | | | 12 | | | | 1,627 | | |
Class R3 | | | — | | | | — | | | | — | | | | — | | | | — | | |
Shareholder servicing agent fees: | |
Investor Class | | | 11 | | | | — | | | | 32 | | | | — | | | | — | | |
Trust Class | | | — | | | | — | | | | 1 | | | | — | | | | 5 | | |
Institutional Class | | | 1 | | | | 56 | | | | — | | | | 1 | | | | 17 | | |
Class A | | | — | | | | — | | | | 1 | | | | 1 | | | | 47 | | |
Class C | | | — | | | | — | | | | — | | | | — | | | | 6 | | |
Class R3 | | | — | | | | — | | | | — | | | | — | | | | — | | |
Class R6 | | | — | | | | — | | | | — | | | | — | | | | 3 | | |
Organization expense (Note A) | | | — | | | | — | | | | — | | | | — | | | | — | | |
Audit fees | | | 60 | | | | 33 | | | | 62 | | | | 38 | | | | 71 | | |
Custodian and accounting fees | | | 108 | | | | 61 | | | | 95 | | | | 159 | | | | 680 | | |
Insurance expense | | | 7 | | | | 2 | | | | 3 | | | | 5 | | | | 75 | | |
Legal fees | | | 74 | | | | 83 | | | | 96 | | | | 74 | | | | 84 | | |
Registration and filing fees | | | 68 | | | | 24 | | | | 97 | | | | 58 | | | | 144 | | |
Repayment to Management of expenses previously
assumed by Management (Note B) | | | — | | | | — | | | | — | | | | — | | | | — | | |
Shareholder reports | | | 12 | | | | 8 | | | | 12 | | | | 6 | | | | 184 | | |
Trustees' fees and expenses | | | 45 | | | | 44 | | | | 44 | | | | 44 | | | | 53 | | |
Interest expense | | | — | | | | — | | | | — | | | | — | | | | 5 | | |
Miscellaneous | | | 14 | | | | 5 | | | | 8 | | | | 9 | | | | 235 | | |
Total expenses | | | 1,322 | | | | 556 | | | | 900 | | | | 1,104 | | | | 17,241 | | |
225
Statements of Operations (cont'd)
Neuberger Berman Income Funds (cont'd)
(000's omitted)
| | | CORE BOND
FUND | | CORE PLUS
FUND | | EMERGING
MARKETS
DEBT FUND | | FLOATING
RATE INCOME
FUND | | HIGH INCOME
BOND FUND | | MUNICIPAL
HIGH INCOME
FUND | |
| | | For the
Year Ended
October 31,
2017 | | Period from
July 18, 2017
(Commencement
of Operations) to
October 31,
2017 | | For the
Year Ended
October 31,
2017 | | For the
Year Ended
October 31,
2017 | | For the
Year Ended
October 31,
2017 | | For the
Year Ended
October 31,
2017 | |
Expenses reimbursed by Management (Note B) | | | (352 | ) | | | (212 | ) | | | (349 | ) | | | (457 | ) | | | (9 | ) | | | (347 | ) | |
Investment management fees waived (Note A) | | | — | | | | — | | | | — | | | | — | | | | — | | | | — | | |
Custodian out-of-pocket expenses refunded (Note G) | | | — | | | | — | | | | — | | | | — | | | | (64 | ) | | | — | | |
Total net expenses | | | 1,824 | | | | 13 | | | | 1,365 | | | | 2,990 | | | | 25,385 | | | | 492 | | |
Net investment income (loss) | | $ | 8,312 | | | $ | 73 | | | $ | 9,060 | | | $ | 13,507 | | | $ | 198,030 | | | $ | 3,401 | | |
Realized and Unrealized Gain (Loss)
on Investments (Note A): | |
Net realized gain (loss) on: | |
Transactions in investment securities of unaffiliated issuers | | | (3,074 | ) | | | 9 | | | | (149 | )* | | | 153 | | | | 74,618 | | | | (1,617 | ) | |
Redemption in-kind (Note A) | | | — | | | | — | | | | — | | | | — | | | | — | | | | — | | |
Settlement of forward foreign currency contracts | | | — | | | | — | | | | 475 | | | | — | | | | — | | | | — | | |
Settlement of foreign currency transactions | | | 17 | | | | — | | | | (237 | ) | | | — | | | | — | | | | — | | |
Expiration or closing of futures contracts | | | 418 | | | | (3 | ) | | | (134 | ) | | | — | | | | — | | | | — | | |
Expiration or closing of swap contracts | | | — | | | | (3 | ) | | | (27 | ) | | | — | | | | — | | | | — | | |
Change in net unrealized appreciation
(depreciation) in value of: | |
Investment securities of unaffiliated issuers | | | (1,660 | ) | | | (8 | ) | | | 1,161 | ** | | | 1,220 | | | | (31,605 | ) | | | (1,271 | ) | |
Investment securities of affiliated issuers | | | — | | | | — | | | | — | | | | — | | | | — | | | | — | | |
Unfunded loan commitments | | | — | | | | — | | | | — | | | | 1 | | | | — | | | | — | | |
Forward foreign currency contracts | | | — | | | | — | | | | 64 | | | | — | | | | — | | | | — | | |
Foreign currency transactions | | | (6 | ) | | | — | | | | (105 | ) | | | — | | | | — | | | | — | | |
Futures contracts | | | (878 | ) | | | (24 | ) | | | (97 | ) | | | — | | | | — | | | | — | | |
Swap contracts | | | — | | | | 16 | | | | 763 | | | | — | | | | — | | | | — | | |
Net gain (loss) on investments | | | (5,183 | ) | | | (13 | ) | | | 1,714 | | | | 1,374 | | | | 43,013 | | | | (2,888 | ) | |
Net increase (decrease) in net assets resulting from operations | | $ | 3,129 | | | $ | 60 | | | $ | 10,774 | | | $ | 14,881 | | | $ | 241,043 | | | $ | 513 | | |
* Net of foreign capital gains tax $38,228.
** Change in accrued foreign capital gains tax amounted to $15,475.
See Notes to Financial Statements
226
| | | MUNICIPAL
INTERMEDIATE
BOND FUND | | NEW YORK
MUNICIPAL
INCOME FUND | | SHORT
DURATION
BOND FUND | | SHORT
DURATION
HIGH INCOME
FUND | | STRATEGIC
INCOME FUND | |
| | | For the
Year Ended
October 31,
2017 | | For the
Year Ended
October 31,
2017 | | For the
Year Ended
October 31,
2017 | | For the
Year Ended
October 31,
2017 | | For the
Year Ended
October 31,
2017 | |
Expenses reimbursed by Management (Note B) | | | (176 | ) | | | — | | | | (334 | ) | | | (218 | ) | | | (441 | ) | |
Investment management fees waived (Note A) | | | — | | | | — | | | | — | | | | — | | | | (449 | ) | |
Custodian out-of-pocket expenses refunded (Note G) | | | — | | | | (1 | ) | | | — | | | | — | | | | — | | |
Total net expenses | | | 1,146 | | | | 555 | | | | 566 | | | | 886 | | | | 16,351 | | |
Net investment income (loss) | | $ | 4,357 | | | $ | 1,344 | | | $ | 930 | | | $ | 4,782 | | | $ | 75,839 | | |
Realized and Unrealized Gain (Loss)
on Investments (Note A): | |
Net realized gain (loss) on: | |
Transactions in investment securities of unaffiliated issuers | | | 910 | | | | 104 | | | | (78 | ) | | | 1,132 | | | | 16,776 | | |
Redemption in-kind (Note A) | | | — | | | | — | | | | — | | | | — | | | | (311 | ) | |
Settlement of forward foreign currency contracts | | | — | | | | — | | | | — | | | | — | | | | — | | |
Settlement of foreign currency transactions | | | — | | | | — | | | | — | | | | — | | | | 105 | | |
Expiration or closing of futures contracts | | | — | | | | — | | | | — | | | | — | | | | 6,340 | | |
Expiration or closing of swap contracts | | | — | | | | — | | | | — | | | | — | | | | (3,998 | ) | |
Change in net unrealized appreciation
(depreciation) in value of: | |
Investment securities of unaffiliated issuers | | | (1,977 | ) | | | (986 | ) | | | (265 | ) | | | (184 | ) | | | 9,626 | | |
Investment securities of affiliated issuers | | | — | | | | — | | | | — | | | | — | | | | 1,430 | | |
Unfunded loan commitments | | | — | | | | — | | | | — | | | | — | | | | — | | |
Forward foreign currency contracts | | | — | | | | — | | | | — | | | | — | | | | — | | |
Foreign currency transactions | | | — | | | | — | | | | — | | | | — | | | | 58 | | |
Futures contracts | | | — | | | | — | | | | (70 | ) | | | — | | | | (7,795 | ) | |
Swap contracts | | | — | | | | — | | | | — | | | | — | | | | 2,879 | | |
Net gain (loss) on investments | | | (1,067 | ) | | | (882 | ) | | | (413 | ) | | | 948 | | | | 25,110 | | |
Net increase (decrease) in net assets resulting from operations | | $ | 3,290 | | | $ | 462 | | | $ | 517 | | | $ | 5,730 | | | $ | 100,949 | | |
227
Statements of Operations (cont'd)
Neuberger Berman Income Funds
(000's omitted)
| | | UNCONSTRAINED
BOND FUND | |
| | | For the
Year Ended
October 31,
2017 | |
Investment Income: | |
Income (Note A): | |
Interest income—unaffiliated issuers | | $ | 2,181 | | |
Dividend income—unaffiliated issuers | | | 59 | | |
Dividend income—affiliated issuers (Note F) | | | — | | |
Foreign taxes withheld (Note A) | | | — | | |
Total income | | $ | 2,240 | | |
Expenses: | |
Investment management fees (Note B) | | | 317 | | |
Administration fees (Note B) | | | 24 | | |
Administration fees (Note B): | |
Investor Class | | | — | | |
Trust Class | | | — | | |
Institutional Class | | | 24 | | |
Class A | | | 1 | | |
Class C | | | — | | |
Class R3 | | | — | | |
Class R6 | | | 21 | | |
Distribution fees (Note B): | |
Investor Class | | | — | | |
Trust Class | | | — | | |
Class A | | | 1 | | |
Class C | | | — | | |
Class R3 | | | — | | |
Shareholder servicing agent fees: | |
Investor Class | | | — | | |
Trust Class | | | — | | |
Institutional Class | | | 6 | | |
Class A | | | — | | |
Class C | | | — | | |
Class R3 | | | — | | |
Class R6 | | | — | | |
Organization expense (Note A) | | | — | | |
Audit fees | | | 65 | | |
Custodian and accounting fees | | | 179 | | |
Insurance expense | | | 2 | | |
Legal fees | | | 81 | | |
Registration and filing fees | | | 105 | | |
Repayment to Management of expenses previously assumed by Management (Note B) | | | — | | |
Shareholder reports | | | 3 | | |
Trustees' fees and expenses | | | 44 | | |
Interest expense | | | — | | |
Miscellaneous | | | 25 | | |
Total expenses | | | 898 | | |
See Notes to Financial Statements
228
Statements of Operations (cont'd)
Neuberger Berman Income Funds (cont'd)
(000's omitted)
| | | UNCONSTRAINED
BOND FUND | |
| | | For the
Year Ended
October 31,
2017 | |
Expenses reimbursed by Management (Note B) | | | (448 | ) | |
Investment management fees waived (Note A) | | | — | | |
Custodian out-of-pocket expenses refunded (Note G) | | | — | | |
Total net expenses | | | 450 | | |
Net investment income (loss) | | $ | 1,790 | | |
Realized and Unrealized Gain (Loss) on Investments (Note A): | |
Net realized gain (loss) on: | |
Transactions in investment securities of unaffiliated issuers | | | 1,000 | | |
Redemption in-kind (Note A) | | | — | | |
Settlement of Forward foreign currency contracts | | | (1,748 | ) | |
Settlement of foreign currency transactions | | | 399 | | |
Expiration or closing of futures contracts | | | 144 | | |
Expiration or closing of swap contracts | | | (1,673 | ) | |
Change in net unrealized appreciation (depreciation) in value of: | |
Investment securities of unaffiliated issuers | | | 2,667 | | |
Investment securities of affiliated issuers | | | — | | |
Unfunded loan commitments | | | — | | |
Forward foreign currency contracts | | | 127 | | |
Foreign currency translations | | | 69 | | |
Futures contracts | | | 223 | | |
Swap contracts | | | (270 | ) | |
Net gain (loss) on investments | | | 938 | | |
Net increase (decrease) in net assets resulting from operations | | $ | 2,728 | | |
* Net of foreign capital gains tax $38,228.
** Change in accrued foreign capital gains tax amounted to $15,475.
See Notes to Financial Statements
229
Statements of Changes in Net Assets
Neuberger Berman Income Funds
(000's omitted)
| | | CORE BOND FUND | | CORE PLUS FUND | | EMERGING MARKETS
DEBT FUND | |
| | | Year Ended
October 31,
2017 | | Year Ended
October 31,
2016 | | Period from
July 18, 2017
(Commencement of
Operations) to
October 31,
2017 | | Year Ended
October 31,
2017 | | Year Ended
October 31,
2016 | |
Increase (Decrease) in Net Assets: | |
From Operations: | |
Net investment income (loss) (Note A) | | $ | 8,312 | | | $ | 7,645 | | | $ | 73 | | | $ | 9,060 | | | $ | 7,307 | | |
Net realized gain (loss) on investments (Note A) | | | (2,639 | ) | | | 3,040 | | | | 3 | | | | (72 | ) | | | (11,593 | ) | |
Change in net unrealized appreciation
(depreciation) of investments (Note A) | | | (2,544 | ) | | | 4,152 | | | | (16 | ) | | | 1,786 | | | | 15,463 | | |
Net increase (decrease) in net assets resulting from operations | | | 3,129 | | | | 14,837 | | | | 60 | | | | 10,774 | | | | 11,177 | | |
Distributions to Shareholders From (Note A): | |
Net investment income: | |
Investor Class | | | (204 | ) | | | (246 | ) | | | — | | | | — | | | | — | | |
Trust Class | | | — | | | | — | | | | — | | | | — | | | | — | | |
Institutional Class | | | (7,180 | ) | | | (6,803 | ) | | | (71 | ) | | | (8,066 | ) | | | — | | |
Class A | | | (434 | ) | | | (611 | ) | | | (2 | ) | | | (27 | ) | | | — | | |
Class C | | | (41 | ) | | | (62 | ) | | | (1 | ) | | | (8 | ) | | | — | | |
Class R3 | | | — | | | | — | | | | — | | | | — | | | | — | | |
Class R6 | | | — | | | | — | | | | (19 | ) | | | — | | | | — | | |
Net realized gain on investments: | |
Investor Class | | | (66 | ) | | | (53 | ) | | | — | | | | — | | | | — | | |
Institutional Class | | | (1,756 | ) | | | (1,167 | ) | | | — | | | | — | | | | — | | |
Class A | | | (143 | ) | | | (130 | ) | | | — | | | | — | | | | — | | |
Class C | | | (25 | ) | | | (20 | ) | | | — | | | | — | | | | — | | |
Tax return of capital: | |
Investor Class | | | (37 | ) | | | — | | | | — | | | | — | | | | — | | |
Trust Class | | | — | | | | — | | | | — | | | | — | | | | — | | |
Institutional Class | | | (1,055 | ) | | | — | | | | — | | | | (821 | ) | | | (7,218 | ) | |
Class A | | | (78 | ) | | | — | | | | — | | | | (3 | ) | | | (10 | ) | |
Class C | | | (13 | ) | | | — | | | | — | | | | (1 | ) | | | (12 | ) | |
Class R6 | | | — | | | | — | | | | — | | | | — | | | | — | | |
Total distributions to shareholders | | | (11,032 | ) | | | (9,092 | ) | | | (93 | ) | | | (8,926 | ) | | | (7,240 | ) | |
From Fund Share Transactions (Note D): | |
Proceeds from shares sold: | |
Investor Class | | | 1,693 | | | | 1,859 | | | | — | | | | — | | | | — | | |
Trust Class | | | — | | | | — | | | | — | | | | — | | | | — | | |
Institutional Class | | | 114,170 | | | | 141,846 | | | | 7,600 | | | | 126,153 | | | | 5,774 | | |
Class A | | | 6,052 | | | | 6,969 | | | | 214 | | | | 2,781 | | | | 60 | | |
Class C | | | 495 | | | | 3,421 | | | | 200 | | | | 411 | | | | 25 | | |
Class R3 | | | — | | | | — | | | | — | | | | — | | | | — | | |
Class R6 | | | — | | | | — | | | | 2,000 | | | | — | | | | — | | |
Proceeds from reinvestment of dividends and distributions: | |
Investor Class | | | 283 | | | | 271 | | | | — | | | | — | | | | — | | |
Trust Class | | | — | | | | — | | | | — | | | | — | | | | — | | |
Institutional Class | | | 7,934 | | | | 6,166 | | | | 71 | | | | 8,848 | | | | 7,206 | | |
Class A | | | 609 | | | | 661 | | | | — | | | | 21 | | | | 4 | | |
Class C | | | 56 | | | | 47 | | | | — | | | | 4 | | | | 2 | | |
Class R3 | | | — | | | | — | | | | — | | | | — | | | | — | | |
Class R6 | | | — | | | | — | | | | — | | | | — | | | | — | | |
Payments for shares redeemed: | |
Investor Class | | | (2,884 | ) | | | (2,690 | ) | | | — | | | | — | | | | — | | |
Trust Class | | | — | | | | — | | | | — | | | | — | | | | — | | |
Institutional Class | | | (97,793 | ) | | | (72,550 | ) | | | (71 | ) | | | (9,410 | ) | | | (65,376 | ) | |
Class A | | | (9,559 | ) | | | (12,768 | ) | | | — | | | | (2,529 | ) | | | (187 | ) | |
Class C | | | (2,054 | ) | | | (2,027 | ) | | | — | | | | (136 | ) | | | (50 | ) | |
Class R3 | | | — | | | | — | | | | — | | | | — | | | | — | | |
Class R6 | | | — | | | | — | | | | — | | | | — | | | | — | | |
Net increase (decrease) from Fund share transactions | | | 19,002 | | | | 71,205 | | | | 10,014 | | | | 126,143 | | | | (52,542 | ) | |
Net Increase (Decrease) in Net Assets | | | 11,099 | | | | 76,950 | | | | 9,981 | | | | 127,991 | | | | (48,605 | ) | |
Net Assets: | |
Beginning of year | | | 363,546 | | | | 286,596 | | | | — | | | | 120,571 | | | | 169,176 | | |
End of year | | $ | 374,645 | | | $ | 363,546 | | | $ | 9,981 | | | $ | 248,562 | | | $ | 120,571 | | |
Undistributed net investment income (loss) at end of year | | $ | — | | | $ | — | | | $ | — | | | $ | — | | | $ | 112 | | |
Distributions in excess of net investment income at end of year | | $ | (159 | ) | | $ | (121 | ) | | $ | (4 | ) | | $ | (104 | ) | | $ | — | | |
See Notes to Financial Statements
230
| | | FLOATING RATE
INCOME FUND | | HIGH INCOME BOND FUND | | MUNICIPAL
HIGH INCOME FUND | |
| | | Year Ended
October 31,
2017 | | Year Ended
October 31,
2016 | | Year Ended
October 31,
2017 | | Year Ended
October 31,
2016 | | Year Ended
October 31,
2017 | | Year Ended
October 31,
2016 | |
Increase (Decrease) in Net Assets: | |
From Operations: | |
Net investment income (loss) (Note A) | | $ | 13,507 | | | $ | 10,077 | | | $ | 198,030 | | | $ | 213,515 | | | $ | 3,401 | | | $ | 3,281 | | |
Net realized gain (loss) on investments (Note A) | | | 153 | | | | (11,623 | ) | | | 74,618 | | | | (102,952 | ) | | | (1,617 | ) | | | 765 | | |
Change in net unrealized appreciation
(depreciation) of investments (Note A) | | | 1,221 | | | | 9,647 | | | | (31,605 | ) | | | 259,869 | | | | (1,271 | ) | | | 1,572 | | |
Net increase (decrease) in net assets resulting from operations | | | 14,881 | | | | 8,101 | | | | 241,043 | | | | 370,432 | | | | 513 | | | | 5,618 | | |
Distributions to Shareholders From (Note A): | |
Net investment income: | |
Investor Class | | | — | | | | — | | | | (6,532 | ) | | | (8,460 | ) | | | — | | | | — | | |
Trust Class | | | — | | | | — | | | | — | | | | — | | | | — | | | | — | | |
Institutional Class | | | (12,243 | ) | | | (8,545 | ) | | | (139,862 | ) | | | (154,104 | ) | | | (3,382 | ) | | | (3,212 | ) | |
Class A | | | (674 | ) | | | (730 | ) | | | (4,009 | ) | | | (5,109 | ) | | | (13 | ) | | | (63 | ) | |
Class C | | | (574 | ) | | | (724 | ) | | | (1,199 | ) | | | (1,536 | ) | | | (8 | ) | | | (6 | ) | |
Class R3 | | | — | | | | — | | | | (532 | ) | | | (336 | ) | | | — | | | | — | | |
Class R6 | | | — | | | | — | | | | (45,894 | ) | | | (43,972 | ) | | | — | | | | — | | |
Net realized gain on investments: | |
Investor Class | | | — | | | | — | | | | — | | | | — | | | | — | | | | — | | |
Institutional Class | | | — | | | | — | | | | — | | | | — | | | | (728 | ) | | | (15 | ) | |
Class A | | | — | | | | — | | | | — | | | | — | | | | (6 | ) | | | (2 | ) | |
Class C | | | — | | | | — | | | | — | | | | — | | | | (2 | ) | | | (0 | ) | |
Tax return of capital: | |
Investor Class | | | — | | | | — | | | | — | | | | — | | | | — | | | | — | | |
Trust Class | | | — | | | | — | | | | — | | | | — | | | | — | | | | — | | |
Institutional Class | | | (15 | ) | | | (63 | ) | | | — | | | | — | | | | — | | | | — | | |
Class A | | | (1 | ) | | | (6 | ) | | | — | | | | — | | | | — | | | | — | | |
Class C | | | (1 | ) | | | (8 | ) | | | — | | | | — | | | | — | | | | — | | |
Class R6 | | | — | | | | — | | | | — | | | | — | | | | — | | | | — | | |
Total distributions to shareholders | | | (13,508 | ) | | | (10,076 | ) | | | (198,028 | ) | | | (213,517 | ) | | | (4,139 | ) | | | (3,298 | ) | |
From Fund Share Transactions (Note D): | |
Proceeds from shares sold: | |
Investor Class | | | — | | | | — | | | | 9,915 | | | | 14,354 | | | | — | | | | — | | |
Trust Class | | | — | | | | — | | | | — | | | | — | | | | — | | | | — | | |
Institutional Class | | | 254,672 | | | | 145,234 | | | | 559,461 | | | | 1,754,843 | | | | 26,407 | | | | 110,537 | | |
Class A | | | 15,546 | | | | 11,589 | | | | 64,916 | | | | 74,260 | | | | 192 | | | | 12,051 | | |
Class C | | | 2,623 | | | | 3,859 | | | | 909 | | | | 2,277 | | | | 558 | | | | 298 | | |
Class R3 | | | — | | | | — | | | | 9,833 | | | | 14,022 | | | | — | | | | — | | |
Class R6 | | | — | | | | — | | | | 986,552 | | | | 291,720 | | | | — | | | | — | | |
Proceeds from reinvestment of dividends and distributions: | |
Investor Class | | | — | | | | — | | | | 5,951 | | | | 7,856 | | | | — | | | | — | | |
Trust Class | | | — | | | | — | | | | — | | | | — | | | | — | | | | — | | |
Institutional Class | | | 11,161 | | | | 7,502 | | | | 80,425 | | | | 94,743 | | | | 4,109 | | | | 3,219 | | |
Class A | | | 549 | | | | 583 | | | | 3,573 | | | | 4,184 | | | | 17 | | | | 58 | | |
Class C | | | 363 | | | | 389 | | | | 690 | | | | 853 | | | | 10 | | | | 2 | | |
Class R3 | | | — | | | | — | | | | 501 | | | | 282 | | | | — | | | | — | | |
Class R6 | | | — | | | | — | | | | 41,697 | | | | 43,857 | | | | — | | | | — | | |
Payments for shares redeemed: | |
Investor Class | | | — | | | | — | | | | (39,466 | ) | | | (71,234 | ) | | | — | | | | — | | |
Trust Class | | | — | | | | — | | | | — | | | | — | | | | — | | | | — | | |
Institutional Class | | | (185,522 | ) | | | (190,299 | ) | | | (2,218,315 | ) | | | (974,887 | ) | | | (53,223 | ) | | | (16,475 | ) | |
Class A | | | (22,065 | ) | | | (10,033 | ) | | | (85,588 | ) | | | (89,265 | ) | | | (713 | ) | | | (16,404 | ) | |
Class C | | | (7,096 | ) | | | (6,888 | ) | | | (9,558 | ) | | | (13,017 | ) | | | (155 | ) | | | (495 | ) | |
Class R3 | | | — | | | | — | | | | (4,706 | ) | | | (15,440 | ) | | | — | | | | — | | |
Class R6 | | | — | | | | — | | | | (443,904 | ) | | | (248,976 | ) | | | — | | | | — | | |
Net increase (decrease) from Fund share transactions | | | 70,231 | | | | (38,064 | ) | | | (1,037,114 | ) | | | 890,432 | | | | (22,798 | ) | | | 92,791 | | |
Net Increase (Decrease) in Net Assets | | | 71,604 | | | | (40,039 | ) | | | (994,099 | ) | | | 1,047,347 | | | | (26,424 | ) | | | 95,111 | | |
Net Assets: | |
Beginning of year | | | 302,256 | | | | 342,295 | | | | 4,242,062 | | | | 3,194,715 | | | | 123,490 | | | | 28,379 | | |
End of year | | $ | 373,860 | | | $ | 302,256 | | | $ | 3,247,963 | | | $ | 4,242,062 | | | $ | 97,066 | | | $ | 123,490 | | |
Undistributed net investment income (loss) at end of year | | $ | — | | | $ | — | | | $ | 149 | | | $ | 147 | | | $ | — | | | $ | 2 | | |
Distributions in excess of net investment income at end of year | | $ | (154 | ) | | $ | (170 | ) | | $ | — | | | $ | — | | | $ | — | | | $ | — | | |
231
Statements of Changes in Net Assets (cont'd)
Neuberger Berman Income Funds (cont'd)
(000's omitted)
| | | MUNICIPAL INTERMEDIATE
BOND FUND | | NEW YORK MUNICIPAL
INCOME FUND | | SHORT DURATION
BOND FUND | |
| | | Year Ended
October 31,
2017 | | Year Ended
October 31,
2016 | | Year Ended
October 31,
2017 | | Year Ended
October 31,
2016 | | Year Ended
October 31,
2017 | | Year Ended
October 31,
2016 | |
Increase (Decrease) in Net Assets: | |
From Operations: | |
Net investment income (loss) (Note A) | | $ | 4,357 | | | $ | 3,648 | | | $ | 1,344 | | | $ | 1,388 | | | $ | 930 | | | $ | 563 | | |
Net realized gain (loss) on investments (Note A) | | | 910 | | | | 1,290 | | | | 104 | | | | 670 | | | | (78 | ) | | | 97 | | |
Change in net unrealized appreciation (depreciation)
of investments (Note A) | | | (1,977 | ) | | | 250 | | | | (986 | ) | | | 69 | | | | (335 | ) | | | 46 | | |
Net increase (decrease) in net assets resulting from operations | | | 3,290 | | | | 5,188 | | | | 462 | | | | 2,127 | | | | 517 | | | | 706 | | |
Distributions to Shareholders From (Note A): | |
Net investment income: | |
Investor Class | | | (274 | ) | | | (312 | ) | | | — | | | | — | | | | (329 | ) | | | (322 | ) | |
Trust Class | | | — | | | | — | | | | — | | | | — | | | | (29 | ) | | | (27 | ) | |
Institutional Class | | | (3,959 | ) | | | (3,180 | ) | | | (1,344 | ) | | | (1,388 | ) | | | (926 | ) | | | (463 | ) | |
Class A | | | (89 | ) | | | (126 | ) | | | — | | | | — | | | | (39 | ) | | | (49 | ) | |
Class C | | | (35 | ) | | | (30 | ) | | | — | | | | — | | | | (7 | ) | | | (6 | ) | |
Class R3 | | | — | | | | — | | | | — | | | | — | | | | — | | | | — | | |
Class R6 | | | — | | | | — | | | | — | | | | — | | | | — | | | | — | | |
Net realized gain on investments: | |
Investor Class | | | (94 | ) | | | (26 | ) | | | — | | | | — | | | | — | | | | — | | |
Institutional Class | | | (1,131 | ) | | | (229 | ) | | | (658 | ) | | | (148 | ) | | | — | | | | — | | |
Class A | | | (41 | ) | | | (8 | ) | | | — | | | | — | | | | — | | | | — | | |
Class C | | | (23 | ) | | | (4 | ) | | | — | | | | — | | | | — | | | | — | | |
Tax return of capital: | |
Trust Class | | | — | | | | — | | | | — | | | | — | | | | — | | | | — | | |
Institutional Class | | | — | | | | — | | | | — | | | | — | | | | — | | | | — | | |
Class A | | | — | | | | — | | | | — | | | | — | | | | — | | | | — | | |
Class C | | | — | | | | — | | | | — | | | | — | | | | — | | | | — | | |
Class R6 | | | — | | | | — | | | | — | | | | — | | | | — | | | | — | | |
Total distributions to shareholders | | | (5,646 | ) | | | (3,915 | ) | | | (2,002 | ) | | | (1,536 | ) | | | (1,330 | ) | | | (867 | ) | |
From Fund Share Transactions (Note D): | |
Proceeds from shares sold: | |
Investor Class | | | 487 | | | | 959 | | | | — | | | | — | | | | 1,758 | | | | 3,720 | | |
Trust Class | | | — | | | | — | | | | — | | | | — | | | | 383 | | | | 735 | | |
Institutional Class | | | 62,797 | | | | 44,300 | | | | 395 | | | | 364 | | | | 58,980 | | | | 43,184 | | |
Class A | | | 4,444 | | | | 9,345 | | | | — | | | | — | | | | 1,353 | | | | 4,964 | | |
Class C | | | 527 | | | | 2,434 | | | | — | | | | — | | | | 348 | | | | 3,443 | | |
Class R3 | | | — | | | | — | | | | — | | | | — | | | | — | | | | — | | |
Class R6 | | | — | | | | — | | | | — | | | | — | | | | — | | | | — | | |
Proceeds from reinvestment of dividends and distributions: | |
Investor Class | | | 312 | | | | 283 | | | | — | | | | — | | | | 304 | | | | 298 | | |
Trust Class | | | — | | | | — | | | | — | | | | — | | | | 29 | | | | 27 | | |
Institutional Class | | | 4,410 | | | | 3,031 | | | | 1,816 | | | | 1,377 | | | | 907 | | | | 432 | | |
Class A | | | 91 | | | | 73 | | | | — | | | | — | | | | 25 | | | | 33 | | |
Class C | | | 38 | | | | 14 | | | | — | | | | — | | | | 5 | | | | 3 | | |
Class R3 | | | — | | | | — | | | | — | | | | — | | | | — | | | | — | | |
Class R6 | | | — | | | | — | | | | — | | | | — | | | | — | | | | — | | |
Payments for shares redeemed: | |
Investor Class | | | (2,604 | ) | | | (1,821 | ) | | | — | | | | — | | | | (6,668 | ) | | | (5,030 | ) | |
Trust Class | | | — | | | | — | | | | — | | | | — | | | | (711 | ) | | | (1,105 | ) | |
Institutional Class | | | (35,356 | ) | | | (15,306 | ) | | | (3,395 | ) | | | (3,695 | ) | | | (34,919 | ) | | | (25,462 | ) | |
Class A | | | (7,621 | ) | | | (3,090 | ) | | | — | | | | — | | | | (3,716 | ) | | | (4,265 | ) | |
Class C | | | (1,450 | ) | | | (531 | ) | | | — | | | | — | | | | (1,727 | ) | | | (2,436 | ) | |
Class R3 | | | — | | | | — | | | | — | | | | — | | | | — | | | | — | | |
Class R6 | | | — | | | | — | | | | — | | | | — | | | | — | | | | — | | |
Net increase (decrease) from Fund share transactions | | | 26,075 | | | | 39,691 | | | | (1,184 | ) | | | (1,954 | ) | | | 16,351 | | | | 18,541 | | |
Net Increase (Decrease) in Net Assets | | | 23,719 | | | | 40,964 | | | | (2,724 | ) | | | (1,363 | ) | | | 15,538 | | | | 18,380 | | |
Net Assets: | |
Beginning of year | | | 200,125 | | | | 159,161 | | | | 62,269 | | | | 63,632 | | | | 87,627 | | | | 69,247 | | |
End of year | | $ | 223,844 | | | $ | 200,125 | | | $ | 59,545 | | | $ | 62,269 | | | $ | 103,165 | | | $ | 87,627 | | |
Undistributed net investment income (loss) at end of year | | $ | — | | | $ | — | | | $ | 12 | | | $ | 12 | | | $ | 156 | | | $ | 151 | | |
Distributions in excess of net investment income at end of year | | $ | — | | | $ | — | | | $ | — | | | $ | — | | | $ | — | | | $ | — | | |
See Notes to Financial Statements
232
| | | SHORT DURATION
HIGH INCOME FUND | |
STRATEGIC INCOME FUND | | UNCONSTRAINED
BOND FUND | |
| | | Year Ended
October 31,
2017 | | Year Ended
October 31,
2016 | | Year Ended
October 31,
2017 | | Year Ended
October 31,
2016 | | Year Ended
October 31,
2017 | | Year Ended
October 31,
2016 | |
Increase (Decrease) in Net Assets: | |
From Operations: | |
Net investment income (loss) (Note A) | | $ | 4,782 | | | $ | 7,224 | | | $ | 75,839 | | | $ | 65,809 | | | $ | 1,790 | | | $ | 2,772 | | |
Net realized gain (loss) on investments (Note A) | | | 1,132 | | | | (11,823 | ) | | | 18,912 | | | | (52,459 | ) | | | (1,878 | ) | | | (16,177 | ) | |
Change in net unrealized appreciation (depreciation)
of investments (Note A) | | | (184 | ) | | | 10,060 | | | | 6,198 | | | | 104,107 | | | | 2,816 | | | | 6,595 | | |
Net increase (decrease) in net assets resulting from operations | | | 5,730 | | | | 5,461 | | | | 100,949 | | | | 117,457 | | | | 2,728 | | | | (6,810 | ) | |
Distributions to Shareholders From (Note A): | |
Net investment income: | |
Investor Class | | | — | | | | — | | | | — | | | | — | | | | — | | | | — | | |
Trust Class | | | — | | | | — | | | | (778 | ) | | | (908 | ) | | | — | | | | — | | |
Institutional Class | | | (4,632 | ) | | | (7,086 | ) | | | (58,742 | ) | | | (46,068 | ) | | | (216 | ) | | | — | | |
Class A | | | (114 | ) | | | (108 | ) | | | (6,793 | ) | | | (10,103 | ) | | | (4 | ) | | | — | | |
Class C | | | (36 | ) | | | (30 | ) | | | (3,865 | ) | | | (4,632 | ) | | | (0 | ) | | | — | | |
Class R3 | | | — | | | | — | | | | — | | | | — | | | | — | | | | — | | |
Class R6 | | | — | | | | — | | | | (7,995 | ) | | | (8,260 | ) | | | (635 | ) | | | — | | |
Net realized gain on investments: | |
Investor Class | | | — | | | | — | | | | — | | | | — | | | | — | | | | — | | |
Institutional Class | | | — | | | | — | | | | — | | | | — | | | | — | | | | — | | |
Class A | | | — | | | | — | | | | — | | | | — | | | | — | | | | — | | |
Class C | | | — | | | | — | | | | — | | | | — | | | | — | | | | — | | |
Tax return of capital: | |
Trust Class | | | — | | | | — | | | | (20 | ) | | | (25 | ) | | | — | | | | — | | |
Institutional Class | | | — | | | | — | | | | (1,363 | ) | | | (1,153 | ) | | | (60 | ) | | | (2,642 | ) | |
Class A | | | — | | | | — | | | | (179 | ) | | | (283 | ) | | | (2 | ) | | | (15 | ) | |
Class C | | | — | | | | — | | | | (131 | ) | | | (167 | ) | | | (0 | ) | | | (1 | ) | |
Class R6 | | | — | | | | — | | | | (183 | ) | | | (201 | ) | | | (167 | ) | | | (228 | ) | |
Total distributions to shareholders | | | (4,782 | ) | | | (7,224 | ) | | | (80,049 | ) | | | (71,800 | ) | | | (1,084 | ) | | | (2,886 | ) | |
From Fund Share Transactions (Note D): | |
Proceeds from shares sold: | |
Investor Class | | | — | | | | — | | | | — | | | | — | | | | — | | | | — | | |
Trust Class | | | — | | | | — | | | | 3,910 | | | | 4,542 | | | | — | | | | — | | |
Institutional Class | | | 40,202 | | | | 36,746 | | | | 965,626 | | | | 633,736 | | | | 42,602 | | | | 5,937 | | |
Class A | | | 952 | | | | 10,857 | | | | 88,398 | | | | 127,239 | | | | 16 | | | | 513 | | |
Class C | | | 253 | | | | 1,032 | | | | 19,279 | | | | 29,985 | | | | — | | | | 11 | | |
Class R3 | | | — | | | | — | | | | — | | | | — | | | | — | | | | — | | |
Class R6 | | | — | | | | — | | | | 131,568 | | | | 36,828 | | | | 1,275 | | | | 48,965 | | |
Proceeds from reinvestment of dividends and distributions: | |
Investor Class | | | — | | | | — | | | | — | | | | — | | | | — | | | | — | | |
Trust Class | | | — | | | | — | | | | 784 | | | | 919 | | | | — | | | | — | | |
Institutional Class | | | 4,628 | | | | 6,945 | | | | 45,802 | | | | 35,079 | | | | 273 | | | | 1,461 | | |
Class A | | | 113 | | | | 92 | | | | 6,334 | | | | 8,280 | | | | 5 | | | | 14 | | |
Class C | | | 35 | | | | 30 | | | | 3,011 | | | | 3,321 | | | | — | | | | 1 | | |
Class R3 | | | — | | | | — | | | | — | | | | — | | | | — | | | | — | | |
Class R6 | | | — | | | | — | | | | 8,175 | | | | 8,425 | | | | 802 | | | | 227 | | |
Payments for shares redeemed: | |
Investor Class | | | — | | | | — | | | | — | | | | — | | | | — | | | | — | | |
Trust Class | | | — | | | | — | | | | (12,527 | ) | | | (31,045 | ) | | | — | | | | — | | |
Institutional Class | | | (38,078 | ) | | | (169,792 | ) | | | (425,601 | ) | | | (616,878 | ) | | | (2,089 | ) | | | (181,754 | ) | |
Class A | | | (1,931 | ) | | | (10,387 | ) | | | (191,794 | ) | | | (212,185 | ) | | | (191 | ) | | | (51 | ) | |
Class C | | | (378 | ) | | | (186 | ) | | | (56,916 | ) | | | (56,525 | ) | | | — | | | | (156 | ) | |
Class R3 | | | — | | | | — | | | | — | | | | — | | | | — | | | | — | | |
Class R6 | | | — | | | | — | | | | (37,029 | ) | | | (74,919 | ) | | | (242 | ) | | | (75 | ) | |
Net increase (decrease) from Fund share transactions | | | 5,796 | | | | (124,663 | ) | | | 549,020 | | | | (103,198 | ) | | | 42,451 | | | | (124,907 | ) | |
Net Increase (Decrease) in Net Assets | | | 6,744 | | | | (126,426 | ) | | | 569,920 | | | | (57,541 | ) | | | 44,095 | | | | (134,603 | ) | |
Net Assets: | |
Beginning of year | | | 111,654 | | | | 238,080 | | | | 2,145,434 | | | | 2,202,975 | | | | 54,986 | | | | 189,589 | | |
End of year | | $ | 118,398 | | | $ | 111,654 | | | $ | 2,715,354 | | | $ | 2,145,434 | | | $ | 99,081 | | | $ | 54,986 | | |
Undistributed net investment income (loss) at end of year | | $ | — | | | $ | — | | | $ | — | | | $ | — | | | $ | 358 | | | $ | 113 | | |
Distributions in excess of net investment income at end of year | | $ | (1 | ) | | $ | (1 | ) | | $ | (3,838 | ) | | $ | (414 | ) | | $ | — | | | $ | — | | |
233
Notes to Financial Statements Income Funds
Note A—Summary of Significant Accounting Policies:
1 General: Neuberger Berman Income Funds (the "Trust") is a Delaware statutory trust organized pursuant to an Amended and Restated Trust Instrument dated March 27, 2014. The Trust is registered as an open-end management investment company under the Investment Company Act of 1940, as amended (the "1940 Act"), and its shares are registered under the Securities Act of 1933, as amended (the "1933 Act"). Each of Neuberger Berman Core Bond Fund ("Core Bond"), Neuberger Berman Core Plus Fund ("Core Plus"), Neuberger Berman Emerging Markets Debt Fund ("Emerging Markets Debt"), Neuberger Berman Floating Rate Income Fund ("Floating Rate Income"), Neuberger Berman High Income Bond Fund ("High Income"), Neuberger Berman Municipal High Income Fund ("Municipal High Income"), Neuberger Berman Municipal Intermediate Bond Fund ("Municipal Intermediate Bond"), Neuberger Berman New York Municipal Income Fund ("New York Municipal Income"), Neuberger Berman Short Duration Bond Fund ("Short Duration"), Neuberger Berman Short Duration High Income Fund ("Short Duration High Income"), Neuberger Berman Strategic Income Fund ("Strategic Income") and Neuberger Berman Unconstrained Bond Fund ("Unconstrained Bond") (each individually a "Fund," and collectively, the "Funds") is a separate operating series of the Trust. Each Fund (except Emerging Markets Debt, New York Municipal Income and Unconstrained Bond) is diversified. Four Funds offer Investor Class shares, two offer Trust Class shares, twelve offer Institutional Class shares, eleven offer Class A shares, eleven offer Class C shares, one offers Class R3 shares and four offer Class R6 shares. Core Plus had no operations until July 18, 2017, other than matters relating to its organization and registration of its shares under the 1933 Act. The Trust's Board of Trustees (the "Board") may establish additional series or classes of shares without the approval of shareholders.
A zero balance, if any, reflects an actual amount rounding to less than $1,000.
The assets of each Fund belong only to that Fund, and the liabilities of each Fund are borne solely by that Fund and no other.
Each Fund is an investment company and accordingly follows the investment company accounting and reporting guidance of the Financial Accounting Standards Board ("FASB") Accounting Standard Codification Topic 946 "Financial Services — Investment Companies."
The preparation of financial statements in accordance with U.S. generally accepted accounting principles ("GAAP") requires Neuberger Berman Investment Advisers LLC ("NBIA" or "Management") to make estimates and assumptions at the date of the financial statements. Actual results could differ from those estimates.
2 Portfolio valuation: In accordance with Accounting Standards Codification ("ASC") 820 "Fair Value Measurement" ("ASC 820"), all investments held by each of the Funds are carried at the value that Management believes a Fund would receive upon selling an investment in an orderly transaction to an independent buyer in the principal or most advantageous market for the investment under current market conditions. Various inputs, including the volume and level of activity for the asset or liability in the market, are considered in valuing the Funds' investments, some of which are discussed below. Significant Management judgment may be necessary to value investments in accordance with ASC 820.
ASC 820 established a three-tier hierarchy of inputs to create a classification of value measurements for disclosure purposes. The three-tier hierarchy of inputs is summarized in the three broad Levels listed below.
• Level 1 – quoted prices in active markets for identical investments
• Level 2 – other observable inputs (including quoted prices for similar investments, interest rates, prepayment speeds, credit risk, amortized cost, etc.)
• Level 3 – unobservable inputs (including a Fund's own assumptions in determining the fair value of investments)
234
The inputs or methodology used for valuing an investment are not necessarily an indication of the risk associated with investing in those securities.
The value of the Funds' investments in equity securities and exchange-traded funds, for which market quotations are readily available, is generally determined by Management by obtaining valuations from independent pricing services based on the latest sale price quoted on a principal exchange or market for that security (Level 1 inputs). Securities traded primarily on the NASDAQ Stock Market are normally valued at the NASDAQ Official Closing Price ("NOCP") provided by NASDAQ each business day. The NOCP is the most recently reported price as of 4:00:02 p.m., Eastern Time, unless that price is outside the range of the "inside" bid and asked prices (i.e., the bid and asked prices that dealers quote to each other when trading for their own accounts); in that case, NASDAQ will adjust the price to equal the inside bid or asked price, whichever is closer. Because of delays in reporting trades, the NOCP may not be based on the price of the last trade to occur before the market closes. If there is no sale of a security on a particular day, the independent pricing services may value the security based on market quotations.
The value of the Funds' investments in debt securities for long positions is determined by Management primarily by obtaining valuations from independent pricing services based on readily available bid quotations, or if quotations are not available, by methods which include various considerations based on security type (generally Level 2 inputs). In addition to the consideration of yields or prices of securities of comparable quality, coupon, maturity and type, indications as to values from dealers, and general market conditions, the following is a description of other Level 2 inputs and related valuation techniques used by independent pricing services to value certain types of debt securities held by the Funds:
Corporate Bonds. Inputs used to value corporate debt securities generally include relative credit information, observed market movements, sector news, U.S. Treasury yield curve or relevant benchmark curve, and other market information, which may include benchmark yields, reported trades, broker-dealer quotes, issuer spreads, benchmark securities, bids, offers, and reference data, such as market research publications, when available ("Other Market Information").
U.S. Treasury Obligations. Inputs used to value U.S. Treasury securities generally include quotes from several inter-dealer brokers and Other Market Information.
U.S. Government Agency Securities. Inputs used to value U.S. Government Agency securities generally include obtaining benchmark quotes and Other Market Information.
Asset-Backed Securities and Mortgage-Backed Securities. Inputs used to value asset-backed securities and mortgage-backed securities generally include models that consider a number of factors, which may include the following: prepayment speeds, cash flows, spread adjustments and Other Market Information.
High Yield Securities. Inputs used to value high yield securities generally include a number of observations of equity and credit default swap curves related to the issuer and Other Market Information.
Municipal Debt Securities. Inputs used to value municipal debt securities include current trades, bid-wanted lists (which informs the market that a holder is interested in selling a position and that offers will be considered), offerings, general information on market movement, direction, trends, and specific data on specialty issues.
Emerging Markets Debt, Sovereign Debt, and Quasi-Sovereign Debt. Inputs used to value emerging markets debt, sovereign debt and quasi-sovereign debt generally include dealer quotes, bond market activity, discounted cash flow models, and other relevant information such as credit spreads, benchmark curves and Other Market Information.
The value of forward contracts is determined by Management by obtaining valuations from independent pricing services based on actual traded currency rates on independent pricing services' networks, along with other traded and quoted currency rates provided to the pricing services by leading market participants (Level 2 inputs).
The value of loan assignments is determined by Management primarily by obtaining valuations from independent pricing services based on broker quotes (generally Level 2 or Level 3 inputs depending on the number of quotes available).
235
The value of futures is determined by Management by obtaining valuations from independent pricing services at the settlement price at the market close (Level 1 inputs).
The value of interest rate swaps is determined by Management primarily by obtaining valuations from independent pricing services based on references to the underlying rates including the local overnight index swap rate and the respective interbank offered forward rate to produce the daily price. The present value is calculated based off of expected cash flows based on swap parameters along with reference to the underlying yield curve and reference rate (generally Level 2 inputs).
The value of credit default swaps is determined by Management by obtaining valuations from independent pricing services using a model that considers a number of factors, which may include default probabilities, credit curves, recovery rates and cash flows (Level 2 inputs).
The value of cross currency swaps is determined by Management by obtaining valuations from independent pricing services based on present value of expected cash flows based on swap parameters along with reference to the underlying yield curve and reference rate (Level 2 inputs).
Management has developed a process to periodically review information provided by independent pricing services for all types of securities.
Commercial papers are valued at amortized cost (Level 2 inputs).
Investments in non-exchange traded investment companies are valued using the respective fund's daily calculated net asset value per share (Level 2 inputs).
If a valuation is not available from an independent pricing service, or if Management has reason to believe that the valuation received does not represent the amount a Fund might reasonably expect to receive on a current sale in an orderly transaction, Management seeks to obtain quotations from brokers or dealers (generally considered Level 2 or Level 3 inputs depending on the number of quotes available). If such quotations are not readily available, the security is valued using methods the Board has approved in the good-faith belief that the resulting valuation will reflect the fair value of the security. Numerous factors may be considered when determining the fair value of a security based on Level 2 or Level 3 inputs, including available analyst, media or other reports, securities within the same industry with recent highly correlated performance, trading in futures or American Depositary Receipts and whether the issuer of the security being fair valued has other securities outstanding.
The value of the Funds' investments in foreign securities is generally determined using the same valuation methods and inputs as other Fund investments, as discussed above. Foreign security prices expressed in local currency values are normally translated from the local currency into U.S. dollars using the exchange rates as of 4:00 p.m., Eastern Time on days the New York Stock Exchange ("NYSE") is open for business. The Board has approved the use of Interactive Data Pricing and Reference Data LLC ("Interactive") to evaluate the prices of foreign debt securities as of the time as of which a Fund's share price is calculated. Interactive utilizes benchmark spread and yield curves and evaluates available market activity from the local close to the time as of which a Fund's share price is calculated (Level 2 inputs) to assist in determining prices for certain foreign debt securities. In the absence of precise information about the market values of these foreign securities as of the time as of which a Fund's share price is calculated, the Board has determined on the basis of available data that prices evaluated in this way are likely to be closer to the prices a Fund could realize on a current sale than are the prices of those securities established at the close of the foreign markets in which the securities primarily trade.
Fair value prices are necessarily estimates, and there is no assurance that such a price will be at or close to the price at which the security is next quoted or next trades.
3 Foreign currency translations: Core Bond, Core Plus, Emerging Markets Debt, Floating Rate Income, High Income, Short Duration, Short Duration High Income, Strategic Income and Unconstrained Bond may invest in foreign securities denominated in foreign currencies. The accounting records of the Funds are maintained in U.S. dollars. Foreign currency amounts are normally translated into U.S. dollars using the exchange rate as of 4:00 p.m. Eastern Time, on days the NYSE is open for business, to determine the value of investments, other assets and liabilities. Purchase and sale prices of securities, and income and expenses, are translated into U.S. dollars at the prevailing rate of exchange on the respective dates of such transactions. Net unrealized foreign currency gain/(loss), if any, arises from changes in the value of assets and liabilities, other than investments in securities, as a result of changes in exchange rates and is stated separately in the Statements of Operations.
236
4 Securities transactions and investment income: Securities transactions are recorded on trade date for financial reporting purposes. Dividend income is recorded on the ex-dividend date or, for certain foreign dividends, as soon as a Fund becomes aware of the dividends. Non-cash dividends included in dividend income, if any, are recorded at the fair market value of the securities received. Interest income, including accretion of discount (adjusted for original issue discount, where applicable) and amortization of premium, where applicable, is recorded on the accrual basis. Realized gains and losses from securities transactions (for each Fund) and foreign currency transactions (for Core Bond, Core Plus, Emerging Markets Debt, Floating Rate Income, High Income, Short Duration, Short Duration High Income, Strategic Income and Unconstrained Bond), if any, are recorded on the basis of identified cost and stated separately in the Statements of Operations. Included in net realized gain/(loss) on investments are proceeds from the settlements of class action litigation in which each of Core Bond, High Income, Short Duration, Strategic Income and Unconstrained Bond participated as a class member. The amounts of such proceeds for the year ended October 31, 2017 were $4,681, $62,515, $3,925, $985 and $956 for Core Bond, High Income, Short Duration, Strategic Income and Unconstrained Bond, respectively.
5 Income tax information: Each Fund is treated as a separate entity for U.S. federal income tax purposes. It is the policy of each Fund, except Core Plus, to continue to, and the intention of Core Plus to, qualify for treatment as a regulated investment company ("RIC") by complying with the requirements of the U.S. Internal Revenue Code applicable to RICs and to distribute substantially all of its net investment income and net realized capital gains to its shareholders. To the extent a Fund distributes substantially all of its net investment income and net realized capital gains to shareholders, no federal income or excise tax provision is required.
The Funds have adopted the provisions of ASC 740 "Income Taxes" ("ASC 740"). ASC 740 sets forth a minimum threshold for financial statement recognition of a tax position taken, or expected to be taken, in a tax return. The Funds recognize interest and penalties, if any, related to unrecognized tax positions as an income tax expense in the Statements of Operations. The Funds are subject to examination by U.S. federal and state tax authorities for returns filed for the tax years for which the applicable statutes of limitations have not yet expired. As of October 31, 2017, the Funds did not have any unrecognized tax positions.
At October 31, 2017, selected Fund information for all long security positions and derivative instruments (if any) for U.S. federal income tax purposes was as follows:
(000's omitted) | | Cost | | Gross
Unrealized
Appreciation | | Gross
Unrealized
Depreciation | | Net
Unrealized
Appreciation/
(Depreciation) | |
Core Bond | | $ | 410,409 | | | $ | 3,428 | | | $ | 3,608 | | | $ | (180 | ) | |
Core Plus | | | 11,775 | | | | 60 | | | | 75 | | | | (15 | ) | |
Emerging Markets Debt | | | 244,547 | | | | 8,852 | | | | 6,878 | | | | 1,974 | | |
Floating Rate Income | | �� | 373,775 | | | | 3,394 | | | | 3,138 | | | | 256 | | |
High Income | | | 3,132,041 | | | | 139,885 | | | | 33,074 | | | | 106,811 | | |
Municipal High Income | | | 94,604 | | | | 1,552 | | | | 1,024 | | | | 528 | | |
Municipal Intermediate Bond | | | 228,360 | | | | 4,840 | | | | 807 | | | | 4,033 | | |
New York Municipal Income | | | 57,191 | | | | 1,838 | | | | 134 | | | | 1,704 | | |
Short Duration Bond | | | 106,957 | | | | 50 | | | | 378 | | | | (328 | ) | |
Short Duration High Income Bond | | | 115,883 | | | | 1,983 | | | | 644 | | | | 1,339 | | |
Strategic Income | | | 3,328,707 | | | | 84,429 | | | | 47,899 | | | | 36,530 | | |
Unconstrained Bond | | | 94,384 | | | | 6,076 | | | | 3,584 | | | | 2,492 | | |
Income distributions and capital gain distributions are determined in accordance with income tax regulations, which may differ from GAAP. These differences are primarily due to differing treatments of income and gains on various investment securities held by each Fund, timing differences and differing characterization of distributions made by each Fund. The Funds may also utilize earnings and profits distributed to shareholders on redemption of their shares as a part of the dividends-paid deduction for income tax purposes.
237
As determined on October 31, 2017, permanent differences resulting primarily from different book and tax accounting were reclassified at year end. Such differences may be attributed to the tax treatment of one or more of the following: net operating losses; foreign currency gains and losses; amortization of bond premium; gains and losses from swaps; rollforward of swap true-up from prior years; foreign currencies and forwards; non-affiliated and affiliated capital gain reclass; non-deductible stock issuance costs; return of capital distributions; expiration of capital loss carryforwards; return of capital distributions; paydown gains and losses on mortgage-backed and asset-backed securities; defaulted bond income adjustments; capital gains tax and deemed distributions on shareholder redemptions; tax adjustments related to swap contracts. These reclassifications had no effect on net income, net asset value ("NAV") or NAV per share of each Fund. For the year ended October 31, 2017, the Funds recorded the following permanent reclassifications:
| | | Paid-in Capital | | Undistributed
Net Investment
Income/(Loss) | | Accumulated Net
Realized Gains/
(Losses) on
Investments | |
Core Bond | | $ | — | | | $ | (490,479 | ) | | $ | 490,479 | | |
Core Plus | | | (3,141 | ) | | | 15,834 | | | | (12,693 | ) | |
Emerging Markets Debt | | | — | | | | (1,166,387 | ) | | | 1,166,387 | | |
Floating Rate Income | | | — | | | | — | | | | — | | |
High Income | | | — | | | | — | | | | — | | |
Municipal High Income | | | — | | | | — | | | | — | | |
Municipal Intermediate Bond | | | 130,909 | | | | — | | | | (130,909 | ) | |
New York Municipal Income | | | 6,136 | | | | — | | | | (6,136 | ) | |
Short Duration Bond | | | (8,069,282 | ) | | | 405,049 | | | | 7,664,233 | | |
Short Duration High Income Bond | | | — | | | | — | | | | — | | |
Strategic Income | | | (325,954 | ) | | | (1,089,692 | ) | | | 1,415,646 | | |
Unconstrained Bond | | | — | | | | (689,829 | ) | | | 689,829 | | |
The tax character of distributions paid during the years ended October 31, 2017 and October 31, 2016 was as follows:
| | Distributions Paid From: | |
| | Taxable Income | | Tax-Exempt
Income | | Long-Term
Capital Gain | | Return of
Capital | | Total | |
| | 2017 | | 2016 | | 2017 | | 2016 | | 2017 | | 2016 | | 2017 | | 2016 | | 2017 | | 2016 | |
Core Bond | | $ | 9,849,506 | | | $ | 9,092,477 | | | $ | — | | | $ | — | | | $ | — | | | $ | — | | | $ | 1,182,601 | | | $ | — | | | $ | 11,032,107 | | | $ | 9,092,477 | | |
Core Plus | | | 92,596 | (a) | | | — | | | | — | (a) | | | — | | | | — | (a) | | | — | | | | — | (a) | | | — | | | | 92,596 | (a) | | | — | | |
Emerging
Markets Debt | | | 8,101,457 | | | | — | | | | — | | | | — | | | | — | | | | — | | | | 824,582 | | | | 7,239,937 | | | | 8,926,039 | | | | 7,239,937 | | |
Floating Rate
Income | | | 13,491,579 | | | | 9,998,301 | | | | — | | | | — | | | | — | | | | — | | | | 17,066 | | | | 77,491 | | | | 13,508,645 | | | | 10,075,792 | | |
High Income | | | 198,028,367 | | | | 213,516,639 | | | | — | | | | — | | | | — | | | | — | | | | — | | | | — | | | | 198,028,367 | | | | 213,516,639 | | |
Municipal High
Income | | | 691,647 | | | | 25,212 | | | | 3,398,162 | | | | 3,272,590 | | | | 49,229 | | | | — | | | | — | | | | — | | | | 4,139,038 | | | | 3,297,802 | | |
Municipal
Intermediate
Bond | | | 39,810 | | | | 16,267 | | | | 4,356,974 | | | | 3,648,257 | | | | 1,249,435 | | | | 250,786 | | | | — | | | | — | | | | 5,646,219 | | | | 3,915,310 | | |
New York
Municipal
Income | | | 168,144 | | | | 4,808 | | | | 1,343,980 | | | | 1,387,301 | | | | 491,145 | | | | 143,937 | | | | — | | | | — | | | | 2,003,269 | | | | 1,536,046 | | |
Short Duration
Bond | | | 1,330,263 | | | | 866,457 | | | | — | | | | — | | | | — | | | | — | | | | — | | | | — | | | | 1,330,263 | | | | 866,457 | | |
Short Duration
High Income
Bond | | | 4,781,943 | | | | 7,224,475 | | | | — | | | | — | | | | — | | | | — | | | | — | | | | — | | | | 4,781,943 | | | | 7,224,475 | | |
Strategic
Income | | | 78,173,393 | | | | 69,971,155 | | | | — | | | | — | | | | — | | | | — | | | | 1,875,707 | | | | 1,829,367 | | | | 80,049,100 | | | | 71,800,522 | | |
Unconstrained
Bond | | | 855,373 | | | | — | | | | — | | | | — | | | | — | | | | — | | | | 228,899 | | | | 2,885,754 | | | | 1,084,272 | | | | 2,885,754 | | |
(a) Period from July 18, 2017 (Commencement of Operations) to October 31, 2017.
238
As of October 31, 2017, the components of distributable earnings (accumulated losses) on a U.S. federal income tax basis were as follows:
| | Undistributed
Ordinary
Income | | Undistributed
Tax-Exempt
Income | | Undistributed
Long-Term
Capital Gain | | Unrealized
Appreciation/
(Depreciation) | | Loss
Carryforwards
and Deferrals | | Other
Temporary
Differences | | Total | |
Core Bond | | $ | — | | | $ | — | | | $ | — | | | $ | (188,523 | ) | | $ | (2,898,080 | ) | | $ | (308,396 | ) | | $ | (3,394,999 | ) | |
Core Plus | | | 18,218 | | | | — | | | | — | | | | (14,938 | ) | | | (26,250 | ) | | | (6,836 | ) | | | (29,806 | ) | |
Emerging
Markets Debt | | | — | | | | — | | | | — | | | | 1,839,095 | | | | (6,282,486 | ) | | | (77,364 | ) | | | (4,520,755 | ) | |
Floating Rate
Income | | | — | | | | — | | | | — | | | | 256,004 | | | | (16,827,429 | ) | | | (161,469 | ) | | | (16,732,894 | ) | |
High Income | | | 4,560,986 | | | | — | | | | — | | | | 106,811,156 | | | | (121,812,156 | ) | | | (4,415,276 | ) | | | (14,855,290 | ) | |
Municipal High
Income | | | — | | | | 17,892 | | | | — | | | | 528,035 | | | | (1,587,046 | ) | | | (17,755 | ) | | | (1,058,874 | ) | |
Municipal
Intermediate
Bond | | | — | | | | 60,378 | | | | 777,826 | | | | 4,033,602 | | | | — | | | | (60,501 | ) | | | 4,811,305 | | |
New York
Municipal
Income | | | — | | | | 23,248 | | | | 98,554 | | | | 1,703,637 | | | | — | | | | (11,340 | ) | | | 1,814,099 | | |
Short Duration
Bond | | | 161,069 | | | | — | | | | — | | | | (328,472 | ) | | | (6,871,940 | ) | | | (4,424 | ) | | | (7,043,767 | ) | |
Short Duration
High Income
Bond | | | 1,029 | | | | — | | | | — | | | | 1,338,076 | | | | (14,081,095 | ) | | | (2,843 | ) | | | (12,744,833 | ) | |
Strategic Income | | | — | | | | — | | | | — | | | | 36,436,534 | | | | (33,213,406 | ) | | | (1,644,309 | ) | | | 1,578,819 | | |
Unconstrained
Bond | | | — | | | | — | | | | — | | | | 2,509,016 | | | | (11,102,214 | ) | | | (23,146 | ) | | | (8,616,344 | ) | |
The temporary differences between book basis and tax basis distributable earnings are primarily due to: losses disallowed and recognized on wash sales and straddles; timing differences of distribution payments; defaulted bond income adjustments; delayed settlement compensation on bank loans; mark-to-market adjustments on swaps, futures and forwards; amortization of bond premium; tax adjustments related to swap contracts; and unamortized organization expenses.
To the extent each Fund's net realized capital gains, if any, can be offset by capital loss carryforwards, it is the policy of each Fund not to distribute such gains. The Regulated Investment Company Modernization Act of 2010 (the "Act") made changes to the capital loss carryforward rules allowing for RICs to carry forward capital losses indefinitely and to retain the character of capital loss carryforwards as short-term or long-term ("Post-Enactment"). Rules in effect previously limited the carryforward period to eight years and all carryforwards were considered short-term in character ("Pre-Enactment"). As determined at October 31, 2017, the following Funds had unused capital loss carryforwards available for federal income tax purposes to offset net realized capital gains, if any, as follows:
| | | Pre-Enactment | |
| | | Expiring in: | |
| | 2018 | | 2019 | |
Floating Rate Income | | $ | — | | | $ | 835,287 | | |
Short Duration | | | 850,271 | | | | 1,276,932 | | |
239
| | | Post-Enactment | |
| | | Long-Term | | Short-Term | |
Core Bond | | $ | 865,786 | | | $ | 2,032,294 | | |
Core Plus | | | 16,642 | | | | 9,608 | | |
Emerging Markets Debt | | | 4,172,777 | | | | 2,109,709 | | |
Floating Rate Income | | | 10,972,231 | | | | 5,019,911 | | |
High Income | | | 120,435,256 | | | | 1,376,900 | | |
Municipal High Income | | | 193,324 | | | | 1,393,722 | | |
Short Duration | | | 4,116,664 | | | | 628,073 | | |
Short Duration High Income | | | 11,234,553 | | | | 2,846,542 | | |
Strategic Income | | | 30,632,469 | | | | 2,580,937 | | |
Unconstrained Bond | | | 2,596,442 | | | | 8,505,772 | | |
Post-Enactment capital loss carryforwards must be fully used before Pre-Enactment capital loss carryforwards; therefore, under certain circumstances, Pre-Enactment capital loss carryforwards available as of the report date may expire unused.
During the year ended October 31, 2017, Emerging Markets Debt, Floating Rate Income, High Income, Short Duration High Income and Strategic Income utilized capital loss carryforwards of $809,289, $197,288, $75,608,422, $1,104,553 and $10,939,748, respectively.
During the year ended October 31, 2017, Short Duration had capital loss carryforwards expire of $8,069,282.
6 Distributions to shareholders: Each Fund earns income, net of expenses, daily on its investments. Ordinarily, distributions from net investment income are declared on each business day and paid monthly, and distributions from net realized capital gains, if any, are generally distributed once a year (usually in December). Distributions to shareholders are recorded on the ex-date.
7 Expense allocation: Certain expenses are applicable to multiple funds within the complex of related investment companies. Expenses directly attributable to a Fund are charged to that Fund. Expenses of the Trust that are not directly attributable to a particular series of the Trust (e.g., a Fund) are allocated among the series of the Trust, on the basis of relative net assets, except where a more appropriate allocation of expenses to each of the series can otherwise be made fairly. Expenses borne by the complex of related investment companies, which includes open-end and closed-end investment companies for which Management serves as investment manager, that are not directly attributable to a particular investment company in the complex (e.g., the Trust) or series thereof are allocated among the investment companies in the complex or series thereof on the basis of relative net assets, except where a more appropriate allocation of expenses to each of the investment companies in the complex or series thereof can otherwise be made fairly. Each Fund's expenses (other than those specific to each class) are allocated proportionally each day among the classes based upon the relative net assets of each class.
8 Dollar rolls: Core Bond, Core Plus, Emerging Markets Debt, Floating Rate Income, High Income, Short Duration, Short Duration High Income, Strategic Income and Unconstrained Bond may enter into dollar roll transactions with respect to mortgage-backed securities. In a dollar roll transaction, a Fund sells securities for delivery in the current month and simultaneously agrees to repurchase substantially similar (i.e., same type and coupon) securities on a specified future date from the same party. During the period before this repurchase, a Fund forgoes principal and interest payments on the securities. A Fund is compensated by the difference between the current sales price and the forward price for the future purchase (often referred to as the "drop"), as well as by the interest earned on the cash proceeds of the initial sale. Dollar rolls may increase fluctuations in a Fund's NAV and may be viewed as a form of leverage. There is a risk that the counterparty will be unable or unwilling to complete the transaction as scheduled, which may result in losses to a Fund.
240
9 When-issued/delayed delivery securities: Each Fund may purchase securities with delivery or payment to occur at a later date beyond the normal settlement period. At the time a Fund enters into a commitment to purchase a security, the transaction is recorded and the value of the security is reflected in the NAV. The price of such security and the date when the security will be delivered and paid for are fixed at the time the transaction is negotiated. The value of the security may vary with market fluctuations. No interest accrues to a Fund until payment takes place. At the time a Fund enters into this type of transaction it is required to segregate cash or other liquid assets at least equal to the amount of the commitment. When-issued and delayed delivery transactions can have a leverage-like effect on a Fund, which can increase fluctuations in the Fund's share price. Certain risks may arise upon entering into when-issued or delayed delivery securities from the potential inability of counterparties to meet the terms of their contracts or if the issuer does not issue the securities due to political, economic, or other factors. Additionally, losses may arise due to changes in the value of the underlying securities.
10 Foreign taxes: Foreign taxes withheld pertaining to interest or dividends, if any, represent amounts withheld by foreign tax authorities, net of refunds recoverable.
Foreign capital gains on certain foreign securities may be subject to foreign taxes, which are accrued as applicable. At October 31, 2017, Emerging Markets Debt had accrued capital gains taxes of $75,301, which is reflected in the Statements of Assets and Liabilities.
11 Investments in foreign securities: Investing in foreign securities may involve sovereign and other risks, in addition to the credit and market risks normally associated with domestic securities. These additional risks include the possibility of adverse political and economic developments (including political instability, nationalization, expropriation, or confiscatory taxation) and the potentially adverse effects of unavailability of public information regarding issuers, less governmental supervision and regulation of financial markets, reduced liquidity of certain financial markets, and the lack of uniform accounting, auditing, and financial reporting standards or the application of standards that are different or less stringent than those applied in the United States. Foreign securities also may experience greater price volatility, higher rates of inflation, and delays in settlement.
12 Derivative instruments: Certain of the Funds' use of derivatives during the year ended October 31, 2017, is described below. Please see the Schedule of Investments for each Fund's open positions in derivatives, if any, at October 31, 2017. The Funds have adopted the provisions of ASC 815 "Derivatives and Hedging" ("ASC 815"). The disclosure requirements of ASC 815 distinguish between derivatives that qualify for hedge accounting and those that do not. Because investment companies value their derivatives at fair value and recognize changes in fair value through the Statements of Operations, they do not qualify for hedge accounting. Accordingly, even though a Fund's investments in derivatives may represent economic hedges, they are considered non-hedge transactions for purposes of this disclosure.
Futures contracts: During the year ended October 31, 2017, Core Bond and Emerging Markets Debt used futures for economic hedging purposes, including as a maturity or duration management device. During the year ended October 31, 2017, Core Plus used futures as a means of hedging risk and/or for investment purposes, including altering the Fund's exposure to interest rates and currencies. During the year ended October 31, 2017, Short Duration used U.S. Treasury futures for economic hedging purposes, including as a maturity or duration management device. During the year ended October 31, 2017, Strategic Income used futures for economic hedging purposes, including as a maturity or duration management device and to manage currency exposure. During the year ended October 31, 2017, Unconstrained Bond used futures to manage or adjust the risk profile and investment exposure of the Fund or individual positions, to obtain or reduce exposure to certain markets, to establish net short or long positions for markets, currencies or securities, adjust the duration of the Fund's portfolio and to enhance total return.
At the time a Fund enters into a futures contract, it is required to deposit with the futures commission merchant a specified amount of cash or liquid securities, known as "initial margin," which is a percentage of the value of the futures contract being traded that is set by the exchange upon which the futures contract is traded. Each day, the futures contract is valued at the official settlement price of the board of trade or U.S. commodity exchange on which such futures contract is traded. Subsequent payments, known as "variation margin," to and from the broker
241
are made on a daily basis, or as needed, as the market price of the futures contract fluctuates. Daily variation margin adjustments, arising from this "mark to market," are recorded by a Fund as unrealized gains or losses.
Although some futures by their terms call for actual delivery or acquisition of the underlying securities or currency, in most cases the contracts are closed out prior to delivery by offsetting purchases or sales of matching futures. When the contracts are closed, a Fund recognizes a gain or loss. Risks of entering into futures contracts include the possibility there may be an illiquid market, possibly at a time of rapidly declining prices, and/or a change in the value of the contract may not correlate with changes in the value of the underlying securities. Futures executed on regulated futures exchanges have minimal counterparty risk to a Fund because the exchange's clearinghouse assumes the position of the counterparty in each transaction. Thus, a Fund is exposed to risk only in connection with the clearinghouse and not in connection with the original counterparty to the transaction.
For U.S. federal income tax purposes, the futures transactions undertaken by a Fund may cause the Fund to recognize gains or losses from marking contracts to market even though its positions have not been sold or terminated, may affect the character of the gains or losses recognized as long-term or short-term, and may affect the timing of some capital gains and losses realized by the Fund. Also, a Fund's losses on transactions involving futures contracts may be deferred rather than being taken into account currently in calculating such Fund's taxable income.
Forward foreign currency contracts: During the year ended October 31, 2017, Emerging Markets Debt used forward contracts to manage or adjust views on foreign exchange rate movements and currency exposure, to add value by applying foreign exchange leverage, and to gain exposure to the markets where the portfolio managers believe these instruments provide better liquidity and value than bonds. During the year ended October 31, 2017, Unconstrained Bond used forward contracts to obtain or reduce exposure to certain markets, to establish net short or long positions for currencies, hedge risk and to enhance total return.
A forward contract is an agreement between two parties to buy or sell a specific currency for another at a set price on a future date, and is individually negotiated and privately traded by currency traders and their customers in the interbank market. The market value of a forward contract fluctuates with changes in forward currency exchange rates. Forward contracts are marked to market daily, and the change in value is recorded by a Fund as an unrealized gain or loss. At the consummation of a forward contract to purchase or sell currency, a Fund may either exchange the currencies specified at the maturity of the forward contract or enter into a closing transaction involving the purchase or sale of an offsetting forward contract. Closing transactions with respect to forward contracts are usually performed with the counterparty to the original forward contract. The gain or loss arising from the difference between the U.S. dollar cost of the original contract and the value of the foreign currency in U.S. dollars upon closing a contract is included in "Net realized gain (loss) on forward foreign currency contracts" in the Statements of Operations. These contracts may involve market risk in excess of the unrealized gain or loss reflected in a Fund's Statement of Assets and Liabilities. In addition, a Fund could be exposed to risks associated with fluctuations in foreign currency and the risk the counterparty will fail to fulfill its obligation.
Credit default swap contracts: During the period ended October 31, 2017, Core Plus used credit default swaps for investment purposes, including altering the Fund's exposure to sectors. During the year ended October 31, 2017, Emerging Markets Debt used credit default swaps as a relative value trade, such as having a long position in Brazilian sovereign debt while funding it with a short position in Mexican credit default swaps, to take advantage of the portfolio managers' views on sovereign credit spreads and spreads in emerging market corporates, or on the portfolio spread duration (with emerging market credit default swaps) without using cash. During the year ended October 31, 2017, Strategic Income used credit default swaps for economic hedging purposes, including as a sector allocation adjustment mechanism towards credit. During the year ended October 31, 2017, Unconstrained Bond used credit default swaps for economic hedging purposes, to manage or adjust the risk profile and investment exposure of the Fund or individual positions, to obtain or reduce exposure to certain markets, to establish net short or long positions for markets or securities and to enhance total return. When a Fund is the buyer of a credit default swap contract, it is entitled to receive the notional amount of the swap from the counterparty if a credit event occurs. In return, the Fund pays the counterparty a periodic stream of payments over the term of the contract provided that no credit event has occurred. If no credit event occurs, the Fund would have spent the stream of payments and received no proceeds from
242
the contract. When a Fund is the seller of a credit default swap contract, it receives the stream of payments, but is obligated to pay to the buyer of the protection an amount up to the notional amount of the swap and in certain instances take delivery of securities of the reference entity upon the occurrence of a credit event, as defined under the terms of that particular swap agreement. Credit events are contract specific but may include bankruptcy, failure to pay, restructuring, obligation acceleration and repudiation/moratorium. If a Fund is a seller of protection and a credit event occurs, the maximum potential amount of future payments that the Fund could be required to make (or the risk of loss) would be an amount equal to the notional amount of the agreement. This potential amount would be partially offset by any recovery value of the respective referenced obligation, or net amount received from the settlement of a buy protection credit default swap agreement entered into by the Fund for the same referenced obligation. As the seller, the Fund may add economic leverage to its portfolio because, in addition to its total net assets, the Fund is subject to investment exposure on the notional amount of the swap. The net periodic payments paid or received on the swap contract are accrued daily as a component of unrealized appreciation/(depreciation) and are recorded as realized gain upon receipt or realized loss upon payment. The Fund also records an increase or decrease to unrealized appreciation/(depreciation) in an amount equal to the daily valuation of swaps. For financial reporting purposes, unamortized upfront payments/(receipts), if any, are netted with unrealized appreciation or (depreciation) and net interest received or paid on swap contracts to determine the fair value of swaps.
Interest rate swap contracts: During the year ended October 31, 2017, Emerging Markets Debt used interest rate swaps to manage or adjust interest rate risk of the Fund, to take advantage of the portfolio managers' views on interest rates and market pricing of future monetary policy, to obtain exposure on a maturity horizon where bonds are illiquid or are unavailable, and to add value by obtaining leveraged rate positions. During the year ended October 31, 2017, Unconstrained Bond used interest rate swaps to hedge risk, manage or adjust the risk profile of the Fund, obtain or reduce exposure to certain markets, establish net short positions for individual markets, adjust the duration of the Fund's portfolio, alter the Fund's exposure to interest rates and to enhance total return. Under the terms of interest rate swaps, the Fund agrees to pay the swap counterparty a fixed-rate payment in exchange for the counterparty's paying the Fund a variable-rate payment, or the Fund agrees to pay the swap counterparty a variable-rate payment in exchange for the counterparty's paying the Fund a fixed-rate payment. The fixed-rate and variable rate payment flows are netted against each other, with the difference being paid by one party to the other on a monthly or quarterly basis. The Fund segregates cash or liquid securities having a value at least equal to the Fund's net payment obligations under any interest rate swaps, marked to market daily. There is no guarantee that these interest rate swap transactions will be successful in reducing or limiting risk.
Risks may arise if the counterparty to an interest rate swap contract fails to comply with the terms of its contract. The loss incurred due to the failure of a counterparty is generally limited to the net interest payment to be received by the Fund and/or the termination value at the end of the contract. Additionally, risks may arise if there is no liquid market for these agreements or from movements in interest rates unanticipated by Management.
Periodic expected interim net interest payments or receipts on the swaps are recorded as an adjustment to unrealized gains/losses, along with the fair value of the future periodic payment or receivable streams on the swaps. The unrealized gains/losses associated with the periodic interim net interest payments or receipts are reclassified to realized gains/losses in conjunction with the actual net payment or receipt of such amounts. The reclassifications do not impact the Fund's total net assets or its total net increase (decrease) in net assets resulting from operations.
Centrally cleared swap contracts: Certain clearinghouses currently offer clearing for limited types of derivative transactions. In a cleared derivative transaction, a Fund typically enters into the transaction with a financial institution counterparty that is then cleared through a central clearinghouse. Upon acceptance of a swap by a central clearinghouse, the original swap is extinguished and replaced with a swap with the clearinghouse, thereby reducing or eliminating the Fund's exposure to the credit risk of the original counterparty. A Fund typically will be required to post specified levels of both initial and variation margin with the clearinghouse or at the instruction of the clearinghouse. The daily change in valuation is recorded as a receivable or payable for variation margin and settled in cash with the centrally clearing party. For financial reporting purposes, unamortized upfront payments, if any, are netted with unrealized appreciation or depreciation and net interest received or paid on swap contracts to determine the fair value of swaps.
243
Cross currency swap contracts: During the year ended October 31, 2017, Emerging Markets Debt used cross currency swap transactions to manage or adjust interest rate risk of the Fund, to take advantage of the portfolio managers' views on interest rate movements and market pricing of future monetary policy, to obtain exposure on a maturity horizon where bonds are illiquid or do not exist, and to add value by obtaining leveraged rate positions. Cross currency swaps are interest rate swaps in which interest payments and principal amounts are exchanged in two different currencies. The notional amounts are typically determined based on the spot exchange rates at the inception of the trade. The entire principal value of a cross currency swap is subject to the risk that the counterparty to the swap will default on its contractual delivery obligations. Additionally, risks may arise if there is no liquid market for these agreements or from movements in interest rates unanticipated by Management. Periodic expected interim net interest payments or receipts on the swaps are recorded as an adjustment to unrealized gains/losses, along with the fair value of the future periodic payment or receivable streams on the swaps. The unrealized gains/losses associated with the periodic interim net interest payments or receipts are reclassified to realized gains/losses in conjunction with the actual net payment or receipt of such amounts. The reclassifications do not impact the Fund's total net assets or its total net increase (decrease) in net assets resulting from operations.
At October 31, 2017, the Funds had the following derivatives (which did not qualify as hedging instruments under ASC 815), grouped by primary risk exposure:
Asset Derivatives
(000's omitted)
Derivative Type | | Statements of
Assets and
Liabilities Location | | Interest
Rate Risk | | Credit Risk | | Currency Risk | | Total | |
Core Bond | |
Futures | | Receivable/Payable for
variation margin on
futures contracts(a) | | $ | 32 | | | $ | — | | | $ | 123 | | | $ | 155 | | |
Total Value—Assets | | | | $ | 32 | | | $ | — | | | $ | 123 | | | $ | 155 | | |
Core Plus | |
Futures | | Receivable/Payable for | | $ | 0 | (d) | | $ | — | | | $ | 4 | | | $ | 4 | | |
| | | variation margin on
futures contracts(a) | | | | | | | | | |
Centrally cleared swaps | | Receivable/Payable for
variation margin on centrally
cleared swap contracts(b) | | | 45 | | | | — | | | | — | | | | 45 | | |
Total Value—Assets | | | | $ | 45 | | | $ | — | | | $ | 4 | | | $ | 49 | | |
Emerging Markets Debt | |
| Futures | | Receivable/Payable for
variation margin on
futures contracts(a) | | $ | 123 | | | $ | — | | | $ | — | | | $ | 123 | | |
Forward contracts | | Receivable for
forward foreign
currency contracts | | | — | | | | — | | | | 1,433 | | | | 1,433 | | |
Centrally cleared swaps | | Receivable/Payable for
variation margin on centrally
cleared swap contracts(b) | | | 93 | | | | — | | | | — | | | | 93 | | |
OTC swaps | | OTC Swap contracts,
at value(c) | | | 708 | | | | — | | | | 5 | | | | 713 | | |
Total Value—Assets | | | | $ | 924 | | | $ | — | | | $ | 1,438 | | | $ | 2,362 | | |
244
Derivative Type | | Statements of
Assets and
Liabilities Location | | Interest
Rate Risk | | Credit Risk | | Currency Risk | | Total | |
Strategic Income | |
Futures | | Receivable/Payable for
variation margin on
futures contracts(a) | | $ | 127 | | | $ | — | | | $ | 1,341 | | | $ | 1,468 | | |
| Centrally cleared swaps | | Receivable/Payable for
variation margin on centrally
cleared swap contracts(b) | | | — | | | | 7,906 | | | | — | | | | 7,906 | | |
Total Value—Assets | | | | $ | 127 | | | $ | 7,906 | | | $ | 1,341 | | | $ | 9,374 | | |
Unconstrained Bond | |
Futures | | Receivable/Payable for
variation margin on
futures contracts(a) | | $ | 1,272 | | | $ | — | | | $ | — | | | $ | 1,272 | | |
Forward contracts | | Receivable for
forward foreign
currency contracts | | | — | | | | — | | | | 2,694 | | | | 2,694 | | |
| Centrally cleared swaps | | Receivable/Payable for
variation margin on centrally
cleared swap contracts(b) | | | — | | | | 586 | | | | — | | | | 586 | | |
Total Value—Assets | | | | $ | 1,272 | | | $ | 586 | | | $ | 2,694 | | | $ | 4,552 | | |
Liability Derivatives
(000's omitted)
Derivative Type | | Statements of
Assets and
Liabilities Location | | Interest
Rate Risk | | Credit Risk | | Currency Risk | | Total | |
Core Bond | |
Futures | | Receivable/Payable for
variation margin on
futures contracts(a) | | $ | (481 | ) | | $ | — | | | $ | (193 | ) | | $ | (674 | ) | |
Total Value—Liabilities | | | | $ | (481 | ) | | $ | — | | | $ | (193 | ) | | $ | (674 | ) | |
Core Plus | |
Futures | | Receivable/Payable for
variation margin on
futures contracts(a) | | $ | (21 | ) | | $ | — | | | $ | (7 | ) | | $ | (28 | ) | |
| Centrally cleared swaps | | Receivable/Payable for
variation margin on centrally
cleared swap contracts(b) | | | (4 | ) | | | — | | | | — | | | | (4 | ) | |
Total Value—Liabilities | | | | $ | (25 | ) | | $ | — | | | $ | (7 | ) | | $ | (32 | ) | |
245
Derivative Type | | Statements of
Assets and
Liabilities Location | | Interest
Rate Risk | | Credit Risk | | Currency Risk | | Total | |
Emerging Markets Debt | |
Futures | | Receivable/Payable for
variation margin on
futures contracts(a) | | $ | (140 | ) | | $ | — | | | $ | — | | | $ | (140 | ) | |
Forward contracts | | Payable for forward
foreign currency contracts | | | — | | | | — | | | | (1,635 | ) | | | (1,635 | ) | |
Centrally cleared swaps | | Receivable/Payable for
variation margin on centrally
cleared swap contracts(b) | | | (50 | ) | | | — | | | | — | | | | (50 | ) | |
OTC swaps | | OTC Swap contracts,
at value(c) | | | (443 | ) | | | — | | | | (34 | ) | | | (477 | ) | |
Total Value—Liabilities | | | | $ | (633 | ) | | $ | — | | | $ | (1,669 | ) | | $ | (2,302 | ) | |
Short Duration | |
Futures | | Receivable/Payable for
variation margin on
futures contracts(a) | | $ | (69 | ) | | $ | — | | | $ | — | | | $ | (69 | ) | |
Total Value—Liabilities | | | | $ | (69 | ) | | $ | — | | | $ | — | | | $ | (69 | ) | |
Strategic Income | |
Futures | | Receivable/Payable for
variation margin on
futures contracts(a) | | $ | (3,406 | ) | | $ | — | | | $ | (2,650 | ) | | $ | (6,056 | ) | |
Total Value—Liabilities | | | | $ | (3,406 | ) | | $ | — | | | $ | (2,650 | ) | | $ | (6,056 | ) | |
Unconstrained Bond | |
Futures | | Receivable/Payable for
variation margin on
futures contracts(a) | | $ | (547 | ) | | $ | — | | | $ | — | | | $ | (547 | ) | |
Forward contracts | | Payable for forward
foreign currency contracts | | | — | | | | — | | | | (1,999 | ) | | | (1,999 | ) | |
Centrally cleared swaps | | Receivable/Payable for
variation margin on centrally
cleared swap contracts(b) | | | (20 | ) | | | (1,583 | ) | | | — | | | | (1,603 | ) | |
Total Value—Liabilities | | | | $ | (567 | ) | | $ | (1,583 | ) | | $ | (1,999 | ) | | $ | (4,149 | ) | |
(a) "Futures" reflects the cumulative unrealized appreciation/(depreciation) of futures as of October 31, 2017, which is reflected in the Statements of Assets and Liabilities under the caption "Net unrealized appreciation/(depreciation) in value of investments." The outstanding variation margin as of October 31, 2017, if any, is reflected in the Statements of Assets and Liabilities under the caption "Receivable/Payable for variation margin on futures contracts."
(b) "Centrally cleared swaps" reflects cumulative unrealized appreciation/(depreciation) of centrally cleared credit default swaps as of October 31, 2017, which is reflected in the Statements of Assets and Liabilities under the caption "Net unrealized appreciation/(depreciation) in value of investments." Variation margin on centrally cleared credit default swaps is reported within the Statements of Assets and Liabilities under the caption "Receivable/Payable for variation margin on centrally cleared swap contracts."
246
(c) "OTC swaps" reflects the cumulative unrealized appreciation/(depreciation) of the OTC swap contracts plus accrued interest as of October 31, 2017, which is reflected in the Statements of Assets and Liabilities under the caption "OTC swap contracts, at value."
(d) Amount less than one thousand.
The impact of the use of these derivative instruments on the Statements of Operations during the year ended October 31, 2017, was as follows:
Realized Gain/(Loss)
(000's omitted)
Derivative Type | | Statements of
Operations
Location | | Interest
Rate Risk | | Credit Risk | | Currency Risk | | Total | |
Core Bond | |
| Futures | | Net realized gain/(loss) on:
expiration or closing of
futures contracts | | $ | 666 | | | $ | — | | | $ | (248 | ) | | $ | 418 | | |
Total Realized Gain/(Loss) | | | | $ | 666 | | | $ | — | | | $ | (248 | ) | | $ | 418 | | |
Core Plus | |
Futures | | Net realized gain/(loss) on:
expiration or closing of
futures contracts | | $ | (6 | ) | | $ | 3 | | | $ | — | | | $ | (3 | ) | |
Swaps | | Net realized gain/(loss) on:
expiration or closing of
swap contracts | | | — | | | | (3 | ) | | | — | | | | (3 | ) | |
Total Realized Gain/(Loss) | | | | $ | (6 | ) | | $ | — | | | $ | — | | | $ | (6 | ) | |
Emerging Markets Debt | |
| Futures | | Net realized gain/(loss) on:
expiration or closing of
futures contracts | | $ | (134 | ) | | $ | — | | | $ | — | | | $ | (134 | ) | |
| Forward contracts | | Net realized gain/(loss) on:
settlement of forward foreign
currency contracts | | | — | | | | — | | | | 475 | | | | 475 | | |
| Swaps | | Net realized gain/(loss) on:
expiration or closing of
swap contracts | | | (80 | ) | | | (3 | ) | | | 56 | | | | (27 | ) | |
Total Realized Gain/(Loss) | | | | $ | (214 | ) | | $ | (3 | ) | | $ | 531 | | | $ | 314 | | |
Short Duration | |
| Futures | | Net realized gain/(loss) on:
expiration or closing of
futures contracts | | $ | 0 | (a) | | $ | — | | | $ | — | | | $ | 0 | (a) | |
Total Realized Gain/(Loss) | | | | $ | 0 | (a) | | $ | — | | | $ | — | | | $ | 0 | (a) | |
247
| Derivative Type | | Statements of
Operations
Location | | Interest
Rate Risk | | Credit Risk | | Currency Risk | | Total | |
Strategic Income | |
Futures | | Net realized gain (loss) on:
expiration or closing of
futures contracts | | $ | 4,548 | | | $ | — | | | $ | 1,792 | | | $ | 6,340 | | |
Swaps | | Net realized gain (loss) on:
expiration or closing of
swap contracts | | | — | | | | (3,998 | ) | | | — | | | | (3,998 | ) | |
Total Realized Gain/(Loss) | | | | $ | 4,548 | | | $ | (3,998 | ) | | $ | 1,792 | | | $ | 2,342 | | |
Unconstrained Bond | |
Futures | | Net realized gain/(loss) on:
expiration or closing of
futures contracts | | $ | 144 | | | $ | — | | | $ | — | | | $ | 144 | | |
Forward contracts | | Net realized gain/(loss) on:
settlement of forward foreign
currency contracts | | | — | | | | — | | | | (1,748 | ) | | | (1,748 | ) | |
Swaps | | Net realized gain/(loss) on:
expiration or closing of
swap contracts | | | 2,314 | | | | (3,987 | ) | | | — | | | | (1,673 | ) | |
Total Realized Gain/(Loss) | | | | $ | 2,458 | | | $ | (3,987 | ) | | $ | (1,748 | ) | | $ | (3,277 | ) | |
(a) Amount less than one thousand.
Change in Appreciation/(Depreciation)
(000's omitted)
| Derivative Type | | Statements of
Operations
Location | | Interest
Rate Risk | | Credit Risk | | Currency Risk | | Total | |
Core Bond | |
| Futures | | Change in net unrealized
appreciation/ (depreciation)
in value of: futures contracts | | $ | (983 | ) | | $ | — | | | $ | 105 | | | $ | (878 | ) | |
Total Change in Appreciation/(Depreciation) | | | | $ | (983 | ) | | $ | — | | | $ | 105 | | | $ | (878 | ) | |
Core Plus | |
Futures | | Change in net unrealized
appreciation/ (depreciation)
in value of: futures contracts | | $ | (21 | ) | | $ | — | | | $ | (3 | ) | | $ | (24 | ) | |
Swaps | | Change in net unrealized
appreciation/ (depreciation)
in value of: swap contracts | | | — | | | | 16 | | | | — | | | | 16 | | |
Total Change in Appreciation/(Depreciation) | | | | $ | (21 | ) | | $ | 16 | | | $ | (3 | ) | | $ | (8 | ) | |
248
Derivative Type | | Statements of
Operations
Location | | Interest
Rate Risk | | Credit Risk | | Currency Risk | | Total | |
Emerging Markets Debt | |
| Futures | | Change in net unrealized
appreciation/ (depreciation)
in value of: futures contracts | | $ | (97 | ) | | $ | — | | | $ | — | | | $ | (97 | ) | |
| Forward contracts | | Change in net unrealized
appreciation/ (depreciation)
in value of: forward foreign
currency contracts | | | — | | | | — | | | | 64 | | | | 64 | | |
| Swaps | | Change in net unrealized
appreciation/ (depreciation)
in value of: swap contracts | | | 750 | | | | — | | | | 13 | | | | 763 | | |
Total Change in Appreciation/(Depreciation) | | | | $ | 653 | | | $ | — | | | $ | 77 | | | $ | 730 | | |
Short Duration | |
Futures | | Change in net unrealized
appreciation/ (depreciation)
in value of: futures contracts | | $ | (70 | ) | | $ | — | | | $ | — | | | $ | (70 | ) | |
Total change in Appreciation/(Depreciation) | | | | $ | (70 | ) | | $ | — | | | $ | — | | | $ | (70 | ) | |
Strategic Income | |
| Futures | | Change in net unrealized
appreciation/ (depreciation)
in value of: futures contracts | | $ | (7,179 | ) | | $ | — | | | $ | (616 | ) | | $ | (7,795 | ) | |
| Swaps | | Change in net unrealized
appreciation/ (depreciation)
in value of: swap contracts | | | — | | | | 2,879 | | | | — | | | | 2,879 | | |
Total Change in Appreciation/(Depreciation) | | | | $ | (7,179 | ) | | $ | 2,879 | | | $ | (616 | ) | | $ | (4,916 | ) | |
Unconstrained Bond | |
| Futures | | Change in net unrealized
appreciation/ (depreciation)
in value of: futures contracts | | $ | 223 | | | $ | — | | | $ | — | | | $ | 223 | | |
| Forward contracts | | Change in net unrealized
appreciation/ (depreciation)
in value of: forward foreign
currency contracts | | | — | | | | — | | | | 127 | | | | 127 | | |
Swaps | | Change in net unrealized
appreciation/ (depreciation)
in value of: swap contracts | | | (31 | ) | | | (239 | ) | | | — | | | | (270 | ) | |
Total Change in Appreciation/(Depreciation) | | | | $ | 192 | | | $ | (239 | ) | | $ | 127 | | | $ | 80 | | |
Management has concluded that the Funds, except Core Bond, Core Plus, Emerging Markets Debt, Short Duration, Strategic Income and Unconstrained Bond, did not hold any derivative instruments during the year ended October 31, 2017, that require additional disclosures pursuant to ASC 815.
The Funds adopted the provisions of Accounting Standards Update ("ASU") 2011-11 Disclosures about Offsetting Assets and Liabilities ("ASU 2011-11"). ASU 2011-11 is intended to enhance disclosure requirements on the offsetting of financial assets and liabilities. Pursuant to ASU 2011-11, an entity is required to disclose both gross and net information for assets and liabilities related to derivatives, repurchase and reverse repurchase agreements,
249
and securities lending and securities borrowing transactions that are eligible for offset or subject to an enforceable master netting or similar agreement. ASU 2011-11 is applicable to only Emerging Markets Debt and Unconstrained Bond at October 31, 2017. Emerging Markets Debt's and Unconstrained Bond's derivative assets and liabilities at fair value by type are reported gross in the Statements of Assets and Liabilities. The following tables present Emerging Markets Debt's and Unconstrained Bond's derivative assets and liabilities by counterparty, net of amounts available for offset under a master netting agreement and net of the related collateral received by Emerging Markets Debt and Unconstrained Bond for assets and pledged by Emerging Markets Debt and Unconstrained Bond for liabilities as of October 31, 2017.
Description
(000's omitted) | | Gross Amounts of
Recognized Assets | | Gross Amounts
Offset in the
Statements of
Assets and
Liabilities | | Net Amounts of Assets Presented in the
Statements of Assets and Liabilities | |
Emerging Markets Debt | |
OTC swap contracts | | $ | 713 | | | $ | — | | | $ | 713 | | |
Forward contracts | | | 1,433 | | | | — | | | | 1,433 | | |
Total | | $ | 2,146 | | | $ | — | | | $ | 2,146 | | |
Unconstrained Bond | |
Forward contracts | | $ | 2,694 | | | $ | — | | | $ | 2,694 | | |
Total | | $ | 2,694 | | | $ | — | | | $ | 2,694 | | |
| | | Gross Amounts Not Offset in the Statements of Assets and Liabilities | |
Counterparty
(000's omitted) | | Net Amounts of
Assets Presented in
the Statements of
Assets and Liabilities | | Liabilities
Available for
Offset | | Cash Collateral
Received(a) | | Net Amount(b) | |
Emerging Markets Debt | |
Citibank, N.A. | | $ | 252 | | | $ | (252 | ) | | $ | — | | | $ | — | | |
Goldman Sachs International | | | 1,078 | | | | (939 | ) | | | — | | | | 139 | | |
JPMorgan Chase Bank, N.A. | | | 597 | | | | (597 | ) | | | — | | | | — | | |
Standard Chartered Bank | | | 219 | | | | (171 | ) | | | — | | | | 48 | | |
Total | | $ | 2,146 | | | $ | (1,959 | ) | | $ | — | | | $ | 187 | | |
Unconstrained Bond | |
Citibank, N.A. | | $ | 106 | | | $ | (41 | ) | | $ | — | | | $ | 65 | | |
Goldman Sachs International | | | 403 | | | | (403 | ) | | | — | | | | — | | |
JPMorgan Chase Bank, N.A. | | | 17 | | | | (5 | ) | | | — | | | | 12 | | |
Royal Bank of Canada | | | 632 | | | | (331 | ) | | | — | | | | 301 | | |
Societe Generale | | | 659 | | | | (613 | ) | | | — | | | | 46 | | |
State Street Bank and Trust Company | | | 877 | | | | (588 | ) | | | — | | | | 289 | | |
Total | | $ | 2,694 | | | $ | (1,981 | ) | | $ | — | | | $ | 713 | | |
250
Description
(000's omitted) | | Gross Amounts of
Recognized Liabilities | | Gross Amounts
Offset in the
Statements of
Assets and
Liabilities | | Net Amounts of Liabilities Presented in the
Statements of Assets and Liabilities | |
Emerging Markets Debt | |
OTC swap contracts | | $ | (477 | ) | | $ | — | | | $ | (477 | ) | |
Forward contracts | | | (1,635 | ) | | | — | | | | (1,635 | ) | |
Total | | $ | (2,112 | ) | | $ | — | | | $ | (2,112 | ) | |
Unconstrained Bond | |
Forward contracts | | | (1,999 | ) | | | — | | | | (1,999 | ) | |
Total | | $ | (1,999 | ) | | | | $ | (1,999 | ) | |
| | | Gross Amounts Not Offset in the Statements of Assets and Liabilities | |
Counterparty
(000's omitted) | | Net Amounts of
Liabilities Presented in
the Statements of
Assets and Liabilities | | Assets
Available for
Offset | | Cash Collateral
Pledged(a) | | Net Amount(c) | |
Emerging Markets Debt | |
Citibank, N.A. | | $ | (372 | ) | | $ | 252 | | | $ | 120 | | | $ | — | | |
Goldman Sachs International | | | (939 | ) | | | 939 | | | | — | | | | — | | |
JPMorgan Chase Bank, N.A. | | | (630 | ) | | | 597 | | | | 33 | | | | — | | |
Standard Chartered Bank | | | (171 | ) | | | 171 | | | | — | | | | — | | |
Total | | $ | (2,112 | ) | | $ | 1,959 | | | $ | 153 | | | $ | — | | |
Unconstrained Bond | |
Citibank, N.A. | | $ | (41 | ) | | $ | 41 | | | $ | — | | | $ | — | | |
Goldman Sachs International | | | (421 | ) | | | 403 | | | | — | | | | (18 | ) | |
JPMorgan Chase Bank, N.A. | | | (5 | ) | | | 5 | | | | — | | | | — | | |
Royal Bank of Canada | | | (331 | ) | | | 331 | | | | — | | | | — | | |
Societe Generale | | | (613 | ) | | | 613 | | | | — | | | | — | | |
State Street Bank and Trust Company | | | (588 | ) | | | 588 | | | | — | | | | — | | |
Total | | $ | (1,999 | ) | | $ | 1,981 | | | $ | — | | | $ | (18 | ) | |
(a) Cash collateral received (or pledged) is limited to an amount not to exceed 100% of the net amount of assets (or liabilities) in the tables presented above, for each respective counterparty.
(b) Net Amount represents amounts subject to loss as of October 31, 2017, in the event of a counterparty failure.
(c) Net Amount represents amounts under-collateralized to each counterparty as of October 31, 2017.
13 Indemnifications: Like many other companies, the Trust's organizational documents provide that its officers ("Officers") and trustees ("Trustees") are indemnified against certain liabilities arising out of the performance of their duties to the Trust. In addition, both in some of its principal service contracts and in the normal course of its business, the Trust enters into contracts that provide indemnifications to other parties for certain types of losses or liabilities. The Trust's maximum exposure under these arrangements is unknown as this could involve future claims against the Trust.
14 Transactions with other funds managed by Neuberger Berman Investment Advisers LLC: Neuberger Berman Income Funds and Management have obtained from the Securities and Exchange Commission ("SEC") an exemptive order that permits the Funds to invest in both affiliated and unaffiliated investment companies, including exchange-traded funds ("ETFs"), in excess of the limits in Section 12(d)(1)(A) of the 1940 Act, as
251
amended, subject to the terms and conditions of such order. Through October 31, 2017, Strategic Income invested in Emerging Markets Debt and Short Duration (collectively the "Underlying Funds") (see Note F).
For Strategic Income's investment in the Underlying Funds, Management waived a portion of its management fee equal to the management fee it received from the Underlying Funds on those assets (the "Arrangement"). For the year ended October 31, 2017, management fees waived under this Arrangement are reflected in the Statements of Operations under the caption "Investment management fees waived." For the year ended October 31, 2017, income earned under this Arrangement on Strategic Income's investments is reflected in the Statements of Operations under the caption "Dividend income-affiliated issuers." For the year ended October 31, 2017, management fees waived and income earned under this Arrangement on Strategic Income's investments in the Underlying Funds were as follows:
| | | Management Fees Waived | | Income Earned | |
Strategic Income | | $ | 449,120 | | | $ | 4,220,778 | | |
15 Investment company securities and exchange-traded funds: The Funds may invest in shares of other registered investment companies, including exchange-traded funds ("ETFs"), within the limitations prescribed by the 1940 Act or pursuant to an exemptive order from the SEC that permits the Funds to invest in both affiliated and unaffiliated investment companies, including ETFs, in excess of the limits in Section 12(d)(1)(A) of the 1940 Act, as amended, subject to the terms and conditions of such order (see Note A-14 for more information about the exemptive order). Some ETFs seek to track the performance of a particular market index. These indices include both broad-based market indices and more narrowly-based indices, including those relating to particular sectors, markets, regions or industries. However, some ETFs have an actively-managed investment objective. ETF shares are traded like traditional equity securities on a national securities exchange or NASDAQ. A Fund will indirectly bear its proportionate share of any management fees and other expenses paid by such other investment companies, which will increase expenses and decrease returns.
16 Unfunded loan commitments: The Funds may enter into certain credit agreements all or a portion of which may be unfunded. The Funds are obligated to fund these commitments at the borrower's discretion. As of October 31, 2017, the value of unfunded loan commitments was approximately $57,000 for Floating Rate Income pursuant to the following loan agreement:
Floating Rate Income
(000's omitted) | |
Borrower | | Principal
Amount | | Value | |
Tricorbraun, First Lien Term Loan DD, 3.75%, due 10/31/23 | | $ | 57 | | | $ | 57 | | |
17 In-kind subscriptions: Under certain circumstances, and when considered to be in the best interest of a Fund, the Fund may accept portfolio securities rather than cash as payment for the purchase of Fund shares (in-kind subscription). For financial reporting and tax purposes, the cost basis of contributed securities is equal to the market value of the securities, less any applicable foreign security taxes, on the date of contribution. In-kind subscriptions result in no gain or loss and no tax consequences for a Fund. During the year ended October 31, 2016, Floating Rate Income accepted $25,716,866 of in-kind subscriptions. There were no in-kind subscriptions for any fund during the year ended October 31, 2017.
18 In-kind redemptions: In accordance with guidelines described in a Fund's prospectus and in accordance with procedures adopted by the Board, a Fund may distribute portfolio securities rather than cash as payment for a redemption of Fund shares (in-kind redemption). For financial reporting purposes, the Fund recognizes a gain on in-kind redemptions to the extent the value of the distributed securities on the date of redemption exceeds the cost of those securities. Gains and losses realized on in-kind redemptions are not recognized for tax purposes and are reclassified from undistributed realized gain (loss) to paid-in capital. During the year ended October 31, 2017, Strategic Income realized $(310,903) of net loss on $16,064,021 of in-kind redemptions.
252
19 Organization expenses: Costs incurred by Core Plus in connection with its organization, which amounted to $88,799 and is reflected in Organization expense in the Statements of Operations, have been expensed as incurred.
20 Other: All net investment income and realized and unrealized capital gains and losses of each Fund are allocated, on the basis of relative net assets, pro rata among its respective classes.
Note B—Investment Management Fees, Administration Fees, Distribution Arrangements, and Other Transactions with Affiliates:
Each Fund retains Management as its investment manager under a Management Agreement. For such investment management services, each Fund pays Management a fee according to the following table:
Investment Management Fee as a Percentage of Average Daily Net Assets:
| | | First
$250
million | | Next
$250
million | | Next
$250
million | | Next
$250
million | | Next
$500
million | | Next
$500
million | | Thereafter | |
For Core Bond, Municipal Intermediate Bond, New York Municipal Income and Short Duration: | | | |
| | | | | | 0.25 | % | | | 0.25 | % | | | 0.225 | % | | | 0.225 | % | | | 0.20 | % | | | 0.175 | % | | | 0.15 | % | |
For Core Plus: | | | |
| | | | | | 0.25 | % | | | 0.25 | % | | | 0.25 | % | | | 0.25 | % | | | 0.25 | % | | | 0.25 | % | | | 0.25 | % | |
For Floating Rate Income: | | | |
| | | | | | 0.50 | % | | | 0.50 | % | | | 0.50 | % | | | 0.50 | % | | | 0.50 | % | | | 0.50 | % | | | 0.50 | % | |
For High Income: | | | |
| | | | | | 0.48 | % | | | 0.48 | % | | | 0.48 | % | | | 0.48 | % | | | 0.48 | % | | | 0.48 | % | | | 0.48 | % | |
For Municipal High Income: | | | |
| | | | | | 0.40 | % | | | 0.40 | % | | | 0.375 | % | | | 0.375 | % | | | 0.35 | % | | | 0.325 | % | | | 0.30 | % | |
For Short Duration High Income and Unconstrained Bond: | | | |
| | | | | | 0.45 | % | | | 0.45 | % | | | 0.45 | % | | | 0.45 | % | | | 0.45 | % | | | 0.45 | % | | | 0.45 | % | |
For Emerging Markets Debt: | | | |
| | | | | | 0.55 | % | | | 0.55 | % | | | 0.55 | % | | | 0.55 | % | | | 0.55 | % | | | 0.55 | % | | | 0.55 | % | |
| For Strategic Income(a)(b): | | | |
| | | | | | 0.40 | % | | | 0.40 | % | | | 0.40 | % | | | 0.40 | % | | | 0.40 | % | | | 0.40 | % | | | 0.40 | % | |
(a) 0.39% after management fee waiver (see Note A).
(b) 0.55% prior to December 1, 2016.
Accordingly, for the year ended October 31, 2017, the investment management fee pursuant to the Management Agreement was equivalent to an annual effective rate of each Fund's average daily net assets, as follows:
| | | Effective Rate | |
Core Bond | | | 0.25 | % | |
Municipal High Income | | | 0.40 | % | |
Municipal Intermediate Bond | | | 0.25 | % | |
New York Municipal Income | | | 0.25 | % | |
Short Duration | | | 0.25 | % | |
Strategic Income | | | 0.41 | % | |
253
Each Fund retains Management as its administrator under an Administration Agreement. Prior to July 1, 2017, each Fund paid Management an administration fee at the annual rate of 0.06% of its average daily net assets under this agreement in addition to an annual fee for certain class level services (specifically, 0.21% for each of Investor Class, Class A, Class C and Class R3; 0.44% for Trust Class of Short Duration Bond; 0.34% for Trust Class of Strategic Income; 0.09% for Institutional Class and 0.02% for Class R6, each as a percentage of average daily net assets). Effective July 1, 2017, the administration fee will only be assessed at the Class level and as such each share class of a Fund, as applicable, pays Management an annual administration fee equal to the following: 0.27% for each of Investor Class, Class A, Class C and Class R3; 0.50% for Trust Class of Short Duration Bond; 0.40% for Trust Class of Strategic Income; 0.15% for Institutional Class; and 0.08% for Class R6, each as a percentage of its average daily net assets. This will not result in an increase in any administration expense for any Fund or share class. Additionally, Management retains State Street Bank and Trust Company ("State Street") as its sub-administrator under a Sub-Administration Agreement. Management pays State Street a fee for all services received under the Sub-Administration Agreement.
Management has contractually agreed to waive fees and/or reimburse certain expenses of the Investor Class, Trust Class, Institutional Class, Class A, Class C, Class R3 and Class R6 of each Fund that offers those classes so that the total annual operating expenses of those classes do not exceed the expense limitations as detailed in the following table. These undertakings exclude interest, taxes, brokerage commissions, acquired fund fees and expenses, extraordinary expenses, and dividend and interest expenses relating to short sales, if any (commitment fees relating to borrowings are treated as interest for purposes of this exclusion); consequently, net expenses may exceed the contractual expense limitations. Each Fund has agreed that each of its respective classes will repay Management for fees and expenses waived or reimbursed for that class provided that repayment does not cause that class's annual operating expenses to exceed its contractual expense limitation in place at the time the fees and expenses were waived or reimbursed, or the expense limitation in place at the time the Fund repays Management, whichever is lower. Any such repayment must be made within three years after the year in which Management incurred the expense.
During the year ended October 31, 2017, the following classes repaid Management under their contractual expense limitation agreements as follows:
Class | | Expenses Repaid to Management | |
High Income Class R3 | | $ | 2,212 | | |
At October 31, 2017, contingent liabilities to Management under the agreements were as follows:
| | | | | | | Expenses Reimbursed in
Year Ending October 31, | |
| | | | | | | 2015 | | 2016 | | 2017 | |
| | | | | | | Subject to Repayment Until October 31, | |
Class | | Contractual
Expense
Limitation(a) | | Expiration | | 2018 | | 2019 | | 2020 | |
Core Bond Investor Class | | | 0.85 | % | | 10/31/21 | | $ | 37,780 | | | $ | 35,596 | | | $ | 29,581 | | |
Core Bond Institutional Class | | | 0.45 | % | | 10/31/21 | | | 343,782 | | | | 382,027 | | | | 302,617 | | |
Core Bond Class A | | | 0.85 | % | | 10/31/21 | | | 49,871 | | | | 35,829 | | | | 16,842 | | |
Core Bond Class C | | | 1.60 | % | | 10/31/21 | | | 4,844 | | | | 5,463 | | | | 2,798 | | |
Core Plus Institutional Class | | | 0.45 | %(b) | | 10/31/20 | | | — | | | | — | | | | 161,151 | (c) | |
Core Plus Class A | | | 0.82 | %(b) | | 10/31/20 | | | — | | | | — | | | | 4,377 | (c) | |
Core Plus Class C | | | 1.57 | %(b) | | 10/31/20 | | | — | | | | — | | | | 4,273 | (c) | |
Core Plus Class R6 | | | 0.38 | %(b) | | 10/31/20 | | | — | | | | — | | | | 42,429 | (c) | |
Emerging Markets Debt Institutional Class | | | 0.78 | %(d) | | 10/31/20 | | | 322,766 | | | | 373,165 | | | | 347,032 | | |
254
| | | | | | Expenses Reimbursed in
Year Ending October 31, | |
| | | | | | 2015 | | 2016 | | 2017 | |
| | | | | | Subject to Repayment Until October 31, | |
| Class | | Contractual
Expense
Limitation(a) | | Expiration | | 2018 | | 2019 | | 2020 | |
Emerging Markets Debt Class A | | | 1.15 | %(d) | | 10/31/20 | | $ | 428 | | | $ | 785 | | | $ | 1,400 | | |
Emerging Markets Debt Class C | | | 1.90 | %(d) | | 10/31/20 | | | 455 | | | | 870 | | | | 499 | | |
Floating Rate Income Institutional Class | | | 0.70 | % | | 10/31/20 | | | 431,280 | | | | 466,719 | | | | 400,905 | | |
Floating Rate Income Class A | | | 1.07 | % | | 10/31/21 | | | 40,300 | | | | 48,465 | | | | 28,087 | | |
Floating Rate Income Class C | | | 1.82 | % | | 10/31/21 | | | 44,243 | | | | 56,490 | | | | 28,361 | | |
High Income Investor Class | | | 1.00 | % | | 10/31/20 | | | — | | | | — | | | | — | | |
High Income Institutional Class | | | 0.75 | % | | 10/31/20 | | | — | | | | — | | | | — | | |
High Income Class A | | | 1.12 | % | | 10/31/20 | | | — | | | | — | | | | 9,011 | | |
High Income Class C | | | 1.87 | % | | 10/31/20 | | | — | | | | — | | | | — | | |
High Income Class R3 | | | 1.37 | % | | 10/31/20 | | | — | | | | — | | | | — | | |
High Income Class R6 | | | 0.68 | % | | 10/31/20 | | | — | | | | — | | | | — | | |
Municipal High Income Institutional Class | | | 0.50 | %(b)(e) | | 2/28/19 | | | 229,057 | (f) | | | 404,441 | | | | 343,644 | | |
Municipal High Income Class A | | | 0.87 | %(b)(e) | | 2/28/19 | | | 21,622 | (f) | | | 13,157 | | | | 2,162 | | |
Municipal High Income Class C | | | 1.62 | %(b)(e) | | 2/28/19 | | | 6,987 | (f) | | | 1,526 | | | | 1,262 | | |
Municipal Intermediate Bond Investor Class | | | 0.65 | % | | 10/31/20 | | | 31,785 | | | | 30,651 | | | | 17,913 | | |
Municipal Intermediate Bond
Institutional Class | | | 0.50 | % | | 10/31/20 | | | 212,056 | | | | 227,929 | | | | 150,041 | | |
Municipal Intermediate Bond Class A | | | 0.87 | % | | 10/31/20 | | | 7,612 | | | | 11,816 | | | | 4,415 | | |
Municipal Intermediate Bond Class C | | | 1.62 | % | | 10/31/20 | | | 3,580 | | | | 4,967 | | | | 3,184 | | |
New York Municipal Income
Institutional Class | | | 1.00 | % | | 10/31/20 | | | — | | | | — | | | | — | | |
Short Duration Investor Class | | | 0.70 | % | | 10/31/20 | | | 170,610 | | | | 148,552 | | | | 99,584 | | |
Short Duration Trust Class | | | 0.80 | % | | 10/31/20 | | | 19,213 | | | | 15,145 | | | | 10,328 | | |
Short Duration Institutional Class | | | 0.50 | % | | 10/31/20 | | | 145,334 | | | | 168,696 | | | | 204,660 | | |
Short Duration Class A | | | 0.87 | % | | 10/31/20 | | | 28,747 | | | | 25,265 | | | | 12,847 | | |
Short Duration Class C | | | 1.62 | % | | 10/31/20 | | | 10,162 | | | | 14,268 | | | | 7,070 | | |
Short Duration High Income
Institutional Class | | | 0.75 | % | | 10/31/20 | | | 122,652 | | | | 194,129 | | | | 209,217 | | |
Short Duration High Income Class A | | | 1.12 | % | | 10/31/20 | | | 2,821 | | | | 5,114 | | | | 6,750 | | |
Short Duration High Income Class C | | | 1.87 | % | | 10/31/20 | | | 357 | | | | 1,742 | | | | 2,485 | | |
Strategic Income Trust Class | | | 0.94 | %(g) | | 10/31/20 | | | 17,108 | | | | 9,298 | | | | 9,016 | | |
Strategic Income Institutional Class | | | 0.59 | %(g) | | 10/31/21 | | | 342,222 | | | | 287,082 | | | | 305,847 | | |
Strategic Income Class A | | | 0.99 | %(g) | | 10/31/21 | | | 72,281 | | | | 63,154 | | | | 18,909 | | |
Strategic Income Class C | | | 1.69 | %(g) | | 10/31/21 | | | 105,407 | | | | 93,893 | | | | 66,990 | | |
Strategic Income Class R6 | | | 0.52 | %(g) | | 10/31/20 | | | 53,205 | | | | 51,475 | | | | 40,217 | | |
Unconstrained Bond Institutional Class | | | 0.65 | %(b)(h) | | 10/31/20 | | | 480,996 | | | | 479,020 | | | | 114,474 | | |
Unconstrained Bond Class A | | | 1.02 | %(b)(h) | | 10/31/20 | | | 24,923 | | | | 3,371 | | | | 3,521 | | |
Unconstrained Bond Class C | | | 1.77 | %(b)(h) | | 10/31/20 | | | 4,376 | | | | 313 | | | | 266 | | |
Unconstrained Bond Class R6 | | | 0.58 | %(b)(h) | | 10/31/20 | | | 23,926 | | | | 58,338 | | | | 329,830 | | |
255
(a) Expense limitation per annum of the respective class's average daily net assets.
(b) In addition, Management voluntarily waived its fees as necessary to maintain a minimum yield for Municipal High Income from June 22, 2015 (Commencement of Operations) to June 24, 2015. For the period ended October 31, 2015, voluntary reimbursements for the Institutional Class, Class A and Class C of Municipal High Income amounted to $370, $36 and $67, respectively. These amounts are not subject to recovery by Management. These undertakings were in addition to the contractual undertakings as stated above. In addition, Management voluntarily waived its fees as necessary to maintain a minimum yield for Unconstrained Bond from February 13, 2014 (Commencement of Operations) to February 18, 2014. For the period ended October 31, 2014, voluntary reimbursements for the Institutional Class, Class A, Class C and Class R6 of Unconstrained Bond amounted to $2,303, $1,180, $292 and $739, respectively. These amounts are not subject to recovery by Management. These undertakings were in addition to the contractual undertakings as stated above. In addition, Management voluntarily waived its fees as necessary to maintain a minimum yield for Core Plus on July 18, 2017 (Commencement of Operations). For the period ended October 31, 2017, voluntary reimbursements for the Institutional Class, Class A, Class C and Class R6 of Core Plus amounted to $94, $4, $9 and $21, respectively. These amounts are not subject to recovery by Management. These undertakings were in addition to the contractual undertakings as stated above.
(c) Period from July 18, 2017 (Commencement of Operations) to October 31, 2017.
(d) Prior to February 28, 2017, the contractual expense limitation was 0.90% for Institutional Class, 1.27% for Class A and 2.02% for Class C.
(e) From March 1, 2019 to October 31, 2020, the contractual expense limitation is 0.60%, 0.97% and 1.72% for the Institutional Class, Class A and Class C, respectively.
(f) Period from June 22, 2015 (Commencement of Operations) to October 31, 2015.
(g) Prior to December 1, 2016, the contractual expense limitation was 1.10% for Trust Class, 0.75% for Institutional Class, 1.15% for Class A, 1.85% for Class C, and 0.68% for Class R6.
(h) From November 1, 2014 to February 28, 2015, the contractual expense limitation was 0.85%, 1.22%, 1.97% and 0.78% for Institutional Class, Class A, Class C and Class R6, respectively.
Neuberger Berman Europe Limited ("NBEL"), as the sub-adviser to Emerging Markets Debt and Unconstrained Bond, is retained by Management to choose each Fund's investments and handle its day-to-day business for the portion of each Fund's assets allocated to it by Management, and receives a monthly fee paid by Management. As investment manager, Management is responsible for overseeing the investment activities of NBEL. Several individuals who are Officers and/or Trustees of the Trust are also employees of NBEL and/or Management.
Prior to January 1, 2016, Management retained Neuberger Berman Fixed Income LLC ("NBFI") to serve as the sub-adviser to certain Funds. NBFI, as the sub-adviser to High Income, Municipal Intermediate Bond, Short Duration and Strategic Income, was retained by Management through December 31, 2015 to furnish it with investment recommendations and research information without added cost to each Fund it sub-advised. NBFI, as the sub-adviser to Core Bond, Floating Rate Income, Municipal High Income, New York Municipal Income and Short Duration High Income, was retained by Management through December 31, 2015 to provide day-to-day investment management services and received a monthly fee paid by Management. NBFI, as the sub-adviser to Emerging Markets Debt and Unconstrained Bond, was retained by Management through December 31, 2015 to choose each Fund's investments and handle its day-to-day business for the portion of each Fund's assets allocated to it by Management, and received a monthly fee paid by Management. As a result of the entity consolidation described on page 41 of this Annual Report, the services previously provided by NBFI under the subadvisory agreements are now provided by NBIA as of January 1, 2016.
256
Each Fund also has a distribution agreement with Neuberger Berman BD LLC (the "Distributor") with respect to each class of shares. The Distributor acts as agent in arranging for the sale of class shares without sales commission or other compensation, except as described below, and bears the advertising and promotion expenses.
However, the Distributor receives fees from Core Bond's Investor Class, Strategic Income's Trust Class, High Income's Class R3, and each Fund's Class A and Class C under their distribution plans (each a "Plan", collectively, the "Plans") pursuant to Rule 12b-1 under the 1940 Act. The Plans provide that, as compensation for administrative and other services provided to these classes, the Distributor's activities and expenses related to the sale and distribution of these classes, and ongoing services provided to investors in these classes, the Distributor receives from each of these respective classes a fee at the annual rate of 0.25% of Core Bond Investor Class', Core Bond Class A's, Core Plus Class A's, Emerging Markets Debt Class A's, Floating Rate Income Class A's, High Income Class A's, Municipal High Income Class A's, Municipal Intermediate Bond Class A's, Short Duration Class A's, Short Duration High Income Class A's, Strategic Income Class A's and Unconstrained Bond Class A's average daily net assets; 0.10% of Strategic Income Trust Class' average daily net assets; 0.50% of High Income Class R3's average daily net assets; and 1.00% of Core Bond Class C's, Core Plus Class C's, Emerging Markets Debt Class C's, Floating Rate Income Class C's, High Income Class C's, Municipal High Income Class C's, Municipal Intermediate Bond Class C's, Short Duration Class C's, Short Duration High Income Class C's, Strategic Income Class C's and Unconstrained Bond Class C's average daily net assets. The Distributor receives this amount to provide distribution and shareholder servicing for these classes and pays a portion of it to institutions that provide such services. Those institutions may use the payments for, among other purposes, compensating employees engaged in sales and/or shareholder servicing. The amount of fees paid by each class during any year may be more or less than the cost of distribution and other services provided to that class. FINRA rules limit the amount of annual distribution fees that may be paid by a mutual fund and impose a ceiling on the cumulative distribution fees paid. The Trust's Plans comply with those rules.
Class A shares of each Fund (except Short Duration) are generally sold with an initial sales charge of up to 4.25%. Class A shares of Short Duration are generally sold with an initial sales charge of up to 2.50%. Class A shares of each Fund are generally sold with no contingent deferred sales charge ("CDSC"), except that a CDSC of 1.00% applies to certain redemptions made within 18 months following purchases of $1 million or more without an initial sales charge. Class C shares of each Fund are sold with no initial sales charge and a 1.00% CDSC if shares are sold within one year after purchase.
For the year ended October 31, 2017, Neuberger Berman, acting as underwriter and broker-dealer, received net initial sales charges from the purchase of Class A shares and CDSCs from the redemption of Class A and Class C shares as follows:
| | | Underwriter | | Broker-Dealer | |
| | | Net Initial
Sales Charges | | CDSC | | Net Initial
Sales Charges | | CDSC | |
Core Bond Class A | | $ | 188 | | | $ | — | | | $ | — | | | $ | — | | |
Core Bond Class C | | | — | | | | 3,922 | | | | — | | | | — | | |
| Core Plus Class A(a) | | | — | | | | — | | | | — | | | | — | | |
| Core Plus Class C(a) | | | — | | | | — | | | | — | | | | — | | |
Emerging Markets Debt Class A | | | 172 | | | | — | | | | — | | | | — | | |
Emerging Markets Debt Class C | | | — | | | | 137 | | | | — | | | | — | | |
Floating Rate Income Class A | | | 1,967 | | | | — | | | | — | | | | — | | |
Floating Rate Income Class C | | | — | | | | 2,284 | | | | — | | | | — | | |
High Income Class A | | | 900 | | | | — | | | | — | | | | — | | |
High Income Class C | | | — | | | | 6,894 | | | | — | | | | — | | |
Municipal High Income Class A | | | 50 | | | | — | | | | — | | | | — | | |
257
| | Underwriter | | Broker-Dealer | |
| | Net Initial
Sales Charges | | CDSC | | Net Initial
Sales Charges | | CDSC | |
Municipal High Income Class C | | $ | — | | | $ | 833 | | | $ | — | | | $ | — | | |
Municipal Intermediate Bond Class A | | | 498 | | | | — | | | | — | | | | — | | |
Municipal Intermediate Bond Class C | | | — | | | | 2,073 | | | | — | | | | — | | |
Short Duration Class A | | | 55 | | | | — | | | | — | | | | — | | |
Short Duration Class C | | | — | | | | 12,546 | | | | — | | | | — | | |
Short Duration High Income Class A | | | 1,191 | | | | — | | | | — | | | | — | | |
Short Duration High Income Class C | | | — | | | | 240 | | | | — | | | | — | | |
Strategic Income Class A | | | 17,415 | | | | — | | | | — | | | | — | | |
Strategic Income Class C | | | — | | | | 15,614 | | | | — | | | | — | | |
Unconstrained Bond Class A | | | — | | | | — | | | | — | | | | — | | |
Unconstrained Bond Class C | | | — | | | | — | | | | — | | | | — | | |
(a) Period from July 18, 2017 (Commencement of Operations) to October 31, 2017.
Note C—Securities Transactions:
Cost of purchases and proceeds of sales and maturities of long-term securities (excluding swaps, forward contracts and futures) for the year ended October 31, 2017, were as follows:
(000's omitted) | | Purchases of
U.S. Government and
Agency Obligations | | Purchases excluding
U.S. Government and
Agency Obligations | | Sales and
Maturities of
U.S. Government and
Agency Obligations | | Sales and
Maturities excluding
U.S. Government and
Agency Obligations | |
Core Bond | | $ | 794,316 | | | $ | 237,849 | | | $ | 776,622 | | | $ | 220,909 | | |
| Core Plus(a) | | | 17,770 | | | | 5,839 | | | | 11,509 | | | | 715 | | |
Emerging Markets Debt | | | | | 216,112 | | | | | | 101,106 | | |
Floating Rate Income | | | — | | | | 342,968 | | | | — | | | | 275,371 | | |
High Income | | | — | | | | 2,134,581 | | | | — | | | | 3,139,902 | | |
Municipal High Income | | | — | | | | 103,539 | | | | — | | | | 130,942 | | |
Municipal Intermediate Bond | | | — | | | | 185,435 | | | | — | | | | 151,462 | | |
New York Municipal Income | | | | | 27,710 | | | | | | 28,848 | | |
Short Duration | | | 30,331 | | | | 73,933 | | | | 42,180 | | | | 50,240 | | |
Short Duration High Income | | | — | | | | 100,678 | | | | — | | | | 92,101 | | |
Strategic Income | | | 8,347,866 | | | | 1,756,014 | | | | 7,855,292 | | | | 1,668,676 | | |
Unconstrained Bond | | | 26,389 | | | | 67,240 | | | | 13,243 | | | | 40,183 | | |
(a) Period from July 18, 2017 (Commencement of Operations) to October 31, 2017.
258
Note D—Fund Share Transactions:
Share activity for the years ended October 31, 2017 and October 31, 2016 was as follows:
| | | For the Year Ended October 31, 2017 | | For the Year Ended October 31, 2016 | |
(000's omitted) | | Shares
Sold | | Shares Issued
on Reinvestment
of Dividends
and Distributions | | Shares
Redeemed | | Total | | Shares
Sold | | Shares Issued
on Reinvestment
of Dividends
and Distributions | | Shares
Redeemed | | Total | |
Core Bond | |
Investor Class | | | 164 | | | | 28 | | | | (280 | ) | | | (88 | ) | | | 177 | | | | 26 | | | | (257 | ) | | | (54 | ) | |
Institutional Class | | | 11,091 | | | | 771 | | | | (9,505 | ) | | | 2,357 | | | | 13,556 | | | | 588 | | | | (6,932 | ) | | | 7,212 | | |
Class A | | | 586 | | | | 60 | | | | (930 | ) | | | (284 | ) | | | 669 | | | | 63 | | | | (1,214 | ) | | | (482 | ) | |
Class C | | | 48 | | | | 5 | | | | (200 | ) | | | (147 | ) | | | 330 | | | | 4 | | | | (193 | ) | | | 141 | | |
Core Plus | |
| Institutional Class(a) | | | 760 | | | | 7 | | | | (7 | ) | | | 760 | | | | — | | | | — | | | | — | | | | — | | |
| Class A(a) | | | 21 | | | | 0 | z | | | — | | | | 21 | | | | — | | | | — | | | | — | | | | — | | |
| Class C(a) | | | 20 | | | | — | | | | — | | | | 20 | | | | — | | | | — | | | | — | | | | — | | |
| Class R6(a) | | | 200 | | | | — | | | | — | | | | 200 | | | | — | | | | — | | | | — | | | | — | | |
Emerging Markets Debt | |
Institutional Class | | | 14,052 | | | | 993 | | | | (1,081 | ) | | | 13,964 | | | | 663 | | | | 842 | | | | (8,064 | ) | | | (6,559 | ) | |
Class A | | | 307 | | | | 2 | | | | (282 | ) | | | 27 | | | | 7 | | | | 1 | | | | (22 | ) | | | (14 | ) | |
Class C | | | 45 | | | | 1 | | | | (16 | ) | | | 30 | | | | 3 | | | | 1 | | | | (6 | ) | | | (2 | ) | |
Floating Rate Income | |
Institutional Class | | | 25,631 | | | | 1,124 | | | | (18,673 | ) | | | 8,082 | | | | 14,810 | | | | 773 | | | | (19,712 | ) | | | (4,129 | ) | |
Class A | | | 1,566 | | | | 55 | | | | (2,220 | ) | | | (599 | ) | | | 1,186 | | | | 60 | | | | (1,037 | ) | | | 209 | | |
Class C | | | 264 | | | | 37 | | | | (715 | ) | | | (414 | ) | | | 396 | | | | 40 | | | | (709 | ) | | | (273 | ) | |
High Income | |
Investor Class | | | 1,134 | | | | 678 | | | | (4,511 | ) | | | (2,699 | ) | | | 1,738 | | | | 944 | | | | (8,588 | ) | | | (5,906 | ) | |
Institutional Class | | | 63,838 | | | | 9,164 | | | | (253,075 | ) | | | (180,073 | ) | | | 216,940 | | | | 11,307 | | | | (117,174 | ) | | | 111,073 | | |
Class A | | | 7,411 | | | | 407 | | | | (9,821 | ) | | | (2,003 | ) | | | 8,951 | | | | 500 | | | | (10,715 | ) | | | (1,264 | ) | |
Class C | | | 103 | | | | 79 | | | | (1,090 | ) | | | (908 | ) | | | 277 | | | | 102 | | | | (1,573 | ) | | | (1,194 | ) | |
Class R3 | | | 1,122 | | | | 57 | | | | (537 | ) | | | 642 | | | | 1,649 | | | | 34 | | | | (1,804 | ) | | | (121 | ) | |
Class R6 | | | 112,180 | | | | 4,750 | | | | (50,630 | ) | | | 66,300 | | | | 34,425 | | | | 5,234 | | | | (29,934 | ) | | | 9,725 | | |
Municipal High Income | |
Institutional Class | | | 2,642 | | | | 412 | | | | (5,382 | ) | | | (2,328 | ) | | | 10,761 | | | | 308 | | | | (1,588 | ) | | | 9,481 | | |
Class A | | | 19 | | | | 2 | | | | (72 | ) | | | (51 | ) | | | 1,184 | | | | 6 | | | | (1,609 | ) | | | (419 | ) | |
Class C | | | 55 | | | | 1 | | | | (15 | ) | | | 41 | | | | 28 | | | | 0 | z | | | (48 | ) | | | (20 | ) | |
Municipal Intermediate Bond | |
Investor Class | | | 42 | | | | 27 | | | | (222 | ) | | | (153 | ) | | | 80 | | | | 23 | | | | (152 | ) | | | (49 | ) | |
Institutional Class | | | 5,390 | | | | 378 | | | | (3,026 | ) | | | 2,742 | | | | 3,677 | | | | 252 | | | | (1,274 | ) | | | 2,655 | | |
Class A | | | 376 | | | | 8 | | | | (655 | ) | | | (271 | ) | | | 779 | | | | 6 | | | | (257 | ) | | | 528 | | |
Class C | | | 45 | | | | 3 | | | | (123 | ) | | | (75 | ) | | | 202 | | | | 1 | | | | (44 | ) | | | 159 | | |
259
| | | For the Year Ended October 31, 2017 | | For the Year Ended October 31, 2016 | |
(000's omitted) | | Shares
Sold | | Shares Issued
on Reinvestment
of Dividends
and Distributions | | Shares
Redeemed | | Total | | Shares
Sold | | Shares Issued
on Reinvestment
of Dividends
and Distributions | | Shares
Redeemed | | Total | |
New York Municipal Income | |
Institutional Class | | | 23 | | | | 106 | | | | (196 | ) | | | (67 | ) | | | 20 | | | | 77 | | | | (207 | ) | | | (110 | ) | |
Short Duration | |
Investor Class | | | 225 | | | | 39 | | | | (853 | ) | | | (589 | ) | | | 473 | | | | 38 | | | | (639 | ) | | | (128 | ) | |
Trust Class | | | 51 | | | | 4 | | | | (95 | ) | | | (40 | ) | | | 98 | | | | 3 | | | | (147 | ) | | | (46 | ) | |
Institutional Class | | | 7,552 | | | | 116 | | | | (4,473 | ) | | | 3,195 | | | | 5,486 | | | | 55 | | | | (3,237 | ) | | | 2,304 | | |
Class A | | | 182 | | | | 3 | | | | (499 | ) | | | (314 | ) | | | 662 | | | | 4 | | | | (569 | ) | | | 97 | | |
Class C | | | 46 | | | | 1 | | | | (232 | ) | | | (185 | ) | | | 459 | | | | 0 | z | | | (324 | ) | | | 135 | | |
Short Duration High Income | |
Institutional Class | | | 4,151 | | | | 475 | | | | (3,912 | ) | | | 714 | | | | 3,952 | | | | 734 | | | | (18,049 | ) | | | (13,363 | ) | |
Class A | | | 98 | | | | 11 | | | | (199 | ) | | | (90 | ) | | | 1,156 | | | | 10 | | | | (1,104 | ) | | | 62 | | |
Class C | | | 26 | | | | 4 | | | | (39 | ) | | | (9 | ) | | | 110 | | | | 3 | | | | (20 | ) | | | 93 | | |
Strategic Income | |
Trust Class | | | 355 | | | | 71 | | | | (1,135 | ) | | | (709 | ) | | | 419 | | | | 85 | | | | (2,915 | ) | | | (2,411 | ) | |
Institutional Class | | | 87,590 | | | | 4,144 | | | | (38,632 | ) | | | 53,102 | | | | 59,054 | | | | 3,256 | | | | (58,019 | ) | | | 4,291 | | |
Class A | | | 8,018 | | | | 574 | | | | (17,532 | ) | | | (8,940 | ) | | | 11,826 | | | | 769 | | | | (19,762 | ) | | | (7,167 | ) | |
Class C | | | 1,749 | | | | 273 | | | | (5,174 | ) | | | (3,152 | ) | | | 2,786 | | | | 309 | | | | (5,274 | ) | | | (2,179 | ) | |
Class R6 | | | 11,842 | | | | 741 | | | | (3,361 | ) | | | 9,222 | | | | 3,437 | | | | 784 | | | | (6,955 | ) | | | (2,734 | ) | |
Unconstrained Bond | |
Institutional Class | | | 4,553 | | | | 29 | | | | (226 | ) | | | 4,356 | | | | 642 | | | | 161 | | | | (20,461 | ) | | | (19,658 | ) | |
Class A | | | 1 | | | | 1 | | | | (21 | ) | | | (19 | ) | | | 55 | | | | 2 | | | | (6 | ) | | | 51 | | |
Class C | | | — | | | | 0 | z | | | — | | | | — | | | | 2 | | | | 0 | z | | | (17 | ) | | | (15 | ) | |
Class R6 | | | 137 | | | | 86 | | | | (25 | ) | | | 198 | | | | 5,372 | | | | 25 | | | | (9 | ) | | | 5,388 | | |
(a) Period from July 18, 2017 (Commencement of Operations) to October 31, 2017.
z Amount less than one thousand.
Note E—Line of Credit:
At October 31, 2017, each Fund was a participant in a syndicated committed, unsecured $700,000,000 line of credit (the "Credit Facility"), to be used only for temporary or emergency purposes. Series of other investment companies managed by Management also participate in this line of credit on substantially the same terms except that some do not have access to the full amount of the Credit Facility. Interest is charged on borrowings under this Credit Facility at the highest of (a) a federal funds effective rate plus 1.00% per annum, (b) a Eurodollar rate for a one-month period plus 1.00% per annum, and (c) an overnight bank funding rate plus 1.00% per annum. The Credit Facility has an annual commitment fee of 0.15% per annum of the available line of credit, which is paid quarterly. Each Fund that is a participant has agreed to pay its pro rata share of the annual commitment fee, based on the ratio of its individual net assets to the net assets of all participants at the time the fee is due and payable and the level of its access to the Credit Facility, and interest charged on any borrowing made by such Fund and other costs incurred by such Fund. Because several mutual funds participate in the Credit Facility, there is no assurance that an individual
260
Fund will have access to all or any part of the $700,000,000 at any particular time. There were no loans outstanding under the Credit Facility at October 31, 2017. During the year ended October 31, 2017, none of the Funds utilized the Credit Facility.
Note F—Investments in Affiliates(a):
| | | Balance of
Shares Held
October 31,
2016 | | Gross
Purchases
and
Additions | | Gross
Sales and
Reductions | | Balance of
Shares Held
October 31,
2017 | | Value
October 31,
2017 | | Distributions
from
Investments
in Affiliated
Issuers(b) | | Net
Realized
Gain/(Loss)
from
Investments
in Affiliated
Issuers | | Change
in Net
Unrealized
Appreciation/
(Depreciation)
from
Investments
in
Affiliated
Issuers | |
Strategic Income: | |
Emerging Markets
Debt Institutional
Class | | | 8,666,985 | | | | 419,806 | | | | — | | | | 9,086,791 | | | $ | 81,962,854 | | | $ | 3,740,154 | | | $ | — | | | $ | 1,481,606 | | |
Short Duration
Institutional Class | | | — | | | | 2,571,930 | | | | — | | | | 2,571,930 | | | | 20,035,331 | | | | 117,412 | | | | — | | | | (51,426 | ) | |
| Total(c) | | | | | | | | | | $ | 101,998,185 | | | $ | 3,857,566 | | | $ | — | | | $ | 1,430,180 | | |
(a) Affiliated issuers, as defined in the 1940 Act.
(b) Distributions received include distributions from net investment income and net realized capital gains, if any, from the Underlying Fund.
(c) At October 31, 2017, these securities amounted to approximately 3.7% of net assets of the Fund.
Other: At October 31, 2017, Neuberger Berman Global Allocation Fund and Neuberger Berman Multi-Asset Income Fund, which are also managed by Management, held 0.12% and 0.28%, respectively, of the outstanding shares of Floating Rate Income. At October 31, 2017, Neuberger Berman Global Allocation Fund and Neuberger Berman Multi-Asset Income Fund, which are also managed by Management, held 0.04% and 0.07 %, respectively, of the outstanding shares of High Income. At October 31, 2017, Neuberger Berman Global Allocation Fund, Neuberger Berman Multi-Asset Income Fund and Strategic Income, which are also managed by Management, held 0.21%, 0.42% and 32.96%, respectively, of the outstanding shares of Emerging Markets Debt. At October 31, 2017, Strategic Income, which is also managed by Management, held 19.36% of the outstanding shares of Short Duration.
In addition, at October 31, 2017, affiliated investors owned 0.02%, 0.05%, 0.03% and 0.10% of the outstanding shares of Emerging Markets Debt, Municipal High Income, Short Duration High Income and Unconstrained Bond, respectively.
Note G—Custodian Out-of-Pocket Expenses Refunded:
In May 2016, the Funds' custodian, State Street, announced that it had identified inconsistencies in the way in which certain Funds were invoiced for categories of expenses, particularly those deemed "out-of-pocket" costs, from 1998 through November 2015. The amounts in the table below represent the refunded expenses and interest determined to be payable to certain Funds for the period in question. These amounts were refunded to those Funds by State Street during the period ended October 31, 2017.
261
| | | Expenses Refunded | | Interest Paid to the Funds | |
High Income | | $ | 63,791 | | | $ | 4,294 | | |
New York Municipal Income | | | 967 | | | | 5 | | |
Note H—Legal Matters:
On June 1, 2015, High Income was served with a lawsuit filed in the United States Bankruptcy Court for the Southern District of New York, entitled Motors Liquidation Company Avoidance Action Trust vs. JPMorgan Chase Bank, N.A. et al. and numbered Adv. No. 09-00504 (MG). In addition to the Fund, the lawsuit also names over five hundred other institutional investors as defendants. The lawsuit does not allege any misconduct by the defendants, but seeks to recover payments made by General Motors Corporation (n/k/a Motors Liquidation Company) and its affiliates (collectively, "GM") to the defendants shortly prior to and after GM's Chapter 11 bankruptcy filing on June 1, 2009 (the "Petition Date"). The complaint alleges that GM made the payments to the defendants under a certain term loan agreement, dated as of November 29, 2006, as amended by that first amendment dated as of March 4, 2009 (the "Term Loan Agreement"); that the payments occurred both during the ninety (90) days prior to the Petition Date (the "Prepetition Transfer") and after the Petition Date when all amounts due under the Term Loan Agreement were paid in full in connection with GM's postpetition financing (the "Postpetition Transfer"); that the lien purportedly securing the Term Loan Agreement was not perfected as of the Petition Date; and that the lenders under the Term Loan Agreement should therefore have been treated as unsecured creditors rather than paid in full as secured creditors. The plaintiff seeks avoidance of the lien securing the Term Loan Agreement as unperfected under Section 544(a) of the Bankruptcy Code; disgorgement of all amounts paid to the defendants as Postpetition Transfer (plus interest) under Section 549 of the Bankruptcy Code; and disallowance of any bankruptcy claims of the defendants against GM until they repay all such amounts under Section 502(d) of the Bankruptcy Code. On November 17, 2016, all claims against High Income relating to the Prepetition Transfer were dismissed from the action. On May 5, 2017, the Bankruptcy Court concluded the evidentiary portion of a trial on certain legal issues with respect to the defendants' right to the Postpetition Transfer. On September 26, 2017, the Bankruptcy Court issued its decision (a) the representative list of fixtures that still secure the term loan; and (b) the valuation of those fixtures. The Bankruptcy Court held that 33 of the 40 assets at issue were fixtures and that the majority of the assets should be valued on a going concern basis. The Motors Liquidation Company Avoidance Action Trust sought leave to appeal portions of the decision on October 10, 2017. The parties have agreed to attend a mediation in December 2017 in an attempt to resolve the dispute. During 2009, High Income received pay downs from GM in connection with the term loan totaling approximately $5.9 million. High Income cannot predict the outcome of the lawsuit. If the lawsuit were to be decided or settled in a manner adverse to the Fund, the payment of such judgment or settlement could have an adverse effect on the Fund's net asset value. However, no liability for litigation relating to this matter has been accrued in the financial statements as neither the likelihood nor the amount of any liability can reasonably be determined at this time. High Income will incur legal expenses associated with the defense of the lawsuit.
Note I—Recent Accounting Pronouncement:
In December 2016, FASB issued ASU No. 2016-19, "Technical Corrections and Improvements" ("ASU 2016-19"). The guidance includes an amendment to Topic 820, Fair Value Measurement, which clarifies the difference between a valuation approach and a valuation technique. The amendments also require an entity to disclose when it has changed either a valuation approach and/or a valuation technique. The guidance is effective for interim and annual reporting periods beginning after December 15, 2016. Management is currently evaluating the impact, if any, of applying this guidance.
262
This page has been left blank intentionally
The following tables include selected data for a share outstanding throughout each year and other performance information
derived from the Financial Statements. Amounts that do not round to $0.01 or $(0.01) per share are presented as $0.00 or $(0.00),
respectively. Ratios that do not round to 0.01% or (0.01)% are presented as 0.00% or (0.00)%, respectively. Net Asset
amounts with a zero balance, if any, may reflect actual amounts rounding to less than $0.1 million. A "—" indicates that the line
item was not applicable in the corresponding period.
| | | Net Asset
Value,
Beginning
of Year | | Net
Investment
Income (Loss) | | Net Gains or
Losses on
Securities
(both
realized and
unrealized) | | Total From
Investment
Operations | | Dividends
from Net
Investment
Income | | Distributions
from Net
Realized
Capital Gains | | Tax
Return of
Capital | | Total
Distributions | |
Core Bond Fund | |
Investor Class | |
10/31/2017 | | $ | 10.54 | | | $ | 0.20 | @ | | $ | (0.15 | ) | | $ | 0.05 | | | $ | (0.19 | ) | | $ | (0.06 | ) | | $ | (0.03 | ) | | $ | (0.28 | ) | |
10/31/2016 | | $ | 10.37 | | | $ | 0.21 | @ | | $ | 0.22 | | | $ | 0.43 | | | $ | (0.22 | ) | | $ | (0.04 | ) | | $ | — | | | $ | (0.26 | ) | |
10/31/2015 | | $ | 10.50 | | | $ | 0.22 | @ | | $ | (0.09 | ) | | $ | 0.13 | | | $ | (0.19 | ) | | $ | (0.07 | ) | | $ | — | | | $ | (0.26 | ) | |
10/31/2014 | | $ | 10.35 | | | $ | 0.22 | @ | | $ | 0.16 | | | $ | 0.38 | | | $ | (0.22 | ) | | $ | (0.01 | ) | | $ | — | | | $ | (0.23 | ) | |
10/31/2013 | | $ | 11.04 | | | $ | 0.16 | @ | | $ | (0.39 | ) | | $ | (0.23 | ) | | $ | (0.16 | ) | | $ | (0.28 | ) | | $ | (0.02 | ) | | $ | (0.46 | ) | |
Institutional Class | |
10/31/2017 | | $ | 10.57 | | | $ | 0.24 | @ | | $ | (0.15 | ) | | $ | 0.09 | | | $ | (0.23 | ) | | $ | (0.06 | ) | | $ | (0.03 | ) | | $ | (0.32 | ) | |
10/31/2016 | | $ | 10.39 | | | $ | 0.25 | @ | | $ | 0.23 | | | $ | 0.48 | | | $ | (0.26 | ) | | $ | (0.04 | ) | | $ | — | | | $ | (0.30 | ) | |
10/31/2015 | | $ | 10.52 | | | $ | 0.26 | @ | | $ | (0.08 | ) | | $ | 0.18 | | | $ | (0.24 | ) | | $ | (0.07 | ) | | $ | — | | | $ | (0.31 | ) | |
10/31/2014 | | $ | 10.37 | | | $ | 0.26 | @ | | $ | 0.17 | | | $ | 0.43 | | | $ | (0.27 | ) | | $ | (0.01 | ) | | $ | — | | | $ | (0.28 | ) | |
10/31/2013 | | $ | 11.06 | | | $ | 0.20 | @ | | $ | (0.39 | ) | | $ | (0.19 | ) | | $ | (0.20 | ) | | $ | (0.28 | ) | | $ | (0.02 | ) | | $ | (0.50 | ) | |
Class A | |
10/31/2017 | | $ | 10.53 | | | $ | 0.20 | @ | | $ | (0.15 | ) | | $ | 0.05 | | | $ | (0.19 | ) | | $ | (0.06 | ) | | $ | (0.03 | ) | | $ | (0.28 | ) | |
10/31/2016 | | $ | 10.35 | | | $ | 0.21 | @ | | $ | 0.23 | | | $ | 0.44 | | | $ | (0.22 | ) | | $ | (0.04 | ) | | $ | — | | | $ | (0.26 | ) | |
10/31/2015 | | $ | 10.49 | | | $ | 0.22 | @ | | $ | (0.10 | ) | | $ | 0.12 | | | $ | (0.19 | ) | | $ | (0.07 | ) | | $ | — | | | $ | (0.26 | ) | |
10/31/2014 | | $ | 10.34 | | | $ | 0.22 | @ | | $ | 0.16 | | | $ | 0.38 | | | $ | (0.22 | ) | | $ | (0.01 | ) | | $ | — | | | $ | (0.23 | ) | |
10/31/2013 | | $ | 11.02 | | | $ | 0.16 | @ | | $ | (0.38 | ) | | $ | (0.22 | ) | | $ | (0.16 | ) | | $ | (0.28 | ) | | $ | (0.02 | ) | | $ | (0.46 | ) | |
Class C | |
10/31/2017 | | $ | 10.54 | | | $ | 0.13 | @ | | $ | (0.16 | ) | | $ | (0.03 | ) | | $ | (0.11 | ) | | $ | (0.06 | ) | | $ | (0.03 | ) | | $ | (0.20 | ) | |
10/31/2016 | | $ | 10.36 | | | $ | 0.13 | @ | | $ | 0.23 | | | $ | 0.36 | | | $ | (0.14 | ) | | $ | (0.04 | ) | | $ | — | | | $ | (0.18 | ) | |
10/31/2015 | | $ | 10.50 | | | $ | 0.14 | @ | | $ | (0.09 | ) | | $ | 0.05 | | | $ | (0.12 | ) | | $ | (0.07 | ) | | $ | — | | | $ | (0.19 | ) | |
10/31/2014 | | $ | 10.35 | | | $ | 0.14 | @ | | $ | 0.17 | | | $ | 0.31 | | | $ | (0.15 | ) | | $ | (0.01 | ) | | $ | — | | | $ | (0.16 | ) | |
10/31/2013 | | $ | 11.03 | | | $ | 0.08 | @ | | $ | (0.38 | ) | | $ | (0.30 | ) | | $ | (0.08 | ) | | $ | (0.28 | ) | | $ | (0.02 | ) | | $ | (0.38 | ) | |
Core Plus Fund | |
Institutional Class | |
Period from 7/18/2017^ to
10/31/2017 | | $ | 10.00 | | | $ | 0.07 | @ | | $ | (0.01 | ) | | $ | 0.06 | | | $ | (0.09 | ) | | $ | — | | | $ | — | | | $ | (0.09 | ) | |
See Notes to Financial Highlights
264
| | | Voluntary
Contribution
from
Management | | Net Asset
Value, End of
Year | | Total
Returna | | Net Assets,
End of Year
(in millions) | | Ratio of
Gross
Expenses
to Average
Net Assets# | | Ratio of Net
Expenses
to Average
Net AssetsØ | | Ratio of Net
Investment
Income/
(Loss) to
Average Net
Assets | | Portfolio
Turnover
Rate | |
Core Bond Fund | |
Investor Class | |
10/31/2017 | | $ | — | | | $ | 10.31 | | | | 0.54 | %b | | $ | 11.0 | | | | 1.13 | % | | | 0.86 | % | | | 1.97 | % | | | 175 | %c | |
10/31/2016 | | $ | — | | | $ | 10.54 | | | | 4.16 | %b | | $ | 12.1 | | | | 1.15 | % | | | 0.86 | % | | | 2.00 | % | | | 148 | %c | |
10/31/2015 | | $ | — | | | $ | 10.37 | | | | 1.28 | % | | $ | 12.5 | | | | 1.14 | % | | | 0.85 | % | | | 2.08 | % | | | 125 | %c | |
10/31/2014 | | $ | 0.00 | | | $ | 10.50 | | | | 3.74 | %d | | $ | 13.7 | | | | 1.13 | % | | | 0.85 | % | | | 2.10 | % | | | 142 | %c | |
10/31/2013 | | $ | — | | | $ | 10.35 | | | | (2.11 | )% | | $ | 13.5 | | | | 1.10 | % | | | 0.85 | % | | | 1.51 | % | | | 139 | %c | |
Institutional Class | |
10/31/2017 | | $ | — | | | $ | 10.34 | | | | 0.95 | %b | | $ | 338.0 | | | | 0.55 | % | | | 0.46 | % | | | 2.37 | % | | | 175 | %c | |
10/31/2016 | | $ | — | | | $ | 10.57 | | | | 4.67 | %b | | $ | 320.6 | | | | 0.59 | % | | | 0.46 | % | | | 2.40 | % | | | 148 | %c | |
10/31/2015 | | $ | — | | | $ | 10.39 | | | | 1.69 | % | | $ | 240.3 | | | | 0.61 | % | | | 0.45 | % | | | 2.49 | % | | | 125 | %c | |
10/31/2014 | | $ | 0.00 | | | $ | 10.52 | | | | 4.16 | %d | | $ | 169.0 | | | | 0.63 | % | | | 0.45 | % | | | 2.49 | % | | | 142 | %c | |
10/31/2013 | | $ | — | | | $ | 10.37 | | | | (1.71 | )% | | $ | 165.9 | | | | 0.61 | % | | | 0.45 | % | | | 1.90 | % | | | 139 | %c | |
Class A | |
10/31/2017 | | $ | — | | | $ | 10.30 | | | | 0.54 | %b | | $ | 22.4 | | | | 0.93 | % | | | 0.86 | % | | | 1.96 | % | | | 175 | %c | |
10/31/2016 | | $ | — | | | $ | 10.53 | | | | 4.26 | %b | | $ | 25.9 | | | | 0.98 | % | | | 0.86 | % | | | 2.01 | % | | | 148 | %c | |
10/31/2015 | | $ | — | | | $ | 10.35 | | | | 1.18 | % | | $ | 30.5 | | | | 1.00 | % | | | 0.85 | % | | | 2.08 | % | | | 125 | %c | |
10/31/2014 | | $ | 0.00 | | | $ | 10.49 | | | | 3.75 | %d | | $ | 31.9 | | | | 1.02 | % | | | 0.85 | % | | | 2.10 | % | | | 142 | %c | |
10/31/2013 | | $ | — | | | $ | 10.34 | | | | (2.03 | )% | | $ | 30.1 | | | | 1.04 | % | | | 0.85 | % | | | 1.49 | % | | | 139 | %c | |
Class C | |
10/31/2017 | | $ | — | | | $ | 10.31 | | | | (0.21 | )%b | | $ | 3.3 | | | | 1.68 | % | | | 1.61 | % | | | 1.22 | % | | | 175 | %c | |
10/31/2016 | | $ | — | | | $ | 10.54 | | | | 3.49 | %b | | $ | 4.9 | | | | 1.72 | % | | | 1.61 | % | | | 1.25 | % | | | 148 | %c | |
10/31/2015 | | $ | — | | | $ | 10.36 | | | | 0.43 | % | | $ | 3.4 | | | | 1.75 | % | | | 1.60 | % | | | 1.33 | % | | | 125 | %c | |
10/31/2014 | | $ | 0.00 | | | $ | 10.50 | | | | 2.97 | %d | | $ | 3.5 | | | | 1.77 | % | | | 1.60 | % | | | 1.34 | % | | | 142 | %c | |
10/31/2013 | | $ | — | | | $ | 10.35 | | | | (2.76 | )% | | $ | 5.0 | | | | 1.75 | % | | | 1.60 | % | | | 0.75 | % | | | 139 | %c | |
Core Plus Fund | |
Institutional Class | |
Period from 7/18/2017^ to
10/31/2017 | | $ | — | | | $ | 9.97 | | | | 0.63 | %* | | $ | 7.6 | | | | 5.59 | %‡** | | | 0.45 | %‡** | | | 2.52 | %‡** | | | 51 | %*c | |
265
Financial Highlights (cont'd)
| | | Net Asset
Value,
Beginning
of Year | | Net
Investment
Income (Loss) | | Net Gains or
Losses on
Securities
(both
realized and
unrealized) | | Total From
Investment
Operations | | Dividends
from Net
Investment
Income | | Distributions
from Net
Realized
Capital Gains | | Tax
Return of
Capital | | Total
Distributions | |
Core Plus Fund (cont'd) | |
Class A | |
Period from 7/18/2017^ to
10/31/2017 | | $ | 10.00 | | | $ | 0.06 | @ | | $ | (0.01 | ) | | $ | 0.05 | | | $ | (0.08 | ) | | $ | — | | | $ | — | | | $ | (0.08 | ) | |
Class C | |
Period from 7/18/2017^ to
10/31/2017 | | $ | 10.00 | | | $ | 0.04 | @ | | $ | (0.01 | ) | | $ | 0.03 | | | $ | (0.06 | ) | | $ | — | | | $ | — | | | $ | (0.06 | ) | |
Class R6 | |
Period from 7/18/2017^ to
10/31/2017 | | $ | 10.00 | | | $ | 0.08 | @ | | $ | (0.02 | ) | | $ | 0.06 | | | $ | (0.09 | ) | | $ | — | | | $ | — | | | $ | (0.09 | ) | |
Emerging Markets Debt Fund | |
Institutional Class | |
10/31/2017 | | $ | 8.90 | | | $ | 0.48 | @ | | $ | 0.10 | | | $ | 0.58 | | | $ | (0.42 | ) | | $ | — | | | $ | (0.04 | ) | | $ | (0.46 | ) | |
10/31/2016 | | $ | 8.41 | | | $ | 0.51 | @ | | $ | 0.48 | | | $ | 0.99 | | | $ | — | | | $ | — | | | $ | (0.50 | ) | | $ | (0.50 | ) | |
10/31/2015 | | $ | 9.94 | | | $ | 0.48 | @ | | $ | (1.52 | ) | | $ | (1.04 | ) | | $ | (0.08 | ) | | $ | (0.01 | ) | | $ | (0.40 | ) | | $ | (0.49 | ) | |
10/31/2014 | | $ | 10.20 | | | $ | 0.51 | @ | | $ | (0.22 | ) | | $ | 0.29 | | | $ | (0.43 | ) | | $ | (0.12 | ) | | $ | — | | | $ | (0.55 | ) | |
Period from 9/27/2013^ to
10/31/2013 | | $ | 10.00 | | | $ | 0.04 | @ | | $ | 0.20 | | | $ | 0.24 | | | $ | (0.04 | ) | | $ | — | | | $ | — | | | $ | (0.04 | ) | |
Class A | |
10/31/2017 | | $ | 8.90 | | | $ | 0.46 | @ | | $ | 0.08 | | | $ | 0.54 | | | $ | (0.39 | ) | | $ | — | | | $ | (0.04 | ) | | $ | (0.43 | ) | |
10/31/2016 | | $ | 8.41 | | | $ | 0.47 | @ | | $ | 0.49 | | | $ | 0.96 | | | $ | — | | | $ | — | | | $ | (0.47 | ) | | $ | (0.47 | ) | |
10/31/2015 | | $ | 9.94 | | | $ | 0.45 | @ | | $ | (1.52 | ) | | $ | (1.07 | ) | | $ | (0.08 | ) | | $ | (0.01 | ) | | $ | (0.37 | ) | | $ | (0.46 | ) | |
10/31/2014 | | $ | 10.20 | | | $ | 0.47 | @ | | $ | (0.21 | ) | | $ | 0.26 | | | $ | (0.40 | ) | | $ | (0.12 | ) | | $ | — | | | $ | (0.52 | ) | |
Period from 9/27/2013^ to
10/31/2013 | | $ | 10.00 | | | $ | 0.03 | @ | | $ | 0.20 | | | $ | 0.23 | | | $ | (0.03 | ) | | $ | — | | | $ | — | | | $ | (0.03 | ) | |
Class C | |
10/31/2017 | | $ | 8.90 | | | $ | 0.38 | @ | | $ | 0.09 | | | $ | 0.47 | | | $ | (0.32 | ) | | $ | — | | | $ | (0.04 | ) | | $ | (0.36 | ) | |
10/31/2016 | | $ | 8.41 | | | $ | 0.41 | @ | | $ | 0.49 | | | $ | 0.90 | | | $ | — | | | $ | — | | | $ | (0.41 | ) | | $ | (0.41 | ) | |
10/31/2015 | | $ | 9.94 | | | $ | 0.38 | @ | | $ | (1.52 | ) | | $ | (1.14 | ) | | $ | (0.06 | ) | | $ | (0.01 | ) | | $ | (0.32 | ) | | $ | (0.39 | ) | |
10/31/2014 | | $ | 10.20 | | | $ | 0.39 | @ | | $ | (0.21 | ) | | $ | 0.18 | | | $ | (0.32 | ) | | $ | (0.12 | ) | | $ | — | | | $ | (0.44 | ) | |
Period from 9/27/2013^ to
10/31/2013 | | $ | 10.00 | | | $ | 0.03 | @ | | $ | 0.20 | | | $ | 0.23 | | | $ | (0.03 | ) | | $ | — | | | $ | — | | | $ | (0.03 | ) | |
See Notes to Financial Highlights
266
| | | Voluntary
Contribution
from
Management | | Net Asset
Value, End of
Year | | Total
Returna | | Net Assets,
End of Year
(in millions) | | Ratio of
Gross
Expenses
to Average
Net Assets# | | Ratio of Net
Expenses
to Average
Net AssetsØ | | Ratio of Net
Investment
Income/
(Loss) to
Average Net
Assets | | Portfolio
Turnover
Rate | |
Core Plus Fund (cont'd) | |
Class A | |
Period from 7/18/2017^ to
10/31/2017 | | $ | — | | | $ | 9.97 | | | | 0.52 | %* | | $ | 0.2 | | | | 5.99 | %‡** | | | 0.81 | %‡** | | | 2.15 | %‡** | | | 51 | %*c | |
Class C | |
Period from 7/18/2017^ to
10/31/2017 | | $ | — | | | $ | 9.97 | | | | 0.31 | %* | | $ | 0.2 | | | | 6.76 | %‡** | | | 1.56 | %‡** | | | 1.41 | %‡** | | | 51 | %*c | |
Class R6 | |
Period from 7/18/2017^ to
10/31/2017 | | $ | — | | | $ | 9.97 | | | | 0.65 | %* | | $ | 2.0 | | | | 5.52 | %‡** | | | 0.38 | %‡** | | | 2.58 | %‡** | | | 51 | %*c | |
Emerging Markets Debt Fund | |
Institutional Class | |
10/31/2017 | | $ | — | | | $ | 9.02 | | | | 6.77 | % | | $ | 247.7 | | | | 1.02 | % | | | 0.81 | % | | | 5.41 | % | | | 64 | % | |
10/31/2016 | | $ | — | | | $ | 8.90 | | | | 12.17 | % | | $ | 120.2 | | | | 1.21 | % | | | 0.91 | % | | | 5.92 | % | | | 80 | % | |
10/31/2015 | | $ | 0.00 | | | $ | 8.41 | | | | (10.64 | )%e | | $ | 168.7 | | | | 1.07 | % | | | 0.90 | % | | | 5.35 | % | | | 100 | % | |
10/31/2014 | | $ | 0.00 | | | $ | 9.94 | | | | 2.98 | %d | | $ | 197.6 | | | | 1.11 | % | | | 0.90 | % | | | 5.06 | % | | | 98 | % | |
Period from 9/27/2013^ to
10/31/2013 | | $ | — | | | $ | 10.20 | | | | 2.36 | %* | | $ | 87.2 | | | | 1.64 | %‡** | | | 0.80 | %‡** | | | 3.60 | %‡** | | | 5 | %* | |
Class A | |
10/31/2017 | | $ | — | | | $ | 9.01 | | | | 6.26 | % | | $ | 0.4 | | | | 1.42 | % | | | 1.16 | % | | | 5.04 | % | | | 64 | % | |
10/31/2016 | | $ | — | | | $ | 8.90 | | | | 11.76 | % | | $ | 0.1 | | | | 1.73 | % | | | 1.28 | % | | | 5.56 | % | | | 80 | % | |
10/31/2015 | | $ | 0.00 | | | $ | 8.41 | | | | (10.96 | )%e | | $ | 0.2 | | | | 1.53 | % | | | 1.27 | % | | | 5.04 | % | | | 100 | % | |
10/31/2014 | | $ | 0.00 | | | $ | 9.94 | | | | 2.61 | %d | | $ | 0.1 | | | | 1.74 | % | | | 1.27 | % | | | 4.68 | % | | | 98 | % | |
Period from 9/27/2013^ to
10/31/2013 | | $ | — | | | $ | 10.20 | | | | 2.32 | %* | | $ | 0.0 | | | | 42.54 | %‡** | | | 1.13 | %‡** | | | 3.28 | %‡** | | | 5 | %* | |
Class C | |
10/31/2017 | | $ | — | | | $ | 9.01 | | | | 5.47 | % | | $ | 0.5 | | | | 2.13 | % | | | 1.90 | % | | | 4.31 | % | | | 64 | % | |
10/31/2016 | | $ | — | | | $ | 8.90 | | | | 10.93 | % | | $ | 0.3 | | | | 2.36 | % | | | 2.03 | % | | | 4.80 | % | | | 80 | % | |
10/31/2015 | | $ | 0.00 | | | $ | 8.41 | | | | (11.64 | )%e | | $ | 0.3 | | | | 2.21 | % | | | 2.02 | % | | | 4.23 | % | | | 100 | % | |
10/31/2014 | | $ | 0.00 | | | $ | 9.94 | | | | 1.83 | %d | | $ | 0.2 | | | | 2.45 | % | | | 2.02 | % | | | 3.89 | % | | | 98 | % | |
Period from 9/27/2013^ to
10/31/2013 | | $ | — | | | $ | 10.20 | | | | 2.26 | %* | | $ | 0.0 | | | | 43.10 | %‡** | | | 1.79 | %‡** | | | 2.60 | %‡** | | | 5 | %* | |
267
Financial Highlights (cont'd)
| | | Net Asset
Value,
Beginning
of Year | | Net
Investment
Income (Loss) | | Net Gains or
Losses on
Securities
(both
realized and
unrealized) | | Total From
Investment
Operations | | Dividends
from Net
Investment
Income | | Distributions
from Net
Realized
Capital Gains | | Tax
Return of
Capital | | Total
Distributions | |
Floating Rate Income Fund | |
Institutional Class | |
10/31/2017 | | $ | 9.90 | | | $ | 0.36 | @ | | $ | 0.04 | | | $ | 0.40 | | | $ | (0.36 | ) | | $ | — | | | $ | (0.00 | ) | | $ | (0.36 | ) | |
10/31/2016 | | $ | 9.86 | | | $ | 0.39 | @ | | $ | 0.04 | | | $ | 0.43 | | | $ | (0.39 | ) | | $ | — | | | $ | (0.00 | ) | | $ | (0.39 | ) | |
10/31/2015 | | $ | 10.11 | | | $ | 0.40 | @ | | $ | (0.25 | ) | | $ | 0.15 | | | $ | (0.40 | ) | | $ | — | | | $ | — | | | $ | (0.40 | ) | |
10/31/2014 | | $ | 10.29 | | | $ | 0.38 | @ | | $ | (0.17 | ) | | $ | 0.21 | | | $ | (0.39 | ) | | $ | — | | | $ | — | | | $ | (0.39 | ) | |
10/31/2013 | | $ | 10.22 | | | $ | 0.42 | @ | | $ | 0.08 | | | $ | 0.50 | | | $ | (0.43 | ) | | $ | — | | | $ | — | | | $ | (0.43 | ) | |
Class A | |
10/31/2017 | | $ | 9.90 | | | $ | 0.32 | @ | | $ | 0.05 | | | $ | 0.37 | | | $ | (0.33 | ) | | $ | — | | | $ | (0.00 | ) | | $ | (0.33 | ) | |
10/31/2016 | | $ | 9.85 | | | $ | 0.35 | @ | | $ | 0.05 | | | $ | 0.40 | | | $ | (0.35 | ) | | $ | — | | | $ | (0.00 | ) | | $ | (0.35 | ) | |
10/31/2015 | | $ | 10.11 | | | $ | 0.36 | @ | | $ | (0.26 | ) | | $ | 0.10 | | | $ | (0.36 | ) | | $ | — | | | $ | — | | | $ | (0.36 | ) | |
10/31/2014 | | $ | 10.29 | | | $ | 0.35 | @ | | $ | (0.18 | ) | | $ | 0.17 | | | $ | (0.35 | ) | | $ | — | | | $ | — | | | $ | (0.35 | ) | |
10/31/2013 | | $ | 10.22 | | | $ | 0.38 | @ | | $ | 0.08 | | | $ | 0.46 | | | $ | (0.39 | ) | | $ | — | | | $ | — | | | $ | (0.39 | ) | |
Class C | |
10/31/2017 | | $ | 9.90 | | | $ | 0.25 | @ | | $ | 0.04 | | | $ | 0.29 | | | $ | (0.25 | ) | | $ | — | | | $ | (0.00 | ) | | $ | (0.25 | ) | |
10/31/2016 | | $ | 9.86 | | | $ | 0.28 | @ | | $ | 0.04 | | | $ | 0.32 | | | $ | (0.28 | ) | | $ | — | | | $ | (0.00 | ) | | $ | (0.28 | ) | |
10/31/2015 | | $ | 10.11 | | | $ | 0.29 | @ | | $ | (0.25 | ) | | $ | 0.04 | | | $ | (0.29 | ) | | $ | — | | | $ | — | | | $ | (0.29 | ) | |
10/31/2014 | | $ | 10.29 | | | $ | 0.27 | @ | | $ | (0.18 | ) | | $ | 0.09 | | | $ | (0.27 | ) | | $ | — | | | $ | — | | | $ | (0.27 | ) | |
10/31/2013 | | $ | 10.22 | | | $ | 0.29 | @ | | $ | 0.09 | | | $ | 0.38 | | | $ | (0.31 | ) | | $ | — | | | $ | — | | | $ | (0.31 | ) | |
High Income Bond Fund | |
Investor Class | |
10/31/2017 | | $ | 8.68 | | | $ | 0.47 | @ | | $ | 0.11 | | | $ | 0.58 | | | $ | (0.47 | ) | | $ | — | | | $ | — | | | $ | (0.47 | ) | |
10/31/2016 | | $ | 8.50 | | | $ | 0.46 | @ | | $ | 0.18 | | | $ | 0.64 | | | $ | (0.46 | ) | | $ | — | | | $ | — | | | $ | (0.46 | ) | |
10/31/2015 | | $ | 9.28 | | | $ | 0.48 | @ | | $ | (0.72 | ) | | $ | (0.24 | ) | | $ | (0.48 | ) | | $ | (0.06 | ) | | $ | — | | | $ | (0.54 | ) | |
10/31/2014 | | $ | 9.63 | | | $ | 0.51 | @ | | $ | (0.11 | ) | | $ | 0.40 | | | $ | (0.51 | ) | | $ | (0.24 | ) | | $ | — | | | $ | (0.75 | ) | |
10/31/2013 | | $ | 9.46 | | | $ | 0.55 | @ | | $ | 0.28 | | | $ | 0.83 | | | $ | (0.55 | ) | | $ | (0.11 | ) | | $ | — | | | $ | (0.66 | ) | |
Institutional Class | |
10/31/2017 | | $ | 8.70 | | | $ | 0.48 | @ | | $ | 0.10 | | | $ | 0.58 | | | $ | (0.48 | ) | | $ | — | | | $ | — | | | $ | (0.48 | ) | |
10/31/2016 | | $ | 8.51 | | | $ | 0.48 | @ | | $ | 0.18 | | | $ | 0.66 | | | $ | (0.47 | ) | | $ | — | | | $ | — | | | $ | (0.47 | ) | |
10/31/2015 | | $ | 9.29 | | | $ | 0.50 | @ | | $ | (0.72 | ) | | $ | (0.22 | ) | | $ | (0.50 | ) | | $ | (0.06 | ) | | $ | — | | | $ | (0.56 | ) | |
10/31/2014 | | $ | 9.64 | | | $ | 0.52 | @ | | $ | (0.11 | ) | | $ | 0.41 | | | $ | (0.52 | ) | | $ | (0.24 | ) | | $ | — | | | $ | (0.76 | ) | |
10/31/2013 | | $ | 9.48 | | | $ | 0.57 | @ | | $ | 0.27 | | | $ | 0.84 | | | $ | (0.57 | ) | | $ | (0.11 | ) | | $ | — | | | $ | (0.68 | ) | |
See Notes to Financial Highlights
268
| | Voluntary
Contribution
from
Management | | Net Asset
Value, End of
Year | | Total
Returna | | Net Assets,
End of Year
(in millions) | | Ratio of
Gross
Expenses
to Average
Net Assets# | | Ratio of Net
Expenses
to Average
Net AssetsØ | | Ratio of Net
Investment
Income/
(Loss) to
Average Net
Assets | | Portfolio
Turnover
Rate | |
Floating Rate Income Fund | |
Institutional Class | |
10/31/2017 | | $ | — | | | $ | 9.94 | | | | 4.14 | % | | $ | 335.8 | | | | 0.82 | % | | | 0.70 | % | | | 3.67 | % | | | 76 | % | |
10/31/2016 | | $ | — | | | $ | 9.90 | | | | 4.52 | % | | $ | 254.4 | | | | 0.92 | % | | | 0.70 | % | | | 4.01 | % | | | 64 | % | |
10/31/2015 | | $ | — | | | $ | 9.86 | | | | 1.48 | % | | $ | 294.0 | | | | 0.84 | % | | | 0.70 | % | | | 3.96 | % | | | 44 | % | |
10/31/2014 | | $ | 0.00 | | | $ | 10.11 | | | | 2.01 | %d | | $ | 358.6 | | | | 0.78 | % | | | 0.70 | % | | | 3.75 | % | | | 77 | % | |
10/31/2013 | | $ | — | | | $ | 10.29 | | | | 4.96 | % | | $ | 430.7 | | | | 0.81 | % | | | 0.70 | % | | | 4.06 | % | | | 78 | % | |
Class A | |
10/31/2017 | | $ | — | | | $ | 9.94 | | | | 3.76 | % | | $ | 17.4 | | | | 1.21 | % | | | 1.07 | % | | | 3.27 | % | | | 76 | % | |
10/31/2016 | | $ | — | | | $ | 9.90 | | | | 4.24 | % | | $ | 23.3 | | | | 1.31 | % | | | 1.07 | % | | | 3.65 | % | | | 64 | % | |
10/31/2015 | | $ | — | | | $ | 9.85 | | | | 1.00 | % | | $ | 21.1 | | | | 1.22 | % | | | 1.07 | % | | | 3.61 | % | | | 44 | % | |
10/31/2014 | | $ | 0.00 | | | $ | 10.11 | | | | 1.64 | %d | | $ | 34.8 | | | | 1.16 | % | | | 1.07 | % | | | 3.39 | % | | | 77 | % | |
10/31/2013 | | $ | — | | | $ | 10.29 | | | | 4.57 | % | | $ | 74.7 | | | | 1.18 | % | | | 1.07 | % | | | 3.66 | % | | | 78 | % | |
Class C | |
10/31/2017 | | $ | — | | | $ | 9.94 | | | | 2.99 | % | | $ | 20.6 | | | | 1.95 | % | | | 1.82 | % | | | 2.53 | % | | | 76 | % | |
10/31/2016 | | $ | — | | | $ | 9.90 | | | | 3.36 | % | | $ | 24.6 | | | | 2.05 | % | | | 1.82 | % | | | 2.91 | % | | | 64 | % | |
10/31/2015 | | $ | — | | | $ | 9.86 | | | | 0.35 | % | | $ | 27.2 | | | | 1.96 | % | | | 1.82 | % | | | 2.86 | % | | | 44 | % | |
10/31/2014 | | $ | 0.00 | | | $ | 10.11 | | | | 0.88 | %d | | $ | 37.4 | | | | 1.91 | % | | | 1.82 | % | | | 2.64 | % | | | 77 | % | |
10/31/2013 | | $ | — | | | $ | 10.29 | | | | 3.78 | % | | $ | 51.8 | | | | 1.93 | % | | | 1.82 | % | | | 2.85 | % | | | 78 | % | |
High Income Bond Fund | |
Investor Class | |
10/31/2017 | | $ | — | | | $ | 8.79 | | | | 6.84 | %bg | | $ | 112.7 | | | | 0.84 | % | | | 0.80 | %f | | | 5.38 | %f | | | 62 | % | |
10/31/2016 | | $ | — | | | $ | 8.68 | | | | 7.90 | %b | | $ | 134.8 | | | | 0.83 | % | | | 0.83 | % | | | 5.54 | % | | | 72 | % | |
10/31/2015 | | $ | — | | | $ | 8.50 | | | | (2.61 | )% | | $ | 182.1 | | | | 0.83 | % | | | 0.83 | % | | | 5.42 | % | | | 54 | % | |
10/31/2014 | | $ | 0.00 | | | $ | 9.28 | | | | 4.24 | %d | | $ | 266.4 | | | | 0.83 | % | | | 0.83 | % | | | 5.35 | % | | | 60 | % | |
10/31/2013 | | $ | — | | | $ | 9.63 | | | | 9.10 | % | | $ | 311.5 | | | | 0.84 | % | | | 0.84 | % | | | 5.80 | % | | | 80 | % | |
Institutional Class | |
10/31/2017 | | $ | — | | | $ | 8.80 | | | | 6.82 | %bg | | $ | 1,519.4 | | | | 0.70 | % | | | 0.70 | %f | | | 5.49 | %f | | | 62 | % | |
10/31/2016 | | $ | — | | | $ | 8.70 | | | | 8.17 | %b | | $ | 3,067.9 | | | | 0.69 | % | | | 0.69 | % | | | 5.67 | % | | | 72 | % | |
10/31/2015 | | $ | — | | | $ | 8.51 | | | | (2.46 | )% | | $ | 2,056.5 | | | | 0.69 | % | | | 0.69 | % | | | 5.56 | % | | | 54 | % | |
10/31/2014 | | $ | 0.00 | | | $ | 9.29 | | | | 4.38 | %d | | $ | 2,120.4 | | | | 0.69 | % | | | 0.69 | % | | | 5.48 | % | | | 60 | % | |
10/31/2013 | | $ | — | | | $ | 9.64 | | | | 9.14 | % | | $ | 1,949.6 | | | | 0.69 | % | | | 0.69 | % | | | 5.94 | % | | | 80 | % | |
269
Financial Highlights (cont'd)
| | | Net Asset
Value,
Beginning
of Year | | Net
Investment
Income (Loss) | | Net Gains or
Losses on
Securities
(both
realized and
unrealized) | | Total From
Investment
Operations | | Dividends
from Net
Investment
Income | | Distributions
from Net
Realized
Capital Gains | | Tax
Return of
Capital | | Total
Distributions | |
High Income Bond Fund (cont'd) | |
Class A | |
10/31/2017 | | $ | 8.68 | | | $ | 0.44 | @ | | $ | 0.11 | | | $ | 0.55 | | | $ | (0.44 | ) | | $ | — | | | $ | — | | | $ | (0.44 | ) | |
10/31/2016 | | $ | 8.50 | | | $ | 0.44 | @ | | $ | 0.18 | | | $ | 0.62 | | | $ | (0.44 | ) | | $ | — | | | $ | — | | | $ | (0.44 | ) | |
10/31/2015 | | $ | 9.28 | | | $ | 0.47 | @ | | $ | (0.73 | ) | | $ | (0.26 | ) | | $ | (0.46 | ) | | $ | (0.06 | ) | | $ | — | | | $ | (0.52 | ) | |
10/31/2014 | | $ | 9.63 | | | $ | 0.48 | @ | | $ | (0.11 | ) | | $ | 0.37 | | | $ | (0.48 | ) | | $ | (0.24 | ) | | $ | — | | | $ | (0.72 | ) | |
10/31/2013 | | $ | 9.46 | | | $ | 0.53 | @ | | $ | 0.28 | | | $ | 0.81 | | | $ | (0.53 | ) | | $ | (0.11 | ) | | $ | — | | | $ | (0.64 | ) | |
Class C | |
10/31/2017 | | $ | 8.70 | | | $ | 0.38 | @ | | $ | 0.11 | | | $ | 0.49 | | | $ | (0.38 | ) | | $ | — | | | $ | — | | | $ | (0.38 | ) | |
10/31/2016 | | $ | 8.51 | | | $ | 0.38 | @ | | $ | 0.19 | | | $ | 0.57 | | | $ | (0.38 | ) | | $ | — | | | $ | — | | | $ | (0.38 | ) | |
10/31/2015 | | $ | 9.29 | | | $ | 0.40 | @ | | $ | (0.72 | ) | | $ | (0.32 | ) | | $ | (0.40 | ) | | $ | (0.06 | ) | | $ | — | | | $ | (0.46 | ) | |
10/31/2014 | | $ | 9.64 | | | $ | 0.41 | @ | | $ | (0.11 | ) | | $ | 0.30 | | | $ | (0.41 | ) | | $ | (0.24 | ) | | $ | — | | | $ | (0.65 | ) | |
10/31/2013 | | $ | 9.48 | | | $ | 0.46 | @ | | $ | 0.27 | | | $ | 0.73 | | | $ | (0.46 | ) | | $ | (0.11 | ) | | $ | — | | | $ | (0.57 | ) | |
Class R3 | |
10/31/2017 | | $ | 8.69 | | | $ | 0.42 | @ | | $ | 0.11 | | | $ | 0.53 | | | $ | (0.42 | ) | | $ | — | | | $ | — | | | $ | (0.42 | ) | |
10/31/2016 | | $ | 8.50 | | | $ | 0.42 | @ | | $ | 0.19 | | | $ | 0.61 | | | $ | (0.42 | ) | | $ | — | | | $ | — | | | $ | (0.42 | ) | |
10/31/2015 | | $ | 9.28 | | | $ | 0.44 | @ | | $ | (0.72 | ) | | $ | (0.28 | ) | | $ | (0.44 | ) | | $ | (0.06 | ) | | $ | — | | | $ | (0.50 | ) | |
10/31/2014 | | $ | 9.63 | | | $ | 0.46 | @ | | $ | (0.11 | ) | | $ | 0.35 | | | $ | (0.46 | ) | | $ | (0.24 | ) | | $ | — | | | $ | (0.70 | ) | |
10/31/2013 | | $ | 9.47 | | | $ | 0.50 | @ | | $ | 0.28 | | | $ | 0.78 | | | $ | (0.51 | ) | | $ | (0.11 | ) | | $ | — | | | $ | (0.62 | ) | |
Class R6 | |
10/31/2017 | | $ | 8.70 | | | $ | 0.49 | @ | | $ | 0.11 | | | $ | 0.60 | | | $ | (0.49 | ) | | $ | — | | | $ | — | | | $ | (0.49 | ) | |
10/31/2016 | | $ | 8.51 | | | $ | 0.48 | @ | | $ | 0.19 | | | $ | 0.67 | | | $ | (0.48 | ) | | $ | — | | | $ | — | | | $ | (0.48 | ) | |
10/31/2015 | | $ | 9.29 | | | $ | 0.50 | @ | | $ | (0.72 | ) | | $ | (0.22 | ) | | $ | (0.50 | ) | | $ | (0.06 | ) | | $ | — | | | $ | (0.56 | ) | |
10/31/2014 | | $ | 9.64 | | | $ | 0.53 | @ | | $ | (0.11 | ) | | $ | 0.42 | | | $ | (0.53 | ) | | $ | (0.24 | ) | | $ | — | | | $ | (0.77 | ) | |
Period from 3/15/2013^ to
10/31/2013 | | $ | 9.59 | | | $ | 0.36 | @ | | $ | 0.05 | | | $ | 0.41 | | | $ | (0.36 | ) | | $ | — | | | $ | — | | | $ | (0.36 | ) | |
Municipal High Income Fund | |
Institutional Class | |
10/31/2017 | | $ | 10.42 | | | $ | 0.36 | @ | | $ | (0.14 | ) | | $ | 0.22 | | | $ | (0.36 | ) | | $ | (0.08 | ) | | $ | — | | | $ | (0.44 | ) | |
10/31/2016 | | $ | 10.10 | | | $ | 0.35 | @ | | $ | 0.32 | | | $ | 0.67 | | | $ | (0.35 | ) | | $ | (0.00 | ) | | $ | — | | | $ | (0.35 | ) | |
Period from 6/22/2015^ to
10/31/2015 | | $ | 10.00 | | | $ | 0.13 | @ | | $ | 0.10 | | | $ | 0.23 | | | $ | (0.13 | ) | | $ | — | | | $ | — | | | $ | (0.13 | ) | |
See Notes to Financial Highlights
270
| | | Voluntary
Contribution
from
Management | | Net Asset
Value, End of
Year | | Total
Returna | | Net Assets,
End of Year
(in millions) | | Ratio of
Gross
Expenses
to Average
Net Assets# | | Ratio of Net
Expenses
to Average
Net AssetsØ | | Ratio of Net
Investment
Income/
(Loss) to
Average Net
Assets | | Portfolio
Turnover
Rate | |
High Income Bond Fund (cont'd) | |
Class A | |
10/31/2017 | | $ | — | | | $ | 8.79 | | | | 6.49 | %bg | | $ | 76.8 | | | | 1.14 | % | | | 1.12 | %f | | | 5.05 | %f | | | 62 | % | |
10/31/2016 | | $ | — | | | $ | 8.68 | | | | 7.65 | %b | | $ | 93.3 | | | | 1.07 | % | | | 1.07 | % | | | 5.30 | % | | | 72 | % | |
10/31/2015 | | $ | — | | | $ | 8.50 | | | | (2.86 | )% | | $ | 102.1 | | | | 1.08 | % | | | 1.08 | % | | | 5.18 | % | | | 54 | % | |
10/31/2014 | | $ | 0.00 | | | $ | 9.28 | | | | 3.98 | %d | | $ | 313.0 | | | | 1.08 | % | | | 1.08 | % | | | 5.10 | % | | | 60 | % | |
10/31/2013 | | $ | — | | | $ | 9.63 | | | | 8.83 | % | | $ | 395.6 | | | | 1.09 | % | | | 1.09 | % | | | 5.56 | % | | | 80 | % | |
Class C | |
10/31/2017 | | $ | — | | | $ | 8.81 | | | | 5.77 | %bg | | $ | 23.6 | | | | 1.81 | % | | | 1.81 | %f | | | 4.38 | %f | | | 62 | % | |
10/31/2016 | | $ | — | | | $ | 8.70 | | | | 6.98 | %b | | $ | 31.2 | | | | 1.81 | % | | | 1.81 | % | | | 4.57 | % | | | 72 | % | |
10/31/2015 | | $ | — | | | $ | 8.51 | | | | (3.55 | )% | | $ | 40.7 | | | | 1.81 | % | | | 1.81 | % | | | 4.45 | % | | | 54 | % | |
10/31/2014 | | $ | 0.00 | | | $ | 9.29 | | | | 3.21 | %d | | $ | 57.1 | | | | 1.82 | % | | | 1.82 | % | | | 4.36 | % | | | 60 | % | |
10/31/2013 | | $ | — | | | $ | 9.64 | | | | 7.91 | % | | $ | 60.0 | | | | 1.83 | % | | | 1.83 | % | | | 4.82 | % | | | 80 | % | |
Class R3 | |
10/31/2017 | | $ | — | | | $ | 8.80 | | | | 6.20 | %bg | | $ | 12.3 | | | | 1.37 | % | | | 1.37 | %§f | | | 4.81 | %f | | | 62 | % | |
10/31/2016 | | $ | — | | | $ | 8.69 | | | | 7.48 | %b | | $ | 6.6 | | | | 1.41 | % | | | 1.37 | % | | | 4.99 | % | | | 72 | % | |
10/31/2015 | | $ | — | | | $ | 8.50 | | | | (3.08 | )% | | $ | 7.5 | | | | 1.32 | % | | | 1.32 | % | | | 4.93 | % | | | 54 | % | |
10/31/2014 | | $ | 0.00 | | | $ | 9.28 | | | | 3.73 | %d | | $ | 9.6 | | | | 1.31 | % | | | 1.31 | % | | | 4.87 | % | | | 60 | % | |
10/31/2013 | | $ | — | | | $ | 9.63 | | | | 8.46 | % | | $ | 10.9 | | | | 1.32 | % | | | 1.32 | % | | | 5.30 | % | | | 80 | % | |
Class R6 | |
10/31/2017 | | $ | — | | | $ | 8.81 | | | | 7.03 | %bg | | $ | 1,503.1 | | | | 0.61 | % | | | 0.61 | %f | | | 5.56 | %f | | | 62 | % | |
10/31/2016 | | $ | — | | | $ | 8.70 | | | | 8.26 | %b | | $ | 908.2 | | | | 0.61 | % | | | 0.61 | % | | | 5.75 | % | | | 72 | % | |
10/31/2015 | | $ | — | | | $ | 8.51 | | | | (2.39 | )% | | $ | 805.9 | | | | 0.61 | % | | | 0.61 | % | | | 5.64 | % | | | 54 | % | |
10/31/2014 | | $ | 0.00 | | | $ | 9.29 | | | | 4.46 | %d | | $ | 761.2 | | | | 0.61 | % | | | 0.61 | % | | | 5.55 | % | | | 60 | % | |
Period from 3/15/2013^ to
10/31/2013 | | $ | — | | | $ | 9.64 | | | | 4.34 | %* | | $ | 535.0 | | | | 0.62 | %** | | | 0.62 | %** | | | 5.95 | %** | | | 80 | %^^ | |
Municipal High Income Fund | |
Institutional Class | |
10/31/2017 | | $ | — | | | $ | 10.20 | | | | 2.24 | % | | $ | 96.1 | | | | 0.86 | % | | | 0.50 | % | | | 3.53 | % | | | 107 | % | |
10/31/2016 | | $ | — | | | $ | 10.42 | | | | 6.70 | % | | $ | 122.4 | | | | 0.93 | % | | | 0.50 | % | | | 3.36 | % | | | 75 | % | |
Period from 6/22/2015^ to
10/31/2015 | | $ | — | | | $ | 10.10 | | | | 2.27 | %* | | $ | 22.9 | | | | 2.34 | %**‡ | | | 0.50 | %**‡ | | | 3.64 | %**‡ | | | 37 | %* | |
271
Financial Highlights (cont'd)
| | | Net Asset
Value,
Beginning
of Year | | Net
Investment
Income (Loss) | | Net Gains or
Losses on
Securities
(both
realized and
unrealized) | | Total From
Investment
Operations | | Dividends
from Net
Investment
Income | | Distributions
from Net
Realized
Capital Gains | | Tax
Return of
Capital | | Total
Distributions | |
Municipal High Income Fund (cont'd) | |
Class A | |
10/31/2017 | | $ | 10.42 | | | $ | 0.32 | @ | | $ | (0.14 | ) | | $ | 0.18 | | | $ | (0.32 | ) | | $ | (0.08 | ) | | $ | — | | | $ | (0.40 | ) | |
10/31/2016 | | $ | 10.11 | | | $ | 0.30 | @ | | $ | 0.32 | | | $ | 0.62 | | | $ | (0.31 | ) | | $ | (0.00 | ) | | $ | — | | | $ | (0.31 | ) | |
Period from 6/22/2015^ to
10/31/2015 | | $ | 10.00 | | | $ | 0.12 | @ | | $ | 0.10 | | | $ | 0.22 | | | $ | (0.11 | ) | | $ | — | | | $ | — | | | $ | (0.11 | ) | |
Class C | |
10/31/2017 | | $ | 10.42 | | | $ | 0.24 | @ | | $ | (0.13 | ) | | $ | 0.11 | | | $ | (0.24 | ) | | $ | (0.08 | ) | | $ | — | | | $ | (0.32 | ) | |
10/31/2016 | | $ | 10.10 | | | $ | 0.23 | @ | | $ | 0.32 | | | $ | 0.55 | | | $ | (0.23 | ) | | $ | (0.00 | ) | | $ | — | | | $ | (0.23 | ) | |
Period from 6/22/2015^ to
10/31/2015 | | $ | 10.00 | | | $ | 0.09 | @ | | $ | 0.10 | | | $ | 0.19 | | | $ | (0.09 | ) | | $ | — | | | $ | — | | | $ | (0.09 | ) | |
Municipal Intermediate Bond Fund | |
Investor Class | |
10/31/2017 | | $ | 11.97 | | | $ | 0.23 | @ | | $ | (0.08 | ) | | $ | 0.15 | | | $ | (0.23 | ) | | $ | (0.08 | ) | | $ | — | | | $ | (0.31 | ) | |
10/31/2016 | | $ | 11.86 | | | $ | 0.23 | @ | | $ | 0.13 | | | $ | 0.36 | | | $ | (0.23 | ) | | $ | (0.02 | ) | | $ | — | | | $ | (0.25 | ) | |
10/31/2015 | | $ | 11.92 | | | $ | 0.26 | @ | | $ | (0.05 | ) | | $ | 0.21 | | | $ | (0.26 | ) | | $ | (0.01 | ) | | $ | — | | | $ | (0.27 | ) | |
10/31/2014 | | $ | 11.58 | | | $ | 0.27 | @ | | $ | 0.41 | | | $ | 0.68 | | | $ | (0.27 | ) | | $ | (0.07 | ) | | $ | — | | | $ | (0.34 | ) | |
10/31/2013 | | $ | 12.07 | | | $ | 0.26 | @ | | $ | (0.41 | ) | | $ | (0.15 | ) | | $ | (0.26 | ) | | $ | (0.08 | ) | | $ | — | | | $ | (0.34 | ) | |
Institutional Class | |
10/31/2017 | | $ | 11.96 | | | $ | 0.25 | @ | | $ | (0.09 | ) | | $ | 0.16 | | | $ | (0.24 | ) | | $ | (0.08 | ) | | $ | — | | | $ | (0.32 | ) | |
10/31/2016 | | $ | 11.85 | | | $ | 0.25 | @ | | $ | 0.13 | | | $ | 0.38 | | | $ | (0.25 | ) | | $ | (0.02 | ) | | $ | — | | | $ | (0.27 | ) | |
10/31/2015 | | $ | 11.91 | | | $ | 0.28 | @ | | $ | (0.05 | ) | | $ | 0.23 | | | $ | (0.28 | ) | | $ | (0.01 | ) | | $ | — | | | $ | (0.29 | ) | |
10/31/2014 | | $ | 11.57 | | | $ | 0.29 | @ | | $ | 0.41 | | | $ | 0.70 | | | $ | (0.29 | ) | | $ | (0.07 | ) | | $ | — | | | $ | (0.36 | ) | |
10/31/2013 | | $ | 12.06 | | | $ | 0.27 | @ | | $ | (0.41 | ) | | $ | (0.14 | ) | | $ | (0.27 | ) | | $ | (0.08 | ) | | $ | — | | | $ | (0.35 | ) | |
Class A | |
10/31/2017 | | $ | 11.96 | | | $ | 0.20 | @ | | $ | (0.09 | ) | | $ | 0.11 | | | $ | (0.20 | ) | | $ | (0.08 | ) | | $ | — | | | $ | (0.28 | ) | |
10/31/2016 | | $ | 11.84 | | | $ | 0.21 | @ | | $ | 0.14 | | | $ | 0.35 | | | $ | (0.21 | ) | | $ | (0.02 | ) | | $ | — | | | $ | (0.23 | ) | |
10/31/2015 | | $ | 11.91 | | | $ | 0.24 | @ | | $ | (0.06 | ) | | $ | 0.18 | | | $ | (0.24 | ) | | $ | (0.01 | ) | | $ | — | | | $ | (0.25 | ) | |
10/31/2014 | | $ | 11.57 | | | $ | 0.24 | @ | | $ | 0.41 | | | $ | 0.65 | | | $ | (0.24 | ) | | $ | (0.07 | ) | | $ | — | | | $ | (0.31 | ) | |
10/31/2013 | | $ | 12.06 | | | $ | 0.23 | @ | | $ | (0.41 | ) | | $ | (0.18 | ) | | $ | (0.23 | ) | | $ | (0.08 | ) | | $ | — | | | $ | (0.31 | ) | |
See Notes to Financial Highlights
272
| | | Voluntary
Contribution
from
Management | | Net Asset
Value, End of
Year | | Total
Returna | | Net Assets,
End of Year
(in millions) | | Ratio of
Gross
Expenses
to Average
Net Assets# | | Ratio of Net
Expenses
to Average
Net AssetsØ | | Ratio of Net
Investment
Income/
(Loss) to
Average Net
Assets | | Portfolio
Turnover
Rate | |
Municipal High Income Fund (cont'd) | |
Class A | |
10/31/2017 | | $ | — | | | $ | 10.20 | | | | 1.87 | % | | $ | 0.3 | | | | 1.40 | % | | | 0.87 | % | | | 3.20 | % | | | 107 | % | |
10/31/2016 | | $ | — | | | $ | 10.42 | | | | 6.21 | % | | $ | 0.8 | | | | 1.47 | % | | | 0.87 | % | | | 2.90 | % | | | 75 | % | |
Period from 6/22/2015^ to
10/31/2015 | | $ | — | | | $ | 10.11 | | | | 2.24 | %* | | $ | 5.0 | | | | 2.94 | %**‡ | | | 0.86 | %**‡ | | | 3.41 | %**‡ | | | 37 | %* | |
Class C | |
10/31/2017 | | $ | — | | | $ | 10.21 | | | | 1.20 | % | | $ | 0.7 | | | | 1.99 | % | | | 1.62 | % | | | 2.41 | % | | | 107 | % | |
10/31/2016 | | $ | — | | | $ | 10.42 | | | | 5.52 | % | | $ | 0.3 | | | | 2.15 | % | | | 1.62 | % | | | 2.21 | % | | | 75 | % | |
Period from 6/22/2015^ to
10/31/2015 | | $ | — | | | $ | 10.10 | | | | 1.87 | %* | | $ | 0.5 | | | | 4.28 | %**‡ | | | 1.58 | %**‡ | | | 2.38 | %**‡ | | | 37 | %* | |
Municipal Intermediate Bond Fund | |
Investor Class | |
10/31/2017 | | $ | — | | | $ | 11.81 | | | | 1.28 | % | | $ | 13.8 | | | | 0.78 | % | | | 0.65 | % | | | 1.94 | % | | | 71 | % | |
10/31/2016 | | $ | — | | | $ | 11.97 | | | | 3.09 | % | | $ | 15.8 | | | | 0.84 | % | | | 0.65 | % | | | 1.95 | % | | | 44 | % | |
10/31/2015 | | $ | — | | | $ | 11.86 | | | | 1.82 | % | | $ | 16.2 | | | | 0.84 | % | | | 0.65 | % | | | 2.21 | % | | | 22 | % | |
10/31/2014 | | $ | — | | | $ | 11.92 | | | | 5.98 | % | | $ | 17.4 | | | | 0.85 | % | | | 0.65 | % | | | 2.30 | % | | | 47 | % | |
10/31/2013 | | $ | — | | | $ | 11.58 | | | | (1.30 | )% | | $ | 18.8 | | | | 0.83 | % | | | 0.65 | % | | | 2.18 | % | | | 57 | % | |
Institutional Class | |
10/31/2017 | | $ | — | | | $ | 11.80 | | | | 1.43 | % | | $ | 200.1 | | | | 0.58 | % | | | 0.50 | % | | | 2.10 | % | | | 71 | % | |
10/31/2016 | | $ | — | | | $ | 11.96 | | | | 3.24 | % | | $ | 170.1 | | | | 0.65 | % | | | 0.50 | % | | | 2.10 | % | | | 44 | % | |
10/31/2015 | | $ | — | | | $ | 11.85 | | | | 1.97 | % | | $ | 137.0 | | | | 0.66 | % | | | 0.50 | % | | | 2.36 | % | | | 22 | % | |
10/31/2014 | | $ | — | | | $ | 11.91 | | | | 6.14 | % | | $ | 135.3 | | | | 0.67 | % | | | 0.50 | % | | | 2.45 | % | | | 47 | % | |
10/31/2013 | | $ | — | | | $ | 11.57 | | | | (1.15 | )% | | $ | 132.0 | | | | 0.67 | % | | | 0.50 | % | | | 2.34 | % | | | 57 | % | |
Class A | |
10/31/2017 | | $ | — | | | $ | 11.79 | | | | 0.96 | % | | $ | 6.7 | | | | 0.96 | % | | | 0.87 | % | | | 1.72 | % | | | 71 | % | |
10/31/2016 | | $ | — | | | $ | 11.96 | | | | 2.95 | % | | $ | 10.1 | | | | 1.03 | % | | | 0.87 | % | | | 1.70 | % | | | 44 | % | |
10/31/2015 | | $ | — | | | $ | 11.84 | | | | 1.51 | % | | $ | 3.7 | | | | 1.04 | % | | | 0.87 | % | | | 2.00 | % | | | 22 | % | |
10/31/2014 | | $ | — | | | $ | 11.91 | | | | 5.75 | % | | $ | 8.9 | | | | 1.07 | % | | | 0.87 | % | | | 2.07 | % | | | 47 | % | |
10/31/2013 | | $ | — | | | $ | 11.57 | | | | (1.52 | )% | | $ | 5.0 | | | | 1.06 | % | | | 0.87 | % | | | 1.96 | % | | | 57 | % | |
273
Financial Highlights (cont'd)
| | | Net Asset
Value,
Beginning
of Year | | Net
Investment
Income (Loss) | | Net Gains or
Losses on
Securities
(both
realized and
unrealized) | | Total From
Investment
Operations | | Dividends
from Net
Investment
Income | | Distributions
from Net
Realized
Capital Gains | | Tax
Return of
Capital | | Total
Distributions | |
Municipal Intermediate Bond Fund (cont'd) | |
Class C | |
10/31/2017 | | $ | 11.96 | | | $ | 0.11 | @ | | $ | (0.08 | ) | | $ | 0.03 | | | $ | (0.11 | ) | | $ | (0.08 | ) | | $ | — | | | $ | (0.19 | ) | |
10/31/2016 | | $ | 11.84 | | | $ | 0.12 | @ | | $ | 0.14 | | | $ | 0.26 | | | $ | (0.12 | ) | | $ | (0.02 | ) | | $ | — | | | $ | (0.14 | ) | |
10/31/2015 | | $ | 11.91 | | | $ | 0.15 | @ | | $ | (0.06 | ) | | $ | 0.09 | | | $ | (0.15 | ) | | $ | (0.01 | ) | | $ | — | | | $ | (0.16 | ) | |
10/31/2014 | | $ | 11.57 | | | $ | 0.16 | @ | | $ | 0.41 | | | $ | 0.57 | | | $ | (0.16 | ) | | $ | (0.07 | ) | | $ | — | | | $ | (0.23 | ) | |
10/31/2013 | | $ | 12.06 | | | $ | 0.14 | @ | | $ | (0.41 | ) | | $ | (0.27 | ) | | $ | (0.14 | ) | | $ | (0.08 | ) | | $ | — | | | $ | (0.22 | ) | |
New York Municipal Income Fund | |
| Institutional ClassØØ | |
10/31/2017 | | $ | 17.76 | | | $ | 0.39 | @ | | $ | (0.25 | ) | | $ | 0.14 | | | $ | (0.39 | ) | | $ | (0.19 | ) | | $ | — | | | $ | (0.58 | ) | |
10/31/2016 | | $ | 17.60 | | | $ | 0.39 | @ | | $ | 0.20 | | | $ | 0.59 | | | $ | (0.39 | ) | | $ | (0.04 | ) | | $ | — | | | $ | (0.43 | ) | |
10/31/2015 | | $ | 17.72 | | | $ | 0.43 | @ | | $ | (0.08 | ) | | $ | 0.35 | | | $ | (0.43 | ) | | $ | (0.04 | ) | | $ | — | | | $ | (0.47 | ) | |
10/31/2014 | | $ | 17.14 | | | $ | 0.42 | @ | | $ | 0.61 | | | $ | 1.03 | | | $ | (0.42 | ) | | $ | (0.03 | ) | | $ | — | | | $ | (0.45 | ) | |
Period from 3/1/2013ß to
10/31/2013 | | $ | 17.80 | | | $ | 0.31 | @ | | $ | (0.66 | ) | | $ | (0.35 | ) | | $ | (0.31 | ) | | $ | — | | | $ | — | | | $ | (0.31 | ) | |
2/28/2013 | | $ | 17.75 | | | $ | 0.31 | | | $ | 0.05 | | | $ | 0.36 | | | $ | (0.31 | ) | | $ | — | | | $ | — | | | $ | (0.31 | ) | |
Short Duration Bond Fund | |
Investor Class | |
10/31/2017 | | $ | 7.86 | | | $ | 0.07 | @ | | $ | (0.04 | ) | | $ | 0.03 | | | $ | (0.10 | ) | | $ | — | | | $ | — | | | $ | (0.10 | ) | |
10/31/2016 | | $ | 7.87 | | | $ | 0.06 | @ | | $ | 0.02 | | | $ | 0.08 | | | $ | (0.09 | ) | | $ | — | | | $ | — | | | $ | (0.09 | ) | |
10/31/2015 | | $ | 7.92 | | | $ | 0.01 | @ | | $ | 0.02 | | | $ | 0.03 | | | $ | (0.08 | ) | | $ | — | | | $ | — | | | $ | (0.08 | ) | |
10/31/2014 | | $ | 7.98 | | | $ | 0.07 | @ | | $ | (0.03 | ) | | $ | 0.04 | | | $ | (0.10 | ) | | $ | — | | | $ | — | | | $ | (0.10 | ) | |
10/31/2013 | | $ | 8.02 | | | $ | 0.05 | @ | | $ | 0.03 | | | $ | 0.08 | | | $ | (0.12 | ) | | $ | — | | | $ | — | | | $ | (0.12 | ) | |
Trust Class | |
10/31/2017 | | $ | 7.49 | | | $ | 0.06 | @ | | $ | (0.03 | ) | | $ | 0.03 | | | $ | (0.09 | ) | | $ | — | | | $ | — | | | $ | (0.09 | ) | |
10/31/2016 | | $ | 7.50 | | | $ | 0.04 | @ | | $ | 0.03 | | | $ | 0.07 | | | $ | (0.08 | ) | | $ | — | | | $ | — | | | $ | (0.08 | ) | |
10/31/2015 | | $ | 7.55 | | | $ | 0.00 | @ | | $ | 0.02 | | | $ | 0.02 | | | $ | (0.07 | ) | | $ | — | | | $ | — | | | $ | (0.07 | ) | |
10/31/2014 | | $ | 7.60 | | | $ | 0.06 | @ | | $ | (0.02 | ) | | $ | 0.04 | | | $ | (0.09 | ) | | $ | — | | | $ | — | | | $ | (0.09 | ) | |
10/31/2013 | | $ | 7.65 | | | $ | 0.04 | @ | | $ | 0.02 | | | $ | 0.06 | | | $ | (0.11 | ) | | $ | — | | | $ | — | | | $ | (0.11 | ) | |
See Notes to Financial Highlights
274
| | Voluntary
Contribution
from
Management | | Net Asset
Value, End of
Year | | Total
Returna | | Net Assets,
End of Year
(in millions) | | Ratio of
Gross
Expenses
to Average
Net Assets# | | Ratio of Net
Expenses
to Average
Net AssetsØ | | Ratio of Net
Investment
Income/
(Loss) to
Average Net
Assets | | Portfolio
Turnover
Rate | |
Municipal Intermediate Bond Fund (cont'd) | |
Class C | |
10/31/2017 | | $ | — | | | $ | 11.80 | | | | 0.30 | % | | $ | 3.2 | | | | 1.71 | % | | | 1.62 | % | | | 0.97 | % | | | 71 | % | |
10/31/2016 | | $ | — | | | $ | 11.96 | | | | 2.18 | % | | $ | 4.1 | | | | 1.78 | % | | | 1.62 | % | | | 0.96 | % | | | 44 | % | |
10/31/2015 | | $ | — | | | $ | 11.84 | | | | 0.76 | % | | $ | 2.2 | | | | 1.80 | % | | | 1.62 | % | | | 1.24 | % | | | 22 | % | |
10/31/2014 | | $ | — | | | $ | 11.91 | | | | 4.96 | % | | $ | 1.5 | | | | 1.88 | % | | | 1.62 | % | | | 1.33 | % | | | 47 | % | |
10/31/2013 | | $ | — | | | $ | 11.57 | | | | (2.25 | )% | | $ | 1.5 | | | | 1.86 | % | | | 1.62 | % | | | 1.21 | % | | | 57 | % | |
New York Municipal Income Fund | |
| Institutional ClassØØ | |
10/31/2017 | | $ | — | | | $ | 17.32 | | | | 0.84 | %g | | $ | 59.5 | | | | 0.92 | % | | | 0.92 | %f | | | 2.24 | %f | | | 46 | % | |
10/31/2016 | | $ | — | | | $ | 17.76 | | | | 3.38 | % | | $ | 62.3 | | | | 0.96 | % | | | 0.96 | % | | | 2.19 | % | | | 28 | % | |
10/31/2015 | | $ | — | | | $ | 17.60 | | | | 1.99 | % | | $ | 63.6 | | | | 0.89 | % | | | 0.89 | % | | | 2.42 | % | | | 17 | % | |
10/31/2014 | | $ | — | | | $ | 17.72 | | | | 6.15 | % | | $ | 67.7 | | | | 0.87 | % | | | 0.87 | % | | | 2.44 | % | | | 53 | % | |
Period from 3/1/2013ß to
10/31/2013 | | $ | — | | | $ | 17.14 | | | | (1.98 | )%* | | $ | 68.3 | | | | 0.86 | %** | | | 0.86 | %** | | | 2.64 | %** | | | 52 | %* | |
2/28/2013 | | $ | — | | | $ | 17.80 | | | | 2.01 | % | | $ | 36.2 | | | | 1.06 | % | | | 1.06 | % | | | 1.71 | % | | | 28 | % | |
Short Duration Bond Fund | |
Investor Class | |
10/31/2017 | | $ | — | | | $ | 7.79 | | | | 0.41 | %b | | $ | 24.0 | | | | 1.10 | % | | | 0.70 | % | | | 0.88 | % | | | 107 | % | |
10/31/2016 | | $ | — | | | $ | 7.86 | | | | 0.98 | %b | | $ | 28.9 | | | | 1.21 | % | | | 0.70 | % | | | 0.70 | % | | | 104 | % | |
10/31/2015 | | $ | — | | | $ | 7.87 | | | | 0.44 | % | | $ | 29.9 | | | | 1.27 | % | | | 0.70 | % | | | 0.13 | % | | | 75 | % | |
10/31/2014 | | $ | 0.00 | | | $ | 7.92 | | | | 0.52 | %d | | $ | 30.7 | | | | 1.20 | % | | | 0.70 | % | | | 0.85 | % | | | 71 | % | |
10/31/2013 | | $ | — | | | $ | 7.98 | | | | 1.03 | % | | $ | 32.8 | | | | 1.19 | % | | | 0.70 | % | | | 0.67 | % | | | 86 | % | |
Trust Class | |
10/31/2017 | | $ | — | | | $ | 7.43 | | | | 0.40 | %b | | $ | 2.3 | | | | 1.23 | % | | | 0.80 | % | | | 0.78 | % | | | 107 | % | |
10/31/2016 | | $ | — | | | $ | 7.49 | | | | 0.88 | %b | | $ | 2.6 | | | | 1.36 | % | | | 0.80 | % | | | 0.60 | % | | | 104 | % | |
10/31/2015 | | $ | — | | | $ | 7.50 | | | | 0.30 | % | | $ | 3.0 | | | | 1.43 | % | | | 0.80 | % | | | 0.03 | % | | | 75 | % | |
10/31/2014 | | $ | 0.00 | | | $ | 7.55 | | | | 0.52 | %d | | $ | 3.3 | | | | 1.35 | % | | | 0.80 | % | | | 0.76 | % | | | 71 | % | |
10/31/2013 | | $ | — | | | $ | 7.60 | | | | 0.77 | % | | $ | 4.0 | | | | 1.35 | % | | | 0.80 | % | | | 0.57 | % | | | 86 | % | |
275
Financial Highlights (cont'd)
| | | Net Asset
Value,
Beginning
of Year | | Net
Investment
Income (Loss) | | Net Gains or
Losses on
Securities
(both
realized and
unrealized) | | Total From
Investment
Operations | | Dividends
from Net
Investment
Income | | Distributions
from Net
Realized
Capital Gains | | Tax
Return of
Capital | | Total
Distributions | |
Short Duration Bond Fund (cont'd) | |
Institutional Class | |
10/31/2017 | | $ | 7.85 | | | $ | 0.09 | @ | | $ | (0.03 | ) | | $ | 0.06 | | | $ | (0.12 | ) | | $ | — | | | $ | — | | | $ | (0.12 | ) | |
10/31/2016 | | $ | 7.87 | | | $ | 0.07 | @ | | $ | 0.01 | | | $ | 0.08 | | | $ | (0.10 | ) | | $ | — | | | $ | — | | | $ | (0.10 | ) | |
10/31/2015 | | $ | 7.92 | | | $ | 0.03 | @ | | $ | 0.02 | | | $ | 0.05 | | | $ | (0.10 | ) | | $ | — | | | $ | — | | | $ | (0.10 | ) | |
10/31/2014 | | $ | 7.97 | | | $ | 0.08 | @ | | $ | (0.01 | ) | | $ | 0.07 | | | $ | (0.12 | ) | | $ | — | | | $ | — | | | $ | (0.12 | ) | |
10/31/2013 | | $ | 8.02 | | | $ | 0.07 | @ | | $ | 0.02 | | | $ | 0.09 | | | $ | (0.14 | ) | | $ | — | | | $ | — | | | $ | (0.14 | ) | |
Class A | |
10/31/2017 | | $ | 7.49 | | | $ | 0.05 | @ | | $ | (0.04 | ) | | $ | 0.01 | | | $ | (0.08 | ) | | $ | — | | | $ | — | | | $ | (0.08 | ) | |
10/31/2016 | | $ | 7.49 | | | $ | 0.04 | @ | | $ | 0.03 | | | $ | 0.07 | | | $ | (0.07 | ) | | $ | — | | | $ | — | | | $ | (0.07 | ) | |
10/31/2015 | | $ | 7.55 | | | $ | 0.00 | @ | | $ | 0.01 | | | $ | 0.01 | | | $ | (0.07 | ) | | $ | — | | | $ | — | | | $ | (0.07 | ) | |
10/31/2014 | | $ | 7.60 | | | $ | 0.05 | @ | | $ | (0.02 | ) | | $ | 0.03 | | | $ | (0.08 | ) | | $ | — | | | $ | — | | | $ | (0.08 | ) | |
10/31/2013 | | $ | 7.64 | | | $ | 0.04 | @ | | $ | 0.02 | | | $ | 0.06 | | | $ | (0.10 | ) | | $ | — | | | $ | — | | | $ | (0.10 | ) | |
Class C | |
10/31/2017 | | $ | 7.49 | | | $ | (0.00 | )@ | | $ | (0.04 | ) | | $ | (0.04 | ) | | $ | (0.03 | ) | | $ | — | | | $ | — | | | $ | (0.03 | ) | |
10/31/2016 | | $ | 7.50 | | | $ | (0.02 | )@ | | $ | 0.02 | | | $ | 0.00 | | | $ | (0.01 | ) | | $ | — | | | $ | — | | | $ | (0.01 | ) | |
10/31/2015 | | $ | 7.55 | | | $ | (0.06 | )@ | | $ | 0.02 | | | $ | (0.04 | ) | | $ | (0.01 | ) | | $ | — | | | $ | — | | | $ | (0.01 | ) | |
10/31/2014 | | $ | 7.61 | | | $ | (0.00 | )@ | | $ | (0.03 | ) | | $ | (0.03 | ) | | $ | (0.03 | ) | | $ | — | | | $ | — | | | $ | (0.03 | ) | |
10/31/2013 | | $ | 7.65 | | | $ | (0.02 | )@ | | $ | 0.03 | | | $ | 0.01 | | | $ | (0.05 | ) | | $ | — | | | $ | — | | | $ | (0.05 | ) | |
Short Duration High Income Fund | |
Institutional Class | |
10/31/2017 | | $ | 9.69 | | | $ | 0.41 | @ | | $ | 0.06 | | | $ | 0.47 | | | $ | (0.41 | ) | | $ | — | | | $ | — | | | $ | (0.41 | ) | |
10/31/2016 | | $ | 9.63 | | | $ | 0.40 | @ | | $ | 0.06 | | | $ | 0.46 | | | $ | (0.40 | ) | | $ | — | | | $ | — | | | $ | (0.40 | ) | |
10/31/2015 | | $ | 10.05 | | | $ | 0.40 | @ | | $ | (0.42 | ) | | $ | (0.02 | ) | | $ | (0.40 | ) | | $ | — | | | $ | — | | | $ | (0.40 | ) | |
10/31/2014 | | $ | 10.18 | | | $ | 0.40 | @ | | $ | (0.12 | ) | | $ | 0.28 | | | $ | (0.40 | ) | | $ | (0.01 | ) | | $ | — | | | $ | (0.41 | ) | |
10/31/2013 | | $ | 10.01 | | | $ | 0.42 | @ | | $ | 0.22 | | | $ | 0.64 | | | $ | (0.44 | ) | | $ | (0.03 | ) | | $ | — | | | $ | (0.47 | ) | |
Class A | |
10/31/2017 | | $ | 9.70 | | | $ | 0.38 | @ | | $ | 0.05 | | | $ | 0.43 | | | $ | (0.37 | ) | | $ | — | | | $ | — | | | $ | (0.37 | ) | |
10/31/2016 | | $ | 9.63 | | | $ | 0.36 | @ | | $ | 0.07 | | | $ | 0.43 | | | $ | (0.36 | ) | | $ | — | | | $ | — | | | $ | (0.36 | ) | |
10/31/2015 | | $ | 10.05 | | | $ | 0.36 | @ | | $ | (0.42 | ) | | $ | (0.06 | ) | | $ | (0.36 | ) | | $ | — | | | $ | — | | | $ | (0.36 | ) | |
10/31/2014 | | $ | 10.19 | | | $ | 0.36 | @ | | $ | (0.12 | ) | | $ | 0.24 | | | $ | (0.37 | ) | | $ | (0.01 | ) | | $ | — | | | $ | (0.38 | ) | |
10/31/2013 | | $ | 10.01 | | | $ | 0.37 | @ | | $ | 0.24 | | | $ | 0.61 | | | $ | (0.40 | ) | | $ | (0.03 | ) | | $ | — | | | $ | (0.43 | ) | |
See Notes to Financial Highlights
276
| | | Voluntary
Contribution
from
Management | | Net Asset
Value, End of
Year | | Total
Returna | | Net Assets,
End of Year
(in millions) | | Ratio of
Gross
Expenses
to Average
Net Assets# | | Ratio of Net
Expenses
to Average
Net AssetsØ | | Ratio of Net
Investment
Income/
(Loss) to
Average Net
Assets | | Portfolio
Turnover
Rate | |
Short Duration Bond Fund (cont'd) | |
Institutional Class | |
10/31/2017 | | $ | — | | | $ | 7.79 | | | | 0.74 | %b | | $ | 72.8 | | | | 0.84 | % | | | 0.50 | % | | | 1.10 | % | | | 107 | % | |
10/31/2016 | | $ | — | | | $ | 7.85 | | | | 1.06 | %b | | $ | 48.3 | | | | 0.99 | % | | | 0.50 | % | | | 0.91 | % | | | 104 | % | |
10/31/2015 | | $ | — | | | $ | 7.87 | | | | 0.64 | % | | $ | 30.3 | | | | 1.04 | % | | | 0.50 | % | | | 0.32 | % | | | 75 | % | |
10/31/2014 | | $ | 0.00 | | | $ | 7.92 | | | | 0.85 | %d | | $ | 28.5 | | | | 1.00 | % | | | 0.50 | % | | | 1.04 | % | | | 71 | % | |
10/31/2013 | | $ | — | | | $ | 7.97 | | | | 1.11 | % | | $ | 18.1 | | | | 0.98 | % | | | 0.50 | % | | | 0.87 | % | | | 86 | % | |
Class A | |
10/31/2017 | | $ | — | | | $ | 7.42 | | | | 0.20 | %b | | $ | 2.5 | | | | 1.24 | % | | | 0.87 | % | | | 0.69 | % | | | 107 | % | |
10/31/2016 | | $ | — | | | $ | 7.49 | | | | 0.94 | %b | | $ | 4.9 | | | | 1.36 | % | | | 0.87 | % | | | 0.54 | % | | | 104 | % | |
10/31/2015 | | $ | — | | | $ | 7.49 | | | | 0.10 | % | | $ | 4.1 | | | | 1.41 | % | | | 0.87 | % | | | (0.03 | )% | | | 75 | % | |
10/31/2014 | | $ | 0.00 | | | $ | 7.55 | | | | 0.45 | %d | | $ | 6.7 | | | | 1.36 | % | | | 0.87 | % | | | 0.66 | % | | | 71 | % | |
10/31/2013 | | $ | — | | | $ | 7.60 | | | | 0.83 | % | | $ | 6.3 | | | | 1.37 | % | | | 0.87 | % | | | 0.50 | % | | | 86 | % | |
Class C | |
10/31/2017 | | $ | — | | | $ | 7.42 | | | | (0.55 | )%b | | $ | 1.6 | | | | 1.99 | % | | | 1.62 | % | | | (0.06 | )% | | | 107 | % | |
10/31/2016 | | $ | — | | | $ | 7.49 | | | | 0.05 | %b | | $ | 3.0 | | | | 2.11 | % | | | 1.62 | % | | | (0.20 | )% | | | 104 | % | |
10/31/2015 | | $ | — | | | $ | 7.50 | | | | (0.49 | )% | | $ | 2.0 | | | | 2.17 | % | | | 1.62 | % | | | (0.79 | )% | | | 75 | % | |
10/31/2014 | | $ | 0.00 | | | $ | 7.55 | | | | (0.43 | )%d | | $ | 2.0 | | | | 2.12 | % | | | 1.62 | % | | | (0.05 | )% | | | 71 | % | |
10/31/2013 | | $ | — | | | $ | 7.61 | | | | 0.08 | % | | $ | 2.2 | | | | 2.13 | % | | | 1.62 | % | | | (0.24 | )% | | | 86 | % | |
Short Duration High Income Fund | |
Institutional Class | |
10/31/2017 | | $ | — | | | $ | 9.75 | | | | 4.94 | % | | $ | 114.7 | | | | 0.94 | % | | | 0.75 | % | | | 4.20 | % | | | 84 | % | |
10/31/2016 | | $ | — | | | $ | 9.69 | | | | 4.92 | % | | $ | 107.0 | | | | 0.87 | % | | | 0.75 | % | | | 4.20 | % | | | 51 | % | |
10/31/2015 | | $ | — | | | $ | 9.63 | | | | (0.22 | )% | | $ | 235.0 | | | | 0.81 | % | | | 0.75 | % | | | 4.05 | % | | | 45 | % | |
10/31/2014 | | $ | 0.00 | | | $ | 10.05 | | | | 2.81 | %d | | $ | 214.9 | | | | 0.85 | % | | | 0.75 | % | | | 3.95 | % | | | 49 | % | |
10/31/2013 | | $ | — | | | $ | 10.18 | | | | 6.51 | % | | $ | 102.9 | | | | 1.18 | % | | | 0.75 | % | | | 4.16 | % | | | 53 | % | |
Class A | |
10/31/2017 | | $ | — | | | $ | 9.76 | | | | 4.55 | % | | $ | 2.6 | | | | 1.35 | % | | | 1.12 | % | | | 3.86 | % | | | 84 | % | |
10/31/2016 | | $ | — | | | $ | 9.70 | | | | 4.64 | % | | $ | 3.4 | | | | 1.30 | % | | | 1.12 | % | | | 3.82 | % | | | 51 | % | |
10/31/2015 | | $ | — | | | $ | 9.63 | | | | (0.59 | )% | | $ | 2.8 | | | | 1.21 | % | | | 1.12 | % | | | 3.68 | % | | | 45 | % | |
10/31/2014 | | $ | 0.00 | | | $ | 10.05 | | | | 2.34 | %d | | $ | 3.6 | | | | 1.24 | % | | | 1.12 | % | | | 3.57 | % | | | 49 | % | |
10/31/2013 | | $ | — | | | $ | 10.19 | | | | 6.21 | % | | $ | 1.2 | | | | 1.74 | % | | | 1.12 | % | | | 3.73 | % | | | 53 | % | |
277
Financial Highlights (cont'd)
| | | Net Asset
Value,
Beginning
of Year | | Net
Investment
Income (Loss) | | Net Gains or
Losses on
Securities
(both
realized and
unrealized) | | Total From
Investment
Operations | | Dividends
from Net
Investment
Income | | Distributions
from Net
Realized
Capital Gains | | Tax
Return of
Capital | | Total
Distributions | |
Short Duration High Income Fund (cont'd) | |
Class C | |
10/31/2017 | | $ | 9.69 | | | $ | 0.30 | @ | | $ | 0.06 | | | $ | 0.36 | | | $ | (0.30 | ) | | $ | — | | | $ | — | | | $ | (0.30 | ) | |
10/31/2016 | | $ | 9.63 | | | $ | 0.29 | @ | | $ | 0.06 | | | $ | 0.35 | | | $ | (0.29 | ) | | $ | — | | | $ | — | | | $ | (0.29 | ) | |
10/31/2015 | | $ | 10.05 | | | $ | 0.29 | @ | | $ | (0.42 | ) | | $ | (0.13 | ) | | $ | (0.29 | ) | | $ | — | | | $ | — | | | $ | (0.29 | ) | |
10/31/2014 | | $ | 10.19 | | | $ | 0.29 | @ | | $ | (0.13 | ) | | $ | 0.16 | | | $ | (0.29 | ) | | $ | (0.01 | ) | | $ | — | | | $ | (0.30 | ) | |
10/31/2013 | | $ | 10.01 | | | $ | 0.30 | @ | | $ | 0.24 | | | $ | 0.54 | | | $ | (0.33 | ) | | $ | (0.03 | ) | | $ | — | | | $ | (0.36 | ) | |
Strategic Income Fund | |
Trust Class | |
10/31/2017 | | $ | 11.06 | | | $ | 0.33 | @ | | $ | 0.11 | | | $ | 0.44 | | | $ | (0.34 | ) | | $ | — | | | $ | (0.01 | ) | | $ | (0.35 | ) | |
10/31/2016 | | $ | 10.79 | | | $ | 0.32 | @ | | $ | 0.30 | | | $ | 0.62 | | | $ | (0.34 | ) | | $ | — | | | $ | (0.01 | ) | | $ | (0.35 | ) | |
10/31/2015 | | $ | 11.32 | | | $ | 0.32 | @ | | $ | (0.43 | ) | | $ | (0.11 | ) | | $ | (0.32 | ) | | $ | (0.06 | ) | | $ | (0.04 | ) | | $ | (0.42 | ) | |
10/31/2014 | | $ | 11.18 | | | $ | 0.38 | @ | | $ | 0.16 | | | $ | 0.54 | | | $ | (0.40 | ) | | $ | — | | | $ | — | | | $ | (0.40 | ) | |
10/31/2013 | | $ | 11.67 | | | $ | 0.36 | @ | | $ | (0.23 | ) | | $ | 0.13 | | | $ | (0.39 | ) | | $ | (0.23 | ) | | $ | — | | | $ | (0.62 | ) | |
Institutional Class | |
10/31/2017 | | $ | 11.07 | | | $ | 0.37 | @ | | $ | 0.11 | | | $ | 0.48 | | | $ | (0.38 | ) | | $ | — | | | $ | (0.01 | ) | | $ | (0.39 | ) | |
10/31/2016 | | $ | 10.79 | | | $ | 0.36 | @ | | $ | 0.31 | | | $ | 0.67 | | | $ | (0.38 | ) | | $ | — | | | $ | (0.01 | ) | | $ | (0.39 | ) | |
10/31/2015 | | $ | 11.32 | | | $ | 0.36 | @ | | $ | (0.43 | ) | | $ | (0.07 | ) | | $ | (0.35 | ) | | $ | (0.07 | ) | | $ | (0.04 | ) | | $ | (0.46 | ) | |
10/31/2014 | | $ | 11.19 | | | $ | 0.41 | @ | | $ | 0.16 | | | $ | 0.57 | | | $ | (0.44 | ) | | $ | — | | | $ | — | | | $ | (0.44 | ) | |
10/31/2013 | | $ | 11.67 | | | $ | 0.40 | @ | | $ | (0.22 | ) | | $ | 0.18 | | | $ | (0.43 | ) | | $ | (0.23 | ) | | $ | — | | | $ | (0.66 | ) | |
Class A | |
10/31/2017 | | $ | 11.08 | | | $ | 0.33 | @ | | $ | 0.11 | | | $ | 0.44 | | | $ | (0.34 | ) | | $ | — | | | $ | (0.01 | ) | | $ | (0.35 | ) | |
10/31/2016 | | $ | 10.80 | | | $ | 0.32 | @ | | $ | 0.31 | | | $ | 0.63 | | | $ | (0.34 | ) | | $ | — | | | $ | (0.01 | ) | | $ | (0.35 | ) | |
10/31/2015 | | $ | 11.33 | | | $ | 0.32 | @ | | $ | (0.43 | ) | | $ | (0.11 | ) | | $ | (0.32 | ) | | $ | (0.06 | ) | | $ | (0.04 | ) | | $ | (0.42 | ) | |
10/31/2014 | | $ | 11.19 | | | $ | 0.37 | @ | | $ | 0.17 | | | $ | 0.54 | | | $ | (0.40 | ) | | $ | — | | | $ | — | | | $ | (0.40 | ) | |
10/31/2013 | | $ | 11.68 | | | $ | 0.36 | @ | | $ | (0.24 | ) | | $ | 0.12 | | | $ | (0.38 | ) | | $ | (0.23 | ) | | $ | — | | | $ | (0.61 | ) | |
Class C | |
10/31/2017 | | $ | 11.06 | | | $ | 0.25 | @ | | $ | 0.11 | | | $ | 0.36 | | | $ | (0.26 | ) | | $ | — | | | $ | (0.01 | ) | | $ | (0.27 | ) | |
10/31/2016 | | $ | 10.79 | | | $ | 0.24 | @ | | $ | 0.30 | | | $ | 0.54 | | | $ | (0.26 | ) | | $ | — | | | $ | (0.01 | ) | | $ | (0.27 | ) | |
10/31/2015 | | $ | 11.32 | | | $ | 0.24 | @ | | $ | (0.43 | ) | | $ | (0.19 | ) | | $ | (0.24 | ) | | $ | (0.06 | ) | | $ | (0.04 | ) | | $ | (0.34 | ) | |
10/31/2014 | | $ | 11.19 | | | $ | 0.29 | @ | | $ | 0.16 | | | $ | 0.45 | | | $ | (0.32 | ) | | $ | — | | | $ | — | | | $ | (0.32 | ) | |
10/31/2013 | | $ | 11.67 | | | $ | 0.28 | @ | | $ | (0.23 | ) | | $ | 0.05 | | | $ | (0.30 | ) | | $ | (0.23 | ) | | $ | — | | | $ | (0.53 | ) | |
See Notes to Financial Highlights
278
| | | Voluntary
Contribution
from
Management | | Net Asset
Value, End of
Year | | Total
Returna | | Net Assets,
End of Year
(in millions) | | Ratio of
Gross
Expenses
to Average
Net Assets# | | Ratio of Net
Expenses
to Average
Net AssetsØ | | Ratio of Net
Investment
Income/
(Loss) to
Average Net
Assets | | Portfolio
Turnover
Rate | |
Short Duration High Income Fund (cont'd) | |
Class C | |
10/31/2017 | | $ | — | | | $ | 9.75 | | | | 3.78 | % | | $ | 1.1 | | | | 2.09 | % | | | 1.87 | % | | | 3.10 | % | | | 84 | % | |
10/31/2016 | | $ | — | | | $ | 9.69 | | | | 3.77 | % | | $ | 1.2 | | | | 2.05 | % | | | 1.87 | % | | | 3.10 | % | | | 51 | % | |
10/31/2015 | | $ | — | | | $ | 9.63 | | | | (1.33 | )% | | $ | 0.3 | | | | 1.99 | % | | | 1.87 | % | | | 2.93 | % | | | 45 | % | |
10/31/2014 | | $ | 0.00 | | | $ | 10.05 | | | | 1.57 | %d | | $ | 0.4 | | | | 2.03 | % | | | 1.87 | % | | | 2.83 | % | | | 49 | % | |
10/31/2013 | | $ | — | | | $ | 10.19 | | | | 5.43 | % | | $ | 0.2 | | | | 3.80 | % | | | 1.87 | % | | | 3.03 | % | | | 53 | % | |
Strategic Income Fund | |
Trust Class | |
10/31/2017 | | $ | — | | | $ | 11.15 | | | | 4.09 | %b | | $ | 20.0 | | | | 1.00 | % | | | 0.94 | % | | | 3.03 | % | | | 136 | %c | |
10/31/2016 | | $ | — | | | $ | 11.06 | | | | 5.91 | % | | $ | 27.7 | | | | 1.14 | % | | | 1.09 | % | | | 2.99 | % | | | 141 | %c | |
10/31/2015 | | $ | — | | | $ | 10.79 | | | | (1.03 | )%b | | $ | 53.1 | | | | 1.14 | % | | | 1.06 | % | | | 2.90 | % | | | 103 | %c | |
10/31/2014 | | $ | 0.00 | | | $ | 11.32 | | | | 4.95 | %d | | $ | 49.4 | | | | 1.15 | % | | | 1.05 | % | | | 3.33 | % | | | 124 | %c | |
10/31/2013 | | $ | — | | | $ | 11.18 | | | | 1.07 | % | | $ | 43.8 | | | | 1.18 | % | | | 1.10 | % | | | 3.22 | % | | | 161 | %c | |
Institutional Class | |
10/31/2017 | | $ | — | | | $ | 11.16 | | | | 4.45 | %b | | $ | 2,041.0 | | | | 0.63 | % | | | 0.59 | % | | | 3.37 | % | | | 136 | %c | |
10/31/2016 | | $ | — | | | $ | 11.07 | | | | 6.38 | % | | $ | 1,436.8 | | | | 0.78 | % | | | 0.74 | % | | | 3.33 | % | | | 141 | %c | |
10/31/2015 | | $ | — | | | $ | 10.79 | | | | (0.69 | )%b | | $ | 1,355.2 | | | | 0.78 | % | | | 0.71 | % | | | 3.25 | % | | | 103 | %c | |
10/31/2014 | | $ | 0.00 | | | $ | 11.32 | | | | 5.22 | %d | | $ | 1,043.0 | | | | 0.80 | % | | | 0.70 | % | | | 3.66 | % | | | 124 | %c | |
10/31/2013 | | $ | — | | | $ | 11.19 | | | | 1.52 | % | | $ | 739.1 | | | | 0.81 | % | | | 0.75 | % | | | 3.57 | % | | | 161 | %c | |
Class A | |
10/31/2017 | | $ | — | | | $ | 11.17 | | | | 4.03 | %b | | $ | 193.1 | | | | 1.02 | % | | | 1.00 | % | | | 2.98 | % | | | 136 | %c | |
10/31/2016 | | $ | — | | | $ | 11.08 | | | | 5.95 | % | | $ | 290.5 | | | | 1.18 | % | | | 1.14 | % | | | 2.96 | % | | | 141 | %c | |
10/31/2015 | | $ | — | | | $ | 10.80 | | | | (1.08 | )%b | | $ | 360.8 | | | | 1.17 | % | | | 1.11 | % | | | 2.84 | % | | | 103 | %c | |
10/31/2014 | | $ | 0.00 | | | $ | 11.33 | | | | 4.89 | %d | | $ | 310.3 | | | | 1.19 | % | | | 1.10 | % | | | 3.28 | % | | | 124 | %c | |
10/31/2013 | | $ | — | | | $ | 11.19 | | | | 1.02 | % | | $ | 311.8 | | | | 1.21 | % | | | 1.15 | % | | | 3.14 | % | | | 161 | %c | |
Class C | |
10/31/2017 | | $ | — | | | $ | 11.15 | | | | 3.31 | %b | | $ | 150.2 | | | | 1.75 | % | | | 1.69 | % | | | 2.28 | % | | | 136 | %c | |
10/31/2016 | | $ | — | | | $ | 11.06 | | | | 5.13 | % | | $ | 183.9 | | | | 1.91 | % | | | 1.84 | % | | | 2.45 | % | | | 141 | %c | |
10/31/2015 | | $ | — | | | $ | 10.79 | | | | (1.77 | )%b | | $ | 202.9 | | | | 1.91 | % | | | 1.81 | % | | | 2.14 | % | | | 103 | %c | |
10/31/2014 | | $ | 0.00 | | | $ | 11.32 | | | | 4.07 | %d | | $ | 184.5 | | | | 1.93 | % | | | 1.80 | % | | | 2.58 | % | | | 124 | %c | |
10/31/2013 | | $ | — | | | $ | 11.19 | | | | 0.40 | % | | $ | 191.7 | | | | 1.94 | % | | | 1.85 | % | | | 2.45 | % | | | 161 | %c | |
279
Financial Highlights (cont'd)
| | | Net Asset
Value,
Beginning
of Year | | Net
Investment
Income (Loss) | | Net Gains or
Losses on
Securities
(both
realized and
unrealized) | | Total From
Investment
Operations | | Dividends
from Net
Investment
Income | | Distributions
from Net
Realized
Capital Gains | | Tax
Return of
Capital | | Total
Distributions | |
Strategic Income Fund (cont'd) | |
Class R6 | |
10/31/2017 | | $ | 11.06 | | | $ | 0.38 | @ | | $ | 0.11 | | | $ | 0.49 | | | $ | (0.39 | ) | | $ | — | | | $ | (0.01 | ) | | $ | (0.40 | ) | |
10/31/2016 | | $ | 10.79 | | | $ | 0.37 | @ | | $ | 0.30 | | | $ | 0.67 | | | $ | (0.39 | ) | | $ | — | | | $ | (0.01 | ) | | $ | (0.40 | ) | |
10/31/2015 | | $ | 11.32 | | | $ | 0.37 | @ | | $ | (0.43 | ) | | $ | (0.06 | ) | | $ | (0.36 | ) | | $ | (0.07 | ) | | $ | (0.04 | ) | | $ | (0.47 | ) | |
10/31/2014 | | $ | 11.18 | | | $ | 0.42 | @ | | $ | 0.17 | | | $ | 0.59 | | | $ | (0.45 | ) | | $ | — | | | $ | — | | | $ | (0.45 | ) | |
Period from 3/15/2013^ to
10/31/2013 | | $ | 11.44 | | | $ | 0.26 | @ | | $ | (0.25 | ) | | $ | 0.01 | | | $ | (0.27 | ) | | $ | — | | | $ | — | | | $ | (0.27 | ) | |
Unconstrained Bond Fund | |
Institutional Class | |
10/31/2017 | | $ | 9.18 | | | $ | 0.23 | @ | | $ | 0.14 | | | $ | 0.37 | | | $ | (0.10 | ) | | $ | — | | | $ | (0.04 | ) | | $ | (0.14 | ) | |
10/31/2016 | | $ | 9.38 | | | $ | 0.27 | @ | | $ | (0.20 | ) | | $ | 0.07 | | | $ | — | | | $ | — | | | $ | (0.27 | ) | | $ | (0.27 | ) | |
10/31/2015 | | $ | 9.89 | | | $ | 0.27 | @ | | $ | (0.49 | ) | | $ | (0.22 | ) | | $ | (0.16 | ) | | $ | — | | | $ | (0.13 | ) | | $ | (0.29 | ) | |
Period from 2/13/2014^ to
10/31/2014 | | $ | 10.00 | | | $ | 0.21 | @ | | $ | (0.12 | ) | | $ | 0.09 | | | $ | (0.20 | ) | | $ | — | | | $ | (0.00 | ) | | $ | (0.20 | ) | |
Class A | |
10/31/2017 | | $ | 9.17 | | | $ | 0.20 | @ | | $ | 0.15 | | | $ | 0.35 | | | $ | (0.07 | ) | | $ | — | | | $ | (0.04 | ) | | $ | (0.11 | ) | |
10/31/2016 | | $ | 9.37 | | | $ | 0.22 | @ | | $ | (0.19 | ) | | $ | 0.03 | | | $ | — | | | $ | — | | | $ | (0.23 | ) | | $ | (0.23 | ) | |
10/31/2015 | | $ | 9.89 | | | $ | 0.26 | @ | | $ | (0.53 | ) | | $ | (0.27 | ) | | $ | (0.12 | ) | | $ | — | | | $ | (0.13 | ) | | $ | (0.25 | ) | |
Period from 2/13/2014^ to
10/31/2014 | | $ | 10.00 | | | $ | 0.18 | @ | | $ | (0.12 | ) | | $ | 0.06 | | | $ | (0.17 | ) | | $ | — | | | $ | (0.00 | ) | | $ | (0.17 | ) | |
Class C | |
10/31/2017 | | $ | 9.18 | | | $ | 0.13 | @ | | $ | 0.15 | | | $ | 0.28 | | | $ | (0.00 | ) | | $ | — | | | $ | (0.04 | ) | | $ | (0.04 | ) | |
10/31/2016 | | $ | 9.38 | | | $ | 0.17 | @ | | $ | (0.20 | ) | | $ | (0.03 | ) | | $ | — | | | $ | — | | | $ | (0.17 | ) | | $ | (0.17 | ) | |
10/31/2015 | | $ | 9.89 | | | $ | 0.19 | @ | | $ | (0.52 | ) | | $ | (0.33 | ) | | $ | (0.05 | ) | | $ | — | | | $ | (0.13 | ) | | $ | (0.18 | ) | |
Period from 2/13/2014^ to
10/31/2014 | | $ | 10.00 | | | $ | 0.13 | @ | | $ | (0.12 | ) | | $ | 0.01 | | | $ | (0.12 | ) | | $ | — | | | $ | (0.00 | ) | | $ | (0.12 | ) | |
Class R6 | |
10/31/2017 | | $ | 9.19 | | | $ | 0.24 | @ | | $ | 0.14 | | | $ | 0.38 | | | $ | (0.11 | ) | | $ | — | | | $ | (0.04 | ) | | $ | (0.15 | ) | |
10/31/2016 | | $ | 9.38 | | | $ | 0.25 | @ | | $ | (0.17 | ) | | $ | 0.08 | | | $ | — | | | $ | — | | | $ | (0.27 | ) | | $ | (0.27 | ) | |
10/31/2015 | | $ | 9.89 | | | $ | 0.31 | @ | | $ | (0.53 | ) | | $ | (0.22 | ) | | $ | (0.16 | ) | | $ | — | | | $ | (0.13 | ) | | $ | (0.29 | ) | |
Period from 2/13/2014^ to
10/31/2014 | | $ | 10.00 | | | $ | 0.21 | @ | | $ | (0.12 | ) | | $ | 0.09 | | | $ | (0.20 | ) | | $ | — | | | $ | (0.00 | ) | | $ | (0.20 | ) | |
See Notes to Financial Highlights
280
| | | Voluntary
Contribution
from
Management | | Net Asset
Value, End of
Year | | Total
Returna | | Net Assets,
End of Year
(in millions) | | Ratio of
Gross
Expenses
to Average
Net Assets# | | Ratio of Net
Expenses
to Average
Net AssetsØ | | Ratio of Net
Investment
Income/
(Loss) to
Average Net
Assets | | Portfolio
Turnover
Rate | |
Strategic Income Fund (cont'd) | |
Class R6 | |
10/31/2017 | | $ | — | | | $ | 11.15 | | | | 4.52 | %b | | $ | 311.0 | | | | 0.56 | % | | | 0.52 | % | | | 3.43 | % | | | 136 | %c | |
10/31/2016 | | $ | — | | | $ | 11.06 | | | | 6.36 | % | | $ | 206.5 | | | | 0.71 | % | | | 0.67 | % | | | 3.43 | % | | | 141 | %c | |
10/31/2015 | | $ | — | | | $ | 10.79 | | | | (0.62 | )%b | | $ | 230.9 | | | | 0.71 | % | | | 0.64 | % | | | 3.32 | % | | | 103 | %c | |
10/31/2014 | | $ | 0.00 | | | $ | 11.32 | | | | 5.39 | %d | | $ | 149.4 | | | | 0.72 | % | | | 0.63 | % | | | 3.69 | % | | | 124 | %c | |
Period from 3/15/2013^ to
10/31/2013 | | $ | — | | | $ | 11.18 | | | | 0.09 | %* | | $ | 17.5 | | | | 0.77 | %** | | | 0.68 | %** | | | 3.70 | %** | | | 161 | %^^c | |
Unconstrained Bond Fund | |
Institutional Class | |
10/31/2017 | | $ | — | | | $ | 9.41 | | | | 4.05 | %b | | $ | 45.8 | | | | 1.30 | % | | | 0.68 | % | | | 2.48 | % | | | 73 | %c | |
10/31/2016 | | $ | — | | | $ | 9.18 | | | | 0.79 | % | | $ | 4.7 | | | | 1.24 | % | | | 0.66 | % | | | 3.01 | % | | | 50 | %c | |
10/31/2015 | | $ | — | | | $ | 9.38 | | | | (2.28 | )% | | $ | 189.1 | | | | 1.27 | % | | | 0.67 | % | | | 2.80 | % | | | 75 | %c | |
Period from 2/13/2014^ to
10/31/2014 | | $ | — | | | $ | 9.89 | | | | 0.88 | %* | | $ | 23.1 | | | | 2.22 | %‡** | | | 0.84 | %‡** | | | 2.94 | %‡** | | | 118 | %* | |
Class A | |
10/31/2017 | | $ | — | | | $ | 9.41 | | | | 3.78 | %b | | $ | 0.5 | | | | 1.78 | % | | | 1.06 | % | | | 2.13 | % | | | 73 | %c | |
10/31/2016 | | $ | — | | | $ | 9.17 | | | | 0.41 | % | | $ | 0.6 | | | | 1.61 | % | | | 1.03 | % | | | 2.48 | % | | | 50 | %c | |
10/31/2015 | | $ | — | | | $ | 9.37 | | | | (2.74 | )% | | $ | 0.1 | | | | 1.76 | % | | | 1.14 | % | | | 2.73 | % | | | 75 | %c | |
Period from 2/13/2014^ to
10/31/2014 | | $ | — | | | $ | 9.89 | | | | 0.61 | %* | | $ | 7.1 | | | | 2.62 | %‡** | | | 1.20 | %‡** | | | 2.57 | %‡** | | | 118 | %* | |
Class C | |
10/31/2017 | | $ | — | | | $ | 9.42 | | | | 3.02 | %b | | $ | 0.0 | | | | 2.56 | % | | | 1.81 | % | | | 1.38 | % | | | 73 | %c | |
10/31/2016 | | $ | — | | | $ | 9.18 | | | | (0.34 | )% | | $ | 0.0 | | | | 2.40 | % | | | 1.78 | % | | | 1.86 | % | | | 50 | %c | |
10/31/2015 | | $ | — | | | $ | 9.38 | | | | (3.36 | )% | | $ | 0.2 | | | | 2.50 | % | | | 1.87 | % | | | 1.96 | % | | | 75 | %c | |
Period from 2/13/2014^ to
10/31/2014 | | $ | — | | | $ | 9.89 | | | | 0.09 | %* | | $ | 1.0 | | | | 3.56 | %‡** | | | 1.93 | %‡** | | | 1.84 | %‡** | | | 118 | %* | |
Class R6 | |
10/31/2017 | | $ | — | | | $ | 9.42 | | | | 4.12 | %b | | $ | 52.8 | | | | 1.26 | % | | | 0.62 | % | | | 2.57 | % | | | 73 | %c | |
10/31/2016 | | $ | — | | | $ | 9.19 | | | | 0.97 | % | | $ | 49.7 | | | | 1.13 | % | | | 0.59 | % | | | 2.66 | % | | | 50 | %c | |
10/31/2015 | | $ | — | | | $ | 9.38 | | | | (2.21 | )% | | $ | 0.2 | | | | 1.32 | % | | | 0.70 | % | | | 3.19 | % | | | 75 | %c | |
Period from 2/13/2014^ to
10/31/2014 | | $ | — | | | $ | 9.89 | | | | 0.92 | %* | | $ | 7.1 | | | | 2.18 | %‡** | | | 0.77 | %‡** | | | 3.00 | %‡** | | | 118 | %* | |
281
Notes to Financial Highlights
# Represents the annualized ratios of net expenses to average daily net assets if Management had not reimbursed certain expenses and/or waived a portion of the investment management fee.
Ø Prior to January 1, 2013, the Fund had an expense offset arrangement in connection with its custodian contract. The impact of expense reductions related to expense offset arrangements, if any, was less than 0.01%.
ØØ Effective after the close of business on March 8, 2013, Management succeeded Glickenhaus & Co., as the Fund's investment manager. The financial highlights for the period ended October 31, 2013 include the income and expenses attributable to the Empire Builder Tax Free Bond Fund prior to March 11, 2013, and the income and expenses of New York Municipal Income thereafter.
@ Calculated based on the average number of shares outstanding during each fiscal period.
** Annualized.
* Not annualized.
^ The date investment operations commenced.
‡ Organization expense, which is a non-recurring expense, is included in these ratios on a non-annualized basis.
§ After repayment of expenses previously reimbursed and/or fees previously waived by Management, as applicable. Had the Fund not made such repayments, the annualized ratios of net expenses to average net assets would have been:
| | | Year Ended
October 31,
2017 | |
High Income Bond Class R3 | | | 1.35 | % | |
^^ Portfolio turnover is calculated at the Fund level. Percentage indicated was calculated for the year ended October 31, 2013 for High Income and Strategic Income (Class R6).
ß New York Municipal Income's fiscal year end changed from February 28 to October 31.
a Total return based on per share NAV reflects the effects of changes in NAV on the performance of each Fund during each fiscal period. Returns assume income dividends and other distributions, if any, were reinvested, but do not reflect the effect of sales charges. Results represent past performance and do not indicate future results. Current returns may be lower or higher than the performance data quoted. Investment returns and principal may fluctuate and shares when redeemed may be worth more or less than original cost. Total return would have been lower if Management had not reimbursed and/or waived certain expenses. Total return would have been higher if Management had not recouped previously reimbursed and/or waived expenses.
b The class action proceeds listed in Note A-4 of the Notes to Financial Statements had no impact on the Funds' total returns for the year ended October 31, 2017. The class action proceeds received in 2016 had no impact on the Funds' total returns for the year ended October 31, 2016. The class action proceeds received in 2015 had no impact on the Funds' total returns for the year ended October 31, 2015.
c The portfolio turnover rates including mortgage dollar roll transactions were 269%, 222%, 240%, 307% and 346% for the years ended October 31, 2017, 2016, 2015, 2014, and 2013, respectively, for Core Bond, 104% for the period ended October 31, 2017 for Core Plus, 352%, 363%, 357%, 365% and 384% for the years ended October 31, 2017, 2016, 2015, 2014 and 2013, respectively, for Strategic Income and 88%, 65% and 86% for the years ended October 31, 2017, 2016 and 2015, respectively, for Unconstrained Bond.
282
Notes to Financial Highlights (cont'd)
d The voluntary contribution received in 2014 had no impact on the Funds' total returns for the year ended October 31, 2014.
e The voluntary contribution received in 2015 had no impact on the Fund's total returns for the year ended October 31, 2015.
f Custodian Out-of-Pocket Expenses Refunded, as listed in Note G of the Notes to Financial Statements, is non-recurring, and is included in these ratios. Had the Funds not received the refund the annualized ratios of net expenses to average net assets and net investment income/(loss) to average net assets would have been:
| | | Ratio of
Net Expenses
to Average
Net Assets
Year Ended
October 31,
2017 | | Ratio of
Net Investment
Income/(Loss)
to Average
Net Assets
Year Ended
October 31,
2017 | |
High Income Bond Investor Class | | | 0.84 | % | | | 5.34 | % | |
High Income Bond Institutional Class | | | 0.70 | % | | | 5.49 | % | |
High Income Bond Class A | | | 1.14 | % | | | 5.05 | % | |
High Income Bond Class C | | | 1.81 | % | | | 4.38 | % | |
High Income Bond Class R3 | | | 1.37 | % | | | 4.81 | % | |
High Income Bond Class R6 | | | 0.61 | % | | | 5.56 | % | |
New York Municipal Income Institutional Class | | | 0.92 | % | | | 2.23 | % | |
g The Custodian Out-of-Pocket Expenses Refunded listed in Note G of the Notes to Financial Statements had no impact on the Funds' total returns for the year ended October 31, 2017.
283
Report of Independent Registered Public Accounting Firm
To the Board of Trustees and Shareholders of:
Neuberger Berman Emerging Markets Debt Fund
Neuberger Berman High Income Bond Fund
Neuberger Berman Municipal Intermediate Bond Fund
Neuberger Berman Short Duration Bond Fund
Neuberger Berman Strategic Income Fund
Neuberger Berman Unconstrained Bond Fund
We have audited the accompanying statements of assets and liabilities, including the schedules of investments, of Neuberger Berman Emerging Markets Debt Fund, Neuberger Berman High Income Bond Fund, Neuberger Berman Municipal Intermediate Bond Fund, Neuberger Berman Short Duration Bond Fund, Neuberger Berman Strategic Income Fund, and Neuberger Berman Unconstrained Bond Fund, six of the series constituting Neuberger Berman Income Funds (the "Trust") as of October 31, 2017, and the related statements of operations for the year then ended, and the statements of changes in net assets for each of the two years in the period then ended and the financial highlights for each of the periods indicated therein. These financial statements and financial highlights are the responsibility of the Trust's management. Our responsibility is to express an opinion on these financial statements and financial highlights based on our audits.
We conducted our audits in accordance with the standards of the Public Company Accounting Oversight Board (United States). Those standards require that we plan and perform the audit to obtain reasonable assurance about whether the financial statements and financial highlights are free of material misstatement. We were not engaged to perform an audit of the Trust's internal control over financial reporting. Our audits included consideration of internal control over financial reporting as a basis for designing audit procedures that are appropriate in the circumstances, but not for the purpose of expressing an opinion on the effectiveness of the Trust's internal control over financial reporting. Accordingly, we express no such opinion. An audit also includes examining, on a test basis, evidence supporting the amounts and disclosures in the financial statements and financial highlights, assessing the accounting principles used and significant estimates made by management, and evaluating the overall financial statement presentation. Our procedures included confirmation of securities owned as of October 31, 2017, by correspondence with the custodian and others or by other appropriate auditing procedures where replies from others were not received. We believe that our audits provide a reasonable basis for our opinion.
In our opinion, the financial statements and financial highlights referred to above present fairly, in all material respects, the financial position of the above-mentioned series of the Neuberger Berman Income Funds, at October 31, 2017, and the results of their operations for the year then ended, the changes in their net assets for each of the two years in the period then ended and the financial highlights for each of the periods indicated therein in conformity with U.S. generally accepted accounting principles.

Boston, Massachusetts
December 22, 2017
284
Report of Independent Registered Public Accounting Firm
To the Board of Trustees and Shareholders
Neuberger Berman Income Funds
We have audited the accompanying statements of assets and liabilities of Neuberger Berman Core Bond Fund, Neuberger Berman Floating Rate Income Fund, Neuberger Berman New York Municipal Income Fund, Neuberger Berman Short Duration High Income Fund, Neuberger Berman Municipal High Income Fund, and Neuberger Berman Core Plus Fund, each a series of Neuberger Berman Income Funds (the "Trust"), including the schedules of investments, as of October 31, 2017, and the related statements of operations for the year then ended (with respect to Neuberger Berman Core Plus Fund, for the period July 18, 2017 to October 31, 2017), the statements of changes in net assets for each of the two years in the period then ended (with respect to Neuberger Berman Core Plus Fund, for the period July 18, 2017 to October 31, 2017), and the financial highlights for each of the five years in the period then ended (with respect to Neuberger Berman New York Municipal Income Fund, for each of the four years in the period then ended, for the period March 1, 2013 to October 31, 2013, and for the year ended February 28, 2013, with respect to Neuberger Berman Municipal High Income Fund, for each of the two years in the period then ended and for the period June 22, 2015 to October 31, 2015, and with respect to Neuberger Berman Core Plus Fund, for the period July 18, 2017 to October 31, 2017). These financial statements and financial highlights are the responsibility of the Trust's management. Our responsibility is to express an opinion on these financial statements and financial highlights based on our audits.
We conducted our audits in accordance with the standards of the Public Company Accounting Oversight Board (United States). Those standards require that we plan and perform the audits to obtain reasonable assurance about whether the financial statements and financial highlights are free of material misstatement. The Trust is not required to have, nor were we engaged to perform, an audit of its internal control over financial reporting. Our audits included consideration of internal control over financial reporting as a basis for designing audit procedures that are appropriate in the circumstances, but not for the purpose of expressing an opinion on the effectiveness of the Trust's internal control over financial reporting. Accordingly, we express no such opinion. An audit also includes examining, on a test basis, evidence supporting the amounts and disclosures in the financial statements, assessing the accounting principles used and significant estimates made by management, as well as evaluating the overall financial statement presentation. Our procedures included confirmation of securities owned as of October 31, 2017, by correspondence with the custodian and brokers or by other appropriate auditing procedures where replies from brokers were not received. We believe that our audits provide a reasonable basis for our opinion.
In our opinion, the financial statements and financial highlights referred to above present fairly, in all material respects, the financial position of the above mentioned series of the Neuberger Berman Income Funds, as of October 31, 2017, and the results of their operations, the changes in their net assets, and the financial highlights for the periods indicated above, in conformity with accounting principles generally accepted in the United States of America.

Philadelphia, Pennsylvania
December 21, 2017
285
Investment Manager and Administrator
Neuberger Berman Investment Advisers LLC
1290 Avenue of the Americas
New York, NY 10104-0002
212.476.8800
Intermediary Client Services 800.366.6264
Distributor
Neuberger Berman BD LLC
1290 Avenue of the Americas
New York, NY 10104-0002
800.877.9700 or 212.476.8800
Intermediary Client Services 800.366.6264
Sub-Adviser
Neuberger Berman Europe Limited
Lansdowne House
57 Berkeley Square
London, United Kingdom W1J 6ER
Custodian and Shareholder Servicing Agent
State Street Bank and Trust Company
One Lincoln Street
Boston, MA 02111
For Investor Class Shareholders
Address correspondence to:
Neuberger Berman Funds
Boston Service Center
P.O. Box 8403
Boston, MA 02266-8403
800.877.9700 or 212.476.8800
For Class A, Class C, Class R3 and Class R6 Shareholders:
Please contact your investment provider
For Trust Class and Institutional Class Shareholders Address correspondence to:
Neuberger Berman Investment Advisers LLC
1290 Avenue of the Americas
New York, NY 10104-0002
Intermediary Client Services 800.366.6264
Legal Counsel
K&L Gates LLP
1601 K Street, NW
Washington, DC 20006-1600
Independent Registered Public Accounting Firms
Ernst & Young LLP
200 Clarendon Street
Boston, MA 02116
Tait, Weller & Baker LLP
1818 Market Street
Suite 2400
Philadelphia, PA 19103
286
The following tables set forth information concerning the Trustees and Officers of each of the Funds. All persons named as Trustees and Officers also serve in similar capacities for other funds administered or managed by NBIA (formerly, Neuberger Berman Fixed Income LLC ("NBFI") and including predecessor entities). Each Fund's Statement of Additional Information includes additional information about the Trustees as of the time of the Fund's most recent public offering and is available upon request, without charge, by calling (800) 877-9700.
Information about the Board of Trustees
Name, (Year of Birth),
and Address(1) | | Position(s)
and Length of
Time Served(2) | | Principal Occupation(s)(3) | | Number of
Funds in Fund
Complex
Overseen by
Fund Trustee | | Other Directorships
Held Outside Fund
Complex by Fund
Trustee(3) | |
Independent Fund Trustees | |
Michael J. Cosgrove (1949) | | Trustee since 2015 | | President, Carragh Consulting USA, since 2014; formerly, Executive, General Electric Company, 1970 to 2014, including President, Mutual Funds and Global Investment Programs, GE Asset Management, 2011 to 2014, President and Chief Executive Officer, Mutual Funds and Intermediary Business, GE Asset Management, 2007 to 2011, President, Institutional Sales and Marketing, GE Asset Management, 1998 to 2007, and Chief Financial Officer, GE Asset Management, and Deputy Treasurer, GE Company, 1988 to 1993. | | | 56 | | | Director, America Press, Inc. (not-for-profit Jesuit publisher), since 2015; Director, Fordham University, since 2001; formerly, Director, The Gabelli Go Anywhere Trust, June 2015 to June 2016; Director, Skin Cancer Foundation (not-for-profit), 2006 to 2015; Director, GE Investments Funds, Inc., 1997 to 2014; Trustee, GE Institutional Funds, 1997 to 2014; Director, GE Asset Management, 1988 to 2014; Director, Elfun Trusts, 1988 to 2014; Trustee, GE Pension & Benefit Plans, 1988 to 2014. | |
287
Name, (Year of Birth),
and Address(1) | | Position(s)
and Length of
Time Served(2) | | Principal Occupation(s)(3) | | Number of
Funds in Fund
Complex
Overseen by
Fund Trustee | | Other Directorships
Held Outside Fund
Complex by Fund
Trustee(3) | |
Marc Gary (1952) | | Trustee since 2015 | | Executive Vice Chancellor and Chief Operating Officer, Jewish Theological Seminary, since 2012; formerly, Executive Vice President and General Counsel, Fidelity Investments, 2007 to 2012; Executive Vice President and General Counsel, BellSouth Corporation, 2004 to 2007; Vice President and Associate General Counsel, BellSouth Corporation, 2000 to 2004; Associate, Partner, and National Litigation Practice Co-Chair, Mayer, Brown LLP, 1981 to 2000; Associate Independent Counsel, Office of Independent Counsel, 1990 to 1992. | | | 56 | | | Trustee, Jewish Theological Seminary, since 2015; Director, Counsel on Call (privately held for-profit company), since 2012; Director, Lawyers Committee for Civil Rights Under Law (not-for-profit), since 2005; formerly, Director, Equal Justice Works (not-for-profit), 2005 to 2014; Director, Corporate Counsel Institute, Georgetown University Law Center, 2007 to 2012; Director, Greater Boston Legal Services (not-for-profit), 2007 to 2012. | |
Martha C. Goss (1949) | | Trustee since 2007 | | President, Woodhill Enterprises Inc./Chase Hollow Associates LLC (personal investment vehicle), since 2006; formerly, Consultant, Resources Global Professionals (temporary staffing), 2002 to 2006.. | | | 56 | | | Director, American Water (water utility), since 2003; Director, Allianz Life of New York (insurance), since 2005; Director, Berger Group Holdings, Inc. (engineering consulting firm), since 2013; Director, Financial Women's Association of New York (not-for-profit association), since 2003; Trustee Emerita, Brown University, since 1998; Director, Museum of American Finance (not-for-profit), since 2013; formerly, Non-Executive Chair and Director, Channel Reinsurance (financial guaranty reinsurance), 2006 to 2010; formerly, Director, Ocwen Financial Corporation (mortgage servicing), 2005 to 2010; formerly, Director, Claire's Stores, Inc. (retailer), 2005 to 2007; formerly, Director, Parsons Brinckerhoff Inc. (engineering consulting firm), 2007 to 2010; formerly, Director, Bank Leumi (commercial bank), 2005 to 2007; formerly, Advisory Board Member, Attensity (software developer), 2005 to 2007. | |
288
Name, (Year of Birth),
and Address(1) | | Position(s)
and Length of
Time Served(2) | | Principal Occupation(s)(3) | | Number of
Funds in Fund
Complex
Overseen by
Fund Trustee | | Other Directorships
Held Outside Fund
Complex by Fund
Trustee(3) | |
Michael M. Knetter (1960) | | Trustee since 2007 | | President and Chief Executive Officer, University of Wisconsin Foundation, since October 2010; formerly, Dean, School of Business, University of Wisconsin — Madison; formerly, Professor of International Economics and Associate Dean, Amos Tuck School of Business — Dartmouth College, 1998 to 2002. | | 56 | | Board Member, American Family Insurance (a mutual company, not publicly traded), since March 2009; formerly, Trustee, Northwestern Mutual Series Fund, Inc., 2007 to 2011; formerly, Director, Wausau Paper, 2005 to 2011; formerly, Director, Great Wolf Resorts, 2004 to 2009. | |
Deborah C. McLean (1954) | | Trustee since 2015 | | Member, Circle Financial Group (private wealth management membership practice), since 2011; Managing Director, Golden Seeds LLC (an angel investing group), since 2009; Adjunct Professor, Columbia University School of International and Public Affairs, since 2008; formerly, Visiting Assistant Professor, Fairfield University, Dolan School of Business, Fall 2007; formerly, Adjunct Associate Professor of Finance, Richmond, The American International University in London, 1999 to 2007. | | 56 | | Board member, Norwalk Community College Foundation, since 2014; Dean's Advisory Council, Radcliffe Institute for Advanced Study, since 2014; formerly, Director and Treasurer, At Home in Darien (not-for-profit), 2012 to 2014; Director, National Executive Service Corps (not-for-profit), 2012 to 2013; Trustee, Richmond, The American International University in London, 1999 to 2013. | |
George W. Morriss (1947) | | Trustee since 2007 | | Adjunct Professor, Columbia University School of International and Public Affairs, since October 2012; formerly, Executive Vice President and Chief Financial Officer, People's United Bank, Connecticut (a financial services company), 1991 to 2001. | | 56 | | Director, National Association of Corporate Directors, Connecticut Chapter, since 2011; Trustee, Steben Alternative Investment Funds, Steben Select Multi-Strategy Fund, and Steben Select Multi-Strategy Master Fund, since 2013; formerly, Treasurer, National Association of Corporate Directors, Connecticut Chapter, 2011 to 2015; formerly, Manager, Larch Lane Multi-Strategy Fund complex (which consisted of three funds), 2006 to 2011; formerly, Member, NASDAQ Issuers' Affairs Committee, 1995 to 2003. | |
289
Name, (Year of Birth),
and Address(1) | | Position(s)
and Length of
Time Served(2) | | Principal Occupation(s)(3) | | Number of
Funds in Fund
Complex
Overseen by
Fund Trustee | | Other Directorships
Held Outside Fund
Complex by Fund
Trustee(3) | |
Tom D. Seip (1950) | | Trustee since 2000; Chairman of the Board since 2008; formerly Lead Independent Trustee from 2006 to 2008 | | General Partner, Ridgefield Farm LLC (a private investment vehicle); formerly, President and CEO, Westaff, Inc. (temporary staffing), May 2001 to January 2002; formerly, Senior Executive, The Charles Schwab Corporation, 1983 to 1998, including Chief Executive Officer, Charles Schwab Investment Management, Inc.; Trustee, Schwab Family of Funds and Schwab Investments, 1997 to 1998; and Executive Vice President-Retail Brokerage, Charles Schwab & Co., Inc., 1994 to 1997. | | 56 | | Director, H&R Block, Inc. (financial services company), since May 2001; Chairman, Governance and Nominating Committee, H&R Block, Inc., since 2011; formerly, Chairman, Compensation Committee, H&R Block, Inc., 2006 to 2010; formerly, Director, Forward Management, Inc. (asset management company), 1999 to 2006. | |
James G. Stavridis (1955) | | Trustee since 2015 | | Dean, Fletcher School of Law and Diplomacy, Tufts University since 2013; formerly, Admiral, United States Navy, 2006 to 2013, including Supreme Allied Commander, NATO and Commander, European Command, 2009 to 2013, and Commander, United States Southern Command, 2006 to 2009. | | 56 | | Director, Utilidata Inc., since 2015; Director, BMC Software Federal, LLC, since 2014; Director, Vertical Knowledge, LLC, since 2013; formerly, Director, Navy Federal Credit Union, 2000-2002. | |
290
Name, (Year of Birth),
and Address(1) | | Position(s)
and Length of
Time Served(2) | | Principal Occupation(s)(3) | | Number of
Funds in Fund
Complex
Overseen by
Fund Trustee | | Other Directorships
Held Outside Fund
Complex by Fund
Trustee(3) | |
Candace L. Straight (1947) | | Trustee since 1993 | | Private investor and consultant specializing in the insurance industry; formerly, Advisory Director, Securitas Capital LLC (a global private equity investment firm dedicated to making investments in the insurance sector), 1998 to 2003. | | 56 | | Formerly, Public Member, Board of Governors and Board of Trustees, Rutgers University, 2011 to 2016; formerly, Director, Montpelier Re Holdings Ltd. (reinsurance company), 2006 to 2015; formerly, Director, National Atlantic Holdings Corporation (property and casualty insurance company), 2004 to 2008; formerly, Director, The Proformance Insurance Company (property and casualty insurance company), 2004 to 2008; formerly, Director, Providence Washington Insurance Company (property and casualty insurance company), 1998 to 2006; formerly, Director, Summit Global Partners (insurance brokerage firm), 2000 to 2005. | |
Peter P. Trapp (1944) | | Trustee since 2000 | | Retired; formerly, Regional Manager for Mid-Southern Region, Ford Motor Credit Company, September 1997 to 2007; formerly, President, Ford Life Insurance Company, April 1995 to August 1997. | | 56 | | None. | |
291
Name, (Year of Birth),
and Address(1) | | Position(s)
and Length of
Time Served(2) | | Principal Occupation(s)(3) | | Number of
Funds in Fund
Complex
Overseen by
Fund Trustee | | Other Directorships
Held Outside Fund
Complex by Fund
Trustee(3) | |
Fund Trustees who are "Interested Persons" | |
Joseph V. Amato* (1962) | | Trustee since 2009 | | President and Director, Neuberger Berman Group LLC, since 2009; President and Chief Executive Officer, Neuberger Berman BD LLC ("Neuberger Berman") and Neuberger Berman Holdings LLC (including its predecessor, Neuberger Berman Inc.), since 2007; Chief Investment Officer (Equities) and President (Equities), Neuberger Berman Investment Advisers LLC ("NBIA") (formerly, Neuberger Berman Fixed Income LLC ("NBFI") and including predecessor entities), since 2007, and Board Member of NBIA since 2006; formerly, Global Head of Asset Management of Lehman Brothers Holdings Inc.'s ("LBHI") Investment Management Division, 2006 to 2009; formerly, member of LBHI's Investment Management Division's Executive Management Committee, 2006 to 2009; formerly, Managing Director, Lehman Brothers Inc. ("LBI"), 2006 to 2008; formerly, Chief Recruiting and Development Officer, LBI, 2005 to 2006; formerly, Global Head of LBI's Equity Sales and a Member of its Equities Division Executive Committee, 2003 to 2005. | | 56 | | Member of Board of Advisors, McDonough School of Business, Georgetown University, since 2001; Member of New York City Board of Advisors, Teach for America, since 2005; Trustee, Montclair Kimberley Academy (private school), since 2007; Member of Board of Regents, Georgetown University, since 2013. | |
292
Name, (Year of Birth),
and Address(1) | | Position(s)
and Length of
Time Served(2) | | Principal Occupation(s)(3) | | Number of
Funds in Fund
Complex
Overseen by
Fund Trustee | | Other Directorships
Held Outside Fund
Complex by Fund
Trustee(3) | |
Robert Conti* (1956) | | Chief Executive Officer, President and Trustee since 2008; prior thereto, Executive Vice President in 2008 and Vice President from 2000 to 2008 | | Managing Director, Neuberger Berman, since 2007; President — Mutual Funds, NBIA, since 2008; formerly, Senior Vice President, Neuberger Berman, 2003 to 2006; formerly, Vice President, Neuberger Berman, 1999 to 2003; President and Chief Executive Officer, twenty-six registered investment companies for which NBIA acts as investment manager and/or administrator. | | 56 | | Director, Staten Island Mental Health Society, since 1994; formerly, Chairman of the Board, Staten Island Mental Health Society, 2008 to 2011. | |
(1) The business address of each listed person is 1290 Avenue of the Americas, New York, NY 10104
(2) Pursuant to the Trust's Trust Instrument, subject to any limitations on the term of service imposed by the By-Laws or any retirement policy adopted by the Trustees, each of these Trustees shall hold office for life or until his or her successor is elected or the Trust terminates; except that (a) any Trustee may resign by delivering a written resignation; (b) any Trustee may be removed with or without cause at any time by a written instrument signed by at least two-thirds of the other Trustees; (c) any Trustee who requests to be retired, or who has become unable to serve, may be retired by a written instrument signed by a majority of the other Trustees; and (d) any Trustee may be removed at any shareholder meeting by a vote of at least two-thirds of the outstanding shares.
(3) Except as otherwise indicated, each individual has held the positions shown during at least the last five years.
* Indicates a Trustee who is an "interested person" within the meaning of the 1940 Act. Mr. Amato and Mr. Conti are interested persons of the Trust by virtue of the fact that each is an officer of NBIA and/or its affiliates.
293
Information about the Officers of the Trust
Name, (Year of Birth),
and Address(1) | | Position(s)
and Length of
Time Served(2) | | Principal Occupation(s)(3) | |
Claudia A. Brandon (1956) | | Executive Vice President since 2008 and Secretary since 1985 | | Senior Vice President, Neuberger Berman, since 2007 and Employee since 1999; Senior Vice President, NBIA, since 2008 and Assistant Secretary since 2004; formerly, Vice President, Neuberger Berman, 2002 to 2006; formerly, Vice President — Mutual Fund Board Relations, NBIA, 2000 to 2008; formerly, Vice President, NBIA, 1986 to 1999 and Employee, 1984 to 1999; Executive Vice President and Secretary, twenty-six registered investment companies for which NBIA acts as investment manager and/or administrator. | |
Agnes Diaz (1971) | | Vice President since 2013 | | Senior Vice President, Neuberger Berman, since 2012; Senior Vice President, NBIA, since 2012 and Employee since 1996; formerly, Vice President, Neuberger Berman, 2007 to 2012; Vice President, ten registered investment companies for which NBIA acts as investment manager and/or administrator. | |
Anthony DiBernardo (1979) | | Assistant Treasurer since 2011 | | Senior Vice President, Neuberger Berman, since 2014; Senior Vice President, NBIA, since 2014, and Employee since 2003; formerly, Vice President, Neuberger Berman, 2009 to 2014; Assistant Treasurer, ten registered investment companies for which NBIA acts as investment manager and/or administrator. | |
Corey A. Issing (1978) | | Chief Legal Officer since 2016 (only for purposes of sections 307 and 406 of the Sarbanes-Oxley Act of 2002) and Anti-Money Laundering Compliance Officer since 2016 | | General Counsel and Head of Compliance — Mutual Funds since 2016 and Managing Director, NBIA, since 2017; formerly, Associate General Counsel (2015 to 2016), Counsel (2007 to 2015), Senior Vice President (2013 — 2016), Vice President (2009 — 2013); Chief Legal Officer (only for purposes of sections 307 and 406 of the Sarbanes-Oxley Act of 2002), twenty-six registered investment companies for which NBIA acts as investment manager and/or administrator; Anti-Money Laundering Compliance Officer, twenty-six registered investment companies for which NBIA acts as investment manager and/or administrator. | |
Sheila R. James (1965) | | Assistant Secretary since 2002 | | Vice President, Neuberger Berman, since 2008 and Employee since 1999; Vice President, NBIA, since 2008; formerly, Assistant Vice President, Neuberger Berman, 2007; Employee, NBIA, 1991 to 1999; Assistant Secretary, twenty-six registered investment companies for which NBIA acts as investment manager and/or administrator. | |
Brian Kerrane (1969) | | Chief Operating Officer since 2015 and Vice President since 2008 | | Managing Director, Neuberger Berman, since 2013; Chief Operating Officer — Mutual Funds and Managing Director, NBIA, since 2015; formerly, Senior Vice President, Neuberger Berman, 2006 to 2014; Vice President, NBIA, 2008 to 2015 and Employee since 1991; Chief Operating Officer, ten registered investment companies for which NBIA acts as investment manager and/or administrator; Vice President, twenty-six registered investment companies for which NBIA acts as investment manager and/or administrator. | |
Josephine Marone (1963) | | Assistant Secretary since 2017 | | Senior Paralegal, Neuberger Berman, since 2007 and Employee since 2007; Assistant Secretary, twenty-six registered investment companies for which NBIA acts as investment manager and/or administrator. | |
294
Name, (Year of Birth),
and Address(1) | | Position(s)
and Length of
Time Served(2) | | Principal Occupation(s)(3) | |
Anthony Maltese (1959) | | Vice President since 2015 | | Senior Vice President, Neuberger Berman, since 2014 and Employee since 2000; Senior Vice President, NBIA, since 2014; Vice President, ten registered investment companies for which NBIA acts as investment manager and/or administrator. | |
Owen F. McEntee, Jr. (1961) | | Vice President since 2008 | | Vice President, Neuberger Berman, since 2006; Vice President, NBIA, since 2006 and Employee since 1992; Vice President, ten registered investment companies for which NBIA acts as investment manager and/or administrator. | |
John M. McGovern (1970) | | Treasurer and Principal Financial and Accounting Officer since 2005 | | Senior Vice President, Neuberger Berman, since 2007; Senior Vice President, NBIA, since 2007 and Employee since 1993; formerly, Vice President, Neuberger Berman, 2004 to 2006; formerly, Assistant Treasurer, 2002 to 2005; Treasurer and Principal Financial and Accounting Officer, twenty-six registered investment companies for which NBIA acts as investment manager and/or administrator. | |
Frank Rosato (1971) | | Assistant Treasurer since 2005 | | Vice President, Neuberger Berman, since 2006; Vice President, NBIA, since 2006 and Employee since 1995; Assistant Treasurer, ten registered investment companies for which NBIA acts as investment manager and/or administrator. | |
Chamaine Williams (1971) | | Chief Compliance Officer since 2005 | | Chief Compliance Officer — Mutual Funds and Senior Vice President, NBIA, since 2006; formerly, Senior Vice President, LBI, 2007 to 2008; formerly, Vice President, LBI, 2003 to 2006; formerly, Chief Compliance Officer, Lehman Brothers Asset Management Inc., 2003 to 2007; formerly, Chief Compliance Officer, Lehman Brothers Alternative Investment Management LLC, 2003 to 2007; Chief Compliance Officer, twenty-six registered investment companies for which NBIA acts as investment manager and/or administrator. | |
(1) The business address of each listed person is 1290 Avenue of the Americas, New York, NY 10104.
(2) Pursuant to the By-Laws of the Trust, each officer elected by the Trustees shall hold office until his or her successor shall have been elected and qualified or until his or her earlier death, inability to serve, or resignation. Officers serve at the pleasure of the Trustees and may be removed at any time with or without cause.
(3) Except as otherwise indicated, each individual has held the positions shown during at least the last five years.
295
Proxy Voting Policies and Procedures
A description of the policies and procedures that the Trust uses to determine how to vote proxies relating to portfolio securities is available, without charge, by calling 800-877-9700 (toll-free) and on the Securities and Exchange Commission's website at www.sec.gov. Information regarding how the Trust voted proxies relating to portfolio securities during the most recent 12-month period ended June 30 is also available upon request, without charge, by calling 800-877-9700 (toll-free), on the Securities and Exchange Commission's website at www.sec.gov, and on Management's website at www.nb.com.
Quarterly Portfolio Schedule
The Trust files a complete schedule of portfolio holdings for each Fund with the Securities and Exchange Commission for the first and third quarters of each fiscal year on Form N-Q. The Trust's Forms N-Q are available on the Securities and Exchange Commission's website at www.sec.gov and may be reviewed and copied at the Securities and Exchange Commission's Public Reference Room in Washington, DC. Information on the operation of the Public Reference Room may be obtained by calling 800-SEC-0330. The information on Form N-Q is available upon request, without charge, by calling 800-877-9700 (toll-free).
Board Consideration of the Management and Sub-Advisory Agreements
On an annual basis, the Board of Trustees (the "Board") of Neuberger Berman Income Funds (the "Trust"), including the Trustees who are not "interested persons" of the Trust or of Neuberger Berman Investment Advisers LLC ("NBIA" or "Management") (including its affiliates) ("Independent Fund Trustees"), considers whether to continue the management agreements with Management (the "Management Agreement") with respect to each series (each a "Fund") and the sub-advisory agreements between Management and Neuberger Berman Europe Limited ("NBEL") (the "Sub-Advisory Agreements" and collectively with the Management Agreement, the "Agreements") with respect to Neuberger Berman Emerging Markets Debt Fund and Neuberger Berman Unconstrained Bond Fund. Throughout the process, the Independent Fund Trustees are advised by counsel that is experienced in Investment Company Act of 1940 matters and that is independent of Management ("Independent Counsel"). At a meeting held on September 28, 2017, the Board, including the Independent Fund Trustees, approved the continuation of the Agreements for each Fund.
In evaluating the Agreements with respect to each Fund, the Board, including the Independent Fund Trustees, reviewed extensive materials provided by Management in response to questions submitted by the Independent Fund Trustees and Independent Counsel, and met with senior representatives of Management regarding its personnel, operations and financial condition as they relate to the Funds. The annual contract review extends over at least two regular meetings of the Board to ensure that Management and NBEL have time to respond to any questions the Independent Fund Trustees may have on their initial review of the materials and that the Independent Fund Trustees have time to consider those responses.
In connection with its deliberations, the Board also considered the broad range of information relevant to the annual contract review that is provided to the Board (including its various standing committees) at meetings throughout the year, including reports on investment performance, portfolio risk and other portfolio information for each Fund, including the use of derivatives if used as part of the Fund's strategy, as well as periodic reports on, among other matters, pricing and valuation; brokerage and execution; compliance; and shareholder and other services provided by Management, NBEL and their affiliates. The Contract Review Committee, which is comprised of Independent Fund Trustees, was established by the Board to assist in its deliberations regarding the annual contract review. The Board has also established other committees that focus throughout the year on specific areas relevant to the annual contract review, such as Fund performance or compliance matters, and that are charged with specific responsibilities regarding the annual contract review. Those committees provide reports to the Contract Review Committee and the full Board, which consider that information as part of the annual contract review process. The Board's Contract Review Committee annually considers and updates the questions it asks of Management in light of developments in the industry, in the markets, in mutual fund regulation and litigation, and in Management's business model.
296
The Independent Fund Trustees received from Independent Counsel a memorandum discussing the legal standards for their consideration of the proposed continuation of the Agreements. During the course of the year and during their deliberations regarding the annual contract review, the Contract Review Committee and the Independent Fund Trustees met with Independent Counsel separately from representatives of Management and NBEL.
Provided below is a description of the Board's contract approval process and the material factors that the Board considered at its meetings regarding renewals of the Agreements and the compensation to be paid thereunder. In connection with its approval of the continuation of the Agreements, the Board evaluated the terms of the Agreements, the overall fairness of the Agreements to each Fund and whether the Agreements were in the best interests of each Fund and Fund shareholders. The Board's determination to approve the continuation of the Agreements was based on a comprehensive consideration of all information provided to the Board throughout the year and specifically in connection with the annual contract review.
This description is not intended to include all of the factors considered by the Board. The Board members did not identify any particular information or factor that was all-important or controlling, and each Trustee may have attributed different weights to the various factors. The Board focused on the costs and benefits of the Agreements to each Fund and, through the Fund, its shareholders.
Nature, Extent and Quality of Services
With respect to the nature, extent and quality of the services provided, the Board considered the investment philosophy and decision-making processes of, and the qualifications, experience, and capabilities of, and the resources available to, the portfolio management personnel of Management and NBEL who perform services for the Funds. The Board noted that Management also provides certain administrative services, including fund accounting and compliance services. The Board also considered Management's and NBEL's policies and practices regarding brokerage, commissions and other trading costs, and allocation of portfolio transactions and reviewed the quality of the execution services that Management had provided. Moreover, the Board considered Management's approach to potential conflicts of interest between each Fund's investments and those of other funds or accounts managed by Management or NBEL.
The Board noted the extensive range of services that Management provides to the Funds beyond the investment management services. The Board noted that Management is also responsible for monitoring compliance with each Fund's investment objectives, policies and restrictions, as well as compliance with applicable law. The Board considered that Management's responsibilities include continual management of investment, operational, enterprise, legal, regulatory and compliance risks as they relate to each Fund, and considered information regarding Management's processes for managing risk. It also noted Management's activities under its contractual obligation to oversee the Funds' various outside service providers, including its renegotiation of certain service providers' fees and its evaluation of service providers' infrastructure, cybersecurity programs and business continuity programs, among other matters. The Board also considered Management's ongoing development of its own infrastructure and information technology to support the Funds through, among other things, cybersecurity, business continuity planning, and risk management. In addition, the Board noted the positive compliance history of Management and NBEL, as no significant compliance problems were reported to the Board with respect to either firm. The Board also considered the general structure of the portfolio managers' compensation and whether this structure provides appropriate incentives to act in the best interests of the Funds. The Board also considered the ability of Management and NBEL to attract and retain qualified personnel to service the Funds.
The Board noted that Management assumes significant ongoing risks with respect to all Funds, including investment, operational, enterprise, litigation, regulatory and compliance risks, for which Management is entitled to compensation. The Board also noted that when Management launches a new fund or share class, it assumes entrepreneurial risk with respect to that fund or class, and that some funds and share classes have been liquidated without ever having been profitable to Management.
As in past years, the Board also considered the manner in which Management addressed various matters that arose during the year, some of them a result of developments in the broader fund industry or the regulations governing it,
297
including the Department of Labor Fiduciary Rule. In addition, the Board considered actions taken by Management and NBEL in response to recent market conditions, such as regulatory concerns about changes in fixed-income market liquidity and potential volatility, and considered the overall performance of Management and NBEL in this context.
Fund Performance
The Board requested a report from an outside consulting firm that specializes in the analysis of fund industry data that compared each Fund's performance, along with its fees and other expenses, to a group of industry peers and a broad universe of similar peers. The Board considered each Fund's performance and fees in light of the limitations inherent in the methodology for constructing such peer groups and determining which investment companies should be included in the peer groups.
With respect to investment performance, the Board considered information regarding each Fund's short-, intermediate- and long-term performance, as applicable, both on an absolute basis and relative to an appropriate benchmark index and the median performance of the composite peer group (constructed by the consulting firm) of investment companies pursuing broadly similar strategies. The Board also reviewed performance in relation to certain measures of the degree of investment risk undertaken by the portfolio managers.
In the case of those Funds that had underperformed their benchmark indices and/or peer groups to an extent, or over a period of time, that the Board found to raise concerns, the Board discussed with Management each such Fund's performance and evaluated steps that Management had taken, or intended to take, to improve performance. The Board also met with the portfolio managers of certain Funds during the period since the last contract renewal to discuss the Fund's performance. The Board also considered Management's responsiveness with respect to the Funds that experienced lagging performance. In this regard, the Board noted that performance, especially short-term performance, is only one of the factors that it deems relevant to its consideration of the Agreements and that, after considering all relevant factors, it may be appropriate to approve the continuation of the Agreements notwithstanding a Fund's underperformance.
Fee Rates, Profitability, and Fall-out Benefits
With respect to the overall fairness of the Agreements, the Board considered the fee structure for each Fund under the Agreements as compared to the peer group provided by the consulting firm. With respect to Neuberger Berman Strategic Income Fund, the Board considered that the Fund invests in affiliated underlying funds and considered the fee structure for that arrangement. The Board reviewed a comparison of each Fund's management fee and total expense ratio to a peer group of comparable funds. The Board noted that the comparative management fee analysis includes, in each Fund's management fee, the separate administrative fees paid to Management, but it was not clear whether this was the case for all funds in the peer group. Accordingly, the Board also considered each Fund's total expense ratio.
The Board compared each Fund's contractual and actual management fees to the mean and median of the contractual and actual management fees, respectively, of that Fund's peer group. (The actual management fees are the contractual management fees reduced by any fee waivers or other adjustments.) Where a Fund's management fee was higher than the peer group mean and/or median, the Board considered whether specific portfolio management, administration or oversight needs contributed to the management fee. The Board also noted that for some classes of certain Funds, the overall expense ratio is maintained through a contractual or voluntary fee cap and/or expense reimbursements by Management.
In concluding that the benefits accruing to Management and its affiliates, including NBEL, by virtue of their relationship with each Fund were reasonable in light of the costs of providing the investment advisory and other services and the benefits accruing to that Fund, the Board reviewed specific data as to Management's profit or loss on each Fund for a recent period on a pre-tax basis without regard to distribution expenses, including year-over-year changes in each of Management's reported expense categories. (The Board also reviewed data on Management's profit or loss on each Fund after distribution expenses and taxes were factored in, as indicators of the health of the business and the extent to which Management is directing its profits into the growth of the business.) The Board considered the cost allocation
298
methodology that Management used in developing its profitability figures. The Board engaged an independent forensic accountant to review the profitability methodology utilized by Management when preparing this information and discussed with the consultant its conclusion that Management's process for calculating and reporting its profit or loss was not unreasonable. Recognizing that there is no uniform methodology within the asset management industry for determining profitability for this purpose and that the use of different reasonable methodologies can give rise to different profit and loss results, the Board requested from Management examples of profitability calculated by different methods and noted that the profitability levels were still reasonable when calculated by these other methods. In addition, the Board recognized that Management's calculations regarding its costs may not reflect all risks, including regulatory, legal, operational, reputational, and, where appropriate, entrepreneurial risks, associated with offering and managing a mutual fund in the current regulatory and market environment. The Board also considered any fall-out benefits likely to accrue to Management or its affiliates from their relationship with each Fund. The Board recognized that Management and its affiliates should be entitled to earn a reasonable level of profits for services they provide to each Fund and, based on its review, concluded that Management's reported level of profitability, if any, on each Fund was reasonable.
Information Regarding Services to Other Clients
The Board also considered whether there were other funds or separate accounts that were advised or sub-advised by Management or its affiliates with investment objectives, policies and strategies that were similar to those of any of the Funds. In the cases where such funds or separate accounts exist, the Board compared the fees charged to the Fund to the fees charged to such comparable funds and/or separate accounts. The Board considered the appropriateness and reasonableness of any differences between the fees charged to a Fund and such comparable funds and/or separate accounts, and determined that differences in fees and fee structures were consistent with the differences in the management and other services provided. The Board explored with Management its assertion that although, generally, the rates of fees paid by such accounts were lower than the fee rates paid by the corresponding Funds, the differences reflected Management's greater level of responsibilities and significantly broader scope of services regarding the Funds, the more extensive regulatory obligations and risks associated with managing the Funds, and other financial considerations with respect to creation and sponsorship of the Funds.
Economies of Scale
The Board also evaluated apparent or anticipated economies of scale in relation to the services Management provides to each Fund. The Board considered whether each Fund's fee structure provides for a reduction of payments resulting from the use of breakpoints and whether any such breakpoints are set at appropriate asset levels. The Board gave careful thought to the size of any breakpoints in each Fund's advisory fees and the asset levels at which they are set. It also considered whether the breakpoints were set at an appropriate level and compared the breakpoint structure to that of the peer group. The Board also considered that Management has provided, at no added cost to the Funds, certain additional services that were required by new regulations or regulatory interpretations, impelled by changes in the securities markets or the business landscape, and/or requested by the Board, and that this is a way of sharing economies of scale with the Funds and their shareholders.
Fund-by-Fund Analysis
With regard to the investment performance of each Fund and the fees charged to each Fund, the Board considered the following information. The peer groups and broad universes of similar funds referenced in this section are those identified by the consulting firm, as discussed above; the risk/return ratios referenced are the Sharpe ratios. The data used to provide the benchmark comparison was provided by Management. In the case of underperformance for the periods reflected, the Board considered the magnitude of that underperformance relative to the peer group median and the benchmark (i.e., the amount by which a Fund underperformed, including, for example, whether the Fund slightly underperformed or significantly underperformed the peer group median or benchmark). Where a Fund has more than one class of shares outstanding, information for Institutional Class has been provided below. The Board also reviewed information related to the other classes of shares, some of which have higher fees and expenses reflecting their separate
299
distribution and servicing arrangements. The Board considered that, to the extent those classes have higher expenses, their performance will be lower than that of Institutional Class.
• Neuberger Berman Core Bond Fund (Institutional Class)—The Board considered that, as compared to its peer group, the Fund's contractual management fee was equal to the median, but the actual management fee net of fees waived by Management was lower than the median. The Board considered that, as compared to its peer group, the Fund's performance was lower than the median for the 1, 3, 5, and 10-year periods. The Board also considered that, as compared to its benchmark, the Fund's performance was higher for the 1, 5, and 10-year periods, but lower for the 3-year period. In determining to renew the Management Agreement, the Board considered the Fund's history of delivering performance above its benchmark for most historical periods and very close to the average performance of the broad universe of core bond funds, but with risk/return ratios that were better than the median of the broad universe, over the 3 and 5-year periods.
• Neuberger Berman Emerging Markets Debt Fund (Institutional Class)—The Board considered that, as compared to its peer group, the Fund's contractual management fee and the actual management fee net of fees waived by Management were both lower than the respective medians. The Board also noted that Management, in response to Board requests and/or market pressures, had recently lowered its fee caps for the Fund. The Board considered that, as compared to its peer group, the Fund's performance was lower than the median for the 1 and 3-year periods. The Board also considered that, as compared to its benchmark, the Fund's performance was lower for the 1 and 3-year periods. The Fund was launched in 2013 and therefore does not have 5 or 10-year performance. In determining to renew the Management Agreement, the Board considered the Fund's very strong performance versus its benchmark year-to-date through August 31, which placed it in the top decile against its peer group for the period. The Board met with a member of the portfolio management team to better understand the Fund's performance and volatility.
• Neuberger Berman Floating Rate Income Fund (Institutional Class)—The Board considered that, as compared to its peer group, the Fund's contractual management fee was higher than the median, but the actual management fee net of fees waived by Management was lower than the median. The Board considered that, as compared to its peer group, the Fund's performance was higher than the median for the 1-year period, but lower than the median for the 3 and 5-year periods. The Board also considered that, as compared to its benchmark, the Fund's performance was lower for the 1, 3, and 5-year periods. The Fund was launched in 2009 and therefore does not have 10-year performance. The Board met with the Portfolio Managers prior to renewing the contract. In determining to renew the Management Agreement, the Board considered that for the 3 and 5-year periods, the Fund slightly out-performed the average of the broad universe of loan participation funds and showed a risk/return ratio that was better than the median of the broad universe for the same periods.
• Neuberger Berman High Income Bond Fund (Institutional Class)—The Board considered that, as compared to its peer group, the Fund's contractual management fee and the actual management fee were both higher than the respective medians. The Board considered that, as compared to its peer group, the Fund's performance was lower than the median for the 1, 3, and 5-year periods. The Board also considered that, as compared to its benchmark, the Fund's performance was lower for the 1, 3, and 5-year periods. The Fund's Institutional Class was launched in 2009 and therefore does not have 10-year performance. The Board met with the portfolio managers to better understand the factors affecting the Fund's performance. In determining to renew the Management Agreement, the Board considered management's representation that the Fund's underperformance largely reflected its positioning in the higher quality portion of the high income bond market. The Board also considered management's representation that this bias toward higher quality is not reflected in a comparison of the Fund's risk/return ratio to those of other funds in its broad universe because recent years have been a relatively benign period for high income corporate bonds of all ratings, as reflected in the fact that for an extended period of time the default rate for all high income bonds as a group has been lower than the long-term average default rate for high income bonds. The Board also considered that, although the Fund's contractual management fee and the actual management fee were both higher than the respective medians, the Fund's total expense ratio was lower than the peer group median.
300
• Neuberger Berman Municipal High Income Bond Fund (Institutional Class)—The Board considered that, as compared to its peer group, the Fund's contractual management fee and the actual management fee net of fees waived by Management were both lower than the respective medians. The Board considered that, as compared to its peer group, the Fund's performance was equal to the median for the 1-year period. The Board also considered that, as compared to its benchmark, the Fund's performance was lower for the 1-year period. The Fund was launched in 2015 and therefore does not have 3, 5 or 10-year performance. In determining to renew the Management Agreement, the Board considered that the Fund showed strong year-to-date performance through August 31 and had outperformed its benchmark for the period since inception.
• Neuberger Berman Municipal Intermediate Bond Fund (Institutional Class)—The Board considered that, as compared to its peer group, the Fund's contractual management fee and the actual management fee net of fees waived by Management were both lower than the respective medians. The Board considered that, as compared to its peer group, the Fund's performance was higher than the median for the 1 and 3-year periods, but lower than the median for the 5-year period. The Board also considered that, as compared to its benchmark, the Fund's performance was higher for the 1, 3, and 5-year periods. The Fund's Institutional Class was launched in 2010 and therefore does not have 10-year performance. In determining to renew the Management Agreement, the Board considered that the Fund has performed well compared to its peer group and its benchmark, and that its risk/return ratio was better than the median of the broad universe of intermediate municipal debt funds for the 3 and 5-year periods.
• Neuberger Berman New York Municipal Income Fund (Institutional Class)—The Board considered that, as compared to its peer group, the Fund's contractual management fee and the actual management fee were both lower than the respective medians. The Board considered that, as compared to its peer group, the Fund's performance was higher than the median for the 1 and 3-year periods. The Board also considered that, as compared to its benchmark, the Fund's performance was higher for the 1 and 3-year periods. NBIA assumed the management of the Fund in 2013; therefore, the Fund does not have 5 or 10-year performance under Management's management. In determining to renew the Management Agreement, the Board considered that the Fund has performed well compared to its peer group and its benchmark, and that its risk/return ratio was better than the median of the broad universe of New York intermediate municipal debt funds over the 3-year period.
• Neuberger Berman Short Duration Bond Fund (Institutional Class)—The Board considered that, as compared to its peer group, the Fund's contractual management fee was equal to the median, but the actual management fee net of fees waived by Management was lower than the median. The Board considered that, as compared to its peer group, the Fund's performance was lower than the median for the 1, 3, and 5-year periods. The Board also considered that, as compared to its benchmark, the Fund's performance was lower for the 1 and 3-year periods, but higher for the 5-year period. The Fund's Institutional Class was launched in 2010 and therefore does not have 10-year performance. In determining to renew the Management Agreement, the Board considered that Management added a new portfolio manager to the team in February 2017, that there had been a slight increase in performance year-to-date through August 31, and that the Fund's risk/return ratio was better than the median of the broad universe of short investment grade debt funds for the 5-year period.
• Neuberger Berman Short Duration High Income Fund (Institutional Class)—The Board considered that, as compared to its peer group, the Fund's contractual management fee and the actual management fee net of fees waived by Management were both lower than the respective medians. The Board considered that, as compared to its peer group, the Fund's performance was lower than the median for the 1 and 3-year periods. The Board also considered that, as compared to its benchmark, the Fund's performance was lower for the 1 and 3-year periods. The Fund was launched in 2012 and therefore does not have 5 or 10-year performance. The Board met with the portfolio managers to better understand the factors affecting the Fund's performance. In determining to renew the Management Agreement, the Board considered management's representation that the Fund's underperformance largely reflected its positioning in the higher quality portion of the high income bond market. The Board also considered management's representation that this bias toward higher quality is not reflected in a
301
comparison of the Fund's risk/return ratio to those of other funds in its broad universe because recent years have been a relatively benign period for high income corporate bonds of all ratings, as reflected in the fact that for an extended period of time, the default rate for all high income bonds as a group has been lower than the long-term average default rate for high income bonds.
• Neuberger Berman Strategic Income Fund (Institutional Class)—The Board considered that, as compared to its peer group, the Fund's contractual management fee and the actual management fee net of fees waived by Management had both been higher than the respective medians. The Board also noted that Management, in response to Board requests and/or market pressures, had recently lowered its contractual management fees and fee caps for the Fund. The Board considered that, as compared to its peer group, the Fund's performance was lower than the median for the 1, 3, 5, and 10-year periods. The Board also considered that, as compared to its benchmark, the Fund's performance was higher for the 1, 5 and 10-year periods, but lower for the 3-year period. In determining to renew the Management Agreement, the Board considered that the Fund out-performed its benchmark for the 1, 5 and 10-year periods and that its risk/return ratio was nearly equal to or was better than the median of multi-sector income funds for the 3 and 5-year periods. The Board also considered the Fund's strong performance year-to-date through August 31.
• Neuberger Berman Unconstrained Bond Fund (Institutional Class)—The Board considered that, as compared to its peer group, the Fund's contractual management fee was equal to the median, but the actual management fee net of fees waived by Management was lower than the median. The Board considered that, as compared to its peer group, the Fund's performance was lower than the median for the 1-year period. The Board also considered that, as compared to its benchmark, the Fund's performance was higher for the 1-year period. The Fund was launched in 2014 and therefore does not have 3, 5 or 10-year performance. In determining to renew the Management Agreement, the Board considered that the Fund performed well versus its benchmark year-to-date through August 31. The Board also considered that a new portfolio manager had been added to the team in February 2016.
Conclusions
In approving the continuation of the Agreements, the Board concluded that, in its business judgment, the terms of each Agreement are fair and reasonable to each Fund and that approval of the continuation of the Agreements is in the best interests of each Fund and its shareholders. In reaching this determination, the Board considered that Management and NBEL could be expected to continue to provide a high level of service to each Fund; that the performance of each Fund was satisfactory over time, or, in the case of an underperforming Fund, that the Board retained confidence in Management's and NBEL's capabilities to manage the Fund; that each Fund's fee structure appeared to the Board to be reasonable given the nature, extent and quality of services provided; and that the benefits accruing to Management and its affiliates by virtue of their relationship with each Fund were reasonable in light of the costs of providing the investment advisory and other services and the benefits accruing to each Fund. The Board's conclusions may be based in part on its consideration of materials prepared in connection with the approval or continuance of the Agreements in prior years and on the Board's ongoing regular review of Fund performance and operations throughout the year, in addition to material prepared specifically for the most recent annual review of the Agreements.
Notice to Shareholders
For the fiscal period ended October 31, 2017 the percentages representing the portion of distributions from net investment income that is exempt from federal tax, other than alternative minimum tax are as follows:
Municipal High Income | | | 99.86 | % | |
Municipal Intermediate Bond | | | 100.00 | % | |
New York Municipal Income | | | 99.97 | % | |
302
For the fiscal period ended October 31, 2017, the maximum amount of ordinary income distribution that is designated as qualified interest income, pursuant to the American Jobs Creation Act of 2004, is as follows:
| | | Ordinary
Income | | Short-Term
Capital Gains | |
Core Bond | | $ | 8,126,835 | | | $ | 1,991,714 | | |
Floating Rate Income | | | 15,288,456 | | | | — | | |
High Income | | | 184,976,211 | | | | — | | |
Strategic Income | | | 76,548,896 | | | | — | | |
In January 2018, you will receive information to be used in filing your 2017 tax returns, which will include a notice of the exact tax status of all dividends paid to you by each Fund during calendar year 2017. Please consult your own tax advisor for details as to how this information should be reflected on your tax returns.
Municipal High Income, Municipal Intermediate Bond and New York Municipal Income designate $49,229, $1,380,344 and $497,281, respectively, as a capital gain distribution.
303
Neuberger Berman Investment Advisers LLC
1290 Avenue of the Americas
New York, NY 10104-0002
Retail Services: 800.877.9700
Broker-Dealer and Institutional Services: 800.366.6264/888.556.9030
Web site: www.nb.com
Statistics and projections in this report are derived from sources deemed to be reliable but cannot be regarded as a representation of future results of the Funds. This report is prepared for the general information of shareholders and is not an offer of shares of the Funds. Shares are sold only through the currently effective prospectus, which you can obtain by calling 1.877.628.2583. An investor should consider a Fund's investment objectives, risks, fees and expenses, which are described in its prospectus, before investing.
H0648 12/17
Item 2. Code of Ethics.
The Board of Trustees (“Board”) of Neuberger Berman Income Funds (“Registrant”) has adopted a code of ethics that applies to the Registrant’s principal executive officer, principal financial officer, principal accounting officer or controller, or persons performing similar functions (“Code of Ethics”). During the period covered by this Form N-CSR, there were no substantive amendments to the Code of Ethics and there were no waivers from the Code of Ethics granted to the Registrant’s principal executive officer, principal financial officer, principal accounting officer or controller, or persons performing similar functions.
A copy of the Code of Ethics is incorporated by reference to Neuberger Berman Advisers Management Trust’s Form N-CSRS, Investment Company Act file number 811-04255 (filed August 25, 2016). The Code of Ethics is also available, without charge, by calling 1-800-877-9700 (toll-free).
Item 3. Audit Committee Financial Expert.
The Board has determined that the Registrant has two audit committee financial experts serving on its audit committee. The Registrant’s audit committee financial experts are Michael J. Cosgrove and Deborah C. McLean. Mr. Cosgrove and Ms. McLean are independent trustees as defined by Form N-CSR.
Item 4. Principal Accountant Fees and Services.
Ernst & Young LLP (“E&Y”) serves as independent registered public accounting firm to Neuberger Berman Emerging Markets Debt Fund, Neuberger Berman High Income Bond Fund, Neuberger Berman Municipal Intermediate Bond Fund, Neuberger Berman Short Duration Bond Fund, Neuberger Berman Strategic Income Fund and Neuberger Berman Unconstrained Bond Fund. Neuberger Berman Emerging Markets Debt Fund, Neuberger Berman High Income Bond Fund, Neuberger Berman Municipal Intermediate Bond Fund, Neuberger Berman Short Duration Bond Fund, Neuberger Berman Strategic Income Fund and Neuberger Berman Unconstrained Bond Fund commenced operations on September 27, 2013, February 1, 1992, July 9, 1987, June 9, 1986, July 11, 2003, and February 13, 2014, respectively.
Tait, Weller & Baker LLP (“Tait Weller”) serves as independent registered public accounting firm to Neuberger Berman Core Bond Fund, Neuberger Berman Core Plus Fund, Neuberger Berman Floating Rate Income Fund, Neuberger Berman Municipal High Income Fund, Neuberger Berman New York Municipal Income Fund and Neuberger Berman Short Duration High Income Fund. Neuberger Berman Core Bond Fund, Neuberger Berman Core Plus Fund, Neuberger Berman Floating Rate Income Fund, Neuberger Berman Municipal High Income Fund, Neuberger Berman New York Municipal Income Fund and Neuberger Berman Short Duration High Income Fund commenced operations on October 1, 1995, July 18, 2017, December 29, 2009, June 22, 2015, March 11, 2013, and September 28, 2012, respectively.
(a) Audit Fees
The aggregate fees billed for professional services rendered by E&Y for the audit of the annual financial statements or services that are normally provided by E&Y in connection with statutory and regulatory filings or engagements were $317,020 and $317,020 for the fiscal years ended 2016 and 2017, respectively.
The aggregate fees billed for professional services rendered by Tait Weller for the audit of the annual financial statements or services that are normally provided by Tait Weller in connection with statutory and regulatory filings or engagements were $136,645 and $163,020 for the fiscal years ended 2016 and 2017, respectively.
(b) Audit-Related Fees
The aggregate fees billed to the Registrant for assurance and related services by E&Y that are reasonably related to the performance of the audit of the Registrant’s financial statements and are not reported above in Audit Fees were $0 and $0 for the fiscal years ended 2016 and 2017, respectively. The Audit Committee approved 0% and 0% of these services provided by E&Y for the fiscal years ended 2016 and 2017, respectively, pursuant to the waiver provisions of Rule 2-01(c)(7)(i)(C) of Regulation S-X.
The fees billed to other entities in the investment company complex for assurance and related services by E&Y that are reasonably related to the performance of the audit that the Audit Committee was required to approve because the engagement related directly to the operations and financial reporting of the Registrant were $0 and $0 for the fiscal years ended 2016 and 2017, respectively. The Audit Committee approved 0% and 0% of these services provided by E&Y for the fiscal years ended 2016 and 2017, respectively, pursuant to the waiver provisions of Rule 2-01(c)(7)(i)(C) of Regulation S-X.
The aggregate fees billed to the Registrant for assurance and related services by Tait Weller that are reasonably related to the performance of the audit of the Registrant’s financial statements and are not reported above in Audit Fees were $0 and $0 for the fiscal years ended 2016 and 2017, respectively. The Audit Committee approved 0% and 0% of these services provided by Tait Weller for the fiscal years ended 2016 and 2017, respectively, pursuant to the waiver provisions of Rule 2-01(c)(7)(i)(C) of Regulation S-X.
The fees billed to other entities in the investment company complex for assurance and related services by Tait Weller that are reasonably related to the performance of the audit that the Audit Committee was required to approve because the engagement related directly to the operations and financial reporting of the Registrant were $0 and $0 for the fiscal years ended 2016 and 2017, respectively. The Audit Committee approved 0% and 0% of these services provided by Tait Weller for the fiscal years ended 2016 and 2017, respectively, pursuant to the waiver provisions of Rule 2-01(c)(7)(i)(C) of Regulation S-X.
(c) Tax Fees
The aggregate fees billed to the Registrant for professional services rendered by E&Y for tax compliance, tax advice, and tax planning were $69,000 and $69,000 for the fiscal years ended 2016 and 2017, respectively. The nature of the services provided includes preparation of the Federal and State tax extensions and tax returns, review of annual excise tax calculations, and preparation of form 8613, in addition to guidance with the identification of Passive Foreign Investment Companies ("PFICs"), assistance with determination of various foreign withholding taxes, and assistance with Internal Revenue Code and tax regulation requirements for fund investments. The Audit Committee approved 0% and 0% of these services provided by E&Y for the fiscal years ended 2016 and 2017, respectively, pursuant to the waiver provisions of Rule 2-01(c)(7)(i)(C) of Regulation S-X.
The fees billed to other entities in the investment company complex for professional services rendered by E&Y for tax compliance, tax advice, and tax planning that the Audit Committee was required to approve because the engagement related directly to the operations and financial reporting of the Registrant were $0 and $0 for the fiscal years ended 2016 and 2017, respectively. The Audit Committee approved 0% and 0% of these services provided by E&Y for the fiscal years ended 2016 and 2017, respectively, pursuant to the waiver provisions of Rule 2-01(c)(7)(i)(C) of Regulation S-X.
The aggregate fees billed to the Registrant for professional services rendered by Tait Weller for tax compliance, tax advice, and tax planning were $28,150 and $29,155 for the fiscal years ended 2016 and 2017, respectively. The nature of the services provided includes preparation of the Federal and State tax extensions and tax returns, review of annual excise tax calculations, and preparation of form 8613, in addition to guidance with the identification of PFICs, assistance with determination of various foreign withholding taxes, and assistance with Internal Revenue Code and tax regulation requirements for fund investments. The Audit Committee approved 0% and 0% of these services provided by Tait Weller for the fiscal years ended 2016 and 2017, respectively, pursuant to the waiver provisions of Rule 2-01(c)(7)(i)(C) of Regulation S-X.
The fees billed to other entities in the investment company complex for professional services rendered by Tait Weller for tax compliance, tax advice, and tax planning that the Audit Committee was required to approve because the engagement related directly to the operations and financial reporting of the Registrant were $0 and $0 for the fiscal years ended 2016 and 2017, respectively. The Audit Committee approved 0% and 0% of these services provided by Tait Weller for the fiscal years ended 2016 and 2017, respectively, pursuant to the waiver provisions of Rule 2-01(c)(7)(i)(C) of Regulation S-X.
(d) All Other Fees
The aggregate fees billed to the Registrant for products and services provided by E&Y, other than services reported in Audit Fees, Audit-Related Fees, and Tax Fees were $0 and $0 for the fiscal years ended 2016 and 2017, respectively. The Audit Committee approved 0% and 0% of these services provided by E&Y for the fiscal years ended 2016 and 2017, respectively, pursuant to the waiver provisions of Rule 2-01(c)(7)(i)(C) of Regulation S-X.
The fees billed to other entities in the investment company complex for products and services provided by E&Y, other than services reported in Audit Fees, Audit-Related Fees, and Tax Fees that the Audit Committee was required to approve because the engagement related directly to the operations and financial reporting of the Registrant were $0 and $0 for the fiscal years ended 2016 and 2017, respectively. The Audit Committee approved 0% and 0% of these services provided by E&Y for the fiscal years ended 2016 and 2017, respectively, pursuant to the waiver provisions of Rule 2-01(c)(7)(i)(C) of Regulation S-X.
The aggregate fees billed to the Registrant for products and services provided by Tait Weller, other than services reported in Audit Fees, Audit-Related Fees, and Tax Fees were $0 and $0 for the fiscal years ended 2016 and 2017, respectively. The Audit Committee approved 0% and 0% of these services provided by Tait Weller for the fiscal years ended 2016 and 2017, respectively, pursuant to the waiver provisions of Rule 2-01(c)(7)(i)(C) of Regulation S-X.
The fees billed to other entities in the investment company complex for products and services provided by Tait Weller, other than services reported in Audit Fees, Audit-Related Fees, and Tax Fees that the Audit Committee was required to approve because the engagement related directly to the operations and financial reporting of the Registrant were $0 and $0 for the fiscal years ended 2016 and 2017, respectively. The Audit Committee approved 0% and 0% of these services provided by Tait Weller for the fiscal years ended 2016 and 2017, respectively, pursuant to the waiver provisions of Rule 2-01(c)(7)(i)(C) of Regulation S-X.
(e) Audit Committee’s Pre-Approval Policies and Procedures
(1) The Audit Committee’s pre-approval policies and procedures for the Registrant to engage an accountant to render audit and non-audit services delegate to each member of the Committee the power to pre-approve services between meetings of the Committee.
(2) None of the services described in paragraphs (b) through (d) above were approved by the Audit Committee pursuant to paragraph (c)(7)(i)(C) of Rule 2-01 of Regulation S-X.
(f) Hours Attributed to Other Persons
Not applicable.
(g) Non-Audit Fees
Non-audit fees billed by E&Y for services rendered to the Registrant were $69,000 and $69,000 for the fiscal years ended 2016 and 2017, respectively.
Non-audit fees billed by E&Y for services rendered to the Registrant’s investment adviser and any entity controlling, controlled by, or under common control with the adviser that provides ongoing services to the Registrant were $0 and $0 for the fiscal years ended 2016 and 2017, respectively.
Non-audit fees billed by Tait Weller for services rendered to the Registrant were $0 and $0 for the fiscal years ended 2016 and 2017, respectively.
Non-audit fees billed by Tait Weller for services rendered to the Registrant’s investment adviser and any entity controlling, controlled by, or under common control with the adviser that provides ongoing services to the Registrant were $0 and $0 for the fiscal years ended 2016 and 2017, respectively.
(h) The Audit Committee of the Board considered whether the provision of non-audit services rendered to the Registrant’s investment adviser and any entity controlling, controlled by, or under common control with the adviser that provides ongoing services to the Registrant that were not pre-approved by the Audit Committee because the engagement did not relate directly to the operations and financial reporting of the Registrant is compatible with maintaining E&Y’s and Tait Weller’s independence.
Item 5. Audit Committee of Listed Registrants.
Not applicable to the Registrant.
Item 6. Schedule of Investments.
The complete schedule of investments for each series is disclosed in the Registrant’s applicable annual report included as Item 1 of this Form N-CSR.
Item 7. Disclosure of Proxy Voting Policies and Procedures for Closed-End Management Investment Companies.
Not applicable to the Registrant.
Item 8. Portfolio Managers of Closed-End Management Investment Companies.
Not applicable to the Registrant.
Item 9. Purchases of Equity Securities by Closed-End Management Investment Company and Affiliated Purchasers.
Not applicable to the Registrant.
Item 10. Submission of Matters to a Vote of Security Holders.
There were no changes to the procedures by which shareholders may recommend nominees to the Board.
Item 11. Controls and Procedures.
| (a) | Based on an evaluation of the disclosure controls and procedures (as defined in Rule 30a-3(c) under the Act) as of a date within 90 days of the filing date of this report, the Chief Executive Officer and President and the Treasurer and Principal Financial and Accounting Officer of the Registrant have concluded that such disclosure controls and procedures are effectively designed to ensure that information required to be disclosed by the Registrant on Form N-CSR is accumulated and communicated to the Registrant’s management to allow timely decisions regarding required disclosure. |
| (b) | There were no significant changes in the Registrant’s internal controls over financial reporting (as defined in Rule 30a-3(d) under the Act) that occurred during the Registrant’s second fiscal quarter of the period covered by this report that have materially affected, or are reasonably likely to materially affect, the Registrant’s internal control over financial reporting. |
Item 12. Disclosure of Securities Lending Activities for Closed-End Management Investment Companies.
Not applicable to the Registrant.
Item 13. Exhibits.
| (a)(1) | A copy of the Code of Ethics is incorporated by reference to Neuberger Berman Advisers Management Trust’s Form N-CSRS, Investment Company Act file number 811-04255 (filed August 25, 2016). |
| (a)(2) | The certifications required by Rule 30a-2(a) under the Act and Section 302 of the Sarbanes-Oxley Act of 2002 (“Sarbanes-Oxley Act”) are filed herewith. |
| (a)(3) | Not applicable to the Registrant. |
| (a)(4) | Not applicable to the Registrant. |
| (b) | The certification required by Rule 30a-2(b) under the Act and Section 906 of the Sarbanes-Oxley Act is furnished herewith. |
The certification furnished pursuant to Rule 30a-2(b) under the Act and Section 906 of the Sarbanes-Oxley Act will not be deemed “filed” for purposes of Section 18 of the Securities Exchange Act of 1934, as amended (“Exchange Act”), or otherwise subject to the liability of that section. Such certification will not be deemed to be incorporated by reference into any filing under the Securities Act of 1933, as amended, or the Exchange Act, except to the extent that the Registrant specifically incorporates it by reference.
SIGNATURES
Pursuant to the requirements of the Securities Exchange Act of 1934 and the Investment Company Act of 1940, the Registrant has duly caused this report to be signed on its behalf by the undersigned, thereunto duly authorized.
Neuberger Berman Income Funds
| By: | /s/ Robert Conti | |
| | Robert Conti | |
| | Chief Executive Officer and President | |
| | | |
| Date: | January 4, 2018 | |
| | | |
| | | |
| Pursuant to the requirements of the Securities Exchange Act of 1934 and the Investment Company Act of 1940, this report has been signed below by the following persons on behalf of the Registrant and in the capacities and on the dates indicated. |
| | | |
| | | |
| | | |
| By: | /s/ Robert Conti | |
| | Robert Conti | |
| | Chief Executive Officer and President | |
| | | |
| Date: | January 4, 2018 | |
| | | |
| | | |
| | | |
| By: | /s/ John M. McGovern | |
| | John M. McGovern | |
| | Treasurer and Principal Financial | |
| | and Accounting Officer | |
| | | |
| Date: | January 4, 2018 | |