As filed with the Securities and Exchange Commission on January 2, 2020
UNITED STATES
SECURITIES AND EXCHANGE COMMISSION
Washington, D.C. 20549
FORM N-CSR
CERTIFIED SHAREHOLDER REPORT OF
REGISTERED MANAGEMENT INVESTMENT COMPANIES
Investment Company Act file number: 811-03802
NEUBERGER BERMAN INCOME FUNDS
(Exact name of registrant as specified in charter)
c/o Neuberger Berman Investment Advisers LLC
1290 Avenue of the Americas
New York, New York 10104-0002
(Address of principal executive offices – Zip Code)
Joseph V. Amato
Chief Executive Officer and President
Neuberger Berman Income Funds
c/o Neuberger Berman Investment Advisers LLC
1290 Avenue of the Americas
New York, New York 10104-0002
Arthur C. Delibert, Esq.
K&L Gates LLP
1601 K Street, N.W.
Washington, D.C. 20006-1600
(Names and addresses of agents for service)
Registrant's telephone number, including area code: (212) 476-8800
Date of fiscal year end: October 31
Date of reporting period: October 31, 2019
Form N-CSR is to be used by management investment companies to file reports with the Commission not later than 10 days after the transmission to stockholders of any report that is required to be transmitted to stockholders under Rule 30e-1 under the Investment Company Act of 1940, as amended (“Act”) (17 CFR 270.30e-1). The Commission may use the information provided on Form N-CSR in its regulatory, disclosure review, inspection, and policymaking roles.
A registrant is required to disclose the information specified by Form N-CSR, and the Commission will make this information public. A registrant is not required to respond to the collection of information contained in Form N-CSR unless the Form displays a currently valid Office of Management and Budget (“OMB”) control number. Please direct comments concerning the accuracy of the information collection burden estimate and any suggestions for reducing the burden to Secretary, Securities and Exchange Commission, 100 F Street, NE, Washington, DC 20549-1090. The OMB has reviewed this collection of information under the clearance requirements of 44 U.S.C. § 3507.
Item 1. Report to Shareholders.
Following is a copy of the annual report transmitted to shareholders pursuant to Rule 30e-1 under the Act.

Neuberger Berman
Income Funds
Investor Class Shares
Trust Class Shares
Institutional Class Shares
Core Bond Fund
Emerging Markets Debt Fund
Floating Rate Income Fund
High Income Bond Fund
Municipal High Income Fund
Municipal Impact Fund
Class A Shares
Class C Shares
Class R3 Shares
Class R6 Shares
Municipal Intermediate Bond Fund
Short Duration Bond Fund
Short Duration High Income Fund
Strategic Income Fund
Unconstrained Bond Fund
Annual Report
October 31, 2019
Beginning on January 1, 2021, as permitted by regulations adopted by the U.S. Securities and Exchange Commission, paper copies of the Fund's annual and semi-annual shareholder reports will no longer be sent by mail, unless you specifically request paper copies of the reports. Instead, the reports will be made available on the Fund's website www.nb.com/fundliterature, and you will be notified by mail each time a report is posted and provided with a website link to access the report.
If you already elected to receive shareholder reports electronically, you will not be affected by this change and you need not take any action. You may elect to receive shareholder reports and other communications from the Fund electronically anytime by contacting your financial intermediary (such as a broker-dealer or bank) or, if you are a direct investor, by calling 800.877.9700 or by sending an e-mail request to fundinfo@nb.com.
Beginning on January 1, 2019, you may elect to receive all future reports in paper free of charge. If you invest through a financial intermediary, you can contact your financial intermediary to request that you continue to receive paper copies of your shareholder reports. If you invest directly with the Fund, you can call 800.877.9700 or send an email request to fundinfo@nb.com to inform the Fund that you wish to continue receiving paper copies of your shareholder reports. Your election to receive reports in paper will apply to all funds held in your account if you invest through your financial intermediary or all funds held with the fund complex if you invest directly with the Fund.
Contents
THE FUNDS
PORTFOLIO COMMENTARY
Core Bond Fund | | | 2 | | |
Emerging Markets Debt Fund | | | 5 | | |
Floating Rate Income Fund | | | 9 | | |
High Income Bond Fund | | | 12 | | |
Municipal High Income Fund | | | 15 | | |
Municipal Impact Fund | | | 18 | | |
Municipal Intermediate Bond Fund | | | 21 | | |
Short Duration Bond Fund | | | 24 | | |
Short Duration High Income Fund | | | 27 | | |
Strategic Income Fund | | | 30 | | |
Unconstrained Bond Fund | | | 33 | | |
FUND EXPENSE INFORMATION | | | 42 | | |
LEGEND | | | 45 | | |
SCHEDULE OF INVESTMENTS
Core Bond Fund | | | 47 | | |
Emerging Markets Debt Fund | | | 58 | | |
Positions by Industry | | | 74 | | |
Floating Rate Income Fund | | | 86 | | |
High Income Bond Fund | | | 100 | | |
Municipal High Income Fund | | | 115 | | |
Municipal Impact Fund | | | 124 | | |
Municipal Intermediate Bond Fund | | | 129 | | |
Short Duration Bond Fund | | | 138 | | |
Short Duration High Income Fund | | | 146 | | |
Strategic Income Fund | | | 158 | | |
Unconstrained Bond Fund | | | 210 | | |
FINANCIAL STATEMENTS | | | 230 | | |
FINANCIAL HIGHLIGHTS (ALL CLASSES)/PER SHARE DATA
Core Bond Fund | | | 272 | | |
Emerging Markets Debt Fund | | | 274 | | |
Floating Rate Income Fund | | | 274 | | |
High Income Bond Fund | | | 276 | | |
Municipal High Income Fund | | | 278 | | |
Municipal Impact Fund | | | 280 | | |
Municipal Intermediate Bond Fund | | | 280 | | |
Short Duration Bond Fund | | | 282 | | |
Short Duration High Income Fund | | | 284 | | |
Strategic Income Fund | | | 284 | | |
Unconstrained Bond Fund | | | 286 | | |
Reports of Independent Registered Public Accounting Firms | | | 292 | | |
Directory | | | 294 | | |
Trustees and Officers | | | 295 | | |
Proxy Voting Policies and Procedures | | | 305 | | |
Quarterly Portfolio Schedule | | | 305 | | |
Board Consideration of the Management Agreements | | | 305 | | |
Notice to Shareholders | | | 312 | | |
The "Neuberger Berman" name and logo and "Neuberger Berman Investment Advisers LLC" name are registered service marks of Neuberger Berman Group LLC. The individual Fund names in this piece are either service marks or registered service marks of Neuberger Berman Investment Advisers LLC, an affiliate of Neuberger Berman BD LLC, distributor, member FINRA. ©2019 Neuberger Berman BD LLC, distributor. All rights reserved.
Dear Shareholder,
I am pleased to present this annual shareholder report for the Neuberger Berman Income Funds.
The slow-but-positive U.S. economic expansion continued over the 12 months ended October 31, 2019 (reporting period), supported largely by resilient personal consumption and a strong labor market. In terms of the latter, the unemployment rate was reported at 3.6% in October 2019, close to its lowest reading in nearly 50 years. However, other areas of the U.S. economy showed signs of softening. For example, in August 2019, measures of manufacturing sector activity slipped into contraction territory, the first such occurrence in three years. Elsewhere, growth outside of the U.S. continued to weaken amid mounting global trade and geopolitical headwinds.
Against this backdrop, key central banks shifted away from a desire to normalize policy to a desire to support growth. The U.S. Federal Reserve Board (Fed), after raising interest rates four times in calendar year 2018, lowered rates three times in 2019. Elsewhere, the European Central Bank cut policy rates and announced a new round of quantitative easing, while the Bank of Japan signaled they were prepared to implement more accommodative policy as needed.
U.S. Treasury yields rallied meaningfully over the reporting period. Both short- and long-dated Treasury yields declined, seemingly fueled by growing fears of moderating global growth. Furthermore, at times investors were drawn to the relative safety of government bonds given uncertainties surrounding the trade negotiations between the U.S. and China, questions regarding Brexit and a number of geopolitical issues.
In this environment, the Bloomberg Barclays U.S. Aggregate Bond Index returned 11.51% during the reporting period. Other fixed income subsectors also produced solid absolute returns, including investment-grade and non-investment grade credit, emerging markets debt and select securitized sectors.
Looking ahead, we anticipate the U.S. economy to continue its soft landing trajectory—supported by an accommodative Fed and resilient personal spending—while other regions and countries face more risk.
Thank you for your support and trust. We look forward to continue serving your investment needs in the years to come.
Sincerely,

JOSEPH V. AMATO
PRESIDENT AND CEO
NEUBERGER BERMAN INCOME FUNDS
1
Core Bond Fund Commentary (Unaudited)
Neuberger Berman Core Bond Fund Institutional Class generated a 11.24% total return for the 12 months ended October 31, 2019 and underperformed its benchmark, the Bloomberg Barclays U.S. Aggregate Bond Index (the Index), which saw a 11.51% total return for the same period. (Performance for all share classes is provided in the table immediately following this letter.)
The overall fixed income market generated strong results during the 12 months ended October 31, 2019. Both short- and long-term U.S. Treasury yields moved sharply lower as the U.S. Federal Reserve Board (Fed) had a "dovish pivot" and lowered interest rates three times during the second half of the reporting period. In addition, global growth continued to moderate, partially due to the ongoing trade conflict between the U.S. and China. Investor sentiment was also challenged at times given uncertainties surrounding Brexit, numerous other geopolitical issues and a downturn in manufacturing activity. Against this backdrop, a number of central banks outside the U.S., including the European Central Bank, also introduced accommodative monetary policies, and government yields outside the U.S. also moved lower.
Security selection in investment grade credit was the largest contributor to relative performance versus the Index during the reporting period, primarily due to positive issuer selection in the banking, healthcare and food & beverage subsectors. The Fund was underweight corporate credit during the volatile November/December 2018 period. Given wider spreads and our view that global economic growth would moderate but remain positive, we briefly moved to overweight corporates in the first quarter of 2019. We then reduced our position to a neutral posture in the second quarter of 2019 and ended the period modestly underweight. These adjustments all contributed to relative performance. An overweight exposure to commercial mortgage-backed securities (CMBS) and an allocation to mortgage credit were other primary contributors to performance. Conversely, the Fund's allocation to U.S. Treasury Inflation-Protection Securities detracted the most from results as future inflation expectations remained weak relative to inflation readings during the reporting period. Elsewhere, yield curve positioning, along with security selection in agency mortgage-backed securities, also detracted from results.
The Fund's use of futures contracts detracted from performance during the reporting period.
There were several adjustments made to the portfolio during the reporting period. We moved from overweight to a neutral position in asset-backed securities (ABS), as their valuations became less attractive in our view. However, consumer balance sheets remained quite strong, which bodes well for ABS fundamentals. We increased the Fund's exposure to CMBS and mortgage credit, which we continue to view as attractive in light of still supportive commercial and residential real estate fundamentals. In addition, we opened a modest position in AAA rated collateralized loan obligations due to compelling relative valuations. Finally, we lengthened the Fund's duration modestly, ending the reporting period longer than the Index by roughly one third of a year.
Our main thesis since early 2019 has been that global growth would slow, but we would experience a global soft economic landing, which we believed would ultimately support a range of credit sectors. To date, that has been the case, but as we look forward, we believe we should bifurcate the outlook. For the U.S. in particular, we still believe in slow-but-positive growth: the base of consumption spending and labor trends means that it's difficult to envision a serious slowdown over the coming quarters. But for other regions and countries, we believe the soft landing is transitioning to something riskier. In our view, continental Europe, the U.K. and some major emerging market countries are seeing, and will likely continue to see, weak growth rates that may look and feel like recessions, even if technical definitions of a recession are not met.
Sincerely,
THANOS BARDAS, DAVID M. BROWN, NATHAN KUSH AND BRAD TANK
PORTFOLIO MANAGERS
Information about principal risks of investing in the Fund is set forth in the prospectus and statement of additional information.
The portfolio composition, industries and holdings of the Fund are subject to change without notice.
The opinions expressed are those of the Fund's portfolio managers. The opinions are as of the date of this report and are subject to change without notice.
2
Core Bond Fund (Unaudited)
TICKER SYMBOLS
Investor Class | | NCRIX | |
Institutional Class | | NCRLX | |
Class A | | NCRAX | |
Class C | | NCRCX | |
Class R6 | | NRCRX | |
PORTFOLIO BY TYPE OF SECURITY
(as a % of Total Net Assets) | |
Asset-Backed Securities | | | 6.9 | % | |
Corporate Bonds | | | 23.7 | | |
Mortgage-Backed Securities | | | 48.2 | | |
U.S. Government Agency Securities | | | 0.9 | | |
U.S. Treasury Obligations | | | 22.4 | | |
Short-Term Investments | | | 0.7 | | |
Liabilities Less Other Assets | | | (2.8 | )* | |
Total | | | 100.0 | % | |
* Includes the impact of the Fund's open positions in derivatives, if any.
PERFORMANCE HIGHLIGHTS2,18
| | Inception | | Average Annual Total Return
Ended 10/31/2019 | |
| | Date | | 1 Year | | 5 Years | | 10 Years | | Life of Fund | |
At NAV | | | | | | | | | | | |
| Investor Class3 | | 02/01/1997 | | | 10.81 | % | | | 2.69 | % | | | 3.58 | % | | | 4.71 | % | |
| Institutional Class3 | | 10/01/1995 | | | 11.24 | % | | | 3.10 | % | | | 4.00 | % | | | 5.11 | % | |
| Class A4 | | 12/20/2007 | | | 10.82 | % | | | 2.69 | % | | | 3.59 | % | | | 4.90 | % | |
| Class C4 | | 12/20/2007 | | | 9.99 | % | | | 1.93 | % | | | 2.82 | % | | | 4.51 | % | |
| Class R64 | | 01/18/2019 | | | 11.33 | % | | | 3.12 | % | | | 4.01 | % | | | 5.11 | % | |
With Sales Charge | | | | | | | | | | | |
| Class A4 | | | | | 6.14 | % | | | 1.80 | % | | | 3.14 | % | | | 4.71 | % | |
| Class C4 | | | | | 8.99 | % | | | 1.93 | % | | | 2.82 | % | | | 4.51 | % | |
Index | |
Bloomberg Barclays U.S. Aggregate
Bond Index1,14 | | | | | 11.51 | % | | | 3.24 | % | | | 3.73 | % | | | 5.23 | % | |
The performance data quoted represent past performance and do not indicate future results. Current performance may be lower or higher than the performance data quoted. For current performance data, please visit www.nb.com/performance.
The results shown in the table reflect the reinvestment of income dividends and other distributions, if any. The results do not reflect the effect of taxes a shareholder would pay on Fund distributions or on the redemption of Fund shares.
The investment return and principal value of an investment will fluctuate and shares, when redeemed, may be worth more or less than their original cost.
Returns would have been lower if Neuberger Berman Investment Advisers LLC ("Management") had not reimbursed certain expenses and/or waived a portion of the investment management fees during certain of the periods shown. Repayment by a class (of expenses previously reimbursed and/or fees previously waived by Management) will decrease the class's returns. Please see Note B in the Notes to Financial Statements for specific information regarding expense reimbursement and/or fee waiver arrangements.
For the period ended October 31, 2019, the 30-day SEC yields were 2.60%, 3.00%, 2.60%, 1.85% and 3.11% for Investor Class, Institutional Class, Class A, Class C and Class R6 shares, respectively. Absent expense reimbursements and/or fee waivers, the 30-day SEC yields would have been 2.34%, 2.90%, 2.52%, 1.78% and 2.99% for Investor Class, Institutional Class, Class A, Class C and Class R6 shares, respectively.
As stated in the Fund's most recent prospectus, the total annual operating expense ratios for fiscal year 2018 were 1.12%, 0.55%, 0.92%, and 1.67% for Investor Class, Institutional Class, Class A, and Class C shares, respectively, and the estimated total annual operating expense ratio for fiscal year 2019 is 0.45% for Class R6 (before expense reimbursements and/or fee waivers, if any, and after restatement for Class R6 shares). The expense ratios for fiscal year 2018 were 0.86%, 0.46%, 0.86%, and 1.61% for Investor Class, Institutional Class, Class A, and Class C shares, respectively, and the estimated total annual operating expense ratio for fiscal year 2019 is 0.36% for Class R6 after expense reimbursements and/or fee waivers and/or restatement. The expense ratios for the annual period ended October 31, 2019 can be found in the Financial Highlights section of this report.
Returns shown with a sales charge reflect the deduction of the current maximum initial sales charge of 4.25% for Class A shares and the contingent deferred sales charge (CDSC) for Class C shares. The CDSC for Class C shares is 1%, which is reduced to 0% after 1 year. The performance of the Fund's share classes will differ primarily due to different sales charge structures and class expenses. Please see the prospectus for more information about sales charge structures, if any, and class expenses for your share class.
3
Core Bond Fund (Unaudited)
COMPARISON OF A $1,000,000 INVESTMENT
(000's omitted)

This graph shows the change in value of a hypothetical $1,000,000 investment in the Fund over the past 10 fiscal years, or since the Fund's inception if it has not operated for 10 years. The graph is based on the Institutional Class shares only; the performance of the Fund's share classes will differ primarily due to different sales charge structures and class expenses (see Performance Highlights chart on previous page). The result is compared with benchmarks, which include a broad-based market index and may include a more narrowly based index. Market indices have not been reduced to reflect any of the fees and costs of investing. The results shown in the graph reflect the reinvestment of income dividends and other distributions, if any. The results do not reflect the effect of taxes a shareholder would pay on Fund distributions or on the redemption of Fund shares. Results represent past performance and do not indicate future results.
4
Emerging Markets Debt Fund Commentary (Unaudited)
Neuberger Berman Emerging Markets Debt Fund Institutional Class generated a 13.26% total return for the 12 months ended October 31, 2019 and underperformed its benchmark, a blend consisting of 50% J.P. Morgan Government Bond Index—Emerging Markets Global Diversified, 25% J.P. Morgan Emerging Markets Bond Index—Global Diversified, and 25% J.P. Morgan Corporate Emerging Markets Bond Index—Diversified (the Index), which delivered a 14.65% total return for the same period. (Performance for all share classes is provided in the table immediately following this letter.)
For the 12 months ended October 31, 2019, emerging markets (EM) debt experienced positive tailwinds supporting strong performance. The hard currency sovereign debt index (J.P. Morgan Emerging Markets Bond Index-Global Diversified) delivered a 14.35% return, the corporate debt index (J.P. Morgan Corporate Emerging Markets Bond Index-Diversified) delivered 12.81%, and the local currency index (J.P. Morgan Government Bond Index-Emerging Markets Global Diversified) returned 15.59%.
Following a drawdown in the closing months of 2018 after the U.S. Federal Reserve Board (Fed) rate hike, EM debt posted strong gains in 2019. The recovery was driven by spread compression as risk appetite returned to global markets, while a sharp drop in U.S. Treasury yields drove gains from March onwards as the market started to price in multiple rate cuts by the Fed for 2019. A more dovish monetary policy stance in developed markets also acted as a tailwind for EM assets, especially in local markets where local interest rates moved down. The ongoing trade negotiations between the U.S. and China contributed to market volatility over the reporting period, however, this has abated to the extent investors expect that the countries are moving toward "phase 1" of a trade agreement.
The primary driver of the Fund's underperformance versus the Index came from the overweight risk position in Argentina. Argentine assets grabbed headlines in August 2019, as hard currency sovereigns declined more than 50% in the month and the peso slumped. This occurred after the unexpected results of the presidential primary election mid-month which caused instability in the financial markets and led to extreme measures to stabilize the situation. This included the government's actions to re-profile its short-term local debt and the introduction of capital controls. The stress was compounded by the leading candidate, and ultimate winner, Alberto Fernandez who has blamed the Macri administration and the International Monetary Fund for the crisis, leading to further doubts on policy continuity if and when he would take over.
Aside from Argentina, in hard currency, country allocation detracted from performance due to the overweight exposure to Venezuela. This was somewhat mitigated by the underweight exposure to Lebanon and overweight to Ukraine. Security selection was positive because of instrument selection in Argentina and Venezuela. In the corporate space in addition to Argentina, the overweight exposure to Mexico and underweight to Russia detracted from performance. We added value primarily due to the overweight position and security selection in Brazil. By sector, security selection in the utilities, oil and gas, and real estate was positive while security selection in metals and mining was a drag on performance. The local currency part of the portfolio outperformed the benchmark, with both local rates and foreign currency (FX) positioning contributing positively. In local rates, our duration overweights in Mexico, Russia and Indonesia were the main contributors while in FX, our positions in select frontier market currencies including the Egyptian pound and the Ukrainian hryvnia added most value. Meanwhile positioning in Argentina was also the main detractor in local currency, mostly due to short end credit exposures as well as positions in local floaters and inflation-linked instruments, while our underweight in Asian currencies also detracted over the reporting period.
The Fund's aggregate use of futures, forward foreign currency, and swap contracts, contributed positively to performance during the reporting period.
Over the trailing 12 months, there were a number of changes across the portfolio. Within hard currency sovereigns, we increased the exposure to Indonesia, Ukraine and Russia where we saw fundamental improvements. We also have an underweight exposure to the Gulf countries which entered the J.P. Morgan Emerging Markets Bond Index—Global Diversified over the course of the year. We trimmed exposure to Turkey as policy risks have escalated and valuations became less attractive to us.
5
In corporate positioning, we actively participated in the new issuance market throughout the reporting period. We were particularly active in the Asian markets as Asia accounts for 65% of the new issuance supply this year. Overall, we added exposure in Mexican metals and mining, financials and telecom services as well as in Brazilian pulp and paper. We reduced exposure in Chile, Peru, and Thailand. By sector, we increased exposure to technology, media, and telecom as well as utilities while taking profits in metals and mining names.
On the local currency side, we reduced the risk profile earlier in the year by trimming the overall exposure to currencies and trimming the duration overweight in rates. However, we reestablished positions as global market conditions improved during the reporting period. On the rates side we reduced exposure to Colombia, where we moved underweight. In central & eastern Europe, the Middle East and Africa, we cut duration to Poland and Romania and neutralized our underweight in the Czech Republic. We also moved to an overweight position in Russia. In Asia we moved to overweight positions in China, Korea, and Indonesia. We were active in FX markets throughout the reporting period due to the volatility. The largest moves came in Russia and Turkey, where we are now overweight the ruble and underweight the lira. We moved from underweight to an overweight in the Chinese yuan and Malaysian ringgit, while removing our exposure to Sri Lanka. In Latin America, we moved from neutral to overweight in the Brazilian real and neutralized the position in the Peruvian sol.
Against the current backdrop of gradually slowing global growth, we are starting to see signs that different drivers of this slowdown are bottoming out, such as the lagged effects of monetary policy tightening in the U.S. and China and a dwindling of inventories. Together with a substantial de-escalation in the U.S.-China trade war, if it occurs, we believe this should raise confidence and improve the outlook for EM assets. We anticipate EM growth to decelerate this year but foresee a modest pickup in growth in 2020. Other cyclical indicators such as fiscal and current account balances have been favorable while inflation has been on a downward trajectory, allowing a continued accommodative monetary policy stance by EM central banks.
Sincerely,
ROB DRIJKONINGEN, GORKY URQUIETA, BART VAN DER MADE, RAOUL LUTTIK,
JENNIFER GORGOLL, VERA KARTSEVA AND NISH POPAT
PORTFOLIO CO-MANAGERS
Information about principal risks of investing in the Fund is set forth in the prospectus and statement of additional information.
The portfolio composition, industries and holdings of the Fund are subject to change without notice.
The opinions expressed are those of the Fund's portfolio managers. The opinions are as of the date of this report and are subject to change without notice.
6
Emerging Markets Debt Fund (Unaudited)
TICKER SYMBOLS
Institutional Class | | NERIX | |
Class A | | NERAX | |
Class C | | NERCX | |
PERFORMANCE HIGHLIGHTS
| | Inception | | Average Annual Total Return
Ended 10/31/2019 | |
| | Date | | 1 Year | | 5 Year | | Life of Fund | |
At NAV | |
Institutional Class | | 09/27/2013 | | | 13.26 | % | | | 2.61 | % | | | 3.02 | % | |
Class A | | 09/27/2013 | | | 12.85 | % | | | 2.21 | % | | | 2.63 | % | |
Class C | | 09/27/2013 | | | 12.01 | % | | | 1.45 | % | | | 1.86 | % | |
With Sales Charge | |
Class A | | | | | 8.01 | % | | | 1.33 | % | | | 1.90 | % | |
Class C | | | | | 11.01 | % | | | 1.45 | % | | | 1.86 | % | |
Index | |
| Blended Benchmark*1,14 | | | | | 14.65 | % | | | 3.16 | % | | | 3.39 | % | |
* Blended benchmark is composed of 50% J.P. Morgan Government Bond Index (GBI)—Emerging Markets Global Diversified, 25% J.P. Morgan Emerging Markets Bond Index (EMBI)—Global Diversified, and 25% J.P. Morgan Corporate Emerging Markets Bond Index (CEMBI)—Diversified, and is rebalanced monthly.
The performance data quoted represent past performance and do not indicate future results. Current performance may be lower or higher than the performance data quoted. For current performance data, please visit www.nb.com/performance.
The results shown in the table reflect the reinvestment of income dividends and other distributions, if any. The results do not reflect the effect of taxes a shareholder would pay on Fund distributions or on the redemption of Fund shares.
The investment return and principal value of an investment will fluctuate and shares, when redeemed, may be worth more or less than their original cost.
Returns would have been lower if Neuberger Berman Investment Advisers LLC ("Management") had not reimbursed certain expenses and/or waived a portion of the investment management fees during certain of the periods shown. Repayment by a class (of expenses previously reimbursed and/or fees previously waived by Management) will decrease the class's returns. Please see Note B in the Notes to Financial Statements for specific information regarding expense reimbursement and/or fee waiver arrangements.
For the period ended October 31, 2019, the 30-day SEC yields were 5.32%, 4.96% and 4.21% for Institutional Class, Class A and Class C shares, respectively. Absent expense reimbursements and/or fee waivers, the 30-day SEC yields would have been 5.20%, 4.81% and 4.07% for Institutional Class, Class A and Class C shares, respectively.
As stated in the Fund's most recent prospectus, the total annual operating expense ratios for fiscal year 2018 were 1.01%, 1.40% and 2.14% for Institutional Class, Class A and Class C shares, respectively (before expense reimbursements and/or fee waivers, if any). The expense ratios were 0.79%, 1.16% and 1.91% for Institutional Class, Class A and Class C shares, respectively, after expense reimbursements and/or fee waivers. The expense ratios for the annual period ended October 31, 2019 can be found in the Financial Highlights section of this report.
Returns shown with a sales charge reflect the deduction of the current maximum initial sales charge of 4.25% for Class A shares and the contingent deferred sales charge (CDSC) for Class C shares. The CDSC for Class C shares is 1%, which is reduced to 0% after 1 year. The performance of the Fund's share classes will differ primarily due to different sales charge structures and class expenses. Please see the prospectus for more information about sales charge structures, if any, and class expenses for your share class.
7
Emerging Markets Debt Fund (Unaudited)
COMPARISON OF A $1,000,000 INVESTMENT
(000's omitted)
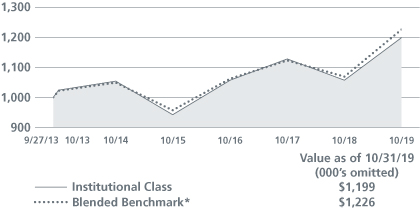
This graph shows the change in value of a hypothetical $1,000,000 investment in the Fund over the past 10 fiscal years, or since the Fund's inception if it has not operated for 10 years. The graph is based on the Institutional Class shares only; the performance of the Fund's share classes will differ primarily due to different sales charge structures and class expenses (see Performance Highlights chart on previous page). The result is compared with benchmarks, which include a broad-based market index and may include a more narrowly based index. Market indices have not been reduced to reflect any of the fees and costs of investing. The results shown in the graph reflect the reinvestment of income dividends and other distributions, if any. The results do not reflect the effect of taxes a shareholder would pay on Fund distributions or on the redemption of Fund shares. Results represent past performance and do not indicate future results.
* Blended benchmark is composed of 50% J.P. Morgan Government Bond Index (GBI)—Emerging Markets Global Diversified, 25% J.P. Morgan Emerging Markets Bond Index (EMBI)—Global Diversified, and 25% J.P. Morgan Corporate Emerging Markets Bond Index (CEMBI)—Diversified, and is rebalanced monthly.
8
Floating Rate Income Fund Commentary (Unaudited)
Neuberger Berman Floating Rate Income Fund Institutional Class generated a 2.12% total return for the 12 months ended October 31, 2019 and underperformed its benchmark, the S&P/LSTA Leveraged Loan Index (the Index), which provided a 2.67% total return for the same period. (Performance for all share classes is provided in the table immediately following this letter.)
The senior floating rate bank loan market, as measured by the Index, posted a positive return during the 12 months ended October 31, 2019. The market was supported by a number of factors, including a "dovish pivot" by the U.S. Federal Reserve Board (Fed), as it lowered interest rates three times during the second half of the reporting period. While falling interest rates can create a technically challenging environment for the floating rate loan market, the backdrop of a more accommodative Fed was supportive of issuer fundamentals and investor risk sentiment. Additionally, the U.S. economy was resilient and corporate profits often exceeded lowered expectations. Late in the reporting period, there were also reports of progress in U.S./China trade negotiations. For the reporting period, securities rated BB and B in the Index returned 4.1% and 2.5%, respectively, whereas securities rated CCC returned -4.3%.
The Fund tactically adjusted its position upward in non-floating rate securities towards the end of the reporting period. We have the flexibility to allocate up to 20% of net assets to these securities, usually fixed-rate senior bonds. Relative value between floating rate loans and fixed-rate bonds fluctuated during the reporting period given the increase in volatility. Against this backdrop, the Fund's non-floating rate allocation in long term securities ended the reporting period at approximately 4.1% of net assets, which was modestly additive to performance.
In terms of the Fund's quality biases, an underweight to CCC and below rated issues added the most to performance versus the Index. Conversely, security selection within issues rated BB and an underweight to issues rated BBB detracted from results.
From a sector perspective, security selection within retailers and lodging & casinos, along with an underweight to home furnishings, added the most to performance during the reporting period. In contrast, security selection within electronics and drugs, coupled with an overweight to oil & gas, were the largest detractors from returns.
We continue to believe that yields in the loan market are compensating investors for a relatively benign default environment. While headline risk and market volatility remain potential risks, operating performance of most issuers has been relatively stable: revenue growth has been positive and leverage has risen only modestly. The ability of issuers to cover interest payments also remains relatively constructive. While economic growth has slowed, the Fed and other central banks continue to be supportive of monetary policy actions which would tend to shore up further deterioration in economic activity. While we believe the outlook for most issuer fundamentals remains constructive, risks continue to exist, including uncertainty around global growth expectations, U.S.-China trade policy and political event risk, which could lead to periods of volatility. We believe our portfolio is well-positioned to mitigate the downside as market volatility rises and we will look to tactically take advantage of increased volatility to add to credits with more stable and/or improving fundamentals and valuations.
Sincerely,
THOMAS P. O'REILLY*, JOSEPH P. LYNCH, STEPHEN J. CASEY AND DANIEL DOYLE
PORTFOLIO MANAGERS
* As previously disclosed in a supplement to the Fund's prospectus, Thomas P. O'Reilly will retire on or about December 31, 2019. Joseph P. Lynch, Stephen J. Casey and Daniel Doyle will continue to manage Neuberger Berman Floating Rate Income Fund.
Information about principal risks of investing in the Fund is set forth in the prospectus and statement of additional information.
The portfolio composition, industries and holdings of the Fund are subject to change without notice.
The opinions expressed are those of the Fund's portfolio managers. The opinions are as of the date of this report and are subject to change without notice.
The loan ratings noted above represent segments of the S&P/LSTA Leveraged Loan Index, which are determined based on the ratings issued by Standard & Poor's.
9
Floating Rate Income Fund (Unaudited)
TICKER SYMBOLS
Institutional Class | | NFIIX | |
Class A | | NFIAX | |
Class C | | NFICX | |
PORTFOLIO BY MATURITY DISTRIBUTION
(as a % of Total Investments*) | |
One to less than Five Years | | | 44.8 | % | |
Five to less than Ten Years | | | 53.5 | | |
Ten Years or Greater | | | 1.7 | | |
Total | | | 100.0 | % | |
* Does not include Short-Term Investments or the impact of the Fund's open positions in derivatives, if any.
PERFORMANCE HIGHLIGHTS
| | Inception | | Average Annual Total Return
Ended 10/31/2019 | |
| | Date | | 1 Year | | 5 Years | | Life of Fund | |
At NAV | |
| Institutional Class5 | | 12/30/2009 | | | 2.12 | % | | | 3.14 | % | | | 4.12 | % | |
Class A | | 12/29/2009 | | | 1.75 | % | | | 2.76 | % | | | 3.73 | % | |
| Class C5 | | 12/30/2009 | | | 0.99 | % | | | 1.99 | % | | | 2.98 | % | |
With Sales Charge | |
Class A | | | | | -2.60 | % | | | 1.86 | % | | | 3.28 | % | |
| Class C5 | | | | | 0.02 | % | | | 1.99 | % | | | 2.98 | % | |
Index | |
| S&P/LSTA Leveraged Loan Index1,14 | | | | | 2.67 | % | | | 3.83 | % | | | 4.89 | % | |
The performance data quoted represent past performance and do not indicate future results. Current performance may be lower or higher than the performance data quoted. For current performance data, please visit www.nb.com/performance.
The results shown in the table reflect the reinvestment of income dividends and other distributions, if any. The results do not reflect the effect of taxes a shareholder would pay on Fund distributions or on the redemption of Fund shares.
The investment return and principal value of an investment will fluctuate and shares, when redeemed, may be worth more or less than their original cost.
Returns would have been lower if Neuberger Berman Investment Advisers LLC ("Management") had not reimbursed certain expenses and/or waived a portion of the investment management fees during certain of the periods shown. Repayment by a class (of expenses previously reimbursed and/or fees previously waived by Management) will decrease the class's returns. Please see Note B in the Notes to Financial Statements for specific information regarding expense reimbursement and/or fee waiver arrangements.
For the period ended October 31, 2019, the 30-day SEC yields were 5.01%, 4.64% and 3.88% for Institutional Class, Class A and Class C shares, respectively. Absent expense reimbursements and/or fee waivers, the 30-day SEC yields would have been 4.89%, 4.54% and 3.76% for Institutional Class, Class A and Class C shares, respectively.
As stated in the Fund's most recent prospectus, the total annual operating expense ratios for fiscal year 2018 were 0.86%, 1.24% and 1.98% for Institutional Class, Class A and Class C shares, respectively (before expense reimbursements and/or fee waivers, if any). The expense ratios were 0.71%, 1.08% and 1.83% for Institutional Class, Class A and Class C shares, respectively, after expense reimbursements and/or fee waivers. The expense ratios for the annual period ended October 31, 2019 can be found in the Financial Highlights section of this report.
Returns shown with a sales charge reflect the deduction of the current maximum initial sales charge of 4.25% for Class A shares and the contingent deferred sales charge (CDSC) for Class C shares. The CDSC for Class C shares is 1%, which is reduced to 0% after 1 year. The performance of the Fund's share classes will differ primarily due to different sales charge structures and class expenses. Please see the prospectus for more information about sales charge structures, if any, and class expenses for your share class.
10
Floating Rate Income Fund (Unaudited)
COMPARISON OF A $1,000,000 INVESTMENT
(000's omitted)
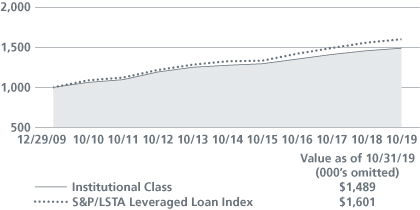
This graph shows the change in value of a hypothetical $1,000,000 investment in the Fund over the past 10 fiscal years, or since the Fund's inception if it has not operated for 10 years. The graph is based on the Institutional Class shares only; the performance of the Fund's share classes will differ primarily due to different sales charge structures and class expenses (see Performance Highlights chart on previous page). The result is compared with benchmarks, which include a broad-based market index and may include a more narrowly based index. Market indices have not been reduced to reflect any of the fees and costs of investing. The results shown in the graph reflect the reinvestment of income dividends and other distributions, if any. The results do not reflect the effect of taxes a shareholder would pay on Fund distributions or on the redemption of Fund shares. Results represent past performance and do not indicate future results.
11
High Income Bond Fund Commentary (Unaudited)
Neuberger Berman High Income Bond Fund Investor Class generated a 7.72% total return for the 12 months ended October 31, 2019 and underperformed its benchmark, the ICE BofAML U.S. High Yield Constrained Index (the Index), which provided an 8.32% total return for the same period. (Performance for all share classes is provided in the table immediately following this letter.)
The overall high yield market, as measured by the Index, generated strong results during the 12 months ended October 31, 2019. After moving lower over the first two months of the reporting period, the high yield market posted positive returns during nine of the next ten months. The market's turnaround was triggered by a number of factors, including a "dovish pivot" by the U.S. Federal Reserve Board (Fed), as it lowered interest rates three times during the second half of the reporting period. In addition, the U.S. economy was resilient and corporate profits often exceeded lowered expectations. Late in the reporting period there were also reports of progress in U.S.-China trade negotiations.
From a sector perspective, an underweight to banking, and underweight to and security selection within super retail, and security selection within gas distribution detracted the most from performance. In contrast, an underweight to energy, along with security selection within support-services and metals/mining, contributed the most to results.
In terms of the Fund's quality biases, an underweight to CCC and below rated securities and security selection within B rated securities contributed the most to performance. Conversely, security selection within BB rated securities was the primary detractor from performance.
Among the adjustments we made to the portfolio over the reporting period, the Fund's allocations to securities rated B were increased by 15% and securities rated BB decreased 13% over the reporting period. The Fund ended the reporting period with a BB rated allocation below that of the Index and a B rated allocation above that of the Index. From a sector perspective, the Fund increased its allocations to consumer products & services, media—broadcast & diversified and aerospace & defense, while reducing its diversified financial services and energy exposures.
Looking ahead, we continue to believe that spreads are compensating investors for a relatively benign default environment. While headline risk and market volatility remain potential risks, operating performance of most issuers has been relatively stable; revenue growth has been positive and leverage has risen only modestly. We believe the ability of issuers to cover interest payments remains relatively constructive. Furthermore, refinancing activity has significantly reduced the amount of bonds maturing in the near term. While economic growth has slowed, the Fed and other central banks continue to be supportive of monetary policy actions which would tend to shore up further deterioration in economic activity. While we believe the outlook for most issuer fundamentals remains constructive, risks continue to exist, including uncertainty around global growth expectations, U.S.-China trade policy and political event risk, which could lead to periods of volatility. We believe our portfolio is well-positioned to provide downside protection as market volatility rises and we will look to tactically take advantage of increased volatility to add issuers with more stable and/or improving fundamentals and valuations.
Sincerely,
THOMAS P. O'REILLY*, RUSS COVODE, DANIEL DOYLE, JOE LIND AND CHRISTOPHER KOCINSKI
PORTFOLIO CO-MANAGERS
* As previously disclosed in a supplement to the Fund's prospectus, Thomas P. O'Reilly will retire on or about December 31, 2019. Russ Covode, Daniel Doyle, Joe Lind and Christopher Kocinski will continue to manage Neuberger Berman High Income Bond Fund.
Information about principal risks of investing in the Fund is set forth in the prospectus and statement of additional information.
The portfolio composition, industries and holdings of the Fund are subject to change without notice.
The opinions expressed are those of the Fund's portfolio managers. The opinions are as of the date of this report and are subject to change without notice.
The performance of certain rated bonds within the benchmark, as noted above, represent issues that are rated B1/B+ through B3/B-, Ba1/BB+ through Ba3/BB- and CCC+/Caa1 or lower, based on an average of Moody's, S&P and Fitch, as calculated by ICE BofAML.
12
High Income Bond Fund (Unaudited)
TICKER SYMBOLS
Investor Class | | NHINX | |
Institutional Class | | NHILX | |
Class A | | NHIAX | |
Class C | | NHICX | |
Class R3 | | NHIRX | |
Class R6 | | NRHIX | |
PORTFOLIO BY MATURITY DISTRIBUTION
(as a % of Total Investments*) | |
Less than One Year | | | 1.2 | % | |
One to less than Five Years | | | 22.4 | | |
Five to less than Ten Years | | | 72.7 | | |
Ten Years or Greater | | | 3.7 | | |
Total | | | 100.0 | % | |
* Does not include Short-Term Investments or the impact of the Fund's open positions in derivatives, if any.
PERFORMANCE HIGHLIGHTS6,19
| | Inception | | Average Annual Total Return
Ended 10/31/2019 | |
| | Date | | 1 Year | | 5 Years | | 10 Years | | Life of Fund | |
At NAV | | | | | | | | | | | |
| Investor Class7 | | 02/01/1992 | | | 7.72 | % | | | 3.90 | % | | | 6.67 | % | | | 7.30 | % | |
| Institutional Class8 | | 05/27/2009 | | | 7.89 | % | | | 4.05 | % | | | 6.81 | % | | | 7.37 | % | |
| Class A8 | | 05/27/2009 | | | 7.43 | % | | | 3.62 | % | | | 6.40 | % | | | 7.20 | % | |
| Class C8 | | 05/27/2009 | | | 6.81 | % | | | 2.92 | % | | | 5.64 | % | | | 6.92 | % | |
| Class R38 | | 05/27/2009 | | | 7.37 | % | | | 3.40 | % | | | 6.14 | % | | | 7.11 | % | |
| Class R68 | | 03/15/2013 | | | 8.12 | % | | | 4.16 | % | | | 6.82 | % | | | 7.36 | % | |
With Sales Charge | |
| Class A8 | | | | | 2.88 | % | | | 2.73 | % | | | 5.94 | % | | | 7.04 | % | |
| Class C8 | | | | | 5.81 | % | | | 2.92 | % | | | 5.64 | % | | | 6.92 | % | |
Index | |
ICE BofAML U.S. High Yield
Constrained Index1,14 | | | | | 8.32 | % | | | 5.18 | % | | | 7.67 | % | | | N/A | | |
The performance data quoted represent past performance and do not indicate future results. Current performance may be lower or higher than the performance data quoted. For current performance data, please visit www.nb.com/performance.
The results shown in the table reflect the reinvestment of income dividends and other distributions, if any. The results do not reflect the effect of taxes a shareholder would pay on Fund distributions or on the redemption of Fund shares.
The investment return and principal value of an investment will fluctuate and shares, when redeemed, may be worth more or less than their original cost.
Returns would have been lower if Neuberger Berman Investment Advisers LLC ("Management") had not reimbursed certain expenses and/or waived a portion of the investment management fees during certain of the periods shown. Repayment by a class (of expenses previously reimbursed and/or fees previously waived by Management) will decrease the class's returns. Please see Note B in the Notes to Financial Statements for specific information regarding expense reimbursement and/or fee waiver arrangements.
For the period ended October 31, 2019, the 30-day SEC yields were 4.44%, 4.60%, 4.18%, 3.47%, 4.01% and 4.70% for Investor Class, Institutional Class, Class A, Class C, Class R3 and Class R6 shares, respectively. Absent expense reimbursements and/or fee waivers, the 30-day SEC yield would have been 3.81% for Class A shares.
As stated in the Fund's most recent prospectus, the total annual operating expense ratios for fiscal year 2018 were 0.86%, 0.70%, 1.15%, 1.83%, 1.37% and 0.61% for Investor Class, Institutional Class, Class A, Class C, Class R3 and Class R6 shares, respectively (before expense reimbursements and/or fee waivers, if any, and after restatement for Class R6 shares). The expense ratio was 1.13% for Class A shares after expense reimbursements and/or fee waivers. The expense ratios for the annual period ended October 31, 2019 can be found in the Financial Highlights section of this report.
Returns shown with a sales charge reflect the deduction of the current maximum initial sales charge of 4.25% for Class A shares and the contingent deferred sales charge (CDSC) for Class C shares. The CDSC for Class C shares is 1%, which is reduced to 0% after 1 year. The performance of the Fund's share classes will differ primarily due to different sales charge structures and class expenses. Please see the prospectus for more information about sales charge structures, if any, and class expenses for your share class.
13
High Income Bond Fund (Unaudited)
COMPARISON OF A $10,000 INVESTMENT
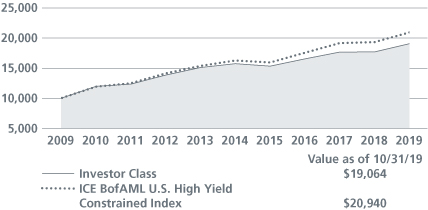
This graph shows the change in value of a hypothetical $10,000 investment in the Fund over the past 10 fiscal years, or since the Fund's inception if it has not operated for 10 years. The graph is based on the Investor Class shares only; the performance of the Fund's share classes will differ primarily due to different sales charge structures and class expenses (see Performance Highlights chart on previous page). The result is compared with benchmarks, which include a broad-based market index and may include a more narrowly based index. Market indices have not been reduced to reflect any of the fees and costs of investing. The results shown in the graph reflect the reinvestment of income dividends and other distributions, if any. The results do not reflect the effect of taxes a shareholder would pay on Fund distributions or on the redemption of Fund shares. Results represent past performance and do not indicate future results.
14
Municipal High Income Fund Commentary (Unaudited)
Neuberger Berman Municipal High Income Fund Institutional Class generated a 9.62% total return for the 12 months ended October 31, 2019 and underperformed its benchmark, a blend consisting of 65% Bloomberg Barclays Municipal Bond Index and 35% Bloomberg Barclays Municipal High Yield Index (the Index), which provided a 10.20% total return for the same period. (Performance for all share classes is provided in the table immediately following this letter.)
All told, for the reporting period, the Bloomberg Barclays Municipal Bond Index returned 9.42% whereas the overall taxable bond market, as measured by the Bloomberg Barclays U.S. Aggregate Bond Index, returned 11.51%. Both short- and long-term U.S. Treasury yields moved sharply lower as the U.S. Federal Reserve Board had a "dovish pivot" and lowered interest rates three times during the second half of the reporting period. Municipal securities were also supported by overall positive fundamentals, as well as strong investor demand at times.
Duration positioning detracted from the Fund's performance during the reporting period. In particular, having a duration that was modestly shorter than the Index was a headwind for results as rates moved lower across the yield curve. On the upside, security selection was additive for returns, led by our allocations to tobacco securitization bonds, Puerto Rico-issued bonds and Illinois state general obligation bonds. The Fund's credit biases were also beneficial for results. In particular, an overweight to securities rated below investment-grade and an underweight to securities rated AAA versus the Index contributed to results, as lower rated issues outperformed their higher rated counterparts.
A number of changes were made to the Fund during the reporting period. Despite recently increasing duration, the Fund's overall duration was shortened during the reporting period. In addition, we upgraded the overall credit quality of the portfolio.
Our main thesis since early 2019 has been that global growth would slow, but we would experience a global soft economic landing, which we believed would ultimately provide support for fixed income assets. Despite periods of volatility, we believe the outlook for the muni market continues to look promising for the balance of 2019. We anticipate that demand from retail and institutional investors will likely mitigate the larger than expected supply that may be present during the fourth quarter of 2019. While we anticipate economic growth to moderate, we do not anticipate any systemic deterioration in overall municipal credit quality. We continue to seek out attractive trading opportunities for our investors.
Sincerely,
JAMES L. ISELIN, S. BLAKE MILLER AND ERIC J. PELIO
PORTFOLIO MANAGERS
Information about principal risks of investing in the Fund is set forth in the prospectus and statement of additional information.
The portfolio composition, industries and holdings of the Fund are subject to change without notice.
The opinions expressed are those of the Fund's portfolio managers. The opinions are as of the date of this report and are subject to change without notice.
The bond ratings noted above represent segments of the Bloomberg Barclays Municipal Bond Index and Bloomberg Barclays Municipal High Yield Index, which are determined based on the average ratings issued by Standard & Poor's, Moody's and Fitch.
15
Municipal High Income Fund (Unaudited)
TICKER SYMBOLS
Institutional Class | | NMHIX | |
Class A | | NMHAX | |
Class C | | NMHCX | |
PORTFOLIO BY STATE AND TERRITORY
(as a % of Total Net Assets) | |
Alabama | | | 0.4 | % | |
Arizona | | | 4.3 | | |
California | | | 10.8 | | |
Colorado | | | 4.4 | | |
Connecticut | | | 0.1 | | |
Florida | | | 4.7 | | |
Georgia | | | 1.5 | | |
Hawaii | | | 1.2 | | |
Illinois | | | 10.2 | | |
Indiana | | | 0.6 | | |
Iowa | | | 0.3 | | |
Kansas | | | 0.4 | | |
Kentucky | | | 2.1 | | |
Louisiana | | | 2.5 | | |
Maine | | | 0.6 | | |
Maryland | | | 2.1 | | |
Michigan | | | 2.0 | | |
Minnesota | | | 3.9 | | |
Missouri | | | 0.9 | | |
Nevada | | | 0.4 | | |
New Jersey | | | 5.2 | | |
New Mexico | | | 0.4 | | |
New York | | | 6.0 | | |
North Carolina | | | 1.9 | | |
North Dakota | | | 0.4 | | |
Ohio | | | 6.8 | | |
Oklahoma | | | 0.3 | | |
Oregon | | | 0.4 | | |
Pennsylvania | | | 2.7 | | |
Puerto Rico | | | 4.3 | | |
Rhode Island | | | 2.6 | | |
South Carolina | | | 1.6 | | |
Tennessee | | | 3.5 | | |
Texas | | | 6.0 | | |
Utah | | | 0.9 | | |
Vermont | | | 1.2 | | |
Virginia | | | 0.5 | | |
Washington | | | 0.9 | | |
West Virginia | | | 1.3 | | |
Wisconsin | | | 2.2 | | |
Other Assets Less Liabilities | | | (2.5 | )* | |
Total | | | 100.0 | % | |
* Includes the impact of the Fund's open positions in derivatives, if any.
PERFORMANCE HIGHLIGHTS10
| | Inception | | Average Annual Total Return
Ended 10/31/2019 | |
| | Date | | 1 Year | | Life of Fund | |
At NAV | | | | | | | |
Institutional Class | | 06/22/2015 | | | 9.62 | % | | | 5.11 | % | |
Class A | | 06/22/2015 | | | 9.13 | % | | | 4.70 | % | |
Class C | | 06/22/2015 | | | 8.41 | % | | | 3.94 | % | |
With Sales Charge | | | | | | | |
Class A | | | | | 4.53 | % | | | 3.67 | % | |
Class C | | | | | 7.41 | % | | | 3.94 | % | |
Index | |
| Blended Benchmark*1,14 | | | | | 10.20 | % | | | 4.77 | % | |
* Blended benchmark is composed of 65% Bloomberg Barclays Municipal Bond Index and 35% Bloomberg Barclays Municipal High Yield Index and is rebalanced monthly.
The performance data quoted represent past performance and do not indicate future results. Current performance may be lower or higher than the performance data quoted. For current performance data, please visit www.nb.com/performance.
The results shown in the table reflect the reinvestment of income dividends and other distributions, if any. The results do not reflect the effect of taxes a shareholder would pay on Fund distributions or on the redemption of Fund shares.
The investment return and principal value of an investment will fluctuate and shares, when redeemed, may be worth more or less than their original cost.
Returns would have been lower if Neuberger Berman Investment Advisers LLC ("Management") had not reimbursed certain expenses and/or waived a portion of the investment management fees during certain of the periods shown. Repayment by a class (of expenses previously reimbursed and/or fees previously waived by Management) will decrease the class's returns. Please see Note B in the Notes to Financial Statements for specific information regarding expense reimbursement and/or fee waiver arrangements.
For the period ended October 31, 2019, the 30-day SEC yields were 2.62%, 2.25% and 1.50% for Institutional Class, Class A and Class C shares, respectively. The tax-equivalent yields were 4.43%, 3.80% and 2.53% for Institutional Class, Class A and Class C shares, respectively, for a shareholder in the highest federal income tax bracket (37% plus 3.8% Medicare contribution tax).9 Absent expense reimbursements and/or fee waivers, the 30-day SEC yields would have been 2.33%, 1.92% and 1.21% for Institutional Class, Class A and Class C shares, respectively.
As stated in the Fund's most recent prospectus, the total annual operating expense ratios for fiscal year 2018 were 0.88%, 1.35% and 2.01% for Institutional Class, Class A and Class C shares, respectively (before expense reimbursements and/or fee waivers, if any). The expense ratios were 0.51%, 0.88% and 1.63% for Institutional Class, Class A and Class C shares, respectively, after expense reimbursements and/or fee waivers. The expense ratios for the annual period ended October 31, 2019 can be found in the Financial Highlights section of this report.
Returns shown with a sales charge reflect the deduction of the current maximum initial sales charge of 4.25% for Class A shares and the contingent deferred sales charge (CDSC) for Class C shares. The CDSC for Class C shares is 1%, which is reduced to 0% after 1 year. The performance of the Fund's share classes will differ primarily due to different sales charge structures and class expenses. Please see the prospectus for more information about sales charge structures, if any, and class expenses for your share class.
16
Municipal High Income Fund (Unaudited)
COMPARISON OF A $1,000,000 INVESTMENT
(000's omitted)

This graph shows the change in value of a hypothetical $1,000,000 investment in the Fund over the past 10 fiscal years, or since the Fund's inception if it has not operated for 10 years. The graph is based on the Institutional Class shares only; the performance of the Fund's share classes will differ primarily due to different sales charge structures and class expenses (see Performance Highlights chart on previous page). The result is compared with benchmarks, which include a broad-based market index and may include a more narrowly based index. Market indices have not been reduced to reflect any of the fees and costs of investing. The results shown in the graph reflect the reinvestment of income dividends and other distributions, if any. The results do not reflect the effect of taxes a shareholder would pay on Fund distributions or on the redemption of Fund shares. Results represent past performance and do not indicate future results.
* Blended benchmark is composed of 65% Bloomberg Barclays Municipal Bond Index and 35% Bloomberg Barclays Municipal High Yield Index and is rebalanced monthly.
17
Municipal Impact Fund Commentary (Unaudited)
Neuberger Berman Municipal Impact Fund Institutional Class generated an 8.93% total return for the 12 months ended October 31, 2019. Over the same period the Fund's benchmark, the Bloomberg Barclays Municipal Bond Index (the Index), returned 9.42%. (Performance for all share classes is provided in the table immediately following this letter.)
The investment grade municipal bond market generated a strong absolute return, but lagged the taxable bond market on a relative basis during 12 months ended October 31, 2019. All told, for the reporting period, the Index returned 9.42% whereas the overall taxable bond market, as measured by the Bloomberg Barclays U.S. Aggregate Bond Index, returned 11.51%. Both short- and long-term U.S. Treasury yields moved sharply lower as the U.S. Federal Reserve Board had a "dovish pivot" and lowered interest rates three times during the second half of the reporting period. Municipal securities were also supported by overall positive fundamentals, as well as strong investor demand at times.
Duration positioning was a headwind for the Fund's performance during the reporting period. In particular, having a duration that was shorter than the Index detracted from results versus the Index as rates moved lower across the yield curve. On the upside, security selection, overall, was additive for returns, led by our longer-term hospital revenue bonds. The Fund's credit biases were also beneficial for results. Having an overweight versus the Index to below investment-grade securities and an underweight to securities rated AAA contributed to results, as lower rated issues outperformed their higher rated counterparts.
A number of changes were made to the Fund during the reporting period. We modestly shortened the Fund's overall duration during the reporting period. We also opportunistically added to the Fund's exposure to non-investment grade securities.
Our main thesis since early 2019 has been that global growth would slow, but we would experience a global soft economic landing, which we believed would ultimately provide support for fixed income assets. Despite periods of volatility, we believe the outlook for the muni market continues to look promising for the balance of 2019. We anticipate that demand from retail and institutional investors will likely mitigate the larger than expected supply that may be present during the fourth quarter of 2019. While we anticipate economic growth to moderate, we do not anticipate any systemic deterioration in overall municipal credit quality. We continue to seek out attractive trading opportunities for our investors.
Sincerely,
JAMES L. ISELIN, S. BLAKE MILLER, JAMES LYMAN AND JEFFREY HUNN
PORTFOLIO MANAGERS
Information about principal risks of investing in the Fund is set forth in the prospectus and statement of additional information.
The portfolio composition, industries and holdings of the Fund are subject to change without notice.
The opinions expressed are those of the Fund's portfolio managers. The opinions are as of the date of this report and are subject to change without notice.
The bond ratings noted above represent segments of the Bloomberg Barclays Municipal Bond Index, which are determined based on the average ratings issued by Standard & Poor's, Moody's and Fitch.
18
Municipal Impact Fund (Unaudited)
TICKER SYMBOLS
Institutional Class | | NMIIX | |
Class A | | NIMAX | |
Class C | | NIMCX | |
PORTFOLIO BY STATE AND TERRITORY
(as a % of Total Net Assets) | |
Alabama | | | 1.2 | % | |
Arkansas | | | 1.8 | | |
California | | | 1.2 | | |
District of Columbia | | | 3.2 | | |
Florida | | | 3.9 | | |
Georgia | | | 2.0 | | |
Illinois | | | 3.7 | | |
Indiana | | | 3.5 | | |
Kansas | | | 1.1 | | |
Kentucky | | | 3.7 | | |
Louisiana | | | 5.8 | | |
Michigan | | | 10.3 | | |
Minnesota | | | 3.8 | | |
Mississippi | | | 3.8 | | |
Missouri | | | 4.5 | | |
New Jersey | | | 1.2 | | |
New York | | | 7.2 | | |
North Carolina | | | 1.2 | | |
North Dakota | | | 0.4 | | |
Ohio | | | 3.5 | | |
Oklahoma | | | 3.9 | | |
Pennsylvania | | | 8.5 | | |
Rhode Island | | | 0.9 | | |
South Carolina | | | 2.7 | | |
Texas | | | 7.6 | | |
Utah | | | 1.7 | | |
West Virginia | | | 5.3 | | |
Wisconsin | | | 0.7 | | |
Other Assets Less Liabilities | | | 1.7 | * | |
Total | | | 100.0 | % | |
* Includes the impact of the Fund's open positions in derivatives, if any.
PERFORMANCE HIGHLIGHTS10,20
| | Inception | | Average Annual Total Return
Ended 10/31/2019 | |
| | Date | | 1 Year | | 5 Years | | Life of Fund | |
At NAV | |
Institutional Class | | 03/11/201316 | | | 8.93 | % | | | 2.65 | % | | | 2.65 | % | |
| Class A21 | | 06/19/2018 | | | 8.58 | % | | | 2.55 | % | | | 2.58 | % | |
| Class C21 | | 06/19/2018 | | | 7.75 | % | | | 2.34 | % | | | 2.42 | % | |
With Sales Charge | |
| Class A21 | | | | | 3.94 | % | | | 1.66 | % | | | 1.91 | % | |
| Class C21 | | | | | 6.75 | % | | | 2.34 | % | | | 2.42 | % | |
Index | |
Bloomberg Barclays Municipal
Bond Index1,14 | | | | | 9.42 | % | | | 3.55 | % | | | 3.48 | % | |
The performance data quoted represent past performance and do not indicate future results. Current performance may be lower or higher than the performance data quoted. For current performance data, please visit www.nb.com/performance.
The results shown in the table reflect the reinvestment of income dividends and other distributions, if any. The results do not reflect the effect of taxes a shareholder would pay on Fund distributions or on the redemption of Fund shares.
The investment return and principal value of an investment will fluctuate and shares, when redeemed, may be worth more or less than their original cost.
Returns would have been lower if Neuberger Berman Investment Advisers LLC ("Management") had not reimbursed certain expenses and/or waived a portion of the investment management fees during certain of the periods shown. Repayment by a class (of expenses previously reimbursed and/or fees previously waived by Management) will decrease the class's returns. Please see Note B in the Notes to Financial Statements for specific information regarding expense reimbursement and/or fee waiver arrangements.
For the period ended October 31, 2019, the 30-day SEC yields were 1.32%, 0.96% and 0.22% for Institutional Class, Class A and Class C shares, respectively. The tax-equivalent yields were 2.23%, 1.62% and 0.37% for Institutional Class, Class A and Class C shares, respectively, for a shareholder in the highest federal income tax bracket (37% plus 3.8% Medicare contribution tax).9 Absent expense reimbursements and/or fee waivers, the 30-day SEC yields would have been 0.91%, 0.51% and -0.47% for Institutional Class, Class A and Class C shares, respectively. A negative 30-day SEC yield results when a fund's accrued expenses exceed its income for the relevant period. Please note, in such instances the 30-day SEC yield may not equal the Fund's actual rate of income earned and distributed by the Fund and, therefore, a per share distribution may still be paid to shareholders.
As stated in the Fund's most recent prospectus, the total annual operating expense ratio for fiscal year 2018 was 0.91% for Institutional Class, and the estimated total annual operating expense ratios for fiscal year 2019 are 1.18% and 1.93% for Class A and Class C shares, respectively (before expense reimbursements and/or fee waivers, if any, and after restatement for Institutional Class shares). The expense ratio for fiscal year 2018 was 0.43% for Institutional Class and the estimated total annual operating expense ratios for fiscal year 2019 are 0.80% and 1.55% for Class A and Class C shares, respectively, after expense reimbursements and/or fee waivers and/or restatement. The restated Institutional Class expense ratio for the fiscal year ended 2018 does not include the portion of extraordinary proxy-related expenses borne by the Institutional Class. The expense ratios for the annual period ended October 31, 2019 can be found in the Financial Highlights section of this report.
19
Municipal Impact Fund (Unaudited)
COMPARISON OF A $1,000,000 INVESTMENT
(000's omitted)
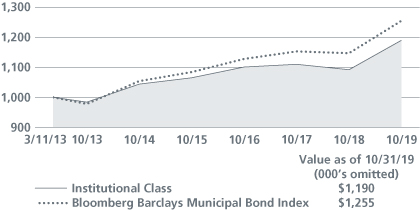
This graph shows the change in value of a hypothetical $1,000,000 investment in the Fund over the past 10 fiscal years, or since the Fund's inception if it has not operated for 10 years. The graph is based on the Institutional Class shares only; the performance of the Fund's share classes will differ primarily due to different sales charge structures and class expenses (see Performance Highlights chart on previous page). The result is compared with benchmarks, which include a broad-based market index and may include a more narrowly based index. Market indices have not been reduced to reflect any of the fees and costs of investing. The results shown in the graph reflect the reinvestment of income dividends and other distributions, if any. The results do not reflect the effect of taxes a shareholder would pay on Fund distributions or on the redemption of Fund shares. Results represent past performance and do not indicate future results.
20
Municipal Intermediate Bond Fund Commentary (Unaudited)
Neuberger Berman Municipal Intermediate Bond Fund Investor Class generated an 8.46% total return for the 12 months ended October 31, 2019 and underperformed its benchmark, the Bloomberg Barclays 7-Year General Obligation (G.O.) Index (the Index), which provided an 8.63% total return for the same period. (Performance for all share classes is provided in the table immediately following this letter.)
The investment grade municipal bond market generated a strong absolute return, but lagged the taxable bond market on a relative basis during the 12 months ended October 31, 2019. All told, the Bloomberg Barclays Municipal Bond Index returned 9.42% for the 12 months ended October 31, 2019, whereas the overall taxable bond market, as measured by the Bloomberg Barclays U.S. Aggregate Bond Index, returned 11.51%. Both short- and long-term U.S. Treasury yields moved sharply lower as the U.S. Federal Reserve Board had a "dovish pivot" and lowered interest rates three times during the second half of the reporting period. Municipal securities were also supported by overall positive fundamentals, as well as strong investor demand at times.
From a security selection perspective, certain of our longer-term holdings that we added later in the reporting period detracted from performance versus the Index as rates moved higher in October 2019. On the upside, the Fund's allocations to Illinois, Connecticut and New Jersey state G.O. bonds were additive for results. The Fund's credit biases contributed to returns during the reporting period. In particular, having overweights to securities rated BBB and A versus the Index benefited results as lower rated investment grade issues outperformed their higher rated AAA counterparts. Having a modestly longer duration than the Index contributed to returns, as did our yield curve positioning.
In terms of changes to the portfolio, we slightly shortened the Fund's overall duration during the reporting period. Meanwhile, we maintained a barbell approach (investing in shorter and longer maturities) versus the Index.
Our main thesis since early 2019 has been that global growth would slow, but we would experience a global soft economic landing, which we believed would ultimately provide support for fixed income assets. Despite periods of volatility, we believe the outlook for the muni market continues to look promising for the balance of 2019. We anticipate that demand from retail and institutional investors will likely mitigate the larger than expected supply that may be present during the fourth quarter of 2019. While we anticipated economic growth to moderate, we do not anticipate any systemic deterioration in overall municipal credit quality. We continue to seek out attractive trading opportunities for our investors.
Sincerely,
JAMES L. ISELIN AND S. BLAKE MILLER
PORTFOLIO MANAGERS
Information about principal risks of investing in the Fund is set forth in the prospectus and statement of additional information.
The portfolio composition, industries and holdings of the Fund are subject to change without notice.
The opinions expressed are those of the Fund's portfolio managers. The opinions are as of the date of this report and are subject to change without notice.
The bond ratings noted above represent segments of the Bloomberg Barclays 7-Year General Obligation (G.O.) Index, which are determined based on the average ratings issued by Standard & Poor's, Moody's and Fitch.
21
Municipal Intermediate Bond Fund (Unaudited)
TICKER SYMBOLS
Investor Class | | NMUIX | |
Institutional Class | | NMNLX | |
Class A | | NMNAX | |
Class C | | NMNCX | |
PORTFOLIO BY STATE AND TERRITORY
(as a % of Total Net Assets) | |
Alaska | | | 1.2 | % | |
Arizona | | | 0.8 | | |
California | | | 5.1 | | |
Colorado | | | 2.4 | | |
Connecticut | | | 4.0 | | |
Delaware | | | 0.7 | | |
District of Columbia | | | 0.4 | | |
Florida | | | 4.4 | | |
Georgia | | | 2.9 | | |
Illinois | | | 7.6 | | |
Indiana | | | 0.3 | | |
Iowa | | | 0.3 | | |
Kansas | | | 1.7 | | |
Kentucky | | | 0.8 | | |
Louisiana | | | 0.1 | | |
Maryland | | | 4.7 | | |
Massachusetts | | | 2.4 | | |
Michigan | | | 1.5 | | |
Minnesota | | | 0.9 | | |
Mississippi | | | 3.3 | | |
Missouri | | | 2.0 | | |
New Jersey | | | 4.1 | | |
New York | | | 11.4 | | |
Ohio | | | 1.3 | | |
Oklahoma | | | 2.4 | | |
Oregon | | | 0.8 | | |
Pennsylvania | | | 9.1 | | |
Rhode Island | | | 3.1 | | |
South Carolina | | | 1.2 | | |
Tennessee | | | 2.2 | | |
Texas | | | 8.1 | | |
Utah | | | 1.7 | | |
Vermont | | | 0.4 | | |
Virginia | | | 1.2 | | |
Washington | | | 3.4 | | |
West Virginia | | | 0.4 | | |
Wisconsin | | | 2.4 | | |
Liabilities Less Other Assets | | | (0.7 | )* | |
Total | | | 100.0 | % | |
* Includes the impact of the Fund's open positions in derivatives, if any.
PERFORMANCE HIGHLIGHTS10
| | Inception | | Average Annual Total Return
Ended 10/31/2019 | |
| | Date | | 1 Year | | 5 Years | | 10 Years | | Life of Fund | |
At NAV | |
Investor Class | | 07/09/1987 | | | 8.46 | % | | | 2.66 | % | | | 3.53 | % | | | 4.67 | % | |
| Institutional Class11 | | 06/21/2010 | | | 8.63 | % | | | 2.82 | % | | | 3.67 | % | | | 4.71 | % | |
| Class A11 | | 06/21/2010 | | | 8.24 | % | | | 2.42 | % | | | 3.30 | % | | | 4.60 | % | |
| Class C11 | | 06/21/2010 | | | 7.43 | % | | | 1.66 | % | | | 2.58 | % | | | 4.37 | % | |
With Sales Charge | |
| Class A11 | | | | | 3.68 | % | | | 1.53 | % | | | 2.85 | % | | | 4.46 | % | |
| Class C11 | | | | | 6.43 | % | | | 1.66 | % | | | 2.58 | % | | | 4.37 | % | |
Index | |
Bloomberg Barclays
7-Year G.O. Index1,14 | | | | | 8.63 | % | | | 2.90 | % | | | 3.86 | % | | | 5.44 | % | |
The performance data quoted represent past performance and do not indicate future results. Current performance may be lower or higher than the performance data quoted. For current performance data, please visit www.nb.com/performance.
The results shown in the table reflect the reinvestment of income dividends and other distributions, if any. The results do not reflect the effect of taxes a shareholder would pay on Fund distributions or on the redemption of Fund shares.
The investment return and principal value of an investment will fluctuate and shares, when redeemed, may be worth more or less than their original cost.
Returns would have been lower if Neuberger Berman Investment Advisers LLC ("Management") had not reimbursed certain expenses and/or waived a portion of the investment management fees during certain of the periods shown. Repayment by a class (of expenses previously reimbursed and/or fees previously waived by Management) will decrease the class's returns. Please see Note B in the Notes to Financial Statements for specific information regarding expense reimbursement and/or fee waiver arrangements.
For the period ended October 31, 2019, the 30-day SEC yields were 1.35%, 1.50%, 1.13% and 0.38% for Investor Class, Institutional Class, Class A and Class C shares, respectively. The tax-equivalent yields were 2.28%, 2.53%, 1.91% and 0.64% for Investor Class, Institutional Class, Class A and Class C shares, respectively, for a shareholder in the highest federal income tax bracket (37% plus 3.8% Medicare contribution tax).9 Absent expense reimbursements and/or fee waivers, the 30-day SEC yields would have been 1.14%, 1.31%, 0.94% and 0.20% for Investor Class, Institutional Class, Class A and Class C shares, respectively.
As stated in the Fund's most recent prospectus, the total annual operating expense ratios for fiscal year 2018 were 0.65%, 0.46%, 0.83% and 1.58% for Investor Class, Institutional Class, Class A and Class C shares, respectively (before expense reimbursements and/or fee waivers, if any, and after restatement). The expense ratios were 0.45%, 0.30%, 0.67% and 1.42% for Investor Class, Institutional Class, Class A and Class C shares, respectively, after expense reimbursements and/or fee waivers and/or restatement. The expense ratios for the annual period ended October 31, 2019 can be found in the Financial Highlights section of this report.
Returns shown with a sales charge reflect the deduction of the current maximum initial sales charge of 4.25% for Class A shares and the contingent deferred sales charge (CDSC) for Class C shares. The CDSC for Class C shares is 1%, which is reduced to 0% after 1 year. The performance of the Fund's share classes will differ primarily due to different sales charge structures and class expenses. Please see the prospectus for more information about sales charge structures, if any, and class expenses for your share class.
22
Municipal Intermediate Bond Fund (Unaudited)
COMPARISON OF A $10,000 INVESTMENT
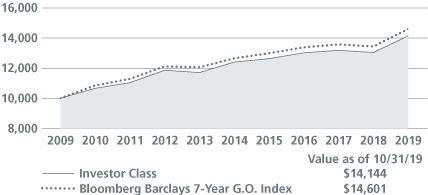
This graph shows the change in value of a hypothetical $10,000 investment in the Fund over the past 10 fiscal years, or since the Fund's inception if it has not operated for 10 years. The graph is based on the Investor Class shares only; the performance of the Fund's share classes will differ primarily due to different sales charge structures and class expenses (see Performance Highlights chart on previous page). The result is compared with benchmarks, which include a broad-based market index and may include a more narrowly based index. Market indices have not been reduced to reflect any of the fees and costs of investing. The results shown in the graph reflect the reinvestment of income dividends and other distributions, if any. The results do not reflect the effect of taxes a shareholder would pay on Fund distributions or on the redemption of Fund shares. Results represent past performance and do not indicate future results.
23
Short Duration Bond Fund Commentary (Unaudited)
Neuberger Berman Short Duration Bond Fund Investor Class generated a 4.40% total return for the 12 months ended October 31, 2019 and underperformed its benchmark, the Bloomberg Barclays 1-3 Year U.S. Government/Credit Bond Index (the Index), which provided a 4.89% total return for the same period. (Performance for all share classes is provided in the table immediately following this letter.)
The overall fixed income market generated strong results during the 12 months ended October 31, 2019. Both short- and long-term U.S. Treasury yields moved sharply lower as the U.S. Federal Reserve Board (Fed) had a "dovish pivot" and lowered interest rates three times during the second half of the reporting period. In addition, global growth continued to moderate, partially due to the ongoing trade conflict between the U.S. and China. Investor sentiment was also challenged at times given uncertainties surrounding Brexit and a number of geopolitical issues. Against this backdrop, a number of central banks outside the U.S., including the European Central Bank, also introduced accommodative monetary policies, and government yields outside the U.S. also moved lower.
The primary detractor from the Fund's relative performance versus the Index during the reporting period was its duration positioning. We began the reporting period with a neutral posture and then moved to a more defensive duration position as economic growth in the U.S. remained solid. This was a headwind for results as the market priced in what we felt were aggressive Fed rate cuts as 2019 progressed, whereas our estimation was that the Fed would remain on hold. We then moved back to a neutral duration position in September 2019. Elsewhere, the Fund's allocation to asset-backed securities (ABS) was a modest detractor from returns. On the upside, the Fund's overweight allocation to investment-grade corporate bonds was beneficial as their spreads tightened. Elsewhere, the Fund's exposure to commercial mortgage-backed securities (CMBS) contributed to performance as their spreads also narrowed.
The Fund's use of futures contracts contributed positively to performance during the reporting period.
We maintained the Fund's overall positioning over the reporting period, with an overweight to non-Treasury securities and underweights to Treasuries, agency debt and non-corporate securities. That being said, we pared further the Fund's exposures to Treasuries and cash. Those proceeds were redeployed into corporate bonds, ABS and CMBS. Meanwhile, we actively participated in the primary and secondary credit markets when we found individual securities that we believed were attractively valued.
Looking ahead, we anticipate the U.S. economy to experience a soft landing, followed by continued expansion. Supporting the economy, in our view, will be a healthy labor market and wage growth which, in turn, should lead to solid consumer spending. Against this backdrop, we believe the Fed will remain on hold for the time being while it analyzes incoming economic data. As we move into 2020 we anticipate periods of market volatility. This may be triggered by any number of factors, including uncertainties regarding the November 2020 elections, ongoing trade negotiations between the U.S. and China and potential geopolitical factors. We view market volatility as potential opportunities to purchase securities at attractive valuations.
Sincerely,
THOMAS SONTAG, MICHAEL FOSTER AND MATTHEW MCGINNIS
PORTFOLIO MANAGERS
Information about principal risks of investing in the Fund is set forth in the prospectus and statement of additional information.
The portfolio composition, industries and holdings of the Fund are subject to change without notice.
The opinions expressed are those of the Fund's portfolio managers. The opinions are as of the date of this report and are subject to change without notice.
24
Short Duration Bond Fund (Unaudited)
TICKER SYMBOLS
Investor Class | | NSBIX | |
Trust Class | | NSBTX | |
Institutional Class | | NSHLX | |
Class A | | NSHAX | |
Class C | | NSHCX | |
PORTFOLIO BY TYPE OF SECURITY
(as a % of Total Net Assets) | |
Asset-Backed Securities | | | 7.3 | % | |
Corporate Bonds | | | 56.7 | | |
Mortgage-Backed Securities | | | 36.7 | | |
U.S. Treasury Obligations | | | 0.7 | | |
Short-Term Investments | | | 2.2 | | |
Liabilities Less Other Assets | | | (3.6 | )* | |
Total | | | 100.0 | % | |
* Includes the impact of the Fund's open positions in derivatives, if any.
PERFORMANCE HIGHLIGHTS15
| | Inception | | Average Annual Total Return
Ended 10/31/2019 | |
| | Date | | 1 Year | | 5 Years | | 10 Years | | Life of Fund | |
At NAV | | | | | | | | | | | |
Investor Class | | 06/09/1986 | | | 4.40 | % | | | 1.28 | % | | | 1.91 | % | | | 4.00 | % | |
| Trust Class12 | | 08/30/1993 | | | 4.25 | % | | | 1.16 | % | | | 1.81 | % | | | 3.92 | % | |
| Institutional Class12 | | 06/21/2010 | | | 4.62 | % | | | 1.46 | % | | | 2.09 | % | | | 4.05 | % | |
| Class A12 | | 06/21/2010 | | | 4.18 | % | | | 1.09 | % | | | 1.74 | % | | | 3.95 | % | |
| Class C12 | | 06/21/2010 | | | 3.55 | % | | | 0.34 | % | | | 1.03 | % | | | 3.73 | % | |
With Sales Charge | |
| Class A12 | | | | | 1.53 | % | | | 0.59 | % | | | 1.49 | % | | | 3.87 | % | |
| Class C12 | | | | | 2.55 | % | | | 0.34 | % | | | 1.03 | % | | | 3.73 | % | |
Index | |
Bloomberg Barclays 1-3 Year
U.S. Government/Credit Bond Index1,14 | | | | | 4.89 | % | | | 1.60 | % | | | 1.52 | % | | | 4.74 | % | |
The performance data quoted represent past performance and do not indicate future results. Current performance may be lower or higher than the performance data quoted. For current performance data, please visit www.nb.com/performance.
The results shown in the table reflect the reinvestment of income dividends and other distributions, if any. The results do not reflect the effect of taxes a shareholder would pay on Fund distributions or on the redemption of Fund shares.
The investment return and principal value of an investment will fluctuate and shares, when redeemed, may be worth more or less than their original cost.
Returns would have been lower if Neuberger Berman Investment Advisers LLC ("Management") had not reimbursed certain expenses and/or waived a portion of the investment management fees during certain of the periods shown. Repayment by a class (of expenses previously reimbursed and/or fees previously waived by Management) will decrease the class's returns. Please see Note B in the Notes to Financial Statements for specific information regarding expense reimbursement and/or fee waiver arrangements.
For the period ended October 31, 2019, the 30-day SEC yields were 2.80%, 2.70%, 3.00%, 2.63% and 1.88% for Investor Class, Trust Class, Institutional Class, Class A and Class C shares, respectively. Absent expense reimbursements and/or fee waivers, the 30-day SEC yields would have been 2.41%, 2.32%, 2.66%, 2.27% and 1.53% for Investor Class, Trust Class, Institutional Class, Class A and Class C shares, respectively.
As stated in the Fund's most recent prospectus, the total annual operating expense ratios for fiscal year 2018 were 1.08%, 1.20%, 0.83%, 1.22% and 1.97% for Investor Class, Trust Class, Institutional Class, Class A and Class C shares, respectively (before expense reimbursements and/or fee waivers, if any, and after restatement).The expense ratios were 0.60%, 0.70%, 0.40%, 0.77% and 1.52% for Investor Class, Trust Class, Institutional Class, Class A and Class C shares, respectively, after expense reimbursements and/or fee waivers and/or restatement. The expense ratios for the annual period ended October 31, 2019 can be found in the Financial Highlights section of this report.
Returns shown with a sales charge reflect the deduction of the current maximum initial sales charge of 2.50% for Class A shares and the contingent deferred sales charge (CDSC) for Class C shares. The CDSC for Class C shares is 1%, which is reduced to 0% after 1 year. The performance of the Fund's share classes will differ primarily due to different sales charge structures and class expenses. Please see the prospectus for more information about sales charge structures, if any, and class expenses for your share class.
25
Short Duration Bond Fund (Unaudited)
COMPARISON OF A $10,000 INVESTMENT
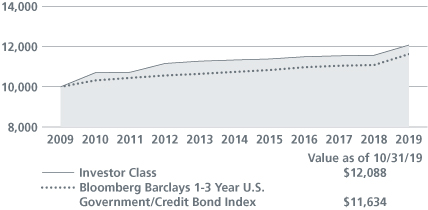
This graph shows the change in value of a hypothetical $10,000 investment in the Fund over the past 10 fiscal years, or since the Fund's inception if it has not operated for 10 years. The graph is based on the Investor Class shares only; the performance of the Fund's share classes will differ primarily due to different sales charge structures and class expenses (see Performance Highlights chart on previous page). The result is compared with benchmarks, which include a broad-based market index and may include a more narrowly based index. Market indices have not been reduced to reflect any of the fees and costs of investing. The results shown in the graph reflect the reinvestment of income dividends and other distributions, if any. The results do not reflect the effect of taxes a shareholder would pay on Fund distributions or on the redemption of Fund shares. Results represent past performance and do not indicate future results.
26
Short Duration High Income Fund Commentary (Unaudited)
Neuberger Berman Short Duration High Income Fund Institutional Class generated a 6.06% total return for the 12 months ended October 31, 2019 and underperformed its benchmark, the ICE BofAML 0-5 Year BB-B U.S. High Yield Constrained Index (the Index), which provided a 6.89% total return for the same period. (Performance for all share classes is provided in the table immediately following this letter.)
The overall high yield market, as measured by the ICE BofAML U.S. High Yield Constrained Index, generated strong results during the 12 months ended October 31, 2019. After moving lower over the first two months of the reporting period, the high yield market posted positive returns during nine of the next ten months. The market's turnaround was triggered by a number of factors, including a "dovish pivot" by the U.S. Federal Reserve Board (Fed), as it lowered interest rates three times during the second half of the reporting period. In addition, the U.S. economy was resilient and corporate profits often exceeded lowered expectations. Late in the reporting period there were also reports of progress in U.S./China trade negotiations.
For the Fund, the sectors that contributed the most to absolute performance were health care, metals/mining, media-cable and diversified financial services. The sectors that detracted or contributed the least to absolute performance during the reporting period were energy, technology & electronics and real estate & homebuilders. From a quality perspective, approximately 97% of the portfolio was held in securities rated B and higher and cash. This positioning was accretive to the Fund's absolute performance.
During the reporting period, the Fund increased its allocations to consumer products & services and capital goods, while reducing its allocation to media—cable, diversified financial services and health care.
Looking ahead, we continue to believe that spreads are compensating investors for a relatively benign default environment. While headline risk and market volatility remain potential risks, operating performance of most issuers has been relatively stable; revenue growth has been positive and leverage has risen only modestly. We believe the ability of issuers to cover interest payments remains relatively constructive. Furthermore, refinancing activity has significantly reduced the amount of bonds maturing in the near term. While economic growth has slowed, the Fed and other central banks continue to be supportive of monetary policy actions which would tend to shore up further deterioration in economic activity. While we believe the outlook for most issuer fundamentals remains constructive, risks continue to exist, including uncertainty around global growth expectations, U.S.-China trade policy and political event risk, which could lead to periods of volatility. We believe our portfolio is well-positioned to provide downside protection as market volatility rises and we will look to tactically take advantage of increased volatility to add issuers with more stable and/or improving fundamentals and valuations.
Sincerely,
THOMAS P. O'REILLY*, RUSS COVODE, DANIEL DOYLE, JOE LIND AND CHRISTOPHER KOCINSKI
PORTFOLIO CO-MANAGERS
* As previously disclosed in a supplement to the Fund's prospectus, Thomas P. O'Reilly will retire on or about December 31, 2019. Russ Covode, Daniel Doyle, Joe Lind and Christopher Kocinski will continue to manage Neuberger Berman Short Duration High Income Fund.
Information about principal risks of investing in the Fund is set forth in the prospectus and statement of additional information.
The portfolio composition, industries and holdings of the Fund are subject to change without notice.
The opinions expressed are those of the Fund's portfolio managers. The opinions are as of the date of this report and are subject to change without notice.
27
Short Duration High Income Fund (Unaudited)
TICKER SYMBOLS
Institutional Class | | NHSIX | |
Class A | | NHSAX | |
Class C | | NHSCX | |
PORTFOLIO BY TYPE OF SECURITY
(as a % of Total Net Assets) | |
Corporate Bonds | | | 86.8 | % | |
Loan Assignments | | | 8.9 | | |
Short-Term Investments | | | 3.2 | | |
Other Assets Less Liabilities | | | 1.1 | * | |
Total | | | 100.0 | % | |
* Includes the impact of the Fund's open positions in derivatives, if any.
PERFORMANCE HIGHLIGHTS
| | Inception | | Average Annual Total Return
Ended 10/31/2019 | |
| | Date | | 1 Year | | 5 Years | | Life of Fund | |
At NAV | |
Institutional Class | | 09/28/2012 | | | 6.06 | % | | | 3.31 | % | | | 3.69 | % | |
Class A | | 09/28/2012 | | | 5.78 | % | | | 2.95 | % | | | 3.33 | % | |
Class C | | 09/28/2012 | | | 5.00 | % | | | 2.16 | % | | | 2.55 | % | |
With Sales Charge | |
Class A | | | | | 1.27 | % | | | 2.05 | % | | | 2.70 | % | |
Class C | | | | | 4.00 | % | | | 2.16 | % | | | 2.55 | % | |
Index | | | | | | | | | |
ICE BofAML 0-5 Year BB-B
U.S. High Yield Constrained Index1,14 | | | | | 6.89 | % | | | 4.37 | % | | | 4.90 | % | |
The performance data quoted represent past performance and do not indicate future results. Current performance may be lower or higher than the performance data quoted. For current performance data, please visit www.nb.com/performance.
The results shown in the table reflect the reinvestment of income dividends and other distributions, if any. The results do not reflect the effect of taxes a shareholder would pay on Fund distributions or on the redemption of Fund shares.
The investment return and principal value of an investment will fluctuate and shares, when redeemed, may be worth more or less than their original cost.
Returns would have been lower if Neuberger Berman Investment Advisers LLC ("Management") had not reimbursed certain expenses and/or waived a portion of the investment management fees during certain of the periods shown. Repayment by a class (of expenses previously reimbursed and/or fees previously waived by Management) will decrease the class's returns. Please see Note B in the Notes to Financial Statements for specific information regarding expense reimbursement and/or fee waiver arrangements.
For the period ended October 31, 2019, the 30-day SEC yields were 3.59%, 3.22% and 2.47% for Institutional Class, Class A and Class C shares, respectively. Absent expense reimbursements and/or fee waivers, the 30-day SEC yields would have been 2.88%, 2.44% and 1.74% for Institutional Class, Class A and Class C shares, respectively.
As stated in the Fund's most recent prospectus, the total annual operating expense ratios for fiscal year 2018 were 1.05%, 1.47% and 2.21% for Institutional Class, Class A and Class C shares, respectively (before expense reimbursements and/or fee waivers, if any). The expense ratios were 0.76%, 1.13% and 1.88% for Institutional Class, Class A and Class C shares, respectively, after expense reimbursements and/or fee waivers. The expense ratios for the annual period ended October 31, 2019 can be found in the Financial Highlights section of this report.
Returns shown with a sales charge reflect the deduction of the current maximum initial sales charge of 4.25% for Class A shares and the contingent deferred sales charge (CDSC) for Class C shares. The CDSC for Class C shares is 1%, which is reduced to 0% after 1 year. The performance of the Fund's share classes will differ primarily due to different sales charge structures and class expenses. Please see the prospectus for more information about sales charge structures, if any, and class expenses for your share class.
28
Short Duration High Income Fund (Unaudited)
COMPARISON OF A $1,000,000 INVESTMENT
(000's omitted)
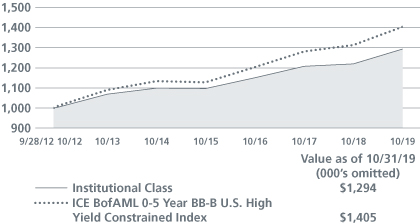
This graph shows the change in value of a hypothetical $1,000,000 investment in the Fund over the past 10 fiscal years, or since the Fund's inception if it has not operated for 10 years. The graph is based on the Institutional Class shares only; the performance of the Fund's share classes will differ primarily due to different sales charge structures and class expenses (see Performance Highlights chart on previous page). The result is compared with benchmarks, which include a broad-based market index and may include a more narrowly based index. Market indices have not been reduced to reflect any of the fees and costs of investing. The results shown in the graph reflect the reinvestment of income dividends and other distributions, if any. The results do not reflect the effect of taxes a shareholder would pay on Fund distributions or on the redemption of Fund shares. Results represent past performance and do not indicate future results.
29
Strategic Income Fund Commentary (Unaudited)
Neuberger Berman Strategic Income Fund Institutional Class generated a 7.87% total return for the 12 months ended October 31, 2019, but underperformed its benchmark, the Bloomberg Barclays U.S. Aggregate Bond Index (the Index), which provided a 11.51% total return for the same period. (Performance for all share classes is provided in the table immediately following this letter.)
The overall fixed income market generated strong results during the 12 months ended October 31, 2019. Both short- and long-term U.S. Treasury yields moved sharply lower as the U.S. Federal Reserve Board had a "dovish pivot" and lowered interest rates three times during the second half of the reporting period. In addition, global growth continued to moderate, partially due to the ongoing trade conflict between the U.S. and China. Investor sentiment was also challenged at times given uncertainties surrounding Brexit, numerous other geopolitical issues and a downturn in manufacturing activity. Against this backdrop, a number of central banks outside the U.S., including the European Central Bank, also introduced accommodative monetary policies, and government yields outside the U.S. also moved lower.
The Fund's duration underweight versus the Index was the primary detractor from relative performance versus the Index, as U.S. Treasuries rallied over the reporting period. To a lesser degree, security selection in agency mortgage-backed securities and an allocation to U.S. Treasury Inflation-Protection Securities also weighed on results. The Fund's exposure to emerging markets debt helped partially offset these headwinds, as the sector benefited from dovish central bank policy and easing financial conditions in developed markets. Security selection in investment-grade credit was another notable contributor, with issuer selection in the banking and food & beverage subsectors adding the most value. Elsewhere, exposure to high-yield credit (both U.S. dollar and euro-denominated) contributed to performance during the reporting period.
The Fund's aggregate use of futures, swaps and forward currency and bond forward contracts detracted from performance during the reporting period.
There were several adjustments made to the portfolio during the reporting period. We reduced the Fund's exposure to emerging markets debt and European corporate credit following strong performance in the first half of 2019. In addition, we saw heightened growth risks associated with global trade and manufacturing. We have increased our allocations to senior floating rate loans, collateralized loan obligations and floating-rate investment-grade corporates. We believe there are compelling risk-adjusted opportunities in these sectors as recent underperformance has been primarily due to technical reasons rather than fundamentals. Within high-yield credit, we have been focusing exposure in domestic and services-oriented issuers, which we believe are more insulated from trade-related volatility.
Our main thesis since early 2019 has been that global growth would slow, but we would experience a global soft economic landing, which we believed would ultimately support a range of credit sectors. To date, that has been the case but, as we look forward, we believe we should bifurcate the outlook. For the U.S. in particular, we still believe in slow-but-positive growth: the base of consumption spending and labor trends means that it's difficult to envision a serious slowdown over the coming quarters. But for other regions and countries, we believe the soft landing is transitioning to something riskier. In our view, continental Europe, the U.K. and some major emerging market countries are seeing, and will likely continue to see, weak growth rates that may look and feel like recessions, even if technical definitions of a recession are not met.
Sincerely,
THANOS BARDAS, ASHOK BHATIA, DAVID M. BROWN AND BRAD TANK
PORTFOLIO MANAGERS
Information about principal risks of investing in the Fund is set forth in the prospectus and statement of additional information.
The portfolio composition, industries and holdings of the Fund are subject to change without notice.
The opinions expressed are those of the Fund's portfolio managers. The opinions are as of the date of this report and are subject to change without notice.
30
Strategic Income Fund (Unaudited)
TICKER SYMBOLS
Trust Class | | NSTTX | |
Institutional Class | | NSTLX | |
Class A | | NSTAX | |
Class C | | NSTCX | |
Class R6 | | NRSIX | |
PORTFOLIO BY TYPE OF SECURITY
(as a % of Total Net Assets) | |
Asset-Backed Securities | | | 7.0 | % | |
Corporate Bonds | | | 45.7 | | |
Developed Markets Ex- U.S. | | | 0.1 | | |
Foreign Government Securities | | | 2.3 | | |
Loan Assignments | | | 6.9 | | |
Mortgage-Backed Securities | | | 25.7 | | |
Municipal Notes | | | 1.7 | | |
U.S. Government Agency Securities | | | 0.1 | | |
U.S. Treasury Obligations | | | 27.8 | | |
Short-Term Investments | | | 0.4 | | |
Liabilities Less Other Assets | | | (17.7 | )* | |
Total | | | 100.0 | % | |
* Includes the impact of the Fund's open positions in derivatives, if any.
PERFORMANCE HIGHLIGHTS17
| | Inception | | Average Annual Total Return
Ended 10/31/2019 | |
| | Date | | 1 Year | | 5 Years | | 10 Years | | Life of Fund | |
At NAV | | | | | | | | | | | |
| Trust Class13 | | 04/02/2007 | | | 7.60 | % | | | 3.00 | % | | | 4.82 | % | | | 6.12 | % | |
Institutional Class | | 07/11/2003 | | | 7.87 | % | | | 3.36 | % | | | 5.19 | % | | | 6.40 | % | |
| Class A13 | | 12/20/2007 | | | 7.44 | % | | | 2.95 | % | | | 4.77 | % | | | 6.09 | % | |
| Class C13 | | 12/20/2007 | | | 6.70 | % | | | 2.23 | % | | | 4.04 | % | | | 5.55 | % | |
| Class R613 | | 03/15/2013 | | | 7.98 | % | | | 3.42 | % | | | 5.23 | % | | | 6.43 | % | |
With Sales Charge | | | | | | | | | | | |
| Class A13 | | | | | 2.89 | % | | | 2.06 | % | | | 4.31 | % | | | 5.81 | % | |
| Class C13 | | | | | 5.70 | % | | | 2.23 | % | | | 4.04 | % | | | 5.55 | % | |
Index | | | | | | | | | | | |
Bloomberg Barclays U.S.
Aggregate Bond Index1,14 | | | | | 11.51 | % | | | 3.24 | % | | | 3.73 | % | | | 4.12 | % | |
The performance data quoted represent past performance and do not indicate future results. Current performance may be lower or higher than the performance data quoted. For current performance data, please visit www.nb.com/performance.
The results shown in the table reflect the reinvestment of income dividends and other distributions, if any. The results do not reflect the effect of taxes a shareholder would pay on Fund distributions or on the redemption of Fund shares.
The investment return and principal value of an investment will fluctuate and shares, when redeemed, may be worth more or less than their original cost.
Returns would have been lower if Neuberger Berman Investment Advisers LLC ("Management") had not reimbursed certain expenses and/or waived a portion of the investment management fees during certain of the periods shown. Repayment by a class (of expenses previously reimbursed and/or fees previously waived by Management) will decrease the class's returns. Please see Note B in the Notes to Financial Statements for specific information regarding expense reimbursement and/or fee waiver arrangements.
For the period ended October 31, 2019, the 30-day SEC yields were 2.99%, 3.35%, 2.95%, 2.25% and 3.45% for Trust Class, Institutional Class, Class A, Class C and Class R6 shares, respectively. Absent expense reimbursements and/or fee waivers, the 30-day SEC yields would have been 2.92%, 3.33%, 2.95%, 2.21% and 3.43% for Trust Class, Institutional Class, Class A, Class C and Class R6 shares, respectively.
As stated in the Fund's most recent prospectus, the total annual operating expense ratios for fiscal year 2018 were 1.00%, 0.62%, 1.01%, 1.74% and 0.52% for Trust Class, Institutional Class, Class A, Class C and Class R6 shares, respectively (before expense reimbursements and/or fee waivers, if any, and after restatement for Class R6 shares). The expense ratios were 0.95%, 0.60%, 1.00%, 1.70% and 0.50% for Trust Class, Institutional Class, Class A, Class C and Class R6 shares, respectively, after expense reimbursements and/or fee waivers and/or restatement. The expense ratios for the annual period ended October 31, 2019 can be found in the Financial Highlights section of this report.
Returns shown with a sales charge reflect the deduction of the current maximum initial sales charge of 4.25% for Class A shares and the contingent deferred sales charge (CDSC) for Class C shares. The CDSC for Class C shares is 1%, which is reduced to 0% after 1 year. The performance of the Fund's share classes will differ primarily due to different sales charge structures and class expenses. Please see the prospectus for more information about sales charge structures, if any, and class expenses for your share class.
31
Strategic Income Fund (Unaudited)
COMPARISON OF A $1,000,000 INVESTMENT
(000's omitted)
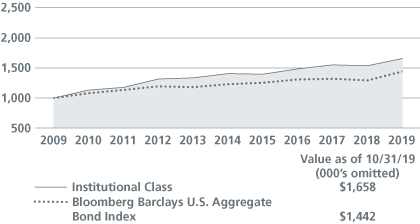
This graph shows the change in value of a hypothetical $1,000,000 investment in the Fund over the past 10 fiscal years, or since the Fund's inception if it has not operated for 10 years. The graph is based on the Institutional Class shares only; the performance of the Fund's share classes will differ primarily due to different sales charge structures and class expenses (see Performance Highlights chart on previous page). The result is compared with benchmarks, which include a broad-based market index and may include a more narrowly based index. Market indices have not been reduced to reflect any of the fees and costs of investing. The results shown in the graph reflect the reinvestment of income dividends and other distributions, if any. The results do not reflect the effect of taxes a shareholder would pay on Fund distributions or on the redemption of Fund shares. Results represent past performance and do not indicate future results.
32
Unconstrained Bond Fund Commentary (Unaudited)
Neuberger Berman Unconstrained Bond Fund Institutional Class generated a -1.66% total return for the 12 months ended October 31, 2019. In contrast, its benchmark, the ICE BofAML 3-Month U.S. Treasury Bill Index (the Index), provided a 2.40% total return for the same period. (Performance for all share classes is provided in the table immediately following this letter.)
The overall fixed income market generated strong results during the 12 months ended October 31, 2019. Both short- and long-term U.S. Treasury yields moved sharply lower as the U.S. Federal Reserve Board (Fed) had a "dovish pivot" and lowered interest rates three times during the second half of the reporting period. In addition, global growth continued to moderate, partially due to the ongoing trade conflict between the U.S. and China. Investor sentiment was also challenged at times given uncertainties surrounding Brexit, numerous other geopolitical issues and a downturn in manufacturing activity. Against this backdrop, a number of central banks outside the U.S., including the European Central Bank, also introduced accommodative monetary policies, and government yields outside the U.S. also moved lower.
The Fund's short exposures to U.S. and core European rates were the primary detractors from performance versus the Index, due to the rally in developed markets government bond yields. Elsewhere, the Fund's allocation to U.S. Treasury Inflation-Protection Securities (TIPS) and global inflation-linked bonds modestly weighed on results, as future inflation expectations remained weak relative to inflation readings during the reporting period. On the upside, the Fund's exposure to emerging markets (EM) debt, both hard and local currency, contributed the most to results over the reporting period. EM assets in particular benefited from dovish central bank policy and easing financial conditions in developed markets. The Fund's exposure to global investment-grade credit—both U.S. dollar and euro-denominated—was another notable contributor to returns given spreads tightening over the reporting period. The Fund's currency positioning also aided performance.
The Fund's aggregate use of futures (including options on futures), forward foreign currency, and swap contracts detracted from performance during the reporting period.
There were several adjustments made to the portfolio during the reporting period. We further reduced our negative duration by roughly half a year (moving it closer to zero), with shorts focused in U.S. and core European rates. We maintained exposure to TIPS, as we believe the Fed has a strong desire to see inflation move modestly higher. In addition, in our view, TIPS still appear attractively priced relative to fundamentals. In corporate credit, we have realized some profits in European investment-grade and high-yield following solid performance. We also believe relative value in corporate credit has shifted to the U.S. Elsewhere, we remain overweight EM sovereign bonds in hard and local currency, and favor countries where we see sound fundamentals and which are supported by fiscal reforms and strong international support.
Our main thesis since early 2019 has been that global growth would slow, but we would experience a global soft economic landing, which we believed would ultimately support a range of credit sectors. To date, that has been the case, but as we look forward, we believe we should bifurcate the outlook. For the U.S. in particular, we still believe in slow-but-positive growth: the base of consumption spending and labor trends means that it's difficult to envision a serious slowdown over the coming quarters. But for other regions and countries, we believe the soft landing is transitioning to something riskier. In our view, continental Europe, the U.K. and some major emerging market countries are seeing, and will likely continue to see, weak growth rates that may look and feel like recessions, even if technical definitions of a recession are not met.
Sincerely,
THANOS BARDAS, ASHOK BHATIA, DAVID M. BROWN, JON JONSSON, UGO LANCIONI, NATHAN KUSH AND BRAD TANK
PORTFOLIO MANAGERS
Information about principal risks of investing in the Fund is set forth in the prospectus and statement of additional information.
The portfolio composition, industries and holdings of the Fund are subject to change without notice.
The opinions expressed are those of the Fund's portfolio managers. The opinions are as of the date of this report and are subject to change without notice.
33
Unconstrained Bond Fund (Unaudited)
TICKER SYMBOLS
Institutional Class | | NUBIX | |
Class A | | NUBAX | |
Class C | | NUBCX | |
Class R6 | | NRUBX | |
PORTFOLIO BY TYPE OF SECURITY
(as a % of Total Net Assets) | |
Asset-Backed Securities | | | 7.8 | % | |
Corporate Bonds | | | 47.2 | | |
Exchange-Traded Funds | | | 6.7 | | |
Foreign Government Securities | | | 10.0 | | |
Mortgage-Backed Securities | | | 9.2 | | |
U.S. Treasury Obligations | | | 13.6 | | |
Short-Term Investments | | | 0.6 | | |
Other Assets Less Liabilities | | | 4.9 | * | |
Total | | | 100.0 | % | |
* Includes the impact of the Fund's open positions in derivatives, if any.
PERFORMANCE HIGHLIGHTS
| | Inception | | Average Annual Total Return
Ended 10/31/2019 | |
| | Date | | 1 Year | | 5 Years | | Life of Fund | |
At NAV | | | | | | | | | |
Institutional Class | | 02/13/2014 | | | -1.66 | % | | | 0.40 | % | | | 0.50 | % | |
Class A | | 02/13/2014 | | | -1.70 | % | | | 0.05 | % | | | 0.16 | % | |
Class C | | 02/13/2014 | | | -2.75 | % | | | -0.69 | % | | | -0.59 | % | |
Class R6 | | 02/13/2014 | | | -1.56 | % | | | 0.50 | % | | | 0.60 | % | |
With Sales Charge | | | | | | | | | |
Class A | | | | | -5.86 | % | | | -0.81 | % | | | -0.60 | % | |
Class C | | | | | -3.70 | % | | | -0.69 | % | | | -0.59 | % | |
Index | | | | | | | | | |
ICE BofAML 3-Month
U.S. Treasury Bill Index1,14 | | | | | 2.40 | % | | | 1.02 | % | | | 0.90 | % | |
The performance data quoted represent past performance and do not indicate future results. Current performance may be lower or higher than the performance data quoted. For current performance data, please visit www.nb.com/performance.
The results shown in the table reflect the reinvestment of income dividends and other distributions, if any. The results do not reflect the effect of taxes a shareholder would pay on Fund distributions or on the redemption of Fund shares.
The investment return and principal value of an investment will fluctuate and shares, when redeemed, may be worth more or less than their original cost.
Returns would have been lower if Neuberger Berman Investment Advisers LLC ("Management") had not reimbursed certain expenses and/or waived a portion of the investment management fees during certain of the periods shown. Repayment by a class (of expenses previously reimbursed and/or fees previously waived by Management) will decrease the class's returns. Please see Note B in the Notes to Financial Statements for specific information regarding expense reimbursement and/or fee waiver arrangements.
For the period ended October 31, 2019, the 30-day SEC yields were 3.22%, 2.84%, 2.10% and 3.26% for Institutional Class, Class A, Class C and Class R6 shares, respectively. Absent expense reimbursements and/or fee waivers, the 30-day SEC yields would have been 2.34%, 1.76%, 1.17% and 2.37% for Institutional Class, Class A, Class C and Class R6 shares, respectively.
As stated in the Fund's most recent prospectus, the total annual operating expense ratios for fiscal year 2018 were 1.08%, 1.52%, 2.28% and 0.98% for Institutional Class, Class A, Class C and Class R6 shares, respectively (before expense reimbursements and/or fee waivers, if any, and after restatement for Class R6 shares). The expense ratios were 0.69%, 1.06%, 1.80% and 0.59% for Institutional Class, Class A, Class C and Class R6 shares, respectively, after expense reimbursements and/or fee waivers and/or restatement. The expense ratios for the annual period ended October 31, 2019 can be found in the Financial Highlights section of this report.
Returns shown with a sales charge reflect the deduction of the current maximum initial sales charge of 4.25% for Class A shares and the contingent deferred sales charge (CDSC) for Class C shares. The CDSC for Class C shares is 1%, which is reduced to 0% after 1 year. The performance of the Fund's share classes will differ primarily due to different sales charge structures and class expenses. Please see the prospectus for more information about sales charge structures, if any, and class expenses for your share class.
34
Unconstrained Bond Fund (Unaudited)
COMPARISON OF A $1,000,000 INVESTMENT
(000's omitted)

This graph shows the change in value of a hypothetical $1,000,000 investment in the Fund over the past 10 fiscal years, or since the Fund's inception if it has not operated for 10 years. The graph is based on the Institutional Class shares only; the performance of the Fund's share classes will differ primarily due to different sales charge structures and class expenses (see Performance Highlights chart on previous page). The result is compared with benchmarks, which include a broad-based market index and may include a more narrowly based index. Market indices have not been reduced to reflect any of the fees and costs of investing. The results shown in the graph reflect the reinvestment of income dividends and other distributions, if any. The results do not reflect the effect of taxes a shareholder would pay on Fund distributions or on the redemption of Fund shares. Results represent past performance and do not indicate future results.
35
1 Please see "Glossary of Indices" on page 39 for a description of indices. Please note that individuals cannot invest directly in any index. The indices described in this report do not take into account any fees, expenses or tax consequences of investing in the individual securities that they track. Data about the performance of an index are prepared or obtained by Neuberger Berman Investment Advisers LLC ("Management") and reflect the reinvestment of income dividends and other distributions, if any. The Fund may invest in securities not included in a described index and generally does not invest in all securities included in a described index.
2 The performance information for periods prior to June 13, 2005, is that of the Fund's predecessor, Ariel Premier Bond Fund ("Ariel Fund"). The investment policies, guidelines and restrictions of the Fund are in all material respects equivalent to those of Ariel Fund. Returns would have been lower if Ariel Fund's manager had not waived certain of its fees during these periods.
3 The performance information for Institutional Class is that of Ariel Fund Institutional Class for the period October 1, 1995 (inception date) through June 10, 2005. The performance information for Investor Class is that of Ariel Fund Institutional Class for the period October 1, 1995 through January 31, 1997 (the period prior to the Investor Class' inception date), and that of Ariel Fund Investor Class for the period February 1, 1997 through June 10, 2005. Ariel Fund Institutional Class had lower expenses and typically higher returns than Ariel Fund Investor Class.
4 The performance information for Class A, Class C and Class R6 prior to the classes' inception date is that of the Institutional Class of Neuberger Berman Core Bond Fund (please see Endnote 3). The performance information for the Institutional Class has been adjusted to reflect the appropriate sales charges applicable to Class A and Class C shares, but has not been adjusted to take into account differences in class specific operating expenses (such as 12b-1 fees). The Institutional Class has lower expenses and typically higher returns than Class A and Class C. The Institutional Class has higher expenses and typically lower returns than Class R6.
5 The performance information for Institutional Class and Class C prior to the classes' inception date is that of Class A of Neuberger Berman Floating Rate Income Fund. The performance information (at NAV) of Class A has been adjusted to reflect the appropriate sales charge applicable to Class C shares, but has not been adjusted to take into account differences in class specific operating expenses (such as 12b-1 fees). Class A has higher expenses and typically lower returns (at NAV) than Institutional Class. Class A has lower expenses and typically higher returns (at NAV) than Class C.
6 The performance information for the period April 1, 1996 through September 6, 2002, is that of the Fund's predecessor, Lipper High Income Bond Fund ("Lipper Fund"), and the performance information for the period February 1, 1992 through March 31, 1996, is that of Lipper Fund's predecessor partnership. The investment policies, objectives, guidelines and restrictions of the Fund are in all material respects equivalent to those of Lipper Fund, and the investment policies, objectives, guidelines and restrictions of Lipper Fund were in all material respects equivalent to those of its predecessor partnership. As mutual funds registered under the Investment Company Act of 1940, as amended ("1940 Act"), the Fund is, and Lipper Fund was, subject to certain restrictions under the 1940 Act and the Internal Revenue Code of 1986, as amended ("Code"), to which Lipper Fund's predecessor partnership was not subject. Had Lipper Fund's predecessor partnership been registered under the 1940 Act and been subject to the provisions of the 1940 Act and the Code, its investment performance may have been adversely affected. Returns would have been lower if Lipper Fund's manager had not waived certain of its fees during these periods.
7 The performance information for Investor Class is that of Lipper Fund Premier Class for the period April 1, 1996 through September 6, 2002, and that of Lipper Fund's predecessor partnership for the period February 1, 1992 (inception date) through March 31, 1996 (please see Endnote 6).
36
8 The performance information for Institutional Class, Class A, Class C, Class R3 and Class R6 prior to the classes' respective inception dates is that of the Investor Class of Neuberger Berman High Income Bond Fund (please see Endnote 7). The performance information of the Investor Class has been adjusted to reflect the appropriate sales charges applicable to Class A and Class C shares, but has not been adjusted to take into account differences in class specific operating expenses (such as 12b-1 fees). The Investor Class has lower expenses and typically higher returns than Class A, Class C and Class R3. The Investor Class has higher expenses and typically lower returns than Institutional Class and Class R6.
9 Tax-equivalent effective yield is the taxable effective yield that a shareholder would have had to receive in order to realize the same level of yield after federal income taxes at the highest federal tax rate, currently 37% plus the 3.8% Medicare contribution tax, assuming that all of the Fund's income is exempt from federal income taxes.
10 A portion of the Fund's income may be a tax preference item for purposes of the federal alternative minimum tax for certain shareholders.
11 The performance information for Institutional Class, Class A and Class C prior to the classes' inception date is that of the Investor Class of Neuberger Berman Municipal Intermediate Bond Fund. The performance information of the Investor Class has been adjusted to reflect the appropriate sales charges applicable to Class A and Class C shares, but has not been adjusted to take into account differences in class specific operating expenses (such as 12b-1 fees). The Investor Class has lower expenses and typically higher returns than Class A and Class C. The Investor Class has higher expenses and typically lower returns than Institutional Class.
12 The performance information for Trust Class, Institutional Class, Class A and Class C prior to the classes' respective inception dates is that of the Investor Class of Neuberger Berman Short Duration Bond Fund. The performance information of the Investor Class has been adjusted to reflect the appropriate sales charges applicable to Class A and Class C shares, but has not been adjusted to take into account differences in class specific operating expenses (such as 12b-1 fees). The Investor Class has lower expenses and typically higher returns than Trust Class, Class A and Class C. The Investor Class has higher expenses and typically lower returns than Institutional Class.
13 The performance information for Trust Class, Class A, Class C and Class R6 prior to the classes' respective inception dates is that of the Institutional Class of Neuberger Berman Strategic Income Fund. The performance information of the Institutional Class has been adjusted to reflect the appropriate sales charges applicable to Class A and Class C shares, but has not been adjusted to take into account differences in class specific operating expenses (such as 12b-1 fees). The Institutional Class has lower expenses and typically higher returns than Trust Class, Class A and Class C. The Institutional Class has higher expenses and typically lower returns than Class R6.
14 The date used to calculate Life of Fund performance for the index is the inception date of the oldest share class.
15 The investments for the Fund are managed by the same portfolio manager(s) who manage(s) one or more other registered funds that have names, investment objectives and investment styles that are similar to those of the Fund. You should be aware that the Fund is likely to differ from the other mutual fund(s) in size, cash flow pattern and tax matters. Accordingly, the holdings and performance of the Fund can be expected to vary from those of the other mutual fund(s).
16 This date reflects when Management first became the investment manager to the Fund.
17 The Fund had a different goal, to maximize income without undue risk to principal, and investment strategy, which included managing assets by an asset allocation committee, prior to February 28, 2008. Its performance prior to that date might have been different if the current goal and investment strategy had been in effect.
18 The Fund had a different goal, to maximize total return through a combination of income and capital appreciation, and investment strategy, which did not include investments in derivatives and non-U.S. dollar denominated securities, prior to February 28, 2008. Its performance prior to that date might have been different if the current goal and investment strategy had been in effect.
37
19 The Fund's policies limited its ability to invest in bonds rated below "B" prior to July 6, 2006. Its performance prior to that date might have been different if current policies had been in effect.
20 Effective June 16, 2018, New York Municipal Income Fund changed its name to Municipal Impact Fund in connection with changes to the Fund's principal investment strategies and risks. Prior to June 16, 2018, the Fund had a different goal and different principal investment strategies, which included a policy to invest 80% of its net assets in securities of municipal issuers that provide interest income that is exempt from New York State and New York City personal income taxes and invest in only investment grade securities. Its performance prior to that date might have been different if the current goal and investment strategy had been in effect.
21 The performance information for Class A and Class C prior to the classes' inception date is that of the Institutional Class of Neuberger Berman Municipal Impact Fund (formerly, Neuberger Berman New York Municipal Income Fund). The performance information for the Institutional Class has been adjusted to reflect the appropriate sales charges applicable to Class A and Class C shares, but has not been adjusted to take into account differences in class specific operating expenses (such as 12b-1 fees). The Institutional Class has lower expenses and typically higher returns than Class A and Class C.
For more complete information on any of the Neuberger Berman Income Funds, call us at (800) 877-9700, or visit our website at www.nb.com.
38
Bloomberg Barclays 7-Year General Obligation (G.O.) Index: | | The index is the 7-year (6-8 years to maturity) component of the Bloomberg Barclays G.O. Index. The Bloomberg Barclays G.O. Index measures the investment grade, U.S. dollar-denominated, long-term, tax-exempt state and local general obligation bond market. | |
Bloomberg Barclays U.S. Aggregate Bond Index: | | The index measures the investment grade, U.S. dollar-denominated, fixed-rate, taxable bond market and includes Treasuries, government-related and corporate securities, mortgage-backed securities (MBS) (agency fixed-rate and hybrid adjustable rate mortgage (ARM) pass-throughs), asset-backed securities (ABS), and commercial mortgage-backed securities (CMBS) (agency and nonagency). | |
Bloomberg Barclays Municipal Bond Index: | | The index is a rules-based, market-value-weighted index engineered for the long-term tax-exempt bond market. To be included in the index, bonds must be rated investment-grade (Baa3/BBB- or higher) by at least two of the following ratings agencies: Moody's, S&P, Fitch. If only two of the three agencies rate the security, the lower rating is used to determine index eligibility. If only one of the three agencies rates a security, the rating must be investment-grade. They must have an outstanding par value of at least $7 million and be issued as part of a transaction of at least $75 million. The bonds must be fixed rate, have a dated date after December 31, 1990, and must be at least one year from their maturity date. Remarketed issues, taxable municipal bonds, bonds with floating rates, and derivatives, are excluded from the benchmark. | |
Bloomberg Barclays Municipal High Yield Index: | | The index measures the performance of the high yield municipal bond market. To be included in the index, bonds must be rated non-investment-grade (Ba1/BB+ or lower) by at least two of the following ratings agencies: Moody's, S&P, Fitch. If only two of the three agencies rate the security, the lower rating is used to determine index eligibility. If only one of the three agencies rates a security, the rating must be non-investment-grade. They must have an outstanding par value of at least $7 million and be issued as part of a transaction of at least $75 million. The bonds must be fixed rate, have a dated date after December 31, 1990, and must be at least one year from their maturity date. Remarketed issues, taxable municipal bonds, bonds with floating rates, and derivatives, are excluded from the benchmark. | |
65% Bloomberg Barclays Municipal Bond Index and 35% Bloomberg Barclays Municipal High Yield Index: | | The blended index is composed of 65% Bloomberg Barclays Municipal Bond Index and 35% Bloomberg Barclays Municipal High Yield Index (both described above) and is rebalanced monthly. | |
Bloomberg Barclays 1-3 Year U.S. Government/Credit Bond Index: | | The index is the 1-3 year component of the Bloomberg Barclays U.S. Government/Credit Index. The Bloomberg Barclays U.S. Government/Credit Index is the non-securitized component of the Bloomberg Barclays U.S. Aggregate Bond Index and includes Treasuries and government-related (agency, sovereign, supranational, and local authority debt guaranteed by the U.S. government) and investment grade corporate securities. | |
39
ICE BofAML U.S. High Yield Constrained Index: | | The index tracks the performance of U.S. dollar-denominated below investment grade corporate debt publicly issued in the U.S. domestic market. In addition to meeting other criteria, qualifying securities must have a below investment grade rating (based on an average of Moody's, S&P and Fitch ratings), and have risk exposure to countries that are members of the FX-G10, Western Europe or territories of the U.S. and Western Europe. Securities in legal default are excluded from the index. Index constituents are capitalization-weighted, provided the total allocation to an individual issuer does not exceed 2%. | |
ICE BofAML 3-Month U.S. Treasury Bill Index: | | The index is comprised of a single issue purchased at the beginning of the month and held for a full month. At the end of the month that issue is sold and rolled into a newly selected issue. The issue selected at each month-end rebalancing is the outstanding Treasury Bill that matures closest to, but not beyond, three months from the rebalancing date. | |
ICE BofAML 0-5 Year BB-B U.S. High Yield Constrained Index: | | The index tracks the performance of short-term U.S. dollar-denominated below investment grade corporate debt publicly issued in the U.S. domestic market. In addition to meeting other criteria, qualifying securities must have less than five years remaining term to final maturity, be rated BB1 through B3, inclusive (based on an average of Moody's, S&P and Fitch ratings), and have risk exposure to countries that are members of the FX-G10, Western Europe or territories of the U.S. and Western Europe. Index constituents are capitalization-weighted, provided the total allocation to an individual issuer does not exceed 2%. | |
J.P. Morgan Corporate Emerging Markets Bond Index (CEMBI)—Diversified: | | The index tracks the performance of U.S. dollar-denominated corporate emerging market bonds, including emerging market countries from Asia, Europe, Latin America and the Middle East/Africa. The Diversified version of the index is market capitalization-weighted and limits the weights of those index countries with larger corporate debt stocks by including only specified portions of those countries' eligible current face amounts of debt outstanding. | |
J.P. Morgan Emerging Markets Bond Index (EMBI)—Global Diversified: | | The index tracks the performance of U.S. dollar-denominated debt instruments issued by emerging market sovereign and quasi-sovereign entities (Brady bonds, loans and Eurobonds), including emerging market countries from Asia, Europe, Latin America and the Middle East/Africa. The Global version of the index captures a broad, comprehensive universe of emerging market issues. The Diversified version of the index is market capitalization-weighted and limits the weights of those index countries with larger debt stocks by including only specified portions of those countries' eligible current face amounts of debt outstanding. | |
J.P. Morgan Government Bond Index (GBI)—Emerging Markets Global Diversified: | | The index tracks the performance of local currency denominated bonds issued by emerging market governments, including emerging market countries from Asia, Europe, Latin America and the Middle East/Africa. The Global version of the index includes only countries that are accessible by most of the international investor base, while countries with explicit capital controls are excluded. The Diversified version of the index is market capitalization-weighted, with a maximum weight to a country capped at 10%. | |
40
50% J.P. Morgan GBI—Emerging Markets Global Diversified, 25% J.P. Morgan EMBI—Global Diversified, and 25% J.P. Morgan CEMBI—Diversified: | | The blended index is composed of 50% J.P. Morgan GBI—Emerging Markets Global Diversified, 25% J.P. Morgan EMBI—Global Diversified, and 25% J.P. Morgan CEMBI—Diversified (all described above) and is rebalanced monthly. | |
S&P/LSTA Leveraged Loan Index: | | A market value-weighted index that measures the performance of the U.S. leveraged loan market based upon market weightings, spreads and interest payments. Eligible loans must be senior secured and US dollar denominated, with a minimum initial term of one year, a minimum initial spread of LIBOR + 125 basis points, and a $50 million initial funding. Defaulted loans remain in the index until removal upon exit from bankruptcy or restructuring. LSTA (Loan Syndications and Trading Association) / Thomson Reuters LPC Mark-to-Market Pricing is used to price each loan in the index. (Note, LIBOR is expected to stop being published at the end of 2021.) | |
41
Information About Your Fund's Expenses (Unaudited)
As a Fund shareholder, you incur two types of costs: (1) transaction costs, including sales charges (loads) on purchase payments or redemption proceeds (if applicable); and (2) ongoing costs, including management fees, distribution and/or service (12b-1) fees (if applicable), and other Fund expenses. This example is intended to help you understand your ongoing costs (in U.S. dollars) of investing in a Fund and compare these costs with the ongoing costs of investing in other mutual funds.
This table is designed to provide information regarding costs related to your investments. The following examples are based on an investment of $1,000 made at the beginning of the six month period ended October 31, 2019 and held for the entire period. The table illustrates the Fund's costs in two ways:
Actual Expenses and Performance: | | The first section of the table provides information about actual account values and actual expenses in dollars, based on the Fund's actual performance during the period indicated. You may use the information in this line, together with the amount you invested, to estimate the expenses you paid over the period. Simply divide your account value by $1,000 (for example, an $8,600 account value divided by $1,000 = 8.6), then multiply the result by the number in the first section of the table under the heading entitled "Expenses Paid During the Period" to estimate the expenses you paid over the period. | |
Hypothetical Example for
Comparison Purposes: | | The second section of the table provides information about hypothetical account values and hypothetical expenses based on the Fund's actual expense ratio and an assumed rate of return at 5% per year before expenses. This return is not the Fund's actual return. The hypothetical account values and expenses may not be used to estimate the actual ending account balance or expenses you paid for the period. You may use this information to compare the ongoing costs of investing in a Fund versus other funds. To do so, compare the expenses shown in this 5% hypothetical example with the 5% hypothetical examples that appear in the shareholder reports of other funds. | |
Please note that the expenses in the table are meant to highlight your ongoing costs only and do not include any transaction costs, such as sales charges (loads) (if applicable). Therefore, the information under the heading "Hypothetical (5% annual return before expenses)" is useful in comparing ongoing costs only, and will not help you determine the relative total costs of owning different funds. In addition, if these transaction costs were included, your costs would have been higher.
42
Expense Example (Unaudited)
Neuberger Berman Income Funds | |
| | | ACTUAL | | HYPOTHETICAL (5% ANNUAL RETURN BEFORE EXPENSES) | |
| | | Beginning
Account
Value
5/1/19 | | Ending
Account
Value
10/31/19 | | Expenses Paid
During the
Period(1)
5/1/19 - 10/31/19 | | Expense
Ratio | | Beginning
Account
Value
5/1/19 | | Ending
Account
Value
10/31/19 | | Expenses Paid
During the
Period(2)
5/1/19 - 10/31/19 | |
Expense
Ratio | |
Core Bond Fund | |
Investor Class | | $ | 1,000.00 | | | $ | 1,049.80 | | | $ | 4.44 | | | | 0.86 | % | | $ | 1,000.00 | | | $ | 1,020.87 | | | $ | 4.38 | | | | 0.86 | % | |
Institutional Class | | $ | 1,000.00 | | | $ | 1,051.90 | | | $ | 2.38 | | | | 0.46 | % | | $ | 1,000.00 | | | $ | 1,022.89 | | | $ | 2.35 | | | | 0.46 | % | |
Class A | | $ | 1,000.00 | | | $ | 1,050.90 | | | $ | 4.45 | | | | 0.86 | % | | $ | 1,000.00 | | | $ | 1,020.87 | | | $ | 4.38 | | | | 0.86 | % | |
Class C | | $ | 1,000.00 | | | $ | 1,045.90 | | | $ | 8.30 | | | | 1.61 | % | | $ | 1,000.00 | | | $ | 1,017.09 | | | $ | 8.19 | | | | 1.61 | % | |
Class R6 | | $ | 1,000.00 | | | $ | 1,052.50 | | | $ | 1.86 | | | | 0.36 | % | | $ | 1,000.00 | | | $ | 1,023.39 | | | $ | 1.84 | | | | 0.36 | % | |
Emerging Markets Debt Fund | |
Institutional Class | | $ | 1,000.00 | | | $ | 1,060.80 | | | $ | 4.10 | | | | 0.79 | % | | $ | 1,000.00 | | | $ | 1,021.22 | | | $ | 4.02 | | | | 0.79 | % | |
Class A | | $ | 1,000.00 | | | $ | 1,058.90 | | | $ | 6.02 | | | | 1.16 | % | | $ | 1,000.00 | | | $ | 1,019.36 | | | $ | 5.90 | | | | 1.16 | % | |
Class C | | $ | 1,000.00 | | | $ | 1,054.90 | | | $ | 9.89 | | | | 1.91 | % | | $ | 1,000.00 | | | $ | 1,015.58 | | | $ | 9.70 | | | | 1.91 | % | |
Floating Rate Income Fund | |
Institutional Class | | $ | 1,000.00 | | | $ | 1,001.10 | | | $ | 3.63 | | | | 0.72 | % | | $ | 1,000.00 | | | $ | 1,021.58 | | | $ | 3.67 | | | | 0.72 | % | |
Class A | | $ | 1,000.00 | | | $ | 999.30 | | | $ | 5.49 | | | | 1.09 | % | | $ | 1,000.00 | | | $ | 1,019.71 | | | $ | 5.55 | | | | 1.09 | % | |
Class C | | $ | 1,000.00 | | | $ | 995.50 | | | $ | 9.31 | | | | 1.85 | % | | $ | 1,000.00 | | | $ | 1,015.88 | | | $ | 9.40 | | | | 1.85 | % | |
High Income Bond Fund | |
Investor Class | | $ | 1,000.00 | | | $ | 1,028.10 | | | $ | 4.40 | | | | 0.86 | % | | $ | 1,000.00 | | | $ | 1,020.87 | | | $ | 4.38 | | | | 0.86 | % | |
Institutional Class | | $ | 1,000.00 | | | $ | 1,029.00 | | | $ | 3.58 | | | | 0.70 | % | | $ | 1,000.00 | | | $ | 1,021.68 | | | $ | 3.57 | | | | 0.70 | % | |
Class A | | $ | 1,000.00 | | | $ | 1,026.80 | | | $ | 5.72 | | | | 1.12 | % | | $ | 1,000.00 | | | $ | 1,019.56 | | | $ | 5.70 | | | | 1.12 | % | |
Class C | | $ | 1,000.00 | | | $ | 1,024.30 | | | $ | 9.34 | | | | 1.83 | % | | $ | 1,000.00 | | | $ | 1,015.98 | | | $ | 9.30 | | | | 1.83 | % | |
Class R3 | | $ | 1,000.00 | | | $ | 1,025.90 | | | $ | 6.64 | | | | 1.30 | % | | $ | 1,000.00 | | | $ | 1,018.65 | | | $ | 6.61 | | | | 1.30 | % | |
Class R6 | | $ | 1,000.00 | | | $ | 1,030.70 | | | $ | 3.07 | | | | 0.60 | % | | $ | 1,000.00 | | | $ | 1,022.18 | | | $ | 3.06 | | | | 0.60 | % | |
Municipal High Income Fund | |
Institutional Class | | $ | 1,000.00 | | | $ | 1,042.30 | | | $ | 2.57 | | | | 0.50 | % | | $ | 1,000.00 | | | $ | 1,022.68 | | | $ | 2.55 | | | | 0.50 | % | |
Class A | | $ | 1,000.00 | | | $ | 1,039.40 | | | $ | 4.47 | | | | 0.87 | % | | $ | 1,000.00 | | | $ | 1,020.82 | | | $ | 4.43 | | | | 0.87 | % | |
Class C | | $ | 1,000.00 | | | $ | 1,035.40 | | | $ | 8.31 | | | | 1.62 | % | | $ | 1,000.00 | | | $ | 1,017.04 | | | $ | 8.24 | | | | 1.62 | % | |
Municipal Impact Fund | |
Institutional Class | | $ | 1,000.00 | | | $ | 1,032.00 | | | $ | 2.25 | | | | 0.44 | % | | $ | 1,000.00 | | | $ | 1,022.99 | | | $ | 2.24 | | | | 0.44 | % | |
Class A | | $ | 1,000.00 | | | $ | 1,030.10 | | | $ | 4.14 | | | | 0.81 | % | | $ | 1,000.00 | | | $ | 1,021.12 | | | $ | 4.13 | | | | 0.81 | % | |
Class C | | $ | 1,000.00 | | | $ | 1,026.20 | | | $ | 7.97 | | | | 1.56 | % | | $ | 1,000.00 | | | $ | 1,017.34 | | | $ | 7.93 | | | | 1.56 | % | |
Municipal Intermediate Bond Fund | |
Investor Class | | $ | 1,000.00 | | | $ | 1,031.20 | | | $ | 2.82 | | | | 0.55 | % | | $ | 1,000.00 | | | $ | 1,022.43 | | | $ | 2.80 | | | | 0.55 | % | |
Institutional Class | | $ | 1,000.00 | | | $ | 1,032.00 | | | $ | 2.05 | | | | 0.40 | % | | $ | 1,000.00 | | | $ | 1,023.19 | | | $ | 2.04 | | | | 0.40 | % | |
Class A | | $ | 1,000.00 | | | $ | 1,029.20 | | | $ | 3.99 | | | | 0.78 | % | | $ | 1,000.00 | | | $ | 1,021.27 | | | $ | 3.97 | | | | 0.78 | % | |
Class C | | $ | 1,000.00 | | | $ | 1,025.30 | | | $ | 7.76 | | | | 1.52 | % | | $ | 1,000.00 | | | $ | 1,017.54 | | | $ | 7.73 | | | | 1.52 | % | |
Short Duration Bond Fund | |
Investor Class | | $ | 1,000.00 | | | $ | 1,020.00 | | | $ | 3.00 | | | | 0.59 | % | | $ | 1,000.00 | | | $ | 1,022.23 | | | $ | 3.01 | | | | 0.59 | % | |
Trust Class | | $ | 1,000.00 | | | $ | 1,019.80 | | | $ | 3.51 | | | | 0.69 | % | | $ | 1,000.00 | | | $ | 1,021.73 | | | $ | 3.52 | | | | 0.69 | % | |
Institutional Class | | $ | 1,000.00 | | | $ | 1,021.00 | | | $ | 1.99 | | | | 0.39 | % | | $ | 1,000.00 | | | $ | 1,023.24 | | | $ | 1.99 | | | | 0.39 | % | |
Class A | | $ | 1,000.00 | | | $ | 1,019.40 | | | $ | 3.87 | | | | 0.76 | % | | $ | 1,000.00 | | | $ | 1,021.37 | | | $ | 3.87 | | | | 0.76 | % | |
Class C | | $ | 1,000.00 | | | $ | 1,015.60 | | | $ | 7.67 | | | | 1.51 | % | | $ | 1,000.00 | | | $ | 1,017.59 | | | $ | 7.68 | | | | 1.51 | % | |
Short Duration High Income Fund | |
Institutional Class | | $ | 1,000.00 | | | $ | 1,018.90 | | | $ | 3.87 | | | | 0.76 | % | | $ | 1,000.00 | | | $ | 1,021.37 | | | $ | 3.87 | | | | 0.76 | % | |
Class A | | $ | 1,000.00 | | | $ | 1,017.00 | | | $ | 5.74 | | | | 1.13 | % | | $ | 1,000.00 | | | $ | 1,019.51 | | | $ | 5.75 | | | | 1.13 | % | |
Class C | | $ | 1,000.00 | | | $ | 1,013.20 | | | $ | 9.54 | | | | 1.88 | % | | $ | 1,000.00 | | | $ | 1,015.73 | | | $ | 9.55 | | | | 1.88 | % | |
43
Expense Example (Unaudited) (cont'd)
Neuberger Berman Income Funds | |
| | | ACTUAL | | HYPOTHETICAL (5% ANNUAL RETURN BEFORE EXPENSES) | |
| | | Beginning
Account
Value
5/1/19 | | Ending
Account
Value
10/31/19 | | Expenses Paid
During the
Period(1)
5/1/19 - 10/31/19 | | Expense
Ratio | | Beginning
Account
Value
5/1/19 | | Ending
Account
Value
10/31/19 | | Expenses Paid
During the
Period(2)
5/1/19 - 10/31/19 | | Expense
Ratio | |
Strategic Income Fund | |
Trust Class | | $ | 1,000.00 | | | $ | 1,027.10 | | | $ | 4.85 | | | | 0.95 | % | | $ | 1,000.00 | | | $ | 1,020.42 | | | $ | 4.84 | | | | 0.95 | % | |
Institutional Class | | $ | 1,000.00 | | | $ | 1,028.90 | | | $ | 3.07 | | | | 0.60 | % | | $ | 1,000.00 | | | $ | 1,022.18 | | | $ | 3.06 | | | | 0.60 | % | |
Class A | | $ | 1,000.00 | | | $ | 1,026.80 | | | $ | 5.11 | | | | 1.00 | % | | $ | 1,000.00 | | | $ | 1,020.16 | | | $ | 5.09 | | | | 1.00 | % | |
Class C | | $ | 1,000.00 | | | $ | 1,023.20 | | | $ | 8.67 | | | | 1.70 | % | | $ | 1,000.00 | | | $ | 1,016.64 | | | $ | 8.64 | | | | 1.70 | % | |
Class R6 | | $ | 1,000.00 | | | $ | 1,029.40 | | | $ | 2.56 | | | | 0.50 | % | | $ | 1,000.00 | | | $ | 1,022.68 | | | $ | 2.55 | | | | 0.50 | % | |
Unconstrained Bond Fund | |
Institutional Class | | $ | 1,000.00 | | | $ | 978.10 | | | $ | 3.29 | | | | 0.66 | % | | $ | 1,000.00 | | | $ | 1,021.88 | | | $ | 3.36 | | | | 0.66 | % | |
Class A | | $ | 1,000.00 | | | $ | 977.40 | | | $ | 5.13 | | | | 1.03 | % | | $ | 1,000.00 | | | $ | 1,020.01 | | | $ | 5.24 | | | | 1.03 | % | |
Class C | | $ | 1,000.00 | | | $ | 973.80 | | | $ | 8.86 | | | | 1.78 | % | | $ | 1,000.00 | | | $ | 1,016.23 | | | $ | 9.05 | | | | 1.78 | % | |
Class R6 | | $ | 1,000.00 | | | $ | 978.70 | | | $ | 2.79 | | | | 0.56 | % | | $ | 1,000.00 | | | $ | 1,022.38 | | | $ | 2.85 | | | | 0.56 | % | |
(1) For each class, expenses are equal to the annualized expense ratio for the class, multiplied by the average account value over the period, multiplied by 184/365 (to reflect the one-half year period shown), unless otherwise indicated.
(2) Hypothetical expenses are equal to the annualized expense ratios for each class, multiplied by the average account value over the period (assuming a 5% annual return), multiplied by 184/365 (to reflect the one-half year period shown).
44
Legend October 31, 2019 (Unaudited)
Neuberger Berman Income Funds
Benchmarks:
ARLLMONP = Argentina Blended Historical Policy Rate
BADDLARPP = Argentina Deposit Rates Badlar Private Banks
BUBOR = Budapest Interbank Offer Rate
CETIP = Overnight Brazil
CLICP = Sinacofi Chile Interbank Rate Average
CNRR007 = China Fixing Rate Repo Rates 7 Day
EURIBOR = Euro Interbank Offered Rate
IBRCOL = Colombia Overnight Interbank Reference Rate
JIBAR = Johannesburg International Interbank Agreed Rate
LIBOR = London Interbank Offered Rate
MOSPRIME = Moscow Prime Offered Rate
PRIBOR = Prague Interbank Offer Rate
TIIE = Mexican Interbank Equilibrium Interest Rate
WIBOR = Poland Warsaw Interbank Offer Rate
Currency Abbreviations:
ARS = Argentine Peso
AUD = Australian Dollar
BRL = Brazilian Real
CAD = Canadian Dollar
CHF = Swiss Franc
CLP = Chilean Peso
CNH(a) = Chinese Yuan Renminbi
CNY(a) = Chinese Yuan Renminbi
COP = Colombian Peso
CZK = Czech Koruna
DKK = Danish Krone
DOP = Dominican Peso
EGP = Egyptian Pound
EUR = Euro
GBP = Pound Sterling
GHS = Ghanaian Cedi
HUF = Hungarian Forint
IDR = Indonesian Rupiah
ILS = Israeli Shekel
INR = Indian Rupee
JPY = Japanese Yen
KRW = South Korean Won
KZT = Kazakhstani Tenge
MXN = Mexican Peso
MYR = Malaysian Ringgit
NGN = Nigeria Naira
NOK = Norwegian Krone
Currency Abbreviations (cont'd):
NZD = New Zealand Dollar
PEN = Peruvian Nuevo Sol
PHP = Philippine Peso
PLN = Polish Zloty
RON = New Romanian Leu
RUB = Russian Ruble
SEK = Swedish Krona
SGD = Singapore Dollar
THB = Thai Baht
TRY = Turkish Lira
TWD = New Taiwan Dollar
UAH = Ukraine Hryvna
USD = United States Dollar
UYU = Uruguayan Peso
ZAR = South African Rand
Non-Deliverable Forward Contracts:
ARS = Argentine Peso
BRL = Brazilian Real
CLP = Chilean Peso
COP = Colombian Peso
EGP = Egyptian Pound
IDR = Indonesian Rupiah
INR = Indian Rupee
KRW = South Korean Won
KZT = Kazakhstani Tenge
MYR = Malaysian Ringgit
PEN = Peruvian Nuevo Sol
PHP = Philippine Peso
RUB = Russian Ruble
TWD = New Taiwan Dollar
Counterparties:
CITI = Citibank, N.A.
GSI = Goldman Sachs International
HSBC = HSBC Bank plc
JPM = JPMorgan Chase Bank N.A.
MS = Morgan Stanley Capital Services LLC
RBC = Royal Bank of Canada
SCB = Standard Chartered Bank
SG = Societe Generale
SSB = State Street Bank and Trust Company
Clearinghouses:
CME = CME Group, Inc.
ICE CC = ICE Clear Credit LLC
LCH = LCH Clearnet Limited
45
Legend (Unaudited) (cont'd)
Neuberger Berman Income Funds
Index Periods/Payment Frequencies:
28D = 28 Days
1M = 1 Month
2M = 2 Months
3M = 3 Months
6M = 6 Months
1W = 1 Week
1Y = 1 Year
T = Termination
(a) There is one official currency held in China, the Chinese Yuan Renminbi. CNY is traded onshore, in mainland China and CNH is traded offshore, mainly in the Hong Kong market. Both at two different exchange rates.
46
Schedule of Investments Core Bond Fund^ October 31, 2019
PRINCIPAL AMOUNT | | | | VALUE | |
U.S. Treasury Obligations 22.4% | | | |
$ | 490,000 | | | U.S. Treasury Bill, 2.35%, due 1/2/2020 | | $ | 488,692 | (a)(b) | |
| | | | | U.S. Treasury Bonds | | | | | |
| | 1,215,000 | | | 4.50%, due 2/15/2036 | | | 1,663,506 | | |
| | 19,680,000 | | | 2.75%, due 8/15/2042 | | | 21,813,281 | | |
| | | | | U.S. Treasury Inflation-Indexed Bonds(c) | | | | | |
| | 13,223,798 | | | 0.13%, due 4/15/2022 | | | 13,117,478 | | |
| | 2,243,430 | | | 2.13%, due 2/15/2040 | | | 2,950,715 | | |
| | 2,163,131 | | | 1.38%, due 2/15/2044 | | | 2,569,970 | | |
| | | | | U.S. Treasury Notes | | | | | |
| | 8,635,000 | | | 2.00%, due 1/15/2021 | | | 8,676,826 | | |
| | 3,575,000 | | | 2.88%, due 5/31/2025 | | | 3,823,574 | | |
| | 975,000 | | | 3.00%, due 10/31/2025 | | | 1,053,609 | | |
| | 12,945,000 | | | 2.75%, due 2/15/2028 | | | 14,051,393 | | |
| | 5,540,000 | | | 3.13%, due 11/15/2028 | | | 6,212,807 | | |
| | 5,645,000 | | | 2.38%, due 5/15/2029 | | | 5,985,685 | | |
| | | | | Total U.S. Treasury Obligations (Cost $80,154,395) | | | 82,407,536 | | |
U.S. Government Agency Securities 0.9% | | | |
| | 1,160,000 | | | Federal Home Loan Bank, 5.50%, due 7/15/2036 | | | 1,674,160 | | |
| | 455,000 | | | Federal National Mortgage Association, 5.63%, due 7/15/2037 | | | 676,306 | | |
| | 700,000 | | | Tennessee Valley Authority, 5.25%, due 9/15/2039 | | | 981,648 | | |
| | | | | Total U.S. Government Agency Securities (Cost $2,888,296) | | | 3,332,114 | | |
Mortgage-Backed Securities 48.2% | | | |
Collateralized Mortgage Obligations 8.4% | | | |
| | 3,413,323 | | | Angel Oak Mortgage Trust I LLC, Ser. 2019-1, Class A1, 3.92%, due 11/25/2048 | | | 3,462,553 | (d)(e) | |
| 851,018 | | | Bear Stearns ALT-A Trust, Ser. 2004-8, Class 2A, (1M USD LIBOR + 0.68%), 2.50%,
due 9/25/2034 | | | 852,647 | (f) | |
| | 2,437,705 | | | Bunker Hill Loan Depositary Trust, Ser. 2019-1, Class A1, 3.61%, due 10/26/2048 | | | 2,468,746 | (d) | |
| 2,095,319 | | | Connecticut Avenue Securities Trust, Ser. 2019-R01, Class 2M1,
(1M USD LIBOR + 0.85%), 2.67%, due 7/25/2031 | | | 2,096,774 | (d)(f) | |
| | 3,633,867 | | | Deephaven Residential Mortgage Trust, Ser. 2019-1A, Class A1, 3.74%, due 1/25/2059 | | | 3,671,268 | (d)(e) | |
| | | | | Fannie Mae Connecticut Avenue Securities | | | | | |
| | 643,969 | | | Ser. 2019-R04, Class 2M1, (1M USD LIBOR + 0.75%), 2.77%, due 6/25/2039 | | | 644,249 | (d)(f) | |
| | 848,344 | | | Ser. 2019-R06, Class 2M1, (1M USD LIBOR + 0.75%), 2.57%, due 9/25/2039 | | | 848,661 | (d)(f) | |
| | 2,490,000 | | | Ser. 2019-R07, Class 1M1, (1M USD LIBOR + 0.77%), 2.59%, due 10/25/2039 | | | 2,489,892 | (d)(f)(g) | |
| | | | | Fannie Mae REMICS | | | | | |
| | 2,144,132 | | | Ser. 2012-70, Class HS, (6.00% – 1M USD LIBOR), 4.18%, due 7/25/2042 | | | 417,786 | (f)(h) | |
| | 2,281,702 | | | Ser. 2012-140, Class PI, 3.50%, due 12/25/2042 | | | 251,450 | (h) | |
| | 2,281,232 | | | Ser. 2017-100, Class S, (6.15% – 1M USD LIBOR), 4.33%, due 12/25/2042 | | | 403,059 | (f)(h) | |
| | 1,660,775 | | | Ser. 2012-130, Class AS, (6.70% – 1M USD LIBOR), 4.88%, due 12/25/2042 | | | 290,145 | (f)(h) | |
| | 1,400,446 | | | Ser. 2013-6, Class SB, (6.10% – 1M USD LIBOR), 4.28%, due 2/25/2043 | | | 273,039 | (f)(h) | |
| | 2,284,863 | | | Ser. 2016-32, Class LI, 3.50%, due 6/25/2046 | | | 344,294 | (h) | |
| | 1,001,019 | | | Ser. 2016-40, Class SA, (5.85% – 1M USD LIBOR), 4.03%, due 7/25/2046 | | | 166,704 | (f)(h) | |
| | 2,992,262 | | | Ser. 2016-95, Class US, (6.00% – 1M USD LIBOR), 4.18%, due 12/25/2046 | | | 543,651 | (f)(h) | |
| 10,817 | | | Fannie Mae Whole Loan, Ser. 2003-W5, Class A, (1M USD LIBOR + 0.11%), 2.24%,
due 4/25/2033 | | | 10,584 | (f) | |
| | | | | Freddie Mac REMICS | | | | | |
| | 796,889 | | | Ser. 4018, Class HS, (6.45% – 1M USD LIBOR), 4.42%, due 3/15/2042 | | | 164,473 | (f)(h) | |
| | 1,929,791 | | | Ser. 4120, Class SV, (6.15% – 1M USD LIBOR), 4.12%, due 10/15/2042 | | | 361,619 | (f)(h) | |
| | 1,668,315 | | | Ser. 4385, Class IA, 4.50%, due 9/15/2044 | | | 298,564 | (h) | |
| | 2,762,980 | | | Ser. 4572, Class SA, (6.05% – 1M USD LIBOR), 4.13%, due 4/15/2046 | | | 577,982 | (f)(h) | |
See Notes to Financial Statements
47
Schedule of Investments Core Bond Fund^ (cont'd)
PRINCIPAL AMOUNT | | | | VALUE | |
| | | | | Freddie Mac Strips | | | | | |
$ | 2,937,442 | | | Ser. 303, Class C10, 3.50%, due 1/15/2033 | | $ | 327,731 | (h) | |
| | 1,823,798 | | | Ser. 132, Class S1, (5.95% - 1M USD LIBOR), 4.03%, due 9/15/2043 | | | 323,793 | (f)(h) | |
| | | | | Freddie Mac Structured Agency Credit Risk Debt Notes | | | | | |
| | 730,000 | | | Ser. 2017-HQA3, Class M2, (1M USD LIBOR + 2.35%), 4.37%, due 4/25/2030 | | | 739,671 | (f) | |
| | 1,900,275 | | | Ser. 2019-DNA1, Class M1, (1M USD LIBOR + 0.90%), 2.72%, due 1/25/2049 | | | 1,901,439 | (d)(f) | |
| | 1,073,922 | | | Ser. 2019-HQA1, Class M1, (1M USD LIBOR + 0.90%), 2.72%, due 2/25/2049 | | | 1,074,718 | (d)(f) | |
| | 492,716 | | | Ser. 2019-DNA2, Class M1, (1M USD LIBOR + 0.80%), 2.62%, due 3/25/2049 | | | 492,822 | (d)(f) | |
| | 2,250,000 | | | Ser. 2019-HQA3, Class M1, (1M USD LIBOR + 0.75%), 2.57%, due 9/25/2049 | | | 2,251,133 | (d)(f) | |
| | | | | Government National Mortgage Association | | | | | |
| | 2,083,671 | | | Ser. 2013-5, Class BI, 3.50%, due 1/20/2043 | | | 344,884 | (h) | |
| | 2,064,193 | | | Ser. 2019-22, Class SA, (5.60% - 1M USD LIBOR), 3.75%, due 2/20/2045 | | | 369,925 | (f)(h) | |
| | 1,575,231 | | | Ser. 2016-91, Class NS, (6.08% - 1M USD LIBOR), 4.04%, due 7/20/2046 | | | 350,805 | (f)(h) | |
| 250,000 | | | Permanent Master Issuer PLC, Ser. 2018-1A, Class 1A1, (3M USD LIBOR + 0.38%), 2.37%,
due 7/15/2058 | | | 249,947 | (d)(f) | |
| | 1,130,724 | | | Starwood Mortgage Residential Trust, Ser. 2019-INV1, Class A1, 2.61%, due 8/25/2049 | | | 1,128,633 | (d)(e) | |
| | 830,000 | | | Verus Securitization Trust Verus, Ser. 2019-4, Class A1, 2.64%, due 11/25/2059 | | | 830,558 | (d) | |
| | | | 31,024,199 | | |
Commercial Mortgage-Backed 13.9% | | | |
| | | | | Bank | | | | | |
| | 580,000 | | | Ser. 2018-BN10, Class A5, 3.69%, due 2/15/2061 | | | 633,853 | | |
| | 2,332,277 | | | Ser. 2018-BN13, Class A1, 3.22%, due 8/15/2061 | | | 2,380,220 | | |
| | 800,000 | | | BBCMS Mortgage Trust, Ser. 2019-C4, Class A5, 2.92%, due 8/15/2052 | | | 827,357 | | |
| 3,494,490 | | | BX Commercial Mortgage Trust, Ser. 2018-IND, Class A, (1M USD LIBOR + 0.75%), 2.66%,
due 11/15/2035 | | | 3,491,214 | (d)(f) | |
| | 602,085 | | | CD Mortgage Trust, Ser. 2018-CD7, Class A1, 3.28%, due 8/15/2051 | | | 617,078 | | |
| | | | | Citigroup Commercial Mortgage Trust | | | | | |
| | 965,000 | | | Ser. 2013-GC11, Class B, 3.73%, due 4/10/2046 | | | 995,342 | (e) | |
| | 330,000 | | | Ser. 2013-GC17, Class B, 5.10%, due 11/10/2046 | | | 361,078 | (e) | |
| | 793,442 | | | Ser. 2014-GC23, Class AAB, 3.34%, due 7/10/2047 | | | 816,685 | | |
| | 745,000 | | | Ser. 2014-GC23, Class B, 4.18%, due 7/10/2047 | | | 791,751 | (e) | |
| | 4,681,651 | | | Ser. 2014-GC25, Class XA, 1.00%, due 10/10/2047 | | | 196,809 | (e)(h) | |
| | 2,481,100 | | | Ser. 2015-GC27, Class XA, 1.36%, due 2/10/2048 | | | 137,873 | (e)(h) | |
| | 550,000 | | | Ser. 2015-P1, Class A5, 3.72%, due 9/15/2048 | | | 591,724 | | |
| | 1,048,403 | | | Ser. 2018-C6, Class A1, 3.30%, due 11/10/2051 | | | 1,073,503 | | |
| | | | | Commercial Mortgage Trust | | | | | |
| | 1,000,000 | | | Ser. 2012 -CR4, Class AM, 3.25%, due 10/15/2045 | | | 1,004,598 | | |
| | 1,000,000 | | | Ser. 2013-LC6, Class B, 3.74%, due 1/10/2046 | | | 1,036,637 | | |
| | 5,425,017 | | | Ser. 2014-CR16, Class XA, 0.98%, due 4/10/2047 | | | 201,388 | (e)(h) | |
| | 3,402,368 | | | Ser. 2014-LC15, Class XA, 1.10%, due 4/10/2047 | | | 138,045 | (e)(h) | |
| | 5,408,932 | | | Ser. 2014-CR17, Class XA, 0.98%, due 5/10/2047 | | | 203,337 | (e)(h) | |
| | 3,138,615 | | | Ser. 2014-UBS3, Class XA, 1.09%, due 6/10/2047 | | | 132,658 | (e)(h) | |
| | 485,000 | | | Ser. 2014-CR21, Class AM, 3.99%, due 12/10/2047 | | | 521,123 | | |
| | 4,318,474 | | | Ser. 2014-UBS6, Class XA, 0.92%, due 12/10/2047 | | | 156,746 | (e)(h) | |
| | 335,000 | | | Ser. 2015-LC21, Class A4, 3.71%, due 7/10/2048 | | | 359,897 | | |
| | 740,000 | | | Ser. 2015-CR25, Class A4, 3.76%, due 8/10/2048 | | | 798,199 | | |
| | 410,709 | | | Ser. 2017-COR2, Class A1, 2.11%, due 9/10/2050 | | | 410,496 | | |
| | | | | CSAIL Commercial Mortgage Trust | | | | | |
| | 353,000 | | | Ser. 2016-C7, Class A5, 3.50%, due 11/15/2049 | | | 376,416 | | |
| | 1,185,000 | | | Ser. 2015-C1, Class B, 4.04%, due 4/15/2050 | | | 1,259,602 | (e) | |
| | 405,111 | | | Ser. 2017-CX9, Class A1, 2.02%, due 9/15/2050 | | | 404,335 | | |
| | 1,280,000 | | | Ser. 2017-CX9, Class A5, 3.45%, due 9/15/2050 | | | 1,366,731 | | |
| | 420,000 | | | Ser. 2019-C17, Class A5, 3.02%, due 9/15/2052 | | | 436,827 | | |
See Notes to Financial Statements
48
Schedule of Investments Core Bond Fund^ (cont'd)
PRINCIPAL AMOUNT | | | | VALUE | |
$ | 1,970,000
| | | Freddie Mac Multifamily Aggregation Risk Transfer Trust, Ser. 2017-KT01, Class A,
(1M USD LIBOR + 0.32%), 2.14%, due 2/25/2020 | | $ | 1,969,744
| (f) | |
| | | | | Freddie Mac Multifamily Structured Pass Through Certificates | | | | | |
| | 25,579,645 | | | Ser. KW03, Class X1, 0.84%, due 6/25/2027 | | | 1,265,110 | (e)(h) | |
| | 63,186,000 | | | Ser. K088, Class XAM, 0.42%, due 1/25/2029 | | | 2,407,636 | (e)(h) | |
| | 22,992,162 | | | Ser. K090, Class X1, 0.71%, due 2/25/2029 | | | 1,361,005 | (e)(h) | |
| | 10,000,000 | | | Ser. K098, Class XAM, 1.52%, due 8/25/2029 | | | 1,201,259 | (e)(h) | |
| | | | | GS Mortgage Securities Trust | | | | | |
| | 770,000 | | | Ser. 2012-GCJ9, Class B, 3.75%, due 11/10/2045 | | | 793,470 | (d) | |
| | 9,720,423 | | | Ser. 2014-GC18, Class XA, 1.02%, due 1/10/2047 | | | 349,657 | (e)(h) | |
| | 335,000 | | | Ser. 2015-GC32, Class A4, 3.76%, due 7/10/2048 | | | 361,235 | | |
| | 785,000 | | | Ser. 2015-GC34, Class A4, 3.51%, due 10/10/2048 | | | 837,356 | | |
| | 900,000 | | | Ser. 2015-GS1, Class C, 4.42%, due 11/10/2048 | | | 928,208 | (e) | |
| | 790,000 | | | Ser. 2019-GC42, Class A4, 3.00%, due 9/1/2052 | | | 825,734 | | |
| | | | | JP Morgan Chase Commercial Mortgage Securities Trust | | | | | |
| | 800,000 | | | Ser. 2013-LC11, Class B, 3.50%, due 4/15/2046 | | | 819,828 | | |
| | 660,000 | | | Ser. 2011-C5, Class B, 5.40%, due 8/15/2046 | | | 691,087 | (d)(e) | |
| | | | | JPMBB Commercial Mortgage Securities Trust | | | | | |
| | 765,000 | | | Ser. 2015-C33, Class AS, 4.02%, due 12/15/2048 | | | 824,881 | | |
| | 355,000 | | | Ser. 2016-C1, Class A5, 3.58%, due 3/15/2049 | | | 380,808 | | |
| | | | | Morgan Stanley Bank of America Merrill Lynch Trust | | | | | |
| | 3,766,327 | | | Ser. 2014-C16, Class XA, 1.01%, due 6/15/2047 | | | 132,915 | (e)(h) | |
| | 710,000 | | | Ser. 2015-C24, Class A4, 3.73%, due 5/15/2048 | | | 765,209 | | |
| | 392,174 | | | Ser. 2017-C34, Class A1, 2.11%, due 11/15/2052 | | | 391,952 | | |
| | | | | Morgan Stanley Capital I Trust | | | | | |
| | 1,000,000 | | | Ser. 2017-H1, Class A5, 3.53%, due 6/15/2050 | | | 1,076,903 | | |
| | 1,000,000 | | | Ser. 2019-L2, Class C, 4.98%, due 3/15/2052 | | | 1,131,380 | (e) | |
| | | | | UBS Commercial Mortgage Trust | | | | | |
| | 500,000 | | | Ser. 2017-C2, Class A4, 3.49%, due 8/15/2050 | | | 535,469 | | |
| | 541,400 | | | Ser. 2017-C4, Class A1, 2.13%, due 10/15/2050 | | | 541,055 | | |
| | 1,538,488 | | | Ser. 2018-C14, Class A1, 3.38%, due 12/15/2051 | | | 1,578,965 | | |
| | | | | Wells Fargo Commercial Mortgage Trust | | | | | |
| | 725,000 | | | Ser. 2012-LC5, Class B, 4.14%, due 10/15/2045 | | | 758,357 | | |
| | 500,000 | | | Ser. 2015-C29, Class A4, 3.64%, due 6/15/2048 | | | 535,525 | | |
| | 685,000 | | | Ser. 2016-C35, Class B, 3.44%, due 7/15/2048 | | | 714,839 | | |
| | 225,000 | | | Ser. 2016-LC24, Class A4, 2.94%, due 10/15/2049 | | | 232,491 | | |
| | 950,000 | | | Ser. 2016-NXS6, Class A4, 2.92%, due 11/15/2049 | | | 982,939 | | |
| | 712,500 | | | Ser. 2015-LC20, Class C, 4.06%, due 4/15/2050 | | | 737,006 | (e) | |
| | 546,954 | | | Ser. 2017-C39, Class A1, 1.98%, due 9/15/2050 | | | 546,041 | | |
| | 580,000 | | | Ser. 2017-C39, Class A5, 3.42%, due 9/15/2050 | | | 620,008 | | |
| | 526,284 | | | Ser. 2018-C46, Class A1, 3.16%, due 8/15/2051 | | | 536,408 | | |
| | 445,000 | | | Ser. 2016-LC25, Class A4, 3.64%, due 12/15/2059 | | | 481,236 | | |
| | | | | WF-RBS Commercial Mortgage Trust | | | | | |
| | 1,000,000 | | | Ser. 2012-C8, Class B, 4.31%, due 8/15/2045 | | | 1,046,674 | | |
| | 5,989,358 | | | Ser. 2014-C25, Class XA, 0.83%, due 11/15/2047 | | | 200,929 | (e)(h) | |
| | 13,793,605 | | | Ser. 2014-C22, Class XA, 0.81%, due 9/15/2057 | | | 438,924 | (e)(h) | |
| | 560,000 | | | Ser. 2014-C22, Class AS, 4.07%, due 9/15/2057 | | | 598,126 | (e) | |
| | | | 51,321,891 | | |
Fannie Mae 14.3% | | | |
| | | | | Pass-Through Certificates | | | | | |
| | 5,755,404 | | | 3.00%, due 7/1/2046 – 11/1/2049 | | | 5,866,109 | (i) | |
| | 17,927,649 | | | 3.50%, due 12/1/2041 – 8/1/2049 | | | 18,659,494 | | |
| | 21,581,826 | | | 4.00%, due 1/1/2041 – 9/1/2048 | | | 22,741,150 | | |
| | 2,693,731 | | | 4.50%, due 4/1/2034 – 1/1/2047 | | | 2,897,844 | | |
See Notes to Financial Statements
49
Schedule of Investments Core Bond Fund^ (cont'd)
PRINCIPAL AMOUNT | | | | VALUE | |
$ | 1,464,481 | | | 5.00%, due 4/1/2023 – 9/1/2041 | | $ | 1,596,745 | | |
| | 361,682 | | | 5.50%, due 5/1/2038 – 3/1/2041 | | | 404,123 | | |
| | 363,258 | | | 6.00%, due 4/1/2037 – 11/1/2038 | | | 408,365 | | |
| | | | 52,573,830 | | |
Freddie Mac 8.5% | | | |
| | | | | Pass-Through Certificates | | | | | |
| | 3,586,814 | | | 3.00%, due 5/1/2049 – 11/1/2049 | | | 3,647,211 | (i) | |
| | 11,226,565 | | | 3.50%, due 7/1/2042 – 7/1/2048 | | | 11,703,001 | | |
| | 12,595,547 | | | 4.00%, due 11/1/2040 – 12/1/2048 | | | 13,283,444 | | |
| | 1,878,608 | | | 4.50%, due 6/1/2039 – 7/1/2047 | | | 2,013,487 | | |
| | 682,123 | | | 5.00%, due 5/1/2023 – 5/1/2041 | | | 732,338 | | |
| | 88,825 | | | 5.50%, due 5/1/2035 – 11/1/2038 | | | 99,995 | | |
| | 8,974 | | | 6.00%, due 12/1/2037 | | | 10,333 | | |
| | 2,450 | | | 6.50%, due 11/1/2025 | | | 2,730 | | |
| | | | 31,492,539 | | |
Ginnie Mae 2.8% | | | |
| | | | | Pass-Through Certificates | | | | | |
| | 220,000 | | | 3.00%, due 10/20/2049 | | | 226,497 | (i) | |
| | 5,210,125 | | | 3.50%, due 1/20/2043 – 9/20/2049 | | | 5,432,561 | | |
| | 1,102,125 | | | 4.00%, due 11/20/2044 – 7/20/2047 | | | 1,159,298 | | |
| | 2,470,000 | | | 3.00%, TBA, 30 Year Maturity | | | 2,542,035 | (j) | |
| | 790,000 | | | 3.50%, TBA, 30 Year Maturity | | | 819,748 | (j) | |
| | | | 10,180,139 | | |
Uniform Mortgage-Backed Securities 0.3% | | | |
| | 1,110,000 | | | Pass-Through Certificates, 3.00%, TBA, 30 Year Maturity | | | 1,127,951 | (j) | |
| | | | | Total Mortgage-Backed Securities (Cost $177,361,346) | | | 177,720,549 | | |
Corporate Bonds 23.7% | | | |
Agriculture 0.2% | | | |
| | 775,000 | | | BAT Capital Corp., 4.54%, due 8/15/2047 | | | 748,908 | | |
Auto Manufacturers 0.5% | | | |
| | 1,620,000 | | | Volkswagen Group of America Finance LLC, 2.70%, due 9/26/2022 | | | 1,635,574 | (d) | |
Banks 5.9% | | | |
| | 695,000 | | | Banco Santander SA, 3.80%, due 2/23/2028 | | | 733,009 | | |
| | | | | Bank of America Corp. | | | | | |
| | 1,020,000 | | | 2.74%, due 1/23/2022 | | | 1,028,074 | (k) | |
| | 1,005,000 | | | 4.45%, due 3/3/2026 | | | 1,101,582 | | |
| | 1,410,000 | | | 3.97%, due 3/5/2029 | | | 1,535,661 | (k) | |
| | 760,000 | | | Barclays PLC, 4.38%, due 1/12/2026 | | | 816,672 | | |
| | | | | Citigroup, Inc. | | | | | |
| | 1,990,000 | | | 3.89%, due 1/10/2028 | | | 2,141,843 | (k)(l) | |
| | 695,000 | | | 3.52%, due 10/27/2028 | | | 732,378 | (k) | |
| | 1,580,000 | | | Commonwealth Bank of Australia, 3.74%, due 9/12/2039 | | | 1,583,567 | (d) | |
See Notes to Financial Statements
50
Schedule of Investments Core Bond Fund^ (cont'd)
PRINCIPAL AMOUNT | | | | VALUE | |
| | | | | Goldman Sachs Group, Inc. | | | | | |
$ | 1,310,000 | | | 3.69%, due 6/5/2028 | | $ | 1,384,124 | (k) | |
| | 2,075,000 | | | 3.81%, due 4/23/2029 | | | 2,204,229 | (k)(l) | |
| | 810,000 | | | 4.22%, due 5/1/2029 | | | 886,258 | (k) | |
| | 465,000 | | | 4.02%, due 10/31/2038 | | | 503,038 | (k) | |
| | 550,000 | | | 5.15%, due 5/22/2045 | | | 660,266 | | |
| | 1,345,000 | | | HSBC Holdings PLC, 6.00%, due 5/22/2027 | | | 1,396,110 | (k)(m) | |
| | | | | JPMorgan Chase & Co. | | | | | |
| | 1,545,000 | | | 3.22%, due 3/1/2025 | | | 1,603,661 | (k) | |
| | 975,000 | | | 3.88%, due 7/24/2038 | | | 1,070,100 | (k) | |
| | 2,355,000 | | | Morgan Stanley, 3.59%, due 7/22/2028 | | | 2,489,224 | (k)(l) | |
| | | | 21,869,796 | | |
Beverages 1.0% | | | |
| | | | | Anheuser-Busch InBev Worldwide, Inc. | | | | | |
| | 865,000 | | | 4.60%, due 4/15/2048 | | | 992,567 | | |
| | 1,260,000 | | | 4.75%, due 4/15/2058 | | | 1,473,053 | | |
| | 970,000 | | | 5.80%, due 1/23/2059 | | | 1,316,980 | | |
| | | | 3,782,600 | | |
Biotechnology 0.4% | | | |
| | 1,195,000 | | | Celgene Corp., 3.90%, due 2/20/2028 | | | 1,312,917 | | |
Computers 2.1% | | | |
| | | | | Apple, Inc. | | | | | |
| | 1,130,000 | | | 3.00%, due 2/9/2024 | | | 1,178,946 | | |
| | 1,155,000 | | | 4.65%, due 2/23/2046 | | | 1,446,263 | | |
| | 1,805,000 | | | Diamond 1 Finance Corp./Diamond 2 Finance Corp., 5.45%, due 6/15/2023 | | | 1,962,372 | (d) | |
| | 920,000 | | | HP Enterprise Co., 3.60%, due 10/15/2020 | | | 932,341 | | |
| | | | | IBM Corp. | | | | | |
| | 665,000 | | | 4.15%, due 5/15/2039 | | | 749,559 | | |
| | 1,405,000 | | | 4.25%, due 5/15/2049 | | | 1,596,507 | | |
| | | | 7,865,988 | | |
Diversified Financial Services 1.4% | | | |
| | 1,700,000 | | | AerCap Ireland Capital DAC/AerCap Global Aviation Trust, 4.45%, due 10/1/2025 | | | 1,844,482 | | |
| | 1,160,000 | | | Avolon Holdings Funding Ltd., 3.95%, due 7/1/2024 | | | 1,204,312 | (d) | |
| | 2,165,000 | | | Synchrony Financial, 2.85%, due 7/25/2022 | | | 2,190,155 | | |
| | | | 5,238,949 | | |
Electric 1.1% | | | |
| | | | | DTE Energy Co. | | | | | |
| | 880,000 | | | 2.25%, due 11/1/2022 | | | 885,526 | (g) | |
| | 1,565,000 | | | Ser. C, 3.40%, due 6/15/2029 | | | 1,638,486 | | |
| | 1,430,000 | | | Evergy, Inc., 2.90%, due 9/15/2029 | | | 1,437,913 | | |
| | | | 3,961,925 | | |
See Notes to Financial Statements
51
Schedule of Investments Core Bond Fund^ (cont'd)
PRINCIPAL AMOUNT | | | | VALUE | |
Food 0.8% | | | |
$ | 1,415,000 | | | Grupo Bimbo SAB de CV, 4.70%, due 11/10/2047 | | $ | 1,513,569 | (d) | |
| | 1,170,000 | | | Kraft Heinz Foods Co., 3.75%, due 4/1/2030 | | | 1,195,820 | (d) | |
| | 310,000 | | | Kroger Co., 5.40%, due 1/15/2049 | | | 367,625 | | |
| | | | 3,077,014 | | |
Healthcare - Products 0.4% | | | |
| | 1,425,000 | | | DH Europe Finance II S.a.r.l., 3.40%, due 11/15/2049 | | | 1,463,446 | (g) | |
Healthcare - Services 0.6% | | | |
| | 1,290,000 | | | HCA, Inc., 5.25%, due 6/15/2049 | | | 1,428,417 | | |
| | 880,000 | | | UnitedHealth Group, Inc., 3.88%, due 8/15/2059 | | | 933,346 | | |
| | | | 2,361,763 | | |
Insurance 0.3% | | | |
| | 1,015,000 | | | AXA Equitable Holdings, Inc., 5.00%, due 4/20/2048 | | | 1,088,183 | | |
Media 1.4% | | | |
| | | | | Comcast Corp. | | | | | |
| | 1,225,000 | | | 3.70%, due 4/15/2024 | | | 1,312,742 | | |
| | 690,000 | | | 4.00%, due 8/15/2047 | | | 762,624 | | |
| | 1,370,000 | | | 4.95%, due 10/15/2058 | | | 1,767,855 | (l) | |
| | 1,005,000 | | | Fox Corp., 5.58%, due 1/25/2049 | | | 1,261,151 | (d) | |
| | | | 5,104,372 | | |
Mining 0.5% | | | |
| | | | | Anglo American Capital PLC | | | | | |
| | 805,000 | | | 3.63%, due 9/11/2024 | | | 835,314 | (d) | |
| | 850,000 | | | 4.00%, due 9/11/2027 | | | 880,463 | (d) | |
| | | | 1,715,777 | | |
Miscellaneous Manufacturer 0.3% | | | |
| | 1,010,000 | | | General Electric Co., Ser. D, 5.00%, due 1/21/2021 | | | 974,105 | (k)(m) | |
Oil & Gas 1.3% | | | |
| | 905,000 | | | Concho Resources, Inc., 4.88%, due 10/1/2047 | | | 1,021,548 | | |
| | 1,175,000 | | | Marathon Oil Corp., 4.40%, due 7/15/2027 | | | 1,262,570 | | |
| | | | | Occidental Petroleum Corp. | | | | | |
| | 1,280,000 | | | 3.20%, due 8/15/2026 | | | 1,295,816 | | |
| | 1,305,000 | | | 3.50%, due 8/15/2029 | | | 1,321,939 | | |
| | | | 4,901,873 | | |
See Notes to Financial Statements
52
Schedule of Investments Core Bond Fund^ (cont'd)
PRINCIPAL AMOUNT | | | | VALUE | |
Pharmaceuticals 1.0% | | | |
$ | 1,110,000 | | | AbbVie, Inc., 4.70%, due 5/14/2045 | | $ | 1,186,555 | | |
| | 965,000 | | | Cigna Corp., 4.80%, due 8/15/2038 | | | 1,095,535 | | |
| | 1,195,000 | | | CVS Health Corp., 5.05%, due 3/25/2048 | | | 1,368,888 | | |
| | | | 3,650,978 | | |
Pipelines 1.7% | | | |
| | 835,000 | | | Energy Transfer Operating L.P., 6.25%, due 4/15/2049 | | | 1,003,274 | | |
| | 1,535,000 | | | Kinder Morgan Energy Partners L.P., 4.15%, due 2/1/2024 | | | 1,634,694 | | |
| | 1,320,000 | | | Kinder Morgan, Inc., 5.55%, due 6/1/2045 | | | 1,547,435 | | |
| | 1,170,000 | | | MPLX L.P., 4.70%, due 4/15/2048 | | | 1,181,913 | | |
| | 965,000 | | | Plains All American Pipeline L.P./PAA Finance Corp., 3.55%, due 12/15/2029 | | | 919,205 | | |
| | | | 6,286,521 | | |
Real Estate Investment Trusts 0.4% | | | |
| | 1,300,000 | | | Healthcare Trust of America Holdings L.P., 3.10%, due 2/15/2030 | | | 1,298,953 | | |
Retail 1.0% | | | |
| | | | | Walmart, Inc. | | | | | |
| | 2,240,000 | | | 3.40%, due 6/26/2023 | | | 2,364,118 | (l) | |
| | 1,160,000 | | | 3.25%, due 7/8/2029 | | | 1,255,212 | | |
| | | | 3,619,330 | | |
Semiconductors 0.4% | | | |
| | 1,515,000 | | | Microchip Technology, Inc., 4.33%, due 6/1/2023 | | | 1,603,100 | | |
Software 0.1% | | | |
| | 370,000 | | | Oracle Corp., 4.00%, due 7/15/2046 | | | 409,791 | | |
Telecommunications 0.9% | | | |
| | | | | AT&T, Inc. | | | | | |
| | 410,000 | | | 4.35%, due 6/15/2045 | | | 431,271 | | |
| | 1,450,000 | | | 5.45%, due 3/1/2047 | | | 1,750,664 | | |
| | 1,200,000 | | | 4.50%, due 3/9/2048 | | | 1,282,124 | | |
| | | | 3,464,059 | | |
| | | | | Total Corporate Bonds (Cost $81,093,441) | | | 87,435,922 | | |
Asset-Backed Securities 6.9% | | | |
| | 1,140,000 | | | AM Capital Funding LLC, Ser. 2018-1, Class A, 4.98%, due 12/15/2023 | | | 1,196,940 | (d) | |
| | | | | Asset Backed Funding Certificates | | | | | |
| | 186,935 | | | Ser. 2003-OPT1, Class A3, (1M USD LIBOR + 0.68%), 2.50%, due 4/25/2033 | | | 185,489 | (f) | |
| | 1,135,129 | | | Ser. 2004-OPT3, Class A4, (1M USD LIBOR + 0.78%), 2.60%, due 11/25/2033 | | | 1,119,406 | (f) | |
| 1,074,730 | | | Centex Home Equity Loan Trust, Ser. 2005-D, Class M3, (1M USD LIBOR + 0.48%), 2.30%,
due 10/25/2035 | | | 1,075,551 | (f) | |
| 14,966 | | | Chase Funding Mortgage Loan Asset-Backed Certificates, Ser. 2004-1, Class 2A2,
(1M USD LIBOR + 0.46%), 2.28%, due 12/25/2033 | | | 14,662 | (f) | |
See Notes to Financial Statements
53
Schedule of Investments Core Bond Fund^ (cont'd)
PRINCIPAL AMOUNT | | | | VALUE | |
$ | 1,550,000
| | | CIFC Funding Ltd., Ser. 2019-5A, Class A1, (3M USD LIBOR + 1.34%), 0.00%,
due 10/15/2032 | | $ | 1,545,152
| (d)(f) | |
| | 577,157 | | | Corevest American Finance Trust, Ser. 2019-1, Class A, 3.32%, due 3/15/2052 | | | 599,659 | (d) | |
| 194,052 | | | Countrywide Asset-Backed Certificates, Ser. 2004-5, Class 1A,
(1M USD LIBOR + 0.50%), 2.32%, due 10/25/2034 | | | 193,508 | (f) | |
| 2,999,442 | | | Credit Suisse First Boston Mortgage Securities Corp., Ser. 2004-AA1, Class M2,
(1M USD LIBOR + 1.05%), 2.87%, due 2/25/2035 | | | 3,006,623 | (f) | |
| 1,900,000 | | | Elmwood CLO III Ltd., Ser. 2019-3A, Class A1, (3M USD LIBOR + 1.37%), 0.00%,
due 10/15/2032 | | | 1,900,000 | (d)(f)(g)(n) | |
| 4,429 | | | Fannie Mae Grantor Trust, Ser. 2002-T5, Class A1, (1M USD LIBOR + 0.24%), 2.06%,
due 5/25/2032 | | | 4,385 | (f) | |
| 2,083,620 | | | Home Equity Asset Trust, Ser. 2003-5, Class A1, (1M USD LIBOR + 0.58%), 2.40%,
due 12/25/2033 | | | 2,047,988 | (f) | |
| | 1,500,000 | | | Kayne CLO 5 Ltd., Ser. 2019-5A, Class A, (3M USD LIBOR + 1.35%), 3.53%, due 7/24/2032 | | | 1,496,295 | (d)(f) | |
| | | | | Navient Student Loan Trust | | | | | |
| | 102,907 | | | Ser. 2017-3A, Class A1, (1M USD LIBOR + 0.30%), 2.12%, due 7/26/2066 | | | 102,915 | (d)(f) | |
| | 166,353 | | | Ser. 2017-4A, Class A1, (1M USD LIBOR + 0.24%), 2.06%, due 9/27/2066 | | | 166,303 | (d)(f) | |
| | 102,961 | | | Ser. 2018-3A, Class A1, (1M USD LIBOR + 0.27%), 2.09%, due 3/25/2067 | | | 102,932 | (d)(f) | |
| 2,200,000 | | | Octagon Investment Partners 44 Ltd., Ser. 2019-1A, Class A, (3M USD LIBOR + 1.30%),
3.27%, due 7/20/2032 | | | 2,194,655 | (d)(f) | |
| 202,281 | | | Popular ABS Mortgage Pass-Through Trust, Ser. 2005-2, Class AV1B,
(1M USD LIBOR + 0.26%), 2.08%, due 4/25/2035 | | | 202,096 | (f) | |
| 32,499 | | | Residential Asset Mortgage Products, Inc., Ser. 2005-RS4, Class M3,
(1M USD LIBOR + 0.48%), 2.30%, due 4/25/2035 | | | 32,501 | (f) | |
| 1,350,000 | | | Residential Asset Securities Corp., Ser. 2005-KS12, Class M2, (1M USD LIBOR + 0.46%),
2.28%, due 1/25/2036 | | | 1,348,112 | (f) | |
| 8,946 | | | Saxon Asset Securities Trust, Ser. 2004-1, Class A, (1M USD LIBOR + 0.54%), 2.36%,
due 3/25/2035 | | | 8,515 | (f) | |
| 2,200,000 | | | Southwick Park CLO LLC, Ser. 2019-4A, Class A1, (3M USD LIBOR + 1.30%), 3.47%,
due 7/20/2032 | | | 2,197,459 | (d)(f) | |
| | 239,508 | | | Verizon Owner Trust, Ser. 2016-2A, Class A, 1.68%, due 5/20/2021 | | | 239,438 | (d) | |
| | 3,050,000 | | | Voya CLO Ltd., Ser. 2019-2A, Class A, (3M USD LIBOR + 1.27%), 3.52%, due 7/20/2032 | | | 3,040,539 | (d)(f) | |
| 1,297,961 | | | Wells Fargo Home Equity Asset-Backed Securities Trust, Ser. 2004-2, Class M1,
(1M USD LIBOR + 0.90%), 2.72%, due 10/25/2034 | | | 1,286,866 | (f) | |
| | 9,411 | | | World Omni Auto Receivables Trust, Ser. 2018-A, Class A2, 2.19%, due 5/17/2021 | | | 9,411 | | |
| | | | | Total Asset-Backed Securities (Cost $24,790,709) | | | 25,317,400 | | |
NUMBER OF SHARES | | | | | |
Short-Term Investments 0.7% | | | |
Investment Companies 0.7% | | | |
| 2,695,183 | | | State Street Institutional U.S. Government Money Market Fund Premier Class, 1.75%(o)
(Cost $2,695,183) | | | 2,695,183 | (l) | |
| | | | | Total Investments 102.8% (Cost $368,983,370) | | | 378,908,704 | | |
| | | | | Liabilities Less Other Assets (2.8)% | | | (10,341,581 | )(p) | |
| | | | | Net Assets 100.0% | | $ | 368,567,123 | | |
(a) Rate shown was the discount rate at the date of purchase.
(b) All or a portion of the security is pledged as collateral for futures.
(c) Index-linked bond whose principal amount adjusts according to a government retail price index.
See Notes to Financial Statements
54
Schedule of Investments Core Bond Fund^ (cont'd)
(d) Securities were purchased under Rule 144A of the Securities Act of 1933, as amended, or are otherwise restricted and, unless registered under the Securities Act of 1933 or exempted from registration, may only be sold to qualified institutional investors or may have other restrictions on resale. At October 31, 2019, these securities amounted to $55,441,593, which represents 15.0% of net assets of the Fund. These securities have been deemed by the investment manager to be liquid.
(e) Variable or floating rate security where the stated interest rate is not based on a published reference rate and spread. Rather, the interest rate adjusts periodically based on changes in current interest rates and prepayments on the underlying pool of assets. The interest rate shown was the current rate as of October 31, 2019.
(f) Variable or floating rate security. The interest rate shown was the current rate as of October 31, 2019 and changes periodically.
(g) When-issued security. Total value of all such securities at October 31, 2019, amounted to $6,738,864, which represents 1.8% of net assets of the Fund.
(h) Interest only security. These securities represent the right to receive the monthly interest payments on an underlying pool of mortgages. Payments of principal on the pool reduce the value of the "interest only" holding.
(i) All or a portion of this security was purchased on a delayed delivery basis.
(j) TBA (To Be Announced) Securities are purchased/sold on a forward commitment basis with an approximate principal amount and no defined maturity date. The actual principal amount and maturity date will be determined upon settlement when the specific mortgage pools are assigned. Total value of all such securities (excluding forward sales contracts, if any) at October 31, 2019 amounted to $4,489,734, which represents 1.2% of net assets of the Fund.
(k) Security issued at a fixed coupon rate, which converts to a variable rate at a future date. Rate shown is the rate in effect as of period end.
(l) All or a portion of this security is segregated in connection with obligations for to be announced securities, when-issued securities, futures and/or delayed delivery securities with a total value of $13,662,452.
(m) Perpetual Bond Security. The rate reflected was the rate in effect on October 31, 2019. The maturity date reflects the next call date.
(n) Security fair valued as of October 31, 2019 in accordance with procedures approved by the Board of Trustees. Total value of all such securities at October 31, 2019 amounted to $1,900,000, which represents 0.5% of net assets of the Fund.
(o) Represents 7-day effective yield as of October 31, 2019.
(p) Includes the impact of the Fund's open positions in derivatives at October 31, 2019.
See Notes to Financial Statements
55
Schedule of Investments Core Bond Fund^ (cont'd)
Derivative Instruments
Futures contracts ("futures")
At October 31, 2019, open positions in futures for the Fund were as follows:
Long Futures:
Expiration
Date | | Number of
Contracts | | Open Contracts | | Notional
Amount | | Value and
Unrealized
Appreciation/
(Depreciation) | |
12/2019 | | | 1 | | | Australian Dollar | | $ | 68,960 | | | $ | 215 | | |
12/2019 | | | 10 | | | Euro | | | 1,397,063 | | | | 11,139 | | |
12/2019 | | | 21 | | | U.S. Treasury Long Bond | | | 3,388,875 | | | | (70,976 | ) | |
12/2019 | | | 68 | | | U.S. Treasury Note, 2 Year | | | 14,660,906 | | | | (25,131 | ) | |
12/2019 | | | 113 | | | U.S. Treasury Note, 5 Year | | | 13,469,953 | | | | (16,387 | ) | |
12/2019 | | | 92 | | | U.S. Treasury Note, 10 Year | | | 11,987,313 | | | | (59,641 | ) | |
12/2019 | | | 1 | | | U.S. Treasury Note, Ultra 10 Year | | | 142,109 | | | | 52 | | |
Total Long Positions | | | | | | $ | 45,115,179 | | | $ | (160,729 | ) | |
Short Futures:
Expiration
Date | | Number of
Contracts | | Open Contracts | | Notional
Amount | | Value and
Unrealized
Appreciation/
(Depreciation) | |
12/2019 | | | 2 | | | South African Rand | | $ | (65,900 | ) | | $ | 2,163 | | |
12/2019 | | | 39 | | | U.S. Treasury Ultra Long Bond | | | (7,400,250 | ) | | | 33,375 | | |
2/2020 | | | 1 | | | Federal Funds, 30 day | | | (410,762 | ) | | | (3,125 | ) | |
Total Short Positions | | | | | | $ | (7,876,912 | ) | | $ | 32,413 | | |
Total Futures | | | | | | | | $ | (128,316 | ) | |
At October 31, 2019, the Fund had $196,708 deposited in a segregated account to cover margin requirements on open futures. At October 31, 2019, the Fund had securities pledged in the amount of $274,266 to cover collateral requirements on open futures.
For the year ended October 31, 2019, the average notional value of futures for the Fund was $51,056,408 for long positions and $(28,573,404) for short positions.
See Notes to Financial Statements
56
Schedule of Investments Core Bond Fund^ (cont'd)
The following is a summary, categorized by Level (see Note A of Notes to Financial Statements), of inputs used to value the Fund's investments as of October 31, 2019:
Asset Valuation Inputs
| | | Level 1 | | Level 2 | | Level 3 | | Total | |
Investments: | |
U.S. Treasury Obligations | | $ | — | | | $ | 82,407,536 | | | $ | — | | | $ | 82,407,536 | | |
U.S. Government Agency Securities | | | — | | | | 3,332,114 | | | | — | | | | 3,332,114 | | |
| Mortgage-Backed Securities(a) | | | — | | | | 177,720,549 | | | | — | | | | 177,720,549 | | |
| Corporate Bonds(a) | | | — | | | | 87,435,922 | | | | — | | | | 87,435,922 | | |
Asset-Backed Securities | | | — | | | | 25,317,400 | | | | — | | | | 25,317,400 | | |
Short-Term Investments | | | — | | | | 2,695,183 | | | | — | | | | 2,695,183 | | |
Total Investments | | $ | — | | | $ | 378,908,704 | | | $ | — | | | $ | 378,908,704 | | |
(a) The Schedule of Investments provides information on the industry or sector categorization for the portfolio.
The following is a summary, categorized by Level (see Note A of Notes to Financial Statements), of inputs used to value the Fund's derivatives as of October 31, 2019:
Other Financial Instruments
| | | Level 1 | | Level 2 | | Level 3 | | Total | |
| Futures(a) | |
Assets | | $ | 46,944 | | | $ | — | | | $ | — | | | $ | 46,944 | | |
Liabilities | | | (175,260 | ) | | | — | | | | — | | | | (175,260 | ) | |
Total | | $ | (128,316 | ) | | $ | — | | | $ | — | | | $ | (128,316 | ) | |
(a) Futures are reported at the cumulative unrealized appreciation/(depreciation) of the instrument.
^ A balance indicated with a "—", reflects either a zero balance or an amount that rounds to less than 1.
See Notes to Financial Statements
57
Schedule of Investments Emerging Markets Debt Fund^ October 31, 2019
| PRINCIPAL AMOUNT(a) | | | | VALUE | |
Corporate Bonds 29.8% | | | |
Argentina 0.7% | | | |
$ | 300,000 | | | Agua y Saneamientos Argentinos SA, 6.63%, due 2/1/2023 | | $ | 117,750 | (b)(c) | |
| | 86,000 | | | Genneia SA, 8.75%, due 1/20/2022 | | | 58,050 | (d) | |
| | 200,000 | | | Pampa Energia SA, 7.38%, due 7/21/2023 | | | 174,000 | (b) | |
| | 234,000 | | | Rio Energy SA/UGEN SA/UENSA SA, 6.88%, due 2/1/2025 | | | 135,723 | (d) | |
| | 44,000 | | | Tecpetrol SA, 4.88%, due 12/12/2022 | | | 40,260 | (b) | |
| | 200,000 | | | Telecom Argentina SA, 8.00%, due 7/18/2026 | | | 179,500 | (d) | |
| | 225,000 | | | YPF Energia Electrica SA, 10.00%, due 7/25/2026 | | | 170,190 | (d) | |
| | | | | YPF SA | | | | | |
| | 83,000 | | | (BADLARPP + 4.00%, 18.00% Floor), 63.35%, due 7/7/2020 | | | 17,853 | (b)(e) | |
| | 200,000 | | | 8.50%, due 7/28/2025 | | | 158,400 | (b) | |
| | 206,000 | | | 7.00%, due 12/15/2047 | | | 146,262 | (d) | |
| | | | 1,197,988 | | |
Azerbaijan 1.2% | | | |
| | | | | Southern Gas Corridor CJSC | | | | | |
| | 1,500,000 | | | 6.88%, due 3/24/2026 | | | 1,747,500 | (b)(c) | |
| | 200,000 | | | 6.88%, due 3/24/2026 | | | 233,000 | (b)(c) | |
| | | | 1,980,500 | | |
Bahrain 0.1% | | | |
| | 219,000 | | | Oil & Gas Holding Co., 7.63%, due 11/7/2024 | | | 248,018 | (c)(d) | |
Brazil 2.5% | | | |
| | 200,000 | | | Banco do Brasil SA, 9.00%, due 6/18/2024 | | | 227,940 | (b)(c)(f)(g) | |
| | 316,000 | | | Banco Votorantim SA, 4.50%, due 9/24/2024 | | | 325,843 | (d) | |
| | 200,000 | | | BRF SA, 4.88%, due 1/24/2030 | | | 199,480 | (d) | |
| | 200,000 | | | Cemig Geracao e Transmissao SA, 9.25%, due 12/5/2024 | | | 233,202 | (c)(d) | |
| | 200,000 | | | Cosan Ltd., 5.50%, due 9/20/2029 | | | 208,000 | (d) | |
| | 327,000 | | | CSN Resources SA, 7.63%, due 4/17/2026 | | | 331,905 | (c)(d) | |
| | 365,000 | | | Itau Unibanco Holding SA, 6.50%, due 3/19/2023 | | | 380,056 | (c)(d)(f)(g) | |
| | 200,000 | | | JBS Investments II GmbH, 5.75%, due 1/15/2028 | | | 208,400 | (d) | |
| | 200,000 | | | Light Servicos de Eletricidade SA/Light Energia SA, 7.25%, due 5/3/2023 | | | 215,502 | (d) | |
| | 276,000 | | | MARB BondCo PLC, 6.88%, due 1/19/2025 | | | 287,509 | (c)(d) | |
| | 313,000 | | | MV24 Capital BV, 6.75%, due 6/1/2034 | | | 327,241 | (c)(d) | |
| | | | | Petrobras Global Finance BV | | | | | |
| | 38,000 | | | 5.09%, due 1/15/2030 | | | 40,299 | (d) | |
| | 166,000 | | | 6.90%, due 3/19/2049 | | | 192,942 | | |
| | 200,000 | | | Rumo Luxembourg Sarl, 7.38%, due 2/9/2024 | | | 215,760 | (b)(c) | |
| | | | | Suzano Austria GmbH | | | | | |
| | 213,000 | | | 5.00%, due 1/15/2030 | | | 219,284 | (c) | |
| | 200,000 | | | 7.00%, due 3/16/2047 | | | 233,125 | (c)(d) | |
| | 117,000 | | | Vale Overseas Ltd., 8.25%, due 1/17/2034 | | | 159,998 | | |
| | | | 4,006,486 | | |
Chile 0.8% | | | |
| | | | | AES Gener SA | | | | | |
| | 200,000 | | | 7.13%, due 3/26/2079 | | | 207,690 | (d)(g) | |
| | 207,000 | | | 6.35%, due 10/7/2079 | | | 207,890 | (d)(g) | |
See Notes to Financial Statements
58
Schedule of Investments Emerging Markets Debt Fund^ (cont'd)
| PRINCIPAL AMOUNT(a) | | | | VALUE | |
| | | | | Codelco, Inc. | | | | | |
$ | 238,000 | | | 3.00%, due 9/30/2029 | | $ | 237,182 | (d) | |
| | 204,000 | | | 4.38%, due 2/5/2049 | | | 225,257 | (c)(d) | |
| | 200,000 | | | Empresa Electrica Guacolda SA, 4.56%, due 4/30/2025 | | | 172,346 | (b) | |
| | 179,000 | | | VTR Finance BV, 6.88%, due 1/15/2024 | | | 183,475 | (b) | |
| | | | 1,233,840 | | |
China 3.4% | | | |
| | 212,000 | | | Alibaba Group Holding Ltd., 4.20%, due 12/6/2047 | | | 239,579 | (c) | |
| | 200,000 | | | CDBL Funding 1, 3.00%, due 4/24/2023 | | | 200,831 | (b) | |
| | 200,000 | | | CFLD Cayman Investment Ltd., 8.60%, due 4/8/2024 | | | 203,266 | (b)(c) | |
| | 200,000 | | | Champion Sincerity Holdings Ltd., 8.13%, due 2/8/2022 | | | 210,770 | (b)(c)(f)(g) | |
| | 200,000 | | | Charming Light Investments Ltd., 4.38%, due 12/21/2027 | | | 215,094 | (b)(c) | |
| | 200,000 | | | China Construction Bank Corp., 4.25%, due 2/27/2029 | | | 209,988 | (b)(g) | |
| | 300,000 | | | China Evergrande Group, 8.25%, due 3/23/2022 | | | 278,433 | (b)(c) | |
| | | | | China Minmetals Corp. | | | | | |
| | 210,000 | | | 4.45%, due 5/13/2021 | | | 213,470 | (b)(c)(f)(g) | |
| | 416,000 | | | 3.75%, due 11/13/2022 | | | 419,063 | (b)(c)(f)(g) | |
| | 200,000 | | | China Overseas Finance Cayman VI Ltd., 5.95%, due 5/8/2024 | | | 226,635 | (b)(c) | |
| | 200,000 | | | China Reinsurance Finance Corp. Ltd., 3.38%, due 3/9/2022 | | | 200,665 | (b) | |
| | 200,000 | | | China Resources Land Ltd., 4.13%, due 2/26/2029 | | | 217,214 | (b)(c) | |
| | 200,000 | | | CNAC HK Finbridge Co. Ltd., 3.38%, due 6/19/2024 | | | 202,720 | (b) | |
| | 200,000 | | | CNOOC Finance 2015 USA LLC, 3.50%, due 5/5/2025 | | | 208,259 | | |
| | 201,000 | | | Dianjian Int'l Finance Ltd., 4.60%, due 3/13/2023 | | | 208,081 | (b)(f)(g) | |
| | 200,000 | | | Easy Tactic Ltd., 8.13%, due 2/27/2023 | | | 198,994 | (b) | |
| | 200,000 | | | Greenland Global Investment Ltd., 6.75%, due 6/25/2022 | | | 206,101 | (b) | |
| | 200,000 | | | Huarong Finance 2017 Co. Ltd., 4.00%, due 11/7/2022 | | | 201,493 | (b)(f)(g) | |
| | 20,000 | | | Nexen, Inc., 5.88%, due 3/10/2035 | | | 25,862 | | |
| | 200,000 | | | Proven Glory Capital Ltd., 3.25%, due 2/21/2022 | | | 200,220 | (b) | |
| | 200,000 | | | Sino-Ocean Land Treasure IV Ltd., 4.75%, due 8/5/2029 | | | 197,877 | (b) | |
| | 312,000 | | | Sinopec Group Overseas Development 2017 Ltd., 3.25%, due 9/13/2027 | | | 319,198 | (c)(d) | |
| | 228,000 | | | Sinopec Group Overseas Development 2018 Ltd., 2.50%, due 8/8/2024 | | | 227,262 | (c)(d) | |
| | 250,000 | | | Sunac China Holdings Ltd., 8.35%, due 4/19/2023 | | | 257,340 | (b)(c) | |
| | 200,000 | | | Tencent Holdings Ltd., 3.60%, due 1/19/2028 | | | 208,393 | (b)(c) | |
| | | | 5,496,808 | | |
Colombia 1.3% | | | |
| | 100,000 | | | Bancolombia SA, 5.13%, due 9/11/2022 | | | 105,240 | | |
| | | | | Ecopetrol SA | | | | | |
| | 300,000 | | | 7.38%, due 9/18/2043 | | | 398,253 | (c) | |
| | 200,000 | | | 5.88%, due 5/28/2045 | | | 230,940 | (c) | |
| | | | | Empresas Publicas de Medellin ESP | | | | | |
COP | 807,000,000 | | | 7.63%, due 9/10/2024 | | | 251,016 | (c)(d) | |
COP | 1,600,000,000 | | | 8.38%, due 11/8/2027 | | | 510,785 | (c)(d) | |
$ | 201,000 | | | 4.25%, due 7/18/2029 | | | 210,407 | (d) | |
COP | 437,000,000 | | | Financiera de Desarrollo Territorial SA Findeter, 7.88%, due 8/12/2024 | | | 137,669 | (d) | |
$ | 300,000 | | | Millicom Int'l Cellular SA, 6.25%, due 3/25/2029 | | | 327,369 | (b)(c) | |
| | | | 2,171,679 | | |
Ghana 0.3% | | | |
| | 200,000 | | | Kosmos Energy Ltd., 7.13%, due 4/4/2026 | | | 208,500 | (d) | |
| | 210,000 | | | Tullow Oil PLC, 7.00%, due 3/1/2025 | | | 216,562 | (d) | |
| | | | 425,062 | | |
See Notes to Financial Statements
59
Schedule of Investments Emerging Markets Debt Fund^ (cont'd)
| PRINCIPAL AMOUNT(a) | | | | VALUE | |
Guatemala 0.2% | | | |
$ | 250,000 | | | Central American Bottling Corp., 5.75%, due 1/31/2027 | | $ | 263,752 | (c)(d) | |
Hong Kong 1.0% | | | |
| | 309,000 | | | Celestial Miles Ltd., 5.75%, due 1/31/2024 | | | 326,661 | (b)(c)(f)(g) | |
| | 200,000 | | | Li & Fung Ltd., 4.38%, due 10/4/2024 | | | 202,683 | (b) | |
| | | | | Melco Resorts Finance Ltd. | | | | | |
| | 200,000 | | | 4.88%, due 6/6/2025 | | | 204,408 | (d) | |
| | 200,000 | | | 5.63%, due 7/17/2027 | | | 208,594 | (d) | |
| | 400,000 | | | Metropolitan Light Co. Ltd., 5.50%, due 11/21/2022 | | | 414,040 | (b)(c) | |
| | 200,000 | | | NWD MTN Ltd., 4.13%, due 7/18/2029 | | | 199,485 | (b) | |
| | | 1,555,871 | | |
India 0.8% | | | |
| | 200,000 | | | ABJA Investment Co. Pte Ltd., 5.45%, due 1/24/2028 | | | 195,602 | (b) | |
| | 300,000 | | | Greenko Dutch BV, 5.25%, due 7/24/2024 | | | 302,178 | (b)(c) | |
| | 200,000 | | | Greenko Solar Mauritius Ltd., 5.55%, due 1/29/2025 | | | 200,358 | (d) | |
| | 228,000 | | | Network i2i Ltd., 5.65%, due 1/15/2025 | | | 214,776 | (d)(f)(g) | |
| | 200,000 | | | Oil India Ltd., 5.13%, due 2/4/2029 | | | 225,528 | (b)(c) | |
| | 200,000 | | | Vedanta Resources PLC, 6.38%, due 7/30/2022 | | | 197,800 | (b) | |
| | | | 1,336,242 | | |
Indonesia 1.5% | | | |
| | 200,000 | | | Indika Energy Capital III Pte Ltd., 5.88%, due 11/9/2024 | | | 193,880 | (b) | |
| | 400,000 | | | Indonesia Asahan Aluminium Persero PT, 6.76%, due 11/15/2048 | | | 513,539 | (b)(c) | |
| | 400,000 | | | Medco Oak Tree Pte Ltd., 7.38%, due 5/14/2026 | | | 407,243 | (b)(c) | |
| | 210,000 | | | Pertamina Persero PT, 3.65%, due 7/30/2029 | | | 215,533 | (c)(d) | |
| | | | | Perusahaan Listrik Negara PT | | | | | |
EUR | 200,000 | | | 1.88%, due 11/5/2031 | | | 221,882 | (d)(h) | |
$ | 200,000 | | | 6.15%, due 5/21/2048 | | | 251,340 | (c)(d) | |
| | 207,000 | | | 4.38%, due 2/5/2050 | | | 207,210 | (d)(h) | |
| | 400,000 | | | Saka Energi Indonesia PT, 4.45%, due 5/5/2024 | | | 404,016 | (b)(c) | |
| | | | 2,414,643 | | |
Israel 0.5% | | | |
| | 400,000 | | | Altice Financing SA, 7.50%, due 5/15/2026 | | | 425,000 | (b)(c) | |
| | 200,000 | | | Israel Electric Corp. Ltd., 5.00%, due 11/12/2024 | | | 219,900 | (b)(c) | |
| | 250,000 | | | Teva Pharmaceutical Finance Netherlands III BV, 3.15%, due 10/1/2026 | | | 188,125 | | |
| | | | 833,025 | | |
Kazakhstan 0.8% | | | |
| | | | | KazMunayGas National Co. JSC | | | | | |
| | 299,000 | | | 5.38%, due 4/24/2030 | | | 343,856 | (c)(d) | |
| | 560,000 | | | 5.75%, due 4/19/2047 | | | 654,350 | (b)(c) | |
| | 225,000 | | | 6.38%, due 10/24/2048 | | | 283,005 | (c)(d) | |
| | | | 1,281,211 | | |
See Notes to Financial Statements
60
Schedule of Investments Emerging Markets Debt Fund^ (cont'd)
| PRINCIPAL AMOUNT(a) | | | | VALUE | |
Korea 0.8% | | | |
$ | 316,000 | | | Hanwha Life Insurance Co. Ltd., 4.70%, due 4/23/2023 | | $ | 319,175 | (c)(d)(f)(g) | |
| | 200,000 | | | Hyundai Capital America, 2.75%, due 9/27/2026 | | | 195,333 | (b) | |
| | 200,000 | | | Kyobo Life Insurance Co. Ltd., 3.95%, due 7/24/2022 | | | 200,000 | (b)(f)(g) | |
| | 200,000 | | | SK Hynix, Inc., 3.00%, due 9/17/2024 | | | 199,777 | (b) | |
| | 300,000 | | | Woori Bank, 4.75%, due 4/30/2024 | | | 321,413 | (b)(c) | |
| | | 1,235,698 | | |
Kuwait 0.1% | | | |
| | 200,000 | | | NBK Tier 1 Financing Ltd., 5.75%, due 4/9/2021 | | | 205,800 | (b)(f)(g) | |
Macau 0.7% | | | |
| | 200,000 | | | MGM China Holdings Ltd., 5.88%, due 5/15/2026 | | | 211,500 | (b) | |
| | 400,000 | | | Sands China Ltd., 5.40%, due 8/8/2028 | | | 452,556 | (c) | |
| | 200,000 | | | Studio City Finance Ltd., 7.25%, due 2/11/2024 | | | 212,500 | (b) | |
| | 200,000 | | | Studio City Finance Ltd., 7.25%, due 2/11/2024 | | | 212,500 | (d) | |
| | | 1,089,056 | | |
Malaysia 0.1% | | | |
| | 200,000 | | | TNB Global Ventures Capital Bhd, 4.85%, due 11/1/2028 | | | 228,079 | (b)(c) | |
Mexico 4.6% | | | |
| | 200,000 | | | Alfa SAB de CV, 6.88%, due 3/25/2044 | | | 238,304 | (b)(c) | |
| | 275,000 | | | America Movil SAB de CV, 3.63%, due 4/22/2029 | | | 293,070 | (c) | |
| | 200,000 | | | Banco Mercantil del Norte SA, 7.63%, due 1/10/2028 | | | 209,002 | (b)(f)(g) | |
| | 200,000 | | | BBVA Bancomer SA, 5.13%, due 1/18/2033 | | | 194,860 | (b)(g) | |
| | 358,530 | | | Cometa Energia SA de CV, 6.38%, due 4/24/2035 | | | 388,109 | (c)(d) | |
MXN | 6,480,000 | | | Comision Federal de Electricidad, Ser. 14-2, 7.35%, due 11/25/2025 | | | 311,644 | | |
$ | 300,000 | | | Elementia SAB de CV, 5.50%, due 1/15/2025 | | | 300,750 | (b)(c) | |
| | 209,000 | | | Industrias Penoles SAB de CV, 5.65%, due 9/12/2049 | | | 215,009 | (d) | |
| | 200,000 | | | Infraestructura Energetica Nova SAB de CV, 4.88%, due 1/14/2048 | | | 190,500 | (d) | |
| | 400,000 | | | Mexichem SAB de CV, 5.88%, due 9/17/2044 | | | 422,496 | (b)(c) | |
| | 242,000 | | | Mexico City Airport Trust, 5.50%, due 7/31/2047 | | | 241,806 | (c)(d) | |
| | 258,000 | | | Minera Mexico SA de CV, 4.50%, due 1/26/2050 | | | 253,021 | (d) | |
| | | | | Petroleos Mexicanos | | | | | |
MXN | 13,180,000 | | | 7.19%, due 9/12/2024 | | | 609,789 | (b) | |
$ | 41,000 | | | 6.88%, due 8/4/2026 | | | 44,854 | | |
MXN | 41,442,700 | | | Ser. 14-2, 7.47%, due 11/12/2026 | | | 1,820,450 | | |
$ | 79,000 | | | 6.84%, due 1/23/2030 | | | 84,364 | (d) | |
| | 419,000 | | | 6.35%, due 2/12/2048 | | | 400,669 | (c) | |
| | 604,000 | | | 7.69%, due 1/23/2050 | | | 658,601 | (d) | |
| | 200,000 | | | Sigma Alimentos SA de CV, 4.13%, due 5/2/2026 | | | 208,502 | (b) | |
| | | | | Trust F/1401 | | | | | |
| | 200,000 | | | 6.95%, due 1/30/2044 | | | 231,252 | (b)(c) | |
| | 200,000 | | | 6.39%, due 1/15/2050 | | | 213,500 | (d) | |
| | | | 7,530,552 | | |
Mongolia 0.1% | | | |
| | 200,000 | | | Trade & Development Bank of Mongolia LLC, 9.38%, due 5/19/2020 | | | 205,000 | (b) | |
See Notes to Financial Statements
61
Schedule of Investments Emerging Markets Debt Fund^ (cont'd)
| PRINCIPAL AMOUNT(a) | | | | VALUE | |
Nigeria 0.3% | | | |
$ | 200,000 | | | IHS Netherlands Holdco BV, 8.00%, due 9/18/2027 | | $ | 209,040 | (d) | |
| | 200,000 | | | United Bank for Africa PLC, 7.75%, due 6/8/2022 | | | 211,844 | (b) | |
| | | | 420,884 | | |
Oman 0.1% | | | |
| | 242,000 | | | Oztel Holdings SPC Ltd., 6.63%, due 4/24/2028 | | | 249,187 | (c)(d) | |
Panama 0.4% | | | |
| | 200,000 | | | C&W Senior Financing Designated Activity Co., 6.88%, due 9/15/2027 | | | 210,500 | (d) | |
| | 206,000 | | | Cable Onda SA, 4.50%, due 1/30/2030 | | | 208,734 | (d)(h) | |
| | 200,000 | | | Empresa de Transmision Electrica SA, 5.13%, due 5/2/2049 | | | 228,750 | (c)(d) | |
| | | | 647,984 | | |
Peru 1.1% | | | |
PEN | 843,000 | | | Fondo MIVIVIENDA SA, 7.00%, due 2/14/2024 | | | 280,395 | (d) | |
$ | 200,000 | | | Hunt Oil Co. of Peru LLC Sucursal Del Peru, 6.38%, due 6/1/2028 | | | 218,750 | (c)(d) | |
| | 205,000 | | | Inkia Energy Ltd., 5.88%, due 11/9/2027 | | | 212,433 | (d) | |
| | | | | Orazul Energy Egenor S en C por A | | | | | |
| | 200,000 | | | 5.63%, due 4/28/2027 | | | 205,000 | (d) | |
| | 200,000 | | | 5.63%, due 4/28/2027 | | | 205,000 | (b) | |
| | 200,000 | | | Petroleos del Peru SA, 4.75%, due 6/19/2032 | | | 215,252 | (c)(d) | |
| | 250,000 | | | Southern Copper Corp., 6.75%, due 4/16/2040 | | | 322,606 | (c) | |
| | 165,000 | | | Volcan Cia Minera SAA, 5.38%, due 2/2/2022 | | | 170,983 | (b) | |
| | | | 1,830,419 | | |
Qatar 0.1% | | | |
| | 100,000 | | | Nakilat, Inc., 6.07%, due 12/31/2033 | | | 121,130 | (b) | |
Russia 1.7% | | | |
| | 300,000 | | | Evraz Group SA, 5.38%, due 3/20/2023 | | | 320,157 | (b)(c) | |
| | | | | Gazprom OAO Via Gaz Capital SA | | | | | |
| | 391,000 | | | 5.15%, due 2/11/2026 | | | 427,385 | (c)(d) | |
| | 200,000 | | | 5.15%, due 2/11/2026 | | | 218,612 | (b)(c) | |
| | 200,000 | | | GTH Finance BV, 7.25%, due 4/26/2023 | | | 223,344 | (b)(c) | |
| | 273,000 | | | GTLK Europe Capital DAC, 4.95%, due 2/18/2026 | | | 278,225 | (b) | |
| | 200,000 | | | GTLK Europe DAC, 5.95%, due 7/19/2021 | | | 208,838 | (b) | |
| | 200,000 | | | Sberbank of Russia Via SB Capital SA, 5.13%, due 10/29/2022 | | | 210,768 | (b) | |
| | 205,000 | | | SCF Capital Ltd., 5.38%, due 6/16/2023 | | | 217,220 | (c)(d) | |
| | 239,000 | | | Veon Holdings BV, 4.00%, due 4/9/2025 | | | 245,527 | (d) | |
| | 300,000 | | | Vnesheconombank Via VEB Finance PLC, 6.80%, due 11/22/2025 | | | 349,168 | (b)(c) | |
| | | 2,699,244 | | |
Saudi Arabia 0.1% | | | |
| | 200,000 | | | Saudi Electricity Global Sukuk Co. 4, 4.22%, due 1/27/2024 | | | 211,514 | (b) | |
See Notes to Financial Statements
62
Schedule of Investments Emerging Markets Debt Fund^ (cont'd)
| PRINCIPAL AMOUNT(a) | | | | VALUE | |
Singapore 0.6% | | | |
$ | 300,000 | | | BOC Aviation Ltd., 3.50%, due 10/10/2024 | | $ | 308,445 | (b)(c) | |
| | 200,000 | | | DBS Group Holdings Ltd., 4.52%, due 12/11/2028 | | | 212,242 | (c)(d)(g) | |
| | 200,000 | | | Oversea-Chinese Banking Corp. Ltd., 4.25%, due 6/19/2024 | | | 212,074 | (b) | |
| | 200,000 | | | Parkway Pantai Ltd., 4.25%, due 7/27/2022 | | | 198,686 | (b)(f)(g) | |
| | | | 931,447 | | |
South Africa 0.8% | | | |
| | | | | Eskom Holdings SOC Ltd. | | | | | |
| | 260,000 | | | 6.75%, due 8/6/2023 | | | 266,772 | (b)(c) | |
| | 206,000 | | | 6.35%, due 8/10/2028 | | | 217,898 | (c)(d) | |
| | 318,000 | | | Liquid Telecommunications Financing PLC, 8.50%, due 7/13/2022 | | | 316,601 | (c)(d) | |
| | | | | SASOL Financing USA LLC | | | | | |
| | 200,000 | | | 5.88%, due 3/27/2024 | | | 215,695 | (c) | |
| | 200,000 | | | 6.50%, due 9/27/2028 | | | 223,616 | (c) | |
| | | | 1,240,582 | | |
Supranational 0.2% | | | |
| | | | | Banque Ouest Africaine de Developpement | | | | | |
| | 205,000 | | | 5.00%, due 7/27/2027 | | | 216,921 | (c)(d) | |
| | 200,000 | | | 4.70%, due 10/22/2031 | | | 201,264 | (d) | |
| | | | 418,185 | | |
Thailand 0.4% | | | |
| | 400,000 | | | PTT PCL, 4.50%, due 10/25/2042 | | | 453,540 | (b)(c) | |
| | 200,000 | | | PTTEP Treasury Center Co. Ltd., 4.60%, due 7/17/2022 | | | 205,191 | (b)(f)(g) | |
| | | | 658,731 | | |
Turkey 1.0% | | | |
| | 200,000 | | | Akbank TAS, 5.13%, due 3/31/2025 | | | 191,028 | (d) | |
| | 200,000 | | | SISECAM, 6.95%, due 3/14/2026 | | | 208,000 | (d) | |
| | 200,000 | | | Turkcell Iletisim Hizmetleri AS, 5.80%, due 4/11/2028 | | | 194,008 | (d) | |
| | | | | Turkiye Garanti Bankasi AS | | | | | |
| | 200,000 | | | 5.25%, due 9/13/2022 | | | 200,500 | (b) | |
| | 200,000 | | | 5.88%, due 3/16/2023 | | | 202,811 | (b) | |
| | 200,000 | | | Turkiye Is Bankasi AS, 6.13%, due 4/25/2024 | | | 194,656 | (b) | |
| | | | | Yapi ve Kredi Bankasi AS | | | | | |
| | 200,000 | | | 5.75%, due 2/24/2022 | | | 200,225 | (b) | |
| | 200,000 | | | 5.85%, due 6/21/2024 | | | 192,910 | (d) | |
| | | | 1,584,138 | | |
Ukraine 0.3% | | | |
| | 200,000 | | | MHP Lux SA, 6.95%, due 4/3/2026 | | | 206,336 | (b) | |
EUR | 260,000 | | | NAK Naftogaz Ukraine via Kondor Finance PLC, 7.13%, due 7/19/2024 | | | 303,120 | (b) | |
| | | | 509,456 | | |
See Notes to Financial Statements
63
Schedule of Investments Emerging Markets Debt Fund^ (cont'd)
| PRINCIPAL AMOUNT(a) | | | | VALUE | |
United Arab Emirates 1.0% | | | |
| | | | | Abu Dhabi Crude Oil Pipeline LLC | | | | | |
$ | 285,000 | | | 3.65%, due 11/2/2029 | | $ | 306,050 | (c)(d) | |
| | 200,000 | | | 3.65%, due 11/2/2029 | | | 214,772 | (b)(c) | |
| | 200,000 | | | ADCB Finance Cayman Ltd., 4.00%, due 3/29/2023 | | | 209,000 | (d) | |
| | 200,000 | | | DP World Ltd., 6.85%, due 7/2/2037 | | | 262,693 | (b)(c) | |
| | 200,000 | | | Emirates NBD PJSC, 6.13%, due 3/20/2025 | | | 207,975 | (b)(f)(g) | |
| | | | | MDGH-GMTN BV | | | | | |
| | 200,000 | | | 4.50%, due 11/7/2028 | | | 225,250 | (c)(d) | |
| | 200,000 | | | 3.70%, due 11/7/2049 | | | 200,808 | (d)(h) | |
| | | | 1,626,548 | | |
Venezuela 0.2% | | | |
| | | | | Petroleos de Venezuela SA | | | | | |
| | 1,347,609 | | | 6.00%, due 5/16/2024 | | | 80,857 | (b)(i)(j) | |
| | 1,631,452 | | | 6.00%, due 11/15/2026 | | | 97,887 | (b)(i)(j) | |
| | 650,000 | | | 5.38%, due 4/12/2027 | | | 39,000 | (b)(i)(j) | |
| | 784,800 | | | 5.38%, due 4/12/2027 | | | 47,088 | (b)(i)(j) | |
| | | | 264,832 | | |
| | | | | Total Corporate Bonds (Cost $48,399,452) | | | 48,353,591 | | |
Foreign Government Securities 61.9% | | | |
Albania 0.1% | | | |
EUR | 101,000 | | | Republic of Albania, 3.50%, due 10/9/2025 | | | 122,022 | (b) | |
Angola 0.4% | | | |
| | | | | Angolan Government International Bond | | | | | |
$ | 458,000 | | | 9.38%, due 5/8/2048 | | | 484,704 | (b) | |
| | 200,000 | | | 9.38%, due 5/8/2048 | | | 211,661 | (b) | |
| | | | 696,365 | | |
Argentina 1.7% | | | |
ARS | 3,000,000 | | | Argentina POM Politica Monteria, (ARLLMONP), 72.61%, due 6/21/2020 | | | 16,345 | (e) | |
ARS | 500,000 | | | Argentina Treasury Bond BONCER, 2.50%, due 7/22/2021 | | | 6,245 | | |
ARS | 1,467,546 | | | Argentine Bonos del Tesoro, 18.20%, due 10/3/2021 | | | 6,650 | | |
| | | | | Argentine Republic Government International Bond | | | | | |
EUR | 350,000 | | | 3.38%, due 1/15/2023 | | | 147,558 | | |
EUR | 1,824,610 | | | 7.82%, due 12/31/2033 | | | 971,910 | (c) | |
EUR | 255,953 | | | 3.38%, due 12/31/2038 | | | 110,086 | (k) | |
EUR | 2,194,047 | | | 3.38%, due 12/31/2038 | | | 957,470 | (c)(k) | |
ARS | 5,078,000 | | | Bonos de la Nacion Argentina con Ajuste por CER, 4.00%, due 3/6/2020 | | | 37,730 | | |
$ | 536,000 | | | Bonos de la Nacion Argentina en Moneda Dua, 4.50%, due 2/13/2020 | | | 150,884 | | |
| | | | | City of Buenos Aires Argentina | | | | | |
ARS | 19,249,831 | | | (BADLARPP + 3.25%), 58.06%, due 3/29/2024 | | | 155,739 | (e) | |
ARS | 13,270,000 | | | (BADLARPP + 3.75%), 61.07%, due 2/22/2028 | | | 105,755 | (e) | |
EUR | 130,000 | | | Provincia de Buenos Aires, 5.38%, due 1/20/2023 | | | 47,702 | (b) | |
| | | | 2,714,074 | | |
See Notes to Financial Statements
64
Schedule of Investments Emerging Markets Debt Fund^ (cont'd)
| PRINCIPAL AMOUNT(a) | | | | VALUE | |
Armenia 0.1% | | | |
$ | 200,000 | | | Republic of Armenia International Bond, 3.95%, due 9/26/2029 | | $ | 194,844 | (b) | |
Azerbaijan 0.9% | | | |
| | | | | State Oil Co. of the Azerbaijan Republic | | | | | |
| | 810,000 | | | 4.75%, due 3/13/2023 | | | 843,259 | (b)(c) | |
| | 200,000 | | | 6.95%, due 3/18/2030 | | | 240,164 | (b)(c) | |
| | 310,000 | | | 6.95%, due 3/18/2030 | | | 372,255 | (b)(c) | |
| | | | 1,455,678 | | |
Belize 0.1% | | | |
| | 311,000 | | | Belize Government International Bond, 4.94%, due 2/20/2034 | | | 189,710 | (b) | |
Bermuda 0.5% | | | |
| | | | | Bermuda Government International Bond | | | | | |
| | 200,000 | | | 3.72%, due 1/25/2027 | | | 209,502 | (b) | |
| | 490,000 | | | 4.75%, due 2/15/2029 | | | 553,700 | (b) | |
| | | | 763,202 | | |
Brazil 0.8% | | | |
| | 540,000 | | | Brazil Minas SPE via State of Minas Gerais, 5.33%, due 2/15/2028 | | | 573,755 | (b)(c) | |
| | 670,000 | | | Brazilian Government International Bond, 5.00%, due 1/27/2045 | | | 696,472 | | |
| | | | 1,270,227 | | |
Chile 0.8% | | | |
| | | | | Bonos de la Tesoreria de la Republica en pesos | | | | | |
CLP | 260,000,000 | | | 4.70%, due 9/1/2030 | | | 396,632 | (b) | |
CLP | 205,000,000 | | | 5.00%, due 3/1/2035 | | | 329,049 | | |
CLP | 220,000,000 | | | 6.00%, due 1/1/2043 | | | 412,753 | | |
CLP | 95,000,000 | | | 5.10%, due 7/15/2050 | | | 160,289 | | |
| | | | 1,298,723 | | |
China 0.9% | | | |
CNY | 10,000,000 | | | China Government Bond, 3.19%, due 4/11/2024 | | | 1,428,299 | (c) | |
Colombia 2.6% | | | |
| | | | | Colombia Government International Bond | | | | | |
COP | 423,000,000 | | | 4.38%, due 3/21/2023 | | | 122,742 | | |
$ | 130,000 | | | 6.13%, due 1/18/2041 | | | 168,350 | | |
| | 310,000 | | | 5.63%, due 2/26/2044 | | | 384,868 | | |
| | 230,000 | | | 5.00%, due 6/15/2045 | | | 267,607 | | |
| | 201,000 | | | 5.20%, due 5/15/2049 | | | 241,504 | | |
| | | | | Colombian TES | | | | | |
COP | 2,359,500,000 | | | Ser. B, 6.25%, due 11/26/2025 | | | 725,477 | (c) | |
COP | 157,500,000 | | | Ser. B, 7.50%, due 8/26/2026 | | | 51,590 | | |
COP | 2,179,400,000 | | | Ser. B, 7.75%, due 9/18/2030 | | | 731,716 | | |
See Notes to Financial Statements
65
Schedule of Investments Emerging Markets Debt Fund^ (cont'd)
| PRINCIPAL AMOUNT(a) | | | | VALUE | |
COP | 2,636,400,000 | | | Ser. B, 7.00%, due 6/30/2032 | | $ | 836,651 | | |
COP | 2,315,000,000 | | | Ser. B, 7.25%, due 10/18/2034 | | | 753,552 | | |
| | | | 4,284,057 | | |
Costa Rica 0.4% | | | |
$ | 720,000 | | | Costa Rica Government International Bond, 7.00%, due 4/4/2044 | | | 710,107 | (b) | |
Cote D'Ivoire 1.2% | | | |
| | | | | Ivory Coast Government International Bond | | | | | |
EUR | 165,000 | | | 5.88%, due 10/17/2031 | | | 186,191 | (b) | |
$ | 875,600 | | | 5.75%, due 12/31/2032 | | | 863,985 | (b)(k) | |
| | 52,800 | | | 5.75%, due 12/31/2032 | | | 52,161 | (b)(k) | |
EUR | 207,000 | | | 6.88%, due 10/17/2040 | | | 235,371 | (b) | |
EUR | 490,000 | | | 6.63%, due 3/22/2048 | | | 539,416 | (b) | |
| | | | 1,877,124 | | |
Croatia 0.6% | | | |
| | | | | Croatia Government International Bond | | | | | |
EUR | 100,000 | | | 3.00%, due 3/20/2027 | | | 132,240 | (b) | |
EUR | 360,000 | | | 1.13%, due 6/19/2029 | | | 421,260 | (b) | |
EUR | 322,000 | | | 2.75%, due 1/27/2030 | | | 434,471 | (b) | |
| | | | 987,971 | | |
Czech Republic 1.9% | | | |
| | | | | Czech Republic Government Bond | | | | | |
CZK | 28,570,000 | | | 2.40%, due 9/17/2025 | | | 1,326,868 | (b) | |
CZK | 22,550,000 | | | 2.75%, due 7/23/2029 | | | 1,105,267 | | |
CZK | 17,080,000 | | | 0.95%, due 5/15/2030 | | | 711,920 | (b) | |
| | | | 3,144,055 | | |
Dominican Republic 0.8% | | | |
DOP | 4,900,000 | | | Dominican Republic Bond, 11.25%, due 2/5/2027 | | | 99,020 | (b) | |
| | | | | Dominican Republic International Bond | | | | | |
DOP | 22,500,000 | | | 8.90%, due 2/15/2023 | | | 424,780 | (d) | |
DOP | 8,650,000 | | | 9.75%, due 6/5/2026 | | | 166,530 | (d) | |
$ | 442,000 | | | 6.85%, due 1/27/2045 | | | 498,359 | (b) | |
| | 150,000 | | | 6.40%, due 6/5/2049 | | | 162,377 | (b) | |
| | | | 1,351,066 | | |
Ecuador 0.7% | | | |
| | | | | Ecuador Government International Bond | | | | | |
| | 300,000 | | | 7.95%, due 6/20/2024 | | | 288,378 | (b) | |
| | 240,000 | | | 8.88%, due 10/23/2027 | | | 223,560 | (b) | |
| | 320,000 | | | 7.88%, due 1/23/2028 | | | 286,720 | (b) | |
| | 200,000 | | | 10.75%, due 1/31/2029 | | | 203,002 | (b) | |
| | 200,000 | | | 9.50%, due 3/27/2030 | | | 192,500 | (b) | |
| | | | 1,194,160 | | |
See Notes to Financial Statements
66
Schedule of Investments Emerging Markets Debt Fund^ (cont'd)
| PRINCIPAL AMOUNT(a) | | | | VALUE | |
Egypt 1.7% | | | |
EGP | 24,222,000 | | | Egypt Government Bond, 15.90%, due 7/2/2024 | | $ | 1,579,375 | (c) | |
| | | | | Egypt Government International Bond | | | | | |
EUR | 200,000 | | | 5.63%, due 4/16/2030 | | | 223,676 | (b) | |
EUR | 101,000 | | | 6.38%, due 4/11/2031 | | | 117,010 | (b) | |
$ | 600,000 | | | 8.50%, due 1/31/2047 | | | 631,867 | (b) | |
| | 200,000 | | | 8.70%, due 3/1/2049 | | | 214,074 | (b) | |
| | | | 2,766,002 | | |
El Salvador 0.3% | | | |
| | | | | El Salvador Government International Bond | | | | | |
| | 150,000 | | | 7.75%, due 1/24/2023 | | | 163,877 | (b) | |
| | 100,000 | | | 7.65%, due 6/15/2035 | | | 108,751 | (b) | |
| | 152,000 | | | 7.12%, due 1/20/2050 | | | 154,204 | (b) | |
| | | | 426,832 | | |
Ghana 0.5% | | | |
GHS | 556 | | | Ghana Government Bond, 24.75%, due 7/19/2021 | | | 108 | | |
| | | | | Ghana Government International Bond | | | | | |
$ | 400,000 | | | 10.75%, due 10/14/2030 | | | 505,174 | (b) | |
| | 316,000 | | | 8.63%, due 6/16/2049 | | | 315,766 | (b) | |
| | | | 821,048 | | |
Hungary 1.5% | | | |
| | | | | Hungary Government Bond | | | | | |
HUF | 396,330,000 | | | 3.00%, due 6/26/2024 | | | 1,476,709 | (c) | |
HUF | 46,000,000 | | | 5.50%, due 6/24/2025 | | | 193,926 | | |
HUF | 159,870,000 | | | 3.00%, due 10/27/2027 | | | 601,742 | (c) | |
HUF | 48,050,000 | | | 6.75%, due 10/22/2028 | | | 231,035 | | |
| | | | 2,503,412 | | |
Indonesia 5.8% | | | |
| | | | | Indonesia Government International Bond | | | | | |
$ | 200,000 | | | 5.25%, due 1/17/2042 | | | 238,589 | (b) | |
| | 370,000 | | | 5.13%, due 1/15/2045 | | | 439,441 | (b) | |
| | | | | Indonesia Treasury Bond | | | | | |
IDR | 2,732,000,000 | | | 7.00%, due 5/15/2022 | | | 197,914 | | |
IDR | 10,400,000,000 | | | 8.38%, due 3/15/2024 | | | 794,540 | | |
IDR | 15,264,000,000 | | | 8.13%, due 5/15/2024 | | | 1,160,185 | | |
IDR | 1,000,000,000 | | | 6.50%, due 6/15/2025 | | | 71,311 | | |
IDR | 17,500,000,000 | | | 7.00%, due 5/15/2027 | | | 1,263,536 | | |
IDR | 13,304,000,000 | | | 6.13%, due 5/15/2028 | | | 903,843 | | |
IDR | 9,975,000,000 | | | 9.00%, due 3/15/2029 | | | 803,068 | | |
IDR | 11,204,000,000 | | | 8.75%, due 5/15/2031 | | | 888,901 | | |
IDR | 3,500,000,000 | | | 7.50%, due 8/15/2032 | | | 252,022 | | |
IDR | 12,377,000,000 | | | 6.63%, due 5/15/2033 | | | 829,145 | | |
IDR | 5,344,000,000 | | | 8.38%, due 3/15/2034 | | | 411,592 | | |
IDR | 3,683,000,000 | | | 8.25%, due 5/15/2036 | | | 277,808 | | |
IDR | 1,205,000,000 | | | 7.50%, due 5/15/2038 | | | 85,448 | | |
IDR | 10,700,000,000 | | | 8.38%, due 4/15/2039 | | | 817,246 | | |
| | | | 9,434,589 | | |
See Notes to Financial Statements
67
Schedule of Investments Emerging Markets Debt Fund^ (cont'd)
| PRINCIPAL AMOUNT(a) | | | | VALUE | |
Kazakhstan 0.1% | | | |
EUR | 100,000 | | | Kazakhstan Government International Bond, 2.38%, due 11/9/2028 | | $ | 125,639 | (b) | |
Kenya 0.1% | | | |
$ | 200,000 | | | Kenya Government International Bond, 8.00%, due 5/22/2032 | | | 213,038 | (b) | |
Malaysia 4.3% | | | |
| | 1,000,000 | | | 1MDB Global Investments Ltd., 4.40%, due 3/9/2023 | | | 966,993 | (b)(c) | |
| | | | | Malaysia Government Bond | | | | | |
MYR | 6,399,000 | | | 3.49%, due 3/31/2020 | | | 1,534,298 | (c) | |
MYR | 400,000 | | | 4.05%, due 9/30/2021 | | | 97,376 | | |
MYR | 1,500,000 | | | 3.76%, due 4/20/2023 | | | 364,575 | | |
MYR | 2,500,000 | | | 3.80%, due 8/17/2023 | | | 609,365 | | |
MYR | 700,000 | | | 4.18%, due 7/15/2024 | | | 173,563 | | |
MYR | 1,800,000 | | | 4.06%, due 9/30/2024 | | | 444,653 | | |
MYR | 1,500,000 | | | 3.96%, due 9/15/2025 | | | 369,619 | | |
MYR | 700,000 | | | 3.91%, due 7/15/2026 | | | 172,549 | | |
MYR | 1,700,000 | | | 3.90%, due 11/16/2027 | | | 418,957 | | |
MYR | 1,150,000 | | | 3.73%, due 6/15/2028 | | | 279,916 | | |
MYR | 950,000 | | | 3.89%, due 8/15/2029 | | | 235,782 | | |
MYR | 435,000 | | | 4.23%, due 6/30/2031 | | | 109,874 | | |
MYR | 300,000 | | | 4.64%, due 11/7/2033 | | | 78,731 | | |
MYR | 375,000 | | | 3.83%, due 7/5/2034 | | | 91,408 | | |
MYR | 1,200,000 | | | 4.89%, due 6/8/2038 | | | 327,318 | | |
MYR | 350,000 | | | 4.94%, due 9/30/2043 | | | 96,503 | | |
| | | | | Malaysia Government Investment Issue | | | | | |
MYR | 2,000,000 | | | 4.07%, due 9/30/2026 | | | 497,143 | | |
MYR | 500,000 | | | 4.37%, due 10/31/2028 | | | 128,199 | | |
| | | | 6,996,822 | | |
Mexico 2.9% | | | |
| | | | | Mexican Bonos | | | | | |
MXN | 8,810,000 | | | Ser. M20, 7.50%, due 6/3/2027 | | | 478,565 | | |
MXN | 16,480,000 | | | Ser. M20, 8.50%, due 5/31/2029 | | | 959,997 | | |
MXN | 16,490,000 | | | Ser. M, 7.75%, due 5/29/2031 | | | 916,742 | | |
MXN | 25,940,000 | | | Ser. M, 7.75%, due 11/13/2042 | | | 1,440,431 | | |
$ | 800,000 | | | Mexico Government International Bond, 5.75%, due 10/12/2110 | | | 929,008 | | |
| | | | 4,724,743 | | |
Mongolia 0.6% | | | |
| | 200,000 | | | Development Bank of Mongolia LLC, 7.25%, due 10/23/2023 | | | 209,692 | (d) | |
| | | | | Mongolia Government International Bond | | | | | |
| | 500,000 | | | 5.63%, due 5/1/2023 | | | 511,485 | (b) | |
| | 200,000 | | | 8.75%, due 3/9/2024 | | | 225,932 | (b) | |
| | 42,000 | | | 8.75%, due 3/9/2024 | | | 47,437 | (b) | |
| | | | 994,546 | | |
Nigeria 1.2% | | | |
NGN | 304,378,000 | | | Nigeria Government Bond, 13.98%, due 2/23/2028 | | | 866,206 | | |
See Notes to Financial Statements
68
Schedule of Investments Emerging Markets Debt Fund^ (cont'd)
| PRINCIPAL AMOUNT(a) | | | | VALUE | |
| | | | | Nigeria Government International Bond | | | | | |
$ | 200,000 | | | 8.75%, due 1/21/2031 | | $ | 220,418 | (b) | |
| | 400,000 | | | 7.88%, due 2/16/2032 | | | 413,262 | (b) | |
| | 380,000 | | | 9.25%, due 1/21/2049 | | | 421,693 | (b) | |
NGN | 397,000 | | | Nigeria Treasury Bill, 13.56%, due 2/27/2020 | | | 1,055 | (l) | |
| | | | 1,922,634 | | |
Oman 0.2% | | | |
$ | 415,000 | | | Oman Government International Bond, 6.75%, due 1/17/2048 | | | 389,867 | (b) | |
Paraguay 0.2% | | | |
| | 230,000 | | | Paraguay Government International Bond, 6.10%, due 8/11/2044 | | | 279,740 | (b) | |
Peru 2.0% | | | |
| | | | | Peru Government Bond | | | | | |
PEN | 2,717,000 | | | 5.94%, due 2/12/2029 | | | 920,540 | (b) | |
PEN | 1,347,000 | | | 6.15%, due 8/12/2032 | | | 462,470 | (b) | |
PEN | 192,000 | | | 5.40%, due 8/12/2034 | | | 61,639 | (b) | |
| | | | | Peruvian Government International Bond | | | | | |
PEN | 489,000 | | | 5.70%, due 8/12/2024 | | | 162,790 | (d) | |
PEN | 1,156,000 | | | 5.70%, due 8/12/2024 | | | 384,836 | (b) | |
PEN | 2,032,000 | | | 8.20%, due 8/12/2026 | | | 769,448 | (b) | |
EUR | 334,000 | | | 3.75%, due 3/1/2030 | | | 483,362 | | |
| | | | 3,245,085 | | |
Philippines 0.2% | | | |
PHP | 12,000,000 | | | Philippine Government International Bond, 3.90%, due 11/26/2022 | | | 235,469 | | |
Poland 2.8% | | | |
| | | | | Poland Government Bond | | | | | |
PLN | 4,647,000 | | | 2.50%, due 1/25/2023 | | | 1,249,637 | (c) | |
PLN | 3,708,000 | | | 3.25%, due 7/25/2025 | | | 1,045,344 | | |
PLN | 902,000 | | | 2.50%, due 7/25/2026 | | | 245,146 | | |
PLN | 6,179,000 | | | 2.50%, due 7/25/2027 | | | 1,683,264 | (c) | |
PLN | 900,000 | | | 2.75%, due 4/25/2028 | | | 250,240 | | |
| | | | 4,473,631 | | |
Qatar 0.6% | | | |
| | | | | Qatar Government International Bond | | | | | |
$ | 275,000 | | | 4.50%, due 4/23/2028 | | | 314,864 | (b) | |
| | 213,000 | | | 5.10%, due 4/23/2048 | | | 271,043 | (b) | |
| | 336,000 | | | 4.82%, due 3/14/2049 | | | 412,440 | (b) | |
| | | | 998,347 | | |
See Notes to Financial Statements
69
Schedule of Investments Emerging Markets Debt Fund^ (cont'd)
| PRINCIPAL AMOUNT(a) | | | | VALUE | |
Romania 0.4% | | | |
| | | | | Romania Government Bond | | | | | |
RON | 10,000 | | | 4.25%, due 6/28/2023 | | $ | 2,392 | | |
RON | 1,520,000 | | | 5.80%, due 7/26/2027 | | | 395,883 | | |
| | | | | Romanian Government International Bond | | | | | |
EUR | 198,000 | | | 2.12%, due 7/16/2031 | | | 228,559 | (b) | |
EUR | 14,000 | | | 3.88%, due 10/29/2035 | | | 18,621 | (b) | |
| | | | 645,455 | | |
Russia 3.7% | | | |
| | | | | Russian Federal Bond - Obligatsyi Federal'novo Zaima | | | | | |
RUB | 91,470,000 | | | 7.10%, due 10/16/2024 | | | 1,485,146 | (c) | |
RUB | 89,070,000 | | | 7.95%, due 10/7/2026 | | | 1,518,951 | (c) | |
RUB | 56,114,000 | | | 6.90%, due 5/23/2029 | | | 907,581 | | |
RUB | 24,452,000 | | | 7.25%, due 5/10/2034 | | | 404,594 | | |
| | | | | Russian Foreign Bond - Eurobond | | | | | |
$ | 600,000 | | | 4.25%, due 6/23/2027 | | | 644,024 | (b) | |
| | 1,000,000 | | | 4.38%, due 3/21/2029 | | | 1,081,496 | (b) | |
| | 14,085 | | | 7.50%, due 3/31/2030 | | | 16,100 | (b) | |
| | | | 6,057,892 | | |
Senegal 0.1% | | | |
| | 210,000 | | | Senegal Government International Bond, 6.25%, due 5/23/2033 | | | 214,362 | (b) | |
Serbia 0.5% | | | |
| | | | | Serbia International Bond | | | | | |
| | 70,000 | | | 7.25%, due 9/28/2021 | | | 76,370 | (b) | |
| | 200,000 | | | 7.25%, due 9/28/2021 | | | 218,200 | (b) | |
EUR | 404,000 | | | 1.50%, due 6/26/2029 | | | 464,017 | (b) | |
| | | | 758,587 | | |
South Africa 3.7% | | | |
| | | | | Republic of South Africa Government Bond | | | | | |
ZAR | 17,581,329 | | | 8.25%, due 3/31/2032 | | | 1,053,493 | (c) | |
ZAR | 15,779,129 | | | 8.88%, due 2/28/2035 | | | 969,143 | | |
ZAR | 26,488,797 | | | 9.00%, due 1/31/2040 | | | 1,595,285 | (c) | |
ZAR | 27,722,052 | | | 8.75%, due 1/31/2044 | | | 1,608,185 | (c) | |
| | | | | Republic of South Africa Government International Bond | | | | | |
$ | 277,000 | | | 5.88%, due 6/22/2030 | | | 294,465 | | |
| | 273,000 | | | 5.65%, due 9/27/2047 | | | 267,540 | | |
| | 200,000 | | | 5.75%, due 9/30/2049 | | | 193,524 | | |
| | | | 5,981,635 | | |
Sri Lanka 1.0% | | | |
| | | | | Sri Lanka Government International Bond | | | | | |
| | 350,000 | | | 6.20%, due 5/11/2027 | | | 336,305 | (b) | |
| | 844,000 | | | 6.75%, due 4/18/2028 | | | 824,849 | (b) | |
| | 203,000 | | | 7.85%, due 3/14/2029 | | | 208,553 | (b) | |
| | 200,000 | | | 7.55%, due 3/28/2030 | | | 202,274 | (b) | |
| | | | 1,571,981 | | |
See Notes to Financial Statements
70
Schedule of Investments Emerging Markets Debt Fund^ (cont'd)
| PRINCIPAL AMOUNT(a) | | | | VALUE | |
Thailand 4.0% | | | |
| | | | | Thailand Government Bond | | | | | |
THB | 45,000,000 | | | 2.40%, due 12/17/2023 | | $ | 1,549,386 | (c) | |
THB | 2,457,000 | | | 3.85%, due 12/12/2025 | | | 92,895 | | |
THB | 26,500,000 | | | 2.13%, due 12/17/2026 | | | 913,813 | | |
THB | 27,231,000 | | | 2.88%, due 12/17/2028 | | | 1,003,826 | (c) | |
THB | 4,400,000 | | | 4.88%, due 6/22/2029 | | | 188,926 | | |
THB | 27,500,000 | | | 3.65%, due 6/20/2031 | | | 1,110,969 | (c) | |
THB | 5,000,000 | | | 3.78%, due 6/25/2032 | | | 206,943 | | |
THB | 17,350,000 | | | 3.40%, due 6/17/2036 | | | 720,538 | | |
THB | 13,650,000 | | | 3.30%, due 6/17/2038 | | | 570,387 | | |
THB | 1,248,000 | | | 2.88%, due 6/17/2046 | | | 50,928 | | |
| | | | 6,408,611 | | |
Tunisia 0.4% | | | |
| | | | | Banque Centrale de Tunisie International Bond | | | | | |
EUR | 460,000 | | | 5.63%, due 2/17/2024 | | | 501,403 | (b) | |
EUR | 104,000 | | | 6.38%, due 7/15/2026 | | | 113,166 | (b) | |
| | | | 614,569 | | |
Turkey 5.1% | | | |
| | | | | Export Credit Bank of Turkey | | | | | |
$ | 420,000 | | | 5.38%, due 10/24/2023 | | | 407,400 | (c)(d) | |
| | 200,000 | | | 8.25%, due 1/24/2024 | | | 213,320 | (d) | |
| | 200,000 | | | 6.13%, due 5/3/2024 | | | 197,524 | (d) | |
| | | | | Turkey Government Bond | | | | | |
TRY | 1,488,963 | | | 7.40%, due 2/5/2020 | | | 257,308 | | |
TRY | 600,000 | | | 10.70%, due 2/17/2021 | | | 103,424 | | |
TRY | 1,908,749 | | | 9.20%, due 9/22/2021 | | | 318,333 | | |
TRY | 1,788,824 | | | 9.50%, due 1/12/2022 | | | 295,986 | | |
TRY | 6,608,000 | | | 11.00%, due 3/2/2022 | | | 1,124,016 | | |
TRY | 11,523,000 | | | 10.70%, due 8/17/2022 | | | 1,928,814 | (c) | |
TRY | 1,335,677 | | | 8.50%, due 9/14/2022 | | | 213,064 | | |
TRY | 9,367,000 | | | 12.20%, due 1/18/2023 | | | 1,635,098 | (c) | |
| | | | | Turkey Government International Bond | | | | | |
EUR | 357,000 | | | 5.20%, due 2/16/2026 | | | 417,509 | | |
$ | 250,000 | | | 4.88%, due 10/9/2026 | | | 234,091 | | |
| | 620,000 | | | 6.00%, due 3/25/2027 | | | 613,428 | | |
| | 381,000 | | | 6.13%, due 10/24/2028 | | | 375,508 | | |
| | | | 8,334,823 | | |
Ukraine 2.8% | | | |
| | | | | Ukraine Government International Bond | | | | | |
UAH | 17,500,000 | | | 15.70%, due 1/20/2021 | | | 699,824 | (d)(j) | |
$ | 504,000 | | | 7.75%, due 9/1/2025 | | | 540,540 | (b) | |
| | 200,000 | | | 7.75%, due 9/1/2027 | | | 214,980 | (b) | |
| | 1,870,000 | | | 9.75%, due 11/1/2028 | | | 2,226,445 | (b)(c) | |
| | 206,000 | | | 7.38%, due 9/25/2032 | | | 215,873 | (b) | |
| | 170,000 | | | 0.00%, due 5/31/2040 | | | 159,379 | (b)(m) | |
| | 286,000 | | | 0.00%, due 5/31/2040 | | | 268,132 | (d)(m) | |
| | 129,167 | | | Ukreximbank Via Biz Finance PLC, 9.63%, due 4/27/2022 | | | 134,333 | (c)(d) | |
| | | | 4,459,506 | | |
See Notes to Financial Statements
71
Schedule of Investments Emerging Markets Debt Fund^ (cont'd)
| PRINCIPAL AMOUNT(a) | | | | VALUE | |
United Arab Emirates 0.1% | | | |
$ | 203,000 | | | Abu Dhabi Government International Bond, 3.13%, due 9/30/2049 | | $ | 195,963 | (b) | |
Uruguay 0.2% | | | |
| | | | | Uruguay Government International Bond | | | | | |
| | 93,000 | | | 4.38%, due 1/23/2031 | | | 103,742 | | |
| | 165,000 | | | 5.10%, due 6/18/2050 | | | 197,588 | | |
| | | | 301,330 | | |
Uzbekistan 0.3% | | | |
| | | | | Republic of Uzbekistan Bond | | | | | |
| | 210,000 | | | 4.75%, due 2/20/2024 | | | 220,481 | (b) | |
| | 200,000 | | | 5.38%, due 2/20/2029 | | | 219,419 | (b) | |
| | | | 439,900 | | |
Venezuela 0.1% | | | |
| | 916,200 | | | Venezuela Government International Bond, 8.25%, due 10/13/2024 | | | 95,056 | (b)(i)(j) | |
| | | | | Total Foreign Government Securities (Cost $101,093,983) | | | 100,312,798 | | |
NUMBER OF SHARES | | | | | |
Short-Term Investments 4.4% | | | |
Investment Companies 4.4% | | | |
| 7,038,328 | | | State Street Institutional U.S. Government Money Market Fund Premier Class, 1.75%(n)
(Cost $7,038,328) | | | 7,038,328 | (c) | |
| | | | | Total Investments 96.1% (Cost $156,531,763) | | | 155,704,717 | | |
| | | | | Other Assets Less Liabilities 3.9% | | | 6,384,615 | (o) | |
| | | | | Net Assets 100.0% | | $ | 162,089,332 | | |
(a) Principal amount is stated in the currency in which the security is denominated.
(b) Security exempt from registration pursuant to Regulation S under the Securities Act of 1933, as amended. Regulation S applies to securities offerings that are made outside of the United States and do not involve directed selling efforts in the United States and as such may have restrictions on resale. Total value of all such securities at October 31, 2019 amounted to $55,770,238, which represents 34.4% of net assets of the Fund.
(c) All or a portion of this security is segregated in connection with obligations for when-issued securities, futures, forward foreign currency contracts and/or swaps with a total value of $64,075,075.
(d) Securities were purchased under Rule 144A of the Securities Act of 1933, as amended, or are otherwise restricted and, unless registered under the Securities Act of 1933 or exempted from registration, may only be sold to qualified institutional investors or may have other restrictions on resale. At October 31, 2019, these securities amounted to $21,183,500, which represents 13.1% of net assets of the Fund. Securities denoted with (d) but without (j), if any, have been deemed by the investment manager to be liquid.
See Notes to Financial Statements
72
Schedule of Investments Emerging Markets Debt Fund^ (cont'd)
(e) Variable or floating rate security. The interest rate shown was the current rate as of October 31, 2019 and changes periodically.
(f) Perpetual Bond Security. The rate reflected was the rate in effect on October 31, 2019. The maturity date reflects the next call date.
(g) Security issued at a fixed coupon rate, which converts to a variable rate at a future date. Rate shown is the rate in effect as of period end.
(h) When-issued security. Total value of all such securities at October 31, 2019, amounted to $838,634, which represents 0.5% of net assets of the Fund.
(i) Defaulted security.
(j) Illiquid security.
(k) Step Bond. Coupon rate is a fixed rate for an initial period that either resets at a specific date or may reset in the future contingent upon a predetermined trigger. The interest rate shown was the current rate as of October 31, 2019.
(l) Rate shown was the discount rate at the date of purchase.
(m) Currently a zero coupon security; will convert to variable in 2021 where it will be linked to the IMF Ukraine GDP Index.
(n) Represents 7-day effective yield as of October 31, 2019.
(o) Includes the impact of the Fund's open positions in derivatives at October 31, 2019.
See Notes to Financial Statements
73
Schedule of Investments Emerging Markets Debt Fund^ (cont'd)
POSITIONS BY INDUSTRY
Industry | | Investments at
Value | | Percentage of
Net Assets | |
Foreign Government* | | $ | 97,359,600 | | | | 60.1 | % | |
Oil & Gas | | | 12,593,488 | | | | 7.8 | % | |
Banks | | | 5,932,581 | | | | 3.7 | % | |
Electric | | | 5,806,919 | | | | 3.6 | % | |
Telecommunications | | | 3,068,142 | | | | 1.9 | % | |
Pipelines | | | 2,501,322 | | | | 1.5 | % | |
Real Estate | | | 2,196,115 | | | | 1.3 | % | |
Mining | | | 2,135,397 | | | | 1.3 | % | |
Diversified Financial Services | | | 1,693,321 | | | | 1.0 | % | |
Engineering & Construction | | | 1,618,121 | | | | 1.0 | % | |
Lodging | | | 1,502,058 | | | | 0.9 | % | |
Chemicals | | | 1,064,527 | | | | 0.7 | % | |
Iron—Steel | | | 1,007,662 | | | | 0.6 | % | |
Food | | | 903,491 | | | | 0.5 | % | |
Media | | | 817,209 | | | | 0.5 | % | |
Energy—Alternate Sources | | | 808,449 | | | | 0.5 | % | |
Transportation | | | 760,221 | | | | 0.5 | % | |
Insurance | | | 719,840 | | | | 0.4 | % | |
Regional (state/province) | | | 621,457 | | | | 0.4 | % | |
Forest Products & Paper | | | 452,409 | | | | 0.3 | % | |
Internet | | | 447,972 | | | | 0.3 | % | |
Real Estate Investment Trusts | | | 444,752 | | | | 0.3 | % | |
Investment Companies | | | 426,058 | | | | 0.3 | % | |
Multi-National | | | 418,185 | | | | 0.3 | % | |
Agriculture | | | 414,736 | | | | 0.2 | % | |
Metal Fabricate—Hardware | | | 300,750 | | | | 0.2 | % | |
Beverages | | | 263,752 | | | | 0.2 | % | |
Commercial Services | | | 262,693 | | | | 0.2 | % | |
Municipal | | | 261,494 | | | | 0.2 | % | |
Holding Companies—Diversified | | | 238,304 | | | | 0.1 | % | |
Housewares | | | 208,000 | | | | 0.1 | % | |
Distribution—Wholesale | | | 202,683 | | | | 0.1 | % | |
Semiconductors | | | 199,777 | | | | 0.1 | % | |
Healthcare—Services | | | 198,686 | | | | 0.1 | % | |
Auto Manufacturers | | | 195,333 | | | | 0.1 | % | |
Coal | | | 193,880 | | | | 0.1 | % | |
Pharmaceuticals | | | 188,125 | | | | 0.1 | % | |
Gas | | | 121,130 | | | | 0.1 | % | |
Water | | | 117,750 | | | | 0.1 | % | |
Short-Term Investments and Other Assets—Net | | | 13,422,943 | | | | 8.3 | % | |
| | $ | 162,089,332 | | | | 100.0 | % | |
*Foreign Governments do not constitute an industry.
See Notes to Financial Statements
74
Schedule of Investments Emerging Markets Debt Fund^ (cont'd)
Derivative Instruments
Futures contracts ("futures")
At October 31, 2019, open positions in futures for the Fund were as follows:
Long Futures:
Expiration
Date | | Number of
Contracts | | Open Contracts | | Notional
Amount | | Value and
Unrealized
Appreciation/
(Depreciation) | |
12/2019 | | | 44 | | | Korea Bond, 3 year | | $ | 4,164,958 | | | $ | (26,554 | ) | |
12/2019 | | | 12 | | | U.S. Treasury Note, 10 Year | | | 1,563,563 | | | | (20,683 | ) | |
12/2019 | | | 5 | | | U.S. Treasury Ultra Long Bond | | | 948,750 | | | | (44,570 | ) | |
Total Long Positions | | | | | | $ | 6,677,271 | | | $ | (91,807 | ) | |
Short Futures:
Expiration
Date | | Number of
Contracts | | Open Contracts | | Notional
Amount | | Value and
Unrealized
Appreciation/
(Depreciation) | |
12/2019 | | | 44 | | | Euro-Bund | | $ | (8,428,810 | ) | | $ | 196,269 | | |
12/2019 | | | 3 | | | Euro-Buxl Bond, 30 Year | | | (702,505 | ) | | | 45,370 | | |
12/2019 | | | 8 | | | Korea Bond, 10 year | | | (892,449 | ) | | | 19,019 | | |
12/2019 | | | 20 | | | U.S. Treasury Long Bond | | | (3,227,500 | ) | | | 56,269 | | |
12/2019 | | | 18 | | | U.S. Treasury Note, 10 Year | | | (2,345,344 | ) | | | (3,942 | ) | |
Total Short Positions | | | | | | $ | (15,596,608 | ) | | $ | 312,985 | | |
Total Futures | | | | | | | | $ | 221,178 | | |
At October 31, 2019, the Fund had $136,568 deposited in a segregated account to cover margin requirements on open futures.
For the year ended October 31, 2019, the average notional value of futures for the Fund was $8,644,038 for long positions and $(13,143,110) for short positions.
Forward foreign currency contracts ("forward contracts")
At October 31, 2019, open forward contracts for the Fund were as follows:
Currency Purchased | | Currency Sold | | Counterparty | | Settlement
Date | | Net
Unrealized
Appreciation/
(Depreciation) | |
| | 9,086,274 | | | ARS | | | | | 152,191 | | | USD | | | | GSI | | 11/1/2019 | | $ | 335 | | |
| | 4,783,943 | | | BRL | | | | | 1,154,254 | | | USD | | | | SCB | | 11/4/2019 | | | 38,602 | | |
| | 554,556 | | | BRL | | | | | 132,806 | | | USD | | | | CITI | | 11/4/2019 | | | 5,472 | | |
| | 3,300,000 | | | BRL | | | | | 790,609 | | | USD | | | | GSI | | 11/4/2019 | | | 32,232 | | |
| | 1,171,567 | | | BRL | | | | | 284,444 | | | USD | | | | GSI | | 11/4/2019 | | | 7,681 | | |
| | 2,955,782 | | | BRL | | | | | 708,918 | | | USD | | | | JPM | | 11/4/2019 | | | 28,093 | | |
| | 2,000,000 | | | BRL | | | | | 486,431 | | | USD | | | | JPM | | 11/4/2019 | | | 12,260 | | |
| | 1,637,433 | | | BRL | | | | | 401,676 | | | USD | | | | JPM | | 11/4/2019 | | | 6,610 | | |
| | 11,454,805 | | | BRL | | | | | 2,808,927 | | | USD | | | | SCB | | 12/11/2019 | | | 40,883 | | |
See Notes to Financial Statements
75
Schedule of Investments Emerging Markets Debt Fund^ (cont'd)
Currency Purchased | | Currency Sold | | Counterparty | | Settlement
Date | | Net
Unrealized
Appreciation/
(Depreciation) | |
| | 5,532,214 | | | BRL | | | | | 1,327,976 | | | USD | | | | GSI | | 12/18/2019 | | $ | 47,908 | | |
| | 4,453,616 | | | BRL | | | | | 1,079,795 | | | USD | | | | CITI | | 12/20/2019 | | | 27,731 | | |
| | 2,446,727 | | | BRL | | | | | 596,704 | | | USD | | | | CITI | | 12/20/2019 | | | 11,748 | | |
| | 4,441,666 | | | BRL | | | | | 1,069,572 | | | USD | | | | MS | | 1/15/2020 | | | 33,531 | | |
| | 1,194,761 | | | USD | | | | | 4,783,943 | | | BRL | | | | SCB | | 11/4/2019 | | | 1,907 | | |
| | 138,497 | | | USD | | | | | 554,556 | | | BRL | | | | CITI | | 11/4/2019 | | | 221 | | |
| | 824,155 | | | USD | | | | | 3,300,000 | | | BRL | | | | GSI | | 11/4/2019 | | | 1,315 | | |
| | 292,592 | | | USD | | | | | 1,171,567 | | | BRL | | | | GSI | | 11/4/2019 | | | 467 | | |
| | 738,189 | | | USD | | | | | 2,955,782 | | | BRL | | | | JPM | | 11/4/2019 | | | 1,178 | | |
| | 499,488 | | | USD | | | | | 2,000,000 | | | BRL | | | | JPM | | 11/4/2019 | | | 797 | | |
| | 408,939 | | | USD | | | | | 1,637,433 | | | BRL | | | | JPM | | 11/4/2019 | | | 653 | | |
| | 3,108,466 | | | USD | | | | | 12,376,047 | | | BRL | | | | MS | | 11/4/2019 | | | 22,555 | | |
| | 101,687 | | | USD | | | | | 72,663,575 | | | CLP | | | | JPM | | 12/18/2019 | | | 3,599 | | |
| | 742,994 | | | USD | | | | | 534,063,794 | | | CLP | | | | CITI | | 12/18/2019 | | | 22,067 | | |
| | 369,400 | | | USD | | | | | 264,157,681 | | | CLP | | | | CITI | | 12/18/2019 | | | 12,816 | | |
| | 2,250,966,829 | | | COP | | | | | 654,351 | | | USD | | | | JPM | | 12/17/2019 | | | 10,605 | | |
| | 2,342,498,559 | | | COP | | | | | 690,188 | | | USD | | | | JPM | | 12/17/2019 | | | 1,807 | | |
| | 1,124,818,127 | | | COP | | | | | 330,732 | | | USD | | | | JPM | | 12/17/2019 | | | 1,550 | | |
| | 1,634,920,579 | | | COP | | | | | 481,851 | | | USD | | | | JPM | | 12/17/2019 | | | 1,119 | | |
| | 252,152 | | | USD | | | | | 850,243,617 | | | COP | | | | CITI | | 12/17/2019 | | | 982 | | |
| | 243,753 | | | USD | | | | | 821,838,849 | | | COP | | | | JPM | | 12/17/2019 | | | 975 | | |
| | 319,945 | | | EUR | | | | | 349,841 | | | USD | | | | SSB | | 11/5/2019 | | | 7,017 | | |
| | 900,000 | | | EUR | | | | | 989,967 | | | USD | | | | JPM | | 11/5/2019 | | | 13,868 | | |
| | 200,000 | | | EUR | | | | | 219,872 | | | USD | | | | HSBC | | 11/5/2019 | | | 3,202 | | |
| | 319,180 | | | EUR | | | | | 348,319 | | | USD | | | | CITI | | 11/5/2019 | | | 7,685 | | |
| | 400,745 | | | EUR | | | | | 443,297 | | | USD | | | | SCB | | 11/5/2019 | | | 3,683 | | |
| | 332,254 | | | EUR | | | | | 369,864 | | | USD | | | | HSBC | | 11/5/2019 | | | 723 | | |
| | 318,793 | | | EUR | | | | | 351,794 | | | USD | | | | JPM | | 11/5/2019 | | | 3,779 | | |
| | 318,794 | | | EUR | | | | | 351,108 | | | USD | | | | SCB | | 11/5/2019 | | | 4,466 | | |
| | 270,501 | | | EUR | | | | | 300,059 | | | USD | | | | SCB | | 11/5/2019 | | | 1,650 | | |
| | 70,923 | | | EUR | | | | | 77,754 | | | USD | | | | SCB | | 11/5/2019 | | | 1,352 | | |
| | 3,325,911 | | | EUR | | | | | 3,660,909 | | | USD | | | | SSB | | 11/5/2019 | | | 48,719 | | |
| | 494,125 | | | EUR | | | | | 546,391 | | | USD | | | | CITI | | 12/4/2019 | | | 5,773 | | |
| | 480,000 | | | EUR | | | | | 529,972 | | | USD | | | | CITI | | 12/4/2019 | | | 6,409 | | |
| | 989,545 | | | EUR | | | | | 1,101,605 | | | USD | | | | SCB | | 12/4/2019 | | | 4,172 | | |
| | 165,216 | | | EUR | | | | | 706,687 | | | PLN | | | | JPM | | 1/14/2020 | | | 134 | | |
| | 222,483 | | | USD | | | | | 199,280 | | | EUR | | | | HSBC | | 11/5/2019 | | | 212 | | |
| | 221,241,652 | | | HUF | | | | | 666,158 | | | EUR | | | | GSI | | 12/18/2019 | | | 7,492 | | |
| | 300,000,000 | | | HUF | | | | | 897,989 | | | EUR | | | | GSI | | 1/8/2020 | | | 15,893 | | |
| | 13,009,514,548 | | | IDR | | | | | 917,455 | | | USD | | | | GSI | | 11/20/2019 | | | 4,568 | | |
| | 8,419,508,800 | | | IDR | | | | | 594,095 | | | USD | | | | SCB | | 11/20/2019 | | | 2,621 | | |
| | 2,735,050,623 | | | IDR | | | | | 192,122 | | | USD | | | | SCB | | 11/26/2019 | | | 1,609 | | |
| | 3,308,493,000 | | | IDR | | | | | 232,208 | | | USD | | | | JPM | | 11/26/2019 | | | 2,142 | | |
| | 1,430,833,300 | | | IDR | | | | | 100,423 | | | USD | | | | JPM | | 11/26/2019 | | | 926 | | |
| | 2,702,691 | | | ILS | | | | | 766,721 | | | USD | | | | CITI | | 12/10/2019 | | | 1,491 | | |
| | 53,313,530 | | | INR | | | | | 740,311 | | | USD | | | | SCB | | 1/17/2020 | | | 3,366 | | |
See Notes to Financial Statements
76
Schedule of Investments Emerging Markets Debt Fund^ (cont'd)
Currency Purchased | | Currency Sold | | Counterparty | | Settlement
Date | | Net
Unrealized
Appreciation/
(Depreciation) | |
| | 813,160,820 | | | KRW | | | | | 687,314 | | | USD | | | | GSI | | 11/18/2019 | | $ | 7,666 | | |
| | 1,294,033,373 | | | KRW | | | | | 1,097,662 | | | USD | | | | JPM | | 12/20/2019 | | | 9,076 | | |
| | 602,065,433 | | | KRW | | | | | 506,546 | | | USD | | | | CITI | | 12/20/2019 | | | 8,378 | | |
| | 260,000,000 | | | KZT | | | | | 661,578 | | | USD | | | | GSI | | 12/6/2019 | | | 1,955 | | |
| | 8,500,000 | | | MXN | | | | | 427,784 | | | USD | | | | GSI | | 11/1/2019 | | | 14,085 | | |
| | 4,350,000 | | | MXN | | | | | 221,471 | | | USD | | | | SSB | | 11/1/2019 | | | 4,662 | | |
| | 3,905,238 | | | MXN | | | | | 198,665 | | | USD | | | | CITI | | 11/1/2019 | | | 4,347 | | |
| | 5,000,000 | | | MXN | | | | | 255,897 | | | USD | | | | CITI | | 11/1/2019 | | | 4,025 | | |
| | 3,818,453 | | | MXN | | | | | 194,817 | | | USD | | | | CITI | | 11/1/2019 | | | 3,684 | | |
| | 86,840,076 | | | MXN | | | | | 4,442,048 | | | USD | | | | GSI | | 11/1/2019 | | | 72,291 | | |
| | 10,400,000 | | | MXN | | | | | 514,667 | | | USD | | | | GSI | | 11/1/2019 | | | 25,972 | | |
| | 4,337,395 | | | MXN | | | | | 222,213 | | | USD | | | | GSI | | 11/1/2019 | | | 3,264 | | |
| | 4,303,981 | | | MXN | | | | | 222,358 | | | USD | | | | SSB | | 11/1/2019 | | | 1,383 | | |
| | 21,452,704 | | | MXN | | | | | 1,099,615 | | | USD | | | | CITI | | 12/20/2019 | | | 7,814 | | |
| | 11,749,102 | | | MXN | | | | | 598,153 | | | USD | | | | CITI | | 12/20/2019 | | | 8,358 | | |
| | 858,663 | | | USD | | | | | 16,486,097 | | | MXN | | | | SSB | | 11/1/2019 | | | 1,641 | | |
| | 207,777 | | | USD | | | | | 4,039,978 | | | MXN | | | | CITI | | 2/5/2020 | | | 660 | | |
| | 722,862 | | | MYR | | | | | 172,797 | | | USD | | | | SCB | | 11/27/2019 | | | 705 | | |
| | 307,799 | | | MYR | | | | | 73,487 | | | USD | | | | SCB | | 11/27/2019 | | | 392 | | |
| | 758,667 | | | MYR | | | | | 180,937 | | | USD | | | | SCB | | 12/9/2019 | | | 1,131 | | |
| | 1,161,587 | | | PEN | | | | | 343,502 | | | USD | | | | CITI | | 12/18/2019 | | | 3,330 | | |
| | 1,061,634 | | | PEN | | | | | 315,822 | | | USD | | | | CITI | | 12/18/2019 | | | 1,166 | | |
| | 1,126,860 | | | PEN | | | | | 336,376 | | | USD | | | | GSI | | 12/18/2019 | | | 87 | | |
| | 564,845 | | | USD | | | | | 1,874,155 | | | PEN | | | | CITI | | 12/18/2019 | | | 5,250 | | |
| | 7,184,889 | | | PHP | | | | | 140,695 | | | USD | | | | SCB | | 11/4/2019 | | | 893 | | |
| | 40,049,961 | | | PHP | | | | | 777,066 | | | USD | | | | CITI | | 11/4/2019 | | | 12,174 | | |
| | 47,234,850 | | | PHP | | | | | 930,186 | | | USD | | | | CITI | | 11/4/2019 | | | 642 | | |
| | 2,204,947 | | | PHP | | | | | 42,070 | | | USD | | | | GSI | | 11/5/2019 | | | 1,381 | | |
| | 1,781,910 | | | PHP | | | | | 33,999 | | | USD | | | | GSI | | 11/5/2019 | | | 1,116 | | |
| | 84,507,648 | | | PHP | | | | | 1,616,819 | | | USD | | | | SSB | | 11/5/2019 | | | 48,521 | | |
| | 3,797,409 | | | PHP | | | | | 74,122 | | | USD | | | | SCB | | 1/30/2020 | | | 424 | | |
| | 1,000,000 | | | PLN | | | | | 230,539 | | | EUR | | | | MS | | 11/7/2019 | | | 4,568 | | |
| | 2,100,000 | | | PLN | | | | | 482,255 | | | EUR | | | | CITI | | 11/7/2019 | | | 11,686 | | |
| | 1,109,483 | | | PLN | | | | | 257,547 | | | EUR | | | | CITI | | 11/7/2019 | | | 3,096 | | |
| | 3,647,322 | | | PLN | | | | | 831,783 | | | EUR | | | | GSI | | 11/7/2019 | | | 26,776 | | |
| | 16,960,813 | | | PLN | | | | | 3,929,662 | | | EUR | | | | JPM | | 11/7/2019 | | | 55,689 | | |
| | 1,300,000 | | | PLN | | | | | 295,339 | | | EUR | | | | SSB | | 11/7/2019 | | | 10,804 | | |
| | 5,613,733 | | | PLN | | | | | 1,443,098 | | | USD | | | | CITI | | 12/16/2019 | | | 26,645 | | |
| | 7,321,122 | | | RON | | | | | 1,532,965 | | | EUR | | | | GSI | | 12/17/2019 | | | 1,867 | | |
| | 673,233 | | | RON | | | | | 140,737 | | | EUR | | | | JPM | | 12/17/2019 | | | 429 | | |
| | 431,108 | | | RON | | | | | 89,447 | | | EUR | | | | JPM | | 4/2/2020 | | | 41 | | |
| | 1,851,186 | | | RUB | | | | | 28,552 | | | USD | | | | GSI | | 12/4/2019 | | | 195 | | |
| | 92,315,760 | | | RUB | | | | | 1,374,385 | | | USD | | | | SCB | | 12/4/2019 | | | 59,188 | | |
| | 28,759,069 | | | RUB | | | | | 425,417 | | | USD | | | | SCB | | 12/4/2019 | | | 21,183 | | |
| | 4,731,867 | | | RUB | | | | | 72,944 | | | USD | | | | SCB | | 12/4/2019 | | | 537 | | |
| | 56,805,512 | | | RUB | | | | | 847,663 | | | USD | | | | GSI | | 12/4/2019 | | | 34,471 | | |
See Notes to Financial Statements
77
Schedule of Investments Emerging Markets Debt Fund^ (cont'd)
Currency Purchased | | Currency Sold | | Counterparty | | Settlement
Date | | Net
Unrealized
Appreciation/
(Depreciation) | |
| | 22,689,435 | | | RUB | | | | | 335,469 | | | USD | | | | JPM | | 12/4/2019 | | $ | 16,876 | | |
| | 1,009,714 | | | SGD | | | | | 732,643 | | | USD | | | | SCB | | 11/4/2019 | | | 9,548 | | |
| | 1,017,807 | | | SGD | | | | | 742,735 | | | USD | | | | CITI | | 11/12/2019 | | | 5,449 | | |
| | 23,852,953 | | | THB | | | | | 780,529 | | | USD | | | | GSI | | 11/4/2019 | | | 9,435 | | |
| | 3,749,639 | | | THB | | | | | 122,580 | | | USD | | | | GSI | | 11/4/2019 | | | 1,601 | | |
| | 9,197,655 | | | THB | | | | | 301,988 | | | USD | | | | SCB | | 12/16/2019 | | | 2,749 | | |
| | 3,544,963 | | | THB | | | | | 117,312 | | | USD | | | | JPM | | 12/16/2019 | | | 140 | | |
| | 1,022,786 | | | TRY | | | | | 169,264 | | | USD | | | | JPM | | 12/9/2019 | | | 7,847 | | |
| | 694,519 | | | TRY | | | | | 117,065 | | | USD | | | | MS | | 12/9/2019 | | | 3,202 | | |
| | 3,000,000 | | | TRY | | | | | 510,318 | | | USD | | | | MS | | 12/18/2019 | | | 7,979 | | |
| | 355,259 | | | USD | | | | | 5,342,897 | | | ZAR | | | | JPM | | 11/6/2019 | | | 1,766 | | |
| | 398,955 | | | USD | | | | | 5,819,377 | | | ZAR | | | | CITI | | 11/6/2019 | | | 13,937 | | |
| | 775,859 | | | USD | | | | | 11,512,209 | | | ZAR | | | | GSI | | 11/6/2019 | | | 14,195 | | |
| | 370,054 | | | USD | | | | | 5,446,511 | | | ZAR | | | | JPM | | 11/6/2019 | | | 9,705 | | |
| | 656,649 | | | USD | | | | | 9,869,530 | | | ZAR | | | | JPM | | 11/6/2019 | | | 3,667 | | |
| | 459,848 | | | USD | | | | | 6,686,798 | | | ZAR | | | | MS | | 11/6/2019 | | | 17,440 | | |
| | 112,778 | | | USD | | | | | 1,647,321 | | | ZAR | | | | SSB | | 11/6/2019 | | | 3,788 | | |
| | 3,500,000 | | | ZAR | | | | | 230,908 | | | USD | | | | SSB | | 11/6/2019 | | | 657 | | |
| | 3,147,864 | | | ZAR | | | | | 205,667 | | | USD | | | | CITI | | 11/6/2019 | | | 2,600 | | |
| | 2,168,486 | | | ZAR | | | | | 142,376 | | | USD | | | | GSI | | 11/6/2019 | | | 1,094 | | |
| | 34,667,131 | | | ZAR | | | | | 2,248,923 | | | USD | | | | SCB | | 11/6/2019 | | | 44,703 | | |
Total unrealized appreciation | | | | | | | | | | | | $ | 1,222,677 | | |
| | 136,226 | | | USD | | | | | 9,086,274 | | | ARS | | | | GSI | | 11/1/2019 | | | (16,298 | ) | |
| | 1,559,530 | | | BRL | | | | | 389,483 | | | USD | | | | CITI | | 11/4/2019 | | | (622 | ) | |
| | 2,467,704 | | | BRL | | | | | 616,294 | | | USD | | | | GSI | | 11/4/2019 | | | (983 | ) | |
| | 12,376,047 | | | BRL | | | | | 3,090,844 | | | USD | | | | MS | | 11/4/2019 | | | (4,932 | ) | |
| | 12,376,047 | | | BRL | | | | | 3,095,947 | | | USD | | | | MS | | 1/22/2020 | | | (23,508 | ) | |
| | 383,554 | | | USD | | | | | 1,559,530 | | | BRL | | | | CITI | | 11/4/2019 | | | (5,308 | ) | |
| | 590,911 | | | USD | | | | | 2,467,704 | | | BRL | | | | GSI | | 11/4/2019 | | | (24,400 | ) | |
| | 277,455 | | | USD | | | | | 1,135,764 | | | BRL | | | | GSI | | 12/18/2019 | | | (5,014 | ) | |
| | 277,620 | | | USD | | | | | 1,150,150 | | | BRL | | | | GSI | | 12/18/2019 | | | (8,427 | ) | |
| | 312,533 | | | USD | | | | | 1,260,600 | | | BRL | | | | SSB | | 1/22/2020 | | | (421 | ) | |
| | 390,722,435 | | | CLP | | | | | 537,149 | | | USD | | | | SCB | | 12/18/2019 | | | (9,717 | ) | |
| | 218,233,302 | | | CLP | | | | | 302,346 | | | USD | | | | CITI | | 12/18/2019 | | | (7,755 | ) | |
| | 248,388,782 | | | CLP | | | | | 344,410 | | | USD | | | | CITI | | 12/18/2019 | | | (9,113 | ) | |
| | 256,352,528 | | | CLP | | | | | 356,045 | | | USD | | | | CITI | | 12/18/2019 | | | (9,998 | ) | |
| | 695,089,657 | | | CLP | | | | | 980,173 | | | USD | | | | CITI | | 12/18/2019 | | | (41,879 | ) | |
| | 1,518,351 | | | USD | | | | | 10,743,760 | | | CNH | | | | SCB | | 1/31/2020 | | | (2,298 | ) | |
| | 150,765 | | | USD | | | | | 518,755,228 | | | COP | | | | CITI | | 12/17/2019 | | | (2,480 | ) | |
| | 162,137 | | | USD | | | | | 566,205,637 | | | COP | | | | CITI | | 12/17/2019 | | | (5,125 | ) | |
| | 390,165 | | | USD | | | | | 1,322,660,530 | | | COP | | | | CITI | | 12/17/2019 | | | (561 | ) | |
| | 354,239 | | | USD | | | | | 6,100,000 | | | EGP | | | | CITI | | 3/23/2020 | | | (10,240 | ) | |
| | 93,604 | | | EUR | | | | | 2,424,685 | | | CZK | | | | JPM | | 12/17/2019 | | | (1,323 | ) | |
| | 76,393 | | | EUR | | | | | 1,973,698 | | | CZK | | | | HSBC | | 12/17/2019 | | | (854 | ) | |
See Notes to Financial Statements
78
Schedule of Investments Emerging Markets Debt Fund^ (cont'd)
Currency Purchased | | Currency Sold | | Counterparty | | Settlement
Date | | Net
Unrealized
Appreciation/
(Depreciation) | |
| | 533,101 | | | EUR | | | | | 13,863,322 | | | CZK | | | | JPM | | 12/17/2019 | | $ | (9,896 | ) | |
| | 59,379 | | | EUR | | | | | 19,928,435 | | | HUF | | | | GSI | | 12/18/2019 | | | (1,375 | ) | |
| | 118,693 | | | EUR | | | | | 39,591,541 | | | HUF | | | | GSI | | 12/18/2019 | | | (1,919 | ) | |
| | 669,940 | | | EUR | | | | | 223,148,944 | | | HUF | | | | HSBC | | 12/18/2019 | | | (9,750 | ) | |
| | 83,270 | | | EUR | | | | | 27,683,668 | | | HUF | | | | CITI | | 12/18/2019 | | | (1,033 | ) | |
| | 673,603 | | | EUR | | | | | 221,696,079 | | | HUF | | | | HSBC | | 12/18/2019 | | | (708 | ) | |
| | 669,925 | | | EUR | | | | | 223,211,553 | | | HUF | | | | GSI | | 1/8/2020 | | | (9,823 | ) | |
| | 117,761 | | | EUR | | | | | 514,679 | | | PLN | | | | SSB | | 11/7/2019 | | | (3,346 | ) | |
| | 184,871 | | | EUR | | | | | 801,743 | | | PLN | | | | SSB | | 11/7/2019 | | | (3,619 | ) | |
| | 584,806 | | | EUR | | | | | 2,563,486 | | | PLN | | | | SCB | | 11/7/2019 | | | (18,601 | ) | |
| | 81,038 | | | EUR | | | | | 355,741 | | | PLN | | | | JPM | | 11/7/2019 | | | (2,712 | ) | |
| | 139,917 | | | EUR | | | | | 608,643 | | | PLN | | | | CITI | | 11/7/2019 | | | (3,226 | ) | |
| | 899,333 | | | EUR | | | | | 3,880,418 | | | PLN | | | | CITI | | 11/7/2019 | | | (12,433 | ) | |
| | 449,725 | | | EUR | | | | | 1,978,614 | | | PLN | | | | CITI | | 11/7/2019 | | | (16,202 | ) | |
| | 896,917 | | | EUR | | | | | 3,880,421 | | | PLN | | | | GSI | | 11/7/2019 | | | (15,129 | ) | |
| | 739,990 | | | EUR | | | | | 3,215,283 | | | PLN | | | | GSI | | 11/7/2019 | | | (16,092 | ) | |
| | 209,567 | | | EUR | | | | | 1,000,000 | | | RON | | | | SCB | | 12/17/2019 | | | (57 | ) | |
| | 709,220 | | | EUR | | | | | 3,409,410 | | | RON | | | | JPM | | 2/3/2020 | | | (2,607 | ) | |
| | 709,718 | | | EUR | | | | | 3,427,485 | | | RON | | | | GSI | | 4/2/2020 | | | (1,922 | ) | |
| | 226,919 | | | USD | | | | | 206,583 | | | EUR | | | | GSI | | 11/5/2019 | | | (3,498 | ) | |
| | 3,585,710 | | | USD | | | | | 3,280,000 | | | EUR | | | | GSI | | 11/5/2019 | | | (72,710 | ) | |
| | 148,393 | | | USD | | | | | 134,886 | | | EUR | | | | JPM | | 11/5/2019 | | | (2,055 | ) | |
| | 220,689 | | | USD | | | | | 200,550 | | | EUR | | | | JPM | | 11/5/2019 | | | (2,999 | ) | |
| | 232,335 | | | USD | | | | | 211,677 | | | EUR | | | | JPM | | 11/5/2019 | | | (3,764 | ) | |
| | 590,812 | | | USD | | | | | 535,026 | | | EUR | | | | JPM | | 11/5/2019 | | | (5,942 | ) | |
| | 739,905 | | | USD | | | | | 669,325 | | | EUR | | | | JPM | | 11/5/2019 | | | (6,641 | ) | |
| | 92,375 | | | USD | | | | | 83,444 | | | EUR | | | | HSBC | | 11/5/2019 | | | (696 | ) | |
| | 148,679 | | | USD | | | | | 134,996 | | | EUR | | | | MS | | 11/5/2019 | | | (1,892 | ) | |
| | 295,199 | | | USD | | | | | 267,021 | | | EUR | | | | MS | | 11/5/2019 | | | (2,628 | ) | |
| | 303,228 | | | USD | | | | | 274,799 | | | EUR | | | | MS | | 11/5/2019 | | | (3,275 | ) | |
| | 73,689 | | | USD | | | | | 66,789 | | | EUR | | | | SCB | | 11/5/2019 | | | (806 | ) | |
| | 376,229 | | | USD | | | | | 342,514 | | | EUR | | | | SCB | | 11/5/2019 | | | (5,801 | ) | |
| | 336,712 | | | USD | | | | | 302,990 | | | EUR | | | | HSBC | | 11/5/2019 | | | (1,234 | ) | |
| | 337,165 | | | USD | | | | | 303,509 | | | EUR | | | | JPM | | 11/5/2019 | | | (1,360 | ) | |
| | 299,298 | | | USD | | | | | 269,767 | | | EUR | | | | JPM | | 11/5/2019 | | | (1,592 | ) | |
| | 299,195 | | | USD | | | | | 269,768 | | | EUR | | | | JPM | | 11/5/2019 | | | (1,697 | ) | |
| | 310,560 | | | USD | | | | | 283,237 | | | EUR | | | | JPM | | 11/5/2019 | | | (5,355 | ) | |
| | 318,034 | | | USD | | | | | 286,649 | | | EUR | | | | SCB | | 11/5/2019 | | | (1,686 | ) | |
| | 410,718 | | | USD | | | | | 370,004 | | | EUR | | | | JPM | | 12/4/2019 | | | (2,746 | ) | |
| | 285,485 | | | USD | | | | | 260,000 | | | EUR | | | | JPM | | 12/4/2019 | | | (5,054 | ) | |
| | 4,589,050 | | | USD | | | | | 4,166,041 | | | EUR | | | | SSB | | 12/4/2019 | | | (66,333 | ) | |
| | 22,068 | | | USD | | | | | 313,314,820 | | | IDR | | | | JPM | | 11/26/2019 | | | (125 | ) | |
| | 293,979 | | | USD | | | | | 4,198,018,130 | | | IDR | | | | JPM | | 11/26/2019 | | | (3,378 | ) | |
| | 206,487 | | | USD | | | | | 2,933,002,607 | | | IDR | | | | CITI | | 11/26/2019 | | | (1,266 | ) | |
| | 1,486,623 | | | USD | | | | | 21,115,993,297 | | | IDR | | | | JPM | | 11/26/2019 | | | (9,081 | ) | |
| | 1,290,084 | | | ILS | | | | | 368,838 | | | USD | | | | CITI | | 12/10/2019 | | | (2,145 | ) | |
See Notes to Financial Statements
79
Schedule of Investments Emerging Markets Debt Fund^ (cont'd)
Currency Purchased | | Currency Sold | | Counterparty | | Settlement
Date | | Net
Unrealized
Appreciation/
(Depreciation) | |
| | 1,279,085 | | | ILS | | | | | 366,395 | | | USD | | | | CITI | | 12/10/2019 | | $ | (2,828 | ) | |
| | 748,834 | | | USD | | | | | 81,455,769 | | | JPY | | | | JPM | | 11/29/2019 | | | (6,492 | ) | |
| | 739,546 | | | USD | | | | | 869,114,612 | | | KRW | | | | GSI | | 11/18/2019 | | | (3,255 | ) | |
| | 227,031 | | | USD | | | | | 90,074,350 | | | KZT | | | | GSI | | 12/6/2019 | | | (2,844 | ) | |
| | 16,486,097 | | | MXN | | | | | 846,150 | | | USD | | | | SSB | | 2/5/2020 | | | (962 | ) | |
| | 159,335 | | | USD | | | | | 3,161,876 | | | MXN | | | | SSB | | 11/1/2019 | | | (5,034 | ) | |
| | 215,667 | | | USD | | | | | 4,246,175 | | | MXN | | | | SSB | | 11/1/2019 | | | (5,068 | ) | |
| | 373,972 | | | USD | | | | | 7,250,000 | | | MXN | | | | CITI | | 11/1/2019 | | | (2,915 | ) | |
| | 175,180 | | | USD | | | | | 3,438,442 | | | MXN | | | | CITI | | 11/1/2019 | | | (3,566 | ) | |
| | 480,902 | | | USD | | | | | 9,476,826 | | | MXN | | | | CITI | | 11/1/2019 | | | (11,746 | ) | |
| | 646,667 | | | USD | | | | | 12,863,410 | | | MXN | | | | CITI | | 11/1/2019 | | | (22,031 | ) | |
| | 162,102 | | | USD | | | | | 3,216,939 | | | MXN | | | | GSI | | 11/1/2019 | | | (5,129 | ) | |
| | 724,907 | | | USD | | | | | 14,308,830 | | | MXN | | | | GSI | | 11/1/2019 | | | (18,931 | ) | |
| | 632,452 | | | USD | | | | | 12,615,853 | | | MXN | | | | JPM | | 11/1/2019 | | | (23,377 | ) | |
| | 661,589 | | | USD | | | | | 12,879,500 | | | MXN | | | | SSB | | 11/1/2019 | | | (7,945 | ) | |
| | 249,627 | | | USD | | | | | 4,962,322 | | | MXN | | | | SSB | | 11/1/2019 | | | (8,337 | ) | |
| | 574,189 | | | USD | | | | | 11,488,818 | | | MXN | | | | SSB | | 11/1/2019 | | | (23,052 | ) | |
| | 745,205 | | | USD | | | | | 15,060,054 | | | MXN | | | | SSB | | 11/1/2019 | | | (37,685 | ) | |
| | 147,527 | | | USD | | | | | 616,912 | | | MYR | | | | SCB | | 11/27/2019 | | | (546 | ) | |
| | 186,792 | | | USD | | | | | 784,338 | | | MYR | | | | SCB | | 11/27/2019 | | | (1,466 | ) | |
| | 2,298,087 | | | USD | | | | | 9,692,643 | | | MYR | | | | SCB | | 11/27/2019 | | | (28,356 | ) | |
| | 263,411 | | | USD | | | | | 1,105,010 | | | MYR | | | | SCB | | 12/9/2019 | | | (1,772 | ) | |
| | 1,072,236 | | | USD | | | | | 4,506,717 | | | MYR | | | | SCB | | 12/9/2019 | | | (9,299 | ) | |
| | 469,789 | | | PEN | | | | | 140,584 | | | USD | | | | CITI | | 12/18/2019 | | | (312 | ) | |
| | 839,210 | | | PEN | | | | | 251,939 | | | USD | | | | JPM | | 12/18/2019 | | | (1,364 | ) | |
| | 155,671 | | | USD | | | | | 526,770 | | | PEN | | | | GSI | | 12/18/2019 | | | (1,614 | ) | |
| | 355,347 | | | USD | | | | | 1,209,422 | | | PEN | | | | GSI | | 12/18/2019 | | | (5,768 | ) | |
| | 200,349 | | | USD | | | | | 680,406 | | | PEN | | | | MS | | 12/18/2019 | | | (2,810 | ) | |
| | 141,491 | | | USD | | | | | 7,184,889 | | | PHP | | | | SCB | | 11/4/2019 | | | (98 | ) | |
| | 910,762 | | | USD | | | | | 47,234,850 | | | PHP | | | | CITI | | 11/4/2019 | | | (20,066 | ) | |
| | 788,696 | | | USD | | | | | 40,049,961 | | | PHP | | | | CITI | | 11/4/2019 | | | (544 | ) | |
| | 74,369 | | | USD | | | | | 3,797,409 | | | PHP | | | | SCB | | 11/5/2019 | | | (465 | ) | |
| | 1,622,954 | | | USD | | | | | 84,697,096 | | | PHP | | | | GSI | | 11/5/2019 | | | (46,119 | ) | |
| | 48,033,859 | | | RUB | | | | | 751,468 | | | USD | | | | CITI | | 12/4/2019 | | | (5,550 | ) | |
| | 45,337,858 | | | RUB | | | | | 707,741 | | | USD | | | | GSI | | 12/4/2019 | | | (3,688 | ) | |
| | 47,582,401 | | | RUB | | | | | 743,243 | | | USD | | | | GSI | | 12/4/2019 | | | (4,335 | ) | |
| | 48,065,110 | | | RUB | | | | | 752,900 | | | USD | | | | JPM | | 12/4/2019 | | | (6,496 | ) | |
| | 774,481 | | | USD | | | | | 50,844,699 | | | RUB | | | | GSI | | 12/4/2019 | | | (15,087 | ) | |
| | 776,111 | | | USD | | | | | 50,435,585 | | | RUB | | | | SCB | | 12/4/2019 | | | (7,104 | ) | |
| | 160,518 | | | USD | | | | | 10,571,273 | | | RUB | | | | CITI | | 12/4/2019 | | | (3,644 | ) | |
| | 791,742 | | | USD | | | | | 51,384,040 | | | RUB | | | | GSI | | 12/4/2019 | | | (6,202 | ) | |
| | 733,110 | | | USD | | | | | 47,663,135 | | | RUB | | | | JPM | | 12/4/2019 | | | (7,052 | ) | |
| | 728,176 | | | USD | | | | | 1,005,829 | | | SGD | | | | JPM | | 11/4/2019 | | | (11,160 | ) | |
| | 732,808 | | | USD | | | | | 1,011,510 | | | SGD | | | | JPM | | 11/12/2019 | | | (10,747 | ) | |
| | 791,109 | | | USD | | | | | 24,057,629 | | | THB | | | | SCB | | 11/4/2019 | | | (5,633 | ) | |
| | 117,284 | | | USD | | | | | 3,544,963 | | | THB | | | | JPM | | 11/4/2019 | | | (119 | ) | |
See Notes to Financial Statements
80
Schedule of Investments Emerging Markets Debt Fund^ (cont'd)
Currency Purchased | | Currency Sold | | Counterparty | | Settlement
Date | | Net
Unrealized
Appreciation/
(Depreciation) | |
| | 1,290,434 | | | USD | | | | | 7,459,999 | | | TRY | | | | JPM | | 11/6/2019 | | $ | (12,715 | ) | |
| | 387,758 | | | USD | | | | | 2,257,789 | | | TRY | | | | CITI | | 12/9/2019 | | | (3,212 | ) | |
| | 217,132 | | | USD | | | | | 1,258,900 | | | TRY | | | | CITI | | 12/9/2019 | | | (866 | ) | |
| | 309,025 | | | USD | | | | | 1,795,104 | | | TRY | | | | CITI | | 12/9/2019 | | | (1,824 | ) | |
| | 205,747 | | | USD | | | | | 1,227,931 | | | TRY | | | | CITI | | 12/9/2019 | | | (6,888 | ) | |
| | 179,211 | | | USD | | | | | 1,092,572 | | | TRY | | | | CITI | | 12/9/2019 | | | (9,984 | ) | |
| | 292,461 | | | USD | | | | | 1,689,516 | | | TRY | | | | GSI | | 12/9/2019 | | | (104 | ) | |
| | 111,535 | | | USD | | | | | 674,169 | | | TRY | | | | GSI | | 12/9/2019 | | | (5,207 | ) | |
| | 1,721,485 | | | USD | | | | | 10,063,072 | | | TRY | | | | GSI | | 12/18/2019 | | | (17,067 | ) | |
| | 7,676,855 | | | UYU | | | | | 205,318 | | | USD | | | | JPM | | 12/12/2019 | | | (8,715 | ) | |
| | 184,693 | | | USD | | | | | 2,813,061 | | | ZAR | | | | SSB | | 11/6/2019 | | | (1,423 | ) | |
| | 211,827 | | | USD | | | | | 3,233,612 | | | ZAR | | | | JPM | | 11/6/2019 | | | (2,114 | ) | |
| | 91,109 | | | USD | | | | | 1,407,156 | | | ZAR | | | | CITI | | 11/6/2019 | | | (1,990 | ) | |
| | 10,294,991 | | | ZAR | | | | | 691,517 | | | USD | | | | SCB | | 11/6/2019 | | | (10,386 | ) | |
| | 9,124,915 | | | ZAR | | | | | 609,913 | | | USD | | | | CITI | | 12/20/2019 | | | (9,740 | ) | |
| | 16,356,350 | | | ZAR | | | | | 1,104,953 | | | USD | | | | SCB | | 12/20/2019 | | | (29,146 | ) | |
| | 3,984,283 | | | ZAR | | | | | 261,242 | | | USD | | | | CITI | | 2/6/2020 | | | (855 | ) | |
| | 9,869,530 | | | ZAR | | | | | 648,642 | | | USD | | | | JPM | | 2/6/2020 | | | (3,634 | ) | |
Total unrealized depreciation | | | | | | | | | | | | $ | (1,061,948 | ) | |
Total net unrealized appreciation | | | | | | | | | | | | $ | 160,729 | | |
For the year ended October 31, 2019, the Fund's investments in forward contracts had an average notional value of $202,110,798.
Credit default swap contracts ("credit default swaps")
At October 31, 2019, the Fund had outstanding credit default swaps as follows:
Over-the-counter credit default swaps—Sell Protection
| Counterparty | | Reference
Entity | | Notional
Amount | | Financing
Rate
Received
by the
Fund | | Payment
Frequency | | Maturity
Date | | Upfront
Payments/
(Receipts) | | Unrealized
Appreciation/
(Depreciation) | | Accrued
Net
Interest
Receivable/
(Payable) | | Value | |
| JPM | | Republic of
Argentina,
Senior
Securities | | USD | 719,399 | | | | 5.00 | % | | | 3M | | | 6/20/2023 | | $ | 39,875 | | | $ | (477,697 | ) | | $ | 4,196 | | | $ | (433,626 | ) | |
See Notes to Financial Statements
81
Schedule of Investments Emerging Markets Debt Fund^ (cont'd)
For the year ended October 31, 2019, the average notional value of credit default swaps for the Fund was $4,449,990 for buy protection and $559,372 for sell protection.
Cross currency swap contracts ("cross currency swaps")
At October 31, 2019, the Fund had outstanding cross currency swaps as follows:
Over-the-counter cross currency swaps
| | | Counterparty | | Notional
Amount | | Fund
Receives/
Pays
Floating
Rate | | Floating
Rate
Index | | Annual
Fixed-
Rate | | Frequency
of Fund
Receipt/
Payment | | Maturity
Date | | Unrealized
Appreciation/
(Depreciation) | | Accrued
Net
Interest
Receivable/
(Payable) | | Value | |
| | GSI | | TRY | 4,000,000 | | | Receive | | 3M USD
LIBOR | | | 18.23 | % | | 3M/1Y | | 12/9/2024 | | $ | (181,765 | ) | | $ | — | | | $ | (181,765 | ) | |
| | JPM | | TRY | 5,200,000 | | | Receive | | 3M USD
LIBOR | | | 12.90 | % | | 3M/1Y | | 10/7/2025 | | | (55,196 | ) | | | — | | | | (55,196 | ) | |
Total | | | | | | | | | | | | | | | | $ | (236,961 | ) | | $ | — | | | $ | (236,961 | ) | |
Interest rate swap contracts ("interest rate swaps")
At October 31, 2019, the Fund had outstanding interest rate swaps as follows:
Centrally cleared interest rate swaps
| Clearinghouse | | Notional
Amount | | Fund
Receives/
Pays
Floating
Rate | | Floating
Rate Index | | Annual
Fixed-
Rate | | Frequency
of Fund
Receipt/
Payment | | Maturity
Date | | Unrealized
Appreciation/
(Depreciation) | | Accrued
Net
Interest
Receivable/
(Payable) | | Value | |
| CME | | BRL | 33,030,903 | | | Receive | | 1D CETIP | | | 7.45 | % | | T/T | | 1/2/2020 | | $ | (35,556 | ) | | $ | (99,711 | ) | | $ | (135,267 | ) | |
| CME | | BRL | 8,248,167 | | | Pay | | 1D CETIP | | | 5.89 | % | | T/T | | 1/3/2022 | | | 42,256 | | | | 1,094 | | | | 43,350 | | |
| CME | | BRL | 3,601,775 | | | Pay | | 1D CETIP | | | 6.07 | % | | T/T | | 1/3/2022 | | | 21,703 | | | | 723 | | | | 22,426 | | |
| CME | | BRL | 3,015,415 | | | Pay | | 1D CETIP | | | 6.23 | % | | T/T | | 1/3/2022 | | | 21,060 | | | | 886 | | | | 21,946 | | |
| CME | | BRL | 5,079,021 | | | Pay | | 1D CETIP | | | 6.24 | % | | T/T | | 1/3/2022 | | | 35,675 | | | | 1,525 | | | | 37,200 | | |
| CME | | BRL | 5,584,084 | | | Pay | | 1D CETIP | | | 6.48 | % | | T/T | | 1/2/2023 | | | 48,828 | | | | 2,784 | | | | 51,612 | | |
| CME | | BRL | 588,077 | | | Pay | | 1D CETIP | | | 9.26 | % | | T/T | | 1/2/2023 | | | 20,392 | | | | 6,439 | | | | 26,831 | | |
| CME | | BRL | 1,568,375 | | | Pay | | 1D CETIP | | | 11.45 | % | | T/T | | 1/2/2025 | | | 141,060 | | | | 28,196 | | | | 169,256 | | |
| CME | | BRL | 1,836,954 | | | Pay | | 1D CETIP | | | 12.34 | % | | T/T | | 1/2/2025 | | | 197,083 | | | | 38,996 | | | | 236,079 | | |
| LCH | | CNY | 7,200,000 | | | Pay | | 7D CNRR007 | | | 2.86 | % | | 3M/3M | | 7/3/2024 | | | (10,696 | ) | | | 25 | | | | (10,671 | ) | |
| LCH | | CNY | 7,200,000 | | | Pay | | 7D CNRR007 | | | 2.75 | % | | 3M/3M | | 7/5/2024 | | | (15,854 | ) | | | 6 | | | | (15,848 | ) | |
| CME | | COP | 1,742,073,468 | | | Receive | | 1D IBRCOL | | | 5.81 | % | | 3M/3M | | 4/3/2029 | | | (18,338 | ) | | | (680 | ) | | | (19,018 | ) | |
| CME | | COP | 1,300,000,000 | | | Receive | | 1D IBRCOL | | | 5.92 | % | | 3M/3M | | 5/15/2029 | | | (16,576 | ) | | | (1,469 | ) | | | (18,045 | ) | |
| LCH | | CZK | 40,000,000 | | | Pay | | 6M PRIBOR | | | 2.07 | % | | 1Y/6M | | 9/30/2021 | | | 143 | | | | (155 | ) | | | (12 | ) | |
| LCH | | CZK | 46,655,139 | | | Pay | | 6M PRIBOR | | | 2.10 | % | | 1Y/6M | | 9/30/2021 | | | 1,318 | | | | (127 | ) | | | 1,191 | | |
| LCH | | CZK | 22,000,000 | | | Pay | | 6M PRIBOR | | | 2.10 | % | | 1Y/6M | | 10/3/2021 | | | 588 | | | | (75 | ) | | | 513 | | |
| LCH | | CZK | 17,000,000 | | | Receive | | 6M PRIBOR | | | 1.58 | % | | 6M/1Y | | 1/11/2023 | | | 7,677 | | | | (4,424 | ) | | | 3,253 | | |
| LCH | | CZK | 44,000,000 | | | Receive | | 6M PRIBOR | | | 1.70 | % | | 6M/1Y | | 6/18/2024 | | | 5,709 | | | | 3,777 | | | | 9,486 | | |
| LCH | | CZK | 4,700,000 | | | Receive | | 6M PRIBOR | | | 1.64 | % | | 6M/1Y | | 6/21/2024 | | | 1,153 | | | | 440 | | | | 1,593 | | |
| LCH | | CZK | 7,070,223 | | | Receive | | 6M PRIBOR | | | 1.68 | % | | 6M/1Y | | 7/17/2024 | | | 1,171 | | | | 500 | | | | 1,671 | | |
See Notes to Financial Statements
82
Schedule of Investments Emerging Markets Debt Fund^ (cont'd)
Clearinghouse | | Notional
Amount | | Fund
Receives/
Pays
Floating
Rate | | Floating
Rate Index | | Annual
Fixed-
Rate | | Frequency
of Fund
Receipt/
Payment | | Maturity
Date | | Unrealized
Appreciation/
(Depreciation) | | Accrued
Net
Interest
Receivable/
(Payable) | | Value | |
LCH | | HUF | 25,000,000 | | | Pay | | 6M BUBOR | | | 0.81 | % | | 1Y/6M | | 9/12/2024 | | $ | 504 | | | $ | 64 | | | $ | 568 | | |
LCH | | HUF | 135,000,000 | | | Pay | | 6M BUBOR | | | 1.88 | % | | 1Y/6M | | 9/13/2029 | | | 888 | | | | — | | | | 888 | | |
CME | | MXN | 55,942,028 | | | Receive | | 28D TIIE | | | 8.09 | % | | 28D/28D | | 1/28/2021 | | | (45,190 | ) | | | — | | | | (45,190 | ) | |
CME | | MXN | 57,243,005 | | | Receive | | 28D TIIE | | | 8.15 | % | | 28D/28D | | 1/28/2021 | | | (47,812 | ) | | | — | | | | (47,812 | ) | |
CME | | MXN | 3,500,000 | | | Pay | | 28D TIIE | | | 7.71 | % | | 28D/28D | | 1/21/2022 | | | 5,029 | | | | (43 | ) | | | 4,986 | | |
CME | | MXN | 12,211,377 | | | Pay | | 28D TIIE | | | 6.75 | % | | 28D/28D | | 6/23/2022 | | | 6,431 | | | | (331 | ) | | | 6,100 | | |
CME | | MXN | 19,000,000 | | | Pay | | 28D TIIE | | | 7.35 | % | | 28D/28D | | 3/20/2024 | | | 40,680 | | | | (411 | ) | | | 40,269 | | |
CME | | MXN | 20,933,047 | | | Pay | | 28D TIIE | | | 6.75 | % | | 28D/28D | | 8/26/2024 | | | 20,523 | | | | (149 | ) | | | 20,374 | | |
CME | | MXN | 1,800,000 | | | Pay | | 28D TIIE | | | 7.72 | % | | 28D/28D | | 12/3/2026 | | | 7,031 | | | | (11 | ) | | | 7,020 | | |
CME | | MXN | 3,300,000 | | | Pay | | 28D TIIE | | | 8.16 | % | | 28D/28D | | 12/28/2026 | | | 17,350 | | | | 13 | | | | 17,363 | | |
CME | | MXN | 6,685,611 | | | Pay | | 28D TIIE | | | 7.51 | % | | 28D/28D | | 4/20/2027 | | | 22,223 | | | | (80 | ) | | | 22,143 | | |
CME | | MXN | 12,369,618 | | | Receive | | 28D TIIE | | | 6.94 | % | | 28D/28D | | 8/20/2029 | | | (15,961 | ) | | | 75 | | | | (15,886 | ) | |
CME | | MXN | 16,120,878 | | | Receive | | 28D TIIE | | | 6.92 | % | | 28D/28D | | 8/31/2029 | | | (19,638 | ) | | | 529 | | | | (19,109 | ) | |
CME | | MXN | 10,567,193 | | | Receive | | 28D TIIE | | | 6.82 | % | | 28D/28D | | 9/10/2029 | | | (8,581 | ) | | | 197 | | | | (8,384 | ) | |
LCH | | PLN | 2,655,221 | | | Pay | | 6M WIBOR | | | 2.21 | % | | 1Y/6M | | 11/16/2021 | | | 6,545 | | | | 8,954 | | | | 15,499 | | |
LCH | | PLN | 1,250,000 | | | Pay | | 6M WIBOR | | | 2.33 | % | | 1Y/6M | | 4/6/2022 | | | 4,639 | | | | 3,922 | | | | 8,561 | | |
LCH | | PLN | 8,300,000 | | | Receive | | 6M WIBOR | | | 1.99 | % | | 6M/1Y | | 3/25/2024 | | | (22,826 | ) | | | (20,296 | ) | | | (43,122 | ) | |
LCH | | PLN | 1,200,000 | | | Pay | | 6M WIBOR | | | 1.62 | % | | 1Y/6M | | 8/16/2029 | | | (4,921 | ) | | | (116 | ) | | | (5,037 | ) | |
LCH | | ZAR | 3,042,152 | | | Receive | | 3M JIBAR | | | 7.29 | % | | 3M/3M | | 1/7/2021 | | | (1,364 | ) | | | (71 | ) | | | (1,435 | ) | |
LCH | | ZAR | 23,000,000 | | | Pay | | 3M JIBAR | | | 8.49 | % | | 3M/3M | | 7/18/2029 | | | (11,553 | ) | | | — | | | | (11,553 | ) | |
Total | | | | | | | | | | | | | | $ | 402,793 | | | $ | (29,004 | ) | | $ | 373,789 | | |
Over-the-counter interest rate swaps
| Counterparty | | Notional
Amount | | Fund
Receives/
Pays
Floating
Rate | | Floating
Rate Index | | Annual
Fixed-
Rate | | Frequency
of Fund
Receipt/
Payment | | Maturity
Date | | Unrealized
Appreciation/
(Depreciation) | | Accrued
Net
Interest
Receivable/
(Payable) | | Value | |
| GSI | | BRL | 1,152,498 | | | Pay | | 1D CETIP | | | 9.73 | % | | T/T | | 1/2/2020 | | $ | 2,676 | | | $ | 21,071 | | | $ | 23,747 | | |
| GSI | | BRL | 1,000,000 | | | Pay | | 1D CETIP | | | 11.99 | % | | T/T | | 1/2/2023 | | | 86,524 | | | | 31,264 | | | | 117,788 | | |
| JPM | | BRL | 1,984,200 | | | Pay | | 1D CETIP | | | 9.07 | % | | T/T | | 1/2/2020 | | | 3,919 | | | | 27,651 | | | | 31,570 | | |
| JPM | | BRL | 930,916 | | | Pay | | 1D CETIP | | | 9.61 | % | | T/T | | 1/2/2020 | | | 2,111 | | | | 16,068 | | | | 18,179 | | |
| JPM | | BRL | 1,063,932 | | | Pay | | 1D CETIP | | | 11.46 | % | | T/T | | 1/2/2020 | | | 3,579 | | | | 32,376 | | | | 35,955 | | |
| JPM | | BRL | 7,778,457 | | | Pay | | 1D CETIP | | | 8.87 | % | | T/T | | 1/4/2021 | | | 112,536 | | | | 102,097 | | | | 214,633 | | |
| JPM | | BRL | 2,071,383 | | | Pay | | 1D CETIP | | | 9.20 | % | | T/T | | 1/4/2021 | | | 32,717 | | | | 31,329 | | | | 64,046 | | |
| JPM | | BRL | 1,614,106 | | | Pay | | 1D CETIP | | | 9.28 | % | | T/T | | 1/4/2021 | | | 25,854 | | | | 25,047 | | | | 50,901 | | |
| JPM | | BRL | 489,151 | | | Pay | | 1D CETIP | | | 10.04 | % | | T/T | | 1/4/2021 | | | 9,362 | | | | 9,980 | | | | 19,342 | | |
| JPM | | BRL | 31,354 | | | Pay | | 1D CETIP | | | 10.23 | % | | T/T | | 1/4/2021 | | | 627 | | | | 683 | | | | 1,310 | | |
| JPM | | CLP | 231,188,535 | | | Pay | | 1D CLICP | | | 3.43 | % | | 6M/6M | | 5/10/2022 | | | 14,150 | | | | 1,558 | | | | 15,708 | | |
| GSI | | HUF | 359,014,464 | | | Receive | | 6M BUBOR | | | 1.27 | % | | 6M/1Y | | 1/10/2022 | | | (23,202 | ) | | | (11,301 | ) | | | (34,503 | ) | |
| GSI | | HUF | 500,000,000 | | | Pay | | 6M BUBOR | | | 0.84 | % | | 1Y/6M | | 9/21/2022 | | | 18,141 | | | | 1,061 | | | | 19,202 | | |
| JPM | | HUF | 382,000,000 | | | Receive | | 6M BUBOR | | | 0.69 | % | | 6M/1Y | | 4/20/2020 | | | (2,682 | ) | | | (4,624 | ) | | | (7,306 | ) | |
| JPM | | HUF | 128,246,450 | | | Receive | | 6M BUBOR | | | 1.38 | % | | 6M/1Y | | 6/17/2021 | | | (7,359 | ) | | | (1,787 | ) | | | (9,146 | ) | |
See Notes to Financial Statements
83
Schedule of Investments Emerging Markets Debt Fund^ (cont'd)
Counterparty | | Notional
Amount | | Fund
Receives/
Pays
Floating
Rate | | Floating
Rate Index | | Annual
Fixed-
Rate | | Frequency
of Fund
Receipt/
Payment | | Maturity
Date | | Unrealized
Appreciation/
(Depreciation) | | Accrued
Net
Interest
Receivable/
(Payable) | | Value | |
JPM | | HUF | 45,000,000 | | | Receive | | 6M BUBOR | | | 1.30 | % | | 6M/1Y | | 4/6/2022 | | $ | (3,275 | ) | | $ | (1,100 | ) | | $ | (4,375 | ) | |
GSI | | MXN | 9,000,000 | | | Pay | | 28D TIIE | | | 5.37 | % | | 28D/28D | | 3/17/2021 | | | (7,966 | ) | | | (68 | ) | | | (8,034 | ) | |
GSI | | MXN | 28,033,731 | | | Pay | | 28D TIIE | | | 5.90 | % | | 28D/28D | | 9/12/2022 | | | (16,453 | ) | | | (1,532 | ) | | | (17,985 | ) | |
GSI | | MXN | 10,713,184 | | | Pay | | 28D TIIE | | | 6.21 | % | | 28D/28D | | 12/8/2025 | | | (5,355 | ) | | | (305 | ) | | | (5,660 | ) | |
GSI | | MXN | 9,462,643 | | | Pay | | 28D TIIE | | | 6.17 | % | | 28D/28D | | 3/5/2026 | | | (6,369 | ) | | | (200 | ) | | | (6,569 | ) | |
GSI | | MXN | 5,000,000 | | | Pay | | 28D TIIE | | | 6.38 | % | | 28D/28D | | 9/16/2026 | | | (956 | ) | | | (105 | ) | | | (1,061 | ) | |
JPM | | MXN | 7,500,000 | | | Pay | | 28D TIIE | | | 6.13 | % | | 28D/28D | | 6/18/2026 | | | (6,421 | ) | | | (303 | ) | | | (6,724 | ) | |
GSI | | RUB | 337,196,904 | | | Pay | | 3M MOSPRIME | | | 9.01 | % | | 1Y/3M | | 2/21/2021 | | | 120,249 | | | | — | | | | 120,249 | | |
GSI | | RUB | 350,542,739 | | | Pay | | 3M MOSPRIME | | | 7.52 | % | | 1Y/3M | | 6/10/2021 | | | 49,336 | | | | — | | | | 49,336 | | |
GSI | | RUB | 223,218,139 | | | Pay | | 3M MOSPRIME | | | 8.11 | % | | 1Y/3M | | 3/23/2022 | | | 97,202 | | | | — | | | | 97,202 | | |
Total | | | | | | | | | | | | | | $ | 498,945 | | | $ | 278,860 | | | $ | 777,805 | | |
For the year ended October 31, 2019, the average notional value of cross currency swaps and interest rate swaps for the Fund was $32,771,200 when the Fund paid the fixed rate and $47,954,579 when the Fund received the fixed rate.
At October 31, 2019, the Fund received cash collateral of $270,000 from Goldman Sachs International to cover collateral requirements on over-the-counter derivatives.
The following is a summary, categorized by Level (see Note A of Notes to Financial Statements), of inputs used to value the Fund's investments as of October 31, 2019:
Asset Valuation Inputs
| | | Level 1 | | Level 2 | | Level 3 | | Total | |
Investments: | |
| Corporate Bonds(a) | | $ | — | | | $ | 48,353,591 | | | $ | — | | | $ | 48,353,591 | | |
| Foreign Government Securities(a) | | | — | | | | 100,312,798 | | | | — | | | | 100,312,798 | | |
Short-Term Investments | | | — | | | | 7,038,328 | | | | — | | | | 7,038,328 | | |
Total Investments | | $ | — | | | $ | 155,704,717 | | | $ | — | | | $ | 155,704,717 | | |
(a) The Schedule of Investments provides a geographic categorization as well as a Positions by Industry summary.
See Notes to Financial Statements
84
Schedule of Investments Emerging Markets Debt Fund^ (cont'd)
The following is a summary, categorized by Level (see Note A of Notes to Financial Statements), of inputs used to value the Fund's derivatives as of October 31, 2019:
Other Financial Instruments
| | | Level 1 | | Level 2 | | Level 3 | | Total | |
| Futures(a) | |
Assets | | $ | 316,927 | | | $ | — | | | $ | — | | | $ | 316,927 | | |
Liabilities | | | (95,749 | ) | | | — | | | | — | | | | (95,749 | ) | |
| Forward Contracts(a) | |
Assets | | | — | | | | 1,222,677 | | | | — | | | | 1,222,677 | | |
Liabilities | | | — | | | | (1,061,948 | ) | | | — | | | | (1,061,948 | ) | |
Swaps | |
Assets | | | — | | | | 1,649,346 | | | | — | | | | 1,649,346 | | |
Liabilities | | | — | | | | (1,168,339 | ) | | | — | | | | (1,168,339 | ) | |
Total | | $ | 221,178 | | | $ | 641,736 | | | $ | — | | | $ | 862,914 | | |
(a) Futures and forward contracts are reported at the cumulative unrealized appreciation/(depreciation) of the instrument.
^ A balance indicated with a "—", reflects either a zero balance or an amount that rounds to less than 1.
See Notes to Financial Statements
85
Schedule of Investments Floating Rate Income Fund^ October 31, 2019
NUMBER OF SHARES | | | | VALUE | |
Common Stocks 0.6% | | | |
Business Equipment & Services 0.2% | | | |
| | 21,820 | | | Brock Holdings III, Inc. | | $ | 436,400 | *(a)(b)(c) | |
Media 0.3% | | | |
| | 81,399 | | | Clear Channel Outdoor Holdings, Inc. | | | 189,660 | * | |
| | 34,616 | | | iHeartMedia, Inc. | | | 496,393 | * | |
| | | | 686,053 | | |
Media - Broadcast 0.1% | | | |
| | 16,445 | | | Cumulus Media, Inc., Class A | | | 225,132 | * | |
| | | | | Total Common Stocks (Cost $1,500,472) | | | 1,347,585 | | |
PRINCIPAL AMOUNT | | | | | |
| Loan Assignments(d) 89.9% | | | |
Aerospace & Defense 1.0% | | | |
$ | 746,050
| | | Atlantic Aviation FBO Inc., Term Loan B, (1M USD LIBOR + 3.75%), 5.54%,
due 12/6/2025 | | | 748,848
| (a) | |
| | 270,000 | | | MHI Holdings, LLC, Term Loan B, (1M USD LIBOR + 5.00%), 6.79%, due 9/21/2026 | | | 267,300 | (a) | |
| | 1,310,743 | | | TransDigm, Inc., Term Loan F, (1M USD LIBOR + 2.50%), 4.29%, due 6/9/2023 | | | 1,304,019 | | |
| | | | 2,320,167 | | |
| Air Transport 0.0%(e) | | | |
| | 77 | | | American Airlines, Inc., Term Loan B, (1M USD LIBOR + 1.75%), 3.55%, due 6/27/2025 | | | 76 | | |
Automotive 1.4% | | | |
| | 597,139 | | | Belron Finance US LLC, Term Loan B, (3M USD LIBOR + 2.25%), 4.46%, due 11/7/2024 | | | 596,393 | | |
| 1,190,000
| | | Panther BF Aggregator 2 LP, Term Loan B, (1M USD LIBOR + 3.50%), 5.30%,
due 4/30/2026 | | | 1,172,650
| | |
| 1,326,675
| | | Wand NewCo 3, Inc., First Lien Term Loan, (1M USD LIBOR + 3.50%), 5.29%,
due 2/5/2026 | | | 1,330,986
| | |
| | | | 3,100,029 | | |
Building & Development 4.1% | | | |
| | | | | Capital Automotive L.P. | | | | | |
| | 300,385 | | | First Lien Term Loan, (1M USD LIBOR + 2.50%), 4.29%, due 3/24/2024 | | | 299,956 | | |
| | 739,911 | | | Second Lien Term Loan, (1M USD LIBOR + 6.00%), 7.79%, due 3/24/2025 | | | 739,911 | | |
| | 797,306 | | | Core & Main LP, Term Loan B, (USD LIBOR + 2.75%), 4.81%, due 8/1/2024 | | | 778,370 | (f) | |
| | 726,523 | | | CPG International Inc., Term Loan, (3M USD LIBOR + 3.75%), 5.93%, due 5/5/2024 | | | 714,717 | | |
| | 1,542,904 | | | DTZ U.S. Borrower LLC, Term Loan B, (1M USD LIBOR + 3.25%), 5.04%, due 8/21/2025 | | | 1,544,184 | | |
| | 1,343,790 | | | Forterra Finance, LLC, Term Loan B, (1M USD LIBOR + 3.00%), 4.79%, due 10/25/2023 | | | 1,265,689 | (g)(h) | |
| | 810,842 | | | NCI Building Systems, Inc., Term Loan, (1M USD LIBOR + 3.75%), 5.66%, due 4/12/2025 | | | 783,136 | | |
| 642,692
| | | Quikrete Holdings, Inc., First Lien Term Loan, (1M USD LIBOR + 2.75%), 4.54%,
due 11/15/2023 | | | 639,678
| | |
See Notes to Financial Statements
86
Schedule of Investments Floating Rate Income Fund^ (cont'd)
PRINCIPAL AMOUNT | | | | VALUE | |
$ | 895,816 | | | Realogy Group LLC, Term Loan B, (1M USD LIBOR + 2.25%), 4.07%, due 2/8/2025 | | $ | 847,666 | | |
| | 1,658,812 | | | Wilsonart LLC, Term Loan B, (3M USD LIBOR + 3.25%), 5.36%, due 12/19/2023 | | | 1,621,489 | | |
| | | | 9,234,796 | | |
Business Equipment & Services 11.3% | | | |
| 626,316
| | | Advantage Sales & Marketing, Inc., Term Loan B2, (1M USD LIBOR + 3.25%), 5.04%,
due 7/25/2021 | | | 578,334
| | |
| | 602,232 | | | AlixPartners, LLP, Term Loan B, (1M USD LIBOR + 2.75%), 4.54%, due 4/4/2024 | | | 601,226 | | |
| 354,185
| | | BrightView Landscapes, LLC, First Lien Term Loan B, (USD LIBOR + 2.50%), 4.38%,
due 8/15/2025 | | | 354,738
| (f) | |
| | 597,590 | | | Carbonite, Inc, Term Loan B, (3M USD LIBOR + 3.75%), 5.68%, due 3/26/2026 | | | 595,947 | | |
| 920,375
| | | Cast and Crew Payroll, LLC, First Lien Term Loan, (1M USD LIBOR + 4.00%), 5.79%,
due 2/9/2026 | | | 924,213
| | |
| 977,713
| | | Ceridian HCM Holding Inc., Term Loan B, (1M USD LIBOR + 3.00%), 4.80%,
due 4/30/2025 | | | 978,935
| | |
| 956,560
| | | Change Healthcare Holdings LLC, Term Loan B, (1M USD LIBOR + 2.50%), 4.29%,
due 3/1/2024 | | | 950,361
| | |
| 455,000
| | | Clear Channel Outdoor Holdings, Inc., Term Loan B, (1M USD LIBOR + 3.50%), 5.29%,
due 8/21/2026 | | | 455,733
| | |
| | 601,975 | | | ConvergeOne Holdings, Inc., Term Loan, (1M USD LIBOR + 5.00%), 6.79%, due 1/4/2026 | | | 534,506 | | |
| 1,120,000
| | | Cortes NP Acquisition Corporation, Term Loan B, (3M USD LIBOR + 4.00%), 5.93%,
due 11/30/2023 | | | 1,052,520
| | |
| 699,810
| | | Cypress Intermediate Holdings III, Inc., First Lien Term Loan, (1M USD LIBOR + 2.75%),
4.54%, due 4/29/2024 | | | 687,185
| | |
| 1,319,900
| | | Deerfield Dakota Holding, LLC, Term Loan B, (1M USD LIBOR + 3.25%), 5.04%,
due 2/13/2025 | | | 1,271,116
| | |
| | | | | DiscoverOrg, LLC | | | | | |
| | 626,850 | | | First Lien Term Loan, (1M USD LIBOR + 4.50%), 6.29%, due 2/2/2026 | | | 616,664 | | |
| | 95,000 | | | Second Lien Term Loan, (1M USD LIBOR + 8.50%), 10.53%, due 2/1/2027 | | | 94,050 | | |
| | 1,255,767 | | | EIG Investors Corp., First Lien Term Loan, (3M USD LIBOR + 3.75%), 5.88%, due 2/9/2023 | | | 1,191,408 | | |
| 620,313
| | | Financial & Risk US Holdings, Inc., Term Loan, (1M USD LIBOR + 3.75%), 5.54%,
due 10/1/2025 | | | 623,259
| | |
| 379,038
| | | Flexera Software LLC, First Lien Term Loan, (1M USD LIBOR + 3.50%), 5.29%,
due 2/26/2025 | | | 379,106
| | |
| 1,740,000
| | | Garda World Security Corporation, First Lien Term Loan B, (USD LIBOR + 4.75%),
due 10/17/2026 | | | 1,729,125
| (g)(h) | |
| | 444,974 | | | Iron Mountain, Inc., Term Loan B, (1M USD LIBOR + 1.75%), 3.54%, due 1/2/2026 | | | 438,113 | | |
| | | | | Kronos Incorporated | | | | | |
| | 1,439,306 | | | Term Loan B, (3M USD LIBOR + 3.00%), 5.25%, due 11/1/2023 | | | 1,435,578 | | |
| | 230,000 | | | Second Lien Term Loan, (3M USD LIBOR + 8.25%), 10.50%, due 11/1/2024 | | | 230,904 | | |
| 840,732
| | | Learning Care Group, Inc., First Lien Term Loan, (USD LIBOR + 3.25%), 5.34%,
due 3/13/2025 | | | 826,280
| (f) | |
| | 1,301,839 | | | MX Holdings US, Inc., Term Loan B1C, (1M USD LIBOR + 3.00%), 4.80%, due 7/31/2025 | | | 1,305,914 | | |
| 1,450,000
| | | Prime Security Services Borrower, LLC, Term Loan B1, (1M USD LIBOR + 3.25%), 5.25%,
due 9/23/2026 | | | 1,398,728
| | |
| | 581,772 | | | ServiceMaster Company, Term Loan B, (1M USD LIBOR + 2.50%), 4.29%, due 11/8/2023 | | | 580,801 | | |
| | 948,058 | | | Solera, LLC, Term Loan B, (1M USD LIBOR + 2.75%), 4.54%, due 3/3/2023 | | | 938,748 | | |
| | 373,548 | | | Switch, Ltd., Term Loan B, (1M USD LIBOR + 2.25%), 4.05%, due 6/27/2024 | | | 374,482 | | |
| | 1,245,668 | | | Tempo Acquisition LLC, Term Loan, (1M USD LIBOR + 3.00%), 4.79%, due 5/1/2024 | | | 1,245,406 | | |
| | 1,049,014 | | | West Corporation, Term Loan, (USD LIBOR + 4.00%), 5.93%, due 10/10/2024 | | | 870,304 | (f) | |
| | 636,800 | | | WEX Inc., Term Loan B3, (1M USD LIBOR + 2.25%), 4.04%, due 5/15/2026 | | | 638,736 | | |
| 1,694,874
| | | William Morris Endeavor Entertainment, LLC, First Lien Term Loan, (USD LIBOR + 2.75%),
4.60%, due 5/18/2025 | | | 1,635,909
| (f) | |
| | | | 25,538,329 | | |
See Notes to Financial Statements
87
Schedule of Investments Floating Rate Income Fund^ (cont'd)
PRINCIPAL AMOUNT | | | | VALUE | |
Cable & Satellite Television 4.0% | | | |
$ | 363,476 | | | Altice Financing SA, Term Loan B, (1M USD LIBOR + 2.75%), 4.66%, due 7/15/2025 | | $ | 350,558 | | |
| | | | | Altice France S.A. | | | | | |
| | 1,102,188 | | | Term Loan B12, (1M USD LIBOR + 3.69%), 5.61%, due 1/31/2026 | | | 1,074,237 | | |
| | 2,030,244 | | | Term Loan B13, (1M USD LIBOR + 4.00%), 5.92%, due 8/14/2026 | | | 1,995,446 | | |
| 525,000
| | | Charter Communications Operating, LLC, Term Loan B2, (USD LIBOR + 1.75%),
due 2/1/2027 | | | 526,685
| (g)(h) | |
| | 728,175 | | | CSC Holdings, LLC, Term Loan B5, (3M USD LIBOR + 2.50%), 4.33%, due 4/15/2027 | | | 726,871 | | |
| 369,632
| | | Lions Gate Capital Holdings LLC, Term Loan B, (1M USD LIBOR + 2.25%), 4.04%,
due 3/24/2025 | | | 357,619
| | |
| 1,672,367
| | | Radiate Holdco, LLC, First Lien Term Loan, (1M USD LIBOR + 3.00%), 4.79%,
due 2/1/2024 | | | 1,654,021
| | |
| | 540,000 |
| | Telenet Financing USD LLC, Term Loan AN, (1M USD LIBOR + 2.25%), 4.17%,
due 8/15/2026 | | | 539,023 | | |
| | 785,000 | | | Virgin Media Bristol LLC, Term Loan N, (3M USD LIBOR + 2.50%), 4.42%, due 1/31/2028 | | | 781,405 | | |
| 1,095,970
| | | WideOpenWest Finance LLC, Term Loan B, (1M USD LIBOR + 3.25%), 5.05%,
due 8/18/2023 | | | 1,050,422
| | |
| | | | 9,056,287 | | |
Chemicals & Plastics 2.9% | | | |
| | 862,838 | | | Charter NEX US, Inc., Term Loan, (1M USD LIBOR + 3.50%), 5.29%, due 5/16/2024 | | | 852,863 | | |
| | 816,022 | | | Diamond (BC) B.V., Term Loan, (USD LIBOR + 3.00%), 4.93%, due 9/6/2024 | | | 758,493 | (f) | |
| | 379,050 | | | Hexion Inc, Term Loan, (3M USD LIBOR + 3.50%), 5.60%, due 7/1/2026 | | | 377,155 | | |
| | 671,625 | | | Messer Industries GmbH, Term Loan, (3M USD LIBOR + 2.50%), 4.60%, due 3/1/2026 | | | 665,480 | | |
| 713,213
| | | Momentive Performance Materials Inc., Term Loan B, (1M USD LIBOR + 3.25%), 5.04%,
due 5/15/2024 | | | 699,397
| | |
| | 548,870 | | | PQ Corporation, Term Loan B, (3M USD LIBOR + 2.50%), 4.43%, due 2/8/2025 | | | 548,030 | | |
| | | | | Solenis Holdings LLC | | | | | |
| | 775,188 | | | First Lien Term Loan, (3M USD LIBOR + 4.00%), 6.12%, due 6/26/2025 | | | 735,653 | | |
| | 45,000 | | | Second Lien Term Loan, (3M USD LIBOR + 8.50%), 10.62%, due 6/26/2026 | | | 41,625 | | |
| | 1,299,337 | | | Starfruit Finco B.V., Term Loan B, (1M USD LIBOR + 3.25%), 5.19%, due 10/1/2025 | | | 1,265,515 | | |
| | 543,505 | | | Univar Inc., Term Loan B, (1M USD LIBOR + 2.25%), 4.04%, due 7/1/2024 | | | 544,863 | | |
| | | | 6,489,074 | | |
Containers & Glass Products 3.3% | | | |
| 551,254
| | | Albea Beauty Holdings S.A, Term Loan B2, (6M USD LIBOR + 3.00%), 5.52%,
due 4/22/2024 | | | 528,746
| | |
| | 1,184,601 | | | Berlin Packaging LLC, First Lien Term Loan, (USD LIBOR + 3.00%), 5.00%, due 11/7/2025 | | | 1,149,063 | (f)(g)(h) | |
| | | | | Berry Global, Inc. | | | | | |
| | 650,000 | | | Term Loan W, (USD LIBOR + 2.00%), due 10/1/2022 | | | 651,625 | (g)(h) | |
| | 185,000 | | | Term Loan X, (USD LIBOR + 2.00%), due 1/19/2024 | | | 185,355 | (g)(h) | |
| | 1,333,791 | | | BWAY Holding Company, Term Loan B, (3M USD LIBOR + 3.25%), 5.23%, due 4/3/2024 | | | 1,296,659 | | |
| 696,101
| | | Consolidated Container Company LLC, First Lien Term Loan, (1M USD LIBOR + 2.75%),
4.54%, due 5/22/2024 | | | 683,627
| | |
| | 1,202,611 | | | Reynolds Group Holdings Inc., Term Loan, (1M USD LIBOR + 2.75%), 4.54%, due 2/5/2023 | | | 1,201,950 | | |
| 847,994
| | | TricorBraun Holdings, Inc., First Lien Term Loan, (USD LIBOR + 2.75%), 5.86%,
due 11/30/2023 | | | 826,794
| (f) | |
| 1,008,158
| | | Trident TPI Holdings, Inc., Term Loan B1, (1M USD LIBOR + 3.25%), 5.04%,
due 10/17/2024 | | | 946,409
| | |
| | | | 7,470,228 | | |
See Notes to Financial Statements
88
Schedule of Investments Floating Rate Income Fund^ (cont'd)
PRINCIPAL AMOUNT | | | | VALUE | |
Cosmetics - Toiletries 0.7% | | | |
$ | 280,000 | | | Edgewell Personal Care Company, Term Loan B, (USD LIBOR + 3.00%), due 9/19/2026 | | $ | 279,827 | (g)(h) | |
| 1,315,000
| | | Sunshine Luxembourg VII SARL, First Lien Term Loan, (2M USD LIBOR + 4.25%),
6.35%, due 10/1/2026 | | | 1,315,552
| | |
| | | | 1,595,379 | | |
Diversified Insurance 1.4% | | | |
| | 1,323,342 | | | Hub International Limited, Term Loan B, (USD LIBOR + 3.00%), 4.94%, due 4/25/2025 | | | 1,293,329 | (f) | |
| | | | | Sedgwick Claims Management Services, Inc. | | | | | |
| | 1,075,644 | | | Term Loan B, (1M USD LIBOR + 3.25%), 5.04%, due 12/31/2025 | | | 1,042,535 | | |
| | 753,113 | | | Term Loan B, (1M USD LIBOR + 4.00%), 5.79%, due 9/3/2026 | | | 746,681 | | |
| | | | 3,082,545 | | |
Drugs 3.3% | | | |
| | 732,696 | | | Akorn, Inc., Term Loan B, (USD LIBOR + 0.75%), 8.81%, due 4/16/2021 | | | 676,645 | (f) | |
| 1,211,732
| | | Amneal Pharmaceuticals LLC, Term Loan B, (1M USD LIBOR + 3.50%), 5.31%,
due 5/4/2025 | | | 922,734
| | |
| 1,270,684
| | | Bausch Health Companies Inc., Term Loan B, (1M USD LIBOR + 3.00%), 4.92%,
due 6/2/2025 | | | 1,274,788
| | |
| 1,655,536
| | | Endo Luxembourg Finance Company I S.a.r.l., Term Loan B, (1M USD LIBOR + 4.25%),
6.06%, due 4/29/2024 | | | 1,519,782
| | |
| | 1,428,126 | | | Jaguar Holding Company II, Term Loan, (1M USD LIBOR + 2.50%), 4.29%, due 8/18/2022 | | | 1,424,555 | | |
| | | | | Mallinckrodt International Finance S.A. | | | | | |
| | 785,498 | | | Term Loan B, (3M USD LIBOR + 2.75%), 4.85%, due 9/24/2024 | | | 613,812 | | |
| | 137,199 | | | Term Loan B, (3M USD LIBOR + 3.00%), 5.18%, due 2/24/2025 | | | 106,587 | | |
| 868,568
| | | Parexel International Corporation, Term Loan B, (1M USD LIBOR + 2.75%), 4.54%,
due 9/27/2024 | | | 828,397
| | |
| | | | 7,367,300 | | |
Electronics - Electrical 8.9% | | | |
| | | | | Applied Systems, Inc. | | | | | |
| | 1,195,600 | | | First Lien Term Loan, (3M USD LIBOR + 3.00%), 5.10%, due 9/19/2024 | | | 1,187,697 | | |
| | 500,000 | | | Second Lien Term Loan, (3M USD LIBOR + 7.00%), 9.10%, due 9/19/2025 | | | 504,585 | | |
| 872,125
| | | Barracuda Networks, Inc., First Lien Term Loan, (3M USD LIBOR + 3.25%), 5.40%,
due 2/12/2025 | | | 867,494
| | |
| | 1,115,000 | | | CommScope, Inc., Term Loan B, (1M USD LIBOR + 3.25%), 5.04%, due 4/6/2026 | | | 1,092,354 | | |
| | 375,000 | | | Dell International LLC, Term Loan B, (1M USD LIBOR + 2.00%), 3.79%, due 9/19/2025 | | | 376,346 | | |
| | 760,823 | | | Dynatrace LLC, First Lien Term Loan, (1M USD LIBOR + 2.75%), 4.54%, due 8/22/2025 | | | 762,725 | | |
| 1,099,141
| | | Epicor Software Corporation, First Lien Term Loan, (1M USD LIBOR + 3.25%), 5.04%,
due 6/1/2022 | | | 1,095,019
| | |
| 490,000
| | | Go Daddy Operating Company, LLC, Term Loan, (1M USD LIBOR + 1.75%), 3.54%,
due 2/15/2024 | | | 490,279
| | |
| | | | | Hyland Software, Inc. | | | | | |
| | 846,412 | | | First Lien Term Loan, (1M USD LIBOR + 3.25%), 5.04%, due 7/1/2024 | | | 840,064 | | |
| | 460,578 | | | Second Lien Term Loan, (1M USD LIBOR + 7.00%), 8.79%, due 7/7/2025 | | | 461,154 | | |
| | 905,809 | | | Infor (US), Inc., Term Loan B6, (3M USD LIBOR + 2.75%), 4.85%, due 2/1/2022 | | | 905,809 | | |
| | 575,594 | | | Informatica LLC, Term Loan, (1M USD LIBOR + 3.25%), 5.04%, due 8/5/2022 | | | 576,417 | | |
| 554,000
| | | Lumentum Holdings, First Lien Term Loan, (1M USD LIBOR + 2.50%), 4.29%,
due 12/10/2025 | | | 554,000
| (a) | |
| | | | | McAfee, LLC | | | | | |
| | 1,430,383 | | | Term Loan B, (1M USD LIBOR + 3.75%), 5.55%, due 9/30/2024 | | | 1,429,239 | | |
| | 272,045 | | | Second Lien Term Loan, (1M USD LIBOR + 8.50%), 10.30%, due 9/29/2025 | | | 272,998 | | |
See Notes to Financial Statements
89
Schedule of Investments Floating Rate Income Fund^ (cont'd)
PRINCIPAL AMOUNT | | | | VALUE | |
$ | 200,000
| | | ON Semiconductor Corporation, Term Loan B, (1M USD LIBOR + 2.00%), 3.79%,
due 9/19/2026 | | $ | 200,772
| | |
| | | | | Optiv Security, Inc. | | | | | |
| | 901,817 | | | First Lien Term Loan, (1M USD LIBOR + 3.25%), 5.04%, due 2/1/2024 | | | 726,414 | | |
| | 425,000 | | | Second Lien Term Loan, (1M USD LIBOR + 7.25%), 9.04%, due 2/1/2025 | | | 212,500 | | |
| | | | | Project Alpha Intermediate Holding, Inc. | | | | | |
| | 457,659 | | | Term Loan B, (3M USD LIBOR + 3.50%), 5.49%, due 4/26/2024 | | | 446,790 | | |
| | 249,375 | | | Term Loan B, (3M USD LIBOR + 4.25%), 6.24%, due 4/26/2024 | | | 248,597 | | |
| 2,117,466
| | | Rackspace Hosting, Inc., First Lien Term Loan, (3M USD LIBOR + 3.00%), 5.29%,
due 11/3/2023 | | | 1,879,907
| | |
| | 356,237 | | | Riverbed Technology, Inc., Term Loan, (1M USD LIBOR + 3.25%), 5.04%, due 4/24/2022 | | | 273,736 | | |
| 200,000
| | | S2P Acquisition Borrower, Inc., Term Loan, (1M USD LIBOR + 4.00%), 5.79%,
due 8/14/2026 | | | 199,166
| | |
| 568,575
| | | Sirius Computer Solutions, Inc., Term Loan B, (3M USD LIBOR + 4.25%), 6.35%,
due 7/1/2026 | | | 569,365
| | |
| | 1,574,507 | | | Sophia, L.P., Term Loan B, (3M USD LIBOR + 3.25%), 5.35%, due 9/30/2022 | | | 1,572,539 | | |
| 218,661
| | | SS&C Technologies Holdings Europe S.A.R.L., Term Loan B4, (1M USD LIBOR + 2.25%),
4.04%, due 4/16/2025 | | | 219,026
| | |
| | | | | SS&C Technologies Inc. | | | | | |
| | 334,970 | | | Term Loan B3, (1M USD LIBOR + 2.25%), 4.04%, due 4/16/2025 | | | 335,530 | | |
| | 582,040 | | | Term Loan B5, (1M USD LIBOR + 2.25%), 4.04%, due 4/16/2025 | | | 583,425 | | |
| | 670,000 | | | Tibco Software Inc., Term Loan B, (1M USD LIBOR + 4.00%), 6.00%, due 6/30/2026 | | | 665,812 | | |
| | 407,641 | | | Vertafore, Inc., First Lien Term Loan, (1M USD LIBOR + 3.25%), 5.04%, due 7/2/2025 | | | 394,103 | | |
| | | | 19,943,862 | | |
Financial Intermediaries 2.1% | | | |
| | 668,937 | | | Citco Funding LLC, Term Loan, (1M USD LIBOR + 2.50%), 4.29%, due 9/28/2023 | | | 664,756 | (a) | |
| | | | | Edelman Financial Center, LLC | | | | | |
| | 1,052,771 | | | First Lien Term Loan, (1M USD LIBOR + 3.25%), 5.10%, due 7/21/2025 | | | 1,042,907 | | |
| | 240,000 | | | Second Lien Term Loan, (1M USD LIBOR + 6.75%), 8.60%, due 7/20/2026 | | | 228,600 | (a) | |
| 525,446
| | | Grosvenor Capital Management Holdings, LLP, Term Loan B, (1M USD LIBOR + 2.75%),
4.54%, due 3/31/2025 | | | 524,952
| | |
| | 525,681 | | | Guggenheim Partners, LLC, Term Loan, (1M USD LIBOR + 2.75%), 4.54%, due 7/21/2023 | | | 518,453 | | |
| 611,149
| | | LPL Holdings, Inc., First Lien Term Loan B, (1M USD LIBOR + 2.25%), 4.05%,
due 9/23/2024 | | | 610,770
| | |
| 354,101
| | | PI US MergerCo, Inc., First Lien Term Loan, (1M USD LIBOR + 3.25%), 5.04%,
due 1/3/2025 | | | 351,622
| | |
| 729,623
| | | Victory Capital Holdings, Inc., Term Loan B, (3M USD LIBOR + 3.25%), 5.35%,
due 7/1/2026 | | | 731,812
| | |
| | | | 4,673,872 | | |
Food & Drug Retailers 0.4% | | | |
| | 792,669 | | | Albertsons, LLC, Term Loan B8, (1M USD LIBOR + 2.75%), 4.54%, due 8/17/2026 | | | 796,482 | | |
Food Products 0.7% | | | |
| | 662,983 | | | CHG PPC Parent LLC, Term Loan B, (1M USD LIBOR + 2.75%), 4.54%, due 3/31/2025 | | | 659,668 | (a) | |
| 351,282
| | | Del Monte Foods, Inc., First Lien Term Loan, (3M USD LIBOR + 3.25%), 5.39%,
due 2/18/2021 | | | 302,103
| | |
| 579,990
| | | Nomad Foods Europe Midco Limited, Term Loan B4, (1M USD LIBOR + 2.25%), 4.16%,
due 5/15/2024 | | | 577,456
| | |
| | | | 1,539,227 | | |
See Notes to Financial Statements
90
Schedule of Investments Floating Rate Income Fund^ (cont'd)
PRINCIPAL AMOUNT | | | | VALUE | |
Food Service 0.7% | | | |
$ | 710,862
| | | 1011778 B.C. Unlimited Liability Company, Term Loan B3, (1M USD LIBOR + 2.25%),
4.04%, due 2/16/2024 | | $ | 711,395
| | |
| | 798,000 | | | Welbilt, Inc., Term Loan B, (1M USD LIBOR + 2.50%), 4.29%, due 10/23/2025 | | | 791,018 | | |
| | | | 1,502,413 | | |
Health Care 8.7% | | | |
| | | | | Acadia Healthcare Company, Inc. | | | | | |
| | 483,759 | | | Term Loan B3, (1M USD LIBOR + 2.50%), 4.29%, due 2/11/2022 | | | 484,136 | | |
| | 609,810 | | | Term Loan B4, (1M USD LIBOR + 2.50%), 4.29%, due 2/16/2023 | | | 610,286 | | |
| | 288,550 | | | Agiliti Health, Inc., Term Loan, (1M USD LIBOR + 3.00%), 5.06%, due 1/4/2026 | | | 287,468 | (a) | |
| | 1,671,600 | | | Athenahealth, Inc., Term Loan B, (3M USD LIBOR + 4.50%), 6.68%, due 2/11/2026 | | | 1,656,455 | | |
| 905,450
| | | Auris Luxembourg III S.a.r.l., Term Loan B2, (1M USD LIBOR + 3.75%), 5.54%,
due 2/27/2026 | | | 887,568
| | |
| | 674,862 | | | Concentra Inc., First Lien Term Loan, (3M USD LIBOR + 2.50%), 4.54%, due 6/1/2022 | | | 674,579 | | |
| | 530,000 | | | DaVita, Inc., Term Loan B, (1M USD LIBOR + 2.25%), 4.04%, due 8/12/2026 | | | 531,182 | | |
| | 835,000 | | | Emerald TopCo Inc, Term Loan, (1M USD LIBOR + 3.50%), 5.29%, due 7/24/2026 | | | 821,223 | (g)(h) | |
| 1,548,300
| | | Envision Healthcare Corporation, First Lien Term Loan, (1M USD LIBOR + 3.75%), 5.54%,
due 10/10/2025 | | | 1,247,589
| | |
| 628,413
| | | Gentiva Health Services, Inc., First Lien Term Loan, (1M USD LIBOR + 3.75%), 5.56%,
due 7/2/2025 | | | 626,842
| (a) | |
| 384,023
| | | Global Medical Response, Inc., Term Loan B1, (1M USD LIBOR + 3.25%), 5.10%,
due 4/28/2022 | | | 344,061
| | |
| | 970,000 | | | HCA Inc., Term Loan B12, (1M USD LIBOR + 1.75%), 3.54%, due 3/13/2025 | | | 973,938 | | |
| 1,491,217
| | | MPH Acquisition Holdings LLC, Term Loan B, (3M USD LIBOR + 2.75%), 4.85%,
due 6/7/2023 | | | 1,395,138
| | |
| | 340,000 | | | Navicure, Inc., Term Loan B, (USD LIBOR + 4.00%), due 10/22/2026 | | | 338,725 | (g)(h) | |
| 1,159,150
| | | Ortho-Clinical Diagnostics SA, Term Loan B, (3M USD LIBOR + 3.25%), 5.31%,
due 6/30/2025 | | | 1,106,026
| | |
| | | | | Pearl Intermediate Parent LLC | | | | | |
| | 829,015 | | | First Lien Term Loan, (1M USD LIBOR + 2.75%), 4.54%, due 2/14/2025 | | | 804,832 | | |
| | 232,727 | | | Second Lien Term Loan, (1M USD LIBOR + 6.25%), 8.04%, due 2/13/2026 | | | 226,909 | | |
| 942,137
| | | Project Ruby Ultimate Parent Corp., Term Loan B, (1M USD LIBOR + 3.50%), 5.29%,
due 2/9/2024 | | | 925,649
| | |
| | 529,279 | | | Select Medical Corporation, Term Loan B, (USD LIBOR + 2.50%), 4.58%, due 3/6/2025 | | | 525,971 | (f) | |
| | | | | Sound Inpatient Physicians | | | | | |
| | 819,625 | | | First Lien Term Loan, (1M USD LIBOR + 2.75%), 4.54%, due 6/27/2025 | | | 816,043 | | |
| | 215,000 | | | Second Lien Term Loan, (1M USD LIBOR + 6.75%), 8.54%, due 6/26/2026 | | | 213,925 | | |
| 1,399,945
| | | Team Health Holdings, Inc., First Lien Term Loan, (1M USD LIBOR + 2.75%), 4.54%,
due 2/6/2024 | | | 1,074,458
| | |
| | | | | Tivity Health Inc. | | | | | |
| | 297,000 | | | Term Loan A, (1M USD LIBOR + 4.25%), 6.04%, due 3/8/2024 | | | 295,886 | | |
| | 961,499 | | | Term Loan B, (1M USD LIBOR + 5.25%), 7.04%, due 3/6/2026 | | | 961,499 | (a) | |
| | 1,666,668 | | | Verscend Holding Corp., Term Loan B, (1M USD LIBOR + 4.50%), 6.29%, due 8/27/2025 | | | 1,666,668 | | |
| | | | 19,497,056 | | |
Industrial Equipment 2.5% | | | |
| 1,270,400
| | | Brookfield WEC Holdings Inc., First Lien Term Loan, (1M USD LIBOR + 3.50%), 5.29%,
due 8/1/2025 | | | 1,261,405
| | |
| 819,879
| | | Circor International, Inc., First Lien Term Loan, (1M USD LIBOR + 3.50%), 5.42%,
due 12/11/2024 | | | 811,885
| | |
| 603,488
| | | Crosby US Acquisition Corp., Term Loan B, (3M USD LIBOR + 4.75%), 6.60%,
due 6/26/2026 | | | 572,559
| | |
See Notes to Financial Statements
91
Schedule of Investments Floating Rate Income Fund^ (cont'd)
PRINCIPAL AMOUNT | | | | VALUE | |
$ | 617,567
| | | Filtration Group Corporation, First Lien Term Loan, (1M USD LIBOR + 3.00%), 4.79%,
due 3/29/2025 | | $ | 616,505
| | |
| | 592,518 | | | Gardner Denver, Inc., Term Loan B, (1M USD LIBOR + 2.75%), 4.54%, due 7/30/2024 | | | 593,383 | | |
| | 559,221 | | | Gates Global LLC, Term Loan B, (1M USD LIBOR + 2.75%), 4.54%, due 4/1/2024 | | | 547,013 | | |
| | 675,000 | | | Granite Holdings US Acquisition Co., Term Loan B, (USD LIBOR + 5.25%), due 9/25/2026 | | | 637,875 | (a)(g)(h) | |
| | 399,375 | | | Hyster-Yale Group, Inc., Term Loan B, (1M USD LIBOR + 3.25%), 5.04%, due 5/30/2023 | | | 393,883 | | |
| | 183,848 | | | Sundyne US Purchaser, Inc., Term Loan, (1M USD LIBOR + 4.00%), 5.79%, due 5/15/2026 | | | 181,091 | (a) | |
| | | | 5,615,599 | | |
Leisure Goods - Activities - Movies 4.2% | | | |
| 1,368,125
| | | AMC Entertainment Holdings, Inc., Term Loan B, (6M USD LIBOR + 3.00%), 5.23%,
due 4/22/2026 | | | 1,366,798
| | |
| | 658,766 | | | CityCenter Holdings, LLC, Term Loan B, (1M USD LIBOR + 2.25%), 4.04%, due 4/18/2024 | | | 658,561 | | |
| | 907,351 | | | Crown Finance US, Inc., Term Loan, (1M USD LIBOR + 2.25%), 4.04%, due 2/28/2025 | | | 894,467 | | |
| | 1,065,000 | | | Delta 2 (LUX) S.a.r.l., Term Loan, (1M USD LIBOR + 2.50%), 4.29%, due 2/1/2024 | | | 1,047,694 | | |
| 1,194,467
| | | Emerald Expositions Holding, Inc., Term Loan B, (1M USD LIBOR + 2.75%), 4.54%,
due 5/22/2024 | | | 1,128,772
| (a) | |
| | 785,000 | | | Match Group Inc., Term Loan B, (3M USD LIBOR + 2.50%), 4.44%, due 11/16/2022 | | | 786,962 | (a) | |
| | 406,566 | | | Merlin Entertainments PLC, Term Loan B, (USD LIBOR + 3.25%), due 10/17/2026 | | | 407,920 | (g)(h) | |
| | 555,000 | | | NASCAR Holdings, Inc, Term Loan B, (1M USD LIBOR + 2.75%), 4.63%, due 10/19/2026 | | | 557,514 | | |
| 1,353,242
| | | SeaWorld Parks & Entertainment, Inc., Term Loan B5, (1M USD LIBOR + 3.00%), 4.79%,
due 3/31/2024 | | | 1,347,207
| | |
| 608,475
| | | Twin River Worldwide Holdings, Inc., Term Loan B, (1M USD LIBOR + 2.75%), 4.79%,
due 5/10/2026 | | | 608,475
| | |
| | 550,000 | | | WMG Acquisition Corp., Term Loan F, (1M USD LIBOR + 2.13%), 3.91%, due 11/1/2023 | | | 549,648 | | |
| | | | 9,354,018 | | |
Lodging & Casinos 3.4% | | | |
| 693,034
| | | Alterra Mountain Company, Term Loan B1, (1M USD LIBOR + 3.00%), 4.79%,
due 7/31/2024 | | | 693,609
| | |
| 610,441
| | | Caesars Resort Collection, LLC, First Lien Term Loan B, (1M USD LIBOR + 2.75%), 4.54%,
due 12/23/2024 | | | 600,967
| | |
| 971,085
| | | Golden Entertainment, Inc., First Lien Term Loan, (1M USD LIBOR + 3.00%), 4.81%,
due 10/21/2024 | | | 971,697
| | |
| | 384,150 | | | GVC Holdings PLC, Term Loan B2, (6M USD LIBOR + 2.25%), 4.45%, due 3/29/2024 | | | 383,912 | | |
| 1,417,908
| | | Mohegan Tribal Gaming Authority, Term Loan B, (1M USD LIBOR + 4.00%), 5.79%,
due 10/13/2023 | | | 1,309,353
| | |
| | 565,745 | | | PCI Gaming Authority, Term Loan, (1M USD LIBOR + 3.00%), 4.79%, due 5/29/2026 | | | 568,930 | | |
| 461,513
| | | Penn National Gaming, Inc., First Lien Term Loan B, (1M USD LIBOR + 2.25%), 4.04%,
due 10/15/2025 | | | 462,897
| | |
| 1,213,392
| | | Scientific Games International, Inc., Term Loan B5, (1M USD LIBOR + 2.75%), 4.54%,
due 8/14/2024 | | | 1,198,601
| | |
| 874,853
| | | Stars Group Holdings B.V. (The), Term Loan, (3M USD LIBOR + 3.50%), 5.60%,
due 7/10/2025 | | | 878,064
| | |
| | 605,053 | | | Station Casinos LLC, Term Loan B, (1M USD LIBOR + 2.50%), 4.29%, due 6/8/2023 | | | 605,307 | | |
| | | | 7,673,337 | | |
Nonferrous Metals - Minerals 0.4% | | | |
| | 795,081 | | | Covia Holdings Corporation, Term Loan, (3M USD LIBOR + 4.00%), 6.04%, due 6/1/2025 | | | 552,582 | | |
| | 398,979 | | | U.S. Silica Company, Term Loan B, (1M USD LIBOR + 4.00%), 5.81%, due 5/1/2025 | | | 329,014 | | |
| | | | 881,596 | | |
See Notes to Financial Statements
92
Schedule of Investments Floating Rate Income Fund^ (cont'd)
PRINCIPAL AMOUNT | | | | VALUE | |
Oil & Gas 5.2% | | | |
$ | 1,316,700 | | | BCP Raptor II, LLC, First Lien Term Loan, (1M USD LIBOR + 4.75%), 6.54%, due 11/3/2025 | | $ | 1,153,758 | | |
| | 1,617,864 | | | BCP Raptor, LLC, Term Loan B, (1M USD LIBOR + 4.25%), 6.04%, due 6/24/2024 | | | 1,417,654 | | |
| 1,486,188
| | | BCP Renaissance Parent LLC, Term Loan B, (2M USD LIBOR + 3.50%), 5.36%,
due 10/31/2024 | | | 1,340,363
| | |
| | 675,450 | | | Brazos Delaware II, LLC, Term Loan B, (1M USD LIBOR + 4.00%), 5.85%, due 5/21/2025 | | | 577,510 | | |
| | 630,000 | | | Buckeye Partners, L.P., Term Loan B, (USD LIBOR + 2.75%), due 11/15/2026 | | | 632,760 | (g)(h) | |
| 735,000
| | | Gavilan Resources, LLC, Second Lien Term Loan, (1M USD LIBOR + 6.00%), 7.79%,
due 3/1/2024 | | | 309,310
| | |
| 887,775
| | | Lower Cadence Holdings LLC, Term Loan B, (1M USD LIBOR + 4.00%), 5.80%,
due 5/22/2026 | | | 823,411
| | |
| 1,630,792
| | | Lucid Energy Group II Borrower, LLC, First Lien Term Loan, (1M USD LIBOR + 3.00%),
4.79%, due 2/17/2025 | | | 1,426,943
| | |
| 1,358,303
| | | Medallion Midland Acquisition, LLC, First Lien Term Loan, (1M USD LIBOR + 3.25%),
5.04%, due 10/30/2024 | | | 1,273,409
| | |
| 861,300
| | | NorthRiver Midstream Finance LP, Term Loan B, (3M USD LIBOR + 3.25%), 5.35%,
due 10/1/2025 | | | 846,537
| | |
| | 824,352 | | | Prairie ECI Acquiror LP, Term Loan B, (3M USD LIBOR + 4.75%), 6.85%, due 3/11/2026 | | | 802,366 | | |
| 1,287,000
| | | Traverse Midstream Partners LLC, Term Loan, (1M USD LIBOR + 4.00%), 5.80%,
due 9/27/2024 | | | 1,126,125
| | |
| | | | 11,730,146 | | |
Property & Casualty Insurance 1.4% | | | |
| | 937,288 | | | AssuredPartners, Inc., First Lien Term Loan, (1M USD LIBOR + 3.50%), 5.29%, due 10/22/2024 | | | 919,911 | | |
| | | | | Asurion LLC | | | | | |
| | 1,539,722 | | | Term Loan B7, (1M USD LIBOR + 3.00%), 4.79%, due 11/3/2024 | | | 1,540,692 | | |
| | 705,000 | | | Second Lien Term Loan, (1M USD LIBOR + 6.50%), 8.29%, due 8/4/2025 | | | 707,820 | | |
| | | | 3,168,423 | | |
Publishing 0.1% | | | |
| 269,875
| | | Harland Clarke Holdings Corp., Term Loan B7, (3M USD LIBOR + 4.75%), 6.85%,
due 11/3/2023 | | | 209,490
| | |
Radio & Television 2.1% | | | |
| 525,000
| | | Cumulus Media New Holdings Inc., Term Loan B, (1M USD LIBOR + 3.75%), 5.54%,
due 3/31/2026 | | | 527,079
| | |
| | 910,000 | | | Diamond Sports Group, LLC, Term Loan, (1M USD LIBOR + 3.25%), 5.08%, due 8/24/2026 | | | 913,412 | | |
| | 1,279,138 | | | iHeartCommunications, Inc., Term Loan, (1M USD LIBOR + 4.00%), 6.03%, due 5/1/2026 | | | 1,282,733 | | |
| | 125,382 | | | Mission Broadcasting, Inc., Term Loan B3, (1M USD LIBOR + 2.25%), 4.28%, due 1/17/2024 | | | 125,500 | | |
| | 630,994 | | | Nexstar Broadcasting, Inc., Term Loan B3, (1M USD LIBOR + 2.25%), 4.05%, due 1/17/2024 | | | 631,587 | | |
| 1,316,908
| | | Univision Communications Inc., Term Loan C5, (1M USD LIBOR + 2.75%), 4.54%,
due 3/15/2024 | | | 1,268,669
| (a) | |
| | | | 4,748,980 | | |
Retailers (except food & drug) 3.2% | | | |
| | 2,373,041 | | | Bass Pro Group, LLC, Term Loan B, (1M USD LIBOR + 5.00%), 6.79%, due 9/25/2024 | | | 2,286,164 | | |
| 1,379,972
| | | BJ's Wholesale Club, Inc., First Lien Term Loan, (1M USD LIBOR + 2.75%), 4.67%,
due 2/3/2024 | | | 1,379,737
| | |
| | | | | EG America LLC | | | | | |
| | 1,222,892 | | | Term Loan, (3M USD LIBOR + 4.00%), 6.10%, due 2/7/2025 | | | 1,177,951 | | |
| | 100,494 | | | Second Lien Term Loan, (3M USD LIBOR + 8.00%), 10.10%, due 4/20/2026 | | | 94,590 | | |
See Notes to Financial Statements
93
Schedule of Investments Floating Rate Income Fund^ (cont'd)
PRINCIPAL AMOUNT | | | | VALUE | |
$ | 630,400 | | | EG Group Limited, Term Loan B, (3M USD LIBOR + 4.00%), 6.10%, due 2/7/2025 | | $ | 607,233 | | |
| | 1,684,304 | | | Staples, Inc., Term Loan, (3M USD LIBOR + 5.00%), 7.12%, due 4/16/2026 | | | 1,658,551 | | |
| | | | 7,204,226 | | |
Steel 1.2% | | | |
| | 1,295,666 | | | Big River Steel LLC, Term Loan B, (3M USD LIBOR + 5.00%), 7.10%, due 8/23/2023 | | | 1,283,526 | | |
| 656,124
| | | MRC Global (US) Inc., First Lien Term Loan B, (1M USD LIBOR + 3.00%), 4.79%,
due 9/20/2024 | | | 646,283
| (a) | |
| | 916,258 | | | TMS International Corp., Term Loan B2, (USD LIBOR + 2.75%), 4.62%, due 8/14/2024 | | | 868,154 | (a)(f) | |
| | | | 2,797,963 | | |
Surface Transport 0.4% | | | |
| | 924,844 | | | Hertz Corporation, (The), Term Loan B, (1M USD LIBOR + 2.75%), 4.54%, due 6/30/2023 | | | 924,558 | | |
Telecommunications 6.5% | | | |
| | 1,856,734 | | | CenturyLink, Inc., Term Loan B, (1M USD LIBOR + 2.75%), 4.54%, due 1/31/2025 | | | 1,836,552 | | |
| | 1,535,000 | | | Connect Finco Sarl, Term Loan B, (USD LIBOR + 4.50%), due 9/23/2026 | | | 1,510,532 | (g)(h) | |
| 721,671
| | | Consolidated Communications, Inc., Term Loan B, (1M USD LIBOR + 3.00%), 4.79%,
due 10/4/2023 | | | 668,224
| | |
| 1,281,251
| | | Frontier Communications Corp., Term Loan B1, (1M USD LIBOR + 3.75%), 5.54%,
due 6/15/2024 | | | 1,275,165
| | |
| | 1,659,087 | | | GTT Communications, Inc., Term Loan B, (1M USD LIBOR + 2.75%), 4.54%, due 5/31/2025 | | | 1,226,696 | | |
| | | | | Intelsat Jackson Holdings S.A. | | | | | |
| | 2,070,000 | | | Term Loan B3, (6M USD LIBOR + 3.75%), 5.68%, due 11/27/2023 | | | 2,066,129 | | |
| | 145,000 | | | Term Loan B4, (6M USD LIBOR + 4.50%), 6.43%, due 1/2/2024 | | | 146,450 | | |
| | 240,000 | | | Iridium Satellite LLC, Term Loan, (USD LIBOR + 3.75%), due 10/17/2026 | | | 241,275 | (g)(h) | |
| | 865,000 | | | Level 3 Financing Inc., Term Loan B, (1M USD LIBOR + 2.25%), 4.04%, due 2/22/2024 | | | 865,649 | | |
| 1,212,632
| | | MTN Infrastructure TopCo Inc, First Lien Term Loan B, (1M USD LIBOR + 3.00%), 4.79%,
due 11/15/2024 | | | 1,196,964
| | |
| | 2,212,274 | | | Sprint Communications, Inc., Term Loan B, (1M USD LIBOR + 3.00%), 4.81%, due 2/2/2024 | | | 2,197,518 | | |
| | | | | Syniverse Holdings, Inc. | | | | | |
| | 738,301 | | | First Lien Term Loan, (3M USD LIBOR + 5.00%), 6.92%, due 3/9/2023 | | | 662,994 | | |
| | 265,000 | | | Second Lien Term Loan, (1M USD LIBOR + 9.00%), 10.92%, due 3/11/2024 | | | 200,340 | | |
| | 600,501 | | | Telesat Canada, Term Loan B4, (3M USD LIBOR + 2.50%), 4.61%, due 11/17/2023 | | | 600,051 | | |
| | | | 14,694,539 | | |
Utilities 4.4% | | | |
| | 1,296,750 | | | Blackstone CQP Holdco LP, Term Loan B, (3M USD LIBOR + 3.50%), 5.66%, due 9/30/2024 | | | 1,289,462 | | |
| | 847,875 | | | Calpine Corporation, Term Loan B9, (3M USD LIBOR + 2.75%), 4.86%, due 4/5/2026 | | | 848,197 | | |
| 473,059
| | | Carroll County Energy, LLC, Term Loan B, (3M USD LIBOR + 3.50%), 5.60%,
due 2/15/2026 | | | 473,849
| | |
| 767,889
| | | Compass Power Generation LLC, Term Loan B, (1M USD LIBOR + 3.50%), 5.29%,
due 12/20/2024 | | | 768,611
| | |
| | 976,511 | | | Eastern Power, LLC, Term Loan B, (1M USD LIBOR + 3.75%), 5.54%, due 10/2/2023 | | | 973,464 | | |
| 1,178,706
| | | Edgewater Generation, L.L.C., Term Loan, (1M USD LIBOR + 3.75%), 5.54%,
due 12/13/2025 | | | 1,127,432
| (g)(h) | |
| | 1,006,792 | | | Kestrel Acquisition, LLC, Term Loan B, (1M USD LIBOR + 4.25%), 6.04%, due 6/2/2025 | | | 926,248 | | |
| | | | | Lonestar II Generation Holdings LLC | | | | | |
| | 289,453 | | | Term Loan B, (1M USD LIBOR + 5.00%), 6.79%, due 4/20/2026 | | | 289,453 | (a) | |
| | 34,821 | | | Term Loan C, (1M USD LIBOR + 5.00%), 6.79%, due 4/20/2026 | | | 34,821 | (a) | |
See Notes to Financial Statements
94
Schedule of Investments Floating Rate Income Fund^ (cont'd)
PRINCIPAL AMOUNT | | | | VALUE | |
$ | 1,261,463
| | | Nautilus Power, LLC, Term Loan B, (1M USD LIBOR + 4.25%), 6.04%, due 5/16/2024
Revere Power, LLC | | $ | 1,239,388
| (a) | |
| | 82,450 | | | Term Loan C, (3M USD LIBOR + 4.25%), 6.35%, due 3/29/2026 | | | 80,870 | | |
| | 529,085 | | | Term Loan B, (3M USD LIBOR + 4.25%), 6.35%, due 3/29/2026 | | | 518,943 | | |
| | 985,000 | | | Talen Energy Supply, LLC, Term Loan B, (1M USD LIBOR + 3.75%), 5.69%, due 7/8/2026 | | | 972,688 | (a) | |
| 355,000
| | | West Deptford Energy Holdings, LLC, Term Loan B, (1M USD LIBOR + 3.75%), 5.54%,
due 7/29/2026 | | | 353,225
| (a) | |
| | | | 9,896,651 | | |
| | | | | Total Loan Assignments (Cost $208,084,373) | | | 202,106,648 | | |
Corporate Bonds 3.5% | | | |
Business Equipment & Services 0.2% | | | |
| | 333,427 | | | Brock Holdings Notes 2022, 15.00%, due 4/24/2022 | | | 333,427 | (a)(b)(c) | |
Electric - Integrated 0.1% | | | |
| | 325,000 | | | Talen Energy Supply LLC, 6.63%, due 1/15/2028 | | | 313,625 | (i) | |
Media Content 0.6% | | | |
| | 510,000 | | | Diamond Sports Group LLC/Diamond Sports Finance Co., 5.38%, due 8/15/2026 | | | 532,312 | (i) | |
| | 195,762 | | | iHeartCommunications, Inc., 6.38%, due 5/1/2026 | | | 210,689 | | |
| | 720,000 | | | Univision Communications, Inc., 5.13%, due 2/15/2025 | | | 702,900 | (i) | |
| | | | 1,445,901 | | |
Medical Products 0.2% | | | |
| | 565,000 | | | Ortho-Clinical Diagnostics, Inc./Ortho-Clinical Diagnostics SA, 6.63%, due 5/15/2022 | | | 545,931 | (i) | |
Packaging 0.7% | | | |
| | 1,190,000 | | | Berry Global Escrow Corp., 4.88%, due 7/15/2026 | | | 1,250,987 | (i) | |
| | 305,000 | | | Trivium Packaging Finance BV, 5.50%, due 8/15/2026 | | | 319,869 | (i) | |
| | | | 1,570,856 | | |
Pharmaceuticals 0.3% | | | |
| | 530,000 | | | Bausch Health Cos., Inc., 5.75%, due 8/15/2027 | | | 575,547 | (i) | |
Specialty Retail 0.2% | | | |
| | 415,000 | | | eG Global Finance PLC, 8.50%, due 10/30/2025 | | | 435,750 | (i) | |
Support - Services 0.4% | | | |
| | 121,000 | | | Prime Security Services Borrower LLC/Prime Finance, Inc., 9.25%, due 5/15/2023 | | | 127,292 | (i) | |
| | 655,000 | | | Staples, Inc., 7.50%, due 4/15/2026 | | | 682,838 | (i) | |
| | | | 810,130 | | |
See Notes to Financial Statements
95
Schedule of Investments Floating Rate Income Fund^ (cont'd)
PRINCIPAL AMOUNT | | | | VALUE | |
Technology Hardware & Equipment 0.2% | | | |
| | | | | CommScope Finance LLC | | | | | |
$ | 235,000 | | | 5.50%, due 3/1/2024 | | $ | 238,172 | (i) | |
| | 175,000 | | | 6.00%, due 3/1/2026 | | | 179,813 | (i) | |
| | | | 417,985 | | |
Telecom - Wireline Integrated & Services 0.6% | | | |
| | 535,000 | | | Altice Financing SA, 6.63%, due 2/15/2023 | | | 549,552 | (i) | |
| | 830,000 | | | Altice France SA, 5.50%, due 1/15/2028 | | | 845,563 | (i) | |
| | | | 1,395,115 | | |
| | | | | Total Corporate Bonds (Cost $7,605,455) | | | 7,844,267 | | |
Asset-Backed Securities 2.7% | | | |
| | 390,000 | | | Apidos CLO, Ser. 2015-22A, Class D, (3M USD LIBOR + 6.00%), 7.97%, due 10/20/2027 | | | 361,333 | (d)(i) | |
| 500,000
| | | Ares XLIII CLO Ltd., Ser. 2017-43A, Class E, (3M USD LIBOR + 6.47%), 8.47%,
due 10/15/2029 | | | 450,761
| (d)(i) | |
| 400,000
| | | BlueMountain CLO Ltd., Ser. 2018-2A, Class E, (3M USD LIBOR + 6.05%), 8.21%,
due 8/15/2031 | | | 341,290
| (d)(i) | |
| | | | | Magnetite CLO Ltd. | | | | | |
| | 500,000 | | | Ser. 2014-8A, Class ER2, (3M USD LIBOR + 5.65%), 7.65%, due 4/15/2031 | | | 457,904 | (d)(i) | |
| | 385,000 | | | Ser. 2015-15A, Class ER, (3M USD LIBOR + 5.20%), 7.14%, due 7/25/2031 | | | 319,621 | (d)(i) | |
| | 700,000 | | | Ser. 2015-12A, Class ER, (3M USD LIBOR + 5.68%), 7.68%, due 10/15/2031 | | | 622,886 | (d)(i) | |
| 1,000,000
| | | Palmer Square CLO Ltd., Ser. 2015-1A, Class DR2, (3M USD LIBOR + 6.25%), 8.40%,
due 5/21/2029 | | | 921,738
| (d)(i) | |
| | 600,000 | | | Parallel Ltd., Ser. 2018-1A, Class C, (3M USD LIBOR + 2.80%), 4.77%, due 4/20/2031 | | | 532,825 | (d)(i) | |
| 1,250,000
| | | TCI-Flatiron CLO Ltd., Ser. 2016-1A, Class ER, (3M USD LIBOR + 6.90%), 8.90%,
due 7/17/2028 | | | 1,178,315
| (d)(i) | |
| 1,000,000
| | | TRESTLES CLO Ltd., Ser. 2017-1A, Class D, (3M USD LIBOR + 6.68%), 8.62%,
due 7/25/2029 | | | 949,258
| (d)(i) | |
| | | | | Total Asset-Backed Securities (Cost $6,651,666) | | | 6,135,931 | | |
NUMBER OF SHARES | | | | | |
Short-Term Investments 6.0% | | | |
Investment Companies 6.0% | | | |
| 13,497,766
| | | State Street Institutional U.S. Government Money Market Fund Premier Class, 1.75%(j)
(Cost $13,497,766) | | | 13,497,766
| (k) | |
| | | | | Total Investments 102.7% (Cost $237,339,732) | | | 230,932,197 | | |
| | | | | Liabilities Less Other Assets (2.7)% | | | (5,989,801 | )(l) | |
| | | | | Net Assets 100.0% | | $ | 224,942,396 | | |
* Non-income producing security.
(a) Value determined using significant unobservable inputs.
(b) Illiquid security.
(c) Security fair valued as of October 31, 2019 in accordance with procedures approved by the Board of Trustees. Total value of all such securities at October 31, 2019 amounted to $769,827, which represents 0.3% of net assets of the Fund.
See Notes to Financial Statements
96
Schedule of Investments Floating Rate Income Fund^ (cont'd)
(d) Variable or floating rate security. The interest rate shown was the current rate as of October 31, 2019 and changes periodically.
(e) Represents less than 0.05% of net assets of the Fund.
(f) The stated interest rate represents the weighted average interest rate at October 31, 2019 of the underlying contracts within the Loan Assignment. Interest rates on the underlying contracts are primarily determined by reference to the indicated base lending rate and spread, which are indicated in the security description, and the reset period, which is generally weekly, monthly or quarterly.
(g) All or a portion of this security was purchased on a delayed delivery basis.
(h) All or a portion of this security has not settled as of October 31, 2019 and thus may not have an interest rate in effect. Interest rates do not take effect until settlement.
(i) Securities were purchased under Rule 144A of the Securities Act of 1933, as amended, or are otherwise restricted and, unless registered under the Securities Act of 1933 or exempted from registration, may only be sold to qualified institutional investors or may have other restrictions on resale. At October 31, 2019, these securities amounted to $13,436,082, which represents 6.0% of net assets of the Fund. Securities denoted with (i) but without (b), if any, have been deemed by the investment manager to be liquid.
(j) Represents 7-day effective yield as of October 31, 2019.
(k) All or a portion of this security is segregated in connection with obligations for delayed delivery securities with a total value of $13,497,766.
(l) As of October 31, 2019, the value of unfunded loan commitments was $53,612 of the Fund (see Note A of Notes to Financial Statements).
The following is a summary, categorized by Level (see Note A of Notes to Financial Statements), of inputs used to value the Fund's investments as of October 31, 2019:
Asset Valuation Inputs
| | | Level 1 | | Level 2 | | Level 3(b) | | Total | |
Investments: | |
Common Stocks | |
Business Equipment & Services | | $ | — | | | $ | — | | | $ | 436,400 | | | $ | 436,400 | | |
| Other Common Stocks(a) | | | 911,185 | | | | — | | | | — | | | | 911,185 | | |
Total Common Stocks | | | 911,185 | | | | — | | | | 436,400 | | | | 1,347,585 | | |
Loan Assignments | |
Aerospace & Defense | | | — | | | | 1,304,019 | | | | 1,016,148 | | | | 2,320,167 | | |
Electronics—Electrical | | | — | | | | 19,389,862 | | | | 554,000 | | | | 19,943,862 | | |
Financial Intermediaries | | | — | | | | 3,780,516 | | | | 893,356 | | | | 4,673,872 | | |
Food Products | | | — | | | | 879,559 | | | | 659,668 | | | | 1,539,227 | | |
Health Care | | | — | | | | 17,621,247 | | | | 1,875,809 | | | | 19,497,056 | | |
Industrial Equipment | | | — | | | | 4,796,633 | | | | 818,966 | | | | 5,615,599 | | |
Leisure Goods—Activities—Movies | | | — | | | | 7,438,284 | | | | 1,915,734 | | | | 9,354,018 | | |
Radio & Television | | | — | | | | 3,480,311 | | | | 1,268,669 | | | | 4,748,980 | | |
See Notes to Financial Statements
97
Schedule of Investments Floating Rate Income Fund^ (cont'd)
Asset Valuation Inputs
| | | Level 1 | | Level 2 | | Level 3(b) | | Total | |
Steel | | $ | — | | | $ | 1,283,526 | | | $ | 1,514,437 | | | $ | 2,797,963 | | |
Utilities | | | — | | | | 7,007,076 | | | | 2,889,575 | | | | 9,896,651 | | |
| Other Loan Assignments(a) | | | — | | | | 121,719,253 | | | | — | | | | 121,719,253 | | |
Total Loan Assignments | | | — | | | | 188,700,286 | | | | 13,406,362 | | | | 202,106,648 | | |
Corporate Bonds | |
Business Equipment & Services | | | — | | | | — | | | | 333,427 | | | | 333,427 | | |
| Other Corporate Bonds(a) | | | — | | | | 7,510,840 | | | | — | | | | 7,510,840 | | |
Total Corporate Bonds | | | — | | | | 7,510,840 | | | | 333,427 | | | | 7,844,267 | | |
Asset-Backed Securities | | | — | | | | 6,135,931 | | | | — | | | | 6,135,931 | | |
Short-Term Investments | | | — | | | | 13,497,766 | | | | — | | | | 13,497,766 | | |
Total Investments | | $ | 911,185 | | | $ | 215,844,823 | | | $ | 14,176,189 | | | $ | 230,932,197 | | |
(a) The Schedule of Investments provides information on the industry or sector categorization for the portfolio.
(b) The following is a reconciliation between the beginning and ending balances of investments in which unobservable inputs (Level 3) were used in determining value:
(000's omitted) | | Beginning
balance, as
of 11/1/2018 | | Accrued
discounts/
(premiums) | | Realized
gain/
(loss) | | Change
in unrealized
appreciation/
(depreciation) | | Purchases | | Sales | | Transfers
into
Level 3 | | Transfers
out of
Level 3 | | Balance,
as of
10/31/2019 | | Net change
in unrealized
appreciation/
(depreciation)
from
investments
still held at
10/31/2019 | |
Investments in
Securities: | |
| Common Stocks(c) | |
Business
Equipment &
Services | | $ | 436 | | | $ | — | | | $ | — | | | $ | — | | | $ | — | | | $ | — | | | $ | — | | | $ | — | | | $ | 436 | | | $ | — | | |
| Loan Assignments(d) | |
Aerospace &
Defense | | | — | | | | — | | | | — | | | | 5 | | | | 1,017 | | | | (6 | ) | | | — | | | | — | | | | 1,016 | | | | 5 | | |
Building &
Development | | | 1,762 | | | | — | | | | (3 | ) | | | (2 | ) | | | — | | | | (658 | ) | | | — | | | | (1,099 | ) | | | — | | | | — | | |
Business
Equipment &
Services | | | 1,026 | | | | — | | | | — | | | | — | | | | — | | | | — | | | | — | | | | (1,026 | ) | | | — | | | | — | | |
Chemicals &
Plastics | | | 149 | | | | — | | | | (11 | ) | | | — | | | | — | | | | (138 | ) | | | — | | | | — | | | | — | | | | — | | |
Electronics
Electrical | | | 802 | | | | — | | | | (2 | ) | | | — | | | | — | | | | (246 | ) | | | — | | | | — | | | | 554 | | | | — | | |
See Notes to Financial Statements
98
Schedule of Investments Floating Rate Income Fund^ (cont'd)
(000's omitted) | | Beginning
balance, as
of 11/1/2018 | | Accrued
discounts/
(premiums) | | Realized
gain/
(loss) | | Change
in unrealized
appreciation/
(depreciation) | | Purchases | | Sales | | Transfers
into
Level 3 | | Transfers
out of
Level 3 | | Balance,
as of
10/31/2019 | | Net change
in unrealized
appreciation/
(depreciation)
from
investments
still held at
10/31/2019 | |
Financial
Intermediaries | | $ | 560 | | | $ | — | | | $ | (28 | ) | | $ | (14 | ) | | $ | 238 | | | $ | (868 | ) | | $ | 1,005 | | | $ | — | | | $ | 893 | | | $ | (14 | ) | |
Food Products | | | 882 | | | | — | | | | — | | | | (1 | ) | | | — | | | | (221 | ) | | | — | | | | — | | | | 660 | | | | (1 | ) | |
Food Service | | | 1,137 | | | | — | | | | — | | | | — | | | | — | | | | — | | | | — | | | | (1,137 | ) | | | — | | | | — | | |
Health Care | | | 233 | | | | 2 | | | | 2 | | | | 16 | | | | 1,913 | | | | (57 | ) | | | — | | | | (233 | ) | | | 1,876 | | | | 16 | | |
Industrial
Equipment | | | 1,000 | | | | — | | | | (27 | ) | | | (21 | ) | | | 1,331 | | | | (1,464 | ) | | | — | | | | — | | | | 819 | | | | (22 | ) | |
Leisure Goods—
Activities—
Movies | | | 789 | | | | 1 | | | | (43 | ) | | | (60 | ) | | | 546 | | | | (1,888 | ) | | | 2,571 | | | | — | | | | 1,916 | | | | (60 | ) | |
Lodging &
Casinos | | | 2,074 | | | | — | | | | (4 | ) | | | (108 | ) | | | — | | | | (1,962 | ) | | | — | | | | — | | | | — | | | | — | | |
Oil & Gas | | | 1,310 | | | | — | | | | — | | | | — | | | | — | | | | — | | | | — | | | | (1,310 | ) | | | — | | | | — | | |
Radio &
Television | | | — | | | | 4 | | | | (109 | ) | | | 74 | | | | — | | | | (1,808 | ) | | | 3,108 | | | | — | | | | 1,269 | | | | 74 | | |
Retailers
(except food &
drug) | | | 241 | | | | — | | | | (12 | ) | | | 2 | | | | — | | | | (231 | ) | | | — | | | | — | | | | — | | | | — | | |
Steel | | | 2,389 | | | | — | | | | (6 | ) | | | (58 | ) | | | — | | | | (811 | ) | | | — | | | | — | | | | 1,514 | | | | (58 | ) | |
Utilities | | | 652 | | | | 3 | | | | (33 | ) | | | (36 | ) | | | 2,657 | | | | (1,851 | ) | | | 1,498 | | | | — | | | | 2,890 | | | | (36 | ) | |
| Corporate Bonds(c) | |
Business
Equipment &
Services | | | 288 | | | | — | | | | — | | | | — | | | | 355 | | | | (310 | ) | | | — | | | | — | | | | 333 | | | | — | | |
Total | | $ | 15,730 | | | $ | 10 | | | $ | (276 | ) | | $ | (203 | ) | | $ | 8,057 | | | $ | (12,519 | ) | | $ | 8,182 | | | $ | (4,805 | ) | | $ | 14,176 | | | $ | (96 | ) | |
(c) As of the year ended October 31, 2019, these investments were valued in accordance with procedures approved by the Board of Trustees. These investments did not have a material impact on the Fund's net assets and, therefore, disclosure of unobservable inputs used in formulating valuations is not presented.
(d) Securities categorized as Level 3 were valued based on a single quotation obtained from a dealer. The Fund does not have access to unobservable inputs and therefore cannot disclose such inputs used in formulating such quotation.
^ A balance indicated with a "—", reflects either a zero balance or an amount that rounds to less than 1.
See Notes to Financial Statements
99
Schedule of Investments High Income Bond Fund^ October 31, 2019
PRINCIPAL AMOUNT | | | | VALUE | |
| Loan Assignments(a) 4.8% | | | |
Building & Development 0.2% | | | |
$ | 5,740,002 | | | Forterra Finance, LLC, Term Loan B, (1M USD LIBOR + 3.00%), 4.79%, due 10/25/2023 | | $ | 5,406,393 | (b)(c) | |
Cable & Satellite Television 0.3% | | | |
| | 7,897,731 | | | Altice France S.A., Term Loan B13, (1M USD LIBOR + 4.00%), 5.92%, due 8/14/2026 | | | 7,762,364 | | |
Chemicals & Plastics 0.1% | | | |
| | 2,118,590 | | | Starfruit Finco B.V., Term Loan B, (1M USD LIBOR + 3.25%), 5.19%, due 10/1/2025 | | | 2,063,443 | | |
Containers & Glass Products 0.2% | | | |
| | 559,677 | | | Berlin Packaging LLC, First Lien Term Loan, (USD LIBOR + 3.00%), 5.00%, due 11/7/2025 | | | 542,886 | (d) | |
| | 3,971,034 | | | BWAY Holding Company, Term Loan B, (3M USD LIBOR + 3.25%), 5.23%, due 4/3/2024 | | | 3,860,481 | | |
| | | | 4,403,367 | | |
Cosmetics - Toiletries 0.3% | | | |
| 7,205,000 |
| | Sunshine Luxembourg VII SARL, First Lien Term Loan, (2M USD LIBOR + 4.25%), 6.35%,
due 10/1/2026 | | | 7,208,026 | (b)(c) | |
Diversified Insurance 0.2% | | | |
| | | | | Sedgwick Claims Management Services, Inc. | | | | | |
| | 3,850,900 | | | Term Loan B, (1M USD LIBOR + 3.25%), 5.04%, due 12/31/2025 | | | 3,732,369 | | |
| | 1,596,000 | | | Term Loan B, (1M USD LIBOR + 4.00%), 5.79%, due 9/3/2026 | | | 1,582,370 | | |
| | | | 5,314,739 | | |
Health Care 0.8% | | | |
| 5,310,692 | | | MPH Acquisition Holdings LLC, Term Loan B, (3M USD LIBOR + 2.75%), 4.85%,
due 6/7/2023 | | | 4,968,525 | | |
| 6,512,994 | | | Team Health Holdings, Inc., First Lien Term Loan, (1M USD LIBOR + 2.75%), 4.54%,
due 2/6/2024 | | | 4,998,723 | | |
| | | | | Tivity Health Inc. | | | | | |
| | 3,471,482 | | | Term Loan A, (1M USD LIBOR + 4.25%), 6.04%, due 3/8/2024 | | | 3,458,464 | | |
| | 4,518,569 | | | Term Loan B, (1M USD LIBOR + 5.25%), 7.04%, due 3/6/2026 | | | 4,518,569 | (e) | |
| | | | 17,944,281 | | |
Industrial Equipment 0.2% | | | |
| | 4,360,000 | | | Granite Holdings US Acquisition Co., Term Loan B, (USD LIBOR + 5.25%), due 9/25/2026 | | | 4,120,200 | (b)(c)(e) | |
Leisure Goods - Activities - Movies 0.3% | | | |
| 7,624,624 | | | SeaWorld Parks & Entertainment, Inc., Term Loan B5, (1M USD LIBOR + 3.00%),
4.79%, due 3/31/2024 | | | 7,590,618 | | |
Lodging & Casinos 0.2% | | | |
| 4,856,401 | | | Mohegan Tribal Gaming Authority, Term Loan B, (1M USD LIBOR + 4.00%), 5.79%,
due 10/13/2023 | | | 4,484,595 | | |
See Notes to Financial Statements
100
Schedule of Investments High Income Bond Fund^ (cont'd)
PRINCIPAL AMOUNT | | | | VALUE | |
Oil & Gas 0.3% | | | |
$ | 3,887,929 | | | BCP Raptor, LLC, Term Loan B, (1M USD LIBOR + 4.25%), 6.04%, due 6/24/2024 | | $ | 3,406,797 | | |
| 3,895,132 | | | Brazos Delaware II, LLC, Term Loan B, (1M USD LIBOR + 4.00%), 5.85%,
due 5/21/2025 | | | 3,330,338 | | |
| 1,117,200 | | | Lower Cadence Holdings LLC, Term Loan B, (1M USD LIBOR + 4.00%), 5.80%,
due 5/22/2026 | | | 1,036,203 | | |
| | | | 7,773,338 | | |
Property & Casualty Insurance 0.3% | | | |
| | | | | Asurion LLC | | | | | |
| | 845,566 | | | Term Loan B6, (1M USD LIBOR + 3.00%), 4.79%, due 11/3/2023 | | | 846,471 | | |
| | 2,622,253 | | | Term Loan B7, (1M USD LIBOR + 3.00%), 4.79%, due 11/3/2024 | | | 2,623,905 | | |
| | 2,084,044 | | | Second Lien Term Loan, (1M USD LIBOR + 6.50%), 8.29%, due 8/4/2025 | | | 2,092,380 | | |
| | | | 5,562,756 | | |
Retailers (except food & drug) 0.8% | | | |
| | 9,850,993 | | | Bass Pro Group, LLC, Term Loan B, (1M USD LIBOR + 5.00%), 6.79%, due 9/25/2024 | | | 9,490,349 | | |
| | 10,038,110 | | | Staples, Inc., Term Loan, (3M USD LIBOR + 5.00%), 7.12%, due 4/16/2026 | | | 9,884,627 | | |
| | | | 19,374,976 | | |
Telecommunications 0.6% | | | |
| 8,154,145 | | | Frontier Communications Corp., Term Loan B1, (1M USD LIBOR + 3.75%), 5.54%,
due 6/15/2024 | | | 8,115,413 | | |
| 3,195,000 | | | Intelsat Jackson Holdings S.A., Term Loan B3, (6M USD LIBOR + 3.75%), 5.68%,
due 11/27/2023 | | | 3,189,025 | | |
| 3,191,960 | | | Sprint Communications, Inc., Term Loan B, (1M USD LIBOR + 3.00%), 4.81%,
due 2/2/2024 | | | 3,170,670 | | |
| | | | 14,475,108 | | |
| | | | | Total Loan Assignments (Cost $116,534,842) | | | 113,484,204 | | |
Corporate Bonds 91.9% | | | |
Advertising 2.7% | | | |
| | | | | Clear Channel Worldwide Holdings, Inc. | | | | | |
| | 5,418,000 | | | 9.25%, due 2/15/2024 | | | 5,959,800 | (f) | |
| | 10,377,000 | | | 5.13%, due 8/15/2027 | | | 10,801,730 | (f) | |
| | | | | Lamar Media Corp. | | | | | |
| | 2,375,000 | | | 5.00%, due 5/1/2023 | | | 2,418,047 | | |
| | 780,000 | | | 5.75%, due 2/1/2026 | | | 825,825 | | |
| | 7,405,000 | | | Nielsen Co. Luxembourg S.a.r.l., 5.00%, due 2/1/2025 | | | 7,377,231 | (f) | |
| | | | | Nielsen Finance LLC/Nielsen Finance Co. | | | | | |
| | 6,755,000 | | | 4.50%, due 10/1/2020 | | | 6,767,666 | | |
| | 11,485,000 | | | 5.00%, due 4/15/2022 | | | 11,542,655 | (f) | |
| | | | | Outfront Media Capital LLC/Outfront Media Capital Corp. | | | | | |
| | 2,150,000 | | | 5.63%, due 2/15/2024 | | | 2,206,437 | | |
| | 5,860,000 | | | 5.88%, due 3/15/2025 | | | 6,050,450 | | |
| | 8,243,000 | | | 5.00%, due 8/15/2027 | | | 8,634,790 | (f) | |
| | | | 62,584,631 | | |
See Notes to Financial Statements
101
Schedule of Investments High Income Bond Fund^ (cont'd)
PRINCIPAL AMOUNT | | | | VALUE | |
Aerospace & Defense 2.1% | | | |
$ | 3,715,000 | | | BBA U.S. Holdings, Inc., 5.38%, due 5/1/2026 | | $ | 3,882,175 | (f) | |
| | 4,800,000 | | | TransDigm UK Holdings PLC, 6.88%, due 5/15/2026 | | | 5,124,000 | | |
| | | | | TransDigm, Inc. | | | | | |
| | 14,390,000 | | | 6.25%, due 3/15/2026 | | | 15,415,287 | (f) | |
| | 5,595,000 | | | 6.38%, due 6/15/2026 | | | 5,853,769 | | |
| | 10,055,000 | | | 7.50%, due 3/15/2027 | | | 10,859,400 | | |
| | 7,850,000 | | | 5.50%, due 11/15/2027 | | | 7,824,017 | (f)(g) | |
| | | | 48,958,648 | | |
Brokerage 0.7% | | | |
| | 16,470,000 | | | LPL Holdings, Inc., 5.75%, due 9/15/2025 | | | 17,087,625 | (f) | |
Building & Construction 1.0% | | | |
| | 1,585,000 | | | Lennar Corp., 5.38%, due 10/1/2022 | | | 1,695,950 | | |
| | 3,210,000 | | | Shea Homes L.P./Shea Homes Funding Corp., 6.13%, due 4/1/2025 | | | 3,322,350 | (f) | |
| | | | | Taylor Morrison Communities, Inc. | | | | | |
| | 3,210,000 | | | 5.88%, due 6/15/2027 | | | 3,584,607 | (f) | |
| | 3,225,000 | | | 5.75%, due 1/15/2028 | | | 3,567,656 | (f) | |
| | 3,473,000 | | | Taylor Morrison Communities, Inc./Taylor Morrison Holdings II, Inc., 5.63%, due 3/1/2024 | | | 3,746,499 | (f) | |
| | | | | Toll Brothers Finance Corp. | | | | | |
| | 2,535,000 | | | 4.88%, due 3/15/2027 | | | 2,753,644 | | |
| | 4,585,000 | | | 4.35%, due 2/15/2028 | | | 4,766,967 | | |
| | | | 23,437,673 | | |
Building Materials 1.4% | | | |
| | 9,415,000 | | | Beacon Roofing Supply, Inc., 4.88%, due 11/1/2025 | | | 9,250,708 | (f) | |
| | 6,105,000 | | | CD&R Waterworks Merger Sub LLC, 6.13%, due 8/15/2025 | | | 6,204,206 | (f) | |
| | | | | Jeld-Wen, Inc. | | | | | |
| | 1,675,000 | | | 4.63%, due 12/15/2025 | | | 1,658,250 | (f) | |
| | 7,330,000 | | | 4.88%, due 12/15/2027 | | | 7,183,400 | (f) | |
| | | | | Masonite Int'l Corp. | | | | | |
| | 3,535,000 | | | 5.75%, due 9/15/2026 | | | 3,751,519 | (f) | |
| | 4,110,000 | | | 5.38%, due 2/1/2028 | | | 4,346,325 | (f) | |
| | | | 32,394,408 | | |
Cable & Satellite Television 6.7% | | | |
| | | | | CCO Holdings LLC/CCO Holdings Capital Corp. | | | | | |
| | 3,810,000 | | | 5.25%, due 9/30/2022 | | | 3,862,387 | | |
| | 5,660,000 | | | 5.13%, due 5/1/2023 | | | 5,794,425 | (f) | |
| | 3,205,000 | | | 5.88%, due 4/1/2024 | | | 3,341,213 | (f) | |
| | 11,045,000 | | | 5.75%, due 2/15/2026 | | | 11,663,520 | (f) | |
| | 22,955,000 | | | 5.00%, due 2/1/2028 | | | 24,016,669 | (f) | |
| | 2,565,000 | | | 4.75%, due 3/1/2030 | | | 2,613,094 | (f) | |
| | | | | CSC Holdings LLC | | | | | |
| | 4,450,000 | | | 5.38%, due 7/15/2023 | | | 4,561,161 | (f) | |
| | 7,395,000 | | | 7.75%, due 7/15/2025 | | | 7,931,137 | (f) | |
| | 4,995,000 | | | 6.63%, due 10/15/2025 | | | 5,319,675 | (f) | |
| | 6,623,000 | | | 10.88%, due 10/15/2025 | | | 7,473,791 | (f) | |
| | 3,250,000 | | | 5.50%, due 5/15/2026 | | | 3,424,688 | (f) | |
| | 11,465,000 | | | 5.50%, due 4/15/2027 | | | 12,153,015 | (f) | |
| | 7,830,000 | | | 7.50%, due 4/1/2028 | | | 8,808,750 | (f) | |
See Notes to Financial Statements
102
Schedule of Investments High Income Bond Fund^ (cont'd)
PRINCIPAL AMOUNT | | | | VALUE | |
$ | 1,645,000 | | | 6.50%, due 2/1/2029 | | $ | 1,842,400 | (f) | |
| | 9,145,000 | | | 5.75%, due 1/15/2030 | | | 9,625,112 | (f) | |
| | | | | DISH DBS Corp. | | | | | |
| | 2,245,000 | | | 6.75%, due 6/1/2021 | | | 2,362,863 | | |
| | 11,225,000 | | | 5.88%, due 11/15/2024 | | | 11,253,062 | | |
| | 4,230,000 | | | Radiate Holdco LLC/Radiate Finance, Inc., 6.63%, due 2/15/2025 | | | 4,272,300 | (f) | |
| | 9,400,000 | | | Telenet Finance Luxembourg Notes S.a.r.l., 5.50%, due 3/1/2028 | | | 9,999,529 | (f) | |
| | 3,465,000 | | | UPCB Finance IV Ltd., 5.38%, due 1/15/2025 | | | 3,573,281 | (f) | |
| | 3,860,000 | | | Virgin Media Finance PLC, 6.00%, due 10/15/2024 | | | 3,980,625 | (f) | |
| | 8,550,000 | | | Virgin Media Secured Finance PLC, 5.50%, due 8/15/2026 | | | 8,988,187 | (f) | |
| | | | 156,860,884 | | |
Chemicals 2.1% | | | |
| | 340,000 | | | Alpha 3 BV/Alpha U.S. Bidco, Inc., 6.25%, due 2/1/2025 | | | 341,700 | (f) | |
| | 1,727,000 | | | H.B. Fuller Co., 4.00%, due 2/15/2027 | | | 1,692,460 | | |
| | 6,850,000 | | | INEOS Group Holdings SA, 5.63%, due 8/1/2024 | | | 7,004,125 | (f) | |
| | 7,380,000 | | | NOVA Chemicals Corp., 4.88%, due 6/1/2024 | | | 7,490,700 | (f) | |
| | 7,940,000 | | | Olin Corp., 5.63%, due 8/1/2029 | | | 8,243,864 | | |
| | 6,710,000 | | | Platform Specialty Products Corp., 5.88%, due 12/1/2025 | | | 7,004,619 | (f) | |
| | 4,865,000 | | | PQ Corp., 6.75%, due 11/15/2022 | | | 5,023,112 | (f) | |
| | 3,825,000 | | | Starfruit Finco BV/Starfruit U.S. Holdco LLC, 8.00%, due 10/1/2026 | | | 3,805,875 | (f) | |
| | 1,340,000 | | | Tronox Finance PLC, 5.75%, due 10/1/2025 | | | 1,262,950 | (f) | |
| | 2,535,000 | | | Tronox, Inc., 6.50%, due 4/15/2026 | | | 2,433,600 | (f) | |
| | 4,495,000 | | | WR Grace & Co-Conn, 5.13%, due 10/1/2021 | | | 4,663,563 | (f) | |
| | | | 48,966,568 | | |
Consumer - Commercial Lease Financing 0.8% | | | |
| | 6,166,000 | | | AerCap Global Aviation Trust, 6.50%, due 6/15/2045 | | | 6,759,477 | (f)(h) | |
| | 5,830,000 | | | Global Aircraft Leasing Co. Ltd., 6.50% Cash/7.25% PIK, due 9/15/2024 | | | 5,966,714 | (f)(i) | |
| | | | | Springleaf Finance Corp. | | | | | |
| | 3,135,000 | | | 8.25%, due 12/15/2020 | | | 3,334,856 | | |
| | 3,510,000 | | | 6.13%, due 5/15/2022 | | | 3,777,638 | | |
| | | | 19,838,685 | | |
Diversified Capital Goods 0.2% | | | |
| | 4,505,000 | | | Resideo Funding, Inc., 6.13%, due 11/1/2026 | | | 4,538,788 | (f) | |
Electric - Generation 3.7% | | | |
| | | | | Calpine Corp. | | | | | |
| | 13,390,000 | | | 5.38%, due 1/15/2023 | | | 13,606,918 | | |
| | 19,380,000 | | | 5.75%, due 1/15/2025 | | | 19,864,500 | | |
| | 3,665,000 | | | Drax Finco PLC, 6.63%, due 11/1/2025 | | | 3,880,319 | (f) | |
| | 2,145,000 | | | NextEra Energy Operating Partners L.P., 4.25%, due 7/15/2024 | | | 2,203,344 | (f) | |
| | | | | NRG Energy, Inc. | | | | | |
| | 9,165,000 | | | 7.25%, due 5/15/2026 | | | 10,035,950 | | |
| | 13,340,000 | | | 6.63%, due 1/15/2027 | | | 14,457,225 | | |
| | | | | Vistra Operations Co. LLC | | | | | |
| | 4,275,000 | | | 5.50%, due 9/1/2026 | | | 4,517,478 | (f) | |
| | 8,085,000 | | | 5.63%, due 2/15/2027 | | | 8,570,100 | (f) | |
| | 10,300,000 | | | 5.00%, due 7/31/2027 | | | 10,660,500 | (f) | |
| | | | 87,796,334 | | |
See Notes to Financial Statements
103
Schedule of Investments High Income Bond Fund^ (cont'd)
PRINCIPAL AMOUNT | | | | VALUE | |
Electric - Integrated 1.0% | | | |
| | | | | Talen Energy Supply LLC | | | | | |
$ | 14,415,000 | | | 10.50%, due 1/15/2026 | | $ | 12,396,900 | (f) | |
| | 7,155,000 | | | 7.25%, due 5/15/2027 | | | 7,137,113 | (f) | |
| | 3,315,000 | | | 6.63%, due 1/15/2028 | | | 3,198,975 | (f) | |
| | | | 22,732,988 | | |
Electronics 0.8% | | | |
| | 6,810,000 | | | Amkor Technology, Inc., 6.63%, due 9/15/2027 | | | 7,456,950 | (f) | |
| | 5,595,000 | | | Sensata Technologies UK Financing Co. PLC, 6.25%, due 2/15/2026 | | | 5,986,650 | (f) | |
| | 6,135,000 | | | Sensata Technologies, Inc., 4.38%, due 2/15/2030 | | | 6,177,178 | (f) | |
| | | | 19,620,778 | | |
Energy - Exploration & Production 3.1% | | | |
| | | | | Ascent Resources Utica Holdings LLC/ARU Finance Corp. | | | | | |
| | 2,095,000 | | | 10.00%, due 4/1/2022 | | | 1,982,498 | (f) | |
| | 13,110,000 | | | 7.00%, due 11/1/2026 | | | 10,029,150 | (f) | |
| | 4,055,000 | | | Bruin E&P Partners LLC, 8.88%, due 8/1/2023 | | | 2,676,300 | (f) | |
| | 5,510,000 | | | Centennial Resource Production LLC, 6.88%, due 4/1/2027 | | | 5,399,800 | (f) | |
| | 5,041,000 | | | Chesapeake Energy Corp., 8.00%, due 3/15/2026 | | | 3,201,035 | (f) | |
| | 13,875,000 | | | CrownRock L.P./CrownRock Finance, Inc., 5.63%, due 10/15/2025 | | | 13,563,090 | (f) | |
| | 5,825,000 | | | Extraction Oil & Gas, Inc., 5.63%, due 2/1/2026 | | | 2,475,625 | (f) | |
| | 6,415,000 | | | Matador Resources Co., 5.88%, due 9/15/2026 | | | 6,158,400 | | |
| | 2,745,000 | | | Oasis Petroleum, Inc., 6.25%, due 5/1/2026 | | | 1,867,973 | (f) | |
| | 8,410,000 | | | PDC Energy, Inc., 5.75%, due 5/15/2026 | | | 7,863,350 | | |
| | | | | Range Resources Corp. | | | | | |
| | 4,450,000 | | | 5.00%, due 3/15/2023 | | | 3,849,250 | | |
| | 4,115,000 | | | 4.88%, due 5/15/2025 | | | 3,302,287 | | |
| | 4,985,000 | | | SM Energy Co., 6.63%, due 1/15/2027 | | | 4,187,400 | | |
| | | | | WPX Energy, Inc. | | | | | |
| | 3,890,000 | | | 5.25%, due 9/15/2024 | | | 3,928,900 | | |
| | 2,135,000 | | | 5.75%, due 6/1/2026 | | | 2,145,675 | | |
| | | | 72,630,733 | | |
Food - Wholesale 1.1% | | | |
| | 8,710,000 | | | Performance Food Group, Inc., 5.50%, due 10/15/2027 | | | 9,210,825 | (f) | |
| | | | | Post Holdings, Inc. | | | | | |
| | 5,115,000 | | | 5.50%, due 3/1/2025 | | | 5,358,474 | (f) | |
| | 4,380,000 | | | 5.75%, due 3/1/2027 | | | 4,663,079 | (f) | |
| | 5,350,000 | | | 5.63%, due 1/15/2028 | | | 5,724,500 | (f) | |
| | | | 24,956,878 | | |
Gaming 3.3% | | | |
| | | | | Boyd Gaming Corp. | | | | | |
| | 4,350,000 | | | 6.88%, due 5/15/2023 | | | 4,513,125 | | |
| | 11,895,000 | | | 6.38%, due 4/1/2026 | | | 12,638,438 | | |
| | 2,975,000 | | | Caesars Resort Collection LLC/CRC Finco, Inc., 5.25%, due 10/15/2025 | | | 3,045,656 | (f) | |
| | 15,210,000 | | | Churchill Downs, Inc., 5.50%, due 4/1/2027 | | | 16,122,600 | (f) | |
| | 5,935,000 | | | Eldorado Resorts, Inc., 6.00%, due 9/15/2026 | | | 6,506,244 | | |
| | 2,915,000 | | | MGM Resorts Int'l, 6.63%, due 12/15/2021 | | | 3,159,131 | | |
| | 8,505,000 | | | Station Casinos LLC, 5.00%, due 10/1/2025 | | | 8,621,944 | (f) | |
See Notes to Financial Statements
104
Schedule of Investments High Income Bond Fund^ (cont'd)
PRINCIPAL AMOUNT | | | | VALUE | |
$ | 1,750,000 | | | Twin River Worldwide Holdings, Inc., 6.75%, due 6/1/2027 | | $ | 1,842,400 | (f) | |
| | 2,369,913 | | | VICI Properties 1 LLC/VICI FC, Inc., 8.00%, due 10/15/2023 | | | 2,580,243 | | |
| | 17,073,000 | | | Wynn Las Vegas LLC/Wynn Las Vegas Capital Corp., 5.50%, due 3/1/2025 | | | 18,140,062 | (f) | |
| | | | 77,169,843 | | |
Gas Distribution 6.1% | | | |
| | 7,955,000 | | | Antero Midstream Partners L.P./Antero Midstream Finance Corp., 5.38%, due 9/15/2024 | | | 6,443,550 | | |
| | | | | Buckeye Partners L.P. | | | | | |
| | 12,130,000 | | | 3.95%, due 12/1/2026 | | | 11,204,646 | | |
| | 4,760,000 | | | 4.13%, due 12/1/2027 | | | 4,393,500 | | |
| | | | | Cheniere Energy Partners L.P. | | | | | |
| | 11,810,000 | | | 5.25%, due 10/1/2025 | | | 12,223,350 | | |
| | 5,500,000 | | | 5.63%, due 10/1/2026 | | | 5,809,375 | | |
| | 3,175,000 | | | 4.50%, due 10/1/2029 | | | 3,242,469 | (f) | |
| | | | | Crestwood Midstream Partners L.P./Crestwood Midstream Finance Corp. | | | | | |
| | 2,950,000 | | | 6.25%, due 4/1/2023 | | | 3,000,740 | | |
| | 5,865,000 | | | 5.75%, due 4/1/2025 | | | 6,055,612 | | |
| | 10,425,000 | | | DCP Midstream LLC, 5.85%, due 5/21/2043 | | | 9,330,375 | (f)(h) | |
| | | | | DCP Midstream Operating L.P. | | | | | |
| | 2,360,000 | | | 5.38%, due 7/15/2025 | | | 2,483,900 | | |
| | 4,850,000 | | | 5.60%, due 4/1/2044 | | | 4,584,705 | | |
| | | | | Genesis Energy L.P./Genesis Energy Finance Corp. | | | | | |
| | 6,565,000 | | | 6.50%, due 10/1/2025 | | | 6,236,750 | | |
| | 5,200,000 | | | 6.25%, due 5/15/2026 | | | 4,810,000 | | |
| | 3,630,000 | | | Global Partners L.P./GLP Finance Corp., 7.00%, due 8/1/2027 | | | 3,775,817 | (f) | |
| | | | | NuStar Logistics L.P. | | | | | |
| | 4,445,000 | | | 4.80%, due 9/1/2020 | | | 4,479,538 | | |
| | 1,100,000 | | | 6.75%, due 2/1/2021 | | | 1,139,798 | | |
| | 1,680,000 | | | 4.75%, due 2/1/2022 | | | 1,705,200 | | |
| | 3,820,000 | | | 6.00%, due 6/1/2026 | | | 4,082,434 | | |
| | 4,035,000 | | | 5.63%, due 4/28/2027 | | | 4,196,400 | | |
| | | | | Summit Midstream Holdings LLC/Summit Midstream Finance Corp. | | | | | |
| | 2,405,000 | | | 5.50%, due 8/15/2022 | | | 2,152,475 | | |
| | 12,975,000 | | | 5.75%, due 4/15/2025 | | | 10,055,625 | | |
| | 10,095,000 | | | Tallgrass Energy Partners L.P./Tallgrass Energy Finance Corp., 5.50%, due 1/15/2028 | | | 9,464,062 | (f) | |
| | | | | Targa Resources Partners L.P./Targa Resources Partners Finance Corp. | | | | | |
| | 4,105,000 | | | 4.25%, due 11/15/2023 | | | 4,124,293 | | |
| | 5,827,000 | | | 6.75%, due 3/15/2024 | | | 6,043,284 | | |
| | 4,395,000 | | | 5.13%, due 2/1/2025 | | | 4,504,963 | | |
| | 3,397,000 | | | 5.38%, due 2/1/2027 | | | 3,477,679 | | |
| | 3,465,000 | | | 6.50%, due 7/15/2027 | | | 3,707,619 | (f) | |
| | | | 142,728,159 | | |
Health Facilities 2.4% | | | |
| | 4,900,000 | | | Columbia/HCA Corp., 7.69%, due 6/15/2025 | | | 5,916,750 | | |
| | | | | HCA, Inc. | | | | | |
| | 9,370,000 | | | 5.38%, due 9/1/2026 | | | 10,213,300 | | |
| | 5,430,000 | | | 5.63%, due 9/1/2028 | | | 6,101,962 | | |
| | 6,695,000 | | | MEDNAX, Inc., 6.25%, due 1/15/2027 | | | 6,624,033 | (f) | |
| | 9,935,000 | | | Select Medical Corp., 6.25%, due 8/15/2026 | | | 10,580,775 | (f) | |
| | | | | Tenet Healthcare Corp. | | | | | |
| | 9,470,000 | | | 8.13%, due 4/1/2022 | | | 10,251,275 | | |
| | 7,125,000 | | | 6.75%, due 6/15/2023 | | | 7,552,500 | | |
| | | | 57,240,595 | | |
See Notes to Financial Statements
105
Schedule of Investments High Income Bond Fund^ (cont'd)
PRINCIPAL AMOUNT | | | | VALUE | |
Health Services 1.4% | | | |
$ | 6,735,000 | | | Eagle Holding Co. II LLC, 7.75% Cash/8.50% PIK, due 5/15/2022 | | $ | 6,836,025 | (f)(i) | |
| | 5,785,000 | | | IQVIA, Inc., 5.00%, due 10/15/2026 | | | 6,103,175 | (f) | |
| | 8,775,000 | | | Service Corp. Int'l, 5.38%, due 5/15/2024 | | | 9,049,219 | | |
| | 2,935,000 | | | Team Health Holdings, Inc., 6.38%, due 2/1/2025 | | | 1,893,075 | (f) | |
| | 4,982,000 | | | Vizient, Inc., 6.25%, due 5/15/2027 | | | 5,372,738 | (f) | |
| | 4,525,000 | | | West Street Merger Sub, Inc., 6.38%, due 9/1/2025 | | | 4,298,750 | (f) | |
| | | | 33,552,982 | | |
Hotels 0.2% | | | |
| | 4,340,000 | | | Hilton Domestic Operating Co., Inc., 5.13%, due 5/1/2026 | | | 4,557,000 | | |
Insurance Brokerage 1.6% | | | |
| | 8,200,000 | | | Alliant Holdings Intermediate LLC/Alliant Holdings Co-Issuer, 6.75%, due 10/15/2027 | | | 8,528,902 | (f) | |
| | 7,800,000 | | | AssuredPartners, Inc., 7.00%, due 8/15/2025 | | | 7,770,750 | (f) | |
| | 5,205,000 | | | GTCR AP Finance, Inc., 8.00%, due 5/15/2027 | | | 5,322,112 | (f) | |
| | 16,350,000 | | | HUB Int'l Ltd., 7.00%, due 5/1/2026 | | | 16,840,500 | (f) | |
| | | | 38,462,264 | | |
Machinery 1.7% | | | |
| | | | | CFX Escrow Corp. | | | | | |
| | 4,060,000 | | | 6.00%, due 2/15/2024 | | | 4,313,750 | (f) | |
| | 3,190,000 | | | 6.38%, due 2/15/2026 | | | 3,457,162 | (f) | |
| | 2,735,000 | | | Granite Holdings U.S. Acquisition Co., 11.00%, due 10/1/2027 | | | 2,536,713 | (f) | |
| | 10,675,000 | | | Harsco Corp., 5.75%, due 7/31/2027 | | | 11,088,870 | (f) | |
| | 7,235,000 | | | RBS Global, Inc./Rexnord LLC, 4.88%, due 12/15/2025 | | | 7,461,094 | (f) | |
| | 11,535,000 | | | Terex Corp., 5.63%, due 2/1/2025 | | | 11,621,512 | (f) | |
| | | | 40,479,101 | | |
Managed Care 0.8% | | | |
| | | | | Centene Corp. | | | | | |
| | 3,130,000 | | | 4.75%, due 5/15/2022 | | | 3,196,513 | | |
| | 2,095,000 | | | 6.13%, due 2/15/2024 | | | 2,178,151 | | |
| | 14,465,000 | | | MPH Acquisition Holdings LLC, 7.13%, due 6/1/2024 | | | 13,488,612 | (f) | |
| | | | 18,863,276 | | |
Media Content 7.2% | | | |
| | | | | AMC Networks, Inc. | | | | | |
| | 945,000 | | | 5.00%, due 4/1/2024 | | | 962,539 | | |
| | 2,390,000 | | | 4.75%, due 8/1/2025 | | | 2,413,900 | | |
| | 4,345,000 | | | Cumulus Media New Holdings, Inc., 6.75%, due 7/1/2026 | | | 4,605,700 | (f) | |
| | | | | Diamond Sports Group LLC/Diamond Sports Finance Co. | | | | | |
| | 5,475,000 | | | 5.38%, due 8/15/2026 | | | 5,714,531 | (f) | |
| | 7,905,000 | | | 6.63%, due 8/15/2027 | | | 8,142,150 | (f) | |
| | 7,110,000 | | | Gray Television, Inc., 7.00%, due 5/15/2027 | | | 7,780,260 | (f) | |
| | | | | iHeartCommunications, Inc. | | | | | |
| | 6,680,000 | | | 6.38%, due 5/1/2026 | | | 7,189,350 | | |
| | 5,370,000 | | | 8.38%, due 5/1/2027 | | | 5,759,325 | | |
| | 3,185,000 | | | 5.25%, due 8/15/2027 | | | 3,285,965 | (f) | |
| | 4,600,000 | | | Lions Gate Capital Holdings LLC, 5.88%, due 11/1/2024 | | | 4,335,500 | (f) | |
See Notes to Financial Statements
106
Schedule of Investments High Income Bond Fund^ (cont'd)
PRINCIPAL AMOUNT | | | | VALUE | |
| | | | | Netflix, Inc. | | | | | |
$ | 2,230,000 | | | 5.38%, due 2/1/2021 | | $ | 2,308,050 | | |
| | 3,135,000 | | | 5.50%, due 2/15/2022 | | | 3,323,100 | | |
| | 11,090,000 | | | 4.88%, due 4/15/2028 | | | 11,459,186 | | |
| | 5,585,000 | | | 5.88%, due 11/15/2028 | | | 6,150,481 | | |
| | 12,030,000 | | | 6.38%, due 5/15/2029 | | | 13,503,675 | (f) | |
| | 7,365,000 | | | 5.38%, due 11/15/2029 | | | 7,760,869 | (f) | |
| | 9,265,000 | | | 4.88%, due 6/15/2030 | | | 9,366,915 | (f) | |
| | 10,335,000 | | | Nexstar Escrow, Inc., 5.63%, due 7/15/2027 | | | 10,900,324 | (f) | |
| | | | | Sinclair Television Group, Inc. | | | | | |
| | 2,125,000 | | | 5.88%, due 3/15/2026 | | | 2,217,969 | (f) | |
| | 4,015,000 | | | 5.13%, due 2/15/2027 | | | 4,045,113 | (f) | |
| | | | | Sirius XM Radio, Inc. | | | | | |
| | 1,725,000 | | | 3.88%, due 8/1/2022 | | | 1,761,656 | (f) | |
| | 3,740,000 | | | 4.63%, due 5/15/2023 | | | 3,798,344 | (f) | |
| | 6,915,000 | | | 4.63%, due 7/15/2024 | | | 7,226,175 | (f) | |
| | 7,735,000 | | | 5.38%, due 7/15/2026 | | | 8,160,425 | (f) | |
| | 4,645,000 | | | 5.00%, due 8/1/2027 | | | 4,883,056 | (f) | |
| | 12,195,000 | | | 5.50%, due 7/1/2029 | | | 13,178,222 | (f) | |
| | 8,300,000 | | | TEGNA, Inc., 5.00%, due 9/15/2029 | | | 8,414,125 | (f) | |
| | | | 168,646,905 | | |
Medical Products 1.0% | | | |
| | 8,810,000 | | | Avantor, Inc., 9.00%, due 10/1/2025 | | | 9,842,532 | (f) | |
| | 15,040,000 | | | Ortho-Clinical Diagnostics, Inc./Ortho-Clinical Diagnostics SA, 6.63%, due 5/15/2022 | | | 14,532,400 | (f) | |
| | | | 24,374,932 | | |
Metals - Mining Excluding Steel 2.1% | | | |
| | 6,250,000 | | | Cleveland Cliffs, Inc., 5.88%, due 6/1/2027 | | | 5,960,938 | (f) | |
| | 6,044,000 | | | Constellium NV, 6.63%, due 3/1/2025 | | | 6,325,348 | (f) | |
| | 3,745,000 | | | First Quantum Minerals Ltd., 6.88%, due 3/1/2026 | | | 3,665,419 | (f) | |
| | | | | Freeport-McMoRan, Inc. | | | | | |
| | 3,105,000 | | | 5.00%, due 9/1/2027 | | | 3,170,981 | | |
| | 2,435,000 | | | 5.25%, due 9/1/2029 | | | 2,478,343 | | |
| | 2,545,000 | | | 5.40%, due 11/14/2034 | | | 2,484,556 | | |
| | 10,480,000 | | | 5.45%, due 3/15/2043 | | | 9,746,400 | | |
| | 4,629,000 | | | Hudbay Minerals, Inc., 7.63%, due 1/15/2025 | | | 4,712,901 | (f) | |
| | | | | Novelis Corp. | | | | | |
| | 2,310,000 | | | 6.25%, due 8/15/2024 | | | 2,419,725 | (f) | |
| | 6,985,000 | | | 5.88%, due 9/30/2026 | | | 7,334,948 | (f) | |
| | | | 48,299,559 | | |
Oil Field Equipment & Services 1.0% | | | |
| | | | | Precision Drilling Corp. | | | | | |
| | 3,995,000 | | | 7.75%, due 12/15/2023 | | | 3,775,275 | | |
| | 11,915,000 | | | 5.25%, due 11/15/2024 | | | 10,038,387 | | |
| | 2,230,000 | | | 7.13%, due 1/15/2026 | | | 1,928,950 | (f) | |
| | 8,655,000 | | | USA Compression Partners L.P./USA Compression Finance Corp., 6.88%, due 9/1/2027 | | | 8,655,000 | (f) | |
| | | | 24,397,612 | | |
See Notes to Financial Statements
107
Schedule of Investments High Income Bond Fund^ (cont'd)
PRINCIPAL AMOUNT | | | | VALUE | |
Packaging 2.7% | | | |
$ | 7,005,000 | | | Berry Global Escrow Corp., 5.63%, due 7/15/2027 | | $ | 7,434,056 | (f) | |
| | 5,620,000 | | | Berry Global, Inc., 4.50%, due 2/15/2026 | | | 5,655,125 | (f) | |
| | 5,440,000 | | | Berry Plastics Corp., 5.13%, due 7/15/2023 | | | 5,576,000 | | |
| | | | | BWAY Holding Co. | | | | | |
| | 6,990,000 | | | 5.50%, due 4/15/2024 | | | 7,190,963 | (f) | |
| | 9,645,000 | | | 7.25%, due 4/15/2025 | | | 9,223,031 | (f) | |
| | 7,240,000 | | | Crown Americas LLC/Crown Americas Capital Corp. VI, 4.75%, due 2/1/2026 | | | 7,602,000 | | |
| | | | | Reynolds Group Issuer, Inc. | | | | | |
| | 9,022,393 | | | 5.75%, due 10/15/2020 | | | 9,053,520 | | |
| | 6,750,000 | | | 5.13%, due 7/15/2023 | | | 6,925,163 | (f) | |
| | 5,185,000 | | | Trident TPI Holdings, Inc., 9.25%, due 8/1/2024 | | | 5,029,450 | (f) | |
| | | | 63,689,308 | | |
Personal & Household Products 2.0% | | | |
| | | | | Energizer Holdings, Inc. | | | | | |
| | 7,215,000 | | | 4.70%, due 5/24/2022 | | | 7,449,487 | | |
| | 5,595,000 | | | 6.38%, due 7/15/2026 | | | 5,965,948 | (f) | |
| | 12,215,000 | | | 7.75%, due 1/15/2027 | | | 13,528,112 | (f) | |
| | 2,085,000 | | | Energizer SpinCo, Inc., 5.50%, due 6/15/2025 | | | 2,163,188 | (f) | |
| | 4,290,000 | | | Prestige Brands, Inc., 6.38%, due 3/1/2024 | | | 4,477,688 | (f) | |
| | | | | Spectrum Brands, Inc. | | | | | |
| | 1,190,000 | | | 6.13%, due 12/15/2024 | | | 1,230,163 | | |
| | 9,050,000 | | | 5.75%, due 7/15/2025 | | | 9,434,625 | | |
| | 1,950,000 | | | 5.00%, due 10/1/2029 | | | 1,993,875 | (f) | |
| | | | 46,243,086 | | |
Pharmaceuticals 1.9% | | | |
| | 2,380,000 | | | Bausch Health Americas, Inc., 8.50%, due 1/31/2027 | | | 2,677,500 | (f) | |
| | 1,335,000 | | | Bausch Health Cos., Inc., 5.75%, due 8/15/2027 | | | 1,449,727 | (f) | |
| | 3,645,000 | | | Endo Ltd./Endo Finance LLC/Endo Finco, Inc., 6.00%, due 7/15/2023 | | | 2,410,256 | (f) | |
| | | | | Valeant Pharmaceuticals Int'l, Inc. | | | | | |
| | 676,000 | | | 5.50%, due 3/1/2023 | | | 681,915 | (f) | |
| | 817,000 | | | 5.88%, due 5/15/2023 | | | 828,847 | (f) | |
| | 4,540,000 | | | 7.00%, due 3/15/2024 | | | 4,749,635 | (f) | |
| | 23,140,000 | | | 6.13%, due 4/15/2025 | | | 24,022,212 | (f) | |
| | 6,840,000 | | | 5.50%, due 11/1/2025 | | | 7,147,868 | (f) | |
| | | | 43,967,960 | | |
Real Estate Development & Management 0.8% | | | |
| | | | | Realogy Group LLC/Realogy Co-Issuer Corp. | | | | | |
| | 6,040,000 | | | 4.88%, due 6/1/2023 | | | 5,874,504 | (f) | |
| | 12,395,000 | | | 9.38%, due 4/1/2027 | | | 12,178,088 | (f) | |
| | | | 18,052,592 | | |
Real Estate Investment Trusts 2.2% | | | |
| | | | | ESH Hospitality, Inc. | | | | | |
| | 9,888,000 | | | 5.25%, due 5/1/2025 | | | 10,197,000 | (f) | |
| | 7,110,000 | | | 4.63%, due 10/1/2027 | | | 7,128,486 | (f) | |
See Notes to Financial Statements
108
Schedule of Investments High Income Bond Fund^ (cont'd)
PRINCIPAL AMOUNT | | | | VALUE | |
| | | | | MPT Operating Partnership L.P./MPT Finance Corp. | | | | | |
$ | 6,945,000 | | | 6.38%, due 3/1/2024 | | $ | 7,248,844 | | |
| | 5,165,000 | | | 5.50%, due 5/1/2024 | | | 5,300,581 | | |
| | 3,555,000 | | | 5.25%, due 8/1/2026 | | | 3,732,750 | | |
| | 8,590,000 | | | Ryman Hospitality Properties, Inc., 4.75%, due 10/15/2027 | | | 8,880,772 | (f) | |
| | | | | Starwood Property Trust, Inc. | | | | | |
| | 6,270,000 | | | 3.63%, due 2/1/2021 | | | 6,317,025 | | |
| | 2,625,000 | | | 4.75%, due 3/15/2025 | | | 2,725,898 | | |
| | | | 51,531,356 | | |
Recreation & Travel 1.2% | | | |
| | 8,225,000 | | | Cedar Fair L.P., 5.25%, due 7/15/2029 | | | 8,821,312 | (f) | |
| 3,960,000 | | | Cedar Fair L.P./Canada's Wonderland Co./Magnum Management Corp., 5.38%,
due 4/15/2027 | | | 4,217,400 | | |
| | 6,378,000 | | | NCL Corp. Ltd., 4.75%, due 12/15/2021 | | | 6,465,697 | (f) | |
| | | | | Six Flags Entertainment Corp. | | | | | |
| | 3,755,000 | | | 4.88%, due 7/31/2024 | | | 3,877,038 | (f) | |
| | 5,420,000 | | | 5.50%, due 4/15/2027 | | | 5,677,450 | (f) | |
| | | | 29,058,897 | | |
Restaurants 1.2% | | | |
| | | | | 1011778 BC ULC/New Red Finance, Inc. | | | | | |
| | 5,465,000 | | | 4.25%, due 5/15/2024 | | | 5,608,456 | (f) | |
| | 8,515,000 | | | 5.00%, due 10/15/2025 | | | 8,770,450 | (f) | |
| | 8,330,000 | | | KFC Holding Co./Pizza Hut Holdings LLC/Taco Bell of America LLC, 5.25%, due 6/1/2026 | | | 8,808,975 | (f) | |
| | 3,820,000 | | | Yum! Brands, Inc., 4.75%, due 1/15/2030 | | | 4,006,225 | (f) | |
| | | | 27,194,106 | | |
Software - Services 2.7% | | | |
| | 8,600,000 | | | CDK Global, Inc., 4.88%, due 6/1/2027 | | | 9,062,250 | | |
| | 5,915,000 | | | Go Daddy Operating Co. LLC/GD Finance Co., Inc., 5.25%, due 12/1/2027 | | | 6,269,900 | (f) | |
| | 7,355,000 | | | j2 Cloud Services LLC/j2 Global Co-Obligor, Inc., 6.00%, due 7/15/2025 | | | 7,814,687 | (f) | |
| | 4,810,000 | | | Match Group, Inc., 5.63%, due 2/15/2029 | | | 5,152,713 | (f) | |
| | 5,270,000 | | | Open Text Corp., 5.88%, due 6/1/2026 | | | 5,619,138 | (f) | |
| | 13,835,000 | | | Rackspace Hosting, Inc., 8.63%, due 11/15/2024 | | | 12,659,025 | (f) | |
| | 16,460,000 | | | SS&C Technologies, Inc., 5.50%, due 9/30/2027 | | | 17,560,762 | (f) | |
| | | | 64,138,475 | | |
Specialty Retail 1.6% | | | |
| | 10,005,000 | | | L Brands, Inc., 5.25%, due 2/1/2028 | | | 9,279,638 | | |
| | 4,090,000 | | | Liberty Media Corp., 8.50%, due 7/15/2029 | | | 4,222,925 | | |
| | | | | Penske Automotive Group, Inc. | | | | | |
| | 8,715,000 | | | 3.75%, due 8/15/2020 | | | 8,758,575 | | |
| | 9,260,000 | | | 5.50%, due 5/15/2026 | | | 9,676,700 | | |
| | 815,000 | | | QVC, Inc., 5.45%, due 8/15/2034 | | | 820,689 | | |
| | 5,245,000 | | | William Carter Co., 5.63%, due 3/15/2027 | | | 5,592,481 | (f) | |
| | | | 38,351,008 | | |
See Notes to Financial Statements
109
Schedule of Investments High Income Bond Fund^ (cont'd)
PRINCIPAL AMOUNT | | | | VALUE | |
Steel Producers - Products 0.5% | | | |
$ | 10,571,000 | | | Big River Steel LLC/BRS Finance Corp., 7.25%, due 9/1/2025 | | $ | 10,861,703 | (f) | |
Support - Services 8.9% | | | |
| | 3,685,000 | | | ADT Corp., 4.88%, due 7/15/2032 | | | 3,188,631 | (f) | |
| | | | | Aramark Services, Inc. | | | | | |
| | 8,555,000 | | | 5.13%, due 1/15/2024 | | | 8,822,344 | | |
| | 5,365,000 | | | 5.00%, due 2/1/2028 | | | 5,613,131 | (f) | |
| | | | | Avis Budget Car Rental LLC/Avis Budget Finance, Inc. | | | | | |
| | 370,000 | | | 5.50%, due 4/1/2023 | | | 377,289 | | |
| | 5,245,000 | | | 5.25%, due 3/15/2025 | | | 5,349,900 | (f) | |
| | 10,385,000 | | | 5.75%, due 7/15/2027 | | | 10,592,700 | (f) | |
| | 5,905,000 | | | frontdoor, Inc., 6.75%, due 8/15/2026 | | | 6,465,975 | (f) | |
| | 12,895,000 | | | Garda World Security Corp., 8.75%, due 5/15/2025 | | | 12,895,000 | (f) | |
| | 4,535,000 | | | GW B-CR Security Corp., 9.50%, due 11/1/2027 | | | 4,659,713 | (f) | |
| | | | | Hertz Corp. | | | | | |
| | 12,825,000 | | | 5.50%, due 10/15/2024 | | | 12,723,682 | (f) | |
| | 8,175,000 | | | 7.13%, due 8/1/2026 | | | 8,440,687 | (f) | |
| | 6,380,000 | | | IAA Spinco, Inc., 5.50%, due 6/15/2027 | | | 6,835,532 | (f) | |
| | 3,790,000 | | | Iron Mountain U.S. Holdings, Inc., 5.38%, due 6/1/2026 | | | 3,932,125 | (f) | |
| | | | | Iron Mountain, Inc. | | | | | |
| | 1,725,000 | | | 6.00%, due 8/15/2023 | | | 1,761,656 | | |
| | 8,921,000 | | | 4.88%, due 9/15/2027 | | | 9,188,630 | (f) | |
| | 19,319,000 | | | 5.25%, due 3/15/2028 | | | 20,284,950 | (f) | |
| | 8,930,000 | | | 4.88%, due 9/15/2029 | | | 9,142,087 | (f) | |
| | 14,660,000 | | | KAR Auction Services, Inc., 5.13%, due 6/1/2025 | | | 15,301,375 | (f) | |
| | | | | Prime Security Services Borrower LLC/Prime Finance, Inc. | | | | | |
| | 3,372,000 | | | 9.25%, due 5/15/2023 | | | 3,547,344 | (f) | |
| | 20,680,000 | | | 5.75%, due 4/15/2026 | | | 21,209,925 | (f) | |
| | 5,645,000 | | | Ritchie Bros Auctioneers, Inc., 5.38%, due 1/15/2025 | | | 5,884,913 | (f) | |
| | 7,795,000 | | | ServiceMaster Co. LLC, 5.13%, due 11/15/2024 | | | 8,077,569 | (f) | |
| | | | | Staples, Inc. | | | | | |
| | 16,900,000 | | | 7.50%, due 4/15/2026 | | | 17,618,250 | (f) | |
| | 2,255,000 | | | 10.75%, due 4/15/2027 | | | 2,345,200 | (f) | |
| | 3,190,000 | | | United Rentals N.A., Inc., 5.50%, due 5/15/2027 | | | 3,363,456 | | |
| | | | 207,622,064 | | |
Technology Hardware & Equipment 2.0% | | | |
| | 2,940,000 | | | CDW LLC/CDW Finance Corp., 5.00%, due 9/1/2025 | | | 3,072,300 | | |
| | | | | CommScope Finance LLC | | | | | |
| | 3,260,000 | | | 6.00%, due 3/1/2026 | | | 3,349,650 | (f) | |
| | 4,895,000 | | | 8.25%, due 3/1/2027 | | | 4,636,691 | (f) | |
| | | | | CommScope Technologies LLC | | | | | |
| | 13,366,000 | | | 6.00%, due 6/15/2025 | | | 11,982,619 | (f) | |
| | 12,945,000 | | | 5.00%, due 3/15/2027 | | | 10,582,537 | (f) | |
| | 13,845,000 | | | Western Digital Corp., 4.75%, due 2/15/2026 | | | 14,104,594 | | |
| | | | 47,728,391 | | |
Telecom - Satellite 1.2% | | | |
| | 9,320,000 | | | Connect Finco S.a.r.l./Connect U.S. Finco LLC, 6.75%, due 10/1/2026 | | | 9,657,850 | (f) | |
| | 19,580,000 | | | Intelsat Jackson Holdings SA, 5.50%, due 8/1/2023 | | | 18,307,300 | | |
| | | | 27,965,150 | | |
See Notes to Financial Statements
110
Schedule of Investments High Income Bond Fund^ (cont'd)
PRINCIPAL AMOUNT | | | | VALUE | |
Telecom - Wireless 2.5% | | | |
$ | 1,610,000 | | | Sprint Capital Corp., 8.75%, due 3/15/2032 | | $ | 1,963,202 | | |
| | | | | Sprint Corp. | | | | | |
| | 7,730,000 | | | 7.88%, due 9/15/2023 | | | 8,531,987 | | |
| | 30,621,000 | | | 7.13%, due 6/15/2024 | | | 33,223,785 | | |
| | 6,570,000 | | | 7.63%, due 3/1/2026 | | | 7,268,063 | | |
| | | | | T-Mobile USA, Inc. | | | | | |
| | 1,760,000 | | | 6.00%, due 4/15/2024 | | | 1,826,000 | | |
| | 2,320,000 | | | 6.50%, due 1/15/2026 | | | 2,482,632 | | |
| | 3,160,000 | | | 4.50%, due 2/1/2026 | | | 3,258,750 | | |
| | | | 58,554,419 | | |
Telecom - Wireline Integrated & Services 3.1% | | | |
| | | | | Altice France SA | | | | | |
| | 7,515,000 | | | 8.13%, due 2/1/2027 | | | 8,332,256 | (f) | |
| | 5,585,000 | | | 5.50%, due 1/15/2028 | | | 5,689,719 | (f) | |
| | | | | Altice Luxembourg SA | | | | | |
| | 3,070,000 | | | 7.63%, due 2/15/2025 | | | 3,165,938 | (f) | |
| | 1,175,000 | | | 10.50%, due 5/15/2027 | | | 1,329,219 | (f) | |
| | 15,835,000 | | | Frontier Communications Corp., 8.00%, due 4/1/2027 | | | 16,626,750 | (f) | |
| | | | | Level 3 Financing, Inc. | | | | | |
| | 4,910,000 | | | 5.13%, due 5/1/2023 | | | 4,971,375 | | |
| | 9,360,000 | | | 4.63%, due 9/15/2027 | | | 9,512,100 | (f) | |
| | 15,565,000 | | | Numericable-SFR SA, 7.38%, due 5/1/2026 | | | 16,667,702 | (f) | |
| | | | | Zayo Group LLC/Zayo Capital, Inc. | | | | | |
| | 2,465,000 | | | 6.00%, due 4/1/2023 | | | 2,535,277 | | |
| | 105,000 | | | 6.38%, due 5/15/2025 | | | 107,940 | | |
| | 2,985,000 | | | 5.75%, due 1/15/2027 | | | 3,033,894 | (f) | |
| | | | 71,972,170 | | |
Theaters & Entertainment 1.2% | | | |
| | | | | AMC Entertainment Holdings, Inc. | | | | | |
| | 12,477,000 | | | 5.75%, due 6/15/2025 | | | 11,854,398 | | |
| | 2,910,000 | | | 5.88%, due 11/15/2026 | | | 2,651,737 | | |
| | | | | Live Nation Entertainment, Inc. | | | | | |
| | 4,395,000 | | | 4.88%, due 11/1/2024 | | | 4,548,825 | (f) | |
| | 9,790,000 | | | 4.75%, due 10/15/2027 | | | 10,207,054 | (f) | |
| | | | 29,262,014 | | |
| | | | | Total Corporate Bonds (Cost $2,105,059,690) | | | 2,157,370,548 | | |
Convertible Bonds 0.1% | | | |
Energy - Exploration & Production 0.1% | | | |
| | 2,415,000 | | | Chesapeake Energy Corp., 5.50%, due 9/15/2026 (Cost $2,335,181) | | | 1,332,778 | | |
Asset-Backed Securities 0.9% | | | |
| 1,100,000 | | | Annisa CLO Ltd., Ser. 2016-2A, Class ER, (3M USD LIBOR + 6.00%), 7.97%,
due 7/20/2031 | | | 962,838 | (a)(f) | |
| 350,000 | | | Apidos CLO XXIV, Ser. 2016-24A, Class DR, (3M USD LIBOR + 5.80%), 7.77%,
due 10/20/2030 | | | 303,526 | (a)(f) | |
| 1,250,000 | | | Ares XLV CLO Ltd., Ser. 2017-45A, Class E, (3M USD LIBOR + 6.10%), 8.10%,
due 10/15/2030 | | | 1,126,392 | (a)(f) | |
See Notes to Financial Statements
111
Schedule of Investments High Income Bond Fund^ (cont'd)
PRINCIPAL AMOUNT | | | | VALUE | |
$ | 1,000,000
| | | Assurant CLO I Ltd., Ser. 2017-1A, Class E, (3M USD LIBOR + 6.46%), 8.43%,
due 10/20/2029 | | $ | 958,849
| (a)(f) | |
| 500,000 | | | BlueMountain CLO Ltd., Ser. 2018-2A, Class E, (3M USD LIBOR + 6.05%), 8.21%,
due 8/15/2031 | | | 426,613 | (a)(f) | |
| 250,000 | | | Canyon Capital CLO Ltd., Ser. 2018-1A, Class E, (3M USD LIBOR + 5.75%), 7.75%,
due 7/15/2031 | | | 212,092 | (a)(f) | |
| 1,000,000 | | | Carbone CLO Ltd., Ser. 2017-1A, Class D, (3M USD LIBOR + 5.90%), 7.87%,
due 1/20/2031 | | | 905,215 | (a)(f) | |
| 250,000 | | | Dryden 65 CLO Ltd., Ser. 2018-65A, Class E, (3M USD LIBOR + 5.75%), 7.75%,
due 7/18/2030 | | | 218,155 | (a)(f) | |
| 600,000 | | | Eaton Vance CLO Ltd., Ser. 2015-1A, Class ER, (3M USD LIBOR + 5.60%), 7.57%,
due 1/20/2030 | | | 511,318 | (a)(f) | |
| 250,000 | | | Galaxy XVIII CLO Ltd., Ser. 2018-28A, Class E, (3M USD LIBOR + 6.00%), 8.00%,
due 7/15/2031 | | | 205,438 | (a)(f) | |
| 1,500,000 | | | Galaxy XXV CLO Ltd., Ser. 2018-25A, Class E, (3M USD LIBOR + 5.95%), 7.89%,
due 10/25/2031 | | | 1,290,185 | (a)(f) | |
| 1,000,000 | | | HPS Investment Partners, Ser. 2013-2A, Class DR, (3M USD LIBOR + 6.60%), 8.57%,
due 10/20/2029 | | | 932,308 | (a)(f) | |
| 1,250,000 | | | Jay Park CLO Ltd., Ser. 2016-1A, Class DR, (3M USD LIBOR + 5.20%), 7.17%,
due 10/20/2027 | | | 1,165,940 | (a)(f) | |
| | 2,000,000 | | | KKR CLO 16 Ltd., Ser. 2016, Class DR, (3M USD LIBOR + 6.75%), 8.72%, due 1/20/2029 | | | 1,860,978 | (a)(f) | |
| | | | | Magnetite CLO Ltd. | | | | | |
| | 900,000 | | | Ser. 2014-8A, Class ER2, (3M USD LIBOR + 5.65%), 7.65%, due 4/15/2031 | | | 824,227 | (a)(f) | |
| | 2,000,000 | | | Ser. 2015-12A, Class ER, (3M USD LIBOR + 5.68%), 7.68%, due 10/15/2031 | | | 1,779,673 | (a)(f) | |
| 1,000,000 | | | Milos CLO Ltd., Ser. 2017-1A, Class E, (3M USD LIBOR + 6.30%), 8.27%,
due 10/20/2030 | | | 904,453 | (a)(f) | |
| 1,200,000 | | | OCP CLO Ltd., Ser. 2017-14A, Class D, (3M USD LIBOR + 5.80%), 7.94%,
due 11/20/2030 | | | 1,052,755 | (a)(f) | |
| 825,000 | | | Octagon Investment Partners 27 Ltd., Ser. 2016-1A, Class ER, (3M USD LIBOR + 5.95%),
7.95%, due 7/15/2030 | | | 748,066 | (a)(f) | |
| 710,000 | | | Octagon Investment Partners 39 Ltd., Ser. 2018-3A, Class E, (3M USD LIBOR + 5.75%),
7.72%, due 10/20/2030 | | | 618,109 | (a)(f) | |
| 700,000 | | | Octagon Loan Funding Ltd., Ser. 2014-1A, Class ERR, (3M USD LIBOR + 6.00%),
8.12%, due 11/18/2031 | | | 605,404 | (a)(f) | |
| 450,000 | | | Palmer Square CLO Ltd., Ser. 2014-1A, Class DR2, (3M USD LIBOR + 5.70%), 7.70%,
due 1/17/2031 | | | 389,634 | (a)(f) | |
| | 1,000,000 | | | Post CLO Ltd., Ser. 2018-1A, Class E, (3M USD LIBOR + 5.87%), 7.87%, due 4/16/2031 | | | 871,612 | (a)(f) | |
| 300,000 | | | TICP CLO XI Ltd., Ser. 2018-11A, Class E, (3M USD LIBOR + 6.00%), 7.97%,
due 10/20/2031 | | | 273,564 | (a)(f) | |
| 1,100,000 | | | TICP CLO XIII Ltd., Ser. 2019-13A, Class E, (3M USD LIBOR + 6.75%), 9.12%,
due 7/15/2032 | | | 1,047,446 | (a)(f) | |
| | 650,000 | | | Voya CLO Ltd., Ser. 2016-3A, Class DR, (3M USD LIBOR + 6.08%), 8.08%, due 10/18/2031 | | | 554,685 | (a)(f) | |
| | | | | Total Asset-Backed Securities (Cost $22,953,390) | | | 20,749,475 | | |
NUMBER OF SHARES | | | | | |
Short-Term Investments 0.8% | | | |
Investment Companies 0.8% | | | |
| 18,935,190 | | | State Street Institutional U.S. Government Money Market Fund Premier Class, 1.75%(j)
(Cost $18,935,190) | | | 18,935,190 | (k) | |
| | | | | Total Investments 98.5% (Cost $2,265,818,293) | | | 2,311,872,195 | | |
| | | | | Other Assets Less Liabilities 1.5% | | | 34,620,995 | | |
| | | | | Net Assets 100.0% | | $ | 2,346,493,190 | | |
See Notes to Financial Statements
112
Schedule of Investments High Income Bond Fund^ (cont'd)
(a) Variable or floating rate security. The interest rate shown was the current rate as of October 31, 2019 and changes periodically.
(b) All or a portion of this security was purchased on a delayed delivery basis.
(c) All or a portion of this security had not settled as of October 31, 2019 and thus may not have an interest rate in effect. Interest rates do not take effect until settlement.
(d) The stated interest rate represents the weighted average interest rate at October 31, 2019 of the underlying contracts within the Loan Assignment. Interest rates on the underlying contracts are primarily determined by reference to the indicated base lending rate and spread, which are indicated in the security description, and the reset period, which is generally weekly, monthly or quarterly.
(e) Value determined using significant unobservable inputs.
(f) Securities were purchased under Rule 144A of the Securities Act of 1933, as amended, or are otherwise restricted and, unless registered under the Securities Act of 1933 or exempted from registration, may only be sold to qualified institutional investors or may have other restrictions on resale. At October 31, 2019, these securities amounted to $1,489,796,187, which represents 63.5% of net assets of the Fund. These securities have been deemed by the investment manager to be liquid.
(g) When-issued security. Total value of all such securities at October 31, 2019, amounted to $7,824,017, which represents 0.3% of net assets of the Fund.
(h) Security issued at a fixed coupon rate, which converts to a variable rate at a future date. Rate shown is the rate in effect as of period end.
(i) Payment-in-kind (PIK) security.
(j) Represents 7-day effective yield as of October 31, 2019.
(k) All or a portion of this security is segregated in connection with obligations for when-issued securities and/or delayed delivery securities with a total value of $18,935,190.
The following is a summary, categorized by Level (see Note A of Notes to Financial Statements), of inputs used to value the Fund's investments as of October 31, 2019:
Asset Valuation Inputs
| | | Level 1 | | Level 2 | | Level 3(b) | | Total | |
Investments: | |
Loan Assignments | |
Health Care | | $ | — | | | $ | 13,425,712 | | | $ | 4,518,569 | | | $ | 17,944,281 | | |
Industrial Equipment | | | — | | | | — | | | | 4,120,200 | | | | 4,120,200 | | |
| Other Loan Assignments(a) | | | — | | | | 91,419,723 | | | | — | | | | 91,419,723 | | |
Total Loan Assignments | | | — | | | | 104,845,435 | | | | 8,638,769 | | | | 113,484,204 | | |
| Corporate Bonds(a) | | | — | | | | 2,157,370,548 | | | | — | | | | 2,157,370,548 | | |
| Convertible Bonds(a) | | | — | | | | 1,332,778 | | | | — | | | | 1,332,778 | | |
Asset-Backed Securities | | | — | | | | 20,749,475 | | | | — | | | | 20,749,475 | | |
Short-Term Investments | | | — | | | | 18,935,190 | | | | — | | | | 18,935,190 | | |
Total Investments | | $ | — | | | $ | 2,303,233,426 | | | $ | 8,638,769 | | | $ | 2,311,872,195 | | |
See Notes to Financial Statements
113
Schedule of Investments High Income Bond Fund^ (cont'd)
(a) The Schedule of Investments provides information on the industry or sector categorization for the portfolio.
(b) The following is a reconciliation between the beginning and ending balances of investments in which unobservable inputs (Level 3) were used in determining value:
(000's omitted) | | Beginning
balance, as
of 11/1/2018 | | Accrued
discounts/
(premiums) | | Realized
gain/
(loss) | | Change in
unrealized
appreciation/
(depreciation) | | Purchases | | Sales | | Transfers
into
Level 3 | | Transfers
out of
Level 3 | | Balance,
as of
10/31/2019 | | Net change
in unrealized
appreciation/
(depreciation)
from
investments
still held as
of 10/31/2019 | |
Investments in
Securities: | |
Loan
Assignments(c) | |
Health Care | | $ | — | | | $ | 8 | | | $ | 6 | | | $ | 105 | | | $ | 4,651 | | | $ | (251 | ) | | $ | — | | | $ | — | | | $ | 4,519 | | | $ | 105 | | |
Industrial
Equipment | | | — | | | | — | | | | — | | | | (109 | ) | | | 4,229 | | | | — | | | | — | | | | — | | | | 4,120 | | | | (109 | ) | |
Lodging &
Casinos | | | 7,404 | | | | 7 | | | | 293 | | | | (703 | ) | | | — | | | | (7,001 | ) | | | — | | | | — | | | | — | | | | — | | |
Total | | $ | 7,404 | | | $ | 15 | | | $ | 299 | | | $ | (707 | ) | | $ | 8,880 | | | $ | (7,252 | ) | | $ | — | | | $ | — | | | $ | 8,639 | | | $ | (4 | ) | |
(c) Securities categorized as Level 3 were valued based on a single quotation obtained from a dealer. The Fund does not have access to unobservable inputs and therefore cannot disclose such inputs used in formulating such quotation.
^ A balance indicated with a "—", reflects either a zero balance or an amount that rounds to less than 1.
See Notes to Financial Statements
114
Schedule of Investments Municipal High Income Fund^ October 31, 2019
PRINCIPAL AMOUNT | | | | VALUE | |
Municipal Notes 102.5% | | | |
Alabama 0.4% | | | |
$ | 300,000
| | | Birmingham Spec. Care Facs. Fin. Au. Rev. (Methodist Home for The Aging),
Ser. 2016-2015-1, 5.75%, due 6/1/2045 | | $ | 335,409
| | |
| | 100,000 | | | Taylor-Ryan Imp. Dist. Rev. Ref., Ser. 2005, (LOC: Synovus Bank), 1.27%, due 11/1/2035 | | | 100,000 | (a) | |
| | | | 435,409 | | |
Arizona 4.3% | | | |
| 500,000 | | | Maricopa Co. Ind. Dev. Au. Ed. Ref. Rev. (Paradise Sch. Proj. Paragon Management, Inc.),
Ser. 2016, 5.00%, due 7/1/2036 | | | 546,665 | (b) | |
| 800,000 | | | Maricopa Co. Ind. Dev. Au. Solid Waste Disp. Rev. (Waste Management, Inc. Proj.),
Ser. 2001, 3.38%, due 12/1/2031 Putable 6/3/2024 | | | 817,304 | | |
| 1,230,000 | | | Maricopa Co. Ind. Dev. Au. Sr. Living Fac. Ref. Rev. (Christian Care Retirement Apts. Inc.
Proj.), Ser. 2016-A, 5.00%, due 1/1/2025 | | | 1,450,170 | | |
| | 500,000 | | | Maricopa Co. Ind. Dev. Au. Sr. Living Fac. Rev. (Christian Care Surprise, Inc. Proj.),
Ser. 2016, 5.00%, due 1/1/2026 | | | 511,500 | (b) | |
| | 250,000 | | | Navajo Nation Ref. Rev., Ser. 2015-A, 5.00%, due 12/1/2025 | | | 279,282 | (b) | |
| 500,000 | | | Phoenix Ind. Dev. Au. Ed. Ref. Rev. (Great Hearts Academies), Ser. 2016-A, 5.00%,
due 7/1/2046 | | | 548,105 | | |
| 600,000 | | | Phoenix Ind. Dev. Au. Rev. (Deer Valley Veterans Assisted Living Proj.), Ser. 2016-A, 5.13%,
due 7/1/2036 | | | 607,788 | | |
| 500,000 | | | Pima Co. Ind. Dev. Au. Ed. Ref. Rev. (American Leadership Academy Proj.), Ser. 2015, 5.38%,
due 6/15/2035 | | | 548,190 | (b) | |
| | | | 5,309,004 | | |
California 10.8% | | | |
| | 997,796 | | | California Hsg. Fin. Agcy. Muni. Cert., Ser. 2019-A, 4.25%, due 1/15/2035 | | | 1,170,913 | | |
| 250,000 | | | California Muni. Fin. Au. Charter Sch. Lease Rev. (Santa Rosa Academy Proj.), Ser. 2015,
5.13%, due 7/1/2035 | | | 274,310 | (b) | |
| 500,000 | | | California Muni. Fin. Au. Charter Sch. Rev. (John Adams Academics Proj.), Ser. 2015-A,
4.50%, due 10/1/2025 | | | 519,840 | | |
| 500,000 | | | California Muni. Fin. Au. Charter Sch. Rev. (Palmdale Aerospace Academy Proj.),
Ser. 2016, 5.00%, due 7/1/2031 | | | 562,500 | (b) | |
| | 400,000 | | | California Muni. Fin. Au. Rev. (Baptist Univ.), Ser. 2015-A, 5.00%, due 11/1/2030 | | | 457,960 | (b) | |
| 500,000 | | | California Muni. Fin. Au. Spec. Fac. Rev. (United Airlines, Inc., Proj.), Ser. 2019, 4.00%,
due 7/15/2029 | | | 567,145 | (c) | |
| 830,000 | | | California St. Dept. of Veterans Affairs Home Purchase Ref. Rev., Ser. 2016-A, 2.85%,
due 12/1/2027 | | | 861,416 | | |
| 470,000 | | | California St. Poll. Ctrl. Fin. Au. Solid Waste Disp. Rev. (Aemerge Redpak Svcs. So.
California LLC Proj.), Ser. 2016, 7.00%, due 12/1/2027 | | | 235,000 | (b)(d)(e) | |
| 250,000 | | | California St. Poll. Ctrl. Fin. Au. Solid Waste Disp. Rev. (Calplant I Green Bond Proj.),
Ser. 2019, 7.50%, due 12/1/2039 | | | 242,430 | (b) | |
| 250,000 | | | California St. Poll. Ctrl. Fin. Au. Solid Waste Disp. Rev. (Green Bond-Rialto Bioenergy Fac.
LLC, Proj.), Ser. 2019, 7.50%, due 12/1/2040 | | | 260,145 | (b) | |
| 500,000 | | | California St. Sch. Fin. Au. Charter Sch. Rev. (Downtown College Prep-Oblig. Group),
Ser. 2016, 4.75%, due 6/1/2036 | | | 536,715 | (b) | |
| 600,000 | | | California St. Sch. Fin. Au. Charter Sch. Rev. (Rocketship Ed.), Ser. 2016-A, 5.00%,
due 6/1/2031 | | | 646,470 | (b) | |
| 300,000 | | | California Statewide CDA College Hsg. Rev. (NCCD-Hooper Street LLC-College of the
Arts Proj.), Ser. 2019, 5.25%, due 7/1/2052 | | | 343,755 | (b) | |
| 400,000 | | | California Statewide CDA Rev. Ref. (Lancer Ed. Std. Hsg. Proj.), Ser. 2016-A, 5.00%,
due 6/1/2036 | | | 450,200 | (b) | |
See Notes to Financial Statements
115
Schedule of Investments Municipal High Income Fund^ (cont'd)
PRINCIPAL AMOUNT | | | | VALUE | |
$ | 135,000
| | | California Statewide CDA Spec. Tax Rev. Ref. (Comm. Facs. Dist. Number 2007-01
Orinda Wilder Proj.), Ser. 2015, 4.50%, due 9/1/2025 | | $ | 153,706
| | |
| | 400,000 | | | Del Mar Race Track Au. Ref. Rev., Ser. 2015, 5.00%, due 10/1/2038 | | | 400,800 | | |
| | | | | Golden St. Tobacco Securitization Corp. Tobacco Settlement Rev. Ref. | | | | | |
| | 500,000 | | | Ser. 2018-A-1, 5.00%, due 6/1/2047 | | | 513,955 | | |
| | 4,500,000 | | | Ser. 2018-A-2, 5.00%, due 6/1/2047 | | | 4,625,595 | | |
| 500,000 | | | Tobacco Securitization Au. Southern California Tobacco Settlement Rev. Ref. (San Diego Co.
Asset Securitization Corp.), Ser. 2019-A, Class 1, 5.00%, due 6/1/2048 | | | 595,440 | (c) | |
| | | | 13,418,295 | | |
Colorado 4.4% | | | |
| 750,000 | | | Colorado St. Hlth. Facs. Au. Hosp. Rev. Ref. (Commonspirit Hlth.), Ser. 2019-A-2, 4.00%,
due 8/1/2049 | | | 801,870 | | |
| | 471,000 | | | Crystal Crossing Metro. Dist. Ref. G.O., Ser. 2016, 4.50%, due 12/1/2026 | | | 490,660 | | |
| | 1,000,000 | | | Denver Convention Ctr. Hotel Au. Ref. Rev., Ser. 2016, 5.00%, due 12/1/2027 | | | 1,188,440 | | |
| | 1,250,000 | | | Denver Hlth. & Hosp. Au. Healthcare Rev. Ref., Ser. 2019-A, 4.00%, due 12/1/2040 | | | 1,374,450 | | |
| | 500,000 | | | Littleton Village Metro. Dist. Number 2 Ref. G.O., Ser. 2015, 5.38%, due 12/1/2045 | | | 520,125 | | |
| | | | | Park Creek Metro. Dist. Ref. Tax Allocation Rev. (Sr. Ltd. Prop. Tax Supported) | | | | | |
| | 250,000 | | | Ser. 2015-A, 5.00%, due 12/1/2034 | | | 289,897 | | |
| | 250,000 | | | Ser. 2015-A, 5.00%, due 12/1/2035 | | | 289,300 | | |
| | 500,000 | | | Ser. 2015-A, 5.00%, due 12/1/2045 | | | 563,470 | | |
| | | | 5,518,212 | | |
Connecticut 0.1% | | | |
| 145,000 | | | Mohegan Tribe of Indians Gaming Au. Ref. Rev. (Priority Dist.), Ser. 2015-C, 4.75%,
due 2/1/2020 | | | 145,740 | (b) | |
Florida 4.7% | | | |
| | 300,000 | | | Broward Co. IDR (Florida Pwr. & Lt. Co. Proj.), Ser. 2018-A, 1.40%, due 12/1/2048 | | | 300,000 | (a) | |
| 200,000 | | | Cap. Trust Agcy. Sr. Living Rev. (H-Bay Ministries, Inc. Superior Residences-Third Tier),
Ser. 2018-C, 7.50%, due 7/1/2053 | | | 209,358 | (b) | |
| 650,000 | | | Florida Dev. Fin. Corp. Ed. Facs. Rev. Ref. (Pepin Academies, Inc.), Ser. 2016-A, 5.00%,
due 7/1/2036 | | | 655,817 | | |
| 450,000 | | | Florida St. Dev. Fin. Corp. Ed. Facs. Rev. (Renaissance Charter Sch., Inc. Proj.),
Ser. 2015-A, 6.00%, due 6/15/2035 | | | 497,453 | (b) | |
| 350,000 | | | Florida St. Dev. Fin. Corp. Sr. Living Rev. (Tuscan Isle Champions Gate Proj.),
Ser. 2016-A, 6.38%, due 6/1/2046 | | | 266,000 | (b)(d) | |
| | 430,000 | | | Florida St. Hsg. Fin. Corp. Rev., Ser. 2015-1, 3.75%, due 7/1/2035 | | | 454,497 | | |
| 400,000 | | | Greater Orlando Aviation Au. Arpt. Facs. Spec. Purp. Rev. (JetBlue Airways Corp. Proj.),
Ser. 2013, 5.00%, due 11/15/2036 | | | 426,820 | | |
| 525,000 | | | Lee Co. Ind. Dev. Au. Rev. (Cypress Cove Hlth. Park, Inc. Memory Care Proj.),
Ser. 2014, 4.50%, due 10/1/2032 | | | 558,065 | | |
| 2,500,000 | | | St. Lucie Co. Solid Waste Disp. Rev. Ref. (Florida Pwr. & Lt. Co. Proj.), Ser. 2003, 1.40%,
due 5/1/2024 | | | 2,500,000 | (a) | |
| | | | 5,868,010 | | |
Georgia 1.5% | | | |
| 250,000 | | | Cobb Co. Dev. Au. Sr. Living Ref. Rev. (Provident Village Creekside Proj.), Ser. 2016-A, 6.00%,
due 7/1/2036 | | | 248,415 | (b)(e) | |
| 500,000 | | | DeKalb Co. Hsg. Au. Sr. Living Rev. Ref. (Baptist Retirement Comm. of Georgia Proj.),
Ser. 2019-A, 5.13%, due 1/1/2049 | | | 483,445 | (b) | |
See Notes to Financial Statements
116
Schedule of Investments Municipal High Income Fund^ (cont'd)
PRINCIPAL AMOUNT | | | | VALUE | |
$ | 1,000,000
| | | Muni. Elec. Au. of Georgia (Plant Vogtle units 3&4 Proj. M Bonds), Ser. 2019-A, 5.00%,
due 1/1/2056 | | $ | 1,152,770
| | |
| | | | 1,884,630 | | |
Hawaii 1.2% | | | |
| 750,000 | | | Hawaii St. Dept. of Budget & Fin. Spec. Purp. Rev. (Hawaiian Elec. Co., Inc. - Subsidiary),
Ser. 2019, 3.50%, due 10/1/2049 | | | 753,638 | | |
| | | | | Hawaii St. Dept. of Budget & Fin. Spec. Purp. Rev. Ref. | | | | | |
| | 250,000 | | | Ser. 2015, 5.00%, due 1/1/2035 | | | 258,940 | (b) | |
| | 500,000 | | | Ser. 2015, 5.00%, due 1/1/2045 | | | 511,135 | (b) | |
| | | | 1,523,713 | | |
Illinois 10.2% | | | |
| | | | | Chicago G.O. | | | | | |
| | 2,000,000 | | | Ser. 2019-A, 5.00%, due 1/1/2044 | | | 2,249,940 | | |
| | 500,000 | | | Ser. 2019-A, 5.50%, due 1/1/2049 | | | 581,660 | | |
| | 200,000 | | | Chicago O'Hare Int'l Arpt. Rev. Ref., Ser. 2015-A, 5.00%, due 1/1/2028 | | | 230,728 | | |
| 500,000 | | | Chicago O'Hare Int'l Arpt. Spec. Fac. Rev. (Trips Obligated Group), Ser. 2018, 5.00%,
due 7/1/2048 | | | 582,265 | | |
| | | | | Chicago Ref. G.O. | | | | | |
| | 1,000,000 | | | Ser. 2012-C, 5.00%, due 1/1/2020 | | | 1,004,670 | | |
| | 500,000 | | | Ser. 2012-C, 5.00%, due 1/1/2024 | | | 527,380 | | |
| | 155,000 | | | Chicago Wastewater Rev. (Second Lien Proj.), Ser. 2014, 5.00%, due 11/1/2027 | | | 176,562 | | |
| | 500,000 | | | Chicago Wastewater Transmission Rev. Ref. (Second Lien), Ser. 2008-C, 5.00%, due 1/1/2039 | | | 555,160 | | |
| 400,000 | | | Illinois Fin. Au. Charter Sch. Rev. (Intrinsic Sch.-Belmont Sch. Proj.), Ser. 2015-A, 5.75%,
due 12/1/2035 | | | 424,560 | (b) | |
| 425,000 | | | Illinois Fin. Au. Rev. Ref. (Rosalind Franklin Univ. of Medicine & Science), Ser. 2017-A, 5.00%,
due 8/1/2047 | | | 479,842 | | |
| | 2,000,000 | | | Illinois St. G.O., Ser. 2017-D, 5.00%, due 11/1/2028 | | | 2,287,840 | | |
| | | | | Illinois St. G.O. Ref. | | | | | |
| | 860,000 | | | Ser. 2016, 5.00%, due 2/1/2024 | | | 946,516 | | |
| | 1,055,000 | | | Ser. 2016, 5.00%, due 2/1/2025 | | | 1,179,173 | | |
| | 485,000 | | | Ser. 2016, 5.00%, due 2/1/2026 | | | 550,970 | | |
| | 395,000 | | | Illinois St. Sales Tax Rev., Ser. 1992-P, 6.50%, due 6/15/2022 | | | 408,225 | | |
| 500,000 | | | Upper Illinois River Valley Dev. Au. Rev. Ref. (Cambridge Lakes Learning Ctr.),
Ser. 2017-A, 5.25%, due 12/1/2047 | | | 530,000 | (b) | |
| | | | 12,715,491 | | |
Indiana 0.6% | | | |
| 700,000 | | | Indianapolis Econ. Dev. Rev. Ref. (Brookhaven Co. Line Apts. Proj.), Ser. 2013-A, 6.25%,
due 7/1/2043 Pre-Refunded 7/1/23 | | | 804,048 | | |
Iowa 0.3% | | | |
| 400,000 | | | Iowa Higher Ed. Loan Au. Ref. Rev. (Wartburg College Proj.), Ser. 2015, 5.00%,
due 10/1/2032 | | | 421,064 | | |
Kansas 0.4% | | | |
| 500,000 | | | Goddard Kansas Sales Tax Spec. Oblig. Rev. Ref. (Olympic Park Star Bond Proj.),
Ser. 2019, 3.60%, due 6/1/2030 | | | 494,380 | (c) | |
See Notes to Financial Statements
117
Schedule of Investments Municipal High Income Fund^ (cont'd)
PRINCIPAL AMOUNT | | | | VALUE | |
Kentucky 2.1% | | | |
$ | 405,000
| | | Kentucky Econ. Dev. Fin. Au. (Sr. Next Generation Information Hwy. Proj.),
Ser. 2015-A, 4.00%, due 7/1/2029 | | $ | 434,909
| | |
| 435,000 | | | Kentucky Econ. Dev. Fin. Au. Rev. Ref. (Owensboro Hlth., Inc. Obligated Group),
Ser. 2017-A, (AGM Insured), 4.00%, due 6/1/2037 | | | 472,136 | | |
| 1,000,000 | | | Kentucky Muni. Pwr. Agcy. Pwr. Sys. Rev. Ref. (Prairie St. Proj.), Ser. 2019-A, 4.00%,
due 9/1/2045 | | | 1,063,110 | | |
| 200,000 | | | Kentucky St. Pub. Energy Au. Gas Supply Rev., Ser. 2018-A, 4.00%, due 4/1/2048
Putable 4/1/2024 | | | 218,014 | | |
| | 475,000 | | | Ohio Co. PCR Ref. (Big Rivers Elec. Corp. Proj.), Ser. 2010-A, 6.00%, due 7/15/2031 | | | 484,044 | | |
| | | | 2,672,213 | | |
Louisiana 2.5% | | | |
| | | | | Greater Ouachita Wtr. Co., Inc. Waterworks & Swr. Sys. Rev. Ref. | | | | | |
| | 1,000,000 | | | Ser. 2019, (BAM Insured), 3.00%, due 9/1/2049 | | | 992,150 | | |
| | 250,000 | | | Ser. 2019, (BAM Insured), 4.00%, due 9/1/2037 | | | 281,385 | | |
| 400,000 | | | Louisiana Local Gov't Env. Facs. & Comm. Dev. Au. Rev. Ref. (Westside Habilitation Ctr. Proj.),
Ser. 2017-A, 5.75%, due 2/1/2032 | | | 425,244 | (b) | |
| 300,000 | | | Louisiana St. Local Gov't Env. Facs. & Comm. Dev. Au. Rev. (Lafourche Parish Gomesa Proj.),
Ser. 2019, 3.95%, due 11/1/2043 | | | 299,847 | (b)(c) | |
| | 500,000 | | | New Orleans Aviation Board Rev. (Gen. Arpt. Terminal), Ser. 2017-B, 5.00%, due 1/1/2026 | | | 591,690 | | |
| 500,000 | | | St. John the Baptist Parish LA Rev. Ref. (Marathon Oil Corp. Proj.), Ser. 2017-A-1, 2.00%,
due 6/1/2037 Putable 4/1/2023 | | | 499,935 | | |
| | | | 3,090,251 | | |
Maine 0.6% | | | |
| 445,000 | | | Maine St. Ed. Loan Au. Std. Loan Rev. (Supplemental Ed. Loan), Ser. 2014-A-1,
(AGM Insured), 4.00%, due 12/1/2020 | | | 455,475 | | |
| 200,000 | | | Maine St. Fin. Au. Solid Waste Disp. Rev. (Casella Waste Sys. Proj.), Ser. 2015, 5.13%,
due 8/1/2035 Putable 8/1/2025 | | | 227,452 | (b) | |
| | | | 682,927 | | |
Maryland 2.1% | | | |
| 250,000 | | | Baltimore Spec. Oblig. Ref. Rev. Sr. Lien (Harbor Point Proj.), Ser. 2019-A, 3.63%,
due 6/1/2046 | | | 251,202 | (b) | |
| | 2,000,000 | | | Prince Georges Co. G.O. (Cons. Pub. Imp.), Ser. 2018-A, 4.00%, due 7/15/2032 | | | 2,336,720 | | |
| | | | 2,587,922 | | |
Michigan 2.0% | | | |
| | 1,000,000 | | | Michigan St. Fin. Au. Rev. Ref. (Std. Loan), Ser. 2014-25-A, 5.00%, due 11/1/2020 | | | 1,032,610 | | |
| | 1,000,000 | | | Michigan St. Hsg. Dev. Au. Rev., Ser. 2016-C, 2.15%, due 6/1/2023 | | | 1,012,000 | | |
| | 400,000 | | | Summit Academy Pub. Sch. Academy Ref. Rev., Ser. 2005, 6.38%, due 11/1/2035 | | | 400,312 | | |
| | | | 2,444,922 | | |
Minnesota 3.9% | | | |
| 4,000,000 | | | JP Morgan Chase Putters/Drivers Trust Var. Sts. (Putters), Ser. 2019-5027, 1.47%,
due 6/1/2021 | | | 4,000,000 | (a)(b) | |
| 500,000 | | | St. Paul Hsg. & Redev. Au. Charter Sch. Lease Rev. (Academia Cesar Chavez Sch. Proj.),
Ser. 2015-A, 5.25%, due 7/1/2050 | | | 526,680 | | |
See Notes to Financial Statements
118
Schedule of Investments Municipal High Income Fund^ (cont'd)
PRINCIPAL AMOUNT | | | | VALUE | |
$ | 300,000
| | | St. Paul Hsg. & Redev. Au. Charter Sch. Lease Rev. (Twin Cities Academy Proj.),
Ser. 2015-A, 5.00%, due 7/1/2035 | | $ | 320,205
| | |
| | | | 4,846,885 | | |
Missouri 0.9% | | | |
| | | | | St. Louis Co. Ind. Dev. Au. Ref. Rev. (Nazareth Living Ctr. Proj.) | | | | | |
| | 255,000 | | | Ser. 2015-A, 5.00%, due 8/15/2030 | | | 277,073 | | |
| | 390,000 | | | Ser. 2015-A, 5.00%, due 8/15/2035 | | | 416,773 | | |
| | 355,000 | | | Ser. 2015-A, 5.13%, due 8/15/2045 | | | 376,726 | | |
| | | | 1,070,572 | | |
Nevada 0.4% | | | |
| 500,000 | | | Director of the St. of Nevada Dept. of Bus. & Ind. Rev. (Somerset Academy),
Ser. 2015-A, 5.13%, due 12/15/2045 | | | 541,775 | (b) | |
New Jersey 5.2% | | | |
| | | | | Atlantic City G.O. Ref. | | | | | |
| | 200,000 | | | Ser. 2017-A, (BAM Insured), 5.00%, due 3/1/2026 | | | 239,038 | | |
| | 200,000 | | | Ser. 2017-A, (BAM Insured), 5.00%, due 3/1/2032 | | | 238,220 | | |
| | 200,000 | | | Ser. 2017-A, (BAM Insured), 5.00%, due 3/1/2042 | | | 232,934 | | |
| 200,000 | | | Essex Co. Imp. Au. Solid Waste Disp. Rev. (Covanta Energy Proj.), Ser. 2015, 5.25%,
due 7/1/2045 | | | 204,624 | (b) | |
| 350,000 | | | New Jersey Econ. Dev. Au. Spec. Fac. Rev. Ref. (Port Newark Container Term. LLC Proj.),
Ser. 2017, 5.00%, due 10/1/2047 | | | 399,963 | | |
| | 250,000 | | | New Jersey Higher Ed. Assist. Au. Rev. (Std. Loan Rev.), Ser. 2017-1A, 5.00%, due 12/1/2025 | | | 295,510 | | |
| 750,000 | | | New Jersey Higher Ed. Assist. Au. Rev. Ref. (Std. Loan Rev.), Ser. 2018-B, 5.00%,
due 12/1/2027 | | | 914,017 | | |
| | | | | New Jersey Hlth. Care Facs. Fin. Au. Contract Rev. Ref. (Hosp. Asset Trans. Prog.) | | | | | |
| | 1,265,000 | | | Ser. 2017, 5.00%, due 10/1/2026 | | | 1,492,599 | | |
| | 1,000,000 | | | Ser. 2017, 5.00%, due 10/1/2028 | | | 1,189,350 | | |
| | 1,250,000 | | | New Jersey St. Trans. Trust Fund Au., Ser. 2019-BB, 4.00%, due 6/15/2050 | | | 1,298,487 | | |
| | | | 6,504,742 | | |
New Mexico 0.4% | | | |
| 500,000 | | | Winrock Town Ctr. Tax Increment Dev. Dist. Number 1 Tax Allocation Sr., Lien Rev.
(Gross Receipts Tax Increment Bonds), Ser. 2015, 5.25%, due 5/1/2025 | | | 509,725 | (b)(e) | |
New York 6.0% | | | |
| | 200,000 | | | Build NYC Res. Corp. Rev., Ser. 2014, 5.25%, due 11/1/2034 | | | 215,522 | | |
| 750,000 | | | New York Liberty Dev. Corp. Rev. Ref. (Bank of American Tower at One Bryant Park Proj.),
Ser. 2019, Class 3, 2.80%, due 9/15/2069 | | | 764,782 | | |
| 400,000 | | | New York St. Dorm. Au. Rev. Non St. Supported Debt (St. Josephs College), Ser. 2010,
5.25%, due 7/1/2025 | | | 400,804 | | |
| 300,000 | | | New York St. Dorm. Au. Rev. Ref. Non St. Supported Debt (Montefiore Obligated Group),
Ser. 2018-A, 4.00%, due 8/1/2037 | | | 332,820 | | |
| 900,000 | | | New York St. Dorm. Au. Rev. Ref. Non St. Supported Debt (Orange Reg. Med. Ctr.),
Ser. 2017, 5.00%, due 12/1/2022 | | | 988,776 | (b) | |
| | 100,000 | | | New York St. HFA Rev. (Clinton Green North LLC), Ser. 2005-A, 1.16%, due 11/1/2038 | | | 100,000 | (a) | |
| 200,000 | | | New York St. HFA Rev. (Prospect Plaza Apts.), Ser. 2007-A, (LOC: Citibank N.A.), 1.16%,
due 11/1/2039 | | | 200,000 | (a) | |
See Notes to Financial Statements
119
Schedule of Investments Municipal High Income Fund^ (cont'd)
PRINCIPAL AMOUNT | | | | VALUE | |
$ | 200,000
| | | New York St. HFA Rev. (Tribeca Pointe LLC), Ser. 1997-A, (FNMA Insured), 1.16%,
due 5/15/2029 | | $ | 200,000
| (a) | |
| 500,000 | | | New York St. Trans. Dev. Corp. Spec. Fac. Rev. (American Airlines, Inc., John F Kennedy
Int'l Arpt. Proj.), Ser. 2016, 5.00%, due 8/1/2031 | | | 523,255 | | |
| 1,000,000 | | | New York St. Trans. Dev. Corp. Spec. Fac. Rev. (Delta Airlines, Inc.-LaGuardia Arpt. Term.
C&D Redev.), Ser. 2018, 5.00%, due 1/1/2028 | | | 1,219,560 | | |
| 40,000 | | | New York St. Trans. Dev. Corp. Spec. Fac. Rev. (LaGuardia Arpt. Term. B Redev. Proj.),
Ser. 2016-A, 4.00%, due 7/1/2041 | | | 42,038 | | |
| | | | | Oneida Co. Local Dev. Corp. Rev. Ref. (Mohawk Valley Hlth. Sys. Proj.) | | | | | |
| | 1,500,000 | | | Ser. 2019-A, (AGM Insured), 3.00%, due 12/1/2044 | | | 1,461,060 | (c) | |
| | 500,000 | | | Ser. 2019-A, (AGM Insured), 4.00%, due 12/1/2049 | | | 548,015 | (c) | |
| 400,000 | | | Westchester Co. Local Dev. Corp. Rev. Ref. (Wartburg Sr. Hsg. Proj.), Ser. 2015-A, 5.00%,
due 6/1/2030 | | | 417,160 | (b) | |
| | | | 7,413,792 | | |
North Carolina 1.9% | | | |
| 1,750,000 | | | Columbus Co. Ind. Facs. & Poll. Ctrl. Fin. Au. Rev. Ref. (AMT Int'l Paper Co. Proj.),
Ser. 2019-C, 2.10%, due 3/1/2027 Putable 10/1/2024 | | | 1,772,470 | | |
| 250,000 | | | North Carolina Med. Care Commission Hlth. Care Fac. First Mtge. Rev. (Lutheran Svcs. for
Aging, Inc.), Ser. 2012-A, 5.00%, due 3/1/2037 | | | 261,655 | | |
| 300,000 | | | North Carolina Med. Care Commission Retirement Facs. Rev. (Twin Lakes Comm.),
Ser. 2019-A, 5.00%, due 1/1/2049 | | | 342,273 | | |
| | | | 2,376,398 | | |
North Dakota 0.4% | | | |
| 500,000 | | | Grand Forks Co. Solid Waste Disp. Rev. (Green Bond-Red River Biorefinery, LLC Proj.),
Ser. 2018, 5.38%, due 9/15/2038 | | | 484,665 | (b) | |
Ohio 6.8% | | | |
| 4,530,000 | | | Buckeye Tobacco Settlement Fin. Au. Asset-Backed Sr. Rev. (Turbo), Ser. 2007-A-2, 5.88%,
due 6/1/2030 | | | 4,542,412 | | |
| 500,000 | | | Ohio St. Air Quality Dev. Au. Exempt Facs. Rev. (AMG Vanadium LLC), Ser. 2019-D, 5.00%,
due 7/1/2049 | | | 551,930 | (b) | |
| 1,000,000 | | | Ohio St. Air Quality Dev. Au. Exempt Facs. Rev. (Pratt Paper LLC Proj.), Ser. 2017, 4.50%,
due 1/15/2048 | | | 1,080,300 | (b) | |
| 1,500,000 | | | Ohio St. Air Quality Dev. Au. Rev. (Ohio Valley Elec. Corp. Proj.), Ser. 2014-B, 2.60%,
due 6/1/2041 Putable 10/1/2029 | | | 1,515,060 | (f) | |
| 750,000 | | | Ohio St. Air Quality Dev. Au. Rev. Ref. (Ohio Valley Elec. Corp. Proj.), Ser. 2019-A, 3.25%,
due 9/1/2029 | | | 771,990 | | |
| | | | 8,461,692 | | |
Oklahoma 0.3% | | | |
| 325,000 | | | Oklahoma St. Dev. Fin. Au. Hlth. Sys. Rev. (OU Medicine Proj.), Ser. 2018-B, 5.50%,
due 8/15/2057 | | | 387,283 | | |
Oregon 0.4% | | | |
| 490,000 | | | Western Generation Agcy. Rev. (Wauna Cogeneration Proj.), Ser. 2006-A, 5.00%,
due 1/1/2021 | | | 490,054 | | |
See Notes to Financial Statements
120
Schedule of Investments Municipal High Income Fund^ (cont'd)
PRINCIPAL AMOUNT | | | | VALUE | |
Pennsylvania 2.7% | | | |
$ | 500,000
| | | Commonwealth Fin. Au. Tobacco Master Settlement Payment Rev. (Tobacco Master
Settlement Payment Bonds), Ser. 2018, 5.00%, due 6/1/2020 | | $ | 510,240
| | |
| | | | | Lancaster Co. Hosp. Au. Rev. (Brethren Village Proj.) | | | | | |
| | 250,000 | | | Ser. 2015, 5.25%, due 7/1/2035 | | | 271,200 | | |
| | 150,000 | | | Ser. 2015, 5.50%, due 7/1/2045 | | | 163,662 | | |
| | 200,000 | | | Luzerne Co. G.O. Ref, Ser. 2017-B, (AGM Insured), 5.00%, due 12/15/2027 | | | 242,564 | | |
| | 750,000 | | | Pennsylvania Econ. Dev. Fin. Au. Rev. (Bridges Finco LP), Ser. 2016-C, 5.00%, due 12/31/2038 | | | 854,212 | | |
| 400,000 | | | Pennsylvania Econ. Dev. Fin. Au. Rev. Ref. (Tapestry Moon Sr. Hsg. Proj.), Ser. 2018-A,
6.75%, due 12/1/2053 | | | 404,020 | (b) | |
| 300,000 | | | Pennsylvania St. Econ. Dev. Fin. Au. Solid Waste Disp. Rev. (CarbonLite P LLC Proj.),
Ser. 2019, 5.75%, due 6/1/2036 | | | 319,527 | (b) | |
| | 500,000 | | | Pennsylvania St. Turnpike Commission Turnpike Rev., Subser. 2017-B-1, 5.25%, due 6/1/2047 | | | 590,935 | | |
| | | | 3,356,360 | | |
Puerto Rico 4.3% | | | |
| | 5,045,000 | | | Puerto Rico Sales Tax Fin. Corp. Sales Tax Rev., Ser. 2018-A-1, 5.00%, due 7/1/2058 | | | 5,296,241 | (f) | |
Rhode Island 2.6% | | | |
| | | | | Rhode Island St. Hsg. & Mtge. Fin. Corp. Ref. Rev. | | | | | |
| | 255,000 | | | Ser. 2016-1-C, 2.75%, due 4/1/2025 | | | 264,644 | | |
| | 275,000 | | | Ser. 2016-1-C, 2.85%, due 10/1/2025 | | | 286,028 | | |
| | 280,000 | | | Ser. 2016-1-C, 2.95%, due 4/1/2026 | | | 290,150 | | |
| | 185,000 | | | Ser. 2016-1-C, 3.00%, due 10/1/2026 | | | 192,792 | | |
| 750,000 | | | Rhode Island St. Hsg. & Mtge. Fin. Corp. Ref. Rev. (Home Funding), Ser. 2012-5,
(GNMA/FNMA/FHLMC Insured), 3.35%, due 10/1/2033 | | | 768,668 | | |
| | | | | Rhode Island St. Std. Loan Au. Std. Loan Rev. (Sr. Prog.) | | | | | |
| | 665,000 | | | Ser. 2013-A, 3.25%, due 12/1/2022 | | | 675,899 | | |
| | 675,000 | | | Ser. 2017-A, 5.00%, due 12/1/2024 | | | 777,573 | | |
| | | | 3,255,754 | | |
South Carolina 1.6% | | | |
| 500,000 | | | Lancaster Co. Assessment Rev. Ref. (Walnut Creek Imp. Dist.), Ser. 2016-A-1, 5.00%,
due 12/1/2031 | | | 524,945 | | |
| 550,000 | | | South Carolina Jobs Econ. Dev. Au. Econ. Dev. Rev. (River Park Sr. Living Proj.),
Ser. 2017-A, 7.75%, due 10/1/2057 | | | 565,752 | | |
| 325,000 | | | South Carolina Jobs Econ. Dev. Au. Solid Waste Disp. Rev. (Green Bond-Jasper Pellets LLC,
Proj.), Ser. 2018-A, 7.00%, due 11/1/2038 | | | 339,076 | (b) | |
| 500,000 | | | South Carolina Jobs Econ. Dev. Au. Solid Waste Disp. Rev. (Repower South Berkeley LLC
Proj.), Ser. 2017, 6.25%, due 2/1/2045 | | | 533,765 | (b)(e) | |
| | | | 1,963,538 | | |
Tennessee 3.5% | | | |
| | 3,500,000 | | | Tennessee St. G.O., Ser. 2019-A, 5.00%, due 9/1/2035 | | | 4,342,835 | | |
Texas 6.0% | | | |
| 750,000 | | | Anson Ed. Facs. Corp. Ed. Rev. (Arlington Classics Academy), Ser. 2016-A, 5.00%,
due 8/15/2045 | | | 833,445 | | |
| | 400,000 | | | Fort Bend Co. Ind. Dev. Corp. Rev. (NRG Energy, Inc.), Ser. 2012-A, 4.75%, due 5/1/2038 | | | 421,852 | | |
| | 400,000 | | | Houston Arpt. Sys. Rev., Ser. 2015-B-1, 5.00%, due 7/15/2030 | | | 449,412 | | |
See Notes to Financial Statements
121
Schedule of Investments Municipal High Income Fund^ (cont'd)
PRINCIPAL AMOUNT | | | | VALUE | |
$ | 300,000
| | | Mission Econ. Dev. Corp. Wtr. Supply Rev. (Green Bond-Env. Wtr. Minerals Proj.),
Ser. 2015, 7.75%, due 1/1/2045 | | $ | 270,000
| (b)(d)(e) | |
| 500,000 | | | New Hope Cultural Ed. Facs. Fin. Corp. Rev. (Beta Academy), Ser. 2019, 5.00%,
due 8/15/2049 | | | 525,305 | (b) | |
| 250,000 | | | New Hope Cultural Ed. Facs. Fin. Corp. Sr. Living Rev. (Bridgemoor Plano Proj.),
Ser. 2018-A, 7.25%, due 12/1/2053 | | | 264,440 | | |
| 500,000 | | | New Hope Cultural Ed. Facs. Fin. Corp. Sr. Living Rev. (Cardinal Bay, Inc. Village On
The Park Carriage), Ser. 2016-C, 5.75%, due 7/1/2051 | | | 527,930 | | |
| 500,000 | | | New Hope Cultural Ed. Facs. Fin. Corp. Std. Hsg. Rev. (NCCD-College Sta. Properties LLC),
Ser. 2015-A, 5.00%, due 7/1/2047 | | | 462,105 | | |
| 2,000,000 | | | Texas St. Private Activity Bond Surface Trans. Corp. Rev. (Segment 3C Proj.),
Ser. 2019, 5.00%, due 6/30/2058 | | | 2,329,440 | | |
| 500,000 | | | Texas St. Private Activity Bond Surface Trans. Corp. Rev. (Sr. Lien-Blueridge Trans. Group LLC),
Ser. 2016, 5.00%, due 12/31/2040 | | | 560,355 | | |
| | 750,000 | | | Texas St. Trans. Commission Turnpike Sys. Rev. Ref., Ser. 2015-C, 5.00%, due 8/15/2034 | | | 848,400 | | |
| | | | 7,492,684 | | |
Utah 0.9% | | | |
| | 500,000 | | | Utah Charter Sch. Fin. Au. Rev. (Spectrum Academy Proj.), Ser. 2015, 6.00%, due 4/15/2045 | | | 504,410 | (b) | |
| | 600,000 | | | Utah Infrastructure Agcy. Telecommunication Rev., Ser. 2019, 4.00%, due 10/15/2036 | | | 633,198 | (c) | |
| | | | 1,137,608 | | |
Vermont 1.2% | | | |
| 500,000 | | | Vermont Econ. Dev. Au. Solid Waste Disp. Rev. (Casella Waste Sys., Inc.), Ser. 2013, 4.63%,
due 4/1/2036 Putable 4/3/2028 | | | 567,170 | (b) | |
| | | | | Vermont Std. Assist. Corp. Ed. Loan Rev. | | | | | |
| | 620,000 | | | Ser. 2013-A, 3.90%, due 6/15/2022 | | | 650,448 | | |
| | 290,000 | | | Ser. 2015-A, 4.13%, due 6/15/2028 | | | 311,463 | | |
| | | | 1,529,081 | | |
Virginia 0.5% | | | |
| | 400,000 | | | Embrey Mill Comm. Dev Au. Spec. Assessment Rev., Ser. 2015, 5.30%, due 3/1/2035 | | | 416,132 | (b) | |
| 200,000 | | | Virginia College Bldg. Au. Ed. Facs. Rev. (Green Bonds-Marymount Univ. Proj.),
Ser. 2015-B, 5.25%, due 7/1/2035 | | | 219,538 | (b) | |
| | | | 635,670 | | |
Washington 0.9% | | | |
| 500,000 | | | Washington St. Hlth. Care Fac. Au. Rev. Ref. (Virginia Mason Med. Ctr.), Ser. 2017, 5.00%,
due 8/15/2026 | | | 586,310 | | |
| 500,000 | | | Washington St. Hsg. Fin. Commission Rev. Ref. (Bayview Manor Homes), Ser. 2016-A, 5.00%,
due 7/1/2046 | | | 538,670 | (b) | |
| | | | 1,124,980 | | |
West Virginia 1.3% | | | |
| 735,000 | | | West Virginia Econ. Dev. Au. Energy Rev. Ref. (Morgantown Energy Assoc. Proj.), Ser. 2016,
2.88%, due 12/15/2026 | | | 742,637 | | |
| | | | | West Virginia Hosp. Fin. Au. Rev. Ref. (Cabell Huntington Hosp. Obligated Group) | | | | | |
| | 400,000 | | | Ser. 2018-A, 5.00%, due 1/1/2043 | | | 469,480 | | |
| | 425,000 | | | Ser. 2018-A, 4.13%, due 1/1/2047 | | | 453,611 | | |
| | | | 1,665,728 | | |
See Notes to Financial Statements
122
Schedule of Investments Municipal High Income Fund^ (cont'd)
PRINCIPAL AMOUNT | | | | VALUE | |
Wisconsin 2.2% | | | |
$ | 400,000 | | | Pub. Fin. Au. Ed. Rev. (Pine Lake Preparatory), Ser. 2015, 4.95%, due 3/1/2030 | | $ | 433,596 | (b) | |
| | 300,000 | | | Pub. Fin. Au. Ed. Rev. (Research Triangle High Sch. Proj.), Ser. 2015, 5.38%, due 7/1/2035 | | | 314,340 | (b) | |
| | 750,000 | | | Pub. Fin. Au. Exempt Facs. Ref. Rev. (Celanese Proj.), Ser. 2016-C, 4.30%, due 11/1/2030 | | | 818,212 | | |
| | 200,000 | | | Pub. Fin. Au. Retirement Fac. Rev. Ref. (Friends Homes), Ser. 2019, 5.00%, due 9/1/2054 | | | 218,430 | (b) | |
| 411,673 | | | Pub. Fin. Au. Rev. (Goodwill Industries of So. Nevada Proj.), Ser. 2015-A, 5.50%,
due 12/1/2038 | | | 362,919 | (e) | |
| 500,000 | | | Pub. Fin. Au. Rev. (Sr.-Maryland Proton Treatment Ctr. LLC), Ser. 2018-A-1, 6.38%,
due 1/1/2048 | | | 527,575 | (b) | |
| | | | 2,675,072 | | |
| | | | | Total Investments 102.5% (Cost $124,127,723) | | | 127,579,365 | | |
| | | | | Liabilities Less Other Assets (2.5)% | | | (3,101,666 | ) | |
| | | | | Net Assets 100.0% | | $ | 124,477,699 | | |
(a) Variable rate demand obligation where the stated interest rate is not based on a published reference rate and spread. Rather, the interest rate generally resets daily or weekly and is determined by the remarketing agent. The rate shown represents the rate in effect at October 31, 2019.
(b) Securities were purchased under Rule 144A of the Securities Act of 1933, as amended, or are otherwise restricted and, unless registered under the Securities Act of 1933 or exempted from registration, may only be sold to qualified institutional investors or may have other restrictions on resale. At October 31, 2019, these securities amounted to $25,584,422, which represents 20.6% of net assets of the Fund. Securities denoted with (b) but without (e), if any, have been deemed by the investment manager to be liquid.
(c) When-issued security. Total value of all such securities at October 31, 2019 amounted to $4,599,085, which represents 3.7% of net assets of the Fund.
(d) Defaulted security.
(e) Illiquid security.
(f) All or a portion of this security is segregated in connection with obligations for when-issued securities with a total value of $5,499,051.
The following is a summary, categorized by Level (see Note A of Notes to Financial Statements), of inputs used to value the Fund's investments as of October 31, 2019:
Asset Valuation Inputs
| | | Level 1 | | Level 2 | | Level 3 | | Total | |
Investments: | |
| Municipal Notes(a) | | $ | — | | | $ | 127,579,365 | | | $ | — | | | $ | 127,579,365 | | |
Total Investments | | $ | — | | | $ | 127,579,365 | | | $ | — | | | $ | 127,579,365 | | |
(a) The Schedule of Investments provides a categorization by state/territory for the portfolio.
^ A balance indicated with a "—", reflects either a zero balance or an amount that rounds to less than 1.
See Notes to Financial Statements
123
Schedule of Investments Municipal Impact Fund^ October 31, 2019
PRINCIPAL AMOUNT | | | | VALUE | |
Municipal Notes 98.3% | | | |
Alabama 1.2% | | | |
$ | 565,000 | | | Fort Payne City G.O. (Sch. Warrants), Ser. 2018-B, (AGM Insured), 5.00%, due 5/1/2027 | | $ | 699,899 | | |
Arkansas 1.8% | | | |
| | | | | Russellville City Wtr. & Swr. Rev. | | | | | |
| | 315,000 | | | Ser. 2018, (AGM Insured), 4.00%, due 7/1/2028 | | | 352,526 | | |
| | 660,000 | | | Ser. 2018, (AGM Insured), 4.00%, due 7/1/2030 | | | 732,290 | | |
| | | | 1,084,816 | | |
California 1.2% | | | |
| 200,000 | | | San Diego Assoc. of Gov't Cap. Grant Receipts Rev. (Green Bond Mid-Coast Corridor
Transit Proj.), Ser. 2019-A, 5.00%, due 11/15/2024 | | | 229,918 | | |
| | 500,000 | | | Univ. of California Regents Med. Ctr. Pooled Rev., Ser. 2013-K, 0.93%, due 5/15/2047 | | | 500,000 | (a) | |
| | | | 729,918 | | |
District of Columbia 3.2% | | | |
| 1,000,000 | | | Dist. of Columbia Hsg. Fin. Agcy. Rev., Ser. 2018-B-1, (FHA Insured), 2.55%, due 9/1/2023
Putable 3/1/2022 | | | 1,022,850 | | |
| | 725,000 | | | Washington Metro. Area Transit Au. Gross Rev., Ser. 2017-B, 5.00%, due 7/1/2024 | | | 847,032 | | |
| | | | 1,869,882 | | |
Florida 3.9% | | | |
| | 700,000 | | | Florida St. Dept. Env. Port Preservation Rev. Ref., Ser. 2016-A, 5.00%, due 7/1/2022 | | | 770,854 | | |
| | 1,225,000 | | | Miami-Dade Co. (Bldg. Better Comm. Prog.), Ser. 2015-D-REMK, 5.00%, due 7/1/2026 | | | 1,510,339 | | |
| | | | 2,281,193 | | |
Georgia 2.0% | | | |
| | 1,000,000 | | | Metropolitan Atlanta Rapid Transit Au. Sales Tax Rev. Ref., Ser. 2016-B, 5.00%, due 7/1/2035 | | | 1,202,470 | | |
Illinois 3.7% | | | |
| 1,000,000 | | | Cook Co. Comm. Cons. Sch. Dist. # 21 G.O. (Wheeling Sch. Bldg.), Ser. 2019-A,
(AGM Insured), 4.00%, due 12/1/2035 | | | 1,122,010 | (b) | |
| | 1,000,000 | | | Illinois Fin. Au. Rev. (Clean Wtr. Initiative), Ser. 2017, 5.00%, due 1/1/2022 | | | 1,081,360 | | |
| | | | 2,203,370 | | |
Indiana 3.5% | | | |
| | | | | Anderson Sch. Bldg. Corp. (First Mtge.) | | | | | |
| | 850,000 | | | Ser. 2018, 5.00%, due 1/15/2024 | | | 976,387 | | |
| | 895,000 | | | Ser. 2018, 5.00%, due 1/15/2026 | | | 1,081,491 | | |
| | | | 2,057,878 | | |
Kansas 1.1% | | | |
| | 500,000 | | | Wyandotte Co. Unified Sch. Dist. # 203 G.O. Impt., Ser. 2018-A, 5.00%, due 9/1/2035 | | | 620,790 | | |
See Notes to Financial Statements
124
Schedule of Investments Municipal Impact Fund^ (cont'd)
PRINCIPAL AMOUNT | | | | VALUE | |
Kentucky 3.7% | | | |
$ | 500,000
| | | Kentucky Rural Wtr. Fin. Corp. Pub. Proj. Rev. (Construction Notes), Ser. 2018-E-1, 2.25%,
due 3/1/2020 | | $ | 500,215
| | |
| | 500,000 | | | Lewis Co. Sch. Dist. Fin. Corp. Rev., Ser. 2017-B, 2.00%, due 9/1/2022 | | | 504,970 | | |
| 1,000,000 | | | Logan-Todd Reg. Wtr. Commission Rev. Ref., Ser. 2016-A, (AGM Insured), 5.00%,
due 7/1/2028 | | | 1,207,090 | | |
| | | | 2,212,275 | | |
Louisiana 5.8% | | | |
| 250,000 | | | Greater Ouachita Wtr. Co., Inc. Waterworks & Swr. Sys. Rev. Ref., Ser. 2019, (BAM Insured),
4.00%, due 9/1/2037 | | | 281,385 | | |
| | 845,000 | | | Louisiana Pub. Facs. Au. Rev. Ref. (Hurricane Rec. Prog.), Ser. 2014, 5.00%, due 6/1/2024 | | | 976,710 | | |
| 530,000 | | | Louisiana St. Local Gov't Env. Facs. & Comm. Dev. Au. Rev. (Sub. Lien-East Baton Rouge Swr.),
Ser. 2014-A, 5.00%, due 2/1/2044 | | | 591,422 | | |
| | | | | Natchitoches Parish Sch. Dist. G.O. # 9 | | | | | |
| | 505,000 | | | Ser. 2018, (AGM Insured), 5.00%, due 3/1/2027 | | | 620,276 | | |
| | 755,000 | | | Ser. 2018, (AGM Insured), 5.00%, due 3/1/2028 | | | 942,957 | | |
| | | | 3,412,750 | | |
Michigan 10.3% | | | |
| | 1,000,000 | | | Dearborn G.O. (Swr.), Ser. 2018, 4.00%, due 4/1/2033 | | | 1,136,920 | | |
| | 500,000 | | | Livonia Pub. Sch. Dist. G.O., Ser. 2016, (AGM Insured), 5.00%, due 5/1/2028 | | | 600,030 | | |
| | 750,000 | | | Michigan St. Hsg. Dev. Au. Rev. (Non Ace), Ser. 2016-B, 2.50%, due 12/1/2026 | | | 776,235 | | |
| | 290,000 | | | Michigan St. Hsg. Dev. Au. Rev. Ref., Ser. 2018-B, 3.15%, due 4/1/2028 | | | 311,976 | | |
| 1,000,000 | | | Michigan St. Hsg. Dev. Au. Single Family Mtge. Rev. (Non Ace), Ser. 2018-C, 2.90%,
due 12/1/2024 | | | 1,059,150 | | |
| | | | | Trenton Pub. Sch. Dist. G.O. (Sch. Bldg. & Site) | | | | | |
| | 1,025,000 | | | Ser. 2018, 5.00%, due 5/1/2039 | | | 1,239,584 | | |
| | 785,000 | | | Ser. 2018, 5.00%, due 5/1/2036 | | | 958,179 | | |
| | | | 6,082,074 | | |
Minnesota 3.8% | | | |
| 1,000,000 | | | Minnesota Hsg. Fin. Agcy. (Rental Hsg.), Ser. 2019-A, (HUD SECT 8 Insured), 2.00%,
due 8/1/2020 | | | 1,001,480 | | |
| 1,000,000 | | | Minnesota Rural Wtr. Fin. Au. (Pub. Proj. Construction Notes), Ser. 2019, 2.00%,
due 8/1/2020 | | | 1,001,910 | | |
| 210,000 | | | St. Paul Hsg. & Redev. Au. Charter Sch. Lease Rev. (Metro Deaf Sch. Proj.),
Ser. 2018-A, 5.00%, due 6/15/2038 | | | 222,188 | (c) | |
| | | | 2,225,578 | | |
Mississippi 3.8% | | | |
| | 500,000 | | | Mississippi St. G.O., Ser. 2019-B, 4.00%, due 10/1/2039 | | | 570,725 | | |
| | | | | West Rankin Utils. Au. Rev. | | | | | |
| | 440,000 | | | Ser. 2018, (AGM Insured), 5.00%, due 1/1/2043 | | | 516,001 | | |
| | 1,000,000 | | | Ser. 2018, (AGM Insured), 5.00%, due 1/1/2048 | | | 1,166,200 | | |
| | | | 2,252,926 | | |
See Notes to Financial Statements
125
Schedule of Investments Municipal Impact Fund^ (cont'd)
PRINCIPAL AMOUNT | | | | VALUE | |
Missouri 4.5% | | | |
$ | 1,000,000
| | | Bi- St. Dev. Agcy. of the Missouri-Illinois Metro. Dist. Rev. Ref. (Combined Lien Mass Transit
Sales Tax Appropriation), Ser. 2019, 4.00%, due 10/1/2036 | | $ | 1,157,580
| | |
| | | | | Missouri St. Env. Imp. & Energy Res. Au. Wtr. PCR | | | | | |
| | 660,000 | | | Ser. 2018-A, 5.00%, due 7/1/2029 | | | 849,843 | | |
| | 510,000 | | | Ser. 2018-A, 5.00%, due 1/1/2030 | | | 653,993 | | |
| | | | 2,661,416 | | |
New Jersey 1.2% | | | |
| 650,000 | | | New Jersey St. Hsg. & Mtge. Fin. Agcy. Multi-Family Rev. Ref., Ser. 2017-A, 2.60%,
due 11/1/2024 | | | 677,671 | | |
New York 7.2% | | | |
| 200,000 | | | Buffalo & Erie Co. Ind. Land Dev. Corp. Rev. Ref. (Charter Sch. for Applied Technologies Proj.),
Ser. 2017-A, 4.00%, due 6/1/2022 | | | 207,458 | | |
| | 200,000 | | | Build NYC Res. Corp. Rev. (New Dawn Charter Sch. Proj.), Ser. 2019, 5.75%, due 2/1/2049 | | | 212,340 | (c) | |
| | | | | Dutchess Co. Local Dev. Corp. Rev. | | | | | |
| | 225,000 | | | Ser. 2014-A, 5.00%, due 7/1/2021 | | | 238,916 | | |
| | 150,000 | | | Ser. 2014-A, 5.00%, due 7/1/2022 | | | 164,784 | | |
| | 135,000 | | | Ser. 2014-A, 4.00%, due 7/1/2023 | | | 148,335 | | |
| | 115,000 | | | Ser. 2014-A, 5.00%, due 7/1/2025 | | | 134,171 | | |
| 450,000 | | | Monroe Co. Ind. Dev. Corp. Rev. Ref. (Highland Hosp. Rochester Proj.), Ser. 2015, 5.00%,
due 7/1/2022 | | | 493,807 | | |
| 150,000 | | | Nassau Co. Local Econ. Assist. Corp. Rev. (Catholic Hlth. Svcs. of Long Island Obligated
Group Proj.), Ser. 2014, 5.00%, due 7/1/2027 | | | 171,249 | | |
| 420,000 | | | New York City Muni. Wtr. Fin. Au. Wtr. & Swr. Sys. Rev. (Second Gen. Resolution Rev. Bonds),
Ser. 2013-AA-2, (LOC: JP Morgan Chase Bank N.A.), 1.35%, due 6/15/2050 | | | 420,000 | (a) | |
| 200,000 | | | New York St. Dorm. Au. Rev. Non St. Supported Debt (North Shore-Long Island Jewish
Oblig. Group), Ser. 2011-A, 5.00%, due 5/1/2022 Pre-Refunded 5/1/2021 | | | 211,448 | | |
| 1,000,000 | | | New York St. HFA Rev. (Affordable Hsg.), (SONYMA, FNMA/FHLMC Insured),
Ser. 2019-O, 1.45%, due 5/1/2023 | | | 1,000,290 | (d) | |
| 500,000 | | | New York St. Hsg. Fin. Agcy. Rev. (Green Bond), Ser. 2018-F, (SONYMA Insured), 2.15%,
due 5/1/2021 | | | 500,255 | | |
| | 350,000 | | | Rockland Co. G.O. (Pub. Imp.), Ser. 2014-C, (AGM Insured), 4.00%, due 5/1/2021 | | | 364,711 | (b) | |
| | | | 4,267,764 | | |
North Carolina 1.2% | | | |
| | | | | Scotland Co. Rev. | | | | | |
| | 350,000 | | | Ser. 2018, 5.00%, due 12/1/2024 | | | 411,534 | | |
| | 250,000 | | | Ser. 2018, 5.00%, due 12/1/2026 | | | 307,000 | | |
| | | | 718,534 | | |
North Dakota 0.4% | | | |
| 250,000 | | | Grand Forks Co. Solid Waste Disp. Rev. (Green Bond-Red River Biorefinery, LLC Proj.),
Ser. 2018, 5.38%, due 9/15/2038 | | | 242,333 | (c) | |
Ohio 3.5% | | | |
| 750,000 | | | American Muni. Pwr. Ohio, Inc. Rev. (Comb. Hydroelectric Proj.), Ser. 2018-A, 2.25%,
due 2/15/2048 Putable 8/15/2021 | | | 756,337 | | |
See Notes to Financial Statements
126
Schedule of Investments Municipal Impact Fund^ (cont'd)
PRINCIPAL AMOUNT | | | | VALUE | |
| | | | | American Muni. Pwr. Ohio, Inc. Rev. Solar Elec. Pre-Payment (Green Bond) | | | | | |
$ | 305,000 | | | Ser. 2019-A, 5.00%, due 2/15/2020 | | $ | 308,142 | | |
| | 200,000 | | | Ser. 2019-A, 5.00%, due 2/15/2021 | | | 209,364 | | |
| | 300,000 | | | Ser. 2019-A, 5.00%, due 2/15/2022 | | | 325,254 | | |
| | 175,000 | | | Ser. 2019-A, 5.00%, due 2/15/2023 | | | 195,622 | | |
| 250,000 | | | Ohio St. Air Quality Dev. Au. Exempt Facs. Rev. (AMG Vanadium LLC), Ser. 2019-D, 5.00%,
due 7/1/2049 | | | 275,965 | (c) | |
| | | | 2,070,684 | | |
Oklahoma 3.9% | | | |
| 935,000 | | | Delaware Co. Ed. Facs. Au. Ed. Facs. Lease Rev. (Grove Pub. Sch. Proj.), Ser. 2015, 5.00%,
due 9/1/2022 | | | 1,024,947 | | |
| 555,000 | | | Lincoln Co. Ed. Facs. Au. Ed. Facs. Lease Rev. (Stroud Pub. Sch. Proj.), Ser. 2016, 5.00%,
due 9/1/2027 | | | 667,226 | | |
| 535,000 | | | Tulsa Co. Ind. Au. Ed. Facs. Lease Rev. (Glenpool Pub. Sch. Proj.), Ser. 2017-A, 5.00%,
due 9/1/2023 | | | 604,652 | | |
| | | | 2,296,825 | | |
Pennsylvania 8.5% | | | |
| | | | | Allegheny Co. Sanitary Au. Rev. | | | | | |
| | 290,000 | | | Ser. 2018, 5.00%, due 6/1/2030 | | | 362,390 | | |
| | 565,000 | | | Ser. 2018, 5.00%, due 6/1/2032 | | | 701,182 | | |
| 100,000 | | | Pennsylvania St. Econ. Dev. Fin. Au. Solid Waste Disp. Rev. (CarbonLite P LLC Proj.),
Ser. 2019, 5.75%, due 6/1/2036 | | | 106,509 | (c) | |
| 1,000,000 | | | Pennsylvania St. Hsg. Fin. Agcy. Single Family Mtge. Rev., Ser. 2018-127B, 2.85%,
due 4/1/2026 | | | 1,066,120 | | |
| | 1,000,000 | | | Philadelphia Au. For Ind. Dev. City Svc. Agreement Rev., Ser. 2018, 5.00%, due 5/1/2030 | | | 1,239,070 | | |
| | 850,000 | | | Philadelphia Sch. Dist. G.O. (Green Bond), Ser. 2019-B, 5.00%, due 9/1/2024 | | | 985,371 | (d) | |
| | 500,000 | | | Philadelphia Wtr. & Wastewater Rev. Ref., Ser. 2016, 5.00%, due 10/1/2023 | | | 572,185 | | |
| | | | 5,032,827 | | |
Rhode Island 0.9% | | | |
| 500,000 | | | Rhode Island St. Providence Plantation Lease Ref. Cert. of Participation (Sch. Deaf Proj.),
Ser. 2017-D, 5.00%, due 4/1/2022 | | | 543,505 | | |
South Carolina 2.7% | | | |
| 500,000 | | | Allendale Co. Sch. Dist. Energy Savings Spec. Oblig. Rev. Ref. (Impt.), Ser. 2014, 3.00%,
due 12/1/2020 | | | 507,265 | | |
| 800,000 | | | Newberry Investing in Children's Ed. Installment Purchase Rev. Ref. (Newberry Co. Sch. Dist.),
Ser. 2014, 5.00%, due 12/1/2023 | | | 915,024 | | |
| 175,000 | | | South Carolina Jobs Econ. Dev. Au. Solid Waste Disp. Rev. (Green Bond-Jasper Pellets LLC,
Proj.), Ser. 2018-A, 7.00%, due 11/1/2038 | | | 182,579 | (c) | |
| | | | 1,604,868 | | |
Texas 7.6% | | | |
| | 910,000 | | | El Paso Wtr. & Swr. Rev. Ref., Ser. 2014, 5.00%, due 3/1/2024 | | | 1,052,069 | | |
| | 850,000 | | | Laredo Independent Sch. Dist. G.O. (Sch. Bldg.), Ser. 2013, 5.00%, due 8/1/2024 | | | 959,676 | | |
| | 1,015,000 | | | Weslaco G.O. Ref., Ser. 2017, (AGM Insured), 5.00%, due 8/15/2027 | | | 1,265,532 | | |
| 1,000,000 | | | Ysleta Independent Sch. Dist. G.O. (Sch. Bldg.), Ser. 2017, (PSF-GTD Insured), 5.00%,
due 8/15/2041 | | | 1,187,320 | | |
| | | | 4,464,597 | | |
See Notes to Financial Statements
127
Schedule of Investments Municipal Impact Fund^ (cont'd)
PRINCIPAL AMOUNT | | | | VALUE | |
Utah 1.7% | | | |
$ | 915,000 | | | Grand Co. Sch. Dist. Local Bldg. Au. Rev., Ser. 2019, (AGM Insured), 5.00%, due 12/15/2022 | | $ | 1,018,139 | | |
West Virginia 5.3% | | | |
| 500,000 | | | West Virginia Hosp. Fin. Au. Rev. (Impt. West Virginia Univ. Hlth. Sys. Obligated Group),
Ser. 2018-A, 5.00%, due 6/1/2052 | | | 584,225 | | |
| 700,000 | | | West Virginia Hosp. Fin. Au. Rev. (West Virginia Univ. Hlth. Sys.), Ser. 2017-A, 5.00%,
due 6/1/2035 | | | 834,435 | | |
| | | | | West Virginia Hsg. Dev. Fund Rev. (Hsg. Fin.) | | | | | |
| | 220,000 | | | Ser. 2018-A, (HUD SECT 8 Insured), 1.88%, due 11/1/2020 | | | 221,199 | | |
| | 275,000 | | | Ser. 2018-A, (HUD SECT 8 Insured), 2.65%, due 11/1/2024 | | | 288,035 | | |
| | 990,000 | | | West Virginia Wtr. Dev. Au. Rev. Ref. (Loan Prog.), Ser. 2018-A-IV, 5.00%, due 11/1/2036 | | | 1,217,997 | | |
| | | | 3,145,891 | | |
Wisconsin 0.7% | | | |
| | 395,000 | | | Oregon Sch. Dist. G.O. (Green Bond-Sch. Bldg. & Impt.), Ser. 2019, 5.00%, due 3/1/2022 | | | 429,258 | | |
| | | | | Total Investments 98.3% (Cost $55,510,118) | | | 58,110,131 | | |
| | | | | Other Assets Less Liabilities 1.7% | | | 992,138 | | |
| | | | | Net Assets 100.0% | | $ | 59,102,269 | | |
(a) Variable rate demand obligation where the stated interest rate is not based on a published reference rate and spread. Rather, the interest rate generally resets daily or weekly and is determined by the remarketing agent. The rate shown represents the rate in effect at October 31, 2019.
(b) All or a portion of this security is segregated in connection with obligations for when-issued securities with a total value of $1,486,721.
(c) Securities were purchased under Rule 144A of the Securities Act of 1933, as amended, or are otherwise restricted and, unless registered under the Securities Act of 1933 or exempted from registration, may only be sold to qualified institutional investors or may have other restrictions on resale. At October 31, 2019, these securities amounted to $1,241,914, which represents 2.1% of net assets of the Fund. These securities have been deemed by the investment manager to be liquid.
(d) When-issued security. Total value of all such securities at October 31, 2019 amounted to $1,985,661, which represents 3.4% of net assets of the Fund.
The following is a summary, categorized by Level (see Note A of Notes to Financial Statements), of inputs used to value the Fund's investments as of October 31, 2019:
Asset Valuation Inputs
| | | Level 1 | | Level 2 | | Level 3 | | Total | |
Investments: | |
| Municipal Notes(a) | | $ | — | | | $ | 58,110,131 | | | $ | — | | | $ | 58,110,131 | | |
Total Investments | | $ | — | | | $ | 58,110,131 | | | $ | — | | | $ | 58,110,131 | | |
(a) The Schedule of Investments provides a categorization by state/territory for the portfolio.
^ A balance indicated with a "—", reflects either a zero balance or an amount that rounds to less than 1.
See Notes to Financial Statements
128
Schedule of Investments Municipal Intermediate Bond Fund^
October 31, 2019
PRINCIPAL AMOUNT | | | | VALUE | |
Municipal Notes 100.7% | | | |
Alaska 1.2% | | | |
$ | 2,000,000 | | | Alaska St. Hsg. Fin. Corp. Ref. Rev. (Cap. Proj. Bonds II), Ser. 2014-D, 5.00%, due 12/1/2025 | | $ | 2,345,000 | | |
Arizona 0.8% | | | |
| 500,000 | | | Maricopa Co. Ind. Dev. Au. Rev. (Banner Hlth. Obligated Group), Ser. 2017-C, 5.00%,
due 1/1/2048 Putable 10/18/2024 | | | 583,385 | | |
| 950,000 | | | Maricopa Co. Ind. Dev. Au. Sr. Living Fac. Rev. Ref. (Christian Care Retirement Apts., Inc. Proj.),
Ser. 2016-A, 5.00%, due 1/1/2024 | | | 1,091,693 | | |
| | | | 1,675,078 | | |
California 5.1% | | | |
| | 2,000,000 | | | California Pub. Works Board Lease Rev. Ref., Ser. 2017-B, 5.00%, due 10/1/2026 | | | 2,476,940 | | |
| | 1,000,000 | | | California St. G.O. Ref., Ser. 2019, 5.00%, due 4/1/2032 | | | 1,355,980 | | |
| 250,000 | | | California Statewide Communities Dev. Au. Rev. (Henry Mayo Newhall Mem. Hosp.),
Ser. 2014-A, (AGM Insured), 5.00%, due 10/1/2028 | | | 287,672 | | |
| 1,665,000 | | | Contra Costa Co. Redev. Agcy. Successor Agcy. Tax Allocation Ref., Ser. 2017-A,
(BAM Insured), 5.00%, due 8/1/2032 | | | 2,064,234 | | |
| | | | | Fresno Joint Pwr. Fin. Au. Lease Rev. Ref. (Master Lease Proj.) | | | | | |
| | 1,300,000 | | | Ser. 2017-A, (AGM Insured), 5.00%, due 4/1/2027 | | | 1,608,633 | | |
| | 400,000 | | | Ser. 2017-A, (AGM Insured), 5.00%, due 4/1/2032 | | | 484,440 | | |
| | 560,000 | | | Placer Co. Wtr. Agcy. Cert. of Participation Ref. Rev., Ser. 2016, 4.00%, due 7/1/2030 | | | 646,240 | | |
| | | | | San Marcos Unified Sch. Dist. G.O. Cap. Appreciation (Election 2010) | | | | | |
| | 740,000 | | | Ser. 2012-B, 0.00%, due 8/1/2026 | | | 657,623 | | |
| | 645,000 | | | Ser. 2012-B, 0.00%, due 8/1/2027 | | | 558,054 | | |
| | | | 10,139,816 | | |
Colorado 2.4% | | | |
| | 1,250,000 | | | Colorado Springs Utils. Rev. Ref. (Unrefunded), Ser. 2011-A, 5.00%, due 11/15/2026 | | | 1,343,238 | | |
| 945,000 | | | Colorado St. Ed. & Cultural Facs. Au. Rev. Ref. (Alexander Dawson Sch. Proj.),
Ser. 2016, 5.00%, due 5/15/2025 | | | 1,113,210 | | |
| 750,000 | | | Colorado St. Hlth. Facs. Au. Hosp. Rev. Ref. (Commonspirit Hlth.), Ser. 2019-A-2, 4.00%,
due 8/1/2049 | | | 801,870 | | |
| | 1,000,000 | | | Denver Hlth. & Hosp. Au. Healthcare Rev. Ref., Ser. 2019-A, 4.00%, due 12/1/2037 | | | 1,111,290 | | |
| | 300,000 | | | Westminster Cert. of Participation Ref., Ser. 2013, 4.00%, due 12/1/2025 | | | 330,654 | | |
| | | | 4,700,262 | | |
Connecticut 4.0% | | | |
| | 1,990,000 | | | Connecticut HFA Hsg. Fin. Mtg. Prog. Rev. Ref., Subser. 2017-A-4, 3.65%, due 11/15/2032 | | | 2,085,062 | | |
| | 3,000,000 | | | Connecticut St. G.O., Ser. 2018-C, 4.00%, due 6/15/2024 | | | 3,320,940 | | |
| | 400,000 | | | Connecticut St. G.O. Ref., Ser. 2019-B, 5.00%, due 2/15/2029 | | | 505,992 | | |
| 2,000,000 | | | Connecticut St. Hlth. & Ed. Facs. Au. Rev. (Yale Univ.), Ser. 1997-T-2, 1.65%, due 7/1/2029
Putable 2/3/2020 | | | 2,001,700 | | |
| | | | 7,913,694 | | |
Delaware 0.7% | | | |
| | | | | Delaware St. Hlth. Facs. Au. Rev. (Beebe Med. Ctr.) | | | | | |
| | 610,000 | | | Ser. 2018, 5.00%, due 6/1/2027 | | | 731,884 | | |
| | 500,000 | | | Ser. 2018, 5.00%, due 6/1/2028 | | | 608,285 | | |
| | | | 1,340,169 | | |
See Notes to Financial Statements
129
Schedule of Investments Municipal Intermediate Bond Fund^ (cont'd)
PRINCIPAL AMOUNT | | | | VALUE | |
District of Columbia 0.4% | | | |
| | | | | Dist. of Columbia Rev. (Assoc. of American Med. College) | | | | | |
$ | 460,000 | | | Ser. 2011-A, 5.00%, due 10/1/2021 | | $ | 492,513 | | |
| | 350,000 | | | Ser. 2011-A, 5.00%, due 10/1/2022 | | | 385,252 | | |
| | | | 877,765 | | |
Florida 4.4% | | | |
| | 700,000 | | | Cape Coral Spec. Obligation Ref. Rev., Ser. 2015, 4.00%, due 10/1/2030 | | | 782,418 | | |
| | 1,000,000 | | | CityPlace Comm. Dev. Dist. Spec. Assessment Ref. Rev., Ser. 2012, 5.00%, due 5/1/2026 | | | 1,140,430 | | |
| 825,000 | | | Escambia Co. Florida Env. Imp. Rev. Ref. (Int'l Paper Co. Proj.), Ser. 2019-B, 2.00%,
due 11/1/2033 Putable 10/1/2024 | | | 834,900 | | |
| | 340,000 | | | JEA Elec. Sys. Rev., Ser. 2013-A, 5.00%, due 10/1/2029 Pre-Refunded 10/1/2022 | | | 377,124 | | |
| | 2,000,000 | | | Miami-Dade Co. G.O. Ref., Ser. 2015-B, 4.00%, due 7/1/2032 | | | 2,186,400 | | |
| 1,155,000 | | | Port St. Lucie Research Facs. Rev. (Oregon Hlth. and Science Univ. Vaccine and Gene
Therapy Institute Florida Corp. Proj.), Ser. 2010, 5.00%, due 5/1/2022 Pre-Refunded 5/1/2020 | | | 1,176,506 | | |
| 2,040,000 | | | Seminole Co. Sales Tax Rev. Ref., Ser. 2006-B, (National Public Finance Guarantee Corp.
Insured), 5.25%, due 10/1/2023 | | | 2,358,995 | | |
| | | | 8,856,773 | | |
Georgia 2.9% | | | |
| 1,645,000 | | | Bulloch Co. Dev. Au. Std. Hsg. Rev. Ref. (Georgia So. Univ. Hsg. Foundation One LLC),
Ser. 2012, (AGM Insured), 5.00%, due 8/1/2022 | | | 1,802,953 | | |
| | 1,000,000 | | | Forsyth Co. G.O. Ref., Ser. 2015-B, 5.00%, due 3/1/2027 | | | 1,193,380 | | |
| | | | | Muni. Elec. Au. of Georgia (Plant Vogtle units 3&4 Proj. M Bonds) | | | | | |
| | 500,000 | | | Ser. 2019-A, 5.00%, due 1/1/2032 | | | 602,945 | | |
| | 400,000 | | | Ser. 2019-A, 5.00%, due 1/1/2033 | | | 480,532 | | |
| | | | | Private Colleges & Univ. Au. Rev. (Savannah College of Art & Design, Inc.) | | | | | |
| | 290,000 | | | Ser. 2014, 5.00%, due 4/1/2022 | | | 315,882 | | |
| | 540,000 | | | Ser. 2014, 5.00%, due 4/1/2025 | | | 625,369 | | |
| 850,000 | | | Savannah Econ. Dev. Au. Rev. Ref. (Int'l Paper Co. Proj.), Ser. 2019-A, 2.00%,
due 11/1/2033 Putable 10/1/2024 | | | 860,200 | | |
| | | | 5,881,261 | | |
Illinois 7.6% | | | |
| 470,000 | | | Bureau Co. Township High Sch. Dist. No. 502 G.O., Ser. 2017-A, (BAM Insured), 5.00%,
due 12/1/2033 | | | 559,342 | | |
| 1,400,000 | | | Cook Co. Sch. Dist. No. 144 Prairie Hills G.O. (Ltd. Sch.), Ser. 2010-A, (AGM Insured), 5.25%,
due 12/1/2027 Pre-Refunded 12/1/2020 | | | 1,460,214 | | |
| 1,000,000 | | | Cook Co. Sch. Dist. No. 83 G.O. (Ref. Sch.), Ser. 2011-D, 5.13%, due 12/1/2030
Pre-Refunded 12/1/2021 | | | 1,079,760 | | |
| 750,000 | | | Dekalb Kane LaSalle Cos. Comm. College Dist. No. 523 G.O., Ser. 2011-B, 0.00%,
due 2/1/2025 | | | 579,180 | | |
| 1,085,000 | | | Illinois Fin. Au. Rev. (LOC Gov't Prog.-Brookfield Lagrange Park Sch. Dist. No. 95 Proj.),
Ser. 2018, 4.00%, due 12/1/2038 | | | 1,186,578 | | |
| | | | | Illinois Fin. Au. Rev. (LOC Gov't Prog.-E Prairie Sch. Dist. No. 73 Proj.) | | | | | |
| | 1,065,000 | | | Ser. 2018, (BAM Insured), 5.00%, due 12/1/2029 | | | 1,313,507 | | |
| | 485,000 | | | Ser. 2018, (BAM Insured), 4.00%, due 12/1/2042 | | | 527,859 | | |
| | | | | Illinois St. Fin. Au. Rev. (Downers Grove Comm. High Sch. Dist. No. 99 Proj.) | | | | | |
| | 1,000,000 | | | Ser. 2019, 4.00%, due 12/15/2030 | | | 1,171,730 | | |
| | 1,000,000 | | | Ser. 2019, 4.00%, due 12/15/2031 | | | 1,159,100 | | |
See Notes to Financial Statements
130
Schedule of Investments Municipal Intermediate Bond Fund^ (cont'd)
PRINCIPAL AMOUNT | | | | VALUE | |
| | | | | Illinois St. G.O. | | | | | |
$ | 250,000 | | | Ser. 2017-D, 5.00%, due 11/1/2026 | | $ | 284,090 | | |
| | 2,000,000 | | | Ser. 2017-D, 5.00%, due 11/1/2028 | | | 2,287,840 | | |
| | 125,000 | | | Illinois St. G.O. Ref., Ser. 2010, 5.00%, due 1/1/2020 | | | 125,595 | | |
| | 500,000 | | | Sales Tax Securitization Corp. Rev. Ref., Ser. 2017-A, 5.00%, due 1/1/2028 | | | 600,490 | | |
| | | | | So. Illinois Univ. Cert. of Participation (Cap. Imp. Proj.) | | | | | |
| | 500,000 | | | Ser. 2014-A1, (BAM Insured), 4.00%, due 2/15/2026 | | | 540,050 | | |
| | 500,000 | | | Ser. 2014-A1, (BAM Insured), 5.00%, due 2/15/2027 | | | 559,200 | | |
| | | | | Springfield G.O. | | | | | |
| | 950,000 | | | Ser. 2014, 4.25%, due 12/1/2027 | | | 1,039,310 | | |
| | 665,000 | | | Ser. 2014, 5.00%, due 12/1/2028 | | | 764,271 | | |
| | | | 15,238,116 | | |
Indiana 0.3% | | | |
| | 500,000 | | | Indiana St. Muni. Pwr. Agcy. Ref. Rev., Ser. 2016-C, 5.00%, due 1/1/2027 | | | 609,580 | | |
Iowa 0.3% | | | |
| 640,000 | | | Iowa St. Fin. Au. Single Family Mtge. Rev. (Non Ace-Mtge.-Backed Sec. Prog.),
Ser. 2017-C, (GNMA/FNMA/FHLMC Insured), 2.30%, due 1/1/2026 | | | 663,622 | | |
Kansas 1.7% | | | |
| 500,000 | | | Goddard Kansas Sales Tax Spec. Oblig. Rev. Ref. (Olympic Park Star Bond Proj.),
Ser. 2019, 3.60%, due 6/1/2030 | | | 494,380 | (a) | |
| | | | | Wichita City Sales Tax. Spec. Oblig. Rev. (River Dist. Stadium Star Bond Proj.) | | | | | |
| | 305,000 | | | Ser. 2018, 5.00%, due 9/1/2025 | | | 364,701 | | |
| | 1,000,000 | | | Ser. 2018, 5.00%, due 9/1/2027 | | | 1,248,780 | | |
| 1,245,000 | | | Wyandotte Co. - Kansas City Unified Gov't Utils. Sys. Rev. (Impt.), Ser. 2012-B, 5.00%,
due 9/1/2032 | | | 1,358,295 | | |
| | | | 3,466,156 | | |
Kentucky 0.8% | | | |
| 1,470,000 | | | Laurel Co. Judicial Ctr. Pub. Properties Corp. Ref. Rev. (Justice Center Proj.),
Ser. 2015, 4.00%, due 3/1/2024 | | | 1,610,517 | | |
Louisiana 0.1% | | | |
| | 145,000 | | | Monroe Sales & Use Tax Ref. Rev., Ser. 2012, 4.00%, due 7/1/2023 | | | 151,028 | | |
Maryland 4.7% | | | |
| | 2,645,000 | | | Anne Arundel Co. G.O., Ser. 2018, 5.00%, due 10/1/2023 | | | 3,032,307 | | |
| | 250,000 | | | Baltimore Spec. Oblig. Ref. Rev. Sr. Lien (Harbor Point Proj.), Ser. 2019-A, 3.63%, due 6/1/2046 | | | 251,203 | (b) | |
| | 2,500,000 | | | Maryland St. Dept. of Trans. Ref. Rev. Ref., Ser. 2016, 4.00%, due 9/1/2025 | | | 2,877,450 | | |
| | 3,060,000 | | | Maryland St. G.O. (Local Fac. Loan), Ser. 2013-A, 4.00%, due 8/1/2025 | | | 3,209,389 | | |
| | | | 9,370,349 | | |
Massachusetts 2.4% | | | |
| 230,000 | | | Boston Wtr. & Swr. Commission Rev., Ser. 1993-A, (National Public Finance Guarantee Corp.
Insured), 5.25%, due 11/1/2019 | | | 230,000 | | |
| | 775,000 | | | Massachusetts Dev. Fin. Agcy. Rev. Ref., Ser. 2019-A, 5.00%, due 7/1/2031 | | | 950,018 | | |
See Notes to Financial Statements
131
Schedule of Investments Municipal Intermediate Bond Fund^ (cont'd)
PRINCIPAL AMOUNT | | | | VALUE | |
$ | 400,000
| | | Massachusetts St. Dev. Fin. Agcy. Rev. (CareGroup Obligated Group), Ser. 2018-J2, 5.00%,
due 7/1/2053 | | $ | 469,944
| | |
| | 2,890,000 | | | Massachusetts St. Sch. Bldg. Au. Sales Tax Rev., Ser. 2011-B, 5.00%, due 10/15/2035 | | | 3,093,370 | | |
| | | | 4,743,332 | | |
Michigan 1.5% | | | |
| 1,000,000 | | | Detroit Downtown Dev. Au. Tax Increment Rev. Ref. (Catalyst Dev. Proj.), Ser. 2018-A,
(AGM Insured), 5.00%, due 7/1/2029 | | | 1,133,140 | | |
| | 1,830,000 | | | Michigan St. Hsg. Dev. Au. Rev., Ser. 2016-B, 2.30%, due 6/1/2025 | | | 1,898,753 | | |
| | | | 3,031,893 | | |
Minnesota 0.9% | | | |
| | 550,000 | | | Minnesota St. G.O., Ser. 2015-A, 5.00%, due 8/1/2029 | | | 658,240 | | |
| 1,000,000 | | | St. Paul Hsg. & Redev. Au. Hlth. Care Rev. Ref. (Fairview Hlth. Svcs. Obligated Group),
Ser. 2017-A, 4.00%, due 11/15/2043 | | | 1,094,500 | | |
| | | | 1,752,740 | | |
Mississippi 3.3% | | | |
| 1,250,000 | | | Mississippi Dev. Bank Spec. Oblig. (Madison Co. Hwy. Proj.), Ser. 2013-C, 5.00%,
due 1/1/2027 | | | 1,534,862 | | |
| | 1,325,000 | | | Mississippi St. G.O. Ref., Ser. 2015-C, 5.00%, due 10/1/2026 | | | 1,597,049 | | |
| 2,100,000 | | | Warren Co. Gulf Opportunity Zone Rev. Ref. (Int'l Paper Co. Proj.), Ser. 2018, 2.90%,
due 9/1/2032 Putable 9/1/2023 | | | 2,189,964 | | |
| | 1,000,000 | | | West Rankin Utils. Au. Rev., Ser. 2018, (AGM Insured), 5.00%, due 1/1/2043 | | | 1,172,730 | | |
| | | | 6,494,605 | | |
Missouri 2.0% | | | |
| 2,000,000 | | | Missouri St. Hlth. & Ed. Facs. Au. Hlth. Fac. Rev. Ref. (SSM Hlth. Care Oblig.),
Ser. 2018-C, 5.00%, due 6/1/2036 Putable 6/1/2023 | | | 2,194,120 | | |
| | | | | Missouri St. Hsg. Dev. Commission Single Family Mtge. Rev. (Non-AMT Spec.
Homeownership Loan Prog.) | | | | | |
| | 770,000 | | | Ser. 2014-A,(GNMA/FNMA/FHLMC Insured), 3.80%, due 11/1/2034 | | | 814,044 | | |
| | 895,000 | | | Ser. 2014-A,(GNMA/FNMA/FHLMC Insured), 4.00%, due 11/1/2039 | | | 941,549 | | |
| | | | 3,949,713 | | |
New Jersey 4.1% | | | |
| | 1,000,000 | | | New Jersey Econ. Dev. Au. Rev., Ser. 2017-DDD, 5.00%, due 6/15/2042 | | | 1,125,780 | | |
| 1,130,000 | | | New Jersey Hlth. Care Fac. Fin. Au. Rev. (Inspira Hlth. Obligated Group),
Ser. 2017-A, 5.00%, due 7/1/2029 | | | 1,384,646 | | |
| 1,500,000 | | | New Jersey Hlth. Care Facs. Fin. Au. Contract Rev. Ref. (Hosp. Asset Trans. Prog.),
Ser. 2017, 5.00%, due 10/1/2028 | | | 1,784,025 | | |
| 1,000,000 | | | New Jersey Hlth. Care Facs. Fin. Au. Contract Rev. Ref. (Princeton Hlth. Care Sys.),
Ser. 2017, 5.00%, due 10/1/2026 | | | 1,179,920 | | |
| | | | | New Jersey St. Trans. Trust Fund Au. | | | | | |
| | 600,000 | | | Ser. 2019-BB, 5.00%, due 6/15/2029 | | | 717,810 | | |
| | 500,000 | | | Ser. 2019-BB, 4.00%, due 6/15/2050 | | | 519,395 | | |
| | 1,000,000 | | | New Jersey St. Trans. Trust Fund Au. Trans. Sys. Rev. Ref, Ser. 2018-A, 5.00%, due 12/15/2032 | | | 1,173,390 | | |
| | 295,000 | | | Union Co. Imp. Au. Rev. (Correctional Fac. Proj.), Ser. 2013, 4.00%, due 6/15/2023 | | | 322,234 | | |
| | | | 8,207,200 | | |
See Notes to Financial Statements
132
Schedule of Investments Municipal Intermediate Bond Fund^ (cont'd)
PRINCIPAL AMOUNT | | | | VALUE | |
New York 11.4% | | | |
$ | 390,000
| | | Albany Cap. Res. Corp. Ref. Rev. (Albany College of Pharmacy & Hlth. Sciences),
Ser. 2014-A, 5.00%, due 12/1/2026 | | $ | 451,682
| | |
| | 650,000 | | | Albany Co. G.O., Ser. 2012-B, 4.00%, due 11/1/2022 Pre-Refunded 11/1/2020 | | | 669,000 | | |
| 1,140,000 | | | Hempstead Town Local Dev. Corp. Rev. Ref. (Molloy College Proj.), Ser. 2017, 5.00%,
due 7/1/2029 | | | 1,376,083 | | |
| | | | | Long Beach, G.O. | | | | | |
| | 335,000 | | | Ser. 2014-A, (BAM Insured), 4.00%, due 11/15/2021 | | | 352,929 | | |
| | 520,000 | | | Ser. 2014-A, (BAM Insured), 4.00%, due 11/15/2023 | | | 571,953 | | |
| | 1,000,000 | | | Monroe Co. G.O. (Pub. Imp.), Ser. 2019-A, (BAM Insured), 4.00%, due 6/1/2028 | | | 1,156,440 | | |
| | 505,000 | | | MTA Hudson Rail Yards Trust Oblig. Rev., Ser. 2016-A, 5.00%, due 11/15/2046 | | | 505,838 | | |
| | 500,000 | | | New Paltz Central Sch. Dist. G.O., Ser. 2019, 4.00%, due 2/15/2029 | | | 589,470 | | |
| 4,000,000 | | | New York City Muni. Wtr. Fin. Au. Wtr. & Swr. Sys. Rev. Ref., Ser. 2011-AA, 5.00%,
due 6/15/2033 | | | 4,230,080 | (c) | |
| | | | | New York City Transitional Fin. Au. Rev. (Future Tax Secured) | | | | | |
| | 1,850,000 | | | Subser. 2016-A-1, 4.00%, due 5/1/2031 | | | 2,101,951 | | |
| | 3,300,000 | | | Subser. 2018-B-4, (LOC: JP Morgan Chase Bank N.A.), 1.35%, due 8/1/2042 | | | 3,300,000 | (d) | |
| | | | | New York City Trust for Cultural Res. Rev. Ref. (Carnegie Hall) | | | | | |
| | 310,000 | | | Ser. 2019, 5.00%, due 12/1/2037 | | | 396,788 | | |
| | 600,000 | | | Ser. 2019, 5.00%, due 12/1/2038 | | | 765,924 | | |
| | 300,000 | | | Ser. 2019, 5.00%, due 12/1/2039 | | | 381,954 | | |
| | 800,000 | | | New York St. Dorm. Au. Personal Income Tax Rev., Ser. 2014-C, 5.00%, due 3/15/2025 | | | 928,528 | | |
| | 125,000 | | | New York St. Dorm. Au. Personal Income Tax Rev. Ref., Ser. 2015-E, 5.00%, due 3/15/2026 | | | 150,783 | | |
| | 900,000 | | | New York St. Dorm. Au. Sales Tax Rev., Ser. 2013-A, 5.00%, due 3/15/2028 | | | 1,012,779 | | |
| | | | | Oneida Co. Local Dev. Corp. Rev. Ref. (Mohawk Valley Hlth. Sys. Proj.) | | | | | |
| | 2,250,000 | | | Ser. 2019-A, (AGM Insured), 3.00%, due 12/1/2044 | | | 2,191,590 | (a) | |
| | 500,000 | | | Ser. 2019-A, (AGM Insured), 4.00%, due 12/1/2049 | | | 548,015 | (a) | |
| | 1,000,000 | | | Utils. Debt Securitization Au. Rev., Ser. 2013-TE, 5.00%, due 12/15/2028 | | | 1,152,000 | | |
| | | | 22,833,787 | | |
Ohio 1.3% | | | |
| | 1,515,000 | | | Dayton Metro Library G.O. (Library Impt.), Ser. 2013-A, 5.00%, due 12/1/2028 | | | 1,629,746 | | |
| 1,000,000 | | | Ohio St. Air Quality Dev. Au. Rev. (American Elec. Pwr. Co. Proj.), Ser. 2014-A, 2.40%,
due 12/1/2038 Putable 10/1/2029 | | | 1,012,910 | | |
| | | | 2,642,656 | | |
Oklahoma 2.4% | | | |
| | 2,000,000 | | | Carter Co. Pub. Fac. Au. Ed. Fac. Lease Rev., Ser. 2018, 5.00%, due 9/1/2029 | | | 2,467,760 | | |
| 455,000 | | | Cleveland Co. Ed. Facs. Au. Lease Rev. Ref. (Noble Pub. Sch. Proj.), Ser. 2017, 5.00%,
due 9/1/2031 | | | 544,203 | | |
| 1,500,000 | | | Weatherford Ind. Trust Ed. Fac. Lease Rev. (Weatherford Pub. Sch. Proj.), Ser. 2019, 5.00%,
due 3/1/2033 | | | 1,840,350 | | |
| | | | 4,852,313 | | |
Oregon 0.8% | | | |
| 1,485,000 | | | Multnomah Co. Sch. Dist. # 3 Park Rose G.O., Ser. 2011-A, 5.00%, due 6/30/2031
Pre-Refunded 6/30/2021 | | | 1,576,699 | | |
Pennsylvania 9.1% | | | |
| 2,675,000 | | | Allegheny Co. Hosp. Dev. Au. Rev. Ref. (Univ. Pittsburgh Med. Ctr.), Ser. 2019-A, 5.00%,
due 7/15/2029 | | | 3,423,813 | | |
See Notes to Financial Statements
133
Schedule of Investments Municipal Intermediate Bond Fund^ (cont'd)
PRINCIPAL AMOUNT | | | | VALUE | |
| | | | | Lackawanna Co. Ind. Dev. Au. Rev. Ref. (Univ. of Scranton) | | | | | |
$ | 940,000 | | | Ser. 2017, 5.00%, due 11/1/2028 | | $ | 1,143,125 | | |
| | 600,000 | | | Ser. 2017, 5.00%, due 11/1/2029 | | | 727,080 | | |
| | 500,000 | | | Ser. 2017, 5.00%, due 11/1/2030 | | | 602,470 | | |
| | | | | Luzerne Co. G.O. Ref | | | | | |
| | 500,000 | | | Ser. 2017-A, (AGM Insured), 5.00%, due 12/15/2025 | | | 588,630 | | |
| | 500,000 | | | Ser. 2017-A, (AGM Insured), 5.00%, due 12/15/2026 | | | 598,880 | | |
| | 400,000 | | | Ser. 2017-A, (AGM Insured), 5.00%, due 12/15/2027 | | | 485,128 | | |
| | 300,000 | | | Ser. 2017-B, (AGM Insured), 5.00%, due 12/15/2025 | | | 353,178 | | |
| | 170,000 | | | Ser. 2017-B, (AGM Insured), 5.00%, due 12/15/2026 | | | 203,619 | | |
| | | | | Luzerne Co. Ind. Dev. Au. Lease Rev. Ref. Gtd. | | | | | |
| | 550,000 | | | Ser. 2017, (AGM Insured), 5.00%, due 12/15/2025 | | | 641,619 | | |
| | 525,000 | | | Ser. 2017, (AGM Insured), 5.00%, due 12/15/2026 | | | 608,548 | | |
| | 250,000 | | | Ser. 2017, (AGM Insured), 5.00%, due 12/15/2027 | | | 288,445 | | |
| | 1,000,000 | | | Pennsylvania St. G.O., Ser. 2015, 5.00%, due 3/15/2029 | | | 1,170,650 | | |
| | 225,000 | | | Pennsylvania St. Ref. G.O., Ser. 2016, 5.00%, due 9/15/2026 | | | 275,074 | | |
| | 2,065,000 | | | Pennsylvania St. Turnpike Commission Rev. Ref., Ser. 2016, 5.00%, due 6/1/2027 | | | 2,460,716 | | |
| | | | | Pennsylvania St. Turnpike Commission Turnpike Rev. | | | | | |
| | 400,000 | | | Subser. 2019-A, 5.00%, due 12/1/2033 | | | 500,028 | | |
| | 1,000,000 | | | Subser. 2019-A, 4.00%, due 12/1/2049 | | | 1,092,430 | | |
| 2,100,000 | | | Philadelphia Hosp. & Higher Ed. Facs. Au. Rev. Ref. (Children's Hosp.),
Ser. 2005-A, (LOC: Wells Fargo Bank N.A.), 1.30%, due 2/15/2021 | | | 2,100,000 | (d) | |
| | 750,000 | | | Southeastern Trans. Au. Rev. Ref., Ser. 2017, 5.00%, due 3/1/2028 | | | 943,717 | | |
| | | | 18,207,150 | | |
Rhode Island 3.1% | | | |
| | 500,000 | | | Providence Redev. Agcy. Ref. Rev., Ser. 2015-A, 5.00%, due 4/1/2022 | | | 535,610 | | |
| | | | | Rhode Island Commerce Corp. Spec. Fac. Rev. Ref. (1st Lien - Rhode Island Arpt. Corp.
Int'l Fac. Proj.) | | | | | |
| | 1,170,000 | | | Ser. 2018, 5.00%, due 7/1/2028 | | | 1,437,591 | | |
| | 645,000 | | | Ser. 2018, (BAM-TCRS Insured), 5.00%, due 7/1/2034 | | | 775,600 | | |
| | | | | Rhode Island St. Hlth. & Ed. Bldg. Corp. Pub. Sch. Rev. Ref. | | | | | |
| | 500,000 | | | Ser. 2017-A, (AGM Insured), 5.00%, due 5/15/2024 | | | 578,185 | | |
| | 400,000 | | | Ser. 2017-A, (AGM Insured), 5.00%, due 5/15/2025 | | | 472,828 | | |
| 625,000 | | | Rhode Island St. Hlth. & Ed. Bldg. Corp. Rev. (Providence Pub. Sch. Prog.),
Ser. 2013-A, 5.00%, due 5/15/2022 | | | 679,431 | | |
| 1,505,000 | | | Rhode Island St. Hsg. & Mtge. Fin. Corp. Ref. Rev. (Home Funding), Ser. 2012-5,
(GNMA/FNMA/FHLMC Insured), 3.35%, due 10/1/2033 | | | 1,542,459 | | |
| | 200,000 | | | Rhode Island St. Std. Loan Au. Std. Loan Rev. (Sr. Prog.), Ser. 2010-A, 4.40%, due 12/1/2019 | | | 200,600 | | |
| | | | 6,222,304 | | |
South Carolina 1.2% | | | |
| 100,000 | | | South Carolina Jobs Econ. Dev. Au. Econ. Dev. Rev. (River Park Sr. Living Proj.),
Ser. 2017-A, 7.75%, due 10/1/2057 | | | 102,864 | | |
| | 2,000,000 | | | South Carolina St. Pub. Svc. Au. Oblig. Rev. Ref., Ser. 2014-C, 5.00%, due 12/1/2028 | | | 2,320,620 | | |
| | | | 2,423,484 | | |
Tennessee 2.2% | | | |
| 700,000 | | | Greeneville Hlth. & Ed. Facs. Board Hosp. Rev. Ref. (Ballad Hlth. Obligated Group),
Ser. 2018-A, 5.00%, due 7/1/2032 | | | 778,603 | | |
| 1,500,000 | | | Tennessee St. Energy Acquisition Corp. Gas Rev., Ser. 2018, 4.00%, due 11/1/2049
Putable 11/1/2025 | | | 1,654,395 | | |
See Notes to Financial Statements
134
Schedule of Investments Municipal Intermediate Bond Fund^ (cont'd)
PRINCIPAL AMOUNT | | | | VALUE | |
$ | 1,505,000 | | | Tennessee St. G.O., Ser. 2019-A, 5.00%, due 9/1/2035 | | $ | 1,867,419 | | |
| | | | 4,300,417 | | |
Texas 8.1% | | | |
| | 1,650,000 | | | Bexar Co. G.O. (Cert. Oblig.), Ser. 2013-B, 5.00%, due 6/15/2022 | | | 1,811,172 | | |
| | 2,700,000 | | | Dallas Co. G.O. (Cert. Oblig.), Ser. 2016, 5.00%, due 8/15/2023 | | | 3,076,461 | | |
| 400,000 | | | Gulf Coast Waste Disp. Au. Rev. (Bayport Area Sys.), Ser. 2013, (AGM Insured), 3.00%,
due 10/1/2026 | | | 415,036 | | |
| 600,000 | | | Houston Wtr. & Swr. Sys. Jr. Lien Ref. Rev., Ser. 2001-B, (National Public Finance
Guarantee Corp. Insured), 5.50%, due 12/1/2024 | | | 694,812 | | |
| 1,250,000 | | | La Joya Independent Sch. Dist. Ref. G.O., Ser. 2013, (PSF-GTD Insured), 5.00%,
due 2/15/2033 | | | 1,548,475 | | |
| | 1,250,000 | | | Laredo Independent Sch. Dist. G.O. (Sch. Bldg.), Ser. 2013, 5.00%, due 8/1/2027 | | | 1,407,400 | | |
| | | | | New Hope Cultural Ed. Facs. Fin. Corp. Std. Hsg. Rev. (Collegiate Hsg. College Sta. I LLC) | | | | | |
| | 160,000 | | | Ser. 2014-A, (AGM Insured), 4.00%, due 4/1/2020 | | | 161,429 | | |
| | 200,000 | | | Ser. 2014-A, (AGM Insured), 4.00%, due 4/1/2021 | | | 206,174 | | |
| | 200,000 | | | Ser. 2014-A, (AGM Insured), 4.00%, due 4/1/2022 | | | 210,578 | | |
| | 125,000 | | | Ser. 2014-A, (AGM Insured), 4.00%, due 4/1/2023 | | | 134,183 | | |
| | 220,000 | | | Ser. 2014-A, (AGM Insured), 4.00%, due 4/1/2024 | | | 240,517 | | |
| | 1,900,000 | | | North Tollway Au. First Tier Rev. Ref., Ser. 2017-A, 5.00%, due 1/1/2043 | | | 2,275,991 | | |
| | 1,290,000 | | | Pampa Independent Sch. Dist. G.O. Ref., Ser. 2016, (PSF-GTD Insured), 5.00%, due 8/15/2032 | | | 1,520,665 | | |
| 700,000 | | | Prosper Independent Sch. Dist. G.O. (Sch. Bldg.), Ser. 2019, (PSF-GTD Insured), 5.00%,
due 2/15/2030 | | | 903,203 | | |
| 1,420,000 | | | Southwest Independent Sch. Dist. G.O. (Sch. Bldg.), Ser. 2013, (PSF-GTD Insured), 5.00%,
due 2/1/2026 | | | 1,534,267 | | |
| | 50,000 | | | Texas Pub. Fin. Au. Rev. (So. Univ. Fin. Sys.), Ser. 2013, (BAM Insured), 5.00%, due 11/1/2020 | | | 51,646 | | |
| | | | 16,192,009 | | |
Utah 1.7% | | | |
| | | | | Midvale Redev. Agcy. Tax Increment & Sales Tax Rev. | | | | | |
| | 660,000 | | | Ser. 2018, 5.00%, due 5/1/2032 | | | 810,922 | | |
| | 695,000 | | | Ser. 2018, 5.00%, due 5/1/2033 | | | 851,667 | | |
| | 380,000 | | | Ser. 2018, 5.00%, due 5/1/2034 | | | 464,619 | | |
| | 200,000 | | | Utah Infrastructure Agcy. Telecommunication Rev., Ser. 2019, 4.00%, due 10/15/2036 | | | 211,066 | (a) | |
| 990,000 | | | Weber Co. Spec. Assessment (Summit Mountain Assessment Area), Ser. 2013, 5.50%,
due 1/15/2028 | | | 1,117,591 | | |
| | | | 3,455,865 | | |
Vermont 0.4% | | | |
| | 685,000 | | | Burlington Elec. Sys. Rev., Ser. 2014-A, (AGM Insured), 3.63%, due 7/1/2029 | | | 736,402 | | |
Virginia 1.2% | | | |
| | 2,000,000 | | | Henrico Co. Wtr. & Swr. Ref. Rev., Ser. 2016, 5.00%, due 5/1/2027 | | | 2,461,360 | | |
Washington 3.4% | | | |
| | | | | Kent Ref. G.O. | | | | | |
| | 900,000 | | | Ser. 2016, 4.00%, due 12/1/2029 | | | 1,030,491 | | |
| | 1,000,000 | | | Ser. 2016, 4.00%, due 12/1/2030 | | | 1,133,590 | | |
See Notes to Financial Statements
135
Schedule of Investments Municipal Intermediate Bond Fund^ (cont'd)
PRINCIPAL AMOUNT | | | | VALUE | |
| | | | | North Thurston Pub. Sch. G.O. | | | | | |
$ | 215,000 | | | Ser. 2016, 4.00%, due 12/1/2028 | | $ | 247,366 | | |
| | 250,000 | | | Ser. 2016, 4.00%, due 12/1/2029 | | | 285,580 | | |
| | 375,000 | | | Ser. 2016, 4.00%, due 12/1/2030 | | | 425,344 | | |
| | | | | Washington St. Hlth. Care Fac. Au. Rev. Ref. (Virginia Mason Med. Ctr.) | | | | | |
| | 15,000 | | | Ser. 2017, 5.00%, due 8/15/2025 | | | 17,330 | | |
| | 1,045,000 | | | Ser. 2017, 5.00%, due 8/15/2026 | | | 1,225,388 | | |
| | 320,000 | | | Washington St. Ref. G.O., Ser. 2016-B, 5.00%, due 7/1/2026 | | | 389,165 | | |
| | | | | Whitman Co. Sch. Dist. No. 267 Pullman G.O. | | | | | |
| | 800,000 | | | Ser. 2016, 4.00%, due 12/1/2029 | | | 907,992 | | |
| | 975,000 | | | Ser. 2016, 4.00%, due 12/1/2030 | | | 1,102,023 | | |
| | | | 6,764,269 | | |
West Virginia 0.4% | | | |
| 700,000 | | | West Virginia Hosp. Fin. Au. Rev. Ref. (Cabell Huntington Hosp. Obligated Group),
Ser. 2018-A, 5.00%, due 1/1/2029 | | | 869,218 | | |
Wisconsin 2.4% | | | |
| | 2,650,000 | | | Cedarburg Sch. Dist. G.O., Ser. 2019, 4.00%, due 3/1/2032 | | | 3,014,349 | | |
| | 470,000 | | | Pub. Fin. Au. Lease Dev. Rev. (Central Dist. Dev. Proj.), Ser. 2016, 5.00%, due 3/1/2032 | | | 556,917 | | |
| | 200,000 | | | Pub. Fin. Au. Retirement Fac. Rev. Ref. (Friends Homes), Ser. 2019, 5.00%, due 9/1/2054 | | | 218,430 | (b) | |
| 1,000,000 | | | Wisconsin St. Hlth. & Ed. Facs. Au. Rev. Ref. (Ascension Health Credit Group),
Ser. 2016-A, 4.00%, due 11/15/2039 | | | 1,092,240 | | |
| | | | 4,881,936 | | |
| | | | | Total Investments 100.7% (Cost $194,295,897) | | | 201,438,538 | | |
| | | | | Liabilities Less Other Assets (0.7)% | | | (1,440,919 | ) | |
| | | | | Net Assets 100.0% | | $ | 199,997,619 | | |
(a) When-issued security. Total value of all such securities at October 31, 2019, amounted to $3,445,051, which represents 1.7% of net assets of the Fund.
(b) Securities were purchased under Rule 144A of the Securities Act of 1933, as amended, or are otherwise restricted and, unless registered under the Securities Act of 1933 or exempted from registration, may only be sold to qualified institutional investors or may have other restrictions on resale. At October 31, 2019, these securities amounted to $469,633, which represents 0.2% of net assets of the Fund. These securities have been deemed by the investment manager to be liquid.
(c) All or a portion of this security is segregated in connection with obligations for when-issued securities with a total value of $4,230,080.
See Notes to Financial Statements
136
Schedule of Investments Municipal Intermediate Bond Fund^ (cont'd)
(d) Variable rate demand obligation where the stated interest rate is not based on a published reference rate and spread. Rather, the interest rate generally resets daily or weekly and is determined by the remarketing agent. The rate shown represents the rate in effect at October 31, 2019.
The following is a summary, categorized by Level (see Note A of Notes to Financial Statements), of inputs used to value the Fund's investments as of October 31, 2019:
Asset Valuation Inputs
| | | Level 1 | | Level 2 | | Level 3 | | Total | |
Investments: | |
| Municipal Notes(a) | | $ | — | | | $ | 201,438,538 | | | $ | — | | | $ | 201,438,538 | | |
Total Investments | | $ | — | | | $ | 201,438,538 | | | $ | — | | | $ | 201,438,538 | | |
(a) The Schedule of Investments provides a categorization by state/territory for the portfolio.
^ A balance indicated with a "—", reflects either a zero balance or an amount that rounds to less than 1.
See Notes to Financial Statements
137
Schedule of Investments Short Duration Bond Fund^ October 31, 2019
PRINCIPAL AMOUNT | | | | VALUE | |
U.S. Treasury Obligations 0.7% | | | |
$ | 565,000 | | | U.S. Treasury Notes, 1.38%, due 10/15/2022 (Cost $562,552) | | $ | 562,727 | | |
Mortgage-Backed Securities 36.7% | | | |
Collateralized Mortgage Obligations 8.3% | | | |
| | 716,798 | | | Angel Oak Mortgage Trust I LLC, Ser. 2019-1, Class A1, 3.92%, due 11/25/2048 | | | 727,136 | (a)(b) | |
| | | | | Fannie Mae Connecticut Avenue Securities | | | | | |
| | 975,711 | | | Ser. 2019-R04, Class 2M1, (1M USD LIBOR + 0.75%), 2.57%, due 6/25/2039 | | | 976,135 | (a)(c) | |
| | 982,468 | | | Ser. 2019-R05, Class 1M1, (1M USD LIBOR + 0.75%), 2.57%, due 7/25/2039 | | | 982,754 | (a)(c) | |
| | | | | Freddie Mac Structured Agency Credit Risk Debt Notes | | | | | |
| | 350,000 | | | Ser. 2017-HQA3, Class M2, (1M USD LIBOR + 2.35%), 4.17%, due 4/25/2030 | | | 354,637 | (c) | |
| | 801,668 | | | Ser. 2018-HQA2, Class M1, (1M USD LIBOR + 0.75%), 2.57%, due 10/25/2048 | | | 802,407 | (a)(c) | |
| | 1,000,000 | | | Ser. 2019-HQA3, Class M1, (1M USD LIBOR + 0.75%), 2.57%, due 9/25/2049 | | | 1,000,503 | (a)(c) | |
| | 978,522 | | | GCAT Trust, Ser. 2019-NQM2, Class A1, 2.86%, due 9/25/2059 | | | 981,534 | (a)(d) | |
| 47,278 | | | Harborview Mortgage Loan Trust, Ser. 2004-4, Class 3A, (1M USD LIBOR + 1.13%), 3.16%,
due 6/19/2034 | | | 46,996 | (c) | |
| | 991,863 | | | Starwood Mortgage Residential Trust, Ser. 2019-INV1, Class A1, 2.61%, due 8/25/2049 | | | 990,029 | (a)(b) | |
| | | | 6,862,131 | | |
Commercial Mortgage-Backed 26.4% | | | |
| | 387,231 | | | BBCMS Mortgage Trust, Ser. 2017-C1, Class A1, 2.01%, due 2/15/2050 | | | 386,210 | | |
| 981,598 | | | BX Commercial Mortgage Trust, Ser. 2018-IND, Class A, (1M USD LIBOR + 0.75%), 2.66%,
due 11/15/2035 | | | 980,678 | (a)(c) | |
| | | | | CD Mortgage Trust | | | | | |
| | 439,753 | | | Ser. 2016-CD1, Class A1, 1.44%, due 8/10/2049 | | | 437,061 | | |
| | 262,129 | | | Ser. 2017-CD3, Class A1, 1.97%, due 2/10/2050 | | | 261,896 | | |
| | 585,515 | | | Ser. 2017-CD5, Class A1, 2.03%, due 8/15/2050 | | | 585,205 | | |
| | | | | Citigroup Commercial Mortgage Trust | | | | | |
| | 423,768 | | | Ser. 2016-C2, Class A1, 1.50%, due 8/10/2049 | | | 421,170 | | |
| | 904,845 | | | Ser. 2018-C5, Class A1, 3.13%, due 6/10/2051 | | | 921,503 | | |
| | | | | Commercial Mortgage Trust | | | | | |
| | 417,487 | | | Ser. 2012-CR3, Class ASB, 2.37%, due 10/15/2045 | | | 418,905 | | |
| | 45,389 | | | Ser. 2015-CR25, Class A1, 1.74%, due 8/10/2048 | | | 45,329 | | |
| | 247,569 | | | Ser. 2016-CR28, Class A1, 1.77%, due 2/10/2049 | | | 246,883 | | |
| | 5,707,628 | | | Ser. 2014-UBS6, Class XA, 0.92%, due 12/10/2047 | | | 207,168 | (b)(e) | |
| | 1,000,000 | | | Ser. 2012 -CR4, Class AM, 3.25%, due 10/15/2045 | | | 1,004,598 | | |
| | 1,000,000 | | | Ser. 2013-LC6, Class B, 3.74%, due 1/10/2046 | | | 1,036,636 | | |
| | 1,446,186 | | | Ser. 2014-UBS3, Class XA, 1.09%, due 6/10/2047 | | | 61,125 | (b)(e) | |
| | 692,403 | | | CSAIL Commercial Mortgage Trust, Ser. 2017-CX10, Class A1, 2.23%, due 11/15/2050 | | | 693,329 | | |
| | 362,072 | | | DBJPM Mortgage Trust, Ser. 2016-C3, Class A1, 1.50%, due 8/10/2049 | | | 360,032 | | |
| | 1,460,849 | | | DBUBS Mortgage Trust, Ser. 2011-LC1A, Class A3, 5.00%, due 11/10/2046 | | | 1,489,396 | (a) | |
| 1,024,989 | | | Four Times Square Trust Commercial Mortgage Pass-Through Certificates, Ser. 2006-4TS,
Class A, 5.40%, due 12/13/2028 | | | 1,055,098 | (a) | |
| | | | | Freddie Mac Multifamily Structured Pass Through Certificates | | | | | |
| | 5,962,656 | | | Ser. KW03, Class X1, 0.84%, due 6/25/2027 | | | 294,899 | (b)(e) | |
| | 3,432,360 | | | Ser. K095, Class X1, 0.95%, due 6/25/2029 | | | 260,049 | (b)(e) | |
| | 5,299,341 | | | Ser. K096, Class X1, 1.26%, due 7/25/2029 | | | 491,088 | (b)(e) | |
| | 4,100,000 | | | Ser. K098, Class XAM, 1.52%, due 8/25/2029 | | | 492,516 | (b)(e) | |
| | 100,000 | | | Great Wolf Trust, Ser. 2017, Class A, (1M USD LIBOR + 0.85%), 2.76%, due 9/15/2034 | | | 99,968 | (a)(c) | |
See Notes to Financial Statements
138
Schedule of Investments Short Duration Bond Fund^ (cont'd)
PRINCIPAL AMOUNT | | | | VALUE | |
| | | | | GS Mortgage Securities Trust | | | | | |
$ | 730,000 | | | Ser. 2010-C1, Class B, 5.15%, due 8/10/2043 | | $ | 739,500 | (a) | |
| | 500,000 | | | Ser. 2012-GCJ7, Class B, 4.74%, due 5/10/2045 | | | 522,546 | | |
| | 100,000 | | | Ser. 2014-GC18, Class AS, 4.38%, due 1/10/2047 | | | 106,132 | | |
| | 100,440 | | | Ser. 2015-GS1, Class A1, 1.94%, due 11/10/2048 | | | 100,180 | | |
| 1,017,672 | | | Ladder Capital Commercial Mortgage Securities LLC, Ser. 2017-LC26, Class A1, 1.98%,
due 7/12/2050 | | | 1,015,529 | (a) | |
| 588,134 | | | Morgan Stanley Bank of America Merrill Lynch Trust, Ser. 2017-C33, Class A1, 2.03%,
due 5/15/2050 | | | 587,697 | | |
| | 253,383 | | | SG Commercial Mortgage Securities Trust, Ser. 2016-C5, Class A1, 1.35%, due 10/10/2048 | | | 251,761 | | |
| | | | | Wells Fargo Commercial Mortgage Trust | | | | | |
| | 1,000,000 | | | Ser. 2012-LC5, Class C, 4.69%, due 10/15/2045 | | | 1,051,192 | (b) | |
| | 100,696 | | | Ser. 2015-P2, Class A1, 1.97%, due 12/15/2048 | | | 100,545 | | |
| | 559,476 | | | Ser. 2016-NXS6, Class A1, 1.42%, due 11/15/2049 | | | 555,991 | | |
| | 692,347 | | | Ser. 2017-C39, Class A1, 1.98%, due 9/15/2050 | | | 691,192 | | |
| | 1,450,609 | | | Ser. 2018-C45, Class A1, 3.13%, due 6/15/2051 | | | 1,478,373 | | |
| | 4,099,650 | | | Ser. 2019-C52, Class XA, 1.62%, due 8/15/2052 | | | 490,093 | (b)(e) | |
| | 156,093 | | | Ser. 2015-LC22, Class A1, 1.64%, due 9/15/2058 | | | 155,719 | | |
| | 236,515 | | | Ser. 2016-NXS5, Class A1, 1.56%, due 1/15/2059 | | | 235,826 | | |
| | 319,405 | | | Ser. 2016-C32, Class A1, 1.58%, due 1/15/2059 | | | 318,273 | | |
| | 1,000,000 | | | WF-RBS Commercial Mortgage Trust, Ser. 2011-C2, Class C, 5.39%, due 2/15/2044 | | | 1,025,733 | (a)(b) | |
| | | | 21,677,024 | | |
Fannie Mae 1.1% | | | |
| | | | | Pass-Through Certificates | | | | | |
| | 180,448 | | | 3.50%, due 10/1/2025 | | | 186,829 | | |
| | 432,707 | | | 3.00%, due 9/1/2027 | | | 444,411 | | |
| | 271,266 | | | 4.50%, due 4/1/2039 – 5/1/2044 | | | 291,391 | | |
| | | | 922,631 | | |
Freddie Mac 0.9% | | | |
| | | | | Pass-Through Certificates | | | | | |
| | 215,688 | | | 3.50%, due 5/1/2026 | | | 223,447 | | |
| | 300,813 | | | 3.00%, due 1/1/2027 | | | 309,575 | | |
| | 198,228 | | | 4.50%, due 11/1/2039 | | | 214,910 | | |
| | | | 747,932 | | |
| | | | | Total Mortgage-Backed Securities (Cost $30,129,205) | | | 30,209,718 | | |
Corporate Bonds 56.7% | | | |
Aerospace & Defense 2.2% | | | |
| | 650,000 | | | General Dynamics Corp., (3M USD LIBOR + 0.38%), 2.56%, due 5/11/2021 | | | 653,080 | (c) | |
| | 150,000 | | | TransDigm, Inc., 6.25%, due 3/15/2026 | | | 160,688 | (a) | |
| | 1,000,000 | | | United Technologies Corp., (3M USD LIBOR + 0.35%), 2.60%, due 11/1/2019 | | | 1,000,000 | (c) | |
| | | | 1,813,768 | | |
Agriculture 2.6% | | | |
| | 850,000 | | | BAT Capital Corp., (3M USD LIBOR + 0.88%), 3.04%, due 8/15/2022 | | | 854,220 | (c) | |
| | 1,250,000 | | | Imperial Tobacco Finance, 3.75%, due 7/21/2022 | | | 1,289,305 | (a) | |
| | | | 2,143,525 | | |
See Notes to Financial Statements
139
Schedule of Investments Short Duration Bond Fund^ (cont'd)
PRINCIPAL AMOUNT | | | | VALUE | |
Auto Manufacturers 1.8% | | | |
$ | 705,000 | | | Daimler Finance N.A. LLC, (3M USD LIBOR + 0.90%), 3.06%, due 2/15/2022 | | $ | 709,519 | (a)(c) | |
| | 810,000 | | | Harley-Davidson Financial Services, Inc., (3M USD LIBOR + 0.50%), 2.65%, due 5/21/2020 | | | 810,483 | (a)(c) | |
| | | | 1,520,002 | | |
Banks 16.3% | | | |
| | 1,675,000 | | | Bank of America Corp., (3M USD LIBOR + 0.65%), 2.76%, due 6/25/2022 | | | 1,683,146 | (c) | |
| | 2,150,000 | | | Citigroup, Inc., (3M USD LIBOR + 0.96%), 2.90%, due 4/25/2022 | | | 2,176,581 | (c) | |
| | | | | Goldman Sachs Group, Inc. | | | | | |
| | 700,000 | | | (3M USD LIBOR + 0.78%), 2.71%, due 10/31/2022 | | | 703,374 | (c) | |
| | 1,115,000 | | | (3M USD LIBOR + 1.11%), 3.05%, due 4/26/2022 | | | 1,126,502 | (c) | |
| | 850,000 | | | HSBC Holdings PLC, (3M USD LIBOR + 0.60%), 2.72%, due 5/18/2021 | | | 850,842 | (c) | |
| | 1,820,000 | | | JPMorgan Chase & Co., (3M USD LIBOR + 0.61%), 2.76%, due 6/18/2022 | | | 1,826,024 | (c) | |
| | 2,000,000 | | | Morgan Stanley, (3M USD LIBOR + 0.93%), 2.88%, due 7/22/2022 | | | 2,018,090 | (c) | |
| | 1,235,000 | | | Santander UK PLC, 2.50%, due 1/5/2021 | | | 1,242,069 | | |
| | 795,000 | | | Sumitomo Mitsui Banking Corp., 2.51%, due 1/17/2020 | | | 795,874 | | |
| | 195,000 | | | Wells Fargo & Co., (3M USD LIBOR + 0.93%), 3.11%, due 2/11/2022 | | | 196,280 | (c) | |
| | 805,000 | | | Wells Fargo Bank N.A., (3M USD LIBOR + 0.66%), 2.80%, due 9/9/2022 | | | 807,913 | (c) | |
| | | | 13,426,695 | | |
Beverages 2.5% | | | |
| | 1,023,000 | | | Anheuser-Busch InBev Worldwide, Inc., 4.38%, due 2/15/2021 | | | 1,052,088 | | |
| | 1,000,000 | | | Diageo Capital PLC, (3M USD LIBOR + 0.24%), 2.36%, due 5/18/2020 | | | 1,000,728 | (c) | |
| | | | 2,052,816 | | |
Commercial Services 1.2% | | | |
| | 230,000 | | | Avis Budget Car Rental LLC/Avis Budget Finance, Inc., 5.25%, due 3/15/2025 | | | 234,600 | (a) | |
| | 735,000 | | | ERAC USA Finance LLC, 5.25%, due 10/1/2020 | | | 757,201 | (a) | |
| | | | 991,801 | | |
Diversified Financial Services 5.2% | | | |
| | 1,525,000 | | | American Express Co., (3M USD LIBOR + 0.62%), 2.76%, due 5/20/2022 | | | 1,532,141 | (c) | |
| | 895,000 | | | Avolon Holdings Funding Ltd., 3.63%, due 5/1/2022 | | | 913,616 | (a) | |
| | 1,400,000 | | | Capital One Financial Corp., (3M USD LIBOR + 0.95%), 3.05%, due 3/9/2022 | | | 1,411,253 | (c) | |
| | 370,000 | | | LPL Holdings, Inc., 5.75%, due 9/15/2025 | | | 383,875 | (a) | |
| | | | 4,240,885 | | |
Electric 1.7% | | | |
| | 1,060,000 | | | Pennsylvania Electric Co., 5.20%, due 4/1/2020 | | | 1,073,141 | | |
| | 340,000 | | | Talen Energy Supply LLC, 10.50%, due 1/15/2026 | | | 292,400 | (a) | |
| | | | 1,365,541 | | |
Electronics 0.1% | | | |
| | 80,000 | | | ADT Corp., 4.13%, due 6/15/2023 | | | 81,200 | | |
See Notes to Financial Statements
140
Schedule of Investments Short Duration Bond Fund^ (cont'd)
PRINCIPAL AMOUNT | | | | VALUE | |
Entertainment 0.2% | | | |
$ | 80,000 | | | Scientific Games Int'l, Inc., 5.00%, due 10/15/2025 | | $ | 82,400 | (a) | |
| | 80,000 | | | Six Flags Entertainment Corp., 4.88%, due 7/31/2024 | | | 82,600 | (a) | |
| | | | 165,000 | | |
Healthcare - Services 0.5% | | | |
| | 390,000 | | | Tenet Healthcare Corp., 4.63%, due 7/15/2024 | | | 401,700 | | |
Internet 0.4% | | | |
| | 310,000 | | | Zayo Group LLC/Zayo Capital, Inc., 6.38%, due 5/15/2025 | | | 318,680 | | |
Lodging 0.1% | | | |
| | 80,000 | | | Wynn Las Vegas LLC/Wynn Las Vegas Capital Corp., 4.25%, due 5/30/2023 | | | 82,808 | (a) | |
Media 3.3% | | | |
| | 580,000 | | | Comcast Corp., (3M USD LIBOR + 0.44%), 2.54%, due 10/1/2021 | | | 583,091 | (c) | |
| | 380,000 | | | CSC Holdings LLC, 5.50%, due 5/15/2026 | | | 400,425 | (a) | |
| | 310,000 | | | Cumulus Media New Holdings, Inc., 6.75%, due 7/1/2026 | | | 328,600 | (a) | |
| | 385,000 | | | Fox Corp., 3.67%, due 1/25/2022 | | | 398,575 | (a) | |
| | 380,000 | | | Gray Television, Inc., 5.13%, due 10/15/2024 | | | 393,775 | (a) | |
| | 70,000 | | | iHeartCommunications, Inc., 6.38%, due 5/1/2026 | | | 75,338 | | |
| | 150,000 | | | Sinclair Television Group, Inc., 5.88%, due 3/15/2026 | | | 156,562 | (a) | |
| | 380,000 | | | Sirius XM Radio, Inc., 5.38%, due 7/15/2026 | | | 400,900 | (a) | |
| | | | 2,737,266 | | |
Miscellaneous Manufacturer 1.2% | | | |
| | 1,000,000 | | | General Electric Capital Corp., (3M USD LIBOR + 0.62%), 2.63%, due 1/9/2020 | | | 999,736 | (c) | |
Oil & Gas 2.6% | | | |
| | 1,090,000 | | | BP Capital Markets America, Inc., (3M USD LIBOR + 0.65%), 2.81%, due 9/19/2022 | | | 1,096,042 | (c) | |
| | 1,005,000 | | | Occidental Petroleum Corp., (3M USD LIBOR + 1.25%), 3.44%, due 8/13/2021 | | | 1,011,362 | (c) | |
| | | | 2,107,404 | | |
Packaging & Containers 0.9% | | | |
| | 380,000 | | | Ardagh Packaging Finance PLC/Ardagh Holdings USA, Inc., 6.00%, due 2/15/2025 | | | 399,000 | (a) | |
| | 310,000 | | | BWAY Holding Co., 5.50%, due 4/15/2024 | | | 318,912 | (a) | |
| | | | 717,912 | | |
Pharmaceuticals 3.2% | | | |
| | 1,235,000 | | | AbbVie, Inc., 2.50%, due 5/14/2020 | | | 1,238,589 | | |
| | 1,000,000 | | | Cigna Corp., (3M USD LIBOR + 0.65%), 2.79%, due 9/17/2021 | | | 1,000,160 | (c) | |
| | 380,000 | | | Valeant Pharmaceuticals Int'l, Inc., 5.50%, due 11/1/2025 | | | 397,104 | (a) | |
| | | | 2,635,853 | | |
See Notes to Financial Statements
141
Schedule of Investments Short Duration Bond Fund^ (cont'd)
PRINCIPAL AMOUNT | | | | VALUE | |
Pipelines 2.7% | | | |
$ | 230,000
| | | Crestwood Midstream Partners L.P./Crestwood Midstream Finance Corp., 5.75%,
due 4/1/2025 | | $ | 237,475
| | |
| | 310,000 | | | Genesis Energy L.P./Genesis Energy Finance Corp., 6.00%, due 5/15/2023 | | | 300,700 | | |
| | 1,435,000 | | | MPLX L.P., (3M USD LIBOR + 0.90%), 3.00%, due 9/9/2021 | | | 1,440,496 | (c) | |
| | 320,000 | | | Summit Midstream Holdings LLC/Summit Midstream Finance Corp., 5.50%, due 8/15/2022 | | | 286,400 | | |
| | | | 2,265,071 | | |
Real Estate 0.5% | | | |
| | 460,000 | | | Realogy Group LLC/Realogy Co-Issuer Corp., 4.88%, due 6/1/2023 | | | 447,396 | (a) | |
Real Estate Investment Trusts 0.1% | | | |
| | 80,000 | | | Iron Mountain U.S. Holdings, Inc., 5.38%, due 6/1/2026 | | | 83,000 | (a) | |
Retail 0.6% | | | |
| | 150,000 | | | L Brands, Inc., 5.63%, due 10/15/2023 | | | 159,188 | | |
| | 310,000 | | | Staples, Inc., 7.50%, due 4/15/2026 | | | 323,175 | (a) | |
| | | | 482,363 | | |
Semiconductors 2.1% | | | |
| | 1,725,000 | | | Broadcom, Inc., 3.13%, due 4/15/2021 | | | 1,745,597 | (a) | |
Telecommunications 4.7% | | | |
| | 1,700,000 | | | AT&T, Inc., (3M USD LIBOR + 0.95%), 2.95%, due 7/15/2021 | | | 1,717,340 | (c) | |
| | 340,000 | | | CommScope, Inc., 5.50%, due 6/15/2024 | | | 321,725 | (a) | |
| | 70,000 | | | Intelsat Jackson Holdings SA, 9.50%, due 9/30/2022 | | | 80,762 | (a) | |
| | 370,000 | | | Numericable-SFR SA, 7.38%, due 5/1/2026 | | | 396,213 | (a) | |
| | 280,000 | | | Sprint Corp., 7.88%, due 9/15/2023 | | | 309,050 | | |
| | 1,000,000 | | | Verizon Communications, Inc., (3M USD LIBOR + 1.00%), 3.12%, due 3/16/2022 | | | 1,016,113 | (c) | |
| | | | 3,841,203 | | |
| | | | | Total Corporate Bonds (Cost $46,623,059) | | | 46,667,222 | | |
Asset-Backed Securities 7.3% | | | |
| | 500,000 | | | CIFC Funding Ltd., Ser. 2019-2A, Class D, (3M USD LIBOR + 3.60%), 5.60%, due 4/17/2030 | | | 488,181 | (a)(c)(f) | |
| | 38,632 | | | Colony American Finance Ltd., Ser. 2016-1, Class A, 2.54%, due 6/15/2048 | | | 38,579 | (a) | |
| | | | | CoreVest American Finance Trust | | | | | |
| | 174,349 | | | Ser. 2017-1, Class A, 2.97%, due 10/15/2049 | | | 175,790 | (a) | |
| | 100,000 | | | Ser. 2017-1, Class B, 3.36%, due 10/15/2049 | | | 100,922 | (a) | |
| 1,000,000 | | | Dryden Senior Loan Fund, Ser. 2018-64A, Class D, (3M USD LIBOR + 2.65%), 4.65%,
due 4/18/2031 | | | 917,744 | (a)(c)(f) | |
| | 82,254 | | | Nissan Auto Receivables Owner Trust, Ser. 2016-C, Class A3, 1.18%, due 1/15/2021 | | | 82,164 | | |
| 1,000,000 | | | Octagon Investment Partners 43 Ltd., Ser. 2019-1A, Class D, (3M USD LIBOR + 3.90%),
5.99%, due 10/25/2032 | | | 975,306 | (a)(c)(f) | |
| | 1,000,000 | | | PFS Financing Corp., Ser. 2019-B, Class A, (1M USD LIBOR + 0.55%), 2.47%, due 9/15/2023 | | | 1,000,108 | (a)(c) | |
| | 1,000,000 | | | Prosper Marketplace Issuance Trust, Ser. 2019-4A, Class A, 2.48%, due 2/17/2026 | | | 999,920 | (a)(g) | |
| | 215,000 | | | Verizon Owner Trust, Ser. 2019-A, Class A1A, 2.93%, due 9/20/2023 | | | 219,079 | | |
| | 1,000,000 | | | Voya CLO Ltd., Ser. 2016-2A, Class CR, (3M USD LIBOR + 4.00%), 5.97%, due 7/19/2028 | | | 970,359 | (a)(c)(f) | |
| | | | | Total Asset-Backed Securities (Cost $6,063,170) | | | 5,968,152 | | |
See Notes to Financial Statements
142
Schedule of Investments Short Duration Bond Fund^ (cont'd)
NUMBER OF SHARES | | | | VALUE | |
Short-Term Investments 2.2% | | | |
Investment Companies 2.2% | | | |
| | 1,829,408 | | | State Street Institutional U.S. Government Money Market Fund Premier Class, 1.75%(h)
(Cost $1,829,408) | | $ | 1,829,408
| (i) | |
| | | | | Total Investments 103.6% (Cost $85,207,394) | | | 85,237,227 | | |
| | | | | Liabilities Less Other Assets (3.6)% | | | (2,959,359 | )(j) | |
| | | | | Net Assets 100.0% | | $ | 82,277,868 | | |
(a) Securities were purchased under Rule 144A of the Securities Act of 1933, as amended, or are otherwise restricted and, unless registered under the Securities Act of 1933 or exempted from registration, may only be sold to qualified institutional investors or may have other restrictions on resale. At October 31, 2019, these securities amounted to $30,924,525, which represents 37.6% of net assets of the Fund. Securities denoted with (a) but without (f), if any, have been deemed by the investment manager to be liquid.
(b) Variable or floating rate security where the stated interest rate is not based on a published reference rate and spread. Rather, the interest rate adjusts periodically based on changes in current interest rates and prepayments on the underlying pool of assets. The interest rate shown was the current rate as of October 31, 2019.
(c) Variable or floating rate security. The interest rate shown was the current rate as of October 31, 2019 and changes periodically.
(d) Step Bond. Coupon rate is a fixed rate for an initial period that either resets at a specific date or may reset in the future contingent upon a predetermined trigger. The interest rate shown was the current rate as of October 31, 2019.
(e) Interest only security. These securities represent the right to receive the monthly interest payments on an underlying pool of mortgages. Payments of principal on the pool reduce the value of the "interest only" holding.
(f) Illiquid security.
(g) When-issued security. Total value of all such securities at October 31, 2019, amounted to $999,920, which represents 1.2% of net assets of the Fund.
(h) Represents 7-day effective yield as of October 31, 2019.
(i) All or a portion of this security is segregated in connection with obligations for futures and when-issued securities with a total value of $1,829,408.
(j) Includes the impact of the Fund's open positions in derivatives at October 31, 2019.
See Notes to Financial Statements
143
Schedule of Investments Short Duration Bond Fund^ (cont'd)
Derivative Instruments
Futures contracts ("futures")
At October 31, 2019, open positions in futures for the Fund were as follows:
Long Futures:
Expiration Date | | Number of
Contracts | | Open Contracts | | Notional
Amount | | Value and
Unrealized
Appreciation/
(Depreciation) | |
12/2019 | | | 187 | | | U.S. Treasury Note, 2 Year | | $ | 40,317,492 | | | $ | (55,219 | ) | |
Total Long Positions | | | | | | $ | 40,317,492 | | | $ | (55,219 | ) | |
Short Futures:
Expiration Date | | Number of
Contracts | | Open Contracts | | Notional
Amount | | Value and
Unrealized
Appreciation/
(Depreciation) | |
12/2019 | | | 9 | | | U.S. Treasury Note, 10 Year | | $ | (1,172,672 | ) | | $ | 13,078 | | |
Total Short Positions | | | | | | $ | (1,172,672 | ) | | $ | 13,078 | | |
Total Futures | | | | | | | | $ | (42,141 | ) | |
At October 31, 2019, the Fund had $240,272 deposited in a segregated account to cover margin requirements on open futures.
For the year ended October 31, 2019, the average notional value of futures for the Fund was $22,922,630 for long positions and $(1,172,672) for short positions.
The following is a summary, categorized by Level (see Note A of Notes to Financial Statements), of inputs used to value the Fund's investments as of October 31, 2019:
Asset Valuation Inputs
| | | Level 1 | | Level 2 | | Level 3 | | Total | |
Investments: | |
U.S. Treasury Obligations | | $ | — | | | $ | 562,727 | | | $ | — | | | $ | 562,727 | | |
| Mortgage-Backed Securities(a) | | | — | | | | 30,209,718 | | | | — | | | | 30,209,718 | | |
| Corporate Bonds(a) | | | — | | | | 46,667,222 | | | | — | | | | 46,667,222 | | |
Asset-Backed Securities | | | — | | | | 5,968,152 | | | | — | | | | 5,968,152 | | |
Short-Term Investments | | | — | | | | 1,829,408 | | | | — | | | | 1,829,408 | | |
Total Investments | | $ | — | | | $ | 85,237,227 | | | $ | — | | | $ | 85,237,227 | | |
(a) The Schedule of Investments provides information on the industry or sector categorization for the portfolio.
See Notes to Financial Statements
144
Schedule of Investments Short Duration Bond Fund^ (cont'd)
The following is a summary, categorized by Level (see Note A of Notes to Financial Statements), of inputs used to value the Fund's derivatives as of October 31, 2019:
Other Financial Instruments
| | | Level 1 | | Level 2 | | Level 3 | | Total | |
| Futures(a) | |
Assets | | $ | 13,078 | | | $ | — | | | $ | — | | | $ | 13,078 | | |
Liabilities | | | (55,219 | ) | | | — | | | | — | | | | (55,219 | ) | |
Total | | $ | (42,141 | ) | | $ | — | | | $ | — | | | $ | (42,141 | ) | |
(a) Futures are reported at the cumulative unrealized appreciation/(depreciation) of the instrument.
^ A balance indicated with a "—", reflects either a zero balance or an amount that rounds to less than 1.
See Notes to Financial Statements
145
Schedule of Investments Short Duration High Income Fund^ October 31, 2019
PRINCIPAL AMOUNT | | | | VALUE | |
| Loan Assignments(a) 8.9% | |
Aerospace & Defense 0.2% | |
$ | 55,000 | | | MHI Holdings, LLC, Term Loan B, (1M USD LIBOR + 5.00%), 6.79%, due 9/21/2026 | | $ | 54,450 | (b) | |
Building & Development 0.8% | |
| | 84,778 | | | Forterra Finance, LLC, Term Loan B, (1M USD LIBOR + 3.00%), 4.79%, due 10/25/2023 | | | 79,851 | (c)(d) | |
| | 103,366 | | | Jeld-Wen Inc., First Lien Term Loan, (3M USD LIBOR + 2.00%), 4.10%, due 12/14/2024 | | | 103,081 | | |
| | 64,747 | | | Realogy Group LLC, Term Loan B, (1M USD LIBOR + 2.25%), 4.07%, due 2/8/2025 | | | 61,267 | | |
| | | | 244,199 | | |
Business Equipment & Services 0.7% | |
| 195,000 | | | Prime Security Services Borrower, LLC, Term Loan B1, (1M USD LIBOR + 3.25%), 5.25%,
due 9/23/2026 | | | 188,105 | | |
| | 36,970 | | | West Corporation, Term Loan, (USD LIBOR + 4.00%), 5.93%, due 10/10/2024 | | | 30,671 | (e) | |
| | | | 218,776 | | |
Chemicals & Plastics 0.2% | |
| | 56,801 | | | Starfruit Finco B.V., Term Loan B, (1M USD LIBOR + 3.25%), 5.19%, due 10/1/2025 | | | 55,323 | | |
Containers & Glass Products 0.7% | |
| | 78,775 | | | Berlin Packaging LLC, First Lien Term Loan, (USD LIBOR + 3.00%), 5.00%, due 11/7/2025 | | | 76,412 | (e) | |
| | 157,423 | | | BWAY Holding Company, Term Loan B, (3M USD LIBOR + 3.25%), 5.23%, due 4/3/2024 | | | 153,040 | | |
| | | | 229,452 | | |
Cosmetics - Toiletries 0.3% | |
| 95,000 | | | Sunshine Luxembourg VII S.a.r.l., First Lien Term Loan, (2M USD LIBOR + 4.25%), 6.35%,
due 10/1/2026 | | | 95,040 | | |
Diversified Insurance 0.7% | |
| | | Hub International Limited | | | | | |
| | 35,000 | | | Term Loan B, (USD LIBOR + 4.00%), due 4/25/2025 | | | 34,930 | (c)(d) | |
| | 99,572 | | | Term Loan B, (3M USD LIBOR + 3.00%), 4.94%, due 4/25/2025 | | | 97,313 | (e) | |
| due 12/31/2025 69,288 | | Sedgwick Claims Management Services, Inc., Term Loan B, (1M USD LIBOR + 3.25%), 5.04%, | | | 67,156 | | |
| | | | 199,399 | | |
Drugs 1.0% | |
| | | Bausch Health Companies Inc. | | | | | |
| | 34,452 | | | Term Loan B, (1M USD LIBOR + 3.00%), 4.92%, due 6/2/2025 | | | 34,564 | | |
| | 60,667 | | | Term Loan B, (1M USD LIBOR + 2.75%), 4.67%, due 11/27/2025 | | | 60,717 | | |
| 98,408 | | | Endo Luxembourg Finance Company I S.a.r.l., Term Loan B, (1M USD LIBOR + 4.25%), 6.06%,
due 4/29/2024 | | | 90,338 | | |
| | 39,792 | | | Jaguar Holding Company II, Term Loan, (1M USD LIBOR + 2.50%), 4.29%, due 8/18/2022 | | | 39,693 | | |
| | 70,793 | | | Parexel International Corporation, Term Loan B, (1M USD LIBOR + 2.75%), 4.54%, due 9/27/2024 | | | 67,518 | | |
| | | | 292,830 | | |
See Notes to Financial Statements
146
Schedule of Investments Short Duration High Income Fund^ (cont'd)
PRINCIPAL AMOUNT | | | | VALUE | |
Electronics - Electrical 0.5% | | | |
$ | 39,808 | | | Epicor Software Corporation, First Lien Term Loan, (1M USD LIBOR + 3.25%), 5.04%, due 6/1/2022 | | $ | 39,659 | | |
| | 85,426 | | | Rackspace Hosting, Inc., First Lien Term Loan, (3M USD LIBOR + 3.00%), 5.29%, due 11/3/2023 | | | 75,842 | | |
| | 39,778 | | | Sophia, L.P., Term Loan B, (3M USD LIBOR + 3.25%), 5.35%, due 9/30/2022 | | | 39,728 | | |
| | | | 155,229 | | |
Health Care 0.3% | | | |
| | 109,096 | | | Team Health Holdings, Inc., First Lien Term Loan, (1M USD LIBOR + 2.75%), 4.54%, due 2/6/2024 | | | 83,731 | | |
Leisure Goods - Activities - Movies 0.3% | | | |
| 93,480 | | | SeaWorld Parks & Entertainment, Inc., Term Loan B5, (1M USD LIBOR + 3.00%), 4.79%,
due 3/31/2024 | | | 93,063 | | |
Lodging & Casinos 1.4% | | | |
| | 53,923 | | | Boyd Gaming Corporation, Term Loan B3, (1W USD LIBOR + 2.25%), 3.96%, due 9/15/2023 | | | 53,940 | | |
| 98,391 | | | Caesars Resort Collection, LLC, First Lien Term Loan B, (1M USD LIBOR + 2.75%), 4.54%,
due 12/23/2024 | | | 96,864 | | |
| | 91,638 | | | Eldorado Resorts LLC, Term Loan B, (USD LIBOR + 2.25%), 4.21%, due 4/17/2024 | | | 91,485 | (e) | |
| | | | | Mohegan Tribal Gaming Authority | | | | | |
| | 27,888 | | | Term Loan A, (1M USD LIBOR + 3.75%), 5.54%, due 10/13/2021 | | | 26,912 | | |
| | 39,129 | | | Term Loan B, (1M USD LIBOR + 4.00%), 5.79%, due 10/13/2023 | | | 36,133 | | |
| | 128,130 | | | Station Casinos LLC, Term Loan B, (1M USD LIBOR + 2.50%), 4.29%, due 6/8/2023 | | | 128,184 | | |
| | | | 433,518 | | |
Oil & Gas 0.3% | | | |
| | 29,793 | | | BCP Raptor, LLC, Term Loan B, (1M USD LIBOR + 4.25%), 6.04%, due 6/24/2024 | | | 26,106 | | |
| | 29,848 | | | Brazos Delaware II, LLC, Term Loan B, (1M USD LIBOR + 4.00%), 5.85%, due 5/21/2025 | | | 25,520 | | |
| | 24,937 | | | Lower Cadence Holdings LLC, Term Loan B, (1M USD LIBOR + 4.00%), 5.80%, due 5/22/2026 | | | 23,130 | | |
| 29,825 | | | Lucid Energy Group II Borrower, LLC, First Lien Term Loan, (1M USD LIBOR + 3.00%), 4.79%,
due 2/17/2025 | | | 26,097 | | |
| | | | 100,853 | | |
Retailers (except food & drug) 0.9% | | | |
| | 138,602 | | | Bass Pro Group, LLC, Term Loan B, (1M USD LIBOR + 5.00%), 6.79%, due 9/25/2024 | | | 133,528 | | |
| | 147,105 | | | Staples, Inc., Term Loan, (3M USD LIBOR + 5.00%), 7.12%, due 4/16/2026 | | | 144,856 | | |
| | | | 278,384 | | |
Telecommunications 0.1% | | | |
| | 29,202 | | | Syniverse Holdings, Inc., First Lien Term Loan, (3M USD LIBOR + 5.00%), 6.92%, due 3/9/2023 | | | 26,223 | | |
Utilities 0.5% | | | |
| | 29,925 | | | Blackstone CQP Holdco LP, Term Loan B, (3M USD LIBOR + 3.50%), 5.66%, due 9/30/2024 | | | 29,757 | | |
| | 130,000 | | | Talen Energy Supply, LLC, Term Loan B, (1M USD LIBOR + 3.75%), 5.69%, due 7/8/2026 | | | 128,375 | (b) | |
| | | | 158,132 | | |
| | | | | Total Loan Assignments (Cost $2,781,148) | | | 2,718,602 | | |
See Notes to Financial Statements
147
Schedule of Investments Short Duration High Income Fund^ (cont'd)
PRINCIPAL AMOUNT | | | | VALUE | |
Corporate Bonds 86.8% | | | |
Advertising 2.7% | | | |
$ | 30,000 | | | Clear Channel Worldwide Holdings, Inc., 9.25%, due 2/15/2024 | | $ | 33,000 | (f) | |
| | 150,000 | | | Nielsen Co. Luxembourg S.a.r.l., 5.50%, due 10/1/2021 | | | 150,375 | (f) | |
| | | | | Nielsen Finance LLC/Nielsen Finance Co. | | | | | |
| | 220,000 | | | 4.50%, due 10/1/2020 | | | 220,412 | | |
| | 330,000 | | | 5.00%, due 4/15/2022 | | | 331,657 | (f) | |
| | 85,000 | | | Outfront Media Capital LLC/Outfront Media Capital Corp., 5.63%, due 2/15/2024 | | | 87,231 | | |
| | | | 822,675 | | |
Aerospace & Defense 0.9% | | | |
| | | | | TransDigm, Inc. | | | | | |
| | 60,000 | | | 6.00%, due 7/15/2022 | | | 61,020 | | |
| | 207,000 | | | 6.50%, due 7/15/2024 | | | 213,727 | | |
| | | | 274,747 | | |
Auto Parts & Equipment 0.5% | | | |
| | 140,000 | | | LKQ Corp., 4.75%, due 5/15/2023 | | | 142,755 | | |
Banking 1.0% | | | |
| | | | | Ally Financial, Inc. | | | | | |
| | 90,000 | | | 8.00%, due 3/15/2020 | | | 91,649 | | |
| | 85,000 | | | 7.50%, due 9/15/2020 | | | 88,613 | | |
| | 70,000 | | | 4.25%, due 4/15/2021 | | | 71,770 | | |
| | 55,000 | | | 4.13%, due 2/13/2022 | | | 56,856 | | |
| | | | 308,888 | | |
Brokerage 0.3% | | | |
| | 95,000 | | | LPL Holdings, Inc., 5.75%, due 9/15/2025 | | | 98,562 | (f) | |
Building & Construction 3.3% | | | |
| | | | | Lennar Corp. | | | | | |
| | 85,000 | | | 4.75%, due 4/1/2021 | | | 87,023 | | |
| | 30,000 | | | 4.13%, due 1/15/2022 | | | 30,825 | | |
| | 20,000 | | | 5.38%, due 10/1/2022 | | | 21,400 | | |
| | | | | Meritage Homes Corp. | | | | | |
| | 65,000 | | | 7.15%, due 4/15/2020 | | | 66,219 | | |
| | 160,000 | | | 7.00%, due 4/1/2022 | | | 174,800 | | |
| | 156,000 | | | Shea Homes L.P./Shea Homes Funding Corp., 5.88%, due 4/1/2023 | | | 159,510 | (f) | |
| | | | | Taylor Morrison Communities, Inc./Taylor Morrison Holdings II, Inc. | | | | | |
| | 45,000 | | | 5.88%, due 4/15/2023 | | | 48,600 | (f) | |
| | 95,000 | | | 5.63%, due 3/1/2024 | | | 102,481 | (f) | |
| | 120,000 | | | Toll Brothers Finance Corp., 5.88%, due 2/15/2022 | | | 127,650 | | |
| | 175,000 | | | TRI Pointe Group, Inc., 4.88%, due 7/1/2021 | | | 179,812 | | |
| | | | 998,320 | | |
See Notes to Financial Statements
148
Schedule of Investments Short Duration High Income Fund^ (cont'd)
PRINCIPAL AMOUNT | | | | VALUE | |
Building Materials 0.3% | | | |
$ | 75,000 | | | Masonite Int'l Corp., 5.75%, due 9/15/2026 | | $ | 79,594 | (f) | |
Cable & Satellite Television 5.4% | | | |
| | | | | CCO Holdings LLC/CCO Holdings Capital Corp. | | | | | |
| | 325,000 | | | 5.13%, due 2/15/2023 | | | 331,906 | | |
| | 165,000 | | | 4.00%, due 3/1/2023 | | | 167,887 | (f) | |
| | 13,000 | | | 5.75%, due 1/15/2024 | | | 13,321 | | |
| | 110,000 | | | 5.88%, due 4/1/2024 | | | 114,675 | (f) | |
| | | | | CSC Holdings LLC | | | | | |
| | 135,000 | | | 6.75%, due 11/15/2021 | | | 145,463 | | |
| | 200,000 | | | 5.38%, due 7/15/2023 | | | 204,996 | (f) | |
| | 70,000 | | | 5.25%, due 6/1/2024 | | | 75,425 | | |
| | | | | DISH DBS Corp. | | | | | |
| | 225,000 | | | 6.75%, due 6/1/2021 | | | 236,812 | | |
| | 215,000 | | | 5.88%, due 7/15/2022 | | | 224,849 | | |
| | 50,000 | | | 5.00%, due 3/15/2023 | | | 50,375 | | |
| | 87,000 | | | Radiate Holdco LLC/Radiate Finance, Inc., 6.88%, due 2/15/2023 | | | 88,958 | (f) | |
| | | | 1,654,667 | | |
Chemicals 3.2% | | | |
| | 40,000 | | | CF Industries, Inc., 3.45%, due 6/1/2023 | | | 40,600 | | |
| | 293,000 | | | INEOS Group Holdings SA, 5.63%, due 8/1/2024 | | | 299,592 | (f) | |
| | 135,000 | | | NOVA Chemicals Corp., 5.25%, due 8/1/2023 | | | 136,266 | (f) | |
| | 200,000 | | | PQ Corp., 6.75%, due 11/15/2022 | | | 206,500 | (f) | |
| | 50,000 | | | Tronox Finance PLC, 5.75%, due 10/1/2025 | | | 47,125 | (f) | |
| | 235,000 | | | WR Grace & Co-Conn, 5.13%, due 10/1/2021 | | | 243,813 | (f) | |
| | | | 973,896 | | |
Consumer - Commercial Lease Financing 2.9% | | | |
| | 50,000 | | | Avolon Holdings Funding Ltd., 5.13%, due 10/1/2023 | | | 53,950 | (f) | |
| | 95,000 | | | Global Aircraft Leasing Co. Ltd., 6.50% Cash/7.25% PIK, due 9/15/2024 | | | 97,228 | (f)(g) | |
| | 125,000 | | | Navient Corp., 6.50%, due 6/15/2022 | | | 133,750 | | |
| | | | | Park Aerospace Holdings Ltd. | | | | | |
| | 65,000 | | | 4.50%, due 3/15/2023 | | | 68,283 | (f) | |
| | 140,000 | | | 5.50%, due 2/15/2024 | | | 153,916 | (f) | |
| | 95,000 | | | SLM Corp., 7.25%, due 1/25/2022 | | | 103,046 | | |
| | 270,000 | | | Springleaf Finance Corp., 7.75%, due 10/1/2021 | | | 294,305 | | |
| | | | 904,478 | | |
Diversified Capital Goods 0.6% | | | |
| | 90,000 | | | Anixter, Inc., 5.13%, due 10/1/2021 | | | 92,925 | | |
| | 75,000 | | | SPX FLOW, Inc., 5.63%, due 8/15/2024 | | | 78,094 | (f) | |
| | | | 171,019 | | |
Electric - Generation 2.5% | | | |
| | | | | Calpine Corp. | | | | | |
| | 265,000 | | | 6.00%, due 1/15/2022 | | | 265,371 | (f) | |
| | 125,000 | | | 5.38%, due 1/15/2023 | | | 127,025 | | |
| | 140,000 | | | 5.88%, due 1/15/2024 | | | 143,080 | (f) | |
See Notes to Financial Statements
149
Schedule of Investments Short Duration High Income Fund^ (cont'd)
PRINCIPAL AMOUNT | | | | VALUE | |
$ | 95,000 | | | Dynegy, Inc., 5.88%, due 6/1/2023 | | $ | 97,019 | | |
| | 125,000 | | | NextEra Energy Operating Partners L.P., 4.25%, due 7/15/2024 | | | 128,400 | (f) | |
| | | | 760,895 | | |
Electronics 0.2% | | | |
| | 70,000 | | | Sensata Technologies BV, 5.63%, due 11/1/2024 | | | 76,825 | (f) | |
Energy - Exploration & Production 2.0% | | | |
| | 162,000 | | | Ascent Resources Utica Holdings LLC/ARU Finance Corp., 10.00%, due 4/1/2022 | | | 153,300 | (f) | |
| | 20,000 | | | Bruin E&P Partners LLC, 8.88%, due 8/1/2023 | | | 13,200 | (f) | |
| | | | | Chesapeake Energy Corp. | | | | | |
| | 80,000 | | | 5.75%, due 3/15/2023 | | | 58,400 | | |
| | 50,000 | | | 7.00%, due 10/1/2024 | | | 33,625 | | |
| | 20,000 | | | Extraction Oil & Gas, Inc., 7.38%, due 5/15/2024 | | | 8,200 | (f) | |
| | 105,000 | | | Oasis Petroleum, Inc., 6.88%, due 1/15/2023 | | | 90,825 | | |
| | 64,000 | | | Parsley Energy LLC/Parsley Finance Corp., 6.25%, due 6/1/2024 | | | 66,640 | (f) | |
| | 75,000 | | | PDC Energy, Inc., 6.13%, due 9/15/2024 | | | 72,797 | | |
| | | | | Range Resources Corp. | | | | | |
| | 55,000 | | | 5.88%, due 7/1/2022 | | | 52,250 | | |
| | 45,000 | | | 5.00%, due 8/15/2022 | | | 42,525 | | |
| | 30,000 | | | WPX Energy, Inc., 8.25%, due 8/1/2023 | | | 33,450 | | |
| | | | 625,212 | | |
Food - Wholesale 0.1% | | | |
| | 35,000 | | | Post Holdings, Inc., 5.50%, due 3/1/2025 | | | 36,666 | (f) | |
Gaming 3.8% | | | |
| | 135,000 | | | Boyd Gaming Corp., 6.88%, due 5/15/2023 | | | 140,062 | | |
| | 45,000 | | | Eldorado Resorts, Inc., 6.00%, due 4/1/2025 | | | 47,306 | | |
| | 200,000 | | | Int'l Game Technology PLC, 6.25%, due 2/15/2022 | | | 210,500 | (f) | |
| | 52,000 | | | Jack Ohio Finance LLC/Jack Ohio Finance 1 Corp., 6.75%, due 11/15/2021 | | | 53,105 | (f) | |
| | | | | MGM Resorts Int'l | | | | | |
| | 205,000 | | | 6.63%, due 12/15/2021 | | | 222,169 | | |
| | 70,000 | | | 7.75%, due 3/15/2022 | | | 78,400 | | |
| | 80,000 | | | 6.00%, due 3/15/2023 | | | 88,226 | | |
| | 70,000 | | | VICI Properties 1 LLC/VICI FC, Inc., 8.00%, due 10/15/2023 | | | 76,213 | | |
| | | | | Wynn Las Vegas LLC/Wynn Las Vegas Capital Corp. | | | | | |
| | 210,000 | | | 4.25%, due 5/30/2023 | | | 217,371 | (f) | |
| | 30,000 | | | 5.50%, due 3/1/2025 | | | 31,875 | (f) | |
| | | | 1,165,227 | | |
Gas Distribution 5.8% | | | |
| | 60,000 | | | Antero Midstream Partners L.P./Antero Midstream Finance Corp., 5.38%, due 9/15/2024 | | | 48,600 | | |
| | 155,000 | | | Buckeye Partners L.P., 4.35%, due 10/15/2024 | | | 155,431 | | |
| | 125,000 | | | Crestwood Midstream Partners L.P./Crestwood Midstream Finance Corp., 6.25%, due 4/1/2023 | | | 127,150 | | |
| | | | | DCP Midstream LLC | | | | | |
| | 96,000 | | | 5.35%, due 3/15/2020 | | | 96,720 | (f) | |
| | 155,000 | | | 4.75%, due 9/30/2021 | | | 158,100 | (f) | |
| | 30,000 | | | DCP Midstream Operating L.P., 4.95%, due 4/1/2022 | | | 30,978 | | |
| | 150,000 | | | Genesis Energy L.P./Genesis Energy Finance Corp., 6.00%, due 5/15/2023 | | | 145,500 | | |
See Notes to Financial Statements
150
Schedule of Investments Short Duration High Income Fund^ (cont'd)
PRINCIPAL AMOUNT | | | | VALUE | |
$ | 60,000 | | | Global Partners L.P./GLP Finance Corp., 7.00%, due 6/15/2023 | | $ | 61,994 | | |
| | | | | NuStar Logistics L.P. | | | | | |
| | 180,000 | | | 6.75%, due 2/1/2021 | | | 186,512 | | |
| | 125,000 | | | 4.75%, due 2/1/2022 | | | 126,875 | | |
| | 160,000 | | | Summit Midstream Holdings LLC/Summit Midstream Finance Corp., 5.50%, due 8/15/2022 | | | 143,200 | | |
| | 185,000 | | | Tallgrass Energy Partners L.P./ Tallgrass Energy Finance Corp., 5.50%, due 9/15/2024 | | | 179,913 | (f) | |
| | | | | Targa Resources Partners L.P./Targa Resources Partners Finance Corp. | | | | | |
| | 220,000 | | | 5.25%, due 5/1/2023 | | | 220,825 | | |
| | 100,000 | | | 4.25%, due 11/15/2023 | | | 100,470 | | |
| | | | 1,782,268 | | |
Health Facilities 3.3% | | | |
| | | | | Acadia Healthcare Co., Inc. | | | | | |
| | 145,000 | | | 5.13%, due 7/1/2022 | | | 146,269 | | |
| | 50,000 | | | 5.63%, due 2/15/2023 | | | 50,750 | | |
| | 50,000 | | | 6.50%, due 3/1/2024 | | | 51,750 | | |
| | | | | HCA, Inc. | | | | | |
| | 90,000 | | | 7.50%, due 2/15/2022 | | | 99,855 | | |
| | 105,000 | | | 5.88%, due 5/1/2023 | | | 115,206 | | |
| | 150,000 | | | MEDNAX, Inc., 5.25%, due 12/1/2023 | | | 151,875 | (f) | |
| | | | | Tenet Healthcare Corp. | | | | | |
| | 270,000 | | | 8.13%, due 4/1/2022 | | | 292,275 | | |
| | 35,000 | | | 6.75%, due 6/15/2023 | | | 37,100 | | |
| | 75,000 | | | 5.13%, due 5/1/2025 | | | 76,781 | | |
| | | | 1,021,861 | | |
Health Services 0.5% | | | |
| | 45,000 | | | Eagle Holding Co. II LLC, 7.75% Cash/8.50% PIK, due 5/15/2022 | | | 45,675 | (f)(g) | |
| | 110,000 | | | Jaguar Holding Co. II/Pharmaceutical Product Development LLC, 6.38%, due 8/1/2023 | | | 113,850 | (f) | |
| | | | 159,525 | | |
Insurance Brokerage 0.5% | | | |
| | 75,000 | | | AssuredPartners, Inc., 7.00%, due 8/15/2025 | | | 74,719 | (f) | |
| | 75,000 | | | HUB Int'l Ltd., 7.00%, due 5/1/2026 | | | 77,250 | (f) | |
| | | | 151,969 | | |
Machinery 1.5% | | | |
| | 315,000 | | | CFX Escrow Corp., 6.00%, due 2/15/2024 | | | 334,687 | (f) | |
| | 120,000 | | | Terex Corp., 5.63%, due 2/1/2025 | | | 120,900 | (f) | |
| | | | 455,587 | | |
Managed Care 0.6% | | | |
| | 50,000 | | | Centene Corp., 4.75%, due 5/15/2022 | | | 51,062 | | |
| | 130,000 | | | MPH Acquisition Holdings LLC, 7.13%, due 6/1/2024 | | | 121,225 | (f) | |
| | | | 172,287 | | |
See Notes to Financial Statements
151
Schedule of Investments Short Duration High Income Fund^ (cont'd)
PRINCIPAL AMOUNT | | | | VALUE | |
Media Content 4.6% | | | |
$ | 35,000 | | | AMC Networks, Inc., 5.00%, due 4/1/2024 | | $ | 35,650 | | |
| | 40,000 | | | Cumulus Media New Holdings, Inc., 6.75%, due 7/1/2026 | | | 42,400 | (f) | |
| | 265,000 | | | Gray Television, Inc., 5.13%, due 10/15/2024 | | | 274,606 | (f) | |
| | 45,000 | | | Lions Gate Capital Holdings LLC, 5.88%, due 11/1/2024 | | | 42,412 | (f) | |
| | 140,000 | | | Netflix, Inc., 5.75%, due 3/1/2024 | | | 154,110 | | |
| | | | | Nexstar Broadcasting, Inc. | | | | | |
| | 40,000 | | | 6.13%, due 2/15/2022 | | | 40,550 | (f) | |
| | 35,000 | | | 5.88%, due 11/15/2022 | | | 35,525 | | |
| | 105,000 | | | Nexstar Escrow Corp., 5.63%, due 8/1/2024 | | | 109,555 | (f) | |
| | | | | Sirius XM Radio, Inc. | | | | | |
| | 195,000 | | | 3.88%, due 8/1/2022 | | | 199,144 | (f) | |
| | 85,000 | | | 4.63%, due 5/15/2023 | | | 86,326 | (f) | |
| | 130,000 | | | 4.63%, due 7/15/2024 | | | 135,850 | (f) | |
| | 75,000 | | | 5.38%, due 7/15/2026 | | | 79,125 | (f) | |
| | 170,000 | | | WMG Acquisition Corp., 5.00%, due 8/1/2023 | | | 174,250 | (f) | |
| | | | 1,409,503 | | |
Medical Products 1.3% | | | |
| | 240,000 | | | Avantor, Inc., 6.00%, due 10/1/2024 | | | 256,531 | (f) | |
| | 144,000 | | | Ortho-Clinical Diagnostics, Inc./Ortho-Clinical Diagnostics SA, 6.63%, due 5/15/2022 | | | 139,140 | (f) | |
| | | | 395,671 | | |
Metals - Mining Excluding Steel 4.7% | | | |
| | 70,000 | | | Arconic, Inc., 5.40%, due 4/15/2021 | | | 72,216 | | |
| | 125,000 | | | Cleveland-Cliffs, Inc., 4.88%, due 1/15/2024 | | | 128,438 | (f) | |
| | 250,000 | | | Constellium NV, 5.75%, due 5/15/2024 | | | 257,212 | (f) | |
| | 78,000 | | | First Quantum Minerals Ltd., 7.25%, due 4/1/2023 | | | 78,244 | (f) | |
| | 65,000 | | | FMG Resources (August 2006) Pty Ltd., 4.75%, due 5/15/2022 | | | 66,950 | (f) | |
| | | | | Freeport-McMoRan, Inc. | | | | | |
| | 420,000 | | | 3.55%, due 3/1/2022 | | | 424,725 | | |
| | 75,000 | | | 4.55%, due 11/14/2024 | | | 78,000 | | |
| | 178,000 | | | Hudbay Minerals, Inc., 7.25%, due 1/15/2023 | | | 183,990 | (f) | |
| | 130,000 | | | Novelis Corp., 6.25%, due 8/15/2024 | | | 136,175 | (f) | |
| | | | 1,425,950 | | |
Oil Field Equipment & Services 1.2% | | | |
| | 110,000 | | | Exterran Partners L.P., 6.00%, due 10/1/2022 | | | 110,825 | | |
| | 229,000 | | | Precision Drilling Corp., 7.75%, due 12/15/2023 | | | 216,405 | | |
| | 24,500 | | | Transocean Phoenix 2 Ltd., 7.75%, due 10/15/2024 | | | 25,419 | (f) | |
| | 26,250 | | | Transocean Proteus Ltd., 6.25%, due 12/1/2024 | | | 26,315 | (f) | |
| | | | 378,964 | | |
Packaging 4.1% | | | |
| | | | | Berry Plastics Corp. | | | | | |
| | 120,000 | | | 5.50%, due 5/15/2022 | | | 121,650 | | |
| | 60,000 | | | 6.00%, due 10/15/2022 | | | 61,050 | | |
| | 210,000 | | | 5.13%, due 7/15/2023 | | | 215,250 | | |
| | 150,000 | | | BWAY Holding Co., 5.50%, due 4/15/2024 | | | 154,312 | (f) | |
| | 25,000 | | | Crown Americas LLC/Crown Americas Capital Corp. IV, 4.50%, due 1/15/2023 | | | 26,125 | | |
See Notes to Financial Statements
152
Schedule of Investments Short Duration High Income Fund^ (cont'd)
PRINCIPAL AMOUNT | | | | VALUE | |
| | | | | Graphic Packaging Int'l LLC | | | | | |
$ | 90,000 | | | 4.75%, due 4/15/2021 | | $ | 92,616 | | |
| | 79,000 | | | 4.88%, due 11/15/2022 | | | 82,950 | | |
| | 65,000 | | | Owens-Brockway Glass Container, Inc., 5.00%, due 1/15/2022 | | | 67,113 | (f) | |
| | | | | Reynolds Group Issuer, Inc. | | | | | |
| | 35,000 | | | (3M USD LIBOR + 3.50%), 5.50%, due 7/15/2021 | | | 35,088 | (a)(f) | |
| | 250,000 | | | 5.13%, due 7/15/2023 | | | 256,487 | (f) | |
| | 80,000 | | | Sealed Air Corp., 5.25%, due 4/1/2023 | | | 85,400 | (f) | |
| | 75,000 | | | Trident TPI Holdings, Inc., 9.25%, due 8/1/2024 | | | 72,750 | (f) | |
| | | | 1,270,791 | | |
Personal & Household Products 2.3% | | | |
| | | | | Energizer Holdings, Inc. | | | | | |
| | 101,000 | | | 4.70%, due 5/19/2021 | | | 103,399 | | |
| | 140,000 | | | 4.70%, due 5/24/2022 | | | 144,550 | | |
| | 295,000 | | | Energizer SpinCo, Inc., 5.50%, due 6/15/2025 | | | 306,062 | (f) | |
| | 112,000 | | | Prestige Brands, Inc., 5.38%, due 12/15/2021 | | | 112,140 | (f) | |
| | 30,000 | | | Spectrum Brands, Inc., 6.13%, due 12/15/2024 | | | 31,013 | | |
| | | | 697,164 | | |
Pharmaceuticals 1.3% | | | |
| | | | | Valeant Pharmaceuticals Int'l, Inc. | | | | | |
| | 35,000 | | | 6.50%, due 3/15/2022 | | | 36,057 | (f) | |
| | 30,000 | | | 5.50%, due 3/1/2023 | | | 30,263 | (f) | |
| | 26,000 | | | 5.88%, due 5/15/2023 | | | 26,377 | (f) | |
| | 225,000 | | | 7.00%, due 3/15/2024 | | | 235,389 | (f) | |
| | 75,000 | | | 6.13%, due 4/15/2025 | | | 77,859 | (f) | |
| | | | 405,945 | | |
Real Estate Development & Management 0.8% | | | |
| | | | | Realogy Group LLC/Realogy Co-Issuer Corp. | | | | | |
| | 170,000 | | | 5.25%, due 12/1/2021 | | | 170,000 | (f) | |
| | 85,000 | | | 4.88%, due 6/1/2023 | | | 82,671 | (f) | |
| | | | 252,671 | | |
Real Estate Investment Trusts 1.9% | | | |
| | | | | MPT Operating Partnership L.P./MPT Finance Corp. | | | | | |
| | 110,000 | | | 6.38%, due 3/1/2024 | | | 114,812 | | |
| | 90,000 | | | 5.50%, due 5/1/2024 | | | 92,363 | | |
| | 70,000 | | | RHP Hotel Properties L.P./RHP Finance Corp., 5.00%, due 4/15/2023 | | | 71,400 | | |
| | | | | Starwood Property Trust, Inc. | | | | | |
| | 70,000 | | | 3.63%, due 2/1/2021 | | | 70,525 | | |
| | 240,000 | | | 5.00%, due 12/15/2021 | | | 248,400 | | |
| | | | 597,500 | | |
See Notes to Financial Statements
153
Schedule of Investments Short Duration High Income Fund^ (cont'd)
PRINCIPAL AMOUNT | | | | VALUE | |
Recreation & Travel 2.7% | | | |
$ | 170,000 | | | Cedar Fair L.P./Canada's Wonderland Co./Magnum Management Corp., 5.38%, due 6/1/2024 | | $ | 174,675 | | |
| | 403,000 | | | NCL Corp. Ltd., 4.75%, due 12/15/2021 | | | 408,541 | (f) | |
| | 225,000 | | | Six Flags Entertainment Corp., 4.88%, due 7/31/2024 | | | 232,313 | (f) | |
| | | | 815,529 | | |
Restaurants 0.7% | | | |
| | 85,000 | | | 1011778 BC ULC/New Red Finance, Inc., 4.25%, due 5/15/2024 | | | 87,231 | (f) | |
| | 45,000 | | | KFC Holding Co./Pizza Hut Holdings LLC/Taco Bell of America LLC, 5.00%, due 6/1/2024 | | | 46,688 | (f) | |
| | 70,000 | | | Yum! Brands, Inc., 3.88%, due 11/1/2020 | | | 70,700 | | |
| | | | 204,619 | | |
Software - Services 1.6% | | | |
| | 55,000 | | | CDK Global, Inc., 5.00%, due 10/15/2024 | | | 59,483 | | |
| | 215,000 | | | Open Text Corp., 5.63%, due 1/15/2023 | | | 219,031 | (f) | |
| | 110,000 | | | Rackspace Hosting, Inc., 8.63%, due 11/15/2024 | | | 100,650 | (f) | |
| | 103,000 | | | WEX, Inc., 4.75%, due 2/1/2023 | | | 104,031 | (f) | |
| | | | 483,195 | | |
Specialty Retail 1.5% | | | |
| | 175,000 | | | L Brands, Inc., 5.63%, due 10/15/2023 | | | 185,719 | | |
| | | | | Penske Automotive Group, Inc. | | | | | |
| | 125,000 | | | 3.75%, due 8/15/2020 | | | 125,625 | | |
| | 45,000 | | | 5.75%, due 10/1/2022 | | | 45,562 | | |
| | 40,000 | | | 5.38%, due 12/1/2024 | | | 41,100 | | |
| | 70,000 | | | QVC, Inc., 5.13%, due 7/2/2022 | | | 73,844 | | |
| | | | 471,850 | | |
Steel Producers/Products 0.8% | | | |
| | 240,000 | | | Big River Steel LLC/BRS Finance Corp., 7.25%, due 9/1/2025 | | | 246,600 | (f) | |
Support - Services 5.3% | | | |
| | 355,000 | | | ADT Corp., 4.13%, due 6/15/2023 | | | 360,325 | | |
| | 105,000 | | | Aramark Services, Inc., 5.00%, due 4/1/2025 | | | 109,331 | (f) | |
| | | | | Avis Budget Car Rental LLC/Avis Budget Finance, Inc. | | | | | |
| | 25,000 | | | 5.50%, due 4/1/2023 | | | 25,493 | | |
| | 75,000 | | | 5.25%, due 3/15/2025 | | | 76,500 | (f) | |
| | 75,000 | | | Garda World Security Corp., 8.75%, due 5/15/2025 | | | 75,000 | (f) | |
| | | | | Hertz Corp. | | | | | |
| | 115,000 | | | 7.63%, due 6/1/2022 | | | 119,456 | (f) | |
| | 230,000 | | | 5.50%, due 10/15/2024 | | | 228,183 | (f) | |
| | | | | Iron Mountain, Inc. | | | | | |
| | 170,000 | | | 4.38%, due 6/1/2021 | | | 171,913 | (f) | |
| | 85,000 | | | 6.00%, due 8/15/2023 | | | 86,806 | | |
| | 50,000 | | | 5.75%, due 8/15/2024 | | | 50,438 | | |
| | 87,000 | | | Prime Security Services Borrower LLC/Prime Finance, Inc., 9.25%, due 5/15/2023 | | | 91,524 | (f) | |
| | 165,000 | | | Staples, Inc., 7.50%, due 4/15/2026 | | | 172,012 | (f) | |
| | 60,000 | | | United Rentals N.A., Inc., 4.63%, due 10/15/2025 | | | 61,275 | | |
| | | | 1,628,256 | | |
See Notes to Financial Statements
154
Schedule of Investments Short Duration High Income Fund^ (cont'd)
PRINCIPAL AMOUNT | | | | VALUE | |
Technology Hardware & Equipment 2.0% | | | |
$ | 240,000 | | | CommScope Finance LLC, 5.50%, due 3/1/2024 | | $ | 243,240 | (f) | |
| | | | | CommScope, Inc. | | | | | |
| | 48,000 | | | 5.00%, due 6/15/2021 | | | 48,000 | (f) | |
| | 165,000 | | | 5.50%, due 6/15/2024 | | | 156,131 | (f) | |
| | | | | Diamond 1 Finance Corp./Diamond 2 Finance Corp. | | | | | |
| | 89,000 | | | 5.88%, due 6/15/2021 | | | 90,369 | (f) | |
| | 70,000 | | | 7.13%, due 6/15/2024 | | | 74,218 | (f) | |
| | | | 611,958 | | |
Telecom - Satellite 0.7% | | | |
| | 180,000 | | | Intelsat Jackson Holdings SA, 9.50%, due 9/30/2022 | | | 207,675 | (f) | |
Telecom - Wireless 2.7% | | | |
| | | | | Sprint Corp. | | | | | |
| | 440,000 | | | 7.25%, due 9/15/2021 | | | 469,506 | | |
| | 70,000 | | | 7.88%, due 9/15/2023 | | | 77,263 | | |
| | 85,000 | | | 7.13%, due 6/15/2024 | | | 92,225 | | |
| | 75,000 | | | Sprint Nextel Corp., 6.00%, due 11/15/2022 | | | 79,312 | | |
| | | | | T-Mobile USA, Inc. | | | | | |
| | 65,000 | | | 4.00%, due 4/15/2022 | | | 67,094 | | |
| | 35,000 | | | 6.00%, due 4/15/2024 | | | 36,313 | | |
| | | | 821,713 | | |
Telecom - Wireline Integrated & Services 3.8% | | | |
| | | | | CenturyLink, Inc. | | | | | |
| | 70,000 | | | Ser. V, 5.63%, due 4/1/2020 | | | 70,875 | | |
| | 130,000 | | | Ser. T, 5.80%, due 3/15/2022 | | | 137,475 | | |
| | 65,000 | | | Equinix, Inc., 5.38%, due 1/1/2022 | | | 66,281 | | |
| | | | | Level 3 Financing, Inc. | | | | | |
| | 85,000 | | | 5.63%, due 2/1/2023 | | | 85,850 | | |
| | 115,000 | | | 5.13%, due 5/1/2023 | | | 116,437 | | |
| | 45,000 | | | 5.38%, due 1/15/2024 | | | 45,844 | | |
| | 331,000 | | | Numericable-SFR SA, 7.38%, due 5/1/2026 | | | 354,450 | (f) | |
| | 25,000 | | | Qwest Corp., 6.75%, due 12/1/2021 | �� | | 26,982 | | |
| | 250,000 | | | Zayo Group LLC/Zayo Capital, Inc., 6.00%, due 4/1/2023 | | | 257,127 | | |
| | | | 1,161,321 | | |
Theaters & Entertainment 0.9% | | | |
| | 65,000 | | | AMC Entertainment Holdings, Inc., 5.75%, due 6/15/2025 | | | 61,757 | | |
| | | | | Live Nation Entertainment, Inc. | | | | | |
| | 110,000 | | | 5.38%, due 6/15/2022 | | | 111,477 | (f) | |
| | 85,000 | | | 4.88%, due 11/1/2024 | | | 87,975 | (f) | |
| | | | 261,209 | | |
| | | | | Total Corporate Bonds (Cost $26,292,581) | | | 26,586,007 | | |
See Notes to Financial Statements
155
Schedule of Investments Short Duration High Income Fund^ (cont'd)
NUMBER OF SHARES | | | | VALUE | |
Short-Term Investments 3.2% | | | |
Investment Companies 3.2% | | | |
| 981,626
| | | State Street Institutional U.S. Government Money Market Fund Premier Class, 1.75%(h)
(Cost $981,626) | | $ | 981,626
| (i) | |
| | | | | Total Investments 98.9% (Cost $30,055,355) | | | 30,286,235 | | |
| | | | | Other Assets Less Liabilities 1.1% | | | 350,190 | | |
| | | | | Net Assets 100.0% | | $ | 30,636,425 | | |
(a) Variable or floating rate security. The interest rate shown was the current rate as of October 31, 2019 and changes periodically.
(b) Value determined using significant unobservable inputs.
(c) All or a portion of this security was purchased on a delayed delivery basis.
(d) All or a portion of this security had not settled as of October 31, 2019 and thus may not have an interest rate in effect. Interest rates do not take effect until settlement.
(e) The stated interest rate represents the weighted average interest rate at October 31, 2019 of the underlying contracts within the Loan Assignment. Interest rates on the underlying contracts are primarily determined by reference to the indicated base lending rate and spread, which are indicated in the security description, and the reset period, which is generally weekly, monthly or quarterly.
(f) Securities were purchased under Rule 144A of the Securities Act of 1933, as amended, or are otherwise restricted and, unless registered under the Securities Act of 1933 or exempted from registration, may only be sold to qualified institutional investors or may have other restrictions on resale. At October 31, 2019, these securities amounted to $13,937,648, which represents 45.5% of net assets of the Fund. These securities have been deemed by the investment manager to be liquid.
(g) Payment-in-kind (PIK) security.
(h) Represents 7-day effective yield as of October 31, 2019.
(i) All or a portion of this security is segregated in connection with obligations for delayed delivery securities with a total value of $981,626.
See Notes to Financial Statements
156
Schedule of Investments Short Duration High Income Fund^ (cont'd)
The following is a summary, categorized by Level (see Note A of Notes to Financial Statements), of inputs used to value the Fund's investments as of October 31, 2019:
Asset Valuation Inputs
| | | Level 1 | | Level 2 | | Level 3(b) | | Total | |
Investments: | |
Loan Assignments | |
Aerospace & Defense | | $ | — | | | $ | — | | | $ | 54,450 | | | $ | 54,450 | | |
Utilities | | | — | | | | 29,757 | | | | 128,375 | | | | 158,132 | | |
| Other Loan Assignments(a) | | | — | | | | 2,506,020 | | | | — | | | | 2,506,020 | | |
Total Loan Assignments | | | — | | | | 2,535,777 | | | | 182,825 | | | | 2,718,602 | | |
| Corporate Bonds(a) | | | — | | | | 26,586,007 | | | | — | | | | 26,586,007 | | |
Short-Term Investments | | | — | | | | 981,626 | | | | — | | | | 981,626 | | |
Total Investments | | $ | — | | | $ | 30,103,410 | | | $ | 182,825 | | | $ | 30,286,235 | | |
(a) The Schedule of Investments provides information on the industry or sector categorization for the portfolio.
(b) The following is a reconciliation between the beginning and ending balances of investments in which unobservable inputs (Level 3) were used in determining value:
(000's omitted) | | Beginning
balance, as
of 11/1/2018 | | Accrued
discounts/
(premiums) | | Realized
gain/
(loss) | | Change in
unrealized
appreciation/
(depreciation) | | Purchases | | Sales | | Transfers
into
Level 3 | | Transfers
out of
Level 3 | | Balance,
as of
10/31/2019 | | Net change
in unrealized
appreciation/
(depreciation)
from
investments
still held as
of 10/31/2019 | |
Investments in
Securities: | |
| Loan Assignments(c) | |
Aerospace &
Defense | | $ | — | | | $ | — | | | $ | — | | | $ | — | | | $ | 54 | | | $ | — | | | $ | — | | | $ | — | | | $ | 54 | | | $ | — | | |
Food Service | | | 40 | | | | — | | | | — | | | | — | | | | — | | | | (40 | ) | | | — | | | | — | | | | — | | | | — | | |
Lodging &
Casinos | | | 205 | | | | — | | | | (12 | ) | | | 1 | | | | — | | | | (194 | ) | | | — | | | | — | | | | — | | | | — | | |
Utilities | | | — | | | | — | | | | — | | | | — | | | | 128 | | | | — | | | | — | | | | — | | | | 128 | | | | — | | |
Total | | $ | 245 | | | $ | — | | | $ | (12 | ) | | $ | 1 | | | $ | 182 | | | $ | (234 | ) | | $ | — | | | $ | — | | | $ | 182 | | | $ | — | | |
(c) Securities categorized as Level 3 are valued based on single quotation obtained from a dealer. The Fund does not have access to unobservable inputs and therefore cannot disclose such inputs used in formulating such quotation.
^ A balance indicated with a "—", reflects either a zero balance or an amount that rounds to less than 1.
See Notes to Financial Statements
157
Schedule of Investments Strategic Income Fund^ October 31, 2019
| PRINCIPAL AMOUNT(a) | | | | VALUE | |
| Loan Assignments (b) 6.9% | | | |
Aerospace & Defense 0.1% | | | |
$ | 930,000
| | | MHI Holdings, LLC, Term Loan B, (1M USD LIBOR + 5.00%),
6.79%, due 9/21/2026 | | $ | 920,700
| (c) | |
| | 1,328,258 | | | TransDigm, Inc., Term Loan F, (1M USD LIBOR + 2.50%), 4.29%, due 6/9/2023 | | | 1,321,444 | | |
| | | | 2,242,144 | | |
| Automotive 0.0%(d) | | | |
| 1,395,000 | | | Panther BF Aggregator 2 LP, Term Loan B, (1M USD LIBOR + 3.50%),
5.30%, due 4/30/2026 | | | 1,374,661 | | |
Building & Development 0.3% | | | |
| | | | | Capital Automotive L.P. | | | | | |
| | 1,391,062 | | | First Lien Term Loan, (1M USD LIBOR + 2.50%), 4.29%, due 3/24/2024 | | | 1,389,072 | | |
| | 229,875 | | | Second Lien Term Loan, (1M USD LIBOR + 6.00%), 7.79%, due 3/24/2025 | | | 229,875 | | |
| | 525,000 | | | CPG International Inc., Term Loan, (3M USD LIBOR + 3.75%), due 5/5/2024 | | | 516,469 | (e)(f) | |
| 1,313,367 | | | DTZ U.S. Borrower LLC, Term Loan B, (1M USD LIBOR + 3.25%), 5.04%,
due 8/21/2025 | | | 1,314,457 | | |
| | 1,651,351 | | | Forterra Finance, LLC, Term Loan B, (1M USD LIBOR + 3.00%), due 10/25/2023 | | | 1,555,375 | (e)(f) | |
| | 1,836,883 | | | Realogy Group LLC, Term Loan B, (1M USD LIBOR + 2.25%), 4.07%, due 2/8/2025 | | | 1,738,150 | | |
| | 1,071,260 | | | Wilsonart LLC, Term Loan B, (3M USD LIBOR + 3.25%), 5.36%, due 12/19/2023 | | | 1,047,157 | | |
| | | | 7,790,555 | | |
Business Equipment & Services 0.7% | | | |
| 198,090 | | | Advantage Sales & Marketing, Inc., First Lien Term Loan, (1M USD LIBOR + 3.25%),
5.04%, due 7/23/2021 | | | 184,372 | | |
| | 520,000 | | | AlixPartners, LLP, Term Loan B, (1M USD LIBOR + 2.75%), due 4/4/2024 | | | 519,132 | (e)(f) | |
| | 499,455 | | | Carbonite, Inc., Term Loan B, (3M USD LIBOR + 3.75%), due 3/26/2026 | | | 498,082 | (e)(f) | |
| 1,315,257 | | | Ceridian HCM Holding Inc., Term Loan B, (1M USD LIBOR + 3.00%),
4.80%, due 4/30/2025 | | | 1,316,901 | | |
| 1,525,662 | | | Change Healthcare Holdings LLC, Term Loan B, (1M USD LIBOR + 2.50%),
4.29%, due 3/1/2024 | | | 1,515,776 | | |
| 1,390,000 | | | Clear Channel Outdoor Holdings, Inc., Term Loan B, (1M USD LIBOR + 3.50%),
5.29%, due 8/21/2026 | | | 1,392,238 | | |
| 560,000 | | | Cortes NP Acquisition Corporation, Term Loan B, (3M USD LIBOR + 4.00%), 5.93%,
due 11/30/2023 | | | 526,260 | | |
| 1,335,969 | | | Deerfield Dakota Holding, LLC, Term Loan B, (1M USD LIBOR + 3.25%), 5.04%,
due 2/13/2025 | | | 1,286,591 | | |
| | 1,050,000 | | | DiscoverOrg, LLC, First Lien Term Loan, (1M USD LIBOR + 4.50%), due 2/2/2026 | | | 1,032,938 | (e)(f) | |
| 1,525,000 | | | Fleet U.S. Bidco Inc., Term Loan B, (3M USD LIBOR + 3.25%), 5.24%,
due 10/7/2026 | | | 1,525,000 | (c) | |
| 1,595,000 | | | Garda World Security Corporation, First Lien Term Loan B, (USD LIBOR + 4.75%),
due 10/17/2026 | | | 1,585,031 | (e)(f) | |
| 1,387,187 | | | Kronos Incorporated, Term Loan B, (3M USD LIBOR + 3.00%), 5.25%,
due 11/1/2023 | | | 1,383,594 | | |
| 525,000 | | | Learning Care Group, Inc., First Lien Term Loan, (3M USD LIBOR + 3.25%),
due 3/13/2025 | | | 515,975 | (e)(f) | |
| 821,693 | | | MX Holdings US, Inc., Term Loan B1C, (1M USD LIBOR + 3.00%), 4.80%,
due 7/31/2025 | | | 824,265 | | |
| 1,150,000 | | | Prime Security Services Borrower, LLC, Term Loan B1, (1M USD LIBOR + 3.25%),
5.25%, due 9/23/2026 | | | 1,109,336 | | |
| 1,076,195 | | | ServiceMaster Company, Term Loan B, (1M USD LIBOR + 2.50%), 4.29%,
due 11/8/2023 | | | 1,074,398 | | |
See Notes to Financial Statements
158
Schedule of Investments Strategic Income Fund^ (cont'd)
| PRINCIPAL AMOUNT(a) | | | | VALUE | |
$ | 1,321,007 | | | Solera, LLC, Term Loan B, (1M USD LIBOR + 2.75%), 4.54%, due 3/3/2023 | | $ | 1,308,034 | | |
| 1,320,260
| | | Tempo Acquisition LLC, Term Loan, (1M USD LIBOR + 3.00%), 4.79%,
due 5/1/2024 | | | 1,319,982
| | |
| | 864,846 | | | West Corporation, Term Loan, (USD LIBOR + 4.00%), 5.93%, due 10/10/2024 | | | 717,511 | (g) | |
| 885,326 | | | William Morris Endeavor Entertainment, LLC, First Lien Term Loan,
(USD LIBOR + 2.75%), 4.60%, due 5/18/2025 | | | 854,526 | (g) | |
| | | | 20,489,942 | | |
Cable & Satellite Television 0.5% | | | |
| | | | | Altice France S.A. | | | | | |
| | 478,779 | | | Term Loan B12, (1M USD LIBOR + 3.69%), 5.61%, due 1/31/2026 | | | 466,637 | | |
| | 1,857,112 | | | Term Loan B13, (1M USD LIBOR + 4.00%), 5.92%, due 8/14/2026 | | | 1,825,281 | | |
| 2,585,000 | | | Charter Communications Operating, LLC, Term Loan B2, (USD LIBOR + 1.75%),
due 2/1/2027 | | | 2,593,298 | (e)(f) | |
| | | | | CSC Holdings, LLC | | | | | |
| | 345,000 | | | Term Loan DD, (1M USD LIBOR + 2.50%), 4.33%, due 4/15/2027 | | | 344,138 | (c) | |
| | 2,769,513 | | | Term Loan B5, (3M USD LIBOR + 2.50%), 4.33%, due 4/15/2027 | | | 2,764,555 | | |
| 1,322,494 | | | Lions Gate Capital Holdings LLC, Term Loan B, (1M USD LIBOR + 2.25%), 4.04%,
due 3/24/2025 | | | 1,279,513 | | |
| | 525,000 | | | Radiate Holdco, LLC, First Lien Term Loan, (1M USD LIBOR + 3.00%), due 2/1/2024 | | | 519,241 | (e)(f) | |
| 1,395,000 | | | Telenet Financing USD LLC, Term Loan AN, (1M USD LIBOR + 2.25%), 4.17%,
due 8/15/2026 | | | 1,392,475 | | |
| 710,000 | | | Virgin Media Bristol LLC, Term Loan N, (3M USD LIBOR + 2.50%), 4.42%,
due 1/31/2028 | | | 706,748 | | |
| 890,457 | | | WideOpenWest Finance LLC, Term Loan B, (1M USD LIBOR + 3.25%), 5.05%,
due 8/18/2023 | | | 853,449 | | |
| 1,345,000 | | | Ziggo Secured Finance Partnership, Term Loan E, (1M USD LIBOR + 2.50%), 4.42%,
due 4/15/2025 | | | 1,327,690 | | |
| | | | 14,073,025 | | |
Chemicals & Plastics 0.2% | | | |
| 525,000 | | | Momentive Performance Materials Inc., Term Loan B, (1M USD LIBOR + 3.25%),
due 5/15/2024 | | | 514,831 | (e)(f) | |
| 1,028,251 | | | Platform Specialty Products Corporation, Term Loan, (1M USD LIBOR + 2.25%),
4.04%, due 1/30/2026 | | | 1,031,140 | | |
| | 1,210,529 | | | PQ Corporation, Term Loan B, (3M USD LIBOR + 2.50%), 4.43%, due 2/8/2025 | | | 1,208,677 | | |
| 1,318,325 | | | Solenis Holdings LLC, First Lien Term Loan, (3M USD LIBOR + 4.00%), 6.12%,
due 6/26/2025 | | | 1,251,090 | | |
| | 1,401,442 | | | Starfruit Finco B.V., Term Loan B, (1M USD LIBOR + 3.25%), 5.19%, due 10/1/2025 | | | 1,364,963 | | |
| | 1,320,000 | | | Univar Inc., Term Loan B, (1M USD LIBOR + 2.25%), 4.04%, due 7/1/2024 | | | 1,323,300 | | |
| | | | 6,694,001 | | |
| Conglomerates 0.0%(d) | | | |
| 1,194,531 | | | Penn Engineering & Manufacturing Corp., Term Loan B, (1M USD LIBOR + 2.75%),
4.54%, due 6/27/2024 | | | 1,175,120 | (c) | |
Containers & Glass Products 0.3% | | | |
| | 1,052,336 | | | Berlin Packaging LLC, First Lien Term Loan, (1M USD LIBOR + 3.00%), due 11/7/2025 | | | 1,020,766 | (e)(f) | |
| | | | | Berry Global, Inc. | | | | | |
| | 2,410,000 | | | Term Loan W, (USD LIBOR + 2.00%), due 10/1/2022 | | | 2,416,025 | (e)(f) | |
| | 685,000 | | | Term Loan X, (USD LIBOR + 2.00%), due 1/19/2024 | | | 686,315 | (e)(f) | |
See Notes to Financial Statements
159
Schedule of Investments Strategic Income Fund^ (cont'd)
| PRINCIPAL AMOUNT(a) | | | | VALUE | |
$ | 1,344,038 | | | BWAY Holding Company, Term Loan B, (3M USD LIBOR + 3.25%), 5.23%,
due 4/3/2024 | | $ | 1,306,620 | | |
| 2,068,248 | | | Reynolds Group Holdings Inc., Term Loan, (1M USD LIBOR + 2.75%), 4.54%,
due 2/5/2023 | | | 2,067,110 | (e)(f) | |
| | 1,436,048 | | | Trident TPI Holdings, Inc., Term Loan B1, (1M USD LIBOR + 3.25%), 5.04%,
due 10/17/2024 | | | 1,348,091
| | |
| | | | 8,844,927 | | |
Cosmetics - Toiletries 0.1% | | | |
| 930,000 | | | Edgewell Personal Care Company, Term Loan B, (USD LIBOR + 3.00%),
due 9/19/2026 | | | 929,424 | (e)(f) | |
| 920,000 | | | Sunshine Luxembourg VII SARL, First Lien Term Loan, (2M USD LIBOR + 4.25%),
6.35%, due 10/1/2026 | | | 920,386 | | |
| | | | 1,849,810 | | |
Diversified Insurance 0.2% | | | |
| | | | | Hub International Limited | | | |
| | 1,047,349 | | | Term Loan B, (3M USD LIBOR + 3.00%), due 4/25/2025 | | | 1,023,595 | (e)(f) | |
| | 1,575,000 | | | Term Loan B, (USD LIBOR + 4.00%), due 4/25/2025 | | | 1,571,850 | (e)(f) | |
| | | | | Sedgwick Claims Management Services, Inc. | | | |
| | 1,321,368 | | | Term Loan B, (1M USD LIBOR + 3.25%), 5.04%, due 12/31/2025 | | | 1,280,696 | | |
| | 548,625 | | | Term Loan B, (1M USD LIBOR + 4.00%), 5.79%, due 9/3/2026 | | | 543,940 | | |
| | | | 4,420,081 | | |
Drugs 0.3% | | | |
| 1,308,374 | | | Amneal Pharmaceuticals LLC, Term Loan B, (1M USD LIBOR + 3.50%), 5.31%,
due 5/4/2025 | | | 996,327 | | |
| | | | | Bausch Health Companies Inc. | | | |
| | 622,721 | | | Term Loan B, (1M USD LIBOR + 3.00%), 4.92%, due 6/2/2025 | | | 624,732 | | |
| | 2,030,921 | | | Term Loan B, (1M USD LIBOR + 2.75%), 4.67%, due 11/27/2025 | | | 2,032,607 | | |
| 1,240,475 | | | Endo Luxembourg Finance Company I S.a.r.l., Term Loan B,
(1M USD LIBOR + 4.25%), 6.06%, due 4/29/2024 | | | 1,138,756 | | |
| 2,315,506 | | | Jaguar Holding Company II, Term Loan, (1M USD LIBOR + 2.50%), 4.29%,
due 8/18/2022 | | | 2,309,717 | | |
| 1,105,000 | | | Parexel International Corporation, Term Loan B, (1M USD LIBOR + 2.75%),
due 9/27/2024 | | | 1,053,894 | (e)(f) | |
| | | | 8,156,033 | | |
Electronics - Electrical 0.8% | | | |
| | 1,555,000 | | | Applied Systems, Inc., First Lien Term Loan, (3M USD LIBOR + 3.00%), due 9/19/2024 | | | 1,544,721 | (e)(f) | |
| | 2,185,000 | | | CommScope, Inc., Term Loan B, (1M USD LIBOR + 3.25%), 5.04%, due 4/6/2026 | | | 2,140,623 | | |
| 2,785,000 | | | Dell International LLC, Term Loan B, (1M USD LIBOR + 2.00%), 3.79%,
due 9/19/2025 | | | 2,794,998 | | |
| 1,557,578 | | | Epicor Software Corporation, First Lien Term Loan, (1M USD LIBOR + 3.25%),
5.04%, due 6/1/2022 | | | 1,551,737 | | |
| 2,075,000 | | | Go Daddy Operating Company, LLC, Term Loan, (1M USD LIBOR + 1.75%), 3.54%,
due 2/15/2024 | | | 2,076,183 | | |
| | | | | Hyland Software, Inc. | | | |
| | 773,048 | | | First Lien Term Loan, (1M USD LIBOR + 3.25%), 5.04%, due 7/1/2024 | | | 767,250 | | |
| | 160,420 | | | Second Lien Term Loan, (1M USD LIBOR + 7.00%), 8.79%, due 7/7/2025 | | | 160,621 | | |
See Notes to Financial Statements
160
Schedule of Investments Strategic Income Fund^ (cont'd)
| PRINCIPAL AMOUNT(a) | | | | VALUE | |
$ | 200,000 | | | IGT Holding IV AB, Term Loan B2, (3M USD LIBOR + 3.75%), 5.60%,
due 7/31/2024 | | $ | 197,250 | | |
| | 774,198 | | | Infor (US), Inc., Term Loan B6, (3M USD LIBOR + 2.75%), 4.85%, due 2/1/2022 | | | 774,198 | | |
| | 922,646 | | | Informatica LLC, Term Loan, (1M USD LIBOR + 3.25%), 5.04%, due 8/5/2022 | | | 923,965 | | |
| | 1,550,000 | | | McAfee, LLC, Term Loan B, (1M USD LIBOR + 3.75%), 5.55%, due 9/30/2024 | | | 1,548,760 | | |
| 1,327,740
| | | MKS Instruments, Inc., Term Loan B6, (1M USD LIBOR + 1.75%), 3.54%,
due 2/2/2026 | | | 1,328,071
| | |
| 525,000 | | | Project Alpha Intermediate Holding, Inc., Term Loan B, (3M USD LIBOR + 3.50%),
5.49%, due 4/26/2024 | | | 512,531 | | |
| 1,382,628 | | | Rackspace Hosting, Inc., First Lien Term Loan, (3M USD LIBOR + 3.00%), 5.29%,
due 11/3/2023 | | | 1,227,511 | | |
| 629,173 | | | Riverbed Technology, Inc., Term Loan, (1M USD LIBOR + 3.25%), 5.04%,
due 4/24/2022 | | | 483,463 | | |
| | 2,305,807 | | | Sophia, L.P., Term Loan B, (3M USD LIBOR + 3.25%), 5.35%, due 9/30/2022 | | | 2,302,925 | | |
| 613,144 | | | SS&C Technologies Holdings Europe S.A.R.L., Term Loan B4,
(1M USD LIBOR + 2.25%), 4.04%, due 4/16/2025 | | | 614,168 | | |
| 1,073,882 | | | SS&C Technologies Inc., Term Loan B3, (1M USD LIBOR + 2.25%), 4.04%,
due 4/16/2025 | | | 1,075,675 | | |
| 587,219 | | | Vertafore, Inc., First Lien Term Loan, (1M USD LIBOR + 3.25%), 5.04%,
due 7/2/2025 | | | 567,718 | | |
| | | | 22,592,368 | | |
Financial Intermediaries 0.1% | | | |
| 1,035,000 | | | Edelman Financial Center, LLC, First Lien Term Loan, (1M USD LIBOR + 3.25%),
5.10%, due 7/21/2025 | | | 1,025,302 | | |
| 2,189,719 | | | LPL Holdings, Inc., First Lien Term Loan B, (1M USD LIBOR + 2.25%), 4.05%,
due 9/23/2024 | | | 2,188,362 | | |
| | 525,000 | | | PI US MergerCo, Inc., First Lien Term Loan, (1M USD LIBOR + 3.25%), due 1/3/2025 | | | 521,325 | (e)(f) | |
| | | | 3,734,989 | | |
| Food Products 0.0%(d) | | | |
| 1,301,074 | | | Nomad Foods Europe Midco Limited, Term Loan B4, (1M USD LIBOR + 2.25%),
4.16%, due 5/15/2024 | | | 1,295,388 | | |
Food Service 0.2% | | | |
| 2,544,727 | | | 1011778 B.C. Unlimited Liability Company, Term Loan B3, (1M USD LIBOR + 2.25%),
4.04%, due 2/16/2024 | | | 2,546,636 | | |
| | | | | US Foods, Inc. | | | |
| | 1,323,162 | | | Term Loan B, (1M USD LIBOR + 2.00%), 3.79%, due 6/27/2023 | | | 1,326,642 | | |
| | 60,000 | | | Term Loan B, (1M USD LIBOR + 2.00%), 3.79%, due 9/13/2026 | | | 60,158 | | |
| | 880,000 | | | Welbilt, Inc., Term Loan B, (1M USD LIBOR + 2.50%), 4.29%, due 10/23/2025 | | | 872,300 | | |
| | | | 4,805,736 | | |
| Food/Drug Retailers 0.0%(d) | | | |
| | 823,390 | | | Albertsons, LLC, Term Loan B8, (1M USD LIBOR + 2.75%), 4.54%, due 8/17/2026 | | | 827,351 | | |
Health Care 0.5% | | | |
| 922,632 | | | Acadia Healthcare Company, Inc., Term Loan B4, (1M USD LIBOR + 2.50%), 4.29%,
due 2/16/2023 | | | 923,352 | | |
| | 1,045,600 | | | Athenahealth, Inc., Term Loan B, (3M USD LIBOR + 4.50%), 6.68%, due 2/11/2026 | | | 1,036,127 | | |
See Notes to Financial Statements
161
Schedule of Investments Strategic Income Fund^ (cont'd)
| PRINCIPAL AMOUNT(a) | | | | VALUE | |
$ | 1,228,825 | | | Auris Luxembourg III S.a.r.l., Term Loan B2, (1M USD LIBOR + 3.75%), 5.54%,
due 2/27/2026 | | $ | 1,204,556 | | |
| 1,324,652 | | | Concentra Inc., First Lien Term Loan, (3M USD LIBOR + 2.50%), 4.54%,
due 6/1/2022 | | | 1,324,096 | | |
| | 1,045,000 | | | Emerald TopCo Inc., Term Loan, (1M USD LIBOR + 3.50%), due 7/24/2026 | | | 1,027,757 | (e)(f) | |
| 918,747 | | | Envision Healthcare Corporation, First Lien Term Loan, (1M USD LIBOR + 3.75%),
5.54%, due 10/10/2025 | | | 740,308 | | |
| 2,188,776
| | | Grifols Worldwide Operations USA, Inc., Term Loan, (1W USD LIBOR + 2.25%),
4.09%, due 1/31/2025 | | | 2,190,658
| | |
| | 875,000 | | | HCA Inc., Term Loan B12, (1M USD LIBOR + 1.75%), 3.54%, due 3/13/2025 | | | 878,553 | | |
| 1,443,915 | | | MPH Acquisition Holdings LLC, Term Loan B, (3M USD LIBOR + 2.75%), 4.85%,
due 6/7/2023 | | | 1,350,883 | | |
| | 930,000 | | | Navicure, Inc., Term Loan B, (USD LIBOR + 4.00%), due 10/22/2026 | | | 926,513 | (e)(f) | |
| 1,090,000 | | | Ortho-Clinical Diagnostics SA, Term Loan B, (3M USD LIBOR + 3.25%), 5.31%,
due 6/30/2025 | | | 1,040,045 | (e)(f) | |
| 1,320,000 | | | Select Medical Corporation, Term Loan B, (USD LIBOR + 2.50%), 4.58%,
due 3/6/2025 | | | 1,311,750 | (g) | |
| 143,845 | | | Sound Inpatient Physicians, First Lien Term Loan, (1M USD LIBOR + 2.75%), 4.54%,
due 6/27/2025 | | | 143,217 | | |
| 1,034,428 | | | Verscend Holding Corp., Term Loan B, (1M USD LIBOR + 4.50%), 6.29%,
due 8/27/2025 | | | 1,034,428 | | |
| | | | 15,132,243 | | |
Industrial Equipment 0.2% | | | |
| 765,422 | | | Brookfield WEC Holdings Inc., First Lien Term Loan, (1M USD LIBOR + 3.50%),
5.29%, due 8/1/2025 | | | 760,003 | | |
| 520,000 | | | Circor International, Inc., First Lien Term Loan, (1M USD LIBOR + 3.50%),
due 12/11/2024 | | | 514,930 | (e)(f) | |
| 932,663 | | | Crosby US Acquisition Corp., Term Loan B, (3M USD LIBOR + 4.75%), 6.60%,
due 6/26/2026 | | | 884,863 | | |
| 1,262,384 | | | Filtration Group Corporation, First Lien Term Loan, (1M USD LIBOR + 3.00%),
4.79%, due 3/29/2025 | | | 1,260,213 | | |
| | 1,391,450 | | | Gates Global LLC, Term Loan B, (1M USD LIBOR + 2.75%), 4.54%, due 4/1/2024 | | | 1,361,075 | | |
| | | | 4,781,084 | | |
Leisure Goods - Activities - Movies 0.4% | | | |
| 2,189,000 | | | AMC Entertainment Holdings, Inc., Term Loan B, (6M USD LIBOR + 3.00%), 5.23%,
due 4/22/2026 | | | 2,186,877 | | |
| 1,323,231 | | | CityCenter Holdings, LLC, Term Loan B, (1M USD LIBOR + 2.25%), 4.04%,
due 4/18/2024 | | | 1,322,821 | | |
| 1,617,216 | | | Crown Finance US, Inc., Term Loan, (1M USD LIBOR + 2.25%), 4.04%,
due 2/28/2025 | | | 1,594,251 | | |
| | 1,350,000 | | | Delta 2 (LUX) S.a.r.l., Term Loan, (1M USD LIBOR + 2.50%), 4.29%, due 2/1/2024 | | | 1,328,063 | | |
| 1,332,926 | | | Emerald Expositions Holding, Inc., Term Loan B, (1M USD LIBOR + 2.75%), 4.54%,
due 5/22/2024 | | | 1,259,615 | (c) | |
| 1,318,240 | | | SeaWorld Parks & Entertainment, Inc., Term Loan B5, (1M USD LIBOR + 3.00%),
4.79%, due 3/31/2024 | | | 1,312,360 | | |
| 1,395,000 | | | WMG Acquisition Corp., Term Loan F, (1M USD LIBOR + 2.13%), 3.91%,
due 11/1/2023 | | | 1,394,107 | | |
| | | | 10,398,094 | | |
See Notes to Financial Statements
162
Schedule of Investments Strategic Income Fund^ (cont'd)
| PRINCIPAL AMOUNT(a) | | | | VALUE | |
Lodging & Casinos 0.2% | | | |
$ | 1,292,418 | | | Caesars Resort Collection, LLC, First Lien Term Loan B, (1M USD LIBOR + 2.75%),
4.54%, due 12/23/2024 | | $ | 1,272,360 | | |
| 278,737 | | | Golden Entertainment, Inc., First Lien Term Loan, (1M USD LIBOR + 3.00%), 4.81%,
due 10/21/2024 | | | 278,912 | | |
| | | | | Mohegan Tribal Gaming Authority | | | |
| | 162,724 | | | Term Loan A, (1M USD LIBOR + 3.75%), 5.54%, due 10/13/2021 | | | 157,029 | | |
| | 1,173,791 | | | Term Loan B, (1M USD LIBOR + 4.00%), 5.79%, due 10/13/2023 | | | 1,083,926 | | |
| 1,323,283 | | | Scientific Games International, Inc., Term Loan B5, (1M USD LIBOR + 2.75%),
4.54%, due 8/14/2024 | | | 1,307,152 | | |
| 1,313,154
| | | Station Casinos LLC, Term Loan B, (1M USD LIBOR + 2.50%), 4.29%,
due 6/8/2023 | | | 1,313,705
| | |
| | | | 5,413,084 | | |
| Nonferrous Metals - Minerals 0.0%(d) | | | |
| 208,874 | | | Covia Holdings Corporation, Term Loan, (3M USD LIBOR + 4.00%), 6.04%,
due 6/1/2025 | | | 145,167 | | |
Oil & Gas 0.2% | | | |
| 1,394,254 | | | BCP Renaissance Parent LLC, Term Loan B, (2M USD LIBOR + 3.50%), 5.36%,
due 10/31/2024 | | | 1,257,449 | | |
| | 575,000 | | | Buckeye Partners, L.P., Term Loan B, (USD LIBOR + 2.75%), due 11/15/2026 | | | 577,519 | (e)(f) | |
| 465,000 | | | Gavilan Resources, LLC, Second Lien Term Loan, (1M USD LIBOR + 6.00%), 7.79%,
due 3/1/2024 | | | 195,686 | | |
| 1,339,700 | | | Lucid Energy Group II Borrower, LLC, First Lien Term Loan, (1M USD LIBOR + 3.00%),
4.79%, due 2/17/2025 | | | 1,172,237 | | |
| 1,320,623 | | | Medallion Midland Acquisition, LLC, First Lien Term Loan, (1M USD LIBOR + 3.25%),
5.04%, due 10/30/2024 | | | 1,238,084 | | |
| 933,459 | | | Prairie ECI Acquiror LP, Term Loan B, (3M USD LIBOR + 4.75%), 6.85%,
due 3/11/2026 | | | 908,564 | | |
| | | | 5,349,539 | | |
Property & Casualty Insurance 0.1% | | | |
| 1,390,975 | | | AssuredPartners, Inc., First Lien Term Loan, (1M USD LIBOR + 3.50%), 5.29%,
due 10/22/2024 | | | 1,365,187 | | |
| | 2,180,286 | | | Asurion LLC, Term Loan B7, (1M USD LIBOR + 3.00%), 4.79%, due 11/3/2024 | | | 2,181,659 | | |
| | | | 3,546,846 | | |
Publishing 0.1% | | | |
| 514,090 | | | Harland Clarke Holdings Corp., Term Loan B7, (3M USD LIBOR + 4.75%), 6.85%,
due 11/3/2023 | | | 399,062 | | |
| 2,208,673 | | | Nielsen Finance LLC, Term Loan B4, (1M USD LIBOR + 2.00%), 3.94%,
due 10/4/2023 | | | 2,200,391 | | |
| | | | 2,599,453 | | |
Radio & Television 0.2% | | | |
| 1,555,000 | | | Cumulus Media New Holdings Inc., Term Loan B, (1M USD LIBOR + 3.75%), 5.54%,
due 3/31/2026 | | | 1,561,158 | | |
| 1,036,810 | | | iHeartCommunications, Inc., Term Loan, (1M USD LIBOR + 4.00%), 6.03%,
due 5/1/2026 | | | 1,039,723 | | |
See Notes to Financial Statements
163
Schedule of Investments Strategic Income Fund^ (cont'd)
| PRINCIPAL AMOUNT(a) | | | | VALUE | |
$ | 1,898,027 | | | Univision Communications Inc., Term Loan C5, (1M USD LIBOR + 2.75%), 4.54%,
due 3/15/2024 | | $ | 1,828,503 | (c) | |
| | | | 4,429,384 | | |
Retailers (except food & drug) 0.3% | | | |
| 1,819,027 | | | Bass Pro Group, LLC, Term Loan B, (1M USD LIBOR + 5.00%), 6.79%,
due 9/25/2024 | | | 1,752,433 | | |
| 1,309,619 | | | BJ's Wholesale Club, Inc., First Lien Term Loan, (1M USD LIBOR + 2.75%), 4.67%,
due 2/3/2024 | | | 1,309,396 | | |
| | 1,380,000 | | | CDW LLC, Term Loan B, (1M USD LIBOR + 1.75%), 3.54%, due 10/13/2026 | | | 1,384,195 | | |
| | | | | EG America LLC | | | |
| | 824,412 | | | Term Loan, (3M USD LIBOR + 4.00%), 6.10%, due 2/7/2025 | | | 794,115 | | |
| | 61,593 | | | Second Lien Term Loan, (3M USD LIBOR + 8.00%), 10.10%, due 4/20/2026 | | | 57,974 | | |
| | 1,899,743 | | | Staples, Inc., Term Loan, (3M USD LIBOR + 5.00%), 7.12%, due 4/16/2026 | | | 1,870,696 | | |
| | | | 7,168,809 | | |
Steel 0.1% | | | |
| | 1,040,000 | | | Big River Steel LLC, Term Loan B, (3M USD LIBOR + 5.00%), due 8/23/2023 | | | 1,030,255 | (e)(f) | |
| 1,301,859 | | | MRC Global (US) Inc., First Lien Term Loan B, (1M USD LIBOR + 3.00%), 4.79%,
due 9/20/2024 | | | 1,282,331 | (c) | |
| 1,374,708 | | | TMS International Corp., Term Loan B2, (USD LIBOR + 2.75%), 4.62%,
due 8/14/2024 | | | 1,302,536 | (c)(g) | |
| | | | 3,615,122 | | |
| Surface Transport 0.0%(d) | | | |
| 1,321,057 | | | Hertz Corporation, (The), Term Loan B, (1M USD LIBOR + 2.75%), 4.54%,
due 6/30/2023 | | | 1,320,648 | | |
Telecommunications 0.5% | | | |
| | 1,787,692 | | | CenturyLink, Inc., Term Loan B, (1M USD LIBOR+ 2.75%), 4.54%, due 1/31/2025 | | | 1,768,259 | | |
| | 1,365,000 | | | Connect Finco Sarl, Term Loan B, (USD LIBOR + 4.50%), due 9/23/2026 | | | 1,343,242 | (e)(f) | |
| 1,339,738 | | | Frontier Communications Corp., Term Loan B1, (1M USD LIBOR + 3.75%), 5.54%,
due 6/15/2024 | | | 1,333,374 | | |
| 1,365,819 | | | GTT Communications, Inc., Term Loan B, (1M USD LIBOR + 2.75%), 4.54%,
due 5/31/2025 | | | 1,009,859 | | |
| | | | | Intelsat Jackson Holdings S.A. | | | |
| | 2,707,500 | | | Term Loan B3, (6M USD LIBOR + 3.75%), 5.68%, due 11/27/2023 | | | 2,702,437 | | |
| | 62,500 | | | Term Loan B4, (6M USD LIBOR + 4.50%), 6.43%, due 1/2/2024 | | | 63,125 | | |
| 2,645,000 | | | Level 3 Financing Inc., Term Loan B, (1M USD LIBOR + 2.25%), 4.04%,
due 2/22/2024 | | | 2,646,984 | | |
| 658,329 | | | MTN Infrastructure TopCo Inc., First Lien Term Loan B, (1M USD LIBOR + 3.00%),
4.79%, due 11/15/2024 | | | 649,824 | | |
| 2,775,414 | | | Sprint Communications, Inc., Term Loan B, (1M USD LIBOR + 3.00%), 4.81%,
due 2/2/2024 | | | 2,756,903 | | |
| 120,000 | | | Syniverse Holdings, Inc., Second Lien Term Loan, (1M USD LIBOR + 9.00%),
10.92%, due 3/11/2024 | | | 90,720 | | |
| | 1,323,283 | | | Telesat Canada, Term Loan B4, (3M USD LIBOR + 2.50%), 4.61%, due 11/17/2023 | | | 1,322,290 | | |
| | | | 15,687,017 | | |
See Notes to Financial Statements
164
Schedule of Investments Strategic Income Fund^ (cont'd)
| PRINCIPAL AMOUNT(a) | | | | VALUE | |
Utilities 0.3% | | | |
$ | 1,097,250 | | | Blackstone CQP Holdco LP, Term Loan B, (3M USD LIBOR + 3.50%), 5.66%,
due 9/30/2024 | | $ | 1,091,083 | | |
| | | | | Calpine Corporation | | | |
| | 1,321,687 | | | Term Loan B9, (3M USD LIBOR + 2.75%), 4.86%, due 4/5/2026 | | | 1,322,190 | | |
| | 990,000 | | | Term Loan B10, (1M USD LIBOR + 2.50%), 4.29%, due 8/12/2026 | | | 987,832 | | |
| | 1,252,754 | | | Eastern Power, LLC, Term Loan B, (1M USD LIBOR + 3.75%), 5.54%, due 10/2/2023 | | | 1,248,845 | | |
| 1,311,696 | | | Edgewater Generation, L.L.C., Term Loan, (1M USD LIBOR + 3.75%), 5.54%,
due 12/13/2025 | | | 1,254,637 | | |
| | 559,222 | | | Kestrel Acquisition, LLC, Term Loan B, (1M USD LIBOR + 4.25%), due 6/2/2025 | | | 514,484 | (e)(f) | |
| | 1,029,331 | | | Nautilus Power, LLC, Term Loan B, (1M USD LIBOR + 4.25%), 6.04%, due 5/16/2024 | | | 1,011,318 | (c) | |
| | 730,000 | | | Talen Energy Supply, LLC, Term Loan B, (1M USD LIBOR + 3.75%), due 7/8/2026 | | | 720,875 | (c)(e)(f) | |
| | | | 8,151,264 | | |
| | | | | Total Loan Assignments (Cost $201,570,670) | | | 198,103,885 | | |
U.S. Treasury Obligations 27.8% | | | |
| | | | | U.S. Treasury Bill | | | |
| | 348,200 | | | 1.86%, due 12/12/2019 | | | 347,607 | (h)(i) | |
| | 15,100,000 | | | 2.34%, due 1/2/2020 | | | 15,059,687 | (h)(j) | |
| | | | | U.S. Treasury Bonds | | | |
| | 5,000 | | | 4.50%, due 2/15/2036 | | | 6,846 | | |
| | 125,000 | | | 3.88%, due 8/15/2040 | | | 163,247 | | |
| | 75,940,000 | | | 2.75%, due 8/15/2042 | | | 84,171,777 | | |
| | | | | U.S. Treasury Inflation-Indexed Bonds(k) | | | |
| | 137,920,051 | | | 0.13%, due 4/15/2021 | | | 136,836,177 | | |
| | 523,459 | | | 3.63%, due 4/15/2028 | | | 671,169 | | |
| | 29,341,620 | | | 3.38%, due 4/15/2032 | | | 40,439,160 | | |
| | 58,411,037 | | | 1.00%, due 2/15/2046 – 2/15/2048 | | | 64,740,034 | | |
| | | | | U.S. Treasury Notes | | | |
| | 16,355,000 | | | 1.38%, due 1/15/2020 | | | 16,347,972 | | |
| | 304,170,000 | | | 2.00%, due 1/31/2020 – 1/15/2021 | | | 304,523,946 | | |
| | 39,030,000 | | | 2.88%, due 5/31/2025 | | | 41,743,805 | | |
| | 67,975,000 | | | 2.25%, due 11/15/2027 | | | 71,129,465 | | |
| | 21,770,000 | | | 2.75%, due 2/15/2028 | | | 23,630,655 | | |
| | | | | Total U.S. Treasury Obligations (Cost $782,680,378) | | | 799,811,547 | | |
U.S. Government Agency Securities 0.1% | | | |
| | 2,030,000 | | | Federal National Mortgage Association, 5.63%, due 7/15/2037 (Cost $2,835,428) | | | 3,017,368 | | |
Mortgage-Backed Securities 25.7% | | | |
Collateralized Mortgage Obligations 7.4% | | | |
| | 308,273 | | | Angel Oak Mortgage Trust LLC, Ser. 2017-3, Class A1, 2.71%, due 11/25/2047 | | | 307,658 | (l)(m) | |
| | | | | Fannie Mae Connecticut Avenue Securities | | | |
| | 19,918,000 | | | Ser. 2017-C02, Class 2M2, (1M USD LIBOR + 3.65%), 5.47%, due 9/25/2029 | | | 20,881,862 | (b)(i) | |
| | 16,585,000 | | | Ser. 2017-C03, Class 1M2, (1M USD LIBOR + 3.00%), 4.82%, due 10/25/2029 | | | 17,259,434 | (b) | |
| | 6,598,000 | | | Ser. 2017-C04, Class 2M2, (1M USD LIBOR + 2.85%), 4.67%, due 11/25/2029 | | | 6,785,563 | (b) | |
| | 8,950,000 | | | Ser. 2017-C06, Class 1M2, (1M USD LIBOR + 2.65%), 4.47%, due 2/25/2030 | | | 9,139,340 | (b) | |
| | 10,770,000 | | | Ser. 2017-C06, Class 2M2, (1M USD LIBOR + 2.80%), 4.62%, due 2/25/2030 | | | 10,984,969 | (b) | |
| | 2,670,000 | | | Ser. 2017-C07, Class 1M2, (1M USD LIBOR + 2.40%), 4.22%, due 5/25/2030 | | | 2,709,938 | (b) | |
| | 16,691,000 | | | Ser. 2017-C07, Class 2M2, (1M USD LIBOR + 2.50%), 4.32%, due 5/25/2030 | | | 16,895,037 | (b)(i) | |
| | 12,430,000 | | | Ser. 2018-C01, Class 1M2, (1M USD LIBOR + 2.25%), 4.07%, due 7/25/2030 | | | 12,550,665 | (b) | |
| | 10,400,000 | | | Ser. 2018-C02, Class 2M2, (1M USD LIBOR + 2.20%), 4.02%, due 8/25/2030 | | | 10,480,277 | (b) | |
See Notes to Financial Statements
165
Schedule of Investments Strategic Income Fund^ (cont'd)
| PRINCIPAL AMOUNT(a) | | | | VALUE | |
$ | 21,268,168 | | | Fannie Mae REMICS, Ser. 2018-18, Class ST, (6.10% - 1M USD LIBOR), 4.28%,
due 12/25/2044 | | $ | 3,908,753
| (b)(n) | |
| | | | | Freddie Mac Multifamily Structured Pass Through Certificates | | | |
| | 70,984,000 | | | Ser. K083, Class XAM, 0.05%, due 10/25/2028 | | | 567,277 | (m)(n) | |
| | 77,922,000 | | | Ser. K085, Class XAM, 0.06%, due 10/25/2028 | | | 691,114 | (m)(n) | |
| 14,105,387 | | | Freddie Mac REMICS, Ser. 4150, Class SP, (6.15% - 1M USD LIBOR), 4.23%,
due 1/15/2043 | | | 2,491,016 | (b)(n) | |
| | | | | Freddie Mac Structured Agency Credit Risk Debt Notes | | | |
| | 9,610,000 | | | Ser. 2017-DNA1, Class M2, (1M USD LIBOR + 3.25%), 5.07%, due 7/25/2029 | | | 10,073,760 | (b) | |
| | 19,826,000 | | | Ser. 2017-DNA2, Class M2, (1M USD LIBOR + 3.45%), 5.27%, due 10/25/2029 | | | 21,051,227 | (b) | |
| | 9,935,000 | | | Ser. 2017-HQA2, Class M2, (1M USD LIBOR + 2.65%), 4.47%, due 12/25/2029 | | | 10,197,611 | (b)(i) | |
| | 16,454,000 | | | Ser. 2017-DNA3, Class M2, (1M USD LIBOR + 2.50%), 4.32%, due 3/25/2030 | | | 16,783,393 | (b) | |
| | 3,250,000 | | | Ser. 2017-HQA3, Class M2, (1M USD LIBOR + 2.35%), 4.17%, due 4/25/2030 | | | 3,293,054 | (b) | |
| | 5,680,000 | | | Ser. 2018-DNA1, Class M2, (1M USD LIBOR + 1.80%), 3.62%, due 7/25/2030 | | | 5,677,564 | (b)(i) | |
| | 15,275,000 | | | Ser. 2018-HQA1, Class M2, (1M USD LIBOR + 2.30%), 4.12%, due 9/25/2030 | | | 15,386,908 | (b) | |
| 410,590 | | | JP Morgan Alternative Loan Trust, Ser. 2006-A5, Class 1A1, (1M USD LIBOR + 0.16%),
1.98%, due 10/25/2036 | | | 409,439 | (b) | |
| | | | | OBX Trust | | | |
| | 8,365,298 | | | Ser. 2019-EXP2, Class 2A1A, (1M USD LIBOR + 0.90%), 2.72%, due 6/25/2059 | | | 8,365,511 | (b)(l) | |
| | 6,575,000 | | | Ser. 2019-EXP3, Class 2A1A, (1M USD LIBOR + 0.90%), 2.78%, due 10/25/2059 | | | 6,574,029 | (b)(l) | |
| 1,000,000 | | | Permanent Master Issuer PLC, Ser. 2018-1A, Class 1A1, (3M USD LIBOR + 0.38%),
2.37%, due 7/15/2058 | | | 999,786 | (b)(l) | |
| | | | 214,465,185 | | |
Commercial Mortgage-Backed 1.7% | | | |
| | | | | BX Commercial Mortgage Trust | | | |
| | 7,449,939 | | | Ser. 2018-IND, Class A, (1M USD LIBOR + 0.75%), 2.66%, due 11/15/2035 | | | 7,442,954 | (b)(l) | |
| | 1,751,171 | | | Ser. 2018-IND, Class B, (1M USD LIBOR + 0.90%), 2.81%, due 11/15/2035 | | | 1,748,981 | (b)(l) | |
| | | | | Citigroup Commercial Mortgage Trust | | | |
| | 5,256,703 | | | Ser. 2012-GC8, Class XA, 1.77%, due 9/10/2045 | | | 215,799 | (l)(m)(n) | |
| | 1,720,944 | | | Ser. 2012-GC8, Class AAB, 2.61%, due 9/10/2045 | | | 1,733,793 | | |
| | 1,000,000 | | | Ser. 2012-GC8, Class B, 4.29%, due 9/10/2045 | | | 1,041,864 | (l) | |
| | 53,388,611 | | | Ser. 2014-GC25, Class XA, 1.00%, due 10/10/2047 | | | 2,244,366 | (m)(n) | |
| | 30,971,623 | | | Ser. 2015-GC27, Class XA, 1.36%, due 2/10/2048 | | | 1,721,071 | (m)(n) | |
| | | | | Commercial Mortgage Trust | | | |
| | 35,068,491 | | | Ser. 2012-CR2, Class XA, 1.64%, due 8/15/2045 | | | 1,268,476 | (m)(n) | |
| | 164,498 | | | Ser. 2012-CR3, Class XA, 1.86%, due 10/15/2045 | | | 7,323 | (m)(n) | |
| | 32,175,960 | | | Ser. 2014-CR16, Class XA, 0.98%, due 4/10/2047 | | | 1,194,439 | (m)(n) | |
| | 29,524,235 | | | Ser. 2014-CR17, Class XA, 0.98%, due 5/10/2047 | | | 1,109,902 | (m)(n) | |
| | 40,982,566 | | | Ser. 2014-UBS3, Class XA, 1.09%, due 6/10/2047 | | | 1,732,181 | (m)(n) | |
| | 48,656,430 | | | Ser. 2014-UBS6, Class XA, 0.92%, due 12/10/2047 | | | 1,766,068 | (m)(n) | |
| | | | | CSAIL Commercial Mortgage Trust | | | |
| | 7,735,583 | | | Ser. 2018-CX11, Class A1, 2.89%, due 4/15/2051 | | | 7,821,684 | | |
| | 34,965,857 | | | Ser. 2015-C2, Class XA, 0.77%, due 6/15/2057 | | | 1,202,049 | (m)(n) | |
| | | | | FRESB Mortgage Trust | | | |
| | 2,515,072 | | | Ser. 2017-SB29, Class B, 3.42%, due 3/25/2037 | | | 2,065,209 | (m) | |
| | 7,011,114 | | | Ser. 2017-SB38, Class B, 3.80%, due 8/25/2037 | | | 5,764,180 | (l)(m) | |
| | | | | GS Mortgage Securities Trust | | | |
| | 262,561 | | | Ser. 2011-GC5, Class XA, 1.33%, due 8/10/2044 | | | 4,604 | (l)(m)(n) | |
| | 60,705,220 | | | Ser. 2014-GC18, Class XA, 1.02%, due 1/10/2047 | | | 2,183,652 | (m)(n) | |
| | 53,069,234 | | | Ser. 2015-GC30, Class XA, 0.82%, due 5/10/2050 | | | 1,645,024 | (m)(n) | |
| | 495,101 | | | Morgan Stanley Capital I Trust, Ser. 2011-C3, Class XA, 0.63%, due 7/15/2049 | | | 3,791 | (l)(m)(n) | |
| | | | | WF-RBS Commercial Mortgage Trust | | | |
| | 8,535,131 | | | Ser. 2011-C2, Class XA, 0.78%, due 2/15/2044 | | | 62,347 | (l)(m)(n) | |
| | 218,157 | | | Ser. 2012-C6, Class XA, 2.07%, due 4/15/2045 | | | 7,442 | (l)(m)(n) | |
See Notes to Financial Statements
166
Schedule of Investments Strategic Income Fund^ (cont'd)
| PRINCIPAL AMOUNT(a) | | | | VALUE | |
$ | 102,868,000 | | | Ser. 2013-C14, Class XB, 0.14%, due 6/15/2046 | | $ | 735,722 | (m)(n) | |
| | 34,758,025 | | | Ser. 2014-C21, Class XA, 1.04%, due 8/15/2047 | | | 1,393,759 | (m)(n) | |
| | 58,602,141 | | | Ser. 2014-C25, Class XA, 0.83%, due 11/15/2047 | | | 1,965,967 | (m)(n) | |
| | 16,976,206 | | | Ser. 2014-C22, Class XA, 0.81%, due 9/15/2057 | | | 540,197 | (m)(n) | |
| | | | 48,622,844 | | |
Fannie Mae 0.1% | | | |
| | | | | Pass-Through Certificates | | | |
| | 9,713,769 | | | 3.98%, due 6/25/2046 | | | 1,709,409 | | |
| | 5,820 | | | 5.00%, due 6/1/2040 – 7/1/2040 | | | 6,410 | | |
| | 75,911 | | | 6.00%, due 9/1/2033 – 9/1/2040 | | | 85,423 | | |
| | 445 | | | 6.50%, due 9/1/2032 | | | 495 | | |
| | 388 | | | 7.50%, due 12/1/2032 | | | 441 | | |
| | | | 1,802,178 | | |
| Freddie Mac 0.0%(d) | | | |
| | 5,656 | | | Pass-Through Certificates, 5.00%, due 12/1/2028 | | | 6,050 | | |
Ginnie Mae 5.8% | | | |
| | | | | Pass-Through Certificates | | | |
| | 404 | | | 6.50%, due 7/15/2032 | | | 455 | | |
| | 707 | | | 7.00%, due 8/15/2032 | | | 839 | | |
| | 18,905,000 | | | 3.00%, TBA, 30 Year Maturity | | | 19,456,347 | (o) | |
| | 50,070,000 | | | 3.50%, TBA, 30 Year Maturity | | | 51,955,449 | (o) | |
| | 91,960,000 | | | 4.00%, TBA, 30 Year Maturity | | | 95,596,461 | (o) | |
| | | | 167,009,551 | | |
Uniform Mortgage-Backed Securities 10.7% | | | |
| | | | | Pass-Through Certificates | | | |
| | 13,610,000 | | | 2.50%, TBA, 15 Year Maturity | | | 13,756,733 | (o) | |
| | 104,790,000 | | | 3.00%, TBA, 30 Year Maturity | | | 106,484,651 | (o) | |
| | 107,530,000 | | | 3.50%, TBA, 30 Year Maturity | | | 110,411,468 | (o) | |
| | 74,470,000 | | | 4.00%, TBA, 30 Year Maturity | | | 77,269,388 | (o) | |
| | | | 307,922,240 | | |
| | | | | Total Mortgage-Backed Securities (Cost $756,518,901) | | | 739,828,048 | | |
Corporate Bonds 45.7% | | | |
Advertising 0.6% | | | |
| | | | | Clear Channel Worldwide Holdings, Inc. | | | |
| | 1,311,000 | | | 9.25%, due 2/15/2024 | | | 1,442,100 | (l) | |
| | 2,129,000 | | | 5.13%, due 8/15/2027 | | | 2,216,140 | (l) | |
| | | | | Lamar Media Corp. | | | |
| | 60,000 | | | 5.38%, due 1/15/2024 | �� | | 61,489 | | |
| | 1,085,000 | | | 5.75%, due 2/1/2026 | | | 1,148,744 | | |
| | | | | Nielsen Co. Luxembourg S.a.r.l. | | | |
| | 390,000 | | | 5.50%, due 10/1/2021 | | | 390,975 | (l) | |
| | 1,420,000 | | | 5.00%, due 2/1/2025 | | | 1,414,675 | (l) | |
See Notes to Financial Statements
167
Schedule of Investments Strategic Income Fund^ (cont'd)
| PRINCIPAL AMOUNT(a) | | | | VALUE | |
| | | | | Nielsen Finance LLC/Nielsen Finance Co. | | | |
$ | 1,115,000 | | | 4.50%, due 10/1/2020 | | $ | 1,117,091 | | |
| | 3,830,000 | | | 5.00%, due 4/15/2022 | | | 3,849,227 | (i)(l) | |
| | | | | Outfront Media Capital LLC/Outfront Media Capital Corp. | | | |
| | 590,000 | | | 5.63%, due 2/15/2024 | | | 605,487 | | |
| | 1,930,000 | | | 5.88%, due 3/15/2025 | | | 1,992,725 | | |
| | 1,416,000 | | | 5.00%, due 8/15/2027 | | | 1,483,302 | (l) | |
| | | | 15,721,955 | | |
Aerospace & Defense 0.5% | | | |
| | 1,225,000 | | | BBA U.S. Holdings, Inc., 5.38%, due 5/1/2026 | | | 1,280,125 | (l) | |
| | | | | TransDigm, Inc. | | | |
| | 165,000 | | | 6.00%, due 7/15/2022 | | | 167,805 | | |
| | 471,000 | | | 6.50%, due 7/15/2024 | | | 486,308 | | |
| | 3,850,000 | | | 6.25%, due 3/15/2026 | | | 4,124,312 | (l) | |
| | 1,935,000 | | | 6.38%, due 6/15/2026 | | | 2,024,494 | | |
| | 2,570,000 | | | 7.50%, due 3/15/2027 | | | 2,775,600 | | |
| | 1,710,000 | | | 5.50%, due 11/15/2027 | | | 1,704,340 | (l)(p) | |
| | 624,000 | | | United Technologies Corp., (3M USD LIBOR + 0.65%), 2.82%, due 8/16/2021 | | | 624,120 | (b) | |
| | | | 13,187,104 | | |
Agriculture 0.3% | | | |
| | | | | BAT Capital Corp. | | | |
| | 1,190,000 | | | (3M USD LIBOR + 0.59%), 2.77%, due 8/14/2020 | | | 1,192,380 | (b) | |
| | 6,365,000 | | | 4.54%, due 8/15/2047 | | | 6,150,706 | | |
| | 1,225,000 | | | Darling Ingredients, Inc., 5.25%, due 4/15/2027 | | | 1,286,250 | (l) | |
| | 200,000 | | | JBS Investments II GmbH, 7.00%, due 1/15/2026 | | | 216,800 | (q) | |
| | | | 8,846,136 | | |
| Airlines 0.0%(d) | | | |
| | 650,000 | | | Unity 1 Sukuk Ltd., 3.86%, due 11/30/2021 | | | 662,663 | (q) | |
| Apparel 0.0%(d) | | | |
EUR | 265,000 | | | Levi Strauss & Co., 3.38%, due 3/15/2027 | | | 315,858 | | |
Auto Manufacturers 0.9% | | | |
| | | | | BMW U.S. Capital LLC | | | |
$ | 350,000 | | | (3M USD LIBOR + 0.38%), 2.42%, due 4/6/2020 | | | 350,422 | (b)(l) | |
| | 750,000 | | | (3M USD LIBOR + 0.50%), 2.68%, due 8/13/2021 | | | 751,411 | (b)(l) | |
| | | | | Daimler Finance N.A. LLC | | | |
| | 500,000 | | | (3M USD LIBOR + 0.43%), 2.61%, due 2/12/2021 | | | 499,916 | (b)(l) | |
| | 6,500,000 | | | (3M USD LIBOR + 0.90%), 3.06%, due 2/15/2022 | | | 6,541,665 | (b)(l) | |
| | 4,075,000 | | | General Motors Financial Co., Inc., 5.10%, due 1/17/2024 | | | 4,401,701 | (i) | |
EUR | 204,000 | | | Jaguar Land Rover Automotive PLC, 4.50%, due 1/15/2026 | | | 214,451 | (q) | |
$ | 12,585,000 | | | Volkswagen Group of America Finance LLC, 2.70%, due 9/26/2022 | | | 12,705,990 | (l) | |
| | | | 25,465,556 | | |
See Notes to Financial Statements
168
Schedule of Investments Strategic Income Fund^ (cont'd)
| PRINCIPAL AMOUNT(a) | | | | VALUE | |
Auto Parts & Equipment 0.1% | | | |
EUR | 290,000 | | | Goodyear Europe BV, 3.75%, due 12/15/2023 | | $ | 326,267 | (q) | |
$ | 85,000 | | | Goodyear Tire & Rubber Co., 5.13%, due 11/15/2023 | | | 86,264 | | |
EUR | 419,000 | | | Grupo Antolin-Irausa SA, 3.38%, due 4/30/2026 | | | 396,660 | (q) | |
EUR | 392,000 | | | IHO Verwaltungs GmbH, 3.75% Cash/4.50% PIK, due 9/15/2026 | | | 442,745 | (q)(r) | |
$ | 1,705,000 | | | LKQ Corp., 4.75%, due 5/15/2023 | | | 1,738,554 | | |
EUR | 443,000 | | | LKQ Italia Bondco SpA, 3.88%, due 4/1/2024 | | | 552,848 | (q) | |
EUR | 173,000 | | | Panther BF Aggregator 2 L.P./Panther Finance Co., Inc., 4.38%, due 5/15/2026 | | | 193,638 | (q) | |
| | | | 3,736,976 | | |
Banking 0.1% | | | |
| | | | | Ally Financial, Inc. | | | |
$ | 380,000 | | | 8.00%, due 3/15/2020 | | | 386,962 | | |
| | 400,000 | | | 7.50%, due 9/15/2020 | | | 417,000 | | |
| | 170,000 | | | 4.25%, due 4/15/2021 | | | 174,299 | | |
| | 120,000 | | | 4.13%, due 2/13/2022 | | | 124,050 | | |
| | | | | CIT Group, Inc. | | | |
| | 95,000 | | | 4.13%, due 3/9/2021 | | | 97,138 | | |
| | 160,000 | | | 5.00%, due 8/15/2022 | | | 170,091 | | |
| | | | 1,369,540 | | |
Banks 6.9% | | | |
| | 500,000 | | | ABN AMRO Bank NV, (3M USD LIBOR + 0.57%), 2.70%, due 8/27/2021 | | | 501,846 | (b)(l) | |
| | 200,000 | | | Banco Davivienda SA, 5.88%, due 7/9/2022 | | | 213,002 | (q) | |
| | 90,000 | | | Banco de Credito del Peru, 2.70%, due 1/11/2025 | | | 89,550 | (l) | |
| | 200,000 | | | Banco Inbursa SA Institucion De Banca Multiple Grupo Financiero Inbursa, | | | 207,250 | (q) | |
| | | | | 4.13%, due 6/6/2024 | | | | | |
| | 150,000 | | | Banco Int'l del Peru SAA Interbank, 3.38%, due 1/18/2023 | | | 151,800 | (q) | |
| | 5,895,000 | | | Banco Santander SA, 3.80%, due 2/23/2028 | | | 6,217,398 | (i) | |
| | 211,000 | | | Banco Votorantim SA, 4.50%, due 9/24/2024 | | | 217,573 | (l) | |
| | | | | Bancolombia SA | | | |
| | 122,000 | | | 5.95%, due 6/3/2021 | | | 128,222 | | |
| | 200,000 | | | 5.13%, due 9/11/2022 | | | 210,480 | | |
| | | | | Bank of America Corp. | | | |
| | 6,095,000 | | | 2.74%, due 1/23/2022 | | | 6,143,247 | (i)(s) | |
| | 1,375,000 | | | (3M USD LIBOR + 0.65%), 2.76%, due 6/25/2022 | | | 1,381,687 | (b) | |
| | 9,400,000 | | | 3.71%, due 4/24/2028 | | | 10,057,534 | (i)(s) | |
| | 7,380,000 | | | 3.97%, due 3/5/2029 | | | 8,037,715 | (i)(s) | |
| | 725,000 | | | Bank of New York Mellon, (3M USD LIBOR + 0.28%), 2.41%, due 6/4/2021 | | | 725,964 | (b) | |
| | 5,920,000 | | | Barclays PLC, 4.38%, due 1/12/2026 | | | 6,361,447 | (i) | |
| | | | | BBVA Bancomer SA | | | |
| | 101,000 | | | 7.25%, due 4/22/2020 | | | 103,223 | (q) | |
| | 200,000 | | | 6.75%, due 9/30/2022 | | | 219,740 | (q) | |
| | | | | Citigroup, Inc. | | | |
| | 7,900,000 | | | (3M USD LIBOR + 0.96%), 2.90%, due 4/25/2022 | | | 7,997,668 | (b) | |
| | 12,720,000 | | | 3.89%, due 1/10/2028 | | | 13,690,576 | (i)(s) | |
| | 5,165,000 | | | 3.52%, due 10/27/2028 | | | 5,442,783 | (i)(s) | |
| | 12,055,000 | | | Commonwealth Bank of Australia, 3.74%, due 9/12/2039 | | | 12,082,215 | (l) | |
| | | | | DIB Sukuk Ltd. | | | |
| | 400,000 | | | 2.92%, due 6/3/2020 | | | 400,273 | (q) | |
| | 200,000 | | | 3.60%, due 3/30/2021 | | | 202,173 | (q) | |
| | 200,000 | | | 3.63%, due 2/6/2023 | | | 204,976 | (q) | |
| | 200,000 | | | Emirates Development Bank PJSC, 3.52%, due 3/6/2024 | | | 206,401 | (q) | |
| | | | | Goldman Sachs Group, Inc. | | | |
See Notes to Financial Statements
169
Schedule of Investments Strategic Income Fund^ (cont'd)
| PRINCIPAL AMOUNT(a) | | | | VALUE | |
$ | 705,000 | | | (3M USD LIBOR + 1.11%), 3.05%, due 4/26/2022 | | $ | 712,273 | (b) | |
| | 10,760,000 | | | (3M USD LIBOR + 0.78%), 2.71%, due 10/31/2022 | | | 10,811,863 | (b) | |
| | 8,765,000 | | | 3.69%, due 6/5/2028 | | | 9,260,951 | (s) | |
| | 16,540,000 | | | 3.81%, due 4/23/2029 | | | 17,570,093 | (i)(s) | |
| | 3,550,000 | | | 4.02%, due 10/31/2038 | | | 3,840,396 | (i)(s) | |
| | 4,325,000 | | | 5.15%, due 5/22/2045 | | | 5,192,088 | (i) | |
| | 200,000 | | | Grupo Aval Ltd., 4.75%, due 9/26/2022 | | | 207,460 | (q) | |
| | 289,000 | | | Gulf Int'l Bank BSC, 3.50%, due 3/25/2022 | | | 291,774 | (q) | |
| | | | | HSBC Holdings PLC | | | |
| | 500,000 | | | (3M USD LIBOR + 0.60%), 2.72%, due 5/18/2021 | | | 500,495 | (b) | |
| | 10,535,000 | | | 6.00%, due 5/22/2027 | | | 10,935,330 | (i)(s)(t) | |
| | | | | JPMorgan Chase & Co. | | | |
| | 1,150,000 | | | (3M USD LIBOR + 0.55%), 2.65%, due 3/9/2021 | | | 1,151,541 | (b) | |
| | 6,335,000 | | | (3M USD LIBOR + 0.61%), 2.76%, due 6/18/2022 | | | 6,355,969 | (b) | |
| | 6,740,000 | | | 3.88%, due 7/24/2038 | | | 7,397,407 | (i)(s) | |
| | | | | Morgan Stanley | | | |
| | 4,915,000 | | | Ser. H, 5.61%, due 1/15/2020 | | | 4,944,490 | (i)(s)(t) | |
| | 8,695,000 | | | (3M USD LIBOR + 0.93%), 2.88%, due 7/22/2022 | | | 8,773,646 | (b) | |
| | 16,475,000 | | | 3.59%, due 7/22/2028 | | | 17,414,002 | (i)(s) | |
| | 600,000 | | | National Australia Bank Ltd., (3M USD LIBOR + 0.35%), 2.35%, due 1/12/2021 | | | 601,282 | (b)(l) | |
| | 200,000 | | | Philippine National Bank, 3.28%, due 9/27/2024 | | | 202,134 | (q) | |
| | 200,000 | | | QIB Sukuk Ltd., 3.25%, due 5/23/2022 | | | 202,374 | (q) | |
| | 200,000 | | | QNB Finance Ltd., (3M USD LIBOR + 1.35%), 3.47%, due 5/31/2021 | | | 201,371 | (b)(q) | |
| | 595,000 | | | QNB Finansbank A/S, 6.88%, due 9/7/2024 | | | 626,164 | (l) | |
| | 950,000 | | | Royal Bank of Canada, (3M USD LIBOR + 0.47%), 2.40%, due 4/29/2022 | | | 951,385 | (b) | |
| | 500,000 | | | Santander UK PLC, (3M USD LIBOR + 0.62%), 2.76%, due 6/1/2021 | | | 501,545 | (b) | |
| | 200,000 | | | Shinhan Bank Co. Ltd., 3.88%, due 12/7/2026 | | | 204,465 | (q)(s) | |
| | 200,000 | | | Trade & Development Bank of Mongolia LLC, 9.38%, due 5/19/2020 | | | 205,000 | (q) | |
| | 200,000 | | | Turkiye Vakiflar Bankasi TAO, 5.50%, due 10/27/2021 | | | 198,478 | (q) | |
| | 280,000 | | | U.S. Bank N.A., (3M USD LIBOR + 0.29%), 2.44%, due 5/21/2021 | | | 280,280 | (b) | |
| | 200,000 | | | United Bank for Africa PLC, 7.75%, due 6/8/2022 | | | 211,843 | (q) | |
| | 7,365,000 | | | Wells Fargo & Co., (3M USD LIBOR + 0.93%), 3.11%, due 2/11/2022 | | | 7,413,344 | (b) | |
| | 495,000 | | | Wells Fargo Bank N.A., (3M USD LIBOR + 0.66%), 2.80%, due 9/9/2022 | | | 496,791 | (b) | |
| | 1,000,000 | | | Westpac Banking Corp., (3M USD LIBOR + 0.85%), 2.97%, due 8/19/2021 | | | 1,010,983 | (b) | |
| | | | 199,861,960 | | |
Beverages 1.1% | | | |
| | 605,000 | | | Anheuser-Busch InBev Finance, Inc., (3M USD LIBOR + 1.26%), 3.16%, due 2/1/2021 | | | 612,768 | (b) | |
| | | | | Anheuser-Busch InBev Worldwide, Inc. | | | |
| | 6,175,000 | | | 4.60%, due 4/15/2048 | | | 7,085,670 | (i) | |
| | 9,870,000 | | | 4.75%, due 4/15/2058 | | | 11,538,916 | (i) | |
| | 7,315,000 | | | 5.80%, due 1/23/2059 | | | 9,931,657 | (i) | |
| | 675,000 | | | Diageo Capital PLC, (3M USD LIBOR + 0.24%), 2.36%, due 5/18/2020 | | | 675,491 | (b) | |
EUR | 576,000 | | | Sunshine Mid BV, 6.50%, due 5/15/2026 | | | 658,968 | (q) | |
| | | | 30,503,470 | | |
Brokerage 0.1% | | | |
$ | 3,705,000 | | | LPL Holdings, Inc., 5.75%, due 9/15/2025 | | | 3,843,938 | (i)(l) | |
Building & Construction 0.5% | | | |
| | | | | Lennar Corp. | | | |
| | 415,000 | | | 4.75%, due 4/1/2021 | | | 424,877 | | |
| | 45,000 | | | 4.13%, due 1/15/2022 | | | 46,238 | | |
See Notes to Financial Statements
170
Schedule of Investments Strategic Income Fund^ (cont'd)
| PRINCIPAL AMOUNT(a) | | | | VALUE | |
| | | | | Meritage Homes Corp. | | | |
$ | 240,000 | | | 7.15%, due 4/15/2020 | | $ | 244,500 | | |
| | 760,000 | | | 7.00%, due 4/1/2022 | | | 830,300 | | |
| | 565,000 | | | 5.13%, due 6/6/2027 | | | 608,787 | | |
| | | | | Shea Homes L.P./Shea Homes Funding Corp. | | | |
| | 524,000 | | | 5.88%, due 4/1/2023 | | | 535,790 | (l) | |
| | 1,250,000 | | | 6.13%, due 4/1/2025 | | | 1,293,750 | (l) | |
| | | | | Taylor Morrison Communities, Inc. | | | |
| | 1,410,000 | | | 5.88%, due 6/15/2027 | | | 1,574,547 | (l) | |
| | 1,520,000 | | | 5.75%, due 1/15/2028 | | | 1,681,500 | (l) | |
| | | | | Taylor Morrison Communities, Inc./Taylor Morrison Holdings II, Inc. | | | |
| | 235,000 | | | 5.88%, due 4/15/2023 | | | 253,800 | (l) | |
| | 1,005,000 | | | 5.63%, due 3/1/2024 | | | 1,084,144 | (l) | |
| | | | | Toll Brothers Finance Corp. | | | |
| | 390,000 | | | 5.88%, due 2/15/2022 | | | 414,863 | | |
| | 560,000 | | | 4.38%, due 4/15/2023 | | | 588,000 | | |
| | 650,000 | | | 5.63%, due 1/15/2024 | | | 710,125 | | |
| | 465,000 | | | 4.88%, due 3/15/2027 | | | 505,106 | | |
| | 1,665,000 | | | 4.35%, due 2/15/2028 | | | 1,731,080 | | |
| | 835,000 | | | TRI Pointe Group, Inc., 4.88%, due 7/1/2021 | | | 857,962 | | |
| | | | 13,385,369 | | |
Building Materials 0.4% | | | |
| | 2,950,000 | | | Beacon Roofing Supply, Inc., 4.88%, due 11/1/2025 | | | 2,898,522 | (l) | |
| | 975,000 | | | CD&R Waterworks Merger Sub LLC, 6.13%, due 8/15/2025 | | | 990,844 | (l) | |
| | | | | Jeld-Wen, Inc. | | | |
| | 1,260,000 | | | 4.63%, due 12/15/2025 | | | 1,247,400 | (l) | |
| | 2,825,000 | | | 4.88%, due 12/15/2027 | | | 2,768,500 | (l) | |
| | | | | Masonite Int'l Corp. | | | |
| | 2,845,000 | | | 5.75%, due 9/15/2026 | | | 3,019,256 | (l) | |
| | 1,500,000 | | | 5.38%, due 2/1/2028 | | | 1,586,250 | (l) | |
| | 200,000 | | | Votorantim Cimentos Int'l SA, 7.25%, due 4/5/2041 | | | 253,002 | (q) | |
| | | | 12,763,774 | | |
Cable & Satellite Television 1.0% | | | |
| | | | | CCO Holdings LLC/CCO Holdings Capital Corp. | | | |
| | 850,000 | | | 5.25%, due 9/30/2022 | | | 861,687 | (i) | |
| | 1,215,000 | | | 5.13%, due 2/15/2023 | | | 1,240,819 | (i) | |
| | 525,000 | | | 4.00%, due 3/1/2023 | | | 534,188 | (l) | |
| | 595,000 | | | 5.13%, due 5/1/2023 | | | 609,131 | (i)(l) | |
| | 27,000 | | | 5.75%, due 1/15/2024 | | | 27,667 | | |
| | 705,000 | | | 5.88%, due 4/1/2024 | | | 734,963 | (l) | |
| | 2,365,000 | | | 5.75%, due 2/15/2026 | | | 2,497,440 | (i)(l) | |
| | 3,945,000 | | | 5.00%, due 2/1/2028 | | | 4,127,456 | (i)(l) | |
| | 345,000 | | | 4.75%, due 3/1/2030 | | | 351,469 | (l) | |
| | | | | CSC Holdings LLC | | | |
| | 670,000 | | | 6.75%, due 11/15/2021 | | | 721,925 | | |
| | 980,000 | | | 5.38%, due 7/15/2023 | | | 1,004,480 | (i)(l) | |
| | 255,000 | | | 5.25%, due 6/1/2024 | | | 274,763 | | |
| | 770,000 | | | 7.75%, due 7/15/2025 | | | 825,825 | (l) | |
| | 365,000 | | | 6.63%, due 10/15/2025 | | | 388,725 | (l) | |
| | 1,051,000 | | | 10.88%, due 10/15/2025 | | | 1,186,011 | (i)(l) | |
| | 1,095,000 | | | 5.50%, due 5/15/2026 | | | 1,153,856 | (l) | |
| | 470,000 | | | 5.50%, due 4/15/2027 | | | 498,205 | (l) | |
See Notes to Financial Statements
171
Schedule of Investments Strategic Income Fund^ (cont'd)
| PRINCIPAL AMOUNT(a) | | | | VALUE | |
$ | 870,000 | | | 7.50%, due 4/1/2028 | | $ | 978,750 | (l) | |
| | 515,000 | | | 6.50%, due 2/1/2029 | | | 576,800 | (l) | |
| | 2,550,000 | | | 5.75%, due 1/15/2030 | | | 2,683,875 | (l) | |
| | | | | DISH DBS Corp. | | | |
| | 1,185,000 | | | 6.75%, due 6/1/2021 | | | 1,247,212 | (i) | |
| | 660,000 | | | 5.88%, due 7/15/2022 | | | 690,235 | | |
| | 130,000 | | | 5.00%, due 3/15/2023 | | | 130,975 | | |
| | 1,530,000 | | | 5.88%, due 11/15/2024 | | | 1,533,825 | (i) | |
| | | | | Radiate Holdco LLC/Radiate Finance, Inc. | | | |
| | 208,000 | | | 6.88%, due 2/15/2023 | | | 212,680 | (l) | |
| | 995,000 | | | 6.63%, due 2/15/2025 | | | 1,004,950 | (l) | |
| | | | | Virgin Media Finance PLC | | | |
| | 530,000 | | | 5.25%, due 2/15/2022 | | | 543,250 | | |
| | 480,000 | | | 6.00%, due 10/15/2024 | | | 495,000 | (l) | |
| | 1,250,000 | | | Virgin Media Secured Finance PLC, 5.50%, due 8/15/2026 | | | 1,314,062 | (i)(l) | |
| | | | 28,450,224 | | |
Chemicals 0.6% | | | |
EUR | 500,000 | | | Arkema SA, 2.75%, due 6/17/2024 | | | 584,836 | (q)(s)(t) | |
$ | 315,000 | | | Ashland LLC, 4.75%, due 8/15/2022 | | | 329,963 | | |
EUR | 390,000 | | | Axalta Coating Systems LLC, 4.25%, due 8/15/2024 | | | 446,928 | (q) | |
$ | 200,000 | | | Bluestar Finance Holdings Ltd., 3.50%, due 9/30/2021 | | | 202,193 | (q) | |
| | 200,000 | | | Braskem Finance Ltd., 5.75%, due 4/15/2021 | | | 209,000 | (q) | |
| | 200,000 | | | Braskem Netherlands Finance BV, 3.50%, due 1/10/2023 | | | 203,002 | (q) | |
EUR | 510,000 | | | CeramTec BondCo GmbH, 5.25%, due 12/15/2025 | | | 586,448 | (q) | |
| | | | | CF Industries, Inc. | | | |
$ | 210,000 | | | 3.45%, due 6/1/2023 | | | 213,150 | | |
| | 1,395,000 | | | 5.38%, due 3/15/2044 | | | 1,429,875 | | |
| | 400,000 | | | CNAC HK Finbridge Co. Ltd., 3.38%, due 6/19/2024 | | | 405,440 | (q) | |
| | 205,000 | | | H.B. Fuller Co., 4.00%, due 2/15/2027 | | | 200,900 | | |
EUR | 421,000 | | | INEOS Finance PLC, 2.13%, due 11/15/2025 | | | 454,770 | (q) | |
$ | 2,416,000 | | | INEOS Group Holdings SA, 5.63%, due 8/1/2024 | | | 2,470,360 | (l) | |
EUR | 422,000 | | | Kronos Int'l, Inc., 3.75%, due 9/15/2025 | | | 463,597 | (q) | |
$ | 311,000 | | | Mexichem SAB de CV, 4.88%, due 9/19/2022 | | | 326,164 | (q) | |
| | | | | NOVA Chemicals Corp. | | | |
| | 680,000 | | | 5.25%, due 8/1/2023 | | | 686,375 | (i)(l) | |
| | 905,000 | | | 4.88%, due 6/1/2024 | | | 918,575 | (l) | |
| | 2,320,000 | | | Platform Specialty Products Corp., 5.88%, due 12/1/2025 | | | 2,421,865 | (l) | |
| | 610,000 | | | PQ Corp., 6.75%, due 11/15/2022 | | | 629,825 | (l) | |
| | 200,000 | | | SASOL Financing USA LLC, 5.88%, due 3/27/2024 | | | 215,695 | | |
EUR | 453,000 | | | SGL Carbon SE, 4.63%, due 9/30/2024 | | | 457,333 | (q) | |
EUR | 300,000 | | | Solvay SA, 4.25%, due 12/4/2023 | | | 368,450 | (q)(s)(t) | |
| | | | | Starfruit Finco BV/Starfruit U.S. Holdco LLC | | | |
EUR | 392,000 | | | 6.50%, due 10/1/2026 | | | 441,045 | (q) | |
$ | 495,000 | | | 8.00%, due 10/1/2026 | | | 492,525 | (l) | |
| | 400,000 | | | Tronox Finance PLC, 5.75%, due 10/1/2025 | | | 377,000 | (l) | |
| | 455,000 | | | Tronox, Inc., 6.50%, due 4/15/2026 | | | 436,800 | (l) | |
| | 945,000 | | | WR Grace & Co-Conn, 5.13%, due 10/1/2021 | | | 980,437 | (l) | |
| | | | 16,952,551 | | |
| Coal 0.0%(d) | | | |
| | 126,540 | | | Indo Energy Finance II BV, 6.38%, due 1/24/2023 | | | 126,720 | (q) | |
| | 200,000 | | | Shandong Energy Australia Pty Ltd., 4.55%, due 7/26/2020 | | | 199,379 | (q) | |
| | | | 326,099 | | |
See Notes to Financial Statements
172
Schedule of Investments Strategic Income Fund^ (cont'd)
| PRINCIPAL AMOUNT(a) | | | | VALUE | |
Commercial Services 0.2% | | | |
EUR | 336,000 | | | Avis Budget Finance PLC, 4.50%, due 5/15/2025 | | $ | 386,492 | (q) | |
$ | 200,000 | | | DP World Crescent Ltd., 3.91%, due 5/31/2023 | | | 207,061 | (q) | |
EUR | 334,000 | | | Europcar Mobility Group, 4.13%, due 11/15/2024 | | | 351,705 | (q) | |
$ | 1,240,000 | | | Gartner, Inc., 5.13%, due 4/1/2025 | | | 1,300,388 | (l) | |
EUR | 437,000 | | | Intertrust Group BV, 3.38%, due 11/15/2025 | | | 508,823 | (q) | |
EUR | 200,000 | | | La Financiere Atalian SAS, 4.00%, due 5/15/2024 | | | 148,493 | (q) | |
EUR | 344,000 | | | Loxam SAS, 6.00%, due 4/15/2025 | | | 384,354 | (q) | |
EUR | 520,000 | | | Techem Verwaltungsgesellschaft 674 mbH, 6.00%, due 7/30/2026 | | | 629,153 | (q) | |
$ | 1,115,000 | | | United Rentals N.A., Inc., 5.25%, due 1/15/2030 | | | 1,172,144 | | |
| | | | 5,088,613 | | |
Computers 1.7% | | | |
| | 8,220,000 | | | Apple, Inc., 4.65%, due 2/23/2046 | | | 10,292,887 | (i) | |
EUR | 408,000 | | | Banff Merger Sub, Inc., 8.38%, due 9/1/2026 | | | 426,538 | (q) | |
$ | 13,970,000 | | | Diamond 1 Finance Corp./Diamond 2 Finance Corp., 5.45%, due 6/15/2023 | | | 15,188,001 | (i)(l) | |
| | 4,375,000 | | | HP Enterprise Co., 3.60%, due 10/15/2020 | | | 4,433,684 | (i) | |
| | | | | IBM Corp. | | | |
| | 970,000 | | | (3M USD LIBOR + 0.40%), 2.58%, due 5/13/2021 | | | 974,455 | (b) | |
| | 4,270,000 | | | 4.15%, due 5/15/2039 | | | 4,812,960 | (i) | |
| | 10,030,000 | | | 4.25%, due 5/15/2049 | | | 11,397,129 | (i) | |
| | | | 47,525,654 | | |
Consumer - Commercial Lease Financing 0.2% | | | |
| | 777,000 | | | AerCap Global Aviation Trust, 6.50%, due 6/15/2045 | | | 851,786 | (l)(s) | |
| | 110,000 | | | Avolon Holdings Funding Ltd., 5.13%, due 10/1/2023 | | | 118,690 | (l) | |
| | 1,200,000 | | | Global Aircraft Leasing Co. Ltd., 6.50% Cash/7.25% PIK, due 9/15/2024 | | | 1,228,140 | (l)(r) | |
| | | | | Navient Corp. | | | |
| | 740,000 | | | 8.00%, due 3/25/2020 | | | 755,725 | | |
| | 375,000 | | | 5.88%, due 3/25/2021 | | | 389,070 | | |
| | 300,000 | | | 6.63%, due 7/26/2021 | | | 317,250 | | |
| | 295,000 | | | 6.50%, due 6/15/2022 | | | 315,650 | | |
| | | | | Park Aerospace Holdings Ltd. | | | |
| | 140,000 | | | 4.50%, due 3/15/2023 | | | 147,070 | (l) | |
| | 560,000 | | | 5.50%, due 2/15/2024 | | | 615,664 | (i)(l) | |
| | 340,000 | | | SLM Corp., 7.25%, due 1/25/2022 | | | 368,798 | | |
| | | | | Springleaf Finance Corp. | | | |
| | 880,000 | | | 7.75%, due 10/1/2021 | | | 959,218 | (i) | |
| | 645,000 | | | 6.13%, due 5/15/2022 | | | 694,181 | | |
| | | | 6,761,242 | | |
| Distribution - Wholesale 0.0%(d) | | | |
| | 175,000 | | | Anixter, Inc., 5.50%, due 3/1/2023 | | | 179,480 | | |
| | 1,075,000 | | | HD Supply, Inc., 5.38%, due 10/15/2026 | | | 1,134,125 | (l) | |
| | | | 1,313,605 | | |
Diversified Capital Goods 0.2% | | | |
| | 220,000 | | | Anixter, Inc., 5.13%, due 10/1/2021 | | | 227,150 | | |
| | 1,820,000 | | | Resideo Funding, Inc., 6.13%, due 11/1/2026 | | | 1,833,650 | (l) | |
See Notes to Financial Statements
173
Schedule of Investments Strategic Income Fund^ (cont'd)
| PRINCIPAL AMOUNT(a) | | | | VALUE | |
| | | | | SPX FLOW, Inc. | | | |
$ | 405,000 | | | 5.63%, due 8/15/2024 | | $ | 421,706 | (l) | |
| | 1,710,000 | | | 5.88%, due 8/15/2026 | | | 1,791,225 | (l) | |
| | | | 4,273,731 | | |
Diversified Financial Services 1.9% | | | |
| | 10,915,000 | | | AerCap Ireland Capital DAC/AerCap Global Aviation Trust, 4.45%, due 10/1/2025 | | | 11,842,660 | (i) | |
| | | | | American Express Co. | | | |
| | 1,300,000 | | | (3M USD LIBOR + 0.53%), 2.65%, due 5/17/2021 | | | 1,304,579 | (b) | |
| | 3,618,000 | | | (3M USD LIBOR + 0.62%), 2.76%, due 5/20/2022 | | | 3,634,942 | (b) | |
| | 9,160,000 | | | Avolon Holdings Funding Ltd., 3.95%, due 7/1/2024 | | | 9,509,912 | (i)(l) | |
| | | | | Capital One Financial Corp. | | | |
| | 535,000 | | | (3M USD LIBOR + 0.76%), 2.94%, due 5/12/2020 | | | 536,268 | (b) | |
| | 7,765,000 | | | (3M USD LIBOR + 0.95%), 3.05%, due 3/9/2022 | | | 7,827,413 | (b) | |
| | 200,000 | | | CCBL Cayman Corp. Ltd., 3.25%, due 7/28/2020 | | | 200,737 | (q) | |
| | 200,000 | | | CDBL Funding 2, 2.63%, due 8/1/2020 | | | 199,678 | (q) | |
| | 273,000 | | | GTLK Europe Capital DAC, 4.95%, due 2/18/2026 | | | 278,225 | (q) | |
| | 200,000 | | | GTLK Europe DAC, 5.95%, due 7/19/2021 | | | 208,838 | (q) | |
| | | | | Huarong Finance 2017 Co. Ltd. | | | |
| | 200,000 | | | (3M USD LIBOR + 1.65%), 3.59%, due 4/27/2020 | | | 200,452 | (b)(q) | |
| | 267,000 | | | 4.50%, due 1/24/2022 | | | 271,660 | (q)(s)(t) | |
| | 267,000 | | | (3M USD LIBOR + 1.85%), 3.79%, due 4/27/2022 | | | 270,556 | (b)(q) | |
| | 420,000 | | | 4.00%, due 11/7/2022 | | | 423,135 | (q)(s)(t) | |
| | | | | ICBCIL Finance Co. Ltd. | | | |
| | 355,000 | | | 3.20%, due 11/10/2020 | | | 356,889 | (q) | |
| | 200,000 | | | 2.50%, due 9/29/2021 | | | 198,980 | (q) | |
EUR | 364,000 | | | Lincoln Financing S.a.r.l., (3M EURIBOR + 3.88%, Floor 3.88%), 3.88%, due 4/1/2024 | | | 404,792 | (b)(q) | |
$ | 50,000 | | | Mestenio Ltd., 8.50%, due 1/2/2020 | | | 50,313 | (q) | |
| | 200,000 | | | Rural Electrification Corp. Ltd., 3.07%, due 12/18/2020 | | | 201,015 | (q) | |
| | 16,620,000 | | | Synchrony Financial, 2.85%, due 7/25/2022 | | | 16,813,103 | | |
| | | | 54,734,147 | | |
Electric 1.3% | | | |
| | 1,500,000 | | | 1MDB Energy Ltd., 5.99%, due 5/11/2022 | | | 1,582,554 | (q) | |
GBP | 180,000 | | | Drax Finco PLC, 4.25%, due 5/1/2022 | | | 237,197 | (q) | |
| | | | | DTE Energy Co. | | | |
$ | 6,920,000 | | | 2.25%, due 11/1/2022 | | | 6,963,457 | (p) | |
| | 11,950,000 | | | Ser. C, 3.40%, due 6/15/2029 | | | 12,511,119 | (i) | |
| | 405,000 | | | Empresa de Transmision Electrica SA, 5.13%, due 5/2/2049 | | | 463,219 | (l) | |
| | | | | Eskom Holdings SOC Ltd. | | | |
| | 200,000 | | | 5.75%, due 1/26/2021 | | | 201,292 | (q) | |
| | 650,000 | | | 6.75%, due 8/6/2023 | | | 666,930 | (q) | |
| | 10,905,000 | | | Evergy, Inc., 2.90%, due 9/15/2029 | | | 10,965,344 | | |
| | 1,200,000 | | | Florida Power & Light Co., (3M USD LIBOR + 0.40%), 2.64%, due 5/6/2022 | | | 1,200,060 | (b) | |
| | 178,000 | | | Genneia SA, 8.75%, due 1/20/2022 | | | 120,150 | (q) | |
| | 605,000 | | | NRG Energy, Inc., 5.25%, due 6/15/2029 | | | 648,863 | (l) | |
GBP | 285,000 | | | NWEN Finance PLC, 5.88%, due 6/21/2021 | | | 383,019 | (q) | |
EUR | 300,000 | | | Orano SA, 4.88%, due 9/23/2024 | | | 390,212 | | |
$ | 300,000 | | | Pampa Energia SA, 7.38%, due 7/21/2023 | | | 261,000 | (q) | |
| | | | 36,594,416 | | |
See Notes to Financial Statements
174
Schedule of Investments Strategic Income Fund^ (cont'd)
| PRINCIPAL AMOUNT(a) | | | | VALUE | |
Electric - Generation 0.5% | | | |
| | | | | Calpine Corp. | | | |
$ | 780,000 | | | 6.00%, due 1/15/2022 | | $ | 781,092 | (i)(l) | |
| | 1,590,000 | | | 5.38%, due 1/15/2023 | | | 1,615,758 | (i) | |
| | 1,400,000 | | | 5.88%, due 1/15/2024 | | | 1,430,800 | (l) | |
| | 300,000 | | | 5.50%, due 2/1/2024 | | | 300,750 | | |
| | 1,875,000 | | | 5.75%, due 1/15/2025 | | | 1,921,875 | | |
| | 1,355,000 | | | Dynegy, Inc., 5.88%, due 6/1/2023 | | | 1,383,794 | (i) | |
| | 975,000 | | | NextEra Energy Operating Partners L.P., 4.25%, due 7/15/2024 | | | 1,001,520 | (l) | |
| | | | | NRG Energy, Inc. | | | |
| | 580,000 | | | 7.25%, due 5/15/2026 | | | 635,117 | (i) | |
| | 1,565,000 | | | 6.63%, due 1/15/2027 | | | 1,696,069 | (i) | |
| | | | | Vistra Operations Co. LLC | | | |
| | 655,000 | | | 5.50%, due 9/1/2026 | | | 692,151 | (l) | |
| | 1,095,000 | | | 5.63%, due 2/15/2027 | | | 1,160,700 | (l) | |
| | 1,315,000 | | | 5.00%, due 7/31/2027 | | | 1,361,025 | (l) | |
| | | | 13,980,651 | | |
Electric - Integrated 0.1% | | | |
| | | | | Talen Energy Supply LLC | | | |
| | 525,000 | | | 6.50%, due 6/1/2025 | | | 393,761 | | |
| | 1,875,000 | | | 10.50%, due 1/15/2026 | | | 1,612,500 | (l) | |
| | 960,000 | | | 7.25%, due 5/15/2027 | | | 957,600 | (l) | |
| | 275,000 | | | 6.63%, due 1/15/2028 | | | 265,375 | (l) | |
| | | | 3,229,236 | | |
| Electrical Components & Equipment 0.0%(d) | | | |
EUR | 378,000 | | | Belden, Inc., 3.38%, due 7/15/2027 | | | 428,691 | (q) | |
EUR | 327,000 | | | Energizer Gamma Acquisition BV, 4.63%, due 7/15/2026 | | | 384,535 | (q) | |
| | | | 813,226 | | |
Electronics 0.2% | | | |
$ | 1,880,000 | | | Amkor Technology, Inc., 6.63%, due 9/15/2027 | | | 2,058,600 | (l) | |
| | 450,000 | | | Honeywell Int'l, Inc., (3M USD LIBOR + 0.37%), 2.56%, due 8/8/2022 | | | 451,980 | (b) | |
| | | | | Sensata Technologies BV | | | |
| | 25,000 | | | 4.88%, due 10/15/2023 | | | 26,407 | (l) | |
| | 230,000 | | | 5.63%, due 11/1/2024 | | | 252,425 | (l) | |
| | 1,200,000 | | | Sensata Technologies UK Financing Co. PLC, 6.25%, due 2/15/2026 | | | 1,284,000 | (l) | |
| | 660,000 | | | Sensata Technologies, Inc., 4.38%, due 2/15/2030 | | | 664,537 | (l) | |
| | | | 4,737,949 | | |
| Energy - Alternate Sources 0.0%(d) | | | |
| | 311,000 | | | Azure Power Energy Ltd., 5.50%, due 11/3/2022 | | | 314,514 | (q) | |
| | 200,000 | | | Greenko Dutch BV, 4.88%, due 7/24/2022 | | | 201,252 | (q) | |
| | 274,000 | | | Rio Energy SA/UGEN SA/UENSA SA, 6.88%, due 2/1/2025 | | | 158,923 | (l) | |
| | | | 674,689 | | |
See Notes to Financial Statements
175
Schedule of Investments Strategic Income Fund^ (cont'd)
| PRINCIPAL AMOUNT(a) | | | | VALUE | |
Energy - Exploration & Production 0.6% | | | |
| | | | | Ascent Resources Utica Holdings LLC/ARU Finance Corp. | | | |
$ | 992,000 | | | 10.00%, due 4/1/2022 | | $ | 938,730 | (i)(l) | |
| | 1,240,000 | | | 7.00%, due 11/1/2026 | | | 948,600 | (i)(l) | |
| | 1,100,000 | | | Bruin E&P Partners LLC, 8.88%, due 8/1/2023 | | | 726,000 | (l) | |
| | 1,145,000 | | | Centennial Resource Production LLC, 6.88%, due 4/1/2027 | | | 1,122,100 | (l) | |
| | | | | Chesapeake Energy Corp. | | | |
| | 210,000 | | | 5.75%, due 3/15/2023 | | | 153,300 | | |
| | 185,000 | | | 7.00%, due 10/1/2024 | | | 124,412 | | |
| | 564,000 | | | 8.00%, due 3/15/2026 | | | 358,140 | (l) | |
| | 460,000 | | | 8.00%, due 6/15/2027 | | | 287,500 | | |
| | 3,250,000 | | | CrownRock L.P./CrownRock Finance, Inc., 5.63%, due 10/15/2025 | | | 3,176,940 | (l) | |
| | | | | Extraction Oil & Gas, Inc. | | | |
| | 90,000 | | | 7.38%, due 5/15/2024 | | | 36,900 | (l) | |
| | 665,000 | | | 5.63%, due 2/1/2026 | | | 282,625 | (l) | |
| | 2,855,000 | | | Matador Resources Co., 5.88%, due 9/15/2026 | | | 2,740,800 | | |
| | | | | Oasis Petroleum, Inc. | | | |
| | 285,000 | | | 6.88%, due 1/15/2023 | | | 246,525 | | |
| | 365,000 | | | 6.25%, due 5/1/2026 | | | 248,382 | (l) | |
| | 331,000 | | | Parsley Energy LLC/Parsley Finance Corp., 6.25%, due 6/1/2024 | | | 344,654 | (l) | |
| | | | | PDC Energy, Inc. | | | |
| | 245,000 | | | 6.13%, due 9/15/2024 | | | 237,803 | | |
| | 2,280,000 | | | 5.75%, due 5/15/2026 | | | 2,131,800 | | |
| | | | | Range Resources Corp. | | | |
| | 180,000 | | | 5.88%, due 7/1/2022 | | | 171,000 | | |
| | 90,000 | | | 5.00%, due 8/15/2022 | | | 85,050 | | |
| | 990,000 | | | 5.00%, due 3/15/2023 | | | 856,350 | | |
| | 800,000 | | | 4.88%, due 5/15/2025 | | | 642,000 | | |
| | 565,000 | | | SM Energy Co., 6.63%, due 1/15/2027 | | | 474,600 | | |
| | | | | WPX Energy, Inc. | | | |
| | 130,000 | | | 8.25%, due 8/1/2023 | | | 144,950 | | |
| | 885,000 | | | 5.25%, due 9/15/2024 | | | 893,850 | | |
| | 945,000 | | | 5.75%, due 6/1/2026 | | | 949,725 | | |
| | | | 18,322,736 | | |
Engineering & Construction 0.1% | | | |
| | 289,000 | | | Aeropuerto Int'l de Tocumen SA, 6.00%, due 11/18/2048 | | | 359,805 | (l) | |
| | 200,000 | | | Chang Development Int'l Ltd., 3.63%, due 1/20/2020 | | | 199,790 | (q) | |
| | | | | China Minmetals Corp. | | | |
| | 200,000 | | | 4.45%, due 5/13/2021 | | | 203,305 | (q)(s)(t) | |
| | 1,370,000 | | | 3.75%, due 11/13/2022 | | | 1,380,087 | (q)(s)(t) | |
| | 200,000 | | | IHS Netherlands Holdco BV, 8.00%, due 9/18/2027 | | | 209,040 | (l) | |
EUR | 200,000 | | | Swissport Financing S.a.r.l., 9.00%, due 2/15/2025 | | | 228,742 | (q) | |
| | | | 2,580,769 | | |
Entertainment 0.1% | | | |
GBP | 424,000 | | | AMC Entertainment Holdings, Inc., 6.38%, due 11/15/2024 | | | 525,132 | | |
EUR | 450,000 | | | Cirsa Finance Int'l S.a.r.l., 4.75%, due 5/22/2025 | | | 520,583 | (q) | |
EUR | 343,000 | | | lnt'l Game Technology PLC, 3.50%, due 6/15/2026 | | | 405,895 | (q) | |
GBP | 382,000 | | | Ladbrokes Group Finance PLC, 5.13%, due 9/8/2023 | | | 532,004 | (q) | |
EUR | 169,000 | | | Scientific Games Int'l, Inc., 5.50%, due 2/15/2026 | | | 183,753 | (q) | |
GBP | 450,000 | | | William Hill PLC, 4.75%, due 5/1/2026 | | | 611,154 | (q) | |
| | | | 2,778,521 | | |
See Notes to Financial Statements
176
Schedule of Investments Strategic Income Fund^ (cont'd)
| PRINCIPAL AMOUNT(a) | | | | VALUE | |
| Environmental Control 0.0%(d) | | | |
GBP | 283,000 | | | Kelda Finance No. 3 PLC, 5.75%, due 2/17/2020 | | $ | 368,595 | (q) | |
EUR | 514,000 | | | Paprec Holding SA, 4.00%, due 3/31/2025 | | | 515,943 | (q) | |
| | | | 884,538 | | |
Food 0.9% | | | |
EUR | 700,000 | | | Casino Guichard Perrachon SA, 4.05%, due 8/5/2026 | | | 620,895 | (q) | |
GBP | 349,000 | | | Co-operative Group Holdings 2011 Ltd., 7.50%, due 7/8/2026 | | | 514,978 | (q) | |
$ | 11,320,000 | | | Grupo Bimbo SAB de CV, 4.70%, due 11/10/2047 | | | 12,108,551 | (i)(l) | |
| | 9,165,000 | | | Kraft Heinz Foods Co., 3.75%, due 4/1/2030 | | | 9,367,253 | (l) | |
| | 2,070,000 | | | Kroger Co., 5.40%, due 1/15/2049 | | | 2,454,788 | (i) | |
GBP | 349,000 | | | Premier Foods Finance PLC, 6.25%, due 10/15/2023 | | | 467,320 | (q) | |
| | | | 25,533,785 | | |
Food - Wholesale 0.2% | | | |
$ | 1,195,000 | | | Performance Food Group, Inc., 5.50%, due 10/15/2027 | | | 1,263,712 | (l) | |
| | | | | Post Holdings, Inc. | | | |
| | 1,185,000 | | | 5.50%, due 3/1/2025 | | | 1,241,406 | (l) | |
| | 565,000 | | | 5.75%, due 3/1/2027 | | | 601,516 | (l) | |
| | 1,710,000 | | | 5.63%, due 1/15/2028 | | | 1,829,700 | (l) | |
| | | | 4,936,334 | | |
| Forest Products & Paper 0.0%(d) | | | |
| | 213,000 | | | Suzano Austria GmbH, 5.00%, due 1/15/2030 | | | 219,284 | | |
Gaming 0.7% | | | |
| | | | | Boyd Gaming Corp. | | | |
| | 1,615,000 | | | 6.88%, due 5/15/2023 | | | 1,675,563 | (i) | |
| | 2,475,000 | | | 6.38%, due 4/1/2026 | | | 2,629,687 | (i) | |
| | 1,690,000 | | | Caesars Resort Collection LLC/CRC Finco, Inc., 5.25%, due 10/15/2025 | | | 1,730,138 | (l) | |
| | 2,745,000 | | | Churchill Downs, Inc., 5.50%, due 4/1/2027 | | | 2,909,700 | (l) | |
| | | | | Eldorado Resorts, Inc. | | | |
| | 105,000 | | | 6.00%, due 4/1/2025 | | | 110,381 | | |
| | 585,000 | | | 6.00%, due 9/15/2026 | | | 641,306 | | |
| | 370,000 | | | Int'l Game Technology PLC, 6.25%, due 2/15/2022 | | | 389,425 | (l) | |
| | 321,000 | | | Jack Ohio Finance LLC/Jack Ohio Finance 1 Corp., 6.75%, due 11/15/2021 | | | 327,821 | (l) | |
| | | | | MGM Resorts Int'l | | | |
| | 730,000 | | | 5.25%, due 3/31/2020 | | | 736,388 | | |
| | 505,000 | | | 6.63%, due 12/15/2021 | | | 547,294 | | |
| | 365,000 | | | 7.75%, due 3/15/2022 | | | 408,800 | | |
| | 570,000 | | | 6.00%, due 3/15/2023 | | | 628,607 | | |
| | 251,000 | | | Scientific Games Int'l, Inc., 10.00%, due 12/1/2022 | | | 258,216 | | |
| | 2,295,000 | | | Station Casinos LLC, 5.00%, due 10/1/2025 | | | 2,326,556 | (l) | |
| | 190,000 | | | Twin River Worldwide Holdings, Inc., 6.75%, due 6/1/2027 | | | 200,032 | (l) | |
| | 265,000 | | | VICI Properties 1 LLC/VICI FC, Inc., 8.00%, due 10/15/2023 | | | 288,519 | | |
| | | | | Wynn Las Vegas LLC/Wynn Las Vegas Capital Corp. | | | |
| | 715,000 | | | 4.25%, due 5/30/2023 | | | 740,097 | (l) | |
| | 3,160,000 | | | 5.50%, due 3/1/2025 | | | 3,357,500 | (l) | |
| | | | 19,906,030 | | |
See Notes to Financial Statements
177
Schedule of Investments Strategic Income Fund^ (cont'd)
| PRINCIPAL AMOUNT(a) | | | | VALUE | |
| Gas 0.0%(d) | | | |
$ | 200,000 | | | Binhai Investment Co. Ltd., 4.45%, due 11/30/2020 | | $ | 190,126 | (q) | |
| 1,000,000 | | | Dominion Energy Gas Holdings LLC, Ser. A, (3M USD LIBOR + 0.60%), 2.72%,
due 6/15/2021 | | | 1,004,850 | (b) | |
| | | | 1,194,976 | | |
Gas Distribution 1.0% | | | |
| 1,975,000 | | | Antero Midstream Partners L.P./Antero Midstream Finance Corp., 5.38%,
due 9/15/2024 | | | 1,599,750 | (i) | |
| | | | | Buckeye Partners L.P. | | | |
| | 500,000 | | | 4.35%, due 10/15/2024 | | | 501,391 | | |
| | 1,585,000 | | | 3.95%, due 12/1/2026 | | | 1,464,086 | | |
| | 630,000 | | | 4.13%, due 12/1/2027 | | | 581,493 | | |
| | 100,000 | | | Cheniere Corpus Christi Holdings LLC, 7.00%, due 6/30/2024 | | | 115,008 | | |
| | | | | Cheniere Energy Partners L.P. | | | |
| | 1,555,000 | | | 5.25%, due 10/1/2025 | | | 1,609,425 | (i) | |
| | 490,000 | | | 5.63%, due 10/1/2026 | | | 517,563 | | |
| | | | | Crestwood Midstream Partners L.P./Crestwood Midstream Finance Corp. | | | |
| | 1,140,000 | | | 6.25%, due 4/1/2023 | | | 1,159,608 | | |
| | 1,205,000 | | | 5.75%, due 4/1/2025 | | | 1,244,162 | | |
| | 425,000 | | | 5.63%, due 5/1/2027 | | | 427,665 | (l) | |
| | | | | DCP Midstream LLC | | | |
| | 390,000 | | | 5.35%, due 3/15/2020 | | | 392,925 | (l) | |
| | 495,000 | | | 4.75%, due 9/30/2021 | | | 504,900 | (l) | |
| | 1,530,000 | | | 5.85%, due 5/21/2043 | | | 1,369,350 | (l)(s) | |
| | | | | DCP Midstream Operating L.P. | | | |
| | 180,000 | | | 4.95%, due 4/1/2022 | | | 185,868 | | |
| | 175,000 | | | 3.88%, due 3/15/2023 | | | 176,750 | | |
| | 255,000 | | | 5.38%, due 7/15/2025 | | | 268,388 | | |
| | 1,415,000 | | | 5.60%, due 4/1/2044 | | | 1,337,599 | | |
| | | | | Genesis Energy L.P./Genesis Energy Finance Corp. | | | |
| | 490,000 | | | 6.00%, due 5/15/2023 | | | 475,300 | | |
| | 1,185,000 | | | 6.50%, due 10/1/2025 | | | 1,125,750 | | |
| | 755,000 | | | 6.25%, due 5/15/2026 | | | 698,375 | | |
| | | | | Global Partners L.P./GLP Finance Corp. | | | |
| | 325,000 | | | 7.00%, due 6/15/2023 | | | 335,801 | | |
| | 480,000 | | | 7.00%, due 8/1/2027 | | | 499,282 | (l) | |
| | | | | NuStar Logistics L.P. | | | |
| | 520,000 | | | 4.80%, due 9/1/2020 | | | 524,040 | | |
| | 970,000 | | | 6.75%, due 2/1/2021 | | | 1,005,095 | | |
| | 740,000 | | | 4.75%, due 2/1/2022 | | | 751,100 | | |
| | 430,000 | | | 6.00%, due 6/1/2026 | | | 459,541 | | |
| | 440,000 | | | 5.63%, due 4/28/2027 | | | 457,600 | | |
| | | | | Summit Midstream Holdings LLC/Summit Midstream Finance Corp. | | | |
| | 755,000 | | | 5.50%, due 8/15/2022 | | | 675,725 | | |
| | 1,440,000 | | | 5.75%, due 4/15/2025 | | | 1,116,000 | (i) | |
| | | | | Tallgrass Energy Partners L.P./Tallgrass Energy Finance Corp. | | | |
| | 595,000 | | | 5.50%, due 9/15/2024 | | | 578,637 | (l) | |
| | 1,110,000 | | | 5.50%, due 1/15/2028 | | | 1,040,625 | (l) | |
| | | | | Targa Resources Partners L.P./Targa Resources Partners Finance Corp. | | | |
| | 575,000 | | | 5.25%, due 5/1/2023 | | | 577,156 | | |
| | 1,200,000 | | | 4.25%, due 11/15/2023 | | | 1,205,640 | | |
| | 735,000 | | | 6.75%, due 3/15/2024 | | | 762,281 | (i) | |
| | 680,000 | | | 5.13%, due 2/1/2025 | | | 697,014 | | |
| | 334,000 | | | 5.38%, due 2/1/2027 | | | 341,933 | | |
See Notes to Financial Statements
178
Schedule of Investments Strategic Income Fund^ (cont'd)
| PRINCIPAL AMOUNT(a) | | | | VALUE | |
$ | 825,000 | | | 6.50%, due 7/15/2027 | | $ | 882,766 | (l) | |
| | 185,000 | | | 5.00%, due 1/15/2028 | | | 183,613 | | |
| | 165,000 | | | 6.88%, due 1/15/2029 | | | 178,406 | (l) | |
| | | | 28,027,611 | | |
Health Facilities 0.5% | | | |
| | | | | Acadia Healthcare Co., Inc. | | | |
| | 345,000 | | | 5.13%, due 7/1/2022 | | | 348,019 | | |
| | 450,000 | | | 5.63%, due 2/15/2023 | | | 456,750 | | |
| | 235,000 | | | 6.50%, due 3/1/2024 | | | 243,225 | | |
| | 705,000 | | | Columbia/HCA Corp., 7.69%, due 6/15/2025 | | | 851,287 | (i) | |
| | | | | HCA, Inc. | | | |
| | 320,000 | | | 7.50%, due 2/15/2022 | | | 355,040 | | |
| | 270,000 | | | 5.88%, due 5/1/2023 | | | 296,244 | | |
| | 1,145,000 | | | 5.38%, due 9/1/2026 | | | 1,248,050 | (i) | |
| | 1,140,000 | | | 5.63%, due 9/1/2028 | | | 1,281,075 | (i) | |
| | 1,565,000 | | | 5.88%, due 2/1/2029 | | | 1,774,319 | | |
| | | | | MEDNAX, Inc. | | | |
| | 480,000 | | | 5.25%, due 12/1/2023 | | | 486,000 | (l) | |
| | 1,245,000 | | | 6.25%, due 1/15/2027 | | | 1,231,803 | (l) | |
| | 875,000 | | | Select Medical Corp., 6.25%, due 8/15/2026 | | | 931,875 | (l) | |
| | | | | Tenet Healthcare Corp. | | | |
| | 3,165,000 | | | 8.13%, due 4/1/2022 | | | 3,426,112 | | |
| | 980,000 | | | 6.75%, due 6/15/2023 | | | 1,038,800 | | |
| | 210,000 | | | 5.13%, due 5/1/2025 | | | 214,988 | | |
| | 540,000 | | | THC Escrow Corp., 7.00%, due 8/1/2025 | | | 557,550 | | |
| | 195,000 | | | Universal Health Services, Inc., 4.75%, due 8/1/2022 | | | 197,194 | (l) | |
| | | | 14,938,331 | | |
Health Services 0.1% | | | |
| | 895,000 | | | Eagle Holding Co. II LLC, 7.75% Cash/8.50% PIK, due 5/15/2022 | | | 908,425 | (l)(r) | |
| | 325,000 | | | Jaguar Holding Co. II/Pharmaceutical Product Development LLC, 6.38%, due 8/1/2023 | | | 336,375 | (l) | |
| | 320,000 | | | Team Health Holdings, Inc., 6.38%, due 2/1/2025 | | | 206,400 | (l) | |
| | 530,000 | | | Vizient, Inc., 6.25%, due 5/15/2027 | | | 571,568 | (l) | |
| | 1,005,000 | | | West Street Merger Sub, Inc., 6.38%, due 9/1/2025 | | | 954,750 | (l) | |
| | | | 2,977,518 | | |
Healthcare - Products 0.4% | | | |
EUR | 441,000 | | | Avantor, Inc., 4.75%, due 10/1/2024 | | | 522,765 | (q) | |
$ | 11,210,000 | | | DH Europe Finance II S.a.r.l., 3.40%, due 11/15/2049 | | | 11,512,440 | (p) | |
| | | | 12,035,205 | | |
Healthcare - Services 0.9% | | | |
EUR | 479,000 | | | Catalent Pharma Solutions, Inc., 4.75%, due 12/15/2024 | | | 548,922 | (q) | |
| | | | | HCA, Inc. | | | |
$ | 6,715,000 | | | 4.13%, due 6/15/2029 | | | 7,117,510 | | |
| | 9,815,000 | | | 5.25%, due 6/15/2049 | | | 10,868,151 | (i) | |
| | | | | UnitedHealth Group, Inc. | | | |
| | 1,000,000 | | | (3M USD LIBOR + 0.26%), 2.38%, due 6/15/2021 | | | 998,892 | (b) | |
| | 6,940,000 | | | 3.88%, due 8/15/2059 | | | 7,360,705 | | |
| | | | 26,894,180 | | |
See Notes to Financial Statements
179
Schedule of Investments Strategic Income Fund^ (cont'd)
| PRINCIPAL AMOUNT(a) | | | | VALUE | |
| Home Builders 0.0%(d) | | | |
GBP | 413,000 | | | Miller Homes Group Holdings PLC, 5.50%, due 10/15/2024 | | $ | 552,958 | (q) | |
| Hotels 0.0%(d) | | | |
$ | 1,230,000 | | | Hilton Domestic Operating Co., Inc., 5.13%, due 5/1/2026 | | | 1,291,500 | | |
| Household Products - Wares 0.0%(d) | | | |
EUR | 280,000 | | | Spectrum Brands, Inc., 4.00%, due 10/1/2026 | | | 328,868 | (q) | |
| Housewares 0.0%(d) | | | |
$ | 500,000 | | | SISECAM, 6.95%, due 3/14/2026 | | | 520,000 | (l) | |
Insurance 0.3% | | | |
| | 7,915,000 | | | AXA Equitable Holdings, Inc., 5.00%, due 4/20/2048 | | | 8,485,684 | (i) | |
| | 615,000 | | | Marsh & McLennan Cos., Inc., (3M USD LIBOR + 1.20%), 3.30%, due 12/29/2021 | | | 615,758 | (b) | |
| | 500,000 | | | New York Life Global Funding, (3M USD LIBOR + 0.44%), 2.44%, due 7/12/2022 | | | 501,061 | (b)(l) | |
| | | | 9,602,503 | | |
Insurance Brokerage 0.3% | | | |
| | 910,000 | | | Alliant Holdings Intermediate LLC/Alliant Holdings Co-Issuer, 6.75%, due 10/15/2027 | | | 946,500 | (l) | |
| | 1,865,000 | | | AssuredPartners, Inc., 7.00%, due 8/15/2025 | | | 1,858,006 | (l) | |
| | 1,715,000 | | | GTCR AP Finance, Inc., 8.00%, due 5/15/2027 | | | 1,753,588 | (l) | |
| | 4,315,000 | | | HUB Int'l Ltd., 7.00%, due 5/1/2026 | | | 4,444,450 | (l) | |
| | | | 9,002,544 | | |
Internet 0.1% | | | |
| | | | | Netflix, Inc. | | | |
EUR | 547,000 | | | 3.63%, due 5/15/2027 | | | 642,005 | | |
$ | 1,955,000 | | | 6.38%, due 5/15/2029 | | | 2,194,487 | (l) | |
| | 1,245,000 | | | Symantec Corp., 5.00%, due 4/15/2025 | | | 1,276,125 | (l) | |
| | | | 4,112,617 | | |
| Investment Companies 0.0%(d) | | | |
| | 200,000 | | | MDGH - GMTN BV, 3.70%, due 11/7/2049 | | | 200,808 | (l)(p) | |
Iron - Steel 0.1% | | | |
| | 200,000 | | | Baosteel Financing 2015 Pty Ltd., 3.88%, due 1/28/2020 | | | 200,519 | (q) | |
| | | | | CSN Resources SA | | | |
| | 347,000 | | | 7.63%, due 2/13/2023 | | | 358,972 | (l) | |
| | 200,000 | | | 7.63%, due 2/13/2023 | | | 206,900 | (q) | |
| | 200,000 | | | Severstal OAO Via Steel Capital SA, 5.90%, due 10/17/2022 | | | 216,470 | (q) | |
| | 400,000 | | | Shougang Group Co. Ltd., 3.38%, due 12/9/2019 | | | 400,279 | (q) | |
| | | | 1,383,140 | | |
See Notes to Financial Statements
180
Schedule of Investments Strategic Income Fund^ (cont'd)
| PRINCIPAL AMOUNT(a) | | | | VALUE | |
| Leisure Time 0.0%(d) | | | |
EUR | 350,000 | | | Piaggio & C SpA, 3.63%, due 4/30/2025 | | $ | 409,139 | (q) | |
| Lodging 0.0%(d) | | | |
GBP | 345,000 | | | TVL Finance PLC, (3M GBP LIBOR + 5.38%), 6.16%, due 7/15/2025 | | | 431,254 | (b)(q) | |
Machinery 0.2% | | | |
| | | | | CFX Escrow Corp. | | | |
$ | 1,410,000 | | | 6.00%, due 2/15/2024 | | | 1,498,125 | (l) | |
| | 350,000 | | | 6.38%, due 2/15/2026 | | | 379,313 | (l) | |
| | 365,000 | | | Granite Holdings U.S. Acquisition Co., 11.00%, due 10/1/2027 | | | 338,538 | (l) | |
| | 1,500,000 | | | Harsco Corp., 5.75%, due 7/31/2027 | | | 1,558,155 | (l) | |
| | 120,000 | | | Oshkosh Corp., 5.38%, due 3/1/2025 | | | 124,260 | | |
| | 180,000 | | | RBS Global, Inc./Rexnord LLC, 4.88%, due 12/15/2025 | | | 185,625 | (l) | |
| | 2,925,000 | | | Terex Corp., 5.63%, due 2/1/2025 | | | 2,946,937 | (l) | |
| | | | 7,030,953 | | |
| Machinery - Construction & Mining 0.0%(d) | | | |
| | 1,250,000 | | | Caterpillar Financial Services Corp., (3M USD LIBOR + 0.28%), 2.38%, due 9/7/2021 | | | 1,250,363 | (b) | |
| Machinery - Diversified 0.0%(d) | | | |
| | 715,000 | | | John Deere Capital Corp., (3M USD LIBOR + 0.40%), 2.50%, due 6/7/2021 | | | 717,457 | (b) | |
EUR | 513,000 | | | Platin 1426 GmbH, 5.38%, due 6/15/2023 | | | 537,499 | (q) | |
| | | | 1,254,956 | | |
Managed Care 0.2% | | | |
$ | 325,000 | | | Centene Corp., 4.75%, due 5/15/2022 | | | 331,906 | | |
| | 3,560,000 | | | MPH Acquisition Holdings LLC, 7.13%, due 6/1/2024 | | | 3,319,700 | (l) | |
| | | | | WellCare Health Plans, Inc. | | | |
| | 715,000 | | | 5.25%, due 4/1/2025 | | | 748,292 | | |
| | 605,000 | | | 5.38%, due 8/15/2026 | | | 643,569 | (l) | |
| | | | 5,043,467 | | |
Media 0.9% | | | |
EUR | 299,000 | | | Altice Finco SA, 4.75%, due 1/15/2028 | | | 323,686 | (q) | |
| | | | | Altice Luxembourg SA | | | |
EUR | 368,000 | | | 6.25%, due 2/15/2025 | | | 426,334 | (q) | |
EUR | 200,000 | | | 8.00%, due 5/15/2027 | | | 243,406 | (q) | |
| | | | | Comcast Corp. | | | |
$ | 5,265,000 | | | 4.00%, due 8/15/2047 | | | 5,819,154 | (i) | |
| | 11,035,000 | | | 4.95%, due 10/15/2058 | | | 14,239,623 | (i) | |
| | 1,300,000 | | | NBCUniversal Enterprise, Inc., (3M USD LIBOR + 0.40%), 2.50%, due 4/1/2021 | | | 1,304,368 | (b)(l) | |
| | 410,000 | | | Sirius XM Radio, Inc., 5.38%, due 4/15/2025 | | | 426,400 | (l) | |
EUR | 369,000 | | | Summer BidCo BV, 9.00% Cash/9.75% PIK, due 11/15/2025 | | | 428,303 | (q)(r) | |
$ | 1,000,000 | | | Telenet Finance Luxembourg Notes S.a.r.l., 5.50%, due 3/1/2028 | | | 1,063,780 | (l) | |
EUR | 337,500 | | | UPCB Finance IV Ltd., 4.00%, due 1/15/2027 | | | 395,234 | (q) | |
GBP | 637,200 | | | Virgin Media Secured Finance PLC, 6.25%, due 3/28/2029 | | | 878,016 | (q) | |
EUR | 334,000 | | | Ziggo BV, 4.25%, due 1/15/2027 | | | 401,274 | (q) | |
| | | | 25,949,578 | | |
See Notes to Financial Statements
181
Schedule of Investments Strategic Income Fund^ (cont'd)
| PRINCIPAL AMOUNT(a) | | | | VALUE | |
Media Content 1.3% | | | |
| | | | | AMC Networks, Inc. | | | |
$ | 220,000 | | | 5.00%, due 4/1/2024 | | $ | 224,083 | | |
| | 1,175,000 | | | 4.75%, due 8/1/2025 | | | 1,186,750 | | |
| | 2,540,000 | | | Cumulus Media New Holdings, Inc., 6.75%, due 7/1/2026 | | | 2,692,400 | (l) | |
| | | | | Diamond Sports Group LLC/Diamond Sports Finance Co. | | | |
| | 780,000 | | | 5.38%, due 8/15/2026 | | | 814,125 | (l) | |
| | 960,000 | | | 6.63%, due 8/15/2027 | | | 988,800 | (l) | |
| | 142,000 | | | Gannett Co., Inc., 5.13%, due 7/15/2020 | | | 142,355 | | |
| | | | | Gray Television, Inc. | | | |
| | 895,000 | | | 5.13%, due 10/15/2024 | | | 927,444 | (l) | |
| | 1,790,000 | | | 7.00%, due 5/15/2027 | | | 1,958,743 | (l) | |
| | | | | iHeartCommunications, Inc. | | | |
| | 1,150,000 | | | 6.38%, due 5/1/2026 | | | 1,237,688 | | |
| | 1,430,000 | | | 8.38%, due 5/1/2027 | | | 1,533,675 | | |
| | 1,540,000 | | | 5.25%, due 8/15/2027 | | | 1,588,818 | (l) | |
| | 1,465,000 | | | Lions Gate Capital Holdings LLC, 5.88%, due 11/1/2024 | | | 1,380,763 | (l) | |
| | | | | Netflix, Inc. | | | |
| | 810,000 | | | 5.38%, due 2/1/2021 | | | 838,350 | | |
| | 35,000 | | | 5.50%, due 2/15/2022 | | | 37,100 | | |
| | 470,000 | | | 5.75%, due 3/1/2024 | | | 517,370 | | |
| | 975,000 | | | 4.88%, due 4/15/2028 | | | 1,007,458 | | |
| | 1,135,000 | | | 5.88%, due 11/15/2028 | | | 1,249,919 | | |
| | 2,375,000 | | | 5.38%, due 11/15/2029 | | | 2,502,656 | (l) | |
| | 920,000 | | | 4.88%, due 6/15/2030 | | | 930,120 | (l) | |
| | | | | Nexstar Broadcasting, Inc. | | | |
| | 60,000 | | | 6.13%, due 2/15/2022 | | | 60,825 | (l) | |
| | 120,000 | | | 5.88%, due 11/15/2022 | | | 121,800 | | |
| | 225,000 | | | 5.63%, due 8/1/2024 | | | 234,761 | (l) | |
| | 2,775,000 | | | Nexstar Escrow, Inc., 5.63%, due 7/15/2027 | | | 2,926,792 | (l) | |
| | | | | Sinclair Television Group, Inc. | | | |
| | 205,000 | | | 5.63%, due 8/1/2024 | | | 211,150 | (l) | |
| | 240,000 | | | 5.88%, due 3/15/2026 | | | 250,500 | (l) | |
| | 1,510,000 | | | 5.13%, due 2/15/2027 | | | 1,521,325 | (l) | |
| | | | | Sirius XM Radio, Inc. | | | |
| | 1,105,000 | | | 3.88%, due 8/1/2022 | | | 1,128,481 | (l) | |
| | 275,000 | | | 4.63%, due 5/15/2023 | | | 279,290 | (l) | |
| | 1,360,000 | | | 4.63%, due 7/15/2024 | | | 1,421,200 | (l) | |
| | 1,725,000 | | | 5.38%, due 7/15/2026 | | | 1,819,875 | (l) | |
| | 1,325,000 | | �� | 5.00%, due 8/1/2027 | | | 1,392,906 | (l) | |
| | 3,085,000 | | | 5.50%, due 7/1/2029 | | | 3,333,728 | (l) | |
| | 1,095,000 | | | TEGNA, Inc., 5.00%, due 9/15/2029 | | | 1,110,056 | (l) | |
| | 390,000 | | | WMG Acquisition Corp., 5.00%, due 8/1/2023 | | | 399,750 | (l) | |
| | | | 37,971,056 | | |
Medical Products 0.2% | | | |
| | | | | Avantor, Inc. | | | |
| | 860,000 | | | 6.00%, due 10/1/2024 | | | 919,237 | (l) | |
| | 2,280,000 | | | 9.00%, due 10/1/2025 | | | 2,547,216 | (l) | |
| | 2,433,000 | | | Ortho-Clinical Diagnostics, Inc./Ortho-Clinical Diagnostics SA, 6.63%, due 5/15/2022 | | | 2,350,886 | (l) | |
| | | | 5,817,339 | | |
See Notes to Financial Statements
182
Schedule of Investments Strategic Income Fund^ (cont'd)
| PRINCIPAL AMOUNT(a) | | | | VALUE | |
Metals - Mining Excluding Steel 0.5% | | | |
| | | | | Arconic, Inc. | | | |
$ | 60,000 | | | 6.15%, due 8/15/2020 | | $ | 61,657 | | |
| | 140,000 | | | 5.40%, due 4/15/2021 | | | 144,432 | | |
| | 120,000 | | | 5.87%, due 2/23/2022 | | | 128,317 | | |
| | | | | Cleveland Cliffs, Inc. | | | |
| | 530,000 | | | 4.88%, due 1/15/2024 | | | 544,575 | (l) | |
| | 1,730,000 | | | 5.88%, due 6/1/2027 | | | 1,649,988 | (l) | |
| | | | | Constellium NV | | | |
| | 411,000 | | | 5.75%, due 5/15/2024 | | | 422,857 | (l) | |
| | 707,000 | | | 6.63%, due 3/1/2025 | | | 739,911 | (l) | |
| | 241,000 | | | First Quantum Minerals Ltd., 7.25%, due 4/1/2023 | | | 241,753 | (l) | |
| | | | | FMG Resources (August 2006) Pty Ltd. | | | |
| | 525,000 | | | 4.75%, due 5/15/2022 | | | 540,750 | (l) | |
| | 45,000 | | | 5.13%, due 3/15/2023 | | | 46,856 | (l) | |
| | 1,235,000 | | | 5.13%, due 5/15/2024 | | | 1,296,750 | (l) | |
| | | | | Freeport-McMoRan, Inc. | | | |
| | 1,325,000 | | | 3.55%, due 3/1/2022 | | | 1,339,906 | (i) | |
| | 245,000 | | | 4.55%, due 11/14/2024 | | | 254,800 | | |
| | 550,000 | | | 5.00%, due 9/1/2027 | | | 561,688 | | |
| | 915,000 | | | 5.25%, due 9/1/2029 | | | 931,287 | | |
| | 295,000 | | | 5.40%, due 11/14/2034 | | | 287,994 | | |
| | 1,135,000 | | | 5.45%, due 3/15/2043 | | | 1,055,550 | (i) | |
| | | | | Hudbay Minerals, Inc. | | | |
| | 665,000 | | | 7.25%, due 1/15/2023 | | | 687,377 | (l) | |
| | 544,000 | | | 7.63%, due 1/15/2025 | | | 553,860 | (l) | |
| | | | | Novelis Corp. | | | |
| | 735,000 | | | 6.25%, due 8/15/2024 | | | 769,913 | (l) | |
| | 830,000 | | | 5.88%, due 9/30/2026 | | | 871,583 | (l) | |
| | | | 13,131,804 | | |
Mining 0.4% | | | |
| | 6,660,000 | | | Anglo American Capital PLC, 4.00%, due 9/11/2027 | | | 6,898,685 | (l) | |
| | 238,000 | | | Codelco, Inc., 3.00%, due 9/30/2029 | | | 237,182 | (l) | |
EUR | 461,000 | | | Constellium NV, 4.25%, due 2/15/2026 | | | 532,406 | (q) | |
| | | | | Indonesia Asahan Aluminium Persero PT | | | |
$ | 211,000 | | | 5.23%, due 11/15/2021 | | | 220,917 | (l) | |
| | 200,000 | | | 5.71%, due 11/15/2023 | | | 219,691 | (l) | |
| | 1,330,000 | | | 6.76%, due 11/15/2048 | | | 1,707,517 | (q) | |
| | 200,000 | | | Minera Mexico SA de CV, 4.50%, due 1/26/2050 | | | 196,140 | (l) | |
| | 200,000 | | | Minsur SA, 6.25%, due 2/7/2024 | | | 220,750 | (q) | |
| | | | | Vedanta Resources PLC | | | |
| | 400,000 | | | 8.25%, due 6/7/2021 | | | 416,200 | (q) | |
| | 300,000 | | | 6.38%, due 7/30/2022 | | | 296,700 | (q) | |
| | 550,000 | | | VM Holding SA, 5.38%, due 5/4/2027 | | | 583,693 | (q) | |
| | 200,000 | | | Volcan Cia Minera SAA, 5.38%, due 2/2/2022 | | | 207,252 | (q) | |
| | | | 11,737,133 | | |
Miscellaneous Manufacturer 0.2% | | | |
| | 750,000 | | | General Electric Capital Corp., (3M USD LIBOR + 0.62%), 2.63%, due 1/9/2020 | | | 749,802 | (b) | |
| | 5,525,000 | | | General Electric Co., Ser. D, 5.00%, due 1/21/2021 | | | 5,328,642 | (i)(s)(t) | |
| | | | 6,078,444 | | |
See Notes to Financial Statements
183
Schedule of Investments Strategic Income Fund^ (cont'd)
| PRINCIPAL AMOUNT(a) | | | | VALUE | |
| Multi-National 0.0%(d) | | | |
$ | 200,000 | | | African Export-Import Bank, 3.99%, due 9/21/2029 | | $ | 200,064 | (l) | |
| | 200,000 | | | Banque Ouest Africaine de Developpement, 4.70%, due 10/22/2031 | | | 201,264 | (l) | |
| | | | 401,328 | | |
Oil & Gas 2.1% | | | |
| | 300,000 | | | BP Capital Markets PLC, (3M USD LIBOR + 0.25%), 2.38%, due 11/24/2020 | | | 300,552 | (b) | |
| | 4,530,000 | | | Canadian Natural Resources Ltd., 4.95%, due 6/1/2047 | | | 5,306,629 | (i) | |
| | 6,310,000 | | | Concho Resources, Inc., 4.88%, due 10/1/2047 | | | 7,122,618 | (i) | |
| | 89,000 | | | Ecopetrol SA, 5.88%, due 9/18/2023 | | | 98,652 | | |
| | | | | Gazprom OAO Via Gaz Capital SA | | | |
| | 200,000 | | | 4.95%, due 7/19/2022 | | | 211,538 | (q) | |
| | 661,000 | | | 5.15%, due 2/11/2026 | | | 722,511 | (l) | |
| | | | | KazMunayGas National Co. JSC | | | |
| | 508,000 | | | 5.38%, due 4/24/2030 | | | 584,210 | (l) | |
| | 1,089,000 | | | 6.38%, due 10/24/2048 | | | 1,369,744 | (i)(l) | |
| | 9,115,000 | | | Marathon Oil Corp., 4.40%, due 7/15/2027 | | | 9,794,322 | (i) | |
| | | | | Occidental Petroleum Corp. | | | |
| | 770,000 | | | (3M USD LIBOR + 1.25%), 3.44%, due 8/13/2021 | | | 774,874 | (b) | |
| | 7,350,000 | | | (3M USD LIBOR + 1.45%), 3.64%, due 8/15/2022 | | | 7,395,465 | (b) | |
| | 9,930,000 | | | 3.20%, due 8/15/2026 | | | 10,052,696 | | |
| | 9,950,000 | | | 3.50%, due 8/15/2029 | | | 10,079,150 | | |
| | 1,260,000 | | | Parsley Energy LLC/Parsley Finance Corp., 5.25%, due 8/15/2025 | | | 1,291,525 | (l) | |
| | 211,000 | | | Pertamina Persero PT, 3.65%, due 7/30/2029 | | | 216,560 | (l) | |
| | | | | Petrobras Global Finance BV | | | |
EUR | 416,000 | | | 4.75%, due 1/14/2025 | | | 539,359 | | |
$ | 310,000 | | | 6.90%, due 3/19/2049 | | | 360,313 | | |
| | | | | Petroleos Mexicanos | | | |
| | 83,000 | | | 6.84%, due 1/23/2030 | | | 88,636 | (l) | |
| | 1,231,000 | | | 7.69%, due 1/23/2050 | | | 1,342,282 | (l) | |
EUR | 329,000 | | | Repsol Int'l Finance BV, 4.50%, due 3/25/2075 | | | 421,108 | (q)(s) | |
$ | 1,033,000 | | | Saudi Arabian Oil Co., 4.25%, due 4/16/2039 | | | 1,106,481 | (l) | |
| | 456,000 | | | Sinopec Group Overseas Development 2018 Ltd., 2.50%, due 8/8/2024 | | | 454,524 | (l) | |
| | 244,000 | | | Tecpetrol SA, 4.88%, due 12/12/2022 | | | 223,260 | (q) | |
| | 178,000 | | | YPF SA, 8.50%, due 3/23/2021 | | | 162,425 | (q) | |
| | | | 60,019,434 | | |
Oil Field Equipment & Services 0.1% | | | |
| | 330,000 | | | Exterran Partners L.P., 6.00%, due 10/1/2022 | | | 332,475 | | |
| | | | | Precision Drilling Corp. | | | |
| | 1,221,000 | | | 7.75%, due 12/15/2023 | | | 1,153,845 | | |
| | 800,000 | | | 5.25%, due 11/15/2024 | | | 674,000 | (i) | |
| | 285,000 | | | 7.13%, due 1/15/2026 | | | 246,525 | (l) | |
| | 73,500 | | | Transocean Phoenix 2 Ltd., 7.75%, due 10/15/2024 | | | 76,256 | (l) | |
| | 82,500 | | | Transocean Proteus Ltd., 6.25%, due 12/1/2024 | | | 82,707 | (l) | |
| | 1,515,000 | | | USA Compression Partners L.P./USA Compression Finance Corp., 6.88%, due 9/1/2027 | | | 1,515,000 | (l) | |
| | | | 4,080,808 | | |
Packaging 0.6% | | | |
| | | | | ARD Finance SA | | | |
EUR | 340,000 | | | 6.63% Cash/7.38% PIK, due 9/15/2023 | | | 392,474 | (r) | |
$ | 465,000 | | | 7.13% Cash/7.88% PIK, due 9/15/2023 | | | 483,019 | (r) | |
See Notes to Financial Statements
184
Schedule of Investments Strategic Income Fund^ (cont'd)
| PRINCIPAL AMOUNT(a) | | | | VALUE | |
| | | | | Ardagh Packaging Finance PLC/Ardagh Holdings USA, Inc. | | | |
$ | 390,000 | | | 4.63%, due 5/15/2023 | | $ | 398,580 | (l) | |
| | 1,100,000 | | | 6.00%, due 2/15/2025 | | | 1,155,000 | (i)(l) | |
| | 1,135,000 | | | Berry Global Escrow Corp., 5.63%, due 7/15/2027 | | | 1,204,519 | (l) | |
| | 465,000 | | | Berry Global, Inc., 4.50%, due 2/15/2026 | | | 467,906 | (l) | |
| | | | | Berry Plastics Corp. | | | |
| | 630,000 | | | 5.50%, due 5/15/2022 | | | 638,662 | | |
| | 100,000 | | | 6.00%, due 10/15/2022 | | | 101,750 | | |
| | 1,270,000 | | | 5.13%, due 7/15/2023 | | | 1,301,750 | (i) | |
| | | | | BWAY Holding Co. | | | |
| | 2,150,000 | | | 5.50%, due 4/15/2024 | | | 2,211,812 | (i)(l) | |
| | 1,545,000 | | | 7.25%, due 4/15/2025 | | | 1,477,406 | (l) | |
| | 420,000 | | | Crown Americas LLC/Crown Americas Capital Corp. IV, 4.50%, due 1/15/2023 | | | 438,900 | | |
| | | | | Graphic Packaging Int'l, Inc. | | | |
| | 325,000 | | | 4.75%, due 4/15/2021 | | | 334,445 | | |
| | 352,000 | | | 4.88%, due 11/15/2022 | | | 369,600 | | |
| | 285,000 | | | Owens-Brockway Glass Container, Inc., 5.00%, due 1/15/2022 | | | 294,263 | (l) | |
| | | | | Reynolds Group Issuer, Inc. | | | |
| | 1,875,223 | | | 5.75%, due 10/15/2020 | | | 1,881,693 | (i) | |
| | 216,586 | | | 6.88%, due 2/15/2021 | | | 216,857 | | |
| | 1,860,000 | | | 5.13%, due 7/15/2023 | | | 1,908,267 | (i)(l) | |
| | | | | Sealed Air Corp. | | | |
| | 220,000 | | | 4.88%, due 12/1/2022 | | | 232,925 | (l) | |
| | 335,000 | | | 5.25%, due 4/1/2023 | | | 357,613 | (l) | |
| | 1,310,000 | | | Trident TPI Holdings, Inc., 9.25%, due 8/1/2024 | | | 1,270,700 | (l) | |
| | | | 17,138,141 | | |
Packaging & Containers 0.2% | | | |
GBP | 350,000 | | | Ardagh Packaging Finance PLC/Ardagh Holdings USA, Inc., 4.75%, due 7/15/2027 | | | 466,867 | (q) | |
EUR | 610,000 | | | BWAY Holding Co., 4.75%, due 4/15/2024 | | | 701,385 | (q) | |
EUR | 385,000 | | | Guala Closures SpA, (3M EURIBOR + 3.50%, 3.50% Floor), 3.50%, due 4/15/2024 | | | 434,303 | (b)(q) | |
$ | 1,215,000 | | | Sealed Air Corp., 5.50%, due 9/15/2025 | | | 1,324,350 | (l) | |
| | 1,260,000 | | | Silgan Holdings, Inc., 4.75%, due 3/15/2025 | | | 1,288,350 | | |
| | | | 4,215,255 | | |
Personal & Household Products 0.4% | | | |
| | | | | Energizer Holdings, Inc. | | | |
| | 425,000 | | | 4.70%, due 5/19/2021 | | | 435,094 | | |
| | 1,655,000 | | | 4.70%, due 5/24/2022 | | | 1,708,787 | (i) | |
| | 1,315,000 | | | 6.38%, due 7/15/2026 | | | 1,402,185 | (l) | |
| | 3,445,000 | | | 7.75%, due 1/15/2027 | | | 3,815,337 | (l) | |
| | 1,505,000 | | | Energizer SpinCo, Inc., 5.50%, due 6/15/2025 | | | 1,561,437 | (l) | |
| | 340,000 | | | Prestige Brands, Inc., 5.38%, due 12/15/2021 | | | 340,425 | (l) | |
| | | | | Spectrum Brands, Inc. | | | |
| | 1,075,000 | | | 6.13%, due 12/15/2024 | | | 1,111,281 | | |
| | 2,080,000 | | | 5.75%, due 7/15/2025 | | | 2,168,400 | | |
| | 165,000 | | | 5.00%, due 10/1/2029 | | | 168,713 | (l) | |
| | | | 12,711,659 | | |
Pharmaceuticals 1.4% | | | |
| | 8,010,000 | | | AbbVie, Inc., 4.70%, due 5/14/2045 | | | 8,562,434 | (i) | |
| | 655,000 | | | Bausch Health Americas, Inc., 8.50%, due 1/31/2027 | | | 736,875 | (l) | |
| | 290,000 | | | Bausch Health Cos., Inc., 5.75%, due 8/15/2027 | | | 314,922 | (l) | |
See Notes to Financial Statements
185
Schedule of Investments Strategic Income Fund^ (cont'd)
| PRINCIPAL AMOUNT(a) | | | | VALUE | |
$ | 750,000 | | | Bristol-Myers Squibb Co., (3M USD LIBOR + 0.38%), 2.55%, due 5/16/2022
Cigna Corp. | | $ | 750,750 | (b)(l) | |
| | 625,000 | | | (3M USD LIBOR + 0.65%), 2.79%, due 9/17/2021 | | | 625,100 | (b) | |
| | 7,655,000 | | | 4.80%, due 8/15/2038 | | | 8,690,491 | | |
| | | | | CVS Health Corp. | | | |
| | 1,125,000 | | | (3M USD LIBOR + 0.72%), 2.82%, due 3/9/2021 | | | 1,131,210 | (b) | |
| | 9,470,000 | | | 5.05%, due 3/25/2048 | | | 10,848,007 | (i) | |
| | 561,000 | | | Endo Ltd./Endo Finance LLC/Endo Finco, Inc., 6.00%, due 7/15/2023 | | | 370,961 | (l) | |
| | 850,000 | | | GlaxoSmithKline Capital PLC, (3M USD LIBOR + 0.35%), 2.53%, due 5/14/2021 | | | 851,925 | (b) | |
EUR | 448,000 | | | Nidda BondCo GmbH, 5.00%, due 9/30/2025 | | | 509,777 | (q) | |
EUR | 439,000 | | | Rossini S.a.r.l., 6.75%, due 10/30/2025 | | | 541,169 | (q) | |
EUR | 393,000 | | | Teva Pharmaceutical Finance Netherlands II BV, 1.88%, due 3/31/2027 | | | 330,507 | (q) | |
| | | | | Valeant Pharmaceuticals Int'l, Inc. | | | |
$ | 785,000 | | | 6.50%, due 3/15/2022 | | | 808,707 | (l) | |
| | 39,000 | | | 5.50%, due 3/1/2023 | | | 39,341 | (l) | |
EUR | 401,000 | | | 4.50%, due 5/15/2023 | | | 452,416 | (q) | |
$ | 204,000 | | | 5.88%, due 5/15/2023 | | | 206,958 | (l) | |
| | 1,050,000 | | | 7.00%, due 3/15/2024 | | | 1,098,484 | (l) | |
| | 2,860,000 | | | 6.13%, due 4/15/2025 | | | 2,969,037 | (l) | |
| | 865,000 | | | 5.50%, due 11/1/2025 | | | 903,934 | (l) | |
| | 50,000 | | | 9.00%, due 12/15/2025 | | | 56,302 | (l) | |
| | | | 40,799,307 | | |
Pipelines 2.5% | | | |
| | 1,000,000 | | | Abu Dhabi Crude Oil Pipeline LLC, 4.60%, due 11/2/2047 | | | 1,154,100 | (q) | |
| | | | | Energy Transfer Operating L.P. | | | |
| | 11,110,000 | | | Ser. B, 6.63%, due 2/15/2028 | | | 10,596,162 | (i)(s)(t) | |
| | 6,720,000 | | | Ser. 20Y, 6.25%, due 4/15/2049 | | | 8,074,256 | (i) | |
| | 1,004,000 | | | Enterprise Products Operating LLC, 5.25%, due 1/31/2020 | | | 1,011,692 | | |
| | 10,105,000 | | | Kinder Morgan Energy Partners L.P., 4.15%, due 2/1/2024 | | | 10,761,292 | (i) | |
| | 10,665,000 | | | Kinder Morgan, Inc., 5.55%, due 6/1/2045 | | | 12,502,569 | (i) | |
| | | | | MPLX L.P. | | | |
| | 8,995,000 | | | (3M USD LIBOR + 0.90%), 3.00%, due 9/9/2021 | | | 9,029,451 | (b) | |
| | 9,120,000 | | | 4.70%, due 4/15/2048 | | | 9,212,856 | (i) | |
| | 7,500,000 | | | Plains All American Pipeline L.P./PAA Finance Corp., 3.55%, due 12/15/2029 | | | 7,144,083 | | |
| | 2,430,000 | | | Southern Gas Corridor CJSC, 6.88%, due 3/24/2026 | | | 2,830,950 | (q) | |
| 175,000 | | | Targa Resources Partners L.P./Targa Resources Partners Finance Corp., 5.88%,
due 4/15/2026 | | | 182,674 | | |
| | | | 72,500,085 | | |
Real Estate 0.1% | | | |
| | 200,000 | | | CIFI Holdings Group Co. Ltd., 6.38%, due 5/2/2020 | | | 201,630 | (q) | |
| | 200,000 | | | Greenland Global Investment Ltd., 6.75%, due 9/26/2023 | | | 204,456 | (q) | |
| | 200,000 | | | NWD MTN Ltd., 4.13%, due 7/18/2029 | | | 199,485 | (q) | |
| | 250,000 | | | Qatari Diar Finance Co., 5.00%, due 7/21/2020 | | | 254,447 | (q) | |
| | 200,000 | | | Sino-Ocean Land Treasure IV Ltd., (3M USD LIBOR + 2.30%), 4.23%, due 7/31/2021 | | | 200,899 | (b)(q) | |
EUR | 386,000 | | | Summit Properties Ltd., 2.00%, due 1/31/2025 | | | 411,590 | (q) | |
| | | | | Sunac China Holdings Ltd. | | | |
$ | 200,000 | | | 8.63%, due 7/27/2020 | | | 204,607 | (q) | |
| | 200,000 | | | 7.50%, due 2/1/2024 | | | 198,060 | (q) | |
| | 200,000 | | | Wisdom Glory Group Ltd., 5.25%, due 7/19/2020 | | | 200,593 | (q)(s)(t) | |
| | | | 2,075,767 | | |
See Notes to Financial Statements
186
Schedule of Investments Strategic Income Fund^ (cont'd)
| PRINCIPAL AMOUNT(a) | | | | VALUE | |
Real Estate Development & Management 0.2% | | | |
| | | | | Realogy Group LLC/Realogy Co-Issuer Corp. | | | |
$ | 835,000 | | | 5.25%, due 12/1/2021 | | $ | 835,000 | (l) | |
| | 2,645,000 | | | 4.88%, due 6/1/2023 | | | 2,572,527 | (l) | |
| | 1,120,000 | | | 9.38%, due 4/1/2027 | | | 1,100,400 | (l) | |
| | | | 4,507,927 | | |
Real Estate Investment Trusts 0.7% | | | |
| | 1,080,000 | | | Equinix, Inc., 5.88%, due 1/15/2026 | | | 1,147,176 | | |
| | 2,290,000 | | | ESH Hospitality, Inc., 5.25%, due 5/1/2025 | | | 2,361,562 | (i)(l) | |
| | 9,940,000 | | | Healthcare Trust of America Holdings L.P., 3.10%, due 2/15/2030 | | | 9,931,994 | | |
GBP | 336,000 | | | Iron Mountain UK PLC, 3.88%, due 11/15/2025 | | | 434,607 | (q) | |
| | | | | MPT Operating Partnership L.P./MPT Finance Corp. | | | |
$ | 1,135,000 | | | 6.38%, due 3/1/2024 | | | 1,184,656 | | |
| | 1,035,000 | | | 5.50%, due 5/1/2024 | | | 1,062,169 | (i) | |
EUR | 328,000 | | | 3.33%, due 3/24/2025 | | | 405,769 | | |
$ | 535,000 | | | 5.25%, due 8/1/2026 | | | 561,750 | | |
| | 160,000 | | | RHP Hotel Properties L.P./RHP Finance Corp., 5.00%, due 4/15/2023 | | | 163,200 | | |
| | | | | Starwood Property Trust, Inc. | | | |
| | 940,000 | | | 3.63%, due 2/1/2021 | | | 947,050 | | |
| | 945,000 | | | 5.00%, due 12/15/2021 | | | 978,075 | | |
| | 255,000 | | | 4.75%, due 3/15/2025 | | | 264,802 | | |
| | 200,000 | | | Trust F/1401, 5.25%, due 12/15/2024 | | | 214,750 | (q) | |
| | | | 19,657,560 | | |
Recreation & Travel 0.4% | | | |
| | 1,900,000 | | | Cedar Fair L.P., 5.25%, due 7/15/2029 | | | 2,037,750 | (l) | |
| | | | | Cedar Fair L.P./Canada's Wonderland Co./Magnum Management Corp. | | | |
| | 480,000 | | | 5.38%, due 6/1/2024 | | | 493,200 | | |
| | 1,780,000 | | | 5.38%, due 4/15/2027 | | | 1,895,700 | | |
| | 1,160,000 | | | NCL Corp. Ltd., 4.75%, due 12/15/2021 | | | 1,175,950 | (i)(l) | |
| | | | | Six Flags Entertainment Corp. | | | |
| | 3,480,000 | | | 4.88%, due 7/31/2024 | | | 3,593,100 | (l) | |
| | 1,020,000 | | | 5.50%, due 4/15/2027 | | | 1,068,450 | (l) | |
| | | | 10,264,150 | | |
Restaurants 0.2% | | | |
| | | | | 1011778 BC ULC/New Red Finance, Inc. | | | |
| | 1,480,000 | | | 4.25%, due 5/15/2024 | | | 1,518,850 | (l) | |
| | 2,250,000 | | | 5.00%, due 10/15/2025 | | | 2,317,500 | (l) | |
| | | | | KFC Holding Co./Pizza Hut Holdings LLC/Taco Bell of America LLC | | | |
| | 160,000 | | | 5.00%, due 6/1/2024 | | | 166,000 | (l) | |
| | 2,295,000 | | | 5.25%, due 6/1/2026 | | | 2,426,963 | (i)(l) | |
| | | | | Yum! Brands, Inc. | | | |
| | 90,000 | | | 3.88%, due 11/1/2020 | | | 90,900 | | |
| | 515,000 | | | 4.75%, due 1/15/2030 | | | 540,106 | (l) | |
| | | | 7,060,319 | | |
Retail 0.4% | | | |
EUR | 364,000 | | | eG Global Finance PLC, 3.63%, due 2/7/2024 | | | 396,960 | (q) | |
GBP | 221,000 | | | Enterprise Inns PLC, 6.00%, due 10/6/2023 | | | 289,303 | (q) | |
See Notes to Financial Statements
187
Schedule of Investments Strategic Income Fund^ (cont'd)
| PRINCIPAL AMOUNT(a) | | | | VALUE | |
GBP | 309,000 | | | Stonegate Pub Co. Financing PLC, 4.88%, due 3/15/2022 | | $ | 408,703 | (q) | |
EUR | 300,000 | | | Tasty Bondco 1 SA, 6.25%, due 5/15/2026 | | | 346,541 | (q) | |
$ | 8,305,000 | | | Walmart, Inc., 3.25%, due 7/8/2029 | | | 8,986,665 | (i) | |
| | | | 10,428,172 | | |
Semiconductors 0.4% | | | |
| | 9,725,000 | | | Microchip Technology, Inc., 4.33%, due 6/1/2023 | | | 10,290,527 | (i) | |
Software 0.2% | | | |
| | 600,000 | | | CDK Global, Inc., 5.88%, due 6/15/2026 | | | 642,000 | | |
EUR | 297,000 | | | InterXion Holding NV, 4.75%, due 6/15/2025 | | | 360,211 | (q) | |
EUR | 638,000 | | | IQVIA, Inc., 2.88%, due 9/15/2025 | | | 731,044 | (q) | |
$ | 2,960,000 | | | Oracle Corp., 4.00%, due 7/15/2046 | | | 3,278,325 | | |
EUR | 333,000 | | | Playtech PLC, 4.25%, due 3/7/2026 | | | 394,413 | (q) | |
| | | | 5,405,993 | | |
Software - Services 0.5% | | | |
| | | | | CDK Global, Inc. | | | |
$ | 190,000 | | | 5.00%, due 10/15/2024 | | | 205,485 | | |
| | 630,000 | | | 4.88%, due 6/1/2027 | | | 663,863 | | |
| | 1,240,000 | | | Go Daddy Operating Co. LLC/GD Finance Co., Inc., 5.25%, due 12/1/2027 | | | 1,314,400 | (l) | |
| | 2,915,000 | | | j2 Cloud Services LLC/j2 Global Co-Obligor, Inc., 6.00%, due 7/15/2025 | | | 3,097,188 | (l) | |
| | | | | Open Text Corp. | | | |
| | 740,000 | | | 5.63%, due 1/15/2023 | | | 753,875 | (l) | |
| | 2,220,000 | | | 5.88%, due 6/1/2026 | | | 2,367,075 | (i)(l) | |
| | 2,435,000 | | | Rackspace Hosting, Inc., 8.63%, due 11/15/2024 | | | 2,228,025 | (i)(l) | |
| | 2,110,000 | | | SS&C Technologies, Inc., 5.50%, due 9/30/2027 | | | 2,251,106 | (l) | |
| | 232,000 | | | WEX, Inc., 4.75%, due 2/1/2023 | | | 234,322 | (l) | |
| | | | 13,115,339 | | |
Specialty Retail 0.4% | | | |
| | | | | L Brands, Inc. | | | |
| | 740,000 | | | 5.63%, due 10/15/2023 | | | 785,325 | | |
| | 1,605,000 | | | 5.25%, due 2/1/2028 | | | 1,488,637 | | |
| | 635,000 | | | Liberty Media Corp., 8.50%, due 7/15/2029 | | | 655,638 | | |
| | | | | Penske Automotive Group, Inc. | | | |
| | 1,435,000 | | | 3.75%, due 8/15/2020 | | | 1,442,175 | (i) | |
| | 360,000 | | | 5.75%, due 10/1/2022 | | | 364,500 | | |
| | 120,000 | | | 5.38%, due 12/1/2024 | | | 123,300 | | |
| | 2,065,000 | | | 5.50%, due 5/15/2026 | | | 2,157,925 | | |
| | 215,000 | | | QVC, Inc., 5.13%, due 7/2/2022 | | | 226,806 | | |
| | 3,560,000 | | | William Carter Co., 5.63%, due 3/15/2027 | | | 3,795,850 | (l) | |
| | | | 11,040,156 | | |
Steel Producers - Products 0.1% | | | |
| | 1,945,000 | | | Big River Steel LLC/BRS Finance Corp., 7.25%, due 9/1/2025 | | | 1,998,488 | (i)(l) | |
See Notes to Financial Statements
188
Schedule of Investments Strategic Income Fund^ (cont'd)
| PRINCIPAL AMOUNT(a) | | | | VALUE | |
Support - Services 1.7% | | | |
| | | | | ADT Corp. | | | |
$ | 385,000 | | | 6.25%, due 10/15/2021 | | $ | 411,469 | | |
| | 865,000 | | | 4.13%, due 6/15/2023 | | | 877,975 | | |
| | 430,000 | | | 4.88%, due 7/15/2032 | | | 372,079 | (l) | |
| | | | | Aramark Services, Inc. | | | |
| | 360,000 | | | 5.00%, due 4/1/2025 | | | 374,850 | (l) | |
| | 1,090,000 | | | 5.00%, due 2/1/2028 | | | 1,140,412 | (l) | |
| | | | | Avis Budget Car Rental LLC/Avis Budget Finance, Inc. | | | |
| | 76,000 | | | 5.50%, due 4/1/2023 | | | 77,497 | | |
| | 890,000 | | | 5.25%, due 3/15/2025 | | | 907,800 | (l) | |
| | 3,290,000 | | | 5.75%, due 7/15/2027 | | | 3,355,800 | (l) | |
| | 1,030,000 | | | frontdoor, Inc., 6.75%, due 8/15/2026 | | | 1,127,850 | (l) | |
| | 1,725,000 | | | Garda World Security Corp., 8.75%, due 5/15/2025 | | | 1,725,000 | (l) | |
| | 600,000 | | | GW B-CR Security Corp., 9.50%, due 11/1/2027 | | | 616,500 | (l) | |
| | | | | Hertz Corp. | | | |
| | 190,000 | | | 7.63%, due 6/1/2022 | | | 197,363 | (l) | |
| | 1,980,000 | | | 5.50%, due 10/15/2024 | | | 1,964,358 | (i)(l) | |
| | 2,420,000 | | | 7.13%, due 8/1/2026 | | | 2,498,650 | (l) | |
| | 3,035,000 | | | IAA Spinco, Inc., 5.50%, due 6/15/2027 | | | 3,251,699 | (l) | |
| | 320,000 | | | Iron Mountain U.S. Holdings, Inc., 5.38%, due 6/1/2026 | | | 332,000 | (l) | |
| | | | | Iron Mountain, Inc. | | | |
| | 750,000 | | | 4.38%, due 6/1/2021 | | | 758,438 | (l) | |
| | 345,000 | | | 6.00%, due 8/15/2023 | | | 352,331 | | |
| | 95,000 | | | 5.75%, due 8/15/2024 | | | 95,831 | | |
| | 860,000 | | | 4.88%, due 9/15/2027 | | | 885,800 | (l) | |
| | 5,220,000 | | | 5.25%, due 3/15/2028 | | | 5,481,000 | (l) | |
| | 1,260,000 | | | 4.88%, due 9/15/2029 | | | 1,289,925 | (l) | |
| | 3,270,000 | | | KAR Auction Services, Inc., 5.13%, due 6/1/2025 | | | 3,413,062 | (l) | |
| | | | | Prime Security Services Borrower LLC/Prime Finance, Inc. | | | |
| | 722,000 | | | 9.25%, due 5/15/2023 | | | 759,544 | (l) | |
| | 5,765,000 | | | 5.75%, due 4/15/2026 | | | 5,912,728 | (l) | |
| | 2,070,000 | | | Ritchie Bros Auctioneers, Inc., 5.38%, due 1/15/2025 | | | 2,157,975 | (l) | |
| | 2,115,000 | | | ServiceMaster Co. LLC, 5.13%, due 11/15/2024 | | | 2,191,669 | (l) | |
| | | | | Staples, Inc. | | | |
| | 4,955,000 | | | 7.50%, due 4/15/2026 | | | 5,165,587 | (l) | |
| | 280,000 | | | 10.75%, due 4/15/2027 | | | 291,200 | (l) | |
| | | | | United Rentals N.A., Inc. | | | |
| | 270,000 | | | 4.63%, due 10/15/2025 | | | 275,738 | | |
| | 850,000 | | | 5.50%, due 5/15/2027 | | | 896,219 | | |
| | | | 49,158,349 | | |
Technology Hardware & Equipment 0.4% | | | |
| | 1,230,000 | | | CDW LLC/CDW Finance Corp., 5.00%, due 9/1/2025 | | | 1,285,350 | | |
| | | | | CommScope Finance LLC | | | |
| | 960,000 | | | 5.50%, due 3/1/2024 | | | 972,960 | (l) | |
| | 325,000 | | | 6.00%, due 3/1/2026 | | | 333,938 | (l) | |
| | 1,340,000 | | | 8.25%, due 3/1/2027 | | | 1,269,288 | (l) | |
| | | | | CommScope Technologies LLC | | | |
| | 1,408,000 | | | 6.00%, due 6/15/2025 | | | 1,262,272 | (i)(l) | |
| | 1,970,000 | | | 5.00%, due 3/15/2027 | | | 1,610,475 | (l) | |
| | | | | CommScope, Inc. | | | |
| | 139,000 | | | 5.00%, due 6/15/2021 | | | 139,000 | (l) | |
| | 525,000 | | | 5.50%, due 6/15/2024 | | | 496,781 | (l) | |
| | | | | Diamond 1 Finance Corp./Diamond 2 Finance Corp. | | | |
| | 268,000 | | | 5.88%, due 6/15/2021 | | | 272,122 | (l) | |
See Notes to Financial Statements
189
Schedule of Investments Strategic Income Fund^ (cont'd)
| PRINCIPAL AMOUNT(a) | | | | VALUE | |
$ | 490,000 | | | 7.13%, due 6/15/2024 | | $ | 519,522 | (l) | |
| | 1,860,000 | | | Western Digital Corp., 4.75%, due 2/15/2026 | | | 1,894,875 | | |
| | | | 10,056,583 | | |
Telecom - Satellite 0.1% | | | |
| | 940,000 | | | Connect Finco S.a.r.l./Connect U.S. Finco LLC, 6.75%, due 10/1/2026 | | | 974,075 | (l) | |
| | | | | Intelsat Jackson Holdings SA | | | |
| | 625,000 | | | 9.50%, due 9/30/2022 | | | 721,094 | (l) | |
| | 2,605,000 | | | 5.50%, due 8/1/2023 | | | 2,435,675 | (i) | |
| | | | 4,130,844 | | |
Telecom - Wireless 0.4% | | | |
| | 220,000 | | | Sprint Capital Corp., 8.75%, due 3/15/2032 | | | 268,264 | | |
| | | | | Sprint Corp. | | | |
| | 1,040,000 | | | 7.25%, due 9/15/2021 | | | 1,109,742 | | |
| | 1,300,000 | | | 7.88%, due 9/15/2023 | | | 1,434,875 | | |
| | 4,860,000 | | | 7.13%, due 6/15/2024 | | | 5,273,100 | (i) | |
| | 920,000 | | | 7.63%, due 3/1/2026 | | | 1,017,750 | | |
| | 465,000 | | | Sprint Nextel Corp., 6.00%, due 11/15/2022 | | | 491,738 | | |
| | | | | T-Mobile USA, Inc. | | | |
| | 360,000 | | | 6.00%, due 4/15/2024 | | | 373,500 | | |
| | 190,000 | | | 6.50%, due 1/15/2026 | | | 203,319 | | |
| | 445,000 | | | 4.50%, due 2/1/2026 | | | 458,906 | | |
| | | | 10,631,194 | | |
Telecom - Wireline Integrated & Services 0.7% | | | |
| | | | | Altice France SA | | | |
| | 1,845,000 | | | 8.13%, due 2/1/2027 | | | 2,045,644 | (l) | |
| | 690,000 | | | 5.50%, due 1/15/2028 | | | 702,937 | (l) | |
| | | | | Altice Luxembourg SA | | | |
| | 410,000 | | | 7.63%, due 2/15/2025 | | | 422,812 | (i)(l) | |
| | 365,000 | | | 10.50%, due 5/15/2027 | | | 412,906 | (l) | |
| | | | | CenturyLink, Inc. | | | |
| | 210,000 | | | Ser. V, 5.63%, due 4/1/2020 | | | 212,625 | | |
| | 650,000 | | | Ser. T, 5.80%, due 3/15/2022 | | | 687,375 | | |
| | | | | Equinix, Inc. | | | |
| | 140,000 | | | 5.38%, due 1/1/2022 | | | 142,758 | | |
| | 1,215,000 | | | 5.75%, due 1/1/2025 | | | 1,256,043 | | |
| | 3,265,000 | | | Frontier Communications Corp., 8.00%, due 4/1/2027 | | | 3,428,250 | (l) | |
| | | | | Level 3 Financing, Inc. | | | |
| | 38,000 | | | 5.38%, due 8/15/2022 | | | 38,143 | | |
| | 350,000 | | | 5.63%, due 2/1/2023 | | | 353,500 | | |
| | 1,085,000 | | | 5.13%, due 5/1/2023 | | | 1,098,562 | | |
| | 1,180,000 | | | 5.38%, due 1/15/2024 | | | 1,202,125 | | |
| | 915,000 | | | 4.63%, due 9/15/2027 | | | 929,869 | (l) | |
| | 2,877,000 | | | Numericable-SFR SA, 7.38%, due 5/1/2026 | | | 3,080,821 | (i)(l) | |
| | 140,000 | | | Qwest Corp., 6.75%, due 12/1/2021 | | | 151,098 | | |
| | | | | Zayo Group LLC/Zayo Capital, Inc. | | | |
| | 1,225,000 | | | 6.00%, due 4/1/2023 | | | 1,259,925 | | |
| | 1,750,000 | | | 6.38%, due 5/15/2025 | | | 1,799,000 | | |
| | 1,100,000 | | | 5.75%, due 1/15/2027 | | | 1,118,018 | (l) | |
| | | | 20,342,411 | | |
See Notes to Financial Statements
190
Schedule of Investments Strategic Income Fund^ (cont'd)
| PRINCIPAL AMOUNT(a) | | | | VALUE | |
Telecommunications 1.6% | | | |
EUR | 567,000 | | | Altice France SA, 5.88%, due 2/1/2027 | | $ | 697,105 | (q) | |
| | | | | AT&T, Inc. | | | | | |
$ | 1,300,000 | | | (3M USD LIBOR + 0.95%), 2.95%, due 7/15/2021 | | | 1,313,260 | (b) | |
| | 2,929,000 | | | 4.35%, due 6/15/2045 | | | 3,080,957 | | |
| | 11,385,000 | | | 5.45%, due 3/1/2047 | | | 13,745,735 | (i) | |
| | 8,800,000 | | | 4.50%, due 3/9/2048 | | | 9,402,243 | (i) | |
| | 200,000 | | | Batelco Int'l Finance No. 1 Ltd., 4.25%, due 5/1/2020 | | | 199,999 | (q) | |
| | 200,000 | | | Comunicaciones Celulares SA via Comcel Trust, 6.88%, due 2/6/2024 | | | 206,000 | (q) | |
EUR | 272,000 | | | DKT Finance ApS, 7.00%, due 6/17/2023 | | | 320,801 | (q) | |
$ | 1,182,000 | | | Liquid Telecommunications Financing PLC, 8.50%, due 7/13/2022 | | | 1,176,799 | (i)(l) | |
EUR | 401,000 | | | SoftBank Group Corp., 5.00%, due 4/15/2028 | | | 490,860 | (q) | |
EUR | 506,000 | | | Telecom Italia SpA, 3.63%, due 5/25/2026 | | | 626,006 | (q) | |
EUR | 400,000 | | | Telefonica Europe BV, 3.88%, due 6/22/2026 | | | 474,966 | (q)(s)(t) | |
$ | 239,000 | | | VEON Holdings BV, 4.00%, due 4/9/2025 | | | 245,527 | (l) | |
| | | | | Verizon Communications, Inc. | | | |
| | 1,300,000 | | | (3M USD LIBOR + 1.00%), 3.12%, due 3/16/2022 | | | 1,320,946 | (b) | |
| | 9,570,000 | | | 4.52%, due 9/15/2048 | | | 11,387,505 | (i) | |
GBP | 399,000 | | | Vodafone Group PLC, 4.88%, due 10/3/2078 | | | 549,799 | (q)(s) | |
| | | | 45,238,508 | | |
Theaters & Entertainment 0.3% | | | |
| | | | | AMC Entertainment Holdings, Inc. | | | |
$ | 1,725,000 | | | 5.75%, due 6/15/2025 | | | 1,638,922 | (i) | |
| | 1,175,000 | | | 5.88%, due 11/15/2026 | | | 1,070,719 | | |
| | 1,245,000 | | | 6.13%, due 5/15/2027 | | | 1,125,947 | | |
| | | | | Live Nation Entertainment, Inc. | | | |
| | 425,000 | | | 5.38%, due 6/15/2022 | | | 430,708 | (l) | |
| | 2,495,000 | | | 4.88%, due 11/1/2024 | | | 2,582,325 | (l) | |
| | 1,310,000 | | | 4.75%, due 10/15/2027 | | | 1,365,806 | (l) | |
| | | | 8,214,427 | | |
| Transportation 0.0%(d) | | | |
| | 200,000 | | | Rumo Luxembourg S.a.r.l., 7.38%, due 2/9/2024 | | | 215,760 | (q) | |
| Water 0.0%(d) | | | |
| | 1,130,000 | | | Agua y Saneamientos Argentinos SA, 6.63%, due 2/1/2023 | | | 443,525 | (q) | |
GBP | 220,000 | | | Anglian Water Osprey Financing PLC, 4.00%, due 3/8/2026 | | | 266,210 | (q) | |
| | | | 709,735 | | |
| | | | | Total Corporate Bonds (Cost $1,259,386,663) | | | 1,315,858,800 | | |
Municipal Notes 1.7% | | | |
California 0.2% | | | |
$ | 3,525,000 | | | California St. G.O. Ref., Ser. 2019, 5.00%, due 10/1/2029 | | | 4,634,000 | | |
| | 710,000 | | | Sacramento Co. Arpt. Sys. Rev. Ref., Ser. 2018-C, 5.00%, due 7/1/2033 | | | 871,326 | | |
| | | | 5,505,326 | | |
See Notes to Financial Statements
191
Schedule of Investments Strategic Income Fund^ (cont'd)
| PRINCIPAL AMOUNT(a) | | | | VALUE | |
| Colorado 0.0%(d) | | | |
$ | 705,000 | | | Colorado St. Hlth. Facs. Au. Hosp. Rev. Ref. (CommonSpirit Hlth.), Ser. 2019-A-2,
4.00%, due 8/1/2049 | | $ | 753,758 | | |
| Delaware 0.0%(d) | | | |
| 720,000 | | | Delaware St. Hlth. Fac. Au. Rev. (Beebe Med. Ctr. Inc.), Ser. 2018,
5.00%, due 6/1/2048 | | | 843,559 | | |
Illinois 0.1% | | | |
| 675,000 | | | Chicago O'Hare Int'l Arpt. Spec. Fac. Rev. (Trips Obligated Group), Ser. 2018,
5.00%, due 7/1/2048 | | | 786,058 | | |
| 880,000 | | | Illinois Fin. Au. Rev. (Local Gov't Prog.-East Prairie Sch. Dist. # 73 Proj.),
(BAM Insured), Ser. 2018, 4.00%, due 12/1/2042 | | | 957,765 | | |
| | | | 1,743,823 | | |
Maryland 0.6% | | | |
| | 7,050,000 | | | Maryland St. G.O., Ser. 2019-A, 5.00%, due 8/1/2031 | | | 9,174,799 | | |
| | 6,350,000 | | | Prince Georges Co. G.O. (Cons. Pub. Imp.), Ser. 2019-A, 4.00%, due 7/15/2032 | | | 7,531,164 | | |
| | | | 16,705,963 | | |
Massachusetts 0.1% | | | |
| 1,055,000 | | | Massachusetts St. Dev. Fin. Agcy. Rev. (CareGroup Obligated Group),
Ser. 2018-J2, 5.00%, due 7/1/2053 | | | 1,239,477 | | |
| | 1,060,000 | | | Massachusetts St. Ed. Fin. Au. Rev. Ref., Ser. 2018-A, 4.08%, due 7/1/2027 | | | 1,171,003 | | |
| | | | 2,410,480 | | |
Michigan 0.1% | | | |
| 720,000 | | | Detroit Downtown Dev. Au. Tax Increment Rev. Ref. (Catalyst Dev. Proj.),
Ser. 2018-A, (AGM Insured), 5.00%, due 7/1/2048 | | | 799,251 | | |
| 910,000 | | | Michigan St. Strategic Fund Ltd. Oblig. Rev. (I-75 Improvement Proj.),
Ser. 2018, 5.00%, due 6/30/2048 | | | 1,075,356 | | |
| | | | 1,874,607 | | |
New Jersey 0.2% | | | |
| | 695,000 | | | Atlantic City G.O. Ref., Ser. 2018, 4.29%, due 9/1/2026 | | | 756,688 | | |
| 1,095,000 | | | New Jersey Econ. Dev. Au. Spec. Fac. Rev. Ref.
(Port Newark Container Term. LLC Proj.), Ser. 2017, 5.00%, due 10/1/2047 | | | 1,251,311 | | |
| 700,000 | | | New Jersey Higher Ed. Assist. Au. Rev. Ref. (Std. Loan Rev.), Ser. 2018-B,
5.00%, due 12/1/2026 | | | 840,406 | | |
| 675,000 | | | New Jersey St. Hsg. & Mtge. Fin. Agcy. Rev. Ref. (Single Family Hsg.),
Ser. 2018-B, 3.80%, due 10/1/2032 | | | 731,005 | | |
| 880,000 | | | New Jersey St. Trans. Trust Fund Au. Trans. Sys. Rev. Ref.,
Ser. 2018-A, 5.00%, due 12/15/2036 | | | 1,021,002 | | |
| | 695,000 | | | South Jersey Port Corp. Rev. (Sub-Marine Term), Ser. 2017-B, 5.00%, due 1/1/2048 | | | 797,360 | | |
| | | | 5,397,772 | | |
See Notes to Financial Statements
192
Schedule of Investments Strategic Income Fund^ (cont'd)
| PRINCIPAL AMOUNT(a) | | | | VALUE | |
| Oklahoma 0.0%(d) | | | |
$ | 715,000 | | | Oklahoma St. Dev. Fin. Au. Hlth. Sys. Rev. (OU Medicine Proj.),
Ser. 2018-B, 5.50%, due 8/15/2057 | | $ | 852,023 | | |
Pennsylvania 0.1% | | | |
| 355,000 | | | Commonwealth of Pennsylvania Cert. of Participation Ref.,
Ser. 2018, 5.00%, due 7/1/2043 | | | 421,712 | | |
| 1,060,000 | | | Pennsylvania St. Turnpike Commission Oil Franchise Tax Rev.,
Subser. 2018-B, 5.00%, due 12/1/2048 | | | 1,272,148 | | |
| | | | 1,693,860 | | |
Rhode Island 0.1% | | | |
| 1,035,000 | | | Rhode Island Commerce Corp. Spec. Fac. Rev. Ref.
(1st Lien - R I Arpt. Corp. Int'l Fac. Proj.), Ser. 2018, 5.00%, due 7/1/2034 | | | 1,244,567 | | |
| 770,000 | | | Rhode Island St. Std. Loan Au. Std. Loan Rev. (Sr. Prog.), Ser. 2018, 5.00%,
due 12/1/2025 | | | 904,850 | | |
| | | | 2,149,417 | | |
| Tennessee 0.0%(d) | | | |
| 530,000 | | | Greeneville Hlth. & Ed. Facs. Board Hosp. Rev. Ref. (Ballad Hlth. Obligated Group),
Ser. 2018-A, 5.00%, due 7/1/2029 | | | 650,973 | | |
Texas 0.1% | | | |
| 1,070,000 | | | Austin Comm. College Dist. Pub. Fac. Corp. Lease Rev., Ser. 2018-C, 4.00%,
due 8/1/2042 | | | 1,194,034 | | |
| 705,000 | | | Texas St. Private Activity Bond Surface Trans. Corp. Rev. (Segment 3C Proj.),
Ser. 2019, 5.00%, due 6/30/2058 | | | 821,128 | | |
| | | | 2,015,162 | | |
| Utah 0.0%(d) | | | |
| | 1,060,000 | | | Salt Lake City Corp. Arpt. Rev., Ser. 2018-A, 5.00%, due 7/1/2043 | | | 1,261,941 | | |
Virginia 0.1% | | | |
| | 3,705,000 | | | Henrico Co. G.O., Ser. 2019, 5.00%, due 8/1/2030 | | | 4,863,516 | | |
| West Virginia 0.0%(d) | | | |
| 705,000 | | | West Virginia Hosp. Fin. Au. Rev. (Imp. West Virginia Univ. Hlth. Sys.
Obligated Group), Ser. 2018-A, 5.00%, due 6/1/2052 | | | 823,757 | | |
| | | | | Total Municipal Notes (Cost $48,297,670) | | | 49,545,937 | | |
Asset-Backed Securities 7.0% | | | |
| | 1,100,000 | | | AIMCO CLO, Ser. 2018-AA, Class E, (3M USD LIBOR + 5.15%), 7.15%, due 4/17/2031 | | | 900,625 | (b)(l) | |
| | | | | AIMCO CLO 10 Ltd. | | | |
| | 1,050,000 | | | Ser. 2019-10A, Class D, (3M USD LIBOR + 3.55%), 5.85%, due 7/22/2032 | | | 992,073 | (b)(l) | |
| | 2,000,000 | | | Ser. 2019-10A, Class E, (3M USD LIBOR + 6.55%), 8.85%, due 7/22/2032 | | | 1,796,480 | (b)(l) | |
| | 550,000 | | | Alinea CLO Ltd., Ser. 2018-1A, Class E, (3M USD LIBOR + 6.00%), 7.97%,
due 7/20/2031 | | | 469,143 | (b)(l) | |
See Notes to Financial Statements
193
Schedule of Investments Strategic Income Fund^ (cont'd)
| PRINCIPAL AMOUNT(a) | | | | VALUE | |
$ | 7,960,000 | | | AM Capital Funding LLC, Ser. 2018-1, Class A, 4.98%, due 12/15/2023 | | $ | 8,357,584 | (l) | |
| 1,000,000 | | | American Express Credit Account Master Trust, Ser. 2017-2, Class A,
(1M USD LIBOR + 0.45%), 2.36%, due 9/16/2024 | | | 1,004,501 | (b) | |
| | | | | Apidos CLO XXVIII | | | |
| | 500,000 | | | Ser. 2017-28A, Class C, (3M USD LIBOR + 2.50%), 4.47%, due 1/20/2031 | | | 449,645 | (b)(l) | |
| | 500,000 | | | Ser. 2017-28A, Class D, (3M USD LIBOR + 5.50%), 7.47%, due 1/20/2031 | | | 424,747 | (b)(l) | |
| 5,000,000 | | | Apidos CLO XXXI, Ser. 2019-31A, Class D, (3M USD LIBOR + 3.65%),
5.65%, due 4/15/2031 | | | 4,776,575 | (b)(l) | |
| | | | | Ares LIII CLO Ltd. | | | |
| | 4,750,000 | | | Ser. 2019-53A, Class D, (3M USD LIBOR + 3.75%), 6.27%, due 4/24/2031 | | | 4,579,754 | (b)(l) | |
| | 1,700,000 | | | Ser. 2019-53A, Class E, (3M USD LIBOR + 6.85%), 9.37%, due 4/24/2031 | | | 1,625,899 | (b)(l) | |
| 2,000,000 | | | Ares XLV CLO Ltd., Ser. 2017-45A, Class E, (3M USD LIBOR + 6.10%),
8.10%, due 10/15/2030 | | | 1,802,228 | (b)(l) | |
| | | | | Asset Backed Securities Corp. Home Equity | | | |
| | 374,671 | | | Ser. 2004-HE5, Class M2, (1M USD LIBOR + 1.88%), 3.70%, due 8/25/2034 | | | 374,264 | (b) | |
| | 315,830 | | | Ser. 2006-HE1, Class A3, (1M USD LIBOR + 0.20%), 2.02%, due 1/25/2036 | | | 315,063 | (b) | |
| 3,300,000 | | | Assurant CLO I Ltd., Ser. 2017-1A, Class E, (3M USD LIBOR + 6.46%),
8.43%, due 10/20/2029 | | | 3,164,200 | (b)(l) | |
| | | | | Assurant CLO II Ltd. | | | |
| | 250,000 | | | Ser. 2018-1A, Class D, (3M USD LIBOR + 2.85%), 4.82%, due 4/20/2031 | | | 231,353 | (b)(l) | |
| | 1,500,000 | | | Ser. 2018-1A, Class E, (3M USD LIBOR + 5.60%), 7.57%, due 4/20/2031 | | | 1,285,249 | (b)(l) | |
| 2,797,000 | | | Bear Stearns Asset-Backed Securities I Trust, Ser. 2006-HE1, Class 1M3,
(1M USD LIBOR + 0.46%), 2.28%, due 12/25/2035 | | | 2,784,592 | (b) | |
| | | | | Bear Stearns Asset-Backed Securities Trust | | | |
| | 1,332,927 | | | Ser. 2004-SD3, Class M2, (1M USD LIBOR + 1.88%), 3.70%, due 9/25/2034 | | | 1,350,435 | (b) | |
| | 7,265,000 | | | Ser. 2006-SD2, Class M2, (1M USD LIBOR + 0.80%), 2.62%, due 6/25/2036 | | | 7,302,418 | (b) | |
| 3,000,000 | | | Benefit Street Partners CLO XII Ltd., Ser. 2017-12A, Class D,
(3M USD LIBOR + 6.41%), 8.41%, due 10/15/2030 | | | 2,663,902 | (b)(l) | |
| 700,000 | | | BlueMountain CLO XXV Ltd., Ser. 2019-25A, Class D, (3M USD LIBOR + 3.55%),
5.84%, due 7/15/2032 | | | 665,214 | (b)(l) | |
| 650,000 | | | Canyon Capital CLO Ltd., Ser. 2014-1A, Class DR, (3M USD LIBOR + 5.50%),
7.44%, due 1/30/2031 | | | 544,850 | (b)(l) | |
| 1,005,000 | | | Capital One Multi-Asset Execution Trust, Ser. 2016-A7, Class A7,
(1M LIBOR + 0.51%), 2.43%, due 9/16/2024 | | | 1,010,080 | (b) | |
| | | | | Carbone CLO Ltd. | | | |
| | 1,000,000 | | | Ser. 2017-1A, Class C, (3M USD LIBOR + 2.60%), 4.57%, due 1/20/2031 | | | 909,080 | (b)(l) | |
| | 1,000,000 | | | Ser. 2017-1A, Class D, (3M USD LIBOR + 5.90%), 7.87%, due 1/20/2031 | | | 905,215 | (b)(l) | |
| 1,120,000 | | | Carlye U.S. CLO Ltd., Ser. 2017-5A, Class D, (3M USD LIBOR + 5.30%),
7.27%, due 1/20/2030 | | | 939,060 | (b)(l) | |
| 8,971,719 | | | Carrington Mortgage Loan Trust, Ser. 2006-RFC1, Class A4,
(1M USD LIBOR + 0.24%), 2.06%, due 3/25/2036 | | | 8,942,809 | (b)(i) | |
| 1,000,000 | | | Chase Issuance Trust, Ser. 2016-A3, Class A3, (1M LIBOR + 0.55%),
2.47%, due 6/15/2023 | | | 1,005,617 | (b) | |
| 2,350,000 | | | CIFC Funding III Ltd., Ser. 2019-3A, Class D, (3M USD LIBOR + 6.80%),
8.80%, due 7/16/2032 | | | 2,229,590 | (b)(l) | |
| 2,500,000 | | | Citibank Credit Card Issuance Trust, Ser. 2017-A7, Class A7, (1M LIBOR + 0.37%),
2.35%, due 8/8/2024 | | | 2,500,502 | (b) | |
| 521,375 | | | Citigroup Mortgage Loan Trust, Inc., Ser. 2006-AMC1, Class A2B,
(1M USD LIBOR + 0.16%), 1.98%, due 9/25/2036 | | | 461,438 | (b) | |
| | 236,427 | | | Colony American Finance Ltd., Ser. 2016-1, Class A, 2.54%, due 6/15/2048 | | | 236,102 | (l) | |
| 3,650,000 | | | Dryden 36 Senior Loan Fund, Ser. 2014-36A, Class ER2, (3M USD LIBOR + 6.88%),
8.88%, due 4/15/2029 | | | 3,322,253 | (b)(l) | |
| 250,000 | | | Dryden 45 Senior Loan Fund, Ser. 2016-45A, Class ER, (3M USD LIBOR + 5.85%),
7.85%, due 10/15/2030 | | | 219,391 | (b)(l) | |
| | | | | Dryden 53 CLO Ltd. | | | |
| | 300,000 | | | Ser. 2017-53A, Class D, (3M USD LIBOR + 2.40%), 4.40%, due 1/15/2031 | | | 265,454 | (b)(l) | |
| | 750,000 | | | Ser. 2017-53A, Class E, (3M USD LIBOR + 5.30%), 7.30%, due 1/15/2031 | | | 627,096 | (b)(l)(u) | |
See Notes to Financial Statements
194
Schedule of Investments Strategic Income Fund^ (cont'd)
| PRINCIPAL AMOUNT(a) | | | | VALUE | |
$ | 2,350,000 | | | Dryden 54 Senior Loan Fund, Ser. 2017-54A, Class E, (3M USD LIBOR + 6.20%),
8.17%, due 10/19/2029 | | $ | 2,069,090 | (b)(l) | |
| | | | | Eaton Vance CLO Ltd. | | | |
| | 850,000 | | | Ser. 2015-1A, Class DR, (3M USD LIBOR + 2.50%), 4.47%, due 1/20/2030 | | | 757,973 | (b)(l) | |
| | 900,000 | | | Ser. 2015-1A, Class ER, (3M USD LIBOR + 5.60%), 7.57%, due 1/20/2030 | | | 766,977 | (b)(l) | |
| | 750,000 | | | Ser. 2018-1A, Class E, (3M USD LIBOR + 6.00%), 8.00%, due 10/15/2030 | | | 663,412 | (b)(l) | |
| | | | | Elmwood CLO II Ltd. | | | |
| | 2,400,000 | | | Ser. 2019-2A, Class D, (3M USD LIBOR + 3.95%), 5.92%, due 4/20/2031 | | | 2,396,640 | (b)(l) | |
| | 2,700,000 | | | Ser. 2019-2A, Class E, (3M USD LIBOR + 6.80%), 8.77%, due 4/20/2031 | | | 2,543,569 | (b)(l) | |
| 2,250,480 | | | EquiFirst Mortgage Loan Trust, Ser. 2003-2, Class 1A1, (1M USD LIBOR + 1.13%),
3.04%, due 9/25/2033 | | | 2,244,039 | (b) | |
| 920,000 | | | Evergreen Credit Card Trust, Ser. 2019-1, Class A, (1M USD LIBOR + 0.48%),
2.39%, due 1/15/2023 | | | 921,816 | (b)(l) | |
| 161,324 | | | First Franklin Mortgage Loan Asset Backed Certificates, Ser. 2005-FF5, Class M2,
(1M USD LIBOR + 0.74%), 2.56%, due 5/25/2035 | | | 161,454 | (b) | |
| 700,000 | | | Flatiron CLO 17 Ltd., Ser. 2017-1A, Class E, (3M USD LIBOR + 6.00%), 8.16%,
due 5/15/2030 | | | 622,237 | (b)(l) | |
| 2,150,000 | | | Flatiron CLO 18 Ltd., Ser. 2018-1A, Class E, (3M USD LIBOR + 5.15%), 7.15%,
due 4/17/2031 | | | 1,800,280 | (b)(i)(l) | |
| | 1,617,039 | | | Foundation Finance Trust, Ser. 2019-1A, Class A , 3.86%, due 11/15/2034 | | | 1,644,947 | (l) | |
| | 352,180 | | | Freedom Financial Trust, Ser. 2018-1, Class A, 3.61%, due 7/18/2024 | | | 354,035 | (l) | |
| 1,600,000 | | | Galaxy XVIII CLO Ltd., Ser. 2018-28A, Class E, (3M USD LIBOR + 6.00%),
8.00%, due 7/15/2031 | | | 1,314,802 | (b)(l) | |
| 250,000 | | | Galaxy XXVII CLO Ltd., Ser. 2018-27A, Class E, (3M USD LIBOR + 5.78%),
7.95%, due 5/16/2031 | | | 205,370 | (b)(l) | |
| 1,600,000 | | | Gilbert Park CLO Ltd., Ser. 2017-1A, Class E, (3M USD LIBOR + 6.40%), 8.70%,
due 10/15/2030 | | | 1,483,958 | (b)(l) | |
| | 1,813,864 | | | Global SC Finance IV Ltd., Ser. 2018-1A, Class A, 4.29%, due 5/17/2038 | | | 1,881,892 | (l) | |
| 500,000 | | | Golden Credit Card Trust, Ser. 2019-2A, Class A, (1M USD LIBOR + 0.35%),
2.24%, due 10/15/2023 | | | 500,000 | (b)(l) | |
| | 199,194 | | | Home Equity Mortgage Trust, Ser. 2004-5, Class M2, (1M USD LIBOR + 1.60%),
3.42%, due 2/25/2035 | | | 199,211
| (b) | |
| | | | | Invitation Homes Trust | | | |
| | 1,408,392 | | | Ser. 2017-SFR2, Class A, (1M USD LIBOR + 0.85%), 2.74%, due 12/17/2036 | | | 1,406,412 | (b)(l) | |
| | 1,886,098 | | | Ser. 2018-SFR1, Class A, (1M USD LIBOR + 0.70%), 2.59%, due 3/17/2037 | | | 1,869,812 | (b)(l) | |
| 1,250,000 | | | Jay Park CLO Ltd., Ser. 2019-1A, Class DR, (3M USD LIBOR + 5.20%), 7.17%,
due 10/20/2027 | | | 1,165,940 | (b)(l) | |
| | | | | JP Morgan Mortgage Acquisition Trust | | | |
| | 3,497,000 | | | Ser. 2006-CH1, Class M1, (1M USD LIBOR + 0.22%), 2.04%, due 7/25/2036 | | | 3,487,999 | (b) | |
| | 5,260,000 | | | Ser. 2007-CH1, Class MV2, (1M USD LIBOR + 0.28%), 2.10%, due 11/25/2036 | | | 5,247,336 | (b) | |
| 2,000,000 | | | KKR CLO 16 Ltd., Ser. 2016, Class DR, (3M USD LIBOR + 6.75%), 8.72%,
due 1/20/2029 | | | 1,860,978 | (b)(l) | |
| 5,500,000 | | | KKR CLO 25 Ltd., Ser. 2025, Class D, (3M USD LIBOR + 3.85%), 5.85%,
due 4/15/2032 | | | 5,355,623 | (b)(l) | |
| 2,750,000 | | | Madison Park Funding XXXIV Ltd., Ser. 2019-34A, Class E, (3M USD LIBOR + 6.75%),
8.69%, due 4/25/2031 | | | 2,608,087 | (b)(l) | |
| 3,000,000 | | | Madison Park Funding XXXV Ltd., Ser. 2019-35A, Class E, (3M USD LIBOR + 6.75%),
8.72%, due 4/20/2031 | | | 2,856,626 | (b)(l) | |
| | | | | Magnetite CLO Ltd. | | | |
| | 3,000,000 | | | Ser. 2019-22A, Class D, (3M USD LIBOR + 3.65%), 6.03%, due 4/15/2031 | | | 2,871,868 | (b)(l) | |
| | 250,000 | | | Ser. 2018-20A, Class D, (3M USD LIBOR + 2.50%), 4.47%, due 4/20/2031 | | | 229,602 | (b)(l) | |
| | 250,000 | | | Ser. 2018-20A, Class E, (3M USD LIBOR + 5.35%), 7.32%, due 4/20/2031 | | | 215,820 | (b)(l) | |
| | 1,000,000 | | | Ser. 2015-12A, Class ER, (3M USD LIBOR + 5.68%), 7.68%, due 10/15/2031 | | | 889,837 | (b)(l) | |
| 500,000 | | | Marble Point CLO XI Ltd., Ser. 2017-2A, Class D, (3M USD LIBOR + 2.80%), 4.80%,
due 12/18/2030 | | | 445,262 | (b)(l) | |
| 3,250,000 | | | Mariner CLO LLC, Ser. 2019-1A, Class D, (3M USD LIBOR + 3.85%), 6.39%,
due 4/30/2032 | | | 3,137,563 | (b)(l) | |
See Notes to Financial Statements
195
Schedule of Investments Strategic Income Fund^ (cont'd)
| PRINCIPAL AMOUNT(a) | | | | VALUE | |
$ | 2,250,000 | | | Marlette Funding Trust, Ser. 2019-4A, Class A, 2.39%, due 12/17/2029 | | $ | 2,251,500 | (l) | |
| | | | | Navient Student Loan Trust | | | |
| | 65,860 | | | Ser. 2017-3A, Class A1, (1M USD LIBOR + 0.30%), 2.12%, due 7/26/2066 | | | 65,866 | (b)(l) | |
| | 704,773 | | | Ser. 2018-3A, Class A1, (1M USD LIBOR + 0.27%), 2.09%, due 3/25/2067 | | | 704,580 | (b)(l) | |
| | 327,304 | | | Ser. 2019-1A, Class A1, (1M USD LIBOR + 0.33%), 2.15%, due 12/27/2067 | | | 327,304 | (b)(l) | |
| 9,476,000 | | | Newcastle Mortgage Securities Trust, Ser. 2006-1, Class M2,
(1M USD LIBOR + 0.37%), 2.19%, due 3/25/2036 | | | 9,489,463 | (b)(i) | |
| 750,000 | | | Niagara Park CLO Ltd., Ser. 2019-1A, Class D, (3M USD LIBOR + 3.55%),
5.55%, due 7/17/2032 | | | 711,205 | (b)(l) | |
| | | | | OCP CLO Ltd. | | | |
| | 3,000,000 | | | Ser. 2015-8A, Class CR, (3M USD LIBOR + 2.80%), 4.80%, due 4/17/2027 | | | 2,959,699 | (b)(l) | |
| | 2,800,000 | | | Ser. 2015-10A, Class CR, (3M USD LIBOR + 2.60%), 4.54%, due 10/26/2027 | | | 2,765,356 | (b)(l) | |
| | 3,800,000 | | | Ser. 2017-14A, Class C, (3M USD LIBOR + 2.60%), 4.74%, due 11/20/2030 | | | 3,552,644 | (b)(l) | |
| | 1,800,000 | | | Ser. 2017-14A, Class D, (3M USD LIBOR + 5.80%), 7.94%, due 11/20/2030 | | | 1,579,132 | (b)(l) | |
| | 1,000,000 | | | Ser. 2018-15A, Class D, (3M USD LIBOR + 5.85%), 7.82%, due 7/20/2031 | | | 864,991 | (b)(l) | |
| 3,200,000 | | | Octagon Investment Partners 41 Ltd., Ser. 2019-2A, Class E,
(3M USD LIBOR + 6.90%), 8.90%, due 4/15/2031 | | | 3,003,660 | (b)(l) | |
| 1,000,000 | | | OHA Credit Funding 3 Ltd., Ser. 2019-3A, Class D, (3M USD LIBOR + 3.55%),
6.18%, due 7/20/2032 | | | 949,584 | (b)(l) | |
| 750,000 | | | OHA Credit Partners XV Ltd., Ser. 2017-15A, Class D, (3M USD LIBOR + 2.45%),
4.42%, due 1/20/2030 | | | 674,730 | (b)(l) | |
| | | | | Palmer Square CLO Ltd. | | | |
| | 2,500,000 | | | Ser. 2015-1A, Class DR2, (3M USD LIBOR + 6.25%), 8.40%, due 5/21/2029 | | | 2,304,345 | (b)(l) | |
| | 700,000 | | | Ser. 2014-1A, Class DR2, (3M USD LIBOR + 5.70%), 7.70%, due 1/17/2031 | | | 606,098 | (b)(l) | |
| | 1,600,000 | | | Ser. 2018-1A, Class D, (3M USD LIBOR + 5.15%), 7.45%, due 4/18/2031 | | | 1,353,706 | (b)(l) | |
| 300,000 | | | PPM CLO 3 Ltd., Ser. 2019-3A, Class D, (3M USD LIBOR + 3.70%), 5.70%,
due 7/17/2030 | | | 294,098 | (b)(l) | |
| 97,498 | | | Residential Asset Mortgage Products, Inc., Ser. 2005-RS4, Class M3,
(1M USD LIBOR + 0.48%), 2.30%, due 4/25/2035 | | | 97,502 | (b) | |
| 1,000,000 | | | Riserva CLO Ltd., Ser. 2016-3A, Class ER, (3M USD LIBOR + 6.35%), 8.35%,
due 10/18/2028 | | | 920,709 | (b)(l) | |
| 1,151,369 | | | Saxon Asset Securities Trust, Ser. 2004-2, Class MV1, (1M USD LIBOR + 0.87%),
2.69%, due 8/25/2035 | | | 1,151,255 | (b) | |
| 326,317 | | | Securitized Asset Backed Receivables LLC Trust, Ser. 2004-DO1, Class M1,
(1M USD LIBOR + 0.98%), 2.80%, due 7/25/2034 | | | 328,350 | (b) | |
| | 64,418 | | | SoFi Consumer Loan Program Trust, Ser. 2018-1, Class A1, 2.55%, due 2/25/2027 | | | 64,430 | (l) | |
| 650,827 | | | SoFi Professional Loan Program LLC, Ser. 2017-E, Class A1, (1M USD LIBOR + 0.50%),
2.32%, due 11/26/2040 | | | 650,827 | (b)(l) | |
| | | | | Structured Asset Securities Corp. | | | |
| | 152,495 | | | Ser. 2005-NC2, Class M3, (1M USD LIBOR + 0.43%), 2.25%, due 5/25/2035 | | | 152,540 | (b) | |
| | 64,399 | | | Ser. 2006-AM1, Class A4, (1M USD LIBOR + 0.16%), 1.98%, due 4/25/2036 | | | 64,363 | (b) | |
| | 186,900 | | | Ser. 2006-NC1, Class A4, (1M USD LIBOR + 0.15%), 1.97%, due 5/25/2036 | | | 186,717 | (b) | |
| 1,000,000 | | | Symphony CLO XXI Ltd., Ser. 2019-21A, Class D, (3M USD LIBOR + 3.65%),
6.01%, due 7/15/2032 | | | 957,483 | (b)(l) | |
| 1,150,000 | | | TICP CLO V Ltd., Ser. 2016-5A, Class ER, (3M USD LIBOR + 5.75%), 7.75%,
due 7/17/2031 | | | 1,007,084 | (b)(l) | |
| 3,500,000 | | | TICP CLO VIII Ltd., Ser. 2017-8A, Class D, (3M USD LIBOR + 6.55%), 8.52%,
due 10/20/2030 | | | 3,284,670 | (b)(l) | |
| 1,000,000 | | | TICP CLO X Ltd., Ser. 2018-10A, Class E, (3M USD LIBOR + 5.50%), 7.47%,
due 4/20/2031 | | | 869,958 | (b)(l) | |
| 1,150,000 | | | TICP CLO XIII Ltd., Ser. 2019-13E, Class E, (3M USD LIBOR + 6.75%), 9.12%,
due 7/15/2032 | | | 1,095,057 | (b)(l) | |
| 1,300,000 | | | TRESTLES CLO II Ltd., Ser. 2018-2A, Class D, (3M USD LIBOR + 5.75%), 7.69%,
due 7/25/2031 | | | 1,112,252 | (b)(l) | |
| 1,200,000 | | | TRESTLES CLO Ltd., Ser. 2017-1A, Class D, (3M USD LIBOR + 6.68%), 8.62%,
due 7/25/2029 | | | 1,139,109 | (b)(l) | |
| | 4,000,000 | | | VERDE CLO, Ser. 2019-1A, Class D, (3M USD LIBOR + 3.80%), 5.80%, due 4/15/2032 | | | 3,940,855 | (b)(l) | |
See Notes to Financial Statements
196
Schedule of Investments Strategic Income Fund^ (cont'd)
| PRINCIPAL AMOUNT(a) | | | | VALUE | |
| | | | | Verizon Owner Trust | | | |
$ | 3,734,328 | | | Ser. 2017-1A, Class A, 2.06%, due 9/20/2021 | | $ | 3,734,283 | (l) | |
| | 590,000 | | | Ser. 2019-A, Class A1B, (1M USD LIBOR + 0.33%), 2.18%, due 9/20/2023 | | | 589,886 | (b) | |
| | 1,000,000 | | | Ser. 2019-B, Class A1B, (1M USD LIBOR + 0.45%), 2.30%, due 12/20/2023 | | | 1,001,315 | (b) | |
| | | | | Voya CLO Ltd. | | | |
| | 250,000 | | | Ser. 2018-3A, Class E, (3M USD LIBOR + 5.75%), 7.75%, due 10/15/2031 | | | 215,661 | (b)(l) | |
| | 350,000 | | | Ser. 2016-3A, Class DR, (3M USD LIBOR + 6.08%), 8.08%, due 10/18/2031 | | | 298,677 | (b)(l) | |
| 3,325,000 | | | Westcott Park CLO Ltd., Ser. 2016-1A, Class ER, (3M USD LIBOR + 6.40%),
8.37%, due 7/20/2028 | | | 3,123,724 | (b)(l) | |
| | 13,000,000 | | | World Omni Auto Receivables Trust, Ser. 2019-A, Class A3, 3.04%, due 5/15/2024 | | | 13,273,074 | (i) | |
| 1,550,000 | | | York CLO-2 Ltd., Ser. 2015-1A, Class DR, (3M USD LIBOR + 2.60%), 4.55%,
due 1/22/2031 | | | 1,398,419 | (b)(l) | |
| | | | | Total Asset-Backed Securities (Cost $202,779,537) | | | 202,731,109 | | |
Foreign Government Securities 2.3% | | | |
| | 2,300,000 | | | 1MDB Global Investments Ltd., 4.40%, due 3/9/2023 | | | 2,224,083 | (q) | |
| | 221,000 | | | Abu Dhabi Government International Bond, 3.13%, due 9/30/2049 | | | 213,339 | (q) | |
| | | | | Angolan Government International Bond | | | |
| | 400,000 | | | 9.50%, due 11/12/2025 | | | 451,989 | (q) | |
| | 424,000 | | | 9.38%, due 5/8/2048 | | | 448,721 | (q) | |
| | 180,000 | | | 9.38%, due 5/8/2048 | | | 190,495 | (q) | |
| | | | | Argentine Republic Government International Bond | | | |
EUR | 610,000 | | | 3.88%, due 1/15/2022 | | | 267,031 | (q) | |
$ | 202,000 | | | 4.63%, due 1/11/2023 | | | 81,002 | | |
| | 250,000 | | | 6.88%, due 1/26/2027 | | | 98,128 | | |
EUR | 3,500,000 | | | 3.38%, due 12/31/2038 | | | 1,527,381 | (v) | |
| | | | | Banque Centrale de Tunisie International Bond | | | |
EUR | 1,040,000 | | | 5.63%, due 2/17/2024 | | | 1,133,606 | (q) | |
EUR | 100,000 | | | 6.38%, due 7/15/2026 | | | 108,814 | (q) | |
| | | | | Brazil Notas do Tesouro Nacional | | | |
BRL | 4,042,000 | | | Ser. F, 10.00%, due 1/1/2023 | | | 1,138,270 | | |
BRL | 8,170,000 | | | Ser. F, 10.00%, due 1/1/2029 | | | 2,519,090 | | |
$ | 290,000 | | | Brazilian Government International Bond, 5.63%, due 2/21/2047 | | | 326,108 | | |
| | | | | Colombian TES | | | |
COP | 4,036,000,000 | | | Ser. B, 7.00%, due 5/4/2022 | | | 1,251,886 | | |
COP | 4,880,700,000 | | | Ser. B, 6.00%, due 4/28/2028 | | | 1,462,059 | | |
COP | 4,336,300,000 | | | Ser. B, 7.25%, due 10/18/2034 | | | 1,411,503 | | |
$ | 1,261,000 | | | Costa Rica Government International Bond, 7.16%, due 3/12/2045 | | | 1,254,708 | (q) | |
| | | | | Croatia Government International Bond | | | |
EUR | 210,000 | | | 1.13%, due 6/19/2029 | | | 245,735 | (q) | |
EUR | 694,000 | | | 2.75%, due 1/27/2030 | | | 936,406 | (q) | |
$ | 756,000 | | | Development Bank of Mongolia LLC, 7.25%, due 10/23/2023 | | | 792,636 | (l) | |
| | | | | Dominican Republic International Bond | | | |
| | 750,000 | | | 6.88%, due 1/29/2026 | | | 856,882 | (l) | |
| | 150,000 | | | 6.40%, due 6/5/2049 | | | 162,377 | (q) | |
| | | | | Ecuador Government International Bond | | | |
| | 850,000 | | | 7.88%, due 1/23/2028 | | | 761,600 | (q) | |
| | 262,000 | | | 10.75%, due 1/31/2029 | | | 264,623 | (q) | |
| | 200,000 | | | 9.50%, due 3/27/2030 | | | 192,500 | (q) | |
| | | | | Egypt Government International Bond | | | |
| | 200,000 | | | 5.58%, due 2/21/2023 | | | 205,132 | (q) | |
EUR | 257,000 | | | 5.63%, due 4/16/2030 | | | 287,424 | (q) | |
$ | 1,110,000 | | | 8.50%, due 1/31/2047 | | | 1,168,953 | (q) | |
| | 418,000 | | | 7.90%, due 2/21/2048 | | | 419,086 | (q) | |
| | 152,000 | | | El Salvador Government International Bond, 7.12%, due 1/20/2050 | | | 154,204 | (q) | |
See Notes to Financial Statements
197
Schedule of Investments Strategic Income Fund^ (cont'd)
| PRINCIPAL AMOUNT(a) | | | | VALUE | |
| | | | | Export Credit Bank of Turkey | | | |
$ | 360,000 | | | 5.38%, due 10/24/2023 | | $ | 349,200 | (q) | |
| | 604,000 | | | 8.25%, due 1/24/2024 | | | 644,226 | (l) | |
| | 950,000 | | | Ghana Government International Bond, 10.75%, due 10/14/2030 | | | 1,199,789 | (q) | |
| | 200,000 | | | Indonesia Government International Bond, 5.25%, due 1/17/2042 | | | 238,589 | (q) | |
IDR | 85,253,000,000 | | | Indonesia Treasury Bond, 6.13%, due 5/15/2028 | | | 5,791,892 | | |
| | | | | Ivory Coast Government International Bond | | | |
$ | 1,873,520 | | | 5.75%, due 12/31/2032 | | | 1,850,850 | (q) | |
EUR | 774,000 | | | 6.63%, due 3/22/2048 | | | 852,057 | (q) | |
$ | 266,000 | | | Kenya Government International Bond, 8.00%, due 5/22/2032 | | | 283,341 | (q) | |
| | 291,000 | | | Korea Development Bank, (3M USD LIBOR + 0.48%), 2.57%, due 10/1/2022 | | | 291,403 | (b) | |
| | | | | Mexican Bonos | | | |
MXN | 55,976,700 | | | Ser. M20, 7.50%, due 6/3/2027 | | | 3,040,693 | | |
MXN | 25,070,000 | | | Ser. M, 7.75%, due 11/13/2042 | | | 1,392,120 | | |
$ | 880,000 | | | Mexico Government International Bond, 5.75%, due 10/12/2110 | | | 1,021,909 | | |
| | 470,000 | | | Mongolia Government International Bond, 8.75%, due 3/9/2024 | | | 530,846 | (q) | |
| | 730,000 | | | Namibia International Bonds, 5.25%, due 10/29/2025 | | | 740,673 | (l) | |
| | 1,780,000 | | | Nigeria Government International Bond, 7.88%, due 2/16/2032 | | | 1,835,532 | (q) | |
| | | | | Oman Government International Bond | | | |
| | 206,000 | | | 4.13%, due 1/17/2023 | | | 206,859 | (q) | |
| | 326,000 | | | 6.75%, due 1/17/2048 | | | 306,257 | (q) | |
| | 30,000 | | | 6.75%, due 1/17/2048 | | | 28,125 | (q) | |
| | 206,000 | | | Papua New Guinea Government International Bond, 8.38%, due 10/4/2028 | | | 220,935 | (q) | |
| | 320,000 | | | Paraguay Government International Bond, 6.10%, due 8/11/2044 | | | 389,203 | (q) | |
| | | | | Qatar Government International Bond | | | |
| | 370,000 | | | 3.88%, due 4/23/2023 | | | 390,615 | (q) | |
| | 764,000 | | | 4.82%, due 3/14/2049 | | | 937,810 | (q) | |
| | 200,000 | | | Republic of Armenia International Bond, 3.95%, due 9/26/2029 | | | 194,844 | (q) | |
| | | | | Republic of South Africa Government Bond | | | |
ZAR | 14,264,866 | | | Ser. R186, 10.50%, due 12/21/2026 | | | 1,035,731 | | |
ZAR | 20,567,125 | | | 8.25%, due 3/31/2032 | | | 1,232,405 | | |
ZAR | 6,594,921 | | | 9.00%, due 1/31/2040 | | | 397,178 | | |
| | | | | Republic of South Africa Government International Bond | | | |
$ | 200,000 | | | 4.85%, due 9/30/2029 | | | 198,210 | | |
| | 1,253,000 | | | 5.88%, due 6/22/2030 | | | 1,332,002 | | |
| | 200,000 | | | 5.75%, due 9/30/2049 | | | 193,524 | | |
| | 203,000 | | | Republic of Uzbekistan Bond, 5.38%, due 2/20/2029 | | | 222,710 | (q) | |
EUR | 98,000 | | | Romanian Government International Bond, 4.63%, due 4/3/2049 | | | 142,198 | (q) | |
| | | | | Russian Federal Bond - OFZ | | | |
RUB | 120,000,000 | | | 7.95%, due 10/7/2026 | | | 2,046,414 | | |
RUB | 103,364,000 | | | 7.05%, due 1/19/2028 | | | 1,687,740 | | |
RUB | 44,181,000 | | | 7.70%, due 3/23/2033 | | | 758,599 | | |
$ | 740,000 | | | Senegal Government International Bond, 6.25%, due 5/23/2033 | | | 755,371 | (q) | |
EUR | 479,000 | | | Serbia International Bond, 1.50%, due 6/26/2029 | | | 550,159 | (q) | |
| | | | | Sri Lanka Government International Bond | | | |
$ | 302,000 | | | 6.85%, due 3/14/2024 | | | 311,036 | (q) | |
| | 200,000 | | | 6.35%, due 6/28/2024 | | | 202,693 | (q) | |
| | 2,323,000 | | | 6.75%, due 4/18/2028 | | | 2,270,290 | (q) | |
| | 200,000 | | | 7.55%, due 3/28/2030 | | | 202,274 | (q) | |
| | 590,000 | | | Trinidad & Tobago Government International Bond, 4.50%, due 8/4/2026 | | | 611,393 | (l) | |
| | | | | Turkey Government Bond | | | |
TRY | 8,990,133 | | | 10.70%, due 8/17/2022 | | | 1,504,842 | | |
TRY | 7,925,205 | | | 12.40%, due 3/8/2028 | | | 1,382,033 | | |
| | | | | Turkey Government International Bond | | | |
$ | 400,000 | | | 5.75%, due 3/22/2024 | | | 402,986 | | |
EUR | 698,000 | | | 5.20%, due 2/16/2026 | | | 816,307 | | |
$ | 458,000 | | | 6.13%, due 10/24/2028 | | | 451,398 | | |
| | 200,000 | | | 7.63%, due 4/26/2029 | | | 214,500 | | |
See Notes to Financial Statements
198
Schedule of Investments Strategic Income Fund^ (cont'd)
| PRINCIPAL AMOUNT(a) | | | | VALUE | |
| | | | | Ukraine Government International Bond | | | |
$ | 220,000 | | | 7.75%, due 9/1/2020 | | $ | 225,830 | (q) | |
EUR | 134,000 | | | 6.75%, due 6/20/2026 | | | 165,131 | (q) | |
$ | 360,000 | | | 7.75%, due 9/1/2026 | | | 386,550 | (q) | |
| | 1,290,000 | | | 7.75%, due 9/1/2027 | | | 1,386,621 | (q) | |
| | 630,000 | | | 9.75%, due 11/1/2028 | | | 750,086 | (q) | |
| | 166,667 | | | Ukreximbank Via Biz Finance PLC, 9.63%, due 4/27/2022 | | | 173,333 | (q) | |
| | 1,295,300 | | | Venezuela Government International Bond, 8.25%, due 10/13/2024 | | | 134,387 | (q)(u)(w) | |
| | | | | Total Foreign Government Securities (Cost $67,412,119) | | | 67,437,470 | | |
Developed Markets Ex- U.S. 0.1% | | | |
Regional (state/province) 0.1% | | | |
| | 1,409,007 | | | Brazil Loan Trust 1, 5.48%, due 7/24/2023 | | | 1,463,621 | (q) | |
| | 200,000 | | | Provincia de Cordoba, 7.13%, due 6/10/2021 | | | 149,002 | (q) | |
| | | | | Total Developed Markets Ex- U.S. (Cost $1,690,026) | | | 1,612,623 | | |
NUMBER OF SHARES | | | |
Short-Term Investments 0.4% | | | |
Investment Companies 0.4% | | | |
| 13,057,103
| | | State Street Institutional U.S. Government Money Market Fund Premier Class,
1.75%(x) (Cost $13,057,103) | | | 13,057,103
| (i) | |
| | | | | Total Investments 117.7% (Cost $3,336,228,495) | | | 3,391,003,890 | | |
| | | | | Liabilities Less Other Assets (17.7)% | | | (509,440,307 | )(y) | |
| | | | | Net Assets 100.0% | | $ | 2,881,563,583 | | |
(a) Principal amount is stated in the currency in which the security is denominated.
(b) Variable or floating rate security. The interest rate shown was the current rate as of October 31, 2019 and changes periodically.
(c) Value determined using significant unobservable inputs.
(d) Represents less than 0.05% of net assets of the Fund.
(e) All or a portion of this security was purchased on a delayed delivery basis.
(f) All or a portion of this security had not settled as of October 31, 2019 and thus may not have an interest rate in effect. Interest rates do not take effect until settlement.
(g) The stated interest rate represents the weighted average interest rate at October 31, 2019 of the underlying contracts within the Loan Assignment. Interest rates on the underlying contracts are primarily determined by reference to the indicated base lending rate and spread, which are indicated in the security description, and the reset period, which is generally weekly, monthly or quarterly.
(h) Rate shown was the discount rate at the date of purchase.
See Notes to Financial Statements
199
Schedule of Investments Strategic Income Fund^ (cont'd)
(i) All or a portion of this security is segregated in connection with obligations for to be announced securities, when-issued securities, futures, forward foreign currency contracts, bond forward contracts and/or delayed delivery securities with a total value of $598,062,261.
(j) All or a portion of the security is pledged as collateral for futures.
(k) Index-linked bond whose principal amount adjusts according to a government retail price index.
(l) Securities were purchased under Rule 144A of the Securities Act of 1933, as amended, or are otherwise restricted and, unless registered under the Securities Act of 1933 or exempted from registration, may only be sold to qualified institutional investors or may have other restrictions on resale. At October 31, 2019, these securities amounted to $618,858,219, which represents 21.5% of net assets of the Fund. Securities denoted with (l) but without (u), if any, have been deemed by the investment manager to be liquid.
(m) Variable or floating rate security where the stated interest rate is not based on a published reference rate and spread. Rather, the interest rate adjusts periodically based on changes in current interest rates and prepayments on the underlying pool of assets. The interest rate shown was the current rate as of October 31, 2019.
(n) Interest only security. These securities represent the right to receive the monthly interest payments on an underlying pool of mortgages. Payments of principal on the pool reduce the value of the "interest only" holding.
(o) TBA (To Be Announced) Securities are purchased/sold on a forward commitment basis with an approximate principal amount and no defined maturity date. The actual principal and maturity date will be determined upon settlement when the specific mortgage pools are assigned. Total value of all such securities (excluding forward sales contracts, if any) at October 31, 2019, amounted to $474,930,497, which represents 16.5% of net assets of the Fund.
(p) When-issued security. Total value of all such securities at October 31, 2019, amounted to $20,381,045, which represents 0.7% of net assets of the Fund.
(q) Security exempt from registration pursuant to Regulation S under the Securities Act of 1933, as amended. Regulation S applies to securities offerings that are made outside of the United States and do not involve directed selling efforts in the United States and as such may have restrictions on resale. Total value of all such securities at October 31, 2019 amounted to $91,655,726, which represents 3.2% of net assets of the Fund.
(r) Payment-in-kind (PIK) security.
(s) Security issued at a fixed coupon rate, which converts to a variable rate at a future date. Rate shown is the rate in effect as of period end.
(t) Perpetual Bond Security. The rate reflected was the rate in effect on October 31, 2019. The maturity date reflects the next call date.
(u) Illiquid security.
(v) Step Bond. Coupon rate is a fixed rate for an initial period that either resets at a specific date or may reset in the future contingent upon a predetermined trigger. The interest rate shown was the current rate as of October 31, 2019.
(w) Defaulted security.
(x) Represents 7-day effective yield as of October 31, 2019.
(y) Includes the impact of the Fund's open positions in derivatives at October 31, 2019.
See Notes to Financial Statements
200
Schedule of Investments Strategic Income Fund^ (cont'd)
Derivative Instruments
Futures contracts ("futures")
At October 31, 2019, open positions in futures for the Fund were as follows:
Long Futures:
Expiration Date | | Number of
Contracts | | Open Contracts | | Notional
Amount | | Value and
Unrealized
Appreciation/
(Depreciation) | |
12/2019 | | | 4 | | | Australian Dollar | | $ | 275,840 | | | $ | 700 | | |
12/2019 | | | 25 | | | Canadian Dollar | | | 1,899,375 | | | | 3,000 | | |
12/2019 | | | 483 | | | Euro-Bobl | | | 72,518,414 | | | | (366,512 | ) | |
12/2019 | | | 5 | | | Euro-Buxl Bond, 30 Year | | | 1,170,842 | | | | (65,795 | ) | |
12/2019 | | | 21 | | | Pound Sterling | | | 1,700,606 | | | | 77,175 | | |
12/2019 | | | 132 | | | United Kingdom Long Gilt Bond | | | 22,713,810 | | | | (36,404 | ) | |
12/2019 | | | 728 | | | U.S. Treasury Note, 2 Year | | | 156,957,937 | | | | (269,047 | ) | |
12/2019 | | | 334 | | | U.S. Treasury Note, 5 Year | | | 39,813,844 | | | | (148,981 | ) | |
12/2019 | | | 284 | | | U.S. Treasury Note, 10 Year | | | 37,004,312 | | | | (306,339 | ) | |
12/2019 | | | 73 | | | U.S. Treasury Long Bond | | | 11,780,375 | | | | (161,781 | ) | |
12/2019 | | | 4 | | | U.S. Treasury Ultra Long Bond | | | 759,000 | | | | (8,379 | ) | |
Total Long Positions | | | | | | $ | 346,594,355 | | | $ | (1,282,363 | ) | |
Short Futures:
Expiration Date | | Number of
Contracts | | Open Contracts | | Notional
Amount | | Value and
Unrealized
Appreciation/
(Depreciation) | |
12/2019 | | | 563 | | | Euro-Bobl | | $ | (84,529,745 | ) | | $ | 1,267,042 | | |
12/2019 | | | 60 | | | Euro-Bund | | | (11,493,832 | ) | | | 301,820 | | |
12/2019 | | | 4 | | | Euro-Buxl Bond, 30 Year | | | (936,673 | ) | | | 52,634 | | |
12/2019 | | | 23 | | | Euro | | | (3,213,244 | ) | | | (25,587 | ) | |
12/2019 | | | 147 | | | United Kingdom Long Gilt Bond | | | (25,294,925 | ) | | | 138,581 | | |
12/2019 | | | 1,143 | | | U.S. Treasury Note, Ultra 10 Year | | | (162,431,016 | ) | | | 2,380,512 | | |
12/2019 | | | 1,221 | | | U.S. Treasury Ultra Long Bond | | | (231,684,750 | ) | | | 2,654,154 | | |
Total Short Positions | | | | | | $ | (519,584,185 | ) | | $ | 6,769,156 | | |
Total Futures | | | | | | | | $ | 5,486,793 | | |
The Fund had securities pledged in the amount of $8,143,202 to cover collateral requirements on open futures. For the year ended October 31, 2019, the average notional value of futures for the Fund was $631,922,852 for long positions and $(809,090,116) for short positions.
See Notes to Financial Statements
201
Schedule of Investments Strategic Income Fund^ (cont'd)
Forward foreign currency contracts ("forward contracts")
At October 31, 2019, open forward contracts for the Fund were as follows:
Currency Purchased | | Currency Sold | | Counterparty | | Settlement
Date | | Net
Unrealized
Appreciation/
(Depreciation) | |
| | 1,908,950 | | | BRL | | | | | 463,472 | | | USD | | | | GSI | | 11/4/2019 | | $ | 12,516 | | |
| | 252,211 | | | BRL | | | | | 62,374 | | | USD | | | | JPM | | 11/4/2019 | | | 514 | | |
| | 425,658 | | | BRL | | | | | 102,701 | | | USD | | | | SCB | | 11/4/2019 | | | 3,435 | | |
| | 909,059 | | | BRL | | | | | 223,328 | | | USD | | | | SCB | | 11/4/2019 | | | 3,342 | | |
| | 51,781,647 | | | BRL | | | | | 12,368,129 | | | USD | | | | GSI | | 11/5/2019 | | | 542,645 | | |
| | 51,781,647 | | | BRL | | | | | 12,847,769 | | | USD | | | | GSI | | 12/3/2019 | | | 40,014 | | |
| | 932,528 | | | BRL | | | | | 228,673 | | | USD | | | | SCB | | 12/11/2019 | | | 3,328 | | |
| | 476,749 | | | USD | | | | | 1,908,950 | | | BRL | | | | GSI | | 11/4/2019 | | | 761 | | |
| | 62,988 | | | USD | | | | | 252,211 | | | BRL | | | | JPM | | 11/4/2019 | | | 101 | | |
| | 875,524 | | | USD | | | | | 3,495,878 | | | BRL | | | | MS | | 11/4/2019 | | | 3,842 | | |
| | 227,032 | | | USD | | | | | 909,059 | | | BRL | | | | SCB | | 11/4/2019 | | | 362 | | |
| | 106,306 | | | USD | | | | | 425,658 | | | BRL | | | | SCB | | 11/4/2019 | | | 170 | | |
| | 12,124,623 | | | USD | | | | | 8,899,473,162 | | | CLP | | | | GSI | | 11/5/2019 | | | 124,255 | | |
| | 12,107,303 | | | USD | | | | | 8,899,473,162 | | | CLP | | | | GSI | | 11/5/2019 | | | 106,935 | | |
| | 724,175 | | | USD | | | | | 520,247,282 | | | CLP | | | | JPM | | 12/18/2019 | | | 21,899 | | |
| | 287,536 | | | USD | | | | | 205,424,527 | | | CLP | | | | SCB | | 12/18/2019 | | | 10,236 | | |
| | 43,505,066,972 | | | COP | | | | | 12,595,196 | | | USD | | | | GSI | | 11/5/2019 | | | 276,125 | | |
| | 43,505,066,972 | | | COP | | | | | 12,858,805 | | | USD | | | | GSI | | 11/5/2019 | | | 12,516 | | |
| | 43,505,066,972 | | | COP | | | | | 12,809,171 | | | USD | | | | GSI | | 12/3/2019 | | | 49,727 | | |
| | 1,497,365,369 | | | COP | | | | | 435,759 | | | USD | | | | GSI | | 12/17/2019 | | | 6,576 | | |
| | 538,991,008 | | | COP | | | | | 153,749 | | | USD | | | | SCB | | 12/17/2019 | | | 5,474 | | |
| | 146,614 | | | CZK | | | | | 5,639 | | | EUR | | | | MS | | 12/17/2019 | | | 103 | | |
| | 6,331,176 | | | DKK | | | | | 939,926 | | | USD | | | | GSI | | 1/22/2020 | | | 11,116 | | |
| | 285,534 | | | EUR | | | | | 315,089 | | | USD | | | | JPM | | 11/5/2019 | | | 3,388 | | |
| | 364,132 | | | EUR | | | | | 402,866 | | | USD | | | | JPM | | 11/5/2019 | | | 3,276 | | |
| | 286,917 | | | EUR | | | | | 319,381 | | | USD | | | | JPM | | 11/5/2019 | | | 638 | | |
| | 295,409 | | | EUR | | | | | 327,679 | | | USD | | | | MS | | 11/5/2019 | | | 1,812 | | |
| | 462,330 | | | EUR | | | | | 508,893 | | | USD | | | | SCB | | 11/5/2019 | | | 6,777 | | |
| | 285,535 | | | EUR | | | | | 314,501 | | | USD | | | | SCB | | 11/5/2019 | | | 3,977 | | |
| | 117,582 | | | EUR | | | | | 128,317 | | | USD | | | | SCB | | 11/5/2019 | | | 2,831 | | |
| | 181,953 | | | EUR | | | | | 200,230 | | | USD | | | | SCB | | 11/5/2019 | | | 2,716 | | |
| | 117,691 | | | EUR | | | | | 128,688 | | | USD | | | | SCB | | 11/5/2019 | | | 2,581 | | |
| | 52,112 | | | EUR | | | | | 57,421 | | | USD | | | | SCB | | 11/5/2019 | | | 703 | | |
| | 26,134 | | | EUR | | | | | 28,651 | | | USD | | | | SCB | | 11/5/2019 | | | 498 | | |
| | 240,000 | | | EUR | | | | | 264,974 | | | USD | | | | SCB | | 12/4/2019 | | | 3,216 | | |
| | 42,542 | | | EUR | | | | | 47,597 | | | USD | | | | CITI | | 1/22/2020 | | | 114 | | |
| | 40,237,520 | | | EUR | | | | | 44,583,172 | | | USD | | | | GSI | | 1/22/2020 | | | 543,519 | | |
| | 4,808,232 | | | EUR | | | | | 5,327,896 | | | USD | | | | GSI | | 1/22/2020 | | | 64,573 | | |
| | 13,298,942 | | | EUR | | | | | 14,885,506 | | | USD | | | | GSI | | 1/22/2020 | | | 29,361 | | |
| | 791,117 | | | EUR | | | | | 876,620 | | | USD | | | | GSI | | 1/22/2020 | | | 10,625 | | |
| | 329,493 | | | EUR | | | | | 364,823 | | | USD | | | | GSI | | 1/22/2020 | | | 4,706 | | |
See Notes to Financial Statements
202
Schedule of Investments Strategic Income Fund^ (cont'd)
Currency Purchased | | Currency Sold | | Counterparty | | Settlement
Date | | Net
Unrealized
Appreciation/
(Depreciation) | |
| | 200,033 | | | EUR | | | | | 221,115 | | | USD | | | | GSI | | 1/22/2020 | | $ | 3,224 | | |
| | 1,164,628 | | | EUR | | | | | 1,304,597 | | | USD | | | | GSI | | 1/22/2020 | | | 1,543 | | |
| | 198,024 | | | USD | | | | | 177,375 | | | EUR | | | | JPM | | 11/5/2019 | | | 185 | | |
| | 1,454,492 | | | USD | | | | | 1,300,318 | | | EUR | | | | GSI | | 12/4/2019 | | | 1,439 | | |
| | 3,405,986 | | | GBP | | | | | 4,214,676 | | | USD | | | | GSI | | 1/22/2020 | | | 208,949 | | |
| | 129,627,956 | | | HUF | | | | | 390,702 | | | EUR | | | | GSI | | 12/18/2019 | | | 3,949 | | |
| | 9,679,364,178 | | | IDR | | | | | 675,462 | | | USD | | | | SCB | | 1/23/2020 | | | 5,835 | | |
| | 1,682,608 | | | ILS | | | | | 477,112 | | | USD | | | | SCB | | 12/10/2019 | | | 1,152 | | |
| | 52,091,761 | | | INR | | | | | 722,393 | | | USD | | | | GSI | | 1/17/2020 | | | 4,242 | | |
| | 15,739,693,383 | | | KRW | | | | | 13,130,636 | | | USD | | | | GSI | | 11/5/2019 | | | 388,004 | | |
| | 858,441,827 | | | KRW | | | | | 725,286 | | | USD | | | | SCB | | 12/5/2019 | | | 8,684 | | |
| | 500,951,525 | | | KRW | | | | | 421,000 | | | USD | | | | SCB | | 12/5/2019 | | | 7,316 | | |
| | 848,103,104 | | | KRW | | | | | 721,471 | | | USD | | | | SCB | | 12/5/2019 | | | 3,660 | | |
| | 8,419,591 | | | MXN | | | | | 430,890 | | | USD | | | | GSI | | 11/1/2019 | | | 6,798 | | |
| | 11,135 | | | USD | | | | | 216,596 | | | MXN | | | | GSI | | 2/5/2020 | | | 31 | | |
| | 1,308,029 | | | PEN | | | | | 386,808 | | | USD | | | | CITI | | 12/18/2019 | | | 3,750 | | |
| | 21,604,991 | | | PHP | | | | | 415,305 | | | USD | | | | GSI | | 11/5/2019 | | | 10,451 | | |
| | 37,586,317 | | | PHP | | | | | 729,732 | | | USD | | | | SCB | | 11/5/2019 | | | 10,958 | | |
| | 2,750,920 | | | PLN | | | | | 627,477 | | | EUR | | | | GSI | | 11/7/2019 | | | 20,060 | | |
| | 4,343,818 | | | PLN | | | | | 1,006,422 | | | EUR | | | | JPM | | 11/7/2019 | | | 14,263 | | |
| | 57,996 | | | PLN | | | | | 13,600 | | | EUR | | | | JPM | | 11/7/2019 | | | 9 | | |
| | 1,933 | | | RON | | | | | 405 | | | EUR | | | | GSI | | 12/17/2019 | | | 1 | | |
| | 28,623,866 | | | RUB | | | | | 427,131 | | | USD | | | | GSI | | 12/4/2019 | | | 17,370 | | |
| | 421,650 | | | RUB | | | | | 6,272 | | | USD | | | | GSI | | 12/4/2019 | | | 275 | | |
| | 39,864,643 | | | RUB | | | | | 589,378 | | | USD | | | | SCB | | 12/4/2019 | | | 29,681 | | |
| | 577,366 | | | SGD | | | | | 419,000 | | | USD | | | | MS | | 11/4/2019 | | | 5,394 | | |
| | 989,666 | | | SGD | | | | | 722,759 | | | USD | | | | SCB | | 11/4/2019 | | | 4,696 | | |
| | 21,865,323 | | | THB | | | | | 718,266 | | | USD | | | | MS | | 12/18/2019 | | | 6,198 | | |
| | 5,813,742 | | | TRY | | | | | 1,012,847 | | | USD | | | | JPM | | 11/6/2019 | | | 2,726 | | |
| | 1,373,144 | | | TRY | | | | | 229,907 | | | USD | | | | SCB | | 11/6/2019 | | | 9,960 | | |
| | 292,213 | | | TRY | | | | | 49,917 | | | USD | | | | SCB | | 11/6/2019 | | | 1,128 | | |
| | 3,758,758 | | | TRY | | | | | 643,009 | | | USD | | | | GSI | | 12/18/2019 | | | 6,375 | | |
| | 954,614 | | | TRY | | | | | 156,843 | | | USD | | | | SCB | | 12/18/2019 | | | 8,081 | | |
| | 22,346,045 | | | TWD | | | | | 722,518 | | | USD | | | | SCB | | 11/21/2019 | | | 12,015 | | |
| | 412,565 | | | USD | | | | | 6,064,156 | | | ZAR | | | | GSI | | 11/6/2019 | | | 11,352 | | |
| | 189,835 | | | USD | | | | | 2,852,939 | | | ZAR | | | | JPM | | 11/6/2019 | | | 1,081 | | |
| | 64,356 | | | USD | | | | | 948,049 | | | ZAR | | | | MS | | 11/6/2019 | | | 1,631 | | |
| | 357,206 | | | USD | | | | | 5,210,963 | | | ZAR | | | | SCB | | 11/6/2019 | | | 12,442 | | |
| | 686,068 | | | USD | | | | | 10,190,893 | | | ZAR | | | | SCB | | 11/6/2019 | | | 11,823 | | |
| | 12,216,903 | | | ZAR | | | | | 792,534 | | | USD | | | | SCB | | 11/6/2019 | | | 15,754 | | |
| | 1,429,956 | | | ZAR | | | | | 93,130 | | | USD | | | | SCB | | 11/6/2019 | | | 1,478 | | |
Total unrealized appreciation | | | | | | | | | | | | $ | 2,785,266 | | |
| | 3,495,878 | | | BRL | | | | | 873,075 | | | USD | | | | MS | | 11/4/2019 | | | (1,395 | ) | |
| | 3,495,878 | | | BRL | | | | | 871,834 | | | USD | | | | MS | | 1/22/2020 | | | (3,959 | ) | |
See Notes to Financial Statements
203
Schedule of Investments Strategic Income Fund^ (cont'd)
Currency Purchased | | Currency Sold | | Counterparty | | Settlement
Date | | Net
Unrealized
Appreciation/
(Depreciation) | |
| | 12,868,203 | | | USD | | | | | 51,781,647 | | | BRL | | | | GSI | | 11/5/2019 | | $ | (42,572 | ) | |
| | 8,899,473,162 | | | CLP | | | | | 12,107,303 | | | USD | | | | GSI | | 11/5/2019 | | | (106,936 | ) | |
| | 8,899,473,162 | | | CLP | | | | | 12,241,029 | | | USD | | | | GSI | | 11/5/2019 | | | (240,661 | ) | |
| | 8,899,473,162 | | | CLP | | | | | 12,132,888 | | | USD | | | | GSI | | 12/3/2019 | | | (123,835 | ) | |
| | 300,686,082 | | | CLP | | | | | 414,781 | | | USD | | | | GSI | | 12/18/2019 | | | (8,888 | ) | |
| | 309,703,598 | | | CLP | | | | | 428,211 | | | USD | | | | GSI | | 12/18/2019 | | | (10,145 | ) | |
| | 217,091,574 | | | CLP | | | | | 300,914 | | | USD | | | | MS | | 12/18/2019 | | | (7,865 | ) | |
| | 207,894,153 | | | CLP | | | | | 288,926 | | | USD | | | | MS | | 12/18/2019 | | | (8,292 | ) | |
| | 5,888,316,386 | | | COP | | | | | 1,746,917 | | | USD | | | | GSI | | 12/17/2019 | | | (7,455 | ) | |
| | 478,399,316 | | | COP | | | | | 141,790 | | | USD | | | | SCB | | 12/17/2019 | | | (466 | ) | |
| | 12,858,805 | | | USD | | | | | 43,505,066,972 | | | COP | | | | GSI | | 11/5/2019 | | | (12,516 | ) | |
| | 12,817,851 | | | USD | | | | | 43,505,066,972 | | | COP | | | | GSI | | 11/5/2019 | | | (53,471 | ) | |
| | 1,446,258 | | | USD | | | | | 4,969,662,061 | | | COP | | | | GSI | | 12/17/2019 | | | (21,825 | ) | |
| | 432,926 | | | USD | | | | | 1,467,186,959 | | | COP | | | | SCB | | 12/17/2019 | | | (494 | ) | |
| | 7,840 | | | USD | | | | | 52,806 | | | DKK | | | | GSI | | 1/22/2020 | | | (92 | ) | |
| | 1,300,318 | | | EUR | | | | | 1,451,768 | | | USD | | | | GSI | | 11/5/2019 | | | (1,429 | ) | |
| | 35,464 | | | EUR | | | | | 11,901,279 | | | HUF | | | | GSI | | 12/18/2019 | | | (818 | ) | |
| | 650,092 | | | EUR | | | | | 216,519,537 | | | HUF | | | | MS | | 12/18/2019 | | | (9,398 | ) | |
| | 400,447 | | | EUR | | | | | 131,740,478 | | | HUF | | | | MS | | 12/18/2019 | | | (235 | ) | |
| | 389,049 | | | EUR | | | | | 129,698,710 | | | HUF | | | | GSI | | 1/8/2020 | | | (5,949 | ) | |
| | 361,726 | | | EUR | | | | | 1,561,724 | | | PLN | | | | GSI | | 11/7/2019 | | | (5,251 | ) | |
| | 642,569 | | | EUR | | | | | 2,782,597 | | | PLN | | | | GSI | | 11/7/2019 | | | (11,516 | ) | |
| | 646,349 | | | EUR | | | | | 2,808,413 | | | PLN | | | | GSI | | 11/7/2019 | | | (14,055 | ) | |
| | 13,542 | | | EUR | | | | | 57,996 | | | PLN | | | | JPM | | 1/14/2020 | | | (9 | ) | |
| | 390,428 | | | EUR | | | | | 1,876,893 | | | RON | | | | JPM | | 2/3/2020 | | | (1,435 | ) | |
| | 651,256 | | | EUR | | | | | 3,145,025 | | | RON | | | | GSI | | 4/2/2020 | | | (1,733 | ) | |
| | 144,467 | | | USD | | | | | 131,323 | | | EUR | | | | GSI | | 11/5/2019 | | | (2,007 | ) | |
| | 100,982 | | | USD | | | | | 91,219 | | | EUR | | | | JPM | | 11/5/2019 | | | (761 | ) | |
| | 177,818 | | | USD | | | | | 160,329 | | | EUR | | | | JPM | | 11/5/2019 | | | (1,009 | ) | |
| | 115,701 | | | USD | | | | | 105,056 | | | EUR | | | | JPM | | 11/5/2019 | | | (1,476 | ) | |
| | 143,780 | | | USD | | | | | 130,302 | | | EUR | | | | JPM | | 11/5/2019 | | | (1,556 | ) | |
| | 288,140 | | | USD | | | | | 260,628 | | | EUR | | | | JPM | | 11/5/2019 | | | (2,557 | ) | |
| | 227,565 | | | USD | | | | | 207,333 | | | EUR | | | | JPM | | 11/5/2019 | | | (3,689 | ) | |
| | 722,226 | | | USD | | | | | 653,374 | | | EUR | | | | JPM | | 11/5/2019 | | | (6,529 | ) | |
| | 1,672,580 | | | USD | | | | | 1,530,000 | | | EUR | | | | JPM | | 11/5/2019 | | | (33,939 | ) | |
| | 28,864 | | | USD | | | | | 26,162 | | | EUR | | | | MS | | 11/5/2019 | | | (316 | ) | |
| | 133,736 | | | USD | | | | | 120,343 | | | EUR | | | | MS | | 11/5/2019 | | | (491 | ) | |
| | 356,237 | | | USD | | | | | 320,678 | | | EUR | | | | MS | | 11/5/2019 | | | (1,438 | ) | |
| | 213,340 | | | USD | | | | | 194,219 | | | EUR | | | | MS | | 11/5/2019 | | | (3,286 | ) | |
| | 163,055 | | | USD | | | | | 146,968 | | | EUR | | | | SCB | | 11/5/2019 | | | (869 | ) | |
| | 326,153 | | | USD | | | | | 293,970 | | | EUR | | | | SCB | | 11/5/2019 | | | (1,732 | ) | |
| | 256,096 | | | USD | | | | | 233,563 | | | EUR | | | | SCB | | 11/5/2019 | | | (4,414 | ) | |
| | 577,319 | | | USD | | | | | 522,805 | | | EUR | | | | SCB | | 11/5/2019 | | | (5,803 | ) | |
| | 120,746 | | | USD | | | | | 110,000 | | | EUR | | | | SCB | | 12/4/2019 | | | (2,175 | ) | |
See Notes to Financial Statements
204
Schedule of Investments Strategic Income Fund^ (cont'd)
Currency Purchased | | Currency Sold | | Counterparty | | Settlement
Date | | Net
Unrealized
Appreciation/
(Depreciation) | |
| | 3,620,478 | | | USD | | | | | 3,287,268 | | | EUR | | | | SCB | | 12/4/2019 | | $ | (52,911 | ) | |
| | 244,545 | | | USD | | | | | 218,134 | | | EUR | | | | GSI | | 1/22/2020 | | | (94 | ) | |
| | 235,748 | | | USD | | | | | 210,473 | | | EUR | | | | GSI | | 1/22/2020 | | | (299 | ) | |
| | 338,249 | | | USD | | | | | 303,354 | | | EUR | | | | GSI | | 1/22/2020 | | | (1,964 | ) | |
| | 421,051 | | | USD | | | | | 378,814 | | | EUR | | | | GSI | | 1/22/2020 | | | (3,792 | ) | |
| | 1,528,654 | | | USD | | | | | 1,367,697 | | | EUR | | | | GSI | | 1/22/2020 | | | (5,228 | ) | |
| | 3,868,818 | | | USD | | | | | 3,491,713 | | | EUR | | | | GSI | | 1/22/2020 | | | (47,165 | ) | |
| | 11,560,935 | | | USD | | | | | 10,433,322 | | | EUR | | | | GSI | | 1/22/2020 | | | (140,117 | ) | |
| | 28,090,808 | | | USD | | | | | 25,352,715 | | | EUR | | | | GSI | | 1/22/2020 | | | (342,458 | ) | |
| | 393,074 | | | USD | | | | | 305,469 | | | GBP | | | | GSI | | 1/22/2020 | | | (3,663 | ) | |
| | 258,459 | | | USD | | | | | 205,124 | | | GBP | | | | GSI | | 1/22/2020 | | | (7,952 | ) | |
| | 288,063 | | | USD | | | | | 228,619 | | | GBP | | | | GSI | | 1/22/2020 | | | (8,863 | ) | |
| | 1,440,741 | | | USD | | | | | 1,164,770 | | | GBP | | | | GSI | | 1/22/2020 | | | (72,038 | ) | |
| | 2,146,039 | | | USD | | | | | 1,734,969 | | | GBP | | | | GSI | | 1/22/2020 | | | (107,304 | ) | |
| | 4,815,289 | | | USD | | | | | 3,891,357 | | | GBP | | | | GSI | | 1/22/2020 | | | (238,726 | ) | |
| | 669,132 | | | USD | | | | | 9,638,843,689 | | | IDR | | | | SCB | | 1/23/2020 | | | (9,313 | ) | |
| | 1,105,142 | | | ILS | | | | | 316,456 | | | USD | | | | MS | | 12/10/2019 | | | (2,331 | ) | |
| | 1,405,565 | | | ILS | | | | | 401,933 | | | USD | | | | SCB | | 12/10/2019 | | | (2,416 | ) | |
| | 15,739,693,383 | | | KRW | | | | | 13,479,804 | | | USD | | | | GSI | | 12/3/2019 | | | (22,905 | ) | |
| | 13,469,999 | | | USD | | | | | 15,739,693,383 | | | KRW | | | | GSI | | 11/5/2019 | | | (48,641 | ) | |
| | 733,059 | | | USD | | | | | 858,201,229 | | | KRW | | | | GSI | | 12/5/2019 | | | (706 | ) | |
| | 1,114,219 | | | USD | | | | | 1,349,054,629 | | | KRW | | | | MS | | 12/5/2019 | | | (39,227 | ) | |
| | 216,596 | | | MXN | | | | | 11,300 | | | USD | | | | GSI | | 11/1/2019 | | | (41 | ) | |
| | 3,620,979 | | | MXN | | | | | 188,362 | | | USD | | | | GSI | | 11/1/2019 | | | (127 | ) | |
| | 52,914 | | | USD | | | | | 1,052,823 | | | MXN | | | | GSI | | 11/1/2019 | | | (1,816 | ) | |
| | 471,595 | | | USD | | | | | 9,295,272 | | | MXN | | | | GSI | | 11/1/2019 | | | (11,615 | ) | |
| | 97,648 | | | USD | | | | | 1,909,071 | | | MXN | | | | JPM | | 11/1/2019 | | | (1,594 | ) | |
| | 1,135,746 | | | USD | | | | | 59,237,108 | | | PHP | | | | GSI | | 11/5/2019 | | | (31,603 | ) | |
| | 25,910,052 | | | RUB | | | | | 404,508 | | | USD | | | | SCB | | 12/4/2019 | | | (2,151 | ) | |
| | 28,648,110 | | | RUB | | | | | 448,220 | | | USD | | | | SCB | | 12/4/2019 | | | (3,343 | ) | |
| | 46,922,903 | | | RUB | | | | | 733,614 | | | USD | | | | SCB | | 12/4/2019 | | | (4,947 | ) | |
| | 47,778,240 | | | RUB | | | | | 748,112 | | | USD | | | | SCB | | 12/4/2019 | | | (6,163 | ) | |
| | 285,593 | | | USD | | | | | 18,549,993 | | | RUB | | | | GSI | | 12/4/2019 | | | (2,470 | ) | |
| | 514,807 | | | USD | | | | | 33,462,110 | | | RUB | | | | GSI | | 12/4/2019 | | | (4,826 | ) | |
| | 406,195 | | | USD | | | | | 26,519,908 | | | RUB | | | | GSI | | 12/4/2019 | | | (5,633 | ) | |
| | 739,637 | | | USD | | | | | 47,987,768 | | | RUB | | | | MS | | 12/4/2019 | | | (5,566 | ) | |
| | 424,306 | | | USD | | | | | 27,840,855 | | | RUB | | | | MS | | 12/4/2019 | | | (8,035 | ) | |
| | 427,872 | | | USD | | | | | 591,405 | | | SGD | | | | MS | | 11/4/2019 | | | (6,841 | ) | |
| | 706,045 | | | USD | | | | | 975,656 | | | SGD | | | | SCB | | 11/4/2019 | | | (11,111 | ) | |
| | 718,876 | | | USD | | | | | 21,865,323 | | | THB | | | | GSI | | 12/18/2019 | | | (5,589 | ) | |
| | 737,066 | | | USD | | | | | 4,234,249 | | | TRY | | | | GSI | | 11/6/2019 | | | (2,593 | ) | |
| | 190,168 | | | USD | | | | | 1,090,590 | | | TRY | | | | JPM | | 11/6/2019 | | | (341 | ) | |
| | 270,442 | | | USD | | | | | 1,563,427 | | | TRY | | | | JPM | | 11/6/2019 | | | (2,665 | ) | |
| | 101,747 | | | USD | | | | | 590,833 | | | TRY | | | | SCB | | 11/6/2019 | | | (1,463 | ) | |
See Notes to Financial Statements
205
Schedule of Investments Strategic Income Fund^ (cont'd)
Currency Purchased | | Currency Sold | | Counterparty | | Settlement
Date | | Net
Unrealized
Appreciation/
(Depreciation) | |
| | 356,004 | | | USD | | | | | 2,071,528 | | | TRY | | | | SCB | | 12/9/2019 | | $ | (2,712 | ) | |
| | 989,093 | | | USD | | | | | 5,813,742 | | | TRY | | | | JPM | | 2/6/2020 | | | (2,793 | ) | |
| | 717,254 | | | USD | | | | | 22,346,045 | | | TWD | | | | GSI | | 11/21/2019 | | | (17,280 | ) | |
| | 11,620,141 | | | ZAR | | | | | 780,761 | | | USD | | | | MS | | 11/6/2019 | | | (11,956 | ) | |
| | 2,852,939 | | | ZAR | | | | | 187,520 | | | USD | | | | JPM | | 2/6/2020 | | | (1,071 | ) | |
Total unrealized depreciation | | | | | | | | | | | | $ | (2,091,200 | ) | |
Total net unrealized appreciation | | | | | | | | | | | | $ | 694,066 | | |
For the year ended October 31, 2019, the Fund's investments in forward contracts had an average notional value of $499,743,032.
Bond forward contracts ("bond forwards")
At October 31, 2019, open bond forwards for the Fund were as follows:
Counterparty | | Reference Entity | | Notional
Amount | | Expiration
Date | | Unrealized
Appreciation/
(Depreciation) | |
GSI | | U.S. Treasury Inflation-Indexed Bonds, 0.88%, due 2/15/2047 | | USD | 2,756,289 | | | 11/20/2019 | | $ | 6,289 | | |
Total unrealized appreciation | | | | | | | | $ | 6,289 | | |
GSI | | U.S. Treasury Inflation-Indexed Bonds, 0.13%, due 4/15/2022 | | USD | 6,743,532 | | | 11/20/2019 | | $ | (6,468 | ) | |
GSI | | U.S. Treasury Inflation-Indexed Bonds, 0.63%, due 4/15/2023 | | USD | 5,740,518 | | | 11/20/2019 | | | (9,482 | ) | |
GSI | | U.S. Treasury Inflation-Indexed Bonds, 0.63%, due 1/15/2024 | | USD | 4,487,210 | | | 11/20/2019 | | | (12,791 | ) | |
GSI | | U.S. Treasury Inflation-Indexed Bonds, 0.25%, due 1/15/2025 | | USD | 5,819,441 | | | 11/20/2019 | | | (5,559 | ) | |
GSI | | U.S. Treasury Inflation-Indexed Bonds, 0.38%, due 4/15/2027 | | USD | 4,724,279 | | | 11/20/2019 | | | (5,721 | ) | |
GSI | | U.S. Treasury Inflation-Indexed Bonds, 3.63%, due 4/15/2028 | | USD | 4,687,656 | | | 11/20/2019 | | | (12,344 | ) | |
GSI | | U.S. Treasury Inflation-Indexed Bonds, 2.13%, due 2/15/2040 | | USD | 1,071,115 | | | 11/20/2019 | | | (3,885 | ) | |
GSI | | U.S. Treasury Inflation-Indexed Bonds, 1.38%, due 2/15/2044 | | USD | 2,298,656 | | | 11/20/2019 | | | (1,344 | ) | |
Total unrealized depreciation | | | | | | | | $ | (57,594 | ) | |
Total net unrealized depreciation | | | | | | | | $ | (51,305 | ) | |
For the year ended October 31, 2019, the Fund's investments in bond forward contracts had an average notional value of $37,277,420.
At October 31, 2019, the Fund had cash collateral of $50,000 deposited in a segregated account for JPMorgan Chase Bank N.A. and received cash collateral of $660,000 from Goldman Sachs International to cover collateral requirements on over-the-counter derivatives.
Credit default swap contracts ("credit default swaps")
At October 31, 2019, the Fund did not have any outstanding credit default swap contracts.
For the year ended October 31, 2019, the average notional value of credit default swaps for the Fund was $24,888,049 for buy protection and $14,196,360 for sell protection.
See Notes to Financial Statements
206
Schedule of Investments Strategic Income Fund^ (cont'd)
The following is a summary, categorized by Level (see Note A of Notes to Financial Statements), of inputs used to value the Fund's investments as of October 31, 2019:
Asset Valuation Inputs
| | | Level 1 | | Level 2 | | Level 3(b) | | Total | |
Investments: | |
Loan Assignments | |
Aerospace & Defense | | $ | — | | | $ | 1,321,444 | | | $ | 920,700 | | | $ | 2,242,144 | | |
Business Equipment & Services | | | — | | | | 18,964,942 | | | | 1,525,000 | | | | 20,489,942 | | |
Cable & Satellite Television | | | — | | | | 13,728,887 | | | | 344,138 | | | | 14,073,025 | | |
Conglomerates | | | — | | | | — | | | | 1,175,120 | | | | 1,175,120 | | |
Leisure Goods—Activities—Movies | | | — | | | | 9,138,479 | | | | 1,259,615 | | | | 10,398,094 | | |
Radio & Television | | | — | | | | 2,600,881 | | | | 1,828,503 | | | | 4,429,384 | | |
Steel | | | — | | | | 1,030,255 | | | | 2,584,867 | | | | 3,615,122 | | |
Utilities | | | — | | | | 6,419,071 | | | | 1,732,193 | | | | 8,151,264 | | |
| Other Loan Assignments(a) | | | — | | | | 133,529,790 | | | | — | | | | 133,529,790 | | |
Total Loan Assignments | | | — | | | | 186,733,749 | | | | 11,370,136 | | | | 198,103,885 | | |
U.S. Treasury Obligations | | | — | | | | 799,811,547 | | | | — | | | | 799,811,547 | | |
U.S. Government Agency Securities | | | — | | | | 3,017,368 | | | | — | | | | 3,017,368 | | |
| Mortgage-Backed Securities(a) | | | — | | | | 739,828,048 | | | | — | | | | 739,828,048 | | |
| Corporate Bonds(a) | | | — | | | | 1,315,858,800 | | | | — | | | | 1,315,858,800 | | |
| Municipal Notes(a) | | | — | | | | 49,545,937 | | | | — | | | | 49,545,937 | | |
Asset-Backed Securities | | | — | | | | 202,731,109 | | | | — | | | | 202,731,109 | | |
Foreign Government Securities | | | — | | | | 67,437,470 | | | | — | | | | 67,437,470 | | |
| Developed Markets Ex- U.S.(a) | | | — | | | | 1,612,623 | | | | — | | | | 1,612,623 | | |
Short-Term Investments | | | — | | | | 13,057,103 | | | | — | | | | 13,057,103 | | |
Total Investments | | $ | — | | | $ | 3,379,633,754 | | | $ | 11,370,136 | | | $ | 3,391,003,890 | | |
(a) The Schedule of Investments provides information on the industry, state/territory or sector categorization for the portfolio.
See Notes to Financial Statements
207
Schedule of Investments Strategic Income Fund^ (cont'd)
(b) The following is a reconciliation between the beginning and ending balances of investments in which unobservable inputs (Level 3) were used in determining value:
(000's omitted) | | Beginning
balance, as
of 11/1/2018 | | Accrued
discounts/
(premiums) | | Realized
gain/
(loss) | | Change in
unrealized
appreciation/
(depreciation) | | Purchases | | Sales | | Transfers
into
Level 3 | | Transfers
out of
Level 3 | | Balance,
as of
10/31/2019 | | Net change
in unrealized
appreciation/
(depreciation)
from
investments
still held as
of 10/31/2019 | |
Investments in
Securities: | |
| Loan Assignments(c) | |
Aerospace &
Defense | | $ | — | | | $ | — | | | $ | — | | | $ | — | | | $ | 921 | | | $ | — | | | $ | — | | | $ | — | | | $ | 921 | | | $ | — | | |
Building &
Development | | | 434 | | | | — | | | | (11 | ) | | | — | | | | — | | | | (423 | ) | | | — | | | | — | | | | — | | | | — | | |
Business
Equipment &
Services | | | 621 | | | | — | | | | — | | | | 4 | | | | 1,521 | | | | — | | | | — | | | | (621 | ) | | | 1,525 | | | | 4 | | |
Cable & Satellite
Television | | | — | | | | — | | | | — | | | | (1 | ) | | | 345 | | | | — | | | | — | | | | — | | | | 344 | | | | (1 | ) | |
Chemicals &
Plastics | | | 70 | | | | — | | | | — | | | | — | | | | — | | | | (70 | ) | | | — | | | | — | | | | — | | | | — | | |
Conglomerates | | | — | | | | — | | | | (16 | ) | | | (13 | ) | | | 1,282 | | | | (1,378 | ) | | | 1,300 | | | | — | | | | 1,175 | | | | (13 | ) | |
Electronics—
Electrical | | | 175 | | | | — | | | | (1 | ) | | | (1 | ) | | | — | | | | (173 | ) | | | — | | | | — | | | | — | | | | — | | |
Food Products | | | 209 | | | | — | | | | — | | | | — | | | | — | | | | (209 | ) | | | — | | | | — | | | | — | | | | — | | |
Food Service | | | 459 | | | | — | | | | — | | | | — | | | | — | | | | — | | | | — | | | | (459 | ) | | | — | | | | — | | |
Health Care | | | 103 | | | | — | | | | (6 | ) | | | 1 | | | | — | | | | (98 | ) | | | — | | | | — | | | | — | | | | — | | |
Leisure Goods—
Activities—
Movies | | | — | | | | 1 | | | | (16 | ) | | | (66 | ) | | | 1,330 | | | | (969 | ) | | | 980 | | | | — | | | | 1,260 | | | | (66 | ) | |
Oil & Gas | | | 511 | | | | — | | | | (24 | ) | | | 1 | | | | — | | | | (488 | ) | | | — | | | | — | | | | — | | | | — | | |
Radio & Television | | | — | | | | 4 | | | | (95 | ) | | | 49 | | | | 1,349 | | | | (1,332 | ) | | | 1,854 | | | | — | | | | 1,829 | | | | 49 | | |
Steel | | | 1,195 | | | | — | | | | (15 | ) | | | (93 | ) | | | 2,095 | | | | (597 | ) | | | — | | | | — | | | | 2,585 | | | | (93 | ) | |
Utilities | | | — | | | | 1 | | | | — | | | | (24 | ) | | | 1,023 | | | | (43 | ) | | | 775 | | | | — | | | | 1,732 | | | | (24 | ) | |
Total | | $ | 3,777 | | | $ | 6 | | | $ | (184 | ) | | $ | (143 | ) | | $ | 9,866 | | | $ | (5,780 | ) | | $ | 4,909 | | | $ | (1,080 | ) | | $ | 11,371 | | | $ | (144 | ) | |
(c) Securities categorized as Level 3 are valued based on a single quotation obtained from a dealer. The Fund does not have access to unobservable inputs and therefore cannot disclose such inputs used in formulating such quotation.
See Notes to Financial Statements
208
Schedule of Investments Strategic Income Fund^ (cont'd)
The following is a summary, categorized by Level (see Note A of Notes to Financial Statements), of inputs used to value the Fund's derivatives as of October 31, 2019:
Other Financial Instruments
| | | Level 1 | | Level 2 | | Level 3 | | Total | |
| Futures(a) | |
Assets | | $ | 6,875,618 | | | $ | — | | | $ | — | | | $ | 6,875,618 | | |
Liabilities | | | (1,388,825 | ) | | | — | | | | — | | | | (1,388,825 | ) | |
| Forward Contracts(a) | |
Assets | | | — | | | | 2,785,266 | | | | — | | | | 2,785,266 | | |
Liabilities | | | — | | | | (2,091,200 | ) | | | — | | | | (2,091,200 | ) | |
| Bond Forwards(a) | |
Assets | | | — | | | | 6,289 | | | | — | | | | 6,289 | | |
Liabilities | | | — | | | | (57,594 | ) | | | — | | | | (57,594 | ) | |
Total | | $ | 5,486,793 | | | $ | 642,761 | | | $ | — | | | $ | 6,129,554 | | |
(a) Futures, forward contracts and bond forwards are reported at the cumulative unrealized appreciation/(depreciation) of the instrument.
^ A balance indicated with a "—", reflects either a zero balance or an amount that rounds to less than 1.
See Notes to Financial Statements
209
Schedule of Investments Unconstrained Bond Fund^ October 31, 2019
| PRINCIPAL AMOUNT(a) | | | | VALUE | |
U.S. Treasury Obligations 13.6% | | | |
$ | 1,245,000 | | | U.S. Treasury Bill, 2.34%, due 1/2/2020 | | $ | 1,241,676 | (b)(c) | |
| | | | | U.S. Treasury Inflation-Indexed Bonds(q) | | | | | |
| | 3,328,367 | | | 0.13%, due 4/15/2022 | | | 3,301,607 | | |
| | 1,210,740 | | | 2.13%, due 2/15/2040 | | | 1,592,450 | | |
| | 897,177 | | | 1.38%, due 2/15/2044 | | | 1,065,916 | | |
| | | | | Total U.S. Treasury Obligations (Cost $7,253,030) | | | 7,201,649 | | |
Mortgage-Backed Securities 9.2% | | | |
Collateralized Mortgage Obligations 6.5% | | | |
| | | | | Fannie Mae Connecticut Avenue Securities | | | | | |
| | 575,000 | | | Ser. 2017-C02, Class 2M2, (1M USD LIBOR + 3.65%), 5.47%, due 9/25/2029 | | | 602,825 | (d) | |
| | 635,000 | | | Ser. 2017-C03, Class 1M2, (1M USD LIBOR + 3.00%), 4.82%, due 10/25/2029 | | | 660,822 | (d) | |
| | 631,000 | | | Ser. 2017-C04, Class 2M2, (1M USD LIBOR + 2.85%), 4.67%, due 11/25/2029 | | | 648,938 | (d) | |
| | | | | Freddie Mac Structured Agency Credit Risk Debt Notes | | | | | |
| | 850,000 | | | Ser. 2017-DNA2, Class M2, (1M USD LIBOR + 3.45%), 5.27%, due 10/25/2029 | | | 902,529 | (d) | |
| | 600,000 | | | Ser. 2017-HQA2, Class M2, (1M USD LIBOR + 2.65%), 4.47%, due 12/25/2029 | | | 615,860 | (d) | |
| | | | 3,430,974 | | |
Commercial Mortgage-Backed 0.6% | | | |
| | 936,264 | | | Citigroup Commercial Mortgage Trust, Ser. 2015-GC27, Class XA, 1.36%, due 2/10/2048 | | | 52,027 | (e)(f) | |
| | | | | Commercial Mortgage Trust | | | | | |
| | 651,002 | | | Ser. 2014-CR16, Class XA, 0.98%, due 4/10/2047 | | | 24,167 | (e)(f) | |
| | 738,041 | | | Ser. 2014-LC15, Class XA, 1.10%, due 4/10/2047 | | | 29,945 | (e)(f) | |
| 682,647 |
| | Morgan Stanley Bank of America Merrill Lynch Trust, Ser. 2014-C16, Class XA, 1.01%,
due 6/15/2047 | | | 24,091 | (e)(f) | |
| | | | | WF-RBS Commercial Mortgage Trust | | | | | |
| | 876,569 | | | Ser. 2014-LC14, Class XA, 1.22%, due 3/15/2047 | | | 35,375 | (e)(f) | |
| | 3,487,321 | | | Ser. 2014-C21, Class XA, 1.04%, due 8/15/2047 | | | 139,838 | (e)(f) | |
| | | | 305,443 | | |
Uniform Mortgage-Backed Securities 2.1% | | | |
| | | | | Pass-Through Certificates | | | | | |
| | 660,000 | | | 3.00%, TBA, 30 Year Maturity | | | 670,673 | (g) | |
| | 450,000 | | | 3.50%, TBA, 30 Year Maturity | | | 462,059 | (g) | |
| | | | 1,132,732 | | |
| | | | | Total Mortgage-Backed Securities (Cost $4,990,794) | | | 4,869,149 | | |
Corporate Bonds 47.2% | | | |
Airlines 0.3% | | | |
| | 147,784 | | | American Airlines, Inc., 4.38%, due 10/1/2022 | | | 152,088 | | |
Apparel 0.2% | | | |
EUR | 100,000 | | | Levi Strauss & Co., 3.38%, due 3/15/2027 | | | 119,192 | | |
See Notes to Financial Statements
210
Schedule of Investments Unconstrained Bond Fund^ (cont'd)
| PRINCIPAL AMOUNT(a) | | | | VALUE | |
Auto Manufacturers 2.1% | | | |
EUR | 107,000 | | | Jaguar Land Rover Automotive PLC, 4.50%, due 1/15/2026 | | $ | 112,482 | (h) | |
EUR | 455,000 | | | Volkswagen Bank GmbH, 1.25%, due 12/15/2025 | | | 522,971 | (h)(i) | |
EUR | 400,000 | | | Volkswagen Int'l Finance NV, 2.50%, due 3/20/2022 | | | 456,729 | (h)(j)(k) | |
| | | | 1,092,182 | | |
Auto Parts & Equipment 1.0% | | | |
EUR | 237,000 | | | Grupo Antolin-Irausa SA, 3.38%, due 4/30/2026 | | | 224,364 | (h) | |
EUR | 100,000 | | | IHO Verwaltungs GmbH, 3.75% Cash/4.50% PIK, due 9/15/2026 | | | 112,945 | (h)(l) | |
EUR | 150,000 | | | LKQ Italia Bondco SpA, 3.88%, due 4/1/2024 | | | 187,194 | (h) | |
| | | | 524,503 | | |
Banks 1.2% | | | |
$ | 425,000 | | | HSBC Holdings PLC, 6.00%, due 5/22/2027 | | | 441,150 | (i)(j)(k) | |
EUR | 150,000 | | | Lloyds Banking Group PLC, 1.00%, due 11/9/2023 | | | 171,881 | (h) | |
| | | | 613,031 | | |
Beverages 0.9% | | | |
$ | 270,000 | | | Anheuser-Busch InBev Worldwide, Inc., 4.75%, due 1/23/2029 | | | 313,716 | | |
EUR | 150,000 | | | Sunshine Mid BV, 6.50%, due 5/15/2026 | | | 171,606 | (h) | |
| | | | 485,322 | | |
Building Materials 0.3% | | | |
EUR | 152,000 | | | Cemex SAB de CV, 3.13%, due 3/19/2026 | | | 173,953 | (h) | |
Chemicals 2.3% | | | |
EUR | 100,000 | | | Arkema SA, 2.75%, due 6/17/2024 | | | 116,967 | (h)(j)(k) | |
EUR | 100,000 | | | Axalta Coating Systems Dutch Holding B BV, 3.75%, due 1/15/2025 | | | 114,513 | (h) | |
EUR | 100,000 | | | Axalta Coating Systems LLC, 4.25%, due 8/15/2024 | | | 114,597 | (h) | |
EUR | 203,000 | | | CeramTec BondCo GmbH, 5.25%, due 12/15/2025 | | | 233,429 | (h) | |
EUR | 250,000 | | | Ineos Group Holdings SA, 5.38%, due 8/1/2024 | | | 284,922 | (h) | |
EUR | 109,000 | | | Kronos Int'l, Inc., 3.75%, due 9/15/2025 | | | 119,744 | (h) | |
EUR | 100,000 | | | SGL Carbon SE, 4.63%, due 9/30/2024 | | | 100,957 | (h) | |
EUR | 100,000 | | | Solvay Finance SA, 5.87%, due 6/3/2024 | | | 131,605 | (h)(j)(k) | |
| | | | 1,216,734 | | |
Commercial Services 2.3% | | | |
EUR | 100,000 | | | Avis Budget Finance PLC, 4.50%, due 5/15/2025 | | | 115,027 | (h) | |
EUR | 190,000 | | | Europcar Mobility Group, 4.13%, due 11/15/2024 | | | 200,071 | (h) | |
EUR | 125,000 | | | House of Finance NV, 4.38%, due 7/15/2026 | | | 136,478 | (h) | |
EUR | 332,000 | | | Intertrust Group BV, 3.38%, due 11/15/2025 | | | 386,566 | (h) | |
EUR | 121,000 | | | La Financiere Atalian SAS, 4.00%, due 5/15/2024 | | | 89,838 | (h) | |
EUR | 100,000 | | | Loxam SAS, 6.00%, due 4/15/2025 | | | 111,731 | (h) | |
EUR | 136,000 | | | Techem Verwaltungsgesellschaft 674 mbH, 6.00%, due 7/30/2026 | | | 164,548 | (h) | |
| | | | 1,204,259 | | |
See Notes to Financial Statements
211
Schedule of Investments Unconstrained Bond Fund^ (cont'd)
| PRINCIPAL AMOUNT(a) | | | | VALUE | |
Computers 0.9% | | | |
EUR | 100,000 | | | Banff Merger Sub, Inc., 8.38%, due 9/1/2026 | | $ | 104,544 | (h) | |
$ | 320,000 | | | Diamond 1 Finance Corp./Diamond 2 Finance Corp., 6.02%, due 6/15/2026 | | | 365,193 | (i)(m) | |
| | | | 469,737 | | |
Diversified Financial Services 0.4% | | | |
EUR | 206,000 | | | Lincoln Financing S.a.r.l., (3M EURIBOR + 3.88%, Floor 3.88%), 3.88%, due 4/1/2024 | | | 229,085 | (d)(h) | |
Electric 3.5% | | | |
| | | | | EnBW Energie Baden-Wuerttemberg AG | | | | | |
EUR | 100,000 | | | 3.63%, due 4/2/2076 | | | 116,302 | (h)(k) | |
EUR | 100,000 | | | 3.38%, due 4/5/2077 | | | 118,085 | (h)(k) | |
$ | 200,000 | | | Eskom Holdings SOC Ltd., 7.13%, due 2/11/2025 | | | 205,571 | (h) | |
GBP | 417,000 | | | NGG Finance PLC, 5.63%, due 6/18/2073 | | | 604,536 | (h)(i)(k) | |
GBP | 155,000 | | | NWEN Finance PLC, 5.88%, due 6/21/2021 | | | 208,308 | (h) | |
EUR | 50,000 | | | Orano SA, 3.50%, due 3/22/2021 | | | 58,024 | (h) | |
$ | 525,000 | | | SSE PLC, 4.75%, due 9/16/2077 | | | 531,510 | (h)(i)(k) | |
| | | | 1,842,336 | | |
Electrical Components & Equipment 0.6% | | | |
EUR | 196,000 | | | Belden, Inc., 3.38%, due 7/15/2027 | | | 222,284 | (h) | |
EUR | 100,000 | | | Energizer Gamma Acquisition BV, 4.63%, due 7/15/2026 | | | 117,595 | (h) | |
| | | | 339,879 | | |
Engineering & Construction 1.4% | | | |
GBP | 100,000 | | | BAA SH PLC, 3.88%, due 3/1/2027 | | | 129,918 | (h) | |
EUR | 200,000 | | | Cellnex Telecom SA, 2.88%, due 4/18/2025 | | | 243,625 | (h) | |
$ | 200,000 | | | China Minmetals Corp., 3.75%, due 11/13/2022 | | | 201,473 | (h)(j)(k) | |
EUR | 134,000 | | | Swissport Financing S.a.r.l., 9.00%, due 2/15/2025 | | | 153,257 | (h) | |
| | | | 728,273 | | |
Entertainment 1.5% | | | |
GBP | 100,000 | | | AMC Entertainment Holdings, Inc., 6.38%, due 11/15/2024 | | | 123,852 | | |
EUR | 200,000 | | | Cirsa Finance Int'l S.a.r.l., 4.75%, due 5/22/2025 | | | 231,371 | (h) | |
EUR | 171,000 | | | Int'l Game Technology PLC, 3.50%, due 6/15/2026 | | | 202,356 | (h) | |
EUR | 100,000 | | | Scientific Games Int'l, Inc., 3.38%, due 2/15/2026 | | | 112,608 | (h) | |
EUR | 130,000 | | | WMG Acquisition Corp., 3.63%, due 10/15/2026 | | | 152,947 | (h) | |
| | | | 823,134 | | |
Environmental Control 0.6% | | | |
GBP | 100,000 | | | Kelda Finance No. 3 PLC, 5.75%, due 2/17/2020 | | | 130,246 | (h) | |
EUR | 185,000 | | | Paprec Holding SA, 4.00%, due 3/31/2025 | | | 185,699 | (h) | |
| | | | 315,945 | | |
Food 1.1% | | | |
EUR | 300,000 | | | Casino Guichard Perrachon SA, 4.50%, due 3/7/2024 | | | 288,574 | (h) | |
GBP | 100,000 | | | Co-operative Group Holdings 2011 Ltd., 7.50%, due 7/8/2026 | | | 147,558 | (h)(n) | |
GBP | 100,000 | | | Premier Foods Finance PLC, 6.25%, due 10/15/2023 | | | 133,903 | (h) | |
| | | | 570,035 | | |
See Notes to Financial Statements
212
Schedule of Investments Unconstrained Bond Fund^ (cont'd)
| PRINCIPAL AMOUNT(a) | | | | VALUE | |
Forest Products & Paper 0.4% | | | |
EUR | 155,000 | | | Smurfit Kappa Acquisitions, 2.75%, due 2/1/2025 | | $ | 188,424 | (h) | |
Gas 0.9% | | | |
| | | | | Centrica PLC | | | | | |
GBP | 200,000 | | | 6.40%, due 9/4/2026 | | | 335,203 | (h) | |
EUR | 132,000 | | | 3.00%, due 4/10/2076 | | | 150,167 | (h)(k) | |
| | | | 485,370 | | |
Hand - Machine Tools 0.2% | | | |
EUR | 100,000 | | | Colfax Corp., 3.25%, due 5/15/2025 | | | 114,314 | (h) | |
Healthcare - Products 0.3% | | | |
EUR | 136,000 | | | Avantor, Inc., 4.75%, due 10/1/2024 | | | 161,216 | (h) | |
Healthcare - Services 0.4% | | | |
EUR | 165,000 | | | Catalent Pharma Solutions, Inc., 4.75%, due 12/15/2024 | | | 189,086 | (h) | |
Home Builders 0.4% | | | |
GBP | 145,000 | | | Miller Homes Group Holdings PLC, 5.50%, due 10/15/2024 | | | 194,138 | (h) | |
Household Products - Wares 0.4% | | | |
EUR | 200,000 | | | Spectrum Brands, Inc., 4.00%, due 10/1/2026 | | | 234,906 | (h) | |
Insurance 0.3% | | | |
GBP | 125,000 | | | Phoenix Group Holdings, 5.75%, due 7/7/2021 | | | 172,103 | (h) | |
Internet 0.4% | | | |
EUR | 200,000 | | | Netflix, Inc., 3.63%, due 5/15/2027 | | | 234,737 | | |
Lodging 0.4% | | | |
GBP | 170,000 | | | TVL Finance PLC, (3M GBP LIBOR + 5.38%), 6.16%, due 7/15/2025 | | | 212,502 | (d)(h) | |
Machinery-Diversified 0.4% | | | |
EUR | 225,000 | | | Platin 1426 GmbH, 5.38%, due 6/15/2023 | | | 235,745 | (h) | |
Media 3.3% | | | |
| | | | | Altice Finco SA | | | | | |
EUR | 100,000 | | | 9.00%, due 6/15/2023 | | | 115,556 | (h) | |
EUR | 115,000 | | | 4.75%, due 1/15/2028 | | | 124,495 | (h) | |
| | | | | Altice Luxembourg SA | | | | | |
EUR | 175,000 | | | 6.25%, due 2/15/2025 | | | 202,740 | (h) | |
EUR | 100,000 | | | 8.00%, due 5/15/2027 | | | 121,703 | (h) | |
$ | 355,000
| | | Charter Communications Operating LLC/Charter Communications Operating
Capital, 4.20%, due 3/15/2028 | | | 376,913
| (i) | |
EUR | 100,000 | | | Summer BidCo BV, 9.00% Cash/9.75% PIK, due 11/15/2025 | | | 116,071 | (h)(l) | |
EUR | 180,000 | | | UPCB Finance IV Ltd., 4.00%, due 1/15/2027 | | | 210,792 | (h) | |
GBP | 180,000 | | | Virgin Media Secured Finance PLC, 6.25%, due 3/28/2029 | | | 248,027 | (h) | |
EUR | 191,000 | | | Ziggo BV, 4.25%, due 1/15/2027 | | | 229,471 | (h) | |
| | | | 1,745,768 | | |
See Notes to Financial Statements
213
Schedule of Investments Unconstrained Bond Fund^ (cont'd)
| PRINCIPAL AMOUNT(a) | | | | VALUE | |
Mining 0.3% | | | |
EUR | 130,000 | | | Anglo American Capital PLC, 3.25%, due 4/3/2023 | | $ | 159,292 | (h) | |
Miscellaneous Manufacturers 0.5% | | | |
$ | 275,000 | | | General Electric Co., Ser. D, 5.00%, due 1/21/2021 | | | 265,226 | (i)(j)(k) | |
Multi-National 0.4% | | | |
| | 200,000 | | | Banque Ouest Africaine de Developpement, 5.00%, due 7/27/2027 | | | 211,960 | (h) | |
Oil & Gas 2.6% | | | |
| | 460,000 | | | Apache Corp., 4.38%, due 10/15/2028 | | | 456,568 | (i) | |
| | 200,000 | | | KazMunayGas National Co. JSC, 6.38%, due 10/24/2048 | | | 251,560 | (h) | |
| | | | | Petrobras Global Finance BV | | | | | |
| | 150,000 | | | 5.38%, due 10/1/2029 | | | 213,481 | | |
| | 101,000 | | | 6.90%, due 3/19/2049 | | | 117,392 | | |
| | | | | Petroleos de Venezuela SA | | | | | |
GBP | 21,649 | | | 6.00%, due 5/16/2024 | | | 1,299 | (h)(o)(p) | |
$ | 251,399 | | | 6.00%, due 11/15/2026 | | | 15,084 | (h)(o)(p) | |
| | 362,400 | | | 5.38%, due 4/12/2027 | | | 21,744 | (h)(o)(p) | |
| | | | | Petroleos Mexicanos | | | | | |
| | 16,000 | | | 6.50%, due 1/23/2029 | | | 16,688 | | |
| | 12,000 | | | 6.84%, due 1/23/2030 | | | 12,815 | (m) | |
| | 133,000 | | | 7.69%, due 1/23/2050 | | | 145,023 | (m) | |
EUR | 100,000 | | | Repsol Int'l Finance BV, 4.50%, due 3/25/2075 | | | 127,996 | (h)(k) | |
| | | | 1,379,650 | | |
Packaging & Containers 2.0% | | | |
EUR | 250,000 | | | ARD Finance SA, 6.63% Cash/7.38% PIK, due 9/15/2023 | | | 288,584 | (l) | |
GBP | 150,000 | | | Ardagh Packaging Finance PLC/Ardagh Holdings USA, Inc., 4.75%, due 7/15/2027 | | | 200,086 | (h) | |
EUR | 253,000 | | | BWAY Holding Co., 4.75%, due 4/15/2024 | | | 290,902 | (h) | |
EUR | 220,000 | | | Crown European Holdings SA, 3.38%, due 5/15/2025 | | | 269,926 | (h) | |
| | | | 1,049,498 | | |
Pharmaceuticals 2.0% | | | |
$ | 365,000 | | | CVS Health Corp., 4.30%, due 3/25/2028 | | | 396,215 | (i) | |
EUR | 200,000 | | | Nidda BondCo GmbH, 5.00%, due 9/30/2025 | | | 227,579 | (h) | |
EUR | 103,000 | | | Rossini S.a.r.l., 6.75%, due 10/30/2025 | | | 126,971 | (h) | |
EUR | 200,000 | | | Teva Pharmaceutical Finance Netherlands II BV, 1.88%, due 3/31/2027 | | | 168,197 | (h) | |
EUR | 110,000 | | | Valeant Pharmaceuticals Int'l, Inc., 4.50%, due 5/15/2023 | | | 124,104 | (h) | |
| | | | 1,043,066 | | |
Pipelines 2.5% | | | |
$ | 200,000 | | | Abu Dhabi Crude Oil Pipeline LLC, 4.60%, due 11/2/2047 | | | 230,874 | (m) | |
| | 440,000 | | | Energy Transfer Operating L.P., Ser. B, 6.63%, due 2/15/2028 | | | 419,650 | (i)(j)(k) | |
| | 365,000 | | | MPLX LP, 4.00%, due 3/15/2028 | | | 379,296 | (i) | |
| | 280,000 | | | Southern Gas Corridor CJSC, 6.88%, due 3/24/2026 | | | 326,200 | (h) | |
| | | | 1,356,020 | | |
See Notes to Financial Statements
214
Schedule of Investments Unconstrained Bond Fund^ (cont'd)
| PRINCIPAL AMOUNT(a) | | | | VALUE | |
Private Equity 0.4% | | | |
EUR | 200,000 | | | Vivion Investments S.a.r.l., 3.00%, due 8/8/2024 | | $ | 222,050 | (h) | |
Real Estate 0.2% | | | |
EUR | 100,000 | | | Summit Properties Ltd., 2.00%, due 1/31/2025 | | | 106,630 | (h) | |
Real Estate Investment Trusts 0.9% | | | |
GBP | 198,000 | | | Iron Mountain UK PLC, 3.88%, due 11/15/2025 | | | 256,108 | (h) | |
EUR | 200,000 | | | MPT Operating Partnership L.P./MPT Finance Corp., 3.33%, due 3/24/2025 | | | 247,420 | | |
| | | | 503,528 | | |
Retail 2.0% | | | |
EUR | 103,000 | | | eG Global Finance PLC, 3.63%, due 2/7/2024 | | | 112,326 | (h) | |
GBP | 550,000 | | | Next Group PLC, 4.38%, due 10/2/2026 | | | 798,336 | (h)(i) | |
EUR | 130,000 | | | Tasty Bondco 1 SA, 6.25%, due 5/15/2026 | | | 150,168 | (h) | |
| | | | 1,060,830 | | |
Software 1.0% | | | |
EUR | 190,000 | | | InterXion Holding NV, 4.75%, due 6/15/2025 | | | 230,438 | (h) | |
EUR | 169,000 | | | IQVIA, Inc., 3.25%, due 3/15/2025 | | | 192,726 | (h) | |
EUR | 109,000 | | | Playtech PLC, 4.25%, due 3/7/2026 | | | 129,102 | (h) | |
| | | | 552,266 | | |
Telecommunications 3.6% | | | |
EUR | 145,000 | | | Altice France SA, 5.88%, due 2/1/2027 | | | 178,272 | (h) | |
$ | 420,000 | | | AT&T, Inc., 4.35%, due 3/1/2029 | | | 465,173 | (i) | |
EUR | 123,000 | | | DKT Finance ApS, 7.00%, due 6/17/2023 | | | 145,068 | (h) | |
EUR | 35,000 | | | Olivetti Finance SA, Ser. 14, 7.75%, due 1/24/2033 | | | 57,917 | | |
EUR | 100,000 | | | SoftBank Group Corp., 5.00%, due 4/15/2028 | | | 122,409 | (h) | |
| | | | | Telecom Italia SpA | | | | | |
EUR | 50,000 | | | 5.25%, due 2/10/2022 | | | 62,198 | (h) | |
EUR | 350,000 | | | 3.63%, due 1/19/2024 | | | 428,667 | (h) | |
EUR | 200,000 | | | 3.00%, due 9/30/2025 | | | 239,476 | (h) | |
GBP | 170,000 | | | Vodafone Group PLC, 4.88%, due 10/3/2078 | | | 234,250 | (h)(k) | |
| | | | 1,933,430 | | |
Water 0.4% | | | |
GBP | 150,000 | | | Anglian Water Osprey Financing PLC, 5.00%, due 4/30/2023 | | | 196,615 | (h) | |
| | | | | Total Corporate Bonds (Cost $24,948,416) | | | 25,108,058 | | |
Asset-Backed Securities 7.8% | | | |
$ | 280,000 | | | AM Capital Funding LLC, Ser. 2018-1, Class A, 4.98%, due 12/15/2023 | | | 293,985 | (m) | |
| 250,000 |
| | Ares XLV CLO Ltd., Ser. 2017-45A, Class E, (3M USD LIBOR + 6.10%), 8.10%,
due 10/15/2030 | | | 225,278 | (d)(m) | |
| 300,000 |
| | Assurant CLO I Ltd., Ser. 2017-1A, Class E, (3M USD LIBOR + 6.46%), 8.43%,
due 10/20/2029 | | | 287,655 | (d)(m) | |
See Notes to Financial Statements
215
Schedule of Investments Unconstrained Bond Fund^ (cont'd)
| PRINCIPAL AMOUNT(a) | | | | VALUE | |
| | | | | Bear Stearns Asset-Backed Securities Trust | | | | | |
$ | 229,321 | | | Ser. 2004-SD3, Class M2, (1M USD LIBOR + 1.88%), 3.70%, due 9/25/2034 | | $ | 232,333 | (d) | |
| | 482,704 | | | Ser. 2005-SD2, Class 1M2, (1M USD LIBOR + 1.00%), 2.82%, due 3/25/2035 | | | 487,876 | (d) | |
| 250,000 |
| | Benefit Street Partners CLO XII Ltd., Ser. 2017-12A, Class D, (3M USD LIBOR + 6.41%), 8.41%,
due 10/15/2030 | | | 221,992 | (d)(m) | |
| 251,579 |
| | Carrington Mortgage Loan Trust, Ser. 2006-RFC1, Class A4, (1M USD LIBOR + 0.24%), 2.06%,
due 3/25/2036 | | | 250,769 | (d) | |
| 500,000 |
| | Dewolf Park CLO Ltd., Ser. 2017-1A, Class E, (3M USD LIBOR + 6.20%), 8.20%,
due 10/15/2030 | | | 440,072 | (d)(m) | |
| 250,000 |
| | Dryden 54 Senior Loan Fund, Ser. 2017-54A, Class E, (3M USD LIBOR + 6.20%), 8.17%,
due 10/19/2029 | | | 220,116 | (d)(m) | |
| | 300,000 | | | Flatiron CLO Ltd., Ser. 2017-1A, Class E, (3M USD LIBOR + 6.00%), 8.16%, due 5/15/2030 | | | 266,673 | (d)(m) | |
| | 250,000 | | | Milos CLO Ltd., Ser. 2017-1A, Class E, (3M USD LIBOR + 6.30%), 8.27%, due 10/20/2030 | | | 226,113 | (d)(m) | |
| 330,000 |
| | Newcastle Mortgage Securities Trust, Ser. 2006-1, Class M2, (1M USD LIBOR + 0.37%), 2.19%,
due 3/25/2036 | | | 330,469 | (d) | |
| 90,113 |
| | Securitized Asset Backed Receivables LLC Trust, Ser. 2004-DO1, Class M1,
(1M USD LIBOR + 0.98%), 2.80%, due 7/25/2034 | | | 90,674 | (d) | |
| 15,289 |
| | Structured Asset Securities Corp., Ser. 2006-AM1, Class A4, (1M USD LIBOR + 0.16%), 1.98%,
due 4/25/2036 | | | 15,280 | (d) | |
| 580,000 |
| | Trafigura Securitisation Finance PLC, Ser. 2017-1A, Class B, (1M USD LIBOR + 1.70%), 3.62%,
due 12/15/2020 | | | 580,574 | (d)(m) | |
| | | | | Total Asset-Backed Securities (Cost $4,144,798) | | | 4,169,859 | | |
Foreign Government Securities 10.0% | | | |
| | 200,000 | | | Angolan Government International Bond, 8.25%, due 5/9/2028 | | | 209,092 | (h) | |
| | | | | Argentine Republic Government International Bond | | | | | |
EUR | 137,610 | | | 7.82%, due 12/31/2033 | | | 73,300 | | |
EUR | 450,000 | | | 3.38%, due 12/31/2038 | | | 196,377 | (n) | |
$ | 80,000 | | | Belize Government International Bond, 4.94%, due 2/20/2034 | | | 48,800 | (h)(n) | |
| | 243,000 | | | Brazil Minas SPE via State of Minas Gerais, 5.33%, due 2/15/2028 | | | 258,190 | (h) | |
| | 200,000 | | | Costa Rica Government International Bond, 7.16%, due 3/12/2045 | | | 199,002 | (h) | |
EUR | 15,000 | | | Cyprus Government International Bond, 2.75%, due 2/26/2034 | | | 20,863 | (h) | |
EUR | 35,835 | | | Deutsche Bundesrepublik Inflation Linked Bond, 0.10%, due 4/15/2026 | | | 43,836 | (h)(q) | |
$ | 200,000 | | | Development Bank of Mongolia LLC, 7.25%, due 10/23/2023 | | | 209,692 | (m) | |
| | 100,000 | | | Dominican Republic International Bond, 6.85%, due 1/27/2045 | | | 112,751 | (h) | |
| | 200,000 | | | Ecuador Government International Bond, 8.88%, due 10/23/2027 | | | 186,300 | (h) | |
| | 200,000 | | | Egypt Government International Bond, 7.90%, due 2/21/2048 | | | 200,520 | (h) | |
| | 70,000 | | | El Salvador Government International Bond, 7.75%, due 1/24/2023 | | | 76,476 | (h) | |
| | | | | French Republic Government Bond OAT | | | | | |
EUR | 37,184 | | | 0.25%, due 7/25/2024 | | | 44,694 | (h) | |
EUR | 26,171 | | | 0.10%, due 3/1/2029 | | | 32,576 | (h) | |
$ | 200,000 | | | Ghana Government International Bond, 10.75%, due 10/14/2030 | | | 252,587 | (h) | |
| | 200,000 | | | Indonesia Government International Bond, 5.13%, due 1/15/2045 | | | 237,535 | (h) | |
| | | | | Ireland Government Bond | | | | | |
EUR | 10,000 | | | 2.40%, due 5/15/2030 | | | 13,893 | (h) | |
EUR | 26,000 | | | 1.35%, due 3/18/2031 | | | 32,940 | (h) | |
| | | | | Italy Buoni Poliennali Del Tesoro | | | | | �� |
EUR | 39,290 | | | 0.25%, due 11/20/2023 | | | 43,880 | (h) | |
EUR | 30,094 | | | 0.40%, due 4/11/2024 | | | 33,639 | (h) | |
EUR | 35,017 | | | 0.65%, due 10/28/2027 | | | 39,067 | (h) | |
EUR | 33,000 | | | 3.00%, due 8/1/2029 | | | 43,895 | (h) | |
EUR | 30,365 | | | 0.40%, due 5/15/2030 | | | 34,011 | (h) | |
| | | | | Ivory Coast Government International Bond | | | | | |
$ | 264,000 | | | 5.75%, due 12/31/2032 | | | 260,498 | (h)(n) | |
| | 96,800 | | | 5.75%, due 12/31/2032 | | | 95,629 | (h)(n) | |
See Notes to Financial Statements
216
Schedule of Investments Unconstrained Bond Fund^ (cont'd)
| PRINCIPAL AMOUNT(a) | | | | VALUE | |
EUR | 34,000 | | | Kingdom of Belgium Government Bond, 5.00%, due 3/28/2035 | | $ | 65,379 | (h) | |
$ | 140,000 | | | Mexico Government International Bond, 5.75%, due 10/12/2110 | | | 162,576 | | |
| | 270,000 | | | Nigeria Government International Bond, 7.88%, due 2/16/2032 | | | 278,423 | (h) | |
| | 200,000 | | | Qatar Government International Bond, 4.00%, due 3/14/2029 | | | 222,175 | (h) | |
| | 200,000 | | | Republic of South Africa Government International Bond, 4.85%, due 9/27/2027 | | | 203,259 | | |
| | | | | Russian Foreign Bond - Eurobond | | | | | |
| | 200,000 | | | 4.75%, due 5/27/2026 | | | 220,241 | (h) | |
| | 200,000 | | | 4.25%, due 6/23/2027 | | | 214,675 | (h) | |
| | | | | Sri Lanka Government International Bond | | | | | |
| | 200,000 | | | 5.88%, due 7/25/2022 | | | 201,795 | (h) | |
| | 200,000 | | | 6.75%, due 4/18/2028 | | | 195,462 | (h) | |
| | 200,000 | | | Turkey Government International Bond, 6.13%, due 10/24/2028 | | | 197,117 | | |
| | | | | Ukraine Government International Bond | | | | | |
| | 100,000 | | | 7.75%, due 9/1/2025 | | | 107,250 | (h) | |
EUR | 100,000 | | | 6.75%, due 6/20/2026 | | | 123,232 | (h) | |
$ | 100,000 | | | 7.75%, due 9/1/2027 | | | 107,490 | (h) | |
| | 93,700 | | | Venezuela Government International Bond, 8.25%, due 10/13/2024 | | | 9,721 | (h)(o)(p) | |
| | | | | Total Foreign Government Securities (Cost $5,402,582) | | | 5,308,838 | | |
NUMBER OF SHARES | | | | | |
Exchange-Traded Funds 6.7% | | | |
| | 105,147 | | | VanEck Vectors J.P. Morgan EM Local Currency Bond ETF (Cost $4,044,711) | | | 3,568,689 | | |
Short-Term Investments 0.6% | | | |
Investment Companies 0.6% | | | |
| 328,683 | | | State Street Institutional U.S. Government Money Market Fund Premier Class, 1.75%(r)
(Cost $328,683) | | | 328,683 | (i) | |
| | | | | Total Investments 95.1% (Cost $51,113,014) | | | 50,554,925 | | |
| | | | | Other Assets Less Liabilities 4.9% | | | 2,615,094 | (s) | |
| | | | | Net Assets 100.0% | | $ | 53,170,019 | | |
(a) Principal amount is stated in the currency in which the security is denominated.
(b) Rate shown was the discount rate at the date of purchase.
(c) All or a portion of the security is pledged as collateral for futures.
(d) Variable or floating rate security. The interest rate shown was the current rate as of October 31, 2019 and changes periodically.
(e) Variable or floating rate security where the stated interest rate is not based on a published reference rate and spread. Rather, the interest rate adjusts periodically based on changes in current interest rates and prepayments on the underlying pool of assets. The interest rate shown was the current rate as of October 31, 2019.
(f) Interest only security. These securities represent the right to receive the monthly interest payments on an underlying pool of mortgages. Payments of principal on the pool reduce the value of the "interest only" holding.
See Notes to Financial Statements
217
Schedule of Investments Unconstrained Bond Fund^ (cont'd)
(g) TBA (To Be Announced) Securities are purchased/sold on a forward commitment basis with an approximate principal amount and no defined maturity date. The actual principal and maturity date will be determined upon settlement when the specific mortgage pools are assigned. Total value of all such securities (excluding forward sales contracts, if any) at October 31, 2019, amounted to $1,132,732, which represents 2.1% of net assets of the Fund.
(h) Security exempt from registration pursuant to Regulation S under the Securities Act of 1933, as amended. Regulation S applies to securities offerings that are made outside of the United States and do not involve directed selling efforts in the United States and as such may have restrictions on resale. Total value of all such securities at October 31, 2019 amounted to $23,535,412, which represents 44.3% of net assets of the Fund.
(i) All or a portion of this security is segregated in connection with obligations for to be announced securities, futures, forward foreign currency contracts and/or swaps with a total value of $6,351,421.
(j) Perpetual Bond Security. The rate reflected was the rate in effect on October 31, 2019. The maturity date reflects the next call date.
(k) Security issued at a fixed coupon rate, which converts to a variable rate at a future date. Rate shown is the rate in effect as of period end.
(l) Payment-in-kind (PIK) security.
(m) Securities were purchased under Rule 144A of the Securities Act of 1933, as amended, or are otherwise restricted and, unless registered under the Securities Act of 1933 or exempted from registration, may only be sold to qualified institutional investors or may have other restrictions on resale. At October 31, 2019, these securities amounted to $3,726,055, which represents 7.0% of net assets of the Fund. Securities denoted with (m) but without (o), if any, have been deemed by the investment manager to be liquid.
(n) Step Bond. Coupon rate is a fixed rate for an initial period that either resets at a specific date or may reset in the future contingent upon a predetermined trigger. The interest rate shown was the current rate as of October 31, 2019.
(o) Illiquid security.
(p) Defaulted security.
(q) Index-linked bond whose principal amount adjusts according to a government retail price index.
(r) Represents 7-day effective yield as of October 31, 2019.
(s) Includes the impact of the Fund's open positions in derivatives at October 31, 2019.
See Notes to Financial Statements
218
Schedule of Investments Unconstrained Bond Fund^ (cont'd)
Derivative Instruments
Futures contracts ("futures")
At October 31, 2019, open positions in futures for the Fund were as follows:
Long Futures:
Expiration Date | | Number of
Contracts | | Open Contracts | | Notional
Amount | | Value and
Unrealized
Appreciation/
(Depreciation) | |
12/2019 | | | 65 | | | Euro-Bund | | $ | 12,451,652 | | | $ | (328,163 | ) | |
12/2019 | | | 25 | | | U.S. Treasury Ultra Long Bond | | | 4,743,750 | | | | (80,471 | ) | |
12/2019 | | | 179 | | | U.S. Treasury Note, 2 Year | | | 38,592,680 | | | | (66,153 | ) | |
12/2019 | | | 147 | | | U.S. Treasury Note, 5 Year | | | 17,522,859 | | | | (65,569 | ) | |
Total Long Positions | | | | | | $ | 73,310,941 | | | $ | (540,356 | ) | |
Short Futures:
Expiration Date | | Number of
Contracts | | Open Contracts | | Notional
Amount | | Value and
Unrealized
Appreciation/
(Depreciation) | |
12/2019 | | | 34 | | | Euro-Bobl | | $ | (5,104,816 | ) | | $ | 76,598 | | |
12/2019 | | | 83 | | | Euro-Bund | | | (15,899,801 | ) | | | 431,187 | | |
12/2019 | | | 4 | | | Euro-Buxl Bond, 30 Year | | | (936,673 | ) | | | 52,642 | | |
12/2019 | | | 11 | | | Euro-OAT | | | (2,065,736 | ) | | | 45,883 | | |
12/2019 | | | 8 | | | U.S. Treasury Long Bond | | | (1,291,000 | ) | | | 27,075 | | |
12/2019 | | | 177 | | | U.S. Treasury Note, 10 Year | | | (23,062,547 | ) | | | 149,172 | | |
12/2019 | | | 126 | | | U.S. Treasury Note, Ultra 10 Year | | | (17,905,781 | ) | | | 265,885 | | |
12/2019 | | | 40 | | | U.S. Treasury Ultra Long Bond | | | (7,590,000 | ) | | | 126,736 | | |
12/2019 | | | 14 | | | United Kingdom Long Gilt Bond | | | (2,409,041 | ) | | | 13,236 | | |
Total Short Positions | | | | | | $ | (76,265,395 | ) | | $ | 1,188,414 | | |
Options on exchange-traded futures contracts
Long Positions:
| Expiration Date | | Number of
Contracts | | Open Contracts | | Notional
Amount | | Value and
Unrealized
Appreciation/
(Depreciation) | |
11/2019 | | | 1 | | | Put Options Exercise Price EUR 169.5 on
German Euro-Bund Futures | | $ | 191,564 | | | $ | (323 | ) | |
Total Long Positions | | | | | | $ | 191,564 | | | $ | (323 | ) | |
Total Futures | | | | | | | | $ | 647,735 | | |
The Fund had securities pledged in the amount of $892,611 to cover collateral requirements on open futures.
For the year ended October 31, 2019, the average notional value of futures for the Fund was $120,226,356 for long positions and $(129,798,790) for short positions.
See Notes to Financial Statements
219
Schedule of Investments Unconstrained Bond Fund^ (cont'd)
Forward foreign currency contracts ("forward contracts")
At October 31, 2019, open forward contracts for the Fund were as follows:
Currency Purchased | | Currency Sold | | Counterparty | | Settlement
Date | | Net
Unrealized
Appreciation/
(Depreciation) | |
| | 310,161 | | | AUD | | | | | 209,684 | | | USD | | | | CITI | | 1/22/2020 | | $ | 4,552 | | |
| | 405,164 | | | AUD | | | | | 276,018 | | | USD | | | | CITI | | 1/22/2020 | | | 3,840 | | |
| | 13,991,165 | | | AUD | | | | | 9,464,114 | | | USD | | | | GSI | | 1/22/2020 | | | 199,964 | | |
| | 2,815,196 | | | AUD | | | | | 1,904,297 | | | USD | | | | GSI | | 1/22/2020 | | | 40,235 | | |
| | 47,114 | | | AUD | | | | | 31,870 | | | USD | | | | GSI | | 1/22/2020 | | | 673 | | |
| | 208,304 | | | AUD | | | | | 143,198 | | | USD | | | | RBC | | 1/22/2020 | | | 683 | | |
| | 2,119,932 | | | AUD | | | | | 1,434,070 | | | USD | | | | SG | | 1/22/2020 | | | 30,224 | | |
| | 797,251 | | | AUD | | | | | 539,316 | | | USD | | | | SG | | 1/22/2020 | | | 11,367 | | |
| | 324,260 | | | AUD | | | | | 219,535 | | | USD | | | | SSB | | 1/22/2020 | | | 4,440 | | |
| | 4,385,067 | | | BRL | | | | | 1,065,475 | | | USD | | | | GSI | | 1/22/2020 | | | 23,148 | | |
| | 3,558,368 | | | BRL | | | | | 861,987 | | | USD | | | | GSI | | 1/22/2020 | | | 21,402 | | |
| | 463,255 | | | BRL | | | | | 112,220 | | | USD | | | | GSI | | 1/22/2020 | | | 2,786 | | |
| | 10,876,163 | | | CAD | | | | | 8,181,441 | | | USD | | | | CITI | | 1/22/2020 | | | 79,871 | | |
| | 10,494,566 | | | CAD | | | | | 7,894,391 | | | USD | | | | CITI | | 1/22/2020 | | | 77,069 | | |
| | 783,024 | | | CAD | | | | | 589,132 | | | USD | | | | CITI | | 1/22/2020 | | | 5,637 | | |
| | 759,103 | | | CAD | | | | | 574,771 | | | USD | | | | CITI | | 1/22/2020 | | | 1,828 | | |
| | 363,347 | | | CAD | | | | | 275,952 | | | USD | | | | CITI | | 1/22/2020 | | | 39 | | |
| | 1,692,350 | | | CAD | | | | | 1,272,772 | | | USD | | | | RBC | | 1/22/2020 | | | 12,703 | | |
| | 12,502 | | | CAD | | | | | 9,402 | | | USD | | | | RBC | | 1/22/2020 | | | 94 | | |
| | 17,255,286 | | | CAD | | | | | 12,980,048 | | | USD | | | | SG | | 1/22/2020 | | | 126,718 | | |
| | 295,763 | | | USD | | | | | 386,162 | | | CAD | | | | GSI | | 1/22/2020 | | | 2,443 | | |
| | 344,569 | | | USD | | | | | 451,246 | | | CAD | | | | RBC | | 1/22/2020 | | | 1,811 | | |
| | 3,050,588 | | | CHF | | | | | 3,100,160 | | | USD | | | | CITI | | 1/22/2020 | | | 11,906 | | |
| | 277,197 | | | CHF | | | | | 282,444 | | | USD | | | | CITI | | 1/22/2020 | | | 339 | | |
| | 1,354,088 | | | CHF | | | | | 1,377,365 | | | USD | | | | GSI | | 1/22/2020 | | | 4,011 | | |
| | 44,214 | | | CHF | | | | | 44,843 | | | USD | | | | GSI | | 1/22/2020 | | | 262 | | |
| | 64,726 | | | CHF | | | | | 65,979 | | | USD | | | | RBC | | 1/22/2020 | | | 51 | | |
| | 8,617,804 | | | CHF | | | | | 8,754,017 | | | USD | | | | SSB | | 1/22/2020 | | | 37,459 | | |
| | 12,028 | | | USD | | | | | 8,663,409 | | | CLP | | | | CITI | | 1/22/2020 | | | 322 | | |
| | 13,493,854 | | | CZK | | | | | 575,431 | | | USD | | | | CITI | | 1/22/2020 | | | 15,129 | | |
| | 2,034,403 | | | CZK | | | | | 86,787 | | | USD | | | | GSI | | 1/22/2020 | | | 2,249 | | |
| | 13,209,190 | | | CZK | | | | | 563,917 | | | USD | | | | SSB | | 1/22/2020 | | | 14,184 | | |
| | 10,750,906 | | | DKK | | | | | 1,594,567 | | | USD | | | | SSB | | 1/22/2020 | | | 20,387 | | |
| | 5,637,545 | | | EUR | | | | | 6,218,945 | | | USD | | | | CITI | | 1/22/2020 | | | 103,605 | | |
| | 3,944,806 | | | EUR | | | | | 4,358,616 | | | USD | | | | CITI | | 1/22/2020 | | | 65,514 | | |
| | 372,899 | | | EUR | | | | | 416,675 | | | USD | | | | CITI | | 1/22/2020 | | | 1,534 | | |
| | 9,142 | | | EUR | | | | | 10,172 | | | USD | | | | CITI | | 1/22/2020 | | | 81 | | |
| | 13,003,670 | | | EUR | | | | | 14,393,190 | | | USD | | | | GSI | | 1/22/2020 | | | 190,527 | | |
| | 4,895,605 | | | EUR | | | | | 5,418,730 | | | USD | | | | GSI | | 1/22/2020 | | | 71,729 | | |
| | 3,005,315 | | | EUR | | | | | 3,326,451 | | | USD | | | | GSI | | 1/22/2020 | | | 44,033 | | |
| | 264,576 | | | EUR | | | | | 293,072 | | | USD | | | | GSI | | 1/22/2020 | | | 3,652 | | |
| | 104,436 | | | EUR | | | | | 116,388 | | | USD | | | | GSI | | 1/22/2020 | | | 738 | | |
| | 14,045 | | | EUR | | | | | 15,492 | | | USD | | | | GSI | | 1/22/2020 | | | 260 | | |
See Notes to Financial Statements
220
Schedule of Investments Unconstrained Bond Fund^ (cont'd)
Currency Purchased | | Currency Sold | | Counterparty | | Settlement
Date | | Net
Unrealized
Appreciation/
(Depreciation) | |
| | 9,803,941 | | | EUR | | | | | 10,851,335 | | | USD | | | | JPM | | 1/22/2020 | | $ | 143,861 | | |
| | 282,348 | | | EUR | | | | | 312,512 | | | USD | | | | JPM | | 1/22/2020 | | | 4,143 | | |
| | 33,188 | | | EUR | | | | | 36,612 | | | USD | | | | JPM | | 1/22/2020 | | | 608 | | |
| | 417,154 | | | EUR | | | | | 460,135 | | | USD | | | | RBC | | 1/22/2020 | | | 7,707 | | |
| | 1,654,124 | | | EUR | | | | | 1,828,138 | | | USD | | | | SCB | | 1/22/2020 | | | 26,975 | | |
| | 148,278 | | | EUR | | | | | 163,877 | | | USD | | | | SCB | | 1/22/2020 | | | 2,418 | | |
| | 2,296,957 | | | EUR | | | | | 2,533,843 | | | USD | | | | SSB | | 1/22/2020 | | | 42,213 | | |
| | 37,809 | | | EUR | | | | | 41,848 | | | USD | | | | SSB | | 1/22/2020 | | | 555 | | |
| | 180,959 | | | EUR | | | | | 202,466 | | | USD | | | | SSB | | 1/22/2020 | | | 481 | | |
| | 22,663 | | | EUR | | | | | 25,000 | | | USD | | | | SSB | | 1/22/2020 | | | 416 | | |
| | 46,222 | | | EUR | | | | | 51,613 | | | USD | | | | SSB | | 1/22/2020 | | | 225 | | |
| | 6,055,715 | | | GBP | | | | | 7,417,997 | | | USD | | | | CITI | | 1/22/2020 | | | 447,043 | | |
| | 728,164 | | | GBP | | | | | 892,481 | | | USD | | | | GSI | | 1/22/2020 | | | 53,243 | | |
| | 116,516 | | | GBP | | | | | 147,900 | | | USD | | | | GSI | | 1/22/2020 | | | 3,428 | | |
| | 201,251 | | | GBP | | | | | 258,789 | | | USD | | | | GSI | | 1/22/2020 | | | 2,592 | | |
| | 9,157 | | | GBP | | | | | 11,548 | | | USD | | | | GSI | | 1/22/2020 | | | 345 | | |
| | 553 | | | GBP | | | | | 678 | | | USD | | | | GSI | | 1/22/2020 | | | 41 | | |
| | 4,859,743 | | | GBP | | | | | 5,962,803 | | | USD | | | | JPM | | 1/22/2020 | | | 348,933 | | |
| | 98,890 | | | GBP | | | | | 121,336 | | | USD | | | | JPM | | 1/22/2020 | | | 7,100 | | |
| | 37,164 | | | GBP | | | | | 45,523 | | | USD | | | | JPM | | 1/22/2020 | | | 2,744 | | |
| | 2,472,324 | | | GBP | | | | | 3,029,465 | | | USD | | | | RBC | | 1/22/2020 | | | 181,540 | | |
| | 505,681 | | | GBP | | | | | 619,637 | | | USD | | | | RBC | | 1/22/2020 | | | 37,131 | | |
| | 71,266 | | | GBP | | | | | 87,316 | | | USD | | | | SG | | 1/22/2020 | | | 5,243 | | |
| | 97,594 | | | GBP | | | | | 125,866 | | | USD | | | | SCB | | 1/22/2020 | | | 887 | | |
| | 8,080 | | | GBP | | | | | 9,897 | | | USD | | | | SCB | | 1/22/2020 | | | 597 | | |
| | 2,527,065 | | | GBP | | | | | 3,112,275 | | | USD | | | | SSB | | 1/22/2020 | | | 169,826 | | |
| | 751,536 | | | GBP | | | | | 920,867 | | | USD | | | | SSB | | 1/22/2020 | | | 55,212 | | |
| | 47,852 | | | GBP | | | | | 58,659 | | | USD | | | | SSB | | 1/22/2020 | | | 3,490 | | |
| | 33,613 | | | GBP | | | | | 41,187 | | | USD | | | | SSB | | 1/22/2020 | | | 2,469 | | |
| | 204,513,636 | | | HUF | | | | | 675,989 | | | USD | | | | GSI | | 1/22/2020 | | | 21,271 | | |
| | 28,408,400 | | | JPY | | | | | 263,921 | | | USD | | | | CITI | | 1/22/2020 | | | 555 | | |
| | 35,108,432 | | | JPY | | | | | 325,161 | | | USD | | | | GSI | | 1/22/2020 | | | 1,692 | | |
| | 5,296,979 | | | JPY | | | | | 48,910 | | | USD | | | | GSI | | 1/22/2020 | | | 403 | | |
| | 5,613,509 | | | JPY | | | | | 52,146 | | | USD | | | | GSI | | 1/22/2020 | | | 114 | | |
| | 26,668,692 | | | JPY | | | | | 247,158 | | | USD | | | | RBC | | 1/22/2020 | | | 1,122 | | |
| | 37,269,397 | | | JPY | | | | | 344,235 | | | USD | | | | SSB | | 1/22/2020 | | | 2,735 | | |
| | 28,833,304 | | | JPY | | | | | 266,790 | | | USD | | | | SSB | | 1/22/2020 | | | 1,642 | | |
| | 147,333 | | | USD | | | | | 15,652,626 | | | JPY | | | | CITI | | 1/22/2020 | | | 1,610 | | |
| | 1,614,195 | | | USD | | | | | 171,386,381 | | | JPY | | | | GSI | | 1/22/2020 | | | 18,624 | | |
| | 2,401,009 | | | USD | | | | | 254,813,079 | | | JPY | | | | JPM | | 1/22/2020 | | | 28,753 | | |
| | 2,696,886 | | | USD | | | | | 286,363,438 | | | JPY | | | | RBC | | 1/22/2020 | | | 30,903 | | |
| | 2,596,085 | | | USD | | | | | 275,597,827 | | | JPY | | | | SG | | 1/22/2020 | | | 30,328 | | |
| | 3,480,765 | | | USD | | | | | 370,425,818 | | | JPY | | | | SSB | | 1/22/2020 | | | 32,179 | | |
| | 431,791 | | | USD | | | | | 45,869,166 | | | JPY | | | | SSB | | 1/22/2020 | | | 4,759 | | |
| | 231,372 | | | USD | | | | | 24,622,816 | | | JPY | | | | SSB | | 1/22/2020 | | | 2,139 | | |
| | 63,011,198 | | | KRW | | | | | 52,928 | | | USD | | | | GSI | | 1/22/2020 | | | 1,011 | | |
See Notes to Financial Statements
221
Schedule of Investments Unconstrained Bond Fund^ (cont'd)
Currency Purchased | | Currency Sold | | Counterparty | | Settlement
Date | | Net
Unrealized
Appreciation/
(Depreciation) | |
| | 3,255,886 | | | MXN | | | | | 163,666 | | | USD | | | | GSI | | 1/22/2020 | | $ | 3,602 | | |
| | 34,665,528 | | | MXN | | | | | 1,744,862 | | | USD | | | | RBC | | 1/22/2020 | | | 36,043 | | |
| | 31,480,791 | | | MXN | | | | | 1,584,561 | | | USD | | | | RBC | | 1/22/2020 | | | 32,731 | | |
| | 23,933,722 | | | MXN | | | | | 1,204,334 | | | USD | | | | SSB | | 1/22/2020 | | | 25,236 | | |
| | 22,283,006 | | | MXN | | | | | 1,121,270 | | | USD | | | | SSB | | 1/22/2020 | | | 23,496 | | |
| | 248,668 | | | USD | | | | | 4,840,190 | | | MXN | | | | GSI | | 1/22/2020 | | | 8 | | |
| | 788,522 | | | NOK | | | | | 85,682 | | | USD | | | | GSI | | 1/22/2020 | | | 106 | | |
| | 65,505 | | | USD | | | | | 598,166 | | | NOK | | | | GSI | | 1/22/2020 | | | 427 | | |
| | 2,725,046 | | | USD | | | | | 24,892,652 | | | NOK | | | | JPM | | 1/22/2020 | | | 16,822 | | |
| | 1,776,712 | | | USD | | | | | 16,231,240 | | | NOK | | | | SCB | | 1/22/2020 | | | 10,816 | | |
| | 4,076,228 | | | USD | | | | | 37,197,574 | | | NOK | | | | SSB | | 1/22/2020 | | | 29,276 | | |
| | 202,795 | | | USD | | | | | 1,848,594 | | | NOK | | | | SSB | | 1/22/2020 | | | 1,675 | | |
| | 322,393 | | | USD | | | | | 2,957,397 | | | NOK | | | | SSB | | 1/22/2020 | | | 639 | | |
| | 9,835,286 | | | NZD | | | | | 6,225,736 | | | USD | | | | CITI | | 1/22/2020 | | | 89,075 | | |
| | 378,402 | | | NZD | | | | | 239,528 | | | USD | | | | CITI | | 1/22/2020 | | | 3,427 | | |
| | 532,977 | | | NZD | | | | | 338,828 | | | USD | | | | CITI | | 1/22/2020 | | | 3,373 | | |
| | 9,411,107 | | | NZD | | | | | 5,961,183 | | | USD | | | | GSI | | 1/22/2020 | | | 81,281 | | |
| | 5,131,934 | | | NZD | | | | | 3,250,670 | | | USD | | | | GSI | | 1/22/2020 | | | 44,323 | | |
| | 201,732 | | | NZD | | | | | 128,055 | | | USD | | | | GSI | | 1/22/2020 | | | 1,468 | | |
| | 4,912,279 | | | NZD | | | | | 3,112,779 | | | USD | | | | JPM | | 1/22/2020 | | | 41,183 | | |
| | 1,573,333 | | | NZD | | | | | 996,162 | | | USD | | | | RBC | | 1/22/2020 | | | 14,007 | | |
| | 4,855,106 | | | NZD | | | | | 3,075,467 | | | USD | | | | SG | | 1/22/2020 | | | 41,786 | | |
| | 235,666 | | | NZD | | | | | 149,728 | | | USD | | | | SCB | | 1/22/2020 | | | 1,583 | | |
| | 151,182 | | | USD | | | | | 235,250 | | | NZD | | | | RBC | | 1/22/2020 | | | 138 | | |
| | 2,002,931 | | | PLN | | | | | 508,448 | | | USD | | | | CITI | | 1/22/2020 | | | 16,085 | | |
| | 26,020,674 | | | RUB | | | | | 393,707 | | | USD | | | | GSI | | 1/22/2020 | | | 7,847 | | |
| | 2,399,786 | | | SEK | | | | | 245,892 | | | USD | | | | CITI | | 1/22/2020 | | | 3,794 | | |
| | 2,742,847 | | | SEK | | | | | 283,798 | | | USD | | | | GSI | | 1/22/2020 | | | 1,583 | | |
| | 1,040,056 | | | SEK | | | | | 105,811 | | | USD | | | | JPM | | 1/22/2020 | | | 2,402 | | |
| | 42,463,887 | | | SEK | | | | | 4,320,363 | | | USD | | | | RBC | | 1/22/2020 | | | 97,806 | | |
| | 15,258,283 | | | SEK | | | | | 1,551,719 | | | USD | | | | SCB | | 1/22/2020 | | | 35,834 | | |
| | 3,428,990 | | | SEK | | | | | 355,870 | | | USD | | | | SCB | | 1/22/2020 | | | 900 | | |
| | 97,032,471 | | | SEK | | | | | 9,886,544 | | | USD | | | | SSB | | 1/22/2020 | | | 209,232 | | |
| | 694,768 | | | SEK | | | | | 70,789 | | | USD | | | | SSB | | 1/22/2020 | | | 1,498 | | |
| | 264,933 | | | USD | | | | | 2,544,854 | | | SEK | | | | SSB | | 1/22/2020 | | | 153 | | |
| | 466,615 | | | TRY | | | | | 77,562 | | | USD | | | | GSI | | 1/22/2020 | | | 2,346 | | |
| | 1,062,559 | | | TRY | | | | | 176,314 | | | USD | | | | SSB | | 1/22/2020 | | | 5,650 | | |
| | 547,415 | | | USD | | | | | 8,129,275 | | | ZAR | | | | GSI | | 1/22/2020 | | | 15,073 | | |
| | 5,713,091 | | | ZAR | | | | | 370,187 | | | USD | | | | CITI | | 1/22/2020 | | | 3,932 | | |
| | 35,784,902 | | | ZAR | | | | | 2,313,539 | | | USD | | | | GSI | | 1/22/2020 | | | 29,818 | | |
| | 872,728 | | | ZAR | | | | | 56,423 | | | USD | | | | GSI | | 1/22/2020 | | | 727 | | |
| | 31,966,871 | | | ZAR | | | | | 2,067,362 | | | USD | | | | RBC | | 1/22/2020 | | | 25,973 | | |
| | 7,699,280 | | | ZAR | | | | | 497,707 | | | USD | | | | SG | | 1/22/2020 | | | 6,477 | | |
| | Total unrealized appreciation | | | | | | | | | | | | | | | | | $ | 3,940,456 | | |
See Notes to Financial Statements
222
Schedule of Investments Unconstrained Bond Fund^ (cont'd)
Currency Purchased | | Currency Sold | | Counterparty | | Settlement
Date | | Net
Unrealized
Appreciation/
(Depreciation) | |
| | 260,970 | | | USD | | | | | 378,057 | | | AUD | | | | CITI | | 1/22/2020 | | $ | (164 | ) | |
| | 129,893 | | | USD | | | | | 189,080 | | | AUD | | | | CITI | | 1/22/2020 | | | (709 | ) | |
| | 145,848 | | | USD | | | | | 215,736 | | | AUD | | | | CITI | | 1/22/2020 | | | (3,166 | ) | |
| | 273,153 | | | USD | | | | | 398,205 | | | AUD | | | | GSI | | 1/22/2020 | | | (1,898 | ) | |
| | 271,545 | | | USD | | | | | 397,135 | | | AUD | | | | GSI | | 1/22/2020 | | | (2,767 | ) | |
| | 2,694,246 | | | USD | | | | | 3,983,503 | | | AUD | | | | JPM | | 1/22/2020 | | | (57,267 | ) | |
| | 2,127,740 | | | USD | | | | | 3,146,427 | | | AUD | | | | RBC | | 1/22/2020 | | | (45,583 | ) | |
| | 3,233,511 | | | USD | | | | | 4,781,602 | | | AUD | | | | RBC | | 1/22/2020 | | | (69,272 | ) | |
| | 179,202 | | | USD | | | | | 261,796 | | | AUD | | | | SCB | | 1/22/2020 | | | (1,628 | ) | |
| | 1,155,128 | | | USD | | | | | 1,708,871 | | | AUD | | | | SCB | | 1/22/2020 | | | (25,235 | ) | |
| | 276,280 | | | USD | | | | | 403,559 | | | AUD | | | | SSB | | 1/22/2020 | | | (2,469 | ) | |
| | 262,134 | | | USD | | | | | 387,697 | | | AUD | | | | SSB | | 1/22/2020 | | | (5,658 | ) | |
| | 4,533,527 | | | USD | | | | | 6,696,149 | | | AUD | | | | SSB | | 1/22/2020 | | | (91,685 | ) | |
| | 41,343 | | | USD | | | | | 169,929 | | | BRL | | | | GSI | | 1/22/2020 | | | (843 | ) | |
| | 52,495 | | | USD | | | | | 216,049 | | | BRL | | | | GSI | | 1/22/2020 | | | (1,141 | ) | |
| | 52,844 | | | USD | | | | | 218,145 | | | BRL | | | | GSI | | 1/22/2020 | | | (1,312 | ) | |
| | 451,911 | | | USD | | | | | 1,865,533 | | | BRL | | | | GSI | | 1/22/2020 | | | (11,221 | ) | |
| | 264,191 | | | CAD | | | | | 202,078 | | | USD | | | | CITI | | 1/22/2020 | | | (1,404 | ) | |
| | 5,058,154 | | | USD | | | | | 6,726,764 | | | CAD | | | | GSI | | 1/22/2020 | | | (51,359 | ) | |
| | 2,743,829 | | | USD | | | | | 3,649,715 | | | CAD | | | | JPM | | 1/22/2020 | | | (28,421 | ) | |
| | 11,048,711 | | | USD | | | | | 14,690,996 | | | CAD | | | | RBC | | 1/22/2020 | | | (110,272 | ) | |
| | 68,720 | | | USD | | | | | 91,354 | | | CAD | | | | SG | | 1/22/2020 | | | (671 | ) | |
| | 370,662 | | | USD | | | | | 492,925 | | | CAD | | | | SCB | | 1/22/2020 | | | (3,754 | ) | |
| | 49,407 | | | USD | | | | | 65,706 | | | CAD | | | | SSB | | 1/22/2020 | | | (502 | ) | |
| | 4,780,711 | | | USD | | | | | 6,352,638 | | | CAD | | | | SSB | | 1/22/2020 | | | (44,624 | ) | |
| | 9,114,885 | | | USD | | | | | 12,111,914 | | | CAD | | | | SSB | | 1/22/2020 | | | (85,079 | ) | |
| | 83,053 | | | USD | | | | | 81,965 | | | CHF | | | | CITI | | 1/22/2020 | | | (564 | ) | |
| | 261,554 | | | USD | | | | | 257,487 | | | CHF | | | | CITI | | 1/22/2020 | | | (1,122 | ) | |
| | 158,676 | | | USD | | | | | 155,796 | | | CHF | | | | GSI | | 1/22/2020 | | | (260 | ) | |
| | 243,625 | | | USD | | | | | 241,403 | | | CHF | | | | GSI | | 1/22/2020 | | | (2,643 | ) | |
| | 875,923 | | | USD | | | | | 861,358 | | | CHF | | | | JPM | | 1/22/2020 | | | (2,794 | ) | |
| | 4,829,650 | | | USD | | | | | 4,748,314 | | | CHF | | | | RBC | | 1/22/2020 | | | (14,355 | ) | |
| | 8,458,201 | | | USD | | | | | 8,312,255 | | | CHF | | | | SG | | 1/22/2020 | | | (21,567 | ) | |
| | 225,257 | | | USD | | | | | 222,736 | | | CHF | | | | SCB | | 1/22/2020 | | | (1,968 | ) | |
| | 837,171 | | | USD | | | | | 823,751 | | | CHF | | | | SCB | | 1/22/2020 | | | (3,181 | ) | |
| | 41,662 | | | USD | | | | | 40,936 | | | CHF | | | | SSB | | 1/22/2020 | | | (99 | ) | |
| | 8,665,864 | | | CLP | | | | | 12,013 | | | USD | | | | GSI | | 1/22/2020 | | | (304 | ) | |
| | 86,781 | | | USD | | | | | 2,034,244 | | | CZK | | | | GSI | | 1/22/2020 | | | (2,248 | ) | |
| | 465,853 | | | USD | | | | | 10,920,181 | | | CZK | | | | GSI | | 1/22/2020 | | | (12,069 | ) | |
| | 1,571,248 | | | USD | | | | | 10,615,822 | | | DKK | | | | CITI | | 1/22/2020 | | | (23,414 | ) | |
| | 278,201 | | | EUR | | | | | 312,578 | | | USD | | | | CITI | | 1/22/2020 | | | (574 | ) | |
| | 59,636 | | | USD | | | | | 53,596 | | | EUR | | | | CITI | | 1/22/2020 | | | (472 | ) | |
| | 284,608 | | | USD | | | | | 256,408 | | | EUR | | | | CITI | | 1/22/2020 | | | (2,956 | ) | |
| | 249,110 | | | USD | | | | | 225,196 | | | EUR | | | | CITI | | 1/22/2020 | | | (3,449 | ) | |
| | 2,918,585 | | | USD | | | | | 2,641,492 | | | EUR | | | | CITI | | 1/22/2020 | | | (43,869 | ) | |
| | 5,092,642 | | | USD | | | | | 4,609,143 | | | EUR | | | | CITI | | 1/22/2020 | | | (76,548 | ) | |
| | 534 | | | USD | | | | | 483 | | | EUR | | | | GSI | | 1/22/2020 | | | (7 | ) | |
See Notes to Financial Statements
223
Schedule of Investments Unconstrained Bond Fund^ (cont'd)
Currency Purchased | | Currency Sold | | Counterparty | | Settlement
Date | | Net
Unrealized
Appreciation/
(Depreciation) | |
| | 30,532 | | | USD | | | | | 27,364 | | | EUR | | | | GSI | | 1/22/2020 | | $ | (157 | ) | |
| | 49,283 | | | USD | | | | | 44,103 | | | EUR | | | | GSI | | 1/22/2020 | | | (178 | ) | |
| | 269,709 | | | USD | | | | | 240,663 | | | EUR | | | | GSI | | 1/22/2020 | | | (197 | ) | |
| | 32,119 | | | USD | | | | | 28,917 | | | EUR | | | | GSI | | 1/22/2020 | | | (312 | ) | |
| | 129,126 | | | USD | | | | | 115,421 | | | EUR | | | | GSI | | 1/22/2020 | | | (319 | ) | |
| | 265,881 | | | USD | | | | | 239,554 | | | EUR | | | | GSI | | 1/22/2020 | | | (2,780 | ) | |
| | 9,976,631 | | | USD | | | | | 9,045,046 | | | EUR | | | | GSI | | 1/22/2020 | | | (167,458 | ) | |
| | 895,139 | | | USD | | | | | 809,245 | | | EUR | | | | RBC | | 1/22/2020 | | | (12,435 | ) | |
| | 3,357,034 | | | USD | | | | | 3,034,906 | | | EUR | | | | RBC | | 1/22/2020 | | | (46,637 | ) | |
| | 15,034,795 | | | USD | | | | | 13,592,114 | | | EUR | | | | RBC | | 1/22/2020 | | | (208,866 | ) | |
| | 67,766 | | | USD | | | | | 61,232 | | | EUR | | | | SG | | 1/22/2020 | | | (906 | ) | |
| | 1,034,694 | | | USD | | | | | 938,108 | | | EUR | | | | SG | | 1/22/2020 | | | (17,402 | ) | |
| | 2,743,104 | | | USD | | | | | 2,478,623 | | | EUR | | | | SG | | 1/22/2020 | | | (36,690 | ) | |
| | 58 | | | USD | | | | | 53 | | | EUR | | | | SSB | | 1/22/2020 | | | (1 | ) | |
| | 12,151 | | | USD | | | | | 10,882 | | | EUR | | | | SSB | | 1/22/2020 | | | (53 | ) | |
| | 353,224 | | | USD | | | | | 316,257 | | | EUR | | | | SSB | | 1/22/2020 | | | (1,460 | ) | |
| | 535,312 | | | USD | | | | | 482,624 | | | EUR | | | | SSB | | 1/22/2020 | | | (5,955 | ) | |
| | 608,645 | | | USD | | | | | 550,000 | | | EUR | | | | SSB | | 1/22/2020 | | | (8,184 | ) | |
| | 2,221,506 | | | USD | | | | | 2,000,000 | | | EUR | | | | SSB | | 1/22/2020 | | | (21,510 | ) | |
| | 10,294,314 | | | USD | | | | | 9,299,794 | | | EUR | | | | SSB | | 1/22/2020 | | | (135,477 | ) | |
| | 11,457,761 | | | USD | | | | | 10,350,842 | | | EUR | | | | SSB | | 1/22/2020 | | | (150,789 | ) | |
| | 26,933 | | | USD | | | | | 21,154 | | | GBP | | | | CITI | | 1/22/2020 | | | (541 | ) | |
| | 240,388 | | | USD | | | | | 186,183 | | | GBP | | | | CITI | | 1/22/2020 | | | (1,422 | ) | |
| | 873,661 | | | USD | | | | | 713,216 | | | GBP | | | | CITI | | 1/22/2020 | | | (52,649 | ) | |
| | 5,267,116 | | | USD | | | | | 4,299,827 | | | GBP | | | | CITI | | 1/22/2020 | | | (317,411 | ) | |
| | 12 | | | USD | | | | | 10 | | | GBP | | | | GSI | | 1/22/2020 | | | (1 | ) | |
| | 9,679 | | | USD | | | | | 7,483 | | | GBP | | | | GSI | | 1/22/2020 | | | (40 | ) | |
| | 34,555 | | | USD | | | | | 27,401 | | | GBP | | | | GSI | | 1/22/2020 | | | (1,033 | ) | |
| | 184,783 | | | USD | | | | | 149,339 | | | GBP | | | | GSI | | 1/22/2020 | | | (9,175 | ) | |
| | 3,493,036 | | | USD | | | | | 2,851,500 | | | GBP | | | | GSI | | 1/22/2020 | | | (210,434 | ) | |
| | 4,072,228 | | | USD | | | | | 3,322,478 | | | GBP | | | | GSI | | 1/22/2020 | | | (242,938 | ) | |
| | 55,174 | | | USD | | | | | 42,513 | | | GBP | | | | RBC | | 1/22/2020 | | | (41 | ) | |
| | 7,096,485 | | | USD | | | | | 5,792,122 | | | GBP | | | | RBC | | 1/22/2020 | | | (426,205 | ) | |
| | 683,564 | | | USD | | | | | 557,770 | | | GBP | | | | SG | | 1/22/2020 | | | (40,856 | ) | |
| | 1,395,065 | | | USD | | | | | 1,138,336 | | | GBP | | | | SG | | 1/22/2020 | | | (83,383 | ) | |
| | 1,421,878 | | | USD | | | | | 1,160,802 | | | GBP | | | | SCB | | 1/22/2020 | | | (85,748 | ) | |
| | 407 | | | USD | | | | | 331 | | | GBP | | | | SSB | | 1/22/2020 | | | (23 | ) | |
| | 2,462,297 | | | USD | | | | | 1,999,304 | | | GBP | | | | SSB | | 1/22/2020 | | | (134,359 | ) | |
| | 623,421 | | | USD | | | | | 188,771,776 | | | HUF | | | | CITI | | 1/22/2020 | | | (20,170 | ) | |
| | 187,500 | | | USD | | | | | 56,647,043 | | | HUF | | | | SSB | | 1/22/2020 | | | (5,630 | ) | |
| | 24,297,808 | | | JPY | | | | | 227,925 | | | USD | | | | CITI | | 1/22/2020 | | | (1,718 | ) | |
| | 234,077,575 | | | JPY | | | | | 2,203,290 | | | USD | | | | CITI | | 1/22/2020 | | | (24,077 | ) | |
| | 16,577,922 | | | JPY | | | | | 156,138 | | | USD | | | | GSI | | 1/22/2020 | | | (1,801 | ) | |
| | 220,724,118 | | | JPY | | | | | 2,078,714 | | | USD | | | | RBC | | 1/22/2020 | | | (23,819 | ) | |
| | 431,147,790 | | | JPY | | | | | 4,060,422 | | | USD | | | | RBC | | 1/22/2020 | | | (46,527 | ) | |
| | 152,196,142 | | | JPY | | | | | 1,433,662 | | | USD | | | | SG | | 1/22/2020 | | | (16,748 | ) | |
| | 300,911,736 | | | JPY | | | | | 2,833,150 | | | USD | | | | SCB | | 1/22/2020 | | | (31,725 | ) | |
See Notes to Financial Statements
224
Schedule of Investments Unconstrained Bond Fund^ (cont'd)
Currency Purchased | | Currency Sold | | Counterparty | | Settlement
Date | | Net
Unrealized
Appreciation/
(Depreciation) | |
| | 5,478,233 | | | JPY | | | | | 51,600 | | | USD | | | | SSB | | 1/22/2020 | | $ | (599 | ) | |
| | 286,090,078 | | | JPY | | | | | 2,688,291 | | | USD | | | | SSB | | 1/22/2020 | | | (24,853 | ) | |
| | 271,667 | | | USD | | | | | 29,421,434 | | | JPY | | | | GSI | | 1/22/2020 | | | (2,241 | ) | |
| | 136,689 | | | USD | | | | | 163,104,026 | | | KRW | | | | GSI | | 1/22/2020 | | | (2,934 | ) | |
| | 186,848 | | | USD | | | | | 222,647,539 | | | KRW | | | | SSB | | 1/22/2020 | | | (3,746 | ) | |
| | 2,389,937 | | | USD | | | | | 47,442,634 | | | MXN | | | | CITI | | 1/22/2020 | | | (47,378 | ) | |
| | 406,712 | | | USD | | | | | 8,090,922 | | | MXN | | | | GSI | | 1/22/2020 | | | (8,951 | ) | |
| | 2,075,667 | | | USD | | | | | 41,292,284 | | | MXN | | | | GSI | | 1/22/2020 | | | (45,680 | ) | |
| | 697,148 | | | USD | | | | | 13,852,329 | | | MXN | | | | SG | | 1/22/2020 | | | (14,501 | ) | |
| | 1,337,222 | | | USD | | | | | 26,574,606 | | | MXN | | | | SSB | | 1/22/2020 | | | (28,021 | ) | |
| | 77,806,679 | | | NOK | | | | | 8,522,090 | | | USD | | | | CITI | | 1/22/2020 | | | (57,024 | ) | |
| | 2,172,753 | | | NOK | | | | | 237,680 | | | USD | | | | GSI | | 1/22/2020 | | | (1,293 | ) | |
| | 2,605,802 | | | NOK | | | | | 285,219 | | | USD | | | | RBC | | 1/22/2020 | | | (1,718 | ) | |
| | 22,325,401 | | | NOK | | | | | 2,445,249 | | | USD | | | | RBC | | 1/22/2020 | | | (16,332 | ) | |
| | 27,419,673 | | | NOK | | | | | 3,003,184 | | | USD | | | | SG | | 1/22/2020 | | | (20,030 | ) | |
| | 1,088,381 | | | NOK | | | | | 119,182 | | | USD | | | | SSB | | 1/22/2020 | | | (770 | ) | |
| | 232,981 | | | USD | | | | | 368,165 | | | NZD | | | | CITI | | 1/22/2020 | | | (3,402 | ) | |
| | 3,479,824 | | | USD | | | | | 5,491,514 | | | NZD | | | | JPM | | 1/22/2020 | | | (46,039 | ) | |
| | 1,637,168 | | | USD | | | | | 2,585,735 | | | NZD | | | | RBC | | 1/22/2020 | | | (23,020 | ) | |
| | 7,647,825 | | | USD | | | | | 12,078,934 | | | NZD | | | | RBC | | 1/22/2020 | | | (107,535 | ) | |
| | 169,478 | | | USD | | | | | 267,548 | | | NZD | | | | SG | | 1/22/2020 | | | (2,303 | ) | |
| | 4,806,618 | | | USD | | | | | 7,587,999 | | | NZD | | | | SG | | 1/22/2020 | | | (65,308 | ) | |
| | 132,491 | | | USD | | | | | 209,346 | | | NZD | | | | SCB | | 1/22/2020 | | | (1,921 | ) | |
| | 4,182,250 | | | USD | | | | | 6,608,283 | | | NZD | | | | SCB | | 1/22/2020 | | | (60,642 | ) | |
| | 87,419 | | | USD | | | | | 138,040 | | | NZD | | | | SSB | | 1/22/2020 | | | (1,211 | ) | |
| | 1,734,330 | | | USD | | | | | 2,738,625 | | | NZD | | | | SSB | | 1/22/2020 | | | (24,022 | ) | |
| | 508,263 | | | USD | | | | | 2,002,812 | | | PLN | | | | GSI | | 1/22/2020 | | | (16,239 | ) | |
| | 5,985 | | | USD | | | | | 395,550 | | | RUB | | | | SG | | 1/22/2020 | | | (119 | ) | |
| | 505,466 | | | USD | | | | | 33,257,828 | | | RUB | | | | SSB | | 1/22/2020 | | | (7,772 | ) | |
| | 484,518 | | | SEK | | | | | 50,536 | | | USD | | | | RBC | | 1/22/2020 | | | (125 | ) | |
| | 401,174 | | | USD | | | | | 3,886,813 | | | SEK | | | | CITI | | 1/22/2020 | | | (3,231 | ) | |
| | 7,163,929 | | | USD | | | | | 70,410,675 | | | SEK | | | | CITI | | 1/22/2020 | | | (161,973 | ) | |
| | 96,241 | | | USD | | | | | 945,406 | | | SEK | | | | GSI | | 1/22/2020 | | | (2,124 | ) | |
| | 4,310,168 | | | USD | | | | | 42,340,115 | | | SEK | | | | GSI | | 1/22/2020 | | | (95,124 | ) | |
| | 952,616 | | | USD | | | | | 9,363,601 | | | SEK | | | | JPM | | 1/22/2020 | | | (21,623 | ) | |
| | 5,234 | | | USD | | | | | 51,439 | | | SEK | | | | RBC | | 1/22/2020 | | | (118 | ) | |
| | 1,598 | | | USD | | | | | 15,705 | | | SEK | | | | SG | | 1/22/2020 | | | (36 | ) | |
| | 2,529,277 | | | USD | | | | | 24,853,945 | | | SEK | | | | SG | | 1/22/2020 | | | (56,660 | ) | |
| | 60,624 | | | USD | | | | | 595,901 | | | SEK | | | | SSB | | 1/22/2020 | | | (1,377 | ) | |
| | 678,846 | | | USD | | | | | 10,476,628 | | | ZAR | | | | CITI | | 1/22/2020 | | | (7,211 | ) | |
| | 141,622 | | | USD | | | | | 2,193,944 | | | ZAR | | | | JPM | | 1/22/2020 | | | (2,047 | ) | |
| | 3,880,286 | | | USD | | | | | 59,999,442 | | | ZAR | | | | RBC | | 1/22/2020 | | | (48,749 | ) | |
| | 159,442 | | | USD | | | | | 2,451,309 | | | ZAR | | | | SSB | | 1/22/2020 | | | (1,081 | ) | |
| | 186,770 | | | USD | | | | | 2,871,465 | | | ZAR | | | | SSB | | 1/22/2020 | | | (1,266 | ) | |
| | 4,083,084 | | | ZAR | | | | | 271,671 | | | USD | | | | GSI | | 1/22/2020 | | | (4,293 | ) | |
| | Total unrealized depreciation | | | | | | | | | | | | | | | | | $ | (4,501,449 | ) | |
| | Total net unrealized depreciation | | | | | | | | | | | | | | | | | $ | (560,993 | ) | |
See Notes to Financial Statements
225
Schedule of Investments Unconstrained Bond Fund^ (cont'd)
At October 31, 2019, the Fund had cash collateral of $210,000 and $590,000 deposited in segregated accounts for Goldman Sachs International and Royal Bank of Canada, respectively, to cover collateral requirements on over-the-counter derivatives.
For the year ended October 31, 2019, the Fund's investments in forward contracts had an average notional value of $549,939,120.
Credit default swap contracts ("credit default swaps")
At October 31, 2019, the Fund had outstanding credit default swaps as follows:
Centrally Cleared Credit Default Swaps—Buy Protection
| | | Clearinghouse | | Reference
Entity | | Notional
Amount | | Financing
Rate
Paid by
the Fund | | Payment
Frequency | | Maturity
Date | | Upfront
Payments/
(Receipts) | | Unrealized
Appreciation/
(Depreciation) | | Accrued
Net
Interest
Receivable/
(Payable) | | Value | |
| | ICE CC | | CDX
Emerging
Markets
Index,
Ser. 32 V.1 | | USD | 2,805,000 | | | | 1.00 | % | | 3M | | 12/20/2024 | | $ | 139,958 | | | $ | (10,397 | ) | | $ | (3,273 | ) | | $ | 126,288 | | |
| | ICE CC | | iTraxx
Europe
Crossover
Index,
Ser. 32 V.1 | | EUR | 11,230,000 | | | | 5.00 | % | | 3M | | 12/20/2024 | | | (1,602,071 | ) | | | 57,986 | | | | (73,061 | ) | | | (1,617,146 | ) | |
| | | | | Total | | | | | | | | | | | | $ | (1,462,113 | ) | | $ | 47,589 | | | $ | (76,334 | ) | | $ | (1,490,858 | ) | |
For the year ended October 31, 2019, the average notional value of credit default swaps for the Fund was $19,334,265 for buy protection.
Interest rate swap contracts ("interest rate swaps")
At October 31, 2019, the Fund had outstanding interest rate swaps as follows:
Centrally cleared interest rate swaps
| Clearinghouse | | Notional
Amount | | Fund
Receives/
Pays
Floating
Rate | | Floating
Rate Index | | Annual
Fixed-
Rate | | Frequency
of Fund
Receipt/
Payment | | Maturity
Date | | Unrealized
Appreciation/
(Depreciation) | | Accrued
Net
Interest
Receivable/
(Payable) | | Value | |
| LCH | | SEK | 85,000,000 | | | Receive | | 3M STIBOR | | | (0.17 | )% | | 3M/1Y | | 12/23/2019 | | $ | 1,391 | | | $ | 11,796 | | | $ | 13,187 | | |
| LCH | | SEK | 30,000,000 | | | Receive | | 3M STIBOR | | | (0.01 | )% | | 3M/1Y | | 7/18/2020 | | | 2,476 | | | | 22 | | | | 2,498 | | |
| LCH | | SEK | 27,000,000 | | | Receive | | 3M STIBOR | | | 0.01 | % | | 3M/1Y | | 8/29/2020 | | | 2,705 | | | | (33 | ) | | | 2,672 | | |
| LCH | | SEK | 9,000,000 | | | Receive | | 3M STIBOR | | | 0.15 | % | | 3M/1Y | | 1/15/2021 | | | (370 | ) | | | (1,188 | ) | | | (1,558 | ) | |
| LCH | | SEK | 16,480,000 | | | Receive | | 3M STIBOR | | | 0.10 | % | | 3M/1Y | | 8/9/2021 | | | 904 | | | | (524 | ) | | | 380 | | |
| CME | | USD | 550,000 | | | Receive | | 3M USD LIBOR | | | 2.43 | % | | 3M/6M | | 12/7/2027 | | | (37,080 | ) | | | (3,647 | ) | | | (40,727 | ) | |
| | | Total | | | | | | | | | | | | $ | (29,974 | ) | | $ | 6,426 | | | $ | (23,548 | ) | |
See Notes to Financial Statements
226
Schedule of Investments Unconstrained Bond Fund^ (cont'd)
At October 31, 2019, the Fund had $2,060,861 deposited in a segregated account to cover margin requirements for centrally cleared swaps.
For the year ended October 31, 2019, the average notional value of interest rate swaps was $18,413,540 when the Fund paid the fixed rate.
The following is a summary, categorized by Level (see Note A of Notes to Financial Statements), of inputs used to value the Fund's investments as of October 31, 2019:
Asset Valuation Inputs
| | | Level 1 | | Level 2 | | Level 3(b) | | Total | |
Investments: | |
U.S. Treasury Obligations | | $ | — | | | $ | 7,201,649 | | | $ | — | | | $ | 7,201,649 | | |
Mortgage-Backed Securities(a) | | | — | | | | 4,869,149 | | | | — | | | | 4,869,149 | | |
Corporate Bonds(a) | | | — | | | | 25,108,058 | | | | — | | | | 25,108,058 | | |
Asset-Backed Securities | | | — | | | | 4,169,859 | | | | — | | | | 4,169,859 | | |
Foreign Government Securities | | | — | | | | 5,308,838 | | | | — | | | | 5,308,838 | | |
Exchange-Traded Funds | | | 3,568,689 | | | | — | | | | — | | | | 3,568,689 | | |
Short-Term Investments | | | — | | | | 328,683 | | | | — | | | | 328,683 | | |
Total Investments | | $ | 3,568,689 | | | $ | 46,986,236 | | | $ | — | | | $ | 50,554,925 | | |
(a) The Schedule of Investments provides information on the industry or sector categorization for the portfolio.
(b) The following is a reconciliation between the beginning and ending balances of investments in which unobservable inputs (Level 3) were used in determining the value:
(000's omitted) | | Beginning
balance, as
of 11/1/2018 | | Accrued
discounts/
(premiums) | | Realized
gain/
(loss) | | Change in
unrealized
appreciation/
(depreciation) | | Purchases | | Sales | | Transfers
into
Level 3 | | Transfers
out of
Level 3 | | Balance,
as of
10/31/2019 | | Net change
in unrealized
appreciation/
(depreciation)
from
investments
still held as
of 10/31/2019 | |
Investments in
Securities: | |
| Corporate Bonds(c) | |
Airlines | | $ | 173 | | | $ | — | | | $ | — | | | $ | — | | | $ | — | | | $ | — | | | $ | — | | | $ | (173 | ) | | $ | — | | | $ | — | | |
Total | | $ | 173 | | | $ | — | | | $ | — | | | $ | — | | | $ | — | | | $ | — | | | $ | — | | | $ | (173 | ) | | $ | — | | | $ | — | | |
(c) At the beginning of the year, these investments were valued based on a single quotation obtained from a dealer. The Fund held no Level 3 investments at October 31, 2019.
See Notes to Financial Statements
227
Schedule of Investments Unconstrained Bond Fund^ (cont'd)
The following is a summary, categorized by Level (see Note A of Notes to Financial Statements), of inputs used to value the Fund's derivatives as of October 31, 2019:
Other Financial Instruments
| | | Level 1 | | Level 2 | | Level 3 | | Total | |
| Futures(a) | |
Assets | | $ | 1,188,414 | | | $ | — | | | $ | — | | | $ | 1,188,414 | | |
Liabilities | | | (540,679 | ) | | | — | | | | — | | | | (540,679 | ) | |
| Forward Contracts(a) | |
Assets | | | — | | | | 3,940,456 | | | | — | | | | 3,940,456 | | |
Liabilities | | | — | | | | (4,501,449 | ) | | | — | | | | (4,501,449 | ) | |
Swaps | |
Assets | | | — | | | | 145,025 | | | | — | | | | 145,025 | | |
Liabilities | | | — | | | | (1,659,431 | ) | | | — | | | | (1,659,431 | ) | |
| Total | | $ | 647,735 | | | $ | (2,075,399 | ) | | $ | — | | | $ | (1,427,664 | ) | |
(a) Futures and forward contracts are reported at the cumulative unrealized appreciation/(depreciation) of the instrument.
^ A balance indicated with a "—", reflects either a zero balance or an amount that rounds to less than 1.
See Notes to Financial Statements
228
This page has been left blank intentionally
Statements of Assets and Liabilities
Neuberger Berman Income Funds
| | | CORE BOND
FUND | | EMERGING
MARKETS
DEBT FUND | | FLOATING
RATE INCOME
FUND | | HIGH INCOME
BOND FUND | | MUNICIPAL
HIGH INCOME
FUND | | MUNICIPAL
IMPACT FUND | |
| | | October 31,
2019 | | October 31,
2019 | | October 31,
2019 | | October 31,
2019 | | October 31,
2019 | | October 31,
2019 | |
Assets | |
Investments in securities, at value*
(Note A)—see Schedule of Investments: | |
| Unaffiliated issuers(a) | | $ | 378,908,704 | | | $ | 155,704,717 | | | $ | 230,932,197 | | | $ | 2,311,872,195 | | | $ | 127,579,365 | | | $ | 58,110,131 | | |
Cash | | | 9,340 | | | | — | | | | — | | | | 64,475 | | | | 64,627 | | | | 1,051,696 | | |
| Foreign currency(b) | | | 21,406 | | | | 2,878,199 | | | | — | | | | — | | | | — | | | | — | | |
Cash collateral segregated for futures contracts (Note A) | | | 196,708 | | | | 136,568 | | | | — | | | | — | | | | — | | | | — | | |
Cash collateral segregated for centrally cleared swap
contracts (Note A) | | | — | | | | — | | | | — | | | | — | | | | — | | | | — | | |
Cash collateral segregated for over-the-counter
derivatives (Note A) | | | — | | | | — | | | | — | | | | — | | | | — | | | | — | | |
Dividends and interest receivable | | | 1,957,057 | | | | 2,447,815 | | | | 800,277 | | | | 32,504,076 | | | | 1,528,884 | | | | 653,936 | | |
Receivable for securities sold | | | 2,815,452 | | | | 1,716,616 | | | | 1,753,189 | | | | 25,051,075 | | | | — | | | | 1,301,063 | | |
Receivable for accumulated variation margin on futures
contracts (Note A) | | | — | | | | 221,178 | | | | — | | | | — | | | | — | | | | — | | |
Receivable from Management—net (Note B) | | | — | | | | — | | | | — | | | | — | | | | 13,038 | | | | 13,199 | | |
Receivable for Fund shares sold | | | 520,116 | | | | 87,690 | | | | 118,356 | | | | 1,686,195 | | | | 114,500 | | | | 60,000 | | |
Receivable for accumulated variation margin on centrally
cleared swap contracts(c)(d) (Note A) | | | — | | | | 373,789 | | | | — | | | | — | | | | — | | | | — | | |
Receivable for bond forward contracts (Note A) | | | — | | | | — | | | | — | | | | — | | | | — | | | | — | | |
Receivable for forward foreign currency contracts (Note A) | | | — | | | | 1,222,677 | | | | — | | | | — | | | | — | | | | — | | |
| Over-the-counter swap contracts, at value(e) (Note A) | | | — | | | | 879,168 | | | | — | | | | — | | | | — | | | | — | | |
Receivable for unfunded loan commitments (Note A) | | | — | | | | — | | | | 312 | | | | — | | | | — | | | | — | | |
Prepaid expenses and other assets | | | 43,957 | | | | 28,615 | | | | 22,603 | | | | 102,391 | | | | 28,631 | | | | 14,708 | | |
Total Assets | | | 384,472,740 | | | | 165,697,032 | | | | 233,626,934 | | | | 2,371,280,407 | | | | 129,329,045 | | | | 61,204,733 | | |
Liabilities | |
| Over-the-counter swap contracts, at value(e) (Note A) | | | — | | | | 771,950 | | | | — | | | | — | | | | — | | | | — | | |
Cash collateral segregated for centrally cleared swap
contracts due to broker (Note A) | | | — | | | | 135,001 | | | | — | | | | — | | | | — | | | | — | | |
Cash collateral segregated for over-the-counter derivatives
due to broker (Note A) | | | — | | | | 270,000 | | | | — | | | | — | | | | — | | | | — | | |
Cash collateral segregated for futures contracts due to
broker (Note A) | | | — | | | | — | | | | — | | | | — | | | | — | | | | — | | |
Payable to investment manager—net (Note B) | | | 77,359 | | | | 74,632 | | | | 96,315 | | | | 946,423 | | | | 41,317 | | | | 12,543 | | |
Due to custodian | | | — | | | | — | | | | — | | | | — | | | | — | | | | — | | |
Payable for securities purchased | | | 15,031,864 | | | | 831,801 | | | | 8,099,746 | | | | 18,836,827 | | | | 4,581,576 | | | | 1,984,173 | | |
Payable for Fund shares redeemed | | | 152,681 | | | | 210,018 | | | | 270,688 | | | | 2,723,269 | | | | 151,430 | | | | 4,851 | | |
Payable for accumulated variation margin on futures
contracts (Note A) | | | 128,316 | | | | — | | | | — | | | | — | | | | — | | | | — | | |
Payable for bond forward contracts (Note A) | | | — | | | | — | | | | — | | | | — | | | | — | | | | — | | |
Payable for forward foreign currency contracts (Note A) | | | — | | | | 1,061,948 | | | | — | | | | — | | | | — | | | | — | | |
Payable for accumulated variation margin on centrally
cleared swap contracts(c)(d) (Note A) | | | — | | | | — | | | | — | | | | — | | | | — | | | | — | | |
Payable to administrator—net (Note B) | | | 25,876 | | | | 4,380 | | | | 19,209 | | | | 255,180 | | | | — | | | | — | | |
Payable to trustees | | | 2,917 | | | | 2,917 | | | | 2,917 | | | | 2,917 | | | | 2,917 | | | | 2,917 | | |
Payable for audit fees | | | 33,900 | | | | 54,190 | | | | 40,900 | | | | 64,296 | | | | 28,950 | | | | 28,900 | | |
Payable for custodian fees | | | 36,471 | | | | 16,525 | | | | 82,251 | | | | 98,036 | | | | 20,221 | | | | 18,319 | | |
Interest payable (Note A) | | | — | | | | — | | | | 142 | | | | — | | | | — | | | | — | | |
Distributions payable | | | 363,307 | | | | 3,763 | | | | 28,642 | | | | 1,634,401 | | | | 786 | | | | 9,094 | | |
Accrued capital gains taxes (Note A) | | | — | | | | 80,977 | | | | — | | | | — | | | | — | | | | — | | |
Other accrued expenses and payables | | | 52,926 | | | | 89,598 | | | | 43,728 | | | | 225,868 | | | | 24,149 | | | | 41,667 | | |
Total Liabilities | | | 15,905,617 | | | | 3,607,700 | | | | 8,684,538 | | | | 24,787,217 | | | | 4,851,346 | | | | 2,102,464 | | |
Net Assets | | $ | 368,567,123 | | | $ | 162,089,332 | | | $ | 224,942,396 | | | $ | 2,346,493,190 | | | $ | 124,477,699 | | | $ | 59,102,269 | | |
Net Assets consist of: | |
Paid-in capital | | $ | 362,906,530 | | | $ | 169,541,605 | | | $ | 254,255,994 | | | $ | 2,450,883,979 | | | $ | 122,228,348 | | | $ | 56,117,156 | | |
Total distributable earnings/(losses) | | | 5,660,593 | | | | (7,452,273 | ) | | | (29,313,598 | ) | | | (104,390,789 | ) | | | 2,249,351 | | | | 2,985,113 | | |
Net Assets | | $ | 368,567,123 | | | $ | 162,089,332 | | | $ | 224,942,396 | | | $ | 2,346,493,190 | | | $ | 124,477,699 | | | $ | 59,102,269 | | |
Net Assets | |
Investor Class | | $ | 11,347,686 | | | $ | — | | | $ | — | | | $ | 86,030,436 | | | $ | — | | | $ | — | | |
Trust Class | | | — | | | | — | | | | — | | | | — | | | | — | | | | — | | |
Institutional Class | | | 332,275,036 | | | | 158,485,764 | | | | 206,802,872 | | | | 1,471,789,093 | | | | 122,701,996 | | | | 58,997,209 | | |
Class A | | | 19,380,891 | | | | 3,246,884 | | | | 6,547,919 | | | | 25,141,354 | | | | 1,121,321 | | | | 78,927 | | |
Class C | | | 2,197,833 | | | | 356,684 | | | | 11,591,605 | | | | 11,961,909 | | | | 654,382 | | | | 26,133 | | |
Class R3 | | | — | | | | — | | | | — | | | | 4,191,128 | | | | — | | | | — | | |
Class R6 | | | 3,365,677 | | | | — | | | | — | | | | 747,379,270 | | | | — | | | | — | | |
See Notes to Financial Statements
230
| | | MUNICIPAL
INTERMEDIATE
BOND FUND | | SHORT
DURATION
BOND FUND | | SHORT
DURATION
HIGH INCOME
FUND | | STRATEGIC
INCOME FUND | | UNCONSTRAINED
BOND FUND | |
| | | October 31,
2019 | | October 31,
2019 | | October 31,
2019 | | October 31,
2019 | | October 31,
2019 | |
Assets | |
Investments in securities, at value*
(Note A)—see Schedule of Investments: | |
| Unaffiliated issuers(a) | | $ | 201,438,538 | | | $ | 85,237,227 | | | $ | 30,286,235 | | | $ | 3,391,003,890 | | | $ | 50,554,925 | | |
Cash | | | — | | | | — | | | | 225 | | | | 79,431 | | | | — | | |
| Foreign currency(b) | | | — | | | | — | | | | — | | | | 1,088,900 | | | | 2,817,519 | | |
Cash collateral segregated for futures contracts (Note A) | | | — | | | | 240,272 | | | | — | | | | — | | | | — | | |
Cash collateral segregated for centrally cleared swap
contracts (Note A) | | | — | | | | — | | | | — | | | | — | | | | 2,060,861 | | |
Cash collateral segregated for over-the-counter
derivatives (Note A) | | | — | | | | — | | | | — | | | | 50,000 | | | | 800,000 | | |
Dividends and interest receivable | | | 2,326,521 | | | | 407,794 | | | | 381,847 | | | | 22,479,362 | | | | 398,951 | | |
Receivable for securities sold | | | 170,098 | | | | — | | | | 201,114 | | | | 25,254,860 | | | | 315,516 | | |
Receivable for accumulated variation margin on futures
contracts (Note A) | | | — | | | | — | | | | — | | | | 5,486,793 | | | | 647,735 | | |
Receivable from Management—net (Note B) | | | 1,475 | | | | 9,970 | | | | 13,550 | | | | — | | | | 36,315 | | |
Receivable for Fund shares sold | | | 42,316 | | | | 2,659 | | | | — | | | | 6,579,613 | | | | — | | |
Receivable for accumulated variation margin on centrally
cleared swap contracts(c)(d) (Note A) | | | — | | | | — | | | | — | | | | — | | | | — | | |
Receivable for bond forward contracts (Note A) | | | — | | | | — | | | | — | | | | 6,289 | | | | — | | |
Receivable for forward foreign currency contracts (Note A) | | | — | | | | — | | | | — | | | | 2,785,266 | | | | 3,940,456 | | |
| Over-the-counter swap contracts, at value(e) (Note A) | | | — | | | | — | | | | — | | | | — | | | | — | | |
Receivable for unfunded loan commitments (Note A) | | | — | | | | — | | | | — | | | | — | | | | — | | |
Prepaid expenses and other assets | | | 28,531 | | | | 33,687 | | | | 22,679 | | | | 92,766 | | | | 11,574 | | |
Total Assets | | | 204,007,479 | | | | 85,931,609 | | | | 30,905,650 | | | | 3,454,907,170 | | | | 61,583,852 | | |
Liabilities | |
| Over-the-counter swap contracts, at value(e) (Note A) | | | — | | | | — | | | | — | | | | — | | | | — | | |
Cash collateral segregated for centrally cleared swap
contracts due to broker (Note A) | | | — | | | | — | | | | — | | | | — | | | | — | | |
Cash collateral segregated for over-the-counter derivatives
due to broker (Note A) | | | — | | | | — | | | | — | | | | 660,000 | | | | — | | |
Cash collateral segregated for futures contracts due to
broker (Note A) | | | — | | | | — | | | | — | | | | 8,833,626 | | | | 733,618 | | |
Payable to investment manager—net (Note B) | | | 23,797 | | | | 14,090 | | | | 10,902 | | | | 965,508 | | | | 20,374 | | |
Due to custodian | | | 18,946 | | | | — | | | | — | | | | — | | | | — | | |
Payable for securities purchased | | | 3,444,425 | | | | 3,406,049 | | | | 110,698 | | | | 553,311,742 | | | | 1,481,029 | | |
Payable for Fund shares redeemed | | | 28,431 | | | | 65,902 | | | | 55,613 | | | | 5,051,461 | | | | 25,960 | | |
Payable for accumulated variation margin on futures
contracts (Note A) | | | — | | | | 42,141 | | | | — | | | | — | | | | — | | |
Payable for bond forward contracts (Note A) | | | — | | | | — | | | | — | | | | 57,594 | | | | — | | |
Payable for forward foreign currency contracts (Note A) | | | — | | | | — | | | | — | | | | 2,091,200 | | | | 4,501,449 | | |
Payable for accumulated variation margin on centrally
cleared swap contracts(c)(d) (Note A) | | | — | | | | — | | | | — | | | | — | | | | 1,514,406 | | |
Payable to administrator—net (Note B) | | | — | | | | — | | | | — | | | | 434,432 | | | | — | | |
Payable to trustees | | | 2,917 | | | | 2,917 | | | | 2,917 | | | | 2,917 | | | | 2,917 | | |
Payable for audit fees | | | 57,973 | | | | 60,323 | | | | 31,400 | | | | 69,171 | | | | 62,936 | | |
Payable for custodian fees | | | 22,413 | | | | 21,385 | | | | 33,585 | | | | 192,113 | | | | 45,790 | | |
Interest payable (Note A) | | | — | | | | — | | | | — | | | | — | | | | — | | |
Distributions payable | | | 370,295 | | | | 3,965 | | | | 202 | | | | 1,457,408 | | | | 242 | | |
Accrued capital gains taxes (Note A) | | | — | | | | — | | | | — | | | | 2,654 | | | | — | | |
Other accrued expenses and payables | | | 40,663 | | | | 36,969 | | | | 23,908 | | | | 213,761 | | | | 25,112 | | |
Total Liabilities | | | 4,009,860 | | | | 3,653,741 | | | | 269,225 | | | | 573,343,587 | | | | 8,413,833 | | |
Net Assets | | $ | 199,997,619 | | | $ | 82,277,868 | | | $ | 30,636,425 | | | $ | 2,881,563,583 | | | $ | 53,170,019 | | |
Net Assets consist of: | |
Paid-in capital | | $ | 191,798,268 | | | $ | 87,097,807 | | | $ | 45,745,659 | | | $ | 2,916,616,940 | | | $ | 66,926,500 | | |
Total distributable earnings/(losses) | | | 8,199,351 | | | | (4,819,939 | ) | | | (15,109,234 | ) | | | (35,053,357 | ) | | | (13,756,481 | ) | |
Net Assets | | $ | 199,997,619 | | | $ | 82,277,868 | | | $ | 30,636,425 | | | $ | 2,881,563,583 | | | $ | 53,170,019 | | |
Net Assets | |
Investor Class | | $ | 13,271,975 | | | $ | 21,829,500 | | | $ | — | | | $ | — | | | $ | — | | |
Trust Class | | | — | | | | 1,962,722 | | | | — | | | | 8,632,460 | | | | — | | |
Institutional Class | | | 182,260,792 | | | | 56,348,495 | | | | 28,512,104 | | | | 2,357,538,726 | | | | 21,174,767 | | |
Class A | | | 1,833,785 | | | | 767,972 | | | | 1,078,754 | | | | 113,513,971 | | | | 151,733 | | |
Class C | | | 2,631,067 | | | | 1,369,179 | | | | 1,045,567 | | | | 100,460,271 | | | | 28,245 | | |
Class R3 | | | — | | | | — | | | | — | | | | — | | | | — | | |
Class R6 | | | — | | | | — | | | | — | | | | 301,418,155 | | | | 31,815,274 | | |
231
Statements of Assets and Liabilities (cont'd)
Neuberger Berman Income Funds (cont'd)
| | CORE BOND
FUND | | EMERGING
MARKETS
DEBT FUND | | FLOATING
RATE INCOME
FUND | | HIGH INCOME
BOND FUND | | MUNICIPAL
HIGH INCOME
FUND | | MUNICIPAL
IMPACT FUND | |
| | | October 31,
2019 | | October 31,
2019 | | October 31,
2019 | | October 31,
2019 | | October 31,
2019 | | October 31,
2019 | |
Shares Outstanding ($.001 par value;
unlimited shares authorized) | |
Investor Class | | | 1,079,500 | | | | — | | | | — | | | | 10,095,333 | | | | — | | | | — | | |
Trust Class | | | — | | | | — | | | | — | | | | — | | | | — | | | | — | | |
Institutional Class | | | 31,544,895 | | | | 18,369,303 | | | | 21,656,789 | | | | 172,458,803 | | | | 11,591,690 | | | | 3,340,276 | | |
Class A | | | 1,846,075 | | | | 376,728 | | | | 685,719 | | | | 2,950,451 | | | | 106,003 | | | | 4,467 | | |
Class C | | | 209,113 | | | | 41,372 | | | | 1,214,104 | | | | 1,401,219 | | | | 61,809 | | | | 1,479 | | |
Class R3 | | | — | | | | — | | | | — | | | | 491,269 | | | | — | | | | — | | |
Class R6 | | | 319,480 | | | | — | | | | — | | | | 87,545,703 | | | | — | | | | — | | |
Net Asset Value, offering and redemption price per share | |
Investor Class | | $ | 10.51 | | | $ | — | | | $ | — | | | $ | 8.52 | | | $ | — | | | $ | — | | |
Trust Class | | | — | | | | — | | | | — | | | | — | | | | — | | | | — | | |
Institutional Class | | | 10.53 | | | | 8.63 | | | | 9.55 | | | | 8.53 | | | | 10.59 | | | | 17.66 | | |
Class R3 | | | — | | | | — | | | | — | | | | 8.53 | | | | — | | | | — | | |
Class R6 | | | 10.53 | | | | — | | | | — | | | | 8.54 | | | | — | | | | — | | |
Net Asset Value and redemption price per share | |
Class A | | $ | 10.50 | | | $ | 8.62 | | | $ | 9.55 | | | $ | 8.52 | | | $ | 10.58 | | | $ | 17.67 | | |
Offering Price per share | |
Class A‡ | | $ | 10.97 | | | $ | 9.00 | | | $ | 9.97 | | | $ | 8.90 | | | $ | 11.05 | | | $ | 18.45 | | |
Net Asset Value and offering price per share | |
Class C^ | | $ | 10.51 | | | $ | 8.62 | | | $ | 9.55 | | | $ | 8.54 | | | $ | 10.59 | | | $ | 17.67 | | |
*Cost of Investments: | |
(a) Unaffiliated issuers | | $ | 368,983,370 | | | $ | 156,531,763 | | | $ | 237,339,732 | | | $ | 2,265,818,293 | | | $ | 124,127,723 | | | $ | 55,510,118 | | |
(b) Total cost of foreign currency | | $ | 20,825 | | | $ | 2,881,317 | | | $ | — | | | $ | — | | | $ | — | | | $ | — | | |
(c) Unamortized upfront receipts on centrally cleared
swap contracts | | $ | — | | | $ | — | | | $ | — | | | $ | — | | | $ | — | | | $ | — | | |
(d) Unamortized upfront payments on centrally cleared
swap contracts | | $ | — | | | $ | — | | | $ | — | | | $ | — | | | $ | — | | | $ | — | | |
(e) Unamortized upfront payments on over-the-counter
swap contracts | | $ | — | | | $ | 39,875 | | | $ | — | | | $ | — | | | $ | — | | | $ | — | | |
‡ On single retail sales of less than $50,000. On sales of $50,000 or more or in certain other circumstances described in the Fund's prospectus, offering price is reduced.
^ Redemption price per share is equal to net asset value less any applicable contingent deferred sales charge.
See Notes to Financial Statements
232
| | | MUNICIPAL
INTERMEDIATE
BOND FUND | | SHORT
DURATION
BOND FUND | | SHORT
DURATION
HIGH INCOME
FUND | | STRATEGIC
INCOME FUND | | UNCONSTRAINED
BOND FUND | |
| | | October 31,
2019 | | October 31,
2019 | | October 31,
2019 | | October 31,
2019 | | October 31,
2019 | |
Shares Outstanding ($.001 par value;
unlimited shares authorized) | |
Investor Class | | | 1,102,585 | | | | 2,800,073 | | | | — | | | | — | | | | — | | |
Trust Class | | | — | | | | 264,111 | | | | — | | | | 785,693 | | | | — | | |
Institutional Class | | | 15,155,858 | | | | 7,233,002 | | | | 2,986,908 | | | | 214,503,054 | | | | 2,399,744 | | |
Class A | | | 152,618 | | | | 103,425 | | | | 112,894 | | | | 10,318,233 | | | | 17,182 | | |
Class C | | | 218,847 | | | | 184,331 | | | | 109,508 | | | | 9,141,404 | | | | 3,200 | | |
Class R3 | | | — | | | | — | | | | — | | | | — | | | | — | | |
Class R6 | | | — | | | | — | | | | — | | | | 27,447,186 | | | | 3,603,354 | | |
Net Asset Value, offering and redemption price per share | |
Investor Class | | $ | 12.04 | | | $ | 7.80 | | | $ | — | | | $ | — | | | $ | — | | |
Trust Class | | | — | | | | 7.43 | | | | — | | | | 10.99 | | | | — | | |
Institutional Class | | | 12.03 | | | | 7.79 | | | | 9.55 | | | | 10.99 | | | | 8.82 | | |
Class R3 | | | — | | | | — | | | | — | | | | — | | | | — | | |
Class R6 | | | — | | | | — | | | | — | | | | 10.98 | | | | 8.83 | | |
Net Asset Value and redemption price per share | |
Class A | | $ | 12.02 | | | $ | 7.43 | | | $ | 9.56 | | | $ | 11.00 | | | $ | 8.83 | | |
Offering Price per share | |
Class A‡ | | $ | 12.55 | | | $ | 7.62 | | | $ | 9.98 | | | $ | 11.49 | | | $ | 9.22 | | |
Net Asset Value and offering price per share | |
Class C^ | | $ | 12.02 | | | $ | 7.43 | | | $ | 9.55 | | | $ | 10.99 | | | $ | 8.83 | | |
*Cost of Investments: | |
(a) Unaffiliated issuers | | $ | 194,295,897 | | | $ | 85,207,394 | | | $ | 30,055,355 | | | $ | 3,336,228,495 | | | $ | 51,113,014 | | |
(b) Total cost of foreign currency | | $ | — | | | $ | — | | | $ | — | | | $ | 1,081,406 | | | $ | 2,797,397 | | |
(c) Unamortized upfront receipts on centrally cleared
swap contracts | | $ | — | | | $ | — | | | $ | — | | | $ | — | | | $ | (1,602,071 | ) | |
(d) Unamortized upfront payments on centrally cleared
swap contracts | | $ | — | | | $ | — | | | $ | — | | | $ | — | | | $ | 139,958 | | |
(e) Unamortized upfront payments on over-the-counter
swap contracts | | $ | — | | | $ | — | | | $ | — | | | $ | — | | | $ | — | | |
233
Neuberger Berman Income Funds
| | | CORE BOND
FUND | | EMERGING
MARKETS
DEBT FUND | | FLOATING
RATE INCOME
FUND | | HIGH INCOME
BOND FUND | | MUNICIPAL
HIGH INCOME
FUND | | MUNICIPAL
IMPACT FUND | |
| | | For the
Year Ended
October 31,
2019 | | For the
Year Ended
October 31,
2019 | | For the
Year Ended
October 31,
2019 | | For the
Year Ended
October 31,
2019 | | For the
Year Ended
October 31,
2019 | | For the
Year Ended
October 31,
2019 | |
Investment Income: | |
Income (Note A): | |
Interest and other income—unaffiliated issuers | | $ | 12,922,785 | | | $ | 12,306,845 | | | $ | 16,706,392 | | | $ | 141,184,777 | | | $ | 3,704,887 | | | $ | 1,621,355 | | |
Dividend income—unaffiliated issuers | | | — | | | | — | | | | — | | | | — | | | | — | | | | — | | |
Foreign taxes withheld | | | — | | | | (120,381 | ) | | | — | | | | — | | | | — | | | | — | | |
Total income | | $ | 12,922,785 | | | $ | 12,186,464 | | | $ | 16,706,392 | | | $ | 141,184,777 | | | $ | 3,704,887 | | | $ | 1,621,355 | | |
Expenses: | |
Investment management fees (Note B) | | | 939,850 | | | | 1,089,951 | | | | 1,421,498 | | | | 10,766,390 | | | | 374,087 | | | | 141,434 | | |
Administration fees (Note B): | |
Investor Class | | | 28,238 | | | | — | | | | — | | | | 242,111 | | | | — | | | | — | | |
Trust Class | | | — | | | | — | | | | — | | | | — | | | | — | | | | — | | |
Institutional Class | | | 515,474 | | | | 286,131 | | | | 391,518 | | | | 2,125,181 | | | | 137,900 | | | | 84,736 | | |
Class A | | | 52,273 | | | | 18,938 | | | | 24,878 | | | | 89,625 | | | | 2,808 | | | | 154 | | |
Class C | | | 6,051 | | | | 1,093 | | | | 37,999 | | | | 37,871 | | | | 1,481 | | | | 69 | | |
Class R3 | | | — | | | | — | | | | — | | | | 10,849 | | | | — | | | | — | | |
Class R6 | | | 116 | | | | — | | | | — | | | | 363,024 | | | | — | | | | — | | |
Distribution fees (Note B): | |
Investor Class | | | 26,147 | | | | — | | | | — | | | | — | | | | — | | | | — | | |
Trust Class | | | — | | | | — | | | | — | | | | — | | | | — | | | | — | | |
Class A | | | 48,401 | | | | 17,535 | | | | 23,036 | | | | 82,986 | | | | 2,600 | | | | 142 | | |
Class C | | | 22,412 | | | | 4,048 | | | | 140,735 | | | | 140,261 | | | | 5,486 | | | | 256 | | |
Class R3 | | | — | | | | — | | | | — | | | | 20,092 | | | | — | | | | — | | |
Shareholder servicing agent fees: | |
Investor Class | | | 20,458 | | | | — | | | | — | | | | 39,396 | | | | — | | | | — | | |
Trust Class | | | — | | | | — | | | | — | | | | — | | | | — | | | | — | | |
Institutional Class | | | 3,871 | | | | 2,019 | | | | 1,688 | | | | 36,425 | | | | 290 | | | | 50,258 | | |
Class A | | | 1,191 | | | | 587 | | | | 2,206 | | | | 36,543 | | | | 644 | | | | 74 | | |
Class C | | | 280 | | | | 69 | | | | 589 | | | | 1,846 | | | | 57 | | | | 74 | | |
Class R6 | | | 52 | | | | — | | | | — | | | | 23,886 | | | | — | | | | — | | |
Audit fees | | | 33,900 | | | | 60,206 | | | | 40,900 | | | | 64,296 | | | | 28,950 | | | | 28,900 | | |
Custodian and accounting fees | | | 164,027 | | | | 316,680 | | | | 358,180 | | | | 402,974 | | | | 81,065 | | | | 74,539 | | |
Insurance expense | | | 12,812 | | | | 7,125 | | | | 11,509 | | | | 81,429 | | | | 2,900 | | | | 1,878 | | |
Legal fees | | | 64,591 | | | | 59,859 | | | | 56,247 | | | | 78,113 | | | | 58,901 | | | | 117,647 | | |
Registration and filing fees | | | 118,159 | | | | 61,010 | | | | 92,162 | | | | 207,940 | | | | 51,577 | | | | 61,671 | | |
Shareholder reports | | | 78,493 | | | | 12,511 | | | | 23,593 | | | | 335,510 | | | | 7,864 | | | | 9,017 | | |
Trustees' fees and expenses | | | 47,657 | | | | 47,240 | | | | 47,485 | | | | 51,830 | | | | 46,987 | | | | 46,903 | | |
Interest expense | | | 1,123 | | | | 3,750 | | | | 25,646 | (Note E) | | | 1,151 | | | | 972 | | | | 1,879 | | |
Miscellaneous | | | 41,070 | | | | 21,793 | | | | 37,588 | | | | 190,756 | | | | 13,683 | | | | 10,918 | | |
Total expenses | | | 2,226,646 | | | | 2,010,545 | | | | 2,737,457 | | | | 15,430,485 | | | | 818,252 | | | | 630,549 | | |
Expenses reimbursed by Management (Note B) | | | (371,913 | ) | | | (423,189 | ) | | | (515,444 | ) | | | (16,174 | ) | | | (336,104 | ) | | | (382,758 | ) | |
Total net expenses | | | 1,854,733 | | | | 1,587,356 | | | | 2,222,013 | | | | 15,414,311 | | | | 482,148 | | | | 247,791 | | |
Net investment income/(loss) | | $ | 11,068,052 | | | $ | 10,599,108 | | | $ | 14,484,379 | | | $ | 125,770,466 | | | $ | 3,222,739 | | | $ | 1,373,564 | | |
See Notes to Financial Statements
234
| | | MUNICIPAL
INTERMEDIATE
BOND FUND | | SHORT
DURATION
BOND FUND | | SHORT
DURATION
HIGH INCOME
FUND | | STRATEGIC
INCOME FUND | | UNCONSTRAINED
BOND FUND | |
| | | For the
Year Ended
October 31,
2019 | | For the
Year Ended
October 31,
2019 | | For the
Year Ended
October 31,
2019 | | For the
Year Ended
October 31,
2019 | | For the
Year Ended
October 31,
2019 | |
Investment Income: | |
Income (Note A): | |
Interest and other income—unaffiliated issuers | | $ | 6,041,844 | | | $ | 2,447,000 | | | $ | 2,733,471 | | | $ | 121,012,230 | | | $ | 3,170,551 | | |
Dividend income—unaffiliated issuers | | | — | | | | — | | | | — | | | | — | | | | 241,349 | | |
Foreign taxes withheld | | | — | | | | — | | | | — | | | | (6,468 | ) | | | — | | |
Total income | | $ | 6,041,844 | | | $ | 2,447,000 | | | $ | 2,733,471 | | | $ | 121,005,762 | | | $ | 3,411,900 | | |
Expenses: | |
Investment management fees (Note B) | | | 444,609 | | | | 176,994 | | | | 227,882 | | | | 10,913,266 | | | | 367,822 | | |
Administration fees (Note B): | |
Investor Class | | | 35,661 | | | | 58,597 | | | | — | | | | — | | | | — | | |
Trust Class | | | — | | | | 9,680 | | | | — | | | | 42,382 | | | | — | | |
Institutional Class | | | 275,712 | | | | 92,709 | | | | 72,797 | | | | 3,294,108 | | | | 45,215 | | |
Class A | | | 10,760 | | | | 4,574 | | | | 2,760 | | | | 310,908 | | | | 394 | | |
Class C | | | 8,146 | | | | 3,666 | | | | 2,934 | | | | 296,089 | | | | 74 | | |
Class R3 | | | — | | | | — | | | | — | | | | — | | | | — | | |
Class R6 | | | — | | | | — | | | | — | | | | 158,353 | | | | 27,256 | | |
Distribution fees (Note B): | |
Investor Class | | | — | | | | — | | | | — | | | | — | | | | — | | |
Trust Class | | | — | | | | — | | | | — | | | | 10,596 | | | | — | | |
Class A | | | 9,963 | | | | 4,235 | | | | 2,555 | | | | 287,877 | | | | 364 | | |
Class C | | | 30,170 | | | | 13,579 | | | | 10,868 | | | | 1,096,625 | | | | 275 | | |
Class R3 | | | — | | | | — | | | | — | | | | — | | | | — | | |
Shareholder servicing agent fees: | |
Investor Class | | | 9,747 | | | | 27,945 | | | | — | | | | — | | | | — | | |
Trust Class | | | — | | | | 448 | | | | — | | | | 5,155 | | | | — | | |
Institutional Class | | | 985 | | | | 465 | | | | 605 | | | | 14,365 | | | | 228 | | |
Class A | | | 239 | | | | 264 | | | | 661 | | | | 19,077 | | | | 279 | | |
Class C | | | 221 | | | | 249 | | | | 212 | | | | 3,877 | | | | 25 | | |
Class R6 | | | — | | | | — | | | | — | | | | 4,854 | | | | 140 | | |
Audit fees | | | 57,973 | | | | 60,323 | | | | 31,400 | | | | 69,171 | | | | 62,936 | | |
Custodian and accounting fees | | | 90,689 | | | | 89,271 | | | | 141,167 | | | | 837,629 | | | | 181,415 | | |
Insurance expense | | | 7,223 | | | | 2,984 | | | | 2,043 | | | | 92,171 | | | | 3,072 | | |
Legal fees | | | 58,780 | | | | 53,691 | | | | 57,664 | | | | 57,251 | | | | 53,606 | | |
Registration and filing fees | | | 70,162 | | | | 102,547 | | | | 50,908 | | | | 218,609 | | | | 66,473 | | |
Shareholder reports | | | 16,883 | | | | 9,855 | | | | 5,858 | | | | 318,576 | | | | 7,092 | | |
Trustees' fees and expenses | | | 47,272 | | | | 46,971 | | | | 46,924 | | | | 53,095 | | | | 46,985 | | |
Interest expense | | | 4,794 | | | | 182 | | | | 20 | | | | 22,124 | | | | 1,072 | | |
Miscellaneous | | | 24,450 | | | | 15,043 | | | | 11,927 | | | | 244,169 | | | | 14,183 | | |
Total expenses | | | 1,204,439 | | | | 774,272 | | | | 669,185 | | | | 18,370,327 | | | | 878,906 | | |
Expenses reimbursed by Management (Note B) | | | (281,947 | ) | | | (354,525 | ) | | | (270,553 | ) | | | (728,772 | ) | | | (392,124 | ) | |
Total net expenses | | | 922,492 | | | | 419,747 | | | | 398,632 | | | | 17,641,555 | | | | 486,782 | | |
Net investment income/(loss) | | $ | 5,119,352 | | | $ | 2,027,253 | | | $ | 2,334,839 | | | $ | 103,364,207 | | | $ | 2,925,118 | | |
235
Statements of Operations (cont'd)
Neuberger Berman Income Funds (cont'd)
| | | CORE BOND
FUND | | EMERGING
MARKETS
DEBT FUND | | FLOATING
RATE INCOME
FUND | | HIGH INCOME
BOND FUND | | MUNICIPAL
HIGH INCOME
FUND | | MUNICIPAL
IMPACT FUND | |
| | | For the
Year Ended
October 31,
2019 | | For the
Year Ended
October 31,
2019 | | For the
Year Ended
October 31,
2019 | | For the
Year Ended
October 31,
2019 | | For the
Year Ended
October 31,
2019 | | For the
Year Ended
October 31,
2019 | |
Realized and Unrealized Gain/(Loss)
on Investments (Note A): | |
Net realized gain/(loss) on: | |
Transactions in investment securities of unaffiliated issuers | | | 5,437,437 | | | | (2,691,542 | )* | | | (6,302,285 | ) | | | (21,842,323 | ) | | | 206,883 | | | | 263,062 | | |
Redemption in-kind | | | — | | | | — | | | | — | | | | — | | | | — | | | | — | | |
Settlement of bond forward contracts | | | — | | | | — | | | | — | | | | — | | | | — | | | | — | | |
Settlement of forward foreign currency contracts | | | — | | | | (378,541 | ) | | | — | | | | — | | | | — | | | | — | | |
Settlement of foreign currency transactions | | | 9,943 | | | | (30,803 | ) | | | — | | | | — | | | | — | | | | — | | |
Expiration or closing of futures contracts | | | (1,085,473 | ) | | | (801,668 | ) | | | — | | | | — | | | | — | | | | — | | |
Expiration or closing of swap contracts | | | — | | | | (268,122 | ) | | | — | | | | — | | | | — | | | | — | | |
Change in net unrealized appreciation/
(depreciation) in value of: | |
Investment securities of unaffiliated issuers | | | 24,757,326 | | | | 16,605,509 | ** | | | (3,711,463 | ) | | | 68,454,711 | | | | 4,734,468 | | | | 3,126,668 | | |
Unfunded loan commitments | | | — | | | | — | | | | 1,042 | | | | — | | | | — | | | | — | | |
Forward foreign currency contracts | | | — | | | | 581,479 | | | | — | | | | — | | | | — | | | | — | | |
Bond forward contracts | | | — | | | | — | | | | — | | | | — | | | | — | | | | — | | |
Foreign currency translations | | | 17,704 | | | | 42,504 | | | | — | | | | — | | | | — | | | | — | | |
Futures contracts | | | (323,536 | ) | | | 219,635 | | | | — | | | | — | | | | — | | | | — | | |
Swap contracts | | | — | | | | 1,073,882 | | | | — | | | | — | | | | — | | | | — | | |
Net gain/(loss) on investments | | | 28,813,401 | | | | 14,352,333 | | | | (10,012,706 | ) | | | 46,612,388 | | | | 4,941,351 | | | | 3,389,730 | | |
Net increase/(decrease) in net assets resulting from operations | | $ | 39,881,453 | | | $ | 24,951,441 | | | $ | 4,471,673 | | | $ | 172,382,854 | | | $ | 8,164,090 | | | $ | 4,763,294 | | |
* Net of foreign capital gains tax of $6,898 for Emerging Markets Debt Fund and $3,788 for Strategic Income Fund.
** Change in accrued foreign capital gains tax amounted to $(72,079) for Emerging Market Debt Fund and $(2,654) for Strategic Income Fund.
See Notes to Financial Statements
236
| | | MUNICIPAL
INTERMEDIATE
BOND FUND | | SHORT
DURATION
BOND FUND | | SHORT
DURATION
HIGH INCOME
FUND | | STRATEGIC
INCOME FUND | | UNCONSTRAINED
BOND FUND | |
| | | For the
Year Ended
October 31,
2019 | | For the
Year Ended
October 31,
2019 | | For the
Year Ended
October 31,
2019 | | For the
Year Ended
October 31,
2019 | | For the
Year Ended
October 31,
2019 | |
Realized and Unrealized Gain/(Loss)
on Investments (Note A): | |
Net realized gain/(loss) on: | |
Transactions in investment securities of unaffiliated issuers | | | 706,336 | | | | 676,672 | | | | (582,620 | ) | | | 26,311,106 | * | | | (737,815 | ) | |
Redemption in-kind | | | — | | | | — | | | | — | | | | (1,794,284 | ) | | | — | | |
Settlement of bond forward contracts | | | — | | | | — | | | | — | | | | 368,492 | | | | — | | |
Settlement of forward foreign currency contracts | | | — | | | | — | | | | — | | | | 14,608,706 | | | | 2,691,516 | | |
Settlement of foreign currency transactions | | | — | | | | — | | | | — | | | | (868,680 | ) | | | (608,233 | ) | |
Expiration or closing of futures contracts | | | — | | | | 298,521 | | | | — | | | | (86,663,619 | ) | | | (7,218,044 | ) | |
Expiration or closing of swap contracts | | | — | | | | — | | | | — | | | | 220,213 | | | | (656,829 | ) | |
Change in net unrealized appreciation/
(depreciation) in value of: | |
Investment securities of unaffiliated issuers | | | 11,202,697 | | | | 973,941 | | | | 1,281,354 | | | | 162,498,660 | ** | | | 3,574,276 | | |
Unfunded loan commitments | | | — | | | | — | | | | (413 | ) | | | 230 | | | | — | | |
Forward foreign currency contracts | | | — | | | | — | | | | — | | | | (3,389,038 | ) | | | (1,309,061 | ) | |
Bond forward contracts | | | — | | | | — | | | | — | | | | (51,305 | ) | | | — | | |
Foreign currency translations | | | — | | | | — | | | | — | | | | 132,239 | | | | 82,365 | | |
Futures contracts | | | — | | | | (15,766 | ) | | | — | | | | (12,992,889 | ) | | | (453,807 | ) | |
Swap contracts | | | — | | | | — | | | | — | | | | — | | | | (21,726 | ) | |
Net gain/(loss) on investments | | | 11,909,033 | | | | 1,933,368 | | | | 698,321 | | | | 98,379,831 | | | | (4,657,358 | ) | |
Net increase/(decrease) in net assets resulting from operations | | $ | 17,028,385 | | | $ | 3,960,621 | | | $ | 3,033,160 | | | $ | 201,744,038 | | | $ | (1,732,240 | ) | |
237
Statements of Changes in Net Assets
Neuberger Berman Income Funds
| | | CORE BOND FUND | | EMERGING MARKETS
DEBT FUND | | FLOATING RATE
INCOME FUND | |
| | | Fiscal Year
Ended
October 31,
2019 | | Fiscal Year
Ended
October 31,
2018 | | Fiscal Year
Ended
October 31,
2019 | | Fiscal Year
Ended
October 31,
2018 | | Fiscal Year
Ended
October 31,
2019 | | Fiscal Year
Ended
October 31,
2018 | |
Increase/(Decrease) in Net Assets: | |
From Operations (Note A): | |
Net investment income/(loss) | | $ | 11,068,052 | | | $ | 10,740,407 | | | $ | 10,599,108 | | | $ | 11,487,649 | | | $ | 14,484,379 | | | $ | 15,317,224 | | |
Net realized gain/(loss) on investments | | | 4,361,907 | | | | (6,113,390 | ) | | | (4,170,676 | ) | | | (4,875,071 | ) | | | (6,302,285 | ) | | | (402,942 | ) | |
Change in net unrealized appreciation/
(depreciation) of investments | | | 24,451,494 | | | | (14,790,506 | ) | | | 18,523,009 | | | | (20,947,861 | ) | | | (3,710,421 | ) | | | (3,000,702 | ) | |
Net increase/(decrease) in net assets resulting
from operations | | | 39,881,453 | | | | (10,163,489 | ) | | | 24,951,441 | | | | (14,335,283 | ) | | | 4,471,673 | | | | 11,913,580 | | |
Distributions to Shareholders From (Note A): | |
Distributable earnings: | |
Investor Class | | | (253,152 | ) | | | (226,566 | ) | | | — | | | | — | | | | — | | | | — | | |
Trust Class | | | — | | | | — | | | | — | | | | — | | | | — | | | | — | | |
Institutional Class | | | (9,630,153 | ) | | | (9,544,610 | ) | | | (6,084,654 | ) | | | (7,108,565 | ) | | | (13,480,972 | ) | | | (13,978,560 | ) | |
Class A | | | (467,959 | ) | | | (456,374 | ) | | | (197,926 | ) | | | (197,084 | ) | | | (443,114 | ) | | | (753,246 | ) | |
Class C | | | (37,340 | ) | | | (39,926 | ) | | | (8,401 | ) | | | (12,314 | ) | | | (573,832 | ) | | | (571,520 | ) | |
Class R3 | | | — | | | | — | | | | — | | | | — | | | | — | | | | — | | |
Class R6 | | | (6,292 | ) | | | — | | | | — | | | | — | | | | — | | | | — | | |
Tax return of capital: | |
Investor Class | | | (59,291 | ) | | | (31,251 | ) | | | — | | | | — | | | | — | | | | — | | |
Institutional Class | | | (1,949,134 | ) | | | (1,107,274 | ) | | | (3,945,557 | ) | | | (4,001,607 | ) | | | — | | | | — | | |
Class A | | | (109,931 | ) | | | (63,061 | ) | | | (145,583 | ) | | | (128,467 | ) | | | — | | | | — | | |
Class C | | | (12,718 | ) | | | (8,401 | ) | | | (8,381 | ) | | | (10,505 | ) | | | — | | | | — | | |
Class R6 | | | (1,614 | ) | | | — | | | | — | | | | — | | | | — | | | | — | | |
Total distributions to shareholders | | | (12,527,584 | ) | | | (11,477,463 | ) | | | (10,390,502 | ) | | | (11,458,542 | ) | | | (14,497,918 | ) | | | (15,303,326 | ) | |
From Fund Share Transactions (Note D): | |
Proceeds from shares sold: | |
Investor Class | | | 1,324,925 | | | | 828,571 | | | | — | | | | — | | | | — | | | | — | | |
Trust Class | | | — | | | | — | | | | — | | | | — | | | | — | | | | — | | |
Institutional Class | | | 118,807,560 | | | | 173,592,111 | | | | 61,315,025 | | | | 90,516,430 | | | | 152,168,862 | | | | 171,455,587 | | |
Class A | | | 5,550,368 | | | | 2,092,066 | | | | 2,131,472 | | | | 10,647,571 | | | | 1,582,981 | | | | 8,427,161 | | |
Class C | | | 711,546 | | | | 254,670 | | | | 25,299 | | | | 471,946 | | | | 265,956 | | | | 1,530,878 | | |
Class R3 | | | — | | | | — | | | | — | | | | — | | | | — | | | | — | | |
Class R6 | | | 3,385,955 | | | | — | | | | — | | | | — | | | | — | | | | — | | |
Proceeds from reinvestment of dividends and distributions: | |
Investor Class | | | 284,777 | | | | 234,621 | | | | — | | | | — | | | | — | | | | — | | |
Trust Class | | | — | | | | — | | | | — | | | | — | | | | — | | | | — | | |
Institutional Class | | | 7,105,915 | | | | 7,129,832 | | | | 9,941,289 | | | | 10,733,998 | | | | 13,208,218 | | | | 13,227,919 | | |
Class A | | | 533,687 | | | | 497,036 | | | | 335,922 | | | | 323,006 | | | | 353,838 | | | | 566,565 | | |
Class C | | | 35,723 | | | | 38,455 | | | | 14,419 | | | | 18,618 | | | | 384,090 | | | | 381,061 | | |
Class R3 | | | — | | | | — | | | | — | | | | — | | | | — | | | | — | | |
Class R6 | | | — | | | | — | | | | — | | | | — | | | | — | | | | — | | |
Payments for shares redeemed: | |
Investor Class | | | (828,003 | ) | | | (1,653,280 | ) | | | — | | | | — | | | | — | | | | — | | |
Trust Class | | | — | | | | — | | | | — | | | | — | | | | — | | | | — | | |
Institutional Class | | | (192,017,094 | ) | | | (125,525,240 | ) | | | (121,706,299 | ) | | | (129,637,534 | ) | | | (282,893,763 | ) | | | (183,994,957 | ) | |
Class A | | | (6,381,585 | ) | | | (5,637,014 | ) | | | (8,506,123 | ) | | | (1,203,287 | ) | | | (15,217,548 | ) | | | (5,948,837 | ) | |
Class C | | | (928,780 | ) | | | (1,223,060 | ) | | | (188,106 | ) | | | (473,360 | ) | | | (5,310,584 | ) | | | (5,688,734 | ) | |
Class R3 | | | — | | | | — | | | | — | | | | — | | | | — | | | | — | | |
Class R6 | | | (4,283 | ) | | | — | | | | — | | | | — | | | | — | | | | — | | |
Net increase/(decrease) from Fund share transactions | | | (62,419,289 | ) | | | 50,628,768 | | | | (56,637,102 | ) | | | (18,602,612 | ) | | | (135,457,950 | ) | | | (43,357 | ) | |
Net Increase/(Decrease) in Net Assets | | | (35,065,420 | ) | | | 28,987,816 | | | | (42,076,163 | ) | | | (44,396,437 | ) | | | (145,484,195 | ) | | | (3,433,103 | ) | |
Net Assets: | |
Beginning of year | | | 403,632,543 | | | | 374,644,727 | | | | 204,165,495 | | | | 248,561,932 | | | | 370,426,591 | | | | 373,859,694 | | |
End of year | | $ | 368,567,123 | | | $ | 403,632,543 | | | $ | 162,089,332 | | | $ | 204,165,495 | | | $ | 224,942,396 | | | $ | 370,426,591 | | |
See Notes to Financial Statements
238
| | | HIGH INCOME BOND FUND | | MUNICIPAL
HIGH INCOME FUND | | MUNICIPAL IMPACT FUND | |
| | | Fiscal Year
Ended
October 31,
2019 | | Fiscal Year
Ended
October 31,
2018 | | Fiscal Year
Ended
October 31,
2019 | | Fiscal Year
Ended
October 31,
2018 | | Fiscal Year
Ended
October 31,
2019 | | Fiscal Year
Ended
October 31,
2018 | |
Increase/(Decrease) in Net Assets: | |
From Operations (Note A): | |
Net investment income/(loss) | | $ | 125,770,466 | | | $ | 133,388,892 | | | $ | 3,222,739 | | | $ | 3,316,441 | | | $ | 1,373,564 | | | $ | 1,345,510 | | |
Net realized gain/(loss) on investments | | | (21,842,323 | ) | | | (1,932,147 | ) | | | 206,883 | | | | (34,213 | ) | | | 263,062 | | | | (45,851 | ) | |
Change in net unrealized appreciation/
(depreciation) of investments | | | 68,454,711 | | | | (134,280,078 | ) | | | 4,734,468 | | | | (1,859,064 | ) | | | 3,126,668 | | | | (2,230,292 | ) | |
Net increase/(decrease) in net assets resulting
from operations | | | 172,382,854 | | | | (2,823,333 | ) | | | 8,164,090 | | | | 1,423,164 | | | | 4,763,294 | | | | (930,633 | ) | |
Distributions to Shareholders From (Note A): | |
Distributable earnings: | |
Investor Class | | | (4,874,294 | ) | | | (5,422,349 | ) | | | — | | | | — | | | | — | | | | — | | |
Trust Class | | | — | | | | — | | | | — | | | | — | | | | — | | | | — | | |
Institutional Class | | | (79,294,224 | ) | | | (72,816,234 | ) | | | (3,177,326 | ) | | | (3,287,513 | ) | | | (1,372,101 | ) | | | (1,443,780 | ) | |
Class A | | | (1,734,014 | ) | | | (2,673,205 | ) | | | (32,234 | ) | | | (17,287 | ) | | | (1,135 | ) | | | (236 | ) | |
Class C | | | (627,957 | ) | | | (828,514 | ) | | | (12,732 | ) | | | (11,641 | ) | | | (328 | ) | | | (165 | ) | |
Class R3 | | | (199,809 | ) | | | (495,622 | ) | | | — | | | | — | | | | — | | | | — | | |
Class R6 | | | (38,976,423 | ) | | | (51,152,375 | ) | | | — | | | | — | | | | — | | | | — | | |
Tax return of capital: | |
Investor Class | | | — | | | | — | | | | — | | | | — | | | | — | | | | — | | |
Institutional Class | | | — | | | | — | | | | — | | | | — | | | | — | | | | — | | |
Class A | | | — | | | | — | | | | — | | | | — | | | | — | | | | — | | |
Class C | | | — | | | | — | | | | — | | | | — | | | | — | | | | — | | |
Class R6 | | | — | | | | — | | | | — | | | | — | | | | — | | | | — | | |
Total distributions to shareholders | | | (125,706,721 | ) | | | (133,388,299 | ) | | | (3,222,292 | ) | | | (3,316,441 | ) | | | (1,373,564 | ) | | | (1,444,181 | ) | |
From Fund Share Transactions (Note D): | |
Proceeds from shares sold: | |
Investor Class | | | 5,550,693 | | | | 6,947,368 | | | | — | | | | — | | | | — | | | | — | | |
Trust Class | | | — | | | | — | | | | — | | | | — | | | | — | | | | — | | |
Institutional Class | | | 1,098,520,829 | | | | 297,994,293 | | | | 49,388,141 | | | | 18,281,478 | | | | 6,390,443 | | | | 117,859 | | |
Class A | | | 72,800,536 | | | | 50,258,078 | | | | 1,520,083 | | | | 993,763 | | | | 51,600 | | | | 25,000 | | |
Class C | | | 639,343 | | | | 485,571 | | | | 402,974 | | | | 176,994 | | | | — | | | | 25,000 | | |
Class R3 | | | 2,148,689 | | | | 2,601,101 | | | | — | | | | — | | | | — | | | | — | | |
Class R6 | | | 184,071,040 | | | | 109,461,329 | | | | — | | | | — | | | | — | | | | — | | |
Proceeds from reinvestment of dividends and distributions: | |
Investor Class | | | 4,590,454 | | | | 5,134,051 | | | | — | | | | — | | | | — | | | | — | | |
Trust Class | | | — | | | | — | | | | — | | | | — | | | | — | | | | — | | |
Institutional Class | | | 62,063,355 | | | | 61,548,532 | | | | 3,177,326 | | | | 3,287,163 | | | | 1,252,176 | | | | 1,302,870 | | |
Class A | | | 1,529,427 | | | | 2,358,947 | | | | 23,380 | | | | 14,218 | | | | 610 | | | | — | | |
Class C | | | 379,715 | | | | 504,395 | | | | 12,119 | | | | 10,964 | | | | — | | | | — | | |
Class R3 | | | 186,999 | | | | 474,730 | | | | — | | | | — | | | | — | | | | — | | |
Class R6 | | | 38,201,120 | | | | 51,034,547 | | | | — | | | | — | | | | — | | | | — | | |
Payments for shares redeemed: | |
Investor Class | | | (19,317,111 | ) | | | (25,981,873 | ) | | | — | | | | — | | | | — | | | | — | | |
Trust Class | | | — | | | | — | | | | — | | | | — | | | | — | | | | — | | |
Institutional Class | | | (922,417,021 | ) | | | (605,988,407 | ) | | | (22,364,490 | ) | | | (28,135,064 | ) | | | (4,338,660 | ) | | | (6,284,465 | ) | |
Class A | | | (86,983,742 | ) | | | (88,898,895 | ) | | | (1,305,985 | ) | | | (428,095 | ) | | | (563 | ) | | | — | | |
Class C | | | (5,313,543 | ) | | | (7,601,966 | ) | | | (253,812 | ) | | | (438,255 | ) | | | — | | | | — | | |
Class R3 | | | (1,720,932 | ) | | | (11,400,746 | ) | | | — | | | | — | | | | — | | | | — | | |
Class R6 | | | (200,607,639 | ) | | | (895,187,336 | ) | | | — | | | | — | | | | — | | | | — | | |
Net increase/(decrease) from Fund share transactions | | | 234,322,212 | | | | (1,046,256,281 | ) | | | 30,599,736 | | | | (6,236,834 | ) | | | 3,355,606 | | | | (4,813,736 | ) | |
Net Increase/(Decrease) in Net Assets | | | 280,998,345 | | | | (1,182,467,913 | ) | | | 35,541,534 | | | | (8,130,111 | ) | | | 6,745,336 | | | | (7,188,550 | ) | |
Net Assets: | |
Beginning of year | | | 2,065,494,845 | | | | 3,247,962,758 | | | | 88,936,165 | | | | 97,066,276 | | | | 52,356,933 | | | | 59,545,483 | | |
End of year | | $ | 2,346,493,190 | | | $ | 2,065,494,845 | | | $ | 124,477,699 | | | $ | 88,936,165 | | | $ | 59,102,269 | | | $ | 52,356,933 | | |
239
Statements of Changes in Net Assets (cont'd)
Neuberger Berman Income Funds
| | | MUNICIPAL INTERMEDIATE
BOND FUND | | SHORT DURATION
BOND FUND | | SHORT DURATION
HIGH INCOME FUND | |
| | | Fiscal Year
Ended
October 31,
2019 | | Fiscal Year
Ended
October 31,
2018 | | Fiscal Year
Ended
October 31,
2019 | | Fiscal Year
Ended
October 31,
2018 | | Fiscal Year
Ended
October 31,
2019 | | Fiscal Year
Ended
October 31,
2018 | |
Increase/(Decrease) in Net Assets: | |
From Operations (Note A): | |
Net investment income/(loss) | | $ | 5,119,352 | | | $ | 5,385,813 | | | $ | 2,027,253 | | | $ | 1,382,450 | | | $ | 2,334,839 | | | $ | 3,507,351 | | |
Net realized gain/(loss) on investments | | | 706,336 | | | | 394,041 | | | | 975,193 | | | | (528,251 | ) | | | (582,620 | ) | | | (616,131 | ) | |
Change in net unrealized appreciation/
(depreciation) of investments | | | 11,202,697 | | | | (8,093,658 | ) | | | 958,175 | | | | (678,978 | ) | | | 1,280,941 | | | | (2,446,823 | ) | |
Net increase/(decrease) in net assets resulting
from operations | | | 17,028,385 | | | | (2,313,804 | ) | | | 3,960,621 | | | | 175,221 | | | | 3,033,160 | | | | 444,397 | | |
Distributions to Shareholders From (Note A): | |
Distributable earnings: | |
Investor Class | | | (341,134 | ) | | | (332,693 | ) | | | (543,998 | ) | | | (423,220 | ) | | | — | | | | — | | |
Trust Class | | | — | | | | — | | | | (46,548 | ) | | | (43,247 | ) | | | — | | | | — | | |
Institutional Class | | | (5,025,234 | ) | | | (5,623,892 | ) | | | (1,668,703 | ) | | | (1,205,726 | ) | | | (2,255,053 | ) | | | (3,406,763 | ) | |
Class A | | | (97,963 | ) | | | (158,732 | ) | | | (38,076 | ) | | | (34,737 | ) | | | (43,541 | ) | | | (64,942 | ) | |
Class C | | | (48,880 | ) | | | (49,027 | ) | | | (21,580 | ) | | | (13,382 | ) | | | (38,238 | ) | | | (33,421 | ) | |
Class R3 | | | — | | | | — | | | | — | | | | — | | | | — | | | | — | | |
Class R6 | | | — | | | | — | | | | — | | | | — | | | | — | | | | — | | |
Tax return of capital: | |
Investor Class | | | — | | | | — | | | | — | | | | — | | | | — | | | | — | | |
Institutional Class | | | — | | | | — | | | | — | | | | — | | | | — | | | | — | | |
Class A | | | — | | | | — | | | | — | | | | — | | | | — | | | | — | | |
Class C | | | — | | | | — | | | | — | | | | — | | | | — | | | | — | | |
Class R6 | | | — | | | | — | | | | — | | | | — | | | | — | | | | — | | |
Total distributions to shareholders | | | (5,513,211 | ) | | | (6,164,344 | ) | | | (2,318,905 | ) | | | (1,720,312 | ) | | | (2,336,832 | ) | | | (3,505,126 | ) | |
From Fund Share Transactions (Note D): | |
Proceeds from shares sold: | |
Investor Class | | | 2,673,297 | | | | 862,997 | | | | 2,295,757 | | | | 1,138,004 | | | | — | | | | — | | |
Trust Class | | | — | | | | — | | | | 173,455 | | | | 809,716 | | | | — | | | | — | | |
Institutional Class | | | 26,733,857 | | | | 46,378,636 | | | | 34,487,723 | | | | 32,614,223 | | | | 10,524,818 | | | | 36,893,274 | | |
Class A | | | 213,843 | | | | 1,974,554 | | | | 3,626,142 | | | | 3,182,157 | | | | 220,766 | | | | 206,496 | | |
Class C | | | 218,268 | | | | 645,544 | | | | 595,261 | | | | 184,349 | | | | 302,430 | | | | 105,402 | | |
Class R3 | | | — | | | | — | | | | — | | | | — | | | | — | | | | — | | |
Class R6 | | | — | | | | — | | | | — | | | | — | | | | — | | | | — | | |
Proceeds from reinvestment of dividends and distributions: | |
Investor Class | | | 282,271 | | | | 274,435 | | | | 513,869 | | | | 393,371 | | | | — | | | | — | | |
Trust Class | | | — | | | | — | | | | 46,494 | | | | 43,113 | | | | — | | | | — | | |
Institutional Class | | | 784,427 | | | | 1,977,904 | | | | 1,668,558 | | | | 1,193,248 | | | | 2,122,723 | | | | 3,402,460 | | |
Class A | | | 87,409 | | | | 138,245 | | | | 35,328 | | | | 22,468 | | | | 43,279 | | | | 64,200 | | |
Class C | | | 31,588 | | | | 31,538 | | | | 16,880 | | | | 9,600 | | | | 37,079 | | | | 32,423 | | |
Class R3 | | | — | | | | — | | | | — | | | | — | | | | — | | | | — | | |
Class R6 | | | — | | | | — | | | | — | | | | — | | | | — | | | | — | | |
Payments for shares redeemed: | |
Investor Class | | | (3,198,034 | ) | | | (1,633,021 | ) | | | (2,272,690 | ) | | | (4,254,735 | ) | | | — | | | | — | | |
Trust Class | | | — | | | | — | | | | (366,026 | ) | | | (1,025,943 | ) | | | — | | | | — | | |
Institutional Class | | | (59,849,074 | ) | | | (36,596,803 | ) | | | (35,639,765 | ) | | | (50,873,041 | ) | | | (63,190,184 | ) | | | (73,662,349 | ) | |
Class A | | | (5,275,378 | ) | | | (2,086,570 | ) | | | (4,373,616 | ) | | | (4,216,077 | ) | | | (269,884 | ) | | | (1,701,288 | ) | |
Class C | | | (1,034,366 | ) | | | (518,961 | ) | | | (430,313 | ) | | | (580,956 | ) | | | (294,682 | ) | | | (234,427 | ) | |
Class R3 | | | — | | | | — | | | | — | | | | — | | | | — | | | | — | | |
Class R6 | | | — | | | | — | | | | — | | | | — | | | | — | | | | — | | |
Net increase/(decrease) from Fund share transactions | | | (38,331,892 | ) | | | 11,448,498 | | | | 377,057 | | | | (21,360,503 | ) | | | (50,503,655 | ) | | | (34,893,809 | ) | |
Net Increase/(Decrease) in Net Assets | | | (26,816,718 | ) | | | 2,970,350 | | | | 2,018,773 | | | | (22,905,594 | ) | | | (49,807,327 | ) | | | (37,954,538 | ) | |
Net Assets: | |
Beginning of year | | | 226,814,337 | | | | 223,843,987 | | | | 80,259,095 | | | | 103,164,689 | | | | 80,443,752 | | | | 118,398,290 | | |
End of year | | $ | 199,997,619 | | | $ | 226,814,337 | | | $ | 82,277,868 | | | $ | 80,259,095 | | | $ | 30,636,425 | | | $ | 80,443,752 | | |
See Notes to Financial Statements
240
| | | STRATEGIC INCOME FUND | | UNCONSTRAINED
BOND FUND | |
| | | Fiscal Year
Ended
October 31,
2019 | | Fiscal Year
Ended
October 31,
2018 | | Fiscal Year
Ended
October 31,
2019 | | Fiscal Year
Ended
October 31,
2018 | |
Increase/(Decrease) in Net Assets: | |
From Operations (Note A): | |
Net investment income/(loss) | | $ | 103,364,207 | | | $ | 105,194,467 | | | $ | 2,925,118 | | | $ | 3,027,562 | | |
Net realized gain/(loss) on investments | | | (47,818,066 | ) | | | (4,510,012 | ) | | | (6,529,405 | ) | | | 4,192,046 | | |
Change in net unrealized appreciation/
(depreciation) of investments | | | 146,197,897 | | | | (128,393,528 | ) | | | 1,872,047 | | | | (5,898,198 | ) | |
Net increase/(decrease) in net assets resulting
from operations | | | 201,744,038 | | | | (27,709,073 | ) | | | (1,732,240 | ) | | | 1,321,410 | | |
Distributions to Shareholders From (Note A): | |
Distributable earnings: | |
Investor Class | | | — | | | | — | | | | — | | | | — | | |
Trust Class | | | (352,311 | ) | | | (666,656 | ) | | | — | | | | — | | |
Institutional Class | | | (79,965,455 | ) | | | (89,950,897 | ) | | | (882,144 | ) | | | (1,051,783 | ) | |
Class A | | | (3,745,676 | ) | | | (6,442,351 | ) | | | (2,959 | ) | | | (8,719 | ) | |
Class C | | | (2,800,544 | ) | | | (4,041,756 | ) | | | (419 | ) | | | (340 | ) | |
Class R3 | | | — | | | | — | | | | — | | | | — | | |
Class R6 | | | (11,106,490 | ) | | | (13,390,292 | ) | | | (1,447,692 | ) | | | (1,335,252 | ) | |
Tax return of capital: | |
Investor Class | | | (56,210 | ) | | | — | | | | — | | | | — | | |
Institutional Class | | | (11,550,914 | ) | | | — | | | | (285,343 | ) | | | — | | |
Class A | | | (609,707 | ) | | | — | | | | (1,380 | ) | | | — | | |
Class C | | | (577,578 | ) | | | — | | | | (260 | ) | | | — | | |
Class R6 | | | (1,563,839 | ) | | | — | | | | (486,767 | ) | | | — | | |
Total distributions to shareholders | | | (112,328,724 | ) | | | (114,491,952 | ) | | | (3,106,964 | ) | | | (2,396,094 | ) | |
From Fund Share Transactions (Note D): | |
Proceeds from shares sold: | |
Investor Class | | | — | | | | — | | | | — | | | | — | | |
Trust Class | | | 2,901,774 | | | | 6,900,607 | | | | — | | | | — | | |
Institutional Class | | | 879,370,988 | | | | 915,494,401 | | | | 11,948,133 | | | | 18,574,275 | | |
Class A | | | 60,999,530 | | | | 56,054,640 | | | | 85,233 | | | | 74,866 | | |
Class C | | | 14,049,457 | | | | 15,262,480 | | | | 2,408 | | | | 3,219 | | |
Class R3 | | | — | | | | — | | | | — | | | | — | | |
Class R6 | | | 79,664,923 | | | | 56,909,714 | | | | 527,659 | | | | 1,603,489 | | |
Proceeds from reinvestment of dividends and distributions: | |
Investor Class | | | — | | | | — | | | | — | | | | — | | |
Trust Class | | | 378,573 | | | | 653,788 | | | | — | | | | — | | |
Institutional Class | | | 72,400,190 | | | | 69,587,423 | | | | 1,157,053 | | | | 1,043,971 | | |
Class A | | | 3,427,640 | | | | 5,736,595 | | | | 1,256 | | | | 7,523 | | |
Class C | | | 2,600,637 | | | | 3,126,914 | | | | 98 | | | | 26 | | |
Class R3 | | | — | | | | — | | | | — | | | | — | | |
Class R6 | | | 12,641,352 | | | | 13,389,897 | | | | 1,933,596 | | | | 1,334,728 | | |
Payments for shares redeemed: | |
Investor Class | | | — | | | | — | | | | — | | | | — | | |
Trust Class | | | (14,409,674 | ) | | | (7,203,953 | ) | | | — | | | | — | | |
Institutional Class | | | (886,525,556 | ) | | | (696,395,584 | ) | | | (33,856,766 | ) | | | (21,155,287 | ) | |
Class A | | | (114,938,262 | ) | | | (85,486,267 | ) | | | (309,224 | ) | | | (142,769 | ) | |
Class C | | | (42,130,513 | ) | | | (39,754,532 | ) | | | (8 | ) | | | (11,452 | ) | |
Class R3 | | | — | | | | — | | | | — | | | | — | | |
Class R6 | | | (149,256,458 | ) | | | (16,455,779 | ) | | | (21,998,104 | ) | | | (820,566 | ) | |
Net increase/(decrease) from Fund share transactions | | | (78,825,399 | ) | | | 297,820,344 | | | | (40,508,666 | ) | | | 512,023 | | |
Net Increase/(Decrease) in Net Assets | | | 10,589,915 | | | | 155,619,319 | | | | (45,347,870 | ) | | | (562,661 | ) | |
Net Assets: | |
Beginning of year | | | 2,870,973,668 | | | | 2,715,354,349 | | | | 98,517,889 | | | | 99,080,550 | | |
End of year | | $ | 2,881,563,583 | | | $ | 2,870,973,668 | | | $ | 53,170,019 | | | $ | 98,517,889 | | |
241
Notes to Financial Statements Income Funds
Note A—Summary of Significant Accounting Policies:
1 General: Neuberger Berman Income Funds (the "Trust") is a Delaware statutory trust organized pursuant to an Amended and Restated Trust Instrument dated March 27, 2014. The Trust is registered as an open-end management investment company under the Investment Company Act of 1940, as amended (the "1940 Act"), and its shares are registered under the Securities Act of 1933, as amended (the "1933 Act"). Each of Neuberger Berman Core Bond Fund ("Core Bond"), Neuberger Berman Emerging Markets Debt Fund ("Emerging Markets Debt"), Neuberger Berman Floating Rate Income Fund ("Floating Rate Income"), Neuberger Berman High Income Bond Fund ("High Income"), Neuberger Berman Municipal High Income Fund ("Municipal High Income"), Neuberger Berman Municipal Impact Fund ("Municipal Impact"), Neuberger Berman Municipal Intermediate Bond Fund ("Municipal Intermediate Bond"), Neuberger Berman Short Duration Bond Fund ("Short Duration"), Neuberger Berman Short Duration High Income Fund ("Short Duration High Income"), Neuberger Berman Strategic Income Fund ("Strategic Income") and Neuberger Berman Unconstrained Bond Fund ("Unconstrained Bond") (each individually a "Fund," and collectively, the "Funds") is a separate operating series of the Trust. Each Fund (except Emerging Markets Debt) is diversified. Under the 1940 Act, the status of a Fund that was registered as non-diversified may, under certain circumstances, change to that of a diversified fund (Unconstrained Bond became diversified in December 2017). Additionally, Municipal Impact became diversified in June 2018 in connection with its investment strategy change. Four Funds offer Investor Class shares, two offer Trust Class shares, eleven offer Institutional Class shares, eleven offer Class A shares, eleven offer Class C shares, one offers Class R3 shares and four offer Class R6 shares. The Trust's Board of Trustees (the "Board") may establish additional series or classes of shares without the approval of shareholders.
A balance indicated with a "—", reflects either a zero balance or a balance that rounds to less than 1.
The assets of each Fund belong only to that Fund, and the liabilities of each Fund are borne solely by that Fund and no other.
Each Fund is an investment company and accordingly follows the investment company accounting and reporting guidance of the Financial Accounting Standards Board ("FASB") Accounting Standards Codification ("ASC") Topic 946 "Financial Services—Investment Companies."
The preparation of financial statements in accordance with U.S. generally accepted accounting principles ("GAAP") requires Neuberger Berman Investment Advisers LLC ("Management" or "NBIA") to make estimates and assumptions at the date of the financial statements. Actual results could differ from those estimates.
2 Portfolio valuation: In accordance with ASC 820 "Fair Value Measurement" ("ASC 820"), all investments held by each of the Funds are carried at the value that Management believes a Fund would receive upon selling an investment in an orderly transaction to an independent buyer in the principal or most advantageous market for the investment under current market conditions. Various inputs, including the volume and level of activity for the asset or liability in the market, are considered in valuing the Funds' investments, some of which are discussed below. Significant Management judgment may be necessary to value investments in accordance with ASC 820.
ASC 820 established a three-tier hierarchy of inputs to create a classification of value measurements for disclosure purposes. The three-tier hierarchy of inputs is summarized in the three broad Levels listed below.
• Level 1 – quoted prices in active markets for identical investments
• Level 2 – other observable inputs (including quoted prices for similar investments, interest rates, prepayment speeds, credit risk, amortized cost, etc.)
• Level 3 – unobservable inputs (including a Fund's own assumptions in determining the fair value of investments)
242
The inputs or methodology used for valuing an investment are not necessarily an indication of the risk associated with investing in those securities.
The value of the Funds' investments in equity securities, exchange-traded funds ("ETFs") and exchange-traded options purchased for which market quotations are readily available, is generally determined by Management by obtaining valuations from independent pricing services based on the latest sale price quoted on a principal exchange or market for that security (Level 1 inputs). Securities traded primarily on the NASDAQ Stock Market are normally valued at the NASDAQ Official Closing Price ("NOCP") provided by NASDAQ each business day. The NOCP is the most recently reported price as of 4:00:02 p.m., Eastern Time, unless that price is outside the range of the "inside" bid and asked prices (i.e., the bid and asked prices that dealers quote to each other when trading for their own accounts); in that case, NASDAQ will adjust the price to equal the inside bid or asked price, whichever is closer. Because of delays in reporting trades, the NOCP may not be based on the price of the last trade to occur before the market closes. If there is no sale of a security on a particular day, the independent pricing services may value the security based on market quotations.
The value of the Funds' investments in debt securities is determined by Management primarily by obtaining valuations from independent pricing services based on readily available bid quotations, or if quotations are not available, by methods which include various considerations based on security type (generally Level 2 inputs). In addition to the consideration of yields or prices of securities of comparable quality, coupon, maturity and type, indications as to values from dealers, and general market conditions, the following is a description of other Level 2 inputs and related valuation techniques used by independent pricing services to value certain types of debt securities held by the Funds:
Corporate Bonds. Inputs used to value corporate debt securities generally include relative credit information, observed market movements, sector news, U.S. Treasury yield curve or relevant benchmark curve, and other market information, which may include benchmark yield curves, reported trades, broker-dealer quotes, issuer spreads, comparable securities, and reference data, such as market research publications, when available ("Other Market Information").
Convertible Bonds. Inputs used to value convertible bonds generally include underlying stock data, dealer quotes, conversion premiums, listed bond and preferred stock prices and other market information, which may include benchmark curves, trade execution data, and sensitivity analysis, when available.
U.S. Treasury Obligations. Inputs used to value U.S. Treasury securities generally include quotes from several inter-dealer brokers and Other Market Information.
U.S. Government Agency Securities. Inputs used to value U.S. Government Agency securities generally include obtaining benchmark quotes and Other Market Information.
Asset-Backed Securities and Mortgage-Backed Securities. Inputs used to value asset-backed securities and mortgage-backed securities generally include models that consider a number of factors, which may include the following: prepayment speeds, cash flows, spread adjustments and Other Market Information.
High Yield Securities. Inputs used to value high yield securities generally include a number of observations of equity and credit default swap curves related to the issuer and Other Market Information.
Municipal Debt Securities. Inputs used to value municipal debt securities include current trades, bid-wanted lists (which informs the market that a holder is interested in selling a position and that offers will be considered), offerings, general information on market movement, direction, trends, and specific data on specialty issues.
Emerging Markets Debt, Sovereign Debt, and Quasi-Sovereign Debt. Inputs used to value emerging markets debt, sovereign debt and quasi-sovereign debt generally include dealer quotes, bond market activity, discounted cash flow models, and other relevant information such as credit spreads, benchmark curves and Other Market Information.
243
The value of forward contracts is determined by Management by obtaining valuations from independent pricing services based on actual traded currency rates on independent pricing services' networks, along with other traded and quoted currency rates provided to the pricing services by leading market participants (Level 2 inputs).
The value of loan assignments is determined by Management primarily by obtaining valuations from independent pricing services based on broker quotes (generally Level 2 or Level 3 inputs depending on the number of quotes available).
The value of futures is determined by Management by obtaining valuations from independent pricing services at the settlement price at the market close (Level 1 inputs).
The value of bond forwards is determined by Management by obtaining valuations from independent pricing services using a model that considers the current price of the underlying bond and the forward curve (Level 2 inputs).
The value of interest rate swaps is determined by Management primarily by obtaining valuations from independent pricing services based on references to the underlying rates including the local overnight index swap rate and the respective interbank offered forward rate to produce the daily price. The present value is calculated based off of expected cash flows based on swap parameters along with reference to the underlying yield curve and reference rate (generally Level 2 inputs).
The value of credit default swaps is determined by Management by obtaining valuations from independent pricing services using a model that considers a number of factors, which may include default probabilities, credit curves, recovery rates and cash flows (Level 2 inputs).
The value of cross currency swaps is determined by Management by obtaining valuations from independent pricing services based on present value of expected cash flows based on swap parameters along with reference to the underlying yield curve and reference rate (Level 2 inputs).
Management has developed a process to periodically review information provided by independent pricing services for all types of securities.
Investments in non-exchange traded investment companies are valued using the respective fund's daily calculated net asset value ("NAV") per share (Level 2 inputs).
If a valuation is not available from an independent pricing service, or if Management has reason to believe that the valuation received does not represent the amount a Fund might reasonably expect to receive on a current sale in an orderly transaction, Management seeks to obtain quotations from brokers or dealers (generally considered Level 2 or Level 3 inputs depending on the number of quotes available). If such quotations are not readily available, the security is valued using methods the Board has approved in the good-faith belief that the resulting valuation will reflect the fair value of the security. Numerous factors may be considered when determining the fair value of a security based on Level 2 or Level 3 inputs, including available analyst, media or other reports, securities within the same industry with recent highly correlated performance, trading in futures or American Depositary Receipts and whether the issuer of the security being fair valued has other securities outstanding.
The value of the Funds' investments in foreign securities is generally determined using the same valuation methods and inputs as other Fund investments, as discussed above. Foreign security prices expressed in local currency values are normally translated from the local currency into U.S. dollars using the exchange rates as of 4:00 p.m., Eastern Time on days the New York Stock Exchange ("NYSE") is open for business. The Board has approved the use of ICE Data Pricing and Reference Data LLC ("ICE") to evaluate the prices of foreign debt securities as of the time as of which a Fund's share price is calculated. ICE utilizes benchmark spread and yield curves and evaluates available market activity from the local close to the time as of which a Fund's share price is calculated (Level 2 inputs) to assist in determining prices for certain foreign debt securities. In the absence of precise information about the market values of these foreign securities as of the time as of which a Fund's share
244
price is calculated, the Board has determined on the basis of available data that prices evaluated in this way are likely to be closer to the prices a Fund could realize on a current sale than are the prices of those securities established at the close of the foreign markets in which the securities primarily trade.
Fair value prices are necessarily estimates, and there is no assurance that such a price will be at or close to the price at which the security is next quoted or next trades.
3 Foreign currency translations: Core Bond, Emerging Markets Debt, Floating Rate Income, High Income, Short Duration, Short Duration High Income, Strategic Income and Unconstrained Bond may invest in foreign securities denominated in foreign currencies. The accounting records of the Funds are maintained in U.S. dollars. Foreign currency amounts are normally translated into U.S. dollars using the exchange rate as of 4:00 p.m. Eastern Time, on days the NYSE is open for business, to determine the value of investments, other assets and liabilities. Purchase and sale prices of securities, and income and expenses, are translated into U.S. dollars at the prevailing rate of exchange on the respective dates of such transactions. Net unrealized foreign currency gain/(loss), if any, arises from changes in the value of assets and liabilities, other than investments in securities, as a result of changes in exchange rates and is stated separately in the Statements of Operations.
4 Securities transactions and investment income: Securities transactions are recorded on trade date for financial reporting purposes. Dividend income is recorded on the ex-dividend date or, for certain foreign dividends, as soon as a Fund becomes aware of the dividends. Non-cash dividends included in dividend income, if any, are recorded at the fair market value of the securities received. Interest income, including accretion of discount (adjusted for original issue discount, where applicable) and amortization of premium, where applicable, is recorded on the accrual basis. Realized gains and losses from securities transactions and foreign currency transactions, if any, are recorded on the basis of identified cost and stated separately in the Statements of Operations. Included in net realized gain/(loss) on investments are proceeds from the settlement of class action litigation(s) in which certain of the Funds participated as a class member. The amounts of such proceeds for the year ended October 31, 2019, were $5,211, $19,428 and $150 for Core Bond, Short Duration and Strategic Income, respectively.
5 Income tax information: Each Fund is treated as a separate entity for U.S. federal income tax purposes. It is the policy of each Fund to continue to qualify for treatment as a regulated investment company ("RIC") by complying with the requirements of the U.S. Internal Revenue Code applicable to RICs and to distribute substantially all of its net investment income and net realized capital gains to its shareholders. To the extent a Fund distributes substantially all of its net investment income and net realized capital gains to shareholders, no federal income or excise tax provision is required.
The Funds have adopted the provisions of ASC 740 "Income Taxes" ("ASC 740"). ASC 740 sets forth a minimum threshold for financial statement recognition of a tax position taken, or expected to be taken, in a tax return. The Funds recognize interest and penalties, if any, related to unrecognized tax positions as an income tax expense in the Statements of Operations. The Funds are subject to examination by U.S. federal and state tax authorities for returns filed for the tax years for which the applicable statutes of limitations have not yet expired. As of October 31, 2019, the Funds did not have any unrecognized tax positions.
245
At October 31, 2019, selected Fund information for all long security positions and derivative instruments, if any, for U.S. federal income tax purposes was as follows:
| | Cost | | Gross
Unrealized
Appreciation | | Gross
Unrealized
Depreciation | | Net
Unrealized
Appreciation/
(Depreciation) | |
Core Bond | | $ | 369,180,986 | | | $ | 12,747,417 | | | $ | 3,019,699 | | | $ | 9,727,718 | | |
Emerging Markets Debt | | | 157,806,292 | | | | 9,965,240 | | | | 11,056,715 | | | | (1,091,475 | ) | |
Floating Rate Income | | | 237,405,606 | | | | 833,004 | | | | 7,306,101 | | | | (6,473,097 | ) | |
High Income | | | 2,268,612,534 | | | | 70,443,416 | | | | 27,183,755 | | | | 43,259,661 | | |
Municipal High Income | | | 123,876,976 | | | | 4,305,713 | | | | 603,324 | | | | 3,702,389 | | |
Municipal Impact | | | 55,397,920 | | | | 2,722,965 | | | | 10,754 | | | | 2,712,211 | | |
Municipal Intermediate Bond | | | 193,182,249 | | | | 8,407,210 | | | | 150,921 | | | | 8,256,289 | | |
Short Duration | | | 85,366,602 | | | | 293,198 | | | | 422,573 | | | | (129,375 | ) | |
Short Duration High Income | | | 30,109,996 | | | | 428,646 | | | | 252,407 | | | | 176,239 | | |
Strategic Income | | | 3,342,010,123 | | | | 92,335,814 | | | | 43,410,589 | | | | 48,925,225 | | |
Unconstrained Bond | | | 51,180,784 | | | | 5,286,269 | | | | 5,945,454 | | | | (659,185 | ) | |
Income distributions and capital gain distributions are determined in accordance with income tax regulations, which may differ from GAAP. These differences are primarily due to differing treatments of income and gains on various investment securities held by each Fund, timing differences and differing characterization of distributions made by each Fund. The Funds may also utilize earnings and profits distributed to shareholders on redemption of their shares as a part of the dividends-paid deduction for income tax purposes.
Any permanent differences resulting from different book and tax treatment are reclassified at year-end and have no impact on net income, NAV or NAV per share of the Funds. For the year ended October 31, 2019, the Funds recorded the following permanent reclassifications primarily related to one or more of the following: gains (losses) & tax adjustments on securities redeemed in kind; adjustments to the prior period accumulated balances, distribution in excess and expiration of capital loss carryforwards. For the year ended October 31, 2019, the Funds recorded the following permanent reclassifications:
| | | Paid-in Capital | | Distributable
Earnings | |
Core Bond | | $ | — | | | $ | — | | |
Emerging Markets Debt | | | (61,268 | ) | | | 61,268 | | |
Floating Rate Income | | | (835,287 | ) | | | 835,287 | | |
High Income | | | — | | | | — | | |
Municipal High Income | | | (259,704 | ) | | | 259,704 | | |
Municipal Impact | | | (156,098 | ) | | | 156,098 | | |
Municipal Intermediate Bond | | | (351,020 | ) | | | 351,020 | | |
Short Duration | | | (1,276,932 | ) | | | 1,276,932 | | |
Short Duration High Income | | | — | | | | — | | |
Strategic Income | | | (1,794,895 | ) | | | 1,794,895 | | |
Unconstrained Bond | | | — | | | | — | | |
246
The tax character of distributions paid during the years ended October 31, 2019, and October 31, 2018, was as follows:
| | Distributions Paid From: | |
| | Taxable Income | | Tax-Exempt
Income | | Long-Term
Capital Gain | | Return of
Capital | | Total | |
| | 2019 | | 2018 | | 2019 | | 2018 | | 2019 | | 2018 | | 2019 | | 2018 | | 2019 | | 2018 | |
Core Bond | | $ | 10,394,896 | | | $ | 10,267,476 | | | $ | — | | | $ | — | | | $ | — | | | $ | — | | | $ | 2,132,688 | | | $ | 1,209,987 | | | $ | 12,527,584 | | | $ | 11,477,463 | | |
Emerging Markets
Debt | | | 6,290,981 | | | | 7,317,963 | | | | — | | | | — | | | | — | | | | — | | | | 4,099,521 | | | | 4,140,579 | | | | 10,390,502 | | | | 11,458,542 | | |
Floating Rate Income | | | 14,497,918 | | | | 15,303,326 | | | | — | | | | — | | | | — | | | | — | | | | — | | | | — | | | | 14,497,918 | | | | 15,303,326 | | |
High Income | | | 125,706,721 | | | | 133,388,300 | | | | — | | | | — | | | | — | | | | — | | | | — | | | | — | | | | 125,706,721 | | | | 133,388,300 | | |
Municipal High
Income | | | 9,859 | | | | 3,005 | | | | 3,212,433 | | | | 3,313,436 | | | | — | | | | — | | | | — | | | | — | | | | 3,222,292 | | | | 3,316,441 | | |
Municipal Impact | | | 18,138 | | | | 68 | | | | 1,250,658 | | | | 1,345,559 | | | | 104,768 | | | | 98,554 | | | | — | | | | — | | | | 1,373,564 | | | | 1,444,181 | | |
Municipal
Intermediate Bond | | | 644,458 | | | | — | | | | 4,450,231 | | | | 5,385,850 | | | | 418,522 | | | | 778,494 | | | | — | | | | — | | | | 5,513,211 | | | | 6,164,344 | | |
Short Duration | | | 2,318,905 | | | | 1,720,312 | | | | — | | | | — | | | | — | | | | — | | | | — | | | | — | | | | 2,318,905 | | | | 1,720,312 | | |
Short Duration
High Income | | | 2,336,832 | | | | 3,505,126 | | | | — | | | | — | | | | — | | | | — | | | | — | | | | — | | | | 2,336,832 | | | | 3,505,126 | | |
Strategic Income | | | 97,970,476 | | | | 114,491,952 | | | | — | | | | — | | | | — | | | | — | | | | 14,358,248 | | | | — | | | | 112,328,724 | | | | 114,491,952 | | |
Unconstrained Bond | | | 2,333,214 | | | | 2,396,094 | | | | — | | | | — | | | | — | | | | — | | | | 773,750 | | | | — | | | | 3,106,964 | | | | 2,396,094 | | |
As of October 31, 2019, the components of distributable earnings (accumulated losses) on a U.S. federal income tax basis were as follows:
| | | Undistributed
Ordinary
Income/(Loss) | | Undistributed
Tax-Exempt
Income | | Undistributed
Long-Term
Capital Gain | | Unrealized
Appreciation/
(Depreciation) | | Loss
Carryforwards
and Deferrals | | Other
Temporary
Differences | | Total | |
Core Bond | | $ | — | | | $ | — | | | $ | — | | | $ | 9,754,503 | | | $ | (2,341,288 | ) | | $ | (1,752,622 | ) | | $ | 5,660,593 | | |
Emerging
Markets Debt | | | — | | | | — | | | | — | | | | (1,086,785 | ) | | | (6,330,274 | ) | | | (35,214 | ) | | | (7,452,273 | ) | |
Floating Rate
Income | | | 49,875 | | | | — | | | | — | | | | (6,473,097 | ) | | | (22,828,969 | ) | | | (61,407 | ) | | | (29,313,598 | ) | |
High Income | | | 1,880,603 | | | | — | | | | — | | | | 43,259,661 | | | | (147,896,652 | ) | | | (1,634,401 | ) | | | (104,390,789 | ) | |
Municipal High
Income | | | — | | | | — | | | | — | | | | 3,702,389 | | | | (1,437,421 | ) | | | (15,617 | ) | | | 2,249,351 | | |
Municipal Impact | | | — | | | | — | | | | 281,996 | | | | 2,712,211 | | | | — | | | | (9,094 | ) | | | 2,985,113 | | |
Municipal
Intermediate
Bond | | | — | | | | — | | | | 313,357 | | | | 8,256,289 | | | | — | | | | (370,295 | ) | | | 8,199,351 | | |
Short Duration | | | 176,037 | | | | — | | | | — | | | | (129,375 | ) | | | (4,862,634 | ) | | | (3,967 | ) | | | (4,819,939 | ) | |
Short Duration
High Income | | | 1,453 | | | | — | | | | — | | | | 176,239 | | | | (15,284,605 | ) | | | (2,321 | ) | | | (15,109,234 | ) | |
Strategic Income | | | — | | | | — | | | | — | | | | 48,852,284 | | | | (68,714,232 | ) | | | (15,191,409 | ) | | | (35,053,357 | ) | |
Unconstrained
Bond | | | — | | | | — | | | | — | | | | (600,115 | ) | | | (13,137,826 | ) | | | (18,540 | ) | | | (13,756,481 | ) | |
The temporary differences between book basis and tax basis distributable earnings are primarily due to: losses disallowed and/or recognized on wash sales and straddles; timing differences of fund level distributions, mark-to-market adjustments on swaps, futures and forwards; amortization of bond premium, bank loan tax adjustments, loss limitation due to ownership change, unamortized organization expenses and tax adjustments related to treasury inflation protection securities, ("TIPS"), swap contracts and other investments.
247
To the extent each Fund's net realized capital gains, if any, can be offset by capital loss carryforwards, it is the policy of each Fund not to distribute such gains. Capital loss carryforward rules allow for RICs to carry forward capital losses indefinitely and to retain the character of capital loss carryforwards as short-term or long-term. As determined at October 31, 2019, the following Funds had unused capital loss carryforwards available for federal income tax purposes to offset net realized capital gains, if any, as follows:
| | Capital Loss Carryforwards | |
| | Long-Term | | Short-Term | |
Core Bond | | $ | 2,341,288 | | | $ | — | | |
Emerging Markets Debt | | | 4,464,800 | | | | 1,865,474 | | |
Floating Rate Income | | | 16,232,079 | | | | 6,596,890 | | |
High Income | | | 136,964,311 | | | | 10,932,341 | | |
Municipal High Income | | | 589,877 | | | | 847,544 | | |
Municipal Impact | | | — | | | | — | | |
Municipal Intermediate Bond | | | — | | | | — | | |
Short Duration | | | 4,342,151 | | | | 520,483 | | |
Short Duration High Income | | | 11,720,663 | * | | | 3,563,942 | * | |
Strategic Income | | | 68,714,232 | | | | — | | |
Unconstrained Bond | | | 3,789,876 | | | | 9,347,950 | | |
* Future utilization is limited under current tax regulation.
During the year ended October 31, 2019, Core Bond, Emerging Markets Debt, Municipal High Income, Municipal Impact and Short Duration, utilized capital loss carryforwards of $5,960,710, $532,754, $183,838, $45,851 and $583,440, respectively.
During the year ended October 31, 2019, Floating Rate Income and Short Duration had capital loss carryforwards expire of $835,287 and $1,276,932, respectively.
6 Distributions to shareholders: Each Fund earns income, net of expenses, daily on its investments. Ordinarily, distributions from net investment income are declared on each business day and paid monthly, and distributions from net realized capital gains, if any, are generally distributed once a year (usually in December). Distributions to shareholders are recorded on the ex-date.
7 Expense allocation: Certain expenses are applicable to multiple funds within the complex of related investment companies. Expenses directly attributable to a fund are charged to that fund. Expenses of the Trust that are not directly attributable to a particular series of the Trust (e.g., a Fund) are allocated among the series of the Trust, on the basis of relative net assets, except where a more appropriate allocation of expenses to each of the series can otherwise be made fairly. Expenses borne by the complex of related investment companies, which includes open-end and closed-end investment companies for which Management serves as investment manager, that are not directly attributable to a particular investment company in the complex (e.g., the Trust) or series thereof are allocated among the investment companies in the complex or series thereof on the basis of relative net assets, except where a more appropriate allocation of expenses to each of the investment companies in the complex or series thereof can otherwise be made fairly. Each Fund's expenses (other than those specific to each class) are allocated proportionally each day among its classes based upon the relative net assets of each class.
8 Dollar rolls: Core Bond, Emerging Markets Debt, Floating Rate Income, High Income, Short Duration, Short Duration High Income, Strategic Income and Unconstrained Bond may enter into dollar roll transactions with respect to mortgage-backed securities. In a dollar roll transaction, a Fund sells securities for delivery in the current month and simultaneously agrees to repurchase substantially similar (i.e., same type and coupon) securities on a specified future date from the same party. During the period before this repurchase, a Fund forgoes principal and interest payments on the securities. A Fund is compensated by the difference between the current sales price and
248
the forward price for the future purchase (often referred to as the "drop"), as well as by the interest earned on the cash proceeds of the initial sale. Dollar rolls may increase fluctuations in a Fund's NAV and may be viewed as a form of leverage. There is a risk that the counterparty will be unable or unwilling to complete the transaction as scheduled, which may result in losses to a Fund.
9 When-issued/delayed delivery securities: Each Fund may purchase securities with delivery or payment to occur at a later date beyond the normal settlement period. At the time a Fund enters into a commitment to purchase a security, the transaction is recorded and the value of the security is reflected in the NAV. The price of such security and the date when the security will be delivered and paid for are fixed at the time the transaction is negotiated. The value of the security may vary with market fluctuations. No interest accrues to a Fund until payment takes place. At the time a Fund enters into this type of transaction it is required to segregate cash or other liquid assets at least equal to the amount of the commitment. When-issued and delayed delivery transactions can have a leverage-like effect on a Fund, which can increase fluctuations in the Fund's NAV. Certain risks may arise upon entering into when-issued or delayed delivery securities transactions from the potential inability of counterparties to meet the terms of their contracts or if the issuer does not issue the securities due to political, economic, or other factors. Additionally, losses may arise due to changes in the value of the underlying securities.
10 Foreign taxes: Foreign taxes withheld pertaining to interest or dividends, if any, represent amounts withheld by foreign tax authorities, net of refunds recoverable.
Emerging Markets Debt and Strategic Income accrue capital gains tax on unrealized and realized gains for certain securities. At October 31, 2019, Emerging Markets Debt and Strategic Income had accrued capital gains taxes of $80,977 and $2,654 respectively, which is reflected in the Statements of Assets and Liabilities. For the year ended October 31, 2019, Emerging Markets Debt and Strategic Income had realized capital gains taxes of $6,898 and $3,788, respectively, which is reflected in the Statements of Operations.
11 Investments in foreign securities: Investing in foreign securities may involve sovereign and other risks, in addition to the credit and market risks normally associated with domestic securities. These additional risks include the possibility of adverse political and economic developments (including political instability, nationalization, expropriation, or confiscatory taxation) and the potentially adverse effects of unavailability of public information regarding issuers, less governmental supervision and regulation of financial markets, reduced liquidity of certain financial markets, and the lack of uniform accounting, auditing, and financial reporting standards or the application of standards that are different or less stringent than those applied in the United States. Foreign securities also may experience greater price volatility, higher rates of inflation, and delays in settlement.
12 Securities lending: Each Fund, using State Street Bank and Trust Company ("State Street") as its lending agent, may loan securities to qualified brokers and dealers in exchange for negotiated lender's fees. These fees, if any, would be disclosed within the Statements of Operations under the caption "Income from securities loaned-net" and are net of expenses retained by State Street as compensation for its services as lending agent.
The initial cash collateral received by a Fund at the beginning of each transaction shall have a value equal to at least 102% of the prior day's market value of the loaned securities (105% in the case of international securities). Thereafter, the value of the cash collateral is monitored on a daily basis, and cash collateral is moved daily between a counterparty and a Fund until the close of the transaction. A Fund may only receive collateral in the form of cash (U.S. dollars). Cash collateral is generally invested in a money market fund registered under the 1940 Act that is managed by an affiliate of State Street. The risks associated with lending portfolio securities include, but are not limited to, possible delays in receiving additional collateral or in the recovery of the loaned securities. Any increase or decrease in the fair value of the securities loaned and any interest earned or dividends paid or owed on those securities during the term of the loan would accrue to the Fund.
As of October 31, 2019, the Funds did not participate in securities lending.
13 Derivative instruments: Certain Funds' use of derivatives during the year ended October 31, 2019, is described below. Please see the Schedule of Investments for each Fund's open positions in derivatives, if any, at October 31, 2019. The Funds have adopted the provisions of ASC 815 "Derivatives and Hedging" ("ASC 815"). The disclosure
249
requirements of ASC 815 distinguish between derivatives that qualify for hedge accounting and those that do not. Because investment companies value their derivatives at fair value and recognize changes in fair value through the Statements of Operations, they do not qualify for hedge accounting. Accordingly, even though a Fund's investments in derivatives may represent economic hedges, they are considered non-hedge transactions for purposes of this disclosure.
Futures contracts: During the year ended October 31, 2019, Core Bond used futures to manage or adjust the risk profile and investment exposure of the Fund, including to adjust the duration and yield curve exposure of the Fund's portfolio. During the year ended October 31, 2019, Emerging Markets Debt and Short Duration used futures for economic hedging purposes, including as a maturity or duration management device. During the year ended October 31, 2019, Strategic Income and Unconstrained Bond used futures to manage or adjust the risk profile and investment exposure of the Fund or individual positions, to obtain or reduce exposure to certain markets, to establish net short or long positions for markets, currencies or securities, adjust the duration of the Fund's portfolio and to enhance total return.
At the time a Fund enters into a futures contract, it is required to deposit with the futures commission merchant a specified amount of cash or liquid securities, known as "initial margin," which is a percentage of the value of the futures contract being traded that is set by the exchange upon which the futures contract is traded. Each day, the futures contract is valued at the official settlement price of the board of trade or U.S. commodity exchange on which such futures contract is traded. Subsequent payments, known as "variation margin," to and from the broker are made on a daily basis, or as needed, as the market price of the futures contract fluctuates. Daily variation margin adjustments, arising from this "mark to market," are recorded by a Fund as unrealized gains or losses.
Although some futures by their terms call for actual delivery or acquisition of the underlying securities or currency, in most cases the contracts are closed out prior to delivery by offsetting purchases or sales of matching futures. When the contracts are closed, a Fund recognizes a gain or loss. Risks of entering into futures contracts include the possibility there may be an illiquid market, possibly at a time of rapidly declining prices, and/or a change in the value of the contract may not correlate with changes in the value of the underlying securities. Futures executed on regulated futures exchanges have minimal counterparty risk to a Fund because the exchange's clearinghouse assumes the position of the counterparty in each transaction. Thus, a Fund is exposed to risk only in connection with the clearinghouse and not in connection with the original counterparty to the transaction.
For U.S. federal income tax purposes, the futures transactions undertaken by a Fund may cause the Fund to recognize gains or losses from marking contracts to market even though its positions have not been sold or terminated, may affect the character of the gains or losses recognized as long-term or short-term, and may affect the timing of some capital gains and losses realized by the Fund. Also, a Fund's losses on transactions involving futures contracts may be deferred rather than being taken into account currently in calculating such Fund's taxable income.
Bond forward contracts: During the year ended October 31, 2019, Strategic Income used bond forwards to obtain economic exposure in the Fund to certain markets and securities. A bond forward is a contractual agreement between a Fund and another party to buy or sell an underlying asset at an agreed-upon future price and date. In a bond forward transaction, no cash premium is paid when the parties enter into the bond forward. If the transaction is collateralized, an exchange of margin collateral will take place according to an agreed-upon schedule. Otherwise, no asset of any kind changes hands until the bond forward matures (typically in 30 days) or is rolled over for another agreed-upon period. Generally, the value of the bond forward will change based on changes in the value of the underlying asset. Bond forwards are subject to market risk (the risk that the market value of the underlying bond may change), non-correlation risk (the risk that the market value of the bond forward might move independently of the market value of the underlying bond) and counterparty credit risk (the risk that a counterparty will be unable to meet its obligation under the contract). If there is no cash exchanged at the time a Fund enters into the bond forward, counterparty risk may be limited to the loss of any marked-to-market profit on the contract and any delays or limitations on the Fund's ability to sell or otherwise use the investments posted as collateral for the bond forward.
250
Forward foreign currency contracts: During the year ended October 31, 2019, Emerging Markets Debt used forward contracts to manage or adjust views on foreign exchange rate movements and currency exposure, to apply foreign exchange leverage, and to gain exposure to the markets where the portfolio managers believe these instruments provide better liquidity and value than bonds. During the year ended October 31, 2019, Strategic Income used forward contracts to manage or adjust the risk profile for foreign currency exposures in the Fund, to obtain or reduce economic exposure, to establish net short or long positions for markets or securities and to enhance total return. During the year ended October 31, 2019, Unconstrained Bond used forward contracts to obtain or reduce exposure to certain markets, to establish net short or long positions for currencies, hedge risk and to enhance total return.
A forward contract is an agreement between two parties to buy or sell a specific currency for another at a set price on a future date, and is individually negotiated and privately traded by currency traders and their customers in the interbank market. The market value of a forward contract fluctuates with changes in forward currency exchange rates. Forward contracts are marked to market daily, and the change in value is recorded by a Fund as an unrealized gain or loss. At the consummation of a forward contract to purchase or sell currency, a Fund may either exchange the currencies specified at the maturity of the forward contract or enter into a closing transaction involving the purchase or sale of an offsetting forward contract. Closing transactions with respect to forward contracts are usually performed with the counterparty to the original forward contract. The gain or loss arising from the difference between the U.S. dollar cost of the original contract and the value of the foreign currency in U.S. dollars upon closing a contract is included in "Net realized gain/(loss) on settlement of forward foreign currency contracts" in the Statements of Operations. These contracts may involve market risk in excess of the unrealized gain or loss reflected in a Fund's Statement of Assets and Liabilities. In addition, a Fund could be exposed to risks associated with fluctuations in foreign currency and the risk the counterparty will fail to fulfill its obligation.
Credit default swap contracts: During the year ended October 31, 2019, Emerging Markets Debt used credit default swaps to manage or adjust credit risk of the Fund, to take advantage of the portfolio managers' views on credit risk, market pricing of credit events and in an effort to leverage risk exposures by selling protection. During the year ended October 31, 2019, Strategic Income and Unconstrained Bond used credit default swaps for economic hedging purposes, to manage or adjust the risk profile and investment exposure of the Fund or individual positions, to obtain or reduce exposure to certain markets, to establish net short or long positions for markets or securities and to enhance total return. When a Fund is the buyer of a credit default swap contract, it is entitled to receive the notional amount of the swap from the counterparty if a credit event occurs. In return, the Fund pays the counterparty a periodic stream of payments over the term of the contract provided that no credit event has occurred. If no credit event occurs, the Fund would have spent the stream of payments and received no proceeds from the contract. When a Fund is the seller of a credit default swap contract, it receives the stream of payments, but is obligated to pay to the buyer of the protection an amount up to the notional amount of the swap and in certain instances take delivery of securities of the reference entity upon the occurrence of a credit event, as defined under the terms of that particular swap agreement. Credit events are contract specific but may include bankruptcy, failure to pay, restructuring, obligation acceleration and repudiation/moratorium. If a Fund is a seller of protection and a credit event occurs, the maximum potential amount of future payments that the Fund could be required to make (or the risk of loss) would be an amount equal to the notional amount of the agreement. This potential amount would be partially offset by any recovery value of the respective referenced obligation, or net amount received from the settlement of a buy protection credit default swap agreement entered into by the Fund for the same referenced obligation. As the seller, the Fund may add economic leverage to its portfolio because, in addition to its total net assets, the Fund is subject to investment exposure on the notional amount of the swap. The net periodic payments paid or received on the swap contract are accrued daily as a component of unrealized appreciation/(depreciation) and are recorded as realized gain upon receipt or realized loss upon payment. The Fund also records an increase or decrease to unrealized appreciation/(depreciation) in an amount equal to the daily valuation of swaps. For financial reporting purposes, unamortized upfront payments/(receipts), if any, are netted with unrealized appreciation or (depreciation) and net interest received or paid on swap contracts to determine the fair value of swaps.
251
Interest rate swap contracts: During the year ended October 31, 2019, Emerging Markets Debt used interest rate swaps to manage or adjust interest rate risk of the Fund, to take advantage of the portfolio managers' views on interest rates and market pricing of future monetary policy, to obtain exposure on a maturity horizon where bonds are illiquid or are unavailable, and to obtain leveraged rate positions. During the year ended October 31, 2019, Unconstrained Bond used interest rate swaps to hedge risk, manage or adjust the risk profile of the Fund, obtain or reduce exposure to certain markets, establish net short positions for individual markets, adjust the duration of the Fund's portfolio, alter the Fund's exposure to interest rates and to enhance total return. Under the terms of interest rate swaps, the Fund agrees to pay the swap counterparty a fixed-rate payment in exchange for the counterparty's paying the Fund a variable-rate payment, or the Fund agrees to pay the swap counterparty a variable-rate payment in exchange for the counterparty's paying the Fund a fixed-rate payment. The fixed-rate and variable-rate payment flows are paid by one party to the other on a periodic basis and netted against each other when applicable. The Fund segregates cash or liquid securities having a value at least equal to the Fund's net payment obligations under any interest rate swaps, marked to market daily. There is no guarantee that these interest rate swap transactions will be successful in reducing or limiting risk.
Risks may arise if the counterparty to an interest rate swap contract fails to comply with the terms of its contract. The loss incurred due to the failure of a counterparty is generally limited to the net interest payment to be received by the Fund and/or the termination value at the end of the contract. Additionally, risks may arise if there is no liquid market for these agreements or from movements in interest rates unanticipated by Management.
Periodic expected interim net interest payments or receipts on the swaps are recorded as an adjustment to unrealized gains/losses, along with the fair value of the future periodic payment or receivable streams on the swaps. The unrealized gains/losses associated with the periodic interim net interest payments or receipts are reclassified to realized gains/losses in conjunction with the actual net payment or receipt of such amounts. The reclassifications do not impact the Fund's total net assets or its total net increase (decrease) in net assets resulting from operations.
Centrally cleared swap contracts: Certain clearinghouses currently offer clearing for limited types of derivative transactions. In a cleared derivative transaction, a Fund typically enters into the transaction with a financial institution counterparty that is then cleared through a central clearinghouse. Upon acceptance of a swap by a central clearinghouse, the original swap is extinguished and replaced with a swap with the clearinghouse, thereby reducing or eliminating the Fund's exposure to the credit risk of the original counterparty. A Fund typically will be required to post specified levels of both initial and variation margin with the clearinghouse or at the instruction of the clearinghouse. The daily change in valuation is recorded as a receivable or payable for variation margin and settled in cash with the centrally clearing party. For financial reporting purposes, unamortized upfront payments, if any, are netted with unrealized appreciation or depreciation and net interest received or paid on swap contracts to determine the fair value of swaps.
Cross currency swap contracts: During the year ended October 31, 2019, Emerging Markets Debt used cross currency swaps to manage or adjust interest rate risk of the Fund, to take advantage of the portfolio managers' views on interest rates and market pricing of future monetary policy, to obtain exposure on a maturity horizon where bonds are illiquid or are unavailable, and to obtain leveraged rate positions. Cross currency swaps are interest rate swaps in which interest payments and principal amounts are exchanged in two different currencies. The notional amounts are typically determined based on the spot exchange rates at the inception of the trade. The entire principal value of a cross currency swap is subject to the risk that the counterparty to the swap will default on its contractual delivery obligations. Additionally, risks may arise if there is no liquid market for these agreements or from movements in interest rates unanticipated by Management. Periodic expected interim net interest payments or receipts on the swaps are recorded as an adjustment to unrealized gains/losses, along with the fair value of the future periodic payment or receivable streams on the swaps. The unrealized gains/losses associated with the periodic interim net interest payments or receipts are reclassified to realized gains/losses in conjunction with the actual net payment or receipt of such amounts. The reclassifications do not impact the Fund's total net assets or its total net increase/(decrease) in net assets resulting from operations.
252
Options: During the year ended October 31, 2019, Unconstrained Bond used options on exchange-traded futures contracts ("futures option") to manage or adjust the risk profile and investment exposure of the Fund or individual positions, to obtain or reduce exposure to certain markets, to establish net short or long positions for markets, currencies or securities, adjust the duration of the Fund's portfolio and to enhance total return.
Premiums paid by a Fund upon purchasing a call or put option are recorded in the asset section of the Fund's Statement of Assets and Liabilities and are subsequently adjusted to the current market value. When an option is exercised, closed, or expired, a Fund realizes a gain or loss and the asset is eliminated. For purchased call options, a Fund's loss is limited to the amount of the option premium paid.
Premiums received by a Fund upon writing a call option or a put option are recorded in the liability section of the Fund's Statement of Assets and Liabilities and are subsequently adjusted to the current market value. When an option is exercised, closed, or expired, a Fund realizes a gain or loss and the liability is eliminated.
When writing a covered call option, a Fund, in return for the premium, gives up the opportunity for profit from a price increase in the underlying security above the exercise price, but conversely retains the risk of loss should the price of the security decline. When writing a put option, a Fund, in return for the premium, takes the risk that it must purchase the underlying security at a price that may be higher than the current market price of the security. If a call or put option that a Fund has written expires unexercised, a Fund will realize a gain for the amount of the premium. All securities covering outstanding written options are held in escrow by the custodian bank.
A Fund may write or purchase futures option to hedge an existing position or future investment, for speculative purposes or to manage exposure to market movements. A futures option is an option contract in which the underlying instrument is a specific futures contract.
At October 31, 2019, the Funds listed below had the following derivatives (which did not qualify as hedging instruments under ASC 815), grouped by primary risk exposure:
Asset Derivatives | |
Derivative Type | | Statements of
Assets and
Liabilities Location | | Interest
Rate Risk | | Currency Risk | | Credit Risk | | Total | |
Core Bond | |
Futures | | Receivable/Payable for
accumulated variation
margin on futures contracts | | $ | 33,427 | | | $ | 13,517 | | | $ | — | | | $ | 46,944 | | |
Total Value—Assets | | | | $ | 33,427 | | | $ | 13,517 | | | $ | — | | | $ | 46,944 | | |
Emerging Markets Debt | |
Futures
| | Receivable/Payable for
accumulated variation
margin on futures contracts | | $ | 316,927 | | | $ | — | | | $ | — | | | $ | 316,927 | | |
Forward contracts | | Receivable for forward
foreign currency contracts | | | — | | | | 1,222,677 | | | | — | | | | 1,222,677 | | |
Centrally cleared swaps | | Receivable/Payable for
accumulated variation
margin on centrally cleared
swap contracts(a) | | | 770,178 | | | | — | | | | — | | | | 770,178 | | |
Over-the-counter swaps | | Over-the-counter
swap contracts, at value(a) | | | 879,168 | | | | — | | | | — | | | | 879,168 | | |
Total Value—Assets | | | | $ | 1,966,273 | | | $ | 1,222,677 | | | $ | — | | | $ | 3,188,950 | | |
253
Derivative Type | | Statements of
Assets and
Liabilities Location | | Interest
Rate Risk | | Currency Risk | | Credit Risk | | Total | |
Short Duration | |
Futures | | Receivable/Payable for
accumulated variation
margin on futures contracts | | $ | 13,078 | | | $ | — | | | $ | — | | | $ | 13,078 | | |
Total Value—Assets | | | | $ | 13,078 | | | $ | — | | | $ | — | | | $ | 13,078 | | |
Strategic Income | |
| Futures | | Receivable/Payable for
accumulated variation
margin on futures contracts | | $ | 6,794,743 | | | $ | 80,875 | | | $ | — | | | $ | 6,875,618 | | |
| Bond forward contracts | | Receivable for bond forward
contracts | | | 6,289 | | | | — | | | | — | | | | 6,289 | | |
Forward contracts | | Receivable for forward
foreign currency contracts | | | — | | | | 2,785,266 | | | | — | | | | 2,785,266 | | |
Total Value—Assets | | | | $ | 6,801,032 | | | $ | 2,866,141 | | | $ | — | | | $ | 9,667,173 | | |
Unconstrained Bond | |
Futures | | Receivable/Payable for
accumulated variation
margin on futures contracts | | $ | 1,188,414 | | | $ | — | | | $ | — | | | $ | 1,188,414 | | |
Forward contracts | | Receivable for forward
foreign currency contracts | | | — | | | | 3,940,456 | | | | — | | | | 3,940,456 | | |
Centrally cleared swaps | | Receivable/Payable for
variation margin on centrally
cleared swap contracts(a) | | | 18,737 | | | | — | | | | 126,288 | | | | 145,025 | | |
Total Value—Assets | | | | $ | 1,207,151 | | | $ | 3,940,456 | | | $ | 126,288 | | | $ | 5,273,895 | | |
Liability Derivatives | |
| Derivative Type | | Statements of
Assets and
Liabilities Location | | Interest
Rate Risk | | Currency Risk | | Credit Risk | | Total | |
Core Bond | |
Futures | | Receivable/Payable for
accumulated variation
margin on futures contracts | | $ | (175,260 | ) | | $ | — | | | $ | — | | | $ | (175,260 | ) | |
Total Value—Liabilities | | | | $ | (175,260 | ) | | $ | — | | | $ | — | | | $ | (175,260 | ) | |
Emerging Markets Debt | |
Futures | | Receivable/Payable for
accumulated variation
margin on futures contracts | | $ | (95,749 | ) | | $ | — | | | $ | — | | | $ | (95,749 | ) | |
Forward contracts | | Payable for forward
foreign currency contracts | | | — | | | | (1,061,948 | ) | | | — | | | | (1,061,948 | ) | |
Centrally cleared swaps | | Receivable/Payable for
accumulated variation
margin on centrally cleared
swap contracts(a) | | | (396,389 | ) | | | — | | | | — | | | | (396,389 | ) | |
254
Derivative Type | | Statements of
Assets and
Liabilities Location | | Interest
Rate Risk | | Currency Risk | | Credit Risk | | Total | |
Over-the-counter swaps | | Over-the-counter
swap contracts, at value(a) | | $ | (101,363 | ) | | $ | (236,961 | ) | | $ | (433,626 | ) | | $ | (771,950 | ) | |
Total Value—Liabilities | | | | $ | (593,501 | ) | | $ | (1,298,909 | ) | | $ | (433,626 | ) | | $ | (2,326,036 | ) | |
Short Duration | |
Futures | | Receivable/Payable for
accumulated variation
margin on futures contracts | | $ | (55,219 | ) | | $ | — | | | $ | — | | | $ | (55,219 | ) | |
Total Value—Liabilities | | | | $ | (55,219 | ) | | $ | — | | | $ | — | | | $ | (55,219 | ) | |
Strategic Income | |
Futures | | Receivable/Payable for
accumulated variation
margin on futures contracts | | $ | (1,363,238 | ) | | $ | (25,587 | ) | | $ | — | | | $ | (1,388,825 | ) | |
Bond forward contracts | | Payable for bond forward
contracts | | | (57,594 | ) | | | — | | | | — | | | | (57,594 | ) | |
Forward contracts | | Payable for forward
foreign currency contracts | | | — | | | | (2,091,200 | ) | | | — | | | | (2,091,200 | ) | |
Total Value—Liabilities | | | | $ | (1,420,832 | ) | | $ | (2,116,787 | ) | | $ | — | | | $ | (3,537,619 | ) | |
Unconstrained Bond | |
Futures | | Receivable/Payable for
accumulated variation
margin on futures contracts | | $ | (540,679 | ) | | $ | — | | | $ | — | | | $ | (540,679 | ) | |
Forward contracts | | Payable for forward foreign
currency contracts | | | — | | | | (4,501,449 | ) | | | — | | | | (4,501,449 | ) | |
Centrally cleared swaps | | Receivable/Payable for
accumulated variation
margin on centrally cleared
swap contracts(a) | | | (42,285 | ) | | | — | | | | (1,617,146 | ) | | | (1,659,431 | ) | |
Total Value—Liabilities | | | | $ | (582,964 | ) | | $ | (4,501,449 | ) | | $ | (1,617,146 | ) | | $ | (6,701,559 | ) | |
(a) "Centrally cleared swaps" and "over-the-counter swaps" reflect the cumulative unrealized appreciation/(depreciation) of the centrally cleared swap or over-the-counter swap contracts plus accrued interest as of October 31, 2019, which are reflected in the Statements of Assets and Liabilities under the captions "Receivable/Payable for accumulated variation margin on centrally cleared swap contracts" and "Over-the-counter swap contracts, at value", respectively.
The impact of the use of these derivative instruments on the Statements of Operations during the year ended October 31, 2019, was as follows:
Realized Gain/(Loss) | |
Derivative Type | | Statements of
Operations
Location | | Interest
Rate Risk | | Currency Risk | | Credit Risk | | Total | |
Core Bond | |
| Futures | | Net realized gain/(loss) on:
Expiration or closing of
futures contracts | | $ | (859,357 | ) | | $ | (226,116 | ) | | $ | — | | | $ | (1,085,473 | ) | |
Total Realized Gain/(Loss) | | | | $ | (859,357 | ) | | $ | (226,116 | ) | | $ | — | | | $ | (1,085,473 | ) | |
255
| Derivative Type | | Statements of
Operations
Location | | Interest
Rate Risk | | Currency Risk | | Credit Risk | | Total | |
Emerging Markets Debt | |
| Futures | | Net realized gain/(loss) on:
Expiration or closing of
futures contracts | | $ | (801,668 | ) | | $ | — | | | $ | — | | | $ | (801,668 | ) | |
| Forward contracts | | Net realized gain/(loss) on:
Settlement of forward foreign
currency contracts | | | — | | | | (378,541 | ) | | | — | | | | (378,541 | ) | |
| Swaps | | Net realized gain/(loss) on:
Expiration or closing of
swap contracts | | | (166,175 | ) | | | (80,485 | ) | | | (21,462 | ) | | | (268,122 | ) | |
Total Realized Gain/(Loss) | | | | $ | (967,843 | ) | | $ | (459,026 | ) | | $ | (21,462 | ) | | $ | (1,448,331 | ) | |
Short Duration | |
| Futures | | Net realized gain/(loss) on:
Expiration or closing of
futures contracts | | $ | 298,521 | | | $ | — | | | $ | — | | | $ | 298,521 | | |
Total Realized Gain/(Loss) | | | | $ | 298,521 | | | $ | — | | | $ | — | | | $ | 298,521 | | |
Strategic Income | |
| Futures | | Net realized gain/(loss) on:
Expiration or closing of
futures contracts | | $ | (86,753,398 | ) | | $ | 89,779 | | | $ | — | | | $ | (86,663,619 | ) | |
Bond forward contracts | | Net realized gain/(loss) on:
Settlement of bond
forward contracts | | | 368,492 | | | | — | | | | — | | | | 368,492 | | |
| Forward contracts | | Net realized gain/(loss) on:
Settlement of forward foreign
currency contracts | | | — | | | | 14,608,706 | | | | — | | | | 14,608,706 | | |
| Swaps | | Net realized gain/(loss) on:
Expiration or closing of
swap contracts | | | — | | | | — | | | | 220,213 | | | | 220,213 | | |
Total Realized Gain/(Loss) | | | | $ | (86,384,906 | ) | | $ | 14,698,485 | | | $ | 220,213 | | | $ | (71,466,208 | ) | |
Unconstrained Bond | |
| Futures | | Net realized gain/(loss) on:
Expiration or closing of
futures contracts | | $ | (7,218,044 | ) | | $ | — | | | $ | — | | | $ | (7,218,044 | ) | |
| Forward contracts | | Net realized gain/(loss) on:
Settlement of forward foreign
currency contracts | | | — | | | | 2,691,516 | | | | — | | | | 2,691,516 | | |
| Swaps | | Net realized gain/(loss) on:
Expiration or closing of
swap contracts | | | — | | | | — | | | | (656,829 | ) | | | (656,829 | ) | |
Total Realized Gain/(Loss) | | | | $ | (7,218,044 | ) | | $ | 2,691,516 | | | $ | (656,829 | ) | | $ | (5,183,357 | ) | |
256
Change in Appreciation/(Depreciation) | |
Derivative Type | | Statements of
Operations
Location | | Interest
Rate Risk | | Currency Risk | | Credit Risk | | Total | |
Core Bond | |
Futures | | Change in net unrealized
appreciation/(depreciation)
in value of: Futures contracts | | $ | (306,287 | ) | | $ | (17,249 | ) | | $ | — | | | $ | (323,536 | ) | |
Total Change in
Appreciation/(Depreciation) | | | | $ | (306,287 | ) | | $ | (17,249 | ) | | $ | — | | | $ | (323,536 | ) | |
Emerging Markets Debt | |
Futures | | Change in net unrealized
appreciation/(depreciation)
in value of: Futures contracts | | $ | 219,635 | | | $ | — | | | $ | — | | | $ | 219,635 | | |
Forward contracts | | Change in net unrealized
appreciation/(depreciation)
in value of: Forward foreign
currency contracts | | | — | | | | 581,479 | | | | — | | | | 581,479 | | |
Swaps | | Change in net unrealized
appreciation/(depreciation)
in value of: Swap contracts | | | 1,648,249 | | | | (175,693 | ) | | | (398,674 | ) | | | 1,073,882 | | |
Total Change in
Appreciation/(Depreciation) | | | | $ | 1,867,884 | | | $ | 405,786 | | | $ | (398,674 | ) | | $ | 1,874,996 | | |
Short Duration | |
Futures | | Change in net unrealized
appreciation/(depreciation)
in value of: Futures contracts | | $ | (15,766 | ) | | $ | — | | | $ | — | | | $ | (15,766 | ) | |
Total Change in
Appreciation/(Depreciation) | | | | $ | (15,766 | ) | | $ | — | | | $ | — | | | $ | (15,766 | ) | |
Strategic Income | |
| Futures | | Change in net unrealized
appreciation/(depreciation)
in value of: Futures contracts | | $ | (13,018,223 | ) | | $ | 25,334 | | | $ | — | | | $ | (12,992,889 | ) | |
Bond forward contracts | | Change in net unrealized
appreciation/(depreciation)
in value of: Bond
forward contracts | | | (51,305 | ) | | | — | | | | — | | | | (51,305 | ) | |
Forward contracts | | Change in net unrealized
appreciation/(depreciation)
in value of: Forward foreign
currency contracts | | | — | | | | (3,389,038 | ) | | | — | | | | (3,389,038 | ) | |
Total Change in
Appreciation/(Depreciation) | | | | $ | (13,069,528 | ) | | $ | (3,363,704 | ) | | $ | — | | | $ | (16,433,232 | ) | |
257
| Derivative Type | | Statements of
Operations
Location | | Interest
Rate Risk | | Currency Risk | | Credit Risk | | Total | |
Unconstrained Bond | |
| Futures | | Change in net unrealized
appreciation/(depreciation)
in value of: Futures contracts | | $ | (453,807 | ) | | $ | — | | | $ | — | | | $ | (453,807 | ) | |
| Forward contracts | | Change in net unrealized
appreciation/(depreciation)
in value of: Forward foreign
currency contracts | | | — | | | | (1,309,061 | ) | | | — | | | | (1,309,061 | ) | |
Swaps | | Change in net unrealized
appreciation/(depreciation)
in value of: Swap contracts | | | (57,796 | ) | | | — | | | | 36,070 | | | | (21,726 | ) | |
Total Change in
Appreciation/(Depreciation) | | | | $ | (511,603 | ) | | $ | (1,309,061 | ) | | $ | 36,070 | | | $ | (1,784,594 | ) | |
While the Funds may receive redeemable preference shares, rights and warrants in connection with their investments in securities, these preference shares, rights and warrants are not considered "derivative instruments" under ASC 815.
Management has concluded that the Funds, except Core Bond, Emerging Markets Debt, Short Duration, Strategic Income and Unconstrained Bond, did not hold any derivative instruments during the year ended October 31, 2019, that require additional disclosures pursuant to ASC 815.
The Funds are required to disclose both gross and net information for assets and liabilities related to derivatives, repurchase and reverse repurchase agreements, and securities lending and securities borrowing transactions that are eligible for offset or subject to an enforceable master netting or similar agreement. Emerging Markets Debt, Strategic Income and Unconstrained Bond held investments in these securities at October 31, 2019. The Funds' derivative assets and liabilities at fair value by type are reported gross in the Statements of Assets and Liabilities. The following tables present derivative assets and liabilities, by counterparty, net of amounts available for offset under a master netting or similar agreement and net of the related collateral received by a Fund for assets and pledged by a Fund for liabilities as of October 31, 2019.
Description | | Gross Amounts of
Recognized Assets | | Gross Amounts
Offset in the
Statements of
Assets and
Liabilities | | Net Amounts of Assets Presented in the
Statements of Assets and Liabilities | |
Emerging Markets Debt | |
Over-the-counter swap contracts | | $ | 879,168 | | | $ | — | | | $ | 879,168 | | |
Forward contracts | | | 1,222,677 | | | | — | | | | 1,222,677 | | |
Total | | $ | 2,101,845 | | | $ | — | | | $ | 2,101,845 | | |
Strategic Income | |
Bond forward contracts | | $ | 6,289 | | | $ | — | | | $ | 6,289 | | |
Forward contracts | | | 2,785,266 | | | | — | | | | 2,785,266 | | |
Total | | $ | 2,791,555 | | | $ | — | | | $ | 2,791,555 | | |
Unconstrained Bond | |
Forward contracts | | $ | 3,940,456 | | | $ | — | | | $ | 3,940,456 | | |
Total | | $ | 3,940,456 | | | $ | — | | | $ | 3,940,456 | | |
258
| | | Gross Amounts Not Offset in the Statements of Assets and Liabilities | |
Counterparty | | Net Amounts of
Assets Presented in
the Statements of
Assets and Liabilities | | Liabilities
Available for
Offset | | Cash Collateral
Received(a) | | Net Amount(b) | |
Emerging Markets Debt | |
CITI | | $ | 225,636 | | | $ | (225,636 | ) | | $ | — | | | $ | — | | |
GSI | | | 762,866 | | | | (568,517 | ) | | | (194,349 | ) | | | — | | |
HSBC | | | 4,137 | | | | (4,137 | ) | | | — | | | | — | | |
JPM | | | 646,975 | | | | (646,975 | ) | | | — | | | | — | | |
MS | | | 89,275 | | | | (39,045 | ) | | | — | | | | 50,230 | | |
SCB | | | 245,764 | | | | (133,237 | ) | | | — | | | | 112,527 | | |
SSB | | | 127,192 | | | | (127,192 | ) | | | — | | | | — | | |
Total | | $ | 2,101,845 | | | $ | (1,744,739 | ) | | $ | (194,349 | ) | | $ | 162,757 | | |
Strategic Income | |
CITI | | $ | 3,864 | | | $ | — | | | $ | — | | | $ | 3,864 | | |
GSI | | | 2,526,322 | | | | (1,864,256 | ) | | | (660,000 | ) | | | 2,066 | | |
JPM | | | 48,080 | | | | (48,080 | ) | | | — | | | | — | | |
MS | | | 18,980 | | | | (18,980 | ) | | | — | | | | — | | |
SCB | | | 194,309 | | | | (112,483 | ) | | | — | | | | 81,826 | | |
Total | | $ | 2,791,555 | | | $ | (2,043,799 | ) | | $ | (660,000 | ) | | $ | 87,756 | | |
Unconstrained Bond | |
CITI | | $ | 940,160 | | | $ | (856,618 | ) | | $ | — | | | $ | 83,542 | | |
GSI | | | 899,485 | | | | (899,485 | ) | | | — | | | | — | | |
JPM | | | 596,549 | | | | (158,191 | ) | | | — | | | | 438,358 | | |
RBC | | | 480,443 | | | | (480,443 | ) | | | — | | | | — | | |
SCB | | | 80,010 | | | | (80,010 | ) | | | — | | | | — | | |
SG | | | 252,143 | | | | (252,143 | ) | | | — | | | | — | | |
SSB | | | 691,666 | | | | (691,666 | ) | | | — | | | | — | | |
Total | | $ | 3,940,456 | | | $ | (3,418,556 | ) | | $ | — | | | $ | 521,900 | | |
Description | | Gross Amounts of
Recognized Liabilities | | Gross Amounts
Offset in the
Statements of
Assets and
Liabilities | | Net Amounts of Liabilities Presented in the
Statements of Assets and Liabilities | |
Emerging Markets Debt Fund | |
Over-the-counter swap contracts | | $ | (771,950 | ) | | $ | — | | | $ | (771,950 | ) | |
Forward contracts | | | (1,061,948 | ) | | | — | | | | (1,061,948 | ) | |
Total | | $ | (1,833,898 | ) | | $ | — | | | $ | (1,833,898 | ) | |
Strategic Income | |
Bond forward contracts | | $ | (57,594 | ) | | $ | — | | | $ | (57,594 | ) | |
Forward contracts | | | (2,091,200 | ) | | | — | | | | (2,091,200 | ) | |
Total | | $ | (2,148,794 | ) | | $ | — | | | $ | (2,148,794 | ) | |
Unconstrained Bond | |
Forward contracts | | $ | (4,501,449 | ) | | $ | — | | | $ | (4,501,449 | ) | |
Total | | $ | (4,501,449 | ) | | $ | — | | | $ | (4,501,449 | ) | |
259
| | | Gross Amounts Not Offset in the Statements of Assets and Liabilities | |
Counterparty | | Net Amounts of
Liabilities Presented in
the Statements of
Assets and Liabilities | | Assets
Available for
Offset | | Cash Collateral
Pledged(a) | | Net Amount(c) | |
Emerging Markets Debt | |
CITI | | $ | (237,947 | ) | | $ | 225,636 | | | $ | — | | | $ | (12,311 | ) | |
GSI | | | (568,517 | ) | | | 568,517 | | | | — | | | | — | | |
HSBC | | | (13,242 | ) | | | 4,137 | | | | — | | | | (9,105 | ) | |
JPM | | | (678,685 | ) | | | 646,975 | | | | — | | | | (31,710 | ) | |
MS | | | (39,045 | ) | | | 39,045 | | | | — | | | | — | | |
SCB | | | (133,237 | ) | | | 133,237 | | | | — | | | | — | | |
SSB | | | (163,225 | ) | | | 127,192 | | | | — | | | | (36,033 | ) | |
Total | | $ | (1,833,898 | ) | | $ | 1,744,739 | | | $ | — | | | $ | (89,159 | ) | |
Strategic Income | |
GSI | | $ | (1,864,256 | ) | | $ | 1,864,256 | | | $ | — | | | $ | — | | |
JPM | | | (61,424 | ) | | | 48,080 | | | | 13,344 | | | | — | | |
MS | | | (110,631 | ) | | | 18,980 | | | | — | | | | (91,651 | ) | |
SCB | | | (112,483 | ) | | | 112,483 | | | | — | | | | — | | |
Total | | $ | (2,148,794 | ) | | $ | 2,043,799 | | | $ | 13,344 | | | $ | (91,651 | ) | |
Unconstrained Bond | |
CITI | | $ | (856,618 | ) | | $ | 856,618 | | | $ | — | | | $ | — | | |
GSI | | | (903,774 | ) | | | 899,485 | | | | 4,289 | | | | — | | |
JPM | | | (158,191 | ) | | | 158,191 | | | | — | | | | — | | |
RBC | | | (1,201,609 | ) | | | 480,443 | | | | 590,000 | | | | (131,166 | ) | |
SCB | | | (215,802 | ) | | | 80,010 | | | | — | | | | (135,792 | ) | |
SG | | | (377,180 | ) | | | 252,143 | | | | — | | | | (125,037 | ) | |
SSB | | | (788,275 | ) | | | 691,666 | | | | — | | | | (96,609 | ) | |
Total | | $ | (4,501,449 | ) | | $ | 3,418,556 | | | $ | 594,289 | | | $ | (488,604 | ) | |
(a) Collateral received (or pledged) is limited to an amount not to exceed 100% of the net amount of assets (or liabilities) in the tables presented above, for each respective counterparty.
(b) Net Amount represents amounts subject to loss as of October 31, 2019, in the event of a counterparty failure.
(c) Net Amount represents amounts under-collateralized to each counterparty as of October 31, 2019.
14 Indemnifications: Like many other companies, the Trust's organizational documents provide that its officers ("Officers") and trustees ("Trustees") are indemnified against certain liabilities arising out of the performance of their duties to the Trust. In addition, both in some of its principal service contracts and in the normal course of its business, the Trust enters into contracts that provide indemnifications to other parties for certain types of losses or liabilities. The Trust's maximum exposure under these arrangements is unknown as this could involve future claims against the Trust.
15 Investment company securities and exchange-traded funds: The Funds may invest in shares of other registered investment companies, including ETFs, within the limitations prescribed by (a) the 1940 Act, (b) the exemptive order from the Securities and Exchange Commission ("SEC") that permits the Funds to invest in both affiliated and unaffiliated investment companies, including ETFs, in excess of the limits in Section 12(d)(1)(A) of the 1940 Act, subject to the terms and conditions of such order, or (c) the ETF's exemptive order or other relief. Some ETFs seek to track the performance of a particular market index. These indices include both broad-based market indices and more narrowly-based indices, including those relating to particular sectors, markets, regions or industries. However, some ETFs have an actively-managed investment objective. ETF shares are traded like
260
traditional equity securities on a national securities exchange or NASDAQ. A Fund will indirectly bear its proportionate share of any management fees and other expenses paid by such other investment companies, which will decrease returns.
16 Unfunded loan commitments: The Funds may enter into certain credit agreements all or a portion of which may be unfunded. The Funds are obligated to fund these commitments at the borrower's discretion. As of October 31, 2019, the value of unfunded loan commitments was $53,612 for Floating Rate Income pursuant to the following loan agreement:
Floating Rate Income
| Borrower | | Principal
Amount | | Value | |
| Merlin Entertainments PLC, Term Loan B DD, due 10/17/2026(a) | | $ | 53,434 | | | $ | 53,612 | | |
(a) Variable or floating rate security. The interest rate shown was the current rate as of October 31, 2019 and changes periodically.
17 In-kind redemptions: In accordance with guidelines described in a Fund's prospectus and in accordance with procedures adopted by the Board, a Fund may distribute portfolio securities rather than cash as payment for a redemption of Fund shares ("in-kind redemption"). For financial reporting purposes, a Fund recognizes a gain on in-kind redemptions to the extent the value of the distributed securities on the date of redemption exceeds the cost of those securities. Gains and losses realized on in-kind redemptions are not recognized for tax purposes and are reclassified from undistributed realized gain (loss) to paid-in capital. During the year ended October 31, 2019, Strategic Income realized a net loss of $(1,794,284) on $31,646,140 of in-kind redemptions.
18 Other: All net investment income and realized and unrealized capital gains and losses of each Fund are allocated, on the basis of relative net assets, pro rata among its respective classes.
Note B—Investment Management Fees, Administration Fees, Distribution Arrangements, and Other Transactions with Affiliates:
Each Fund retains NBIA as its investment manager under a Management Agreement. For such investment management services, each Fund pays NBIA an investment management fee as a percentage of average daily net assets according to the following table:
| | First
$250
million | | Next
$250
million | | Next
$250
million | | Next
$250
million | | Next
$500
million | | Next
$500
million | | Thereafter | |
For Core Bond and Municipal Impact: | |
| | | | 0.25 | % | | | 0.25 | % | | | 0.225 | % | | | 0.225 | % | | | 0.20 | % | | | 0.175 | % | | | 0.15 | % | |
For Emerging Markets Debt: | |
| | | | 0.55 | % | | | 0.55 | % | | | 0.55 | % | | | 0.55 | % | | | 0.55 | % | | | 0.55 | % | | | 0.55 | % | |
For Floating Rate Income: | |
| | | | 0.50 | % | | | 0.50 | % | | | 0.50 | % | | | 0.50 | % | | | 0.50 | % | | | 0.50 | % | | | 0.50 | % | |
For High Income: | |
| | | | 0.48 | % | | | 0.48 | % | | | 0.48 | % | | | 0.48 | % | | | 0.48 | % | | | 0.48 | % | | | 0.48 | % | |
For Municipal High Income: | |
| | | | 0.40 | % | | | 0.40 | % | | | 0.375 | % | | | 0.375 | % | | | 0.35 | % | | | 0.325 | % | | | 0.30 | % | |
| For Municipal Intermediate Bond(a): | |
| | | 0.14 | % | | | 0.14 | % | | | 0.14 | % | | | 0.14 | % | | | 0.14 | % | | | 0.14 | % | | | 0.14 | % | |
261
| | First
$250
million | | Next
$250
million | | Next
$250
million | | Next
$250
million | | Next
$500
million | | Next
$500
million | | Thereafter | |
For Short Duration: | |
| | | | 0.20 | % | | | 0.20 | % | | | 0.20 | % | | | 0.20 | % | | | 0.20 | % | | | 0.175 | % | | | 0.15 | % | |
For Short Duration High Income and Unconstrained Bond: | |
| | | | 0.45 | % | | | 0.45 | % | | | 0.45 | % | | | 0.45 | % | | | 0.45 | % | | | 0.45 | % | | | 0.45 | % | |
For Strategic Income: | |
| | | | 0.40 | % | | | 0.40 | % | | | 0.40 | % | | | 0.40 | % | | | 0.40 | % | | | 0.40 | % | | | 0.40 | % | |
(a) 0.23% of the first $500 million, 0.225% for the next $500 million, 0.20% for the next $500 million, 0.175% for the next $500 million and 0.15% in excess of $2 billion prior to September 12, 2019.
Accordingly, for the year ended October 31, 2019, the investment management fee pursuant to the Management Agreement was equivalent to an annual effective rate of each Fund's average daily net assets, as follows:
| | | Effective Rate | |
Core Bond | | | 0.25 | % | |
Municipal High Income | | | 0.40 | % | |
Municipal Impact | | | 0.25 | % | |
Municipal Intermediate Bond | | | 0.22 | % | |
Short Duration | | | 0.20 | % | |
Each Fund retains NBIA as its administrator under an Administration Agreement. The administration fee is assessed at the Class level and each share class of a Fund, as applicable, pays NBIA an annual administration fee equal to the following: 0.27% for each of Investor Class, Class A, Class C and Class R3; 0.50% for Trust Class of Short Duration; 0.40% for Trust Class of Strategic Income; 0.15% for Institutional Class; and 0.05% for Class R6 (0.08% prior to December 6, 2018), each as a percentage of its average daily net assets. Additionally, NBIA retains State Street as its sub-administrator under a Sub-Administration Agreement. NBIA pays State Street a fee for all services received under the Sub-Administration Agreement.
NBIA has contractually agreed to waive fees and/or reimburse certain expenses of the Investor Class, Trust Class, Institutional Class, Class A, Class C, Class R3 and Class R6 of each Fund that offers those classes so that the total annual operating expenses of those classes do not exceed the expense limitations as detailed in the following table. These undertakings exclude interest, taxes, brokerage commissions, acquired fund fees and expenses, extraordinary expenses, and dividend and interest expenses relating to short sales, if any (commitment fees relating to borrowings are treated as interest for purposes of this exclusion) ("annual operating expenses"); consequently, net expenses may exceed the contractual expense limitations.
At October 31, 2019, contingent liabilities to NBIA under the agreements were as follows:
| | | | | | | Expenses Reimbursed in
Year Ended October 31, | |
| | | | | | | 2017 | | 2018 | | 2019 | |
| | | | | | | Subject to Repayment until October 31, | |
Class | | Contractual
Expense
Limitation(a) | | Expiration | | 2020 | | 2021 | | 2022 | |
Core Bond Investor Class | | | 0.85 | % | | 10/31/22 | | $ | 29,581 | | | $ | 27,349 | | | $ | 27,317 | | |
Core Bond Institutional Class | | | 0.45 | % | | 10/31/22 | | | 302,617 | | | | 325,526 | | | | 328,676 | | |
Core Bond Class A | | | 0.85 | % | | 10/31/22 | | | 16,842 | | | | 13,557 | | | | 13,844 | | |
262
| | | | | | | Expenses Reimbursed in
Year Ended October 31, | |
| | | | | | | 2017 | | 2018 | | 2019 | |
| | | | | | | Subject to Repayment until October 31, | |
Class | | Contractual
Expense
Limitation(a) | | Expiration | | 2020 | | 2021 | | 2022 | |
Core Bond Class C | | | 1.60 | % | | 10/31/22 | | $ | 2,798 | | | $ | 1,869 | | | $ | 1,746 | | |
Core Bond Class R6 | | | 0.35 | % | | 10/31/22 | | | — | | | | — | | | | 330 | (b) | |
Emerging Markets Debt Institutional Class | | | 0.78 | %(c) | | 10/31/22 | | | 347,032 | | | | 457,406 | | | | 406,354 | | |
Emerging Markets Debt Class A | | | 1.15 | %(c) | | 10/31/22 | | | 1,400 | | | | 15,759 | | | | 15,905 | | |
Emerging Markets Debt Class C | | | 1.90 | %(c) | | 10/31/22 | | | 499 | | | | 1,301 | | | | 930 | | |
Floating Rate Income Institutional Class | | | 0.70 | % | | 10/31/22 | | | 400,905 | | | | 475,802 | | | | 469,596 | | |
Floating Rate Income Class A | | | 1.07 | % | | 10/31/22 | | | 28,087 | | | | 30,445 | | | | 19,217 | | |
Floating Rate Income Class C | | | 1.82 | % | | 10/31/22 | | | 28,361 | | | | 26,854 | | | | 26,631 | | |
High Income Investor Class | | | 1.00 | % | | 10/31/22 | | | — | | | | — | | | | — | | |
High Income Institutional Class | | | 0.75 | % | | 10/31/22 | | | — | | | | — | | | | — | | |
High Income Class A | | | 1.12 | % | | 10/31/22 | | | 9,011 | | | | 11,115 | | | | 16,174 | | |
High Income Class C | | | 1.87 | % | | 10/31/22 | | | — | | | | — | | | | — | | |
High Income Class R3 | | | 1.37 | % | | 10/31/22 | | | — | | | | — | | | | — | | |
High Income Class R6 | | | 0.65 | %(c) | | 10/31/22 | | | — | | | | — | | | | — | | |
Municipal High Income Institutional Class | | | 0.50 | % | | 10/31/22 | | | 343,644 | | | | 341,403 | | | | 329,680 | | |
Municipal High Income Class A | | | 0.87 | % | | 10/31/22 | | | 2,162 | | | | 2,546 | | | | 4,413 | | |
Municipal High Income Class C | | | 1.62 | % | | 10/31/22 | | | 1,262 | | | | 1,802 | | | | 2,011 | | |
Municipal Impact Institutional Class | | | 0.43 | %(c) | | 10/31/22 | | | — | | | | 162,783 | | | | 382,133 | | |
Municipal Impact Class A | | | 0.80 | % | | 10/31/22 | | | — | | | | 89 | (d) | | | 400 | | |
Municipal Impact Class C | | | 1.55 | % | | 10/31/22 | | | — | | | | 91 | (d) | | | 225 | | |
Municipal Intermediate Bond Investor Class | | | 0.45 | %(c) | | 10/31/22 | | | 17,913 | | | | 18,441 | | | | 23.657 | | |
Municipal Intermediate Bond
Institutional Class | | | 0.30 | %(c) | | 10/31/22 | | | 150,041 | | | | 202,676 | | | | 248,495 | | |
Municipal Intermediate Bond Class A | | | 0.67 | %(c) | | 10/31/22 | | | 4,415 | | | | 6,691 | | | | 5,508 | | |
Municipal Intermediate Bond Class C | | | 1.42 | %(c) | | 10/31/22 | | | 3,184 | | | | 3,285 | | | | 4,287 | | |
Short Duration Investor Class | | | 0.59 | %(c) | | 10/31/22 | | | 99,584 | | | | 102,348 | | | | 94,340 | | |
Short Duration Trust Class | | | 0.69 | %(c) | | 10/31/22 | | | 10,328 | | | | 11,423 | | | | 8,902 | | |
Short Duration Institutional Class | | | 0.39 | %(c) | | 10/31/22 | | | 204,660 | | | | 232,853 | | | | 239,009 | | |
Short Duration Class A | | | 0.76 | %(c) | | 10/31/22 | | | 12,847 | | | | 8,714 | | | | 6,786 | | |
Short Duration Class C | | | 1.51 | %(c) | | 10/31/22 | | | 7,070 | | | | 5,866 | | | | 5,488 | | |
Short Duration High Income
Institutional Class | | | 0.75 | % | | 10/31/22 | | | 209,217 | | | | 234,823 | | | | 256,499 | | |
Short Duration High Income Class A | | | 1.12 | % | | 10/31/22 | | | 6,750 | | | | 5,713 | | | | 7,033 | | |
Short Duration High Income Class C | | | 1.87 | % | | 10/31/22 | | | 2,485 | | | | 3,512 | | | | 7,021 | | |
Strategic Income Trust Class | | | 0.94 | %(c) | | 10/31/22 | | | 9,016 | | | | 9,494 | | | | 7,844 | | |
Strategic Income Institutional Class | | | 0.59 | %(c) | | 10/31/22 | | | 305,847 | | | | 540,043 | | | | 573,799 | | |
Strategic Income Class A | | | 0.99 | %(c) | | 10/31/22 | | | 18,909 | | | | 20,071 | | | | 13,789 | | |
Strategic Income Class C | | | 1.69 | %(c) | | 10/31/22 | | | 66,990 | | | | 63,520 | | | | 53,704 | | |
Strategic Income Class R6 | | | 0.49 | %(c) | | 10/31/22 | | | 40,217 | | | | 81,957 | | | | 79,636 | | |
263
| | | | | | | Expenses Reimbursed in
Year Ended October 31, | |
| | | | | | | 2017 | | 2018 | | 2019 | |
| | | | | | | Subject to Repayment until October 31, | |
Class | | Contractual
Expense
Limitation(a) | | Expiration | | 2020 | | 2021 | | 2022 | |
Unconstrained Bond Institutional Class | | | 0.65 | % | | 10/31/22 | | $ | 114,474 | | | $ | 173,383 | | | $ | 143,135 | | |
Unconstrained Bond Class A | | | 1.02 | % | | 10/31/22 | | | 3,521 | | | | 1,991 | | | | 980 | | |
Unconstrained Bond Class C | | | 1.77 | % | | 10/31/22 | | | 266 | | | | 125 | | | | 161 | | |
Unconstrained Bond Class R6 | | | 0.55 | %(c) | | 10/31/22 | | | 329,830 | | | | 213,488 | | | | 247,848 | | |
(a) Expense limitation per annum of the respective class's average daily net assets.
(b) Period from January 18, 2019 (Commencement of Operations) to October 31, 2019.
(c) Classes that have had changes to their respective limitations are noted below.
| Class | | Expense
Limitation | | Prior to | |
Emerging Markets Debt Institutional Class | | | 0.90 | % | | 2/28/17 | |
Emerging Markets Debt Class A | | | 1.27 | % | | 2/28/17 | |
Emerging Markets Debt Class C | | | 2.02 | % | | 2/28/17 | |
High Income Class R6 | | | 0.68 | % | | 12/6/18 | |
Municipal Impact Institutional Class | | | 1.00 | % | | 6/18/18 | |
Municipal Intermediate Bond Investor Class | | | 0.65 | % | | 2/28/18 | |
Municipal Intermediate Bond Institutional Class | | | 0.50 | % | | 2/28/18 | |
Municipal Intermediate Bond Class A | | | 0.87 | % | | 2/28/18 | |
Municipal Intermediate Bond Class C | | | 1.62 | % | | 2/28/18 | |
Municipal Intermediate Bond Investor Class | | | 0.58 | % | | 9/12/19 | |
Municipal Intermediate Bond Institutional Class | | | 0.43 | % | | 9/12/19 | |
Municipal Intermediate Bond Class A | | | 0.80 | % | | 9/12/19 | |
Municipal Intermediate Bond Class C | | | 1.55 | % | | 9/12/19 | |
Short Duration Investor Class | | | 0.70 | % | | 2/28/18 | |
Short Duration Trust Class | | | 0.80 | % | | 2/28/18 | |
Short Duration Institutional Class | | | 0.50 | % | | 2/28/18 | |
Short Duration Class A | | | 0.87 | % | | 2/28/18 | |
Short Duration Class C | | | 1.62 | % | | 2/28/18 | |
Strategic Income Trust Class | | | 1.10 | % | | 12/1/16 | |
Strategic Income Institutional Class | | | 0.75 | % | | 12/1/16 | |
Strategic Income Class A | | | 1.15 | % | | 12/1/16 | |
Strategic Income Class C | | | 1.85 | % | | 12/1/16 | |
Strategic Income Class R6 | | | 0.68 | % | | 12/1/16 | |
Strategic Income Class R6 | | | 0.52 | % | | 12/6/18 | |
Unconstrained Bond Class R6 | | | 0.58 | % | | 12/6/18 | |
(d) Period from June 19, 2018 (Commencement of Operations) to October 31, 2018.
Each Fund has agreed that each of its respective classes will repay NBIA for fees and expenses waived or reimbursed for that class provided that repayment does not cause that class's annual operating expenses to exceed
264
its contractual expense limitation in place at the time the fees and expenses were waived or reimbursed, or the expense limitation in place at the time the Fund repays NBIA, whichever is lower. Any such repayment must be made within three years after the year in which NBIA incurred the expense.
During the year ended October 31, 2019, there was no repayment to NBIA under these agreements.
Neuberger Berman Europe Limited ("NBEL"), as the sub-adviser to Emerging Markets Debt and Unconstrained Bond, is retained by NBIA to choose each Fund's investments and handle its day-to-day business for the portion of each Fund's assets allocated to it by NBIA, and receives a monthly fee paid by NBIA. As investment manager, NBIA is responsible for overseeing the investment activities of NBEL. Several individuals who are Officers and/or Trustees of the Trust are also employees of NBEL and/or NBIA.
Each Fund also has a distribution agreement with Neuberger Berman BD LLC (the "Distributor") with respect to each class of shares. The Distributor acts as agent in arranging for the sale of class shares without sales commission or other compensation, except as described below, and bears the advertising and promotion expenses.
However, the Distributor receives fees from Core Bond's Investor Class, Strategic Income's Trust Class, High Income's Class R3, and each Fund's Class A and Class C under their distribution plans (each a "Plan", collectively, the "Plans") pursuant to Rule 12b-1 under the 1940 Act. The Plans provide that, as compensation for administrative and other services provided to these classes, the Distributor's activities and expenses related to the sale and distribution of these classes, and ongoing services provided to investors in these classes, the Distributor receives from each of these respective classes a fee at the annual rate of 0.25% of Core Bond Investor Class', Core Bond Class A's, Emerging Markets Debt Class A's, Floating Rate Income Class A's, High Income Class A's, Municipal High Income Class A's, Municipal Impact Class A's, Municipal Intermediate Bond Class A's, Short Duration Class A's, Short Duration High Income Class A's, Strategic Income Class A's and Unconstrained Bond Class A's average daily net assets; 0.10% of Strategic Income Trust Class' average daily net assets; 0.50% of High Income Class R3's average daily net assets; and 1.00% of Core Bond Class C's, Emerging Markets Debt Class C's, Floating Rate Income Class C's, High Income Class C's, Municipal High Income Class C's, Municipal Impact Class C's, Municipal Intermediate Bond Class C's, Short Duration Class C's, Short Duration High Income Class C's, Strategic Income Class C's and Unconstrained Bond Class C's average daily net assets. The Distributor receives this amount to provide distribution and shareholder servicing for these classes and pays a portion of it to institutions that provide such services. Those institutions may use the payments for, among other purposes, compensating employees engaged in sales and/or shareholder servicing. The amount of fees paid by each class during any year may be more or less than the cost of distribution and other services provided to that class. FINRA rules limit the amount of annual distribution fees that may be paid by a mutual fund and impose a ceiling on the cumulative distribution fees paid. The Trust's Plans comply with those rules.
Class A shares of each Fund (except Short Duration) are generally sold with an initial sales charge of up to 4.25%. Class A shares of Short Duration are generally sold with an initial sales charge of up to 2.50%. Class A shares of each Fund are generally sold with no contingent deferred sales charge ("CDSC"), except that a CDSC of 1.00% applies to certain redemptions made within 18 months following purchases of $1 million or more without an initial sales charge. Class C shares of each Fund are sold with no initial sales charge and a 1.00% CDSC if shares are sold within one year after purchase.
For the year ended October 31, 2019, Neuberger Berman, acting as underwriter and broker-dealer, received net initial sales charges from the purchase of Class A shares and CDSCs from the redemption of Class A and Class C shares as follows:
| | | Underwriter | | Broker-Dealer | |
| | | Net Initial
Sales Charge | | CDSC | | Net Initial
Sales Charges | | Net Initial
Sales Charges | |
Core Bond Class A | | $ | 155 | | | $ | — | | | $ | — | | | $ | — | | |
Core Bond Class C | | | — | | | | 416 | | | | — | | | | — | | |
265
| | | Underwriter | | Broker-Dealer | |
| | | Net Initial
Sales Charge | | CDSC | | Net Initial
Sales Charges | | Net Initial
Sales Charges | |
Emerging Markets Debt Class A | | $ | 289 | | | $ | — | | | $ | — | | | $ | — | | |
Emerging Markets Debt Class C | | | — | | | | — | | | | — | | | | — | | |
Floating Rate Income Class A | | | 396 | | | | — | | | | — | | | | — | | |
Floating Rate Income Class C | | | — | | | | 567 | | | | — | | | | — | | |
High Income Class A | | | 219 | | | | — | | | | — | | | | — | | |
High Income Class C | | | — | | | | 1,436 | | | | — | | | | — | | |
Municipal High Income Class A | | | 817 | | | | — | | | | — | | | | — | | |
Municipal High Income Class C | | | — | | | | 1,753 | | | | — | | | | — | | |
Municipal Impact Class A | | | 115 | | | | — | | | | — | | | | — | | |
Municipal Impact Class C | | | — | | | | — | | | | — | | | | — | | |
Municipal Intermediate Bond Class A | | | — | | | | — | | | | — | | | | — | | |
Municipal Intermediate Bond Class C | | | — | | | | 1,818 | | | | — | | | | — | | |
Short Duration Class A | | | 393 | | | | — | | | | — | | | | — | | |
Short Duration Class C | | | — | | | | — | | | | — | | | | — | | |
Short Duration High Income Class A | | | — | | | | — | | | | — | | | | — | | |
Short Duration High Income Class C | | | — | | | | — | | | | — | | | | — | | |
Strategic Income Class A | | | 32,909 | | | | — | | | | — | | | | — | | |
Strategic Income Class C | | | — | | | | 29,691 | | | | — | | | | — | | |
Unconstrained Bond Class A | | | — | | | | — | | | | — | | | | — | | |
Unconstrained Bond Class C | | | — | | | | — | | | | — | | | | — | | |
Note C—Securities Transactions:
During the year ended October 31, 2019, there were purchase and sale transactions of long-term securities (excluding swaps, bond forwards, forward contracts and futures) as follows:
| | | Purchases of
U.S. Government and
Agency Obligations | | Purchases excluding
U.S. Government and
Agency Obligations | | Sales and
Maturities of
U.S. Government and
Agency Obligations | | Sales and
Maturities excluding
U.S. Government and
Agency Obligations | |
Core Bond | | $ | 566,401,703 | | | $ | 159,355,527 | | | $ | 618,770,385 | | | $ | 176,405,362 | | |
Emerging Markets Debt | | | — | | | | 120,819,953 | | | | — | | | | 154,393,301 | | |
Floating Rate Income | | | — | | | | 162,076,948 | | | | — | | | | 303,309,776 | | |
High Income | | | — | | | | 2,306,671,480 | | | | — | | | | 2,064,891,929 | | |
Municipal High Income | | | — | | | | 142,787,649 | | | | — | | | | 107,223,920 | | |
Municipal Impact | | | — | | | | 58,980,052 | | | | — | | | | 56,090,727 | | |
Municipal Intermediate Bond | | | — | | | | 187,896,304 | | | | — | | | | 221,165,082 | | |
Short Duration | | | 30,365,454 | | | | 82,557,727 | | | | 30,354,664 | | | | 78,222,006 | | |
Short Duration High Income | | | — | | | | 30,926,776 | | | | — | | | | 79,106,458 | | |
Strategic Income | | | 8,631,974,442 | | | | 1,744,092,483 | | | | 8,820,270,506 | | | | 2,098,686,089 | | |
Unconstrained Bond | | | 41,929,354 | | | | 25,331,920 | | | | 55,350,229 | | | | 55,876,163 | | |
During the year ended October 31, 2019, no brokerage commissions on securities transactions were paid to affiliated brokers.
266
Note D—Fund Share Transactions:
Share activity for the years ended October 31, 2019, and October 31, 2018, was as follows:
| | | For the Year Ended October 31, 2019 | | For the Year Ended October 31, 2018 | |
| | | Shares
Sold | | Shares Issued
on
Reinvestment
of Dividends
and
Distributions | | Shares
Redeemed | | Total | | Shares
Sold | | Shares Issued
on
Reinvestment
of Dividends
and
Distributions | | Shares
Redeemed | | Total | |
Core Bond | |
Investor Class | | | 129,288 | | | | 27,784 | | | | (81,520 | ) | | | 75,552 | | | | 82,477 | | | | 23,386 | | | | (163,920 | ) | | | (58,057 | ) | |
Institutional
Class | | | 11,669,819 | | | | 693,274 | | | | (18,958,065 | ) | | | (6,594,972 | ) | | | 17,163,495 | | | | 708,830 | | | | (12,431,092 | ) | | | 5,441,233 | | |
Class A | | | 544,560 | | | | 52,162 | | | | (623,991 | ) | | | (27,269 | ) | | | 207,834 | | | | 49,606 | | | | (562,776 | ) | | | (305,336 | ) | |
Class C | | | 69,568 | | | | 3,489 | | | | (90,610 | ) | | | (17,553 | ) | | | 25,131 | | | | 3,831 | | | | (121,673 | ) | | | (92,711 | ) | |
| Class R6(a) | | | 319,888 | | | | — | | | | (408 | ) | | | 319,480 | | | | — | | | | — | | | | — | | | | — | | |
Emerging
Markets Debt | |
Institutional
Class | | | 7,343,891 | | | | 1,181,758 | | | | (14,437,586 | ) | | | (5,911,937 | ) | | | 10,084,579 | | | | 1,231,630 | | | | (14,503,409 | ) | | | (3,187,200 | ) | |
Class A | | | 254,996 | | | | 40,054 | | | | (1,016,665 | ) | | | (721,615 | ) | | | 1,167,464 | | | | 37,820 | | | | (147,859 | ) | | | 1,057,425 | | |
Class C | | | 2,973 | | | | 1,715 | | | | (22,545 | ) | | | (17,857 | ) | | | 51,212 | | | | 2,148 | | | | (53,869 | ) | | | (509 | ) | |
Floating Rate
Income | |
Institutional
Class | | | 15,712,965 | | | | 1,367,567 | | | | (29,270,410 | ) | | | (12,189,878 | ) | | | 17,295,268 | | | | 1,336,506 | | | | (18,565,746 | ) | | | 66,028 | | |
Class A | | | 163,715 | | | | 36,745 | | | | (1,573,396 | ) | | | (1,372,936 | ) | | | 850,847 | | | | 57,243 | | | | (600,153 | ) | | | 307,937 | | |
Class C | | | 27,499 | | | | 39,781 | | | | (548,500 | ) | | | (481,220 | ) | | | 154,712 | | | | 38,496 | | | | (574,130 | ) | | | (380,922 | ) | |
High Income | |
Investor Class | | | 661,267 | | | | 546,182 | | | | (2,302,538 | ) | | | (1,095,089 | ) | | | 810,778 | | | | 601,850 | | | | (3,041,624 | ) | | | (1,628,996 | ) | |
Institutional
Class | | | 130,670,292 | | | | 7,364,804 | | | | (109,461,663 | ) | | | 28,573,433 | | | | 34,807,312 | | | | 7,202,408 | | | | (70,709,757 | ) | | | (28,700,037 | ) | |
Class A | | | 8,715,029 | | | | 182,231 | | | | (10,448,641 | ) | | | (1,551,381 | ) | | | 5,862,345 | | | | 276,327 | | | | (10,381,148 | ) | | | (4,242,476 | ) | |
Class C | | | 77,119 | | | | 45,135 | | | | (631,901 | ) | | | (509,647 | ) | | | 56,654 | | | | 59,002 | | | | (886,365 | ) | | | (770,709 | ) | |
Class R3 | | | 253,610 | | | | 22,174 | | | | (203,094 | ) | | | 72,690 | | | | 302,105 | | | | 55,536 | | | | (1,340,945 | ) | | | (983,304 | ) | |
Class R6 | | | 21,665,740 | | | | 4,536,329 | | | | (23,859,026 | ) | | | 2,343,043 | | | | 12,775,937 | | | | 5,957,557 | | | | (104,223,985 | ) | | | (85,490,491 | ) | |
Municipal
High Income | |
Institutional
Class | | | 4,714,758 | | | | 306,240 | | | | (2,195,158 | ) | | | 2,825,840 | | | | 1,800,198 | | | | 323,981 | | | | (2,775,585 | ) | | | (651,406 | ) | |
Class A | | | 147,521 | | | | 2,256 | | | | (126,447 | ) | | | 23,330 | | | | 98,084 | | | | 1,402 | | | | (42,363 | ) | | | 57,123 | | |
Class C | | | 39,174 | | | | 1,166 | | | | (24,777 | ) | | | 15,563 | | | | 17,352 | | | | 1,081 | | | | (42,984 | ) | | | (24,551 | ) | |
Municipal
Impact | |
Institutional
Class | | | 369,153 | | | | 72,147 | | | | (250,539 | ) | | | 190,761 | | | | 6,964 | | | | 76,973 | | | | (371,954 | ) | | | (288,017 | ) | |
Class A | | | 2,985 | | | | 35 | | | | (32 | ) | | | 2,988 | | | | 1,479 | | | | — | | | | — | | | | 1,479 | (b) | |
Class C | | | — | | | | — | | | | — | | | | — | | | | 1,479 | | | | — | | | | — | | | | 1,479 | (b) | |
267
| | | For the Year Ended October 31, 2019 | | For the Year Ended October 31, 2018 | |
| | | Shares
Sold | | Shares Issued
on
Reinvestment
of Dividends
and
Distributions | | Shares
Redeemed | | Total | | Shares
Sold | | Shares Issued
on
Reinvestment
of Dividends
and
Distributions | | Shares
Redeemed | | Total | |
Municipal
Intermediate
Bond | |
Investor Class | | | 222,174 | | | | 23,837 | | | | (266,656 | ) | | | (20,645 | ) | | | 74,609 | | | | 23,669 | | | | (140,571 | ) | | | (42,293 | ) | |
Institutional
Class | | | 2,275,975 | | | | 66,834 | | | | (5,143,138 | ) | | | (2,800,329 | ) | | | 3,995,544 | | | | 169,707 | | | | (3,172,491 | ) | | | 992,760 | | |
Class A | | | 18,211 | | | | 7,453 | | | | (446,656 | ) | | | (420,992 | ) | | | 169,612 | | | | 11,947 | | | | (179,398 | ) | | | 2,161 | | |
Class C | | | 18,865 | | | | 2,677 | | | | (87,660 | ) | | | (66,118 | ) | | | 55,735 | | | | 2,723 | | | | (44,542 | ) | | | 13,916 | | |
Short
Duration | |
Investor Class | | | 297,520 | | | | 66,255 | | | | (293,763 | ) | | | 70,012 | | | | 147,859 | | | | 51,115 | | | | (552,273 | ) | | | (353,299 | ) | |
Trust Class | | | 23,502 | | | | 6,290 | | | | (49,886 | ) | | | (20,094 | ) | | | 110,271 | | | | 5,879 | | | | (139,859 | ) | | | (23,709 | ) | |
Institutional
Class | | | 4,467,502 | | | | 215,326 | | | | (4,596,654 | ) | | | 86,174 | | | | 4,232,778 | | | | 155,183 | | | | (6,588,355 | ) | | | (2,200,394 | ) | |
Class A | | | 494,831 | | | | 4,791 | | | | (594,127 | ) | | | (94,505 | ) | | | 431,181 | | | | 3,062 | | | | (572,912 | ) | | | (138,669 | ) | |
Class C | | | 81,042 | | | | 2,283 | | | | (58,438 | ) | | | 24,887 | | | | 25,227 | | | | 1,310 | | | | (79,339 | ) | | | (52,802 | ) | |
Short
Duration
High Income | |
Institutional
Class | | | 1,110,991 | | | | 223,973 | | | | (6,662,034 | ) | | | (5,327,070 | ) | | | 3,878,638 | | | | 355,700 | | | | (7,680,206 | ) | | | (3,445,868 | ) | |
Class A | | | 23,186 | | | | 4,552 | | | | (28,574 | ) | | | (836 | ) | | | 21,586 | | | | 6,703 | | | | (177,501 | ) | | | (149,212 | ) | |
Class C | | | 32,490 | | | | 3,903 | | | | (31,114 | ) | | | 5,279 | | | | 10,900 | | | | 3,395 | | | | (24,398 | ) | | | (10,103 | ) | |
Strategic
Income | |
Trust Class | | | 269,644 | | | | 35,070 | | | | (1,354,937 | ) | | | (1,050,223 | ) | | | 634,575 | | | | 60,075 | | | | (655,803 | ) | | | 38,847 | | |
Institutional
Class | | | 81,372,377 | | | | 6,680,421 | | | | (82,606,322 | ) | | | 5,446,476 | | | | 83,678,291 | | | | 6,394,883 | | | | (63,966,130 | ) | | | 26,107,044 | | |
Class A | | | 5,651,265 | | | | 317,392 | | | | (10,781,417 | ) | | | (4,812,760 | ) | | | 5,113,702 | | | | 526,205 | | | | (7,800,265 | ) | | | (2,160,358 | ) | |
Class C | | | 1,294,692 | | | | 240,429 | | | | (3,900,160 | ) | | | (2,365,039 | ) | | | 1,390,919 | | | | 287,177 | | | | (3,638,900 | ) | | | (1,960,804 | ) | |
Class R6 | | | 7,388,299 | | | | 1,168,591 | | | | (13,979,131 | ) | | | (5,422,241 | ) | | | 5,242,469 | | | | 1,231,503 | | | | (1,504,001 | ) | | | 4,969,971 | | |
Unconstrained
Bond | |
Institutional
Class | | | 1,321,192 | | | | 129,007 | | | | (3,762,920 | ) | | | (2,312,721 | ) | | | 1,971,052 | | | | 111,188 | | | | (2,236,591 | ) | | | (154,351 | ) | |
Class A | | | 9,546 | | | | 139 | | | | (34,285 | ) | | | (24,600 | ) | | | 7,938 | | | | 803 | | | | (15,168 | ) | | | (6,427 | ) | |
Class C | | | 267 | | | | 11 | | | | (1 | ) | | | 277 | | | | 340 | | | | 3 | | | | (1,215 | ) | | | (872 | ) | |
Class R6 | | | 58,414 | | | | 215,515 | | | | (2,496,965 | ) | | | (2,223,036 | ) | | | 168,935 | | | | 142,056 | | | | (87,112 | ) | | | 223,879 | | |
(a) Period from January 18, 2019 (Commencement of Operations) to October 31, 2019.
(b) Period from June 19, 2018 (Commencement of Operations) to October 31, 2018.
Note E—Line of Credit:
At October 31, 2019, each Fund was a participant in a syndicated committed, unsecured $700,000,000 line of credit (the "Credit Facility"), to be used only for temporary or emergency purposes. Series of other investment
268
companies managed by NBIA also participate in this line of credit on substantially the same terms. Interest is charged on borrowings under this Credit Facility at the highest of (a) a federal funds effective rate plus 1.00% per annum, (b) a Eurodollar rate for a one-month period plus 1.00% per annum, and (c) an overnight bank funding rate plus 1.00% per annum. The Credit Facility has an annual commitment fee of 0.15% per annum of the available line of credit, which is paid quarterly. Each Fund that is a participant has agreed to pay its pro rata share of the annual commitment fee, based on the ratio of its individual net assets to the net assets of all participants at the time the fee is due, and interest charged on any borrowing made by such Fund and other costs incurred by such Fund. Because several mutual funds participate in the Credit Facility, there is no assurance that an individual Fund will have access to all or any part of the $700,000,000 at any particular time. There were no loans outstanding under the Credit Facility at October 31, 2019.
During the year ended October 31, 2019, the following Fund had borrowings under the Credit Facility:
| Fund | | Number of Days
Borrowed | | Greatest
Amount
Borrowed | | Average Interest
Rate | | Interest
Paid(1) | |
Floating Rate Income | | | 11 | | | $ | 40,000,000 | | | | 3.37 | % | | $ | 25,503 | | |
(1) Interest paid is reflected in the Statements of Operations under the caption "Interest expense."
Note F—Investments in Affiliates(a):
At October 31, 2019, the following Funds were held by other affiliated funds which are also managed by NBIA:
| | | Held by | | Percentage of
Outstanding
Shares Held | |
Emerging Markets Debt | | Neuberger Berman Global Allocation Fund | | | 0.13 | % | |
Emerging Markets Debt | | Neuberger Berman Multi-Asset Income Fund | | | 0.40 | % | |
Floating Rate Income | | Neuberger Berman Global Allocation Fund | | | 0.17 | % | |
Floating Rate Income | | Neuberger Berman Multi-Asset Income Fund | | | 0.57 | % | |
High Income | | Neuberger Berman Global Allocation Fund | | | 0.03 | % | |
High Income | | Neuberger Berman Multi-Asset Income Fund | | | 0.06 | % | |
Short Duration High Income | | Neuberger Berman Global Allocation Fund | | | 0.59 | % | |
In addition, at October 31, 2019, affiliated persons, as defined in the 1940 Act, owned 0.34%, 8.02%, 6.83%, 2.63%, 0.04%, 0.09%, 0.00%, 13.84%, 0.48% and 0.17% of the outstanding shares of Core Bond, Emerging Markets Debt, Floating Rate Income, High Income, Municipal High Income, Municipal Impact, Municipal Intermediate Bond, Short Duration High Income, Strategic Income, and Unconstrained Bond, respectively.
(a) Affiliated persons, as defined in the 1940 Act.
Note G—Legal Matters:
On June 1, 2015, High Income was served with a lawsuit filed in the United States Bankruptcy Court for the Southern District of New York, entitled Motors Liquidation Company Avoidance Action Trust vs. JPMorgan Chase Bank, N.A. et al. and numbered Adv. No. 09-00504 (MG). In addition to the Fund, the lawsuit also named over five hundred other institutional investors as defendants. The lawsuit did not allege any misconduct by the defendants, but sought to recover payments made by General Motors Corporation (n/k/a Motors Liquidation Company) and its affiliates (collectively, "GM") to the defendants shortly prior to and after GM's Chapter 11 bankruptcy filing on June 1, 2009 (the "Petition Date"). The complaint alleged that GM made the payments to the defendants under a certain term loan agreement, dated as of November 29, 2006, as amended by that first
269
amendment dated as of March 4, 2009 (the "Term Loan Agreement"); that the payments occurred both during the ninety (90) days prior to the Petition Date (the "Prepetition Transfer") and after the Petition Date when all amounts due under the Term Loan Agreement were paid in full in connection with GM's postpetition financing (the "Postpetition Transfer"); that the lien purportedly securing the Term Loan Agreement was not perfected as of the Petition Date; and that the lenders under the Term Loan Agreement should therefore have been treated as unsecured creditors rather than paid in full as secured creditors. The plaintiff sought avoidance of the lien securing the Term Loan Agreement as unperfected under Section 544(a) of the Bankruptcy Code; disgorgement of all amounts paid to the defendants as Postpetition Transfer (plus interest) under Section 549 of the Bankruptcy Code; and disallowance of any bankruptcy claims of the defendants against GM until they repay all such amounts under Section 502(d) of the Bankruptcy Code. On February 1, 2019, the parties informed the Bankruptcy Court that they reached an agreement on terms to resolve the lawsuit. On May 10, 2019, the settlement agreement was signed by all the parties necessary to commence the Bankruptcy Court approval process. The Bankruptcy Court entered an order approving the settlement agreement on June 13, 2019 and as part of the settlement the Fund was reimbursed a percentage of the legal expenses incurred in defending the lawsuit (approximately $23,416).
Note H—Recent Accounting Pronouncements:
In March 2017, FASB issued Accounting Standards Update No. 2017-08, "Receivables—Nonrefundable Fees and Other Costs (Subtopic 310-20), Premium Amortization on Purchased Callable Debt Securities" ("ASU 2017-08"). ASU 2017-08 shortens the amortization period to the earliest call date for certain purchased callable debt securities held at a premium. The guidance is effective for fiscal years, and interim periods within those fiscal years, beginning after December 15, 2018. Management is currently evaluating the impact of applying this guidance.
In August 2018, FASB issued Accounting Standards Update No. 2018-13, "Fair Value Measurement (Topic 820: Disclosure Framework—Changes to the Disclosure Requirements for Fair Value Measurement") ("ASU 2018-13"). ASU 2018-13 eliminates the requirement to disclose the amount of and reasons for transfers between Level 1 and Level 2 of the fair value hierarchy, the timing of transfers between levels of the fair value hierarchy and the valuation processes for Level 3 fair value measurements. ASU 2018-13 will require the disclosure of the range and weighted average used to develop significant unobservable inputs for Level 3 fair value measurements and the changes in unrealized gains and losses for recurring Level 3 fair value measurements. ASU 2018-13 will also require that information is provided about the measurement uncertainty of Level 3 fair value measurements as of the reporting date. The guidance is effective for fiscal years, and interim periods within those fiscal years, beginning after December 15, 2019, and allows for early adoption of either the entire standard or only the provisions that eliminate or modify the disclosure requirements. Management has elected to adopt early the provisions that eliminate the disclosure requirements. Management is still currently evaluating the impact of applying the rest of the guidance.
270
This page has been left blank intentionally
The following tables include selected data for a share outstanding throughout each period and other performance information
derived from the Financial Statements. Amounts that do not round to $0.01 or $(0.01) per share are presented as $0.00 or $(0.00),
respectively. Ratios that do not round to 0.01% or (0.01)% are presented as 0.00% or (0.00)%, respectively. Net Asset
amounts with a zero balance, if any, may reflect actual amounts rounding to less than $0.1 million. A "—" indicates that the line
item was not applicable in the corresponding period.
| | | Net Asset
Value,
Beginning
of Year | | Net
Investment
Income (Loss)@ | | Net Gains or
Losses on
Securities
(both
realized and
unrealized) | | Total From
Investment
Operations | | Dividends
from Net
Investment
Income | | Distributions
from Net
Realized
Capital Gains | | Tax
Return of
Capital | | Total
Distributions | |
Core Bond Fund | |
Investor Class | |
10/31/2019 | | $ | 9.77 | | | $ | 0.26 | | | $ | 0.78 | | | $ | 1.04 | | | $ | (0.24 | ) | | $ | — | | | $ | (0.06 | ) | | $ | (0.30 | ) | |
10/31/2018 | | $ | 10.31 | | | $ | 0.23 | | | $ | (0.52 | ) | | $ | (0.29 | ) | | $ | (0.22 | ) | | $ | — | | | $ | (0.03 | ) | | $ | (0.25 | ) | |
10/31/2017 | | $ | 10.54 | | | $ | 0.20 | | | $ | (0.15 | ) | | $ | 0.05 | | | $ | (0.19 | ) | | $ | (0.06 | ) | | $ | (0.03 | ) | | $ | (0.28 | ) | |
10/31/2016 | | $ | 10.37 | | | $ | 0.21 | | | $ | 0.22 | | | $ | 0.43 | | | $ | (0.22 | ) | | $ | (0.04 | ) | | $ | — | | | $ | (0.26 | ) | |
10/31/2015 | | $ | 10.50 | | | $ | 0.22 | | | $ | (0.09 | ) | | $ | 0.13 | | | $ | (0.19 | ) | | $ | (0.07 | ) | | $ | — | | | $ | (0.26 | ) | |
Institutional Class | |
10/31/2019 | | $ | 9.79 | | | $ | 0.30 | | | $ | 0.79 | | | $ | 1.09 | | | $ | (0.29 | ) | | $ | — | | | $ | (0.06 | ) | | $ | (0.35 | ) | |
10/31/2018 | | $ | 10.34 | | | $ | 0.28 | | | $ | (0.54 | ) | | $ | (0.26 | ) | | $ | (0.26 | ) | | $ | — | | | $ | (0.03 | ) | | $ | (0.29 | ) | |
10/31/2017 | | $ | 10.57 | | | $ | 0.24 | | | $ | (0.15 | ) | | $ | 0.09 | | | $ | (0.23 | ) | | $ | (0.06 | ) | | $ | (0.03 | ) | | $ | (0.32 | ) | |
10/31/2016 | | $ | 10.39 | | | $ | 0.25 | | | $ | 0.23 | | | $ | 0.48 | | | $ | (0.26 | ) | | $ | (0.04 | ) | | $ | — | | | $ | (0.30 | ) | |
10/31/2015 | | $ | 10.52 | | | $ | 0.26 | | | $ | (0.08 | ) | | $ | 0.18 | | | $ | (0.24 | ) | | $ | (0.07 | ) | | $ | — | | | $ | (0.31 | ) | |
Class A | |
10/31/2019 | | $ | 9.76 | | | $ | 0.26 | | | $ | 0.78 | | | $ | 1.04 | | | $ | (0.24 | ) | | $ | — | | | $ | (0.06 | ) | | $ | (0.30 | ) | |
10/31/2018 | | $ | 10.30 | | | $ | 0.23 | | | $ | (0.52 | ) | | $ | (0.29 | ) | | $ | (0.22 | ) | | $ | — | | | $ | (0.03 | ) | | $ | (0.25 | ) | |
10/31/2017 | | $ | 10.53 | | | $ | 0.20 | | | $ | (0.15 | ) | | $ | 0.05 | | | $ | (0.19 | ) | | $ | (0.06 | ) | | $ | (0.03 | ) | | $ | (0.28 | ) | |
10/31/2016 | | $ | 10.35 | | | $ | 0.21 | | | $ | 0.23 | | | $ | 0.44 | | | $ | (0.22 | ) | | $ | (0.04 | ) | | $ | — | | | $ | (0.26 | ) | |
10/31/2015 | | $ | 10.49 | | | $ | 0.22 | | | $ | (0.10 | ) | | $ | 0.12 | | | $ | (0.19 | ) | | $ | (0.07 | ) | | $ | — | | | $ | (0.26 | ) | |
Class C | |
10/31/2019 | | $ | 9.77 | | | $ | 0.19 | | | $ | 0.78 | | | $ | 0.97 | | | $ | (0.17 | ) | | $ | — | | | $ | (0.06 | ) | | $ | (0.23 | ) | |
10/31/2018 | | $ | 10.31 | | | $ | 0.16 | | | $ | (0.52 | ) | | $ | (0.36 | ) | | $ | (0.15 | ) | | $ | — | | | $ | (0.03 | ) | | $ | (0.18 | ) | |
10/31/2017 | | $ | 10.54 | | | $ | 0.13 | | | $ | (0.16 | ) | | $ | (0.03 | ) | | $ | (0.11 | ) | | $ | (0.06 | ) | | $ | (0.03 | ) | | $ | (0.20 | ) | |
10/31/2016 | | $ | 10.36 | | | $ | 0.13 | | | $ | 0.23 | | | $ | 0.36 | | | $ | (0.14 | ) | | $ | (0.04 | ) | | $ | — | | | $ | (0.18 | ) | |
10/31/2015 | | $ | 10.50 | | | $ | 0.14 | | | $ | (0.09 | ) | | $ | 0.05 | | | $ | (0.12 | ) | | $ | (0.07 | ) | | $ | — | | | $ | (0.19 | ) | |
Class R6 | |
Period from 1/18/2019^ to
10/31/2019 | | $ | 9.93 | | | $ | 0.24 | | | $ | 0.65 | | | $ | 0.89 | | | $ | (0.23 | ) | | $ | — | | | $ | (0.06 | ) | | $ | (0.29 | ) | |
See Notes to Financial Highlights
272
| | Voluntary
Contribution
from
Management | | Net Asset
Value, End of
Year | | Total
Returna | | Net Assets,
End of Year
(in millions) | | Ratio of
Gross
Expenses
to Average
Net Assets# | | Ratio of Net
Expenses
to Average
Net Assets | | Ratio of Net
Investment
Income/
(Loss) to
Average Net
Assets | | Portfolio
Turnover
Rate | |
Core Bond Fund | |
Investor Class | |
10/31/2019 | | $ | — | | | $ | 10.51 | | | | 10.81 | %b | | $ | 11.3 | | | | 1.12 | % | | | 0.85 | % | | | 2.60 | % | | | 147 | %c | |
10/31/2018 | | $ | — | | | $ | 9.77 | | | | (2.83 | )%b | | $ | 9.8 | | | | 1.12 | % | | | 0.86 | % | | | 2.32 | % | | | 136 | %c | |
10/31/2017 | | $ | — | | | $ | 10.31 | | | | 0.54 | %b | | $ | 11.0 | | | | 1.13 | % | | | 0.86 | % | | | 1.97 | % | | | 175 | %c | |
10/31/2016 | | $ | — | | | $ | 10.54 | | | | 4.16 | %b | | $ | 12.1 | | | | 1.15 | % | | | 0.86 | % | | | 2.00 | % | | | 148 | %c | |
10/31/2015 | | $ | — | | | $ | 10.37 | | | | 1.28 | % | | $ | 12.5 | | | | 1.14 | % | | | 0.85 | % | | | 2.08 | % | | | 125 | %c | |
Institutional Class | |
10/31/2019 | | $ | — | | | $ | 10.53 | | | | 11.24 | %b | | $ | 332.3 | | | | 0.55 | % | | | 0.45 | % | | | 2.98 | % | | | 147 | %c | |
10/31/2018 | | $ | — | | | $ | 9.79 | | | | (2.52 | )%b | | $ | 373.3 | | | | 0.54 | % | | | 0.46 | % | | | 2.73 | % | | | 136 | %c | |
10/31/2017 | | $ | — | | | $ | 10.34 | | | | 0.95 | %b | | $ | 338.0 | | | | 0.55 | % | | | 0.46 | % | | | 2.37 | % | | | 175 | %c | |
10/31/2016 | | $ | — | | | $ | 10.57 | | | | 4.67 | %b | | $ | 320.6 | | | | 0.59 | % | | | 0.46 | % | | | 2.40 | % | | | 148 | %c | |
10/31/2015 | | $ | — | | | $ | 10.39 | | | | 1.69 | % | | $ | 240.3 | | | | 0.61 | % | | | 0.45 | % | | | 2.49 | % | | | 125 | %c | |
Class A | |
10/31/2019 | | $ | — | | | $ | 10.50 | | | | 10.82 | %b | | $ | 19.4 | | | | 0.93 | % | | | 0.85 | % | | | 2.60 | % | | | 147 | %c | |
10/31/2018 | | $ | — | | | $ | 9.76 | | | | (2.83 | )%b | | $ | 18.3 | | | | 0.92 | % | | | 0.86 | % | | | 2.32 | % | | | 136 | %c | |
10/31/2017 | | $ | — | | | $ | 10.30 | | | | 0.54 | %b | | $ | 22.4 | | | | 0.93 | % | | | 0.86 | % | | | 1.96 | % | | | 175 | %c | |
10/31/2016 | | $ | — | | | $ | 10.53 | | | | 4.26 | %b | | $ | 25.9 | | | | 0.98 | % | | | 0.86 | % | | | 2.01 | % | | | 148 | %c | |
10/31/2015 | | $ | — | | | $ | 10.35 | | | | 1.18 | % | | $ | 30.5 | | | | 1.00 | % | | | 0.85 | % | | | 2.08 | % | | | 125 | %c | |
Class C | |
10/31/2019 | | $ | — | | | $ | 10.51 | | | | 9.99 | %b | | $ | 2.2 | | | | 1.68 | % | | | 1.60 | % | | | 1.85 | % | | | 147 | %c | |
10/31/2018 | | $ | — | | | $ | 9.77 | | | | (3.55 | )%b | | $ | 2.2 | | | | 1.67 | % | | | 1.61 | % | | | 1.56 | % | | | 136 | %c | |
10/31/2017 | | $ | — | | | $ | 10.31 | | | | (0.21 | )%b | | $ | 3.3 | | | | 1.68 | % | | | 1.61 | % | | | 1.22 | % | | | 175 | %c | |
10/31/2016 | | $ | — | | | $ | 10.54 | | | | 3.49 | %b | | $ | 4.9 | | | | 1.72 | % | | | 1.61 | % | | | 1.25 | % | | | 148 | %c | |
10/31/2015 | | $ | — | | | $ | 10.36 | | | | 0.43 | % | | $ | 3.4 | | | | 1.75 | % | | | 1.60 | % | | | 1.33 | % | | | 125 | %c | |
Class R6 | |
Period from 1/18/2019^ to
10/31/2019 | | $ | — | | | $ | 10.53 | | | | 9.06 | %b* | | $ | 3.4 | | | | 0.50 | %** | | | 0.36 | %** | | | 2.94 | %** | | | 147 | %c^^ | |
273
Financial Highlights (cont'd)
| | | Net Asset
Value,
Beginning
of Year | | Net
Investment
Income (Loss)@ | | Net Gains or
Losses on
Securities
(both
realized and
unrealized) | | Total From
Investment
Operations | | Dividends
from Net
Investment
Income | | Distributions
from Net
Realized
Capital Gains | | Tax
Return of
Capital | | Total
Distributions | |
Emerging Markets Debt Fund | |
Institutional Class | |
10/31/2019 | | $ | 8.03 | | | $ | 0.45 | | | $ | 0.59 | | | $ | 1.04 | | | $ | (0.27 | ) | | $ | — | | | $ | (0.17 | ) | | $ | (0.44 | ) | |
10/31/2018 | | $ | 9.02 | | | $ | 0.46 | | | $ | (0.99 | ) | | $ | (0.53 | ) | | $ | (0.29 | ) | | $ | — | | | $ | (0.17 | ) | | $ | (0.46 | ) | |
10/31/2017 | | $ | 8.90 | | | $ | 0.48 | | | $ | 0.10 | | | $ | 0.58 | | | $ | (0.42 | ) | | $ | — | | | $ | (0.04 | ) | | $ | (0.46 | ) | |
10/31/2016 | | $ | 8.41 | | | $ | 0.51 | | | $ | 0.48 | | | $ | 0.99 | | | $ | — | | | $ | — | | | $ | (0.50 | ) | | $ | (0.50 | ) | |
10/31/2015 | | $ | 9.94 | | | $ | 0.48 | | | $ | (1.52 | ) | | $ | (1.04 | ) | | $ | (0.08 | ) | | $ | (0.01 | ) | | $ | (0.40 | ) | | $ | (0.49 | ) | |
Class A | |
10/31/2019 | | $ | 8.02 | | | $ | 0.42 | | | $ | 0.59 | | | $ | 1.01 | | | $ | (0.24 | ) | | $ | — | | | $ | (0.17 | ) | | $ | (0.41 | ) | |
10/31/2018 | | $ | 9.01 | | | $ | 0.42 | | | $ | (0.98 | ) | | $ | (0.56 | ) | | $ | (0.26 | ) | | $ | — | | | $ | (0.17 | ) | | $ | (0.43 | ) | |
10/31/2017 | | $ | 8.90 | | | $ | 0.46 | | | $ | 0.08 | | | $ | 0.54 | | | $ | (0.39 | ) | | $ | — | | | $ | (0.04 | ) | | $ | (0.43 | ) | |
10/31/2016 | | $ | 8.41 | | | $ | 0.47 | | | $ | 0.49 | | | $ | 0.96 | | | $ | — | | | $ | — | | | $ | (0.47 | ) | | $ | (0.47 | ) | |
10/31/2015 | | $ | 9.94 | | | $ | 0.45 | | | $ | (1.52 | ) | | $ | (1.07 | ) | | $ | (0.08 | ) | | $ | (0.01 | ) | | $ | (0.37 | ) | | $ | (0.46 | ) | |
Class C | |
10/31/2019 | | $ | 8.02 | | | $ | 0.36 | | | $ | 0.59 | | | $ | 0.95 | | | $ | (0.18 | ) | | $ | — | | | $ | (0.17 | ) | | $ | (0.35 | ) | |
10/31/2018 | | $ | 9.01 | | | $ | 0.36 | | | $ | (0.99 | ) | | $ | (0.63 | ) | | $ | (0.19 | ) | | $ | — | | | $ | (0.17 | ) | | $ | (0.36 | ) | |
10/31/2017 | | $ | 8.90 | | | $ | 0.38 | | | $ | 0.09 | | | $ | 0.47 | | | $ | (0.32 | ) | | $ | — | | | $ | (0.04 | ) | | $ | (0.36 | ) | |
10/31/2016 | | $ | 8.41 | | | $ | 0.41 | | | $ | 0.49 | | | $ | 0.90 | | | $ | — | | | $ | — | | | $ | (0.41 | ) | | $ | (0.41 | ) | |
10/31/2015 | | $ | 9.94 | | | $ | 0.38 | | | $ | (1.52 | ) | | $ | (1.14 | ) | | $ | (0.06 | ) | | $ | (0.01 | ) | | $ | (0.32 | ) | | $ | (0.39 | ) | |
Floating Rate Income Fund | |
Institutional Class | |
10/31/2019 | | $ | 9.85 | | | $ | 0.50 | | | $ | (0.30 | ) | | $ | 0.20 | | | $ | (0.50 | ) | | $ | — | | | $ | — | | | $ | (0.50 | ) | |
10/31/2018 | | $ | 9.94 | | | $ | 0.43 | | | $ | (0.09 | ) | | $ | 0.34 | | | $ | (0.43 | ) | | $ | — | | | $ | — | | | $ | (0.43 | ) | |
10/31/2017 | | $ | 9.90 | | | $ | 0.36 | | | $ | 0.04 | | | $ | 0.40 | | | $ | (0.36 | ) | | $ | — | | | $ | (0.00 | ) | | $ | (0.36 | ) | |
10/31/2016 | | $ | 9.86 | | | $ | 0.39 | | | $ | 0.04 | | | $ | 0.43 | | | $ | (0.39 | ) | | $ | — | | | $ | (0.00 | ) | | $ | (0.39 | ) | |
10/31/2015 | | $ | 10.11 | | | $ | 0.40 | | | $ | (0.25 | ) | | $ | 0.15 | | | $ | (0.40 | ) | | $ | — | | | $ | — | | | $ | (0.40 | ) | |
Class A | |
10/31/2019 | | $ | 9.85 | | | $ | 0.46 | | | $ | (0.29 | ) | | $ | 0.17 | | | $ | (0.47 | ) | | $ | — | | | $ | — | | | $ | (0.47 | ) | |
10/31/2018 | | $ | 9.94 | | | $ | 0.39 | | | $ | (0.09 | ) | | $ | 0.30 | | | $ | (0.39 | ) | | $ | — | | | $ | — | | | $ | (0.39 | ) | |
10/31/2017 | | $ | 9.90 | | | $ | 0.32 | | | $ | 0.05 | | | $ | 0.37 | | | $ | (0.33 | ) | | $ | — | | | $ | (0.00 | ) | | $ | (0.33 | ) | |
10/31/2016 | | $ | 9.85 | | | $ | 0.35 | | | $ | 0.05 | | | $ | 0.40 | | | $ | (0.35 | ) | | $ | — | | | $ | (0.00 | ) | | $ | (0.35 | ) | |
10/31/2015 | | $ | 10.11 | | | $ | 0.36 | | | $ | (0.26 | ) | | $ | 0.10 | | | $ | (0.36 | ) | | $ | — | | | $ | — | | | $ | (0.36 | ) | |
See Notes to Financial Highlights
274
| | Voluntary
Contribution
from
Management | | Net Asset
Value, End of
Year | | Total
Returna | | Net Assets,
End of Year
(in millions) | | Ratio of
Gross
Expenses
to Average
Net Assets# | | Ratio of Net
Expenses
to Average
Net Assets | | Ratio of Net
Investment
Income/
(Loss) to
Average Net
Assets | | Portfolio
Turnover
Rate | |
Emerging Markets Debt Fund | |
Institutional Class | |
10/31/2019 | | $ | — | | | $ | 8.63 | | | | 13.26 | % | | $ | 158.5 | | | | 1.00 | % | | | 0.79 | % | | | 5.36 | % | | | 68 | % | |
10/31/2018 | | $ | — | | | $ | 8.03 | | | | (6.15 | )% | | $ | 194.8 | | | | 1.00 | % | | | 0.79 | % | | | 5.28 | % | | | 86 | % | |
10/31/2017 | | $ | — | | | $ | 9.02 | | | | 6.77 | % | | $ | 247.7 | | | | 1.02 | % | | | 0.81 | % | | | 5.41 | % | | | 64 | % | |
10/31/2016 | | $ | — | | | $ | 8.90 | | | | 12.17 | % | | $ | 120.2 | | | | 1.21 | % | | | 0.91 | % | | | 5.92 | % | | | 80 | % | |
10/31/2015 | | $ | 0.00 | | | $ | 8.41 | | | | (10.64 | )%d | | $ | 168.7 | | | | 1.07 | % | | | 0.90 | % | | | 5.35 | % | | | 100 | % | |
Class A | |
10/31/2019 | | $ | — | | | $ | 8.62 | | | | 12.85 | % | | $ | 3.2 | | | | 1.38 | % | | | 1.16 | % | | | 5.01 | % | | | 68 | % | |
10/31/2018 | | $ | — | | | $ | 8.02 | | | | (6.51 | )% | | $ | 8.8 | | | | 1.39 | % | | | 1.16 | % | | | 4.88 | % | | | 86 | % | |
10/31/2017 | | $ | — | | | $ | 9.01 | | | | 6.26 | % | | $ | 0.4 | | | | 1.42 | % | | | 1.16 | % | | | 5.04 | % | | | 64 | % | |
10/31/2016 | | $ | — | | | $ | 8.90 | | | | 11.76 | % | | $ | 0.1 | | | | 1.73 | % | | | 1.28 | % | | | 5.56 | % | | | 80 | % | |
10/31/2015 | | $ | 0.00 | | | $ | 8.41 | | | | (10.96 | )%d | | $ | 0.2 | | | | 1.53 | % | | | 1.27 | % | | | 5.04 | % | | | 100 | % | |
Class C | |
10/31/2019 | | $ | — | | | $ | 8.62 | | | | 12.01 | % | | $ | 0.4 | | | | 2.14 | % | | | 1.91 | % | | | 4.25 | % | | | 68 | % | |
10/31/2018 | | $ | — | | | $ | 8.02 | | | | (7.21 | )% | | $ | 0.5 | | | | 2.14 | % | | | 1.91 | % | | | 4.15 | % | | | 86 | % | |
10/31/2017 | | $ | — | | | $ | 9.01 | | | | 5.47 | % | | $ | 0.5 | | | | 2.13 | % | | | 1.90 | % | | | 4.31 | % | | | 64 | % | |
10/31/2016 | | $ | — | | | $ | 8.90 | | | | 10.93 | % | | $ | 0.3 | | | | 2.36 | % | | | 2.03 | % | | | 4.80 | % | | | 80 | % | |
10/31/2015 | | $ | 0.00 | | | $ | 8.41 | | | | (11.64 | )%d | | $ | 0.3 | | | | 2.21 | % | | | 2.02 | % | | | 4.23 | % | | | 100 | % | |
Floating Rate Income Fund | |
Institutional Class | |
10/31/2019 | | $ | — | | | $ | 9.55 | | | | 2.12 | % | | $ | 206.8 | | | | 0.89 | % | | | 0.71 | % | | | 5.16 | % | | | 60 | % | |
10/31/2018 | | $ | — | | | $ | 9.85 | | | | 3.45 | % | | $ | 333.4 | | | | 0.85 | % | | | 0.70 | % | | | 4.31 | % | | | 55 | % | |
10/31/2017 | | $ | — | | | $ | 9.94 | | | | 4.14 | % | | $ | 335.8 | | | | 0.82 | % | | | 0.70 | % | | | 3.67 | % | | | 76 | % | |
10/31/2016 | | $ | — | | | $ | 9.90 | | | | 4.52 | % | | $ | 254.4 | | | | 0.92 | % | | | 0.70 | % | | | 4.01 | % | | | 64 | % | |
10/31/2015 | | $ | — | | | $ | 9.86 | | | | 1.48 | % | | $ | 294.0 | | | | 0.84 | % | | | 0.70 | % | | | 3.96 | % | | | 44 | % | |
Class A | |
10/31/2019 | | $ | — | | | $ | 9.55 | | | | 1.75 | % | | $ | 6.5 | | | | 1.29 | % | | | 1.08 | % | | | 4.80 | % | | | 60 | % | |
10/31/2018 | | $ | — | | | $ | 9.85 | | | | 3.07 | % | | $ | 20.3 | | | | 1.23 | % | | | 1.07 | % | | | 3.94 | % | | | 55 | % | |
10/31/2017 | | $ | — | | | $ | 9.94 | | | | 3.76 | % | | $ | 17.4 | | | | 1.21 | % | | | 1.07 | % | | | 3.27 | % | | | 76 | % | |
10/31/2016 | | $ | — | | | $ | 9.90 | | | | 4.24 | % | | $ | 23.3 | | | | 1.31 | % | | | 1.07 | % | | | 3.65 | % | | | 64 | % | |
10/31/2015 | | $ | — | | | $ | 9.85 | | | | 1.00 | % | | $ | 21.1 | | | | 1.22 | % | | | 1.07 | % | | | 3.61 | % | | | 44 | % | |
275
Financial Highlights (cont'd)
| | | Net Asset
Value,
Beginning
of Year | | Net
Investment
Income (Loss)@ | | Net Gains or
Losses on
Securities
(both
realized and
unrealized) | | Total From
Investment
Operations | | Dividends
from Net
Investment
Income | | Distributions
from Net
Realized
Capital Gains | | Tax
Return of
Capital | | Total
Distributions | |
Floating Rate Income Fund (cont'd) | |
Class C | |
10/31/2019 | | $ | 9.85 | | | $ | 0.39 | | | $ | (0.30 | ) | | $ | 0.09 | | | $ | (0.39 | ) | | $ | — | | | $ | — | | | $ | (0.39 | ) | |
10/31/2018 | | $ | 9.94 | | | $ | 0.31 | | | $ | (0.08 | ) | | $ | 0.23 | | | $ | (0.32 | ) | | $ | — | | | $ | — | | | $ | (0.32 | ) | |
10/31/2017 | | $ | 9.90 | | | $ | 0.25 | | | $ | 0.04 | | | $ | 0.29 | | | $ | (0.25 | ) | | $ | — | | | $ | (0.00 | ) | | $ | (0.25 | ) | |
10/31/2016 | | $ | 9.86 | | | $ | 0.28 | | | $ | 0.04 | | | $ | 0.32 | | | $ | (0.28 | ) | | $ | — | | | $ | (0.00 | ) | | $ | (0.28 | ) | |
10/31/2015 | | $ | 10.11 | | | $ | 0.29 | | | $ | (0.25 | ) | | $ | 0.04 | | | $ | (0.29 | ) | | $ | — | | | $ | — | | | $ | (0.29 | ) | |
High Income Bond Fund | |
Investor Class | |
10/31/2019 | | $ | 8.35 | | | $ | 0.46 | | | $ | 0.17 | | | $ | 0.63 | | | $ | (0.46 | ) | | $ | — | | | $ | — | | | $ | (0.46 | ) | |
10/31/2018 | | $ | 8.79 | | | $ | 0.45 | | | $ | (0.44 | ) | | $ | 0.01 | | | $ | (0.45 | ) | | $ | — | | | $ | — | | | $ | (0.45 | ) | |
10/31/2017 | | $ | 8.68 | | | $ | 0.47 | | | $ | 0.11 | | | $ | 0.58 | | | $ | (0.47 | ) | | $ | — | | | $ | — | | | $ | (0.47 | ) | |
10/31/2016 | | $ | 8.50 | | | $ | 0.46 | | | $ | 0.18 | | | $ | 0.64 | | | $ | (0.46 | ) | | $ | — | | | $ | — | | | $ | (0.46 | ) | |
10/31/2015 | | $ | 9.28 | | | $ | 0.48 | | | $ | (0.72 | ) | | $ | (0.24 | ) | | $ | (0.48 | ) | | $ | (0.06 | ) | | $ | — | | | $ | (0.54 | ) | |
Institutional Class | |
10/31/2019 | | $ | 8.36 | | | $ | 0.47 | | | $ | 0.17 | | | $ | 0.64 | | | $ | (0.47 | ) | | $ | — | | | $ | — | | | $ | (0.47 | ) | |
10/31/2018 | | $ | 8.80 | | | $ | 0.47 | | | $ | (0.44 | ) | | $ | 0.03 | | | $ | (0.47 | ) | | $ | — | | | $ | — | | | $ | (0.47 | ) | |
10/31/2017 | | $ | 8.70 | | | $ | 0.48 | | | $ | 0.10 | | | $ | 0.58 | | | $ | (0.48 | ) | | $ | — | | | $ | — | | | $ | (0.48 | ) | |
10/31/2016 | | $ | 8.51 | | | $ | 0.48 | | | $ | 0.18 | | | $ | 0.66 | | | $ | (0.47 | ) | | $ | — | | | $ | — | | | $ | (0.47 | ) | |
10/31/2015 | | $ | 9.29 | | | $ | 0.50 | | | $ | (0.72 | ) | | $ | (0.22 | ) | | $ | (0.50 | ) | | $ | (0.06 | ) | | $ | — | | | $ | (0.56 | ) | |
Class A | |
10/31/2019 | | $ | 8.35 | | | $ | 0.44 | | | $ | 0.16 | | | $ | 0.60 | | | $ | (0.43 | ) | | $ | — | | | $ | — | | | $ | (0.43 | ) | |
10/31/2018 | | $ | 8.79 | | | $ | 0.43 | | | $ | (0.44 | ) | | $ | (0.01 | ) | | $ | (0.43 | ) | | $ | — | | | $ | — | | | $ | (0.43 | ) | |
10/31/2017 | | $ | 8.68 | | | $ | 0.44 | | | $ | 0.11 | | | $ | 0.55 | | | $ | (0.44 | ) | | $ | — | | | $ | — | | | $ | (0.44 | ) | |
10/31/2016 | | $ | 8.50 | | | $ | 0.44 | | | $ | 0.18 | | | $ | 0.62 | | | $ | (0.44 | ) | | $ | — | | | $ | — | | | $ | (0.44 | ) | |
10/31/2015 | | $ | 9.28 | | | $ | 0.47 | | | $ | (0.73 | ) | | $ | (0.26 | ) | | $ | (0.46 | ) | | $ | (0.06 | ) | | $ | — | | | $ | (0.52 | ) | |
Class C | |
10/31/2019 | | $ | 8.36 | | | $ | 0.38 | | | $ | 0.18 | | | $ | 0.56 | | | $ | (0.38 | ) | | $ | — | | | $ | — | | | $ | (0.38 | ) | |
10/31/2018 | | $ | 8.81 | | | $ | 0.37 | | | $ | (0.45 | ) | | $ | (0.08 | ) | | $ | (0.37 | ) | | $ | — | | | $ | — | | | $ | (0.37 | ) | |
10/31/2017 | | $ | 8.70 | | | $ | 0.38 | | | $ | 0.11 | | | $ | 0.49 | | | $ | (0.38 | ) | | $ | — | | | $ | — | | | $ | (0.38 | ) | |
10/31/2016 | | $ | 8.51 | | | $ | 0.38 | | | $ | 0.19 | | | $ | 0.57 | | | $ | (0.38 | ) | | $ | — | | | $ | — | | | $ | (0.38 | ) | |
10/31/2015 | | $ | 9.29 | | | $ | 0.40 | | | $ | (0.72 | ) | | $ | (0.32 | ) | | $ | (0.40 | ) | | $ | (0.06 | ) | | $ | — | | | $ | (0.46 | ) | |
See Notes to Financial Highlights
276
| | | Voluntary
Contribution
from
Management | | Net Asset
Value, End of
Year | | Total
Returna | | Net Assets,
End of Year
(in millions) | | Ratio of
Gross
Expenses
to Average
Net Assets# | | Ratio of Net
Expenses
to Average
Net Assets | | Ratio of Net
Investment
Income/
(Loss) to
Average Net
Assets | | Portfolio
Turnover
Rate | |
Floating Rate Income Fund (cont'd) | |
Class C | |
10/31/2019 | | $ | — | | | $ | 9.55 | | | | 0.99 | % | | $ | 11.6 | | | | 2.02 | % | | | 1.84 | % | | | 4.07 | % | | | 60 | % | |
10/31/2018 | | $ | — | | | $ | 9.85 | | | | 2.30 | % | | $ | 16.7 | | | | 1.97 | % | | | 1.82 | % | | | 3.17 | % | | | 55 | % | |
10/31/2017 | | $ | — | | | $ | 9.94 | | | | 2.99 | % | | $ | 20.6 | | | | 1.95 | % | | | 1.82 | % | | | 2.53 | % | | | 76 | % | |
10/31/2016 | | $ | — | | | $ | 9.90 | | | | 3.36 | % | | $ | 24.6 | | | | 2.05 | % | | | 1.82 | % | | | 2.91 | % | | | 64 | % | |
10/31/2015 | | $ | — | | | $ | 9.86 | | | | 0.35 | % | | $ | 27.2 | | | | 1.96 | % | | | 1.82 | % | | | 2.86 | % | | | 44 | % | |
High Income Bond Fund | |
Investor Class | |
10/31/2019 | | $ | — | | | $ | 8.52 | | | | 7.72 | % | | $ | 86.0 | | | | 0.86 | % | | | 0.86 | % | | | 5.44 | % | | | 96 | % | |
10/31/2018 | | $ | — | | | $ | 8.35 | | | | 0.14 | %b | | $ | 93.4 | | | | 0.85 | % | | | 0.85 | % | | | 5.28 | % | | | 46 | % | |
10/31/2017 | | $ | — | | | $ | 8.79 | | | | 6.84 | %bf | | $ | 112.7 | | | | 0.84 | % | | | 0.80 | %e | | | 5.38 | %e | | | 62 | % | |
10/31/2016 | | $ | — | | | $ | 8.68 | | | | 7.90 | %b | | $ | 134.8 | | | | 0.83 | % | | | 0.83 | % | | | 5.54 | % | | | 72 | % | |
10/31/2015 | | $ | — | | | $ | 8.50 | | | | (2.61 | )% | | $ | 182.1 | | | | 0.83 | % | | | 0.83 | % | | | 5.42 | % | | | 54 | % | |
Institutional Class | |
10/31/2019 | | $ | — | | | $ | 8.53 | | | | 7.89 | % | | $ | 1,471.8 | | | | 0.70 | % | | | 0.70 | % | | | 5.60 | % | | | 96 | % | |
10/31/2018 | | $ | — | | | $ | 8.36 | | | | 0.31 | %b | | $ | 1,202.7 | | | | 0.69 | % | | | 0.69 | % | | | 5.44 | % | | | 46 | % | |
10/31/2017 | | $ | — | | | $ | 8.80 | | | | 6.82 | %bf | | $ | 1,519.4 | | | | 0.70 | % | | | 0.70 | %e | | | 5.49 | %e | | | 62 | % | |
10/31/2016 | | $ | — | | | $ | 8.70 | | | | 8.17 | %b | | $ | 3,067.9 | | | | 0.69 | % | | | 0.69 | % | | | 5.67 | % | | | 72 | % | |
10/31/2015 | | $ | — | | | $ | 8.51 | | | | (2.46 | )% | | $ | 2,056.5 | | | | 0.69 | % | | | 0.69 | % | | | 5.56 | % | | | 54 | % | |
Class A | |
10/31/2019 | | $ | — | | | $ | 8.52 | | | | 7.43 | % | | $ | 25.1 | | | | 1.17 | % | | | 1.12 | % | | | 5.23 | % | | | 96 | % | |
10/31/2018 | | $ | — | | | $ | 8.35 | | | | (0.13 | )%b | | $ | 37.6 | | | | 1.14 | % | | | 1.12 | % | | | 4.98 | % | | | 46 | % | |
10/31/2017 | | $ | — | | | $ | 8.79 | | | | 6.49 | %bf | | $ | 76.8 | | | | 1.14 | % | | | 1.12 | %e | | | 5.05 | %e | | | 62 | % | |
10/31/2016 | | $ | — | | | $ | 8.68 | | | | 7.65 | %b | | $ | 93.3 | | | | 1.07 | % | | | 1.07 | % | | | 5.30 | % | | | 72 | % | |
10/31/2015 | | $ | — | | | $ | 8.50 | | | | (2.86 | )% | | $ | 102.1 | | | | 1.08 | % | | | 1.08 | % | | | 5.18 | % | | | 54 | % | |
Class C | |
10/31/2019 | | $ | — | | | $ | 8.54 | | | | 6.81 | % | | $ | 12.0 | | | | 1.83 | % | | | 1.83 | % | | | 4.48 | % | | | 96 | % | |
10/31/2018 | | $ | — | | | $ | 8.36 | | | | (0.93 | )%b | | $ | 16.0 | | | | 1.82 | % | | | 1.82 | % | | | 4.31 | % | | | 46 | % | |
10/31/2017 | | $ | — | | | $ | 8.81 | | | | 5.77 | %bf | | $ | 23.6 | | | | 1.81 | % | | | 1.81 | %e | | | 4.38 | %e | | | 62 | % | |
10/31/2016 | | $ | — | | | $ | 8.70 | | | | 6.98 | %b | | $ | 31.2 | | | | 1.81 | % | | | 1.81 | % | | | 4.57 | % | | | 72 | % | |
10/31/2015 | | $ | — | | | $ | 8.51 | | | | (3.55 | )% | | $ | 40.7 | | | | 1.81 | % | | | 1.81 | % | | | 4.45 | % | | | 54 | % | |
277
Financial Highlights (cont'd)
| | | Net Asset
Value,
Beginning
of Year | | Net
Investment
Income (Loss)@ | | Net Gains or
Losses on
Securities
(both
realized and
unrealized) | | Total From
Investment
Operations | | Dividends
from Net
Investment
Income | | Distributions
from Net
Realized
Capital Gains | | Tax
Return of
Capital | | Total
Distributions | |
High Income Bond Fund (cont'd) | |
Class R3 | |
10/31/2019 | | $ | 8.35 | | | $ | 0.42 | | | $ | 0.18 | | | $ | 0.60 | | | $ | (0.42 | ) | | $ | — | | | $ | — | | | $ | (0.42 | ) | |
10/31/2018 | | $ | 8.80 | | | $ | 0.41 | | | $ | (0.45 | ) | | $ | (0.04 | ) | | $ | (0.41 | ) | | $ | — | | | $ | — | | | $ | (0.41 | ) | |
10/31/2017 | | $ | 8.69 | | | $ | 0.42 | | | $ | 0.11 | | | $ | 0.53 | | | $ | (0.42 | ) | | $ | — | | | $ | — | | | $ | (0.42 | ) | |
10/31/2016 | | $ | 8.50 | | | $ | 0.42 | | | $ | 0.19 | | | $ | 0.61 | | | $ | (0.42 | ) | | $ | — | | | $ | — | | | $ | (0.42 | ) | |
10/31/2015 | | $ | 9.28 | | | $ | 0.44 | | | $ | (0.72 | ) | | $ | (0.28 | ) | | $ | (0.44 | ) | | $ | (0.06 | ) | | $ | — | | | $ | (0.50 | ) | |
Class R6 | |
10/31/2019 | | $ | 8.36 | | | $ | 0.48 | | | $ | 0.18 | | | $ | 0.66 | | | $ | (0.48 | ) | | $ | — | | | $ | — | | | $ | (0.48 | ) | |
10/31/2018 | | $ | 8.81 | | | $ | 0.47 | | | $ | (0.45 | ) | | $ | 0.02 | | | $ | (0.47 | ) | | $ | — | | | $ | — | | | $ | (0.47 | ) | |
10/31/2017 | | $ | 8.70 | | | $ | 0.49 | | | $ | 0.11 | | | $ | 0.60 | | | $ | (0.49 | ) | | $ | — | | | $ | — | | | $ | (0.49 | ) | |
10/31/2016 | | $ | 8.51 | | | $ | 0.48 | | | $ | 0.19 | | | $ | 0.67 | | | $ | (0.48 | ) | | $ | — | | | $ | — | | | $ | (0.48 | ) | |
10/31/2015 | | $ | 9.29 | | | $ | 0.50 | | | $ | (0.72 | ) | | $ | (0.22 | ) | | $ | (0.50 | ) | | $ | (0.06 | ) | | $ | — | | | $ | (0.56 | ) | |
Municipal High Income Fund | |
Institutional Class | |
10/31/2019 | | $ | 10.00 | | | $ | 0.36 | | | $ | 0.59 | | | $ | 0.95 | | | $ | (0.36 | ) | | $ | — | | | $ | — | | | $ | (0.36 | ) | |
10/31/2018 | | $ | 10.20 | | | $ | 0.36 | | | $ | (0.20 | ) | | $ | 0.16 | | | $ | (0.36 | ) | | $ | — | | | $ | — | | | $ | (0.36 | ) | |
10/31/2017 | | $ | 10.42 | | | $ | 0.36 | | | $ | (0.14 | ) | | $ | 0.22 | | | $ | (0.36 | ) | | $ | (0.08 | ) | | $ | — | | | $ | (0.44 | ) | |
10/31/2016 | | $ | 10.10 | | | $ | 0.35 | | | $ | 0.32 | | | $ | 0.67 | | | $ | (0.35 | ) | | $ | (0.00 | ) | | $ | — | | | $ | (0.35 | ) | |
Period from 6/22/2015^ to
10/31/2015 | | $ | 10.00 | | | $ | 0.13 | | | $ | 0.10 | | | $ | 0.23 | | | $ | (0.13 | ) | | $ | — | | | $ | — | | | $ | (0.13 | ) | |
Class A | |
10/31/2019 | | $ | 10.00 | | | $ | 0.32 | | | $ | 0.58 | | | $ | 0.90 | | | $ | (0.32 | ) | | $ | — | | | $ | — | | | $ | (0.32 | ) | |
10/31/2018 | | $ | 10.20 | | | $ | 0.33 | | | $ | (0.20 | ) | | $ | 0.13 | | | $ | (0.33 | ) | | $ | — | | | $ | — | | | $ | (0.33 | ) | |
10/31/2017 | | $ | 10.42 | | | $ | 0.32 | | | $ | (0.14 | ) | | $ | 0.18 | | | $ | (0.32 | ) | | $ | (0.08 | ) | | $ | — | | | $ | (0.40 | ) | |
10/31/2016 | | $ | 10.11 | | | $ | 0.30 | | | $ | 0.32 | | | $ | 0.62 | | | $ | (0.31 | ) | | $ | (0.00 | ) | | $ | — | | | $ | (0.31 | ) | |
Period from 6/22/2015^ to
10/31/2015 | | $ | 10.00 | | | $ | 0.12 | | | $ | 0.10 | | | $ | 0.22 | | | $ | (0.11 | ) | | $ | — | | | $ | — | | | $ | (0.11 | ) | |
Class C | |
10/31/2019 | | $ | 10.00 | | | $ | 0.24 | | | $ | 0.59 | | | $ | 0.83 | | | $ | (0.24 | ) | | $ | — | | | $ | — | | | $ | (0.24 | ) | |
10/31/2018 | | $ | 10.21 | | | $ | 0.25 | | | $ | (0.21 | ) | | $ | 0.04 | | | $ | (0.25 | ) | | $ | — | | | $ | — | | | $ | (0.25 | ) | |
10/31/2017 | | $ | 10.42 | | | $ | 0.24 | | | $ | (0.13 | ) | | $ | 0.11 | | | $ | (0.24 | ) | | $ | (0.08 | ) | | $ | — | | | $ | (0.32 | ) | |
10/31/2016 | | $ | 10.10 | | | $ | 0.23 | | | $ | 0.32 | | | $ | 0.55 | | | $ | (0.23 | ) | | $ | (0.00 | ) | | $ | — | | | $ | (0.23 | ) | |
Period from 6/22/2015^ to
10/31/2015 | | $ | 10.00 | | | $ | 0.09 | | | $ | 0.10 | | | $ | 0.19 | | | $ | (0.09 | ) | | $ | — | | | $ | — | | | $ | (0.09 | ) | |
See Notes to Financial Highlights
278
| | | Voluntary
Contribution
from
Management | | Net Asset
Value, End of
Year | | Total
Returna | | Net Assets,
End of Year
(in millions) | | Ratio of
Gross
Expenses
to Average
Net Assets# | | Ratio of Net
Expenses
to Average
Net Assets | | Ratio of Net
Investment
Income/
(Loss) to
Average Net
Assets | | Portfolio
Turnover
Rate | |
High Income Bond Fund (cont'd) | |
Class R3 | |
10/31/2019 | | $ | — | | | $ | 8.53 | | | | 7.37 | % | | $ | 4.2 | | | | 1.30 | % | | | 1.30 | % | | | 4.98 | % | | | 96 | % | |
10/31/2018 | | $ | — | | | $ | 8.35 | | | | (0.49 | )%b | | $ | 3.5 | | | | 1.37 | % | | | 1.37 | % | | | 4.77 | % | | | 46 | % | |
10/31/2017 | | $ | — | | | $ | 8.80 | | | | 6.20 | %bf | | $ | 12.3 | | | | 1.37 | % | | | 1.37 | %e§ | | | 4.81 | %e | | | 62 | % | |
10/31/2016 | | $ | — | | | $ | 8.69 | | | | 7.48 | %b | | $ | 6.6 | | | | 1.41 | % | | | 1.37 | % | | | 4.99 | % | | | 72 | % | |
10/31/2015 | | $ | — | | | $ | 8.50 | | | | (3.08 | )% | | $ | 7.5 | | | | 1.32 | % | | | 1.32 | % | | | 4.93 | % | | | 54 | % | |
Class R6 | |
10/31/2019 | | $ | — | | | $ | 8.54 | | | | 8.12 | % | | $ | 747.4 | | | | 0.60 | % | | | 0.60 | % | | | 5.69 | % | | | 96 | % | |
10/31/2018 | | $ | — | | | $ | 8.36 | | | | 0.26 | %b | | $ | 712.4 | | | | 0.63 | % | | | 0.63 | % | | | 5.48 | % | | | 46 | % | |
10/31/2017 | | $ | — | | | $ | 8.81 | | | | 7.03 | %bf | | $ | 1,503.1 | | | | 0.61 | % | | | 0.61 | %e | | | 5.56 | %e | | | 62 | % | |
10/31/2016 | | $ | — | | | $ | 8.70 | | | | 8.26 | %b | | $ | 908.2 | | | | 0.61 | % | | | 0.61 | % | | | 5.75 | % | | | 72 | % | |
10/31/2015 | | $ | — | | | $ | 8.51 | | | | (2.39 | )% | | $ | 805.9 | | | | 0.61 | % | | | 0.61 | % | | | 5.64 | % | | | 54 | % | |
Municipal High Income Fund | |
Institutional Class | |
10/31/2019 | | $ | — | | | $ | 10.59 | | | | 9.62 | % | | $ | 122.7 | | | | 0.86 | % | | | 0.50 | % | | | 3.46 | % | | | 112 | % | |
10/31/2018 | | $ | — | | | $ | 10.00 | | | | 1.61 | % | | $ | 87.6 | | | | 0.88 | % | | | 0.51 | % | | | 3.58 | % | | | 106 | % | |
10/31/2017 | | $ | — | | | $ | 10.20 | | | | 2.24 | % | | $ | 96.1 | | | | 0.86 | % | | | 0.50 | % | | | 3.53 | % | | | 107 | % | |
10/31/2016 | | $ | — | | | $ | 10.42 | | | | 6.70 | % | | $ | 122.4 | | | | 0.93 | % | | | 0.50 | % | | | 3.36 | % | | | 75 | % | |
Period from 6/22/2015^ to
10/31/2015 | | $ | — | | | $ | 10.10 | | | | 2.27 | %* | | $ | 22.9 | | | | 2.34 | %‡** | | | 0.50 | %‡** | | | 3.64 | %‡** | | | 37 | %* | |
Class A | |
10/31/2019 | | $ | — | | | $ | 10.58 | | | | 9.13 | % | | $ | 1.1 | | | | 1.30 | % | | | 0.87 | % | | | 3.10 | % | | | 112 | % | |
10/31/2018 | | $ | — | | | $ | 10.00 | | | | 1.24 | % | | $ | 0.8 | | | | 1.35 | % | | | 0.88 | % | | | 3.23 | % | | | 106 | % | |
10/31/2017 | | $ | — | | | $ | 10.20 | | | | 1.87 | % | | $ | 0.3 | | | | 1.40 | % | | | 0.87 | % | | | 3.20 | % | | | 107 | % | |
10/31/2016 | | $ | — | | | $ | 10.42 | | | | 6.21 | % | | $ | 0.8 | | | | 1.47 | % | | | 0.87 | % | | | 2.90 | % | | | 75 | % | |
Period from 6/22/2015^ to
10/31/2015 | | $ | — | | | $ | 10.11 | | | | 2.24 | %* | | $ | 5.0 | | | | 2.94 | %‡** | | | 0.86 | %‡** | | | 3.41 | %‡** | | | 37 | %* | |
Class C | |
10/31/2019 | | $ | — | | | $ | 10.59 | | | | 8.41 | % | | $ | 0.7 | | | | 1.99 | % | | | 1.62 | % | | | 2.32 | % | | | 112 | % | |
10/31/2018 | | $ | — | | | $ | 10.00 | | | | 0.38 | % | | $ | 0.5 | | | | 2.01 | % | | | 1.63 | % | | | 2.46 | % | | | 106 | % | |
10/31/2017 | | $ | — | | | $ | 10.21 | | | | 1.20 | % | | $ | 0.7 | | | | 1.99 | % | | | 1.62 | % | | | 2.41 | % | | | 107 | % | |
10/31/2016 | | $ | — | | | $ | 10.42 | | | | 5.52 | % | | $ | 0.3 | | | | 2.15 | % | | | 1.62 | % | | | 2.21 | % | | | 75 | % | |
Period from 6/22/2015^ to
10/31/2015 | | $ | — | | | $ | 10.10 | | | | 1.87 | %* | | $ | 0.5 | | | | 4.28 | %‡** | | | 1.58 | %‡** | | | 2.38 | %‡** | | | 37 | %* | |
279
Financial Highlights (cont'd)
| | | Net Asset
Value,
Beginning
of Year | | Net
Investment
Income (Loss)@ | | Net Gains or
Losses on
Securities
(both
realized and
unrealized) | | Total From
Investment
Operations | | Dividends
from Net
Investment
Income | | Distributions
from Net
Realized
Capital Gains | | Tax
Return of
Capital | | Total
Distributions | |
Municipal Impact Fund | |
Institutional Class | |
10/31/2019 | | $ | 16.61 | | | $ | 0.42 | | | $ | 1.05 | | | $ | 1.47 | | | $ | (0.42 | ) | | $ | — | | | $ | — | | | $ | (0.42 | ) | |
10/31/2018 | | $ | 17.32 | | | $ | 0.40 | | | $ | (0.68 | ) | | $ | (0.28 | ) | | $ | (0.40 | ) | | $ | (0.03 | ) | | $ | — | | | $ | (0.43 | ) | |
10/31/2017 | | $ | 17.76 | | | $ | 0.39 | | | $ | (0.25 | ) | | $ | 0.14 | | | $ | (0.39 | ) | | $ | (0.19 | ) | | $ | — | | | $ | (0.58 | ) | |
10/31/2016 | | $ | 17.60 | | | $ | 0.39 | | | $ | 0.20 | | | $ | 0.59 | | | $ | (0.39 | ) | | $ | (0.04 | ) | | $ | — | | | $ | (0.43 | ) | |
10/31/2015 | | $ | 17.72 | | | $ | 0.43 | | | $ | (0.08 | ) | | $ | 0.35 | | | $ | (0.43 | ) | | $ | (0.04 | ) | | $ | — | | | $ | (0.47 | ) | |
Class A | |
10/31/2019 | | $ | 16.61 | | | $ | 0.35 | | | $ | 1.06 | | | $ | 1.41 | | | $ | (0.35 | ) | | $ | — | | | $ | — | | | $ | (0.35 | ) | |
Period from 6/19/2018^ to
10/31/2018 | | $ | 16.90 | | | $ | 0.16 | | | $ | (0.29 | ) | | $ | (0.13 | ) | | $ | (0.16 | ) | | $ | — | | | $ | — | | | $ | (0.16 | ) | |
Class C | |
10/31/2019 | | $ | 16.61 | | | $ | 0.23 | | | $ | 1.05 | | | $ | 1.28 | | | $ | (0.22 | ) | | $ | — | | | $ | — | | | $ | (0.22 | ) | |
Period from 6/19/2018^ to
10/31/2018 | | $ | 16.90 | | | $ | 0.11 | | | $ | (0.29 | ) | | $ | (0.18 | ) | | $ | (0.11 | ) | | $ | — | | | $ | — | | | $ | (0.11 | ) | |
Municipal Intermediate Bond Fund | |
Investor Class | |
10/31/2019 | | $ | 11.39 | | | $ | 0.28 | | | $ | 0.68 | | | $ | 0.96 | | | $ | (0.29 | ) | | $ | (0.02 | ) | | $ | — | | | $ | (0.31 | ) | |
10/31/2018 | | $ | 11.81 | | | $ | 0.25 | | | $ | (0.38 | ) | | $ | (0.13 | ) | | $ | (0.25 | ) | | $ | (0.04 | ) | | $ | — | | | $ | (0.29 | ) | |
10/31/2017 | | $ | 11.97 | | | $ | 0.23 | | | $ | (0.08 | ) | | $ | 0.15 | | | $ | (0.23 | ) | | $ | (0.08 | ) | | $ | — | | | $ | (0.31 | ) | |
10/31/2016 | | $ | 11.86 | | | $ | 0.23 | | | $ | 0.13 | | | $ | 0.36 | | | $ | (0.23 | ) | | $ | (0.02 | ) | | $ | — | | | $ | (0.25 | ) | |
10/31/2015 | | $ | 11.92 | | | $ | 0.26 | | | $ | (0.05 | ) | | $ | 0.21 | | | $ | (0.26 | ) | | $ | (0.01 | ) | | $ | — | | | $ | (0.27 | ) | |
Institutional Class | |
10/31/2019 | | $ | 11.38 | | | $ | 0.30 | | | $ | 0.67 | | | $ | 0.97 | | | $ | (0.30 | ) | | $ | (0.02 | ) | | $ | — | | | $ | (0.32 | ) | |
10/31/2018 | | $ | 11.80 | | | $ | 0.27 | | | $ | (0.38 | ) | | $ | (0.11 | ) | | $ | (0.27 | ) | | $ | (0.04 | ) | | $ | — | | | $ | (0.31 | ) | |
10/31/2017 | | $ | 11.96 | | | $ | 0.25 | | | $ | (0.09 | ) | | $ | 0.16 | | | $ | (0.24 | ) | | $ | (0.08 | ) | | $ | — | | | $ | (0.32 | ) | |
10/31/2016 | | $ | 11.85 | | | $ | 0.25 | | | $ | 0.13 | | | $ | 0.38 | | | $ | (0.25 | ) | �� | $ | (0.02 | ) | | $ | — | | | $ | (0.27 | ) | |
10/31/2015 | | $ | 11.91 | | | $ | 0.28 | | | $ | (0.05 | ) | | $ | 0.23 | | | $ | (0.28 | ) | | $ | (0.01 | ) | | $ | — | | | $ | (0.29 | ) | |
Class A | |
10/31/2019 | | $ | 11.37 | | | $ | 0.25 | | | $ | 0.68 | | | $ | 0.93 | | | $ | (0.26 | ) | | $ | (0.02 | ) | | $ | — | | | $ | (0.28 | ) | |
10/31/2018 | | $ | 11.79 | | | $ | 0.23 | | | $ | (0.38 | ) | | $ | (0.15 | ) | | $ | (0.23 | ) | | $ | (0.04 | ) | | $ | — | | | $ | (0.27 | ) | |
10/31/2017 | | $ | 11.96 | | | $ | 0.20 | | | $ | (0.09 | ) | | $ | 0.11 | | | $ | (0.20 | ) | | $ | (0.08 | ) | | $ | (0.00 | ) | | $ | (0.28 | ) | |
10/31/2016 | | $ | 11.84 | | | $ | 0.21 | | | $ | 0.14 | | | $ | 0.35 | | | $ | (0.21 | ) | | $ | (0.02 | ) | | $ | — | | | $ | (0.23 | ) | |
10/31/2015 | | $ | 11.91 | | | $ | 0.24 | | | $ | (0.06 | ) | | $ | 0.18 | | | $ | (0.24 | ) | | $ | (0.01 | ) | | $ | — | | | $ | (0.25 | ) | |
See Notes to Financial Highlights
280
| | | Voluntary
Contribution
from
Management | | Net Asset
Value, End of
Year | | Total
Returna | | Net Assets,
End of Year
(in millions) | | Ratio of
Gross
Expenses
to Average
Net Assets# | | Ratio of Net
Expenses
to Average
Net Assets | | Ratio of Net
Investment
Income/
(Loss) to
Average Net
Assets | | Portfolio
Turnover
Rate | |
Municipal Impact Fund | |
Institutional Class | |
10/31/2019 | | $ | — | | | $ | 17.66 | | | | 8.93 | % | | $ | 59.0 | | | | 1.11 | % | | | 0.44 | % | | | 2.43 | % | | | 100 | % | |
10/31/2018 | | $ | — | | | $ | 16.61 | | | | (1.61 | )% | | $ | 52.3 | | | | 1.16 | %‡ | | | 0.87 | %‡ | | | 2.38 | %‡ | | | 92 | % | |
10/31/2017 | | $ | — | | | $ | 17.32 | | | | 0.84 | %f | | $ | 59.5 | | | | 0.92 | % | | | 0.92 | %e | | | 2.24 | %e | | | 46 | % | |
10/31/2016 | | $ | — | | | $ | 17.76 | | | | 3.38 | % | | $ | 62.3 | | | | 0.96 | % | | | 0.96 | % | | | 2.19 | % | | | 28 | % | |
10/31/2015 | | $ | — | | | $ | 17.60 | | | | 1.99 | % | | $ | 63.6 | | | | 0.89 | % | | | 0.89 | % | | | 2.42 | % | | | 17 | % | |
Class A | |
10/31/2019 | | $ | — | | | $ | 17.67 | | | | 8.58 | % | | $ | 0.1 | | | | 1.51 | % | | | 0.81 | % | | | 2.01 | % | | | 100 | % | |
Period from 6/19/2018^ to
10/31/2018 | | $ | — | | | $ | 16.61 | | | | (0.78 | )%* | | $ | 0.0 | | | | 1.77 | %‡** | | | 0.81 | %‡** | | | 2.47 | %‡** | | | 92 | %^^ | |
Class C | |
10/31/2019 | | $ | — | | | $ | 17.67 | | | | 7.75 | % | | $ | 0.0 | | | | 2.43 | % | | | 1.55 | % | | | 1.31 | % | | | 100 | % | |
Period from 6/19/2018^ to
10/31/2018 | | $ | — | | | $ | 16.61 | | | | (1.06 | )%* | | $ | 0.0 | | | | 2.55 | %‡** | | | 1.56 | %‡** | | | 1.71 | %‡** | | | 92 | %^^ | |
Municipal Intermediate Bond Fund | |
Investor Class | |
10/31/2019 | | $ | — | | | $ | 12.04 | | | | 8.46 | % | | $ | 13.3 | | | | 0.75 | % | | | 0.57 | % | | | 2.40 | % | | | 92 | % | |
10/31/2018 | | $ | — | | | $ | 11.39 | | | | (1.10 | )% | | $ | 12.8 | | | | 0.75 | % | | | 0.61 | % | | | 2.17 | % | | | 98 | % | |
10/31/2017 | | $ | — | | | $ | 11.81 | | | | 1.28 | % | | $ | 13.8 | | | | 0.78 | % | | | 0.65 | % | | | 1.94 | % | | | 71 | % | |
10/31/2016 | | $ | — | | | $ | 11.97 | | | | 3.09 | % | | $ | 15.8 | | | | 0.84 | % | | | 0.65 | % | | | 1.95 | % | | | 44 | % | |
10/31/2015 | | $ | — | | | $ | 11.86 | | | | 1.82 | % | | $ | 16.2 | | | | 0.84 | % | | | 0.65 | % | | | 2.21 | % | | | 22 | % | |
Institutional Class | |
10/31/2019 | | $ | — | | | $ | 12.03 | | | | 8.63 | % | | $ | 182.3 | | | | 0.55 | % | | | 0.42 | % | | | 2.54 | % | | | 92 | % | |
10/31/2018 | | $ | — | | | $ | 11.38 | | | | (0.95 | )% | | $ | 204.3 | | | | 0.55 | % | | | 0.46 | % | | | 2.32 | % | | | 98 | % | |
10/31/2017 | | $ | — | | | $ | 11.80 | | | | 1.43 | % | | $ | 200.1 | | | | 0.58 | % | | | 0.50 | % | | | 2.10 | % | | | 71 | % | |
10/31/2016 | | $ | — | | | $ | 11.96 | | | | 3.24 | % | | $ | 170.1 | | | | 0.65 | % | | | 0.50 | % | | | 2.10 | % | | | 44 | % | |
10/31/2015 | | $ | — | | | $ | 11.85 | | | | 1.97 | % | | $ | 137.0 | | | | 0.66 | % | | | 0.50 | % | | | 2.36 | % | | | 22 | % | |
Class A | |
10/31/2019 | | $ | — | | | $ | 12.02 | | | | 8.24 | % | | $ | 1.8 | | | | 0.94 | % | | | 0.80 | % | | | 2.15 | % | | | 92 | % | |
10/31/2018 | | $ | — | | | $ | 11.37 | | | | (1.32 | )% | | $ | 6.5 | | | | 0.93 | % | | | 0.83 | % | | | 1.95 | % | | | 98 | % | |
10/31/2017 | | $ | — | | | $ | 11.79 | | | | 0.96 | % | | $ | 6.7 | | | | 0.96 | % | | | 0.87 | % | | | 1.72 | % | | | 71 | % | |
10/31/2016 | | $ | — | | | $ | 11.96 | | | | 2.95 | % | | $ | 10.1 | | | | 1.03 | % | | | 0.87 | % | | | 1.70 | % | | | 44 | % | |
10/31/2015 | | $ | — | | | $ | 11.84 | | | | 1.51 | % | | $ | 3.7 | | | | 1.04 | % | | | 0.87 | % | | | 2.00 | % | | | 22 | % | |
281
Financial Highlights (cont'd)
| | | Net Asset
Value,
Beginning
of Year | | Net
Investment
Income (Loss)@ | | Net Gains or
Losses on
Securities
(both
realized and
unrealized) | | Total From
Investment
Operations | | Dividends
from Net
Investment
Income | | Distributions
from Net
Realized
Capital Gains | | Tax
Return of
Capital | | Total
Distributions | |
Municipal Intermediate Bond Fund (cont'd) | |
Class C | |
10/31/2019 | | $ | 11.37 | | | $ | 0.17 | | | $ | 0.67 | | | $ | 0.84 | | | $ | (0.17 | ) | | $ | (0.02 | ) | | $ | — | | | $ | (0.19 | ) | |
10/31/2018 | | $ | 11.80 | | | $ | 0.14 | | | $ | (0.39 | ) | | $ | (0.25 | ) | | $ | (0.14 | ) | | $ | (0.04 | ) | | $ | — | | | $ | (0.18 | ) | |
10/31/2017 | | $ | 11.96 | | | $ | 0.11 | | | $ | (0.08 | ) | | $ | 0.03 | | | $ | (0.11 | ) | | $ | (0.08 | ) | | $ | — | | | $ | (0.19 | ) | |
10/31/2016 | | $ | 11.84 | | | $ | 0.12 | | | $ | 0.14 | | | $ | 0.26 | | | $ | (0.12 | ) | | $ | (0.02 | ) | | $ | — | | | $ | (0.14 | ) | |
10/31/2015 | | $ | 11.91 | | | $ | 0.15 | | | $ | (0.06 | ) | | $ | 0.09 | | | $ | (0.15 | ) | | $ | (0.01 | ) | | $ | — | | | $ | (0.16 | ) | |
Short Duration Bond Fund | |
Investor Class | |
10/31/2019 | | $ | 7.66 | | | $ | 0.17 | | | $ | 0.16 | | | $ | 0.33 | | | $ | (0.19 | ) | | $ | — | | | $ | — | | | $ | (0.19 | ) | |
10/31/2018 | | $ | 7.79 | | | $ | 0.12 | | | $ | (0.10 | ) | | $ | 0.02 | | | $ | (0.15 | ) | | $ | — | | | $ | — | | | $ | (0.15 | ) | |
10/31/2017 | | $ | 7.86 | | | $ | 0.07 | | | $ | (0.04 | ) | | $ | 0.03 | | | $ | (0.10 | ) | | $ | — | | | $ | — | | | $ | (0.10 | ) | |
10/31/2016 | | $ | 7.87 | | | $ | 0.06 | | | $ | 0.02 | | | $ | 0.08 | | | $ | (0.09 | ) | | $ | — | | | $ | — | | | $ | (0.09 | ) | |
10/31/2015 | | $ | 7.92 | | | $ | 0.01 | | | $ | 0.02 | | | $ | 0.03 | | | $ | (0.08 | ) | | $ | — | | | $ | — | | | $ | (0.08 | ) | |
Trust Class | |
10/31/2019 | | $ | 7.30 | | | $ | 0.15 | | | $ | 0.16 | | | $ | 0.31 | | | $ | (0.18 | ) | | $ | — | | | $ | — | | | $ | (0.18 | ) | |
10/31/2018 | | $ | 7.43 | | | $ | 0.10 | | | $ | (0.10 | ) | | $ | 0.00 | | | $ | (0.13 | ) | | $ | — | | | $ | — | | | $ | (0.13 | ) | |
10/31/2017 | | $ | 7.49 | | | $ | 0.06 | | | $ | (0.03 | ) | | $ | 0.03 | | | $ | (0.09 | ) | | $ | — | | | $ | — | | | $ | (0.09 | ) | |
10/31/2016 | | $ | 7.50 | | | $ | 0.04 | | | $ | 0.03 | | | $ | 0.07 | | | $ | (0.08 | ) | | $ | — | | | $ | — | | | $ | (0.08 | ) | |
10/31/2015 | | $ | 7.55 | | | $ | 0.00 | | | $ | 0.02 | | | $ | 0.02 | | | $ | (0.07 | ) | | $ | — | | | $ | — | | | $ | (0.07 | ) | |
Institutional Class | |
10/31/2019 | | $ | 7.65 | | | $ | 0.18 | | | $ | 0.17 | | | $ | 0.35 | | | $ | (0.21 | ) | | $ | — | | | $ | — | | | $ | (0.21 | ) | |
10/31/2018 | | $ | 7.79 | | | $ | 0.13 | | | $ | (0.11 | ) | | $ | 0.02 | | | $ | (0.16 | ) | | $ | — | | | $ | — | | | $ | (0.16 | ) | |
10/31/2017 | | $ | 7.85 | | | $ | 0.09 | | | $ | (0.03 | ) | | $ | 0.06 | | | $ | (0.12 | ) | | $ | — | | | $ | — | | | $ | (0.12 | ) | |
10/31/2016 | | $ | 7.87 | | | $ | 0.07 | | | $ | 0.01 | | | $ | 0.08 | | | $ | (0.10 | ) | | $ | — | | | $ | — | | | $ | (0.10 | ) | |
10/31/2015 | | $ | 7.92 | | | $ | 0.03 | | | $ | 0.02 | | | $ | 0.05 | | | $ | (0.10 | ) | | $ | — | | | $ | — | | | $ | (0.10 | ) | |
Class A | |
10/31/2019 | | $ | 7.30 | | | $ | 0.14 | | | $ | 0.16 | | | $ | 0.30 | | | $ | (0.17 | ) | | $ | — | | | $ | — | | | $ | (0.17 | ) | |
10/31/2018 | | $ | 7.42 | | | $ | 0.09 | | | $ | (0.08 | ) | | $ | 0.01 | | | $ | (0.13 | ) | | $ | — | | | $ | — | | | $ | (0.13 | ) | |
10/31/2017 | | $ | 7.49 | | | $ | 0.05 | | | $ | (0.04 | ) | | $ | 0.01 | | | $ | (0.08 | ) | | $ | — | | | $ | — | | | $ | (0.08 | ) | |
10/31/2016 | | $ | 7.49 | | | $ | 0.04 | | | $ | 0.03 | | | $ | 0.07 | | | $ | (0.07 | ) | | $ | — | | | $ | — | | | $ | (0.07 | ) | |
10/31/2015 | | $ | 7.55 | | | $ | 0.00 | | | $ | 0.01 | | | $ | 0.01 | | | $ | (0.07 | ) | | $ | — | | | $ | — | | | $ | (0.07 | ) | |
See Notes to Financial Highlights
282
| | | Voluntary
Contribution
from
Management | | Net Asset
Value, End of
Year | | Total
Returna | | Net Assets,
End of Year
(in millions) | | Ratio of
Gross
Expenses
to Average
Net Assets# | | Ratio of Net
Expenses
to Average
Net Assets | | Ratio of Net
Investment
Income/
(Loss) to
Average Net
Assets | | Portfolio
Turnover
Rate | |
Municipal Intermediate Bond Fund (cont'd) | |
Class C | |
10/31/2019 | | $ | — | | | $ | 12.02 | | | | 7.43 | % | | $ | 2.6 | | | | 1.68 | % | | | 1.54 | % | | | 1.43 | % | | | 92 | % | |
10/31/2018 | | $ | — | | | $ | 11.37 | | | | (2.14 | )% | | $ | 3.2 | | | | 1.68 | % | | | 1.58 | % | | | 1.20 | % | | | 98 | % | |
10/31/2017 | | $ | — | | | $ | 11.80 | | | | 0.30 | % | | $ | 3.2 | | | | 1.71 | % | | | 1.62 | % | | | 0.97 | % | | | 71 | % | |
10/31/2016 | | $ | — | | | $ | 11.96 | | | | 2.18 | % | | $ | 4.1 | | | | 1.78 | % | | | 1.62 | % | | | 0.96 | % | | | 44 | % | |
10/31/2015 | | $ | — | | | $ | 11.84 | | | | 0.76 | % | | $ | 2.2 | | | | 1.80 | % | | | 1.62 | % | | | 1.24 | % | | | 22 | % | |
Short Duration Bond Fund | |
Investor Class | |
10/31/2019 | | $ | — | | | $ | 7.80 | | | | 4.40 | %b | | $ | 21.8 | | | | 1.03 | % | | | 0.59 | % | | | 2.18 | % | | | 131 | % | |
10/31/2018 | | $ | — | | | $ | 7.66 | | | | 0.22 | %b | | $ | 20.9 | | | | 1.09 | % | | | 0.63 | % | | | 1.50 | % | | | 99 | % | |
10/31/2017 | | $ | — | | | $ | 7.79 | | | | 0.41 | %b | | $ | 24.0 | | | | 1.10 | % | | | 0.70 | % | | | 0.88 | % | | | 107 | % | |
10/31/2016 | | $ | — | | | $ | 7.86 | | | | 0.98 | %b | | $ | 28.9 | | | | 1.21 | % | | | 0.70 | % | | | 0.70 | % | | | 104 | % | |
10/31/2015 | | $ | — | | | $ | 7.87 | | | | 0.44 | % | | $ | 29.9 | | | | 1.27 | % | | | 0.70 | % | | | 0.13 | % | | | 75 | % | |
Trust Class | |
10/31/2019 | | $ | — | | | $ | 7.43 | | | | 4.25 | %b | | $ | 2.0 | | | | 1.15 | % | | | 0.69 | % | | | 2.07 | % | | | 131 | % | |
10/31/2018 | | $ | — | | | $ | 7.30 | | | | 0.04 | %b | | $ | 2.1 | | | | 1.21 | % | | | 0.73 | % | | | 1.42 | % | | | 99 | % | |
10/31/2017 | | $ | — | | | $ | 7.43 | | | | 0.40 | %b | | $ | 2.3 | | | | 1.23 | % | | | 0.80 | % | | | 0.78 | % | | | 107 | % | |
10/31/2016 | | $ | — | | | $ | 7.49 | | | | 0.88 | %b | | $ | 2.6 | | | | 1.36 | % | | | 0.80 | % | | | 0.60 | % | | | 104 | % | |
10/31/2015 | | $ | — | | | $ | 7.50 | | | | 0.30 | % | | $ | 3.0 | | | | 1.43 | % | | | 0.80 | % | | | 0.03 | % | | | 75 | % | |
Institutional Class | |
10/31/2019 | | $ | — | | | $ | 7.79 | | | | 4.62 | %b | | $ | 56.3 | | | | 0.78 | % | | | 0.39 | % | | | 2.37 | % | | | 131 | % | |
10/31/2018 | | $ | — | | | $ | 7.65 | | | | 0.29 | %b | | $ | 54.7 | | | | 0.84 | % | | | 0.43 | % | | | 1.71 | % | | | 99 | % | |
10/31/2017 | | $ | — | | | $ | 7.79 | | | | 0.74 | %b | | $ | 72.8 | | | | 0.84 | % | | | 0.50 | % | | | 1.10 | % | | | 107 | % | |
10/31/2016 | | $ | — | | | $ | 7.85 | | | | 1.06 | %b | | $ | 48.3 | | | | 0.99 | % | | | 0.50 | % | | | 0.91 | % | | | 104 | % | |
10/31/2015 | | $ | — | | | $ | 7.87 | | | | 0.64 | % | | $ | 30.3 | | | | 1.04 | % | | | 0.50 | % | | | 0.32 | % | | | 75 | % | |
Class A | |
10/31/2019 | | $ | — | | | $ | 7.43 | | | | 4.18 | %b | | $ | 0.8 | | | | 1.17 | % | | | 0.76 | % | | | 1.92 | % | | | 131 | % | |
10/31/2018 | | $ | — | | | $ | 7.30 | | | | 0.11 | %b | | $ | 1.4 | | | | 1.24 | % | | | 0.81 | % | | | 1.28 | % | | | 99 | % | |
10/31/2017 | | $ | — | | | $ | 7.42 | | | | 0.20 | %b | | $ | 2.5 | | | | 1.24 | % | | | 0.87 | % | | | 0.69 | % | | | 107 | % | |
10/31/2016 | | $ | — | | | $ | 7.49 | | | | 0.94 | %b | | $ | 4.9 | | | | 1.36 | % | | | 0.87 | % | | | 0.54 | % | | | 104 | % | |
10/31/2015 | | $ | — | | | $ | 7.49 | | | | 0.10 | % | | $ | 4.1 | | | | 1.41 | % | | | 0.87 | % | | | (0.03 | )% | | | 75 | % | |
283
Financial Highlights (cont'd)
| | | Net Asset
Value,
Beginning
of Year | | Net
Investment
Income (Loss)@ | | Net Gains or
Losses on
Securities
(both
realized and
unrealized) | | Total From
Investment
Operations | | Dividends
from Net
Investment
Income | | Distributions
from Net
Realized
Capital Gains | | Tax
Return of
Capital | | Total
Distributions | |
Short Duration Bond Fund (cont'd) | |
Class C | |
10/31/2019 | | $ | 7.29 | | | $ | 0.09 | | | $ | 0.17 | | | $ | 0.26 | | | $ | (0.12 | ) | | $ | — | | | $ | — | | | $ | (0.12 | ) | |
10/31/2018 | | $ | 7.42 | | | $ | 0.04 | | | $ | (0.10 | ) | | $ | (0.06 | ) | | $ | (0.07 | ) | | $ | — | | | $ | — | | | $ | (0.07 | ) | |
10/31/2017 | | $ | 7.49 | | | $ | (0.00 | ) | | $ | (0.04 | ) | | $ | (0.04 | ) | | $ | (0.03 | ) | | $ | — | | | $ | — | | | $ | (0.03 | ) | |
10/31/2016 | | $ | 7.50 | | | $ | (0.02 | ) | | $ | 0.02 | | | $ | 0.00 | | | $ | (0.01 | ) | | $ | — | | | $ | — | | | $ | (0.01 | ) | |
10/31/2015 | | $ | 7.55 | | | $ | (0.06 | ) | | $ | 0.02 | | | $ | (0.04 | ) | | $ | (0.01 | ) | | $ | — | | | $ | — | | | $ | (0.01 | ) | |
Short Duration High Income Fund | |
Institutional Class | |
10/31/2019 | | $ | 9.43 | | | $ | 0.44 | | | $ | 0.12 | | | $ | 0.56 | | | $ | (0.44 | ) | | $ | — | | | $ | — | | | $ | (0.44 | ) | |
10/31/2018 | | $ | 9.75 | | | $ | 0.41 | | | $ | (0.32 | ) | | $ | 0.09 | | | $ | (0.41 | ) | | $ | — | | | $ | — | | | $ | (0.41 | ) | |
10/31/2017 | | $ | 9.69 | | | $ | 0.41 | | | $ | 0.06 | | | $ | 0.47 | | | $ | (0.41 | ) | | $ | — | | | $ | — | | | $ | (0.41 | ) | |
10/31/2016 | | $ | 9.63 | | | $ | 0.40 | | | $ | 0.06 | | | $ | 0.46 | | | $ | (0.40 | ) | | $ | — | | | $ | — | | | $ | (0.40 | ) | |
10/31/2015 | | $ | 10.05 | | | $ | 0.40 | | | $ | (0.42 | ) | | $ | (0.02 | ) | | $ | (0.40 | ) | | $ | — | | | $ | — | | | $ | (0.40 | ) | |
Class A | |
10/31/2019 | | $ | 9.43 | | | $ | 0.40 | | | $ | 0.14 | | | $ | 0.54 | | | $ | (0.41 | ) | | $ | — | | | $ | — | | | $ | (0.41 | ) | |
10/31/2018 | | $ | 9.76 | | | $ | 0.38 | | | $ | (0.33 | ) | | $ | 0.05 | | | $ | (0.38 | ) | | $ | — | | | $ | — | | | $ | (0.38 | ) | |
10/31/2017 | | $ | 9.70 | | | $ | 0.38 | | | $ | 0.05 | | | $ | 0.43 | | | $ | (0.37 | ) | | $ | — | | | $ | — | | | $ | (0.37 | ) | |
10/31/2016 | | $ | 9.63 | | | $ | 0.36 | | | $ | 0.07 | | | $ | 0.43 | | | $ | (0.36 | ) | | $ | — | | | $ | — | | | $ | (0.36 | ) | |
10/31/2015 | | $ | 10.05 | | | $ | 0.36 | | | $ | (0.42 | ) | | $ | (0.06 | ) | | $ | (0.36 | ) | | $ | — | | | $ | — | | | $ | (0.36 | ) | |
Class C | |
10/31/2019 | | $ | 9.42 | | | $ | 0.33 | | | $ | 0.13 | | | $ | 0.46 | | | $ | (0.33 | ) | | $ | — | | | $ | — | | | $ | (0.33 | ) | |
10/31/2018 | | $ | 9.75 | | | $ | 0.31 | | | $ | (0.33 | ) | | $ | (0.02 | ) | | $ | (0.31 | ) | | $ | — | | | $ | — | | | $ | (0.31 | ) | |
10/31/2017 | | $ | 9.69 | | | $ | 0.30 | | | $ | 0.06 | | | $ | 0.36 | | | $ | (0.30 | ) | | $ | — | | | $ | — | | | $ | (0.30 | ) | |
10/31/2016 | | $ | 9.63 | | | $ | 0.29 | | | $ | 0.06 | | | $ | 0.35 | | | $ | (0.29 | ) | | $ | — | | | $ | — | | | $ | (0.29 | ) | |
10/31/2015 | | $ | 10.05 | | | $ | 0.29 | | | $ | (0.42 | ) | | $ | (0.13 | ) | | $ | (0.29 | ) | | $ | — | | | $ | — | | | $ | (0.29 | ) | |
Strategic Income Fund | |
Trust Class | |
10/31/2019 | | $ | 10.61 | | | $ | 0.38 | | | $ | 0.41 | | | $ | 0.79 | | | $ | (0.35 | ) | | $ | — | | | $ | (0.06 | ) | | $ | (0.41 | ) | |
10/31/2018 | | $ | 11.15 | | | $ | 0.37 | | | $ | (0.51 | ) | | $ | (0.14 | ) | | $ | (0.40 | ) | | $ | — | | | $ | — | | | $ | (0.40 | ) | |
10/31/2017 | | $ | 11.06 | | | $ | 0.33 | | | $ | 0.11 | | | $ | 0.44 | | | $ | (0.34 | ) | | $ | — | | | $ | (0.01 | ) | | $ | (0.35 | ) | |
10/31/2016 | | $ | 10.79 | | | $ | 0.32 | | | $ | 0.30 | | | $ | 0.62 | | | $ | (0.34 | ) | | $ | — | | | $ | (0.01 | ) | | $ | (0.35 | ) | |
10/31/2015 | | $ | 11.32 | | | $ | 0.32 | | | $ | (0.43 | ) | | $ | (0.11 | ) | | $ | (0.32 | ) | | $ | (0.06 | ) | | $ | (0.04 | ) | | $ | (0.42 | ) | |
See Notes to Financial Highlights
284
| | Voluntary
Contribution
from
Management | | Net Asset
Value, End of
Year | | Total
Returna | | Net Assets,
End of Year
(in millions) | | Ratio of
Gross
Expenses
to Average
Net Assets# | | Ratio of Net
Expenses
to Average
Net Assets | | Ratio of Net
Investment
Income/
(Loss) to
Average Net
Assets | | Portfolio
Turnover
Rate | |
Short Duration Bond Fund (cont'd) | |
Class C | |
10/31/2019 | | $ | — | | | $ | 7.43 | | | | 3.55 | %b | | $ | 1.4 | | | | 1.92 | % | | | 1.51 | % | | | 1.26 | % | | | 131 | % | |
10/31/2018 | | $ | — | | | $ | 7.29 | | | | (0.78 | )%b | | $ | 1.2 | | | | 1.98 | % | | | 1.55 | % | | | 0.57 | % | | | 99 | % | |
10/31/2017 | | $ | — | | | $ | 7.42 | | | | (0.55 | )%b | | $ | 1.6 | | | | 1.99 | % | | | 1.62 | % | | | (0.06 | )% | | | 107 | % | |
10/31/2016 | | $ | — | | | $ | 7.49 | | | | 0.05 | %b | | $ | 3.0 | | | | 2.11 | % | | | 1.62 | % | | | (0.20 | )% | | | 104 | % | |
10/31/2015 | | $ | — | | | $ | 7.50 | | | | (0.49 | )% | | $ | 2.0 | | | | 2.17 | % | | | 1.62 | % | | | (0.79 | )% | | | 75 | % | |
Short Duration High Income Fund | |
Institutional Class | |
10/31/2019 | | $ | — | | | $ | 9.55 | | | | 6.06 | % | | $ | 28.5 | | | | 1.28 | % | | | 0.76 | % | | | 4.64 | % | | | 64 | % | |
10/31/2018 | | $ | — | | | $ | 9.43 | | | | 0.98 | % | | $ | 78.4 | | | | 1.05 | % | | | 0.75 | % | | | 4.30 | % | | | 78 | % | |
10/31/2017 | | $ | — | | | $ | 9.75 | | | | 4.94 | % | | $ | 114.7 | | | | 0.94 | % | | | 0.75 | % | | | 4.20 | % | | | 84 | % | |
10/31/2016 | | $ | — | | | $ | 9.69 | | | | 4.92 | % | | $ | 107.0 | | | | 0.87 | % | | | 0.75 | % | | | 4.20 | % | | | 51 | % | |
10/31/2015 | | $ | — | | | $ | 9.63 | | | | (0.22 | )% | | $ | 235.0 | | | | 0.81 | % | | | 0.75 | % | | | 4.05 | % | | | 45 | % | |
Class A | |
10/31/2019 | | $ | — | | | $ | 9.56 | | | | 5.78 | % | | $ | 1.1 | | | | 1.82 | % | | | 1.13 | % | | | 4.26 | % | | | 64 | % | |
10/31/2018 | | $ | — | | | $ | 9.43 | | | | 0.51 | % | | $ | 1.1 | | | | 1.47 | % | | | 1.12 | % | | | 3.92 | % | | | 78 | % | |
10/31/2017 | | $ | — | | | $ | 9.76 | | | | 4.55 | % | | $ | 2.6 | | | | 1.35 | % | | | 1.12 | % | | | 3.86 | % | | | 84 | % | |
10/31/2016 | | $ | — | | | $ | 9.70 | | | | 4.64 | % | | $ | 3.4 | | | | 1.30 | % | | | 1.12 | % | | | 3.82 | % | | | 51 | % | |
10/31/2015 | | $ | — | | | $ | 9.63 | | | | (0.59 | )% | | $ | 2.8 | | | | 1.21 | % | | | 1.12 | % | | | 3.68 | % | | | 45 | % | |
Class C | |
10/31/2019 | | $ | — | | | $ | 9.55 | | | | 5.00 | % | | $ | 1.0 | | | | 2.52 | % | | | 1.88 | % | | | 3.52 | % | | | 64 | % | |
10/31/2018 | | $ | — | | | $ | 9.42 | | | | (0.24 | )% | | $ | 1.0 | | | | 2.21 | % | | | 1.88 | % | | | 3.20 | % | | | 78 | % | |
10/31/2017 | | $ | — | | | $ | 9.75 | | | | 3.78 | % | | $ | 1.1 | | | | 2.09 | % | | | 1.87 | % | | | 3.10 | % | | | 84 | % | |
10/31/2016 | | $ | — | | | $ | 9.69 | | | | 3.77 | % | | $ | 1.2 | | | | 2.05 | % | | | 1.87 | % | | | 3.10 | % | | | 51 | % | |
10/31/2015 | | $ | — | | | $ | 9.63 | | | | (1.33 | )% | | $ | 0.3 | | | | 1.99 | % | | | 1.87 | % | | | 2.93 | % | | | 45 | % | |
Strategic Income Fund | |
Trust Class | |
10/31/2019 | | $ | — | | | $ | 10.99 | | | | 7.60 | %b | | $ | 8.6 | | | | 1.02 | % | | | 0.94 | % | | | 3.53 | % | | | 113 | %c | |
10/31/2018 | | $ | — | | | $ | 10.61 | | | | (1.24 | )%b | | $ | 19.5 | | | | 1.00 | % | | | 0.94 | % | | | 3.37 | % | | | 116 | %c | |
10/31/2017 | | $ | — | | | $ | 11.15 | | | | 4.09 | %b | | $ | 20.0 | | | | 1.00 | % | | | 0.94 | % | | | 3.03 | % | | | 136 | %c | |
10/31/2016 | | $ | — | | | $ | 11.06 | | | | 5.91 | % | | $ | 27.7 | | | | 1.14 | % | | | 1.09 | % | | | 2.99 | % | | | 141 | %c | |
10/31/2015 | | $ | — | | | $ | 10.79 | | | | (1.03 | )%b | | $ | 53.1 | | | | 1.14 | % | | | 1.06 | % | | | 2.90 | % | | | 103 | %c | |
285
Financial Highlights (cont'd)
| | | Net Asset
Value,
Beginning
of Year | | Net
Investment
Income (Loss)@ | | Net Gains or
Losses on
Securities
(both
realized and
unrealized) | | Total From
Investment
Operations | | Dividends
from Net
Investment
Income | | Distributions
from Net
Realized
Capital Gains | | Tax
Return of
Capital | | Total
Distributions | |
Strategic Income Fund (cont'd) | |
Institutional Class | |
10/31/2019 | | $ | 10.62 | | | $ | 0.42 | | | $ | 0.40 | | | $ | 0.82 | | | $ | (0.39 | ) | | $ | — | | | $ | (0.06 | ) | | $ | (0.45 | ) | |
10/31/2018 | | $ | 11.16 | | | $ | 0.41 | | | $ | (0.51 | ) | | $ | (0.10 | ) | | $ | (0.44 | ) | | $ | — | | | $ | — | | | $ | (0.44 | ) | |
10/31/2017 | | $ | 11.07 | | | $ | 0.37 | | | $ | 0.11 | | | $ | 0.48 | | | $ | (0.38 | ) | | $ | — | | | $ | (0.01 | ) | | $ | (0.39 | ) | |
10/31/2016 | | $ | 10.79 | | | $ | 0.36 | | | $ | 0.31 | | | $ | 0.67 | | | $ | (0.38 | ) | | $ | — | | | $ | (0.01 | ) | | $ | (0.39 | ) | |
10/31/2015 | | $ | 11.32 | | | $ | 0.36 | | | $ | (0.43 | ) | | $ | (0.07 | ) | | $ | (0.35 | ) | | $ | (0.07 | ) | | $ | (0.04 | ) | | $ | (0.46 | ) | |
Class A | |
10/31/2019 | | $ | 10.63 | | | $ | 0.37 | | | $ | 0.41 | | | $ | 0.78 | | | $ | (0.35 | ) | | $ | — | | | $ | (0.06 | ) | | $ | (0.41 | ) | |
10/31/2018 | | $ | 11.17 | | | $ | 0.36 | | | $ | (0.50 | ) | | $ | (0.14 | ) | | $ | (0.40 | ) | | $ | — | | | $ | — | | | $ | (0.40 | ) | |
10/31/2017 | | $ | 11.08 | | | $ | 0.33 | | | $ | 0.11 | | | $ | 0.44 | | | $ | (0.34 | ) | | $ | — | | | $ | (0.01 | ) | | $ | (0.35 | ) | |
10/31/2016 | | $ | 10.80 | | | $ | 0.32 | | | $ | 0.31 | | | $ | 0.63 | | | $ | (0.34 | ) | | $ | — | | | $ | (0.01 | ) | | $ | (0.35 | ) | |
10/31/2015 | | $ | 11.33 | | | $ | 0.32 | | | $ | (0.43 | ) | | $ | (0.11 | ) | | $ | (0.32 | ) | | $ | (0.06 | ) | | $ | (0.04 | ) | | $ | (0.42 | ) | |
Class C | |
10/31/2019 | | $ | 10.62 | | | $ | 0.30 | | | $ | 0.40 | | | $ | 0.70 | | | $ | (0.27 | ) | | $ | — | | | $ | (0.06 | ) | | $ | (0.33 | ) | |
10/31/2018 | | $ | 11.15 | | | $ | 0.29 | | | $ | (0.50 | ) | | $ | (0.21 | ) | | $ | (0.32 | ) | | $ | — | | | $ | — | | | $ | (0.32 | ) | |
10/31/2017 | | $ | 11.06 | | | $ | 0.25 | | | $ | 0.11 | | | $ | 0.36 | | | $ | (0.26 | ) | | $ | — | | | $ | (0.01 | ) | | $ | (0.27 | ) | |
10/31/2016 | | $ | 10.79 | | | $ | 0.24 | | | $ | 0.30 | | | $ | 0.54 | | | $ | (0.26 | ) | | $ | — | | | $ | (0.01 | ) | | $ | (0.27 | ) | |
10/31/2015 | | $ | 11.32 | | | $ | 0.24 | | | $ | (0.43 | ) | | $ | (0.19 | ) | | $ | (0.24 | ) | | $ | (0.06 | ) | | $ | (0.04 | ) | | $ | (0.34 | ) | |
Class R6 | |
10/31/2019 | | $ | 10.61 | | | $ | 0.43 | | | $ | 0.40 | | | $ | 0.83 | | | $ | (0.40 | ) | | $ | — | | | $ | (0.06 | ) | | $ | (0.46 | ) | |
10/31/2018 | | $ | 11.15 | | | $ | 0.42 | | | $ | (0.51 | ) | | $ | (0.09 | ) | | $ | (0.45 | ) | | $ | — | | | $ | — | | | $ | (0.45 | ) | |
10/31/2017 | | $ | 11.06 | | | $ | 0.38 | | | $ | 0.11 | | | $ | 0.49 | | | $ | (0.39 | ) | | $ | — | | | $ | (0.01 | ) | | $ | (0.40 | ) | |
10/31/2016 | | $ | 10.79 | | | $ | 0.37 | | | $ | 0.30 | | | $ | 0.67 | | | $ | (0.39 | ) | | $ | — | | | $ | (0.01 | ) | | $ | (0.40 | ) | |
10/31/2015 | | $ | 11.32 | | | $ | 0.37 | | | $ | (0.43 | ) | | $ | (0.06 | ) | | $ | (0.36 | ) | | $ | (0.07 | ) | | $ | (0.04 | ) | | $ | (0.47 | ) | |
Unconstrained Bond Fund | |
Institutional Class | |
10/31/2019 | | $ | 9.30 | | | $ | 0.32 | | | $ | (0.47 | ) | | $ | (0.15 | ) | | $ | (0.24 | ) | | $ | — | | | $ | (0.09 | ) | | $ | (0.33 | ) | |
10/31/2018 | | $ | 9.41 | | | $ | 0.29 | | | $ | (0.17 | ) | | $ | 0.12 | | | $ | (0.23 | ) | | $ | — | | | $ | — | | | $ | (0.23 | ) | |
10/31/2017 | | $ | 9.18 | | | $ | 0.23 | | | $ | 0.14 | | | $ | 0.37 | | | $ | (0.10 | ) | | $ | — | | | $ | (0.04 | ) | | $ | (0.14 | ) | |
10/31/2016 | | $ | 9.38 | | | $ | 0.27 | | | $ | (0.20 | ) | | $ | 0.07 | | | $ | — | | | $ | — | | | $ | (0.27 | ) | | $ | (0.27 | ) | |
10/31/2015 | | $ | 9.89 | | | $ | 0.27 | | | $ | (0.49 | ) | | $ | (0.22 | ) | | $ | (0.16 | ) | | $ | — | | | $ | (0.13 | ) | | $ | (0.29 | ) | |
See Notes to Financial Highlights
286
| | Voluntary
Contribution
from
Management | | Net Asset
Value, End of
Year | | Total
Returna | | Net Assets,
End of Year
(in millions) | | Ratio of
Gross
Expenses
to Average
Net Assets# | | Ratio of Net
Expenses
to Average
Net Assets | | Ratio of Net
Investment
Income/
(Loss) to
Average Net
Assets | | Portfolio
Turnover
Rate | |
Strategic Income Fund (cont'd) | |
Institutional Class | |
10/31/2019 | | $ | — | | | $ | 10.99 | | | | 7.87 | %b | | $ | 2,357.5 | | | | 0.62 | % | | | 0.59 | % | | | 3.84 | % | | | 113 | %c | |
10/31/2018 | | $ | — | | | $ | 10.62 | | | | (0.89 | )%b | | $ | 2,219.8 | | | | 0.62 | % | | | 0.59 | % | | | 3.75 | % | | | 116 | %c | |
10/31/2017 | | $ | — | | | $ | 11.16 | | | | 4.45 | %b | | $ | 2,041.0 | | | | 0.63 | % | | | 0.59 | % | | | 3.37 | % | | | 136 | %c | |
10/31/2016 | | $ | — | | | $ | 11.07 | | | | 6.38 | % | | $ | 1,436.8 | | | | 0.78 | % | | | 0.74 | % | | | 3.33 | % | | | 141 | %c | |
10/31/2015 | | $ | — | | | $ | 10.79 | | | | (0.69 | )%b | | $ | 1,355.2 | | | | 0.78 | % | | | 0.71 | % | | | 3.25 | % | | | 103 | %c | |
Class A | |
10/31/2019 | | $ | — | | | $ | 11.00 | | | | 7.44 | %b | | $ | 113.5 | | | | 1.01 | % | | | 0.99 | % | | | 3.45 | % | | | 113 | %c | |
10/31/2018 | | $ | — | | | $ | 10.63 | | | | (1.29 | )%b | | $ | 160.8 | | | | 1.01 | % | | | 0.99 | % | | | 3.32 | % | | | 116 | %c | |
10/31/2017 | | $ | — | | | $ | 11.17 | | | | 4.03 | %b | | $ | 193.1 | | | | 1.02 | % | | | 1.00 | % | | | 2.98 | % | | | 136 | %c | |
10/31/2016 | | $ | — | | | $ | 11.08 | | | | 5.95 | % | | $ | 290.5 | | | | 1.18 | % | | | 1.14 | % | | | 2.96 | % | | | 141 | %c | |
10/31/2015 | | $ | — | | | $ | 10.80 | | | | (1.08 | )%b | | $ | 360.8 | | | | 1.17 | % | | | 1.11 | % | | | 2.84 | % | | | 103 | %c | |
Class C | |
10/31/2019 | | $ | — | | | $ | 10.99 | | | | 6.70 | %b | | $ | 100.5 | | | | 1.74 | % | | | 1.69 | % | | | 2.75 | % | | | 113 | %c | |
10/31/2018 | | $ | — | | | $ | 10.62 | | | | (1.89 | )%b | | $ | 122.2 | | | | 1.74 | % | | | 1.69 | % | | | 2.62 | % | | | 116 | %c | |
10/31/2017 | | $ | — | | | $ | 11.15 | | | | 3.31 | %b | | $ | 150.2 | | | | 1.75 | % | | | 1.69 | % | | | 2.28 | % | | | 136 | %c | |
10/31/2016 | | $ | — | | | $ | 11.06 | | | | 5.13 | % | | $ | 183.9 | | | | 1.91 | % | | | 1.84 | % | | | 2.45 | % | | | 141 | %c | |
10/31/2015 | | $ | — | | | $ | 10.79 | | | | (1.77 | )%b | | $ | 202.9 | | | | 1.91 | % | | | 1.81 | % | | | 2.14 | % | | | 103 | %c | |
Class R6 | |
10/31/2019 | | $ | — | | | $ | 10.98 | | | | 7.98 | %b | | $ | 301.4 | | | | 0.52 | % | | | 0.50 | % | | | 3.94 | % | | | 113 | %c | |
10/31/2018 | | $ | — | | | $ | 10.61 | | | | (0.83 | )%b | | $ | 348.7 | | | | 0.55 | % | | | 0.52 | % | | | 3.82 | % | | | 116 | %c | |
10/31/2017 | | $ | — | | | $ | 11.15 | | | | 4.52 | %b | | $ | 311.0 | | | | 0.56 | % | | | 0.52 | % | | | 3.43 | % | | | 136 | %c | |
10/31/2016 | | $ | — | | | $ | 11.06 | | | | 6.36 | % | | $ | 206.5 | | | | 0.71 | % | | | 0.67 | % | | | 3.43 | % | | | 141 | %c | |
10/31/2015 | | $ | — | | | $ | 10.79 | | | | (0.62 | )%b | | $ | 230.9 | | | | 0.71 | % | | | 0.64 | % | | | 3.32 | % | | | 103 | %c | |
Unconstrained Bond Fund | |
Institutional Class | |
10/31/2019 | | $ | — | | | $ | 8.82 | | | | (1.66 | )% | | $ | 21.2 | | | | 1.13 | % | | | 0.66 | % | | | 3.52 | % | | | 61 | %c | |
10/31/2018 | | $ | — | | | $ | 9.30 | | | | 1.24 | %b | | $ | 43.8 | | | | 1.06 | % | | | 0.67 | % | | | 3.03 | % | | | 57 | %c | |
10/31/2017 | | $ | — | | | $ | 9.41 | | | | 4.05 | % | | $ | 45.8 | | | | 1.30 | % | | | 0.68 | % | | | 2.48 | % | | | 73 | %c | |
10/31/2016 | | $ | — | | | $ | 9.18 | | | | 0.79 | % | | $ | 4.7 | | | | 1.24 | % | | | 0.66 | % | | | 3.01 | % | | | 50 | %c | |
10/31/2015 | | $ | — | | | $ | 9.38 | | | | (2.28 | )% | | $ | 189.1 | | | | 1.27 | % | | | 0.67 | % | | | 2.80 | % | | | 75 | %c | |
287
Financial Highlights (cont'd)
| | | Net Asset
Value,
Beginning
of Year | | Net
Investment
Income (Loss)@ | | Net Gains or
Losses on
Securities
(both
realized and
unrealized) | | Total From
Investment
Operations | | Dividends
from Net
Investment
Income | | Distributions
from Net
Realized
Capital Gains | | Tax
Return of
Capital | | Total
Distributions | |
Unconstrained Bond Fund (cont'd) | |
Class A | |
10/31/2019 | | $ | 9.28 | | | $ | 0.28 | | | $ | (0.44 | ) | | $ | (0.16 | ) | | $ | (0.20 | ) | | $ | — | | | $ | (0.09 | ) | | $ | (0.29 | ) | |
10/31/2018 | | $ | 9.41 | | | $ | 0.25 | | | $ | (0.19 | ) | | $ | 0.06 | | | $ | (0.19 | ) | | $ | — | | | $ | — | | | $ | (0.19 | ) | |
10/31/2017 | | $ | 9.17 | | | $ | 0.20 | | | $ | 0.15 | | | $ | 0.35 | | | $ | (0.07 | ) | | $ | — | | | $ | (0.04 | ) | | $ | (0.11 | ) | |
10/31/2016 | | $ | 9.37 | | | $ | 0.22 | | | $ | (0.19 | ) | | $ | 0.03 | | | $ | — | | | $ | — | | | $ | (0.23 | ) | | $ | (0.23 | ) | |
10/31/2015 | | $ | 9.89 | | | $ | 0.26 | | | $ | (0.53 | ) | | $ | (0.27 | ) | | $ | (0.12 | ) | | $ | — | | | $ | (0.13 | ) | | $ | (0.25 | ) | |
Class C | |
10/31/2019 | | $ | 9.31 | | | $ | 0.21 | | | $ | (0.47 | ) | | $ | (0.26 | ) | | $ | (0.13 | ) | | $ | — | | | $ | (0.09 | ) | | $ | (0.22 | ) | |
10/31/2018 | | $ | 9.42 | | | $ | 0.18 | | | $ | (0.17 | ) | | $ | 0.01 | | | $ | (0.12 | ) | | $ | — | | | $ | — | | | $ | (0.12 | ) | |
10/31/2017 | | $ | 9.18 | | | $ | 0.13 | | | $ | 0.15 | | | $ | 0.28 | | | $ | (0.00 | ) | | $ | — | | | $ | (0.04 | ) | | $ | (0.04 | ) | |
10/31/2016 | | $ | 9.38 | | | $ | 0.17 | | | $ | (0.20 | ) | | $ | (0.03 | ) | | $ | — | | | $ | — | | | $ | (0.17 | ) | | $ | (0.17 | ) | |
10/31/2015 | | $ | 9.89 | | | $ | 0.19 | | | $ | (0.52 | ) | | $ | (0.33 | ) | | $ | (0.05 | ) | | $ | — | | | $ | (0.13 | ) | | $ | (0.18 | ) | |
Class R6 | |
10/31/2019 | | $ | 9.31 | | | $ | 0.33 | | | $ | (0.48 | ) | | $ | (0.15 | ) | | $ | (0.24 | ) | | $ | — | | | $ | (0.09 | ) | | $ | (0.33 | ) | |
10/31/2018 | | $ | 9.42 | | | $ | 0.29 | | | $ | (0.17 | ) | | $ | 0.12 | | | $ | (0.23 | ) | | $ | — | | | $ | — | | | $ | (0.23 | ) | |
10/31/2017 | | $ | 9.19 | | | $ | 0.24 | | | $ | 0.14 | | | $ | 0.38 | | | $ | (0.11 | ) | | $ | — | | | $ | (0.04 | ) | | $ | (0.15 | ) | |
10/31/2016 | | $ | 9.38 | | | $ | 0.25 | | | $ | (0.17 | ) | | $ | 0.08 | | | $ | — | | | $ | — | | | $ | (0.27 | ) | | $ | (0.27 | ) | |
10/31/2015 | | $ | 9.89 | | | $ | 0.31 | | | $ | (0.53 | ) | | $ | (0.22 | ) | | $ | (0.16 | ) | | $ | — | | | $ | (0.13 | ) | | $ | (0.29 | ) | |
See Notes to Financial Highlights
288
| | Voluntary
Contribution
from
Management | | Net Asset
Value, End of
Year | | Total
Returna | | Net Assets,
End of Year
(in millions) | | Ratio of
Gross
Expenses
to Average
Net Assets# | | Ratio of Net
Expenses
to Average
Net Assets | | Ratio of Net
Investment
Income/
(Loss) to
Average Net
Assets | | Portfolio
Turnover
Rate | |
Unconstrained Bond Fund (cont'd) | |
Class A | |
10/31/2019 | | $ | — | | | $ | 8.83 | | | | (1.70 | )% | | $ | 0.2 | | | | 1.70 | % | | | 1.03 | % | | | 3.13 | % | | | 61 | %c | |
10/31/2018 | | $ | — | | | $ | 9.28 | | | | 0.65 | %b | | $ | 0.4 | | | | 1.50 | % | | | 1.04 | % | | | 2.67 | % | | | 57 | %c | |
10/31/2017 | | $ | — | | | $ | 9.41 | | | | 3.78 | % | | $ | 0.5 | | | | 1.78 | % | | | 1.06 | % | | | 2.13 | % | | | 73 | %c | |
10/31/2016 | | $ | — | | | $ | 9.17 | | | | 0.41 | % | | $ | 0.6 | | | | 1.61 | % | | | 1.03 | % | | | 2.48 | % | | | 50 | %c | |
10/31/2015 | | $ | — | | | $ | 9.37 | | | | (2.74 | )% | | $ | 0.1 | | | | 1.76 | % | | | 1.14 | % | | | 2.73 | % | | | 75 | %c | |
Class C | |
10/31/2019 | | $ | — | | | $ | 8.83 | | | | (2.75 | )% | | $ | 0.0 | | | | 2.36 | % | | | 1.77 | % | | | 2.36 | % | | | 61 | %c | |
10/31/2018 | | $ | — | | | $ | 9.31 | | | | 0.12 | %b | | $ | 0.0 | | | | 2.26 | % | | | 1.78 | % | | | 1.94 | % | | | 57 | %c | |
10/31/2017 | | $ | — | | | $ | 9.42 | | | | 3.02 | % | | $ | 0.0 | | | | 2.56 | % | | | 1.81 | % | | | 1.38 | % | | | 73 | %c | |
10/31/2016 | | $ | — | | | $ | 9.18 | | | | (0.34 | )% | | $ | 0.0 | | | | 2.40 | % | | | 1.78 | % | | | 1.86 | % | | | 50 | %c | |
10/31/2015 | | $ | — | | | $ | 9.38 | | | | (3.36 | )% | | $ | 0.2 | | | | 2.50 | % | | | 1.87 | % | | | 1.96 | % | | | 75 | %c | |
Class R6 | |
10/31/2019 | | $ | — | | | $ | 8.83 | | | | (1.56 | )% | | $ | 31.8 | | | | 1.04 | % | | | 0.56 | % | | | 3.62 | % | | | 61 | %c | |
10/31/2018 | | $ | — | | | $ | 9.31 | | | | 1.31 | %b | | $ | 54.3 | | | | 0.99 | % | | | 0.60 | % | | | 3.12 | % | | | 57 | %c | |
10/31/2017 | | $ | — | | | $ | 9.42 | | | | 4.12 | % | | $ | 52.8 | | | | 1.26 | % | | | 0.62 | % | | | 2.57 | % | | | 73 | %c | |
10/31/2016 | | $ | — | | | $ | 9.19 | | | | 0.97 | % | | $ | 49.7 | | | | 1.13 | % | | | 0.59 | % | | | 2.66 | % | | | 50 | %c | |
10/31/2015 | | $ | — | | | $ | 9.38 | | | | (2.21 | )% | | $ | 0.2 | | | | 1.32 | % | | | 0.70 | % | | | 3.19 | % | | | 75 | %c | |
289
Notes to Financial Highlights Income Funds
# Represents the annualized ratios of net expenses to average daily net assets if Management had not reimbursed certain expenses and/or waived a portion of the investment management fee and if High Income and Municipal Impact had not received refunds, plus interest, from State Street noted in (f) below for custodian out-of-pocket expenses previously paid during the year ended October 31, 2017.
@ Calculated based on the average number of shares outstanding during each fiscal period.
** Annualized.
* Not annualized.
^ The date investment operations commenced.
‡ Organization expense and/or proxy-related expense, which is a non-recurring expense, is included in these ratios on a non-annualized basis.
§ After repayment of expenses previously reimbursed and/or fees previously waived by Management, as applicable. Had the Fund not made such repayments, the annualized ratios of net expenses to average net assets would have been:
| | | Year Ended
October 31,
2017 | |
High Income Class R3 | | | 1.35 | % | |
^^ Portfolio turnover is calculated at the Fund level. Percentage indicated was calculated for the year ended October 31, 2019, for Core Bond and for the year ended October 31, 2018, for Municipal Impact.
a Total return based on per share NAV reflects the effects of changes in NAV on the performance of each Fund during each fiscal period. Returns assume income dividends and other distributions, if any, were reinvested, but do not reflect the effect of sales charges. Results represent past performance and do not indicate future results. Current returns may be lower or higher than the performance data quoted. Investment returns and principal will fluctuate and shares when redeemed may be worth more or less than original cost. Total return would have been lower if Management had not reimbursed and/or waived certain expenses. Total return would have been higher if Management had not recouped previously reimbursed and/or waived expenses.
b The class action proceeds listed in Note A of the Notes to Financial Statements, if any, had no impact on the Funds' total returns for the year ended October 31, 2019. The class action proceeds received in 2018, 2017, 2016 and 2015 had no impact on the Funds' total returns for the years ended October 31, 2018, 2017, 2016 and 2015, respectively.
c Excluding mortgage dollar roll transactions. Had mortgage dollar roll transactions been included, the portfolio turnover rate would have been:
| | | Year Ended October 31, | |
| | | 2019 | | 2018 | | 2017 | | 2016 | | 2015 | |
Core Bond | | | 187 | % | | | 224 | % | | | 269 | % | | | 222 | % | | | 240 | % | |
Strategic Income | | | 325 | % | | | 345 | % | | | 352 | % | | | 363 | % | | | 357 | % | |
Unconstrained Bond | | | 86 | % | | | 77 | % | | | 88 | % | | | 65 | % | | | 86 | % | |
d The voluntary contribution received in 2015 for Emerging Markets Debt had no impact on the Fund's total returns for the year ended October 31, 2015.
290
Notes to Financial Highlights Income Funds (cont'd)
e The custodian expenses refund noted in (f) below is non-recurring and is included in these ratios. Had High Income and Municipal Impact not received the refund, the annualized ratios of net expenses to average net assets and the annualized ratios of net investment income/(loss) to average net assets would have been:
| | | Ratio of
Net Expenses
to Average
Net Assets | | Ratio of
Net Investment
Income/(Loss)
to Average
Net Assets | |
| | | Year Ended October 31, 2017 | |
High Income Bond Investor Class | | | 0.84 | % | | | 5.34 | % | |
High Income Bond Institutional Class | | | 0.70 | % | | | 5.49 | % | |
High Income Bond Class A | | | 1.14 | % | | | 5.05 | % | |
High Income Bond Class C | | | 1.81 | % | | | 4.38 | % | |
High Income Bond Class R3 | | | 1.37 | % | | | 4.81 | % | |
High Income Bond Class R6 | | | 0.61 | % | | | 5.56 | % | |
Municipal Impact Institutional Class | | | 0.92 | % | | | 2.23 | % | |
f In May 2016, the Funds' custodian, State Street, announced that it had identified inconsistencies in the way in which certain Funds were invoiced for categories of expenses, particularly those deemed "out-of-pocket" costs, from 1998 through November 2015, and refunded to High Income and Municipal Impact Funds certain expenses, plus interest, determined to be payable to those Funds for the period in question. These amounts were refunded to those Funds by State Street during the year ended October 31, 2017. These amounts had no impact on High Income's and Municipal Impact's total returns for the year ended October 31, 2017.
291
Report of Independent Registered Public Accounting Firm
To the Board of Trustees and Shareholders of
Neuberger Berman Income Funds
Opinion on the Financial Statements
We have audited the accompanying statements of assets and liabilities of Neuberger Berman Core Bond Fund, Neuberger Berman Floating Rate Income Fund, Neuberger Berman Municipal High Income Fund, Neuberger Berman Municipal Impact Fund, and Neuberger Berman Short Duration High Income Fund (the "Funds"), each a series of Neuberger Berman Income Funds (the "Trust"), including the schedule of investments, as of October 31, 2019, and the related statements of operations for the year then ended, the statements of changes in net assets for each of the two years in the period then ended, and the financial highlights for each of the five years in the period then ended (with respect to Neuberger Berman Municipal High Income Fund, for each of the four years in the period then ended and for the period June 22, 2015 to October 31, 2015), and the related notes (collectively referred to as the "financial statements"). In our opinion, the financial statements present fairly, in all material respects, the financial position of the Funds as of October 31, 2019, the results of their operations for the year then ended, the changes in their net assets for each of the two years in the period then ended, and their financial highlights for the periods stated above, in conformity with accounting principles generally accepted in the United States of America.
Basis for Opinion
These financial statements are the responsibility of the Funds' management. Our responsibility is to express an opinion on the Funds' financial statements based on our audits. We are a public accounting firm registered with the Public Company Accounting Oversight Board (United States) ("PCAOB") and are required to be independent with respect to the Funds in accordance with the U.S. federal securities laws and the applicable rules and regulations of the Securities and Exchange Commission and the PCAOB. We have served as the auditor of one or more of the funds in the Trust since 2005.
We conducted our audits in accordance with the standards of the PCAOB. Those standards require that we plan and perform the audits to obtain reasonable assurance about whether the financial statements are free of material misstatement, whether due to error or fraud. The Funds are not required to have, nor were we engaged to perform, an audit of the Funds' internal control over financial reporting. As part of our audits we are required to obtain an understanding of internal control over financial reporting, but not for the purpose of expressing an opinion on the effectiveness of the Funds' internal control over financial reporting. Accordingly, we express no such opinion.
Our audits included performing procedures to assess the risks of material misstatement of the financial statements, whether due to error or fraud, and performing procedures that respond to those risks. Such procedures included examining, on a test basis, evidence regarding the amounts and disclosures in the financial statements. Our audits also included evaluating the accounting principles used and significant estimates made by management, as well as evaluating the overall presentation of the financial statements. Our procedures included confirmation of securities owned as of October 31, 2019 by correspondence with the custodian, agent banks, companies and brokers; when replies were not received, we performed other auditing procedures. We believe that our audits provide a reasonable basis for our opinion.

Philadelphia, Pennsylvania
December 20, 2019
292
Report of Independent Registered Public Accounting Firm
To the Shareholders of Neuberger Berman Emerging Markets Debt Fund, Neuberger Berman High Income Bond Fund, Neuberger Berman Municipal Intermediate Bond Fund, Neuberger Berman Short Duration Bond Fund, Neuberger Berman Strategic Income Fund and Neuberger Berman Unconstrained Bond Fund and the Board of Trustees of Neuberger Berman Income Funds
Opinion on the Financial Statements
We have audited the accompanying statements of assets and liabilities of Neuberger Berman Emerging Markets Debt Fund, Neuberger Berman High Income Bond Fund, Neuberger Berman Municipal Intermediate Bond Fund, Neuberger Berman Short Duration Bond Fund, Neuberger Berman Strategic Income Fund, and Neuberger Berman Unconstrained Bond Fund (collectively referred to as the "Funds"), six of the series constituting Neuberger Berman Income Funds (the "Trust"), including the schedules of investments, as of October 31, 2019 and the related statements of operations, the statements of changes in net assets for each of the two years in the period ended, and the financial highlights for each of the five years in the period then ended and the related notes (collectively referred to as the "financial statements"). In our opinion, the financial statements present fairly, in all material respects, the financial position of the Funds (six of the series constituting Neuberger Berman Income Funds) at October 31, 2019, the results of their operations, the changes in net assets for each of the two years in the period then ended and their financial highlights for each of the five years in the period then ended, in conformity with U.S. generally accepted accounting principles.
Basis for Opinion
These financial statements are the responsibility of the Trust's management. Our responsibility is to express an opinion on each of the Funds' financial statements based on our audits. We are a public accounting firm registered with the Public Company Accounting Oversight Board (United States) ("PCAOB") and are required to be independent with respect to the Trust in accordance with the U.S. federal securities laws and the applicable rules and regulations of the Securities and Exchange Commission and the PCAOB.
We conducted our audits in accordance with the standards of the PCAOB. Those standards require that we plan and perform the audit to obtain reasonable assurance about whether the financial statements are free of material misstatement, whether due to error or fraud. The Trust is not required to have, nor were we engaged to perform, an audit of the Trust's internal control over financial reporting. As part of our audits, we are required to obtain an understanding of internal control over financial reporting, but not for the purpose of expressing an opinion on the effectiveness of the Trust's internal control over financial reporting. Accordingly, we express no such opinion.
Our audits included performing procedures to assess the risks of material misstatement of the financial statements, whether due to error or fraud, and performing procedures that respond to those risks. Such procedures included examining, on a test basis, evidence regarding the amounts and disclosures in the financial statements. Our procedures included confirmation of securities owned as of October 31, 2019, by correspondence with the custodian and others or by other appropriate auditing procedures where replies from others were not received. Our audits also included evaluating the accounting principles used and significant estimates made by management, as well as evaluating the overall presentation of the financial statements. We believe that our audits provide a reasonable basis for our opinion.

We have served as the auditor of one or more Neuberger Berman investment companies since 1954.
Boston, Massachusetts
December 20, 2019
293
Investment Manager and Administrator
Neuberger Berman Investment Advisers LLC
1290 Avenue of the Americas
New York, NY 10104-0002
800.877.9700 or 212.476.8800
Intermediary Client Services 800.366.6264
Distributor
Neuberger Berman BD LLC
1290 Avenue of the Americas
New York, NY 10104-0002
800.877.9700 or 212.476.8800
Intermediary Client Services 800.366.6264
Sub-Adviser
Neuberger Berman Europe Limited
Lansdowne House
57 Berkeley Square
London, United Kingdom W1J 6ER
Custodian
State Street Bank and Trust Company
One Lincoln Street
Boston, MA 02111
Shareholder Servicing Agent
DST Asset Manager Solutions Inc.
430 West 7th Street, Suite 219189
Kansas City, MO 64105-1407
For Investor, Trust & Institutional Class Shareholders
address correspondence to:
Neuberger Berman Funds
P.O. Box 219189
Kansas City, MO 64121-9189
Shareholder Services 800.877.9700 or 212.476.8800
Intermediary Client Services 800.366.6264
For Class A, Class C, Class R3 and Class R6 Shareholders:
Please contact your investment provider
Legal Counsel
K&L Gates LLP
1601 K Street, NW
Washington, DC 20006-1600
Independent Registered Public Accounting Firms
Ernst & Young LLP
200 Clarendon Street
Boston, MA 02116
Tait, Weller & Baker LLP
Two Liberty Place
50 South 16th Street, Suite 2900
Philadelphia, PA 19102
294
The following tables set forth information concerning the Trustees and Officers of each of the Funds. All persons named as Trustees and Officers also serve in similar capacities for other funds administered or managed by Neuberger Berman Investment Advisers LLC ("NBIA"). Each Fund's Statement of Additional Information includes additional information about the Trustees as of the time of the Fund's most recent public offering and is available upon request, without charge, by calling (800) 877-9700.
Information about the Board of Trustees
Name, (Year of Birth),
and Address(1) | | Position(s)
and Length of
Time Served(2) | | Principal Occupation(s)(3) | | Number of
Funds in Fund
Complex
Overseen by
Fund Trustee | | Other Directorships
Held Outside Fund
Complex by Fund
Trustee(3) | |
Independent Fund Trustees | |
Michael J. Cosgrove (1949) | | Trustee since 2015 | | President, Carragh Consulting USA, since 2014; formerly, Executive, General Electric Company, 1970 to 2014, including President, Mutual Funds and Global Investment Programs, GE Asset Management, 2011 to 2014, President and Chief Executive Officer, Mutual Funds and Intermediary Business, GE Asset Management, 2007 to 2011, President, Institutional Sales and Marketing, GE Asset Management, 1998 to 2007, and Chief Financial Officer, GE Asset Management, and Deputy Treasurer, GE Company, 1988 to 1993. | | | 51 | | | Director, America Press, Inc. (not-for-profit Jesuit publisher), since 2015; formerly, Director, Fordham University, 2001 to 2018; formerly, Director, The Gabelli Go Anywhere Trust, June 2015 to June 2016; formerly, Director, Skin Cancer Foundation (not-for-profit), 2006 to 2015; formerly, Director, GE Investments Funds, Inc., 1997 to 2014; formerly, Trustee, GE Institutional Funds, 1997 to 2014; formerly, Director, GE Asset Management, 1988 to 2014; formerly, Director, Elfun Trusts, 1988 to 2014; formerly, Trustee, GE Pension & Benefit Plans, 1988 to 2014; formerly, Member of Board of Governors, Investment Company Institute. | |
295
Name, (Year of Birth),
and Address(1) | | Position(s)
and Length of
Time Served(2) | | Principal Occupation(s)(3) | | Number of
Funds in Fund
Complex
Overseen by
Fund Trustee | | Other Directorships
Held Outside Fund
Complex by Fund
Trustee(3) | |
Marc Gary (1952) | | Trustee since 2015 | | Executive Vice Chancellor and Chief Operating Officer, Jewish Theological Seminary, since 2012; formerly, Executive Vice President and General Counsel, Fidelity Investments, 2007 to 2012; formerly, Executive Vice President and General Counsel, BellSouth Corporation, 2004 to 2007; formerly, Vice President and Associate General Counsel, BellSouth Corporation, 2000 to 2004; formerly, Associate, Partner, and National Litigation Practice Co-Chair, Mayer, Brown LLP, 1981 to 2000; formerly, Associate Independent Counsel, Office of Independent Counsel, 1990 to 1992. | | | 51 | | | Trustee, Jewish Theological Seminary, since 2015; Director, Legility, Inc. (privately held for-profit company), since 2012; Director, Lawyers Committee for Civil Rights Under Law (not-for-profit), since 2005; formerly, Director, Equal Justice Works (not-for-profit), 2005 to 2014; formerly, Director, Corporate Counsel Institute, Georgetown University Law Center, 2007 to 2012; formerly, Director, Greater Boston Legal Services (not-for-profit), 2007 to 2012. | |
296
Name, (Year of Birth),
and Address(1) | | Position(s)
and Length of
Time Served(2) | | Principal Occupation(s)(3) | | Number of
Funds in Fund
Complex
Overseen by
Fund Trustee | | Other Directorships
Held Outside Fund
Complex by Fund
Trustee(3) | |
Martha C. Goss (1949) | | Trustee since 2007 | | President, Woodhill Enterprises Inc./Chase Hollow Associates LLC (personal investment vehicle), since 2006; formerly, Consultant, Resources Global Professionals (temporary staffing), 2002 to 2006; formerly, Chief Financial Officer, Booz-Allen & Hamilton, Inc., 1995 to 1999; formerly, Enterprise Risk Officer, Prudential Insurance, 1994 to1995; formerly, President, Prudential Asset Management Company, 1992 to 1994; formerly, President, Prudential Power Funding (investments in electric and gas utilities and alternative energy projects), 1989 to 1992; formerly, Treasurer, Prudential Insurance Company, 1983 to 1989. | | | 51 | | | Director, American Water (water utility), since 2003; Director, Allianz Life of New York (insurance), since 2005; Director, Berger Group Holdings, Inc. (engineering consulting firm), since 2013; Director, Financial Women's Association of New York (not-for-profit association), since 2003; Trustee Emerita, Brown University, since 1998; Director, Museum of American Finance (not-for-profit), since 2013; formerly, Non-Executive Chair and Director, Channel Reinsurance (financial guaranty reinsurance), 2006 to 2010; formerly, Director, Ocwen Financial Corporation (mortgage servicing), 2005 to 2010; formerly, Director, Claire's Stores, Inc. (retailer), 2005 to 2007; formerly, Director, Parsons Brinckerhoff Inc. (engineering consulting firm), 2007 to 2010; formerly, Director, Bank Leumi (commercial bank), 2005 to 2007; formerly, Advisory Board Member, Attensity (software developer), 2005 to 2007. | |
Michael M. Knetter (1960) | | Trustee since 2007 | | President and Chief Executive Officer, University of Wisconsin Foundation, since 2010; formerly, Dean, School of Business, University of Wisconsin — Madison; formerly, Professor of International Economics and Associate Dean, Amos Tuck School of Business — Dartmouth College, 1998 to 2002. | | | 51 | | | Director, 1 William Street Credit Income Fund, since 2018; Board Member, American Family Insurance (a mutual company, not publicly traded), since March 2009; formerly, Trustee, Northwestern Mutual Series Fund, Inc., 2007 to 2011; formerly, Director, Wausau Paper, 2005 to 2011; formerly, Director, Great Wolf Resorts, 2004 to 2009. | |
297
Name, (Year of Birth),
and Address(1) | | Position(s)
and Length of
Time Served(2) | | Principal Occupation(s)(3) | | Number of
Funds in Fund
Complex
Overseen by
Fund Trustee | | Other Directorships
Held Outside Fund
Complex by Fund
Trustee(3) | |
Deborah C. McLean (1954) | | Trustee since 2015 | | Member, Circle Financial Group (private wealth management membership practice), since 2011; Managing Director, Golden Seeds LLC (an angel investing group), since 2009; Adjunct Professor, Columbia University School of International and Public Affairs, since 2008; formerly, Visiting Assistant Professor, Fairfield University, Dolan School of Business, Fall 2007; formerly, Adjunct Associate Professor of Finance, Richmond, The American International University in London, 1999 to 2007. | | | 51 | | | Board member, Norwalk Community College Foundation, since 2014; Dean's Advisory Council, Radcliffe Institute for Advanced Study, since 2014; formerly, Director and Treasurer, At Home in Darien (not-for-profit), 2012 to 2014; formerly, Director, National Executive Service Corps (not-for-profit), 2012 to 2013; formerly, Trustee, Richmond, The American International University in London, 1999 to 2013. | |
George W. Morriss (1947) | | Trustee since 2007 | | Adjunct Professor, Columbia University School of International and Public Affairs, since 2012; formerly, Executive Vice President and Chief Financial Officer, People's United Bank, Connecticut (a financial services company), 1991 to 2001. | | | 51 | | | Director, 1 William Street Credit Income Fund, since 2018; Director and Chair, Thrivent Church Loan and Income Fund, since 2018; formerly, Trustee, Steben Alternative Investment Funds, Steben Select Multi-Strategy Fund, and Steben Select Multi-Strategy Master Fund, 2013 to 2017; formerly, Treasurer, National Association of Corporate Directors, Connecticut Chapter, 2011 to 2015; formerly, Manager, Larch Lane Multi-Strategy Fund complex (which consisted of three funds), 2006 to 2011; formerly, Member, NASDAQ Issuers' Affairs Committee, 1995 to 2003. | |
298
Name, (Year of Birth),
and Address(1) | | Position(s)
and Length of
Time Served(2) | | Principal Occupation(s)(3) | | Number of
Funds in Fund
Complex
Overseen by
Fund Trustee | | Other Directorships
Held Outside Fund
Complex by Fund
Trustee(3) | |
Tom D. Seip (1950) | | Trustee since 2000; Chairman of the Board since 2008; formerly Lead Independent Trustee from 2006 to 2008 | | Formerly, Managing Member, Ridgefield Farm LLC (a private investment vehicle), 2004 to 2016; formerly, President and CEO, Westaff, Inc. (temporary staffing), May 2001 to January 2002; formerly, Senior Executive, The Charles Schwab Corporation, 1983 to 1998, including Chief Executive Officer, Charles Schwab Investment Management, Inc.; Trustee, Schwab Family of Funds and Schwab Investments, 1997 to 1998; and Executive Vice President-Retail Brokerage, Charles Schwab & Co., Inc., 1994 to 1997. | | | 51 | | | Formerly, Director, H&R Block, Inc. (tax services company), 2001 to 2018; formerly, Director, Talbot Hospice Inc., 2013 to 2016; formerly, Chairman, Governance and Nominating Committee, H&R Block, Inc., 2011 to 2015; formerly, Chairman, Compensation Committee, H&R Block, Inc., 2006 to 2010; formerly, Director, Forward Management, Inc. (asset management company), 1999 to 2006. | |
James G. Stavridis (1955) | | Trustee since 2015 | | Operating Executive, The Carlyle Group, since 2018; Commentator, NBC News, since 2015; formerly, Dean, Fletcher School of Law and Diplomacy, Tufts University, 2013 to 2018; formerly, Admiral, United States Navy, 1976 to 2013, including Supreme Allied Commander, NATO and Commander, European Command, 2009 to 2013, and Commander, United States Southern Command, 2006 to 2009. | | | 51 | | | Director, American Water (water utility), since 2018; Director, NFP Corp. (insurance broker and consultant), since 2017; Director, U.S. Naval Institute, since 2014; Director, Onassis Foundation, since 2014; Director, BMC Software Federal, LLC, since 2014; Director, Vertical Knowledge, LLC, since 2013; formerly, Director, Navy Federal Credit Union, 2000-2002. | |
299
Name, (Year of Birth),
and Address(1) | | Position(s)
and Length of
Time Served(2) | | Principal Occupation(s)(3) | | Number of
Funds in Fund
Complex
Overseen by
Fund Trustee | | Other Directorships
Held Outside Fund
Complex by Fund
Trustee(3) | |
Candace L. Straight (1947) | | Trustee since 1993 | | Private investor and consultant specializing in the insurance industry; formerly, Advisory Director, Securitas Capital LLC (a global private equity investment firm dedicated to making investments in the insurance sector), 1998 to 2003. | | | 51 | | | Director, ERA Coalition (not-for-profit), since January 2019; Director, Re belle Media (a privately held TV and film production company), since 2018; formerly, Public Member, Board of Governors and Board of Trustees, Rutgers University, 2011 to 2016; formerly, Director, Montpelier Re Holdings Ltd. (reinsurance company), 2006 to 2015; formerly, Director, National Atlantic Holdings Corporation (property and casualty insurance company), 2004 to 2008; formerly, Director, The Proformance Insurance Company (property and casualty insurance company), 2004 to 2008; formerly, Director, Providence Washington Insurance Company (property and casualty insurance company), 1998 to 2006; formerly, Director, Summit Global Partners (insurance brokerage firm), 2000 to 2005. | |
Peter P. Trapp (1944) | | Trustee since 2000 | | Retired; formerly, Regional Manager for Mid-Southern Region, Ford Motor Credit Company, September 1997 to 2007; formerly, President, Ford Life Insurance Company, April 1995 to August 1997. | | | 51 | | | None. | |
300
Name, (Year of Birth),
and Address(1) | | Position(s)
and Length of
Time Served(2) | | Principal Occupation(s)(3) | | Number of
Funds in Fund
Complex
Overseen by
Fund Trustee | | Other Directorships
Held Outside Fund
Complex by Fund
Trustee(3) | |
Fund Trustees who are "Interested Persons" | |
Joseph V. Amato* (1962) | | Chief Executive Officer and President since 2018 and Trustee since 2009 | | President and Director, Neuberger Berman Group LLC, since 2009; President and Chief Executive Officer, Neuberger Berman BD LLC ("Neuberger Berman") and Neuberger Berman Holdings LLC (including its predecessor, Neuberger Berman Inc.), since 2007; Chief Investment Officer (Equities) and President (Equities), Neuberger Berman Investment Advisers LLC ("NBIA") (formerly, Neuberger Berman Fixed Income LLC and including predecessor entities), since 2007, and Board Member of NBIA since 2006; formerly, Global Head of Asset Management of Lehman Brothers Holdings Inc.'s ("LBHI") Investment Management Division, 2006 to 2009; formerly, member of LBHI's Investment Management Division's Executive Management Committee, 2006 to 2009; formerly, Managing Director, Lehman Brothers Inc. ("LBI"), 2006 to 2008; formerly, Chief Recruiting and Development Officer, LBI, 2005 to 2006; formerly, Global Head of LBI's Equity Sales and a Member of its Equities Division Executive Committee, 2003 to 2005; President and Chief Executive Officer, ten registered investment companies for which NBIA acts as investment manager and/or administrator. | | | 51 | | | Member of Board of Advisors, McDonough School of Business, Georgetown University, since 2001; Member of New York City Board of Advisors, Teach for America, since 2005; Trustee, Montclair Kimberley Academy (private school), since 2007; Member of Board of Regents, Georgetown University, since 2013. | |
301
Name, (Year of Birth),
and Address(1) | | Position(s)
and Length of
Time Served(2) | | Principal Occupation(s)(3) | | Number of
Funds in Fund
Complex
Overseen by
Fund Trustee | | Other Directorships
Held Outside Fund
Complex by Fund
Trustee(3) | |
Robert Conti* (1956) | | Trustee since 2008; prior thereto, Chief Executive Officer and President from 2008 to 2018 | | Retired; formerly, Managing Director, Neuberger Berman, 2007 to 2018; formerly, President — Mutual Funds, NBIA, 2008 to 2018; formerly, Senior Vice President, Neuberger Berman, 2003 to 2006; formerly, Vice President, Neuberger Berman, 1999 to 2003. | | | 51 | | | Director, Staten Island Mental Health Society, since 1994; formerly, Chairman of the Board, Staten Island Mental Health Society, 2008 to 2011; formerly, Member of the Board of Governors, Investment Company Institute. | |
(1) The business address of each listed person is 1290 Avenue of the Americas, New York, NY 10104.
(2) Pursuant to the Trust's Amended and Restated Trust Instrument, subject to any limitations on the term of service imposed by the By-Laws or any retirement policy adopted by the Fund Trustees, each Fund Trustee shall hold office for life or until his or her successor is elected or the Trust terminates; except that (a) any Fund Trustee may resign by delivering a written resignation; (b) any Fund Trustee may be removed with or without cause at any time by a written instrument signed by at least two-thirds of the other Fund Trustees; (c) any Fund Trustee who requests to be retired, or who has become unable to serve, may be retired by a written instrument signed by a majority of the other Fund Trustees; and (d) any Fund Trustee may be removed at any shareholder meeting by a vote of at least two-thirds of the outstanding shares.
(3) Except as otherwise indicated, each individual has held the positions shown during at least the last five years.
* Indicates a Fund Trustee who is an "interested person" within the meaning of the 1940 Act. Mr. Amato is an interested person of the Trust by virtue of the fact that he is an officer of NBIA and/or its affiliates. Mr. Conti is an interested person of the Trust by virtue of the fact that he was an officer of NBIA and/or its affiliates until June 2018.
302
Information about the Officers of the Trust
Name, (Year of Birth),
and Address(1) | | Position(s)
and Length of
Time Served(2) | | Principal Occupation(s)(3) | |
Claudia A. Brandon (1956) | | Executive Vice President since 2008 and Secretary since 1985 | | Senior Vice President, Neuberger Berman, since 2007 and Employee since 1999; Senior Vice President, NBIA, since 2008 and Assistant Secretary since 2004; formerly, Vice President, Neuberger Berman, 2002 to 2006; formerly, Vice President — Mutual Fund Board Relations, NBIA, 2000 to 2008; formerly, Vice President, NBIA, 1986 to 1999 and Employee, 1984 to 1999; Executive Vice President and Secretary, twenty-nine registered investment companies for which NBIA acts as investment manager and/or administrator. | |
Agnes Diaz (1971) | | Vice President since 2013 | | Senior Vice President, Neuberger Berman, since 2012; Senior Vice President, NBIA, since 2012 and Employee since 1996; formerly, Vice President, Neuberger Berman, 2007 to 2012; Vice President, ten registered investment companies for which NBIA acts as investment manager and/or administrator. | |
Anthony DiBernardo (1979) | | Assistant Treasurer since 2011 | | Senior Vice President, Neuberger Berman, since 2014; Senior Vice President, NBIA, since 2014, and Employee since 2003; formerly, Vice President, Neuberger Berman, 2009 to 2014; Assistant Treasurer, ten registered investment companies for which NBIA acts as investment manager and/or administrator. | |
Savonne L. Ferguson (1973) | | Chief Compliance Officer since 2018 | | Senior Vice President, Chief Compliance Officer (Mutual Funds) and Associate General Counsel, NBIA, since November 2018; formerly, Vice President T. Rowe Price Group, Inc. (2018), Vice President and Senior Legal Counsel, T. Rowe Price Associates, Inc. (2014-2018), Vice President and Director of Regulatory Fund Administration, PNC Capital Advisors, LLC (2009-2014), Secretary, PNC Funds and PNC Advantage Funds (2010-2014); Chief Compliance Officer, twenty-nine registered investment companies for which NBIA acts as investment manager and/or administrator. | |
Corey A. Issing (1978) | | Chief Legal Officer since 2016 (only for purposes of sections 307 and 406 of the Sarbanes-Oxley Act of 2002) | | General Counsel and Head of Compliance — Mutual Funds since 2016 and Managing Director, NBIA, since 2017; formerly, Associate General Counsel (2015 to 2016), Counsel (2007 to 2015), Senior Vice President (2013-2016), Vice President (2009-2013); Chief Legal Officer (only for purposes of sections 307 and 406 of the Sarbanes-Oxley Act of 2002), twenty-nine registered investment companies for which NBIA acts as investment manager and/or administrator. | |
Sheila R. James (1965) | | Assistant Secretary since 2002 | | Vice President, Neuberger Berman, since 2008 and Employee since 1999; Vice President, NBIA, since 2008; formerly, Assistant Vice President, Neuberger Berman, 2007; Employee, NBIA, 1991 to 1999; Assistant Secretary, twenty-nine registered investment companies for which NBIA acts as investment manager and/or administrator. | |
Brian Kerrane (1969) | | Chief Operating Officer since 2015 and Vice President since 2008 | | Managing Director, Neuberger Berman, since 2013; Chief Operating Officer — Mutual Funds and Managing Director, NBIA, since 2015; formerly, Senior Vice President, Neuberger Berman, 2006 to 2014; Vice President, NBIA, 2008 to 2015 and Employee since 1991; Chief Operating Officer, ten registered investment companies for which NBIA acts as investment manager and/or administrator; Vice President, twenty-nine registered investment companies for which NBIA acts as investment manager and/or administrator. | |
303
Name, (Year of Birth),
and Address(1) | | Position(s)
and Length of
Time Served(2) | | Principal Occupation(s)(3) | |
Anthony Maltese (1959) | | Vice President since 2015 | | Senior Vice President, Neuberger Berman, since 2014 and Employee since 2000; Senior Vice President, NBIA, since 2014; Vice President, ten registered investment companies for which NBIA acts as investment manager and/or administrator. | |
Josephine Marone (1963) | | Assistant Secretary since 2017 | | Senior Paralegal, Neuberger Berman, since 2007 and Employee since 2007; Assistant Secretary, twenty-nine registered investment companies for which NBIA acts as investment manager and/or administrator. | |
Owen F. McEntee, Jr. (1961) | | Vice President since 2008 | | Vice President, Neuberger Berman, since 2006; Vice President, NBIA, since 2006 and Employee since 1992; Vice President, ten registered investment companies for which NBIA acts as investment manager and/or administrator. | |
John M. McGovern (1970) | | Treasurer and Principal Financial and Accounting Officer since 2005 | | Senior Vice President, Neuberger Berman, since 2007; Senior Vice President, NBIA, since 2007 and Employee since 1993; formerly, Vice President, Neuberger Berman, 2004 to 2006; formerly, Assistant Treasurer, 2002 to 2005; Treasurer and Principal Financial and Accounting Officer, twenty-nine registered investment companies for which NBIA acts as investment manager and/or administrator. | |
Frank Rosato (1971) | | Assistant Treasurer since 2005 | | Vice President, Neuberger Berman, since 2006; Vice President, NBIA, since 2006 and Employee since 1995; Assistant Treasurer, ten registered investment companies for which NBIA acts as investment manager and/or administrator. | |
Niketh Velamoor (1979) | | Anti-Money Laundering Compliance Officer since 2018 | | Senior Vice President and Associate General Counsel, Neuberger Berman, since July 2018; Assistant United States Attorney, Southern District of New York, 2009 to 2018; Anti-Money Laundering Compliance Officer, four registered investment companies for which NBIA acts as investment manager and/or administrator. | |
(1) The business address of each listed person is 1290 Avenue of the Americas, New York, NY 10104.
(2) Pursuant to the By-Laws of the Trust, each officer elected by the Fund Trustees shall hold office until his or her successor shall have been elected and qualified or until his or her earlier death, inability to serve, or resignation. Officers serve at the pleasure of the Fund Trustees and may be removed at any time with or without cause.
(3) Except as otherwise indicated, each individual has held the positions shown during at least the last five years.
304
Proxy Voting Policies and Procedures
A description of the policies and procedures that the Trust uses to determine how to vote proxies relating to portfolio securities is available, without charge, by calling 800-877-9700 (toll-free) and on the SEC's website at www.sec.gov. Information regarding how the Trust voted proxies relating to portfolio securities during the most recent 12-month period ended June 30 is also available upon request, without charge, by calling 800-877-9700 (toll-free), on the SEC's website at www.sec.gov, and on Neuberger Berman's website at www.nb.com.
Quarterly Portfolio Schedule
The Trust files a complete schedule of portfolio holdings for each Fund with the SEC for the first and third quarters of each fiscal year as an exhibit to its report on Form N-PORT (Form N-Q for filings prior to March 31, 2019). The Trust's Forms N-Q and N-PORT are available on the SEC's website at www.sec.gov. The portfolio holdings information on Form N-Q or Form N-PORT is available upon request, without charge, by calling 800-877-9700 (toll-free).
Board Consideration of the Management Agreements
On an annual basis, the Board of Trustees (the "Board") of Neuberger Berman Income Funds (the "Trust"), including the Trustees who are not "interested persons" of the Trust or of Neuberger Berman Investment Advisers LLC ("Management") (including its affiliates) ("Independent Fund Trustees"), considers whether to continue the management agreements with Management (the "Management Agreements") with respect to each series and the sub-advisory agreements between Management and Neuberger Berman Europe Limited ("NBEL") (the "Sub-Advisory Agreements" and collectively with the Management Agreement, the "Agreements") with respect to Neuberger Berman Emerging Markets Debt Fund and Neuberger Berman Unconstrained Bond Fund. Throughout the process, the Independent Fund Trustees are advised by counsel that is experienced in Investment Company Act of 1940 matters and that is independent of Management ("Independent Counsel"). At a meeting held on September 12, 2019, the Board, including the Independent Fund Trustees, approved the continuation of the Agreements for each Fund.
In evaluating the Agreements with respect to each Fund, the Board, including the Independent Fund Trustees, reviewed extensive materials provided by Management in response to questions submitted by the Independent Fund Trustees and Independent Counsel, and met with senior representatives of Management regarding its personnel, operations, and financial condition as they relate to the Funds. The annual contract review extends over at least two regular meetings of the Board to ensure that Management and NBEL have time to respond to any questions the Independent Fund Trustees may have on their initial review of the materials and that the Independent Fund Trustees have time to consider those responses.
In connection with its deliberations, the Board also considered the broad range of information relevant to the annual contract review that is provided to the Board (including its various standing committees) at meetings throughout the year, including reports on investment performance, portfolio risk, and other portfolio information for each Fund, including the use of derivatives if used as part of the Fund's strategy, as well as periodic reports on, among other matters, pricing and valuation; quality and cost of portfolio trade execution; compliance; and shareholder and other services provided by Management, NBEL, and their affiliates. The Contract Review Committee, which is comprised of Independent Fund Trustees, was established by the Board to assist in its deliberations regarding the annual contract review. The Board has also established other committees that focus throughout the year on specific areas relevant to the annual contract review, such as Fund performance or compliance matters, and that are charged with specific responsibilities regarding the annual contract review. Those committees provide reports to the Contract Review Committee and the full Board, which consider that information as part of the annual contract review process. The Board's Contract Review Committee annually considers and updates the questions it asks of Management in light of legal advice furnished to them by Independent Counsel; their own business judgment; and developments in the industry, in the markets, in mutual fund regulation and litigation, and in Management's business model.
305
The Independent Fund Trustees received from Independent Counsel a memorandum discussing the legal standards for their consideration of the proposed continuation of the Agreements. During the course of the year and during their deliberations regarding the annual contract review, the Contract Review Committee and the Independent Fund Trustees met with Independent Counsel separately from representatives of Management and NBEL.
Provided below is a description of the Board's contract approval process and material factors that the Board considered at its meetings regarding renewals of the Agreements and the compensation to be paid thereunder. In connection with its approval of the continuation of the Agreements, the Board evaluated the terms of the Agreements, the overall fairness of the Agreements to each Fund, and whether the Agreements were in the best interests of each Fund and Fund shareholders. The Board's determination to approve the continuation of the Agreements was based on a comprehensive consideration of all information provided to the Board throughout the year and specifically in connection with the annual contract review. The Board considered each Fund's investment management and sub-advisory agreements separately from those of the other Funds.
This description is not intended to include all of the factors considered by the Board. The Board members did not identify any particular information or factor that was all-important or controlling, and each Trustee may have attributed different weights to the various factors. The Board focused on the costs and benefits of the Agreements to each Fund and, through the Fund, its shareholders.
Nature, Extent, and Quality of Services
With respect to the nature, extent, and quality of the services provided, the Board considered the investment philosophy and decision-making processes of, and the qualifications, experience, and capabilities of, and the resources available to, the portfolio management personnel of Management and NBEL who perform services for the Funds. The Board noted that Management also provides certain administrative services, including fund accounting and compliance services. The Board also considered Management's and NBEL's policies and practices regarding trade execution, transaction costs, and allocation of portfolio transactions and reviewed the quality of the execution services that Management had provided. Moreover, the Board considered Management's approach to potential conflicts of interest both generally and between the Funds' investments and those of other funds or accounts managed by Management or NBEL. The Board also noted that Management had increased its research capabilities with respect to environmental, social, and corporate governance matters and how those factors may relate to investment performance.
The Board noted the extensive range of services that Management provides to the Funds beyond the investment management services. The Board noted that Management is also responsible for monitoring compliance with the Fund's investment objectives, policies, and restrictions, as well as compliance with applicable law, including implementing rulemaking initiatives of the U.S. Securities and Exchange Commission. The Board considered that Management assumes significant ongoing risks with respect to all Funds, for which it is entitled to reasonable compensation. Specifically, Management's responsibilities include continual management of investment, operational, enterprise, legal, regulatory, and compliance risks as they relate to the Funds, and the Board considers on a regular basis information regarding Management's processes for monitoring and managing risk. In addition, the Board also noted that when Management launches a new fund or share class, it assumes entrepreneurial risk with respect to that fund or share class, and that some funds and share classes have been liquidated without ever having been profitable to Management.
The Board also noted Management's activities under its contractual obligation to oversee the Funds' various outside service providers, including its renegotiation of certain service providers' fees and its evaluation of service providers' infrastructure, cybersecurity programs, compliance programs, and business continuity programs, among other matters. The Board also considered Management's ongoing development of its own infrastructure and information technology to support the Funds through, among other things, cybersecurity, business continuity planning, and risk management. In addition, the Board noted the positive compliance history of Management and NBEL, as no significant compliance problems were reported to the Board with respect to either firm. The Board also considered the general structure of the portfolio managers' compensation and whether this structure provides appropriate incentives to act in the best interests of the Funds. The Board also considered the ability of Management and NBEL to attract and retain qualified personnel to service the Funds.
306
As in past years, the Board also considered the manner in which Management addressed various matters that arose during the year, some of them a result of developments in the broader fund industry or the regulations governing it. In addition, the Board considered actions taken by Management and NBEL in response to recent market conditions, such as regulatory concerns about changes in fixed-income market liquidity and potential volatility, and considered the overall performance of Management and NBEL in this context.
Fund Performance
The Board requested a report from an outside consulting firm that specializes in the analysis of fund industry data that compared each Fund's performance, along with its fees and other expenses, to a group of industry peers and a broader universe of funds pursuing generally similar strategies with the same investment classification and/or objective. The Board considered each Fund's performance and fees in light of the limitations inherent in the methodology for constructing such comparative groups and determining which investment companies should be included in the comparative groups.
With respect to investment performance, the Board considered information regarding each Fund's short-, intermediate- and long-term performance, as applicable, net of the Fund's fees and expenses, on an absolute basis, relative to a benchmark index that does not deduct the fees or expenses of investing, and compared to the performance of the industry peer group and a broader universe of funds, each constructed by the consulting firm. The Board also reviewed performance in relation to certain measures of the degree of investment risk undertaken by the portfolio managers.
In the case of underperformance for any periods, the Board considered the magnitude and duration of that underperformance relative to the broader universe and/or the benchmark (e.g., the amount by which a Fund underperformed, including, for example, whether the Fund slightly underperformed or significantly underperformed its benchmark). For those Funds that the Board identified as having underperformed their benchmark indices, industry peer groups, and/or a broader universe of funds to an extent, or over a period of time, that the Board felt warranted additional inquiry, the Board discussed with Management each such Fund's performance, potential reasons for the relative performance, and, if necessary, steps that Management had taken, or intended to take, to improve performance. The Board also met with the portfolio managers of certain Funds during the 12 months prior to voting on the contract renewal to discuss the Funds' performance. The Board also considered Management's responsiveness with respect to the relative performance. In this regard, the Board noted that performance, especially short-term performance, is only one of the factors that it deems relevant to its consideration of the Agreements and that, after considering all relevant factors, it may be appropriate to approve the continuation of the Agreements notwithstanding a Fund's relative performance.
Fee Rates, Profitability, and Fall-out Benefits
With respect to the overall fairness of the Agreements, the Board considered the fee structure for each Fund under the Agreements as compared to the peer group provided by the consulting firm. The Board reviewed a comparison of each Fund's management fee to a peer group of comparable funds. The Board noted that the comparative management fee analysis includes, in each Fund's management fee, the separate administrative fees paid to Management. However, the Board noted that some funds in the peer group pay directly from fund assets for certain services that Management covers out of the administration fees for the Funds. Accordingly, the Board also considered each Fund's total expense ratio as compared with its peer group as a way of taking account of these differences.
The Board compared each Fund's contractual and actual management fees to the median of the contractual and actual management fees, respectively, of that Fund's peer group. (The actual management fees are the contractual management fees reduced by any fee waivers or other adjustments.) The Board also compared each Fund's total expenses to the median of the total expenses of that Fund's peer group. Where a Fund's management fee or total expenses were higher than the peer group median, the Board considered whether specific portfolio management, administration or oversight needs contributed to the Fund's management fee or total expenses. The Board also noted that for some classes of certain Funds, the overall expense ratio is maintained through a contractual or voluntary fee cap and/or expense reimbursements by Management.
307
In concluding that the benefits accruing to Management and its affiliates, including NBEL, by virtue of their relationship with each Fund were reasonable in light of the costs of providing the investment advisory and other services and the benefits accruing to that Fund, the Board reviewed specific data as to Management's estimated profit or loss on each Fund for a recent period on a pre-tax basis without regard to distribution expenses, including year-over-year changes in each of Management's reported expense categories. (The Board also reviewed data on Management's estimated profit or loss on each Fund after distribution expenses and taxes were factored in, as indicators of the health of the business and the extent to which Management is directing its profits into the growth of the business.) The Board considered the cost allocation methodology that Management used in developing its estimated profitability figures. In recent years, the Board engaged an independent forensic accountant to review the profitability methodology utilized by Management when preparing this information and discussed with the consultant its conclusion that Management's process for calculating and reporting its estimated profit or loss was not unreasonable.
Recognizing that there is no uniform methodology within the asset management industry for determining profitability for this purpose and that the use of different reasonable methodologies can give rise to different profit and loss results, the Board, in recent years, requested from Management examples of profitability calculated by different methods and noted that the estimated profitability levels were still reasonable when calculated by these other methods. The Board further noted Management's representation that its estimate of profitability is derived using methodology that is consistent with the methodology used to assess and/or report measures of profitability elsewhere at the firm. In addition, the Board recognized that Management's calculations regarding its costs may not reflect all risks, including regulatory, legal, operational, reputational, and, where appropriate, entrepreneurial risks, associated with offering and managing a mutual fund in the current regulatory and market environment. The Board also considered any fall-out (i.e., indirect) benefits likely to accrue to Management or its affiliates from their relationship with each Fund. The Board recognized that Management and its affiliates should be entitled to earn a reasonable level of profits for services they provide to each Fund and, based on its review, concluded that Management's reported level of estimated profitability, if any, on each Fund was reasonable.
Information Regarding Services to Other Clients
The Board also considered whether there were other funds or separate accounts that were advised or sub-advised by Management or its affiliates with investment objectives, policies, and strategies that were similar to those of any of the Funds. In the cases where such funds or separate accounts exist, the Board compared the fees charged to the Fund to the fees charged to such comparable funds and/or separate accounts. The Board considered the appropriateness and reasonableness of any differences between the fees charged to a Fund and such comparable funds and/or separate accounts, and determined that differences in fees and fee structures were consistent with the differences in the management and other services provided. The Board explored with Management its assertion that although, generally, the rates of fees paid by such accounts were lower than the fee rates paid by the corresponding Funds, the differences reflected Management's greater level of responsibilities and significantly broader scope of services regarding the Funds, the more extensive regulatory obligations and risks associated with managing the Funds, and other financial considerations with respect to creation and sponsorship of the Funds.
Economies of Scale
The Board also evaluated apparent or anticipated economies of scale in relation to the services Management provides to each Fund. The Board considered whether each Fund's fee structure provides for a reduction of payments resulting from the use of breakpoints, the size of any breakpoints in each Fund's advisory fees, and whether any such breakpoints are set at appropriate asset levels. The Board also compared the breakpoint structure to that of the peer group. In addition, the Board considered the expense limitation and/or fee waiver arrangements that reduce many Funds' expenses at all asset levels which can have an effect similar to breakpoints in sharing economies of scale with shareholders and provide protection from an increase in expenses if a Fund's assets decline. In addition, for Funds that do not have breakpoints, the Board considered that setting competitive fee rates and pricing a Fund to scale before it has actually experienced an increase in assets are other means of sharing potential economies of scale with shareholders. The Board also considered
308
that Management has provided, at no added cost to the Funds, certain additional services, including but not limited to, services required by new regulations or regulatory interpretations, services impelled by changes in the securities markets or the business landscape, and/or services requested by the Board. The Board considered that this is a way of sharing economies of scale with the Funds and their shareholders.
Fund-by-Fund Analysis
With regard to the investment performance of each Fund and the fees charged to each Fund, the Board considered the following information. The broader universes of funds referenced in this section are those identified by the consulting firm, as discussed above, and the risk/return ratios referenced are the Sharpe ratios provided by the consulting firm. With respect to performance quintile rankings for a Fund compared to its broader universe ("Performance Universe"), the first quintile represents the highest (best) performance and the fifth quintile represents the lowest performance. With respect to the quintile rankings for fees and total expenses (net of waivers or other adjustments, if any) for a Fund compared to its peer group ("Expense Group"), the first quintile represents the lowest fees and/or total expenses and the fifth quintile represents the highest fees and/or total expenses. Where a Fund has more than one class of shares outstanding, information for Institutional Class has been provided as identified below. The Board reviewed the expense structures of all the other classes of shares of the Funds, some of which have higher fees and expenses that reflect their separate distribution and servicing arrangements and the differing needs of different investors. As a proxy for the class expense structure, the Board reviewed the expenses of each class for one Fund in the Trust in comparison to Expense Groups for those classes. The Board noted the effect of higher expenses on the performance of the other classes of shares.
• Neuberger Berman Core Bond Fund (Institutional Class)—The Board considered that, based on performance data for the periods ended December 31, 2018: (1) as compared to its benchmark, the Fund's performance was lower for the 1-, 3-, and 5-year periods and higher for the 10-year period; and (2) as compared to its Performance Universe, the Fund's performance was in the fourth quintile for the 1- and 3-year periods, the third quintile for the 5-year period, and the second quintile for the 10-year period. The Board considered that, as compared to its Expense Group, the Fund's contractual management fee, the actual management fee net of fees waived by Management, and total expenses each ranked in the third quintile. The Board took into account that the Fund showed a risk/return ratio that was better than the median of its Performance Universe for the 5-year period, meaning that per unit of risk taken versus a presumed risk-free investment, the Fund achieved a higher level of return than the median of its Performance Universe for that period. The Board also met with a member of the portfolio management team in December 2018 to discuss the Fund's performance. The Board also noted the Fund's outperformance versus its benchmark during the 7-month period ending July 31, 2019.
• Neuberger Berman Emerging Markets Debt Fund (Institutional Class)—The Board considered that, based on performance data for the periods ended December 31, 2018: (1) as compared to its benchmark, the Fund's performance was higher for the 1-year period and lower for the 3- and 5-year periods; and (2) as compared to its Performance Universe, the Fund's performance was in the fourth quintile for the 1- and 5-year periods and the second quintile for the 3-year period. The Fund was launched in 2013 and therefore does not have 10-year performance. The Board considered that, as compared to its Expense Group, the Fund's contractual management fee and total expenses each ranked in the third quintile and the actual management fee net of fees waived by Management ranked in the first quintile.
• Neuberger Berman Floating Rate Income Fund (Institutional Class)—The Board considered that, based on performance data for the periods ended December 31, 2018: (1) as compared to its benchmark, the Fund's performance was lower for the 1-, 3-, and 5-year periods; and (2) as compared to its Performance Universe, the Fund's performance was in the fourth quintile for the 1- and 3-year periods and the third quintile for the 5-year period. The Fund was launched in 2009 and therefore does not have 10-year performance. The Board considered that, as compared to its Expense Group, the Fund's contractual management fee and total expenses each ranked in the third quintile and the actual management fee net of fees waived by Management ranked in the second quintile. In addition, the Board met with a member of the portfolio management team in June 2019 to discuss the Fund's
309
performance. The Board also noted the Fund's second quintile ranking against its Morningstar peer category for the 7-month period ending July 31, 2019.
• Neuberger Berman High Income Bond Fund (Institutional Class)—The Board considered that, based on performance data for the periods ended December 31, 2018: (1) as compared to its benchmark, the Fund's performance was lower for the 1-, 3-, and 5-year periods; and (2) as compared to its Performance Universe, the Fund's performance was in the second quintile for the 1-year period and the third quintile for the 3- and 5-year periods. The Fund's Institutional Class was launched in 2009 and therefore does not have 10-year performance. The Board considered that, as compared to its Expense Group, the Fund's contractual management fee and the actual management fee each ranked in the fifth quintile and total expenses ranked in the third quintile. In determining to renew the Agreement, the Board took into account Management's representations regarding the effect that the composition of the Fund's Performance Universe had on the Fund's performance relative to its peers due to, among other matters, the Fund's positioning in the higher quality portion of the high income bond market, which positioning also affected its performance versus its benchmark. In addition, the Board met with the Fund's portfolio managers in June 2019 to discuss the Fund's performance and positioning in the market. The Board also noted that Management added a new portfolio manager to the Fund in May 2019. The Board also considered Management's representations regarding the relatively small spread between the Fund's contractual management fee and the median of its Expense Group and the competitiveness of its relative total expenses.
• Neuberger Berman Municipal High Income Fund (Institutional Class)—The Board considered that, based on performance data for the periods ended December 31, 2018: (1) as compared to its benchmark, the Fund's performance was higher for the 1-year period and lower for the 3-year period; and (2) as compared to its Performance Universe, the Fund's performance was in the second quintile for the 1- and 3-year periods. The Fund was launched in 2015 and therefore does not have 5- or 10-year performance. The Board considered that, as compared to its Expense Group, the Fund's contractual management fee ranked in the second quintile and the actual management fee net of fees waived by Management and total expenses each ranked in the first quintile. The Board also took into account that Management reduced the Fund's expense limitations for each share class in 2019.
• Neuberger Berman Municipal Impact Fund (Institutional Class)—The Board took into account that the Fund adopted a new investment strategy and benchmark on June 16, 2018, and that the management fee was substantially reduced at that time; accordingly, the fee and performance information for earlier periods does not reflect the current strategy or fee arrangement and therefore the utility of such comparisons is limited until the Fund's new investment strategy has a longer track record. The Board considered that, based on performance data for the periods ended December 31, 2018: (1) as compared to its benchmark, the Fund's performance was lower for the 1-, 3-, and 5-year periods; and (2) as compared to its Performance Universe, the Fund's performance was in the second quintile for the 1-year period, the fourth quintile for the 3-year period, and the fifth quintile for the 5-year period. The Board noted that the performance comparison data for the periods prior to the date of the investment strategy change includes the performance of the Fund's prior investment strategy. NBIA assumed the management of the Fund in 2013; therefore, the Fund does not have does not have 10-year performance under NBIA's management. The Board considered that, as compared to its Expense Group, the Fund's contractual management fee ranked in the first quintile, the actual management fee net of fees waived by Management ranked in the second quintile, and total expenses ranked in the fifth quintile. The Board further noted that the Total Expense Ratio reflected organizational expenses and/or proxy-related expenses associated with the Fund's change in investment strategy, which are non-recurring expense.
• Neuberger Berman Municipal Intermediate Bond Fund (Institutional Class)—The Board considered that, based on performance data for the periods ended December 31, 2018: (1) as compared to its benchmark, the Fund's performance was lower for the 1- year period and higher for the 3- and 5-year period; and (2) as compared to its Performance Universe, the Fund's performance was in the second quintile for the 1-, 3-, and 5-year periods. The Board considered that, as compared to its Expense Group, the Fund's contractual management fee ranked in
310
the first quintile and the actual management fee net of fees waived by Management and total expenses each ranked in the second quintile.
• Neuberger Berman Short Duration Bond Fund (Institutional Class)—The Board considered that, based on performance data for the periods ended December 31, 2018: (1) as compared to its benchmark, the Fund's performance was lower for the 1-, 3-, and 5-year periods; and (2) as compared to its Performance Universe, the Fund's performance was in the second quintile for the 1-year period, the fifth quintile for the 3-year period, and the fourth quintile for the 5-year period. The Fund's Institutional Class was launched in 2010 and therefore does not have 10-year performance. The Board considered that, as compared to its Expense Group, the Fund's contractual management fee and total expenses each ranked in the second quintile and the actual management fee net of fees waived by Management ranked in the first quintile.
• Neuberger Berman Short Duration High Income Fund (Institutional Class)—The Board considered that, based on performance data for the periods ended December 31, 2018: (1) as compared to its benchmark, the Fund's performance was lower for the 1-, 3-, and 5-year periods; and (2) as compared to its Performance Universe, the Fund's performance was in the first quintile for the 1-year period, the fifth quintile for the 3-year period, and the fourth quintile for the 5-year period. The Fund was launched in 2012 and therefore does not have 10-year performance. The Board considered that, as compared to its Expense Group, the Fund's contractual management fee and total expenses each ranked in the third quintile and the actual management fee net of fees waived by Management ranked in the first quintile. In determining to renew the Agreement, the Board took into account Management's representations regarding the effect that the composition of the Fund's Performance Universe had on the Fund's performance relative to its peers due to, among other matters, the Fund's positioning in the higher quality portion of the high income bond market, which positioning also affected its performance versus its benchmark. In addition, The Board also met with a member of the portfolio management team in June 2019 to discuss the Fund's performance. The Board also took into account that the Fund showed a risk/return ratio that was better than the median of its Performance Universe for the 3-year period, meaning that per unit of risk taken versus a presumed risk-free investment, the Fund achieved a higher level of return than the median of its Performance Universe for that period.
• Neuberger Berman Strategic Income Fund (Institutional Class)—The Board considered that, based on performance data for the periods ended December 31, 2018: (1) as compared to its benchmark, the Fund's performance was lower for the 1-year period and higher for the 3-year period; and (2) as compared to its Performance Universe, the Fund's performance was in the third quintile for the 1-, 3-, and 5-year periods and the fourth quintile for the 10-year period. The Board considered that, as compared to its Expense Group, the Fund's contractual management fee, the actual management fee net of fees waived by Management, and total expenses each ranked in the second quintile.
• Neuberger Berman Unconstrained Bond Fund (Institutional Class)—The Board considered that, based on performance data for the periods ended December 31, 2018: (1) as compared to its benchmark, the Fund's performance was lower for the 1-year period and higher for the 3-year period; and (2) as compared to its Performance Universe, the Fund's performance was in the fourth quintile for the 1-year period and the fifth quintile for the 3-year period. The Fund was launched in 2014 and therefore does not have 5- or 10-year performance. The Board considered that, as compared to its Expense Group, the Fund's contractual management fee ranked in the third quintile, the actual management fee net of fees waived by Management ranked in the first quintile, and total expenses ranked in the second quintile. In addition, the Board met with a member of the portfolio management team in December 2018 to discuss the Fund's performance.
Conclusions
In approving the continuation of the Agreements, the Board concluded that, in its business judgment, the terms of each Agreement are fair and reasonable to each Fund and that approval of the continuation of the Agreements is in the best interests of each Fund and its shareholders. In reaching this determination, the Board considered that Management and NBEL could be expected to continue to provide a high level of service to each Fund; that the performance of each Fund
311
was satisfactory over time, or, in the case of an underperforming Fund, that the Board retained confidence in Management's and NBEL's capabilities to manage the Fund; that each Fund's fee structure appeared to the Board to be reasonable given the nature, extent, and quality of services provided; and that the benefits accruing to Management and its affiliates by virtue of their relationship with each Fund were reasonable in light of the costs of providing the investment advisory and other services and the benefits accruing to each Fund. The Board's conclusions may be based in part on its consideration of materials prepared in connection with the approval or continuance of the Agreements in prior years and on the Board's ongoing regular review of Fund performance and operations throughout the year, in addition to material prepared specifically for the most recent annual review of the Agreements.
Notice to Shareholders
For the fiscal period ended October 31, 2019 the percentages representing the portion of distributions from net investment income that is exempt from federal tax, other than alternative minimum tax are as follows:
Municipal High Income | | | 99.69 | % | |
Municipal Impact | | | 99.40 | % | |
Municipal Intermediate Bond | | | 100.00 | % | |
For the fiscal year ended October 31, 2019, each Fund makes the following designation, or up to the maximum amount of such qualified interest income, as Capital Gains Distributions, Ordinary Income and Short-Term Capital Gains.
Capital Gains
Distributions | | Ordinary
Income | | Short-Term
Capital Gains | |
| Core Bond $— | | $ | 13,405,221 | | | $ | — | | |
| Floating Rate Income — | | | 15,483,338 | | | | — | | |
| High Income — | | | 116,826,812 | | | | — | | |
| Municipal Impact 112,302 | | | — | | | | — | | |
| Municipal Intermediate Bond 418,522 | | | — | | | | — | | |
| Strategic Income — | | | 93,798,119 | | | | — | | |
In January 2020, you will receive information to be used in filing your 2019 tax returns, which will include a notice of the exact tax status of all dividends paid to you by each Fund during calendar year 2019. Please consult your own tax advisor for details as to how this information should be reflected on your tax returns.
312
Neuberger Berman Investment Advisers LLC
1290 Avenue of the Americas
New York, NY 10104-0002
Retail Services: 800.877.9700
Broker-Dealer and Institutional Services: 800.366.6264/888.556.9030
Web site: www.nb.com
Statistics and projections in this report are derived from sources deemed to be reliable but cannot be regarded as a representation of future results of the Funds. This report is prepared for the general information of shareholders and is not an offer of shares of the Funds. Shares are sold only through the currently effective prospectus, which you can obtain by calling 1.877.628.2583. An investor should consider a Fund's investment objectives, risks and fees and expenses, which are described in its prospectus, before investing.
H0648 12/19
The Board of Trustees (“Board”) of Neuberger Berman Income Funds (“Registrant”) has adopted a code of ethics that applies to the Registrant’s principal executive officer, principal financial officer, principal accounting officer or controller, or persons performing similar functions (“Code of Ethics”). During the period covered by this Form N-CSR, there were no substantive amendments to the Code of Ethics and there were no waivers from the Code of Ethics granted to the Registrant’s principal executive officer, principal financial officer, principal accounting officer or controller, or persons performing similar functions.
A copy of the Code of Ethics is incorporated by reference to Neuberger Berman Municipal Fund Inc.’s Form N-CSR, Investment Company Act file number 811-21168 (filed January 7, 2019). The Code of Ethics is also available, without charge, by calling 1-800-877-9700 (toll-free).
Item 3. Audit Committee Financial Expert.
The Board has determined that the Registrant has three audit committee financial experts serving on its audit committee. The Registrant’s audit committee financial experts are Michael J. Cosgrove, Martha C. Goss, and Deborah C. McLean. Mr. Cosgrove, Ms. Goss, and Ms. McLean are independent trustees as defined by Form N-CSR.
Item 4. Principal Accountant Fees and Services.
Ernst & Young LLP (“E&Y”) serves as independent registered public accounting firm to Neuberger Berman Emerging Markets Debt Fund, Neuberger Berman High Income Bond Fund, Neuberger Berman Municipal Intermediate Bond Fund, Neuberger Berman Short Duration Bond Fund, Neuberger Berman Strategic Income Fund and Neuberger Berman Unconstrained Bond Fund. Neuberger Berman Emerging Markets Debt Fund, Neuberger Berman High Income Bond Fund, Neuberger Berman Municipal Intermediate Bond Fund, Neuberger Berman Short Duration Bond Fund, Neuberger Berman Strategic Income Fund and Neuberger Berman Unconstrained Bond Fund commenced operations on September 27, 2013, February 1, 1992, July 9, 1987, June 9, 1986, July 11, 2003, and February 13, 2014, respectively.
Tait, Weller & Baker LLP (“Tait Weller”) serves as independent registered public accounting firm to Neuberger Berman Core Bond Fund, Neuberger Berman Floating Rate Income Fund, Neuberger Berman Municipal High Income Fund, Neuberger Berman Municipal Impact Fund and Neuberger Berman Short Duration High Income Fund. Neuberger Berman Core Bond Fund, Neuberger Berman Floating Rate Income Fund, Neuberger Berman Municipal High Income Fund, Neuberger Berman Municipal Impact Fund and Neuberger Berman Short Duration High Income Fund commenced operations on October 1, 1995, December 29, 2009, June 22, 2015, March 11, 2013, and September 28, 2012, respectively.
(a) Audit Fees
The aggregate fees billed for professional services rendered by E&Y for the audit of the annual financial statements or services that are normally provided by E&Y in connection with statutory and regulatory filings or engagements were $317,020 and $309,095 for the fiscal years ended 2018 and 2019, respectively.
The aggregate fees billed for professional services rendered by Tait Weller for the audit of the annual financial statements or services that are normally provided by Tait Weller in connection with statutory and regulatory filings or engagements were $169,900 and $134,050 for the fiscal years ended 2018 and 2019, respectively.
(b) Audit-Related Fees
The aggregate fees billed to the Registrant for assurance and related services by E&Y that are reasonably related to the performance of the audit of the Registrant’s financial statements and are not reported above in Audit Fees were $0 and $0 for the fiscal years ended 2018 and 2019, respectively. The Audit Committee approved 0% and 0% of these services provided by E&Y for the fiscal years ended 2018 and 2019, respectively, pursuant to the waiver provisions of Rule 2-01(c)(7)(i)(C) of Regulation S-X.
The fees billed to other entities in the investment company complex for assurance and related services by E&Y that are reasonably related to the performance of the audit that the Audit Committee was required to approve because the engagement related directly to the operations and financial reporting of the Registrant were $0 and $0 for the fiscal years ended 2018 and 2019, respectively. The Audit Committee approved 0% and 0% of these services provided by E&Y for the fiscal years ended 2018 and 2019, respectively, pursuant to the waiver provisions of Rule 2-01(c)(7)(i)(C) of Regulation S-X.
The aggregate fees billed to the Registrant for assurance and related services by Tait Weller that are reasonably related to the performance of the audit of the Registrant’s financial statements and are not reported above in Audit Fees were $0 and $0 for the fiscal years ended 2018 and 2019, respectively. The Audit Committee approved 0% and 0% of these services provided by Tait Weller for the fiscal years ended 2018 and 2019, respectively, pursuant to the waiver provisions of Rule 2-01(c)(7)(i)(C) of Regulation S-X.
The fees billed to other entities in the investment company complex for assurance and related services by Tait Weller that are reasonably related to the performance of the audit that the Audit Committee was required to approve because the engagement related directly to the operations and financial reporting of the Registrant were $0 and $0 for the fiscal years ended 2018 and 2019, respectively. The Audit Committee approved 0% and 0% of these services provided by Tait Weller for the fiscal years ended 2018 and 2019, respectively, pursuant to the waiver provisions of Rule 2-01(c)(7)(i)(C) of Regulation S-X.
(c) Tax Fees
The aggregate fees billed to the Registrant for professional services rendered by E&Y for tax compliance, tax advice, and tax planning were $67,500 and $65,820 for the fiscal years ended 2018 and 2019, respectively. The nature of the services provided includes preparation of the Federal and State tax extensions and tax returns, review of annual excise tax calculations, and preparation of form 8613, in addition to assistance with the identification of Passive Foreign Investment Companies ("PFICs"), assistance with determination of various foreign withholding taxes, and assistance with Internal Revenue Code and tax regulation requirements for fund investments. The Audit Committee approved 0% and 0% of these services provided by E&Y for the fiscal years ended 2018 and 2019, respectively, pursuant to the waiver provisions of Rule 2-01(c)(7)(i)(C) of Regulation S-X.
The fees billed to other entities in the investment company complex for professional services rendered by E&Y for tax compliance, tax advice, and tax planning that the Audit Committee was required to approve because the engagement related directly to the operations and financial reporting of the Registrant were $0 and $0 for the fiscal years ended 2018 and 2019, respectively. The Audit Committee approved 0% and 0% of these services provided by E&Y for the fiscal years ended 2018 and 2019, respectively, pursuant to the waiver provisions of Rule 2-01(c)(7)(i)(C) of Regulation S-X.
The aggregate fees billed to the Registrant for professional services rendered by Tait Weller for tax compliance, tax advice, and tax planning were $36,120 and $30,000 for the fiscal years ended 2018 and 2019, respectively. The nature of the services provided includes preparation of the Federal and State tax extensions
and tax returns, review of annual excise tax calculations, and preparation of form 8613, in addition to assistance with the identification of PFICs, assistance with determination of various foreign withholding taxes, and assistance with Internal Revenue Code and tax regulation requirements for fund investments. The Audit Committee approved 0% and 0% of these services provided by Tait Weller for the fiscal years ended 2018 and 2019, respectively, pursuant to the waiver provisions of Rule 2-01(c)(7)(i)(C) of Regulation S-X.
The fees billed to other entities in the investment company complex for professional services rendered by Tait Weller for tax compliance, tax advice, and tax planning that the Audit Committee was required to approve because the engagement related directly to the operations and financial reporting of the Registrant were $0 and $0 for the fiscal years ended 2018 and 2019, respectively. The Audit Committee approved 0% and 0% of these services provided by Tait Weller for the fiscal years ended 2018 and 2019, respectively, pursuant to the waiver provisions of Rule 2-01(c)(7)(i)(C) of Regulation S-X.
(d) All Other Fees
The aggregate fees billed to the Registrant for products and services provided by E&Y, other than services reported in Audit Fees, Audit-Related Fees, and Tax Fees were $0 and $0 for the fiscal years ended 2018 and 2019, respectively. The Audit Committee approved 0% and 0% of these services provided by E&Y for the fiscal years ended 2018 and 2019, respectively, pursuant to the waiver provisions of Rule 2-01(c)(7)(i)(C) of Regulation S-X.
The fees billed to other entities in the investment company complex for products and services provided by E&Y, other than services reported in Audit Fees, Audit-Related Fees, and Tax Fees that the Audit Committee was required to approve because the engagement related directly to the operations and financial reporting of the Registrant were $0 and $0 for the fiscal years ended 2018 and 2019, respectively. The Audit Committee approved 0% and 0% of these services provided by E&Y for the fiscal years ended 2018 and 2019, respectively, pursuant to the waiver provisions of Rule 2-01(c)(7)(i)(C) of Regulation S-X.
The aggregate fees billed to the Registrant for products and services provided by Tait Weller, other than services reported in Audit Fees, Audit-Related Fees, and Tax Fees were $0 and $0 for the fiscal years ended 2018 and 2019, respectively. The Audit Committee approved 0% and 0% of these services provided by Tait Weller for the fiscal years ended 2018 and 2019, respectively, pursuant to the waiver provisions of Rule 2-01(c)(7)(i)(C) of Regulation S-X.
The fees billed to other entities in the investment company complex for products and services provided by Tait Weller, other than services reported in Audit Fees, Audit-Related Fees, and Tax Fees that the Audit Committee was required to approve because the engagement related directly to the operations and financial reporting of the Registrant were $0 and $0 for the fiscal years ended 2018 and 2019, respectively. The Audit Committee approved 0% and 0% of these services provided by Tait Weller for the fiscal years ended 2018 and 2019, respectively, pursuant to the waiver provisions of Rule 2-01(c)(7)(i)(C) of Regulation S-X.
(e) Audit Committee’s Pre-Approval Policies and Procedures
(1) The Audit Committee’s pre-approval policies and procedures for the Registrant to engage an accountant to render audit and non-audit services delegate to each member of the Committee the power to pre-approve services between meetings of the Committee.
(2) None of the services described in paragraphs (b) through (d) above were approved by the Audit Committee pursuant to paragraph (c)(7)(i)(C) of Rule 2-01 of Regulation S-X.
(f) Hours Attributed to Other Persons
Not applicable.
(g) Non-Audit Fees
Non-audit fees billed by E&Y for services rendered to the Registrant were $67,500 and $65,820 for the fiscal years ended 2018 and 2019, respectively.
Non-audit fees billed by E&Y for services rendered to the Registrant’s investment adviser and any entity controlling, controlled by, or under common control with the adviser that provides ongoing services to the Registrant were $0 and $0 for the fiscal years ended 2018 and 2019, respectively.
Non-audit fees billed by Tait Weller for services rendered to the Registrant were $0 and $0 for the fiscal years ended 2018 and 2019, respectively.
Non-audit fees billed by Tait Weller for services rendered to the Registrant’s investment adviser and any entity controlling, controlled by, or under common control with the adviser that provides ongoing services to the Registrant were $0 and $0 for the fiscal years ended 2018 and 2019, respectively.
(h) The Audit Committee of the Board considered whether the provision of non-audit services rendered to the Registrant’s investment adviser and any entity controlling, controlled by, or under common control with the adviser that provides ongoing services to the Registrant that were not pre-approved by the Audit Committee because the engagement did not relate directly to the operations and financial reporting of the Registrant is compatible with maintaining E&Y’s and Tait Weller’s independence.
Item 5. Audit Committee of Listed Registrants.
Not applicable to the Registrant.
Item 6. Schedule of Investments.
The complete schedule of investments for each series is disclosed in the Registrant’s annual report, which is included in Item 1 of this Form N-CSR.
Item 7. Disclosure of Proxy Voting Policies and Procedures for Closed-End Management Investment Companies.
Not applicable to the Registrant.
Item 8. Portfolio Managers of Closed-End Management Investment Companies.
Not applicable to the Registrant.
Item 9. Purchases of Equity Securities by Closed-End Management Investment Company and Affiliated Purchasers.
Not applicable to the Registrant.
Item 10. Submission of Matters to a Vote of Security Holders.
There were no changes to the procedures by which shareholders may recommend nominees to the Board.
Item 11. Controls and Procedures.
| (a) | Based on an evaluation of the disclosure controls and procedures (as defined in Rule 30a-3(c) under the Act) as of a date within 90 days of the filing date of this report, the Chief Executive Officer and President and the Treasurer and Principal Financial and Accounting Officer of the Registrant have concluded that such disclosure controls and procedures are effectively designed to ensure that information required to be disclosed by the Registrant on Form N-CSR is accumulated and communicated to the Registrant’s management to allow timely decisions regarding required disclosure. |
| (b) | There were no significant changes in the Registrant’s internal controls over financial reporting (as defined in Rule 30a-3(d) under the Act) that occurred during the most recent fiscal half-year period covered by this report that have materially affected, or are reasonably likely to materially affect, the Registrant’s internal control over financial reporting. |
Item 12. Disclosure of Securities Lending Activities for Closed-End Management Investment Companies.
Not applicable to the Registrant.
Item 13. Exhibits.
| (a)(1) | A copy of the Code of Ethics is incorporated by reference to Neuberger Berman Municipal Fund Inc.’s Form N-CSR, Investment Company Act file number 811-21168 (filed January 7, 2019). |
| (a)(2) | The certifications required by Rule 30a-2(a) under the Act and Section 302 of the Sarbanes-Oxley Act of 2002 (“Sarbanes-Oxley Act”) are filed herewith. |
| (a)(3) | Not applicable to the Registrant. |
| (a)(4) | Not applicable to the Registrant. |
| (b) | The certification required by Rule 30a-2(b) under the Act and Section 906 of the Sarbanes-Oxley Act is furnished herewith. |
The certification furnished pursuant to Rule 30a-2(b) under the Act and Section 906 of the Sarbanes-Oxley Act will not be deemed “filed” for purposes of Section 18 of the Securities Exchange Act of 1934, as amended (“Exchange Act”), or otherwise subject to the liability of that section. Such certification will not be deemed to be incorporated by reference into any filing under the Securities Act of 1933, as amended, or the Exchange Act, except to the extent that the Registrant specifically incorporates it by reference.
SIGNATURES
Pursuant to the requirements of the Securities Exchange Act of 1934 and the Investment Company Act of 1940, the Registrant has duly caused this report to be signed on its behalf by the undersigned, thereunto duly authorized.
Neuberger Berman Income Funds
| By: | /s/ Joseph V. Amato | |
| | Joseph V. Amato | |
| | Chief Executive Officer and President | |
Date: January 2, 2020
Pursuant to the requirements of the Securities Exchange Act of 1934 and the Investment Company Act of 1940, this report has been signed below by the following persons on behalf of the Registrant and in the capacities and on the dates indicated.
| By: | /s/ Joseph V. Amato | |
| | Joseph V. Amato | |
| | Chief Executive Officer and President | |
Date: January 2, 2020
| By: | /s/ John M. McGovern | |
| | John M. McGovern | |
| | Treasurer and Principal Financial
|
| | and Accounting Officer |
Date: January 2, 2020