As filed with the Securities and Exchange Commission on January 5, 2023
UNITED STATES
SECURITIES AND EXCHANGE COMMISSION
Washington, D.C. 20549
FORM N-CSR
CERTIFIED SHAREHOLDER REPORT OF
REGISTERED MANAGEMENT INVESTMENT COMPANIES
Investment Company Act file number: 811-03802
NEUBERGER BERMAN INCOME FUNDS
(Exact Name of Registrant as specified in charter)
c/o Neuberger Berman Investment Advisers LLC
1290 Avenue of the Americas
New York, New York 10104-0002
(Address of Principal Executive Offices – Zip Code)
Joseph V. Amato
Chief Executive Officer and President
Neuberger Berman Income Funds
c/o Neuberger Berman Investment Advisers LLC
1290 Avenue of the Americas
New York, New York 10104-0002
Lori L. Schneider, Esq.
K&L Gates LLP
1601 K Street, N.W.
Washington, D.C. 20006-1600
(Names and Addresses of agents for service)
Registrant's telephone number, including area code: (212) 476-8800
Date of fiscal year end: October 31
Date of reporting period: October 31, 2022
Form N-CSR is to be used by management investment companies to file reports with the Commission not later than 10 days after the transmission to stockholders of any report that is required to be transmitted to stockholders under Rule 30e-1 under the Investment Company Act of 1940, as amended (“Act”) (17 CFR 270.30e-1). The Commission may use the information provided on Form N-CSR in its regulatory, disclosure review, inspection, and policymaking roles.
A registrant is required to disclose the information specified by Form N-CSR, and the Commission will make this information public. A registrant is not required to respond to the collection of information contained in Form N-CSR unless the Form displays a currently valid Office of Management and Budget (“OMB”) control number. Please direct comments concerning the accuracy of the information collection burden estimate and any suggestions for reducing the burden to the Secretary, Securities and Exchange Commission, 100 F Street, NE, Washington, DC 20549-1090. The OMB has reviewed this collection of information under the clearance requirements of 44 U.S.C. § 3507.
Item 1. Report to Shareholders.
(a) Following is a copy of the annual report transmitted to shareholders pursuant to Rule 30e-1 under the Act.
Neuberger Berman
Income Funds
| |
| |
Institutional Class Shares | |
| |
|
Emerging Markets Debt Fund |
Floating Rate Income Fund |
|
Municipal High Income Fund |
|
Municipal Intermediate Bond Fund |
|
|
Annual Report
October 31, 2022
The "Neuberger Berman" name and logo and "Neuberger Berman Investment Advisers LLC" name are registered service marks of Neuberger Berman Group LLC. The individual Fund names in this piece are either service marks or registered service marks of Neuberger Berman Investment Advisers LLC, an affiliate of Neuberger Berman BD LLC, distributor, member FINRA. ©2022 Neuberger Berman BD LLC, distributor. All rights reserved.
President’s Letter
Dear Shareholder,
I am pleased to present this annual shareholder report for the Neuberger Berman Income Funds covering the fiscal year ended October 31, 2022 (the reporting period).
It was an extremely challenging period in the fixed income market during the reporting period. Sharply rising and persistent inflation was a major factor impacting the market. The U.S. Federal Reserve Board (Fed) initially thought rising prices were transitory and they would come down as COVID-driven supply chain bottlenecks eased. However, these issues continued, labor markets and consumer demand remained robust, and the impact from the war in Ukraine created a "perfect storm," pushing inflation in the U.S. to a new 40-year high.
This caused the Fed to pivot from its highly accommodative monetary policy that was in place to support the economy during the pandemic, to an aggressively tightening policy in an attempt to rein in inflation. The Fed first raised interest rates in March 2022 from a range between 0.00% to 0.25% to a range between 0.25% to 0.50%. With inflation moving steadily higher, the central bank increased the magnitude of its rate hikes at its meetings in May and June and maintained its aggressive 0.75% (75 basis point) hikes in July, September and early November (after the reporting period ended). With the last increase, the Fed funds rate moved to a range between 3.75% and 4.00% and the Fed expects to continue raising rates "until the job is done."
Turning to the fixed income market, with short- and long-term U.S. Treasury yields moving sharply higher, bond prices declined (yields and bond prices move in the opposite direction). Meanwhile, credit spreads significantly widened due to increased investor risk aversion and the Fed’s rate hikes. All told, the broad taxable investment-grade bond market, as measured by the Bloomberg U.S. Aggregate Bond Index, returned -15.68% during the reporting period. The high yield and tax-free bond markets were also negatively impacted by rising rates.
Looking ahead, we believe inflation will moderate in 2023. That said, this will require the Fed to remain vigilant. In particular, we anticipate the central bank to continue to raise rates and leave them higher for longer to ensure inflation remains under control. While we anticipate volatility in fixed income and interest rates markets for some time to come, we believe yields are beginning to look attractive across a growing swath of the fixed income markets as a potential source of both income and diversification. That said, we believe active portfolio management can be valuable to help navigate the factors impacting the markets, and to seek out attractive relative-value opportunities.
Thank you for your support and trust. We look forward to continue serving your investment needs in the years to come.
Sincerely,
Joseph V. Amato
President and CEO
Neuberger Berman Income Funds
Core Bond Fund Commentary (Unaudited)
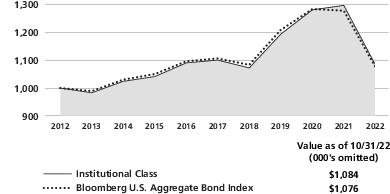
Neuberger Berman Core Bond Fund Institutional Class delivered a -16.37% total return for the fiscal year ended October 31, 2022 (the reporting period) and underperformed its benchmark, the Bloomberg U.S. Aggregate Bond Index (the Index), which returned -15.68% for the same period. (Performance for all share classes is provided in the table immediately following this letter.)
The fixed income market generated weak results during the reporting period. Whereas the U.S. Federal Reserve Board (Fed) initially characterized rising inflation as being "transitory," this was not the case. Monetary and fiscal policy support provided in earlier periods in response to COVID-19, robust labor markets and consumer spending, supply chain bottlenecks, repercussions from the war in Ukraine, and other factors pushed U.S. inflation to a 40-year high. Against this backdrop, the Fed began an aggressive rate hike campaign in March 2022 to subdue rapidly rising inflation, even if to the detriment of economic growth. Rising yields dragged down fixed income market performance, as yields and bond prices moved in the opposite direction. Meanwhile, U.S. credit spreads significantly widened due to periods of risk aversion and the Fed’s monetary tightening campaign.
In terms of relative performance, sector allocations to non-agency mortgage-backed securities (MBS), commercial mortgage-backed securities (CMBS), U.S. Treasuries and U.S. Treasury Inflation-Protected Securities as well as security selection in investment-grade credit were notable detractors from the Fund’s results. This was partly offset by positive contributions from an underweight exposure to investment-grade credit and security selection within non-agency MBS. In a period of heightened interest rate volatility, the Fund’s interest rate positioning contributed to relative performance, particularly an underweight duration exposure and positioning for a flatter yield curve at times during the reporting period.
There were several adjustments made to the Fund during the reporting period. We increased the Fund’s exposure to investment-grade credit, collateralized loan obligations (CLOs) and asset-backed securities (ABS), and we reduced exposure to U.S. Treasuries and CMBS. At the end of the reporting period, the Fund was overweight in a diversified mix of securitized sectors—including ABS, CMBS, non-agency residential MBS, CLOs, and agency MBS—balanced by underweight exposure in U.S. Treasuries.
The Fund’s use of futures contracts contributed positively to performance during the reporting period.
Looking ahead, while we have conviction that U.S. inflation will head lower for much of next year, we believe it will take continued effort by the Fed. In our view, the central bank is likely to be conservative in leaving rates higher for longer in order to avoid a "double-dip" rise in inflation, as occurred in the 1970s; we believe it will likely look for a convincing decline in inflation before starting to cut rates. We believe inflation and central bank policy should continue to drive market behavior. We anticipate further tightening by developed market central banks, counterbalanced by the potential for slower tightening by emerging markets, which began their tightening cycles much earlier. In our view, this, in turn, is likely to result in a general upward trend in yields. We believe this environment is well suited to active management given the array of macro events and the opportunities that can arise during periods of elevated volatility.
Sincerely,
Thanos Bardas, David M. Brown, Nathan Kush and Brad Tank
Portfolio Managers
Information about principal risks of investing in the Fund is set forth in the prospectus and statement of additional information.
The portfolio composition, industries and holdings of the Fund are subject to change without notice.
The opinions expressed are those of the Fund’s portfolio managers. The opinions are as of the date of this report and are subject to change without notice.
Core Bond Fund (Unaudited)
PORTFOLIO BY INVESTMENT TYPE |
(as a % of Total Net Assets) |
| |
| |
Foreign Government Securities | |
Mortgage-Backed Securities | |
U.S. Government Agency Securities | |
U.S. Treasury Obligations | |
| |
Liabilities Less Other Assets | |
| |
| Includes the impact of the Fund's open positions in derivatives, if any. |
PERFORMANCE HIGHLIGHTS1,2 | | | |
| | Average Annual Total Return
Ended 10/31/2022 |
| | | | |
| | | | | |
| | | | | |
| | | | | |
| | | | | |
| | | | | |
| | | | | |
| | | | |
| | | | | |
| | | | | |
| | | | | |
Bloomberg U.S. Aggregate Bond Index5,6 | | | | |
The performance data quoted represent past performance and do not indicate future results. Current performance may be lower or higher than the performance data quoted. For current performance data, including current to the most recent month-end, please visit www.nb.com/performance.
The results shown in the table reflect the reinvestment of income dividends and other distributions, if any. The results do not reflect the effect of taxes a shareholder would pay on Fund distributions or on the redemption of Fund shares.
The investment return and principal value of an investment will fluctuate and shares, when redeemed, may be worth more or less than their original cost.
Returns would have been lower if Neuberger Berman Investment Advisers LLC ("NBIA") had not reimbursed certain expenses and/or waived a portion of the investment management fees during certain of the periods shown. Repayment by a class (of expenses previously reimbursed and/or fees previously waived by NBIA) will decrease the class’s returns. Please see Note B in the Notes to Financial Statements for specific information regarding expense reimbursement and/or fee waiver arrangements.
For the period ended October 31, 2022, the 30-day SEC yields were 4.28%, 4.69%, 4.28%, 3.52% and 4.79% for Investor Class, Institutional Class, Class A, Class C and Class R6 shares, respectively. Absent expense reimbursements and/or fee waivers, the 30-day SEC yields would have been 4.09%, 4.62%, 4.24%, 3.47% and 4.72% for Investor Class, Institutional Class, Class A, Class C and Class R6 shares, respectively.
As stated in the Fund’s most recent prospectus, the total annual operating expense ratios for fiscal year 2021 were 0.88%, 0.43%, 0.80%, 1.57% and 0.33% for Investor Class, Institutional Class, Class A, Class C and Class R6 shares, respectively (before expense reimbursements and/or fee waivers, if any, and after restatement). The expense ratios were 0.79%, 0.39%, 0.79%, 1.54% and 0.29% for Investor Class, Institutional Class, Class A, Class C and Class R6 shares, respectively, after expense reimbursements and/or fee waivers and restatement. The expense ratios for the annual period ended October 31, 2022, can be found in the Financial Highlights section of this report.
Returns shown with a sales charge reflect the deduction of the current maximum initial sales charge of 4.25% for Class A shares and the contingent deferred sales charge (CDSC) for Class C shares. The CDSC for Class C shares is 1.00%, which is reduced to 0% after 1 year. The performance of the Fund’s share classes will differ primarily due to different sales charge structures and class expenses. Please see the prospectus for more information about sales charge structures, if any, and class expenses for your share class.
Core Bond Fund (Unaudited)
COMPARISON OF A $1,000,000 INVESTMENT
(000's omitted)
This graph shows the change in value of a hypothetical $1,000,000 investment in the Fund over the past 10 fiscal years, or since the Fund’s inception if it has not operated for 10 years. The graph is based on the Institutional Class shares only; the performance of the Fund’s share classes will differ primarily due to different sales charge structures and class expenses (see Performance Highlights chart on previous page). The result is compared with benchmarks, which include a broad-based market index and may include a more narrowly based index. Market indices have not been reduced to reflect any of the fees and costs of investing. The results shown in the graph reflect the reinvestment of income dividends and other distributions, if any. The results do not reflect the effect of taxes a shareholder would pay on Fund distributions or on the redemption of Fund shares. Results represent past performance and do not indicate future results.
Emerging Markets Debt Fund Commentary (Unaudited)
Neuberger Berman Emerging Markets Debt Fund Institutional Class generated a -21.48% total return for the fiscal year ended October 31, 2022 (the reporting period), and underperformed its benchmark, a blend consisting of 50% J.P. Morgan Government Bond Index—Emerging Markets (GBI-EM) Global Diversified, 25% J.P. Morgan Emerging Markets Bond Index (EMBI®)—Global Diversified, and 25% J.P. Morgan Corporate Emerging Markets Bond Index (CEMBI)—Diversified (collectively, the Index), which delivered a -20.89% total return for the same period. (Performance for all share classes is provided in the table immediately following this letter.)
For the reporting period, emerging markets (EM) debt experienced a negative shock from Russia’s invasion of Ukraine and then the subsequent rate hiking cycle initiated by the U.S. Federal Reserve Board (Fed) ultimately leading to negative performance across the asset class. The hard currency sovereign debt index (J.P. Morgan EMBI Global Diversified) delivered a -24.19% total return, the corporate debt index (J.P. Morgan CEMBI Diversified) delivered -18.89%, and the local currency index (J.P. Morgan GBI-EM Global Diversified) returned -20.27%.
This was an extremely turbulent period for EM which experienced the resurgence of COVID-19, Russia’s invasion of Ukraine, persistently high inflation, the specter of rising interest rates, and the strengthening dollar. The more transmissible Omicron variant of COVID-19 led to renewed restrictions in multiple countries over the winter and carried into the spring. The largest impact to growth was seen in China where its zero-Covid policy remained in place. In February 2022, Russia’s invasion of Ukraine and consequent sanctions isolated significant parts of Russia’s economy and its financial markets. As a result, EM saw a major risk-off move. Throughout the reporting period, fixed income markets saw continued headwinds from high inflation, with the U.S. consumer price index peaking at 9.1% in June 2022. In late 2021, the Fed announced that it would be tapering asset purchases while also considering rate hikes, which came to fruition in March 2022. With inflation prints persistently higher, the hiking cycle is expected to continue through the year end which the Fed reiterated at Jackson Hole in August, and, at the end of the reporting period, our Fed funds rate expectations were as high as 4.6% for the year ending 2023. The European Central Bank (ECB) also raised rates and signaled it will continue hiking as inflation has soared in the region. As such we saw a sharp rise in core rates, as well as a new multi-decade high for the U.S. dollar index.
The primary driver of relative performance early during the reporting period was the underweight exposure to Russia leading up to its invasion of Ukraine across the portfolio. During the reporting period, the underlying hard currency sovereign sleeves detracted from performance, while corporates and local currency contributed to performance. In hard currency country selection, our overweight allocations to frontier and high yielding countries, including positioning in distressed and defaulted countries such as Ghana, Sri Lanka, Ukraine, and Ecuador detracted the most. The absence from Pakistan and Belarus was positive. In instrument selection, our positioning in euro-denominated Romanian sovereign debt was the negative driver. Within corporates, country allocation, and the overweight exposure to Mexico, Brazil and Peru versus the Index was positive while underweight exposure to investment grade Asian countries detracted. Security selection in China detracted due to exposure to the property sector, which faced significant stress resulting in ongoing defaults. The Fund’s local currency sleeve outperformed the Index over the reporting period, driven mainly by rates positioning, though foreign currency (FX) positioning was also positive. The main contributors in rates, in addition to the underweight exposure to Russia, included underweight duration exposure in Poland and Turkey and a long duration exposure in Egypt. Detractors in rates included the underweight in Hungary and exposure to front-end Brazil and Mexico duration given upward pressures on yields amid Fed hawkishness. On the FX side, active positioning throughout the reporting period was additive. The primary contributors were underweights to the Chinese renminbi and an overweight to the Egyptian pound until the devaluation in October when we moved to take off the overweight. Detractors included frontier exposures in Kazakhstan and Ghana.
The contribution from tactical allocation was neutral over the reporting period. The short U.S. interest rate duration position and a credit default swap index (CDX) position that we held to potentially mitigate against the higher risk profile of the strategy were additive. However, the overweight exposure to hard currency sovereigns
relative to the Index was negative even though the neutral position in corporates and the underweight to local currency in favor of cash which were positive.
The Fund’s aggregate use of futures, forward foreign currency, and swap contracts detracted from performance during the reporting period.
Over the reporting period there were a number of changes across the Fund’s portfolio within the tactical asset allocation as well as the underlying sub-asset classes. The Fund partially exited its Russian positions across the portfolio as market conditions permitted.
Within the tactical asset allocation, the Fund started the reporting period with an underweight to hard and local currency while holding a 4% cash position. We deployed cash to move to an overweight position in hard currency in November 2021 and moved back to a neutral position in September 2022. We shifted to a neutral allocation to corporates in March which we have since maintained. The underweight to local currency has been steady throughout. We have also actively traded a basket of currencies and a CDX position in the tactical asset allocation overlay. Finally, we had an interest rate duration underweight through July when we moved to a neutral position.
Within hard currency sovereigns, as of the end of the reporting period we maintained an overweight in the high yield (HY) segment of the market, biased toward BBs, as we believe that the spread widening in the EM HY space has been excessive and exacerbated by a trend of strong outflows from the asset class coupled with below-average levels of trading liquidity. In terms of changes over the reporting period, we increased exposure to Egypt as it remains under an International Monetary Fund (IMF) agreement. We also increased exposure to the Dominican Republic and Panama. We reduced exposure to countries where we have seen valuations tighten, including Costa Rica and Croatia. We also reduced exposure to countries where we believe the fundamentals continue to deteriorate, such as Turkey and Colombia.
In corporate positioning, we actively participated in the new issuance market, though activity was much more limited during the reporting period as issuers adapted to the rising rate environment. Aside from partially exiting Russia, the largest shift in the space was to reduce exposure in China property as the sector faced a series of defaults and limited policy support for offshore issuance. Ancillary to this, we reduced gaming exposure in Macau as China’s zero-Covid policy continued to weigh on tourism and gaming activity. We also reduced exposure in Turkey as the country’s fundamentals have created headwinds for the corporates operating in the country. We added to the Middle East and Latin America. By sector we increased exposure to the utilities and financials sectors while reducing exposure to real estate and metals & mining.
On the local currency side, we maintained a cautious risk stance over the reporting period. Our key overweights in rates include Mexico and Brazil, where we see inflation peaking and central banks that have finished or are near finishing their hiking cycles. Meanwhile, we are underweight in predominately lower yielding countries that have lagged with tightening cycles, particularly in Asia. We stay cautious on EM currencies though given growth pressures and vulnerability to deteriorating current accounts. The FX beta1 exposure is hovering near neutral in the Fund, as it has most of the reporting period, as we focus primarily on relative value positioning across currencies.
EM economies continue to face significant risks from slowing global growth, tighter financial conditions, the zero-Covid policy in China and the fallout of the war in Ukraine. Mitigating these risks, many EM central banks have been proactively raising rates, creating buffers for some time ahead, while IMF engagement by different EM countries support funding needs and reform agendas. While rising U.S. rates have been a major headwind for EM debt returns over the past year, we believe that this factor should pose a more limited downside risk going forward given the sizable rate hikes that are now behind us, and the further rises priced in for the next year.
Sincerely,
Rob Drijkoningen, Gorky Urquieta, Bart Van der Made, Raoul Luttik,
Jennifer Gorgoll, Vera Kartseva and Nish Popat
Portfolio Co-Managers
1 Beta is a measure of the systematic risk of a portfolio. It is the covariance of the portfolio and a market index divided by the variance of the market index. Beta measures the historical sensitivity of a portfolio's returns to movements in the market index. The beta of the market index will always be one. A portfolio with a beta above the market index (i.e., ˃1) means that the portfolio has greater volatility than the market index. If the beta of the portfolio is 1.2, a market increase in return of 1% implies a 1.2% increase in the portfolio's return. If the beta of the portfolio is 0.8, a market decrease in return of 1% implies a 0.8% decrease in the portfolio's return.
Information about principal risks of investing in the Fund is set forth in the prospectus and statement of additional information.
The portfolio composition, industries and holdings of the Fund are subject to change without notice.
The opinions expressed are those of the Fund’s portfolio managers. The opinions are as of the date of this report and are subject to change without notice.
Emerging Markets Debt Fund (Unaudited)
| | |
| | Average Annual Total Return
Ended 10/31/2022 |
| | | |
| | | | |
| | | | |
| | | | |
| | | | |
| | | |
| | | | |
| | | | |
| | | | |
| | | |
*
Blended Benchmark is composed of 50% J.P. Morgan Government Bond Index—Emerging Markets (GBI-EM) Global Diversified, 25% J.P. Morgan Emerging Markets Bond Index (EMBI)—Global Diversified, and 25% J.P. Morgan Corporate Emerging Markets Bond Index (CEMBI)—Diversified, and is rebalanced monthly.
The performance data quoted represent past performance and do not indicate future results. Current performance may be lower or higher than the performance data quoted. For current performance data, including current to the most recent month-end, please visit www.nb.com/performance.
The results shown in the table reflect the reinvestment of income dividends and other distributions, if any. The results do not reflect the effect of taxes a shareholder would pay on Fund distributions or on the redemption of Fund shares.
The investment return and principal value of an investment will fluctuate and shares, when redeemed, may be worth more or less than their original cost.
Returns would have been lower if Neuberger Berman Investment Advisers LLC ("NBIA") had not reimbursed certain expenses and/or waived a portion of the investment management fees during certain of the periods shown. Repayment by a class (of expenses previously reimbursed and/or fees previously waived by NBIA) will decrease the class’s returns. Please see Note B in the Notes to Financial Statements for specific information regarding expense reimbursement and/or fee waiver arrangements.
For the period ended October 31, 2022, the 30-day SEC yields were 8.47%, 8.10% and 7.33% for Institutional Class, Class A and Class C shares, respectively. Absent expense reimbursements and/or fee waivers, the 30-day SEC yields would have been 8.18%, 7.66% and 7.01% for Institutional Class, Class A and Class C shares, respectively.
As stated in the Fund’s most recent prospectus, the total annual operating expense ratios for fiscal year 2021 were 0.96%, 1.39% and 2.12% for Institutional Class, Class A and Class C shares, respectively (before expense reimbursements and/or fee waivers, if any). The expense ratios were 0.79%, 1.16% and 1.91% for Institutional Class, Class A and Class C shares, respectively, after expense reimbursements and/or fee waivers. The expense ratios for the annual period ended October 31, 2022, can be found in the Financial Highlights section of this report.
Returns shown with a sales charge reflect the deduction of the current maximum initial sales charge of 4.25% for Class A shares and the contingent deferred sales charge (CDSC) for Class C shares. The CDSC for Class C shares is 1.00%, which is reduced to 0% after 1 year. The performance of the Fund’s share classes will differ primarily due to different sales charge structures and class expenses. Please see the prospectus for more information about sales charge structures, if any, and class expenses for your share class.
Emerging Markets Debt Fund (Unaudited)
COMPARISON OF A $1,000,000 INVESTMENT
(000's omitted)
This graph shows the change in value of a hypothetical $1,000,000 investment in the Fund over the past 10 fiscal years, or since the Fund’s inception if it has not operated for 10 years. The graph is based on the Institutional Class shares only; the performance of the Fund’s share classes will differ primarily due to different sales charge structures and class expenses (see Performance Highlights chart on previous page). The result is compared with benchmarks, which include a broad-based market index and may include a more narrowly based index. Market indices have not been reduced to reflect any of the fees and costs of investing. The results shown in the graph reflect the reinvestment of income dividends and other distributions, if any. The results do not reflect the effect of taxes a shareholder would pay on Fund distributions or on the redemption of Fund shares. Results represent past performance and do not indicate future results.
*
Blended benchmark is composed of 50% J.P. Morgan Government Bond Index (GBI)—Emerging Markets Global Diversified, 25% J.P. Morgan Emerging Markets Bond Index (EMBI)—Global Diversified, and 25% J.P. Morgan Corporate Emerging Markets Bond Index (CEMBI)—Diversified, and is rebalanced monthly.
Floating Rate Income Fund Commentary (Unaudited)
Neuberger Berman Floating Rate Income Fund Institutional Class generated a -2.96% total return for the fiscal year ended October 31, 2022 (the reporting period) and underperformed its benchmark, the Morningstar LSTA US Leveraged Loan Index* (the Index), which provided a -1.78% total return for the same period. (Performance for all share classes is provided in the table immediately following this letter.)
While the senior floating rate bank loan market saw negative returns during the reporting period, the drawdowns were much less pronounced than other fixed income categories given the short duration and floating rate nature of the asset class, which acts as an inflation hedge. Whereas the U.S. Federal Reserve Board (Fed) initially characterized rising inflation as being "transitory," this was not the case. Higher inflation cut into real growth as robust consumer spending, supply chain bottlenecks, a tight labor market, repercussions from the war in Ukraine, and other factors combined to push U.S. inflation to a 40-year high. Against this backdrop, the Fed began an aggressive rate hike campaign in March 2022, which is expected to continue until inflation is under control. Weighted average bid prices on the loan market declined over the period due to risk aversion and concerns over rising recession odds.
The Fund tactically adjusted its position in non-floating rate securities during the reporting period. We have the flexibility to allocate up to 20% of the portfolio to these securities, usually fixed-rate senior bonds. Relative value between floating rate loans and fixed-rate bonds fluctuated given the heightened volatility and wider high yield bond credit spreads. Against this backdrop, the Fund's non-floating rate allocation ended the reporting period at approximately 7.3% of net assets compared to 5.4% of net assets at the beginning of the reporting period.
In terms of the Fund's portfolio credit quality, security selection within B and CCC and below rated issuers were the best performers. Conversely, an underweight to and security selection within BB, an underweight to and security selection within BBB, and an overweight to CCC and below and B rated issuers versus the Index were the worst performers.
The Fund’s use of swap contracts detracted from performance during the reporting period.
From a sector perspective, security selection within and an underweight to software, security selection within entertainment, and security selection within and an underweight to retailers were the best performers. In contrast, security selection within information technology services, security selection within and an overweight to health care, and security selection within and an underweight to electronics (technology) versus the Index were the worst performers.
Looking ahead, we believe current floating rate loan valuations offer investors an attractive opportunity, especially given our below average default outlook. While the tightening of financial conditions, still-elevated inflation and challenging news out of Europe have been creating incremental volatility, real growth is slowing but still positive with supply chains returning back to normal. We see these factors acting to mitigate inflationary pressures, which could eventually lead to a less aggressive path for Fed policy. In our view, healthy consumer and business balance sheets, growing nominal gross domestic product and solid job growth should remain supportive for issuer fundamentals. While inventories are building as a result of slowing demand, we remain focused on sector dynamics and idiosyncratic risks to individual issuers. Despite short-term volatility resulting from heightened uncertainty in commodity prices, central bank tightening and negative news flow out of Europe, we believe our bottom-up, fundamental credit research that focuses on security selection, avoiding credit deterioration, and putting only our "best ideas" into portfolios, will position us well to take advantage of the increased volatility.
Sincerely,
Joseph P. Lynch and Stephen J. Casey
Portfolio Managers
*Neuberger Berman Floating Rate Income Fund’s benchmark was renamed from S&P/LSTA Leveraged Loan Index to Morningstar LSTA US Leveraged Loan Index effective 8/29/2022.
Information about principal risks of investing in the Fund is set forth in the prospectus and statement of additional information.
The portfolio composition, industries and holdings of the Fund are subject to change without notice.
The opinions expressed are those of the Fund’s portfolio managers. The opinions are as of the date of this report and are subject to change without notice.
The loan ratings noted above represent segments of the Morningstar LSTA US Leveraged Loan Index, which are determined based on the ratings issued by S&P Global.
Floating Rate Income Fund (Unaudited)
PORTFOLIO BY MATURITY DISTRIBUTION |
(as a % of Total Investments*) |
| |
One to less than Five Years | |
Five to less than Ten Years | |
| |
| |
| |
| Does not include Short-Term Investments or the impact of the Fund’s open positions in derivatives, if any. |
| |
| | | |
| | Average Annual Total Return
Ended 10/31/2022 |
| | | | |
| | | | | |
| | | | | |
| | | | | |
| | | | | |
| | | | |
| | | | | |
| | | | | |
| | | | | |
Morningstar LSTA US Leveraged Loan Index*5 ,6 | | | | |
*
Effective August 29, 2022, the S&P/LSTA Leveraged Loan Index changed its name to Morningstar LSTA US Leveraged Loan Index.
The performance data quoted represent past performance and do not indicate future results. Current performance may be lower or higher than the performance data quoted. For current performance data, including current to the most recent month-end, please visit www.nb.com/performance.
The results shown in the table reflect the reinvestment of income dividends and other distributions, if any. The results do not reflect the effect of taxes a shareholder would pay on Fund distributions or on the redemption of Fund shares.
The investment return and principal value of an investment will fluctuate and shares, when redeemed, may be worth more or less than their original cost.
Returns would have been lower if Neuberger Berman Investment Advisers LLC ("NBIA") had not reimbursed certain expenses and/or waived a portion of the investment management fees during certain of the periods shown. Repayment by a class (of expenses previously reimbursed and/or fees previously waived by NBIA) will decrease the class’s returns. Please see Note B in the Notes to Financial Statements for specific information regarding expense reimbursement and/or fee waiver arrangements.
For the period ended October 31, 2022, the 30-day SEC yields were 7.50%, 7.12% and 6.36% for Institutional Class, Class A and Class C shares, respectively. Absent expense reimbursements and/or fee waivers, the 30-day SEC yields would have been 7.37%, 6.97% and 6.23% for Institutional Class, Class A and Class C shares, respectively.
As stated in the Fund’s most recent prospectus, the total annual operating expense ratios for fiscal year 2021 were 0.79%, 1.19% and 1.93% for Institutional Class, Class A and Class C shares, respectively (before expense reimbursements and/or fee waivers, if any, and after restatement). The expense ratios were 0.61%, 0.98% and 1.73% for Institutional Class, Class A and Class C shares, respectively, after expense reimbursements and/or fee waivers and restatement. The expense ratios for the annual period ended October 31, 2022, can be found in the Financial Highlights section of this report.
Returns shown with a sales charge reflect the deduction of the current maximum initial sales charge of 4.25% for Class A shares and the contingent deferred sales charge (CDSC) for Class C shares. The CDSC for Class C shares is 1.00%, which is reduced to 0% after 1 year. The performance of the Fund’s share classes will differ primarily due to different sales charge structures and class expenses. Please see the prospectus for more information about sales charge structures, if any, and class expenses for your share class.
Floating Rate Income Fund (Unaudited)
COMPARISON OF A $1,000,000 INVESTMENT
(000's omitted)
This graph shows the change in value of a hypothetical $1,000,000 investment in the Fund over the past 10 fiscal years, or since the Fund’s inception if it has not operated for 10 years. The graph is based on the Institutional Class shares only; the performance of the Fund’s share classes will differ primarily due to different sales charge structures and class expenses (see Performance Highlights chart on previous page). The result is compared with benchmarks, which include a broad-based market index and may include a more narrowly based index. Market indices have not been reduced to reflect any of the fees and costs of investing. The results shown in the graph reflect the reinvestment of income dividends and other distributions, if any. The results do not reflect the effect of taxes a shareholder would pay on Fund distributions or on the redemption of Fund shares. Results represent past performance and do not indicate future results.
*
Effective August 29, 2022, the S&P/LSTA Leveraged Loan Index changed its name to Morningstar LSTA US Leveraged Loan Index.
High Income Bond Fund Commentary (Unaudited)
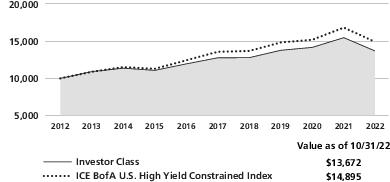
Neuberger Berman High Income Bond Fund Investor Class generated a -11.62% total return for the fiscal year ended October 31, 2022 (the reporting period), underperforming its benchmark, the ICE BofA U.S. High Yield Constrained Index (the Index), which provided a -11.45% total return for the same period. (Performance for all share classes is provided in the table immediately following this letter.)
The overall high yield market, as measured by the Index, generated weak results during the reporting period. Whereas the U.S. Federal Reserve Board (Fed) initially characterized rising inflation as being "transitory," this was not the case. Robust consumer spending, supply chain bottlenecks, a tight labor market, repercussions from the war in Ukraine, and other factors combined to push U.S. inflation to a 40-year high. Against this backdrop, the Fed began an aggressive rate hike campaign in March 2022, which is expected to continue until inflation is under control, even if it potentially leads to a recession. U.S. credit spreads significantly widened due to periods of risk aversion and the Fed’s monetary tightening campaign.
From a sector perspective, security selection within and an overweight versus the Index to gas distribution, security selection within and an underweight to health care, and security selection within diversified financial services were the top performers. In contrast, security selection within technology & electronics and real estate & homebuilders, and security selection within and an underweight to energy were the worst performers.
In terms of the Fund's portfolio credit quality, security selection within BB and an overweight to non-rated and B rated issuers were the best performers. Conversely, an overweight to CCC and below, security selection within B, and security selection within and an underweight to BBB and above rated issuers versus the Index were the worst performers.
The Fund’s use of swap contracts detracted from performance during the reporting period.
As it became increasingly clear that the Fed would have to become more aggressive with tightening monetary policy, we selectively increased the Fund’s exposure to shorter duration BB and B rated issuers, while reducing exposure to CCC and below rated issuers. As credit spreads widened over the reporting period, we subsequently looked to decrease the Fund’s exposure to higher beta1 (risk) issuers, particularly in the CCC and below credit tier.
Looking ahead, we believe current high yield valuations offer investors an attractive opportunity, especially given our below average default outlook. While the tightening of financial conditions, still-elevated inflation and challenging news out of Europe have been creating incremental volatility, real growth is slowing but still positive, with supply chains returning back to normal. We see these factors acting to mitigate inflationary pressures, which could eventually lead to a less aggressive path for Fed policy. In our view, healthy consumer and business balance sheets, growing nominal gross domestic product and solid job growth should remain supportive for issuer fundamentals. While inventories are building as a result of slowing demand, we remain focused on sector dynamics and idiosyncratic risks to individual issuers. Despite short-term volatility resulting from heightened uncertainty in commodity prices, central bank tightening and negative news flow out of Europe, we believe our bottom-up, fundamental credit research that focuses on security selection, avoiding credit deterioration, and putting only our "best ideas" into portfolios, will position us well to take advantage of the increased volatility.
Sincerely,
Joe Lind and Christopher Kocinski
Portfolio Co-Managers
1 Beta is a measure of the systematic risk of a portfolio. It is the covariance of the portfolio and a market index divided by the variance of the market index. Beta measures the historical sensitivity of a portfolio's returns to movements in the market index. The beta of the market index will always be one. A portfolio with a beta above the market index (i.e. ˃1) means that the portfolio has greater volatility than the market index. If the beta of the portfolio is 1.2, a market increase in return of 1% implies a 1.2% increase in the portfolio's return. If the beta of the portfolio is 0.8, a market decrease in return of 1% implies a 0.8% decrease in the portfolio's return.
Information about principal risks of investing in the Fund is set forth in the prospectus and statement of additional information.
The portfolio composition, industries and holdings of the Fund are subject to change without notice.
The opinions expressed are those of the Fund’s portfolio managers. The opinions are as of the date of this report and are subject to change without notice.
The performance of certain rated bonds within the benchmark, as noted above, represent issues that are rated Ba1/BB+ through Ba3/BB-, B1/B+ through B3/B- and Caa1/CCC+ or lower, based on an average of Moody’s, S&P and Fitch, as calculated by ICE BofA. Issues rated Baa3/BBB- and higher are not in the Index.
High Income Bond Fund (Unaudited)
PORTFOLIO BY MATURITY DISTRIBUTION |
(as a % of Total Investments*) |
| |
One to less than Five Years | |
Five to less than Ten Years | |
| |
| |
| Does not include Short-Term Investments or the impact of the Fund’s open positions in derivatives, if any. |
PERFORMANCE HIGHLIGHTS8,9 | | | |
| | Average Annual Total Return
Ended 10/31/2022 |
| | | | |
| | | | | |
| | | | | |
| | | | | |
| | | | | |
| | | | | |
| | | | | |
| | | | | |
| | | | | |
| | | | |
| | | | | |
| | | | | |
| | | | | |
ICE BofA U.S. High Yield Constrained Index5,6 | | | | |
The performance data quoted represent past performance and do not indicate future results. Current performance may be lower or higher than the performance data quoted. For current performance data, including current to the most recent month-end, please visit www.nb.com/performance.
The results shown in the table reflect the reinvestment of income dividends and other distributions, if any. The results do not reflect the effect of taxes a shareholder would pay on Fund distributions or on the redemption of Fund shares.
The investment return and principal value of an investment will fluctuate and shares, when redeemed, may be worth more or less than their original cost.
Returns would have been lower if Neuberger Berman Investment Advisers LLC ("NBIA") had not reimbursed certain expenses and/or waived a portion of the investment management fees during certain of the periods shown. Repayment by a class (of expenses previously reimbursed and/or fees previously waived by NBIA) will decrease the class’s returns. Please see Note B in the Notes to Financial Statements for specific information regarding expense reimbursement and/or fee waiver arrangements.
For the period ended October 31, 2022, the 30-day SEC yields were 8.10%, 8.26%, 7.93%, 7.10%, 7.60%, 8.36% and 8.76% for Investor Class, Institutional Class, Class A, Class C, Class R3, Class R6 and Class E shares, respectively. Absent repayments, the 30-day SEC yield would have been 7.86% for Class A shares.
As stated in the Fund’s most recent prospectus, the total annual operating expense ratios for fiscal year 2021 were 0.85%, 0.69%, 1.13%, 1.83%, 1.33% and 0.59% for Investor Class, Institutional Class, Class A, Class C, Class R3 and Class R6 shares, respectively, and the estimated total annual operating expense ratio for fiscal year 2022 is 0.55% for Class E (before expense reimbursements and/or fee waivers, if any). The total annual operating expense ratio for Class A includes the class’s repayment of expenses previously reimbursed and/or fees previously waived under the contractual expense limitation by NBIA. The estimated expense ratio for fiscal year 2022 is 0.07% for Class E after expense reimbursements and/or fee waivers. The expense ratios for the annual period ended October 31, 2022, can be found in the Financial Highlights section of this report.
Returns shown with a sales charge reflect the deduction of the current maximum initial sales charge of 4.25% for Class A shares and the contingent deferred sales charge (CDSC) for Class C shares. The CDSC for Class C shares is 1.00%, which is reduced to 0% after 1 year. The performance of the Fund’s share classes will differ primarily due to different sales charge structures and class expenses. Please see the prospectus for more information about sales charge structures, if any, and class expenses for your share class.
High Income Bond Fund (Unaudited)
COMPARISON OF A $10,000 INVESTMENT
This graph shows the change in value of a hypothetical $10,000 investment in the Fund over the past 10 fiscal years, or since the Fund’s inception if it has not operated for 10 years. The graph is based on the Investor Class shares only; the performance of the Fund’s share classes will differ primarily due to different sales charge structures and class expenses (see Performance Highlights chart on previous page). The result is compared with benchmarks, which include a broad-based market index and may include a more narrowly based index. Market indices have not been reduced to reflect any of the fees and costs of investing. The results shown in the graph reflect the reinvestment of income dividends and other distributions, if any. The results do not reflect the effect of taxes a shareholder would pay on Fund distributions or on the redemption of Fund shares. Results represent past performance and do not indicate future results.
Municipal High Income Fund Commentary (Unaudited)
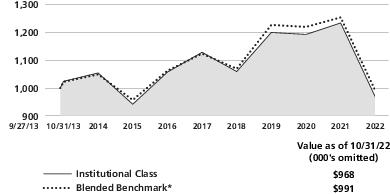
Neuberger Berman Municipal High Income Fund Institutional Class generated a -16.80% total return for the fiscal year ended October 31, 2022 (the reporting period) and underperformed its benchmark, a blend consisting of 65% Bloomberg Municipal Bond Index and 35% Bloomberg Municipal High Yield Index (collectively, the Index), which provided a -13.56% total return for the same period. (Performance for all share classes is provided in the table immediately following this letter.)
The investment-grade municipal bond market generated weak results but outperformed the taxable bond market during the reporting period. All told, the Bloomberg Municipal Bond Index returned -11.98% for the reporting period, whereas the overall taxable investment-grade bond market, as measured by the Bloomberg U.S. Aggregate Bond Index, returned -15.68%. Whereas the U.S. Federal Reserve Board (Fed) initially characterized rising inflation as being "transitory," this was not the case. Robust consumer spending, supply chain bottlenecks, repercussions from the war in Ukraine, and other factors combined to push U.S. inflation to a 40-year high. Against this backdrop, the Fed began an aggressive rate hike campaign in March 2022, which is expected to continue until inflation is under control, even if it potentially leads to a recession. Rising yields dragged down fixed income market performance, as yields and bond prices moved in the opposite direction.
In terms of the Fund’s performance, having a slightly longer duration than the Index detracted from returns as interest rates moved sharply higher. An overweight to lower coupon/longer duration bonds versus the Index was also a headwind for results. A significant overweight to bonds rated BBB was also detrimental, as these higher yielding securities underperformed. On the upside, security selection in the housing sector contributed to returns.
In terms of portfolio changes during the reporting period, the Fund’s exposure to securities rated AAA was decreased, whereas its allocation to securities rated A was increased. Meanwhile, we increased the Fund’s duration over the reporting period.
Looking ahead, we anticipate market volatility to remain elevated until there is more clarity on the economic outlook. From a supply/demand perspective, municipal mutual fund outflows reached record highs during the reporting period, as the Fed raises rates in an attempt to rein in inflation. Meanwhile, municipal supply remains lower than in 2021 and new issuance tends to be lighter as we near the end of the year. While municipal credit fundamentals have generally peaked in our view, for the most part, we believe issuers are cushioned with solid balance sheets. In addition, we believe stronger cash positions should help mitigate losses as economic growth moderates. We continue to be cautious in terms of our duration positioning but believe higher yields and volatility create a favorable backdrop to deploy cash and capitalize on attractively valued securities.
Sincerely,
James L. Iselin, S. Blake Miller and Eric J. Pelio
Portfolio Managers
Information about principal risks of investing in the Fund is set forth in the prospectus and statement of additional information.
The portfolio composition, industries and holdings of the Fund are subject to change without notice.
The opinions expressed are those of the Fund’s portfolio managers. The opinions are as of the date of this report and are subject to change without notice.
The bond ratings noted above represent segments of the Bloomberg Municipal Bond Index and Bloomberg Municipal High Yield Index, which are determined based on the average ratings issued by S&P Global, Moody’s and Fitch.
Municipal High Income Fund (Unaudited)
PORTFOLIO BY STATE AND TERRITORY |
(as a % of Total Net Assets) |
| |
| |
| |
| |
| |
| |
| |
| |
| |
| |
| |
| |
| |
| |
| |
| |
| |
| |
| |
| |
| |
| |
| |
| |
| |
| |
| |
| |
| |
| |
| |
| |
| |
| |
| |
| |
| |
| |
| |
Other Assets Less Liabilities | |
| |
| Includes the impact of the Fund's open positions in derivatives, if any. |
| | |
| | Average Annual Total Return
Ended 10/31/2022 |
| | | |
| | | | |
| | | | |
| | | | |
| | | | |
| | | |
| | | | |
| | | | |
| | | | |
| | | |
*
Blended benchmark is composed of 65% Bloomberg Municipal Bond Index and 35% Bloomberg Municipal High Yield Index and is rebalanced monthly.
The performance data quoted represent past performance and do not indicate future results. Current performance may be lower or higher than the performance data quoted. For current performance data, including current to the most recent month-end, please visit www.nb.com/performance.
The results shown in the table reflect the reinvestment of income dividends and other distributions, if any. The results do not reflect the effect of taxes a shareholder would pay on Fund distributions or on the redemption of Fund shares.
The investment return and principal value of an investment will fluctuate and shares, when redeemed, may be worth more or less than their original cost.
Returns would have been lower if Neuberger Berman Investment Advisers LLC ("NBIA") had not reimbursed certain expenses and/or waived a portion of the investment management fees during certain of the periods shown. Repayment by a class (of expenses previously reimbursed and/or fees previously waived by NBIA) will decrease the class’s returns. Please see Note B in the Notes to Financial Statements for specific information regarding expense reimbursement and/or fee waiver arrangements.
For the period ended October 31, 2022, the 30-day SEC yields were 4.03%, 3.66% and 2.89% for Institutional Class, Class A and Class C shares, respectively. The tax-equivalent yields were 6.81%, 6.18% and 4.88% for Institutional Class, Class A and Class C shares, respectively, for a shareholder in the highest federal income tax bracket (37% plus 3.8% Medicare contribution tax).13 Absent expense reimbursements and/or fee waivers, the 30-day SEC yields would have been 3.69%, 1.25% and -16.38% for Institutional Class, Class A and Class C shares, respectively. A negative 30-day SEC yield results when a fund’s accrued expenses exceed its income for the relevant period. Please note, in such instances the 30-day SEC yield may not equal the Fund’s actual rate of income earned and distributed by the Fund and, therefore, a per share distribution may still be paid to shareholders.
As stated in the Fund’s most recent prospectus, the total annual operating expense ratios for fiscal year 2021 were 0.79%, 1.21% and 2.02% for Institutional Class, Class A and Class C shares, respectively (before expense reimbursements and/or fee waivers, if any). The expense ratios were 0.52%, 0.89% and 1.64% for Institutional Class, Class A and Class C shares, respectively, after expense reimbursements and/or fee waivers. The expense ratios for the annual period ended October 31, 2022, can be found in the Financial Highlights section of this report.
Returns shown with a sales charge reflect the deduction of the current maximum initial sales charge of 4.25% for Class A shares and the contingent deferred sales charge (CDSC) for Class C shares. The CDSC for Class C shares is 1.00%, which is reduced to 0% after 1 year. The performance of the Fund’s share classes will differ primarily due to different sales charge structures and class expenses. Please see the prospectus for more information about sales charge structures, if any, and class expenses for your share class.
Municipal High Income Fund (Unaudited)
COMPARISON OF A $1,000,000 INVESTMENT
(000's omitted)
This graph shows the change in value of a hypothetical $1,000,000 investment in the Fund over the past 10 fiscal years, or since the Fund’s inception if it has not operated for 10 years. The graph is based on the Institutional Class shares only; the performance of the Fund’s share classes will differ primarily due to different sales charge structures and class expenses (see Performance Highlights chart on previous page). The result is compared with benchmarks, which include a broad-based market index and may include a more narrowly based index. Market indices have not been reduced to reflect any of the fees and costs of investing. The results shown in the graph reflect the reinvestment of income dividends and other distributions, if any. The results do not reflect the effect of taxes a shareholder would pay on Fund distributions or on the redemption of Fund shares. Results represent past performance and do not indicate future results.
*
Blended benchmark is composed of 65% Bloomberg Municipal Bond Index and 35% Bloomberg Municipal High Yield Index and is rebalanced monthly.
Municipal Impact Fund Commentary (Unaudited)
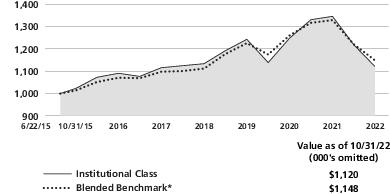
Neuberger Berman Municipal Impact Fund Institutional Class generated a -10.88% total return for the fiscal year ended October 31, 2022 (the reporting period) and outperformed its benchmark, the Bloomberg Municipal Bond Index (the Index), which provided a -11.98% total return for the same period. (Performance for all share classes is provided in the table immediately following this letter.)
The investment-grade municipal bond market generated weak results but outperformed the taxable bond market during the reporting period. All told, the Index returned -11.98% for the reporting period, whereas the overall taxable investment-grade bond market, as measured by the Bloomberg U.S. Aggregate Bond Index, returned -15.68%. Whereas the U.S. Federal Reserve Board (Fed) initially characterized rising inflation as being "transitory," this was not the case. Robust consumer spending, supply chain bottlenecks, repercussions from the war in Ukraine, and other factors combined to push U.S. inflation to a 40-year high. Against this backdrop, the Fed began an aggressive rate hike campaign in March 2022, which is expected to continue until inflation is under control, even if it potentially leads to a recession. Rising yields dragged down fixed income market performance, as yields and bond prices moved in the opposite direction.
Looking at the Fund’s performance, having a shorter duration than the Index contributed to relative returns as interest rates moved sharply higher during the reporting period.
An underweight to securities rated BBB versus the Index was additive for performance, as was security selection of these bonds that we did own. On the downside, security selection of revenue bonds detracted from results. An overweight to securities issued by the state of Michigan was also a headwind for performance.
In terms of adjustments to the portfolio during the reporting period, we extended the Fund’s duration, but remained shorter than the Index. We also increased the Fund’s allocation to securities rated BBB during the reporting period. As always, the Fund maintained its exposure to what we believed were projects that were impactful for their communities. We also continued to focus on sustainable issuers with what we view as having best-in-class operations, with managements that make sound financial decisions.
Looking ahead, we anticipate market volatility to remain elevated until there is more clarity on the economic outlook. From a supply/demand perspective, municipal mutual fund outflows reached record highs during the reporting period, as the Fed raises rates in an attempt to rein in inflation. Meanwhile, municipal supply remains lower than in 2021 and new issuance tends to be lighter as we near the end of the year. While municipal credit fundamentals have generally peaked in our view, for the most part, we believe issuers are cushioned with solid balance sheets. In addition, we believe stronger cash positions should help mitigate losses as economic growth moderates. We continue to be cautious in terms of our duration positioning but believe higher yields and volatility create a favorable backdrop to deploy cash and capitalize on attractively valued securities.
Sincerely,
James L. Iselin, S. Blake Miller, James Lyman and Jeffrey Hunn
Portfolio Managers
Information about principal risks of investing in the Fund is set forth in the prospectus and statement of additional information.
The portfolio composition, industries and holdings of the Fund are subject to change without notice.
The opinions expressed are those of the Fund’s portfolio managers. The opinions are as of the date of this report and are subject to change without notice.
The bond ratings noted above represent segments of the Bloomberg Municipal Bond Index, which are determined based on the average ratings issued by S&P Global, Moody’s and Fitch.
Municipal Impact Fund (Unaudited)
PORTFOLIO BY STATE AND TERRITORY |
(as a % of Total Net Assets) |
| |
| |
| |
| |
| |
| |
| |
| |
| |
| |
| |
| |
| |
| |
| |
| |
| |
| |
| |
| |
| |
| |
| |
| |
| |
| |
| |
| |
| |
| |
| |
| |
Other Assets Less Liabilities | |
| |
| Includes the impact of the Fund’s open positions in derivatives, if any. |
PERFORMANCE HIGHLIGHTS12,14 | | |
| | Average Annual Total Return
Ended 10/31/2022 |
| | | |
| | | | |
| | | | |
| | | | |
| | | | |
| | | |
| | | | |
| | | | |
| | | | |
Bloomberg Municipal Bond Index5,6 | | | |
The performance data quoted represent past performance and do not indicate future results. Current performance may be lower or higher than the performance data quoted. For current performance data, including current to the most recent month-end, please visit www.nb.com/performance.
The results shown in the table reflect the reinvestment of income dividends and other distributions, if any. The results do not reflect the effect of taxes a shareholder would pay on Fund distributions or on the redemption of Fund shares.
The investment return and principal value of an investment will fluctuate and shares, when redeemed, may be worth more or less than their original cost.
Returns would have been lower if Neuberger Berman Investment Advisers LLC ("NBIA") had not reimbursed certain expenses and/or waived a portion of the investment management fees during certain of the periods shown. Repayment by a class (of expenses previously reimbursed and/or fees previously waived by NBIA) will decrease the class’s returns. Please see Note B in the Notes to Financial Statements for specific information regarding expense reimbursement and/or fee waiver arrangements.
For the period ended October 31, 2022, the 30-day SEC yields were 2.84%, 2.47% and 1.72% for Institutional Class, Class A and Class C shares, respectively. The tax-equivalent yields were 4.80%, 4.17% and 2.91% for Institutional Class, Class A and Class C shares, respectively, for a shareholder in the highest federal income tax bracket (37% plus 3.8% Medicare contribution tax).13 Absent expense reimbursements and/or fee waivers, the 30-day SEC yields would have been 2.37%, -11.88% and -13.54% for Institutional Class, Class A and Class C shares, respectively. A negative 30-day SEC yield results when a fund’s accrued expenses exceed its income for the relevant period. Please note, in such instances the 30-day SEC yield may not equal the Fund’s actual rate of income earned and distributed by the Fund and, therefore, a per share distribution may still be paid to shareholders.
As stated in the Fund’s most recent prospectus, the total annual operating expense ratios for fiscal year 2021 were 0.84%, 1.43%, and 2.22% for Institutional Class, Class A and Class C shares, respectively (before expense reimbursements and/or fee waivers, if any). The expense ratios were 0.43%, 0.80% and 1.55% for Institutional Class, Class A and Class C shares, respectively, after expense reimbursements and/or fee waivers. The expense ratios for the annual period ended October 31, 2022, can be found in the Financial Highlights section of this report.
Returns shown with a sales charge reflect the deduction of the current maximum initial sales charge of 4.25% for Class A shares and the contingent deferred sales charge (CDSC) for Class C shares. The CDSC for Class C shares is 1.00%, which is reduced to 0% after 1 year. The performance of the Fund’s share classes will differ primarily due to different sales charge structures and class expenses. Please see the prospectus for more information about sales charge structures, if any, and class expenses for your share class.
Municipal Impact Fund (Unaudited)
COMPARISON OF A $1,000,000 INVESTMENT
(000's omitted)
This graph shows the change in value of a hypothetical $1,000,000 investment in the Fund over the past 10 fiscal years, or since the Fund’s inception if it has not operated for 10 years. The graph is based on the Institutional Class shares only; the performance of the Fund’s share classes will differ primarily due to different sales charge structures and class expenses (see Performance Highlights chart on previous page). The result is compared with benchmarks, which include a broad-based market index and may include a more narrowly based index. Market indices have not been reduced to reflect any of the fees and costs of investing. The results shown in the graph reflect the reinvestment of income dividends and other distributions, if any. The results do not reflect the effect of taxes a shareholder would pay on Fund distributions or on the redemption of Fund shares. Results represent past performance and do not indicate future results.
Municipal Intermediate Bond Fund Commentary (Unaudited)
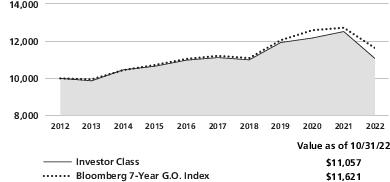
Neuberger Berman Municipal Intermediate Bond Fund Investor Class generated a -11.66% total return for the fiscal year ended October 31, 2022 (the reporting period) and underperformed its benchmark, the Bloomberg 7-Year General Obligation (G.O.) Index (the Index), which provided a -8.64% total return for the same period. (Performance for all share classes is provided in the table immediately following this letter.)
The investment-grade municipal bond market generated weak results but outperformed the taxable bond market during the reporting period. All told, the Bloomberg Municipal Bond Index returned -11.98% for the reporting period, whereas the overall taxable investment-grade bond market, as measured by the Bloomberg U.S. Aggregate Bond Index, returned -15.68%. Whereas the U.S. Federal Reserve Board (Fed) initially characterized rising inflation as being "transitory," this was not the case. Robust consumer spending, supply chain bottlenecks, repercussions from the war in Ukraine, and other factors combined to push U.S. inflation to a 40-year high. Against this backdrop, the Fed began an aggressive rate hike campaign in March 2022, which is expected to continue until inflation is under control, even if it potentially leads to a recession. Rising yields dragged down fixed income market performance, as yields and bond prices moved in the opposite direction.
In terms of the Fund’s performance, having a slightly longer duration than the Index detracted from returns as interest rates moved sharply higher. An overweight to lower coupon/longer duration bonds versus the Index was also a headwind for results. An out-of-benchmark allocation to certain revenue bonds was not rewarded, as they underperformed their general obligation bond counterparts. However, allocations to the electric and industrial revenue sectors were additive for returns. An overweight exposure to bonds rated BBB was also detrimental, as these higher yielding securities underperformed. Finally, an overweight to securities issued by the state of New York contributed to performance.
In terms of portfolio changes during the reporting period, the Fund’s exposure to securities rated AAA was decreased, whereas its allocation to securities rated A was increased. Duration was managed in a fairly tight band during the reporting period.
Looking ahead, we anticipate market volatility to remain elevated until there is more clarity on the economic outlook. From a supply/demand perspective, municipal mutual fund outflows reached record highs during the reporting period, as the Fed raises rates in an attempt to rein in inflation. Meanwhile, municipal supply remains lower than in 2021 and new issuance tends to be lighter as we near the end of the year. While municipal credit fundamentals have generally peaked in our view, for the most part, we believe issuers are cushioned with solid balance sheets. In addition, we believe stronger cash positions should help mitigate losses as economic growth moderates. We continue to be cautious in terms of our duration positioning but believe higher yields and volatility create a favorable backdrop to deploy cash and capitalize on attractively valued securities.
Sincerely,
James L. Iselin and S. Blake Miller
Portfolio Managers
Information about principal risks of investing in the Fund is set forth in the prospectus and statement of additional information.
The portfolio composition, industries and holdings of the Fund are subject to change without notice.
The opinions expressed are those of the Fund’s portfolio managers. The opinions are as of the date of this report and are subject to change without notice.
The bond ratings noted above represent segments of the Bloomberg 7-Year General Obligation (G.O.) Index, which are determined based on the average ratings issued by S&P Global, Moody’s and Fitch.
Municipal Intermediate Bond Fund (Unaudited)
PORTFOLIO BY STATE AND TERRITORY |
(as a % of Total Net Assets) |
| |
| |
| |
| |
| |
| |
| |
| |
| |
| |
| |
| |
| |
| |
| |
| |
| |
| |
| |
| |
| |
| |
| |
| |
| |
| |
| |
| |
| |
| |
| |
| |
| |
| |
| |
| |
| |
| |
| |
Other Assets Less Liabilities | |
| |
| Includes the impact of the Fund's open positions in derivatives, if any. |
| | | |
| | Average Annual Total Return
Ended 10/31/2022 |
| | | | |
| | | | | |
| | | | | |
| | | | | |
| | | | | |
| | | | | |
| | | | |
| | | | | |
| | | | | |
| | | | | |
Bloomberg 7-Year G.O. Index5,6 | | | | |
The performance data quoted represent past performance and do not indicate future results. Current performance may be lower or higher than the performance data quoted. For current performance data, including current to the most recent month-end, please visit www.nb.com/performance.
The results shown in the table reflect the reinvestment of income dividends and other distributions, if any. The results do not reflect the effect of taxes a shareholder would pay on Fund distributions or on the redemption of Fund shares.
The investment return and principal value of an investment will fluctuate and shares, when redeemed, may be worth more or less than their original cost.
Returns would have been lower if Neuberger Berman Investment Advisers LLC ("NBIA") had not reimbursed certain expenses and/or waived a portion of the investment management fees during certain of the periods shown. Repayment by a class (of expenses previously reimbursed and/or fees previously waived by NBIA) will decrease the class’s returns. Please see Note B in the Notes to Financial Statements for specific information regarding expense reimbursement and/or fee waiver arrangements.
For the period ended October 31, 2022, the 30-day SEC yields were 3.10%, 3.25%, 2.88% and 2.12% for Investor Class, Institutional Class, Class A and Class C shares, respectively. The tax-equivalent yields were 5.24%, 5.49%, 4.86% and 3.58% for Investor Class, Institutional Class, Class A and Class C shares, respectively, for a shareholder in the highest federal income tax bracket (37% plus 3.8% Medicare contribution tax).13 Absent expense reimbursements and/or fee waivers, the 30-day SEC yields would have been 2.73%, 3.09%, 1.84% and -1.74% for Investor Class, Institutional Class, Class A and Class C shares, respectively. A negative 30-day SEC yield results when a fund’s accrued expenses exceed its income for the relevant period. Please note, in such instances the 30-day SEC yield may not equal the Fund’s actual rate of income earned and distributed by the Fund and, therefore, a per share distribution may still be paid to shareholders.
As stated in the Fund’s most recent prospectus, the total annual operating expense ratios for fiscal year 2021 were 0.60%, 0.44%, 0.82% and 1.58% for Investor Class, Institutional Class, Class A and Class C shares, respectively (before expense reimbursements and/or fee waivers, if any). The expense ratios were 0.45%, 0.30%, 0.67% and 1.42% for Investor Class, Institutional Class, Class A and Class C shares, respectively, after expense reimbursements and/or fee waivers. The expense ratios for the annual period ended October 31, 2022, can be found in the Financial Highlights section of this report.
Returns shown with a sales charge reflect the deduction of the current maximum initial sales charge of 4.25% for Class A shares and the contingent deferred sales charge (CDSC) for Class C shares. The CDSC for Class C shares is 1.00%, which is reduced to 0% after 1 year. The performance of the Fund’s share classes will differ primarily due to different sales charge structures and class expenses. Please see the prospectus for more information about sales charge structures, if any, and class expenses for your share class.
Municipal Intermediate Bond Fund (Unaudited)
COMPARISON OF A $10,000 INVESTMENT
This graph shows the change in value of a hypothetical $10,000 investment in the Fund over the past 10 fiscal years, or since the Fund’s inception if it has not operated for 10 years. The graph is based on the Investor Class shares only; the performance of the Fund’s share classes will differ primarily due to different sales charge structures and class expenses (see Performance Highlights chart on previous page). The result is compared with benchmarks, which include a broad-based market index and may include a more narrowly based index. Market indices have not been reduced to reflect any of the fees and costs of investing. The results shown in the graph reflect the reinvestment of income dividends and other distributions, if any. The results do not reflect the effect of taxes a shareholder would pay on Fund distributions or on the redemption of Fund shares. Results represent past performance and do not indicate future results.
Short Duration Bond Fund Commentary (Unaudited)
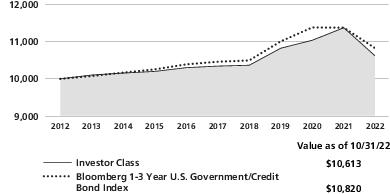
Neuberger Berman Short Duration Bond Fund Investor Class generated a -6.70% total return for the fiscal year ended October 31, 2022 (the reporting period) and underperformed its benchmark, the Bloomberg 1-3 Year U.S. Government/Credit Bond Index (the Index), which provided a -4.88% total return for the same period. (Performance for all share classes is provided in the table immediately following this letter.)
The fixed income market generated weak results during the reporting period. The U.S. Federal Reserve Board (Fed) initially characterized rising inflation as being "transitory," however this was not the case. Robust consumer spending, supply chain bottlenecks, repercussions from the war in Ukraine, and other factors combined to push U.S. inflation to a 40-year high. Against this backdrop, the Fed began an aggressive rate hike campaign in March 2022, which is expected to continue until inflation is under control, even if it potentially leads to a recession. Rising yields dragged down fixed income market performance, as yields and bond prices moved in the opposite direction. Meanwhile, U.S. credit spreads significantly widened due to periods of risk aversion and the Fed’s monetary tightening campaign.
The largest detractor from the Fund’s performance during the reporting period was its exposure to corporate bonds. Their spreads widened due to their duration, interest rate sensitivity and periods of investor risk aversion, not because of significantly weakening corporate fundamentals, in our view. Elsewhere, the allocation to structured products, including commercial mortgage-backed securities (CMBS), mortgage credit and collateralized loan obligations (CLO), were headwinds for results. Futures contracts were used to manage the Fund’s overall duration positioning. On the upside, having a modestly short duration versus the Index was a small contributor to relative performance as interest rates moved sharply higher.
The Fund’s use of futures and swap contracts detracted from performance during the reporting period.
We maintained the Fund’s overall positioning over the reporting period, focusing on a diversified mix of non-Treasury spread sectors. During the second half of the reporting period, we trimmed our allocations to CMBS and credit risk transfer securities. The proceeds were then largely redeployed into CLOs, agency pass-through securities and asset-backed securities.
Looking ahead, while we have conviction that U.S. inflation will head lower for much of next year, we believe it will take continued effort by the Fed. In our view, the central bank is likely to be conservative in leaving rates higher for longer in order to avoid a "double-dip" rise in inflation, as occurred in the 1970s; we believe it will likely look for a convincing decline in inflation before starting to cut rates. We believe inflation and central bank policy should continue to drive market behavior. We anticipate further tightening by developed market central banks, counterbalanced by the potential for slower tightening by emerging markets, which began their tightening cycles much earlier. In our view, this, in turn, is likely to result in a general upward trend in yields. We believe this environment is well suited to active management given the array of macro events and the opportunities that can arise during periods of elevated volatility.
Sincerely,
Michael Foster, Matthew McGinnis, Ashok Bhatia and David M. Brown
Portfolio Managers
Information about principal risks of investing in the Fund is set forth in the prospectus and statement of additional information.
The portfolio composition, industries and holdings of the Fund are subject to change without notice.
The opinions expressed are those of the Fund’s portfolio managers. The opinions are as of the date of this report and are subject to change without notice.
Short Duration Bond Fund (Unaudited)
PORTFOLIO BY INVESTMENT TYPE |
(as a % of Total Net Assets) |
| |
| |
| |
Mortgage-Backed Securities | |
| |
U.S. Treasury Obligations | |
| |
Other Assets Less Liabilities | |
| |
| Includes the impact of the Fund's open positions in derivatives, if any. |
| | | |
| | Average Annual Total Return
Ended 10/31/2022 |
| | | | |
| | | | | |
| | | | | |
| | | | | |
| | | | | |
| | | | | |
| | | | | |
| | | | |
| | | | | |
| | | | | |
| | | | | |
Bloomberg 1-3 Year U.S.
Government/Credit Bond Index5,6 | | | | |
The performance data quoted represent past performance and do not indicate future results. Current performance may be lower or higher than the performance data quoted. For current performance data, including current to the most recent month-end, please visit www.nb.com/performance.
The results shown in the table reflect the reinvestment of income dividends and other distributions, if any. The results do not reflect the effect of taxes a shareholder would pay on Fund distributions or on the redemption of Fund shares.
The investment return and principal value of an investment will fluctuate and shares, when redeemed, may be worth more or less than their original cost.
Returns would have been lower if Neuberger Berman Investment Advisers LLC ("NBIA") had not reimbursed certain expenses and/or waived a portion of the investment management fees during certain of the periods shown. Repayment by a class (of expenses previously reimbursed and/or fees previously waived by NBIA) will decrease the class’s returns. Please see Note B in the Notes to Financial Statements for specific information regarding expense reimbursement and/or fee waiver arrangements.
For the period ended October 31, 2022, the 30-day SEC yields were 4.99%, 4.89%, 5.20%, 4.82% and 4.07% for Investor Class, Trust Class, Institutional Class, Class A and Class C shares, respectively. Absent expense reimbursements and/or fee waivers, the 30-day SEC yields would have been 4.69%, 4.54%, 4.94%, 4.54% and 3.78% for Investor Class, Trust Class, Institutional Class, Class A and Class C shares, respectively.
As stated in the Fund’s most recent prospectus, the total annual operating expense ratios for fiscal year 2021 were 0.96%, 1.13%, 0.76%, 1.15% and 1.90% for Investor Class, Trust Class, Institutional Class, Class A and Class C shares, respectively (before expense reimbursements and/or fee waivers, if any, and after restatement).The expense ratios were 0.57%, 0.67%, 0.37%, 0.74% and 1.49% for Investor Class, Trust Class, Institutional Class, Class A and Class C shares, respectively, after expense reimbursements and/or fee waivers and restatement. The expense ratios for the annual period ended October 31, 2022, can be found in the Financial Highlights section of this report.
Returns shown with a sales charge reflect the deduction of the current maximum initial sales charge of 2.50% for Class A shares and the contingent deferred sales charge (CDSC) for Class C shares. The CDSC for Class C shares is 1.00%, which is reduced to 0% after 1 year. The performance of the Fund’s share classes will differ primarily due to different sales charge structures and class expenses. Please see the prospectus for more information about sales charge structures, if any, and class expenses for your share class.
Short Duration Bond Fund (Unaudited)
COMPARISON OF A $10,000 INVESTMENT
This graph shows the change in value of a hypothetical $10,000 investment in the Fund over the past 10 fiscal years, or since the Fund’s inception if it has not operated for 10 years. The graph is based on the Investor Class shares only; the performance of the Fund’s share classes will differ primarily due to different sales charge structures and class expenses (see Performance Highlights chart on previous page). The result is compared with benchmarks, which include a broad-based market index and may include a more narrowly based index. Market indices have not been reduced to reflect any of the fees and costs of investing. The results shown in the graph reflect the reinvestment of income dividends and other distributions, if any. The results do not reflect the effect of taxes a shareholder would pay on Fund distributions or on the redemption of Fund shares. Results represent past performance and do not indicate future results.
Strategic Income Fund Commentary (Unaudited)
Neuberger Berman Strategic Income Fund Institutional Class delivered a -13.59% total return for the fiscal year ended October 31, 2022 (the reporting period), outperforming its benchmark, the Bloomberg U.S. Aggregate Bond Index (the Index), which provided a -15.68% total return for the same period. (Performance for all share classes is provided in the table immediately following this letter.)
The fixed income market generated weak results during the reporting period. Whereas the U.S. Federal Reserve Board (Fed) initially characterized rising inflation as being "transitory," this was not the case. Monetary and fiscal policy support provided in earlier periods in response to COVID-19, robust labor markets and consumer spending, supply chain bottlenecks, repercussions from the war in Ukraine, and other factors pushed U.S. inflation to a 40-year high. Against this backdrop, the Fed began an aggressive rate hike campaign in March 2022 to subdue rapidly rising inflation, even if to the detriment of economic growth. Rising yields dragged down fixed income market performance, as yields and bond prices moved in the opposite direction. Meanwhile, U.S. credit spreads significantly widened due to periods of risk aversion and the Fed’s monetary tightening campaign.
Against a backdrop of rising interest rates, the Fund’s duration underweight was the key driver of relative outperformance over the reporting period. The Fund’s underweight exposure in U.S. Treasuries contributed modestly to performance. Sector allocation in non-agency mortgage-backed securities (MBS), U.S. and European high-yield along with security selection to agency MBS, U.S. investment-grade credit and emerging market debt were detractors for the reporting period.
The Fund’s aggregate use of futures, swaps, forward foreign currency, bond forward and option contracts contributed positively to performance during the reporting period.
We made some relative value positioning adjustments during the reporting period. We reduced exposure to bank loans and agency MBS, and we gradually increased duration in the Fund by adding exposures to U.S. investment-grade and high-yield credit, with emphasis on financials. We also added to select commercial MBS, credit risk transfer, and asset-backed security deals. Looking ahead, we are watching for opportunities in low-dollar-priced investment-grade securities and tactical trading opportunities spurred by macro-driven volatility.
While we have conviction that U.S. inflation will head lower for much of next year, we believe it will take continued effort by the Fed. In our view, the central bank is likely to be conservative in leaving rates higher for longer in order to avoid a "double-dip" rise in inflation, as occurred in the 1970s; we believe it will likely look for a convincing decline in inflation before starting to cut rates. We believe inflation and central bank policy should continue to drive market behavior. We anticipate further tightening by developed market central banks, counterbalanced by the potential for slower tightening by emerging markets, which began their tightening cycles much earlier. In our view, this, in turn, is likely to result in a general upward trend in yields. We believe this environment is well suited to active management given the array of macro events and the opportunities that can arise during periods of elevated volatility.
Sincerely,
Thanos Bardas, Ashok Bhatia, David M. Brown and Brad Tank
Portfolio Managers
Information about principal risks of investing in the Fund is set forth in the prospectus and statement of additional information.
The portfolio composition, industries and holdings of the Fund are subject to change without notice.
The opinions expressed are those of the Fund’s portfolio managers. The opinions are as of the date of this report and are subject to change without notice.
Strategic Income Fund (Unaudited)
PORTFOLIO BY INVESTMENT TYPE |
(as a % of Total Net Assets) |
| |
| |
| |
| |
| |
Foreign Government Securities | |
| |
Mortgage-Backed Securities | |
| |
U.S. Government Agency Securities | |
U.S. Treasury Obligations | |
| |
Liabilities Less Other Assets | |
| |
| Includes the impact of the Fund's open positions in derivatives, if any. |
| | | |
| | Average Annual Total Return
Ended 10/31/2022 |
| | | | |
| | | | | |
| | | | | |
| | | | | |
| | | | | |
| | | | | |
| | | | | |
| | | | |
| | | | | |
| | | | | |
| | | | | |
Bloomberg U.S. Aggregate Bond Index5,6 | | | | |
The performance data quoted represent past performance and do not indicate future results. Current performance may be lower or higher than the performance data quoted. For current performance data, including current to the most recent month-end, please visit www.nb.com/performance.
The results shown in the table reflect the reinvestment of income dividends and other distributions, if any. The results do not reflect the effect of taxes a shareholder would pay on Fund distributions or on the redemption of Fund shares.
The investment return and principal value of an investment will fluctuate and shares, when redeemed, may be worth more or less than their original cost.
Returns would have been lower if Neuberger Berman Investment Advisers LLC ("NBIA") had not reimbursed certain expenses and/or waived a portion of the investment management fees during certain of the periods shown. Repayment by a class (of expenses previously reimbursed and/or fees previously waived by NBIA) will decrease the class’s returns. Please see Note B in the Notes to Financial Statements for specific information regarding expense reimbursement and/or fee waiver arrangements.
For the period ended October 31, 2022, the 30-day SEC yields were 6.74%, 7.10%, 6.70%, 5.99% and 7.20% for Trust Class, Institutional Class, Class A, Class C and Class R6 shares, respectively. Absent expense reimbursements and/or fee waivers, the 30-day SEC yields would have been 6.67%, 7.08%, 6.69%, 5.94% and 7.18% for Trust Class, Institutional Class, Class A, Class C and Class R6 shares, respectively.
As stated in the Fund’s most recent prospectus, the total annual operating expense ratios for fiscal year 2021 were 0.99%, 0.61%, 1.00%, 1.73% and 0.51% for Trust Class, Institutional Class, Class A, Class C and Class R6 shares, respectively (before expense reimbursements and/or fee waivers, if any). The expense ratios were 0.95%, 0.60%, 1.00%, 1.70% and 0.50% for Trust Class, Institutional Class, Class A, Class C and Class R6 shares, respectively, after expense reimbursements and/or fee waivers. The total annual operating expense ratio for Class A includes the class’s repayment of expenses previously reimbursed and/or fees previously waived under the contractual expense limitation by NBIA. The expense ratios for the annual period ended October 31, 2022, can be found in the Financial Highlights section of this report.
Returns shown with a sales charge reflect the deduction of the current maximum initial sales charge of 4.25% for Class A shares and the contingent deferred sales charge (CDSC) for Class C shares. The CDSC for Class C shares is 1.00%, which is reduced to 0% after 1 year. The performance of the Fund’s share classes will differ primarily due to different sales charge structures and class expenses. Please see the prospectus for more information about sales charge structures, if any, and class expenses for your share class.
Strategic Income Fund (Unaudited)
COMPARISON OF A $1,000,000 INVESTMENT
(000's omitted)
This graph shows the change in value of a hypothetical $1,000,000 investment in the Fund over the past 10 fiscal years, or since the Fund’s inception if it has not operated for 10 years. The graph is based on the Institutional Class shares only; the performance of the Fund’s share classes will differ primarily due to different sales charge structures and class expenses (see Performance Highlights chart on previous page). The result is compared with benchmarks, which include a broad-based market index and may include a more narrowly based index. Market indices have not been reduced to reflect any of the fees and costs of investing. The results shown in the graph reflect the reinvestment of income dividends and other distributions, if any. The results do not reflect the effect of taxes a shareholder would pay on Fund distributions or on the redemption of Fund shares. Results represent past performance and do not indicate future results.
| The Fund had a different goal, to maximize total return through a combination of income and capital appreciation, and investment strategy, which did not include investments in derivatives and non-U.S. dollar denominated securities, prior to February 28, 2008. Its performance prior to that date might have been different if the current goal and investment strategy had been in effect. |
| The performance information for periods prior to June 13, 2005, is that of the Fund’s predecessor, Ariel Premier Bond Fund ("Ariel Fund"). The investment policies, guidelines and restrictions of the Fund are in all material respects equivalent to those of Ariel Fund. Returns would have been lower if Ariel Fund’s manager had not waived certain of its fees during these periods. |
| The performance information for Institutional Class is that of Ariel Fund Institutional Class for the period October 1, 1995 (inception date) through June 10, 2005. The performance information for Investor Class is that of Ariel Fund Institutional Class for the period October 1, 1995 through January 31, 1997 (the period prior to the Investor Class’ inception date), and that of Ariel Fund Investor Class for the period February 1, 1997 through June 10, 2005. Ariel Fund Institutional Class had lower expenses and typically higher returns than Ariel Fund Investor Class. |
| The performance information for Class A, Class C and Class R6 prior to the classes’ inception date is that of the Institutional Class of Neuberger Berman Core Bond Fund (please see Endnote 3). The performance information for the Institutional Class has been adjusted to reflect the appropriate sales charges applicable to Class A and Class C shares, but has not been adjusted to take into account differences in class specific operating expenses (such as 12b-1 fees). The Institutional Class has lower expenses and typically higher returns than Class A and Class C. The Institutional Class has higher expenses and typically lower returns than Class R6. |
| Please see "Glossary of Indices" on page 36 for a description of indices. Please note that individuals cannot invest directly in any index. The indices described in this report do not take into account any fees, expenses or tax consequences of investing in the individual securities that they track. Data about the performance of an index are prepared or obtained by Neuberger Berman Investment Advisers LLC ("NBIA") and reflect the reinvestment of income dividends and other distributions, if any. The Fund may invest in securities not included in a described index and generally does not invest in all securities included in a described index. |
| The date used to calculate Life of Fund performance for the index is the inception date of the oldest share class. |
| The performance information for Institutional Class and Class C prior to the classes’ inception date is that of Class A of Neuberger Berman Floating Rate Income Fund. The performance information (at NAV) of Class A has been adjusted to reflect the appropriate sales charge applicable to Class C shares, but has not been adjusted to take into account differences in class specific operating expenses (such as 12b-1 fees). Class A has higher expenses and typically lower returns (at NAV) than Institutional Class. Class A has lower expenses and typically higher returns (at NAV) than Class C. |
| The performance information for the period April 1, 1996 through September 6, 2002, is that of the Fund’s predecessor, Lipper High Income Bond Fund (“Lipper Fund”), and the performance information for the period February 1, 1992 through March 31, 1996, is that of Lipper Fund’s predecessor partnership. The investment policies, objectives, guidelines and restrictions of the Fund are in all material respects equivalent to those of Lipper Fund, and the investment policies, objectives, guidelines and restrictions of Lipper Fund were in all material respects equivalent to those of its predecessor partnership. As mutual funds registered under the Investment Company Act of 1940, as amended (“1940 Act”), the Fund is, and Lipper Fund was, subject to certain restrictions under the 1940 Act and the Internal Revenue Code of 1986, as amended (“Code”), to which Lipper Fund’s predecessor partnership was not subject. Had Lipper Fund’s predecessor partnership been registered under the 1940 Act and been subject to the provisions of the 1940 Act and the Code, its investment performance may have been adversely affected. Returns would have been lower if Lipper Fund’s manager had not waived certain of its fees during these periods. |
Endnotes (Unaudited) (cont’d)
| The Fund’s policies limited its ability to invest in bonds rated below "B" prior to July 6, 2006. Its performance prior to that date might have been different if current policies had been in effect. |
| The performance information for Investor Class is that of Lipper Fund Premier Class for the period April 1, 1996 through September 6, 2002, and that of Lipper Fund’s predecessor partnership for the period February 1, 1992 (inception date) through March 31, 1996 (please see Endnote 8). |
| The performance information for Institutional Class, Class A, Class C, Class R3, Class R6 and Class E prior to the classes’ respective inception dates is that of the Investor Class of Neuberger Berman High Income Bond Fund (please see Endnote 10). The performance information of the Investor Class has been adjusted to reflect the appropriate sales charges applicable to Class A and Class C shares, but has not been adjusted to take into account differences in class specific operating expenses (such as 12b-1 fees). The Investor Class has lower expenses and typically higher returns than Class A, Class C and Class R3. The Investor Class has higher expenses and typically lower returns than Institutional Class, Class R6 and Class E. |
| A portion of the Fund’s income may be a tax preference item for purposes of the federal alternative minimum tax for certain shareholders. |
| Tax-equivalent effective yield is the taxable effective yield that a shareholder would have had to receive in order to realize the same level of yield after federal income taxes at the highest federal tax rate, currently 37% plus the 3.8% Medicare contribution tax, assuming that all of the Fund’s income is exempt from federal income taxes. |
| The Fund had a different goal and different principal investment strategies, which included a policy to invest 80% of its net assets in securities of municipal issuers that provide interest income that is exempt from New York State and New York City personal income taxes and invest in only investment grade securities, prior to June 16, 2018. Its performance prior to that date might have been different if the current goal and investment strategy had been in effect. |
| This date reflects when NBIA first became the investment manager to the Fund. |
| The performance information for Class A and Class C prior to the classes’ inception date is that of the Institutional Class of Neuberger Berman Municipal Impact Fund (formerly, Neuberger Berman New York Municipal Income Fund). The performance information for the Institutional Class has been adjusted to reflect the appropriate sales charges applicable to Class A and Class C shares, but has not been adjusted to take into account differences in class specific operating expenses (such as 12b-1 fees). The Institutional Class has lower expenses and typically higher returns than Class A and Class C. |
| The performance information for Institutional Class, Class A and Class C prior to the classes’ inception date is that of the Investor Class of Neuberger Berman Municipal Intermediate Bond Fund. The performance information of the Investor Class has been adjusted to reflect the appropriate sales charges applicable to Class A and Class C shares, but has not been adjusted to take into account differences in class specific operating expenses (such as 12b-1 fees). The Investor Class has lower expenses and typically higher returns than Class A and Class C. The Investor Class has higher expenses and typically lower returns than Institutional Class. |
| The investments for the Fund are managed by the same portfolio manager(s) who manage(s) one or more other registered funds that have names, investment objectives and investment styles that are similar to those of the Fund. You should be aware that the Fund is likely to differ from the other mutual fund(s) in size, cash flow pattern and tax matters. Accordingly, the holdings and performance of the Fund can be expected to vary from those of the other mutual fund(s). |
Endnotes (Unaudited) (cont’d)
| The performance information for Trust Class, Institutional Class, Class A and Class C prior to the classes’ respective inception dates is that of the Investor Class of Neuberger Berman Short Duration Bond Fund. The performance information of the Investor Class has been adjusted to reflect the appropriate sales charges applicable to Class A and Class C shares, but has not been adjusted to take into account differences in class specific operating expenses (such as 12b-1 fees). The Investor Class has lower expenses and typically higher returns than Trust Class, Class A and Class C. The Investor Class has higher expenses and typically lower returns than Institutional Class. |
| The Fund had a different goal, to maximize income without undue risk to principal, and investment strategy, which included managing assets by an asset allocation committee, prior to February 28, 2008. Its performance prior to that date might have been different if the current goal and investment strategy had been in effect. |
| The performance information for Trust Class, Class A, Class C and Class R6 prior to the classes’ respective inception dates is that of the Institutional Class of Neuberger Berman Strategic Income Fund. The performance information of the Institutional Class has been adjusted to reflect the appropriate sales charges applicable to Class A and Class C shares, but has not been adjusted to take into account differences in class specific operating expenses (such as 12b-1 fees). The Institutional Class has lower expenses and typically higher returns than Trust Class, Class A and Class C. The Institutional Class has higher expenses and typically lower returns than Class R6. |
For more complete information on any of the Neuberger Berman Income Funds, call us at (800) 877-9700, or visit our website at www.nb.com.
Glossary of Indices (Unaudited)
Bloomberg 7-Year General Obligation (G.O.) Index: | The index is the 7-year (6-8 years to maturity) component of the Bloomberg G.O. Index. The Bloomberg G.O. Index measures the investment grade, U.S. dollar-denominated, long-term, tax-exempt state and local general obligation bond market. Effective August 24, 2021 all Bloomberg Barclays fixed income indices were rebranded as "Bloomberg indices". |
Bloomberg U.S. Aggregate Bond Index: | The index measures the investment grade, U.S. dollar-denominated, fixed-rate, taxable bond market and includes Treasuries, government-related and corporate securities, mortgage-backed securities (MBS) (agency fixed-rate and hybrid adjustable rate mortgage (ARM) pass-throughs), asset-backed securities (ABS), and commercial mortgage-backed securities (CMBS) (agency and nonagency). Effective August 24, 2021 all Bloomberg Barclays fixed income indices were rebranded as "Bloomberg indices". |
Bloomberg Municipal Bond Index: | The index is a rules-based, market-value-weighted index engineered for the long-term tax-exempt bond market. To be included in the index, bonds must be rated investment-grade (Baa3/BBB- or higher) by at least two of the following ratings agencies: Moody’s, S&P, Fitch. If only two of the three agencies rate the security, the lower rating is used to determine index eligibility. If only one of the three agencies rates a security, the rating must be investment-grade. They must have an outstanding par value of at least $7 million and be issued as part of a transaction of at least $75 million. The bonds must be fixed rate, have a dated date after December 31, 1990, and must be at least one year from their maturity date. Remarketed issues, taxable municipal bonds, bonds with floating rates, and derivatives, are excluded from the benchmark. Effective August 24, 2021 all Bloomberg Barclays fixed income indices were rebranded as "Bloomberg indices". |
Bloomberg Municipal High Yield Index: | The index measures the performance of the high yield municipal bond market. To be included in the index, bonds must be rated non-investment-grade (Ba1/BB+ or lower) by at least two of the following ratings agencies: Moody’s, S&P, Fitch. If only two of the three agencies rate the security, the lower rating is used to determine index eligibility. If only one of the three agencies rates a security, the rating must be non-investment-grade. They must have an outstanding par value of at least $7 million and be issued as part of a transaction of at least $75 million. The bonds must be fixed rate, have a dated date after December 31, 1990, and must be at least one year from their maturity date. Remarketed issues, taxable municipal bonds, bonds with floating rates, and derivatives, are excluded from the benchmark. Effective August 24, 2021 all Bloomberg Barclays fixed income indices were rebranded as "Bloomberg indices". |
65% Bloomberg Municipal Bond Index and 35% Bloomberg Municipal High Yield Index: | The blended index is composed of 65% Bloomberg Municipal Bond Index and 35% Bloomberg Municipal High Yield Index (both described above) and is rebalanced monthly. Effective August 24, 2021 all Bloomberg Barclays fixed income indices were rebranded as "Bloomberg indices". |
Bloomberg 1-3 Year U.S. Government/Credit Bond Index: | The index is the 1-3 year component of the Bloomberg U.S. Government/Credit Index. The Bloomberg U.S. Government/Credit Index is the non-securitized component of the Bloomberg U.S. Aggregate Bond Index and includes Treasuries and government-related (agency, sovereign, supranational, and local authority debt guaranteed by the U.S. government) and investment grade corporate securities. Effective August 24, 2021 all Bloomberg Barclays fixed income indices were rebranded as "Bloomberg indices". |
Glossary of Indices (Unaudited) (cont’d)
ICE BofA U.S. High Yield Constrained Index: | The index tracks the performance of U.S. dollar-denominated below investment grade corporate debt publicly issued in the U.S. domestic market. In addition to meeting other criteria, qualifying securities must have a below investment grade rating (based on an average of Moody’s, S&P and Fitch ratings), and have risk exposure to countries that are members of the FX-G10, Western Europe or territories of the U.S. and Western Europe. Securities in legal default are excluded from the index. Index constituents are capitalization-weighted, provided the total allocation to an individual issuer does not exceed 2%. Transaction costs will be incorporated into the calculation of total return for ICE fixed income indices beginning in July 2022. |
J.P. Morgan Corporate Emerging Markets Bond Index (CEMBI)—Diversified: | The index tracks the performance of U.S. dollar-denominated corporate emerging market bonds, including emerging market countries from Asia, Europe, Latin America and the Middle East/Africa. The Diversified version of the index is market capitalization-weighted and limits the weights of those index countries with larger corporate debt stocks by including only specified portions of those countries’ eligible current face amounts of debt outstanding. Effective March 31, 2022, Russia and Belarus were excluded from the J.P. Morgan fixed income indices. The index market value for all Russian and Belarus debt was set to zero, reflecting a total return loss due to market disruption. |
J.P. Morgan Emerging Markets Bond Index (EMBI)—Global Diversified: | The index tracks the performance of U.S. dollar-denominated debt instruments issued by emerging market sovereign and quasi-sovereign entities (Brady bonds, loans and Eurobonds), including emerging market countries from Asia, Europe, Latin America and the Middle East/Africa. The Global version of the index captures a broad, comprehensive universe of emerging market issues. The Diversified version of the index is market capitalization-weighted and limits the weights of those index countries with larger debt stocks by including only specified portions of those countries’ eligible current face amounts of debt outstanding. Effective March 31, 2022, Russia and Belarus were excluded from the J.P. Morgan fixed income indices. The index market value for all Russian and Belarus debt was set to zero, reflecting a total return loss due to market disruption. |
J.P. Morgan Government Bond Index (GBI)—Emerging Markets Global Diversified: | The index tracks the performance of local currency denominated bonds issued by emerging market governments, including emerging market countries from Asia, Europe, Latin America and the Middle East/Africa. The Global version of the index includes only countries that are accessible by most of the international investor base, while countries with explicit capital controls are excluded. The Diversified version of the index is market capitalization-weighted, with a maximum weight to a country capped at 10%. Effective March 31, 2022, Russia and Belarus were excluded from the J.P. Morgan fixed income indices. The index market value for all Russian and Belarus debt was set to zero, reflecting a total return loss due to market disruption. |
50% J.P. Morgan GBI—Emerging Markets Global Diversified, 25% J.P. Morgan EMBI—Global Diversified, and 25% J.P. Morgan CEMBI—Diversified: | The blended index is composed of 50% J.P. Morgan GBI—Emerging Markets Global Diversified, 25% J.P. Morgan EMBI—Global Diversified, and 25% J.P. Morgan CEMBI—Diversified (all described above) and is rebalanced monthly. Effective March 31, 2022, Russia and Belarus were excluded from the J.P. Morgan fixed income indices. The index market value for all Russian and Belarus debt was set to zero, reflecting a total return loss due to market disruption. |
Morningstar LSTA US Leveraged Loan Index: | The index is a market-value weighted index designed to measure the performance of the US leveraged loan market. The starting universe consists of senior secured, USD denominated syndicated term leveraged loans with a minimum initial term of one year, a minimum initial spread of base rate (LIBOR/SOFR) plus 125 basis points, and a minimum initial issue size of $50 million. The index is rebalanced on a weekly basis every Friday. The index was renamed from S&P/LSTA Leveraged Loan Index to Morningstar LSTA US Leveraged Loan Index effective 8/29/2022. |
Information About Your Fund’s Expenses (Unaudited)
As a Fund shareholder, you incur two types of costs: (1) transaction costs, including sales charges (loads) on purchase payments or redemption proceeds (if applicable); and (2) ongoing costs, including management fees, distribution and/or service (12b-1) fees (if applicable), and other Fund expenses. This example is intended to help you understand your ongoing costs (in U.S. dollars) of investing in a Fund and compare these costs with the ongoing costs of investing in other mutual funds.
This table is designed to provide information regarding costs related to your investments. The following examples are based on an investment of $1,000 made at the beginning of the six month period ended October 31, 2022 and held for the entire period. The table illustrates each Fund’s costs in two ways:
Actual Expenses and Performance: | The first section of the table provides information about actual account values and actual expenses in dollars, based on the Fund’s actual performance during the period indicated. You may use the information in this line, together with the amount you invested, to estimate the expenses you paid over the period. Simply divide your account value by $1,000 (for example, an $8,600 account value divided by $1,000 = 8.6), then multiply the result by the number in the first section of the table under the heading entitled "Expenses Paid During the Period" to estimate the expenses you paid over the period. |
Hypothetical Example for Comparison Purposes: | The second section of the table provides information about hypothetical account values and hypothetical expenses based on the Fund’s actual expense ratio and an assumed rate of return at 5% per year before expenses. This return is not the Fund’s actual return. The hypothetical account values and expenses may not be used to estimate the actual ending account balance or expenses you paid for the period. You may use this information to compare the ongoing costs of investing in a Fund versus other funds. To do so, compare the expenses shown in this 5% hypothetical example with the 5% hypothetical examples that appear in the shareholder reports of other funds. |
Please note that the expenses in the table are meant to highlight your ongoing costs only and do not include any transaction costs, such as sales charges (loads) (if applicable). Therefore, the information under the heading "Hypothetical (5% annual return before expenses)" is useful in comparing ongoing costs only, and will not help you determine the relative total costs of owning different funds. In addition, if these transaction costs were included, your costs would have been higher.
Expense Example (Unaudited)
Neuberger Berman Income Funds
| | HYPOTHETICAL (5% ANNUAL RETURN BEFORE EXPENSES) |
| Beginning
Account
Value
5/1/22 | Ending
Account
Value
10/31/22 | Expenses Paid
During the
5/1/22 – 10/31/22 | | Beginning
Account
Value
5/1/22 | Ending
Account
Value
10/31/22 | Expenses Paid
During the
Period(2)
5/1/22 – 10/31/22 | |
|
| | | | | | | | |
| | | | | | | | |
| | | | | | | | |
| | | | | | | | |
| | | | | | | | |
Emerging Markets Debt Fund |
| | | | | | | | |
| | | | | | | | |
| | | | | | | | |
Floating Rate Income Fund |
| | | | | | | | |
| | | | | | | | |
| | | | | | | | |
|
| | | | | | | | |
| | | | | | | | |
| | | | | | | | |
| | | | | | | | |
| | | | | | | | |
| | | | | | | | |
| | | | | | | | |
Municipal High Income Fund |
| | | | | | | | |
| | | | | | | | |
| | | | | | | | |
|
| | | | | | | | |
| | | | | | | | |
| | | | | | | | |
Municipal Intermediate Bond Fund |
| | | | | | | | |
| | | | | | | | |
| | | | | | | | |
| | | | | | | | |
|
| | | | | | | | |
| | | | | | | | |
| | | | | | | | |
| | | | | | | | |
| | | | | | | | |
|
| | | | | | | | |
| | | | | | | | |
| | | | | | | | |
| | | | | | | | |
| | | | | | | | |
| For each class, expenses are equal to the annualized expense ratio for the class, multiplied by the average account value over the period, multiplied by 184/365 (to reflect the one-half year period shown), unless otherwise indicated. |
Expense Example (Unaudited) (cont’d)
Neuberger Berman Income Funds
| Hypothetical expenses are equal to the annualized expense ratios for each class, multiplied by the average account value over the period (assuming a 5% annual return), multiplied by 184/365 (to reflect the one-half year period shown). |
Legend October 31, 2022 (Unaudited)
Neuberger Berman Income Funds
|
| = Budapest Interbank Offered Rate |
| = Canadian Dollar Offered Rate |
| = Overnight Brazil Interbank Deposit Rate |
| = Sinacofi Chile Interbank Rate Average |
| = CME Group, Inc. Term Secured Overnight Financing Rate |
| = China Fixing Rate Repo Rates 7 Day |
| = Eurostat Eurozone Harmonised Indices of Consumer Prices Ex Tobacco Unrevised Series NSA |
| = Euro Interbank Offered Rate |
| |
| = France Consumer Price Index Ex Tobacco |
| = Colombia Overnight Interbank Reference Rate |
| = London Interbank Offered Rate |
| = Mumbai Interbank Offered Rate |
| = Prague Interbank Offered Rate |
| = Secured Overnight Financing Rate |
| = 30 Day Average Secured Overnight Financing Rate |
| = Taipei Interbank Offered Rate |
| = Mexican Interbank Equilibrium Interest Rate |
| = Poland Warsaw Interbank Offered Rate |
|
| |
| |
| |
|
| |
| |
| |
| |
| = Goldman Sachs International |
| |
| = JPMorgan Chase Bank N.A. |
| = Morgan Stanley Capital Services LLC |
| = Standard Chartered Bank |
| = State Street Bank and Trust Company |
Index Periods/Payment Frequencies: |
| |
| |
| |
| |
| |
| |
| |
| |
| |
Legend October 31, 2022 (Unaudited) (cont’d)
Non-Deliverable Forward Contracts: |
| |
| |
| |
| |
| |
| |
| |
| |
| |
| |
| |
| |
| |
| |
|
| = Contingent Value Instrument. An instrument that gives the holder the right to receive additional debt service payments from the debtor in the event that certain growth-linked triggers (such as increases in gross domestic product or government revenues) are met. |
| = Neuberger Berman Investment Advisers LLC |
|
| |
| |
| |
| |
| |
| |
| |
| |
| |
| |
| |
| |
| |
| |
| |
| |
| |
| |
| |
| |
| |
| |
| |
| |
| |
| |
| |
Legend October 31, 2022 (Unaudited) (cont’d)
Currency Abbreviations (cont’d): |
| |
| |
| |
| |
| |
| |
| |
| |
(a)
There is one official currency held in China, the Chinese Yuan Renminbi. CNY is traded onshore, in mainland China and CNH is traded offshore, mainly in the Hong Kong market, each at a different exchange rate.
Schedule of Investments Core Bond Fund^
October 31, 2022
| |
U.S. Treasury Obligations 24.7% | |
| | | |
| | | |
| | | |
| | | |
| | | |
| | 2.75%, due 11/15/2023 - 8/15/2047 | |
| | | |
| | | |
| | | |
| | | |
| | 3.13%, due 11/15/2041 - 8/15/2044 | |
| | 3.00%, due 5/15/2042 - 8/15/2052 | |
| | | |
| | 3.38%, due 8/15/2042 - 11/15/2048 | |
| | | |
| | | |
| | | |
| | | |
| | | |
| | | |
| | 2.88%, due 9/30/2023 - 5/15/2032 | |
| | | |
| | | |
| | | |
| | | |
| | 3.25%, due 6/30/2027 - 6/30/2029 | |
| | | |
| | | |
| | | |
| | 2.75%, due 5/31/2029 - 8/15/2032 | |
| | | |
Total U.S. Treasury Obligations (Cost $121,528,551) | |
U.S. Government Agency Securities 0.7% | |
| | Fannie Mae Principal Strip, 0.00%, due 7/15/2037 | |
| | Federal Home Loan Bank, 5.50%, due 7/15/2036 | |
| | Federal National Mortgage Association, 5.63%, due 7/15/2037 | |
| | Tennessee Valley Authority, 5.25%, due 9/15/2039 | |
Total U.S. Government Agency Securities (Cost $4,117,098) | |
|
Mortgage-Backed Securities 40.3% |
Collateralized Mortgage Obligations 4.9% | |
| | | |
| | Ser. 2019-6, Class A1, 2.62%, due 11/25/2059 | |
| | Ser. 2021-3, Class A1, 1.07%, due 5/25/2066 | |
| | Angel Oak Mortgage Trust I LLC, Ser. 2019-1, Class A1, 3.92%, due 11/25/2048 | |
See Notes to Financial Statements
Schedule of Investments Core Bond Fund^ (cont’d)
| |
|
Collateralized Mortgage Obligations – cont'd | |
| | Connecticut Avenue Securities Trust | |
| | Ser. 2021-R01, Class 1M2, (SOFR30A + 1.55%), 4.55%, due 10/25/2041 | |
| | Ser. 2022-R01, Class 1M2, (SOFR30A + 1.90%), 4.90%, due 12/25/2041 | |
| | Ser. 2022-R03, Class 1M2, (SOFR30A + 3.50%), 6.50%, due 3/25/2042 | |
| | Ser. 2022-R07, Class 1M1, (SOFR30A + 2.95%), 5.97%, due 6/25/2042 | |
| | Ellington Financial Mortgage Trust, Ser. 2022-1, Class A1, 2.21%, due 1/25/2067 | |
| | Fannie Mae Connecticut Avenue Securities, Ser. 2017-C03, Class 1M2, (1M USD LIBOR + 3.00%), 6.59%, due 10/25/2029 | |
| | Fannie Mae Interest Strip, Ser. 418, Class C24, 4.00%, due 8/25/2043 | |
| | Fannie Mae Real Estate Mortgage Investment Conduits | |
| | Ser. 2012-15, Class S, (5.95% - 1M USD LIBOR), 2.36%, due 3/25/2042 | |
| | Ser. 2012-70, Class HS, (6.00% - 1M USD LIBOR), 2.41%, due 7/25/2042 | |
| | Ser. 2017-100, Class S, (6.15% - 1M USD LIBOR), 2.56%, due 12/25/2042 | |
| | Ser. 2012-140, Class PI, 3.50%, due 12/25/2042 | |
| | Ser. 2013-6, Class SB, (6.10% - 1M USD LIBOR), 2.51%, due 2/25/2043 | |
| | Ser. 2013-18, Class PS, (6.10% - 1M USD LIBOR), 2.51%, due 3/25/2043 | |
| | Ser. 2015-32, Class SA, (6.20% - 1M USD LIBOR), 2.61%, due 5/25/2045 | |
| | Ser. 2016-32, Class LI, 3.50%, due 6/25/2046 | |
| | Ser. 2016-40, Class SA, (5.85% - 1M USD LIBOR), 2.26%, due 7/25/2046 | |
| | Ser. 2016-95, Class US, (6.00% - 1M USD LIBOR), 2.41%, due 12/25/2046 | |
| | Ser. 2018-7, Class CI, 4.00%, due 2/25/2048 | |
| | Ser. 2020-52, Class GI, 4.50%, due 8/25/2050 | |
| | Freddie Mac Real Estate Mortgage Investment Conduits | |
| | Ser. 4018, Class HS, (6.45% - 1M USD LIBOR), 3.04%, due 3/15/2042 | |
| | Ser. 4120, Class SV, (6.15% - 1M USD LIBOR), 2.74%, due 10/15/2042 | |
| | Ser. 4159, Class KS, (6.15% - 1M USD LIBOR), 2.74%, due 1/15/2043 | |
| | Ser. 4385, Class IA, 4.50%, due 9/15/2044 | |
| | Ser. 4572, Class SA, (6.05% - 1M USD LIBOR), 2.64%, due 4/15/2046 | |
| | Ser. 4623, Class MS, (6.00% - 1M USD LIBOR), 2.59%, due 10/15/2046 | |
| | Freddie Mac Strips, Ser. 312, Class S1, (5.95% - 1M USD LIBOR), 2.54%, due 9/15/2043 | |
| | Freddie Mac Structured Agency Credit Risk Debt Notes | |
| | Ser. 2017-DNA1, Class M2, (1M USD LIBOR + 3.25%), 6.84%, due 7/25/2029 | |
| | Ser. 2017-HQA3, Class M2, (1M USD LIBOR + 2.35%), 5.94%, due 4/25/2030 | |
| | Ser. 2018-HQA1, Class M2, (1M USD LIBOR + 2.30%), 5.89%, due 9/25/2030 | |
| | Ser. 2019-CS03, Class M1, (1M USD LIBOR + 0.00%), 3.59%, due 10/25/2032 | |
| | Freddie Mac Structured Agency Credit Risk Debt Notes Real Estate Mortgage Investment Conduits | |
| | Ser. 2021-DNA7, Class M1, (SOFR30A + 0.85%), 3.85%, due 11/25/2041 | |
| | Ser. 2022-HQA1, Class M1B, (SOFR30A + 3.50%), 6.50%, due 3/25/2042 | |
| | Ser. 2022-DNA3, Class M1B, (SOFR30A + 2.90%), 5.90%, due 4/25/2042 | |
| | | |
| | Ser. 2019-NQM3, Class A1, 2.69%, due 11/25/2059 | |
| | Ser. 2021-NQM5, Class A1, 1.26%, due 7/25/2066 | |
See Notes to Financial Statements
Schedule of Investments Core Bond Fund^ (cont’d)
| |
|
Collateralized Mortgage Obligations – cont'd | |
| | Government National Mortgage Association | |
| | Ser. 2013-5, Class BI, 3.50%, due 1/20/2043 | |
| | Ser. 2013-23, Class IT, 3.50%, due 2/20/2043 | |
| | Ser. 2018-124, Class DS, (6.10% - 1M USD LIBOR), 2.69%, due 12/16/2043 | |
| | Ser. 2016-77, Class TS, (6.15% - 1M USD LIBOR), 2.66%, due 12/20/2044 | |
| | Ser. 2019-22, Class SA, (5.60% - 1M USD LIBOR), 2.11%, due 2/20/2045 | |
| | Ser. 2018-7, Class SA, (6.20% - 1M USD LIBOR), 2.71%, due 1/20/2048 | |
| | Ser. 2020-173, Class MI, 2.50%, due 11/20/2050 | |
| | Ser. 2021-26, Class AI, 2.00%, due 2/20/2051 | |
| | Ser. 2021-116, Class IA, 2.50%, due 6/20/2051 | |
| | New Residential Mortgage Loan Trust, Ser. 2019-NQM5, Class A1, 2.71%, due 11/25/2059 | |
| | Starwood Mortgage Residential Trust, Ser. 2021-3, Class A1, 1.13%, due 6/25/2056 | |
| | Towd Point Mortgage Trust | |
| | Ser. 2017-2, Class A2, 3.25%, due 4/25/2057 | |
| | Ser. 2022-4, Class A1, 3.75%, due 9/25/2062 | |
| | Verus Securitization Trust | |
| | Ser. 2019-4, Class A1, 2.64%, due 11/25/2059 | |
| | Ser. 2021-3, Class A1, 1.05%, due 6/25/2066 | |
| | Ser. 2021-6, Class A1, 1.63%, due 10/25/2066 | |
| | | |
Commercial Mortgage-Backed 5.8% | |
| | BANK, Ser. 2022-BNK39, Class A4, 2.93%, due 2/15/2055 | |
| | BB-UBS Trust, Ser. 2012-SHOW, Class A, 3.43%, due 11/5/2036 | |
| | | |
| | Ser. 2020-B21, Class A5, 1.98%, due 12/17/2053 | |
| | Ser. 2021-B26, Class XA, 0.89%, due 6/15/2054 | |
| | Ser. 2021-B29, Class A5, 2.39%, due 9/15/2054 | |
| | Ser. 2021-B31, Class D, 2.25%, due 12/15/2054 | |
| | Ser. 2021-B31, Class A5, 2.67%, due 12/15/2054 | |
| | Ser. 2021-B31, Class C, 3.20%, due 12/15/2054 | |
| | BX Commercial Mortgage Trust, Ser. 2021-VOLT, Class D, (1M USD LIBOR + 1.65%), 5.06%, due 9/15/2036 | |
| | | |
| | Ser. 2021-SDMF, Class E, (1M USD LIBOR + 1.59%), 5.00%, due 9/15/2034 | |
| | Ser. 2019-OC11, Class A, 3.20%, due 12/9/2041 | |
| | BXP Trust, Ser. 2017-GM, Class A, 3.38%, due 6/13/2039 | |
| | CAMB Commercial Mortgage Trust, Ser. 2019-LIFE, Class B, (1M USD LIBOR + 1.25%), 4.66%, due 12/15/2037 | |
| | CD Mortgage Trust, Ser. 2018-CD7, Class A1, 3.28%, due 8/15/2051 | |
| | Citigroup Commercial Mortgage Trust | |
| | Ser. 2013-GC11, Class B, 3.73%, due 4/10/2046 | |
| | Ser. 2013-GC17, Class B, 5.10%, due 11/10/2046 | |
| | Ser. 2014-GC23, Class B, 4.18%, due 7/10/2047 | |
| | Ser. 2014-GC25, Class XA, 0.95%, due 10/10/2047 | |
| | Ser. 2015-GC27, Class XA, 1.31%, due 2/10/2048 | |
| | Ser. 2022-GC48, Class A5, 4.58%, due 5/15/2054 | |
See Notes to Financial Statements
Schedule of Investments Core Bond Fund^ (cont’d)
| |
|
Commercial Mortgage-Backed – cont'd | |
| | Commercial Mortgage Trust | |
| | Ser. 2012-CR4, Class AM, 3.25%, due 10/15/2045 | |
| | Ser. 2013-LC6, Class B, 3.74%, due 1/10/2046 | |
| | Ser. 2014-CR15, Class B, 4.62%, due 2/10/2047 | |
| | Ser. 2014-CR16, Class XA, 0.94%, due 4/10/2047 | |
| | Ser. 2014-LC15, Class XA, 1.05%, due 4/10/2047 | |
| | Ser. 2014-LC15, Class AM, 4.20%, due 4/10/2047 | |
| | Ser. 2014-CR17, Class XA, 0.95%, due 5/10/2047 | |
| | Ser. 2014-UBS3, Class XA, 1.06%, due 6/10/2047 | |
| | Ser. 2014-CR18, Class XA, 0.99%, due 7/15/2047 | |
| | Ser. 2014-UBS6, Class XA, 0.85%, due 12/10/2047 | |
| | Ser. 2014-CR21, Class AM, 3.99%, due 12/10/2047 | |
| | CSAIL Commercial Mortgage Trust | |
| | Ser. 2016-C5, Class XA, 0.91%, due 11/15/2048 | |
| | Ser. 2015-C1, Class B, 4.04%, due 4/15/2050 | |
| | Ser. 2017-CX9, Class A5, 3.45%, due 9/15/2050 | |
| | Freddie Mac Multifamily Structured Pass Through Certificates | |
| | Ser. KW03, Class X1, 0.83%, due 6/25/2027 | |
| | Ser. K088, Class XAM, 0.42%, due 1/25/2029 | |
| | Ser. K090, Class X1, 0.71%, due 2/25/2029 | |
| | Ser. K098, Class XAM, 1.39%, due 8/25/2029 | |
| | GS Mortgage Securities Trust | |
| | Ser. 2014-GC18, Class XA, 1.03%, due 1/10/2047 | |
| | Ser. 2019-GSA1, Class A4, 3.05%, due 11/10/2052 | |
| | Ser. 2020-GC47, Class A5, 2.38%, due 5/12/2053 | |
| | JP Morgan Chase Commercial Mortgage Securities Trust, Ser. 2022-OPO, Class B, 3.38%, due 1/5/2039 | |
| | JPMBB Commercial Mortgage Securities Trust, Ser. 2015-C33, Class AS, 4.02%, due 12/15/2048 | |
| | Manhattan West Mortgage Trust, Ser. 2020-1MW, Class A, 2.13%, due 9/10/2039 | |
| | Morgan Stanley Bank of America Merrill Lynch Trust, Ser. 2014-C16, Class XA, 0.94%, due 6/15/2047 | |
| | Taubman Centers Commercial Mortgage Trust, Ser. 2022-DPM, Class A, (1M CME Term SOFR + 2.19%), 5.56%, due 5/15/2037 | |
| | Wells Fargo Commercial Mortgage Trust, Ser. 2015-NXS4, Class C, 4.69%, due 12/15/2048 | |
| | WF-RBS Commercial Mortgage Trust | |
| | Ser. 2014-C25, Class XA, 0.79%, due 11/15/2047 | |
| | Ser. 2014-C22, Class XA, 0.79%, due 9/15/2057 | |
| | Ser. 2014-C22, Class AS, 4.07%, due 9/15/2057 | |
| | | |
| |
| | Pass-Through Certificates | |
| | 2.00%, due 1/1/2051 - 10/1/2051 | |
| | 2.50%, due 8/1/2050 - 4/1/2052 | |
| | 3.00%, due 10/1/2041 - 2/1/2052 | |
| | 3.50%, due 12/1/2041 - 6/1/2052 | |
| | 4.00%, due 1/1/2041 - 6/1/2052 | |
| | 4.50%, due 4/1/2034 - 8/1/2052 | |
| | 5.00%, due 6/1/2033 - 10/1/2052 | |
| | | |
See Notes to Financial Statements
Schedule of Investments Core Bond Fund^ (cont’d)
| |
|
| |
| | Pass-Through Certificates | |
| | 2.00%, due 12/1/2050 - 11/1/2051 | |
| | 2.50%, due 7/1/2050 - 9/1/2051 | |
| | 3.00%, due 8/1/2046 - 9/1/2050 | |
| | 3.50%, due 7/1/2042 - 1/1/2050 | |
| | 4.00%, due 11/1/2040 - 9/1/2052 | |
| | 4.50%, due 6/1/2039 - 8/1/2052 | |
| | 5.00%, due 5/1/2023 - 10/1/2052 | |
| | 5.50%, due 9/1/2052 - 10/1/2052 | |
| | | |
| |
| | Pass-Through Certificates | |
| | 2.00%, due 2/20/2051 - 6/20/2052 | |
| | 2.50%, due 2/20/2051 - 12/20/2051 | |
| | 3.00%, due 1/20/2052 - 3/20/2052 | |
| | 3.50%, due 1/20/2043 - 7/20/2052 | |
| | 4.00%, due 2/20/2050 - 9/20/2052 | |
| | 4.50%, due 7/20/2052 - 9/20/2052 | |
| | 4.50%, TBA, 30 Year Maturity | |
| | 5.00%, TBA, 30 Year Maturity | |
| | 5.50%, TBA, 30 Year Maturity | |
| | | |
Uniform Mortgage-Backed Securities 3.2% | |
| | Pass-Through Certificates | |
| | 4.00%, TBA, 30 Year Maturity | |
| | 4.50%, TBA, 30 Year Maturity | |
| | 5.00%, TBA, 30 Year Maturity | |
| | 5.50%, TBA, 30 Year Maturity | |
| | 6.00%, TBA, 30 Year Maturity | |
| | | |
Total Mortgage-Backed Securities (Cost $215,642,555) | |
Asset-Backed Securities 9.5% | |
| | 522 Funding CLO Ltd., Ser. 2019-5A, Class AR, (3M CME Term SOFR + 1.33%), 5.19%, due 4/15/2035 | |
| | AIG CLO Ltd., Ser. 2021-2A, Class A, (3M USD LIBOR + 1.17%), 5.41%, due 7/20/2034 | |
| | AM Capital Funding LLC, Ser. 2018-1, Class A, 4.98%, due 12/15/2023 | |
| | Amur Equipment Finance Receivables XI LLC, Ser. 2022-2A, Class A2, 5.30%, due 6/21/2028 | |
| | Aqua Finance Trust, Ser. 2021-A, Class A, 1.54%, due 7/17/2046 | |
| | Avis Budget Rental Car Funding AESOP LLC | |
| | Ser. 2021-2A, Class A, 1.66%, due 2/20/2028 | |
| | Ser. 2021-2A, Class B, 1.90%, due 2/20/2028 | |
| | Beacon Container Finance II LLC, Ser. 2021-1A, Class A, 2.25%, due 10/22/2046 | |
| | Chase Funding Trust, Ser. 2004-1, Class 2A2, (1M USD LIBOR + 0.46%), 4.05%, due 12/25/2033 | |
| | Corevest American Finance Trust, Ser. 2019-1, Class A, 3.32%, due 3/15/2052 | |
| | Crown Castle Towers LLC, 4.24%, due 7/15/2028 | |
| | Eaton Vance CLO Ltd., Ser. 2013-1A, Class A13R, (3M USD LIBOR + 1.25%), 5.33%, due 1/15/2034 | |
| | Elmwood CLO III Ltd., Ser. 2019-3A, Class AR, (3M USD LIBOR + 1.16%), 5.40%, due 10/20/2034 | |
See Notes to Financial Statements
Schedule of Investments Core Bond Fund^ (cont’d)
| |
Asset-Backed Securities – cont'd | |
| | Halseypoint CLO 5 Ltd., Ser. 2021-5A, Class A1A, (3M USD LIBOR + 1.21%), 5.62%, due 1/30/2035 | |
| | JPMorgan Chase Bank NA, Ser. 2021-3, Class B, 0.76%, due 2/26/2029 | |
| | Magnetite XXIII Ltd., Ser. 2019-23A, Class AR, (3M USD LIBOR + 1.13%), 5.49%, due 1/25/2035 | |
| | Magnetite XXIV Ltd., Ser. 2019-24A, Class AR, (3M CME Term SOFR + 1.31%), 5.17%, due 4/15/2035 | |
| | Marlette Funding Trust, Ser. 2021-2A, Class A, 0.51%, due 9/15/2031 | |
| | | |
| | Ser. 2021-2A, Class A, 1.43%, due 5/20/2039 | |
| | Ser. 2021-2A, Class B, 1.83%, due 5/20/2039 | |
| | Navient Private Ed. Refi Loan Trust, Ser. 2021-EA, Class A, 0.97%, due 12/16/2069 | |
| | Navient Student Loan Trust, Ser. 2019-7A, Class A1, (1M USD LIBOR + 0.50%), 4.09%, due 1/25/2068 | |
| | Oaktree CLO Ltd., Ser. 2021-2A, Class A, (3M USD LIBOR + 1.18%), 5.26%, due 1/15/2035 | |
| | PFS Financing Corp., Ser. 2021-B, Class A, 0.77%, due 8/15/2026 | |
| | PPM CLO 3 Ltd., Ser. 2019-3A, Class AR, (3M USD LIBOR + 1.09%), 5.17%, due 4/17/2034 | |
| | Prestige Auto Receivables Trust, Ser. 2021-1A, Class C, 1.53%, due 2/15/2028 | |
| | Residential Asset Securities Corp., Ser. 2005-KS12, Class M2, (1M USD LIBOR + 0.46%), 4.28%, due 1/25/2036 | |
| | Saxon Asset Securities Trust, Ser. 2004-1, Class A, (1M USD LIBOR + 0.54%), 2.47%, due 3/25/2035 | |
| | | |
| | | |
| | | |
| | | |
| | Sierra Timeshare Receivables Funding LLC | |
| | Ser. 2019-2A, Class A, 2.59%, due 5/20/2036 | |
| | Ser. 2020-2A, Class A, 1.33%, due 7/20/2037 | |
| | Ser. 2020-2A, Class C, 3.51%, due 7/20/2037 | |
| | Ser. 2021-2A, Class A, 1.35%, due 9/20/2038 | |
| | SoFi Professional Loan Program Trust, Ser. 2021-A, Class AFX, 1.03%, due 8/17/2043 | |
| | Taco Bell Funding LLC, Ser. 2021-1A, Class A2I, 1.95%, due 8/25/2051 | |
| | TCI-Flatiron CLO Ltd., Ser. 2018-1A, Class ANR, (3M USD LIBOR + 1.06%), 5.47%, due 1/29/2032 | |
| | Thayer Park CLO Ltd., Ser. 2017-1A, Class A1R, (3M USD LIBOR + 1.04%), 5.28%, due 4/20/2034 | |
| | TRESTLES CLO Ltd., Ser. 2017-1A, Class A1R, (3M USD LIBOR + 0.99%), 5.35%, due 4/25/2032 | |
| | TRESTLES CLO V Ltd., Ser. 2021-5A, Class A1, (3M USD LIBOR + 1.17%), 5.41%, due 10/20/2034 | |
| | Vantage Data Centers Issuer LLC | |
| | Ser. 2019-1A, Class A2, 3.19%, due 7/15/2044 | |
| | Ser. 2021-1A, Class A2, 2.17%, due 10/15/2046 | |
| | Voya CLO Ltd., Ser. 2019-2A, Class A, (3M USD LIBOR + 1.27%), 5.51%, due 7/20/2032 | |
| | Whitebox CLO III Ltd., Ser. 2021-3A, Class A1, (3M USD LIBOR + 1.22%), 5.30%, due 10/15/2034 | |
Total Asset-Backed Securities (Cost $47,574,539) | |
|
|
| |
| | | |
| | | |
| | | |
| | | |
See Notes to Financial Statements
Schedule of Investments Core Bond Fund^ (cont’d)
| |
|
Aerospace & Defense – cont'd | |
| | | |
| | | |
| | | |
| | | |
| |
| | Altria Group, Inc., 3.88%, due 9/16/2046 | |
| | BAT Capital Corp., 3.73%, due 9/25/2040 | |
| | | |
| |
| | United Airlines Pass Through Trust, Ser. 2020-1, Class A, 5.88%, due 10/15/2027 | |
| |
| | General Motors Co., 6.13%, due 10/1/2025 | |
| |
| | | |
| | | |
| | | |
| | | |
| | | |
| | | |
| | | |
| | | |
| | BNP Paribas SA, 3.05%, due 1/13/2031 | |
| | | |
| | | |
| | | |
| | Credit Suisse Group AG, 6.54%, due 8/12/2033 | |
| | Goldman Sachs Group, Inc. | |
| | | |
| | | |
| | | |
| | HSBC Holdings PLC, 6.00%, due 5/22/2027 | |
| | | |
| | | |
| | | |
| | KFW, 3.00%, due 5/20/2027 | |
| | Lloyds Banking Group PLC, 1.63%, due 5/11/2027 | |
| | | |
| | | |
| | | |
| | | |
| | | |
| | U.S. Bancorp, 4.97%, due 7/22/2033 | |
| | UBS Group AG, 4.75%, due 5/12/2028 | |
| | | |
| | | |
| | | |
| | | |
| | Westpac Banking Corp., 2.67%, due 11/15/2035 | |
| | | |
See Notes to Financial Statements
Schedule of Investments Core Bond Fund^ (cont’d)
| |
|
| |
| | Anheuser-Busch Cos. LLC/Anheuser-Busch InBev Worldwide, Inc., 4.70%, due 2/1/2036 | |
| | Anheuser-Busch InBev Worldwide, Inc., 5.80%, due 1/23/2059 | |
| | | |
| |
| | Apple, Inc., 4.65%, due 2/23/2046 | |
| | Dell Int'l LLC/EMC Corp., 6.02%, due 6/15/2026 | |
| | | |
Cosmetics - Personal Care 0.6% | |
| | GSK Consumer Healthcare Capital U.S. LLC | |
| | | |
| | | |
| | | |
Diversified Financial Services 1.2% | |
| | AerCap Ireland Capital Designated Activity Co./AerCap Global Aviation Trust | |
| | | |
| | | |
| | | |
| | | |
| | | |
| | | |
| | | |
| |
| | American Electric Power Co., Inc., 5.95%, due 11/1/2032 | |
| | Dominion Energy, Inc., 4.35%, due 8/15/2032 | |
| | Duke Energy Corp., 5.00%, due 8/15/2052 | |
| | Exelon Corp., 4.70%, due 4/15/2050 | |
| | Interstate Power & Light Co., 2.30%, due 6/1/2030 | |
| | NextEra Energy Capital Holdings, Inc., 1.90%, due 6/15/2028 | |
| | Pacific Gas and Electric Co., 2.50%, due 2/1/2031 | |
| | WEC Energy Group, Inc., 5.15%, due 10/1/2027 | |
| | Wisconsin Electric Power Co., 4.75%, due 9/30/2032 | |
| | | |
| |
| | Magallanes, Inc., 5.05%, due 3/15/2042 | |
| | Warnermedia Holdings, Inc., 5.14%, due 3/15/2052 | |
| | | |
| |
| | Grupo Bimbo SAB de CV, 4.70%, due 11/10/2047 | |
| | Sysco Corp., 6.60%, due 4/1/2050 | |
| | | |
| |
| | Southern Co. Gas Capital Corp., 3.15%, due 9/30/2051 | |
Healthcare - Services 0.8% | |
| | | |
| | | |
| | | |
| | Roche Holdings, Inc., 2.61%, due 12/13/2051 | |
See Notes to Financial Statements
Schedule of Investments Core Bond Fund^ (cont’d)
| |
|
Healthcare - Services – cont'd | |
| | UnitedHealth Group, Inc., 6.05%, due 2/15/2063 | |
| | | |
| |
| | AXA Equitable Holdings, Inc., 5.00%, due 4/20/2048 | |
| |
| | Meta Platforms, Inc., 4.45%, due 8/15/2052 | |
| |
| | Comcast Corp., 2.94%, due 11/1/2056 | |
| |
| | South32 Treasury Ltd., 4.35%, due 4/14/2032 | |
| |
| | Asian Development Bank, 3.13%, due 4/27/2032 | |
| | Int'l Bank for Reconstruction & Development | |
| | | |
| | | |
| | Int'l Finance Corp., 3.63%, due 9/15/2025 | |
| | | |
Office - Business Equipment 0.7% | |
| | CDW LLC/CDW Finance Corp. | |
| | | |
| | | |
| | | |
| | | |
| |
| | Canadian Natural Resources Ltd., 4.95%, due 6/1/2047 | |
| | ConocoPhillips Co., 3.80%, due 3/15/2052 | |
| | | |
| | | |
| | | |
| | Hess Corp., 5.60%, due 2/15/2041 | |
| | Marathon Petroleum Corp., 4.70%, due 5/1/2025 | |
| | Occidental Petroleum Corp., 4.30%, due 8/15/2039 | |
| | Phillips 66, 1.30%, due 2/15/2026 | |
| | Pioneer Natural Resources Co., 2.15%, due 1/15/2031 | |
| | | |
| |
| | | |
| | | |
| | | |
| | | |
| | | |
| | | |
| | Cigna Corp., 3.20%, due 3/15/2040 | |
| | | |
| | | |
| | | |
| | Merck & Co., Inc., 2.75%, due 12/10/2051 | |
See Notes to Financial Statements
Schedule of Investments Core Bond Fund^ (cont’d)
| |
|
| |
| | | |
| | | |
| | | |
| | | |
| |
| | Kinder Morgan, Inc., 5.55%, due 6/1/2045 | |
| | MPLX L.P., 4.70%, due 4/15/2048 | |
| | | |
| |
| | | |
| | | |
| | | |
| | | |
| | Starbucks Corp., 2.55%, due 11/15/2030 | |
| | | |
| |
| | Broadcom, Inc., 4.93%, due 5/15/2037 | |
| | Marvell Technology, Inc., 2.95%, due 4/15/2031 | |
| | NXP BV/NXP Funding LLC/NXP USA, Inc., 5.00%, due 1/15/2033 | |
| | | |
| |
| | | |
| | | |
| | | |
| | | |
| |
| | | |
| | | |
| | | |
| | | |
| | | |
| | | |
| | | |
| | | |
| | Verizon Communications, Inc. | |
| | | |
| | | |
| | | |
| | | |
Total Corporate Bonds (Cost $153,044,486) | |
Foreign Government Securities 0.8% | |
| | Japan International Cooperation Agency, 3.25%, due 5/25/2027 | |
| | Mexico Government International Bond, 2.66%, due 5/24/2031 | |
| | Province of Ontario Canada, 2.13%, due 1/21/2032 | |
Total Foreign Government Securities (Cost $4,489,951) | |
See Notes to Financial Statements
Schedule of Investments Core Bond Fund^ (cont’d)
| |
|
Short-Term Investments 2.6% |
Investment Companies 2.6% | |
| | State Street Institutional U.S. Government Money Market Fund Premier Class, 3.00%(m) (Cost $12,025,025) | |
Total Investments 107.2% (Cost $558,422,205) | |
Liabilities Less Other Assets (7.2)% | |
| |
| Rate shown was the discount rate at the date of purchase. |
| Principal only security. This security entitles the holder to receive principal payments from an underlying pool of assets or on the security itself. |
| Securities were purchased under Rule 144A of the Securities Act of 1933, as amended, or are otherwise restricted and, unless registered under the Securities Act of 1933 or exempted from registration, may only be sold to qualified institutional investors or may have other restrictions on resale. At October 31, 2022, these securities amounted to $76,286,869, which represents 16.7% of net assets of the Fund. |
| Variable or floating rate security where the stated interest rate is not based on a published reference rate and spread. Rather, the interest rate adjusts periodically based on changes in current interest rates and prepayments on the underlying pool of assets. The interest rate shown was the current rate as of October 31, 2022. |
| Variable or floating rate security. The interest rate shown was the current rate as of October 31, 2022 and changes periodically. |
| Interest only security. These securities represent the right to receive the monthly interest payments on an underlying pool of mortgages. Payments of principal on the pool reduce the value of the “interest only” holding. |
| Step Bond. Coupon rate is a fixed rate for an initial period that either resets at a specific date or may reset in the future contingent upon a predetermined trigger. The interest rate shown was the current rate as of October 31, 2022. |
| All or a portion of this security was purchased on a delayed delivery basis. |
| TBA (To Be Announced) Securities are purchased/sold on a forward commitment basis with an approximate principal amount and no defined maturity date. The actual principal amount and maturity date will be determined upon settlement when the specific mortgage pools are assigned. Total value of all such securities (excluding forward sales contracts, if any) at October 31, 2022 amounted to $23,949,802, which represents 5.2% of net assets of the Fund. |
| Security issued at a fixed coupon rate, which converts to a variable rate at a future date. Rate shown is the rate in effect as of period end. |
| Perpetual security. Perpetual securities have no stated maturity date, but they may be called/redeemed by the issuer. The date shown reflects the next call date. |
| When-issued security. Total value of all such securities at October 31, 2022 amounted to $1,782,740, which represents 0.4% of net assets of the Fund. |
| Represents 7-day effective yield as of October 31, 2022. |
| Includes the impact of the Fund’s open positions in derivatives at October 31, 2022. |
See Notes to Financial Statements
Schedule of Investments Core Bond Fund^ (cont’d)
Derivative Instruments
Futures contracts ("futures")
At October 31, 2022, open positions in futures for the Fund were as follows:
| | | | Value and
Unrealized
Appreciation/
(Depreciation) |
| | | | |
| | U.S. Treasury Note, 2 Year | | |
| | |
| | | | Value and
Unrealized
Appreciation/
(Depreciation) |
| | U.S. Treasury Note, 5 Year | | |
| | U.S. Treasury Note, Ultra 10 Year | | |
| | | | |
| | |
| | |
At October 31, 2022, the Fund had $814,271 deposited in a segregated account to cover margin requirements on open futures.
For the year ended October 31, 2022, the average notional value for the months where the Fund had futures outstanding was $40,911,166 for long positions and $(39,255,131) for short positions.
The following is a summary, categorized by Level (see Note A of the Notes to Financial Statements), of inputs used to value the Fund’s investments as of October 31, 2022:
| | | | |
| | | | |
U.S. Treasury Obligations | | | | |
U.S. Government Agency Securities | | | | |
Mortgage-Backed Securities# | | | | |
| | | | |
| | | | |
Foreign Government Securities | | | | |
| | | | |
| | | | |
| The Schedule of Investments provides information on the industry or sector categorization. |
See Notes to Financial Statements
Schedule of Investments Core Bond Fund^ (cont’d)
The following is a summary, categorized by Level (see Note A of the Notes to Financial Statements), of inputs used to value the Fund’s derivatives as of October 31, 2022:
Other Financial Instruments | | | | |
| | | | |
| | | | |
| | | | |
| | | | |
| Futures are reported at the cumulative unrealized appreciation/(depreciation) of the instrument. |
^
A balance indicated with a "—", reflects either a zero balance or an amount that rounds to less than 1.
See Notes to Financial Statements
Schedule of Investments Emerging Markets Debt Fund^
October 31, 2022
| |
|
| | |
| | Rio Energy SA/UGEN SA/UENSA SA, 6.88%, due 2/1/2025 | |
| | Transportadora de Gas del Sur SA, 6.75%, due 5/2/2025 | |
| | YPF SA, 7.00%, due 12/15/2047 | |
| | | |
| | |
| | Southern Gas Corridor CJSC | |
| | | |
| | | |
| | | |
| | |
| | Oil & Gas Holding Co., 7.63%, due 11/7/2024 | |
| | |
| | Aegea Finance S.a.r.l., 6.75%, due 5/20/2029 | |
| | Azul Investments LLP, 7.25%, due 6/15/2026 | |
| | Banco do Brasil SA, 6.25%, due 4/15/2024 | |
| | Braskem Netherlands Finance BV, 8.50%, due 1/23/2081 | |
| | CSN Resources SA, 4.63%, due 6/10/2031 | |
| | FS Luxembourg S.a.r.l., 10.00%, due 12/15/2025 | |
| | Gol Finance SA, 7.00%, due 1/31/2025 | |
| | Klabin Austria GmbH, 3.20%, due 1/12/2031 | |
| | Light Servicos de Eletricidade SA/Light Energia SA, 4.38%, due 6/18/2026 | |
| | MARB BondCo PLC, 3.95%, due 1/29/2031 | |
| | MV24 Capital BV, 6.75%, due 6/1/2034 | |
| | Nexa Resources SA, 6.50%, due 1/18/2028 | |
| | Petrobras Global Finance BV, 5.50%, due 6/10/2051 | |
| | Rede D'or Finance S.a.r.l., 4.50%, due 1/22/2030 | |
| | Simpar Europe SA, 5.20%, due 1/26/2031 | |
| | Suzano Austria GmbH, 5.00%, due 1/15/2030 | |
| | Unigel Luxembourg SA, 8.75%, due 10/1/2026 | |
| | | |
| | |
| | Endeavour Mining PLC, 5.00%, due 10/14/2026 | |
| | |
| | AES Gener SA, 6.35%, due 10/7/2079 | |
| | Agrosuper SA, 4.60%, due 1/20/2032 | |
| | Alfa Desarrollo SpA, 4.55%, due 9/27/2051 | |
| | Banco de Credito e Inversiones SA, 2.88%, due 10/14/2031 | |
| | Cencosud SA, 4.38%, due 7/17/2027 | |
| | Cia Cervecerias Unidas SA, 3.35%, due 1/19/2032 | |
| | | |
| | | |
| | | |
| | Empresa Nacional del Petroleo, 3.45%, due 9/16/2031 | |
| | VTR Finance NV, 6.38%, due 7/15/2028 | |
| | | |
See Notes to Financial Statements
Schedule of Investments Emerging Markets Debt Fund^ (cont’d)
| |
| | |
| | Alibaba Group Holding Ltd., 4.00%, due 12/6/2037 | |
| | Central Plaza Development Ltd., 5.75%, due 11/14/2024 | |
| | China Hongqiao Group Ltd., 6.25%, due 6/8/2024 | |
| | China Minmetals Corp., 3.75%, due 11/13/2022 | |
| | China Overseas Finance Cayman VI Ltd., 5.95%, due 5/8/2024 | |
| | CIFI Holdings Group Co. Ltd., 5.95%, due 10/20/2025 | |
| | Country Garden Holdings Co. Ltd., 4.80%, due 8/6/2030 | |
| | Dianjian Int'l Finance Ltd., 4.60%, due 3/13/2023 | |
| | Huarong Finance II Co. Ltd., 5.50%, due 1/16/2025 | |
| | Lenovo Group Ltd., 3.42%, due 11/2/2030 | |
| | Meituan, 3.05%, due 10/28/2030 | |
| | Powerchina Roadbridge Group British Virgin Islands Ltd., 3.08%, due 4/1/2026 | |
| | Prosus NV, 3.83%, due 2/8/2051 | |
| | SF Holding Investment 2021 Ltd., 3.13%, due 11/17/2031 | |
| | Sunac China Holdings Ltd., 6.50%, due 1/26/2026 | |
| | | |
| | |
| | Bancolombia SA, 4.63%, due 12/18/2029 | |
| | Canacol Energy Ltd., 5.75%, due 11/24/2028 | |
| | Ecopetrol SA, 5.88%, due 5/28/2045 | |
| | Empresas Publicas de Medellin ESP | |
| | | |
| | | |
| | Financiera de Desarrollo Territorial SA Findeter, 7.88%, due 8/12/2024 | |
| | Geopark Ltd., 5.50%, due 1/17/2027 | |
| | Millicom Int'l Cellular SA, 6.25%, due 3/25/2029 | |
| | SierraCol Energy Andina LLC, 6.00%, due 6/15/2028 | |
| | Suramericana SA, 5.50%, due 4/29/2026 | |
| | | |
| | |
| | Kosmos Energy Ltd., 7.13%, due 4/4/2026 | |
| | Tullow Oil PLC, 10.25%, due 5/15/2026 | |
| | | |
| | |
| | Central American Bottling Corp./CBC Bottling Holdco SL/Beliv Holdco SL, 5.25%, due 4/27/2029 | |
| | CT Trust, 5.13%, due 2/3/2032 | |
| | Investment Energy Resources Ltd., 6.25%, due 4/26/2029 | |
| | | |
| | |
| | AIA Group Ltd., 3.20%, due 9/16/2040 | |
| | Celestial Miles Ltd., 5.75%, due 1/31/2024 | |
| | NWD MTN Ltd., 4.13%, due 7/18/2029 | |
| | | |
| | |
| | Adani Electricity Mumbai Ltd., 3.95%, due 2/12/2030 | |
| | Greenko Dutch BV, 3.85%, due 3/29/2026 | |
| | HDFC Bank Ltd., 3.70%, due 8/25/2026 | |
See Notes to Financial Statements
Schedule of Investments Emerging Markets Debt Fund^ (cont’d)
| |
| | |
| | JSW Steel Ltd., 5.05%, due 4/5/2032 | |
| | Network i2i Ltd., 5.65%, due 1/15/2025 | |
| | Oil India Ltd., 5.13%, due 2/4/2029 | |
| | Periama Holdings LLC, 5.95%, due 4/19/2026 | |
| | REC Ltd., 2.25%, due 9/1/2026 | |
| | Reliance Industries Ltd., 2.88%, due 1/12/2032 | |
| | Vedanta Resources Ltd., 7.13%, due 5/31/2023 | |
| | | |
| | |
| | Bank Negara Indonesia Persero Tbk PT, 3.75%, due 3/30/2026 | |
| | Indofood CBP Sukses Makmur Tbk PT, 3.54%, due 4/27/2032 | |
| | Medco Oak Tree Pte Ltd., 7.38%, due 5/14/2026 | |
| | Perusahaan Listrik Negara PT | |
| | | |
| | | |
| | | |
| | | |
| | |
| | Energean Israel Finance Ltd., 4.88%, due 3/30/2026 | |
| | Leviathan Bond Ltd., 6.50%, due 6/30/2027 | |
| | Mizrahi Tefahot Bank Ltd., 3.08%, due 4/7/2031 | |
| | Teva Pharmaceutical Finance Netherlands III BV | |
| | | |
| | | |
| | | |
| | |
| | KazMunayGas National Co. JSC | |
| | | |
| | | |
| | | |
| | Tengizchevroil Finance Co. Int'l Ltd., 3.25%, due 8/15/2030 | |
| | | |
| | |
| | Kookmin Bank, 2.50%, due 11/4/2030 | |
| | Shinhan Bank Co. Ltd., 4.38%, due 4/13/2032 | |
| | Shinhan Financial Group Co. Ltd., 5.88%, due 8/13/2023 | |
| | | |
| | |
| | Equate Petrochemical BV, 2.63%, due 4/28/2028 | |
| | | |
| | | |
| | | |
| | NBK Tier 1 Financing 2 Ltd., 4.50%, due 8/27/2025 | |
| | | |
| | |
| | Altice Financing SA, 5.00%, due 1/15/2028 | |
See Notes to Financial Statements
Schedule of Investments Emerging Markets Debt Fund^ (cont’d)
| |
| | |
| | Sands China Ltd., 5.90%, due 8/8/2028 | |
| | Studio City Finance Ltd., 6.50%, due 1/15/2028 | |
| | Wynn Macau Ltd., 5.63%, due 8/26/2028 | |
| | | |
| | |
| | TNB Global Ventures Capital Bhd, 4.85%, due 11/1/2028 | |
| | |
| | Alfa SAB de CV, 6.88%, due 3/25/2044 | |
| | Alpek SAB de CV, 3.25%, due 2/25/2031 | |
| | Alsea SAB de CV, 7.75%, due 12/14/2026 | |
| | Banco Mercantil del Norte SA | |
| | | |
| | | |
| | Braskem Idesa SAPI, 6.99%, due 2/20/2032 | |
| | Cemex SAB de CV, 3.88%, due 7/11/2031 | |
| | Comision Federal de Electricidad | |
| | Ser. 14-2, 7.35%, due 11/25/2025 | |
| | | |
| | | |
| | Mexichem SAB de CV, 5.88%, due 9/17/2044 | |
| | | |
| | | |
| | | |
| | | |
| | | |
| | | |
| | |
| | Development Bank of Mongolia LLC, 7.25%, due 10/23/2023 | |
| | |
| | IHS Netherlands Holdco BV, 8.00%, due 9/18/2027 | |
| | SEPLAT Petroleum Development Co. PLC, 7.75%, due 4/1/2026 | |
| | | |
| | |
| | Bank Muscat SAOG, 4.75%, due 3/17/2026 | |
| | Oztel Holdings SPC Ltd., 6.63%, due 4/24/2028 | |
| | | |
| | |
| | C&W Senior Financing Designated Activity Co., 6.88%, due 9/15/2027 | |
| | Empresa de Transmision Electrica SA, 5.13%, due 5/2/2049 | |
| | | |
| | |
| | Telefonica Celular del Paraguay SA, 5.88%, due 4/15/2027 | |
| | |
| | Banco de Credito del Peru SA, 3.13%, due 7/1/2030 | |
| | Cia de Minas Buenaventura SAA, 5.50%, due 7/23/2026 | |
| | Fondo MIVIVIENDA SA, 7.00%, due 2/14/2024 | |
| | Inkia Energy Ltd., 5.88%, due 11/9/2027 | |
See Notes to Financial Statements
Schedule of Investments Emerging Markets Debt Fund^ (cont’d)
| |
| | |
| | Kallpa Generacion SA, 4.13%, due 8/16/2027 | |
| | Minsur SA, 4.50%, due 10/28/2031 | |
| | | |
| | | |
| | | |
| | Southern Copper Corp., 6.75%, due 4/16/2040 | |
| | | |
| | |
| | Globe Telecom, Inc., 4.20%, due 8/2/2026 | |
| | |
| | | |
| | | |
| | | |
| | Commercial Bank PSQC, 4.50%, due 3/3/2026 | |
| | Nakilat, Inc., 6.07%, due 12/31/2033 | |
| | Ooredoo Int'l Finance Ltd., 2.63%, due 4/8/2031 | |
| | | |
| | | |
| | | |
| | QIB Sukuk Ltd., 3.98%, due 3/26/2024 | |
| | QNB Finance Ltd., 2.63%, due 5/12/2025 | |
| | | |
| | |
| | Gazprom PJSC Via Gaz Finance PLC, 3.25%, due 2/25/2030 | |
| | Vnesheconombank Via VEB Finance PLC, 6.80%, due 11/22/2025 | |
| | | |
| | |
| | | |
| | | |
| | | |
| | Saudi Electricity Global Sukuk Co. 4, 4.72%, due 9/27/2028 | |
| | SNB Funding Ltd., 2.75%, due 10/2/2024 | |
| | | |
| | |
| | BOC Aviation Ltd., 3.00%, due 9/11/2029 | |
| | DBS Group Holdings Ltd., 4.52%, due 12/11/2028 | |
| | United Overseas Bank Ltd., 2.00%, due 10/14/2031 | |
| | | |
| | |
| | FirstRand Bank Ltd., 6.25%, due 4/23/2028 | |
| | | |
| | | |
| | | |
| | | |
| | |
| | African Export-Import Bank, 3.99%, due 9/21/2029 | |
See Notes to Financial Statements
Schedule of Investments Emerging Markets Debt Fund^ (cont’d)
| |
| | |
| | Banque Ouest Africaine de Developpement | |
| | | |
| | | |
| | | |
| | |
| | TSMC Arizona Corp., 4.25%, due 4/22/2032 | |
| | |
| | | |
| | | |
| | | |
| | GC Treasury Center Co. Ltd., 4.40%, due 3/30/2032 | |
| | Krung Thai Bank PCL, 4.40%, due 3/25/2026 | |
| | Thaioil Treasury Center Co. Ltd., 3.75%, due 6/18/2050 | |
| | | |
| | |
| | Akbank TAS, 5.13%, due 3/31/2025 | |
| | Turk Telekomunikasyon AS, 6.88%, due 2/28/2025 | |
| | | |
| | |
| | NAK Naftogaz Ukraine via Kondor Finance PLC, 7.13%, due 7/19/2024 | |
United Arab Emirates 1.7% | | |
| | Abu Dhabi Crude Oil Pipeline LLC, 4.60%, due 11/2/2047 | |
| | Abu Dhabi National Energy Co. PJSC, 2.00%, due 4/29/2028 | |
| | DIB Sukuk Ltd., 2.95%, due 1/16/2026 | |
| | DP World PLC, 6.85%, due 7/2/2037 | |
| | Emirates NBD PJSC, 6.13%, due 3/20/2025 | |
| | Galaxy Pipeline Assets Bidco Ltd. | |
| | | |
| | | |
| | Mashreqbank PSC, 4.25%, due 2/26/2024 | |
| | Shelf Drill Hold Ltd. Co., 8.25%, due 2/15/2025 | |
| | | |
| | |
| | Petroleos de Venezuela SA | |
| | | |
| | | |
| | | |
| | | |
| | | |
| | |
| | First Quantum Minerals Ltd., 6.88%, due 10/15/2027 | |
|
Total Corporate Bonds (Cost $42,489,731) | |
See Notes to Financial Statements
Schedule of Investments Emerging Markets Debt Fund^ (cont’d)
| |
|
Foreign Government Securities 62.8% |
| | |
| | Angolan Government International Bond | |
| | | |
| | | |
| | | |
| | | |
| | |
| | Argentine Republic Government International Bond | |
| | | |
| | | |
| | | |
| | | |
| | Provincia de Buenos Aires/Government Bonds, 4.00%, due 9/1/2037 | |
| | | |
| | |
| | Armenia International Bond, 3.60%, due 2/2/2031 | |
| | |
| | Republic of Azerbaijan International Bond, 5.13%, due 9/1/2029 | |
| | State Oil Co. of the Azerbaijan Republic | |
| | | |
| | | |
| | | |
| | |
| | Bahamas Government International Bond, 6.00%, due 11/21/2028 | |
| | |
| | Benin Government International Bond, 4.95%, due 1/22/2035 | |
| | |
| | Bermuda Government International Bond, 4.75%, due 2/15/2029 | |
| | |
| | Brazil Minas SPE via State of Minas Gerais, 5.33%, due 2/15/2028 | |
| | Brazil Notas do Tesouro Nacional | |
| | Ser. F, 10.00%, due 1/1/2025 | |
| | Ser. F, 10.00%, due 1/1/2027 | |
| | Ser. F, 10.00%, due 1/1/2029 | |
| | Brazilian Government International Bond, 5.00%, due 1/27/2045 | |
| | | |
Cameroon, Republic of 0.1% | | |
| | Republic of Cameroon International Bond, 5.95%, due 7/7/2032 | |
| | |
| | Bonos de la Tesoreria de la Republica, 1.90%, due 9/1/2030 | |
See Notes to Financial Statements
Schedule of Investments Emerging Markets Debt Fund^ (cont’d)
| |
| | |
| | Bonos de la Tesoreria de la Republica en pesos | |
| | | |
| | | |
| | | |
| | | |
| | | |
| | Chile Government International Bond, 3.25%, due 9/21/2071 | |
| | | |
| | |
| | | |
| | | |
| | | |
| | | |
| | | |
| | | |
| | | |
| | | |
| | | |
| | | |
| | | |
| | | |
| | | |
| | | |
| | | |
| | | |
| | | |
| | | |
| | | |
| | | |
| | | |
| | | |
| | |
| | Colombia Government International Bond | |
| | | |
| | | |
| | | |
| | | |
| | | |
| | Ser. B, 6.25%, due 11/26/2025 | |
| | Ser. B, 5.75%, due 11/3/2027 | |
| | Ser. B, 6.00%, due 4/28/2028 | |
| | Ser. UVR, 2.25%, due 4/18/2029 | |
| | Ser. B, 7.00%, due 3/26/2031 | |
| | Ser. G, 7.00%, due 3/26/2031 | |
| | Ser. B, 7.00%, due 6/30/2032 | |
| | Ser. UVR, 3.00%, due 3/25/2033 | |
| | Ser. B, 7.25%, due 10/18/2034 | |
| | Ser. B, 9.25%, due 5/28/2042 | |
| | | |
See Notes to Financial Statements
Schedule of Investments Emerging Markets Debt Fund^ (cont’d)
| |
| | |
| | Ivory Coast Government International Bond | |
| | | |
| | | |
| | | |
| | | |
| | |
| | Czech Republic Government Bond | |
| | | |
| | | |
| | | |
| | | |
| | | |
| | | |
| | |
| | Dominican Republic International Bond | |
| | | |
| | | |
| | | |
| | | |
| | | |
| | | |
| | |
| | Ecuador Government International Bond | |
| | | |
| | | |
| | | |
| | | |
| | | |
| | | |
| | |
| | Egypt Government International Bond | |
| | | |
| | | |
| | | |
| | | |
| | | |
| | | |
| | |
| | El Salvador Government International Bond | |
| | | |
| | | |
| | | |
| | |
| | | |
| | | |
| | | |
See Notes to Financial Statements
Schedule of Investments Emerging Markets Debt Fund^ (cont’d)
| |
| | |
| | Ghana Government International Bond | |
| | | |
| | | |
| | | |
| | | |
| | | |
| | | |
| | | |
| | |
| | Guatemala Government Bond, 3.70%, due 10/7/2033 | |
| | |
| | Hungary Government International Bond | |
| | | |
| | | |
| | | |
| | |
| | Indonesia Government International Bond | |
| | | |
| | | |
| | | |
| | | |
| | | |
| | | |
| | | |
| | | |
| | | |
| | | |
| | | |
| | | |
| | | |
| | | |
| | | |
| | | |
| | | |
| | | |
| | | |
| | | |
| | | |
| | | |
| | | |
| | | |
| | Perusahaan Penerbit SBSN Indonesia III, 4.70%, due 6/6/2032 | |
| | | |
| | |
| | Iraq International Bond, 5.80%, due 1/15/2028 | |
| | |
| | Ivory Coast Government International Bond, 5.25%, due 3/22/2030 | |
See Notes to Financial Statements
Schedule of Investments Emerging Markets Debt Fund^ (cont’d)
| |
| | |
| | Lebanon Government International Bond | |
| | | |
| | | |
| | | |
| | | |
| | | |
| | | |
| | |
| | 1MDB Global Investments Ltd., 4.40%, due 3/9/2023 | |
| | | |
| | | |
| | | |
| | | |
| | | |
| | | |
| | | |
| | | |
| | | |
| | | |
| | | |
| | | |
| | | |
| | | |
| | | |
| | | |
| | | |
| | | |
| | | |
| | | |
| | | |
| | | |
| | | |
| | Malaysia Government Investment Issue | |
| | | |
| | | |
| | | |
| | |
| | | |
| | Ser. M20, 7.50%, due 6/3/2027 | |
| | Ser. M20, 8.50%, due 5/31/2029 | |
| | Ser. M20, 8.50%, due 5/31/2029 | |
| | Ser. M, 7.75%, due 5/29/2031 | |
| | Ser. M30, 8.50%, due 11/18/2038 | |
| | Ser. M, 7.75%, due 11/13/2042 | |
| | Ser. M, 8.00%, due 11/7/2047 | |
| | Mexican Udibonos, 3.50%, due 11/16/2023 | |
| | Mexico Government International Bond, 5.75%, due 10/12/2110 | |
| | | |
See Notes to Financial Statements
Schedule of Investments Emerging Markets Debt Fund^ (cont’d)
| |
| | |
| | Mongolia Government International Bond, 3.50%, due 7/7/2027 | |
| | |
| | Nigeria Government International Bond, 9.25%, due 1/21/2049 | |
| | |
| | Oman Government International Bond | |
| | | |
| | | |
| | | |
| | |
| | Panama Government International Bond, 2.25%, due 9/29/2032 | |
| | |
| | Papua New Guinea Government International Bond, 8.38%, due 10/4/2028 | |
| | |
| | Paraguay Government International Bond, 6.10%, due 8/11/2044 | |
| | |
| | | |
| | | |
| | | |
| | | |
| | Peruvian Government International Bond | |
| | | |
| | | |
| | | |
| | | |
| | | |
| | | |
| | | |
| | |
| | Philippine Government International Bond | |
| | | |
| | | |
| | | |
| | |
| | | |
| | | |
| | | |
| | | |
| | | |
| | | |
| | Ser. 1030, 1.25%, due 10/25/2030 | |
| | | |
| | |
| | Qatar Government International Bond, 4.82%, due 3/14/2049 | |
See Notes to Financial Statements
Schedule of Investments Emerging Markets Debt Fund^ (cont��d)
| |
| | |
| | | |
| | | |
| | | |
| | | |
| | | |
| | | |
| | | |
| | | |
| | | |
| | | |
| | | |
| | | |
| | Romanian Government International Bond | |
| | | |
| | | |
| | | |
| | | |
| | | |
| | | |
| | |
| | Saudi Government International Bond, 3.75%, due 1/21/2055 | |
| | |
| | Senegal Government International Bond, 4.75%, due 3/13/2028 | |
| | |
| | Serbia International Bond | |
| | | |
| | | |
| | | |
| | | |
| | | |
| | | |
| | | |
| | |
| | Republic of South Africa Government Bond | |
| | | |
| | | |
| | | |
| | | |
| | | |
| | | |
| | Republic of South Africa Government International Bond | |
| | | |
| | | |
| | | |
| | | |
See Notes to Financial Statements
Schedule of Investments Emerging Markets Debt Fund^ (cont’d)
| |
| | |
| | Sri Lanka Government International Bond | |
| | | |
| | | |
| | | |
| | | |
| | | |
| | |
| | | |
| | | |
| | | |
| | | |
| | | |
| | | |
| | | |
| | | |
| | | |
| | | |
| | | |
| | | |
| | | |
| | | |
| | | |
| | | |
| | | |
| | | |
| | |
| | Banque Centrale de Tunisie International Bond, 6.38%, due 7/15/2026 | |
| | |
| | Turkey Government Bond, 1.50%, due 6/18/2025 | |
| | Turkey Government International Bond, 6.50%, due 9/20/2033 | |
| | | |
| | |
| | Uganda Government Bond, 14.25%, due 6/22/2034 | |
| | |
| | Ukraine Government International Bond | |
| | | |
| | | |
| | | |
| | | |
| | | |
| | | |
United Arab Emirates 0.2% | | |
| | UAE International Government Bond, 4.95%, due 7/7/2052 | |
| | |
| | Uruguay Government International Bond, 8.25%, due 5/21/2031 | |
| | |
| | Republic of Uzbekistan Bond, 3.70%, due 11/25/2030 | |
See Notes to Financial Statements
Schedule of Investments Emerging Markets Debt Fund^ (cont’d)
| |
| | |
| | Uzbekneftegaz JSC, 4.75%, due 11/16/2028 | |
| | | |
| | |
| | Venezuela Government International Bond, 8.25%, due 10/13/2024 | |
| | |
| | Zambia Government Bond, 13.00%, due 1/25/2031 | |
| | Zambia Government International Bond | |
| | | |
| | | |
| | | |
| | | |
Total Foreign Government Securities (Cost $85,912,377) | |
| |
|
Short-Term Investments 2.1% |
Investment Companies 2.1% | |
| | State Street Institutional U.S. Government Money Market Fund Premier Class, 3.01%(l) (Cost $2,178,051) | |
Total Investments 95.6% (Cost $130,580,159) | |
Other Assets Less Liabilities 4.4% | |
| |
| Principal amount is stated in the currency in which the security is denominated. |
| Security exempt from registration pursuant to Regulation S under the Securities Act of 1933, as amended. Regulation S applies to securities offerings that are made outside of the United States and do not involve directed selling efforts in the United States and as such may have restrictions on resale. Total value of all such securities at October 31, 2022 amounted to $32,247,459, which represents 30.7% of net assets of the Fund. |
| Securities were purchased under Rule 144A of the Securities Act of 1933, as amended, or are otherwise restricted and, unless registered under the Securities Act of 1933 or exempted from registration, may only be sold to qualified institutional investors or may have other restrictions on resale. At October 31, 2022, these securities amounted to $11,727,015, which represents 11.2% of net assets of the Fund. |
| Security issued at a fixed coupon rate, which converts to a variable rate at a future date. Rate shown is the rate in effect as of period end. |
| Perpetual security. Perpetual securities have no stated maturity date, but they may be called/redeemed by the issuer. The date shown reflects the next call date. |
| |
| Represents less than 0.05% of net assets of the Fund. |
| Step Bond. Coupon rate is a fixed rate for an initial period that either resets at a specific date or may reset in the future contingent upon a predetermined trigger. The interest rate shown was the current rate as of October 31, 2022. |
See Notes to Financial Statements
Schedule of Investments Emerging Markets Debt Fund^ (cont’d)
| Index-linked bond whose principal amount adjusts according to a government retail price index. |
| Rate shown was the discount rate at the date of purchase. |
| Variable or floating rate security. The interest rate shown was the current rate as of October 31, 2022 and changes periodically. |
| Represents 7-day effective yield as of October 31, 2022. |
| Includes the impact of the Fund’s open positions in derivatives at October 31, 2022. |
See Notes to Financial Statements
Schedule of Investments Emerging Markets Debt Fund^ (cont’d)
|
| | |
| | |
| | |
| | |
| | |
| | |
| | |
| | |
| | |
Engineering & Construction | | |
Diversified Financial Services | | |
Energy - Alternate Sources | | |
| | |
| | |
| | |
| | |
| | |
| | |
| | |
| | |
| | |
| | |
| | |
| | |
| | |
| | |
| | |
| | |
| | |
Holding Companies - Diversified | | |
| | |
| | |
| | |
| | |
| | |
| | |
Short-Term Investments and Other Assets—Net | | |
| | |
| Foreign Governments do not constitute an industry. |
See Notes to Financial Statements
Schedule of Investments Emerging Markets Debt Fund^ (cont’d)
Derivative Instruments
Futures contracts ("futures")
At October 31, 2022, open positions in futures for the Fund were as follows:
| | | | Value and
Unrealized
Appreciation/
(Depreciation) |
| | | | |
| | | | |
| | U.S. Treasury Note, 10 Year | | |
| | U.S. Treasury Note, 5 Year | | |
| | | | |
| | |
| | | | Value and
Unrealized
Appreciation/
(Depreciation) |
| | | | |
| | | | |
| | | | |
| | U.S. Treasury Note, 10 Year | | |
| | |
| | |
At October 31, 2022, the Fund had $545,721 deposited in a segregated account to cover margin requirements on open futures.
For the year ended October 31, 2022, the average notional value for the months where the Fund had futures outstanding was $12,501,991 for long positions and $(8,792,097) for short positions.
Forward foreign currency contracts ("forward FX contracts")
At October 31, 2022, open forward FX contracts for the Fund were as follows:
| | | | Net
Unrealized
Appreciation/
(Depreciation) |
| | | | | | |
| | | | | | |
| | | | | | |
| | | | | | |
| | | | | | |
| | | | | | |
| | | | | | |
| | | | | | |
| | | | | | |
See Notes to Financial Statements
Schedule of Investments Emerging Markets Debt Fund^ (cont’d)
| | | | Net Unrealized Appreciation/ (Depreciation) |
| | | | | | |
| | | | | | |
| | | | | | |
| | | | | | |
| | | | | | |
| | | | | | |
| | | | | | |
| | | | | | |
| | | | | | |
| | | | | | |
| | | | | | |
| | | | | | |
| | | | | | |
| | | | | | |
| | | | | | |
| | | | | | |
| | | | | | |
| | | | | | |
| | | | | | |
| | | | | | |
| | | | | | |
| | | | | | |
| | | | | | |
| | | | | | |
| | | | | | |
| | | | | | |
| | | | | | |
| | | | | | |
| | | | | | |
| | | | | | |
| | | | | | |
| | | | | | |
| | | | | | |
| | | | | | |
| | | | | | |
| | | | | | |
| | | | | | |
| | | | | | |
| | | | | | |
| | | | | | |
| | | | | | |
| | | | | | |
| | | | | | |
| | | | | | |
| | | | | | |
| | | | | | |
See Notes to Financial Statements
Schedule of Investments Emerging Markets Debt Fund^ (cont’d)
| | | | Net Unrealized Appreciation/ (Depreciation) |
| | | | | | |
| | | | | | |
| | | | | | |
| | | | | | |
| | | | | | |
| | | | | | |
| | | | | | |
| | | | | | |
| | | | | | |
| | | | | | |
| | | | | | |
| | | | | | |
| | | | | | |
| | | | | | |
| | | | | | |
| | | | | | |
| | | | | | |
| | | | | | |
Total unrealized appreciation | | |
| | | | | | |
| | | | | | |
| | | | | | |
| | | | | | |
| | | | | | |
| | | | | | |
| | | | | | |
| | | | | | |
| | | | | | |
| | | | | | |
| | | | | | |
| | | | | | |
| | | | | | |
| | | | | | |
| | | | | | |
| | | | | | |
| | | | | | |
| | | | | | |
| | | | | | |
| | | | | | |
| | | | | | |
| | | | | | |
| | | | | | |
| | | | | | |
| | | | | | |
| | | | | | |
| | | | | | |
See Notes to Financial Statements
Schedule of Investments Emerging Markets Debt Fund^ (cont’d)
| | | | Net Unrealized Appreciation/ (Depreciation) |
| | | | | | |
| | | | | | |
| | | | | | |
| | | | | | |
| | | | | | |
| | | | | | |
| | | | | | |
| | | | | | |
| | | | | | |
| | | | | | |
| | | | | | |
| | | | | | |
| | | | | | |
| | | | | | |
| | | | | | |
| | | | | | |
| | | | | | |
| | | | | | |
| | | | | | |
| | | | | | |
| | | | | | |
| | | | | | |
| | | | | | |
| | | | | | |
| | | | | | |
| | | | | | |
| | | | | | |
| | | | | | |
| | | | | | |
| | | | | | |
| | | | | | |
| | | | | | |
| | | | | | |
| | | | | | |
| | | | | | |
| | | | | | |
| | | | | | |
| | | | | | |
| | | | | | |
| | | | | | |
| | | | | | |
| | | | | | |
| | | | | | |
| | | | | | |
| | | | | | |
| | | | | | |
See Notes to Financial Statements
Schedule of Investments Emerging Markets Debt Fund^ (cont’d)
| | | | Net Unrealized Appreciation/ (Depreciation) |
| | | | | | |
| | | | | | |
| | | | | | |
| | | | | | |
| | | | | | |
| | | | | | |
| | | | | | |
| | | | | | |
Total unrealized depreciation | | |
Total net unrealized depreciation | | |
For the year ended October 31, 2022, the average notional value for the months where the Fund had forward FX contracts outstanding was $163,204,498.
Credit default swap contracts ("credit default swaps")
At October 31, 2022, the Fund had outstanding credit default swaps as follows:
Over-the-counter Credit Default Swaps - Buy Protection |
| | | Financing
Rate
Received
by
the Fund | | | Upfront
Payments/
(Receipts) | Unrealized
Appreciation/
(Depreciation) | Accrued
Net
Interest
Receivable/
(Payable) | |
| CDX Emerging
Markets Index,
Ser. 38 V. 1 | | | | | | | | | |
Centrally Cleared Credit Default Swaps — Buy Protection |
| | | Financing
Rate
Received
by
the Fund | | | Upfront
Payments/
(Receipts) | Unrealized
Appreciation/
(Depreciation) | Accrued
Net
Interest
Receivable/
(Payable) | |
| CDX Emerging
Markets Index,
Ser. 38 V.1 | | | | | | | | | |
For the year ended October 31, 2022, the average notional value for the months where the Fund had credit default swaps outstanding was $6,947,130 for buy protection.
See Notes to Financial Statements
Schedule of Investments Emerging Markets Debt Fund^ (cont’d)
Interest rate swap contracts ("interest rate swaps")
At October 31, 2022, the Fund had outstanding interest rate swaps as follows:
Centrally cleared interest rate swaps
| | Fund
Receives/
Pays
Floating
Rate | | | | Frequency
of Fund
Receipt/
Payment | | Unrealized
Appreciation/
(Depreciation) | Accrued
Net
Interest
Receivable/
(Payable) | |
| | | | | | | | | | | |
| | | | | | | | | | | |
| | | | | | | | | | | |
| | | | | | | | | | | |
| | | | | | | | | | | |
| | | | | | | | | | | |
| | | | | | | | | | | |
| | | | | | | | | | | |
| | | | | | | | | | | |
| | | | | | | | | | | |
| | | | | | | | | | | |
| | | | | | | | | | | |
| | | | | | | | | | | |
| | | | | | | | | | | |
| | | | | | | | | | | |
| | | | | | | | | | | |
| | | | | | | | | | | |
| | | | | | | | | | | |
| | | | | | | | | | | |
| | | | | | | | | | | |
| | | | | | | | | | | |
| | | | | | | | | | | |
| | | | | | | | | | | |
| | | | | | | | | | | |
| | | | | | | | | | | |
| | | | | | | | | | | |
| | | | | | | | | | | |
| | | | | | | | | | | |
| | | | | | | | | | | |
| | | | | | | | | | | |
| | | | | | | | | | | |
| | | | | | | | | | | |
| | | | | | | | | | | |
| | | | | | | | | | | |
| | | | | | | | | | | |
| | | | | | | | | | | |
| | | | | | | | | | | |
| | | | | | | | | | | |
| | | | | | | | | | | |
| | | | | | | | | | | |
| | | | | | | | | | | |
See Notes to Financial Statements
Schedule of Investments Emerging Markets Debt Fund^ (cont’d)
| | Fund Receives/ Pays Floating Rate | | | | Frequency of Fund Receipt/ Payment | | Unrealized Appreciation/ (Depreciation) | Accrued Net Interest Receivable/ (Payable) | |
| | | | | | | | | | | |
| | | | | | | | | | | |
| | | | | | | | | | | |
| | | | | | | | | | | |
| | | | | | | | | | | |
| | | | | | | | | | | |
| | | | | | | | | | | |
| | | | | | | | | | | |
| | | | | | | | | | | |
| | | | | | | | | | | |
| | | | | | | | | | | |
| | | | | | | | | | | |
| | | | | | | | | | | |
| | | | | | | | | | | |
| | | | | | | | | | | |
| | | | | | | | | | | |
| | | | | | | | | | | |
| | | | | | | | | | | |
| | | | | | | | | | | |
| | | | | | | | | | | |
| | | | | | | | | | | |
| | | | | | | | | | | |
| | | | | | | | | | | |
| | | | | | | | | | | |
| | | | | | | | | | | |
| Forward swap. Effective date reflects the date interest accruals will commence. |
At October 31, 2022, the Fund had $1,285,332 deposited in a segregated account to cover margin requirements for centrally cleared swaps.
Over-the-counter interest rate swaps
| | | Fund
Receives/
Pays
Floating
Rate | | | Frequency
of Fund
Receipt/
Payment | | Unrealized
Appreciation/
(Depreciation) | Accrued
Net
Interest
Receivable/
(Payable) | |
| | | | | | | | | | |
| | | | | | | | | | |
| | | | | | | | | | |
| | | | | | | | | | |
For the year ended October 31, 2022, the average notional value for the months the Fund had interest rate swaps outstanding was $18,361,336 when the Fund paid the fixed rate and $45,009,457 when the Fund received the fixed rate.
At October 31, 2022, the Fund had cash collateral of $180,000 deposited in a segregated account for JPMorgan Chase Bank N.A. and cash collateral of $120,000, $180,000 and $9,958 received from Citibank, N.A., Goldman
See Notes to Financial Statements
Schedule of Investments Emerging Markets Debt Fund^ (cont’d)
Sachs International and Morgan Stanley Capital Services LLC, respectively, to cover collateral requirements on over-the-counter derivatives.
The following is a summary, categorized by Level (see Note A of the Notes to Financial Statements), of inputs used to value the Fund’s investments as of October 31, 2022:
| | | | |
| | | | |
| | | | |
Foreign Government Securities# | | | | |
| | | | |
| | | | |
| The Schedule of Investments provides a geographic categorization as well as a Positions by Industry summary. |
The following is a summary, categorized by Level (see Note A of the Notes to Financial Statements), of inputs used to value the Fund’s derivatives as of October 31, 2022:
Other Financial Instruments | | | | |
| | | | |
| | | | |
| | | | |
| | | | |
| | | | |
| | | | |
| | | | |
| | | | |
| | | | |
| | | | |
| Futures and forward FX contracts are reported at the cumulative unrealized appreciation/(depreciation) of the instrument. |
^
A balance indicated with a "—", reflects either a zero balance or an amount that rounds to less than 1.
See Notes to Financial Statements
Schedule of Investments Floating Rate Income Fund^
October 31, 2022
| |
Asset-Backed Securities 1.4% |
| 37 Capital CLO Ltd., Ser. 2021-1A, Class E, (3M USD LIBOR + 7.20%), 11.28%, due 10/15/2034 | |
| AGL Static CLO 18 Ltd., Ser. 2022-18A, Class F, (3M CME Term SOFR + 8.25%), 12.24%, due 4/21/2031 | |
| Barings CLO Ltd., Ser. 2018-3A, Class E, (3M USD LIBOR + 5.75%), 9.99%, due 7/20/2029 | |
| Benefit Street Partners CLO XII Ltd., Ser. 2017-12A, Class D, (3M USD LIBOR + 6.41%), 10.49%, due 10/15/2030 | |
| Flatiron CLO Ltd., Ser. 2017-1A, Class ER, (3M USD LIBOR + 5.90%), 8.81%, due 5/15/2030 | |
| Galaxy XV CLO Ltd., Ser. 2013-15A, Class ER, (3M USD LIBOR + 6.65%), 10.72%, due 10/15/2030 | |
| Magnetite XV Ltd., Ser. 2015-15A, Class ER, (3M USD LIBOR + 5.20%), 9.56%, due 7/25/2031 | |
| Palmer Square Loan Funding Ltd., Ser. 2022-1A, Class D, (3M CME Term SOFR + 5.00%), 8.86%, due 4/15/2030 | |
| Stratus CLO Ltd., Ser. 2021-3A, Class F, (3M USD LIBOR + 7.70%), 11.94%, due 12/29/2029 | |
Total Asset-Backed Securities (Cost $7,502,830) | |
|
|
|
| American Airlines, Inc., 11.75%, due 7/15/2025 | |
|
| Bank of America Corp., Ser. TT, 6.13%, due 4/27/2027 | |
| JPMorgan Chase & Co., Ser. HH, 4.60%, due 2/1/2025 | |
| | |
Cable & Satellite Television 0.1% |
| DISH DBS Corp., 5.25%, due 12/1/2026 | |
|
| SCIH Salt Holdings, Inc., 4.88%, due 5/1/2028 | |
| SCIL IV LLC/SCIL USA Holdings LLC, 5.38%, due 11/1/2026 | |
| WR Grace Holdings LLC, 4.88%, due 6/15/2027 | |
| | |
|
| Prime Security Services Borrower LLC/Prime Finance, Inc., 3.38%, due 8/31/2027 | |
|
| Tempo Acquisition LLC/Tempo Acquisition Finance Corp., 5.75%, due 6/1/2025 | |
Consumer - Commercial Lease Financing 0.2% |
| Global Aircraft Leasing Co. Ltd., 6.50% Cash/7.25% PIK, due 9/15/2024 | |
Engineering & Construction 0.1% |
| Powerteam Services LLC, 9.03%, due 12/4/2025 | |
|
| Scientific Games Int'l, Inc., 7.00%, due 5/15/2028 | |
|
| Aramark Services, Inc., 6.38%, due 5/1/2025 | |
|
| Ahlstrom-Munksjo Holding 3 Oy, 4.88%, due 2/4/2028 | |
|
| Caesars Resort Collection LLC/CRC Finco, Inc., 5.75%, due 7/1/2025 | |
See Notes to Financial Statements
Schedule of Investments Floating Rate Income Fund^ (cont’d)
| |
|
|
| Summit Midstream Holdings LLC, 8.50%, due 10/15/2026 | |
Investments & Misc. Financial Services 0.1% |
| Brock Holdings Notes 2022, 15.00%, due 1/24/2024 | |
|
| Vertical U.S. Newco, Inc., 5.25%, due 7/15/2027 | |
|
| Altice Financing SA, 5.00%, due 1/15/2028 | |
| Cumulus Media New Holdings, Inc., 6.75%, due 7/1/2026 | |
| | |
|
| Banijay Entertainment SASU, 5.38%, due 3/1/2025 | |
|
| Trivium Packaging Finance BV, 5.50%, due 8/15/2026 | |
Packaging & Containers 0.3% |
| BWAY Holding Co., 5.50%, due 4/15/2024 | |
| Trident TPI Holdings, Inc., 6.63%, due 11/1/2025 | |
| | |
|
| Cheniere Energy, Inc., 4.63%, due 10/15/2028 | |
| Genesis Energy L.P./Genesis Energy Finance Corp., 5.63%, due 6/15/2024 | |
| | |
Real Estate Investment Trusts 0.2% |
| XHR L.P., 6.38%, due 8/15/2025 | |
|
| Cedar Fair L.P./Canada's Wonderland Co./Magnum Management Corp./Millennium Op, 5.50%, due 5/1/2025 | |
| NCL Corp. Ltd., 5.88%, due 2/15/2027 | |
| Six Flags Entertainment Corp., 4.88%, due 7/31/2024 | |
| | |
|
| Legends Hospitality Holding Co. LLC/Legends Hospitality Co-Issuer, Inc., 5.00%, due 2/1/2026 | |
|
| | |
| | |
| | |
| | |
|
| Rackspace Technology Global, Inc., 3.50%, due 2/15/2028 | |
|
| APX Group, Inc., 6.75%, due 2/15/2027 | |
| Garda World Security Corp., 4.63%, due 2/15/2027 | |
| KAR Auction Services, Inc., 5.13%, due 6/1/2025 | |
| | |
See Notes to Financial Statements
Schedule of Investments Floating Rate Income Fund^ (cont’d)
| |
|
Telecom - Wireline Integrated & Services 0.7% |
| Altice France SA, 5.50%, due 1/15/2028 | |
| Consolidated Communications, Inc., 5.00%, due 10/1/2028 | |
| Frontier Communications Corp., 8.75%, due 5/15/2030 | |
| | |
| | |
| | |
| | |
|
| Connect Finco S.a.r.l./Connect U.S. Finco LLC, 6.75%, due 10/1/2026 | |
| Level 3 Financing, Inc., 3.40%, due 3/1/2027 | |
| | |
Total Corporate Bonds (Cost $35,428,707) | |
|
Loan Assignments(b) 86.4% |
|
| AI Convoy (Luxembourg) S.a.r.l, Term Loan B, (3M USD LIBOR + 3.50%, 6M USD LIBOR + 3.50%), 7.73% – 8.17%, due 1/18/2027 | |
| Amentum Government Services Holdings LLC, Term Loan, (3M CME Term SOFR + 4.00%), 7.21% – 7.56%, due 2/15/2029 | |
| Brown Group Holding, LLC, Term Loan B2, (1M CME Term SOFR + 3.75%), 7.42%, due 7/2/2029 | |
| Cobham Ultra SeniorCo S.a.r.l., Term Loan B, (6M USD LIBOR + 3.75%), 7.06%, due 8/3/2029 | |
| KKR Apple Bidco, LLC, Second Lien Term Loan, (1M USD LIBOR + 5.75%), 9.50%, due 9/21/2029 | |
| MHI Holdings, LLC, Term Loan B, (1M USD LIBOR + 5.00%), 8.75%, due 9/21/2026 | |
| | |
| Term Loan B, (1M USD LIBOR + 3.75%), 7.50%, due 2/1/2028 | |
| Second Lien Term Loan B1, (1M USD LIBOR + 7.75%), 11.16%, due 2/1/2029 | |
| Propulsion (BC) Finco S.a.r.l., Term Loan, (3M SOFR + 4.00%), 7.18%, due 9/14/2029 | |
| Spirit Aerosystems, Inc., Term Loan B, (1M USD LIBOR + 3.75%), 7.50%, due 1/15/2025 | |
| | |
| Term Loan G, (3M USD LIBOR + 2.25%), 5.92%, due 8/22/2024 | |
| Term Loan F, (3M USD LIBOR + 2.25%), 5.92%, due 12/9/2025 | |
| | |
|
| Air Canada, Term Loan B, (3M USD LIBOR + 3.50%), 6.42%, due 8/11/2028 | |
| | |
| Term Loan B, (1M USD LIBOR + 1.75%), 5.35%, due 6/27/2025 | |
| Term Loan, (3M USD LIBOR + 4.75%), 8.99%, due 4/20/2028 | |
| Mileage Plus Holdings LLC, Term Loan B, (3M USD LIBOR + 5.25%), 8.78%, due 6/21/2027 | |
| SkyMiles IP Ltd., Term Loan B, (3M USD LIBOR + 3.75%), 7.99%, due 10/20/2027 | |
| United Airlines, Inc., Term Loan B, (3M USD LIBOR + 3.75%), 8.11%, due 4/21/2028 | |
| | |
Auto Parts & Equipment 0.9% |
| Adient US LLC, Term Loan B, (1M USD LIBOR), due 4/10/2028 | |
| BBB Industries LLC, Term Loan, (1M CME Term SOFR + 5.25%), 8.98%, due 7/25/2029 | |
| DexKo Global Inc., Term Loan B, (1M USD LIBOR + 3.75%, 3M USD LIBOR + 3.75%), 7.42% – 7.50%, due 10/4/2028 | |
| | |
See Notes to Financial Statements
Schedule of Investments Floating Rate Income Fund^ (cont’d)
| |
|
|
| American Trailer World Corp., Term Loan B, (1M CME Term SOFR + 3.75%), 7.58%, due 3/3/2028 | |
| Dealer Tire, LLC, Term Loan B, (1M USD LIBOR + 4.25%), 8.00%, due 12/12/2025 | |
| | |
| Term Loan, (3M CME Term SOFR + 5.00%), 8.37%, due 3/30/2027 | |
| Second Lien Term Loan, (3M USD LIBOR + 8.50%), 11.87%, due 3/30/2028 | |
| | |
| Second Lien Term Loan, (1M USD LIBOR + 6.75%), 10.33%, due 2/2/2026 | |
| Term Loan, (1M CME Term SOFR + 3.75%), 7.43%, due 2/23/2029 | |
| Wand NewCo 3, Inc., Term Loan, (1M USD LIBOR + 3.00%), 6.75%, due 2/5/2026 | |
| | |
Building & Development 2.3% |
| Cornerstone Building Brands, Inc., Term Loan B, (1M USD LIBOR + 3.25%), 6.59%, due 4/12/2028 | |
| MI Windows and Doors, LLC, Term Loan, (1M CME Term SOFR + 3.50%), 7.33%, due 12/18/2027 | |
| Potters Industries, LLC, Term Loan B, (3M USD LIBOR + 4.00%), 7.67%, due 12/14/2027 | |
| | |
| Term Loan B, (1M USD LIBOR + 3.50%), 7.25%, due 6/2/2028 | |
| Term Loan, (1M CME Term SOFR + 3.50%), 7.33%, due 6/2/2028 | |
| | |
| Term Loan, (1M USD LIBOR + 4.25%), 8.00%, due 4/10/2028 | |
| Second Lien Term Loan, (1M USD LIBOR + 8.50%), 12.25%, due 4/9/2029 | |
| White Cap Buyer LLC, Term Loan B, (1M CME Term SOFR + 3.75%), 7.48%, due 10/19/2027 | |
| Wilsonart LLC, Term Loan E, (3M USD LIBOR + 3.25%), 6.93%, due 12/31/2026 | |
| | |
|
| Chamberlain Group, Inc., Term Loan B, (1M USD LIBOR + 3.50%), 7.25%, due 11/3/2028 | |
| FloWorks International LLC, Term Loan B, (3M CME Term SOFR + 5.75%), 9.66%, due 12/27/2028 | |
| | |
| First Lien Term Loan, (3M USD LIBOR + 3.75%), 7.42%, due 12/22/2028 | |
| Second Lien Term Loan, (3M USD LIBOR + 6.75%), 10.42%, due 12/21/2029 | |
| Oscar AcquisitionCo, LLC, Term Loan B, (3M CME Term SOFR + 4.50%), 8.15%, due 4/29/2029 | |
| Solis IV BV, Term Loan B1, (3M CME Term SOFR + 3.50%), 6.34%, due 2/26/2029 | |
| Vector WP Holdco, Inc., Term Loan B, (1M USD LIBOR + 5.00%), 8.50%, due 10/12/2028 | |
| | |
Business Equipment & Services 8.9% |
| Allied Universal Holdco LLC, Term Loan B, (1M USD LIBOR + 3.75%), 7.50%, due 5/12/2028 | |
| AlterDomus, Term Loan B, (3M CME Term SOFR + 3.50%), 7.05%, due 2/17/2028 | |
| Anticimex International AB, Term Loan B1, (3M USD LIBOR + 3.50%), 6.57%, due 11/16/2028 | |
| APFS Staffing Holdings, Inc., Term Loan, (1M CME Term SOFR + 4.00%, 3M CME Term SOFR + 4.00%), 7.73% – 8.09%, due 12/29/2028 | |
| APX Group, Inc., Term Loan B, (3M USD LIBOR + 2.25%, 3M USD LIBOR + 3.25%), 6.73% – 8.50%, due 7/10/2028 | |
| AqGen Island Holdings, Inc., Term Loan, (3M USD LIBOR + 3.50%), 7.19%, due 8/2/2028 | |
| BrightView Landscapes, LLC, Term Loan B, (1M CME Term SOFR + 3.25%), 6.98%, due 4/20/2029 | |
| Cast and Crew Payroll, LLC, Term Loan, (1M CME Term SOFR + 3.75%), 7.48%, due 12/29/2028 | |
| Constant Contact Inc, Term Loan, (3M USD LIBOR + 4.00%), 7.91%, due 2/10/2028 | |
| ConvergeOne Holdings, Inc. | |
| Term Loan, (1M USD LIBOR + 5.00%), 8.75%, due 1/4/2026 | |
| Second Lien Term Loan, (1M USD LIBOR + 8.50%), 12.25%, due 1/4/2027 | |
| Cyxtera DC Holdings, Inc., Term Loan B, (3M USD LIBOR + 3.00%), 7.36%, due 5/1/2024 | |
See Notes to Financial Statements
Schedule of Investments Floating Rate Income Fund^ (cont’d)
| |
|
Business Equipment & Services – cont'd |
| Deerfield Dakota Holding, LLC, Term Loan B, (1M CME Term SOFR + 3.75%), 7.48%, due 4/9/2027 | |
| Element Materials Technology Group US Holdings Inc. | |
| Term Loan, (3M CME Term SOFR + 4.25%), 7.90%, due 7/6/2029 | |
| Term Loan, (3M CME Term SOFR + 4.25%), 7.90%, due 7/6/2029 | |
| Endure Digital Inc., Term Loan, (1M USD LIBOR + 3.50%), 6.70%, due 2/10/2028 | |
| EP Purchaser, LLC, Term Loan B, (3M USD LIBOR + 3.50%), 7.17%, due 11/6/2028 | |
| Garda World Security Corporation, Term Loan B, (3M USD LIBOR + 4.25%), 7.24%, due 10/30/2026 | |
| Greeneden U.S. Holdings II, LLC, Term Loan B4, (1M USD LIBOR + 4.00%), 7.75%, due 12/1/2027 | |
| Intrado Corporation, Term Loan, (3M USD LIBOR + 4.00%), 8.41%, due 10/10/2024 | |
| Learning Care Group, Inc., First Lien Term Loan, (3M USD LIBOR + 3.25%), 6.92% – 7.66%, due 3/13/2025 | |
| Loire Finco Luxembourg S.a.r.l. | |
| Term Loan, (1M USD LIBOR + 3.00%), 6.75%, due 4/21/2027 | |
| Term Loan B2, (1M USD LIBOR + 3.50%), 7.25%, due 4/21/2027 | |
| Packaging Coordinators Midco, Inc., First Lien Term Loan, (3M USD LIBOR + 3.75%), 7.42%, due 11/30/2027 | |
| | |
| Term Loan, (1M USD LIBOR + 3.75%), 7.50%, due 12/16/2027 | |
| Term Loan, (1M USD LIBOR + 3.75%), 7.50%, due 12/16/2027 | |
| Service Logic Acquisition, Inc., Term Loan, (2M USD LIBOR + 4.00%, 3M USD LIBOR + 4.00%), 7.69% – 8.41%, due 10/29/2027 | |
| Summer (BC) Holdco B S.a r.l, Term Loan B2, (3M USD LIBOR + 4.50%), 8.17%, due 12/4/2026 | |
| Surf Holdings, LLC, Term Loan, (3M USD LIBOR + 3.50%), 6.67%, due 3/5/2027 | |
| System One Holdings, LLC, Term Loan B, (3M CME Term SOFR + 4.00%), 7.70%, due 3/2/2028 | |
| Vaco Holdings, LLC, Term Loan, (1M CME Term SOFR + 5.00%, 3M CME Term SOFR + 5.00%), 8.70% – 8.83%, due 1/21/2029 | |
| WebHelp, Term Loan, (3M SOFR + 3.75%), 6.79%, due 8/4/2028 | |
| West Corporation, Term Loan B1, (3M USD LIBOR + 3.50%), 7.91%, due 10/10/2024 | |
| William Morris Endeavor Entertainment, LLC, First Lien Term Loan, (1M USD LIBOR + 2.75%), 6.51%, due 5/18/2025 | |
| | |
Cable & Satellite Television 1.9% |
| Altice Financing SA, First Lien Term Loan, (3M USD LIBOR + 2.75%), 6.83%, due 1/31/2026 | |
| Altice France S.A., Term Loan B13, (3M USD LIBOR + 4.00%), 6.91%, due 8/14/2026 | |
| | |
| Term Loan B1, (1M USD LIBOR + 2.25%), 5.66%, due 7/17/2025 | |
| Term Loan B5, due 4/15/2027 | |
| McGraw-Hill Global Education Holdings, LLC, Term Loan, (3M USD LIBOR + 4.75%, 6M USD LIBOR + 4.75%), 7.82% – 8.32%, due 7/28/2028 | |
| Numericable Group SA, Term Loan B11, (3M USD LIBOR + 2.75%), 7.16%, due 7/31/2025 | |
| Radiate Holdco, LLC, Term Loan B, (1M USD LIBOR + 3.25%), 7.00%, due 9/25/2026 | |
| | |
|
| Caldic B.V., Term Loan B, (3M CME Term SOFR + 3.75%), 7.84%, due 2/28/2029 | |
| Olympus Water US Holding Corporation | |
| Term Loan B, (3M USD LIBOR + 3.75%), 7.44%, due 11/9/2028 | |
| Term Loan, (3M CME Term SOFR + 4.50%), 8.15%, due 11/9/2028 | |
| PMHC II, Inc., Term Loan B, (3M CME Term SOFR + 4.25%), 8.49%, due 4/23/2029 | |
See Notes to Financial Statements
Schedule of Investments Floating Rate Income Fund^ (cont’d)
| |
|
|
| | |
| First Lien Term Loan, (6M USD LIBOR + 3.75%), 7.98%, due 10/4/2028 | |
| Second Lien Term Loan, (6M USD LIBOR + 7.00%), 11.23%, due 10/4/2029 | |
| | |
Chemicals & Plastics 1.5% |
| Avient Corporation, Term Loan B, (3M CME Term SOFR + 3.25%), 7.34%, due 8/29/2029 | |
| Charter NEX US, Inc., Term Loan, (1M USD LIBOR + 3.75%), 7.50%, due 12/1/2027 | |
| Ineos US Finance LLC, Term Loan B, (1M USD LIBOR + 2.00%), 5.75%, due 4/1/2024 | |
| SCIH Salt Holdings, Inc., Term Loan B, (3M USD LIBOR + 4.00%), 8.41%, due 3/16/2027 | |
| Sparta U.S. HoldCo LLC, Term Loan, (1M USD LIBOR + 3.25%), 6.38%, due 8/2/2028 | |
| W.R. Grace & Co.-Conn., Term Loan B, (3M USD LIBOR + 3.75%), 7.44%, due 9/22/2028 | |
| | |
|
| Birkenstock GmbH & Co. KG, Term Loan B, (6M USD LIBOR + 3.25%), 5.10%, due 4/28/2028 | |
| | |
| Term Loan, (1M USD LIBOR + 5.00%), 8.34%, due 3/11/2028 | |
| Second Lien Term Loan, (1M USD LIBOR + 8.75%), 12.09%, due 3/9/2029 | |
| Varsity Brands, Inc., Term Loan B, (1M USD LIBOR + 3.50%), 7.25%, due 12/15/2024 | |
| | |
|
| Foundational Education Group, Inc., Second Lien Term Loan, (3M CME Term SOFR + 6.50%), 10.31%, due 8/31/2029 | |
| R1 RCM, Inc., Term Loan B, (1M CME Term SOFR + 3.00%), 6.73%, due 6/21/2029 | |
| | |
Communication Services 0.4% |
| AEA International Holdings (Lux) S.a.r.l., Term Loan B, (3M USD LIBOR + 3.75%), 7.44%, due 9/7/2028 | |
| Foundational Education Group, Inc., First Lien Term Loan, (3M CME Term SOFR + 3.75%), 7.56%, due 8/31/2028 | |
| | |
|
| | |
| Term Loan, (3M CME Term SOFR + 8.00%), 10.90%, due 2/28/2023 | |
| Term Loan B, (1M USD LIBOR + 3.50%), 7.00%, due 6/30/2024 | |
| | |
Containers & Glass Products 1.7% |
| Anchor Packaging, Inc., Term Loan B, (1M USD LIBOR + 4.00%), 7.75%, due 7/18/2026 | |
| | |
| Term Loan B4, (1M USD LIBOR + 3.25%, 3M USD LIBOR + 3.25%), 6.38% – 6.93%, due 3/11/2028 | |
| Term Loan B5, (1M USD LIBOR + 3.75%, 3M USD LIBOR + 3.75%), 6.88% – 7.43%, due 3/11/2028 | |
| BWAY Holding Company, Term Loan B, (1M USD LIBOR + 3.25%), 6.38%, due 4/3/2024 | |
| Klockner-Pentaplast of America, Inc., Term Loan B, (6M USD LIBOR + 4.75%), 8.26%, due 2/12/2026 | |
| Spa Holdings 3 Oy, Term Loan B, (3M USD LIBOR + 3.75%), 7.42%, due 2/4/2028 | |
| TricorBraun Holdings, Inc., Term Loan, (1M USD LIBOR + 3.25%), 7.00%, due 3/3/2028 | |
See Notes to Financial Statements
Schedule of Investments Floating Rate Income Fund^ (cont’d)
| |
|
Containers & Glass Products – cont'd |
| Trident TPI Holdings, Inc. | |
| Term Loan B1, (3M USD LIBOR + 3.25%), 6.92%, due 10/17/2024 | |
| Term Loan, (3M USD LIBOR + 4.00%), 7.67%, due 9/15/2028 | |
| Term Loan, (3M USD LIBOR + 4.00%), 7.67%, due 9/15/2028 | |
| | |
Cosmetics - Toiletries 0.3% |
| Sunshine Luxembourg VII SARL, Term Loan B3, (3M USD LIBOR + 3.75%), 7.42%, due 10/1/2026 | |
Diversified Financial Services 0.4% |
| Eisner Advisory Group LLC, Term Loan, (1M CME Term SOFR + 5.25%), 9.09%, due 7/28/2028 | |
| Superannuation and Investments US LLC, Term Loan, (1M USD LIBOR + 3.75%), 7.50%, due 12/1/2028 | |
| | |
Diversified Insurance 1.3% |
| Gainwell Acquisition Corp., Term Loan B, (3M USD LIBOR + 4.00%), 7.67%, due 10/1/2027 | |
| Hub International Limited, Term Loan B, (3M USD LIBOR + 3.25%), 7.23% – 7.53%, due 4/25/2025 | |
| | |
Ecological Services & Equipment 0.2% |
| Denali Water Solutions, Term Loan B, (3M USD LIBOR + 4.25%), 7.92%, due 3/27/2028 | |
|
| Generation Bridge Acquisition, LLC | |
| Term Loan C, (3M USD LIBOR + 5.00%), 8.67%, due 12/1/2028 | |
| Term Loan B, (3M USD LIBOR + 5.00%), 8.67%, due 12/1/2028 | |
| Generation Bridge II, LLC | |
| Term Loan B, (3M USD LIBOR + 5.00%), 9.41%, due 2/23/2029 | |
| Term Loan C, (3M USD LIBOR + 5.00%), 9.41%, due 2/23/2029 | |
| | |
Electronics - Electrical 10.0% |
| Ahead DB Holdings, LLC, Term Loan B, (3M USD LIBOR + 3.75%), 7.43%, due 10/18/2027 | |
| | |
| First Lien Term Loan, (3M USD LIBOR + 3.00%), 6.67%, due 9/19/2024 | |
| Second Lien Term Loan, (3M USD LIBOR + 5.50%), 9.17%, due 9/19/2025 | |
| AQA Acquisition Holding, Inc., First Lien Term Loan, (3M USD LIBOR + 4.25%), 7.32%, due 3/3/2028 | |
| Cloudera, Inc., Term Loan, (1M USD LIBOR + 3.75%), 7.50%, due 10/8/2028 | |
| CommScope, Inc., Term Loan B, (1M USD LIBOR + 3.25%), 7.00%, due 4/6/2026 | |
| Confluence Technologies, Inc | |
| Term Loan, (3M USD LIBOR + 3.75%), 8.16%, due 7/31/2028 | |
| Second Lien Term Loan, (3M USD LIBOR + 6.50%), 10.91%, due 7/30/2029 | |
| Epicor Software Corporation | |
| Term Loan, (1M USD LIBOR + 3.25%), 7.00%, due 7/30/2027 | |
| Second Lien Term Loan, (1M USD LIBOR + 7.75%), 11.50%, due 7/31/2028 | |
| Finastra USA, Inc., First Lien Term Loan, (3M USD LIBOR + 3.50%), 6.87%, due 6/13/2024 | |
| Flexera Software LLC, Term Loan B, (1M USD LIBOR + 3.75%), 7.51%, due 3/3/2028 | |
| Go Daddy Operating Company, LLC, Term Loan B5, due 10/21/2029 | |
| Helios Software Holdings, Inc., Term Loan B, (3M CME Term SOFR + 3.75%), 7.45%, due 3/11/2028 | |
| | |
| First Lien Term Loan, (1M USD LIBOR + 3.50%), 7.25%, due 7/1/2024 | |
| Second Lien Term Loan, (1M USD LIBOR + 6.25%), 10.00%, due 7/7/2025 | |
| IGT Holding IV AB, Term Loan B2, (3M USD LIBOR + 3.40%), 7.07%, due 3/31/2028 | |
See Notes to Financial Statements
Schedule of Investments Floating Rate Income Fund^ (cont’d)
| |
|
Electronics - Electrical – cont'd |
| | |
| Term Loan, (1M USD LIBOR + 3.75%), 7.50%, due 12/1/2027 | |
| Term Loan, (1M SOFR + 4.25%), 7.98%, due 12/1/2027 | |
| Ingram Micro, Inc., Term Loan B, (3M USD LIBOR + 3.50%), 7.17%, due 6/30/2028 | |
| | |
| Term Loan B, (3M USD LIBOR + 4.00%), 7.14%, due 12/1/2027 | |
| Term Loan B, (3M USD LIBOR + 4.25%), 7.33%, due 12/1/2027 | |
| | |
| Term Loan, (3M USD LIBOR + 3.75%), 8.16%, due 5/18/2028 | |
| Second Lien Term Loan, (3M USD LIBOR + 6.75%), 11.16%, due 5/18/2029 | |
| McAfee, LLC, Term Loan B, (1M CME Term SOFR + 3.75%), 6.87%, due 3/1/2029 | |
| Netsmart Technologies, Inc., Term Loan B, (1M USD LIBOR + 4.00%), 7.75%, due 10/1/2027 | |
| | |
| First Lien Term Loan, (6M USD LIBOR + 3.25%), 7.42%, due 2/1/2024 | |
| Second Lien Term Loan, (6M USD LIBOR + 7.25%), 11.42%, due 1/31/2025 | |
| Polaris Newco LLC, Term Loan B, (3M USD LIBOR + 4.00%), 7.67%, due 6/2/2028 | |
| Proofpoint, Inc., Second Lien Term Loan, (3M USD LIBOR + 6.25%), 9.32%, due 8/31/2029 | |
| Rackspace Technology Global, Inc., Term Loan B, (3M USD LIBOR + 2.75%), 5.62%, due 2/15/2028 | |
| RealPage, Inc., Second Lien Term Loan, (1M USD LIBOR + 6.50%), 10.25%, due 4/23/2029 | |
| | |
| Term Loan, (3M USD LIBOR + 4.75%), 9.11%, due 4/27/2028 | |
| Second Lien Term Loan, (3M USD LIBOR + 7.75%), 12.11%, due 4/27/2029 | |
| Riverbed Technology, Inc., Term Loan, (1M USD LIBOR + 2.00%, 1M USD LIBOR + 6.00%), 2.00% – 9.20%, due 12/7/2026 | |
| S2P Acquisition Borrower, Inc., Term Loan, (1M CME Term SOFR + 3.75%), 7.48%, due 8/14/2026 | |
| Sabre GLBL Inc., First Lien Term Loan, (1M CME Term SOFR + 5.00%), 8.83%, due 6/30/2028 | |
| Sovos Compliance, LLC, Term Loan, (1M USD LIBOR + 4.50%), 8.25%, due 8/11/2028 | |
| Storable, Inc., Term Loan B, (1M CME Term SOFR + 3.50%, 2M CME Term SOFR + 3.50%), 6.08% – 7.23%, due 4/17/2028 | |
| Token Buyer, Inc., Term Loan B, (3M CME Term SOFR + 6.00%), 9.70%, due 5/31/2029 | |
| Ultimate Software Group, Inc. (The) | |
| Term Loan, (3M USD LIBOR + 3.25%), 7.00%, due 5/4/2026 | |
| Second Lien Term Loan, (1M USD LIBOR + 5.25%), 9.00%, due 5/3/2027 | |
| | |
| Term Loan, (3M USD LIBOR + 4.00%), 8.36%, due 4/24/2028 | |
| Second Lien Term Loan, (3M USD LIBOR + 7.25%), 11.61%, due 4/23/2029 | |
| Weld North Education, LLC, Term Loan B, (1M USD LIBOR + 3.75%), 7.50%, due 12/21/2027 | |
| | |
|
| 888 Acquisitions Limited, Term Loan B, (3M CME Term SOFR + 5.25%), 8.28%, due 7/8/2028 | |
| Great Canadian Gaming Corporation, Term Loan, (3M USD LIBOR + 4.00%), 7.60%, due 11/1/2026 | |
| Herschend Entertainment Company, LLC, Term Loan, (1M USD LIBOR + 3.75%), 7.56%, due 8/27/2028 | |
| | |
|
| PECF USS Intermediate Holding III Corporation, Term Loan B, (1M USD LIBOR + 4.25%), 8.00%, due 12/15/2028 | |
Financial Intermediaries 3.8% |
| Apex Group Treasury LLC, Term Loan, (3M USD LIBOR + 3.75%), 6.56%, due 7/27/2028 | |
See Notes to Financial Statements
Schedule of Investments Floating Rate Income Fund^ (cont’d)
| |
|
Financial Intermediaries – cont'd |
| | |
| Second Lien Term Loan B3, (1M USD LIBOR + 5.25%), 9.00%, due 1/31/2028 | |
| Second Lien Term Loan B4, (1M USD LIBOR + 5.25%), 9.00%, due 1/20/2029 | |
| Blackstone Mortgage Trust, Inc., Term Loan B4, (1M CME Term SOFR + 3.50%), 7.23%, due 5/9/2029 | |
| Camelot U.S. Acquisition LLC, Term Loan B, (1M USD LIBOR + 3.00%), 6.75%, due 10/30/2026 | |
| Citco Group Limited (The), Term Loan B, due 4/19/2028 | |
| Edelman Financial Center, LLC | |
| Second Lien Term Loan, (1M USD LIBOR + 6.75%), 10.50%, due 7/20/2026 | |
| Term Loan B, (1M USD LIBOR + 3.50%), 7.25%, due 4/7/2028 | |
| Galaxy US Opco, Inc., Term Loan, (1M CME Term SOFR + 4.75%), 8.48%, due 4/29/2029 | |
| GT Polaris, Inc., Term Loan, (3M USD LIBOR + 3.75%), 8.16%, due 9/24/2027 | |
| Mediaocean LLC, Term Loan, (1M USD LIBOR + 3.50%), 7.25%, due 12/15/2028 | |
| OEG Borrower, LLC, Term Loan, (3M CME Term SOFR + 5.00%), 8.44%, due 6/18/2029 | |
| Sedgwick Claims Management Services, Inc. | |
| Term Loan B, (1M USD LIBOR + 3.75%), 7.50%, due 9/3/2026 | |
| Term Loan B3, (1M USD LIBOR + 4.25%), 8.00%, due 9/3/2026 | |
| | |
|
| Sovos Brands Intermediate, Inc., Term Loan, (3M USD LIBOR + 3.50%), 7.91%, due 6/8/2028 | |
| WOOF Holdings, Inc., First Lien Term Loan, (3M USD LIBOR + 3.75%), 7.32%, due 12/21/2027 | |
| | |
|
| AHP Health Partners, Inc., Term Loan B, (1M USD LIBOR + 3.50%), 7.25%, due 8/24/2028 | |
| Athenahealth, Inc., Term Loan B, (1M CME Term SOFR + 3.50%), 6.97%, due 2/15/2029 | |
| Auris Luxembourg III S.a.r.l., Term Loan B2, (2M USD LIBOR + 3.75%, 3M USD LIBOR + 3.75%, 6M USD LIBOR + 3.75%), 7.82% – 8.68%, due 2/27/2026 | |
| | |
| Term Loan, (1M USD LIBOR + 3.75%), 3.75%, due 7/17/2028 | |
| Term Loan B, (1M USD LIBOR + 3.75%), 7.32%, due 7/17/2028 | |
| Second Lien Term Loan, (1M USD LIBOR + 7.00%), 10.57%, due 12/10/2029 | |
| Bella Holding Company, LLC, Term Loan B, (1M USD LIBOR + 3.75%), 7.50%, due 5/10/2028 | |
| CHG Healthcare Services, Inc., Term Loan, (3M USD LIBOR + 3.25%), 7.00%, due 9/29/2028 | |
| | |
| Term Loan, (1M USD LIBOR + 4.00%), 7.50% – 7.75%, due 11/30/2028 | |
| Term Loan B, (1M USD LIBOR + 4.00%), 7.75%, due 11/30/2028 | |
| Confluent Medical Technologies, Inc., Term Loan, (3M CME Term SOFR + 3.75%), 7.30%, due 2/16/2029 | |
| Curium BidCo S.a r.l., Term Loan, (3M USD LIBOR + 4.25%), 7.92%, due 12/2/2027 | |
| Electron BidCo, Inc., Term Loan, (1M USD LIBOR + 3.00%), 6.75%, due 11/1/2028 | |
| Envision Healthcare Corporation | |
| Term Loan, (3M CME Term SOFR + 3.75%), 6.33%, due 3/31/2027 | |
| Term Loan, (3M CME Term SOFR + 4.25%), 6.83%, due 3/31/2027 | |
| Term Loan, (3M CME Term SOFR + 7.88%), 11.60%, due 3/31/2027 | |
| Heartland Dental, LLC, First Lien Term Loan, (1M USD LIBOR + 3.50%), 7.25%, due 4/30/2025 | |
| Impala Bidco 0 Limited, Term Loan, (1M CME Term SOFR + 4.60%), 7.61%, due 6/8/2028 | |
| Insulet Corporation, Term Loan B, (1M USD LIBOR + 3.25%), 7.00%, due 5/4/2028 | |
| MedAssets Software Intermediate Holdings, Inc. | |
| Term Loan, (1M USD LIBOR + 4.00%), 7.75%, due 12/18/2028 | |
| Second Lien Term Loan, (1M USD LIBOR + 6.75%), 10.50%, due 12/17/2029 | |
See Notes to Financial Statements
Schedule of Investments Floating Rate Income Fund^ (cont’d)
| |
|
|
| Medical Solutions Holdings, Inc., First Lien Term Loan, (3M USD LIBOR + 3.50%), 6.38%, due 11/1/2028 | |
| Medline Borrower, LP, Term Loan B, (1M USD LIBOR + 3.25%), 7.00%, due 10/23/2028 | |
| MPH Acquisition Holdings LLC, Term Loan B, (3M USD LIBOR + 4.25%), 7.32%, due 9/1/2028 | |
| National Mentor Holdings, Inc. | |
| Term Loan, (1M USD LIBOR + 3.75%, 3M USD LIBOR + 3.75%), 7.43% – 7.51%, due 3/2/2028 | |
| Term Loan C, (3M USD LIBOR + 3.75%), 7.43%, due 3/2/2028 | |
| Second Lien Term Loan, (3M USD LIBOR + 7.25%), 10.93%, due 3/2/2029 | |
| Navicure, Inc., Term Loan B, (1M USD LIBOR + 4.00%), 7.75%, due 10/22/2026 | |
| Parexel International Corporation, First Lien Term Loan, (1M USD LIBOR + 3.25%), 7.00%, due 11/15/2028 | |
| Pearl Intermediate Parent LLC, Second Lien Term Loan, (1M USD LIBOR + 6.25%), 10.00%, due 2/13/2026 | |
| PetVet Care Centers, LLC, Term Loan B3, (1M USD LIBOR + 3.50%), 7.25%, due 2/14/2025 | |
| Project Ruby Ultimate Parent Corp., Term Loan, (1M USD LIBOR + 3.25%), 7.00%, due 3/10/2028 | |
| Quantum Health, Inc., Term Loan, (1M USD LIBOR + 4.50%, 3M USD LIBOR + 4.50%), 8.17% – 8.25%, due 12/22/2027 | |
| RegionalCare Hospital Partners Holdings, Inc., Term Loan B, (3M USD LIBOR + 3.75%), 8.16%, due 11/16/2025 | |
| Sharp Midco LLC, Term Loan B, (3M USD LIBOR + 4.00%), 7.67%, due 12/31/2028 | |
| Sound Inpatient Physicians, Second Lien Term Loan, (1M USD LIBOR + 6.75%), 10.50%, due 6/26/2026 | |
| Southern Veterinary Partners, LLC, Term Loan, (1M USD LIBOR + 4.00%), 7.75%, due 10/5/2027 | |
| Summit Behavioral Healthcare LLC | |
| First Lien Term Loan, (3M USD LIBOR + 4.75%), 7.73%, due 11/24/2028 | |
| Second Lien Term Loan, (3M USD LIBOR + 7.75%), 10.73%, due 11/26/2029 | |
| Team Health Holdings, Inc., Term Loan B, (1M SOFR + 5.25%), 8.98%, due 3/2/2027 | |
| | |
| Term Loan, (6M USD LIBOR + 5.00%), 9.93%, due 12/20/2027 | |
| Second Lien Term Loan, (6M USD LIBOR + 9.00%), 13.93%, due 12/18/2028 | |
| U.S. Anesthesia Partners, Inc. | |
| Term Loan, (1M USD LIBOR + 4.25%), 7.38%, due 10/1/2028 | |
| Second Lien Term Loan, (1M USD LIBOR + 7.50%), 10.63%, due 10/1/2029 | |
| Verscend Holding Corp., Term Loan B, (1M USD LIBOR + 4.00%), 7.75%, due 8/27/2025 | |
| | |
|
| Hoffmaster Group, Inc., First Lien Term Loan, (3M USD LIBOR + 4.00%), 7.67%, due 11/21/2023 | |
| Weber-Stephen Products LLC, Term Loan B, (1M USD LIBOR + 3.25%), 7.00%, due 10/30/2027 | |
| | |
Industrial Equipment 4.9% |
| | |
| Term Loan, (1M CME Term SOFR + 5.25%), 8.62%, due 2/8/2029 | |
| Second Lien Term Loan, (1M CME Term SOFR + 10.00%), 13.37%, due 2/8/2030 | |
| AZZ, Inc., Term Loan B, (1M CME Term SOFR + 4.25%), 8.08%, due 5/13/2029 | |
| BCPE Empire Holdings, Inc. | |
| Term Loan B, (1M USD LIBOR + 4.00%), 7.75%, due 6/11/2026 | |
| Term Loan, (1M USD LIBOR + 4.00%), 7.75%, due 6/11/2026 | |
| Circor International, Inc., Term Loan B, (1M USD LIBOR + 5.50%), 9.08%, due 12/20/2028 | |
| CMBF LLC, Term Loan, (1M USD LIBOR + 6.00%), 9.32%, due 8/2/2028 | |
| Crosby US Acquisition Corp., Term Loan B, (1M USD LIBOR + 4.75%), 8.32%, due 6/26/2026 | |
See Notes to Financial Statements
Schedule of Investments Floating Rate Income Fund^ (cont’d)
| |
|
Industrial Equipment – cont'd |
| Engineered Machinery Holdings, Inc. | |
| Term Loan, (3M USD LIBOR + 3.75%), 7.42%, due 5/19/2028 | |
| Second Lien Term Loan, (3M USD LIBOR + 6.00%), 9.67%, due 5/21/2029 | |
| Second Lien Term Loan, (3M USD LIBOR + 6.50%), 10.17%, due 5/21/2029 | |
| Filtration Group Corporation, Term Loan, (1M USD LIBOR + 3.50%), 7.25%, due 10/21/2028 | |
| Fluid-Flow Products, Inc. | |
| Term Loan, (3M USD LIBOR + 3.75%), 7.42%, due 3/31/2028 | |
| Second Lien Term Loan, (3M USD LIBOR + 6.75%), 10.42%, due 3/16/2029 | |
| Granite Holdings US Acquisition Co., Term Loan B, (3M USD LIBOR + 4.00%), 7.69%, due 9/30/2026 | |
| Groupe Solmax, Inc., Term Loan, (3M USD LIBOR + 4.75%), 8.39%, due 5/29/2028 | |
| Madison IAQ LLC, Term Loan, (3M USD LIBOR + 3.25%), 6.82%, due 6/21/2028 | |
| Pro Mach Group, Inc., Term Loan B, (1M USD LIBOR + 4.00%), 7.75%, due 8/31/2028 | |
| Restaurant Technologies, Inc., Term Loan B, (3M CME Term SOFR + 4.25%), 7.80%, due 4/2/2029 | |
| SPX Flow, Inc., Term Loan, (1M CME Term SOFR + 4.50%), 8.33%, due 4/5/2029 | |
| Star US Bidco LLC, Term Loan B, (1M USD LIBOR + 4.25%), 8.00%, due 3/17/2027 | |
| | |
|
| WatchGuard Technologies Inc., Term Loan, (1M CME Term SOFR + 5.25%), 8.98%, due 7/2/2029 | |
Leisure Goods - Activities - Movies 1.1% |
| Banijay Entertainment S.A.S, Term Loan, (1M USD LIBOR + 3.75%), 6.88%, due 3/1/2025 | |
| | |
| Term Loan B, (6M USD LIBOR + 3.00%), 5.88%, due 6/30/2025 | |
| Term Loan B, (6M USD LIBOR + 3.25%), 6.13%, due 10/18/2028 | |
| Creative Artists Agency, LLC | |
| Term Loan B, due 11/27/2026 | |
| Term Loan B2, (1M CME Term SOFR + 4.25%), 7.98%, due 11/27/2026 | |
| Emerald Expositions Holding, Inc., Term Loan B, (1M USD LIBOR + 2.75%), 6.50%, due 5/22/2024 | |
| | |
| Term Loan B1, (3M USD LIBOR + 3.25%), 6.92%, due 11/12/2026 | |
| Term Loan B2, (3M USD LIBOR + 2.75%), 6.92%, due 11/12/2026 | |
| UFC Holdings, LLC, Term Loan B, (3M USD LIBOR + 2.75%), 7.11%, due 4/29/2026 | |
| | |
|
| Alterra Mountain Company, Term Loan, (1M USD LIBOR + 3.50%), 7.25%, due 8/17/2028 | |
| Aristocrat Technologies, Inc., Term Loan B, (3M CME Term SOFR + 2.25%), 5.90%, due 5/24/2029 | |
| GVC Holdings (Gibraltar) Limited, Term Loan B, due 10/18/2029 | |
| Playa Resorts Holding B.V., Term Loan B, (1M USD LIBOR + 2.75%), 6.50%, due 4/29/2024 | |
| Scientific Games Holdings LP, Term Loan B, (3M CME Term SOFR + 3.50%), 7.10%, due 4/4/2029 | |
| Stars Group Holdings B.V. (The), Term Loan B, (3M CME Term SOFR + 3.25%), 6.78%, due 7/22/2028 | |
| | |
Nonferrous Metals - Minerals 1.8% |
| Covia Holdings Corporation, Term Loan, (3M USD LIBOR + 4.00%), 7.75%, due 7/31/2026 | |
| Ozark Holdings LLC, Term Loan B, (1M USD LIBOR + 3.75%), 7.50%, due 12/16/2027 | |
| U.S. Silica Company, Term Loan B, (1M USD LIBOR + 4.00%), 7.81%, due 5/1/2025 | |
| | |
|
| AL GCX Holdings, LLC, Term Loan B, (3M CME Term SOFR + 3.75%), 7.57%, due 5/17/2029 | |
| AL NGPL Holdings, LLC, Term Loan B, (3M USD LIBOR + 3.75%), 7.53%, due 4/14/2028 | |
See Notes to Financial Statements
Schedule of Investments Floating Rate Income Fund^ (cont’d)
| |
|
|
| BCP Renaissance Parent LLC, Term Loan B3, (3M CME Term SOFR + 3.50%), 7.05%, due 10/31/2026 | |
| Brazos Delaware II, LLC, Term Loan B, (1M USD LIBOR + 4.00%), 7.50%, due 5/21/2025 | |
| CQP Holdco LP, Term Loan B, (3M USD LIBOR + 3.75%), 7.42%, due 6/5/2028 | |
| Freeport LNG Investments, LLLP, Term Loan B, (3M USD LIBOR + 3.50%), 7.74%, due 12/21/2028 | |
| Medallion Midland Acquisition, LLC, Term Loan, (1M USD LIBOR + 3.75%), 7.42%, due 10/18/2028 | |
| Oryx Midstream Services Permian Basin LLC, Term Loan B, (3M USD LIBOR + 3.25%), 6.21%, due 10/5/2028 | |
| Prairie ECI Acquiror LP, Term Loan B, (1M USD LIBOR + 4.75%), 8.50%, due 3/11/2026 | |
| TransMontaigne Operating Company L.P., Term Loan B, (1M USD LIBOR + 3.50%), 6.99% – 7.07%, due 11/17/2028 | |
| Traverse Midstream Partners LLC, Term Loan, (1M CME Term SOFR + 4.25%), 7.98%, due 9/27/2024 | |
| Waterbridge Midstream Operating LLC, Term Loan B, (3M USD LIBOR + 5.75%), 9.13%, due 6/22/2026 | |
| | |
|
| Reynolds Group Holdings, Inc., Term Loan B, (1M USD LIBOR + 3.50%), 7.25%, due 9/24/2028 | |
| Ring Container Technologies Group, LLC, Term Loan B, (1M USD LIBOR + 3.75%), 7.50%, due 8/12/2028 | |
| | |
|
| M6 ETX Holdings II Midco LLC, Term Loan B, (1M CME Term SOFR + 4.50%), 8.07%, due 9/19/2029 | |
Property & Casualty Insurance 0.5% |
| Alliant Holdings Intermediate, LLC, Term Loan B4, (1M USD LIBOR + 3.50%), 6.98%, due 11/6/2027 | |
| Broadstreet Partners, Inc., Term Loan B2, (1M USD LIBOR + 3.25%), 7.00%, due 1/27/2027 | |
| | |
|
| | |
| Term Loan, (1M USD LIBOR + 3.50%), 7.13%, due 12/11/2028 | |
| Second Lien Term Loan, (1M USD LIBOR + 5.75%), 9.50%, due 12/10/2029 | |
| | |
|
| Diamond Sports Group, LLC, Second Lien Term Loan, (1M CME Term SOFR + 3.35%), 6.46%, due 8/24/2026 | |
| Univision Communications Inc., Term Loan C5, (1M USD LIBOR + 2.75%), 6.50%, due 3/15/2024 | |
| | |
|
| Brookfield Property REIT, Inc., First Lien Term Loan B, (1M CME Term SOFR + 2.50%), 6.33%, due 8/27/2025 | |
|
| LIDS Holdings, Inc., Term Loan, (3M CME Term SOFR + 5.50%), 8.99%, due 12/14/2026 | |
Retailers (except food & drug) 2.4% |
| | |
| Term Loan, (3M CME Term SOFR + 3.50%), 7.24%, due 11/8/2027 | |
| Second Lien Term Loan, (3M USD LIBOR + 6.75%), 10.49%, due 11/6/2028 | |
| EG America LLC, Term Loan, (3M USD LIBOR + 4.00%), 7.67%, due 2/7/2025 | |
| EG Group Limited, Term Loan, (3M USD LIBOR + 4.25%), 7.92%, due 3/31/2026 | |
| Great Outdoors Group, LLC, Term Loan B1, (1M USD LIBOR + 3.75%), 7.50%, due 3/6/2028 | |
See Notes to Financial Statements
Schedule of Investments Floating Rate Income Fund^ (cont’d)
| |
|
Retailers (except food & drug) – cont'd |
| Les Schwab Tire Centers, Term Loan B, (3M USD LIBOR + 3.25%), 6.58%, due 11/2/2027 | |
| Medical Solutions Holdings, Inc., Term Loan, (3M USD LIBOR + 3.50%), 3.50%, due 11/1/2028 | |
| Petco Health and Wellness Company, Inc., Term Loan B, (3M USD LIBOR + 3.25%), 6.92%, due 3/3/2028 | |
| PetSmart, Inc., Term Loan B, (1M USD LIBOR + 3.75%), 7.50%, due 2/11/2028 | |
| | |
|
| CDK Global, Inc., Term Loan B, (3M CME Term SOFR + 4.50%), 8.11%, due 7/6/2029 | |
| Cloudera, Inc., Second Lien Term Loan, (1M USD LIBOR + 6.00%), 9.75%, due 10/8/2029 | |
| ConnectWise, LLC, Term Loan B, (3M USD LIBOR + 3.50%), 7.17%, due 9/29/2028 | |
| Renaissance Holding Corp. | |
| Second Lien Term Loan, (1M USD LIBOR + 7.00%), 10.75%, due 5/29/2026 | |
| Term Loan, (1M CME Term SOFR + 4.50%), 7.61%, due 3/30/2029 | |
| | |
|
| ChampionX Corporation, Term Loan B1, (1M CME Term SOFR + 3.25%), 6.62%, due 6/7/2029 | |
| TMS International Corp., Term Loan B2, (1M USD LIBOR + 2.75%, 3M USD LIBOR + 2.75%), 6.50% – 7.16%, due 8/14/2024 | |
| | |
|
| Avis Budget Car Rental, LLC, Term Loan C, (1M CME Term SOFR + 3.50%), 7.33%, due 3/16/2029 | |
| | |
| Term Loan B, (1M USD LIBOR + 3.25%), 7.01%, due 6/30/2028 | |
| Term Loan C, (1M USD LIBOR + 3.25%), 7.01%, due 6/30/2028 | |
| Kenan Advantage Group, Inc. | |
| Term Loan B1, (1M USD LIBOR + 3.75%), 7.50%, due 3/24/2026 | |
| Second Lien Term Loan, (1M USD LIBOR + 7.25%), 11.00%, due 9/1/2027 | |
| PAI Holdco, Inc., Term Loan B, (3M USD LIBOR + 3.75%), 8.16%, due 10/28/2027 | |
| | |
|
| CenturyLink, Inc., Term Loan B, (1M USD LIBOR + 2.25%), 6.00%, due 3/15/2027 | |
| Cincinnati Bell, Inc., Term Loan B2, (1M CME Term SOFR + 3.25%), 7.08%, due 11/22/2028 | |
| Connect Finco Sarl, Term Loan B, (1M USD LIBOR + 3.50%), 7.26%, due 12/11/2026 | |
| Consolidated Communications, Inc., Term Loan B, (1M USD LIBOR + 3.50%), 7.31%, due 10/2/2027 | |
| Frontier Communications Corp., First Lien Term Loan, (3M USD LIBOR + 3.75%), 7.44%, due 5/1/2028 | |
| GTT Communications, Inc., Term Loan B, (3M USD LIBOR + 3.75%), 10.00%, due 5/31/2025 | |
| Telesat Canada, Term Loan B5, (3M USD LIBOR + 2.75%), 7.17%, due 12/7/2026 | |
| ViaSat, Inc., Term Loan, (1M CME Term SOFR + 4.50%), 8.34%, due 3/2/2029 | |
| Voyage Australia Pty Limited, Term Loan B, (3M USD LIBOR + 3.50%), 7.74%, due 7/20/2028 | |
| Zayo Group Holdings, Inc. | |
| Term Loan, (1M USD LIBOR + 3.00%), 6.75%, due 3/9/2027 | |
| Term Loan B, (1M CME Term SOFR + 4.25%), 7.98%, due 3/9/2027 | |
| | |
|
| ASP Dream Acquisition Co., LLC, Term Loan B, (1M CME Term SOFR + 4.25%), 8.08%, due 12/15/2028 | |
See Notes to Financial Statements
Schedule of Investments Floating Rate Income Fund^ (cont’d)
| |
|
|
| | |
| Term Loan, (6M USD LIBOR + 4.50%), 7.38%, due 5/7/2028 | |
| Second Lien Term Loan, (3M USD LIBOR + 7.50%), 10.38%, due 5/7/2029 | |
| Latam Airlines Group S.A., Term Loan B, due 10/11/2027 | |
| Worldwide Express Operations, LLC | |
| First Lien Term Loan, (3M USD LIBOR + 4.00%), 7.67%, due 7/26/2028 | |
| Second Lien Term Loan, (3M USD LIBOR + 7.00%), 10.67%, due 7/26/2029 | |
| | |
|
| APLP Holdings Limited Partnership, Term Loan B, (3M USD LIBOR + 3.75%), 7.40%, due 5/14/2027 | |
| Artera Services, LLC, Term Loan, (3M USD LIBOR + 3.50%), 7.17%, due 3/6/2025 | |
| Astoria Energy LLC, Term Loan B, (1M USD LIBOR + 3.50%), 7.26%, due 12/10/2027 | |
| CPV Maryland Holding Company II, LLC, Term Loan B, (1M USD LIBOR + 4.00%), 7.75%, due 5/11/2028 | |
| Eastern Power, LLC, Term Loan B, (3M USD LIBOR + 3.75%), 7.42%, due 10/2/2025 | |
| Edgewater Generation, L.L.C., Term Loan, (1M USD LIBOR + 3.75%), 7.50%, due 12/13/2025 | |
| EFS Cogen Holdings I LLC, Term Loan B, (1M USD LIBOR + 3.50%, 3M USD LIBOR + 3.50%), 7.18% – 7.26%, due 10/1/2027 | |
| Granite Generation LLC, Term Loan B, (1M USD LIBOR + 3.75%), 7.50%, due 11/9/2026 | |
| Kestrel Acquisition, LLC, Term Loan B, (1M USD LIBOR + 4.25%), 8.01%, due 6/2/2025 | |
| | |
| Term Loan B, (3M SOFR + 5.75%), 9.48%, due 2/1/2027 | |
| Term Loan C, (3M SOFR + 5.75%), 9.48%, due 2/1/2027 | |
| Lonestar II Generation Holdings LLC | |
| Term Loan B, (1M USD LIBOR + 5.00%), 8.75%, due 4/20/2026 | |
| Term Loan C, (1M USD LIBOR + 5.00%), 8.75%, due 4/20/2026 | |
| Nautilus Power, LLC, Term Loan B, (1M USD LIBOR + 4.25%), 8.00%, due 5/16/2024 | |
| Osmose Utilities Services, Inc., Term Loan, (1M USD LIBOR + 3.25%), 6.88%, due 6/23/2028 | |
| | |
| Term Loan, (1M USD LIBOR + 3.50%), 7.25%, due 5/12/2028 | |
| Second Lien Term Loan, (1M USD LIBOR + 6.50%), 10.25%, due 5/14/2029 | |
| West Deptford Energy Holdings, LLC, Term Loan B, (1M USD LIBOR + 3.75%), 7.50%, due 8/3/2026 | |
| | |
Total Loan Assignments (Cost $427,633,322) | |
|
|
Cable & Satellite Television 0.2% |
| DISH Network Corp., 2.38%, due 3/15/2024 (Cost $1,242,703) | |
| |
|
|
Business Equipment & Services 0.1% |
| | |
|
| Riverbed Technology, Inc. | |
See Notes to Financial Statements
Schedule of Investments Floating Rate Income Fund^ (cont’d)
| |
|
|
| | |
|
| iHeartMedia, Inc. Class A | |
Total Common Stocks (Cost $1,056,613) | |
|
Short-Term Investments 6.0% |
Investment Companies 6.0% |
| State Street Institutional U.S. Government Money Market Fund Premier Class, 3.01%(p) (Cost $27,732,171) | |
Total Investments 101.2% (Cost $500,596,346) | |
Liabilities Less Other Assets (1.2)% | |
| |
| Non-income producing security. |
| Securities were purchased under Rule 144A of the Securities Act of 1933, as amended, or are otherwise restricted and, unless registered under the Securities Act of 1933 or exempted from registration, may only be sold to qualified institutional investors or may have other restrictions on resale. At October 31, 2022, these securities amounted to $32,476,613, which represents 7.0% of net assets of the Fund. |
| Variable or floating rate security. The interest rate shown was the current rate as of October 31, 2022 and changes periodically. |
| Security issued at a fixed coupon rate, which converts to a variable rate at a future date. Rate shown is the rate in effect as of period end. |
| Perpetual security. Perpetual securities have no stated maturity date, but they may be called/redeemed by the issuer. The date shown reflects the next call date. |
| Payment-in-kind (PIK) security. |
| Security fair valued as of October 31, 2022 in accordance with procedures approved by the valuation designee. Total value of all such securities at October 31, 2022 amounted to $2,294,959, which represents 0.5% of net assets of the Fund. |
| All or a portion of this security had not settled as of October 31, 2022 and thus may not have an interest rate in effect. Interest rates do not take effect until settlement. |
| When-issued security. Total value of all such securities at October 31, 2022 amounted to $1,584,000, which represents 0.3% of net assets of the Fund. |
| Value determined using significant unobservable inputs. |
| Security exempt from registration pursuant to Regulation S under the Securities Act of 1933, as amended. Regulation S applies to securities offerings that are made outside of the United States and do not involve directed selling efforts in the United States and as such may have restrictions on resale. Total value of all such securities at October 31, 2022 amounted to $774,774, which represents 0.2% of net assets of the Fund. |
| The stated interest rates represent the range of rates at October 31, 2022 of the underlying contracts within the Loan Assignment. |
| All or a portion of this security was purchased on a delayed delivery basis. |
See Notes to Financial Statements
Schedule of Investments Floating Rate Income Fund^ (cont’d)
| All or a portion of this security had not settled as of October 31, 2022 and thus may not have an interest rate in effect. Interest rates do not take effect until settlement. |
| |
| Represents less than 0.05% of net assets of the Fund. |
| Represents 7-day effective yield as of October 31, 2022. |
| As of October 31, 2022, the value of unfunded loan commitments was $1,025,938 for the Fund (see Note A of the Notes to Financial Statements). |
# These securities have been deemed by Management to be illiquid, and are subject to restrictions on resale. At October 31, 2022, these securities amounted to $710,959, which represents 0.2% of net assets of the Fund. Acquisition dates shown with a range, if any, represent securities that were acquired over the period shown in the table.
| | | | Fair Value
Percentage
of Net Assets
as of
10/31/2022 |
| | | | |
Brock Holdings Notes 2022 | | | | |
| | | | |
|
| | |
| | |
| | |
| | |
| | |
| | |
| | |
| | |
| | |
| | |
| | |
| | |
| | |
| | |
| | |
| | |
| | |
| | |
Short-Term Investments and Other Liabilities—Net | | |
| | |
See Notes to Financial Statements
Schedule of Investments Floating Rate Income Fund^ (cont’d)
Derivative Instruments
At October 31, 2022, the Fund did not have any outstanding total return swaps.
For the year ended October 31, 2022, the average notional value for the months where the Fund had total return swaps outstanding was $21,204,669 for long positions.
The following is a summary, categorized by Level (see Note A of the Notes to Financial Statements), of inputs used to value the Fund’s investments as of October 31, 2022:
| | | | |
| | | | |
| | | | |
| | | | |
Investments & Misc. Financial Services | | | | |
| | | | |
| | | | |
| | | | |
| | | | |
| | | | |
| | | | |
Business Equipment & Services | | | | |
| | | | |
| | | | |
| | | | |
Diversified Financial Services | | | | |
Ecological Services & Equipment | | | | |
| | | | |
| | | | |
| | | | |
| | | | |
| | | | |
| | | | |
Leisure Goods - Activities - Movies | | | | |
| | | | |
| | | | |
| | | | |
| | | | |
| | | | |
| | | | |
| | | | |
Business Equipment & Services | | | | |
| | | | |
| | | | |
| | | | |
| | | | |
| | | | |
| | | | |
| The Schedule of Investments provides information on the industry or sector categorization as well as a Positions by Country summary. |
See Notes to Financial Statements
Schedule of Investments Floating Rate Income Fund^ (cont’d)
| The following is a reconciliation between the beginning and ending balances of investments in which unobservable inputs (Level 3) were used in determining value: |
| Beginning
balance as
of 11/1/2021 | Accrued
discounts/
(premiums) | | Change
in unrealized
appreciation/
(depreciation) | | | | | | Net change in
unrealized
appreciation/
(depreciation)
from
investments
still held as of
10/31/2022 |
Investments in
Securities: | | | | | | | | | | |
| | | | | | | | | | |
| | | | | | | | | | |
| | | | | | | | | | |
| | | | | | | | | | |
(1) Quantitative Information about Level 3 Fair Value Measurements: |
| | | | | | Impact to
valuation
from
increase
in input(b) |
| | | Enterprise value/
EBITDA multiple(c) (EV/EBITDA) | | | |
| | | | | | |
(a) The weighted averages disclosed in the table above were weighted by relative fair value. |
(b) Represents the expected directional change in the fair value of the Level 3 investments that would result from an increase or decrease in the corresponding input. Significant changes in these inputs could result in significantly higher or lower fair value measurements. |
(c) Represents amounts used when the reporting entity has determined that market participants would use such multiples when pricing the investments. |
(2) Securities categorized as Level 3 were valued using a single quotation obtained from a dealer. The Fund does not have access to unobservable inputs and therefore cannot disclose such inputs used in formulating such quotation. |
^
A balance indicated with a "—", reflects either a zero balance or an amount that rounds to less than 1.
See Notes to Financial Statements
Schedule of Investments High Income Bond Fund^
October 31, 2022
| |
Asset-Backed Securities 0.9% | |
| | 37 Capital CLO Ltd., Ser. 2021-1A, Class E, (3M USD LIBOR + 7.20%), 11.28%, due 10/15/2034 | |
| | AIG CLO Ltd., Ser. 2019-1A, Class ER, (3M CME Term SOFR + 6.70%), 10.63%, due 4/18/2035 | |
| | Barings CLO Ltd., Ser. 2017-1A, Class E, (3M USD LIBOR + 6.00%), 10.19%, due 7/18/2029 | |
| | Bristol Park CLO Ltd., Ser. 2016-1A, Class ER, (3M USD LIBOR + 7.00%), 11.08%, due 4/15/2029 | |
| | Crown City CLO II, Ser. 2020-2A, Class DR, (3M CME Term SOFR + 7.11%), 11.07%, due 4/20/2035 | |
| | Galaxy XV CLO Ltd., Ser. 2013-15A, Class ER, (3M USD LIBOR + 6.65%), 10.72%, due 10/15/2030 | |
| | Gilbert Park CLO Ltd., Ser. 2017-1A, Class E, (3M USD LIBOR + 6.40%), 10.48%, due 10/15/2030 | |
| | Post CLO Ltd., Ser. 2018-1A, Class E, (3M USD LIBOR + 5.87%), 9.95%, due 4/16/2031 | |
| | Sandstone Peak Ltd., Ser. 2021-1A, Class E, (3M USD LIBOR + 6.80%), 10.88%, due 10/15/2034 | |
| | Voya CLO Ltd., Ser. 2019-2A, Class E, (3M USD LIBOR + 6.60%), 10.84%, due 7/20/2032 | |
Total Asset-Backed Securities (Cost $8,558,451) | |
|
|
| |
| | | |
| | | |
| | | |
| | | |
| | | |
| |
| | American Airlines, Inc./AAdvantage Loyalty IP Ltd. | |
| | | |
| | | |
| | | |
| | | |
| | | |
| | | |
| | | |
| | | |
| | VistaJet Malta Finance PLC/XO Management Holding, Inc. | |
| | | |
| | | |
| | | |
| |
| | Ford Motor Credit Co. LLC | |
| | | |
| | | |
| | | |
| | | |
| | | |
Auto Parts & Equipment 0.6% | |
| | Adient Global Holdings Ltd., 4.88%, due 8/15/2026 | |
| | Dana, Inc., 4.50%, due 2/15/2032 | |
| | Goodyear Tire & Rubber Co. | |
| | | |
| | | |
See Notes to Financial Statements
Schedule of Investments High Income Bond Fund^ (cont’d)
| |
|
Auto Parts & Equipment – cont'd | |
| | IHO Verwaltungs GmbH, 6.38% Cash/7.13% PIK, due 5/15/2029 | |
| | | |
| |
| | | |
| | | |
| | | |
| | | |
| | Jaguar Land Rover Automotive PLC | |
| | | |
| | | |
| | | |
| |
| | Bank of America Corp., Ser. TT, 6.13%, due 4/27/2027 | |
| | JPMorgan Chase & Co., Ser. HH, 4.60%, due 2/1/2025 | |
| | PNC Financial Services Group, Inc., Ser. T, 3.40%, due 9/15/2026 | |
| | Truist Financial Corp., Ser. P, 4.95%, due 9/1/2025 | |
| | | |
| |
| | | |
| | | |
| | | |
| | | |
Building & Construction 1.4% | |
| | Global Infrastructure Solutions, Inc. | |
| | | |
| | | |
| | KB Home, 7.25%, due 7/15/2030 | |
| | | |
| | | |
| | | |
| | MDC Holdings, Inc., 2.50%, due 1/15/2031 | |
| | Toll Brothers Finance Corp., 3.80%, due 11/1/2029 | |
| | Tri Pointe Homes, Inc., 5.25%, due 6/1/2027 | |
| | | |
| |
| | Advanced Drainage Systems, Inc., 6.38%, due 6/15/2030 | |
| | Builders FirstSource, Inc. | |
| | | |
| | | |
| | Camelot Return Merger Sub, Inc., 8.75%, due 8/1/2028 | |
| | Cornerstone Building Brands, Inc., 6.13%, due 1/15/2029 | |
| | | |
| | | |
| | | |
| | Masonite Int'l Corp., 5.38%, due 2/1/2028 | |
| | MIWD Holdco II LLC/MIWD Finance Corp., 5.50%, due 2/1/2030 | |
| | Standard Industries, Inc., 4.38%, due 7/15/2030 | |
| | | |
See Notes to Financial Statements
Schedule of Investments High Income Bond Fund^ (cont’d)
| |
|
Cable & Satellite Television 4.2% | |
| | CCO Holdings LLC/CCO Holdings Capital Corp. | |
| | | |
| | | |
| | | |
| | | |
| | | |
| | | |
| | | |
| | Charter Communications Operating LLC/Charter Communications Operating Capital, 3.90%, due 6/1/2052 | |
| | | |
| | | |
| | | |
| | | |
| | | |
| | | |
| | | |
| | | |
| | Radiate Holdco LLC/Radiate Finance, Inc., 6.50%, due 9/15/2028 | |
| | | |
| |
| | Avient Corp., 7.13%, due 8/1/2030 | |
| | Axalta Coating Systems LLC/Axalta Coating Systems Dutch Holding B BV, 4.75%, due 6/15/2027 | |
| | Cheever Escrow Issuer LLC, 7.13%, due 10/1/2027 | |
| | | |
| | | |
| | | |
| | Olympus Water U.S. Holding Corp. | |
| | | |
| | | |
| | PMHC II, Inc., 9.00%, due 2/15/2030 | |
| | SCIH Salt Holdings, Inc., 6.63%, due 5/1/2029 | |
| | SCIL IV LLC/SCIL USA Holdings LLC, 5.38%, due 11/1/2026 | |
| | Tronox, Inc., 4.63%, due 3/15/2029 | |
| | | |
| | | |
| | | |
| | | |
Consumer - Commercial Lease Financing 3.2% | |
| | AerCap Global Aviation Trust, 6.50%, due 6/15/2045 | |
| | Ally Financial, Inc., 5.75%, due 11/20/2025 | |
| | Avolon Holdings Funding Ltd., 5.25%, due 5/15/2024 | |
| | Global Aircraft Leasing Co. Ltd., 6.50% Cash/7.25% PIK, due 9/15/2024 | |
| | | |
| | | |
| | | |
See Notes to Financial Statements
Schedule of Investments High Income Bond Fund^ (cont’d)
| |
|
Consumer - Commercial Lease Financing – cont'd | |
| | | |
| | | |
| | | |
| | | |
| | | |
| | | |
Diversified Capital Goods 0.3% | |
| | Resideo Funding, Inc., 4.00%, due 9/1/2029 | |
| | Stevens Holding Co, Inc., 6.13%, due 10/1/2026 | |
| | | |
Electric - Generation 2.9% | |
| | | |
| | | |
| | | |
| | | |
| | | |
| | Leeward Renewable Energy Operations LLC, 4.25%, due 7/1/2029 | |
| | | |
| | | |
| | | |
| | Sunnova Energy Corp., 5.88%, due 9/1/2026 | |
| | Vistra Corp., 7.00%, due 12/15/2026 | |
| | Vistra Operations Co. LLC | |
| | | |
| | | |
| | | |
| | | |
| |
| | Amkor Technology, Inc., 6.63%, due 9/15/2027 | |
| | Clarios Global L.P., 6.75%, due 5/15/2025 | |
| | | |
| | | |
| | | |
| | | |
Energy - Exploration & Production 6.0% | |
| | Ascent Resources Utica Holdings LLC/ARU Finance Corp. | |
| | | |
| | | |
| | | |
| | | |
| | | |
| | | |
| | | |
| | Chesapeake Energy Corp., 6.75%, due 4/15/2029 | |
| | Colgate Energy Partners III LLC, 5.88%, due 7/1/2029 | |
| | | |
| | | |
| | | |
See Notes to Financial Statements
Schedule of Investments High Income Bond Fund^ (cont’d)
| |
|
Energy - Exploration & Production – cont'd | |
| | Hilcorp Energy I L.P./Hilcorp Finance Co. | |
| | | |
| | | |
| | | |
| | | |
| | Northern Oil and Gas, Inc., 8.13%, due 3/1/2028 | |
| | Occidental Petroleum Corp. | |
| | | |
| | | |
| | Rockcliff Energy II LLC, 5.50%, due 10/15/2029 | |
| | Southwestern Energy Co., 4.75%, due 2/1/2032 | |
| | | |
| |
| | Performance Food Group, Inc. | |
| | | |
| | | |
| | Pilgrim's Pride Corp., 4.25%, due 4/15/2031 | |
| | | |
| | | |
| | | |
| | | |
Food & Drug Retailers 0.2% | |
| | Albertsons Cos., Inc./Safeway, Inc./New Albertsons LP/Albertsons LLC | |
| | | |
| | | |
| | | |
| |
| | Ahlstrom-Munksjo Holding 3 Oy, 4.88%, due 2/4/2028 | |
| | Glatfelter Corp., 4.75%, due 11/15/2029 | |
| | | |
| |
| | Caesars Entertainment, Inc. | |
| | | |
| | | |
| | Churchill Downs, Inc., 5.50%, due 4/1/2027 | |
| | Everi Holdings, Inc., 5.00%, due 7/15/2029 | |
| | Golden Entertainment, Inc., 7.63%, due 4/15/2026 | |
| | Midwest Gaming Borrower LLC, 4.88%, due 5/1/2029 | |
| | Penn Entertainment, Inc., 5.63%, due 1/15/2027 | |
| | Raptor Acquisition Corp./Raptor Co-Issuer LLC, 4.88%, due 11/1/2026 | |
| | SC Games Holdings L.P./U.S. FinCo LLC, 6.63%, due 3/1/2030 | |
| | Wynn Las Vegas LLC/Wynn Las Vegas Capital Corp., 5.50%, due 3/1/2025 | |
| | Wynn Resorts Finance LLC/Wynn Resorts Capital Corp., 5.13%, due 10/1/2029 | |
| | | |
See Notes to Financial Statements
Schedule of Investments High Income Bond Fund^ (cont’d)
| |
|
| |
| | Antero Midstream Partners L.P./Antero Midstream Finance Corp. | |
| | | |
| | | |
| | | |
| | | |
| | | |
| | | |
| | | |
| | | |
| | Crestwood Midstream Partners L.P./Crestwood Midstream Finance Corp. | |
| | | |
| | | |
| | | |
| | | |
| | DCP Midstream LLC, 5.85%, due 5/21/2043 | |
| | DT Midstream, Inc., 4.13%, due 6/15/2029 | |
| | EnLink Midstream LLC, 6.50%, due 9/1/2030 | |
| | EnLink Midstream Partners L.P. | |
| | | |
| | | |
| | | |
| | EQM Midstream Partners L.P. | |
| | | |
| | | |
| | | |
| | | |
| | | |
| | EQT Midstream Partners L.P. | |
| | | |
| | | |
| | Genesis Energy L.P./Genesis Energy Finance Corp. | |
| | | |
| | | |
| | | |
| | | |
| | Harvest Midstream I L.P., 7.50%, due 9/1/2028 | |
| | Howard Midstream Energy Partners LLC, 6.75%, due 1/15/2027 | |
| | ITT Holdings LLC, 6.50%, due 8/1/2029 | |
| | Kinetik Holdings L.P., 5.88%, due 6/15/2030 | |
| | New Fortress Energy, Inc. | |
| | | |
| | | |
| | Solaris Midstream Holdings LLC, 7.63%, due 4/1/2026 | |
| | Summit Midstream Holdings LLC, 8.50%, due 10/15/2026 | |
| | Summit Midstream Holdings LLC/Summit Midstream Finance Corp. | |
| | | |
| | | |
See Notes to Financial Statements
Schedule of Investments High Income Bond Fund^ (cont’d)
| |
|
Gas Distribution – cont'd | |
| | Tallgrass Energy Partners L.P./Tallgrass Energy Finance Corp. | |
| | | |
| | | |
| | | |
| | | |
| | | |
| | | |
| |
| | CHS/Community Health Systems, Inc. | |
| | | |
| | | |
| | | |
| | | |
| | Encompass Health Corp., 4.50%, due 2/1/2028 | |
| | | |
| | | |
| | | |
| | Select Medical Corp., 6.25%, due 8/15/2026 | |
| | Surgery Center Holdings, Inc., 10.00%, due 4/15/2027 | |
| | | |
| | | |
| | | |
| | | |
| |
| | Consensus Cloud Solutions, Inc. | |
| | | |
| | | |
| | | |
| | | |
| | | |
| | Envision Healthcare Corp., 8.75%, due 10/15/2026 | |
| | Team Health Holdings, Inc., 6.38%, due 2/1/2025 | |
| | U.S. Acute Care Solutions LLC, 6.38%, due 3/1/2026 | |
| | Verscend Escrow Corp., 9.75%, due 8/15/2026 | |
| | | |
| |
| | Hilton Domestic Operating Co., Inc., 4.88%, due 1/15/2030 | |
| | Park Intermediate Holdings LLC/PK Domestic Property LLC/PK Finance Co-Issuer, 7.50%, due 6/1/2025 | |
| | Wyndham Hotels & Resorts, Inc., 4.38%, due 8/15/2028 | |
| | | |
| |
| | Alliant Holdings Intermediate LLC/Alliant Holdings Co-Issuer, 6.75%, due 10/15/2027 | |
| | AmWINS Group, Inc., 4.88%, due 6/30/2029 | |
| | | |
| | | |
| | | |
| | BroadStreet Partners, Inc., 5.88%, due 4/15/2029 | |
See Notes to Financial Statements
Schedule of Investments High Income Bond Fund^ (cont’d)
| |
|
Insurance Brokerage – cont'd | |
| | GTCR AP Finance, Inc., 8.00%, due 5/15/2027 | |
| | | |
Investments & Misc. Financial Services 0.8% | |
| | Bank of New York Mellon Corp., Ser. H, 3.70%, due 3/20/2026 | |
| | CQP Holdco L.P./BIP-V Chinook Holdco LLC, 5.50%, due 6/15/2031 | |
| | MoneyGram Int'l, Inc., 5.38%, due 8/1/2026 | |
| | | |
| | | |
| | | |
| | | |
| |
| | Granite U.S. Holdings Corp., 11.00%, due 10/1/2027 | |
| | Shea Homes L.P./Shea Homes Funding Corp., 4.75%, due 2/15/2028 | |
| | SPX FLOW, Inc., 8.75%, due 4/1/2030 | |
| | Terex Corp., 5.00%, due 5/15/2029 | |
| | | |
| |
| | | |
| | | |
| | | |
| | | |
| | HealthEquity, Inc., 4.50%, due 10/1/2029 | |
| | Molina Healthcare, Inc., 3.88%, due 5/15/2032 | |
| | MPH Acquisition Holdings LLC | |
| | | |
| | | |
| | | |
| |
| | Diamond Sports Group LLC/Diamond Sports Finance Co., 5.38%, due 8/15/2026 | |
| | iHeartCommunications, Inc., 6.38%, due 5/1/2026 | |
| | | |
| | | |
| | | |
| | | |
| | | |
| | | |
| | WMG Acquisition Corp., 3.88%, due 7/15/2030 | |
| | | |
| |
| | 180 Medical, Inc., 3.88%, due 10/15/2029 | |
| | | |
| | | |
| | | |
| | | |
Metals - Mining Excluding Steel 0.4% | |
| | First Quantum Minerals Ltd., 6.88%, due 10/15/2027 | |
| | FMG Resources August 2006 Pty Ltd., 4.38%, due 4/1/2031 | |
See Notes to Financial Statements
Schedule of Investments High Income Bond Fund^ (cont’d)
| |
|
Metals - Mining Excluding Steel – cont'd | |
| | | |
| | | |
| | | |
| | | |
Oil Field Equipment & Services 0.4% | |
| | Nabors Industries Ltd., 7.25%, due 1/15/2026 | |
| | Nabors Industries, Inc., 7.38%, due 5/15/2027 | |
| | | |
| |
| | Ardagh Metal Packaging Finance USA LLC/Ardagh Metal Packaging Finance PLC | |
| | | |
| | | |
| | Ardagh Packaging Finance PLC/Ardagh Holdings USA, Inc. | |
| | | |
| | | |
| | Ball Corp., 5.25%, due 7/1/2025 | |
| | Berry Global Escrow Corp., 5.63%, due 7/15/2027 | |
| | BWAY Holding Co., 7.25%, due 4/15/2025 | |
| | Canpack SA/Canpack US LLC, 3.13%, due 11/1/2025 | |
| | Crown Americas LLC/Crown Americas Capital Corp. V, 4.25%, due 9/30/2026 | |
| | Graham Packaging Co., Inc., 7.13%, due 8/15/2028 | |
| | Intelligent Packaging Ltd. Finco, Inc./Intelligent Packaging Ltd. Co-Issuer LLC, 6.00%, due 9/15/2028 | |
| | Pactiv Evergreen Group Issuer LLC/Pactiv Evergreen Group Issuer, Inc., 4.38%, due 10/15/2028 | |
| | Pactiv Evergreen Group Issuer, Inc./Pactiv Evergreen Group Issuer LLC/Reynolds Group Issuer, Inc., 4.00%, due 10/15/2027 | |
| | Trident TPI Holdings, Inc., 9.25%, due 8/1/2024 | |
| | Trivium Packaging Finance BV | |
| | | |
| | | |
| | | |
Personal & Household Products 0.3% | |
| | CD&R Smokey Buyer, Inc., 6.75%, due 7/15/2025 | |
| | Diamond BC BV, 4.63%, due 10/1/2029 | |
| | | |
| |
| | Grifols Escrow Issuer SA, 4.75%, due 10/15/2028 | |
| | Organon & Co./Organon Foreign Debt Co-Issuer BV, 5.13%, due 4/30/2031 | |
| | | |
Printing & Publishing 0.4% | |
| | | |
| | | |
| | | |
| | | |
See Notes to Financial Statements
Schedule of Investments High Income Bond Fund^ (cont’d)
| |
|
Real Estate Development & Management 1.2% | |
| | Realogy Group LLC/Realogy Co-Issuer Corp. | |
| | | |
| | | |
| | | |
Real Estate Investment Trusts 3.3% | |
| | American Finance Trust, Inc./American Finance Operating Partner L.P., 4.50%, due 9/30/2028 | |
| | Blackstone Mortgage Trust, Inc., 3.75%, due 1/15/2027 | |
| | EPR Properties, 3.75%, due 8/15/2029 | |
| | GLP Capital LP/GLP Financing II, Inc., 3.25%, due 1/15/2032 | |
| | Hospitality Properties Trust | |
| | | |
| | | |
| | | |
| | | |
| | | |
| | | |
| | | |
| | | |
| | | |
| | MPT Operating Partnership L.P./MPT Finance Corp. | |
| | | |
| | | |
| | RHP Hotel Properties L.P./RHP Finance Corp., 4.50%, due 2/15/2029 | |
| | RLJ Lodging Trust L.P., 4.00%, due 9/15/2029 | |
| | Starwood Property Trust, Inc., 3.75%, due 12/31/2024 | |
| | VICI Properties L.P., 5.63%, due 5/15/2052 | |
| | VICI Properties LP/VICI Note Co, Inc., 4.13%, due 8/15/2030 | |
| | XHR L.P., 6.38%, due 8/15/2025 | |
| | | |
| |
| | | |
| | | |
| | | |
| | Carnival Holdings Bermuda Ltd., 10.38%, due 5/1/2028 | |
| | Cedar Fair L.P./Canada's Wonderland Co./Magnum Management Corp./Millennium Op, 6.50%, due 10/1/2028 | |
| | Lindblad Expeditions LLC, 6.75%, due 2/15/2027 | |
| | Motion Bondco Designated Activity Co., 6.63%, due 11/15/2027 | |
| | | |
| | | |
| | | |
| | | |
| | Royal Caribbean Cruises Ltd., 5.50%, due 4/1/2028 | |
| | Six Flags Entertainment Corp. | |
| | | |
| | | |
| | | |
See Notes to Financial Statements
Schedule of Investments High Income Bond Fund^ (cont’d)
| |
|
| |
| | 1011778 BC ULC/New Red Finance, Inc. | |
| | | |
| | | |
| | Legends Hospitality Holding Co. LLC/Legends Hospitality Co-Issuer, Inc., 5.00%, due 2/1/2026 | |
| | | |
| |
| | Ahead DB Holdings LLC, 6.63%, due 5/1/2028 | |
| | Central Parent, Inc./Central Merger Sub, Inc., 7.25%, due 6/15/2029 | |
| | Condor Merger Sub, Inc., 7.38%, due 2/15/2030 | |
| | Endurance Int'l Group Holdings, Inc., 6.00%, due 2/15/2029 | |
| | Fair Isaac Corp., 5.25%, due 5/15/2026 | |
| | Match Group, Inc., 5.63%, due 2/15/2029 | |
| | | |
| | | |
| | | |
| | | |
| | | |
| | | |
| | Open Text Holdings, Inc., 4.13%, due 12/1/2031 | |
| | Presidio Holdings, Inc., 8.25%, due 2/1/2028 | |
| | Rackspace Technology Global, Inc. | |
| | | |
| | | |
| | VM Consolidated, Inc., 5.50%, due 4/15/2029 | |
| | Ziff Davis, Inc., 4.63%, due 10/15/2030 | |
| | | |
| |
| | Asbury Automotive Group, Inc., 4.63%, due 11/15/2029 | |
| | Foot Locker, Inc., 4.00%, due 10/1/2029 | |
| | Gap, Inc., 3.63%, due 10/1/2029 | |
| | Ken Garff Automotive LLC, 4.88%, due 9/15/2028 | |
| | LCM Investments Holdings II LLC, 4.88%, due 5/1/2029 | |
| | | |
Steel Producers - Products 0.9% | |
| | Allegheny Technologies, Inc., 5.88%, due 12/1/2027 | |
| | Allegheny Technologies, Inc., 4.88%, due 10/1/2029 | |
| | Carpenter Technology Corp., 7.63%, due 3/15/2030 | |
| | TMS Int'l Corp., 6.25%, due 4/15/2029 | |
| | | |
| |
| | Allied Universal Holdco LLC/Allied Universal Finance Corp., 6.00%, due 6/1/2029 | |
| | APi Escrow Corp., 4.75%, due 10/15/2029 | |
| | APi Group DE, Inc., 4.13%, due 7/15/2029 | |
| | | |
| | | |
| | | |
| | Aramark Services, Inc., 5.00%, due 2/1/2028 | |
| | ASGN, Inc., 4.63%, due 5/15/2028 | |
See Notes to Financial Statements
Schedule of Investments High Income Bond Fund^ (cont’d)
| |
|
Support - Services – cont'd | |
| | Avis Budget Car Rental LLC/Avis Budget Finance, Inc. | |
| | | |
| | | |
| | BCPE Empire Holdings, Inc., 7.63%, due 5/1/2027 | |
| | Beacon Roofing Supply, Inc., 4.50%, due 11/15/2026 | |
| | Clarivate Science Holdings Corp., 4.88%, due 7/1/2029 | |
| | Garda World Security Corp. | |
| | | |
| | | |
| | GYP Holdings III Corp., 4.63%, due 5/1/2029 | |
| | | |
| | | |
| | | |
| | KAR Auction Services, Inc., 5.13%, due 6/1/2025 | |
| | Korn/Ferry Int'l, 4.63%, due 12/15/2027 | |
| | PECF USS Intermediate Holding III Corp., 8.00%, due 11/15/2029 | |
| | Prime Security Services Borrower LLC/Prime Finance, Inc. | |
| | | |
| | | |
| | SRS Distribution, Inc., 6.13%, due 7/1/2029 | |
| | Summer BC Bidco B LLC, 5.50%, due 10/31/2026 | |
| | United Rentals N.A., Inc. | |
| | | |
| | | |
| | | |
| | Univar Solutions USA, Inc., 5.13%, due 12/1/2027 | |
| | White Cap Parent LLC, 8.25% Cash/9.00% PIK, due 3/15/2026 | |
| | ZipRecruiter, Inc., 5.00%, due 1/15/2030 | |
| | | |
Technology Hardware & Equipment 1.5% | |
| | Ciena Corp. Co., 4.00%, due 1/31/2030 | |
| | CommScope Technologies LLC | |
| | | |
| | | |
| | | |
| | | |
| | | |
| | Imola Merger Corp., 4.75%, due 5/15/2029 | |
| | | |
| |
| | | |
| | | |
| | | |
| | | |
| | | |
| | | |
| | | |
| | | |
| | | |
| | | |
See Notes to Financial Statements
Schedule of Investments High Income Bond Fund^ (cont’d)
| |
|
Telecom - Wireline Integrated & Services 6.4% | |
| | Altice France Holding SA, 6.00%, due 2/15/2028 | |
| | Altice France SA, 5.50%, due 1/15/2028 | |
| | Cablevision Lightpath LLC, 5.63%, due 9/15/2028 | |
| | Consolidated Communications, Inc. | |
| | | |
| | | |
| | Frontier Communications Corp. | |
| | | |
| | | |
| | | |
| | | |
| | | |
| | | |
| | | |
| | | |
| | | |
| | | |
| | | |
| | | |
| | Lumen Technologies, Inc., 4.50%, due 1/15/2029 | |
| | Northwest Fiber LLC/Northwest Fiber Finance Sub, Inc. | |
| | | |
| | | |
| | | |
| | Telecom Italia Capital SA | |
| | | |
| | | |
| | Uniti Group L.P./Uniti Fiber Holdings, Inc./CSL Capital LLC, 7.88%, due 2/15/2025 | |
| | Uniti Group L.P./Uniti Group Finance, Inc./CSL Capital LLC, 6.50%, due 2/15/2029 | |
| | Vmed O2 UK Financing I PLC, 4.75%, due 7/15/2031 | |
| | Zayo Group Holdings, Inc., 6.13%, due 3/1/2028 | |
| | | |
Theaters & Entertainment 0.5% | |
| | Live Nation Entertainment, Inc. | |
| | | |
| | | |
| | | |
Total Corporate Bonds (Cost $828,734,716) | |
|
|
| |
| | Tenneco, Inc., Term Loan B, (1M USD LIBOR + 3.00%), 6.21%, due 10/1/2025 | |
Business Equipment & Services 0.1% | |
| | Cyxtera DC Holdings, Inc., Term Loan B, (3M USD LIBOR + 3.00%), 7.36%, due 5/1/2024 | |
Chemicals & Plastics 0.1% | |
| | Ineos US Finance LLC, Term Loan B, (1M USD LIBOR + 2.00%), 5.75%, due 4/1/2024 | |
Containers & Glass Products 0.3% | |
| | BWAY Holding Company, Term Loan B, (1M USD LIBOR + 3.25%), 6.38%, due 4/3/2024 | |
See Notes to Financial Statements
Schedule of Investments High Income Bond Fund^ (cont’d)
| |
|
Containers & Glass Products – cont'd | |
| | Trident TPI Holdings, Inc., Term Loan B1, (3M USD LIBOR + 3.25%), 6.92%, due 10/17/2024 | |
| | | |
Diversified Insurance 0.3% | |
| | Gainwell Acquisition Corp., Term Loan B, (3M USD LIBOR + 4.00%), 7.67%, due 10/1/2027 | |
Financial Intermediaries 0.2% | |
| | Asurion LLC, Term Loan B7, (1M USD LIBOR + 3.00%), 6.75%, due 11/3/2024 | |
| |
| | Parexel Int'l Corporation, Second Lien Term Loan, (1M USD LIBOR + 6.50%), 10.25%, due 11/15/2029 | |
| | RegionalCare Hospital Partners Holdings, Inc., Term Loan B, (3M USD LIBOR + 3.75%), 8.16%, due 11/16/2025 | |
| | Team Health Holdings, Inc., Term Loan B, (1M SOFR + 5.25%), 8.98%, due 3/2/2027 | |
| | Verscend Holding Corp., Term Loan B, (1M USD LIBOR + 4.00%), 7.75%, due 8/27/2025 | |
| | | |
Nonferrous Metals - Minerals 0.3% | |
| | U.S. Silica Company, Term Loan B, (1M USD LIBOR + 4.00%), 7.81%, due 5/1/2025 | |
| |
| | Prairie ECI Acquiror LP, Term Loan B, (1M USD LIBOR + 4.75%), 8.50%, due 3/11/2026 | |
| | Waterbridge Midstream Operating LLC, Term Loan B, (3M USD LIBOR + 5.75%), 9.13%, due 6/22/2026 | |
| | | |
Retailers (except food & drug) 0.3% | |
| | Great Outdoors Group, LLC, Term Loan B1, (1M USD LIBOR + 3.75%), 7.50%, due 3/6/2028 | |
| |
| | | |
| | Term Loan B, (3M SOFR + 5.75%), 9.48%, due 2/1/2027 | |
| | Term Loan C, (3M SOFR + 5.75%), 9.48%, due 2/1/2027 | |
| | | |
Total Loan Assignments (Cost $34,793,122) | |
|
|
Cable & Satellite Television 0.5% | |
| | DISH Network Corp., 3.38%, due 8/15/2026 (Cost $5,215,498) | |
See Notes to Financial Statements
Schedule of Investments High Income Bond Fund^ (cont’d)
| |
|
Short-Term Investments 7.5% |
Investment Companies 7.5% | |
| | State Street Institutional U.S. Government Money Market Fund Premier Class, 3.01%(k) (Cost $63,660,981) | |
Total Investments 99.9% (Cost $940,962,768) | |
Other Assets Less Liabilities 0.1% | |
| |
| Securities were purchased under Rule 144A of the Securities Act of 1933, as amended, or are otherwise restricted and, unless registered under the Securities Act of 1933 or exempted from registration, may only be sold to qualified institutional investors or may have other restrictions on resale. At October 31, 2022, these securities amounted to $616,333,507, which represents 73.0% of net assets of the Fund. |
| Variable or floating rate security. The interest rate shown was the current rate as of October 31, 2022 and changes periodically. |
| Payment-in-kind (PIK) security. |
| Security issued at a fixed coupon rate, which converts to a variable rate at a future date. Rate shown is the rate in effect as of period end. |
| Perpetual security. Perpetual securities have no stated maturity date, but they may be called/redeemed by the issuer. The date shown reflects the next call date. |
| Security fair valued as of October 31, 2022 in accordance with procedures approved by the valuation designee. Total value of all such securities at October 31, 2022 amounted to $316,800, which represents 0.0% of net assets of the Fund. |
| All or a portion of this security had not settled as of October 31, 2022 and thus may not have an interest rate in effect. Interest rates do not take effect until settlement. |
| When-issued security. Total value of all such securities at October 31, 2022 amounted to $316,800, which represents 0.0% of net assets of the Fund. |
| All or a portion of this security was purchased on a delayed delivery basis. |
| All or a portion of this security had not settled as of October 31, 2022 and thus may not have an interest rate in effect. Interest rates do not take effect until settlement. |
| Represents 7-day effective yield as of October 31, 2022. |
| Includes the impact of the Fund’s open positions in derivatives at October 31, 2022. |
See Notes to Financial Statements
Schedule of Investments High Income Bond Fund^ (cont’d)
|
| | |
| | |
| | |
| | |
| | |
| | |
| | |
| | |
| | |
| | |
| | |
| | |
| | |
| | |
| | |
| | |
Other countries, each representing less than 0.05% of net assets of the Fund | | |
Short-Term Investments and Other Assets—Net | | |
| | |
Reverse Repurchase Agreements
There were no reverse repurchase agreements outstanding as of October 31, 2022. For the year ended October 31, 2022, the average interest rate paid and the average principal amount for the months where the Fund had reverse repurchase agreements oustanding were 2.00% and $9,025,931, respectively.
See Notes to Financial Statements
Schedule of Investments High Income Bond Fund^ (cont’d)
Derivative Instruments
Total return swap contracts (“total return swaps”)
At October 31, 2022, the Fund had outstanding total return swaps as follows:
Over-the-counter total return swaps—Long(a) |
| | | | | | | Frequency
of Fund
Receipt/
Payment | Unrealized
Appreciation/
(Depreciation) | Accrued
Net
Interest
Receivable/
(Payable) | |
| iBoxx USD Liquid High Yield Index | | | | | | | | | | |
| | | | | | | | | | | |
| The Fund pays a specified rate based on a reference rate plus or minus a spread, and receives the total return on the reference entity. |
| Effective rate at October 31, 2022. |
For the year ended October 31, 2022, the average notional value for the months where the Fund had total
return swaps outstanding was $18,056,386 for long positions.
At October 31, 2022, the Fund had cash collateral of $27 deposited in a segregated account for Goldman Sachs International to cover collateral requirements on over-the-counter derivatives.
The following is a summary, categorized by Level (see Note A of the Notes to Financial Statements), of inputs used to value the Fund’s investments as of October 31, 2022:
| The Schedule of Investments provides information on the industry or sector categorization as well as a Positions by Country summary. |
See Notes to Financial Statements
Schedule of Investments High Income Bond Fund^ (cont’d)
| The following is a reconciliation between the beginning and ending balances of investments in which unobservable inputs (Level 3) were used in determining value: |
| Beginning
balance as
of 11/1/2021 | Accrued
discounts/
(premiums) | | Change
in unrealized
appreciation/
(depreciation) | | | | | | Net change in
unrealized
appreciation/
(depreciation)
from
investments
still held as of
10/31/2022 |
Investments in
Securities: | | | | | | | | | | |
| | | | | | | | | | |
| | | | | | | | | | |
(1) At the beginning of the year, these investments were valued in accordance with the procedures approved by the Board of Trustees. The Fund held no Level 3 investments at October 31, 2022. |
The following is a summary, categorized by Level (see Note A of the Notes to Financial Statements), of inputs used to value the Fund’s derivatives as of October 31, 2022:
Other Financial Instruments | | | | |
| | | | |
| | | | |
| | | | |
^
A balance indicated with a "—", reflects either a zero balance or an amount that rounds to less than 1.
See Notes to Financial Statements
Schedule of Investments Municipal High Income Fund^
October 31, 2022
| |
|
| |
| | Black Belt Energy Gas Dist. (Alabama Gas Prepay Gas Supply Rev. Proj. Number 5), (LOC: Morgan Stanley), Ser. 2020-A-1, 4.00%, due 10/1/2049 Putable 10/1/2026 | |
| | Black Belt Energy Gas Dist. (Alabama Gas Prepay Gas Supply Rev. Proj. Number 7), (LOC: Goldman Sachs Group, Inc.), Ser. 2021-C-1, 4.00%, due 12/1/2026 | |
| | Lower Alabama Gas Dist. Rev. (Gas Proj. 2), (LOC: Goldman Sachs Group, Inc.), Ser. 2020, 4.00%, due 12/1/2050 Putable 12/1/2025 | |
| | Sumter Co. Ind. Dev. Au.(Green Bond-Enviva, Inc.), Ser. 2022, 6.00%, due 7/15/2052 Putable 7/15/2032 | |
| | | |
| |
| | American Samoa Econ. Dev. Au. Gen. Rev., 5.00%, due 9/1/2038 | |
| |
| | Maricopa Co. Ind. Dev. Au. Ed. Ref. Rev. (Paradise Sch. Proj. Paragon Management, Inc.), Ser. 2016, 5.00%, due 7/1/2036 | |
| | Maricopa Co. Ind. Dev. Au. Exempt Fac. Rev. (Commercial Metals Co. Proj.), Ser. 2022, 4.00%, due 10/15/2047 | |
| | Navajo Nation Ref. Rev., Ser. 2015-A, 5.00%, due 12/1/2025 | |
| | Phoenix Ind. Dev. Au. Ed. Ref. Rev. (Great Hearts Academies), Ser. 2016-A, 5.00%, due 7/1/2046 | |
| | Pima Co. Ind. Dev. Au. Ed. Ref. Rev. (American Leadership Academy Proj.), Ser. 2015, 5.38%, due 6/15/2035 | |
| | | |
| |
| | Batesville Pub. Facs. Board Hosp. Rev. Ref. (White River Hlth. Sys. Inc.), Ser. 2020, 3.00%, due 6/1/2028 | |
| |
| | California Co. Tobacco Securitization Agcy. Ref. Rev., Ser. 2020-B-1, 5.00%, due 6/1/2049 | |
| | California HFA Muni. Cert. | |
| | Ser. 2019-A, 4.25%, due 1/15/2035 | |
| | Ser. 2021-1-A, 3.50%, due 11/20/2035 | |
| | California Muni. Fin. Au. Charter Sch. Lease Rev. (Santa Rosa Academy Proj.), Ser. 2015, 5.13%, due 7/1/2035 | |
| | California Muni. Fin. Au. Charter Sch. Rev. (John Adams Academics Proj.) | |
| | Ser. 2015-A, 4.50%, due 10/1/2025 | |
| | Ser. 2019-A, 5.00%, due 10/1/2049 | |
| | California Muni. Fin. Au. Charter Sch. Rev. (Palmdale Aerospace Academy Proj.), Ser. 2016, 5.00%, due 7/1/2031 | |
| | California Muni. Fin. Au. Rev. (Baptist Univ.), Ser. 2015-A, 5.00%, due 11/1/2030 | |
| | California St. Poll. Ctrl. Fin. Au. Solid Waste Disp. Rev. (Aemerage Redak Svcs. So. California LLC Proj.), Ser. 2016, 7.00%, due 12/1/2027 | |
| | California St. Poll. Ctrl. Fin. Au. Solid Waste Disp. Rev. (Calplant I Green Bond Proj.), Ser. 2019, 7.50%, due 12/1/2039 | |
| | California St. Poll. Ctrl. Fin. Au. Solid Waste Disp. Rev. (Green Bond-Rialto Bioenergy Fac. LLC, Proj.), Ser. 2019, 7.50%, due 12/1/2040 | |
| | California St. Sch. Fin. Au. Charter Sch. Rev. (Downtown College Prep-Oblig. Group), Ser. 2016, 4.75%, due 6/1/2036 | |
| | California St. Sch. Fin. Au. Charter Sch. Rev. (Rocketship Ed.), Ser. 2016-A, 5.00%, due 6/1/2031 | |
| | California Statewide CDA Rev. Ref. (Lancer Ed. Std. Hsg. Proj.), Ser. 2016-A, 5.00%, due 6/1/2036 | |
| | California Statewide CDA Spec. Tax Rev. Ref. (Comm. Facs. Dist. Number 2007-01 Orinda Wilder Proj.), Ser. 2015, 4.50%, due 9/1/2025 | |
See Notes to Financial Statements
Schedule of Investments Municipal High Income Fund^ (cont’d)
| |
| |
| | Golden St. Tobacco Securitization Corp. Tobacco Settlement Rev. Ref., Ser. 2021-B-2, 0.00%, due 6/1/2066 | |
| | Tobacco Securitization Au. Southern California Tobacco Settlement Rev. Ref. (San Diego Co. Asset Securitization Corp.), Ser. 2019-A, Class 1, 5.00%, due 6/1/2048 | |
| | | |
| |
| | Crystal Crossing Metro. Dist. Ref. G.O., Ser. 2016, 4.50%, due 12/1/2026 | |
| | Denver Hlth. & Hosp. Au. Healthcare Rev. Ref., Ser. 2019-A, 4.00%, due 12/1/2040 | |
| | Littleton Village Metro. Dist. Number 2 Ref. G.O., Ser. 2015, 5.38%, due 12/1/2045 | |
| | Park Creek Metro. Dist. Ref. Tax Allocation Rev. (Sr. Ltd. Prop. Tax Supported) | |
| | Ser. 2015-A, 5.00%, due 12/1/2034 | |
| | Ser. 2015-A, 5.00%, due 12/1/2035 | |
| | Ser. 2015-A, 5.00%, due 12/1/2045 | |
| | Pueblo Urban Tax Increment Rev. Au. (Evraz Proj.), Ser. 2021-A, 4.75%, due 12/1/2045 | |
| | | |
| |
| | Cap. Trust Agcy. Sr. Living Rev. (H-Bay Ministries, Inc. Superior Residences-Third Tier), Ser. 2018-C, 7.50%, due 7/1/2053 | |
| | Cap. Trust Agcy. Sr. Living Rev. (Wonderful Foundations Sch. Proj.), Ser. 2020-A-1, 5.00%, due 1/1/2055 | |
| | Florida Dev. Fin. Corp. Ed. Facs. Rev. Ref. (Pepin Academies, Inc.), Ser. 2016-A, 5.00%, due 7/1/2036 | |
| | Florida St. Dev. Fin. Corp. Ed. Facs. Rev. (Renaissance Charter Sch., Inc. Proj.), Ser. 2015-A, 6.00%, due 6/15/2035 | |
| | Florida St. Hsg. Fin. Corp. Rev., Ser. 2015-1, (GNMA/FNMA/FHLMC Insured), 3.75%, due 7/1/2035 | |
| | Miami Beach Hlth. Fac. Au. (Mount Sinai Med. Ctr. of Florida) | |
| | Ser. 2021-B, 4.00%, due 11/15/2038 | |
| | Ser. 2021-B, 4.00%, due 11/15/2039 | |
| | Village Comm. Dev. Dist. Number 13 Spec. Assessment Rev., Ser. 2019, 3.70%, due 5/1/2050 | |
| | | |
| |
| | DeKalb Co. Hsg. Au. Sr. Living Rev. Ref. (Baptist Retirement Comm. of Georgia Proj.), Ser. 2019-A, 5.13%, due 1/1/2049 | |
| | Main Street Natural Gas, Inc. Gas Supply Rev., Ser. 2022, 4.00%, due 8/1/2052 Putable 11/1/2027 | |
| | Monroe Co. Dev. Au. PCR Rev. (Georgia Pwr. Co. Plant-Scherer Proj.), Ser. 2009, 1.00%, due 7/1/2049 Putable 8/21/2026 | |
| | | |
| |
| | A.B. Won Pat Int'l Arpt. Au. Rev. Ref., Ser. 2023-A, 5.38%, due 10/1/2043 | |
| | Guam Gov't Bus. Privilege Tax Rev. Ref., Ser. 2021-F, 4.00%, due 1/1/2036 | |
| | Guam Pwr. Au. Rev., Ser. 2022-A, 5.00%, due 10/1/2034 | |
| | | |
| |
| | Hawaii St. Dept. of Budget & Fin. Spec. Purp. Rev. Ref., Ser. 2015-A, 5.00%, due 1/1/2035 | |
| |
| | | |
| | Ser. 2019-A, 5.00%, due 1/1/2044 | |
| | Ser. 2019-A, 5.50%, due 1/1/2049 | |
| | Chicago O'Hare Int'l Arpt. Rev. Ref., Ser. 2015-A, 5.00%, due 1/1/2028 | |
| | Chicago O'Hare Int'l Arpt. Spec. Fac. Rev. (Trips Obligated Group), Ser. 2018, 5.00%, due 7/1/2048 | |
See Notes to Financial Statements
Schedule of Investments Municipal High Income Fund^ (cont’d)
| |
| |
| | Chicago Ref. G.O., Ser. 2021-A, 4.00%, due 1/1/2035 | |
| | Chicago Wastewater Rev. (Second Lien Proj.), Ser. 2014, 5.00%, due 11/1/2027 | |
| | Chicago Wastewater Transmission Rev. Ref. (Second Lien), Ser. 2008-C, 5.00%, due 1/1/2039 | |
| | Illinois Fin. Au. Charter Sch. Rev. (Intrinsic Sch.-Belmont Sch. Proj.), Ser. 2015-A, 5.75%, due 12/1/2035 | |
| | Illinois Fin. Au. Rev. Ref. (Rosalind Franklin Univ. of Medicine & Science), Ser. 2017-A, 5.00%, due 8/1/2047 | |
| | | |
| | Ser. 2020, 5.75%, due 5/1/2045 | |
| | Ser. 2021-A, 5.00%, due 3/1/2046 | |
| | Upper Illinois River Valley Dev. Au. Rev. Ref. (Cambridge Lakes Learning Ctr.), Ser. 2017-A, 5.25%, due 12/1/2047 | |
| | | |
| |
| | Indiana St. Fin. Au. Rev. (Greencroft Oblig. Group), Ser. 2021, 4.00%, due 11/15/2043 | |
| |
| | Iowa Higher Ed. Loan Au. Rev. (Private College Des Moines Univ. Proj.) | |
| | Ser. 2020, 5.00%, due 10/1/2029 | |
| | Ser. 2020, 5.00%, due 10/1/2030 | |
| | | |
| |
| | Goddard Kansas Sales Tax Spec. Oblig. Rev. (Olympic Park Star Bond Proj.), Ser. 2019, 3.60%, due 6/1/2030 | |
| |
| | Kentucky Econ. Dev. Fin. Au. (Sr. Next Generation Information Hwy. Proj.), Ser. 2015-A, 4.00%, due 7/1/2029 | |
| | Kentucky Econ. Dev. Fin. Au. Rev. Ref. (Owensboro Hlth., Inc. Obligated Group), Ser. 2017-A, (AGM Insured), 4.00%, due 6/1/2037 | |
| | Kentucky Muni. Pwr. Agcy. Pwr. Sys. Rev. Ref. (Prairie St. Proj.), Ser. 2019-A, 4.00%, due 9/1/2045 | |
| | Kentucky St. Pub. Energy Au. Gas Supply Rev., (Morgan Stanley), Ser. 2018-A, 4.00%, due 4/1/2048 Putable 4/1/2024 | |
| | | |
| |
| | Louisiana Local Gov't Env. Facs. & Comm. Dev. Au. Rev. Ref. (Westside Habilitation Ctr. Proj.), Ser. 2017-A, 5.75%, due 2/1/2032 | |
| | Louisiana St. Local Gov’t Env. Facs. & Comm. Dev. Au. Rev. (Lafourche Parish Gomesa Proj.), Ser. 2019, 3.95%, due 11/1/2043 | |
| | New Orleans Aviation Board Rev. (Gen. Arpt. Terminal), Ser. 2017-B, 5.00%, due 1/1/2026 | |
| | | |
| |
| | Maine St. Fin. Au. (Green Bond-Go Lab Madison, LLC Proj.), Ser. 2021, 8.00%, due 12/1/2051 | |
| | Maine St. Fin. Au. Solid Waste Disp. Rev. (Casella Waste Sys. Proj.), Ser. 2015, 5.13%, due 8/1/2035 Putable 8/1/2025 | |
| | | |
| |
| | Baltimore Spec. Oblig. Ref. Rev. Sr. Lien (Harbor Point Proj.) | |
| | Ser. 2019-A, 3.63%, due 6/1/2046 | |
| | Ser. 2022, 5.00%, due 6/1/2051 | |
See Notes to Financial Statements
Schedule of Investments Municipal High Income Fund^ (cont’d)
| |
| |
| | Maryland St. Hsg. & Comm. Dev. Administration Dept. Rev., Ser. 2020-D, 1.95%, due 9/1/2035 | |
| | | |
| |
| | Detroit Social Bonds G.O., Ser. 2021-A, 4.00%, due 4/1/2042 | |
| | Michigan St. Strategic Fund Ltd. Oblig. Rev. (Green Bond-Recycled Board Machine Proj.), Ser. 2021, 4.00%, due 10/1/2061 Putable 10/1/2026 | |
| | Summit Academy Pub. Sch. Academy Ref. Rev., Ser. 2005, 6.38%, due 11/1/2035 | |
| | | |
| |
| | St. Paul Hsg. & Redev. Au. Charter Sch. Lease Rev. (Academia Cesar Chavez Sch. Proj.), Ser. 2015-A, 5.25%, due 7/1/2050 | |
| | St. Paul Hsg. & Redev. Au. Charter Sch. Lease Rev. (Twin Cities Academy Proj.), Ser. 2015-A, 5.00%, due 7/1/2035 | |
| | | |
| |
| | Mississippi Dev. Bank Spec. Oblig. (Jackson Co. Gomesa Proj.), Ser. 2021, 3.63%, due 11/1/2036 | |
| |
| | Gallatin Co. IDR (Bozeman Fiber Proj.), Ser. 2021-A, 4.00%, due 10/15/2051 | |
| |
| | Director of the St. of Nevada Dept. of Bus. & Ind. Rev. (Somerset Academy), Ser. 2015-A, 5.13%, due 12/15/2045 | |
| |
| | National Fin. Au. Rev. (Green Bond), Ser. 2020-B, 3.75%, due 7/1/2045 Putable 7/2/2040 | |
| |
| | New Jersey Econ. Dev. Au. Spec. Fac. Rev. Ref. (Port Newark Container Term. LLC Proj.), Ser. 2017, 5.00%, due 10/1/2047 | |
| | New Jersey Higher Ed. Assist. Au. Rev. Ref. (Std. Loan Rev.), Ser. 2018-B, 5.00%, due 12/1/2027 | |
| | New Jersey Hlth. Care Facs. Fin. Au. Contract Rev. Ref. (Hosp. Asset Trans. Prog.), Ser. 2017, 5.00%, due 10/1/2028 | |
| | Newark Board of Ed. G.O. (Sustainability Bonds), Ser. 2021, (BAM Insured), 5.00%, due 7/15/2030 | |
| | | |
| |
| | Winrock Town Ctr. Tax Increment Dev. Dist. Number 1 (Sr. Lien), Ser. 2022, 4.25%, due 5/1/2040 | |
| |
| | New York City Transitional Fin. Au. Future Tax Secured Rev. Ref., Ser. 2022-B, 5.25%, due 11/1/2038 | |
| | New York St. Dorm. Au. Rev. Ref. Non St. Supported Debt (Garnet Hlth. Med. Ctr.), Ser. 2017, 5.00%, due 12/1/2035 | |
| | New York St. Thruway Au. Rev. Ref. (Bidding Group4), Ser. 2022-A, 5.00%, due 3/15/2046 | |
| | New York St. Trans. Dev. Corp. Fac. Rev. (Empire St. Thruway Svc. Areas Proj.), Ser. 2021, 4.00%, due 4/30/2053 | |
| | New York St. Trans. Dev. Corp. Spec. Fac. Ref. Rev. (American Airlines, Inc.-John F Kennedy Int'l Arpt. Proj.), Ser. 2016, 5.00%, due 8/1/2031 | |
| | New York St. Trans. Dev. Corp. Spec. Fac. Rev. (Delta Airlines, Inc.-LaGuardia Arpt. Term. C&D Redev.), Ser. 2018, 5.00%, due 1/1/2028 | |
| | New York St. Trans. Dev. Corp. Spec. Fac. Rev. Ref. (American Airlines, Inc., John F Kennedy Int'l Arpt. Proj.), Ser. 2021, 3.00%, due 8/1/2031 | |
| | Suffolk Tobacco Asset Securitization Corp. Ref. (Tobacco Settle Asset Backed Sub. Bonds), Ser. 2021-B-1, 4.00%, due 6/1/2050 | |
See Notes to Financial Statements
Schedule of Investments Municipal High Income Fund^ (cont’d)
| |
| |
| | Westchester Co. Local Dev. Corp. Rev. (Purchase Sr. Learning Comm., Inc. Proj.), Ser. 2021-A, 5.00%, due 7/1/2056 | |
| | Westchester Co. Local Dev. Corp. Rev. Ref. (Kendal on Hudson Proj.), Ser. 2022-B, 5.00%, due 1/1/2051 | |
| | Yonkers Econ. Dev. Corp. Ed. Rev. (Charter Sch. of Ed. Excellence Proj.), Ser. 2019-A, 5.00%, due 10/15/2039 | |
| | | |
| |
| | Charlotte-Mecklenburg Hosp. Au. Rev., (LOC: JP Morgan Chase Bank N.A.), Ser. 2018-H, 1.43%, due 1/15/2048 | |
| |
| | Akron Bath Copley Jt. Twp. Hosp. Dist. (Summa Hlth. Sys. Oblig.), Ser. 2020, 4.00%, due 11/15/2035 | |
| | Buckeye Tobacco Settlement Fin. Au. Asset-Backed Sr. Ref. Rev., Ser. 2020-B-2, 5.00%, due 6/1/2055 | |
| | Cleveland-Cuyahoga Co. Port Au. Tax Increment Fin. Rev. Ref. (Sr.-Flats East Bank Proj.), Ser. 2021-A, 4.00%, due 12/1/2055 | |
| | Ohio St. Air Quality Dev. Au. (Ohio Valley Elec. Corp. Proj.), Ser. 2009-B, 1.38%, due 2/1/2026 Putable 11/1/2024 | |
| | Ohio St. Air Quality Dev. Au. Exempt Facs. Rev. (AMG Vanadium LLC), Ser. 2019-D, 5.00%, due 7/1/2049 | |
| | Ohio St. Air Quality Dev. Au. Exempt Facs. Rev. (Pratt Paper LLC Proj.), Ser. 2017, 4.50%, due 1/15/2048 | |
| | Ohio St. Air Quality Dev. Au. Rev. (Ohio Valley Elec. Corp. Proj.), Ser. 2014-B, 2.60%, due 6/1/2041 Putable 10/1/2029 | |
| | Ohio St. Air Quality Dev. Au. Rev. Ref. (Ohio Valley Elec. Corp. Proj.), Ser. 2019-A, 3.25%, due 9/1/2029 | |
| | So. Ohio Port Exempt Fac. Au. Rev., (PureCycle Proj.), Ser. 2020-A, 7.00%, due 12/1/2042 | |
| | | |
| |
| | Yamhill Co. Hosp. Au. Ref. Rev. (Friends View), Ser. 2021-A, 5.00%, due 11/15/2051 | |
| |
| | JPMorgan Chase Putters/Drivers Trust Var. Sts. Rev. (Putters), (LOC: JP Morgan Chase Bank N.A.), Ser. 2019, 2.42%, due 3/20/2024 | |
| |
| | Pennsylvania Econ. Dev. Fin. Au. Rev. (Bridges Finco LP), Ser. 2016-C, 5.00%, due 12/31/2038 | |
| | Pennsylvania Econ. Dev. Fin. Au. Rev. Ref. (Tapestry Moon Sr. Hsg. Proj.), Ser. 2018-A, 6.75%, due 12/1/2053 | |
| | | |
See Notes to Financial Statements
Schedule of Investments Municipal High Income Fund^ (cont’d)
| |
| |
| | Puerto Rico Commonwealth G.O. (Restructured) | |
| | Ser. 2021-A-1, 5.25%, due 7/1/2023 | |
| | Ser. 2021-A-1, 0.00%, due 7/1/2024 | |
| | Ser. 2021-A-1, 5.38%, due 7/1/2025 | |
| | Ser. 2021-A-1, 5.63%, due 7/1/2027 | |
| | Ser. 2021-A-1, 5.63%, due 7/1/2029 | |
| | Ser. 2021-A-1, 5.75%, due 7/1/2031 | |
| | Ser. 2021-A-1, 0.00%, due 7/1/2033 | |
| | Ser. 2021-A-1, 4.00%, due 7/1/2033 | |
| | Ser. 2021-A-1, 4.00%, due 7/1/2035 | |
| | Ser. 2021-A-1, 4.00%, due 7/1/2037 | |
| | Ser. 2021-A-1, 4.00%, due 7/1/2041 | |
| | Ser. 2021-A-1, 4.00%, due 7/1/2046 | |
| | Puerto Rico Commonwealth G.O., CVI, Subser. 2022, due 11/1/2043 | |
| | Puerto Rico Elec. Pwr. Au. Pwr. Rev., Ser. 2012-A, 5.00%, due 7/1/2042 | |
| | Puerto Rico Ind. Tourist Ed. Med. & Env. Ctrl. Fac. Rev. (Hosp. Auxilio Mutuo Oblig. Group Proj.) | |
| | Ser. 2021, 5.00%, due 7/1/2030 | |
| | Ser. 2021, 5.00%, due 7/1/2034 | |
| | Puerto Rico Sales Tax Fin. Corp. Sales Tax Rev., Ser. 2018-A-1, 5.00%, due 7/1/2058 | |
| | | |
| |
| | Lancaster Co. Assessment Rev. Ref. (Walnut Creek Imp. Dist.), Ser. 2016-A-1, 5.00%, due 12/1/2031 | |
| | South Carolina Jobs Econ. Dev. Au. Econ. Dev. Rev. (River Park Sr. Living Proj.), Ser. 2017-A, 7.75%, due 10/1/2057 | |
| | South Carolina Jobs Econ. Dev. Au. Solid Waste Disp. Rev. (Green Bond-Jasper Pellets LLC, Proj.), Ser. 2018-A, 7.00%, due 11/1/2038 | |
| | South Carolina Jobs Econ. Dev. Au. Solid Waste Disp. Rev. (RePower South Berkeley LLC Proj.), Ser. 2017, 6.25%, due 2/1/2045 | |
| | South Carolina St. Jobs Econ. Dev. Au. Solid Waste Disp. Rev. (AMT-Green Bond-Last Step Recycling LLC Proj.), Ser. 2021-A, 6.50%, due 6/1/2051 | |
| | | |
| |
| | Anson Ed. Facs. Corp. Ed. Rev. (Arlington Classics Academy), Ser. 2016-A, 5.00%, due 8/15/2045 | |
| | Fort Bend Co. Ind. Dev. Corp. Rev. (NRG Energy, Inc.), Ser. 2012-A, 4.75%, due 5/1/2038 | |
| | Hale Ctr. Ed. Fac. Corp. Rev. Ref. (Wayland Baptist Univ. Proj.), Ser. 2022, 5.00%, due 3/1/2033 | |
| | Hidalgo Co. Reg. Mobility Au. Toll & Vehicle Registration Jr. Lien Ref. | |
| | Ser. 2022-B, 4.00%, due 12/1/2037 | |
| | Ser. 2022-B, 4.00%, due 12/1/2039 | |
| | Ser. 2022-B, 4.00%, due 12/1/2040 | |
| | Houston Arpt. Sys. Rev. (United Airlines, Inc. Terminal Imp. Proj.) | |
| | Ser. 2015-B-1, 5.00%, due 7/15/2030 | |
| | Ser. 2021-B-1, 4.00%, due 7/15/2041 | |
| | Mission Econ. Dev. Corp. Wtr. Supply Rev. (Green Bond-Env. Wtr. Minerals Proj.), Ser. 2015, 7.75%, due 1/1/2045 | |
| | New Hope Cultural Ed. Facs. Fin. Corp. Rev. (Beta Academy), Ser. 2019, 5.00%, due 8/15/2049 | |
| | New Hope Cultural Ed. Facs. Fin. Corp. Sr. Living Rev. (Cardinal Bay, Inc. Village On The Park Carriage), Ser. 2016-C, 5.50%, due 7/1/2046 | |
| | New Hope Cultural Ed. Facs. Fin. Corp. Std. Hsg. Rev. (NCCD-College Sta. Properties LLC), Ser. 2015-A, 5.00%, due 7/1/2047 | |
| | Port Beaumont Navigation Dist. Dock & Wharf Fac. Rev. Ref. (Jefferson Gulf Coast Energy Proj.), Ser. 2020-A, 3.63%, due 1/1/2035 | |
See Notes to Financial Statements
Schedule of Investments Municipal High Income Fund^ (cont’d)
| |
| |
| | Texas St. Private Activity Bond Surface Trans. Corp. Rev. (Sr. Lien-Blueridge Trans. Group LLC), Ser. 2016, 5.00%, due 12/31/2040 | |
| | Texas St. Private Activity Bond Surface Trans. Corp. Sr. Lien Rev. Ref. (Sr. North Tarrant Express Managed Lanes Proj.), Ser. 2019-A, 5.00%, due 12/31/2030 | |
| | | |
| |
| | Mida Mountain Village Pub. Infrastructure Dist. Spec. Assessment (Mountain Village Assessment Area Number 2), Ser. 2021, 4.00%, due 8/1/2050 | |
| | Utah Infrastructure Agcy. Telecommunication Rev. | |
| | Ser. 2019-A, 4.00%, due 10/15/2036 | |
| | Ser. 2021, 3.00%, due 10/15/2045 | |
| | | |
| |
| | Vermont Econ. Dev. Au. Solid Waste Disp. Rev. (Casella Waste Sys., Inc.), Ser. 2013, 4.63%, due 4/1/2036 Putable 4/3/2028 | |
| | Vermont Std. Assist. Corp. Ed. Loan Rev., Ser. 2015-A, 4.13%, due 6/15/2028 | |
| | | |
| |
| | Embrey Mill Comm. Dev Au. Spec. Assessment Rev., Ser. 2015, 5.30%, due 3/1/2035 Pre-Refunded 3/1/2025 | |
| | Virginia College Bldg. Au. Ed. Facs. Rev. (Green Bonds-Marymount Univ. Proj.), Ser. 2015-B, 5.25%, due 7/1/2035 | |
| | | |
| |
| | Pub. Fin. Au. Ed. Rev. (Resh Triangle High Sch. Proj.), Ser. 2015-A, 5.38%, due 7/1/2035 | |
| | Pub. Fin. Au. Hosp. Rev. (Carson Valley Med. Ctr.), Ser. 2021-A, 4.00%, due 12/1/2051 | |
| | Pub. Fin. Au. Rev. (Goodwill Industries of So. Nevada Proj.), Ser. 2015-A, 5.50%, due 12/1/2038 | |
| | Pub. Fin. Spec. Fac. Au. Rev. (Sky Harbour Cap. LLC Aviation Fac. Proj.), Ser. 2021, 4.00%, due 7/1/2041 | |
| | St. Croix Chippewa Indians of Wisconsin Ref., Ser. 2021, 5.00%, due 9/30/2041 | |
| | | |
Total Investments 97.0% (Cost $98,764,291) | |
Other Assets Less Liabilities 3.0% | |
| |
| Securities were purchased under Rule 144A of the Securities Act of 1933, as amended, or are otherwise restricted and, unless registered under the Securities Act of 1933 or exempted from registration, may only be sold to qualified institutional investors or may have other restrictions on resale. At October 31, 2022, these securities amounted to $23,193,083, which represents 27.2% of net assets of the Fund. |
| |
| When-issued security. Total value of all such securities at October 31, 2022 amounted to $436,476, which represents 0.5% of net assets of the Fund. |
| Variable rate demand obligation where the stated interest rate is not based on a published reference rate and spread. Rather, the interest rate generally resets daily or weekly and is determined by the remarketing agent. The rate shown represents the rate in effect at October 31, 2022. |
See Notes to Financial Statements
Schedule of Investments Municipal High Income Fund^ (cont’d)
The following is a summary, categorized by Level (see Note A of the Notes to Financial Statements), of inputs used to value the Fund’s investments as of October 31, 2022:
| The Schedule of Investments provides information on the state/territory or industry categorization. |
^
A balance indicated with a "—", reflects either a zero balance or an amount that rounds to less than 1.
See Notes to Financial Statements
Schedule of Investments Municipal Impact Fund^
October 31, 2022
| |
|
| |
| | Fort Payne City G.O. (Sch. Warrants), Ser. 2018-B, (AGM Insured), 5.00%, due 5/1/2027 | |
| | Sumter Co. Ind. Dev. Au.(Green Bond-Enviva, Inc.), Ser. 2022, 6.00%, due 7/15/2052 Putable 7/15/2032 | |
| | | |
| |
| | Benton Washington Reg. Pub. Wtr. Au. Rev. Green Bond, Ser. 2022, (BAM Insured), 4.00%, due 10/1/2033 | |
| | Russellville City Wtr. & Swr. Rev., Ser. 2018, (AGM Insured), 4.00%, due 7/1/2028 | |
| | | |
| |
| | California HFA Rev. (833 Bryant Apt.), Ser. 2020-N, 5.00%, due 4/1/2027 | |
| | California St. Hlth. Fac. Fin. Au. Rev. (Green Bond-Kaiser Foundation Hosp.), Subser. 2017-A-1, 5.00%, due 11/1/2027 | |
| | Glendale City Wtr. Rev. Ref., Ser. 2020, 2.00%, due 2/1/2033 | |
| | San Diego Assoc. of Gov't Cap. Grant Receipts Rev. (Green Bond Mid-Coast Corridor Transit Proj.), Ser. 2019-A, 5.00%, due 11/15/2024 | |
| | | |
| |
| | Pueblo Urban Tax Increment Rev. Au. (Evraz Proj.), Ser. 2021-A, 4.75%, due 12/1/2045 | |
| | Univ. of Colorado Enterprise Sys. Rev. Ref. (Univ. Enterprise Green Bond), Ser. 2021-C-3B, 2.00%, due 6/1/2051 Putable 10/15/2026 | |
| | | |
District of Columbia 0.8% | |
| | Washington Metro. Area Transit Au. Gross Rev., Ser. 2017-B, 5.00%, due 7/1/2024 | |
| |
| | Miami-Dade Co. (Bldg. Better Comm. Prog.), Ser. 2015-D-REMK, 5.00%, due 7/1/2026 | |
| | Tampa Wtr. & Wastewater Sys. Rev., Ser. 2020-A, 5.00%, due 10/1/2033 | |
| | | |
| |
| | Metropolitan Atlanta Rapid Transit Au. Sales Tax Rev. Ref., Ser. 2016-B, 5.00%, due 7/1/2035 | |
| |
| | Cook Co. Comm. Cons. Sch. Dist. # 21 G.O. (Wheeling Sch. Bldg.), Ser. 2019-A, (AGM Insured), 4.00%, due 12/1/2035 | |
| |
| | Anderson Sch. Bldg. Corp. (First Mtge.) | |
| | Ser. 2018, 5.00%, due 1/15/2024 | |
| | Ser. 2018, 5.00%, due 1/15/2026 | |
| | West Central Conservancy Dist. Savage Rev. Ref. | |
| | Ser. 2021, 4.00%, due 7/1/2029 | |
| | Ser. 2021, 4.00%, due 7/1/2030 | |
| | Ser. 2021, 4.00%, due 1/1/2032 | |
| | | |
| |
| | Iowa St. Board Regents Hosp. Rev. (Univ. of Iowa Hosp. & Clinics), Ser. 2022-A, 5.00%, due 9/1/2032 | |
See Notes to Financial Statements
Schedule of Investments Municipal Impact Fund^ (cont’d)
| |
| |
| | Breathitt Co. Sch. Dist. Fin. Corp. Rev. | |
| | Ser. 2021, 2.00%, due 4/1/2027 | |
| | Ser. 2021, 2.00%, due 4/1/2029 | |
| | Daviess Co. Sch. Dist. Fin. Corp. Rev. | |
| | Ser. 2021-A, 5.00%, due 12/1/2027 | |
| | Ser. 2021-A, 2.00%, due 12/1/2031 | |
| | Green Co. Sch. Dist. Fin. Corp. | |
| | Ser. 2021, 2.00%, due 10/1/2024 | |
| | Ser. 2021, 2.00%, due 10/1/2025 | |
| | Ser. 2021, 2.00%, due 10/1/2026 | |
| | Lewis Co. Sch. Dist. Fin. Corp. Rev. | |
| | Ser. 2021-B, 2.00%, due 8/1/2024 | |
| | Ser. 2021-B, 2.00%, due 8/1/2025 | |
| | Logan-Todd Reg. Wtr. Commission Rev. Ref., Ser. 2016-A, (AGM Insured), 5.00%, due 7/1/2028 | |
| | | |
| |
| | Louisiana Pub. Facs. Au. Rev. Ref. (Hurricane Rec. Prog.), Ser. 2014, 5.00%, due 6/1/2024 | |
| | Natchitoches Parish Sch. Dist. G.O. # 9 | |
| | Ser. 2018, (AGM Insured), 5.00%, due 3/1/2027 | |
| | Ser. 2018, (AGM Insured), 5.00%, due 3/1/2028 | |
| | | |
| |
| | Maine St. Fin. Au. (Green Bond-Go Lab Madison, LLC Proj.), Ser. 2021, 8.00%, due 12/1/2051 | |
| |
| | Massachusetts HFA Rev., Ser. 2020-C-2, (HUD Section 8 Insured), 0.50%, due 6/1/2023 | |
| |
| | City of Detroit MI G.O., Ser. 2021-A, 4.00%, due 4/1/2040 | |
| | Dearborn G.O. (Swr.), Ser. 2018, 4.00%, due 4/1/2033 | |
| | Fowlerville Comm. Sch. Dist. Ref. G.O. | |
| | Ser. 2022, 3.00%, due 5/1/2029 | |
| | Ser. 2022, 4.00%, due 5/1/2033 | |
| | Kent Hosp. Fin. Au. Rev. (Mary Free Bed Rehabilitation Hosp.) | |
| | Ser. 2021-A, 5.00%, due 4/1/2028 | |
| | Ser. 2021-A, 4.00%, due 4/1/2033 | |
| | Livonia Pub. Sch. Dist. G.O., Ser. 2016, (AGM Insured), 5.00%, due 5/1/2028 | |
| | Michigan St. Hsg. Dev. Au. Rev. (Non Ace), Ser. 2016-B, 2.50%, due 12/1/2026 | |
| | Michigan St. Hsg. Dev. Au. Rev. Ref., Ser. 2018-B, 3.15%, due 4/1/2028 | |
| | Michigan St. Hsg. Dev. Au. Single Family Mtge. Rev. (Non Ace), Ser. 2018-C, 2.90%, due 12/1/2024 | |
| | Michigan St. Strategic Fund Ltd. Oblig. Rev. (Green Bond-Recycled Board Machine Proj.), Ser. 2021, 4.00%, due 10/1/2061 Putable 10/1/2026 | |
| | Trenton Pub. Sch. Dist. G.O. (Sch. Bldg. & Site) | |
| | Ser. 2018, 5.00%, due 5/1/2036 | |
| | Ser. 2018, 5.00%, due 5/1/2039 | |
| | | |
| |
| | Duluth Econ. Dev. Au. Rev. Ref. (ST. Luke's Hosp. of Duluth) | |
| | Ser. 2022-A, 5.00%, due 6/15/2027 | |
| | Ser. 2022-A, 5.00%, due 6/15/2028 | |
See Notes to Financial Statements
Schedule of Investments Municipal Impact Fund^ (cont’d)
| |
| |
| | Minnesota Rural Wtr. Fin. Au. (Pub. Proj. Construction Notes), Ser. 2022, 2.63%, due 12/1/2023 | |
| | St. Paul Hsg. & Redev. Au. Charter Sch. Lease Rev. (Metro Deaf Sch. Proj.), Ser. 2018-A, 5.00%, due 6/15/2038 | |
| | | |
| |
| | West Rankin Utils. Au. Rev. | |
| | Ser. 2018, (AGM Insured), 5.00%, due 1/1/2043 Pre-Refunded 1/1/2028 | |
| | Ser. 2018, (AGM Insured), 5.00%, due 1/1/2048 Pre-Refunded 1/1/2028 | |
| | | |
| |
| | Bi- St. Dev. Agcy. of the Missouri-Illinois Metro. Dist. Rev. Ref. (Combined Lien Mass Transit Sales Tax Appropriation), Ser. 2019, 4.00%, due 10/1/2036 | |
| | Missouri St. Env. Imp. & Energy Res. Au. Wtr. PCR | |
| | Ser. 2018-A, 5.00%, due 7/1/2029 | |
| | Ser. 2018-A, 5.00%, due 1/1/2030 | |
| | Missouri St. Hlth. & Ed. Fac. Au. (St. Louis Collage of Pharmacy Proj.), Ser. 2013, 5.00%, due 5/1/2023 | |
| | | |
| |
| | New Jersey St. Econ. Dev. Au. Rev. (Social Bonds), Ser. 2021-QQQ, 5.00%, due 6/15/2025 | |
| | New Jersey St. Hsg. & Mtge. Fin. Agcy. Multi-Family Rev. Ref., Ser. 2017-A, 2.60%, due 11/1/2024 | |
| | New Jersey St. Trans. Trust Fund Au. Rev. Ref., Ser. 2021-A, 5.00%, due 6/15/2031 | |
| | Newark Board of Ed. G.O. (Sustainability Bonds), Ser. 2021, (BAM Insured), 3.00%, due 7/15/2038 | |
| | | |
| |
| | Buffalo Swr. Au. Env. Impact Rev. (Green Bond), Ser. 2021, (BAM Insured), 1.75%, due 6/15/2049 | |
| | Build NYC Res. Corp. Rev. (New Dawn Charter Sch. Proj.), Ser. 2019, 5.75%, due 2/1/2049 | |
| | | |
| | Ser. 2008-B-3, 5.00%, due 11/15/2023 | |
| | Ser. 2016-B, 5.00%, due 11/15/2025 | |
| | Metro. Trans. Au. Rev. (Green Bond), Ser. 2017-B, 5.00%, due 11/15/2023 | |
| | Nassau Co. Local Econ. Assist. Corp. Rev. (Catholic Hlth. Svcs. of Long Island Obligated Group Proj.), Ser. 2014, 5.00%, due 7/1/2027 | |
| | New York City Hlth. & Hosp. Corp. Hlth. Sys. Rev., Ser. 2021-A, 5.00%, due 2/15/2029 | |
| | New York City Hsg. Dev. Corp. Multi-Family Hsg. Rev. (Sustainable Dev. Bonds) | |
| | Ser. 2020-A-3, 1.13%, due 5/1/2060 Putable 11/1/2024 | |
| | Ser. 2021-F-1, 1.05%, due 5/1/2028 | |
| | Ser. 2021-F-1, 1.25%, due 5/1/2029 | |
| | New York City Hsg. Dev. Corp. Rev., Ser. 2020-C, (HUD Section 8, Fannie Mae Insured), 2.15%, due 8/1/2035 | |
| | New York City Muni. Wtr. Fin. Au. Wtr. & Swr. Sys. Rev. (Second Gen. Resolution Rev. Bonds), Ser. 2022-DD, 2.53%, due 6/15/2033 | |
| | New York St. HFA Rev. (Affordable Hsg.), Ser. 2018-I, 2.65%, due 5/1/2023 | |
| | New York St. HFA Rev. Ref. (Affordable Hsg.), Ser. 2020-H, 2.45%, due 11/1/2044 | |
| | New York St. Hsg. Fin. Agcy. Rev. (Climate Bond Certified/ Sustainability Bonds), Ser. 2019-P, 1.55%, due 11/1/2023 | |
| | New York St. Pwr. Au. Rev. (Green Transmission Proj. -Green Bond), Ser. 2022-A, (AGM Insured), 5.00%, due 11/15/2024 | |
| | Rhinebeck Central Sch. Dist., Ser. 2021, 3.00%, due 6/15/2024 | |
| | | |
See Notes to Financial Statements
Schedule of Investments Municipal Impact Fund^ (cont’d)
| |
| |
| | North Carolina HFA Homeownership Ref. Rev., Ser. 2020-45, (GNMA/FNMA/FHLMC Insured), 2.20%, due 7/1/2040 | |
| | Scotland Co. Rev., Ser. 2018, 5.00%, due 12/1/2026 | |
| | | |
| |
| | Cass Co. Jt. Wtr. Res. Dist., Ser. 2021-A, 0.48%, due 5/1/2024 | |
| | City of Larimore ND G.O., Ser. 2021, 0.85%, due 5/1/2024 | |
| | | |
| |
| | Akron Bath Copley Jt. Twp. Hosp. Dist. (Summa Hlth. Sys. Oblig.), Ser. 2020, 4.00%, due 11/15/2036 | |
| | American Muni. Pwr. Ohio, Inc. Rev. (Comb. Hydroelectric Proj.), Ser. 2021-A-2, 1.00%, due 2/15/2048 Putable 8/15/2024 | |
| | American Muni. Pwr. Ohio, Inc. Rev. Solar Elec. Pre-Payment (Green Bond), Ser. 2019-A, 5.00%, due 2/15/2023 | |
| | Cuyahoga Metro. Hsg. Au. Rev., Ser. 2021, (2045 Initiative Proj.), 2.00%, due 12/1/2031 | |
| | Ohio St. Air Quality Dev. Au. Exempt Facs. Rev. (AMG Vanadium LLC), Ser. 2019-D, 5.00%, due 7/1/2049 | |
| | So. Ohio Port Exempt Fac. Au. Rev., (PureCycle Proj.), Ser. 2020-A, 7.00%, due 12/1/2042 | |
| | | |
| |
| | Johnston Co. Ed. Fac. Au. Lease Rev. (Tishomingo Pub. Sch. Proj.), Ser. 2022, 4.00%, due 9/1/2030 | |
| | Lincoln Co. Ed. Facs. Au. Ed. Facs. Lease Rev. (Stroud Pub. Sch. Proj.), Ser. 2016, 5.00%, due 9/1/2027 | |
| | | |
| |
| | Allegheny Co. Sanitary Au. Rev. | |
| | Ser. 2018, 5.00%, due 6/1/2030 | |
| | Ser. 2018, 5.00%, due 6/1/2032 | |
| | Pennsylvania St. Hsg. Fin. Agcy. Single Family Mtge. Rev. | |
| | Ser. 2018-127B, 2.85%, due 4/1/2026 | |
| | Ser. 2019-131A, 1.75%, due 4/1/2025 | |
| | Philadelphia Wtr. & Wastewater Rev. Ref., Ser. 2016, 5.00%, due 10/1/2023 | |
| | | |
| |
| | Puerto Rico Ind. Tourist Ed. Med. & Env. Ctrl. Fac. Rev. (Hosp. Auxilio Mutuo Oblig. Group Proj.) | |
| | Ser. 2021, 5.00%, due 7/1/2035 | |
| | Ser. 2021, 4.00%, due 7/1/2036 | |
| | Ser. 2021, 4.00%, due 7/1/2038 | |
| | | |
| |
| | Dillon Co. Sch. Fac. Corp. Cert. of Participation Ref. | |
| | Ser. 2020, 5.00%, due 12/1/2026 | |
| | Ser. 2020, 5.00%, due 12/1/2027 | |
| | Newberry Investing in Children's Ed. Installment Purchase Rev. Ref. (Newberry Co. Sch. Dist.), Ser. 2014, 5.00%, due 12/1/2023 | |
| | South Carolina Jobs Econ. Dev. Au. Solid Waste Disp. Rev. (Green Bond-Jasper Pellets LLC, Proj.), Ser. 2018-A, 7.00%, due 11/1/2038 | |
See Notes to Financial Statements
Schedule of Investments Municipal Impact Fund^ (cont’d)
| |
| |
| | South Carolina St. Jobs Econ. Dev. Au. Solid Waste Disp. Rev. (AMT-Green Bond-Last Step Recycling LLC Proj.), Ser. 2021-A, 6.50%, due 6/1/2051 | |
| | | |
| |
| | Tennessee Hsg. Dev. Agcy. Residential Fin. Prog. Rev. | |
| | Ser. 2019, 3.25%, due 7/1/2032 | |
| | Ser. 2021-1, 1.80%, due 1/1/2031 | |
| | | |
| |
| | El Paso Wtr. & Swr. Rev. Ref., Ser. 2014, 5.00%, due 3/1/2024 | |
| | Hidalgo Co. Reg. Mobility Au. Rev. Toll & Vehicle Registration Jr. Lien Ref., Ser. 2022-B, 4.00%, due 12/1/2038 | |
| | New Caney Independent Sch. Dist., Ser. 2018, (PSF-GTD Insured), 1.25%, due 2/15/2050 Putable 8/15/2024 | |
| | San Antonio Wtr. Sys. Jr. Lien Rev. Ref., Ser. 2019-C, 5.00%, due 5/15/2034 | |
| | Weslaco G.O. Ref., Ser. 2017, (AGM Insured), 5.00%, due 8/15/2027 | |
| | Ysleta Independent Sch. Dist. G.O. (Sch. Bldg.), Ser. 2017, (PSF-GTD Insured), 5.00%, due 8/15/2041 | |
| | | |
| |
| | Virginia St. Hsg. Dev. Au., Ser. 2019 E, 2.90%, due 12/1/2038 | |
| |
| | Discovery Clean Wtr. Alliance Swr. Rev., Ser. 2022, 5.00%, due 12/1/2037 | |
| | Washington St. Hsg. Fin. Commission, Ser. 2021-A-1, 3.50%, due 12/20/2035 | |
| | | |
| |
| | West Virginia Hosp. Fin. Au. Rev. (Impt. West Virginia Univ. Hlth. Sys. Obligated Group), Ser. 2018-A, 5.00%, due 6/1/2052 | |
| | West Virginia Hosp. Fin. Au. Rev. (West Virginia Univ. Hlth. Sys.), Ser. 2017-A, 5.00%, due 6/1/2035 | |
| | West Virginia Hsg. Dev. Fund Rev. (Hsg. Fin.), Ser. 2018-A, (HUD Section 8 Insured), 2.65%, due 11/1/2024 | |
| | West Virginia Wtr. Dev. Au. Rev. Ref. (Loan Prog.), Ser. 2018-A-IV, 5.00%, due 11/1/2036 | |
| | | |
Total Investments 95.6% (Cost $81,926,353) | |
Other Assets Less Liabilities 4.4% | |
| |
| Securities were purchased under Rule 144A of the Securities Act of 1933, as amended, or are otherwise restricted and, unless registered under the Securities Act of 1933 or exempted from registration, may only be sold to qualified institutional investors or may have other restrictions on resale. At October 31, 2022, these securities amounted to $1,322,925, which represents 1.7% of net assets of the Fund. |
| Step Bond. Coupon rate is a fixed rate for an initial period that either resets at a specific date or may reset in the future contingent upon a predetermined trigger. The interest rate shown was the current rate as of October 31, 2022. |
| Variable rate demand obligation where the stated interest rate is not based on a published reference rate and spread. Rather, the interest rate generally resets daily or weekly and is determined by the remarketing agent. The rate shown represents the rate in effect at October 31, 2022. |
See Notes to Financial Statements
Schedule of Investments Municipal Impact Fund^ (cont’d)
The following is a summary, categorized by Level (see Note A of the Notes to Financial Statements), of inputs used to value the Fund’s investments as of October 31, 2022:
| The Schedule of Investments provides information on the state/territory categorization. |
^
A balance indicated with a "—", reflects either a zero balance or an amount that rounds to less than 1.
See Notes to Financial Statements
Schedule of Investments Municipal Intermediate Bond Fund^
October 31, 2022
| |
|
| |
| | Black Belt Energy Gas Dist. (Alabama Gas Prepay Gas Supply Rev. Proj. Number 5), (LOC: Morgan Stanley), Ser. 2020-A-1, 4.00%, due 10/1/2049 Putable 10/1/2026 | |
| | Black Belt Energy Gas Dist. (Alabama Gas Prepay Gas Supply Rev. Proj. Number 7), (LOC: Goldman Sachs Group, Inc.), Ser. 2021-C-1, 4.00%, due 10/1/2052 Putable 12/1/2026 | |
| | Columbia IDB PCR Ref. (Alabama Pwr. Co. Proj.), Ser. 2014-A, 1.72%, due 12/1/2037 | |
| | Lower Alabama Gas Dist. Rev. (Gas Proj. 2), (LOC: Goldman Sachs Group, Inc.), Ser. 2020, 4.00%, due 12/1/2050 Putable 12/1/2025 | |
| | Wilsonville IDB PCR Rev. Ref. (Alabama Pwr. Co.), Ser. 2005-D, 1.74%, due 1/1/2024 | |
| | | |
| |
| | Maricopa Co. Ind. Dev. Au. Rev. (Banner Hlth. Obligated Group), Ser. 2017-C, 5.00%, due 1/1/2048 Putable 10/18/2024 | |
| | Maricopa Co. Ind. Dev. Au. Sr. Living Fac. Rev. Ref. (Christian Care Retirement Apts., Inc. Proj.), Ser. 2016-A, 5.00%, due 1/1/2024 | |
| | | |
| |
| | Mountain Home AR Sales & Use Tax Rev., Ser. 2021-B, 2.00%, due 9/1/2038 | |
| |
| | California HFA Muni. Cert. | |
| | Ser. 2019-2, Class A, 4.00%, due 3/20/2033 | |
| | Ser. 2021-1-A, 3.50%, due 11/20/2035 | |
| | California St. G.O., Ser. 2020, 4.00%, due 11/1/2034 | |
| | California Statewide Communities Dev. Au. Rev. (Henry Mayo Newhall Mem. Hosp.), Ser. 2014-A, (AGM Insured), 5.00%, due 10/1/2028 Pre-Refunded 10/1/2024 | |
| | Contra Costa Co. Redev. Agcy. Successor Agcy. Tax Allocation Ref., Ser. 2017-A, (BAM Insured), 5.00%, due 8/1/2032 | |
| | Fresno Joint Pwr. Fin. Au. Lease Rev. Ref. (Master Lease Proj.) | |
| | Ser. 2017-A, (AGM Insured), 5.00%, due 4/1/2027 | |
| | Ser. 2017-A, (AGM Insured), 5.00%, due 4/1/2032 | |
| | San Marcos Unified Sch. Dist. G.O. Cap. Appreciation (Election 2010), Ser. 2012-B, 0.00%, due 8/1/2027 | |
| | Santa Monica-Malibu Unified Sch. Dist. G.O., Ser. 2019-E, 3.00%, due 8/1/2034 | |
| | | |
| |
| | Colorado St. Ed. & Cultural Facs. Au. Rev. Ref. (Alexander Dawson Sch. Proj.), Ser. 2016, 5.00%, due 5/15/2025 | |
| | Colorado St. Hlth. Facs. Au. Hosp. Rev. Ref. (Commonspirit Hlth.), Ser. 2019-A-2, 4.00%, due 8/1/2049 | |
| | Denver Hlth. & Hosp. Au. Healthcare Rev. Ref., Ser. 2019-A, 4.00%, due 12/1/2037 | |
| | | |
| |
| | Connecticut HFA Hsg. Fin. Mtge. Prog. Rev. Ref., Subser. 2017-A-4, 3.65%, due 11/15/2032 | |
| | Connecticut St. G.O., Ser. 2020-C, 4.00%, due 6/1/2037 | |
| | Connecticut St. G.O. Ref., Ser. 2019-B, 5.00%, due 2/15/2029 | |
| | Meriden City G.O., Ser. 2020-B, 3.00%, due 7/1/2031 | |
| | | |
See Notes to Financial Statements
Schedule of Investments Municipal Intermediate Bond Fund^ (cont’d)
| |
| |
| | Delaware St. Hlth. Facs. Au. Rev. (Beebe Med. Ctr.) | |
| | Ser. 2018, 5.00%, due 6/1/2027 | |
| | Ser. 2018, 5.00%, due 6/1/2028 | |
| | | |
District of Columbia 0.7% | |
| | Washington Convention & Sports Au. Rev. | |
| | Ser. 2021-A, 5.00%, due 10/1/2027 | |
| | Ser. 2021-A, 5.00%, due 10/1/2028 | |
| | | |
| |
| | Cape Coral Spec. Obligation Ref. Rev., Ser. 2015, 4.00%, due 10/1/2030 | |
| | CityPlace Comm. Dev. Dist. Spec. Assessment Ref. Rev., Ser. 2012, 5.00%, due 5/1/2026 | |
| | Escambia Co. Florida Env. Imp. Rev. Ref. (Int’l Paper Co. Proj.), Ser. 2019-B, 2.00%, due 11/1/2033 Putable 10/1/2024 | |
| | Escambia Co. Hlth. Facs. Au. Ref. Rev. (Baptist Hlth. Care Corp. Obligated Group), Ser. 2020-A, 5.00%, due 8/15/2031 | |
| | Gainesville Utils. Sys. Rev., (LOC: Barclays Bank PLC), Ser. 2012-B, 1.64%, due 10/1/2042 | |
| | Miami-Dade Co. G.O. Ref., Ser. 2015-B, 4.00%, due 7/1/2032 | |
| | Miami-Dade Co. Hsg. Fin. Au. Rev. (Platform II LLC), Ser. 2021, 0.25%, due 8/1/2024 Putable 8/1/2023 | |
| | Village Comm. Dev. Dist. Number 13 Spec. Assessment Rev., Ser. 2019, 3.00%, due 5/1/2029 | |
| | Wildwood Utils. Dependent Dist. Rev. (Sr.-South Sumter Utils. Proj.) | |
| | Ser. 2021, (BAM Insured), 5.00%, due 10/1/2034 | |
| | Ser. 2021, (BAM Insured), 5.00%, due 10/1/2035 | |
| | Ser. 2021, (BAM Insured), 5.00%, due 10/1/2036 | |
| | Ser. 2021, (BAM Insured), 5.00%, due 10/1/2037 | |
| | | |
| |
| | Monroe Co. Dev. Au. PCR Rev. (Georgia Pwr. Co. Plant-Scherer Proj.), Ser. 2009, 1.00%, due 7/1/2049 Putable 8/21/2026 | |
| | Muni. Elec. Au. of Georgia (Plant Vogtle Units 3&4 Proj. M Bonds) | |
| | Ser. 2019-A, 5.00%, due 1/1/2032 | |
| | Ser. 2019-A, 5.00%, due 1/1/2033 | |
| | Savannah Econ. Dev. Au. Rev. Ref. (Int'l Paper Co. Proj.), Ser. 2019-A, 2.00%, due 11/1/2033 Putable 10/1/2024 | |
| | | |
| |
| | Bureau Co. Township High Sch. Dist. No. 502 G.O., Ser. 2017-A, (BAM Insured), 5.00%, due 12/1/2033 Pre-Refunded 12/1/2027 | |
| | Chicago O'Hare Int'l Arpt. Sr. Lien Ref. Rev., Ser. 2022-D, 5.00%, due 1/1/2035 | |
| | | |
| | Ser. 2020-A, 5.00%, due 1/1/2026 | |
| | Ser. 2021-A, 4.00%, due 1/1/2035 | |
| | | |
| | Ser. 2018 (Gov't Prog.-Brookfield Lagrange Park Sch. Dist. No. 95 Proj.), 4.00%, due 12/1/2038 | |
| | Ser. 2018, (BAM Insured) (Gov't Prog.-E Prairie Sch. Dist. No. 73 Proj.), 5.00%, due 12/1/2029 | |
| | Ser. 2018, (BAM Insured) (Gov't Prog.-E Prairie Sch. Dist. No. 73 Proj.), 4.00%, due 12/1/2042 | |
| | Illinois St. Fin. Au. Rev. (Downers Grove Comm. High Sch. Dist. No. 99 Proj.) | |
| | Ser. 2019, 4.00%, due 12/15/2030 | |
| | Ser. 2019, 4.00%, due 12/15/2031 | |
See Notes to Financial Statements
Schedule of Investments Municipal Intermediate Bond Fund^ (cont’d)
| |
| |
| | | |
| | Ser. 2017-D, 5.00%, due 11/1/2027 | |
| | Ser. 2017-D, 5.00%, due 11/1/2028 | |
| | Ser. 2020, 5.75%, due 5/1/2045 | |
| | Ser. 2021-A, 4.00%, due 3/1/2039 | |
| | Ser. 2021-A, 5.00%, due 3/1/2046 | |
| | Peoria Co. Sch. Dist. No. 150 G.O. Ref. | |
| | Ser. 2020-A, (AGM Insured), 4.00%, due 12/1/2026 | |
| | Ser. 2020-A, (AGM Insured), 4.00%, due 12/1/2027 | |
| | Ser. 2020-A, (AGM Insured), 4.00%, due 12/1/2028 | |
| | Sales Tax Securitization Corp. Rev. Ref., Ser. 2017-A, 5.00%, due 1/1/2028 | |
| | Sales Tax Securitization Corp. Rev. Ref. Second Lien, Ser. 2020-A, 5.00%, due 1/1/2026 | |
| | | |
| | Ser. 2014, 4.25%, due 12/1/2027 | |
| | Ser. 2014, 5.00%, due 12/1/2028 | |
| | | |
| |
| | Indiana Fin. Au. Midwestern Disaster Relief Rev. (Ohio Valley Elec. Corp. Proj.), Ser. 2012-B, 3.00%, due 11/1/2030 | |
| | Indiana St. Fin. Au. Rev. (Greencroft Oblig. Group), Ser. 2021, 4.00%, due 11/15/2043 | |
| | Indiana St. Hsg. & CDA Single Family Mtge. Rev. | |
| | Ser. 2019-B, (GNMA/FNMA/FHLMC Insured), 2.40%, due 7/1/2034 | |
| | Ser. 2020-B-1, (GNMA Insured), 1.60%, due 1/1/2031 | |
| | Ser. 2020-B-1, (GNMA Insured), 1.75%, due 7/1/2032 | |
| | Indiana St. Muni. Pwr. Agcy. Ref. Rev., Ser. 2016-C, 5.00%, due 1/1/2027 | |
| | | |
| |
| | Iowa Higher Ed. Loan Au. Rev. (Private College Des Moines Univ. Proj.), Ser. 2020, 5.00%, due 10/1/2027 | |
| | Iowa St. Fin. Au. Single Family Mtge. Rev., Ser. 2021-B, (GNMA/FNMA/FHLMC Insured), 1.85%, due 7/1/2032 | |
| | Iowa St. Fin. Au. Single Family Mtge. Rev. (Non Ace-Mtge.-Backed Sec. Prog.), Ser. 2017-C, (GNMA/FNMA/FHLMC Insured), 2.30%, due 1/1/2026 | |
| | | |
| |
| | Wichita City Sales Tax. Spec. Oblig. Rev. (River Dist. Stadium Star Bond Proj.) | |
| | Ser. 2018, 5.00%, due 9/1/2025 | |
| | Ser. 2018, 5.00%, due 9/1/2027 | |
| | | |
| |
| | Laurel Co. Judicial Ctr. Pub. Properties Corp. Ref. Rev. (Justice Center Proj.), Ser. 2015, 4.00%, due 3/1/2024 | |
| |
| | St. John the Baptist Parish LA Rev. Ref. (Marathon Oil Corp. Proj.), Subser. 2017-B-2, 2.38%, due 6/1/2037 Putable 7/1/2026 | |
| |
| | Baltimore Spec. Oblig. Ref. Rev. Sr. Lien (Harbor Point Proj.), Ser. 2019-A, 3.63%, due 6/1/2046 | |
See Notes to Financial Statements
Schedule of Investments Municipal Intermediate Bond Fund^ (cont’d)
| |
| |
| | Maryland St. Hsg. & Comm. Dev. Administration Dept. Rev., Ser. 2020-D, 1.95%, due 9/1/2035 | |
| | | |
| |
| | Massachusetts Dev. Fin. Agcy. Rev. Ref., Ser. 2021-G, 5.00%, due 7/1/2050 | |
| |
| | Detroit Downtown Dev. Au. Tax Increment Rev. Ref. (Catalyst Dev. Proj.), Ser. 2018-A, (AGM Insured), 5.00%, due 7/1/2029 | |
| | Michigan St. Hsg. Dev. Au. Rev., Ser. 2016-B, 2.30%, due 6/1/2025 | |
| | Walled Lake Cons. Sch. Dist. | |
| | Ser. 2020, 5.00%, due 5/1/2032 | |
| | Ser. 2020, 5.00%, due 5/1/2033 | |
| | | |
| |
| | St. Paul Hsg. & Redev. Au. Hlth. Care Rev. Ref. (Fairview Hlth. Svcs. Obligated Group), Ser. 2017-A, 4.00%, due 11/15/2043 | |
| |
| | Mississippi Dev. Bank Spec. Oblig. (Madison Co. Hwy. Proj.), Ser. 2013-C, 5.00%, due 1/1/2027 | |
| | Mississippi St. G.O. Ref., Ser. 2015-C, 5.00%, due 10/1/2026 | |
| | Warren Co. Gulf Opportunity Zone Rev. Ref. (Int'l Paper Co. Proj.), Ser. 2018, 2.90%, due 9/1/2032 Putable 9/1/2023 | |
| | | |
| |
| | Missouri St. Hlth. & Ed. Facs. Au. Hlth. Fac. Rev. (St. Louis Univ.), Ser. 2008-B1, (LOC: Deutsche Bank AG), 1.69%, due 10/1/2035 | |
| | Missouri St. Hlth. & Ed. Facs. Au. Hlth. Fac. Rev. Ref. (SSM Hlth. Care Oblig.), Ser. 2018-C, 5.00%, due 6/1/2036 Putable 6/1/2023 | |
| | Missouri St. Hsg. Dev. Commission Single Family Mtge. Rev. (Non-AMT Spec. Homeownership Loan Prog.) | |
| | Ser. 2014-A, (GNMA/FNMA/FHLMC Insured), 3.80%, due 11/1/2034 | |
| | Ser. 2014-A, (GNMA/FNMA/FHLMC Insured), 4.00%, due 11/1/2039 | |
| | | |
| |
| | Clark Co. Sch. Dist. G.O., Ser. 2020-A, (AGM Insured), 5.00%, due 6/15/2028 | |
| |
| | New Hampshire Hlth. & Ed. Facs. Au. Rev. (Univ. Sys. New Hampshire), Ser. 2011-B, 1.62%, due 7/1/2033 | |
| |
| | New Jersey Econ. Dev. Au. Rev. (Portal North Bridge Proj.), Ser. 2022-A, 5.00%, due 11/1/2029 | |
| | New Jersey Hlth. Care Fac. Fin. Au. Rev. (Inspira Hlth. Obligated Group), Ser. 2017-A, 5.00%, due 7/1/2029 | |
| | New Jersey Hlth. Care Facs. Fin. Au. Contract Rev. Ref. (Hosp. Asset Trans. Prog.), Ser. 2017, 5.00%, due 10/1/2028 | |
| | New Jersey St. Trans. Trust Fund Au., Ser. 2019-BB, 5.00%, due 6/15/2029 | |
| | New Jersey St. Trans. Trust Fund Au. Trans. Sys. Rev. Ref. | |
| | Ser. 2018-A, 5.00%, due 12/15/2032 | |
| | Ser. 2019-A, 5.00%, due 12/15/2028 | |
| | New Jersey St. Turnpike. Au. Rev., Ser. 2021-A, 4.00%, due 1/1/2051 | |
| | Newark G.O., Ser. 2020-A, (AGM Insured), 5.00%, due 10/1/2027 | |
See Notes to Financial Statements
Schedule of Investments Municipal Intermediate Bond Fund^ (cont’d)
| |
| |
| | Union Co. Imp. Au. Rev. (Correctional Fac. Proj.), Ser. 2013, 4.00%, due 6/15/2023 | |
| | | |
| |
| | Albany Cap. Res. Corp. Ref. Rev. (Albany College of Pharmacy & Hlth. Sciences), Ser. 2014-A, 5.00%, due 12/1/2026 | |
| | Broome Co. Local Dev. Corp. Rev. (Good Shepherd Village at Endwell, Inc. Proj.), Ser. 2021, 4.00%, due 1/1/2047 | |
| | Dutchess Co. Local Dev. Corp. Rev. Ref. (Culinary Institute of America Proj.) | |
| | Ser. 2021, 5.00%, due 7/1/2033 | |
| | Ser. 2021, 4.00%, due 7/1/2035 | |
| | Ser. 2021, 4.00%, due 7/1/2036 | |
| | Ser. 2021, 4.00%, due 7/1/2037 | |
| | Ser. 2021, 4.00%, due 7/1/2039 | |
| | Ser. 2021, 4.00%, due 7/1/2040 | |
| | Long Beach, G.O., Ser. 2014-A, (BAM Insured), 4.00%, due 11/15/2023 | |
| | Long Island Pwr. Au. Elec. Sys. Gen. Rev., Ser. 2020-A, 5.00%, due 9/1/2033 | |
| | Metro. Trans. Au. Rev., Ser. 2020-A-1, 5.00%, due 2/1/2023 | |
| | Metro. Trans. Au. Rev. (Green Bond), Ser. 2020-E, 4.00%, due 11/15/2045 | |
| | Monroe Co. G.O. (Pub. Imp.), Ser. 2019-A, (BAM Insured), 4.00%, due 6/1/2028 | |
| | New Paltz Central Sch. Dist. G.O., Ser. 2019, 4.00%, due 2/15/2029 | |
| | New York City Hlth. & Hosp. Corp. Hlth. Sys. Rev., Ser. 2021-A, 5.00%, due 2/15/2028 | |
| | New York City Hsg. Dev. Corp. Rev., Ser. 2020-C, (HUD Section 8, Fannie Mae Insured), 2.15%, due 8/1/2035 | |
| | New York City Muni. Wtr. Fin. Au. Wtr. & Swr. Sys. Rev. (Second Gen. Resolution Rev. Bonds) | |
| | Ser. 2008, 1.59%, due 6/15/2039 | |
| | Ser. 2008-BB-1, 2.20%, due 6/15/2036 | |
| | Ser. 2013-AA-2, 1.59%, due 6/15/2050 | |
| | New York City Transitional Fin. Au. Rev. (Future Tax Secured) | |
| | Ser. 2015-C, 5.00%, due 11/1/2027 | |
| | Subser. 2016-A-1, 4.00%, due 5/1/2031 | |
| | New York City Trust for Cultural Res. Rev. Ref. (Carnegie Hall) | |
| | Ser. 2019, 5.00%, due 12/1/2037 | |
| | Ser. 2019, 5.00%, due 12/1/2038 | |
| | Ser. 2019, 5.00%, due 12/1/2039 | |
| | | |
| | Ser. 2018 E-1, 5.00%, due 3/1/2031 | |
| | Subser. 2018-F-1, 5.00%, due 4/1/2034 | |
| | New York Liberty Dev. Corp. Ref. Rev. Green Bonds (4 World Trade Ctr. Proj.) | |
| | Ser. 2021-A, 2.50%, due 11/15/2036 | |
| | Ser. 2021-A, 2.75%, due 11/15/2041 | |
| | New York St. Dorm. Au. Personal Income Tax Rev., Ser. 2014-C, 5.00%, due 3/15/2025 | |
| | Oneida Co. Local Dev. Corp. Rev. Ref. (Mohawk Valley Hlth. Sys. Proj.), Ser. 2019-A, (AGM Insured), 4.00%, due 12/1/2049 | |
| | Onondaga Civic Dev. Corp. (Le Moyne Collage Proj.), Ser. 2021, 5.00%, due 7/1/2034 | |
| | Onondaga Civic Dev. Corp. Ref. (Le Moyne Collage Proj.) | |
| | Ser. 2022, 4.00%, due 7/1/2034 | |
| | Ser. 2022, 4.00%, due 7/1/2036 | |
| | Ser. 2022, 4.00%, due 7/1/2039 | |
| | Ser. 2022, 4.00%, due 7/1/2042 | |
| | Suffolk Tobacco Asset Securitization Corp. Ref. (Tobacco Settle Asset Backed Sub. Bonds), Ser. 2021-B-1, 4.00%, due 6/1/2050 | |
See Notes to Financial Statements
Schedule of Investments Municipal Intermediate Bond Fund^ (cont’d)
| |
| |
| | Triborough Bridge & Tunnel Au. Rev., Ser. 2021-A-2, 2.00%, due 5/15/2045 Putable 5/15/2024 | |
| | Westchester Co. Local Dev. Corp. Rev. Ref. (Kendal on Hudson Proj.), Ser. 2022-B, 5.00%, due 1/1/2041 | |
| | Yonkers Econ. Dev. Corp. Ed. Rev. (Charter Sch. of Ed. Excellence Proj.), Ser. 2019-A, 5.00%, due 10/15/2049 | |
| | | |
| |
| | North Carolina St. Turnpike Au., Ser. 2020, 5.00%, due 2/1/2024 | |
| |
| | Buckeye Tobacco Settlement Fin. Au. Asset-Backed Sr. Ref. Rev., Ser. 2020-B-2, 5.00%, due 6/1/2055 | |
| | Ohio St. Air Quality Dev. Au. (Ohio Valley Elec. Corp. Proj.), Ser. 2009-B, 1.38%, due 2/1/2026 Putable 11/1/2024 | |
| | Ohio St. Air Quality Dev. Au. Rev. (American Elec. Pwr. Co. Proj.), Ser. 2014-A, 2.40%, due 12/1/2038 Putable 10/1/2029 | |
| | Port Au. of Greater Cincinnati Dev. Rev. (Convention Ctr. Hotel Acquisition and Demolition Proj.), Ser. 2020-A, 3.00%, due 5/1/2023 | |
| | | |
| |
| | Weatherford Ind. Trust Ed. Fac. Lease Rev. (Weatherford Pub. Sch. Proj.), Ser. 2019, 5.00%, due 3/1/2033 | |
| |
| | Allegheny Co. Hosp. Dev. Au. Rev. Ref. (Univ. Pittsburgh Med. Ctr.), Ser. 2019-A, 5.00%, due 7/15/2029 | |
| | Lackawanna Co. Ind. Dev. Au. Rev. Ref. (Univ. of Scranton) | |
| | Ser. 2017, 5.00%, due 11/1/2028 | |
| | Ser. 2017, 5.00%, due 11/1/2029 | |
| | Ser. 2017, 5.00%, due 11/1/2030 | |
| | | |
| | Ser. 2017-A, (AGM Insured), 5.00%, due 12/15/2025 | |
| | Ser. 2017-A, (AGM Insured), 5.00%, due 12/15/2027 | |
| | Ser. 2017-B, (AGM Insured), 5.00%, due 12/15/2025 | |
| | Ser. 2017-B, (AGM Insured), 5.00%, due 12/15/2026 | |
| | Luzerne Co. Ind. Dev. Au. Lease Rev. Ref. Gtd. | |
| | Ser. 2017, (AGM Insured), 5.00%, due 12/15/2025 | |
| | Ser. 2017, (AGM Insured), 5.00%, due 12/15/2026 | |
| | Ser. 2017, (AGM Insured), 5.00%, due 12/15/2027 | |
| | Pennsylvania St. G.O., Ser. 2015, 5.00%, due 3/15/2029 | |
| | Pennsylvania St. Turnpike Commission Rev. Ref., Ser. 2016, 5.00%, due 6/1/2027 | |
| | Pennsylvania St. Turnpike Commission Turnpike Rev., Subser. 2019-A, 5.00%, due 12/1/2033 | |
| | Philadelphia City Wtr. & Wastewater Rev. Ref., Ser. 2020-A, 5.00%, due 11/1/2039 | |
| | Southeastern Trans. Au. Rev. Ref., Ser. 2017, 5.00%, due 3/1/2028 | |
| | | |
| |
| | Puerto Rico Ind. Tourist Ed. Med. & Env. Ctrl. Fac. Rev. (Hosp. Auxilio Mutuo Oblig. Group Proj.), Ser. 2021, 5.00%, due 7/1/2029 | |
| | Puerto Rico Sales Tax Fin. Corp. Sales Tax Rev., Ser. 2018-A-1, 5.00%, due 7/1/2058 | |
| | | |
See Notes to Financial Statements
Schedule of Investments Municipal Intermediate Bond Fund^ (cont’d)
| |
| |
| | South Carolina St. Hsg. Fin. & Dev. Au. Mtge. Rev., Ser. 2021 A, 1.85%, due 7/1/2036 | |
| | South Carolina St. Pub. Svc. Au. Oblig. Rev. Ref., Ser. 2014-C, 5.00%, due 12/1/2028 | |
| | | |
| |
| | Greeneville Hlth. & Ed. Facs. Board Hosp. Rev. Ref. (Ballad Hlth. Obligated Group), Ser. 2018-A, 5.00%, due 7/1/2032 | |
| | Tennessee Hsg. Dev. Agcy. Residential Fin. Prog. Rev., Ser. 2019-2, 3.00%, due 7/1/2039 | |
| | Tennessee St. Energy Acquisition Corp. Gas Rev. (Goldman Sachs Group, Inc.) | |
| | Ser. 2017-A, 4.00%, due 5/1/2048 Putable 5/1/2023 | |
| | Ser. 2018, 4.00%, due 11/1/2049 Putable 11/1/2025 | |
| | | |
| |
| | Central Texas Reg. Mobility Au. Sr. Lien Ref. Rev., Ser. 2020-A, 5.00%, due 1/1/2027 | |
| | Dallas Co. G.O. (Cert. Oblig.), Ser. 2016, 5.00%, due 8/15/2023 | |
| | Hidalgo Co. Reg. Mobility Au. Rev., Ser. 2022-B, 4.00%, due 12/1/2041 | |
| | La Joya Independent Sch. Dist. Ref. G.O., Ser. 2013, (PSF-GTD Insured), 5.00%, due 2/15/2033 | |
| | Laredo Independent Sch. Dist. G.O. (Sch. Bldg.), Ser. 2013, 5.00%, due 8/1/2027 | |
| | New Hope Cultural Ed. Facs. Fin. Corp. Std. Hsg. Rev. (Collegiate Hsg. College Sta. I LLC), Ser. 2014-A, (AGM Insured), 4.00%, due 4/1/2023 | |
| | Pampa Independent Sch. Dist. G.O. Ref., Ser. 2016, (PSF-GTD Insured), 5.00%, due 8/15/2032 Pre-Refunded 8/15/2025 | |
| | Prosper Independent Sch. Dist. G.O. (Sch. Bldg.), Ser. 2019, (PSF-GTD Insured), 5.00%, due 2/15/2030 | |
| | San Antonio Pub. Fac. Rev. (Convention Cert. Facs Proj.), Ser. 2022, 5.00%, due 9/15/2034 | |
| | Tender Option Bond Trust Receipts/CTFS Various St. (Floaters), Ser. 2021, (LOC: Deutsche Bank A.G.), 2.49%, due 1/1/2061 | |
| | | |
| |
| | Midvale Redev. Agcy. Tax Increment & Sales Tax Rev. | |
| | Ser. 2018, 5.00%, due 5/1/2032 | |
| | Ser. 2018, 5.00%, due 5/1/2034 | |
| | Utah Infrastructure Agcy. Telecommunication Rev. | |
| | Ser. 2019-A, 4.00%, due 10/15/2036 | |
| | Ser. 2021-A, 4.00%, due 10/15/2038 | |
| | Utah St. G.O., Ser. 2020-B, 3.00%, due 7/1/2030 | |
| | Weber Co. Spec. Assessment (Summit Mountain Assessment Area), Ser. 2013, 5.50%, due 1/15/2028 | |
| | | |
| |
| | Virginia St. Hsg. Dev. Au., Ser. 2021, ( (GNMA/FNMA/FHLMC Insured), 1.05%, due 12/1/2027 | |
| |
| | North Thurston Pub. Sch. G.O., Ser. 2016, 4.00%, due 12/1/2028 | |
| | Whitman Co. Sch. Dist. No. 267 Pullman G.O., Ser. 2016, 4.00%, due 12/1/2029 | |
| | | |
| |
| | West Virginia Hosp. Fin. Au. Rev. Ref. (Cabell Huntington Hosp. Obligated Group), Ser. 2018-A, 5.00%, due 1/1/2029 | |
See Notes to Financial Statements
Schedule of Investments Municipal Intermediate Bond Fund^ (cont’d)
| |
| |
| | Pub. Fin. Au. Hosp. Rev. (Carson Valley Med. Ctr.), Ser. 2021-A, 4.00%, due 12/1/2051 | |
| | Pub. Fin. Au. Sr. Rev. (Wonderful Foundations Charter Sch. Portfolio Proj.), Ser. 2020-A-1, 5.00%, due 1/1/2055 | |
| | Wisconsin St. Hlth. & Ed. Facs. Au. Rev. Ref. (Ascension Health Credit Group), Ser. 2016-A, 4.00%, due 11/15/2039 | |
| | Wisconsin St. Hsg. & Econ. Dev. Au. Home Ownership Rev. | |
| | Ser. 2021-A, 1.25%, due 3/1/2028 | |
| | Ser. 2021-A, 1.35%, due 9/1/2028 | |
| | Ser. 2021-A, 1.45%, due 3/1/2029 | |
| | | |
Total Investments 96.1% (Cost $178,040,129) | |
Other Assets Less Liabilities 3.9% | |
| |
| Variable rate demand obligation where the stated interest rate is not based on a published reference rate and spread. Rather, the interest rate generally resets daily or weekly and is determined by the remarketing agent. The rate shown represents the rate in effect at October 31, 2022. |
| Securities were purchased under Rule 144A of the Securities Act of 1933, as amended, or are otherwise restricted and, unless registered under the Securities Act of 1933 or exempted from registration, may only be sold to qualified institutional investors or may have other restrictions on resale. At October 31, 2022, these securities amounted to $1,231,095, which represents 0.7% of net assets of the Fund. |
The following is a summary, categorized by Level (see Note A of the Notes to Financial Statements), of inputs used to value the Fund’s investments as of October 31, 2022:
| The Schedule of Investments provides information on the state/territory categorization. |
^
A balance indicated with a "—", reflects either a zero balance or an amount that rounds to less than 1.
See Notes to Financial Statements
Schedule of Investments Short Duration Bond Fund^
October 31, 2022
| |
U.S. Treasury Obligations 6.4% | |
| | U.S. Treasury Bills, 2.72%, due 11/1/2022 | |
| | U.S. Treasury Notes, 0.38%, due 8/15/2024 | |
Total U.S. Treasury Obligations (Cost $10,848,941) | |
|
Mortgage-Backed Securities 24.4% |
Collateralized Mortgage Obligations 8.8% | |
| | Angel Oak Mortgage Trust I LLC, Ser. 2019-1, Class A1, 3.92%, due 11/25/2048 | |
| | COLT Mortgage Loan Trust, Ser. 2021-5, Class A1, 1.73%, due 11/26/2066 | |
| | Connecticut Avenue Securities Trust | |
| | Ser. 2019-R02, Class 1M2, (1M USD LIBOR + 2.30%), 5.89%, due 8/25/2031 | |
| | Ser. 2021-R01, Class 1M2, (SOFR30A + 1.55%), 4.55%, due 10/25/2041 | |
| | Ser. 2022-R01, Class 1M2, (SOFR30A + 1.90%), 4.90%, due 12/25/2041 | |
| | Ser. 2022-R04, Class 1M2, (SOFR30A + 3.10%), 6.10%, due 3/25/2042 | |
| | Ser. 2022-R03, Class 1M2, (SOFR30A + 3.50%), 6.50%, due 3/25/2042 | |
| | Ser. 2022-R07, Class 1M1, (SOFR30A + 2.95%), 5.97%, due 6/25/2042 | |
| | Ser. 2022-R08, Class 1M2, (SOFR30A + 3.60%), 6.60%, due 7/25/2042 | |
| | Ellington Financial Mortgage Trust, Ser. 2022-1, Class A1, 2.21%, due 1/25/2067 | |
| | Fannie Mae Connecticut Avenue Securities | |
| | Ser. 2016-C01, Class 2M2, (1M USD LIBOR + 6.95%), 10.54%, due 8/25/2028 | |
| | Ser. 2016-C02, Class 1M2, (1M USD LIBOR + 6.00%), 9.59%, due 9/25/2028 | |
| | Ser. 2016-C03, Class 1M2, (1M USD LIBOR + 5.30%), 8.89%, due 10/25/2028 | |
| | Ser. 2016-C04, Class 1M2, (1M USD LIBOR + 4.25%), 7.84%, due 1/25/2029 | |
| | Ser. 2017-C03, Class 1M2, (1M USD LIBOR + 3.00%), 6.59%, due 10/25/2029 | |
| | Ser. 2017-C04, Class 2M2, (1M USD LIBOR + 2.85%), 6.44%, due 11/25/2029 | |
| | Ser. 2017-C05, Class 1M2, (1M USD LIBOR + 2.20%), 5.79%, due 1/25/2030 | |
| | Ser. 2017-C06, Class 2M2, (1M USD LIBOR + 2.80%), 6.39%, due 2/25/2030 | |
| | Ser. 2018-C01, Class 1M2, (1M USD LIBOR + 2.25%), 5.84%, due 7/25/2030 | |
| | Ser. 2018-C02, Class 2M2, (1M USD LIBOR + 2.20%), 5.79%, due 8/25/2030 | |
| | Ser. 2018-C03, Class 1M2, (1M USD LIBOR + 2.15%), 5.74%, due 10/25/2030 | |
| | Freddie Mac Structured Agency Credit Risk Debt Notes | |
| | Ser. 2017-DNA1, Class M2, (1M USD LIBOR + 3.25%), 6.84%, due 7/25/2029 | |
| | Ser. 2017-HQA3, Class M2, (1M USD LIBOR + 2.35%), 5.94%, due 4/25/2030 | |
| | Ser. 2019-CS03, Class M1, (1M USD LIBOR + 0.00%), 3.59%, due 10/25/2032 | |
| | Freddie Mac Structured Agency Credit Risk Debt Notes Real Estate Mortgage Investment Conduits | |
| | Ser. 2022-DNA2, Class M2, (SOFR30A + 3.75%), 6.75%, due 2/25/2042 | |
| | Ser. 2022-HQA1, Class M2, (SOFR30A + 5.25%), 8.25%, due 3/25/2042 | |
| | Ser. 2022-HQA3, Class M1B, (SOFR30A + 3.55%), 6.55%, due 8/25/2042 | |
| | GCAT Trust, Ser. 2021-NQM5, Class A1, 1.26%, due 7/25/2066 | |
| | Harborview Mortgage Loan Trust, Ser. 2004-4, Class 3A, (1M USD LIBOR + 1.13%), 4.25%, due 6/19/2034 | |
| | New Residential Mortgage Loan Trust, Ser. 2019-NQM5, Class A1, 2.71%, due 11/25/2059 | |
| | SG Residential Mortgage Trust, Ser. 2021-2, Class A1, 1.74%, due 12/25/2061 | |
| | Towd Point Mortgage Trust, Ser. 2022-4, Class A1, 3.75%, due 9/25/2062 | |
| | Verus Securitization Trust | |
| | Ser. 2021-3, Class A3, 1.44%, due 6/25/2066 | |
| | Ser. 2021-6, Class A3, 1.89%, due 10/25/2066 | |
| | | |
Commercial Mortgage-Backed 13.6% | |
| | BANK, Ser. 2020-BN30, Class A1, 0.45%, due 12/15/2053 | |
See Notes to Financial Statements
Schedule of Investments Short Duration Bond Fund^ (cont’d)
| |
|
Commercial Mortgage-Backed – cont'd | |
| | | |
| | Ser. 2020-C7, Class A1, 1.08%, due 4/15/2053 | |
| | Ser. 2021-C11, Class XA, 1.39%, due 9/15/2054 | |
| | Ser. 2022-C17, Class XA, 1.15%, due 9/15/2055 | |
| | BB-UBS Trust, Ser. 2012-SHOW, Class A, 3.43%, due 11/5/2036 | |
| | | |
| | Ser. 2019-B12, Class A2, 3.00%, due 8/15/2052 | |
| | Ser. 2019-B12, Class AS, 3.42%, due 8/15/2052 | |
| | Ser. 2021-B30, Class XA, 0.82%, due 11/15/2054 | |
| | Ser. 2021-B31, Class D, 2.25%, due 12/15/2054 | |
| | Ser. 2021-B31, Class E, 2.25%, due 12/15/2054 | |
| | Ser. 2019-B10, Class B, 4.18%, due 3/15/2062 | |
| | BPR Trust, Ser. 2022-OANA, Class D, (1M CME Term SOFR + 3.69%), 7.07%, due 4/15/2037 | |
| | BX Commercial Mortgage Trust | |
| | Ser. 2021-VOLT, Class A, (1M USD LIBOR + 0.70%), 4.11%, due 9/15/2036 | |
| | Ser. 2021-VOLT, Class D, (1M USD LIBOR + 1.65%), 5.06%, due 9/15/2036 | |
| | Ser. 2019-XL, Class D, (1M USD LIBOR + 1.45%), 4.86%, due 10/15/2036 | |
| | | |
| | Ser. 2019-OC11, Class A, 3.20%, due 12/9/2041 | |
| | Ser. 2019-OC11, Class D, 3.94%, due 12/9/2041 | |
| | BXMT Ltd., Ser. 2020-FL2, Class A, (1M CME Term SOFR + 1.01%), 4.39%, due 2/15/2038 | |
| | CAMB Commercial Mortgage Trust | |
| | Ser. 2019-LIFE, Class D, (1M USD LIBOR + 1.75%), 5.16%, due 12/15/2037 | |
| | Ser. 2019-LIFE, Class E, (1M USD LIBOR + 2.15%), 5.56%, due 12/15/2037 | |
| | Ser. 2019-LIFE, Class F, (1M USD LIBOR + 2.55%), 5.96%, due 12/15/2037 | |
| | Citigroup Commercial Mortgage Trust | |
| | Ser. 2014-GC25, Class AAB, 3.37%, due 10/10/2047 | |
| | Ser. 2015-GC27, Class AAB, 2.94%, due 2/10/2048 | |
| | Ser. 2015-P1, Class A5, 3.72%, due 9/15/2048 | |
| | Ser. 2016-P4, Class AAB, 2.78%, due 7/10/2049 | |
| | Ser. 2016-C2, Class A1, 1.50%, due 8/10/2049 | |
| | Commercial Mortgage Trust | |
| | Ser. 2012-CR4, Class AM, 3.25%, due 10/15/2045 | |
| | Ser. 2013-LC6, Class B, 3.74%, due 1/10/2046 | |
| | Ser. 2014-UBS2, Class A5, 3.96%, due 3/10/2047 | |
| | Ser. 2014-UBS3, Class XA, 1.06%, due 6/10/2047 | |
| | Ser. 2014-CR19, Class ASB, 3.50%, due 8/10/2047 | |
| | Ser. 2014-UBS6, Class XA, 0.85%, due 12/10/2047 | |
| | Ser. 2016-COR1, Class AM, 3.49%, due 10/10/2049 | |
| | Ser. 2015-PC1, Class ASB, 3.61%, due 7/10/2050 | |
| | Ser. 2013-CR11, Class ASB, 3.66%, due 8/10/2050 | |
| | CSAIL Commercial Mortgage Trust | |
| | Ser. 2016-C5, Class XA, 0.91%, due 11/15/2048 | |
| | Ser. 2016-C5, Class ASB, 3.53%, due 11/15/2048 | |
| | Eleven Madison Mortgage Trust, Ser. 2015-11MD, Class A, 3.55%, due 9/10/2035 | |
| | Freddie Mac Multiclass Certificates, Ser. 2020-RR02, Class CX, 1.27%, due 3/27/2029 | |
| | Freddie Mac Multifamily Structured Pass Through Certificates | |
| | Ser. KW03, Class X1, 0.83%, due 6/25/2027 | |
| | Ser. K095, Class X1, 0.95%, due 6/25/2029 | |
| | Ser. K096, Class X1, 1.13%, due 7/25/2029 | |
| | Ser. K098, Class XAM, 1.39%, due 8/25/2029 | |
See Notes to Financial Statements
Schedule of Investments Short Duration Bond Fund^ (cont’d)
| |
|
Commercial Mortgage-Backed – cont'd | |
| | GS Mortgage Securities Corp. Trust, Ser. 2022-ECI, Class A, (1M CME Term SOFR + 2.19%), 5.57%, due 8/15/2039 | |
| | GS Mortgage Securities Trust | |
| | Ser. 2010-C1, Class B, 5.15%, due 8/10/2043 | |
| | Ser. 2013-GC13, Class XA, 0.06%, due 7/10/2046 | |
| | Ser. 2014-GC18, Class AS, 4.38%, due 1/10/2047 | |
| | Ser. 2015-GC34, Class AAB, 3.28%, due 10/10/2048 | |
| | Ser. 2015-GC30, Class XA, 0.73%, due 5/10/2050 | |
| | Hilton USA Trust, Ser. 2016-HHV, Class D, 4.19%, due 11/5/2038 | |
| | Hudson Yards Mortgage Trust, Ser. 2016-10HY, Class A, 2.84%, due 8/10/2038 | |
| | ILPT Commercial Mortgage Trust, Ser. 2022-LPF2, Class A, (1M CME Term SOFR + 2.25%), 5.62%, due 10/15/2039 | |
| | INTOWN STAY Mortgage Trust, Ser. 2022-STAY, Class A, (1M CME Term SOFR + 2.48%), 5.86%, due 8/15/2039 | |
| | J.P. Morgan Chase Commercial Mortgage Securities Trust, Ser. 2022-OPO, Class D, 3.45%, due 1/5/2039 | |
| | Morgan Stanley Bank of America Merrill Lynch Trust, Ser. 2017-C33, Class C, 4.56%, due 5/15/2050 | |
| | NYO Commercial Mortgage Trust, Ser. 2021-1290, Class D, (1M USD LIBOR + 2.55%), 5.96%, due 11/15/2038 | |
| | ONE Park Mortgage Trust, Ser. 2021-PARK, Class E, (1M CME Term SOFR + 1.86%), 5.24%, due 3/15/2036 | |
| | Taubman Centers Commercial Mortgage Trust | |
| | Ser. 2022-DPM, Class A, (1M CME Term SOFR + 2.19%), 5.56%, due 5/15/2037 | |
| | Ser. 2022-DPM, Class B, (1M CME Term SOFR + 2.93%), 6.31%, due 5/15/2037 | |
| | Ser. 2022-DPM, Class C, (1M CME Term SOFR + 3.78%), 7.15%, due 5/15/2037 | |
| | Wells Fargo Commercial Mortgage Trust, Ser. 2019-C52, Class XA, 1.60%, due 8/15/2052 | |
| | WFRBS Commercial Mortgage Trust, Ser. 2014-C25, Class A5, 3.63%, due 11/15/2047 | |
| | | |
| |
| | Pass-Through Certificates | |
| | 4.50%, due 4/1/2039 - 5/1/2044 | |
| | | |
| | | |
| |
| | Pass-Through Certificates | |
| | | |
| | | |
| | | |
| | | |
Total Mortgage-Backed Securities (Cost $46,577,562) | |
Asset-Backed Securities 15.6% | |
| | 37 Capital CLO I Ltd., Ser. 2021-1A, Class A, (3M USD LIBOR + 1.20%), 5.28%, due 10/15/2034 | |
| | AM Capital Funding LLC, Ser. 2018-1, Class A, 4.98%, due 12/15/2023 | |
| | Aqua Finance Trust, Ser. 2021-A, Class A, 1.54%, due 7/17/2046 | |
| | Avis Budget Rental Car Funding AESOP LLC | |
| | Ser. 2020-1A, Class A, 2.33%, due 8/20/2026 | |
| | Ser. 2020-2A, Class B, 2.96%, due 2/20/2027 | |
| | Ser. 2021-2A, Class B, 1.90%, due 2/20/2028 | |
| | Beacon Container Finance II LLC, Ser. 2021-1A, Class A, 2.25%, due 10/22/2046 | |
See Notes to Financial Statements
Schedule of Investments Short Duration Bond Fund^ (cont’d)
| |
Asset-Backed Securities – cont'd | |
| | Crown Castle Towers LLC, 3.66%, due 5/15/2025 | |
| | Dryden 64 CLO Ltd., Ser. 2018-64A, Class D, (3M USD LIBOR + 2.65%), 6.84%, due 4/18/2031 | |
| | Fort Washington CLO Ltd., Ser. 2021-2A, Class A, (3M USD LIBOR + 1.22%), 5.46%, due 10/20/2034 | |
| | Gulf Stream Meridian 3 Ltd., Ser. 2021-IIIA, Class A1, (3M USD LIBOR + 1.32%), 5.40%, due 4/15/2034 | |
| | Hilton Grand Vacations Trust | |
| | Ser. 2022-2A, Class A, 4.30%, due 1/25/2037 | |
| | Ser. 2022-2A, Class B, 4.74%, due 1/25/2037 | |
| | JPMorgan Chase Bank NA, Ser. 2021-3, Class B, 0.76%, due 2/26/2029 | |
| | MetroNet Infrastructure Issuer LLC, Ser. 2022-1A, Class A2, 6.35%, due 10/20/2052 | |
| | | |
| | Ser. 2021-2A, Class A, 1.43%, due 5/20/2039 | |
| | Ser. 2021-2A, Class B, 1.83%, due 5/20/2039 | |
| | Ser. 2021-1WA, Class B, 1.44%, due 1/22/2041 | |
| | Navient Private Ed. Refi Loan Trust, Ser. 2021-EA, Class A, 0.97%, due 12/16/2069 | |
| | Navient Student Loan Trust | |
| | Ser. 2021-BA, Class A, 0.94%, due 7/15/2069 | |
| | Ser. 2021-CA, Class A, 1.06%, due 10/15/2069 | |
| | Ser. 2021-FA, Class A, 1.11%, due 2/18/2070 | |
| | Oaktree CLO Ltd., Ser. 2022-3A, Class A2, (3M CME Term SOFR + 2.30%), 5.12%, due 7/15/2035 | |
| | Octagon Investment Partners 43 Ltd., Ser. 2019-1A, Class D, (3M USD LIBOR + 3.90%), 8.26%, due 10/25/2032 | |
| | OneMain Financial Issuance Trust | |
| | Ser. 2020-1A, Class A, 3.84%, due 5/14/2032 | |
| | Ser. 2022-2A, Class A, 4.89%, due 10/14/2034 | |
| | Park Blue CLO Ltd., Ser. 2022-1A, Class A1, (3M CME Term SOFR + 2.45%), 2.45%, due 10/20/2034 | |
| | | |
| | Ser. 2021-A, Class A, 0.71%, due 4/15/2026 | |
| | Ser. 2022-A, Class A, 2.47%, due 2/15/2027 | |
| | Prestige Auto Receivables Trust | |
| | Ser. 2021-1A, Class D, 2.08%, due 2/15/2028 | |
| | Ser. 2022-1A, Class B, 6.55%, due 7/17/2028 | |
| | SBA Tower Trust, Ser. 2014-2A, Class C, 3.87%, due 10/15/2049 | |
| | Sierra Timeshare Receivables Funding LLC | |
| | Ser. 2019-2A, Class A, 2.59%, due 5/20/2036 | |
| | Ser. 2020-2A, Class C, 3.51%, due 7/20/2037 | |
| | Ser. 2022-1A, Class A, 3.05%, due 10/20/2038 | |
| | Ser. 2022-1A, Class C, 3.94%, due 10/20/2038 | |
| | Ser. 2022-2A, Class B, 5.04%, due 6/20/2040 | |
| | SoFi Professional Loan Program Trust | |
| | Ser. 2021-A, Class AFX, 1.03%, due 8/17/2043 | |
| | Ser. 2018-C, Class BFX, 4.13%, due 1/25/2048 | |
| | Storm King Park CLO Ltd., Ser. 2022-1A, Class A1, (3M CME Term SOFR + 2.05%), 5.66%, due 10/15/2035 | |
| | Taco Bell Funding LLC, Ser. 2021-1A, Class A2I, 1.95%, due 8/25/2051 | |
| | TAL Advantage VII LLC, Ser. 2020-1A, Class A, 2.05%, due 9/20/2045 | |
| | TICP CLO VII Ltd., Ser. 2017-7A, Class DR, (3M USD LIBOR + 3.20%), 7.28%, due 4/15/2033 | |
| | T-Mobile U.S. Trust, Ser. 2022-1A, Class A, 4.91%, due 5/22/2028 | |
| | Vantage Data Centers Issuer LLC, Ser. 2019-1A, Class A2, 3.19%, due 7/15/2044 | |
| | Voya CLO Ltd., Ser. 2016-2A, Class CR, (3M USD LIBOR + 4.00%), 8.23%, due 7/19/2028 | |
See Notes to Financial Statements
Schedule of Investments Short Duration Bond Fund^ (cont’d)
| |
Asset-Backed Securities – cont'd | |
| | Whitebox CLO III Ltd., Ser. 2021-3A, Class A1, (3M USD LIBOR + 1.22%), 5.30%, due 10/15/2034 | |
Total Asset-Backed Securities (Cost $28,584,586) | |
|
|
| |
| | Boeing Co., 2.20%, due 2/4/2026 | |
| |
| | BAT Capital Corp., 2.26%, due 3/25/2028 | |
| |
| | American Airlines, Inc./AAdvantage Loyalty IP Ltd. | |
| | | |
| | | |
| | Delta Air Lines, Inc., 7.00%, due 5/1/2025 | |
| | Delta Air Lines, Inc./SkyMiles IP Ltd., 4.50%, due 10/20/2025 | |
| | United Airlines, Inc., 4.38%, due 4/15/2026 | |
| | | |
| |
| | Ford Motor Credit Co. LLC, 2.90%, due 2/10/2029 | |
| |
| | General Motors Financial Co., Inc. | |
| | | |
| | | |
| | | |
| | Volkswagen Group of America Finance LLC | |
| | | |
| | | |
| | | |
Auto Parts & Equipment 0.5% | |
| | Dana Financing Luxembourg S.a.r.l., 5.75%, due 4/15/2025 | |
| | Goodyear Tire & Rubber Co., 5.00%, due 5/31/2026 | |
| | | |
| |
| | | |
| | | |
| | | |
| | | |
| | Ser. L, 3.95%, due 4/21/2025 | |
| | | |
| | | |
| | BNP Paribas SA, 3.80%, due 1/10/2024 | |
| | | |
| | | |
| | | |
| | Goldman Sachs Group, Inc. | |
| | | |
| | | |
See Notes to Financial Statements
Schedule of Investments Short Duration Bond Fund^ (cont’d)
| |
|
| |
| | | |
| | | |
| | | |
| | | |
| | | |
| | | |
| | | |
| | | |
| | Royal Bank of Canada, 3.38%, due 4/14/2025 | |
| | U.S. Bancorp, 5.73%, due 10/21/2026 | |
| | | |
| | | |
| | | |
| | | |
| |
| | Jeld-Wen, Inc., 4.63%, due 12/15/2025 | |
Cosmetics - Personal Care 0.2% | |
| | GSK Consumer Healthcare Capital U.S. LLC, 3.02%, due 3/24/2024 | |
Diversified Financial Services 2.8% | |
| | AerCap Ireland Capital Designated Activity Co./AerCap Global Aviation Trust | |
| | | |
| | | |
| | American Express Co., 3.95%, due 8/1/2025 | |
| | Capital One Financial Corp., 4.17%, due 5/9/2025 | |
| | Global Aircraft Leasing Co. Ltd., 6.50% Cash/7.25% PIK, due 9/15/2024 | |
| | GTP Acquisition Partners I LLC, 3.48%, due 6/16/2025 | |
| | OneMain Finance Corp., 3.50%, due 1/15/2027 | |
| | Springleaf Finance Corp., 6.88%, due 3/15/2025 | |
| | | |
| |
| | DTE Energy Co., 4.22%, due 11/1/2024 | |
| | Duke Energy Corp., 2.65%, due 9/1/2026 | |
| | | |
Electric - Generation 0.3% | |
| | Sunnova Energy Corp., 5.88%, due 9/1/2026 | |
| |
| | Warnermedia Holdings, Inc., 3.76%, due 3/15/2027 | |
| |
| | JBS USA LUX SA/JBS USA Food Co./JBS USA Finance, Inc., 2.50%, due 1/15/2027 | |
Healthcare - Products 0.5% | |
| | Baxter Int'l, Inc., 1.32%, due 11/29/2024 | |
Healthcare - Services 1.3% | |
| | Select Medical Corp., 6.25%, due 8/15/2026 | |
| | UnitedHealth Group, Inc., 3.70%, due 5/15/2027 | |
| | | |
See Notes to Financial Statements
Schedule of Investments Short Duration Bond Fund^ (cont’d)
| |
|
| |
| | Tri Pointe Homes, Inc., 5.25%, due 6/1/2027 | |
| |
| | Jackson National Life Global Funding, 1.75%, due 1/12/2025 | |
| |
| | Carnival Corp., 5.75%, due 3/1/2027 | |
| | Lindblad Expeditions LLC, 6.75%, due 2/15/2027 | |
| | NCL Corp. Ltd., 3.63%, due 12/15/2024 | |
| | Royal Caribbean Cruises Ltd., 4.25%, due 7/1/2026 | |
| | | |
| |
| | | |
| | | |
| | | |
| | Fox Corp., 3.05%, due 4/7/2025 | |
| | | |
| |
| | Ascent Resources Utica Holdings LLC/ARU Finance Corp., 7.00%, due 11/1/2026 | |
| | Callon Petroleum Co., 6.38%, due 7/1/2026 | |
| | CrownRock L.P./CrownRock Finance, Inc., 5.63%, due 10/15/2025 | |
| | Northern Oil and Gas, Inc., 8.13%, due 3/1/2028 | |
| | PDC Energy, Inc., 5.75%, due 5/15/2026 | |
| | | |
Packaging & Containers 0.8% | |
| | Sonoco Products Co., 1.80%, due 2/1/2025 | |
| |
| | AbbVie, Inc., 2.95%, due 11/21/2026 | |
| | Takeda Pharmaceutical Co. Ltd., 4.40%, due 11/26/2023 | |
| | Viatris, Inc., 1.65%, due 6/22/2025 | |
| | | |
| |
| | Blue Racer Midstream LLC/Blue Racer Finance Corp., 7.63%, due 12/15/2025 | |
| | Buckeye Partners L.P., 4.35%, due 10/15/2024 | |
| | Crestwood Midstream Partners L.P./Crestwood Midstream Finance Corp., 5.75%, due 4/1/2025 | |
| | EQM Midstream Partners L.P. | |
| | | |
| | | |
| | Genesis Energy L.P./Genesis Energy Finance Corp., 6.50%, due 10/1/2025 | |
| | MPLX L.P., 4.88%, due 6/1/2025 | |
| | New Fortress Energy, Inc. | |
| | | |
| | | |
| | Summit Midstream Holdings LLC/Summit Midstream Finance Corp., 8.50%, due 10/15/2026 | |
| | Tallgrass Energy Partners L.P./Tallgrass Energy Finance Corp. | |
| | | |
| | | |
| | | |
See Notes to Financial Statements
Schedule of Investments Short Duration Bond Fund^ (cont’d)
| |
|
Real Estate Investment Trusts 1.4% | |
| | | |
| | | |
| | | |
| | Hospitality Properties Trust, 4.35%, due 10/1/2024 | |
| | Starwood Property Trust, Inc., 4.75%, due 3/15/2025 | |
| | VICI Properties L.P./VICI Note Co., Inc., 4.63%, due 6/15/2025 | |
| | | |
| |
| | Lowe's Cos., Inc., 1.70%, due 9/15/2028 | |
| |
| | Broadcom, Inc., 3.15%, due 11/15/2025 | |
| | Marvell Technology, Inc., 1.65%, due 4/15/2026 | |
| | | |
| |
| | Infor, Inc., 1.45%, due 7/15/2023 | |
| | NortonLifeLock, Inc., 6.75%, due 9/30/2027 | |
| | Oracle Corp., 1.65%, due 3/25/2026 | |
| | | |
| |
| | | |
| | | |
| | | |
| | Level 3 Financing, Inc., 3.63%, due 1/15/2029 | |
| | | |
| | | |
| | | |
| | Verizon Communications, Inc. | |
| | | |
| | | |
| | | |
Total Corporate Bonds (Cost $85,470,092) | |
|
|
| |
| | DISH Network Corp., 2.38%, due 3/15/2024 | |
| | DISH Network Corp., 3.38%, due 8/15/2026 | |
Total Convertible Bonds (Cost $623,551) | |
|
|
| |
| | Louisiana St. Local Gov't Env. Facs. & Comm. Dev. Au. Rev. (Utils. Restoration Corp. Proj.), Ser. 2022-A, 3.62%, due 2/1/2029 (Cost $1,200,000) | |
See Notes to Financial Statements
Schedule of Investments Short Duration Bond Fund^ (cont’d)
| |
|
Short-Term Investments 5.0% |
Investment Companies 5.0% | |
| | State Street Institutional U.S. Government Money Market Fund Premier Class, 3.01%(k) (Cost $8,607,783) | |
Total Investments 98.6% (Cost $181,912,515) | |
Other Assets Less Liabilities 1.4% | |
| |
| Rate shown was the discount rate at the date of purchase. |
| Securities were purchased under Rule 144A of the Securities Act of 1933, as amended, or are otherwise restricted and, unless registered under the Securities Act of 1933 or exempted from registration, may only be sold to qualified institutional investors or may have other restrictions on resale. At October 31, 2022, these securities amounted to $63,717,495, which represents 37.3% of net assets of the Fund. |
| Variable or floating rate security where the stated interest rate is not based on a published reference rate and spread. Rather, the interest rate adjusts periodically based on changes in current interest rates and prepayments on the underlying pool of assets. The interest rate shown was the current rate as of October 31, 2022. |
| Variable or floating rate security. The interest rate shown was the current rate as of October 31, 2022 and changes periodically. |
| Interest only security. These securities represent the right to receive the monthly interest payments on an underlying pool of mortgages. Payments of principal on the pool reduce the value of the “interest only” holding. |
| All or a portion of this security was purchased on a delayed delivery basis. |
| When-issued security. Total value of all such securities at October 31, 2022 amounted to $315,148, which represents 0.2% of net assets of the Fund. |
| Security issued at a fixed coupon rate, which converts to a variable rate at a future date. Rate shown is the rate in effect as of period end. |
| Payment-in-kind (PIK) security. |
| Security fair valued as of October 31, 2022 in accordance with procedures approved by the valuation designee. Total value of all such securities at October 31, 2022 amounted to $220,800, which represents 0.1% of net assets of the Fund. |
| Represents 7-day effective yield as of October 31, 2022. |
| Includes the impact of the Fund’s open positions in derivatives at October 31, 2022. |
See Notes to Financial Statements
Schedule of Investments Short Duration Bond Fund^ (cont’d)
|
| | |
| | |
| | |
| | |
| | |
| | |
| | |
| | |
| | |
| | |
| | |
Short-Term Investments and Other Assets—Net | | |
| | |
See Notes to Financial Statements
Schedule of Investments Short Duration Bond Fund^ (cont’d)
Derivative Instruments
Futures contracts ("futures")
At October 31, 2022, open positions in futures for the Fund were as follows:
| | | | Value and
Unrealized
Appreciation/
(Depreciation) |
| | U.S. Treasury Note, 2 Year | | |
| | |
| | | | Value and
Unrealized
Appreciation/
(Depreciation) |
| | U.S. Treasury Note, 10 Year | | |
| | U.S. Treasury Note, 5 Year | | |
| | U.S. Treasury Note, Ultra 10 Year | | |
| | | | |
| | |
| | |
At October 31, 2022, the Fund had $796,117 deposited in a segregated account to cover margin requirements on open futures.
For the year ended October 31, 2022, the average notional value for the months where the Fund had futures outstanding was $83,037,266 for long positions and $(43,175,341) for short positions.
Over-the-counter total return swaps—Long(a) |
| | | | | | | Frequency
of Fund
Receipt/
Payment | Unrealized
Appreciation/
(Depreciation) | Accrued
Net
Interest
Receivable/
(Payable) | |
| iShares iBoxx High Yield Corporate Bond ETF | | | | | | | | | | |
| | | | | | | | | | | |
| The Fund pays a specified rate based on a reference rate plus or minus a spread, and receives the total return on the reference entity. |
| Effective rate at October 31, 2022. |
For the year ended October 31, 2022, the average notional value for the months where the Fund had total
return swaps outstanding was $4,468,439 for long positions.
See Notes to Financial Statements
Schedule of Investments Short Duration Bond Fund^ (cont’d)
The following is a summary, categorized by Level (see Note A of the Notes to Financial Statements), of inputs used to value the Fund’s investments as of October 31, 2022:
| | | | |
| | | | |
U.S. Treasury Obligations | | | | |
Mortgage-Backed Securities# | | | | |
| | | | |
| | | | |
| | | | |
| | | | |
| | | | |
| | | | |
| The Schedule of Investments provides information on the industry, state/territory or sector categorization as well as a Positions by Country summary. |
The following is a summary, categorized by Level (see Note A of the Notes to Financial Statements), of inputs used to value the Fund’s derivatives as of October 31, 2022:
Other Financial Instruments | | | | |
| | | | |
| | | | |
| | | | |
| | | | |
| | | | |
| | | | |
| Futures are reported at the cumulative unrealized appreciation/(depreciation) of the instrument. |
^
A balance indicated with a "—", reflects either a zero balance or an amount that rounds to less than 1.
See Notes to Financial Statements
Schedule of Investments Strategic Income Fund^
October 31, 2022
| |
U.S. Treasury Obligations 4.6% | |
| | | |
| | | |
| | | |
| | | |
| | | |
| | | |
| | | |
| | | |
| | | |
| | | |
| | | |
| | | |
| | U.S. Treasury Inflation-Indexed Bonds | |
| | | |
| | | |
| | | |
| | | |
| | U.S. Treasury Inflation-Indexed Notes, 0.13%, due 4/15/2027 - 1/15/2032 | |
| | | |
| | | |
| | | |
| | | |
Total U.S. Treasury Obligations (Cost $139,276,409) | |
U.S. Government Agency Securities 0.1% | |
| | Federal National Mortgage Association, 5.63%, due 7/15/2037 (Cost $2,835,428) | |
|
Mortgage-Backed Securities 40.9% |
Collateralized Mortgage Obligations 9.1% | |
| | Connecticut Avenue Securities Trust | |
| | Ser. 2019-R06, Class 2M2, (1M USD LIBOR + 2.10%), 5.69%, due 9/25/2039 | |
| | Ser. 2020-R02, Class 2B1, (1M USD LIBOR + 3.00%), 6.59%, due 1/25/2040 | |
| | Ser. 2022-R01, Class 1M2, (SOFR30A + 1.90%), 4.90%, due 12/25/2041 | |
| | Ser. 2022-R04, Class 1M2, (SOFR30A + 3.10%), 6.10%, due 3/25/2042 | |
| | Ser. 2022-R03, Class 1M2, (SOFR30A + 3.50%), 6.50%, due 3/25/2042 | |
| | Ser. 2022-R07, Class 1M1, (SOFR30A + 2.95%), 5.97%, due 6/25/2042 | |
| | Fannie Mae Connecticut Avenue Securities | |
| | Ser. 2017-C03, Class 1M2, (1M USD LIBOR + 3.00%), 6.59%, due 10/25/2029 | |
| | Ser. 2017-C05, Class 1M2, (1M USD LIBOR + 2.20%), 5.79%, due 1/25/2030 | |
| | Ser. 2017-C06, Class 2M2, (1M USD LIBOR + 2.80%), 6.39%, due 2/25/2030 | |
| | Ser. 2017-C07, Class 1M2, (1M USD LIBOR + 2.40%), 5.99%, due 5/25/2030 | |
| | Ser. 2018-C01, Class 1M2, (1M USD LIBOR + 2.25%), 5.84%, due 7/25/2030 | |
| | Ser. 2018-C02, Class 2M2, (1M USD LIBOR + 2.20%), 5.79%, due 8/25/2030 | |
| | Ser. 2018-C04, Class 2M2, (1M USD LIBOR + 2.55%), 6.14%, due 12/25/2030 | |
| | Ser. 2018-C05, Class 1M2, (1M USD LIBOR + 2.35%), 5.94%, due 1/25/2031 | |
| | Fannie Mae Interest Strip | |
| | Ser. 413, Class C26, 4.00%, due 10/25/2041 | |
| | Ser. 418, Class C24, 4.00%, due 8/25/2043 | |
See Notes to Financial Statements
Schedule of Investments Strategic Income Fund^ (cont’d)
| |
|
Collateralized Mortgage Obligations – cont'd | |
| | Fannie Mae Real Estate Mortgage Investment Conduits | |
| | Ser. 2012-96, Class PS, (6.70% - 1M USD LIBOR), 3.11%, due 7/25/2041 | |
| | Ser. 2019-49, Class DS, (6.15% - 1M USD LIBOR), 2.56%, due 6/25/2043 | |
| | Ser. 2018-18, Class ST, (6.10% - 1M USD LIBOR), 2.51%, due 12/25/2044 | |
| | Ser. 2016-8, Class SB, (6.10% - 1M USD LIBOR), 2.51%, due 3/25/2046 | |
| | Ser. 2016-31, Class HS, (6.00% - 1M USD LIBOR), 2.41%, due 6/25/2046 | |
| | Ser. 2016-67, Class KS, (6.00% - 1M USD LIBOR), 2.41%, due 9/25/2046 | |
| | Ser. 2016-62, Class SA, (6.00% - 1M USD LIBOR), 2.41%, due 9/25/2046 | |
| | Ser. 2019-33, Class SN, (6.10% - 1M USD LIBOR), 2.51%, due 7/25/2049 | |
| | Ser. 2021-76, Class AI, 3.50%, due 11/25/2051 | |
| | Freddie Mac Real Estate Mortgage Investment Conduits | |
| | Ser. 4117, Class IO, 4.00%, due 10/15/2042 | |
| | Ser. 4150, Class SP, (6.15% - 1M USD LIBOR), 2.74%, due 1/15/2043 | |
| | Ser. 4456, Class SA, (6.15% - 1M USD LIBOR), 2.74%, due 3/15/2045 | |
| | Ser. 4627, Class SA, (6.00% - 1M USD LIBOR), 2.59%, due 10/15/2046 | |
| | Ser. 4994, Class LI, 4.00%, due 12/25/2048 | |
| | Ser. 4953, Class BI, 4.50%, due 2/25/2050 | |
| | Ser. 5142, Class CI, 2.50%, due 9/25/2051 | |
| | Freddie Mac Structured Agency Credit Risk Debt Notes | |
| | Ser. 2018-DNA1, Class M2, (1M USD LIBOR + 1.80%), 5.39%, due 7/25/2030 | |
| | Ser. 2018-HQA1, Class M2, (1M USD LIBOR + 2.30%), 5.89%, due 9/25/2030 | |
| | Ser. 2019-HQA1, Class B1, (1M USD LIBOR + 4.40%), 7.99%, due 2/25/2049 | |
| | Ser. 2019-DNA2, Class B1, (1M USD LIBOR + 4.35%), 7.94%, due 3/25/2049 | |
| | Ser. 2019-HQA2, Class B1, (1M USD LIBOR + 4.10%), 7.69%, due 4/25/2049 | |
| | Freddie Mac Structured Agency Credit Risk Debt Notes Real Estate Mortgage Investment Conduits | |
| | Ser. 2022-DNA2, Class M2, (SOFR30A + 3.75%), 6.75%, due 2/25/2042 | |
| | Ser. 2022-HQA1, Class M2, (SOFR30A + 5.25%), 8.25%, due 3/25/2042 | |
| | Ser. 2022-DNA3, Class M1B, (SOFR30A + 2.90%), 5.90%, due 4/25/2042 | |
| | Government National Mortgage Association | |
| | Ser. 2013-186, Class SA, (6.10% - 1M USD LIBOR), 2.69%, due 12/16/2043 | |
| | Ser. 2015-144, Class HS, (6.20% - 1M USD LIBOR), 2.71%, due 10/20/2045 | |
| | Ser. 2015-187, Class AI, 4.50%, due 12/20/2045 | |
| | Ser. 2017-112, Class KS, (6.20% - 1M USD LIBOR), 2.71%, due 7/20/2047 | |
| | Ser. 2020-151, Class MI, 2.50%, due 10/20/2050 | |
| | Ser. 2021-30, Class DI, 2.50%, due 2/20/2051 | |
| | Ser. 2021-196, Class IO, 2.50%, due 11/20/2051 | |
| | JP Morgan Alternative Loan Trust, Ser. 2006-A5, Class 1A1, (1M USD LIBOR + 0.32%), 3.91%, due 10/25/2036 | |
| | Onslow Bay Mortgage Loan Trust, Ser. 2021-NQM4, Class A1, 1.96%, due 10/25/2061 | |
| | SG Residential Mortgage Trust, Ser. 2021-2, Class A1, 1.74%, due 12/25/2061 | |
| | Starwood Mortgage Residential Trust, Ser. 2021-5, Class A1, 1.92%, due 9/25/2066 | |
| | Towd Point Mortgage Trust, Ser. 2022-4, Class A1, 3.75%, due 9/25/2062 | |
| | Verus Securitization Trust | |
| | Ser. 2021-6, Class A1, 1.63%, due 10/25/2066 | |
| | Ser. 2021-6, Class A3, 1.89%, due 10/25/2066 | |
| | Ser. 2022-4, Class A3, 4.74%, due 4/25/2067 | |
| | | |
See Notes to Financial Statements
Schedule of Investments Strategic Income Fund^ (cont’d)
| |
|
Commercial Mortgage-Backed 4.4% | |
| | | |
| | Ser. 2021-C11, Class XA, 1.39%, due 9/15/2054 | |
| | Ser. 2022-C17, Class XA, 1.15%, due 9/15/2055 | |
| | | |
| | Ser. 2021-B30, Class XA, 0.82%, due 11/15/2054 | |
| | Ser. 2021-B31, Class E, 2.25%, due 12/15/2054 | |
| | BPR Trust, Ser. 2022-OANA, Class D, (1M CME Term SOFR + 3.69%), 7.07%, due 4/15/2037 | |
| | BX Commercial Mortgage Trust, Ser. 2021-VOLT, Class D, (1M USD LIBOR + 1.65%), 5.06%, due 9/15/2036 | |
| | | |
| | Ser. 2021-SDMF, Class E, (1M USD LIBOR + 1.59%), 5.00%, due 9/15/2034 | |
| | Ser. 2019-OC11, Class D, 3.94%, due 12/9/2041 | |
| | CAMB Commercial Mortgage Trust | |
| | Ser. 2019-LIFE, Class E, (1M USD LIBOR + 2.15%), 5.56%, due 12/15/2037 | |
| | Ser. 2019-LIFE, Class F, (1M USD LIBOR + 2.55%), 5.96%, due 12/15/2037 | |
| | Citigroup Commercial Mortgage Trust | |
| | Ser. 2012-GC8, Class B, 4.29%, due 9/10/2045 | |
| | Ser. 2014-GC25, Class XA, 0.95%, due 10/10/2047 | |
| | Ser. 2015-GC27, Class XA, 1.31%, due 2/10/2048 | |
| | Commercial Mortgage Trust | |
| | Ser. 2012-CR4, Class AM, 3.25%, due 10/15/2045 | |
| | Ser. 2014-CR16, Class XA, 0.94%, due 4/10/2047 | |
| | Ser. 2014-CR17, Class XA, 0.95%, due 5/10/2047 | |
| | Ser. 2014-UBS3, Class XA, 1.06%, due 6/10/2047 | |
| | Ser. 2014-UBS6, Class XA, 0.85%, due 12/10/2047 | |
| | CSAIL Commercial Mortgage Trust, Ser. 2015-C2, Class XA, 0.72%, due 6/15/2057 | |
| | Freddie Mac Multiclass Certificates | |
| | Ser. 2020-RR03, Class X1, 1.71%, due 7/27/2028 | |
| | Ser. 2020-RR02, Class DX, 1.82%, due 9/27/2028 | |
| | Ser. 2020-RR04, Class X, 2.13%, due 2/27/2029 | |
| | Ser. 2020-RR02, Class CX, 1.27%, due 3/27/2029 | |
| | Freddie Mac Multifamily Structured Pass Through Certificates | |
| | Ser. K083, Class XAM, 0.05%, due 10/25/2028 | |
| | Ser. K085, Class XAM, 0.06%, due 10/25/2028 | |
| | GS Mortgage Securities Corp. Trust, Ser. 2022-ECI, Class A, (1M CME Term SOFR + 2.19%), 5.57%, due 8/15/2039 | |
| | GS Mortgage Securities Trust | |
| | Ser. 2014-GC18, Class XA, 1.03%, due 1/10/2047 | |
| | Ser. 2015-GC30, Class XA, 0.73%, due 5/10/2050 | |
| | Hilton USA Trust, Ser. 2016-HHV, Class C, 4.19%, due 11/5/2038 | |
| | Hudson Yards Mortgage Trust, Ser. 2016-10HY, Class C, 2.98%, due 8/10/2038 | |
| | INTOWN STAY Mortgage Trust, Ser. 2022-STAY, Class A, (1M CME Term SOFR + 2.48%), 5.86%, due 8/15/2039 | |
| | J.P. Morgan Chase Commercial Mortgage Securities Trust, Ser. 2022-OPO, Class D, 3.45%, due 1/5/2039 | |
| | Morgan Stanley Bank of America Merrill Lynch Trust, Ser. 2017-C33, Class C, 4.56%, due 5/15/2050 | |
| | NYO Commercial Mortgage Trust, Ser. 2021-1290, Class D, (1M USD LIBOR + 2.55%), 5.96%, due 11/15/2038 | |
| | ONE Park Mortgage Trust, Ser. 2021-PARK, Class E, (1M CME Term SOFR + 1.86%), 5.24%, due 3/15/2036 | |
See Notes to Financial Statements
Schedule of Investments Strategic Income Fund^ (cont’d)
| |
|
Commercial Mortgage-Backed – cont'd | |
| | Taubman Centers Commercial Mortgage Trust | |
| | Ser. 2022-DPM, Class B, (1M CME Term SOFR + 2.93%), 6.31%, due 5/15/2037 | |
| | Ser. 2022-DPM, Class C, (1M CME Term SOFR + 3.78%), 7.15%, due 5/15/2037 | |
| | WF-RBS Commercial Mortgage Trust | |
| | Ser. 2013-C14, Class XB, 0.12%, due 6/15/2046 | |
| | Ser. 2014-C21, Class XA, 1.01%, due 8/15/2047 | |
| | Ser. 2014-C25, Class XA, 0.79%, due 11/15/2047 | |
| | Ser. 2014-C22, Class XA, 0.79%, due 9/15/2057 | |
| | | |
| |
| | Pass-Through Certificates | |
| | 2.50%, due 8/1/2051 - 5/1/2052 | |
| | 3.00%, due 6/1/2050 - 6/1/2052 | |
| | 3.50%, due 5/1/2051 - 6/1/2052 | |
| | 4.00%, due 5/1/2052 - 7/1/2052 | |
| | | |
| | | |
| | | |
| |
| | Pass-Through Certificates | |
| | 2.50%, due 5/1/2051 - 4/1/2052 | |
| | 3.00%, due 12/1/2051 - 5/1/2052 | |
| | 3.50%, due 5/1/2052 - 9/1/2052 | |
| | 4.00%, due 6/1/2052 - 7/1/2052 | |
| | 4.50%, due 7/1/2052 - 8/1/2052 | |
| | | |
| |
| | Pass-Through Certificates | |
| | | |
| | 4.00%, TBA, 30 Year Maturity | |
| | 4.50%, TBA, 30 Year Maturity | |
| | 5.00%, TBA, 30 Year Maturity | |
| | 5.50%, TBA, 30 Year Maturity | |
| | | |
Uniform Mortgage-Backed Securities 15.6% | |
| | Pass-Through Certificates | |
| | 3.00%, TBA, 30 Year Maturity | |
| | 3.50%, TBA, 30 Year Maturity | |
| | 4.00%, TBA, 30 Year Maturity | |
| | 4.50%, TBA, 30 Year Maturity | |
| | 5.00%, TBA, 30 Year Maturity | |
| | 5.50%, TBA, 30 Year Maturity | |
| | | |
Total Mortgage-Backed Securities (Cost $1,122,054,938) | |
Asset-Backed Securities 8.6% | |
| | 37 Capital CLO Ltd., Ser. 2021-1A, Class E, (3M USD LIBOR + 7.20%), 11.28%, due 10/15/2034 | |
See Notes to Financial Statements
Schedule of Investments Strategic Income Fund^ (cont’d)
| |
Asset-Backed Securities – cont'd | |
| | AB BSL CLO, Ser. 2020-1A, Class DR, (3M CME Term SOFR + 3.45%), 7.31%, due 1/15/2035 | |
| | | |
| | Ser. 2020-1A, Class DR, (3M USD LIBOR + 3.00%), 7.08%, due 4/15/2034 | |
| | Ser. 2020-1A, Class ER, (3M USD LIBOR + 6.30%), 10.38%, due 4/15/2034 | |
| | AIMCO CLO 10 Ltd., Ser. 2019-10A, Class DR, (3M USD LIBOR + 2.90%), 7.22%, due 7/22/2032 | |
| | AIMCO CLO Ltd., Ser. 2018-AA, Class E, (3M USD LIBOR + 5.15%), 9.23%, due 4/17/2031 | |
| | Alinea CLO Ltd., Ser. 2018-1A, Class E, (3M USD LIBOR + 6.00%), 10.24%, due 7/20/2031 | |
| | AM Capital Funding LLC, Ser. 2018-1, Class A, 4.98%, due 12/15/2023 | |
| | Amur Equipment Finance Receivables XI LLC, Ser. 2022-2A, Class A2, 5.30%, due 6/21/2028 | |
| | | |
| | Ser. 2017-28A, Class C, (3M USD LIBOR + 2.50%), 6.74%, due 1/20/2031 | |
| | Ser. 2017-28A, Class D, (3M USD LIBOR + 5.50%), 9.74%, due 1/20/2031 | |
| | Apollo Aviation Securitization Asset Trust, Ser. 2020-1A, Class A, 3.35%, due 1/16/2040 | |
| | | |
| | Ser. 2019-53A, Class D, (3M USD LIBOR + 3.75%), 8.07%, due 4/24/2031 | |
| | Ser. 2019-53A, Class E, (3M USD LIBOR + 6.85%), 11.17%, due 4/24/2031 | |
| | Ares XLV CLO Ltd., Ser. 2017-45A, Class E, (3M USD LIBOR + 6.10%), 10.18%, due 10/15/2030 | |
| | Ares XXVII CLO Ltd., Ser. 2013-2A, Class ER2, (3M USD LIBOR + 6.75%), 11.12%, due 10/28/2034 | |
| | | |
| | Ser. 2018-2A, Class D, (3M USD LIBOR + 2.85%), 7.09%, due 4/20/2031 | |
| | Ser. 2018-2A, Class E, (3M USD LIBOR + 5.60%), 9.84%, due 4/20/2031 | |
| | Avis Budget Rental Car Funding AESOP LLC | |
| | Ser. 2022-3A, Class B, 5.31%, due 2/20/2027 | |
| | Ser. 2021-2A, Class B, 1.90%, due 2/20/2028 | |
| | Ballyrock CLO 19 Ltd., Ser. 2022-19A, Class C, (3M CME Term SOFR + 3.50%), 7.46%, due 4/20/2035 | |
| | Battalion CLO XXI Ltd., Ser. 2021-21A, Class D, (3M USD LIBOR + 3.30%), 7.38%, due 7/15/2034 | |
| | Beacon Container Finance II LLC, Ser. 2021-1A, Class A, 2.25%, due 10/22/2046 | |
| | Benefit Street Partners CLO XII Ltd., Ser. 2017-12A, Class D, (3M USD LIBOR + 6.41%), 10.49%, due 10/15/2030 | |
| | Benefit Street Partners CLO XXII Ltd., Ser. 2020-22A, Class DR, (3M CME Term SOFR + 3.35%), 7.31%, due 4/20/2035 | |
| | BlueMountain CLO XXV Ltd., Ser. 2019-25A, Class D1R, (3M USD LIBOR + 3.30%), 7.38%, due 7/15/2036 | |
| | BlueMountain CLO XXXIII Ltd., Ser. 2021-33A, Class E, (3M USD LIBOR + 6.83%), 9.81%, due 11/20/2034 | |
| | Canadian Pacer Auto Receivables Trust, Ser. 2021-1A, Class A2A, 0.24%, due 10/19/2023 | |
| | | |
| | Ser. 2014-1A, Class DR, (3M USD LIBOR + 5.50%), 9.91%, due 1/30/2031 | |
| | Ser. 2021-1A, Class E, (3M USD LIBOR + 6.41%), 10.49%, due 4/15/2034 | |
| | Capital One Prime Auto Receivables Trust, Ser. 2022-1, Class A2, 2.71%, due 6/16/2025 | |
| | | |
| | Ser. 2017-1A, Class C, (3M USD LIBOR + 2.60%), 6.84%, due 1/20/2031 | |
| | Ser. 2017-1A, Class D, (3M USD LIBOR + 5.90%), 10.14%, due 1/20/2031 | |
See Notes to Financial Statements
Schedule of Investments Strategic Income Fund^ (cont’d)
| |
Asset-Backed Securities – cont'd | |
| | CARLYLE U.S. CLO Ltd., Ser. 2017-5A, Class D, (3M USD LIBOR + 5.30%), 9.54%, due 1/20/2030 | |
| | | |
| | Ser. 2019-3A, Class DR, (3M USD LIBOR + 6.80%), 10.88%, due 10/16/2034 | |
| | Ser. 2020-3A, Class ER, (3M USD LIBOR + 6.50%), 10.74%, due 10/20/2034 | |
| | Ser. 2021-3A, Class D, (3M USD LIBOR + 3.00%), 7.08%, due 7/15/2036 | |
| | Citigroup Mortgage Loan Trust, Inc., Ser. 2006-AMC1, Class A2B, (1M USD LIBOR + 0.32%), 3.91%, due 9/25/2036 | |
| | | |
| | Ser. 2021-1A, Class C, (3M USD LIBOR + 3.30%), 7.54%, due 7/20/2034 | |
| | Ser. 2021-1A, Class D, (3M USD LIBOR + 6.75%), 10.99%, due 7/20/2034 | |
| | DLLMT LLC, Ser. 2021-1A, Class A2, 0.60%, due 3/20/2024 | |
| | DLLST LLC, Ser. 2022-1A, Class A2, 2.79%, due 1/22/2024 | |
| | Dryden 36 Senior Loan Fund, Ser. 2014-36A, Class ER2, (3M USD LIBOR + 6.88%), 10.96%, due 4/15/2029 | |
| | Dryden 45 Senior Loan Fund, Ser. 2016-45A, Class ER, (3M USD LIBOR + 5.85%), 9.93%, due 10/15/2030 | |
| | Dryden 49 Senior Loan Fund, Ser. 2017-49A, Class E, (3M USD LIBOR + 6.30%), 10.49%, due 7/18/2030 | |
| | | |
| | Ser. 2017-53A, Class D, (3M USD LIBOR + 2.40%), 6.48%, due 1/15/2031 | |
| | Ser. 2017-53A, Class E, (3M USD LIBOR + 5.30%), 9.38%, due 1/15/2031 | |
| | Dryden 54 Senior Loan Fund, Ser. 2017-54A, Class E, (3M USD LIBOR + 6.20%), 10.43%, due 10/19/2029 | |
| | | |
| | Ser. 2015-1A, Class DR, (3M USD LIBOR + 2.50%), 6.74%, due 1/20/2030 | |
| | Ser. 2015-1A, Class ER, (3M USD LIBOR + 5.60%), 9.84%, due 1/20/2030 | |
| | Ser. 2018-1A, Class E, (3M USD LIBOR + 6.00%), 10.08%, due 10/15/2030 | |
| | Elmwood CLO VI Ltd., Ser. 2020-3A, Class ER, (3M USD LIBOR + 6.50%), 10.74%, due 10/20/2034 | |
| | | |
| | Ser. 2021-5A, Class D, (3M USD LIBOR + 3.05%), 7.29%, due 1/20/2035 | |
| | Ser. 2021-5A, Class E, (3M USD LIBOR + 6.35%), 10.59%, due 1/20/2035 | |
| | | |
| | Ser. 2017-1A, Class ER, (3M USD LIBOR + 5.90%), 8.81%, due 5/15/2030 | |
| | Ser. 2018-1A, Class E, (3M CME Term SOFR + 5.41%), 9.28%, due 4/17/2031 | |
| | Ford Credit Auto Lease Trust, Ser. 2021-B, Class A2, 0.24%, due 4/15/2024 | |
| | Fort Washington CLO Ltd., Ser. 2019-1A, Class ER, (3M USD LIBOR + 6.75%), 10.99%, due 10/20/2032 | |
| | Foundation Finance Trust, Ser. 2019-1A, Class A, 3.86%, due 11/15/2034 | |
| | Galaxy XV CLO Ltd., Ser. 2013-15A, Class ER, (3M USD LIBOR + 6.65%), 10.72%, due 10/15/2030 | |
| | Galaxy XVIII CLO Ltd., Ser. 2018-28A, Class E, (3M USD LIBOR + 6.00%), 10.08%, due 7/15/2031 | |
| | Galaxy XXV CLO Ltd., Ser. 2018-25A, Class E, (3M USD LIBOR + 5.95%), 10.31%, due 10/25/2031 | |
| | Galaxy XXVII CLO Ltd., Ser. 2018-27A, Class E, (3M USD LIBOR + 5.78%), 8.70%, due 5/16/2031 | |
| | Gedesco Trade Receivables Designated Activity Co., Ser. 2020-1, Class A, (1M EURIBOR + 1.15%), 2.09%, due 1/24/2026 | |
| | Generate CLO 2 Ltd., Ser. 2A, Class DR, (3M USD LIBOR + 2.60%), 6.92%, due 1/22/2031 | |
See Notes to Financial Statements
Schedule of Investments Strategic Income Fund^ (cont’d)
| |
Asset-Backed Securities – cont'd | |
| | Gilbert Park CLO Ltd., Ser. 2017-1A, Class E, (3M USD LIBOR + 6.40%), 10.48%, due 10/15/2030 | |
| | GM Financial Consumer Automobile Receivables Trust | |
| | Ser. 2021-4, Class A2, 0.28%, due 11/18/2024 | |
| | Ser. 2022-1, Class A2, 0.76%, due 2/18/2025 | |
| | Ser. 2022-2, Class A2, 2.52%, due 5/16/2025 | |
| | GreatAmerica Leasing Receivables Funding LLC, Ser. 2021-2, Class A2, 0.38%, due 3/15/2024 | |
| | Gulf Stream Meridian 5 Ltd., Ser. 2021-5A, Class D, (3M USD LIBOR + 6.33%), 10.41%, due 7/15/2034 | |
| | Gulf Stream Meridian 6 Ltd., Ser. 2021-6A, Class D, (3M USD LIBOR + 6.36%), 10.44%, due 1/15/2037 | |
| | HalseyPoint CLO 4 Ltd., Ser. 2021-4A, Class E, (3M USD LIBOR + 6.71%), 10.95%, due 4/20/2034 | |
| | Hilton Grand Vacations Trust, Ser. 2022-1D, Class D, 6.79%, due 6/20/2034 | |
| | Honda Auto Receivables Owner Trust, Ser. 2021-4, Class A2, 0.39%, due 5/21/2024 | |
| | Hyundai Auto Lease Securitization Trust, Ser. 2021-B, Class A2, 0.19%, due 10/16/2023 | |
| | Hyundai Auto Receivables Trust, Ser. 2022-A, Class A2A, 1.81%, due 2/18/2025 | |
| | Jay Park CLO Ltd., Ser. 2016-1A, Class DR, (3M USD LIBOR + 5.20%), 9.44%, due 10/20/2027 | |
| | John Deere Owner Trust, Ser. 2022-C, Class A2, 4.98%, due 8/15/2025 | |
| | KKR CLO 25 Ltd., Ser. 25, Class DR, (3M USD LIBOR + 3.40%), 7.48%, due 7/15/2034 | |
| | Kubota Credit Owner Trust, Ser. 2022-1A, Class A2, 2.34%, due 4/15/2025 | |
| | Madison Park Funding XXXV Ltd., Ser. 2019-35A, Class ER, (3M USD LIBOR + 6.10%), 10.34%, due 4/20/2032 | |
| | | |
| | Ser. 2019-22A, Class DR, (3M USD LIBOR + 3.10%), 7.18%, due 4/15/2031 | |
| | Ser. 2018-20A, Class D, (3M USD LIBOR + 2.50%), 6.74%, due 4/20/2031 | |
| | Ser. 2018-20A, Class E, (3M USD LIBOR + 5.35%), 9.59%, due 4/20/2031 | |
| | Ser. 2020-28A, Class ER, (3M USD LIBOR + 6.15%), 10.39%, due 1/20/2035 | |
| | Marble Point CLO XI Ltd., Ser. 2017-2A, Class D, (3M USD LIBOR + 2.80%), 6.99%, due 12/18/2030 | |
| | Mercedes-Benz Auto Lease Trust, Ser. 2021-B, Class A2, 0.22%, due 1/16/2024 | |
| | MetroNet Infrastructure Issuer LLC, Ser. 2022-1A, Class A2, 6.35%, due 10/20/2052 | |
| | MMAF Equipment Finance LLC | |
| | Ser. 2021-A, Class A2, 0.30%, due 4/15/2024 | |
| | Ser. 2022-A, Class A2, 2.77%, due 2/13/2025 | |
| | Morgan Stanley Eaton Vance CLO Ltd. | |
| | Ser. 2021-1A, Class E, (3M USD LIBOR + 6.75%), 11.07%, due 10/20/2034 | |
| | Ser. 2022-16A, Class D1, (3M CME Term SOFR + 3.25%), 7.11%, due 4/15/2035 | |
| | | |
| | Ser. 2021-2A, Class B, 1.83%, due 5/20/2039 | |
| | Ser. 2022-1A, Class B, 4.40%, due 11/21/2039 | |
| | Navient Student Loan Trust, Ser. 2021-FA, Class A, 1.11%, due 2/18/2070 | |
| | | |
| | Ser. 2017-13A, Class DR, (3M USD LIBOR + 6.50%), 10.58%, due 7/15/2030 | |
| | Ser. 2017-14A, Class C, (3M USD LIBOR + 2.60%), 5.58%, due 11/20/2030 | |
| | Ser. 2017-14A, Class D, (3M USD LIBOR + 5.80%), 8.78%, due 11/20/2030 | |
| | OHA Credit Funding 3 Ltd., Ser. 2019-3A, Class DR, (3M USD LIBOR + 2.90%), 7.14%, due 7/2/2035 | |
See Notes to Financial Statements
Schedule of Investments Strategic Income Fund^ (cont’d)
| |
Asset-Backed Securities – cont'd | |
| | OHA Credit Funding 6 Ltd. | |
| | Ser. 2020-6A, Class DR, (3M USD LIBOR + 3.15%), 7.39%, due 7/20/2034 | |
| | Ser. 2020-6A, Class ER, (3M USD LIBOR + 6.25%), 10.49%, due 7/20/2034 | |
| | OHA Credit Partners XV Ltd., Ser. 2017-15A, Class D, (3M USD LIBOR + 2.45%), 6.69%, due 1/20/2030 | |
| | OneMain Financial Issuance Trust, Ser. 2022-2A, Class A, 4.89%, due 10/14/2034 | |
| | | |
| | Ser. 2014-1A, Class DR2, (3M USD LIBOR + 5.70%), 9.78%, due 1/17/2031 | |
| | Ser. 2018-1A, Class D, (3M USD LIBOR + 5.15%), 9.34%, due 4/18/2031 | |
| | Ser. 2015-1A, Class DR4, (3M USD LIBOR + 6.50%), 9.48%, due 5/21/2034 | |
| | Parallel Ltd., Ser. 2020-1A, Class DR, (3M USD LIBOR + 6.50%), 10.74%, due 7/20/2034 | |
| | Post CLO Ltd., Ser. 2022-1A, Class D, (3M CME Term SOFR + 3.20%), 7.16%, due 4/20/2035 | |
| | PPM CLO 3 Ltd., Ser. 2019-3A, Class DR, (3M USD LIBOR + 3.10%), 7.18%, due 4/17/2034 | |
| | Prestige Auto Receivables Trust | |
| | Ser. 2021-1A, Class D, 2.08%, due 2/15/2028 | |
| | Ser. 2022-1A, Class B, 6.55%, due 7/17/2028 | |
| | Riserva CLO Ltd., Ser. 2016-3A, Class ERR, (3M USD LIBOR + 6.50%), 10.69%, due 1/18/2034 | |
| | | |
| | Ser. 2021-1A, Class D, (3M USD LIBOR + 3.55%), 7.63%, due 10/15/2034 | |
| | Ser. 2021-1A, Class E, (3M USD LIBOR + 6.80%), 10.88%, due 10/15/2034 | |
| | Santander Retail Auto Lease Trust | |
| | Ser. 2021-A, Class A2, 0.32%, due 2/20/2024 | |
| | Ser. 2022-B, Class A2, 2.84%, due 5/20/2025 | |
| | Securitized Asset Backed Receivables LLC Trust, Ser. 2004-DO1, Class M1, (1M USD LIBOR + 0.98%), 4.56%, due 7/25/2034 | |
| | Sierra Timeshare Receivables Funding LLC | |
| | Ser. 2021-2A, Class D, 3.23%, due 9/20/2038 | |
| | Ser. 2022-1A, Class D, 6.00%, due 10/20/2038 | |
| | Signal Peak CLO 7 Ltd., Ser. 2019-1A, Class D, (3M USD LIBOR + 3.85%), 8.26%, due 4/30/2032 | |
| | SoFi Professional Loan Program Trust, Ser. 2020-A, Class BFX, 3.12%, due 5/15/2046 | |
| | Symphony CLO XXI Ltd., Ser. 2019-21A, Class DR, (3M USD LIBOR + 3.30%), 7.38%, due 7/15/2032 | |
| | Taco Bell Funding LLC, Ser. 2021-1A, Class A2I, 1.95%, due 8/25/2051 | |
| | Tesla Auto Lease Trust, Ser. 2021-A, Class A2, 0.36%, due 3/20/2025 | |
| | TICP CLO V Ltd., Ser. 2016-5A, Class ER, (3M USD LIBOR + 5.75%), 9.83%, due 7/17/2031 | |
| | TICP CLO X Ltd., Ser. 2018-10A, Class E, (3M USD LIBOR + 5.50%), 9.74%, due 4/20/2031 | |
| | TICP CLO XIII Ltd., Ser. 2019-13A, Class ER, (3M USD LIBOR + 6.20%), 10.28%, due 4/15/2034 | |
| | Toyota Auto Receivables Owner Trust | |
| | Ser. 2021-B, Class A2, 0.14%, due 1/16/2024 | |
| | Ser. 2022-A, Class A2, 0.74%, due 10/15/2024 | |
| | Ser. 2022-B, Class A2A, 2.35%, due 1/15/2025 | |
| | Toyota Lease Owner Trust, Ser. 2022-A, Class A2, 1.73%, due 7/22/2024 | |
| | TRESTLES CLO II Ltd., Ser. 2018-2A, Class D, (3M USD LIBOR + 5.75%), 10.11%, due 7/25/2031 | |
| | TRESTLES CLO Ltd., Ser. 2017-1A, Class DR, (3M USD LIBOR + 6.25%), 10.61%, due 4/25/2032 | |
See Notes to Financial Statements
Schedule of Investments Strategic Income Fund^ (cont’d)
| |
Asset-Backed Securities – cont'd | |
| | Trinitas CLO X Ltd., Ser. 2019-10A, Class DR, (3M CME Term SOFR + 3.60%), 7.46%, due 1/15/2035 | |
| | Trinitas CLO XVI Ltd., Ser. 2021-16A, Class D, (3M USD LIBOR + 3.30%), 7.54%, due 7/20/2034 | |
| | Vantage Data Centers Issuer LLC, Ser. 2021-1A, Class A2, 2.17%, due 10/15/2046 | |
| | Verde CLO Ltd., Ser. 2019-1A, Class DR, (3M USD LIBOR + 3.25%), 7.33%, due 4/15/2032 | |
| | Volkswagen Auto Lease Trust, Ser. 2022-A, Class A2, 3.02%, due 10/21/2024 | |
| | Volkswagen Auto Loan Enhanced Trust, Ser. 2021-1, Class A2, 0.49%, due 10/21/2024 | |
| | | |
| | Ser. 2018-3A, Class E, (3M USD LIBOR + 5.75%), 9.83%, due 10/15/2031 | |
| | Ser. 2016-3A, Class DR, (3M USD LIBOR + 6.08%), 10.27%, due 10/18/2031 | |
| | Whitebox CLO III Ltd., Ser. 2021-3A, Class E, (3M USD LIBOR + 6.85%), 10.93%, due 10/15/2034 | |
| | World Omni Auto Receivables Trust | |
| | Ser. 2021-C, Class A2, 0.22%, due 9/16/2024 | |
| | Ser. 2022-A, Class A2, 1.15%, due 4/15/2025 | |
| | Ser. 2022-B, Class A2A, 2.77%, due 10/15/2025 | |
| | World Omni Automobile Lease Securitization Trust, Ser. 2022-A, Class A2, 2.63%, due 10/15/2024 | |
Total Asset-Backed Securities (Cost $245,212,764) | |
|
|
| |
| | | |
| | | |
| | | |
| | RAC Bond Co. PLC, 5.25%, due 11/4/2027 | |
| | | |
| |
| | Cars.com, Inc., 6.38%, due 11/1/2028 | |
| | Clear Channel Worldwide Holdings, Inc., 5.13%, due 8/15/2027 | |
| | Lamar Media Corp., 3.63%, due 1/15/2031 | |
| | Match Group, Inc., 3.63%, due 10/1/2031 | |
| | Outfront Media Capital LLC/Outfront Media Capital Corp., 5.00%, due 8/15/2027 | |
| | | |
| |
| | Boeing Co., 5.81%, due 5/1/2050 | |
| | Lockheed Martin Corp., 5.70%, due 11/15/2054 | |
| | Rolls-Royce PLC, 5.75%, due 10/15/2027 | |
| | | |
| | | |
| | | |
| | | |
| | | |
| |
| | BAT Capital Corp., 3.73%, due 9/25/2040 | |
| | MHP SA, 7.75%, due 5/10/2024 | |
| | | |
See Notes to Financial Statements
Schedule of Investments Strategic Income Fund^ (cont’d)
| |
|
| |
| | American Airlines, Inc., 11.75%, due 7/15/2025 | |
| | American Airlines, Inc./AAdvantage Loyalty IP Ltd., 5.75%, due 4/20/2029 | |
| | Delta Air Lines, Inc., 3.75%, due 10/28/2029 | |
| | United Airlines, Inc., 4.38%, due 4/15/2026 | |
| | VistaJet Malta Finance PLC/XO Management Holding, Inc., 7.88%, due 5/1/2027 | |
| | | |
| |
| | United Airlines Pass Through Trust, Ser. 2020-1, Class A, 5.88%, due 10/15/2027 | |
| |
| | PVH Corp., 3.13%, due 12/15/2027 | |
| |
| | Ford Motor Credit Co. LLC | |
| | | |
| | | |
| | | |
| | | |
| | | |
| | | |
| | | |
| | | |
| | | |
| | | |
| | | |
| |
| | General Motors Co., 5.15%, due 4/1/2038 | |
| | General Motors Financial Co., Inc., 3.80%, due 4/7/2025 | |
| | General Motors Financial of Canada Ltd., 1.75%, due 4/15/2026 | |
| | Toyota Motor Credit Corp. | |
| | (SOFR + 0.65%), 3.70%, due 12/29/2023 | |
| | (SOFR + 0.62%), 3.65%, due 3/22/2024 | |
| | Volkswagen Group of America Finance LLC, (SOFR + 0.95%), 3.84%, due 6/7/2024 | |
| | Volkswagen Int'l Finance NV, 3.88%, due 6/17/2029 | |
| | | |
Auto Parts & Equipment 0.4% | |
| | Adient Global Holdings Ltd., 3.50%, due 8/15/2024 | |
| | | |
| | | |
| | | |
| | | |
| | Goodyear Tire & Rubber Co. | |
| | | |
| | | |
| | IHO Verwaltungs GmbH, 3.88% Cash/4.63% PIK, due 5/15/2027 | |
| | Schaeffler AG, 3.38%, due 10/12/2028 | |
| | ZF Europe Finance BV, 3.00%, due 10/23/2029 | |
| | ZF Finance GmbH, 3.75%, due 9/21/2028 | |
| | | |
See Notes to Financial Statements
Schedule of Investments Strategic Income Fund^ (cont’d)
| |
|
| |
| | | |
| | | |
| | | |
| | | |
| | | |
| | Jaguar Land Rover Automotive PLC | |
| | | |
| | | |
| | | |
| | | |
| |
| | Bank of America Corp., Ser. TT, 6.13%, due 4/27/2027 | |
| | JPMorgan Chase & Co., Ser. HH, 4.60%, due 2/1/2025 | |
| | PNC Financial Services Group, Inc., Ser. T, 3.40%, due 9/15/2026 | |
| | | |
| |
| | ABN AMRO Bank NV, 3.32%, due 3/13/2037 | |
| | AMCO - Asset Management Co. SpA, 0.75%, due 4/20/2028 | |
| | Banco Bilbao Vizcaya Argentaria SA, Ser. 9, 6.50%, due 3/5/2025 | |
| | | |
| | | |
| | | |
| | Banco de Bogota SA, 6.25%, due 5/12/2026 | |
| | Banco de Credito del Peru S.A., 2.70%, due 1/11/2025 | |
| | Banco do Brasil SA, 6.25%, due 4/15/2024 | |
| | Banco Inbursa SA Institucion De Banca Multiple Grupo Financiero Inbursa, 4.13%, due 6/6/2024 | |
| | Banco Internacional del Peru SAA Interbank, 3.38%, due 1/18/2023 | |
| | Banco Santander Mexico SA Institucion de Banca Multiple Grupo Financiero Santand, 5.38%, due 4/17/2025 | |
| | | |
| | | |
| | | |
| | | |
| | Banco Votorantim SA, 4.50%, due 9/24/2024 | |
| | Bancolombia SA, 3.00%, due 1/29/2025 | |
| | Bangkok Bank PCL, 4.30%, due 6/15/2027 | |
| | | |
| | Ser. JJ, 5.13%, due 6/20/2024 | |
| | Ser. MM, 4.30%, due 1/28/2025 | |
| | | |
| | Ser. RR, 4.38%, due 1/27/2027 | |
| | Ser. FF, 5.88%, due 3/15/2028 | |
| | | |
| | | |
| | | |
| | Bank of New York Mellon Corp. | |
| | Ser. J, (SOFR + 0.20%), 3.26%, due 10/25/2024 | |
| | Ser. I, 3.75%, due 12/20/2026 | |
See Notes to Financial Statements
Schedule of Investments Strategic Income Fund^ (cont’d)
| |
|
| |
| | Banque Federative du Credit Mutuel SA | |
| | Ser. 99, (EUAMDB10 + 0.10%, Cap 8.00%, Floor 0.00%), 0.96%, due 2/25/2023 | |
| | | |
| | Barclays Bank PLC, (3M EURIBOR + 0.71%), 1.71%, due 12/15/2022 | |
| | | |
| | | |
| | | |
| | | |
| | | |
| | BBK BSC, 5.50%, due 7/9/2024 | |
| | | |
| | | |
| | | |
| | | |
| | BPCE SA, 3.65%, due 1/14/2037 | |
| | | |
| | (3M USD LIBOR + 1.10%), 4.04%, due 5/17/2024 | |
| | Ser. U, 5.00%, due 9/12/2024 | |
| | Ser. V, 4.70%, due 1/30/2025 | |
| | Ser. W, 4.00%, due 12/10/2025 | |
| | | |
| | Ser. Y, 4.15%, due 11/15/2026 | |
| | Citizens Financial Group, Inc. | |
| | Ser. B, 6.00%, due 7/6/2023 | |
| | Ser. C, 6.38%, due 4/6/2024 | |
| | Commerzbank AG, 7.00%, due 4/9/2025 | |
| | | |
| | | |
| | | |
| | | |
| | | |
| | | |
| | | |
| | Development Bank of Kazakhstan JSC, 5.75%, due 5/12/2025 | |
| | Development Bank of Mongolia LLC, 7.25%, due 10/23/2023 | |
| | Dexia Credit Local SA, 0.63%, due 1/17/2026 | |
| | | |
| | | |
| | | |
| | Emirates Development Bank PJSC, 3.52%, due 3/6/2024 | |
| | Emirates NBD PJSC, 6.13%, due 3/20/2025 | |
| | Fifth Third Bancorp, Ser. H, 5.10%, due 6/30/2023 | |
| | Goldman Sachs Group, Inc. | |
| | (3M USD LIBOR + 1.60%), 4.64%, due 11/29/2023 | |
| | Ser. Q, 5.50%, due 8/10/2024 | |
| | | |
| | Ser. R, 4.95%, due 2/10/2025 | |
| | Ser. U, 3.65%, due 8/10/2026 | |
| | Ser. V, 4.13%, due 11/10/2026 | |
| | Grupo Aval Ltd., 4.38%, due 2/4/2030 | |
| | Hana Bank, 3.25%, due 3/30/2027 | |
See Notes to Financial Statements
Schedule of Investments Strategic Income Fund^ (cont’d)
| |
|
| |
| | | |
| | | |
| | | |
| | | |
| | | |
| | Huntington Bancshares, Inc. | |
| | Ser. E, 5.70%, due 4/15/2023 | |
| | Ser. F, 5.63%, due 7/15/2030 | |
| | | |
| | | |
| | | |
| | | |
| | Intesa Sanpaolo SpA, 1.35%, due 2/24/2031 | |
| | Islandsbanki HF, 1.13%, due 1/19/2024 | |
| | Itau Unibanco Holding SA, 2.90%, due 1/24/2023 | |
| | | |
| | Ser. CC, (3M USD LIBOR + 2.58%), 7.02%, due 2/1/2023 | |
| | Ser. FF, 5.00%, due 8/1/2024 | |
| | (SOFR + 0.58%), 3.62%, due 6/23/2025 | |
| | | |
| | Ser. KK, 3.65%, due 6/1/2026 | |
| | | |
| | | |
| | | |
| | | |
| | | |
| | | |
| | | |
| | Landsbankinn HF, 0.50%, due 5/20/2024 | |
| | | |
| | (3M USD LIBOR + 0.81%), 2.91%, due 11/7/2023 | |
| | | |
| | | |
| | | |
| | Ser. G, 5.00%, due 8/1/2024 | |
| | | |
| | Mashreqbank PSC, 4.25%, due 2/26/2024 | |
| | | |
| | (SOFR + 0.63%), 3.69%, due 1/24/2025 | |
| | | |
| | Nationale-Nederlanden Bank NV, 1.00%, due 9/25/2028 | |
| | | |
| | | |
| | | |
| | | |
| | | |
| | Nordea Bank Abp, 3.75%, due 3/1/2029 | |
| | Philippine National Bank, 3.28%, due 9/27/2024 | |
| | | |
| | (3M USD LIBOR + 0.36%), 4.44%, due 1/17/2023 | |
| | | |
See Notes to Financial Statements
Schedule of Investments Strategic Income Fund^ (cont’d)
| |
|
| |
| | Skandinaviska Enskilda Banken AB, 5.13%, due 5/13/2025 | |
| | Societe Generale SA, 4.75%, due 5/26/2026 | |
| | Standard Chartered PLC, 4.30%, due 8/19/2028 | |
| | SVB Financial Group, Ser. D, 4.25%, due 11/15/2026 | |
| | Toronto-Dominion Bank, (SOFR + 0.48%), 3.54%, due 1/27/2023 | |
| | Truist Bank, (SOFR + 0.20%), 3.26%, due 1/17/2024 | |
| | Truist Financial Corp., Ser. Q, 5.10%, due 3/1/2030 | |
| | U.S. Bancorp, 3.70%, due 1/15/2027 | |
| | | |
| | | |
| | | |
| | | |
| | UBS Group Funding AG, 6.88%, due 8/7/2025 | |
| | | |
| | | |
| | | |
| | | |
| | Ser. S, 5.90%, due 6/15/2024 | |
| | Ser. BB, 3.90%, due 3/15/2026 | |
| | | |
| | (3M USD LIBOR + 0.39%), 4.33%, due 1/13/2023 | |
| | | |
| | | |
| | | |
| |
| | Constellation Brands, Inc., 2.25%, due 8/1/2031 | |
| | Molson Coors Beverage Co., 4.20%, due 7/15/2046 | |
| | Premier Foods Finance PLC, 3.50%, due 10/15/2026 | |
| | | |
| |
| | Amgen, Inc., 2.77%, due 9/1/2053 | |
Building & Construction 0.0%(l) | |
| | KB Home, 4.00%, due 6/15/2031 | |
| | TRI Pointe Group, Inc./TRI Pointe Homes, Inc., 5.88%, due 6/15/2024 | |
| | | |
| |
| | Builders FirstSource, Inc., 4.25%, due 2/1/2032 | |
| | Camelot Return Merger Sub, Inc., 8.75%, due 8/1/2028 | |
| | Cornerstone Building Brands, Inc., 6.13%, due 1/15/2029 | |
| | | |
| | | |
| | | |
| | | |
| | | |
| | | |
See Notes to Financial Statements
Schedule of Investments Strategic Income Fund^ (cont’d)
| |
|
Building Materials – cont'd | |
| | Standard Industries, Inc. | |
| | | |
| | | |
| | | |
| | | |
Cable & Satellite Television 1.4% | |
| | CCO Holdings LLC/CCO Holdings Capital Corp. | |
| | | |
| | | |
| | | |
| | | |
| | | |
| | | |
| | | |
| | | |
| | | |
| | | |
| | | |
| | | |
| | | |
| | | |
| | | |
| | | |
| | | |
| | Radiate Holdco LLC/Radiate Finance, Inc. | |
| | | |
| | | |
| | | |
| | | |
| | | |
| | | |
| |
| | Ashland Services BV, 2.00%, due 1/30/2028 | |
| | Avient Corp., 7.13%, due 8/1/2030 | |
| | Axalta Coating Systems LLC, 3.38%, due 2/15/2029 | |
| | Braskem Finance Ltd., 6.45%, due 2/3/2024 | |
| | H.B. Fuller Co., 4.25%, due 10/15/2028 | |
| | | |
| | | |
| | | |
| | INEOS Quattro Finance 1 PLC, 3.75%, due 7/15/2026 | |
| | INEOS Quattro Finance 2 PLC, 3.38%, due 1/15/2026 | |
| | Ingevity Corp., 3.88%, due 11/1/2028 | |
| | Kronos Int'l, Inc., 3.75%, due 9/15/2025 | |
| | MEGlobal Canada ULC, 5.00%, due 5/18/2025 | |
| | | |
| | | |
| | | |
See Notes to Financial Statements
Schedule of Investments Strategic Income Fund^ (cont’d)
| |
|
| |
| | Olympus Water U.S. Holding Corp. | |
| | | |
| | | |
| | Sasol Financing Int'l Ltd., 4.50%, due 11/14/2022 | |
| | Sasol Financing USA LLC, 5.88%, due 3/27/2024 | |
| | SGL Carbon SE, 4.63%, due 9/30/2024 | |
| | Tronox, Inc., 4.63%, due 3/15/2029 | |
| | Unigel Luxembourg SA, 8.75%, due 10/1/2026 | |
| | Valvoline, Inc., 3.63%, due 6/15/2031 | |
| | Westlake Corp., 1.63%, due 7/17/2029 | |
| | WR Grace Holdings LLC, 5.63%, due 8/15/2029 | |
| | | |
| |
| | Autostrade per l'Italia SpA, 2.00%, due 12/4/2028 | |
| | Bidvest Group UK PLC, 3.63%, due 9/23/2026 | |
| | CMHI Finance BVI Co. Ltd., 4.00%, due 6/1/2027 | |
| | DP World Crescent Ltd., 3.91%, due 5/31/2023 | |
| | Georgetown University, Ser. 20A, 2.94%, due 4/1/2050 | |
| | Korea Expressway Corp., 1.13%, due 5/17/2026 | |
| | | |
| |
| | Apple, Inc., 2.55%, due 8/20/2060 | |
Consumer - Commercial Lease Financing 0.9% | |
| | AerCap Global Aviation Trust, 6.50%, due 6/15/2045 | |
| | Ally Financial, Inc., 5.75%, due 11/20/2025 | |
| | Global Aircraft Leasing Co. Ltd., 6.50% Cash/7.25% PIK, due 9/15/2024 | |
| | | |
| | | |
| | | |
| | | |
| | | |
| | | |
| | | |
| | | |
Cosmetics - Personal Care 0.0%(l) | |
| | Natura Cosmeticos SA, 4.13%, due 5/3/2028 | |
Diversified Capital Goods 0.1% | |
| | Stevens Holding Co, Inc., 6.13%, due 10/1/2026 | |
Diversified Financial Services 1.0% | |
| | AerCap Ireland Capital Designated Activity Co./AerCap Global Aviation Trust, 3.30%, due 1/30/2032 | |
| | | |
| | Ser. B, 4.70%, due 5/15/2026 | |
| | Ser. C, 4.70%, due 5/15/2028 | |
| | | |
| | (SOFR + 0.93%), 3.80%, due 3/4/2025 | |
| | | |
See Notes to Financial Statements
Schedule of Investments Strategic Income Fund^ (cont’d)
| |
|
Diversified Financial Services – cont'd | |
| | | |
| | | |
| | | |
| | Capital One Financial Corp. | |
| | (3M USD LIBOR + 0.72%), 5.13%, due 1/30/2023 | |
| | Ser. M, 3.95%, due 9/1/2026 | |
| | Charles Schwab Corp., Ser. H, 4.00%, due 12/1/2030 | |
| | Discover Financial Services, Ser. C, 5.50%, due 10/30/2027 | |
| | Fondo MIVIVIENDA S.A., 4.63%, due 4/12/2027 | |
| | | |
| |
| | Adani Green Energy Ltd., 4.38%, due 9/8/2024 | |
| | AusNet Services Holdings Pty. Ltd., 1.63%, due 3/11/2081 | |
| | China Huadian Overseas Development 2018 Ltd., 3.38%, due 6/23/2025 | |
| | CMS Energy Corp., 3.75%, due 12/1/2050 | |
| | Comision Federal de Electricidad, 4.75%, due 2/23/2027 | |
| | | |
| | Ser. D, (3M USD LIBOR + 0.53%), 3.82%, due 9/15/2023 | |
| | Ser. C, 4.35%, due 1/15/2027 | |
| | Duke Energy Corp., (SOFR + 0.25%), 3.18%, due 6/10/2023 | |
| | Edison Int'l, Ser. B, 5.00%, due 12/15/2026 | |
| | EnBW Energie Baden-Wuerttemberg AG, 1.38%, due 8/31/2081 | |
| | Florida Power & Light Co., (SOFR + 0.25%), 2.92%, due 5/10/2023 | |
| | Genneia SA, 8.75%, due 9/2/2027 | |
| | National Rural Utilities Cooperative Finance Corp. | |
| | Ser. D, (SOFR + 0.40%), 3.03%, due 8/7/2023 | |
| | Ser. D, (SOFR + 0.33%), 3.39%, due 10/18/2024 | |
| | NextEra Energy Capital Holdings, Inc., (SOFR + 0.40%), 3.01%, due 11/3/2023 | |
| | Pacific Gas and Electric Co., 4.30%, due 3/15/2045 | |
| | PPL Electric Utilities Corp., (SOFR + 0.33%), 3.38%, due 6/24/2024 | |
| | Southern California Edison Co., (SOFR + 0.47%), 3.33%, due 12/2/2022 | |
| | | |
| | Ser. B, 4.00%, due 1/15/2051 | |
| | | |
| | | |
Electric - Generation 1.6% | |
| | | |
| | | |
| | | |
| | | |
| | | |
| | | |
| | Leeward Renewable Energy Operations LLC, 4.25%, due 7/1/2029 | |
| | | |
| | | |
| | | |
| | | |
| | | |
| | | |
| | Sunnova Energy Corp., 5.88%, due 9/1/2026 | |
See Notes to Financial Statements
Schedule of Investments Strategic Income Fund^ (cont’d)
| |
|
Electric - Generation – cont'd | |
| | Vistra Corp., 7.00%, due 12/15/2026 | |
| | Vistra Operations Co. LLC | |
| | | |
| | | |
| | | |
| | | |
Electric - Integrated 0.1% | |
| | Electricite de France SA, 2.63%, due 12/1/2027 | |
| | | |
| | | |
| | Ser. C, 5.35%, due 7/15/2047 | |
| | Ser. C, 3.40%, due 3/1/2050 | |
| | | |
Electric-Distribution/Transmission 0.0%(l) | |
| | Centrica PLC, 5.25%, due 4/10/2075 | |
| |
| | Clarios Global L.P., 6.75%, due 5/15/2025 | |
| | Panther BF Aggregator 2 L.P./Panther Finance Co., Inc., 4.38%, due 5/15/2026 | |
| | | |
| | | |
| | | |
| | | |
Energy - Alternate Sources 0.0%(l) | |
| | FS Luxembourg S.a.r.l., 10.00%, due 12/15/2025 | |
| | Greenko Wind Projects Mauritius, Ltd., 5.50%, due 4/6/2025 | |
| | | |
Energy - Exploration & Production 1.1% | |
| | Ascent Resources Utica Holdings LLC/ARU Finance Corp. | |
| | | |
| | | |
| | | |
| | Callon Petroleum Co., 8.00%, due 8/1/2028 | |
| | | |
| | | |
| | | |
| | Hilcorp Energy I L.P./Hilcorp Finance Co. | |
| | | |
| | | |
| | | |
| | Northern Oil and Gas, Inc., 8.13%, due 3/1/2028 | |
| | Occidental Petroleum Corp. | |
| | | |
| | | |
| | | |
| | | |
| | PDC Energy, Inc., 5.75%, due 5/15/2026 | |
| | Rockcliff Energy II LLC, 5.50%, due 10/15/2029 | |
See Notes to Financial Statements
Schedule of Investments Strategic Income Fund^ (cont’d)
| |
|
Energy - Exploration & Production – cont'd | |
| | | |
| | | |
| | | |
| | | |
Engineering & Construction 0.0%(l) | |
| | China Minmetals Corp., 3.75%, due 11/13/2022 | |
| | IHS Holding Ltd., 5.63%, due 11/29/2026 | |
| | | |
| |
| | Live Nation Entertainment, Inc., 4.88%, due 11/1/2024 | |
| | Warnermedia Holdings, Inc. | |
| | (SOFR + 1.78%), 4.75%, due 3/15/2024 | |
| | | |
| | | |
| |
| | | |
| | | |
| | | |
| | | |
| |
| | Cencosud SA, 4.38%, due 7/17/2027 | |
| | JBS USA LUX S.A./JBS USA Food Co./JBS USA Finance, Inc., 5.13%, due 2/1/2028 | |
| | JBS USA LUX SA/JBS USA Food Co./JBS USA Finance, Inc., 2.50%, due 1/15/2027 | |
| | Kraft Heinz Foods Co., 3.88%, due 5/15/2027 | |
| | Post Holdings, Inc., 5.63%, due 1/15/2028 | |
| | | |
| | | |
| | | |
| | | |
| |
| | Darling Ingredients, Inc., 6.00%, due 6/15/2030 | |
| | Performance Food Group, Inc., 5.50%, due 10/15/2027 | |
| | | |
| | | |
| | | |
| | | |
Food & Drug Retailers 0.1% | |
| | Albertsons Cos., Inc./Safeway, Inc./New Albertsons LP/Albertsons LLC | |
| | | |
| | | |
| | Bellis Finco PLC, 4.00%, due 2/16/2027 | |
| | eG Global Finance PLC, 4.38%, due 2/7/2025 | |
| | | |
Forest Products & Paper 0.1% | |
| | Ahlstrom-Munksjo Holding 3 Oy, 3.63%, due 2/4/2028 | |
| | Sappi Papier Holding GmbH, 3.63%, due 3/15/2028 | |
| | | |
See Notes to Financial Statements
Schedule of Investments Strategic Income Fund^ (cont’d)
| |
|
| |
| | Allwyn International AS, 3.88%, due 2/15/2027 | |
| | Caesars Entertainment, Inc. | |
| | | |
| | | |
| | | |
| | Churchill Downs, Inc., 5.50%, due 4/1/2027 | |
| | Cirsa Finance Int'l S.a.r.l., 4.75%, due 5/22/2025 | |
| | Int'l Game Technology PLC, 4.13%, due 4/15/2026 | |
| | Playtech PLC, 4.25%, due 3/7/2026 | |
| | Wynn Las Vegas LLC/Wynn Las Vegas Capital Corp. | |
| | | |
| | | |
| | | |
| |
| | Atmos Energy Corp., (3M USD LIBOR + 0.38%), 3.57%, due 3/9/2023 | |
| | Beijing Gas Singapore Capital Corp., 1.88%, due 1/18/2025 | |
| | CenterPoint Energy Resources Corp., (3M USD LIBOR + 0.50%), 3.60%, due 3/2/2023 | |
| | Southern California Gas Co., (3M USD LIBOR + 0.35%), 3.62%, due 9/14/2023 | |
| | | |
| |
| | Antero Midstream Partners L.P./Antero Midstream Finance Corp. | |
| | | |
| | | |
| | | |
| | | |
| | | |
| | Cheniere Energy Partners L.P., 4.50%, due 10/1/2029 | |
| | DCP Midstream LLC, 5.85%, due 5/21/2043 | |
| | DCP Midstream Operating L.P., 5.60%, due 4/1/2044 | |
| | DT Midstream, Inc., 4.13%, due 6/15/2029 | |
| | EQM Midstream Partners L.P. | |
| | | |
| | | |
| | | |
| | | |
| | | |
| | | |
| | EQT Midstream Partners L.P., 5.50%, due 7/15/2028 | |
| | Genesis Energy L.P./Genesis Energy Finance Corp. | |
| | | |
| | | |
| | | |
| | | |
| | Harvest Midstream I L.P., 7.50%, due 9/1/2028 | |
| | ITT Holdings LLC, 6.50%, due 8/1/2029 | |
| | Kinetik Holdings L.P., 5.88%, due 6/15/2030 | |
| | New Fortress Energy, Inc. | |
| | | |
| | | |
| | NuStar Logistics L.P., 5.75%, due 10/1/2025 | |
See Notes to Financial Statements
Schedule of Investments Strategic Income Fund^ (cont’d)
| |
|
Gas Distribution – cont'd | |
| | Solaris Midstream Holdings LLC, 7.63%, due 4/1/2026 | |
| | Summit Midstream Holdings LLC, 8.50%, due 10/15/2026 | |
| | Summit Midstream Holdings LLC/Summit Midstream Finance Corp. | |
| | | |
| | | |
| | Tallgrass Energy Partners L.P./Tallgrass Energy Finance Corp. | |
| | | |
| | | |
| | | |
| | | |
| | | |
| | Venture Global Calcasieu Pass LLC, 4.13%, due 8/15/2031 | |
| | Western Midstream Operating L.P., 4.30%, due 2/1/2030 | |
| | | |
| |
| | Acadia Healthcare Co., Inc., 5.50%, due 7/1/2028 | |
| | CHS/Community Health Systems, Inc. | |
| | | |
| | | |
| | | |
| | | |
| | Select Medical Corp., 6.25%, due 8/15/2026 | |
| | Tenet Healthcare Corp., 6.13%, due 10/1/2028 | |
| | | |
| |
| | | |
| | | |
| | | |
| | Envision Healthcare Corp., 8.75%, due 10/15/2026 | |
| | Team Health Holdings, Inc., 6.38%, due 2/1/2025 | |
| | | |
Healthcare - Products 0.1% | |
| | Baxter Int'l, Inc., (SOFR + 0.44%), 3.25%, due 11/29/2024 | |
| | Thermo Fisher Scientific, Inc. | |
| | (SOFR + 0.35%), 3.41%, due 4/18/2023 | |
| | (SOFR + 0.39%), 3.45%, due 10/18/2023 | |
| | | |
Healthcare - Services 0.4% | |
| | Ascension Health, Ser. B, 3.11%, due 11/15/2039 | |
| | CommonSpirit Health, 4.19%, due 10/1/2049 | |
| | | |
| | | |
| | | |
| | Mount Sinai Hospitals Group, Inc., Ser. 2019, 3.74%, due 7/1/2049 | |
| | | |
| | (SOFR + 0.56%), 3.48%, due 3/10/2025 | |
| | | |
| | | |
See Notes to Financial Statements
Schedule of Investments Strategic Income Fund^ (cont’d)
| |
|
Holding Companies - Diversified 0.0%(l) | |
| | Alfa S.A., 5.25%, due 3/25/2024 | |
| | KOC Holding AS, 5.25%, due 3/15/2023 | |
| | | |
| |
| | Shea Homes L.P./Shea Homes Funding Corp., 4.75%, due 2/15/2028 | |
| | Taylor Morrison Communities, Inc. | |
| | | |
| | | |
| | Toll Brothers Finance Corp., 4.35%, due 2/15/2028 | |
| | | |
| |
| | Accor SA, 2.63%, due 1/30/2025 | |
| | Hilton Domestic Operating Co, Inc., 3.63%, due 2/15/2032 | |
| | Wyndham Hotels & Resorts, Inc., 4.38%, due 8/15/2028 | |
| | | |
Household Products - Wares 0.0%(l) | |
| | Ontex Group NV, 3.50%, due 7/15/2026 | |
| |
| | AIA Group Ltd., 5.63%, due 10/25/2027 | |
| | Athene Global Funding, 0.83%, due 1/8/2027 | |
| | Corebridge Financial, Inc., 4.35%, due 4/5/2042 | |
| | Liberty Mutual Group, Inc., 4.13%, due 12/15/2051 | |
| | Protective Life Global Funding, (SOFR + 0.98%), 4.03%, due 3/28/2025 | |
| | Prudential Financial, Inc., 5.13%, due 3/1/2052 | |
| | | |
| |
| | Alliant Holdings Intermediate LLC/Alliant Holdings Co-Issuer, 6.75%, due 10/15/2027 | |
| | AmWINS Group, Inc., 4.88%, due 6/30/2029 | |
| | | |
| | | |
| | | |
| | GTCR AP Finance, Inc., 8.00%, due 5/15/2027 | |
| | | |
Integrated Energy 0.0%(l) | |
| | | |
| | | |
| | | |
| | | |
| |
| | | |
| | | |
| | | |
| | United Group BV, 3.13%, due 2/15/2026 | |
| | | |
Investment Companies 0.0%(l) | |
| | CNCBINV 1 BVI Ltd., 1.75%, due 11/17/2024 | |
| | Huarong Finance 2019 Co. Ltd., 3.25%, due 11/13/2024 | |
See Notes to Financial Statements
Schedule of Investments Strategic Income Fund^ (cont’d)
| |
|
Investment Companies – cont'd | |
| | Suramericana SA, 5.50%, due 4/29/2026 | |
| | | |
Investments & Misc. Financial Services 0.5% | |
| | Bank of New York Mellon Corp., Ser. H, 3.70%, due 3/20/2026 | |
| | CQP Holdco L.P./BIP-V Chinook Holdco LLC, 5.50%, due 6/15/2031 | |
| | Encore Capital Group, Inc. | |
| | | |
| | | |
| | House of Finance NV, 4.38%, due 7/15/2026 | |
| | | |
| | | |
| | | |
| | Maison Finco PLC, 6.00%, due 10/31/2027 | |
| | | |
| | | |
| | | |
| | | |
| | | |
| |
| | | |
| | | |
| | | |
| | | |
| | | |
| | | |
| | Periama Holdings LLC, 5.95%, due 4/19/2026 | |
| | POSCO, 4.38%, due 8/4/2025 | |
| | | |
| |
| | Pinnacle Bidco PLC, 5.50%, due 2/15/2025 | |
| |
| | Melco Resorts Finance Ltd., 5.63%, due 7/17/2027 | |
| | Studio City Finance Ltd., 6.00%, due 7/15/2025 | |
| | Wynn Macau Ltd., 5.50%, due 1/15/2026 | |
| | | |
| |
| | SPX FLOW, Inc., 8.75%, due 4/1/2030 | |
| | Terex Corp., 5.00%, due 5/15/2029 | |
| | | |
Machinery - Construction & Mining 0.0%(l) | |
| | Caterpillar Financial Services Corp., (SOFR + 0.27%), 3.21%, due 9/13/2024 | |
Machinery - Diversified 0.1% | |
| | | |
| | (SOFR + 0.12%), 3.18%, due 7/10/2023 | |
| | (SOFR + 0.20%), 3.26%, due 10/11/2024 | |
| | (SOFR + 0.56%), 3.42%, due 3/7/2025 | |
| | | |
See Notes to Financial Statements
Schedule of Investments Strategic Income Fund^ (cont’d)
| |
|
| |
| | | |
| | | |
| | | |
| | | |
| | | |
| | | |
| | HealthEquity, Inc., 4.50%, due 10/1/2029 | |
| | | |
| | | |
| | | |
| | MPH Acquisition Holdings LLC, 5.75%, due 11/1/2028 | |
| | | |
| |
| | Charter Communications Operating LLC/Charter Communications Operating Capital, 4.80%, due 3/1/2050 | |
| | Comcast Cable Communications Holdings, Inc., 9.46%, due 11/15/2022 | |
| | | |
| | (3M USD LIBOR + 0.63%), 4.71%, due 4/15/2024 | |
| | | |
| | Discovery Communications LLC, 4.65%, due 5/15/2050 | |
| | Paramount Global, 6.38%, due 3/30/2062 | |
| | ViacomCBS, Inc., 4.20%, due 5/19/2032 | |
| | Walt Disney Co., 3.06%, due 3/30/2027 | |
| | | |
| |
| | AMC Networks, Inc., 4.25%, due 2/15/2029 | |
| | Banijay Entertainment SASU, 5.38%, due 3/1/2025 | |
| | iHeartCommunications, Inc., 6.38%, due 5/1/2026 | |
| | Lions Gate Capital Holdings LLC, 5.50%, due 4/15/2029 | |
| | | |
| | | |
| | | |
| | | |
| | | |
| | | |
| | | |
| |
| | Medline Borrower L.P., 3.88%, due 4/1/2029 | |
Metals - Mining Excluding Steel 0.6% | |
| | First Quantum Minerals Ltd. | |
| | | |
| | | |
| | FMG Resources August 2006 Pty Ltd. | |
| | | |
| | | |
| | | |
| | | |
| | | |
| | | |
See Notes to Financial Statements
Schedule of Investments Strategic Income Fund^ (cont’d)
| |
|
Metals - Mining Excluding Steel – cont'd | |
| | Novelis Corp., 3.88%, due 8/15/2031 | |
| | | |
| |
| | Chinalco Capital Holdings Ltd., 2.13%, due 6/3/2026 | |
| | Codelco, Inc., 3.15%, due 1/14/2030 | |
| | Endeavour Mining PLC, 5.00%, due 10/14/2026 | |
| | Stillwater Mining Co., 4.00%, due 11/16/2026 | |
| | Volcan Cia Minera SAA, 4.38%, due 2/11/2026 | |
| | | |
Miscellaneous Manufacturer 0.2% | |
| | FXI Holdings, Inc., 7.88%, due 11/1/2024 | |
| | | |
| | (3M USD LIBOR + 1.00%), 4.29%, due 3/15/2023 | |
| | (3M USD LIBOR + 1.00%), 5.08%, due 4/15/2023 | |
| | | |
| |
| | Africa Finance Corp., 3.88%, due 4/13/2024 | |
| | Banque Ouest Africaine de Developpement, 5.00%, due 7/27/2027 | |
| | Corp. Andina de Fomento, 2.25%, due 2/8/2027 | |
| | | |
Office - Business Equipment 0.1% | |
| | CDW LLC/CDW Finance Corp., 3.57%, due 12/1/2031 | |
| |
| | BP Capital PLC, 4.88%, due 3/22/2030 | |
| | CrownRock L.P./CrownRock Finance, Inc., 5.63%, due 10/15/2025 | |
| | | |
| | | |
| | | |
| | | |
| | EQT Corp., 5.70%, due 4/1/2028 | |
| | Geopark Ltd., 5.50%, due 1/17/2027 | |
| | Hunt Oil Co. of Peru LLC Sucursal Del Peru, 6.38%, due 6/1/2028 | |
| | KazMunayGas National Co. JSC | |
| | | |
| | | |
| | Korea National Oil Corp., 1.75%, due 4/18/2025 | |
| | | |
| | | |
| | | |
| | Medco Bell Pte Ltd., 6.38%, due 1/30/2027 | |
| | Pertamina Persero PT, 6.45%, due 5/30/2044 | |
| | Petrobras Global Finance BV, 6.00%, due 1/27/2028 | |
See Notes to Financial Statements
Schedule of Investments Strategic Income Fund^ (cont’d)
| |
|
| |
| | | |
| | | |
| | | |
| | | |
| | | |
| | | |
| | | |
| | Qatar Energy, 1.38%, due 9/12/2026 | |
| | Sinopec Group Overseas Development 2018 Ltd. | |
| | | |
| | | |
| | Tengizchevroil Finance Co. Int'l Ltd., 2.63%, due 8/15/2025 | |
| | Tullow Oil PLC, 10.25%, due 5/15/2026 | |
| | YPF SA, 8.50%, due 3/23/2025 | |
| | | |
Oil Field Equipment & Services 0.0%(l) | |
| | Nabors Industries, Inc., 7.38%, due 5/15/2027 | |
| |
| | Ardagh Metal Packaging Finance USA LLC/Ardagh Metal Packaging Finance PLC | |
| | | |
| | | |
| | Ardagh Packaging Finance PLC/Ardagh Holdings USA, Inc. | |
| | | |
| | | |
| | | |
| | | |
| | | |
| | BWAY Holding Co., 7.25%, due 4/15/2025 | |
| | Graham Packaging Co., Inc., 7.13%, due 8/15/2028 | |
| | Graphic Packaging Int'l LLC, 3.75%, due 2/1/2030 | |
| | Intelligent Packaging Ltd. Finco, Inc./Intelligent Packaging Ltd. Co-Issuer LLC, 6.00%, due 9/15/2028 | |
| | Pactiv Evergreen Group Issuer LLC/Pactiv Evergreen Group Issuer, Inc., 4.38%, due 10/15/2028 | |
| | Pactiv Evergreen Group Issuer, Inc./Pactiv Evergreen Group Issuer LLC/Reynolds Group Issuer, Inc., 4.00%, due 10/15/2027 | |
| | Trivium Packaging Finance BV, 5.50%, due 8/15/2026 | |
| | | |
Packaging & Containers 0.0%(l) | |
| | Kleopatra Holdings 2 SCA, 6.50%, due 9/1/2026 | |
Personal & Household Products 0.4% | |
| | CD&R Smokey Buyer, Inc., 6.75%, due 7/15/2025 | |
| | Coty, Inc., 4.75%, due 4/15/2026 | |
| | Diamond BC BV, 4.63%, due 10/1/2029 | |
| | Energizer Holdings, Inc., 4.75%, due 6/15/2028 | |
| | | |
See Notes to Financial Statements
Schedule of Investments Strategic Income Fund^ (cont’d)
| |
|
| |
| | | |
| | (3M USD LIBOR + 0.65%), 3.63%, due 11/21/2022 | |
| | | |
| | Cheplapharm Arzneimittel GmbH, 4.38%, due 1/15/2028 | |
| | Cigna Corp., (3M USD LIBOR + 0.89%), 4.97%, due 7/15/2023 | |
| | CVS Health Corp., 5.05%, due 3/25/2048 | |
| | Gruenenthal GmbH, 3.63%, due 11/15/2026 | |
| | Merck & Co., Inc., 2.90%, due 12/10/2061 | |
| | Teva Pharmaceutical Finance Netherlands II BV | |
| | | |
| | | |
| | Upjohn Finance BV, 1.91%, due 6/23/2032 | |
| | Upjohn, Inc., 4.00%, due 6/22/2050 | |
| | | |
| |
| | | |
| | (SOFR + 0.63%), 3.34%, due 2/16/2024 | |
| | | |
| | | |
| | Ser. B, 6.63%, due 2/15/2028 | |
| | Ser. G, 7.13%, due 5/15/2030 | |
| | Enterprise Products Operating LLC, 4.20%, due 1/31/2050 | |
| | Kinder Morgan, Inc., 5.55%, due 6/1/2045 | |
| | Plains All American Pipeline L.P./PAA Finance Corp., 3.55%, due 12/15/2029 | |
| | Southern Gas Corridor CJSC, 6.88%, due 3/24/2026 | |
| | Targa Resources Partners L.P./Targa Resources Partners Finance Corp. | |
| | | |
| | | |
| | | |
| | | |
Printing & Publishing 0.1% | |
| | | |
| | | |
| | | |
| | | |
| |
| | Country Garden Holdings Co. Ltd., 4.80%, due 8/6/2030 | |
| | Flamingo Lux II SCA, 5.00%, due 3/31/2029 | |
| | Grand City Properties SA, 2.50%, due 7/24/2023 | |
| | Samhallsbyggnadsbolaget i Norden AB, 2.63%, due 12/14/2025 | |
| | Sunac China Holdings Ltd., 6.50%, due 1/26/2026 | |
| | | |
Real Estate Development & Management 0.3% | |
| | Realogy Group LLC/Realogy Co-Issuer Corp. | |
| | | |
| | | |
| | Samhallsbyggnadsbolaget i Norden AB, 1.00%, due 8/12/2027 | |
| | Vivion Investments S.a.r.l., 3.00%, due 8/8/2024 | |
| | | |
See Notes to Financial Statements
Schedule of Investments Strategic Income Fund^ (cont’d)
| |
|
Real Estate Investment Trusts 2.2% | |
| | | |
| | | |
| | | |
| | Digital Dutch Finco BV, 1.25%, due 2/1/2031 | |
| | EPR Properties, 3.75%, due 8/15/2029 | |
| | Hospitality Properties Trust | |
| | | |
| | | |
| | | |
| | Iron Mountain Information Management Services, Inc., 5.00%, due 7/15/2032 | |
| | | |
| | | |
| | | |
| | | |
| | | |
| | | |
| | | |
| | | |
| | MPT Operating Partnership L.P./MPT Finance Corp. | |
| | | |
| | | |
| | RHP Hotel Properties L.P./RHP Finance Corp., 4.75%, due 10/15/2027 | |
| | RLJ Lodging Trust L.P., 3.75%, due 7/1/2026 | |
| | SBA Communications Corp., 3.13%, due 2/1/2029 | |
| | Simon Property Group L.P., (SOFR + 0.43%), 3.49%, due 1/11/2024 | |
| | Starwood Property Trust, Inc. | |
| | | |
| | | |
| | | |
| | | |
| | | |
| | | |
| | Unibail-Rodamco-Westfield SE, 2.13%, due 7/25/2023 | |
| | Uniti Group L.P./Uniti Group Finance, Inc./CSL Capital LLC, 6.00%, due 1/15/2030 | |
| | VICI Properties L.P./VICI Note Co., Inc., 4.25%, due 12/1/2026 | |
| | XHR L.P., 6.38%, due 8/15/2025 | |
| | | |
| |
| | | |
| | | |
| | | |
| | | |
| | | |
| | Carnival Holdings Bermuda Ltd., 10.38%, due 5/1/2028 | |
| | Cedar Fair L.P., 5.25%, due 7/15/2029 | |
| | Cedar Fair L.P./Canada's Wonderland Co./Magnum Management Corp./Millennium Op | |
| | | |
| | | |
| | Motion Bondco Designated Activity Co., 4.50%, due 11/15/2027 | |
| | Motion Finco S.a.r.l., 7.00%, due 5/15/2025 | |
See Notes to Financial Statements
Schedule of Investments Strategic Income Fund^ (cont’d)
| |
|
Recreation & Travel – cont'd | |
| | | |
| | | |
| | | |
| | | |
| | Pinnacle Bidco PLC, 6.38%, due 2/15/2025 | |
| | Royal Caribbean Cruises Ltd. | |
| | | |
| | | |
| | SeaWorld Parks & Entertainment, Inc., 5.25%, due 8/15/2029 | |
| | Six Flags Entertainment Corp. | |
| | | |
| | | |
| | | |
| |
| | 1011778 BC ULC/New Red Finance, Inc., 4.00%, due 10/15/2030 | |
| | Yum! Brands, Inc., 3.63%, due 3/15/2031 | |
| | | |
| |
| | Alsea SAB de CV, 7.75%, due 12/14/2026 | |
| | Lowe's Cos, Inc., 4.45%, due 4/1/2062 | |
| | Starbucks Corp., (SOFR + 0.42%), 3.11%, due 2/14/2024 | |
| | | |
| |
| | | |
| | (SOFR + 0.25%), 3.30%, due 10/1/2024 | |
| | | |
| | | |
| | | |
| | | |
| | | |
| |
| | | |
| | | |
| | | |
| | | |
| |
| | Condor Merger Sub, Inc., 7.38%, due 2/15/2030 | |
| | Endurance Int'l Group Holdings, Inc., 6.00%, due 2/15/2029 | |
| | Open Text Holdings, Inc., 4.13%, due 12/1/2031 | |
| | | |
| | | |
| | | |
| | Ziff Davis, Inc., 4.63%, due 10/15/2030 | |
| | | |
| |
| | Afflelou SAS, 4.25%, due 5/19/2026 | |
See Notes to Financial Statements
Schedule of Investments Strategic Income Fund^ (cont’d)
| |
|
Specialty Retail – cont'd | |
| | Asbury Automotive Group, Inc. | |
| | | |
| | | |
| | BK LC Lux Finco1 S.a.r.l., 5.25%, due 4/30/2029 | |
| | | |
| | | |
| | | |
| | Gap, Inc., 3.63%, due 10/1/2029 | |
| | Hanesbrands, Inc., 4.63%, due 5/15/2024 | |
| | Maxeda DIY Holding BV, 5.88%, due 10/1/2026 | |
| | | |
Steel Producers - Products 0.0%(l) | |
| | Carpenter Technology Corp., 7.63%, due 3/15/2030 | |
| |
| | ADT Corp., 4.88%, due 7/15/2032 | |
| | Allied Universal Holdco LLC/Allied Universal Finance Corp. | |
| | | |
| | | |
| | Allied Universal Holdco LLC/Allied Universal Finance Corp./Atlas Luxco 4 S.a.r.l. | |
| | | |
| | | |
| | | |
| | | |
| | | |
| | Aramark Int'l Finance S.a.r.l., 3.13%, due 4/1/2025 | |
| | | |
| | | |
| | | |
| | ASGN, Inc., 4.63%, due 5/15/2028 | |
| | Avis Budget Car Rental LLC/Avis Budget Finance, Inc. | |
| | | |
| | | |
| | BCP V Modular Services Finance II PLC, 6.13%, due 11/30/2028 | |
| | Beacon Roofing Supply, Inc., 4.50%, due 11/15/2026 | |
| | Garda World Security Corp. | |
| | | |
| | | |
| | GW B-CR Security Corp., 9.50%, due 11/1/2027 | |
| | IAA Spinco, Inc., 5.50%, due 6/15/2027 | |
| | Kapla Holding SAS, 3.38%, due 12/15/2026 | |
| | KAR Auction Services, Inc., 5.13%, due 6/1/2025 | |
| | Loxam SAS, 5.75%, due 7/15/2027 | |
| | PECF USS Intermediate Holding III Corp., 8.00%, due 11/15/2029 | |
| | Prime Security Services Borrower LLC/Prime Finance, Inc. | |
| | | |
| | | |
| | | |
| | Summer BC Bidco B LLC, 5.50%, due 10/31/2026 | |
| | Techem Verwaltungsgesellschaft 674 mbH, 6.00%, due 7/30/2026 | |
| | Techem Verwaltungsgesellschaft 675 mbH, 2.00%, due 7/15/2025 | |
See Notes to Financial Statements
Schedule of Investments Strategic Income Fund^ (cont’d)
| |
|
Support - Services – cont'd | |
| | United Rentals N.A., Inc. | |
| | | |
| | | |
| | | |
| | | |
| | | |
| | | |
| | White Cap Parent LLC, 8.25% Cash/9.00% PIK, due 3/15/2026 | |
| | | |
Technology Hardware & Equipment 0.4% | |
| | CommScope Finance LLC, 8.25%, due 3/1/2027 | |
| | CommScope Technologies LLC | |
| | | |
| | | |
| | | |
| | | |
| | | |
| | Imola Merger Corp., 4.75%, due 5/15/2029 | |
| | | |
| |
| | Sprint Capital Corp., 8.75%, due 3/15/2032 | |
| | Sprint Corp., 7.63%, due 2/15/2025 | |
| | | |
| | | |
| | | |
| | | |
Telecom - Wireline Integrated & Services 2.4% | |
| | Altice Financing SA, 4.25%, due 8/15/2029 | |
| | Altice Finco SA, 4.75%, due 1/15/2028 | |
| | | |
| | | |
| | | |
| | | |
| | | |
| | | |
| | Cable One, Inc., 4.00%, due 11/15/2030 | |
| | Consolidated Communications, Inc. | |
| | | |
| | | |
| | DKT Finance ApS, 7.00%, due 6/17/2023 | |
| | eircom Finance Designated Activity Co., 3.50%, due 5/15/2026 | |
| | Frontier Communications Corp. | |
| | | |
| | | |
| | | |
| | | |
| | | |
| | | |
See Notes to Financial Statements
Schedule of Investments Strategic Income Fund^ (cont’d)
| |
|
Telecom - Wireline Integrated & Services – cont'd | |
| | | |
| | | |
| | | |
| | | |
| | | |
| | | |
| | | |
| | | |
| | | |
| | | |
| | | |
| | Northwest Fiber LLC/Northwest Fiber Finance Sub, Inc. | |
| | | |
| | | |
| | PLT VII Finance S.a.r.l., 4.63%, due 1/5/2026 | |
| | Telecom Italia SpA, 5.30%, due 5/30/2024 | |
| | Uniti Group L.P./Uniti Group Finance, Inc./CSL Capital LLC, 6.50%, due 2/15/2029 | |
| | Virgin Media Finance PLC, 5.00%, due 7/15/2030 | |
| | Virgin Media Secured Finance PLC, 5.50%, due 5/15/2029 | |
| | Virgin Media Vendor Financing Notes III Designated Activity Co., 4.88%, due 7/15/2028 | |
| | Virgin Media Vendor Financing Notes IV Designated Activity Co., 5.00%, due 7/15/2028 | |
| | Zayo Group Holdings, Inc., 6.13%, due 3/1/2028 | |
| | Ziggo Bond Co. BV, 3.38%, due 2/28/2030 | |
| | | |
| |
| | Altice France Holding SA, 4.00%, due 2/15/2028 | |
| | Altice France SA, 3.38%, due 1/15/2028 | |
| | | |
| | (3M USD LIBOR + 0.89%), 3.80%, due 2/15/2023 | |
| | (SOFR + 0.64%), 3.69%, due 3/25/2024 | |
| | | |
| | | |
| | | |
| | | |
| | Bell Telephone Co. of Canada or Bell Canada, 2.20%, due 5/29/2028 | |
| | C&W Senior Financing Designated Activity Co., 6.88%, due 9/15/2027 | |
| | Oztel Holdings SPC Ltd., 6.63%, due 4/24/2028 | |
| | Rogers Communications, Inc. | |
| | | |
| | | |
| | SoftBank Group Corp., 5.00%, due 4/15/2028 | |
| | | |
| | | |
| | | |
| | Verizon Communications, Inc. | |
| | (SOFR + 0.50%), 3.53%, due 3/22/2024 | |
| | | |
| | | |
| | | |
See Notes to Financial Statements
Schedule of Investments Strategic Income Fund^ (cont’d)
| |
|
Telecommunications – cont'd | |
| | VF Ukraine PAT via VFU Funding PLC, 6.20%, due 2/11/2025 | |
| | | |
Theaters & Entertainment 0.2% | |
| | Live Nation Entertainment, Inc. | |
| | | |
| | | |
| | | |
| |
| | MV24 Capital BV, 6.75%, due 6/1/2034 | |
| | Reseau Ferre France, 2.45%, due 2/28/2023 | |
| | | |
Transportation Infrastructure - Services 0.1% | |
| | Autostrade per l'Italia SpA, 1.88%, due 9/26/2029 | |
| | CMA CGM SA, 7.50%, due 1/15/2026 | |
| | National Express Group PLC, 4.25%, due 11/26/2025 | |
| | | |
| |
| | Veolia Environnement SA, 2.50%, due 1/20/2029 | |
Total Corporate Bonds (Cost $1,633,979,452) | |
|
|
| |
| | First Brands Group, LLC, Term Loan, (3M CME Term SOFR + 5.00%), 8.37%, due 3/30/2027 | |
Business Equipment & Services 0.2% | |
| | Allied Universal Holdco LLC, Term Loan B, (1M USD LIBOR + 3.75%), 7.50%, due 5/12/2028 | |
| | ConvergeOne Holdings, Inc., Term Loan, (1M USD LIBOR + 5.00%), 8.75%, due 1/4/2026 | |
| | Cyxtera DC Holdings, Inc., Term Loan B, (3M USD LIBOR + 3.00%), 7.36%, due 5/1/2024 | |
| | West Corporation, Term Loan B1, (3M USD LIBOR + 3.50%), 7.91%, due 10/10/2024 | |
| | | |
Electronics - Electrical 0.1% | |
| | Finastra USA, Inc., First Lien Term Loan, (3M USD LIBOR + 3.50%), 6.87%, due 6/13/2024 | |
| | | |
| | Term Loan B, (3M USD LIBOR + 4.00%), 7.14%, due 12/1/2027 | |
| | Term Loan B, (3M USD LIBOR + 4.25%), 7.33%, due 12/1/2027 | |
| | Redstone Holdco 2 LP, Term Loan, (3M USD LIBOR + 4.75%), 9.11%, due 4/27/2028 | |
| | | |
Financial Intermediaries 0.0%(l) | |
| | Asurion LLC, Second Lien Term Loan B4, (1M USD LIBOR + 5.25%), 9.00%, due 1/20/2029 | |
See Notes to Financial Statements
Schedule of Investments Strategic Income Fund^ (cont’d)
| |
|
| |
| | | |
| | Term Loan, (1M USD LIBOR + 3.75%), 3.75%, due 7/17/2028 | |
| | Term Loan B, (1M USD LIBOR + 3.75%), 7.32%, due 7/17/2028 | |
| | Envision Healthcare Corporation | |
| | Term Loan, (3M CME Term SOFR + 3.75%), 6.33%, due 3/31/2027 | |
| | Term Loan, (3M CME Term SOFR + 4.25%), 6.83%, due 3/31/2027 | |
| | Term Loan, (3M CME Term SOFR + 7.88%), 11.60%, due 3/31/2027 | |
| | MPH Acquisition Holdings LLC, Term Loan B, (3M USD LIBOR + 4.25%), 7.32%, due 9/1/2028 | |
| | Team Health Holdings, Inc., Term Loan B, (1M SOFR + 5.25%), 8.98%, due 3/2/2027 | |
| | | |
Industrial Equipment 0.0%(l) | |
| | Crosby US Acquisition Corp., Term Loan B, (1M USD LIBOR + 4.75%), 8.32%, due 6/26/2026 | |
| |
| | Ascent Resources - Utica, Second Lien Term Loan, (3M USD LIBOR + 9.00%), 12.94%, due 11/1/2025 | |
| |
| | Consolidated Communications, Inc., Term Loan B, (1M USD LIBOR + 3.50%), 7.31%, due 10/2/2027 | |
| | GTT Communications, Inc., Term Loan B, (3M USD LIBOR + 3.75%), 10.00%, due 5/31/2025 | |
| | | |
| |
| | Eastern Power, LLC, Term Loan B, (3M USD LIBOR + 3.75%), 7.42%, due 10/2/2025 | |
| | Edgewater Generation, L.L.C., Term Loan, (1M USD LIBOR + 3.75%), 7.50%, due 12/13/2025 | |
| | | |
| | Term Loan B, (3M SOFR + 5.75%), 9.48%, due 2/1/2027 | |
| | Term Loan C, (3M SOFR + 5.75%), 9.48%, due 2/1/2027 | |
| | Nautilus Power, LLC, Term Loan B, (1M USD LIBOR + 4.25%), 8.00%, due 5/16/2024 | |
| | | |
Total Loan Assignments (Cost $25,022,945) | |
Foreign Government Securities 4.5% | |
| | 1MDB Global Investments Ltd., 4.40%, due 3/9/2023 | |
| | Airport Authority Hong Kong, 1.75%, due 1/12/2027 | |
| | Angolan Government International Bond | |
| | | |
| | | |
| | | |
| | Argentine Republic Government International Bond | |
| | | |
| | | |
| | Bermuda Government International Bond, 3.72%, due 1/25/2027 | |
| | Brazil Loan Trust 1, 5.48%, due 7/24/2023 | |
| | Brazil Notas do Tesouro Nacional | |
| | Ser. F, 10.00%, due 1/1/2025 | |
| | Ser. F, 10.00%, due 1/1/2029 | |
| | Ser. F, 10.00%, due 1/1/2031 | |
See Notes to Financial Statements
Schedule of Investments Strategic Income Fund^ (cont’d)
| |
Foreign Government Securities – cont'd | |
| | Bundesrepublik Deutschland Bundesanleihe | |
| | | |
| | | |
| | Ser. G, 0.00%, due 8/15/2031 | |
| | | |
| | Chile Government International Bond, 2.75%, due 1/31/2027 | |
| | Colombia Government International Bond | |
| | | |
| | | |
| | | |
| | | |
| | Ser. B, 6.00%, due 4/28/2028 | |
| | Ser. B, 7.00%, due 6/30/2032 | |
| | Ser. B, 7.25%, due 10/18/2034 | |
| | Croatia Government International Bond, 2.75%, due 1/27/2030 | |
| | Dominican Republic International Bond | |
| | | |
| | | |
| | Ecuador Government International Bond | |
| | | |
| | | |
| | | |
| | | |
| | | |
| | | |
| | Egypt Government International Bond | |
| | | |
| | | |
| | | |
| | | |
| | El Salvador Government International Bond, 9.50%, due 7/15/2052 | |
| | Estonia Government International Bond, 4.00%, due 10/12/2032 | |
| | | |
| | | |
| | | |
| | | |
| | | |
| | | |
| | | |
| | | |
| | French Republic Government Bond OAT | |
| | | |
| | | |
| | | |
| | | |
| | | |
| | | |
| | | |
| | | |
| | | |
| | | |
See Notes to Financial Statements
Schedule of Investments Strategic Income Fund^ (cont’d)
| |
Foreign Government Securities – cont'd | |
| | Ghana Government International Bond, 6.38%, due 2/11/2027 | |
| | | |
| | | |
| | | |
| | Indonesia Government International Bond, 4.63%, due 4/15/2043 | |
| | | |
| | | |
| | | |
| | | |
| | Italy Buoni Poliennali Del Tesoro | |
| | | |
| | | |
| | | |
| | | |
| | | |
| | | |
| | | |
| | | |
| | | |
| | | |
| | | |
| | | |
| | Ivory Coast Government International Bond | |
| | | |
| | | |
| | Kazakhstan Government International Bond, 0.60%, due 9/30/2026 | |
| | Kenya Government International Bond, 7.00%, due 5/22/2027 | |
| | Kingdom of Belgium Government Bond | |
| | Ser. 94, 0.35%, due 6/22/2032 | |
| | Ser. 84, 1.45%, due 6/22/2037 | |
| | Ser. 90, 0.40%, due 6/22/2040 | |
| | | |
| | Ser. M20, 8.50%, due 5/31/2029 | |
| | Ser. M, 7.75%, due 5/29/2031 | |
| | Mexico Government International Bond | |
| | | |
| | | |
| | Mongolia Government International Bond, 5.13%, due 4/7/2026 | |
| | Netherlands Government Bond | |
| | | |
| | | |
| | Oman Government International Bond | |
| | | |
| | | |
| | Panama Government International Bond | |
| | | |
| | | |
| | Paraguay Government International Bond, 4.95%, due 4/28/2031 | |
| | Peru Government Bond, 6.15%, due 8/12/2032 | |
| | Perusahaan Penerbit SBSN Indonesia III, 4.40%, due 6/6/2027 | |
See Notes to Financial Statements
Schedule of Investments Strategic Income Fund^ (cont’d)
| |
Foreign Government Securities – cont'd | |
| | Peruvian Government International Bond | |
| | | |
| | | |
| | | |
| | Portugal Obrigacoes do Tesouro OT | |
| | | |
| | | |
| | Provincia de Cordoba, 6.88%, due 12/10/2025 | |
| | Qatar Government International Bond | |
| | | |
| | | |
| | Republic of Austria Government Bond | |
| | | |
| | | |
| | Republic of South Africa Government Bond | |
| | | |
| | | |
| | | |
| | Republic of South Africa Government International Bond | |
| | | |
| | | |
| | Romanian Government International Bond | |
| | | |
| | | |
| | | |
| | | |
| | | |
| | | |
| | | |
| | | |
| | | |
| | Saudi Government International Bond | |
| | | |
| | | |
| | Serbia International Bond, 3.13%, due 5/15/2027 | |
| | Slovakia Government Bond, 4.00%, due 10/19/2032 | |
| | Slovenia Government Bond, 2.25%, due 3/3/2032 | |
| | | |
| | | |
| | | |
| | | |
| | | |
| | | |
| | Spain Government Inflation-Linked Bond, 0.65%, due 11/30/2027 | |
| | Sri Lanka Government International Bond | |
| | | |
| | | |
| | State of North Rhine-Westphalia Germany, 1.65%, due 2/22/2038 | |
| | | |
| | | |
| | | |
See Notes to Financial Statements
Schedule of Investments Strategic Income Fund^ (cont’d)
| |
Foreign Government Securities – cont'd | |
| | Ukraine Government International Bond | |
| | | |
| | | |
| | Uruguay Government International Bond, 5.10%, due 6/18/2050 | |
| | Venezuela Government International Bond, 8.25%, due 10/13/2024 | |
Total Foreign Government Securities (Cost $152,436,895) | |
|
|
Cable & Satellite Television 0.1% | |
| | DISH Network Corp., 2.38%, due 3/15/2024 | |
| | DISH Network Corp., 3.38%, due 8/15/2026 | |
Total Convertible Bonds (Cost $3,644,545) | |
|
|
| |
| | Gilbert Wtr. Res. Muni. Prop. Corp. Utils. Sys. Rev. (Green Bond-Sr. Lien), Ser. 2022, 5.00%, due 7/15/2031 | |
| |
| | Bay Area Toll Au. Toll Bridge Rev. (Build America Bonds), Ser. 2010-S-1, 7.04%, due 4/1/2050 | |
| | California St. G.O. (Build America Bonds), Ser. 2010, 7.63%, due 3/1/2040 | |
| | California St. Univ. Ref. Rev., Ser. 2020-B, 2.98%, due 11/1/2051 | |
| | Foothill-Eastern Trans. Corridor Agcy. Toll Road Rev. Ref., Ser. 2019-A, (AGM Insured), 3.92%, due 1/15/2053 | |
| | Los Angeles Comm. College Dist. G.O. (Build America Bonds), Ser. 2010-E, 6.75%, due 8/1/2049 | |
| | Univ. of California Regents Med. Ctr. Pooled Rev., Ser. 2020-N, 3.01%, due 5/15/2050 | |
| | | |
| |
| | Massachusetts St. Bay Trans. Au. Sr. Sales Tax Rev., Ser. 2006-A, 5.25%, due 7/1/2032 | |
| | Massachusetts St. Dev. Fin. Agcy. Rev. (Harvard Univ. Green Bond), Ser. 2022-B, 5.00%, due 11/15/2032 | |
| | Massachusetts St. Ed. Fin. Au. Rev. Ref., Ser. 2018-A, 4.08%, due 7/1/2027 | |
| | | |
| |
| | Michigan Fin. Au. Hosp. Rev. Ref. (Trinity Hlth. Credit Group), Ser. 2019-T, 3.38%, due 12/1/2040 | |
| |
| | Clark Co. Nevada G.O. (Las Vegas Convention and Visitors Au.), Ser. 2019-D, 3.23%, due 7/1/2044 | |
| |
| | Atlantic City G.O. Ref., Ser. 2018, 4.29%, due 9/1/2026 | |
| | New Jersey St. Hsg. & Mtge. Fin. Agcy. Rev. Ref. (Single Family Hsg.), Ser. 2018-B, 3.80%, due 10/1/2032 | |
| | | |
See Notes to Financial Statements
Schedule of Investments Strategic Income Fund^ (cont’d)
| |
|
| |
| | New York City Muni. Wtr. Fin. Au. Wtr. & Swr. Sys. Rev. (Second Gen. Resolution Rev. Bonds), Ser. 2020-EE, 5.00%, due 6/15/2031 | |
| | | |
| | Ser. 2022-B-1, 5.00%, due 8/1/2032 | |
| | Subser. 2022-D-1, 5.00%, due 5/1/2035 | |
| | New York St. Dorm. Au. Rev. Non St. Supported Debt Ref. (New York Univ.), Ser. 2020-B, 2.69%, due 7/1/2040 | |
| | | |
| |
| | Highland Local Sch. Dist. G.O. Ref., Ser. 2020, 3.19%, due 12/1/2049 | |
| | JobsOhio Beverage Sys. Statewide Liquor Profits Rev. Ref., Ser. 2020-A, 2.83%, due 1/1/2038 | |
| | Ohio St. Turnpike Commission Junior Lien Rev. Ref. (Infrastructure Proj.), Ser. 2020-A, 3.22%, due 2/15/2048 | |
| | Ohio Univ. Gen. Receipt Athens Ref. Rev., Ser. 2020, 2.91%, due 12/1/2043 | |
| | | |
| |
| | Commonwealth Fin. Au. Rev. Ref., Ser. 2020-C, 3.53%, due 6/1/2042 | |
| |
| | Dallas Area Rapid Transit Sales Tax Rev. Ref., Ser. 2020-C, 2.82%, due 12/1/2042 | |
| | Grand Parkway Trans. Corp. Sys. Sub. Tier Toll Rev. Ref., Ser. 2020-B, 3.24%, due 10/1/2052 | |
| | Texas St. Private Activity Bond Surface Trans. Corp. Sr. Lien Rev. Ref. (North Tarrant Express Managed Lanes Proj.), Ser. 2019-B, 3.92%, due 12/31/2049 | |
| | Texas St. Trans. Commission Central Texas Turnpike Sys. First Tier Rev. Ref., Ser. 2020-C, 3.03%, due 8/15/2041 | |
| | | |
| |
| | Utah St. Transit Au. Sales Tax Rev. Ref., Ser. 2020, 2.77%, due 12/15/2038 | |
Total Municipal Notes (Cost $58,129,308) | |
| |
| |
Investment Companies 0.1% | |
| | Neuberger Berman Global Monthly Income Fund Ltd. (Cost $2,363,561) | |
Exchange-Traded Funds 2.1% | |
| | iShares iBoxx $ Investment Grade Corporate Bond ETF | |
| | iShares iBoxx High Yield Corporate Bond ETF | |
Total Exchange-Traded Funds (Cost $54,583,289) | |
See Notes to Financial Statements
Schedule of Investments Strategic Income Fund^ (cont’d)
| |
|
Short-Term Investments 4.1% |
Investment Companies 4.1% | |
| | State Street Institutional U.S. Government Money Market Fund Premier Class, 3.00%(u) (Cost $101,625,290) | |
Total Investments 121.5% (Cost $3,541,164,824) | |
Liabilities Less Other Assets (21.5)% | |
| |
| Principal amount is stated in the currency in which the security is denominated. |
| Index-linked bond whose principal amount adjusts according to a government retail price index. |
| All or a portion of the security is pledged as collateral for futures. |
| Securities were purchased under Rule 144A of the Securities Act of 1933, as amended, or are otherwise restricted and, unless registered under the Securities Act of 1933 or exempted from registration, may only be sold to qualified institutional investors or may have other restrictions on resale. At October 31, 2022, these securities amounted to $1,092,267,362, which represents 43.6% of net assets of the Fund. |
| Variable or floating rate security. The interest rate shown was the current rate as of October 31, 2022 and changes periodically. |
| Interest only security. These securities represent the right to receive the monthly interest payments on an underlying pool of mortgages. Payments of principal on the pool reduce the value of the “interest only” holding. |
| Variable or floating rate security where the stated interest rate is not based on a published reference rate and spread. Rather, the interest rate adjusts periodically based on changes in current interest rates and prepayments on the underlying pool of assets. The interest rate shown was the current rate as of October 31, 2022. |
| All or a portion of this security was purchased on a delayed delivery basis. |
| TBA (To Be Announced) Securities are purchased/sold on a forward commitment basis with an approximate principal amount and no defined maturity date. The actual principal amount and maturity date will be determined upon settlement when the specific mortgage pools are assigned. Total value of all such securities (excluding forward sales contracts, if any) at October 31, 2022 amounted to $520,397,040, which represents 20.8% of net assets of the Fund. |
| Security exempt from registration pursuant to Regulation S under the Securities Act of 1933, as amended. Regulation S applies to securities offerings that are made outside of the United States and do not involve directed selling efforts in the United States and as such may have restrictions on resale. Total value of all such securities at October 31, 2022 amounted to $127,735,630, which represents 5.1% of net assets of the Fund. |
| When-issued security. Total value of all such securities at October 31, 2022 amounted to $8,553,303, which represents 0.4% of net assets of the Fund. |
| Represents less than 0.05% of net assets of the Fund. |
| |
| Security issued at a fixed coupon rate, which converts to a variable rate at a future date. Rate shown is the rate in effect as of period end. |
See Notes to Financial Statements
Schedule of Investments Strategic Income Fund^ (cont’d)
| Perpetual security. Perpetual securities have no stated maturity date, but they may be called/redeemed by the issuer. The date shown reflects the next call date. |
| Payment-in-kind (PIK) security. |
| Step Bond. Coupon rate is a fixed rate for an initial period that either resets at a specific date or may reset in the future contingent upon a predetermined trigger. The interest rate shown was the current rate as of October 31, 2022. |
| Security fair valued as of October 31, 2022 in accordance with procedures approved by the valuation designee. Total value of all such securities at October 31, 2022 amounted to $3,916,800, which represents 0.2% of net assets of the Fund. |
| All or a portion of this security had not settled as of October 31, 2022 and thus may not have an interest rate in effect. Interest rates do not take effect until settlement. |
| Value determined using significant unobservable inputs. |
| Represents 7-day effective yield as of October 31, 2022. |
| Includes the impact of the Fund’s open positions in derivatives at October 31, 2022. |
| As of October 31, 2022, the value of unfunded loan commitments was $231,107 for the Fund (see Note A of the Notes to Financial Statements). |
See Notes to Financial Statements
Schedule of Investments Strategic Income Fund^ (cont’d)
See Notes to Financial Statements
Schedule of Investments Strategic Income Fund^ (cont’d)
POSITIONS BY COUNTRY (cont’d) |
| | |
Other countries, each representing less than 0.05% of net assets of the Fund | | |
Short-Term Investments and Other Liabilities—Net | | |
| | |
See Notes to Financial Statements
Schedule of Investments Strategic Income Fund^ (cont’d)
Derivative Instruments
Futures contracts ("futures")
At October 31, 2022, open positions in futures for the Fund were as follows:
| | | | Value and
Unrealized
Appreciation/
(Depreciation) |
| | | | |
| | | | |
| | | | |
| | | | |
| | | | |
| | U.S. Treasury Note, 10 Year | | |
| | U.S. Treasury Note, 2 Year | | |
| | U.S. Treasury Note, 5 Year | | |
| | U.S. Treasury Note, Ultra 10 Year | | |
| | | | |
| | | | |
| | Government of Canada Bond, 10 Year | | |
| | Euribor Interest Rate, 3 Months | | |
| | ICE SONIA Index, 3 Months | | |
| | |
| | | | Value and
Unrealized
Appreciation/
(Depreciation) |
| | | | |
| | | | |
| | | | |
| | | | |
| | | | |
| | Government of Canada Bond, 5 Year | | |
| | Government of Japan, 10 Year Mini | | |
| | | | |
| | U.S. Treasury Note, 10 Year | | |
| | U.S. Treasury Note, 2 Year | | |
| | U.S. Treasury Note, 5 Year | | |
| | U.S. Treasury Note, Ultra 10 Year | | |
| | | | |
| | | | |
| | ICE SONIA Index, 3 Months | | |
| | |
| | |
At October 31, 2022, the Fund had securities pledged in the amount of $15,779,577 to cover collateral requirements on open futures. For the year ended October 31, 2022, the average notional value for the months
See Notes to Financial Statements
Schedule of Investments Strategic Income Fund^ (cont’d)
where the Fund had futures outstanding was $139,229,992 for long positions and $(1,072,290,282) for short positions.
Forward foreign currency contracts ("forward FX contracts")
At October 31, 2022, open forward FX contracts for the Fund were as follows:
| | | | Net
Unrealized
Appreciation/
(Depreciation) |
| | | | | | |
| | | | | | |
| | | | | | |
| | | | | | |
| | | | | | |
| | | | | | |
| | | | | | |
| | | | | | |
| | | | | | |
| | | | | | |
| | | | | | |
| | | | | | |
| | | | | | |
| | | | | | |
| | | | | | |
| | | | | | |
| | | | | | |
| | | | | | |
| | | | | | |
| | | | | | |
| | | | | | |
| | | | | | |
| | | | | | |
| | | | | | |
| | | | | | |
| | | | | | |
| | | | | | |
| | | | | | |
| | | | | | |
| | | | | | |
| | | | | | |
| | | | | | |
| | | | | | |
| | | | | | |
| | | | | | |
| | | | | | |
| | | | | | |
| | | | | | |
| | | | | | |
| | | | | | |
| | | | | | |
See Notes to Financial Statements
Schedule of Investments Strategic Income Fund^ (cont’d)
| | | | Net Unrealized Appreciation/ (Depreciation) |
| | | | | | |
| | | | | | |
| | | | | | |
| | | | | | |
| | | | | | |
| | | | | | |
| | | | | | |
| | | | | | |
Total unrealized appreciation | | |
| | | | | | |
| | | | | | |
| | | | | | |
| | | | | | |
| | | | | | |
| | | | | | |
| | | | | | |
| | | | | | |
| | | | | | |
| | | | | | |
| | | | | | |
| | | | | | |
| | | | | | |
| | | | | | |
| | | | | | |
| | | | | | |
| | | | | | |
| | | | | | |
| | | | | | |
| | | | | | |
| | | | | | |
| | | | | | |
| | | | | | |
| | | | | | |
| | | | | | |
| | | | | | |
| | | | | | |
| | | | | | |
| | | | | | |
| | | | | | |
| | | | | | |
| | | | | | |
| | | | | | |
| | | | | | |
| | | | | | |
| | | | | | |
| | | | | | |
See Notes to Financial Statements
Schedule of Investments Strategic Income Fund^ (cont’d)
| | | | Net Unrealized Appreciation/ (Depreciation) |
| | | | | | |
| | | | | | |
| | | | | | |
| | | | | | |
| | | | | | |
| | | | | | |
| | | | | | |
| | | | | | |
| | | | | | |
| | | | | | |
| | | | | | |
| | | | | | |
| | | | | | |
| | | | | | |
| | | | | | |
| | | | | | |
| | | | | | |
| | | | | | |
| | | | | | |
Total unrealized depreciation | | |
Total net unrealized depreciation | | |
For the year ended October 31, 2022, the average notional value for the months where the Fund had forward FX contracts outstanding was $339,996,134.
Bond forward contracts (“bond forwards”)
At October 31, 2022, bond forwards for the Fund were as follows:
| | | | Unrealized
Appreciation/
(Depreciation) |
| U.S. Treasury Inflation-Indexed Bonds, 0.63%, due 1/15/2024 | | | |
| U.S. Treasury Inflation-Indexed Bonds, 0.50%, due 4/15/2024 | | | |
| U.S. Treasury Inflation-Indexed Bonds, 0.25%, due 1/15/2025 | | | |
| U.S. Treasury Inflation-Indexed Bonds, 0.13%, due 4/15/2025 | | | |
| U.S. Treasury Inflation-Indexed Bonds, 0.38%, due 1/15/2027 | | | |
| U.S. Treasury Inflation-Indexed Bonds, 3.88%, due 4/15/2029 | | | |
| U.S. Treasury Inflation-Indexed Bonds, 0.13%, due 1/15/2030 | | | |
| U.S. Treasury Inflation-Indexed Bonds, 0.13%, due 1/15/2032 | | | |
| U.S. Treasury Inflation-Indexed Bonds, 1.38%, due 2/15/2044 | | | |
| U.S. Treasury Inflation-Indexed Bonds, 0.13%, due 2/15/2051 | | | |
Total net unrealized depreciation | |
For the year ended October 31, 2022, the average notional value for the months where the Fund had bond forwards outstanding was $41,752,308.
See Notes to Financial Statements
Schedule of Investments Strategic Income Fund^ (cont’d)
Credit default swap contracts ("credit default swaps")
At October 31, 2022, the Fund had outstanding credit default swaps as follows:
Centrally Cleared Credit Default Swaps — Buy Protection |
| | | Financing
Rate
Received
by
the Fund | | | Upfront
Payments/
(Receipts) | Unrealized
Appreciation/
(Depreciation) | Accrued
Net
Interest
Receivable/
(Payable) | |
| CDX Emerging
Markets Index,
Ser. 38 V.1 | | | | | | | | | |
| CDX North America High Yield Index, Ser. 39 V.1 | | | | | | | | | |
| | | | | | | | | | |
Centrally Cleared Credit Default Swaps - Sell Protection |
| | | Financing
Rate
Received
by
the Fund | | | Upfront
Payments/
(Receipts) | Unrealized
Appreciation/
(Depreciation) | Accrued
Net
Interest
Receivable/
(Payable) | |
| CDX North America Investment Grade Index, Ser. 39 V.1 | | | | | | | | | |
For the year ended October 31, 2022, the average notional value for the months where the Fund had credit default swaps outstanding was $66,883,511 for buy protection and $69,691,735 for sell protection.
Interest rate swap contracts ("interest rate swaps")
At October 31, 2022, the Fund had outstanding interest rate swaps as follows:
Centrally cleared interest rate swaps
| | Fund
Receives/
Pays
Floating
Rate | | | Frequency
of Fund
Receipt/
Payment | | Unrealized
Appreciation/
(Depreciation) | Accrued
Net
Interest
Receivable/
(Payable) | |
| | | | | | | | | | |
| | | | | | | | | | |
| | | | | | | | | | |
| | | | | | | | | | |
| | | | | | | | | | |
| | | | | | | | | | |
| | | | | | | | | | |
At October 31, 2022, the Fund had $3,225,469 deposited in a segregated account to cover margin requirements for centrally cleared swaps.
See Notes to Financial Statements
Schedule of Investments Strategic Income Fund^ (cont’d)
Inflation swap contracts (“inflation swaps”)
At October 31, 2022, the Fund had outstanding inflation swaps as follows:
Centrally cleared inflation swaps | | | |
| | Fund
Receives/
Pays
Floating
Rate | | | Frequency
of Fund
Receipt/
Payment | | Unrealized
Appreciation/
(Depreciation) | Accrued
Net
Interest
Receivable/
(Payable) | |
| | | | | | | | | | |
| | | | | | | | | | |
| | | | | | | | | | |
| | | | | | | | | | |
| | | | | | | | | | |
For the year ended October 31, 2022, the average notional value for the months where the Fund had interest rate swaps and inflation rate swaps outstanding was $26,699,730 when the Fund paid the fixed rate and $36,993,978 when the Fund received the fixed rate.
Total return basket swap contracts (“total return basket swaps”)
At October 31, 2022, the Fund did not have any outstanding total return basket swaps.
Total return swap contracts (“total return swaps”)
At October 31, 2022, the Fund had outstanding total return swaps as follows:
Over-the-counter total return swaps—Long(a) |
| | | | | | | Frequency
of Fund
Receipt/
Payment | Unrealized
Appreciation/
(Depreciation) | Accrued
Net
Interest
Receivable/
(Payable) | |
| iShares iBoxx $ High Yield Corp. Bond ETF | | | | | | | | | | |
| iShares iBoxx $ High Yield Corp. Bond ETF | | | | | | | | | | |
| | | | | | | | | | | |
| The Fund pays a specified rate based on a reference rate plus or minus a spread, and receives the total return on the reference entity. |
| Effective rate at October 31, 2022. |
For the year ended October 31, 2022, the average notional value for the months where the Fund had total return basket swaps and total return swaps outstanding was $333,567,570 for long positions.
At October 31, 2022, the Fund had cash collateral of $110,000, $13,580,000, $830,000 deposited in segregated accounts for Barclays Bank PLC, Goldman Sachs International and JPMorgan Chase Bank N.A., respectively, and cash collateral of $260,000 and $50,000 received from Citibank, N.A. and Morgan Stanley Capital Services LLC, respectively, to cover collateral requirements on over-the-counter derivatives.
Purchased option contracts ("options purchased")
At October 31, 2022, the Fund did not have any outstanding options purchased.
See Notes to Financial Statements
Schedule of Investments Strategic Income Fund^ (cont’d)
Written option contracts ("options written")
At October 31, 2022, the Fund did not have any outstanding options written.
For the year ended October 31, 2022, the average market value for the months where the Fund had options purchased and options written outstanding was $22,184 and $(10,122), respectively.
The following is a summary, categorized by Level (see Note A of the Notes to Financial Statements), of inputs used to value the Fund’s investments as of October 31, 2022:
| | | | |
| | | | |
U.S. Treasury Obligations | | | | |
U.S. Government Agency Securities | | | | |
Mortgage-Backed Securities# | | | | |
| | | | |
| | | | |
| | | | |
| | | | |
| | | | |
| | | | |
Foreign Government Securities# | | | | |
| | | | |
| | | | |
| | | | |
| | | | |
| | | | |
| | | | |
| The Schedule of Investments provides information on the industry, state/territory or sector categorization as well as a Positions by Country summary. |
| The following is a reconciliation between the beginning and ending balances of investments in which unobservable inputs (Level 3) were used in determining value: |
| Beginning
balance as
of 11/1/2021 | Accrued
discounts/
(premiums) | | Change
in unrealized
appreciation/
(depreciation) | | | | | | Net change in
unrealized
appreciation/
(depreciation)
from
investments
still held as of
10/31/2022 |
Investments in
Securities: | | | | | | | | | | |
| | | | | | | | | | |
| | | | | | | | | | |
(1) Securities categorized as Level 3 were valued using a single quotation obtained from a dealer. The Fund does not have access to unobservable inputs and therefore cannot disclose such inputs used in formulating such quotation. |
See Notes to Financial Statements
Schedule of Investments Strategic Income Fund^ (cont’d)
The following is a summary, categorized by Level (see Note A of the Notes to Financial Statements), of inputs used to value the Fund’s derivatives as of October 31, 2022:
Other Financial Instruments | | | | |
| | | | |
| | | | |
| | | | |
| | | | |
| | | | |
| | | | |
| | | | |
| | | | |
| | | | |
| | | | |
| | | | |
| | | | |
| Futures, forward FX contracts and bond forwards are reported at the cumulative unrealized appreciation/(depreciation) of the instrument. |
^
A balance indicated with a "—", reflects either a zero balance or an amount that rounds to less than 1.
See Notes to Financial Statements
This page has been left blank intentionally
Statements of Assets and Liabilities
Neuberger Berman Income Funds
| | | | |
| | | | |
| | | | |
Investments in securities, at value* (Notes A & F)—
see Schedule of Investments: | | | | |
| | | | |
| | | | |
| | | | |
| | | | |
| | | | |
Cash collateral segregated for futures contracts (Note A) | | | | |
Cash collateral segregated for centrally cleared swap contracts (Note A) | | | | |
Cash collateral segregated for over-the-counter derivatives (Note A) | | | | |
Dividends and interest receivable | | | | |
Receivable for securities sold | | | | |
Receivable for accumulated variation margin on futures contracts (Note A) | | | | |
Receivable from Management—net (Note B) | | | | |
Receivable for Fund shares sold | | | | |
Receivable for accumulated variation margin on centrally cleared swap contracts(d)(e) (Note A) | | | | |
Receivable for forward foreign currency contracts (Note A) | | | | |
Over-the-counter swap contracts, at value (Note A) | | | | |
Prepaid expenses and other assets | | | | |
| | | | |
| | | | |
Over-the-counter swap contracts, at value (Note A) | | | | |
Cash collateral segregated for over-the-counter derivatives due to broker (Note A) | | | | |
Cash collateral segregated for futures contracts due to broker (Note A) | | | | |
Payable to investment manager—net (Notes A & B) | | | | |
| | | | |
Payable for securities purchased | | | | |
Payable for Fund shares redeemed | | | | |
Payable for accumulated variation margin on futures contracts (Note A) | | | | |
Payable for bond forward contracts (Note A) | | | | |
Payable for forward foreign currency contracts (Note A) | | | | |
Payable for accumulated variation margin on centrally cleared swap contracts(d)(e) (Note A) | | | | |
Payable to administrator—net (Note B) | | | | |
| | | | |
| | | | |
Payable for custodian and accounting fees | | | | |
| | | | |
| | | | |
Payable for unfunded loan commitments (Note A) | | | | |
Accrued capital gains taxes (Note A) | | | | |
Other accrued expenses and payables | | | | |
| | | | |
| | | | |
| | | | |
| | | | |
| | | | |
Total distributable earnings/(losses) | | | | |
| | | | |
| | | | |
| | | | |
| | | | |
| | | | |
| | | | |
| | | | |
| | | | |
| | | | |
| | | | |
| | | | |
See Notes to Financial Statements
| | Municipal
Intermediate
Bond Fund | | |
| | | | |
| | | | |
| | | | |
| | | | |
| | | | |
| | | | |
| | | | |
| | | | |
| | | | |
| | | | |
| | | | |
| | | | |
| | | | |
| | | | |
| | | | |
| | | | |
| | | | |
| | | | |
| | | | |
| | | | |
| | | | |
| | | | |
| | | | |
| | | | |
| | | | |
| | | | |
| | | | |
| | | | |
| | | | |
| | | | |
| | | | |
| | | | |
| | | | |
| | | | |
| | | | |
| | | | |
| | | | |
| | | | |
| | | | |
| | | | |
| | | | |
| | | | |
| | | | |
| | | | |
| | | | |
| | | | |
| | | | |
| | | | |
| | | | |
| | | | |
| | | | |
| | | | |
| | | | |
| | | | |
| | | | |
| | | | |
| | | | |
| | | | |
| | | | |
Statements of Assets and Liabilities (cont’d)
Neuberger Berman Income Funds (cont’d)
| | | | |
| | | | |
Shares Outstanding ($.001 par value; unlimited shares authorized) | | | | |
| | | | |
| | | | |
| | | | |
| | | | |
| | | | |
| | | | |
| | | | |
| | | | |
Net Asset Value, offering and redemption price per share | | | | |
| | | | |
| | | | |
| | | | |
| | | | |
| | | | |
| | | | |
Net Asset Value and redemption price per share | | | | |
| | | | |
| | | | |
| | | | |
Net Asset Value and offering price per share | | | | |
| | | | |
| | | | |
| | | | |
| | | | |
Total cost of investments | | | | |
(c) Total cost of foreign currency | | | | |
(d) Unamortized upfront receipts on centrally cleared swap contracts | | | | |
(e) Unamortized upfront payments on centrally cleared swap contracts | | | | |
| |
| On single retail sales of less than $50,000. On sales of $50,000 or more or in certain other circumstances described in the Fund's prospectus, offering price is reduced. |
| Redemption price per share is equal to net asset value less any applicable contingent deferred sales charge. |
See Notes to Financial Statements
| | Municipal
Intermediate
Bond Fund | | |
| | | | |
| | | | |
| | | | |
| | | | |
| | | | |
| | | | |
| | | | |
| | | | |
| | | | |
| | | | |
| | | | |
| | | | |
| | | | |
| | | | |
| | | | |
| | | | |
| | | | |
| | | | |
| | | | |
| | | | |
| | | | |
| | | | |
| | | | |
| | | | |
| | | | |
| | | | |
| | | | |
| | | | |
| | | | |
| | | | |
Neuberger Berman Income Funds
| | | | |
| For the Fiscal
Year Ended
October 31, 2022 | For the Fiscal
Year Ended
October 31, 2022 | For the Fiscal
Year Ended
October 31, 2022 | For the Fiscal
Year Ended
October 31, 2022 |
| | | | |
| | | | |
Dividend income—unaffiliated issuers | | | | |
Dividend income—affiliated issuers (Note F) | | | | |
Interest and other income—unaffiliated issuers | | | | |
Income from securities loaned—net | | | | |
| | | | |
| | | | |
| | | | |
Investment management fees (Note B) | | | | |
Administration fees (Note B): | | | | |
| | | | |
| | | | |
| | | | |
| | | | |
| | | | |
| | | | |
| | | | |
Distribution fees (Note B): | | | | |
| | | | |
| | | | |
| | | | |
| | | | |
| | | | |
Shareholder servicing agent fees: | | | | |
| | | | |
| | | | |
| | | | |
| | | | |
| | | | |
| | | | |
| | | | |
| | | | |
| | | | |
Custodian and accounting fees | | | | |
| | | | |
| | | | |
Registration and filing fees | | | | |
Repayment to Management of expenses previously assumed by Management (Note B) | | | | |
| | | | |
Trustees' fees and expenses | | | | |
Interest expense on Reverse Repurchase Agreements (Note A) | | | | |
| | | | |
Miscellaneous and other fees (Note A) | | | | |
| | | | |
| | | | |
Expenses reimbursed by Management (Note B) | | | | |
Investment management fees waived (Notes A & B) | | | | |
| | | | |
Net investment income/(loss) | | | | |
| | | | |
See Notes to Financial Statements
| | Municipal
Intermediate
Bond Fund | | |
For the Fiscal
Year Ended
October 31, 2022 | For the Fiscal
Year Ended
October 31, 2022 | For the Fiscal
Year Ended
October 31, 2022 | For the Fiscal
Year Ended
October 31, 2022 | For the Fiscal
Year Ended
October 31, 2022 |
| | | | |
| | | | |
| | | | |
| | | | |
| | | | |
| | | | |
| | | | |
| | | | |
| | | | |
| | | | |
| | | | |
| | | | |
| | | | |
| | | | |
| | | | |
| | | | |
| | | | |
| | | | |
| | | | |
| | | | |
| | | | |
| | | | |
| | | | |
| | | | |
| | | | |
| | | | |
| | | | |
| | | | |
| | | | |
| | | | |
| | | | |
| | | | |
| | | | |
| | | | |
| | | | |
| | | | |
| | | | |
| | | | |
| | | | |
| | | | |
| | | | |
| | | | |
| | | | |
| | | | |
| | | | |
| | | | |
| | | | |
| | | | |
| | | | |
| | | | |
| | | | |
Statements of Operations (cont’d)
Neuberger Berman Income Funds (cont’d)
| | | | |
| For the Fiscal
Year Ended
October 31, 2022 | For the Fiscal
Year Ended
October 31, 2022 | For the Fiscal
Year Ended
October 31, 2022 | For the Fiscal
Year Ended
October 31, 2022 |
Realized and Unrealized Gain/(Loss) on Investments (Note A): | | | | |
Net realized gain/(loss) on: | | | | |
Transactions in investment securities of unaffiliated issuers | | | | |
Settlement of bond forward contracts | | | | |
Settlement of forward foreign currency contracts | | | | |
Settlement of foreign currency transactions | | | | |
Expiration or closing of futures contracts | | | | |
Expiration or closing of option contracts written | | | | |
Expiration or closing of swap contracts | | | | |
Change in net unrealized appreciation/(depreciation) in value of: | | | | |
Investment securities of unaffiliated issuers | | | | |
Investment securities of affiliated issuers | | | | |
Unfunded loan commitments | | | | |
Forward foreign currency contracts | | | | |
| | | | |
Foreign currency translations | | | | |
| | | | |
| | | | |
Net gain/(loss) on investments | | | | |
Net increase/(decrease) in net assets resulting from operations | | | | |
| |
| Net of foreign capital gains tax of $14,375 for Emerging Markets Debt and $8,139 for Strategic Income. |
| Change in accrued foreign capital gains tax amounted to $38,318 for Emerging Markets Debt and $85,702 for Strategic Income. |
See Notes to Financial Statements
| | Municipal
Intermediate
Bond Fund | | |
For the Fiscal
Year Ended
October 31, 2022 | For the Fiscal
Year Ended
October 31, 2022 | For the Fiscal
Year Ended
October 31, 2022 | For the Fiscal
Year Ended
October 31, 2022 | For the Fiscal
Year Ended
October 31, 2022 |
| | | | |
| | | | |
| | | | |
| | | | |
| | | | |
| | | | |
| | | | |
| | | | |
| | | | |
| | | | |
| | | | |
| | | | |
| | | | |
| | | | |
| | | | |
| | | | |
| | | | |
| | | | |
| | | | |
| | | | |
Statements of Changes in Net Assets
Neuberger Berman Income Funds
| | |
| | | | |
| | | | |
Increase/(Decrease) in Net Assets: | | | | |
From Operations (Note A): | | | | |
Net investment income/(loss) | | | | |
Net realized gain/(loss) on investments | | | | |
Change in net unrealized appreciation/(depreciation) of investments | | | | |
Net increase/(decrease) in net assets resulting from operations | | | | |
Distributions to Shareholders From (Note A): | | | | |
| | | | |
| | | | |
| | | | |
| | | | |
| | | | |
| | | | |
| | | | |
| | | | |
| | | | |
| | | | |
| | | | |
| | | | |
Total distributions to shareholders | | | | |
From Fund Share Transactions (Note D): | | | | |
Proceeds from shares sold: | | | | |
| | | | |
| | | | |
| | | | |
| | | | |
| | | | |
| | | | |
| | | | |
Proceeds from reinvestment of dividends and distributions: | | | | |
| | | | |
| | | | |
| | | | |
| | | | |
| | | | |
| | | | |
| | | | |
Payments for shares redeemed: | | | | |
| | | | |
| | | | |
| | | | |
| | | | |
| | | | |
| | | | |
| | | | |
Net increase/(decrease) from Fund share transactions | | | | |
Net Increase/(Decrease) in Net Assets | | | | |
| | | | |
| | | | |
| | | | |
See Notes to Financial Statements
Statements of Changes in Net Assets (cont’d)
Neuberger Berman Income Funds (cont’d)
| Municipal
Intermediate
Bond Fund | |
| | | | |
| | | | |
Increase/(Decrease) in Net Assets: | | | | |
From Operations (Note A): | | | | |
Net investment income/(loss) | | | | |
Net realized gain/(loss) on investments | | | | |
Change in net unrealized appreciation/(depreciation) of investments | | | | |
Net increase/(decrease) in net assets resulting from operations | | | | |
Distributions to Shareholders From (Note A): | | | | |
| | | | |
| | | | |
| | | | |
| | | | |
| | | | |
| | | | |
| | | | |
| | | | |
| | | | |
| | | | |
| | | | |
| | | | |
| | | | |
| | | | |
Total distributions to shareholders | | | | |
From Fund Share Transactions (Note D): | | | | |
Proceeds from shares sold: | | | | |
| | | | |
| | | | |
| | | | |
| | | | |
| | | | |
| | | | |
Proceeds from reinvestment of dividends and distributions: | | | | |
| | | | |
| | | | |
| | | | |
| | | | |
| | | | |
| | | | |
Payments for shares redeemed: | | | | |
| | | | |
| | | | |
| | | | |
| | | | |
| | | | |
| | | | |
Net increase/(decrease) from Fund share transactions | | | | |
Net Increase/(Decrease) in Net Assets | | | | |
| | | | |
| | | | |
| | | | |
See Notes to Financial Statements
Notes to Financial Statements Income Funds
Note A—Summary of Significant Accounting Policies:
1
General: Neuberger Berman Income Funds (the "Trust") is a Delaware statutory trust organized pursuant to
an Amended and Restated Trust Instrument dated March 27, 2014. The Trust is registered as an open-end management investment company under the Investment Company Act of 1940, as amended (the "1940
Act"), and its shares are registered under the Securities Act of 1933, as amended. Each of Neuberger Berman Core Bond Fund ("Core Bond"), Neuberger Berman Emerging Markets Debt Fund ("Emerging Markets Debt"), Neuberger Berman Floating Rate Income Fund ("Floating Rate Income"), Neuberger Berman High Income Bond Fund ("High Income"), Neuberger Berman Municipal High Income Fund ("Municipal High Income"), Neuberger Berman Municipal Impact Fund ("Municipal Impact"), Neuberger Berman Municipal Intermediate Bond Fund ("Municipal Intermediate Bond"), Neuberger Berman Short Duration Bond Fund ("Short Duration") and Neuberger Berman Strategic Income Fund ("Strategic Income")
(each individually a "Fund", and collectively, the "Funds") is a separate operating series of the Trust. Each Fund is diversified. Under the 1940 Act, the status of a Fund that was registered as non-diversified may, under certain circumstances, change to that of a diversified fund. Emerging Markets Debt became diversified in March 2022, and Municipal Impact became diversified in June 2018 in connection with its investment strategy change. Four Funds offer Investor Class shares, two offer Trust Class shares, nine offer Institutional Class shares, nine offer Class A shares, nine offer Class C shares, one offers Class R3 shares, three offer Class R6 shares and one offers Class E shares. The Trust's Board of Trustees (the "Board") may establish additional series or classes of shares without the approval of shareholders.
A balance indicated with a "—", reflects either a zero balance or a balance that rounds to less than 1.
The assets of each Fund belong only to that Fund, and the liabilities of each Fund are borne solely by that Fund and no other series of the Trust.
Each Fund is an investment company and accordingly follows the investment company accounting and reporting guidance of the Financial Accounting Standards Board ("FASB") Accounting Standards Codification ("ASC") Topic 946 "Financial Services—Investment Companies."
The preparation of financial statements in accordance with U.S. generally accepted accounting principles ("GAAP") requires Management to make estimates and assumptions at the date of the financial statements. Actual results could differ from those estimates.
2
Portfolio valuation: In accordance with ASC 820 "Fair Value Measurement" ("ASC 820"), all investments held by each of the Funds are carried at the value that Management believes each Fund would receive upon selling an investment in an orderly transaction to an independent buyer in the principal or most advantageous market for the investment under current market conditions. Various inputs, including the volume and level of activity for the asset or liability in the market, are considered in valuing the Funds' investments, some of which are discussed below. At times, Management may need to apply significant judgment to value investments in accordance with ASC 820.
ASC 820 established a three-tier hierarchy of inputs to create a classification of value measurements for disclosure purposes. The three-tier hierarchy of inputs is summarized in the three broad Levels listed below.
•
Level 1 – unadjusted quoted prices in active markets for identical investments
•
Level 2 – other observable inputs (including quoted prices for similar investments, interest rates, prepayment speeds, credit risk, amortized cost, etc.)
•
Level 3 – unobservable inputs (including a Fund's own assumptions in determining the fair value of investments)
The inputs or methodology used for valuing an investment are not necessarily an indication of the risk associated with investing in those securities.
The value of the Funds’ investments in equity securities, closed-end funds and exchange-traded funds ("ETFs"), for which market quotations are available, is generally determined by Management by obtaining valuations from independent pricing services based on the latest sale price quoted on a principal exchange
or market for that security (Level 1 inputs). Securities traded primarily on the NASDAQ Stock Market are normally valued at the NASDAQ Official Closing Price ("NOCP") provided by NASDAQ each business day. The NOCP is the most recently reported price as of 4:00:02 p.m., Eastern Time, unless that price is outside the range of the "inside" bid and asked prices (i.e., the bid and asked prices that dealers quote to each other when trading for their own accounts); in that case, NASDAQ will adjust the price to equal the inside bid or asked price, whichever is closer. Because of delays in reporting trades, the NOCP may not be based on the price of the last trade to occur before the market closes. If there is no sale of a security on a particular day, the independent pricing services may value the security based on market quotations.
The value of the Funds' investments in debt securities is determined by Management primarily by obtaining valuations from independent pricing services based on bid quotations, or if quotations are not available, by methods which include various considerations based on security type (generally Level 2 inputs). In addition to the consideration of yields or prices of securities of comparable quality, coupon, maturity and type, indications as to values from dealers, and general market conditions, the following is a description of other Level 2 inputs and related valuation techniques used by independent pricing services to value certain types of debt securities held by the Funds:
Corporate Bonds. Inputs used to value corporate debt securities generally include relevant credit information, observed market movements, sector news, U.S. Treasury yield curve or relevant benchmark curve, and other market information, which may include benchmark yield curves, reported trades, broker-dealer quotes, issuer spreads, comparable securities, and reference data, such as market research publications, when available ("Other Market Information").
Convertible Bonds. Inputs used to value convertible bonds generally include underlying stock data, conversion rates, credit specific details, relevant listed bond and preferred stock prices and Other Market Information.
U.S. Treasury Obligations. Inputs used to value U.S. Treasury securities generally include quotes from several inter-dealer brokers and Other Market Information.
U.S. Government Agency Securities. Inputs used to value U.S. Government Agency securities generally include obtaining benchmark quotes and Other Market Information.
Collateralized Loan Obligations (CLOs): The value of collateralized loan obligations is primarily determined by cash flow data, relevant loan pricing data and market color, and research from market participants and trading desks (Level 2 or 3 inputs).
Asset-Backed Securities and Mortgage-Backed Securities. Inputs used to value asset-backed securities and mortgage-backed securities generally include models that consider a number of factors, which may include the following: prepayment speeds, cash flows, spread adjustments and Other Market Information.
High Yield Securities. Inputs used to value high yield securities generally include a number of observations of equity and credit default swap curves related to the issuer and Other Market Information.
Municipal Debt Securities. Inputs used to value municipal debt securities include current trades, bid-wanted lists (which informs the market that a holder is interested in selling a position and that offers will be considered), offerings, general information on market movement, direction, trends, and specific data on specialty issues.
Emerging Markets Debt and Foreign Government Securities. Inputs used to value emerging markets debt and foreign government securities generally include dealer quotes, bond market activity, discounted cash flow models, and other relevant information such as credit spreads, benchmark curves and Other Market Information.
The value of loan assignments is determined by Management primarily by obtaining valuations from independent pricing services based on broker quotes (generally Level 2 or Level 3 inputs depending on the number of quotes available).
The value of futures contracts is determined by Management by obtaining valuations from independent pricing services at the settlement price at the market close (Level 1 inputs).
The value of bond forward contracts ("bond forwards") is determined by Management by obtaining valuations from independent pricing services using a model that considers the current price of the underlying bond and the forward curve (Level 2 inputs).
The value of interest rate swaps is determined by Management primarily by obtaining valuations from independent pricing services based on references to the underlying rates including the local overnight index swap rate and the respective interbank offered forward rate to produce the daily price. The present value is calculated based off of expected cash flows based on swap parameters along with reference to the underlying yield curve and reference rate (Level 2 inputs).
The value of credit default swaps is determined by Management by obtaining valuations from independent pricing services using a model that considers a number of factors, which may include default probabilities, credit curves, recovery rates and cash flows (Level 2 inputs).
The value of inflation swaps is determined by Management primarily by obtaining valuations from independent pricing services based on references to the underlying inflation rates including forward inflation expectation rate and the respective interbank offered forward rate to produce the daily price. The present value is calculated based off of expected cash flows based on swap parameters along with reference to the underlying forward inflation curve and reference rate (Level 2 inputs).
The value of forward foreign currency contracts ("forward FX contracts") is determined by Management by obtaining valuations from independent pricing services based on actual traded currency rates on independent pricing services’ networks, along with other traded and quoted currency rates provided to the pricing services by leading market participants (Level 2 inputs).
The value of total return swaps and total return basket swaps is determined by Management by obtaining valuations from independent pricing services using the underlying asset and stated benchmark interest rate (Level 2 inputs).
Management has developed a process to periodically review information provided by independent pricing services for all types of securities.
Investments in non-exchange traded investment companies are valued using the respective fund’s daily calculated net asset value ("NAV") per share (Level 2 inputs), when available.
If a valuation is not available from an independent pricing service, or if Management has reason to believe that the valuation received does not represent the amount each of the Funds might reasonably expect to receive on a current sale in an orderly transaction, Management seeks to obtain quotations from brokers or dealers (generally considered Level 2 or Level 3 inputs depending on the number of quotes available). If such quotations are not available, the security is valued using methods Management has approved in the good-faith belief that the resulting valuation will reflect the fair value of the security. Pursuant to Rule 2a-5 under the 1940 Act, the Board designated Management as the Funds' valuation designee. As the Funds' valuation designee, Management is responsible for determining fair value in good faith for any and all Fund investments. Inputs and assumptions considered in determining the fair value of a security based on Level 2 or Level 3 inputs may include, but are not limited to, the type of the security; the initial cost of the security; the existence of any contractual restrictions on the security’s disposition; the price and extent of public trading in similar securities of the issuer or of comparable companies; quotations or evaluated prices from broker-dealers and/or pricing services; information obtained from the issuer and/or analysts; an analysis of the company’s or issuer’s financial statements; an evaluation of the inputs that influence the issuer and the market(s) in which the security is purchased and sold.
The value of the Funds’ investments in foreign securities is generally determined using the same valuation methods and inputs as other Fund investments, as discussed above. Foreign security prices expressed in local currency values are normally translated from the local currency into U.S. dollars using the exchange rates as of 4:00 p.m., Eastern Time on days the New York Stock Exchange ("NYSE") is open for business. Management has approved the use of ICE Data Services ("ICE") to evaluate the prices of foreign debt securities as of the time as of which a Fund’s share price is calculated. ICE utilizes benchmark spread and yield curves and evaluates available market activity from the local close to the time as of which a Fund’s share price is calculated (Level 2 inputs) to assist in determining prices for certain foreign debt securities. In the absence of precise information about the market values of these foreign securities as of the time as of which a Fund’s share price is calculated, Management has determined on the basis of available data that prices adjusted or evaluated in this way are likely to be closer to the prices a Fund could realize on a current sale than are the prices of those securities established at the close of the foreign markets in which the securities primarily trade.
Fair value prices are necessarily estimates, and there is no assurance that such a price will be at or close to the price at which the security is next quoted or next trades.
3
Foreign currency translations: Core Bond, Emerging Markets Debt, Floating Rate Income, High Income, Short Duration and Strategic Income may invest in foreign securities denominated in foreign currencies. The accounting records of the Funds are maintained in U.S. dollars. Foreign currency amounts are normally translated into U.S. dollars using the exchange rate as of 4:00 p.m. Eastern Time, on days the NYSE is open for business, to determine the value of investments, other assets and liabilities. Purchase and sale prices of securities, and income and expenses, are translated into U.S. dollars at the prevailing rate of exchange on the respective dates of such transactions. Net unrealized foreign currency gain/(loss), if any, arises from changes in the value of assets and liabilities, other than investments in securities, as a result of changes in exchange rates and is stated separately in the Statements of Operations.
4
Securities transactions and investment income: Securities transactions are recorded on trade date for financial reporting purposes. Dividend income is recorded on the ex-dividend date or, for certain foreign dividends, as soon as a Fund becomes aware of the dividends. Non-cash dividends included in dividend income, if any, are recorded at the fair market value of the securities received. Interest income, including accretion of discount (adjusted for original issue discount, where applicable) and amortization of premium, where applicable, is recorded on the accrual basis. Realized gains and losses from securities transactions and foreign currency transactions, if any, are recorded on the basis of identified cost and stated separately in the Statements of Operations. Included in net realized gain/(loss) on investments are proceeds from the settlement of class action litigation(s) in which certain of the Funds participated as a class member. The amount of such proceeds for the year ended October 31, 2022, was $13 and $24 for Short Duration and Strategic Income, respectively.
5
Income tax information: Each Fund is treated as a separate entity for U.S. federal income tax purposes. It is the policy of each Fund to continue to qualify for treatment as a regulated investment company ("RIC") by complying with the requirements of the U.S. Internal Revenue Code applicable to RICs and to distribute substantially all of its net investment income and net realized capital gains to its shareholders. To the extent a Fund distributes substantially all of its net investment income and net realized capital gains to shareholders, no federal income or excise tax provision is required.
ASC 740 "Income Taxes" sets forth a minimum threshold for financial statement recognition of a tax position taken, or expected to be taken, in a tax return. The Funds recognize interest and penalties, if any, related to unrecognized tax positions as an income tax expense in the Statements of Operations. The Funds are subject to examination by U.S. federal and state tax authorities for returns filed for the tax years for which the applicable statutes of limitations have not yet expired. As of October 31, 2022, the Funds did not have any unrecognized tax positions.
For federal income tax purposes, the estimated cost and unrealized appreciation/(depreciation) in value of investments held at October 31, 2022 were as follows:
| | Gross
Unrealized
Appreciation | Gross
Unrealized
Depreciation | Net Unrealized
Appreciation/
(Depreciation) |
| | | | |
| | | | |
| | | | |
| | | | |
| | | | |
| | | | |
Municipal Intermediate Bond | | | | |
| | | | |
| | | | |
Income distributions and capital gain distributions are determined in accordance with income tax regulations, which may differ from GAAP. These differences are primarily due to differing treatments of income and gains on various investment securities held by each Fund, timing differences and differing characterization of distributions made by each Fund. The Funds may also utilize earnings and profits distributed to shareholders on redemption of their shares as a part of the dividends-paid deduction for income tax purposes.
Any permanent differences resulting from different book and tax treatment are reclassified at year-end and have no impact on net income, NAV or NAV per share of the Funds. For the year ended October 31, 2022, the Funds recorded permanent reclassifications primarily related to prior year true up adjustments. For the year ended October 31, 2022, the Funds recorded the following permanent reclassifications:
| | Total Distributable
Earnings/(Losses) |
| | |
| | |
The tax character of distributions paid during the years ended October 31, 2022, and October 31, 2021, was as follows:
| |
| | | | | |
| | | | | | | | | | |
| | | | | | | | | | |
| | | | | | | | | | |
| | | | | | | | | | |
| | | | | | | | | | |
| | | | | | | | | | |
| | | | | | | | | | |
Municipal Intermediate Bond | | | | | | | | | | |
| | | | | | | | | | |
| | | | | | | | | | |
As of October 31, 2022, the components of distributable earnings (accumulated losses) on a U.S. federal income tax basis were as follows:
| Undistributed
Ordinary
Income | Undistributed
Tax-Exempt
Income | Undistributed
Long-Term
Capital Gain | Unrealized
Appreciation/
(Depreciation) | Loss
Carryforwards
and Deferrals | Other
Temporary
Differences | |
| | | | | | | |
| | | | | | | |
| | | | | | | |
| | | | | | | |
| | | | | | | |
| | | | | | | |
Municipal Intermediate Bond | | | | | | | |
| | | | | | | |
| | | | | | | |
The temporary differences between book basis and tax basis distributable earnings are primarily due to: losses disallowed and/or recognized on wash sales and straddles; timing differences of fund level distributions, mark-to-market adjustments on swaps, futures and forward FX contracts, amortization of bond premium, defaulted bond adjustments, amortization of organizational expenses and tax adjustments related to swap contracts and other investments.
To the extent each Fund’s net realized capital gains, if any, can be offset by capital loss carryforwards, it is the policy of each Fund not to distribute such gains. Capital loss carryforward rules allow for RICs to carry forward capital losses indefinitely and to retain the character of capital loss carryforwards as short-term or long-term. As determined at October 31, 2022, the following Funds had unused capital loss carryforwards available for federal income tax purposes to offset future net realized capital gains, if any, as follows:
| Capital Loss Carryforwards |
| | |
| | |
| | |
| | |
| | |
| | |
| | |
Municipal Intermediate Bond | | |
| | |
| | |
6
Foreign taxes: Foreign taxes withheld, if any, represent amounts withheld by foreign tax authorities, net of refunds recoverable.
Foreign capital gains on certain foreign securities may be subject to foreign taxes, which are accrued as applicable. Emerging Markets Debt and Strategic Income accrue capital gains tax on unrealized and realized gains for certain securities. At October 31, 2022, Emerging Markets Debt and Strategic Income had accrued capital gains taxes of $7,495 and $2,152, respectively, which is reflected in the Statements of Assets and Liabilities. For the year ended October 31, 2022, Emerging Markets Debt and Strategic Income had realized capital gains taxes of $14,375 and $8,139, respectively, which is reflected in the Statements of Operations.
As a result of several European Court of Justice ("ECJ") court cases in certain countries across the European Union ("EU"), certain of the Funds may file tax reclaims for previously withheld taxes on dividends earned in those countries ("ECJ tax reclaims"). These additional filings are subject to various administrative proceedings by the local jurisdictions’ tax authorities within the EU, as well as a number of related judicial proceedings. Income recognized, if any, for ECJ tax reclaims would be reflected as "Interest and other income—unaffiliated issuers" in the Statements of Operations and the cost to file these additional ECJ tax reclaims, if any, would be reflected as "Miscellaneous and other fees" in the Statements of Operations. When the ECJ tax reclaim is "more likely than not" to not be sustained assuming examination by tax authorities due to the uncertainty that exists as to the ultimate resolution of these proceedings, the likelihood of receipt of these ECJ tax reclaims, and the potential timing of payment, no amounts are reflected in the Statements of Assets and Liabilities.
7
Distributions to shareholders: Each Fund earns income, net of expenses, daily on its investments. Ordinarily, distributions from net investment income are declared on each business day and paid monthly, and distributions from net realized capital gains, if any, are generally distributed once a year (usually in December). Distributions to shareholders are recorded on the ex-date.
8
Expense allocation: Certain expenses are applicable to multiple funds within the complex of related investment companies. Expenses directly attributable to a fund are charged to that fund. Expenses of the Trust that are not directly attributable to a particular series of the Trust (e.g., a Fund) are allocated among the series of the Trust, on the basis of relative net assets, except where a more appropriate allocation of expenses to each of the series can otherwise be made fairly. Expenses borne by the complex of related investment companies, which includes open-end and closed-end investment companies for which NBIA serves as investment manager, that are not directly attributable to a particular investment company in the complex (e.g., the Trust) or series thereof are allocated among the investment companies in the complex or series thereof on the basis of relative net assets, except where a more appropriate allocation of expenses to each of the investment companies in the complex or series thereof can otherwise be made fairly. Each Fund’s expenses (other than those specific to each class) are allocated proportionally each day among its classes based upon the relative net assets of each class.
9
Investments in foreign securities: Investing in foreign securities may involve sovereign and other risks, in addition to the credit and market risks normally associated with domestic securities. These additional risks include the possibility of adverse political and economic developments (including political instability, nationalization, expropriation, or confiscatory taxation) and the potentially adverse effects of unavailability of public information regarding issuers, less governmental supervision and regulation of financial markets, reduced liquidity of certain financial markets, and the lack of uniform accounting, auditing, and financial reporting standards or the application of standards that are different or less stringent than those applied in the United States. Foreign securities also may experience greater price volatility, higher rates of inflation, and delays in settlement.
10
When-issued/delayed delivery securities: Each Fund may purchase securities with delivery or payment to occur at a later date beyond the normal settlement period. At the time a Fund enters into a commitment to purchase a security, the transaction is recorded and the value of the security is reflected in the NAV. The price of such security and the date when the security will be delivered and paid for are fixed at the time the transaction is negotiated. The value of the security may vary with market fluctuations. No interest accrues to a Fund until payment takes place. When-issued and delayed delivery transactions can have a leverage-like effect on a Fund, which can increase fluctuations in the Fund’s NAV. Certain risks may arise upon entering into when-issued or delayed delivery securities transactions from the potential inability of counterparties to meet the terms of their contracts or if the issuer does not issue the securities due to political, economic, or other factors. Additionally, losses may arise due to changes in the value of the underlying securities.
Each Fund may also enter into a TBA agreement and "roll over" such agreement prior to the settlement date by selling the obligation to purchase the pools set forth in the agreement and entering into a new TBA agreement for future delivery of pools of mortgage-backed securities. TBA mortgage-backed securities may increase prepayment risks because the underlying mortgages may be less favorable than anticipated by a Fund.
11
Reverse repurchase agreements: In a reverse repurchase agreement, a Fund sells portfolio securities to another party, such as a bank or broker-dealer, in return for cash and agrees to repurchase the securities at an agreed-upon price and date, which reflects an interest payment to that party. In periods of increased demand for a security, the Fund may receive a payment from the counterparty for the use of the security, which is recorded as interest income. Reverse repurchase agreements involve the risk that the other party will fail to return the securities in a timely manner, or at all, which may result in losses to a Fund. A Fund could lose money if it is unable to recover the securities and the value of the cash collateral held by the Fund is less than the value of the securities. These events could also trigger adverse tax consequences to a Fund. Reverse repurchase agreements also involve the risk that the market value of the securities sold will decline below the price at which a Fund is obligated to repurchase them. Reverse repurchase agreements may be viewed as a form of borrowing by a Fund. When a Fund enters into a reverse repurchase agreement, any fluctuations in the market value of either the securities transferred to another party or the securities in which the proceeds may be invested would affect the market value of the Fund’s assets. During the term of the agreement, the Fund may also be obligated to pledge additional cash and/or securities in the event of a decline in the fair value of the transferred security. Management monitors the creditworthiness of counterparties to reverse repurchase agreements.
12
Derivative instruments: Certain Funds' use of derivatives during the year ended October 31, 2022, is described below. Please see the Schedule of Investments for each Fund's open positions in derivatives, if any, at October 31, 2022. The disclosure requirements of ASC 815 "Derivatives and Hedging" ("ASC 815") distinguish between derivatives that qualify for hedge accounting and those that do not. Because investment companies value their derivatives at fair value and recognize changes in fair value through the Statements of Operations, they do not qualify for hedge accounting. Accordingly, even though a Fund's investments in derivatives may represent economic hedges, they are considered non-hedge transactions for purposes of this disclosure.
The SEC adopted Rule 18f-4 under the 1940 Act which, effective August 19, 2022, regulates the use of derivatives for certain funds registered under the 1940 Act ("Rule 18f-4"). The Funds have adopted a Rule 18f-4 Policy which provides, among other things, that unless a Fund qualifies as a "limited derivatives user" as defined in Rule 18f-4, the Fund is subject to a comprehensive derivatives risk management program, is required to comply with certain value-at-risk based leverage limits and is required to provide additional disclosure both publicly and to the SEC regarding its derivatives positions. If a Fund qualifies as a limited derivatives user, Rule 18f-4 requires the Fund to have policies and procedures to manage its aggregate derivatives risk.
Futures contracts: During the year ended October 31, 2022, Core Bond used futures to manage or adjust the risk profile and investment exposure of the Fund, including to adjust the duration and yield curve exposure of the Fund’s portfolio. During year ended October 31, 2022, Emerging Markets Debt and Short Duration each used futures for economic hedging purposes, including as a maturity or duration management device. During year ended October 31, 2022, Strategic Income used futures to manage or adjust the risk profile and investment exposure of the Fund or individual positions, to obtain or reduce exposure to certain markets, to establish net short or long positions for markets, currencies or securities, to adjust the duration of the Fund’s portfolio and to enhance total return.
Futures contracts may include certain options on exchange-traded futures contracts. At the time a Fund enters into a futures contract, it is required to deposit with the futures commission merchant a specified amount of cash or liquid securities, known as "initial margin," which is a percentage of the value of the futures contract being traded that is set by the exchange upon which the futures contract is traded. Each day, the futures contract is valued at the official settlement price of the board of trade or U.S. commodity exchange on which such futures contract is traded. Subsequent payments, known as "variation margin," to and from the broker are made on a daily basis, or as needed, as the market price of the futures contract fluctuates. Daily variation margin adjustments, arising from this "mark to market," are recorded by a Fund as unrealized gains or losses.
Although some futures by their terms call for actual delivery or acquisition of the underlying securities or currency, in most cases the contracts are closed out prior to delivery by offsetting purchases or sales of
matching futures. When the contracts are closed or expire, a Fund recognizes a gain or loss. Risks of entering into futures contracts include the possibility there may be an illiquid market, possibly at a time of rapidly declining prices, and/or a change in the value of the contract may not correlate with changes in the value of the underlying securities. Futures executed on regulated futures exchanges have minimal counterparty risk to a Fund because the exchange’s clearinghouse assumes the position of the counterparty in each transaction. Thus, a Fund is exposed to risk only in connection with the clearinghouse and not in connection with the original counterparty to the transaction.
For U.S. federal income tax purposes, the futures transactions undertaken by a Fund may cause the Fund to recognize gains or losses from marking contracts to market even though its positions have not been sold or terminated, may affect the character of the gains or losses recognized as long-term or short-term, and may affect the timing of some capital gains and losses realized by the Fund. Also, a Fund’s losses on transactions involving futures contracts may be deferred rather than being taken into account currently in calculating such Fund’s taxable income.
Bond forward contracts: During the year ended October 31, 2022, Strategic Income used bond forward contracts to obtain economic exposure in the Fund to certain markets and securities. A bond forward is a contractual agreement between a Fund and another party to buy or sell an underlying asset at an agreed-upon future price and date. In a bond forward transaction, no cash premium is paid when the parties enter into the bond forward. If the transaction is collateralized, an exchange of margin collateral will take place according to an agreed-upon schedule. Otherwise, no asset of any kind changes hands until the bond forward matures (typically in 30 days) or is rolled over for another agreed-upon period. Generally, the value of the bond forward will change based on changes in the value of the underlying asset. Bond forwards are subject to market risk (the risk that the market value of the underlying bond may change), non-correlation risk (the risk that the market value of the bond forward might move independently of the market value of the underlying bond) and counterparty credit risk (the risk that a counterparty will be unable to meet its obligation under the contract). If there is no cash exchanged at the time a Fund enters into the bond forward, counterparty risk may be limited to the loss of any marked-to-market profit on the contract and any delays or limitations on the Fund’s ability to sell or otherwise use the investments posted as collateral for the bond forward.
Forward foreign currency contracts: During the year ended October 31, 2022, Emerging Markets Debt used forward FX contracts to manage or adjust views on foreign exchange rate movements and currency exposure, to apply foreign exchange leverage, and to gain exposure to markets where the portfolio managers believe these instruments provide better liquidity and value than bonds. During the year ended October 31, 2022, Strategic Income used forward FX contracts to manage or adjust the risk profile for foreign currency exposures in the Fund, to obtain or reduce economic exposure, to establish net short or long positions for markets or securities and to enhance total return.
A forward FX contract is an agreement between two parties to buy or sell a specific currency for another at a set price on a future date, and is individually negotiated and privately traded by currency traders and their customers in the interbank market. The market value of a forward FX contract fluctuates with changes in forward currency exchange rates. Forward FX contracts are marked to market daily, and the change in value is recorded by a Fund as an unrealized gain or loss. At the consummation of a forward FX contract to purchase or sell currency, a Fund may either exchange the currencies specified at the maturity of the forward FX contract or enter into a closing transaction involving the purchase or sale of an offsetting forward FX contract. Closing transactions with respect to forward FX contracts are usually performed with the counterparty to the original forward FX contract. The gain or loss arising from the difference between the U.S. dollar cost of the original contract and the value of the foreign currency in U.S. dollars upon closing a contract is included in "Net realized gain/(loss) on settlement of forward foreign currency contracts" in the Statements of Operations. These contracts may involve market risk in excess of the unrealized gain or loss reflected in a Fund’s Statement of Assets and Liabilities. In addition, a Fund could be exposed to risks associated with fluctuations in foreign currency and the risk the counterparty will fail to fulfill its obligation.
Credit default swap contracts: During the year ended October 31, 2022, Emerging Markets Debt used credit default swaps to manage or adjust credit risk of the Fund, to take advantage of the portfolio managers’
views on credit risk, market pricing of credit events and in an effort to leverage risk exposures by selling protection. During the year ended October 31, 2022, Strategic Income used credit default swaps for economic hedging purposes, to manage or adjust the risk profile and investment exposure of the Fund or individual positions, to obtain or reduce exposure to certain markets, to establish net short or long positions for markets or securities and to enhance total return. When a Fund is the buyer of a credit default swap contract, it is entitled to receive the notional amount of the swap from the counterparty if a credit event occurs. In return, the Fund pays the counterparty a periodic stream of payments over the term of the contract provided that no credit event has occurred. If no credit event occurs, the Fund would have spent the stream of payments and received no proceeds from the contract. When a Fund is the seller of a credit default swap contract, it receives the stream of payments, but is obligated to pay to the buyer of the protection an amount up to the notional amount of the swap and in certain instances take delivery of securities of the reference entity upon the occurrence of a credit event, as defined under the terms of that
particular swap agreement. Credit events are contract specific but may include bankruptcy, failure to pay, restructuring, obligation acceleration and repudiation/moratorium. If a Fund is a seller of protection and a credit event occurs, the maximum potential amount of future payments that the Fund could be required to make (or the risk of loss) would be an amount equal to the notional amount of the agreement. This potential amount would be partially offset by any recovery value of the respective referenced obligation, or net amount received from the settlement of a buy protection credit default swap agreement entered into by the Fund for the same referenced obligation. As the seller, the Fund may add economic leverage to its portfolio because, in addition to its total net assets, the Fund is subject to investment exposure on the notional amount of the swap. The net periodic payments paid or received on the swap contract are accrued daily as a component of unrealized appreciation/(depreciation) and are recorded as realized gain upon receipt or realized loss upon payment. The Fund also records an increase or decrease to unrealized appreciation/(depreciation) in an amount equal to the daily valuation of swaps. For over-the-counter ("OTC") credit default swaps, cash settlement in and out of the swaps may occur at a reset date or any other date, at the discretion of the Fund and the counterparty, over the life of the agreement, and is generally determined based on limits and thresholds established as part of an agreement between the Fund and the counterparty. For financial reporting purposes, unamortized upfront payments/(receipts), if any, are netted with unrealized appreciation or (depreciation) and net interest received or paid on swap contracts to determine the fair value of swaps.
Interest rate/Inflation swap contracts: During the year ended October 31, 2022, Emerging Markets Debt used interest rate swaps to manage or adjust interest rate risk of the Fund, to take advantage of the portfolio managers’ views on interest rates and market pricing of future monetary policy, to obtain exposure on a maturity horizon where bonds are illiquid or are unavailable, and to obtain leveraged rate positions. During the year ended October 31, 2022, Strategic Income used interest rate swaps and inflation swaps for economic hedging purposes, to manage or adjust the risk profile and investment exposure of the Fund or individual positions, to obtain or reduce exposure to certain markets, to establish net short or long positions for markets or securities and to enhance total return. Under the terms of interest rate/inflation swaps, the Fund agrees to pay the swap counterparty a fixed-rate payment in exchange for the counterparty’s paying the Fund a variable-rate payment, or the Fund agrees to pay the swap counterparty a variable-rate payment in exchange for the counterparty’s paying the Fund a fixed-rate payment. The fixed-rate and variable-rate payment flows are paid by one party to the other on a periodic basis and netted against each other when applicable. There is no guarantee that these interest rate/inflation swap transactions will be successful in reducing or limiting risk.
Risks may arise if the counterparty to an interest rate/inflation swap contract fails to comply with the terms of its contract. The loss incurred due to the failure of a counterparty is generally limited to the net interest payment to be received by the Fund and/or the termination value at the end of the contract. Additionally, risks may arise if there is no liquid market for these agreements or from movements in interest rates unanticipated by Management.
Periodic expected interim net interest payments or receipts on the swaps are recorded as an adjustment to unrealized gains/losses, along with the fair value of the future periodic payment or receivable streams on the swaps. The unrealized gains/losses associated with the periodic interim net interest payments or receipts
are reclassified to realized gains/losses in conjunction with the actual net payment or receipt of such amounts. For OTC interest rate/inflation swaps, cash settlement in and out of the swaps may occur at a reset date or any other date, at the discretion of the Fund and the counterparty, over the life of the agreement, and is generally determined based on limits and thresholds established as part of an agreement between the Fund and the counterparty. The reclassifications do not impact the Fund’s total net assets or its total net increase (decrease) in net assets resulting from operations.
Centrally cleared swap contracts: Certain clearinghouses currently offer clearing for limited types of derivative transactions. In a cleared derivative transaction, a Fund typically enters into the transaction with a financial institution counterparty that is then cleared through a central clearinghouse. Upon acceptance of a swap by a central clearinghouse, the original swap is extinguished and replaced with a swap with the clearinghouse, thereby reducing or eliminating the Fund’s exposure to the credit risk of the original counterparty. A Fund typically will be required to post specified levels of both initial and variation margin with the clearinghouse or at the instruction of the clearinghouse. The daily change in valuation is recorded as a receivable or payable for variation margin and settled in cash with the central clearing party. For financial reporting purposes, unamortized upfront payments, if any, are netted with unrealized appreciation or depreciation and net interest received or paid on swap contracts to determine the fair value of swaps.
Total return basket swap contracts: During the year ended October 31, 2022, Strategic Income used total return basket swaps for economic hedging purposes, to manage or adjust the risk profile and investment exposure of the Fund or individual positions, to obtain or reduce exposure to certain markets, to establish net short or long positions for markets or securities and to enhance total return. A Fund may enter into a total return basket swap agreement to obtain exposure to a portfolio of long and short securities. Under the terms of the agreement, the swap is designed to function as a portfolio of direct investments in long and short equity or fixed income positions. The Fund has the ability to trade in and out of long and short positions within the swap and will receive all of the economic benefits and risks equivalent to direct investments in these positions such as: capital appreciation/(depreciation), corporate actions, and dividends and interest received and paid, all of which are reflected in the swap value. The swap value also includes interest charges and credits related to the notional values of the long and short positions and cash balances within the swap. These interest charges and credits are based on defined market rates plus or minus a specified spread and are referred to herein as "financing costs". Positions within the swap are reset periodically, and financing costs are reset according to the terms of the contract. During a reset, any unrealized gains (losses) on positions and accrued financing costs become available for cash settlement between the Fund and the swap counterparty. For OTC total return basket swaps, cash settlement in and out of the swap may occur at a reset date or any other date, at the discretion of the Fund and the counterparty, over the life of the agreement, and is generally determined based on limits and thresholds established as part of an agreement between the Fund and the counterparty. A change in the market value of a total return basket swap contract is recognized as a change in unrealized appreciation/(depreciation) on swap contracts in the Statements of Operations. Cash settlements between a Fund and the counterparty are recognized as realized gains (losses) on closing of swap contracts in the Statements of Operations.
Total return swap contracts: During the year ended October 31, 2022, Floating Rate Income and High Income each used total return swaps to enhance liquidity while maintaining exposure to the asset class. During the year ended October 31, 2022, Short Duration used total return swaps for hedging purposes, liquidity management and to manage and adjust the risk profile of the Fund. During the year ended October 31, 2022, Strategic Income used total return swaps for economic hedging purposes, to manage or adjust the risk profile and investment exposure of the Fund or individual positions, to obtain or reduce exposure to certain markets, to establish net short or long positions for markets or securities and to enhance total return. Total return swaps involve commitments to pay fixed or floating rate interest in exchange for a market-linked return based on a notional amount. To the extent the total return of the reference security or index underlying the total return swap exceeds or falls short of the offsetting interest rate obligation, a Fund will receive a payment or make a payment to the counterparty, respectively. Certain risks may arise when entering into total return swap transactions, including counterparty default, liquidity or unfavorable changes in the value of the underlying reference security or index. The value of the swap is adjusted daily and the change in value, if any, is recorded as unrealized appreciation or (depreciation) in the
Statements of Assets and Liabilities. Payments received or made at the end of each measurement period are recorded as realized gain or loss in the Statements of Operations. For OTC total return swaps, cash settlement in and out of the swaps may occur at a reset date or any other date, at the discretion of the Fund and the counterparty, over the life of the agreement, and is generally determined based on limits and thresholds established as part of an agreement between the Fund and the counterparty.
Options: During the year ended October 31, 2022, Strategic Income used written options for economic hedging purposes, to manage or adjust the risk profile and investment exposure of the Fund or individual positions, to obtain or reduce exposure to certain markets, to establish net short or long positions for markets or securities and to enhance total return. During the year ended October 31, 2022, Strategic Income used purchased options for economic hedging purposes, to manage or adjust the risk profile and investment exposure of the Fund or individual positions, to obtain or reduce exposure to certain markets, to establish net short or long positions for markets or securities and to enhance total return.
Premiums paid by a Fund upon purchasing a call or put option are recorded in the asset section of the Fund’s Statement of Assets and Liabilities and are subsequently adjusted to the current market value. When an option is exercised, closed, or expired, a Fund realizes a gain or loss and the asset is eliminated. For purchased call options, a Fund’s loss is limited to the amount of the option premium paid.
Premiums received by a Fund upon writing a call option or a put option are recorded in the liability section of the Fund’s Statement of Assets and Liabilities and are subsequently adjusted to the current market value. When an option is exercised, closed, or expired, a Fund realizes a gain or loss and the liability is eliminated.
When writing a covered call option, a Fund, in return for the premium, gives up the opportunity for profit from a price increase in the underlying security above the exercise price, but conversely retains the risk of loss should the price of the security decline. When writing a put option, a Fund, in return for the premium, takes the risk that it must purchase the underlying security at a price that may be higher than the current market price of the security. If a call or put option that a Fund has written expires unexercised a Fund will realize a gain for the amount of the premium. All securities covering outstanding written options are held in escrow by the custodian bank.
At October 31, 2022, the Funds listed below had the following derivatives (which did not qualify as hedging instruments under ASC 815), grouped by primary risk exposure:
| | |
| Statements of
Assets and Liabilities
Location | | Statements of
Assets and Liabilities
Location | |
| | | | |
| | | | |
| Receivable/Payable for accumulated variation margin on futures contracts | | Receivable/Payable for accumulated variation margin on futures contracts | |
| | | | |
| | | | |
| Receivable/Payable for accumulated variation margin on futures contracts | | Receivable/Payable for accumulated variation margin on futures contracts | |
| | | | |
| Receivable for forward foreign currency contracts | | Payable for forward foreign currency contracts | |
| | | | |
| Receivable/Payable for accumulated variation margin on centrally cleared swap contracts(a) | | Receivable/Payable for accumulated variation margin on centrally cleared swap contracts(a) | |
| | |
| Statements of Assets and Liabilities Location | | Statements of Assets and Liabilities Location | |
| | | | |
| Over-the-counter swap contracts, at value(a) | | Over-the-counter swap contracts, at value(a) | |
| Over-the-counter swap contracts, at value(a) | | Over-the-counter swap contracts, at value(a) | |
Total over-the-counter swaps | | | | |
| | | | |
| | | | |
| Over-the-counter swap contracts, at value(a) | | Over-the-counter swap contracts, at value(a) | |
| | | | |
| | | | |
| Receivable/Payable for accumulated variation margin on futures contracts | | Receivable/Payable for accumulated variation margin on futures contracts | |
| | | | |
| Over-the-counter swap contracts, at value(a) | | Over-the-counter swap contracts, at value(a) | |
| | | | |
| | | | |
| Receivable/Payable for accumulated variation margin on futures contracts | | Receivable/Payable for accumulated variation margin on futures contracts | |
| | | | |
| Receivable for bond forward contracts | | Payable for bond forward contracts | |
| | | | |
| Receivable for forward foreign currency contracts | | Payable for forward foreign currency contracts | |
| | | | |
| Receivable/Payable for accumulated variation margin on centrally cleared swap contracts(a) | | Receivable/Payable for accumulated variation margin on centrally cleared swap contracts(a) | |
| | | | |
| Over-the-counter swap contracts, at value(a) | | Over-the-counter swap contracts, at value(a) | |
| "Centrally cleared swaps" and "over-the counter swaps" reflect the cumulative unrealized appreciation/(depreciation) of the centrally cleared swap contracts plus accrued interest as of October 31, 2022. |
The impact of the use of these derivative instruments on the Statements of Operations during the year ended October 31, 2022, was as follows:
| | | Change in Net Unrealized
Appreciation/
(Depreciation) on
|
| | | |
| | | |
| | | |
| | | |
| | | |
| | | |
| | | |
| | | |
| | | |
| | | |
| | | |
| | | |
| | | |
| | | |
| | | |
| | | |
| | | |
| | | |
| | | |
| | | |
| | | |
| | | |
| | | |
| | | |
| | | |
| | | |
| | | |
| | | |
| | | |
| | | |
| | | |
| | | |
| | | |
| | | |
| | | |
| | | |
| | | |
| | | |
| Net realized gains/(losses) on derivatives are located in the Statements of Operations each under the caption, "Net realized gain/(loss) on:" |
| Expiration or closing of futures contracts |
| Settlement of forward foreign currency contracts |
| Settlement of bond forward contracts |
| Expiration or closing of swap contracts |
| Transactions in investment securities of unaffiliated issuers |
| Expiration or closing of option contracts written |
| Change in net unrealized appreciation/(depreciation) is located in the Statements of Operations each under the caption, "Change in net unrealized appreciation/(depreciation) in value of:" |
| |
| Forward foreign currency contracts |
| |
| |
While the Funds may receive redeemable preference shares, rights and warrants in connection with their investments in securities, these preference shares, rights and warrants are not considered "derivative instruments" under ASC 815.
Management has concluded that Municipal High Income, Municipal Impact and Municipal Intermediate Bond did not hold any derivative instruments during the year ended October 31, 2022 that require additional disclosures pursuant to ASC 815.
13
Securities lending: Each Fund, using State Street Bank and Trust Company ("State Street") as its lending agent, may loan securities to qualified brokers and dealers in exchange for negotiated lender’s fees. These fees, if any, would be disclosed within the Statements of Operations under the caption "Income from securities loaned-net" and are net of expenses retained by State Street as compensation for its services as lending agent.
The initial collateral received by a Fund at the beginning of each transaction shall have a value equal to at least 102% of the prior day’s market value of the loaned securities (105% in the case of international securities). Collateral in the form of cash and/or securities issued or guaranteed by the U.S. government or its agencies, equivalent to at least 100% of the market value of securities, is maintained at all times. Thereafter, the value of the collateral is monitored on a daily basis, and collateral is moved daily between a counterparty and a Fund until the close of the transaction. Cash collateral is generally invested in a money market fund registered under the 1940 Act that is managed by an affiliate of State Street and is included on the Statements of Assets and Liabilities. The total value of securities received as collateral for securities on loan is included in a footnote following the applicable Schedule of Investments, but is not included within the Statements of Assets and Liabilities because the receiving Fund does not have the right to sell or repledge the securities received as collateral. The risks associated with lending portfolio securities include, but are not limited to, possible delays in receiving additional collateral or in the recovery of the loaned securities. Any increase or decrease in the fair value of the securities loaned and any interest earned or dividends paid or owed on those securities during the term of the loan would accrue to that Fund.
As of October 31, 2022, the Funds did not have any outstanding loans of securities.
14
Offsetting Assets and Liabilities: The Funds are required to disclose both gross and net information for assets and liabilities related to OTC derivatives, repurchase and reverse repurchase agreements, and securities lending and securities borrowing transactions that are eligible for offset or subject to an enforceable master netting or similar agreement. Emerging Markets Debt, Floating Rate Income, High Income, Short Duration and Strategic Income held one or more of these investments at October 31, 2022. The Funds' OTC derivative assets and liabilities at fair value by type are reported gross in the Statements of Assets and
Liabilities. The following tables present derivative assets and liabilities by counterparty, net of amounts available for offset under a master netting or similar agreement and net of the related collateral received by a Fund for assets and pledged by a Fund for liabilities as of October 31, 2022.
| Gross Amounts of Assets
Presented in the Statements
of Assets and Liabilities | Gross Amounts of Liabilities
Presented in the Statements
of Assets and Liabilities |
| | |
| | |
Over-the-counter swap contracts | | |
| | |
| | |
Over-the-counter swap contracts | | |
| | |
| | |
Over-the-counter swap contracts | | |
| | |
| | |
| | |
| | |
Over-the-counter swap contracts | | |
| | |
Gross Amounts Not Offset in the Statements of Assets and Liabilities: |
| | |
| Gross Amounts
Presented in
the Statements
of Assets and
Liabilities | Liabilities
Available
for Offset | | | Gross Amounts
Presented in
the Statements
of Assets and
Liabilities | Assets
Available
for Offset | | |
| | | | | | | |
| | | | | | | | |
| | | | | | | | |
| | | | | | | | |
| | | | | | | | |
| | | | | | | | |
| | | | | | | | |
| | | | | | | | |
| | | | | | | | |
| | | | | | | | |
| | | | | | | | |
| | | | | | | | |
| | | | | | | |
| | | | | | | | |
| | | | | | | | |
Gross Amounts Not Offset in the Statements of Assets and Liabilities: |
| | |
| Gross Amounts Presented in the Statements of Assets and Liabilities | Liabilities Available for Offset | | | Gross Amounts Presented in the Statements of Assets and Liabilities | Assets Available for Offset | | |
| | | | | | | |
| | | | | | | | |
| | | | | | | | |
| | | | | | | |
| | | | | | | | |
| | | | | | | | |
| | | | | | | | |
| | | | | | | | |
| | | | | | | | |
| | | | | | | | |
| | | | | | | | |
| | | | | | | | |
| Collateral received (or pledged) is limited to an amount not to exceed 100% of the net amount of assets (or liabilities) in the tables presented above, for each respective counterparty. |
| A net amount greater than zero represents amounts subject to loss as of October 31, 2022, in the event of a counterparty failure. A net amount less than zero represents amounts under-collateralized to each counterparty as of October 31, 2022. |
15
Indemnifications: Like many other companies, the Trust’s organizational documents provide that its officers ("Officers") and trustees ("Trustees") are indemnified against certain liabilities arising out of the performance of their duties to the Trust. In addition, both in some of its principal service contracts and in the normal course of its business, the Trust enters into contracts that provide indemnifications to other parties for certain types of losses or liabilities. The Trust’s maximum exposure under these arrangements is unknown as this could involve future claims against the Trust.
16
Investment in other funds managed by Neuberger Berman Investment Advisers LLC: Through October 31, 2022, Strategic Income invested in Neuberger Berman Global Monthly Income Fund Ltd. (the "Underlying Fund") via a secondary market transaction (See Note F).
For Strategic Income’s investment in the Underlying Fund, NBIA waived a portion of its management fee equal to the management fee it received from the Underlying Fund on those assets (the "Arrangement"). For the year ended October 31, 2022, management fees waived under this Arrangement are reflected in the Statements of Operations under the caption "Investment management fees waived." For the year ended October 31, 2022, income earned from the Underlying Fund on Strategic Income’s investments is reflected in the Statements of Operations under the caption "Dividend income-affiliated issuers". For the year ended October 31, 2022, management fees waived under this Arrangement and distributions from income and capital gains received from Strategic Income’s investments in the Underlying Fund were as follows:
| | Distributions from
Income and
Capital Gains |
| | |
17
Investment company securities and exchange-traded funds: The Funds may invest in shares of other registered investment companies, including ETFs, within the limitations prescribed by the 1940 Act, in
reliance on rules adopted by the SEC, particularly Rule 12d1-4 under the 1940 Act, which the Funds were required to comply with on January 19, 2022, or any other applicable exemptive relief. Prior to the compliance date of Rule 12d1-4, a Fund was permitted to invest in both affiliated and unaffiliated investment companies, including ETFs, in excess of the limits in Section 12(d)(1)(A) of the 1940 Act, subject to the terms and conditions of exemptive orders. These exemptive orders along with Rule 12d1-2 were rescinded upon the compliance date of Rule 12d1-4. Rule 12d1-4 contains elements from the SEC’s prior exemptive orders permitting fund of funds arrangements, and includes (i) limits on control and voting; (ii) required evaluations and findings; (iii) required fund of funds investment agreements; and (iv) limits on complex structures. Some ETFs seek to track the performance of a particular market index. These indices include both broad-based market indices and more narrowly-based indices, including those relating to particular sectors, markets, regions or industries. However, some ETFs have an actively-managed investment objective. ETF shares are traded like traditional equity securities on a national securities exchange or NASDAQ. A Fund will indirectly bear its proportionate share of any management fees and other expenses paid by such other investment companies, which will decrease returns.
18
Unfunded loan commitments: The Funds may enter into certain credit agreements all or a portion of which may be unfunded. The Funds are obligated to fund these commitments at the borrower’s discretion. As of October 31, 2022, the value of unfunded loan commitments was $1,025,938 and $231,107 for Floating Rate Income and Strategic Income, respectively, pursuant to the following loan agreements:
|
| | |
Athenahealth, Inc., Term Loan DD, (3M USD LIBOR + 3.50%), 3.50%, due 2/15/2029(a) | | |
Aveanna Healthcare, LLC, Term Loan DD, (3M USD LIBOR + 3.75%), 3.75%, due 7/17/2028(a) | | |
Bright Bidco B.V., Term Loan DD, (3M USD LIBOR + 0.50%), 0.50%, due 2/28/2023(a) | | |
Confluent Health, LLC, Term Loan DD, (3M USD LIBOR + 4.00%), 4.00%, due 11/30/2028(a) | | |
Refficiency Holdings LLC, Term Loan DD, (3M USD LIBOR + 3.75%), 3.75%, due 12/16/2027(a) | | |
Trident TPI Holdings, Inc., Term Loan DD, (3M USD LIBOR + 4.00%), 4.00%, due 9/15/2028(a) | | |
|
| | |
Aveanna Healthcare, LLC, Term Loan DD, (3M USD LIBOR + 3.75%), 3.75%, due 7/17/2028(a) | | |
| Position is a delayed draw term loan which may be partially or fully unfunded. In accordance with the underlying credit agreement, the interest rate shown reflects the unfunded rate as of October 31, 2022. |
19
Other: All net investment income and realized and unrealized capital gains and losses of each Fund are allocated, on the basis of relative net assets, pro rata among its respective classes.
Note B—Investment Management Fees, Administration Fees, Distribution Arrangements, and Other Transactions with Affiliates:
Each Fund retains NBIA as its investment manager under a Management Agreement. For such investment management services, each Fund pays NBIA an investment management fee as a percentage of average daily net assets according to the following table: |
| | | | | | | |
| | | | | | | |
For Emerging Markets Debt: | | | | | | | |
For Floating Rate Income: | | | | | | | |
| | | | | | | |
| | | | | | | |
For Municipal High Income: | | | | | | | |
| | | | | | | |
For Municipal Intermediate Bond: | | | | | | | |
| | | | | | | |
| | | | | | | |
| NBIA has contractually agreed to waive its Class E management fee for the below Fund. This undertaking lasts until October 31, 2023 and may not be terminated during its term without the consent of the Board. Management fees contractually waived pursuant to this waiver for Class E are not subject to recovery by NBIA. |
| Annualized
Percentage of
Average Daily
Net Assets
Waived | | Management Fees
Waived for the
Period from
January 11, 2022
(Commencement
of Operations) to
October 31, 2022 |
| | | |
Accordingly, for the year ended October 31, 2022, the investment management fee pursuant to the Management Agreement was equivalent to an annual effective rate of each Fund’s average daily net assets, as follows: |
| | |
| |
| |
| |
| |
| |
| |
| After management fee waiver (Note A). |
Each Fund retains NBIA as its administrator under an Administration Agreement. The administration fee is assessed at the class level and each share class of a Fund, as applicable, pays NBIA an annual administration fee equal to the following: 0.27% for each of Investor Class, Class A, Class C and Class R3; 0.50% for Trust Class of Short Duration; 0.40% for Trust Class of Strategic Income; 0.15% for Institutional Class; and 0.05% for Class R6, each as a percentage of its average daily net assets. Class E shares do not pay an administration fee. Additionally, NBIA retains State Street as its sub-administrator under a Sub-Administration Agreement. NBIA pays State Street a fee for all services received under the Sub-Administration Agreement.
NBIA has contractually agreed to waive fees and/or reimburse certain expenses of the Investor Class, Trust Class, Institutional Class, Class A, Class C, Class R3 and Class R6 of each Fund that offers those classes so that the total annual operating expenses of those classes do not exceed the expense limitations as detailed in the following table. These undertakings exclude interest, taxes, brokerage commissions, acquired fund fees and expenses, extraordinary expenses, and dividend and interest expenses relating to short sales, if any (commitment fees relating to borrowings are treated as interest for purposes of this exclusion) ("annual operating expenses"); consequently, net expenses may exceed the contractual expense limitations.
At October 31, 2022, contingent liabilities to NBIA under the agreements were as follows:
| | | Expenses Reimbursed in
Year Ended October 31, |
| | | | | |
| | | Subject to Repayment until
October 31, |
| | | | | |
| | | | | |
Core Bond Institutional Class | | | | | |
| | | | | |
| | | | | |
| | | | | |
Emerging Markets Debt Institutional Class | | | | | |
Emerging Markets Debt Class A | | | | | |
Emerging Markets Debt Class C | | | | | |
Floating Rate Income Institutional Class | | | | | |
Floating Rate Income Class A | | | | | |
Floating Rate Income Class C | | | | | |
High Income Investor Class | | | | | |
High Income Institutional Class | | | | | |
| | | | | |
| | | | | |
| | | | | |
| | | | | |
Municipal High Income Institutional Class | | | | | |
Municipal High Income Class A | | | | | |
Municipal High Income Class C | | | | | |
Municipal Impact Institutional Class | | | | | |
| | | | | |
| | | | | |
Municipal Intermediate Bond Investor Class | | | | | |
Municipal Intermediate Bond Institutional Class | | | | | |
Municipal Intermediate Bond Class A | | | | | |
Municipal Intermediate Bond Class C | | | | | |
Short Duration Investor Class | | | | | |
Short Duration Trust Class | | | | | |
Short Duration Institutional Class | | | | | |
| | | | | |
| | | | | |
Strategic Income Trust Class | | | | | |
Strategic Income Institutional Class | | | | | |
| | | | | |
| | | | | |
Strategic Income Class R6 | | | | | |
| Expense limitation per annum of the respective class’s average daily net assets. |
| Classes that have had changes to their respective limitations are noted below. |
| | |
| | |
Core Bond Institutional Class | | |
| | |
| | |
| | |
Floating Rate Income Institutional Class | | |
Floating Rate Income Class A | | |
Floating Rate Income Class C | | |
Municipal Intermediate Bond Investor Class | | |
Municipal Intermediate Bond Institutional Class | | |
Municipal Intermediate Bond Class A | | |
Municipal Intermediate Bond Class C | | |
Short Duration Investor Class | | |
Short Duration Trust Class | | |
Short Duration Institutional Class | | |
| | |
| | |
Each Fund has agreed that each of its respective classes will repay NBIA for fees and expenses waived or reimbursed for that class provided that repayment does not cause that class’s annual operating expenses to exceed its contractual expense limitation in place at the time the fees and expenses were waived or reimbursed, or the expense limitation in place at the time the Fund repays NBIA, whichever is lower. Any such repayment must be made within three years after the year in which NBIA incurred the expense.
During the year ended October 31, 2022, the following classes repaid NBIA under these agreements as follows:
Neuberger Berman Europe Limited ("NBEL"), as the sub-adviser to Emerging Markets Debt, is retained by NBIA to choose the Fund’s investments and handle its day-to-day business for the portion of the Fund’s assets allocated to it by NBIA, and receives a monthly fee paid by NBIA. As investment manager, NBIA is responsible for overseeing the investment activities of NBEL. Several individuals who are Officers and/or Trustees of the Trust are also employees of NBEL and/or NBIA.
Each Fund also has a distribution agreement with Neuberger Berman BD LLC (the "Distributor") with respect to each class of shares. The Distributor acts as agent in arranging for the sale of class shares without sales commission or other compensation, except as described below, and bears the advertising and promotion expenses.
However, the Distributor receives fees from Core Bond’s Investor Class, Strategic Income’s Trust Class, High Income’s Class R3, and each Fund’s Class A and Class C under their distribution plans (each a "Plan", collectively, the "Plans") pursuant to Rule 12b-1 under the 1940 Act. The Plans provide that, as compensation for administrative and other services provided to these classes, the Distributor’s activities and expenses related to the sale and distribution of these classes, and ongoing services provided to investors in these classes, the Distributor receives from each of these respective classes a fee at the annual rate of 0.25% of Core Bond Investor Class’, and each Fund's Class A's average daily net assets; 0.10% of Strategic
Income Trust Class’ average daily net assets; 0.50% of High Income Class R3’s average daily net assets; and 1.00% of each Fund's Class C's average daily net assets. The Distributor receives this amount to provide distribution and shareholder servicing for these classes and pays a portion of it to institutions that provide such services. Those institutions may use the payments for, among other purposes, compensating employees engaged in sales and/or shareholder servicing. The amount of fees paid by each class during any year may be more or less than the cost of distribution and other services provided to that class. FINRA rules limit the amount of annual distribution fees that may be paid by a mutual fund and impose a ceiling on the cumulative distribution fees paid. The Trust’s Plans comply with those rules.
Class A shares of each Fund (except Short Duration) are generally sold with an initial sales charge of up to 4.25%. Class A shares of Short Duration are generally sold with an initial sales charge of up to 2.50%. Class A shares of each Fund are generally sold with no contingent deferred sales charge ("CDSC"), except that a CDSC of 1.00% applies to certain redemptions made within 18 months following purchases of $1 million or more without an initial sales charge. Class C shares of each Fund are sold with no initial sales charge and a 1.00% CDSC if shares are sold within one year after purchase.
For the year ended October 31, 2022, the Distributor, acting as underwriter and broker-dealer, received net initial sales charges from the purchase of Class A shares and CDSCs from the redemption of Class A and Class C shares as follows:
| | |
| | | | |
| | | | |
| | | | |
Emerging Markets Debt Class A | | | | |
Emerging Markets Debt Class C | | | | |
Floating Rate Income Class A | | | | |
Floating Rate Income Class C | | | | |
| | | | |
| | | | |
Municipal High Income Class A | | | | |
Municipal High Income Class C | | | | |
| | | | |
| | | | |
Municipal Intermediate Bond Class A | | | | |
Municipal Intermediate Bond Class C | | | | |
| | | | |
| | | | |
| | | | |
| | | | |
Note C—Securities Transactions:
During the year ended October 31, 2022, there were purchase and sale transactions of long-term securities (excluding swaps, bond forwards, forward FX contracts, futures and options written) as follows:
| Purchases of
U.S. Government
and Agency
Obligations | Purchases
excluding
U.S. Government
and Agency
Obligations | Sales and
Maturities
of
U.S. Government
and Agency
Obligations | Sales and
Maturities
excluding
U.S. Government
and Agency
Obligations |
| | | | |
| Purchases of U.S. Government and Agency Obligations | Purchases excluding U.S. Government and Agency Obligations | Sales and Maturities of U.S. Government and Agency Obligations | Sales and Maturities excluding U.S. Government and Agency Obligations |
| | | | |
| | | | |
| | | | |
| | | | |
| | | | |
Municipal Intermediate Bond | | | | |
| | | | |
| | | | |
During the year ended October 31, 2022, no brokerage commissions on securities transactions were paid to affiliated brokers.
Note D—Fund Share Transactions:
Share activity for the years ended October 31, 2022, and October 31, 2021, was as follows:
| For the Year Ended October 31, 2022 | For the Year Ended October 31, 2021 |
| | Shares
Issued on
Reinvestment
of Dividends
and
Distributions | | | | Shares
Issued on
Reinvestment
of Dividends
and
Distributions | | |
|
| | | | | | | | |
| | | | | | | | |
| | | | | | | | |
| | | | | | | | |
| | | | | | | | |
|
| | | | | | | | |
| | | | | | | | |
| | | | | | | | |
|
| | | | | | | | |
| | | | | | | | |
| | | | | | | | |
|
| | | | | | | | |
| | | | | | | | |
| | | | | | | | |
| | | | | | | | |
| | | | | | | | |
| | | | | | | | |
| For the Year Ended October 31, 2022 | For the Year Ended October 31, 2021 |
| | Shares Issued on Reinvestment of Dividends and Distributions | | | | Shares Issued on Reinvestment of Dividends and Distributions | | |
| | | | | | | | |
|
| | | | | | | | |
| | | | | | | | |
| | | | | | | | |
|
| | | | | | | | |
| | | | | | | | |
| | | | | | | | |
Municipal Intermediate Bond |
| | | | | | | | |
| | | | | | | | |
| | | | | | | | |
| | | | | | | | |
|
| | | | | | | | |
| | | | | | | | |
| | | | | | | | |
| | | | | | | | |
| | | | | | | | |
|
| | | | | | | | |
| | | | | | | | |
| | | | | | | | |
| | | | | | | | |
| | | | | | | | |
| Period from January 11, 2022 (Commencement of Operations) to October 31, 2022. |
Note E—Line of Credit:
At October 31, 2022, each Fund was a participant in a syndicated committed, unsecured $700,000,000 line of credit (the "Credit Facility"), to be used only for temporary or emergency purposes. Series of other investment companies managed by NBIA also participate in this line of credit on substantially the same terms. Interest is charged on borrowings under this Credit Facility at the highest of (a) a federal funds effective rate plus 1.00% per annum, (b) a daily simple Secured Overnight Financing Rate ("SOFR") plus 1.10% per annum, and (c) an overnight bank funding rate plus 1.00% per annum; provided that should the Administrative Agent of the Credit Facility determine that the daily simple SOFR rate is unavailable, then the interest rate option described in (b) shall be replaced with a benchmark replacement determined to be applicable by such Administrative Agent. The Credit Facility has an annual commitment fee of 0.15% per annum of the available line of credit, which is paid quarterly. Each Fund that is a participant has agreed to
pay its pro rata share of the annual commitment fee, based on the ratio of its individual net assets to the net assets of all participants at the time the fee is due, and interest charged on any borrowing made by such Fund and other costs incurred by such Fund. Because several mutual funds participate in the Credit Facility, there is no assurance that an individual fund will have access to all or any part of the $700,000,000 at any particular time. There were no loans outstanding under the Credit Facility at October 31, 2022.
During the year ended October 31, 2022, the following Funds had borrowings under the Credit Facility:
| Interest paid is reflected in the Statements of Operations under the caption "Interest." |
Note F—Investments in Affiliates(a):
| | | Sales
Proceeds/
Return of
Capital | Change in
Net Unrealized
Appreciation/
(Depreciation)
from
Investments
in Affiliated
Persons | Net Realized
Gain/(Loss)
from
Investments
in Affiliated
Persons | Distributions
from
Investments
in Affiliated
Persons(b) | Shares
Held at
October 31,
2022 | |
| | | | | | | | |
Neuberger Berman Global Monthly Income Fund Ltd. | | | | | | | | |
Sub-total for affiliates held as of 10/31/22(c) | | | | | | | | |
| Affiliated persons, as defined in the 1940 Act. |
| Distributions received include distributions from net investment income and net realized capital gains, if any, from other investment companies managed by NBIA. |
| At October 31, 2022, these securities amounted to 0.07% of net assets of Strategic Income. |
Other: At October 31, 2022, affiliated persons owned outstanding shares of the following Funds:
| Affiliated Person(s)
Percentage
Ownership of
Outstanding Shares |
| |
| |
| |
| |
| Affiliated Person(s) Percentage Ownership of Outstanding Shares |
| |
Municipal Intermediate Bond | |
| |
Note G—Recent Accounting Pronouncements:
In January 2021, the FASB issued Accounting Standards Update No. 2021-01 ("ASU 2021-01"), "Reference Rate Reform (Topic 848)". ASU 2021-01 is an update of ASU 2020-04, which is in response to concerns about structural risks of interbank offered rates, and particularly the risk of cessation of LIBOR, regulators have undertaken reference rate reform initiatives to identify alternative reference rates that are more observable or transaction based and less susceptible to manipulation. ASU 2020-04 provides optional guidance for a limited period of time to ease the potential burden in accounting for (or recognizing the effects of) reference rate reform on financial reporting. ASU 2020-04 is elective and applies to all entities,
subject to meeting certain criteria, that have contracts, hedging relationships, and other transactions that reference LIBOR or another reference rate expected to be discontinued because of reference rate reform. The ASU 2021-01 update clarifies that certain optional expedients and exceptions in Topic 848 for contract modifications and hedge accounting apply to derivatives that are affected by the discounting transition. The amendments in this update are effective immediately through December 31, 2022, for all entities. Management is currently evaluating the implications, if any, of the additional requirements and its impact on the Fund’s financial statements.
In June 2022, FASB issued Accounting Standards Update No. 2022-03, "Fair Value Measurement of Equity Securities Subject to Contractual Sale Restrictions" ("ASU 2022-03"). ASU 2022-03 clarifies the guidance in ASC 820, related to the measurement of the fair value of an equity security subject to contractual sale restrictions, where it eliminates the ability to apply a discount to the fair value of these securities, and introduces disclosure requirements related to such equity securities. The guidance is effective for fiscal years, and interim periods within those fiscal years, beginning after December 15, 2023, and allows for early adoption. Management is currently evaluating the impact of applying this update.
Note H—Other Matters:
Coronavirus: The outbreak of the novel coronavirus in many countries has, among other things, disrupted global travel and supply chains, and adversely impacted global commercial activity, the transportation industry and commodity prices in the energy sector. The impact of this virus has negatively affected and may continue to affect the economies of many nations, individual companies and the global securities and commodities markets, including liquidity and volatility. The development and fluidity of this situation precludes any prediction as to its ultimate impact, which may have a continued adverse effect on global economic and market conditions. Such conditions (which may be across industries, sectors or geographies) have impacted and may continue to impact certain issuers of the securities held by the Funds and in turn, may impact the financial performance of the Funds.
Russia's Invasion of Ukraine: Russia’s invasion of Ukraine, and corresponding events in late February 2022, have had, and could continue to have, severe adverse effects on regional and global economic markets for securities and commodities. Following Russia’s actions, various governments, including the United States, have issued broad-ranging economic sanctions against Russia. The current events have had, and could continue to have, an adverse effect on global markets performance and liquidity, thereby negatively affecting the value of a Fund's investments beyond any direct exposure to Russian or Ukrainian issuers. The duration of ongoing hostilities and the vast array of sanctions and related events cannot be predicted. Those events present material uncertainty and risk with respect to markets globally and the performance of a Fund and its investments or operations could be negatively impacted.
The following tables include selected data for a share outstanding throughout each period and other performance information derived from the Financial Statements. Amounts that do not round to $0.01 or $(0.01) per share are presented as $0.00 or $(0.00), respectively. Ratios that do not round to 0.01% or (0.01)% are presented as 0.00% or (0.00)%, respectively. Net Assets with a zero balance, if any, may reflect actual amounts rounding to less than $0.1 million. A "—" indicates that the line item was not applicable in the corresponding period.
| Net Asset
Value,
Beginning
of Year | Net
Investment
Income/
(Loss)a | Net Gains
or
(Losses) on
Securities
(both
realized
and
unrealized) | Total From
Investment
Operations | Dividends
from Net
Investment
Income | Distributions
from Net
Realized
Capital
Gains | |
|
|
| | | | | | | |
| | | | | | | |
| | | | | | | |
| | | | | | | |
| | | | | | | |
|
|
| | | | | | | |
| | | | | | | |
| | | | | | | |
| | | | | | | |
| | | | | | | |
|
|
| | | | | | | |
| | | | | | | |
| | | | | | | |
| | | | | | | |
| | | | | | | |
|
|
| | | | | | | |
| | | | | | | |
| | | | | | | |
| | | | | | | |
| | | | | | | |
|
|
| | | | | | | |
| | | | | | | |
| | | | | | | |
| | | | | | | |
See Notes to Financial Highlights
| Net Asset
Value,
End of
Year | | Net Assets,
End of
Year
(in millions) | Ratio
of Gross
Expenses to
Average Net
Assetsc | Ratio
of Net
Expenses to
Average
Net
Assets | Ratio
of Net
Investment
Income/
(Loss)
to
Average
Net
Assets | |
| | | | | | | |
| | | | | | | |
| | | | | | | |
| | | | | | | |
| | | | | | | |
| | | | | | | |
| | | | | | | |
|
| | | | | | | |
| | | | | | | |
| | | | | | | |
| | | | | | | |
| | | | | | | |
| | | | | | | |
|
| | | | | | | |
| | | | | | | |
| | | | | | | |
| | | | | | | |
| | | | | | | |
| | | | | | | |
|
| | | | | | | |
| | | | | | | |
| | | | | | | |
| | | | | | | |
| | | | | | | |
| | | | | | | |
|
| | | | | | | |
| | | | | | | |
| | | | | | | |
| | | | | | | |
| | | | | | | |
Financial Highlights (cont’d)
| Net Asset
Value,
Beginning
of Year | Net
Investment
Income/
(Loss)a | Net Gains
or
(Losses) on
Securities
(both
realized
and
unrealized) | Total From
Investment
Operations | Dividends
from Net
Investment
Income | Distributions
from Net
Realized
Capital
Gains | |
Emerging Markets Debt Fund |
|
| | | | | | | |
| | | | | | | |
| | | | | | | |
| | | | | | | |
| | | | | | | |
|
|
| | | | | | | |
| | | | | | | |
| | | | | | | |
| | | | | | | |
| | | | | | | |
|
|
| | | | | | | |
| | | | | | | |
| | | | | | | |
| | | | | | | |
| | | | | | | |
|
Floating Rate Income Fund |
|
| | | | | | | |
| | | | | | | |
| | | | | | | |
| | | | | | | |
| | | | | | | |
|
|
| | | | | | | |
| | | | | | | |
| | | | | | | |
| | | | | | | |
| | | | | | | |
|
|
| | | | | | | |
| | | | | | | |
| | | | | | | |
| | | | | | | |
| | | | | | | |
See Notes to Financial Highlights
| Net Asset
Value,
End of
Year | | Net Assets,
End of
Year
(in millions) | Ratio
of Gross
Expenses to
Average Net
Assetsc | Ratio
of Net
Expenses to
Average
Net
Assets | Ratio
of Net
Investment
Income/
(Loss)
to
Average
Net
Assets | |
| | | | | | | |
| | | | | | | |
| | | | | | | |
| | | | | | | |
| | | | | | | |
| | | | | | | |
| | | | | | | |
|
| | | | | | | |
| | | | | | | |
| | | | | | | |
| | | | | | | |
| | | | | | | |
| | | | | | | |
|
| | | | | | | |
| | | | | | | |
| | | | | | | |
| | | | | | | |
| | | | | | | |
| | | | | | | |
|
| | | | | | | |
| | | | | | | |
| | | | | | | |
| | | | | | | |
| | | | | | | |
| | | | | | | |
| | | | | | | |
|
| | | | | | | |
| | | | | | | |
| | | | | | | |
| | | | | | | |
| | | | | | | |
| | | | | | | |
|
| | | | | | | |
| | | | | | | |
| | | | | | | |
| | | | | | | |
| | | | | | | |
| | | | | | | |
Financial Highlights (cont’d)
| Net Asset
Value,
Beginning
of Year | Net
Investment
Income/
(Loss)a | Net Gains
or
(Losses) on
Securities
(both
realized
and
unrealized) | Total From
Investment
Operations | Dividends
from Net
Investment
Income | Distributions
from Net
Realized
Capital
Gains | |
|
|
| | | | | | | |
| | | | | | | |
| | | | | | | |
| | | | | | | |
| | | | | | | |
|
|
| | | | | | | |
| | | | | | | |
| | | | | | | |
| | | | | | | |
| | | | | | | |
|
|
| | | | | | | |
| | | | | | | |
| | | | | | | |
| | | | | | | |
| | | | | | | |
|
|
| | | | | | | |
| | | | | | | |
| | | | | | | |
| | | | | | | |
| | | | | | | |
|
|
| | | | | | | |
| | | | | | | |
| | | | | | | |
| | | | | | | |
| | | | | | | |
See Notes to Financial Highlights
| Net Asset
Value,
End of
Year | | Net Assets,
End of
Year
(in millions) | Ratio
of Gross
Expenses to
Average Net
Assetsc | Ratio
of Net
Expenses to
Average
Net
Assets | Ratio
of Net
Investment
Income/
(Loss)
to
Average
Net
Assets | |
| | | | | | | |
| | | | | | | |
| | | | | | | |
| | | | | | | |
| | | | | | | |
| | | | | | | |
| | | | | | | |
|
| | | | | | | |
| | | | | | | |
| | | | | | | |
| | | | | | | |
| | | | | | | |
| | | | | | | |
|
| | | | | | | |
| | | | | | | |
| | | | | | | |
| | | | | | | |
| | | | | | | |
| | | | | | | |
|
| | | | | | | |
| | | | | | | |
| | | | | | | |
| | | | | | | |
| | | | | | | |
| | | | | | | |
|
| | | | | | | |
| | | | | | | |
| | | | | | | |
| | | | | | | |
| | | | | | | |
| | | | | | | |
Financial Highlights (cont’d)
| Net Asset
Value,
Beginning
of Year | Net
Investment
Income/
(Loss)a | Net Gains
or
(Losses) on
Securities
(both
realized
and
unrealized) | Total From
Investment
Operations | Dividends
from Net
Investment
Income | Distributions
from Net
Realized
Capital
Gains | |
High Income Bond Fund (cont’d) |
|
| | | | | | | |
| | | | | | | |
| | | | | | | |
| | | | | | | |
| | | | | | | |
|
|
| | | | | | | |
|
Municipal High Income Fund |
|
| | | | | | | |
| | | | | | | |
| | | | | | | |
| | | | | | | |
| | | | | | | |
|
|
| | | | | | | |
| | | | | | | |
| | | | | | | |
| | | | | | | |
| | | | | | | |
|
|
| | | | | | | |
| | | | | | | |
| | | | | | | |
| | | | | | | |
| | | | | | | |
|
|
|
| | | | | | | |
| | | | | | | |
| | | | | | | |
| | | | | | | |
| | | | | | | |
See Notes to Financial Highlights
| Net Asset
Value,
End of
Year | | Net Assets,
End of
Year
(in millions) | Ratio
of Gross
Expenses to
Average Net
Assetsc | Ratio
of Net
Expenses to
Average
Net
Assets | Ratio
of Net
Investment
Income/
(Loss)
to
Average
Net
Assets | |
|
| | | | | | | |
| | | | | | | |
| | | | | | | |
| | | | | | | |
| | | | | | | |
| | | | | | | |
|
| | | | | | | |
| | | | | | | |
|
| | | | | | | |
| | | | | | | |
| | | | | | | |
| | | | | | | |
| | | | | | | |
| | | | | | | |
| | | | | | | |
|
| | | | | | | |
| | | | | | | |
| | | | | | | |
| | | | | | | |
| | | | | | | |
| | | | | | | |
|
| | | | | | | |
| | | | | | | |
| | | | | | | |
| | | | | | | |
| | | | | | | |
| | | | | | | |
|
| | | | | | | |
| | | | | | | |
| | | | | | | |
| | | | | | | |
| | | | | | | |
| | | | | | | |
| | | | | | | |
Financial Highlights (cont’d)
| Net Asset
Value,
Beginning
of Year | Net
Investment
Income/
(Loss)a | Net Gains
or
(Losses) on
Securities
(both
realized
and
unrealized) | Total From
Investment
Operations | Dividends
from Net
Investment
Income | Distributions
from Net
Realized
Capital
Gains | |
Municipal Impact Fund (cont’d) |
|
| | | | | | | |
| | | | | | | |
| | | | | | | |
| | | | | | | |
| | | | | | | |
|
|
| | | | | | | |
| | | | | | | |
| | | | | | | |
| | | | | | | |
| | | | | | | |
|
Municipal Intermediate Bond Fund |
|
| | | | | | | |
| | | | | | | |
| | | | | | | |
| | | | | | | |
| | | | | | | |
|
|
| | | | | | | |
| | | | | | | |
| | | | | | | |
| | | | | | | |
| | | | | | | |
|
|
| | | | | | | |
| | | | | | | |
| | | | | | | |
| | | | | | | |
| | | | | | | |
|
|
| | | | | | | |
| | | | | | | |
| | | | | | | |
| | | | | | | |
| | | | | | | |
See Notes to Financial Highlights
| Net Asset
Value,
End of
Year | | Net Assets,
End of
Year
(in millions) | Ratio
of Gross
Expenses to
Average Net
Assetsc | Ratio
of Net
Expenses to
Average
Net
Assets | Ratio
of Net
Investment
Income/
(Loss)
to
Average
Net
Assets | |
|
| | | | | | | |
| | | | | | | |
| | | | | | | |
| | | | | | | |
| | | | | | | |
| | | | | | | |
|
| | | | | | | |
| | | | | | | |
| | | | | | | |
| | | | | | | |
| | | | | | | |
| | | | | | | |
|
| | | | | | | |
| | | | | | | |
| | | | | | | |
| | | | | | | |
| | | | | | | |
| | | | | | | |
| | | | | | | |
|
| | | | | | | |
| | | | | | | |
| | | | | | | |
| | | | | | | |
| | | | | | | |
| | | | | | | |
|
| | | | | | | |
| | | | | | | |
| | | | | | | |
| | | | | | | |
| | | | | | | |
| | | | | | | |
|
| | | | | | | |
| | | | | | | |
| | | | | | | |
| | | | | | | |
| | | | | | | |
| | | | | | | |
Financial Highlights (cont’d)
| Net Asset
Value,
Beginning
of Year | Net
Investment
Income/
(Loss)a | Net Gains
or
(Losses) on
Securities
(both
realized
and
unrealized) | Total From
Investment
Operations | Dividends
from Net
Investment
Income | Distributions
from Net
Realized
Capital
Gains | |
|
|
| | | | | | | |
| | | | | | | |
| | | | | | | |
| | | | | | | |
| | | | | | | |
|
|
| | | | | | | |
| | | | | | | |
| | | | | | | |
| | | | | | | |
| | | | | | | |
|
|
| | | | | | | |
| | | | | | | |
| | | | | | | |
| | | | | | | |
| | | | | | | |
|
|
| | | | | | | |
| | | | | | | |
| | | | | | | |
| | | | | | | |
| | | | | | | |
|
|
| | | | | | | |
| | | | | | | |
| | | | | | | |
| | | | | | | |
| | | | | | | |
See Notes to Financial Highlights
| Net Asset
Value,
End of
Year | | Net Assets,
End of
Year
(in millions) | Ratio
of Gross
Expenses to
Average Net
Assetsc | Ratio
of Net
Expenses to
Average
Net
Assets | Ratio
of Net
Investment
Income/
(Loss)
to
Average
Net
Assets | |
| | | | | | | |
| | | | | | | |
| | | | | | | |
| | | | | | | |
| | | | | | | |
| | | | | | | |
| | | | | | | |
|
| | | | | | | |
| | | | | | | |
| | | | | | | |
| | | | | | | |
| | | | | | | |
| | | | | | | |
|
| | | | | | | |
| | | | | | | |
| | | | | | | |
| | | | | | | |
| | | | | | | |
| | | | | | | |
|
| | | | | | | |
| | | | | | | |
| | | | | | | |
| | | | | | | |
| | | | | | | |
| | | | | | | |
|
| | | | | | | |
| | | | | | | |
| | | | | | | |
| | | | | | | |
| | | | | | | |
| | | | | | | |
Notes to Financial Highlights Income Funds
| Calculated based on the average number of shares outstanding during each fiscal period. |
| Total return based on per share NAV reflects the effects of changes in NAV on the performance of each Fund during each fiscal period. Returns assume income dividends and other distributions, if any, were reinvested, but do not reflect the effect of sales charges. Results represent past performance and do not indicate future results. Current returns may be lower or higher than the performance data quoted. Investment returns and principal will fluctuate and shares, when redeemed, may be worth more or less than original cost. Total return would have been lower if Management had not reimbursed and/or waived certain expenses. Total return would have been higher if Management had not recouped previously reimbursed and/or waived expenses. |
| Represents the annualized ratios of net expenses to average daily net assets if Management had not reimbursed certain expenses and/or waived a portion of the investment management fee. |
| Excluding TBA roll transactions. Had TBA roll transactions been included, the portfolio turnover rate would have been: |
| The class action proceeds listed in Note A of the Notes to Financial Statements, if any, had no impact on the Funds’ total returns for the year ended October 31, 2022. The class action proceeds received in 2021, 2020, 2019 and 2018 had no impact on the Funds’ total returns for the years ended October 31, 2021, 2020, 2019, and 2018, respectively. |
| The date investment operations commenced. |
| |
| |
| Portfolio turnover is calculated at the Fund level. Percentage indicated was calculated for the year ended October 31, 2022, for High Income, for the year ended October 31, 2019, for Core Bond and for the year ended October 31, 2018, for Municipal Impact. |
| Represents the annualized ratio of net expenses to average daily net assets after utilization of the line of credit by Emerging Markets Debt (2020), Floating Rate Income (2022 & 2019) and Municipal High Income (2022) and/or reimbursement of expenses and/or waiver of a portion of the investment management fee by Management. Had Emerging Markets Debt, Floating Rate Income and Municipal High Income not utilized the line of credit, and had Management not undertaken such action, the annualized ratios of net expenses to average daily net assets would have been: |
| |
| | | | |
Emerging Markets Debt Institutional Class | | | | |
Emerging Markets Debt Class A | | | | |
Emerging Markets Debt Class C | | | | |
Floating Rate Income Institutional Class | | | | |
Floating Rate Income Class A | | | | |
Floating Rate Income Class C | | | | |
Municipal High Income Institutional Class | | | | |
Municipal High Income Class A | | | | |
Municipal High Income Class C | | | | |
Notes to Financial Highlights Income Funds (cont’d)
| Includes interest expense on reverse repurchase agreements of 0.00% for each respective class for the year ended October 31, 2022 for High Income and for the year ended October 31, 2021 for High Income and Strategic Income. |
| After repayment of expenses previously reimbursed and/or fees previously waived by Management, as applicable. Had the Fund not made such repayments, the annualized ratios of net expenses to average net assets would have been: |
| The date investment operations commenced. |
| Organization expense and/or proxy-related expense, which is a non-recurring expense, is included in these ratios on a non-annualized basis. |
Report of Independent Registered Public Accounting Firm
To the Shareholders of Neuberger Berman Core Bond Fund, Neuberger Berman Emerging Markets Debt Fund, Neuberger Berman Floating Rate Income Fund, Neuberger Berman High Income Bond Fund, Neuberger Berman Municipal High Income Fund, Neuberger Berman Municipal Impact Fund, Neuberger Berman Municipal Intermediate Bond Fund, Neuberger Berman Short Duration Bond Fund, Neuberger Berman Strategic Income Fund and the Board of Trustees of Neuberger Berman Income Funds
Opinion on the Financial Statements
We have audited the accompanying statements of assets and liabilities of Neuberger Berman Core Bond Fund, Neuberger Berman Emerging Markets Debt Fund, Neuberger Berman Floating Rate Income Fund, Neuberger Berman High Income Bond Fund, Neuberger Berman Municipal High Income Fund, Neuberger Berman Municipal Impact Fund, Neuberger Berman Municipal Intermediate Bond Fund, Neuberger Berman Short Duration Bond Fund, and Neuberger Berman Strategic Income Fund (collectively referred to as the “Funds”) (nine of the series constituting Neuberger Berman Income Funds (the “Trust”)), including the schedules of investments, as of October 31, 2022 and the related statements of operations, the related statements of operations and changes in net assets, and the financial highlights for each of the periods indicated in the table below and the related notes (collectively referred to as the “financial statements”). In our opinion, the financial statements present fairly, in all material respects, the financial position of the Funds (nine of the series constituting Neuberger Berman Income Funds) at October 31, 2022, and the results of their operations, changes in net assets and financial highlights for each of the periods indicated in the table below, in conformity with U.S. generally accepted accounting principles. The accompanying statements of changes in net assets of the Neuberger Berman Core Bond Fund, Neuberger Berman Floating Rate Income Fund, Neuberger Berman Municipal High Income Fund, and Neuberger Berman Municipal Impact Fund for the year ended October 31, 2021 and the accompanying financial highlights of the Neuberger Berman Core Bond Fund, Neuberger Berman Floating Rate Income Fund, Neuberger Berman Municipal High Income Fund, and Neuberger Berman Municipal Impact Fund for each of the periods in the four years then ended were audited by another independent registered public accounting firm whose report, dated December 21, 2021, expressed an unqualified opinion on the financial statements containing those statements of changes in net assets and financial highlights.
Individual fund constituting Neuberger Berman Income Funds | | Statements of changes in net assets | |
Neuberger Berman Emerging Markets Debt Fund
Neuberger Berman High Income Bond Fund
Neuberger Berman Municipal Intermediate Bond Fund
Neuberger Berman Short Duration Bond Fund
Neuberger Berman Strategic Income Fund
| For the year ended October 31, 2022 | For each of the two years in the period ended October 31, 2022 | For each of the five years in the period ended October 31, 2022 |
Neuberger Berman Core Bond Fund
Neuberger Berman Floating Rate Income Fund
Neuberger Berman Municipal High Income Fund
Neuberger Berman Municipal Impact Fund
| For the year ended October 31, 2022 | For the year ended October 31, 2022 | For the year ended October 31, 2022 |
Basis for Opinion
These financial statements are the responsibility of the Trust’s management. Our responsibility is to express an opinion on each of the Funds’ financial statements based on our audits. We are a public accounting firm registered with the Public Company Accounting Oversight Board (United States) (“PCAOB”) and are required to be independent with respect to the Trust in accordance with the U.S. federal securities laws and the applicable rules and regulations of the Securities and Exchange Commission and the PCAOB.
We conducted our audits in accordance with the standards of the PCAOB. Those standards require that we plan and perform the audit to obtain reasonable assurance about whether the financial statements are free of material misstatement, whether due to error or fraud. The Trust is not required to have, nor were we engaged to perform, an audit of the Trust’s internal control over financial reporting. As part of our audits, we are required to obtain an understanding of internal control over financial reporting, but not for the purpose of expressing an opinion on the effectiveness of the Trust’s internal control over financial reporting. Accordingly, we express no such opinion.
Our audits included performing procedures to assess the risks of material misstatement of the financial statements, whether due to error or fraud, and performing procedures that respond to those risks. Such procedures included examining, on a test basis, evidence regarding the amounts and disclosures in the financial statements. Our procedures included confirmation of securities owned as of October 31, 2022, by correspondence with the custodian, brokers, and others; when replies were not received from other brokers and others, we performed other auditing procedures. Our audits also included evaluating the accounting principles used and significant estimates made by management, as well as evaluating the overall presentation of the financial statements. We believe that our audits provide a reasonable basis for our opinion.
We have served as the auditor of one or more Neuberger Berman investment companies since 1954.
Boston, Massachusetts
December 23, 2022
Investment Manager and Administrator
Neuberger Berman Investment Advisers LLC
1290 Avenue of the Americas
New York, NY 10104-0002
Shareholder Services
800.877.9700 or 212.476.8800
Intermediary Client Services 800.366.6264
Distributor
Neuberger Berman BD LLC
1290 Avenue of the Americas
New York, NY 10104-0002
Shareholder Services
800.877.9700 or 212.476.8800
Intermediary Client Services 800.366.6264
Sub-Adviser
Neuberger Berman Europe Limited
The Zig Zag Building
70 Victoria Street
London, United Kingdom
SW1E 6SQ
Custodian
State Street Bank and Trust Company
One Lincoln Street
Boston, MA 02111
Shareholder Servicing Agent
DST Asset Manager Solutions Inc.
430 West 7th Street, Suite 219189
Kansas City, MO 64105-1407
For Investor, Trust & Institutional Class Shareholders address correspondence to:
Neuberger Berman Funds
PO Box 219189
Kansas City, MO 64121-9189
Shareholder Services 800.877.9700 or 212.476.8800
Intermediary Client Services 800.366.6264
For Class A, Class C, Class R3 and Class R6 Shareholders:
Please contact your investment provider
Legal Counsel
K&L Gates LLP
1601 K Street, NW
Washington, DC 20006-1600
Independent Registered Public Accounting Firm
Ernst & Young LLP
200 Clarendon Street
Boston, MA 02116
Trustees and Officers
The following tables set forth information concerning the Trustees and Officers of the Funds. All persons named as Trustees and Officers also serve in similar capacities for other funds administered or managed by NBIA. The Funds’ Statement of Additional Information includes additional information about the Trustees as of the time of the Funds’ most recent public offering and is available upon request, without charge, by calling (800) 877-9700.
Information about the Board of Trustees
| | Principal Occupation(s)(3) | Number of
Funds in
Fund Complex
Overseen by
Fund Trustee | Other Directorships Held
Outside Fund Complex by
|
Independent Fund Trustees |
Michael J. Cosgrove (1949) | | President, Carragh Consulting USA, since 2014; formerly, Executive, General Electric Company, 1970 to 2014, including President, Mutual Funds and Global Investment Programs, GE Asset Management, 2011 to 2014, President and Chief Executive Officer, Mutual Funds and Intermediary Business, GE Asset Management, 2007 to 2011, President, Institutional Sales and Marketing, GE Asset Management, 1998 to 2007, and Chief Financial Officer, GE Asset Management, and Deputy Treasurer, GE Company, 1988 to 1993. | | Director, America Press, Inc. (not-for-profit Jesuit publisher), 2015 to 2021; formerly, Director, Fordham University, 2001 to 2018; formerly, Director, The Gabelli Go Anywhere Trust, June 2015 to June 2016; formerly, Director, Skin Cancer Foundation (not-for-profit), 2006 to 2015; formerly, Director, GE Investments Funds, Inc., 1997 to 2014; formerly, Trustee, GE Institutional Funds, 1997 to 2014; formerly, Director, GE Asset Management, 1988 to 2014; formerly, Director, Elfun Trusts, 1988 to 2014; formerly, Trustee, GE Pension & Benefit Plans, 1988 to 2014; formerly, Member of Board of Governors, Investment Company Institute. |
Name, (Year of Birth), and Address(1) | Position(s) and Length of Time Served(2) | Principal Occupation(s)(3) | Number of Funds in Fund Complex Overseen by Fund Trustee | Other Directorships Held Outside Fund Complex by Fund Trustee(3) |
| | Executive Vice Chancellor Emeritus, The Jewish Theological Seminary, since 2020; formerly, Executive Vice Chancellor and Chief Operating Officer, Jewish Theological Seminary, 2012 to 2020; formerly, Executive Vice President and General Counsel, Fidelity Investments, 2007 to 2012;formerly, Executive Vice President and General Counsel, BellSouth Corporation, 2004 to 2007; formerly, Vice President and Associate General Counsel, BellSouth Corporation, 2000 to 2004; formerly, Associate, Partner, and National Litigation Practice Co-Chair, Mayer, Brown LLP, 1981 to 2000; formerly, Associate Independent Counsel, Office of Independent Counsel, 1990 to 1992. | | Chair and Director, USCJ Supporting Foundation, since 2021; Director, UJA Federation of Greater New York, since 2019; Trustee, The Jewish Theological Seminary, since 2015; formerly, Director, Legility, Inc. (privately held for-profit company), 2012 to 2021; Director, Lawyers Committee for Civil Rights Under Law (not-for-profit), since 2005; formerly, Director, Equal Justice Works (not-for-profit), 2005 to 2014; formerly, Director, Corporate Counsel Institute, Georgetown University Law Center, 2007 to 2012; formerly, Director, Greater Boston Legal Services (not-for-profit), 2007 to 2012. |
Name, (Year of Birth), and Address(1) | Position(s) and Length of Time Served(2) | Principal Occupation(s)(3) | Number of Funds in Fund Complex Overseen by Fund Trustee | Other Directorships Held Outside Fund Complex by Fund Trustee(3) |
| | Formerly, President, Woodhill Enterprises Inc./Chase Hollow Associates LLC (personal investment vehicle), 2006 to 2020; formerly, Consultant, Resources Global Professionals (temporary staffing), 2002 to 2006; formerly, Chief Financial Officer, Booz-Allen & Hamilton, Inc., 1995 to 1999; formerly, Enterprise Risk Officer, Prudential Insurance, 1994 to1995; formerly, President, Prudential Asset Management Company, 1992 to 1994; formerly, President, Prudential Power Funding (investments in electric and gas utilities and alternative energy projects), 1989 to 1992; formerly, Treasurer, Prudential Insurance Company, 1983 to 1989. | | Director, American Water (water utility), since 2003; Director, Allianz Life of New York (insurance), since 2005; formerly, Director, Berger Group Holdings, Inc. (engineering consulting firm), from 2013 to 2018; formerly, Director, Financial Women’s Association of New York (not-for-profit association), from 1987 to 1996, 2003 to 2019; ; Trustee Emerita, Brown University, since 1998; Director, Museum of American Finance (not-for-profit), since 2013; formerly, Non-Executive Chair and Director, Channel Reinsurance (financial guaranty reinsurance), 2006 to 2010; formerly, Director, Ocwen Financial Corporation (mortgage servicing), 2005 to 2010; formerly, Director, Claire’s Stores, Inc. (retailer), 2005 to 2007; formerly, Director, Parsons Brinckerhoff Inc. (engineering consulting firm), 2007 to 2010; formerly, Director, Bank Leumi (commercial bank), 2005 to 2007; formerly, Advisory Board Member, Attensity (software developer), 2005 to 2007; formerly, Director of Foster Wheeler Manufacturing, 1994 to 2004; formerly Director Dexter Corp., (Manufacturer of Non-Wovens, Plastics, and Medical Supplies), 1992 to 2001. |
Name, (Year of Birth), and Address(1) | Position(s) and Length of Time Served(2) | Principal Occupation(s)(3) | Number of Funds in Fund Complex Overseen by Fund Trustee | Other Directorships Held Outside Fund Complex by Fund Trustee(3) |
Michael M. Knetter (1960) | | President and Chief Executive Officer, University of Wisconsin Foundation, since 2010; formerly, Dean, School of Business, University of Wisconsin - Madison; formerly, Professor of International Economics and Associate Dean, Amos Tuck School of Business - Dartmouth College, 1998 to 2002. | | Director, 1 William Street Credit Income Fund, since 2018; Board Member, American Family Insurance (a mutual company, not publicly traded), since March 2009; formerly, Trustee, Northwestern Mutual Series Fund, Inc., 2007 to 2011; formerly, Director, Wausau Paper, 2005 to 2011; formerly, Director, Great Wolf Resorts, 2004 to 2009. |
| | Member, Circle Financial Group (private wealth management membership practice), since 2011; Managing Director, Golden Seeds LLC (an angel investing group), since 2009; Adjunct Professor (Corporate Finance), Columbia University School of International and Public Affairs, since 2008; formerly, Visiting Assistant Professor, Fairfield University, Dolan School of Business, Fall 2007; formerly, Adjunct Associate Professor of Finance, Richmond, The American International University in London, 1999 to 2007. | | Board member, The Maritime Aquarium at Norwalk, since 2020; Board member, Norwalk Community College Foundation, since 2014; Dean’s Advisory Council, Radcliffe Institute for Advanced Study, since 2014; formerly, Director and Treasurer, At Home in Darien (not-for-profit), 2012 to 2014; formerly, Director, National Executive Service Corps (not-for-profit), 2012 to 2013; formerly, Trustee, Richmond, The American International University in London, 1999 to 2013. |
Name, (Year of Birth), and Address(1) | Position(s) and Length of Time Served(2) | Principal Occupation(s)(3) | Number of Funds in Fund Complex Overseen by Fund Trustee | Other Directorships Held Outside Fund Complex by Fund Trustee(3) |
| | Formerly, Adjunct Professor, Columbia University School of International and Public Affairs, from 2012 to 2018; formerly, Executive Vice President and Chief Financial Officer, People's United Bank, Connecticut (a financial services company), 1991 to 2001. | | Director, 1 WS Credit Income Fund; Chair, Audit Committee, since 2018; Director and Chair, Thrivent Church Loan and Income Fund, since 2018; formerly, Trustee, Steben Alternative Investment Funds, Steben Select Multi-Strategy Fund, and Steben Select Multi-Strategy Master Fund, 2013 to 2017; formerly, Treasurer, National Association of Corporate Directors, Connecticut Chapter, 2011 to 2015; formerly, Manager, Larch Lane Multi-Strategy Fund complex (which consisted of three funds), 2006 to 2011; formerly, Member, NASDAQ Issuers’ Affairs Committee, 1995 to 2003. |
| Trustee since 2000; Chairman of the Board since 2008; formerly Lead Independent Trustee from 2006 to 2008 | Formerly, Managing Member, Ridgefield Farm LLC (a private investment vehicle), 2004 to 2016; formerly, President and CEO, Westaff, Inc. (temporary staffing), May 2001 to January 2002; formerly, Senior Executive, The Charles Schwab Corporation, 1983 to 1998, including Chief Executive Officer, Charles Schwab Investment Management, Inc.; Trustee, Schwab Family of Funds and Schwab Investments, 1997 to 1998; and Executive Vice President-Retail Brokerage, Charles Schwab & Co., Inc., 1994 to 1997. | | Trustee, University of Maryland, Shore Regional Health System, since 2020; formerly, Director, H&R Block, Inc. (tax services company), 2001 to 2018; formerly, Director, Talbot Hospice Inc., 2013 to 2016; formerly, Chairman, Governance and Nominating Committee, H&R Block, Inc., 2011 to 2015; formerly, Chairman, Compensation Committee, H&R Block, Inc., 2006 to 2010; formerly, Director, Forward Management, Inc. (asset management company), 1999 to 2006. |
Name, (Year of Birth), and Address(1) | Position(s) and Length of Time Served(2) | Principal Occupation(s)(3) | Number of Funds in Fund Complex Overseen by Fund Trustee | Other Directorships Held Outside Fund Complex by Fund Trustee(3) |
James G. Stavridis (1955) | | Vice Chairman Global Affairs, The Carlyle Group, since 2018; Commentator, NBC News, since 2015; formerly, Dean, Fletcher School of Law and Diplomacy, Tufts University, 2013 to 2018; formerly, Admiral, United States Navy, 1976 to 2013, including Supreme Allied Commander, NATO and Commander, European Command, 2009 to 2013, and Commander, United States Southern Command, 2006 to 2009. | | Director, Fortinet (cybersecurity), since 2021; Director, Ankura, since 2020; Director, Vigor Shipyard, since 2019; Director, Rockefeller Foundation, since 2018; Director, American Water (water utility), since 2018; Director, NFP Corp. (insurance broker and consultant), since 2017; Director, Onassis Foundation, since 2014; Director, Michael Baker International (construction) since 2014; Director, Vertical Knowledge, LLC, since 2013; formerly, Director, U.S. Naval Institute, 2014 to 2019; formerly, Director, Navy Federal Credit Union, 2000-2002; formerly, Director, BMC Software Federal, LLC, 2014-2019. |
Name, (Year of Birth), and Address(1) | Position(s) and Length of Time Served(2) | Principal Occupation(s)(3) | Number of Funds in Fund Complex Overseen by Fund Trustee | Other Directorships Held Outside Fund Complex by Fund Trustee(3) |
Fund Trustees who are "Interested Persons" |
| Chief Executive Officer and President since 2018 and Trustee since 2009 | President and Director, Neuberger Berman Group LLC, since 2009; President and Chief Executive Officer, Neuberger Berman BD LLC and Neuberger Berman Holdings LLC (including its predecessor, Neuberger Berman Inc.), since 2007; Chief Investment Officer (Equities) and President (Equities), NBIA (formerly, Neuberger Berman Fixed Income LLC and including predecessor entities), since 2007, and Board Member of NBIA since 2006; formerly, Global Head of Asset Management of Lehman Brothers Holdings Inc.’s (“LBHI”) Investment Management Division, 2006 to 2009; formerly, member of LBHI’s Investment Management Division’s Executive Management Committee, 2006 to 2009; formerly, Managing Director, Lehman Brothers Inc. (“LBI”), 2006 to 2008; formerly, Chief Recruiting and Development Officer, LBI, 2005 to 2006; formerly, Global Head of LBI’s Equity Sales and a Member of its Equities Division Executive Committee, 2003 to 2005; President and Chief Executive Officer, twelve registered investment companies for which NBIA acts as investment manager and/or administrator. | | Member of Board of Advisors, McDonough School of Business, Georgetown University, since 2001; Member of New York City Board of Advisors, Teach for America, since 2005; Trustee, Montclair Kimberley Academy (private school), since 2007; Member of Board of Regents, Georgetown University, since 2013. |
(1)
The business address of each listed person is 1290 Avenue of the Americas, New York, New York 10104.
(2)
Pursuant to the Trust’s Amended and Restated Trust Instrument ("Trust Instrument"), subject to any limitations on the term of service imposed by the By-Laws or any retirement policy adopted by the Fund Trustees, each Fund Trustee shall hold office for life or until his or her successor is elected or the Trust
terminates; except that (a) any Fund Trustee may resign by delivering a written resignation; (b) any Fund Trustee may be removed with or without cause at any time by a written instrument signed by at least two-thirds of the other Fund Trustees; (c) any Fund Trustee who requests to be retired, or who has become unable to serve, may be retired by a written instrument signed by a majority of the other Fund Trustees; and (d) any Fund Trustee may be removed at any shareholder meeting by a vote of at least two-thirds of the outstanding shares.
(3)
Except as otherwise indicated, each individual has held the positions shown during at least the last five years.
*
Indicates a Fund Trustee who is an "interested person" within the meaning of the 1940 Act. Mr. Amato is an interested person of the Trust by virtue of the fact that he is an officer of NBIA and/or its affiliates.
Information about the Officers of the Trust
Name, (Year of Birth), and | Position(s) and Length of Time | Principal Occupation(s)(3) |
Claudia A. Brandon (1956) | Executive Vice President since 2008 and Secretary since 1985 | Senior Vice President, Neuberger Berman, since 2007 and Employee since 1999; Senior Vice President, NBIA, since 2008 and Assistant Secretary since 2004; formerly, Vice President, Neuberger Berman, 2002 to 2006; formerly, Vice President — Mutual Fund Board Relations, NBIA, 2000 to 2008; formerly, Vice President, NBIA, 1986 to 1999 and Employee, 1984 to 1999; Executive Vice President and Secretary, thirty-three registered investment companies for which NBIA acts as investment manager and/or administrator. |
| | Senior Vice President, Neuberger Berman, since 2012; Senior Vice President, NBIA, since 2012 and Employee since 1996; formerly, Vice President, Neuberger Berman, 2007 to 2012; Vice President, twelve registered investment companies for which NBIA acts as investment manager and/or administrator. |
Anthony DiBernardo (1979) | Assistant Treasurer since 2011 | Senior Vice President, Neuberger Berman, since 2014; Senior Vice President, NBIA, since 2014, and Employee since 2003; formerly, Vice President, Neuberger Berman, 2009 to 2014; Assistant Treasurer, twelve registered investment companies for which NBIA acts as investment manager and/or administrator. |
Savonne L. Ferguson (1973) | Chief Compliance Officer since 2018 | Senior Vice President, Chief Compliance Officer (Mutual Funds) and Associate General Counsel, NBIA, since November 2018; formerly, Vice President T. Rowe Price Group, Inc. (2018), Vice President and Senior Legal Counsel, T. Rowe Price Associates, Inc. (2014-2018), Vice President and Director of Regulatory Fund Administration, PNC Capital Advisors, LLC (2009-2014), Secretary, PNC Funds and PNC Advantage Funds (2010-2014); Chief Compliance Officer, thirty-three registered investment companies for which NBIA acts as investment manager and/or administrator. |
| Chief Legal Officer since 2016 (only for purposes of sections 307 and 406 of the Sarbanes-Oxley Act of 2002) | General Counsel— Mutual Funds since 2016 and Managing Director, NBIA, since 2017; formerly, Associate General Counsel (2015 to 2016), Counsel (2007 to 2015), Senior Vice President (2013-2016), Vice President (2009 — 2013); Chief Legal Officer (only for purposes of sections 307 and 406 of the Sarbanes-Oxley Act of 2002), thirty-three registered investment companies for which NBIA acts as investment manager and/or administrator. |
| Assistant Secretary since inception | Vice President, Neuberger Berman, since 2008 and Employee since 1999; Vice President, NBIA, since 2008; formerly, Assistant Vice President, Neuberger Berman, 2007; Employee, NBIA, 1991 to 1999; Assistant Secretary, thirty-three registered investment companies for which NBIA acts as investment manager and/or administrator. |
Name, (Year of Birth), and Address(1) | Position(s) and Length of Time Served(2) | Principal Occupation(s)(3) |
| Chief Operating Officer since 2015 and Vice President since 2008 | Managing Director, Neuberger Berman, since 2013; Chief Operating Officer — Mutual Funds and Managing Director, NBIA, since 2015; formerly, Senior Vice President, Neuberger Berman, 2006 to 2014; Vice President, NBIA, 2008 to 2015 and Employee since 1991; Chief Operating Officer, twelve registered investment companies for which NBIA acts as investment manager and/or administrator; Vice President, thirty-three registered investment companies for which NBIA acts as investment manager and/or administrator. |
| | Senior Vice President, Neuberger Berman, since 2014 and Employee since 2000; Senior Vice President, NBIA, since 2014; Vice President, twelve registered investment companies for which NBIA acts as investment manager and/or administrator. |
| Assistant Secretary since 2017 | Senior Paralegal, Neuberger Berman, since 2007 and Employee since 2007; Assistant Secretary, thirty-three registered investment companies for which NBIA acts as investment manager and/or administrator. |
Owen F. McEntee, Jr. (1961) | | Vice President, Neuberger Berman, since 2006; Vice President, NBIA, since 2006 and Employee since 1992; Vice President, twelve registered investment companies for which NBIA acts as investment manager and/or administrator. |
| Treasurer and Principal Financial and Accounting Officer since inception | Managing Director, Neuberger Berman, since 2022; Senior Vice President, Neuberger Berman, 2007 to 2021; Senior Vice President, NBIA, since 2007 and Employee since 1993; formerly, Vice President, Neuberger Berman, 2004 to 2006; formerly, Assistant Treasurer, 2002 to 2005; Treasurer and Principal Financial and Accounting Officer, twelve registered investment companies for which NBIA acts as investment manager and/or administrator. |
| Assistant Treasurer since inception | Vice President, Neuberger Berman, since 2006; Vice President, NBIA, since 2006 and Employee since 1995; Assistant Treasurer, twelve registered investment companies for which NBIA acts as investment manager and/or administrator. |
| Anti-Money Laundering Compliance Officer since 2018 | Senior Vice President and Associate General Counsel, Neuberger Berman, since July 2018; Assistant United States Attorney, Southern District of New York, 2009 to 2018; Anti-Money Laundering Compliance Officer, five registered investment companies for which NBIA acts as investment manager and/or administrator. |
(1)
The business address of each listed person is 1290 Avenue of the Americas, New York, New York 10104.
(2) Pursuant to the By-Laws of the Trust, each officer elected by the Fund Trustees shall hold office until his or her successor shall have been elected and qualified or until his or her earlier death, inability to serve, or resignation. Officers serve at the pleasure of the Fund Trustees and may be removed at any time with or without cause.
(3)
Except as otherwise indicated, each individual has held the positions shown during at least the last five years.
Proxy Voting Policies and Procedures
A description of the policies and procedures that the Trust uses to determine how to vote proxies relating to portfolio securities is available, without charge, by calling 800-877-9700 (toll-free) and on the SEC’s website at www.sec.gov. Information regarding how the Trust voted proxies relating to portfolio securities during the most recent 12-month period ended June 30 is also available upon request, without charge, by calling 800-877-9700 (toll-free), on the SEC’s website at www.sec.gov, and on Neuberger Berman’s website at www.nb.com.
Quarterly Portfolio Schedule
The Trust files a complete schedule of portfolio holdings for each Fund with the SEC for the first and third quarters of each fiscal year as an exhibit to its report on Form N-PORT. The Trust’s Form N-PORT is available on the SEC’s website at www.sec.gov. The portfolio holdings information on Form N-PORT is available upon request, without charge, by calling 800-877-9700 (toll-free).
Liquidity Risk Management Program
Consistent with Rule 22e-4 under the Investment Company Act of 1940 (the "Liquidity Rule"), as amended, the Funds have established a liquidity risk management program (the "Program"). The Program seeks to assess and manage the Funds’ liquidity risk, which is defined as the risk that a Fund is unable to meet investor redemption requests without significantly diluting the remaining investors' interests in a Fund. The Board has approved the designation of NBIA Funds' Liquidity Committee, comprised of NBIA employees, as the program administrator (the "Program Administrator"). The Program Administrator is responsible for implementing and monitoring the Program and utilizes NBIA personnel to assess and review, on an ongoing basis, the Funds' liquidity risk.
The Program includes a number of elements that support the management and assessment of liquidity risk, including an annual assessment of the Funds' liquidity risk factors and the periodic classification (or re-classification, as necessary) of the Funds’ investments into buckets (highly liquid, moderately liquid, less liquid and illiquid) that reflect the Program Administrator's assessment of the investments' liquidity under current market conditions, which for the relevant period included, among other factors, market volatility as a result of geopolitical tensions (e.g., Russia’s invasion of Ukraine) and the emergence of new COVID variants. The Program Administrator also utilizes information about the Funds’ investment strategy, the characteristics of the Funds’ shareholder base and historical redemption activity.
The Program Administrator provided the Board with a written report that addressed the operation of the Program and assessed its adequacy and effectiveness of implementation from April 1, 2021 through March 31, 2022. During the period covered by this report, the Program Administrator reported that the Program effectively assisted the Program Administrator in monitoring whether a Fund maintained a level of liquidity appropriate for its shareholder base and historical redemption activity.
Report of Votes of Shareholders
A Special Meeting of Shareholders was held on June 30, 2022 and adjourned to August 11, 2022 for certain of the Neuberger Berman Income Funds (the "Trust"). Shareholders voted to approve the election of four trustees to the Board of Trustees of the Trust and to approve the amendment of certain fundamental investment policies of each Fund.
Proposal 1 – To approve the election of Michael J. Cosgrove, Marc Gary, Deborah C. McLean, and James G. Stavridis as Trustees to the Board of Trustees of the Trust as follows:
Neuberger Berman Income Funds | | | |
| |
| | | |
| | | |
| | | |
| | | |
| | | |
Proposal 2 – To approve the amendment of certain fundamental investment policies of each Fund as follows:
(A) To approve the amendment of the fundamental investment policy regarding borrowing;
(B) To approve the amendment of the fundamental investment policy regarding commodities;
(C) To approve the amendment of the fundamental investment policy regarding industry concentration;
(D) To approve the amendment of the fundamental investment policy regarding lending;
(E) To approve the amendment of the fundamental investment policy regarding investing in real estate;
(F) To approve the amendment of the fundamental investment policy regarding the issuance of senior securities to permit issuing senior securities; and
(G) To approve the amendment of the fundamental investment policy regarding underwriting.
Floating Rate Income (cont’d): | |
| | | |
| | | |
| | | |
| | | |
Municipal Intermediate Bond: | |
| | | |
| | | |
| | | |
| | | |
| | | |
| | | |
| | | |
| | | |
Board Consideration of the Management Agreements
On an annual basis, the Board of Trustees (the "Board" or "Trustees") of Neuberger Berman Income Funds (the "Trust"), including the Trustees who are not "interested persons" of the Trust or of Neuberger Berman Investment Advisers LLC ("Management") (including its affiliates), as such term is defined under the Investment Company Act of 1940, as amended ("1940 Act"), ("Independent Fund Trustees"), considers whether to continue the management agreements with Management (the "Management Agreements") with respect to each series (each a "Fund") and the sub-advisory agreements between Management and Neuberger Berman Europe Limited ("NBEL") (the "Sub-Advisory Agreements" and collectively with the Management Agreement, the "Agreements") with respect to Neuberger Berman Emerging Markets Debt Fund. Throughout the process, the Independent Fund Trustees are advised by counsel that is experienced in 1940 Act matters and that is independent of Management ("Independent Counsel"). At a meeting held on September 29, 2022, the Board, including the Independent Fund Trustees, approved the continuation of the Agreements for each Fund.
In evaluating the Agreements with respect to each Fund, the Board, including the Independent Fund Trustees, reviewed extensive materials provided by Management in response to questions submitted by the Independent Fund Trustees and Independent Counsel, and by Management (for NBEL), and met with senior representatives of Management regarding its personnel, operations, and profitability as they relate to the Funds. The annual contract review extends over at least two regular meetings of the Board to ensure that Management and NBEL have time to respond to any questions the Independent Fund Trustees may have on their initial review of the materials and that the Independent Fund Trustees have time to consider those responses. Additionally, the Board considered the impact of significant periods of market volatility that occurred during and after the period for which information was requested in conducting its evaluation of Management and NBEL.
In connection with its deliberations, the Board also considered the broad range of information relevant to the annual contract review that is provided to the Board (including its various standing committees) at meetings throughout the year, including reports on investment performance, portfolio risk, liquidity management, and other portfolio information for each Fund, including any use of derivatives, as well as periodic reports on, among other matters, pricing and valuation; quality and cost of portfolio trade execution; compliance; and shareholder and other services provided by Management, NBEL, and their affiliates. The Contract Review Committee, which is comprised solely of Independent Fund Trustees, was established by the Board to assist in its evaluation and analysis of materials for the annual contract review. The Board has also established other committees that focus throughout the year on specific areas relevant to the annual contract review, such as Fund performance or compliance matters, and that are charged with specific responsibilities regarding the annual contract review. Those committees provide reports to the full Board, including the members of the Contract Review Committee, which consider that information as part of the annual contract review process. The Contract Review Committee annually considers and updates the questions it asks of Management in light of legal advice furnished to it by Independent Counsel; its own business judgment; and developments in the industry, in the markets, in mutual fund regulation and litigation, and in Management’s business model.
The Independent Fund Trustees received from Independent Counsel a memorandum discussing the legal standards for their consideration of the proposed continuation of the Agreements. During the course of the year and during their deliberations regarding the annual contract review, the Contract Review Committee and the Independent Fund Trustees met with Independent Counsel separately from representatives of Management.
Provided below is a description of the Board’s contract approval process and material factors that the Board considered at its meetings regarding renewals of the Agreements and the compensation to be paid thereunder. In connection with its approval of the continuation of the Agreements, the Board evaluated the terms of the Agreements, the overall fairness of the Agreements to each Fund, and whether the Agreements were in the best interests of each respective Fund and its shareholders. The Board’s determination to approve the continuation of the Agreements was based on a comprehensive consideration of all information provided to the Board
throughout the year and specifically in connection with the annual contract review. The Board considered each Fund’s investment management and sub-advisory agreements separately from those of the other Funds.
This description is not intended to include all of the factors considered by the Board. The Board members did not identify any particular information or factor that was all-important or controlling, and each Trustee may have attributed different weights to the various factors. The Board focused on the costs and benefits of the Agreements to each Fund and, through the Fund, its shareholders.
Nature, Extent, and Quality of Services
With respect to the nature, extent, and quality of the services provided, the Board considered the investment philosophy and decision-making processes of, and the qualifications, experience, and capabilities of, and the resources available to, the portfolio management personnel of Management and NBEL who perform services for the Funds. The Board noted that Management also provides certain administrative services, including fund accounting and compliance services. The Board also considered Management’s and NBEL’s policies and practices regarding trade execution, transaction costs, and allocation of portfolio transactions and reviewed the quality of the execution services that Management had provided. Moreover, the Board considered Management’s and NBEL's approach to potential conflicts of interest both generally and between the Funds’ investments and those of other funds or accounts managed by Management or NBEL. The Board also noted that Management had increased its capabilities with respect to environmental, social, and corporate governance matters and considered how that might impact the relevant Funds. The Board noted the additional responsibilities of Management in administering the liquidity risk management program.
The Board recognized the extensive range of services that Management provides to the Funds beyond the investment management services. The Board noted that Management is also responsible for monitoring compliance with the Fund’s investment objectives, policies, and restrictions, as well as compliance with applicable law, including implementing rulemaking initiatives of the U.S. Securities and Exchange Commission. The Board considered that Management assumes significant ongoing entrepreneurial and business risks as the investment adviser and sponsor for the Funds, for which it is entitled to reasonable compensation. The Trustees also considered that Management’s responsibilities include continual management of investment, operational, cybersecurity, enterprise, legal, regulatory, and compliance risks as they relate to the Funds, and the Board considers on a regular basis information regarding Management’s processes for monitoring and managing risk. In addition, the Board also noted that when Management launches a new fund or share class, it assumes entrepreneurial risk with respect to that fund or share class, and that some funds and share classes have been liquidated without ever having been profitable to Management.
The Board also reviewed and evaluated Management’s activities under its contractual obligation to oversee the Funds’ various outside service providers, including its renegotiation of certain service providers’ fees and its evaluation of service providers’ infrastructure, cybersecurity programs, compliance programs, and business continuity programs, among other matters. The Board also considered Management’s ongoing development of its own infrastructure and information technology to support the Funds through, among other things, cybersecurity, business continuity planning, and risk management. The Board noted Management’s and NBEL’s largely seamless implementation of their business continuity plan in response to the COVID-19 pandemic and their success in continuously providing services to the Funds not withstanding the disruptions caused by the pandemic. In addition, the Board noted the positive compliance history of Management and NBEL, as no significant compliance problems were reported to the Board with respect to either firm. The Board also considered the general structure of the portfolio managers’ compensation and whether this structure provides appropriate incentives to act in the best interests of the Funds. The Board also considered the ability of Management and NBEL to attract and retain qualified personnel to service the Funds.
As in past years, the Board also considered the manner in which Management and NBEL addressed various matters that arose during the year, some of them a result of developments in the broader fund industry or the
regulations governing it. In addition, the Board considered actions taken by Management and NBEL in response to market conditions over the past year, such as changes in interest rates and the increase in market volatility, and considered the overall performance of Management and NBEL in this context.
Fund Performance
The Board requested a report from an outside consulting firm that specializes in the analysis of fund industry data that compared each Fund’s performance, along with its fees and other expenses, to a group of industry peers ("Expense Group") and to a broader universe of funds pursuing generally similar strategies with the same investment classification and/or objective ("Performance Universe"). The Board considered each Fund’s performance and fees in light of the limitations inherent in the methodology for constructing such comparative groups and determining which investment companies should be included in the comparative groups, noting differences as compared to certain fund industry ranking and rating systems.
With respect to investment performance, the Board considered information regarding each Fund’s short-, intermediate- and long-term performance, as applicable, net of the Fund’s fees and expenses, on an absolute basis, relative to a benchmark index that does not deduct the fees or expenses of investing, and compared to the performance of its Expense Group and Performance Universe, each constructed by the consulting firm. The Board also reviewed performance in relation to certain measures of the degree of investment risk undertaken by the portfolio managers.
In the case of underperformance for any of the periods reported, the Board considered the magnitude and duration of that underperformance relative to the Performance Universe and/or the benchmark (e.g., the amount by which a Fund underperformed, including, for example, whether the Fund slightly underperformed or significantly underperformed its benchmark). For those Funds that the Board identified as having underperformed their benchmark indices, Expense Group, and/or Performance Universe to an extent, or over a period of time, that the Board felt warranted additional inquiry, the Board discussed with Management each such Fund’s performance, potential reasons for the relative performance, and, if necessary, steps that Management had taken, or intended to take, to improve performance. The Board also met with the portfolio managers of certain Funds during the 12 months prior to voting on the contract renewal to discuss the Funds’ performance. The Board also considered Management’s responsiveness with respect to the relative performance. The Board recognized that the performance data reflects a snapshot of a period as of a particular date and that selecting a different performance period could produce significantly different results. The Board further acknowledged that long-term performance could be impacted by even one period of significant outperformance or underperformance, and that a single investment theme could disproportionately affect performance. In this regard, the Board noted that performance, especially short-term performance, is only one of the factors that it deems relevant to its consideration of the Agreements and that, after considering all relevant factors, it determined to approve the continuation of the Agreements notwithstanding a Fund’s relative performance.
Fee Rates, Profitability, and Fall-out Benefits
With respect to the overall fairness of the Agreements, the Board considered the fee structure for each Fund under the Agreements as compared to the Expense Group provided by the consulting firm, as discussed above. The Board reviewed a comparison of each Fund’s management fee to its Expense Group. The Board noted that the comparative management fee analysis includes, in each Fund’s management fee, the separate administrative fees paid to Management. However, the Board noted that some funds in the Expense Group pay directly from fund assets for certain services that Management covers out of the administration fees for the Funds. Accordingly, the Board also considered each Fund’s total expense ratio as compared with its Expense Group as a way of taking account of these differences.
The Board compared each Fund’s contractual and actual management fees to the median of the contractual and actual management fees, respectively, of that Fund’s Expense Group. (The actual management fees are the
contractual management fees reduced by any fee waivers or other adjustments.) The Board also compared each Fund’s total expenses to the median of the total expenses of that Fund’s Expense Group. Where a Fund’s management fee or total expenses were higher than the Expense Group median, the Board considered whether specific portfolio management, administration or oversight needs contributed to the Fund’s management fee or total expenses. The Board also noted that for some classes of certain Funds, the overall expense ratio is maintained through a contractual or voluntary fee cap and/or expense reimbursements by Management.
In concluding that the benefits accruing to Management and its affiliates, including NBEL, by virtue of their relationship with each Fund were reasonable in light of the costs of providing the investment advisory and other services and the benefits accruing to that Fund, the Board reviewed specific data as to Management’s estimated profit or loss on each Fund for a recent period on a pre-tax basis without regard to distribution expenses, including year-over-year changes in each of Management’s reported expense categories. (The Board also reviewed data on Management’s estimated profit or loss on each Fund after distribution expenses and taxes were factored in, as indicators of the health of the business and the extent to which Management is directing its profits into the growth of the business.) The Board considered the cost allocation methodology that Management used in developing its estimated profitability figures. In recent years, the Board engaged an independent forensic accountant to review the profitability methodology utilized by Management when preparing this information and discussed with the consultant its conclusion that Management’s process for calculating and reporting its estimated profit or loss was not unreasonable.
Recognizing that there is no uniform methodology regarding the allocation of firm-wide or complex-wide expenses within the asset management industry for determining profitability for this purpose and that the use of different reasonable methodologies can give rise to different profit and loss results, the Board, in the past, requested from Management examples of profitability calculated by different methods and noted that the estimated profitability levels were still reasonable when calculated by these other methods. The Board further noted Management’s representation that its estimate of profitability is derived using methodology that is consistent with the methodology used to assess and/or report measures of profitability elsewhere at the firm. In addition, the Board recognized that Management’s calculations regarding its costs may not reflect all risks, including regulatory, legal, operational, cybersecurity, reputational, and, where appropriate, entrepreneurial risks, associated with offering and managing a mutual fund in the current regulatory and market environment. The Board also considered any fall-out (i.e., indirect) benefits likely to accrue to Management or its affiliates from their relationship with each Fund. The Board recognized that Management and its affiliates should be entitled to earn a reasonable level of profits for services they provide to each Fund and, based on its review, concluded that Management’s reported level of estimated profitability, if any, on each Fund was reasonable.
Information Regarding Services to Other Clients
The Board also considered whether there were other funds or separate accounts that were advised or sub-advised by Management or its affiliates with investment objectives, policies, and strategies that were similar to those of any of the Funds. In the cases where such funds or separate accounts exist, the Board compared the fees charged to the respective Fund to the fees charged to such comparable funds and/or separate accounts. The Board considered the appropriateness and reasonableness of any differences between the fees charged to a Fund and such comparable funds and/or separate accounts, and determined that differences in fees and fee structures were consistent with the differences in the management and other services provided. The Board explored with Management its assertion that although, generally, the rates of fees paid by such accounts, except other Neuberger Berman mutual funds, were lower than the fee rates paid by the corresponding Funds, the differences reflected Management’s greater level of responsibilities and significantly broader scope of services to the Funds, the more extensive regulatory obligations and risks associated with managing the Funds, and other financial considerations with respect to creation and sponsorship of the Funds.
Economies of Scale
The Board also evaluated apparent or anticipated economies of scale in relation to the services Management provides to each Fund. The Board considered whether each Fund’s fee structure provides for a reduction of payments resulting from the use of breakpoints, the size of any breakpoints in each Fund’s advisory fees, and whether any such breakpoints are set at appropriate asset levels. The Board also compared the breakpoint structure to that of the Expense Group. In addition, the Board considered the expense limitation and/or fee waiver arrangements that reduce many Funds’ expenses at some or all asset levels, which can have an effect similar to breakpoints in sharing economies of scale with shareholders and provide protection from an increase in expenses if a Fund’s assets decline. The Trustees took into account that certain Funds do not have breakpoints in their fees. As to those Funds whose advisory fees do not have breakpoints, the Board discussed with Management the reasons why the Fund’s particular investment program was less likely than others to produce economies of scale. In addition, for Funds that do not have breakpoints, the Board considered that setting competitive fee rates and pricing a Fund to scale before it has actually experienced an increase in assets are other means of sharing potential economies of scale with shareholders. The Board also considered that Management has provided, at no added cost to the Funds, certain additional services, including but not limited to, services required by new regulations or regulatory interpretations, services impelled by changes in the securities markets or the business landscape, and/or services requested by the Board. The Board considered that this is a way of sharing economies of scale with the Funds and their shareholders.
Fund-by-Fund Analysis
With regard to the investment performance of each Fund and the fees charged to each Fund, the Board considered the following information. The Performance Universes referenced in this section are those identified by the consulting firm, as discussed above, and the risk/return ratios referenced are the Sharpe ratios provided by the consulting firm. With respect to performance quintile rankings for a Fund compared to its Performance Universe, the first quintile represents the highest (best) performance and the fifth quintile represents the lowest performance. With respect to the quintile rankings for fees and total expenses (net of waivers or other adjustments, if any) for a Fund compared to its Expense Group, the first quintile represents the lowest (best) fees and/or total expenses and the fifth quintile represents the highest fees and/or total expenses. Where a Fund has more than one class of shares outstanding, information for Institutional Class has been provided as identified below. The Board reviewed the expense structures of all the other classes of shares of the Funds, some of which have higher fees and expenses that reflect their separate distribution and servicing arrangements and the differing needs of different investors. As a proxy for the class expense structure, the Board reviewed the expenses of each class for at least one Fund in the Trust in comparison to Expense Groups for those classes. The Board noted the effect of higher expenses on the performance of the other classes of shares.
• Neuberger Berman Core Bond Fund (Institutional Class)—The Board considered that, based on performance data for the periods ended December 31, 2021: (1) as compared to its benchmark, the Fund’s performance was higher for the 1-, 3-, 5-, and 10-year periods; and (2) as compared to its Performance Universe, the Fund’s performance was in the second quintile for the 1-, 3-, and 5-year periods and the third quintile for the 10-year period. The Board considered that, as compared to its Expense Group, the Fund’s contractual management fee, the actual management fee net of fees waived by Management, and total expenses each ranked in the second quintile. In addition, the Board met with members of the portfolio management team in December 2021 to discuss the Fund’s performance.
• Neuberger Berman Emerging Markets Debt Fund (Institutional Class)—The Board considered that, based on performance data for the periods ended December 31, 2021: (1) as compared to its benchmark, the Fund’s performance was lower for the 1-year period and higher for the 3- and 5-year periods; and (2) as compared to its Performance Universe, the Fund’s performance was in the fifth quintile for the 1- and 3-year periods and the third quintile for the 5-year period. The Fund was launched in 2013 and therefore does not
have 10-year performance. The Board considered that, as compared to its Expense Group, the Fund’s contractual management fee, the actual management fee net of fees waived by Management, and total expenses each ranked in the second quintile. The Board also noted the Fund’s ranking was in the second quintile of its Lipper and Morningstar peer categories for the 7-month period ending July 31, 2022.
• Neuberger Berman Floating Rate Income Fund (Institutional Class)—The Board considered that, based on performance data for the periods ended December 31, 2021: (1) as compared to its benchmark, the Fund’s performance was lower for the 1-, 5-, and 10-year periods and higher for the 3-year period; and (2) as compared to its Performance Universe, the Fund’s performance was in the third quintile for the 1-year period, the first quintile for the 3- and 5-year periods, and the second quintile for the 10-year period. The Board considered that, as compared to its Expense Group, the Fund’s contractual management fee, the actual management fee net of fees waived by Management, and total expenses each ranked in the first quintile.
• Neuberger Berman High Income Bond Fund (Institutional Class)—The Board considered that, based on performance data for the periods ended December 31, 2021: (1) as compared to its benchmark, the Fund’s performance was lower for the 1-, 3-, 5-, and 10-year periods; and (2) as compared to its Performance Universe, the Fund’s performance was in the third quintile for the 1-, 3-, 5-, and 10-year periods. The Board considered that, as compared to its Expense Group, the Fund’s contractual management fee ranked in the fourth quintile, the actual management fee ranked in the fifth quintile, and total expenses ranked in the third quintile. In addition, the Board met with a member of the portfolio management team in June 2022 to discuss the Fund’s performance.
• Neuberger Berman Municipal High Income Fund (Institutional Class)—The Board considered that, based on performance data for the periods ended December 31, 2021: (1) as compared to its benchmark, the Fund’s performance was higher for the 1- and 5-year periods and lower for the 3-year period; and (2) as compared to its Performance Universe, the Fund’s performance was in the fourth quintile for the 1- and 3- year periods and the third quintile for the 5-year period. The Fund was launched in 2015 and therefore does not have a 10-year performance. The Board considered that, as compared to its Expense Group, the Fund’s contractual management fee ranked in the second quintile and the actual management fee net of fees waived by Management and total expenses each ranked in the first quintile.
• Neuberger Berman Municipal Impact Fund (Institutional Class)—The Board considered that, based on performance data for the periods ended December 31, 2021:(1) as compared to its benchmark, the Fund’s performance was lower for the 1-, 3-, and 5-year periods; and (2) as compared to its Performance Universe, the Fund’s performance was in the fifth quintile for the 1-, 3-, and 5-year periods. NBIA assumed the management of the Fund in 2013; therefore, the Fund does not have does not have 10-year performance under NBIA’s management. The Board considered that, as compared to its Expense Group, the Fund’s contractual management fee ranked second out of five funds and the actual management fee net of fees waived by Management and total expenses each ranked first out of five funds. In addition, the Board took into account information provided by Management regarding the challenge of comparing the Fund to its Performance Universe due to the limited number of impact funds included in that peer group. The Board also noted the Fund’s outperformance versus its benchmark during the 7-month period ending July 31, 2022. In addition, the Board noted the Fund’s ranking was in the first quintile of its Lipper peer category and in the second quintile of its Morningstar peer category for the 7-month period ending July 31, 2022. The Board took into account that the Fund adopted a new investment strategy and benchmark on June 16, 2018, and that the management fee was substantially reduced at that time. Accordingly, the Board noted that the fee and performance information for earlier periods does not reflect the current strategy or fee arrangement and therefore the utility of such comparisons is limited until the Fund’s new investment strategy has a longer track record.
• Neuberger Berman Municipal Intermediate Bond Fund (Institutional Class)—The Board considered that, based on performance data for the periods ended December 31, 2021:(1) as compared to its benchmark, the Fund’s performance was higher for the 1- and 10-year periods, lower for the 5-year period, and equal to for the 3-year period; and (2) as compared to its Performance Universe, the Fund’s performance was in the second quintile for the 1-year period and the third quintile for the 3-, 5-, and 10-year periods. The Board considered that, as compared to its Expense Group, the Fund’s contractual management fee, the actual management fee net of fees waived by Management, and total expenses each ranked in the first quintile.
• Neuberger Berman Short Duration Bond Fund (Institutional Class)—The Board considered that, based on performance data for the periods ended December 31, 2021:(1) as compared to its benchmark, the Fund’s performance was higher for the 1-, 3-, 5-, and 10-year periods; and (2) as compared to its Performance Universe, the Fund’s performance was in the first quintile for the 1-year period, the second quintile for the 3- and 5-year periods, and the third quintile for the 10-year period. The Board considered that, as compared to its Expense Group, the Fund’s contractual management fee ranked in the third quintile and the actual management fee net of fees waived by Management and total expenses each ranked in the first quintile. The Board also took into account that in July 2022, Management added a new portfolio manager, and in 2020, Management reduced the Fund’s expense limitation and made changes to the Fund’s investment strategy.
• Neuberger Berman Strategic Income Fund (Institutional Class)—The Board considered that, based on performance data for the periods ended December 31, 2021: (1) as compared to its benchmark, the Fund’s performance was higher for the 1-, 3-, 5-, and 10-year periods; and (2) as compared to its Performance Universe, the Fund’s performance was in the second quintile for the 1-, 3-, 5-, and 10-year periods. The Board considered that, as compared to its Expense Group, the Fund’s contractual management fee ranked in the third quintile, the actual management fee net of fees waived by Management ranked in the fourth quintile, and total expenses ranked in the first quintile. In addition, the Board met with members of the portfolio management team in December 2021 to discuss the Fund’s performance.
Conclusions
In approving the continuation of the Agreements, the Board concluded that, in its business judgment, the terms of each Agreement are fair and reasonable to each Fund and that approval of the continuation of the Agreements is in the best interests of each Fund and its shareholders. In reaching this determination, the Board considered that Management and NBEL, with respect to Neuberger Berman Emerging Markets Debt Fund, could be expected to continue to provide a high level of service to each Fund; that the performance of each Fund was satisfactory over time, or, in the case of a Fund that underperformed relative to its Expense Group or Performance Universe, that the Board retained confidence in Management’s and NBEL’s, with respect to Neuberger Berman Emerging Markets Debt Fund, capabilities to manage each Fund; that each Fund’s fee structure appeared to the Board to be reasonable given the nature, extent, and quality of services provided; and that the benefits accruing to Management and its affiliates by virtue of their relationship with each Fund were reasonable in light of the costs of providing the investment advisory and other services and the benefits accruing to each Fund. The Board’s conclusions may be based in part on its consideration of materials prepared in connection with the approval or continuance of the Agreements in prior years and on the Board’s ongoing regular review of Fund performance and operations throughout the year, in addition to material prepared specifically for the most recent annual review of the Agreements.
Notice to Shareholders
For the fiscal year ended October 31, 2022, the percentages representing the portion of distributions from net investment income that is exempt from federal tax, other than the alternative minimum tax, are as follows:
| |
| |
Municipal Intermediate Bond | |
For the fiscal year ended October 31, 2022, certain Funds make the following designation, or up to the maximum amount of such dividends allowable pursuant to the Internal Revenue Code, as Capital Gains Distributions and Qualified Dividend Income.
| Capital Gains
Distributions | |
| | |
| | |
Municipal Intermediate Bond | | |
| | |
| | |
In January 2023, you will receive information to be used in filing your 2022 tax returns, which will include a notice of the exact tax status of all dividends paid to you by each Fund during calendar year 2022. Please consult your own tax advisor for details as to how this information should be reflected on your tax returns.
Neuberger Berman Investment Advisers LLC
1290 Avenue of the Americas
New York, NY 10104-0002
Retail Services: 800.877.9700
Broker-Dealer and Institutional Services: 800.366.6264/888.556.9030
www.nb.com
Statistics and projections in this report are derived from sources deemed to be reliable but cannot be regarded as a representation of future results of the Funds. This report is prepared for the general information of shareholders and is not an offer of shares of the Funds. Shares are sold only through the currently effective prospectus which you can obtain by calling 877.628.2583. An investor should consider carefully a Fund’s investment objectives, risks and fees and expenses, which are described in its prospectus, before investing.
H0648 12/22
(b) Not applicable to the Registrant.
Item 2. Code of Ethics.
The Board of Trustees (“Board”) of Neuberger Berman Income Funds (“Registrant”) has adopted a code of ethics that applies to the Registrant’s principal executive officer, principal financial officer, principal accounting officer or controller, or persons performing similar functions (“Code of Ethics”). During the period covered by this Form N-CSR, there were no substantive amendments to the Code of Ethics and there were no waivers from the Code of Ethics granted to the Registrant’s principal executive officer, principal financial officer, principal accounting officer or controller, or persons performing similar functions.
Item 3. Audit Committee Financial Expert.
The Board has determined that the Registrant has three audit committee financial experts serving on its audit committee. The Registrant’s audit committee financial experts are Michael J. Cosgrove, Martha C. Goss, and Deborah C. McLean. Mr. Cosgrove, Ms. Goss, and Ms. McLean are independent trustees as defined by Form N-CSR.
Item 4. Principal Accountant Fees and Services.
Ernst & Young, LLP (“E&Y”) serves as independent registered public accounting firm to Neuberger Berman Emerging Markets Debt Fund, Neuberger Berman High Income Bond Fund, Neuberger Berman Municipal Intermediate Bond Fund, Neuberger Berman Short Duration Bond Fund and Neuberger Berman Strategic Income Fund. Neuberger Berman Emerging Markets Debt Fund, Neuberger Berman High Income Bond Fund, Neuberger Berman Municipal Intermediate Bond Fund, Neuberger Berman Short Duration Bond Fund and Neuberger Berman Strategic Income Fund commenced operations on September 27, 2013, February 1, 1992, July 9, 1987, June 9, 1986, and July 11, 2003, respectively. Effective December 15, 2021, E&Y also serves as independent registered public accounting firm to Neuberger Berman Core Bond Fund, Neuberger Berman Floating Rate Income Fund, Neuberger Berman Municipal High Income Fund and Neuberger Berman Municipal Impact Fund. Neuberger Berman Core Bond Fund, Neuberger Berman Floating Rate Income Fund, Neuberger Berman Municipal High Income Fund and Neuberger Berman Municipal Impact Fund commenced operations on October 1, 1995, December 29, 2009, June 22, 2015, and March 11, 2013, respectively.
Prior to December 15, 2021, Tait, Weller & Baker LLP (“Tait Weller”) served as independent registered public accounting firm to Neuberger Berman Core Bond Fund, Neuberger Berman Floating Rate Income Fund, Neuberger Berman Municipal High Income Fund and Neuberger Berman Municipal Impact Fund.
(a) Audit Fees
The aggregate fees billed for professional services rendered by E&Y for the audit of the annual financial statements or services that are normally provided by E&Y in connection with statutory and regulatory filings or engagements were $259,369 and $453,200 for the fiscal years ended 2021 and 2022, respectively.
The aggregate fees billed for professional services rendered by Tait Weller for the audit of the annual financial statements or services that are normally provided by Tait Weller in connection with statutory and regulatory filings or engagements were $114,925 for the fiscal year ended 2021.
(b) Audit-Related Fees
The aggregate fees billed to the Registrant for assurance and related services by E&Y that are reasonably related
to the performance of the audit of the Registrant’s financial statements and are not reported above in Audit Fees were $0 and $0 for the fiscal years ended 2021 and 2022, respectively. The Audit Committee approved 0% and 0% of these services provided by E&Y for the fiscal years ended 2021 and 2022, respectively, pursuant to the waiver provisions of Rule 2-01(c)(7)(i)(C) of Regulation S-X.
The fees billed to other entities in the investment company complex for assurance and related services by E&Y that are reasonably related to the performance of the audit that the Audit Committee was required to approve because the engagement related directly to the operations and financial reporting of the Registrant were $0 and $0 for the fiscal years ended 2021 and 2022, respectively. The Audit Committee approved 0% and 0% of these services provided by E&Y for the fiscal years ended 2021 and 2022, respectively, pursuant to the waiver provisions of Rule 2-01(c)(7)(i)(C) of Regulation S-X.
The aggregate fees billed to the Registrant for assurance and related services by Tait Weller that are reasonably related to the performance of the audit of the Registrant’s financial statements and are not reported above in Audit Fees were $0 for the fiscal year ended 2021. The Audit Committee approved 0% of these services provided by Tait Weller for the fiscal year ended 2021, pursuant to the waiver provisions of Rule 2-01(c)(7)(i)(C) of Regulation S-X.
The fees billed to other entities in the investment company complex for assurance and related services by Tait Weller that are reasonably related to the performance of the audit that the Audit Committee was required to approve because the engagement related directly to the operations and financial reporting of the Registrant were $0 for the fiscal year ended 2021. The Audit Committee approved 0% of these services provided by Tait Weller for the fiscal year ended 2021, pursuant to the waiver provisions of Rule 2-01(c)(7)(i)(C) of Regulation S-X.
(c) Tax Fees
The aggregate fees billed to the Registrant for professional services rendered by E&Y for tax compliance, tax advice, and tax planning were $118,250 and $123,630 for the fiscal years ended 2021 and 2022, respectively. The nature of the services provided includes preparation of the Federal and State tax extensions and tax returns, review of annual excise tax calculations, and preparation of form 8613, in addition to assistance with the identification of Passive Foreign Investment Companies ("PFICs"), assistance with determination of various foreign withholding taxes, and assistance with Internal Revenue Code and tax regulation requirements for fund investments. The Audit Committee approved 0% and 0% of these services provided by E&Y for the fiscal years ended 2021 and 2022, respectively, pursuant to the waiver provisions of Rule 2-01(c)(7)(i)(C) of Regulation S-X.
The fees billed to other entities in the investment company complex for professional services rendered by E&Y for tax compliance, tax advice, and tax planning that the Audit Committee was required to approve because the engagement related directly to the operations and financial reporting of the Registrant were $0 and $0 for the fiscal years ended 2021 and 2022, respectively. The Audit Committee approved 0% and 0% of these services provided by E&Y for the fiscal years ended 2021 and 2022, respectively, pursuant to the waiver provisions of Rule 2-01(c)(7)(i)(C) of Regulation S-X.
The aggregate fees billed to the Registrant for professional services rendered by Tait Weller for tax compliance, tax advice, and tax planning were $0 for the fiscal year ended 2021. The nature of the services provided includes preparation of the Federal and State tax extensions and tax returns, review of annual excise tax calculations, and preparation of form 8613, in addition to assistance with the identification of PFICs, assistance with determination of various foreign withholding taxes, and assistance with Internal Revenue Code and tax regulation requirements for fund investments. The Audit Committee approved 0% of these services provided by Tait Weller for the fiscal year ended 2021, pursuant to the waiver provisions of Rule 2-01(c)(7)(i)(C) of Regulation S-X.
The fees billed to other entities in the investment company complex for professional services rendered by Tait Weller for tax compliance, tax advice, and tax planning that the Audit Committee was required to approve because the engagement related directly to the operations and financial reporting of the Registrant were $0 for the fiscal year ended 2021. The Audit Committee approved 0% of these services provided by Tait Weller for the fiscal year ended 2021, pursuant to the waiver provisions of Rule 2-01(c)(7)(i)(C) of Regulation S-X.
(d) All Other Fees
The aggregate fees billed to the Registrant for products and services provided by E&Y, other than services reported in Audit Fees, Audit-Related Fees, and Tax Fees were $0 and $0 for the fiscal years ended 2021 and 2022, respectively. The Audit Committee approved 0% and 0% of these services provided by E&Y for the fiscal years ended 2021 and 2022, respectively, pursuant to the waiver provisions of Rule 2-01(c)(7)(i)(C) of Regulation S-X.
The fees billed to other entities in the investment company complex for products and services provided by E&Y, other than services reported in Audit Fees, Audit-Related Fees, and Tax Fees that the Audit Committee was required to approve because the engagement related directly to the operations and financial reporting of the Registrant were $0 and $0 for the fiscal years ended 2021 and 2022, respectively. The Audit Committee approved 0% and 0% of these services provided by E&Y for the fiscal years ended 2021 and 2022, respectively, pursuant to the waiver provisions of Rule 2-01(c)(7)(i)(C) of Regulation S-X.
The aggregate fees billed to the Registrant for products and services provided by Tait Weller, other than services reported in Audit Fees, Audit-Related Fees, and Tax Fees were $0 for the fiscal year ended 2021. The Audit Committee approved 0% of these services provided by Tait Weller for the fiscal year ended 2021, pursuant to the waiver provisions of Rule 2-01(c)(7)(i)(C) of Regulation S-X.
The fees billed to other entities in the investment company complex for products and services provided by Tait Weller, other than services reported in Audit Fees, Audit-Related Fees, and Tax Fees that the Audit Committee was required to approve because the engagement related directly to the operations and financial reporting of the Registrant were $0 for the fiscal year ended 2021. The Audit Committee approved 0% of these services provided by Tait Weller for the fiscal year ended 2021, pursuant to the waiver provisions of Rule 2-01(c)(7)(i)(C) of Regulation S-X.
(e) Audit Committee’s Pre-Approval Policies and Procedures
(1) The Audit Committee’s pre-approval policies and procedures for the Registrant to engage an accountant to render audit and non-audit services delegate to each member of the Committee the power to pre-approve services between meetings of the Committee.
(2) None of the services described in paragraphs (b) through (d) above were approved by the Audit Committee pursuant to paragraph (c)(7)(i)(C) of Rule 2-01 of Regulation S-X.
(f) Hours Attributed to Other Persons
Not applicable.
(g) Non-Audit Fees
Non-audit fees billed by E&Y for services rendered to the Registrant were $118,250 and $123,630 for the fiscal years ended 2021 and 2022, respectively.
Non-audit fees billed by E&Y for services rendered to the Registrant’s investment adviser and any entity controlling, controlled by, or under common control with the adviser that provides ongoing services to the Registrant were $0 and $0 for the fiscal years ended 2021 and 2022, respectively.
Non-audit fees billed by Tait Weller for services rendered to the Registrant were $0 for the fiscal year ended 2021.
Non-audit fees billed by Tait Weller for services rendered to the Registrant’s investment adviser and any entity controlling, controlled by, or under common control with the adviser that provides ongoing services to the Registrant were $0 for the fiscal year ended 2021.
(h) The Audit Committee of the Board considered whether the provision of non-audit services rendered to the Registrant’s investment adviser and any entity controlling, controlled by, or under common control with the adviser that provides ongoing services to the Registrant that were not pre-approved by the Audit Committee because the engagement did not relate directly to the operations and financial reporting of the Registrant is compatible with maintaining E&Y’s and Tait Weller’s independence.
Item 5. Audit Committee of Listed Registrants.
Not applicable to the Registrant.
Item 6. Schedule of Investments.
The complete schedule of investments for each series is disclosed in the Registrant’s annual report, which is included as Item 1 of this Form N-CSR.
Item 7. Disclosure of Proxy Voting Policies and Procedures for Closed-End Management Investment Companies.
Not applicable to the Registrant.
Item 8. Portfolio Managers of Closed-End Management Investment Companies.
Not applicable to the Registrant.
Item 9. Purchases of Equity Securities by Closed-End Management Investment Company and Affiliated Purchasers.
Not applicable to the Registrant.
Item 10. Submission of Matters to a Vote of Security Holders.
There were no changes to the procedures by which shareholders may recommend nominees to the Board.
Item 11. Controls and Procedures.
| (a) | Based on an evaluation of the disclosure controls and procedures (as defined in Rule 30a-3(c) under the Act) as of a date within 90 days of the filing date of this report, the Chief Executive Officer and President and the Treasurer and Principal Financial and Accounting Officer of the Registrant have concluded that such disclosure controls and procedures are effectively designed to ensure that information required to be disclosed by the Registrant on Form N-CSR is accumulated and communicated to the Registrant’s management to allow timely decisions regarding required disclosure. |
| (b) | There were no significant changes in the Registrant’s internal controls over financial reporting (as defined in Rule 30a-3(d) under the Act) that occurred during the Registrant’s most recent fiscal half-year period covered by this report that have materially affected, or are reasonably likely to materially affect, the Registrant’s internal control over financial reporting. |
Item 12. Disclosure of Securities Lending Activities for Closed-End Management Investment Companies.
Not applicable to the Registrant.
Item 13. Exhibits.
| (a)(3) | Not applicable to the Registrant. |
The certification furnished pursuant to Rule 30a-2(b) under the Act and Section 906 of the Sarbanes-Oxley Act will not be deemed “filed” for purposes of Section 18 of the Securities Exchange Act of 1934, as amended (“Exchange Act”), or otherwise subject to the liability of that section. Such certification will not be deemed to be incorporated by reference into any filing under the Securities Act of 1933, as amended, or the Exchange Act, except to the extent that the Registrant specifically incorporates it by reference.
SIGNATURES
Pursuant to the requirements of the Securities Exchange Act of 1934 and the Investment Company Act of 1940, the Registrant has duly caused this report to be signed on its behalf by the undersigned, thereunto duly authorized.
Neuberger Berman Income Funds
| By: | /s/ Joseph V. Amato |
| Joseph V. Amato |
| Chief Executive Officer and President |
Date: January 5, 2023
Pursuant to the requirements of the Securities Exchange Act of 1934 and the Investment Company Act of 1940, this report has been signed below by the following persons on behalf of the Registrant and in the capacities and on the dates indicated.
| By: | /s/ Joseph V. Amato |
| Joseph V. Amato |
| Chief Executive Officer and President |
Date: January 5, 2023
| By: | /s/ John M. McGovern
|
| John M. McGovern |
| Treasurer and Principal Financial and Accounting Officer |