As filed with the Securities and Exchange Commission on January 5, 2024
UNITED STATES
SECURITIES AND EXCHANGE COMMISSION
Washington, D.C. 20549
FORM N-CSR
CERTIFIED SHAREHOLDER REPORT OF
REGISTERED MANAGEMENT INVESTMENT COMPANIES
Investment Company Act file number: 811-03802
NEUBERGER BERMAN INCOME FUNDS
(Exact Name of Registrant as specified in charter)
c/o Neuberger Berman Investment Advisers LLC
1290 Avenue of the Americas
New York, New York 10104-0002
(Address of Principal Executive Offices – Zip Code)
Joseph V. Amato
Chief Executive Officer and President
Neuberger Berman Income Funds
c/o Neuberger Berman Investment Advisers LLC
1290 Avenue of the Americas
New York, New York 10104-0002
Lori L. Schneider, Esq.
K&L Gates LLP
1601 K Street, N.W.
Washington, D.C. 20006-1600
(Names and Addresses of agents for service)
Registrant’s telephone number, including area code: (212) 476-8800
Date of fiscal year end: October 31
Date of reporting period: October 31, 2023
Form N-CSR is to be used by management investment companies to file reports with the Commission not later than 10 days after the transmission to stockholders of any report that is required to be transmitted to stockholders under Rule 30e-1 under the Investment Company Act of 1940, as amended (“Act”) (17 CFR 270.30e-1). The Commission may use the information provided on Form N-CSR in its regulatory, disclosure review, inspection, and policymaking roles.
A registrant is required to disclose the information specified by Form N-CSR, and the Commission will make this information public. A registrant is not required to respond to the collection of information contained in Form N-CSR unless the Form displays a currently valid Office of Management and Budget (“OMB”) control number. Please direct comments concerning the accuracy of the information collection burden estimate and any suggestions for reducing the burden to the Secretary, Securities and Exchange Commission, 450 Fifth Street, NW, Washington, DC 20549-0609. The OMB has reviewed this collection of information under the clearance requirements of 44 U.S.C. § 3507.
Item 1. Report to Shareholders.
(a) Following is a copy of the annual report transmitted to shareholders pursuant to Rule 30e-1 under the Act.
Neuberger Berman
Income Funds
| |
| |
Institutional Class Shares | |
| |
|
Emerging Markets Debt Fund |
Floating Rate Income Fund |
|
Municipal High Income Fund |
|
Municipal Intermediate Bond Fund |
|
|
Annual Report
October 31, 2023
The "Neuberger Berman" name and logo and "Neuberger Berman Investment Advisers LLC" name are registered service marks of Neuberger Berman Group LLC. The individual Fund names in this piece are either service marks or registered service marks of Neuberger Berman Investment Advisers LLC, an affiliate of Neuberger Berman BD LLC, distributor, member FINRA. ©2023 Neuberger Berman BD LLC, distributor. All rights reserved.
President’s Letter
Dear Shareholder,
I am pleased to present this annual shareholder report for the Neuberger Berman Income Funds covering the fiscal year ended October 31, 2023 (the reporting period).
The taxable investment-grade fixed income market was largely flat during the reporting period. That said, there were periods of elevated volatility, as investors reacted to the evolving inflation picture, ongoing interest rate hikes by the U.S. Federal Reserve Board (Fed), and a surprisingly resilient economy. Other factors impacting the market were unrest in the banking sector, the threat of a government shutdown, and numerous geopolitical events.
Throughout the reporting period, the Fed remained steadfast in its commitment to rein in inflation, while attempting to orchestrate a "soft landing" for the economy. After raising the federal funds rate seven times in calendar year 2022, the Fed continued to push its policy rate higher with hikes in January, March and May 2023. After pausing in June, the central bank again pushed the policy rate higher in July to a range between 5.25% and 5.50%, the highest level in 22 years. While the Fed held steady in both September and November (after the reporting period ended), it has not ruled out the potential for additional rate hikes in the future.
Short-, intermediate- and long-term Treasury yields moved higher, pushing their prices lower (yields and bond prices generally move in the opposite direction). Meanwhile, credit spreads were mixed, with corporate and emerging markets sovereign spreads tightening, whereas mortgage-backed securities and commercial mortgage-backed securities spreads widened modestly over the reporting period. All told, the broad taxable bond market, as measured by the Bloomberg U.S. Aggregate Bond Index, returned 0.36% during the reporting period. The municipal (i.e., tax-free) market was also negatively impacted by rising interest rates.
While the U.S. economy has surprised to the upside, a number of potential headwinds could cause growth to moderate in the coming quarters, in our view. Inflation remains "sticky" and well above the Fed’s 2% target. This has led to expectations for a "higher for longer" interest rate environment. Meanwhile, robust consumer spending is unlikely to continue at its torrid pace as the cumulative impact from higher long-term interest rates take hold.
Continued volatility in the financial markets cannot be ruled out. In such an environment, it’s our belief that professional portfolio management can be extremely valuable to help navigate shifting market dynamics. While elevated volatility can be unnerving, we believe it’s best to take a long-term approach and look to capitalize on these periods to identify attractive investment opportunities for our shareholders.
Thank you for your support and trust. We look forward to continuing to serve your investment needs in the years to come.
Sincerely,
Joseph V. Amato
President and CEO
Neuberger Berman Income Funds
Core Bond Fund Commentary (Unaudited)
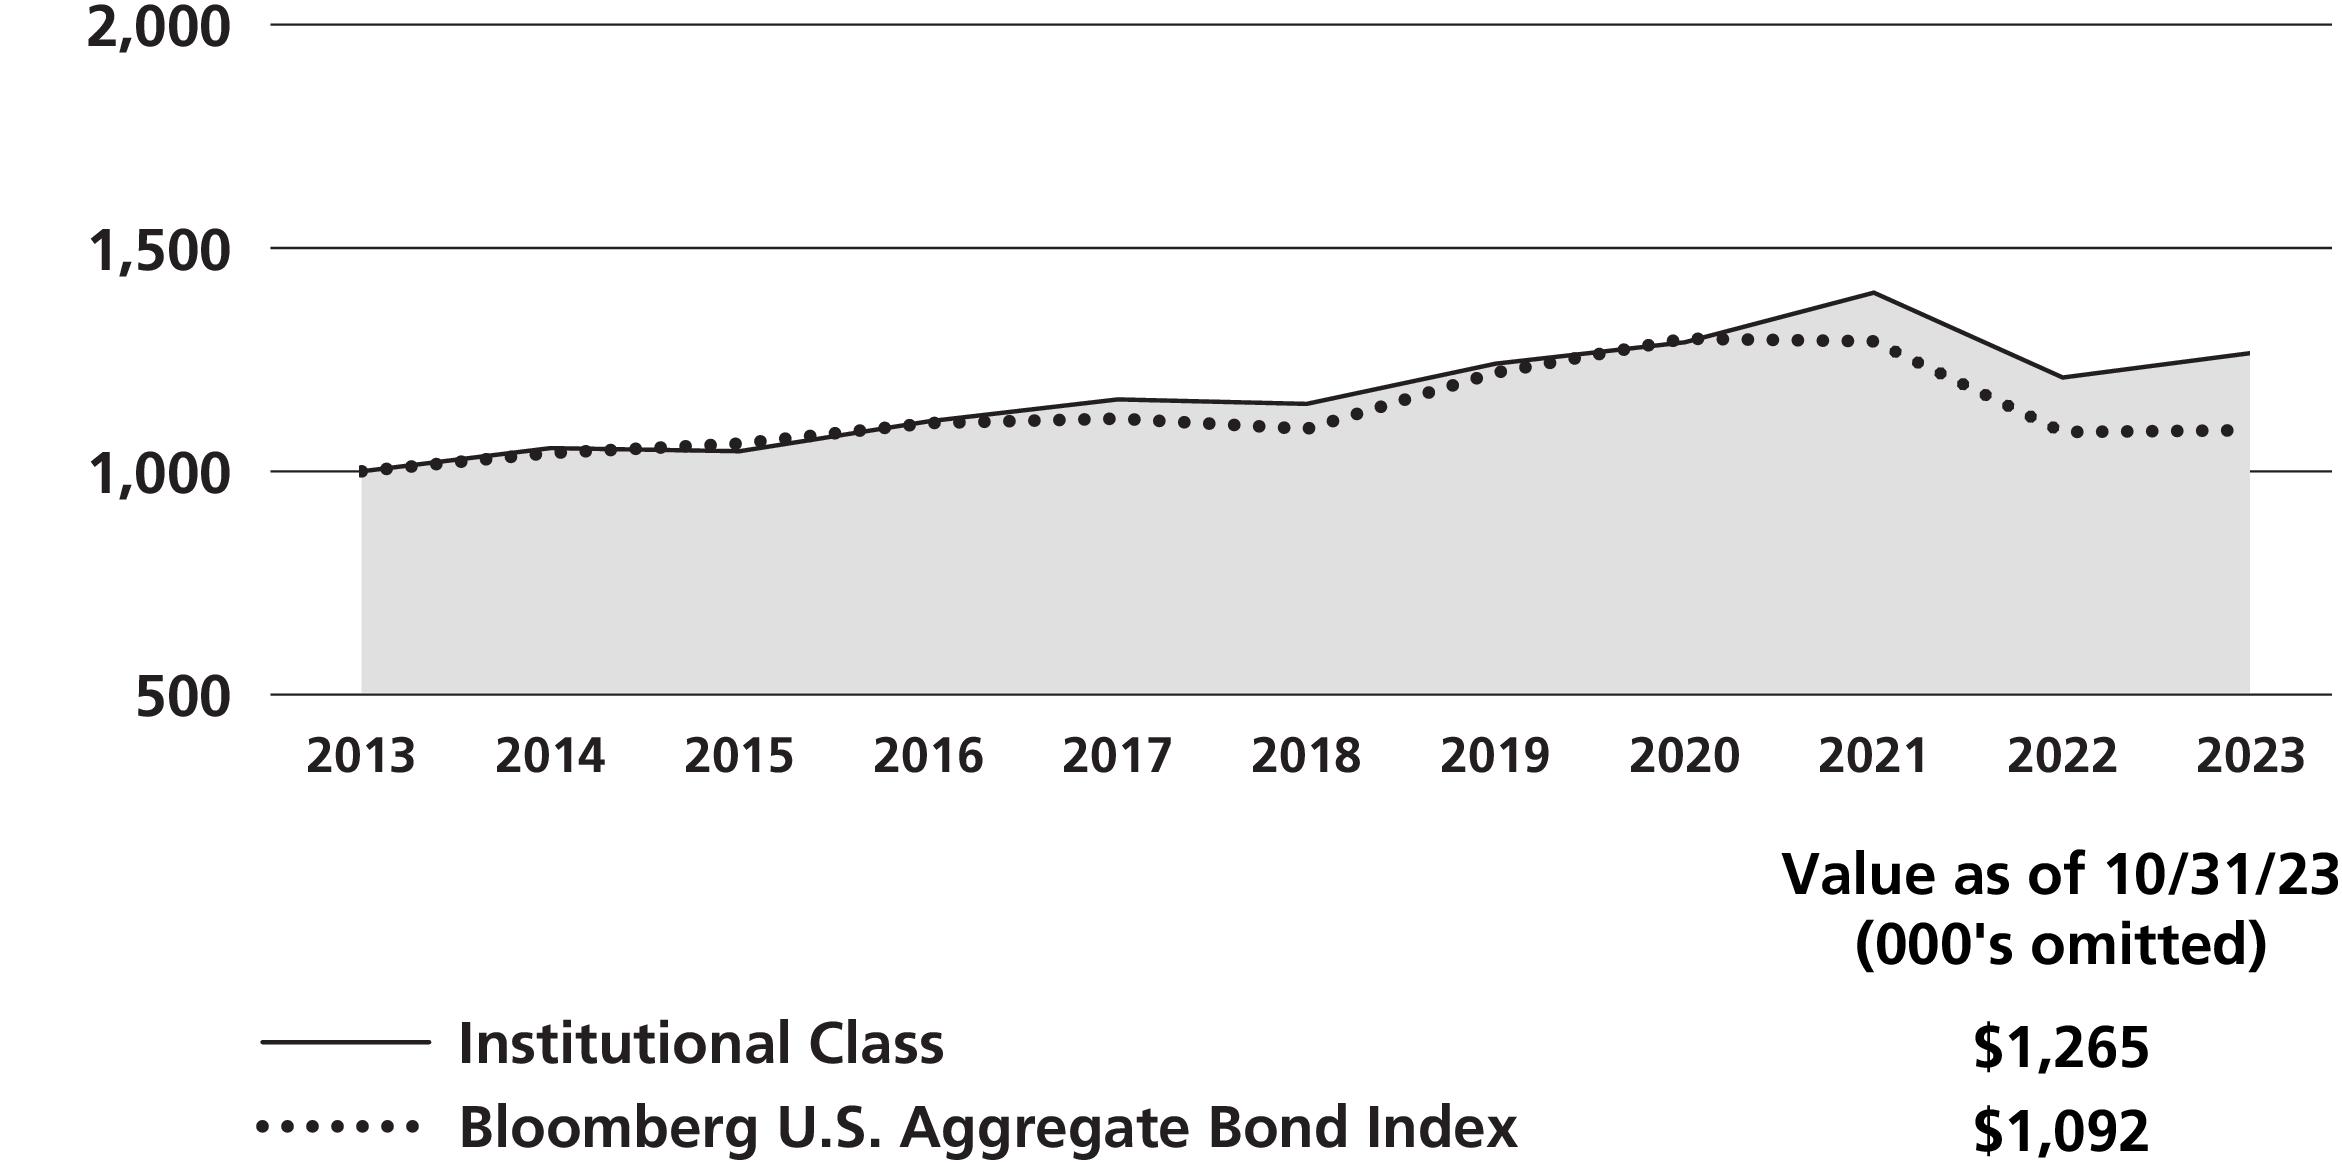
Neuberger Berman Core Bond Fund Institutional Class delivered a 0.46% total return for the fiscal year ended October 31, 2023 (the reporting period) and outperformed its benchmark, the Bloomberg U.S. Aggregate Bond Index (the Index), which provided a 0.36% total return for the same period. (Performance for all share classes is provided in the table immediately following this letter.)
The taxable investment-grade fixed income market, as measured by the Index, posted a modest gain during the reporting period. A number of factors impacted the market, including the evolving inflation picture, ongoing interest rate hikes by the U.S. Federal Reserve Board (Fed), unrest in the regional banking industry, and several geopolitical events. Despite headwinds, the U.S. economy was surprisingly resilient and continued to expand. All told, short-, intermediate- and long-term Treasury yields moved higher (yields and bond prices generally move in the opposite direction) and credit spreads were mixed during the reporting period.
In terms of relative performance, security selection in investment-grade credit and agency mortgage-backed securities (MBS) were the largest contributors during the reporting period, followed by the Fund’s allocations to mortgage credit, collateralized loan obligations (CLOs) and U.S. Treasury Inflation-Protected Securities (TIPS). Security selection in asset-backed securities (ABS) and overweight exposures to ABS and commercial mortgage-backed securities (CMBS) versus the Index were also additive. The Fund’s interest rate positioning was the main detractor from relative performance, primarily due to the Fund’s modest duration overweight; security selection in investment-grade credit slightly detracted.
The Fund’s use of futures contracts detracted from performance during the reporting period.
We made some relative value positioning adjustments during the period. We increased the Fund’s exposure to ABS, agency MBS and mortgage credit, and we reduced exposure to nominal U.S. Treasuries and CMBS. We tactically added exposure to TIPS in March and sold in July due to our views on valuations. As of the end of the reporting period, the Fund was overweight a diversified mix of securitized sectors—including ABS, agency MBS, CMBS, CLOs and mortgage credit—balanced by underweight exposure in nominal U.S. Treasuries.
Coming into 2023, many anticipated a dramatically slowing economy that would lead to progress on inflation and eventually cause central banks to pull back on monetary tightening. However, such expectations underestimated the overhang of COVID-era stimulus and U.S. spending tied to climate and infrastructure. Flush with excess savings and willing to utilize credit, consumers have continued to spend at a robust pace, moving from goods purchases to services and travel. Corporate earnings, although down, have been far more resilient than many expected. Meanwhile inflation has made an encouraging move downward but remains well above target. This has reshuffled expectations around the Fed’s policy stance, resulting in an upward shift in longer-term yields over the past few months. There are signs of fragility, however. In the U.S., consumers appear to be hitting their limit, as savings are depleted, federal student loan payments resume, and credit card balances become overstuffed. The industrial economy, meanwhile, seems ready to rebound given the demand for re-shoring and infrastructure spending. From a policy perspective, we believe the Fed is generally close to done on raising interest rates. However, a slower but still resilient U.S. economy and structural constraints on inflation are likely to keep us in a "higher for longer" rate environment, in our view, as the central bank waits to see the lagging impacts of aggressive tightening.
Sincerely,
Thanos Bardas, David M. Brown, Nathan Kush and Brad Tank
Portfolio Managers
Information about principal risks of investing in the Fund is set forth in the prospectus and statement of additional information.
The portfolio composition, industries and holdings of the Fund are subject to change without notice.
The opinions expressed are those of the Fund’s portfolio managers. The opinions are as of the date of this report and are subject to change without notice.
Core Bond Fund (Unaudited)
PORTFOLIO BY INVESTMENT TYPE |
(as a % of Total Net Assets) |
| |
| |
Foreign Government Securities | |
Mortgage-Backed Securities | |
U.S. Government Agency Securities | |
U.S. Treasury Obligations | |
| |
Other Assets Less Liabilities | |
| |
| Includes the impact of the Fund's open positions in derivatives (other than options purchased), if any. |
PERFORMANCE HIGHLIGHTS1,2 | | | |
| | Average Annual Total Return
Ended 10/31/2023 |
| | | | |
| | | | | |
| | | | | |
| | | | | |
| | | | | |
| | | | | |
| | | | | |
| | | | |
| | | | | |
| | | | | |
| | | | | |
Bloomberg U.S. Aggregate Bond Index5,6 | | | | |
The performance data quoted represent past performance and do not indicate future results. Current performance may be lower or higher than the performance data quoted. For current performance data, including current to the most recent month-end, please visit www.nb.com/performance.
The results shown in the table reflect the reinvestment of income dividends and other distributions, if any. The results do not reflect the effect of taxes a shareholder would pay on Fund distributions or on the redemption of Fund shares.
The investment return and principal value of an investment will fluctuate and shares, when redeemed, may be worth more or less than their original cost.
Returns would have been lower if Neuberger Berman Investment Advisers LLC ("NBIA") had not reimbursed certain expenses and/or waived a portion of the investment management fees during certain of the periods shown. Repayment by a class (of expenses previously reimbursed and/or fees previously waived by NBIA) will decrease the class’s returns. Please see Note B in the Notes to Financial Statements for specific information regarding expense reimbursement and/or fee waiver arrangements.
As stated in the Fund’s most recent prospectus, the total annual operating expense ratios for fiscal year 2022 were 0.93%, 0.43%, 0.80%, 1.58% and 0.34% for Investor Class, Institutional Class, Class A, Class C and Class R6 shares, respectively (before expense reimbursements and/or fee waivers, if any). The expense ratios were 0.78%, 0.38%, 0.78%, 1.54% and 0.29% for Investor Class, Institutional Class, Class A, Class C and Class R6 shares, respectively, after expense reimbursements and/or fee waivers. The expense ratios for the annual period ended October 31, 2023, can be found in the Financial Highlights section of this report.
Returns shown with a sales charge reflect the deduction of the current maximum initial sales charge of 4.25% for Class A shares and the contingent deferred sales charge (CDSC) for Class C shares. The CDSC for Class C shares is 1.00%, which is reduced to 0% after 1 year. The performance of the Fund’s share classes will differ primarily due to different sales charge structures and class expenses. Please see the prospectus for more information about sales charge structures, if any, and class expenses for your share class.
Core Bond Fund (Unaudited)
COMPARISON OF A $1,000,000 INVESTMENT
(000's omitted)
This graph shows the change in value of a hypothetical $1,000,000 investment in the Fund over the past 10 fiscal years, or since the Fund’s inception if it has not operated for 10 years. The graph is based on the Institutional Class shares only; the performance of the Fund’s share classes will differ primarily due to different sales charge structures and class expenses (see Performance Highlights chart on previous page). The result is compared with benchmarks, which include a broad-based market index and may include a more narrowly based index. Market indices have not been reduced to reflect any of the fees and costs of investing. The results shown in the graph reflect the reinvestment of income dividends and other distributions, if any. The results do not reflect the effect of taxes a shareholder would pay on Fund distributions or on the redemption of Fund shares. Results represent past performance and do not indicate future results.
Emerging Markets Debt Fund Commentary (Unaudited)
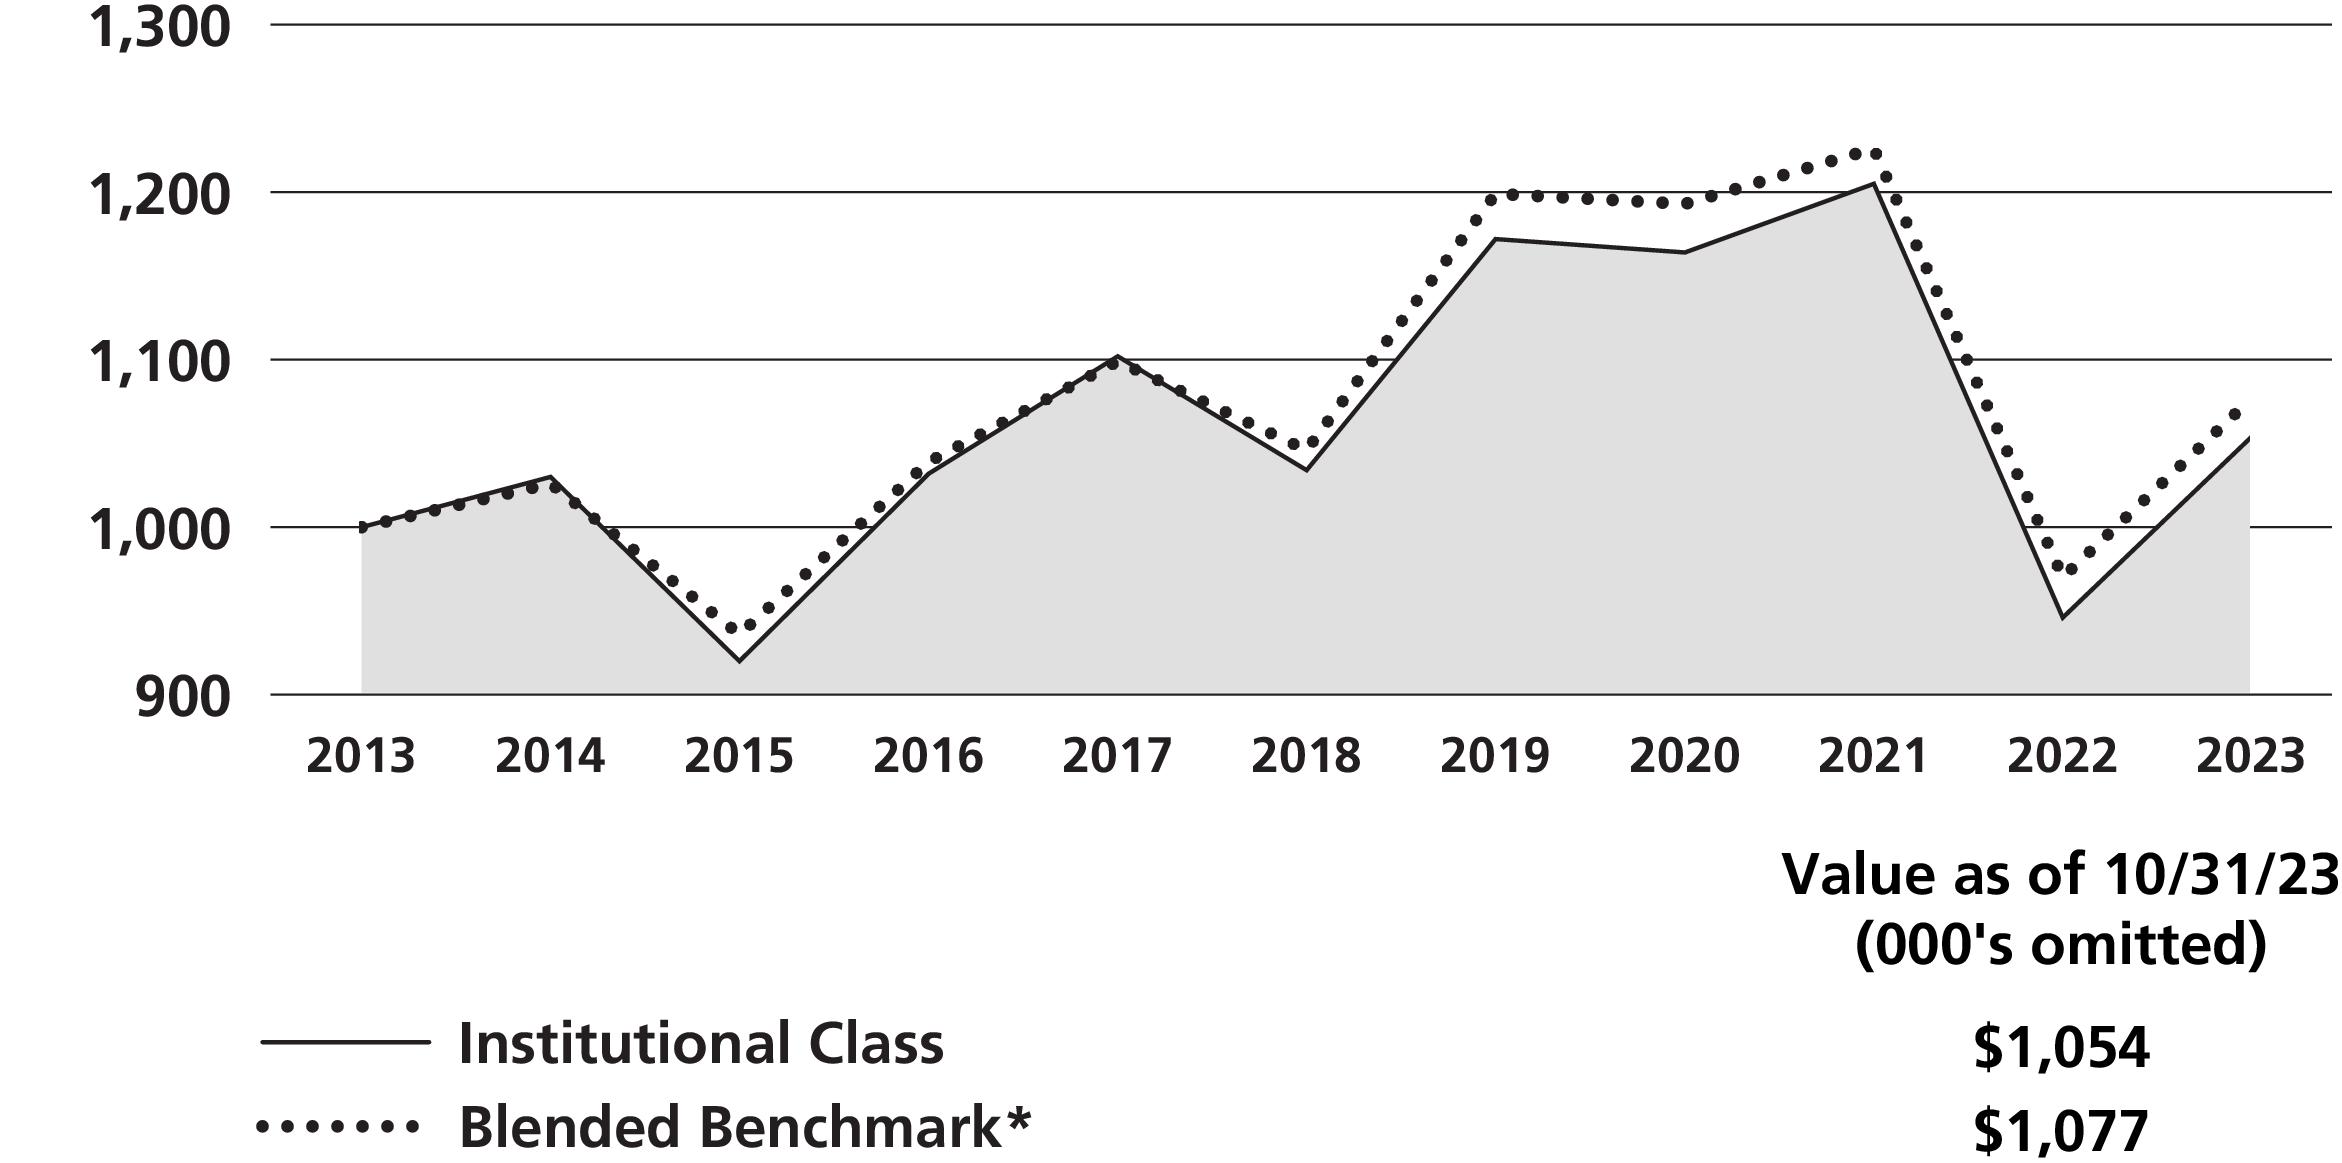
Neuberger Berman Emerging Markets Debt Fund Institutional Class generated an 11.36% total return for the fiscal year ended October 31, 2023 (the reporting period), and outperformed its benchmark, a blend consisting of 50% J.P. Morgan Government Bond Index—Emerging Markets (GBI-EM) Global Diversified, 25% J.P. Morgan Emerging Markets Bond Index (EMBI®)—Global Diversified, and 25% J.P. Morgan Corporate Emerging Markets Bond Index (CEMBI)—Diversified (collectively, the Index), which delivered an 11.05% total return for the same period. (Performance for all share classes is provided in the table immediately following this letter.)
During the reporting period, overall market sentiment was driven by developments around inflation and monetary policy, with signs of peaking hiking cycles and disinflation across various emerging countries supporting local bond returns. China’s reopening was a supportive theme early on in the reporting period while defaulted names continued to make progress towards a restructuring agreement with official and private creditors. However, Treasuries as well as risk assets came under more pressure as the year progressed, with expectations that interest rates might remain higher for longer and economic data might soften further, particularly in Europe and China. Geopolitical events also disrupted markets. U.S. Treasury 10-year yields saw significant volatility, ending the reporting period at 4.88%, higher by nearly 0.80% from the beginning of the reporting period and close to the levels not seen since the 2008 financial crisis. Emerging markets (EM) benchmark spreads tightened to 4.36% from 5.42%, with a trough of 3.98% in July. EM currencies strengthened versus the U.S. dollar on average, with currencies such as Colombian peso and Hungarian forint leading the way.
The Fund outperformed the Index during the reporting period due to the bottom-up security selection in the underlying sleeves in the portfolio. Hard currency positioning in high yielding countries, including Sri Lanka, El Salvador and Argentina, which recovered after the sell-off in 2022, was the primary driver of performance. The underweight to select high-yielding frontier names versus the Index detracted from performance. Corporate positioning was also additive overall given the underweight in Chinese real estate and strong security selection across the financial and metals and mining sectors. Idiosyncratic events in distressed positions in Brazil and Chile weighed on performance. The impact from local currency positioning was neutral over the period. The underweight exposure to Turkish rates and foreign currency (FX) was a strong driver of performance as was the active positioning in Egypt throughout the period. The overweight to the Colombian peso was also additive. However, the overweight rates positions in Brazil, Israel and Mexico detracted from performance.
The contribution from tactical allocation was negative over the reporting period. The tactical overweight to U.S. interest rate duration and a credit default swap index (CDX EM) position that we held due to the higher risk profile of the strategy detracted from performance. We cut these positions late in the period. The impact from asset allocation was negative. While the underweight to hard currency sovereigns and corporates was additive, it came at the cost of the tactical positioning around local currency which outperformed during the period.
The Fund’s aggregate use of futures, forward foreign currency, and swap contracts, detracted from performance during the reporting period.
Over the reporting period there were a number of changes within the Fund’s tactical asset allocation as well as the underlying sub-asset classes. Within the tactical asset allocation, we started the period with a slight underweight to hard currency and corporates and a 3% underweight exposure to local currency, while holding a 3% cash position. We deployed cash to move to an overweight position in hard currency in December 2022 to capture the market optimism but cut the exposure as the U.S. Federal Reserve Board continued to hike rates and U.S. Treasury yields remained elevated. We deployed cash to local currency markets, reaching an overweight of 1.5% in August 2023 before moving to neutral to reduce portfolio beta1 by the end of the reporting period. We also moved the hard currency and corporate sleeves to an underweight in favor of cash during the reporting period as market volatility increased. We actively maintained long positions in selected local rates markets through swaps during the reporting period to have exposure to the secular trend of lower EM inflation. We also removed the CDX EM
Emerging Markets Debt Fund Commentary (Unaudited)
position in the tactical asset allocation near the end of the reporting period. Finally, we had an interest rate duration overweight through September 2023.
From a bottom-up perspective, we continued to hold an overweight in the high yield segment of the market biased toward BB rated issuers, in the hard currency sleeve as we believe that valuations remain attractive in this part of the market. In terms of changes over the reporting period, we took profits in the high yield space early in the period as markets rallied.
In corporate positioning, we actively participated in the new issuance market, though activity was much more limited in the reporting period as issuers adapted to the rising rate environment. We favored financials across regions as we believed financial institutions to be well capitalized. We also favored the metals & mining sector, especially as commodities, especially copper, are likely to see support from improving global growth, combined with the rising global energy transition. We reduced exposure to Chinese real estate throughout the period given the ongoing challenges to growth and limited policy support from the government.
On the local currency side, we held a small amount of EM FX risk given our fundamental view on select currencies. These included modest overweights in Latin America (as well as South Africa). However, we remained close to neutral in overall EM FX positioning, given the recent U.S. dollar strength offering little incentive to add. On the rates side, we pared back our duration overweight leaving room to add in our key duration positions including in Brazil, Mexico, South Africa, Czech Republic, Indonesia, and South Korea, when we saw volatility subside. We have duration underweights in a few low yielding countries where we saw limited upside such as Thailand.
Going forward, uncertainty remains around the need for further monetary tightening in the U.S., given resilience in growth. Once a slowdown starts to materialize, financial conditions are likely to ease, creating the potential for upside in EM fixed income securities. Questions remain around China’s relatively weak recovery, deflation, and structural headwinds. We anticipate growth in China of 5.2% this year and 4.0% in 2024, supported by countercyclical monetary policy and the recent fiscal policy announcements. Still, for EM economies in aggregate, we believe gross domestic product growth is likely to outperform developed markets this year and next.
Broadly, we continue to anticipate disinflation to progress across most EM countries, despite recent volatility in food and energy prices. In our view, local currency bonds will likely regain their strength once core rates markets stabilize.
The key risks to our views are either an unexpected acceleration of inflation dynamics globally which could require substantially more rate hikes, or the unfolding of a global recession, which could push EM risk premia materially higher.
Sincerely,
Rob Drijkoningen, Gorky Urquieta, Bart Van der Made, Raoul Luttik,
Jennifer Gorgoll, Vera Kartseva and Nish Popat
Portfolio Co-Managers
1 Beta is a measure of the systematic risk of a portfolio. It is the covariance of the portfolio and a market index divided by the variance of the market index. Beta measures the historical sensitivity of a portfolio’s returns to movements in the market index. The beta of the market index will always be one. A portfolio with a beta above the market index (i.e., ˃1) means that the portfolio has greater volatility than the market index. If the beta of the portfolio is 1.2, a market increase in return of 1% implies a 1.2% increase in the portfolio’s return. If the beta of the portfolio is 0.8, a market decrease in return of 1% implies a 0.8% decrease in the portfolio’s return.
Information about principal risks of investing in the Fund is set forth in the prospectus and statement of additional information.
The portfolio composition, industries and holdings of the Fund are subject to change without notice.
The opinions expressed are those of the Fund’s portfolio managers. The opinions are as of the date of this report and are subject to change without notice.
Emerging Markets Debt Fund (Unaudited)
| | | |
| | Average Annual Total Return
Ended 10/31/2023 |
| | | | |
| | | | | |
| | | | | |
| | | | | |
| | | | | |
| | | | |
| | | | | |
| | | | | |
| | | | | |
| | | | |
*
Blended Benchmark is composed of 50% J.P. Morgan Government Bond Index—Emerging Markets (GBI-EM) Global Diversified, 25% J.P. Morgan Emerging Markets Bond Index (EMBI)—Global Diversified, and 25% J.P. Morgan Corporate Emerging Markets Bond Index (CEMBI)—Diversified, and is rebalanced monthly.
The performance data quoted represent past performance and do not indicate future results. Current performance may be lower or higher than the performance data quoted. For current performance data, including current to the most recent month-end, please visit www.nb.com/performance.
The results shown in the table reflect the reinvestment of income dividends and other distributions, if any. The results do not reflect the effect of taxes a shareholder would pay on Fund distributions or on the redemption of Fund shares.
The investment return and principal value of an investment will fluctuate and shares, when redeemed, may be worth more or less than their original cost.
Returns would have been lower if Neuberger Berman Investment Advisers LLC ("NBIA") had not reimbursed certain expenses and/or waived a portion of the investment management fees during certain of the periods shown. Repayment by a class (of expenses previously reimbursed and/or fees previously waived by NBIA) will decrease the class’s returns. Please see Note B in the Notes to Financial Statements for specific information regarding expense reimbursement and/or fee waiver arrangements.
As stated in the Fund’s most recent prospectus, the total annual operating expense ratios for fiscal year 2022 were 1.01%, 1.55% and 2.19% for Institutional Class, Class A and Class C shares, respectively (before expense reimbursements and/or fee waivers, if any). The expense ratios were 0.79%, 1.16% and 1.91% for Institutional Class, Class A and Class C shares, respectively, after expense reimbursements and/or fee waivers. The expense ratios for the annual period ended October 31, 2023, can be found in the Financial Highlights section of this report.
Returns shown with a sales charge reflect the deduction of the current maximum initial sales charge of 4.25% for Class A shares and the contingent deferred sales charge (CDSC) for Class C shares. The CDSC for Class C shares is 1.00%, which is reduced to 0% after 1 year. The performance of the Fund’s share classes will differ primarily due to different sales charge structures and class expenses. Please see the prospectus for more information about sales charge structures, if any, and class expenses for your share class.
Emerging Markets Debt Fund (Unaudited)
COMPARISON OF A $1,000,000 INVESTMENT
(000's omitted)
This graph shows the change in value of a hypothetical $1,000,000 investment in the Fund over the past 10 fiscal years, or since the Fund’s inception if it has not operated for 10 years. The graph is based on the Institutional Class shares only; the performance of the Fund’s share classes will differ primarily due to different sales charge structures and class expenses (see Performance Highlights chart on previous page). The result is compared with benchmarks, which include a broad-based market index and may include a more narrowly based index. Market indices have not been reduced to reflect any of the fees and costs of investing. The results shown in the graph reflect the reinvestment of income dividends and other distributions, if any. The results do not reflect the effect of taxes a shareholder would pay on Fund distributions or on the redemption of Fund shares. Results represent past performance and do not indicate future results.
*
Blended benchmark is composed of 50% J.P. Morgan Government Bond Index (GBI)—Emerging Markets Global Diversified, 25% J.P. Morgan Emerging Markets Bond Index (EMBI)—Global Diversified, and 25% J.P. Morgan Corporate Emerging Markets Bond Index (CEMBI)—Diversified, and is rebalanced monthly.
Floating Rate Income Fund Commentary (Unaudited)
Neuberger Berman Floating Rate Income Fund Institutional Class generated an 11.67% total return for the fiscal year ended October 31, 2023 (the reporting period) and underperformed its benchmark, the Morningstar LSTA US Leveraged Loan Index (the Index), which provided a 11.92% total return for the same period. (Performance for all share classes is provided in the table immediately following this letter.)
The senior floating rate bank loan market, as measured by the Index, generated strong positive returns during the reporting period. A number of factors impacted the overall fixed income market, including elevated and persistent inflation, aggressive rate hikes by the U.S. Federal Reserve Board (Fed), unrest in the regional banking industry and several large international banks, as well as several geopolitical events. Despite these headwinds, the U.S. economy was resilient and continued to expand. All told, loan yields moved higher, and investors benefited from this higher income, as base rates rose, and the U.S. loans weighted average bid prices increased over the reporting period.
We have the flexibility to allocate up to 20% of the Fund’s net assets to non-floating rate securities, usually fixed-rate senior bonds. However, over the reporting period, the Fund largely maintained its positioning in non-floating rate securities, as floating rate loans offered attractive relative value compared to fixed-rate bonds. The Fund's non-floating rate allocation ended the reporting period at approximately 7.1% of net assets compared to 7.3% of net assets at beginning of the reporting period.
From a sector perspective on a relative basis versus the Index, security selection within Diversified Financial Services and Software, along with security selection within and an underweight to Diversified Telecommunications Services, were the best performers. Conversely, security selection within and an underweight to Information Technology services, security selection within and an overweight to Health Care Technology, and security selection within Hotels, Restaurants & Leisure were the worst performers.
In terms of the Fund's portfolio credit quality on a relative basis versus the Index, security selection within and an overweight to B, an underweight to and security selection within BBB, security selection within and an underweight to not rated, and security selection within and an underweight to BB rated issuers were the best performers. Conversely, an underweight to and security selection within CCC and below rated issuers were the worst performers.
Looking ahead, with yields just under 10% on the U.S. senior floating rate loan market, we believe valuations are providing more-than-adequate compensation for the around average default outlook by the market, will continue to provide durable income, and are attractive compared to other fixed income alternatives. While the economy remains resilient, we believe slowing real demand has helped inflation continue to move downward. In our view, the lagged effects of monetary tightening, higher current interest rates and shifts in consumer behavior are likely to keep pushing inflation toward the Fed’s target range. However, higher interest rates could put more pressure on the consumer and broader economy. As credit dispersion has been on the rise, our analysts remain keenly focused on the specific fundamentals of individual issuers in their coverage, assessing the base and downside cases in the event of a soft-landing or recession. Relatively healthy consumer and business balance sheets and nominal GDP growth should continue to provide support for most issuers’ fundamentals, in our view. We believe our bottom-up, fundamental credit research that focuses on security selection, avoiding credit deterioration, and putting only our "best ideas" into portfolios, will position us well to take advantage of periods of volatility.
Sincerely,
Joseph P. Lynch and Stephen J. Casey
Portfolio Managers
Information about principal risks of investing in the Fund is set forth in the prospectus and statement of additional information.
The portfolio composition, industries and holdings of the Fund are subject to change without notice.
The opinions expressed are those of the Fund’s portfolio managers. The opinions are as of the date of this report and are subject to change without notice.
Floating Rate Income Fund Commentary (Unaudited)
The loan ratings noted above represent segments of the Morningstar LSTA US Leveraged Loan Index, which are determined based on the ratings issued by S&P Global.
Floating Rate Income Fund (Unaudited)
PORTFOLIO BY MATURITY DISTRIBUTION |
(as a % of Total Investments*) |
| |
One to less than Five Years | |
Five to less than Ten Years | |
| |
| |
| |
| Does not include Short-Term Investments or the impact of the Fund’s open positions in derivatives, if any. |
| |
| | | |
| | Average Annual Total Return
Ended 10/31/2023 |
| | | | |
| | | | | |
| | | | | |
| | | | | |
| | | | | |
| | | | |
| | | | | |
| | | | | |
| | | | | |
| | | | |
The performance data quoted represent past performance and do not indicate future results. Current performance may be lower or higher than the performance data quoted. For current performance data, including current to the most recent month-end, please visit www.nb.com/performance.
The results shown in the table reflect the reinvestment of income dividends and other distributions, if any. The results do not reflect the effect of taxes a shareholder would pay on Fund distributions or on the redemption of Fund shares.
The investment return and principal value of an investment will fluctuate and shares, when redeemed, may be worth more or less than their original cost.
Returns would have been lower if Neuberger Berman Investment Advisers LLC ("NBIA") had not reimbursed certain expenses and/or waived a portion of the investment management fees during certain of the periods shown. Repayment by a class (of expenses previously reimbursed and/or fees previously waived by NBIA) will decrease the class’s returns. Please see Note B in the Notes to Financial Statements for specific information regarding expense reimbursement and/or fee waiver arrangements.
As stated in the Fund’s most recent prospectus, the total annual operating expense ratios for fiscal year 2022 were 0.72%, 1.11% and 1.85% for Institutional Class, Class A and Class C shares, respectively (before expense reimbursements and/or fee waivers, if any, and after restatement). The expense ratios were 0.61%, 0.98% and 1.73% for Institutional Class, Class A and Class C shares, respectively, after expense reimbursements and/or fee waivers and restatement. The expense ratios for the annual period ended October 31, 2023, can be found in the Financial Highlights section of this report.
Returns shown with a sales charge reflect the deduction of the current maximum initial sales charge of 4.25% for Class A shares and the contingent deferred sales charge (CDSC) for Class C shares. The CDSC for Class C shares is 1.00%, which is reduced to 0% after 1 year. The performance of the Fund’s share classes will differ primarily due to different sales charge structures and class expenses. Please see the prospectus for more information about sales charge structures, if any, and class expenses for your share class.
Floating Rate Income Fund (Unaudited)
COMPARISON OF A $1,000,000 INVESTMENT
(000's omitted)
This graph shows the change in value of a hypothetical $1,000,000 investment in the Fund over the past 10 fiscal years, or since the Fund’s inception if it has not operated for 10 years. The graph is based on the Institutional Class shares only; the performance of the Fund’s share classes will differ primarily due to different sales charge structures and class expenses (see Performance Highlights chart on previous page). The result is compared with benchmarks, which include a broad-based market index and may include a more narrowly based index. Market indices have not been reduced to reflect any of the fees and costs of investing. The results shown in the graph reflect the reinvestment of income dividends and other distributions, if any. The results do not reflect the effect of taxes a shareholder would pay on Fund distributions or on the redemption of Fund shares. Results represent past performance and do not indicate future results.
High Income Bond Fund Commentary (Unaudited)
Neuberger Berman High Income Bond Fund Investor Class generated a 4.03% total return for the fiscal year ended October 31, 2023 (the reporting period), underperforming its benchmark, the ICE BofA U.S. High Yield Constrained Index (the Index), which provided a 5.81% total return for the same period. (Performance for all share classes is provided in the table immediately following this letter.)
The high-yield market, as measured by the Index, generated a positive return during the reporting period. A number of factors impacted the overall fixed income market, including elevated and persistent inflation, aggressive rate hikes by the U.S. Federal Reserve Board (Fed), unrest in the regional banking industry and several large international banks, as well as rising geopolitical risk. Despite these headwinds, the U.S. economy was resilient and continued to expand. All told, high-yield credit spreads tightened, and high-yield bond prices rose during the reporting period.
During the reporting period, from a sector perspective on a relative basis versus the Index, security selection within and an overweight to Diversified Financial Services and Building Materials, as well as an underweight to Media-Broadcast, were the best performers. In contrast, security selection within Telecommunications, and Media-Cable, as well as security selection within, and an overweight to Technology & Electronics were the worst performers.
In terms of the Fund's portfolio credit quality on a relative basis versus the Index during the reporting period, security selection within BBB and above, security selection within and an overweight to B, an overweight to not rated, and an underweight to BB rated issuers were the best performers. Conversely, security selection within and an overweight to CCC and below, and security selection within BB and not rated, as well as an overweight to BBB and above rated issuers were the worst performers. Over the reporting period, distressed CCC rated issuers, as measured by the ICE BofA U.S. Distressed High Yield Index, outperformed with a total return of 8.29%. As a result of our disciplined approach, which avoided investing in some of these distressed CCC rated issuers during the reporting period, the Fund’s relative performance was hurt.
The Fund’s use of swap contracts contributed positively to performance during the reporting period.
Looking ahead, we remain constructive on the U.S. high-yield market at current spread levels. In our view, U.S. high-yield valuations and yields are attractive and compensating investors for the around average default outlook by the market. While the economy remains resilient, we believe slowing real demand has helped inflation continue to move downward. In our view, the lagged effects of monetary tightening, higher current interest rates and shifts in consumer behavior are likely to keep pushing inflation toward the Fed’s target range. However, higher interest rates could put more pressure on the consumer and broader economy. As credit dispersion has been on the rise, our analysts remain keenly focused on the specific fundamentals of individual issuers in their coverage, assessing the base and downside cases in the event of a soft-landing or recession. Relatively healthy consumer and business balance sheets and nominal GDP growth should continue to provide support for most issuers’ fundamentals, in our view. While the incoming macroeconomic data and overall credit cycle dynamics can move the high-yield market day-to-day, we remain very focused on industry-specific trends and idiosyncratic risks to individual issuers. We believe our bottom-up, fundamental credit research that focuses on security selection, avoiding credit deterioration, and putting only our "best ideas" into portfolios, will position us well to take advantage of periods of volatility.
Sincerely,
Joe Lind and Christopher Kocinski
Portfolio Co-Managers
Information about principal risks of investing in the Fund is set forth in the prospectus and statement of additional information.
The portfolio composition, industries and holdings of the Fund are subject to change without notice.
The opinions expressed are those of the Fund’s portfolio managers. The opinions are as of the date of this report and are subject to change without notice.
The performance of certain rated bonds within the benchmark, as noted above, represent issues that are rated Ba1/BB+ through Ba3/BB-, B1/B+ through B3/B- and Caa1/CCC+ or lower, based on an average of Moody’s, S&P and Fitch, as calculated by ICE BofA. Issues rated Baa3/BBB- and higher are not in the Index.
High Income Bond Fund (Unaudited)
PORTFOLIO BY MATURITY DISTRIBUTION |
(as a % of Total Investments*) |
| |
One to less than Five Years | |
Five to less than Ten Years | |
| |
| |
| Does not include Short-Term Investments or the impact of the Fund’s open positions in derivatives, if any. |
PERFORMANCE HIGHLIGHTS8,9 | | | |
| | Average Annual Total Return
Ended 10/31/2023 |
| | | | |
| | | | | |
| | | | | |
| | | | | |
| | | | | |
| | | | | |
| | | | | |
| | | | | |
| | | | | |
| | | | |
| | | | | |
| | | | | |
| | | | | |
| | | | |
The performance data quoted represent past performance and do not indicate future results. Current performance may be lower or higher than the performance data quoted. For current performance data, including current to the most recent month-end, please visit www.nb.com/performance.
The results shown in the table reflect the reinvestment of income dividends and other distributions, if any. The results do not reflect the effect of taxes a shareholder would pay on Fund distributions or on the redemption of Fund shares.
The investment return and principal value of an investment will fluctuate and shares, when redeemed, may be worth more or less than their original cost.
Returns would have been lower if Neuberger Berman Investment Advisers LLC ("NBIA") had not reimbursed certain expenses and/or waived a portion of the investment management fees during certain of the periods shown. Repayment by a class (of expenses previously reimbursed and/or fees previously waived by NBIA) will decrease the class’s returns. Please see Note B in the Notes to Financial Statements for specific information regarding expense reimbursement and/or fee waiver arrangements.
As stated in the Fund’s most recent prospectus, the total annual operating expense ratios for fiscal year 2022 were 0.88%, 0.71%, 1.13%, 1.86%, 1.37%, 0.61% and 0.58% for Investor Class, Institutional Class, Class A, Class C, Class R3, Class R6 and Class E shares, respectively. The total annual operating expense ratio for Class A includes the class’s repayment of expenses previously reimbursed and/or fees previously waived under the contractual expense limitation by NBIA. The expense ratio for fiscal year 2022 is 0.10% for Class E after expense reimbursements and/or fee waivers. The expense ratios for the annual period ended October 31, 2023, can be found in the Financial Highlights section of this report.
Returns shown with a sales charge reflect the deduction of the current maximum initial sales charge of 4.25% for Class A shares and the contingent deferred sales charge (CDSC) for Class C shares. The CDSC for Class C shares is 1.00%, which is reduced to 0% after 1 year. The performance of the Fund’s share classes will differ primarily due to different sales charge structures and class expenses. Please see the prospectus for more information about sales charge structures, if any, and class expenses for your share class.
High Income Bond Fund (Unaudited)
COMPARISON OF A $10,000 INVESTMENT
This graph shows the change in value of a hypothetical $10,000 investment in the Fund over the past 10 fiscal years, or since the Fund’s inception if it has not operated for 10 years. The graph is based on the Investor Class shares only; the performance of the Fund’s share classes will differ primarily due to different sales charge structures and class expenses (see Performance Highlights chart on previous page). The result is compared with benchmarks, which include a broad-based market index and may include a more narrowly based index. Market indices have not been reduced to reflect any of the fees and costs of investing. The results shown in the graph reflect the reinvestment of income dividends and other distributions, if any. The results do not reflect the effect of taxes a shareholder would pay on Fund distributions or on the redemption of Fund shares. Results represent past performance and do not indicate future results.
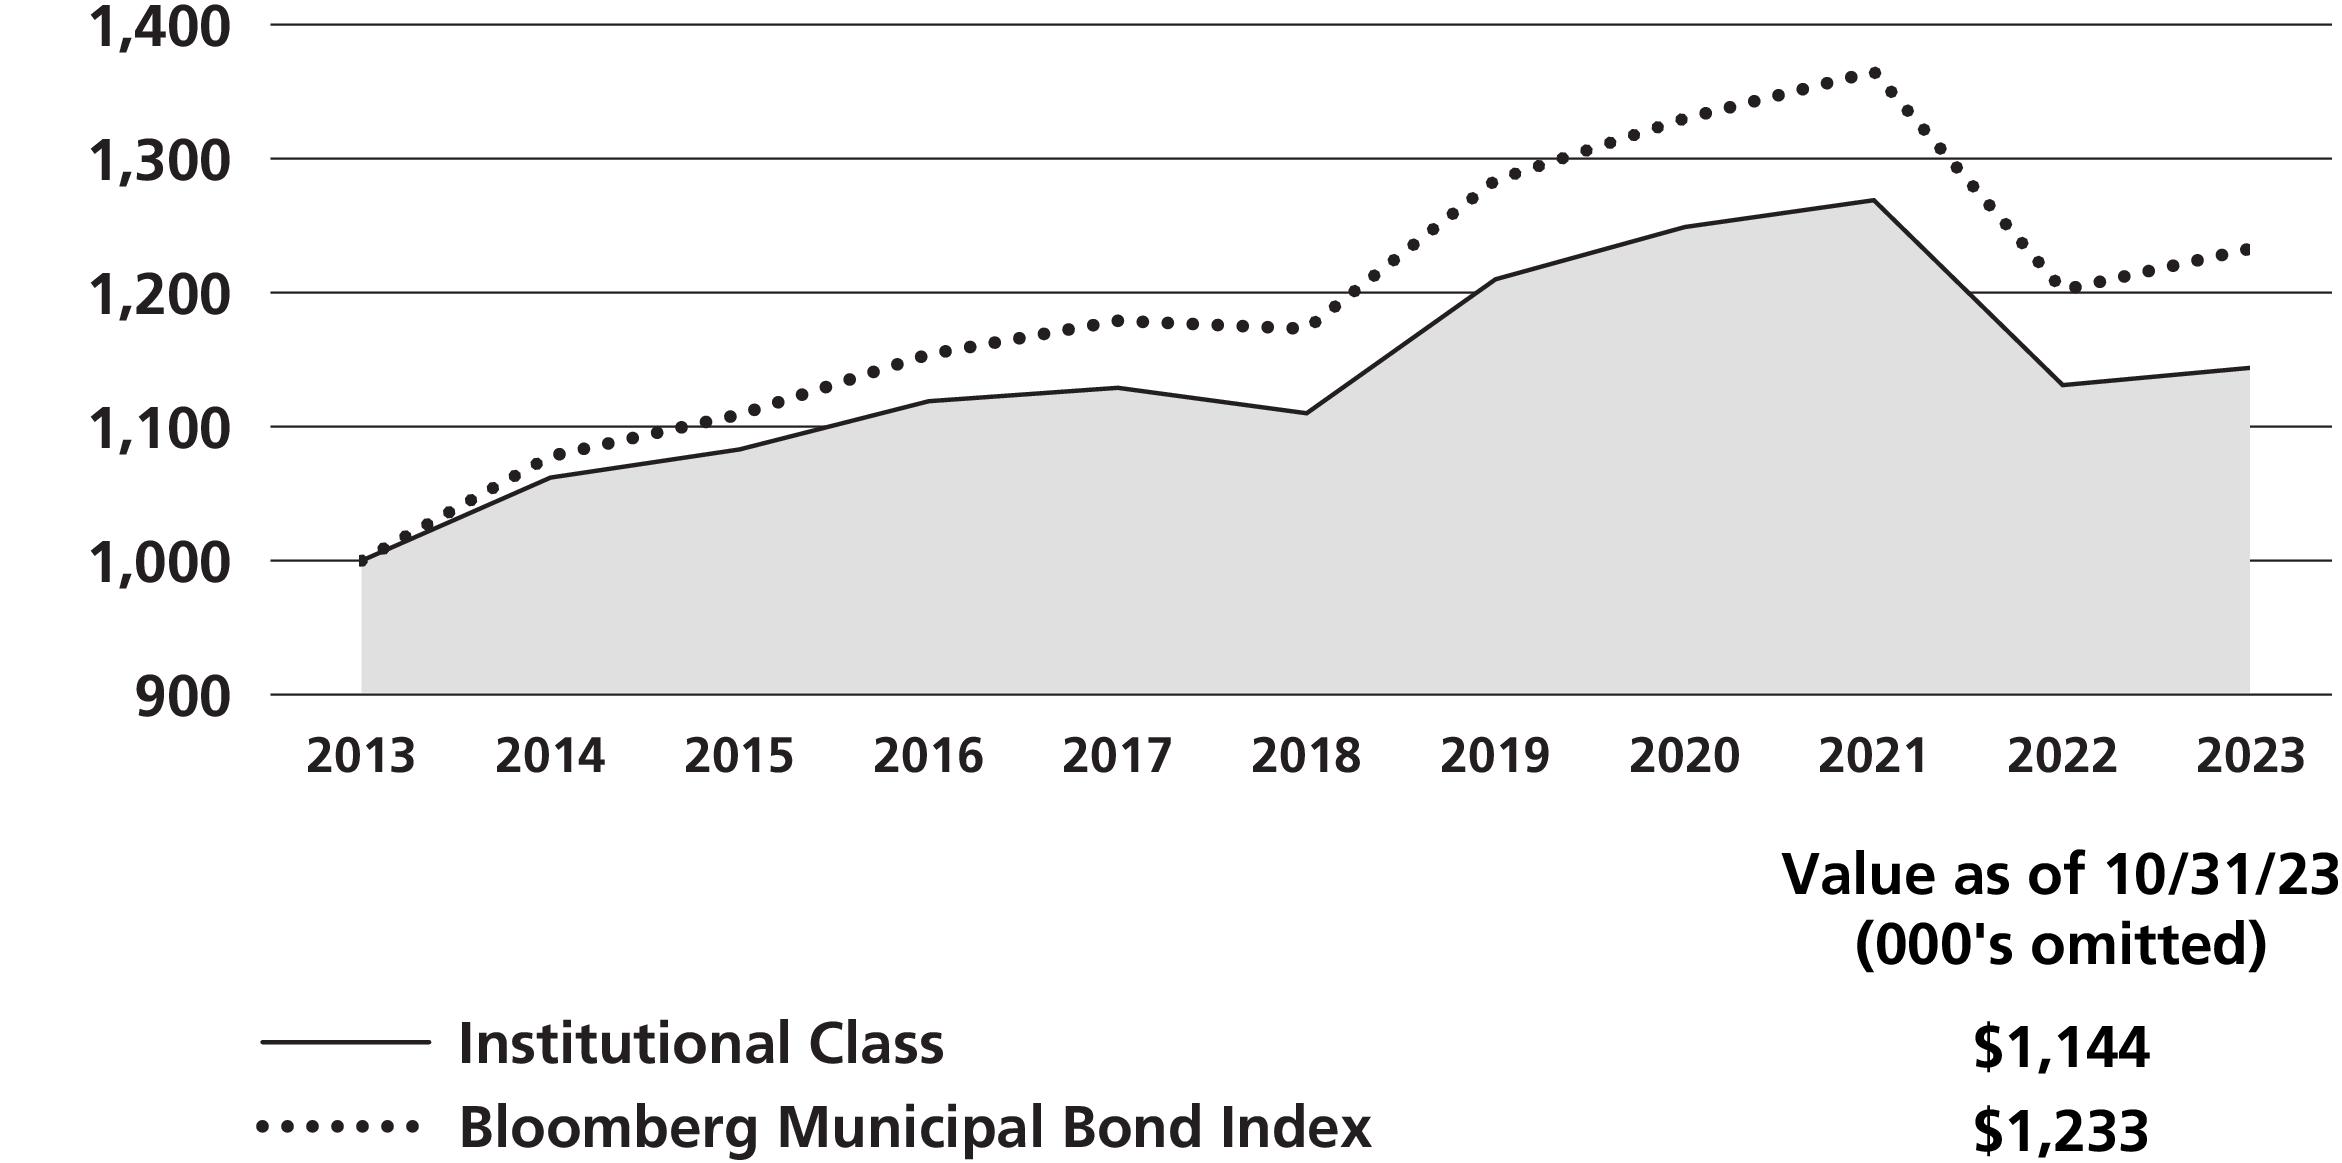
Municipal High Income Fund Commentary (Unaudited)
Neuberger Berman Municipal High Income Fund Institutional Class generated a 0.84% total return for the fiscal year ended October 31, 2023 (the reporting period) and underperformed its benchmark, a blend consisting of 65% Bloomberg Municipal Bond Index and 35% Bloomberg Municipal High Yield Index (collectively, the Index), which provided a 3.11% total return for the same period. (Performance for all share classes is provided in the table immediately following this letter.)
The investment-grade municipal (muni) bond market generated a positive return and outperformed the taxable investment-grade bond market during the reporting period. All told, the Bloomberg Municipal Bond Index returned 2.64% for the reporting period, whereas the overall taxable investment-grade bond market, as measured by the Bloomberg U.S. Aggregate Bond Index, returned 0.36%. A number of factors impacted the fixed income market, including elevated and persistent inflation, aggressive rate hikes by the U.S. Federal Reserve Board, unrest in the regional banking industry, and several geopolitical events. Despite several headwinds, the U.S. economy was resilient and continued to expand. All told, both short- and long-term yields moved higher (yields and bond prices generally move in the opposite direction) during the reporting period.
In terms of the Fund’s relative performance versus the Index during the reporting period, revenue bond security selection detracted from returns. In particular, several project-related securities were headwinds for results. An allocation to Puerto Rico Electric Authority bonds also negatively impacted returns. On the upside, duration positioning contributed to performance. Within the investment-grade portion of the portfolio, allocations to securities rated AAA, AA and BBB were beneficial. Finally, the Fund’s exposure to securities issued by the state of Illinois was rewarded, as they were upgraded during the reporting period.
High quality short to intermediate munis ended the reporting period with yields pushing up against 4%. With increased supply and market volatility, munis have cheapened relative to U.S. Treasury securities. In our opinion, for someone in the highest federal tax bracket, 10-year AAA munis have the potential to offer a higher taxable equivalent yield over the comparable Treasury. In volatile and rising rate environments, we believe active management should shine as more selling pressure creates opportunities to add what we believe to be mispriced securities. In our view, munis are a durable asset class and a good place to be if economic activity slows down more than is currently anticipated.
Sincerely,
James L. Iselin, S. Blake Miller and Eric J. Pelio
Portfolio Managers
Information about principal risks of investing in the Fund is set forth in the prospectus and statement of additional information.
The portfolio composition, industries and holdings of the Fund are subject to change without notice.
The opinions expressed are those of the Fund’s portfolio managers. The opinions are as of the date of this report and are subject to change without notice.
The bond ratings noted above represent segments of the Bloomberg Municipal Bond Index and Bloomberg Municipal High Yield Index, which are determined based on the average ratings issued by S&P Global, Moody’s and Fitch.
Municipal High Income Fund (Unaudited)
PORTFOLIO BY STATE AND TERRITORY |
(as a % of Total Net Assets) |
| |
| |
| |
| |
| |
| |
| |
| |
| |
| |
| |
| |
| |
| |
| |
| |
| |
| |
| |
| |
| |
| |
| |
| |
| |
| |
| |
| |
| |
| |
| |
| |
| |
| |
| |
| |
| |
| |
| |
Other Assets Less Liabilities | |
| |
| Includes the impact of the Fund's open positions in derivatives (other than options purchased), if any. |
| | |
| | Average Annual Total Return
Ended 10/31/2023 |
| | | |
| | | | |
| | | | |
| | | | |
| | | | |
| | | |
| | | | |
| | | | |
| | | | |
| | | |
*
Blended benchmark is composed of 65% Bloomberg Municipal Bond Index and 35% Bloomberg Municipal High Yield Index and is rebalanced monthly.
The performance data quoted represent past performance and do not indicate future results. Current performance may be lower or higher than the performance data quoted. For current performance data, including current to the most recent month-end, please visit www.nb.com/performance.
The results shown in the table reflect the reinvestment of income dividends and other distributions, if any. The results do not reflect the effect of taxes a shareholder would pay on Fund distributions or on the redemption of Fund shares.
The investment return and principal value of an investment will fluctuate and shares, when redeemed, may be worth more or less than their original cost.
Returns would have been lower if Neuberger Berman Investment Advisers LLC ("NBIA") had not reimbursed certain expenses and/or waived a portion of the investment management fees during certain of the periods shown. Repayment by a class (of expenses previously reimbursed and/or fees previously waived by NBIA) will decrease the class’s returns. Please see Note B in the Notes to Financial Statements for specific information regarding expense reimbursement and/or fee waiver arrangements.
As stated in the Fund’s most recent prospectus, the total annual operating expense ratios for fiscal year 2022 were 0.84%, 1.47% and 3.79% for Institutional Class, Class A and Class C shares, respectively (before expense reimbursements and/or fee waivers, if any). The expense ratios were 0.53%, 0.91% and 1.65% for Institutional Class, Class A and Class C shares, respectively, after expense reimbursements and/or fee waivers. The expense ratios for the annual period ended October 31, 2023, can be found in the Financial Highlights section of this report.
Returns shown with a sales charge reflect the deduction of the current maximum initial sales charge of 4.25% for Class A shares and the contingent deferred sales charge (CDSC) for Class C shares. The CDSC for Class C shares is 1.00%, which is reduced to 0% after 1 year. The performance of the Fund’s share classes will differ primarily due to different sales charge structures and class expenses. Please see the prospectus for more information about sales charge structures, if any, and class expenses for your share class.
Municipal High Income Fund (Unaudited)
COMPARISON OF A $1,000,000 INVESTMENT
(000's omitted)
This graph shows the change in value of a hypothetical $1,000,000 investment in the Fund over the past 10 fiscal years, or since the Fund’s inception if it has not operated for 10 years. The graph is based on the Institutional Class shares only; the performance of the Fund’s share classes will differ primarily due to different sales charge structures and class expenses (see Performance Highlights chart on previous page). The result is compared with benchmarks, which include a broad-based market index and may include a more narrowly based index. Market indices have not been reduced to reflect any of the fees and costs of investing. The results shown in the graph reflect the reinvestment of income dividends and other distributions, if any. The results do not reflect the effect of taxes a shareholder would pay on Fund distributions or on the redemption of Fund shares. Results represent past performance and do not indicate future results.
*
Blended benchmark is composed of 65% Bloomberg Municipal Bond Index and 35% Bloomberg Municipal High Yield Index and is rebalanced monthly.
Municipal Impact Fund Commentary (Unaudited)
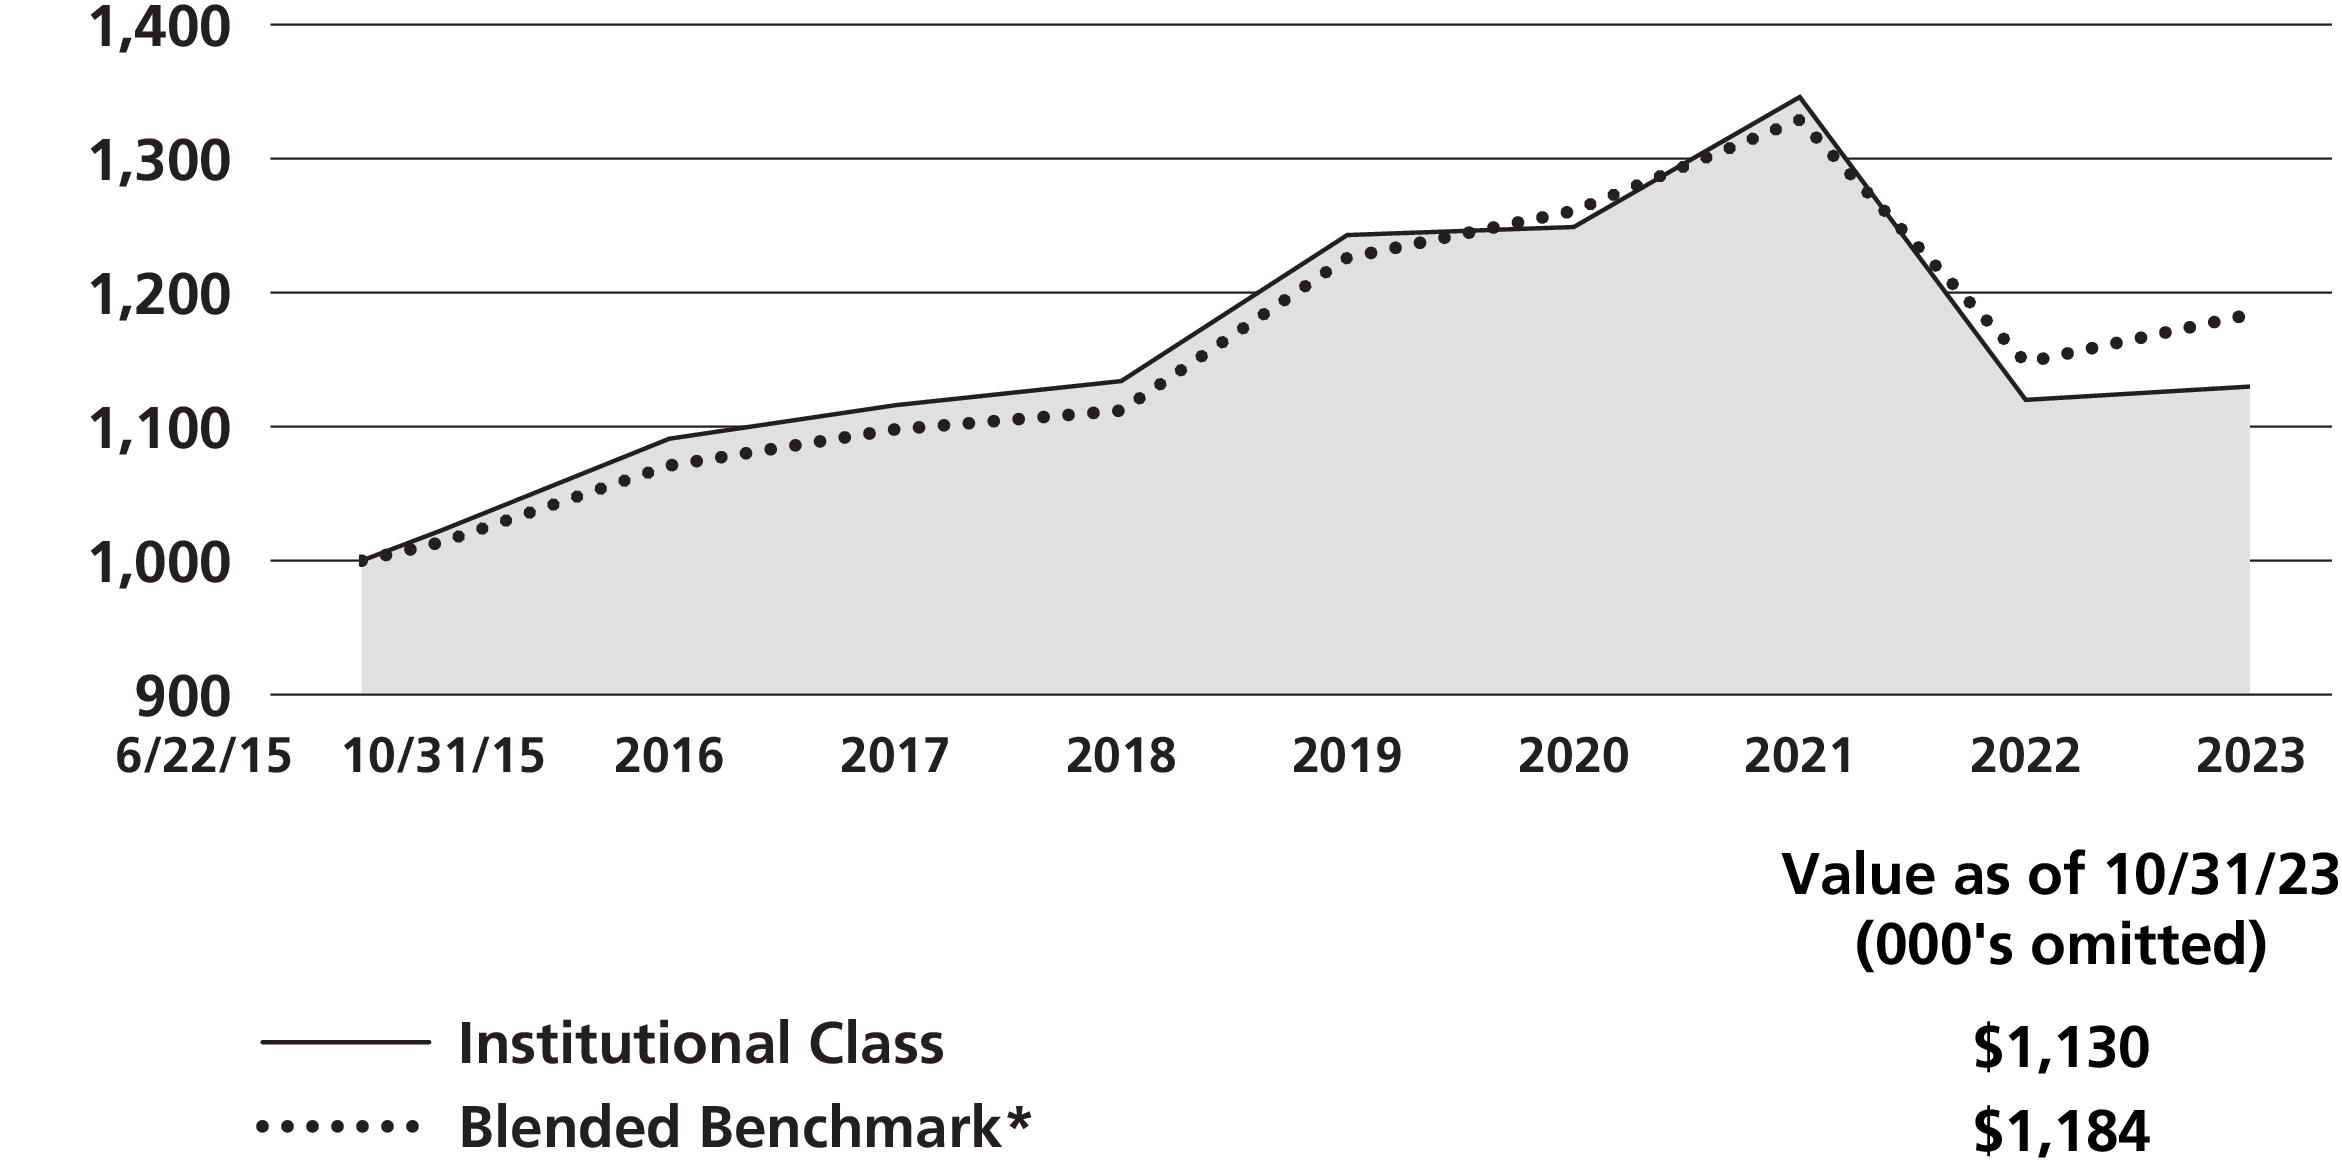
Neuberger Berman Municipal Impact Fund Institutional Class generated a 1.11% total return for the fiscal year ended October 31, 2023 (the reporting period) and underperformed its benchmark, the Bloomberg Municipal Bond Index (the Index), which provided a 2.64% total return for the same period. (Performance for all share classes is provided in the table immediately following this letter.)
The investment-grade municipal (muni) bond market generated a positive return and outperformed the taxable investment-grade bond market during the reporting period. All told, the Index returned 2.64% for the reporting period, whereas the overall taxable investment-grade bond market, as measured by the Bloomberg U.S. Aggregate Bond Index, returned 0.36%. A number of factors impacted the fixed income market, including elevated and persistent inflation, aggressive rate hikes by the U.S. Federal Reserve Board (Fed), unrest in the regional banking industry, and several geopolitical events. Despite several headwinds, the U.S. economy was resilient and continued to expand. All told, both short- and long-term yields moved higher (yields and bond prices generally move in the opposite direction) during the reporting period.
In terms of the Fund’s relative performance versus the Index during the reporting period, duration positioning detracted from results. Revenue bond security selection was also a headwind for returns. In particular, certain positions in the Housing sector negatively impacted performance. On the upside, general obligation bond security selection contributed to results, led by our exposure to school districts in the state of Michigan.
Looking at portfolio changes during the reporting period, we modestly increased the Fund’s duration in anticipation of the Fed nearing the end of its interest rate hiking cycle. As always, the Fund maintained its exposure to what we believed were projects that were impactful for their communities. We also continued to focus on sustainable issuers with what we view as having best-in-class operations, with managements that make sound financial decisions.
High quality short to intermediate munis ended the reporting period with yields pushing up against 4%. With increased supply and market volatility, munis have cheapened relative to U.S. Treasury securities. In our opinion, for someone in the highest federal tax bracket, 10-year AAA munis have the potential to offer a higher taxable equivalent yield over the comparable Treasury. In volatile and rising rate environments, we believe active management should shine as more selling pressure creates opportunities to add what we believe to be mispriced securities. In our view, munis are a durable asset class and a good place to be if economic activity slows down more than is currently anticipated.
Sincerely,
James L. Iselin, S. Blake Miller and Jeffrey Hunn
Portfolio Managers
Information about principal risks of investing in the Fund is set forth in the prospectus and statement of additional information.
The portfolio composition, industries and holdings of the Fund are subject to change without notice.
The opinions expressed are those of the Fund’s portfolio managers. The opinions are as of the date of this report and are subject to change without notice.
The bond ratings noted above represent segments of the Bloomberg Municipal Bond Index, which are determined based on the average ratings issued by S&P Global, Moody’s and Fitch.
Municipal Impact Fund (Unaudited)
PORTFOLIO BY STATE AND TERRITORY |
(as a % of Total Net Assets) |
| |
| |
| |
| |
| |
| |
| |
| |
| |
| |
| |
| |
| |
| |
| |
| |
| |
| |
| |
| |
| |
| |
| |
| |
| |
| |
| |
| |
| |
Other Assets Less Liabilities | |
| |
| Includes the impact of the Fund's open positions in derivatives (other than options purchased), if any. |
PERFORMANCE HIGHLIGHTS12,13 | | | |
| | Average Annual Total Return
Ended 10/31/2023 |
| | | | |
| | | | | |
| | | | | |
| | | | | |
| | | | | |
| | | | |
| | | | | |
| | | | | |
| | | | | |
Bloomberg Municipal Bond Index5,6 | | | | |
The performance data quoted represent past performance and do not indicate future results. Current performance may be lower or higher than the performance data quoted. For current performance data, including current to the most recent month-end, please visit www.nb.com/performance.
The results shown in the table reflect the reinvestment of income dividends and other distributions, if any. The results do not reflect the effect of taxes a shareholder would pay on Fund distributions or on the redemption of Fund shares.
The investment return and principal value of an investment will fluctuate and shares, when redeemed, may be worth more or less than their original cost.
Returns would have been lower if Neuberger Berman Investment Advisers LLC ("NBIA") had not reimbursed certain expenses and/or waived a portion of the investment management fees during certain of the periods shown. Repayment by a class (of expenses previously reimbursed and/or fees previously waived by NBIA) will decrease the class’s returns. Please see Note B in the Notes to Financial Statements for specific information regarding expense reimbursement and/or fee waiver arrangements.
As stated in the Fund’s most recent prospectus, the total annual operating expense ratios for fiscal year 2022 were 0.81%, 3.06%, and 6.71% for Institutional Class, Class A and Class C shares, respectively (before expense reimbursements and/or fee waivers, if any). The expense ratios were 0.43%, 0.80% and 1.55% for Institutional Class, Class A and Class C shares, respectively, after expense reimbursements and/or fee waivers. The expense ratios for the annual period ended October 31, 2023, can be found in the Financial Highlights section of this report.
Returns shown with a sales charge reflect the deduction of the current maximum initial sales charge of 4.25% for Class A shares and the contingent deferred sales charge (CDSC) for Class C shares. The CDSC for Class C shares is 1.00%, which is reduced to 0% after 1 year. The performance of the Fund’s share classes will differ primarily due to different sales charge structures and class expenses. Please see the prospectus for more information about sales charge structures, if any, and class expenses for your share class.
Municipal Impact Fund (Unaudited)
COMPARISON OF A $1,000,000 INVESTMENT
(000's omitted)
This graph shows the change in value of a hypothetical $1,000,000 investment in the Fund over the past 10 fiscal years, or since the Fund’s inception if it has not operated for 10 years. The graph is based on the Institutional Class shares only; the performance of the Fund’s share classes will differ primarily due to different sales charge structures and class expenses (see Performance Highlights chart on previous page). The result is compared with benchmarks, which include a broad-based market index and may include a more narrowly based index. Market indices have not been reduced to reflect any of the fees and costs of investing. The results shown in the graph reflect the reinvestment of income dividends and other distributions, if any. The results do not reflect the effect of taxes a shareholder would pay on Fund distributions or on the redemption of Fund shares. Results represent past performance and do not indicate future results.
Municipal Intermediate Bond Fund Commentary (Unaudited)
Neuberger Berman Municipal Intermediate Bond Fund Investor Class generated a 2.29% total return for the fiscal year ended October 31, 2023 (the reporting period) and outperformed its benchmark, the Bloomberg 7-Year General Obligation (G.O.) Index (the Index), which provided a 1.87% total return for the same period. (Performance for all share classes is provided in the table immediately following this letter.)
The investment-grade municipal (muni) bond market generated a positive return and outperformed the taxable investment-grade bond market during the reporting period. All told, the Bloomberg Municipal Bond Index returned 2.64% for the reporting period, whereas the overall taxable investment-grade bond market, as measured by the Bloomberg U.S. Aggregate Bond Index, returned 0.36%. A number of factors impacted the fixed income market, including elevated and persistent inflation, aggressive rate hikes by the U.S. Federal Reserve Board (Fed), unrest in the regional banking industry, and several geopolitical events. Despite several headwinds, the U.S. economy was resilient and continued to expand. All told, both short- and long-term yields moved higher (yields and bond prices generally move in the opposite direction) during the reporting period.
In terms of the Fund’s relative performance versus the Index during the reporting period, an overweight to bonds rated BBB and below was beneficial, as these higher yielding securities outperformed the Index. G.O. security selection was also beneficial. In particular, the Fund’s exposure to securities issued by the state of Illinois was rewarded, as they were upgraded during the reporting period. On the downside, yield curve positioning was a small detractor from performance.
Looking at portfolio changes during the reporting period, we modestly increased the Fund’s duration in anticipation of the Fed nearing the end of its interest rate hiking cycle.
High quality short to intermediate munis ended the reporting period with yields pushing up against 4%. With increased supply and market volatility, munis have cheapened relative to U.S. Treasury securities. In our opinion, for someone in the highest federal tax bracket, 10-year AAA munis have the potential to offer a higher taxable equivalent yield over the comparable Treasury. In volatile and rising rate environments, we believe active management should shine as more selling pressure creates opportunities to add what we believe to be mispriced securities. In our view, munis are a durable asset class and a good place to be if economic activity slows down more than is currently anticipated.
Sincerely,
James L. Iselin and S. Blake Miller
Portfolio Managers
Information about principal risks of investing in the Fund is set forth in the prospectus and statement of additional information.
The portfolio composition, industries and holdings of the Fund are subject to change without notice.
The opinions expressed are those of the Fund’s portfolio managers. The opinions are as of the date of this report and are subject to change without notice.
The bond ratings noted above represent segments of the Bloomberg 7-Year General Obligation (G.O.) Index, which are determined based on the average ratings issued by S&P Global, Moody’s and Fitch.
Municipal Intermediate Bond Fund (Unaudited)
PORTFOLIO BY STATE AND TERRITORY |
(as a % of Total Net Assets) |
| |
| |
| |
| |
| |
| |
| |
| |
| |
| |
| |
| |
| |
| |
| |
| |
| |
| |
| |
| |
| |
| |
| |
| |
| |
| |
| |
| |
| |
| |
| |
| |
| |
| |
| |
| |
| |
| |
| |
Liabilities Less Other Assets | |
| |
| Includes the impact of the Fund's open positions in derivatives (other than options purchased), if any. |
| | | |
| | Average Annual Total Return
Ended 10/31/2023 |
| | | | |
| | | | | |
| | | | | |
| | | | | |
| | | | | |
| | | | | |
| | | | |
| | | | | |
| | | | | |
| | | | | |
Bloomberg 7-Year G.O. Index5,6 | | | | |
The performance data quoted represent past performance and do not indicate future results. Current performance may be lower or higher than the performance data quoted. For current performance data, including current to the most recent month-end, please visit www.nb.com/performance.
The results shown in the table reflect the reinvestment of income dividends and other distributions, if any. The results do not reflect the effect of taxes a shareholder would pay on Fund distributions or on the redemption of Fund shares.
The investment return and principal value of an investment will fluctuate and shares, when redeemed, may be worth more or less than their original cost.
Returns would have been lower if Neuberger Berman Investment Advisers LLC ("NBIA") had not reimbursed certain expenses and/or waived a portion of the investment management fees during certain of the periods shown. Repayment by a class (of expenses previously reimbursed and/or fees previously waived by NBIA) will decrease the class’s returns. Please see Note B in the Notes to Financial Statements for specific information regarding expense reimbursement and/or fee waiver arrangements.
As stated in the Fund’s most recent prospectus, the total annual operating expense ratios for fiscal year 2022 were 0.67%, 0.46%, 0.96% and 1.79% for Investor Class, Institutional Class, Class A and Class C shares, respectively (before expense reimbursements and/or fee waivers, if any). The expense ratios were 0.45%, 0.30%, 0.67% and 1.42% for Investor Class, Institutional Class, Class A and Class C shares, respectively, after expense reimbursements and/or fee waivers. The expense ratios for the annual period ended October 31, 2023, can be found in the Financial Highlights section of this report.
Returns shown with a sales charge reflect the deduction of the current maximum initial sales charge of 4.25% for Class A shares and the contingent deferred sales charge (CDSC) for Class C shares. The CDSC for Class C shares is 1.00%, which is reduced to 0% after 1 year. The performance of the Fund’s share classes will differ primarily due to different sales charge structures and class expenses. Please see the prospectus for more information about sales charge structures, if any, and class expenses for your share class.
Municipal Intermediate Bond Fund (Unaudited)
COMPARISON OF A $10,000 INVESTMENT
This graph shows the change in value of a hypothetical $10,000 investment in the Fund over the past 10 fiscal years, or since the Fund’s inception if it has not operated for 10 years. The graph is based on the Investor Class shares only; the performance of the Fund’s share classes will differ primarily due to different sales charge structures and class expenses (see Performance Highlights chart on previous page). The result is compared with benchmarks, which include a broad-based market index and may include a more narrowly based index. Market indices have not been reduced to reflect any of the fees and costs of investing. The results shown in the graph reflect the reinvestment of income dividends and other distributions, if any. The results do not reflect the effect of taxes a shareholder would pay on Fund distributions or on the redemption of Fund shares. Results represent past performance and do not indicate future results.
Short Duration Bond Fund Commentary (Unaudited)
Neuberger Berman Short Duration Bond Fund Investor Class generated a 4.62% total return for the fiscal year ended October 31, 2023 (the reporting period) and outperformed its benchmark, the Bloomberg 1–3 Year U.S. Government/Credit Bond Index (the Index), which provided a 3.23% total return for the same period. (Performance for all share classes is provided in the table immediately following this letter.)
The overall investment-grade taxable fixed income market posted a modest gain during the reporting period. A number of factors impacted the market, including elevated and persistent inflation, aggressive rate hikes by the U.S. Federal Reserve Board (Fed), unrest in the regional banking industry, and several geopolitical events. Despite several headwinds, the U.S. economy was resilient and continued to expand. All told, both short- and long-term yields moved higher (yields and bond prices generally move in the opposite direction) and U.S. credit spreads were mixed during the reporting period.
The largest contributor to the Fund’s performance during the reporting period was its exposure to investment-grade corporate bonds. Security selection within the industrials sector was the most beneficial, led by our technology, media, and telecom (TMT) positions. Within the financial sector, our bank holdings added the most value. Elsewhere, an allocation to structured products, including credit risk transfers (CRT), asset-backed securities (ABS), commercial mortgage-backed securities (CMBS) and agency passthroughs all contributed to performance. An allocation to non-investment grade corporates was additive as well. On the downside, duration positioning detracted from returns. In particular, having a longer duration than the Index was not rewarded as rates moved higher.
The Fund’s aggregate use of futures and swap contracts detracted from performance during the reporting period.
We made several adjustments to the Fund’s sector positioning over the reporting period. We increased its allocations to CRT, ABS and agency passthroughs, while reducing its allocation to U.S. Treasury securities. We also increased the Fund’s duration, given our anticipation that the Fed was done or close to done raising interest rates.
Coming into 2023, many anticipated a dramatically slowing economy that would lead to progress on inflation and eventually cause central banks to pull back on monetary tightening. However, such expectations underestimated the overhang of COVID-era stimulus and U.S. spending tied to climate and infrastructure. Flush with excess savings and willing to utilize credit, consumers have continued to spend at a robust pace, moving from goods purchases to services and travel. Corporate earnings, although down, have been far more resilient than many expected. Meanwhile inflation has made an encouraging move downward, but still remains well above target. This has reshuffled expectations around the Fed’s policy stance, resulting in an upward shift in longer-term yields over the past few months. There are signs of fragility, however. In the U.S., consumers appear to be hitting their limit, as savings are depleted, federal student loan payments resume, and credit card balances become overstuffed. The industrial economy, meanwhile, seems ready to rebound given the demand for re-shoring and infrastructure spending. From a policy perspective, we believe the Fed is generally close to done on raising interest rates. However, a slower but still resilient U.S. economy and structural constraints on inflation are likely to keep us in a "higher for longer" rate environment, in our view, as the central bank waits to see the lagging impacts of aggressive tightening.
Sincerely,
Michael Foster, Matthew McGinnis, Ashok Bhatia and David M. Brown
Portfolio Managers
Information about principal risks of investing in the Fund is set forth in the prospectus and statement of additional information.
The portfolio composition, industries and holdings of the Fund are subject to change without notice.
The opinions expressed are those of the Fund’s portfolio managers. The opinions are as of the date of this report and are subject to change without notice.
Short Duration Bond Fund (Unaudited)
PORTFOLIO BY INVESTMENT TYPE |
(as a % of Total Net Assets) |
| |
| |
| |
Mortgage-Backed Securities | |
| |
Other Assets Less Liabilities | |
| |
| Includes the impact of the Fund's open positions in derivatives (other than options purchased), if any. |
| | | |
| | Average Annual Total Return
Ended 10/31/2023 |
| | | | |
| | | | | |
| | | | | |
| | | | | |
| | | | | |
| | | | | |
| | | | | |
| | | | |
| | | | | |
| | | | | |
| | | | | |
Bloomberg 1-3 Year U.S.
Government/Credit Bond Index5,6 | | | | |
The performance data quoted represent past performance and do not indicate future results. Current performance may be lower or higher than the performance data quoted. For current performance data, including current to the most recent month-end, please visit www.nb.com/performance.
The results shown in the table reflect the reinvestment of income dividends and other distributions, if any. The results do not reflect the effect of taxes a shareholder would pay on Fund distributions or on the redemption of Fund shares.
The investment return and principal value of an investment will fluctuate and shares, when redeemed, may be worth more or less than their original cost.
Returns would have been lower if Neuberger Berman Investment Advisers LLC ("NBIA") had not reimbursed certain expenses and/or waived a portion of the investment management fees during certain of the periods shown. Repayment by a class (of expenses previously reimbursed and/or fees previously waived by NBIA) will decrease the class’s returns. Please see Note B in the Notes to Financial Statements for specific information regarding expense reimbursement and/or fee waiver arrangements.
As stated in the Fund’s most recent prospectus, the total annual operating expense ratios for fiscal year 2022 were 0.83%, 0.98%, 0.60%, 0.99% and 1.74% for Investor Class, Trust Class, Institutional Class, Class A and Class C shares, respectively (before expense reimbursements and/or fee waivers, if any).The expense ratios were 0.55%, 0.65%, 0.35%, 0.72% and 1.47% for Investor Class, Trust Class, Institutional Class, Class A and Class C shares, respectively, after expense reimbursements and/or fee waivers. The expense ratios for the annual period ended October 31, 2023, can be found in the Financial Highlights section of this report.
Returns shown with a sales charge reflect the deduction of the current maximum initial sales charge of 2.50% for Class A shares and the contingent deferred sales charge (CDSC) for Class C shares. The CDSC for Class C shares is 1.00%, which is reduced to 0% after 1 year. The performance of the Fund’s share classes will differ primarily due to different sales charge structures and class expenses. Please see the prospectus for more information about sales charge structures, if any, and class expenses for your share class.
Short Duration Bond Fund (Unaudited)
COMPARISON OF A $10,000 INVESTMENT
This graph shows the change in value of a hypothetical $10,000 investment in the Fund over the past 10 fiscal years, or since the Fund’s inception if it has not operated for 10 years. The graph is based on the Investor Class shares only; the performance of the Fund’s share classes will differ primarily due to different sales charge structures and class expenses (see Performance Highlights chart on previous page). The result is compared with benchmarks, which include a broad-based market index and may include a more narrowly based index. Market indices have not been reduced to reflect any of the fees and costs of investing. The results shown in the graph reflect the reinvestment of income dividends and other distributions, if any. The results do not reflect the effect of taxes a shareholder would pay on Fund distributions or on the redemption of Fund shares. Results represent past performance and do not indicate future results.
Strategic Income Fund Commentary (Unaudited)
Neuberger Berman Strategic Income Fund Institutional Class delivered a 4.58% total return for the fiscal year ended October 31, 2023 (the reporting period), outperforming its benchmark, the Bloomberg U.S. Aggregate Bond Index (the Index), which provided a 0.36% total return for the same period. (Performance for all share classes is provided in the table immediately following this letter.)
The taxable investment-grade fixed income market, as measured by the Index, posted a modest gain during the reporting period. A number of factors impacted the market, including the evolving inflation picture, ongoing interest rate hikes by the U.S. Federal Reserve Board (Fed), unrest in the regional banking industry, and several geopolitical events. Despite headwinds, the U.S. economy was surprisingly resilient and continued to expand. All told, short-, intermediate- and long-term Treasury yields moved higher (yields and bond prices generally move in the opposite direction) and credit spreads were mixed during the reporting period.
Over the reporting period, the Fund’s duration and yield curve positioning, allocations to securitized credit and high yield bonds, and security selection in investment-grade credit and agency mortgage-backed securities (MBS) were the largest contributors to relative performance. Allocations to municipal bonds and emerging markets debt were secondary contributors. The Fund’s underweight exposure to investment-grade credit, overweight exposure to agency MBS, and exposure to financial hybrids were the primary detractors from relative performance.
The Fund’s aggregate use of futures, swap, forward foreign currency, bond forward and option contracts contributed positively to performance during the reporting period.
We made some relative value positioning adjustments during the reporting period. We realized profits and reduced exposure to investment-grade and high yield corporate credit and increased our exposure to agency MBS. Looking ahead, we plan to favor a quality bias as a way to defend against potential economic weakness and will continue to dynamically manage the Fund’s rate positioning.
Coming into 2023, many anticipated a dramatically slowing economy that would lead to progress on inflation and eventually cause central banks to pull back on monetary tightening. However, such expectations underestimated the overhang of COVID-era stimulus and U.S. spending tied to climate and infrastructure. Flush with excess savings and willing to utilize credit, consumers have continued to spend at a robust pace, moving from goods purchases to services and travel. Corporate earnings, although down, have been far more resilient than many expected. Meanwhile inflation has made an encouraging move downward but remains well above target. This has reshuffled expectations around the Fed’s policy stance, resulting in an upward shift in longer-term yields over the past few months. There are signs of fragility, however. In the U.S., consumers appear to be hitting their limit, as savings are depleted, federal student loan payments resume, and credit card balances become overstuffed. The industrial economy, meanwhile, seems ready to rebound given the demand for re-shoring and infrastructure spending. From a policy perspective, we believe the Fed is generally close to done on raising interest rates. However, a slower but still resilient U.S. economy and structural constraints on inflation are likely to keep us in a "higher for longer" rate environment, in our view, as the central bank waits to see the lagging impacts of aggressive tightening.
Sincerely,
Thanos Bardas, Ashok Bhatia, David M. Brown and Brad Tank
Portfolio Managers
Information about principal risks of investing in the Fund is set forth in the prospectus and statement of additional information.
The portfolio composition, industries and holdings of the Fund are subject to change without notice.
The opinions expressed are those of the Fund’s portfolio managers. The opinions are as of the date of this report and are subject to change without notice.
Strategic Income Fund (Unaudited)
PORTFOLIO BY INVESTMENT TYPE |
(as a % of Total Net Assets) |
| |
| |
| |
| |
| |
| |
Foreign Government Securities | |
| |
Mortgage-Backed Securities | |
| |
U.S. Government Agency Securities | |
U.S. Treasury Obligations | |
| |
Liabilities Less Other Assets | |
| |
| Includes the impact of the Fund's open positions in derivatives (other than options purchased), if any. |
| | | |
| | Average Annual Total Return
Ended 10/31/2023 |
| | | | |
| | | | | |
| | | | | |
| | | | | |
| | | | | |
| | | | | |
| | | | | |
| | | | |
| | | | | |
| | | | | |
| | | | | |
Bloomberg U.S. Aggregate Bond Index5,6 | | | | |
The performance data quoted represent past performance and do not indicate future results. Current performance may be lower or higher than the performance data quoted. For current performance data, including current to the most recent month-end, please visit www.nb.com/performance.
The results shown in the table reflect the reinvestment of income dividends and other distributions, if any. The results do not reflect the effect of taxes a shareholder would pay on Fund distributions or on the redemption of Fund shares.
The investment return and principal value of an investment will fluctuate and shares, when redeemed, may be worth more or less than their original cost.
Returns would have been lower if Neuberger Berman Investment Advisers LLC ("NBIA") had not reimbursed certain expenses and/or waived a portion of the investment management fees during certain of the periods shown. Repayment by a class (of expenses previously reimbursed and/or fees previously waived by NBIA) will decrease the class’s returns. Please see Note B in the Notes to Financial Statements for specific information regarding expense reimbursement and/or fee waiver arrangements.
As stated in the Fund’s most recent prospectus, the total annual operating expense ratios for fiscal year 2022 were 1.00%, 0.61%, 1.00%, 1.73% and 0.51% for Trust Class, Institutional Class, Class A, Class C and Class R6 shares, respectively (before expense reimbursements and/or fee waivers, if any). The expense ratios were 0.95%, 0.60%, 1.00%, 1.70% and 0.50% for Trust Class, Institutional Class, Class A, Class C and Class R6 shares, respectively, after expense reimbursements and/or fee waivers. The total annual operating expense ratio for Class A includes the class’s repayment of expenses previously reimbursed and/or fees previously waived under the contractual expense limitation by NBIA. The expense ratios for the annual period ended October 31, 2023, can be found in the Financial Highlights section of this report.
Returns shown with a sales charge reflect the deduction of the current maximum initial sales charge of 4.25% for Class A shares and the contingent deferred sales charge (CDSC) for Class C shares. The CDSC for Class C shares is 1.00%, which is reduced to 0% after 1 year. The performance of the Fund’s share classes will differ primarily due to different sales charge structures and class expenses. Please see the prospectus for more information about sales charge structures, if any, and class expenses for your share class.
Strategic Income Fund (Unaudited)
COMPARISON OF A $1,000,000 INVESTMENT
(000's omitted)
This graph shows the change in value of a hypothetical $1,000,000 investment in the Fund over the past 10 fiscal years, or since the Fund’s inception if it has not operated for 10 years. The graph is based on the Institutional Class shares only; the performance of the Fund’s share classes will differ primarily due to different sales charge structures and class expenses (see Performance Highlights chart on previous page). The result is compared with benchmarks, which include a broad-based market index and may include a more narrowly based index. Market indices have not been reduced to reflect any of the fees and costs of investing. The results shown in the graph reflect the reinvestment of income dividends and other distributions, if any. The results do not reflect the effect of taxes a shareholder would pay on Fund distributions or on the redemption of Fund shares. Results represent past performance and do not indicate future results.
| The Fund had a different goal, to maximize total return through a combination of income and capital appreciation, and investment strategy, which did not include investments in derivatives and non-U.S. dollar denominated securities, prior to February 28, 2008. Its performance prior to that date might have been different if the current goal and investment strategy had been in effect. |
| The performance information for periods prior to June 13, 2005, is that of the Fund’s predecessor, Ariel Premier Bond Fund ("Ariel Fund"). The investment policies, guidelines and restrictions of the Fund are in all material respects equivalent to those of Ariel Fund. Returns would have been lower if Ariel Fund’s manager had not waived certain of its fees during these periods. |
| The performance information for Institutional Class is that of Ariel Fund Institutional Class for the period October 1, 1995 (inception date) through June 10, 2005. The performance information for Investor Class is that of Ariel Fund Institutional Class for the period October 1, 1995 through January 31, 1997 (the period prior to the Investor Class’ inception date), and that of Ariel Fund Investor Class for the period February 1, 1997 through June 10, 2005. Ariel Fund Institutional Class had lower expenses and typically higher returns than Ariel Fund Investor Class. |
| The performance information for Class A, Class C and Class R6 prior to the classes’ inception date is that of the Institutional Class of Neuberger Berman Core Bond Fund (please see Endnote 3). The performance information for the Institutional Class has been adjusted to reflect the appropriate sales charges applicable to Class A and Class C shares, but has not been adjusted to take into account differences in class specific operating expenses (such as 12b-1 fees). The Institutional Class has lower expenses and typically higher returns than Class A and Class C. The Institutional Class has higher expenses and typically lower returns than Class R6. |
| Please see "Glossary of Indices" on page 33 for a description of indices. Please note that individuals cannot invest directly in any index. The indices described in this report do not take into account any fees, expenses or tax consequences of investing in the individual securities that they track. Data about the performance of an index are prepared or obtained by Neuberger Berman Investment Advisers LLC ("NBIA") and reflect the reinvestment of income dividends and other distributions, if any. The Fund may invest in securities not included in a described index and generally does not invest in all securities included in a described index. |
| The date used to calculate Life of Fund performance for the index is the inception date of the oldest share class. |
| The performance information for Institutional Class and Class C prior to the classes’ inception date is that of Class A of Neuberger Berman Floating Rate Income Fund. The performance information (at NAV) of Class A has been adjusted to reflect the appropriate sales charge applicable to Class C shares, but has not been adjusted to take into account differences in class specific operating expenses (such as 12b-1 fees). Class A has higher expenses and typically lower returns (at NAV) than Institutional Class. Class A has lower expenses and typically higher returns (at NAV) than Class C. |
| The performance information for the period April 1, 1996 through September 6, 2002, is that of the Fund’s predecessor, Lipper High Income Bond Fund ("Lipper Fund"), and the performance information for the period February 1, 1992 through March 31, 1996, is that of Lipper Fund’s predecessor partnership. The investment policies, objectives, guidelines and restrictions of the Fund are in all material respects equivalent to those of Lipper Fund, and the investment policies, objectives, guidelines and restrictions of Lipper Fund were in all material respects equivalent to those of its predecessor partnership. As mutual funds registered under the Investment Company Act of 1940, as amended ("1940 Act"), the Fund is, and Lipper Fund was, subject to certain restrictions under the 1940 Act and the Internal Revenue Code of 1986, as amended ("Code"), to which Lipper Fund’s predecessor partnership was not subject. Had Lipper Fund’s predecessor partnership been registered under the 1940 Act and been subject to the provisions of the 1940 Act and the Code, its investment performance may have been adversely affected. Returns would have been lower if Lipper Fund’s manager had not waived certain of its fees during these periods. |
Endnotes (Unaudited) (cont’d)
| The Fund’s policies limited its ability to invest in bonds rated below "B" prior to July 6, 2006. Its performance prior to that date might have been different if current policies had been in effect. |
| The performance information for Investor Class is that of Lipper Fund Premier Class for the period April 1, 1996 through September 6, 2002, and that of Lipper Fund’s predecessor partnership for the period February 1, 1992 (inception date) through March 31, 1996 (please see Endnote 8). |
| The performance information for Institutional Class, Class A, Class C, Class R3, Class R6 and Class E prior to the classes’ respective inception dates is that of the Investor Class of Neuberger Berman High Income Bond Fund (please see Endnote 10). The performance information of the Investor Class has been adjusted to reflect the appropriate sales charges applicable to Class A and Class C shares, but has not been adjusted to take into account differences in class specific operating expenses (such as 12b-1 fees). The Investor Class has lower expenses and typically higher returns than Class A, Class C and Class R3. The Investor Class has higher expenses and typically lower returns than Institutional Class, Class R6 and Class E. |
| A portion of the Fund’s income may be a tax preference item for purposes of the federal alternative minimum tax for certain shareholders. |
| The Fund had a different goal and different principal investment strategies, which included a policy to invest 80% of its net assets in securities of municipal issuers that provide interest income that is exempt from New York State and New York City personal income taxes and invest in only investment grade securities, prior to June 16, 2018. Its performance prior to that date might have been different if the current goal and investment strategy had been in effect. |
| This date reflects when NBIA first became the investment manager to the Fund. |
| The performance information for Class A and Class C prior to the classes’ inception date is that of the Institutional Class of Neuberger Berman Municipal Impact Fund (formerly, Neuberger Berman New York Municipal Income Fund). The performance information for the Institutional Class has been adjusted to reflect the appropriate sales charges applicable to Class A and Class C shares, but has not been adjusted to take into account differences in class specific operating expenses (such as 12b-1 fees). The Institutional Class has lower expenses and typically higher returns than Class A and Class C. |
| The performance information for Institutional Class, Class A and Class C prior to the classes’ inception date is that of the Investor Class of Neuberger Berman Municipal Intermediate Bond Fund. The performance information of the Investor Class has been adjusted to reflect the appropriate sales charges applicable to Class A and Class C shares, but has not been adjusted to take into account differences in class specific operating expenses (such as 12b-1 fees). The Investor Class has lower expenses and typically higher returns than Class A and Class C. The Investor Class has higher expenses and typically lower returns than Institutional Class. |
| The investments for the Fund are managed by the same portfolio manager(s) who manage(s) one or more other registered funds that have names, investment objectives and investment styles that are similar to those of the Fund. You should be aware that the Fund is likely to differ from the other mutual fund(s) in size, cash flow pattern and tax matters. Accordingly, the holdings and performance of the Fund can be expected to vary from those of the other mutual fund(s). |
| The performance information for Trust Class, Institutional Class, Class A and Class C prior to the classes’ respective inception dates is that of the Investor Class of Neuberger Berman Short Duration Bond Fund. The performance information of the Investor Class has been adjusted to reflect the appropriate sales charges applicable to Class A and Class C shares, but has not been adjusted to take into account differences in class specific operating expenses (such as 12b-1 fees). The Investor Class has lower expenses and typically higher returns than Trust Class, Class A and Class C. The Investor Class has higher expenses and typically lower returns than Institutional Class. |
Endnotes (Unaudited) (cont’d)
| The Fund had a different goal, to maximize income without undue risk to principal, and investment strategy, which included managing assets by an asset allocation committee, prior to February 28, 2008. Its performance prior to that date might have been different if the current goal and investment strategy had been in effect. |
| The performance information for Trust Class, Class A, Class C and Class R6 prior to the classes’ respective inception dates is that of the Institutional Class of Neuberger Berman Strategic Income Fund. The performance information of the Institutional Class has been adjusted to reflect the appropriate sales charges applicable to Class A and Class C shares, but has not been adjusted to take into account differences in class specific operating expenses (such as 12b-1 fees). The Institutional Class has lower expenses and typically higher returns than Trust Class, Class A and Class C. The Institutional Class has higher expenses and typically lower returns than Class R6. |
For more complete information on any of the Neuberger Berman Income Funds, call us at (800) 877-9700, or visit our website at www.nb.com.
Glossary of Indices (Unaudited)
Bloomberg 7-Year General Obligation (G.O.) Index: | The index is the 7-year (6-8 years to maturity) component of the Bloomberg G.O. Index. The Bloomberg G.O. Index measures the investment grade, U.S. dollar-denominated, long-term, tax-exempt state and local general obligation bond market. Effective August 24, 2021 all Bloomberg Barclays fixed income indices were rebranded as "Bloomberg indices". |
Bloomberg U.S. Aggregate Bond Index: | The index measures the investment grade, U.S. dollar-denominated, fixed-rate, taxable bond market and includes Treasuries, government-related and corporate securities, mortgage-backed securities (MBS) (agency fixed-rate and hybrid adjustable rate mortgage (ARM) pass-throughs), asset-backed securities (ABS), and commercial mortgage-backed securities (CMBS) (agency and nonagency). Effective August 24, 2021 all Bloomberg Barclays fixed income indices were rebranded as "Bloomberg indices". |
Bloomberg Municipal Bond Index: | The index is a rules-based, market-value-weighted index engineered for the long-term tax-exempt bond market. To be included in the index, bonds must be rated investment-grade (Baa3/BBB- or higher) by at least two of the following ratings agencies: Moody’s, S&P, Fitch. If only two of the three agencies rate the security, the lower rating is used to determine index eligibility. If only one of the three agencies rates a security, the rating must be investment-grade. They must have an outstanding par value of at least $7 million and be issued as part of a transaction of at least $75 million. The bonds must be fixed rate, have a dated date after December 31, 1990, and must be at least one year from their maturity date. Remarketed issues, taxable municipal bonds, bonds with floating rates, and derivatives, are excluded from the benchmark. Effective August 24, 2021 all Bloomberg Barclays fixed income indices were rebranded as "Bloomberg indices". |
Bloomberg Municipal High Yield Index: | The index measures the performance of the high yield municipal bond market. To be included in the index, bonds must be rated non-investment-grade (Ba1/BB+ or lower) by at least two of the following ratings agencies: Moody’s, S&P, Fitch. If only two of the three agencies rate the security, the lower rating is used to determine index eligibility. If only one of the three agencies rates a security, the rating must be non-investment-grade. They must have an outstanding par value of at least $7 million and be issued as part of a transaction of at least $75 million. The bonds must be fixed rate, have a dated date after December 31, 1990, and must be at least one year from their maturity date. Remarketed issues, taxable municipal bonds, bonds with floating rates, and derivatives, are excluded from the benchmark. Effective August 24, 2021 all Bloomberg Barclays fixed income indices were rebranded as "Bloomberg indices". |
65% Bloomberg Municipal Bond Index and 35% Bloomberg Municipal High Yield Index: | The blended index is composed of 65% Bloomberg Municipal Bond Index and 35% Bloomberg Municipal High Yield Index (both described above) and is rebalanced monthly. Effective August 24, 2021 all Bloomberg Barclays fixed income indices were rebranded as "Bloomberg indices". |
Bloomberg 1-3 Year U.S. Government/Credit Bond Index: | The index is the 1-3 year component of the Bloomberg U.S. Government/Credit Index. The Bloomberg U.S. Government/Credit Index is the non-securitized component of the Bloomberg U.S. Aggregate Bond Index and includes Treasuries and government-related (agency, sovereign, supranational, and local authority debt guaranteed by the U.S. government) and investment grade corporate securities. Effective August 24, 2021 all Bloomberg Barclays fixed income indices were rebranded as "Bloomberg indices". |
Glossary of Indices (Unaudited) (cont’d)
ICE BofA U.S. High Yield Constrained Index: | The index tracks the performance of U.S. dollar-denominated below investment grade corporate debt publicly issued in the U.S. domestic market. In addition to meeting other criteria, qualifying securities must have a below investment grade rating (based on an average of Moody’s, S&P and Fitch ratings), and have risk exposure to countries that are members of the FX-G10, Western Europe or territories of the U.S. and Western Europe. Securities in legal default are excluded from the index. Index constituents are capitalization-weighted, provided the total allocation to an individual issuer does not exceed 2%. Transaction costs are incorporated into the calculation of total return for ICE fixed income indices beginning in July 2022. |
J.P. Morgan Corporate Emerging Markets Bond Index (CEMBI)—Diversified: | The index tracks the performance of U.S. dollar-denominated corporate emerging market bonds, including emerging market countries from Asia, Europe, Latin America and the Middle East/Africa. The Diversified version of the index is market capitalization-weighted and limits the weights of those index countries with larger corporate debt stocks by including only specified portions of those countries’ eligible current face amounts of debt outstanding. Effective March 31, 2022, Russia and Belarus were excluded from the J.P. Morgan fixed income indices. The index market value for all Russian and Belarus debt was set to zero, reflecting a total return loss due to market disruption. |
J.P. Morgan Emerging Markets Bond Index (EMBI)—Global Diversified: | The index tracks the performance of U.S. dollar-denominated debt instruments issued by emerging market sovereign and quasi-sovereign entities (Brady bonds, loans and Eurobonds), including emerging market countries from Asia, Europe, Latin America and the Middle East/Africa. The Global version of the index captures a broad, comprehensive universe of emerging market issues. The Diversified version of the index is market capitalization-weighted and limits the weights of those index countries with larger debt stocks by including only specified portions of those countries’ eligible current face amounts of debt outstanding. Effective March 31, 2022, Russia and Belarus were excluded from the J.P. Morgan fixed income indices. The index market value for all Russian and Belarus debt was set to zero, reflecting a total return loss due to market disruption. |
J.P. Morgan Government Bond Index (GBI)—Emerging Markets Global Diversified: | The index tracks the performance of local currency denominated bonds issued by emerging market governments, including emerging market countries from Asia, Europe, Latin America and the Middle East/Africa. The Global version of the index includes only countries that are accessible by most of the international investor base, while countries with explicit capital controls are excluded. The Diversified version of the index is market capitalization-weighted, with a maximum weight to a country capped at 10%. Effective March 31, 2022, Russia and Belarus were excluded from the J.P. Morgan fixed income indices. The index market value for all Russian and Belarus debt was set to zero, reflecting a total return loss due to market disruption. |
50% J.P. Morgan GBI—Emerging Markets Global Diversified, 25% J.P. Morgan EMBI—Global Diversified, and 25% J.P. Morgan CEMBI—Diversified: | The blended index is composed of 50% J.P. Morgan GBI—Emerging Markets Global Diversified, 25% J.P. Morgan EMBI—Global Diversified, and 25% J.P. Morgan CEMBI—Diversified (all described above) and is rebalanced monthly. Effective March 31, 2022, Russia and Belarus were excluded from the J.P. Morgan fixed income indices. The index market value for all Russian and Belarus debt was set to zero, reflecting a total return loss due to market disruption. |
Morningstar LSTA US Leveraged Loan Index: | The index is a market-value weighted index designed to measure the performance of the US leveraged loan market. The starting universe consists of senior secured, USD denominated syndicated term leveraged loans with a minimum initial term of one year, a minimum initial spread of base rate (LIBOR/SOFR) plus 125 basis points, and a minimum initial issue size of $50 million. The index is rebalanced on a weekly basis every Friday. The index was renamed from S&P/LSTA Leveraged Loan Index to Morningstar LSTA US Leveraged Loan Index effective 8/29/2022. |
Information About Your Fund’s Expenses (Unaudited)
As a Fund shareholder, you incur two types of costs: (1) transaction costs, including sales charges (loads) on purchase payments or redemption proceeds (if applicable); and (2) ongoing costs, including management fees, distribution and/or service (12b-1) fees (if applicable), and other Fund expenses. This example is intended to help you understand your ongoing costs (in U.S. dollars) of investing in a Fund and compare these costs with the ongoing costs of investing in other mutual funds.
This table is designed to provide information regarding costs related to your investments. The following examples are based on an investment of $1,000 made at the beginning of the six month period ended October 31, 2023 and held for the entire period. The table illustrates each Fund’s costs in two ways:
Actual Expenses and Performance: | The first section of the table provides information about actual account values and actual expenses in dollars, based on the Fund’s actual performance during the period indicated. You may use the information in this line, together with the amount you invested, to estimate the expenses you paid over the period. Simply divide your account value by $1,000 (for example, an $8,600 account value divided by $1,000 = 8.6), then multiply the result by the number in the first section of the table under the heading entitled "Expenses Paid During the Period" to estimate the expenses you paid over the period. |
Hypothetical Example for Comparison Purposes: | The second section of the table provides information about hypothetical account values and hypothetical expenses based on the Fund’s actual expense ratio and an assumed rate of return at 5% per year before expenses. This return is not the Fund’s actual return. The hypothetical account values and expenses may not be used to estimate the actual ending account balance or expenses you paid for the period. You may use this information to compare the ongoing costs of investing in a Fund versus other funds. To do so, compare the expenses shown in this 5% hypothetical example with the 5% hypothetical examples that appear in the shareholder reports of other funds. |
Please note that the expenses in the table are meant to highlight your ongoing costs only and do not include any transaction costs, such as sales charges (loads) (if applicable). Therefore, the information under the heading "Hypothetical (5% annual return before expenses)" is useful in comparing ongoing costs only, and will not help you determine the relative total costs of owning different funds. In addition, if these transaction costs were included, your costs would have been higher.
Expense Example (Unaudited)
Neuberger Berman Income Funds
| | HYPOTHETICAL (5% ANNUAL RETURN BEFORE EXPENSES) |
| Beginning
Account
Value
5/1/23 | Ending
Account
Value
10/31/23 | Expenses Paid
During the
5/1/23 – 10/31/23 | | Beginning
Account
Value
5/1/23 | Ending
Account
Value
10/31/23 | Expenses Paid
During the
Period(2)
5/1/23 – 10/31/23 | |
|
| | | | | | | | |
| | | | | | | | |
| | | | | | | | |
| | | | | | | | |
| | | | | | | | |
Emerging Markets Debt Fund |
| | | | | | | | |
| | | | | | | | |
| | | | | | | | |
Floating Rate Income Fund |
| | | | | | | | |
| | | | | | | | |
| | | | | | | | |
|
| | | | | | | | |
| | | | | | | | |
| | | | | | | | |
| | | | | | | | |
| | | | | | | | |
| | | | | | | | |
| | | | | | | | |
Municipal High Income Fund |
| | | | | | | | |
| | | | | | | | |
| | | | | | | | |
|
| | | | | | | | |
| | | | | | | | |
| | | | | | | | |
Municipal Intermediate Bond Fund |
| | | | | | | | |
| | | | | | | | |
| | | | | | | | |
| | | | | | | | |
|
| | | | | | | | |
| | | | | | | | |
| | | | | | | | |
| | | | | | | | |
| | | | | | | | |
|
| | | | | | | | |
| | | | | | | | |
| | | | | | | | |
| | | | | | | | |
| | | | | | | | |
| For each class, expenses are equal to the annualized expense ratio for the class, multiplied by the average account value over the period, multiplied by 184/365 (to reflect the one-half year period shown), unless otherwise indicated. |
Expense Example (Unaudited) (cont’d)
Neuberger Berman Income Funds
| Hypothetical expenses are equal to the annualized expense ratios for each class, multiplied by the average account value over the period (assuming a 5% annual return), multiplied by 184/365 (to reflect the one-half year period shown). |
Legend October 31, 2023 (Unaudited)
Neuberger Berman Income Funds
|
| = New Zealand Bank Bill Rate |
| = Budapest Interbank Offered Rate |
| = Canadian Dollar Offered Rate |
| = Overnight Brazil Interbank Deposit Rate |
| = Sinacofi Chile Interbank Rate Average |
| = China Fixing Rate Repo Rates 7 Day |
| = Canadian Overnight Repo Rate Average |
| = Eurostat Eurozone Harmonised Indices of Consumer Prices Ex Tobacco Unrevised Series NSA |
| = Euro Interbank Offered Rate |
| |
| = France Consumer Price Index Ex Tobacco |
| = Colombia Overnight Interbank Reference Rate |
| = Johannesburg Interbank Average Rate |
| = London Interbank Offered Rate |
| = Mumbai Interbank Offered Rate |
| = Prague Interbank Offered Rate |
| = Secured Overnight Financing Rate |
| = Sterling Overnight Index Average |
| = Mexican Interbank Equilibrium Interest Rate |
| = Poland Warsaw Interbank Offered Rate |
|
| |
| |
| |
|
| |
| |
| |
| |
| = Goldman Sachs International |
| |
| = JPMorgan Chase Bank N.A. |
| = Morgan Stanley Capital Services LLC |
| = Standard Chartered Bank |
| |
| = State Street Bank and Trust Company |
Index Periods/Payment Frequencies: |
| |
| |
| |
| |
| |
| |
| |
Legend October 31, 2023 (Unaudited) (cont’d)
Non-Deliverable Forward Contracts: |
| |
| |
| |
| |
| |
| |
| |
| |
| |
| |
| |
|
| = Closed Joint Stock Company |
| |
| = Neuberger Berman Investment Advisers LLC |
| = Public Joint Stock Company |
|
| |
| |
| |
| |
| |
| |
| |
| |
| |
| |
| |
| |
| |
| |
| |
| |
| |
| |
| |
| |
| |
| |
| |
| |
| |
| |
| |
| |
| |
| |
Legend October 31, 2023 (Unaudited) (cont’d)
Currency Abbreviations (cont’d): |
| |
| |
| |
| |
| |
| |
(a)
There is one official currency held in China, the Chinese Yuan Renminbi. CNY is traded onshore, in mainland China and CNH is traded offshore, mainly in the Hong Kong market, each at a different exchange rate.
Schedule of Investments Core Bond Fund^ October 31, 2023
| |
U.S. Treasury Obligations 15.7% |
|
| | U.S. Treasury Bills, 5.25%, due 12/14/2023 | |
| | | |
| | | |
| | 3.75%, due 8/15/2041 - 11/15/2043 | |
| | | |
| | | |
| | 3.38%, due 5/15/2044 - 11/15/2048 | |
| | 3.13%, due 8/15/2044 - 5/15/2048 | |
| | 3.00%, due 2/15/2047 - 2/15/2049 | |
| | | |
| | | |
| | | |
| | 4.13%, due 9/30/2027 - 10/31/2027 | |
| | 3.88%, due 11/30/2027 - 9/30/2029 | |
| | | |
| | | |
| | | |
Total U.S. Treasury Obligations (Cost $103,181,308) | |
U.S. Government Agency Securities 0.7% |
|
| | | |
| | | |
| | | |
| | Federal National Mortgage Association Principal Strips, 0.00%, due 7/15/2037 | |
| | Tennessee Valley Authority, 5.25%, due 9/15/2039 | |
Total U.S. Government Agency Securities (Cost $5,126,837) | |
|
Mortgage-Backed Securities 41.5% |
Collateralized Mortgage Obligations 6.0% |
|
| | | |
| | Series 2019-6, Class A1, 2.62%, due 11/25/2059 | |
| | Series 2021-3, Class A1, 1.07%, due 5/25/2066 | |
| | Series 2022-5, Class A1, 4.50%, due 5/25/2067 | |
| | Ellington Financial Mortgage Trust, Series 2022-1, Class A1, 2.21%, due 1/25/2067 | |
| | Federal Home Loan Mortgage Corp. REMICS | |
| | Series 4018, Class HS, (6.34% - 30 day USD SOFR Average), 1.02%, due 3/15/2042 | |
| | Series 4120, Class SV, (6.04% - 30 day USD SOFR Average), 0.72%, due 10/15/2042 | |
| | Series 4159, Class KS, (6.04% - 30 day USD SOFR Average), 0.72%, due 1/15/2043 | |
| | Series 4385, Class IA, 4.50%, due 9/15/2044 | |
| | Series 4572, Class SA, (5.94% - 30 day USD SOFR Average), 0.62%, due 4/15/2046 | |
| | Series 4623, Class MS, (5.89% - 30 day USD SOFR Average), 0.57%, due 10/15/2046 | |
| | Series 5013, Class ID, 3.00%, due 9/25/2050 | |
| | Federal Home Loan Mortgage Corp. STACR REMIC Trust | |
| | Series 2021-DNA7, Class M1, (30 day USD SOFR Average + 0.85%), 6.17%, due 11/25/2041 | |
| | Series 2021-DNA7, Class M2, (30 day USD SOFR Average + 1.80%), 7.12%, due 11/25/2041 | |
| | Series 2022-DNA2, Class M1B, (30 day USD SOFR Average + 2.40%), 7.72%, due 2/25/2042 | |
| | Series 2022-HQA1, Class M1B, (30 day USD SOFR Average + 3.50%), 8.82%, due 3/25/2042 | |
| | Series 2022-DNA3, Class M1B, (30 day USD SOFR Average + 2.90%), 8.22%, due 4/25/2042 | |
| | Series 2022-DNA4, Class M1B, (30 day USD SOFR Average + 3.35%), 8.67%, due 5/25/2042 | |
See Notes to Financial Statements
Schedule of Investments Core Bond Fund^ (cont’d)
| |
|
Collateralized Mortgage Obligations – cont'd |
|
| | Federal Home Loan Mortgage Corp. STACR Trust | |
| | Series 2017-DNA1, Class M2, (30 day USD SOFR Average + 3.36%), 8.69%, due 7/25/2029 | |
| | Series 2017-HQA3, Class M2, (30 day USD SOFR Average + 2.46%), 7.79%, due 4/25/2030 | |
| | Series 2018-HQA1, Class M2, (30 day USD SOFR Average + 2.41%), 7.74%, due 9/25/2030 | |
| | Federal Home Loan Mortgage Corp. Strips, Series 312, Class S1, (5.84% - 30 day USD SOFR Average), 0.52%, due 9/15/2043 | |
| | Federal National Mortgage Association Connecticut Avenue Securities | |
| | Series 2021-R01, Class 1M2, (30 day USD SOFR Average + 1.55%), 6.87%, due 10/25/2041 | |
| | Series 2022-R01, Class 1M2, (30 day USD SOFR Average + 1.90%), 7.22%, due 12/25/2041 | |
| | Series 2022-R04, Class 1M2, (30 day USD SOFR Average + 3.10%), 8.42%, due 3/25/2042 | |
| | Series 2022-R03, Class 1M2, (30 day USD SOFR Average + 3.50%), 8.82%, due 3/25/2042 | |
| | Series 2022-R07, Class 1M1, (30 day USD SOFR Average + 2.95%), 8.27%, due 6/25/2042 | |
| | Series 2022-R07, Class 1M2, (30 day USD SOFR Average + 4.65%), 9.97%, due 6/25/2042 | |
| | Series 2023-R01, Class 1M1, (30 day USD SOFR Average + 2.40%), 7.72%, due 12/25/2042 | |
| | Series 2023-R02, Class 1M1, (30 day USD SOFR Average + 2.30%), 7.62%, due 1/25/2043 | |
| | Federal National Mortgage Association Interest Strip, Series 418, Class C24, 4.00%, due 8/25/2043 | |
| | Federal National Mortgage Association REMICS | |
| | Series 2012-15, Class S, (5.84% - 30 day USD SOFR Average), 0.51%, due 3/25/2042 | |
| | Series 2012-70, Class HS, (5.89% - 30 day USD SOFR Average), 0.56%, due 7/25/2042 | |
| | Series 2017-100, Class S, (6.04% - 30 day USD SOFR Average), 0.71%, due 12/25/2042 | |
| | Series 2012-140, Class PI, 3.50%, due 12/25/2042 | |
| | Series 2013-6, Class SB, (5.99% - 30 day USD SOFR Average), 0.66%, due 2/25/2043 | |
| | Series 2013-18, Class PS, (5.99% - 30 day USD SOFR Average), 0.66%, due 3/25/2043 | |
| | Series 2015-32, Class SA, (6.09% - 30 day USD SOFR Average), 0.76%, due 5/25/2045 | |
| | Series 2016-32, Class LI, 3.50%, due 6/25/2046 | |
| | Series 2016-40, Class SA, (5.74% - 30 day USD SOFR Average), 0.41%, due 7/25/2046 | |
| | Series 2016-95, Class US, (5.89% - 30 day USD SOFR Average), 0.56%, due 12/25/2046 | |
| | Series 2018-7, Class CI, 4.00%, due 2/25/2048 | |
| | Series 2020-52, Class GI, 4.50%, due 8/25/2050 | |
| | | |
| | Series 2019-NQM3, Class A1, 2.69%, due 11/25/2059 | |
| | Series 2021-NQM5, Class A1, 1.26%, due 7/25/2066 | |
| | Government National Mortgage Association REMICS | |
| | Series 2013-5, Class BI, 3.50%, due 1/20/2043 | |
| | Series 2013-23, Class IT, 3.50%, due 2/20/2043 | |
| | Series 2018-124, Class DS, (5.99% - 1 mo. USD Term SOFR), 0.65%, due 12/16/2043 | |
| | Series 2016-77, Class TS, (6.04% - 1 mo. USD Term SOFR), 0.70%, due 12/20/2044 | |
| | Series 2019-22, Class SA, (5.49% - 1 mo. USD Term SOFR), 0.15%, due 2/20/2045 | |
| | Series 2018-7, Class SA, (6.09% - 1 mo. USD Term SOFR), 0.75%, due 1/20/2048 | |
| | Series 2020-107, Class AB, 1.00%, due 7/20/2050 | |
| | Series 2020-112, Class KA, 1.00%, due 8/20/2050 | |
| | Series 2020-173, Class MI, 2.50%, due 11/20/2050 | |
| | Series 2021-26, Class AI, 2.00%, due 2/20/2051 | |
| | Series 2021-103, Class HE, 2.00%, due 6/20/2051 | |
| | Series 2021-116, Class IA, 2.50%, due 6/20/2051 | |
| | JP Morgan Mortgage Trust, Series 2023-HE2, Class A1, (30 day USD SOFR Average + 1.70%), 7.02%, due 3/25/2054 | |
| | New Residential Mortgage Loan Trust, Series 2019-NQM5, Class A1, 2.71%, due 11/25/2059 | |
| | Starwood Mortgage Residential Trust | |
| | Series 2021-3, Class A1, 1.13%, due 6/25/2056 | |
| | Series 2021-6, Class A1, 1.92%, due 11/25/2066 | |
See Notes to Financial Statements
Schedule of Investments Core Bond Fund^ (cont’d)
| |
|
Collateralized Mortgage Obligations – cont'd |
|
| | Towd Point Mortgage Trust | |
| | Series 2017-5, Class A1, (1 mo. USD Term SOFR + 0.71%), 5.51%, due 2/25/2057 | |
| | Series 2017-2, Class A2, 3.25%, due 4/25/2057 | |
| | Series 2022-4, Class A1, 3.75%, due 9/25/2062 | |
| | Verus Securitization Trust | |
| | Series 2019-4, Class A1, 3.64%, due 11/25/2059 | |
| | Series 2021-3, Class A1, 1.05%, due 6/25/2066 | |
| | Series 2021-6, Class A1, 1.63%, due 10/25/2066 | |
| | | |
Commercial Mortgage-Backed 5.0% |
|
| | | |
| | Series 2022-BNK39, Class A4, 2.93%, due 2/15/2055 | |
| | Series 2023-BNK45, Class B, 6.15%, due 2/15/2056 | |
| | BBCMS Mortgage Trust, Series 2022-C18, Class A5, 5.71%, due 12/15/2055 | |
| | BB-UBS Trust, Series 2012-SHOW, Class A, 3.43%, due 11/5/2036 | |
| | | |
| | Series 2020-B21, Class A5, 1.98%, due 12/17/2053 | |
| | Series 2021-B26, Class XA, 0.88%, due 6/15/2054 | |
| | Series 2021-B31, Class A5, 2.67%, due 12/15/2054 | |
| | Series 2021-B31, Class C, 3.20%, due 12/15/2054 | |
| | BX Commercial Mortgage Trust, Series 2021-VOLT, Class D, (1 mo. USD Term SOFR + 1.76%), 7.10%, due 9/15/2036 | |
| | BX Trust, Series 2019-OC11, Class A, 3.20%, due 12/9/2041 | |
| | BXP Trust, Series 2017-GM, Class A, 3.38%, due 6/13/2039 | |
| | CAMB Commercial Mortgage Trust, Series 2019-LIFE, Class B, (1 mo. USD Term SOFR + 1.30%), 6.63%, due 12/15/2037 | |
| | Citigroup Commercial Mortgage Trust | |
| | Series 2013-GC17, Class B, 5.10%, due 11/10/2046 | |
| | Series 2014-GC23, Class B, 4.18%, due 7/10/2047 | |
| | Series 2014-GC25, Class XA, 0.94%, due 10/10/2047 | |
| | Series 2015-GC27, Class XA, 1.30%, due 2/10/2048 | |
| | Series 2022-GC48, Class A5, 4.58%, due 5/15/2054 | |
| | | |
| | Series 2012-CR4, Class AM, 3.25%, due 10/15/2045 | |
| | Series 2014-CR16, Class XA, 0.93%, due 4/10/2047 | |
| | Series 2014-LC15, Class XA, 1.03%, due 4/10/2047 | |
| | Series 2014-LC15, Class AM, 4.20%, due 4/10/2047 | |
| | Series 2014-CR17, Class XA, 0.92%, due 5/10/2047 | |
| | Series 2014-UBS3, Class XA, 1.05%, due 6/10/2047 | |
| | Series 2014-CR18, Class XA, 0.91%, due 7/15/2047 | |
| | Series 2014-UBS6, Class XA, 0.83%, due 12/10/2047 | |
| | Series 2014-CR21, Class AM, 3.99%, due 12/10/2047 | |
| | CSAIL Commercial Mortgage Trust | |
| | Series 2016-C5, Class XA, 0.89%, due 11/15/2048 | |
| | Series 2015-C1, Class B, 4.04%, due 4/15/2050 | |
| | Series 2017-CX9, Class A5, 3.45%, due 9/15/2050 | |
| | Federal Home Loan Mortgage Corp. Multifamily Structured Pass-Through Certificates | |
| | Series KW03, Class X1, 0.83%, due 6/25/2027 | |
| | Series K088, Class XAM, 0.42%, due 1/25/2029 | |
| | Series K090, Class X1, 0.71%, due 2/25/2029 | |
| | Series K098, Class XAM, 1.39%, due 8/25/2029 | |
See Notes to Financial Statements
Schedule of Investments Core Bond Fund^ (cont’d)
| |
|
Commercial Mortgage-Backed – cont'd |
|
| | | |
| | Series 2023-V1, Class A3, 5.67%, due 2/10/2056 | |
| | Series 2023-V1, Class B, 6.40%, due 2/10/2056 | |
| | GS Mortgage Securities Trust | |
| | Series 2014-GC18, Class XA, 0.97%, due 1/10/2047 | |
| | Series 2019-GC42, Class A4, 3.00%, due 9/10/2052 | |
| | Series 2019-GSA1, Class A4, 3.05%, due 11/10/2052 | |
| | Series 2020-GC47, Class A5, 2.38%, due 5/12/2053 | |
| | Hilton USA Trust, Series 2016-HHV, Class A, 3.72%, due 11/5/2038 | |
| | JP Morgan Chase Commercial Mortgage Securities Trust | |
| | Series 2016-NINE, Class A, 2.85%, due 9/6/2038 | |
| | Series 2022-OPO, Class B, 3.38%, due 1/5/2039 | |
| | JPMBB Commercial Mortgage Securities Trust, Series 2015-C33, Class AS, 4.02%, due 12/15/2048 | |
| | Manhattan West Mortgage Trust, Series 2020-1MW, Class A, 2.13%, due 9/10/2039 | |
| | Morgan Stanley Bank of America Merrill Lynch Trust, Series 2014-C16, Class XA, 0.87%, due 6/15/2047 | |
| | ORL Trust, Series 2023-GLKS, Class A, (1 mo. USD Term SOFR + 2.35%), 7.68%, due 10/15/2028 | |
| | Taubman Centers Commercial Mortgage Trust, Series 2022-DPM, Class A, (1 mo. USD Term SOFR + 2.19%), 7.52%, due 5/15/2037 | |
| | Wells Fargo Commercial Mortgage Trust, Series 2015-NXS4, Class C, 4.68%, due 12/15/2048 | |
| | WF-RBS Commercial Mortgage Trust | |
| | Series 2014-C25, Class XA, 0.78%, due 11/15/2047 | |
| | Series 2014-C22, Class XA, 0.76%, due 9/15/2057 | |
| | Series 2014-C22, Class AS, 4.07%, due 9/15/2057 | |
| | | |
Federal Home Loan Mortgage Corp. 10.4% |
|
| | Pass-Through Certificates | |
| | 2.00%, due 12/1/2050 - 3/1/2052 | |
| | 2.50%, due 7/1/2050 - 5/1/2052 | |
| | 3.00%, due 8/1/2046 - 6/1/2052 | |
| | 3.50%, due 7/1/2042 - 11/1/2052 | |
| | 4.00%, due 3/1/2045 - 10/1/2052 | |
| | 4.50%, due 6/1/2039 - 11/1/2052 | |
| | 5.00%, due 3/1/2038 - 6/1/2053 | |
| | 5.50%, due 9/1/2052 - 7/1/2053 | |
| | 6.00%, due 12/1/2052 - 10/1/2053 | |
| | | |
Federal Home Loan Mortgage Corp. 0.1% |
|
| | Pass-Through Certificates, 2.50%, due 4/1/2052 | |
Federal National Mortgage Association 15.7% |
|
| | Pass-Through Certificates | |
| | 2.00%, due 1/1/2051 - 3/1/2052 | |
| | 2.50%, due 8/1/2050 - 9/1/2052 | |
| | 3.00%, due 10/1/2041 - 8/1/2052 | |
| | 3.50%, due 12/1/2041 - 5/1/2053 | |
| | 4.00%, due 10/1/2045 - 10/1/2052 | |
| | 4.50%, due 4/1/2034 - 11/1/2052 | |
| | 5.00%, due 6/1/2033 - 5/1/2053 | |
| | 5.50%, due 11/1/2052 - 6/1/2053 | |
See Notes to Financial Statements
Schedule of Investments Core Bond Fund^ (cont’d)
| |
|
Federal National Mortgage Association – cont'd |
|
| | 6.00%, due 4/1/2053 - 8/1/2053 | |
| | | |
Government National Mortgage Association 4.3% |
|
| | Pass-Through Certificates | |
| | 2.00%, due 2/20/2051 - 6/20/2052 | |
| | 2.50%, due 2/20/2051 - 10/20/2052 | |
| | 3.50%, due 1/20/2043 - 6/20/2052 | |
| | 4.50%, due 3/20/2052 - 10/20/2052 | |
| | 5.00%, due 9/20/2052 - 7/20/2053 | |
| | 5.50%, due 11/20/2052 - 7/20/2053 | |
| | 6.00%, due 12/20/2052 - 8/20/2053 | |
| | | |
Total Mortgage-Backed Securities (Cost $296,355,831) | |
Asset-Backed Securities 10.0% |
|
| | 522 Funding CLO Ltd., Series 2019-5A, Class AR, (3 mo. USD Term SOFR + 1.33%), 6.72%, due 4/15/2035 | |
| | AM Capital Funding LLC, Series 2018-1, Class A, 4.98%, due 12/15/2023 | |
| | Amur Equipment Finance Receivables XI LLC, Series 2022-2A, Class A2, 5.30%, due 6/21/2028 | |
| | Amur Equipment Finance Receivables XII LLC, Series 2023-1A, Class A2, 6.09%, due 12/20/2029 | |
| | Aqua Finance Trust, Series 2021-A, Class A, 1.54%, due 7/17/2046 | |
| | Avis Budget Rental Car Funding AESOP LLC | |
| | Series 2018-2A, Class B, 4.27%, due 3/20/2025 | |
| | Series 2019-3A, Class A, 2.36%, due 3/20/2026 | |
| | Series 2021-2A, Class A, 1.66%, due 2/20/2028 | |
| | Series 2021-2A, Class B, 1.90%, due 2/20/2028 | |
| | Beacon Container Finance II LLC, Series 2021-1A, Class A, 2.25%, due 10/22/2046 | |
| | BMW Vehicle Owner Trust, Series 2023-A, Class A3, 5.47%, due 2/25/2028 | |
| | BOF VII AL Funding Trust I, Series 2023-CAR3, Class A2, 6.29%, due 7/26/2032 | |
| | Carmax Auto Owner Trust, Series 2023-3, Class A3, 5.28%, due 5/15/2028 | |
| | CCG Receivables Trust, Series 2023-1, Class A2, 5.82%, due 9/16/2030 | |
| | Chase Funding Trust, Series 2004-1, Class 2A2, (1 mo. USD Term SOFR + 0.57%), 5.90%, due 12/25/2033 | |
| | Clover CLO LLC, Series 2021-2A, Class A, (3 mo. USD Term SOFR + 1.43%), 6.85%, due 7/20/2034 | |
| | Corevest American Finance Trust, Series 2019-1, Class A, 3.32%, due 3/15/2052 | |
| | Crown Castle Towers LLC, 4.24%, due 7/15/2028 | |
| | Dell Equipment Finance Trust, Series 2023-3, Class A3, 5.93%, due 4/23/2029 | |
| | DLLAA LLC, Series 2023-1A, Class A3, 5.64%, due 2/22/2028 | |
| | Eaton Vance CLO Ltd., Series 2013-1A, Class A13R, (3 mo. USD Term SOFR + 1.51%), 6.91%, due 1/15/2034 | |
| | Elmwood CLO III Ltd., Series 2019-3A, Class AR, (3 mo. USD Term SOFR + 1.42%), 6.84%, due 10/20/2034 | |
| | GM Financial Automobile Leasing Trust, Series 2023-3, Class A3, 5.38%, due 11/20/2026 | |
| | Halseypoint CLO 5 Ltd., Series 2021-5A, Class A1A, (3 mo. USD Term SOFR + 1.47%), 6.86%, due 1/30/2035 | |
| | JPMorgan Chase Bank NA, Series 2021-3, Class B, 0.76%, due 2/26/2029 | |
| | Kubota Credit Owner Trust, Series 2023-2A, Class A3, 5.28%, due 1/18/2028 | |
| | Magnetite XXIII Ltd., Series 2019-23A, Class AR, (3 mo. USD Term SOFR + 1.39%), 6.77%, due 1/25/2035 | |
| | Magnetite XXIV Ltd., Series 2019-24A, Class AR, (3 mo. USD Term SOFR + 1.31%), 6.70%, due 4/15/2035 | |
See Notes to Financial Statements
Schedule of Investments Core Bond Fund^ (cont’d)
| |
Asset-Backed Securities – cont'd |
|
| | MMAF Equipment Finance LLC, Series 2023-A, Class A3, 5.54%, due 12/13/2029 | |
| | | |
| | Series 2021-2A, Class A, 1.43%, due 5/20/2039 | |
| | Series 2021-2A, Class B, 1.83%, due 5/20/2039 | |
| | Navient Private Education Refi Loan Trust | |
| | Series 2021-BA, Class A, 0.94%, due 7/15/2069 | |
| | Series 2021-CA, Class A, 1.06%, due 10/15/2069 | |
| | Series 2021-EA, Class A, 0.97%, due 12/16/2069 | |
| | Series 2021-GA, Class A, 1.58%, due 4/15/2070 | |
| | Oaktree CLO Ltd., Series 2021-2A, Class A, (3 mo. USD Term SOFR + 1.44%), 6.84%, due 1/15/2035 | |
| | OneMain Financial Issuance Trust, Series 2023-2A, Class A1, 5.84%, due 9/15/2036 | |
| | | |
| | Series 2021-B, Class A, 0.77%, due 8/15/2026 | |
| | Series 2022-C, Class A, 3.89%, due 5/15/2027 | |
| | PPM CLO 3 Ltd., Series 2019-3A, Class AR, (3 mo. USD Term SOFR + 1.35%), 6.75%, due 4/17/2034 | |
| | Residential Asset Securities Corporation Trust, Series 2005-KS12, Class M2, (1 mo. USD Term SOFR + 0.57%), 6.13%, due 1/25/2036 | |
| | Saxon Asset Securities Trust, Series 2004-1, Class A, (1 mo. USD Term SOFR + 0.65%), 1.92%, due 3/25/2035 | |
| | | |
| | | |
| | | |
| | Sierra Timeshare Receivables Funding LLC | |
| | Series 2019-2A, Class A, 2.59%, due 5/20/2036 | |
| | Series 2020-2A, Class A, 1.33%, due 7/20/2037 | |
| | Series 2020-2A, Class C, 3.51%, due 7/20/2037 | |
| | Series 2021-2A, Class A, 1.35%, due 9/20/2038 | |
| | Series 2022-1A, Class B, 3.55%, due 10/20/2038 | |
| | Series 2023-2A, Class A, 5.80%, due 4/20/2040 | |
| | Series 2023-3A, Class A, 6.10%, due 9/20/2040 | |
| | SoFi Consumer Loan Program Trust, Series 2023-1S, Class A, 5.81%, due 5/15/2031 | |
| | SoFi Professional Loan Program LLC, Series 2018-A, Class A2B, 2.95%, due 2/25/2042 | |
| | | |
| | Series 2016-1A, Class A23, 4.97%, due 5/25/2046 | |
| | Series 2021-1A, Class A2I, 1.95%, due 8/25/2051 | |
| | TCI-Flatiron CLO Ltd., Series 2018-1A, Class ANR, (3 mo. USD Term SOFR + 1.32%), 6.71%, due 1/29/2032 | |
| | Thayer Park CLO Ltd., Series 2017-1A, Class A1R, (3 mo. USD Term SOFR + 1.30%), 6.72%, due 4/20/2034 | |
| | Toyota Auto Receivables Owner Trust, Series 2023-C, Class A3, 5.16%, due 4/17/2028 | |
| | TRESTLES CLO Ltd., Series 2017-1A, Class A1R, (3 mo. USD Term SOFR + 1.25%), 6.63%, due 4/25/2032 | |
| | TRESTLES CLO V Ltd., Series 2021-5A, Class A1, (3 mo. USD Term SOFR + 1.43%), 6.85%, due 10/20/2034 | |
| | USAA Auto Owner Trust, Series 2023-A, Class A3, 5.58%, due 5/15/2028 | |
| | Vantage Data Centers Issuer LLC, Series 2019-1A, Class A2, 3.19%, due 7/15/2044 | |
| | Voya CLO Ltd., Series 2019-2A, Class A, (3 mo. USD Term SOFR + 1.53%), 6.95%, due 7/20/2032 | |
| | Whitebox CLO III Ltd., Series 2021-3A, Class A1, (3 mo. USD Term SOFR + 1.48%), 6.88%, due 10/15/2034 | |
Total Asset-Backed Securities (Cost $62,673,769) | |
See Notes to Financial Statements
Schedule of Investments Core Bond Fund^ (cont’d)
| |
|
|
|
|
| | | |
| | | |
| | | |
| | | |
| | | |
|
|
| | Philip Morris International, Inc. | |
| | | |
| | | |
| | | |
|
|
| | United Airlines Pass-Through Trust, 5.88%, due 10/15/2027 | |
|
|
| | | |
| | | |
| | | |
| | | |
| | | |
| | | |
| | Barclays PLC, 7.12%, due 6/27/2034 | |
| | | |
| | | |
| | | |
| | Fifth Third Bancorp, 4.34%, due 4/25/2033 | |
| | HSBC Holdings PLC, 6.00%, due 5/22/2027 | |
| | Intesa Sanpaolo SpA, 8.25%, due 11/21/2033 | |
| | JPMorgan Chase & Co., 6.25%, due 10/23/2034 | |
| | Kreditanstalt fuer Wiederaufbau, 4.75%, due 10/29/2030 | |
| | Lloyds Banking Group PLC, 4.98%, due 8/11/2033 | |
| | | |
| | | |
| | | |
| | | |
| | (3 mo. USD LIBOR + 1.34%), 3.59%, due 7/22/2028 | |
| | | |
| | | |
| | | |
| | PNC Financial Services Group, Inc., 6.88%, due 10/20/2034 | |
| | Societe Generale SA, 1.49%, due 12/14/2026 | |
| | UBS AG, 5.65%, due 9/11/2028 | |
| | UBS Group AG, 6.54%, due 8/12/2033 | |
| | | |
|
|
| | Anheuser-Busch Cos. LLC/Anheuser-Busch InBev Worldwide, Inc., 4.70%, due 2/1/2036 | |
| | Anheuser-Busch InBev Worldwide, Inc., 5.45%, due 1/23/2039 | |
| | Constellation Brands, Inc., 4.90%, due 5/1/2033 | |
See Notes to Financial Statements
Schedule of Investments Core Bond Fund^ (cont’d)
| |
|
|
|
| | Molson Coors Beverage Co., 4.20%, due 7/15/2046 | |
| | | |
|
|
| | Amgen, Inc., 5.75%, due 3/2/2063 | |
| | Gilead Sciences, Inc., 5.55%, due 10/15/2053 | |
| | | |
|
|
| | Mohawk Industries, Inc., 5.85%, due 9/18/2028 | |
|
|
| | Dell International LLC/EMC Corp., 6.02%, due 6/15/2026 | |
Diversified Financial Services 0.6% |
|
| | American Express Co., 6.49%, due 10/30/2031 | |
| | Capital One Financial Corp., 7.62%, due 10/30/2031 | |
| | Charles Schwab Corp., 6.14%, due 8/24/2034 | |
| | | |
|
|
| | Duke Energy Corp., 5.00%, due 8/15/2052 | |
| | | |
| | | |
| | | |
| | Interstate Power & Light Co., 2.30%, due 6/1/2030 | |
| | MidAmerican Energy Co., 5.85%, due 9/15/2054 | |
| | NextEra Energy Capital Holdings, Inc. | |
| | | |
| | | |
| | Sempra, 5.50%, due 8/1/2033 | |
| | Southern Co., 5.20%, due 6/15/2033 | |
| | | |
|
|
| | Warnermedia Holdings, Inc., 5.14%, due 3/15/2052 | |
|
|
| | J M Smucker Co., 6.20%, due 11/15/2033 | |
| | Pilgrim's Pride Corp., 6.88%, due 5/15/2034 | |
| | | |
|
|
| | Southern Co. Gas Capital Corp. | |
| | | |
| | | |
| | | |
|
|
| | Travelers Cos., Inc., 5.45%, due 5/25/2053 | |
|
|
| | Meta Platforms, Inc., 4.95%, due 5/15/2033 | |
See Notes to Financial Statements
Schedule of Investments Core Bond Fund^ (cont’d)
| |
|
Machinery - Diversified 0.2% |
|
| | | |
| | | |
| | | |
| | | |
|
|
| | Comcast Corp., 5.35%, due 5/15/2053 | |
| | Cox Communications, Inc., 5.70%, due 6/15/2033 | |
| | Paramount Global, 4.20%, due 5/19/2032 | |
| | | |
|
|
| | Asian Development Bank, 4.50%, due 8/25/2028 | |
| | Corp. Andina de Fomento, 6.00%, due 4/26/2027 | |
| | European Investment Bank, 4.50%, due 10/16/2028 | |
| | Inter-American Development Bank | |
| | | |
| | | |
| | International Bank for Reconstruction & Development, 4.63%, due 8/1/2028 | |
| | | |
Office - Business Equipment 0.3% |
|
| | CDW LLC/CDW Finance Corp. | |
| | | |
| | | |
| | | |
|
|
| | BP Capital Markets America, Inc., 4.81%, due 2/13/2033 | |
| | ConocoPhillips Co., 5.55%, due 3/15/2054 | |
| | Exxon Mobil Corp., 3.10%, due 8/16/2049 | |
| | Marathon Petroleum Corp., 4.70%, due 5/1/2025 | |
| | Occidental Petroleum Corp. | |
| | | |
| | | |
| | | |
| | Phillips 66, 1.30%, due 2/15/2026 | |
| | | |
|
|
| | AbbVie, Inc., 4.05%, due 11/21/2039 | |
| | Bristol-Myers Squibb Co., 6.40%, due 11/15/2063 | |
| | | |
| | | |
| | | |
| | Merck & Co., Inc., 3.90%, due 3/7/2039 | |
| | Pfizer Investment Enterprises Pte. Ltd., 5.34%, due 5/19/2063 | |
| | Takeda Pharmaceutical Co. Ltd., 3.03%, due 7/9/2040 | |
| | | |
Real Estate Investment Trusts 0.2% |
|
| | American Tower Trust 1, 5.49%, due 3/15/2028 | |
See Notes to Financial Statements
Schedule of Investments Core Bond Fund^ (cont’d)
| |
|
|
|
| | McDonald's Corp., 5.45%, due 8/14/2053 | |
|
|
| | Analog Devices, Inc., 2.10%, due 10/1/2031 | |
| | | |
| | | |
| | | |
| | Marvell Technology, Inc., 5.95%, due 9/15/2033 | |
| | NXP BV/NXP Funding LLC/NXP USA, Inc., 5.00%, due 1/15/2033 | |
| | | |
|
|
| | | |
| | | |
| | | |
| | | |
| | Oracle Corp., 6.90%, due 11/9/2052 | |
| | | |
|
|
| | AT&T, Inc., 3.50%, due 9/15/2053 | |
| | Sprint Capital Corp., 8.75%, due 3/15/2032 | |
| | | |
| | | |
| | | |
| | | |
| | Verizon Communications, Inc., 5.05%, due 5/9/2033 | |
| | Vodafone Group PLC, 4.38%, due 2/19/2043 | |
| | | |
Total Corporate Bonds (Cost $187,513,896) | |
Foreign Government Securities 1.1% |
|
| | Japan Bank for International Cooperation, 4.88%, due 10/18/2028 | |
| | Mexico Government International Bonds, 2.66%, due 5/24/2031 | |
| | Province of Manitoba, 4.30%, due 7/27/2033 | |
| | Province of Quebec, 4.50%, due 9/8/2033 | |
|
Total Foreign Government Securities (Cost $7,563,283) | |
|
|
|
Short-Term Investments 0.6% |
Investment Companies 0.6% |
|
| | State Street Institutional U.S. Government Money Market Fund Premier Class, 5.30%(k) (Cost $3,869,872) | |
Total Investments 98.3% (Cost $666,284,796) | |
Other Assets Less Liabilities 1.7% | |
| |
| Rate shown was the discount rate at the date of purchase. |
See Notes to Financial Statements
Schedule of Investments Core Bond Fund^ (cont’d)
| Principal only security. This security entitles the holder to receive principal payments from an underlying pool of assets or on the security itself. |
| Securities were purchased under Rule 144A of the Securities Act of 1933, as amended, or are otherwise restricted and, unless registered under the Securities Act of 1933 or exempted from registration, may only be sold to qualified institutional investors or may have other restrictions on resale. At October 31, 2023, these securities amounted to $104,444,095, which represents 17.1% of net assets of the Fund. |
| Variable or floating rate security where the stated interest rate is not based on a published reference rate and spread. Rather, the interest rate adjusts periodically based on changes in current interest rates and prepayments on the underlying pool of assets. The interest rate shown was the current rate as of October 31, 2023. |
| Step Bond. Coupon rate is a fixed rate for an initial period that either resets at a specific date or may reset in the future contingent upon a predetermined trigger. The interest rate shown was the current rate as of October 31, 2023. |
| Variable or floating rate security. The interest rate shown was the current rate as of October 31, 2023 and changes periodically. |
| Interest only security. These securities represent the right to receive the monthly interest payments on an underlying pool of mortgages. Payments of principal on the pool reduce the value of the "interest only" holding. |
| Security issued at a fixed coupon rate, which converts to a variable rate at a future date. Rate shown is the rate in effect as of period end. |
| Perpetual security. Perpetual securities have no stated maturity date, but they may be called/redeemed by the issuer. The date shown reflects the next call date. |
| When-issued security. Total value of all such securities at October 31, 2023 amounted to $2,112,592, which represents 0.3% of net assets of the Fund. |
| Represents 7-day effective yield as of October 31, 2023. |
| Includes the impact of the Fund’s open positions in derivatives at October 31, 2023. |
See Notes to Financial Statements
Schedule of Investments Core Bond Fund^ (cont’d)
Derivative Instruments
Futures contracts ("futures")
At October 31, 2023, open positions in futures for the Fund were as follows:
| | | | Value and
Unrealized
Appreciation/
(Depreciation) |
| | | | |
| | U.S. Treasury Note, 2 Year | | |
| | U.S. Treasury Note, 5 Year | | |
| | | | |
| | |
| | | | Value and
Unrealized
Appreciation/
(Depreciation) |
| | U.S. Treasury Note, 10 Year | | |
| | U.S. Treasury Note, Ultra 10 Year | | |
| | |
| | |
At October 31, 2023, the Fund had $1,436,193 deposited in a segregated account to cover margin requirements on open futures.
For the year ended October 31, 2023, the average notional value for the months where the Fund had futures outstanding was $108,365,812 for long positions and $(29,910,490) for short positions.
The following is a summary, categorized by Level (see Note A of the Notes to Financial Statements), of inputs used to value the Fund’s investments as of October 31, 2023:
| | | | |
| | | | |
U.S. Treasury Obligations | | | | |
U.S. Government Agency Securities | | | | |
Mortgage-Backed Securities# | | | | |
| | | | |
| | | | |
Foreign Government Securities | | | | |
| | | | |
| | | | |
| The Schedule of Investments provides information on the industry or sector categorization. |
See Notes to Financial Statements
Schedule of Investments Core Bond Fund^ (cont’d)
The following is a summary, categorized by Level (see Note A of the Notes to Financial Statements), of inputs used to value the Fund’s derivatives as of October 31, 2023:
Other Financial Instruments | | | | |
|
|
|
|
|
| | | | |
| | | | |
| | | | |
| Futures are reported at the cumulative unrealized appreciation/(depreciation) of the instrument. |
^
A balance indicated with a "—", reflects either a zero balance or an amount that rounds to less than 1.
See Notes to Financial Statements
Schedule of Investments Emerging Markets Debt Fund^ October 31, 2023
| |
|
| |
|
| | Transportadora de Gas del Sur SA, 6.75%, due 5/2/2025 | |
| | | |
| | | |
| | | |
| | | |
| | | |
| |
|
| | Southern Gas Corridor CJSC | |
| | | |
| | | |
| | | |
| |
|
| | Oil & Gas Holding Co. BSCC, 8.38%, due 11/7/2028 | |
| |
|
| | Banco do Brasil SA, 6.25%, due 4/18/2030 | |
| | Braskem Netherlands Finance BV, 7.25%, due 2/13/2033 | |
| | BRF SA, 4.88%, due 1/24/2030 | |
| | FS Luxembourg SARL, 10.00%, due 12/15/2025 | |
| | Guara Norte SARL, 5.20%, due 6/15/2034 | |
| | Itau Unibanco Holding SA, 3.88%, due 4/15/2031 | |
| | Klabin Austria GmbH, 3.20%, due 1/12/2031 | |
| | MARB BondCo PLC, 3.95%, due 1/29/2031 | |
| | MC Brazil Downstream Trading SARL, 7.25%, due 6/30/2031 | |
| | Minerva Luxembourg SA, 4.38%, due 3/18/2031 | |
| | MV24 Capital BV, 6.75%, due 6/1/2034 | |
| | Petrobras Global Finance BV, 5.50%, due 6/10/2051 | |
| | Rede D'or Finance SARL, 4.50%, due 1/22/2030 | |
| | Vale Overseas Ltd., 6.88%, due 11/21/2036 | |
| | XP, Inc., 3.25%, due 7/1/2026 | |
| | | |
| |
|
| | Agrosuper SA, 4.60%, due 1/20/2032 | |
| | Antofagasta PLC, 5.63%, due 5/13/2032 | |
| | Banco de Chile, 2.99%, due 12/9/2031 | |
| | Banco de Credito e Inversiones SA, 2.88%, due 10/14/2031 | |
| | Banco Santander Chile, 3.18%, due 10/26/2031 | |
| | Cencosud SA, 4.38%, due 7/17/2027 | |
| | Corp. Nacional del Cobre de Chile, 3.70%, due 1/30/2050 | |
| | Empresa Nacional del Petroleo, 3.45%, due 9/16/2031 | |
| | Inversiones CMPC SA, 6.13%, due 6/23/2033 | |
| | VTR Finance NV, 6.38%, due 7/15/2028 | |
| | | |
| |
|
| | Alibaba Group Holding Ltd., 4.00%, due 12/6/2037 | |
| | BOC Aviation Ltd., 4.50%, due 5/23/2028 | |
| | CDBL Funding 2, 2.00%, due 3/4/2026 | |
| | China Hongqiao Group Ltd., 6.25%, due 6/8/2024 | |
See Notes to Financial Statements
Schedule of Investments Emerging Markets Debt Fund^ (cont’d)
| |
| |
|
| | China Overseas Finance Cayman VI Ltd., 5.95%, due 5/8/2024 | |
| | Country Garden Holdings Co. Ltd., 4.80%, due 8/6/2030 | |
| | ENN Clean Energy International Investment Ltd., 3.38%, due 5/12/2026 | |
| | ENN Energy Holdings Ltd., 2.63%, due 9/17/2030 | |
| | Franshion Brilliant Ltd., 4.25%, due 7/23/2029 | |
| | Huarong Finance II Co. Ltd., 5.50%, due 1/16/2025 | |
| | Lenovo Group Ltd., 3.42%, due 11/2/2030 | |
| | Powerchina Roadbridge Group British Virgin Islands Ltd., 3.08%, due 4/1/2026 | |
| | Prosus NV, 3.83%, due 2/8/2051 | |
| | SF Holding Investment 2021 Ltd., 3.13%, due 11/17/2031 | |
| | Tencent Holdings Ltd., 3.68%, due 4/22/2041 | |
| | | |
| |
|
| | Banco Davivienda SA, 6.65%, due 4/22/2031 | |
| | Bancolombia SA, 4.63%, due 12/18/2029 | |
| | Canacol Energy Ltd., 5.75%, due 11/24/2028 | |
| | | |
| | | |
| | | |
| | Empresas Publicas de Medellin ESP | |
| | | |
| | | |
| | Financiera de Desarrollo Territorial SA Findeter, 7.88%, due 8/12/2024 | |
| | Grupo Aval Ltd., 4.38%, due 2/4/2030 | |
| | Grupo de Inversiones Suramericana SA, 5.50%, due 4/29/2026 | |
| | Millicom International Cellular SA, 6.25%, due 3/25/2029 | |
| | SierraCol Energy Andina LLC, 6.00%, due 6/15/2028 | |
| | | |
| |
|
| | Kosmos Energy Ltd., 7.13%, due 4/4/2026 | |
| | Tullow Oil PLC, 10.25%, due 5/15/2026 | |
| | | |
| |
|
| | Central American Bottling Corp./CBC Bottling Holdco SL/Beliv Holdco SL, 5.25%, due 4/27/2029 | |
| | CT Trust, 5.13%, due 2/3/2032 | |
| | Investment Energy Resources Ltd., 6.25%, due 4/26/2029 | |
| | | |
| |
|
| | | |
| | | |
| | | |
| | Melco Resorts Finance Ltd., 5.75%, due 7/21/2028 | |
| | NWD MTN Ltd., 4.13%, due 7/18/2029 | |
| | Prudential Funding Asia PLC, 2.95%, due 11/3/2033 | |
| | Sun Hung Kai Properties Capital Market Ltd., 2.88%, due 1/21/2030 | |
| | | |
See Notes to Financial Statements
Schedule of Investments Emerging Markets Debt Fund^ (cont’d)
| |
| |
|
| | Adani Electricity Mumbai Ltd., 3.95%, due 2/12/2030 | |
| | Adani Green Energy UP Ltd./Prayatna Developers Pvt Ltd./Parampujya Solar Energy, 6.25%, due 12/10/2024 | |
| | Axis Bank Ltd./Gandhinagar, 4.10%, due 9/8/2026 | |
| | Greenko Dutch BV, 3.85%, due 3/29/2026 | |
| | HDFC Bank Ltd., 3.70%, due 8/25/2026 | |
| | JSW Steel Ltd., 5.05%, due 4/5/2032 | |
| | Periama Holdings LLC, 5.95%, due 4/19/2026 | |
| | Power Finance Corp. Ltd., 3.95%, due 4/23/2030 | |
| | Reliance Industries Ltd., 2.88%, due 1/12/2032 | |
| | ReNew Wind Energy AP2/ReNew Power Pvt Ltd. other 9 Subsidiaries, 4.50%, due 7/14/2028 | |
| | Vedanta Resources Finance II PLC | |
| | | |
| | | |
| | | |
| |
|
| | Bank Negara Indonesia Persero Tbk. PT | |
| | | |
| | | |
| | Indofood CBP Sukses Makmur Tbk. PT, 3.54%, due 4/27/2032 | |
| | Medco Oak Tree Pte. Ltd., 7.38%, due 5/14/2026 | |
| | Perusahaan Perseroan Persero PT Perusahaan Listrik Negara | |
| | | |
| | | |
| | | |
| | | |
| | | |
| |
|
| | Bank Leumi Le-Israel BM, 3.28%, due 1/29/2031 | |
| | Energian Israel Finance Ltd., 4.88%, due 3/30/2026 | |
| | Teva Pharmaceutical Finance Netherlands III BV | |
| | | |
| | | |
| | | |
| |
|
| | KazMunayGas National Co. JSC | |
| | | |
| | | |
| | | |
| | Tengizchevroil Finance Co. International Ltd., 3.25%, due 8/15/2030 | |
| | | |
| |
|
| | Hanwha Life Insurance Co. Ltd., 3.38%, due 2/4/2032 | |
| | Kookmin Bank, 2.50%, due 11/4/2030 | |
| | Kyobo Life Insurance Co. Ltd., 5.90%, due 6/15/2052 | |
| | Shinhan Bank Co. Ltd., 4.38%, due 4/13/2032 | |
See Notes to Financial Statements
Schedule of Investments Emerging Markets Debt Fund^ (cont’d)
| |
| |
|
| | | |
| | | |
| | | |
| | | |
| |
|
| | MEGlobal BV, 2.63%, due 4/28/2028 | |
| | MEGlobal Canada ULC, 5.88%, due 5/18/2030 | |
| | NBK Tier 1 Financing 2 Ltd., 4.50%, due 8/27/2025 | |
| | | |
| |
|
| | Altice Financing SA, 5.75%, due 8/15/2029 | |
| |
|
| | Sands China Ltd., 5.65%, due 8/8/2028 | |
| | Studio City Finance Ltd., 6.50%, due 1/15/2028 | |
| | Wynn Macau Ltd., 5.63%, due 8/26/2028 | |
| | | |
| |
|
| | TNB Global Ventures Capital Bhd., 4.85%, due 11/1/2028 | |
| |
|
| | Alfa SAB de CV, 6.88%, due 3/25/2044 | |
| | Alsea SAB de CV, 7.75%, due 12/14/2026 | |
| | America Movil SAB de CV, 3.63%, due 4/22/2029 | |
| | Banco Mercantil del Norte SA | |
| | | |
| | | |
| | | |
| | | |
| | | |
| | Cibanco SA Ibm/PLA Administradora Industrial S de Real de CV, 4.96%, due 7/18/2029 | |
| | Comision Federal de Electricidad | |
| | | |
| | | |
| | | |
| | Orbia Advance Corp. SAB de CV, 5.88%, due 9/17/2044 | |
| | | |
| | | |
| | | |
| | Trust Fibra Uno, 4.87%, due 1/15/2030 | |
| | | |
| |
|
| | IHS Netherlands Holdco BV, 8.00%, due 9/18/2027 | |
| | SEPLAT Energy PLC, 7.75%, due 4/1/2026 | |
| | | |
| |
|
| | Bank Muscat SAOG, 4.75%, due 3/17/2026 | |
| | Oztel Holdings SPC Ltd., 6.63%, due 4/24/2028 | |
| | | |
See Notes to Financial Statements
Schedule of Investments Emerging Markets Debt Fund^ (cont’d)
| |
| |
|
| | Empresa de Transmision Electrica SA, 5.13%, due 5/2/2049 | |
| |
|
| | Telefonica Celular del Paraguay SA, 5.88%, due 4/15/2027 | |
| |
|
| | Banco de Credito del Peru SA, 3.13%, due 7/1/2030 | |
| | Fondo MIVIVIENDA SA, 7.00%, due 2/14/2024 | |
| | Minsur SA, 4.50%, due 10/28/2031 | |
| | | |
| | | |
| | | |
| | Southern Copper Corp., 6.75%, due 4/16/2040 | |
| | | |
| |
|
| | Globe Telecom, Inc., 4.20%, due 8/2/2026 | |
| |
|
| | | |
| | | |
| | | |
| | Commercial Bank PSQC, 4.50%, due 3/3/2026 | |
| | Ooredoo International Finance Ltd., 2.63%, due 4/8/2031 | |
| | | |
| | | |
| | | |
| | QNB Finance Ltd., 2.63%, due 5/12/2025 | |
| | | |
| |
|
| | Vnesheconombank Via VEB Finance PLC, 6.80%, due 11/22/2025 | |
| |
|
| | BSF Finance, 5.50%, due 11/23/2027 | |
| | EIG Pearl Holdings SARL, 4.39%, due 11/30/2046 | |
| | | |
| | | |
| | | |
| | SNB Funding Ltd., 2.75%, due 10/2/2024 | |
| | | |
| |
|
| | BOC Aviation Ltd., 3.00%, due 9/11/2029 | |
| | DBS Group Holdings Ltd., 4.52%, due 12/11/2028 | |
| | United Overseas Bank Ltd., 2.00%, due 10/14/2031 | |
| | | |
| |
|
| | Anglo American Capital PLC, 3.88%, due 3/16/2029 | |
| | AngloGold Ashanti Holdings PLC, 3.38%, due 11/1/2028 | |
| | Bidvest Group U.K. PLC, 3.63%, due 9/23/2026 | |
See Notes to Financial Statements
Schedule of Investments Emerging Markets Debt Fund^ (cont’d)
| |
| |
|
| | | |
| | | |
| | | |
| | | |
| |
|
| | Africa Finance Corp., 2.88%, due 4/28/2028 | |
| | Asian Infrastructure Investment Bank, 0.00%, due 2/8/2038 | |
| | Banque Ouest Africaine de Developpement | |
| | | |
| | | |
| | International Finance Corp., 0.00%, due 8/16/2028 | |
| | | |
| |
|
| | TSMC Arizona Corp., 4.25%, due 4/22/2032 | |
| |
|
| | | |
| | | |
| | | |
| | | |
| | GC Treasury Center Co. Ltd., 4.40%, due 3/30/2032 | |
| | Kasikornbank PCL, 3.34%, due 10/2/2031 | |
| | Thaioil Treasury Center Co. Ltd., 3.75%, due 6/18/2050 | |
| | | |
| |
|
| | Akbank TAS, 5.13%, due 3/31/2025 | |
| | KOC Holding AS, 6.50%, due 3/11/2025 | |
| | | |
| | | |
| | | |
| | Turkcell Iletisim Hizmetleri AS, 5.80%, due 4/11/2028 | |
| | Turkiye Petrol Rafinerileri AS, 4.50%, due 10/18/2024 | |
| | Turkiye Vakiflar Bankasi TAO, 9.00%, due 10/12/2028 | |
| | WE Soda Investments Holding PLC, 9.50%, due 10/6/2028 | |
| | | |
| | | |
| | | |
| | | |
| |
|
| | NAK Naftogaz Ukraine via Kondor Finance PLC, 7.13%, due 7/19/2026 | |
United Arab Emirates 1.4% | |
|
| | Abu Dhabi Commercial Bank PJSC, 4.50%, due 9/14/2027 | |
| | Abu Dhabi Crude Oil Pipeline LLC, 4.60%, due 11/2/2047 | |
| | Abu Dhabi National Energy Co. PJSC, 2.00%, due 4/29/2028 | |
| | DIB Sukuk Ltd., 2.95%, due 1/16/2026 | |
| | DP World Ltd., 6.85%, due 7/2/2037 | |
| | Emirates NBD Bank PJSC, 6.13%, due 3/20/2025 | |
See Notes to Financial Statements
Schedule of Investments Emerging Markets Debt Fund^ (cont’d)
| |
United Arab Emirates – cont'd | |
|
| | Galaxy Pipeline Assets Bidco Ltd. | |
| | | |
| | | |
| | Shelf Drilling Holdings Ltd., 9.63%, due 4/15/2029 | |
| | | |
| |
|
| | CK Hutchison International 23 Ltd. | |
| | | |
| | | |
| | Standard Chartered PLC, 6.30%, due 7/6/2034 | |
| | | |
| |
|
| | JBS USA LUX SA/JBS USA Food Co./JBS USA Finance, Inc., 5.75%, due 4/1/2033 | |
| | Sagicor Financial Co. Ltd., 5.30%, due 5/13/2028 | |
| | | |
| |
|
| | Petroleos de Venezuela SA | |
| | | |
| | | |
| | | |
| | | |
| | | |
| |
|
| | First Quantum Minerals Ltd., 6.88%, due 10/15/2027 | |
|
Total Corporate Bonds (Cost $45,345,373) | |
Foreign Government Securities 61.3% |
| |
|
| | Angolan Government International Bonds | |
| | | |
| | | |
| | | |
| | | |
| | | |
| |
|
| | Argentine Republic Government International Bonds | |
| | | |
| | | |
| | Provincia de Buenos Aires/Government Bonds | |
| | | |
| | | |
| | | |
| |
|
| | Armenia International Bonds, 3.60%, due 2/2/2031 | |
See Notes to Financial Statements
Schedule of Investments Emerging Markets Debt Fund^ (cont’d)
| |
| |
|
| | Azerbaijan International Bonds | |
| | | |
| | | |
| | State Oil Co. of the Azerbaijan Republic | |
| | | |
| | | |
| | | |
| |
|
| | Bahamas Government International Bonds, 6.00%, due 11/21/2028 | |
| |
|
| | Benin Government International Bonds, 4.95%, due 1/22/2035 | |
| |
|
| | Bermuda Government International Bonds | |
| | | |
| | | |
| | | |
| |
|
| | Brazil Government International Bonds | |
| | | |
| | | |
| | Brazil Letras do Tesouro Nacional, 9.59%, due 7/1/2025 | |
| | Brazil Minas SPE via State of Minas Gerais, 5.33%, due 2/15/2028 | |
| | Brazil Notas do Tesouro Nacional | |
| | | |
| | | |
| | | |
| | | |
| | | |
Cameroon, Republic of 0.1% | |
|
| | Cameroon International Bonds, 5.95%, due 7/7/2032 | |
| |
|
| | Bonos de la Tesoreria de la Republica, 1.90%, due 9/1/2030 | |
| | Bonos de la Tesoreria de la Republica en pesos | |
| | | |
| | | |
| | | |
| | | |
| | | |
| | | |
| | Chile Government International Bonds | |
| | | |
| | | |
| | | |
See Notes to Financial Statements
Schedule of Investments Emerging Markets Debt Fund^ (cont’d)
| |
| |
|
| | | |
| | | |
| | | |
| | | |
| | | |
| | | |
| | | |
| | | |
| | | |
| | | |
| | | |
| | | |
| | | |
| | | |
| | | |
| | | |
| | | |
| | | |
| | | |
| | | |
| | | |
| | | |
| | | |
| | | |
| | | |
| | | |
| |
|
| | Colombia Government International Bonds | |
| | | |
| | | |
| | | |
| | | |
| | | |
| | | |
| | | |
| | | |
| | | |
| | | |
| | | |
| | | |
| | | |
| | | |
| | | |
| |
|
| | Costa Rica Government International Bonds, 6.55%, due 4/3/2034 | |
See Notes to Financial Statements
Schedule of Investments Emerging Markets Debt Fund^ (cont’d)
| |
| |
|
| | Ivory Coast Government International Bonds | |
| | | |
| | | |
| | | |
| | | |
| | | |
| | | |
| |
|
| | Czech Republic Government Bonds | |
| | | |
| | | |
| | | |
| | | |
| | | |
| | | |
| | | |
| | | |
| | | |
| | | |
| | | |
| | | |
| | | |
| |
|
| | Dominican Republic International Bonds | |
| | | |
| | | |
| | | |
| | | |
| | | |
| | | |
| | | |
| | | |
| |
|
| | Ecuador Government International Bonds | |
| | | |
| | | |
| | | |
| | | |
| | | |
| | | |
| | | |
| |
|
| | Egypt Government International Bonds | |
| | | |
| | | |
| | | |
| | | |
| | | |
| | | |
See Notes to Financial Statements
Schedule of Investments Emerging Markets Debt Fund^ (cont’d)
| |
| |
|
| | El Salvador Government International Bonds | |
| | | |
| | | |
| | | |
| |
|
| | | |
| | 5.00% Cash/3.35% PIK, due 2/16/2027 | |
| | 5.00% Cash/3.50% PIK, due 2/15/2028 | |
| | 5.00% Cash/3.65% PIK, due 2/13/2029 | |
| | 5.00% Cash/3.80% PIK, due 2/12/2030 | |
| | 5.00% Cash/3.95% PIK, due 2/11/2031 | |
| | 5.00% Cash/4.10% PIK, due 2/10/2032 | |
| | 5.00% Cash/4.25% PIK, due 2/8/2033 | |
| | Ghana Government International Bonds | |
| | | |
| | | |
| | | |
| | | |
| | | |
| | | |
| | | |
| |
|
| | Guatemala Government Bonds | |
| | | |
| | | |
| | | |
| | | |
| |
|
| | | |
| | | |
| | | |
| | | |
| | | |
| | | |
| | | |
| | | |
| | | |
| | | |
| | | |
| |
|
| | Indonesia Government International Bonds | |
| | | |
| | | |
| | | |
See Notes to Financial Statements
Schedule of Investments Emerging Markets Debt Fund^ (cont’d)
| |
| |
|
| | | |
| | | |
| | | |
| | | |
| | | |
| | | |
| | | |
| | | |
| | | |
| | | |
| | | |
| | | |
| | | |
| | | |
| | | |
| | | |
| | | |
| | | |
| | | |
| | | |
| | | |
| | | |
| | | |
| |
|
| | Kazakhstan Government International Bonds, 1.50%, due 9/30/2034 | |
| |
|
| | Lebanon Government International Bonds | |
| | | |
| | | |
| | | |
| | | |
| | | |
| | | |
See Notes to Financial Statements
Schedule of Investments Emerging Markets Debt Fund^ (cont’d)
| |
| |
|
| | Malaysia Government Bonds | |
| | | |
| | | |
| | | |
| | | |
| | | |
| | | |
| | | |
| | | |
| | | |
| | | |
| | | |
| | | |
| | | |
| | | |
| | | |
| | | |
| | | |
| | | |
| | | |
| | Malaysia Government Investment Issue | |
| | | |
| | | |
| | | |
| |
|
| | | |
| | | |
| | | |
| | | |
| | | |
| | | |
| | | |
| | | |
| | | |
| | | |
| | Mexico Government International Bonds | |
| | | |
| | | |
| | | |
| |
|
| | Mongolia Government International Bonds, 3.50%, due 7/7/2027 | |
| |
|
| | Morocco Government International Bonds | |
| | | |
| | | |
| | | |
See Notes to Financial Statements
Schedule of Investments Emerging Markets Debt Fund^ (cont’d)
| |
| |
|
| | Nigeria Government International Bonds | |
| | | |
| | | |
| | | |
| |
|
| | Oman Government International Bonds | |
| | | |
| | | |
| | | |
| | | |
| |
|
| | Panama Government International Bonds | |
| | | |
| | | |
| | | |
| | | |
| | | |
| |
|
| | Papua New Guinea Government International Bonds, 8.38%, due 10/4/2028 | |
| |
|
| | Paraguay Government International Bonds, 6.10%, due 8/11/2044 | |
| |
|
| | | |
| | | |
| | | |
| | | |
| | | |
| | | |
| | Peruvian Government International Bonds | |
| | | |
| | | |
| | | |
| | | |
| | | |
| |
|
| | Philippine Government International Bonds, 1.75%, due 4/28/2041 | |
| |
|
| | Bank Gospodarstwa Krajowego, 5.13%, due 2/22/2033 | |
See Notes to Financial Statements
Schedule of Investments Emerging Markets Debt Fund^ (cont’d)
| |
| |
|
| | | |
| | | |
| | | |
| | | |
| | | |
| | | |
| | | |
| | | |
| | | |
| | | |
| | Poland Government International Bonds , 5.50%, due 4/4/2053 | |
| | | |
| |
|
| | Qatar Government International Bonds, 4.82%, due 3/14/2049 | |
| |
|
| | | |
| | | |
| | | |
| | | |
| | | |
| | | |
| | | |
| | | |
| | | |
| | | |
| | | |
| | | |
| | | |
| | | |
| | Romania Government International Bonds | |
| | | |
| | | |
| | | |
| | | |
| | | |
| | | |
| | | |
| | | |
| |
|
| | Serbia International Bonds | |
| | | |
| | | |
| | | |
| | | |
| | | |
| | | |
| | | |
| | | |
See Notes to Financial Statements
Schedule of Investments Emerging Markets Debt Fund^ (cont’d)
| |
| |
|
| | South Africa Government Bonds | |
| | | |
| | | |
| | | |
| | South Africa Government Bonds | |
| | | |
| | | |
| | | |
| | | |
| | | |
| | South Africa Government International Bonds | |
| | | |
| | | |
| | South Africa Government International Bonds | |
| | | |
| | | |
| | | |
| |
|
| | Sri Lanka Government International Bonds | |
| | | |
| | | |
| | | |
| | | |
| | | |
| | | |
| |
|
| | Bank of Thailand Bills, 1.84%, due 5/9/2024 | |
| | Thailand Government Bonds | |
| | | |
| | | |
| | | |
| | | |
| | | |
| | | |
| | | |
| | | |
| | | |
| | | |
| | | |
| | | |
| | | |
| | | |
| | | |
| | | |
| | | |
| | | |
| |
|
| | Tunisian Republic, 6.38%, due 7/15/2026 | |
See Notes to Financial Statements
Schedule of Investments Emerging Markets Debt Fund^ (cont’d)
| |
| |
|
| | | |
| | | |
| | | |
| | Turkey Government International Bonds, 9.13%, due 7/13/2030 | |
| | | |
| |
|
| | | |
| | | |
| | | |
| | | |
| |
|
| | Ukraine Government International Bonds | |
| | | |
| | | |
| | | |
| | | |
| | | |
United Arab Emirates 0.1% | |
|
| | UAE International Government Bonds, 4.95%, due 7/7/2052 | |
| |
|
| | Uruguay Government International Bonds | |
| | | |
| | | |
| | | |
| | | |
| |
|
| | Uzbekneftegaz JSC, 4.75%, due 11/16/2028 | |
| |
|
| | Venezuela Government International Bonds, 8.25%, due 10/13/2024 | |
| |
|
| | Zambia Government Bonds, 13.00%, due 1/25/2031 | |
| | Zambia Government International Bonds | |
| | | |
| | | |
| | | |
| | | |
Total Foreign Government Securities (Cost $98,823,824) | |
U.S. Treasury Obligations 2.8% |
|
| | | |
| | | |
| | | |
| | | |
| | | |
|
Total U.S. Treasury Obligations (Cost $4,048,269) | |
See Notes to Financial Statements
Schedule of Investments Emerging Markets Debt Fund^ (cont’d)
| |
|
Short-Term Investments 6.6% |
Investment Companies 6.6% |
|
| | State Street Institutional U.S. Government Money Market Fund Premier Class, 5.30%(m) (Cost $ 9,549,332) | |
Total Investments 97.3% (Cost $157,766,798) | |
Other Assets Less Liabilities 2.7% | |
| |
| Principal amount is stated in the currency in which the security is denominated. |
| Security exempt from registration pursuant to Regulation S under the Securities Act of 1933, as amended. Regulation S applies to securities offerings that are made outside of the United States and do not involve directed selling efforts in the United States and as such may have restrictions on resale. Total value of all such securities at October 31, 2023 amounted to $44,137,262, which represents 30.8% of net assets of the Fund. |
| Securities were purchased under Rule 144A of the Securities Act of 1933, as amended, or are otherwise restricted and, unless registered under the Securities Act of 1933 or exempted from registration, may only be sold to qualified institutional investors or may have other restrictions on resale. At October 31, 2023, these securities amounted to $12,089,742, which represents 8.4% of net assets of the Fund. |
| Security issued at a fixed coupon rate, which converts to a variable rate at a future date. Rate shown is the rate in effect as of period end. |
| Perpetual security. Perpetual securities have no stated maturity date, but they may be called/redeemed by the issuer. The date shown reflects the next call date. |
| Represents less than 0.05% of net assets of the Fund. |
| |
| Step Bond. Coupon rate is a fixed rate for an initial period that either resets at a specific date or may reset in the future contingent upon a predetermined trigger. The interest rate shown was the current rate as of October 31, 2023. |
| Rate shown was the discount rate at the date of purchase. |
| Index-linked bond whose principal amount adjusts according to a government retail price index. |
| Payment-in-kind (PIK) security. |
| Variable or floating rate security. The interest rate shown was the current rate as of October 31, 2023 and changes periodically. |
| Represents 7-day effective yield as of October 31, 2023. |
| Includes the impact of the Fund’s open positions in derivatives at October 31, 2023. |
See Notes to Financial Statements
Schedule of Investments Emerging Markets Debt Fund^ (cont’d)
|
| | |
| | |
| | |
| | |
U.S. Treasury Obligations | | |
| | |
| | |
| | |
| | |
| | |
| | |
Diversified Financial Services | | |
| | |
| | |
| | |
Energy - Alternate Sources | | |
| | |
| | |
| | |
Engineering & Construction | | |
| | |
| | |
| | |
| | |
| | |
| | |
Holding Companies - Diversified | | |
Real Estate Investment Trusts | | |
| | |
| | |
| | |
| | |
| | |
| | |
| | |
| | |
| | |
Short-Term Investments and Other Assets—Net | | |
| | |
| Foreign Governments do not constitute an industry. |
See Notes to Financial Statements
Schedule of Investments Emerging Markets Debt Fund^ (cont’d)
Derivative Instruments
Futures contracts ("futures")
At October 31, 2023, open positions in futures for the Fund were as follows:
| | | | Value and
Unrealized
Appreciation/
(Depreciation) |
| | | | |
| | | | |
| | | | |
| | U.S. Treasury Note, 10 Year | | |
| | U.S. Treasury Note, 2 Year | | |
| | U.S. Treasury Note, 5 Year | | |
| | | | |
| | |
| | | | Value and
Unrealized
Appreciation/
(Depreciation) |
| | | | |
| | | | |
| | | | |
| | | | |
| | U.S. Treasury Note, 10 Year | | |
| | | | |
| | |
| | |
At October 31, 2023, the Fund had $803,022 deposited in a segregated account to cover margin requirements on open futures.
For the year ended October 31, 2023, the average notional value for the months where the Fund had futures outstanding was $15,835,972 for long positions and $(9,607,017) for short positions.
Forward foreign currency contracts ("forward FX contracts")
At October 31, 2023, open forward FX contracts for the Fund were as follows:
| | | | Net
Unrealized
Appreciation/
(Depreciation) |
| | | | | | |
| | | | | | |
| | | | | | |
| | | | | | |
See Notes to Financial Statements
Schedule of Investments Emerging Markets Debt Fund^ (cont’d)
| | | | Net Unrealized Appreciation/ (Depreciation) |
| | | | | | |
| | | | | | |
| | | | | | |
| | | | | | |
| | | | | | |
| | | | | | |
| | | | | | |
| | | | | | |
| | | | | | |
| | | | | | |
| | | | | | |
| | | | | | |
| | | | | | |
| | | | | | |
| | | | | | |
| | | | | | |
| | | | | | |
| | | | | | |
| | | | | | |
| | | | | | |
| | | | | | |
| | | | | | |
| | | | | | |
| | | | | | |
| | | | | | |
| | | | | | |
| | | | | | |
| | | | | | |
| | | | | | |
| | | | | | |
| | | | | | |
| | | | | | |
| | | | | | |
| | | | | | |
| | | | | | |
| | | | | | |
| | | | | | |
| | | | | | |
| | | | | | |
| | | | | | |
| | | | | | |
| | | | | | |
| | | | | | |
| | | | | | |
| | | | | | |
| | | | | | |
See Notes to Financial Statements
Schedule of Investments Emerging Markets Debt Fund^ (cont’d)
| | | | Net Unrealized Appreciation/ (Depreciation) |
| | | | | | |
| | | | | | |
| | | | | | |
| | | | | | |
| | | | | | |
| | | | | | |
| | | | | | |
| | | | | | |
| | | | | | |
| | | | | | |
| | | | | | |
| | | | | | |
| | | | | | |
| | | | | | |
| | | | | | |
| | | | | | |
| | | | | | |
| | | | | | |
| | | | | | |
| | | | | | |
| | | | | | |
| | | | | | |
| | | | | | |
| | | | | | |
| | | | | | |
| | | | | | |
| | | | | | |
| | | | | | |
| | | | | | |
| | | | | | |
| | | | | | |
Total unrealized appreciation |
| |
| | | | | | |
| | | | | | |
| | | | | | |
| | | | | | |
| | | | | | |
| | | | | | |
| | | | | | |
| | | | | | |
| | | | | | |
| | | | | | |
| | | | | | |
| | | | | | |
| | | | | | |
| | | | | | |
See Notes to Financial Statements
Schedule of Investments Emerging Markets Debt Fund^ (cont’d)
| | | | Net Unrealized Appreciation/ (Depreciation) |
| | | | | | |
| | | | | | |
| | | | | | |
| | | | | | |
| | | | | | |
| | | | | | |
| | | | | | |
| | | | | | |
| | | | | | |
| | | | | | |
| | | | | | |
| | | | | | |
| | | | | | |
| | | | | | |
| | | | | | |
| | | | | | |
| | | | | | |
| | | | | | |
| | | | | | |
| | | | | | |
| | | | | | |
| | | | | | |
| | | | | | |
| | | | | | |
| | | | | | |
| | | | | | |
| | | | | | |
| | | | | | |
| | | | | | |
| | | | | | |
| | | | | | |
| | | | | | |
| | | | | | |
| | | | | | |
| | | | | | |
| | | | | | |
| | | | | | |
| | | | | | |
| | | | | | |
| | | | | | |
| | | | | | |
| | | | | | |
| | | | | | |
| | | | | | |
| | | | | | |
| | | | | | |
See Notes to Financial Statements
Schedule of Investments Emerging Markets Debt Fund^ (cont’d)
| | | | Net Unrealized Appreciation/ (Depreciation) |
| | | | | | |
| | | | | | |
| | | | | | |
Total unrealized depreciation |
| |
Total net unrealized appreciation |
| |
For the year ended October 31, 2023, the average notional value for the months where the Fund had forward FX contracts outstanding was $110,134,796.
Credit default swap contracts (“credit default swaps”)
At October 31, 2023, the Fund did not have any outstanding credit default swaps.
For the year ended October 31, 2023, the average notional value for the months where the Fund had credit default swaps outstanding was $6,555,143 for buy protection.
Interest rate swap contracts ("interest rate swaps")
At October 31, 2023, the Fund had outstanding interest rate swaps as follows:
Centrally cleared interest rate swaps
| | Fund
Receives/
Pays
Floating
Rate | | | | Frequency
of Fund
Receipt/
Payment | | Unrealized
Appreciation/
(Depreciation) | Accrued
Net
Interest
Receivable/
(Payable) | |
| | | | | | | | | | | |
| | | | | | | | | | | |
| | | | | | | | | | | |
| | | | | | | | | | | |
| | | | | | | | | | | |
| | | | | | | | | | | |
| | | | | | | | | | | |
| | | | | | | | | | | |
| | | | | | | | | | | |
| | | | | | | | | | | |
| | | | | | | | | | | |
| | | | | | | | | | | |
| | | | | | | | | | | |
| | | | | | | | | | | |
| | | | | | | | | | | |
| | | | | | | | | | | |
| | | | | | | | | | | |
| | | | | | | | | | | |
| | | | | | | | | | | |
| | | | | | | | | | | |
| | | | | | | | | | | |
| | | | | | | | | | | |
See Notes to Financial Statements
Schedule of Investments Emerging Markets Debt Fund^ (cont’d)
| | Fund Receives/ Pays Floating Rate | | | | Frequency of Fund Receipt/ Payment | | Unrealized Appreciation/ (Depreciation) | Accrued Net Interest Receivable/ (Payable) | |
| | | | | | | | | | | |
| | | | | | | | | | | |
| | | | | | | | | | | |
| | | | | | | | | | | |
| | | | | | | | | | | |
| | | | | | | | | | | |
| | | | | | | | | | | |
| | | | | | | | | | | |
| | | | | | | | | | | |
| | | | | | | | | | | |
| | | | | | | | | | | |
| | | | | | | | | | | |
| | | | | | | | | | | |
| | | | | | | | | | | |
| | | | | | | | | | | |
| | | | | | | | | | | |
| | | | | | | | | | | |
| | | | | | | | | | | |
| | | | | | | | | | | |
| | | | | | | | | | | |
| | | | | | | | | | | |
| | | | | | | | | | | |
| | | | | | | | | | | |
| | | | | | | | | | | |
| | | | | | | | | | | |
| | | | | | | | | | | |
| | | | | | | | | | | |
| | | | | | | | | | | |
| | | | | | | | | | | |
| | | | | | | | | | | |
| | | | | | | | | | | |
| | | | | | | | | | | |
| | | | | | | | | | | |
| | | | | | | | | | | |
| | | | | | | | | | | |
| |
|
|
|
|
|
|
| | | |
| Forward swap. Effective date, if any, reflects the date interest accruals will commence. |
At October 31, 2023, the Fund had $1,095,882 deposited in a segregated account to cover margin requirements for centrally cleared swaps.
See Notes to Financial Statements
Schedule of Investments Emerging Markets Debt Fund^ (cont’d)
Over-the-counter interest rate swaps
| | Fund
Receives/
Pays
Floating
Rate | | | Frequency
of Fund
Receipt/
Payment | | Unrealized
Appreciation/
(Depreciation) | Accrued
Net
Interest
Receivable/
(Payable) | |
| | | | | | | | | | |
| | | | | | | | | | |
| |
|
|
| |
|
| | | |
For the year ended October 31, 2023, the average notional value for the months where the Fund had interest rate swaps outstanding was $11,867,549 when the Fund paid the fixed rate and $22,640,101 when the Fund received the fixed rate.
At October 31, 2023, the Fund had cash collateral of $110,000 and $10,000 received from Citibank, N.A. and Morgan Stanley Capital Services LLC, respectively, to cover collateral requirements on over-the-counter derivatives.
The following is a summary, categorized by Level (see Note A of the Notes to Financial Statements), of inputs used to value the Fund’s investments as of October 31, 2023:
| | | | |
| | | | |
| | | | |
Foreign Government Securities# | | | | |
U.S. Treasury Obligations | | | | |
| | | | |
| | | | |
| The Schedule of Investments provides a geographic categorization as well as a Positions by Industry summary. |
The following is a summary, categorized by Level (see Note A of the Notes to Financial Statements), of inputs used to value the Fund’s derivatives as of October 31, 2023:
Other Financial Instruments | | | | |
|
|
|
|
|
| | | | |
| | | | |
|
|
|
|
|
| | | | |
| | | | |
|
|
|
|
|
| | | | |
| | | | |
| | | | |
| Futures and forward FX contracts are reported at the cumulative unrealized appreciation/(depreciation) of the instrument. |
^
A balance indicated with a "—", reflects either a zero balance or an amount that rounds to less than 1.
See Notes to Financial Statements
Schedule of Investments Floating Rate Income Fund^ October 31, 2023
| |
Asset-Backed Securities 1.3% |
| 37 Capital CLO 1 Ltd., Series 2021-1A, Class E, (3 mo. USD Term SOFR + 7.46%), 12.86%, due 10/15/2034 | |
| 37 Capital CLO III Ltd., Series 2023-1A, Class E, (3 mo. USD Term SOFR + 9.03%), 14.42%, due 4/15/2036 | |
| Barings CLO Ltd., Series 2018-3A, Class E, (3 mo. USD Term SOFR + 6.01%), 11.43%, due 7/20/2029 | |
| Flatiron CLO Ltd., Series 2017-1A, Class ER, (3 mo. USD Term SOFR + 6.16%), 11.53%, due 5/15/2030 | |
| Galaxy XV CLO Ltd., Series 2013-15A, Class ER, (3 mo. USD Term SOFR + 6.91%), 12.30%, due 10/15/2030 | |
| Magnetite XV Ltd., Series 2015-15A, Class ER, (3 mo. USD Term SOFR + 5.46%), 10.84%, due 7/25/2031 | |
| Palmer Square Loan Funding Ltd., Series 2022-1A, Class D, (3 mo. USD Term SOFR + 5.00%), 10.39%, due 4/15/2030 | |
| Stratus CLO Ltd., Series 2021-3A, Class F, (3 mo. USD Term SOFR + 7.96%), 13.38%, due 12/29/2029 | |
Total Asset-Backed Securities (Cost $6,479,730) | |
|
|
|
| American Airlines, Inc., 11.75%, due 7/15/2025 | |
| American Airlines, Inc./AAdvantage Loyalty IP Ltd. | |
| | |
| | |
| | |
|
| SCIH Salt Holdings, Inc., 4.88%, due 5/1/2028 | |
| SCIL IV LLC/SCIL USA Holdings LLC, 5.38%, due 11/1/2026 | |
| WR Grace Holdings LLC, 4.88%, due 6/15/2027 | |
| | |
|
| APX Group, Inc., 6.75%, due 2/15/2027 | |
| Garda World Security Corp., 4.63%, due 2/15/2027 | |
| Legends Hospitality Holding Co. LLC/Legends Hospitality Co.-Issuer, Inc., 5.00%, due 2/1/2026 | |
| Prime Security Services Borrower LLC/Prime Finance, Inc. | |
| | |
| | |
| | |
Distribution - Wholesale 0.0%(d) |
| OPENLANE, Inc., 5.13%, due 6/1/2025 | |
Engineering & Construction 0.1% |
| Artera Services LLC, 9.03%, due 12/4/2025 | |
|
| Caesars Resort Collection LLC/CRC Finco, Inc., 5.75%, due 7/1/2025 | |
| Cedar Fair LP/Canada's Wonderland Co./Magnum Management Corp./Millennium Op, 5.50%, due 5/1/2025 | |
| Raptor Acquisition Corp./Raptor Co.-Issuer LLC, 4.88%, due 11/1/2026 | |
| | |
See Notes to Financial Statements
Schedule of Investments Floating Rate Income Fund^ (cont’d)
| |
|
Forest Products & Paper 0.1% |
| Ahlstrom Holding 3 Oyj, 4.88%, due 2/4/2028 | |
|
| NCL Corp. Ltd., 5.88%, due 2/15/2027 | |
Machinery - Diversified 0.2% |
| TK Elevator U.S. Newco, Inc., 5.25%, due 7/15/2027 | |
|
| Altice Financing SA, 5.00%, due 1/15/2028 | |
| Cumulus Media New Holdings, Inc., 6.75%, due 7/1/2026 | |
| DISH DBS Corp., 5.25%, due 12/1/2026 | |
| | |
Packaging & Containers 0.4% |
| Ardagh Packaging Finance PLC/Ardagh Holdings USA, Inc., 4.13%, due 8/15/2026 | |
| Mauser Packaging Solutions Holding Co., 9.25%, due 4/15/2027 | |
| Trivium Packaging Finance BV, 5.50%, due 8/15/2026 | |
| | |
|
| Cheniere Energy, Inc., 4.63%, due 10/15/2028 | |
| Summit Midstream Holdings LLC/Summit Midstream Finance Corp., 9.00%, due 10/15/2026 | |
| | |
Real Estate Investment Trusts 0.2% |
| XHR LP, 6.38%, due 8/15/2025 | |
|
| | |
| | |
| | |
| | |
|
| Rackspace Technology Global, Inc., 3.50%, due 2/15/2028 | |
|
| Altice France SA, 5.50%, due 1/15/2028 | |
| Connect Finco Sarl/Connect U.S. Finco LLC, 6.75%, due 10/1/2026 | |
| Consolidated Communications, Inc., 5.00%, due 10/1/2028 | |
| | |
| | |
| | |
| | |
| | |
| | |
| | |
Total Corporate Bonds (Cost $25,606,649) | |
|
Loan Assignments(b) 87.8% |
|
| Amentum Government Services Holdings LLC, Term Loan, (1 mo. USD Term SOFR + 4.00%), 9.33%, due 2/15/2029 | |
See Notes to Financial Statements
Schedule of Investments Floating Rate Income Fund^ (cont’d)
| |
|
Aerospace & Defense – cont'd |
| Brown Group Holding LLC, Term Loan B2, (1 mo. USD Term SOFR + 3.75%, 3 mo. USD Term SOFR + 3.75%), 9.07% – 9.17%, due 7/2/2029 | |
| Cobham Ultra SeniorCo Sarl, Term Loan B, (6 mo. USD Term SOFR + 3.50%), 9.36%, due 8/3/2029 | |
| | |
| Term Loan B, (1 mo. USD Term SOFR + 3.75%), 9.17%, due 2/1/2028 | |
| Second Lien Term Loan B1, (3 mo. USD Term SOFR + 7.75%), 13.23%, due 2/1/2029 | |
| Propulsion (BC) Finco Sarl, Term Loan, (3 mo. USD Term SOFR + 3.75%), 9.14%, due 9/14/2029 | |
| | |
|
| Air Canada, Term Loan B, (3 mo. USD Term SOFR + 3.50%), 9.13%, due 8/11/2028 | |
| American Airlines, Inc., Term Loan, (3 mo. USD Term SOFR + 4.75%), 10.43%, due 4/20/2028 | |
| Mileage Plus Holdings LLC, Term Loan B, (3 mo. USD Term SOFR + 5.25%), 10.80%, due 6/21/2027 | |
| SkyMiles IP Ltd., Term Loan B, (3 mo. USD Term SOFR + 3.75%), 9.17%, due 10/20/2027 | |
| United Airlines, Inc., Term Loan B, (1 mo. USD Term SOFR + 3.75%), 9.19%, due 4/21/2028 | |
| | |
Auto Parts & Equipment 0.6% |
| Adient U.S. LLC, Term Loan B, (1 mo. USD Term SOFR + 3.25%), 8.69%, due 4/10/2028 | |
| BBB Industries LLC, Term Loan, (1 mo. USD Term SOFR + 5.25%), 10.67%, due 7/25/2029 | |
| | |
|
| American Trailer World Corp., Term Loan B, (1 mo. USD Term SOFR + 3.75%), 9.17%, due 3/3/2028 | |
| | |
| Term Loan, (6 mo. USD Term SOFR + 5.00%), 10.88%, due 3/30/2027 | |
| Term Loan, (1 mo. USD Term SOFR), due 3/30/2028 | |
| | |
| Second Lien Term Loan, (1 mo. USD Term SOFR + 6.75%), 12.17%, due 2/2/2026 | |
| Term Loan, (1 mo. USD Term SOFR + 3.75%), 9.19%, due 2/23/2029 | |
| Wand NewCo 3, Inc., Term Loan, (1 mo. USD Term SOFR + 2.75%), 8.17%, due 2/5/2026 | |
| | |
Building & Development 2.9% |
| Cornerstone Building Brands, Inc., Term Loan B, (1 mo. USD Term SOFR + 3.25%), 8.68%, due 4/12/2028 | |
| Cushman & Wakefield U.S. Borrower LLC | |
| Term Loan B, (1 mo. USD Term SOFR + 2.75%), 8.19%, due 8/21/2025 | |
| Term Loan B, (1 mo. USD Term SOFR + 4.00%), 9.32%, due 1/31/2030 | |
| GYP Holdings III Corp., Term Loan, (1 mo. USD Term SOFR + 3.00%), 8.32%, due 5/12/2030 | |
| MI Windows & Doors LLC, Term Loan, (1 mo. USD Term SOFR + 3.50%), 8.92%, due 12/18/2027 | |
| | |
| Term Loan, (1 mo. USD Term SOFR + 3.50%), 8.82%, due 6/2/2028 | |
| Term Loan B, (1 mo. USD Term SOFR + 3.50%), 8.94%, due 6/2/2028 | |
| | |
| Term Loan, (1 mo. USD Term SOFR + 4.00%), 9.44%, due 4/10/2028 | |
| Term Loan B, (1 mo. USD Term SOFR + 4.25%), 9.69%, due 4/10/2028 | |
| White Cap Buyer LLC, Term Loan B, (1 mo. USD Term SOFR + 3.75%), 9.07%, due 10/19/2027 | |
| Wilsonart LLC, Term Loan E, (3 mo. USD Term SOFR + 3.25%), 8.74%, due 12/31/2026 | |
| | |
|
| Chamberlain Group, Inc., Term Loan B, (1 mo. USD Term SOFR + 3.25%), 8.67%, due 11/3/2028 | |
See Notes to Financial Statements
Schedule of Investments Floating Rate Income Fund^ (cont’d)
| |
|
Building Materials – cont'd |
| Emrld Borrower LP, Term Loan B, (3 mo. USD Term SOFR + 3.00%), 8.38%, due 5/31/2030 | |
| Oscar AcquisitionCo LLC, Term Loan B, (3 mo. USD Term SOFR + 4.50%), 9.99%, due 4/29/2029 | |
| Solis IV BV, Term Loan B1, (3 mo. USD Term SOFR + 3.50%), 8.89%, due 2/26/2029 | |
| Vector WP Holdco, Inc., Term Loan B, (1 mo. USD Term SOFR + 5.33%), 10.44%, due 10/12/2028 | |
| | |
Business Equipment & Services 5.3% |
| Allied Universal Holdco LLC, Term Loan B, (1 mo. USD Term SOFR + 3.75%), 9.17%, due 5/12/2028 | |
| Anticimex International AB, Term Loan B1, (3 mo. USD Term SOFR + 3.15%), 8.45%, due 11/16/2028 | |
| | |
| Term Loan B, (1 mo. USD Term SOFR + 3.10%), 8.42%, due 10/25/2028 | |
| Term Loan B, (1 mo. USD Term SOFR + 3.10%), 8.42%, due 8/14/2030 | |
| BrightView Landscapes LLC, Term Loan B, (3 mo. USD Term SOFR + 3.25%), 8.63%, due 4/20/2029 | |
| Constant Contact, Inc., Term Loan, (3 mo. USD Term SOFR + 4.00%), 9.69%, due 2/10/2028 | |
| ConvergeOne Holdings, Inc. | |
| Term Loan, (3 mo. USD LIBOR + 4.00%), 12.50%, due 1/4/2026 | |
| Second Lien Term Loan, (3 mo. USD LIBOR + 8.50%), 14.14%, due 1/4/2027 | |
| Cyxtera DC Holdings, Inc. | |
| Term Loan, (1 mo. USD Term SOFR + 8.50%), 13.95%, due 12/7/2023 | |
| Term Loan B, (3 mo. USD Term SOFR + 2.00%), 10.25%, due 5/1/2024 | |
| Deerfield Dakota Holding LLC, Term Loan B, (3 mo. USD Term SOFR + 3.75%), 9.14%, due 4/9/2027 | |
| Element Materials Technology Group U.S. Holdings, Inc. | |
| Term Loan, (3 mo. USD Term SOFR + 4.25%), 9.74%, due 7/6/2029 | |
| Term Loan, (3 mo. USD Term SOFR + 4.25%), 9.74%, due 7/6/2029 | |
| Endure Digital, Inc., Term Loan, (6 mo. USD Term SOFR + 3.50%), 9.42%, due 2/10/2028 | |
| Garda World Security Corp., Term Loan B, (3 mo. USD Term SOFR + 4.25%), 9.75%, due 10/30/2026 | |
| Loire Finco Luxembourg Sarl | |
| Term Loan B, (1 mo. USD Term SOFR + 3.50%), 8.92%, due 4/21/2027 | |
| Term Loan B2, (1 mo. USD Term SOFR + 3.75%), 9.17%, due 4/21/2027 | |
| MX Holdings U.S., Inc., Term Loan B, (1 mo. USD Term SOFR), due 7/31/2028 | |
| Outfront Media Capital LLC, Term Loan B, (1 mo. USD Term SOFR + 1.75%), 7.07%, due 11/18/2026 | |
| Packaging Coordinators Midco, Inc., First Lien Term Loan, (3 mo. USD Term SOFR + 3.50%), 9.15%, due 11/30/2027 | |
| Prime Security Services Borrower LLC, Term Loan B, (3 mo. USD Term SOFR + 2.50%), 7.83%, due 10/13/2030 | |
| Summer (BC) Holdco B Sarl, Term Loan B2, (3 mo. USD Term SOFR + 4.50%), 10.15%, due 12/4/2026 | |
| Tempo Acquisition LLC, Term Loan B, (1 mo. USD Term SOFR + 2.75%), 8.07%, due 8/31/2028 | |
| Vertiv Group Corporation, Term Loan B, (1 mo. USD Term SOFR), due 3/2/2027 | |
| | |
|
| EP Purchaser LLC, Term Loan B, (3 mo. USD Term SOFR + 4.50%), 10.15%, due 11/6/2028 | |
Cable & Satellite Television 2.3% |
| Altice Financing SA, First Lien Term Loan, (3 mo. USD LIBOR + 2.75%), 8.41%, due 1/31/2026 | |
| Altice France SA, Term Loan B13, (3 mo. USD LIBOR + 4.00%), 9.63%, due 8/14/2026 | |
| Cogeco Communications Finance (USA) LP, Term Loan B, (1 mo. USD Term SOFR + 3.25%), 8.57%, due 9/18/2030 | |
See Notes to Financial Statements
Schedule of Investments Floating Rate Income Fund^ (cont’d)
| |
|
Cable & Satellite Television – cont'd |
| | |
| Term Loan B1, (1 mo. USD LIBOR + 2.25%), 7.70%, due 7/17/2025 | |
| Term Loan, (1 mo. USD LIBOR + 2.25%), 7.70%, due 1/15/2026 | |
| Term Loan B5, (1 mo. USD LIBOR + 2.50%), 7.95%, due 4/15/2027 | |
| Term Loan B6, (1 mo. USD Term SOFR + 4.50%), 9.83%, due 1/18/2028 | |
| McGraw-Hill Global Education Holdings LLC, Term Loan, (1 mo. USD Term SOFR + 4.75%), 10.19%, due 7/28/2028 | |
| Radiate Holdco LLC, Term Loan B, (1 mo. USD Term SOFR + 3.25%), 8.69%, due 9/25/2026 | |
| | |
|
| AqGen Island Holdings, Inc., Term Loan, (1 mo. USD Term SOFR + 3.50%), 8.94%, due 8/2/2028 | |
| Aretec Group, Inc., Term Loan, (1 mo. USD Term SOFR), due 8/9/2030 | |
| | |
|
| INEOS Enterprises Holdings U.S. Finco LLC, First Lien Term Loan B, (3 mo. USD Term SOFR + 3.75%), 9.27%, due 7/8/2030 | |
| Nouryon Finance BV, Term Loan B, (1 mo. USD Term SOFR + 4.00%), 9.43%, due 4/3/2028 | |
| Olympus Water U.S. Holding Corp., Term Loan B, (3 mo. USD Term SOFR + 3.75%), 9.40%, due 11/9/2028 | |
| PEARLS (Netherlands) Bidco BV, Term Loan B, (3 mo. USD Term SOFR + 3.75%), 9.13%, due 2/26/2029 | |
| PMHC II, Inc., Term Loan B, (3 mo. USD Term SOFR + 4.25%), 9.81%, due 4/23/2029 | |
| Tronox Finance LLC, Term Loan B, (1 mo. USD Term SOFR + 3.50%), 8.82%, due 8/16/2028 | |
| Valcour Packaging LLC, Second Lien Term Loan, (1 mo. USD LIBOR + 7.00%), 12.65%, due 10/4/2029 | |
| | |
Chemicals & Plastics 2.4% |
| Avient Corp., Term Loan B7, (3 mo. USD Term SOFR + 2.50%), 7.87%, due 8/29/2029 | |
| HB Fuller Co., Term Loan B, (1 mo. USD Term SOFR + 2.25%), 7.57%, due 2/15/2030 | |
| Illuminate Buyer LLC, Term Loan, (1 mo. USD Term SOFR + 3.50%), 8.94%, due 6/30/2027 | |
| INEOS Quattro Holdings UK Ltd., Term Loan, (1 mo. USD Term SOFR + 3.75%), 9.17%, due 3/14/2030 | |
| | |
| Term Loan B, (1 mo. USD Term SOFR + 3.75%), 9.17%, due 11/8/2027 | |
| Term Loan B, (1 mo. USD Term SOFR + 3.50%), 8.92%, due 2/18/2030 | |
| SCIH Salt Holdings, Inc., Term Loan B, (1 mo. USD Term SOFR + 4.00%), 9.44%, due 3/16/2027 | |
| Sparta U.S. HoldCo LLC, Term Loan, (1 mo. USD Term SOFR + 3.25%), 8.68%, due 8/2/2028 | |
| | |
|
| Hanesbrands, Inc., Term Loan B, (1 mo. USD Term SOFR + 3.75%), 9.07%, due 3/8/2030 | |
| | |
| Term Loan, (3 mo. USD Term SOFR + 5.00%), 10.50%, due 3/11/2028 | |
| Second Lien Term Loan, (3 mo. USD Term SOFR + 8.75%), 14.25%, due 3/9/2029 | |
| | |
|
| ASGN, Inc., Term Loan B, (1 mo. USD Term SOFR + 2.25%), 7.57%, due 8/30/2030 | |
| Foundational Education Group, Inc., Second Lien Term Loan, (3 mo. USD Term SOFR + 6.50%), 12.14%, due 8/31/2029 | |
| | |
See Notes to Financial Statements
Schedule of Investments Floating Rate Income Fund^ (cont’d)
| |
|
Commercial Services & Supplies 1.2% |
| Belfor Holdings, Inc., Term Loan B, (1 mo. USD Term SOFR), due 10/25/2030 | |
| EnergySolutions LLC, Term Loan B, (3 mo. USD Term SOFR + 4.00%), 9.38%, due 9/20/2030 | |
| GTCR W Merger Sub LLC, USD Term Loan B, (1 mo. USD Term SOFR), due 9/20/2030 | |
| | |
Communication Services 0.2% |
| Foundational Education Group, Inc., First Lien Term Loan, (3 mo. USD Term SOFR + 4.25%), 9.89%, due 8/31/2028 | |
|
| Bright Bidco BV, Term Loan, (3 mo. USD Term SOFR + 1.00%), 6.38%, due 10/31/2027 | |
Containers & Glass Products 1.1% |
| Anchor Packaging, Inc., Term Loan B, (1 mo. USD Term SOFR + 3.50%), 8.92%, due 7/18/2026 | |
| Klockner-Pentaplast of America, Inc., Term Loan B, (6 mo. USD Term SOFR + 4.73%), 10.48%, due 2/12/2026 | |
| Reynolds Consumer Products LLC, Term Loan, (1 mo. USD Term SOFR + 1.75%), 7.17%, due 2/4/2027 | |
| Spa Holdings 3 Oy, Term Loan B, (3 mo. USD Term SOFR + 4.00%), 9.65%, due 2/4/2028 | |
| Trident TPI Holdings, Inc., Term Loan B3, (3 mo. USD Term SOFR + 4.00%), 9.65%, due 9/15/2028 | |
| | |
Diversified Capital Markets 0.4% |
| Belron Finance U.S. LLC, Term Loan, (3 mo. USD Term SOFR + 2.75%), 8.25%, due 4/18/2029 | |
Diversified Financial Services 1.2% |
| Avolon TLB Borrower 1 (US) LLC, Term Loan B6, (1 mo. USD Term SOFR + 2.50%), 7.84%, due 6/22/2028 | |
| LSF11 Trinity Bidco, Inc., Term Loan, (1 mo. USD Term SOFR + 4.50%), 9.83%, due 6/14/2030 | |
| Nuvei Technologies Corp., Term Loan, (1 mo. USD Term SOFR + 2.50%), 7.94%, due 9/29/2025 | |
| Superannuation & Investments U.S. LLC, Term Loan, (1 mo. USD Term SOFR + 3.75%), 9.19%, due 12/1/2028 | |
| | |
Diversified Insurance 0.4% |
| Gainwell Acquisition Corp., Term Loan B, (3 mo. USD Term SOFR + 4.00%), 9.49%, due 10/1/2027 | |
|
| Generation Bridge Northeast LLC, Term Loan B, (1 mo. USD Term SOFR + 4.25%), 9.57%, due 8/22/2029 | |
Electronic Components 0.3% |
| II-VI, Inc., Term Loan B, (1 mo. USD Term SOFR + 2.75%), 8.19%, due 7/2/2029 | |
Electronics - Electrical 8.2% |
| Ahead DB Holdings LLC, Term Loan B, (3 mo. USD Term SOFR + 3.75%), 9.24%, due 10/18/2027 | |
| Cloudera, Inc., Term Loan, (1 mo. USD Term SOFR + 3.75%), 9.17%, due 10/8/2028 | |
| CommScope, Inc., Term Loan B, (1 mo. USD Term SOFR + 3.25%), 8.69%, due 4/6/2026 | |
| Epicor Software Corp., Term Loan, (1 mo. USD Term SOFR + 3.25%), 8.69%, due 7/30/2027 | |
| Flexera Software LLC, Term Loan B, (1 mo. USD Term SOFR + 3.75%), 9.19%, due 3/3/2028 | |
| Go Daddy Operating Co. LLC, Term Loan B5, (1 mo. USD Term SOFR + 2.50%), 7.82%, due 11/9/2029 | |
| Helios Software Holdings, Inc., Term Loan B, (3 mo. USD Term SOFR + 4.25%), 9.74%, due 7/18/2030 | |
| IGT Holding IV AB, Term Loan B2, (3 mo. USD Term SOFR + 3.40%), 8.96%, due 3/31/2028 | |
See Notes to Financial Statements
Schedule of Investments Floating Rate Income Fund^ (cont’d)
| |
|
Electronics - Electrical – cont'd |
| | |
| Term Loan, (1 mo. USD Term SOFR + 3.75%), 9.19%, due 12/1/2027 | |
| Term Loan, (1 mo. USD Term SOFR + 4.25%), 9.57%, due 12/1/2027 | |
| Ingram Micro, Inc., Term Loan, (3 mo. USD Term SOFR + 3.00%), 8.65%, due 6/30/2028 | |
| | |
| Term Loan B, (3 mo. USD Term SOFR + 4.00%), 9.67%, due 12/1/2027 | |
| Term Loan B, (3 mo. USD Term SOFR + 4.25%), 9.91%, due 12/1/2027 | |
| | |
| Term Loan, (3 mo. USD Term SOFR + 3.75%), 9.28%, due 5/18/2028 | |
| Second Lien Term Loan, (3 mo. USD Term SOFR + 6.75%), 12.28%, due 5/18/2029 | |
| McAfee LLC, Term Loan B, (1 mo. USD Term SOFR + 3.75%), 9.16%, due 3/1/2029 | |
| MH Sub I LLC, Term Loan, (1 mo. USD Term SOFR + 4.25%), 9.57%, due 5/3/2028 | |
| Netsmart Technologies, Inc., Term Loan B, (1 mo. USD Term SOFR + 3.75%), 9.19%, due 10/1/2027 | |
| Polaris Newco LLC, Term Loan B, (1 mo. USD Term SOFR + 4.00%), 9.44%, due 6/2/2028 | |
| Proofpoint, Inc., Second Lien Term Loan, (1 mo. USD Term SOFR + 6.25%), 11.69%, due 8/31/2029 | |
| Rackspace Technology Global, Inc., Term Loan B, (1 mo. USD Term SOFR + 2.75%), 8.21%, due 2/15/2028 | |
| RealPage, Inc., Second Lien Term Loan, (1 mo. USD Term SOFR + 6.50%), 11.94%, due 4/23/2029 | |
| | |
| Term Loan, (1 mo. USD Term SOFR + 4.75%), 10.19%, due 4/27/2028 | |
| Second Lien Term Loan, (1 mo. USD Term SOFR + 7.75%), 13.19%, due 4/27/2029 | |
| Riverbed Technology, Inc., Term Loan, (3 mo. USD Term SOFR + 4.50%), 9.89%, due 7/1/2028 | |
| S2P Acquisition Borrower, Inc., Term Loan, (1 mo. USD Term SOFR + 4.00%), 9.42%, due 8/14/2026 | |
| Storable, Inc., Term Loan B, (1 mo. USD Term SOFR + 3.50%, 3 mo. USD Term SOFR + 3.50%), 8.82% – 8.84%, due 4/17/2028 | |
| Uber Technologies, Inc., Term Loan B, (3 mo. USD Term SOFR + 2.75%), 8.16%, due 3/3/2030 | |
| Ultimate Software Group, Inc. | |
| Term Loan, (3 mo. USD Term SOFR + 3.25%), 8.76%, due 5/4/2026 | |
| Second Lien Term Loan, (1 mo. USD Term SOFR + 5.25%), 10.76%, due 5/3/2027 | |
| | |
| Term Loan, (3 mo. USD Term SOFR + 4.00%), 9.64%, due 4/24/2028 | |
| Second Lien Term Loan, (3 mo. USD Term SOFR + 7.25%), 12.67% – 12.89%, due 4/23/2029 | |
| ZoomInfo LLC, Term Loan B, (1 mo. USD Term SOFR + 2.75%), 8.17%, due 2/28/2030 | |
| | |
|
| 888 Acquisitions Ltd., Term Loan B, (6 mo. USD Term SOFR + 5.25%), 10.82%, due 7/1/2028 | |
| Delta 2 (LUX) Sarl, Term Loan B, (1 mo. USD Term SOFR + 2.25%), 7.57%, due 1/15/2030 | |
| Great Canadian Gaming Corp., Term Loan, (3 mo. USD Term SOFR + 4.00%), 9.66%, due 11/1/2026 | |
| | |
Financial Intermediaries 5.9% |
| Apex Group Treasury LLC, Term Loan, (3 mo. USD Term SOFR + 3.75%), 9.38%, due 7/27/2028 | |
| Asurion LLC, Second Lien Term Loan B4, (1 mo. USD Term SOFR + 5.25%), 10.69%, due 1/20/2029 | |
| Blackstone Mortgage Trust, Inc., Term Loan B, (1 mo. USD Term SOFR + 2.25%), 7.69%, due 4/23/2026 | |
| Citadel Securities LP, Term Loan B, (1 mo. USD Term SOFR + 2.50%), 7.94%, due 7/29/2030 | |
| Citco Funding LLC, Term Loan B, (3 mo. USD Term SOFR + 3.50%), 8.89%, due 4/27/2028 | |
| Edelman Financial Center LLC | |
| Second Lien Term Loan, (1 mo. USD Term SOFR + 6.75%), 12.19%, due 7/20/2026 | |
| Term Loan B, (1 mo. USD Term SOFR + 3.50%), 8.94%, due 4/7/2028 | |
| FinCo I LLC, Term Loan, (3 mo. USD Term SOFR + 3.00%), 8.38%, due 6/27/2029 | |
See Notes to Financial Statements
Schedule of Investments Floating Rate Income Fund^ (cont’d)
| |
|
Financial Intermediaries – cont'd |
| Focus Financial Partners LLC | |
| Term Loan B5, (1 mo. USD Term SOFR + 3.25%), 8.57%, due 6/30/2028 | |
| Term Loan B6, (1 mo. USD Term SOFR + 3.50%), 8.82%, due 6/30/2028 | |
| Galaxy U.S. Opco, Inc., Term Loan, (3 mo. USD Term SOFR + 4.75%), 10.13%, due 4/29/2029 | |
| Guggenheim Partners LLC, Term Loan B, (3 mo. USD Term SOFR + 3.25%), 8.64%, due 12/12/2029 | |
| Harbourvest Partners LLC, Term Loan B, (3 mo. USD Term SOFR + 3.00%), 8.39%, due 4/22/2030 | |
| OceanKey (U.S.) II Corp., Term Loan, (1 mo. USD Term SOFR + 3.50%), 8.92%, due 12/15/2028 | |
| OEG Borrower LLC, Term Loan, (3 mo. USD Term SOFR + 5.00%), 10.51%, due 6/18/2029 | |
| Orion Advisor Solutions, Inc., Term Loan, (3 mo. USD Term SOFR + 3.75%), 9.39%, due 9/24/2027 | |
| Sedgwick Claims Management Services, Inc., Term Loan B, (1 mo. USD Term SOFR + 3.75%), 9.07%, due 2/24/2028 | |
| Starwood Property Trust, Inc., Term Loan B, (1 mo. USD Term SOFR + 3.25%), 8.57%, due 11/18/2027 | |
| | |
|
| Froneri International Ltd., Term Loan, (1 mo. USD Term SOFR + 2.25%), 7.67%, due 1/29/2027 | |
| Nomad Foods U.S. LLC, Term Loan B4, (6 mo. USD Term SOFR + 3.00%), 8.47%, due 11/13/2029 | |
| WOOF Holdings, Inc., First Lien Term Loan, (3 mo. USD Term SOFR + 3.75%), 9.40%, due 12/21/2027 | |
| | |
|
| U.S. Foods, Inc., Term Loan B, (1 mo. USD Term SOFR + 2.50%), 7.94%, due 11/22/2028 | |
|
| Athenahealth Group, Inc., Term Loan B, (1 mo. USD Term SOFR + 3.25%), 8.58%, due 2/15/2029 | |
| Auris Luxembourg III Sarl, Term Loan B2, (2 mo. USD LIBOR + 3.75%, 3 mo. USD LIBOR + 3.75%, 6 mo. USD LIBOR + 3.75%), 5.61% – 5.87%, due 2/27/2026 | |
| | |
| Term Loan B, (3 mo. USD Term SOFR + 3.75%), 9.27%, due 7/17/2028 | |
| Second Lien Term Loan, (3 mo. USD Term SOFR + 7.00%), 12.57%, due 12/10/2029 | |
| CHG Healthcare Services, Inc., Term Loan, (3 mo. USD Term SOFR + 3.75%), 9.14%, due 9/29/2028 | |
| Confluent Medical Technologies, Inc., Term Loan, (3 mo. USD Term SOFR + 3.75%), 9.14%, due 2/16/2029 | |
| Envision Healthcare Corp., Term Loan, (12 Mo. USD Term SOFR), due 3/31/2027 | |
| Impala Bidco 0 Ltd., Term Loan, (3 mo. USD Term SOFR + 4.50%), 9.90%, due 6/8/2028 | |
| Insulet Corp., Term Loan B, (1 mo. USD Term SOFR + 3.25%), 8.69%, due 5/4/2028 | |
| MedAssets Software Intermediate Holdings, Inc., Term Loan, (1 mo. USD Term SOFR + 4.00%), 9.44%, due 12/18/2028 | |
| Medline Borrower LP, Term Loan B, (1 mo. USD Term SOFR + 3.25%), 8.69%, due 10/23/2028 | |
| National Mentor Holdings, Inc. | |
| Term Loan, (1 mo. USD Term SOFR + 3.75%, 3 mo. USD Term SOFR + 3.75%), 9.17% – 9.24%, due 3/2/2028 | |
| Term Loan C, (3 mo. USD Term SOFR + 3.75%), 9.24%, due 3/2/2028 | |
| Second Lien Term Loan, (3 mo. USD Term SOFR + 7.25%), 12.74%, due 3/2/2029 | |
| Organon & Co., Term Loan, (1 mo. USD Term SOFR + 3.00%), 8.45%, due 6/2/2028 | |
| Pearl Intermediate Parent LLC, Second Lien Term Loan, (1 mo. USD Term SOFR + 6.25%), 11.67%, due 2/13/2026 | |
| Quantum Health, Inc., Term Loan, (3 mo. USD Term SOFR + 4.50%), 10.18%, due 12/22/2027 | |
| Select Medical Corp., Term Loan B1, (1 mo. USD Term SOFR + 3.00%), 8.32%, due 3/6/2027 | |
| Sound Inpatient Physicians, Second Lien Term Loan, (3 mo. USD Term SOFR + 6.75%), 12.39%, due 6/26/2026 | |
See Notes to Financial Statements
Schedule of Investments Floating Rate Income Fund^ (cont’d)
| |
|
|
| Southern Veterinary Partners LLC, Term Loan, (1 mo. USD Term SOFR + 4.00%), 9.44%, due 10/5/2027 | |
| Summit Behavioral Healthcare LLC | |
| First Lien Term Loan, (3 mo. USD Term SOFR + 4.75%), 10.43%, due 11/24/2028 | |
| Second Lien Term Loan, (3 mo. USD Term SOFR + 7.75%), 13.43%, due 11/26/2029 | |
| Team Health Holdings, Inc., Term Loan B, (1 mo. USD Term SOFR + 5.25%, 3 mo. USD Term SOFR + 5.25%), 10.57% – 10.63%, due 3/2/2027 | |
| | |
| Term Loan, (3 mo. USD Term SOFR + 5.00%), 10.88%, due 12/20/2027 | |
| Second Lien Term Loan, (6 mo. USD Term SOFR + 9.00%), 14.88%, due 12/18/2028 | |
| U.S. Anesthesia Partners, Inc. | |
| Term Loan, (1 mo. USD Term SOFR + 4.25%), 9.68%, due 10/1/2028 | |
| Second Lien Term Loan, (1 mo. USD Term SOFR + 7.50%), 12.93%, due 10/1/2029 | |
| | |
Health Care Equipment & Supplies 0.3% |
| Bausch & Lomb Corp., Term Loan, (1 mo. USD Term SOFR + 4.00%), 9.32%, due 9/29/2028 | |
Health Care Providers & Services 0.2% |
| AEA International Holdings (Lux) Sarl, Term Loan B, (3 mo. USD Term SOFR + 3.75%), 9.40%, due 9/7/2028 | |
|
| AmWINS Group, Inc., Term Loan B, (1 mo. USD Term SOFR + 2.75%), 8.19%, due 2/19/2028 | |
|
| Weber-Stephen Products LLC, Term Loan B, (1 mo. USD Term SOFR + 3.25%), 8.69%, due 10/30/2027 | |
Hotels, Restaurants & Leisure 0.6% |
| 1011778 B.C. Unlimited Liability Co., Term Loan B5, (1 mo. USD Term SOFR + 2.25%), 7.57%, due 9/20/2030 | |
Industrial Equipment 2.5% |
| Columbus McKinnon Corp., Term Loan B, (3 mo. USD Term SOFR + 2.75%), 8.42%, due 5/14/2028 | |
| Crosby U.S. Acquisition Corp., Term Loan B, (1 mo. USD Term SOFR), due 6/27/2026 | |
| Eagle Parent Corp., Term Loan B, (3 mo. USD Term SOFR + 4.25%), 9.64%, due 4/2/2029 | |
| Engineered Machinery Holdings, Inc. | |
| Term Loan, (3 mo. USD Term SOFR + 3.50%), 9.15%, due 5/19/2028 | |
| Second Lien Term Loan, (3 mo. USD Term SOFR + 6.00%), 11.65%, due 5/21/2029 | |
| Second Lien Term Loan, (3 mo. USD Term SOFR + 6.50%), 12.15%, due 5/21/2029 | |
| Fluid-Flow Products, Inc. | |
| Term Loan, (3 mo. USD Term SOFR + 3.75%), 9.40%, due 3/31/2028 | |
| Second Lien Term Loan, (3 mo. USD Term SOFR + 6.75%), 12.40%, due 3/30/2029 | |
| Gates Global LLC, Term Loan B4, (1 mo. USD Term SOFR + 3.50%), 8.32%, due 11/16/2029 | |
| Groupe Solmax, Inc., Term Loan, (1 mo. USD Term SOFR + 4.75%, 3 mo. USD Term SOFR + 4.75%), 10.07% – 10.40%, due 5/29/2028 | |
| Madison IAQ LLC, Term Loan, (1 mo. USD Term SOFR + 3.25%), 8.70%, due 6/21/2028 | |
| Star U.S. Bidco LLC, Term Loan B, (1 mo. USD Term SOFR + 4.25%), 9.67%, due 3/17/2027 | |
| | |
See Notes to Financial Statements
Schedule of Investments Floating Rate Income Fund^ (cont’d)
| |
|
|
| | |
| Term Loan, (1 mo. USD Term SOFR), due 9/27/2030 | |
| Term Loan, (3 mo. USD Term SOFR + 3.25%), 8.64%, due 9/27/2030 | |
| | |
|
| Gen Digital, Inc., Term Loan B, (1 mo. USD Term SOFR + 2.00%), 7.42%, due 9/12/2029 | |
| WatchGuard Technologies, Inc., Term Loan, (1 mo. USD Term SOFR + 5.25%), 10.57%, due 7/2/2029 | |
| | |
IT Consulting & Other Services 0.5% |
| World Wide Technology Holding Co. LLC, Term Loan, (1 mo. USD Term SOFR + 3.25%), 8.69%, due 3/1/2030 | |
Leisure Goods - Activities - Movies 1.1% |
| Carnival Corp., Term Loan B, (1 mo. USD Term SOFR + 3.25%), 8.69%, due 10/18/2028 | |
| Creative Artists Agency LLC, Term Loan B, (1 mo. USD Term SOFR + 3.50%), 8.82%, due 11/27/2028 | |
| Playtika Holding Corp., Term Loan, (1 mo. USD Term SOFR + 2.75%), 8.19%, due 3/13/2028 | |
| | |
Life Sciences Tools & Services 0.6% |
| Star Parent, Inc., Term Loan B, (3 mo. USD Term SOFR + 4.00%), 9.39%, due 9/27/2030 | |
|
| | |
| Term Loan, (1 mo. USD Term SOFR + 3.50%), 8.94%, due 8/17/2028 | |
| Term Loan B, (1 mo. USD Term SOFR + 3.75%), 9.17%, due 5/31/2030 | |
| Aristocrat Technologies, Inc., Term Loan B, (3 mo. USD Term SOFR + 2.25%), 7.74%, due 5/24/2029 | |
| Four Seasons Hotels Ltd., Term Loan B, (1 mo. USD Term SOFR + 2.50%), 7.92%, due 11/30/2029 | |
| Golden Entertainment, Inc., Term Loan B, (1 mo. USD Term SOFR + 2.75%), 8.18%, due 5/28/2030 | |
| GVC Holdings (Gibraltar) Ltd., Term Loan B2, (3 mo. USD Term SOFR + 3.50%), 8.99%, due 10/31/2029 | |
| Scientific Games Holdings LP, Term Loan B, (3 mo. USD Term SOFR + 3.50%), 8.91%, due 4/4/2029 | |
| | |
| Term Loan, (3 mo. USD Term SOFR + 2.25%), 7.90%, due 7/21/2026 | |
| Term Loan B, (3 mo. USD Term SOFR + 3.25%), 8.90%, due 7/22/2028 | |
| Wyndham Hotels & Resorts, Inc., Term Loan B, (1 mo. USD Term SOFR + 2.25%), 7.67%, due 5/24/2030 | |
| | |
|
| Barnes Group, Inc., Term Loan B, (1 mo. USD Term SOFR + 3.00%), 8.42%, due 9/3/2030 | |
Machinery Diversified 0.4% |
| Chart Industries, Inc., Term Loan, (1 mo. USD Term SOFR + 3.25%), 8.66%, due 3/15/2030 | |
|
| Arsenal AIC Parent LLC, Term Loan, (3 mo. USD Term SOFR + 4.50%), 9.88%, due 8/18/2030 | |
|
| Peer Holding III BV, Term Loan B4, (1 mo. USD Term SOFR), due 10/19/2030 | |
Nonferrous Metals - Minerals 1.0% |
| Covia Holdings Corp., Term Loan, (3 mo. USD Term SOFR + 4.00%), 9.68%, due 7/31/2026 | |
| Ozark Holdings LLC, Term Loan B, (1 mo. USD Term SOFR + 3.75%), 9.19%, due 12/16/2027 | |
See Notes to Financial Statements
Schedule of Investments Floating Rate Income Fund^ (cont’d)
| |
|
Nonferrous Metals - Minerals – cont'd |
| U.S. Silica Co., Term Loan B, (1 mo. USD Term SOFR + 4.75%), 10.17%, due 3/25/2030 | |
| | |
|
| AL GCX Holdings LLC, Term Loan B, (3 mo. USD Term SOFR + 3.50%), 8.98%, due 5/17/2029 | |
| AL NGPL Holdings LLC, Term Loan B, (1 mo. USD Term SOFR + 3.50%), 8.83%, due 4/13/2028 | |
| Bangl LLC, Term Loan B, (1 mo. USD Term SOFR + 4.50%), 9.89%, due 2/1/2029 | |
| BCP Renaissance Parent LLC, Term Loan B, (3 mo. USD Term SOFR + 3.50%), 8.90%, due 10/31/2028 | |
| Brazos Delaware II LLC, Term Loan B, (1 mo. USD Term SOFR), due 2/11/2030 | |
| Buckeye Partners LP, Term Loan B, (1 mo. USD Term SOFR + 2.25%), 7.67%, due 11/1/2026 | |
| CQP Holdco LP, Term Loan B, (3 mo. USD Term SOFR + 3.50%), 8.99%, due 6/5/2028 | |
| Freeport LNG Investments LLLP, Term Loan B, (3 mo. USD Term SOFR + 3.50%), 9.18%, due 12/21/2028 | |
| Oryx Midstream Services Permian Basin LLC, Term Loan, (1 mo. USD Term SOFR + 3.25%), 8.69%, due 10/5/2028 | |
| Traverse Midstream Partners LLC, Term Loan, (3 mo. USD Term SOFR + 3.75%), 9.24%, due 2/16/2028 | |
| Waterbridge Midstream Operating LLC, Term Loan B, (3 mo. USD Term SOFR + 5.75%), 11.39%, due 6/22/2026 | |
| | |
Oil & Gas Storage & Transportation 0.3% |
| Whitewater Whistler Holdings LLC, Term Loan B, (3 mo. USD Term SOFR + 2.75%), 8.15%, due 2/15/2030 | |
Oil, Gas & Consumable Fuels 0.6% |
| GIP III Stetson I LP, Term Loan B, (1 mo. USD Term SOFR), due 10/5/2028 | |
| GIP Pilot Acquisition Partners LP, Term Loan, (3 mo. USD Term SOFR + 3.00%), 8.39%, due 10/4/2030 | |
| | |
|
| Reynolds Group Holdings, Inc., Term Loan B, (1 mo. USD Term SOFR + 3.25%), 8.69%, due 9/24/2028 | |
| Ring Container Technologies Group LLC, Term Loan B, (1 mo. USD Term SOFR + 3.50%), 8.94%, due 8/12/2028 | |
| | |
Packaging & Containers 0.4% |
| Berry Global, Inc., Term Loan AA, (1 mo. USD Term SOFR + 1.75%), 7.20%, due 7/1/2029 | |
|
| ITT Holdings LLC, Term Loan B, (1 mo. USD Term SOFR), due 10/5/2030 | |
| New Fortress Energy, Inc., Term Loan, (1 mo. USD Term SOFR), due 10/27/2028 | |
| | |
Professional Services 0.7% |
| Genuine Financial Holdings LLC, Term Loan B, (3 mo. USD Term SOFR + 4.00%), 9.39%, due 9/27/2030 | |
| Trans Union LLC, Term Loan B5, (1 mo. USD Term SOFR + 1.75%), 7.17%, due 11/16/2026 | |
| Vaco Holdings LLC, Term Loan, (3 mo. USD Term SOFR + 5.00%), 10.39% – 10.59%, due 1/21/2029 | |
| | |
Property & Casualty Insurance 0.3% |
| Broadstreet Partners, Inc., Term Loan B2, (1 mo. USD Term SOFR + 3.25%), 8.69%, due 1/27/2027 | |
See Notes to Financial Statements
Schedule of Investments Floating Rate Income Fund^ (cont’d)
| |
|
|
| | |
| Term Loan, (1 mo. USD Term SOFR + 3.50%), 8.92%, due 12/11/2028 | |
| Second Lien Term Loan, (1 mo. USD Term SOFR + 5.75%), 11.17%, due 12/10/2029 | |
| | |
|
| iHeartCommunications, Inc., Term Loan, (1 mo. USD Term SOFR + 3.00%), 8.44%, due 5/1/2026 | |
| Sinclair Television Group, Inc., Term Loan B2B, (1 mo. USD Term SOFR + 2.50%), 7.94%, due 9/30/2026 | |
| | |
Real Estate Investment Trusts 0.3% |
| RHP Hotel Properties LP, Term Loan B, (1 mo. USD Term SOFR + 2.75%), 8.07%, due 5/18/2030 | |
Real Estate Management & Development 0.4% |
| Greystar Real Estate Partners LLC, Term Loan, (3 mo. USD Term SOFR + 3.75%), 9.15%, due 8/21/2030 | |
|
| LIDS Holdings, Inc., Term Loan, (3 mo. USD Term SOFR + 5.50%), 11.06%, due 12/14/2026 | |
Retailers (except food & drug) 3.5% |
| BJ's Wholesale Club, Inc., Term Loan B, (3 mo. USD Term SOFR + 2.00%), 7.33%, due 2/3/2029 | |
| | |
| Term Loan, (3 mo. USD Term SOFR + 3.50%), 8.93%, due 11/8/2027 | |
| Second Lien Term Loan, (3 mo. USD Term SOFR + 6.75%), 12.18%, due 11/6/2028 | |
| | |
| Term Loan B, (3 mo. USD Term SOFR), due 2/7/2025 | |
| Term Loan B, (1 mo. USD Term SOFR), due 2/7/2025 | |
| First Lien Term Loan B, (1 mo. USD Term SOFR + 4.00%), 9.41%, due 2/7/2025 | |
| First Lien Term Loan B, (1 mo. USD Term SOFR + 4.00%), 9.41%, due 2/7/2025 | |
| Term Loan B, (1 mo. USD Term SOFR), due 3/31/2026 | |
| Term Loan B, (1 mo. USD Term SOFR), due 3/31/2026 | |
| Great Outdoors Group LLC, Term Loan B1, (1 mo. USD Term SOFR + 3.75%), 9.40%, due 3/6/2028 | |
| Les Schwab Tire Centers, Term Loan B, (1 mo. USD Term SOFR + 3.25%), 8.69%, due 11/2/2027 | |
| Petco Health & Wellness Co., Inc., Term Loan B, (3 mo. USD Term SOFR + 3.25%), 8.90%, due 3/3/2028 | |
| PetSmart, Inc., Term Loan B, (1 mo. USD Term SOFR + 3.75%), 9.17%, due 2/11/2028 | |
| Sally Holdings LLC, Term Loan B, (1 mo. USD Term SOFR + 2.25%), 7.57%, due 2/28/2030 | |
| | |
|
| Central Parent, Inc., Term Loan B, (3 mo. USD Term SOFR + 4.00%), 9.41%, due 7/6/2029 | |
| Cloudera, Inc., Second Lien Term Loan, (1 mo. USD Term SOFR + 6.00%), 11.42%, due 10/8/2029 | |
| ConnectWise LLC, Term Loan B, (1 mo. USD Term SOFR + 3.50%), 8.94%, due 9/29/2028 | |
| | |
|
| Fanatics Commerce Intermediate Holdco LLC, Term Loan B, (1 mo. USD Term SOFR + 3.25%), 8.69%, due 11/24/2028 | |
|
| ChampionX Corp., Term Loan B1, (1 mo. USD Term SOFR + 2.75%), 8.18%, due 6/7/2029 | |
See Notes to Financial Statements
Schedule of Investments Floating Rate Income Fund^ (cont’d)
| |
|
|
| Avis Budget Car Rental LLC, Term Loan C, (1 mo. USD Term SOFR + 3.50%), 8.92%, due 3/16/2029 | |
| | |
| Term Loan B, (1 mo. USD Term SOFR + 3.25%), 8.69%, due 6/30/2028 | |
| Term Loan C, (1 mo. USD Term SOFR + 3.25%), 8.69%, due 6/30/2028 | |
| Kenan Advantage Group, Inc., Term Loan B1, (3 mo. USD Term SOFR + 3.75%), 9.48%, due 3/24/2026 | |
| PAI Holdco, Inc., Term Loan B, (3 mo. USD Term SOFR + 3.75%), 9.39%, due 10/28/2027 | |
| | |
|
| CenturyLink, Inc., Term Loan B, (1 mo. USD Term SOFR + 2.25%), 7.69%, due 3/15/2027 | |
| Ciena Corp., Term Loan B, (1 mo. USD Term SOFR + 2.00%), 7.43%, due 10/24/2030 | |
| Cincinnati Bell, Inc., Term Loan B2, (1 mo. USD Term SOFR + 3.25%), 8.67%, due 11/22/2028 | |
| Connect Finco Sarl, Term Loan B, (1 mo. USD Term SOFR + 3.50%), 8.82%, due 12/11/2026 | |
| Consolidated Communications, Inc., Term Loan B, (1 mo. USD Term SOFR + 3.50%), 8.94%, due 10/2/2027 | |
| Frontier Communications Corp., First Lien Term Loan, (1 mo. USD Term SOFR + 3.75%), 9.19%, due 10/8/2027 | |
| | |
| Term Loan, (1 mo. USD Term SOFR + 7.10%), 12.43%, due 12/30/2027 | |
| Term Loan, (3 mo. USD Term SOFR + 9.10%), 14.49%, due 6/30/2028 | |
| Iridium Satellite LLC, Term Loan B, (1 mo. USD Term SOFR + 2.50%), 7.82%, due 9/20/2030 | |
| Level 3 Financing, Inc., Term Loan B, (1 mo. USD Term SOFR + 1.75%), 7.19%, due 3/1/2027 | |
| Telesat Canada, Term Loan B5, (3 mo. USD Term SOFR + 2.75%), 8.43%, due 12/7/2026 | |
| | |
| Term Loan, (1 mo. USD Term SOFR + 4.50%), 9.82%, due 3/2/2029 | |
| Term Loan, (3 mo. USD Term SOFR), due 5/30/2030 | |
| Voyage Australia Pty. Ltd., Term Loan B, (3 mo. USD Term SOFR + 3.50%), 9.18%, due 7/20/2028 | |
| Zayo Group Holdings, Inc. | |
| Term Loan, (1 mo. USD Term SOFR + 3.00%), 8.44%, due 3/9/2027 | |
| Term Loan B, (1 mo. USD Term SOFR + 4.33%), 9.65%, due 3/9/2027 | |
| | |
Trading Companies & Distributors 0.8% |
| Delos Aircraft Designated Activity Co., Term Loan, (3 mo. USD Term SOFR + 2.00%), 7.40%, due 10/31/2027 | |
| Fastlane Parent Co., Inc., Term Loan B, (1 mo. USD Term SOFR + 4.50%), due 9/29/2028 | |
| | |
|
| ASP Dream Acquisition Co. LLC, Term Loan B, (1 mo. USD Term SOFR + 4.00%), 9.42%, due 12/15/2028 | |
| | |
| Term Loan, (3 mo. USD Term SOFR + 4.50%), 10.40%, due 5/7/2028 | |
| Second Lien Term Loan, (2 mo. USD Term SOFR + 7.50%), 13.40%, due 5/7/2029 | |
| Latam Airlines Group SA, Term Loan B, (3 mo. USD Term SOFR + 9.50%), 15.08%, due 10/12/2027 | |
| Worldwide Express Operations LLC | |
| First Lien Term Loan, (3 mo. USD Term SOFR + 4.00%), 9.65%, due 7/26/2028 | |
| Second Lien Term Loan, (3 mo. USD Term SOFR + 7.00%), 12.65%, due 7/26/2029 | |
| | |
See Notes to Financial Statements
Schedule of Investments Floating Rate Income Fund^ (cont’d)
| |
|
|
| APX Group, Inc., Term Loan B, (3 mo. USD Term SOFR + 2.25%, 3 mo. USD Term SOFR + 3.25%), 8.92% – 10.75%, due 7/10/2028 | |
| Artera Services LLC, Term Loan, (3 mo. USD Term SOFR + 3.50%), 8.99%, due 3/6/2025 | |
| Carroll County Energy LLC, Term Loan B, (3 mo. USD Term SOFR + 3.50%), 8.99%, due 2/13/2026 | |
| Eastern Power LLC, Term Loan B, (1 mo. USD Term SOFR + 3.75%), 9.19%, due 10/2/2025 | |
| Edgewater Generation LLC, Term Loan, (1 mo. USD Term SOFR + 3.75%), 9.19%, due 12/13/2025 | |
| Granite Generation LLC, Term Loan B, (1 mo. USD Term SOFR + 3.75%), 9.19%, due 11/9/2026 | |
| Kestrel Acquisition LLC, Term Loan B, (1 mo. USD Term SOFR + 4.25%), 9.69%, due 6/2/2025 | |
| | |
| Term Loan B, (3 mo. USD Term SOFR + 5.75%), 11.13%, due 1/29/2027 | |
| Term Loan C, (3 mo. USD Term SOFR + 5.75%), 11.13%, due 1/29/2027 | |
| Nautilus Power LLC, Term Loan B, (3 mo. USD Term SOFR + 5.25%), 10.90%, due 11/16/2026 | |
| Osmose Utilities Services, Inc., Term Loan, (1 mo. USD Term SOFR + 3.25%), 8.69%, due 6/23/2028 | |
| | |
| Term Loan C, (3 mo. USD Term SOFR + 4.50%), 9.88%, due 5/17/2030 | |
| Term Loan B, (3 mo. USD Term SOFR + 4.50%), 9.88%, due 5/17/2030 | |
| | |
| Term Loan, (1 mo. USD Term SOFR + 3.50%), 8.94%, due 5/12/2028 | |
| Second Lien Term Loan, (1 mo. USD Term SOFR + 6.50%), 11.94%, due 5/14/2029 | |
| | |
Total Loan Assignments (Cost $403,767,888) | |
|
|
Engineering & Construction 0.1% |
| Brock Group, Inc., 0.00% Cash/15.00% PIK, due 1/24/2024 | |
|
| DISH Network Corp., 2.38%, due 3/15/2024 | |
|
Total Convertible Bonds (Cost $1,225,222) | |
|
|
|
|
Business Equipment & Services 0.1% |
| | |
Electrical Equipment 0.0%(d) |
| Lumileds Exit Private Equity | |
|
| Riverbed Technology, Inc. | |
|
| | |
Real Estate Management & Development 0.0%(d) |
| | |
Total Common Stocks (Cost $995,895) | |
|
See Notes to Financial Statements
Schedule of Investments Floating Rate Income Fund^ (cont’d)
| |
|
Short-Term Investments 8.2% |
Investment Companies 8.2% | |
|
| State Street Institutional U.S. Government Money Market Fund Premier Class, 5.30%(k) (Cost $36,510,734) | |
Total Investments 103.1% (Cost $474,586,118) | |
Liabilities Less Other Assets (3.1)% | |
| |
| Non-income producing security. |
| Securities were purchased under Rule 144A of the Securities Act of 1933, as amended, or are otherwise restricted and, unless registered under the Securities Act of 1933 or exempted from registration, may only be sold to qualified institutional investors or may have other restrictions on resale. At October 31, 2023, these securities amounted to $26,885,568, which represents 6.0% of net assets of the Fund. |
| Variable or floating rate security. The interest rate shown was the current rate as of October 31, 2023 and changes periodically. |
| Security exempt from registration pursuant to Regulation S under the Securities Act of 1933, as amended. Regulation S applies to securities offerings that are made outside of the United States and do not involve directed selling efforts in the United States and as such may have restrictions on resale. Total value of all such securities at October 31, 2023 amounted to $2,778,203, which represents 0.6% of net assets of the Fund. |
| Represents less than 0.05% of net assets of the Fund. |
| The stated interest rates represent the range of rates at October 31, 2023 of the underlying contracts within the Loan Assignment. |
| Value determined using significant unobservable inputs. |
| All or a portion of this security was purchased on a delayed delivery basis. |
| All or a portion of this security had not settled as of October 31, 2023 and thus may not have an interest rate in effect. Interest rates do not take effect until settlement. |
| Security fair valued as of October 31, 2023 in accordance with procedures approved by the valuation designee. Total value of all such securities at October 31, 2023 amounted to $791,040, which represents 0.2% of net assets of the Fund. |
| Payment-in-kind (PIK) security. |
| Represents 7-day effective yield as of October 31, 2023. |
| As of October 31, 2023, the value of unfunded note commitments was $1,000,000 for the Fund (see Note A of the Notes to Financial Statements) |
See Notes to Financial Statements
Schedule of Investments Floating Rate Income Fund^ (cont’d)
#
This security has been deemed by Management to be illiquid, and is subject to restrictions on resale. Total value of all such securities at October 31, 2023 amounted to $791,040, which represents 0.2% of net assets of the Fund. Acquisition dates shown with a range, if any, represent securities that were acquired over the period shown in the table.
| | | | Fair Value
Percentage
of Net Assets
as of
10/31/2023 |
| | | | |
| | | | |
|
| | | |
See Notes to Financial Statements
Schedule of Investments Floating Rate Income Fund^ (cont’d)
|
| | |
| | |
| | |
| | |
| | |
| | |
| | |
| | |
| | |
| | |
| | |
| | |
| | |
| | |
| | |
| | |
Short-Term Investments and Other Liabilities—Net | | |
| | |
The following is a summary, categorized by Level (see Note A of the Notes to Financial Statements), of inputs used to value the Fund’s investments as of October 31, 2023:
| | | | |
| | | | |
| | | | |
| | | | |
|
|
|
|
|
| | | | |
| | | | |
| | | | |
| | | | |
Commercial Services & Supplies | | | | |
Diversified Financial Services | | | | |
| | | | |
| | | | |
| | | | |
Health Care Providers & Services | | | | |
| | | | |
| | | | |
Real Estate Management & Development | | | | |
| | | | |
Retailers (except food & drug) | | | | |
| | | | |
| | | | |
| | | | |
|
|
|
|
|
Engineering & Construction | | | | |
See Notes to Financial Statements
Schedule of Investments Floating Rate Income Fund^ (cont’d)
| | | | |
| | | | |
| | | | |
|
|
|
|
|
Business Equipment & Services | | | | |
| | | | |
| | | | |
| | | | |
Real Estate Management & Development | | | | |
| | | | |
| | | | |
| | | | |
| The Schedule of Investments provides information on the industry or sector categorization as well as a Positions by Country summary. |
| The following is a reconciliation between the beginning and ending balances of investments in which significant unobservable inputs (Level 3) were used in determining value: |
| Beginning
balance as
of 11/1/2022 | Accrued
discounts/
(premiums) | | Change
in unrealized
appreciation/
(depreciation) | | | | | | Net change in
unrealized
appreciation/
(depreciation)
from
investments
still held as of
10/31/2023 |
Investments in
Securities: | | | | | | | | | | |
| | | | | | | | | | |
| | | | | | | | | | |
| | | | | | | | | | |
| | | | | | | | | | |
(1) Securities categorized as Level 3 were valued using a single quotation obtained from a dealer. The Fund does not have access to significant unobservable inputs and therefore cannot disclose such inputs used in formulating such quotation. |
(2) Quantitative Information about Level 3 Fair Value Measurements: |
| | | Significant unobservable
input(s) | | | Impact to
valuation
from
increase
in input(b) |
| | | Enterprise value/
EBITDA multiple(c) (EV/EBITDA) | | | |
| | | | | | |
(a) The weighted averages disclosed in the table above were weighted by relative fair value. |
(b) Represents the expected directional change in the fair value of the Level 3 investments that would result from an increase or decrease in the corresponding input. Significant changes in these inputs could result in significantly higher or lower fair value measurements. |
See Notes to Financial Statements
Schedule of Investments Floating Rate Income Fund^ (cont’d)
(c) Represents amounts used when the reporting entity has determined that market participants would use such multiples when pricing the investments. |
^
A balance indicated with a "—", reflects either a zero balance or an amount that rounds to less than 1.
See Notes to Financial Statements
Schedule of Investments High Income Bond Fund^ October 31, 2023
| |
U.S. Treasury Obligations 2.2% |
|
| | U.S. Treasury Notes, 5.00%, due 8/31/2025 (Cost $14,971,009) | |
Asset-Backed Securities 1.5% |
|
| | 37 Capital CLO 1 Ltd., Series 2021-1A, Class E, (3 mo. USD Term SOFR + 7.46%), 12.86%, due 10/15/2034 | |
| | Canyon Capital CLO Ltd., Series 2021-2A, Class D, (3 mo. USD Term SOFR + 3.61%), 9.01%, due 4/15/2034 | |
| | Galaxy XXII CLO Ltd., Series 2016-22A, Class DRR, (3 mo. USD Term SOFR + 3.61%), 9.01%, due 4/16/2034 | |
| | KKR CLO Ltd., Series 23, Class D, (3 mo. USD Term SOFR + 3.36%), 8.78%, due 10/20/2031 | |
| | OCP CLO Ltd., Series 2015-9A, Class ER, (3 mo. USD Term SOFR + 6.80%), 12.19%, due 1/15/2033 | |
| | Octagon Investment Partners 39 Ltd., Series 2018-3A, Class D, (3 mo. USD Term SOFR + 3.21%), 8.63%, due 10/20/2030 | |
| | Sandstone Peak Ltd., Series 2021-1A, Class E, (3 mo. USD Term SOFR + 7.06%), 12.46%, due 10/15/2034 | |
| | Signal Peak CLO Ltd., Series 2021-10A, Class D, (3 mo. USD Term SOFR + 3.46%), 8.86%, due 1/24/2035 | |
| | Voya CLO Ltd., Series 2019-2A, Class E, (3 mo. USD Term SOFR + 6.86%), 12.28%, due 7/20/2032 | |
Total Asset-Backed Securities (Cost $10,419,591) | |
|
|
|
|
| | Summer BC Bidco B LLC, 5.50%, due 10/31/2026 | |
|
|
| | Bombardier, Inc., 7.88%, due 4/15/2027 | |
| | | |
| | | |
| | | |
| | | |
| | | |
| | | |
| | | |
|
|
| | Darling Ingredients, Inc., 6.00%, due 6/15/2030 | |
|
|
| | American Airlines, Inc., 7.25%, due 2/15/2028 | |
| | American Airlines, Inc./AAdvantage Loyalty IP Ltd. | |
| | | |
| | | |
| | | |
| | | |
| | | |
| | | |
| | | |
| | | |
See Notes to Financial Statements
Schedule of Investments High Income Bond Fund^ (cont’d)
| |
|
|
|
| | VistaJet Malta Finance PLC/Vista Management Holding, Inc. | |
| | | |
| | | |
| | | |
| | | |
|
|
| | Hanesbrands, Inc., 4.88%, due 5/15/2026 | |
| | William Carter Co., 5.63%, due 3/15/2027 | |
| | Wolverine World Wide, Inc., 4.00%, due 8/15/2029 | |
| | | |
|
|
| | | |
| | | |
| | | |
| | | |
| | | |
| | | |
| | Ford Motor Credit Co. LLC | |
| | | |
| | | |
| | | |
| | | |
| | (Secured Overnight Financing Rate + 2.95%), 8.29%, due 3/6/2026 | |
| | | |
| | | |
| | | |
| | | |
| | | |
| | | |
| | Jaguar Land Rover Automotive PLC | |
| | | |
| | | |
| | | |
Auto Parts & Equipment 1.7% |
|
| | | |
| | | |
| | | |
| | Dealer Tire LLC/DT Issuer LLC, 8.00%, due 2/1/2028 | |
| | Goodyear Tire & Rubber Co. | |
| | | |
| | | |
| | | |
| | | |
| | 4.75% Cash/5.50% PIK, due 9/15/2026 | |
| | 6.38% Cash/7.13% PIK, due 5/15/2029 | |
See Notes to Financial Statements
Schedule of Investments High Income Bond Fund^ (cont’d)
| |
|
Auto Parts & Equipment – cont'd |
|
| | ZF North America Capital, Inc. | |
| | | |
| | | |
| | | |
| | | |
|
|
| | Bank of New York Mellon Corp., 3.70%, due 3/20/2026 | |
| | JPMorgan Chase & Co., 4.60%, due 2/1/2025 | |
| | PNC Financial Services Group, Inc., 3.40%, due 9/15/2026 | |
| | | |
|
|
| | Builders FirstSource, Inc. | |
| | | |
| | | |
| | Camelot Return Merger Sub, Inc., 8.75%, due 8/1/2028 | |
| | Cornerstone Building Brands, Inc., 6.13%, due 1/15/2029 | |
| | Emerald Debt Merger Sub LLC, 6.63%, due 12/15/2030 | |
| | | |
| | | |
| | | |
| | Knife River Corp., 7.75%, due 5/1/2031 | |
| | Masonite International Corp. | |
| | | |
| | | |
| | Standard Industries, Inc., 4.38%, due 7/15/2030 | |
| | | |
|
|
| | Ashland, Inc., 3.38%, due 9/1/2031 | |
| | Avient Corp., 7.13%, due 8/1/2030 | |
| | Illuminate Buyer LLC/Illuminate Holdings IV, Inc., 9.00%, due 7/1/2028 | |
| | INEOS Finance PLC, 6.75%, due 5/15/2028 | |
| | INEOS Quattro Finance 2 PLC, 3.38%, due 1/15/2026 | |
| | NOVA Chemicals Corp., 5.25%, due 6/1/2027 | |
| | Olympus Water U.S. Holding Corp. | |
| | | |
| | | |
| | SCIL IV LLC/SCIL USA Holdings LLC, 5.38%, due 11/1/2026 | |
| | | |
| | | |
| | | |
| | Tronox, Inc., 4.63%, due 3/15/2029 | |
| | Vibrantz Technologies, Inc., 9.00%, due 2/15/2030 | |
| | WR Grace Holdings LLC, 5.63%, due 8/15/2029 | |
| | | |
|
|
| | | |
| | | |
| | | |
| | Allied Universal Holdco LLC/Allied Universal Finance Corp., 6.00%, due 6/1/2029 | |
See Notes to Financial Statements
Schedule of Investments High Income Bond Fund^ (cont’d)
| |
|
Commercial Services – cont'd |
|
| | Allied Universal Holdco LLC/Allied Universal Finance Corp./Atlas Luxco 4 SARL, 4.63%, due 6/1/2028 | |
| | APi Group DE, Inc., 4.13%, due 7/15/2029 | |
| | | |
| | | |
| | | |
| | ASGN, Inc., 4.63%, due 5/15/2028 | |
| | Garda World Security Corp. | |
| | | |
| | | |
| | GTCR W-2 Merger Sub LLC, 7.50%, due 1/15/2031 | |
| | Hertz Corp., 4.63%, due 12/1/2026 | |
| | MPH Acquisition Holdings LLC, 5.50%, due 9/1/2028 | |
| | Neptune Bidco U.S., Inc., 9.29%, due 4/15/2029 | |
| | Prime Security Services Borrower LLC/Prime Finance, Inc. | |
| | | |
| | | |
| | United Rentals North America, Inc. | |
| | | |
| | | |
| | | |
| | | |
| | Verscend Escrow Corp., 9.75%, due 8/15/2026 | |
| | Williams Scotsman, Inc., 7.38%, due 10/1/2031 | |
| | | |
|
|
| | Ahead DB Holdings LLC, 6.63%, due 5/1/2028 | |
| | McAfee Corp., 7.38%, due 2/15/2030 | |
| | Presidio Holdings, Inc., 8.25%, due 2/1/2028 | |
| | | |
Cosmetics - Personal Care 0.6% |
|
| | Coty, Inc., 5.00%, due 4/15/2026 | |
| | Coty, Inc./HFC Prestige Products, Inc./HFC Prestige International U.S. LLC, 6.63%, due 7/15/2030 | |
| | | |
Distribution - Wholesale 0.8% |
|
| | BCPE Empire Holdings, Inc., 7.63%, due 5/1/2027 | |
| | Resideo Funding, Inc., 4.00%, due 9/1/2029 | |
| | Ritchie Bros Holdings, Inc., 6.75%, due 3/15/2028 | |
| | Windsor Holdings III LLC, 8.50%, due 6/15/2030 | |
| | | |
Diversified Financial Services 0.9% |
|
| | | |
| | | |
| | | |
| | Global Aircraft Leasing Co. Ltd., 6.50% Cash/7.25% PIK, due 9/15/2024 | |
| | | |
| | | |
| | | |
See Notes to Financial Statements
Schedule of Investments High Income Bond Fund^ (cont’d)
| |
|
Diversified Financial Services – cont'd |
|
| | | |
| | | |
| | | |
| | | |
| | | |
| | | |
| | | |
| | | |
|
|
| | | |
| | | |
| | | |
| | | |
| | | |
| | Clearway Energy Operating LLC, 3.75%, due 1/15/2032 | |
| | Leeward Renewable Energy Operations LLC, 4.25%, due 7/1/2029 | |
| | | |
| | | |
| | | |
| | | |
| | | |
| | Talen Energy Supply LLC, 8.63%, due 6/1/2030 | |
| | TransAlta Corp., 7.75%, due 11/15/2029 | |
| | Vistra Corp., 7.00%, due 12/15/2026 | |
| | Vistra Operations Co. LLC | |
| | | |
| | | |
| | | |
| | | |
Electrical Components & Equipment 0.4% |
|
| | Energizer Holdings, Inc., 6.50%, due 12/31/2027 | |
|
|
| | Imola Merger Corp., 4.75%, due 5/15/2029 | |
| | | |
| | | |
| | | |
| | | |
| | TTM Technologies, Inc., 4.00%, due 3/1/2029 | |
| | | |
Energy - Alternate Sources 0.3% |
|
| | | |
| | | |
| | | |
| | | |
Engineering & Construction 0.9% |
|
| | Global Infrastructure Solutions, Inc., 5.63%, due 6/1/2029 | |
| | VM Consolidated, Inc., 5.50%, due 4/15/2029 | |
| | | |
See Notes to Financial Statements
Schedule of Investments High Income Bond Fund^ (cont’d)
| |
|
|
|
| | Allwyn Entertainment Financing U.K. PLC, 7.88%, due 4/30/2029 | |
| | Banijay Entertainment SASU, 8.13%, due 5/1/2029 | |
| | Caesars Entertainment, Inc. | |
| | | |
| | | |
| | Cedar Fair LP/Canada's Wonderland Co./Magnum Management Corp./Millennium Op | |
| | | |
| | | |
| | | |
| | | |
| | | |
| | | |
| | Everi Holdings, Inc., 5.00%, due 7/15/2029 | |
| | International Game Technology PLC | |
| | | |
| | | |
| | Light & Wonder International, Inc. | |
| | | |
| | | |
| | | |
| | Live Nation Entertainment, Inc. | |
| | | |
| | | |
| | | |
| | Merlin Entertainments Ltd., 5.75%, due 6/15/2026 | |
| | Midwest Gaming Borrower LLC/Midwest Gaming Finance Corp., 4.88%, due 5/1/2029 | |
| | Motion Bondco DAC, 6.63%, due 11/15/2027 | |
| | Penn Entertainment, Inc., 5.63%, due 1/15/2027 | |
| | Raptor Acquisition Corp./Raptor Co.-Issuer LLC, 4.88%, due 11/1/2026 | |
| | Scientific Games Holdings LP/Scientific Games U.S. FinCo, Inc., 6.63%, due 3/1/2030 | |
| | SeaWorld Parks & Entertainment, Inc., 5.25%, due 8/15/2029 | |
| | Warnermedia Holdings, Inc., 5.14%, due 3/15/2052 | |
| | | |
| | | |
| | | |
| | Wynn Resorts Finance LLC/Wynn Resorts Capital Corp., 5.13%, due 10/1/2029 | |
| | | |
Environmental Control 0.2% |
|
| | | |
| | | |
| | | |
| | Madison IAQ LLC, 5.88%, due 6/30/2029 | |
| | | |
|
|
| | Albertsons Cos., Inc./Safeway, Inc./New Albertsons LP/Albertsons LLC | |
| | | |
| | | |
| | | |
| | | |
| | | |
See Notes to Financial Statements
Schedule of Investments High Income Bond Fund^ (cont’d)
| |
|
|
|
| | Performance Food Group, Inc. | |
| | | |
| | | |
| | | |
| | | |
| | | |
| | | |
| | | |
| | TreeHouse Foods, Inc., 4.00%, due 9/1/2028 | |
| | | |
| | | |
| | | |
| | | |
| | | |
| | | |
Forest Products & Paper 0.2% |
|
| | Ahlstrom Holding 3 Oyj, 4.88%, due 2/4/2028 | |
Healthcare - Products 0.7% |
|
| | Bausch & Lomb Escrow Corp., 8.38%, due 10/1/2028 | |
| | | |
| | | |
| | | |
| | | |
Healthcare - Services 3.7% |
|
| | Catalent Pharma Solutions, Inc. | |
| | | |
| | | |
| | CHS/Community Health Systems, Inc. | |
| | | |
| | | |
| | | |
| | | |
| | | |
| | | |
| | Encompass Health Corp., 4.50%, due 2/1/2028 | |
| | Fortrea Holdings, Inc., 7.50%, due 7/1/2030 | |
| | HealthEquity, Inc., 4.50%, due 10/1/2029 | |
| | | |
| | | |
| | | |
| | Legacy LifePoint Health LLC, 4.38%, due 2/15/2027 | |
| | LifePoint Health, Inc., 9.88%, due 8/15/2030 | |
| | | |
| | | |
| | | |
| | RegionalCare Hospital Partners Holdings, Inc./LifePoint Health, Inc., 9.75%, due 12/1/2026 | |
| | Select Medical Corp., 6.25%, due 8/15/2026 | |
| | Star Parent, Inc., 9.00%, due 10/1/2030 | |
See Notes to Financial Statements
Schedule of Investments High Income Bond Fund^ (cont’d)
| |
|
Healthcare - Services – cont'd |
|
| | | |
| | | |
| | | |
| | | |
| | | |
| | | |
| | U.S. Acute Care Solutions LLC, 6.38%, due 3/1/2026 | |
| | | |
Holding Companies - Diversified 0.2% |
|
| | Benteler International AG, 10.50%, due 5/15/2028 | |
|
|
| | KB Home, 7.25%, due 7/15/2030 | |
| | | |
| | | |
| | | |
| | Meritage Homes Corp., 5.13%, due 6/6/2027 | |
| | Shea Homes LP/Shea Homes Funding Corp. | |
| | | |
| | | |
| | Tri Pointe Homes, Inc., 5.25%, due 6/1/2027 | |
| | | |
Household Products - Wares 0.1% |
|
| | Spectrum Brands, Inc., 3.88%, due 3/15/2031 | |
|
|
| | Newell Brands, Inc., 6.38%, due 4/1/2036 | |
|
|
| | Alliant Holdings Intermediate LLC/Alliant Holdings Co.-Issuer | |
| | | |
| | | |
| | | |
| | | |
| | | |
| | BroadStreet Partners, Inc., 5.88%, due 4/15/2029 | |
| | GTCR AP Finance, Inc., 8.00%, due 5/15/2027 | |
| | | |
| | | |
| | | |
| | | |
|
|
| | EquipmentShare.com, Inc., 9.00%, due 5/15/2028 | |
| | | |
| | | |
| | | |
| | Match Group Holdings II LLC, 5.63%, due 2/15/2029 | |
| | Newfold Digital Holdings Group, Inc., 6.00%, due 2/15/2029 | |
| | Northwest Fiber LLC/Northwest Fiber Finance Sub, Inc. | |
| | | |
| | | |
See Notes to Financial Statements
Schedule of Investments High Income Bond Fund^ (cont’d)
| |
|
|
|
| | Ziff Davis, Inc., 4.63%, due 10/15/2030 | |
| | | |
|
|
| | | |
| | | |
| | | |
| | | |
| | Carpenter Technology Corp., 7.63%, due 3/15/2030 | |
| | TMS International Corp., 6.25%, due 4/15/2029 | |
| | | |
|
|
| | Acushnet Co., 7.38%, due 10/15/2028 | |
| | | |
| | | |
| | | |
| | | |
| | | |
| | Carnival Holdings Bermuda Ltd., 10.38%, due 5/1/2028 | |
| | Carnival PLC, 7.88%, due 6/1/2027 | |
| | Lindblad Expeditions Holdings, Inc., 9.00%, due 5/15/2028 | |
| | Lindblad Expeditions LLC, 6.75%, due 2/15/2027 | |
| | NCL Corp. Ltd., 5.88%, due 2/15/2027 | |
| | Royal Caribbean Cruises Ltd. | |
| | | |
| | | |
| | | |
| | | |
| | | |
|
|
| | Wyndham Hotels & Resorts, Inc., 4.38%, due 8/15/2028 | |
Machinery - Construction & Mining 0.4% |
|
| | Manitowoc Co., Inc., 9.00%, due 4/1/2026 | |
| | Terex Corp., 5.00%, due 5/15/2029 | |
| | | |
Machinery - Diversified 1.0% |
|
| | ATS Corp., 4.13%, due 12/15/2028 | |
| | | |
| | | |
| | | |
| | SPX FLOW, Inc., 8.75%, due 4/1/2030 | |
| | TK Elevator Holdco GmbH, 7.63%, due 7/15/2028 | |
| | TK Elevator U.S. Newco, Inc., 5.25%, due 7/15/2027 | |
| | | |
|
|
| | | |
| | | |
| | | |
| | Cable One, Inc., 4.00%, due 11/15/2030 | |
See Notes to Financial Statements
Schedule of Investments High Income Bond Fund^ (cont’d)
| |
|
|
|
| | CCO Holdings LLC/CCO Holdings Capital Corp. | |
| | | |
| | | |
| | | |
| | | |
| | | |
| | | |
| | | |
| | | |
| | | |
| | | |
| | | |
| | | |
| | | |
| | | |
| | | |
| | | |
| | | |
| | Diamond Sports Group LLC/Diamond Sports Finance Co., 5.38%, due 8/15/2026 | |
| | | |
| | | |
| | | |
| | | |
| | DISH Network Corp., 11.75%, due 11/15/2027 | |
| | McGraw-Hill Education, Inc. | |
| | | |
| | | |
| | Midcontinent Communications/Midcontinent Finance Corp., 5.38%, due 8/15/2027 | |
| | Radiate Holdco LLC/Radiate Finance, Inc., 6.50%, due 9/15/2028 | |
| | | |
| | | |
| | | |
| | | |
| | | |
| | TEGNA, Inc., 4.75%, due 3/15/2026 | |
| | | |
Metal Fabricate - Hardware 0.1% |
|
| | Advanced Drainage Systems, Inc., 6.38%, due 6/15/2030 | |
|
|
| | Arsenal AIC Parent LLC, 8.00%, due 10/1/2030 | |
| | First Quantum Minerals Ltd. | |
| | | |
| | | |
| | | |
| | FMG Resources August 2006 Pty. Ltd. | |
| | | |
| | | |
| | | |
| | | |
| | | |
See Notes to Financial Statements
Schedule of Investments High Income Bond Fund^ (cont’d)
| |
|
|
|
| | Novelis Corp., 4.75%, due 1/30/2030 | |
| | | |
Miscellaneous Manufacturer 0.4% |
|
| | Amsted Industries, Inc., 5.63%, due 7/1/2027 | |
| | Calderys Financing LLC, 11.25%, due 6/1/2028 | |
| | | |
Office - Business Equipment 0.1% |
|
| | CDW LLC/CDW Finance Corp., 4.25%, due 4/1/2028 | |
|
|
| | Ascent Resources Utica Holdings LLC/ARU Finance Corp. | |
| | | |
| | | |
| | | |
| | Borr IHC Ltd./Borr Finance LLC | |
| | | |
| | | |
| | Callon Petroleum Co., 7.50%, due 6/15/2030 | |
| | Chesapeake Energy Corp., 6.75%, due 4/15/2029 | |
| | | |
| | | |
| | | |
| | | |
| | | |
| | | |
| | | |
| | Diamond Foreign Asset Co./Diamond Finance LLC, 8.50%, due 10/1/2030 | |
| | Hilcorp Energy I LP/Hilcorp Finance Co. | |
| | | |
| | | |
| | | |
| | | |
| | | |
| | | |
| | | |
| | Nabors Industries, Inc., 7.38%, due 5/15/2027 | |
| | | |
| | | |
| | | |
| | Permian Resources Operating LLC | |
| | | |
| | | |
| | | |
| | Rockcliff Energy II LLC, 5.50%, due 10/15/2029 | |
| | Vital Energy, Inc., 10.13%, due 1/15/2028 | |
| | | |
Packaging & Containers 3.4% |
|
| | Ardagh Metal Packaging Finance USA LLC/Ardagh Metal Packaging Finance PLC | |
| | | |
| | | |
See Notes to Financial Statements
Schedule of Investments High Income Bond Fund^ (cont’d)
| |
|
Packaging & Containers – cont'd |
|
| | Ardagh Packaging Finance PLC/Ardagh Holdings USA, Inc. | |
| | | |
| | | |
| | | |
| | | |
| | | |
| | | |
| | | |
| | | |
| | | |
| | Berry Global, Inc., 5.63%, due 7/15/2027 | |
| | Crown Americas LLC/Crown Americas Capital Corp. VI, 4.75%, due 2/1/2026 | |
| | Intelligent Packaging Ltd. Finco, Inc./Intelligent Packaging Ltd. Co.-Issuer LLC, 6.00%, due 9/15/2028 | |
| | Mauser Packaging Solutions Holding Co. | |
| | | |
| | | |
| | Pactiv Evergreen Group Issuer LLC/Pactiv Evergreen Group Issuer, Inc., 4.38%, due 10/15/2028 | |
| | Pactiv Evergreen Group Issuer, Inc./Pactiv Evergreen Group Issuer LLC, 4.00%, due 10/15/2027 | |
| | Sealed Air Corp., 4.00%, due 12/1/2027 | |
| | Sealed Air Corp./Sealed Air Corp. U.S., 6.13%, due 2/1/2028 | |
| | Trident TPI Holdings, Inc., 12.75%, due 12/31/2028 | |
| | Trivium Packaging Finance BV | |
| | | |
| | | |
| | | |
|
|
| | 180 Medical, Inc., 3.88%, due 10/15/2029 | |
| | | |
| | | |
| | | |
| | | |
| | | |
| | Teva Pharmaceutical Finance Netherlands III BV, 7.88%, due 9/15/2029 | |
| | | |
|
|
| | Antero Midstream Partners LP/Antero Midstream Finance Corp. | |
| | | |
| | | |
| | | |
| | | |
| | | |
| | | |
| | CQP Holdco LP/BIP-V Chinook Holdco LLC, 5.50%, due 6/15/2031 | |
| | Crestwood Midstream Partners LP/Crestwood Midstream Finance Corp. | |
| | | |
| | | |
| | DT Midstream, Inc., 4.13%, due 6/15/2029 | |
| | EnLink Midstream LLC, 6.50%, due 9/1/2030 | |
See Notes to Financial Statements
Schedule of Investments High Income Bond Fund^ (cont’d)
| |
|
|
|
| | EQM Midstream Partners LP | |
| | | |
| | | |
| | | |
| | | |
| | | |
| | | |
| | Genesis Energy LP/Genesis Energy Finance Corp. | |
| | | |
| | | |
| | | |
| | | |
| | Harvest Midstream I LP, 7.50%, due 9/1/2028 | |
| | Howard Midstream Energy Partners LLC | |
| | | |
| | | |
| | ITT Holdings LLC, 6.50%, due 8/1/2029 | |
| | Kinetik Holdings LP, 5.88%, due 6/15/2030 | |
| | New Fortress Energy, Inc. | |
| | | |
| | | |
| | NuStar Logistics LP, 6.00%, due 6/1/2026 | |
| | Summit Midstream Holdings LLC/Summit Midstream Finance Corp., 9.00%, due 10/15/2026 | |
| | Tallgrass Energy Partners LP/Tallgrass Energy Finance Corp. | |
| | | |
| | | |
| | | |
| | | |
| | | |
| | Venture Global Calcasieu Pass LLC | |
| | | |
| | | |
| | | |
| | | |
| | | |
| | | |
| | | |
| | | |
|
|
| | Cushman & Wakefield U.S. Borrower LLC, 8.88%, due 9/1/2031 | |
| | Greystar Real Estate Partners LLC, 7.75%, due 9/1/2030 | |
| | Realogy Group LLC/Realogy Co.-Issuer Corp. | |
| | | |
| | | |
| | | |
Real Estate Investment Trusts 4.0% |
|
| | | |
| | | |
| | | |
See Notes to Financial Statements
Schedule of Investments High Income Bond Fund^ (cont’d)
| |
|
Real Estate Investment Trusts – cont'd |
|
| | | |
| | | |
| | | |
| | | |
| | | |
| | | |
| | | |
| | MPT Operating Partnership LP/MPT Finance Corp. | |
| | | |
| | | |
| | Necessity Retail REIT, Inc./American Finance Operating Partner LP, 4.50%, due 9/30/2028 | |
| | Park Intermediate Holdings LLC/PK Domestic Property LLC/PK Finance Co.-Issuer | |
| | | |
| | | |
| | RHP Hotel Properties LP/RHP Finance Corp. | |
| | | |
| | | |
| | RLJ Lodging Trust LP, 4.00%, due 9/15/2029 | |
| | Service Properties Trust, 3.95%, due 1/15/2028 | |
| | Starwood Property Trust, Inc., 3.75%, due 12/31/2024 | |
| | Uniti Group LP/Uniti Group Finance, Inc./CSL Capital LLC, 10.50%, due 2/15/2028 | |
| | VICI Properties LP, 5.13%, due 5/15/2032 | |
| | VICI Properties LP/VICI Note Co., Inc., 4.13%, due 8/15/2030 | |
| | | |
| | | |
| | | |
| | | |
|
|
| | 1011778 BC ULC/New Red Finance, Inc. | |
| | | |
| | | |
| | | |
| | Asbury Automotive Group, Inc., 4.63%, due 11/15/2029 | |
| | | |
| | | |
| | | |
| | Beacon Roofing Supply, Inc., 6.50%, due 8/1/2030 | |
| | Foot Locker, Inc., 4.00%, due 10/1/2029 | |
| | Gap, Inc., 3.63%, due 10/1/2029 | |
| | GYP Holdings III Corp., 4.63%, due 5/1/2029 | |
| | Macy's Retail Holdings LLC | |
| | | |
| | | |
| | | |
| | | |
| | | |
| | NMG Holding Co., Inc./Neiman Marcus Group LLC, 7.13%, due 4/1/2026 | |
| | Penske Automotive Group, Inc., 3.50%, due 9/1/2025 | |
| | PetSmart, Inc./PetSmart Finance Corp. | |
| | | |
| | | |
See Notes to Financial Statements
Schedule of Investments High Income Bond Fund^ (cont’d)
| |
|
|
|
| | | |
| | | |
| | | |
| | Victoria's Secret & Co., 4.63%, due 7/15/2029 | |
| | White Cap Buyer LLC, 6.88%, due 10/15/2028 | |
| | White Cap Parent LLC, 8.25% Cash/9.00% PIK, due 3/15/2026 | |
| | | |
| | | |
| | | |
| | | |
| | | |
|
|
| | Amkor Technology, Inc., 6.63%, due 9/15/2027 | |
| | ON Semiconductor Corp., 3.88%, due 9/1/2028 | |
| | | |
|
|
| | AthenaHealth Group, Inc., 6.50%, due 2/15/2030 | |
| | Central Parent LLC/CDK Global II LLC/CDK Financing Co., Inc., 8.00%, due 6/15/2029 | |
| | Consensus Cloud Solutions, Inc., 6.50%, due 10/15/2028 | |
| | Fair Isaac Corp., 5.25%, due 5/15/2026 | |
| | | |
| | | |
| | | |
| | Rackspace Technology Global, Inc. | |
| | | |
| | | |
| | RingCentral, Inc., 8.50%, due 8/15/2030 | |
| | ZoomInfo Technologies LLC/ZoomInfo Finance Corp., 3.88%, due 2/1/2029 | |
| | | |
|
|
| | Altice France Holding SA, 6.00%, due 2/15/2028 | |
| | | |
| | | |
| | | |
| | Ciena Corp., 4.00%, due 1/31/2030 | |
| | CommScope Technologies LLC, 5.00%, due 3/15/2027 | |
| | | |
| | | |
| | | |
| | Frontier Communications Holdings LLC | |
| | | |
| | | |
| | | |
| | | |
| | | |
| | | |
See Notes to Financial Statements
Schedule of Investments High Income Bond Fund^ (cont’d)
| |
|
Telecommunications – cont'd |
|
| | | |
| | | |
| | | |
| | | |
| | | |
| | Lumen Technologies, Inc., 4.00%, due 2/15/2027 | |
| | Telecom Italia Capital SA | |
| | | |
| | | |
| | U.S. Cellular Corp., 6.70%, due 12/15/2033 | |
| | | |
| | | |
| | | |
| | Vmed O2 U.K. Financing I PLC, 4.75%, due 7/15/2031 | |
| | Zayo Group Holdings, Inc., 4.00%, due 3/1/2027 | |
| | | |
|
|
| | XPO, Inc., 6.25%, due 6/1/2028 | |
|
|
| | AerCap Global Aviation Trust, 6.50%, due 6/15/2045 | |
|
|
| | Solaris Midstream Holdings LLC, 7.63%, due 4/1/2026 | |
Total Corporate Bonds (Cost $675,485,043) | |
|
|
|
|
| | Peraton Corp., Term Loan B, (1 mo. USD Term SOFR + 3.75%), 9.17%, due 2/1/2028 | |
| | TransDigm, Inc., Term Loan I, (3 mo. USD Term SOFR + 3.25%), 8.64%, due 8/24/2028 | |
| | | |
Business Equipment & Services 0.3% |
|
| | AppLovin Corp., Term Loan B, (1 mo. USD Term SOFR + 3.10%), 8.42%, due 10/25/2028 | |
| | Cyxtera DC Holdings, Inc., Term Loan B, (3 mo. USD Term SOFR + 2.00%), 10.25%, due 5/1/2024 | |
| | | |
Chemicals & Plastics 0.1% |
|
| | Ineos U.S. Finance LLC, Term Loan B, (1 mo. USD Term SOFR + 3.50%), 8.92%, due 2/18/2030 | |
Containers & Glass Products 0.2% |
|
| | Trident TPI Holdings, Inc., Term Loan, (3 mo. USD Term SOFR + 4.50%), 9.89%, due 9/15/2028 | |
Diversified Insurance 0.3% |
|
| | Gainwell Acquisition Corp., Term Loan B, (3 mo. USD Term SOFR + 4.00%), 9.49%, due 10/1/2027 | |
Financial Intermediaries 0.2% |
|
| | Starwood Property Trust, Inc., Term Loan B3, (1 mo. USD Term SOFR + 3.25%), 8.67%, due 7/26/2026 | |
|
|
| | Parexel International Corp., Second Lien Term Loan, (1 mo. USD Term SOFR + 6.50%), 11.94%, due 11/15/2029 | |
See Notes to Financial Statements
Schedule of Investments High Income Bond Fund^ (cont’d)
| |
|
|
|
| | Team Health Holdings, Inc., Term Loan B, (1 mo. USD Term SOFR + 5.25%, 3 mo. USD Term SOFR + 5.25%), 10.57% – 10.63%, due 3/2/2027 | |
| | | |
Industrial Equipment 0.2% |
|
| | Engineered Machinery Holdings, Inc., Second Lien Term Loan, (3 mo. USD Term SOFR + 6.00%), 11.65%, due 5/21/2029 | |
Leisure Goods - Activities - Movies 0.2% |
|
| | Carnival Corp., Term Loan B, (1 mo. USD Term SOFR + 3.00%), 8.34%, due 8/8/2027 | |
Life Sciences Tools & Services 0.2% |
|
| | Star Parent, Inc., Term Loan B, (3 mo. USD Term SOFR + 4.00%), 9.39%, due 9/27/2030 | |
Nonferrous Metals - Minerals 0.3% |
|
| | U.S. Silica Co., Term Loan B, (1 mo. USD Term SOFR + 4.75%), 10.17%, due 3/25/2030 | |
|
|
| | Waterbridge Midstream Operating LLC, Term Loan B, (3 mo. USD Term SOFR + 5.75%), 11.39%, due 6/22/2026 | |
Trading Companies & Distributors 0.2% |
|
| | Fastlane Parent Co., Inc., Term Loan B, (1 mo. USD Term SOFR + 4.50%), due 9/29/2028 | |
|
|
| | | |
| | Term Loan B, (3 mo. USD Term SOFR + 5.75%), 11.13%, due 1/29/2027 | |
| | Term Loan C, (3 mo. USD Term SOFR + 5.75%), 11.13%, due 1/29/2027 | |
| | | |
Total Loan Assignments (Cost $30,310,265) | |
|
|
|
|
| | DISH Network Corp., 3.38%, due 8/15/2026 (Cost $1,722,977) | |
|
|
|
Short-Term Investments 1.7% |
Investment Companies 1.7% |
|
| | State Street Institutional U.S. Government Money Market Fund Premier Class, 5.30%(l) (Cost $12,035,904) | |
Total Investments 98.6% (Cost $744,944,789) | |
Other Assets Less Liabilities 1.4% | |
| |
| Securities were purchased under Rule 144A of the Securities Act of 1933, as amended, or are otherwise restricted and, unless registered under the Securities Act of 1933 or exempted from registration, may only be sold to qualified institutional investors or may have other restrictions on resale. At October 31, 2023, these securities amounted to $538,939,965, which represents 76.9% of net assets of the Fund. |
See Notes to Financial Statements
Schedule of Investments High Income Bond Fund^ (cont’d)
| Variable or floating rate security. The interest rate shown was the current rate as of October 31, 2023 and changes periodically. |
| Payment-in-kind (PIK) security. |
| Security issued at a fixed coupon rate, which converts to a variable rate at a future date. Rate shown is the rate in effect as of period end. |
| Perpetual security. Perpetual securities have no stated maturity date, but they may be called/redeemed by the issuer. The date shown reflects the next call date. |
| |
| When-issued security. Total value of all such securities at October 31, 2023 amounted to $2,299,857, which represents 0.3% of net assets of the Fund. |
| Value determined using significant unobservable inputs. |
| The stated interest rates represent the range of rates at October 31, 2023 of the underlying contracts within the Loan Assignment. |
| All or a portion of this security was purchased on a delayed delivery basis. |
| All or a portion of this security had not settled as of October 31, 2023 and thus may not have an interest rate in effect. Interest rates do not take effect until settlement. |
| Represents 7-day effective yield as of October 31, 2023. |
| As of October 31, 2023, the value of unfunded note commitments was $2,385,000 for the Fund (see Note A of the Notes to Financial Statements) |
See Notes to Financial Statements
Schedule of Investments High Income Bond Fund^ (cont’d)
|
| | |
| | |
| | |
| | |
| | |
| | |
| | |
| | |
| | |
| | |
| | |
| | |
| | |
| | |
| | |
| | |
| | |
| | |
| | |
| | |
Short-Term Investments and Other Assets—Net | | |
| | |
See Notes to Financial Statements
Schedule of Investments High Income Bond Fund^ (cont’d)
Derivative Instruments
Total return swap contracts ("total return swaps")
At October 31, 2023, the Fund did not have any open positions in total return swaps.
For the year ended October 31, 2023, the average notional value for the months where the Fund had total return swaps outstanding was $6,240,539 for long positions.
The following is a summary, categorized by Level (see Note A of the Notes to Financial Statements), of inputs used to value the Fund’s investments as of October 31, 2023:
| | | | |
| | | | |
U.S. Treasury Obligations | | | | |
| | | | |
| | | | |
|
|
|
|
|
| | | | |
| | | | |
| | | | |
| | | | |
| | | | |
| | | | |
| | | | |
| The Schedule of Investments provides information on the industry or sector categorization as well as a Positions by Country summary. |
| The following is a reconciliation between the beginning and ending balances of investments in which significant unobservable inputs (Level 3) were used in determining value: |
| Beginning
balance as
of 11/1/2022 | Accrued
discounts/
(premiums) | | Change
in unrealized
appreciation/
(depreciation) | | | | | | Net change in
unrealized
appreciation/
(depreciation)
from
investments
still held as of
10/31/2023 |
Investments in
Securities: | | | | | | | | | | |
| | | | | | | | | | |
| | | | | | | | | | |
(1) Securities categorized as Level 3 were valued using a single quotation obtained from a dealer. The Fund does not have access to significant unobservable inputs and therefore cannot disclose such inputs used in formulating such quotation. |
^
A balance indicated with a "—", reflects either a zero balance or an amount that rounds to less than 1.
See Notes to Financial Statements
Schedule of Investments Municipal High Income Fund^ October 31, 2023
| |
|
|
|
| | Black Belt Energy Gas District (Alabama Gas Prepay Gas Supply Revenue Project No. 5), Series 2020-A-1, 4.00%, due 10/1/2049 Putable 10/1/2026 | |
| | Black Belt Energy Gas District (Alabama Gas Prepay Gas Supply Revenue Project No. 7), Series 2021-C-1, 4.00%, due 12/1/2026 | |
| | Sumter County Industrial Development Authority (Green Bond-Enviva, Inc.), Series 2022, 6.00%, due 7/15/2052 Putable 7/15/2032 | |
| | | |
|
|
| | American Samoa Economic Development Authority General Revenue, Series 2021-A, 5.00%, due 9/1/2038 | |
|
|
| | Maricopa County Industrial Development Authority Education Refunding Revenue (Paradise School Project Paragon Management, Inc.), Series 2016, 5.00%, due 7/1/2036 | |
| | Maricopa County Industrial Development Authority Exempt Facility Revenue (Commercial Metals Co. Project), Series 2022, 4.00%, due 10/15/2047 | |
| | Navajo Nation Refunding Revenue, Series 2015-A, 5.00%, due 12/1/2025 | |
| | Phoenix Industrial Development Authority Education Refunding Revenue (Great Hearts Academies), Series 2016-A, 5.00%, due 7/1/2046 | |
| | Pima County Industrial Development Authority Education Refunding Revenue (American Leadership Academy Project), Series 2015, 5.38%, due 6/15/2035 | |
| | | |
|
|
| | Batesville Public Facilities Board Hospital Revenue Refunding (White River Health System, Inc.), Series 2020, 3.00%, due 6/1/2028 | |
|
|
| | California County Tobacco Securitization Agency Refunding Revenue, Series 2020-B-1, 5.00%, due 6/1/2049 | |
| | California Housing Finance Agency Municipal Certificate | |
| | Series 2019-A, 4.25%, due 1/15/2035 | |
| | Series 2021-1-A, 3.50%, due 11/20/2035 | |
| | California Municipal Finance Authority Charter School Lease Revenue (Santa Rosa Academy Project), Series 2015, 5.13%, due 7/1/2035 | |
| | California Municipal Finance Authority Charter School Revenue (John Adams Academics Project) | |
| | Series 2015-A, 4.50%, due 10/1/2025 | |
| | Series 2019-A, 5.00%, due 10/1/2049 | |
| | California Municipal Finance Authority Charter School Revenue (Palmdale Aerospace Academy Project), Series 2016, 5.00%, due 7/1/2031 | |
| | California Municipal Finance Authority Revenue (Baptist University), Series 2015-A, 5.00%, due 11/1/2030 | |
| | California State Pollution Control Financing Authority Solid Waste Disposal Revenue (Aemerage Redak Services Southern California LLC Project), Series 2016, 7.00%, due 12/1/2027 | |
| | California State Pollution Control Financing Authority Solid Waste Disposal Revenue (Calplant I Green Bond Project), Series 2019, 7.50%, due 12/1/2039 | |
| | California State Pollution Control Financing Authority Solid Waste Disposal Revenue (Green Bond-Rialto Bioenergy Facility LLC Project), Series 2019, 7.50%, due 12/1/2040 | |
| | California State School Finance Authority Charter School Revenue (Downtown College Prep-Obligation Group), Series 2016, 4.75%, due 6/1/2036 | |
| | California State School Finance Authority Charter School Revenue (Rocketship Education), Series 2016-A, 5.00%, due 6/1/2031 | |
See Notes to Financial Statements
Schedule of Investments Municipal High Income Fund^ (cont’d)
| |
|
|
| | California Statewide Communities Development Authority Revenue Refunding (Lancer Education Student Housing Project), Series 2016-A, 5.00%, due 6/1/2036 | |
| | California Statewide Communities Development Authority Special Tax Revenue Refunding (Community Facility District No. 2007-01 Orinda Wilder Project), Series 2015, 4.50%, due 9/1/2025 | |
| | Chino Valley Unified School District General Obligation, Series 2020-B, (AGM Insured), 3.38%, due 8/1/2050 | |
| | | |
|
|
| | Colorado Educational & Cultural Facilities Authority Revenue (National Jewish Federation Bond Program), (LOC: TD Bank N.A.), Series 2011, 3.95%, due 7/1/2041 | |
| | Crystal Crossing Metropolitan District Refunding General Obligation, Series 2016, 4.50%, due 12/1/2026 | |
| | Littleton Village Metropolitan District No. 2 Refunding General Obligation, Series 2015, 5.38%, due 12/1/2045 | |
| | Park Creek Metropolitan District Refunding Tax Allocation Revenue (Senior Ltd. Property Tax Supported) | |
| | Series 2015-A, 5.00%, due 12/1/2034 | |
| | Series 2015-A, 5.00%, due 12/1/2035 | |
| | Series 2015-A, 5.00%, due 12/1/2045 | |
| | Platte River Metropolitan District General Obligation Refunding, Series 2023-A, 6.50%, due 8/1/2053 | |
| | Pueblo Urban Renewal Authority Tax Increment Revenue (Evraz Project), Series 2021-A, 4.75%, due 12/1/2045 | |
| | | |
|
|
| | Capital Trust Agency Senior Living Revenue (H-Bay Ministries, Inc. Superior Residences-Third Tier), Series 2018-C, 7.50%, due 7/1/2053 | |
| | Capital Trust Agency Senior Living Revenue (Wonderful Foundations School Project), Series 2020-A-1, 5.00%, due 1/1/2055 | |
| | Florida Development Finance Corp. Education Facilities Revenue Refunding (Pepin Academies, Inc.), Series 2016-A, 5.00%, due 7/1/2036 | |
| | Florida State Development Finance Corp. Education Facilities Revenue (Renaissance Charter School, Inc. Project), Series 2015-A, 6.00%, due 6/15/2035 | |
| | Florida State Housing Finance Corp. Revenue, Series 2015-1, (GNMA/FNMA/FHLMC Insured), 3.75%, due 7/1/2035 | |
| | Village Community Development District No. 13 Special Assessment Revenue, Series 2019, 3.70%, due 5/1/2050 | |
| | | |
|
|
| | Main Street Natural Gas, Inc. Gas Supply Revenue | |
| | Series 2022-C, 4.00%, due 8/1/2052 Putable 11/1/2027 | |
| | Series 2023-C, 5.00%, due 9/1/2053 Putable 9/1/2030 | |
| | Municipal Electric Authority of Georgia Revenue (Plant Vogtle Units 3 & 4 Project M Bonds), Series 2023-A, 5.50%, due 7/1/2064 | |
| | | |
|
|
| | Guam Power Authority Revenue, Series 2022-A, 5.00%, due 10/1/2034 | |
|
|
| | Hawaii State Department of Budget & Finance Special Purpose Revenue Refunding, Series 2015-A, 5.00%, due 1/1/2035 | |
See Notes to Financial Statements
Schedule of Investments Municipal High Income Fund^ (cont’d)
| |
|
|
| | Chicago General Obligation | |
| | Series 2019-A, 5.00%, due 1/1/2044 | |
| | Series 2019-A, 5.50%, due 1/1/2049 | |
| | Series 2023-A, 5.50%, due 1/1/2043 | |
| | Chicago O'Hare International Airport Special Facility Revenue (Trips Obligated Group), Series 2018, 5.00%, due 7/1/2048 | |
| | Chicago Waterworks Revenue (Second Lien Project), Series 2014, 5.00%, due 11/1/2027 | |
| | Illinois Finance Authority Charter School Revenue (Intrinsic School-Belmont School Project), Series 2015-A, 5.75%, due 12/1/2035 | |
| | Illinois Finance Authority Revenue Refunding (Rosalind Franklin University of Medicine & Science), Series 2017-A, 5.00%, due 8/1/2047 | |
| | Illinois State General Obligation, Series 2021-A, 5.00%, due 3/1/2046 | |
| | Upper Illinois River Valley Development Authority Revenue Refunding (Cambridge Lakes Learning Center), Series 2017-A, 5.25%, due 12/1/2047 | |
| | | |
|
|
| | Indiana State Finance Authority Revenue (Greencroft Obligation Group), Series 2021-A, 4.00%, due 11/15/2043 | |
|
|
| | Goddard Kansas Sales Tax Special Obligation Revenue (Olympic Park Star Bond Project), Series 2019, 3.60%, due 6/1/2030 | |
|
|
| | Kentucky Economic Development Finance Authority (Senior Next Generation Information Highway Project), Series 2015-A, 4.00%, due 7/1/2029 | |
| | Kentucky Economic Development Finance Authority Revenue Refunding (Owensboro Health), Series 2017-A, 5.00%, due 6/1/2041 | |
| | Kentucky Municipal Power Agency Power System Revenue Refunding (Prairie Saint Project), Series 2019, 4.00%, due 9/1/2045 | |
| | Kentucky State Public Energy Authority Gas Supply Revenue, Series 2018-A, 4.00%, due 4/1/2048 Putable 4/1/2024 | |
| | | |
|
|
| | Louisiana Local Government Environmental Facilities & Community Development Authority Revenue (Lafourche Parish Gomesa Project), Series 2019, 3.95%, due 11/1/2043 | |
| | Louisiana Local Government Environmental Facilities & Community Development Authority Revenue Refunding (Westside Habilitation Center Project), Series 2017-A, 5.75%, due 2/1/2032 | |
| | | |
|
|
| | Maine State Finance Authority (Green Bond-Go Lab Madison LLC Project), Series 2021, 8.00%, due 12/1/2051 | |
| | Maine State Finance Authority Solid Waste Disposal Revenue (Casella Waste System Project), Series 2015, 5.13%, due 8/1/2035 Putable 8/1/2025 | |
| | | |
|
|
| | Baltimore Special Obligation Refunding Revenue Senior Lien (Harbor Point Project) | |
| | Series 2019-A, 3.63%, due 6/1/2046 | |
| | Series 2022, 5.00%, due 6/1/2051 | |
| | | |
See Notes to Financial Statements
Schedule of Investments Municipal High Income Fund^ (cont’d)
| |
|
|
| | Massachusetts State Education Financing Authority Revenue | |
| | Series 2023-B, 4.25%, due 7/1/2044 | |
| | Series 2023-C, 5.00%, due 7/1/2053 | |
| | | |
|
|
| | Detroit Social Bonds General Obligation, Series 2021-A, 4.00%, due 4/1/2042 | |
| | Michigan State Strategic Fund Ltd. Obligation Revenue (Green Bond-Recycled Board Machine Project), Series 2021, 4.00%, due 10/1/2061 Putable 10/1/2026 | |
| | | |
|
|
| | Saint Paul Housing & Redevelopment Authority Charter School Lease Revenue (Academia Cesar Chavez School Project), Series 2015-A, 5.25%, due 7/1/2050 | |
| | Saint Paul Housing & Redevelopment Authority Charter School Lease Revenue (Twin Cities Academy Project), Series 2015-A, 5.00%, due 7/1/2035 | |
| | | |
|
|
| | Mississippi Development Bank Special Obligation (Jackson Co. Gomesa Project), Series 2021, 3.63%, due 11/1/2036 | |
|
|
| | Missouri State Health & Educational Facilities Authority Revenue (Mercy Health), Series 2020, 4.00%, due 6/1/2053 | |
|
|
| | Gallatin County Industrial Development Revenue (Bozeman Fiber Project), Series 2021-A, 4.00%, due 10/15/2051 | |
|
|
| | Director of the State of Nevada Department of Business & Industrial Revenue (Somerset Academy), Series 2015-A, 5.13%, due 12/15/2045 | |
|
|
| | New Hampshire Business Finance Authority Revenue (Green Bond), Series 2020-B, 3.75%, due 7/1/2045 Putable 7/2/2040 | |
|
|
| | New Jersey Transportation Trust Fund Authority Revenue Refunding, Series 2023-AA, 4.25%, due 6/15/2044 | |
|
|
| | Winrock Town Center Tax Increment Development District No. 1 (Senior Lien), Series 2022, 4.25%, due 5/1/2040 | |
|
|
| | Metropolitan Transportation Authority Revenue Refunding, (LOC: Barclays Bank PLC), Series 2012-G-1, 4.00%, due 11/1/2032 | |
| | Nassau County Industrial Development Agency Revenue Refunding (Cold Spring), (LOC: TD Bank N.A.), Series 1999, 3.85%, due 1/1/2034 | |
| | New York State Transportation Development Corp. Special Facility Revenue (Delta Airlines, Inc.-LaGuardia Airport Terminal C & D Redevelopment) | |
| | Series 2018, 5.00%, due 1/1/2028 | |
| | Series 2020, 4.38%, due 10/1/2045 | |
| | New York State Transportation Development Corp. Special Facility Revenue Refunding (American Airlines, Inc., John F. Kennedy International Airport Project), Series 2021, 3.00%, due 8/1/2031 | |
See Notes to Financial Statements
Schedule of Investments Municipal High Income Fund^ (cont’d)
| |
|
|
| | Suffolk Tobacco Asset Securitization Corp. Refunding (Tobacco Settle Asset Backed Subordinated Bonds), Series 2021-B1, 4.00%, due 6/1/2050 | |
| | Westchester County Local Development Corp. Revenue (Purchase Senior Learning Community, Inc. Project), Series 2021-A, 5.00%, due 7/1/2056 | |
| | Westchester County Local Development Corp. Revenue Refunding (Kendal on Hudson Project), Series 2022-B, 5.00%, due 1/1/2051 | |
| | Yonkers Economic Development Corp. Education Revenue (Charter School of Education Excellence Project), Series 2019-A, 5.00%, due 10/15/2039 | |
| | | |
|
|
| | Akron Bath Copley Joint Township Hospital District (Summa Health Systems Obligation), Series 2020, 4.00%, due 11/15/2035 | |
| | Cleveland-Cuyahoga County Port Authority Tax Increment Finance Revenue Refunding (Senior-Flats East Bank Project), Series 2021-A, 4.00%, due 12/1/2055 | |
| | Ohio State Air Quality Development Authority (Ohio Valley Electric Corp. Project), Series 2009-B, 1.38%, due 2/1/2026 Putable 11/1/2024 | |
| | Ohio State Air Quality Development Authority Exempt Facilities Revenue (AMG Vanadium LLC), Series 2019, 5.00%, due 7/1/2049 | |
| | Ohio State Air Quality Development Authority Revenue (Ohio Valley Electric Corp. Project), Series 2014-B, 2.60%, due 6/1/2041 Putable 10/1/2029 | |
| | Ohio State Air Quality Development Authority Revenue Refunding (Ohio Valley Electric Corp. Project), Series 2019-A, 3.25%, due 9/1/2029 | |
| | Southern Ohio Port Exempt Facility Authority Revenue (PureCycle Project), Series 2020-A, 7.00%, due 12/1/2042 | |
| | | |
|
|
| | Portland General Obligation (Transportation Project), Series 2022-A, 2.25%, due 10/1/2041 | |
| | Yamhill County Hospital Authority Refunding Revenue (Friends View), Series 2021-A, 5.00%, due 11/15/2051 | |
| | | |
|
|
| | Pennsylvania Economic Development Financing Authority Revenue (Bridges Finco LP), Series 2016, 5.00%, due 12/31/2038 | |
| | Pennsylvania Economic Development Financing Authority Revenue Refunding (Tapestry Moon Senior Housing Project), Series 2018-A, 6.75%, due 12/1/2053 | |
| | | |
|
|
| | Puerto Rico Commonwealth General Obligation (Restructured) | |
| | Series 2021-A, 0.00%, due 7/1/2024 | |
| | Series 2021-A, 0.00%, due 7/1/2033 | |
| | Series 2021-A1, 5.38%, due 7/1/2025 | |
| | Series 2021-A1, 5.63%, due 7/1/2027 | |
| | Series 2021-A1, 5.63%, due 7/1/2029 | |
| | Series 2021-A1, 5.75%, due 7/1/2031 | |
| | Series 2021-A1, 4.00%, due 7/1/2033 | |
| | Series 2021-A1, 4.00%, due 7/1/2035 | |
| | Series 2021-A1, 4.00%, due 7/1/2037 | |
| | Series 2021-A1, 4.00%, due 7/1/2041 | |
| | Series 2021-A1, 4.00%, due 7/1/2046 | |
See Notes to Financial Statements
Schedule of Investments Municipal High Income Fund^ (cont’d)
| |
|
|
| | Puerto Rico Electric Power Authority Power Revenue | |
| | Series 2010-XX, 5.25%, due 7/1/2035 | |
| | Series 2012-A, 5.00%, due 7/1/2042 | |
| | Puerto Rico Industrial Tourist Education Medical & Environmental Control Facilities Authority Revenue (Hospital Auxilio Mutuo Obligation Group Project) | |
| | Series 2021, 5.00%, due 7/1/2030 | |
| | Series 2021, 5.00%, due 7/1/2034 | |
| | | |
|
|
| | Lancaster County Assessment Revenue Refunding (Walnut Creek Improvement District), Series 2016-A-1, 5.00%, due 12/1/2031 | |
| | South Carolina Jobs Economic Development Authority Economic Development Revenue (River Park Senior Living Project), Series 2017-A, 7.75%, due 10/1/2057 | |
| | South Carolina Jobs Economic Development Authority Solid Waste Disposal Revenue (AMT-Green Bond-Last Step Recycling LLC Project), Series 2021-A, 6.50%, due 6/1/2051 | |
| | South Carolina Jobs Economic Development Authority Solid Waste Disposal Revenue (Green Bond-Jasper Pellets LLC Project), Series 2018-A, 7.00%, due 11/1/2038 | |
| | South Carolina Jobs Economic Development Authority Solid Waste Disposal Revenue (RePower South Berkeley LLC Project), Series 2017, 6.25%, due 2/1/2045 | |
| | | |
|
|
| | Metropolitan Government Nashville & Davidson County Health & Educational Facilities Board Revenue (Blakeford At Green Hills), Series 2020-A, 4.00%, due 11/1/2045 | |
|
|
| | Anson Educational Facilities Corp. Educational Revenue (Arlington Classics Academy), Series 2016-A, 5.00%, due 8/15/2045 | |
| | Dallas Independent School District General Obligation, Series 2022, (PSF-GTD Insured), 2.75%, due 2/15/2052 | |
| | Fort Bend County Industrial Development Corp. Revenue (NRG Energy, Inc.), Series 2012-A, 4.75%, due 5/1/2038 | |
| | Hale Center Education Facilities Corp. Revenue Refunding (Wayland Baptist University Project), Series 2022, 5.00%, due 3/1/2033 | |
| | Harris County Municipal Utility District No. 489 General Obligation, Series 2023, (AGM Insured), 4.00%, due 9/1/2036 | |
| | Hidalgo County Regional Mobility Authority Toll & Vehicle Registration Junior Lien Refunding | |
| | Series 2022-B, 4.00%, due 12/1/2037 | |
| | Series 2022-B, 4.00%, due 12/1/2039 | |
| | Series 2022-B, 4.00%, due 12/1/2040 | |
| | Houston Airport System Revenue (United Airlines, Inc. Terminal Improvement Project) | |
| | Series 2015-B-1, 5.00%, due 7/15/2030 | |
| | Series 2021-B-1, 4.00%, due 7/15/2041 | |
| | New Hope Cultural Education Facilities Finance Corp. Revenue (Beta Academy), Series 2019-A, 5.00%, due 8/15/2049 | |
| | New Hope Cultural Education Facilities Finance Corp. Senior Living Revenue (Cardinal Bay, Inc. Village On The Park Carriage), Series 2016-C, 5.50%, due 7/1/2046 | |
| | New Hope Cultural Education Facilities Finance Corp. Student Housing Revenue (NCCD-College Station Properties LLC), Series 2015-A, 5.00%, due 7/1/2047 | |
| | Port Beaumont Navigation District Dock & Wharf Facility Revenue Refunding (Jefferson Gulf Coast Energy Project), Series 2020-A, 3.63%, due 1/1/2035 | |
| | Texas State Private Activity Bond Surface Transportation Corp. Revenue (Senior Lien-Blueridge Transportation Group LLC), Series 2016, 5.00%, due 12/31/2040 | |
See Notes to Financial Statements
Schedule of Investments Municipal High Income Fund^ (cont’d)
| |
|
|
| | Texas State Private Activity Bond Surface Transportation Corp. Senior Lien Revenue Refunding (Senior North Tarrant Express Managed Lanes Project), Series 2019-A, 5.00%, due 12/31/2030 | |
| | | |
|
|
| | Utah Infrastructure Agency Telecommunication Revenue | |
| | Series 2019-A, 4.00%, due 10/15/2036 | |
| | Series 2021-A, 3.00%, due 10/15/2045 | |
| | | |
|
|
| | Vermont Economic Development Authority Solid Waste Disposal Revenue (Casella Waste System, Inc.), Series 2013, 4.63%, due 4/1/2036 Putable 4/3/2028 | |
| | Vermont Student Assistant Corp. Education Loan Revenue, Series 2015-A, 4.13%, due 6/15/2028 | |
| | | |
|
|
| | West Virginia Hospital Finance Authority Revenue (Vandalia Health Group) | |
| | Series 2023-B, 6.00%, due 9/1/2053 | |
| | Series 2023-B, (AGM Insured), 5.38%, due 9/1/2053 | |
| | | |
|
|
| | Public Finance Authority Education Revenue (Resh Triangle High School Project), Series 2015-A, 5.38%, due 7/1/2035 | |
| | Public Finance Authority Hospital Revenue (Carson Valley Medical Center), Series 2021-A, 4.00%, due 12/1/2051 | |
| | Public Finance Authority Revenue (Goodwill Industries of Southern Nevada Project), Series 2015-A, 5.50%, due 12/1/2038 | |
| | Public Finance Authority Revenue Refunding (Celanese Project), Series 2016-C, 4.30%, due 11/1/2030 | |
| | Public Finance Authority Special Facility Revenue (Sky Harbour Capital LLC Aviation Facility Project), Series 2021, 4.00%, due 7/1/2041 | |
| | Saint Croix Chippewa Indians of Wisconsin Refunding, Series 2021, 5.00%, due 9/30/2041 | |
| | | |
Total Investments 99.0% (Cost $76,767,721) | |
Other Assets Less Liabilities 1.0% | |
| |
| Securities were purchased under Rule 144A of the Securities Act of 1933, as amended, or are otherwise restricted and, unless registered under the Securities Act of 1933 or exempted from registration, may only be sold to qualified institutional investors or may have other restrictions on resale. At October 31, 2023, these securities amounted to $18,581,632, which represents 29.2% of net assets of the Fund. |
| |
| Variable rate demand obligation where the stated interest rate is not based on a published reference rate and spread. Rather, the interest rate generally resets daily or weekly and is determined by the remarketing agent. The rate shown represents the rate in effect at October 31, 2023. |
| When-issued security. Total value of all such securities at October 31, 2023 amounted to $280,943, which represents 0.4% of net assets of the Fund. |
| Value determined using significant unobservable inputs. |
See Notes to Financial Statements
Schedule of Investments Municipal High Income Fund^ (cont’d)
| Security fair valued as of October 31, 2023 in accordance with procedures approved by the valuation designee. Total value of all such securities at October 31, 2023 amounted to $87,450, which represents 0.1% of net assets of the Fund. |
#
This security has been deemed by Management to be illiquid, and is subject to restrictions on resale. Total value of all such securities at October 31, 2023 amounted to $87,450, which represents 0.1% of net assets of the Fund. Acquisition dates shown with a range, if any, represent securities that were acquired over the period shown in the table.
| | | | Fair Value
Percentage
of Net Assets
as of
10/31/2023 |
South Carolina Jobs Economic Development Authority Solid Waste Disposal Revenue (Green Bond-Jasper Pellets LLC Project) | | | | |
See Notes to Financial Statements
Schedule of Investments Municipal High Income Fund^ (cont’d)
The following is a summary, categorized by Level (see Note A of the Notes to Financial Statements), of inputs used to value the Fund’s investments as of October 31, 2023:
| The Schedule of Investments provides information on the state/territory categorization. |
| The following is a reconciliation between the beginning and ending balances of investments in which significant unobservable inputs (Level 3) were used in determining value: |
| Beginning
balance as
of 11/1/2022 | Accrued
discounts/
(premiums) | | Change
in unrealized
appreciation/
(depreciation) | | | | | | Net change in
unrealized
appreciation/
(depreciation)
from
investments
still held as of
10/31/2023 |
Investments in
Securities: | | | | | | | | | | |
| | | | | | | | | | |
| | | | | | | | | | |
(1) Quantitative Information about Level 3 Fair Value Measurements: |
| | | Significant unobservable
input(s) | | | Impact to
valuation
from
increase
in input(b) |
| | | Recovery Value (of Par Value) | | | |
(a) The weighted averages disclosed in the table above were weighted by relative fair value. |
(b) Represents the expected directional change in the fair value of the Level 3 investments that would result from an increase or decrease in the corresponding input. Significant changes in these inputs could result in significantly higher or lower fair value measurements. |
^
A balance indicated with a "—", reflects either a zero balance or an amount that rounds to less than 1.
See Notes to Financial Statements
Schedule of Investments Municipal Impact Fund^ October 31, 2023
| |
|
|
|
| | Fort Payne City General Obligation (School Warrants), Series 2018-B, (AGM Insured), 5.00%, due 5/1/2027 | |
|
|
| | Benton Washington Regional Public Water Authority Revenue Green Bond, Series 2022, (BAM Insured), 4.00%, due 10/1/2033 | |
| | Pulaski County Revenue (Arkansas Children's Hospital), Series 2023, 5.25%, due 3/1/2053 | |
| | Russellville Water & Sewer Revenue, Series 2018, (AGM Insured), 4.00%, due 7/1/2028 | |
| | | |
|
|
| | Glendale Water Revenue Refunding, Series 2020, 2.00%, due 2/1/2033 | |
| | San Diego Association of Governments Capital Grant Receipts Revenue (Green Bond Mid-Coast Corridor Transit Project), Series 2019-A, 5.00%, due 11/15/2024 | |
| | | |
|
|
| | Pueblo Urban Renewal Authority Tax Increment Revenue (Evraz Project), Series 2021-A, 4.75%, due 12/1/2045 | |
| | University of Colorado Enterprise System Revenue Refunding (University Enterprise Green Bond), Series 2021-C-3A, 2.00%, due 6/1/2051 Putable 10/15/2026 | |
| | | |
District of Columbia 0.7% |
|
| | District of Columbia Revenue Refunding (Gallaudet University), Series 2021-A, 5.00%, due 4/1/2051 | |
|
|
| | Miami-Dade County (Building Better Community Program), Series 2015-D, 5.00%, due 7/1/2026 | |
|
|
| | Metropolitan Atlanta Rapid Transit Authority Sales Tax Revenue Refunding, Series 2016-B, 5.00%, due 7/1/2035 | |
|
|
| | Cook County Community Consolidated School District No. 21 General Obligation (Wheeling School Building), Series 2019-A, (AGM Insured), 4.00%, due 12/1/2035 | |
| | Illinois State General Obligation | |
| | Series 2016, 4.00%, due 1/1/2031 | |
| | Series 2023-B, 5.00%, due 5/1/2028 | |
| | Series 2023-B, 5.00%, due 5/1/2036 | |
| | Sales Tax Securitization Corp. Senior Lien Revenue Refunding (Social Bonds) | |
| | Series 2023-A, 5.00%, due 1/1/2033 | |
| | Series 2023-A, 4.00%, due 1/1/2042 | |
| | | |
|
|
| | Anderson School Building Corp. (First Mortgage) | |
| | Series 2018, 5.00%, due 1/15/2024 | |
| | Series 2018, 5.00%, due 1/15/2026 | |
| | Indiana Finance Authority Revenue (Indiana University Health), Series 2023-A, 5.00%, due 10/1/2053 | |
| | West Central Conservancy District Savage Revenue Refunding, Series 2021, 4.00%, due 7/1/2029 | |
| | | |
See Notes to Financial Statements
Schedule of Investments Municipal Impact Fund^ (cont’d)
| |
|
|
| | Breathitt County School District Finance Corp. Revenue | |
| | Series 2021, 2.00%, due 4/1/2027 | |
| | Series 2021, 2.00%, due 4/1/2029 | |
| | Daviess County School District Finance Corp. Revenue | |
| | Series 2021-A, 5.00%, due 12/1/2027 | |
| | Series 2021-A, 2.00%, due 12/1/2031 | |
| | Green County School District Finance Corp. | |
| | Series 2021, 2.00%, due 10/1/2024 | |
| | Series 2021, 2.00%, due 10/1/2025 | |
| | Series 2021, 2.00%, due 10/1/2026 | |
| | Kentucky Economic Development Finance Authority Revenue Refunding (Owensboro Health), Series 2017-A, 5.00%, due 6/1/2041 | |
| | Lewis County School District Finance Corp. Revenue | |
| | Series 2021-B, 2.00%, due 8/1/2024 | |
| | Series 2021-B, 2.00%, due 8/1/2025 | |
| | Logan-Todd Regional Water Commission Revenue Refunding, Series 2016-A, (AGM Insured), 5.00%, due 7/1/2028 | |
| | | |
|
|
| | Louisiana Public Facilities Authority Revenue Refunding (Hurricane Recovery Program), Series 2014, 5.00%, due 6/1/2024 | |
| | Natchitoches Parish School District No. 9 General Obligation | |
| | Series 2018, (AGM Insured), 5.00%, due 3/1/2027 | |
| | Series 2018, (AGM Insured), 5.00%, due 3/1/2028 | |
| | | |
|
|
| | Maine State Finance Authority (Green Bond-Go Lab Madison LLC Project), Series 2021, 8.00%, due 12/1/2051 | |
|
|
| | Dearborn General Obligation (Sewer), Series 2018, 4.00%, due 4/1/2033 | |
| | Detroit General Obligation | |
| | Series 2021-A, 4.00%, due 4/1/2040 | |
| | Series 2023-C, 6.00%, due 5/1/2043 | |
| | Fowlerville Community School District Refunding General Obligation | |
| | Series 2022, 3.00%, due 5/1/2029 | |
| | Series 2022, 4.00%, due 5/1/2033 | |
| | Kent Hospital Finance Authority Revenue (Mary Free Bed Rehabilitation Hospital) | |
| | Series 2021-A, 5.00%, due 4/1/2028 | |
| | Series 2021-A, 4.00%, due 4/1/2033 | |
| | Livonia Public School District General Obligation, Series 2016, (AGM Insured), 5.00%, due 5/1/2028 | |
| | Michigan State Housing Development Authority Revenue (Non Ace), Series 2016-B, 2.50%, due 12/1/2026 | |
| | Michigan State Housing Development Authority Revenue Refunding, Series 2018-B, 3.15%, due 4/1/2028 | |
| | Michigan State Housing Development Authority Single Family Mortgage Revenue (Non Ace), Series 2018-C, 2.90%, due 12/1/2024 | |
| | Michigan State Strategic Fund Ltd. Obligation Revenue (Green Bond-Recycled Board Machine Project), Series 2021, 4.00%, due 10/1/2061 Putable 10/1/2026 | |
See Notes to Financial Statements
Schedule of Investments Municipal Impact Fund^ (cont’d)
| |
|
|
| | Trenton Public School District General Obligation (School Building & Site) | |
| | Series 2018-B, 5.00%, due 5/1/2036 | |
| | Series 2018-B, 5.00%, due 5/1/2039 | |
| | | |
|
|
| | Duluth Economic Development Authority Revenue Refunding (Saint Luke's Hospital of Duluth) | |
| | Series 2022-A, 5.00%, due 6/15/2027 | |
| | Series 2022-A, 5.00%, due 6/15/2028 | |
| | Minnesota Rural Water Finance Authority (Public Project Construction Notes), Series 2022, 2.63%, due 12/1/2023 | |
| | Saint Paul Housing & Redevelopment Authority Charter School Lease Revenue (Metro Deaf School Project), Series 2018-A, 5.00%, due 6/15/2038 | |
| | | |
|
|
| | Bi-State Development Agency of the Missouri-Illinois Metropolitan District Revenue Refunding (Combined Lien Mass Transit Sales Tax Appropriation), Series 2019, 4.00%, due 10/1/2036 | |
| | Saint Louis School District General Obligation, Series 2023, (AGM Insured), 5.00%, due 4/1/2039 | |
| | | |
|
|
| | New Jersey State Economic Development Authority Revenue (Social Bonds), Series 2021-QQQ, 5.00%, due 6/15/2025 | |
| | New Jersey State Housing & Mortgage Finance Agency Multi-Family Revenue Refunding, Series 2017-A, 2.60%, due 11/1/2024 | |
| | New Jersey State Transportation Trust Fund Authority Revenue Refunding, Series 2021-A, 5.00%, due 6/15/2031 | |
| | Newark Board of Education General Obligation (Sustainability Bonds), Series 2021, (BAM Insured), 3.00%, due 7/15/2038 | |
| | | |
|
|
| | Buffalo Sewer Authority Environmental Impact Revenue (Green Bond), Series 2021, 1.75%, due 6/15/2049 | |
| | Build NYC Resource Corp. Revenue (New Dawn Charter School Project), Series 2019, 5.75%, due 2/1/2049 | |
| | Metropolitan Transportation Authority Revenue | |
| | (LOC: Barclays Bank PLC), Series 2015-E-1, 4.00%, due 11/15/2050 | |
| | Series 2016-B, 5.00%, due 11/15/2025 | |
| | Metropolitan Transportation Authority Revenue Refunding, (LOC: Barclays Bank PLC), Series 2012-G-1, 4.00%, due 11/1/2032 | |
| | Nassau County Industrial Development Agency Revenue Refunding (Cold Spring), (LOC: TD Bank N.A.), Series 1999, 3.85%, due 1/1/2034 | |
| | Nassau County Local Economic Assistance Corp. Revenue (Catholic Health Services of Long Island Obligated Group Project), Series 2014, 5.00%, due 7/1/2027 | |
| | New York City Housing Development Corp. Multi-Family Housing Revenue (Sustainable Development Bonds) | |
| | Series 2020-A, 1.13%, due 5/1/2060 Putable 11/1/2024 | |
| | Series 2021-F-1, 1.05%, due 5/1/2028 | |
| | Series 2021-F-1, 1.25%, due 5/1/2029 | |
| | New York City Housing Development Corp. Revenue, Series 2020-C, (HUD Section 8, Fannie Mae Insured), 2.15%, due 8/1/2035 | |
| | New York State Dormitory Authority Revenue (Financing Program), Series 2023-A, (AGM Insured), 5.00%, due 10/1/2036 | |
See Notes to Financial Statements
Schedule of Investments Municipal Impact Fund^ (cont’d)
| |
|
|
| | New York State Housing Finance Agency Revenue (Climate Bond Certified/ Sustainability Bonds), Series 2019-P, 1.55%, due 11/1/2023 | |
| | New York State Housing Finance Agency Revenue (Sustainability Bonds), Series 2021-G, (SONYMA Insured), 2.60%, due 11/1/2046 | |
| | New York State Power Authority Revenue (Green Transmission Project-Green Bond), Series 2022-A, (AGM Insured), 5.00%, due 11/15/2024 | |
| | | |
|
|
| | North Carolina Housing Finance Agency Homeownership Refunding Revenue, Series 2020-45, (GNMA/FNMA/FHLMC Insured), 2.20%, due 7/1/2040 | |
| | Scotland County Revenue, Series 2018, 5.00%, due 12/1/2026 | |
| | | |
|
|
| | Cass County Joint Water Resource District, Series 2021-A, 0.48%, due 5/1/2024 | |
| | Larimore General Obligation, Series 2021, 0.85%, due 5/1/2024 | |
| | | |
|
|
| | Akron Bath Copley Joint Township Hospital District (Summa Health Systems Obligation), Series 2020, 4.00%, due 11/15/2036 | |
| | American Municipal Power Ohio, Inc. Revenue (Combined Hydroelectric Project), Series 2021-A-2, 1.00%, due 2/15/2048 Putable 8/15/2024 | |
| | Cuyahoga Metropolitan Housing Authority Revenue, Series 2021, (2045 Initiative Project), 2.00%, due 12/1/2031 | |
| | Ohio State Air Quality Development Authority Exempt Facilities Revenue (AMG Vanadium LLC), Series 2019, 5.00%, due 7/1/2049 | |
| | Southern Ohio Port Exempt Facility Authority Revenue (PureCycle Project), Series 2020-A, 7.00%, due 12/1/2042 | |
| | | |
|
|
| | Johnston County Educational Facility Authority Lease Revenue (Tishomingo Public School Project), Series 2022, 4.00%, due 9/1/2030 | |
| | Lincoln County Education Facility Authority Education Facilities Lease Revenue (Stroud Public School Project), Series 2016, 5.00%, due 9/1/2027 | |
| | | |
|
|
| | Allegheny County Sanitary Authority Revenue | |
| | Series 2018, 5.00%, due 6/1/2030 | |
| | Series 2018, 5.00%, due 6/1/2032 | |
| | Pennsylvania State Housing Finance Agency Single Family Mortgage Revenue | |
| | Series 2018-127B, 2.85%, due 4/1/2026 | |
| | Series 2019-131A, 1.75%, due 4/1/2025 | |
| | | |
|
|
| | Puerto Rico Industrial Tourist Education Medical & Environmental Control Facilities Authority Revenue (Hospital Auxilio Mutuo Obligation Group Project) | |
| | Series 2021, 5.00%, due 7/1/2035 | |
| | Series 2021, 4.00%, due 7/1/2036 | |
| | Series 2021, 4.00%, due 7/1/2038 | |
| | | |
See Notes to Financial Statements
Schedule of Investments Municipal Impact Fund^ (cont’d)
| |
|
|
| | Dillon County School Facility Corp. Certificate of Participation Refunding | |
| | Series 2020, 5.00%, due 12/1/2026 | |
| | Series 2020, 5.00%, due 12/1/2027 | |
| | South Carolina Jobs Economic Development Authority Solid Waste Disposal Revenue (AMT-Green Bond-Last Step Recycling LLC Project), Series 2021-A, 6.50%, due 6/1/2051 | |
| | South Carolina Jobs Economic Development Authority Solid Waste Disposal Revenue (Green Bond-Jasper Pellets LLC Project), Series 2018-A, 7.00%, due 11/1/2038 | |
| | | |
|
|
| | Tennessee Housing Development Agency Residential Finance Program Revenue | |
| | Series 2019, 3.25%, due 7/1/2032 | |
| | Series 2021, 1.80%, due 1/1/2031 | |
| | | |
|
|
| | Anna Independent School District General Obligation, Series 2023, (PSF-GTD Insured)), 4.13%, due 2/15/2053 | |
| | Hidalgo County Regional Mobility Authority Revenue Toll & Vehicle Registration Junior Lien Refunding, Series 2022-B, 4.00%, due 12/1/2038 | |
| | New Caney Independent School District, Series 2018, (PSF-GTD Insured), 1.25%, due 2/15/2050 Putable 8/15/2024 | |
| | Weslaco General Obligation Refunding, Series 2017, (AGM Insured), 5.00%, due 8/15/2027 | |
| | Ysleta Independent School District General Obligation (School Building), Series 2017-B, (PSF-GTD Insured), 5.00%, due 8/15/2041 | |
| | | |
|
|
| | Virginia State Housing Development Authority, Series 2019 E, 2.90%, due 12/1/2038 | |
|
|
| | Discovery Clean Water Alliance Sewer Revenue, Series 2022, 5.00%, due 12/1/2037 | |
| | Washington State Housing Finance Commission, Series 2021-A-1, 3.50%, due 12/20/2035 | |
| | | |
|
|
| | West Virginia Hospital Finance Authority Revenue (Improvement West Virginia University Health System Obligated Group), Series 2018-A, 5.00%, due 6/1/2052 | |
| | West Virginia Hospital Finance Authority Revenue (University Health System Obligated Group), Series 2023-A, 5.00%, due 6/1/2043 | |
| | West Virginia Hospital Finance Authority Revenue (Vandalia Health Group), Series 2023-B, 6.00%, due 9/1/2053 | |
| | West Virginia Hospital Finance Authority Revenue (West Virginia University Health Systems), Series 2017-A, 5.00%, due 6/1/2035 | |
| | West Virginia Hospital Finance Authority Revenue Refunding (Cabell Huntington Hospital Obligated Group), Series 2018-A, 5.00%, due 1/1/2035 | |
| | West Virginia Housing Development Fund Revenue (Housing Finance), Series 2018-A, (HUD Section 8 Insured), 2.65%, due 11/1/2024 | |
See Notes to Financial Statements
Schedule of Investments Municipal Impact Fund^ (cont’d)
| |
|
|
| | West Virginia Water Development Authority Revenue Refunding (Loan Program), Series 2018-A-IV, 5.00%, due 11/1/2036 | |
| | | |
Total Investments 98.4% (Cost $75,378,648) | |
Other Assets Less Liabilities 1.6% | |
| |
| Securities were purchased under Rule 144A of the Securities Act of 1933, as amended, or are otherwise restricted and, unless registered under the Securities Act of 1933 or exempted from registration, may only be sold to qualified institutional investors or may have other restrictions on resale. At October 31, 2023, these securities amounted to $1,158,209, which represents 1.7% of net assets of the Fund. |
| Step Bond. Coupon rate is a fixed rate for an initial period that either resets at a specific date or may reset in the future contingent upon a predetermined trigger. The interest rate shown was the current rate as of October 31, 2023. |
| Variable rate demand obligation where the stated interest rate is not based on a published reference rate and spread. Rather, the interest rate generally resets daily or weekly and is determined by the remarketing agent. The rate shown represents the rate in effect at October 31, 2023. |
| |
| Value determined using significant unobservable inputs. |
| Security fair valued as of October 31, 2023 in accordance with procedures approved by the valuation designee. Total value of all such securities at October 31, 2023 amounted to $30,608, which represents 0.0% of net assets of the Fund. |
#
This security has been deemed by Management to be illiquid, and is subject to restrictions on resale. Total value of all such securities at October 31, 2023 amounted to $30,608, which represents 0.0% of net assets of the Fund. Acquisition dates shown with a range, if any, represent securities that were acquired over the period shown in the table.
| | | | Fair Value
Percentage
of Net Assets
as of
10/31/2023 |
South Carolina Jobs Economic Development Authority Solid Waste Disposal Revenue (Green Bond-Jasper Pellets LLC Project) | | | | |
The following is a summary, categorized by Level (see Note A of the Notes to Financial Statements), of inputs used to value the Fund’s investments as of October 31, 2023:
See Notes to Financial Statements
Schedule of Investments Municipal Impact Fund^ (cont’d)
| The Schedule of Investments provides information on the state/territory categorization. |
| The following is a reconciliation between the beginning and ending balances of investments in which significant unobservable inputs (Level 3) were used in determining value: |
| Beginning
balance as
of 11/1/2022 | Accrued
discounts/
(premiums) | | Change
in unrealized
appreciation/
(depreciation) | | | | | | Net change in
unrealized
appreciation/
(depreciation)
from
investments
still held as of
10/31/2023 |
Investments in
Securities: | | | | | | | | | | |
| | | | | | | | | | |
| | | | | | | | | | |
(1) Quantitative Information about Level 3 Fair Value Measurements: |
| | | Significant unobservable
input(s) | | | Impact to
valuation
from
increase
in input(b) |
| | | Recovery Value (of Par Value) | | | |
(a) The weighted averages disclosed in the table above were weighted by relative fair value. |
(b) Represents the expected directional change in the fair value of the Level 3 investments that would result from an increase or decrease in the corresponding input. Significant changes in these inputs could result in significantly higher or lower fair value measurements. |
^
A balance indicated with a "—", reflects either a zero balance or an amount that rounds to less than 1.
See Notes to Financial Statements
Schedule of Investments Municipal Intermediate Bond Fund^ October 31, 2023
| |
|
|
|
| | Black Belt Energy Gas District (Alabama Gas Prepay Gas Supply Revenue Project No. 5), Series 2020-A-1, 4.00%, due 10/1/2049 Putable 10/1/2026 | |
| | Black Belt Energy Gas District (Alabama Gas Prepay Gas Supply Revenue Project No. 7), Series 2021-C-1, 4.00%, due 10/1/2052 Putable 12/1/2026 | |
| | Wilsonville Industrial Development Board PCR Revenue Refunding (Alabama Power Co.), Series 2005-D, 4.12%, due 1/1/2024 | |
| | | |
|
|
| | Arizona Health Facilities Authority Revenue (Banner Health), Series 2015-C, (LOC: Bank of America N.A.), 3.87%, due 1/1/2046 | |
| | Maricopa County Industrial Development Authority Revenue (Banner Health Obligated Group), Series 2017-C, 5.00%, due 1/1/2048 Putable 10/18/2024 | |
| | Maricopa County Industrial Development Authority Senior Living Facility Revenue Refunding (Christian Care Retirement Apartments, Inc. Project), Series 2016-A, 5.00%, due 1/1/2024 | |
| | | |
|
|
| | Hot Springs Waterworks Revenue Refunding, Series2023, (BAM Insured), 5.00%, due 10/1/2038 | |
| | Mountain Home Arkansas Sales & Use Tax Revenue, Series 2021-B, 2.00%, due 9/1/2038 | |
| | | |
|
|
| | California Educational Facilities Authority Revenue (Stanford University), Series 2023-V, 5.00%, due 6/1/2033 | |
| | California Housing Finance Agency Municipal Certificate | |
| | Series 2019-2, 4.00%, due 3/20/2033 | |
| | Series 2021-1-A, 3.50%, due 11/20/2035 | |
| | California Municipal Finance Authority Revenue (Northbay Healthcare Group), Series 2017-A, 5.25%, due 11/1/2036 | |
| | California State University Revenue, Series 2023-A, 5.25%, due 11/1/2053 | |
| | California Statewide Communities Development Authority Revenue (Henry Mayo Newhall Memorial Hospital), Series 2014-A, (AGM Insured), 5.00%, due 10/1/2028 Pre-Refunded 10/1/2024 | |
| | Contra Costa County Redevelopment Agency Successor Agency Tax Allocation Refunding, Series 2017-A, (BAM Insured), 5.00%, due 8/1/2032 | |
| | Foothill-Eastern Transportation Corridor Agency Toll Road Revenue Refunding, Series 2021-A, (BAM Insured), 4.00%, due 1/15/2046 | |
| | Fresno Joint Power Financing Authority Lease Revenue Refunding (Master Lease Project) | |
| | Series 2017-A, (AGM Insured), 5.00%, due 4/1/2027 | |
| | Series 2017-A, (AGM Insured), 5.00%, due 4/1/2032 | |
| | Mizuho Floater/Residual Trust Special Tax (Putters), Series 2022-MIZ9110, (LOC: Mizuho Capital Markets LLC), 4.15%, due 9/1/2036 | |
| | Palmdale Elementary School District General Obligation (Election 2022), Series 2023, (BAM Insured), 4.63%, due 8/1/2053 | |
| | San Marcos Unified School District General Obligation Capital Appreciation (Election 2010), Series 2012-B, 0.00%, due 8/1/2027 | |
| | Santa Monica-Malibu Unified School District General Obligation, Series 2019-E, 3.00%, due 8/1/2034 | |
| | | |
|
|
| | Colorado State Educational & Cultural Facility Authority Revenue Refunding (Alexander Dawson School Project), Series 2016, 5.00%, due 5/15/2025 | |
See Notes to Financial Statements
Schedule of Investments Municipal Intermediate Bond Fund^ (cont’d)
| |
|
|
| | Colorado State Health Facilities Authority Hospital Revenue Refunding (Commonspirit Health), Series 2019-A-2, 4.00%, due 8/1/2049 | |
| | Denver Health & Hospital Authority Healthcare Revenue Refunding, Series 2019-A, 4.00%, due 12/1/2037 | |
| | | |
|
|
| | Meriden City General Obligation, Series 2020-B, 3.00%, due 7/1/2031 | |
|
|
| | Delaware State Health Facility Authority Revenue (Beebe Medical Center) | |
| | Series 2018, 5.00%, due 6/1/2027 | |
| | Series 2018, 5.00%, due 6/1/2028 | |
| | Deutsche Bank Spears/Lifers Trust Revenue, (LOC: Deutsche Bank A.G.), Series 2023-DBE-8110, 4.45%, due 12/1/2062 | |
| | | |
District of Columbia 2.5% |
|
| | Deutsche Bank Spears/Lifers Trust Revenue, (LOC: Deutsche Bank A.G.), Series 2020-DBE-8070, 4.54%, due 8/1/2040 | |
| | Washington Convention & Sports Authority Revenue | |
| | Series 2021-A, 5.00%, due 10/1/2027 | |
| | Series 2021-A, 5.00%, due 10/1/2028 | |
| | | |
|
|
| | Cape Coral Special Obligation Refunding Revenue, Series 2015, 4.00%, due 10/1/2030 | |
| | Cityplace Community Development District Special Assessment Refunding Revenue, Series 2012, 5.00%, due 5/1/2026 | |
| | Escambia County Florida Environmental Improvement Revenue Refunding (International Paper Co. Project), Series 2019-B, 2.00%, due 11/1/2033 Putable 10/1/2024 | |
| | Miami-Dade County General Obligation Refunding, Series 2015-B, 4.00%, due 7/1/2032 | |
| | Village Community Development District No. 13 Special Assessment Revenue, Series 2019, 3.00%, due 5/1/2029 | |
| | Wildwood Utility Dependent District Revenue (Senior-South Sumter Utilities Project) | |
| | Series 2021, (BAM Insured), 5.00%, due 10/1/2034 | |
| | Series 2021, (BAM Insured), 5.00%, due 10/1/2035 | |
| | Series 2021, (BAM Insured), 5.00%, due 10/1/2036 | |
| | Series 2021, (BAM Insured), 5.00%, due 10/1/2037 | |
| | | |
|
|
| | Main Street Natural Gas, Inc. Revenue, Series 2023-B, 5.00%, due 7/1/2053 Putable 3/1/2030 | |
| | Monroe County Development Authority PCR Revenue (Georgia Power Co. Plant-Scherer Project), Series 2009, 1.00%, due 7/1/2049 Putable 8/21/2026 | |
| | Municipal Electric Authority of Georgia (Plant Vogtle Units 3 & 4 Project M Bonds) | |
| | Series 2019-A, 5.00%, due 1/1/2032 | |
| | Series 2019-A, 5.00%, due 1/1/2033 | |
| | Municipal Electric Authority of Georgia Revenue (Plant Vogtle Units 3 & 4 Project M Bonds), Series 2023-A, 5.50%, due 7/1/2064 | |
| | Savannah Economic Development Authority Revenue Refunding (International Paper Co. Project), Series 2019-A, 2.00%, due 11/1/2033 Putable 10/1/2024 | |
| | | |
See Notes to Financial Statements
Schedule of Investments Municipal Intermediate Bond Fund^ (cont’d)
| |
|
|
| | Bureau County Township High School District No. 502 General Obligation, Series 2017-A, (BAM Insured), 5.00%, due 12/1/2033 Pre-Refunded 12/1/2027 | |
| | Chicago General Obligation, Series 2023-A, 5.50%, due 1/1/2043 | |
| | Chicago Refunding General Obligation | |
| | Series 2020-A, 5.00%, due 1/1/2026 | |
| | Series 2021-A, 4.00%, due 1/1/2035 | |
| | Cook County Sales Tax Revenue Refunding | |
| | Series 2021-A, 5.00%, due 11/15/2031 | |
| | Series 2021-A, 5.00%, due 11/15/2032 | |
| | Illinois Finance Authority Revenue | |
| | Series 2018 (Government Program-Brookfield Lagrange Park School District No. 95 Project), 4.00%, due 12/1/2038 | |
| | Series 2018, (BAM Insured) (Government Program-E Prairie School District No. 73 Project), 5.00%, due 12/1/2029 | |
| | Series 2018, (BAM Insured) (Government Program-E Prairie School District No. 73 Project), 4.00%, due 12/1/2042 | |
| | Illinois State Finance Authority Revenue (Downers Grove Community High School District No. 99 Project) | |
| | Series 2019, 4.00%, due 12/15/2030 | |
| | Series 2019, 4.00%, due 12/15/2031 | |
| | Illinois State General Obligation | |
| | Series 2017-D, 5.00%, due 11/1/2027 | |
| | Series 2017-D, 5.00%, due 11/1/2028 | |
| | Series 2020, 5.75%, due 5/1/2045 | |
| | Series 2021-A, 4.00%, due 3/1/2039 | |
| | Peoria School District No. 150 General Obligation Refunding | |
| | Series 2020-A, (AGM Insured), 4.00%, due 12/1/2026 | |
| | Series 2020-A, (AGM Insured), 4.00%, due 12/1/2027 | |
| | Series 2020-A, (AGM Insured), 4.00%, due 12/1/2028 | |
| | Sales Tax Securitization Corp. Revenue Refunding, Series 2017-A, 5.00%, due 1/1/2028 | |
| | Sales Tax Securitization Corp. Revenue Refunding Second Lien, Series 2020-A, 5.00%, due 1/1/2026 | |
| | Sales Tax Securitization Corp. Senior Lien Revenue Refunding (Social Bonds), Series 2023-A, 4.00%, due 1/1/2042 | |
| | Springfield General Obligation | |
| | Series 2014, 4.25%, due 12/1/2027 | |
| | Series 2014, 5.00%, due 12/1/2028 | |
| | | |
|
|
| | Fairfield School Building Corp. Revenue, Series 2021, 3.00%, due 7/15/2028 | |
| | Indiana State Finance Authority Revenue (Greencroft Obligation Group), Series 2021-A, 4.00%, due 11/15/2043 | |
| | Indiana State Housing & Community Development Authority Single Family Mortgage Revenue | |
| | Series 2019-B, (GNMA/FNMA/FHLMC Insured), 2.40%, due 7/1/2034 | |
| | Series 2020-B-1, (GNMA Insured), 1.60%, due 1/1/2031 | |
| | Series 2020-B-1, (GNMA Insured), 1.75%, due 7/1/2032 | |
| | Indiana State Municipal Power Agency Refunding Revenue, Series 2016-C, 5.00%, due 1/1/2027 | |
| | | |
|
|
| | Iowa Higher Education Loan Authority Revenue (Private College Des Moines University Project), Series 2020, 5.00%, due 10/1/2027 | |
See Notes to Financial Statements
Schedule of Investments Municipal Intermediate Bond Fund^ (cont’d)
| |
|
|
| | Iowa State Finance Authority Single Family Mortgage Revenue, Series 2021-B, (GNMA/FNMA/FHLMC Insured), 1.85%, due 7/1/2032 | |
| | Iowa State Finance Authority Single Family Mortgage Revenue (Non Ace-Mortgage-Backed Security Program), Series 2017-C, (GNMA/FNMA/FHLMC Insured), 2.30%, due 1/1/2026 | |
| | | |
|
|
| | Wichita Sales Tax Special Obligation Revenue (River District Stadium Star Bond Project) | |
| | Series 2018, 5.00%, due 9/1/2025 | |
| | Series 2018, 5.00%, due 9/1/2027 | |
| | | |
|
|
| | Kentucky State Property & Building Commission Revenue (Project No.128) | |
| | Series 2023-A, 5.00%, due 11/1/2035 | |
| | Series 2023-A, 5.50%, due 11/1/2043 | |
| | Laurel County Judicial Center Public Properties Corp. Refunding Revenue (Justice Center Project), Series 2015, 4.00%, due 3/1/2024 | |
| | | |
|
|
| | Louisiana Stadium & Exposition District Revenue Refunding | |
| | Series 2023-A, 5.00%, due 7/1/2037 | |
| | Series 2023-A, 5.25%, due 7/1/2053 | |
| | Saint John the Baptist Parish LA Revenue Refunding (Marathon Oil Corp. Project), Subseries 2017-B-2, 2.38%, due 6/1/2037 Putable 7/1/2026 | |
| | | |
|
|
| | Baltimore Special Obligation Refunding Revenue Senior Lien (Harbor Point Project), Series 2019-A, 3.63%, due 6/1/2046 | |
| | Maryland State Housing & Community Development Administration Department Revenue, Series 2020-D, 1.95%, due 9/1/2035 | |
| | | |
|
|
| | Massachusetts Commonwealth Transportation Fund Revenue (Rail Enhancement Program), Series 2023-A, 5.00%, due 6/1/2053 | |
| | Massachusetts Development Finance Agency Revenue Refunding, Series 2021-G, 5.00%, due 7/1/2050 | |
| | | |
|
|
| | Detroit Downtown Development Authority Tax Increment Revenue Refunding (Catalyst Development Project), Series 2018-A, (AGM Insured), 5.00%, due 7/1/2029 | |
| | Michigan State Housing Development Authority Revenue, Series 2016-B, 2.30%, due 6/1/2025 | |
| | Walled Lake Consolidated School District | |
| | Series 2020, 5.00%, due 5/1/2032 | |
| | Series 2020, 5.00%, due 5/1/2033 | |
| | | |
|
|
| | Saint Paul Housing & Redevelopment Authority Health Care Revenue Refunding (Fairview Health Services Obligated Group), Series 2017-A, 4.00%, due 11/15/2043 | |
See Notes to Financial Statements
Schedule of Investments Municipal Intermediate Bond Fund^ (cont’d)
| |
|
|
| | Mississippi Development Bank Special Obligation (Meridian Public School District Project), Series 2023, (BAM Insured), 4.00%, due 4/1/2037 | |
| | Mississippi State General Obligation Refunding, Series 2015-C, 5.00%, due 10/1/2026 | |
| | | |
|
|
| | Missouri State Health & Educational Facilities Authority Revenue (Mercy Health), Series 2023, 5.50%, due 12/1/2040 | |
| | Missouri State Housing Development Commission Single Family Mortgage Revenue (Non-AMT Special Homeownership Loan Program) | |
| | Series 2014-A, (GNMA/FNMA/FHLMC Insured), 3.80%, due 11/1/2034 | |
| | Series 2014-A, (GNMA/FNMA/FHLMC Insured), 4.00%, due 11/1/2039 | |
| | | |
|
|
| | Central Plains Energy Project Revenue, Series 2018, 5.00%, due 3/1/2050 Putable 1/1/2024 | |
| | Central Plains Energy Project Revenue Refunding, Series 2023-A, 5.00%, due 5/1/2054 Putable 11/1/2029 | |
| | | |
|
|
| | Clark County School District General Obligation, Series 2020-A, (AGM Insured), 5.00%, due 6/15/2028 | |
|
|
| | New Jersey Economic Development Authority Revenue (Portal North Bridge Project), Series 2022-A, 5.00%, due 11/1/2029 | |
| | New Jersey Health Care Facilities Financing Authority Contract Revenue Refunding (Hospital Asset Transportation Program), Series 2017, 5.00%, due 10/1/2028 | |
| | New Jersey Health Care Facilities Financing Authority Revenue (Inspira Health Obligated Group), Series 2017-A, 5.00%, due 7/1/2029 | |
| | New Jersey State Transportation Trust Fund Authority, Series 2019-BB, 5.00%, due 6/15/2029 | |
| | New Jersey State Transportation Trust Fund Authority Transportation System Revenue Refunding | |
| | Series 2018-A, 5.00%, due 12/15/2032 | |
| | Series 2019-A, 5.00%, due 12/15/2028 | |
| | Newark General Obligation, Series 2020-A, (AGM Insured), 5.00%, due 10/1/2027 | |
| | | |
|
|
| | Albany Capital Resource Corp. Refunding Revenue (Albany College of Pharmacy & Health Sciences), Series 2014-A, 5.00%, due 12/1/2026 | |
| | Broome County Local Development Corp. Revenue (Good Shepherd Village at Endwell, Inc. Project), Series 2021, 4.00%, due 7/1/2047 | |
| | Dutchess County Local Development Corp. Revenue Refunding (Culinary Institute of America Project) | |
| | Series 2021, 5.00%, due 7/1/2033 | |
| | Series 2021, 4.00%, due 7/1/2036 | |
| | Series 2021, 4.00%, due 7/1/2037 | |
| | Series 2021, 4.00%, due 7/1/2039 | |
| | Series 2021, 4.00%, due 7/1/2040 | |
| | Long Beach General Obligation, Series 2014-A, (BAM Insured), 4.00%, due 11/15/2023 | |
| | Metropolitan Transportation Authority Revenue, (LOC: Barclays Bank PLC), Series 2015-E-1, 4.00%, due 11/15/2050 | |
| | Metropolitan Transportation Authority Revenue (Green Bond), Series 2020-E, 4.00%, due 11/15/2045 | |
See Notes to Financial Statements
Schedule of Investments Municipal Intermediate Bond Fund^ (cont’d)
| |
|
|
| | Monroe County General Obligation (Public Improvement), Series 2019-A, (BAM Insured), 4.00%, due 6/1/2028 | |
| | Nassau County Industrial Development Agency Revenue Refunding (Cold Spring), (LOC: TD Bank N.A.), Series 1999, 3.85%, due 1/1/2034 | |
| | New Paltz Central School District General Obligation, Series 2019, 4.00%, due 2/15/2029 | |
| | New York City Housing Development Corp. Revenue, Series 2020-C, (HUD Section 8, Fannie Mae Insured), 2.15%, due 8/1/2035 | |
| | New York City Municipal Water Finance Authority Water & Sewer System Refunding Revenue (Second General Resolution Revenue Bonds), Series 2023-DD, 5.25%, due 6/15/2047 | |
| | New York City Municipal Water Finance Authority Water & Sewer System Revenue (Second General Resolution Revenue Bonds), (LOC: TD Bank N.A.), Series 2008-BB-1, 4.06%, due 6/15/2036 | |
| | New York City Transitional Finance Authority Revenue (Future Tax Secured) | |
| | Series 2015-C, 5.00%, due 11/1/2027 | |
| | Subseries 2016-A-1, 4.00%, due 5/1/2031 | |
| | New York City Trust for Cultural Resource Revenue Refunding (Carnegie Hall) | |
| | Series 2019, 5.00%, due 12/1/2037 | |
| | Series 2019, 5.00%, due 12/1/2038 | |
| | Series 2019, 5.00%, due 12/1/2039 | |
| | New York General Obligation | |
| | Series 2011-D, 4.00%, due 10/1/2039 | |
| | Series 2018 E-1, 5.00%, due 3/1/2031 | |
| | Subseries 2018-F-1, 5.00%, due 4/1/2034 | |
| | New York Liberty Development Corp. Refunding Revenue Green Bonds (4 World Trade Center Project) | |
| | Series 2021-A, 2.50%, due 11/15/2036 | |
| | Series 2021-A, 2.75%, due 11/15/2041 | |
| | New York State Dormitory Authority Personal Income Tax Revenue, Series 2014-C, 5.00%, due 3/15/2025 Pre-Refunded 3/15/2024 | |
| | New York State Power Authority Revenue (Green Transmission Project-Green Bond), Series 2023-A, (AGM Insured), 5.13%, due 11/15/2058 | |
| | Onondaga Civic Development Corp. (Le Moyne Collage Project), Series 2021, 5.00%, due 7/1/2034 | |
| | Onondaga Civic Development Corp. Refunding (Le Moyne Collage Project) | |
| | Series 2022, 4.00%, due 7/1/2034 | |
| | Series 2022, 4.00%, due 7/1/2036 | |
| | Series 2022, 4.00%, due 7/1/2039 | |
| | Series 2022, 4.00%, due 7/1/2042 | |
| | Port Authority New York & New Jersey Consolidated Bonds Revenue Refunding (Two Hundred And Forty), Series 2023-240, 5.00%, due 7/15/2053 | |
| | Suffolk Tobacco Asset Securitization Corp. Refunding (Tobacco Settle Asset Backed Subordinated Bonds), Series 2021-B1, 4.00%, due 6/1/2050 | |
| | Triborough Bridge & Tunnel Authority Revenue, Series 2021-A-2, 2.00%, due 5/15/2045 Putable 5/15/2024 | |
| | Westchester County Local Development Corp. Revenue Refunding (Kendal on Hudson Project), Series 2022-B, 5.00%, due 1/1/2041 | |
| | Yonkers Economic Development Corp. Education Revenue (Charter School of Education Excellence Project), Series 2019-A, 5.00%, due 10/15/2049 | |
| | | |
|
|
| | North Carolina State Turnpike Authority, Series 2020-B, 5.00%, due 2/1/2024 | |
|
|
| | Allen County Hospital Facilities Revenue (Catholic Healthcare), Series 2010-C, (LOC: Bank of Montreal), 4.00%, due 6/1/2034 | |
See Notes to Financial Statements
Schedule of Investments Municipal Intermediate Bond Fund^ (cont’d)
| |
|
|
| | Ohio State Air Quality Development Authority (Ohio Valley Electric Corp. Project), Series 2009-B, 1.38%, due 2/1/2026 Putable 11/1/2024 | |
| | Ohio State Air Quality Development Authority Revenue (American Electric Power Co. Project), Series 2014, 2.40%, due 12/1/2038 Putable 10/1/2029 | |
| | | |
|
|
| | Weatherford Industrial Trust Education Facility Lease Revenue (Weatherford Public School Project), Series 2019, 5.00%, due 3/1/2033 | |
|
|
| | Allegheny County Hospital Development Authority Revenue Refunding (University Pittsburgh Medical Center), Series 2019-A, 5.00%, due 7/15/2029 | |
| | Lackawanna County Industrial Development Authority Revenue Refunding (University of Scranton) | |
| | Series 2017, 5.00%, due 11/1/2028 | |
| | Series 2017, 5.00%, due 11/1/2029 | |
| | Series 2017, 5.00%, due 11/1/2030 | |
| | Luzerne County General Obligation Refunding | |
| | Series 2017-A, (AGM Insured), 5.00%, due 12/15/2027 | |
| | Series 2017-B, (AGM Insured), 5.00%, due 12/15/2026 | |
| | Luzerne County Industrial Development Authority Lease Revenue Refunding Guaranteed | |
| | Series 2017, (AGM Insured), 5.00%, due 12/15/2025 | |
| | Series 2017, (AGM Insured), 5.00%, due 12/15/2026 | |
| | Series 2017, (AGM Insured), 5.00%, due 12/15/2027 | |
| | Pennsylvania Economic Development Financing Authority Revenue, Series 2023-A-1, 5.00%, due 5/15/2031 | |
| | Pennsylvania State Commonwealth General Obligation, Series 2015, 5.00%, due 3/15/2029 | |
| | Pennsylvania State Turnpike Commission Oil Franchise Tax Revenue Refunding, Series 2021-B, 5.00%, due 12/1/2046 | |
| | Pennsylvania State Turnpike Commission Revenue Refunding, Series 2016, 5.00%, due 6/1/2027 | |
| | Pennsylvania State Turnpike Commission Turnpike Revenue, Subseries 2019-A, 5.00%, due 12/1/2033 | |
| | Philadelphia Energy Authority Revenue (Philadelphia Street Lighting Project) | |
| | Series 2023-A, 5.00%, due 11/1/2031 | |
| | Series 2023-A, 5.00%, due 11/1/2034 | |
| | Series 2023-A, 5.00%, due 11/1/2035 | |
| | Tender Option Bond Trust Receipts/Certificates Revenue (Putters), Series 2023-XF1595, 4.00%, due 6/1/2031 | |
| | | |
|
|
| | Puerto Rico Industrial Tourist Education Medical & Environmental Control Facilities Authority Revenue (Hospital Auxilio Mutuo Obligation Group Project), Series 2021, 5.00%, due 7/1/2029 | |
|
|
| | South Carolina State Housing Finance & Development Authority Mortgage Revenue, Series 2021-A, 1.85%, due 7/1/2036 | |
| | South Carolina State Public Service Authority Obligation Revenue Refunding, Series 2014-C, 5.00%, due 12/1/2028 | |
| | | |
|
|
| | Tennessee Housing Development Agency Residential Finance Program Revenue, Series 2019-2, 3.00%, due 7/1/2039 | |
See Notes to Financial Statements
Schedule of Investments Municipal Intermediate Bond Fund^ (cont’d)
| |
|
|
| | Central Texas Regional Mobility Authority Senior Lien Refunding Revenue, Series 2020-A, 5.00%, due 1/1/2027 | |
| | Harris County Municipal Utility District No. 489 General Obligation | |
| | Series 2023, (AGM Insured), 4.00%, due 9/1/2036 | |
| | Series 2023, (AGM Insured), 4.00%, due 9/1/2037 | |
| | Hidalgo County Regional Mobility Authority Revenue, Series 2022-B, 4.00%, due 12/1/2041 | |
| | Irving Independent School District General Obligation, Series 2023, (PSF-GTD Insured), 5.00%, due 2/15/2043 | |
| | La Joya Independent School District Refunding General Obligation, Series 2013, (PSF-GTD Insured), 5.00%, due 2/15/2033 | |
| | Pampa Independent School District General Obligation Refunding, Series 2016, (PSF-GTD Insured), 5.00%, due 8/15/2032 Pre-Refunded 8/15/2025 | |
| | Prosper Independent School District General Obligation (School Building), Series 2019, (PSF-GTD Insured), 5.00%, due 2/15/2030 | |
| | | |
|
|
| | Midvale Redevelopment Agency Tax Increment & Sales Tax Revenue | |
| | Series 2018, 5.00%, due 5/1/2032 | |
| | Series 2018, 5.00%, due 5/1/2034 | |
| | Utah Infrastructure Agency Telecommunication Revenue | |
| | Series 2019-A, 4.00%, due 10/15/2036 | |
| | Series 2021-A, 4.00%, due 10/15/2038 | |
| | Utah State General Obligation, Series 2020-B, 3.00%, due 7/1/2030 | |
| | Utah State Transit Authority Sales Tax Revenue Refunding, Series 2007-A, (NATL Insured), 5.00%, due 6/15/2031 | |
| | Weber County Special Assessment (Summit Mountain Assessment Area), Series 2013, 5.50%, due 1/15/2028 | |
| | | |
|
|
| | Virginia State Housing Development Authority, Series 2021-K, 1.05%, due 12/1/2027 | |
|
|
| | North Thurston Public Schools General Obligation, Series 2016, 4.00%, due 12/1/2028 | |
| | Washington State General Obligation | |
| | Series 2022-C, 5.00%, due 2/1/2037 | |
| | Series 2023 C, 5.00%, due 6/1/2040 | |
| | Whitman County School District No. 267 Pullman General Obligation, Series 2016, 4.00%, due 12/1/2029 | |
| | | |
|
|
| | West Virginia Hospital Finance Authority Revenue (University Health System Obligated Group), Series 2023-A, 5.00%, due 6/1/2043 | |
| | West Virginia Hospital Finance Authority Revenue (Vandalia Health Group), Series 2023-B, (AGM Insured), 5.38%, due 9/1/2053 | |
| | West Virginia Hospital Finance Authority Revenue Refunding (Cabell Huntington Hospital Obligated Group), Series 2018-A, 5.00%, due 1/1/2029 | |
| | | |
|
|
| | Deutsche Bank Spears/Lifers Trust Revenue, (LOC: Deutsche Bank A.G.), Series 2023-DBE-8109, 4.45%, due 4/1/2055 | |
See Notes to Financial Statements
Schedule of Investments Municipal Intermediate Bond Fund^ (cont’d)
| |
|
|
| | Public Finance Authority Hospital Revenue (Carson Valley Medical Center), Series 2021-A, 4.00%, due 12/1/2051 | |
| | Public Finance Authority Senior Revenue (Wonderful Foundations Charter School Portfolio Project), Series 2020-A-1, 5.00%, due 1/1/2055 | |
| | Tender Option Bond Trust Receipts/Certificates Revenue (Putters), Series 2020, (LOC: Mizuho Capital Markets LLC), 4.46%, due 6/15/2045 | |
| | Wisconsin State Health & Education Facility Authority Revenue Refunding (Ascension Health Credit Group), Series 2016-A, 4.00%, due 11/15/2039 | |
| | Wisconsin State Health & Educational Facility Authority Revenue (Marshfield Clinic Health System, Inc.), Series 2018-A, (LOC: Barclays Bank PLC), 4.00%, due 2/15/2050 | |
| | Wisconsin State Housing & Economic Development Authority Home Ownership Revenue | |
| | Series 2021-A, 1.25%, due 3/1/2028 | |
| | Series 2021-A, 1.35%, due 9/1/2028 | |
| | Series 2021-A, 1.45%, due 3/1/2029 | |
| | | |
Total Investments 100.9% (Cost $193,120,482) | |
Liabilities Less Other Assets (0.9)% | |
| |
| Variable rate demand obligation where the stated interest rate is not based on a published reference rate and spread. Rather, the interest rate generally resets daily or weekly and is determined by the remarketing agent. The rate shown represents the rate in effect at October 31, 2023. |
| Securities were purchased under Rule 144A of the Securities Act of 1933, as amended, or are otherwise restricted and, unless registered under the Securities Act of 1933 or exempted from registration, may only be sold to qualified institutional investors or may have other restrictions on resale. At October 31, 2023, these securities amounted to $15,130,183, which represents 8.6% of net assets of the Fund. |
| When-issued security. Total value of all such securities at October 31, 2023 amounted to $3,416,143, which represents 1.9% of net assets of the Fund. |
The following is a summary, categorized by Level (see Note A of the Notes to Financial Statements), of inputs used to value the Fund’s investments as of October 31, 2023:
| The Schedule of Investments provides information on the state/territory categorization. |
^
A balance indicated with a "—", reflects either a zero balance or an amount that rounds to less than 1.
See Notes to Financial Statements
Schedule of Investments Short Duration Bond Fund^ October 31, 2023
| |
Mortgage-Backed Securities 28.0% |
Collateralized Mortgage Obligations 10.4% |
|
| | COLT Mortgage Loan Trust, Series 2021-5, Class A1, 1.73%, due 11/26/2066 | |
| | Ellington Financial Mortgage Trust, Series 2022-1, Class A1, 2.21%, due 1/25/2067 | |
| | Federal Home Loan Mortgage Corp. STACR REMIC Trust | |
| | Series 2021-HQA2, Class M2, (30 day USD SOFR Average + 2.05%), 7.37%, due 12/25/2033 | |
| | Series 2021-DNA6, Class M2, (30 day USD SOFR Average + 1.50%), 6.82%, due 10/25/2041 | |
| | Series 2022-DNA2, Class M1B, (30 day USD SOFR Average + 2.40%), 7.72%, due 2/25/2042 | |
| | Series 2022-DNA2, Class M2, (30 day USD SOFR Average + 3.75%), 9.07%, due 2/25/2042 | |
| | Series 2022-HQA1, Class M2, (30 day USD SOFR Average + 5.25%), 10.57%, due 3/25/2042 | |
| | Series 2022-HQA3, Class M1B, (30 day USD SOFR Average + 3.55%), 8.87%, due 8/25/2042 | |
| | Federal Home Loan Mortgage Corp. STACR Trust | |
| | Series 2017-DNA1, Class M2, (30 day USD SOFR Average + 3.36%), 8.69%, due 7/25/2029 | |
| | Series 2017-HQA3, Class M2, (30 day USD SOFR Average + 2.46%), 7.79%, due 4/25/2030 | |
| | Federal National Mortgage Association Connecticut Avenue Securities | |
| | Series 2016-C01, Class 2M2, (30 day USD SOFR Average + 7.06%), 12.39%, due 8/25/2028 | |
| | Series 2017-C06, Class 2M2, (30 day USD SOFR Average + 2.91%), 8.24%, due 2/25/2030 | |
| | Series 2018-C02, Class 2M2, (30 day USD SOFR Average + 2.31%), 7.64%, due 8/25/2030 | |
| | Series 2021-R01, Class 1M2, (30 day USD SOFR Average + 1.55%), 6.87%, due 10/25/2041 | |
| | Series 2021-R03, Class 1M2, (30 day USD SOFR Average + 1.65%), 6.97%, due 12/25/2041 | |
| | Series 2022-R01, Class 1M2, (30 day USD SOFR Average + 1.90%), 7.22%, due 12/25/2041 | |
| | Series 2022-R04, Class 1M2, (30 day USD SOFR Average + 3.10%), 8.42%, due 3/25/2042 | |
| | Series 2022-R03, Class 1M2, (30 day USD SOFR Average + 3.50%), 8.82%, due 3/25/2042 | |
| | Series 2022-R07, Class 1M1, (30 day USD SOFR Average + 2.95%), 8.27%, due 6/25/2042 | |
| | Series 2022-R07, Class 1M2, (30 day USD SOFR Average + 4.65%), 9.97%, due 6/25/2042 | |
| | Series 2022-R08, Class 1M1, (30 day USD SOFR Average + 2.55%), 7.87%, due 7/25/2042 | |
| | Series 2022-R08, Class 1M2, (30 day USD SOFR Average + 3.60%), 8.92%, due 7/25/2042 | |
| | Series 2022-R08, Class 1B1, (30 day USD SOFR Average + 5.60%), 10.92%, due 7/25/2042 | |
| | Series 2023-R01, Class 1M1, (30 day USD SOFR Average + 2.40%), 7.72%, due 12/25/2042 | |
| | Series 2023-R02, Class 1M2, (30 day USD SOFR Average + 3.35%), 8.67%, due 1/25/2043 | |
| | GCAT Trust, Series 2021-NQM5, Class A1, 1.26%, due 7/25/2066 | |
| | Harborview Mortgage Loan Trust, Series 2004-4, Class 3A, (1 mo. USD Term SOFR + 1.24%), 6.55%, due 6/19/2034 | |
| | JP Morgan Mortgage Trust, Series 2023-HE2, Class A1, (30 day USD SOFR Average + 1.70%), 7.02%, due 3/25/2054 | |
| | New Residential Mortgage Loan Trust, Series 2019-NQM5, Class A1, 2.71%, due 11/25/2059 | |
| | SG Residential Mortgage Trust, Series 2021-2, Class A1, 1.74%, due 12/25/2061 | |
| | Towd Point Mortgage Trust, Series 2022-4, Class A1, 3.75%, due 9/25/2062 | |
| | Verus Securitization Trust | |
| | Series 2021-3, Class A3, 1.44%, due 6/25/2066 | |
| | Series 2021-6, Class A3, 1.89%, due 10/25/2066 | |
| | Series 2022-7, Class A1, 5.15%, due 7/25/2067 | |
| | | |
Commercial Mortgage-Backed 9.7% |
|
| | BANK, Series 2020-BN30, Class A1, 0.45%, due 12/15/2053 | |
| | | |
| | Series 2020-C7, Class A1, 1.08%, due 4/15/2053 | |
| | Series 2021-C11, Class XA, 1.38%, due 9/15/2054 | |
| | Series 2022-C17, Class XA, 1.15%, due 9/15/2055 | |
| | BB-UBS Trust, Series 2012-SHOW, Class A, 3.43%, due 11/5/2036 | |
See Notes to Financial Statements
Schedule of Investments Short Duration Bond Fund^ (cont’d)
| |
Commercial Mortgage-Backed – cont'd |
|
| | | |
| | Series 2019-B12, Class A2, 3.00%, due 8/15/2052 | |
| | Series 2019-B12, Class AS, 3.42%, due 8/15/2052 | |
| | Series 2020-B17, Class C, 3.37%, due 3/15/2053 | |
| | Series 2021-B30, Class XA, 0.81%, due 11/15/2054 | |
| | Series 2019-B10, Class B, 4.18%, due 3/15/2062 | |
| | BPR Trust, Series 2022-OANA, Class D, (1 mo. USD Term SOFR + 3.70%), 9.03%, due 4/15/2037 | |
| | BX Commercial Mortgage Trust | |
| | Series 2021-VOLT, Class A, (1 mo. USD Term SOFR + 0.81%), 6.15%, due 9/15/2036 | |
| | Series 2021-VOLT, Class D, (1 mo. USD Term SOFR + 1.76%), 7.10%, due 9/15/2036 | |
| | Series 2019-XL, Class D, (1 mo. USD Term SOFR + 1.56%), 6.90%, due 10/15/2036 | |
| | BX Trust, Series 2019-OC11, Class D, 3.94%, due 12/9/2041 | |
| | CAMB Commercial Mortgage Trust | |
| | Series 2019-LIFE, Class D, (1 mo. USD Term SOFR + 1.80%), 7.13%, due 12/15/2037 | |
| | Series 2019-LIFE, Class E, (1 mo. USD Term SOFR + 2.20%), 7.53%, due 12/15/2037 | |
| | Series 2019-LIFE, Class F, (1 mo. USD Term SOFR + 2.60%), 7.93%, due 12/15/2037 | |
| | Citigroup Commercial Mortgage Trust | |
| | Series 2023-PRM3, Class C, 6.36%, due 7/10/2028 | |
| | Series 2023-SMRT, Class C, 5.85%, due 10/12/2040 | |
| | Series 2015-GC27, Class AAB, 2.94%, due 2/10/2048 | |
| | Series 2016-P4, Class AAB, 2.78%, due 7/10/2049 | |
| | | |
| | Series 2012-CR4, Class AM, 3.25%, due 10/15/2045 | |
| | Series 2014-UBS2, Class A5, 3.96%, due 3/10/2047 | |
| | Series 2014-UBS3, Class XA, 1.05%, due 6/10/2047 | |
| | Series 2014-CR19, Class ASB, 3.50%, due 8/10/2047 | |
| | Series 2014-UBS6, Class XA, 0.83%, due 12/10/2047 | |
| | Series 2015-PC1, Class ASB, 3.61%, due 7/10/2050 | |
| | CSAIL Commercial Mortgage Trust | |
| | Series 2016-C5, Class XA, 0.89%, due 11/15/2048 | |
| | Series 2016-C5, Class ASB, 3.53%, due 11/15/2048 | |
| | Eleven Madison Trust Mortgage Trust, Series 2015-11MD, Class A, 3.55%, due 9/10/2035 | |
| | Federal Home Loan Mortgage Corp. Multiclass Certificates, Series 2020-RR02, Class CX, 1.27%, due 3/27/2029 | |
| | Federal Home Loan Mortgage Corp. Multifamily Structured Pass-Through Certificates | |
| | Series KW03, Class X1, 0.83%, due 6/25/2027 | |
| | Series K095, Class X1, 0.95%, due 6/25/2029 | |
| | Series K096, Class X1, 1.13%, due 7/25/2029 | |
| | Series K098, Class XAM, 1.39%, due 8/25/2029 | |
| | FIVE Mortgage Trust, Series 2023-V1, Class C, 6.40%, due 2/10/2056 | |
| | GS Mortgage Securities Trust | |
| | Series 2010-C1, Class B, 5.15%, due 8/10/2043 | |
| | Series 2013-GC13, Class XA, 0.37%, due 7/10/2046 | |
| | Series 2015-GC30, Class XA, 0.72%, due 5/10/2050 | |
| | Hilton USA Trust, Series 2016-HHV, Class D, 4.19%, due 11/5/2038 | |
| | Hudson Yards Mortgage Trust, Series 2016-10HY, Class A, 2.84%, due 8/10/2038 | |
| | INTOWN Mortgage Trust, Series 2022-STAY, Class A, (1 mo. USD Term SOFR + 2.49%), 7.82%, due 8/15/2039 | |
| | JP Morgan Chase Commercial Mortgage Securities Trust, Series 2022-OPO, Class D, 3.45%, due 1/5/2039 | |
| | Morgan Stanley Bank of America Merrill Lynch Trust, Series 2017-C33, Class C, 4.56%, due 5/15/2050 | |
See Notes to Financial Statements
Schedule of Investments Short Duration Bond Fund^ (cont’d)
| |
Commercial Mortgage-Backed – cont'd |
|
| | Morgan Stanley Capital I Trust, Series 2018-H4, Class C, 5.06%, due 12/15/2051 | |
| | NYO Commercial Mortgage Trust, Series 2021-1290, Class D, (1 mo. USD Term SOFR + 2.66%), 7.99%, due 11/15/2038 | |
| | ORL Trust, Series 2023-GLKS, Class D, (1 mo. USD Term SOFR + 4.30%), 9.64%, due 10/15/2028 | |
| | Taubman Centers Commercial Mortgage Trust | |
| | Series 2022-DPM, Class A, (1 mo. USD Term SOFR + 2.19%), 7.52%, due 5/15/2037 | |
| | Series 2022-DPM, Class B, (1 mo. USD Term SOFR + 2.93%), 8.27%, due 5/15/2037 | |
| | Series 2022-DPM, Class C, (1 mo. USD Term SOFR + 3.78%), 9.11%, due 5/15/2037 | |
| | Wells Fargo Commercial Mortgage Trust | |
| | Series 2014-LC18, Class A5, 3.41%, due 12/15/2047 | |
| | Series 2019-C52, Class XA, 1.60%, due 8/15/2052 | |
| | | |
Federal Home Loan Mortgage Corp. 4.4% |
|
| | Pass-Through Certificates | |
| | | |
| | 5.50%, due 9/1/2052 - 4/1/2053 | |
| | 6.00%, due 10/1/2052 - 3/1/2053 | |
| | | |
Federal National Mortgage Association 3.5% |
|
| | Pass-Through Certificates | |
| | 4.50%, due 4/1/2039 - 5/1/2044 | |
| | 5.50%, due 11/1/2052 - 5/1/2053 | |
| | 6.00%, due 11/1/2052 - 10/1/2053 | |
| | | |
Total Mortgage-Backed Securities (Cost $50,895,104) | |
Asset-Backed Securities 17.4% |
|
| | 37 Capital CLO 1 Ltd., Series 2021-1A, Class A, (3 mo. USD Term SOFR + 1.46%), 6.86%, due 10/15/2034 | |
| | AM Capital Funding LLC, Series 2018-1, Class A, 4.98%, due 12/15/2023 | |
| | Aqua Finance Trust, Series 2021-A, Class A, 1.54%, due 7/17/2046 | |
| | Avis Budget Rental Car Funding AESOP LLC | |
| | Series 2020-2A, Class B, 2.96%, due 2/20/2027 | |
| | Series 2021-2A, Class B, 1.90%, due 2/20/2028 | |
| | Beacon Container Finance II LLC, Series 2021-1A, Class A, 2.25%, due 10/22/2046 | |
| | BOF VII AL Funding Trust I, Series 2023-CAR3, Class A2, 6.29%, due 7/26/2032 | |
| | CCG Receivables Trust, Series 2023-1, Class A2, 5.82%, due 9/16/2030 | |
| | Crown Castle Towers LLC, 3.66%, due 5/15/2025 | |
| | CyrusOne Data Centers Issuer I LLC, Series 2023-1A, Class A2, 4.30%, due 4/20/2048 | |
| | Dell Equipment Finance Trust, Series 2023-1, Class A2, 5.65%, due 9/22/2028 | |
| | Dryden 64 CLO Ltd., Series 2018-64A, Class D, (3 mo. USD Term SOFR + 2.91%), 8.31%, due 4/18/2031 | |
| | Fort Washington CLO Ltd., Series 2021-2A, Class A, (3 mo. USD Term SOFR + 1.48%), 6.90%, due 10/20/2034 | |
| | Frontier Issuer LLC, Series 2023-1, Class A2, 6.60%, due 8/20/2053 | |
| | Hilton Grand Vacations Trust | |
| | Series 2018-AA, Class A, 3.54%, due 2/25/2032 | |
| | Series 2022-2A, Class A, 4.30%, due 1/25/2037 | |
| | Series 2022-2A, Class B, 4.74%, due 1/25/2037 | |
| | JPMorgan Chase Bank NA, Series 2021-3, Class B, 0.76%, due 2/26/2029 | |
See Notes to Financial Statements
Schedule of Investments Short Duration Bond Fund^ (cont’d)
| |
Asset-Backed Securities – cont'd |
|
| | MetroNet Infrastructure Issuer LLC, Series 2022-1A, Class A2, 6.35%, due 10/20/2052 | |
| | | |
| | Series 2021-2A, Class A, 1.43%, due 5/20/2039 | |
| | Series 2021-2A, Class B, 1.83%, due 5/20/2039 | |
| | Series 2021-1WA, Class B, 1.44%, due 1/22/2041 | |
| | Navient Private Education Refi Loan Trust | |
| | Series 2021-BA, Class A, 0.94%, due 7/15/2069 | |
| | Series 2021-CA, Class A, 1.06%, due 10/15/2069 | |
| | Series 2021-EA, Class A, 0.97%, due 12/16/2069 | |
| | Series 2021-FA, Class A, 1.11%, due 2/18/2070 | |
| | Oaktree CLO Ltd., Series 2022-3A, Class A2, (3 mo. USD Term SOFR + 2.30%), 7.69%, due 7/15/2035 | |
| | Octagon Investment Partners 43 Ltd., Series 2019-1A, Class D, (3 mo. USD Term SOFR + 4.16%), 9.54%, due 10/25/2032 | |
| | OneMain Financial Issuance Trust | |
| | Series 2020-1A, Class A, 3.84%, due 5/14/2032 | |
| | Series 2022-2A, Class A, 4.89%, due 10/14/2034 | |
| | Park Blue CLO Ltd., Series 2022-1A, Class A1, (3 mo. USD Term SOFR + 2.45%), 7.87%, due 10/20/2034 | |
| | | |
| | Series 2021-A, Class A, 0.71%, due 4/15/2026 | |
| | Series 2021-B, Class A, 0.77%, due 8/15/2026 | |
| | Series 2022-A, Class A, 2.47%, due 2/15/2027 | |
| | Prestige Auto Receivables Trust, Series 2021-1A, Class D, 2.08%, due 2/15/2028 | |
| | RRX 3 Ltd., Series 2021-3A, Class A1, (3 mo. USD Term SOFR + 1.58%), 6.98%, due 4/15/2034 | |
| | SBA Tower Trust, Series 2014-2A, Class C, 3.87%, due 10/15/2049 | |
| | Sierra Timeshare Receivables Funding LLC | |
| | Series 2019-1A, Class C, 3.77%, due 1/20/2036 | |
| | Series 2019-2A, Class A, 2.59%, due 5/20/2036 | |
| | Series 2020-2A, Class C, 3.51%, due 7/20/2037 | |
| | Series 2022-1A, Class A, 3.05%, due 10/20/2038 | |
| | Series 2022-1A, Class C, 3.94%, due 10/20/2038 | |
| | Series 2023-2A, Class C, 7.30%, due 4/20/2040 | |
| | Series 2022-2A, Class B, 5.04%, due 6/20/2040 | |
| | Series 2023-3A, Class B, 6.44%, due 9/20/2040 | |
| | Signal Peak CLO 8 Ltd., Series 2020-8A, Class A, (3 mo. USD Term SOFR + 1.53%), 6.95%, due 4/20/2033 | |
| | SoFi Consumer Loan Program Trust, Series 2023-1S, Class A, 5.81%, due 5/15/2031 | |
| | SoFi Professional Loan Program LLC, Series 2018-C, Class BFX, 4.13%, due 1/25/2048 | |
| | | |
| | Series 2016-1A, Class A23, 4.97%, due 5/25/2046 | |
| | Series 2021-1A, Class A2I, 1.95%, due 8/25/2051 | |
| | TAL Advantage VII LLC, Series 2020-1A, Class A, 2.05%, due 9/20/2045 | |
| | TICP CLO VII Ltd., Series 2017-7A, Class DR, (3 mo. USD Term SOFR + 3.46%), 8.86%, due 4/15/2033 | |
| | T-Mobile U.S. Trust, Series 2022-1A, Class A, 4.91%, due 5/22/2028 | |
| | Vantage Data Centers Issuer LLC, Series 2019-1A, Class A2, 3.19%, due 7/15/2044 | |
| | Voya CLO Ltd., Series 2016-2A, Class CR, (3 mo. USD Term SOFR + 4.26%), 9.66%, due 7/19/2028 | |
| | Wellington Management CLO 1 Ltd., Series 2023-1A, Class A, (3 mo. USD Term SOFR + 1.80%), 7.19%, due 10/20/2036 | |
See Notes to Financial Statements
Schedule of Investments Short Duration Bond Fund^ (cont’d)
| |
Asset-Backed Securities – cont'd |
|
| | Whitebox CLO III Ltd., Series 2021-3A, Class A1, (3 mo. USD Term SOFR + 1.48%), 6.88%, due 10/15/2034 | |
Total Asset-Backed Securities (Cost $29,652,174) | |
|
|
|
|
| | Boeing Co., 2.70%, due 2/1/2027 | |
| | L3Harris Technologies, Inc., 5.40%, due 1/15/2027 | |
| | | |
|
|
| | American Airlines, Inc., 7.25%, due 2/15/2028 | |
| | American Airlines, Inc./AAdvantage Loyalty IP Ltd. | |
| | | |
| | | |
| | Delta Air Lines, Inc., 7.00%, due 5/1/2025 | |
| | Delta Air Lines, Inc./SkyMiles IP Ltd., 4.50%, due 10/20/2025 | |
| | VistaJet Malta Finance PLC/Vista Management Holding, Inc. | |
| | | |
| | | |
| | | |
|
|
| | Ford Motor Credit Co. LLC | |
| | | |
| | | |
| | | |
| | | |
| | General Motors Financial Co., Inc. | |
| | | |
| | | |
| | Volkswagen Group of America Finance LLC, 3.35%, due 5/13/2025 | |
| | | |
Auto Parts & Equipment 0.3% |
|
| | Goodyear Tire & Rubber Co., 5.00%, due 5/31/2026 | |
| | IHO Verwaltungs GmbH, 6.00% Cash/6.75% PIK, due 5/15/2027 | |
| | ZF North America Capital, Inc., 6.88%, due 4/14/2028 | |
| | | |
|
|
| | | |
| | | |
| | | |
| | | |
| | | |
| | | |
| | | |
| | BNP Paribas SA, 3.80%, due 1/10/2024 | |
| | | |
| | | |
| | | |
See Notes to Financial Statements
Schedule of Investments Short Duration Bond Fund^ (cont’d)
| |
|
|
|
| | Goldman Sachs Group, Inc. | |
| | (Secured Overnight Financing Rate + 0.51%), 5.85%, due 9/10/2024 | |
| | | |
| | | |
| | | |
| | | |
| | | |
| | | |
| | | |
| | | |
| | | |
| | Royal Bank of Canada, 3.38%, due 4/14/2025 | |
| | U.S. Bancorp, 5.73%, due 10/21/2026 | |
| | Wells Fargo & Co., 3.91%, due 4/25/2026 | |
| | | |
|
|
| | Camelot Return Merger Sub, Inc., 8.75%, due 8/1/2028 | |
| | Jeld-Wen, Inc., 4.63%, due 12/15/2025 | |
| | | |
|
|
| | Olympus Water U.S. Holding Corp., 7.13%, due 10/1/2027 | |
|
|
| | APX Group, Inc., 6.75%, due 2/15/2027 | |
| | Hertz Corp., 4.63%, due 12/1/2026 | |
| | | |
|
|
| | Presidio Holdings, Inc., 4.88%, due 2/1/2027 | |
Cosmetics - Personal Care 0.2% |
|
| | Haleon U.S. Capital LLC, 3.02%, due 3/24/2024 | |
Diversified Financial Services 1.8% |
|
| | AerCap Ireland Capital DAC/AerCap Global Aviation Trust, 6.50%, due 7/15/2025 | |
| | Capital One Financial Corp. | |
| | | |
| | | |
| | GTP Acquisition Partners I LLC, 3.48%, due 6/16/2025 | |
| | OneMain Finance Corp., 3.50%, due 1/15/2027 | |
| | | |
|
|
| | Dominion Energy, Inc., 2.85%, due 8/15/2026 | |
| | Duke Energy Corp., 2.65%, due 9/1/2026 | |
| | NextEra Energy Capital Holdings, Inc., 5.75%, due 9/1/2025 | |
| | | |
See Notes to Financial Statements
Schedule of Investments Short Duration Bond Fund^ (cont’d)
| |
|
Energy - Alternate Sources 0.3% |
|
| | | |
| | | |
| | | |
| | | |
|
|
| | Warnermedia Holdings, Inc. | |
| | | |
| | | |
| | | |
Healthcare - Products 1.2% |
|
| | GE HealthCare Technologies, Inc., 5.55%, due 11/15/2024 | |
| | Medline Borrower LP, 3.88%, due 4/1/2029 | |
| | | |
Holding Companies - Diversified 0.1% |
|
| | Benteler International AG, 10.50%, due 5/15/2028 | |
|
|
| | Tri Pointe Homes, Inc., 5.25%, due 6/1/2027 | |
|
|
| | | |
| | | |
| | | |
| | Jackson National Life Global Funding, 1.75%, due 1/12/2025 | |
| | | |
|
|
| | EquipmentShare.com, Inc., 9.00%, due 5/15/2028 | |
|
|
| | Lindblad Expeditions Holdings, Inc., 9.00%, due 5/15/2028 | |
| | Lindblad Expeditions LLC, 6.75%, due 2/15/2027 | |
| | Royal Caribbean Cruises Ltd., 4.25%, due 7/1/2026 | |
| | | |
|
|
| | Fox Corp., 3.05%, due 4/7/2025 | |
|
|
| | Ascent Resources Utica Holdings LLC/ARU Finance Corp., 7.00%, due 11/1/2026 | |
| | Borr IHC Ltd./Borr Finance LLC, 10.00%, due 11/15/2028 | |
| | | |
| | | |
| | | |
| | | |
|
|
| | AbbVie, Inc., 2.95%, due 11/21/2026 | |
| | CVS Health Corp., 3.63%, due 4/1/2027 | |
| | | |
|
|
| | Blue Racer Midstream LLC/Blue Racer Finance Corp., 7.63%, due 12/15/2025 | |
See Notes to Financial Statements
Schedule of Investments Short Duration Bond Fund^ (cont’d)
| |
|
|
|
| | Energy Transfer LP, 6.05%, due 12/1/2026 | |
| | EQM Midstream Partners LP | |
| | | |
| | | |
| | Genesis Energy LP/Genesis Energy Finance Corp., 6.50%, due 10/1/2025 | |
| | MPLX LP, 4.88%, due 6/1/2025 | |
| | New Fortress Energy, Inc. | |
| | | |
| | | |
| | Tallgrass Energy Partners LP/Tallgrass Energy Finance Corp., 6.00%, due 3/1/2027 | |
| | | |
Real Estate Investment Trusts 1.9% |
|
| | | |
| | | |
| | | |
| | American Tower Trust 1, 5.49%, due 3/15/2028 | |
| | Park Intermediate Holdings LLC/PK Domestic Property LLC/PK Finance Co.-Issuer, 4.88%, due 5/15/2029 | |
| | XHR LP, 6.38%, due 8/15/2025 | |
| | | |
|
|
| | 1011778 BC ULC/New Red Finance, Inc., 3.88%, due 1/15/2028 | |
|
|
| | Broadcom Corp./Broadcom Cayman Finance Ltd., 3.88%, due 1/15/2027 | |
| | | |
| | | |
| | | |
| | | |
|
|
| | | |
| | | |
| | | |
| | | |
|
|
| | AT&T, Inc., 1.70%, due 3/25/2026 | |
| | Level 3 Financing, Inc., 3.63%, due 1/15/2029 | |
| | | |
| | | |
| | | |
| | | |
|
|
| | Solaris Midstream Holdings LLC, 7.63%, due 4/1/2026 | |
Total Corporate Bonds (Cost $81,109,553) | |
|
|
|
|
| | Peraton Corp., Term Loan B, (1 mo. USD Term SOFR + 3.75%), 9.17%, due 2/1/2028 | |
See Notes to Financial Statements
Schedule of Investments Short Duration Bond Fund^ (cont’d)
| |
|
|
|
| | American Airlines, Inc., Term Loan, (3 mo. USD Term SOFR + 4.75%), 10.43%, due 4/20/2028 | |
Business Equipment & Services 0.2% |
|
| | William Morris Endeavor Entertainment LLC, First Lien Term Loan, (1 mo. USD Term SOFR + 2.75%), 8.07%, due 5/18/2025 | |
Diversified Financial Services 0.3% |
|
| | Avolon TLB Borrower 1 (US) LLC, Term Loan B6, (1 mo. USD Term SOFR + 2.50%), 7.84%, due 6/22/2028 | |
Diversified Insurance 0.2% |
|
| | HUB International Ltd., Term Loan B, (3 mo. USD Term SOFR + 4.25%), 9.66%, due 6/20/2030 | |
Electronics - Electrical 0.1% |
|
| | Ingram Micro, Inc., Term Loan, (3 mo. USD Term SOFR + 3.00%), 8.65%, due 6/30/2028 | |
|
|
| | Medline Borrower LP, Term Loan B, (1 mo. USD Term SOFR + 3.25%), 8.69%, due 10/23/2028 | |
| | Select Medical Corp., Term Loan B1, (1 mo. USD Term SOFR + 3.00%), 8.32%, due 3/6/2027 | |
| | | |
Industrial Equipment 0.1% |
|
| | Gates Global LLC, Term Loan B3, (1 mo. USD Term SOFR + 2.50%), 7.92%, due 3/31/2027 | |
|
|
| | Gen Digital, Inc., Term Loan B, (1 mo. USD Term SOFR + 2.00%), 7.42%, due 9/12/2029 | |
Leisure Goods - Activities - Movies 0.2% |
|
| | Carnival Corp., Term Loan B, (1 mo. USD Term SOFR + 3.00%), 8.34%, due 8/8/2027 | |
Life Sciences Tools & Services 0.3% |
|
| | Star Parent, Inc., Term Loan B, (3 mo. USD Term SOFR), due 9/27/2030 | |
Retailers (except food & drug) 0.1% |
|
| | Petco Health & Wellness Co., Inc., Term Loan B, (3 mo. USD Term SOFR + 3.25%), 8.90%, due 3/3/2028 | |
|
Total Loan Assignments (Cost $3,529,961) | |
|
|
|
Short-Term Investments 5.4% |
Investment Companies 5.4% |
|
| | State Street Institutional U.S. Government Money Market Fund Premier Class, 5.30%(k) (Cost $8,933,059) | |
Total Investments 99.7% (Cost $174,119,851) | |
Other Assets Less Liabilities 0.3% | |
| |
| Securities were purchased under Rule 144A of the Securities Act of 1933, as amended, or are otherwise restricted and, unless registered under the Securities Act of 1933 or exempted from registration, may only be sold to qualified institutional investors or may have other restrictions on resale. At October 31, 2023, these securities amounted to $68,906,421, which represents 41.6% of net assets of the Fund. |
See Notes to Financial Statements
Schedule of Investments Short Duration Bond Fund^ (cont’d)
| Variable or floating rate security where the stated interest rate is not based on a published reference rate and spread. Rather, the interest rate adjusts periodically based on changes in current interest rates and prepayments on the underlying pool of assets. The interest rate shown was the current rate as of October 31, 2023. |
| Variable or floating rate security. The interest rate shown was the current rate as of October 31, 2023 and changes periodically. |
| Step Bond. Coupon rate is a fixed rate for an initial period that either resets at a specific date or may reset in the future contingent upon a predetermined trigger. The interest rate shown was the current rate as of October 31, 2023. |
| Interest only security. These securities represent the right to receive the monthly interest payments on an underlying pool of mortgages. Payments of principal on the pool reduce the value of the "interest only" holding. |
| Payment-in-kind (PIK) security. |
| Security issued at a fixed coupon rate, which converts to a variable rate at a future date. Rate shown is the rate in effect as of period end. |
| When-issued security. Total value of all such securities at October 31, 2023 amounted to $462,783, which represents 0.3% of net assets of the Fund. |
| All or a portion of this security was purchased on a delayed delivery basis. |
| All or a portion of this security had not settled as of October 31, 2023 and thus may not have an interest rate in effect. Interest rates do not take effect until settlement. |
| Represents 7-day effective yield as of October 31, 2023. |
| Includes the impact of the Fund’s open positions in derivatives at October 31, 2023. |
See Notes to Financial Statements
Schedule of Investments Short Duration Bond Fund^ (cont’d)
|
| | |
| | |
| | |
| | |
| | |
| | |
| | |
| | |
| | |
| | |
| | |
| | |
Short-Term Investments and Other Assets—Net | | |
| | |
See Notes to Financial Statements
Schedule of Investments Short Duration Bond Fund^ (cont’d)
Derivative Instruments
Futures contracts ("futures")
At October 31, 2023, open positions in futures for the Fund were as follows:
| | | | Value and
Unrealized
Appreciation/
(Depreciation) |
| | U.S. Treasury Note, 2 Year | | |
| | |
| | | | Value and
Unrealized
Appreciation/
(Depreciation) |
| | U.S. Treasury Note, 10 Year | | |
| | U.S. Treasury Note, 5 Year | | |
| | U.S. Treasury Note, Ultra 10 Year | | |
| | | | |
| | |
| | |
At October 31, 2023, the Fund had $358,932 deposited in a segregated account to cover margin requirements on open futures.
For the year ended October 31, 2023, the average notional value for the months where the Fund had futures outstanding was $83,984,032 for long positions and $(38,484,294) for short positions.
The following is a summary, categorized by Level (see Note A of the Notes to Financial Statements), of inputs used to value the Fund’s investments as of October 31, 2023:
| | | | |
| | | | |
Mortgage-Backed Securities# | | | | |
| | | | |
| | | | |
| | | | |
| | | | |
| | | | |
| The Schedule of Investments provides information on the industry or sector categorization as well as a Positions by Country summary. |
See Notes to Financial Statements
Schedule of Investments Short Duration Bond Fund^ (cont’d)
The following is a summary, categorized by Level (see Note A of the Notes to Financial Statements), of inputs used to value the Fund’s derivatives as of October 31, 2023:
Other Financial Instruments | | | | |
|
|
|
|
|
| | | | |
| | | | |
| | | | |
| Futures are reported at the cumulative unrealized appreciation/(depreciation) of the instrument. |
^
A balance indicated with a "—", reflects either a zero balance or an amount that rounds to less than 1.
See Notes to Financial Statements
Schedule of Investments Strategic Income Fund^ October 31, 2023
| |
U.S. Treasury Obligations 6.6% |
|
| | | |
| | | |
| | | |
| | | |
| | | |
| | | |
| | | |
| | | |
| | | |
| | U.S. Treasury Notes, 3.38%, due 5/15/2033 | |
Total U.S. Treasury Obligations (Cost $228,148,145) | |
U.S. Government Agency Securities 0.1% |
|
| | Federal National Mortgage Association, 5.63%, due 7/15/2037 (Cost $2,638,451) | |
|
Mortgage-Backed Securities 61.7% |
Collateralized Mortgage Obligations 8.3% |
|
| | Federal Home Loan Mortgage Corp. REMICS | |
| | Series 4117, Class IO, 4.00%, due 10/15/2042 | |
| | Series 4150, Class SP, (6.04% - 30 day USD SOFR Average), 0.72%, due 1/15/2043 | |
| | Series 4456, Class SA, (6.04% - 30 day USD SOFR Average), 0.72%, due 3/15/2045 | |
| | Series 4627, Class SA, (5.89% - 30 day USD SOFR Average), 0.57%, due 10/15/2046 | |
| | Series 4994, Class LI, 4.00%, due 12/25/2048 | |
| | Series 5146, Class EC, 1.50%, due 2/25/2049 | |
| | Series 4953, Class BI, 4.50%, due 2/25/2050 | |
| | Federal Home Loan Mortgage Corp. STACR REMIC Trust | |
| | Series 2021-DNA5, Class B1, (30 day USD SOFR Average + 3.05%), 8.37%, due 1/25/2034 | |
| | Series 2021-DNA7, Class M2, (30 day USD SOFR Average + 1.80%), 7.12%, due 11/25/2041 | |
| | Series 2022-DNA2, Class M1B, (30 day USD SOFR Average + 2.40%), 7.72%, due 2/25/2042 | |
| | Series 2022-DNA2, Class M2, (30 day USD SOFR Average + 3.75%), 9.07%, due 2/25/2042 | |
| | Series 2022-HQA1, Class M2, (30 day USD SOFR Average + 5.25%), 10.57%, due 3/25/2042 | |
| | Series 2022-DNA3, Class M1B, (30 day USD SOFR Average + 2.90%), 8.22%, due 4/25/2042 | |
| | Series 2022-DNA5, Class M1B, (30 day USD SOFR Average + 4.50%), 9.82%, due 6/25/2042 | |
| | Series 2022-DNA6, Class M1B, (30 day USD SOFR Average + 3.70%), 9.02%, due 9/25/2042 | |
| | Series 2022-DNA6, Class M2, (30 day USD SOFR Average + 5.75%), 11.07%, due 9/25/2042 | |
| | Federal Home Loan Mortgage Corp. STACR Trust | |
| | Series 2018-DNA1, Class M2, (30 day USD SOFR Average + 1.91%), 7.24%, due 7/25/2030 | |
| | Series 2018-HQA1, Class M2, (30 day USD SOFR Average + 2.41%), 7.74%, due 9/25/2030 | |
See Notes to Financial Statements
Schedule of Investments Strategic Income Fund^ (cont’d)
| |
|
Collateralized Mortgage Obligations – cont'd |
|
| | Federal National Mortgage Association Connecticut Avenue Securities | |
| | Series 2017-C06, Class 2M2, (30 day USD SOFR Average + 2.91%), 8.24%, due 2/25/2030 | |
| | Series 2017-C07, Class 1M2, (30 day USD SOFR Average + 2.51%), 7.84%, due 5/25/2030 | |
| | Series 2018-C02, Class 2M2, (30 day USD SOFR Average + 2.31%), 7.64%, due 8/25/2030 | |
| | Series 2018-C04, Class 2M2, (30 day USD SOFR Average + 2.66%), 7.99%, due 12/25/2030 | |
| | Series 2018-C05, Class 1M2, (30 day USD SOFR Average + 2.46%), 7.79%, due 1/25/2031 | |
| | Series 2019-R04, Class 2B1, (30 day USD SOFR Average + 5.36%), 10.69%, due 6/25/2039 | |
| | Series 2019-R05, Class 1B1, (30 day USD SOFR Average + 4.21%), 9.54%, due 7/25/2039 | |
| | Series 2020-R01, Class 1B1, (30 day USD SOFR Average + 3.36%), 8.69%, due 1/25/2040 | |
| | Series 2021-R03, Class 1M2, (30 day USD SOFR Average + 1.65%), 6.97%, due 12/25/2041 | |
| | Series 2022-R01, Class 1M2, (30 day USD SOFR Average + 1.90%), 7.22%, due 12/25/2041 | |
| | Series 2022-R04, Class 1M2, (30 day USD SOFR Average + 3.10%), 8.42%, due 3/25/2042 | |
| | Series 2022-R03, Class 1M2, (30 day USD SOFR Average + 3.50%), 8.82%, due 3/25/2042 | |
| | Series 2022-R03, Class 1B1, (30 day USD SOFR Average + 6.25%), 11.57%, due 3/25/2042 | |
| | Series 2022-R07, Class 1M1, (30 day USD SOFR Average + 2.95%), 8.27%, due 6/25/2042 | |
| | Series 2022-R08, Class 1M2, (30 day USD SOFR Average + 3.60%), 8.92%, due 7/25/2042 | |
| | Series 2022-R08, Class 1B1, (30 day USD SOFR Average + 5.60%), 10.92%, due 7/25/2042 | |
| | Series 2023-R01, Class 1M2, (30 day USD SOFR Average + 3.75%), 9.07%, due 12/25/2042 | |
| | Series 2023-R02, Class 1M2, (30 day USD SOFR Average + 3.35%), 8.67%, due 1/25/2043 | |
| | Federal National Mortgage Association Interest Strip | |
| | Series 413, Class C26, 4.00%, due 10/25/2041 | |
| | Series 418, Class C24, 4.00%, due 8/25/2043 | |
See Notes to Financial Statements
Schedule of Investments Strategic Income Fund^ (cont’d)
| |
|
Collateralized Mortgage Obligations – cont'd |
|
| | Federal National Mortgage Association REMICS | |
| | Series 2012-96, Class PS, (6.59% - 30 day USD SOFR Average), 1.26%, due 7/25/2041 | |
| | Series 2019-49, Class DS, (6.04% - 30 day USD SOFR Average), 0.71%, due 6/25/2043 | |
| | Series 2018-18, Class ST, (5.99% - 30 day USD SOFR Average), 0.66%, due 12/25/2044 | |
| | Series 2016-8, Class SB, (5.99% - 30 day USD SOFR Average), 0.66%, due 3/25/2046 | |
| | Series 2016-31, Class HS, (5.89% - 30 day USD SOFR Average), 0.56%, due 6/25/2046 | |
| | Series 2016-67, Class KS, (5.89% - 30 day USD SOFR Average), 0.56%, due 9/25/2046 | |
| | Series 2016-62, Class SA, (5.89% - 30 day USD SOFR Average), 0.56%, due 9/25/2046 | |
| | Series 2019-33, Class SN, (5.99% - 30 day USD SOFR Average), 0.66%, due 7/25/2049 | |
| | Series 2021-76, Class AI, 3.50%, due 11/25/2051 | |
| | Government National Mortgage Association REMICS | |
| | Series 2013-186, Class SA, (5.99% - 1 mo. USD Term SOFR), 0.65%, due 12/16/2043 | |
| | Series 2015-144, Class HS, (6.09% - 1 mo. USD Term SOFR), 0.75%, due 10/20/2045 | |
| | Series 2015-187, Class AI, 4.50%, due 12/20/2045 | |
| | Series 2017-112, Class KS, (6.09% - 1 mo. USD Term SOFR), 0.75%, due 7/20/2047 | |
| | Series 2020-86, Class WK, 1.00%, due 6/20/2050 | |
| | Series 2020-107, Class AB, 1.00%, due 7/20/2050 | |
| | Series 2020-112, Class KA, 1.00%, due 8/20/2050 | |
| | Series 2020-151, Class MI, 2.50%, due 10/20/2050 | |
| | Series 2021-30, Class DI, 2.50%, due 2/20/2051 | |
| | Series 2021-103, Class HE, 2.00%, due 6/20/2051 | |
| | Series 2021-119, Class NC, 1.50%, due 7/20/2051 | |
| | Series 2021-139, Class IE, 3.50%, due 8/20/2051 | |
| | Series 2021-196, Class IO, 2.50%, due 11/20/2051 | |
| | JP Morgan Alternative Loan Trust, Series 2006-A5, Class 1A1, (1 mo. USD Term SOFR + 0.43%), 5.76%, due 10/25/2036 | |
| | Onslow Bay Mortgage Loan Trust, Series 2021-NQM4, Class A1, 1.96%, due 10/25/2061 | |
| | SG Residential Mortgage Trust, Series 2021-2, Class A1, 1.74%, due 12/25/2061 | |
| | Starwood Mortgage Residential Trust, Series 2021-5, Class A1, 1.92%, due 9/25/2066 | |
| | Towd Point Mortgage Trust, Series 2022-4, Class A1, 3.75%, due 9/25/2062 | |
| | Verus Securitization Trust | |
| | Series 2021-6, Class A1, 1.63%, due 10/25/2066 | |
| | Series 2021-6, Class A3, 1.89%, due 10/25/2066 | |
| | Series 2022-4, Class A3, 4.74%, due 4/25/2067 | |
| | | |
Commercial Mortgage-Backed 4.6% |
|
| | | |
| | Series 2019-BN17, Class C, 4.51%, due 4/15/2052 | |
| | Series 2021-BN38, Class C, 3.22%, due 12/15/2064 | |
| | Barclays Commercial Mortgage Trust, Series 2019-C5, Class C, 3.71%, due 11/15/2052 | |
| | | |
| | Series 2021-C11, Class XA, 1.38%, due 9/15/2054 | |
| | Series 2022-C17, Class XA, 1.15%, due 9/15/2055 | |
See Notes to Financial Statements
Schedule of Investments Strategic Income Fund^ (cont’d)
| |
|
Commercial Mortgage-Backed – cont'd |
|
| | | |
| | Series 2020-B16, Class C, 3.65%, due 2/15/2053 | |
| | Series 2020-B17, Class C, 3.37%, due 3/15/2053 | |
| | Series 2021-B30, Class XA, 0.81%, due 11/15/2054 | |
| | BMO Mortgage Trust, Series 2023-C5, Class C, 6.63%, due 6/15/2056 | |
| | BPR Trust, Series 2022-OANA, Class D, (1 mo. USD Term SOFR + 3.70%), 9.03%, due 4/15/2037 | |
| | BX Commercial Mortgage Trust | |
| | Series 2021-VOLT, Class D, (1 mo. USD Term SOFR + 1.76%), 7.10%, due 9/15/2036 | |
| | Series 2019-XL, Class D, (1 mo. USD Term SOFR + 1.56%), 6.90%, due 10/15/2036 | |
| | | |
| | Series 2019-OC11, Class B, 3.61%, due 12/9/2041 | |
| | Series 2019-OC11, Class D, 3.94%, due 12/9/2041 | |
| | CAMB Commercial Mortgage Trust | |
| | Series 2019-LIFE, Class C, (1 mo. USD Term SOFR + 1.50%), 6.83%, due 12/15/2037 | |
| | Series 2019-LIFE, Class D, (1 mo. USD Term SOFR + 1.80%), 7.13%, due 12/15/2037 | |
| | Series 2019-LIFE, Class E, (1 mo. USD Term SOFR + 2.20%), 7.53%, due 12/15/2037 | |
| | Series 2019-LIFE, Class F, (1 mo. USD Term SOFR + 2.60%), 7.93%, due 12/15/2037 | |
| | Citigroup Commercial Mortgage Trust | |
| | Series 2023-PRM3, Class C, 6.36%, due 7/10/2028 | |
| | Series 2023-SMRT, Class C, 5.85%, due 10/12/2040 | |
| | Series 2014-GC25, Class XA, 0.94%, due 10/10/2047 | |
| | Series 2015-GC27, Class XA, 1.30%, due 2/10/2048 | |
| | Series 2017-P8, Class C, 4.26%, due 9/15/2050 | |
| | | |
| | Series 2012-CR3, Class XA, 0.88%, due 10/15/2045 | |
| | Series 2012-CR4, Class AM, 3.25%, due 10/15/2045 | |
| | Series 2014-CR16, Class XA, 0.93%, due 4/10/2047 | |
| | Series 2014-CR17, Class XA, 0.92%, due 5/10/2047 | |
| | Series 2014-UBS3, Class XA, 1.05%, due 6/10/2047 | |
| | Series 2014-UBS6, Class XA, 0.83%, due 12/10/2047 | |
| | Credit Suisse Mortgage Capital Certificates | |
| | Series 2019-ICE4, Class E, (1 mo. USD Term SOFR + 2.20%), 7.53%, due 5/15/2036 | |
| | Series 2019-ICE4, Class F, (1 mo. USD Term SOFR + 2.70%), 8.03%, due 5/15/2036 | |
| | CSAIL Commercial Mortgage Trust | |
| | Series 2018-C14, Class C, 4.90%, due 11/15/2051 | |
| | Series 2015-C2, Class XA, 0.71%, due 6/15/2057 | |
| | Eleven Madison Trust Mortgage Trust, Series 2015-11MD, Class A, 3.55%, due 9/10/2035 | |
| | Federal Home Loan Mortgage Corp. Multiclass Certificates | |
| | Series 2020-RR03, Class X1, 1.71%, due 7/27/2028 | |
| | Series 2020-RR02, Class DX, 1.82%, due 9/27/2028 | |
| | Series 2020-RR04, Class X, 2.13%, due 2/27/2029 | |
| | Series 2020-RR02, Class CX, 1.27%, due 3/27/2029 | |
| | Federal Home Loan Mortgage Corp. Multifamily Structured Pass-Through Certificates | |
| | Series K083, Class XAM, 0.05%, due 10/25/2028 | |
| | Series K085, Class XAM, 0.06%, due 10/25/2028 | |
| | FIVE Mortgage Trust, Series 2023-V1, Class C, 6.40%, due 2/10/2056 | |
See Notes to Financial Statements
Schedule of Investments Strategic Income Fund^ (cont’d)
| |
|
Commercial Mortgage-Backed – cont'd |
|
| | GS Mortgage Securities Trust | |
| | Series 2011-GC5, Class XA, 0.09%, due 8/10/2044 | |
| | Series 2014-GC18, Class XA, 0.97%, due 1/10/2047 | |
| | Series 2015-GS1, Class AS, 4.04%, due 11/10/2048 | |
| | Series 2015-GC30, Class XA, 0.72%, due 5/10/2050 | |
| | Series 2019-GC42, Class C, 3.69%, due 9/10/2052 | |
| | | |
| | Series 2016-HHV, Class C, 4.19%, due 11/5/2038 | |
| | Series 2016-HHV, Class D, 4.19%, due 11/5/2038 | |
| | Hudson Yards Mortgage Trust, Series 2016-10HY, Class C, 2.98%, due 8/10/2038 | |
| | INTOWN Mortgage Trust, Series 2022-STAY, Class A, (1 mo. USD Term SOFR + 2.49%), 7.82%, due 8/15/2039 | |
| | JP Morgan Chase Commercial Mortgage Securities Trust | |
| | Series 2016-NINE, Class A, 2.85%, due 9/6/2038 | |
| | Series 2022-OPO, Class D, 3.45%, due 1/5/2039 | |
| | Manhattan West Mortgage Trust | |
| | Series 2020-1MW, Class D, 2.34%, due 9/10/2039 | |
| | Series 2020-1MW, Class C, 2.34%, due 9/10/2039 | |
| | Morgan Stanley Bank of America Merrill Lynch Trust, Series 2017-C33, Class C, 4.56%, due 5/15/2050 | |
| | Morgan Stanley Capital I Trust | |
| | Series 2017-H1, Class B, 4.08%, due 6/15/2050 | |
| | Series 2017-H1, Class C, 4.28%, due 6/15/2050 | |
| | Series 2018-H4, Class C, 5.06%, due 12/15/2051 | |
| | MSWF Commercial Mortgage Trust, Series 2023-1, Class C, 6.68%, due 5/15/2056 | |
| | NYO Commercial Mortgage Trust, Series 2021-1290, Class D, (1 mo. USD Term SOFR + 2.66%), 7.99%, due 11/15/2038 | |
| | ORL Trust, Series 2023-GLKS, Class D, (1 mo. USD Term SOFR + 4.30%), 9.64%, due 10/15/2028 | |
| | Taubman Centers Commercial Mortgage Trust | |
| | Series 2022-DPM, Class B, (1 mo. USD Term SOFR + 2.93%), 8.27%, due 5/15/2037 | |
| | Series 2022-DPM, Class C, (1 mo. USD Term SOFR + 3.78%), 9.11%, due 5/15/2037 | |
| | Wells Fargo Commercial Mortgage Trust | |
| | Series 2015-NXS4, Class C, 4.68%, due 12/15/2048 | |
| | Series 2016-NXS6, Class C, 4.39%, due 11/15/2049 | |
| | WF-RBS Commercial Mortgage Trust | |
| | Series 2013-C14, Class XB, 0.00%, due 6/15/2046 | |
| | Series 2014-C21, Class XA, 0.99%, due 8/15/2047 | |
| | Series 2014-C25, Class XA, 0.78%, due 11/15/2047 | |
| | Series 2014-C22, Class XA, 0.76%, due 9/15/2057 | |
| | | |
Federal Home Loan Mortgage Corp. 12.8% |
|
| | Pass-Through Certificates | |
| | 2.50%, due 5/1/2051 - 7/1/2052 | |
| | 3.00%, due 11/1/2050 - 5/1/2052 | |
| | 3.50%, due 4/1/2052 - 12/1/2052 | |
| | 4.00%, due 4/1/2052 - 6/1/2053 | |
| | 4.50%, due 7/1/2052 - 5/1/2053 | |
| | 5.00%, due 10/1/2052 - 8/1/2053 | |
| | 5.50%, due 11/1/2052 - 8/1/2053 | |
See Notes to Financial Statements
Schedule of Investments Strategic Income Fund^ (cont’d)
| |
|
Federal Home Loan Mortgage Corp. – cont'd |
|
| | 6.00%, due 12/1/2052 - 10/1/2053 | |
| | | |
Federal Home Loan Mortgage Corp. 0.9% |
|
| | Pass-Through Certificates | |
| | | |
| | | |
| | | |
| | | |
| | | |
| | | |
| | | |
| | | |
Federal National Mortgage Association 29.9% |
|
| | Pass-Through Certificates | |
| | 2.50%, due 8/1/2051 - 5/1/2052 | |
| | 3.00%, due 6/1/2050 - 3/1/2053 | |
| | 3.50%, due 5/1/2051 - 5/1/2053 | |
| | 4.00%, due 2/1/2052 - 2/1/2053 | |
| | 4.50%, due 6/1/2052 - 4/1/2053 | |
| | 5.00%, due 8/1/2052 - 9/1/2053 | |
| | 5.50%, due 12/1/2052 - 10/1/2053 | |
| | 6.00%, due 1/1/2053 - 10/1/2053 | |
| | 2.50%, TBA, 30 Year Maturity | |
| | 3.50%, TBA, 30 Year Maturity | |
| | 4.00%, TBA, 30 Year Maturity | |
| | 4.50%, TBA, 30 Year Maturity | |
| | 5.00%, TBA, 30 Year Maturity | |
| | 5.50%, TBA, 30 Year Maturity | |
| | 6.00%, TBA, 30 Year Maturity | |
| | | |
Government National Mortgage Association 5.2% |
|
| | Pass-Through Certificates | |
| | 5.00%, due 11/20/2052 - 7/20/2053 | |
| | 5.50%, due 6/20/2053 - 7/20/2053 | |
| | 6.00%, due 12/20/2052 - 10/20/2053 | |
| | | |
| | 5.00%, TBA, 30 Year Maturity | |
| | 5.50%, TBA, 30 Year Maturity | |
| | 6.00%, TBA, 30 Year Maturity | |
| | | |
Total Mortgage-Backed Securities (Cost $2,218,237,713) | |
Asset-Backed Securities 8.1% |
|
| | 37 Capital CLO 1 Ltd., Series 2021-1A, Class E, (3 mo. USD Term SOFR + 7.46%), 12.86%, due 10/15/2034 | |
| | 37 Capital CLO II Ltd., Series 2022-1A, Class A1A, (3 mo. USD Term SOFR + 2.00%), 7.39%, due 7/15/2034 | |
| | AASET Trust, Series 2020-1A, Class A, 3.35%, due 1/16/2040 | |
| | AGL CLO 17 Ltd., Series 2022-17A, Class E, (3 mo. USD Term SOFR + 6.35%), 11.76%, due 1/21/2035 | |
See Notes to Financial Statements
Schedule of Investments Strategic Income Fund^ (cont’d)
| |
Asset-Backed Securities – cont'd |
|
| | AIMCO CLO, Series 2018-AA, Class E, (3 mo. USD Term SOFR + 5.41%), 10.81%, due 4/17/2031 | |
| | Alinea CLO Ltd., Series 2018-1A, Class E, (3 mo. USD Term SOFR + 6.26%), 11.68%, due 7/20/2031 | |
| | AM Capital Funding LLC, Series 2018-1, Class A, 4.98%, due 12/15/2023 | |
| | Amur Equipment Finance Receivables XI LLC, Series 2022-2A, Class A2, 5.30%, due 6/21/2028 | |
| | | |
| | Series 2017-28A, Class C, (3 mo. USD Term SOFR + 2.76%), 8.18%, due 1/20/2031 | |
| | Series 2017-28A, Class D, (3 mo. USD Term SOFR + 5.76%), 11.18%, due 1/20/2031 | |
| | | |
| | Series 2019-53A, Class D, (3 mo. USD Term SOFR + 4.01%), 9.41%, due 4/24/2031 | |
| | Series 2019-53A, Class E, (3 mo. USD Term SOFR + 7.11%), 12.51%, due 4/24/2031 | |
| | Ares XLV CLO Ltd., Series 2017-45A, Class E, (3 mo. USD Term SOFR + 6.36%), 11.76%, due 10/15/2030 | |
| | Ares XXVII CLO Ltd., Series 2013-2A, Class ER2, (3 mo. USD Term SOFR + 7.01%), 12.40%, due 10/28/2034 | |
| | | |
| | Series 2018-2A, Class D, (3 mo. USD Term SOFR + 3.11%), 8.53%, due 4/20/2031 | |
| | Series 2018-2A, Class E, (3 mo. USD Term SOFR + 5.86%), 11.28%, due 4/20/2031 | |
| | Avis Budget Rental Car Funding AESOP LLC | |
| | Series 2020-2A, Class B, 2.96%, due 2/20/2027 | |
| | Series 2022-3A, Class B, 5.31%, due 2/20/2027 | |
| | Series 2021-2A, Class B, 1.90%, due 2/20/2028 | |
| | Ballyrock CLO 19 Ltd., Series 2022-19A, Class C, (3 mo. USD Term SOFR + 3.50%), 8.92%, due 4/20/2035 | |
| | Bank of America Auto Trust, Series 2023-1A, Class A2, 5.83%, due 5/15/2026 | |
| | Battalion CLO XXI Ltd., Series 2021-21A, Class D, (3 mo. USD Term SOFR + 3.56%), 8.96%, due 7/15/2034 | |
| | Beacon Container Finance II LLC, Series 2021-1A, Class A, 2.25%, due 10/22/2046 | |
| | Benefit Street Partners CLO XII Ltd., Series 2017-12A, Class D, (3 mo. USD Term SOFR + 6.67%), 12.07%, due 10/15/2030 | |
| | Benefit Street Partners CLO XX Ltd., Series 2020-20A, Class AR, (3 mo. USD Term SOFR + 1.43%), 6.83%, due 7/15/2034 | |
| | Benefit Street Partners CLO XXII Ltd., Series 2020-22A, Class DR, (3 mo. USD Term SOFR + 3.35%), 8.77%, due 4/20/2035 | |
| | BlueMountain CLO XXV Ltd., Series 2019-25A, Class D1R, (3 mo. USD Term SOFR + 3.56%), 8.96%, due 7/15/2036 | |
| | BlueMountain CLO XXXIII Ltd., Series 2021-33A, Class E, (3 mo. USD Term SOFR + 7.09%), 12.47%, due 11/20/2034 | |
| | BMW Vehicle Lease Trust, Series 2023-1, Class A2, 5.27%, due 2/25/2025 | |
| | Canyon Capital CLO Ltd., Series 2021-1A, Class E, (3 mo. USD Term SOFR + 6.67%), 12.07%, due 4/15/2034 | |
| | Capital One Prime Auto Receivables Trust | |
| | Series 2022-1, Class A2, 2.71%, due 6/16/2025 | |
| | Series 2023-1, Class A2, 5.20%, due 5/15/2026 | |
| | | |
| | Series 2017-1A, Class C, (3 mo. USD Term SOFR + 2.86%), 8.28%, due 1/20/2031 | |
| | Series 2017-1A, Class D, (3 mo. USD Term SOFR + 6.16%), 11.58%, due 1/20/2031 | |
| | Carlyle U.S. CLO Ltd., Series 2017-5A, Class D, (3 mo. USD Term SOFR + 5.56%), 10.98%, due 1/20/2030 | |
| | Carmax Auto Owner Trust, Series 2023-3, Class A2A, 5.72%, due 11/16/2026 | |
See Notes to Financial Statements
Schedule of Investments Strategic Income Fund^ (cont’d)
| |
Asset-Backed Securities – cont'd |
|
| | CIFC Funding Ltd., Series 2021-3A, Class D, (3 mo. USD Term SOFR + 3.26%), 8.66%, due 7/15/2036 | |
| | Citigroup Mortgage Loan Trust, Inc., Series 2006-AMC1, Class A2B, (1 mo. USD Term SOFR + 0.43%), 5.76%, due 9/25/2036 | |
| | Citizens Auto Receivables Trust, Series 2023-1, Class A2A, 6.13%, due 7/15/2026 | |
| | Clover CLO LLC, Series 2020-1A, Class DR, (3 mo. USD Term SOFR + 3.26%), 8.66%, due 4/15/2034 | |
| | CNH Equipment Trust, Series 2021-A, Class A3, 0.40%, due 12/15/2025 | |
| | | |
| | Series 2021-1A, Class C, (3 mo. USD Term SOFR + 3.56%), 8.98%, due 7/20/2034 | |
| | Series 2021-1A, Class D, (3 mo. USD Term SOFR + 7.01%), 12.43%, due 7/20/2034 | |
| | CyrusOne Data Centers Issuer I LLC, Series 2023-1A, Class A2, 4.30%, due 4/20/2048 | |
| | Dell Equipment Finance Trust | |
| | Series 2023-1, Class A2, 5.65%, due 9/22/2028 | |
| | Series 2023-3, Class A2, 6.10%, due 4/23/2029 | |
| | DLLAA LLC, Series 2023-1A, Class A2, 5.93%, due 7/20/2026 | |
| | DLLAD LLC, Series 2023-1A, Class A2, 5.19%, due 4/20/2026 | |
| | DLLMT LLC, Series 2023-1A, Class A2, 5.78%, due 11/20/2025 | |
| | Dryden 36 Senior Loan Fund, Series 2014-36A, Class ER2, (3 mo. USD Term SOFR + 7.14%), 12.54%, due 4/15/2029 | |
| | Dryden 45 Senior Loan Fund, Series 2016-45A, Class ER, (3 mo. USD Term SOFR + 6.11%), 11.51%, due 10/15/2030 | |
| | | |
| | Series 2017-53A, Class D, (3 mo. USD Term SOFR + 2.66%), 8.06%, due 1/15/2031 | |
| | Series 2017-53A, Class E, (3 mo. USD Term SOFR + 5.56%), 10.96%, due 1/15/2031 | |
| | Dryden 54 Senior Loan Fund, Series 2017-54A, Class E, (3 mo. USD Term SOFR + 6.46%), 11.86%, due 10/19/2029 | |
| | | |
| | Series 2015-1A, Class DR, (3 mo. USD Term SOFR + 2.76%), 8.18%, due 1/20/2030 | |
| | Series 2015-1A, Class ER, (3 mo. USD Term SOFR + 5.86%), 11.28%, due 1/20/2030 | |
| | Series 2018-1A, Class E, (3 mo. USD Term SOFR + 6.26%), 11.66%, due 10/15/2030 | |
| | Series 2020-2A, Class AR, (3 mo. USD Term SOFR + 1.41%), 6.81%, due 1/15/2035 | |
| | Elmwood CLO X Ltd., Series 2021-3A, Class A, (3 mo. USD Term SOFR + 1.30%), 6.72%, due 10/20/2034 | |
| | Fifth Third Auto Trust, Series 2023-1, Class A2A, 5.80%, due 11/16/2026 | |
| | | |
| | Series 2017-1A, Class ER, (3 mo. USD Term SOFR + 6.16%), 11.53%, due 5/15/2030 | |
| | Series 2018-1A, Class E, (3 mo. USD Term SOFR + 5.41%), 10.81%, due 4/17/2031 | |
| | Ford Credit Auto Lease Trust, Series 2023-A, Class A2A, 5.19%, due 6/15/2025 | |
| | Fort Washington CLO Ltd., Series 2019-1A, Class ER, (3 mo. USD Term SOFR + 7.01%), 12.43%, due 10/20/2032 | |
| | Foundation Finance Trust, Series 2019-1A, Class A, 3.86%, due 11/15/2034 | |
| | Frontier Issuer LLC, Series 2023-1, Class A2, 6.60%, due 8/20/2053 | |
| | Galaxy XV CLO Ltd., Series 2013-15A, Class ER, (3 mo. USD Term SOFR + 6.91%), 12.30%, due 10/15/2030 | |
| | Galaxy XXV CLO Ltd., Series 2018-25A, Class E, (3 mo. USD Term SOFR + 6.21%), 11.59%, due 10/25/2031 | |
| | Galaxy XXVII CLO Ltd., Series 2018-27A, Class E, (3 mo. USD Term SOFR + 6.04%), 11.41%, due 5/16/2031 | |
| | Galaxy XXVIII CLO Ltd., Series 2018-28A, Class E, (3 mo. USD Term SOFR + 6.26%), 11.66%, due 7/15/2031 | |
| | GECU Auto Receivables Trust, Series 2023-1A, Class A2, 5.95%, due 3/15/2027 | |
See Notes to Financial Statements
Schedule of Investments Strategic Income Fund^ (cont’d)
| |
Asset-Backed Securities – cont'd |
|
| | Gedesco Trade Receivables DAC, Series 2020-1, Class A, (1 mo. EUR EURIBOR + 1.15%), 5.01%, due 1/24/2026 | |
| | Generate CLO 2 Ltd., Series 2A, Class DR, (3 mo. USD Term SOFR + 2.86%), 8.27%, due 1/22/2031 | |
| | GM Financial Automobile Leasing Trust | |
| | Series 2023-1, Class A2A, 5.27%, due 6/20/2025 | |
| | Series 2023-2, Class A2A, 5.44%, due 10/20/2025 | |
| | GM Financial Consumer Automobile Receivables Trust | |
| | Series 2022-2, Class A2, 2.52%, due 5/16/2025 | |
| | Series 2023-1, Class A2A, 5.19%, due 3/16/2026 | |
| | HalseyPoint CLO 4 Ltd., Series 2021-4A, Class E, (3 mo. USD Term SOFR + 6.97%), 12.39%, due 4/20/2034 | |
| | Hilton Grand Vacations Trust, Series 2022-1D, Class D, 6.79%, due 6/20/2034 | |
| | Honda Auto Receivables Owner Trust, Series 2023-2, Class A2, 5.41%, due 4/15/2026 | |
| | HPEFS Equipment Trust, Series 2022-1A, Class B, 1.79%, due 5/21/2029 | |
| | Hyundai Auto Lease Securitization Trust, Series 2023-A, Class A2A, 5.20%, due 4/15/2025 | |
| | Hyundai Auto Receivables Trust | |
| | Series 2022-A, Class A2A, 1.81%, due 2/18/2025 | |
| | Series 2022-C, Class A2A, 5.35%, due 11/17/2025 | |
| | John Deere Owner Trust, Series 2022-C, Class A2, 4.98%, due 8/15/2025 | |
| | Katayma CLO I Ltd., Series 2023-1A, Class A1, (3 mo. USD Term SOFR + 2.00%), 2.00%, due 10/20/2036 | |
| | KKR CLO 25 Ltd., Series 25, Class DR, (3 mo. USD Term SOFR + 3.66%), 9.06%, due 7/15/2034 | |
| | Kubota Credit Owner Trust | |
| | Series 2022-1A, Class A2, 2.34%, due 4/15/2025 | |
| | Series 2023-2A, Class A2, 5.61%, due 7/15/2026 | |
| | Madison Park Funding LXII Ltd., Series 2022-62A, Class AR, (3 mo. USD Term SOFR + 1.85%), 7.25%, due 7/17/2036 | |
| | | |
| | Series 2018-20A, Class D, (3 mo. USD Term SOFR + 2.76%), 8.18%, due 4/20/2031 | |
| | Series 2018-20A, Class E, (3 mo. USD Term SOFR + 5.61%), 11.03%, due 4/20/2031 | |
| | Magnetite XXII Ltd., Series 2019-22A, Class DR, (3 mo. USD Term SOFR + 3.36%), 8.76%, due 4/15/2031 | |
| | Magnetite XXVIII Ltd., Series 2020-28A, Class AR, (3 mo. USD Term SOFR + 1.39%), 6.81%, due 1/20/2035 | |
| | Marble Point CLO XI Ltd., Series 2017-2A, Class D, (3 mo. USD Term SOFR + 3.06%), 8.46%, due 12/18/2030 | |
| | Mercedes-Benz Auto Lease Trust, Series 2023-A, Class A2, 5.24%, due 11/17/2025 | |
| | Mercedes-Benz Auto Receivables Trust | |
| | Series 2023-1, Class A2, 5.09%, due 1/15/2026 | |
| | Series 2023-2, Class A2, 5.92%, due 11/16/2026 | |
| | MetroNet Infrastructure Issuer LLC, Series 2022-1A, Class A2, 6.35%, due 10/20/2052 | |
| | MMAF Equipment Finance LLC, Series 2022-A, Class A2, 2.77%, due 2/13/2025 | |
| | Morgan Stanley Eaton Vance CLO Ltd. | |
| | Series 2021-1A, Class E, (3 mo. USD Term SOFR + 7.01%), 12.42%, due 10/20/2034 | |
| | Series 2022-16A, Class D1, (3 mo. USD Term SOFR + 3.25%), 8.64%, due 4/15/2035 | |
| | | |
| | Series 2021-2A, Class B, 1.83%, due 5/20/2039 | |
| | Series 2022-1A, Class B, 4.40%, due 11/21/2039 | |
See Notes to Financial Statements
Schedule of Investments Strategic Income Fund^ (cont’d)
| |
Asset-Backed Securities – cont'd |
|
| | Navient Private Education Refi Loan Trust | |
| | Series 2021-EA, Class A, 0.97%, due 12/16/2069 | |
| | Series 2021-FA, Class A, 1.11%, due 2/18/2070 | |
| | Series 2021-GA, Class A, 1.58%, due 4/15/2070 | |
| | | |
| | Series 2023-A, Class A2A, 5.10%, due 3/17/2025 | |
| | Series 2023-B, Class A2A, 5.74%, due 8/15/2025 | |
| | Nissan Auto Receivables Owner Trust, Series 2023-A, Class A2A, 5.34%, due 2/17/2026 | |
| | | |
| | Series 2017-13A, Class DR, (3 mo. USD Term SOFR + 6.76%), 12.16%, due 7/15/2030 | |
| | Series 2017-14A, Class C, (3 mo. USD Term SOFR + 2.86%), 8.24%, due 11/20/2030 | |
| | Series 2017-14A, Class D, (3 mo. USD Term SOFR + 6.06%), 11.44%, due 11/20/2030 | |
| | Series 2020-19A, Class ER, (3 mo. USD Term SOFR + 6.76%), 12.18%, due 10/20/2034 | |
| | OHA Credit Funding 3 Ltd., Series 2019-3A, Class DR, (3 mo. USD Term SOFR + 3.16%), 8.58%, due 7/2/2035 | |
| | OHA Credit Funding 4 Ltd., Series 2019-4A, Class AR, (3 mo. USD Term SOFR + 1.41%), 6.82%, due 10/22/2036 | |
| | OHA Credit Funding 6 Ltd., Series 2020-6A, Class DR, (3 mo. USD Term SOFR + 3.41%), 8.83%, due 7/20/2034 | |
| | OHA Credit Partners XV Ltd., Series 2017-15A, Class D, (3 mo. USD Term SOFR + 2.71%), 8.13%, due 1/20/2030 | |
| | OHA Loan Funding Ltd., Series 2015-1A, Class AR3, (3 mo. USD Term SOFR + 1.41%), 6.81%, due 1/19/2037 | |
| | OneMain Financial Issuance Trust, Series 2022-2A, Class A, 4.89%, due 10/14/2034 | |
| | | |
| | Series 2014-1A, Class DR2, (3 mo. USD Term SOFR + 5.96%), 11.36%, due 1/17/2031 | |
| | Series 2018-1A, Class D, (3 mo. USD Term SOFR + 5.41%), 10.81%, due 4/18/2031 | |
| | Series 2015-1A, Class DR4, (3 mo. USD Term SOFR + 6.76%), 12.14%, due 5/21/2034 | |
| | Parallel Ltd., Series 2020-1A, Class DR, (3 mo. USD Term SOFR + 6.76%), 12.18%, due 7/20/2034 | |
| | PFS Financing Corp., Series 2021-A, Class A, 0.71%, due 4/15/2026 | |
| | Porsche Financial Auto Securitization Trust, Series 2023-1A, Class A2, 5.42%, due 12/22/2026 | |
| | PPM CLO 3 Ltd., Series 2019-3A, Class DR, (3 mo. USD Term SOFR + 3.36%), 8.76%, due 4/17/2034 | |
| | Prestige Auto Receivables Trust, Series 2021-1A, Class D, 2.08%, due 2/15/2028 | |
| | Riserva CLO Ltd., Series 2016-3A, Class ERR, (3 mo. USD Term SOFR + 6.76%), 12.16%, due 1/18/2034 | |
| | RRX 5 Ltd., Series 2021-5A, Class D, (3 mo. USD Term SOFR + 6.59%), 11.99%, due 7/15/2034 | |
| | RRX 6 Ltd., Series 2021-6A, Class D, (3 mo. USD Term SOFR + 6.62%), 12.02%, due 1/15/2037 | |
| | | |
| | Series 2021-1A, Class D, (3 mo. USD Term SOFR + 3.81%), 9.21%, due 10/15/2034 | |
| | Series 2021-1A, Class E, (3 mo. USD Term SOFR + 7.06%), 12.46%, due 10/15/2034 | |
| | Santander Retail Auto Lease Trust | |
| | Series 2021-B, Class A3, 0.51%, due 8/20/2024 | |
| | Series 2022-B, Class A2, 2.84%, due 5/20/2025 | |
| | SBNA Auto Lease Trust, Series 2023-A, Class A2, 6.27%, due 4/20/2026 | |
| | Securitized Asset-Backed Receivables LLC Trust, Series 2004-DO1, Class M1, (1 mo. USD Term SOFR + 1.09%), 6.41%, due 7/25/2034 | |
See Notes to Financial Statements
Schedule of Investments Strategic Income Fund^ (cont’d)
| |
Asset-Backed Securities – cont'd |
|
| | Sierra Timeshare Receivables Funding LLC | |
| | Series 2019-3A, Class D, 4.18%, due 8/20/2036 | |
| | Series 2021-2A, Class C, 1.95%, due 9/20/2038 | |
| | Series 2021-2A, Class D, 3.23%, due 9/20/2038 | |
| | Series 2022-1A, Class D, 6.00%, due 10/20/2038 | |
| | Series 2023-1A, Class C, 7.00%, due 1/20/2040 | |
| | Series 2023-2A, Class C, 7.30%, due 4/20/2040 | |
| | Series 2023-2A, Class D, 9.72%, due 4/20/2040 | |
| | Series 2023-3A, Class C, 7.12%, due 9/20/2040 | |
| | Signal Peak CLO 7 Ltd., Series 2019-1A, Class D, (3 mo. USD Term SOFR + 4.11%), 9.50%, due 4/30/2032 | |
| | Sixth Street CLO XIX Ltd., Series 2021-19A, Class A, (3 mo. USD Term SOFR + 1.36%), 6.78%, due 7/20/2034 | |
| | SoFi Professional Loan Program LLC, Series 2020-A, Class BFX, 3.12%, due 5/15/2046 | |
| | Taco Bell Funding LLC, Series 2021-1A, Class A2I, 1.95%, due 8/25/2051 | |
| | Tesla Auto Lease Trust, Series 2023-B, Class A2, 6.02%, due 9/22/2025 | |
| | Texas Debt Capital CLO Ltd., Series 2023-1A, Class A, (3 mo. USD Term SOFR + 1.80%), 7.22%, due 4/20/2036 | |
| | TICP CLO V Ltd., Series 2016-5A, Class ER, (3 mo. USD Term SOFR + 6.01%), 11.41%, due 7/17/2031 | |
| | TICP CLO X Ltd., Series 2018-10A, Class E, (3 mo. USD Term SOFR + 5.76%), 11.18%, due 4/20/2031 | |
| | TICP CLO XV Ltd., Series 2020-15A, Class A, (3 mo. USD Term SOFR + 1.54%), 6.96%, due 4/20/2033 | |
| | Toyota Auto Receivables Owner Trust | |
| | Series 2022-B, Class A2A, 2.35%, due 1/15/2025 | |
| | Series 2023-A, Class A2, 5.05%, due 1/15/2026 | |
| | Series 2022-D, Class A2A, 5.27%, due 1/15/2026 | |
| | Series 2023-B, Class A2A, 5.28%, due 5/15/2026 | |
| | TRESTLES CLO II Ltd., Series 2018-2A, Class D, (3 mo. USD Term SOFR + 6.01%), 11.39%, due 7/25/2031 | |
| | TRESTLES CLO Ltd., Series 2017-1A, Class DR, (3 mo. USD Term SOFR + 6.51%), 11.89%, due 4/25/2032 | |
| | Trinitas CLO XVI Ltd., Series 2021-16A, Class D, (3 mo. USD Term SOFR + 3.56%), 8.98%, due 7/20/2034 | |
| | Trinitas CLO XXIII Ltd., Series 2023-23A, Class A, (3 mo. USD Term SOFR + 1.80%), 7.14%, due 10/20/2036 | |
| | Verde CLO Ltd., Series 2019-1A, Class DR, (3 mo. USD Term SOFR + 3.51%), 8.91%, due 4/15/2032 | |
| | Verizon Master Trust, Series 2022-7, Class A1B, (30 day USD SOFR Average + 0.85%), 6.17%, due 11/22/2027 | |
| | Volkswagen Auto Lease Trust | |
| | Series 2022-A, Class A2, 3.02%, due 10/21/2024 | |
| | Series 2023-A, Class A2A, 5.87%, due 1/20/2026 | |
| | Voya CLO Ltd., Series 2018-3A, Class E, (3 mo. USD Term SOFR + 6.01%), 11.41%, due 10/15/2031 | |
| | Whitebox CLO III Ltd., Series 2021-3A, Class E, (3 mo. USD Term SOFR + 7.11%), 12.51%, due 10/15/2034 | |
| | World Omni Auto Receivables Trust | |
| | Series 2022-A, Class A2, 1.15%, due 4/15/2025 | |
| | Series 2022-B, Class A2A, 2.77%, due 10/15/2025 | |
| | Series 2023-A, Class A2A, 5.18%, due 7/15/2026 | |
| | Series 2023-B, Class A2A, 5.25%, due 11/16/2026 | |
See Notes to Financial Statements
Schedule of Investments Strategic Income Fund^ (cont’d)
| |
Asset-Backed Securities – cont'd |
|
| | World Omni Automobile Lease Securitization Trust, Series 2022-A, Class A2, 2.63%, due 10/15/2024 | |
Total Asset-Backed Securities (Cost $284,971,504) | |
|
|
|
|
| | Summer BC Bidco B LLC, 5.50%, due 10/31/2026 | |
| | Summer BC Holdco B SARL, 5.75%, due 10/31/2026 | |
| | | |
|
|
| | Boeing Co., 5.81%, due 5/1/2050 | |
| | L3Harris Technologies, Inc. | |
| | | |
| | | |
| | | |
| | Lockheed Martin Corp., 5.70%, due 11/15/2054 | |
| | Rolls-Royce PLC, 5.75%, due 10/15/2027 | |
| | | |
| | | |
| | | |
| | | |
| | | |
| | | |
| | | |
|
|
| | MHP SE, 7.75%, due 5/10/2024 | |
| | Philip Morris International, Inc., 5.38%, due 2/15/2033 | |
| | | |
|
|
| | American Airlines, Inc., 7.25%, due 2/15/2028 | |
| | American Airlines, Inc./AAdvantage Loyalty IP Ltd. | |
| | | |
| | | |
| | | |
| | | |
| | | |
| | International Consolidated Airlines Group SA, 3.75%, due 3/25/2029 | |
| | | |
| | | |
| | | |
| | United Airlines, Inc., 4.38%, due 4/15/2026 | |
| | VistaJet Malta Finance PLC/Vista Management Holding, Inc. | |
| | | |
| | | |
| | | |
| | | |
|
|
| | BK LC Lux Finco1 SARL, 5.25%, due 4/30/2029 | |
See Notes to Financial Statements
Schedule of Investments Strategic Income Fund^ (cont’d)
| |
|
|
|
| | PrestigeBidCo GmbH, (3 mo. EUR EURIBOR + 6.00%), 9.97%, due 7/15/2027 | |
| | | |
|
|
| | | |
| | | |
| | | |
| | | |
| | | |
| | Ford Motor Credit Co. LLC | |
| | | |
| | | |
| | | |
| | | |
| | | |
| | | |
| | | |
| | | |
| | | |
| | General Motors Financial Co., Inc. | |
| | | |
| | | |
| | Hyundai Capital America, 5.50%, due 3/30/2026 | |
| | Jaguar Land Rover Automotive PLC | |
| | | |
| | | |
| | Toyota Motor Credit Corp. | |
| | (Secured Overnight Financing Rate Index + 0.65%), 5.99%, due 12/29/2023 | |
| | (Secured Overnight Financing Rate + 0.62%), 5.96%, due 3/22/2024 | |
| | Volkswagen Group of America Finance LLC, (Secured Overnight Financing Rate + 0.95%), 6.29%, due 6/7/2024 | |
| | | |
Auto Parts & Equipment 0.4% |
|
| | Clarios Global LP/Clarios U.S. Finance Co., 4.38%, due 5/15/2026 | |
| | Dana Financing Luxembourg SARL, 8.50%, due 7/15/2031 | |
| | | |
| | | |
| | | |
| | | |
| | | |
| | Goodyear Tire & Rubber Co. | |
| | | |
| | | |
| | | |
| | 3.75% Cash/4.50% PIK, due 9/15/2026 | |
| | 3.88% Cash/4.63% PIK, due 5/15/2027 | |
| | Schaeffler AG, 3.38%, due 10/12/2028 | |
| | TI Automotive Finance PLC, 3.75%, due 4/15/2029 | |
| | Valeo SE, 5.38%, due 5/28/2027 | |
| | ZF Europe Finance BV, 3.00%, due 10/23/2029 | |
See Notes to Financial Statements
Schedule of Investments Strategic Income Fund^ (cont’d)
| |
|
Auto Parts & Equipment – cont'd |
|
| | ZF North America Capital, Inc., 6.88%, due 4/14/2028 | |
| | | |
|
|
| | ABN AMRO Bank NV, 3.32%, due 3/13/2037 | |
| | AMCO - Asset Management Co. SpA, 0.75%, due 4/20/2028 | |
| | Banco Bilbao Vizcaya Argentaria SA, 6.50%, due 3/5/2025 | |
| | | |
| | | |
| | | |
| | Banco de Bogota SA, 6.25%, due 5/12/2026 | |
| | Banco de Credito del Peru SA, 2.70%, due 1/11/2025 | |
| | Banco do Brasil SA, 6.25%, due 4/15/2024 | |
| | Banco Inbursa SA Institucion De Banca Multiple Grupo Financiero Inbursa, 4.13%, due 6/6/2024 | |
| | Banco Santander Mexico SA Institucion de Banca Multiple Grupo Financiero Santand, 5.38%, due 4/17/2025 | |
| | | |
| | | |
| | | |
| | Banco Votorantim SA, 4.50%, due 9/24/2024 | |
| | Bangkok Bank PCL, 4.30%, due 6/15/2027 | |
| | Bank Negara Indonesia Persero Tbk. PT, 3.75%, due 3/30/2026 | |
| | | |
| | | |
| | | |
| | (Secured Overnight Financing Rate + 1.10%), 6.45%, due 4/25/2025 | |
| | | |
| | | |
| | | |
| | Bank of New York Mellon Corp. | |
| | (Secured Overnight Financing Rate + 0.20%), 5.55%, due 10/25/2024 | |
| | | |
| | | |
| | Bank of New Zealand, 2.55%, due 6/29/2027 | |
| | Banque Federative du Credit Mutuel SA, (10 yr. EURIBOR ICE Swap + 0.10%, Cap 8.00%, Floor 0.00%), 3.21%, due 2/25/2024 | |
| | Barclays Bank PLC, (3 mo. EUR EURIBOR + 0.71%), 4.56%, due 12/15/2023 | |
| | | |
| | | |
| | | |
| | BBK BSC, 5.50%, due 7/9/2024 | |
| | | |
| | | |
| | | |
| | | |
| | | |
| | BPCE SA, 3.65%, due 1/14/2037 | |
| | Cie de Financement Foncier SA, 2.00%, due 5/7/2024 | |
| | Citibank NA, 3.65%, due 1/23/2024 | |
See Notes to Financial Statements
Schedule of Investments Strategic Income Fund^ (cont’d)
| |
|
|
|
| | | |
| | | |
| | | |
| | (Secured Overnight Financing Rate + 1.37%), 6.71%, due 5/24/2025 | |
| | | |
| | (Secured Overnight Financing Rate + 1.53%), 6.87%, due 3/17/2026 | |
| | | |
| | | |
| | Citizens Financial Group, Inc. | |
| | (3 mo. USD Term SOFR + 3.26%), 8.69%, due 1/6/2024 | |
| | | |
| | Commerzbank AG, 7.00%, due 4/9/2025 | |
| | Commonwealth Bank of Australia, 0.75%, due 2/28/2028 | |
| | DBS Group Holdings Ltd., 5.48%, due 9/12/2025 | |
| | Development Bank of Kazakhstan JSC, 5.75%, due 5/12/2025 | |
| | Dexia Credit Local SA, 0.63%, due 1/17/2026 | |
| | DIB Sukuk Ltd., 2.95%, due 1/16/2026 | |
| | Emirates Development Bank PJSC, 3.52%, due 3/6/2024 | |
| | Emirates NBD Bank PJSC, 6.13%, due 3/20/2025 | |
| | Federation des Caisses Desjardins du Quebec, 3.25%, due 4/18/2028 | |
| | Fifth Third Bancorp, (3 mo. USD Term SOFR + 3.29%), 8.69%, due 12/1/2023 | |
| | Goldman Sachs Group, Inc. | |
| | (3 mo. USD Term SOFR + 1.86%), 7.27%, due 11/29/2023 | |
| | | |
| | | |
| | | |
| | | |
| | | |
| | Grupo Aval Ltd., 4.38%, due 2/4/2030 | |
| | Hana Bank, 3.25%, due 3/30/2027 | |
| | | |
| | | |
| | | |
| | | |
| | | |
| | Huntington Bancshares, Inc. | |
| | (3 mo. USD Term SOFR + 3.14%), 8.54%, due 1/15/2024 | |
| | | |
| | | |
| | | |
| | | |
| | | |
| | | |
| | | |
| | | |
| | | |
| | | |
See Notes to Financial Statements
Schedule of Investments Strategic Income Fund^ (cont’d)
| |
|
|
|
| | | |
| | (3 mo. USD Term SOFR + 2.84%), 8.22%, due 2/1/2024 | |
| | | |
| | | |
| | (Secured Overnight Financing Rate + 0.58%), 5.92%, due 6/23/2025 | |
| | | |
| | | |
| | Kreditanstalt fuer Wiederaufbau | |
| | | |
| | | |
| | | |
| | | |
| | | |
| | | |
| | | |
| | | |
| | | |
| | | |
| | | |
| | Mashreqbank PSC, 4.25%, due 2/26/2024 | |
| | | |
| | (Secured Overnight Financing Rate + 0.63%), 5.97%, due 1/24/2025 | |
| | | |
| | | |
| | | |
| | National Australia Bank Ltd., 2.35%, due 8/30/2029 | |
| | Nationale-Nederlanden Bank NV, 1.00%, due 9/25/2028 | |
| | | |
| | | |
| | | |
| | | |
| | Nordea Bank Abp, 3.75%, due 3/1/2029 | |
| | Philippine National Bank, 3.28%, due 9/27/2024 | |
| | PNC Financial Services Group, Inc. | |
| | | |
| | | |
| | Royal Bank of Canada, (Secured Overnight Financing Rate Index + 0.44%), 5.78%, due 1/21/2025 | |
| | Skandinaviska Enskilda Banken AB, 5.13%, due 5/13/2025 | |
| | Societe Generale SA, 4.75%, due 5/26/2026 | |
| | | |
| | | |
| | | |
| | Truist Bank, (Secured Overnight Financing Rate + 0.20%), 5.54%, due 1/17/2024 | |
| | | |
| | | |
| | | |
| | | |
| | Turkiye Vakiflar Bankasi TAO, 9.00%, due 10/12/2028 | |
See Notes to Financial Statements
Schedule of Investments Strategic Income Fund^ (cont’d)
| |
|
|
|
| | | |
| | | |
| | | |
| | | |
| | | |
| | (3 mo. EUR EURIBOR + 1.00%), 4.97%, due 1/16/2026 | |
| | | |
| | | |
| | | |
| | | |
| | | |
| | | |
| | | |
| | | |
| | | |
| | | |
| | | |
| | | |
| | | |
| | | |
| | Yapi ve Kredi Bankasi AS, 9.25%, due 10/16/2028 | |
| | | |
|
|
| | Constellation Brands, Inc., 2.25%, due 8/1/2031 | |
| | Molson Coors Beverage Co., 4.20%, due 7/15/2046 | |
| | PepsiCo, Inc., (Secured Overnight Financing Rate Index + 0.40%), 5.74%, due 2/13/2026 | |
| | | |
|
|
| | | |
| | | |
| | | |
| | | |
| | | |
| | | |
| | | |
| | | |
|
|
| | Builders FirstSource, Inc. | |
| | | |
| | | |
| | Camelot Return Merger Sub, Inc., 8.75%, due 8/1/2028 | |
| | Cemex SAB de CV, 9.13%, due 3/14/2028 | |
| | Cornerstone Building Brands, Inc., 6.13%, due 1/15/2029 | |
| | Emerald Debt Merger Sub LLC, 6.63%, due 12/15/2030 | |
| | Jeld-Wen, Inc., 4.88%, due 12/15/2027 | |
| | Masonite International Corp., 3.50%, due 2/15/2030 | |
See Notes to Financial Statements
Schedule of Investments Strategic Income Fund^ (cont’d)
| |
|
Building Materials – cont'd |
|
| | Standard Industries, Inc. | |
| | | |
| | | |
| | | |
|
|
| | Avient Corp., 7.13%, due 8/1/2030 | |
| | HB Fuller Co., 4.25%, due 10/15/2028 | |
| | | |
| | | |
| | | |
| | | |
| | INEOS Quattro Finance 1 PLC, 3.75%, due 7/15/2026 | |
| | INEOS Quattro Finance 2 PLC, 3.38%, due 1/15/2026 | |
| | Kronos International, Inc., 3.75%, due 9/15/2025 | |
| | Lune Holdings SARL, 5.63%, due 11/15/2028 | |
| | MEGlobal Canada ULC, 5.00%, due 5/18/2025 | |
| | Olympus Water U.S. Holding Corp. | |
| | | |
| | | |
| | | |
| | | |
| | Orbia Advance Corp. SAB de CV, 1.88%, due 5/11/2026 | |
| | Sasol Financing USA LLC, 5.88%, due 3/27/2024 | |
| | Synthomer PLC, 3.88%, due 7/1/2025 | |
| | Tronox, Inc., 4.63%, due 3/15/2029 | |
| | WR Grace Holdings LLC, 5.63%, due 8/15/2029 | |
| | | |
|
|
| | | |
| | | |
| | | |
| | ADT Security Corp., 4.88%, due 7/15/2032 | |
| | Allied Universal Holdco LLC/Allied Universal Finance Corp./Atlas Luxco 4 SARL, 4.63%, due 6/1/2028 | |
| | APX Group, Inc., 5.75%, due 7/15/2029 | |
| | ASGN, Inc., 4.63%, due 5/15/2028 | |
| | Avis Budget Finance PLC, 7.25%, due 7/31/2030 | |
| | BCP V Modular Services Finance II PLC, 6.13%, due 11/30/2028 | |
| | Bidvest Group U.K. PLC, 3.63%, due 9/23/2026 | |
| | CK Hutchison International 23 Ltd., 4.75%, due 4/21/2028 | |
| | CMHI Finance BVI Co. Ltd., 4.00%, due 6/1/2027 | |
| | Garda World Security Corp., 7.75%, due 2/15/2028 | |
| | Georgetown University, 2.94%, due 4/1/2050 | |
| | Global Payments, Inc., 4.88%, due 3/17/2031 | |
| | GTCR W-2 Merger Sub LLC, 7.50%, due 1/15/2031 | |
| | | |
| | | |
| | (3 mo. EUR EURIBOR + 5.50%), 9.47%, due 7/15/2027 | |
| | Korea Expressway Corp., 1.13%, due 5/17/2026 | |
See Notes to Financial Statements
Schedule of Investments Strategic Income Fund^ (cont’d)
| |
|
Commercial Services – cont'd |
|
| | | |
| | | |
| | | |
| | Multiversity SRL, (3 mo. EUR EURIBOR + 4.25%), 8.20%, due 10/30/2028 | |
| | Neptune Bidco U.S., Inc., 9.29%, due 4/15/2029 | |
| | Prime Security Services Borrower LLC/Prime Finance, Inc. | |
| | | |
| | | |
| | | |
| | Q-Park Holding I BV, 1.50%, due 3/1/2025 | |
| | RAC Bond Co. PLC, 5.25%, due 11/4/2027 | |
| | Techem Verwaltungsgesellschaft 674 GmbH, 6.00%, due 7/30/2026 | |
| | Techem Verwaltungsgesellschaft 675 GmbH, 2.00%, due 7/15/2025 | |
| | United Rentals North America, Inc. | |
| | | |
| | | |
| | | |
| | | |
| | | |
| | | |
|
|
| | Apple, Inc., 2.85%, due 8/5/2061 | |
| | McAfee Corp., 7.38%, due 2/15/2030 | |
| | | |
| | | |
| | | |
| | | |
Cosmetics - Personal Care 0.1% |
|
| | | |
| | | |
| | | |
| | | |
| | Natura Cosmeticos SA, 4.13%, due 5/3/2028 | |
| | | |
Distribution - Wholesale 0.1% |
|
| | Ritchie Bros Holdings, Inc. | |
| | | |
| | | |
| | Windsor Holdings III LLC, 8.50%, due 6/15/2030 | |
| | | |
Diversified Financial Services 0.9% |
|
| | AerCap Ireland Capital DAC/AerCap Global Aviation Trust, 3.30%, due 1/30/2032 | |
| | | |
| | | |
| | | |
| | | |
| | (Secured Overnight Financing Rate + 0.93%), 6.27%, due 3/4/2025 | |
| | | |
See Notes to Financial Statements
Schedule of Investments Strategic Income Fund^ (cont’d)
| |
|
Diversified Financial Services – cont'd |
|
| | | |
| | | |
| | | |
| | BPCE SFH SA, 3.13%, due 1/24/2028 | |
| | Caisse de Refinancement de l'Habitat SA, 3.00%, due 1/11/2030 | |
| | Capital One Financial Corp. | |
| | (Secured Overnight Financing Rate + 0.69%), 6.03%, due 12/6/2024 | |
| | | |
| | | |
| | | |
| | | |
| | Credit Mutuel Home Loan SFH SA, 2.75%, due 12/8/2027 | |
| | Discover Financial Services, 5.50%, due 10/30/2027 | |
| | Encore Capital Group, Inc., 4.25%, due 6/1/2028 | |
| | Fondo MIVIVIENDA SA, 4.63%, due 4/12/2027 | |
| | Intrum AB, 3.50%, due 7/15/2026 | |
| | | |
| | | |
| | | |
| | SURA Asset Management SA, 4.88%, due 4/17/2024 | |
| | | |
|
|
| | Acquirente Unico SpA, 2.80%, due 2/20/2026 | |
| | Adani Green Energy Ltd., 4.38%, due 9/8/2024 | |
| | AusNet Services Holdings Pty. Ltd., 1.63%, due 3/11/2081 | |
| | | |
| | | |
| | | |
| | | |
| | | |
| | China Huadian Overseas Development 2018 Ltd., 3.38%, due 6/23/2025 | |
| | CMS Energy Corp., 3.75%, due 12/1/2050 | |
| | Comision Federal de Electricidad, 4.69%, due 5/15/2029 | |
| | Constellation Energy Generation LLC, 6.50%, due 10/1/2053 | |
| | Dominion Energy, Inc., 4.35%, due 1/15/2027 | |
| | Edison International, 5.00%, due 12/15/2026 | |
| | EDP - Energias de Portugal SA, 5.94%, due 4/23/2083 | |
| | | |
| | | |
| | | |
| | EnBW Energie Baden-Wuerttemberg AG, 1.38%, due 8/31/2081 | |
| | Iberdrola Finanzas SA, 1.58%, due 8/16/2027 | |
| | Leeward Renewable Energy Operations LLC, 4.25%, due 7/1/2029 | |
| | Mississippi Power Co., (Secured Overnight Financing Rate + 0.30%), 5.64%, due 6/28/2024 | |
| | National Rural Utilities Cooperative Finance Corp., (Secured Overnight Financing Rate + 0.33%), 5.67%, due 10/18/2024 | |
| | NextEra Energy Capital Holdings, Inc. | |
| | (Secured Overnight Financing Rate Index + 0.40%), 5.74%, due 11/3/2023 | |
| | | |
| | NGG Finance PLC, 5.63%, due 6/18/2073 | |
See Notes to Financial Statements
Schedule of Investments Strategic Income Fund^ (cont’d)
| |
|
|
|
| | | |
| | | |
| | | |
| | | |
| | | |
| | Pacific Gas & Electric Co., 4.30%, due 3/15/2045 | |
| | | |
| | | |
| | | |
| | Talen Energy Supply LLC, 8.63%, due 6/1/2030 | |
| | Vistra Corp., 7.00%, due 12/15/2026 | |
| | Vistra Operations Co. LLC | |
| | | |
| | | |
| | | |
| | | |
Electrical Components & Equipment 0.0%(k) |
|
| | Energizer Gamma Acquisition BV, 3.50%, due 6/30/2029 | |
| | Energizer Holdings, Inc., 4.38%, due 3/31/2029 | |
| | | |
|
|
| | Imola Merger Corp., 4.75%, due 5/15/2029 | |
| | | |
| | | |
| | | |
| | | |
Energy - Alternate Sources 0.1% |
|
| | FS Luxembourg SARL, 10.00%, due 12/15/2025 | |
| | Greenko Wind Projects Mauritius Ltd., 5.50%, due 4/6/2025 | |
| | | |
| | | |
| | | |
| | | |
Engineering & Construction 0.0%(k) |
|
| | Abertis Infraestructuras Finance BV, 3.25%, due 11/24/2025 | |
| | Assemblin Group AB, (3 mo. EUR EURIBOR + 5.00%), 8.96%, due 7/5/2029 | |
| | IHS Holding Ltd., 5.63%, due 11/29/2026 | |
| | | |
|
|
| | Allwyn International AS, 3.88%, due 2/15/2027 | |
| | Caesars Entertainment, Inc. | |
| | | |
| | | |
| | | |
| | Cedar Fair LP/Canada's Wonderland Co./Magnum Management Corp./Millennium Op | |
| | | |
| | | |
| | Churchill Downs, Inc., 6.75%, due 5/1/2031 | |
See Notes to Financial Statements
Schedule of Investments Strategic Income Fund^ (cont’d)
| |
|
|
|
| | Cirsa Finance International SARL, 4.75%, due 5/22/2025 | |
| | CPUK Finance Ltd., 6.50%, due 8/28/2026 | |
| | LHMC Finco 2 SARL, 7.25% Cash/8.00% PIK, due 10/2/2025 | |
| | Light & Wonder International, Inc., 7.25%, due 11/15/2029 | |
| | Live Nation Entertainment, Inc. | |
| | | |
| | | |
| | Midwest Gaming Borrower LLC/Midwest Gaming Finance Corp., 4.88%, due 5/1/2029 | |
| | Motion Bondco DAC, 4.50%, due 11/15/2027 | |
| | Raptor Acquisition Corp./Raptor Co.-Issuer LLC, 4.88%, due 11/1/2026 | |
| | SeaWorld Parks & Entertainment, Inc., 5.25%, due 8/15/2029 | |
| | Warnermedia Holdings, Inc., 5.14%, due 3/15/2052 | |
| | | |
|
|
| | Albertsons Cos., Inc./Safeway, Inc./New Albertsons LP/Albertsons LLC | |
| | | |
| | | |
| | | |
| | Bellis Acquisition Co. PLC, 3.25%, due 2/16/2026 | |
| | Bellis Finco PLC, 4.00%, due 2/16/2027 | |
| | Cencosud SA, 4.38%, due 7/17/2027 | |
| | Co.-operative Group Holdings Ltd., 7.50%, due 7/8/2026 | |
| | JBS USA LUX SA/JBS USA Food Co./JBS USA Finance, Inc. | |
| | | |
| | | |
| | Kraft Heinz Foods Co., 3.88%, due 5/15/2027 | |
| | Minerva Luxembourg SA, 8.88%, due 9/13/2033 | |
| | Performance Food Group, Inc., 5.50%, due 10/15/2027 | |
| | Picard Bondco SA, 5.38%, due 7/1/2027 | |
| | | |
| | | |
| | | |
| | | |
| | | |
| | Sigma Holdco BV, 5.75%, due 5/15/2026 | |
| | | |
| | | |
| | | |
| | | |
| | | |
| | | |
| | | |
|
|
| | Aramark International Finance SARL, 3.13%, due 4/1/2025 | |
| | Aramark Services, Inc., 5.00%, due 2/1/2028 | |
| | | |
Forest Products & Paper 0.0%(k) |
|
| | Sappi Papier Holding GmbH, 3.63%, due 3/15/2028 | |
See Notes to Financial Statements
Schedule of Investments Strategic Income Fund^ (cont’d)
| |
|
Forest Products & Paper – cont'd |
|
| | WEPA Hygieneprodukte GmbH, 2.88%, due 12/15/2027 | |
| | | |
|
|
| | Beijing Gas Singapore Capital Corp., 1.88%, due 1/18/2025 | |
| | Centrica PLC, 5.25%, due 4/10/2075 | |
| | | |
Healthcare - Products 0.1% |
|
| | Avantor Funding, Inc., 3.88%, due 7/15/2028 | |
| | Baxter International, Inc., (Secured Overnight Financing Rate Index + 0.44%), 5.78%, due 11/29/2024 | |
| | | |
| | | |
| | | |
| | | |
Healthcare - Services 0.6% |
|
| | Ascension Health, 3.11%, due 11/15/2039 | |
| | CHS/Community Health Systems, Inc. | |
| | | |
| | | |
| | | |
| | | |
| | CommonSpirit Health, 4.19%, due 10/1/2049 | |
| | Encompass Health Corp., 4.75%, due 2/1/2030 | |
| | HCA, Inc., 5.50%, due 6/1/2033 | |
| | | |
| | | |
| | | |
| | Mount Sinai Hospital, 3.74%, due 7/1/2049 | |
| | | |
| | (Secured Overnight Financing Rate + 0.56%), 5.90%, due 3/10/2025 | |
| | | |
| | | |
| | | |
| | | |
| | | |
| | | |
Holding Companies - Diversified 0.0%(k) |
|
| | Benteler International AG | |
| | | |
| | | |
| | | |
|
|
| | | |
| | | |
| | | |
| | Maison Finco PLC, 6.00%, due 10/31/2027 | |
| | Shea Homes LP/Shea Homes Funding Corp., 4.75%, due 2/15/2028 | |
| | | |
See Notes to Financial Statements
Schedule of Investments Strategic Income Fund^ (cont’d)
| |
|
|
|
| | AIA Group Ltd., 5.63%, due 10/25/2027 | |
| | Alliant Holdings Intermediate LLC/Alliant Holdings Co.-Issuer | |
| | | |
| | | |
| | AmWINS Group, Inc., 4.88%, due 6/30/2029 | |
| | | |
| | | |
| | | |
| | Athene Global Funding, 0.83%, due 1/8/2027 | |
| | Corebridge Financial, Inc., 4.35%, due 4/5/2042 | |
| | Corebridge Global Funding, 0.65%, due 6/17/2024 | |
| | GTCR AP Finance, Inc., 8.00%, due 5/15/2027 | |
| | | |
| | | |
| | | |
| | Liberty Mutual Group, Inc., 4.13%, due 12/15/2051 | |
| | Protective Life Global Funding | |
| | (Secured Overnight Financing Rate + 1.05%), 6.39%, due 12/11/2024 | |
| | (Secured Overnight Financing Rate + 0.98%), 6.32%, due 3/28/2025 | |
| | Prudential Financial, Inc., 5.13%, due 3/1/2052 | |
| | Travelers Cos., Inc., 5.45%, due 5/25/2053 | |
| | | |
|
|
| | EquipmentShare.com, Inc., 9.00%, due 5/15/2028 | |
| | Newfold Digital Holdings Group, Inc., 6.00%, due 2/15/2029 | |
| | Northwest Fiber LLC/Northwest Fiber Finance Sub, Inc. | |
| | | |
| | | |
| | United Group BV, 4.63%, due 8/15/2028 | |
| | Ziff Davis, Inc., 4.63%, due 10/15/2030 | |
| | | |
Investment Companies 0.0%(k) |
|
| | CNCBINV 1 BVI Ltd., 1.75%, due 11/17/2024 | |
| | Grupo de Inversiones Suramericana SA, 5.50%, due 4/29/2026 | |
| | Huarong Finance 2019 Co. Ltd., 3.25%, due 11/13/2024 | |
| | | |
|
|
| | Carpenter Technology Corp. | |
| | | |
| | | |
| | | |
| | | |
| | | |
| | | |
| | | |
| | | |
| | Periama Holdings LLC, 5.95%, due 4/19/2026 | |
| | POSCO, 4.38%, due 8/4/2025 | |
| | | |
See Notes to Financial Statements
Schedule of Investments Strategic Income Fund^ (cont’d)
| |
|
|
|
| | | |
| | | |
| | | |
| | | |
| | | |
| | Carnival Holdings Bermuda Ltd., 10.38%, due 5/1/2028 | |
| | NCL Corp. Ltd., 5.88%, due 2/15/2027 | |
| | Royal Caribbean Cruises Ltd. | |
| | | |
| | | |
| | | |
| | | |
|
|
| | Melco Resorts Finance Ltd., 5.63%, due 7/17/2027 | |
| | Studio City Finance Ltd., 6.00%, due 7/15/2025 | |
| | TVL Finance PLC, 10.25%, due 4/28/2028 | |
| | Wyndham Hotels & Resorts, Inc., 4.38%, due 8/15/2028 | |
| | | |
| | | |
| | | |
| | | |
Machinery - Construction & Mining 0.1% |
|
| | Caterpillar Financial Services Corp. | |
| | (Secured Overnight Financing Rate + 0.25%), 5.59%, due 5/17/2024 | |
| | (Secured Overnight Financing Rate + 0.27%), 5.61%, due 9/13/2024 | |
| | Manitowoc Co., Inc., 9.00%, due 4/1/2026 | |
| | Terex Corp., 5.00%, due 5/15/2029 | |
| | | |
Machinery - Diversified 0.2% |
|
| | | |
| | | |
| | | |
| | | |
| | | |
| | | |
| | | |
| | (Secured Overnight Financing Rate + 0.20%), 5.55%, due 10/11/2024 | |
| | (Secured Overnight Financing Rate + 0.56%), 5.90%, due 3/7/2025 | |
| | SPX FLOW, Inc., 8.75%, due 4/1/2030 | |
| | | |
| | | |
| | (3 mo. EUR EURIBOR + 4.75%), 8.72%, due 7/15/2027 | |
| | | |
|
|
| | Altice Financing SA, 4.25%, due 8/15/2029 | |
| | Altice Finco SA, 4.75%, due 1/15/2028 | |
See Notes to Financial Statements
Schedule of Investments Strategic Income Fund^ (cont’d)
| |
|
|
|
| | CCO Holdings LLC/CCO Holdings Capital Corp. | |
| | | |
| | | |
| | | |
| | | |
| | | |
| | | |
| | | |
| | Charter Communications Operating LLC/Charter Communications Operating Capital | |
| | | |
| | | |
| | Comcast Corp., 2.94%, due 11/1/2056 | |
| | | |
| | | |
| | | |
| | | |
| | | |
| | | |
| | | |
| | Discovery Communications LLC, 4.65%, due 5/15/2050 | |
| | DISH DBS Corp., 5.13%, due 6/1/2029 | |
| | McGraw-Hill Education, Inc. | |
| | | |
| | | |
| | Paramount Global, 4.20%, due 5/19/2032 | |
| | Sirius XM Radio, Inc., 4.00%, due 7/15/2028 | |
| | Virgin Media Secured Finance PLC | |
| | | |
| | | |
| | Virgin Media Vendor Financing Notes III DAC, 4.88%, due 7/15/2028 | |
| | Ziggo Bond Co. BV, 3.38%, due 2/28/2030 | |
| | | |
|
|
| | Chinalco Capital Holdings Ltd., 2.13%, due 6/3/2026 | |
| | Corp. Nacional del Cobre de Chile, 3.15%, due 1/14/2030 | |
| | Endeavour Mining PLC, 5.00%, due 10/14/2026 | |
| | First Quantum Minerals Ltd. | |
| | | |
| | | |
| | | |
| | FMG Resources August 2006 Pty. Ltd. | |
| | | |
| | | |
| | | |
| | | |
| | | |
| | Novelis Corp., 3.88%, due 8/15/2031 | |
| | Stillwater Mining Co., 4.00%, due 11/16/2026 | |
| | Volcan Cia Minera SAA, 4.38%, due 2/11/2026 | |
| | | |
See Notes to Financial Statements
Schedule of Investments Strategic Income Fund^ (cont’d)
| |
|
Miscellaneous Manufacturer 0.1% |
|
| | Ctec II GmbH, 5.25%, due 2/15/2030 | |
| | Siemens Financieringsmaatschappij NV, (Secured Overnight Financing Rate + 0.43%), 5.77%, due 3/11/2024 | |
| | | |
|
|
| | Africa Finance Corp., 3.88%, due 4/13/2024 | |
| | African Export-Import Bank, 2.63%, due 5/17/2026 | |
| | Banque Ouest Africaine de Developpement, 5.00%, due 7/27/2027 | |
| | Central American Bank for Economic Integration, 5.00%, due 2/9/2026 | |
| | | |
| | | |
| | | |
| | | |
Office - Business Equipment 0.0%(k) |
|
| | CDW LLC/CDW Finance Corp., 3.57%, due 12/1/2031 | |
|
|
| | Ascent Resources Utica Holdings LLC/ARU Finance Corp. | |
| | | |
| | | |
| | | |
| | BP Capital Markets PLC, 4.88%, due 3/22/2030 | |
| | | |
| | | |
| | | |
| | | |
| | | |
| | | |
| | | |
| | | |
| | | |
| | | |
| | | |
| | | |
| | | |
| | | |
| | Geopark Ltd., 5.50%, due 1/17/2027 | |
| | KazMunayGas National Co. JSC, 5.75%, due 4/19/2047 | |
| | Korea National Oil Corp., 1.75%, due 4/18/2025 | |
| | Leviathan Bond Ltd., 6.13%, due 6/30/2025 | |
| | Medco Bell Pte. Ltd., 6.38%, due 1/30/2027 | |
| | Nabors Industries, Inc., 7.38%, due 5/15/2027 | |
| | Northern Oil & Gas, Inc., 8.13%, due 3/1/2028 | |
| | Permian Resources Operating LLC, 7.00%, due 1/15/2032 | |
| | Pertamina Persero PT, 6.45%, due 5/30/2044 | |
| | Petrobras Global Finance BV, 6.00%, due 1/27/2028 | |
| | | |
| | | |
| | | |
| | | |
| | | |
See Notes to Financial Statements
Schedule of Investments Strategic Income Fund^ (cont’d)
| |
|
|
|
| | QatarEnergy, 1.38%, due 9/12/2026 | |
| | Repsol International Finance BV, 4.25%, due 9/11/2028 | |
| | Rockcliff Energy II LLC, 5.50%, due 10/15/2029 | |
| | SEPLAT Energy PLC, 7.75%, due 4/1/2026 | |
| | Shell International Finance BV, (3 mo. USD Term SOFR + 0.66%), 6.03%, due 11/13/2023 | |
| | Sinopec Group Overseas Development 2018 Ltd. | |
| | | |
| | | |
| | Tengizchevroil Finance Co. International Ltd., 2.63%, due 8/15/2025 | |
| | Tullow Oil PLC, 10.25%, due 5/15/2026 | |
| | Valaris Ltd., 8.38%, due 4/30/2030 | |
| | Wintershall Dea Finance 2 BV, 3.00%, due 7/20/2028 | |
| | | |
Packaging & Containers 0.6% |
|
| | Ardagh Metal Packaging Finance USA LLC/Ardagh Metal Packaging Finance PLC, 6.00%, due 6/15/2027 | |
| | Ardagh Packaging Finance PLC/Ardagh Holdings USA, Inc. | |
| | | |
| | | |
| | | |
| | | |
| | | |
| | | |
| | Berry Global, Inc., 5.63%, due 7/15/2027 | |
| | Canpack SA/Canpack U.S. LLC, 2.38%, due 11/1/2027 | |
| | Fiber Bidco Spa, (3 mo. EUR EURIBOR + 6.00%), 9.96%, due 10/25/2027 | |
| | Guala Closures SpA, 3.25%, due 6/15/2028 | |
| | Kleopatra Holdings 2 SCA, 6.50%, due 9/1/2026 | |
| | Mauser Packaging Solutions Holding Co. | |
| | | |
| | | |
| | Pactiv Evergreen Group Issuer LLC/Pactiv Evergreen Group Issuer, Inc., 4.38%, due 10/15/2028 | |
| | Pactiv Evergreen Group Issuer, Inc./Pactiv Evergreen Group Issuer LLC, 4.00%, due 10/15/2027 | |
| | Sealed Air Corp., 5.00%, due 4/15/2029 | |
| | Trivium Packaging Finance BV | |
| | | |
| | | |
| | | |
|
|
| | AbbVie, Inc., 3.85%, due 6/15/2024 | |
| | Bayer AG, 5.38%, due 3/25/2082 | |
| | Cheplapharm Arzneimittel GmbH, 4.38%, due 1/15/2028 | |
| | CVS Health Corp., 5.05%, due 3/25/2048 | |
| | | |
| | | |
| | | |
| | Merck & Co., Inc., 2.90%, due 12/10/2061 | |
| | Nidda Healthcare Holding GmbH, 7.50%, due 8/21/2026 | |
See Notes to Financial Statements
Schedule of Investments Strategic Income Fund^ (cont’d)
| |
|
|
|
| | Pfizer Investment Enterprises Pte. Ltd., 5.34%, due 5/19/2063 | |
| | Teva Pharmaceutical Finance Netherlands II BV | |
| | | |
| | | |
| | | |
|
|
| | | |
| | | |
| | | |
| | CQP Holdco LP/BIP-V Chinook Holdco LLC, 5.50%, due 6/15/2031 | |
| | | |
| | | |
| | | |
| | Enbridge, Inc., (Secured Overnight Financing Rate Index + 0.63%), 5.97%, due 2/16/2024 | |
| | Enterprise Products Operating LLC | |
| | | |
| | | |
| | EQM Midstream Partners LP | |
| | | |
| | | |
| | | |
| | | |
| | | |
| | | |
| | | |
| | Genesis Energy LP/Genesis Energy Finance Corp. | |
| | | |
| | | |
| | | |
| | Harvest Midstream I LP, 7.50%, due 9/1/2028 | |
| | ITT Holdings LLC, 6.50%, due 8/1/2029 | |
| | | |
| | | |
| | | |
| | Kinetik Holdings LP, 5.88%, due 6/15/2030 | |
| | New Fortress Energy, Inc. | |
| | | |
| | | |
| | Southern Gas Corridor CJSC, 6.88%, due 3/24/2026 | |
| | Summit Midstream Holdings LLC/Summit Midstream Finance Corp., 9.00%, due 10/15/2026 | |
| | Tallgrass Energy Partners LP/Tallgrass Energy Finance Corp. | |
| | | |
| | | |
| | | |
| | | |
See Notes to Financial Statements
Schedule of Investments Strategic Income Fund^ (cont’d)
| |
|
|
|
| | | |
| | | |
| | | |
| | | |
| | | |
|
|
| | Aroundtown SA, 0.38%, due 4/15/2027 | |
| | Country Garden Holdings Co. Ltd., 4.80%, due 8/6/2030 | |
| | Emeria SASU, 3.38%, due 3/31/2028 | |
| | Flamingo Lux II SCA, 5.00%, due 3/31/2029 | |
| | | |
| | | |
| | | |
| | | |
| | | |
| | | |
| | Heimstaden Bostad Treasury BV, 1.63%, due 10/13/2031 | |
| | Longfor Group Holdings Ltd., 4.50%, due 1/16/2028 | |
| | Realogy Group LLC/Realogy Co.-Issuer Corp. | |
| | | |
| | | |
| | Samhallsbyggnadsbolaget i Norden AB, 2.63%, due 12/14/2025 | |
| | | |
Real Estate Investment Trusts 0.4% |
|
| | Digital Dutch Finco BV, 1.25%, due 2/1/2031 | |
| | Iron Mountain Information Management Services, Inc., 5.00%, due 7/15/2032 | |
| | | |
| | | |
| | | |
| | | |
| | MPT Operating Partnership LP/MPT Finance Corp. | |
| | | |
| | | |
| | Park Intermediate Holdings LLC/PK Domestic Property LLC/PK Finance Co.-Issuer, 5.88%, due 10/1/2028 | |
| | RHP Hotel Properties LP/RHP Finance Corp. | |
| | | |
| | | |
| | | |
| | | |
| | | |
| | | |
| | | |
| | | |
| | | |
| | | |
| | | |
| | Unibail-Rodamco-Westfield SE, 7.25%, due 7/3/2028 | |
| | Uniti Group LP/Uniti Group Finance, Inc./CSL Capital LLC, 10.50%, due 2/15/2028 | |
See Notes to Financial Statements
Schedule of Investments Strategic Income Fund^ (cont’d)
| |
|
Real Estate Investment Trusts – cont'd |
|
| | | |
| | | |
| | | |
| | | |
|
|
| | 1011778 BC ULC/New Red Finance, Inc. | |
| | | |
| | | |
| | | |
| | Afflelou SAS, 4.25%, due 5/19/2026 | |
| | Alsea SAB de CV, 7.75%, due 12/14/2026 | |
| | B&M European Value Retail SA, 3.63%, due 7/15/2025 | |
| | | |
| | | |
| | | |
| | Beacon Roofing Supply, Inc., 4.50%, due 11/15/2026 | |
| | CECONOMY AG, 1.75%, due 6/24/2026 | |
| | Constellation Automotive Financing PLC, 4.88%, due 7/15/2027 | |
| | Douglas GmbH, 6.00%, due 4/8/2026 | |
| | | |
| | | |
| | | |
| | eG Global Finance PLC, 4.38%, due 2/7/2025 | |
| | Macy's Retail Holdings LLC | |
| | | |
| | | |
| | | |
| | Maxeda DIY Holding BV, 5.88%, due 10/1/2026 | |
| | PetSmart, Inc./PetSmart Finance Corp. | |
| | | |
| | | |
| | PEU Fin PLC, 7.25%, due 7/1/2028 | |
| | SRS Distribution, Inc., 6.13%, due 7/1/2029 | |
| | White Cap Parent LLC, 8.25% Cash/9.00% PIK, due 3/15/2026 | |
| | Yum! Brands, Inc., 5.38%, due 4/1/2032 | |
| | | |
|
|
| | | |
| | (Secured Overnight Financing Rate Index + 0.25%), 5.59%, due 10/1/2024 | |
| | | |
| | Infineon Technologies AG, 2.88%, due 1/1/2025 | |
| | | |
| | | |
| | | |
| | | |
|
|
| | AthenaHealth Group, Inc., 6.50%, due 2/15/2030 | |
| | Intuit, Inc., 5.50%, due 9/15/2053 | |
See Notes to Financial Statements
Schedule of Investments Strategic Income Fund^ (cont’d)
| |
|
|
|
| | | |
| | | |
| | | |
| | | |
| | | |
| | | |
|
|
| | | |
| | | |
| | | |
| | | |
| | | |
| | | |
| | | |
| | | |
| | | |
| | | |
| | | |
| | British Telecommunications PLC, 8.38%, due 12/20/2083 | |
| | C&W Senior Financing DAC, 6.88%, due 9/15/2027 | |
| | CommScope Technologies LLC, 5.00%, due 3/15/2027 | |
| | | |
| | | |
| | | |
| | eircom Finance DAC, 3.50%, due 5/15/2026 | |
| | Frontier Communications Holdings LLC | |
| | | |
| | | |
| | | |
| | | |
| | | |
| | | |
| | | |
| | | |
| | Koninklijke KPN NV, 6.00%, due 9/21/2027 | |
| | | |
| | | |
| | | |
| | | |
| | | |
| | | |
| | Lorca Telecom Bondco SA, 4.00%, due 9/18/2027 | |
| | Oztel Holdings SPC Ltd., 6.63%, due 4/24/2028 | |
| | PLT VII Finance SARL, 4.63%, due 1/5/2026 | |
| | Rogers Communications, Inc., 3.80%, due 3/15/2032 | |
| | SES SA, 2.88%, due 5/27/2026 | |
| | SoftBank Group Corp., 5.00%, due 4/15/2028 | |
| | | |
| | | |
| | | |
| | | |
See Notes to Financial Statements
Schedule of Investments Strategic Income Fund^ (cont’d)
| |
|
Telecommunications – cont'd |
|
| | | |
| | | |
| | | |
| | | |
| | | |
| | | |
| | Verizon Communications, Inc. | |
| | | |
| | | |
| | VF Ukraine PAT via VFU Funding PLC, 6.20%, due 2/11/2025 | |
| | | |
| | | |
| | | |
| | Wp/ap Telecom Holdings III BV, 5.50%, due 1/15/2030 | |
| | | |
|
|
| | Mobico Group PLC, 4.25%, due 11/26/2025 | |
| | MV24 Capital BV, 6.75%, due 6/1/2034 | |
| | | |
Trucking & Leasing 0.0%(k) |
|
| | AerCap Global Aviation Trust, 6.50%, due 6/15/2045 | |
|
|
| | Solaris Midstream Holdings LLC, 7.63%, due 4/1/2026 | |
| | Thames Water Utilities Finance PLC, 4.38%, due 1/18/2031 | |
| | Veolia Environnement SA, 2.50%, due 1/20/2029 | |
| | | |
Total Corporate Bonds (Cost $1,105,932,805) | |
|
Loan Assignments(d) 0.0%(k) |
Telecommunications 0.0%(k) |
|
| | | |
| | Term Loan, (1 mo. USD Term SOFR + 7.10%), 12.43%, due 12/30/2027 | |
| | Term Loan, (3 mo. USD Term SOFR + 9.10%), 14.49%, due 6/30/2028 | |
| | | |
|
|
| | Nautilus Power LLC, Term Loan B, (3 mo. USD Term SOFR + 5.25%), 10.90%, due 11/16/2026 | |
Total Loan Assignments (Cost $1,100,936) | |
Foreign Government Securities 3.9% |
|
| | Airport Authority, 1.75%, due 1/12/2027 | |
| | Angolan Government International Bonds | |
| | | |
| | | |
| | | |
| | | |
| | | |
See Notes to Financial Statements
Schedule of Investments Strategic Income Fund^ (cont’d)
| |
Foreign Government Securities – cont'd |
|
| | Argentine Republic Government International Bonds | |
| | | |
| | | |
| | Austria Government Bonds, 0.90%, due 2/20/2032 | |
| | Bahamas Government International Bonds, 6.00%, due 11/21/2028 | |
| | Bermuda Government International Bonds, 3.72%, due 1/25/2027 | |
| | Brazil Government International Bonds, 6.00%, due 10/20/2033 | |
| | Brazil Notas do Tesouro Nacional | |
| | Series F, 10.00%, due 1/1/2025 | |
| | | |
| | | |
| | Bundesobligation, 2.40%, due 10/19/2028 | |
| | Bundesrepublik Deutschland Bundesanleihe | |
| | | |
| | | |
| | | |
| | Series G, 0.00%, due 8/15/2031 | |
| | | |
| | Colombia Government International Bonds | |
| | | |
| | | |
| | | |
| | | |
| | | |
| | | |
| | | |
| | | |
| | Dominican Republic International Bonds | |
| | | |
| | | |
| | | |
| | Ecuador Government International Bonds | |
| | | |
| | | |
| | Egypt Government International Bonds | |
| | | |
| | | |
| | | |
| | El Salvador Government International Bonds | |
| | | |
| | | |
| | | |
| | | |
| | | |
| | | |
| | | |
| | | |
| | | |
| | | |
| | Free State of Saxony, 3.38%, due 9/21/2026 | |
See Notes to Financial Statements
Schedule of Investments Strategic Income Fund^ (cont’d)
| |
Foreign Government Securities – cont'd |
|
| | French Republic Government Bonds OAT | |
| | | |
| | | |
| | | |
| | | |
| | | |
| | | |
| | | |
| | | |
| | | |
| | | |
| | | |
| | | |
| | Ghana Government International Bonds, 6.38%, due 2/11/2027 | |
| | Guatemala Government Bonds, 5.25%, due 8/10/2029 | |
| | Hellenic Republic Government Bonds, 4.38%, due 7/18/2038 | |
| | Hungary Government Bonds, 3.25%, due 10/22/2031 | |
| | Hungary Government International Bonds, 5.00%, due 2/22/2027 | |
| | Indonesia Government International Bonds | |
| | | |
| | | |
| | | |
| | | |
| | | |
| | | |
| | | |
| | Ireland Government Bonds, 3.00%, due 10/18/2043 | |
| | Italy Buoni Poliennali Del Tesoro | |
| | | |
| | | |
| | | |
| | | |
| | | |
| | | |
| | | |
| | | |
| | | |
| | | |
| | Ivory Coast Government International Bonds | |
| | | |
| | | |
| | | |
| | Kazakhstan Government International Bonds, 0.60%, due 9/30/2026 | |
| | Kingdom of Belgium Government Bonds | |
| | Series 97, 3.00%, due 6/22/2033 | |
| | Series 84, 1.45%, due 6/22/2037 | |
| | Series 90, 0.40%, due 6/22/2040 | |
| | Kommunekredit, 0.88%, due 11/3/2036 | |
| | Korea Electric Power Corp., 5.38%, due 7/31/2026 | |
| | Korea Housing Finance Corp., 4.63%, due 2/24/2028 | |
| | Korea Hydro & Nuclear Power Co. Ltd., 5.00%, due 7/18/2028 | |
See Notes to Financial Statements
Schedule of Investments Strategic Income Fund^ (cont’d)
| |
Foreign Government Securities – cont'd |
|
| | | |
| | | |
| | | |
| | | |
| | Mexico Government International Bonds | |
| | | |
| | | |
| | MFB Magyar Fejlesztesi Bank Zrt, 6.50%, due 6/29/2028 | |
| | Mongolia Government International Bonds | |
| | | |
| | | |
| | Morocco Government International Bonds, 5.95%, due 3/8/2028 | |
| | Netherlands Government Bonds | |
| | | |
| | | |
| | | |
| | Oman Government International Bonds, 7.00%, due 1/25/2051 | |
| | Panama Government International Bonds | |
| | | |
| | | |
| | | |
| | Paraguay Government International Bonds, 4.95%, due 4/28/2031 | |
| | Peru Government Bonds, 6.15%, due 8/12/2032 | |
| | Peruvian Government International Bonds, 6.90%, due 8/12/2037 | |
| | | |
| | | |
| | | |
| | Poland Government International Bonds, 3.88%, due 2/14/2033 | |
| | Portugal Obrigacoes do Tesouro OT | |
| | | |
| | | |
| | | |
| | | |
| | Provincia de Cordoba, 6.88%, due 12/10/2025 | |
| | Qatar Government International Bonds, 4.40%, due 4/16/2050 | |
| | | |
| | | |
| | | |
See Notes to Financial Statements
Schedule of Investments Strategic Income Fund^ (cont’d)
| |
Foreign Government Securities – cont'd |
|
| | Romania Government International Bonds | |
| | | |
| | | |
| | | |
| | | |
| | | |
| | | |
| | | |
| | | |
| | | |
| | | |
| | | |
| | | |
| | | |
| | | |
| | Saudi Government International Bonds | |
| | | |
| | | |
| | Serbia International Bonds | |
| | | |
| | | |
| | Slovenia Government Bonds | |
| | | |
| | | |
| | South Africa Government Bonds | |
| | | |
| | | |
| | | |
| | South Africa Government International Bonds | |
| | | |
| | | |
| | | |
| | | |
| | | |
| | | |
| | | |
| | | |
| | | |
| | | |
| | | |
| | Sri Lanka Government International Bonds | |
| | | |
| | | |
| | Turkiye Ihracat Kredi Bankasi AS, 9.00%, due 1/28/2027 | |
| | Ukraine Government International Bonds | |
| | | |
| | | |
| | United Kingdom Gilt, 4.00%, due 10/22/2063 | |
| | Uruguay Government International Bonds, 5.10%, due 6/18/2050 | |
| | Venezuela Government International Bonds, 8.25%, due 10/13/2024 | |
Total Foreign Government Securities (Cost $156,131,123) | |
See Notes to Financial Statements
Schedule of Investments Strategic Income Fund^ (cont’d)
| |
|
Convertible Bonds 0.0%(k) |
|
|
| | DISH Network Corp., 3.38%, due 8/15/2026 (Cost $698,916) | |
|
|
|
|
| | Bay Area Toll Authority Toll Bridge Revenue (Build America Bonds), Series 2010-S1, 7.04%, due 4/1/2050 | |
| | California State General Obligation (Build America Bonds), Series 2010, 7.63%, due 3/1/2040 | |
| | California State University Refunding Revenue, Series 2020-B, 2.98%, due 11/1/2051 | |
| | Foothill-Eastern Transportation Corridor Agency Toll Road Revenue Refunding, Series 2019-A, (AGM Insured), 3.92%, due 1/15/2053 | |
| | Los Angeles Community College District General Obligation (Build America Bonds), Series 2010, 6.75%, due 8/1/2049 | |
| | University of California Regents Medical Center Pooled Revenue, Series 2020-N, 3.01%, due 5/15/2050 | |
| | | |
|
|
| | Massachusetts State Education Financing Authority Revenue Refunding, Series 2018-A, 4.08%, due 7/1/2027 | |
|
|
| | Michigan Finance Authority Hospital Revenue Refunding (Trinity Health Credit Group), Series 2019-T, 3.38%, due 12/1/2040 | |
|
|
| | Clark County Nevada General Obligation (Las Vegas Convention & Visitors Authority), Series 2019-D, 3.23%, due 7/1/2044 | |
|
|
| | Atlantic City General Obligation Refunding, Series 2018, 4.29%, due 9/1/2026 | |
| | New Jersey State Housing & Mortgage Finance Agency Revenue Refunding (Single Family Housing), Series 2018-BB, 3.80%, due 10/1/2032 | |
| | | |
|
|
| | New York State Dormitory Authority Revenue Non State Supported Debt Refunding (New York University), Series 2020-B, 2.69%, due 7/1/2040 | |
|
|
| | Highland Local School District General Obligation Refunding, Series 2020, 3.19%, due 12/1/2049 | |
| | JobsOhio Beverage Systems Statewide Liquor Profits Revenue Refunding, Series 2020-A, 2.83%, due 1/1/2038 | |
| | Ohio State Turnpike Commission Junior Lien Revenue Refunding (Infrastructure Project), Series 2020-A, 3.22%, due 2/15/2048 | |
| | Ohio University General Receipt Athens Refunding Revenue, Series 2020, 2.91%, due 12/1/2043 | |
| | | |
|
|
| | Commonwealth Financing Authority Revenue Refunding, Series 2020-C, 3.53%, due 6/1/2042 | |
See Notes to Financial Statements
Schedule of Investments Strategic Income Fund^ (cont’d)
| |
|
|
|
| | Central Texas Turnpike System First Tier Revenue Refunding, Series 2020-C, 3.03%, due 8/15/2041 | |
| | Dallas Area Rapid Transit Sales Tax Revenue Refunding, Series 2020-C, 2.82%, due 12/1/2042 | |
| | Grand Parkway Transportation Corp. System Subordinated Tier Toll Revenue Refunding, Series 2020-B, 3.24%, due 10/1/2052 | |
| | Texas State Private Activity Bond Surface Transportation Corp. Senior Lien Revenue Refunding (North Tarrant Express Managed Lanes Project), Series 2019-B, 3.92%, due 12/31/2049 | |
| | | |
|
|
| | Utah State Transit Authority Sales Tax Revenue Refunding, Series 2020, 2.77%, due 12/15/2038 | |
|
Total Municipal Notes (Cost $41,231,451) | |
|
|
|
|
Real Estate Management & Development 0.0%(k) |
|
| | GTT Communications, Inc. (Cost $121,311) | |
|
|
Investment Companies 0.0%(k)(r) |
|
| | Neuberger Berman Global Monthly Income Fund Ltd. (Cost $871,714) | |
Exchange-Traded Funds 1.8% |
|
| | iShares iBoxx High Yield Corporate Bond ETF | |
| | SPDR Portfolio High Yield Bond ETF | |
Total Exchange-Traded Funds (Cost $59,321,045) | |
|
Short-Term Investments 3.9% |
Investment Companies 3.9% |
|
| | State Street Institutional U.S. Government Money Market Fund Premier Class, 5.30%(s) (Cost $131,318,868) | |
Total Investments 115.2% (Cost $4,230,723,982) | |
Liabilities Less Other Assets (15.2)% | |
| |
| Non-income producing security. |
| Principal amount is stated in the currency in which the security is denominated. |
| Rate shown was the discount rate at the date of purchase. |
| Interest only security. These securities represent the right to receive the monthly interest payments on an underlying pool of mortgages. Payments of principal on the pool reduce the value of the "interest only" holding. |
See Notes to Financial Statements
Schedule of Investments Strategic Income Fund^ (cont’d)
| Variable or floating rate security. The interest rate shown was the current rate as of October 31, 2023 and changes periodically. |
| Securities were purchased under Rule 144A of the Securities Act of 1933, as amended, or are otherwise restricted and, unless registered under the Securities Act of 1933 or exempted from registration, may only be sold to qualified institutional investors or may have other restrictions on resale. At October 31, 2023, these securities amounted to $915,731,018, which represents 27.5% of net assets of the Fund. |
| Variable or floating rate security where the stated interest rate is not based on a published reference rate and spread. Rather, the interest rate adjusts periodically based on changes in current interest rates and prepayments on the underlying pool of assets. The interest rate shown was the current rate as of October 31, 2023. |
| All or a portion of this security was purchased on a delayed delivery basis. |
| TBA (To Be Announced) Securities are purchased/sold on a forward commitment basis with an approximate principal amount and no defined maturity date. The actual principal amount and maturity date will be determined upon settlement when the specific mortgage pools are assigned. Total value of all such securities (excluding forward sales contracts, if any) at October 31, 2023 amounted to $577,407,407, which represents 17.3% of net assets of the Fund. |
| Value determined using significant unobservable inputs. |
| Security exempt from registration pursuant to Regulation S under the Securities Act of 1933, as amended. Regulation S applies to securities offerings that are made outside of the United States and do not involve directed selling efforts in the United States and as such may have restrictions on resale. Total value of all such securities at October 31, 2023 amounted to $141,977,862, which represents 4.3% of net assets of the Fund. |
| Represents less than 0.05% of net assets of the Fund. |
| Step Bond. Coupon rate is a fixed rate for an initial period that either resets at a specific date or may reset in the future contingent upon a predetermined trigger. The interest rate shown was the current rate as of October 31, 2023. |
| Payment-in-kind (PIK) security. |
| Security issued at a fixed coupon rate, which converts to a variable rate at a future date. Rate shown is the rate in effect as of period end. |
| Perpetual security. Perpetual securities have no stated maturity date, but they may be called/redeemed by the issuer. The date shown reflects the next call date. |
| |
| Index-linked bond whose principal amount adjusts according to a government retail price index. |
| Affiliated company as defined under the Investment Company Act of 1940, as amended (see Note A of the Notes to Financial Statements). |
| Represents 7-day effective yield as of October 31, 2023. |
| Includes the impact of the Fund’s open positions in derivatives at October 31, 2023. |
| As of October 31, 2023, the value of unfunded note commitments was $1,580,000 for the Fund (see Note A of the Notes to Financial Statements) |
See Notes to Financial Statements
Schedule of Investments Strategic Income Fund^ (cont’d)
See Notes to Financial Statements
Schedule of Investments Strategic Income Fund^ (cont’d)
POSITIONS BY COUNTRY (cont’d) |
| | |
| | |
Other countries, each representing less than 0.05% of net assets of the Fund | | |
Short-Term Investments and Other Liabilities—Net | | |
| | |
See Notes to Financial Statements
Schedule of Investments Strategic Income Fund^ (cont’d)
Derivative Instruments
Futures contracts ("futures")
At October 31, 2023, open positions in futures for the Fund were as follows:
| | | | Value and
Unrealized
Appreciation/
(Depreciation) |
| | | | |
| | | | |
| | | | |
| | | | |
| | | | |
| | | | |
| | Government of Canada Bond, 2 Year | | |
| | | | |
| | U.S. Treasury Note, 10 Year | | |
| | U.S. Treasury Note, 2 Year | | |
| | U.S. Treasury Note, 5 Year | | |
| | |
| | | | Value and
Unrealized
Appreciation/
(Depreciation) |
| | | | |
| | | | |
| | | | |
| | | | |
| | | | |
| | Government of Canada Bond, 10 Year | | |
| | | | |
| | | | |
| | U.S. Treasury Note, Ultra 10 Year | | |
| | | | |
| | ICE SONIA Index, 3 Months | | |
| | |
| | |
For the year ended October 31, 2023, the average notional value for the months where the Fund had futures outstanding was $633,942,532 for long positions and $(615,442,872) for short positions.
See Notes to Financial Statements
Schedule of Investments Strategic Income Fund^ (cont’d)
Forward foreign currency contracts ("forward FX contracts")
At October 31, 2023, open forward FX contracts for the Fund were as follows:
| | | | Net
Unrealized
Appreciation/
(Depreciation) |
| | | | | | |
| | | | | | |
| | | | | | |
| | | | | | |
| | | | | | |
| | | | | | |
| | | | | | |
| | | | | | |
| | | | | | |
| | | | | | |
| | | | | | |
| | | | | | |
| | | | | | |
| | | | | | |
| | | | | | |
| | | | | | |
| | | | | | |
| | | | | | |
| | | | | | |
| | | | | | |
| | | | | | |
| | | | | | |
| | | | | | |
| | | | | | |
| | | | | | |
| | | | | | |
| | | | | | |
| | | | | | |
| | | | | | |
| | | | | | |
| | | | | | |
| | | | | | |
| | | | | | |
| | | | | | |
| | | | | | |
| | | | | | |
| | | | | | |
| | | | | | |
| | | | | | |
| | | | | | |
| | | | | | |
| | | | | | |
| | | | | | |
| | | | | | |
See Notes to Financial Statements
Schedule of Investments Strategic Income Fund^ (cont’d)
| | | | Net Unrealized Appreciation/ (Depreciation) |
| | | | | | |
| | | | | | |
| | | | | | |
| | | | | | |
| | | | | | |
| | | | | | |
| | | | | | |
| | | | | | |
| | | | | | |
| | | | | | |
| | | | | | |
| | | | | | |
| | | | | | |
| | | | | | |
| | | | | | |
| | | | | | |
| | | | | | |
| | | | | | |
| | | | | | |
| | | | | | |
| | | | | | |
| | | | | | |
| | | | | | |
| | | | | | |
| | | | | | |
| | | | | | |
| | | | | | |
| | | | | | |
| | | | | | |
| | | | | | |
| | | | | | |
| | | | | | |
| | | | | | |
| | | | | | |
| | | | | | |
| | | | | | |
| | | | | | |
| | | | | | |
| | | | | | |
| | | | | | |
| | | | | | |
| | | | | | |
| | | | | | |
| | | | | | |
| | | | | | |
| | | | | | |
See Notes to Financial Statements
Schedule of Investments Strategic Income Fund^ (cont’d)
| | | | Net Unrealized Appreciation/ (Depreciation) |
| | | | | | |
| | | | | | |
| | | | | | |
| | | | | | |
| | | | | | |
| | | | | | |
| | | | | | |
| | | | | | |
| | | | | | |
Total unrealized appreciation |
| |
| | | | | | |
| | | | | | |
| | | | | | |
| | | | | | |
| | | | | | |
| | | | | | |
| | | | | | |
| | | | | | |
| | | | | | |
| | | | | | |
| | | | | | |
| | | | | | |
| | | | | | |
| | | | | | |
| | | | | | |
| | | | | | |
| | | | | | |
| | | | | | |
| | | | | | |
| | | | | | |
| | | | | | |
| | | | | | |
| | | | | | |
| | | | | | |
| | | | | | |
| | | | | | |
| | | | | | |
| | | | | | |
| | | | | | |
| | | | | | |
| | | | | | |
| | | | | | |
| | | | | | |
| | | | | | |
| | | | | | |
| | | | | | |
See Notes to Financial Statements
Schedule of Investments Strategic Income Fund^ (cont’d)
| | | | Net Unrealized Appreciation/ (Depreciation) |
| | | | | | |
| | | | | | |
| | | | | | |
| | | | | | |
| | | | | | |
| | | | | | |
| | | | | | |
| | | | | | |
| | | | | | |
| | | | | | |
| | | | | | |
| | | | | | |
| | | | | | |
| | | | | | |
| | | | | | |
| | | | | | |
| | | | | | |
| | | | | | |
| | | | | | |
| | | | | | |
| | | | | | |
| | | | | | |
| | | | | | |
| | | | | | |
| | | | | | |
| | | | | | |
| | | | | | |
| | | | | | |
| | | | | | |
| | | | | | |
| | | | | | |
| | | | | | |
| | | | | | |
| | | | | | |
| | | | | | |
| | | | | | |
Total unrealized depreciation |
| |
Total net unrealized appreciation |
| |
For the year ended October 31, 2023, the average notional value for the months where the Fund had forward FX contracts outstanding was $245,805,671.
See Notes to Financial Statements
Schedule of Investments Strategic Income Fund^ (cont’d)
Bond forward contracts ("bond forwards")
At October 31, 2023, bond forwards for the Fund were as follows:
| | | | Unrealized
Appreciation/
(Depreciation) |
| U.S. Treasury Inflation-Indexed Bonds, 0.13% | | | |
| U.S. Treasury Inflation-Indexed Bonds, 0.13% | | | |
| U.S. Treasury Inflation-Indexed Bonds, 0.13% | | | |
| U.S. Treasury Inflation-Indexed Bonds, 0.13% | | | |
Total unrealized appreciation | |
| U.S. Treasury Inflation-Indexed Bonds, 1.63% | | | |
| U.S. Treasury Inflation-Indexed Bonds, 0.88% | | | |
| U.S. Treasury Inflation-Indexed Bonds, 0.13% | | | |
| U.S. Treasury Inflation-Indexed Bonds, 0.13% | | | |
| U.S. Treasury Inflation-Indexed Bonds, 1.13% | | | |
| U.S. Treasury Inflation-Indexed Bonds, 0.75% | | | |
| U.S. Treasury Inflation-Indexed Bonds, 1.00% | | | |
| U.S. Treasury Inflation-Indexed Bonds, 1.50% | | | |
Total unrealized depreciation | |
Total net unrealized depreciation | |
For the year ended October 31, 2023, the average notional value for the months where the Fund had bond forwards outstanding was $47,967,308.
Credit default swap contracts ("credit default swaps")
At October 31, 2023, the Fund had outstanding credit default swaps as follows:
Centrally Cleared Credit Default Swaps — Buy Protection |
| | | Financing
Rate
Paid
by
the Fund | | | Upfront
Payments/
(Receipts) | Unrealized
Appreciation/
(Depreciation) | Accrued
Net
Interest
Receivable/
(Payable) | |
| iTraxx Europe Crossover Ser. 40 V.1 | | | | | | | | | |
Centrally Cleared Credit Default Swaps — Sell Protection |
| | | Financing
Rate
Received
by
the Fund | | | Upfront
Payments/
(Receipts) | Unrealized
Appreciation/
(Depreciation) | Accrued
Net
Interest
Receivable/
(Payable) | |
| iTraxx Europe Crossover Ser. 39 V.2 | | | | | | | | | |
See Notes to Financial Statements
Schedule of Investments Strategic Income Fund^ (cont’d)
| | | Financing Rate Received by the Fund | | | Upfront Payments/ (Receipts) | Unrealized Appreciation/ (Depreciation) | Accrued Net Interest Receivable/ (Payable) | |
| CDX North America High Yield Index, Ser. 41.V2 | | | | | | | | | |
| |
|
|
| |
| | | | |
For the year ended October 31, 2023, the average notional value for the months where the Fund had credit default swaps outstanding was $44,396,517 for buy protection and $77,776,652 for sell protection.
Interest rate swap contracts ("interest rate swaps")
At October 31, 2023, the Fund had outstanding interest rate swaps as follows:
Centrally cleared interest rate swaps
| | Fund
Receives/
Pays
Floating
Rate | | | Frequency
of Fund
Receipt/
Payment | | Unrealized
Appreciation/
(Depreciation) | Accrued
Net
Interest
Receivable/
(Payable) | |
| | | | | | | | | | |
| | | | | | | | | | |
| | | | | | | | | | |
| | | | | | | | | | |
| | | | | | | | | | |
| | | | | | | | | | |
| | | | | | | | | | |
| | | | | | | | | | |
| | | | | | | | | | |
| | | | | | | | | | |
| | | | | | | | | | |
| | | | | | | | | | |
| | | | | | | | | | |
| | | | | | | | | | |
| | | | | | | | | | |
| | | | | | | | | | |
| | | | | | | | | | |
| | | | | | | | | | |
| | | | | | | | | | |
| | | | | | | | | | |
| | | | | | | | | | |
| | | | | | | | | | |
| |
|
|
| |
|
| | | |
See Notes to Financial Statements
Schedule of Investments Strategic Income Fund^ (cont’d)
Inflation swap contracts ("inflation swaps")
At October 31, 2023, the Fund had outstanding inflation swaps as follows:
Centrally cleared inflation swaps | |
| | Fund
Receives/
Pays
Floating
Rate | | | Frequency
of Fund
Receipt/
Payment | | Unrealized
Appreciation/
(Depreciation) | Accrued
Net
Interest
Receivable/
(Payable) | |
| | | | | | | | | | |
| | | | | | | | | | |
| | | | | | | | | | |
| |
|
|
| |
|
| | | |
At October 31, 2023, the Fund had $17,044,579 deposited in a segregated account to cover margin requirements for centrally cleared swaps.
For the year ended October 31, 2023, the average notional value for the months where the Fund had interest rate swaps and inflation rate swaps outstanding was $37,259,882 when the Fund paid the fixed rate and $84,374,429 when the Fund received the fixed rate.
Total return swap contracts ("total return swaps")
At October 31, 2023, the Fund had outstanding total return swaps as follows:
Over-the-counter total return swaps—Long(a) |
| | | | | | | Frequency
of Fund
Receipt/
Payment | Unrealized
Appreciation/
(Depreciation) | Accrued
Net
Interest
Receivable/
(Payable) | |
| iShares iBoxx $ High Yield Corp. Bond ETF | | | | | | | | | | |
| iShares iBoxx $ Investment Grade Corporate Bond ETF | | | | | | | | | | |
| |
|
|
|
|
|
|
| | | |
| The Fund pays a specified rate based on a reference rate plus or minus a spread, and receives the total return on the reference entity. |
| Effective rate at October 31, 2023. |
For the year ended October 31, 2023, the average notional value for the months where the Fund had total return swaps outstanding was $100,479,786 for long positions.
At October 31, 2023, the Fund had cash collateral of $379,000 and $6,240,000 deposited in segregated accounts for Citibank, N.A. and Goldman Sachs International, respectively, and cash collateral of $60,000 received from JPMorgan Chase Bank N.A. to cover collateral requirements on over-the-counter derivatives.
Purchased option contracts ("options purchased")
At October 31, 2023, the Fund did not have any outstanding options purchased.
See Notes to Financial Statements
Schedule of Investments Strategic Income Fund^ (cont’d)
Written option contracts ("options written")
At October 31, 2023, the Fund did not have any outstanding options written.
For the year ended October 31, 2023, the average market value for the months where the Fund had options purchased and options written outstanding was $66,072 and $(32,053), respectively.
The following is a summary, categorized by Level (see Note A of the Notes to Financial Statements), of inputs used to value the Fund’s investments as of October 31, 2023:
| | | | |
| | | | |
U.S. Treasury Obligations | | | | |
U.S. Government Agency Securities | | | | |
Mortgage-Backed Securities# | | | | |
| | | | |
| | | | |
| | | | |
Foreign Government Securities | | | | |
| | | | |
| | | | |
| | | | |
| | | | |
| | | | |
| | | | |
| | | | |
| The Schedule of Investments provides information on the industry, state/territory or sector categorization as well as a Positions by Country summary. |
| The following is a reconciliation between the beginning and ending balances of investments in which significant unobservable inputs (Level 3) were used in determining value: |
| Beginning
balance as
of 11/1/2022 | Accrued
discounts/
(premiums) | | Change
in unrealized
appreciation/
(depreciation) | | | | | | Net change in
unrealized
appreciation/
(depreciation)
from
investments
still held as of
10/31/2023 |
Investments in
Securities: | | | | | | | | | | |
Asset-Backed Securities(1) | | | | | | | | | | |
| | | | | | | | | | |
| | | | | | | | | | |
(1) Securities categorized as Level 3 were valued using a single quotation obtained from a dealer. The Fund does not have access to significant unobservable inputs and therefore cannot disclose such inputs used in formulating such quotation. |
(2) At the beginning of the year, these investments were valued based on a single quotation obtained from a dealer. |
See Notes to Financial Statements
Schedule of Investments Strategic Income Fund^ (cont’d)
The following is a summary, categorized by Level (see Note A of the Notes to Financial Statements), of inputs used to value the Fund’s derivatives as of October 31, 2023:
Other Financial Instruments | | | | |
|
|
|
|
|
| | | | |
| | | | |
|
|
|
|
|
| | | | |
| | | | |
|
|
|
|
|
| | | | |
| | | | |
|
|
|
|
|
| | | | |
| | | | |
| | | | |
| Futures, forward FX contracts and bond forwards are reported at the cumulative unrealized appreciation/(depreciation) of the instrument. |
^
A balance indicated with a "—", reflects either a zero balance or an amount that rounds to less than 1.
See Notes to Financial Statements
Statements of Assets and Liabilities
Neuberger Berman Income Funds
| | | | |
| | | | |
|
|
|
|
|
Investments in securities, at value* (Notes A & F)—
see Schedule of Investments: |
|
|
|
|
| | | | |
| | | | |
| | | | |
| | | | |
| | | | |
Cash collateral segregated for futures contracts (Note A) | | | | |
Cash collateral segregated for centrally cleared swap contracts (Note A) | | | | |
Cash collateral segregated for over-the-counter derivatives (Note A) | | | | |
Dividends and interest receivable | | | | |
Receivable for securities sold | | | | |
Receivable for accumulated variation margin on futures contracts (Note A) | | | | |
Receivable from Management—net (Note B) | | | | |
Receivable for Fund shares sold | | | | |
Receivable for accumulated variation margin on centrally cleared swap contracts(d)(e) (Note A) | | | | |
Receivable for bond forward contracts | | | | |
Receivable for forward foreign currency contracts (Note A) | | | | |
Prepaid expenses and other assets | | | | |
| | | | |
|
|
|
|
|
Over-the-counter swap contracts, at value (Note A) | | | | |
Cash collateral segregated for over-the-counter derivatives due to broker (Note A) | | | | |
Cash collateral segregated for futures contracts due to broker (Note A) | | | | |
Payable to investment manager—net (Notes A & B) | | | | |
Payable for securities purchased | | | | |
Payable for Fund shares redeemed | | | | |
Payable for accumulated variation margin on futures contracts (Note A) | | | | |
Payable for bond forward contracts (Note A) | | | | |
Payable for forward foreign currency contracts (Note A) | | | | |
Payable for accumulated variation margin on centrally cleared swap contracts(d)(e) (Note A) | | | | |
Payable to administrator—net (Note B) | | | | |
| | | | |
| | | | |
| | | | |
Payable for shareholder servicing fees | | | | |
| | | | |
Accrued capital gains taxes (Note A) | | | | |
Other accrued expenses and payables | | | | |
| | | | |
Unfunded Commitments (Note A) | | | | |
| | | | |
|
|
|
|
|
|
|
|
|
|
| | | | |
Total distributable earnings/(losses) | | | | |
| | | | |
|
|
|
|
|
| | | | |
| | | | |
| | | | |
| | | | |
| | | | |
| | | | |
| | | | |
| | | | |
|
|
|
|
|
See Notes to Financial Statements
| | Municipal
Intermediate
Bond Fund | | |
| | | | |
|
|
|
|
|
|
|
|
|
|
| | | | |
| | | | |
| | | | |
| | | | |
| | | | |
| | | | |
| | | | |
| | | | |
| | | | |
| | | | |
| | | | |
| | | | |
| | | | |
| | | | |
| | | | |
| | | | |
| | | | |
| | | | |
|
|
|
|
|
| | | | |
| | | | |
| | | | |
| | | | |
| | | | |
| | | | |
| | | | |
| | | | |
| | | | |
| | | | |
| | | | |
| | | | |
| | | | |
| | | | |
| | | | |
| | | | |
| | | | |
| | | | |
| | | | |
| | | | |
| | | | |
|
|
|
|
|
|
|
|
|
|
| | | | |
| | | | |
| | | | |
|
|
|
|
|
| | | | |
| | | | |
| | | | |
| | | | |
| | | | |
| | | | |
| | | | |
| | | | |
|
|
|
|
|
Statements of Assets and Liabilities (cont’d)
Neuberger Berman Income Funds
��
| | | | |
| | | | |
Shares Outstanding ($.001 par value; unlimited shares authorized) |
|
|
|
|
| | | | |
| | | | |
| | | | |
| | | | |
| | | | |
| | | | |
| | | | |
| | | | |
Net Asset Value, offering and redemption price per share |
|
|
|
|
| | | | |
| | | | |
| | | | |
| | | | |
| | | | |
| | | | |
Net Asset Value and redemption price per share |
|
|
|
|
| | | | |
|
|
|
|
|
| | | | |
Net Asset Value and offering price per share |
|
|
|
|
| | | | |
|
|
|
|
|
| | | | |
| | | | |
Total cost of investments | | | | |
(c) Total cost of foreign currency | | | | |
(d) Unamortized upfront receipts on centrally cleared swap contracts | | | | |
(e) Unamortized upfront payments on centrally cleared swap contracts | | | | |
| |
| On single retail sales of less than $50,000. On sales of $50,000 or more or in certain other circumstances described in the Fund's prospectus, offering price is reduced. |
| Redemption price per share is equal to net asset value less any applicable contingent deferred sales charge. |
See Notes to Financial Statements
| | Municipal
Intermediate
Bond Fund | | |
| | | | |
|
|
|
|
|
| | | | |
| | | | |
| | | | |
| | | | |
| | | | |
| | | | |
| | | | |
| | | | |
|
|
|
|
|
| | | | |
| | | | |
| | | | |
| | | | |
| | | | |
| | | | |
|
|
|
|
|
| | | | |
|
|
|
|
|
| | | | |
|
|
|
|
|
| | | | |
|
|
|
|
|
| | | | |
| | | | |
| | | | |
| | | | |
| | | | |
| | | | |
Neuberger Berman Income Funds
| | | | |
| For the Fiscal
Year Ended
October 31,
2023 | For the Fiscal
Year Ended
October 31,
2023 | For the Fiscal
Year Ended
October 31,
2023 | For the Fiscal
Year Ended
October 31,
2023 |
|
|
|
|
|
|
|
|
|
|
Dividend income—unaffiliated issuers | | | | |
Dividend income—affiliated issuers (Note F) | | | | |
Interest and other income—unaffiliated issuers | | | | |
| | | | |
| | | | |
|
|
|
|
|
Investment management fees (Note B) | | | | |
Administration fees (Note B): |
|
|
|
|
| | | | |
| | | | |
| | | | |
| | | | |
| | | | |
| | | | |
| | | | |
Distribution fees (Note B): |
|
|
|
|
| | | | |
| | | | |
| | | | |
| | | | |
| | | | |
Shareholder servicing agent fees: |
|
|
|
|
| | | | |
| | | | |
| | | | |
| | | | |
| | | | |
| | | | |
| | | | |
| | | | |
| | | | |
Custodian and accounting fees | | | | |
| | | | |
| | | | |
Registration and filing fees | | | | |
| | | | |
Trustees' fees and expenses | | | | |
| | | | |
Miscellaneous and other fees (Note A) | | | | |
| | | | |
|
|
|
|
|
Expenses reimbursed by Management (Note B) | | | | |
Investment management fees waived (Notes A & B) | | | | |
| | | | |
Net investment income/(loss) | | | | |
|
|
|
|
|
See Notes to Financial Statements
| | Municipal
Intermediate
Bond Fund | | |
For the Fiscal
Year Ended
October 31,
2023 | For the Fiscal
Year Ended
October 31,
2023 | For the Fiscal
Year Ended
October 31,
2023 | For the Fiscal
Year Ended
October 31,
2023 | For the Fiscal
Year Ended
October 31,
2023 |
|
|
|
|
|
|
|
|
|
|
| | | | |
| | | | |
| | | | |
| | | | |
| | | | |
|
|
|
|
|
| | | | |
|
|
|
|
|
| | | | |
| | | | |
| | | | |
| | | | |
| | | | |
| | | | |
| | | | |
|
|
|
|
|
| | | | |
| | | | |
| | | | |
| | | | |
| | | | |
|
|
|
|
|
| | | | |
| | | | |
| | | | |
| | | | |
| | | | |
| | | | |
| | | | |
| | | | |
| | | | |
| | | | |
| | | | |
| | | | |
| | | | |
| | | | |
| | | | |
| | | | |
| | | | |
| | | | |
|
|
|
|
|
| | | | |
| | | | |
| | | | |
| | | | |
|
|
|
|
|
Statements of Operations (cont’d)
Neuberger Berman Income Funds
| | | | |
| For the Fiscal
Year Ended
October 31,
2023 | For the Fiscal
Year Ended
October 31,
2023 | For the Fiscal
Year Ended
October 31,
2023 | For the Fiscal
Year Ended
October 31,
2023 |
Realized and Unrealized Gain/(Loss) on Investments (Note A): |
|
|
|
|
Net realized gain/(loss) on: |
|
|
|
|
Transactions in investment securities of unaffiliated issuers | | | | |
Transactions in investment securities of affiliated issuers | | | | |
Settlement of bond forward contracts | | | | |
Settlement of forward foreign currency contracts | | | | |
Settlement of foreign currency transactions | | | | |
Expiration or closing of futures contracts | | | | |
Expiration or closing of option contracts written | | | | |
Expiration or closing of swap contracts | | | | |
Change in net unrealized appreciation/(depreciation) in value of: |
|
|
|
|
Investment securities of unaffiliated issuers | | | | |
Investment securities of affiliated issuers | | | | |
| | | | |
Forward foreign currency contracts | | | | |
| | | | |
Foreign currency translations | | | | |
| | | | |
| | | | |
Net gain/(loss) on investments | | | | |
Net increase/(decrease) in net assets resulting from operations | | | | |
| |
| Net of foreign capital gains tax of $10,700 for Emerging Markets Debt and $8,554 for Strategic Income. |
| Change in accrued foreign capital gains tax amounted to $1,683 for Emerging Markets Debt and $530 for Strategic Income. |
See Notes to Financial Statements
| | Municipal
Intermediate
Bond Fund | | |
For the Fiscal
Year Ended
October 31,
2023 | For the Fiscal
Year Ended
October 31,
2023 | For the Fiscal
Year Ended
October 31,
2023 | For the Fiscal
Year Ended
October 31,
2023 | For the Fiscal
Year Ended
October 31,
2023 |
|
|
|
|
|
|
|
|
|
|
| | | | |
| | | | |
| | | | |
| | | | |
| | | | |
| | | | |
| | | | |
| | | | |
|
|
|
|
|
| | | | |
| | | | |
| | | | |
| | | | |
| | | | |
| | | | |
| | | | |
| | | | |
| | | | |
| | | | |
Statements of Changes in Net Assets
Neuberger Berman Income Funds
| | |
| | | | |
| | | | |
Increase/(Decrease) in Net Assets: |
|
|
|
|
From Operations (Note A): |
|
|
|
|
Net investment income/(loss) | | | | |
Net realized gain/(loss) on investments | | | | |
Change in net unrealized appreciation/(depreciation) of investments | | | | |
Net increase/(decrease) in net assets resulting from operations | | | | |
Distributions to Shareholders From (Note A): |
|
|
|
|
|
|
|
|
|
| | | | |
| | | | |
| | | | |
| | | | |
| | | | |
| | | | |
| | | | |
|
|
|
|
|
| | | | |
| | | | |
| | | | |
Total distributions to shareholders | | | | |
From Fund Share Transactions (Note D): |
|
|
|
|
Proceeds from shares sold: |
|
|
|
|
| | | | |
| | | | |
| | | | |
| | | | |
| | | | |
| | | | |
| | | | |
Proceeds from reinvestment of dividends and distributions: |
|
|
|
|
| | | | |
| | | | |
| | | | |
| | | | |
| | | | |
| | | | |
| | | | |
Payments for shares redeemed: |
|
|
|
|
| | | | |
| | | | |
| | | | |
| | | | |
| | | | |
| | | | |
| | | | |
Net increase/(decrease) from Fund share transactions | | | | |
Net Increase/(Decrease) in Net Assets | | | | |
|
|
|
|
|
| | | | |
| | | | |
See Notes to Financial Statements
Statements of Changes in Net Assets (cont’d)
Neuberger Berman Income Funds
| Municipal
Intermediate
Bond Fund | |
| | | | |
| | | | |
Increase/(Decrease) in Net Assets: |
|
|
|
|
From Operations (Note A): |
|
|
|
|
Net investment income/(loss) | | | | |
Net realized gain/(loss) on investments | | | | |
Change in net unrealized appreciation/(depreciation) of investments | | | | |
Net increase/(decrease) in net assets resulting from operations | | | | |
Distributions to Shareholders From (Note A): |
|
|
|
|
|
|
|
|
|
| | | | |
| | | | |
| | | | |
| | | | |
| | | | |
| | | | |
|
|
|
|
|
| | | | |
| | | | |
| | | | |
| | | | |
| | | | |
| | | | |
Total distributions to shareholders | | | | |
From Fund Share Transactions (Note D): |
|
|
|
|
Proceeds from shares sold: |
|
|
|
|
| | | | |
| | | | |
| | | | |
| | | | |
| | | | |
| | | | |
Proceeds from reinvestment of dividends and distributions: |
|
|
|
|
| | | | |
| | | | |
| | | | |
| | | | |
| | | | |
| | | | |
Payments for shares redeemed: |
|
|
|
|
| | | | |
| | | | |
| | | | |
| | | | |
| | | | |
| | | | |
Net increase/(decrease) from Fund share transactions | | | | |
Net Increase/(Decrease) in Net Assets | | | | |
|
|
|
|
|
| | | | |
| | | | |
See Notes to Financial Statements
Notes to Financial Statements Income Funds
Note A—Summary of Significant Accounting Policies:
1
General: Neuberger Berman Income Funds (the "Trust") is a Delaware statutory trust organized pursuant to an Amended and Restated Trust Instrument dated March 27, 2014. The Trust is registered as an open-end management investment company under the Investment Company Act of 1940, as amended (the "1940 Act"), and its shares are registered under the Securities Act of 1933, as amended. Each of Neuberger Berman Core Bond Fund ("Core Bond"), Neuberger Berman Emerging Markets Debt Fund ("Emerging Markets Debt"), Neuberger Berman Floating Rate Income Fund ("Floating Rate Income"), Neuberger Berman High Income Bond Fund ("High Income"), Neuberger Berman Municipal High Income Fund ("Municipal High Income"), Neuberger Berman Municipal Impact Fund ("Municipal Impact"), Neuberger Berman Municipal Intermediate Bond Fund ("Municipal Intermediate Bond"), Neuberger Berman Short Duration Bond Fund ("Short Duration") and Neuberger Berman Strategic Income Fund ("Strategic Income") (each individually a "Fund," and collectively, the "Funds") is a separate operating series of the Trust. Each Fund is diversified. Under the 1940 Act, the status of a Fund that was registered as non-diversified may, under certain circumstances, change to that of a diversified fund. Emerging Markets Debt became diversified in March 2022. Four Funds offer Investor Class shares, two offer Trust Class shares, nine offer Institutional Class shares, nine offer Class A shares, nine offer Class C shares, one offers Class R3 shares, three offer Class R6 shares and one offers Class E shares. The Trust's Board of Trustees (the "Board") may establish additional series or classes of shares without the approval of shareholders.
A balance indicated with a "—", reflects either a zero balance or a balance that rounds to less than 1.
The assets of each Fund belong only to that Fund, and the liabilities of each Fund are borne solely by that Fund and no other series of the Trust.
Each Fund is an investment company and accordingly follows the investment company accounting and reporting guidance of the Financial Accounting Standards Board ("FASB") Accounting Standards Codification ("ASC") Topic 946 "Financial Services—Investment Companies."
The preparation of financial statements in accordance with U.S. generally accepted accounting principles ("GAAP") requires Management to make estimates and assumptions at the date of the financial statements. Actual results could differ from those estimates.
2
Portfolio valuation: In accordance with ASC 820 "Fair Value Measurement" ("ASC 820"), all investments held by each of the Funds are carried at the value that Management believes a Fund would receive upon selling an investment in an orderly transaction to an independent buyer in the principal or most advantageous market for the investment under current market conditions. Various inputs, including the volume and level of activity for the asset or liability in the market, are considered in valuing the Funds' investments, some of which are discussed below. At times, Management may need to apply significant judgment to value investments in accordance with ASC 820.
ASC 820 established a three-tier hierarchy of inputs to create a classification of value measurements for disclosure purposes. The three-tier hierarchy of inputs is summarized in the three broad Levels listed below.
•
Level 1 – unadjusted quoted prices in active markets for identical investments
•
Level 2 – other observable inputs (including quoted prices for similar investments, interest rates, prepayment speeds, credit risk, amortized cost, etc.)
•
Level 3 – unobservable inputs (including a Fund's own assumptions in determining the fair value of investments)
The inputs or methodology used for valuing an investment are not necessarily an indication of the risk associated with investing in those securities.
The value of the Funds’ investments in equity securities, closed-end funds and exchange-traded funds ("ETFs"), for which market quotations are available, is generally determined by Management by obtaining
valuations from independent pricing services based on the latest sale price quoted on a principal exchange or market for that security (Level 1 inputs). Securities traded primarily on the NASDAQ Stock Market are normally valued at the NASDAQ Official Closing Price ("NOCP") provided by NASDAQ each business day. The NOCP is the most recently reported price as of 4:00:02 p.m., Eastern Time, unless that price is outside the range of the "inside" bid and asked prices (i.e., the bid and asked prices that dealers quote to each other when trading for their own accounts); in that case, NASDAQ will adjust the price to equal the inside bid or asked price, whichever is closer. Because of delays in reporting trades, the NOCP may not be based on the price of the last trade to occur before the market closes. If there is no sale of a security on a particular day, the independent pricing services may value the security based on market quotations.
The value of the Funds' investments in debt securities is determined by Management primarily by obtaining valuations from independent pricing services based on bid quotations, or if quotations are not available, by methods that include various considerations based on security type (generally Level 2 inputs). In addition to the consideration of yields or prices of securities of comparable quality, coupon, maturity and type, indications as to values from dealers, and general market conditions, the following is a description of other Level 2 inputs and related valuation techniques used by independent pricing services to value certain types of debt securities held by the Funds:
Corporate Bonds. Inputs used to value corporate debt securities generally include relevant credit information, observed market movements, sector news, U.S. Treasury yield curve or relevant benchmark curve, and other market information, which may include benchmark yield curves, reported trades, broker-dealer quotes, issuer spreads, comparable securities, and reference data, such as market research publications, when available ("Other Market Information").
Convertible Bonds. Inputs used to value convertible bonds generally include underlying stock data, conversion rates, credit-specific details, relevant listed bond and preferred stock prices and Other Market Information.
U.S. Treasury Obligations. Inputs used to value U.S. Treasury securities generally include quotes from several inter-dealer brokers and Other Market Information.
U.S. Government Agency Securities. Inputs used to value U.S. Government Agency securities generally include obtaining benchmark quotes and Other Market Information.
Collateralized Loan Obligations (CLOs). The value of collateralized loan obligations is primarily determined by cash flow data, relevant loan pricing data and market color, and research from market participants and trading desks (Level 2 or 3 inputs).
Asset-Backed Securities and Mortgage-Backed Securities. Inputs used to value asset-backed securities and mortgage-backed securities generally include models that consider a number of factors, which may include the following: prepayment speeds, cash flows, spread adjustments and Other Market Information.
High Yield Securities. Inputs used to value high yield securities generally include a number of observations of equity and credit default swap curves related to the issuer and Other Market Information.
Municipal Debt Securities. Inputs used to value municipal debt securities include current trades, bid-wanted lists (which informs the market that a holder is interested in selling a position and that offers will be considered), offerings, general information on market movement, direction, trends, and specific data on specialty issues.
Emerging Markets Debt and Foreign Government Securities. Inputs used to value emerging markets debt and foreign government securities generally include dealer quotes, bond market activity, discounted cash flow models, and other relevant information such as credit spreads, benchmark curves and Other Market Information.
The value of loan assignments is determined by Management primarily by obtaining valuations from independent pricing services based on broker quotes (generally Level 2 or Level 3 inputs depending on the number of quotes available).
The value of futures contracts is determined by Management by obtaining valuations from independent pricing services at the settlement price at the market close (Level 1 inputs).
The value of bond forward contracts ("bond forwards") is determined by Management by obtaining valuations from independent pricing services using a model that considers the current price of the underlying bond and the forward curve (Level 2 inputs).
The value of interest rate swaps is determined by Management primarily by obtaining valuations from independent pricing services based on references to the underlying rates including the local overnight index swap rate and the respective interbank offered forward rate to produce the daily price. The present value is calculated based off of expected cash flows based on swap parameters along with reference to the underlying yield curve and reference rate (Level 2 inputs).
The value of credit default swaps is determined by Management by obtaining valuations from independent pricing services using a model that considers a number of factors, which may include default probabilities, credit curves, recovery rates and cash flows (Level 2 inputs).
The value of inflation swaps is determined by Management primarily by obtaining valuations from independent pricing services based on references to the underlying inflation rates including forward inflation expectation rate and the respective interbank offered forward rate to produce the daily price. The present value is calculated based off of expected cash flows based on swap parameters along with reference to the underlying forward inflation curve and reference rate (Level 2 inputs).
The value of forward foreign currency contracts ("forward FX contracts") is determined by Management by obtaining valuations from independent pricing services based on actual traded currency rates on independent pricing services’ networks, along with other traded and quoted currency rates provided to the pricing services by leading market participants (Level 2 inputs).
The value of total return swaps is determined by Management by obtaining valuations from independent pricing services using the underlying asset and stated benchmark interest rate (Level 2 inputs).
Management has developed a process to periodically review information provided by independent pricing services for all types of securities.
Investments in non-exchange traded investment companies are valued using the respective fund’s daily calculated net asset value ("NAV") per share (Level 2 inputs), when available.
If a valuation is not available from an independent pricing service, or if Management has reason to believe that the valuation received does not represent the amount a Fund might reasonably expect to receive on a current sale in an orderly transaction, Management seeks to obtain quotations from brokers or dealers (generally considered Level 2 or Level 3 inputs depending on the number of quotes available). If such quotations are not available, the security is valued using methods Management has approved in the good-faith belief that the resulting valuation will reflect the fair value of the security. Pursuant to Rule 2a-5 under the 1940 Act, the Board designated Management as the Funds' valuation designee. As the Funds' valuation designee, Management is responsible for determining fair value in good faith for all Fund investments. Inputs and assumptions considered in determining fair value of a security based on Level 2 or Level 3 inputs may include, but are not limited to, the type of security; the initial cost of the security; the existence of any contractual restrictions on the security’s disposition; the price and extent of public trading in similar securities of the issuer or of comparable companies; quotations or evaluated prices from broker-dealers or pricing services; information obtained from the issuer and analysts; an analysis of the company’s or issuer’s financial statements; an evaluation of the inputs that influence the issuer and the market(s) in which the security is purchased and sold.
The value of the Funds’ investments in foreign securities is generally determined using the same valuation methods and inputs as other Fund investments, as discussed above. Foreign security prices expressed in
local currency values are normally translated from the local currency into U.S. dollars using the exchange rates as of 4:00 p.m., Eastern Time on days the New York Stock Exchange ("NYSE") is open for business. Management has approved the use of ICE Data Services ("ICE") to evaluate the prices of foreign debt securities as of the time at which a Fund’s share price is calculated. ICE utilizes benchmark spread and yield curves and evaluates available market activity from the local close to the time as of which a Fund’s share price is calculated (Level 2 inputs) to assist in determining prices for certain foreign debt securities. In the absence of precise information about the market values of these foreign securities as of the time at which a Fund’s share price is calculated, Management has determined based on available data that prices adjusted or evaluated in this way are likely to be closer to the prices a Fund could realize on a current sale than the prices of those securities established at the close of the foreign markets in which the securities primarily trade.
Fair value prices are necessarily estimates, and there is no assurance that such a price will be at or close to the price at which the security is next quoted or traded.
3
Foreign currency translations: Core Bond, Emerging Markets Debt, Floating Rate Income, High Income, Short Duration and Strategic Income may invest in foreign securities denominated in foreign currencies. The accounting records of the Funds are maintained in U.S. dollars. Foreign currency amounts are normally translated into U.S. dollars using the exchange rate as of 4:00 p.m. Eastern Time, on days the NYSE is open for business, to determine the value of investments, other assets and liabilities. Purchase and sale prices of securities, and income and expenses, are translated into U.S. dollars at the prevailing rate of exchange on the respective dates of such transactions. Net unrealized foreign currency gain/(loss), if any, arises from changes in the value of assets and liabilities, other than investments in securities, as a result of changes in exchange rates and is stated separately in the Statements of Operations.
4
Securities transactions and investment income: Securities transactions are recorded on trade date for financial reporting purposes. Dividend income is recorded on the ex-dividend date or, for certain foreign dividends, as soon as a Fund becomes aware of the dividends. Non-cash dividends included in dividend income, if any, are recorded at the fair market value of the securities received. Interest income, including accretion of discount (adjusted for original issue discount, where applicable) and amortization of premium, where applicable, is recorded on the accrual basis. Realized gains and losses from securities transactions and foreign currency transactions, if any, are recorded on the basis of identified cost and stated separately in the Statements of Operations. Included in net realized gain/(loss) on investments are proceeds from the settlement of class action litigation(s) in which certain of the Funds participated as a class member. The amounts of such proceeds for the year ended October 31, 2023, was $5,277, $879,786, $462 and $130,929 for Core Bond, High Income, Short Duration and Strategic Income.
5
Income tax information: Each Fund is treated as a separate entity for U.S. federal income tax purposes. It is the policy of each Fund to continue to qualify for treatment as a regulated investment company ("RIC") by complying with the requirements of the U.S. Internal Revenue Code applicable to RICs and to distribute substantially all of its net investment income and net realized capital gains to its shareholders. To the extent a Fund distributes substantially all of its net investment income and net realized capital gains to shareholders, no federal income or excise tax provision is required.
ASC 740 "Income Taxes" sets forth a minimum threshold for financial statement recognition of a tax position taken, or expected to be taken, in a tax return. The Funds recognize interest and penalties, if any, related to unrecognized tax positions as an income tax expense in the Statements of Operations. The Funds are subject to examination by U.S. federal and state tax authorities for returns filed for the tax years for which the applicable statutes of limitations have not yet expired. Management has analyzed each Fund's tax positions taken or expected to be taken on federal and state income tax returns for all open tax years (the current and the prior three tax years) and has concluded that no provision for income tax is required in the Funds' financial statements.
For federal income tax purposes, the estimated cost and unrealized appreciation/(depreciation) in value of investments held at October 31, 2023 were as follows:
| | Gross
Unrealized
Appreciation | Gross
Unrealized
Depreciation | Net Unrealized
Appreciation/
(Depreciation) |
| | | | |
| | | | |
| | | | |
| | | | |
| | | | |
| | | | |
Municipal Intermediate Bond | | | | |
| | | | |
| | | | |
Income distributions and capital gain distributions are determined in accordance with income tax regulations, which may differ from GAAP. These differences are primarily due to differing treatments of income and gains on various investment securities held by each Fund, timing differences and differing characterization of distributions made by each Fund. The Funds may also utilize earnings and profits distributed to shareholders on redemption of their shares as a part of the dividends-paid deduction for income tax purposes.
Any permanent differences resulting from different book and tax treatment are reclassified at year-end and have no impact on net income, NAV or NAV per share of the Funds. For the year ended October 31, 2023, the Funds recorded permanent reclassifications primarily related to prior year true up adjustments and distribution in excess of income. For the year ended October 31, 2023, the Funds recorded the following permanent reclassifications:
| | Total Distributable
Earnings/(Losses) |
| | |
Municipal Intermediate Bond | | |
The tax character of distributions paid during the years ended October 31, 2023, and October 31, 2022, was as follows:
| |
| | | | | |
| | | | | | | | | | |
| | | | | | | | | | |
| | | | | | | | | | |
| | | | | | | | | | |
| | | | | | | | | | |
| | | | | | | | | | |
| | | | | | | | | | |
Municipal Intermediate Bond | | | | | | | | | | |
| | | | | | | | | | |
| | | | | | | | | | |
|
|
|
|
|
|
|
|
|
|
|
As of October 31, 2023, the components of distributable earnings (accumulated losses) on a U.S. federal income tax basis were as follows:
| Undistributed
Ordinary
Income | Undistributed
Tax-Exempt
Income | Undistributed
Long-Term
Capital Gain | Unrealized
Appreciation/
(Depreciation) | Loss
Carryforwards
and Deferrals | Other
Temporary
Differences | |
| | | | | | | |
| | | | | | | |
| | | | | | | |
| | | | | | | |
| | | | | | | |
| | | | | | | |
Municipal Intermediate Bond | | | | | | | |
| | | | | | | |
| | | | | | | |
The temporary differences between book basis and tax basis distributable earnings are primarily due to: losses disallowed and/or recognized on wash sales and straddles, timing differences of fund level distributions, mark-to-market adjustments on swaps, futures, forward FX contracts and options, amortization of bond premium, defaulted bond adjustments, amortization of organizational expenses and tax adjustments related to swap contracts and treasury inflation protection securities ("TIPS").
To the extent each Fund’s net realized capital gains, if any, can be offset by capital loss carryforwards, it is the policy of each Fund not to distribute such gains. Capital loss carryforward rules allow for RICs to carry forward capital losses indefinitely and to retain the character of capital loss carryforwards as short-term or
long-term. As determined at October 31, 2023, the following Funds had unused capital loss carryforwards available for federal income tax purposes to offset future net realized capital gains, if any, as follows:
| Capital Loss Carryforwards |
| | |
| | |
| | |
| | |
| | |
| | |
| | |
Municipal Intermediate Bond | | |
| | |
| | |
6
Foreign taxes: Foreign taxes withheld, if any, represent amounts withheld by foreign tax authorities, net of refunds recoverable.
Foreign capital gains on certain foreign securities may be subject to foreign taxes, which are accrued as applicable. Emerging Markets Debt and Strategic Income accrue capital gains tax on unrealized and realized gains for certain securities. At October 31, 2023, Emerging Markets Debt and Strategic Income had accrued capital gains taxes of $5,812 and $1,622, respectively, which is reflected in the Statements of Assets and Liabilities. For the year ended October 31, 2023, Emerging Markets Debt and Strategic Income had realized capital gains taxes of $10,700 and $8,554, respectively, which is reflected in the Statements of Operations.
As a result of several European Court of Justice ("ECJ") court cases in certain countries across the European Union ("EU"), certain of the Funds that invest in foreign securities may file tax reclaims for previously withheld taxes on dividends earned in those countries ("ECJ tax reclaims"). These additional filings are subject to various administrative proceedings by the local jurisdictions’ tax authorities within the EU, as well as a number of related judicial proceedings. When the ECJ tax reclaim is "more likely than not" to not be sustained assuming examination by tax authorities due to the uncertainty that exists as to the ultimate resolution of these proceedings, the likelihood of receipt of these ECJ tax reclaims, and the potential timing of payment, no amounts are included in the Statements of Assets and Liabilities. Income recognized, if any, for ECJ tax reclaims would be included in "Interest and other income—unaffiliated issuers" in the Statements of Operations and the cost to file these additional ECJ tax reclaims, if any, would be included in "Miscellaneous and other fees" in the Statements of Operations.
7
Distributions to shareholders: Each Fund earns income, net of expenses, daily on its investments. Ordinarily, distributions from net investment income are declared on each business day and paid monthly, and distributions from net realized capital gains, if any, are generally distributed once a year (usually in December). Distributions to shareholders are recorded on the ex-date.
8
Expense allocation: Certain expenses are applicable to multiple funds within the complex of related investment companies. Expenses directly attributable to a fund are charged to that fund. Expenses of the Trust that are not directly attributable to a particular series of the Trust (e.g., a Fund) are allocated among the series of the Trust, on the basis of relative net assets, except where a more appropriate allocation of expenses to each of the series can otherwise be made fairly. Expenses borne by the complex of related investment companies, which includes open-end and closed-end investment companies for which NBIA serves as investment manager, that are not directly attributable to a particular investment company in the complex (e.g., the Trust) or series thereof are allocated among the investment companies in the complex or series thereof on the basis of relative net assets, except where a more appropriate allocation of expenses to each of the investment companies in the complex or series thereof can otherwise be made fairly. Each Fund’s expenses (other than those specific to each class) are allocated proportionally each day among its classes based upon the relative net assets of each class.
9
Investments in foreign securities: Investing in foreign securities may involve sovereign and other risks, in addition to the credit and market risks normally associated with domestic securities. These additional risks include the possibility of adverse political and economic developments (including political instability, nationalization, expropriation, or confiscatory taxation) and the potentially adverse effects of unavailability of public information regarding issuers, less governmental supervision and regulation of financial markets, reduced liquidity of certain financial markets, and the lack of uniform accounting, auditing, and financial reporting standards or the application of standards that are different or less stringent than those applied in the United States. Foreign securities also may experience greater price volatility, higher rates of inflation, and delays in settlement.
10
When-issued/delayed delivery securities: Each Fund may purchase securities with delivery or payment to occur at a later date beyond the normal settlement period. At the time a Fund enters into a commitment to purchase a security, the transaction is recorded and the value of the security is reflected in the NAV. The price of such security and the date when the security will be delivered and paid for are fixed at the time the transaction is negotiated. The value of the security may vary with market fluctuations. No interest accrues to a Fund until payment takes place. When-issued and delayed delivery transactions can have a leverage-like effect on a Fund, which can increase fluctuations in the Fund’s NAV. Certain risks may arise upon entering into when-issued or delayed delivery securities transactions from the potential inability of counterparties to meet the terms of their contracts or if the issuer does not issue the securities due to political, economic, or other factors. Additionally, losses may arise due to changes in the value of the underlying securities.
Each Fund may also enter into a TBA (To Be Announced) agreement and "roll over" such agreement prior to the settlement date by selling the obligation to purchase the pools set forth in the agreement and entering into a new TBA agreement for future delivery of pools of mortgage-backed securities. TBA mortgage-backed securities may increase prepayment risks because the underlying mortgages may be less favorable than anticipated by a Fund.
11
Derivative instruments: Certain Funds' use of derivatives during the year ended October 31, 2023, is described below. Please see the Schedule of Investments for each Fund's open positions in derivatives, if any, at October 31, 2023. The disclosure requirements of ASC 815 "Derivatives and Hedging" ("ASC 815") distinguish between derivatives that qualify for hedge accounting and those that do not. Because investment companies value their derivatives at fair value and recognize changes in fair value through the Statements of Operations, they do not qualify for hedge accounting. Accordingly, even though a Fund's investments in derivatives may represent economic hedges, they are considered non-hedge transactions for purposes of this disclosure.
Rule 18f-4 under the 1940 Act regulates the use of derivatives for certain funds registered under the 1940 Act ("Rule 18f-4"). Unless a Fund qualifies as a "limited derivatives user" as defined in Rule 18f-4, the Fund is subject to a comprehensive derivatives risk management program, is required to comply with certain value-at-risk based leverage limits and is required to provide additional disclosure both publicly and to the SEC regarding its derivatives positions. If a Fund qualifies as a limited derivatives user, Rule 18f-4 requires the Fund to have policies and procedures to manage its aggregate derivatives risk.
Futures contracts: During the year ended October 31, 2023, Core Bond used futures to manage or adjust the risk profile and investment exposure of the Fund, including to adjust the duration and yield curve exposure of the Fund’s portfolio. During year ended October 31, 2023, Emerging Markets Debt and Short Duration each used futures for economic hedging purposes, including as a maturity or duration management device. During year ended October 31, 2023, Strategic Income used futures to manage or adjust the risk profile and investment exposure of the Fund or individual positions, to obtain or reduce exposure to certain markets, to establish net short or long positions for markets, currencies or securities, to adjust the duration of the Fund’s portfolio and to enhance total return.
Futures contracts may include certain options on exchange-traded futures contracts. At the time a Fund enters into a futures contract, it is required to deposit with the futures commission merchant a specified amount of cash or liquid securities, known as "initial margin," which is a percentage of the value of the futures contract being traded that is set by the exchange upon which the futures contract is traded. Each day, the futures contract is valued at the official settlement price of the board of trade or U.S. commodity
exchange on which such futures contract is traded. Subsequent payments, known as "variation margin," to and from the broker are made on a daily basis, or as needed, as the market price of the futures contract fluctuates. Daily variation margin adjustments, arising from this "mark to market," are recorded by a Fund as unrealized gains or losses.
Although some futures by their terms call for actual delivery or acquisition of the underlying securities or currency, in most cases the contracts are closed out prior to delivery by offsetting purchases or sales of matching futures. When the contracts are closed or expire, a Fund recognizes a gain or loss. Risks of entering into futures contracts include the possibility there may be an illiquid market, possibly at a time of rapidly declining prices, and/or a change in the value of the contract may not correlate with changes in the value of the underlying securities. Futures executed on regulated futures exchanges have minimal counterparty risk to a Fund because the exchange’s clearinghouse assumes the position of the counterparty in each transaction. Thus, a Fund is exposed to risk only in connection with the clearinghouse and not in connection with the original counterparty to the transaction.
For U.S. federal income tax purposes, the futures transactions undertaken by a Fund may cause the Fund to recognize gains or losses from marking contracts to market even though its positions have not been sold or terminated, may affect the character of the gains or losses recognized as long-term or short-term, and may affect the timing of some capital gains and losses realized by the Fund. Also, a Fund’s losses on transactions involving futures contracts may be deferred rather than being taken into account currently in calculating such Fund’s taxable income.
Bond forward contracts: During the year ended October 31, 2023, Strategic Income used bond forward contracts to obtain economic exposure in the Fund to certain markets and securities. A bond forward is a contractual agreement between a Fund and another party to buy or sell an underlying asset at an agreed-upon future price and date. In a bond forward transaction, no cash premium is paid when the parties enter into the bond forward. If the transaction is collateralized, an exchange of margin collateral will take place according to an agreed-upon schedule. Otherwise, no asset of any kind changes hands until the bond forward matures (typically in 30 days) or is rolled over for another agreed-upon period. Generally, the value of the bond forward will change based on changes in the value of the underlying asset. Bond forwards are subject to market risk (the risk that the market value of the underlying bond may change), non-correlation risk (the risk that the market value of the bond forward might move independently of the market value of the underlying bond) and counterparty credit risk (the risk that a counterparty will be unable to meet its obligation under the contract). If there is no cash exchanged at the time a Fund enters into the bond forward, counterparty risk may be limited to the loss of any marked-to-market profit on the contract and any delays or limitations on the Fund’s ability to sell or otherwise use the investments posted as collateral for the bond forward.
Forward foreign currency contracts: During the year ended October 31, 2023, Emerging Markets Debt used forward FX contracts to manage or adjust views on foreign exchange rate movements and currency exposure, to apply foreign exchange leverage or reduce foreign currency risk, and to gain exposure to markets where the portfolio managers believe these instruments provide better liquidity and value than bonds. During the year ended October 31, 2023, Strategic Income used forward FX contracts to manage or adjust the risk profile for foreign currency exposures in the Fund, to obtain or reduce economic exposure, to establish net short or long positions for markets or securities and to enhance total return.
A forward FX contract is an agreement between two parties to buy or sell a specific currency for another at a set price on a future date, and is individually negotiated and privately traded by currency traders and their customers in the interbank market. The market value of a forward FX contract fluctuates with changes in forward currency exchange rates. Forward FX contracts are marked to market daily, and the change in value is recorded by a Fund as an unrealized gain or loss. At the consummation of a forward FX contract to purchase or sell currency, a Fund may either exchange the currencies specified at the maturity of the forward FX contract or enter into a closing transaction involving the purchase or sale of an offsetting forward FX contract. Closing transactions with respect to forward FX contracts are usually performed with the counterparty to the original forward FX contract. The gain or loss arising from the difference between the U.S. dollar cost of the original contract and the value of the foreign currency in U.S. dollars upon closing
a contract is included in "Net realized gain/(loss) on settlement of forward foreign currency contracts" in the Statements of Operations. These contracts may involve market risk in excess of the unrealized gain or loss reflected in a Fund’s Statement of Assets and Liabilities. In addition, a Fund could be exposed to risks associated with fluctuations in foreign currency and the risk the counterparty will fail to fulfill its obligation.
Credit default swap contracts: During the year ended October 31, 2023, Emerging Markets Debt used credit default swaps to manage or adjust credit risk of the Fund, to take advantage of the portfolio managers’ views on credit risk and market pricing of credit events and in an effort to leverage or reduce risk exposures by selling or buying protection. During the year ended October 31, 2023, Strategic Income used credit default swaps for economic hedging purposes, to manage or adjust the risk profile and investment exposure of the Fund or individual positions, to obtain or reduce exposure to certain markets, to establish net short or long positions for markets or securities and to enhance total return. When a Fund is the buyer of a credit default swap contract, it is entitled to receive the notional amount of the swap from the counterparty if a credit event occurs. In return, the Fund pays the counterparty a periodic stream of payments over the term of the contract provided that no credit event has occurred. If no credit event occurs, the Fund would have spent the stream of payments and received no proceeds from the contract. When a Fund is the seller of a credit default swap contract, it receives the stream of payments, but is obligated to pay to the buyer of the protection an amount up to the notional amount of the swap and in certain instances take delivery of securities of the reference entity upon the occurrence of a credit event, as defined under the terms of that particular swap agreement. Credit events are contract specific but may include bankruptcy, failure to pay, restructuring, obligation acceleration and repudiation/moratorium. If a Fund is a seller of protection and a credit event occurs, the maximum potential amount of future payments that the Fund could be required to make (or the risk of loss) would be an amount equal to the notional amount of the agreement. This potential amount would be partially offset by any recovery value of the respective referenced obligation, or net amount received from the settlement of a buy protection credit default swap agreement entered into by the Fund for the same referenced obligation. As the seller, the Fund may add economic leverage to its portfolio because, in addition to its total net assets, the Fund is subject to investment exposure on the notional amount of the swap. The net periodic payments paid or received on the swap contract are accrued daily as a component of unrealized appreciation/(depreciation) and are recorded as realized gain upon receipt or realized loss upon payment. The Fund also records an increase or decrease to unrealized appreciation/(depreciation) in an amount equal to the daily valuation of swaps. For over-the-counter ("OTC") credit default swaps, cash settlement in and out of the swaps may occur at a reset date or any other date, at the discretion of the Fund and the counterparty, over the life of the agreement, and is generally determined based on limits and thresholds established as part of an agreement between the Fund and the counterparty. For financial reporting purposes, unamortized upfront payments/(receipts), if any, are netted with unrealized appreciation or (depreciation) and net interest receivable or payable on swap contracts to determine the fair value of swaps.
Interest rate/Inflation swap contracts: During the year ended October 31, 2023, Emerging Markets Debt used interest rate swaps to manage or adjust interest rate risk of the Fund, to take advantage of the portfolio managers’ views on interest rates and market pricing of future monetary policy, to obtain exposure on a maturity horizon where bonds are illiquid or are unavailable, and to obtain leveraged or reduced rate positions. During the year ended October 31, 2023, Strategic Income used interest rate swaps and inflation swaps for economic hedging purposes, to manage or adjust the risk profile and investment exposure of the Fund or individual positions, to obtain or reduce exposure to certain markets, to establish net short or long positions for markets or securities and to enhance total return. Under the terms of interest rate/inflation swaps, the Fund agrees to pay the swap counterparty a fixed-rate payment in exchange for the counterparty’s paying the Fund a variable-rate payment, or the Fund agrees to pay the swap counterparty a variable-rate payment in exchange for the counterparty’s paying the Fund a fixed-rate payment. The fixed-rate and variable-rate payment flows are paid by one party to the other on a periodic basis and netted against each other when applicable. There is no guarantee that these interest rate/inflation swap transactions will be successful in reducing or limiting risk.
Risks may arise if the counterparty to an interest rate/inflation swap contract fails to comply with the terms of its contract. The loss incurred due to the failure of a counterparty is generally limited to the net interest
payment to be received by the Fund and/or the termination value at the end of the contract. Additionally, risks may arise if there is no liquid market for these agreements or from movements in interest rates unanticipated by Management.
Periodic expected interim net interest payments or receipts on the swaps are recorded as an adjustment to unrealized gains/losses, along with the fair value of the future periodic payment or receivable streams on the swaps. The unrealized gains/losses associated with the periodic interim net interest payments or receipts are reclassified to realized gains/losses in conjunction with the actual net payment or receipt of such amounts. For OTC interest rate/inflation swaps, cash settlement in and out of the swaps may occur at a reset date or any other date, at the discretion of the Fund and the counterparty, over the life of the agreement, and is generally determined based on limits and thresholds established as part of an agreement between the Fund and the counterparty. The reclassifications do not impact the Fund’s total net assets or its total net increase (decrease) in net assets resulting from operations.
Centrally cleared swap contracts: Certain clearinghouses currently offer clearing for limited types of derivative transactions. In a cleared derivative transaction, a Fund typically enters into the transaction with a financial institution counterparty that is then cleared through a central clearinghouse. Upon acceptance of a swap by a central clearinghouse, the original swap is extinguished and replaced with a swap with the clearinghouse, thereby reducing or eliminating the Fund’s exposure to the credit risk of the original counterparty. A Fund typically will be required to post specified levels of both initial and variation margin with the clearinghouse or at the instruction of the clearinghouse. The daily change in valuation is recorded as a receivable or payable for variation margin and settled in cash with the central clearing party. For financial reporting purposes, unamortized upfront payments, if any, are netted with unrealized appreciation or depreciation and net interest receivable or payable on swap contracts to determine the fair value of swaps.
Total return swap contracts: During the year ended October 31, 2023, High Income used total return swaps to enhance liquidity while maintaining exposure to the asset class. During the year ended October 31, 2023, Short Duration used total return swaps for hedging purposes, liquidity management and to manage and adjust the risk profile of the Fund. During the year ended October 31, 2023, Strategic Income used total return swaps for economic hedging purposes, to manage or adjust the risk profile and investment exposure of the Fund or individual positions, to obtain or reduce exposure to certain markets, to establish net short or long positions for markets or securities and to enhance total return. Total return swaps involve commitments to pay fixed or floating rate interest in exchange for a market-linked return based on a notional amount. To the extent the total return of the reference security or index underlying the total return swap exceeds or falls short of the offsetting interest rate obligation, a Fund will receive a payment or make a payment to the counterparty, respectively. Certain risks may arise when entering into total return swap transactions, including counterparty default, liquidity or unfavorable changes in the value of the underlying reference security or index. The value of the swap is adjusted daily and the change in value, if any, is recorded as unrealized appreciation or (depreciation) in the Statements of Assets and Liabilities. Payments received or made at the end of each measurement period are recorded as realized gain or loss in the Statements of Operations. For OTC total return swaps, cash settlement in and out of the swaps may occur at a reset date or any other date, at the discretion of the Fund and the counterparty, over the life of the agreement, and is generally determined based on limits and thresholds established as part of an agreement between the Fund and the counterparty.
Options: During the year ended October 31, 2023, Strategic Income used options purchased and options written for economic hedging purposes, to manage or adjust the risk profile and investment exposure of the Fund or individual positions, to obtain or reduce exposure to certain markets, to establish net short or long positions for markets or securities and to enhance total return.
Premiums paid by a Fund upon purchasing a call or put option are recorded in the asset section of the Fund’s Statement of Assets and Liabilities and are subsequently adjusted to the current market value. When an option is exercised, closed, or expired, a Fund realizes a gain or loss and the asset is eliminated. For purchased call options, a Fund’s loss is limited to the amount of the option premium paid.
Premiums received by a Fund upon writing a call option or a put option are recorded in the liability section of the Fund’s Statement of Assets and Liabilities and are subsequently adjusted to the current market value. When an option is exercised, closed, or expired, a Fund realizes a gain or loss and the liability is eliminated.
When writing a covered call option, a Fund, in return for the premium, gives up the opportunity for profit from a price increase in the underlying security above the exercise price, but conversely retains the risk of loss should the price of the security decline. When writing a put option, a Fund, in return for the premium, takes the risk that it must purchase the underlying security at a price that may be higher than the current market price of the security. If a call or put option that a Fund has written expires unexercised a Fund will realize a gain for the amount of the premium. All securities covering outstanding written options are held in escrow by the custodian bank.
At October 31, 2023, the Funds listed below had the following derivatives (which did not qualify as hedging instruments under ASC 815), grouped by primary risk exposure:
| | |
| Statements of
Assets and Liabilities
Location | | Statements of
Assets and Liabilities
Location | |
| |
| |
|
| |
| |
|
| Receivable/Payable for accumulated variation margin on futures contracts | | Receivable/Payable for accumulated variation margin on futures contracts | |
| |
| |
|
| |
| |
|
| Receivable/Payable for accumulated variation margin on futures contracts | | Receivable/Payable for accumulated variation margin on futures contracts | |
| |
| |
|
| Receivable for forward foreign currency contracts | | Payable for forward foreign currency contracts | |
| |
| |
|
| Receivable/Payable for accumulated variation margin on centrally cleared swap contracts | | Receivable/Payable for accumulated variation margin on centrally cleared swap contracts | |
| |
| |
|
| Over-the-counter swap contracts, at value | | Over-the-counter swap contracts, at value | |
| |
| |
|
| |
| |
|
| Receivable/Payable for accumulated variation margin on futures contracts | | Receivable/Payable for accumulated variation margin on futures contracts | |
| |
| |
|
| |
| |
|
| Receivable/Payable for accumulated variation margin on futures contracts | | Receivable/Payable for accumulated variation margin on futures contracts | |
| |
| |
|
| Receivable for bond forward contracts | | Payable for bond forward contracts | |
| | |
| Statements of Assets and Liabilities Location | | Statements of Assets and Liabilities Location | |
| |
| |
|
| Receivable for forward foreign currency contracts | | Payable for forward foreign currency contracts | |
| |
| |
|
| Receivable/Payable for accumulated variation margin on centrally cleared swap contracts | | Receivable/Payable for accumulated variation margin on centrally cleared swap contracts | |
| Receivable/Payable for accumulated variation margin on centrally cleared swap contracts(a) | | Receivable/Payable for accumulated variation margin on centrally cleared swap contracts(a) | |
Total centrally cleared swaps | | | | |
| |
| |
|
| Over-the-counter swap contracts, at value(a) | | Over-the-counter swap contracts, at value(a) | |
| "Centrally cleared swaps" and "over-the counter swaps" reflect the cumulative unrealized appreciation/(depreciation) of the centrally cleared swap and over-the-counter swap contracts plus accrued interest as of October 31, 2023. |
The impact of the use of these derivative instruments on the Statements of Operations during the year ended October 31, 2023, was as follows:
| | | Change in Net Unrealized
Appreciation/
(Depreciation) on
|
|
|
|
|
|
|
|
|
| |
| |
|
|
|
|
|
|
|
|
| |
| |
|
|
|
|
| |
| |
|
|
|
|
| |
| |
| |
| |
| |
| |
|
|
|
|
|
|
|
|
| |
| |
| Net Realized Gain/ (Loss) on Derivatives(a) | | Change in Net Unrealized Appreciation/ (Depreciation) on Derivatives(b) |
|
|
|
|
|
|
|
|
| |
| |
|
|
|
|
| |
| |
|
|
|
|
|
|
|
|
| |
| |
|
|
|
|
| |
| |
|
|
|
|
| |
| |
|
|
|
|
| |
| |
| |
| |
| |
| |
|
|
|
|
| |
| |
|
|
|
|
| |
| |
| Net realized gain/(loss) on derivatives is located in the Statements of Operations each under the caption, "Net realized gain/(loss) on:" |
| Expiration or closing of futures contracts |
| Settlement of forward foreign currency contracts |
| Settlement of bond forward contracts |
| Expiration or closing of swap contracts |
| Transactions in investment securities of unaffiliated issuers |
| Expiration or closing of option contracts written |
| Change in net unrealized appreciation/(depreciation) is located in the Statements of Operations each under the caption, "Change in net unrealized appreciation/(depreciation) in value of:" |
| |
| Forward foreign currency contracts |
| |
| |
While the Funds may receive redeemable preference shares, rights and warrants in connection with their investments in securities, these preference shares, rights and warrants are not considered "derivative instruments" under ASC 815.
Management has concluded that Floating Rate Income, Municipal High Income, Municipal Impact and Municipal Intermediate Bond did not hold any derivative instruments during the year ended October 31, 2023 that require additional disclosures pursuant to ASC 815.
12
Securities lending: Each Fund, using State Street Bank and Trust Company ("State Street") as its lending agent, may loan securities to qualified brokers and dealers in exchange for negotiated lender’s fees. These fees, if any, would be disclosed within the Statements of Operations under the caption "Income from securities loaned-net" and are net of expenses retained by State Street as compensation for its services as lending agent.
The initial collateral received by a Fund at the beginning of each transaction shall have a value equal to at least 102% of the prior day’s market value of the loaned securities (105% in the case of international securities). Collateral in the form of cash and/or securities issued or guaranteed by the U.S. government or its agencies, equivalent to at least 100% of the market value of securities, is maintained at all times. Thereafter, the value of the collateral is monitored on a daily basis, and collateral is moved daily between a counterparty and a Fund until the close of the transaction. Cash collateral is generally invested in a money market fund registered under the 1940 Act that is managed by an affiliate of State Street and is included in the Statements of Assets and Liabilities under the caption "Investments in securities, at value—Unaffiliated issuers". The total value of securities received as collateral for securities on loan is included in a footnote following the applicable Schedule of Investments, but is not included within the Statements of Assets and Liabilities because the receiving Fund does not have the right to sell or repledge the securities received as collateral. The risks associated with lending portfolio securities include, but are not limited to, possible delays in receiving additional collateral or in the recovery of the loaned securities. Any increase or decrease in the fair value of the securities loaned and any interest earned or dividends paid or owed on those securities during the term of the loan would accrue to that Fund.
During the year ended October 31, 2023, the Funds did not participate in securities lending.
13
Offsetting assets and liabilities: The Funds are required to disclose both gross and net information for assets and liabilities related to OTC derivatives, repurchase and reverse repurchase agreements, and securities lending and securities borrowing transactions that are eligible for offset or subject to an enforceable master netting or similar agreement. Emerging Markets Debt and Strategic Income held one or more of these investments at October 31, 2023. The Funds' OTC derivative assets and liabilities at fair value by type are reported gross in the Statements of Assets and Liabilities. The following tables present derivative assets and liabilities by counterparty, net of amounts available for offset under a master netting or similar agreement and net of the related collateral received by a Fund for assets and pledged by a Fund for liabilities as of October 31, 2023.
| Gross Amounts of Assets
Presented in the Statements
of Assets and Liabilities | Gross Amounts of Liabilities
Presented in the Statements
of Assets and Liabilities |
|
|
|
| | |
Over-the-counter swap contracts | | |
| | |
|
|
|
| | |
| | |
Over-the-counter swap contracts | | |
| | |
Gross Amounts Not Offset in the Statements of Assets and Liabilities: |
| | |
| Gross Amounts
Presented in
the Statements
of Assets and
Liabilities | Liabilities
Available
for Offset | | | Gross Amounts
Presented in
the Statements
of Assets and
Liabilities | Assets
Available
for Offset | | |
|
|
|
|
|
|
|
|
| | | | | | | | |
| | | | | | | | |
| | | | | | | | |
| | | | | | | | |
| | | | | | | | |
| | | | | | | | |
| | | | | | | | |
| | | | | | | | |
| | | | | | | | |
| | | | | | | | |
| | | | | | | | |
|
|
|
|
|
|
|
|
| | | | | | | | |
| | | | | | | | |
| | | | | | | | |
| | | | | | | | |
| | | | | | | | |
| | | | | | | | |
| | | | | | | | |
| | | | | | | | |
| | | | | | | | |
| Collateral received (or pledged) is limited to an amount not to exceed 100% of the net amount of assets (or liabilities) in the tables presented above, for each respective counterparty. |
| A net amount greater than zero represents amounts subject to loss as of October 31, 2023, in the event of a counterparty failure. A net amount less than zero represents amounts under-collateralized to each counterparty as of October 31, 2023. |
14
Indemnifications: Like many other companies, the Trust’s organizational documents provide that its officers ("Officers") and trustees ("Trustees") are indemnified against certain liabilities arising out of the performance of their duties to the Trust. In addition, both in some of its principal service contracts and in the normal course of its business, the Trust enters into contracts that provide indemnifications to other parties for certain types of losses or liabilities. The Trust’s maximum exposure under these arrangements is unknown as this could involve future claims against the Trust or a Fund.
15
Investment in other funds managed by Neuberger Berman Investment Advisers LLC: Through October 31, 2023, Strategic Income invested in Neuberger Berman Global Monthly Income Fund Ltd. (the "Underlying Fund") via a secondary market transaction (See Note F).
For Strategic Income’s investment in the Underlying Fund, NBIA waived a portion of its management fee equal to the management fee it received from the Underlying Fund on those assets (the "Arrangement"). For the year ended October 31, 2023, management fees waived under this Arrangement are reflected in the Statements of Operations under the caption "Investment management fees waived." For the year ended October 31, 2023, income earned from the Underlying Fund on Strategic Income’s investments is
reflected in the Statements of Operations under the caption "Dividend income-affiliated issuers". For the year ended October 31, 2023, management fees waived under this Arrangement and distributions from income and capital gains received from Strategic Income’s investments in the Underlying Fund were as follows:
| | Distributions from
Income and
Capital Gains |
| | |
16
Investment company securities and exchange-traded funds: The Funds may invest in shares of other registered investment companies, including ETFs, within the limitations prescribed by the 1940 Act, in reliance on rules adopted by the SEC, particularly Rule 12d1-4 or any other applicable exemptive relief. Rule 12d1-4 permits fund of funds arrangements, and includes (i) limits on control and voting; (ii) required evaluations and findings; (iii) required fund of funds investment agreements; and (iv) limits on complex structures. Shareholders of a Fund will indirectly bear their proportionate share of any management fees and other expenses paid by such other investment companies, in addition to the management fees and expenses of the Fund.
17
Unfunded commitments: The Funds may enter into certain credit agreements all or a portion of which may be unfunded. The Funds are obligated to fund these commitments at the borrower’s discretion.
As of October 31, 2023, unfunded commitments for Floating Rate Income, High Income and Strategic Income were as follows:
|
| | |
HCFS Notes, 0.00%, due 12/31/2031(a) | | |
|
| | |
HCFS Notes, 0.00%, due 12/31/2031(a) | | |
|
| | |
HCFS Notes, 0.00%, due 12/31/2031(a) | | |
| Security fair valued as of October 31, 2023 in accordance with procedures approved by the valuation designee. |
18
Other: All net investment income and realized and unrealized capital gains and losses of each Fund are allocated, on the basis of relative net assets, pro rata among its respective classes.
Note B—Investment Management Fees, Administration Fees, Distribution Arrangements, and Other Transactions with Affiliates:
Each Fund retains NBIA as its investment manager under a Management Agreement. For such investment management services, each Fund pays NBIA an investment management fee as a percentage of average daily net assets according to the following table: |
| | | | | | | |
| | | | | | | |
| | | | | | | |
| | | | | | | |
| | | | | | | |
| | | | | | | |
| | | | | | | |
Municipal Intermediate Bond | | | | | | | |
| | | | | | | |
| | | | | | | |
| NBIA has contractually agreed to waive its Class E management fee for the below Fund. This undertaking lasts until October 31, 2023 and may not be terminated during its term without the consent of the Board. Management fees contractually waived pursuant to this waiver for Class E are not subject to recovery by NBIA. |
| Annualized
Percentage of
Average Daily
Net Assets
Waived | | Management Fees
Waived for the
Year Ended
October 31, 2023 |
| | | |
Accordingly, for the year ended October 31, 2023, the investment management fee pursuant to the Management Agreement was equivalent to an annual effective rate of each Fund’s average daily net assets, as follows:
| After waivers, 0.47% annual effective net rate of the Fund’s average daily net assets. |
| After management fee waiver (Note A). |
Each Fund retains NBIA as its administrator under an Administration Agreement. The administration fee is assessed at the class level and each share class of a Fund, as applicable, pays NBIA an annual administration fee equal to the following: 0.27% for each of Investor Class, Class A, Class C and Class R3; 0.50% for Trust Class of Short Duration; 0.40% for Trust Class of Strategic Income; 0.15% for Institutional Class; and 0.05% for Class R6, each as a percentage of its average daily net assets. Class E shares do not pay an administration fee. Additionally, NBIA retains State Street as its sub-administrator under a
Sub-Administration Agreement. NBIA pays State Street a fee for all services received under the Sub-Administration Agreement.
NBIA has contractually agreed to waive fees and/or reimburse certain expenses of the Investor Class, Trust Class, Institutional Class, Class A, Class C, Class R3 and Class R6 of each Fund that offers those classes so that the total annual operating expenses of those classes do not exceed the expense limitations as detailed in the following table. These undertakings exclude interest, taxes, brokerage commissions, acquired fund fees and expenses, extraordinary expenses, and dividend and interest expenses relating to short sales, if any (commitment fees relating to borrowings are treated as interest for purposes of this exclusion) ("annual operating expenses"); consequently, net expenses may exceed the contractual expense limitations.
At October 31, 2023, the Funds' contingent liabilities to NBIA under the agreements were as follows:
| | | Expenses Reimbursed in
Year Ended October 31, |
| | | | | |
| | | Subject to Repayment until
October 31, |
| | | | | |
| | | | | |
Core Bond Institutional Class | | | | | |
| | | | | |
| | | | | |
| | | | | |
Emerging Markets Debt Institutional Class | | | | | |
Emerging Markets Debt Class A | | | | | |
Emerging Markets Debt Class C | | | | | |
Floating Rate Income Institutional Class | | | | | |
Floating Rate Income Class A | | | | | |
Floating Rate Income Class C | | | | | |
High Income Investor Class | | | | | |
High Income Institutional Class | | | | | |
| | | | | |
| | | | | |
| | | | | |
| | | | | |
Municipal High Income Institutional Class | | | | | |
Municipal High Income Class A | | | | | |
Municipal High Income Class C | | | | | |
Municipal Impact Institutional Class | | | | | |
| | | | | |
| | | | | |
Municipal Intermediate Bond Investor Class | | | | | |
Municipal Intermediate Bond Institutional Class | | | | | |
Municipal Intermediate Bond Class A | | | | | |
Municipal Intermediate Bond Class C | | | | | |
Short Duration Investor Class | | | | | |
Short Duration Trust Class | | | | | |
Short Duration Institutional Class | | | | | |
| | | | | |
| | | Expenses Reimbursed in Year Ended October 31, |
| | | | | |
| | | Subject to Repayment until October 31, |
| Contractual Expense Limitation(a) | | | | |
| | | | | |
Strategic Income Trust Class | | | | | |
Strategic Income Institutional Class | | | | | |
| | | | | |
| | | | | |
Strategic Income Class R6 | | | | | |
| Expense limitation per annum of the respective class’s average daily net assets. |
| Classes that have had changes to their respective limitations are noted below. |
| | |
Floating Rate Income Institutional Class | | |
Floating Rate Income Class A | | |
Floating Rate Income Class C | | |
| Effective December 15, 2023, in addition to the contractual undertaking described above for Short Duration, NBIA has voluntarily undertaken to waive fees and/or reimburse certain expenses so that their Operating Expenses, per annum of their respective average daily net assets, are limited to 0.46% for Class A and Class C. NBIA may, at its sole discretion, modify or terminate the voluntary waiver and/or reimbursement without notice to the Fund. Fees voluntarily waived and/or reimbursed are not subject to recovery by NBIA. |
Each Fund has agreed that each of its respective classes will repay NBIA for fees and expenses waived or reimbursed for that class provided that repayment does not cause that class’s annual operating expenses to exceed its contractual expense limitation in place at the time the fees and expenses were waived or reimbursed, or the expense limitation in place at the time the Fund repays NBIA, whichever is lower. Any such repayment must be made within three years after the year in which NBIA incurred the expense.
During the year ended October 31, 2023, there was no repayment to NBIA under these agreements.
Neuberger Berman Europe Limited ("NBEL"), as the sub-adviser to Emerging Markets Debt, is retained by NBIA to choose the Fund’s investments and handle its day-to-day business for the portion of the Fund’s assets allocated to it by NBIA, and receives a monthly fee paid by NBIA. As investment manager, NBIA is responsible for overseeing the investment activities of NBEL. Several individuals who are Officers and/or Trustees of the Trust are also employees of NBEL and/or NBIA.
Each Fund also has a distribution agreement with Neuberger Berman BD LLC (the "Distributor") with respect to each class of shares. The Distributor acts as agent in arranging for the sale of class shares without sales commission or other compensation, except as described below, and bears the advertising and promotion expenses.
However, the Distributor receives fees from Core Bond’s Investor Class, Strategic Income’s Trust Class, High Income’s Class R3, and each Fund’s Class A and Class C under their distribution plans (each a "Plan", collectively, the "Plans") pursuant to Rule 12b-1 under the 1940 Act. The Plans provide that, as compensation for administrative and other services provided to these classes, the Distributor’s activities and expenses related to the sale and distribution of these classes, and ongoing services provided to investors in these classes, the Distributor receives from each of these respective classes a fee at the annual rate of
0.25% of Core Bond Investor Class’, and each Fund's Class A's average daily net assets; 0.10% of Strategic Income Trust Class’ average daily net assets; 0.50% of High Income Class R3’s average daily net assets; and 1.00% of each Fund's Class C's average daily net assets. The Distributor receives this amount to provide distribution and shareholder servicing for these classes and pays a portion of it to institutions that provide such services. Those institutions may use the payments for, among other purposes, compensating employees engaged in sales and/or shareholder servicing. The amount of fees paid by each class during any year may be more or less than the cost of distribution and other services provided to that class. FINRA rules limit the amount of annual distribution fees that may be paid by a mutual fund and impose a ceiling on the cumulative distribution fees paid. The Trust’s Plans comply with those rules. Effective December 15, 2023, Rule 12b-1 fees on all applicable share classes of Short Duration are waived.
Class A shares of each Fund (except Short Duration) are generally sold with an initial sales charge of up to 4.25%. Class A shares of Short Duration are generally sold with an initial sales charge of up to 2.50%. Class A shares of each Fund are generally sold with no contingent deferred sales charge ("CDSC"), except that a CDSC of 1.00% applies to certain redemptions made within 18 months following purchases of $1 million or more without an initial sales charge. Class C shares of each Fund are sold with no initial sales charge and a 1.00% CDSC if shares are sold within one year after purchase.
For the year ended October 31, 2023, the Distributor, acting as underwriter and broker-dealer, received net initial sales charges from the purchase of Class A shares and CDSCs from the redemption of Class A and Class C shares as follows:
| | |
| | | | |
| | | | |
| | | | |
Emerging Markets Debt Class A | | | | |
Emerging Markets Debt Class C | | | | |
Floating Rate Income Class A | | | | |
Floating Rate Income Class C | | | | |
| | | | |
| | | | |
Municipal High Income Class A | | | | |
Municipal High Income Class C | | | | |
| | | | |
| | | | |
Municipal Intermediate Bond Class A | | | | |
Municipal Intermediate Bond Class C | | | | |
| | | | |
| | | | |
| | | | |
| | | | |
Note C—Securities Transactions:
During the year ended October 31, 2023, there were purchase and sale transactions of long-term securities (excluding swaps, bond forwards, forward FX contracts, futures and options written) as follows:
| Purchases of
U.S. Government
and Agency
Obligations | Purchases
excluding
U.S. Government
and Agency
Obligations | Sales and
Maturities
of
U.S. Government
and Agency
Obligations | Sales and
Maturities
excluding
U.S. Government
and Agency
Obligations |
| | | | |
| | | | |
| | | | |
| | | | |
| | | | |
| | | | |
Municipal Intermediate Bond | | | | |
| | | | |
| | | | |
During the year ended October 31, 2023, no brokerage commissions on securities transactions were paid to affiliated brokers.
Note D—Fund Share Transactions:
Share activity for the years ended October 31, 2023, and October 31, 2022, was as follows:
| For the Year Ended October 31, 2023 | For the Year Ended October 31, 2022 |
| | Shares
Issued on
Reinvestment
of Dividends
and
Distributions | | | | Shares
Issued on
Reinvestment
of Dividends
and
Distributions | | |
|
| | | | | | | | |
| | | | | | | | |
| | | | | | | | |
| | | | | | | | |
| | | | | | | | |
|
| | | | | | | | |
| | | | | | | | |
| | | | | | | | |
|
| | | | | | | | |
| | | | | | | | |
| | | | | | | | |
| For the Year Ended October 31, 2023 | For the Year Ended October 31, 2022 |
| | Shares Issued on Reinvestment of Dividends and Distributions | | | | Shares Issued on Reinvestment of Dividends and Distributions | | |
|
| | | | | | | | |
| | | | | | | | |
| | | | | | | | |
| | | | | | | | |
| | | | | | | | |
| | | | | | | | |
| | | | | | | | |
|
| | | | | | | | |
| | | | | | | | |
| | | | | | | | |
|
| | | | | | | | |
| | | | | | | | |
| | | | | | | | |
Municipal Intermediate Bond |
| | | | | | | | |
| | | | | | | | |
| | | | | | | | |
| | | | | | | | |
|
| | | | | | | | |
| | | | | | | | |
| | | | | | | | |
| | | | | | | | |
| | | | | | | | |
|
| | | | | | | | |
| | | | | | | | |
| | | | | | | | |
| | | | | | | | |
| | | | | | | | |
| Period from January 11, 2022 (Commencement of Operations) to October 31, 2022. |
Note E—Line of Credit:
At October 31, 2023, each Fund was a participant in a syndicated committed, unsecured $700,000,000 line of credit (the "Credit Facility"), to be used only for temporary or emergency purposes. Series of other investment companies managed by NBIA also participate in this line of credit on substantially the same terms. Interest is charged on borrowings under the Credit Facility at the highest of (a) a federal funds effective rate plus 1.00% per annum, (b) a daily simple Secured Overnight Financing Rate ("SOFR") plus 1.10% per annum, or (c) an overnight bank funding rate plus 1.00% per annum. The Credit Facility has an annual commitment fee of 0.15% per annum of the available line of credit, which is paid quarterly. Each Fund that is a participant has agreed to pay its pro rata share of the annual commitment fee, based on the ratio of its individual net assets to the net assets of all participants at the time the fee is due, and interest charged on any borrowing made by such Fund and other costs incurred by such Fund. Because several funds participate in the Credit Facility, there is no assurance that an individual fund will have access to all or any part of the $700,000,000 at any particular time. There were no loans outstanding under the Credit Facility at October 31, 2023. During the year ended October 31, 2023, none of the Funds utilized the Credit Facility.
Note F—Investments in Affiliates(a):
| | | Sales
Proceeds/
Return of
Capital | Change in
Net Unrealized
Appreciation/
(Depreciation)
from
Investments
in Affiliated
Persons | Net Realized
Gain/(Loss)
from
Investments
in Affiliated
Persons | Distributions
from
Investments
in Affiliated
Persons(b) | Shares
Held at
October 31,
2023 | |
| | | | | | | | |
Neuberger Berman Global Monthly Income Fund Ltd. | | | | | | | | |
Sub-total for
affiliates held
as of 10/31/23(c) | | | | | | | | |
| Affiliated persons, as defined in the 1940 Act. |
| Distributions received include distributions from net investment income and net realized capital gains, if any, from other investment companies managed by NBIA. |
| At October 31, 2023, these securities amounted to 0.02% of net assets of Strategic Income. |
Other: At October 31, 2023, affiliated persons owned the listed percentage of the outstanding shares of the following Funds:
| Affiliated Person(s)
Percentage
Ownership of
Outstanding Shares |
| |
| |
| |
| |
Municipal Intermediate Bond | |
| |
Note G—Recent Accounting Pronouncements:
In June 2022, FASB issued Accounting Standards Update No. 2022-03, "Fair Value Measurement of Equity Securities Subject to Contractual Sale Restrictions" ("ASU 2022-03"). ASU 2022-03 clarifies the guidance in ASC 820, related to the measurement of the fair value of an equity security subject to contractual sale restrictions, where it eliminates the ability to apply a discount to the fair value of these securities, and introduces disclosure requirements related to such equity securities. The guidance is effective for fiscal years, and interim periods within those fiscal years, beginning after December 15, 2023, and allows for early adoption. Management is currently evaluating the impact of applying this update.
In December 2022, the FASB issued Accounting Standards Update No. 2022-06, "Reference Rate Reform (Topic 848)" ("ASU 2022-06"), which is an update to Accounting Standards Update No. 2021-01, "Reference Rate Reform (Topic 848)" ("ASU 2021-01") and defers the sunset date for applying the reference rate reform relief in Topic 848. ASU 2021-01 is an update of ASU 2020-04, which is in response to concerns about structural risks of interbank offered rates, and particularly the risk of cessation of LIBOR. Regulators have undertaken reference rate reform initiatives to identify alternative reference rates that are more observable or transaction based and less susceptible to manipulation. ASU 2020-04 provides optional guidance for a limited period of time to ease the potential burden in accounting for (or recognizing the effects of) reference rate reform on financial reporting. ASU 2020-04 is elective and applies to all entities, subject to meeting certain criteria, that have contracts, hedging relationships, and other transactions that reference LIBOR or another reference rate expected to be discontinued because of reference rate reform. The ASU 2021-01 update clarifies that certain optional expedients and exceptions in Topic 848 for contract modifications and hedge accounting apply to derivatives that are affected by the discounting transition. The amendments in this update are effective immediately through December 31, 2024, for all entities. Management is currently evaluating the implications, if any, of the additional requirements and its impact on the Funds' financial statements.
Note H—Subsequent Event:
On December 14, 2023, the Board approved the conversion of Short Duration to a newly organized series of Neuberger Berman ETF Trust. It is anticipated that the conversion will be effected through the reorganization of Short Duration into an ETF. After the conversion, shareholders of Short Duration will hold shares of the new ETF instead of shares of their respective Funds. Prior to the conversion, existing shareholders of Short Duration will receive a combined information statement/prospectus describing in detail both the conversion and the respective ETF involved in the conversion.
This page has been left blank intentionally
The following tables include selected data for a share outstanding throughout each period and other performance information derived from the Financial Statements. Amounts that do not round to $0.01 or $(0.01) per share are presented as $0.00 or $(0.00), respectively. Ratios that do not round to 0.01% or (0.01)% are presented as 0.00% or (0.00)%, respectively. Net Assets with a zero balance, if any, may reflect actual amounts rounding to less than $0.1 million. A "—" indicates that the line item was not applicable in the corresponding period.
| Net Asset
Value,
Beginning
of Year | Net
Investment
Income/
(Loss)a | Net Gains
or
(Losses) on
Securities
(both
realized
and
unrealized) | Total From
Investment
Operations | Dividends
from Net
Investment
Income | Distributions
from Net
Realized
Capital
Gains | |
|
|
| | | | | | | |
| | | | | | | |
| | | | | | | |
| | | | | | | |
| | | | | | | |
|
|
| | | | | | | |
| | | | | | | |
| | | | | | | |
| | | | | | | |
| | | | | | | |
|
|
| | | | | | | |
| | | | | | | |
| | | | | | | |
| | | | | | | |
| | | | | | | |
|
|
| | | | | | | |
| | | | | | | |
| | | | | | | |
| | | | | | | |
| | | | | | | |
|
|
| | | | | | | |
| | | | | | | |
| | | | | | | |
| | | | | | | |
| | | | | | | |
See Notes to Financial Highlights
| Net Asset
Value,
End of
Year | | Net Assets,
End of
Year
(in millions) | Ratio
of Gross
Expenses to
Average Net
Assetsc | Ratio
of Net
Expenses to
Average
Net
Assets | Ratio
of Net
Investment
Income/
(Loss)
to
Average
Net
Assets | |
|
|
|
|
|
|
|
|
|
|
|
|
|
|
|
|
| | | | | | | |
| | | | | | | |
| | | | | | | |
| | | | | | | |
| | | | | | | |
|
|
|
|
|
|
|
|
|
| | | | | | | |
| | | | | | | |
| | | | | | | |
| | | | | | | |
| | | | | | | |
|
|
|
|
|
|
|
|
|
| | | | | | | |
| | | | | | | |
| | | | | | | |
| | | | | | | |
| | | | | | | |
|
|
|
|
|
|
|
|
|
| | | | | | | |
| | | | | | | |
| | | | | | | |
| | | | | | | |
| | | | | | | |
|
|
|
|
|
|
|
|
|
| | | | | | | |
| | | | | | | |
| | | | | | | |
| | | | | | | |
| | | | | | | |
Financial Highlights (cont’d)
| Net Asset
Value,
Beginning
of Year | Net
Investment
Income/
(Loss)a | Net Gains
or
(Losses) on
Securities
(both
realized
and
unrealized) | Total From
Investment
Operations | Dividends
from Net
Investment
Income | Distributions
from Net
Realized
Capital
Gains | |
Emerging Markets Debt Fund |
|
| | | | | | | |
| | | | | | | |
| | | | | | | |
| | | | | | | |
| | | | | | | |
|
|
| | | | | | | |
| | | | | | | |
| | | | | | | |
| | | | | | | |
| | | | | | | |
|
|
| | | | | | | |
| | | | | | | |
| | | | | | | |
| | | | | | | |
| | | | | | | |
|
Floating Rate Income Fund |
|
| | | | | | | |
| | | | | | | |
| | | | | | | |
| | | | | | | |
| | | | | | | |
|
|
| | | | | | | |
| | | | | | | |
| | | | | | | |
| | | | | | | |
| | | | | | | |
See Notes to Financial Highlights
| Net Asset
Value,
End of
Year | | Net Assets,
End of
Year
(in millions) | Ratio
of Gross
Expenses to
Average Net
Assetsc | Ratio
of Net
Expenses to
Average
Net
Assets | Ratio
of Net
Investment
Income/
(Loss)
to
Average
Net
Assets | |
|
|
|
|
|
|
|
|
|
|
|
|
|
|
|
|
| | | | | | | |
| | | | | | | |
| | | | | | | |
| | | | | | | |
| | | | | | | |
|
|
|
|
|
|
|
|
|
| | | | | | | |
| | | | | | | |
| | | | | | | |
| | | | | | | |
| | | | | | | |
|
|
|
|
|
|
|
|
|
| | | | | | | |
| | | | | | | |
| | | | | | | |
| | | | | | | |
| | | | | | | |
|
|
|
|
|
|
|
|
|
|
|
|
|
|
|
|
|
| | | | | | | |
| | | | | | | |
| | | | | | | |
| | | | | | | |
| | | | | | | |
|
|
|
|
|
|
|
|
|
| | | | | | | |
| | | | | | | |
| | | | | | | |
| | | | | | | |
| | | | | | | |
Financial Highlights (cont’d)
| Net Asset
Value,
Beginning
of Year | Net
Investment
Income/
(Loss)a | Net Gains
or
(Losses) on
Securities
(both
realized
and
unrealized) | Total From
Investment
Operations | Dividends
from Net
Investment
Income | Distributions
from Net
Realized
Capital
Gains | |
Floating Rate Income Fund (cont’d) |
|
| | | | | | | |
| | | | | | | |
| | | | | | | |
| | | | | | | |
| | | | | | | |
|
|
|
| | | | | | | |
| | | | | | | |
| | | | | | | |
| | | | | | | |
| | | | | | | |
|
|
| | | | | | | |
| | | | | | | |
| | | | | | | |
| | | | | | | |
| | | | | | | |
|
|
| | | | | | | |
| | | | | | | |
| | | | | | | |
| | | | | | | |
| | | | | | | |
|
|
| | | | | | | |
| | | | | | | |
| | | | | | | |
| | | | | | | |
| | | | | | | |
|
|
| | | | | | | |
| | | | | | | |
| | | | | | | |
| | | | | | | |
| | | | | | | |
See Notes to Financial Highlights
| Net Asset
Value,
End of
Year | | Net Assets,
End of
Year
(in millions) | Ratio
of Gross
Expenses to
Average Net
Assetsc | Ratio
of Net
Expenses to
Average
Net
Assets | Ratio
of Net
Investment
Income/
(Loss)
to
Average
Net
Assets | |
|
|
|
|
|
|
|
|
|
| | | | | | | |
| | | | | | | |
| | | | | | | |
| | | | | | | |
| | | | | | | |
|
|
|
|
|
|
|
|
|
|
|
|
|
|
|
|
|
| | | | | | | |
| | | | | | | |
| | | | | | | |
| | | | | | | |
| | | | | | | |
|
|
|
|
|
|
|
|
|
| | | | | | | |
| | | | | | | |
| | | | | | | |
| | | | | | | |
| | | | | | | |
|
|
|
|
|
|
|
|
|
| | | | | | | |
| | | | | | | |
| | | | | | | |
| | | | | | | |
| | | | | | | |
|
|
|
|
|
|
|
|
|
| | | | | | | |
| | | | | | | |
| | | | | | | |
| | | | | | | |
| | | | | | | |
|
|
|
|
|
|
|
|
|
| | | | | | | |
| | | | | | | |
| | | | | | | |
| | | | | | | |
| | | | | | | |
Financial Highlights (cont’d)
| Net Asset
Value,
Beginning
of Year | Net
Investment
Income/
(Loss)a | Net Gains
or
(Losses) on
Securities
(both
realized
and
unrealized) | Total From
Investment
Operations | Dividends
from Net
Investment
Income | Distributions
from Net
Realized
Capital
Gains | |
High Income Bond Fund (cont’d) |
|
| | | | | | | |
| | | | | | | |
| | | | | | | |
| | | | | | | |
| | | | | | | |
|
|
| | | | | | | |
| | | | | | | |
|
Municipal High Income Fund |
|
| | | | | | | |
| | | | | | | |
| | | | | | | |
| | | | | | | |
| | | | | | | |
|
|
| | | | | | | |
| | | | | | | |
| | | | | | | |
| | | | | | | |
| | | | | | | |
|
|
| | | | | | | |
| | | | | | | |
| | | | | | | |
| | | | | | | |
| | | | | | | |
|
|
|
| | | | | | | |
| | | | | | | |
| | | | | | | |
| | | | | | | |
| | | | | | | |
See Notes to Financial Highlights
| Net Asset
Value,
End of
Year | | Net Assets,
End of
Year
(in millions) | Ratio
of Gross
Expenses to
Average Net
Assetsc | Ratio
of Net
Expenses to
Average
Net
Assets | Ratio
of Net
Investment
Income/
(Loss)
to
Average
Net
Assets | |
|
|
|
|
|
|
|
|
|
| | | | | | | |
| | | | | | | |
| | | | | | | |
| | | | | | | |
| | | | | | | |
|
|
|
|
|
|
|
|
|
| | | | | | | |
| | | | | | | |
|
|
|
|
|
|
|
|
|
|
|
|
|
|
|
|
|
| | | | | | | |
| | | | | | | |
| | | | | | | |
| | | | | | | |
| | | | | | | |
|
|
|
|
|
|
|
|
|
| | | | | | | |
| | | | | | | |
| | | | | | | |
| | | | | | | |
| | | | | | | |
|
|
|
|
|
|
|
|
|
| | | | | | | |
| | | | | | | |
| | | | | | | |
| | | | | | | |
| | | | | | | |
|
|
|
|
|
|
|
|
|
|
|
|
|
|
|
|
|
| | | | | | | |
| | | | | | | |
| | | | | | | |
| | | | | | | |
| | | | | | | |
Financial Highlights (cont’d)
| Net Asset
Value,
Beginning
of Year | Net
Investment
Income/
(Loss)a | Net Gains
or
(Losses) on
Securities
(both
realized
and
unrealized) | Total From
Investment
Operations | Dividends
from Net
Investment
Income | Distributions
from Net
Realized
Capital
Gains | |
Municipal Impact Fund (cont’d) |
|
| | | | | | | |
| | | | | | | |
| | | | | | | |
| | | | | | | |
| | | | | | | |
|
|
| | | | | | | |
| | | | | | | |
| | | | | | | |
| | | | | | | |
| | | | | | | |
|
Municipal Intermediate Bond Fund |
|
| | | | | | | |
| | | | | | | |
| | | | | | | |
| | | | | | | |
| | | | | | | |
|
|
| | | | | | | |
| | | | | | | |
| | | | | | | |
| | | | | | | |
| | | | | | | |
|
|
| | | | | | | |
| | | | | | | |
| | | | | | | |
| | | | | | | |
| | | | | | | |
See Notes to Financial Highlights
| Net Asset
Value,
End of
Year | | Net Assets,
End of
Year
(in millions) | Ratio
of Gross
Expenses to
Average Net
Assetsc | Ratio
of Net
Expenses to
Average
Net
Assets | Ratio
of Net
Investment
Income/
(Loss)
to
Average
Net
Assets | |
|
|
|
|
|
|
|
|
|
| | | | | | | |
| | | | | | | |
| | | | | | | |
| | | | | | | |
| | | | | | | |
|
|
|
|
|
|
|
|
|
| | | | | | | |
| | | | | | | |
| | | | | | | |
| | | | | | | |
| | | | | | | |
|
|
|
|
|
|
|
|
|
|
|
|
|
|
|
|
|
| | | | | | | |
| | | | | | | |
| | | | | | | |
| | | | | | | |
| | | | | | | |
|
|
|
|
|
|
|
|
|
| | | | | | | |
| | | | | | | |
| | | | | | | |
| | | | | | | |
| | | | | | | |
|
|
|
|
|
|
|
|
|
| | | | | | | |
| | | | | | | |
| | | | | | | |
| | | | | | | |
| | | | | | | |
Financial Highlights (cont’d)
| Net Asset
Value,
Beginning
of Year | Net
Investment
Income/
(Loss)a | Net Gains
or
(Losses) on
Securities
(both
realized
and
unrealized) | Total From
Investment
Operations | Dividends
from Net
Investment
Income | Distributions
from Net
Realized
Capital
Gains | |
Municipal Intermediate Bond Fund (cont’d) |
|
| | | | | | | |
| | | | | | | |
| | | | | | | |
| | | | | | | |
| | | | | | | |
|
|
|
| | | | | | | |
| | | | | | | |
| | | | | | | |
| | | | | | | |
| | | | | | | |
|
|
| | | | | | | |
| | | | | | | |
| | | | | | | |
| | | | | | | |
| | | | | | | |
|
|
| | | | | | | |
| | | | | | | |
| | | | | | | |
| | | | | | | |
| | | | | | | |
|
|
| | | | | | | |
| | | | | | | |
| | | | | | | |
| | | | | | | |
| | | | | | | |
|
|
| | | | | | | |
| | | | | | | |
| | | | | | | |
| | | | | | | |
| | | | | | | |
See Notes to Financial Highlights
| Net Asset
Value,
End of
Year | | Net Assets,
End of
Year
(in millions) | Ratio
of Gross
Expenses to
Average Net
Assetsc | Ratio
of Net
Expenses to
Average
Net
Assets | Ratio
of Net
Investment
Income/
(Loss)
to
Average
Net
Assets | |
|
|
|
|
|
|
|
|
|
| | | | | | | |
| | | | | | | |
| | | | | | | |
| | | | | | | |
| | | | | | | |
|
|
|
|
|
|
|
|
|
|
|
|
|
|
|
|
|
| | | | | | | |
| | | | | | | |
| | | | | | | |
| | | | | | | |
| | | | | | | |
|
|
|
|
|
|
|
|
|
| | | | | | | |
| | | | | | | |
| | | | | | | |
| | | | | | | |
| | | | | | | |
|
|
|
|
|
|
|
|
|
| | | | | | | |
| | | | | | | |
| | | | | | | |
| | | | | | | |
| | | | | | | |
|
|
|
|
|
|
|
|
|
| | | | | | | |
| | | | | | | |
| | | | | | | |
| | | | | | | |
| | | | | | | |
|
|
|
|
|
|
|
|
|
| | | | | | | |
| | | | | | | |
| | | | | | | |
| | | | | | | |
| | | | | | | |
Financial Highlights (cont’d)
| Net Asset
Value,
Beginning
of Year | Net
Investment
Income/
(Loss)a | Net Gains
or
(Losses) on
Securities
(both
realized
and
unrealized) | Total From
Investment
Operations | Dividends
from Net
Investment
Income | Distributions
from Net
Realized
Capital
Gains | |
|
|
| | | | | | | |
| | | | | | | |
| | | | | | | |
| | | | | | | |
| | | | | | | |
|
|
| | | | | | | |
| | | | | | | |
| | | | | | | |
| | | | | | | |
| | | | | | | |
|
|
| | | | | | | |
| | | | | | | |
| | | | | | | |
| | | | | | | |
| | | | | | | |
|
|
| | | | | | | |
| | | | | | | |
| | | | | | | |
| | | | | | | |
| | | | | | | |
|
|
| | | | | | | |
| | | | | | | |
| | | | | | | |
| | | | | | | |
| | | | | | | |
See Notes to Financial Highlights
| Net Asset
Value,
End of
Year | | Net Assets,
End of
Year
(in millions) | Ratio
of Gross
Expenses to
Average Net
Assetsc | Ratio
of Net
Expenses to
Average
Net
Assets | Ratio
of Net
Investment
Income/
(Loss)
to
Average
Net
Assets | |
|
|
|
|
|
|
|
|
|
|
|
|
|
|
|
|
| | | | | | | |
| | | | | | | |
| | | | | | | |
| | | | | | | |
| | | | | | | |
|
|
|
|
|
|
|
|
|
| | | | | | | |
| | | | | | | |
| | | | | | | |
| | | | | | | |
| | | | | | | |
|
|
|
|
|
|
|
|
|
| | | | | | | |
| | | | | | | |
| | | | | | | |
| | | | | | | |
| | | | | | | |
|
|
|
|
|
|
|
|
|
| | | | | | | |
| | | | | | | |
| | | | | | | |
| | | | | | | |
| | | | | | | |
|
|
|
|
|
|
|
|
|
| | | | | | | |
| | | | | | | |
| | | | | | | |
| | | | | | | |
| | | | | | | |
Notes to Financial Highlights Income Funds
| Calculated based on the average number of shares outstanding during each fiscal period. |
| Total return based on per share NAV reflects the effects of changes in NAV on the performance of each Fund during each fiscal period. Returns assume income dividends and other distributions, if any, were reinvested, but do not reflect the effect of sales charges. Results represent past performance and do not indicate future results. Current returns may be lower or higher than the performance data quoted. Investment returns and principal will fluctuate and shares, when redeemed, may be worth more or less than original cost. Total return would have been lower if Management had not reimbursed and/or waived certain expenses. Total return would have been higher if Management had not recouped previously reimbursed and/or waived expenses. |
| Represents the annualized ratios of net expenses to average daily net assets if Management had not reimbursed certain expenses and/or waived a portion of the investment management fee. |
| Excluding TBA roll transactions. Had TBA roll transactions been included, the portfolio turnover rate would have been: |
| The class action proceeds listed in Note A of the Notes to Financial Statements, if any, had no impact on the Funds’ total returns for the year ended October 31, 2023. The class action proceeds received in 2022, 2021, 2020 and 2019 had no impact on the Funds’ total returns for the years ended October 31, 2022, 2021, 2020 and 2019, respectively. |
| The date investment operations commenced. |
| |
| |
| Portfolio turnover is calculated at the Fund level. Percentage indicated was calculated for the year ended October 31, 2022, for High Income and for the year ended October 31, 2019, for Core Bond. |
| Represents the annualized ratio of net expenses to average daily net assets after utilization of the line of credit by Emerging Markets Debt (2020), Floating Rate Income (2022 & 2019) and Municipal High Income (2022) and/or reimbursement of expenses and/or waiver of a portion of the investment management fee by Management. Had Emerging Markets Debt, Floating Rate Income and Municipal High Income not utilized the line of credit, and had Management not undertaken such action, the annualized ratios of net expenses to average daily net assets would have been: |
| |
| | | | |
Emerging Markets Debt Institutional Class | | | | |
Emerging Markets Debt Class A | | | | |
Emerging Markets Debt Class C | | | | |
Floating Rate Income Institutional Class | | | | |
Floating Rate Income Class A | | | | |
Floating Rate Income Class C | | | | |
Municipal High Income Institutional Class | | | | |
Municipal High Income Class A | | | | |
Municipal High Income Class C | | | | |
| Includes interest expense on reverse repurchase agreements of 0.00% for each respective class for the year ended October 31, 2022 for High Income and for the year ended October 31, 2021 for High Income and Strategic Income. |
Notes to Financial Highlights Income Funds (cont’d)
| After repayment of expenses previously reimbursed and/or fees previously waived pursuant to the terms of the contractual expense limitation agreements by Management, as applicable. Had the Fund not made such repayments, the annualized ratios of net expenses to average net assets would have been: |
Report of Independent Registered Public Accounting Firm
To the Shareholders of Neuberger Berman Core Bond Fund, Neuberger Berman Emerging Markets Debt Fund, Neuberger Berman Floating Rate Income Fund, Neuberger Berman High Income Bond Fund, Neuberger Berman Municipal High Income Fund, Neuberger Berman Municipal Impact Fund, Neuberger Berman Municipal Intermediate Bond Fund, Neuberger Berman Short Duration Bond Fund, Neuberger Berman Strategic Income Fund and the Board of Trustees of Neuberger Berman Income Funds
Opinion on the Financial Statements
We have audited the accompanying statements of assets and liabilities of Neuberger Berman Core Bond Fund, Neuberger Berman Emerging Markets Debt Fund, Neuberger Berman Floating Rate Income Fund, Neuberger Berman High Income Bond Fund, Neuberger Berman Municipal High Income Fund, Neuberger Berman Municipal Impact Fund, Neuberger Berman Municipal Intermediate Bond Fund, Neuberger Berman Short Duration Bond Fund, and Neuberger Berman Strategic Income Fund (collectively referred to as the "Funds") (nine of the series constituting Neuberger Berman Income Funds (the "Trust")), including the schedules of investments, as of October 31, 2023 and the related statements of operations, the related statements of operations and changes in net assets, and the financial highlights for each of the periods indicated in the table below and the related notes (collectively referred to as the "financial statements"). In our opinion, the financial statements present fairly, in all material respects, the financial position of the Funds (nine of the series constituting Neuberger Berman Income Funds) at October 31, 2023, and the results of their operations, changes in net assets and financial highlights for each of the periods indicated in the table below, in conformity with U.S. generally accepted accounting principles. The accompanying financial highlights of the Neuberger Berman Core Bond Fund, Neuberger Berman Floating Rate Income Fund, Neuberger Berman Municipal High Income Fund, and Neuberger Berman Municipal Impact Fund for each of the periods in the three years ended October 31, 2021 were audited by another independent registered public accounting firm whose report, dated December 21, 2021, expressed an unqualified opinion on the financial statements containing those financial highlights.
Individual fund constituting Neuberger Berman Income Funds | | Statements of changes in net assets | |
Neuberger Berman Emerging Markets Debt Fund
Neuberger Berman High Income Bond Fund
Neuberger Berman Municipal Intermediate Bond Fund
Neuberger Berman Short Duration Bond Fund
Neuberger Berman Strategic Income Fund
| For the year ended October 31, 2023 | For each of the two years in the period ended October 31, 2023 | For each of the five years in the period ended October 31, 2023 |
Neuberger Berman Core Bond Fund
Neuberger Berman Floating Rate Income Fund
Neuberger Berman Municipal High Income Fund
Neuberger Berman Municipal Impact Fund
| For the year ended October 31, 2023 | For each of the two years in the period ended October 31, 2023 | For each of the two years in the period ended October 31, 2023 |
Basis for Opinion
These financial statements are the responsibility of the Trust’s management. Our responsibility is to express an opinion on each of the Funds’ financial statements based on our audits. We are a public accounting firm registered with the Public Company Accounting Oversight Board (United States) ("PCAOB") and are required to be independent with respect to the Trust in accordance with the U.S. federal securities laws and the applicable rules and regulations of the Securities and Exchange Commission and the PCAOB.
We conducted our audits in accordance with the standards of the PCAOB. Those standards require that we plan and perform the audit to obtain reasonable assurance about whether the financial statements are free of material misstatement, whether due to error or fraud. The Trust is not required to have, nor were we engaged to perform, an audit of the Trust’s internal control over financial reporting. As part of our audits, we are required to obtain an understanding of internal control over financial reporting, but not for the purpose of expressing an opinion on the effectiveness of the Trust’s internal control over financial reporting. Accordingly, we express no such opinion.
Our audits included performing procedures to assess the risks of material misstatement of the financial statements, whether due to error or fraud, and performing procedures that respond to those risks. Such procedures included examining, on a test basis, evidence regarding the amounts and disclosures in the financial statements. Our procedures included confirmation of securities owned as of October 31, 2023, by correspondence with the custodian, brokers, and others; when replies were not received from other brokers and others, we performed other auditing procedures. Our audits also included evaluating the accounting principles used and significant estimates made by management, as well as evaluating the overall presentation of the financial statements. We believe that our audits provide a reasonable basis for our opinion.
We have served as the auditor of one or more Neuberger Berman investment companies since 1954.
Boston, Massachusetts
December 22, 2023
Investment Manager and Administrator
Neuberger Berman Investment Advisers LLC
1290 Avenue of the Americas
New York, NY 10104-0002
Shareholder Services
800.877.9700 or 212.476.8800
Intermediary Client Services 800.366.6264
Distributor
Neuberger Berman BD LLC
1290 Avenue of the Americas
New York, NY 10104-0002
Shareholder Services
800.877.9700 or 212.476.8800
Intermediary Client Services 800.366.6264
Sub-Adviser
Neuberger Berman Europe Limited
The Zig Zag Building
70 Victoria Street
London, United Kingdom
SW1E 6SQ
Custodian
State Street Bank and Trust Company
One Congress Street, Suite 1
Boston, MA 02114-2016
Shareholder Servicing Agent
SS&C Global Investor & Distribution Solutions, Inc.
430 West 7th Street, Suite 219189
Kansas City, MO 64105-1407
For Investor, Trust & Institutional Class Shareholders address correspondence to:
Neuberger Berman Funds
PO Box 219189
Kansas City, MO 64121-9189
Shareholder Services 800.877.9700 or 212.476.8800
Intermediary Client Services 800.366.6264
For Class A, Class C, Class R3 and Class R6 Shareholders:
Please contact your investment provider
Legal Counsel
K&L Gates LLP
1601 K Street, NW
Washington, DC 20006-1600
Independent Registered Public Accounting Firm
Ernst & Young LLP
200 Clarendon Street
Boston, MA 02116
Trustees and Officers
The following tables set forth information concerning the Trustees and Officers of the Funds. All persons named as Trustees and Officers also serve in similar capacities for other funds administered or managed by NBIA. The Funds’ Statement of Additional Information includes additional information about the Trustees as of the time of the Funds’ most recent public offering and is available upon request, without charge, by calling (800) 877-9700.
Information about the Board of Trustees
| | Principal Occupation(s)(3) | Number of
Funds in
Fund Complex
Overseen by
Fund Trustee | Other Directorships Held
Outside Fund Complex by
|
Independent Fund Trustees |
Michael J. Cosgrove (1949) | | President, Carragh Consulting USA, since 2014; formerly, Executive, General Electric Company, 1970 to 2014, including President, Mutual Funds and Global Investment Programs, GE Asset Management, 2011 to 2014, President and Chief Executive Officer, Mutual Funds and Intermediary Business, GE Asset Management, 2007 to 2011, President, Institutional Sales and Marketing, GE Asset Management, 1998 to 2007, and Chief Financial Officer, GE Asset Management, and Deputy Treasurer, GE Company, 1988 to 1993. | | Member of Advisory Board, Burke Neurological Institute, since 2021; Parish Councilor, St. Pius X, since 2021; formerly, Director, America Press, Inc. (not-for-profit Jesuit publisher), 2015 to 2021; formerly, Director, Fordham University, 2001 to 2018; formerly, Director, The Gabelli Go Anywhere Trust, June 2015 to June 2016; formerly, Director, Skin Cancer Foundation (not-for-profit), 2006 to 2015; formerly, Director, GE Investments Funds, Inc., 1997 to 2014; formerly, Trustee, GE Institutional Funds, 1997 to 2014; formerly, Director, GE Asset Management, 1988 to 2014; formerly, Director, Elfun Trusts, 1988 to 2014; formerly, Trustee, GE Pension & Benefit Plans, 1988 to 2014; formerly, Member of Board of Governors, Investment Company Institute. |
Name, (Year of Birth), and Address(1) | Position(s) and Length of Time Served(2) | Principal Occupation(s)(3) | Number of Funds in Fund Complex Overseen by Fund Trustee | Other Directorships Held Outside Fund Complex by Fund Trustee(3) |
| | Executive Vice Chancellor Emeritus, The Jewish Theological Seminary, since 2020; formerly, Executive Vice Chancellor and Chief Operating Officer, The Jewish Theological Seminary, 2012 to 2020; formerly, Executive Vice President and General Counsel, Fidelity Investments, 2007 to 2012;formerly, Executive Vice President and General Counsel, BellSouth Corporation, 2004 to 2007; formerly, Vice President and Associate General Counsel, BellSouth Corporation, 2000 to 2004; formerly, Associate, Partner, and National Litigation Practice Co-Chair, Mayer, Brown LLP, 1981 to 2000; formerly, Associate Independent Counsel, Office of Independent Counsel, 1990 to 1992. | | Chair and Director, USCJ Supporting Foundation, since 2021; Director, UJA Federation of Greater New York, since 2019; Trustee, The Jewish Theological Seminary, since 2015; Director, Lawyers Committee for Civil Rights Under Law (not-for-profit), since 2005; formerly, Director, Legility, Inc. (privately held for-profit company), 2012 to 2021; formerly, Director, Equal Justice Works (not-for-profit), 2005 to 2014; formerly, Director, Corporate Counsel Institute, Georgetown University Law Center, 2007 to 2012; formerly, Director, Greater Boston Legal Services (not-for-profit), 2007 to 2012. |
Name, (Year of Birth), and Address(1) | Position(s) and Length of Time Served(2) | Principal Occupation(s)(3) | Number of Funds in Fund Complex Overseen by Fund Trustee | Other Directorships Held Outside Fund Complex by Fund Trustee(3) |
| | Formerly, President, Woodhill Enterprises Inc./Chase Hollow Associates LLC (personal investment vehicle), 2006 to 2020; formerly, Consultant, Resources Global Professionals (temporary staffing), 2002 to 2006; formerly, Chief Financial Officer, Booz-Allen & Hamilton, Inc., 1995 to 1999; formerly, Enterprise Risk Officer, Prudential Insurance, 1994 to 1995; formerly, President, Prudential Asset Management Company, 1992 to 1994; formerly, President, Prudential Power Funding (investments in electric and gas utilities and alternative energy projects), 1989 to 1992; formerly, Treasurer, Prudential Insurance Company, 1983 to 1989. | | Director, American Water (water utility), since 2003; Director, Allianz Life of New York (insurance), since 2005; formerly, Director, Berger Group Holdings, Inc. (engineering consulting firm), 2013 to 2018; formerly, Director, Financial Women’s Association of New York (not-for-profit association), 1987 to 1996, and 2003 to 2019; Trustee Emerita, Brown University, since 1998; Director, Museum of American Finance (not-for-profit), since 2013; formerly, Non-Executive Chair and Director, Channel Reinsurance (financial guaranty reinsurance), 2006 to 2010; formerly, Director, Ocwen Financial Corporation (mortgage servicing), 2005 to 2010; formerly, Director, Claire’s Stores, Inc. (retailer), 2005 to 2007; formerly, Director, Parsons Brinckerhoff Inc. (engineering consulting firm), 2007 to 2010; formerly, Director, Bank Leumi (commercial bank), 2005 to 2007; formerly, Advisory Board Member, Attensity (software developer), 2005 to 2007; formerly, Director, Foster Wheeler Manufacturing, 1994 to 2004; formerly, Director, Dexter Corp. (Manufacturer of Non-Wovens, Plastics, and Medical Supplies), 1992 to 2001. |
Name, (Year of Birth), and Address(1) | Position(s) and Length of Time Served(2) | Principal Occupation(s)(3) | Number of Funds in Fund Complex Overseen by Fund Trustee | Other Directorships Held Outside Fund Complex by Fund Trustee(3) |
| | Formerly, Partner, Deloitte LLP, 1982 to 2023, including Vice Chair, 2017 to 2020; formerly, President and Board Chair, Women's Forum of New York, 2014 to 2016. | | |
Michael M. Knetter (1960) | | President and Chief Executive Officer, University of Wisconsin Foundation, since 2010; formerly, Dean, School of Business, University of Wisconsin - Madison; formerly, Professor of International Economics and Associate Dean, Amos Tuck School of Business - Dartmouth College, 1998 to 2002. | | Director, 1WS Credit Income Fund, since 2018; Board Member, American Family Insurance (a mutual company, not publicly traded), since March 2009; formerly, Trustee, Northwestern Mutual Series Fund, Inc., 2007 to 2011; formerly, Director, Wausau Paper, 2005 to 2011; formerly, Director, Great Wolf Resorts, 2004 to 2009. |
| | Member, Circle Financial Group (private wealth management membership practice), since 2011; Managing Director, Golden Seeds LLC (an angel investing group), since 2009; Adjunct Professor (Corporate Finance), Columbia University School of International and Public Affairs, since 2008; formerly, Visiting Assistant Professor, Fairfield University, Dolan School of Business, Fall 2007; formerly, Adjunct Associate Professor of Finance, Richmond, The American International University in London, 1999 to 2007. | | Board Member, The Maritime Aquarium at Norwalk, since 2020; Board Member, Norwalk Community College Foundation, since 2014; Dean’s Advisory Council, Radcliffe Institute for Advanced Study, since 2014; formerly, Director and Treasurer, At Home in Darien (not-for-profit), 2012 to 2014; formerly, Director, National Executive Service Corps (not-for-profit), 2012 to 2013; formerly, Trustee, Richmond, The American International University in London, 1999 to 2013. |
Name, (Year of Birth), and Address(1) | Position(s) and Length of Time Served(2) | Principal Occupation(s)(3) | Number of Funds in Fund Complex Overseen by Fund Trustee | Other Directorships Held Outside Fund Complex by Fund Trustee(3) |
| | Formerly, Adjunct Professor, Columbia University School of International and Public Affairs, 2012 to 2018; formerly, Executive Vice President and Chief Financial Officer, People's United Bank, Connecticut (a financial services company), 1991 to 2001. | | Director, 1WS Credit Income Fund; Chair, Audit Committee, since 2018; Director and Chair, Thrivent Church Loan and Income Fund, since 2018; formerly, Trustee, Steben Alternative Investment Funds, Steben Select Multi-Strategy Fund, and Steben Select Multi-Strategy Master Fund, 2013 to 2017; formerly, Treasurer, National Association of Corporate Directors, Connecticut Chapter, 2011 to 2015; formerly, Manager, Larch Lane Multi-Strategy Fund complex (which consisted of three funds), 2006 to 2011; formerly, Member, NASDAQ Issuers’ Affairs Committee, 1995 to 2003. |
| Trustee since 2000; Chairman of the Board since 2008; formerly, Lead Independent Trustee from 2006 to 2008 | Formerly, Managing Member, Ridgefield Farm LLC (a private investment vehicle), 2004 to 2016; formerly, President and CEO, Westaff, Inc. (temporary staffing), May 2001 to January 2002; formerly, Senior Executive, The Charles Schwab Corporation, 1983 to 1998, including Chief Executive Officer, Charles Schwab Investment Management, Inc.; Trustee, Schwab Family of Funds and Schwab Investments, 1997 to 1998; and Executive Vice President-Retail Brokerage, Charles Schwab & Co., Inc., 1994 to 1997. | | Trustee, University of Maryland, Shore Regional Health System, since 2020; formerly, Director, H&R Block, Inc. (tax services company), 2001 to 2018; formerly, Director, Talbot Hospice Inc., 2013 to 2016; formerly, Chairman, Governance and Nominating Committee, H&R Block, Inc., 2011 to 2015; formerly, Chairman, Compensation Committee, H&R Block, Inc., 2006 to 2010; formerly, Director, Forward Management, Inc. (asset management company), 1999 to 2006. |
| | Formerly, Partner, PricewaterhouseCoopers LLP, 1989 to 2021. | | Director, Zurich American Insurance Company, since 2023. |
Name, (Year of Birth), and Address(1) | Position(s) and Length of Time Served(2) | Principal Occupation(s)(3) | Number of Funds in Fund Complex Overseen by Fund Trustee | Other Directorships Held Outside Fund Complex by Fund Trustee(3) |
James G. Stavridis (1955) | | Vice Chairman Global Affairs, The Carlyle Group, since 2018; Commentator, NBC News, since 2015; formerly, Dean, Fletcher School of Law and Diplomacy, Tufts University, 2013 to 2018; formerly, Admiral, United States Navy, 1976 to 2013, including Supreme Allied Commander, NATO and Commander, European Command, 2009 to 2013, and Commander, United States Southern Command, 2006 to 2009. | | Director, Fortinet (cybersecurity), since 2021; Director, Ankura, since 2020; Director, Vigor Shipyard, since 2019; Director, Rockefeller Foundation, since 2018; Director, American Water (water utility), since 2018; Director, NFP Corp. (insurance broker and consultant), since 2017; Director, Onassis Foundation, since 2014; Director, Michael Baker International (construction) since 2014; Director, Vertical Knowledge, LLC, since 2013; formerly, Director, U.S. Naval Institute, 2014 to 2019; formerly, Director, Navy Federal Credit Union, 2000 to 2002; formerly, Director, BMC Software Federal, LLC, 2014 to 2019. |
Name, (Year of Birth), and Address(1) | Position(s) and Length of Time Served(2) | Principal Occupation(s)(3) | Number of Funds in Fund Complex Overseen by Fund Trustee | Other Directorships Held Outside Fund Complex by Fund Trustee(3) |
Fund Trustees who are "Interested Persons" |
| Chief Executive Officer and President since 2018 and Trustee since 2009 | President and Director, Neuberger Berman Group LLC, since 2009; President and Chief Executive Officer, Neuberger Berman BD LLC and Neuberger Berman Holdings LLC (including its predecessor, Neuberger Berman Inc.), since 2007; Chief Investment Officer (Equities) and President (Equities), NBIA (formerly, Neuberger Berman Fixed Income LLC and including predecessor entities), since 2007, and Board Member of NBIA since 2006; formerly, Global Head of Asset Management of Lehman Brothers Holdings Inc.’s ("LBHI") Investment Management Division, 2006 to 2009; formerly, member of LBHI’s Investment Management Division’s Executive Management Committee, 2006 to 2009; formerly, Managing Director, Lehman Brothers Inc. ("LBI"), 2006 to 2008; formerly, Chief Recruiting and Development Officer, LBI, 2005 to 2006; formerly, Global Head of LBI’s Equity Sales and a Member of its Equities Division Executive Committee, 2003 to 2005; President and Chief Executive Officer, twelve registered investment companies for which NBIA acts as investment manager and/or administrator. | | Member of Board of Advisors, McDonough School of Business, Georgetown University, since 2001; Member of New York City Board of Advisors, Teach for America, since 2005; Trustee, Montclair Kimberley Academy (private school), since 2007; Member of Board of Regents, Georgetown University, since 2013. |
(1)
The business address of each listed person is 1290 Avenue of the Americas, New York, NY 10104.
(2)
Pursuant to the Trust’s Amended and Restated Trust Instrument ("Trust Instrument"), subject to any limitations on the term of service imposed by the By-Laws or any retirement policy adopted by the Fund Trustees, each Fund Trustee shall hold office for life or until his or her successor is elected or the Trust
terminates; except that (a) any Fund Trustee may resign by delivering a written resignation; (b) any Fund Trustee may be removed with or without cause at any time by a written instrument signed by at least two-thirds of the other Fund Trustees; (c) any Fund Trustee who requests to be retired, or who has become unable to serve, may be retired by a written instrument signed by a majority of the other Fund Trustees; and (d) any Fund Trustee may be removed at any shareholder meeting by a vote of at least two-thirds of the outstanding shares.
(3)
Except as otherwise indicated, each individual has held the positions shown during at least the last five years.
*
Indicates a Fund Trustee who is an "interested person" within the meaning of the 1940 Act. Mr. Amato is an interested person of the Trust by virtue of the fact that he is an officer of NBIA and/or its affiliates.
Information about the Officers of the Trust
Name, (Year of Birth), and | Position(s) and Length of Time | Principal Occupation(s)(3) |
Claudia A. Brandon (1956) | Executive Vice President since 2008 and Secretary since 1985 | Senior Vice President, Neuberger Berman, since 2007 and Employee since 1999; Senior Vice President, NBIA, since 2008 and Assistant Secretary since 2004; formerly, Vice President, Neuberger Berman, 2002 to 2006; formerly, Vice President, Mutual Fund Board Relations, NBIA, 2000 to 2008; formerly, Vice President, NBIA, 1986 to 1999 and Employee, 1984 to 1999; Executive Vice President and Secretary, thirty-three registered investment companies for which NBIA acts as investment manager and/or administrator. |
| | Senior Vice President, Neuberger Berman, since 2012; Senior Vice President, NBIA, since 2012 and Employee since 1996; formerly, Vice President, Neuberger Berman, 2007 to 2012; Vice President, twelve registered investment companies for which NBIA acts as investment manager and/or administrator. |
Anthony DiBernardo (1979) | Assistant Treasurer since 2011 | Senior Vice President, Neuberger Berman, since 2014; Senior Vice President, NBIA, since 2014, and Employee since 2003; formerly, Vice President, Neuberger Berman, 2009 to 2014; Assistant Treasurer, twelve registered investment companies for which NBIA acts as investment manager and/or administrator. |
Savonne L. Ferguson (1973) | Chief Compliance Officer since 2018 | Senior Vice President, Chief Compliance Officer, Mutual Funds, and Associate General Counsel, NBIA, since November 2018; formerly, Vice President, T. Rowe Price Group, Inc., 2018; Vice President and Senior Legal Counsel, T. Rowe Price Associates, Inc., 2014 to 2018; Vice President and Director of Regulatory Fund Administration, PNC Capital Advisors, LLC, 2009 to 2014; Secretary, PNC Funds and PNC Advantage Funds, 2010 to 2014; Chief Compliance Officer, thirty-three registered investment companies for which NBIA acts as investment manager and/or administrator. |
| Chief Legal Officer since 2016 (only for purposes of sections 307 and 406 of the Sarbanes-Oxley Act of 2002) | General Counsel, Mutual Funds, since 2016 and Managing Director, NBIA, since 2017; formerly, Associate General Counsel, 2015 to 2016; Counsel, 2007 to 2015; Senior Vice President, 2013 to 2016; Vice President, 2009 to 2013; Chief Legal Officer (only for purposes of sections 307 and 406 of the Sarbanes-Oxley Act of 2002), thirty-three registered investment companies for which NBIA acts as investment manager and/or administrator. |
| Assistant Secretary since 2002 | Senior Vice President, Neuberger Berman, since 2023 and Employee since 1999; Senior Vice President, NBIA, since 2023; formerly, Vice President, Neuberger Berman, 2008 to 2023; Assistant Vice President, Neuberger Berman, 2007; Employee, NBIA, 1991 to 1999; Assistant Secretary, thirty-three registered investment companies for which NBIA acts as investment manager and/or administrator. |
Name, (Year of Birth), and Address(1) | Position(s) and Length of Time Served(2) | Principal Occupation(s)(3) |
| Chief Operating Officer since 2015 and Vice President since 2008 | Managing Director, Neuberger Berman, since 2013; Chief Operating Officer, Mutual Funds, and Managing Director, NBIA, since 2015; formerly, Senior Vice President, Neuberger Berman, 2006 to 2014; Vice President, NBIA, 2008 to 2015 and Employee since 1991; Chief Operating Officer, twelve registered investment companies for which NBIA acts as investment manager and/or administrator; Vice President, thirty-three registered investment companies for which NBIA acts as investment manager and/or administrator. |
| | Senior Vice President, Neuberger Berman, since 2014 and Employee since 2000; Senior Vice President, NBIA, since 2014; Vice President, twelve registered investment companies for which NBIA acts as investment manager and/or administrator. |
| Assistant Secretary since 2017 | Senior Paralegal, Neuberger Berman, since 2007 and Employee since 2007; Assistant Secretary, thirty-three registered investment companies for which NBIA acts as investment manager and/or administrator. |
Owen F. McEntee, Jr. (1961) | | Vice President, Neuberger Berman, since 2006; Vice President, NBIA, since 2006 and Employee since 1992; Vice President, twelve registered investment companies for which NBIA acts as investment manager and/or administrator. |
| Treasurer and Principal Financial and Accounting Officer since 2005 | Managing Director, Neuberger Berman, since 2022; Senior Vice President, Neuberger Berman, 2007 to 2021; Senior Vice President, NBIA, since 2007 and Employee since 1993; formerly, Vice President, Neuberger Berman, 2004 to 2006; formerly, Assistant Treasurer, 2002 to 2005; Treasurer and Principal Financial and Accounting Officer, twelve registered investment companies for which NBIA acts as investment manager and/or administrator. |
| Assistant Treasurer since 2005 | Vice President, Neuberger Berman, since 2006; Vice President, NBIA, since 2006 and Employee since 1995; Assistant Treasurer, twelve registered investment companies for which NBIA acts as investment manager and/or administrator. |
| Anti-Money Laundering Compliance Officer since 2023 | Senior Vice President and Head of Financial Regulation, Neuberger Berman, since February 2023; Assistant United States Attorney, Southern District of New York, 2016 to 2023; Trial Attorney, Department of Justice Antitrust Division, 2012 to 2015; Senior Anti-Money Laundering Compliance Officer, five registered investment companies for which NBIA acts as investment manager and/or administrator. |
(1)
The business address of each listed person is 1290 Avenue of the Americas, New York, NY 10104.
(2) Pursuant to the By-Laws of the Trust, each officer elected by the Fund Trustees shall hold office until his or her successor shall have been elected and qualified or until his or her earlier death, inability to serve, or resignation. Officers serve at the pleasure of the Fund Trustees and may be removed at any time with or without cause.
(3)
Except as otherwise indicated, each individual has held the positions shown during at least the last five years.
Proxy Voting Policies and Procedures
A description of the policies and procedures that the Trust uses to determine how to vote proxies relating to portfolio securities is available, without charge, by calling 800-877-9700 (toll-free) and on the SEC’s website at www.sec.gov. Information regarding how the Trust voted proxies relating to portfolio securities during the most recent 12-month period ended June 30 is also available upon request, without charge, by calling 800-877-9700 (toll-free), on the SEC’s website at www.sec.gov, and on Neuberger Berman’s website at www.nb.com.
Quarterly Portfolio Schedule
The Trust files a complete schedule of portfolio holdings for each Fund with the SEC for the first and third quarters of each fiscal year as an exhibit to its report on Form N-PORT. The Trust’s Form N-PORT is available on the SEC’s website at www.sec.gov. The portfolio holdings information on Form N-PORT is available upon request, without charge, by calling 800-877-9700 (toll-free).
Liquidity Risk Management Program
Consistent with Rule 22e-4 under the Investment Company Act of 1940 (the "Liquidity Rule"), as amended, the Funds have established a liquidity risk management program (the "Program"). The Program seeks to assess and manage the Funds’ liquidity risk, which is defined as the risk that a Fund is unable to meet investor redemption requests without significantly diluting the remaining investors' interests in a Fund. The Board has approved the designation of NBIA Funds' Liquidity Committee, comprised of NBIA employees, as the program administrator (the "Program Administrator"). The Program Administrator is responsible for implementing and monitoring the Program and utilizes NBIA personnel to assess and review, on an ongoing basis, the Funds' liquidity risk.
The Program includes a number of elements that support the management and assessment of liquidity risk, including an annual assessment of the Funds' liquidity risk factors and the periodic classification (or re-classification, as necessary) of the Funds’ investments into buckets (highly liquid, moderately liquid, less liquid and illiquid) that reflect the Program Administrator's assessment of the investments' liquidity under current market conditions, which for the relevant period included, among other factors, market volatility as a result of geopolitical tensions (e.g., Russia’s invasion of Ukraine) and rising inflation. The Program Administrator also utilizes information about the Funds’ investment strategy, the characteristics of the Funds’ shareholder base and historical redemption activity.
The Program Administrator provided the Board with a written report that addressed the operation of the Program and assessed its adequacy and effectiveness of implementation from April 1, 2022 through March 31, 2023. During the period covered by this report, the Program Administrator reported that the Program effectively assisted the Program Administrator in monitoring whether a Fund maintained a level of liquidity appropriate for its shareholder base and historical redemption activity.
Board Consideration of the Management Agreements
On an annual basis, the Board of Trustees (the "Board" or "Trustees") of Neuberger Berman Income Funds (the "Trust"), including the Trustees who are not "interested persons" of the Trust or of Neuberger Berman Investment Advisers LLC ("Management") (including its affiliates), as such term is defined under the Investment Company Act of 1940, as amended ("1940 Act"), ("Independent Fund Trustees"), considers whether to continue the management agreements with Management (the "Management Agreements") with respect to each series (each a "Fund") and the sub-advisory agreements between Management and Neuberger Berman Europe Limited ("NBEL") (the "Sub-Advisory Agreements" and collectively with the Management Agreement, the "Agreements") with respect to Neuberger Berman Emerging Markets Debt Fund. Throughout the process, the Independent Fund Trustees are advised by counsel that is experienced in 1940 Act matters and that is independent of Management ("Independent Counsel"). At a meeting held on October 5, 2023, the Board, including the Independent Fund Trustees, approved the continuation of the Agreements for each Fund. In reaching its determination, the Board considered all factors it believed relevant, including (i) the nature, extent, and quality of the services provided to each Fund and its shareholders; (ii) a comparison of each Fund’s performance, fees and expenses relative to various peers; (iii) the costs of the services provided by, and the estimated profit or loss by Management from its relationships with each Fund; (iv) any apparent or anticipated economies of scale in relation to the services Management provides to each Fund and whether any such economies of scale are shared with Fund shareholders; and (v) any "fall-out" benefits likely to accrue to Management and its affiliates from their relationship with each Fund.
In evaluating the Agreements with respect to each Fund, the Board, including the Independent Fund Trustees, reviewed extensive materials provided by Management and NBEL in response to questions submitted by the Independent Fund Trustees and Independent Counsel, and by Management (for NBEL), which the Contract Review Committee annually considers and updates. It also met with senior representatives of Management regarding its personnel, operations, and profitability as they relate to the Funds. The annual contract review extends over at least two regular meetings of the Board to ensure that Management and NBEL have time to respond to any questions the Independent Fund Trustees may have on their initial review of the materials and that the Independent Fund Trustees have time to consider those responses.
In connection with its deliberations, the Board also considered the broad range of information relevant to the annual contract review that is provided to the Board (including its various standing committees) at meetings throughout the year. The Board established the Contract Review Committee, which is comprised solely of Independent Fund Trustees, to assist in its evaluation and analysis of materials for the annual contract review. The Board has also established other committees that focus throughout the year on specific areas relevant to the annual contract review, such as Fund performance or compliance matters, and that are charged with specific responsibilities regarding the annual contract review. Those committees provide reports to the full Board, including the members of the Contract Review Committee, which consider that information as part of the annual contract review process.
The Independent Fund Trustees received from Independent Counsel a memorandum discussing the legal standards for their consideration of the proposed continuation of the Agreements. During the course of the year and during their deliberations regarding the annual contract review, the Contract Review Committee and the Independent Fund Trustees met with Independent Counsel separately from representatives of Management and NBEL.
Provided below is a description of the Board’s contract approval process and material factors that the Board considered at its meetings regarding renewals of the Agreements and the compensation to be paid thereunder. In connection with its approval of the continuation of the Agreements, the Board evaluated the terms of the Agreements, the overall fairness of the Agreements to each Fund, and whether the Agreements were in the best interests of each respective Fund and its shareholders. The Board’s determination to approve the continuation of the Agreements was based on a comprehensive consideration of all information provided to the Board
throughout the year and specifically in connection with the annual contract review. The Board considered each Fund’s investment management and sub-advisory agreements separately from those of the other Funds.
This description is not intended to include all of the factors considered by the Board. The Board members did not identify any particular information or factor that was all-important or controlling, and each Trustee may have attributed different weights to the various factors. The Board focused on the costs and benefits of the Agreements to each Fund and, through the Fund, its shareholders.
Nature, Extent, and Quality of Services
With respect to the nature, extent, and quality of the services provided, the Board considered the investment philosophy and decision-making processes of, and the qualifications, experience, and capabilities of, and the resources available to, the portfolio management personnel of Management and NBEL who perform services for the Funds. The Board noted that Management also provides certain administrative services, including fund accounting, compliance, and shareholder support services. The Board also considered Management’s and NBEL’s policies and practices regarding trade execution, transaction costs, and allocation of portfolio transactions and reviewed the quality of the execution services that Management had provided. Moreover, the Board considered Management’s approach to potential conflicts of interest both generally and between the Funds’ investments and those of other funds or accounts managed by Management or NBEL.
The Board recognized the extensive range of services that Management provides to the Funds beyond the investment management services. The Board noted that Management is also responsible for monitoring compliance with the Fund’s investment objectives, policies, and restrictions, as well as compliance with applicable law, including implementing rulemaking initiatives of the U.S. Securities and Exchange Commission. The Board considered that Management assumes significant ongoing entrepreneurial and business risks as the investment adviser and sponsor for the Funds, for which it is entitled to reasonable compensation. The Trustees also considered that Management’s responsibilities include continual management of investment, operational, cybersecurity, enterprise, valuation, liquidity, legal, regulatory, and compliance risks as they relate to the Funds, and the Board considers on a regular basis information regarding Management’s processes for monitoring and managing risk. In addition, the Board also noted that when Management launches a new fund or share class, it assumes entrepreneurial risk with respect to that fund or share class, until it maintains a certain level of assets, if ever, that is profitable to Management.
The Board also reviewed and evaluated Management’s activities under its contractual obligation to oversee the Funds’ various outside service providers, including its renegotiation of certain service providers’ fees and its evaluation of service providers’ infrastructure, cybersecurity programs, compliance programs, and business continuity programs, among other matters. The Board also considered Management’s ongoing development of its own infrastructure and information technology to support the Funds through, among other things, cybersecurity, business continuity planning, and risk management. In addition, the Board noted the positive compliance history of Management and NBEL, as no significant compliance problems were reported to the Board with respect to either firm. The Board also considered the general structure of the portfolio managers’ compensation and whether this structure provides appropriate incentives to act in the best interests of the Funds. The Board also considered the ability of Management and NBEL to attract and retain qualified personnel to service the Funds and the plan for succession.
As in past years, the Board also considered the manner in which Management addressed various matters that arose during the year, some of them a result of developments in the broader fund industry or the regulations governing it. In addition, the Board considered actions taken by Management and NBEL in response to market conditions over the past year and considered the overall performance of Management and NBEL in this context.
Fund Performance
The Board requested a report from an outside consulting firm that specializes in the analysis of fund industry data that compared each Fund’s performance, along with its fees and other expenses, to various peers, including a group of industry peers ("Expense Group") and to a broader universe of funds pursuing generally similar strategies with the same investment classification and/or objective ("Performance Universe"). The Board considered each Fund’s performance and fees in light of the limitations inherent in the methodology for constructing such comparative groups and determining which investment companies should be included in the comparative groups, noting differences as compared to certain fund industry ranking and rating systems.
With respect to investment performance, the Board considered information regarding each Fund’s short-, intermediate- and long-term performance, as applicable, net of the Fund’s fees and expenses, on an absolute basis, relative to a benchmark index that does not deduct the fees or expenses of investing, and compared to the performance of its Expense Group and Performance Universe, each constructed by the consulting firm. The Board also reviewed performance in relation to certain measures of the degree of investment risk undertaken by the portfolio managers.
In the case of underperformance for any of the periods reported, the Board considered the magnitude and duration of that underperformance relative to the Performance Universe and/or the benchmark (e.g., the amount by which a Fund underperformed, including, for example, whether the Fund slightly underperformed or significantly underperformed its benchmark). For those Funds that the Board identified as having underperformed their benchmark indices, Expense Group, and/or Performance Universe to an extent, or over a period of time, that the Board felt warranted additional inquiry, the Board discussed with Management each such Fund’s performance, potential reasons for the relative performance, and, if necessary, steps that Management had taken, or intended to take, to improve performance. The Board also met with the portfolio managers of certain Funds during the 12 months prior to voting on the contract renewal to discuss the Funds’ performance. The Board also considered Management’s responsiveness with respect to the relative performance. The Board recognized that the performance data reflects a snapshot of a period as of a particular date and that selecting a different performance period could produce significantly different results. The Board further acknowledged that long-term performance could be impacted by even one period of significant outperformance or underperformance. In this regard, the Board noted that performance, especially short-term performance, is only one of the factors that it deems relevant to its consideration of the Agreements and that, after considering all relevant factors, it determined to approve the continuation of the Agreements notwithstanding a Fund’s relative performance.
Fee Rates, Profitability, and Fall-out Benefits
With respect to the overall fairness of the Agreements, the Board considered the fee structure for each Fund under the Agreements as compared to the Expense Group provided by the consulting firm, as discussed above. The Board reviewed a comparison of each Fund’s management fee to its Expense Group. The Board noted that the comparative management fee analysis includes, in each Fund’s management fee, the separate administrative fees paid to Management. However, the Board noted that some funds in the Expense Group pay directly from fund assets for certain services that Management covers out of the administration fees for the Funds. Accordingly, the Board also considered each Fund’s total expense ratio as compared with its Expense Group as a way of taking account of these differences.
The Board compared each Fund’s contractual and actual management fees to the median of the contractual and actual management fees, respectively, of that Fund’s Expense Group. (The actual management fees are the contractual management fees reduced by any fee waivers or other adjustments.) The Board also compared each Fund’s total expenses to the median of the total expenses of that Fund’s Expense Group. Where a Fund’s management fee or total expenses were higher than the Expense Group median, the Board considered whether specific portfolio management, administration or oversight needs contributed to the Fund’s management fee or total expenses. The Board also noted that for some classes of certain Funds, the overall expense ratio is
maintained through a contractual or voluntary fee cap and/or expense reimbursements by Management. The Board also considered the extent to which Management currently waives management fees and/or reimburses any Fund for other Fund-level expenses at different rates for different share classes and the process for monitoring the use of such waivers to guard against any such waiver resulting in any cross-subsidization by one share class of another share class.
In concluding that the benefits accruing to Management and its affiliates, including NBEL, by virtue of their relationship with each Fund were reasonable in light of the costs of providing the investment advisory and other services and the benefits accruing to that Fund, the Board reviewed specific data as to Management’s estimated profit or loss on each Fund for a recent period on a pre-tax basis without regard to distribution expenses. (The Board also reviewed data on Management’s estimated profit or loss on each Fund after distribution expenses and taxes were factored in, as indicators of the health of the business and the extent to which Management is directing its profits into the growth of the business.)
The Board considered the consistent cost allocation methodology that Management used in developing its estimated profitability figures. In addition, the Board engaged an independent forensic accountant to review the profitability methodology utilized by Management when preparing this information and discussed with the consultant its conclusion that Management’s process for calculating and reporting its estimated profit or loss aligned with the consultant’s guiding principles and industry practices.
The Board further noted Management’s representation that its estimate of profitability is derived using methodology that is consistent with the methodology used to assess and/or report measures of profitability elsewhere at the firm. In addition, the Board recognized that Management’s calculations regarding its costs may not reflect all risks, including regulatory, legal, operational, cybersecurity, reputational, and, where appropriate, entrepreneurial risks, associated with offering and managing a mutual fund in the current regulatory and market environment. The Board also considered any fall-out (i.e., indirect) benefits likely to accrue to Management or its affiliates from their relationship with each Fund. The Board recognized that Management and its affiliates should be entitled to earn a reasonable level of profits for services they provide to each Fund and, based on its review, concluded that Management’s reported level of estimated profitability, if any, on each Fund was reasonable.
Information Regarding Services to Other Clients
The Board also considered whether there were other funds or separate accounts that were advised or sub-advised by Management or its affiliates with investment objectives, policies, and strategies that were similar to those of any of the Funds. In the cases where such funds or separate accounts exist, the Board compared the fees charged to the respective Fund to the fees charged to such comparable funds and/or separate accounts. The Board considered the appropriateness and reasonableness of any differences between the fees charged to a Fund and such comparable funds and/or separate accounts, and determined that differences in fees and fee structures were consistent with the differences in the management and other services provided. The Board explored with Management its assertion that although, generally, the rates of fees paid by such accounts, except other Neuberger Berman mutual funds, were lower than the fee rates paid by the corresponding Funds, the differences reflected Management’s greater level of responsibilities and significantly broader scope of services to the Funds, the more extensive regulatory obligations and risks associated with managing the Funds, and other financial considerations with respect to creation and sponsorship of the Funds.
Economies of Scale
The Board also evaluated apparent or anticipated economies of scale in relation to the services Management provides to each Fund. The Board considered whether each Fund’s fee structure provides for a reduction of payments resulting from the use of breakpoints, the size of any breakpoints in each Fund’s advisory fees, and whether any such breakpoints are set at appropriate asset levels. The Board also compared the breakpoint structure to that of the Expense Group. In addition, the Board considered the expense limitation and/or fee waiver
arrangements that reduce many Funds’ expenses at some or all asset levels, which can have an effect similar to breakpoints in sharing economies of scale with shareholders and provide protection from an increase in expenses if a Fund’s assets decline.
The Trustees took into account that certain Funds do not have breakpoints in their fees. As to those Funds whose advisory fees do not have breakpoints, the Board discussed with Management the reasons why the Fund’s particular investment program was less likely than others to produce economies of scale. In addition, for Funds that do not have breakpoints, the Board considered that setting competitive fee rates and pricing a Fund to scale before it has actually experienced an increase in assets are other means of sharing potential economies of scale with shareholders. The Board also considered that Management has provided, at no added cost to the Funds, certain additional services, including but not limited to, services required by new regulations or regulatory interpretations, services impelled by changes in the securities markets or the business landscape, and/or services requested by the Board. The Board considered that this is a way of sharing economies of scale with the Funds and their shareholders.
Fund-by-Fund Analysis
With regard to the investment performance of each Fund and the fees charged to each Fund, the Board considered the following information. The Performance Universes referenced in this section are those identified by the consulting firm, as discussed above, and the risk/return ratios referenced are the Sharpe ratios provided by the consulting firm. With respect to performance quintile rankings for a Fund compared to its Performance Universe, the first quintile represents the highest (best) performance and the fifth quintile represents the lowest performance. With respect to the quintile rankings for fees and total expenses (net of waivers or other adjustments, if any) for a Fund compared to its Expense Group, the first quintile represents the lowest (best) fees and/or total expenses and the fifth quintile represents the highest fees and/or total expenses. Where a Fund has more than one class of shares outstanding, information for Institutional Class has been provided as identified below. The Board reviewed the expense structures of all the other classes of shares of the Funds, some of which have higher fees and expenses that reflect their separate distribution and servicing arrangements and the differing needs of different investors. As a proxy for the class expense structure, the Board reviewed the expenses of each class for at least one Fund in the Trust in comparison to Expense Groups for those classes. The Board noted the effect of higher expenses on the performance of the other classes of shares.
• Neuberger Berman Core Bond Fund (Institutional Class)—The Board considered that, based on performance data for the periods ended December 31, 2022: (1) as compared to its benchmark, the Fund’s performance was lower for the 1-year period and higher for the 3-, 5- and 10-year periods; and (2) as compared to its Performance Universe, the Fund’s performance was in the third quintile for the 1-year period and the second quintile for the 3-, 5-, 10-year periods. The Board considered that, as compared to its Expense Group, the Fund’s contractual management fee, the actual management fee net of fees waived by Management, and total expenses each ranked in the second quintile.
• Neuberger Berman Emerging Markets Debt Fund (Institutional Class)—The Board considered that, based on performance data for the periods ended December 31, 2022: (1) as compared to its benchmark, the Fund’s performance was higher for the 1-, 3-, and 5-year periods; and (2) as compared to its Performance Universe, the Fund’s performance was in the second quintile for the 1-year period and the fourth quintile for the 3- and 5-year periods. The Fund was launched in 2013 and therefore does not have 10-year performance. The Board considered that, as compared to its Expense Group, the Fund’s contractual management fee and the actual management fee net of fees waived by Management each ranked in the third quartile, and total expenses ranked in the second quintile.
• Neuberger Berman Floating Rate Income Fund (Institutional Class)—The Board considered that, based on performance data for the periods ended December 31, 2022: (1) as compared to its benchmark, the Fund’s performance was lower for the 1-, 3-, 5-, 10-year periods; and (2) as compared to its Performance
Universe, the Fund’s performance was in the second quintile for the 1- and 10-year periods and the first quintile for the 3- and 5-year periods. The Board also took into account that the Fund showed a risk/return ratio that was better than the median of its Performance Universe for the 3- and 5-year periods, meaning that per unit of risk taken versus a presumed risk-free investment, the Fund achieved a higher level of return than the median of its Performance Universe for those same periods. In addition, the Board met with the portfolio management team in March 2023. The Board considered that, as compared to its Expense Group, the Fund’s contractual management fee ranked in the second quintile and that the actual management fee net of fees waived by Management and total expenses each ranked in the first quintile.
• Neuberger Berman High Income Bond Fund (Institutional Class)—The Board considered that, based on performance data for the periods ended December 31, 2022: (1) as compared to its benchmark, the Fund’s performance was lower for the 1-, 3-, 5-, and 10-year periods; and (2) as compared to its Performance Universe, the Fund’s performance was in the 4th quintile for the 1-year period and in the third quintile for the 3-, 5-, and 10-year periods. The Board also took into account that the Fund showed a risk/return ratio that was better than the median of its Performance Universe for the 5-year period, meaning that per unit of risk taken versus a presumed risk-free investment, the Fund achieved a higher level of return than the median of its Performance Universe for that same period. In addition, the Board met with members of the portfolio management team in October 2023 to discuss, among other topics, challenges to the Fund’s performance and recent enhancements to the portfolio management team’s process. The Board considered that, as compared to its Expense Group, the Fund’s contractual management fee and actual management fees each ranked in the fifth quintile, and total expenses ranked in the fourth quintile.
• Neuberger Berman Municipal High Income Fund (Institutional Class)—The Board considered that, based on performance data for the periods ended December 31, 2022: (1) as compared to its benchmark, the Fund’s performance was lower for the 1-, 3- , 5-year periods; and (2) as compared to its Performance Universe, the Fund’s performance was in the second quintile for the 1-year period and in the third quintile for the 3- and 5-year periods. The Fund was launched in 2015 and therefore does not have 10-year performance. In addition, the Board met with the portfolio management team in September 2022. The Board considered that, as compared to its Expense Group, the Fund’s contractual management fee ranked in the third quintile and the actual management fee net of fees waived by Management and total expenses each ranked in the first quintile.
• Neuberger Berman Municipal Impact Fund (Institutional Class)—The Board considered that, based on performance data for the periods ended December 31, 2022: (1) as compared to its benchmark, the Fund’s performance was higher for the 1-year period and lower for the 3-, and 5-year periods; and (2) as compared to its Performance Universe, the Fund’s performance was in the first quintile for the 1-year period, the second quintile for the 3-year period, and the third quintile for the 5-year period. NBIA assumed the management of the Fund in 2013; therefore, the Fund does not have does not have 10-year performance under NBIA’s management. The Board considered that, as compared to its Expense Group, the Fund’s contractual management fee ranked second out of five funds and the actual management fee net of fees waived by Management and total expenses each ranked first out of five funds.
• Neuberger Berman Municipal Intermediate Bond Fund (Institutional Class)—The Board considered that, based on performance data for the periods ended December 31, 2022: (1) as compared to its benchmark, the Fund’s performance was lower for the 1-, 3-, 5- and 10-year periods; and (2) as compared to its Performance Universe, the Fund’s performance was in the fifth quintile for the 1-, and 3-year periods, the fourth quintile for the 5-year period, and the third quintile for the 10-year period. The Board also considered that for the 7-month period ending July 31, 2023, the Fund outperformed its benchmark and ranked in the second quintile of both its Lipper and Morningstar peer categories. In addition, the Board met with the portfolio management team in September 2022. The Board considered that, as compared to its Expense Group, the Fund’s contractual management fee, the actual management fee net of fees waived by Management, and total expenses each ranked in the first quintile.
• Neuberger Berman Short Duration Bond Fund (Institutional Class)—The Board considered that, based on performance data for the periods ended December 31, 2022: (1) as compared to its benchmark, the Fund’s performance was lower for the 1-year period and higher for the 3-, 5-, and 10-year periods; and (2) as compared to its Performance Universe, the Fund’s performance was in the fourth quintile for the 1-year period, the second quintile for the 3- and 5-year periods, and the third quintile for the 10-year period. The Board also took into account that in July 2022, Management added a new portfolio manager. The Board considered that, as compared to its Expense Group, the Fund’s contractual management fee and total expenses each ranked in the second quintile and the actual management fee net of fees waived by Management a ranked in the first quintile.
• Neuberger Berman Strategic Income Fund (Institutional Class)—The Board considered that, based on performance data for the periods ended December 31, 2022: (1) as compared to its benchmark, the Fund’s performance was higher for the 1-, 3-, 5-, and 10-year periods; and (2) as compared to its Performance Universe, the Fund’s performance was in the third quintile for the 1- and 10-year periods and the second quintile for the 3- and 5-year periods. The Board considered that, as compared to its Expense Group, the Fund’s contractual management fee ranked in the third quintile, the actual management fee net of fees waived by Management ranked in the fourth quintile, and total expenses ranked in the first quintile.
Conclusions
In approving the continuation of the Agreements, the Board concluded that, in its business judgment, the terms of each Agreement are fair and reasonable to each Fund and that approval of the continuation of the Agreements is in the best interests of each Fund and its shareholders. In reaching this determination, the Board considered that Management and NBEL, with respect to Neuberger Berman Emerging Markets Debt Fund, could be expected to continue to provide a high level of service to each Fund; that the performance of each Fund was satisfactory over time, or, in the case of a Fund that underperformed relative to its Expense Group or Performance Universe, that the Board retained confidence in Management’s and NBEL’s, with respect to Neuberger Berman Emerging Markets Debt Fund, capabilities to manage each Fund; that each Fund’s fee structure appeared to the Board to be reasonable given the nature, extent, and quality of services provided; and that the benefits accruing to Management and its affiliates by virtue of their relationship with each Fund were reasonable in light of the costs of providing the investment advisory and other services and the benefits accruing to each Fund. The Board’s conclusions are based in part on its consideration of materials prepared in connection with the approval or continuance of the Agreements in prior years and on the Board’s ongoing regular review of Fund performance and operations throughout the year, in addition to material prepared specifically for the most recent annual review of the Agreements.
Notice to Shareholders
For the fiscal year ended October 31, 2023, the percentages representing the portion of distributions from net investment income that is exempt from federal tax, other than the alternative minimum tax, are as follows:
| |
| |
Municipal Intermediate Bond | |
For the fiscal year ended October 31, 2023, certain Funds make the following designation, or up to the maximum amount of such dividends allowable pursuant to the Internal Revenue Code, as Qualified Dividend Income.
In January 2024, you will receive information to be used in filing your 2023 tax returns, which will include a notice of the exact tax status of all dividends paid to you by each Fund during calendar year 2023. Please consult your own tax advisor for details as to how this information should be reflected on your tax returns.
This page has been left blank intentionally
This page has been left blank intentionally
This page has been left blank intentionally
Neuberger Berman Investment Advisers LLC
1290 Avenue of the Americas
New York, NY 10104-0002
Retail Services: 800.877.9700
Broker-Dealer and Institutional Services: 800.366.6264/888.556.9030
www.nb.com
Statistics and projections in this report are derived from sources deemed to be reliable
but cannot be regarded as a representation of future results of the Funds. This report is prepared for the general information of shareholders and is not an offer of shares
of the Funds. Shares are sold only through the currently effective prospectus which you
can obtain by calling 877.628.2583. An investor should consider carefully a Fund’s
investment objectives, risks and fees and expenses, which are described in its prospectus, before investing.
H0648 12/23
(b) Not applicable to the Registrant.
Item 2. Code of Ethics.
The Board of Trustees (“Board”) of Neuberger Berman Income Funds (“Registrant”) has adopted a code of ethics that applies to the Registrant’s principal executive officer, principal financial officer, principal accounting officer or controller, or persons performing similar functions (“Code of Ethics”). During the period covered by this Form N-CSR, there were no substantive amendments to the Code of Ethics and there were no waivers from the Code of Ethics granted to the Registrant’s principal executive officer, principal financial officer, principal accounting officer or controller, or persons performing similar functions.
Item 3. Audit Committee Financial Expert.
The Board has determined that the Registrant has three audit committee financial experts serving on its audit committee. The Registrant’s audit committee financial experts are Michael J. Cosgrove, Martha C. Goss, and Deborah C. McLean. Mr. Cosgrove, Ms. Goss, and Ms. McLean are independent trustees as defined by Form N-CSR.
Item 4. Principal Accountant Fees and Services.
Ernst & Young, LLP (“E&Y”) serves as independent registered public accounting firm to each series of the Registrant.
(a) Audit Fees
The aggregate fees billed for professional services rendered by E&Y for the audit of the annual financial statements or services that are normally provided by E&Y in connection with statutory and regulatory filings or engagements were $453,200 and $460,100 for the fiscal years ended 2022 and 2023, respectively.
(b) Audit-Related Fees
The aggregate fees billed to the Registrant for assurance and related services by E&Y that are reasonably related to the performance of the audit of the Registrant’s financial statements and are not reported above in Audit Fees were $0 and $0 for the fiscal years ended 2022 and 2023, respectively. The Audit Committee approved 0% and 0% of these services provided by E&Y for the fiscal years ended 2022 and 2023, respectively, pursuant to the waiver provisions of Rule 2-01(c)(7)(i)(C) of Regulation S-X.
The fees billed to other entities in the investment company complex for assurance and related services by E&Y that are reasonably related to the performance of the audit that the Audit Committee was required to approve because the engagement related directly to the operations and financial reporting of the Registrant were $0 and $0 for the fiscal years ended 2022 and 2023, respectively. The Audit Committee approved 0% and 0% of these services provided by E&Y for the fiscal years ended 2022 and 2023, respectively, pursuant to the waiver provisions of Rule 2-01(c)(7)(i)(C) of Regulation S-X.
(c) Tax Fees
The aggregate fees billed to the Registrant for professional services rendered by E&Y for tax compliance, tax advice, and tax planning were $123,630 and $124,580 for the fiscal years ended 2022 and 2023, respectively. The nature of the services provided includes preparation of the Federal and State tax extensions and tax returns, review of annual excise tax calculations, and preparation of form 8613, in addition to assistance with the
identification of Passive Foreign Investment Companies, assistance with determination of various foreign withholding taxes, and assistance with Internal Revenue Code and tax regulation requirements for fund investments. The Audit Committee approved 0% and 0% of these services provided by E&Y for the fiscal years ended 2022 and 2023, respectively, pursuant to the waiver provisions of Rule 2-01(c)(7)(i)(C) of Regulation S-X.
The fees billed to other entities in the investment company complex for professional services rendered by E&Y for tax compliance, tax advice, and tax planning that the Audit Committee was required to approve because the engagement related directly to the operations and financial reporting of the Registrant were $0 and $0 for the fiscal years ended 2022 and 2023, respectively. The Audit Committee approved 0% and 0% of these services provided by E&Y for the fiscal years ended 2022 and 2023, respectively, pursuant to the waiver provisions of Rule 2-01(c)(7)(i)(C) of Regulation S-X.
(d) All Other Fees
The aggregate fees billed to the Registrant for products and services provided by E&Y, other than services reported in Audit Fees, Audit-Related Fees, and Tax Fees were $0 and $0 for the fiscal years ended 2022 and 2023, respectively. The Audit Committee approved 0% and 0% of these services provided by E&Y for the fiscal years ended 2022 and 2023, respectively, pursuant to the waiver provisions of Rule 2-01(c)(7)(i)(C) of Regulation S-X.
The fees billed to other entities in the investment company complex for products and services provided by E&Y, other than services reported in Audit Fees, Audit-Related Fees, and Tax Fees that the Audit Committee was required to approve because the engagement related directly to the operations and financial reporting of the Registrant were $0 and $0 for the fiscal years ended 2022 and 2023, respectively. The Audit Committee approved 0% and 0% of these services provided by E&Y for the fiscal years ended 2022 and 2023, respectively, pursuant to the waiver provisions of Rule 2-01(c)(7)(i)(C) of Regulation S-X.
(e) Audit Committee’s Pre-Approval Policies and Procedures
(1) The Audit Committee’s pre-approval policies and procedures for the Registrant to engage an accountant to render audit and non-audit services delegate to each member of the Committee the power to pre-approve services between meetings of the Committee.
(2) None of the services described in paragraphs (b) through (d) above were approved by the Audit Committee pursuant to paragraph (c)(7)(i)(C) of Rule 2-01 of Regulation S-X.
(f) Hours Attributed to Other Persons
Not applicable.
(g) Non-Audit Fees
Non-audit fees billed by E&Y for services rendered to the Registrant were $123,630 and $124,580 for the fiscal years ended 2022 and 2023, respectively.
Non-audit fees billed by E&Y for services rendered to the Registrant’s investment adviser and any entity controlling, controlled by, or under common control with the adviser that provides ongoing services to the Registrant were $0 and $0 for the fiscal years ended 2022 and 2023, respectively.
(h) The Audit Committee of the Board considered whether the provision of non-audit services rendered to the Registrant’s investment adviser and any entity controlling, controlled by, or under common control with the adviser that provides ongoing services to the Registrant that were not pre-approved by the Audit Committee
because the engagement did not relate directly to the operations and financial reporting of the Registrant is compatible with maintaining E&Y’s independence.
(i) Not applicable.
(j) Not applicable.
Item 5. Audit Committee of Listed Registrants.
(a) Not applicable to the Registrant.
(b) Not applicable to the Registrant.
Item 6. Investments.
(a) The complete schedule of investments for each series is disclosed in the Registrant’s annual report, which is included in Item 1 of this Form N-CSR.
(b) Not applicable to the Registrant.
Item 7. Reserved.
Item 8. Reserved.
Item 9. Reserved.
Item 10. Reserved.
Item 11. Reserved.
Item 12. Disclosure of Proxy Voting Policies and Procedures for Closed-End Management Investment Companies.
Not applicable to the Registrant.
Item 13. Portfolio Managers of Closed-End Management Investment Companies.
Not applicable to the Registrant.
Item 14. Purchases of Equity Securities by Closed-End Management Investment Company and Affiliated Purchasers.
Not applicable to the Registrant.
Item 15. Submission of Matters to a Vote of Security Holders.
There were no changes to the procedures by which shareholders may recommend nominees to the Board.
Item 16. Controls and Procedures.
| (a) | Based on an evaluation of the disclosure controls and procedures (as defined in Rule 30a-3(c) under the Act) as of a date within 90 days of the filing date of this report, the Chief Executive Officer and President and the Treasurer and Principal Financial and Accounting Officer of the Registrant have concluded that such disclosure controls and procedures are effectively designed to ensure that information required to be disclosed by the Registrant on Form N-CSR is accumulated and communicated to the Registrant’s management to allow timely decisions regarding required disclosure. |
| (b) | There were no significant changes in the Registrant’s internal controls over financial reporting (as defined in Rule 30a-3(d) under the Act) that occurred during the period covered by this report that have materially affected, or are reasonably likely to materially affect, the Registrant’s internal control over financial reporting. |
Item 17. Disclosure of Securities Lending Activities for Closed-End Management Investment Companies.
Not applicable to the Registrant.
Item 18. Recovery of Erroneously Awarded Compensation.
Not applicable to the Registrant.
Item 19. Exhibits.
| (a)(2) | Not applicable to the Registrant.
|
| (a)(4) | Not applicable to the Registrant.
|
| (a)(5) | Not applicable to the Registrant.
|
The certification furnished pursuant to Rule 30a-2(b) under the Act and Section 906 of the Sarbanes-Oxley Act will not be deemed “filed” for purposes of Section 18 of the Securities Exchange Act of 1934, as amended (“Exchange Act”), or otherwise subject to the liability of that section. Such certification will not be deemed to be incorporated by reference into any filing under the Securities Act of 1933, as amended, or the Exchange Act, except to the extent that the Registrant specifically incorporates it by reference.
SIGNATURES
Pursuant to the requirements of the Securities Exchange Act of 1934 and the Investment Company Act of 1940, the Registrant has duly caused this report to be signed on its behalf by the undersigned, thereunto duly authorized.
Neuberger Berman Income Funds
By: /s/ Joseph V. Amato
Joseph V. Amato
Chief Executive Officer and President
Date: January 5, 2024
Pursuant to the requirements of the Securities Exchange Act of 1934 and the Investment Company Act of 1940, this report has been signed below by the following persons on behalf of the Registrant and in the capacities and on the dates indicated.
By: /s/ Joseph V. Amato
Joseph V. Amato
Chief Executive Officer and President
Date: January 5, 2024
By: /s/ John M. McGovern
John M. McGovern
Treasurer and Principal Financial
and Accounting Officer
Date: January 5, 2024