| | | | | | | | | | |
| | | | | | | | OMB APPROVAL | | |
| | | | | | | | OMB Number: 3235-0570 Expires: January 31, 2017 Estimated average burden hours per response: 20.6 | | |
UNITED STATES
SECURITIES AND EXCHANGE COMMISSION
Washington, D.C. 20549
FORM N-CSR
CERTIFIED SHAREHOLDER REPORT OF REGISTERED
MANAGEMENT INVESTMENT COMPANIES
Investment Company Act file number 811-03826
AIM Sector Funds (Invesco Sector Funds)
(Exact name of registrant as specified in charter)
11 Greenway Plaza, Suite 1000 Houston, Texas 77046
(Address of principal executive offices) (Zip code)
Sheri Morris 11 Greenway Plaza, Suite 1000 Houston, Texas 77046
(Name and address of agent for service)
Registrant’s telephone number, including area code: (713) 626-1919
| | |
| Date of fiscal year end: | | 4/30 |
| |
| Date of reporting period: | | 04/30/16 |
Item 1. Report to Stockholders.
| | | | |
| | |
 | | Annual Report to Shareholders | | April 30, 2016 |
| | |
| | Invesco American Value Fund |
| | Nasdaq: |
| | A: MSAVX n B: MGAVX n C: MSVCX n R: MSARX n Y: MSAIX n R5: MSAJX n R6: MSAFX |

Letters to Shareholders
| | |

Philip Taylor | | Dear Shareholders: This annual report includes information about your Fund, including performance data and a complete list of its investments as of the close of the reporting period. Inside is a discussion of how your Fund was managed and the factors that affected its performance during the reporting period. US economic data were generally positive over the reporting period, with the economy expanding modestly and employment numbers improving steadily. Throughout the reporting period, US consumers benefited from declining energy prices and greater credit availability, but a strengthening dollar crimped the profits of many large multi-national companies doing business overseas. Ending years of uncertainty, the US Federal Reserve in December 2015 finally raised short-term interest rates for the first time since 2006, signaling its confidence that the economy |
| |
was likely to continue expanding and improving. Overseas, the economic story was less positive. The European Central Bank and central banks in China and Japan – as well as other countries – either instituted or maintained extraordinarily accommodative monetary policies in response to economic weakness. Stocks began 2016 on a weak note due to increased concerns about global economic weakness.
Short-term market volatility can prompt some investors to abandon their investment plans – and can cause others to settle for average results. The investment professionals at Invesco, in contrast, invest with high conviction and a long-term perspective. At Invesco, investing with high conviction means offering a wide range of strategies designed to go beyond market benchmarks. We trust our research-driven insights, have confidence in our investment processes and build portfolios that reflect our beliefs. Our goal is to look past market noise in an effort to find attractive opportunities at attractive prices – consistent with the investment strategies spelled out in each fund’s prospectus. Of course, investing with high conviction can’t guarantee a profit or ensure investment success; no investment strategy or risk analysis can. To learn more about how we invest with high conviction, visit invesco.com/HighConviction.
You, too, can invest with high conviction by maintaining a long-term investment perspective and by working with your financial adviser on a regular basis. During periods of short-term market volatility or uncertainty, your financial adviser can keep you focused on your long-term investment goals – a new home, a child’s college education, or a secure retirement. He or she also can share research about the economy, the markets and individual investment options.
Visit our website for more information on your investments
Our website, invesco.com/us, offers a wide range of market insights and investment perspectives. On the website, you’ll find detailed information about our funds, including performance, holdings and portfolio manager commentaries. You can access information about your account by completing a simple, secure online registration. Click on the “Need to register” link in the “Account Access” box on our homepage to get started. Invesco’s mobile apps for iPhone® and iPad® (both available free from the App StoreSM) allow you to obtain the same detailed information, monitor your account and create customizable watch lists.
In addition to the resources accessible on our website and through our mobile app, you can obtain timely updates to help you stay informed about the markets, the economy and investing by connecting with Invesco on Twitter, LinkedIn or Facebook. You can access our blog at blog.invesco.us.com. Our goal is to provide you the information you want, when and where you want it.
Have questions?
For questions about your account, contact an Invesco client services representative at 800 959 4246. For Invesco-related questions or comments, please email me directly at phil@invesco.com.
All of us at Invesco look forward to serving your investment management needs. Thank you for investing with us.
Sincerely,

Philip Taylor
Senior Managing Director, Invesco Ltd.
iPhone and iPad are trademarks of Apple Inc., registered in the US and other countries. App Store is a service mark of Apple Inc. Invesco Distributors, Inc. is not affiliated with Apple Inc.
2 Invesco American Value Fund
| | |

Bruce Crockett | | Dear Fellow Shareholders: Among the many important lessons I’ve learned in more than 40 years in a variety of business
endeavors is the value of a trusted advocate. As independent chair of the Invesco Funds Board, I can assure you that the members of the
Board are strong advocates for the interests of investors in Invesco’s mutual funds. We work
hard to represent your interests through oversight of the quality of the investment management
services your funds receive and other matters important to your investment, including but not
limited to: |
| |
| | n Ensuring that Invesco offers a diverse lineup of mutual funds that your financial adviser can use to strive to meet your financial needs as your investment goals change over time. n Monitoring how the portfolio management teams of the Invesco funds are performing in light of changing economic and market conditions. |
| n | | Assessing each portfolio management team’s investment performance within the context of the investment strategy described in the fund’s prospectus. |
| n | | Monitoring for potential conflicts of interests that may impact the nature of the services that your funds receive. |
We believe one of the most important services we provide our fund shareholders is the annual review of the funds’ advisory and sub-advisory contracts with Invesco Advisers and its affiliates. This review is required by the Investment Company Act of 1940 and focuses on the nature and quality of the services Invesco provides as the adviser to the Invesco funds and the reasonableness of the fees that it charges for those services. Each year, we spend months carefully reviewing information received from Invesco and a variety of independent sources, such as performance and fee data prepared by Lipper Inc., an independent, third-party firm widely recognized as a leader in its field. We also meet with our independent legal counsel and other independent advisers to review and help us assess the information that we have received. Our goal is to assure that you receive quality investment management services for a reasonable fee.
I trust the measures outlined above provide assurance that you have a worthy advocate when it comes to choosing the Invesco Funds.
As always, please contact me at bruce@brucecrockett.com with any questions or concerns you may have. On behalf of the Board, we look forward to continuing to represent your interests and serving your needs.
Sincerely,

Bruce L. Crockett
Independent Chair
Invesco Funds Board of Trustees
3 Invesco American Value Fund
Management’s Discussion of Fund Performance
| | | | |
| Performance summary | |
For the fiscal year ended April 30, 2016, Class A shares of Invesco American Value Fund (the Fund), at net asset value (NAV), underperformed the Russell Midcap Value Index, the Fund’s style-specific benchmark. Your Fund’s long-term performance appears later in this report. | |
| Fund vs. Indexes | |
Total returns, 4/30/15 to 4/30/16, at net asset value (NAV). Performance shown does not include applicable contingent deferred sales charges (CDSC) or front-end sales charges, which would have reduced performance. | |
Class A Shares | | | -9.62 | % |
Class B Shares | | | -9.62 | |
Class C Shares | | | -10.25 | |
Class R Shares | | | -9.82 | |
| Class Y Shares | | | -9.36 | |
| Class R5 Shares | | | -9.26 | |
Class R6 Shares | | | -9.19 | |
S&P 500 Indexq (Broad Market Index) | | | 1.21 | |
Russell Midcap Value Indexq (Style-Specific Index) | | | -0.18 | |
Lipper Mid-Cap Value Funds Index¢ (Peer Group Index) | | | -2.94 | |
Source(s): qFactSet Research Systems Inc.; nLipper Inc. | | | | |
Market conditions and your Fund
Although the health of individual economic sectors varied dramatically, the US economy overall continued its slow but steady growth during the fiscal year ended April 30, 2016. This modest growth led to recurring debate over whether the US economy could withstand global recessionary forces. Many energy, industrial and materials companies experienced cyclical downturns resembling a mild recession even as many consumer- related companies benefited from continued low interest rates, increased availability of credit and a better employment picture. Another significant downturn in oil prices reduced capital investment but also reduced consumers’ energy and gasoline costs.
In the first half of the reporting period, US equity market performance was greatly affected by expectations of when, and whether, the US Federal Reserve (the
Fed) might raise interest rates – and the impact the Fed’s action might have. Markets moved lower in the summer of 2015 as a significant downturn in China’s financial markets and weak global economic growth led to increased concern about the sustainability of US economic growth. In the fall, markets rallied and the Fed saw enough economic stabilization to finally raise interest rates.
US stocks began 2016 on a negative note. Together with a sharp decline in oil prices, this suggested a global recession might be imminent and caused investors to become decidedly risk averse; this helped short-term and income-oriented investments, but hurt longer-term and growth-oriented investments. As companies reported earnings and fundamentals that were better than had been feared, stocks rallied sharply in late February and March. Additionally, oil prices strengthened modestly on the back of a weaker US dollar and as Saudi Arabia and Russia
considered a freeze on their oil output. Overall, US equity markets were mixed, with the S&P 500 Index, considered representative of the performance of the US stock market, finishing the reporting period modestly higher.
Stock selection in the industrials sector was the largest contributor to Fund performance versus its style-specific index, the Russell Midcap Value Index, for the fiscal year. Within the sector, Owens Corning and Masco were strong contributors to the Fund’s performance relative to its style-specific benchmark. During the reporting period, both companies benefited from improvement in residential construction. In particular, Owens Corning reported stronger sales and improving profitability for its asphalt roofing and insulation products. Masco reported strong results from its cabinet division, which drove earnings.
Stock selection in the consumer staples sector also benefited the Fund’s performance relative to its style-specific benchmark. Within the sector, ConAgra Foods was a key contributor. During the reporting period, the company announced plans to exit its private-label business, which had increasingly been seen by investors as a drag on overall performance.
Stock selection in the consumer discretionary sector was the largest detractor from the Fund’s returns relative to its style-specific index for the fiscal year, and a number of retail holdings in this sector were among the Fund’s largest detractors, including Fossil Group and Ascena Retail Group. Fossil Group reported weakening sales and earnings due to declining demand for watches and leather goods. The company also faced headwinds from the stronger US dollar and lowered its earnings guidance for its fiscal year. We eliminated our holdings in Fossil Group during the reporting period.
| | | | |
| Portfolio Composition | |
| By sector | | | % of total net assets | |
| | | | |
| |
Financials | | | 25.2 | % |
Industrials | | | 16.6 | |
Consumer Discretionary | | | 10.9 | |
Health Care | | | 10.7 | |
Information Technology | | | 10.6 | |
Materials | | | 7.6 | |
Energy | | | 7.4 | |
Utilities | | | 3.2 | |
Consumer Staples | | | 2.7 | |
Telecommunication Services | | | 2.7 | |
Money Market Funds | | | | |
Plus Other Assets Less Liabilities | | | 2.4 | |
| | |
| Top 10 Equity Holdings* |
| | % of total net assets |
| | | | | |
| |
1. Johnson Controls, Inc. | | | | 3.7 | % |
2. Universal Health Services, Inc.-Class B | | | | 3.5 | |
3. HealthSouth Corp. | | | | 3.3 | |
4. Forest City Realty Trust, Inc.-Class A | | | | 3.2 | |
5. Willis Towers Watson PLC | | | | 3.1 | |
6. Eastman Chemical Co. | | | | 3.0 | |
7. Textron Inc. | | | | 3.0 | |
8. Wintrust Financial Corp. | | | | 2.9 | |
9. Devon Energy Corp. | | | | 2.8 | |
10. ConAgra Foods, Inc. | | | | 2.8 | |
| | | | | |
| Total Net Assets | | | | $2.0 billion | |
| |
| Total Number of Holdings* | | | | 45 | |
The Fund’s holdings are subject to change, and there is no assurance that the Fund will continue to hold any particular security.
*Excluding money market fund holdings.
Data presented here are as of April 30, 2016.
|
| 4 Invesco American Value Fund |
Within the consumer discretionary sector, DeVry Education Group detracted from the Fund’s performance relative to its style-specific index. During the reporting period, the Federal Trade Commission filed a lawsuit alleging that one of DeVry’s business units made false advertising claims, and the news hurt shares. In our opinion, this action brought about unforeseen risks that were difficult to quantify, and we reduced our position in DeVry during the reporting period.
Stock selection in the information technology (IT) sector also detracted from the Fund’s performance relative to its style-specific benchmark for the fiscal year. Teradata was the largest detractor in the sector. The company reported disappointing earnings due to shrinking margins and foreign currency headwinds.
In addition, stock selection in and an underweight allocation to the financials sector detracted from the Fund’s returns relative to its style-specific index for the fiscal year, due in part to the Fund’s underweight exposure to some of the stronger-performing stocks within the real estate industry. The Fund’s exposure to the insurance and diversified financials industries also drove underperformance within the sector for the reporting period, and Stifel Financial was a key detractor.
The energy sector detracted from the Fund’s performance relative to its style-specific index for the reporting period, and included one of the Fund’s largest individual detractors, Williams Companies. The company’s stock price suffered as continued low oil prices weighed on its shares. Low oil prices were also a cause for concern that Williams’ merger with Energy Transfer Equity (not a Fund holding) may not occur. In our view, however, the company is likely to continue to generate stable cash flows regardless of the ultimate outcome of the deal. We maintained our position in the company during the reporting period.
We used currency forward contracts during the reporting period for the purpose of hedging currency exposure of non-US-based companies held in the Fund. Derivatives were used for the purpose of hedging and not for speculative purposes or leverage. Due to the continued strength of the US dollar, the use of currency forward contracts had a slight positive impact on the Fund’s performance relative to the Russell Midcap Value Index for the reporting period.
During the fiscal year, we increased our exposure to the materials and energy sectors and decreased exposure to the IT and
financials sectors. At the end of the reporting period, our largest overweight allocations versus the style-specific benchmark remained in the industrials and health care sectors, while our largest underweight allocations were in the utilities and financials sectors.
The US equity markets experienced continued volatility during the reporting period as concerns about slow global economic growth, low oil prices and the uncertainty regarding the Fed’s stance on interest rates weighed on investors. We believe market volatility creates opportunities to invest in companies with attractive valuations and strong fundamentals. We believe that ultimately those valuations and fundamentals may be reflected in those companies’ stock prices.
As always, we are committed to working to achieve positive returns for the Fund’s shareholders through an entire market cycle. Thank you for your continued investment in the Invesco American Value Fund.
The views and opinions expressed in management’s discussion of Fund performance are those of Invesco Advisers, Inc. These views and opinions are subject to change at any time based on factors such as market and economic conditions. These views and opinions may not be relied upon as investment advice or recommendations, or as an offer for a particular security. The information is not a complete analysis of every aspect of any market, country, industry, security or the Fund. Statements of fact are from sources considered reliable, but Invesco Advisers, Inc. makes no representation or warranty as to their completeness or accuracy. Although historical performance is no guarantee of future results, these insights may help you understand our investment management philosophy.
See important Fund and, if applicable, index disclosures later in this report.
| | |
 | | Thomas Copper Chartered Financial Analyst, Portfolio Manager, is co-lead manager of Invesco |
| American Value Fund. He joined Invesco in 2010. Mr. Copper earned a BA in economics and political science from Tulane University and an MBA from Baylor University. |
| | |
 | | John Mazanec Portfolio Manager, is co-lead manager of Invesco American Value Fund. He joined Invesco in 2010. Mr. Mazanec |
| earned a BS from DePauw University and an MBA from Harvard University. |
| | |
 | | Sergio Marcheli Portfolio Manager, is manager of Invesco American Value Fund. He joined Invesco in 2010. Mr. Marcheli |
| earned a BBA from the University of Houston and an MBA from the University of St. Thomas. |
|
| 5 Invesco American Value Fund |
Your Fund’s Long-Term Performance
Results of a $10,000 Investment – Oldest Share Class(es)
Fund and index data from 4/30/06
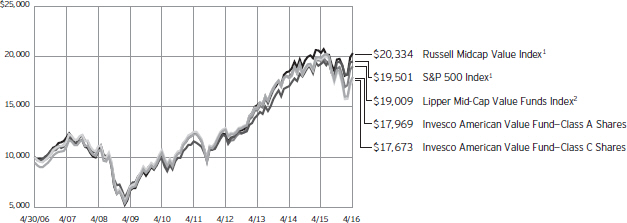
| 1 | Source: FactSet Research Systems Inc. |
Past performance cannot guarantee comparable future results.
The data shown in the chart include reinvested distributions, applicable sales charges and Fund expenses including
management fees. Index results include reinvested dividends, but they do not reflect sales charges. Performance of the peer group, if applicable, reflects fund expenses and management fees;
performance of a market index does not. Performance shown in the chart and table(s) does not reflect deduction of taxes a shareholder would pay on Fund distributions or sale of Fund shares.
continued from page 8
| n | | Value investing style risk. A value investing style subjects the Fund to the risk that the valuations never improve or that the returns on value equity securities are less than returns on other styles of investing or the overall stock market. |
About indexes used in this report
| n | | The S&P 500® Index is an unmanaged index considered representative of the US stock market. |
| n | | The Russell Midcap® Value Index is an unmanaged index considered representative of mid-cap value stocks. The Russell Midcap Value Index is a trademark/service mark of the Frank Russell Co. Russell® is a trademark of the Frank Russell Co. |
| n | | The Lipper Mid-Cap Value Funds Index is an unmanaged index considered representative of mid-cap value funds tracked by Lipper. |
| n | | The Fund is not managed to track the performance of any particular index, including the index(es) described here, and consequently, the performance of the Fund may deviate significantly from the performance of the index(es). |
| n | | A direct investment cannot be made in an index. Unless otherwise indicated, index results include reinvested dividends, and they do not reflect sales charges. Performance of the peer group, if applicable, reflects fund expenses; performance of a market index does not. |
Other information
| n | | The returns shown in management’s discussion of Fund performance are based on net asset values (NAVs) calculated for shareholder transactions. Generally accepted accounting principles require adjustments to be made to the net assets of the Fund at period end for financial reporting purposes, and as such, the NAVs for shareholder transactions and the returns based on those NAVs may differ from the NAVs and returns reported in the Financial Highlights. |
| n | | Industry classifications used in this report are generally according to the Global Industry Classification Standard, which was developed by and is the exclusive property and a service mark of MSCI Inc. and Standard & Poor’s. |
6 Invesco American Value Fund
| | | | |
Average Annual Total Returns As of 4/30/16, including maximum applicable sales charges | |
Class A Shares | | | | |
Inception (10/18/93) | | | 8.97 | % |
10 Years | | | 6.04 | |
5 Years | | | 6.71 | |
1 Year | | | -14.58 | |
| |
Class B Shares | | | | |
Inception (8/1/95) | | | 8.90 | % |
10 Years | | | 6.52 | |
5 Years | | | 7.65 | |
1 Year | | | -13.78 | |
| |
Class C Shares | | | | |
Inception (10/18/93) | | | 8.46 | % |
10 Years | | | 5.86 | |
5 Years | | | 7.15 | |
1 Year | | | -11.08 | |
| |
Class R Shares | | | | |
Inception (3/20/07) | | | 5.73 | % |
5 Years | | | 7.66 | |
1 Year | | | -9.82 | |
| |
Class Y Shares | | | | |
Inception (2/7/06) | | | 7.45 | % |
10 Years | | | 6.90 | |
5 Years | | | 8.20 | |
1 Year | | | -9.36 | |
| |
Class R5 Shares | | | | |
10 Years | | | 6.89 | % |
5 Years | | | 8.36 | |
1 Year | | | -9.26 | |
| |
Class R6 Shares | | | | |
10 Years | | | 6.81 | % |
5 Years | | | 8.28 | |
1 Year | | | -9.19 | |
Effective June 1, 2010, Class A, Class B, Class C, Class I and Class R shares of the predecessor fund, Van Kampen American Value Fund, advised by Van Kampen Asset Management were reorganized into Class A, Class B, Class C, Class Y and Class R shares, respectively, of Invesco Van Kampen American Value Fund (renamed Invesco American Value Fund). Returns shown above for Class A, Class B, Class C, Class R and Class Y shares are blended returns of the predecessor fund and Invesco American Value Fund. Share class returns will differ from the predecessor fund because of different expenses.
Class R5 shares incepted on June 1, 2010. Performance shown prior to that date is that of the predecessor fund’s Class A shares and includes the 12b-1 fees applicable to Class A shares.
| | | | |
Average Annual Total Returns As of 3/31/16, the most recent calendar quarter end, including maximum applicable sales charges | |
Class A Shares | | | | |
Inception (10/18/93) | | | 8.86 | % |
10 Years | | | 6.00 | |
5 Years | | | 6.42 | |
1 Year | | | -17.46 | |
| |
Class B Shares | | | | |
Inception (8/1/95) | | | 8.77 | % |
10 Years | | | 6.48 | |
5 Years | | | 7.35 | |
1 Year | | | -16.66 | |
| |
Class C Shares | | | | |
Inception (10/18/93) | | | 8.34 | % |
10 Years | | | 5.82 | |
5 Years | | | 6.85 | |
1 Year | | | -14.07 | |
| |
Class R Shares | | | | |
Inception (3/20/07) | | | 5.42 | % |
5 Years | | | 7.36 | |
1 Year | | | -12.87 | |
| |
Class Y Shares | | | | |
Inception (2/7/06) | | | 7.18 | % |
10 Years | | | 6.86 | |
5 Years | | | 7.89 | |
1 Year | | | -12.42 | |
| |
Class R5 Shares | | | | |
10 Years | | | 6.85 | % |
5 Years | | | 8.06 | |
1 Year | | | -12.32 | |
| |
Class R6 Shares | | | | |
10 Years | | | 6.77 | % |
5 Years | | | 7.98 | |
1 Year | | | -12.22 | |
Class R6 shares incepted on September 24, 2012. Performance shown prior to that date is that of the Fund’s and the predecessor fund’s Class A shares and includes the 12b-1 fees applicable to Class A shares.
The performance data quoted represent past performance and cannot guarantee comparable future results; current performance may be lower or higher. Please visit invesco.com/performance for the most recent month-end performance. Performance figures reflect reinvested distributions, changes in net asset value and the effect of the maximum sales charge unless otherwise stated. Investment return and principal value will fluctuate so that you may have a gain or loss when you sell shares.
The net annual Fund operating expense ratio set forth in the most recent Fund prospectus as of the date of this report for Class A, Class B, Class C, Class R, Class Y, Class R5 and Class R6 shares was 1.28%, 1.28%, 2.01%, 1.53%, 1.03%, 0.91% and 0.82%, respectively.1 The total annual Fund operating expense ratio set forth in the most recent Fund prospectus as of the date of this report for Class A, Class B, Class C, Class R, Class Y, Class R5 and Class R6 shares was 1.29%, 1.29%, 2.02%, 1.54%, 1.04%, 0.92% and 0.83%, respectively. The expense ratios presented above may vary from the expense ratios presented in other sections of this report that are based on expenses incurred during the period covered by this report.
Class A share performance reflects the maximum 5.50% sales charge, and Class B and Class C share performance reflects the applicable contingent deferred sales charge (CDSC) for the period involved. For shares purchased prior to June 1, 2010, the CDSC on Class B shares declines from 5% at the time of purchase to 0% at the beginning of the sixth year. For shares purchased on or after June 1, 2010, the CDSC on Class B shares declines from 5% at the time of purchase to 0% at the beginning of the seventh year. The CDSC on Class C shares is 1% for the first year after purchase. Class R, Class Y, Class R5 and Class R6 shares do not have a front-end sales charge or a CDSC; therefore, performance is at net asset value.
The performance of the Fund’s share classes will differ primarily due to different sales charge structures and class expenses.
Fund performance reflects any applicable fee waivers and/or expense reimbursements. Had the adviser not waived fees and/or reimbursed expenses currently or in the past, returns would have been lower. See current prospectus for more information.
| 1 | Total annual Fund operating expenses after any contractual fee waivers and/or expense reimbursements by the adviser in effect through at least June 30, 2018. See current prospectus for more information. |
7 Invesco American Value Fund
Invesco American Value Fund’s investment objective is total return through growth of capital and current income.
| n | | Unless otherwise stated, information presented in this report is as of April 30, 2016, and is based on total net assets. |
| n | | Unless otherwise noted, all data provided by Invesco. |
| n | | To access your Fund’s reports/prospectus, visit invesco.com/fundreports. |
About share classes
| n | | Class B shares may not be purchased for new or additional investments. Please see the prospectus for more information. |
| n | | Class R shares are generally available only to employer sponsored retirement and benefit plans. Please see the prospectus for more information. |
| n | | Class Y shares are available only to certain investors. Please see the prospectus for more information. |
| n | | Class R5 shares and Class R6 shares are primarily intended for employer sponsored retirement and benefit plans that meet certain standards and for institutional investors. Please see the prospectus for more information. |
Principal risks of investing in the Fund
| n | | Depositary receipts risk. Investing in depositary receipts involves the same risks as direct investments in foreign securities. In addition, the underlying issuers of certain depositary receipts are under no obligation to distribute shareholder communications or pass through any voting rights with respect to the deposited securities to the holders of such receipts. The Fund may therefore receive less timely information or have less control than if it invested directly in the foreign issuer. |
| n | | Derivatives risk. The value of a derivative instrument depends largely on (and is derived from) the value of an underlying security, currency, commodity, interest rate, index or other asset (each referred to as an underlying asset). In addition to risks relating to the underlying assets, the use of derivatives may include other, possibly greater, risks, including counterparty, leverage and liquidity risks. Counterparty risk is the risk that the counterparty to the derivative contract will default on its obligation to pay the Fund the amount owed or otherwise perform under the derivative contract. Derivatives create leverage risk because they |
| | do not require payment up front equal to the economic exposure created by owning the derivative. As a result, an adverse change in the value of the underlying asset could result in the Fund sustaining a loss that is substantially greater than the amount invested in the derivative, which may make the Fund’s returns more volatile and increase the risk of loss. Derivative instruments may also be less liquid than more traditional investments and the Fund may be unable to sell or close out its derivative positions at a desirable time or price. This risk may be more acute under adverse market conditions, during which the Fund may be most in need of liquidating its derivative positions. Derivatives may also be harder to value, less tax efficient and subject to changing government regulation that could impact the Fund’s ability to use certain derivatives or their cost. Also, derivatives used for hedging or to gain or limit exposure to a particular market segment may not provide the expected benefits, particularly during adverse market conditions. |
| n | | Foreign securities risk. The Fund’s foreign investments may be adversely affected by political and social instability, changes in economic or taxation policies, difficulty in enforcing obligations, decreased liquidity or increased volatility. Foreign investments also involve the risk of the possible seizure, nationalization or expropriation of the issuer or foreign deposits (in which the Fund could lose its entire investments in a certain market) and the possible adoption of foreign governmental restrictions such as exchange controls. Unless the Fund has hedged its foreign securities risk, foreign securities risk also involves the risk of negative foreign currency rate fluctuations, which may cause the value of securities denominated in such foreign currency (or other instruments through which the Fund has exposure to foreign currencies) to decline in value. Currency |
| | | exchange rates may fluctuate significantly over short periods of time. Currency hedging strategies, if used, are not always successful. |
| n | | Management risk. The Fund is actively managed and depends heavily on the Adviser’s judgment about markets, interest rates or the attractiveness, relative values, liquidity, or potential appreciation of particular investments made for the Fund’s portfolio. The Fund could experience losses if these judgments prove to be incorrect. Additionally, legislative, regulatory, or tax developments may adversely affect management of the Fund and, therefore, the ability of the Fund to achieve its investment objective. |
| n | | Market risk. The market values of the Fund’s investments, and therefore the value of the Fund’s shares, will go up and down, sometimes rapidly or unpredictably. Market risk may affect a single issuer, industry or section of the economy, or it may affect the market as a whole. Individual stock prices tend to go up and down more dramatically than those of certain other types of investments, such as bonds. During a general downturn in the financial markets, multiple asset classes may decline in value. When markets perform well, there can be no assurance that specific investments held by the Fund will rise in value. |
| n | | Real estate investment trust (REIT) risk/real estate risk. Investments in real estate related instruments may be affected by economic, legal, cultural, environmental or technological factors that affect property values, rents or occupancies of real estate related to the Fund’s holdings. Shares of real estate related companies, which tend to be small- and mid-cap companies, may be more volatile and less liquid. |
| n | | Small- and mid-capitalization risks. Small- and mid-capitalization companies tend to be more vulnerable to changing market conditions, may have little or no operating history or track record of success, and may have more limited product lines and markets, less experienced management and fewer financial resources than larger companies. These companies’ securities may be more volatile and less liquid than those of more established companies, and their returns may vary, sometimes significantly, from the overall securities market. |
|
This report must be accompanied or preceded by a currently effective Fund prospectus, which contains more complete information, including sales charges and expenses. Investors should read it carefully before investing. |
NOT FDIC INSURED | MAY LOSE VALUE | NO BANK GUARANTEE
8 Invesco American Value Fund
Schedule of Investments(a)
April 30, 2016
| | | | | | | | |
| | | Shares | | | Value | |
Common Stocks & Other Equity Interests–97.60% | |
| Aerospace & Defense–2.95% | |
Textron Inc. | | | 1,547,663 | | | $ | 59,863,605 | |
|
| Alternative Carriers–2.68% | |
Level 3 Communications, Inc.(b) | | | 1,041,667 | | | | 54,437,517 | |
|
| Apparel Retail–1.49% | |
Ascena Retail Group, Inc.(b) | | | 3,431,099 | | | | 30,227,982 | |
|
| Application Software–2.60% | |
Citrix Systems, Inc.(b) | | | 645,076 | | | | 52,793,020 | |
|
| Asset Management & Custody Banks–2.75% | |
American Capital Ltd.(b) | | | 3,535,041 | | | | 55,853,648 | |
| | |
| Auto Parts & Equipment–5.19% | | | | | | | | |
Dana Holding Corp. | | | 2,362,865 | | | | 30,551,844 | |
Johnson Controls, Inc. | | | 1,806,460 | | | | 74,787,444 | |
| | | | 105,339,288 | |
|
| Automotive Retail–1.48% | |
Advance Auto Parts, Inc. | | | 192,681 | | | | 30,077,504 | |
| | |
| Broadcasting–2.24% | | | | | | | | |
TEGNA Inc. | | | 1,946,985 | | | | 45,481,570 | |
| | |
| Building Products–3.87% | | | | | | | | |
Masco Corp. | | | 1,248,508 | | | | 38,341,681 | |
Owens Corning | | | 873,466 | | | | 40,240,578 | |
| | | | 78,582,259 | |
|
| Communications Equipment–2.34% | |
Ciena Corp.(b) | | | 2,823,189 | | | | 47,514,271 | |
|
| Construction & Engineering–2.56% | |
Fluor Corp. | | | 951,790 | | | | 52,024,841 | |
|
| Construction Materials–2.58% | |
Eagle Materials Inc. | | | 705,049 | | | | 52,258,232 | |
| | |
| Diversified Banks–2.63% | | | | | | | | |
Comerica Inc. | | | 1,199,521 | | | | 53,258,732 | |
| | |
| Diversified Chemicals–3.01% | | | | | | | | |
Eastman Chemical Co. | | | 799,982 | | | | 61,102,625 | |
| | |
| Diversified REIT’s–3.21% | | | | | | | | |
Forest City Realty Trust, Inc.–Class A | | | 3,135,297 | | | | 65,151,472 | |
| | |
| Education Services–0.49% | | | | | | | | |
DeVry Education Group Inc. | | | 574,359 | | | | 9,965,129 | |
| | |
| Electric Utilities–2.26% | | | | | | | | |
Edison International | | | 648,774 | | | | 45,874,809 | |
|
| Electronic Equipment & Instruments–2.07% | |
Keysight Technologies, Inc.(b) | | | 1,610,219 | | | | 41,994,511 | |
|
| Environmental & Facilities Services–2.18% | |
Clean Harbors, Inc.(b) | | | 895,979 | | | | 44,261,363 | |
| | | | | | | | |
| | | Shares | | | Value | |
| Health Care Facilities–8.40% | | | | | | | | |
Brookdale Senior Living Inc.(b) | | | 1,752,634 | | | $ | 32,353,624 | |
HealthSouth Corp. | | | 1,600,940 | | | | 66,374,972 | |
Universal Health Services, Inc.–Class B | | | 536,823 | | | | 71,762,499 | |
| | | | 170,491,095 | |
|
| Heavy Electrical Equipment–1.07% | |
Babcock & Wilcox Enterprises, Inc.(b) | | | 952,220 | | | | 21,758,227 | |
| | |
| Industrial Machinery–2.70% | | | | | | | | |
Ingersoll-Rand PLC | | | 834,392 | | | | 54,686,052 | |
| | |
| Insurance Brokers–5.19% | | | | | | | | |
Arthur J. Gallagher & Co. | | | 934,411 | | | | 43,020,282 | |
Willis Towers Watson PLC | | | 498,035 | | | | 62,204,572 | |
| | | | 105,224,854 | |
|
| Investment Banking & Brokerage–1.77% | |
Stifel Financial Corp.(b) | | | 1,091,900 | | | | 35,934,429 | |
|
| IT Consulting & Other Services–2.05% | |
Teradata Corp.(b) | | | 1,642,722 | | | | 41,560,867 | |
|
| Life Sciences Tools & Services–2.34% | |
PerkinElmer, Inc. | | | 940,605 | | | | 47,425,304 | |
| | |
| Multi-Utilities–0.91% | | | | | | | | |
CenterPoint Energy, Inc. | | | 858,246 | | | | 18,409,377 | |
|
| Oil & Gas Equipment & Services–3.08% | |
Amec Foster Wheeler PLC (United Kingdom) | | | 3,200,822 | | | | 23,249,214 | |
Amec Foster Wheeler PLC–ADR (United Kingdom) | | | 143,068 | | | | 1,051,550 | |
Baker Hughes Inc. | | | 789,742 | | | | 38,191,923 | |
| | | | 62,492,687 | |
|
| Oil & Gas Exploration & Production–2.83% | |
Devon Energy Corp. | | | 1,656,208 | | | | 57,437,293 | |
|
| Oil & Gas Storage & Transportation–1.48% | |
Williams Cos., Inc. (The) | | | 1,550,802 | | | | 30,070,051 | |
|
| Packaged Foods & Meats–2.75% | |
ConAgra Foods, Inc. | | | 1,254,372 | | | | 55,894,816 | |
|
| Property & Casualty Insurance–2.50% | |
FNF Group | | | 1,592,755 | | | | 50,808,884 | |
|
| Regional Banks–7.12% | |
BB&T Corp. | | | 1,547,825 | | | | 54,762,048 | |
Wintrust Financial Corp. | | | 1,124,377 | | | | 58,490,092 | |
Zions Bancorp. | | | 1,137,765 | | | | 31,311,293 | |
| | | | | | | | 144,563,433 | |
| | |
| Specialty Chemicals–2.00% | | | | | | | | |
W.R. Grace & Co.(b) | | | 528,379 | | | | 40,516,102 | |
|
| Technology Hardware, Storage & Peripherals–1.50% | |
Diebold, Inc. | | | 1,159,922 | | | | 30,471,151 | |
See accompanying Notes to Financial Statements which are an integral part of the financial statements.
9 Invesco American Value Fund
| | | | | | | | |
| | | Shares | | | Value | |
| Trucking–1.33% | | | | | | | | |
Swift Transportation Co.(b) | | | 1,618,892 | | | $ | 26,905,985 | |
Total Common Stocks & Other Equity Interests
(Cost $1,888,687,679) | | | | 1,980,712,985 | |
| | |
Money Market Funds–2.43% | | | | | | | | |
Liquid Assets Portfolio–Institutional Class, 0.44%(c) | | | 24,664,281 | | | | 24,664,281 | |
Premier Portfolio–Institutional Class, 0.39%(c) | | | 24,664,281 | | | | 24,664,281 | |
Total Money Market Funds
(Cost $49,328,562) | | | | 49,328,562 | |
TOTAL INVESTMENTS–100.03%
(Cost $1,938,016,241) | | | | 2,030,041,547 | |
OTHER ASSETS LESS LIABILITIES–(0.03)% | | | | (550,420 | ) |
NET ASSETS–100.00% | | | $ | 2,029,491,127 | |
Investment Abbreviations:
| | |
| ADR | | – American Depositary Receipt |
| REIT | | – Real Estate Investment Trust |
Notes to Schedule of Investments:
| (a) | Industry and/or sector classifications used in this report are generally according to the Global Industry Classification Standard, which was developed by and is the exclusive property and a service mark of MSCI Inc. and Standard & Poor’s. |
| (b) | Non-income producing security. |
| (c) | The money market fund and the Fund are affiliated by having the same investment adviser. The rate shown is the 7-day SEC standardized yield as of April 30, 2016. |
See accompanying Notes to Financial Statements which are an integral part of the financial statements.
10 Invesco American Value Fund
Statement of Assets and Liabilities
April 30, 2016
| | | | |
Assets: | |
Investments, at value (Cost $1,888,687,679) | | $ | 1,980,712,985 | |
Investments in affiliated money market funds, at value and cost | | | 49,328,562 | |
Total investments, at value (Cost $1,938,016,241) | | | 2,030,041,547 | |
Foreign currencies, at value (Cost $1,066) | | | 1,080 | |
Receivable for: | | | | |
Investments sold | | | 3,705,232 | |
Fund shares sold | | | 2,355,853 | |
Dividends | | | 899,234 | |
Investment for trustee deferred compensation and retirement plans | | | 160,099 | |
Other assets | | | 85,440 | |
Total assets | | | 2,037,248,485 | |
|
Liabilities: | |
Payable for: | | | | |
Investments purchased | | | 1,822,831 | |
Fund shares reacquired | | | 4,341,748 | |
Accrued fees to affiliates | | | 1,301,143 | |
Accrued trustees’ and officers’ fees and benefits | | | 3,774 | |
Accrued other operating expenses | | | 104,172 | |
Trustee deferred compensation and retirement plans | | | 183,690 | |
Total liabilities | | | 7,757,358 | |
Net assets applicable to shares outstanding | | $ | 2,029,491,127 | |
|
Net assets consist of: | |
Shares of beneficial interest | | $ | 1,941,071,175 | |
Undistributed net investment income | | | 5,355,096 | |
Undistributed net realized gain (loss) | | | (8,960,464 | ) |
Net unrealized appreciation | | | 92,025,320 | |
| | | $ | 2,029,491,127 | |
| | | | |
Net Assets: | |
Class A | | $ | 1,122,286,353 | |
Class B | | $ | 13,229,854 | |
Class C | | $ | 103,705,555 | |
Class R | | $ | 66,207,125 | |
Class Y | | $ | 452,702,715 | |
Class R5 | | $ | 128,356,600 | |
Class R6 | | $ | 143,002,925 | |
|
Shares outstanding, $0.01 par value per share,
with an unlimited number of shares authorized: | |
Class A | | | 32,997,350 | |
Class B | | | 438,628 | |
Class C | | | 3,596,661 | |
Class R | | | 1,958,889 | |
Class Y | | | 13,219,488 | |
Class R5 | | | 3,743,774 | |
Class R6 | | | 4,167,206 | |
Class A: | | | | |
Net asset value per share | | $ | 34.01 | |
Maximum offering price per share | | | | |
(Net asset value of $34.01 ¸ 94.50%) | | $ | 35.99 | |
Class B: | | | | |
Net asset value and offering price per share | | $ | 30.16 | |
Class C: | | | | |
Net asset value and offering price per share | | $ | 28.83 | |
Class R: | | | | |
Net asset value and offering price per share | | $ | 33.80 | |
Class Y: | | | | |
Net asset value and offering price per share | | $ | 34.25 | |
Class R5: | | | | |
Net asset value and offering price per share | | $ | 34.29 | |
Class R6: | | | | |
Net asset value and offering price per share | | $ | 34.32 | |
See accompanying Notes to Financial Statements which are an integral part of the financial statements.
11 �� Invesco American Value Fund
Statement of Operations
For the year ended April 30, 2016
| | | | |
Investment income: | |
Dividends | | $ | 30,552,072 | |
Dividends from affiliated money market funds | | | 157,479 | |
Total investment income | | | 30,709,551 | |
| |
Expenses: | | | | |
Advisory fees | | | 14,484,857 | |
Administrative services fees | | | 455,742 | |
Custodian fees | | | 50,328 | |
Distribution fees: | | | | |
Class A | | | 2,906,820 | |
Class B | | | 45,369 | |
Class C | | | 1,116,468 | |
Class R | | | 348,287 | |
Transfer agent fees — A, B, C, R and Y | | | 4,137,137 | |
Transfer agent fees — R5 | | | 100,310 | |
Transfer agent fees — R6 | | | 11,951 | |
Trustees’ and officers’ fees and benefits | | | 56,610 | |
Registration and filing fees | | | 166,888 | |
Reports to shareholders | | | 205,819 | |
Professional services fees | | | 53,765 | |
Other | | | 56,109 | |
Total expenses | | | 24,196,460 | |
Less: Fees waived and expense offset arrangement(s) | | | (136,557 | ) |
Net expenses | | | 24,059,903 | |
Net investment income | | | 6,649,648 | |
| |
Realized and unrealized gain (loss) from: | | | | |
Net realized gain (loss) from: | | | | |
Investment securities | | | 29,488,588 | |
Foreign currencies | | | (17,398 | ) |
Forward foreign currency contracts | | | (357,643 | ) |
| | | | 29,113,547 | |
Change in net unrealized appreciation (depreciation) of: | | | | |
Investment securities | | | (264,733,403 | ) |
Foreign currencies | | | (4 | ) |
Forward foreign currency contracts | | | 1,331,576 | |
| | | | (263,401,831 | ) |
Net realized and unrealized gain (loss) | | | (234,288,284 | ) |
Net increase (decrease) in net assets resulting from operations | | $ | (227,638,636 | ) |
See accompanying Notes to Financial Statements which are an integral part of the financial statements.
12 Invesco American Value Fund
Statement of Changes in Net Assets
For the years ended April 30, 2016 and 2015
| | | | | | | | |
| | | 2016 | | | 2015 | |
Operations: | | | | | |
Net investment income | | $ | 6,649,648 | | | $ | 1,199,106 | |
Net realized gain | | | 29,113,547 | | | | 201,995,974 | |
Change in net unrealized appreciation (depreciation) | | | (263,401,831 | ) | | | 15,886,720 | |
Net increase (decrease) in net assets resulting from operations | | | (227,638,636 | ) | | | 219,081,800 | |
| | |
Distributions to shareholders from net investment income: | | | | | | | | |
Class A | | | (267,252 | ) | | | (613,761 | ) |
Class B | | | (4,958 | ) | | | (16,516 | ) |
Class Y | | | (467,049 | ) | | | (1,319,645 | ) |
Class R5 | | | (104,916 | ) | | | (325,932 | ) |
Class R6 | | | (206,950 | ) | | | (554,270 | ) |
Total distributions from net investment income | | | (1,051,125 | ) | | | (2,830,124 | ) |
| | |
Distributions to shareholders from net realized gains: | | | | | | | | |
Class A | | | (77,822,348 | ) | | | (106,124,825 | ) |
Class B | | | (1,235,547 | ) | | | (2,811,537 | ) |
Class C | | | (8,687,666 | ) | | | (12,501,109 | ) |
Class R | | | (4,617,643 | ) | | | (6,792,137 | ) |
Class Y | | | (34,116,638 | ) | | | (45,549,460 | ) |
Class R5 | | | (6,570,735 | ) | | | (7,953,682 | ) |
Class R6 | | | (9,743,181 | ) | | | (11,526,107 | ) |
Total distributions from net realized gains | | | (142,793,758 | ) | | | (193,258,857 | ) |
| | |
Share transactions–net: | | | | | | | | |
Class A | | | 83,722,233 | | | | 138,903,115 | |
Class B | | | (7,667,419 | ) | | | (8,153,887 | ) |
Class C | | | 651,894 | | | | 14,522,097 | |
Class R | | | 1,561,228 | | | | 8,342,862 | |
Class Y | | | (1,702,438 | ) | | | 88,784,244 | |
Class R5 | | | 47,360,783 | | | | 21,493,373 | |
Class R6 | | | 24,141,535 | | | | 57,856,637 | |
Net increase in net assets resulting from share transactions | | | 148,067,816 | | | | 321,748,441 | |
Net increase (decrease) in net assets | | | (223,415,703 | ) | | | 344,741,260 | |
| | |
Net assets: | | | | | | | | |
Beginning of year | | | 2,252,906,830 | | | | 1,908,165,570 | |
End of year (includes undistributed net investment income of $5,355,096 and $(182,493), respectively) | | $ | 2,029,491,127 | | | $ | 2,252,906,830 | |
Notes to Financial Statements
April 30, 2016
NOTE 1—Significant Accounting Policies
Invesco American Value Fund (the “Fund”) is a series portfolio of AIM Sector Funds (Invesco Sector Funds) (the “Trust”). The Trust is a Delaware statutory trust registered under the Investment Company Act of 1940, as amended (the “1940 Act”), as an open-end series management investment company consisting of ten separate portfolios, each authorized to issue an unlimited number of shares of beneficial interest. The assets, liabilities and operations of each portfolio are accounted for separately. Information presented in these financial statements pertains only to the Fund. Matters affecting each portfolio or class will be voted on exclusively by the shareholders of such portfolio or class.
The Fund’s investment objective is total return through growth of capital and current income.
The Fund currently consists of seven different classes of shares: Class A, Class B, Class C, Class R, Class Y, Class R5 and Class R6. Class Y shares are available only to certain investors. Class A shares are sold with a front-end sales charge unless certain waiver criteria are met and under certain circumstances load waived shares may be subject to contingent deferred sales charges (“CDSC”). Class C shares are sold with a CDSC. Class R, Class Y, Class R5 and Class R6 shares are sold at net asset value. Effective November 30, 2010, new or additional investments in Class B shares are no longer
13 Invesco American Value Fund
permitted. Existing shareholders of Class B shares may continue to reinvest dividends and capital gains distributions in Class B shares until they convert to Class A shares. Also, shareholders in Class B shares will be able to exchange those shares for Class B shares of other Invesco Funds offering such shares until they convert to Class A shares. Generally, Class B shares will automatically convert to Class A shares on or about the month-end, which is at least eight years after the date of purchase. Redemption of Class B shares prior to the conversion date will be subject to a CDSC.
The following is a summary of the significant accounting policies followed by the Fund in the preparation of its financial statements.
| A. | Security Valuations — Securities, including restricted securities, are valued according to the following policy. |
A security listed or traded on an exchange (except convertible securities) is valued at its last sales price or official closing price as of the close of the customary trading session on the exchange where the security is principally traded, or lacking any sales or official closing price on a particular day, the security may be valued at the closing bid price on that day. Securities traded in the over-the-counter market are valued based on prices furnished by independent pricing services or market makers. When such securities are valued by an independent pricing service they may be considered fair valued. Futures contracts are valued at the final settlement price set by an exchange on which they are principally traded. Listed options are valued at the mean between the last bid and asked prices from the exchange on which they are principally traded. Options not listed on an exchange are valued by an independent source at the mean between the last bid and asked prices. For purposes of determining net asset value (“NAV”) per share, futures and option contracts generally are valued 15 minutes after the close of the customary trading session of the New York Stock Exchange (“NYSE”).
Investments in open-end and closed-end registered investment companies that do not trade on an exchange are valued at the end-of-day net asset value per share. Investments in open-end and closed-end registered investment companies that trade on an exchange are valued at the last sales price or official closing price as of the close of the customary trading session on the exchange where the security is principally traded.
Debt obligations (including convertible securities) and unlisted equities are fair valued using an evaluated quote provided by an independent pricing service. Evaluated quotes provided by the pricing service may be determined without exclusive reliance on quoted prices, and may reflect appropriate factors such as institution-size trading in similar groups of securities, developments related to specific securities, dividend rate (for unlisted equities), yield (for debt obligations), quality, type of issue, coupon rate (for debt obligations), maturity (for debt obligations), individual trading characteristics and other market data. Debt obligations are subject to interest rate and credit risks. In addition, all debt obligations involve some risk of default with respect to interest and/or principal payments.
Foreign securities’ (including foreign exchange contracts) prices are converted into U.S. dollar amounts using the applicable exchange rates as of the close of the NYSE. If market quotations are available and reliable for foreign exchange-traded equity securities, the securities will be valued at the market quotations. Because trading hours for certain foreign securities end before the close of the NYSE, closing market quotations may become unreliable. If between the time trading ends on a particular security and the close of the customary trading session on the NYSE, events occur that the Adviser determines are significant and make the closing price unreliable, the Fund may fair value the security. If the event is likely to have affected the closing price of the security, the security will be valued at fair value in good faith using procedures approved by the Board of Trustees. Adjustments to closing prices to reflect fair value may also be based on a screening process of an independent pricing service to indicate the degree of certainty, based on historical data, that the closing price in the principal market where a foreign security trades is not the current value as of the close of the NYSE. Foreign securities’ prices meeting the approved degree of certainty that the price is not reflective of current value will be priced at the indication of fair value from the independent pricing service. Multiple factors may be considered by the independent pricing service in determining adjustments to reflect fair value and may include information relating to sector indices, American Depositary Receipts and domestic and foreign index futures. Foreign securities may have additional risks including exchange rate changes, potential for sharply devalued currencies and high inflation, political and economic upheaval, the relative lack of issuer information, relatively low market liquidity and the potential lack of strict financial and accounting controls and standards.
Securities for which market prices are not provided by any of the above methods may be valued based upon quotes furnished by independent sources. The last bid price may be used to value equity securities. The mean between the last bid and asked prices is used to value debt obligations, including corporate loans.
Securities for which market quotations are not readily available or became unreliable are valued at fair value as determined in good faith by or under the supervision of the Trust’s officers following procedures approved by the Board of Trustees. Issuer specific events, market trends, bid/asked quotes of brokers and information providers and other market data may be reviewed in the course of making a good faith determination of a security’s fair value.
The Fund may invest in securities that are subject to interest rate risk, meaning the risk that the prices will generally fall as interest rates rise and, conversely, the prices will generally rise as interest rates fall. Specific securities differ in their sensitivity to changes in interest rates depending on their individual characteristics. Changes in interest rates may result in increased market volatility, which may affect the value and/or liquidity of certain Fund investments.
Valuations change in response to many factors including the historical and prospective earnings of the issuer, the value of the issuer’s assets, general economic conditions, interest rates, investor perceptions and market liquidity. Because of the inherent uncertainties of valuation, the values reflected in the financial statements may materially differ from the value received upon actual sale of those investments.
| B. | Securities Transactions and Investment Income — Securities transactions are accounted for on a trade date basis. Realized gains or losses on sales are computed on the basis of specific identification of the securities sold. Interest income (net of withholding tax, if any) is recorded on the accrual basis from settlement date. Dividend income (net of withholding tax, if any) is recorded on the ex-dividend date. |
The Fund may periodically participate in litigation related to Fund investments. As such, the Fund may receive proceeds from litigation settlements. Any proceeds received are included in the Statement of Operations as realized gain (loss) for investments no longer held and as unrealized gain (loss) for investments still held.
Brokerage commissions and mark ups are considered transaction costs and are recorded as an increase to the cost basis of securities purchased and/or a reduction of proceeds on a sale of securities. Such transaction costs are included in the determination of net realized and unrealized gain (loss) from investment securities reported in the Statement of Operations and the Statement of Changes in Net Assets and the net realized and unrealized gains (losses) on securities per share in the Financial Highlights. Transaction costs are included in the calculation of the Fund’s net asset value and, accordingly, they reduce the Fund’s total returns. These transaction costs are not considered operating expenses and are not reflected in net investment income reported in the Statement of Operations and the Statement of Changes in Net Assets, or the net
14 Invesco American Value Fund
investment income per share and the ratios of expenses and net investment income reported in the Financial Highlights, nor are they limited by any expense limitation arrangements between the Fund and the investment adviser.
The Fund allocates income and realized and unrealized capital gains and losses to a class based on the relative net assets of each class.
| C. | Country Determination — For the purposes of making investment selection decisions and presentation in the Schedule of Investments, the investment adviser may determine the country in which an issuer is located and/or credit risk exposure based on various factors. These factors include the laws of the country under which the issuer is organized, where the issuer maintains a principal office, the country in which the issuer derives 50% or more of its total revenues and the country that has the primary market for the issuer’s securities, as well as other criteria. Among the other criteria that may be evaluated for making this determination are the country in which the issuer maintains 50% or more of its assets, the type of security, financial guarantees and enhancements, the nature of the collateral and the sponsor organization. Country of issuer and/or credit risk exposure has been determined to be the United States of America, unless otherwise noted. |
| D. | Distributions — Distributions from net investment income and net realized capital gain, if any, are generally declared and paid annually and recorded on the ex-dividend date. The Fund may elect to treat a portion of the proceeds from redemptions as distributions for federal income tax purposes. |
| E. | Federal Income Taxes — The Fund intends to comply with the requirements of Subchapter M of the Internal Revenue Code of 1986, as amended (the “Internal Revenue Code”), necessary to qualify as a regulated investment company and to distribute substantially all of the Fund’s taxable earnings to shareholders. As such, the Fund will not be subject to federal income taxes on otherwise taxable income (including net realized capital gain) that is distributed to shareholders. Therefore, no provision for federal income taxes is recorded in the financial statements. |
The Fund recognizes the tax benefits of uncertain tax positions only when the position is more likely than not to be sustained. Management has analyzed the Fund’s uncertain tax positions and concluded that no liability for unrecognized tax benefits should be recorded related to uncertain tax positions. Management is not aware of any tax positions for which it is reasonably possible that the total amounts of unrecognized tax benefits will change materially in the next 12 months.
The Fund files tax returns in the U.S. Federal jurisdiction and certain other jurisdictions. Generally, the Fund is subject to examinations by such taxing authorities for up to three years after the filing of the return for the tax period.
| F. | Expenses — Fees provided for under the Rule 12b-1 plan of a particular class of the Fund are charged to the operations of such class. Transfer agency fees and expenses and other shareholder recordkeeping fees and expenses attributable to Class R5 and Class R6 are allocated to each share class based on relative net assets. Sub-accounting fees attributable to Class R5 are charged to the operations of the class. Transfer agency fees and expenses and other shareholder recordkeeping fees and expenses relating to all other classes are allocated among those classes based on relative net assets. All other expenses are allocated among the classes based on relative net assets. |
| G. | Accounting Estimates — The preparation of financial statements in conformity with accounting principles generally accepted in the United States of America (“GAAP”) requires management to make estimates and assumptions that affect the reported amounts of assets and liabilities at the date of the financial statements and the reported amounts of revenues and expenses during the reporting period including estimates and assumptions related to taxation. Actual results could differ from those estimates by a significant amount. In addition, the Fund monitors for material events or transactions that may occur or become known after the period-end date and before the date the financial statements are released to print. |
| H. | Indemnifications — Under the Trust’s organizational documents, each Trustee, officer, employee or other agent of the Trust is indemnified against certain liabilities that may arise out of the performance of their duties to the Fund. Additionally, in the normal course of business, the Fund enters into contracts, including the Fund’s servicing agreements, that contain a variety of indemnification clauses. The Fund’s maximum exposure under these arrangements is unknown as this would involve future claims that may be made against the Fund that have not yet occurred. The risk of material loss as a result of such indemnification claims is considered remote. |
| I. | Foreign Currency Translations — Foreign currency is valued at the close of the NYSE based on quotations posted by banks and major currency dealers. Portfolio securities and other assets and liabilities denominated in foreign currencies are translated into U.S. dollar amounts at date of valuation. Purchases and sales of portfolio securities (net of foreign taxes withheld on disposition) and income items denominated in foreign currencies are translated into U.S. dollar amounts on the respective dates of such transactions. The Fund does not separately account for the portion of the results of operations resulting from changes in foreign exchange rates on investments and the fluctuations arising from changes in market prices of securities held. The combined results of changes in foreign exchange rates and the fluctuation of market prices on investments (net of estimated foreign tax withholding) are included with the net realized and unrealized gain or loss from investments in the Statement of Operations. Reported net realized foreign currency gains or losses arise from (1) sales of foreign currencies, (2) currency gains or losses realized between the trade and settlement dates on securities transactions, and (3) the difference between the amounts of dividends, interest, and foreign withholding taxes recorded on the Fund’s books and the U.S. dollar equivalent of the amounts actually received or paid. Net unrealized foreign currency gains and losses arise from changes in the fair values of assets and liabilities, other than investments in securities at fiscal period end, resulting from changes in exchange rates. |
The Fund may invest in foreign securities, which may be subject to foreign taxes on income, gains on investments or currency repatriation, a portion of which may be recoverable. Foreign taxes, if any, are recorded based on the tax regulations and rates that exist in the foreign markets in which the Fund invests and are shown in the Statement of Operations.
| J. | Forward Foreign Currency Contracts — The Fund may engage in foreign currency transactions either on a spot (i.e. for prompt delivery and settlement) basis, or through forward foreign currency contracts, to manage or minimize currency or exchange rate risk. |
The Fund may also enter into forward foreign currency contracts for the purchase or sale of a security denominated in a foreign currency in order to “lock in” the U.S. dollar price of that security, or the Fund may also enter into forward foreign currency contracts that do not provide for physical settlement of the two currencies, but instead are settled by a single cash payment calculated as the difference between the agreed upon exchange rate and the spot rate at settlement based upon an agreed upon notional amount (non-deliverable forwards). The Fund will set aside liquid assets in an amount equal to daily mark-to-market obligation for forward foreign currency contracts.
A forward foreign currency contract is an obligation between two parties (“Counterparties”) to purchase or sell a specific currency for an agreed-upon price at a future date. The use of forward foreign currency contracts does not eliminate fluctuations in the price of the underlying securities the Fund owns or intends to acquire but establishes a rate of exchange in advance. Fluctuations in the value of these contracts are
15 Invesco American Value Fund
measured by the difference in the contract date and reporting date exchange rates and are recorded as unrealized appreciation (depreciation) until the contracts are closed. When the contracts are closed, realized gains (losses) are recorded. Realized and unrealized gains (losses) on the contracts are included in the Statement of Operations. The primary risks associated with forward foreign currency contracts include failure of the Counterparty to meet the terms of the contract and the value of the foreign currency changing unfavorably. These risks may be in excess of the amounts reflected in the Statement of Assets and Liabilities.
NOTE 2—Advisory Fees and Other Fees Paid to Affiliates
The Trust has entered into a master investment advisory agreement with Invesco Advisers, Inc. (the “Adviser” or “Invesco”). Under the terms of the investment advisory agreement, the Fund pays an advisory fee to the Adviser based on the annual rate of the Fund’s average daily net assets as follows:
| | | | | | |
| Average Daily Net Assets | | Rate |
First $500 million | | | 0 | .72% | | |
Next $535 million | | | 0 | .715% | | |
Next $31.965 billion | | | 0 | .65% | | |
Over $33 billion | | | 0 | .64% | | |
For the year ended April 30, 2016, the effective advisory fees incurred by the Fund was 0.68%.
Under the terms of a master sub-advisory agreement between the Adviser and each of Invesco Asset Management Deutschland GmbH, Invesco Asset Management Limited, Invesco Asset Management (Japan) Limited, Invesco Hong Kong Limited, Invesco Senior Secured Management, Inc. and Invesco Canada Ltd. (collectively, the “Affiliated Sub-Advisers”) the Adviser, not the Fund, may pay 40% of the fees paid to the Adviser to any such Affiliated Sub-Adviser(s) that provide(s) discretionary investment management services to the Fund based on the percentage of assets allocated to such Affiliated Sub-Adviser(s).
The Adviser has contractually agreed, through at least June 30, 2017, to waive advisory fees and/or reimburse expenses of all shares to the extent necessary to limit total annual fund operating expenses after fee waiver and/or expense reimbursement (excluding certain items discussed below) of Class A, Class B, Class C, Class R, Class Y, Class R5 and Class R6 shares to 2.00%, 2.75%, 2.75%, 2.25%, 1.75%, 1.75% and 1.75%, respectively, of average daily net assets (the “expense limits”). In determining the Adviser’s obligation to waive advisory fees and/or reimburse expenses, the following expenses are not taken into account, and could cause the total annual fund operating expenses after fee waiver and/or expense reimbursement to exceed the numbers reflected above: (1) interest; (2) taxes; (3) dividend expense on short sales; (4) extraordinary or non-routine items, including litigation expenses; and (5) expenses that the Fund has incurred but did not actually pay because of an expense offset arrangement. Unless Invesco continues the fee waiver agreement, it will terminate on June 30, 2017. During its term, the fee waiver agreement cannot be terminated or amended to increase the expense limits without approval of the Board of Trustees. The Adviser did not waive fees and/or reimburse expenses during the period under these expense limits.
Further, the Adviser has contractually agreed, through at least June 30, 2018, to waive the advisory fee payable by the Fund in an amount equal to 100% of the net advisory fees the Adviser receives from the affiliated money market funds on investments by the Fund of uninvested cash in such affiliated money market funds.
For the year ended April 30, 2016, the Adviser waived advisory fees of $131,530.
The Trust has entered into a master administrative services agreement with Invesco pursuant to which the Fund has agreed to pay Invesco for certain administrative costs incurred in providing accounting services to the Fund. For the year ended April 30, 2016, expenses incurred under the agreement are shown in the Statement of Operations as Administrative services fees.
The Trust has entered into a transfer agency and service agreement with Invesco Investment Services, Inc. (“IIS”) pursuant to which the Fund has agreed to pay IIS a fee for providing transfer agency and shareholder services to the Fund and reimburse IIS for certain expenses incurred by IIS in the course of providing such services. IIS may make payments to intermediaries that provide omnibus account services, sub-accounting services and/or networking services. All fees payable by IIS to intermediaries that provide omnibus account services or sub-accounting are charged back to the Fund, subject to certain limitations approved by the Trust’s Board of Trustees. For the year ended April 30, 2016, expenses incurred under the agreement are shown in the Statement of Operations as Transfer agent fees.
Shares of the Fund are distributed by Invesco Distributors, Inc. (“IDI”). The Fund has adopted a distribution plan pursuant to Rule 12b-1 under the 1940 Act, and a service plan (collectively, the “Plans”) for Class A, Class B, Class C and Class R shares to compensate IDI for the sale, distribution, shareholder servicing and maintenance of shareholder accounts for these shares. Under the Plans, the Fund will incur annual fees of up to 0.25% of Class A average daily net assets, up to 1.00% each of Class B and Class C average daily net assets and up to 0.50% of Class R average daily net assets.
With respect to Class B and Class C shares, the Fund is authorized to reimburse in future years any distribution related expenses that exceed the maximum annual reimbursement rate for such class, so long as such reimbursement does not cause the Fund to exceed the Class B and Class C maximum annual reimbursement rate, respectively. With respect to Class A shares, distribution related expenses that exceed the maximum annual reimbursement rate for such class are not carried forward to future years and the Fund will not reimburse IDI for any such expenses.
For the year ended April 30, 2016, expenses incurred under these agreements are shown in the Statement of Operations as Distribution fees.
Front-end sales commissions and CDSC (collectively, the “sales charges”) are not recorded as expenses of the Fund. Front-end sales commissions are deducted from proceeds from the sales of Fund shares prior to investment in Class A shares of the Fund. CDSC are deducted from redemption proceeds prior to remittance to the shareholder. During the year ended April 30, 2016, IDI advised the Fund that IDI retained $546,202 in front-end sales commissions from the sale of Class A shares and $12,370, $3,119 and $6,523 from Class A, Class B and Class C shares, respectively, for CDSC imposed on redemptions by shareholders.
For the year ended April 30, 2016, the Fund incurred $22,273 in brokerage commissions with Invesco Capital Markets, Inc., an affiliate of the Adviser and IDI, for portfolio transactions executed on behalf of the Fund.
Certain officers and trustees of the Trust are officers and directors of the Adviser, IIS and/or IDI.
16 Invesco American Value Fund
NOTE 3—Additional Valuation Information
GAAP defines fair value as the price that would be received to sell an asset or paid to transfer a liability in an orderly transaction between market participants at the measurement date, under current market conditions. GAAP establishes a hierarchy that prioritizes the inputs to valuation methods, giving the highest priority to readily available unadjusted quoted prices in an active market for identical assets (Level 1) and the lowest priority to significant unobservable inputs (Level 3), generally when market prices are not readily available or are unreliable. Based on the valuation inputs, the securities or other investments are tiered into one of three levels. Changes in valuation methods may result in transfers in or out of an investment’s assigned level:
| | Level 1 — | Prices are determined using quoted prices in an active market for identical assets. |
| | Level 2 — | Prices are determined using other significant observable inputs. Observable inputs are inputs that other market participants may use in pricing a security. These may include quoted prices for similar securities, interest rates, prepayment speeds, credit risk, yield curves, loss severities, default rates, discount rates, volatilities and others. |
| | Level 3 — | Prices are determined using significant unobservable inputs. In situations where quoted prices or observable inputs are unavailable (for example, when there is little or no market activity for an investment at the end of the period), unobservable inputs may be used. Unobservable inputs reflect the Fund’s own assumptions about the factors market participants would use in determining fair value of the securities or instruments and would be based on the best available information. |
The following is a summary of the tiered valuation input levels, as of April 30, 2016. The level assigned to the securities valuations may not be an indication of the risk or liquidity associated with investing in those securities. Because of the inherent uncertainties of valuation, the values reflected in the financial statements may materially differ from the value received upon actual sale of those investments.
| | | | | | | | | | | | | | | | |
| | | Level 1 | | | Level 2 | | | Level 3 | | | Total | |
Equity Securities | | $ | 2,006,792,333 | | | $ | 23,249,214 | | | $ | — | | | $ | 2,030,041,547 | |
NOTE 4—Derivative Investments
Effect of Derivative Investments for the year ended April 30, 2016
The table below summarizes the gains (losses) on derivative investments, detailed by primary risk exposure, recognized in earnings during the period:
| | | | |
| | | Location of Gain (Loss) on
Statement of Operations | |
| | | Forward Foreign Currency
Contracts | |
Realized Gain (Loss): | | | | |
Currency risk | | $ | (357,643 | ) |
Change in Net Unrealized Appreciation: | | | | |
Currency risk | | | 1,331,576 | |
Total | | $ | 973,933 | |
The table below summarizes the eight month average notional value of forward foreign currency contracts outstanding during the period.
| | | | |
| | | Forward
Foreign Currency
Contracts | |
Average notional value | | $ | 35,756,664 | |
NOTE 5—Security Transactions with Affiliated Funds
The Fund is permitted to purchase or sell securities from or to certain other Invesco Funds under specified conditions outlined in procedures adopted by the Board of Trustees of the Trust. The procedures have been designed to ensure that any purchase or sale of securities by the Fund from or to another fund or portfolio that is or could be considered an affiliate by virtue of having a common investment adviser (or affiliated investment advisers), common Trustees and/or common officers complies with Rule 17a-7 of the 1940 Act. Further, as defined under the procedures, each transaction is effected at the current market price. Pursuant to these procedures, for the year ended April 30, 2016, the Fund engaged in securities purchases of $1,658,280.
NOTE 6—Expense Offset Arrangement(s)
The expense offset arrangement is comprised of transfer agency credits which result from balances in demand deposit accounts used by the transfer agent for clearing shareholder transactions. For the year ended April 30, 2016, the Fund received credits from this arrangement, which resulted in the reduction of the Fund’s total expenses of $5,027.
17 Invesco American Value Fund
NOTE 7—Trustees’ and Officers’ Fees and Benefits
Trustees’ and Officers’ Fees and Benefits include amounts accrued by the Fund to pay remuneration to certain Trustees and Officers of the Fund. Trustees have the option to defer compensation payable by the Fund, and Trustees’ and Officers’ Fees and Benefits also include amounts accrued by the Fund to fund such deferred compensation amounts. Those Trustees who defer compensation have the option to select various Invesco Funds in which their deferral accounts shall be deemed to be invested. Finally, certain current Trustees were eligible to participate in a retirement plan that provided for benefits to be paid upon retirement to Trustees over a period of time based on the number of years of service. The Fund may have certain former Trustees who also participate in a retirement plan and receive benefits under such plan. Trustees’ and Officers’ Fees and Benefits include amounts accrued by the Fund to fund such retirement benefits. Obligations under the deferred compensation and retirement plans represent unsecured claims against the general assets of the Fund.
NOTE 8—Cash Balances
The Fund is permitted to temporarily carry a negative or overdrawn balance in its account with State Street Bank and Trust Company, the custodian bank. Such balances, if any at period-end, are shown in the Statement of Assets and Liabilities under the payable caption Amount due custodian. To compensate the custodian bank for such overdrafts, the overdrawn Fund may either (1) leave funds as a compensating balance in the account so the custodian bank can be compensated by earning the additional interest; or (2) compensate by paying the custodian bank at a rate agreed upon by the custodian bank and Invesco, not to exceed the contractually agreed upon rate.
NOTE 9—Distributions to Shareholders and Tax Components of Net Assets
Tax Character of Distributions to Shareholders Paid During the Fiscal Years Ended April 30, 2016 and 2015:
| | | | | | | | |
| | | 2016 | | | 2015 | |
Ordinary income | | $ | 4,770,373 | | | $ | 25,686,688 | |
Long-term capital gain | | | 139,074,510 | | | | 170,402,293 | |
Total distributions | | $ | 143,844,883 | | | $ | 196,088,981 | |
Tax Components of Net Assets at Period-End:
| | | | |
| | | 2016 | |
Undistributed ordinary income | | $ | 5,549,197 | |
Net unrealized appreciation — investments | | | 90,059,256 | |
Net unrealized appreciation — other investments | | | 14 | |
Temporary book/tax differences | | | (686,098 | ) |
Post-October Capital Loss Deferral | | | (6,502,417 | ) |
Shares of beneficial interest | | | 1,941,071,175 | |
Total net assets | | $ | 2,029,491,127 | |
The difference between book-basis and tax-basis unrealized appreciation (depreciation) is due to differences in the timing of recognition of gains and losses on investments for tax and book purposes. The Fund’s net unrealized appreciation difference is attributable primarily to wash sales.
The temporary book/tax differences are a result of timing differences between book and tax recognition of income and/or expenses. The Fund’s temporary book/tax differences are the result of the trustee deferral of compensation and retirement plan benefits.
Capital loss carryforward is calculated and reported as of a specific date. Results of transactions and other activity after that date may affect the amount of capital loss carryforward actually available for the Fund to utilize. Capital losses generated in years beginning after December 22, 2010 can be carried forward for an unlimited period, whereas previous losses expire in eight tax years. Capital losses with an expiration period may not be used to offset capital gains until all net capital losses without an expiration date have been utilized. Capital loss carryforwards with no expiration date will retain their character as either short-term or long-term capital losses instead of as short-term capital losses as under prior law. The ability to utilize capital loss carryforwards in the future may be limited under the Internal Revenue Code and related regulations based on the results of future transactions.
The Fund does not have a capital loss carryforward as of April 30, 2016.
NOTE 10—Investment Securities
The aggregate amount of investment securities (other than short-term securities, U.S. Treasury obligations and money market funds, if any) purchased and sold by the Fund during the year ended April 30, 2016 was $611,189,125 and $565,714,072, respectively. Cost of investments on a tax basis includes the adjustments for financial reporting purposes as of the most recently completed federal income tax reporting period-end.
| | | | |
| Unrealized Appreciation of Investment Securities on a Tax Basis | |
Aggregate unrealized appreciation of investment securities | | $ | 283,078,048 | |
Aggregate unrealized (depreciation) of investment securities | | | (193,018,792 | ) |
Net unrealized appreciation of investment securities | | $ | 90,059,256 | |
Cost of investments for tax purposes is $1,939,982,291.
18 Invesco American Value Fund
NOTE 11—Reclassification of Permanent Differences
Primarily as a result of differing book/tax treatment of foreign currency transactions and income distribution reclasses, on April 30, 2016, undistributed net investment income was decreased by $60,934 and undistributed net realized gain (loss) was increased by $60,934. This reclassification had no effect on the net assets of the Fund.
NOTE 12—Share Information
| | | | | | | | | | | | | | | | |
| | | Summary of Share Activity | |
| | | Years ended April 30, | |
| | | 2016(a) | | | 2015 | |
| | | Shares | | | Amount | | | Shares | | | Amount | |
Sold: | | | | | | | | | | | | | | | | |
Class A | | | 7,137,696 | | | $ | 258,087,074 | | | | 7,226,440 | | | $ | 296,023,552 | |
Class B | | | 16,426 | | | | 533,330 | | | | 19,476 | | | | 720,125 | |
Class C | | | 699,117 | | | | 21,849,862 | | | | 632,344 | | | | 22,658,243 | |
Class R | | | 823,663 | | | | 29,130,609 | | | | 928,011 | | | | 37,908,590 | |
Class Y | | | 4,256,340 | | | | 155,553,783 | | | | 5,227,488 | | | | 216,514,762 | |
Class R5 | | | 2,050,968 | | | | 72,210,351 | | | | 842,999 | | | | 34,561,483 | |
Class R6 | | | 1,185,460 | | | | 44,450,761 | | | | 1,650,850 | | | | 68,103,596 | |
| | | | |
Issued as reinvestment of dividends: | | | | | | | | | | | | | | | | |
Class A | | | 2,278,232 | | | | 74,938,723 | | | | 2,706,420 | | | | 101,988,957 | |
Class B | | | 41,391 | | | | 1,207,602 | | | | 80,954 | | | | 2,729,314 | |
Class C | | | 294,279 | | | | 8,222,165 | | | | 363,182 | | | | 11,854,250 | |
Class R | | | 141,203 | | | | 4,615,933 | | | | 180,809 | | | | 6,791,196 | |
Class Y | | | 912,244 | | | | 30,244,433 | | | | 1,067,984 | | | | 40,468,846 | |
Class R5 | | | 199,420 | | | | 6,618,773 | | | | 218,268 | | | | 8,276,970 | |
Class R6 | | | 299,276 | | | | 9,949,333 | | | | 318,423 | | | | 12,079,078 | |
| | | | |
Automatic conversion of Class B shares to Class A shares: | | | | | | | | | | | | | | | | |
Class A | | | 180,123 | | | | 6,522,318 | | | | 190,640 | | | | 7,816,260 | |
Class B | | | (202,032 | ) | | | (6,522,318 | ) | | | (211,957 | ) | | | (7,816,260 | ) |
| | | | |
Reacquired: | | | | | | | | | | | | | | | | |
Class A | | | (7,323,337 | ) | | | (255,825,882 | ) | | | (6,486,291 | ) | | | (266,925,654 | ) |
Class B | | | (88,825 | ) | | | (2,886,033 | ) | | | (102,261 | ) | | | (3,787,066 | ) |
Class C | | | (978,954 | ) | | | (29,420,133 | ) | | | (561,259 | ) | | | (19,990,396 | ) |
Class R | | | (906,869 | ) | | | (32,185,314 | ) | | | (891,108 | ) | | | (36,356,924 | ) |
Class Y | | | (5,375,982 | ) | | | (187,500,654 | ) | | | (4,108,659 | ) | | | (168,199,364 | ) |
Class R5 | | | (846,727 | ) | | | (31,468,341 | ) | | | (527,549 | ) | | | (21,345,080 | ) |
Class R6 | | | (855,945 | ) | | | (30,258,559 | ) | | | (549,307 | ) | | | (22,326,037 | ) |
Net increase in share activity | | | 3,937,167 | | | $ | 148,067,816 | | | | 8,215,897 | | | $ | 321,748,441 | |
| (a) | There are entities that are record owners of more than 5% of the outstanding shares of the Fund and in the aggregate own 39% of the outstanding shares of the Fund. IDI has an agreement with these entities to sell Fund shares. The Fund, Invesco and/or Invesco affiliates may make payments to these entities, which are considered to be related to the Fund, for providing services to the Fund, Invesco and/or Invesco affiliates including but not limited to services such as securities brokerage, distribution, third party record keeping and account servicing. The Fund has no knowledge as to whether all or any portion of the shares owned of record by these entities are also owned beneficially. |
19 Invesco American Value Fund
NOTE 13—Financial Highlights
The following schedule presents financial highlights for a share of the Fund outstanding throughout the periods indicated.
| | | | | | | | | | | | | | | | | | | | | | | | | | | | | | | | | | | | | | | | | | | | | | | | | | | | | | | | |
| | | Net asset
value,
beginning
of period | | | Net
investment
income
(loss)(a) | | | Net gains
(losses)
on securities
(both
realized and
unrealized) | | | Total from
investment
operations | | | Dividends
from net
investment
income | | | Distributions
from net
realized
gains | | | Total
distributions | | | Net asset
value, end
of period | | | Total
return(b) | | | Net assets,
end of period
(000’s omitted) | | | Ratio of
expenses
to average
net assets
with fee waivers
and/or expenses
absorbed | | | Ratio of
expenses
to average net
assets without
fee waivers
and/or expenses
absorbed | | | Ratio of net
investment
income (loss)
to average
net assets | | | Portfolio
turnover(c) | |
Class A | | | | | | | | | | | | | | | | | | | | | | | | | | | | | | | | | | | | | | | | | | | | | | | | | | | | | | | | |
Year ended 04/30/16 | | $ | 40.44 | | | $ | 0.09 | | | $ | (4.06 | ) | | $ | (3.97 | ) | | $ | (0.01 | ) | | $ | (2.45 | ) | | $ | (2.46 | ) | | $ | 34.01 | | | | (9.62 | )% | | $ | 1,122,286 | | | | 1.19 | %(d) | | | 1.20 | %(d) | | | 0.26 | %(d) | | | 28 | % |
Year ended 04/30/15 | | | 40.11 | | | | 0.00 | | | | 4.23 | | | | 4.23 | | | | (0.02 | ) | | | (3.88 | ) | | | (3.90 | ) | | | 40.44 | | | | 11.27 | | | | 1,242,480 | | | | 1.19 | | | | 1.20 | | | | 0.01 | | | | 34 | |
Year ended 04/30/14 | | | 35.77 | | | | 0.06 | | | | 7.14 | | | | 7.20 | | | | (0.12 | ) | | | (2.74 | ) | | | (2.86 | ) | | | 40.11 | | | | 20.62 | | | | 1,086,506 | | | | 1.19 | | | | 1.20 | | | | 0.15 | | | | 46 | |
Year ended 04/30/13 | | | 30.90 | | | | 0.17 | | | | 4.86 | | | | 5.03 | | | | (0.16 | ) | | | — | | | | (0.16 | ) | | | 35.77 | | | | 16.35 | | | | 846,516 | | | | 1.22 | | | | 1.23 | | | | 0.54 | | | | 28 | |
Year ended 04/30/12 | | | 29.86 | | | | 0.14 | | | | 0.98 | | | | 1.12 | | | | (0.08 | ) | | | — | | | | (0.08 | ) | | | 30.90 | | | | 3.80 | | | | 700,857 | | | | 1.31 | | | | 1.32 | | | | 0.52 | | | | 30 | |
Class B | | | | | | | | | | | | | | | | | | | | | | | | | | | | | | | | | | | | | | | | | | | | | | | | | | | | | | | | |
Year ended 04/30/16 | | | 36.18 | | | | 0.08 | | | | (3.64 | ) | | | (3.56 | ) | | | (0.01 | ) | | | (2.45 | ) | | | (2.46 | ) | | | 30.16 | | | | (9.62 | )(e) | | | 13,230 | | | | 1.19 | (d)(e) | | | 1.20 | (d)(e) | | | 0.26 | (d)(e) | | | 28 | |
Year ended 04/30/15 | | | 36.28 | | | | 0.00 | | | | 3.80 | | | | 3.80 | | | | (0.02 | ) | | | (3.88 | ) | | | (3.90 | ) | | | 36.18 | | | | 11.27 | (e) | | | 24,302 | | | | 1.19 | (e) | | | 1.20 | (e) | | | 0.01 | (e) | | | 34 | |
Year ended 04/30/14 | | | 32.58 | | | | 0.05 | | | | 6.50 | | | | 6.55 | | | | (0.11 | ) | | | (2.74 | ) | | | (2.85 | ) | | | 36.28 | | | | 20.63 | (e) | | | 32,127 | | | | 1.19 | (e) | | | 1.20 | (e) | | | 0.15 | (e) | | | 46 | |
Year ended 04/30/13 | | | 28.15 | | | | 0.16 | | | | 4.42 | | | | 4.58 | | | | (0.15 | ) | | | — | | | | (0.15 | ) | | | 32.58 | | | | 16.33 | (e) | | | 36,720 | | | | 1.22 | (e) | | | 1.23 | (e) | | | 0.54 | (e) | | | 28 | |
Year ended 04/30/12 | | | 27.19 | | | | 0.14 | | | | 0.90 | | | | 1.04 | | | | (0.08 | ) | | | — | | | | (0.08 | ) | | | 28.15 | | | | 3.84 | (e) | | | 43,561 | | | | 1.27 | (e) | | | 1.28 | (e) | | | 0.56 | (e) | | | 30 | |
Class C | | | | | | | | | | | | | | | | | | | | | | | | | | | | | | | | | | | | | | | | | | | | | | | | | | | | | | | | |
Year ended 04/30/16 | | | 34.95 | | | | (0.15 | ) | | | (3.52 | ) | | | (3.67 | ) | | | — | | | | (2.45 | ) | | | (2.45 | ) | | | 28.83 | | | | (10.28 | )(f) | | | 103,706 | | | | 1.93 | (d)(f) | | | 1.94 | (d)(f) | | | (0.48 | )(d)(f) | | | 28 | |
Year ended 04/30/15 | | | 35.41 | | | | (0.26 | ) | | | 3.68 | | | | 3.42 | | | | — | | | | (3.88 | ) | | | (3.88 | ) | | | 34.95 | | | | 10.44 | (f) | | | 125,201 | | | | 1.92 | (f) | | | 1.93 | (f) | | | (0.72 | )(f) | | | 34 | |
Year ended 04/30/14 | | | 32.00 | | | | (0.20 | ) | | | 6.37 | | | | 6.17 | | | | (0.02 | ) | | | (2.74 | ) | | | (2.76 | ) | | | 35.41 | | | | 19.76 | (f) | | | 111,455 | | | | 1.91 | (f) | | | 1.92 | (f) | | | (0.57 | (f) | | | 46 | |
Year ended 04/30/13 | | | 27.70 | | | | (0.06 | ) | | | 4.36 | | | | 4.30 | | | | — | | | | — | | | | — | | | | 32.00 | | | | 15.52 | | | | 88,519 | | | | 1.97 | | | | 1.98 | | | | (0.21 | ) | | | 28 | |
Year ended 04/30/12 | | | 26.89 | | | | (0.05 | ) | | | 0.86 | | | | 0.81 | | | | — | | | | — | | | | — | | | | 27.70 | | | | 3.01 | (f) | | | 76,053 | | | | 2.03 | (f) | | | 2.04 | (f) | | | (0.20 | )(f) | | | 30 | |
Class R | | | | | | | | | | | | | | | | | | | | | | | | | | | | | | | | | | | | | | | | | | | | | | | | | | | | | | | | |
Year ended 04/30/16 | | | 40.29 | | | | 0.00 | | | | (4.04 | ) | | | (4.04 | ) | | | — | | | | (2.45 | ) | | | (2.45 | ) | | | 33.80 | | | | (9.82 | ) | | | 66,207 | | | | 1.44 | (d) | | | 1.45 | (d) | | | 0.01 | (d) | | | 28 | |
Year ended 04/30/15 | | | 40.06 | | | | (0.10 | ) | | | 4.21 | | | | 4.11 | | | | — | | | | (3.88 | ) | | | (3.88 | ) | | | 40.29 | | | | 10.97 | | | | 76,594 | | | | 1.44 | | | | 1.45 | | | | (0.24 | ) | | | 34 | |
Year ended 04/30/14 | | | 35.74 | | | | (0.04 | ) | | | 7.15 | | | | 7.11 | | | | (0.05 | ) | | | (2.74 | ) | | | (2.79 | ) | | | 40.06 | | | | 20.34 | | | | 67,420 | | | | 1.44 | | | | 1.45 | | | | (0.10 | ) | | | 46 | |
Year ended 04/30/13 | | | 30.87 | | | | 0.10 | | | | 4.86 | | | | 4.96 | | | | (0.09 | ) | | | — | | | | (0.09 | ) | | | 35.74 | | | | 16.08 | | | | 58,086 | | | | 1.47 | | | | 1.48 | | | | 0.29 | | | | 28 | |
Year ended 04/30/12 | | | 29.84 | | | | 0.08 | | | | 0.97 | | | | 1.05 | | | | (0.02 | ) | | | — | | | | (0.02 | ) | | | 30.87 | | | | 3.51 | | | | 36,695 | | | | 1.56 | | | | 1.57 | | | | 0.27 | | | | 30 | |
Class Y | | | | | | | | | | | | | | | | | | | | | | | | | | | | | | | | | | | | | | | | | | | | | | | | | | | | | | | | |
Year ended 04/30/16 | | | 40.62 | | | | 0.18 | | | | (4.07 | ) | | | (3.89 | ) | | | (0.03 | ) | | | (2.45 | ) | | | (2.48 | ) | | | 34.25 | | | | (9.36 | ) | | | 452,703 | | | | 0.94 | (d) | | | 0.95 | (d) | | | 0.51 | (d) | | | 28 | |
Year ended 04/30/15 | | | 40.26 | | | | 0.11 | | | | 4.24 | | | | 4.35 | | | | (0.11 | ) | | | (3.88 | ) | | | (3.99 | ) | | | 40.62 | | | | 11.55 | | | | 545,456 | | | | 0.94 | | | | 0.95 | | | | 0.26 | | | | 34 | |
Year ended 04/30/14 | | | 35.90 | | | | 0.16 | | | | 7.16 | | | | 7.32 | | | | (0.22 | ) | | | (2.74 | ) | | | (2.96 | ) | | | 40.26 | | | | 20.91 | | | | 452,580 | | | | 0.94 | | | | 0.95 | | | | 0.40 | | | | 46 | |
Year ended 04/30/13 | | | 31.01 | | | | 0.25 | | | | 4.88 | | | | 5.13 | | | | (0.24 | ) | | | — | | | | (0.24 | ) | | | 35.90 | | | | 16.65 | | | | 285,560 | | | | 0.97 | | | | 0.98 | | | | 0.79 | | | | 28 | |
Year ended 04/30/12 | | | 29.98 | | | | 0.21 | | | | 0.97 | | | | 1.18 | | | | (0.15 | ) | | | — | | | | (0.15 | ) | | | 31.01 | | | | 4.01 | | | | 259,308 | | | | 1.06 | | | | 1.07 | | | | 0.77 | | | | 30 | |
Class R5 | | | | | | | | | | | | | | | | | | | | | | | | | | | | | | | | | | | | | | | | | | | | | | | | | | | | | | | | |
Year ended 04/30/16 | | | 40.63 | | | | 0.22 | | | | (4.07 | ) | | | (3.85 | ) | | | (0.04 | ) | | | (2.45 | ) | | | (2.49 | ) | | | 34.29 | | | | (9.26 | ) | | | 128,357 | | | | 0.82 | (d) | | | 0.83 | (d) | | | 0.63 | (d) | | | 28 | |
Year ended 04/30/15 | | | 40.28 | | | | 0.15 | | | | 4.24 | | | | 4.39 | | | | (0.16 | ) | | | (3.88 | ) | | | (4.04 | ) | | | 40.63 | | | | 11.66 | | | | 95,082 | | | | 0.82 | | | | 0.83 | | | | 0.38 | | | | 34 | |
Year ended 04/30/14 | | | 35.91 | | | | 0.20 | | | | 7.18 | | | | 7.38 | | | | (0.27 | ) | | | (2.74 | ) | | | (3.01 | ) | | | 40.28 | | | | 21.06 | | | | 72,753 | | | | 0.84 | | | | 0.85 | | | | 0.50 | | | | 46 | |
Year ended 04/30/13 | | | 31.02 | | | | 0.29 | | | | 4.89 | | | | 5.18 | | | | (0.29 | ) | | | — | | | | (0.29 | ) | | | 35.91 | | | | 16.81 | | | | 26,519 | | | | 0.86 | | | | 0.87 | | | | 0.90 | | | | 28 | |
Year ended 04/30/12 | | | 29.98 | | | | 0.28 | | | | 0.97 | | | | 1.25 | | | | (0.21 | ) | | | — | | | | (0.21 | ) | | | 31.02 | | | | 4.26 | | | | 12,340 | | | | 0.87 | | | | 0.88 | | | | 0.96 | | | | 30 | |
Class R6 | | | | | | | | | | | | | | | | | | | | | | | | | | | | | | | | | | | | | | | | | | | | | | | | | | | | | | | | |
Year ended 04/30/16 | | | 40.64 | | | | 0.25 | | | | (4.07 | ) | | | (3.82 | ) | | | (0.05 | ) | | | (2.45 | ) | | | (2.50 | ) | | | 34.32 | | | | (9.19 | ) | | | 143,003 | | | | 0.73 | (d) | | | 0.74 | (d) | | | 0.72 | (d) | | | 28 | |
Year ended 04/30/15 | | | 40.28 | | | | 0.19 | | | | 4.25 | | | | 4.44 | | | | (0.20 | ) | | | (3.88 | ) | | | (4.08 | ) | | | 40.64 | | | | 11.77 | | | | 143,793 | | | | 0.73 | | | | 0.74 | | | | 0.47 | | | | 34 | |
Year ended 04/30/14 | | | 35.90 | | | | 0.23 | | | | 7.18 | | | | 7.41 | | | | (0.29 | ) | | | (2.74 | ) | | | (3.03 | ) | | | 40.28 | | | | 21.19 | | | | 85,325 | | | | 0.75 | | | | 0.76 | | | | 0.59 | | | | 46 | |
Year ended 04/30/13(g) | | | 31.40 | | | | 0.22 | | | | 4.45 | | | | 4.67 | | | | (0.17 | ) | | | — | | | | (0.17 | ) | | | 35.90 | | | | 14.92 | | | | 53,538 | | | | 0.75 | (h) | | | 0.76 | (h) | | | 1.01 | (h) | | | 28 | |
| (a) | Calculated using average shares outstanding. |
| (b) | Includes adjustments in accordance with accounting principles generally accepted in the United States of America and as such, the net asset value for financial reporting purposes and the returns based upon those net asset values may differ from the net asset value and returns for shareholder transactions. Does not include sales charges and is not annualized for periods less than one year, if applicable. |
| (c) | Portfolio turnover is calculated at the fund level and is not annualized for periods less than one year, if applicable. For the period ended April 30, 2012, the portfolio turnover calculation excludes the value of securities purchased of $397,951,008 and sold of $108,111,947 in the effort to realign the Fund’s portfolio holdings after the reorganization of Invesco Mid-Cap Value Fund, Invesco Mid Cap Basic Value Fund and Invesco U.S. Mid Cap Value Fund into the Fund. |
| (d) | Ratios are based on average daily net assets (000’s omitted) of $1,162,728, $18,148, $113,406, $69,657, $511,795, $100,397 and $144,963 for Class A, Class B, Class C, Class R, Class Y, Class R5 and Class R6 shares, respectively. |
| (e) | The total return, ratio of expenses to average net assets and ratio of net investment income (loss) to average net assets reflect actual 12b-1 fees of 0.25%, 0.25%, 0.25%, 0.25% and 0.21% for the years ended April 30, 2016, 2015, 2014, 2013 and 2012, respectively. |
| (f) | The total return, ratio of expenses to average net assets and ratio of net investment income (loss) to average net assets reflect actual 12b-1 fees of 0.99%, 0.98%, 0.98% and 0.97% for the years ended April 30, 2016, 2015, 2014 and 2012, respectively. |
| (g) | Commencement date of September 24, 2012 for Class R6 shares. |
20 Invesco American Value Fund
Report of Independent Registered Public Accounting Firm
To the Board of Trustees of AIM Sector Funds (Invesco Sector Funds)
and Shareholders of Invesco American Value Fund:
In our opinion, the accompanying statement of assets and liabilities, including the schedule of investments, and the related statements of operations and of changes in net assets and the financial highlights present fairly, in all material respects, the financial position of Invesco American Value Fund (one of the funds constituting AIM Sector Funds (Invesco Sector Funds), hereafter referred to as the “Fund”) at April 30, 2016, the results of its operations for the year then ended, the changes in its net assets for each of the two years in the period then ended and the financial highlights for each of the five years in the period then ended, in conformity with accounting principles generally accepted in the United States of America. These financial statements and financial highlights (hereafter referred to as “financial statements”) are the responsibility of the Fund’s management; our responsibility is to express an opinion on these financial statements based on our audits. We conducted our audits of these financial statements in accordance with the standards of the Public Company Accounting Oversight Board (United States). Those standards require that we plan and perform the audit to obtain reasonable assurance about whether the financial statements are free of material misstatement. An audit includes examining, on a test basis, evidence supporting the amounts and disclosures in the financial statements, assessing the accounting principles used and significant estimates made by management, and evaluating the overall financial statement presentation. We believe that our audits, which included confirmation of securities at April 30, 2016 by correspondence with the custodian and brokers, and the application of alternative auditing procedures where confirmations of security purchases have not been received, provide a reasonable basis for our opinion.
PRICEWATERHOUSECOOPERS LLP
June 22, 2016
Houston, Texas
21 Invesco American Value Fund
Calculating your ongoing Fund expenses
Example
As a shareholder of the Fund, you incur two types of costs: (1) transaction costs, which may include sales charges (loads) on purchase payments or contingent deferred sales charges on redemptions, if any; and (2) ongoing costs, including management fees, distribution and/or service (12b-1) fees, and other Fund expenses. This example is intended to help you understand your ongoing costs (in dollars) of investing in the Fund and to compare these costs with ongoing costs of investing in other mutual funds. The example is based on an investment of $1,000 invested at the beginning of the period and held for the entire period November 1, 2015 through April 30, 2016.
Actual expenses
The table below provides information about actual account values and actual expenses. You may use the information in this table, together with the amount you invested, to estimate the expenses that you paid over the period. Simply divide your account value by $1,000 (for example, an $8,600 account value divided by $1,000 = 8.6), then multiply the result by the number in the table under the heading entitled “Actual Expenses Paid During Period” to estimate the expenses you paid on your account during this period.
Hypothetical example for comparison purposes
The table below also provides information about hypothetical account values and hypothetical expenses based on the Fund’s actual expense ratio and an assumed rate of return of 5% per year before expenses, which is not the Fund’s actual return.
The hypothetical account values and expenses may not be used to estimate the actual ending account balance or expenses you paid for the period. You may use this information to compare the ongoing costs of investing in the Fund and other funds. To do so, compare this 5% hypothetical example with the 5% hypothetical examples that appear in the shareholder reports of the other funds.
Please note that the expenses shown in the table are meant to highlight your ongoing costs only and do not reflect any transaction costs, such as sales charges (loads) on purchase payments or contingent deferred sales charges on redemptions, if any. Therefore, the hypothetical information is useful in comparing ongoing costs only, and will not help you determine the relative total costs of owning different funds. In addition, if these transaction costs were included, your costs would have been higher.
| | | | | | | | | | | | | | | | | | | | | | | | |
| Class | | Beginning
Account Value
(11/01/15) | | | ACTUAL | | | HYPOTHETICAL
(5% annual return before
expenses) | | | Annualized
Expense
Ratio | |
| | | Ending
Account Value
(04/30/16)1 | | | Expenses
Paid During
Period2 | | | Ending
Account Value
(04/30/16) | | | Expenses
Paid During
Period2 | | |
| A | | $ | 1,000.00 | | | $ | 965.20 | | | $ | 5.96 | | | $ | 1,018.80 | | | $ | 6.12 | | | | 1.22 | % |
| B | | | 1,000.00 | | | | 965.30 | | | | 5.96 | | | | 1,018.80 | | | | 6.12 | | | | 1.22 | |
| C | | | 1,000.00 | | | | 962.20 | | | | 9.46 | | | | 1,015.22 | | | | 9.72 | | | | 1.94 | |
| R | | | 1,000.00 | | | | 964.20 | | | | 7.18 | | | | 1,017.55 | | | | 7.37 | | | | 1.47 | |
| Y | | | 1,000.00 | | | | 966.80 | | | | 4.74 | | | | 1,020.04 | | | | 4.87 | | | | 0.97 | |
| R5 | | | 1,000.00 | | | | 967.40 | | | | 4.06 | | | | 1,020.74 | | | | 4.17 | | | | 0.83 | |
| R6 | | | 1,000.00 | | | | 968.00 | | | | 3.62 | | | | 1,021.18 | | | | 3.72 | | | | 0.74 | |
| 1 | The actual ending account value is based on the actual total return of the Fund for the period November 1, 2015 through April 30, 2016, after actual expenses and will differ from the hypothetical ending account value which is based on the Fund’s expense ratio and a hypothetical annual return of 5% before expenses. |
| 2 | Expenses are equal to the Fund’s annualized expense ratio as indicated above multiplied by the average account value over the period, multiplied by 182/366 to reflect the most recent fiscal half year. |
22 Invesco American Value Fund
Tax Information
Form 1099-DIV, Form 1042-S and other year-end tax information provide shareholders with actual calendar year amounts that should be included in their tax returns. Shareholders should consult their tax advisors.
The following distribution information is being provided as required by the Internal Revenue Code or to meet a specific state’s requirement.
The Fund designates the following amounts or, if subsequently determined to be different, the maximum amount allowable for its fiscal year ended April 30, 2016:
| | | | |
Federal and State Income Tax | |
Long-Term Capital Gain Distributions | | $ | 139,074,510 | |
Qualified Dividend Income* | | | 100 | % |
Corporate Dividends Received Deduction* | | | 100 | % |
U.S. Treasury Obligations* | | | 0.00 | % |
| | * | The above percentages are based on ordinary income dividends paid to shareholders during the Fund’s fiscal year. |
| | | | |
Non-Resident Alien Shareholders | |
Qualified Short-Term Capital Gains | | $ | 3,675,169 | |
23 Invesco American Value Fund
Trustees and Officers
The address of each trustee and officer is AIM Sector Funds (Invesco Sector Funds) (the “Trust”), 11 Greenway Plaza, Suite 1000, Houston, Texas 77046-1173. The trustees serve for the life of the Trust, subject to their earlier death, incapacitation, resignation, retirement or removal as more specifically provided in the Trust’s organizational documents. Each officer serves for a one year term or until their successors are elected and qualified. Column two below includes length of time served with predecessor entities, if any.
| | | | | | | | |
Name, Year of Birth and
Position(s) Held with the Trust | | Trustee and/
or Officer Since | | Principal Occupation(s) During Past 5 Years | | Number of Funds in Fund Complex Overseen by Trustee | | Other Directorship(s) Held by Trustee During Past 5 Years |
| Interested Persons | | | | | | | | |
Martin L. Flanagan1 — 1960 Trustee | | 2007 | | Executive Director, Chief Executive Officer and President, Invesco Ltd. (ultimate parent of Invesco and a global investment management firm); Advisor to the Board, Invesco Advisers, Inc. (formerly known as Invesco Institutional (N.A.), Inc.); Trustee, The Invesco Funds; Vice Chair, Investment Company Institute; and Member of Executive Board, SMU Cox School of Business Formerly: Chairman and Chief Executive Officer, Invesco Advisers, Inc. (registered investment adviser); Director, Chairman, Chief Executive Officer and President, IVZ Inc. (holding company), INVESCO Group Services, Inc. (service provider) and Invesco North American Holdings, Inc. (holding company); Director, Chief Executive Officer and President, Invesco Holding Company Limited (parent of Invesco and a global investment management firm); Director, Invesco Ltd.; Chairman, Investment Company Institute and President, Co-Chief Executive Officer, Co-President, Chief Operating Officer and Chief Financial Officer, Franklin Resources, Inc. (global investment management organization) | | 146 | | None |
Philip A. Taylor2 — 1954 Trustee and Senior Vice President | | 2006 | | Head of the Americas and Senior Managing Director, Invesco Ltd.; Director, Co-Chairman, Co-President and Co-Chief Executive Officer, Invesco Advisers, Inc. (formerly known as Invesco Institutional (N.A.), Inc.) (registered investment adviser); Director, Chairman, Chief Executive Officer and President, Invesco Management Group, Inc. (formerly known as Invesco AIM Management Group, Inc.) (financial services holding company); Director and Chairman, Invesco Investment Services, Inc. (formerly known as Invesco AIM Investment Services, Inc.) (registered transfer agent) Chief Executive Officer, Invesco Corporate Class Inc. (corporate mutual fund company) Director, Chairman and Chief Executive Officer, Invesco Canada Ltd. (formerly known as Invesco Trimark Ltd./Invesco Trimark Ltèe) (registered investment adviser and registered transfer agent); Trustee and Senior Vice President, The Invesco Funds; Director, Invesco Investment Advisers LLC (formerly known as Van Kampen Asset Management); Director, Chief Executive Officer and President, Van Kampen Exchange Corp. Formerly: President and Principal Executive Officer, The Invesco Funds (other than AIM Treasurer’s Series Trust (Invesco Treasurer’s Series Trust), Short-Term Investments Trust and Invesco Management Trust); Executive Vice President, The Invesco Funds (AIM Treasurer’s Series Trust (Invesco Treasurer’s Series Trust), Short-Term Investments Trust and Invesco Management Trust only); Director and President, INVESCO Funds Group, Inc. (registered investment adviser and registered transfer agent); Director and Chairman, IVZ Distributors, Inc. (formerly known as INVESCO Distributors, Inc.) (registered broker dealer); Director, President and Chairman, Invesco Inc. (holding company), Invesco Canada Holdings Inc. (holding company), Trimark Investments Ltd./Placements Trimark Ltèe and Invesco Financial Services Ltd/Services Financiers Invesco Ltèe; Chief Executive Officer, Invesco Canada Fund Inc. (corporate mutual fund company); Director and Chairman, Van Kampen Investor Services Inc.; Director, Chief Executive Officer and President, 1371 Preferred Inc. (holding company) and Van Kampen Investments Inc.; Director and President, AIM GP Canada Inc. (general partner for limited partnerships) and Van Kampen Advisors, Inc.; Director and Chief Executive Officer, Invesco Trimark Dealer Inc. (registered broker dealer); Director, Invesco Distributors, Inc. (formerly known as Invesco AIM Distributors, Inc.) (registered broker dealer); Manager, Invesco PowerShares Capital Management LLC; Director, Chief Executive Officer and President, Invesco Advisers, Inc.; Director, Chairman, Chief Executive Officer and President, Invesco AIM Capital Management, Inc.; President, Invesco Trimark Dealer Inc. and Invesco Trimark Ltd./Invesco Trimark Ltèe; Director and President, AIM Trimark Corporate Class Inc. and AIM Trimark Canada Fund Inc.; Senior Managing Director, Invesco Holding Company Limited; Director and Chairman, Fund Management Company (former registered broker dealer); President and Principal Executive Officer, The Invesco Funds (AIM Treasurer’s Series Trust (Invesco Treasurer’s Series Trust), and Short-Term Investments Trust only); President, AIM Trimark Global Fund Inc. and AIM Trimark Canada Fund Inc. | | 146 | | None |
| 1 | Mr. Flanagan is considered an interested person (within the meaning of Section 2(a)(19) of the 1940 Act) of the Trust because he is an officer of the Adviser to the Trust, and an officer and a director of Invesco Ltd., ultimate parent of the Adviser. |
| 2 | Mr. Taylor is considered an interested person (within the meaning of Section 2(a)(19) of the 1940 Act) of the Trust because he is an officer and a director of the Adviser. |
T-1 Invesco American Value Fund
Trustees and Officers—(continued)
| | | | | | | | |
Name, Year of Birth and
Position(s) Held with the Trust | | Trustee and/
or Officer Since | | Principal Occupation(s) During Past 5 Years | | Number of Funds in Fund Complex Overseen by Trustee | | Other Directorship(s) Held by Trustee During Past 5 Years |
| Independent Trustees | | | | | | | | |
Bruce L. Crockett — 1944 Trustee and Chair | | 2003 | | Chairman, Crockett Technologies Associates (technology consulting company) Formerly: Director, Captaris (unified messaging provider); Director, President and Chief Executive Officer, COMSAT Corporation; Chairman, Board of Governors of INTELSAT (international communications company); ACE Limited (insurance company); Independent Directors Council and Investment Company Institute | | 146 | | ALPS (Attorneys Liability Protection Society) (insurance company) and Globe Specialty Metals, Inc. (metallurgical company); Member of the Audit Committee, Ferroglobe PLC and Investment Company Institute; Member of the Executive Committee and Chair of the Governance Committee, Independent Directors Council |
David C. Arch — 1945 Trustee | | 2010 | | Chairman of Blistex Inc., a consumer health care products manufacturer | | 146 | | Board member of the Illinois Manufacturers’ Association; Member of the Board of Visitors, Institute for the Humanities, University of Michigan |
James T. Bunch — 1942 Trustee | | 2000 | | Managing Member, Grumman Hill Group LLC (family office/private equity investments) Formerly: Chairman of the Board, Denver Film Society, Chairman of the Board of Trustees, Evans Scholarship Foundation; Chairman, Board of Governors, Western Golf Association | | 146 | | Trustee, Evans Scholarship Foundation |
Albert R. Dowden — 1941 Trustee | | 2003 | | Director of a number of public and private business corporations, including Nature’s Sunshine Products, Inc. Formerly: Director, The Boss Group, Ltd. and Reich & Tang Funds (5 portfolios) (registered investment company); Director, Homeowners of America Holding Corporation/Homeowners of America Insurance Company (property casualty company); Director, Continental Energy Services, LLC (oil and gas pipeline service); Director, CompuDyne Corporation (provider of product and services to the public security market) and Director, Annuity and Life Re (Holdings), Ltd. (reinsurance company); Director, President and Chief Executive Officer, Volvo Group North America, Inc.; Senior Vice President, AB Volvo; Director of various public and private corporations; Chairman, DHJ Media, Inc.; Director, Magellan Insurance Company; and Director, The Hertz Corporation, Genmar Corporation (boat manufacturer), National Media Corporation; Advisory Board of Rotary Power International (designer, manufacturer, and seller of rotary power engines); and Chairman, Cortland Trust, Inc. (registered investment company) | | 146 | | Director of Nature’s Sunshine Products, Inc. |
Jack M. Fields — 1952 Trustee | | 2003 | | Chief Executive Officer, Twenty First Century Group, Inc. (government affairs company); and Discovery Learning Alliance (non-profit) Formerly: Owner and Chief Executive Officer, Dos Angeles Ranch L.P. (cattle, hunting, corporate entertainment); Director, Insperity, Inc. (formerly known as Administaff); Chief Executive Officer, Texana Timber LP (sustainable forestry company); Director of Cross Timbers Quail Research Ranch (non-profit); and member of the U.S. House of Representatives | | 146 | | None |
Eli Jones — 1961 Trustee | | 2016 | | Professor and Dean, Mays Business School — Texas A&M University Formerly: Professor and Dean, Walton College of Business, University of Arkansas and E.J. Ourso College of Business, Louisiana State University and Director, Arvest Bank | | 146 | | Director of Insperity, Inc. (formerly known as Administaff) |
Prema Mathai-Davis — 1950 Trustee | | 2003 | | Retired. Formerly: Chief Executive Officer, YWCA of the U.S.A. | | 146 | | None |
Larry Soll — 1942 Trustee | | 1997 | | Retired. Formerly: Chairman, Chief Executive Officer and President, Synergen Corp. (a biotechnology company) | | 146 | | None |
Raymond Stickel, Jr. — 1944 Trustee | | 2005 | | Retired. Formerly: Director, Mainstay VP Series Funds, Inc. (25 portfolios) and Partner, Deloitte & Touche | | 146 | | None |
Robert C. Troccoli — 1949 Trustee | | 2016 | | Adjunct Professor and Executive-in-Residence, University of Denver — Daniels College of Business Formerly: Senior Partner, KPMG LLP | | 146 | | None |
T-2 Invesco American Value Fund
Trustees and Officers—(continued)
| | | | | | | | |
Name, Year of Birth and
Position(s) Held with the Trust | | Trustee and/
or Officer Since | | Principal Occupation(s) During Past 5 Years | | Number of Funds in Fund Complex Overseen by Trustee | | Other Directorship(s) Held by Trustee During Past 5 Years |
| Independent Trustees—(continued) |
Suzanne H. Woolsey — 1941 Trustee | | 2014 | | Retired. Formerly: Chief Executive Officer of Woolsey Partners LLC | | 146 | | Director, SunShare LLC; Trustee, Ocean Conservancy; Emeritus Chair of the Board of Trustees of the Institute for Defense Analyses and of Colorado College; Trustee, Chair, Business and Finance Committee of California Institute of Technology; Prior to 2014, Director of Fluor Corp.; Prior to 2010, Trustee of the German Marshall Fund of the United States; Prior to 2010, Trustee of the Rocky Mountain Institute |
| Other Officers | | | | | | | | |
Sheri Morris — 1964 President, Principal Executive Officer and Treasurer | | 2003 | | President, Principal Executive Officer and Treasurer, The Invesco Funds; Vice President, Invesco Advisers, Inc. (formerly known as Invesco Institutional (N.A.), Inc.) (registered investment adviser); and Vice President, PowerShares Exchange-Traded Fund Trust, PowerShares Exchange-Traded Fund Trust II, PowerShares India Exchange-Traded Fund Trust, PowerShares Actively Managed Exchange-Traded Fund Trust, and PowerShares Actively Managed Exchange-Traded Commodity Fund Trust Formerly: Vice President and Principal Financial Officer, The Invesco Funds; Vice President, Invesco AIM Advisers, Inc., Invesco AIM Capital Management, Inc. and Invesco AIM Private Asset Management, Inc.; Assistant Vice President and Assistant Treasurer, The Invesco Funds and Assistant Vice President, Invesco Advisers, Inc., Invesco AIM Capital Management, Inc. and Invesco AIM Private Asset Management, Inc.; and Treasurer, PowerShares Exchange-Traded Fund Trust, PowerShares Exchange-Traded Fund Trust II, PowerShares India Exchange-Traded Fund Trust and PowerShares Actively Managed Exchange-Traded Fund Trust | | N/A | | N/A |
Russell C. Burk — 1958 Senior Vice President and Senior Officer | | 2005 | | Senior Vice President and Senior Officer, The Invesco Funds | | N/A | | N/A |
John M. Zerr — 1962 Senior Vice President, Chief Legal Officer and Secretary | | 2006 | | Director, Senior Vice President, Secretary and General Counsel, Invesco Management Group, Inc. (formerly known as Invesco AIM Management Group, Inc.) and Van Kampen Exchange Corp.; Senior Vice President, Invesco Advisers, Inc. (formerly known as Invesco Institutional (N.A.), Inc.) (registered investment adviser); Senior Vice President and Secretary, Invesco Distributors, Inc. (formerly known as Invesco AIM Distributors, Inc.); Director, Vice President and Secretary, Invesco Investment Services, Inc. (formerly known as Invesco AIM Investment Services, Inc.) Senior Vice President, Chief Legal Officer and Secretary, The Invesco Funds; Managing Director, Invesco PowerShares Capital Management LLC; Director, Secretary and General Counsel, Invesco Investment Advisers LLC (formerly known as Van Kampen Asset Management); Secretary and General Counsel, Invesco Capital Markets, Inc. (formerly known as Van Kampen Funds Inc.) and Chief Legal Officer, PowerShares Exchange-Traded Fund Trust, PowerShares Exchange-Traded Fund Trust II, PowerShares India Exchange-Traded Fund Trust, PowerShares Actively Managed Exchange-Traded Fund Trust, and PowerShares Actively Managed Exchange-Traded Commodity Fund Trust Formerly: Director, Vice President and Secretary, IVZ Distributors, Inc. (formerly known as INVESCO Distributors, Inc.); Director and Vice President, INVESCO Funds Group, Inc.; Director and Vice President, Van Kampen Advisors Inc.; Director, Vice President, Secretary and General Counsel, Van Kampen Investor Services Inc.; Director, Invesco Distributors, Inc. (formerly known as Invesco AIM Distributors, Inc.); Director, Senior Vice President, General Counsel and Secretary, Invesco AIM Advisers, Inc. and Van Kampen Investments Inc.; Director, Vice President and Secretary, Fund Management Company; Director, Senior Vice President, Secretary, General Counsel and Vice President, Invesco AIM Capital Management, Inc.; Chief Operating Officer and General Counsel, Liberty Ridge Capital, Inc. (an investment adviser); Vice President and Secretary, PBHG Funds (an investment company) and PBHG Insurance Series Fund (an investment company); Chief Operating Officer, General Counsel and Secretary, Old Mutual Investment Partners (a broker-dealer); General Counsel and Secretary, Old Mutual Fund Services (an administrator) and Old Mutual Shareholder Services (a shareholder servicing center); Executive Vice President, General Counsel and Secretary, Old Mutual Capital, Inc. (an investment adviser); and Vice President and Secretary, Old Mutual Advisors Funds (an investment company) | | N/A | | N/A |
T-3 Invesco American Value Fund
Trustees and Officers—(continued)
| | | | | | | | |
Name, Year of Birth and
Position(s) Held with the Trust | | Trustee and/
or Officer Since | | Principal Occupation(s) During Past 5 Years | | Number of Funds in Fund Complex Overseen by Trustee | | Other Directorship(s) Held by Trustee During Past 5 Years |
| Other Officers—(continued) | | | | | | | | |
Karen Dunn Kelley — 1960 Senior Vice President | | 2003 | | Senior Managing Director, Investments, Invesco Ltd.; Director, Co-President, Co-Chief Executive Officer, and Co-Chairman, Invesco Advisers, Inc. (formerly known as Invesco Institutional (N.A.), Inc.) (registered investment adviser); Chairman and Director, Invesco Senior Secured Management, Inc.; Senior Vice President, Invesco Management Group, Inc. (formerly known as Invesco AIM Management Group, Inc.); Executive Vice President, Invesco Distributors, Inc. (formerly known as Invesco AIM Distributors, Inc.); Director, Invesco Mortgage Capital Inc. and Invesco Management Company Limited; Senior Vice President, The Invesco Funds Formerly: Vice President, The Invesco Funds (other than AIM Treasurer’s Series Trust (Invesco Treasurer’s Series Trust), Short-Term Investments Trust and Invesco Management Trust); and President and Principal Executive Officer, The Invesco Funds (AIM Treasurer’s Series Trust (Invesco Treasurer’s Series Trust), Short-Term Investments Trust and Invesco Management Trust only); Director and President, INVESCO Asset Management (Bermuda) Ltd., Director, INVESCO Global Asset Management DAC (formerly known as INVESCO Global Asset Management Limited) and INVESCO Management S.A.; Senior Vice President, Van Kampen Investments Inc. and Invesco Advisers, Inc. (formerly known as Invesco Institutional (N.A.), Inc.) (registered investment adviser); Director and President, Fund Management Company; Chief Cash Management Officer, Director of Cash Management, Senior Vice President, and Managing Director, Invesco AIM Capital Management, Inc.; Director of Cash Management, Senior Vice President, and Vice President, Invesco Advisers, Inc. and The Invesco Funds (AIM Treasurer’s Series Trust (Invesco Treasurer’s Series Trust), and Short-Term Investments Trust only) | | N/A | | N/A |
Kelli Gallegos — 1970 Vice President, Principal Financial Officer and Assistant Treasurer | | 2008 | | Vice President, Principal Financial Officer and Assistant Treasurer, The Invesco Funds; Assistant Treasurer, Invesco PowerShares Capital Management LLC, PowerShares Exchange-Traded Fund Trust, PowerShares Exchange-Traded Fund Trust II, PowerShares India Exchange-Traded Fund Trust, PowerShares Actively Managed Exchange-Traded Fund Trust, and PowerShares Actively Managed Exchange-Traded Commodity Fund Trust Formerly: Assistant Vice President, The Invesco Funds | | N/A | | N/A |
Tracy Sullivan — 1962 Vice President, Chief Tax Officer and Assistant Treasurer | | 2008 | | Vice President, Chief Tax Officer and Assistant Treasurer, The Invesco Funds; Assistant Treasurer, Invesco PowerShares Capital Management LLC, PowerShares Exchange-Traded Fund Trust, PowerShares Exchange-Traded Fund Trust II, PowerShares India Exchange-Traded Fund Trust, PowerShares Actively Managed Exchange-Traded Fund Trust, and PowerShares Actively Managed Exchange-Traded Commodity Fund Trust Formerly: Assistant Vice President, The Invesco Funds | | N/A | | N/A |
Crissie M. Wisdom — 1969 Anti-Money Laundering Compliance Officer | | 2013 | | Anti-Money Laundering Compliance Officer, Invesco Advisers, Inc. (formerly known as Invesco Institutional (N.A.), Inc.) (registered investment adviser), Invesco Capital Markets, Inc. (formerly known as Van Kampen Funds Inc.), Invesco Distributors, Inc., Invesco Investment Services, Inc., Invesco Management Group, Inc., Van Kampen Exchange Corp., The Invesco Funds, and PowerShares Exchange-Traded Fund Trust, PowerShares Exchange-Traded Fund Trust II, PowerShares India Exchange-Traded Fund Trust, PowerShares Actively Managed Exchange-Traded Fund Trust and PowerShares Actively Managed Exchange-Traded Commodity Fund Trust; Anti-Money Laundering Compliance Officer and Bank Secrecy Act Officer, INVESCO National Trust Company and Invesco Trust Company; and Fraud Prevention Manager and Controls and Risk Analysis Manager for Invesco Investment Services, Inc. | | N/A | | N/A |
Robert R. Leveille — 1969 Chief Compliance Officer | | 2016 | | Chief Compliance Officer, Invesco Advisers, Inc. (registered investment adviser); and Chief Compliance Officer, The Invesco Funds Formerly: Chief Compliance Officer, Putnam Investments and the Putnam Funds | | N/A | | N/A |
The Statement of Additional Information of the Trust includes additional information about the Fund’s Trustees and is available upon request, without charge, by calling 1.800.959.4246. Please refer to the Fund’s Statement of Additional Information for information on the Fund’s sub-advisers.
| | | | | | |
Office of the Fund 11 Greenway Plaza, Suite 1000 Houston, TX 77046-1173 | | Investment Adviser Invesco Advisers, Inc. 1555 Peachtree Street, N.E. Atlanta, GA 30309 | | Distributor Invesco Distributors, Inc. 11 Greenway Plaza, Suite 1000 Houston, TX 77046-1173 | | Auditors PricewaterhouseCoopers LLP 1000 Louisiana Street, Suite 5800 Houston, TX 77002-5678 |
| | | |
| | | | | | |
Counsel to the Fund Stradley Ronon Stevens & Young, LLP 2005 Market Street, Suite 2600 Philadelphia, PA 19103-7018 | | Counsel to the Independent Trustees Goodwin Procter LLP 901 New York Avenue, N.W. Washington, D.C. 20001 | | Transfer Agent Invesco Investment Services, Inc. 11 Greenway Plaza, Suite 1000 Houston, TX 77046-1173 | | Custodian State Street Bank and Trust Company 225 Franklin Street Boston, MA 02110-2801 |
T-4 Invesco American Value Fund

Invesco mailing information
Send general correspondence to Invesco Investment Services, Inc., P.O. Box 219078, Kansas City, MO 64121-9078.
Important notice regarding delivery of security holder documents
To reduce Fund expenses, only one copy of most shareholder documents may be mailed to shareholders with multiple accounts at the same address (Householding). Mailing of your shareholder documents may be householded indefinitely unless you instruct us otherwise. If you do not want the mailing of these documents to be combined with those for other members of your household, please contact Invesco Investment Services, Inc. at 800 959 4246 or contact your financial institution. We will begin sending you individual copies for each account within 30 days after receiving your request.
Fund holdings and proxy voting information
The Fund provides a complete list of its holdings four times in each fiscal year, at the quarter ends. For the second and fourth quarters, the lists appear in the Fund’s semiannual and annual reports to shareholders. For the first and third quarters, the Fund files the lists with the Securities and Exchange Commission (SEC) on Form N-Q. The most recent list of portfolio holdings is available at invesco.com/completeqtrholdings. Shareholders can also look up the Fund’s Forms N-Q on the SEC website at sec.gov. Copies of the Fund’s Forms N-Q may be reviewed and copied at the SEC Public Reference Room in Washington, D.C. You can obtain information on the operation of the Public Reference Room, including information about duplicating fee charges, by calling 202 551 8090 or 800 732 0330, or by electronic request at the following email address: publicinfo@sec.gov. The SEC file numbers for the Fund are shown below.
A description of the policies and procedures that the Fund uses to determine how to vote proxies relating to portfolio securities is available without charge, upon request, from our Client Services department at 800 959 4246 or at invesco.com/proxyguidelines. The information is also available on the SEC website, sec.gov.
Information regarding how the Fund voted proxies related to its portfolio securities during the most recent 12-month period ended June 30 is available at invesco.com/proxysearch. The information is also available on the SEC website, sec.gov.
| | |
Invesco Advisers, Inc. is an investment adviser; it provides investment advisory services to individual and institutional clients and does not sell securities. Invesco Distributors, Inc. is the US distributor for Invesco Ltd.’s retail mutual funds, exchange-traded funds and institutional money market funds. Both are wholly owned, indirect subsidiaries of Invesco Ltd. | |  |
| | | | |
| SEC file numbers: 811-03826 and 002-85905 | | VK-AMVA-AR-1 | | Invesco Distributors, Inc. |
| | | | |
| | |
 | | Annual Report to Shareholders | | April 30, 2016 |
| | |
| | Invesco Comstock Fund |
| | Nasdaq: |
| | A: ACSTX n B: ACSWX n C: ACSYX n R: ACSRX n Y: ACSDX n R5: ACSHX n R6: ICSFX |

Letters to Shareholders
| | | | |

Philip Taylor | | | | Dear Shareholders: This annual report includes information about your Fund, including performance data and a complete list of its investments as of the close of the reporting period. Inside is a discussion of how your Fund was managed and the factors that affected its performance during the reporting period. US economic data were generally positive over the reporting period, with the economy expanding modestly and employment numbers improving steadily. Throughout the reporting period, US consumers benefited from declining energy prices and greater credit availability, but a strengthening dollar crimped the profits of many large multi-national companies doing business overseas. Ending years of uncertainty, the US Federal Reserve in December 2015 finally raised short-term interest rates for the first time since 2006, signaling its confidence that the economy |
was likely to continue expanding and improving. Overseas, the economic story was less positive. The European Central Bank and central banks in China and Japan – as well as other countries – either instituted or maintained extraordinarily accommodative monetary policies in response to economic weakness. Stocks began 2016 on a weak note due to increased concerns about global economic weakness.
Short-term market volatility can prompt some investors to abandon their investment plans – and can cause others to settle for average results. The investment professionals at Invesco, in contrast, invest with high conviction and a long-term perspective. At Invesco, investing with high conviction means offering a wide range of strategies designed to go beyond market benchmarks. We trust our research-driven insights, have confidence in our investment processes and build portfolios that reflect our beliefs. Our goal is to look past market noise in an effort to find attractive opportunities at attractive prices – consistent with the investment strategies spelled out in each fund’s prospectus. Of course, investing with high conviction can’t guarantee a profit or ensure investment success; no investment strategy or risk analysis can. To learn more about how we invest with high conviction, visit invesco.com/HighConviction.
You, too, can invest with high conviction by maintaining a long-term investment perspective and by working with your financial adviser on a regular basis. During periods of short-term market volatility or uncertainty, your financial adviser can keep you focused on your long-term investment goals – a new home, a child’s college education, or a secure retirement. He or she also can share research about the economy, the markets and individual investment options.
Visit our website for more information on your investments
Our website, invesco.com/us, offers a wide range of market insights and investment perspectives. On the website, you’ll find detailed information about our funds, including performance, holdings and portfolio manager commentaries. You can access information about your account by completing a simple, secure online registration. Click on the “Need to register” link in the “Account Access” box on our homepage to get started. Invesco’s mobile apps for iPhone® and iPad® (both available free from the App StoreSM) allow you to obtain the same detailed information, monitor your account and create customizable watch lists.
In addition to the resources accessible on our website and through our mobile app, you can obtain timely updates to help you stay informed about the markets, the economy and investing by connecting with Invesco on Twitter, LinkedIn or Facebook. You can access our blog at blog.invesco.us.com. Our goal is to provide you the information you want, when and where you want it.
Have questions?
For questions about your account, contact an Invesco client services representative at 800 959 4246. For Invesco-related questions or comments, please email me directly at phil@invesco.com.
All of us at Invesco look forward to serving your investment management needs. Thank you for investing with us.
Sincerely,

Philip Taylor
Senior Managing Director, Invesco Ltd.
iPhone and iPad are trademarks of Apple Inc., registered in the US and other countries. App Store is a service mark of Apple Inc. Invesco Distributors, Inc. is not affiliated with Apple Inc.
2 Invesco Comstock Fund
| | | | |

Bruce Crockett | | | | Dear Fellow Shareholders: Among the many important lessons I’ve learned in more than 40 years in a variety of business endeavors is the value of a trusted advocate. As independent chair of the Invesco Funds Board, I can assure you that the members of the Board are strong advocates for the interests of investors in Invesco’s mutual funds. We work hard to represent your interests through oversight of the quality of the investment management services your funds receive and other matters important to your investment, including but not limited to: n Ensuring that Invesco offers a diverse lineup of mutual funds that your financial adviser can use to strive to meet your financial needs as your investment goals change over time. n Monitoring how the portfolio management teams of the Invesco funds are performing in light of changing economic and market conditions. |
| n | | Assessing each portfolio management team’s investment performance within the context of the investment strategy described in the fund’s prospectus. |
| n | | Monitoring for potential conflicts of interests that may impact the nature of the services that your funds receive. |
We believe one of the most important services we provide our fund shareholders is the annual review of the funds’ advisory and sub-advisory contracts with Invesco Advisers and its affiliates. This review is required by the Investment Company Act of 1940 and focuses on the nature and quality of the services Invesco provides as the adviser to the Invesco funds and the reasonableness of the fees that it charges for those services. Each year, we spend months carefully reviewing information received from Invesco and a variety of independent sources, such as performance and fee data prepared by Lipper Inc., an independent, third-party firm widely recognized as a leader in its field. We also meet with our independent legal counsel and other independent advisers to review and help us assess the information that we have received. Our goal is to assure that you receive quality investment management services for a reasonable fee.
I trust the measures outlined above provide assurance that you have a worthy advocate when it comes to choosing the Invesco Funds.
As always, please contact me at bruce@brucecrockett.com with any questions or concerns you may have. On behalf of the Board, we look forward to continuing to represent your interests and serving your needs.
Sincerely,

Bruce L. Crockett
Independent Chair
Invesco Funds Board of Trustees
3 Invesco Comstock Fund
Management’s Discussion of Fund Performance
| | | | |
| Performance summary | |
| For the fiscal year ended April 30, 2016, Class A shares of Invesco Comstock Fund (the Fund), at net asset value (NAV), underperformed the Fund’s style-specific benchmark, the Russell 1000 Value Index. | |
Your Fund’s long-term performance appears later in this report. | |
| Fund vs. Indexes | |
Total returns, 4/30/15 to 4/30/16, at net asset value (NAV). Performance shown does not include applicable contingent deferred sales charges (CDSC) or front-end sales charges, which would have reduced performance. | |
| Class A Shares | | | -6.90 | % |
| Class B Shares | | | -6.91 | |
| Class C Shares | | | -7.59 | |
| Class R Shares | | | -7.14 | |
| Class Y Shares | | | -6.67 | |
| Class R5 Shares | | | -6.57 | |
| Class R6 Shares | | | -6.48 | |
| S&P 500 Index▼ (Broad Market Index) | | | 1.21 | |
| Russell 1000 Value Index▼ (Style-Specific Index) | | | -0.40 | |
| Lipper Large-Cap Value Funds Index¢ (Peer Group Index) | | | -2.15 | |
| |
Source(s): ▼FactSet Research Systems Inc.; ¢Lipper Inc. | | | | |
Market conditions and your Fund
Although the health of individual economic sectors varied dramatically, the US economy overall continued its slow but steady growth during the fiscal year ended April 30, 2016. This modest growth led to recurring debate over whether the US economy could withstand global recessionary forces. Many energy, industrial and materials companies experienced cyclical downturns resembling a mild recession even as many consumer-related companies benefited from continued low interest rates, increased availability of credit and a better employment picture. Another significant downturn in oil prices reduced capital investment but also reduced consumers’ energy and gasoline costs.
In the first half of the reporting period, US equity market performance was greatly affected by expectations of when,
and whether, the US Federal Reserve (the Fed) might raise interest rates – and the impact the Fed’s action might have. Markets moved lower in the summer of 2015 as a significant downturn in China’s financial markets and weak global economic growth led to increased concern about the sustainability of US economic growth. In the fall, markets rallied and the Fed saw enough economic stabilization to finally raise interest rates.
US stocks began 2016 on a negative note. Together with a sharp decline in oil prices, this suggested a global recession might be imminent and caused investors to become decidedly risk averse; this helped short-term and income-oriented investments, but hurt longer-term and growth-oriented investments. As companies reported earnings and fundamentals that were better than had been feared, stocks rallied sharply in late February and March. Additionally, oil prices strengthened
modestly on the back of a weaker US dollar and as Saudi Arabia and Russia considered a freeze on their oil output. Overall, US equity markets were mixed, with the S&P 500 Index, considered representative of the performance of the US stock market, finishing the reporting period modestly higher.
Sector performance of the Russell 1000 Value Index was mixed, ranging from positive double-digit performance within defensive areas of the market, like the utilities sector, to negative returns in cyclical areas, like the energy and financials sectors. Stock selection was the main driver of Fund performance relative to its style-specific benchmark for the reporting period.
Stock selection in the consumer staples sector contributed to the Fund’s performance relative to its style-specific benchmark. In the food, beverage and tobacco industry, Coca-Cola and ConAgra Foods were notable contributors. ConAgra Foods performed strongly after an activist investor took a large stake in the company and sought seats on the company’s board of directors. The company also reported earnings that exceeded analysts’ estimates, causing the stock to post double-digit returns for the fiscal year. We sold our holdings in ConAgra Foods before the close of the reporting period.
Select stocks in the industrials sector performed well during the reporting period. However, being materially underweight the sector versus the style-specific benchmark offset any benefit to the Fund’s relative performance. Caterpillar, a relatively new holding in the Fund, was a large relative contributor in the sector.
On the negative side, stock selection in the financials sector detracted from Fund’s relative performance for the reporting period. Fund holdings Citigroup and Morgan Stanley underperformed
| | | | |
| Portfolio Composition | |
By sector | |
| % of total net assets
|
|
| | | | | |
| |
| Financials | | | | 28.3 | % |
| Energy | | | | 16.5 | |
| Consumer Discretionary | | | | 15.1 | |
| Information Technology | | | | 12.0 | |
| Health Care | | | | 10.2 | |
| Industrials | | | | 6.5 | |
| Consumer Staples | | | | 3.4 | |
| Materials | | | | 2.2 | |
| Telecommunication Services | | | | 1.4 | |
| Utilities | | | | 0.9 | |
| Money Market Funds | | | | | |
| Plus Other Assets Less Liabilities | | | | 3.5 | |
| | | | | |
Top 10 Equity Holdings* |
| | |
| % of total net assets
|
|
| | | | | |
| |
| 1. Citigroup Inc. | | | | 4.7 | % |
| 2. JPMorgan Chase & Co. | | | | 3.9 | |
| 3. Bank of America Corp. | | | | 2.8 | |
| 4. Carnival Corp. | | | | 2.8 | |
| 5. Cisco Systems, Inc. | | | | 2.5 | |
| 6. Suncor Energy, Inc. | | | | 2.4 | |
| 7. Pfizer Inc. | | | | 2.1 | |
| 8. Royal Dutch Shell PLC- Class A-ADR | | | | 2.1 | |
| 9. Wells Fargo & Co. | | | | 1.9 | |
| 10. Johnson Controls, Inc. | | | | 1.8 | |
| | | | | |
| Total Net Assets | | | | $12.1 billion | |
| |
| Total Number of Holdings* | | | | 78 | |
The Fund’s holdings are subject to change, and there is no assurance that the Fund will continue to hold any particular security.
*Excluding money market fund holdings.
Data presented here are as of April 30, 2016.
4 Invesco Comstock Fund
both the sector and the Fund’s style-specific benchmark, posting negative double-digit returns. Although Morgan Stanley reported profits and revenues that beat analysts’ estimates, financial stocks in general declined in the latter part of the reporting period due to concerns about a prolonged low interest rate environment.
Weak stock selection in the health care sector was also a large detractor from the Fund’s performance relative to its style-specific benchmark. Notably, Express Scripts, a pharmacy benefits manager, and Novartis, a major European pharmaceuticals firm, were large detractors, both posting steep declines for the reporting period. In addition, not owning select pharmaceutical stocks, such as Johnson & Johnson, hurt the Fund’s relative performance, as that stock posted positive double-digit returns, outperforming the sector and the Fund’s style-specific benchmark.
Stock selection in and overweight exposure to the energy sector also hurt the Fund’s relative performance, mainly due to the declining price of oil. Weatherford International and Murphy Oil were two of the largest detractors within the sector relative to the Fund’s style-specific benchmark. Weatherford International experienced steep declines over the reporting period, along with other oil and gas service companies, due to near-to intermediate-term expectations of lower revenues. We sold our holdings in Murphy Oil before the close of the reporting period, using the proceeds to invest in more promising investments.
A material underweight allocation to the utilities sector impacted the Fund’s performance relative to its style-specific benchmark, as utilities was the benchmark’s top-performing sector. The portfolio has remained materially underweight in the utilities sector because we feel that utilities are generally overvalued, as investors have driven up stock prices in a quest for yield in a low interest rate environment.
We used currency forward contracts during the reporting period solely for the purpose of hedging currency exposure of non-US-based companies held in the Fund. The use of currency forward contracts had a negligible positive impact on the Fund’s relative performance versus the Russell 1000 Value Index for the reporting period.
Although the Fund was underweight the financials sector relative to its style-specific index at the close of the reporting period, we had a favorable view of banks and large diversified financial companies and were overweight these industries versus the Russell 1000 Value benchmark. Also, as of the close of the reporting period, the Fund was overweight in the energy sector compared to the style-specific benchmark. We have been taking advantage of weakness in the energy sector to add to the Fund’s energy holdings. The Fund’s holdings in each sector have a higher beta than that of its style-specific benchmark;1 therefore, the Fund should be more sensitive to broad moves in these sectors for the foreseeable future.
Thank you for your investment in Invesco Comstock Fund and for sharing our long-term investment horizon.
| 1 | Beta is a measure of risk representing how a security is expected to respond to general market movements. |
The views and opinions expressed in management’s discussion of Fund performance are those of Invesco Advisers, Inc. These views and opinions are subject to change at any time based on factors such as market and economic conditions. These views and opinions may not be relied upon as investment advice or recommendations, or as an offer for a particular security. The information is not a complete analysis of every aspect of any market, country, industry, security or the Fund. Statements of fact are from sources considered reliable, but Invesco Advisers, Inc. makes no representation or warranty as to their completeness or accuracy. Although historical performance is no guarantee of future results, these insights may help you understand our investment management philosophy.
See important Fund and, if applicable, index disclosures later in this report.
| | |
 | | Kevin Holt Chartered Financial Analyst, Portfolio Manager and Chief Investment Officer for Invesco US value disciplines, is lead |
| manager of Invesco Comstock Fund. He joined Invesco in 2010. Mr. Holt earned a bachelor’s degree from the University of Iowa and an MBA from the University of Chicago Graduate School of Business. |
| | |
 | | Devin Armstrong Chartered Financial Analyst, Portfolio Manager, is manager of Invesco Comstock Fund. He joined Invesco in 2010. |
Mr. Armstrong earned a BS in psychology and finance from the University of Illinois and an MBA from Columbia University. |
| | |
 | | Charles DyReyes Chartered Financial Analyst, Portfolio Manager, is manager of Invesco Comstock Fund. He joined Invesco in 2015. |
Mr. DyReyes earned a BS in finance from Lehigh University. |
| | |
 | | James (Jay) Warwick Portfolio Manager, is manager of Invesco Comstock Fund. He joined Invesco in 2010. Mr. Warwick earned a BBA |
| from Stephen F. Austin State University and an MBA from the University of Houston. |
Your Fund’s Long-Term Performance
Results of a $10,000 Investment – Oldest Share Class(es)
Fund and index data from 4/30/06
1 Source: FactSet Research Systems Inc.
2 Source: Lipper Inc.
Past performance cannot guarantee comparable future results.
The data shown in the chart include reinvested distributions, applicable sales charges and Fund expenses including
management fees. Index results include reinvested dividends, but they do not reflect sales charges. Performance of the peer group, if applicable, reflects fund expenses and management fees;
performance of a market index does not. Performance shown in the chart and table(s) does not reflect deduction of taxes a shareholder would pay on Fund distributions or sale of Fund shares.
continued from page 8
| n | | Real estate investment trust (REIT)risk/ real estate risk. Investments in real estate related instruments may be affected by economic, legal, cultural, environmental or technological factors that affect property values, rents or occupancies of real estate related to the Fund’s holdings. Shares of real estate related companies, which tend to be small- and mid-cap companies, may be more volatile and less liquid. |
| n | | Small- and mid-capitalization risks. Small- and mid-capitalization companies tend to be more vulnerable to changing market conditions, may have little or no operating history or track record of success, and may have more limited product lines and markets, less experienced management and fewer financial resources than larger companies. These companies’ securities may be more volatile and less liquid than those of more established companies, and their returns may vary, sometimes significantly, from the overall securities market. |
| n | | Value investing style risk. A value investing style subjects the Fund to the risk that the valuations never improve or |
| | that the returns on value equity securities are less than returns on other styles of investing or the overall stock market. |
About indexes used in this report
| n | | The S&P 500® Index is an unmanaged index considered representative of the |
US stock market.
| n | | The Russell 1000® Value Index is an unmanaged index considered representative of large-cap value stocks. The Russell 1000 Value Index is a trademark/service mark of the Frank Russell Co. Russell® is a trademark of the Frank Russell Co. |
| n | | The Lipper Large-Cap Value Funds Index is an unmanaged index considered representative of large-cap value funds tracked by Lipper. |
| n | | The Fund is not managed to track the performance of any particular index, including the index(es) described here, and consequently, the performance of the Fund may deviate significantly from the performance of the index(es). |
| n | | A direct investment cannot be made in an index. Unless otherwise indicated, index results include reinvested dividends, |
| | and they do not reflect sales charges. Performance of the peer group, if applicable, reflects fund expenses; performance of a market index does not. |
Other information
| n | | The returns shown in management’s discussion of Fund performance are based on net asset values (NAVs) calculated for shareholder transactions. Generally accepted accounting principles require adjustments to be made to the net assets of the Fund at period end for financial reporting purposes, and as such, the NAVs for shareholder transactions and the returns based on those NAVs may differ from the NAVs and returns reported in the Financial Highlights. |
| n | | Industry classifications used in this report are generally according to the Global Industry Classification Standard, which was developed by and is the exclusive property and a service mark of MSCI Inc. and Standard & Poor’s. |
6 Invesco Comstock Fund
| | | | | |
| Average Annual Total Returns |
| As of 4/30/16, including maximum applicable sales charges |
| | | | | |
| |
Class A Shares | | | | | |
| Inception (10/7/68) | | | | 10.59 | % |
| 10 Years | | | | 4.84 | |
| 5 Years | | | | 7.14 | |
| 1 Year | | | | -12.04 | |
| |
| Class B Shares | | | | | |
| Inception (10/19/92) | | | | 9.41 | % |
| 10 Years | | | | 5.27 | |
| 5 Years | | | | 7.98 | |
| 1 Year | | | | -11.10 | |
| |
| Class C Shares | | | | | |
| Inception (10/26/93) | | | | 8.71 | % |
| 10 Years | | | | 4.64 | |
| 5 Years | | | | 7.55 | |
| 1 Year | | | | -8.43 | |
| |
| Class R Shares | | | | | |
| Inception (10/1/02) | | | | 8.45 | % |
| 10 Years | | | | 5.17 | |
| 5 Years | | | | 8.10 | |
| 1 Year | | | | -7.14 | |
| |
| Class Y Shares | | | | | |
| Inception (10/29/04) | | | | 6.57 | % |
| 10 Years | | | | 5.70 | |
| 5 Years | | | | 8.63 | |
| 1 Year | | | | -6.67 | |
| |
| Class R5 Shares | | | | | |
| 10 Years | | | | 5.66 | % |
| 5 Years | | | | 8.77 | |
| 1 Year | | | | -6.57 | |
| |
| Class R6 Shares | | | | | |
| 10 Years | | | | 5.60 | % |
| 5 Years | | | | 8.71 | |
| 1 Year | | | | -6.48 | |
Effective June 1, 2010, Class A, Class B, Class C, Class I and Class R shares of the predecessor fund, Van Kampen Comstock Fund, advised by Van Kampen Asset Management were reorganized into Class A, Class B, Class C, Class Y and Class R shares, respectively, of Invesco Van Kampen Comstock Fund (renamed Invesco Comstock Fund). Returns shown above for Class A, Class B, Class C, Class R and Class Y shares are blended returns of the predecessor fund and Invesco Comstock Fund. Share class returns will differ from the predecessor fund because of different expenses.
Class R5 shares incepted on June 1, 2010. Performance shown prior to that date is that of the predecessor fund’s Class A shares and includes the 12b-1 fees applicable to Class A shares.
| | | | | |
| Average Annual Total Returns |
As of 3/31/16, the most recent calendar quarter end, including maximum applicable sales charges |
| | | | | |
| |
| Class A Shares | | | | | |
| Inception (10/7/68) | | | | 10.54 | % |
| 10 Years | | | | 4.77 | |
| 5 Years | | | | 7.16 | |
| 1 Year | | | | -12.69 | |
| |
| Class B Shares | | | | | |
| Inception (10/19/92) | | | | 9.30 | % |
| 10 Years | | | | 5.19 | |
| 5 Years | | | | 8.00 | |
| 1 Year | | | | -11.77 | |
| |
| Class C Shares | | | | | |
| Inception (10/26/93) | | | | 8.59 | % |
| 10 Years | | | | 4.56 | |
| 5 Years | | | | 7.57 | |
| 1 Year | | | | -9.11 | |
| |
| Class R Shares | | | | | |
| Inception (10/1/02) | | | | 8.25 | % |
| 10 Years | | | | 5.09 | |
| 5 Years | | | | 8.11 | |
| 1 Year | | | | -7.84 | |
| |
| Class Y Shares | | | | | |
| Inception (10/29/04) | | | | 6.32 | % |
| 10 Years | | | | 5.62 | |
| 5 Years | | | | 8.64 | |
| 1 Year | | | | -7.42 | |
| |
| Class R5 Shares | | | | | |
| 10 Years | | | | 5.58 | % |
| 5 Years | | | | 8.78 | |
| 1 Year | | | | -7.33 | |
| |
| Class R6 Shares | | | | | |
| 10 Years | | | | 5.52 | % |
| 5 Years | | | | 8.72 | |
| 1 Year | | | | -7.19 | |
Class R6 shares incepted on September 24, 2012. Performance shown prior to that date is that of Fund’s and the predecessor fund’s Class A shares and includes the 12b-1 fees applicable to Class A shares.
The performance data quoted represent past performance and cannot guarantee comparable future results; current performance may be lower or higher. Please visit invesco.com/performance for the most recent month-end performance. Performance figures reflect reinvested distributions, changes in net asset value and the effect of the maximum sales charge unless otherwise stated. Investment return and principal value will fluctuate so that you may have a gain or loss when you sell shares.
The net annual Fund operating expense ratio set forth in the most recent Fund prospectus as of the date of this report for Class A, Class B, Class C, Class R, Class Y, Class R5 and Class R6 shares was 0.83%, 0.83%, 1.58%, 1.08%, 0.58%, 0.50% and 0.40%, respectively.1 The total annual Fund operating expense ratio set forth in the most recent Fund prospectus as of the date of this report for Class A, Class B, Class C, Class R, Class Y, Class R5 and Class R6 shares was 0.84%, 0.84%, 1.59%, 1.09%, 0.59%, 0.51% and 0.41%, respectively. The expense ratios presented above may vary from the expense ratios presented in other sections of this report that are based on expenses incurred during the period covered by this report.
Class A share performance reflects the maximum 5.50% sales charge, and Class B and Class C share performance reflects the applicable contingent deferred sales charge (CDSC) for the period involved. For shares purchased prior to June 1, 2010, the CDSC on Class B shares declines from 5% at the time of purchase to 0% at the beginning of the sixth year. For shares purchased on or after June 1, 2010, the CDSC on Class B shares declines from 5% at the time of purchase to 0% at the beginning of the seventh year. The CDSC on Class C shares is 1% for the first year after purchase. Class R, Class Y, Class R5 and Class R6 shares do not have a front-end sales charge or a CDSC; therefore, performance is at net asset value.
The performance of the Fund’s share classes will differ primarily due to different sales charge structures and class expenses.
Fund performance reflects any applicable fee waivers and/or expense reimbursements. Had the adviser not waived fees and/or reimbursed expenses currently or in the past, returns would have been lower. See current prospectus for more information.
| 1 | Total annual Fund operating expenses after any contractual fee waivers and/or expense reimbursements by the adviser in effect through at least June 30, 2018. See current prospectus for more information. |
7 Invesco Comstock Fund
Invesco Comstock Fund’s investment objective is total return through growth of capital and current income.
| n | | Unless otherwise stated, information presented in this report is as of April 30, 2016, and is based on total net assets. |
| n | | Unless otherwise noted, all data provided by Invesco. |
| n | | To access your Fund’s reports/prospectus, visit invesco.com/fundreports. |
About share classes
| n | | Class B shares may not be purchased for new or additional investments. Please see the prospectus for more information. |
| n | | Class R shares are generally available only to employer sponsored retirement and benefit plans. Please see the prospectus for more information. |
| n | | Class Y shares are available only to certain investors. Please see the prospectus for more information. |
| n | | Class R5 shares and Class R6 shares are primarily intended for employer sponsored retirement and benefit plans that meet certain standards and for institutional investors. Please see the prospectus for more information. |
Principal risks of investing in the Fund
| n | | Depositary receipts risk. Investing in depositary receipts involves the same risks as direct investments in foreign securities. In addition, the underlying issuers of certain depositary receipts are under no obligation to distribute shareholder communications or pass through any voting rights with respect to the deposited securities to the holders of such receipts. The Fund may therefore receive less timely information or have less control than if it invested directly in the foreign issuer. |
| n | | Derivatives risk. The value of a derivative instrument depends largely on (and is derived from) the value of an underlying security, currency, commodity, interest rate, index or other asset (each referred to as an underlying asset). In addition to risks relating to the underlying assets, the use of derivatives may include other, possibly greater, risks, including counterparty, leverage and liquidity risks. Counterparty risk is the risk that the counterparty to the derivative contract will default on its obligation to pay the Fund the amount owed or otherwise perform under the derivative contract. Derivatives create leverage risk because they |
do not require payment up front equal to the economic exposure created by owning the derivative. As a result, an adverse change in the value of the underlying asset could result in the Fund sustaining a loss that is substantially greater than the amount invested in the derivative, which may make the Fund’s returns more volatile and increase the risk of loss. Derivative instruments may also be less liquid than more traditional investments and the Fund may be unable to sell or close out its derivative positions at a desirable time or price. This risk may be more acute under adverse market conditions, during which the Fund may be most in need of liquidating its derivative positions. Derivatives may also be harder to value, less tax efficient and subject to changing government regulation that could impact the Fund’s ability to use certain derivatives or their cost. Also, derivatives used for hedging or to gain or limit exposure to a particular market segment may not provide the expected benefits, particularly during adverse market conditions.
| n | | Emerging markets securities risk. Emerging markets (also referred to as developing markets) are generally subject to greater market volatility, political, social and economic instability, uncertain trading markets and more governmental limitations on foreign investment than more developed markets. In addition, companies operating in emerging markets may be subject to lower trading volume and greater price fluctuations than companies in more developed markets. Securities law and the enforcement of systems of taxation in many emerging market countries may change quickly and unpredictably. In addition, investments in emerging markets securities may also be subject to additional transaction costs, delays in settlement procedures, and lack of timely information. |
| n | | Foreign securities risk. The Fund’s foreign investments may be adversely |
affected by political and social instability, changes in economic or taxation policies, difficulty in enforcing obligations, decreased liquidity or increased volatility. Foreign investments also involve the risk of the possible seizure, nationalization or expropriation of the issuer or foreign deposits (in which the Fund could lose its entire investments in a certain market) and the possible adoption of foreign governmental restrictions such as exchange controls. Unless the Fund has hedged its foreign securities risk, foreign securities risk also involves the risk of negative foreign currency rate fluctuations, which may cause the value of securities denominated in such foreign currency (or other instruments through which the Fund has exposure to foreign currencies) to decline in value. Currency exchange rates may fluctuate significantly over short periods of time. Currency hedging strategies, if used, are not always successful.
| n | | Management risk. The Fund is actively managed and depends heavily on the Adviser’s judgment about markets, interest rates or the attractiveness, relative values, liquidity, or potential appreciation of particular investments made for the Fund’s portfolio. The Fund could experience losses if these judgments prove to be incorrect. Additionally, legislative, regulatory, or tax developments may adversely affect management of the Fund and, therefore, the ability of the Fund to achieve its investment objective. |
| n | | Market risk. The market values of the Fund’s investments, and therefore the value of the Fund’s shares, will go up and down, sometimes rapidly or unpredictably. Market risk may affect a single issuer, industry or section of the economy, or it may affect the market as a whole. Individual stock prices tend to go up and down more dramatically than those of certain other types of investments, such as bonds. During a general downturn in the financial markets, multiple asset classes may decline in value. When markets perform well, there can be no assurance that specific investments held by the Fund will rise in value. |
| | |
This report must be accompanied or preceded by a currently effective Fund prospectus, which contains more complete information, including sales charges and expenses. Investors should read it carefully before investing. | | |
| | continued on page 6 |
| NOT FDIC INSURED | MAY LOSE VALUE | NO BANK GUARANTEE | | |
8 Invesco Comstock Fund
Schedule of Investments(a)
April 30, 2016
| | | | | | | | |
| | | Shares | | | Value | |
Common Stocks & Other Equity Interests–96.52% | |
| Aerospace & Defense–1.26% | |
Textron Inc. | | | 3,933,617 | | | $ | 152,152,306 | |
|
| Aluminum–1.09% | |
Alcoa Inc. | | | 11,740,697 | | | | 131,143,585 | |
|
| Application Software–0.81% | |
Citrix Systems, Inc.(b) | | | 1,191,561 | | | | 97,517,352 | |
|
| Asset Management & Custody Banks–2.67% | |
Bank of New York Mellon Corp. (The) | | | 3,364,967 | | | | 135,406,272 | |
State Street Corp. | | | 2,990,134 | | | | 186,285,348 | |
| | | | | | | | 321,691,620 | |
|
| Auto Parts & Equipment–1.79% | |
Johnson Controls, Inc. | | | 5,220,369 | | | | 216,123,277 | |
|
| Automobile Manufacturers–1.78% | |
General Motors Co. | | | 6,753,231 | | | | 214,752,746 | |
|
| Biotechnology–0.92% | |
AbbVie Inc. | | | 1,819,088 | | | | 110,964,368 | |
|
| Broadcasting–0.52% | |
CBS Corp.–Class B | | | 1,118,994 | | | | 62,562,955 | |
|
| Cable & Satellite–2.91% | |
Comcast Corp.–Class A | | | 3,418,417 | | | | 207,703,017 | |
Time Warner Cable Inc. | | | 674,513 | | | | 143,070,952 | |
| | | | | | | | 350,773,969 | |
|
| Communications Equipment–2.50% | |
Cisco Systems, Inc. | | | 10,949,192 | | | | 300,993,288 | |
|
| Construction Machinery & Heavy Trucks–1.73% | |
Caterpillar Inc. | | | 2,688,940 | | | | 208,984,417 | |
|
| Consumer Finance–1.18% | |
Ally Financial Inc.(b) | | | 7,985,185 | | | | 142,216,145 | |
|
| Data Processing & Outsourced Services–0.84% | |
PayPal Holdings, Inc.(b) | | | 2,600,287 | | | | 101,879,245 | |
|
| Department Stores–0.87% | |
Kohl’s Corp. | | | 2,359,747 | | | | 104,536,792 | |
|
| Diversified Banks–13.75% | |
Bank of America Corp. | | | 23,509,163 | | | | 342,293,413 | |
Citigroup Inc. | | | 12,252,457 | | | | 567,043,710 | |
JPMorgan Chase & Co. | | | 7,356,197 | | | | 464,911,651 | |
U.S. Bancorp | | | 1,194,277 | | | | 50,983,685 | |
Wells Fargo & Co. | | | 4,649,637 | | | | 232,388,857 | |
| | | | | | | | 1,657,621,316 | |
|
| Drug Retail–0.50% | |
CVS Health Corp. | | | 594,373 | | | | 59,734,486 | |
| | | | | | | | |
| | | Shares | | | Value | |
| Electric Utilities–0.95% | |
FirstEnergy Corp. | | | 1,563,679 | | | $ | 50,960,299 | |
PG&E Corp. | | | 1,082,553 | | | | 63,004,584 | |
| | | | | | | | 113,964,883 | |
|
| Electrical Components & Equipment–1.14% | |
Emerson Electric Co. | | | 2,517,865 | | | | 137,550,965 | |
|
| Electronic Components–0.13% | |
Corning Inc. | | | 862,218 | | | | 16,097,610 | |
|
| General Merchandise Stores–1.22% | |
Target Corp. | | | 1,851,726 | | | | 147,212,217 | |
|
| Health Care Equipment–0.80% | |
Medtronic PLC | | | 1,220,399 | | | | 96,594,581 | |
|
| Health Care Services–0.88% | |
Express Scripts Holding Co.(b) | | | 1,444,744 | | | | 106,520,975 | |
|
| Hotels, Resorts & Cruise Lines–2.75% | |
Carnival Corp. | | | 6,751,227 | | | | 331,147,684 | |
|
| Hypermarkets & Super Centers–1.03% | |
Wal-Mart Stores, Inc. | | | 1,856,094 | | | | 124,117,006 | |
|
| Industrial Conglomerates–1.71% | |
General Electric Co. | | | 6,697,477 | | | | 205,947,418 | |
|
| Industrial Machinery–0.66% | |
Ingersoll-Rand PLC | | | 1,218,331 | | | | 79,849,414 | |
|
| Integrated Oil & Gas–8.99% | |
BP PLC–ADR (United Kingdom) | | | 6,284,532 | | | | 211,034,585 | |
Chevron Corp. | | | 2,030,431 | | | | 207,469,440 | |
Occidental Petroleum Corp. | | | 1,595,478 | | | | 122,293,389 | |
Royal Dutch Shell PLC–Class A–ADR (United Kingdom) | | | 4,782,551 | | | | 252,949,122 | |
Suncor Energy, Inc. (Canada) | | | 9,892,274 | | | | 290,536,087 | |
| | | | | | | | 1,084,282,623 | |
|
| Integrated Telecommunication Services–0.99% | |
Frontier Communications Corp. | | | 21,497,448 | | | | 119,525,811 | |
|
| Internet Software & Services–2.05% | |
eBay Inc.(b) | | | 6,649,510 | | | | 162,447,529 | |
Yahoo! Inc.(b) | | | 2,312,704 | | | | 84,644,967 | |
| | | | | | | | 247,092,496 | |
|
| Investment Banking & Brokerage–2.27% | |
Goldman Sachs Group, Inc. (The) | | | 669,883 | | | | 109,934,499 | |
Morgan Stanley | | | 6,051,308 | | | | 163,748,395 | |
| | | | | | | | 273,682,894 | |
|
| Leisure Products–0.33% | |
Mattel, Inc. | | | 1,272,194 | | | | 39,552,511 | |
See accompanying Notes to Financial Statements which are an integral part of the financial statements.
9 Invesco Comstock Fund
| | | | | | | | |
| | | Shares | | | Value | |
| Life & Health Insurance–2.91% | |
Aflac, Inc. | | | 2,458,900 | | | $ | 169,590,333 | |
MetLife, Inc. | | | 4,007,293 | | | | 180,728,914 | |
| | | | | | | | 350,319,247 | |
|
| Managed Health Care–1.11% | |
Anthem, Inc. | | | 951,134 | | | | 133,891,133 | |
|
| Movies & Entertainment–2.96% | |
Time Warner Inc. | | | 774,968 | | | | 58,231,095 | |
Twenty-First Century Fox, Inc.–Class B | | | 4,860,975 | | | | 146,412,567 | |
Viacom Inc.–Class B | | | 3,738,533 | | | | 152,906,000 | |
| | | | | | | | 357,549,662 | |
|
| Multi-Line Insurance–0.30% | |
American International Group, Inc. | | | 654,146 | | | | 36,514,430 | |
|
| Oil & Gas Drilling–0.49% | |
Noble Corp. PLC (United Kingdom) | | | 5,238,978 | | | | 58,833,723 | |
|
| Oil & Gas Equipment & Services–2.68% | |
Halliburton Co. | | | 2,944,412 | | | | 121,633,660 | |
Weatherford International PLC(b) | | | 24,788,548 | | | | 201,530,895 | |
| | | | | | | | 323,164,555 | |
|
| Oil & Gas Exploration & Production–4.31% | |
Canadian Natural Resources Ltd. (Canada) | | | 3,388,694 | | | | 101,753,986 | |
Devon Energy Corp. | | | 4,802,272 | | | | 166,542,793 | |
Hess Corp. | | | 2,489,539 | | | | 148,426,315 | |
QEP Resources Inc. | | | 5,771,776 | | | | 103,487,944 | |
| | | | | | | | 520,211,038 | |
|
| Packaged Foods & Meats–0.39% | |
Mondelez International, Inc.–Class A | | | 1,097,722 | | | | 47,158,137 | |
|
| Paper Packaging–1.13% | |
International Paper Co. | | | 3,145,123 | | | | 136,089,472 | |
|
| Personal Products–0.54% | |
Unilever N.V.–New York Shares (United Kingdom) | | | 1,492,894 | | | | 65,717,194 | |
|
| Pharmaceuticals–6.45% | |
Merck & Co., Inc. | | | 3,713,996 | | | | 203,675,541 | |
Novartis AG (Switzerland) | | | 1,458,308 | | | | 111,288,725 | |
Pfizer Inc. | | | 7,800,314 | | | | 255,148,271 | |
Roche Holding AG–ADR (Switzerland) | | | 3,022,160 | | | | 95,575,508 | |
Sanofi–ADR (France) | | | 2,741,543 | | | | 112,677,417 | |
| | | | | | | | 778,365,462 | |
| | | | | | | | |
| | | Shares | | | Value | |
| Property & Casualty Insurance–1.40% | |
Allstate Corp. (The) | | | 2,586,993 | | | $ | 168,283,895 | |
|
| Regional Banks–3.81% | |
Citizens Financial Group Inc. | | | 4,205,668 | | | | 96,099,514 | |
Fifth Third Bancorp | | | 9,163,163 | | | | 167,777,515 | |
PNC Financial Services Group, Inc. (The) | | | 2,227,534 | | | | 195,532,934 | |
| | | | | | | | 459,409,963 | |
|
| Semiconductors–1.37% | |
Intel Corp. | | | 5,081,484 | | | | 153,867,336 | |
QUALCOMM, Inc. | | | 228,293 | | | | 11,533,362 | |
| | | | | | | | 165,400,698 | |
|
| Soft Drinks–0.98% | |
Coca-Cola Co. (The) | | | 2,640,143 | | | | 118,278,406 | |
|
| Systems Software–2.41% | |
Microsoft Corp. | | | 3,569,485 | | | | 178,010,217 | |
Symantec Corp. | | | 6,785,987 | | | | 112,952,754 | |
| | | | | | | | 290,962,971 | |
|
| Technology Hardware, Storage & Peripherals–1.89% | |
HP Inc. | | | 5,121,462 | | | | 62,840,339 | |
NetApp, Inc. | | | 6,966,662 | | | | 164,691,889 | |
| | | | | | | | 227,532,228 | |
|
| Wireless Telecommunication Services–0.37% | |
Vodafone Group PLC (United Kingdom) | | | 13,928,095 | | | | 45,042,004 | |
Total Common Stocks & Other Equity Interests (Cost $10,463,115,306) | | | | 11,639,511,173 | |
|
Money Market Funds–3.72% | |
Liquid Assets Portfolio–Institutional Class, 0.44%(c) | | | 224,011,666 | | | | 224,011,666 | |
Premier Portfolio–Institutional Class, 0.39%(c) | | | 224,011,665 | | | | 224,011,665 | |
Total Money Market Funds
(Cost $448,023,331) | | | | 448,023,331 | |
TOTAL INVESTMENTS–100.24%
(Cost $10,911,138,637) | | | | 12,087,534,504 | |
OTHER ASSETS LESS LIABILITIES–(0.24)% | | | | (29,429,569 | ) |
NET ASSETS–100.00% | | | $ | 12,058,104,935 | |
Investment Abbreviations:
| | |
| ADR | | – American Depositary Receipt |
Notes to Schedule of Investments:
| (a) | Industry and/or sector classifications used in this report are generally according to the Global Industry Classification Standard, which was developed by and is the exclusive property and a service mark of MSCI Inc. and Standard & Poor’s. |
| (b) | Non-income producing security. |
| (c) | The money market fund and the Fund are affiliated by having the same investment adviser. The rate shown is the 7-day SEC standardized yield as of April 30, 2016. |
See accompanying Notes to Financial Statements which are an integral part of the financial statements.
10 Invesco Comstock Fund
Statement of Assets and Liabilities
April 30, 2016
| | | | |
Assets: | |
Investments, at value (Cost $10,463,115,306) | | $ | 11,639,511,173 | |
Investments in affiliated money market funds, at value and cost | | | 448,023,331 | |
Total investments, at value (Cost $10,911,138,637) | | | 12,087,534,504 | |
Foreign currencies, at value (Cost $558) | | | 570 | |
Receivable for: | | | | |
Investments sold | | | 33,762,940 | |
Fund shares sold | | | 11,264,265 | |
Dividends | | | 14,356,856 | |
Investment for trustee deferred compensation and retirement plans | | | 789,697 | |
Unrealized appreciation on forward foreign currency contracts outstanding | | | 1,316,507 | |
Other assets | | | 189,228 | |
Total assets | | | 12,149,214,567 | |
|
Liabilities: | |
Payable for: | | | | |
Investments purchased | | | 42,496,521 | |
Fund shares reacquired | | | 25,227,391 | |
Accrued fees to affiliates | | | 7,074,190 | |
Accrued trustees’ and officers’ fees and benefits | | | 14,478 | |
Accrued other operating expenses | | | 269,035 | |
Trustee deferred compensation and retirement plans | | | 939,479 | |
Unrealized depreciation on forward foreign currency contracts outstanding | | | 15,088,538 | |
Total liabilities | | | 91,109,632 | |
Net assets applicable to shares outstanding | | $ | 12,058,104,935 | |
|
Net assets consist of: | |
Shares of beneficial interest | | $ | 10,674,789,679 | |
Undistributed net investment income | | | 60,237,143 | |
Undistributed net realized gain | | | 160,512,052 | |
Net unrealized appreciation | | | 1,162,566,061 | |
| | | $ | 12,058,104,935 | |
| | | | |
Net Assets: | |
Class A | | $ | 6,613,286,009 | |
Class B | | $ | 70,700,519 | |
Class C | | $ | 532,229,809 | |
Class R | | $ | 358,834,760 | |
Class Y | | $ | 3,034,619,916 | |
Class R5 | | $ | 824,227,655 | |
Class R6 | | $ | 624,206,267 | |
|
Shares outstanding, $0.01 par value per share,
with an unlimited number of shares authorized: | |
Class A | | | 302,544,605 | |
Class B | | | 3,235,519 | |
Class C | | | 24,357,202 | |
Class R | | | 16,417,948 | |
Class Y | | | 138,813,358 | |
Class R5 | | | 37,715,654 | |
Class R6 | | | 28,569,210 | |
Class A: | | | | |
Net asset value per share | | $ | 21.86 | |
Maximum offering price per share | | | | |
(Net asset value of $21.86 ¸ 94.50%) | | $ | 23.13 | |
Class B: | | | | |
Net asset value and offering price per share | | $ | 21.85 | |
Class C: | | | | |
Net asset value and offering price per share | | $ | 21.85 | |
Class R: | | | | |
Net asset value and offering price per share | | $ | 21.86 | |
Class Y: | | | | |
Net asset value and offering price per share | | $ | 21.86 | |
Class R5: | | | | |
Net asset value and offering price per share | | $ | 21.85 | |
Class R6: | | | | |
Net asset value and offering price per share | | $ | 21.85 | |
See accompanying Notes to Financial Statements which are an integral part of the financial statements.
11 Invesco Comstock Fund
Statement of Operations
For the year ended April 30, 2016
| | | | |
Investment income: | |
Dividends (net of foreign withholding taxes of $6,215,654) | | $ | 339,028,108 | |
Dividends from affiliated money market funds | | | 894,412 | |
Total investment income | | | 339,922,520 | |
| |
Expenses: | | | | |
Advisory fees | | | 46,889,188 | |
Administrative services fees | | | 856,193 | |
Custodian fees | | | 329,931 | |
Distribution fees: | | | | |
Class A | | | 17,251,621 | |
Class B | | | 240,651 | |
Class C | | | 5,574,685 | |
Class R | | | 2,111,589 | |
Transfer agent fees — A, B, C, R and Y | | | 22,119,947 | |
Transfer agent fees — R5 | | | 798,431 | |
Transfer agent fees — R6 | | | 17,478 | |
Trustees’ and officers’ fees and benefits | | | 247,247 | |
Registration and filing fees | | | 348,782 | |
Reports to shareholders | | | 792,648 | |
Professional services fees | | | 144,871 | |
Other | | | 215,657 | |
Total expenses | | | 97,938,919 | |
Less: Fees waived and expense offset arrangement(s) | | | (658,317 | ) |
Net expenses | | | 97,280,602 | |
Net investment income | | | 242,641,918 | |
| |
Realized and unrealized gain (loss) from: | | | | |
Net realized gain (loss) from: | | | | |
Investment securities | | | 542,944,808 | |
Foreign currencies | | | 115,775 | |
Forward foreign currency contracts | | | (8,485,156 | ) |
| | | | 534,575,427 | |
Change in net unrealized appreciation (depreciation) of: | | | | |
Investment securities | | | (1,763,484,572 | ) |
Foreign currencies | | | (41,474 | ) |
Forward foreign currency contracts | | | 27,052,524 | |
| | | | (1,736,473,522 | ) |
Net realized and unrealized gain (loss) | | | (1,201,898,095 | ) |
Net increase (decrease) in net assets resulting from operations | | $ | (959,256,177 | ) |
See accompanying Notes to Financial Statements which are an integral part of the financial statements.
12 Invesco Comstock Fund
Statement of Changes in Net Assets
For the years ended April 30, 2016 and 2015
| | | | | | | | |
| | | 2016 | | | 2015 | |
Operations: | | | | | | | | |
Net investment income | | $ | 242,641,918 | | | $ | 177,442,667 | |
Net realized gain | | | 534,575,427 | | | | 1,111,773,592 | |
Change in net unrealized appreciation (depreciation) | | | (1,736,473,522 | ) | | | (150,243,228 | ) |
Net increase (decrease) in net assets resulting from operations | | | (959,256,177 | ) | | | 1,138,973,031 | |
| | |
Distributions to shareholders from net investment income: | | | | | | | | |
Class A | | | (105,206,606 | ) | | | (122,928,936 | ) |
Class B | | | (1,437,179 | ) | | | (2,579,547 | ) |
Class C | | | (4,505,794 | ) | | | (5,461,975 | ) |
Class R | | | (5,356,689 | ) | | | (6,136,587 | ) |
Class Y | | | (55,413,940 | ) | | | (60,976,835 | ) |
Class R5 | | | (15,019,301 | ) | | | (14,742,092 | ) |
Class R6 | | | (12,141,275 | ) | | | (10,738,658 | ) |
Total distributions from net investment income | | | (199,080,784 | ) | | | (223,564,630 | ) |
| | |
Distributions to shareholders from net realized gains: | | | | | | | | |
Class A | | | (562,668,484 | ) | | | — | |
Class B | | | (7,384,068 | ) | | | — | |
Class C | | | (46,615,384 | ) | | | — | |
Class R | | | (35,892,409 | ) | | | — | |
Class Y | | | (254,406,075 | ) | | | — | |
Class R5 | | | (65,901,013 | ) | | | — | |
Class R6 | | | (49,927,542 | ) | | | — | |
Total distributions from net realized gains | | | (1,022,794,975 | ) | | | — | |
| | |
Share transactions–net: | | | | | | | | |
Class A | | | 122,928,142 | | | | (182,893,310 | ) |
Class B | | | (39,500,740 | ) | | | (67,873,903 | ) |
Class C | | | (4,553,788 | ) | | | 4,767,420 | |
Class R | | | (47,437,654 | ) | | | 120,809,421 | |
Class Y | | | 150,211,762 | | | | 259,556,453 | |
Class R5 | | | 131,211,582 | | | | 147,522,534 | |
Class R6 | | | 127,733,563 | | | | 201,723,595 | |
Net increase in net assets resulting from share transactions | | | 440,592,867 | | | | 483,612,210 | |
Net increase (decrease) in net assets | | | (1,740,539,069 | ) | | | 1,399,020,611 | |
| | |
Net assets: | | | | | | | | |
Beginning of year | | | 13,798,644,004 | | | | 12,399,623,393 | |
End of year (includes undistributed net investment income of $60,237,143 and $17,764,407, respectively) | | $ | 12,058,104,935 | | | $ | 13,798,644,004 | |
Notes to Financial Statements
April 30, 2016
NOTE 1—Significant Accounting Policies
Invesco Comstock Fund (the “Fund”) is a series portfolio of AIM Sector Funds (Invesco Sector Funds) (the “Trust”). The Trust is a Delaware statutory trust registered under the Investment Company Act of 1940, as amended (the “1940 Act”), as an open-end series management investment company consisting of ten separate portfolios, each authorized to issue an unlimited number of shares of beneficial interest. The assets, liabilities and operations of each portfolio are accounted for separately. Information presented in these financial statements pertains only to the Fund. Matters affecting each portfolio or class will be voted on exclusively by the shareholders of such portfolio or class.
The Fund’s investment objective is total return through growth of capital and current income.
The Fund currently consists of seven different classes of shares: Class A, Class B, Class C, Class R, Class Y, Class R5 and Class R6. Class Y shares are available only to certain investors. Class A shares are sold with a front-end sales charge unless certain waiver criteria are met and under certain
13 Invesco Comstock Fund
circumstances load waived shares may be subject to contingent deferred sales charges (“CDSC”). Class C shares are sold with a CDSC. Class R, Class Y, Class R5 and Class R6 shares are sold at net asset value. Effective November 30, 2010, new or additional investments in Class B shares are no longer permitted. Existing shareholders of Class B shares may continue to reinvest dividends and capital gains distributions in Class B shares until they convert to Class A shares. Also, shareholders in Class B shares will be able to exchange those shares for Class B shares of other Invesco Funds offering such shares until they convert to Class A shares. Generally, Class B shares will automatically convert to Class A shares on or about the month-end, which is at least eight years after the date of purchase. Redemption of Class B shares prior to the conversion date will be subject to a CDSC.
The following is a summary of the significant accounting policies followed by the Fund in the preparation of its financial statements.
| A. | Security Valuations — Securities, including restricted securities, are valued according to the following policy. |
A security listed or traded on an exchange (except convertible securities) is valued at its last sales price or official closing price as of the close of the customary trading session on the exchange where the security is principally traded, or lacking any sales or official closing price on a particular day, the security may be valued at the closing bid price on that day. Securities traded in the over-the-counter market are valued based on prices furnished by independent pricing services or market makers. When such securities are valued by an independent pricing service they may be considered fair valued. Futures contracts are valued at the final settlement price set by an exchange on which they are principally traded. Listed options are valued at the mean between the last bid and asked prices from the exchange on which they are principally traded. Options not listed on an exchange are valued by an independent source at the mean between the last bid and asked prices. For purposes of determining net asset value (“NAV”) per share, futures and option contracts generally are valued 15 minutes after the close of the customary trading session of the New York Stock Exchange (“NYSE”).
Investments in open-end and closed-end registered investment companies that do not trade on an exchange are valued at the end-of-day net asset value per share. Investments in open-end and closed-end registered investment companies that trade on an exchange are valued at the last sales price or official closing price as of the close of the customary trading session on the exchange where the security is principally traded.
Debt obligations (including convertible securities) and unlisted equities are fair valued using an evaluated quote provided by an independent pricing service. Evaluated quotes provided by the pricing service may be determined without exclusive reliance on quoted prices, and may reflect appropriate factors such as institution-size trading in similar groups of securities, developments related to specific securities, dividend rate (for unlisted equities), yield (for debt obligations), quality, type of issue, coupon rate (for debt obligations), maturity (for debt obligations), individual trading characteristics and other market data. Debt obligations are subject to interest rate and credit risks. In addition, all debt obligations involve some risk of default with respect to interest and/or principal payments.
Foreign securities’ (including foreign exchange contracts) prices are converted into U.S. dollar amounts using the applicable exchange rates as of the close of the NYSE. If market quotations are available and reliable for foreign exchange-traded equity securities, the securities will be valued at the market quotations. Because trading hours for certain foreign securities end before the close of the NYSE, closing market quotations may become unreliable. If between the time trading ends on a particular security and the close of the customary trading session on the NYSE, events occur that the Adviser determines are significant and make the closing price unreliable, the Fund may fair value the security. If the event is likely to have affected the closing price of the security, the security will be valued at fair value in good faith using procedures approved by the Board of Trustees. Adjustments to closing prices to reflect fair value may also be based on a screening process of an independent pricing service to indicate the degree of certainty, based on historical data, that the closing price in the principal market where a foreign security trades is not the current value as of the close of the NYSE. Foreign securities’ prices meeting the approved degree of certainty that the price is not reflective of current value will be priced at the indication of fair value from the independent pricing service. Multiple factors may be considered by the independent pricing service in determining adjustments to reflect fair value and may include information relating to sector indices, American Depositary Receipts and domestic and foreign index futures. Foreign securities may have additional risks including exchange rate changes, potential for sharply devalued currencies and high inflation, political and economic upheaval, the relative lack of issuer information, relatively low market liquidity and the potential lack of strict financial and accounting controls and standards.
Securities for which market prices are not provided by any of the above methods may be valued based upon quotes furnished by independent sources. The last bid price may be used to value equity securities. The mean between the last bid and asked prices is used to value debt obligations, including corporate loans.
Securities for which market quotations are not readily available or became unreliable are valued at fair value as determined in good faith by or under the supervision of the Trust’s officers following procedures approved by the Board of Trustees. Issuer specific events, market trends, bid/asked quotes of brokers and information providers and other market data may be reviewed in the course of making a good faith determination of a security’s fair value.
The Fund may invest in securities that are subject to interest rate risk, meaning the risk that the prices will generally fall as interest rates rise and, conversely, the prices will generally rise as interest rates fall. Specific securities differ in their sensitivity to changes in interest rates depending on their individual characteristics. Changes in interest rates may result in increased market volatility, which may affect the value and/or liquidity of certain Fund investments.
Valuations change in response to many factors including the historical and prospective earnings of the issuer, the value of the issuer’s assets, general economic conditions, interest rates, investor perceptions and market liquidity. Because of the inherent uncertainties of valuation, the values reflected in the financial statements may materially differ from the value received upon actual sale of those investments.
| B. | Securities Transactions and Investment Income — Securities transactions are accounted for on a trade date basis. Realized gains or losses on sales are computed on the basis of specific identification of the securities sold. Interest income (net of withholding tax, if any) is recorded on the accrual basis from settlement date. Dividend income (net of withholding tax, if any) is recorded on the ex-dividend date. |
The Fund may periodically participate in litigation related to Fund investments. As such, the Fund may receive proceeds from litigation settlements. Any proceeds received are included in the Statement of Operations as realized gain (loss) for investments no longer held and as unrealized gain (loss) for investments still held.
Brokerage commissions and mark ups are considered transaction costs and are recorded as an increase to the cost basis of securities purchased and/or a reduction of proceeds on a sale of securities. Such transaction costs are included in the determination of net realized and unrealized gain (loss) from investment securities reported in the Statement of Operations and the Statement of Changes in Net Assets and the net realized and unrealized gains (losses) on securities per share in the Financial Highlights. Transaction costs are included in the calculation of the
14 Invesco Comstock Fund
Fund’s net asset value and, accordingly, they reduce the Fund’s total returns. These transaction costs are not considered operating expenses and are not reflected in net investment income reported in the Statement of Operations and the Statement of Changes in Net Assets, or the net investment income per share and the ratios of expenses and net investment income reported in the Financial Highlights, nor are they limited by any expense limitation arrangements between the Fund and the investment adviser.
The Fund allocates income and realized and unrealized capital gains and losses to a class based on the relative net assets of each class.
| C. | Country Determination — For the purposes of making investment selection decisions and presentation in the Schedule of Investments, the investment adviser may determine the country in which an issuer is located and/or credit risk exposure based on various factors. These factors include the laws of the country under which the issuer is organized, where the issuer maintains a principal office, the country in which the issuer derives 50% or more of its total revenues and the country that has the primary market for the issuer’s securities, as well as other criteria. Among the other criteria that may be evaluated for making this determination are the country in which the issuer maintains 50% or more of its assets, the type of security, financial guarantees and enhancements, the nature of the collateral and the sponsor organization. Country of issuer and/or credit risk exposure has been determined to be the United States of America, unless otherwise noted. |
| D. | Distributions — Distributions from net investment income, if any, are declared and paid quarterly and are recorded on the ex-dividend date. Distributions from net realized capital gain, if any, are generally declared and paid annually and recorded on the ex-dividend date. The Fund may elect to treat a portion of the proceeds from redemptions as distributions for federal income tax purposes. |
| E. | Federal Income Taxes — The Fund intends to comply with the requirements of Subchapter M of the Internal Revenue Code of 1986, as amended (the “Internal Revenue Code”), necessary to qualify as a regulated investment company and to distribute substantially all of the Fund’s taxable earnings to shareholders. As such, the Fund will not be subject to federal income taxes on otherwise taxable income (including net realized capital gain) that is distributed to shareholders. Therefore, no provision for federal income taxes is recorded in the financial statements. |
The Fund recognizes the tax benefits of uncertain tax positions only when the position is more likely than not to be sustained. Management has analyzed the Fund’s uncertain tax positions and concluded that no liability for unrecognized tax benefits should be recorded related to uncertain tax positions. Management is not aware of any tax positions for which it is reasonably possible that the total amounts of unrecognized tax benefits will change materially in the next 12 months.
The Fund files tax returns in the U.S. Federal jurisdiction and certain other jurisdictions. Generally, the Fund is subject to examinations by such taxing authorities for up to three years after the filing of the return for the tax period.
| F. | Expenses — Fees provided for under the Rule 12b-1 plan of a particular class of the Fund are charged to the operations of such class. Transfer agency fees and expenses and other shareholder recordkeeping fees and expenses attributable to Class R5 and Class R6 are allocated to each share class based on relative net assets. Sub-accounting fees attributable to Class R5 are charged to the operations of the class. Transfer agency fees and expenses and other shareholder recordkeeping fees and expenses relating to all other classes are allocated among those classes based on relative net assets. All other expenses are allocated among the classes based on relative net assets. |
| G. | Accounting Estimates — The preparation of financial statements in conformity with accounting principles generally accepted in the United States of America (“GAAP”) requires management to make estimates and assumptions that affect the reported amounts of assets and liabilities at the date of the financial statements and the reported amounts of revenues and expenses during the reporting period including estimates and assumptions related to taxation. Actual results could differ from those estimates by a significant amount. In addition, the Fund monitors for material events or transactions that may occur or become known after the period-end date and before the date the financial statements are released to print. |
| H. | Indemnifications — Under the Trust’s organizational documents, each Trustee, officer, employee or other agent of the Trust is indemnified against certain liabilities that may arise out of the performance of their duties to the Fund. Additionally, in the normal course of business, the Fund enters into contracts, including the Fund’s servicing agreements, that contain a variety of indemnification clauses. The Fund’s maximum exposure under these arrangements is unknown as this would involve future claims that may be made against the Fund that have not yet occurred. The risk of material loss as a result of such indemnification claims is considered remote. |
| I. | Foreign Currency Translations — Foreign currency is valued at the close of the NYSE based on quotations posted by banks and major currency dealers. Portfolio securities and other assets and liabilities denominated in foreign currencies are translated into U.S. dollar amounts at date of valuation. Purchases and sales of portfolio securities (net of foreign taxes withheld on disposition) and income items denominated in foreign currencies are translated into U.S. dollar amounts on the respective dates of such transactions. The Fund does not separately account for the portion of the results of operations resulting from changes in foreign exchange rates on investments and the fluctuations arising from changes in market prices of securities held. The combined results of changes in foreign exchange rates and the fluctuation of market prices on investments (net of estimated foreign tax withholding) are included with the net realized and unrealized gain or loss from investments in the Statement of Operations. Reported net realized foreign currency gains or losses arise from (1) sales of foreign currencies, (2) currency gains or losses realized between the trade and settlement dates on securities transactions, and (3) the difference between the amounts of dividends, interest, and foreign withholding taxes recorded on the Fund’s books and the U.S. dollar equivalent of the amounts actually received or paid. Net unrealized foreign currency gains and losses arise from changes in the fair values of assets and liabilities, other than investments in securities at fiscal period end, resulting from changes in exchange rates. |
The Fund may invest in foreign securities, which may be subject to foreign taxes on income, gains on investments or currency repatriation, a portion of which may be recoverable. Foreign taxes, if any, are recorded based on the tax regulations and rates that exist in the foreign markets in which the Fund invests and are shown in the Statement of Operations.
| J. | Forward Foreign Currency Contracts — The Fund may engage in foreign currency transactions either on a spot (i.e. for prompt delivery and settlement) basis, or through forward foreign currency contracts, to manage or minimize currency or exchange rate risk. |
The Fund may also enter into forward foreign currency contracts for the purchase or sale of a security denominated in a foreign currency in order to “lock in” the U.S. dollar price of that security, or the Fund may also enter into forward foreign currency contracts that do not provide for physical settlement of the two currencies, but instead are settled by a single cash payment calculated as the difference between the agreed upon exchange rate and the spot rate at settlement based upon an agreed upon notional amount (non-deliverable forwards). The Fund will set aside liquid assets in an amount equal to daily mark-to-market obligation for forward foreign currency contracts.
15 Invesco Comstock Fund
A forward foreign currency contract is an obligation between two parties (“Counterparties”) to purchase or sell a specific currency for an agreed-upon price at a future date. The use of forward foreign currency contracts does not eliminate fluctuations in the price of the underlying securities the Fund owns or intends to acquire but establishes a rate of exchange in advance. Fluctuations in the value of these contracts are measured by the difference in the contract date and reporting date exchange rates and are recorded as unrealized appreciation (depreciation) until the contracts are closed. When the contracts are closed, realized gains (losses) are recorded. Realized and unrealized gains (losses) on the contracts are included in the Statement of Operations. The primary risks associated with forward foreign currency contracts include failure of the Counterparty to meet the terms of the contract and the value of the foreign currency changing unfavorably. These risks may be in excess of the amounts reflected in the Statement of Assets and Liabilities.
NOTE 2—Advisory Fees and Other Fees Paid to Affiliates
The Trust has entered into a master investment advisory agreement with Invesco Advisers, Inc. (the “Adviser” or “Invesco”). Under the terms of the investment advisory agreement, the Fund pays an advisory fee to the Adviser based on the annual rate of the Fund’s average daily net assets as follows:
| | | | |
| Average Daily Net Assets | | Rate | |
First $1 billion | | | 0.50% | |
Next $1 billion | | | 0.45% | |
Next $1 billion | | | 0.40% | |
Over $3 billion | | | 0.35% | |
For the year ended April 30, 2016, the effective advisory fees incurred by the Fund was 0.37%.
Under the terms of a master sub-advisory agreement between the Adviser and each of Invesco Asset Management Deutschland GmbH, Invesco Asset Management Limited, Invesco Asset Management (Japan) Limited, Invesco Hong Kong Limited, Invesco Senior Secured Management, Inc. and Invesco Canada Ltd. (collectively, the “Affiliated Sub-Advisers”) the Adviser, not the Fund, may pay 40% of the fees paid to the Adviser to any such Affiliated Sub-Adviser(s) that provide(s) discretionary investment management services to the Fund based on the percentage of assets allocated to such Affiliated Sub-Adviser(s).
The Adviser has contractually agreed, through at least June 30, 2017, to waive advisory fees and/or reimburse expenses of all shares to the extent necessary to limit total annual fund operating expenses after fee waiver and/or expense reimbursement (excluding certain items discussed below) of Class A, Class B, Class C, Class R, Class Y, Class R5 and Class R6 shares to 2.00%, 2.75%, 2.75%, 2.25%, 1.75%, 1.75% and 1.75% respectively, of average daily net assets (the “expense limits”). In determining the Adviser’s obligation to waive advisory fees and/or reimburse expenses, the following expenses are not taken into account, and could cause the total annual fund operating expenses after fee waiver and/or expense reimbursement to exceed the numbers reflected above: (1) interest; (2) taxes; (3) dividend expense on short sales; (4) extraordinary or non-routine items, including litigation expenses; and (5) expenses that the Fund has incurred but did not actually pay because of an expense offset arrangement. Unless Invesco continues the fee waiver agreement, it will terminate on June 30, 2017. During its term, the fee waiver agreement cannot be terminated or amended to increase the expense limits without approval of the Board of Trustees. The Adviser did not waive fees and/or reimburse expenses during the period under these expense limits.
Further, the Adviser has contractually agreed, through at least June 30, 2018, to waive the advisory fee payable by the Fund in an amount equal to 100% of the net advisory fees the Adviser receives from the affiliated money market funds on investments by the Fund of uninvested cash in such affiliated money market funds.
For the year ended April 30, 2016, the Adviser waived advisory fees of $641,645.
The Trust has entered into a master administrative services agreement with Invesco pursuant to which the Fund has agreed to pay Invesco for certain administrative costs incurred in providing accounting services to the Fund. For the year ended April 30, 2016, expenses incurred under the agreement are shown in the Statement of Operations as Administrative services fees.
The Trust has entered into a transfer agency and service agreement with Invesco Investment Services, Inc. (“IIS”) pursuant to which the Fund has agreed to pay IIS a fee for providing transfer agency and shareholder services to the Fund and reimburse IIS for certain expenses incurred by IIS in the course of providing such services. IIS may make payments to intermediaries that provide omnibus account services, sub-accounting services and/or networking services. All fees payable by IIS to intermediaries that provide omnibus account services or sub-accounting are charged back to the Fund, subject to certain limitations approved by the Trust’s Board of Trustees. For the year ended April 30, 2016, expenses incurred under the agreement are shown in the Statement of Operations as Transfer agent fees.
Shares of the Fund are distributed by Invesco Distributors, Inc. (“IDI”). The Fund has adopted a distribution plan pursuant to Rule 12b-1 under the 1940 Act, and a service plan (collectively, the “Plans”) for Class A, Class B, Class C and Class R shares to compensate IDI for the sale, distribution, shareholder servicing and maintenance of shareholder accounts for these shares. Under the Plans, the Fund will incur annual fees of up to 0.25% of Class A average daily net assets, up to 1.00% each of Class B and Class C average daily net assets and up to 0.50% of Class R average daily net assets.
With respect to Class B and Class C shares, the Fund is authorized to reimburse in future years any distribution related expenses that exceed the maximum annual reimbursement rate for such class, so long as such reimbursement does not cause the Fund to exceed the Class B and Class C maximum annual reimbursement rate, respectively. With respect to Class A shares, distribution related expenses that exceed the maximum annual reimbursement rate for such class are not carried forward to future years and the Fund will not reimburse IDI for any such expenses.
For the year ended April 30, 2016, expenses incurred under these agreements are shown in the Statement of Operations as Distribution fees.
Front-end sales commissions and CDSC (collectively, the “sales charges”) are not recorded as expenses of the Fund. Front-end sales commissions are deducted from proceeds from the sales of Fund shares prior to investment in Class A shares of the Fund. CDSC are deducted from redemption proceeds prior to remittance to the shareholder. During the year ended April 30, 2016, IDI advised the Fund that IDI retained $1,061,735 in front-end sales commissions from the sale of Class A shares and $22,092, $7,490 and $18,948 from Class A, Class B and Class C shares, respectively, for CDSC imposed on redemptions by shareholders.
16 Invesco Comstock Fund
For the year ended April 30, 2016, the Fund incurred $38,839 in brokerage commissions with Invesco Capital Markets, Inc., an affiliate of the Adviser and IDI, for portfolio transactions executed on behalf of the Fund.
Certain officers and trustees of the Trust are officers and directors of the Adviser, IIS and/or IDI.
NOTE 3—Additional Valuation Information
GAAP defines fair value as the price that would be received to sell an asset or paid to transfer a liability in an orderly transaction between market participants at the measurement date, under current market conditions. GAAP establishes a hierarchy that prioritizes the inputs to valuation methods, giving the highest priority to readily available unadjusted quoted prices in an active market for identical assets (Level 1) and the lowest priority to significant unobservable inputs (Level 3), generally when market prices are not readily available or are unreliable. Based on the valuation inputs, the securities or other investments are tiered into one of three levels. Changes in valuation methods may result in transfers in or out of an investment’s assigned level:
| | Level 1 — | Prices are determined using quoted prices in an active market for identical assets. |
| | Level 2 — | Prices are determined using other significant observable inputs. Observable inputs are inputs that other market participants may use in pricing a security. These may include quoted prices for similar securities, interest rates, prepayment speeds, credit risk, yield curves, loss severities, default rates, discount rates, volatilities and others. |
| | Level 3 — | Prices are determined using significant unobservable inputs. In situations where quoted prices or observable inputs are unavailable (for example, when there is little or no market activity for an investment at the end of the period), unobservable inputs may be used. Unobservable inputs reflect the Fund’s own assumptions about the factors market participants would use in determining fair value of the securities or instruments and would be based on the best available information. |
The following is a summary of the tiered valuation input levels, as of April 30, 2016. The level assigned to the securities valuations may not be an indication of the risk or liquidity associated with investing in those securities. Because of the inherent uncertainties of valuation, the values reflected in the financial statements may materially differ from the value received upon actual sale of those investments.
| | | | | | | | | | | | | | | | |
| | | Level 1 | | | Level 2 | | | Level 3 | | | Total | |
Equity Securities | | $ | 11,946,916,992 | | | $ | 140,617,512 | | | $ | — | | | $ | 12,087,534,504 | |
Forward Foreign Currency Contracts* | | | — | | | | (13,772,031 | ) | | | — | | | | (13,772,031 | ) |
Total Investments | | $ | 11,946,916,992 | | | $ | 126,845,481 | | | $ | — | | | $ | 12,073,762,473 | |
| * | Unrealized appreciation (depreciation). |
NOTE 4—Derivative Investments
Value of Derivative Investments at Period-End
The table below summarizes the value of the Fund’s derivative investments, detailed by primary risk exposure, held as of April 30, 2016:
| | | | | | | | |
| | | Value | |
| Risk Exposure/Derivative Type | | Assets | | | Liabilities | |
Currency risk: | | | | | | | | |
Forward foreign currency contracts(a) | | $ | 1,316,507 | | | $ | (15,088,538 | ) |
| (a) | Values are disclosed on the Statement of Assets and Liabilities under the captions Unrealized appreciation on forward foreign currency contracts outstanding and Unrealized depreciation on forward foreign currency contracts outstanding. |
Effect of Derivative Investments for the year ended April 30, 2016
The table below summarizes the gains (losses) on derivative investments, detailed by primary risk exposure, recognized in earnings during the period:
| | | | |
| | | Location of Gain (Loss) on
Statement of Operations | |
| | | Forward Foreign
Currency Contracts | |
Realized Gain: | | | | |
Currency risk | | $ | (8,485,156 | ) |
Change in Net Unrealized Appreciation: | | | | |
Currency risk | | | 27,052,524 | |
Total | | $ | 18,567,368 | |
The table below summarizes the average notional value of forward foreign currency contracts outstanding during the period.
| | | | |
| | | Forward Foreign
Currency Contracts | |
Average notional value | | $ | 1,108,665,189 | |
17 Invesco Comstock Fund
| | | | | | | | | | | | | | | | | | | | | | | | | | |
| Open Forward Foreign Currency Contracts | |
Settlement Date | | Counterparty | | Contract to | | | Notional Value | | | Unrealized
Appreciation
(Depreciation) | |
| | | Deliver | | | | | | Receive | | | |
05/20/16 | | CIBC World Markets Corp. | | | CAD | | | | 101,066,905 | | | | USD | | | | 78,225,159 | | | $ | 80,541,160 | | | $ | (2,316,001 | ) |
05/20/16 | | Deutsche Bank Securities Inc. | | | CAD | | | | 101,064,391 | | | | USD | | | | 78,259,556 | | | | 80,539,156 | | | | (2,279,600 | ) |
05/20/16 | | Goldman Sachs International | | | CAD | | | | 101,064,390 | | | | USD | | | | 78,265,980 | | | | 80,539,156 | | | | (2,273,176 | ) |
05/20/16 | | RBC Capital Markets Corp. | | | CAD | | | | 101,064,391 | | | | USD | | | | 78,253,497 | | | | 80,539,156 | | | | (2,285,659 | ) |
05/20/16 | | CIBC World Markets Corp. | | | CHF | | | | 41,705,187 | | | | USD | | | | 43,845,966 | | | | 43,518,453 | | | | 327,513 | |
05/20/16 | | Deutsche Bank Securities Inc. | | | CHF | | | | 41,705,159 | | | | USD | | | | 43,849,395 | | | | 43,518,424 | | | | 330,971 | |
05/20/16 | | Goldman Sachs International | | | CHF | | | | 41,705,187 | | | | USD | | | | 43,844,814 | | | | 43,518,453 | | | | 326,361 | |
05/20/16 | | RBC Capital Markets Corp. | | | CHF | | | | 41,705,187 | | | | USD | | | | 43,850,115 | | | | 43,518,453 | | | | 331,662 | |
05/20/16 | | Barclays Bank PLC | | | EUR | | | | 62,272,744 | | | | USD | | | | 71,204,088 | | | | 71,349,694 | | | | (145,606 | ) |
05/20/16 | | CIBC World Markets Corp. | | | EUR | | | | 62,272,743 | | | | USD | | | | 71,198,295 | | | | 71,349,693 | | | | (151,398 | ) |
05/20/16 | | Deutsche Bank Securities Inc. | | | EUR | | | | 62,272,742 | | | | USD | | | | 71,202,591 | | | | 71,349,692 | | | | (147,101 | ) |
05/20/16 | | Goldman Sachs International | | | EUR | | | | 62,274,139 | | | | USD | | | | 71,197,400 | | | | 71,351,292 | | | | (153,892 | ) |
05/20/16 | | RBC Capital Markets Corp. | | | EUR | | | | 62,272,743 | | | | USD | | | | 71,195,182 | | | | 71,349,693 | | | | (154,511 | ) |
05/20/16 | | CIBC World Markets Corp. | | | GBP | | | | 28,497,629 | | | | USD | | | | 51,575,689 | | | | 52,959,836 | | | | (1,384,147 | ) |
05/20/16 | | Deutsche Bank Securities Inc. | | | GBP | | | | 28,497,379 | | | | USD | | | | 47,929,386 | | | | 49,171,444 | | | | (1,242,058 | ) |
05/20/16 | | Goldman Sachs International | | | GBP | | | | 28,497,628 | | | | USD | | | | 50,563,532 | | | | 51,851,598 | | | | (1,288,066 | ) |
05/20/16 | | RBC Capital Markets Corp. | | | GBP | | | | 7,089,236 | | | | USD | | | | 50,733,188 | | | | 52,000,511 | | | | (1,267,323 | ) |
Total Open Forward Foreign Currency Contracts — Currency Risk | | | $ | (13,772,031 | ) |
Currency Abbreviations:
| | |
| CAD | | – Canadian Dollar |
| CHF | | – Swiss Franc |
| EUR | | – Euro |
| | |
| GBP | | – British Pound Sterling |
| USD | | – U.S. Dollar |
Offsetting Assets and Liabilities
Accounting Standards Update (“ASU”) No. 2011-11, Disclosures about Offsetting Assets and Liabilities, which was subsequently clarified in Financial Accounting Standards Board ASU 2013-01 “Clarifying the Scope of Disclosures about Offsetting Assets and Liabilities” is intended to enhance disclosures about financial instruments and derivative instruments that are subject to offsetting arrangements on the Statement of Assets and Liabilities and to enable investors to better understand the effect of those arrangements on the Fund’s financial position. In order for an arrangement to be eligible for netting, the Fund must have a basis to conclude that such netting arrangements are legally enforceable. The Fund enters into netting agreements and collateral agreements in an attempt to reduce the Fund’s Counterparty credit risk by providing for a single net settlement with a Counterparty of all financial transactions covered by the agreement in an event of default as defined under such agreement.
The following tables present derivative instruments that are either subject to an enforceable netting agreement or offset by collateral arrangements as of April 30, 2016.
| | | | | | | | | | | | | | | | | | | | |
| | | Gross amounts
of Recognized
Assets | | | Gross Amounts Not Offset in the
Statement of Assets and Liabilities | | | Net
Amount | |
| | | | Financial
Instruments | | | Collateral Received | | |
| Counterparty | | | | Non-Cash | | | Cash | | |
CIBC World Markets Corp. | | $ | 327,513 | | | $ | (327,513 | ) | | $ | — | | | $ | — | | | $ | — | |
Deutsche Bank Securities Inc. | | | 330,971 | | | | (330,971 | ) | | | — | | | | — | | | | — | |
Goldman Sachs International | | | 326,361 | | | | (326,361 | ) | | | — | | | | — | | | | — | |
RBC Capital Markets Corp. | | | 331,662 | | | | (331,662 | ) | | | — | | | | — | | | | — | |
Total | | $ | 1,316,507 | | | $ | (1,316,507 | ) | | $ | — | | | $ | — | | | $ | — | |
| | | | | |
| | | | | | | | | | | | | | | | | | | | |
| | | Gross amounts
of Recognized
Liabilities | | | Gross Amounts Not Offset in the
Statement of Assets and Liabilities | | | Net
Amount | |
| | | | Financial
Instruments | | | Collateral Pledged | | |
| Counterparty | | | | Non-Cash | | | Cash | | |
Barclays Bank PLC | | $ | 145,606 | | | $ | — | | | $ | — | | | $ | — | | | $ | 145,606 | |
CIBC World Markets Corp. | | | 3,851,546 | | | | (327,513 | ) | | | — | | | | — | | | | 3,524,033 | |
Deutsche Bank Securities Inc. | | | 3,668,759 | | | | (330,971 | ) | | | — | | | | — | | | | 3,337,788 | |
Goldman Sachs International | | | 3,715,134 | | | | (326,361 | ) | | | — | | | | — | | | | 3,388,773 | |
RBC Capital Markets Corp. | | | 3,707,493 | | | | (331,662 | ) | | | — | | | | — | | | | 3,375,831 | |
Total | | $ | 15,088,538 | | | $ | (1,316,507 | ) | | $ | — | | | $ | — | | | $ | 13,772,031 | |
18 Invesco Comstock Fund
NOTE 5—Expense Offset Arrangement(s)
The expense offset arrangement is comprised of transfer agency credits which result from balances in demand deposit accounts used by the transfer agent for clearing shareholder transactions. For the year ended April 30, 2016, the Fund received credits from this arrangement, which resulted in the reduction of the Fund’s total expenses of $16,672.
NOTE 6—Trustees’ and Officers’ Fees and Benefits
Trustees’ and Officers’ Fees and Benefits include amounts accrued by the Fund to pay remuneration to certain Trustees and Officers of the Fund. Trustees have the option to defer compensation payable by the Fund, and Trustees’ and Officers’ Fees and Benefits also include amounts accrued by the Fund to fund such deferred compensation amounts. Those Trustees who defer compensation have the option to select various Invesco Funds in which their deferral accounts shall be deemed to be invested. Finally, certain current Trustees were eligible to participate in a retirement plan that provided for benefits to be paid upon retirement to Trustees over a period of time based on the number of years of service. The Fund may have certain former Trustees who also participate in a retirement plan and receive benefits under such plan. Trustees’ and Officers’ Fees and Benefits include amounts accrued by the Fund to fund such retirement benefits. Obligations under the deferred compensation and retirement plans represent unsecured claims against the general assets of the Fund.
NOTE 7—Cash Balances
The Fund is permitted to temporarily carry a negative or overdrawn balance in its account with State Street Bank and Trust Company, the custodian bank. Such balances, if any at period-end, are shown in the Statement of Assets and Liabilities under the payable caption Amount due custodian. To compensate the custodian bank for such overdrafts, the overdrawn Fund may either (1) leave funds as a compensating balance in the account so the custodian bank can be compensated by earning the additional interest; or (2) compensate by paying the custodian bank at a rate agreed upon by the custodian bank and Invesco, not to exceed the contractually agreed upon rate.
NOTE 8—Distributions to Shareholders and Tax Components of Net Assets
Tax Character of Distributions to Shareholders Paid During the Fiscal Years Ended April 30, 2016 and 2015:
| | | | | | | | |
| | | 2016 | | | 2015 | |
Ordinary income | | $ | 219,145,849 | | | $ | 223,564,630 | |
Long-term capital gain | | | 1,002,729,910 | | | | — | |
Total distributions | | $ | 1,221,875,759 | | | $ | 223,564,630 | |
Tax Components of Net Assets at Period-End:
| | | | |
| | | 2016 | |
Undistributed ordinary income | | $ | 61,394,217 | |
Undistributed long-term gain | | | 162,560,671 | |
Net unrealized appreciation — investments | | | 1,169,220,330 | |
Net unrealized appreciation (depreciation) — other investments | | | (57,775 | ) |
Temporary book/tax differences | | | (1,004,506 | ) |
Capital loss carryforward | | | (8,797,681 | ) |
Shares of beneficial interest | | | 10,674,789,679 | |
Total net assets | | $ | 12,058,104,935 | |
The difference between book-basis and tax-basis unrealized appreciation (depreciation) is due to differences in the timing of recognition of gains and losses on investments for tax and book purposes. The Fund’s net unrealized appreciation difference is attributable primarily to wash sales.
The temporary book/tax differences are a result of timing differences between book and tax recognition of income and/or expenses. The Fund’s temporary book/tax differences are the result of the trustee deferral of compensation and retirement plan benefits.
Capital loss carryforward is calculated and reported as of a specific date. Results of transactions and other activity after that date may affect the amount of capital loss carryforward actually available for the Fund to utilize. Capital losses generated in years beginning after December 22, 2010 can be carried forward for an unlimited period, whereas previous losses expire in eight tax years. Capital losses with an expiration period may not be used to offset capital gains until all net capital losses without an expiration date have been utilized. Capital loss carryforwards with no expiration date will retain their character as either short-term or long-term capital losses instead of as short-term capital losses as under prior law. The ability to utilize capital loss carryforwards in the future may be limited under the Internal Revenue Code and related regulations based on the results of future transactions.
The Fund has a capital loss carryforward as of April 30, 2016, which expires as follows:
| | | | | | | | | | | | |
| Capital Loss Carryforward* | |
| Expiration | | Short-Term | | | Long-Term | | | Total | |
April 30, 2017 | | $ | 2,171,613 | | | $ | — | | | $ | 2,171,613 | |
April 30, 2018 | | | 6,626,068 | | | | — | | | | 6,626,068 | |
| | | $ | 8,797,681 | | | $ | — | | | $ | 8,797,681 | |
| * | Capital loss carryforward as of the date listed above is reduced for limitations, if any, to the extent required by the Internal Revenue Code and may be further limited depending upon a variety of factors, including the realization of net unrealized gains or losses as of the date of any reorganization. |
19 Invesco Comstock Fund
NOTE 9—Investment Securities
The aggregate amount of investment securities (other than short-term securities, U.S. Treasury obligations and money market funds, if any) purchased and sold by the Fund during the year ended April 30, 2016 was $1,791,394,255 and $2,127,222,093, respectively. Cost of investments on a tax basis includes the adjustments for financial reporting purposes as of the most recently completed federal income tax reporting period-end.
| | | | |
| Unrealized Appreciation (Depreciation) of Investment Securities on a Tax Basis | |
Aggregate unrealized appreciation of investment securities | | $ | 2,087,018,377 | |
Aggregate unrealized (depreciation) of investment securities | | | (917,798,047 | ) |
Net unrealized appreciation of investment securities | | $ | 1,169,220,330 | |
Cost of investments for tax purposes is $10,918,314,174.
NOTE 10—Reclassification of Permanent Differences
Primarily as a result of differing book/tax treatment of foreign currency transactions and income distribution reclass, on April 30, 2016, undistributed net investment income was decreased by $1,088,398 and undistributed net realized gain was increased by $1,088,398. This reclassification had no effect on the net assets of the Fund.
NOTE 11—Share Information
| | | | | | | | | | | | | | | | |
| | | Summary of Share Activity | |
| | | Years ended April 30, | |
| | | 2016(a) | | | 2015 | |
| | | Shares | | | Amount | | | Shares | | | Amount | |
Sold: | | | | | | | | | | | | | | | | |
Class A | | | 32,160,583 | | | $ | 742,312,009 | | | | 42,805,803 | | | $ | 1,078,465,439 | |
Class B | | | 28,190 | | | | 661,460 | | | | 75,814 | | | | 1,913,667 | |
Class C | | | 2,110,453 | | | | 49,441,501 | | | | 3,116,176 | | | | 78,520,220 | |
Class R | | | 4,830,506 | | | | 112,910,807 | | | | 10,116,917 | | | | 254,005,100 | |
Class Y | | | 25,974,703 | | | | 595,989,119 | | | | 36,967,146 | | | | 932,318,975 | |
Class R5 | | | 8,083,776 | | | | 188,964,768 | | | | 14,008,268 | | | | 353,583,208 | |
Class R6 | | | 9,355,472 | | | | 215,842,096 | | | | 10,727,401 | | | | 269,985,707 | |
| | | | |
Issued as reinvestment of dividends: | | | | | | | | | | | | | | | | |
Class A | | | 29,208,783 | | | | 629,408,125 | | | | 4,545,606 | | | | 114,046,134 | |
Class B | | | 395,739 | | | | 8,539,004 | | | | 98,425 | | | | 2,469,863 | |
Class C | | | 2,196,248 | | | | 47,119,505 | | | | 197,867 | | | | 4,936,679 | |
Class R | | | 1,916,330 | | | | 41,248,008 | | | | 244,796 | | | | 6,132,336 | |
Class Y | | | 13,674,987 | | | | 295,158,296 | | | | 2,318,380 | | | | 58,209,277 | |
Class R5 | | | 3,750,536 | | | | 80,915,802 | | | | 586,740 | | | | 14,740,866 | |
Class R6 | | | 2,876,832 | | | | 62,068,817 | | | | 428,023 | | | | 10,738,658 | |
| | | | |
Automatic conversion of Class B shares to Class A shares: | | | | | | | | | | | | | | | | |
Class A | | | 1,515,806 | | | | 34,981,774 | | | | 1,987,034 | | | | 50,499,220 | |
Class B | | | (1,516,131 | ) | | | (34,981,774 | ) | | | (1,987,504 | ) | | | (50,499,220 | ) |
| | | | |
Reacquired: | | | | | | | | | | | | | | | | |
Class A | | | (55,976,831 | ) | | | (1,283,773,766 | ) | | | (56,569,461 | ) | | | (1,425,904,103 | ) |
Class B | | | (588,444 | ) | | | (13,719,430 | ) | | | (864,629 | ) | | | (21,758,213 | ) |
Class C | | | (4,443,065 | ) | | | (101,114,794 | ) | | | (3,117,313 | ) | | | (78,689,479 | ) |
Class R | | | (9,000,597 | ) | | | (201,596,469 | ) | | | (5,507,490 | ) | | | (139,328,015 | ) |
Class Y | | | (32,245,007 | ) | | | (740,935,653 | ) | | | (28,950,685 | ) | | | (730,971,799 | ) |
Class R5 | | | (6,019,494 | ) | | | (138,668,988 | ) | | | (8,709,350 | ) | | | (220,801,540 | ) |
Class R6 | | | (6,526,230 | ) | | | (150,177,350 | ) | | | (3,126,203 | ) | | | (79,000,770 | ) |
Net increase in share activity | | | 21,763,145 | | | $ | 440,592,867 | | | | 19,391,761 | | | $ | 483,612,210 | |
| (a) | There are entities that are record owners of more than 5% of the outstanding shares of the Fund and in the aggregate own 37% of the outstanding shares of the Fund. IDI has an agreement with these entities to sell Fund shares. The Fund, Invesco and/or Invesco affiliates may make payments to these entities, which are considered to be related to the Fund, for providing services to the Fund, Invesco and/or Invesco affiliates including but not limited to services such as securities brokerage, distribution, third party record keeping and account servicing. The Fund has no knowledge as to whether all or any portion of the shares owned of record by these entities are also owned beneficially. |
20 Invesco Comstock Fund
NOTE 12—Financial Highlights
The following schedule presents financial highlights for a share of the Fund outstanding throughout the periods indicated.
| | | | | | | | | | | | | | | | | | | | | | | | | | | | | | | | | | | | | | | | | | | | | | | | | | | | | | | | |
| | | Net asset
value,
beginning
of period | | | Net
investment
income(a) | | | Net gains
(losses)
on securities
(both
realized and
unrealized) | | | Total from
investment
operations | | | Dividends
from net
investment
income | | | Distributions
from net
realized
gains | | | Total
distributions | | | Net asset
value, end
of period | | | Total
return(b) | | | Net assets,
end of period
(000’s omitted) | | | Ratio of
expenses
to average
net assets
with fee waivers
and/or expenses
absorbed | | | Ratio of
expenses
to average net
assets without
fee waivers
and/or expenses
absorbed | | | Ratio of net
investment
income
to average
net assets | | | Portfolio
turnover(c) | |
Class A | | | | | | | | | | | | | | | | | | | | | | | | | | | | | | | | | | | | | | | | | | | | | | | | | | | | | | | | |
Year ended 04/30/16 | | $ | 26.04 | | | $ | 0.44 | | | $ | (2.29 | ) | | $ | (1.85 | ) | | $ | (0.36 | ) | | $ | (1.97 | ) | | $ | (2.33 | ) | | $ | 21.86 | | | | (6.90 | )% | | $ | 6,613,286 | | | | 0.84 | %(d) | | | 0.85 | %(d) | | | 1.87 | %(d) | | | 15 | % |
Year ended 04/30/15 | | | 24.29 | | | | 0.32 | | | | 1.84 | | | | 2.16 | | | | (0.41 | ) | | | — | | | | (0.41 | ) | | | 26.04 | | | | 8.98 | | | | 7,698,790 | | | | 0.82 | | | | 0.83 | | | | 1.30 | | | | 17 | |
Year ended 04/30/14 | | | 20.25 | | | | 0.36 | | | | 3.96 | | | | 4.32 | | | | (0.28 | ) | | | — | | | | (0.28 | ) | | | 24.29 | | | | 21.47 | | | | 7,356,633 | | | | 0.81 | | | | 0.82 | | | | 1.59 | | | | 11 | |
Year ended 04/30/13 | | | 16.93 | | | | 0.27 | | | | 3.32 | | | | 3.59 | | | | (0.27 | ) | | | — | | | | (0.27 | ) | | | 20.25 | | | | 21.46 | | | | 6,034,792 | | | | 0.86 | | | | 0.86 | | | | 1.56 | | | | 12 | |
Year ended 04/30/12 | | | 17.20 | | | | 0.25 | | | | (0.30 | ) | | | (0.05 | ) | | | (0.22 | ) | | | — | | | | (0.22 | ) | | | 16.93 | | | | (0.19 | ) | | | 5,473,149 | | | | 0.88 | | | | 0.88 | | | | 1.55 | | | | 17 | |
Class B | | | | | | | | | | | | | | | | | | | | | | | | | | | | | | | | | | | | | | | | | | | | | | | | | | | | | | | | |
Year ended 04/30/16 | | | 26.03 | | | | 0.44 | | | | (2.29 | ) | | | (1.85 | ) | | | (0.36 | ) | | | (1.97 | ) | | | (2.33 | ) | | | 21.85 | | | | (6.91 | )(e) | | | 70,701 | | | | 0.84 | (d)(e) | | | 0.85 | (d)(e) | | | 1.87 | (d)(e) | | | 15 | |
Year ended 04/30/15 | | | 24.28 | | | | 0.32 | | | | 1.84 | | | | 2.16 | | | | (0.41 | ) | | | — | | | | (0.41 | ) | | | 26.03 | | | | 8.98 | (e) | | | 127,988 | | | | 0.82 | (e) | | | 0.83 | (e) | | | 1.30 | (e) | | | 17 | |
Year ended 04/30/14 | | | 20.23 | | | | 0.32 | | | | 3.97 | | | | 4.29 | | | | (0.24 | ) | | | — | | | | (0.24 | ) | | | 24.28 | | | | 21.31 | (e) | | | 184,409 | | | | 0.96 | (e) | | | 0.97 | (e) | | | 1.44 | (e) | | | 11 | |
Year ended 04/30/13 | | | 16.93 | | | | 0.23 | | | | 3.30 | | | | 3.53 | | | | (0.23 | ) | | | — | | | | (0.23 | ) | | | 20.23 | | | | 21.11 | | | | 248,404 | | | | 1.09 | | | | 1.61 | | | | 1.33 | | | | 12 | |
Year ended 04/30/12 | | | 17.20 | | | | 0.25 | | | | (0.30 | ) | | | (0.05 | ) | | | (0.22 | ) | | | — | | | | (0.22 | ) | | | 16.93 | | | | (0.19 | )(e) | | | 343,166 | | | | 0.88 | (e) | | | 0.88 | (e) | | | 1.55 | (e) | | | 17 | |
Class C | | | | | | | | | | | | | | | | | | | | | | | | | | | | | | | | | | | | | | | | | | | | | | | | | | | | | | | | |
Year ended 04/30/16 | | | 26.03 | | | | 0.27 | | | | (2.29 | ) | | | (2.02 | ) | | | (0.19 | ) | | | (1.97 | ) | | | (2.16 | ) | | | 21.85 | | | | (7.59 | )(f) | | | 532,230 | | | | 1.56 | (d)(f) | | | 1.57 | (d)(f) | | | 1.15 | (d)(f) | | | 15 | |
Year ended 04/30/15 | | | 24.28 | | | | 0.13 | | | | 1.84 | | | | 1.97 | | | | (0.22 | ) | | | — | | | | (0.22 | ) | | | 26.03 | | | | 8.17 | | | | 637,579 | | | | 1.57 | | | | 1.58 | | | | 0.55 | | | | 17 | |
Year ended 04/30/14 | | | 20.24 | | | | 0.19 | | | | 3.96 | | | | 4.15 | | | | (0.11 | ) | | | — | | | | (0.11 | ) | | | 24.28 | | | | 20.57 | | | | 589,910 | | | | 1.56 | | | | 1.57 | | | | 0.84 | | | | 11 | |
Year ended 04/30/13 | | | 16.93 | | | | 0.14 | | | | 3.31 | | | | 3.45 | | | | (0.14 | ) | | | — | | | | (0.14 | ) | | | 20.24 | | | | 20.52 | | | | 469,962 | | | | 1.61 | | | | 1.61 | | | | 0.81 | | | | 12 | |
Year ended 04/30/12 | | | 17.20 | | | | 0.13 | | | | (0.30 | ) | | | (0.17 | ) | | | (0.10 | ) | | | — | | | | (0.10 | ) | | | 16.93 | | | | (0.94 | ) | | | 448,866 | | | | 1.63 | | | | 1.63 | | | | 0.80 | | | | 17 | |
Class R | | | | | | | | | | | | | | | | | | | | | | | | | | | | | | | | | | | | | | | | | | | | | | | | | | | | | | | | |
Year ended 04/30/16 | | | 26.04 | | | | 0.38 | | | | (2.29 | ) | | | (1.91 | ) | | | (0.30 | ) | | | (1.97 | ) | | | (2.27 | ) | | | 21.86 | | | | (7.14 | ) | | | 358,835 | | | | 1.09 | (d) | | | 1.10 | (d) | | | 1.62 | (d) | | | 15 | |
Year ended 04/30/15 | | | 24.29 | | | | 0.26 | | | | 1.84 | | | | 2.10 | | | | (0.35 | ) | | | — | | | | (0.35 | ) | | | 26.04 | | | | 8.71 | | | | 486,154 | | | | 1.07 | | | | 1.08 | | | | 1.05 | | | | 17 | |
Year ended 04/30/14 | | | 20.24 | | | | 0.30 | | | | 3.97 | | | | 4.27 | | | | (0.22 | ) | | | — | | | | (0.22 | ) | | | 24.29 | | | | 21.22 | | | | 335,562 | | | | 1.06 | | | | 1.07 | | | | 1.34 | | | | 11 | |
Year ended 04/30/13 | | | 16.93 | | | | 0.23 | | | | 3.31 | | | | 3.54 | | | | (0.23 | ) | | | — | | | | (0.23 | ) | | | 20.24 | | | | 21.11 | | | | 220,443 | | | | 1.11 | | | | 1.11 | | | | 1.31 | | | | 12 | |
Year ended 04/30/12 | | | 17.19 | | | | 0.20 | | | | (0.28 | ) | | | (0.08 | ) | | | (0.18 | ) | | | — | | | | (0.18 | ) | | | 16.93 | | | | (0.38 | ) | | | 191,685 | | | | 1.13 | | | | 1.13 | | | | 1.30 | | | | 17 | |
Class Y | | | | | | | | | | | | | | | | | | | | | | | | | | | | | | | | | | | | | | | | | | | | | | | | | | | | | | | | |
Year ended 04/30/16 | | | 26.04 | | | | 0.49 | | | | (2.28 | ) | | | (1.79 | ) | | | (0.42 | ) | | | (1.97 | ) | | | (2.39 | ) | | | 21.86 | | | | (6.67 | ) | | | 3,034,620 | | | | 0.59 | (d) | | | 0.60 | (d) | | | 2.12 | (d) | | | 15 | |
Year ended 04/30/15 | | | 24.29 | | | | 0.39 | | | | 1.84 | | | | 2.23 | | | | (0.48 | ) | | | — | | | | (0.48 | ) | | | 26.04 | | | | 9.26 | | | | 3,422,401 | | | | 0.57 | | | | 0.58 | | | | 1.55 | | | | 17 | |
Year ended 04/30/14 | | | 20.25 | | | | 0.41 | | | | 3.97 | | | | 4.38 | | | | (0.34 | ) | | | — | | | | (0.34 | ) | | | 24.29 | | | | 21.77 | | | | 2,941,152 | | | | 0.56 | | | | 0.57 | | | | 1.84 | | | | 11 | |
Year ended 04/30/13 | | | 16.93 | | | | 0.32 | | | | 3.31 | | | | 3.63 | | | | (0.31 | ) | | | — | | | | (0.31 | ) | | | 20.25 | | | | 21.76 | | | | 2,151,816 | | | | 0.61 | | | | 0.61 | | | | 1.81 | | | | 12 | |
Year ended 04/30/12 | | | 17.20 | | | | 0.28 | | | | (0.29 | ) | | | (0.01 | ) | | | (0.26 | ) | | | — | | | | (0.26 | ) | | | 16.93 | | | | 0.06 | | | | 2,135,728 | | | | 0.63 | | | | 0.63 | | | | 1.80 | | | | 17 | |
Class R5 | | | | | | | | | | | | | | | | | | | | | | | | | | | | | | | | | | | | | | | | | | | | | | | | | | | | | | | | |
Year ended 04/30/16 | | | 26.04 | | | | 0.51 | | | | (2.29 | ) | | | (1.78 | ) | | | (0.44 | ) | | | (1.97 | ) | | | (2.41 | ) | | | 21.85 | | | | (6.61 | ) | | | 824,228 | | | | 0.49 | (d) | | | 0.50 | (d) | | | 2.22 | (d) | | | 15 | |
Year ended 04/30/15 | | | 24.29 | | | | 0.41 | | | | 1.84 | | | | 2.25 | | | | (0.50 | ) | | | — | | | | (0.50 | ) | | | 26.04 | | | | 9.36 | | | | 830,574 | | | | 0.49 | | | | 0.50 | | | | 1.63 | | | | 17 | |
Year ended 04/30/14 | | | 20.24 | | | | 0.43 | | | | 3.97 | | | | 4.40 | | | | (0.35 | ) | | | — | | | | (0.35 | ) | | | 24.29 | | | | 21.92 | | | | 631,780 | | | | 0.49 | | | | 0.50 | | | | 1.91 | | | | 11 | |
Year ended 04/30/13 | | | 16.93 | | | | 0.34 | | | | 3.31 | | | | 3.65 | | | | (0.34 | ) | | | — | | | | (0.34 | ) | | | 20.24 | | | | 21.85 | | | | 398,311 | | | | 0.49 | | | | 0.49 | | | | 1.93 | | | | 12 | |
Year ended 04/30/12 | | | 17.19 | | | | 0.31 | | | | (0.28 | ) | | | 0.03 | | | | (0.29 | ) | | | — | | | | (0.29 | ) | | | 16.93 | | | | 0.33 | | | | 397,292 | | | | 0.44 | | | | 0.44 | | | | 1.99 | | | | 17 | |
Class R6 | | | | | | | | | | | | | | | | | | | | | | | | | | | | | | | | | | | | | | | | | | | | | | | | | | | | | | | | |
Year ended 04/30/16 | | | 26.03 | | | | 0.54 | | | | (2.29 | ) | | | (1.75 | ) | | | (0.46 | ) | | | (1.97 | ) | | | (2.43 | ) | | | 21.85 | | | | (6.48 | ) | | | 624,206 | | | | 0.39 | (d) | | | 0.40 | (d) | | | 2.32 | (d) | | | 15 | |
Year ended 04/30/15 | | | 24.28 | | | | 0.44 | | | | 1.83 | | | | 2.27 | | | | (0.52 | ) | | | — | | | | (0.52 | ) | | | 26.03 | | | | 9.46 | | | | 595,160 | | | | 0.39 | | | | 0.40 | | | | 1.73 | | | | 17 | |
Year ended 04/30/14 | | | 20.25 | | | | 0.45 | | | | 3.95 | | | | 4.40 | | | | (0.37 | ) | | | — | | | | (0.37 | ) | | | 24.28 | | | | 21.92 | | | | 360,178 | | | | 0.40 | | | | 0.41 | | | | 2.00 | | | | 11 | |
Year ended 04/30/13(h) | | | 17.67 | | | | 0.22 | | | | 2.54 | | | | 2.76 | | | | (0.18 | ) | | | — | | | | (0.18 | ) | | | 20.25 | | | | 15.73 | | | | 148,859 | | | | 0.41 | (g) | | | 0.41 | (g) | | | 2.01 | (g) | | | 12 | |
| (a) | Calculated using average shares outstanding. |
| (b) | Includes adjustments in accordance with accounting principles generally accepted in the United States of America and as such, the net asset value for financial reporting purposes and the returns based upon those net asset values may differ from the net asset value and returns for shareholder transactions. Does not include sales charges and is not annualized for periods less than one year, if applicable. |
| (c) | Portfolio turnover is calculated at the fund level and is not annualized for periods less than one year, if applicable. For the period ended April 30, 2012, the portfolio turnover calculation excludes the value of securities purchased of $279,205,287 and sold of $89,253,686 in the effort to realign the Fund’s portfolio holdings after the reorganization of Invesco Large Cap Basic Value Fund, Invesco Value Fund and Invesco Value II into the Fund. |
| (d) | Ratios are based on average daily net assets (000’s omitted) of $6,917,250, $96,261, $569,801, $422,318, $3,125,497, $797,546 and $611,096 for Class A, Class B, Class C, Class R, Class Y, Class R5 and Class R6 shares, respectively. |
| (e) | The total return, ratio of expenses to average net assets and ratio of net investment income (loss) to average net assets reflect actual 12b-1 fees of 0.25% for the years ended April 30, 2016 and April 30, 2015, 0.40% for the year ended April 30, 2014, 0.25% for the year ended April 30, 2012 for Class B shares. |
| (f) | The total return, ratio of expenses to average net assets and ratio of net investment income (loss) to average net assets reflect actual 12b-1 fees of 0.97% for the year ended April 30, 2016 for Class C shares. |
| (h) | Commencement date September 24, 2012. |
21 Invesco Comstock Fund
Report of Independent Registered Public Accounting Firm
To the Board of Trustees of AIM Sector Funds (Invesco Sector Funds)
and Shareholders of Invesco Comstock Fund:
In our opinion, the accompanying statement of assets and liabilities, including the schedule of investments, and the related statements of operations and of changes in net assets and the financial highlights present fairly, in all material respects, the financial position of Invesco Comstock Fund (one of the funds constituting AIM Sector Funds (Invesco Sector Funds), hereafter referred to as the “Fund”) at April 30, 2016, the results of its operations for the year then ended, the changes in its net assets for each of the two years in the period then ended and the financial highlights for each of the five years in the period then ended, in conformity with accounting principles generally accepted in the United States of America. These financial statements and financial highlights (hereafter referred to as “financial statements”) are the responsibility of the Fund’s management; our responsibility is to express an opinion on these financial statements based on our audits. We conducted our audits of these financial statements in accordance with the standards of the Public Company Accounting Oversight Board (United States). Those standards require that we plan and perform the audit to obtain reasonable assurance about whether the financial statements are free of material misstatement. An audit includes examining, on a test basis, evidence supporting the amounts and disclosures in the financial statements, assessing the accounting principles used and significant estimates made by management, and evaluating the overall financial statement presentation. We believe that our audits, which included confirmation of securities at April 30, 2016 by correspondence with the custodian and brokers, and the application of alternative auditing procedures where confirmations of security purchases have not been received, provide a reasonable basis for our opinion.
PRICEWATERHOUSECOOPERS LLP
June 22, 2016
Houston, Texas
22 Invesco Comstock Fund
Calculating your ongoing Fund expenses
Example
As a shareholder of the Fund, you incur two types of costs: (1) transaction costs, which may include sales charges (loads) on purchase payments or contingent deferred sales charges on redemptions, if any; and (2) ongoing costs, including management fees, distribution and/or service (12b-1) fees, and other Fund expenses. This example is intended to help you understand your ongoing costs (in dollars) of investing in the Fund and to compare these costs with ongoing costs of investing in other mutual funds. The example is based on an investment of $1,000 invested at the beginning of the period and held for the entire period November 1, 2015 through April 30, 2016.
Actual expenses
The table below provides information about actual account values and actual expenses. You may use the information in this table, together with the amount you invested, to estimate the expenses that you paid over the period. Simply divide your account value by $1,000 (for example, an $8,600 account value divided by $1,000 = 8.6), then multiply the result by the number in the table under the heading entitled “Actual Expenses Paid During Period” to estimate the expenses you paid on your account during this period.
Hypothetical example for comparison purposes
The table below also provides information about hypothetical account values and hypothetical expenses based on the Fund’s actual expense ratio and an assumed rate of return of 5% per year before expenses, which is not the Fund’s actual return.
The hypothetical account values and expenses may not be used to estimate the actual ending account balance or expenses you paid for the period. You may use this information to compare the ongoing costs of investing in the Fund and other funds. To do so, compare this 5% hypothetical example with the 5% hypothetical examples that appear in the shareholder reports of the other funds.
Please note that the expenses shown in the table are meant to highlight your ongoing costs only and do not reflect any transaction costs, such as sales charges (loads) on purchase payments or contingent deferred sales charges on redemptions, if any. Therefore, the hypothetical information is useful in comparing ongoing costs only, and will not help you determine the relative total costs of owning different funds. In addition, if these transaction costs were included, your costs would have been higher.
| | | | | | | | | | | | | | | | | | | | | | | | |
| Class | | Beginning
Account Value
(11/01/15) | | | ACTUAL | | | HYPOTHETICAL (5% annual return before
expenses) | | | Annualized
Expense
Ratio | |
| | | Ending
Account Value
(04/30/16)1 | | | Expenses
Paid During
Period2 | | | Ending
Account Value
(04/30/16) | | | Expenses
Paid During
Period2 | | |
| A | | $ | 1,000.00 | | | $ | 980.00 | | | $ | 4.23 | | | $ | 1,020.59 | | | $ | 4.32 | | | | 0.86 | % |
| B | | | 1,000.00 | | | | 980.00 | | | | 4.23 | | | | 1,020.59 | | | | 4.32 | | | | 0.86 | |
| C | | | 1,000.00 | | | | 976.40 | | | | 7.86 | | | | 1,016.91 | | | | 8.02 | | | | 1.60 | |
| R | | | 1,000.00 | | | | 978.80 | | | | 5.46 | | | | 1,019.34 | | | | 5.57 | | | | 1.11 | |
| Y | | | 1,000.00 | | | | 981.30 | | | | 3.00 | | | | 1,021.83 | | | | 3.07 | | | | 0.61 | |
| R5 | | | 1,000.00 | | | | 981.80 | | | | 2.46 | | | | 1,022.38 | | | | 2.51 | | | | 0.50 | |
| R6 | | | 1,000.00 | | | | 1,017.60 | | | | 2.06 | | | | 1,022.82 | | | | 2.06 | | | | 0.41 | |
| 1 | The actual ending account value is based on the actual total return of the Fund for the period November 1, 2015 through April 30, 2016, after actual expenses and will differ from the hypothetical ending account value which is based on the Fund’s expense ratio and a hypothetical annual return of 5% before expenses. |
| 2 | Expenses are equal to the Fund’s annualized expense ratio as indicated above multiplied by the average account value over the period, multiplied by 182/366 to reflect the most recent fiscal half year. |
23 Invesco Comstock Fund
Tax Information
Form 1099-DIV, Form 1042-S and other year–end tax information provide shareholders with actual calendar year amounts that should be included in their tax returns. Shareholders should consult their tax advisors.
The following distribution information is being provided as required by the Internal Revenue Code or to meet a specific state’s requirement.
The Fund designates the following amounts or, if subsequently determined to be different, the maximum amount allowable for its fiscal year ended April 30, 2016:
| | | | |
Federal and State Income Tax | |
Long-Term Capital Gain Distributions | | $ | 1,002,729,910 | |
Qualified Dividend Income* | | | 100 | % |
Corporate Dividends Received Deduction* | | | 100 | % |
U.S. Treasury Obligations* | | | 0 | % |
| | * | The above percentages are based on ordinary income dividends paid to shareholders during the Fund’s fiscal year. |
| | | | |
Non-Resident Alien Shareholders | |
Qualified Short-Term Gains | | $ | 18,850,194 | |
24 Invesco Comstock Fund
Trustees and Officers
The address of each trustee and officer is AIM Sector Funds (Invesco Sector Funds) (the “Trust”), 11 Greenway Plaza, Suite 1000, Houston, Texas 77046-1173. The trustees serve for the life of the Trust, subject to their earlier death, incapacitation, resignation, retirement or removal as more specifically provided in the Trust’s organizational documents. Each officer serves for a one year term or until their successors are elected and qualified. Column two below includes length of time served with predecessor entities, if any.
| | | | | | | | |
Name, Year of Birth and
Position(s) Held with the Trust | | Trustee and/
or Officer Since | | Principal Occupation(s) During Past 5 Years | | Number of Funds in Fund Complex Overseen by Trustee | | Other Directorship(s) Held by Trustee During Past 5 Years |
| Interested Persons | | | | | | | | |
Martin L. Flanagan1 — 1960 Trustee | | 2007 | | Executive Director, Chief Executive Officer and President, Invesco Ltd. (ultimate parent of Invesco and a global investment management firm); Advisor to the Board, Invesco Advisers, Inc. (formerly known as Invesco Institutional (N.A.), Inc.); Trustee, The Invesco Funds; Vice Chair, Investment Company Institute; and Member of Executive Board, SMU Cox School of Business Formerly: Chairman and Chief Executive Officer, Invesco Advisers, Inc. (registered investment adviser); Director, Chairman, Chief Executive Officer and President, IVZ Inc. (holding company), INVESCO Group Services, Inc. (service provider) and Invesco North American Holdings, Inc. (holding company); Director, Chief Executive Officer and President, Invesco Holding Company Limited (parent of Invesco and a global investment management firm); Director, Invesco Ltd.; Chairman, Investment Company Institute and President, Co-Chief Executive Officer, Co-President, Chief Operating Officer and Chief Financial Officer, Franklin Resources, Inc. (global investment management organization) | | 146 | | None |
Philip A. Taylor2 — 1954 Trustee and Senior Vice President | | 2006 | | Head of the Americas and Senior Managing Director, Invesco Ltd.; Director, Co-Chairman, Co-President and Co-Chief Executive Officer, Invesco Advisers, Inc. (formerly known as Invesco Institutional (N.A.), Inc.) (registered investment adviser); Director, Chairman, Chief Executive Officer and President, Invesco Management Group, Inc. (formerly known as Invesco AIM Management Group, Inc.) (financial services holding company); Director and Chairman, Invesco Investment Services, Inc. (formerly known as Invesco AIM Investment Services, Inc.) (registered transfer agent) Chief Executive Officer, Invesco Corporate Class Inc. (corporate mutual fund company) Director, Chairman and Chief Executive Officer, Invesco Canada Ltd. (formerly known as Invesco Trimark Ltd./Invesco Trimark Ltèe) (registered investment adviser and registered transfer agent); Trustee and Senior Vice President, The Invesco Funds; Director, Invesco Investment Advisers LLC (formerly known as Van Kampen Asset Management); Director, Chief Executive Officer and President, Van Kampen Exchange Corp. Formerly: President and Principal Executive Officer, The Invesco Funds (other than AIM Treasurer’s Series Trust (Invesco Treasurer’s Series Trust), Short-Term Investments Trust and Invesco Management Trust); Executive Vice President, The Invesco Funds (AIM Treasurer’s Series Trust (Invesco Treasurer’s Series Trust), Short-Term Investments Trust and Invesco Management Trust only); Director and President, INVESCO Funds Group, Inc. (registered investment adviser and registered transfer agent); Director and Chairman, IVZ Distributors, Inc. (formerly known as INVESCO Distributors, Inc.) (registered broker dealer); Director, President and Chairman, Invesco Inc. (holding company), Invesco Canada Holdings Inc. (holding company), Trimark Investments Ltd./Placements Trimark Ltèe and Invesco Financial Services Ltd/Services Financiers Invesco Ltèe; Chief Executive Officer, Invesco Canada Fund Inc. (corporate mutual fund company); Director and Chairman, Van Kampen Investor Services Inc.; Director, Chief Executive Officer and President, 1371 Preferred Inc. (holding company) and Van Kampen Investments Inc.; Director and President, AIM GP Canada Inc. (general partner for limited partnerships) and Van Kampen Advisors, Inc.; Director and Chief Executive Officer, Invesco Trimark Dealer Inc. (registered broker dealer); Director, Invesco Distributors, Inc. (formerly known as Invesco AIM Distributors, Inc.) (registered broker dealer); Manager, Invesco PowerShares Capital Management LLC; Director, Chief Executive Officer and President, Invesco Advisers, Inc.; Director, Chairman, Chief Executive Officer and President, Invesco AIM Capital Management, Inc.; President, Invesco Trimark Dealer Inc. and Invesco Trimark Ltd./Invesco Trimark Ltèe; Director and President, AIM Trimark Corporate Class Inc. and AIM Trimark Canada Fund Inc.; Senior Managing Director, Invesco Holding Company Limited; Director and Chairman, Fund Management Company (former registered broker dealer); President and Principal Executive Officer, The Invesco Funds (AIM Treasurer’s Series Trust (Invesco Treasurer’s Series Trust), and Short-Term Investments Trust only); President, AIM Trimark Global Fund Inc. and AIM Trimark Canada Fund Inc. | | 146 | | None |
| 1 | Mr. Flanagan is considered an interested person (within the meaning of Section 2(a)(19) of the 1940 Act) of the Trust because he is an officer of the Adviser to the Trust, and an officer and a director of Invesco Ltd., ultimate parent of the Adviser. |
| 2 | Mr. Taylor is considered an interested person (within the meaning of Section 2(a)(19) of the 1940 Act) of the Trust because he is an officer and a director of the Adviser. |
T-1 Invesco Comstock Fund
Trustees and Officers—(continued)
| | | | | | | | |
Name, Year of Birth and
Position(s) Held with the Trust | | Trustee and/
or Officer Since | | Principal Occupation(s) During Past 5 Years | | Number of Funds in Fund Complex Overseen by Trustee | | Other Directorship(s) Held by Trustee During Past 5 Years |
| Independent Trustees | | | | | | | | |
Bruce L. Crockett — 1944 Trustee and Chair | | 2003 | | Chairman, Crockett Technologies Associates (technology consulting company) Formerly: Director, Captaris (unified messaging provider); Director, President and Chief Executive Officer, COMSAT Corporation; Chairman, Board of Governors of INTELSAT (international communications company); ACE Limited (insurance company); Independent Directors Council and Investment Company Institute | | 146 | | ALPS (Attorneys Liability Protection Society) (insurance company) and Globe Specialty Metals, Inc. (metallurgical company); Member of the Audit Committee, Ferroglobe PLC and Investment Company Institute; Member of the Executive Committee and Chair of the Governance Committee, Independent Directors Council |
David C. Arch — 1945 Trustee | | 2010 | | Chairman of Blistex Inc., a consumer health care products manufacturer | | 146 | | Board member of the Illinois Manufacturers’ Association; Member of the Board of Visitors, Institute for the Humanities, University of Michigan |
James T. Bunch — 1942 Trustee | | 2000 | | Managing Member, Grumman Hill Group LLC (family office/private equity investments) Formerly: Chairman of the Board, Denver Film Society, Chairman of the Board of Trustees, Evans Scholarship Foundation; Chairman, Board of Governors, Western Golf Association | | 146 | | Trustee, Evans Scholarship Foundation |
Albert R. Dowden — 1941 Trustee | | 2003 | | Director of a number of public and private business corporations, including Nature’s Sunshine Products, Inc. Formerly: Director, The Boss Group, Ltd. and Reich & Tang Funds (5 portfolios) (registered investment company); Director, Homeowners of America Holding Corporation/Homeowners of America Insurance Company (property casualty company); Director, Continental Energy Services, LLC (oil and gas pipeline service); Director, CompuDyne Corporation (provider of product and services to the public security market) and Director, Annuity and Life Re (Holdings), Ltd. (reinsurance company); Director, President and Chief Executive Officer, Volvo Group North America, Inc.; Senior Vice President, AB Volvo; Director of various public and private corporations; Chairman, DHJ Media, Inc.; Director, Magellan Insurance Company; and Director, The Hertz Corporation, Genmar Corporation (boat manufacturer), National Media Corporation; Advisory Board of Rotary Power International (designer, manufacturer, and seller of rotary power engines); and Chairman, Cortland Trust, Inc. (registered investment company) | | 146 | | Director of Nature’s Sunshine Products, Inc. |
Jack M. Fields — 1952 Trustee | | 2003 | | Chief Executive Officer, Twenty First Century Group, Inc. (government affairs company); and Discovery Learning Alliance (non-profit) Formerly: Owner and Chief Executive Officer, Dos Angeles Ranch L.P. (cattle, hunting, corporate entertainment); Director, Insperity, Inc. (formerly known as Administaff); Chief Executive Officer, Texana Timber LP (sustainable forestry company); Director of Cross Timbers Quail Research Ranch (non-profit); and member of the U.S. House of Representatives | | 146 | | None |
Eli Jones — 1961 Trustee | | 2016 | | Professor and Dean, Mays Business School — Texas A&M University Formerly: Professor and Dean, Walton College of Business, University of Arkansas and E.J. Ourso College of Business, Louisiana State University and Director, Arvest Bank | | 146 | | Director of Insperity, Inc. (formerly known as Administaff) |
Prema Mathai-Davis — 1950 Trustee | | 2003 | | Retired. Formerly: Chief Executive Officer, YWCA of the U.S.A. | | 146 | | None |
Larry Soll — 1942 Trustee | | 1997 | | Retired. Formerly: Chairman, Chief Executive Officer and President, Synergen Corp. (a biotechnology company) | | 146 | | None |
Raymond Stickel, Jr. — 1944 Trustee | | 2005 | | Retired. Formerly: Director, Mainstay VP Series Funds, Inc. (25 portfolios) and Partner, Deloitte & Touche | | 146 | | None |
Robert C. Troccoli — 1949 Trustee | | 2016 | | Adjunct Professor and Executive-in-Residence, University of Denver — Daniels College of Business Formerly: Senior Partner, KPMG LLP | | 146 | | None |
T-2 Invesco Comstock Fund
Trustees and Officers—(continued)
| | | | | | | | |
Name, Year of Birth and
Position(s) Held with the Trust | | Trustee and/
or Officer Since | | Principal Occupation(s) During Past 5 Years | | Number of Funds in Fund Complex Overseen by Trustee | | Other Directorship(s) Held by Trustee During Past 5 Years |
| Independent Trustees—(continued) |
Suzanne H. Woolsey — 1941 Trustee | | 2014 | | Retired. Formerly: Chief Executive Officer of Woolsey Partners LLC | | 146 | | Director, SunShare LLC; Trustee, Ocean Conservancy; Emeritus Chair of the Board of Trustees of the Institute for Defense Analyses and of Colorado College; Trustee, Chair, Business and Finance Committee of California Institute of Technology; Prior to 2014, Director of Fluor Corp.; Prior to 2010, Trustee of the German Marshall Fund of the United States; Prior to 2010, Trustee of the Rocky Mountain Institute |
| Other Officers | | | | | | | | |
Sheri Morris — 1964 President, Principal Executive Officer and Treasurer | | 2003 | | President, Principal Executive Officer and Treasurer, The Invesco Funds; Vice President, Invesco Advisers, Inc. (formerly known as Invesco Institutional (N.A.), Inc.) (registered investment adviser); and Vice President, PowerShares Exchange-Traded Fund Trust, PowerShares Exchange-Traded Fund Trust II, PowerShares India Exchange-Traded Fund Trust, PowerShares Actively Managed Exchange-Traded Fund Trust, and PowerShares Actively Managed Exchange-Traded Commodity Fund Trust Formerly: Vice President and Principal Financial Officer, The Invesco Funds; Vice President, Invesco AIM Advisers, Inc., Invesco AIM Capital Management, Inc. and Invesco AIM Private Asset Management, Inc.; Assistant Vice President and Assistant Treasurer, The Invesco Funds and Assistant Vice President, Invesco Advisers, Inc., Invesco AIM Capital Management, Inc. and Invesco AIM Private Asset Management, Inc.; and Treasurer, PowerShares Exchange-Traded Fund Trust, PowerShares Exchange-Traded Fund Trust II, PowerShares India Exchange-Traded Fund Trust and PowerShares Actively Managed Exchange-Traded Fund Trust | | N/A | | N/A |
Russell C. Burk — 1958 Senior Vice President and Senior Officer | | 2005 | | Senior Vice President and Senior Officer, The Invesco Funds | | N/A | | N/A |
John M. Zerr — 1962 Senior Vice President, Chief Legal Officer and Secretary | | 2006 | | Director, Senior Vice President, Secretary and General Counsel, Invesco Management Group, Inc. (formerly known as Invesco AIM Management Group, Inc.) and Van Kampen Exchange Corp.; Senior Vice President, Invesco Advisers, Inc. (formerly known as Invesco Institutional (N.A.), Inc.) (registered investment adviser); Senior Vice President and Secretary, Invesco Distributors, Inc. (formerly known as Invesco AIM Distributors, Inc.); Director, Vice President and Secretary, Invesco Investment Services, Inc. (formerly known as Invesco AIM Investment Services, Inc.) Senior Vice President, Chief Legal Officer and Secretary, The Invesco Funds; Managing Director, Invesco PowerShares Capital Management LLC; Director, Secretary and General Counsel, Invesco Investment Advisers LLC (formerly known as Van Kampen Asset Management); Secretary and General Counsel, Invesco Capital Markets, Inc. (formerly known as Van Kampen Funds Inc.) and Chief Legal Officer, PowerShares Exchange-Traded Fund Trust, PowerShares Exchange-Traded Fund Trust II, PowerShares India Exchange-Traded Fund Trust, PowerShares Actively Managed Exchange-Traded Fund Trust, and PowerShares Actively Managed Exchange-Traded Commodity Fund Trust Formerly: Director, Vice President and Secretary, IVZ Distributors, Inc. (formerly known as INVESCO Distributors, Inc.); Director and Vice President, INVESCO Funds Group, Inc.; Director and Vice President, Van Kampen Advisors Inc.; Director, Vice President, Secretary and General Counsel, Van Kampen Investor Services Inc.; Director, Invesco Distributors, Inc. (formerly known as Invesco AIM Distributors, Inc.); Director, Senior Vice President, General Counsel and Secretary, Invesco AIM Advisers, Inc. and Van Kampen Investments Inc.; Director, Vice President and Secretary, Fund Management Company; Director, Senior Vice President, Secretary, General Counsel and Vice President, Invesco AIM Capital Management, Inc.; Chief Operating Officer and General Counsel, Liberty Ridge Capital, Inc. (an investment adviser); Vice President and Secretary, PBHG Funds (an investment company) and PBHG Insurance Series Fund (an investment company); Chief Operating Officer, General Counsel and Secretary, Old Mutual Investment Partners (a broker-dealer); General Counsel and Secretary, Old Mutual Fund Services (an administrator) and Old Mutual Shareholder Services (a shareholder servicing center); Executive Vice President, General Counsel and Secretary, Old Mutual Capital, Inc. (an investment adviser); and Vice President and Secretary, Old Mutual Advisors Funds (an investment company) | | N/A | | N/A |
T-3 Invesco Comstock Fund
Trustees and Officers—(continued)
| | | | | | | | |
Name, Year of Birth and
Position(s) Held with the Trust | | Trustee and/
or Officer Since | | Principal Occupation(s) During Past 5 Years | | Number of Funds in Fund Complex Overseen by Trustee | | Other Directorship(s) Held by Trustee During Past 5 Years |
| Other Officers—(continued) | | | | | | | | |
Karen Dunn Kelley — 1960 Senior Vice President | | 2003 | | Senior Managing Director, Investments, Invesco Ltd.; Director, Co-President, Co-Chief Executive Officer, and Co-Chairman, Invesco Advisers, Inc. (formerly known as Invesco Institutional (N.A.), Inc.) (registered investment adviser); Chairman and Director, Invesco Senior Secured Management, Inc.; Senior Vice President, Invesco Management Group, Inc. (formerly known as Invesco AIM Management Group, Inc.); Executive Vice President, Invesco Distributors, Inc. (formerly known as Invesco AIM Distributors, Inc.); Director, Invesco Mortgage Capital Inc. and Invesco Management Company Limited; Senior Vice President, The Invesco Funds Formerly: Vice President, The Invesco Funds (other than AIM Treasurer’s Series Trust (Invesco Treasurer’s Series Trust), Short-Term Investments Trust and Invesco Management Trust); and President and Principal Executive Officer, The Invesco Funds (AIM Treasurer’s Series Trust (Invesco Treasurer’s Series Trust), Short-Term Investments Trust and Invesco Management Trust only); Director and President, INVESCO Asset Management (Bermuda) Ltd., Director, INVESCO Global Asset Management DAC (formerly known as INVESCO Global Asset Management Limited) and INVESCO Management S.A.; Senior Vice President, Van Kampen Investments Inc. and Invesco Advisers, Inc. (formerly known as Invesco Institutional (N.A.), Inc.) (registered investment adviser); Director and President, Fund Management Company; Chief Cash Management Officer, Director of Cash Management, Senior Vice President, and Managing Director, Invesco AIM Capital Management, Inc.; Director of Cash Management, Senior Vice President, and Vice President, Invesco Advisers, Inc. and The Invesco Funds (AIM Treasurer’s Series Trust (Invesco Treasurer’s Series Trust), and Short-Term Investments Trust only) | | N/A | | N/A |
Kelli Gallegos — 1970 Vice President, Principal Financial Officer and Assistant Treasurer | | 2008 | | Vice President, Principal Financial Officer and Assistant Treasurer, The Invesco Funds; Assistant Treasurer, Invesco PowerShares Capital Management LLC, PowerShares Exchange-Traded Fund Trust, PowerShares Exchange-Traded Fund Trust II, PowerShares India Exchange-Traded Fund Trust, PowerShares Actively Managed Exchange-Traded Fund Trust, and PowerShares Actively Managed Exchange-Traded Commodity Fund Trust Formerly: Assistant Vice President, The Invesco Funds | | N/A | | N/A |
Tracy Sullivan — 1962 Vice President, Chief Tax Officer and Assistant Treasurer | | 2008 | | Vice President, Chief Tax Officer and Assistant Treasurer, The Invesco Funds; Assistant Treasurer, Invesco PowerShares Capital Management LLC, PowerShares Exchange-Traded Fund Trust, PowerShares Exchange-Traded Fund Trust II, PowerShares India Exchange-Traded Fund Trust, PowerShares Actively Managed Exchange-Traded Fund Trust, and PowerShares Actively Managed Exchange-Traded Commodity Fund Trust Formerly: Assistant Vice President, The Invesco Funds | | N/A | | N/A |
Crissie M. Wisdom — 1969 Anti-Money Laundering Compliance Officer | | 2013 | | Anti-Money Laundering Compliance Officer, Invesco Advisers, Inc. (formerly known as Invesco Institutional (N.A.), Inc.) (registered investment adviser), Invesco Capital Markets, Inc. (formerly known as Van Kampen Funds Inc.), Invesco Distributors, Inc., Invesco Investment Services, Inc., Invesco Management Group, Inc., Van Kampen Exchange Corp., The Invesco Funds, and PowerShares Exchange-Traded Fund Trust, PowerShares Exchange-Traded Fund Trust II, PowerShares India Exchange-Traded Fund Trust, PowerShares Actively Managed Exchange-Traded Fund Trust and PowerShares Actively Managed Exchange-Traded Commodity Fund Trust; Anti-Money Laundering Compliance Officer and Bank Secrecy Act Officer, INVESCO National Trust Company and Invesco Trust Company; and Fraud Prevention Manager and Controls and Risk Analysis Manager for Invesco Investment Services, Inc. | | N/A | | N/A |
Robert R. Leveille — 1969 Chief Compliance Officer | | 2016 | | Chief Compliance Officer, Invesco Advisers, Inc. (registered investment adviser); and Chief Compliance Officer, The Invesco Funds Formerly: Chief Compliance Officer, Putnam Investments and the Putnam Funds | | N/A | | N/A |
The Statement of Additional Information of the Trust includes additional information about the Fund’s Trustees and is available upon request, without charge, by calling 1.800.959.4246. Please refer to the Fund’s Statement of Additional Information for information on the Fund’s sub-advisers.
| | | | | | |
Office of the Fund 11 Greenway Plaza, Suite 1000 Houston, TX 77046-1173 | | Investment Adviser Invesco Advisers, Inc. 1555 Peachtree Street, N.E. Atlanta, GA 30309 | | Distributor Invesco Distributors, Inc. 11 Greenway Plaza, Suite 1000 Houston, TX 77046-1173 | | Auditors PricewaterhouseCoopers LLP 1000 Louisiana Street, Suite 5800 Houston, TX 77002-5678 |
| | | |
| | | | | | |
Counsel to the Fund Stradley Ronon Stevens & Young, LLP 2005 Market Street, Suite 2600 Philadelphia, PA 19103-7018 | | Counsel to the Independent Trustees Goodwin Procter LLP 901 New York Avenue, N.W. Washington, D.C. 20001 | | Transfer Agent Invesco Investment Services, Inc. 11 Greenway Plaza, Suite 1000 Houston, TX 77046-1173 | | Custodian State Street Bank and Trust Company 225 Franklin Street Boston, MA 02110-2801 |
T-4 Invesco Comstock Fund

Invesco mailing information
Send general correspondence to Invesco Investment Services, Inc., P.O. Box 219078, Kansas City, MO 64121-9078.
Important notice regarding delivery of security holder documents
To reduce Fund expenses, only one copy of most shareholder documents may be mailed to shareholders with multiple accounts at the same address (Householding). Mailing of your shareholder documents may be householded indefinitely unless you instruct us otherwise. If you do not want the mailing of these documents to be combined with those for other members of your household, please contact Invesco Investment Services, Inc. at 800 959 4246 or contact your financial institution. We will begin sending you individual copies for each account within 30 days after receiving your request.
Fund holdings and proxy voting information
The Fund provides a complete list of its holdings four times in each fiscal year, at the quarter ends. For the second and fourth quarters, the lists appear in the Fund’s semiannual and annual reports to shareholders. For the first and third quarters, the Fund files the lists with the Securities and Exchange Commission (SEC) on Form N-Q. The most recent list of portfolio holdings is available at invesco.com/completeqtrholdings. Shareholders can also look up the Fund’s Forms N-Q on the SEC website at sec.gov. Copies of the Fund’s Forms N-Q may be reviewed and copied at the SEC Public Reference Room in Washington, D.C. You can obtain information on the operation of the Public Reference Room, including information about duplicating fee charges, by calling 202 551 8090 or 800 732 0330, or by electronic request at the following email address: publicinfo@sec.gov. The SEC file numbers for the Fund are shown below.
A description of the policies and procedures that the Fund uses to determine how to vote proxies relating to portfolio securities is available without charge, upon request, from our Client Services department at 800 959 4246 or at invesco.com/proxyguidelines. The information is also available on the SEC website, sec.gov.
| | |
Information regarding how the Fund voted proxies related to its portfolio securities during the most recent 12-month period ended June 30 is available at invesco.com/proxysearch. The information is also available on the SEC website, sec.gov. Invesco Advisers, Inc. is an investment adviser; it provides investment advisory services to individual and institutional clients and does not sell securities. Invesco Distributors, Inc. is the US distributor for Invesco Ltd.’s retail mutual funds, exchange-traded funds and institutional money market funds. Both are wholly owned, indirect subsidiaries of Invesco Ltd. | |  |
| | | | |
| SEC file numbers: 811-03826 and 002-85905 | | VK-COM-AR-1 | | Invesco Distributors, Inc. |
| | | | |
| | |
 | | Annual Report to Shareholders | | April 30, 2016 |
| | |
| | Invesco Dividend Income Fund |
| | Nasdaq: |
| | A: IAUTX n B: IBUTX n C: IUTCX n Y: IAUYX n Investor: FSTUX n R5: FSIUX n R6: IFUTX |

Letters to Shareholders
| | |

Philip Taylor | | Dear Shareholders: This annual report includes information about your Fund, including performance data and a complete list of its investments as of the close of the reporting period. Inside is a discussion of how your Fund was managed and the factors that affected its performance during the reporting period. US economic data were generally positive over the reporting period, with the economy expanding modestly and employment numbers improving steadily. Throughout the reporting period, US consumers benefited from declining energy prices and greater credit availability, but a strengthening dollar crimped the profits of many large multi-national companies doing business overseas. Ending years of uncertainty, the US Federal Reserve in December 2015 finally raised short-term interest rates for the first time since 2006, signaling its confidence that the economy was likely to continue expanding and improving. Overseas, the economic story was less positive. |
| The European Central Bank and central banks in China and Japan – as well as other countries – either instituted or maintained extraordinarily accommodative monetary policies in response to economic weakness. Stocks began 2016 on a weak note due to increased concerns about global economic weakness. |
Short-term market volatility can prompt some investors to abandon their investment plans – and can cause others to settle for average results. The investment professionals at Invesco, in contrast, invest with high conviction and a long-term perspective. At Invesco, investing with high conviction means offering a wide range of strategies designed to go beyond market benchmarks. We trust our research-driven insights, have confidence in our investment processes and build portfolios that reflect our beliefs. Our goal is to look past market noise in an effort to find attractive opportunities at attractive prices – consistent with the investment strategies spelled out in each fund’s prospectus. Of course, investing with high conviction can’t guarantee a profit or ensure investment success; no investment strategy or risk analysis can. To learn more about how we invest with high conviction, visit invesco.com/HighConviction.
You, too, can invest with high conviction by maintaining a long-term investment perspective and by working with your financial adviser on a regular basis. During periods of short-term market volatility or uncertainty, your financial adviser can keep you focused on your long-term investment goals – a new home, a child’s college education, or a secure retirement. He or she also can share research about the economy, the markets and individual investment options.
Visit our website for more information on your investments
Our website, invesco.com/us, offers a wide range of market insights and investment perspectives. On the website, you’ll find detailed information about our funds, including performance, holdings and portfolio manager commentaries. You can access information about your account by completing a simple, secure online registration. Click on the “Need to register” link in the “Account Access” box on our homepage to get started. Invesco’s mobile apps for iPhone® and iPad® (both available free from the App StoreSM) allow you to obtain the same detailed information, monitor your account and create customizable watch lists.
In addition to the resources accessible on our website and through our mobile app, you can obtain timely updates to help you stay informed about the markets, the economy and investing by connecting with Invesco on Twitter, LinkedIn or Facebook. You can access our blog at blog.invesco.us.com. Our goal is to provide you the information you want, when and where you want it.
Have questions?
For questions about your account, contact an Invesco client services representative at 800 959 4246. For Invesco-related questions or comments, please email me directly at phil@invesco.com.
All of us at Invesco look forward to serving your investment management needs. Thank you for investing with us.
Sincerely,

Philip Taylor
Senior Managing Director, Invesco Ltd.
iPhone and iPad are trademarks of Apple Inc., registered in the US and other countries. App Store is a service mark of Apple Inc. Invesco Distributors, Inc. is not affiliated with Apple Inc.
2 Invesco Dividend Income Fund
| | |

Bruce Crockett | | Dear Fellow Shareholders: Among the many important lessons I’ve learned in more than 40 years in a variety of business endeavors is the value of a trusted advocate. As independent chair of the Invesco Funds Board, I can assure you that the members of the Board are strong advocates for the interests of investors in Invesco’s mutual funds. We work hard to represent your interests through oversight of the quality of the investment management services your funds receive and other matters important to your investment, including but not limited to: |
| | n Ensuring that Invesco offers a diverse lineup of mutual funds that your financial adviser can use to strive to meet your financial needs as your investment goals change over time. n Monitoring how the portfolio management teams of the Invesco funds are performing in light of changing economic and market conditions. |
n Assessing each portfolio management team’s investment performance within the context of the investment strategy described in the fund’s prospectus. n Monitoring for potential conflicts of interests that may impact the nature of the services that your funds receive. We believe one of the most important services we provide our fund shareholders is the annual review of the funds’ advisory and sub-advisory contracts with Invesco Advisers and its affiliates. This review is required by the Investment Company Act of 1940 and focuses on the nature and quality of the services Invesco provides as the adviser to the Invesco funds and the reasonableness of the fees that it charges for those services. Each year, we spend months carefully reviewing information received from Invesco and a variety of independent sources, such as performance and fee data prepared by Lipper Inc., an independent, third-party firm widely recognized as a leader in its field. We also meet with our independent legal counsel and other independent advisers to review and help us assess the information that we have received. Our goal is to assure that you receive quality investment management services for a reasonable fee. I trust the measures outlined above provide assurance that you have a worthy advocate when it comes to choosing the Invesco Funds. As always, please contact me at bruce@brucecrockett.com with any questions or concerns you may have. On behalf of the Board, we look forward to continuing to represent your interests and serving your needs. |
Sincerely,

Bruce L. Crockett
Independent Chair
Invesco Funds Board of Trustees
3 Invesco Dividend Income Fund
Management’s Discussion of Fund Performance
| | | | |
| Performance summary | |
For the fiscal year ended April 30, 2016, Class A shares of Invesco Dividend Income Fund (the Fund), at net asset value (NAV), outperformed the Fund’s style-specific benchmark, the Dow Jones U.S. Select Dividend Index. Your Fund’s long-term performance appears later in this report. | |
Fund vs. Indexes Total returns, 4/30/15 to 4/30/16, at net asset value (NAV). Performance shown does not include applicable contingent deferred sales charges (CDSC) or front-end sales charges, which would have reduced performance. | |
| |
Class A Shares | | | 10.72 | % |
Class B Shares | | | 9.92 | |
Class C Shares | | | 9.94 | |
Class Y Shares | | | 11.01 | |
| Investor Class Shares | | | 10.69 | |
| Class R5 Shares | | | 11.03 | |
| Class R6 Shares | | | 11.13 | |
S&P 500 Indexq (Broad Market Index) | | | 1.21 | |
Dow Jones U.S. Select Dividend Index▼ (Style-Specific Index) | | | 8.85 | |
Russell 1000 Value Index▼ (Style-Specific Index) | | | -0.40 | |
Lipper Equity Income Funds Indexn (Peer Group Index) | | | -0.46 | |
| |
Source(s): ▼FactSet Research Systems Inc.; nLipper Inc. | | | | |
Market conditions and your Fund
During the fiscal year ended April 30,
2016, the US economy improved slowly, although the recovery was uneven across sectors. The energy sector saw a continued slowdown as oil prices fell in response to increasing supply and slowing global demand. In contrast, continued low interest rates, increased availability of credit and a better employment picture all helped consumer-related sectors. In the fall of 2015, US markets rallied and the US Federal Reserve (the Fed) saw enough economic stabilization to raise interest rates. While there were large differences in returns among sectors, the S&P 500 Index, considered representative of the performance of the US stock market, finished the reporting period modestly higher.
During the reporting period, the Fund pursued its objective of current income and long-term growth of capital by
investing in above-market yielding stocks that may help investors earn income, preserve assets and build capital. We believe that dividend-paying stocks should provide a conservative foundation for investors’ portfolios, and we seek to enhance the value of dividend investing by identifying above-market yielding stocks with consistent and defensible dividends. Through fundamental research, we measure the strength and sustainability of a company’s dividend by analyzing its free cash flow potential over the next two to three years. We construct a portfolio that we believe provides above-average dividend income and the potential to build capital over the long term. We seek to manage portfolio risk utilizing careful stock selection, maintaining exposure to multiple sectors and employing a rigorous buy-and-sell discipline.
During the reporting period, the consumer staples and utilities sectors contributed the most to overall Fund
performance. Consumer staples holdings Campbell Soup and Altria Group were the largest contributors to Fund results for the fiscal year. Campbell Soup’s margins expanded significantly as the company achieved higher-than-expected cost savings at an accelerated pace. The company also increased its one-year and three-year cost savings targets. Utilities holdings TECO Energy and AGL Resources were also among the top contributors to Fund performance for the fiscal year. Shares of the two companies rose after both received separate offers to be acquired at values well above their stock prices at the time of the announcements.
The Fund’s underweight position in the energy sector helped Fund results relative to the Dow Jones U.S. Select Dividend Index as energy was one of the worst performing sectors during the fiscal year. Valuations became more attractive in energy as a result of market volatility. We prudently added to our positions in the energy sector where our analysis of companies’ balance sheets and cash flows indicated the ability to withstand potential further asset value impairments in a protracted downturn.
New opportunities also emerged in the industrials sector. While consumer-facing businesses within the sector generally held up during the reporting period, the more capital-intensive businesses with end-markets related to energy, construction and mining were under pressure. During the reporting period, we identified several investments that we believe were undervalued based on our view of their full cycle earnings power, have supportive free cash flow flexibility and also have opportunities to unlock value through portfolio restructuring.
In the financials sector, the Fund’s holdings declined during the fiscal year, along with the sector in general. Waddell
| | | | |
| Portfolio Composition | |
By sector | | | % of total net assets | |
| | | | |
| |
Utilities | | | 18.2 | % |
Consumer Staples | | | 15.4 | |
Financials | | | 9.8 | |
Telecommunication Services | | | 8.5 | |
Energy | | | 7.7 | |
Industrials | | | 6.3 | |
Health Care | | | 5.9 | |
Consumer Discretionary | | | 3.2 | |
Materials | | | 2.8 | |
Information Technology | | | 2.7 | |
| Money Market Funds Plus Other Assets Less Liabilities | | | 19.5 | |
| | |
| Top 10 Equity Holdings* |
| | % of total net assets |
| | | | |
| |
1. Suncor Energy, Inc. | | | 2.7 | % |
2. Coca-Cola Co. (The) | | | 2.4 | |
3. Merck & Co., Inc. | | | 2.4 | |
4. Kraft Heinz Co. (The) | | | 2.3 | |
5. AT&T Inc. | | | 2.3 | |
6. Weyerhaeuser Co. | | | 2.2 | |
7. Exxon Mobil Corp. | | | 2.2 | |
8. Verizon Communications Inc. | | | 2.1 | |
9. General Mills, Inc. | | | 1.8 | |
10. Prosperity Bancshares, Inc. | | | 1.8 | |
| | | | |
| Total Net Assets | | | $1.4 billion | |
| |
| Total Number of Holdings* | | | 61 | |
The Fund’s holdings are subject to change, and there is no assurance that the Fund will continue to hold any particular security.
| *Excluding | money market fund holdings. |
Data presented here are as of April 30, 2016.
|
| 4 Invesco Dividend Income Fund |
& Reed Financial and Federated Investors were among the largest detractors from Fund performance for the reporting period. Waddell & Reed Financial’s shares were under pressure due to personnel turnover and lagging performance in its flagship investment strategies. Select holdings in the consumer discretionary sector also declined during the reporting period including Marks & Spencer and Johnson Controls. We sold our position
in Johnson Controls before the end of the reporting period.
This profit cycle has seen the largest profit margin expansion in 50 years, despite a weaker-than-normal economic expansion versus previous cycles, as measured by gross domestic product growth from recession lows. A key question for us is how much of this margin expansion is structural, due to factors like better supply chain management, and how much was derived from cyclical benefits, including lower funding costs as a result of historically low interest rates. We are conservative with our expectations for continued profit growth as the market has witnessed an unprecedented period of global coordinated easing by central banks that has driven market valuations higher. In this environment, we remain diligent in our assessment of each investment’s risk-reward profile.
At the close of the reporting period, the Fund was focused on companies that we believed were reasonably valued, had sustainable cash flows and that offered defensible dividends over the next few years. We believe the dividend income strategy is a valuable part of a portfolio, potentially helping investors earn income, preserve assets and build capital over the long-term.
We thank you for your investment in Invesco Dividend Income Fund and for sharing our long-term investment horizon.
The views and opinions expressed in management’s discussion of Fund performance are those of Invesco Advisers, Inc. These views and opinions are subject to change at any time based on factors such as market and economic conditions. These views and opinions may not be relied upon as investment advice or recommendations, or as an offer for a particular security. The information is not a complete analysis of every aspect of any market, country, industry, security or the Fund. Statements of fact are from sources considered reliable, but Invesco Advisers, Inc. makes no representation or warranty as to their completeness or accuracy. Although historical performance is no guarantee of future results, these insights may help you understand our investment management philosophy.
See important Fund and, if applicable, index disclosures later in this report.
| | |
 | | Meggan Walsh Chartered Financial Analyst, Portfolio Manager, is lead manager of Invesco Dividend Income |
| Fund. She joined Invesco in 1991. Ms. Walsh earned a BS in finance from the University of Maryland and an MBA from Loyola University Maryland. |
| | |
 | | Robert Botard Chartered Financial Analyst, Portfolio Manager, is manager of Invesco Dividend Income Fund. He joined |
| Invesco in 1993. Mr. Botard earned a BBA in finance and a BBA in international business from The University of Texas at Austin. He also earned a Master of International Management degree from the Thunderbird School of Global Management. |
5 Invesco Dividend Income Fund
Your Fund’s Long-Term Performance
Results of a $10,000 Investment – Oldest Share Class(es)
Fund and index data from 4/30/06
| 1 | It is Invesco’s policy to chart the Fund’s oldest share class(es). Because Investor Class shares do not have a sales charge, we also show the oldest share class with a sales charge, Class C shares. |
| 2 | Source: FactSet Research Systems Inc. |
Past performance cannot guarantee comparable future results.
The data shown in the chart include reinvested distributions, applicable sales charges and Fund expenses including
management fees. Index results include reinvested dividends, but they do not reflect sales charges. Performance of the peer group, if applicable, reflects fund expenses and management fees;
performance of a market index does not. Performance shown in the chart and table(s) does not reflect deduction of taxes a shareholder would pay on Fund distributions or sale of Fund shares.
6 Invesco Dividend Income Fund
| | | | |
Average Annual Total Returns As of 4/30/16, including maximum applicable sales charges | |
Class A Shares | | | | |
Inception (3/28/02) | | | 8.38 | % |
10 Years | | | 7.69 | |
5 Years | | | 10.40 | |
1 Year | | | 4.65 | |
| |
Class B Shares | | | | |
Inception (3/28/02) | | | 8.36 | % |
10 Years | | | 7.65 | |
5 Years | | | 10.56 | |
1 Year | | | 4.92 | |
| |
Class C Shares | | | | |
Inception (2/14/00) | | | 3.27 | % |
10 Years | | | 7.50 | |
5 Years | | | 10.82 | |
1 Year | | | 8.94 | |
| |
Class Y Shares | | | | |
10 Years | | | 8.51 | % |
5 Years | | | 11.94 | |
1 Year | | | 11.01 | |
| |
Investor Class Shares | | | | |
Inception (6/2/86) | | | 8.68 | % |
10 Years | | | 8.30 | |
5 Years | | | 11.65 | |
1 Year | | | 10.69 | |
| |
Class R5 Shares | | | | |
Inception (10/25/05) | | | 8.93 | % |
10 Years | | | 8.75 | |
5 Years | | | 12.03 | |
1 Year | | | 11.03 | |
| |
Class R6 Shares | | | | |
10 Years | | | 8.43 | % |
5 Years | | | 11.92 | |
1 Year | | | 11.13 | |
Class Y shares incepted on October 3, 2008. Performance shown prior to that date is that of Investor Class shares and includes the 12b-1 fees applicable to Investor Class shares.
Class R6 shares incepted on September 24, 2012. Performance shown prior to that date is that of Class A shares and includes the 12b-1 fees applicable to Class A shares.
The performance data quoted represent past performance and cannot guarantee comparable future results; current performance may be lower or higher. Please visit invesco.com/performance for the most recent month-end performance. Performance figures reflect reinvested distributions, changes in net asset value and the effect of the maximum sales charge unless otherwise stated. Investment return and principal
| | | | |
Average Annual Total Returns As of 3/31/16, the most recent calendar quarter end, including maximum applicable sales charges | |
Class A Shares | | | | |
Inception (3/28/02) | | | 8.36 | % |
10 Years | | | 7.79 | |
5 Years | | | 11.11 | |
1 Year | | | 3.16 | |
| |
Class B Shares | | | | |
Inception (3/28/02) | | | 8.34 | % |
10 Years | | | 7.75 | |
5 Years | | | 11.27 | |
1 Year | | | 3.32 | |
| |
Class C Shares | | | | |
Inception (2/14/00) | | | 3.23 | % |
10 Years | | | 7.59 | |
5 Years | | | 11.53 | |
1 Year | | | 7.35 | |
| |
Class Y Shares | | | | |
10 Years | | | 8.60 | % |
5 Years | | | 12.66 | |
1 Year | | | 9.46 | |
| |
Investor Class Shares | | | | |
Inception (6/2/86) | | | 8.67 | % |
10 Years | | | 8.39 | |
5 Years | | | 12.37 | |
1 Year | | | 9.14 | |
| |
Class R5 Shares | | | | |
Inception (10/25/05) | | | 8.90 | % |
10 Years | | | 8.84 | |
5 Years | | | 12.74 | |
1 Year | | | 9.42 | |
| |
Class R6 Shares | | | | |
10 Years | | | 8.52 | % |
5 Years | | | 12.64 | |
1 Year | | | 9.55 | |
value will fluctuate so that you may have a gain or loss when you sell shares.
The net annual Fund operating expense ratio set forth in the most recent Fund prospectus as of the date of this report for Class A, Class B, Class C, Class Y, Investor Class, Class R5 and Class R6 shares was 1.14%, 1.89%. 1.89%, 0.89%, 1.14%, 0.83% and 0.79% respectively.1,2 The total annual Fund operating expense ratio set forth in the most recent Fund prospectus as of the date of this report for Class A, Class B, Class C, Class Y, Investor Class, Class R5 and Class R6 shares was 1.24%, 1.99%, 1.99%, 0.99%, 1.24%, 0.85% and 0.81%, respectively. The expense ratios presented above may vary from the expense ratios presented in other sections of this report that are based on
expenses incurred during the period covered by this report.
Class A share performance reflects the maximum 5.50% sales charge, and Class B and Class C share performance reflects the applicable contingent deferred sales charge (CDSC) for the period involved. The CDSC on Class B shares declines from 5% beginning at the time of purchase to 0% at the beginning of the seventh year. The CDSC on Class C shares is 1% for the first year after purchase. Class Y, Investor Class, Class R5 and Class R6 shares do not have a front-end sales charge or a CDSC; therefore, performance is at net asset value.
The performance of the Fund’s share classes will differ primarily due to different sales charge structures and class expenses.
Fund performance reflects any applicable fee waivers and/or expense reimbursements. Had the adviser not waived fees and/or reimbursed expenses currently or in the past, returns would have been lower. See current prospectus for more information.
| 1 | Total annual Fund operating expenses after any contractual fee waivers and/or expense reimbursements by the adviser in effect through at least August 31, 2016. See current prospectus for more information. |
| 2 | Total annual Fund operating expenses after any contractual fee waivers and/or expense reimbursements by the adviser in effect through at least June 30, 2018. See current prospectus for more information. |
7 Invesco Dividend Income Fund
Invesco Dividend Income Fund’s investment objective is current income and long-term growth of capital.
| n | | Unless otherwise stated, information presented in this report is as of April 30, 2016, and is based on total net assets. |
| n | | Unless otherwise noted, all data provided by Invesco. |
| n | | To access your Fund’s reports/prospectus, visit invesco.com/fundreports. |
About share classes
| n | | Class B shares may not be purchased for new or additional investments. Please see the prospectus for more information. |
| n | | Class Y shares and Investor Class shares are available only to certain investors. Please see the prospectus for more information. |
| n | | Class R5 shares and Class R6 shares are primarily intended for employer sponsored retirement and benefit plans that meet certain standards and for institutional investors. Please see the prospectus for more information. |
Principal risks of investing in the Fund
| n | | Foreign securities risk. The Fund’s foreign investments may be adversely affected by political and social instability, changes in economic or taxation policies, difficulty in enforcing obligations, decreased liquidity or increased volatility. Foreign investments also involve the risk of the possible seizure, nationalization or expropriation of the issuer or foreign deposits (in which the Fund could lose its entire investments in a certain market) and the possible adoption of foreign governmental restrictions such as exchange controls. Unless the Fund has hedged its foreign securities risk, foreign securities risk also involves the risk of negative foreign currency rate fluctuations, which may cause the value of securities denominated in such foreign currency (or other instruments through which the Fund has exposure to foreign currencies) to decline in value. Currency exchange rates may fluctuate significantly over short periods of time. Currency hedging strategies, if used, are not always successful. |
| n | | Management risk. The Fund is actively managed and depends heavily on the Adviser’s judgment about markets, interest rates or the attractiveness, relative values, liquidity, or potential appreciation of particular investments made for the Fund’s portfolio. The Fund could |
experience losses if these judgments prove to be incorrect. Additionally, legislative, regulatory, or tax developments may adversely affect management of the Fund and, therefore, the ability of the Fund to achieve its investment objective.
| n | | Market risk. The market values of the Fund’s investments, and therefore the value of the Fund’s shares, will go up and down, sometimes rapidly or unpredictably. Market risk may affect a single issuer, industry or section of the economy, or it may affect the market as a whole. Individual stock prices tend to go up and down more dramatically than those of certain other types of investments, such as bonds. During a general downturn in the financial markets, multiple asset classes may decline in value. When markets perform well, there can be no assurance that specific investments held by the Fund will rise in value. |
| n | | Small- and mid-capitalization risks. Small- and mid-capitalization companies tend to be more vulnerable to changing market conditions, may have little or no operating history or track record of success, and may have more limited product lines and markets, less experienced management and fewer financial resources than larger companies. These companies’ securities may be more volatile and less liquid than those of more established companies, and their returns may vary, sometimes significantly, from the overall securities market. |
About indexes used in this report
| n | | The S&P 500® Index is an unmanaged index considered representative of the US stock market. |
| n | | The Dow Jones U.S. Select Dividend™ Index represent the country’s leading stocks by dividend yield. |
| n | | The Russell 1000® Value Index is an unmanaged index considered representative of large-cap value stocks. The Russell 1000 Value Index is a trademark/service mark of the Frank Russell |
Co. Russell® is a trademark of the Frank Russell Co.
| n | | The Lipper Equity Income Funds Index is an unmanaged index considered representative of equity income funds tracked by Lipper. |
| n | | The Fund is not managed to track the performance of any particular index, including the index(es) described here, and consequently, the performance of the Fund may deviate significantly from the performance of the index(es). |
| n | | A direct investment cannot be made in an index. Unless otherwise indicated, index results include reinvested dividends, and they do not reflect sales charges. Performance of the peer group, if applicable, reflects fund expenses; performance of a market index does not. |
Other information
| n | | The returns shown in management’s discussion of Fund performance are based on net asset values (NAVs) calculated for shareholder transactions. Generally accepted accounting principles require adjustments to be made to the net assets of the Fund at period end for financial reporting purposes, and as such, the NAVs for shareholder transactions and the returns based on those NAVs may differ from the NAVs and returns reported in the Financial Highlights. |
| n | | Industry classifications used in this report are generally according to the Global Industry Classification Standard, which was developed by and is the exclusive property and a service mark of MSCI Inc. and Standard & Poor’s. |
|
This report must be accompanied or preceded by a currently effective Fund prospectus, which contains more complete information, including sales charges and expenses. Investors should read it carefully before investing. |
|
|
| NOT FDIC INSURED | MAY LOSE VALUE | NO BANK GUARANTEE |
8 Invesco Dividend Income Fund
Schedule of Investments(a)
April 30, 2016
| | | | | | | | |
| | | Shares | | | Value | |
Common Stocks & Other Equity Interests–80.51% | |
| Aerospace & Defense–2.13% | | | | | | | | |
General Dynamics Corp. | | | 72,170 | | | $ | 10,141,328 | |
Lockheed Martin Corp. | | | 87,568 | | | | 20,349,052 | |
| | | | | 30,490,380 | |
|
| Air Freight & Logistics–0.38% | |
United Parcel Service, Inc.–Class B | | | 51,066 | | | | 5,365,505 | |
|
| Asset Management & Custody Banks–1.73% | |
Federated Investors, Inc.–Class B | | | 503,644 | | | | 15,915,150 | |
Waddell & Reed Financial, Inc.–Class A | | | 433,908 | | | | 8,825,689 | |
| | | | | 24,740,839 | |
|
| Department Stores–0.46% | |
Marks & Spencer Group PLC (United Kingdom) | | | 1,070,109 | | | | 6,635,179 | |
|
| Drug Retail–0.91% | |
Walgreens Boots Alliance, Inc. | | | 164,233 | | | | 13,020,392 | |
|
| Electric Utilities–7.43% | |
American Electric Power Co., Inc. | | | 125,360 | | | | 7,960,360 | |
Duke Energy Corp. | | | 306,297 | | | | 24,130,078 | |
Exelon Corp. | | | 499,423 | | | | 17,524,753 | |
Pinnacle West Capital Corp. | | | 253,256 | | | | 18,399,048 | |
Portland General Electric Co. | | | 625,934 | | | | 24,862,099 | |
Xcel Energy, Inc. | | | 334,003 | | | | 13,370,140 | |
| | | | | 106,246,478 | |
|
| Electrical Components & Equipment–2.27% | |
ABB Ltd. (Switzerland) | | | 770,749 | | | | 16,295,652 | |
Emerson Electric Co. | | | 295,898 | | | | 16,164,908 | |
| | | | | 32,460,560 | |
|
| Food Distributors–1.00% | |
Sysco Corp. | | | 309,768 | | | | 14,271,012 | |
|
| Gas Utilities–4.61% | |
AGL Resources Inc. | | | 150,413 | | | | 9,906,200 | |
National Fuel Gas Co. | | | 318,947 | | | | 17,701,559 | |
Southwest Gas Corp. | | | 262,591 | | | | 17,044,782 | |
WGL Holdings Inc. | | | 314,315 | | | | 21,338,845 | |
| | | | | 65,991,386 | |
|
| General Merchandise Stores–0.81% | |
Target Corp. | | | 146,146 | | | | 11,618,607 | |
|
| Household Products–2.10% | |
Kimberly-Clark Corp. | | | 71,058 | | | | 8,895,751 | |
Procter & Gamble Co. (The) | | | 263,218 | | | | 21,089,026 | |
| | | | | 29,984,777 | |
|
| Industrial Machinery–1.55% | |
Kennametal Inc. | | | 948,528 | | | | 22,176,585 | |
| | | | | | | | |
| | | Shares | | | Value | |
| Integrated Oil & Gas–7.71% | | | | | | | | |
Exxon Mobil Corp. | | | 350,357 | | | $ | 30,971,559 | |
Royal Dutch Shell PLC–Class B (United Kingdom) | | | 650,810 | | | | 17,088,332 | |
Suncor Energy, Inc. (Canada) | | | 1,298,826 | | | | 38,120,701 | |
TOTAL S.A. (France) | | | 478,375 | | | | 24,190,608 | |
| | | | | 110,371,200 | |
|
| Integrated Telecommunication Services–8.49% | |
AT&T Inc. | | | 836,177 | | | | 32,460,391 | |
BT Group PLC (United Kingdom) | | | 3,734,495 | | | | 24,264,849 | |
CenturyLink Inc. | | | 333,302 | | | | 10,315,697 | |
Deutsche Telekom AG (Germany) | | | 1,432,422 | | | | 25,070,378 | |
Verizon Communications Inc. | | | 576,436 | | | | 29,363,650 | |
| | | | | 121,474,965 | |
|
| Multi-Utilities–6.13% | |
CMS Energy Corp. | | | 366,826 | | | | 14,922,482 | |
Dominion Resources, Inc. | | | 236,412 | | | | 16,896,366 | |
DTE Energy Co. | | | 120,213 | | | | 10,718,191 | |
National Grid PLC (United Kingdom) | | | 763,174 | | | | 10,892,849 | |
Public Service Enterprise Group Inc. | | | 342,833 | | | | 15,814,886 | |
Sempra Energy | | | 60,061 | | | | 6,207,304 | |
TECO Energy, Inc. | | | 443,344 | | | | 12,311,663 | |
| | | | | 87,763,741 | |
|
| Packaged Foods & Meats–5.87% | |
Campbell Soup Co. | | | 395,948 | | | | 24,433,951 | |
General Mills, Inc. | | | 424,896 | | | | 26,063,121 | |
Kraft Heinz Co. (The) | | | 429,409 | | | | 33,523,960 | |
| | | | | 84,021,032 | |
| | |
| Paper Packaging–2.81% | | | | | | | | |
International Paper Co. | | | 561,863 | | | | 24,311,812 | |
Sonoco Products Co. | | | 338,344 | | | | 15,864,950 | |
| | | | | 40,176,762 | |
|
| Pharmaceuticals–5.87% | |
Bristol-Myers Squibb Co. | | | 324,579 | | | | 23,428,112 | |
Eli Lilly and Co. | | | 171,562 | | | | 12,958,078 | |
Johnson & Johnson | | | 124,623 | | | | 13,967,746 | |
Merck & Co., Inc. | | | 614,448 | | | | 33,696,328 | |
| | | | | 84,050,264 | |
|
| Property & Casualty Insurance–1.48% | |
Travelers Cos., Inc. (The) | | | 193,088 | | | | 21,220,371 | |
| | |
| Regional Banks–4.41% | | | | | | | | |
Cullen/Frost Bankers, Inc. | | | 333,548 | | | | 21,343,737 | |
M&T Bank Corp. | | | 133,172 | | | | 15,756,911 | |
Prosperity Bancshares, Inc. | | | 492,547 | | | | 25,991,705 | |
| | | | | 63,092,353 | |
See accompanying Notes to Financial Statements which are an integral part of the financial statements.
9 Invesco Dividend Income Fund
| | | | | | | | |
| | | Shares | | | Value | |
| Restaurants–1.89% | |
Darden Restaurants, Inc. | | | 167,669 | | | $ | 10,437,395 | |
McDonald’s Corp. | | | 131,477 | | | | 16,630,526 | |
| | | | | 27,067,921 | |
|
| Semiconductors–2.69% | |
Linear Technology Corp. | | | 293,267 | | | | 13,044,516 | |
Microchip Technology Inc. | | | 523,405 | | | | 25,432,249 | |
| | | | | 38,476,765 | |
|
| Soft Drinks–2.37% | |
Coca-Cola Co. (The) | | | 755,426 | | | | 33,843,085 | |
|
| Specialized REIT’s–2.18% | |
Weyerhaeuser Co. | | | 970,749 | | | | 31,180,458 | |
|
| Tobacco–3.23% | |
Altria Group, Inc. | | | 351,811 | | | | 22,062,068 | |
Philip Morris International Inc. | | | 245,378 | | | | 24,076,489 | |
| | | | | 46,138,557 | |
Total Common Stocks & Other Equity Interests
(Cost $945,521,206) | | | | 1,151,879,174 | |
| | | | | | | | |
| | | Shares | | | Value | |
Money Market Funds–19.79% | |
Liquid Assets Portfolio–Institutional Class, 0.44%(b) | | | 141,573,826 | | | $ | 141,573,826 | |
Premier Portfolio–Institutional Class, 0.39%(b) | | | 141,573,827 | | | | 141,573,827 | |
Total Money Market Funds
(Cost $283,147,653) | | | | 283,147,653 | |
TOTAL INVESTMENTS–100.30%
(Cost $1,228,668,859) | | | | 1,435,026,827 | |
OTHER ASSETS LESS LIABILITIES–(0.30)% | | | | (4,232,826 | ) |
NET ASSETS–100.00% | | | $ | 1,430,794,001 | |
Investment Abbreviations:
| | |
| REIT | | – Real Estate Investment Trust |
Notes to Schedule of Investments:
| (a) | Industry and/or sector classifications used in this report are generally according to the Global Industry Classification Standard, which was developed by and is the exclusive property and a service mark of MSCI Inc. and Standard & Poor’s. |
| (b) | The money market fund and the Fund are affiliated by having the same investment adviser. The rate shown is the 7-day SEC standardized yield as of April 30, 2016. |
See accompanying Notes to Financial Statements which are an integral part of the financial statements.
10 Invesco Dividend Income Fund
Statement of Assets and Liabilities
April 30, 2016
| | | | |
Assets: | | | | |
Investments, at value (Cost $945,521,206) | | $ | 1,151,879,174 | |
Investments in affiliated money market funds, at value and cost | | | 283,147,653 | |
Total investments, at value (Cost $1,228,668,859) | | | 1,435,026,827 | |
Foreign currencies, at value (Cost $176,323) | | | 179,017 | |
Receivable for: | | | | |
Fund shares sold | | | 28,129,775 | |
Dividends | | | 2,021,070 | |
Investment for trustee deferred compensation and retirement plans | | | 119,385 | |
Other assets | | | 95,743 | |
Total assets | | | 1,465,571,817 | |
| |
Liabilities: | | | | |
Payable for: | | | | |
Investments purchased | | | 31,444,815 | |
Fund shares reacquired | | | 1,204,019 | |
Accrued fees to affiliates | | | 644,220 | |
Accrued trustees’ and officers’ fees and benefits | | | 2,148 | |
Accrued other operating expenses | | | 73,888 | |
Trustee deferred compensation and retirement plans | | | 133,805 | |
Unrealized depreciation on forward foreign currency contracts outstanding | | | 1,274,921 | |
Total liabilities | | | 34,777,816 | |
Net assets applicable to shares outstanding | | $ | 1,430,794,001 | |
|
Net assets consist of: | |
Shares of beneficial interest | | $ | 1,220,094,269 | |
Undistributed net investment income | | | 290,527 | |
Undistributed net realized gain | | | 5,337,565 | |
Net unrealized appreciation | | | 205,071,640 | |
| | | $ | 1,430,794,001 | |
| | | | |
Net Assets: | | | | |
Class A | | $ | 867,596,131 | |
Class B | | $ | 6,746,484 | |
Class C | | $ | 154,583,897 | |
Class Y | | $ | 249,625,179 | |
Investor Class | | $ | 88,691,315 | |
Class R5 | | $ | 550,537 | |
Class R6 | | $ | 63,000,458 | |
|
Shares outstanding, $0.01 par value per share,
with an unlimited number of shares authorized: | |
Class A | | | 38,872,020 | |
Class B | | | 301,399 | |
Class C | | | 6,841,475 | |
Class Y | | | 11,080,301 | |
Investor Class | | | 3,937,777 | |
Class R5 | | | 24,661 | |
Class R6 | | | 2,819,883 | |
Class A: | | | | |
Net asset value per share | | $ | 22.32 | |
Maximum offering price per share | | | | |
(Net asset value of $22.32 ¸ 94.50%) | | $ | 23.62 | |
Class B: | | | | |
Net asset value and offering price per share | | $ | 22.38 | |
Class C: | | | | |
Net asset value and offering price per share | | $ | 22.60 | |
Class Y: | | | | |
Net asset value and offering price per share | | $ | 22.53 | |
Investor Class: | | | | |
Net asset value and offering price per share | | $ | 22.52 | |
Class R5: | | | | |
Net asset value and offering price per share | | $ | 22.32 | |
Class R6: | | | | |
Net asset value and offering price per share | | $ | 22.34 | |
See accompanying Notes to Financial Statements which are an integral part of the financial statements.
11 Invesco Dividend Income Fund
Statement of Operations
For the year ended April 30, 2016
| | | | |
Investment income: | |
Dividends (net of foreign withholding taxes of $163,705) | | $ | 24,165,475 | |
Dividends from affiliated money market funds | | | 277,946 | |
Total investment income | | | 24,443,421 | |
| |
Expenses: | | | | |
Advisory fees | | | 5,468,201 | |
Administrative services fees | | | 214,761 | |
Custodian fees | | | 36,435 | |
Distribution fees: | | | | |
Class A | | | 1,283,019 | |
Class B | | | 80,422 | |
Class C | | | 760,597 | |
Investor Class | | | 187,039 | |
Transfer agent fees — A, B, C, Y and Investor | | | 1,286,582 | |
Transfer agent fees — R5 | | | 207 | |
Transfer agent fees — R6 | | | 837 | |
Trustees’ and officers’ fees and benefits | | | 33,434 | |
Registration and filing fees | | | 122,335 | |
Reports to shareholders | | | 79,920 | |
Professional services fees | | | 58,977 | |
Other | | | 34,120 | |
Total expenses | | | 9,646,886 | |
Less: Fees waived, expenses reimbursed and expense offset arrangement(s) | | | (384,512 | ) |
Net expenses | | | 9,262,374 | |
Net investment income | | | 15,181,047 | |
| |
Realized and unrealized gain (loss) from: | | | | |
Net realized gain (loss) from: | | | | |
Investment securities (includes net gains from securities sold to affiliates of $366,570) | | | 18,927,212 | |
Foreign currencies | | | (145,841 | ) |
Forward foreign currency contracts | | | (238,154 | ) |
| | | | 18,543,217 | |
Change in net unrealized appreciation (depreciation) of: | | | | |
Investment securities | | | 67,606,469 | |
Foreign currencies | | | 24,991 | |
Forward foreign currency contracts | | | (1,012,573 | ) |
| | | | 66,618,887 | |
Net realized and unrealized gain | | | 85,162,104 | |
Net increase in net assets resulting from operations | | $ | 100,343,151 | |
See accompanying Notes to Financial Statements which are an integral part of the financial statements.
12 Invesco Dividend Income Fund
Statement of Changes in Net Assets
For the years ended April 30, 2016 and 2015
| | | | | | | | |
| | | 2016 | | | 2015 | |
Operations: | | | | | |
Net investment income | | $ | 15,181,047 | | | $ | 11,822,636 | |
Net realized gain | | | 18,543,217 | | | | 9,346,785 | |
Change in net unrealized appreciation | | | 66,618,887 | | | | 30,844,284 | |
Net increase in net assets resulting from operations | | | 100,343,151 | | | | 52,013,705 | |
| | |
Distributions to shareholders from net investment income: | | | | | | | | |
Class A | | | (10,154,258 | ) | | | (7,691,634 | ) |
Class B | | | (98,189 | ) | | | (145,819 | ) |
Class C | | | (927,378 | ) | | | (668,968 | ) |
Class Y | | | (1,672,559 | ) | | | (1,103,554 | ) |
Investor Class | | | (1,470,492 | ) | | | (1,482,212 | ) |
Class R5 | | | (4,711 | ) | | | (12,438 | ) |
Class R6 | | | (1,345,105 | ) | | | (974,628 | ) |
Total distributions from net investment income | | | (15,672,692 | ) | | | (12,079,253 | ) |
| | |
Distributions to shareholders from net realized gains: | | | | | | | | |
Class A | | | (10,853,763 | ) | | | (3,958,525 | ) |
Class B | | | (165,093 | ) | | | (111,515 | ) |
Class C | | | (1,501,782 | ) | | | (544,173 | ) |
Class Y | | | (1,035,782 | ) | | | (566,808 | ) |
Investor Class | | | (1,626,499 | ) | | | (738,661 | ) |
Class R5 | | | (5,856 | ) | | | (7,723 | ) |
Class R6 | | | (1,329,498 | ) | | | (422,224 | ) |
Total distributions from net realized gains | | | (16,518,273 | ) | | | (6,349,629 | ) |
| | |
Share transactions–net: | | | | | | | | |
Class A | | | 411,511,840 | | | | 56,814,324 | |
Class B | | | (3,246,373 | ) | | | (3,557,779 | ) |
Class C | | | 86,032,465 | | | | 16,828,623 | |
Class Y | | | 185,172,547 | | | | 28,741,315 | |
Investor Class | | | 9,115,847 | | | | 26,285 | |
Class R5 | | | 503,726 | | | | (690,850 | ) |
Class R6 | | | 8,323,035 | | | | 15,039,004 | |
Net increase in net assets resulting from share transactions | | | 697,413,087 | | | | 113,200,922 | |
Net increase in net assets | | | 765,565,273 | | | | 146,785,745 | |
| | |
Net assets: | | | | | | | | |
Beginning of year | | | 665,228,728 | | | | 518,442,983 | |
End of year (includes undistributed net investment income of $290,527 and $(136,071), respectively) | | $ | 1,430,794,001 | | | $ | 665,228,728 | |
Notes to Financial Statements
April 30, 2016
NOTE 1—Significant Accounting Policies
Invesco Dividend Income Fund (the “Fund”) is a series portfolio of AIM Sector Funds (Invesco Sector Funds) (the “Trust”). The Trust is a Delaware statutory trust registered under the Investment Company Act of 1940, as amended (the “1940 Act”), as an open-end series management investment company consisting of ten separate portfolios, each authorized to issue an unlimited number of shares of beneficial interest. The assets, liabilities and operations of each portfolio are accounted for separately. Information presented in these financial statements pertains only to the Fund. Matters affecting each portfolio or class will be voted on exclusively by the shareholders of such portfolio or class.
The Fund’s investment objective is current income and long-term growth of capital.
The Fund currently consists of seven different classes of shares: Class A, Class B, Class C, Class Y, Investor Class, Class R5 and Class R6. Class Y and Investor Class shares are available only to certain investors. Class A shares are sold with a front-end sales charge unless certain waiver criteria
13 Invesco Dividend Income Fund
are met and under certain circumstances load waived shares may be subject to contingent deferred sales charges (“CDSC”). Class C shares are sold with a CDSC. Class Y, Investor Class, Class R5 and Class R6 shares are sold at net asset value. Effective November 30, 2010, new or additional investments in Class B shares are no longer permitted. Existing shareholders of Class B shares may continue to reinvest dividends and capital gains distributions in Class B shares until they convert to Class A shares. Also, shareholders in Class B shares will be able to exchange those shares for Class B shares of other Invesco Funds offering such shares until they convert to Class A shares. Generally, Class B shares will automatically convert to Class A shares on or about the month-end, which is at least eight years after the date of purchase. Redemption of Class B shares prior to the conversion date will be subject to a CDSC.
The following is a summary of the significant accounting policies followed by the Fund in the preparation of its financial statements.
| A. | Security Valuations — Securities, including restricted securities, are valued according to the following policy. |
A security listed or traded on an exchange (except convertible securities) is valued at its last sales price or official closing price as of the close of the customary trading session on the exchange where the security is principally traded, or lacking any sales or official closing price on a particular day, the security may be valued at the closing bid price on that day. Securities traded in the over-the-counter market are valued based on prices furnished by independent pricing services or market makers. When such securities are valued by an independent pricing service they may be considered fair valued. Futures contracts are valued at the final settlement price set by an exchange on which they are principally traded. Listed options are valued at the mean between the last bid and asked prices from the exchange on which they are principally traded. Options not listed on an exchange are valued by an independent source at the mean between the last bid and asked prices. For purposes of determining net asset value (“NAV”) per share, futures and option contracts generally are valued 15 minutes after the close of the customary trading session of the New York Stock Exchange (“NYSE”).
Investments in open-end and closed-end registered investment companies that do not trade on an exchange are valued at the end-of-day net asset value per share. Investments in open-end and closed-end registered investment companies that trade on an exchange are valued at the last sales price or official closing price as of the close of the customary trading session on the exchange where the security is principally traded.
Debt obligations (including convertible securities) and unlisted equities are fair valued using an evaluated quote provided by an independent pricing service. Evaluated quotes provided by the pricing service may be determined without exclusive reliance on quoted prices, and may reflect appropriate factors such as institution-size trading in similar groups of securities, developments related to specific securities, dividend rate (for unlisted equities), yield (for debt obligations), quality, type of issue, coupon rate (for debt obligations), maturity (for debt obligations), individual trading characteristics and other market data. Debt obligations are subject to interest rate and credit risks. In addition, all debt obligations involve some risk of default with respect to interest and/or principal payments.
Foreign securities’ (including foreign exchange contracts) prices are converted into U.S. dollar amounts using the applicable exchange rates as of the close of the NYSE. If market quotations are available and reliable for foreign exchange-traded equity securities, the securities will be valued at the market quotations. Because trading hours for certain foreign securities end before the close of the NYSE, closing market quotations may become unreliable. If between the time trading ends on a particular security and the close of the customary trading session on the NYSE, events occur that the Adviser determines are significant and make the closing price unreliable, the Fund may fair value the security. If the event is likely to have affected the closing price of the security, the security will be valued at fair value in good faith using procedures approved by the Board of Trustees. Adjustments to closing prices to reflect fair value may also be based on a screening process of an independent pricing service to indicate the degree of certainty, based on historical data, that the closing price in the principal market where a foreign security trades is not the current value as of the close of the NYSE. Foreign securities’ prices meeting the approved degree of certainty that the price is not reflective of current value will be priced at the indication of fair value from the independent pricing service. Multiple factors may be considered by the independent pricing service in determining adjustments to reflect fair value and may include information relating to sector indices, American Depositary Receipts and domestic and foreign index futures. Foreign securities may have additional risks including exchange rate changes, potential for sharply devalued currencies and high inflation, political and economic upheaval, the relative lack of issuer information, relatively low market liquidity and the potential lack of strict financial and accounting controls and standards.
Securities for which market prices are not provided by any of the above methods may be valued based upon quotes furnished by independent sources. The last bid price may be used to value equity securities. The mean between the last bid and asked prices is used to value debt obligations, including corporate loans.
Securities for which market quotations are not readily available or became unreliable are valued at fair value as determined in good faith by or under the supervision of the Trust’s officers following procedures approved by the Board of Trustees. Issuer specific events, market trends, bid/asked quotes of brokers and information providers and other market data may be reviewed in the course of making a good faith determination of a security’s fair value.
The Fund may invest in securities that are subject to interest rate risk, meaning the risk that the prices will generally fall as interest rates rise and, conversely, the prices will generally rise as interest rates fall. Specific securities differ in their sensitivity to changes in interest rates depending on their individual characteristics. Changes in interest rates may result in increased market volatility, which may affect the value and/or liquidity of certain Fund investments.
Valuations change in response to many factors including the historical and prospective earnings of the issuer, the value of the issuer’s assets, general economic conditions, interest rates, investor perceptions and market liquidity. Because of the inherent uncertainties of valuation, the values reflected in the financial statements may materially differ from the value received upon actual sale of those investments.
| B. | Securities Transactions and Investment Income — Securities transactions are accounted for on a trade date basis. Realized gains or losses on sales are computed on the basis of specific identification of the securities sold. Interest income (net of withholding tax, if any) is recorded on the accrual basis from settlement date. Dividend income (net of withholding tax, if any) is recorded on the ex-dividend date. |
The Fund may periodically participate in litigation related to Fund investments. As such, the Fund may receive proceeds from litigation settlements. Any proceeds received are included in the Statement of Operations as realized gain (loss) for investments no longer held and as unrealized gain (loss) for investments still held.
Brokerage commissions and mark ups are considered transaction costs and are recorded as an increase to the cost basis of securities purchased and/or a reduction of proceeds on a sale of securities. Such transaction costs are included in the determination of net realized and unrealized gain (loss) from investment securities reported in the Statement of Operations and the Statement of Changes in Net Assets and the net
14 Invesco Dividend Income Fund
realized and unrealized gains (losses) on securities per share in the Financial Highlights. Transaction costs are included in the calculation of the Fund’s net asset value and, accordingly, they reduce the Fund’s total returns. These transaction costs are not considered operating expenses and are not reflected in net investment income reported in the Statement of Operations and the Statement of Changes in Net Assets, or the net investment income per share and the ratios of expenses and net investment income reported in the Financial Highlights, nor are they limited by any expense limitation arrangements between the Fund and the investment adviser.
The Fund allocates income and realized and unrealized capital gains and losses to a class based on the relative net assets of each class.
| C. | Country Determination — For the purposes of making investment selection decisions and presentation in the Schedule of Investments, the investment adviser may determine the country in which an issuer is located and/or credit risk exposure based on various factors. These factors include the laws of the country under which the issuer is organized, where the issuer maintains a principal office, the country in which the issuer derives 50% or more of its total revenues and the country that has the primary market for the issuer’s securities, as well as other criteria. Among the other criteria that may be evaluated for making this determination are the country in which the issuer maintains 50% or more of its assets, the type of security, financial guarantees and enhancements, the nature of the collateral and the sponsor organization. Country of issuer and/or credit risk exposure has been determined to be the United States of America, unless otherwise noted. |
| D. | Distributions — Distributions from net investment income, if any, are declared and paid monthly. Distributions from net realized capital gain, if any, are generally declared and paid annually and recorded on the ex-dividend date. The Fund may elect to treat a portion of the proceeds from redemptions as distributions for federal income tax purposes. |
| E. | Federal Income Taxes — The Fund intends to comply with the requirements of Subchapter M of the Internal Revenue Code of 1986, as amended (the “Internal Revenue Code”), necessary to qualify as a regulated investment company and to distribute substantially all of the Fund’s taxable earnings to shareholders. As such, the Fund will not be subject to federal income taxes on otherwise taxable income (including net realized capital gain) that is distributed to shareholders. Therefore, no provision for federal income taxes is recorded in the financial statements. |
The Fund recognizes the tax benefits of uncertain tax positions only when the position is more likely than not to be sustained. Management has analyzed the Fund’s uncertain tax positions and concluded that no liability for unrecognized tax benefits should be recorded related to uncertain tax positions. Management is not aware of any tax positions for which it is reasonably possible that the total amounts of unrecognized tax benefits will change materially in the next 12 months.
The Fund files tax returns in the U.S. Federal jurisdiction and certain other jurisdictions. Generally, the Fund is subject to examinations by such taxing authorities for up to three years after the filing of the return for the tax period.
| F. | Expenses — Fees provided for under the Rule 12b-1 plan of a particular class of the Fund are charged to the operations of such class. Transfer agency fees and expenses and other shareholder recordkeeping fees and expenses attributable to Class R5 and Class R6 are allocated to each share class based on relative net assets. Sub-accounting fees attributable to Class R5 are charged to the operations of the class. Transfer agency fees and expenses and other shareholder recordkeeping fees and expenses relating to all other classes are allocated among those classes based on relative net assets. All other expenses are allocated among the classes based on relative net assets. |
| G. | Accounting Estimates — The preparation of financial statements in conformity with accounting principles generally accepted in the United States of America (“GAAP”) requires management to make estimates and assumptions that affect the reported amounts of assets and liabilities at the date of the financial statements and the reported amounts of revenues and expenses during the reporting period including estimates and assumptions related to taxation. Actual results could differ from those estimates by a significant amount. In addition, the Fund monitors for material events or transactions that may occur or become known after the period-end date and before the date the financial statements are released to print. |
| H. | Indemnifications — Under the Trust’s organizational documents, each Trustee, officer, employee or other agent of the Trust is indemnified against certain liabilities that may arise out of the performance of their duties to the Fund. Additionally, in the normal course of business, the Fund enters into contracts, including the Fund’s servicing agreements, that contain a variety of indemnification clauses. The Fund’s maximum exposure under these arrangements is unknown as this would involve future claims that may be made against the Fund that have not yet occurred. The risk of material loss as a result of such indemnification claims is considered remote. |
| I. | Foreign Currency Translations — Foreign currency is valued at the close of the NYSE based on quotations posted by banks and major currency dealers. Portfolio securities and other assets and liabilities denominated in foreign currencies are translated into U.S. dollar amounts at date of valuation. Purchases and sales of portfolio securities (net of foreign taxes withheld on disposition) and income items denominated in foreign currencies are translated into U.S. dollar amounts on the respective dates of such transactions. The Fund does not separately account for the portion of the results of operations resulting from changes in foreign exchange rates on investments and the fluctuations arising from changes in market prices of securities held. The combined results of changes in foreign exchange rates and the fluctuation of market prices on investments (net of estimated foreign tax withholding) are included with the net realized and unrealized gain or loss from investments in the Statement of Operations. Reported net realized foreign currency gains or losses arise from (1) sales of foreign currencies, (2) currency gains or losses realized between the trade and settlement dates on securities transactions, and (3) the difference between the amounts of dividends, interest, and foreign withholding taxes recorded on the Fund’s books and the U.S. dollar equivalent of the amounts actually received or paid. Net unrealized foreign currency gains and losses arise from changes in the fair values of assets and liabilities, other than investments in securities at fiscal period end, resulting from changes in exchange rates. |
The Fund may invest in foreign securities, which may be subject to foreign taxes on income, gains on investments or currency repatriation, a portion of which may be recoverable. Foreign taxes, if any, are recorded based on the tax regulations and rates that exist in the foreign markets in which the Fund invests and are shown in the Statement of Operations.
| J. | Forward Foreign Currency Contracts — The Fund may engage in foreign currency transactions either on a spot (i.e. for prompt delivery and settlement) basis, or through forward foreign currency contracts, to manage or minimize currency or exchange rate risk. |
The Fund may also enter into forward foreign currency contracts for the purchase or sale of a security denominated in a foreign currency in order to “lock in” the U.S. dollar price of that security, or the Fund may also enter into forward foreign currency contracts that do not provide for physical settlement of the two currencies, but instead are settled by a single cash payment calculated as the difference between the agreed upon exchange rate and the spot rate at settlement based upon an agreed upon notional amount (non-deliverable forwards). The Fund will set aside liquid assets in an amount equal to daily mark-to-market obligation for forward foreign currency contracts.
15 Invesco Dividend Income Fund
A forward foreign currency contract is an obligation between two parties (“Counterparties”) to purchase or sell a specific currency for an agreed-upon price at a future date. The use of forward foreign currency contracts does not eliminate fluctuations in the price of the underlying securities the Fund owns or intends to acquire but establishes a rate of exchange in advance. Fluctuations in the value of these contracts are measured by the difference in the contract date and reporting date exchange rates and are recorded as unrealized appreciation (depreciation) until the contracts are closed. When the contracts are closed, realized gains (losses) are recorded. Realized and unrealized gains (losses) on the contracts are included in the Statement of Operations. The primary risks associated with forward foreign currency contracts include failure of the Counterparty to meet the terms of the contract and the value of the foreign currency changing unfavorably. These risks may be in excess of the amounts reflected in the Statement of Assets and Liabilities.
NOTE 2—Advisory Fees and Other Fees Paid to Affiliates
The Trust has entered into a master investment advisory agreement with Invesco Advisers, Inc. (the “Adviser” or “Invesco”). Under the terms of the investment advisory agreement, the Fund pays an advisory fee to the Adviser based on the annual rate of the Fund’s average daily net assets as follows:
| | | | | | |
| Average Daily Net Assets | | Rate |
First $350 million | | | 0 | .75% | | |
Next $350 million | | | 0 | .65% | | |
Next $1.3 billion | | | 0 | .55% | | |
Next $2 billion | | | 0 | .45% | | |
Next $2 billion | | | 0 | .40% | | |
Next $2 billion | | | 0 | .375% | | |
Over $8 billion | | | 0 | .35% | | |
For the year ended April 30, 2016, the effective advisory fees incurred by the Fund was 0.68%.
Under the terms of a master sub-advisory agreement between the Adviser and each of Invesco Asset Management Deutschland GmbH, Invesco Asset Management Limited, Invesco Asset Management (Japan) Limited, Invesco Hong Kong Limited, Invesco Senior Secured Management, Inc. and Invesco Canada Ltd. (collectively, the “Affiliated Sub-Advisers”) the Adviser, not the Fund, may pay 40% of the fees paid to the Adviser to any such Affiliated Sub-Adviser(s) that provide(s) discretionary investment management services to the Fund based on the percentage of assets allocated to such Affiliated Sub-Adviser(s).
The Adviser has contractually agreed, through at least August 31, 2016, to waive advisory fees and/or reimburse expenses of all shares to the extent necessary to limit total annual fund operating expenses after fee waiver and/or expense reimbursement (excluding certain items discussed below) of Class A, Class B, Class C, Class Y, Investor Class, Class R5 and Class R6 shares to 1.14%, 1.89%, 1.89%, 0.89%, 1.14%, 0.89% and 0.89%, respectively, of average daily net assets (the “expense limits”). In determining the Adviser’s obligation to waive advisory fees and/or reimburse expenses, the following expenses are not taken into account, and could cause the total annual fund operating expenses after fee waivers and/or expense reimbursement to exceed the numbers reflected above: (1) interest; (2) taxes; (3) dividend expense on short sales; (4) extraordinary or non-routine items, including litigation expenses; and (5) expenses that the Fund has incurred but did not actually pay because of an expense offset arrangement. Unless Invesco continues the fee waiver agreement, it will terminate on August 31, 2016. During its term, the fee waiver agreement cannot be terminated or amended to increase the expense limits without approval of the Board of Trustees.
Further, the Adviser has contractually agreed, through at least June 30, 2018, to waive the advisory fee payable by the Fund in an amount equal to 100% of the net advisory fees the Adviser receives from the affiliated money market funds on investments by the Fund of uninvested cash in such affiliated money market funds.
For the year ended April 30, 2016, the Adviser waived advisory fees of $118,551 and reimbursed class level expenses of $180,370, $2,826, $26,732, $25,907 and $26,294 of Class A, Class B, Class C, Class Y and Investor Class shares, respectively.
The Trust has entered into a master administrative services agreement with Invesco pursuant to which the Fund has agreed to pay Invesco for certain administrative costs incurred in providing accounting services to the Fund. For the year ended April 30, 2016, expenses incurred under the agreement are shown in the Statement of Operations as Administrative services fees.
The Trust has entered into a transfer agency and service agreement with Invesco Investment Services, Inc. (“IIS”) pursuant to which the Fund has agreed to pay IIS a fee for providing transfer agency and shareholder services to the Fund and reimburse IIS for certain expenses incurred by IIS in the course of providing such services. IIS may make payments to intermediaries that provide omnibus account services, sub-accounting services and/or networking services. All fees payable by IIS to intermediaries that provide omnibus account services or sub-accounting are charged back to the Fund, subject to certain limitations approved by the Trust’s Board of Trustees. For the year ended April 30, 2016, expenses incurred under the agreement are shown in the Statement of Operations as Transfer agent fees.
The Trust has entered into master distribution agreements with Invesco Distributors, Inc. (“IDI”) to serve as the distributor for the Class A, Class B, Class C, Class Y, Investor Class, Class R5 and Class R6 shares of the Fund. The Trust has adopted plans pursuant to Rule 12b-1 under the 1940 Act with respect to the Fund’s Class A, Class B, Class C and Investor Class shares (collectively, the “Plans”). The Fund, pursuant to the Plans, pays IDI compensation at the annual rate of 0.25% of the Fund’s average daily net assets of Class A shares, 1.00% of the average daily net assets of Class B and Class C shares and 0.25% of the average daily net assets of Investor Class shares. Of the Plan payments, up to 0.25% of the average daily net assets of each class of shares may be paid to furnish continuing personal shareholder services to customers who purchase and own shares of such classes. Any amounts not paid as a service fee under the Plans would constitute an asset-based sales charge. Rules of the Financial Industry Regulatory Authority (“FINRA”) impose a cap on the total sales charges, including asset-based sales charges, that may be paid by any class of shares of the Fund. For the year ended April 30, 2016, expenses incurred under the Plan are shown in the Statement of Operations as Distribution fees.
Front-end sales commissions and CDSC (collectively, the “sales charges”) are not recorded as expenses of the Fund. Front-end sales commissions are deducted from proceeds from the sales of Fund shares prior to investment in Class A shares of the Fund. CDSC are deducted from redemption
16 Invesco Dividend Income Fund
proceeds prior to remittance to the shareholder. During the year ended April 30, 2016, IDI advised the Fund that IDI retained $397,618 in front-end sales commissions from the sale of Class A shares and $7,540, $961 and $6,471 from Class A, Class B and Class C shares, respectively, for CDSC imposed on redemptions by shareholders.
For the year ended April 30, 2016, the Fund incurred $1,667 in brokerage commissions with Invesco Capital Markets, Inc., an affiliate of the Adviser and IDI, for portfolio transactions executed on behalf of the Fund.
Certain officers and trustees of the Trust are officers and directors of the Adviser, IIS and/or IDI.
NOTE 3—Additional Valuation Information
GAAP defines fair value as the price that would be received to sell an asset or paid to transfer a liability in an orderly transaction between market participants at the measurement date, under current market conditions. GAAP establishes a hierarchy that prioritizes the inputs to valuation methods, giving the highest priority to readily available unadjusted quoted prices in an active market for identical assets (Level 1) and the lowest priority to significant unobservable inputs (Level 3), generally when market prices are not readily available or are unreliable. Based on the valuation inputs, the securities or other investments are tiered into one of three levels. Changes in valuation methods may result in transfers in or out of an investment’s assigned level:
| | Level 1 — | Prices are determined using quoted prices in an active market for identical assets. |
| | Level 2 — | Prices are determined using other significant observable inputs. Observable inputs are inputs that other market participants may use in pricing a security. These may include quoted prices for similar securities, interest rates, prepayment speeds, credit risk, yield curves, loss severities, default rates, discount rates, volatilities and others. |
| | Level 3 — | Prices are determined using significant unobservable inputs. In situations where quoted prices or observable inputs are unavailable (for example, when there is little or no market activity for an investment at the end of the period), unobservable inputs may be used. Unobservable inputs reflect the Fund’s own assumptions about the factors market participants would use in determining fair value of the securities or instruments and would be based on the best available information. |
The following is a summary of the tiered valuation input levels, as of April 30, 2016. The level assigned to the securities valuations may not be an indication of the risk or liquidity associated with investing in those securities. Because of the inherent uncertainties of valuation, the values reflected in the financial statements may materially differ from the value received upon actual sale of those investments.
| | | | | | | | | | | | | | | | |
| | | Level 1 | | | Level 2 | | | Level 3 | | | Total | |
Equity Securities | | $ | 1,351,955,010 | | | $ | 83,071,817 | | | $ | — | | | $ | 1,435,026,827 | |
Forward Foreign Currency Contracts* | | | — | | | | (1,274,921 | ) | | | — | | | | (1,274,921 | ) |
Total Investments | | $ | 1,351,955,010 | | | $ | 81,796,896 | | | $ | — | | | $ | 1,433,751,906 | |
| * | Unrealized appreciation (depreciation). |
NOTE 4—Derivative Investments
Value of Derivative Investments at Period-End
The table below summarizes the value of the Fund’s derivative investments, detailed by primary risk exposure, held as of April 30, 2016:
| | | | | | | | |
| | | Value | |
| Risk Exposure/Derivative Type | | Assets | | | Liabilities | |
Currency risk: | | | | | | | | |
Forward foreign currency contracts(a) | | $ | — | | | $ | (1,274,921 | ) |
| (a) | Values are disclosed on the Statement of Assets and Liabilities under the caption Unrealized depreciation on forward foreign currency contracts outstanding. |
Effect of Derivative Investments for the year ended April 30, 2016
The table below summarizes the gains (losses) on derivative investments, detailed by primary risk exposure, recognized in earnings during the period:
| | | | |
| | | Location of Gain (Loss) on
Statement of Operations | |
| | | Forward Foreign Currency Contracts | |
Realized Gain (Loss): | | | | |
Currency risk | | $ | (238,154 | ) |
Change in Net Unrealized Appreciation (Depreciation): | | | | |
Currency risk | | | (1,012,573 | ) |
Total | | $ | (1,250,727 | ) |
The table below summarizes the average notional value of forward foreign currency contracts outstanding during the period.
| | | | |
| | | Forward Foreign Currency Contracts | |
Average notional value | | $ | 17,548,014 | |
17 Invesco Dividend Income Fund
| | | | | | | | | | | | | | | | | | | | | | | | | | |
| Open Forward Foreign Currency Contracts | |
Settlement Date | | Counterparty | | Contract to | | | Notional
Value | | | Unrealized
Appreciation
(Depreciation) | |
| | | Deliver | | | Receive | | | |
05/20/16 | | Citigroup Global Markets Inc. | | | CAD | | | | 7,493,118 | | | | USD | | | | 5,705,435 | | | $ | 5,971,336 | | | $ | (265,901 | ) |
05/20/16 | | Citigroup Global Markets Inc. | | | EUR | | | | 7,192,940 | | | | USD | | | | 8,089,353 | | | | 8,241,391 | | | | (152,038 | ) |
05/20/16 | | Deutsche Bank Securities Inc. | | | CAD | | | | 7,935,788 | | | | USD | | | | 6,048,289 | | | | 6,324,103 | | | | (275,814 | ) |
05/20/16 | | Deutsche Bank Securities Inc. | | | EUR | | | | 6,808,579 | | | | USD | | | | 7,640,026 | | | | 7,801,005 | | | | (160,979 | ) |
05/20/16 | | Goldman Sachs International | | | CAD | | | | 8,103,267 | | | | USD | | | | 6,194,562 | | | | 6,457,569 | | | | (263,007 | ) |
05/20/16 | | Goldman Sachs International | | | EUR | | | | 7,077,783 | | | | USD | | | | 7,952,267 | | | | 8,109,449 | | | | (157,182 | ) |
Total Open Forward Foreign Currency Contracts — Currency Risk | | | | | | | | | | | | | | | | | | | | | | $ | (1,274,921 | ) |
Currency Abbreviations:
| | |
| CAD | | – Canadian Dollar |
| EUR | | – Euro |
| USD | | – U.S. Dollar |
Offsetting Assets and Liabilities
Accounting Standards Update (“ASU”) No. 2011-11, Disclosures about Offsetting Assets and Liabilities, which was subsequently clarified in Financial Accounting Standards Board ASU 2013-01 “Clarifying the Scope of Disclosures about Offsetting Assets and Liabilities” is intended to enhance disclosures about financial instruments and derivative instruments that are subject to offsetting arrangements on the Statement of Assets and Liabilities and to enable investors to better understand the effect of those arrangements on the Fund’s financial position. In order for an arrangement to be eligible for netting, the Fund must have a basis to conclude that such netting arrangements are legally enforceable. The Fund enters into netting agreements and collateral agreements in an attempt to reduce the Fund’s Counterparty credit risk by providing for a single net settlement with a Counterparty of all financial transactions covered by the agreement in an event of default as defined under such agreement.
The following tables present derivative instruments that are either subject to an enforceable netting agreement or offset by collateral arrangements as of April 30, 2016.
| | | | | | | | | | | | | | | | | | | | |
| | | Gross amounts
of Recognized
Liabilities | | | Gross Amounts Not Offset in the
Statement of Assets and Liabilities | | | | |
| | | | Financial
Instruments | | | Collateral Pledged | | | Net
Amount | |
| Counterparty | | | | Non-Cash | | | Cash | | |
Citigroup Global Markets Inc. | | $ | 417,939 | | | $ | — | | | $ | — | | | $ | — | | | $ | 417,939 | |
Deutsche Bank Securities Inc. | | | 436,793 | | | | — | | | | — | | | | — | | | | 436,793 | |
Goldman Sachs International | | | 420,189 | | | | — | | | | — | | | | — | | | | 420,189 | |
Total | | $ | 1,274,921 | | | $ | — | | | $ | — | | | $ | — | | | $ | 1,274,921 | |
NOTE 5—Security Transactions with Affiliated Funds
The Fund is permitted to purchase or sell securities from or to certain other Invesco Funds under specified conditions outlined in procedures adopted by the Board of Trustees of the Trust. The procedures have been designed to ensure that any purchase or sale of securities by the Fund from or to another fund or portfolio that is or could be considered an affiliate by virtue of having a common investment adviser (or affiliated investment advisers), common Trustees and/or common officers complies with Rule 17a-7 of the 1940 Act. Further, as defined under the procedures, each transaction is effected at the current market price. Pursuant to these procedures, for the year ended April 30, 2016, the Fund engaged in securities sales of $3,470,198, which resulted in net realized gains of $366,570.
NOTE 6—Expense Offset Arrangement(s)
The expense offset arrangement is comprised of transfer agency credits which result from balances in demand deposit accounts used by the transfer agent for clearing shareholder transactions. For the year ended April 30, 2016, the Fund received credits from this arrangement, which resulted in the reduction of the Fund’s total expenses of $3,832.
NOTE 7—Trustees’ and Officers’ Fees and Benefits
Trustees’ and Officers’ Fees and Benefits include amounts accrued by the Fund to pay remuneration to certain Trustees and Officers of the Fund. Trustees have the option to defer compensation payable by the Fund, and Trustees’ and Officers’ Fees and Benefits also include amounts accrued by the Fund to fund such deferred compensation amounts. Those Trustees who defer compensation have the option to select various Invesco Funds in which their deferral accounts shall be deemed to be invested. Finally, certain current Trustees were eligible to participate in a retirement plan that provided for benefits to be paid upon retirement to Trustees over a period of time based on the number of years of service. The Fund may have certain former Trustees who also participate in a retirement plan and receive benefits under such plan. Trustees’ and Officers’ Fees and Benefits include amounts accrued by the Fund to fund such retirement benefits. Obligations under the deferred compensation and retirement plans represent unsecured claims against the general assets of the Fund.
18 Invesco Dividend Income Fund
NOTE 8—Cash Balances
The Fund is permitted to temporarily carry a negative or overdrawn balance in its account with State Street Bank and Trust Company, the custodian bank. Such balances, if any at period-end, are shown in the Statement of Assets and Liabilities under the payable caption Amount due custodian. To compensate the custodian bank for such overdrafts, the overdrawn Fund may either (1) leave funds as a compensating balance in the account so the custodian bank can be compensated by earning the additional interest; or (2) compensate by paying the custodian bank at a rate agreed upon by the custodian bank and Invesco, not to exceed the contractually agreed upon rate.
NOTE 9—Distributions to Shareholders and Tax Components of Net Assets
Tax Character of Distributions to Shareholders Paid During the Fiscal Years Ended April 30, 2016 and 2015:
| | | | | | | | |
| | | 2016 | | | 2015 | |
Ordinary income | | $ | 15,103,903 | | | $ | 13,226,341 | |
Long-term capital gain | | | 17,087,062 | | | | 5,202,541 | |
Total distributions | | $ | 32,190,965 | | | $ | 18,428,882 | |
Tax Components of Net Assets at Period-End:
| | | | |
| | | 2016 | |
Undistributed long-term gain | | $ | 5,074,867 | |
Net unrealized appreciation — investments | | | 206,347,645 | |
Net unrealized appreciation (depreciation) — other investments | | | (11,407 | ) |
Temporary book/tax differences | | | (139,634 | ) |
Post-October deferrals | | | (571,739 | ) |
Shares of beneficial interest | | | 1,220,094,269 | |
Total net assets | | $ | 1,430,794,001 | |
The difference between book-basis and tax-basis unrealized appreciation (depreciation) is due to differences in the timing of recognition of gains and losses on investments for tax and book purposes. The Fund’s net unrealized appreciation difference is attributable primarily to wash sales.
The temporary book/tax differences are a result of timing differences between book and tax recognition of income and/or expenses. The Fund’s temporary book/tax differences are the result of the trustee deferral of compensation and retirement plan benefits.
Capital loss carryforward is calculated and reported as of a specific date. Results of transactions and other activity after that date may affect the amount of capital loss carryforward actually available for the Fund to utilize. Capital losses generated in years beginning after December 22, 2010 can be carried forward for an unlimited period, whereas previous losses expire in eight tax years. Capital losses with an expiration period may not be used to offset capital gains until all net capital losses without an expiration date have been utilized. Capital loss carryforwards with no expiration date will retain their character as either short-term or long-term capital losses instead of as short-term capital losses as under prior law. The ability to utilize capital loss carryforwards in the future may be limited under the Internal Revenue Code and related regulations based on the results of future transactions.
The Fund does not have a capital loss carryforward as of April 30, 2016.
NOTE 10—Investment Securities
The aggregate amount of investment securities (other than short-term securities, U.S. Treasury obligations and money market funds, if any) purchased and sold by the Fund during the year ended April 30, 2016 was $518,484,228 and $64,687,176, respectively. Cost of investments on a tax basis includes the adjustments for financial reporting purposes as of the most recently completed federal income tax reporting period-end.
| | | | |
| Unrealized Appreciation (Depreciation) of Investment Securities on a Tax Basis | |
Aggregate unrealized appreciation of investment securities | | $ | 216,477,642 | |
Aggregate unrealized (depreciation) of investment securities | | | (10,129,997 | ) |
Net unrealized appreciation of investment securities | | $ | 206,347,645 | |
Cost of investments for tax purposes is $1,228,679,182.
NOTE 11—Reclassification of Permanent Differences
Primarily as a result of differing book/tax treatment of foreign currency transactions and distributions, on April 30, 2016, undistributed net investment income was increased by $918,243 and undistributed net realized gain was decreased by $918,243. This reclassification had no effect on the net assets of the Fund.
19 Invesco Dividend Income Fund
NOTE 12—Share Information
| | | | | | | | | | | | | | | | |
| | | Summary of Share Activity | |
| | | Years ended April 30, | |
| | | 2016(a) | | | 2015 | |
| | | Shares | | | Amount | | | Shares | | | Amount | |
Sold: | | | | | | | | | | | | | | | | |
Class A | | | 23,155,095 | | | $ | 495,255,985 | | | | 5,806,802 | | | $ | 119,134,915 | |
Class B | | | 45,769 | | | | 985,278 | | | | 48,043 | | | | 997,548 | |
Class C | | | 4,575,659 | | | | 99,778,343 | | | | 1,245,063 | | | | 25,967,572 | |
Class Y | | | 10,201,141 | | | | 221,042,787 | | | | 3,596,311 | | | | 74,966,881 | |
Investor Class | | | 833,236 | | | | 18,217,582 | | | | 257,131 | | | | 5,363,104 | |
Class R5 | | | 25,368 | | | | 541,396 | | | | 3,933 | | | | 79,231 | |
Class R6 | | | 537,995 | | | | 11,376,017 | | | | 844,134 | | | | 17,372,957 | |
| | | | |
Issued as reinvestment of dividends: | | | | | | | | | | | | | | | | |
Class A | | | 899,704 | | | | 18,705,560 | | | | 498,025 | | | | 10,190,879 | |
Class B | | | 11,767 | | | | 244,100 | | | | 11,523 | | | | 236,070 | |
Class C | | | 101,394 | | | | 2,127,305 | | | | 49,988 | | | | 1,036,129 | |
Class Y | | | 107,947 | | | | 2,287,463 | | | | 60,330 | | | | 1,252,805 | |
Investor Class | | | 139,764 | | | | 2,928,943 | | | | 100,627 | | | | 2,085,579 | |
Class R5 | | | 505 | | | | 10,487 | | | | 991 | | | | 20,115 | |
Class R6 | | | 128,598 | | | | 2,674,602 | | | | 68,137 | | | | 1,396,852 | |
| | | | |
Automatic conversion of Class B shares to Class A shares: | | | | | | | | | | | | | | | | |
Class A | | | 151,581 | | | | 3,226,925 | | | | 148,152 | | | | 3,060,361 | |
Class B | | | (151,126 | ) | | | (3,226,925 | ) | | | (147,719 | ) | | | (3,060,361 | ) |
| | | | |
Reacquired: | | | | | | | | | | | | | | | | |
Class A | | | (5,016,182 | ) | | | (105,676,630 | ) | | | (3,668,065 | ) | | | (75,571,831 | ) |
Class B | | | (59,164 | ) | | | (1,248,826 | ) | | | (83,740 | ) | | | (1,731,036 | ) |
Class C | | | (740,023 | ) | | | (15,873,183 | ) | | | (486,102 | ) | | | (10,175,078 | ) |
Class Y | | | (1,767,891 | ) | | | (38,157,703 | ) | | | (2,248,908 | ) | | | (47,478,371 | ) |
Investor Class | | | (567,954 | ) | | | (12,030,678 | ) | | | (358,337 | ) | | | (7,422,398 | ) |
Class R5 | | | (2,232 | ) | | | (48,157 | ) | | | (37,665 | ) | | | (790,196 | ) |
Class R6 | | | (273,544 | ) | | | (5,727,584 | ) | | | (182,547 | ) | | | (3,730,805 | ) |
Net increase in share activity | | | 32,337,407 | | | $ | 697,413,087 | | | | 5,526,107 | | | $ | 113,200,922 | |
| (a) | There are entities that are record owners of more than 5% of the outstanding shares of the Fund and in the aggregate own 36% of the outstanding shares of the Fund. IDI has an agreement with these entities to sell Fund shares. The Fund, Invesco and/or Invesco affiliates may make payments to these entities, which are considered to be related to the Fund, for providing services to the Fund, Invesco and/or Invesco affiliates including but not limited to services such as securities brokerage, distribution, third party record keeping and account servicing. The Fund has no knowledge as to whether all or any portion of the shares owned of record by these entities are also owned beneficially. |
20 Invesco Dividend Income Fund
NOTE 13—Financial Highlights
The following schedule presents financial highlights for a share of the Fund outstanding throughout the periods indicated.
| | | | | | | | | | | | | | | | | | | | | | | | | | | | | | | | | | | | | | | | | | | | | | | | | | | | | | | | |
| | | Net asset
value,
beginning
of period | | | Net
investment
income(a) | | | Net gains
on securities
(both
realized and
unrealized) | | | Total from
investment
operations | | | Dividends
from net
investment
income | | | Distributions
from net
realized
gains | | | Total
Distributions | | | Net asset
value, end
of period | | | Total
return(b) | | | Net assets,
end of period
(000’s omitted) | | | Ratio of
expenses
to average net assets
with fee waivers
and/or expenses
absorbed | | | Ratio of
expenses
to average net
assets without
fee waivers
and/or expenses
absorbed | | | Ratio of net
investment
income to average
net assets | | | Portfolio
turnover(c) | |
Class A | |
Year ended 04/30/16 | | $ | 21.03 | | | $ | 0.40 | | | $ | 1.77 | | | $ | 2.17 | | | $ | (0.41 | ) | | $ | (0.47 | ) | | $ | (0.88 | ) | | $ | 22.32 | | | | 10.72 | % | | $ | 867,596 | | | | 1.13 | %(d) | | | 1.17 | %(d) | | | 1.91 | %(d) | | | 9 | % |
Year ended 04/30/15 | | | 19.88 | | | | 0.41 | | | | 1.37 | | | | 1.78 | | | | (0.42 | ) | | | (0.21 | ) | | | (0.63 | ) | | | 21.03 | | | | 9.07 | | | | 413,896 | | | | 1.12 | | | | 1.22 | | | | 1.99 | | | | 4 | |
Year ended 04/30/14 | | | 18.02 | | | | 0.41 | | | | 2.16 | | | | 2.57 | | | | (0.48 | ) | | | (0.23 | ) | | | (0.71 | ) | | | 19.88 | | | | 14.66 | | | | 335,837 | | | | 1.09 | | | | 1.29 | | | | 2.22 | | | | 4 | |
Year ended 04/30/13 | | | 16.93 | | | | 0.50 | | | | 2.21 | | | | 2.71 | | | | (0.52 | ) | | | (1.10 | ) | | | (1.62 | ) | | | 18.02 | | | | 16.83 | | | | 262,332 | | | | 1.26 | | | | 1.34 | | | | 2.87 | | | | 66 | |
Year ended 04/30/12 | | | 16.18 | | | | 0.43 | | | | 0.73 | | | | 1.16 | | | | (0.41 | ) | | | — | | | | (0.41 | ) | | | 16.93 | | | | 7.31 | | | | 241,103 | | | | 1.32 | | | | 1.37 | | | | 2.66 | | | | 14 | |
Class B | |
Year ended 04/30/16 | | | 21.09 | | | | 0.25 | | | | 1.77 | | | | 2.02 | | | | (0.26 | ) | | | (0.47 | ) | | | (0.73 | ) | | | 22.38 | | | | 9.87 | | | | 6,746 | | | | 1.88 | (d) | | | 1.92 | (d) | | | 1.16 | (d) | | | 9 | |
Year ended 04/30/15 | | | 19.93 | | | | 0.25 | | | | 1.38 | | | | 1.63 | | | | (0.26 | ) | | | (0.21 | ) | | | (0.47 | ) | | | 21.09 | | | | 8.30 | | | | 9,578 | | | | 1.87 | | | | 1.97 | | | | 1.24 | | | | 4 | |
Year ended 04/30/14 | | | 18.07 | | | | 0.27 | | | | 2.16 | | | | 2.43 | | | | (0.34 | ) | | | (0.23 | ) | | | (0.57 | ) | | | 19.93 | | | | 13.76 | | | | 12,479 | | | | 1.84 | | | | 2.04 | | | | 1.47 | | | | 4 | |
Year ended 04/30/13 | | | 16.97 | | | | 0.37 | | | | 2.21 | | | | 2.58 | | | | (0.38 | ) | | | (1.10 | ) | | | (1.48 | ) | | | 18.07 | | | | 15.92 | | | | 15,099 | | | | 2.01 | | | | 2.09 | | | | 2.12 | | | | 66 | |
Year ended 04/30/12 | | | 16.22 | | | | 0.31 | | | | 0.73 | | | | 1.04 | | | | (0.29 | ) | | | — | | | | (0.29 | ) | | | 16.97 | | | | 6.50 | | | | 18,620 | | | | 2.07 | | | | 2.12 | | | | 1.91 | | | | 14 | |
Class C | |
Year ended 04/30/16 | | | 21.28 | | | | 0.25 | | | | 1.80 | | | | 2.05 | | | | (0.26 | ) | | | (0.47 | ) | | | (0.73 | ) | | | 22.60 | | | | 9.94 | | | | 154,584 | | | | 1.88 | (d) | | | 1.92 | (d) | | | 1.16 | (d) | | | 9 | |
Year ended 04/30/15 | | | 20.11 | | | | 0.26 | | | | 1.39 | | | | 1.65 | | | | (0.27 | ) | | | (0.21 | ) | | | (0.48 | ) | | | 21.28 | | | | 8.29 | | | | 61,818 | | | | 1.87 | | | | 1.97 | | | | 1.24 | | | | 4 | |
Year ended 04/30/14 | | | 18.24 | | | | 0.27 | | | | 2.17 | | | | 2.44 | | | | (0.34 | ) | | | (0.23 | ) | | | (0.57 | ) | | | 20.11 | | | | 13.71 | | | | 42,150 | | | | 1.84 | | | | 2.04 | | | | 1.47 | | | | 4 | |
Year ended 04/30/13 | | | 17.11 | | | | 0.37 | | | | 2.24 | | | | 2.61 | | | | (0.38 | ) | | | (1.10 | ) | | | (1.48 | ) | | | 18.24 | | | | 15.99 | | | | 27,793 | | | | 2.01 | | | | 2.09 | | | | 2.12 | | | | 66 | |
Year ended 04/30/12 | | | 16.36 | | | | 0.31 | | | | 0.73 | | | | 1.04 | | | | (0.29 | ) | | | — | | | | (0.29 | ) | | | 17.11 | | | | 6.46 | | | | 26,511 | | | | 2.07 | | | | 2.12 | | | | 1.91 | | | | 14 | |
Class Y | |
Year ended 04/30/16 | | | 21.22 | | | | 0.47 | | | | 1.78 | | | | 2.25 | | | | (0.47 | ) | | | (0.47 | ) | | | (0.94 | ) | | | 22.53 | | | | 11.01 | | | | 249,625 | | | | 0.88 | (d) | | | 0.92 | (d) | | | 2.16 | (d) | | | 9 | |
Year ended 04/30/15 | | | 20.06 | | | | 0.47 | | | | 1.37 | | | | 1.84 | | | | (0.47 | ) | | | (0.21 | ) | | | (0.68 | ) | | | 21.22 | | | | 9.34 | | | | 53,878 | | | | 0.87 | | | | 0.97 | | | | 2.24 | | | | 4 | |
Year ended 04/30/14 | | | 18.18 | | | | 0.46 | | | | 2.17 | | | | 2.63 | | | | (0.52 | ) | | | (0.23 | ) | | | (0.75 | ) | | | 20.06 | | | | 14.95 | | | | 22,690 | | | | 0.84 | | | | 1.04 | | | | 2.47 | | | | 4 | |
Year ended 04/30/13 | | | 17.07 | | | | 0.54 | | | | 2.24 | | | | 2.78 | | | | (0.57 | ) | | | (1.10 | ) | | | (1.67 | ) | | | 18.18 | | | | 17.16 | | | | 5,146 | | | | 1.01 | | | | 1.09 | | | | 3.12 | | | | 66 | |
Year ended 04/30/12 | | | 16.32 | | | | 0.48 | | | | 0.73 | | | | 1.21 | | | | (0.46 | ) | | | — | | | | (0.46 | ) | | | 17.07 | | | | 7.54 | | | | 5,622 | | | | 1.07 | | | | 1.12 | | | | 2.91 | | | | 14 | |
Investor Class | | | | | | | | | | | | | | | | | | | | | | | | | | | | | | | | | | | | | | | | | | | | | | | | | | | | | | | | |
Year ended 04/30/16 | | | 21.22 | | | | 0.41 | | | | 1.78 | | | | 2.19 | | | | (0.42 | ) | | | (0.47 | ) | | | (0.89 | ) | | | 22.52 | | | | 10.69 | | | | 88,691 | | | | 1.13 | (d) | | | 1.17 | (d) | | | 1.91 | (d) | | | 9 | |
Year ended 04/30/15 | | | 20.05 | | | | 0.41 | | | | 1.39 | | | | 1.80 | | | | (0.42 | ) | | | (0.21 | ) | | | (0.63 | ) | | | 21.22 | | | | 9.11 | | | | 74,957 | | | | 1.12 | | | | 1.22 | | | | 1.99 | | | | 4 | |
Year ended 04/30/14 | | | 18.18 | | | | 0.41 | | | | 2.17 | | | | 2.58 | | | | (0.48 | ) | | | (0.23 | ) | | | (0.71 | ) | | | 20.05 | | | | 14.61 | | | | 70,853 | | | | 1.09 | | | | 1.29 | | | | 2.22 | | | | 4 | |
Year ended 04/30/13 | | | 17.07 | | | | 0.50 | | | | 2.23 | | | | 2.73 | | | | (0.52 | ) | | | (1.10 | ) | | | (1.62 | ) | | | 18.18 | | | | 16.84 | | | | 67,130 | | | | 1.26 | | | | 1.34 | | | | 2.87 | | | | 66 | |
Year ended 04/30/12 | | | 16.32 | | | | 0.44 | | | | 0.73 | | | | 1.17 | | | | (0.42 | ) | | | — | | | | (0.42 | ) | | | 17.07 | | | | 7.28 | | | | 62,707 | | | | 1.32 | | | | 1.37 | | | | 2.66 | | | | 14 | |
Class R5 | |
Year ended 04/30/16 | | | 21.04 | | | | 0.47 | | | | 1.75 | | | | 2.22 | | | | (0.47 | ) | | | (0.47 | ) | | | (0.94 | ) | | | 22.32 | | | | 10.98 | | | | 551 | | | | 0.84 | (d) | | | 0.85 | (d) | | | 2.20 | (d) | | | 9 | |
Year ended 04/30/15 | | | 19.88 | | | | 0.46 | | | | 1.39 | | | | 1.85 | | | | (0.48 | ) | | | (0.21 | ) | | | (0.69 | ) | | | 21.04 | | | | 9.44 | | | | 21 | | | | 0.82 | | | | 0.83 | | | | 2.29 | | | | 4 | |
Year ended 04/30/14 | | | 18.03 | | | | 0.45 | | | | 2.15 | | | | 2.60 | | | | (0.52 | ) | | | (0.23 | ) | | | (0.75 | ) | | | 19.88 | | | | 14.87 | | | | 671 | | | | 0.84 | | | | 0.87 | | | | 2.47 | | | | 4 | |
Year ended 04/30/13 | | | 16.94 | | | | 0.56 | | | | 2.22 | | | | 2.78 | | | | (0.59 | ) | | | (1.10 | ) | | | (1.69 | ) | | | 18.03 | | | | 17.32 | | | | 680 | | | | 0.87 | | | | 0.88 | | | | 3.26 | | | | 66 | |
Year ended 04/30/12 | | | 16.19 | | | | 0.51 | | | | 0.72 | | | | 1.23 | | | | (0.48 | ) | | | — | | | | (0.48 | ) | | | 16.94 | | | | 7.77 | | | | 8,692 | | | | 0.85 | | | | 0.86 | | | | 3.13 | | | | 14 | |
Class R6 | |
Year ended 04/30/16 | | | 21.05 | | | | 0.49 | | | | 1.77 | | | | 2.26 | | | | (0.50 | ) | | | (0.47 | ) | | | (0.97 | ) | | | 22.34 | | | | 11.13 | | | | 63,000 | | | | 0.74 | (d) | | | 0.75 | (d) | | | 2.30 | (d) | | | 9 | |
Year ended 04/30/15 | | | 19.89 | | | | 0.48 | | | | 1.38 | | | | 1.86 | | | | (0.49 | ) | | | (0.21 | ) | | | (0.70 | ) | | | 21.05 | | | | 9.49 | | | | 51,080 | | | | 0.78 | | | | 0.79 | | | | 2.33 | | | | 4 | |
Year ended 04/30/14 | | | 18.04 | | | | 0.46 | | | | 2.15 | | | | 2.61 | | | | (0.53 | ) | | | (0.23 | ) | | | (0.76 | ) | | | 19.89 | | | | 14.89 | | | | 33,762 | | | | 0.82 | | | | 0.83 | | | | 2.49 | | | | 4 | |
Year ended 04/30/13(e) | | | 17.55 | | | | 0.34 | | | | 1.58 | | | | 1.92 | | | | (0.33 | ) | | | (1.10 | ) | | | (1.43 | ) | | | 18.04 | | | | 11.58 | | | | 21,141 | | | | 0.89 | (f) | | | 0.89 | (f) | | | 3.24 | (f) | | | 66 | |
| (a) | Calculated using average shares outstanding. |
| (b) | Includes adjustments in accordance with accounting principles generally accepted in the United States of America and as such, the net asset value for financial reporting purposes and the returns based upon those net asset values may differ from the net asset value and returns for shareholder transactions. Does not include sales charges and is not annualized for periods less than one year, if applicable. |
| (c) | Portfolio turnover is calculated at the fund level and is not annualized for periods less than one year, if applicable. For the period ended April 30, 2012, the portfolio turnover calculation excludes the value of securities purchased of $95,656,625 and sold of $8,278,596 in the effort to realign the Fund’s portfolio holdings after the reorganization of Invesco Van Kampen Utility Fund into the Fund. |
| (d) | Ratios are based on average daily net assets (000’s omitted) of $513,208, $8,042, $76,060, $73,713, $74,816, $207 and $57,264 for Class A, Class B, Class C, Class Y, Investor Class, Class R5 and Class R6 shares, respectively. |
| (e) | Commencement date of September 24, 2012 for Class R6 shares. |
21 Invesco Dividend Income Fund
Report of Independent Registered Public Accounting Firm
To the Board of Trustees of AIM Sector Funds (Invesco Sector Funds)
and Shareholders of Invesco Dividend Income Fund:
In our opinion, the accompanying statement of assets and liabilities, including the schedule of investments, and the related statements of operations and of changes in net assets and the financial highlights present fairly, in all material respects, the financial position of Invesco Dividend Income Fund (one of the funds constituting AIM Sector Funds (Invesco Sector Funds), hereafter referred to as the “Fund”) at April 30, 2016, the results of its operations for the year then ended, the changes in its net assets for each of the two years in the period then ended and the financial highlights for each of the five years in the period then ended, in conformity with accounting principles generally accepted in the United States of America. These financial statements and financial highlights (hereafter referred to as “financial statements”) are the responsibility of the Fund’s management; our responsibility is to express an opinion on these financial statements based on our audits. We conducted our audits of these financial statements in accordance with the standards of the Public Company Accounting Oversight Board (United States). Those standards require that we plan and perform the audit to obtain reasonable assurance about whether the financial statements are free of material misstatement. An audit includes examining, on a test basis, evidence supporting the amounts and disclosures in the financial statements, assessing the accounting principles used and significant estimates made by management, and evaluating the overall financial statement presentation. We believe that our audits, which included confirmation of securities at April 30, 2016 by correspondence with the custodian and brokers, and the application of alternative auditing procedures where confirmations of security purchases have not been received, provide a reasonable basis for our opinion.
PRICEWATERHOUSECOOPERS LLP
June 22, 2016
Houston, Texas
22 Invesco Dividend Income Fund
Calculating your ongoing Fund expenses
Example
As a shareholder of the Fund, you incur two types of costs: (1) transaction costs, which may include sales charges (loads) on purchase payments or contingent deferred sales charges on redemptions, if any; and (2) ongoing costs, including management fees, distribution and/or service (12b-1) fees, and other Fund expenses. This example is intended to help you understand your ongoing costs (in dollars) of investing in the Fund and to compare these costs with ongoing costs of investing in other mutual funds. The example is based on an investment of $1,000 invested at the beginning of the period and held for the entire period November 1, 2015 through April 30, 2016.
Actual expenses
The table below provides information about actual account values and actual expenses. You may use the information in this table, together with the amount you invested, to estimate the expenses that you paid over the period. Simply divide your account value by $1,000 (for example, an $8,600 account value divided by $1,000 = 8.6), then multiply the result by the number in the table under the heading entitled “Actual Expenses Paid During Period” to estimate the expenses you paid on your account during this period.
Hypothetical example for comparison purposes
The table below also provides information about hypothetical account values and hypothetical expenses based on the Fund’s actual expense ratio and an assumed rate of return of 5% per year before expenses, which is not the Fund’s actual return.
The hypothetical account values and expenses may not be used to estimate the actual ending account balance or expenses you paid for the period. You may use this information to compare the ongoing costs of investing in the Fund and other funds. To do so, compare this 5% hypothetical example with the 5% hypothetical examples that appear in the shareholder reports of the other funds.
Please note that the expenses shown in the table are meant to highlight your ongoing costs only and do not reflect any transaction costs, such as sales charges (loads) on purchase payments or contingent deferred sales charges on redemptions, if any. Therefore, the hypothetical information is useful in comparing ongoing costs only, and will not help you determine the relative total costs of owning different funds. In addition, if these transaction costs were included, your costs would have been higher.
| | | | | | | | | | | | | | | | | | | | | | | | |
| Class | | Beginning Account Value (11/01/15) | | | ACTUAL | | | HYPOTHETICAL (5% annual return before expenses) | | | Annualized Expense Ratio | |
| | | Ending Account Value (04/30/16)1 | | | Expenses Paid During Period2 | | | Ending Account Value (04/30/16) | | | Expenses Paid During Period2 | | |
| A | | $ | 1,000.00 | | | $ | 1,068.00 | | | $ | 5.76 | | | $ | 1,019.29 | | | $ | 5.62 | | | | 1.12 | % |
| B | | | 1,000.00 | | | | 1,063.70 | | | | 9.60 | | | | 1,015.56 | | | | 9.37 | | | | 1.87 | |
| C | | | 1,000.00 | | | | 1,064.10 | | | | 9.60 | | | | 1,015.56 | | | | 9.37 | | | | 1.87 | |
| Y | | | 1,000.00 | | | | 1,069.20 | | | | 4.48 | | | | 1,020.54 | | | | 4.37 | | | | 0.87 | |
| Investor | | | 1,000.00 | | | | 1,067.40 | | | | 5.76 | | | | 1,019.29 | | | | 5.62 | | | | 1.12 | |
| R5 | | | 1,000.00 | | | | 1,069.50 | | | | 4.27 | | | | 1,020.74 | | | | 4.17 | | | | 0.83 | |
| R6 | | | 1,000.00 | | | | 1,069.90 | | | | 3.76 | | | | 1,021.23 | | | | 3.67 | | | | 0.73 | |
| 1 | The actual ending account value is based on the actual total return of the Fund for the period November 1, 2015 through April 30, 2016, after actual expenses and will differ from the hypothetical ending account value which is based on the Fund’s expense ratio and a hypothetical annual return of 5% before expenses. |
| 2 | Expenses are equal to the Fund’s annualized expense ratio as indicated above multiplied by the average account value over the period, multiplied by 182/366 to reflect the most recent fiscal half year. |
23 Invesco Dividend Income Fund
Tax Information
Form 1099-DIV, Form 1042-S and other year-end tax information provide shareholders with actual calendar year amounts that should be included in their tax returns. Shareholders should consult their tax advisors.
The following distribution information is being provided as required by the Internal Revenue Code or to meet a specific state’s requirement.
The Fund designates the following amounts or, if subsequently determined to be different, the maximum amount allowable for its fiscal year ended April 30, 2016:
| | | | |
Federal and State Income Tax | |
Long-Term Capital Gain Distributions | | $ | 17,087,062 | |
Qualified Dividend Income* | | | 100 | % |
Corporate Dividends Received Deduction* | | | 100 | % |
U.S. Treasury Obligations* | | | 0 | % |
| | * | The above percentages are based on ordinary income dividends paid to shareholders during the Fund’s fiscal year. |
| | | | |
Non-Resident Alien Shareholders | |
Qualified Short-Term Capital Gain Distributions | | $ | 495,003 | |
24 Invesco Dividend Income Fund
Trustees and Officers
The address of each trustee and officer is AIM Sector Funds (Invesco Sector Funds) (the “Trust”), 11 Greenway Plaza, Suite 1000, Houston, Texas 77046-1173. The trustees serve for the life of the Trust, subject to their earlier death, incapacitation, resignation, retirement or removal as more specifically provided in the Trust’s organizational documents. Each officer serves for a one year term or until their successors are elected and qualified. Column two below includes length of time served with predecessor entities, if any.
| | | | | | | | |
Name, Year of Birth and
Position(s) Held with the Trust | | Trustee and/
or Officer Since | | Principal Occupation(s) During Past 5 Years | | Number of Funds in Fund Complex Overseen by Trustee | | Other Directorship(s) Held by Trustee During Past 5 Years |
| Interested Persons | | | | | | | | |
Martin L. Flanagan1 — 1960 Trustee | | 2007 | | Executive Director, Chief Executive Officer and President, Invesco Ltd. (ultimate parent of Invesco and a global investment management firm); Advisor to the Board, Invesco Advisers, Inc. (formerly known as Invesco Institutional (N.A.), Inc.); Trustee, The Invesco Funds; Vice Chair, Investment Company Institute; and Member of Executive Board, SMU Cox School of Business Formerly: Chairman and Chief Executive Officer, Invesco Advisers, Inc. (registered investment adviser); Director, Chairman, Chief Executive Officer and President, IVZ Inc. (holding company), INVESCO Group Services, Inc. (service provider) and Invesco North American Holdings, Inc. (holding company); Director, Chief Executive Officer and President, Invesco Holding Company Limited (parent of Invesco and a global investment management firm); Director, Invesco Ltd.; Chairman, Investment Company Institute and President, Co-Chief Executive Officer, Co-President, Chief Operating Officer and Chief Financial Officer, Franklin Resources, Inc. (global investment management organization) | | 146 | | None |
Philip A. Taylor2 — 1954 Trustee and Senior Vice President | | 2006 | | Head of the Americas and Senior Managing Director, Invesco Ltd.; Director, Co-Chairman, Co-President and Co-Chief Executive Officer, Invesco Advisers, Inc. (formerly known as Invesco Institutional (N.A.), Inc.) (registered investment adviser); Director, Chairman, Chief Executive Officer and President, Invesco Management Group, Inc. (formerly known as Invesco AIM Management Group, Inc.) (financial services holding company); Director and Chairman, Invesco Investment Services, Inc. (formerly known as Invesco AIM Investment Services, Inc.) (registered transfer agent) Chief Executive Officer, Invesco Corporate Class Inc. (corporate mutual fund company) Director, Chairman and Chief Executive Officer, Invesco Canada Ltd. (formerly known as Invesco Trimark Ltd./Invesco Trimark Ltèe) (registered investment adviser and registered transfer agent); Trustee and Senior Vice President, The Invesco Funds; Director, Invesco Investment Advisers LLC (formerly known as Van Kampen Asset Management); Director, Chief Executive Officer and President, Van Kampen Exchange Corp. Formerly: President and Principal Executive Officer, The Invesco Funds (other than AIM Treasurer’s Series Trust (Invesco Treasurer’s Series Trust), Short-Term Investments Trust and Invesco Management Trust); Executive Vice President, The Invesco Funds (AIM Treasurer’s Series Trust (Invesco Treasurer’s Series Trust), Short-Term Investments Trust and Invesco Management Trust only); Director and President, INVESCO Funds Group, Inc. (registered investment adviser and registered transfer agent); Director and Chairman, IVZ Distributors, Inc. (formerly known as INVESCO Distributors, Inc.) (registered broker dealer); Director, President and Chairman, Invesco Inc. (holding company), Invesco Canada Holdings Inc. (holding company), Trimark Investments Ltd./Placements Trimark Ltèe and Invesco Financial Services Ltd/Services Financiers Invesco Ltèe; Chief Executive Officer, Invesco Canada Fund Inc. (corporate mutual fund company); Director and Chairman, Van Kampen Investor Services Inc.; Director, Chief Executive Officer and President, 1371 Preferred Inc. (holding company) and Van Kampen Investments Inc.; Director and President, AIM GP Canada Inc. (general partner for limited partnerships) and Van Kampen Advisors, Inc.; Director and Chief Executive Officer, Invesco Trimark Dealer Inc. (registered broker dealer); Director, Invesco Distributors, Inc. (formerly known as Invesco AIM Distributors, Inc.) (registered broker dealer); Manager, Invesco PowerShares Capital Management LLC; Director, Chief Executive Officer and President, Invesco Advisers, Inc.; Director, Chairman, Chief Executive Officer and President, Invesco AIM Capital Management, Inc.; President, Invesco Trimark Dealer Inc. and Invesco Trimark Ltd./Invesco Trimark Ltèe; Director and President, AIM Trimark Corporate Class Inc. and AIM Trimark Canada Fund Inc.; Senior Managing Director, Invesco Holding Company Limited; Director and Chairman, Fund Management Company (former registered broker dealer); President and Principal Executive Officer, The Invesco Funds (AIM Treasurer’s Series Trust (Invesco Treasurer’s Series Trust), and Short-Term Investments Trust only); President, AIM Trimark Global Fund Inc. and AIM Trimark Canada Fund Inc. | | 146 | | None |
| 1 | Mr. Flanagan is considered an interested person (within the meaning of Section 2(a)(19) of the 1940 Act) of the Trust because he is an officer of the Adviser to the Trust, and an officer and a director of Invesco Ltd., ultimate parent of the Adviser. |
| 2 | Mr. Taylor is considered an interested person (within the meaning of Section 2(a)(19) of the 1940 Act) of the Trust because he is an officer and a director of the Adviser. |
T-1 Invesco Dividend Income Fund
Trustees and Officers—(continued)
| | | | | | | | |
Name, Year of Birth and
Position(s) Held with the Trust | | Trustee and/
or Officer Since | | Principal Occupation(s) During Past 5 Years | | Number of Funds in Fund Complex Overseen by Trustee | | Other Directorship(s) Held by Trustee During Past 5 Years |
| Independent Trustees | | | | | | | | |
Bruce L. Crockett — 1944 Trustee and Chair | | 2003 | | Chairman, Crockett Technologies Associates (technology consulting company) Formerly: Director, Captaris (unified messaging provider); Director, President and Chief Executive Officer, COMSAT Corporation; Chairman, Board of Governors of INTELSAT (international communications company); ACE Limited (insurance company); Independent Directors Council and Investment Company Institute | | 146 | | ALPS (Attorneys Liability Protection Society) (insurance company) and Globe Specialty Metals, Inc. (metallurgical company); Member of the Audit Committee, Ferroglobe PLC and Investment Company Institute; Member of the Executive Committee and Chair of the Governance Committee, Independent Directors Council |
David C. Arch — 1945 Trustee | | 2010 | | Chairman of Blistex Inc., a consumer health care products manufacturer | | 146 | | Board member of the Illinois Manufacturers’ Association; Member of the Board of Visitors, Institute for the Humanities, University of Michigan |
James T. Bunch — 1942 Trustee | | 2000 | | Managing Member, Grumman Hill Group LLC (family office/private equity investments) Formerly: Chairman of the Board, Denver Film Society, Chairman of the Board of Trustees, Evans Scholarship Foundation; Chairman, Board of Governors, Western Golf Association | | 146 | | Trustee, Evans Scholarship Foundation |
Albert R. Dowden — 1941 Trustee | | 2003 | | Director of a number of public and private business corporations, including Nature’s Sunshine Products, Inc. Formerly: Director, The Boss Group, Ltd. and Reich & Tang Funds (5 portfolios) (registered investment company); Director, Homeowners of America Holding Corporation/Homeowners of America Insurance Company (property casualty company); Director, Continental Energy Services, LLC (oil and gas pipeline service); Director, CompuDyne Corporation (provider of product and services to the public security market) and Director, Annuity and Life Re (Holdings), Ltd. (reinsurance company); Director, President and Chief Executive Officer, Volvo Group North America, Inc.; Senior Vice President, AB Volvo; Director of various public and private corporations; Chairman, DHJ Media, Inc.; Director, Magellan Insurance Company; and Director, The Hertz Corporation, Genmar Corporation (boat manufacturer), National Media Corporation; Advisory Board of Rotary Power International (designer, manufacturer, and seller of rotary power engines); and Chairman, Cortland Trust, Inc. (registered investment company) | | 146 | | Director of Nature’s Sunshine Products, Inc. |
Jack M. Fields — 1952 Trustee | | 2003 | | Chief Executive Officer, Twenty First Century Group, Inc. (government affairs company); and Discovery Learning Alliance (non-profit) Formerly: Owner and Chief Executive Officer, Dos Angeles Ranch L.P. (cattle, hunting, corporate entertainment); Director, Insperity, Inc. (formerly known as Administaff); Chief Executive Officer, Texana Timber LP (sustainable forestry company); Director of Cross Timbers Quail Research Ranch (non-profit); and member of the U.S. House of Representatives | | 146 | | None |
Eli Jones — 1961 Trustee | | 2016 | | Professor and Dean, Mays Business School — Texas A&M University Formerly: Professor and Dean, Walton College of Business, University of Arkansas and E.J. Ourso College of Business, Louisiana State University and Director, Arvest Bank | | 146 | | Director of Insperity, Inc. (formerly known as Administaff) |
Prema Mathai-Davis — 1950 Trustee | | 2003 | | Retired. Formerly: Chief Executive Officer, YWCA of the U.S.A. | | 146 | | None |
Larry Soll — 1942 Trustee | | 1997 | | Retired. Formerly: Chairman, Chief Executive Officer and President, Synergen Corp. (a biotechnology company) | | 146 | | None |
Raymond Stickel, Jr. — 1944 Trustee | | 2005 | | Retired. Formerly: Director, Mainstay VP Series Funds, Inc. (25 portfolios) and Partner, Deloitte & Touche | | 146 | | None |
Robert C. Troccoli — 1949 Trustee | | 2016 | | Adjunct Professor and Executive-in-Residence, University of Denver — Daniels College of Business Formerly: Senior Partner, KPMG LLP | | 146 | | None |
T-2 Invesco Dividend Income Fund
Trustees and Officers—(continued)
| | | | | | | | |
Name, Year of Birth and
Position(s) Held with the Trust | | Trustee and/
or Officer Since | | Principal Occupation(s) During Past 5 Years | | Number of Funds in Fund Complex Overseen by Trustee | | Other Directorship(s) Held by Trustee During Past 5 Years |
| Independent Trustees—(continued) |
Suzanne H. Woolsey — 1941 Trustee | | 2014 | | Retired. Formerly: Chief Executive Officer of Woolsey Partners LLC | | 146 | | Director, SunShare LLC; Trustee, Ocean Conservancy; Emeritus Chair of the Board of Trustees of the Institute for Defense Analyses and of Colorado College; Trustee, Chair, Business and Finance Committee of California Institute of Technology; Prior to 2014, Director of Fluor Corp.; Prior to 2010, Trustee of the German Marshall Fund of the United States; Prior to 2010, Trustee of the Rocky Mountain Institute |
| Other Officers | | | | | | | | |
Sheri Morris — 1964 President, Principal Executive Officer and Treasurer | | 2003 | | President, Principal Executive Officer and Treasurer, The Invesco Funds; Vice President, Invesco Advisers, Inc. (formerly known as Invesco Institutional (N.A.), Inc.) (registered investment adviser); and Vice President, PowerShares Exchange-Traded Fund Trust, PowerShares Exchange-Traded Fund Trust II, PowerShares India Exchange-Traded Fund Trust, PowerShares Actively Managed Exchange-Traded Fund Trust, and PowerShares Actively Managed Exchange-Traded Commodity Fund Trust Formerly: Vice President and Principal Financial Officer, The Invesco Funds; Vice President, Invesco AIM Advisers, Inc., Invesco AIM Capital Management, Inc. and Invesco AIM Private Asset Management, Inc.; Assistant Vice President and Assistant Treasurer, The Invesco Funds and Assistant Vice President, Invesco Advisers, Inc., Invesco AIM Capital Management, Inc. and Invesco AIM Private Asset Management, Inc.; and Treasurer, PowerShares Exchange-Traded Fund Trust, PowerShares Exchange-Traded Fund Trust II, PowerShares India Exchange-Traded Fund Trust and PowerShares Actively Managed Exchange-Traded Fund Trust | | N/A | | N/A |
Russell C. Burk — 1958 Senior Vice President and Senior Officer | | 2005 | | Senior Vice President and Senior Officer, The Invesco Funds | | N/A | | N/A |
John M. Zerr — 1962 Senior Vice President, Chief Legal Officer and Secretary | | 2006 | | Director, Senior Vice President, Secretary and General Counsel, Invesco Management Group, Inc. (formerly known as Invesco AIM Management Group, Inc.) and Van Kampen Exchange Corp.; Senior Vice President, Invesco Advisers, Inc. (formerly known as Invesco Institutional (N.A.), Inc.) (registered investment adviser); Senior Vice President and Secretary, Invesco Distributors, Inc. (formerly known as Invesco AIM Distributors, Inc.); Director, Vice President and Secretary, Invesco Investment Services, Inc. (formerly known as Invesco AIM Investment Services, Inc.) Senior Vice President, Chief Legal Officer and Secretary, The Invesco Funds; Managing Director, Invesco PowerShares Capital Management LLC; Director, Secretary and General Counsel, Invesco Investment Advisers LLC (formerly known as Van Kampen Asset Management); Secretary and General Counsel, Invesco Capital Markets, Inc. (formerly known as Van Kampen Funds Inc.) and Chief Legal Officer, PowerShares Exchange-Traded Fund Trust, PowerShares Exchange-Traded Fund Trust II, PowerShares India Exchange-Traded Fund Trust, PowerShares Actively Managed Exchange-Traded Fund Trust, and PowerShares Actively Managed Exchange-Traded Commodity Fund Trust Formerly: Director, Vice President and Secretary, IVZ Distributors, Inc. (formerly known as INVESCO Distributors, Inc.); Director and Vice President, INVESCO Funds Group, Inc.; Director and Vice President, Van Kampen Advisors Inc.; Director, Vice President, Secretary and General Counsel, Van Kampen Investor Services Inc.; Director, Invesco Distributors, Inc. (formerly known as Invesco AIM Distributors, Inc.); Director, Senior Vice President, General Counsel and Secretary, Invesco AIM Advisers, Inc. and Van Kampen Investments Inc.; Director, Vice President and Secretary, Fund Management Company; Director, Senior Vice President, Secretary, General Counsel and Vice President, Invesco AIM Capital Management, Inc.; Chief Operating Officer and General Counsel, Liberty Ridge Capital, Inc. (an investment adviser); Vice President and Secretary, PBHG Funds (an investment company) and PBHG Insurance Series Fund (an investment company); Chief Operating Officer, General Counsel and Secretary, Old Mutual Investment Partners (a broker-dealer); General Counsel and Secretary, Old Mutual Fund Services (an administrator) and Old Mutual Shareholder Services (a shareholder servicing center); Executive Vice President, General Counsel and Secretary, Old Mutual Capital, Inc. (an investment adviser); and Vice President and Secretary, Old Mutual Advisors Funds (an investment company) | | N/A | | N/A |
T-3 Invesco Dividend Income Fund
Trustees and Officers—(continued)
| | | | | | | | |
Name, Year of Birth and
Position(s) Held with the Trust | | Trustee and/
or Officer Since | | Principal Occupation(s) During Past 5 Years | | Number of Funds in Fund Complex Overseen by Trustee | | Other Directorship(s) Held by Trustee During Past 5 Years |
| Other Officers—(continued) | | | | | | | | |
Karen Dunn Kelley — 1960 Senior Vice President | | 2003 | | Senior Managing Director, Investments, Invesco Ltd.; Director, Co-President, Co-Chief Executive Officer, and Co-Chairman, Invesco Advisers, Inc. (formerly known as Invesco Institutional (N.A.), Inc.) (registered investment adviser); Chairman and Director, Invesco Senior Secured Management, Inc.; Senior Vice President, Invesco Management Group, Inc. (formerly known as Invesco AIM Management Group, Inc.); Executive Vice President, Invesco Distributors, Inc. (formerly known as Invesco AIM Distributors, Inc.); Director, Invesco Mortgage Capital Inc. and Invesco Management Company Limited; Senior Vice President, The Invesco Funds Formerly: Vice President, The Invesco Funds (other than AIM Treasurer’s Series Trust (Invesco Treasurer’s Series Trust), Short-Term Investments Trust and Invesco Management Trust); and President and Principal Executive Officer, The Invesco Funds (AIM Treasurer’s Series Trust (Invesco Treasurer’s Series Trust), Short-Term Investments Trust and Invesco Management Trust only); Director and President, INVESCO Asset Management (Bermuda) Ltd., Director, INVESCO Global Asset Management DAC (formerly known as INVESCO Global Asset Management Limited) and INVESCO Management S.A.; Senior Vice President, Van Kampen Investments Inc. and Invesco Advisers, Inc. (formerly known as Invesco Institutional (N.A.), Inc.) (registered investment adviser); Director and President, Fund Management Company; Chief Cash Management Officer, Director of Cash Management, Senior Vice President, and Managing Director, Invesco AIM Capital Management, Inc.; Director of Cash Management, Senior Vice President, and Vice President, Invesco Advisers, Inc. and The Invesco Funds (AIM Treasurer’s Series Trust (Invesco Treasurer’s Series Trust), and Short-Term Investments Trust only) | | N/A | | N/A |
Kelli Gallegos — 1970 Vice President, Principal Financial Officer and Assistant Treasurer | | 2008 | | Vice President, Principal Financial Officer and Assistant Treasurer, The Invesco Funds; Assistant Treasurer, Invesco PowerShares Capital Management LLC, PowerShares Exchange-Traded Fund Trust, PowerShares Exchange-Traded Fund Trust II, PowerShares India Exchange-Traded Fund Trust, PowerShares Actively Managed Exchange-Traded Fund Trust, and PowerShares Actively Managed Exchange-Traded Commodity Fund Trust Formerly: Assistant Vice President, The Invesco Funds | | N/A | | N/A |
Tracy Sullivan — 1962 Vice President, Chief Tax Officer and Assistant Treasurer | | 2008 | | Vice President, Chief Tax Officer and Assistant Treasurer, The Invesco Funds; Assistant Treasurer, Invesco PowerShares Capital Management LLC, PowerShares Exchange-Traded Fund Trust, PowerShares Exchange-Traded Fund Trust II, PowerShares India Exchange-Traded Fund Trust, PowerShares Actively Managed Exchange-Traded Fund Trust, and PowerShares Actively Managed Exchange-Traded Commodity Fund Trust Formerly: Assistant Vice President, The Invesco Funds | | N/A | | N/A |
Crissie M. Wisdom — 1969 Anti-Money Laundering Compliance Officer | | 2013 | | Anti-Money Laundering Compliance Officer, Invesco Advisers, Inc. (formerly known as Invesco Institutional (N.A.), Inc.) (registered investment adviser), Invesco Capital Markets, Inc. (formerly known as Van Kampen Funds Inc.), Invesco Distributors, Inc., Invesco Investment Services, Inc., Invesco Management Group, Inc., Van Kampen Exchange Corp., The Invesco Funds, and PowerShares Exchange-Traded Fund Trust, PowerShares Exchange-Traded Fund Trust II, PowerShares India Exchange-Traded Fund Trust, PowerShares Actively Managed Exchange-Traded Fund Trust and PowerShares Actively Managed Exchange-Traded Commodity Fund Trust; Anti-Money Laundering Compliance Officer and Bank Secrecy Act Officer, INVESCO National Trust Company and Invesco Trust Company; and Fraud Prevention Manager and Controls and Risk Analysis Manager for Invesco Investment Services, Inc. | | N/A | | N/A |
Robert R. Leveille — 1969 Chief Compliance Officer | | 2016 | | Chief Compliance Officer, Invesco Advisers, Inc. (registered investment adviser); and Chief Compliance Officer, The Invesco Funds Formerly: Chief Compliance Officer, Putnam Investments and the Putnam Funds | | N/A | | N/A |
The Statement of Additional Information of the Trust includes additional information about the Fund’s Trustees and is available upon request, without charge, by calling 1.800.959.4246. Please refer to the Fund’s Statement of Additional Information for information on the Fund’s sub-advisers.
| | | | | | |
Office of the Fund 11 Greenway Plaza, Suite 1000 Houston, TX 77046-1173 | | Investment Adviser Invesco Advisers, Inc. 1555 Peachtree Street, N.E. Atlanta, GA 30309 | | Distributor Invesco Distributors, Inc. 11 Greenway Plaza, Suite 1000 Houston, TX 77046-1173 | | Auditors PricewaterhouseCoopers LLP 1000 Louisiana Street, Suite 5800 Houston, TX 77002-5678 |
| | | |
| | | | | | |
Counsel to the Fund Stradley Ronon Stevens & Young, LLP 2005 Market Street, Suite 2600 Philadelphia, PA 19103-7018 | | Counsel to the Independent Trustees Goodwin Procter LLP 901 New York Avenue, N.W. Washington, D.C. 20001 | | Transfer Agent Invesco Investment Services, Inc. 11 Greenway Plaza, Suite 1000 Houston, TX 77046-1173 | | Custodian State Street Bank and Trust Company 225 Franklin Street Boston, MA 02110-2801 |
T-4 Invesco Dividend Income Fund

Invesco mailing information
Send general correspondence to Invesco Investment Services, Inc., P.O. Box 219078, Kansas City, MO 64121-9078.
Important notice regarding delivery of security holder documents
To reduce Fund expenses, only one copy of most shareholder documents may be mailed to shareholders with multiple accounts at the same address (Householding). Mailing of your shareholder documents may be householded indefinitely unless you instruct us otherwise. If you do not want the mailing of these documents to be combined with those for other members of your household, please contact Invesco Investment Services, Inc. at 800 959 4246 or contact your financial institution. We will begin sending you individual copies for each account within 30 days after receiving your request.
Fund holdings and proxy voting information
The Fund provides a complete list of its holdings four times in each fiscal year, at the quarter ends. For the second and fourth quarters, the lists appear in the Fund’s semiannual and annual reports to shareholders. For the first and third quarters, the Fund files the lists with the Securities and Exchange Commission (SEC) on Form N-Q. The most recent list of portfolio holdings is available at invesco.com/completeqtrholdings. Shareholders can also look up the Fund’s Forms N-Q on the SEC website at sec.gov. Copies of the Fund’s Forms N-Q may be reviewed and copied at the SEC Public Reference Room in Washington, D.C. You can obtain information on the operation of the Public Reference Room, including information about duplicating fee charges, by calling 202 551 8090 or 800 732 0330, or by electronic request at the following email address: publicinfo@sec.gov. The SEC file numbers for the Fund are shown below.
A description of the policies and procedures that the Fund uses to determine how to vote proxies relating to portfolio securities is available without charge, upon request, from our Client Services department at 800 959 4246 or at invesco.com/proxyguidelines. The information is also available on the SEC website, sec.gov.
Information regarding how the Fund voted proxies related to its portfolio securities during the most recent 12-month period ended June 30 is available at invesco.com/proxysearch. The information is also available on the SEC website, sec.gov.
| | |
Invesco Advisers, Inc. is an investment adviser; it provides investment advisory services to individual and institutional clients and does not sell securities. Invesco Distributors, Inc. is the US distributor for Invesco Ltd.’s retail mutual funds, exchange-traded funds and institutional money market funds. Both are wholly owned, indirect subsidiaries of Invesco Ltd. | |  |
| | | | |
SEC file numbers: 811-03826 and 002-85905 | | I-DIVI-AR-1 | | Invesco Distributors, Inc. |
| | | | |
| | |
 | | Annual Report to Shareholders | | April 30, 2016 |
| | |
| | Invesco Energy Fund |
| | Nasdaq: |
| | A: IENAX n B: IENBX n C: IEFCX n Y: IENYX n Investor: FSTEX n R5: IENIX |
Letters to Shareholders
| | |

Philip Taylor | | Dear Shareholders: This annual report includes information about your Fund, including performance data and a complete list of its investments as of the close of the reporting period. Inside is a discussion of how your Fund was managed and the factors that affected its performance during the reporting period. US economic data were generally positive over the reporting period, with the economy expanding modestly and employment numbers improving steadily. Throughout the reporting period, US consumers benefited from declining energy prices and greater credit availability, but a strengthening dollar crimped the profits of many large multi-national companies doing business overseas. Ending years of uncertainty, the US Federal Reserve in December 2015 finally raised short-term interest rates for the first time since 2006, signaling its confidence that the economy was likely to continue expanding and improving. Overseas, the economic story was less positive. |
The European Central Bank and central banks in China and Japan – as well as other countries – either instituted or maintained extraordinarily accommodative monetary policies in response to economic weakness. Stocks began 2016 on a weak note due to increased concerns about global economic weakness. Short-term market volatility can prompt some investors to abandon their investment plans – and can cause others to settle for average results. The investment professionals at Invesco, in contrast, invest with high conviction and a long-term perspective. At Invesco, investing with high conviction means offering a wide range of strategies designed to go beyond market benchmarks. We trust our research-driven insights, have confidence in our investment processes and build portfolios that reflect our beliefs. Our goal is to look past market noise in an effort to find attractive opportunities at attractive prices – consistent with the investment strategies spelled out in each fund’s prospectus. Of course, investing with high conviction can’t guarantee a profit or ensure investment success; no investment strategy or risk analysis can. To learn more about how we invest with high conviction, visit invesco.com/HighConviction. You, too, can invest with high conviction by maintaining a long-term investment perspective and by working with your financial adviser on a regular basis. During periods of short-term market volatility or uncertainty, your financial adviser can keep you focused on your long-term investment goals – a new home, a child’s college education, or a secure retirement. He or she also can share research about the economy, the markets and individual investment options. |
Visit our website for more information on your investments
Our website, invesco.com/us, offers a wide range of market insights and investment perspectives. On the website, you’ll find detailed information about our funds, including performance, holdings and portfolio manager commentaries. You can access information about your account by completing a simple, secure online registration. Click on the “Need to register” link in the “Account Access” box on our homepage to get started. Invesco’s mobile apps for iPhone® and iPad® (both available free from the App StoreSM) allow you to obtain the same detailed information, monitor your account and create customizable watch lists.
In addition to the resources accessible on our website and through our mobile app, you can obtain timely updates to help you stay informed about the markets, the economy and investing by connecting with Invesco on Twitter, LinkedIn or Facebook. You can access our blog at blog.invesco.us.com. Our goal is to provide you the information you want, when and where you want it.
Have questions?
For questions about your account, contact an Invesco client services representative at 800 959 4246. For Invesco-related questions or comments, please email me directly at phil@invesco.com.
All of us at Invesco look forward to serving your investment management needs. Thank you for investing with us.
Sincerely,

Philip Taylor
Senior Managing Director, Invesco Ltd.
iPhone and iPad are trademarks of Apple Inc., registered in the US and other countries. App Store is a service mark of Apple Inc. Invesco Distributors, Inc. is not affiliated with Apple Inc.
2 Invesco Energy Fund
| | |

Bruce Crockett | | Dear Fellow Shareholders: Among the many important lessons I’ve learned in more than 40 years in a variety of business endeavors is the value of a trusted advocate. As independent chair of the Invesco Funds Board, I can assure you that the members of the Board are strong advocates for the interests of investors in Invesco’s mutual funds. We work hard to represent your interests through oversight of the quality of the investment management services your funds receive and other matters important to your investment, including but not limited to: |
| | n Ensuring that Invesco offers a diverse lineup of mutual funds that your financial adviser can use to strive to meet your financial needs as your investment goals change over time. n Monitoring how the portfolio management teams of the Invesco funds are performing in light of changing economic and market conditions. |
n Assessing each portfolio management team’s investment performance within the context of the investment strategy described in the fund’s prospectus. n Monitoring for potential conflicts of interests that may impact the nature of the services that your funds receive. We believe one of the most important services we provide our fund shareholders is the annual review of the funds’ advisory and sub-advisory contracts with Invesco Advisers and its affiliates. This review is required by the Investment Company Act of 1940 and focuses on the nature and quality of the services Invesco provides as the adviser to the Invesco funds and the reasonableness of the fees that it charges for those services. Each year, we spend months carefully reviewing information received from Invesco and a variety of independent sources, such as performance and fee data prepared by Lipper Inc., an independent, third-party firm widely recognized as a leader in its field. We also meet with our independent legal counsel and other independent advisers to review and help us assess the information that we have received. Our goal is to assure that you receive quality investment management services for a reasonable fee. I trust the measures outlined above provide assurance that you have a worthy advocate when it comes to choosing the Invesco Funds. As always, please contact me at bruce@brucecrockett.com with any questions or concerns you may have. On behalf of the Board, we look forward to continuing to represent your interests and serving your needs. |
Sincerely,

Bruce L. Crockett
Independent Chair
Invesco Funds Board of Trustees
3 Invesco Energy Fund
Management’s Discussion of Fund Performance
| | | | |
| Performance summary | |
For the fiscal year ended April 30, 2016, Class A shares of Invesco Energy Fund (the Fund), at net asset value (NAV), underperformed the Fund’s style-specific benchmark, the MSCI World Energy Index. Your Fund’s long-term performance appears later in this report. | |
| Fund vs. Indexes | |
Total returns, 4/30/15 to 4/30/16, at net asset value (NAV). Performance shown does not include applicable contingent deferred sales charges (CDSC) or front-end sales charges, which would have reduced performance. | |
Class A Shares* | | | -22.45 | % |
Class B Shares* | | | -23.02 | |
Class C Shares* | | | -23.03 | |
Class Y Shares* | | | -22.26 | |
| Investor Class Shares* | | | -22.43 | |
| Class R5 Shares* | | | -22.10 | |
S&P 500 Indexq (Broad Market Index) | | | 1.21 | |
MSCI World Energy Indexq (Style-Specific Index) | | | -15.64 | |
Lipper Natural Resource Funds Indexn (Peer Group Index) | | | -19.98 | |
Source(s): ▼FactSet Research Systems Inc.; nLipper Inc. *Performance includes litigation proceeds. Had these proceeds not been received, total returns would have been lower. | |
Market conditions and your Fund
Global equities delivered negative returns for the fiscal year ended April 30, 2016. Factors affecting global equity markets’ performance included generally positive, but subdued economic growth, as well as varied monetary policies implemented by central banks around the world – and the effects those varied policies had on currencies.
As the reporting period began, the view that the US Federal Reserve (the Fed) would begin raising rates while other central banks were loosening monetary policies led the US dollar to strengthen against many currencies. At the same time, oil prices continued to decline as increased supply outstripped demand. This had the effect of hurting commodity- and materials-based economies – and companies in related sectors. Mixed economic data from the US and concerns about a possible Greek exit from the eurozone contributed to market uncertainty.
During the summer of 2015, China’s surprise devaluation of the renminbi and a significant downturn in its equity markets triggered a selloff in global equity markets, particularly in already-vulnerable emerging markets. In the fall of 2015, markets around the world began to regain their footing, but the impact of a late-year crash in oil prices offset those gains.
The global economy continued to expand, albeit slowly, during the reporting period. However, that growth became increasingly uneven across developed and emerging economies. Central bank policies also began to diverge as the Fed followed through on its commitment to normalize monetary policy by raising interest rates – even as the European Central Bank extended its asset purchase program and Japan introduced additional quantitative easing and negative interest rates. Oil prices, which are discussed in more detail later in the report, also had a significant impact on equity markets during the reporting period. While both developed and
emerging equity markets finished the reporting period in negative territory, emerging markets lagged significantly.
Energy stocks experienced steep losses during the fiscal year as a result of the sharp decline in energy prices. A combination of high production levels and weakened demand outlook led to further imbalances in supply and demand, causing energy prices to continue to decline. Energy prices were volatile during the reporting period, with crude oil hitting a high of $67 per barrel and a low of $28 per barrel.1 Natural gas hit a high of $3.02 and a low of $1.64 per thousand cubic feet during the reporting period.1 Toward the end of the reporting period, a willingness to consider freezing production by Middle East oil producers, continued capital expenditure cuts by US producers, and a weakening US dollar helped to revive energy prices from their lows. Crude oil and natural gas ended the reporting period at $48 per barrel and $2.18 per thousand cubic feet respectively.1
For the reporting period, key detractors from performance relative to the Fund’s style-specific benchmark included security selection in, and overweight exposure to, the oil and gas exploration and production (E&P) industry and underweight exposure in the integrated oil and gas industry. Overweight exposure in the oil and gas drilling industry, as well as security selection in, and overweight exposure to, the oil and gas equipment and services industry, also detracted from the Fund’s relative performance. Conversely, a lack of holdings in the oil and gas storage and transportation and the coal and consumable fuels industries, as well as security selection in the oil and gas refining and marketing industry, was beneficial to the Fund’s relative performance for the fiscal year. A minor allocation to ancillary cash also helped Fund performance given losses in energy equities.
| | | | |
| Portfolio Composition | |
| By industry | | | % of total net assets | |
| | | | |
| |
| Oil & Gas Exploration & Production | | | 52.7% | |
| Integrated Oil & Gas | | | 25.3 | |
| Oil & Gas Equipment & Services | | | 13.6 | |
| Oil & Gas Drilling | | | 4.0 | |
| Oil & Gas Refining & Marketing | | | 1.6 | |
| Money Market Funds Plus Other Assets Less Liabilities | | | 2.8 | |
| | | | |
| Top 10 Equity Holdings* | |
| | | | % of total net assets | |
| | | | |
| |
1. Apache Corp. | | | 5.3% | |
2. Concho Resources Inc. | | | 4.6 | |
3. Royal Dutch Shell PLC Class A-ADR | | | 4.6 | |
4. Devon Energy Corp. | | | 4.6 | |
5. Canadian Natural Resources Ltd. | | | 4.3 | |
6. Occidental Petroleum Corp. | | | 4.1 | |
7. Schlumberger Ltd. | | | 4.0 | |
8. Chevron Corp. | | | 3.7 | |
9. Core Laboratories N.V. | | | 3.7 | |
10. Suncor Energy, Inc. | | | 3.6 | |
| | | | |
| Total Net Assets | | | $970.6 million | |
| |
| Total Number of Holdings* | | | 34 | |
The Fund’s holdings are subject to change, and there is no assurance that the Fund will continue to hold any particular security.
*Excluding money market fund holdings.
Data presented here are as of April 30, 2016.
Top individual detractors from the Fund’s performance included Cobalt International Energy and Devon Energy. Cobalt is an independent E&P company that suffered from market concerns that the company’s $1.8 billion Angola asset sale to Sonangol (not a Fund holding) may not reach completion. At the close of the reporting period, the company still expected the transaction to close in May 2016. Devon is one of the largest independent E&P companies in North America. The company continued to reposition its asset portfolio by selling non-core assets in favor of high-returning, oil-growth properties in areas such as the Eagle Ford and Permian Basins. While Devon was relatively insulated from falling oil prices in 2015 due to its strong hedged position, continued oil price declines into 2016 raised concerns over the company’s unhedged cash flow outlook. In addition, Devon’s $2.4 billion of acquisitions to purchase assets in the STACK play and Powder River Basin in December 2015 raised market concerns over the company’s leverage profile.
Conversely, the top individual contributors to Fund performance included Core Laboratories and Cameron International. Core Laboratories is an oilfield service firm that provides optimization technologies that increase energy production – a service that can be particularly beneficial for energy producers even in today’s low commodity price environment. During the reporting period, Cameron was acquired by Schlumberger in a deal that represented a 56% premium to Cameron’s pre-announcement closing stock price.2 The primary rationale for the merger was to create technology-driven growth by integrating Schlumberger’s reservoir and well technology with Cameron’s wellhead and surface technology into the industry’s first complete drilling and production system – fully enabled by Schlumberger’s expertise in instrumentation, data processing, software optimization/control and system integration.
At the end of the fiscal year, the Fund had overweight exposure in independent E&P companies and oilfield equipment and service companies, relative to the Fund’s style-specific index. This positioning reflects our opinion of the areas with the best upside potential. Conversely, the Fund had significant underweight exposure to the integrated oil and gas industry, and no exposure to the coal and consumable fuels or the oil and gas storage and transportation industries. The MSCI World Energy Index is a market capitalization weighted index, which causes the
largest integrated oil and gas companies to have a more significant weight in the index as compared to the Fund. Further, we believed the integrated companies were structurally unable to compete effectively in today’s unconventional oil and gas business, which we believe requires flexibility and lean manufacturing capabilities. At the end of the reporting period, integrated companies continued to struggle in these two areas.
During the reporting period, it appeared to us that energy company capital expenditure cuts were beginning to lead to production declines. However, we believe it may still take time for energy prices to normalize. In our view, the disconnect between stock prices and energy fundamentals makes it less risky for companies to buy oil reserves in the equity market than to actively drill for oil. We continue to focus on fundamentals and have positioned the Fund for a turnaround in the commodity.
We believe bottom-up fundamental analysis is key in generating long-term investment returns. Based on years of experience, we also believe that using a normalized commodity price based on the cost of marginal supply cancels out the “cloud of noise” associated with volatile commodity prices. We believe this allows us to effectively analyze a company’s NAV and cash flow generating capabilities – tangible aspects of a company that we believe create shareholder value.
While oil prices may be headline news, the Fund should be considered a long-term investment. As always, thank you for your continued investment in Invesco Energy Fund.
1 Source: Bloomberg LP
2 Source: Schlumberger
The views and opinions expressed in management’s discussion of Fund performance are those of Invesco Advisers, Inc. These views and opinions are subject to change at any time based on factors such as market and economic conditions. These views and opinions may not be relied upon as investment advice or recommendations, or as an offer for a particular security. The information is not a complete analysis of every aspect of any market, country, industry, security or the Fund. Statements of fact are from sources considered reliable, but Invesco Advisers, Inc. makes no representation or warranty as to their completeness or accuracy. Although historical performance is no guarantee of future results, these insights may help you understand our investment management philosophy.
See important Fund and, if applicable, index disclosures later in this report.
| | |
 | | Norman MacDonald Chartered Financial Analyst, Portfolio Manager, is manager of Invesco Energy Fund. He joined |
| Invesco in 2008. Mr. MacDonald earned a Bachelor of Commerce from the University of Windsor. |
5 Invesco Energy Fund
Your Fund’s Long-Term Performance
Results of a $10,000 Investment – Oldest Share Class(es)
Fund and index data from 4/30/06
| 1 | Source: FactSet Research Systems Inc. |
| 2 | It is Invesco’s policy to chart the Fund’s oldest share class(es). Because Investor Class shares do not have a sales charge, we also show the oldest share class with a sales charge, Class C shares. |
Past performance cannot guarantee comparable future results.
The data shown in the chart include reinvested distributions, applicable sales charges and Fund expenses including
management fees. Index results include reinvested dividends, but they do not reflect sales charges. Performance of the peer group, if applicable, reflects fund expenses and management fees;
performance of a market index does not. Performance shown in the chart and table(s) does not reflect deduction of taxes a shareholder would pay on Fund distributions or sale of Fund shares.
continued from page 8
| n | | Small- and mid-capitalization risks. Small- and mid-capitalization companies tend to be more vulnerable to changing market conditions, may have little or no operating history or track record of success, and may have more limited product lines and markets, less experienced management and fewer financial resources than larger companies. These companies’ securities may be more volatile and less liquid than those of more established companies, and their returns may vary, sometimes significantly, from the overall securities market. |
About indexes used in this report
| n | | The S&P 500® Index is an unmanaged index considered representative of the US stock market. |
| n | | The MSCI World Energy Index is a free float-adjusted market-capitalization index that represents the energy segment in global developed market equity performance. The index is computed using the net return, which withholds applicable taxes for non-resident investors. |
| n | | The Lipper Natural Resource Funds Index is an unmanaged index considered representative of natural resource funds tracked by Lipper. |
| n | | The Fund is not managed to track the performance of any particular index, including the index(es) described here, and consequently, the performance of the Fund may deviate significantly from the performance of the index(es). |
| n | | A direct investment cannot be made in an index. Unless otherwise indicated, index results include reinvested dividends, and they do not reflect sales charges. Performance of the peer group, if applicable, reflects fund expenses; performance of a market index does not. |
Other information
| n | | The returns shown in management’s discussion of Fund performance are based on net asset values (NAVs) calculated for shareholder transactions. Generally accepted accounting principles require adjustments to be made to the net assets of the Fund at period end for financial reporting purposes, and as such, the NAVs for shareholder transactions and the returns based on those NAVs may differ from the NAVs and returns reported in the Financial Highlights. |
| n | | Industry classifications used in this report are generally according to the Global Industry Classification Standard, which was developed by and is the exclusive property and a service mark of MSCI Inc. and Standard & Poor’s. |
6 Invesco Energy Fund
| | | | |
Average Annual Total Returns As of 4/30/16, including maximum applicable sales charges | |
| |
Class A Shares | | | | |
Inception (3/28/02) | | | 6.49 | % |
10 Years | | | -0.37 | |
5 Years | | | -8.67 | |
1 Year | | | -26.71 | |
| |
Class B Shares | | | | |
Inception (3/28/02) | | | 6.47 | % |
10 Years | | | -0.41 | |
5 Years | | | -8.64 | |
1 Year | | | -26.82 | |
| |
Class C Shares | | | | |
Inception (2/14/00) | | | 7.68 | % |
10 Years | | | -0.56 | |
5 Years | | | -8.33 | |
1 Year | | | -23.79 | |
| |
Class Y Shares | | | | |
10 Years | | | 0.38 | % |
5 Years | | | -7.41 | |
1 Year | | | -22.26 | |
| |
Investor Class Shares | | | | |
Inception (1/19/84) | | | 7.85 | % |
10 Years | | | 0.19 | |
5 Years | | | -7.63 | |
1 Year | | | -22.43 | |
| |
Class R5 Shares | | | | |
Inception (1/31/06) | | | 0.46 | % |
10 Years | | | 0.60 | |
5 Years | | | -7.28 | |
1 Year | | | -22.10 | |
|
| Performance includes litigation proceeds. Had these proceeds not been received, total returns would have been lower. | |
Class Y shares incepted on October 3, 2008. Performance shown prior to that date is that of Investor Class shares and includes the 12b-1 fees applicable to Investor Class shares.
The performance data quoted represent past performance and cannot guarantee comparable future results; current performance may be lower or higher. Please visit invesco.com/performance for the most recent month-end performance. Performance figures reflect reinvested distributions, changes in net asset value and the effect of the maximum sales charge unless otherwise stated. Investment return and principal value will fluctuate so that you may have a gain or loss when you sell shares.
The net annual Fund operating expense ratio set forth in the most recent Fund prospectus as of the date of this report for Class A, Class B,
| | | | |
Average Annual Total Returns As of 3/31/16, the most recent calendar quarter end, including maximum applicable sales charges | |
Class A Shares | | | | |
Inception (3/28/02) | | | 5.49 | % |
10 Years | | | -1.14 | |
5 Years | | | -11.26 | |
1 Year | | | -27.55 | |
| |
Class B Shares | | | | |
Inception (3/28/02) | | | 5.47 | % |
10 Years | | | -1.18 | |
5 Years | | | -11.23 | |
1 Year | | | -27.67 | |
| |
Class C Shares | | | | |
Inception (2/14/00) | | | 6.81 | % |
10 Years | | | -1.32 | |
5 Years | | | -10.92 | |
1 Year | | | -24.66 | |
| |
Class Y Shares | | | | |
10 Years | | | -0.40 | % |
5 Years | | | -10.03 | |
1 Year | | | -23.15 | |
|
Investor Class Shares | |
Inception (1/19/84) | | | 7.41 | % |
10 Years | | | -0.58 | |
5 Years | | | -10.25 | |
1 Year | | | -23.35 | |
| |
Class R5 Shares | | | | |
Inception (1/31/06) | | | -0.89 | % |
10 Years | | | -0.18 | |
5 Years | | | -9.91 | |
1 Year | | | -23.00 | |
|
| Performance includes litigation proceeds. Had these proceeds not been received, total returns would have been lower. | |
Class C, Class Y, Investor Class and Class R5 shares was 1.17%, 1.92%, 1.92%, 0.92%, 1.17%, and 0.80%, respectively.1 The total annual Fund operating expense ratio set forth in the most recent Fund prospectus as of the date of this report for Class A, Class B, Class C, Class Y, Investor Class and Class R5 shares was 1.18%, 1.93%, 1.93%, 0.93%, 1.18% and 0.81%, respectively. The expense ratios presented above may vary from the expense ratios presented in other sections of this report that are based on expenses incurred during the period covered by this report.
Class A share performance reflects the maximum 5.50% sales charge, and Class B and Class C share performance reflects the applicable contingent deferred sales charge (CDSC) for the period involved. The CDSC on Class B
shares declines from 5% beginning at the time of purchase to 0% at the beginning of the seventh year. The CDSC on Class C shares is 1% for the first year after purchase. Class Y, Investor Class and Class R5 shares do not have a front-end sales charge or a CDSC; therefore, performance is at net asset value.
The performance of the Fund’s share classes will differ primarily due to different sales charge structures and class expenses.
Fund performance reflects any applicable fee waivers and/or expense reimbursements. Had the adviser not waived fees and/or reimbursed expenses currently or in the past, returns would have been lower. See current prospectus for more information.
| 1 | Total annual Fund operating expenses after any contractual fee waivers and/or expense reimbursements by the adviser in effect through at least June 30, 2017. See current prospectus for more information. |
7 Invesco Energy Fund
Invesco Energy Fund’s investment objective is long-term growth of capital.
| n | | Unless otherwise stated, information presented in this report is as of April 30, 2016, and is based on total net assets. |
| n | | Unless otherwise noted, all data provided by Invesco. |
| n | | To access your Fund’s reports/prospectus, visit invesco.com/fundreports. |
About share classes
| n | | Class B shares may not be purchased for new or additional investments. Please see the prospectus for more information. |
| n | | Class Y shares and Investor Class shares are available only to certain investors. Please see the prospectus for more information. |
| n | | Class R5 shares are primarily intended for employer sponsored retirement and benefit plans that meet certain standards and for institutional investors. Please see the prospectus for more information. |
Principal risks of investing in the Fund
| n | | Derivatives risk. The value of a derivative instrument depends largely on (and is derived from) the value of an underlying security, currency, commodity, interest rate, index or other asset (each referred to as an underlying asset). In addition to risks relating to the underlying assets, the use of derivatives may include other, possibly greater, risks, including counterparty, leverage and liquidity risks. Counterparty risk is the risk that the counterparty to the derivative contract will default on its obligation to pay the Fund the amount owed or otherwise perform under the derivative contract. Derivatives create leverage risk because they do not require payment up front equal to the economic exposure created by owning the derivative. As a result, an adverse change in the value of the underlying asset could result in the Fund sustaining a loss that is substantially greater than the amount invested in the derivative, which may make the Fund’s returns more volatile and increase the risk of loss. Derivative instruments may also be less liquid than more traditional investments and the Fund may be unable to sell or close out its derivative positions at a desirable time or price. This risk may be more acute under adverse market conditions, during which the Fund may be |
| | most in need of liquidating its derivative positions. Derivatives may also be harder to value, less tax efficient and subject to changing government regulation that could impact the Fund’s ability to use certain derivatives or their cost. Also, derivatives used for hedging or to gain or limit exposure to a particular market segment may not provide the expected benefits, particularly during adverse market conditions. |
| n | | Emerging markets securities risk. Emerging markets (also referred to as developing markets) are generally subject to greater market volatility, political, social and economic instability, uncertain trading markets and more governmental limitations on foreign investment than more developed markets. In addition, companies operating in emerging markets may be subject to lower trading volume and greater price fluctuations than companies in more developed markets. Securities law and the enforcement of systems of taxation in many emerging market countries may change quickly and unpredictably. In addition, investments in emerging markets securities may also be subject to additional transaction costs, delays in settlement procedures, and lack of timely information. |
| n | | Energy sector risk. The Fund will concentrate its investments in the securities of issuers engaged primarily in energy-related industries. Changes in worldwide energy prices, exploration and production spending, government regulation, world events, economic conditions, exchange rates, transportation and storage costs and labor relations can affect companies in the energy sector. In addition, these companies are at an increased risk of civil liability and environmental damage claims, and are also subject to the risk of loss from terrorism and natural disasters. |
| n | | Foreign securities risk. The Fund’s foreign investments may be adversely affected by political and social instability, changes in economic or taxation policies, difficulty in enforcing obligations, |
| | decreased liquidity or increased volatility. Foreign investments also involve the risk of the possible seizure, nationalization or expropriation of the issuer or foreign deposits (in which the Fund could lose its entire investments in a certain market) and the possible adoption of foreign governmental restrictions such as exchange controls. Unless the Fund has hedged its foreign securities risk, foreign securities risk also involves the risk of negative foreign currency rate fluctuations, which may cause the value of securities denominated in such foreign currency (or other instruments through which the Fund has exposure to foreign currencies) to decline in value. Currency exchange rates may fluctuate significantly over short periods of time. Currency hedging strategies, if used, are not always successful. |
| n | | Management risk. The Fund is actively managed and depends heavily on the Adviser’s judgment about markets, interest rates or the attractiveness, relative values, liquidity, or potential appreciation of particular investments made for the Fund’s portfolio. The Fund could experience losses if these judgments prove to be incorrect. Additionally, legislative, regulatory, or tax developments may adversely affect management of the Fund and, therefore, the ability of the Fund to achieve its investment objective. |
| n | | Market risk. The market values of the Fund’s investments, and therefore the value of the Fund’s shares, will go up and down, sometimes rapidly or unpredictably. Market risk may affect a single issuer, industry or section of the economy, or it may affect the market as a whole. Individual stock prices tend to go up and down more dramatically than those of certain other types of investments, such as bonds. During a general downturn in the financial markets, multiple asset classes may decline in value. When markets perform well, there can be no assurance that specific investments held by the Fund will rise in value. |
continued on page 6
|
This report must be accompanied or preceded by a currently effective Fund prospectus, which contains more complete information, including sales charges and expenses. Investors should read it carefully before investing. |
NOT FDIC INSURED | MAY LOSE VALUE | NO BANK GUARANTEE
8 Invesco Energy Fund
Schedule of Investments(a)
April 30, 2016
| | | | | | | | |
| | | Shares | | | Value | |
Common Stocks & Other Equity Interests–97.19% | |
| Integrated Oil & Gas–25.29% | | | | | | | | |
BP PLC–ADR (United Kingdom) | | | 931,577 | | | $ | 31,282,356 | |
Cenovus Energy Inc. (Canada) | | | 2,097,123 | | | | 33,240,448 | |
Chevron Corp. | | | 350,117 | | | | 35,774,955 | |
Exxon Mobil Corp. | | | 286,732 | | | | 25,347,109 | |
Occidental Petroleum Corp. | | | 522,975 | | | | 40,086,034 | |
Royal Dutch Shell PLC–Class A–ADR (United Kingdom) | | | 840,434 | | | | 44,450,554 | |
Suncor Energy, Inc. (Canada) | | | 1,202,762 | | | | 35,301,211 | |
| | | | | 245,482,667 | |
|
| Oil & Gas Drilling–4.05% | |
Ensco PLC–Class A | | | 1,217,925 | | | | 14,566,383 | |
Helmerich & Payne, Inc. | | | 374,173 | | | | 24,740,319 | |
| | | | | 39,306,702 | |
|
| Oil & Gas Equipment & Services–13.55% | |
Core Laboratories N.V. | | | 265,421 | | | | 35,476,171 | |
Halliburton Co. | | | 257,622 | | | | 10,642,365 | |
Schlumberger Ltd. | | | 485,237 | | | | 38,983,940 | |
Superior Energy Services, Inc. | | | 947,643 | | | | 15,977,261 | |
Tidewater Inc. | | | 697,196 | | | | 6,107,437 | |
Weatherford International PLC(b) | | | 2,994,971 | | | | 24,349,114 | |
| | | | | 131,536,288 | |
|
| Oil & Gas Exploration & Production–52.75% | |
Anadarko Petroleum Corp. | | | 467,414 | | | | 24,660,763 | |
Apache Corp. | | | 937,798 | | | | 51,016,211 | |
Cabot Oil & Gas Corp. | | | 911,555 | | | | 21,330,387 | |
Canadian Natural Resources Ltd. (Canada) | | | 1,377,140 | | | | 41,352,062 | |
Cobalt International Energy, Inc.(b) | | | 7,879,118 | | | | 25,449,551 | |
| | | | | | | | |
| | | Shares | | | Value | |
| Oil & Gas Exploration & Production–(continued) | |
Concho Resources Inc.(b) | | | 384,603 | | | $ | 44,679,331 | |
Continental Resources, Inc.(b) | | | 192,250 | | | | 7,163,235 | |
Devon Energy Corp. | | | 1,280,555 | | | | 44,409,647 | |
EOG Resources, Inc. | | | 395,777 | | | | 32,699,096 | |
Hess Corp. | | | 563,036 | | | | 33,568,206 | |
Marathon Oil Corp. | | | 1,012,190 | | | | 14,261,757 | |
Noble Energy, Inc. | | | 929,607 | | | | 33,568,109 | |
Oasis Petroleum Inc.(b) | | | 2,403,687 | | | | 23,291,727 | |
PrairieSky Royalty Ltd. (Canada) | | | 1,195,629 | | | | 25,173,143 | |
Range Resources Corp. | | | 774,063 | | | | 34,143,919 | |
Tullow Oil PLC (United Kingdom)(b) | | | 6,932,649 | | | | 28,611,679 | |
Ultra Petroleum Corp.(b) | | | 1,429,727 | | | | 446,361 | |
Whiting Petroleum Corp.(b) | | | 2,178,974 | | | | 26,147,688 | |
| | | | | 511,972,872 | |
|
| Oil & Gas Refining & Marketing–1.55% | |
Phillips 66 | | | 183,483 | | | | 15,065,789 | |
Total Common Stocks & Other Equity Interests
(Cost $1,124,574,807) | | | | 943,364,318 | |
|
Money Market Funds–2.70% | |
Liquid Assets Portfolio–Institutional Class, 0.44%(c) | | | 13,089,967 | | | | 13,089,967 | |
Premier Portfolio–Institutional Class, 0.39%(c) | | | 13,089,967 | | | | 13,089,967 | |
Total Money Market Funds
(Cost $26,179,934) | | | | | | | 26,179,934 | |
TOTAL INVESTMENTS–99.89%
(Cost $1,150,754,741) | | | | 969,544,252 | |
OTHER ASSETS LESS LIABILITIES–0.11% | | | | 1,047,648 | |
NET ASSETS–100.00% | | | $ | 970,591,900 | |
Investment Abbreviations:
| | |
| ADR | | – American Depositary Receipt |
Notes to Schedule of Investments:
| (a) | Industry and/or sector classifications used in this report are generally according to the Global Industry Classification Standard, which was developed by and is the exclusive property and a service mark of MSCI Inc. and Standard & Poor’s. |
| (b) | Non-income producing security. |
| (c) | The money market fund and the Fund are affiliated by having the same investment adviser. The rate shown is the 7-day SEC standardized yield as of April 30, 2016. |
See accompanying Notes to Financial Statements which are an integral part of the financial statements.
9 Invesco Energy Fund
Statement of Assets and Liabilities
April 30, 2016
| | | | |
Assets: | | | | |
Investments, at value (Cost $1,124,574,807) | | $ | 943,364,318 | |
Investments in affiliated money market funds, at value and cost | | | 26,179,934 | |
Total investments, at value (Cost $1,150,754,741) | | | 969,544,252 | |
Foreign currencies, at value (Cost $43,140) | | | 43,759 | |
Receivable for: | | | | |
Fund shares sold | | | 3,698,015 | |
Dividends | | | 326,320 | |
Investment for trustee deferred compensation and retirement plans | | | 227,505 | |
Other assets | | | 61,311 | |
Total assets | | | 973,901,162 | |
| |
Liabilities: | | | | |
Payable for: | | | | |
Fund shares reacquired | | | 2,168,846 | |
Accrued fees to affiliates | | | 760,318 | |
Accrued trustees’ and officers’ fees and benefits | | | 2,282 | |
Accrued other operating expenses | | | 112,318 | |
Trustee deferred compensation and retirement plans | | | 265,498 | |
Total liabilities | | | 3,309,262 | |
Net assets applicable to shares outstanding | | $ | 970,591,900 | |
| |
Net assets consist of: | | | | |
Shares of beneficial interest | | $ | 1,155,074,401 | |
Undistributed net investment income | | | 7,721,997 | |
Undistributed net realized gain (loss) | | | (10,989,264 | ) |
Net unrealized appreciation (depreciation) | | | (181,215,234 | ) |
| | | $ | 970,591,900 | |
| | | | |
Net Assets: | | | | |
Class A | | $ | 521,909,630 | |
Class B | | $ | 8,340,780 | |
Class C | | $ | 156,964,108 | |
Class Y | | $ | 50,705,608 | |
Investor Class | | $ | 210,373,522 | |
Class R5 | | $ | 22,298,252 | |
|
Shares outstanding, $0.01 par value per share,
with an unlimited number of shares authorized: | |
Class A | | | 19,302,545 | |
Class B | | | 351,469 | |
Class C | | | 6,809,592 | |
Class Y | | | 1,869,397 | |
Investor Class | | | 7,812,993 | |
Class R5 | | | 802,997 | |
Class A: | | | | |
Net asset value per share | | $ | 27.04 | |
Maximum offering price per share | | | | |
(Net asset value of $27.04 ¸ 94.50%) | | $ | 28.61 | |
Class B: | | | | |
Net asset value and offering price per share | | $ | 23.73 | |
Class C: | | | | |
Net asset value and offering price per share | | $ | 23.05 | |
Class Y: | | | | |
Net asset value and offering price per share | | $ | 27.12 | |
Investor Class: | | | | |
Net asset value and offering price per share | | $ | 26.93 | |
Class R5: | | | | |
Net asset value and offering price per share | | $ | 27.77 | |
See accompanying Notes to Financial Statements which are an integral part of the financial statements.
10 Invesco Energy Fund
Statement of Operations
For the year ended April 30, 2016
| | | | |
Investment income: | |
Dividends (net of foreign withholding taxes of $1,018,300) | | $ | 21,078,346 | |
Dividends from affiliated money market funds | | | 65,431 | |
Total investment income | | | 21,143,777 | |
| |
Expenses: | | | | |
Advisory fees | | | 6,085,228 | |
Administrative services fees | | | 235,564 | |
Custodian fees | | | 52,237 | |
Distribution fees: | | | | |
Class A | | | 1,195,779 | |
Class B | | | 112,190 | |
Class C | | | 1,478,684 | |
Investor Class | | | 526,167 | |
Transfer agent fees — A, B, C, Y and Investor | | | 2,500,439 | |
Transfer agent fees — R5 | | | 19,593 | |
Trustees’ and officers’ fees and benefits | | | 47,491 | |
Registration and filing fees | | | 154,597 | |
Reports to shareholders | | | 156,413 | |
Professional services fees | | | 63,656 | |
Other | | | 39,101 | |
Total expenses | | | 12,667,139 | |
Less: Fees waived and expense offset arrangement(s) | | | (66,787 | ) |
Net expenses | | | 12,600,352 | |
Net investment income | | | 8,543,425 | |
| |
Realized and unrealized gain (loss) from: | | | | |
Net realized gain (loss) from: | | | | |
Investment securities | | | 4,060,520 | |
Foreign currencies | | | (165,044 | ) |
| | | | 3,895,476 | |
Change in net unrealized appreciation (depreciation) of: | | | | |
Investment securities | | | (284,799,638 | ) |
Foreign currencies | | | (7,532 | ) |
| | | | (284,807,170 | ) |
Net realized and unrealized gain (loss) | | | (280,911,694 | ) |
Net increase (decrease) in net assets resulting from operations | | $ | (272,368,269 | ) |
See accompanying Notes to Financial Statements which are an integral part of the financial statements.
11 Invesco Energy Fund
Statement of Changes in Net Assets
For the years ended April 30, 2016 and 2015
| | | | | | | | |
| | | 2016 | | | 2015 | |
Operations: | | | | | | | | |
Net investment income | | $ | 8,543,425 | | | $ | 7,298,598 | |
Net realized gain | | | 3,895,476 | | | | 63,943,084 | |
Change in net unrealized appreciation (depreciation) | | | (284,807,170 | ) | | | (308,271,951 | ) |
Net increase (decrease) in net assets resulting from operations | | | (272,368,269 | ) | | | (237,030,269 | ) |
| | |
Distributions to shareholders from net investment income: | | | | | | | | |
Class A | | | (2,628,816 | ) | | | (1,567,388 | ) |
Class B | | | (33,895 | ) | | | — | |
Class C | | | (503,592 | ) | | | — | |
Class Y | | | (282,334 | ) | | | (353,959 | ) |
Investor Class | | | (1,144,790 | ) | | | (947,439 | ) |
Class R5 | | | (103,029 | ) | | | (216,937 | ) |
Total distributions from net investment income | | | (4,696,456 | ) | | | (3,085,723 | ) |
| | |
Distributions to shareholders from net realized gains: | | | | | | | | |
Class A | | | (3,869,101 | ) | | | (53,578,369 | ) |
Class B | | | (93,593 | ) | | | (2,736,290 | ) |
Class C | | | (1,390,565 | ) | | | (16,754,031 | ) |
Class Y | | | (362,445 | ) | | | (6,004,285 | ) |
Investor Class | | | (1,684,898 | ) | | | (32,386,576 | ) |
Class R5 | | | (124,425 | ) | | | (3,036,417 | ) |
Total distributions from net realized gains | | | (7,525,027 | ) | | | (114,495,968 | ) |
| | |
Share transactions–net: | | | | | | | | |
Class A | | | 36,888,020 | | | | 130,777,969 | |
Class B | | | (5,996,349 | ) | | | (9,321,046 | ) |
Class C | | | 8,239,159 | | | | 63,007,305 | |
Class Y | | | (12,300,352 | ) | | | 32,944,379 | |
Investor Class | | | (15,355,448 | ) | | | (17,924,737 | ) |
Class R5 | | | (4,409,440 | ) | | | 9,429,760 | |
Net increase in net assets resulting from share transactions | | | 7,065,590 | | | | 208,913,630 | |
Net increase (decrease) in net assets | | | (277,524,162 | ) | | | (145,698,330 | ) |
| | |
Net assets: | | | | | | | | |
Beginning of year | | | 1,248,116,062 | | | | 1,393,814,392 | |
End of year (includes undistributed net investment income of $7,721,997 and $4,070,041, respectively) | | $ | 970,591,900 | | | $ | 1,248,116,062 | |
Notes to Financial Statements
April 30, 2016
NOTE 1—Significant Accounting Policies
Invesco Energy Fund (the “Fund”) is a series portfolio of AIM Sector Funds (Invesco Sector Funds) (the “Trust”). The Trust is a Delaware statutory trust registered under the Investment Company Act of 1940, as amended (the “1940 Act”), as an open-end series management investment company consisting of ten separate portfolios, each authorized to issue an unlimited number of shares of beneficial interest. The assets, liabilities and operations of each portfolio are accounted for separately. Information presented in these financial statements pertains only to the Fund. Matters affecting each portfolio or class will be voted on exclusively by the shareholders of such portfolio or class.
The Fund’s investment objective is long-term growth of capital.
The Fund currently consists of six different classes of shares: Class A, Class B, Class C, Class Y, Investor Class and Class R5. Class Y and Investor Class shares are available only to certain investors. Class A shares are sold with a front-end sales charge unless certain waiver criteria are met and under certain circumstances load waived shares may be subject to contingent deferred sales charges (“CDSC”). Class C shares are sold with a CDSC. Class Y, Investor Class and Class R5 shares are sold at net asset value. Effective November 30, 2010, new or additional investments in Class B shares are no longer permitted. Existing shareholders of Class B shares may continue to reinvest dividends and capital gains distributions in Class B shares
12 Invesco Energy Fund
until they convert to Class A shares. Also, shareholders in Class B shares will be able to exchange those shares for Class B shares of other Invesco Funds offering such shares until they convert to Class A shares. Generally, Class B shares will automatically convert to Class A shares on or about the month-end, which is at least eight years after the date of purchase. Redemption of Class B shares prior to the conversion date will be subject to a CDSC.
The following is a summary of the significant accounting policies followed by the Fund in the preparation of its financial statements.
| A. | Security Valuations — Securities, including restricted securities, are valued according to the following policy. |
A security listed or traded on an exchange (except convertible securities) is valued at its last sales price or official closing price as of the close of the customary trading session on the exchange where the security is principally traded, or lacking any sales or official closing price on a particular day, the security may be valued at the closing bid price on that day. Securities traded in the over-the-counter market are valued based on prices furnished by independent pricing services or market makers. When such securities are valued by an independent pricing service they may be considered fair valued. Futures contracts are valued at the final settlement price set by an exchange on which they are principally traded. Listed options are valued at the mean between the last bid and asked prices from the exchange on which they are principally traded. Options not listed on an exchange are valued by an independent source at the mean between the last bid and asked prices. For purposes of determining net asset value (“NAV”) per share, futures and option contracts generally are valued 15 minutes after the close of the customary trading session of the New York Stock Exchange (“NYSE”).
Investments in open-end and closed-end registered investment companies that do not trade on an exchange are valued at the end-of-day net asset value per share. Investments in open-end and closed-end registered investment companies that trade on an exchange are valued at the last sales price or official closing price as of the close of the customary trading session on the exchange where the security is principally traded.
Debt obligations (including convertible securities) and unlisted equities are fair valued using an evaluated quote provided by an independent pricing service. Evaluated quotes provided by the pricing service may be determined without exclusive reliance on quoted prices, and may reflect appropriate factors such as institution-size trading in similar groups of securities, developments related to specific securities, dividend rate (for unlisted equities), yield (for debt obligations), quality, type of issue, coupon rate (for debt obligations), maturity (for debt obligations), individual trading characteristics and other market data. Debt obligations are subject to interest rate and credit risks. In addition, all debt obligations involve some risk of default with respect to interest and/or principal payments.
Foreign securities’ (including foreign exchange contracts) prices are converted into U.S. dollar amounts using the applicable exchange rates as of the close of the NYSE. If market quotations are available and reliable for foreign exchange-traded equity securities, the securities will be valued at the market quotations. Because trading hours for certain foreign securities end before the close of the NYSE, closing market quotations may become unreliable. If between the time trading ends on a particular security and the close of the customary trading session on the NYSE, events occur that the Adviser determines are significant and make the closing price unreliable, the Fund may fair value the security. If the event is likely to have affected the closing price of the security, the security will be valued at fair value in good faith using procedures approved by the Board of Trustees. Adjustments to closing prices to reflect fair value may also be based on a screening process of an independent pricing service to indicate the degree of certainty, based on historical data, that the closing price in the principal market where a foreign security trades is not the current value as of the close of the NYSE. Foreign securities’ prices meeting the approved degree of certainty that the price is not reflective of current value will be priced at the indication of fair value from the independent pricing service. Multiple factors may be considered by the independent pricing service in determining adjustments to reflect fair value and may include information relating to sector indices, American Depositary Receipts and domestic and foreign index futures. Foreign securities may have additional risks including exchange rate changes, potential for sharply devalued currencies and high inflation, political and economic upheaval, the relative lack of issuer information, relatively low market liquidity and the potential lack of strict financial and accounting controls and standards.
Securities for which market prices are not provided by any of the above methods may be valued based upon quotes furnished by independent sources. The last bid price may be used to value equity securities. The mean between the last bid and asked prices is used to value debt obligations, including corporate loans.
Securities for which market quotations are not readily available or became unreliable are valued at fair value as determined in good faith by or under the supervision of the Trust’s officers following procedures approved by the Board of Trustees. Issuer specific events, market trends, bid/asked quotes of brokers and information providers and other market data may be reviewed in the course of making a good faith determination of a security’s fair value.
The Fund may invest in securities that are subject to interest rate risk, meaning the risk that the prices will generally fall as interest rates rise and, conversely, the prices will generally rise as interest rates fall. Specific securities differ in their sensitivity to changes in interest rates depending on their individual characteristics. Changes in interest rates may result in increased market volatility, which may affect the value and/or liquidity of certain Fund investments.
Valuations change in response to many factors including the historical and prospective earnings of the issuer, the value of the issuer’s assets, general economic conditions, interest rates, investor perceptions and market liquidity. Because of the inherent uncertainties of valuation, the values reflected in the financial statements may materially differ from the value received upon actual sale of those investments.
| B. | Securities Transactions and Investment Income — Securities transactions are accounted for on a trade date basis. Realized gains or losses on sales are computed on the basis of specific identification of the securities sold. Interest income (net of withholding tax, if any) is recorded on the accrual basis from settlement date. Dividend income (net of withholding tax, if any) is recorded on the ex-dividend date. |
The Fund may periodically participate in litigation related to Fund investments. As such, the Fund may receive proceeds from litigation settlements. Any proceeds received are included in the Statement of Operations as realized gain (loss) for investments no longer held and as unrealized gain (loss) for investments still held.
Brokerage commissions and mark ups are considered transaction costs and are recorded as an increase to the cost basis of securities purchased and/or a reduction of proceeds on a sale of securities. Such transaction costs are included in the determination of net realized and unrealized gain (loss) from investment securities reported in the Statement of Operations and the Statement of Changes in Net Assets and the net realized and unrealized gains (losses) on securities per share in the Financial Highlights. Transaction costs are included in the calculation of the Fund’s net asset value and, accordingly, they reduce the Fund’s total returns. These transaction costs are not considered operating expenses and are not reflected in net investment income reported in the Statement of Operations and the Statement of Changes in Net Assets, or the net
13 Invesco Energy Fund
investment income per share and the ratios of expenses and net investment income reported in the Financial Highlights, nor are they limited by any expense limitation arrangements between the Fund and the investment adviser.
The Fund allocates income and realized and unrealized capital gains and losses to a class based on the relative net assets of each class.
| C. | Country Determination — For the purposes of making investment selection decisions and presentation in the Schedule of Investments, the investment adviser may determine the country in which an issuer is located and/or credit risk exposure based on various factors. These factors include the laws of the country under which the issuer is organized, where the issuer maintains a principal office, the country in which the issuer derives 50% or more of its total revenues and the country that has the primary market for the issuer’s securities, as well as other criteria. Among the other criteria that may be evaluated for making this determination are the country in which the issuer maintains 50% or more of its assets, the type of security, financial guarantees and enhancements, the nature of the collateral and the sponsor organization. Country of issuer and/or credit risk exposure has been determined to be the United States of America, unless otherwise noted. |
| D. | Distributions — Distributions from net investment income and net realized capital gain, if any, are generally declared and paid annually and recorded on the ex-dividend date. The Fund may elect to treat a portion of the proceeds from redemptions as distributions for federal income tax purposes. |
| E. | Federal Income Taxes — The Fund intends to comply with the requirements of Subchapter M of the Internal Revenue Code of 1986, as amended (the “Internal Revenue Code”), necessary to qualify as a regulated investment company and to distribute substantially all of the Fund’s taxable earnings to shareholders. As such, the Fund will not be subject to federal income taxes on otherwise taxable income (including net realized capital gain) that is distributed to shareholders. Therefore, no provision for federal income taxes is recorded in the financial statements. |
The Fund recognizes the tax benefits of uncertain tax positions only when the position is more likely than not to be sustained. Management has analyzed the Fund’s uncertain tax positions and concluded that no liability for unrecognized tax benefits should be recorded related to uncertain tax positions. Management is not aware of any tax positions for which it is reasonably possible that the total amounts of unrecognized tax benefits will change materially in the next 12 months.
The Fund files tax returns in the U.S. Federal jurisdiction and certain other jurisdictions. Generally, the Fund is subject to examinations by such taxing authorities for up to three years after the filing of the return for the tax period.
| F. | Expenses — Fees provided for under the Rule 12b-1 plan of a particular class of the Fund are charged to the operations of such class. Transfer agency fees and expenses and other shareholder recordkeeping fees and expenses attributable to Class R5 are charged to such class. Transfer agency fees and expenses and other shareholder recordkeeping fees and expenses relating to all other classes are allocated among those classes based on relative net assets. All other expenses are allocated among the classes based on relative net assets. |
| G. | Accounting Estimates — The preparation of financial statements in conformity with accounting principles generally accepted in the United States of America (“GAAP”) requires management to make estimates and assumptions that affect the reported amounts of assets and liabilities at the date of the financial statements and the reported amounts of revenues and expenses during the reporting period including estimates and assumptions related to taxation. Actual results could differ from those estimates by a significant amount. In addition, the Fund monitors for material events or transactions that may occur or become known after the period-end date and before the date the financial statements are released to print. |
| H. | Indemnifications — Under the Trust’s organizational documents, each Trustee, officer, employee or other agent of the Trust is indemnified against certain liabilities that may arise out of the performance of their duties to the Fund. Additionally, in the normal course of business, the Fund enters into contracts, including the Fund’s servicing agreements that contain a variety of indemnification clauses. The Fund’s maximum exposure under these arrangements is unknown as this would involve future claims that may be made against the Fund that have not yet occurred. The risk of material loss as a result of such indemnification claims is considered remote. |
| I. | Foreign Currency Translations — Foreign currency is valued at the close of the NYSE based on quotations posted by banks and major currency dealers. Portfolio securities and other assets and liabilities denominated in foreign currencies are translated into U.S. dollar amounts at date of valuation. Purchases and sales of portfolio securities (net of foreign taxes withheld on disposition) and income items denominated in foreign currencies are translated into U.S. dollar amounts on the respective dates of such transactions. The Fund does not separately account for the portion of the results of operations resulting from changes in foreign exchange rates on investments and the fluctuations arising from changes in market prices of securities held. The combined results of changes in foreign exchange rates and the fluctuation of market prices on investments (net of estimated foreign tax withholding) are included with the net realized and unrealized gain or loss from investments in the Statement of Operations. Reported net realized foreign currency gains or losses arise from (1) sales of foreign currencies, (2) currency gains or losses realized between the trade and settlement dates on securities transactions, and (3) the difference between the amounts of dividends, interest, and foreign withholding taxes recorded on the Fund’s books and the U.S. dollar equivalent of the amounts actually received or paid. Net unrealized foreign currency gains and losses arise from changes in the fair values of assets and liabilities, other than investments in securities at fiscal period end, resulting from changes in exchange rates. |
The Fund may invest in foreign securities, which may be subject to foreign taxes on income, gains on investments or currency repatriation, a portion of which may be recoverable. Foreign taxes, if any, are recorded based on the tax regulations and rates that exist in the foreign markets in which the Fund invests and are shown in the Statement of Operations.
| J. | Forward Foreign Currency Contracts — The Fund may engage in foreign currency transactions either on a spot (i.e. for prompt delivery and settlement) basis, or through forward foreign currency contracts, to manage or minimize currency or exchange rate risk. |
The Fund may also enter into forward foreign currency contracts for the purchase or sale of a security denominated in a foreign currency in order to “lock in” the U.S. dollar price of that security, or the Fund may also enter into forward foreign currency contracts that do not provide for physical settlement of the two currencies, but instead are settled by a single cash payment calculated as the difference between the agreed upon exchange rate and the spot rate at settlement based upon an agreed upon notional amount (non-deliverable forwards). The Fund will set aside liquid assets in an amount equal to daily mark-to-market obligation for forward foreign currency contracts.
A forward foreign currency contract is an obligation between two parties (“Counterparties”) to purchase or sell a specific currency for an agreed-upon price at a future date. The use of forward foreign currency contracts does not eliminate fluctuations in the price of the underlying securities the Fund owns or intends to acquire but establishes a rate of exchange in advance. Fluctuations in the value of these contracts are measured by the difference in the contract date and reporting date exchange rates and are recorded as unrealized appreciation (depreciation)
14 Invesco Energy Fund
until the contracts are closed. When the contracts are closed, realized gains (losses) are recorded. Realized and unrealized gains (losses) on the contracts are included in the Statement of Operations. The primary risks associated with forward foreign currency contracts include failure of the Counterparty to meet the terms of the contract and the value of the foreign currency changing unfavorably. These risks may be in excess of the amounts reflected in the Statement of Assets and Liabilities.
| K. | Other Risks — The Fund’s investments are concentrated in a comparatively narrow segment of the economy, which may make the Fund more volatile. |
The businesses in which the Fund invests may be adversely affected by foreign, federal or state regulations governing energy production, distribution and sale. Although individual security selection drives the performance of the Fund, short-term fluctuations in commodity prices may cause price fluctuations in its shares.
NOTE 2—Advisory Fees and Other Fees Paid to Affiliates
The Trust has entered into a master investment advisory agreement with Invesco Advisers, Inc. (the “Adviser” or “Invesco”). Under the terms of the investment advisory agreement, the Fund pays an advisory fee to the Adviser based on the annual rate of the Fund’s average daily net assets as follows:
| | | | | | |
| Average Daily Net Assets | | Rate |
First $350 million | | | 0 | .75% | | |
Next $350 million | | | 0 | .65% | | |
Next $1.3 billion | | | 0 | .55% | | |
Next $2 billion | | | 0 | .45% | | |
Next $2 billion | | | 0 | .40% | | |
Next $2 billion | | | 0 | .375% | | |
Over $8 billion | | | 0 | .35% | | |
For the year ended April 30, 2016, the effective advisory fees incurred by the Fund was 0.66%.
Under the terms of a master sub-advisory agreement between the Adviser and each of Invesco Asset Management Deutschland GmbH, Invesco Asset Management Limited, Invesco Asset Management (Japan) Limited, Invesco Hong Kong Limited, Invesco Senior Secured Management, Inc. and Invesco Canada Ltd. (collectively, the “Affiliated Sub-Advisers”) the Adviser, not the Fund, may pay 40% of the fees paid to the Adviser to any such Affiliated Sub-Adviser(s) that provide(s) discretionary investment management services to the Fund based on the percentage of assets allocated to such Affiliated Sub-Adviser(s).
The Adviser has contractually agreed, through at least June 30, 2017, to waive advisory fees and/or reimburse expenses of all shares to the extent necessary to limit total annual fund operating expenses after fee waiver and/or expense reimbursement (excluding certain items discussed below) of Class A, Class B, Class C, Class Y, Investor Class and Class R5 shares to 2.00%, 2.75%, 2.75%, 1.75%, 2.00% and 1.75%, respectively, of average daily net assets (the “expense limits”). In determining the Adviser’s obligation to waive advisory fees and/or reimburse expenses, the following expenses are not taken into account, and could cause the total annual fund operating expenses after fee waivers and/or expense reimbursement to exceed the numbers reflected above: (1) interest; (2) taxes; (3) dividend expense on short sales; (4) extraordinary or non-routine items, including litigation expenses; and (5) expenses that the Fund has incurred but did not actually pay because of an expense offset arrangement. Unless Invesco continues the fee waiver agreement, it will terminate on June 30, 2017. During its term, the fee waiver agreement cannot be terminated or amended to increase the expense limits without approval of the Board of Trustees. The Adviser did not waive fees and/or reimburse expenses during the period under these expense limits.
Further, the Adviser has contractually agreed, through at least June 30, 2018, to waive the advisory fee payable by the Fund in an amount equal to 100% of the net advisory fees the Adviser receives from the affiliated money market funds on investments by the Fund of uninvested cash (excluding investments of cash collateral from securities lending) in such affiliated money market funds.
For the year ended April 30, 2016, the Adviser waived advisory fees of $60,567.
For the year ended April 30, 2016, the Fund received $2,637,735 in litigation settlement proceeds from investment securities transactions.
The Trust has entered into a master administrative services agreement with Invesco pursuant to which the Fund has agreed to pay Invesco for certain administrative costs incurred in providing accounting services to the Fund. For the year ended April 30, 2016, expenses incurred under the agreement are shown in the Statement of Operations as Administrative services fees.
The Trust has entered into a transfer agency and service agreement with Invesco Investment Services, Inc. (“IIS”) pursuant to which the Fund has agreed to pay IIS a fee for providing transfer agency and shareholder services to the Fund and reimburse IIS for certain expenses incurred by IIS in the course of providing such services. IIS may make payments to intermediaries that provide omnibus account services, sub-accounting services and/or networking services. All fees payable by IIS to intermediaries that provide omnibus account services or sub-accounting are charged back to the Fund, subject to certain limitations approved by the Trust’s Board of Trustees. For the year ended April 30, 2016, expenses incurred under the agreement are shown in the Statement of Operations as Transfer agent fees.
The Trust has entered into master distribution agreements with Invesco Distributors, Inc. (“IDI”) to serve as the distributor for the Class A, Class B, Class C, Class Y, Investor Class and Class R5 shares of the Fund. The Trust has adopted plans pursuant to Rule 12b-1 under the 1940 Act with respect to the Fund’s Class A, Class B, Class C and Investor Class shares (collectively, the “Plans”). The Fund, pursuant to the Plans, pays IDI compensation at the annual rate of 0.25% of the Fund’s average daily net assets of Class A shares, 1.00% of the average daily net assets of Class B and Class C shares and 0.25% of the average daily net assets of Investor Class shares. Of the Plan payments, up to 0.25% of the average daily net assets of each class of shares may be paid to furnish continuing personal shareholder services to customers who purchase and own shares of such classes. Any amounts not paid as a service fee under the Plans would constitute an asset-based sales charge. Rules of the Financial Industry Regulatory Authority (“FINRA”) impose a cap on the total sales charges, including asset-based sales charges, that may be paid by any class of shares of the Fund. For the year ended April 30, 2016, expenses incurred under the Plan are shown in the Statement of Operations as Distribution fees.
15 Invesco Energy Fund
Front-end sales commissions and CDSC (collectively, the “sales charges”) are not recorded as expenses of the Fund. Front-end sales commissions are deducted from proceeds from the sales of Fund shares prior to investment in Class A shares of the Fund. CDSC are deducted from redemption proceeds prior to remittance to the shareholder. During the year ended April 30, 2016, IDI advised the Fund that IDI retained $445,409 in front-end sales commissions from the sale of Class A shares and $17,031, $7,970 and $21,341 from Class A, Class B and Class C shares, respectively, for CDSC imposed on redemptions by shareholders.
Certain officers and trustees of the Trust are officers and directors of the Adviser, IIS and/or IDI.
NOTE 3—Additional Valuation Information
GAAP defines fair value as the price that would be received to sell an asset or paid to transfer a liability in an orderly transaction between market participants at the measurement date, under current market conditions. GAAP establishes a hierarchy that prioritizes the inputs to valuation methods, giving the highest priority to readily available unadjusted quoted prices in an active market for identical assets (Level 1) and the lowest priority to significant unobservable inputs (Level 3), generally when market prices are not readily available or are unreliable. Based on the valuation inputs, the securities or other investments are tiered into one of three levels. Changes in valuation methods may result in transfers in or out of an investment’s assigned level:
| | Level 1 — | Prices are determined using quoted prices in an active market for identical assets. |
| | Level 2 — | Prices are determined using other significant observable inputs. Observable inputs are inputs that other market participants may use in pricing a security. These may include quoted prices for similar securities, interest rates, prepayment speeds, credit risk, yield curves, loss severities, default rates, discount rates, volatilities and others. |
| | Level 3 — | Prices are determined using significant unobservable inputs. In situations where quoted prices or observable inputs are unavailable (for example, when there is little or no market activity for an investment at the end of the period), unobservable inputs may be used. Unobservable inputs reflect the Fund’s own assumptions about the factors market participants would use in determining fair value of the securities or instruments and would be based on the best available information. |
The following is a summary of the tiered valuation input levels, as of April 30, 2016. The level assigned to the securities valuations may not be an indication of the risk or liquidity associated with investing in those securities. Because of the inherent uncertainties of valuation, the values reflected in the financial statements may materially differ from the value received upon actual sale of those investments.
| | | | | | | | | | | | | | | | |
| | | Level 1 | | | Level 2 | | | Level 3 | | | Total | |
Equity Securities | | $ | 940,932,573 | | | $ | 28,611,679 | | | $ | — | | | $ | 969,544,252 | |
NOTE 4—Expense Offset Arrangement(s)
The expense offset arrangement is comprised of transfer agency credits which result from balances in demand deposit accounts used by the transfer agent for clearing shareholder transactions. For the year ended April 30, 2016, the Fund received credits from this arrangement, which resulted in the reduction of the Fund’s total expenses of $6,220.
NOTE 5—Trustees’ and Officers’ Fees and Benefits
Trustees’ and Officers’ Fees and Benefits include amounts accrued by the Fund to pay remuneration to certain Trustees and Officers of the Fund. Trustees have the option to defer compensation payable by the Fund, and Trustees’ and Officers’ Fees and Benefits also include amounts accrued by the Fund to fund such deferred compensation amounts. Those Trustees who defer compensation have the option to select various Invesco Funds in which their deferral accounts shall be deemed to be invested. Finally, certain current Trustees were eligible to participate in a retirement plan that provided for benefits to be paid upon retirement to Trustees over a period of time based on the number of years of service. The Fund may have certain former Trustees who also participate in a retirement plan and receive benefits under such plan. Trustees’ and Officers’ Fees and Benefits include amounts accrued by the Fund to fund such retirement benefits. Obligations under the deferred compensation and retirement plans represent unsecured claims against the general assets of the Fund.
NOTE 6—Cash Balances
The Fund is permitted to temporarily carry a negative or overdrawn balance in its account with State Street Bank and Trust Company, the custodian bank. Such balances, if any at period-end, are shown in the Statement of Assets and Liabilities under the payable caption Amount due custodian. To compensate the custodian bank for such overdrafts, the overdrawn Fund may either (1) leave funds as a compensating balance in the account so the custodian bank can be compensated by earning the additional interest; or (2) compensate by paying the custodian bank at a rate agreed upon by the custodian bank and Invesco, not to exceed the contractually agreed upon rate.
16 Invesco Energy Fund
NOTE 7—Distributions to Shareholders and Tax Components of Net Assets
Tax Character of Distributions to Shareholders Paid During the Fiscal Years Ended April 30, 2016 and 2015:
| | | | | | | | |
| | | 2016 | | | 2015 | |
Ordinary income | | $ | 4,726,512 | | | $ | 3,085,723 | |
Long-term capital gain | | | 7,494,971 | | | | 114,495,968 | |
Total distributions | | $ | 12,221,483 | | | $ | 117,581,691 | |
| | | | |
| | | 2016 | |
Undistributed ordinary income | | $ | 9,559,929 | |
Net unrealized appreciation (depreciation) — investments | | | (187,221,857 | ) |
Net unrealized appreciation (depreciation) — other investments | | | (4,745 | ) |
Temporary book/tax differences | | | (282,671 | ) |
Capital loss carryforward | | | (6,533,157 | ) |
Shares of beneficial interest | | | 1,155,074,401 | |
Total net assets | | $ | 970,591,900 | |
The difference between book-basis and tax-basis unrealized appreciation (depreciation) is due to differences in the timing of recognition of gains and losses on investments for tax and book purposes. The Fund’s net unrealized appreciation (depreciation) difference is attributable primarily to wash sales and passive foreign investment companies.
The temporary book/tax differences are a result of timing differences between book and tax recognition of income and/or expenses. The Fund’s temporary book/tax differences are the result of the trustee deferral of compensation and retirement plan benefits.
Capital loss carryforward is calculated and reported as of a specific date. Results of transactions and other activity after that date may affect the amount of capital loss carryforward actually available for the Fund to utilize. Capital losses generated in years beginning after December 22, 2010 can be carried forward for an unlimited period, whereas previous losses expire in eight tax years. Capital losses with an expiration period may not be used to offset capital gains until all net capital losses without an expiration date have been utilized. Capital loss carryforwards with no expiration date will retain their character as either short-term or long-term capital losses instead of as short-term capital losses as under prior law. The ability to utilize capital loss carryforwards in the future may be limited under the Internal Revenue Code and related regulations based on the results of future transactions.
The Fund has a capital loss carryforward as of April 30, 2016, which expires as follows:
| | | | | | | | | | | | |
| Capital Loss Carryforward* | |
| Expiration | | Short-Term | | | Long-Term | | | Total | |
Not subject to expiration | | $ | (6,533,157 | ) | | $ | — | | | $ | (6,533,157 | ) |
| * | Capital loss carryforward as of the date listed above is reduced for limitations, if any, to the extent required by the Internal Revenue Code and may be further limited depending upon a variety of factors, including the realization of net unrealized gains or losses as of the date of any reorganization. |
NOTE 8—Investment Securities
The aggregate amount of investment securities (other than short-term securities, U.S. Treasury obligations and money market funds, if any) purchased and sold by the Fund during the year ended April 30, 2016 was $227,925,114 and $194,869,506, respectively. Cost of investments on a tax basis includes the adjustments for financial reporting purposes as of the most recently completed federal income tax reporting period-end.
| | | | |
| Unrealized Appreciation (Depreciation) of Investment Securities on a Tax Basis | |
Aggregate unrealized appreciation of investment securities | | $ | 95,477,844 | |
Aggregate unrealized (depreciation) of investment securities | | | (282,699,701 | ) |
Net unrealized appreciation (depreciation) of investment securities | | $ | (187,221,857 | ) |
Cost of investments for tax purposes is $ 1,156,766,109.
NOTE 9—Reclassification of Permanent Differences
Primarily as a result of differing book/tax treatment of foreign currency transactions and long term distributions, on April 30, 2016, undistributed net investment income was decreased by $195,013 and undistributed net realized gain (loss) was increased by $195,013. This reclassification had no effect on the net assets of the Fund.
17 Invesco Energy Fund
NOTE 10—Share Information
| | | | | | | | | | | | | | | | |
| | | Summary of Share Activity | |
| | | Years ended April 30, | |
| | | 2016(a) | | | 2015 | |
| | | Shares | | | Amount | | | Shares | | | Amount | |
Sold: | | | | | | | | | | | | | | | | |
Class A | | | 6,894,091 | | | $ | 176,267,338 | | | | 8,233,243 | | | $ | 302,703,943 | |
Class B | | | 21,584 | | | | 477,610 | | | | 49,033 | | | | 1,651,530 | |
Class C | | | 2,203,746 | | | | 48,361,914 | | | | 2,994,541 | | | | 89,192,120 | |
Class Y | | | 1,296,407 | | | | 32,163,137 | | | | 1,650,206 | | | | 65,388,372 | |
Investor Class | | | 1,637,230 | | | | 42,164,528 | | | | 1,776,163 | | | | 72,747,502 | |
Class R5 | | | 618,487 | | | | 15,480,249 | | | | 529,293 | | | | 21,836,667 | |
| | | | |
Issued as reinvestment of dividends: | | | | | | | | | | | | | | | | |
Class A | | | 262,886 | | | | 6,062,150 | | | | 1,705,931 | | | | 51,450,867 | |
Class B | | | 5,755 | | | | 116,832 | | | | 93,126 | | | | 2,488,334 | |
Class C | | | 90,762 | | | | 1,789,822 | | | | 600,184 | | | | 15,580,769 | |
Class Y | | | 23,589 | | | | 545,147 | | | | 190,031 | | | | 5,735,139 | |
Investor Class | | | 119,305 | | | | 2,740,428 | | | | 1,072,245 | | | | 32,210,251 | |
Class R5 | | | 9,584 | | | | 226,565 | | | | 105,347 | | | | 3,246,798 | |
| | | | |
Automatic conversion of Class B shares to Class A shares: | | | | | | | | | | | | | | | | |
Class A | | | 127,309 | | | | 3,366,261 | | | | 158,498 | | | | 6,720,540 | |
Class B | | | (144,636 | ) | | | (3,366,261 | ) | | | (177,481 | ) | | | (6,720,540 | ) |
| | | | |
Reacquired: | | | | | | | | | | | | | | | | |
Class A | | | (5,728,346 | ) | | | (148,807,729 | ) | | | (5,642,291 | ) | | | (230,097,381 | ) |
Class B | | | (136,763 | ) | | | (3,224,530 | ) | | | (189,189 | ) | | | (6,740,370 | ) |
Class C | | | (1,897,549 | ) | | | (41,912,577 | ) | | | (1,231,719 | ) | | | (41,765,584 | ) |
Class Y | | | (1,663,347 | ) | | | (45,008,636 | ) | | | (929,983 | ) | | | (38,179,132 | ) |
Investor Class | | | (2,317,117 | ) | | | (60,260,404 | ) | | | (2,910,301 | ) | | | (122,882,490 | ) |
Class R5 | | | (709,269 | ) | | | (20,116,254 | ) | | | (377,140 | ) | | | (15,653,705 | ) |
Net increase in share activity | | | 713,708 | | | $ | 7,065,590 | | | | 7,699,737 | | | $ | 208,913,630 | |
| (a) | There are entities that are record owners of more than 5% of the outstanding shares of the Fund and in the aggregate own 29% of the outstanding shares of the Fund. IDI has an agreement with these entities to sell Fund shares. The Fund, Invesco and/or Invesco affiliates may make payments to these entities, which are considered to be related to the Fund, for providing services to the Fund, Invesco and/or Invesco affiliates including but not limited to services such as securities brokerage, distribution, third party record keeping and account servicing. The Fund has no knowledge as to whether all or any portion of the shares owned of record by these entities are also owned beneficially. |
18 Invesco Energy Fund
NOTE 11—Financial Highlights
The following schedule presents financial highlights for a share of the Fund outstanding throughout the periods indicated.
| | | | | | | | | | | | | | | | | | | | | | | | | | | | | | | | | | | | | | | | | | | | | | | | | | | | | | | | |
| | | Net asset
value,
beginning
of period | | | Net
investment
income
(loss)(a) | | | Net gains
(losses)
on securities
(both
realized and
unrealized) | | | Total from
investment
operations | | | Dividends
from net
investment
income | | | Distributions
from net
realized
gains | | | Total
distributions | | | Net asset
value, end
of period | | | Total
return(b) | | | Net assets,
end of period
(000’s omitted) | | | Ratio of
expenses
to average
net assets
with fee waivers
and/or expenses
absorbed | | | Ratio of
expenses
to average net
assets without
fee waivers
and/or expenses
absorbed | | | Ratio of net
investment
income (loss)
to average
net assets | | | Portfolio
turnover(c) | |
Class A | | | | | | | | | | | | | | | | | | | | | | | | | | | | | | | | | | | | | | | | | |
Year ended 04/30/16 | | $ | 35.41 | | | $ | 0.27 | | | $ | (8.28 | )(d) | | $ | (8.01 | ) | | $ | (0.15 | ) | | $ | (0.21 | ) | | $ | (0.36 | ) | | $ | 27.04 | | | | (22.45 | )%(d) | | $ | 521,910 | | | | 1.26 | %(e) | | | 1.27 | %(e) | | | 1.05 | %(e) | | | 22 | % |
Year ended 04/30/15 | | | 49.87 | | | | 0.29 | | | | (10.33 | ) | | | (10.04 | ) | | | (0.13 | ) | | | (4.29 | ) | | | (4.42 | ) | | | 35.41 | | | | (18.60 | ) | | | 628,443 | | | | 1.16 | | | | 1.17 | | | | 0.69 | | | | 27 | |
Year ended 04/30/14 | | | 40.52 | | | | 0.19 | | | | 9.57 | | | | 9.76 | | | | (0.20 | ) | | | (0.21 | ) | | | (0.41 | ) | | | 49.87 | | | | 24.23 | | | | 662,813 | | | | 1.15 | | | | 1.15 | | | | 0.43 | | | | 14 | |
Year ended 04/30/13 | | | 39.00 | | | | 0.14 | | | | 1.38 | | | | 1.52 | | | | — | | | | — | | | | — | | | | 40.52 | | | | 3.90 | | | | 619,826 | | | | 1.15 | | | | 1.16 | | | | 0.37 | | | | 56 | |
Year ended 04/30/12 | | | 47.26 | | | | 0.01 | | | | (8.27 | ) | | | (8.26 | ) | | | — | | | | — | | | | — | | | | 39.00 | | | | (17.48 | ) | | | 723,304 | | | | 1.12 | | | | 1.13 | | | | 0.03 | | | | 61 | |
Class B | | | | | | | | | | | | | | | | | | | | | | | | | | | | | | | | | | | | | | | | | |
Year ended 04/30/16 | | | 31.28 | | | | 0.07 | | | | (7.33 | )(d) | | | (7.26 | ) | | | (0.08 | ) | | | (0.21 | ) | | | (0.29 | ) | | | 23.73 | | | | (23.05 | )(d) | | | 8,341 | | | | 2.01 | (e) | | | 2.02 | (e) | | | 0.30 | (e) | | | 22 | |
Year ended 04/30/15 | | | 44.93 | | | | (0.02 | ) | | | (9.34 | ) | | | (9.36 | ) | | | — | | | | (4.29 | ) | | | (4.29 | ) | | | 31.28 | | | | (19.20 | ) | | | 18,940 | | | | 1.91 | | | | 1.92 | | | | (0.06 | ) | | | 27 | |
Year ended 04/30/14 | | | 36.63 | | | | (0.13 | ) | | | 8.64 | | | | 8.51 | | | | — | | | | (0.21 | ) | | | (0.21 | ) | | | 44.93 | | | | 23.31 | | | | 37,293 | | | | 1.90 | | | | 1.90 | | | | (0.32 | ) | | | 14 | |
Year ended 04/30/13 | | | 35.52 | | | | (0.13 | ) | | | 1.24 | | | | 1.11 | | | | — | | | | — | | | | — | | | | 36.63 | | | | 3.12 | | | | 50,241 | | | | 1.90 | | | | 1.91 | | | | (0.38 | ) | | | 56 | |
Year ended 04/30/12 | | | 43.37 | | | | (0.26 | ) | | | (7.59 | ) | | | (7.85 | ) | | | — | | | | — | | | | — | | | | 35.52 | | | | (18.10 | ) | | | 73,896 | | | | 1.87 | | | | 1.88 | | | | (0.72 | ) | | | 61 | |
Class C | | | | | | | | | | | | | | | | | | | | | | | | | | | | | | | | | | | | | | | | | |
Year ended 04/30/16 | | | 30.39 | | | | 0.06 | | | | (7.11 | )(d) | | | (7.05 | ) | | | (0.08 | ) | | | (0.21 | ) | | | (0.29 | ) | | | 23.05 | | | | (23.03 | )(d) | | | 156,964 | | | | 2.01 | (e) | | | 2.02 | (e) | | | 0.30 | (e) | | | 22 | |
Year ended 04/30/15 | | | 43.83 | | | | (0.02 | ) | | | (9.13 | ) | | | (9.15 | ) | | | — | | | | (4.29 | ) | | | (4.29 | ) | | | 30.39 | | | | (19.21 | ) | | | 194,893 | | | | 1.91 | | | | 1.92 | | | | (0.06 | ) | | | 27 | |
Year ended 04/30/14 | | | 35.74 | | | | (0.13 | ) | | | 8.43 | | | | 8.30 | | | | — | | | | (0.21 | ) | | | (0.21 | ) | | | 43.83 | | | | 23.31 | | | | 177,502 | | | | 1.90 | | | | 1.90 | | | | (0.32 | ) | | | 14 | |
Year ended 04/30/13 | | | 34.66 | | | | (0.13 | ) | | | 1.21 | | | | 1.08 | | | | — | | | | — | | | | — | | | | 35.74 | | | | 3.12 | | | | 164,978 | | | | 1.90 | | | | 1.91 | | | | (0.38 | ) | | | 56 | |
Year ended 04/30/12 | | | 42.32 | | | | (0.26 | ) | | | (7.40 | ) | | | (7.66 | ) | | | — | | | | — | | | | — | | | | 34.66 | | | | (18.10 | ) | | | 202,489 | | | | 1.87 | | | | 1.88 | | | | (0.72 | ) | | | 61 | |
Class Y | | | | | | | | | | | | | | | | | | | | | | | | | | | | | | | | | | | | | | | | | |
Year ended 04/30/16 | | | 35.47 | | | | 0.34 | | | | (8.31 | )(d) | | | (7.97 | ) | | | (0.17 | ) | | | (0.21 | ) | | | (0.38 | ) | | | 27.12 | | | | (22.28 | )(d) | | | 50,706 | | | | 1.01 | (e) | | | 1.02 | (e) | | | 1.30 | (e) | | | 22 | |
Year ended 04/30/15 | | | 50.00 | | | | 0.38 | | | | (10.37 | ) | | | (9.99 | ) | | | (0.25 | ) | | | (4.29 | ) | | | (4.54 | ) | | | 35.47 | | | | (18.38 | ) | | | 78,476 | | | | 0.91 | | | | 0.92 | | | | 0.94 | | | | 27 | |
Year ended 04/30/14 | | | 40.70 | | | | 0.30 | | | | 9.60 | | | | 9.90 | | | | (0.39 | ) | | | (0.21 | ) | | | (0.60 | ) | | | 50.00 | | | | 24.54 | | | | 65,123 | | | | 0.90 | | | | 0.90 | | | | 0.68 | | | | 14 | |
Year ended 04/30/13 | | | 39.07 | | | | 0.23 | | | | 1.40 | | | | 1.63 | | | | — | | | | — | | | | — | | | | 40.70 | | | | 4.17 | | | | 55,196 | | | | 0.90 | | | | 0.91 | | | | 0.62 | | | | 56 | |
Year ended 04/30/12 | | | 47.23 | | | | 0.11 | | | | (8.27 | ) | | | (8.16 | ) | | | — | | | | — | | | | — | | | | 39.07 | | | | (17.28 | ) | | | 74,126 | | | | 0.87 | | | | 0.88 | | | | 0.28 | | | | 61 | |
Investor Class | | | | | | | | | | | | | | | | | | | | | | | | | | | | | | | | | | | | | | | | | | | | | | | | | | | | | | | | |
Year ended 04/30/16 | | | 35.27 | | | | 0.27 | | | | (8.25 | )(d) | | | (7.98 | ) | | | (0.15 | ) | | | (0.21 | ) | | | (0.36 | ) | | | 26.93 | | | | (22.45 | )(d) | | | 210,374 | | | | 1.26 | (e) | | | 1.27 | (e) | | | 1.05 | (e) | | | 22 | |
Year ended 04/30/15 | | | 49.69 | | | | 0.29 | | | | (10.29 | ) | | | (10.00 | ) | | | (0.13 | ) | | | (4.29 | ) | | | (4.42 | ) | | | 35.27 | | | | (18.59 | ) | | | 295,318 | | | | 1.16 | | | | 1.17 | | | | 0.69 | | | | 27 | |
Year ended 04/30/14 | | | 40.38 | | | | 0.19 | | | | 9.53 | | | | 9.72 | | | | (0.20 | ) | | | (0.21 | ) | | | (0.41 | ) | | | 49.69 | | | | 24.22 | | | | 419,142 | | | | 1.15 | | | | 1.15 | | | | 0.43 | | | | 14 | |
Year ended 04/30/13 | | | 38.86 | | | | 0.14 | | | | 1.38 | | | | 1.52 | | | | — | | | | — | | | | — | | | | 40.38 | | | | 3.91 | | | | 363,981 | | | | 1.15 | | | | 1.16 | | | | 0.37 | | | | 56 | |
Year ended 04/30/12 | | | 47.09 | | | | 0.01 | | | | (8.24 | ) | | | (8.23 | ) | | | — | | | | — | | | | — | | | | 38.86 | | | | (17.48 | ) | | | 428,174 | | | | 1.12 | | | | 1.13 | | | | 0.03 | | | | 61 | |
Class R5 | | | | | | | | | | | | | | | | | | | | | | | | | | | | | | | | | | | | | | | | | |
Year ended 04/30/16 | | | 36.24 | | | | 0.40 | | | | (8.48 | )(d) | | | (8.08 | ) | | | (0.18 | ) | | | (0.21 | ) | | | (0.39 | ) | | | 27.77 | | | | (22.10 | )(d) | | | 22,298 | | | | 0.84 | (e) | | | 0.85 | (e) | | | 1.47 | (e) | | | 22 | |
Year ended 04/30/15 | | | 50.97 | | | | 0.44 | | | | (10.57 | ) | | | (10.13 | ) | | | (0.31 | ) | | | (4.29 | ) | | | (4.60 | ) | | | 36.24 | | | | (18.30 | ) | | | 32,046 | | | | 0.79 | | | | 0.80 | | | | 1.06 | | | | 27 | |
Year ended 04/30/14 | | | 41.51 | | | | 0.35 | | | | 9.80 | | | | 10.15 | | | | (0.48 | ) | | | (0.21 | ) | | | (0.69 | ) | | | 50.97 | | | | 24.68 | | | | 31,942 | | | | 0.79 | | | | 0.79 | | | | 0.79 | | | | 14 | |
Year ended 04/30/13 | | | 39.81 | | | | 0.29 | | | | 1.41 | | | | 1.70 | | | | — | | | | — | | | | — | | | | 41.51 | | | | 4.27 | | | | 24,693 | | | | 0.78 | | | | 0.79 | | | | 0.74 | | | | 56 | |
Year ended 04/30/12 | | | 48.07 | | | | 0.16 | | | | (8.42 | ) | | | (8.26 | ) | | | — | | | | — | | | | — | | | | 39.81 | | | | (17.18 | ) | | | 19,996 | | | | 0.76 | | | | 0.77 | | | | 0.39 | | | | 61 | |
| (a) | Calculated using average shares outstanding. |
| (b) | Includes adjustments in accordance with accounting principles generally accepted in the United States of America and as such, the net asset value for financial reporting purposes and the returns based upon those net asset values may differ from the net asset value and returns for shareholder transactions. Does not include sales charges and is not annualized for periods less than one year, if applicable. |
| (c) | Portfolio turnover is calculated at the fund level and is not annualized for periods less than one year, if applicable. |
| (d) | Includes litigation proceeds received during the period. Had these litigation proceeds not been received, Net gains (losses) on securities (both realized and unrealized) per share would have been $(8.21), $(7.26), $(7.04), $(8.24), $(8.18) and $(8.41). Total returns would have been lower. |
| (e) | Ratios are based on average daily net assets (000’s omitted) of $478,312, $11,219, $147,868, $48,044, $210,467 and $19,586 for Class A, Class B, Class C, Class Y, Investor Class and Class R5 shares, respectively. |
19 Invesco Energy Fund
Report of Independent Registered Public Accounting Firm
To the Board of Trustees of AIM Sector Funds (Invesco Sector Funds)
and Shareholders of Invesco Energy Fund:
In our opinion, the accompanying statement of assets and liabilities, including the schedule of investments, and the related statements of operations and of changes in net assets and the financial highlights present fairly, in all material respects, the financial position of Invesco Energy Fund (one of the funds constituting AIM Sector Funds (Invesco Sector Funds), hereafter referred to as the “Fund”) at April 30, 2016, the results of its operations for the year then ended, the changes in its net assets for each of the two years in the period then ended and the financial highlights for each of the five years in the period then ended, in conformity with accounting principles generally accepted in the United States of America. These financial statements and financial highlights (hereafter referred to as “financial statements”) are the responsibility of the Fund’s management; our responsibility is to express an opinion on these financial statements based on our audits. We conducted our audits of these financial statements in accordance with the standards of the Public Company Accounting Oversight Board (United States). Those standards require that we plan and perform the audit to obtain reasonable assurance about whether the financial statements are free of material misstatement. An audit includes examining, on a test basis, evidence supporting the amounts and disclosures in the financial statements, assessing the accounting principles used and significant estimates made by management, and evaluating the overall financial statement presentation. We believe that our audits, which included confirmation of securities at April 30, 2016 by correspondence with the custodian, provide a reasonable basis for our opinion.
PRICEWATERHOUSECOOPERS LLP
June 22, 2016
Houston, Texas
20 Invesco Energy Fund
Calculating your ongoing Fund expenses
Example
As a shareholder of the Fund, you incur two types of costs: (1) transaction costs, which may include sales charges (loads) on purchase payments or contingent deferred sales charges on redemptions, if any; and (2) ongoing costs, including management fees, distribution and/or service (12b-1) fees, and other Fund expenses. This example is intended to help you understand your ongoing costs (in dollars) of investing in the Fund and to compare these costs with ongoing costs of investing in other mutual funds. The example is based on an investment of $1,000 invested at the beginning of the period and held for the entire period November 1, 2015 through April 30, 2016.
Actual expenses
The table below provides information about actual account values and actual expenses. You may use the information in this table, together with the amount you invested, to estimate the expenses that you paid over the period. Simply divide your account value by $1,000 (for example, an $8,600 account value divided by $1,000 = 8.6), then multiply the result by the number in the table under the heading entitled “Actual Expenses Paid During Period” to estimate the expenses you paid on your account during this period.
Hypothetical example for comparison purposes
The table below also provides information about hypothetical account values and hypothetical expenses based on the Fund’s actual expense ratio and an assumed rate of return of 5% per year before expenses, which is not the Fund’s actual return.
The hypothetical account values and expenses may not be used to estimate the actual ending account balance or expenses you paid for the period. You may use this information to compare the ongoing costs of investing in the Fund and other funds. To do so, compare this 5% hypothetical example with the 5% hypothetical examples that appear in the shareholder reports of the other funds.
Please note that the expenses shown in the table are meant to highlight your ongoing costs only and do not reflect any transaction costs, such as sales charges (loads) on purchase payments or contingent deferred sales charges on redemptions, if any. Therefore, the hypothetical information is useful in comparing ongoing costs only, and will not help you determine the relative total costs of owning different funds. In addition, if these transaction costs were included, your costs would have been higher.
| | | | | | | | | | | | | | | | | | | | | | | | |
| Class | | Beginning
Account Value
(11/01/15) | | | ACTUAL | | | HYPOTHETICAL
(5% annual return before expenses) | | | Annualized
Expense
Ratio | |
| | | Ending
Account Value
(04/30/16)1 | | | Expenses
Paid During
Period2 | | | Ending
Account Value
(04/30/16) | | | Expenses
Paid During
Period2 | | |
| A | | $ | 1,000.00 | | | $ | 1,011.10 | | | $ | 6.55 | | | $ | 1,018.35 | | | $ | 6.57 | | | | 1.31 | % |
| B | | | 1,000.00 | | | | 1,007.10 | | | | 10.28 | | | | 1,014.62 | | | | 10.32 | | | | 2.06 | |
| C | | | 1,000.00 | | | | 1,007.30 | | | | 10.28 | | | | 1,014.62 | | | | 10.32 | | | | 2.06 | |
| Y | | | 1,000.00 | | | | 1,012.40 | | | | 5.30 | | | | 1,019.59 | | | | 5.32 | | | | 1.06 | |
| Investor | | | 1,000.00 | | | | 1,011.10 | | | | 6.55 | | | | 1,018.35 | | | | 6.57 | | | | 1.31 | |
| R5 | | | 1,000.00 | | | | 1,013.60 | | | | 4.31 | | | | 1,020.59 | | | | 4.32 | | | | 0.86 | |
| 1 | The actual ending account value is based on the actual total return of the Fund for the period November 1, 2015 through April 30, 2016, after actual expenses and will differ from the hypothetical ending account value which is based on the Fund’s expense ratio and a hypothetical annual return of 5% before expenses. |
| 2 | Expenses are equal to the Fund’s annualized expense ratio as indicated above multiplied by the average account value over the period, multiplied by 182/366 to reflect the most recent fiscal half year. |
21 Invesco Energy Fund
Tax Information
Form 1099-DIV, Form 1042-S and other year–end tax information provide shareholders with actual calendar year amounts that should be included in their tax returns. Shareholders should consult their tax advisors.
The following distribution information is being provided as required by the Internal Revenue Code or to meet a specific state’s requirement.
The Fund designates the following amounts or, if subsequently determined to be different, the maximum amount allowable for its fiscal year ended April 30, 2016:
| | | | |
Federal and State Income Tax | |
Long-Term Capital Gain Distributions | | $ | 7,494,971 | |
Qualified Dividend Income* | | | 100 | % |
Corporate Dividends Received Deduction* | | | 100 | % |
U.S. Treasury Obligations* | | | 0 | % |
| | * | The above percentages are based on ordinary income dividends paid to shareholders during the Fund’s fiscal year. |
22 Invesco Energy Fund
Trustees and Officers
The address of each trustee and officer is AIM Sector Funds (Invesco Sector Funds) (the “Trust”), 11 Greenway Plaza, Suite 1000, Houston, Texas 77046-1173. The trustees serve for the life of the Trust, subject to their earlier death, incapacitation, resignation, retirement or removal as more specifically provided in the Trust’s organizational documents. Each officer serves for a one year term or until their successors are elected and qualified. Column two below includes length of time served with predecessor entities, if any.
| | | | | | | | |
Name, Year of Birth and
Position(s) Held with the Trust | | Trustee and/
or Officer Since | | Principal Occupation(s) During Past 5 Years | | Number of Funds in Fund Complex Overseen by Trustee | | Other Directorship(s) Held by Trustee During Past 5 Years |
| Interested Persons | | | | | | | | |
Martin L. Flanagan1 — 1960 Trustee | | 2007 | | Executive Director, Chief Executive Officer and President, Invesco Ltd. (ultimate parent of Invesco and a global investment management firm); Advisor to the Board, Invesco Advisers, Inc. (formerly known as Invesco Institutional (N.A.), Inc.); Trustee, The Invesco Funds; Vice Chair, Investment Company Institute; and Member of Executive Board, SMU Cox School of Business Formerly: Chairman and Chief Executive Officer, Invesco Advisers, Inc. (registered investment adviser); Director, Chairman, Chief Executive Officer and President, IVZ Inc. (holding company), INVESCO Group Services, Inc. (service provider) and Invesco North American Holdings, Inc. (holding company); Director, Chief Executive Officer and President, Invesco Holding Company Limited (parent of Invesco and a global investment management firm); Director, Invesco Ltd.; Chairman, Investment Company Institute and President, Co-Chief Executive Officer, Co-President, Chief Operating Officer and Chief Financial Officer, Franklin Resources, Inc. (global investment management organization) | | 146 | | None |
Philip A. Taylor2 — 1954 Trustee and Senior Vice President | | 2006 | | Head of the Americas and Senior Managing Director, Invesco Ltd.; Director, Co-Chairman, Co-President and Co-Chief Executive Officer, Invesco Advisers, Inc. (formerly known as Invesco Institutional (N.A.), Inc.) (registered investment adviser); Director, Chairman, Chief Executive Officer and President, Invesco Management Group, Inc. (formerly known as Invesco AIM Management Group, Inc.) (financial services holding company); Director and Chairman, Invesco Investment Services, Inc. (formerly known as Invesco AIM Investment Services, Inc.) (registered transfer agent) Chief Executive Officer, Invesco Corporate Class Inc. (corporate mutual fund company) Director, Chairman and Chief Executive Officer, Invesco Canada Ltd. (formerly known as Invesco Trimark Ltd./Invesco Trimark Ltèe) (registered investment adviser and registered transfer agent); Trustee and Senior Vice President, The Invesco Funds; Director, Invesco Investment Advisers LLC (formerly known as Van Kampen Asset Management); Director, Chief Executive Officer and President, Van Kampen Exchange Corp. Formerly: President and Principal Executive Officer, The Invesco Funds (other than AIM Treasurer’s Series Trust (Invesco Treasurer’s Series Trust), Short-Term Investments Trust and Invesco Management Trust); Executive Vice President, The Invesco Funds (AIM Treasurer’s Series Trust (Invesco Treasurer’s Series Trust), Short-Term Investments Trust and Invesco Management Trust only); Director and President, INVESCO Funds Group, Inc. (registered investment adviser and registered transfer agent); Director and Chairman, IVZ Distributors, Inc. (formerly known as INVESCO Distributors, Inc.) (registered broker dealer); Director, President and Chairman, Invesco Inc. (holding company), Invesco Canada Holdings Inc. (holding company), Trimark Investments Ltd./Placements Trimark Ltèe and Invesco Financial Services Ltd/Services Financiers Invesco Ltèe; Chief Executive Officer, Invesco Canada Fund Inc. (corporate mutual fund company); Director and Chairman, Van Kampen Investor Services Inc.; Director, Chief Executive Officer and President, 1371 Preferred Inc. (holding company) and Van Kampen Investments Inc.; Director and President, AIM GP Canada Inc. (general partner for limited partnerships) and Van Kampen Advisors, Inc.; Director and Chief Executive Officer, Invesco Trimark Dealer Inc. (registered broker dealer); Director, Invesco Distributors, Inc. (formerly known as Invesco AIM Distributors, Inc.) (registered broker dealer); Manager, Invesco PowerShares Capital Management LLC; Director, Chief Executive Officer and President, Invesco Advisers, Inc.; Director, Chairman, Chief Executive Officer and President, Invesco AIM Capital Management, Inc.; President, Invesco Trimark Dealer Inc. and Invesco Trimark Ltd./Invesco Trimark Ltèe; Director and President, AIM Trimark Corporate Class Inc. and AIM Trimark Canada Fund Inc.; Senior Managing Director, Invesco Holding Company Limited; Director and Chairman, Fund Management Company (former registered broker dealer); President and Principal Executive Officer, The Invesco Funds (AIM Treasurer’s Series Trust (Invesco Treasurer’s Series Trust), and Short-Term Investments Trust only); President, AIM Trimark Global Fund Inc. and AIM Trimark Canada Fund Inc. | | 146 | | None |
| 1 | Mr. Flanagan is considered an interested person (within the meaning of Section 2(a)(19) of the 1940 Act) of the Trust because he is an officer of the Adviser to the Trust, and an officer and a director of Invesco Ltd., ultimate parent of the Adviser. |
| 2 | Mr. Taylor is considered an interested person (within the meaning of Section 2(a)(19) of the 1940 Act) of the Trust because he is an officer and a director of the Adviser. |
T-1 Invesco Energy Fund
Trustees and Officers—(continued)
| | | | | | | | |
Name, Year of Birth and
Position(s) Held with the Trust | | Trustee and/
or Officer Since | | Principal Occupation(s) During Past 5 Years | | Number of Funds in Fund Complex Overseen by Trustee | | Other Directorship(s) Held by Trustee During Past 5 Years |
| Independent Trustees | | | | | | | | |
Bruce L. Crockett — 1944 Trustee and Chair | | 2003 | | Chairman, Crockett Technologies Associates (technology consulting company) Formerly: Director, Captaris (unified messaging provider); Director, President and Chief Executive Officer, COMSAT Corporation; Chairman, Board of Governors of INTELSAT (international communications company); ACE Limited (insurance company); Independent Directors Council and Investment Company Institute | | 146 | | ALPS (Attorneys Liability Protection Society) (insurance company) and Globe Specialty Metals, Inc. (metallurgical company); Member of the Audit Committee, Ferroglobe PLC and Investment Company Institute; Member of the Executive Committee and Chair of the Governance Committee, Independent Directors Council |
David C. Arch — 1945 Trustee | | 2010 | | Chairman of Blistex Inc., a consumer health care products manufacturer | | 146 | | Board member of the Illinois Manufacturers’ Association; Member of the Board of Visitors, Institute for the Humanities, University of Michigan |
James T. Bunch — 1942 Trustee | | 2000 | | Managing Member, Grumman Hill Group LLC (family office/private equity investments) Formerly: Chairman of the Board, Denver Film Society, Chairman of the Board of Trustees, Evans Scholarship Foundation; Chairman, Board of Governors, Western Golf Association | | 146 | | Trustee, Evans Scholarship Foundation |
Albert R. Dowden — 1941 Trustee | | 2003 | | Director of a number of public and private business corporations, including Nature’s Sunshine Products, Inc. Formerly: Director, The Boss Group, Ltd. and Reich & Tang Funds (5 portfolios) (registered investment company); Director, Homeowners of America Holding Corporation/Homeowners of America Insurance Company (property casualty company); Director, Continental Energy Services, LLC (oil and gas pipeline service); Director, CompuDyne Corporation (provider of product and services to the public security market) and Director, Annuity and Life Re (Holdings), Ltd. (reinsurance company); Director, President and Chief Executive Officer, Volvo Group North America, Inc.; Senior Vice President, AB Volvo; Director of various public and private corporations; Chairman, DHJ Media, Inc.; Director, Magellan Insurance Company; and Director, The Hertz Corporation, Genmar Corporation (boat manufacturer), National Media Corporation; Advisory Board of Rotary Power International (designer, manufacturer, and seller of rotary power engines); and Chairman, Cortland Trust, Inc. (registered investment company) | | 146 | | Director of Nature’s Sunshine Products, Inc. |
Jack M. Fields — 1952 Trustee | | 2003 | | Chief Executive Officer, Twenty First Century Group, Inc. (government affairs company); and Discovery Learning Alliance (non-profit) Formerly: Owner and Chief Executive Officer, Dos Angeles Ranch L.P. (cattle, hunting, corporate entertainment); Director, Insperity, Inc. (formerly known as Administaff); Chief Executive Officer, Texana Timber LP (sustainable forestry company); Director of Cross Timbers Quail Research Ranch (non-profit); and member of the U.S. House of Representatives | | 146 | | None |
Eli Jones — 1961 Trustee | | 2016 | | Professor and Dean, Mays Business School — Texas A&M University Formerly: Professor and Dean, Walton College of Business, University of Arkansas and E.J. Ourso College of Business, Louisiana State University and Director, Arvest Bank | | 146 | | Director of Insperity, Inc. (formerly known as Administaff) |
Prema Mathai-Davis — 1950 Trustee | | 2003 | | Retired. Formerly: Chief Executive Officer, YWCA of the U.S.A. | | 146 | | None |
Larry Soll — 1942 Trustee | | 1997 | | Retired. Formerly: Chairman, Chief Executive Officer and President, Synergen Corp. (a biotechnology company) | | 146 | | None |
Raymond Stickel, Jr. — 1944 Trustee | | 2005 | | Retired. Formerly: Director, Mainstay VP Series Funds, Inc. (25 portfolios) and Partner, Deloitte & Touche | | 146 | | None |
Robert C. Troccoli — 1949 Trustee | | 2016 | | Adjunct Professor and Executive-in-Residence, University of Denver — Daniels College of Business Formerly: Senior Partner, KPMG LLP | | 146 | | None |
T-2 Invesco Energy Fund
Trustees and Officers—(continued)
| | | | | | | | |
Name, Year of Birth and
Position(s) Held with the Trust | | Trustee and/
or Officer Since | | Principal Occupation(s) During Past 5 Years | | Number of Funds in Fund Complex Overseen by Trustee | | Other Directorship(s) Held by Trustee During Past 5 Years |
| Independent Trustees—(continued) |
Suzanne H. Woolsey — 1941 Trustee | | 2014 | | Retired. Formerly: Chief Executive Officer of Woolsey Partners LLC | | 146 | | Director, SunShare LLC; Trustee, Ocean Conservancy; Emeritus Chair of the Board of Trustees of the Institute for Defense Analyses and of Colorado College; Trustee, Chair, Business and Finance Committee of California Institute of Technology; Prior to 2014, Director of Fluor Corp.; Prior to 2010, Trustee of the German Marshall Fund of the United States; Prior to 2010, Trustee of the Rocky Mountain Institute |
| Other Officers | | | | | | | | |
Sheri Morris — 1964 President, Principal Executive Officer and Treasurer | | 2003 | | President, Principal Executive Officer and Treasurer, The Invesco Funds; Vice President, Invesco Advisers, Inc. (formerly known as Invesco Institutional (N.A.), Inc.) (registered investment adviser); and Vice President, PowerShares Exchange-Traded Fund Trust, PowerShares Exchange-Traded Fund Trust II, PowerShares India Exchange-Traded Fund Trust, PowerShares Actively Managed Exchange-Traded Fund Trust, and PowerShares Actively Managed Exchange-Traded Commodity Fund Trust Formerly: Vice President and Principal Financial Officer, The Invesco Funds; Vice President, Invesco AIM Advisers, Inc., Invesco AIM Capital Management, Inc. and Invesco AIM Private Asset Management, Inc.; Assistant Vice President and Assistant Treasurer, The Invesco Funds and Assistant Vice President, Invesco Advisers, Inc., Invesco AIM Capital Management, Inc. and Invesco AIM Private Asset Management, Inc.; and Treasurer, PowerShares Exchange-Traded Fund Trust, PowerShares Exchange-Traded Fund Trust II, PowerShares India Exchange-Traded Fund Trust and PowerShares Actively Managed Exchange-Traded Fund Trust | | N/A | | N/A |
Russell C. Burk — 1958 Senior Vice President and Senior Officer | | 2005 | | Senior Vice President and Senior Officer, The Invesco Funds | | N/A | | N/A |
John M. Zerr — 1962 Senior Vice President, Chief Legal Officer and Secretary | | 2006 | | Director, Senior Vice President, Secretary and General Counsel, Invesco Management Group, Inc. (formerly known as Invesco AIM Management Group, Inc.) and Van Kampen Exchange Corp.; Senior Vice President, Invesco Advisers, Inc. (formerly known as Invesco Institutional (N.A.), Inc.) (registered investment adviser); Senior Vice President and Secretary, Invesco Distributors, Inc. (formerly known as Invesco AIM Distributors, Inc.); Director, Vice President and Secretary, Invesco Investment Services, Inc. (formerly known as Invesco AIM Investment Services, Inc.) Senior Vice President, Chief Legal Officer and Secretary, The Invesco Funds; Managing Director, Invesco PowerShares Capital Management LLC; Director, Secretary and General Counsel, Invesco Investment Advisers LLC (formerly known as Van Kampen Asset Management); Secretary and General Counsel, Invesco Capital Markets, Inc. (formerly known as Van Kampen Funds Inc.) and Chief Legal Officer, PowerShares Exchange-Traded Fund Trust, PowerShares Exchange-Traded Fund Trust II, PowerShares India Exchange-Traded Fund Trust, PowerShares Actively Managed Exchange-Traded Fund Trust, and PowerShares Actively Managed Exchange-Traded Commodity Fund Trust Formerly: Director, Vice President and Secretary, IVZ Distributors, Inc. (formerly known as INVESCO Distributors, Inc.); Director and Vice President, INVESCO Funds Group, Inc.; Director and Vice President, Van Kampen Advisors Inc.; Director, Vice President, Secretary and General Counsel, Van Kampen Investor Services Inc.; Director, Invesco Distributors, Inc. (formerly known as Invesco AIM Distributors, Inc.); Director, Senior Vice President, General Counsel and Secretary, Invesco AIM Advisers, Inc. and Van Kampen Investments Inc.; Director, Vice President and Secretary, Fund Management Company; Director, Senior Vice President, Secretary, General Counsel and Vice President, Invesco AIM Capital Management, Inc.; Chief Operating Officer and General Counsel, Liberty Ridge Capital, Inc. (an investment adviser); Vice President and Secretary, PBHG Funds (an investment company) and PBHG Insurance Series Fund (an investment company); Chief Operating Officer, General Counsel and Secretary, Old Mutual Investment Partners (a broker-dealer); General Counsel and Secretary, Old Mutual Fund Services (an administrator) and Old Mutual Shareholder Services (a shareholder servicing center); Executive Vice President, General Counsel and Secretary, Old Mutual Capital, Inc. (an investment adviser); and Vice President and Secretary, Old Mutual Advisors Funds (an investment company) | | N/A | | N/A |
T-3 Invesco Energy Fund
Trustees and Officers—(continued)
| | | | | | | | |
Name, Year of Birth and
Position(s) Held with the Trust | | Trustee and/
or Officer Since | | Principal Occupation(s) During Past 5 Years | | Number of Funds in Fund Complex Overseen by Trustee | | Other Directorship(s) Held by Trustee During Past 5 Years |
| Other Officers—(continued) | | | | | | | | |
Karen Dunn Kelley — 1960 Senior Vice President | | 2003 | | Senior Managing Director, Investments, Invesco Ltd.; Director, Co-President, Co-Chief Executive Officer, and Co-Chairman, Invesco Advisers, Inc. (formerly known as Invesco Institutional (N.A.), Inc.) (registered investment adviser); Chairman and Director, Invesco Senior Secured Management, Inc.; Senior Vice President, Invesco Management Group, Inc. (formerly known as Invesco AIM Management Group, Inc.); Executive Vice President, Invesco Distributors, Inc. (formerly known as Invesco AIM Distributors, Inc.); Director, Invesco Mortgage Capital Inc. and Invesco Management Company Limited; Senior Vice President, The Invesco Funds Formerly: Vice President, The Invesco Funds (other than AIM Treasurer’s Series Trust (Invesco Treasurer’s Series Trust), Short-Term Investments Trust and Invesco Management Trust); and President and Principal Executive Officer, The Invesco Funds (AIM Treasurer’s Series Trust (Invesco Treasurer’s Series Trust), Short-Term Investments Trust and Invesco Management Trust only); Director and President, INVESCO Asset Management (Bermuda) Ltd., Director, INVESCO Global Asset Management DAC (formerly known as INVESCO Global Asset Management Limited) and INVESCO Management S.A.; Senior Vice President, Van Kampen Investments Inc. and Invesco Advisers, Inc. (formerly known as Invesco Institutional (N.A.), Inc.) (registered investment adviser); Director and President, Fund Management Company; Chief Cash Management Officer, Director of Cash Management, Senior Vice President, and Managing Director, Invesco AIM Capital Management, Inc.; Director of Cash Management, Senior Vice President, and Vice President, Invesco Advisers, Inc. and The Invesco Funds (AIM Treasurer’s Series Trust (Invesco Treasurer’s Series Trust), and Short-Term Investments Trust only) | | N/A | | N/A |
Kelli Gallegos — 1970 Vice President, Principal Financial Officer and Assistant Treasurer | | 2008 | | Vice President, Principal Financial Officer and Assistant Treasurer, The Invesco Funds; Assistant Treasurer, Invesco PowerShares Capital Management LLC, PowerShares Exchange-Traded Fund Trust, PowerShares Exchange-Traded Fund Trust II, PowerShares India Exchange-Traded Fund Trust, PowerShares Actively Managed Exchange-Traded Fund Trust, and PowerShares Actively Managed Exchange-Traded Commodity Fund Trust Formerly: Assistant Vice President, The Invesco Funds | | N/A | | N/A |
Tracy Sullivan — 1962 Vice President, Chief Tax Officer and Assistant Treasurer | | 2008 | | Vice President, Chief Tax Officer and Assistant Treasurer, The Invesco Funds; Assistant Treasurer, Invesco PowerShares Capital Management LLC, PowerShares Exchange-Traded Fund Trust, PowerShares Exchange-Traded Fund Trust II, PowerShares India Exchange-Traded Fund Trust, PowerShares Actively Managed Exchange-Traded Fund Trust, and PowerShares Actively Managed Exchange-Traded Commodity Fund Trust Formerly: Assistant Vice President, The Invesco Funds | | N/A | | N/A |
Crissie M. Wisdom — 1969 Anti-Money Laundering Compliance Officer | | 2013 | | Anti-Money Laundering Compliance Officer, Invesco Advisers, Inc. (formerly known as Invesco Institutional (N.A.), Inc.) (registered investment adviser), Invesco Capital Markets, Inc. (formerly known as Van Kampen Funds Inc.), Invesco Distributors, Inc., Invesco Investment Services, Inc., Invesco Management Group, Inc., Van Kampen Exchange Corp., The Invesco Funds, and PowerShares Exchange-Traded Fund Trust, PowerShares Exchange-Traded Fund Trust II, PowerShares India Exchange-Traded Fund Trust, PowerShares Actively Managed Exchange-Traded Fund Trust and PowerShares Actively Managed Exchange-Traded Commodity Fund Trust; Anti-Money Laundering Compliance Officer and Bank Secrecy Act Officer, INVESCO National Trust Company and Invesco Trust Company; and Fraud Prevention Manager and Controls and Risk Analysis Manager for Invesco Investment Services, Inc. | | N/A | | N/A |
Robert R. Leveille — 1969 Chief Compliance Officer | | 2016 | | Chief Compliance Officer, Invesco Advisers, Inc. (registered investment adviser); and Chief Compliance Officer, The Invesco Funds Formerly: Chief Compliance Officer, Putnam Investments and the Putnam Funds | | N/A | | N/A |
The Statement of Additional Information of the Trust includes additional information about the Fund’s Trustees and is available upon request, without charge, by calling 1.800.959.4246. Please refer to the Fund’s Statement of Additional Information for information on the Fund’s sub-advisers.
| | | | | | |
Office of the Fund 11 Greenway Plaza, Suite 1000 Houston, TX 77046-1173 | | Investment Adviser Invesco Advisers, Inc. 1555 Peachtree Street, N.E. Atlanta, GA 30309 | | Distributor Invesco Distributors, Inc. 11 Greenway Plaza, Suite 1000 Houston, TX 77046-1173 | | Auditors PricewaterhouseCoopers LLP 1000 Louisiana Street, Suite 5800 Houston, TX 77002-5678 |
| | | |
| | | | | | |
Counsel to the Fund Stradley Ronon Stevens & Young, LLP 2005 Market Street, Suite 2600 Philadelphia, PA 19103-7018 | | Counsel to the Independent Trustees Goodwin Procter LLP 901 New York Avenue, N.W. Washington, D.C. 20001 | | Transfer Agent Invesco Investment Services, Inc. 11 Greenway Plaza, Suite 1000 Houston, TX 77046-1173 | | Custodian State Street Bank and Trust Company 225 Franklin Street Boston, MA 02110-2801 |
T-4 Invesco Energy Fund

Invesco mailing information
Send general correspondence to Invesco Investment Services, Inc., P.O. Box 219078, Kansas City, MO 64121-9078.
Important notice regarding delivery of security holder documents
To reduce Fund expenses, only one copy of most shareholder documents may be mailed to shareholders with multiple accounts at the same address (Householding). Mailing of your shareholder documents may be householded indefinitely unless you instruct us otherwise. If you do not want the mailing of these documents to be combined with those for other members of your household, please contact Invesco Investment Services, Inc. at 800 959 4246 or contact your financial institution. We will begin sending you individual copies for each account within 30 days after receiving your request.
Fund holdings and proxy voting information
The Fund provides a complete list of its holdings four times in each fiscal year, at the quarter ends. For the second and fourth quarters, the lists appear in the Fund’s semiannual and annual reports to shareholders. For the first and third quarters, the Fund files the lists with the Securities and Exchange Commission (SEC) on Form N-Q. The most recent list of portfolio holdings is available at invesco.com/completeqtrholdings. Shareholders can also look up the Fund’s Forms N-Q on the SEC website at sec.gov. Copies of the Fund’s Forms N-Q may be reviewed and copied at the SEC Public Reference Room in Washington, D.C. You can obtain information on the operation of the Public Reference Room, including information about duplicating fee charges, by calling 202 551 8090 or 800 732 0330, or by electronic request at the following email address: publicinfo@sec.gov. The SEC file numbers for the Fund are shown below.
A description of the policies and procedures that the Fund uses to determine how to vote proxies relating to portfolio securities is available without charge, upon request, from our Client Services department at 800 959 4246 or at invesco.com/proxyguidelines. The information is also available on the SEC website, sec.gov.
| | |
Information regarding how the Fund voted proxies related to its portfolio securities during the most recent 12-month period ended June 30 is available at invesco.com/proxysearch. The information is also available on the SEC website, sec.gov. Invesco Advisers, Inc. is an investment adviser; it provides investment advisory services to individual and institutional clients and does not sell securities. Invesco Distributors, Inc. is the US distributor for Invesco Ltd.’s retail mutual funds, exchange-traded funds and institutional money market funds. Both are wholly owned, indirect subsidiaries of Invesco Ltd. | |  |
| | | | |
| SEC file numbers: 811-03826 and 002-85905 | | I-ENE-AR-1 | | Invesco Distributors, Inc. |
| | | | |
| | |
 | | Annual Report to Shareholders | | April 30, 2016 |
| | |
| | Invesco Gold & Precious Metals Fund |
| | Nasdaq: |
| | A: IGDAX n B: IGDBX n C: IGDCX n Y: IGDYX n Investor: FGLDX |

Letters to Shareholders
| | |

Philip Taylor | | Dear Shareholders: This annual report includes information about your Fund, including performance data and a complete list of its investments as of the close of the reporting period. Inside is a discussion of how your Fund was managed and the factors that affected its performance during the reporting period. US economic data were generally positive over the reporting period, with the economy expanding modestly and employment numbers improving steadily. Throughout the reporting period, US consumers benefited from declining energy prices and greater credit availability, but a strengthening dollar crimped the profits of many large multinational companies doing business overseas. Ending years of uncertainty, the US Federal Reserve in December 2015 finally raised short–term interest rates for the first time since 2006, signaling its confidence that the economy was likely to continue expanding and improving. Overseas, the economic story was less positive. |
The European Central Bank and central banks in China and Japan – as well as other countries – either instituted or maintained extraordinarily accommodative monetary policies in response to economic weakness. Stocks began 2016 on a weak note due to increased concerns about global economic weakness. Short–term market volatility can prompt some investors to abandon their investment plans – and can cause others to settle for average results. The investment professionals at Invesco, in contrast, invest with high conviction and a long–term perspective. At Invesco, investing with high conviction means offering a wide range of strategies designed to go beyond market benchmarks. We trust our researchdriven insights, have confidence in our investment processes and build portfolios that reflect our beliefs. Our goal is to look past market noise in an effort to find attractive opportunities at attractive prices – consistent with the investment strategies spelled out in each fund’s prospectus. Of course, investing with high conviction can’t guarantee a profit or ensure investment success; no investment strategy or risk analysis can. To learn more about how we invest with high conviction, visit invesco.com/HighConviction. You, too, can invest with high conviction by maintaining a long–term investment perspective and by working with your financial adviser on a regular basis. During periods of short–term market volatility or uncertainty, your financial adviser can keep you focused on your long–term investment goals – a new home, a child’s college education, or a secure retirement. He or she also can share research about the economy, the markets and individual investment options. |
Visit our website for more information on your investments
Our website, invesco.com/us, offers a wide range of market insights and investment perspectives. On the website, you’ll find detailed information about our funds, including performance, holdings and portfolio manager commentaries. You can access information about your account by completing a simple, secure online registration. Click on the “Need to register” link in the “Account Access” box on our homepage to get started. Invesco’s mobile apps for iPhone® and iPad® (both available free from the App StoreSM) allow you to obtain the same detailed information, monitor your account and create customizable watch lists.
In addition to the resources accessible on our website and through our mobile app, you can obtain timely updates to help you stay informed about the markets, the economy and investing by connecting with Invesco on Twitter, LinkedIn or Facebook. You can access our blog at blog.invesco.us.com. Our goal is to provide you the information you want, when and where you want it.
Have questions?
For questions about your account, contact an Invesco client services representative at 800 959 4246. For Invesco related questions or comments, please email me directly at phil@invesco.com.
All of us at Invesco look forward to serving your investment management needs. Thank you for investing with us.
Sincerely,

Philip Taylor
Senior Managing Director, Invesco Ltd.
iPhone and iPad are trademarks of Apple Inc., registered in the US and other countries. App Store is a service mark of Apple Inc. Invesco Distributors, Inc. is not affiliated with Apple Inc.
2 Invesco Gold & Precious Metals Fund
| | |

Bruce Crockett | | Dear Fellow Shareholders: Among the many important lessons I’ve learned in more than 40 years in a variety of business endeavors is the value of a trusted advocate. As independent chair of the Invesco Funds Board, I can assure you that the members of the Board are strong advocates for the interests of investors in Invesco’s mutual funds. We work hard to represent your interests through oversight of the quality of the investment management services your funds receive and other matters important to your investment, including but not limited to: |
| | n Ensuring that Invesco offers a diverse lineup of mutual funds that your financial adviser can use to strive to meet your financial needs as your investment goals change over time. n Monitoring how the portfolio management teams of the Invesco funds are performing in light of changing economic and market conditions. |
n Assessing each portfolio management team’s investment performance within the context of the investment strategy described in the fund’s prospectus. n Monitoring for potential conflicts of interests that may impact the nature of the services that your funds receive. We believe one of the most important services we provide our fund shareholders is the annual review of the funds’ advisory and sub-advisory contracts with Invesco Advisers and its affiliates. This review is required by the Investment Company Act of 1940 and focuses on the nature and quality of the services Invesco provides as the adviser to the Invesco funds and the reasonableness of the fees that it charges for those services. Each year, we spend months carefully reviewing information received from Invesco and a variety of independent sources, such as performance and fee data prepared by Lipper Inc., an independent, third-party firm widely recognized as a leader in its field. We also meet with our independent legal counsel and other independent advisers to review and help us assess the information that we have received. Our goal is to assure that you receive quality investment management services for a reasonable fee. I trust the measures outlined above provide assurance that you have a worthy advocate when it comes to choosing the Invesco Funds. As always, please contact me at bruce@brucecrockett.com with any questions or concerns you may have. On behalf of the Board, we look forward to continuing to represent your interests and serving your needs. |
Sincerely,

Bruce L. Crockett
Independent Chair
Invesco Funds Board of Trustees
3 Invesco Gold & Precious Metals Fund
Management’s Discussion of Fund Performance
| | | | | | |
| | | Performance summary | |
| | For the fiscal year ended April 30, 2016, Class A shares of Invesco Gold & Precious Metals Fund (the Fund), at net asset value (NAV), underperformed the Fund’s style-specific benchmark, the Philadelphia Gold & Silver Index (price only). Your Fund’s long-term performance appears later in this report. | |
| | | Fund vs. Indexes | |
| | Total returns, 4/30/15 to 4/30/16, at net asset value (NAV). Performance shown does not include applicable contingent deferred sales charges (CDSC) or front-end sales charges, which would have reduced performance. | |
| | | Class A Shares | | | 26.25 | % |
| | | Class B Shares | | | 25.33 | |
| | | Class C Shares | | | 25.19 | |
| | | Class Y Shares | | | 26.54 | |
| | | Investor Class Shares | | | 26.37 | |
| | | S&P 500 Indexq (Broad Market Index) | | | 1.21 | |
| | | Philadelphia Gold & Silver Index (price only)▼ (Style-Specific Index) | | | 27.42 | |
| | | Lipper Precious Metals Equity Funds Indexn (Peer Group Index) | | | 27.65 | |
| | | Source(s): ▼FactSet Research Systems Inc.; nLipper Inc. | | | | |
Market conditions and your Fund
Global equities delivered negative returns for the fiscal year ended April 30, 2016. Factors affecting global equity markets’ performance included generally positive, but subdued economic growth, as well as varied monetary policies implemented by central banks around the world – and the effects those varied policies had on currencies.
As the reporting period began, the view that the US Federal Reserve (the Fed) would begin raising rates while other central banks were loosening monetary policies led the US dollar to strengthen against many currencies. At the same time, oil prices continued to decline as increased supply outstripped demand. This had the effect of hurting commodity- and materials-based economies – and companies in related sectors. Mixed economic data from the US and concerns about a possible Greek exit from the eurozone contributed to market uncertainty. During the summer of 2015, China’s surprise devaluation of the renminbi and a significant downturn in its equity markets triggered a selloff in global equity markets,
particularly in already-vulnerable emerging markets. In the fall of 2015, markets around the world began to regain their footing, but the impact of a late-year crash in oil prices offset those gains.
The global economy continued to expand, albeit slowly, during the reporting period. However, that growth became increasingly uneven across developed and emerging economies. Central bank policies also began to diverge as the Fed followed through on its commitment to normalize monetary policy by raising interest rates – even as the European Central Bank extended its asset purchase program and Japan introduced additional quantitative easing and negative interest rates. In early 2016, Saudi Arabia and Russia provided some respite to falling oil prices by suggesting willingness to consider freezing their oil output. Oil prices also strengthened on the back of a weakening US dollar. While both developed and emerging equity markets finished the reporting period in negative territory, emerging markets lagged significantly.
The US dollar weakened following the Fed’s decision to raise the federal funds rate in December 2015. Volatility spiked
in August 2015 due to turbulence related to the outlook for China – and was elevated at the start of 2016.
Gold bullion prices rose approximately 9% during the fiscal year to close at $1,293 a troy ounce at the end of the reporting period.1 In general, gold bullion prices were supported by a weakened US dollar and increased uncertainty for the global macroeconomic environment.
For the reporting period, the Fund’s performance relative to its style-specific index was driven primarily by security selection in, and underweight exposure to, silver mining equities. Additionally, ancillary cash and gold bullion – exposure the Fund achieves through exchange traded funds (ETFs) – detracted from the Fund’s relative performance. Security selection in, and underweight exposure to, diversified metals and mining equities, as well as security selection in gold mining equities, were beneficial to the Fund’s relative performance for the fiscal year.
The top individual contributor to Fund performance during the fiscal year was Torex Gold Resources, a company engaged in the exploration and development of the Morelos Gold property in southern Mexico. Torex celebrated a milestone in December 2015 – its first gold and silver pour culminating from its fully operational El Limon-Guajes mine. We believe Torex showcases our process, which seeks to maintain discipline in a volatile space and invest over the long-term.
Conversely, Rubicon Minerals was the largest individual detractor from Fund performance during the fiscal year. Rubicon was initially ordered to temporarily suspend operations at its Phoenix Gold Project in Ontario’s Red Lake camp due to elevated ammonia levels. The company subsequently halted development and explored cost-cutting measures and alternative mining methods for its narrow-vein gold deposit.
| | | | |
| Portfolio Composition | |
| By industry | | | % of total net assets | |
| | | | |
| |
Gold | | | 68.2% | |
Precious Metals & Minerals | | | 9.7 | |
| Investment Companies – Exchange Traded Funds | | | 5.5 | |
| Diversified Metals & Mining | | | 5.1 | |
| Silver | | | 4.8 | |
| Construction & Engineering | | | 0.2 | |
| Money Market Funds Plus Other Assets Less Liabilities | | | 6.5 | |
| | | | |
| Top 10 Equity Holdings* | |
| | | % of total net assets | |
| | | | | |
| | | | |
1. Torex Gold Resources Inc. | | | 6.5 | % |
2. Silver Wheaton Corp. | | | 4.8 | |
3. Barrick Gold Corp. | | | 4.7 | |
4. Tahoe Resources Inc. | | | 4.6 | |
5. Franco-Nevada Corp. | | | 4.5 | |
6. Kinross Gold Corp. | | | 4.3 | |
7. Goldcorp, Inc. | | | 4.3 | |
8. New Gold Inc. | | | 4.1 | |
9. Agnico Eagle Mines Ltd. | | | 4.0 | |
10. Turquoise Hill Resources Ltd. | | | 3.9 | |
| | | | |
| Total Net Assets | | | $341.1 million | |
| |
| Total Number of Holdings* | | | 37 | |
The Fund’s holdings are subject to change, and there is no assurance that the Fund will continue to hold any particular security.
*Excluding money market fund holdings.
Data presented here are as of April 30, 2016.
|
| 4 Invesco Gold & Precious Metals Fund |
We believe the Fed’s decision to raise the federal funds rate, coupled with uncertainty in the global equity markets, may cause further volatility in gold and precious metals prices. At the end of the reporting period, the gold bullion price continued to hover around the marginal cost of new supply, while gold miners need a higher price to profitably grow their businesses. We believe that this potentially suggests lower downside risk compared to upside return for the equities that the Fund holds.
We used volatility throughout the reporting period to increase the Fund’s holdings in select senior producers trading at low price-to-cash flow multiples. We were also opportunistic in increasing our exposure to developers and explorers trading at significant discounts. We believe it may be very difficult for the US dollar to repeat its 2015 strength in the coming fiscal year and, as a result, we believe the macroeconomic environment and the fundamentals of gold miners bode well for the price of bullion.
At the close of the reporting period, compared to the Fund’s
style-specific benchmark, the Fund had slight overweight allocation in gold mining equities, and underweight allocation in silver mining equities, precious metals and minerals mining equities and diversified metals and mining equities. Conversely, the Fund had overweight exposure to gold bullion ETFs and the construction and engineering industry – exposure which the Fund’s style-specific index lacked. Our bottom-up approach led us to shift some of the Fund’s emphasis to quality intermediate producers, as well as select developers. Over time, we believed there would be upside potential from multiple expansions and from merger and acquisition activity as senior producers seek to boost their growth profiles.
As always, thank you for your continued investment in Invesco Gold & Precious Metals Fund.
The views and opinions expressed in management’s discussion of Fund performance are those of Invesco Advisers, Inc. These views and opinions are subject to change at any time based on factors such as market and economic conditions. These views and opinions may not be relied upon as investment advice or recommendations, or as an offer for a particular security. The information is not a complete analysis of every aspect of any market, country, industry, security or the Fund. Statements of fact are from sources considered reliable, but Invesco Advisers, Inc. makes no representation or warranty as to their completeness or accuracy. Although historical performance is no guarantee of future results, these insights may help you understand our investment management philosophy.
See important Fund and, if applicable, index disclosures later in this report.
| | |
 | | Norman MacDonald Chartered Financial Analyst, Portfolio Manager, is manager of Invesco Gold & Precious Metals |
| Fund. He joined Invesco in 2008. Mr. MacDonald earned a Bachelor of Commerce from the University of Windsor. |
5 Invesco Gold & Precious Metals Fund
Your Fund’s Long-Term Performance
Results of a $10,000 Investment – Oldest Share Class(es)
Fund and index data from 4/30/06
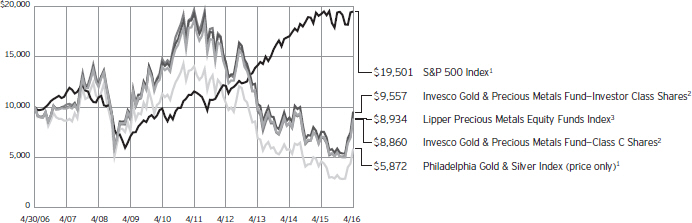
| 1 | Source: FactSet Research Systems Inc. |
| 2 | It is Invesco’s policy to chart the Fund’s oldest share class(es). Because Investor Class shares do not have a sales charge, we also show the oldest share class with a sales charge, Class C shares. |
Past performance cannot guarantee comparable future results.
The data shown in the chart include reinvested distributions, applicable sales charges and Fund expenses including
management fees. Index results include reinvested dividends, but they do not reflect sales charges. Performance of the peer group, if applicable, reflects fund expenses and management fees;
performance of a market index does not. Performance shown in the chart and table(s) does not reflect deduction of taxes a shareholder would pay on Fund distributions or sale of Fund shares.
continued from page 8
| n | | Small- and mid-capitalization risks. Small- and mid-capitalization companies tend to be more vulnerable to changing market conditions, may have little or no operating history or track record of success, and may have more limited product lines and markets, less experienced management and fewer financial resources than larger companies. These companies’ securities may be more volatile and less liquid than those of more established companies, and their returns may vary, sometimes significantly, from the overall securities market. |
About indexes used in this report
| n | | The S&P 500® Index is an unmanaged index considered representative of the US stock market. |
| n | | The Philadelphia Gold & Silver Index (price only) is a capitalization-weighted, price-only index on the Philadelphia Stock Exchange that includes the leading companies involved in mining gold and silver. |
| n | | The Lipper Precious Metals Equity Funds Index is an unmanaged index considered representative of precious metals funds tracked by Lipper. |
| n | | The Fund is not managed to track the performance of any particular index, including the index(es) described here, and consequently, the performance of the Fund may deviate significantly from the performance of the index(es). |
| n | | A direct investment cannot be made in an index. Unless otherwise indicated, index results include reinvested dividends, and they do not reflect sales charges. Performance of the peer group, if applicable, reflects fund expenses; performance of a market index does not. |
Other information
| n | | The returns shown in management’s discussion of Fund performance are based on net asset values (NAVs) calculated for shareholder transactions. Generally accepted accounting principles require adjustments to be made to the net assets of the Fund at period end for financial reporting purposes, and as such, the NAVs for shareholder transactions and the returns based on those NAVs may differ from the NAVs and returns reported in the Financial Highlights. |
| n | | Industry classifications used in this report are generally according to the Global Industry Classification Standard, which was developed by and is the exclusive property and a service mark of MSCI Inc. and Standard & Poor’s. |
6 Invesco Gold & Precious Metals Fund
| | | | |
Average Annual Total Returns As of 4/30/16, including maximum applicable sales charges | |
Class A Shares | | | | |
Inception (3/28/02) | | | 7.03 | % |
10 Years | | | -1.00 | |
5 Years | | | -14.09 | |
1 Year | | | 19.39 | |
| |
Class B Shares | | | | |
Inception (3/28/02) | | | 7.12 | % |
10 Years | | | -1.07 | |
5 Years | | | -14.07 | |
1 Year | | | 20.33 | |
| |
Class C Shares | | | | |
Inception (2/14/00) | | | 8.12 | % |
10 Years | | | -1.20 | |
5 Years | | | -13.77 | |
1 Year | | | 24.19 | |
| |
Class Y Shares | | | | |
10 Years | | | -0.27 | % |
5 Years | | | -12.93 | |
1 Year | | | 26.54 | |
| |
Investor Class Shares | | | | |
Inception (1/19/84) | | | 0.73 | % |
10 Years | | | -0.45 | |
5 Years | | | -13.11 | |
1 Year | | | 26.37 | |
Class Y shares incepted on October 3, 2008. Performance shown prior to that date is that of Investor Class shares and includes the 12b-1 fees applicable to Investor Class shares.
The performance data quoted represent past performance and cannot guarantee comparable future results; current performance may be lower or higher. Please visit invesco.com/performance for the most recent month-end performance. Performance figures reflect reinvested distributions, changes in net asset value and the effect of the maximum sales charge unless otherwise stated. Investment return and principal value will fluctuate so that you may have a gain or loss when you sell shares.
The net annual Fund operating expense ratio set forth in the most recent Fund prospectus as of the date of this report for Class A, Class B, Class C, Class Y and Investor Class shares was 1.49%, 2.24%, 2.24%, 1.24% and 1.49%, respectively.1 The total annual Fund operating expense ratio set forth in the most recent Fund prospectus as of the date of this report for Class A, Class B, Class C, Class Y
| | | | |
Average Annual Total Returns As of 3/31/16, the most recent calendar quarter end, including maximum applicable sales charges | |
Class A Shares | | | | |
Inception (3/28/02) | | | 5.21 | % |
10 Years | | | -2.38 | |
5 Years | | | -17.61 | |
1 Year | | | 3.67 | |
| |
Class B Shares | | | | |
Inception (3/28/02) | | | 5.30 | % |
10 Years | | | -2.41 | |
5 Years | | | -17.63 | |
1 Year | | | 3.80 | |
| |
Class C Shares | | | | |
Inception (2/14/00) | | | 6.53 | % |
10 Years | | | -2.57 | |
5 Years | | | -17.29 | |
1 Year | | | 8.07 | |
| |
Class Y Shares | | | | |
10 Years | | | -1.65 | % |
5 Years | | | -16.48 | |
1 Year | | | 10.11 | |
| |
Investor Class Shares | | | | |
Inception (1/19/84) | | | -0.04 | % |
10 Years | | | -1.84 | |
5 Years | | | -16.69 | |
1 Year | | | 9.67 | |
and Investor Class shares was 1.50%, 2.25%, 2.25%, 1.25% and 1.50%, respectively. The expense ratios presented above may vary from the expense ratios presented in other sections of this report that are based on expenses incurred during the period covered by this report.
Class A share performance reflects the maximum 5.50% sales charge, and Class B and Class C share performance reflects the applicable contingent deferred sales charge (CDSC) for the period involved. The CDSC on Class B shares declines from 5% beginning at the time of purchase to 0% at the beginning of the seventh year. The CDSC on Class C shares is 1% for the first year after purchase. Class Y shares and Investor Class shares do not have a front-end sales charge or a CDSC; therefore, performance is at net asset value.
The performance of the Fund’s share classes will differ primarily due to different sales charge structures and class expenses.
Fund performance reflects any applicable fee waivers and/or expense reimbursements. Had the adviser not waived fees and/or reimbursed expenses currently or in the past, returns would have been lower. See current prospectus for more information.
| 1 | Total annual Fund operating expenses after any contractual fee waivers and/or expense reimbursements by the adviser in effect through at least June 30, 2018. See current prospectus for more information. |
7 Invesco Gold & Precious Metals Fund
Invesco Gold & Precious Metals Fund’s investment objective is long-term growth of capital.
| n | | Unless otherwise stated, information presented in this report is as of April 30, 2016, and is based on total net assets. |
| n | | Unless otherwise noted, all data provided by Invesco. |
| n | | To access your Fund’s reports/prospectus, visit invesco.com/fundreports. |
About share classes
| n | | Class B shares may not be purchased for new or additional investments. Please see the prospectus for more information. |
| n | | Class Y shares and Investor Class shares are available only to certain investors. Please see the prospectus for more information. |
Principal risks of investing in the Fund
| n | | Derivatives risk. The value of a derivative instrument depends largely on (and is derived from) the value of an underlying security, currency, commodity, interest rate, index or other asset (each referred to as an underlying asset). In addition to risks relating to the underlying assets, the use of derivatives may include other, possibly greater, risks, including counterparty, leverage and liquidity risks. Counterparty risk is the risk that the counterparty to the derivative contract will default on its obligation to pay the Fund the amount owed or otherwise perform under the derivative contract. Derivatives create leverage risk because they do not require payment up front equal to the economic exposure created by owning the derivative. As a result, an adverse change in the value of the underlying asset could result in the Fund sustaining a loss that is substantially greater than the amount invested in the derivative, which may make the Fund’s returns more volatile and increase the risk of loss. Derivative instruments may also be less liquid than more traditional investments and the Fund may be unable to sell or close out its derivative positions at a desirable time or price. This risk may be more acute under adverse market conditions, during which the Fund may be most in need of liquidating its derivative positions. Derivatives may also be harder to value, less tax efficient and subject to changing government regulation that could impact the Fund’s ability to use certain derivatives or their |
| | cost. Also, derivatives used for hedging or to gain or limit exposure to a particular market segment may not provide the expected benefits, particularly during adverse market conditions. |
| n | | Emerging markets securities risk. Emerging markets (also referred to as developing markets) are generally subject to greater market volatility, political, social and economic instability, uncertain trading markets and more governmental limitations on foreign investment than more developed markets. In addition, companies operating in emerging markets may be subject to lower trading volume and greater price fluctuations than companies in more developed markets. Securities law and the enforcement of systems of taxation in many emerging market countries may change quickly and unpredictably. In addition, investments in emerging markets securities may also be subject to additional transaction costs, delays in settlement procedures, and lack of timely information. |
| n | | Foreign securities risk. The Fund’s foreign investments may be adversely affected by political and social instability, changes in economic or taxation policies, difficulty in enforcing obligations, decreased liquidity or increased volatility. Foreign investments also involve the risk of the possible seizure, nationalization or expropriation of the issuer or foreign deposits (in which the Fund could lose its entire investments in a certain market) and the possible adoption of foreign governmental restrictions such as exchange controls. Unless the Fund has hedged its foreign securities risk, foreign securities risk also involves the risk of negative foreign currency rate fluctuations, which may cause the value of securities denominated in such foreign currency (or other instruments through which the Fund has exposure to foreign currencies) to decline in value. Currency exchange rates may fluctuate significantly over short periods of time. Currency hedging strategies, if used, are not always successful. |
| | | | | |
| | This report must be accompanied or preceded by a currently effective Fund prospectus, which contains more complete information, including sales charges and expenses. Investors should read it carefully before investing. |
|
NOT FDIC INSURED | MAY LOSE VALUE | NO BANK GUARANTEE |
| n | | Gold bullion risk. To the extent the Fund invests in gold bullion, it will earn no income from such investment. Appreciation in the market price of gold is the sole manner in which the Fund can realize gains on gold bullion, and such investments may incur higher storage and custody costs as compared to purchasing, holding and selling more traditional investments. |
| n | | Gold and precious metals sector risk. The Fund will concentrate its investments in the securities of issuers primarily engaged in gold and precious metals-related industries. Fluctuations in the price of gold and precious metals resulting from supply and demand imbalances, increased mining, transportation or storage costs or other market forces will have a significant impact on the profitability of companies in the gold and precious metals sector. The price of gold and precious metals may also be affected by changes in political or economic conditions of countries where gold and precious metals companies are located. |
| n | | Management risk. The Fund is actively managed and depends heavily on the Adviser’s judgment about markets, interest rates or the attractiveness, relative values, liquidity, or potential appreciation of particular investments made for the Fund’s portfolio. The Fund could experience losses if these judgments prove to be incorrect. Additionally, legislative, regulatory, or tax developments may adversely affect management of the Fund and, therefore, the ability of the Fund to achieve its investment objective. |
| n | | Market risk. The market values of the Fund’s investments, and therefore the value of the Fund’s shares, will go up and down, sometimes rapidly or unpredictably. Market risk may affect a single issuer, industry or section of the economy, or it may affect the market as a whole. Individual stock prices tend to go up and down more dramatically than those of certain other types of investments, such as bonds. During a general downturn in the financial markets, multiple asset classes may decline in value. When markets perform well, there can be no assurance that specific investments held by the Fund will rise in value. |
continued on page 6
8 Invesco Gold & Precious Metals Fund
Schedule of Investments
April 30, 2016
| | | | | | | | |
| | | Shares | | | Value | |
Common Stocks & Other Equity Interests–93.46% | |
| Brazil–2.32% | |
Yamana Gold Inc. | | | 1,601,639 | | | $ | 7,928,113 | |
|
| Canada–68.02% | |
Agnico Eagle Mines Ltd. | | | 289,898 | | | | 13,686,085 | |
Alamos Gold Inc.–Class A | | | 1,135,167 | | | | 8,186,844 | |
B2Gold Corp.(a) | | | 4,003,966 | | | | 8,902,311 | |
Barrick Gold Corp. | | | 820,871 | | | | 15,900,271 | |
Belo Sun Mining Corp.(a) | | | 8,776,355 | | | | 6,924,008 | |
Continental Gold Inc.(a) | | | 4,240,625 | | | | 9,360,905 | |
Detour Gold Corp.(a) | | | 451,073 | | | | 9,673,168 | |
Eldorado Gold Corp. | | | 1,997,065 | | | | 8,418,914 | |
Franco-Nevada Corp. | | | 219,635 | | | | 15,420,045 | |
Goldcorp, Inc. | | | 729,840 | | | | 14,706,276 | |
Ivanhoe Mines Ltd.–Class A(a) | | | 4,622,137 | | | | 3,830,755 | |
Kinross Gold Corp.(a) | | | 2,600,339 | | | | 14,816,451 | |
Lundin Gold Inc.(a) | | | 793,080 | | | | 3,690,949 | |
Lydian International, Ltd.(a) | | | 4,718,347 | | | | 1,071,625 | |
Mandalay Resources Corp. | | | 4,322,401 | | | | 3,892,348 | |
New Gold Inc.(a) | | | 2,999,506 | | | | 14,102,949 | |
Platinum Group Metals Ltd.(a) | | | 1,081,754 | | | | 3,577,541 | |
Pretium Resources Inc.(a) | | | 996,122 | | | | 8,200,136 | |
Primero Mining Corp.(a) | | | 1,717,486 | | | | 3,230,081 | |
Rubicon Minerals Corp.(a) | | | 5,673,471 | | | | 226,062 | |
Sandstorm Gold Ltd.(a) | | | 804,444 | | | | 3,468,177 | |
SEMAFO Inc.(a) | | | 1,975,470 | | | | 8,800,157 | |
Silver Wheaton Corp. | | | 776,534 | | | | 16,268,387 | |
Torex Gold Resources Inc.(a) | | | 12,488,945 | | | | 22,194,164 | |
Turquoise Hill Resources Ltd.(a) | | | 4,497,671 | | | | 13,440,862 | |
| | | | | 231,989,471 | |
|
| Mali–3.58% | |
Randgold Resources Ltd.–ADR | | | 121,558 | | | | 12,216,579 | |
| | | | | | | | |
| | | Shares | | | Value | |
| Mexico–2.17% | |
Fresnillo PLC | | | 453,559 | | | $ | 7,394,614 | |
|
| Monaco–0.92% | |
Endeavour Mining Corp.(a) | | | 233,234 | | | | 3,139,282 | |
|
| South Africa–1.68% | |
Gold Fields Ltd.–ADR | | | 631,082 | | | | 2,966,085 | |
Petra Diamonds Ltd. | | | 1,604,517 | | | | 2,766,439 | |
| | | | | 5,732,524 | |
|
| United States–14.77% | |
Argonaut Gold, Inc.(a) | | | 1,295,504 | | | | 3,035,249 | |
Boart Longyear Ltd.(a) | | | 8,242,804 | | | | 589,215 | |
iShares® Gold Trust–ETF(a) | | | 677,200 | | | | 8,451,456 | |
Newmont Mining Corp. | | | 350,383 | | | | 12,252,894 | |
SPDR® Gold Trust–ETF(a) | | | 84,500 | | | | 10,448,425 | |
Tahoe Resources Inc. | | | 1,104,734 | | | | 15,600,180 | |
| | | | | 50,377,419 | |
Total Common Stocks & Other Equity Interests
(Cost $294,287,847) | | | | 318,778,002 | |
|
Money Market Funds–6.45% | |
Liquid Assets Portfolio–Institutional Class, 0.44%(b) | | | 10,992,376 | | | | 10,992,376 | |
Premier Portfolio–Institutional Class, 0.39%(b) | | | 10,992,376 | | | | 10,992,376 | |
Total Money Market Funds
(Cost $21,984,752) | | | | 21,984,752 | |
TOTAL INVESTMENTS–99.91%
(Cost $316,272,599) | | | | 340,762,754 | |
OTHER ASSETS LESS LIABILITIES–0.09% | | | | 302,338 | |
NET ASSETS–100.00% | | | $ | 341,065,092 | |
Investment Abbreviations:
| | |
| ADR | | – American Depositary Receipt |
| ETF | | – Exchange-Traded Fund |
| SPDR | | – Standard & Poor’s Depositary Receipt |
Notes to Schedule of Investments:
| (a) | Non-income producing security. |
| (b) | The money market fund and the Fund are affiliated by having the same investment adviser. The rate shown is the 7-day SEC standardized yield as of April 30, 2016. |
See accompanying Notes to Financial Statements which are an integral part of the financial statements.
9 Invesco Gold & Precious Metals Fund
Statement of Assets and Liabilities
April 30, 2016
| | | | |
Assets: | |
Investments, at value (Cost $294,287,847) | | $ | 318,778,002 | |
Investments in affiliated money market funds, at value and cost | | | 21,984,752 | |
Total investments, at value (Cost $316,272,599) | | | 340,762,754 | |
Foreign currencies, at value (Cost $536) | | | 444 | |
Receivable for: | | | | |
Fund shares sold | | | 2,255,205 | |
Dividends | | | 108,188 | |
Investment for trustee deferred compensation and retirement plans | | | 89,512 | |
Other assets | | | 38,980 | |
Total assets | | | 343,255,083 | |
|
Liabilities: | |
Payable for: | | | | |
Investments purchased | | | 1,193,003 | |
Fund shares reacquired | | | 547,540 | |
Accrued fees to affiliates | | | 273,004 | |
Accrued trustees’ and officers’ fees and benefits | | | 1,809 | |
Accrued other operating expenses | | | 72,363 | |
Trustee deferred compensation and retirement plans | | | 102,272 | |
Total liabilities | | | 2,189,991 | |
Net assets applicable to shares outstanding | | $ | 341,065,092 | |
|
Net assets consist of: | |
Shares of beneficial interest | | $ | 497,850,772 | |
Undistributed net investment income (loss) | | | (10,824,790 | ) |
Undistributed net realized gain (loss) | | | (170,444,241 | ) |
Net unrealized appreciation | | | 24,483,351 | |
| | | $ | 341,065,092 | |
| | | | |
Net Assets: | |
Class A | | $ | 160,494,006 | |
Class B | | $ | 4,289,233 | |
Class C | | $ | 36,157,169 | |
Class Y | | $ | 42,446,403 | |
Investor Class | | $ | 97,678,281 | |
|
Shares outstanding, $0.01 par value per share,
with an unlimited number of shares authorized: | |
Class A | | | 31,758,165 | |
Class B | | | 903,875 | |
Class C | | | 7,128,690 | |
Class Y | | | 8,238,650 | |
Investor Class | | | 19,223,978 | |
Class A: | | | | |
Net asset value per share | | $ | 5.05 | |
Maximum offering price per share | | | | |
(Net asset value of $5.05 ¸ 94.50%) | | $ | 5.34 | |
Class B: | | | | |
Net asset value and offering price per share | | $ | 4.75 | |
Class C: | | | | |
Net asset value and offering price per share | | $ | 5.07 | |
Class Y: | | | | |
Net asset value and offering price per share | | $ | 5.15 | |
Investor Class: | | | | |
Net asset value and offering price per share | | $ | 5.08 | |
See accompanying Notes to Financial Statements which are an integral part of the financial statements.
10 Invesco Gold & Precious Metals Fund
Statement of Operations
For the year ended April 30, 2016
| | | | |
Investment income: | |
Dividends (net of foreign withholding taxes of $166,989) | | $ | 1,357,961 | |
Dividends from affiliated money market funds | | | 16,097 | |
Total investment income | | | 1,374,058 | |
| |
Expenses: | | | | |
Advisory fees | | | 1,624,487 | |
Administrative services fees | | | 50,000 | |
Custodian fees | | | 36,651 | |
Distribution fees: | | | | |
Class A | | | 250,852 | |
Class B | | | 38,075 | |
Class C | | | 232,275 | |
Investor Class | | | 169,878 | |
Transfer agent fees | | | 845,619 | |
Trustees’ and officers’ fees and benefits | | | 25,855 | |
Registration and filing fees | | | 72,470 | |
Reports to shareholders | | | 56,149 | |
Professional services fees | | | 56,685 | |
Other | | | 20,693 | |
Total expenses | | | 3,479,689 | |
Less: Fees waived and expense offset arrangement(s) | | | (12,957 | ) |
Net expenses | | | 3,466,732 | |
Net investment income (loss) | | | (2,092,674 | ) |
| |
Realized and unrealized gain (loss) from: | | | | |
Net realized gain (loss) from: | | | | |
Investment securities | | | (17,635,000 | ) |
Foreign currencies | | | (58,783 | ) |
| | | | (17,693,783 | ) |
Change in net unrealized appreciation (depreciation) of: | | | | |
Investment securities | | | 92,348,655 | |
Foreign currencies | | | (16,266 | ) |
| | | | 92,332,389 | |
Net realized and unrealized gain | | | 74,638,606 | |
Net increase in net assets resulting from operations | | $ | 72,545,932 | |
See accompanying Notes to Financial Statements which are an integral part of the financial statements.
11 Invesco Gold & Precious Metals Fund
Statement of Changes in Net Assets
For the years ended April 30, 2016 and 2015
| | | | | | | | |
| | | 2016 | | | 2015 | |
Operations: | | | | | | | | |
Net investment income (loss) | | $ | (2,092,674 | ) | | $ | (2,854,600 | ) |
Net realized gain (loss) | | | (17,693,783 | ) | | | (49,195,805 | ) |
Change in net unrealized appreciation (depreciation) | | | 92,332,389 | | | | (4,807,432 | ) |
Net increase (decrease) in net assets resulting from operations | | | 72,545,932 | | | | (56,857,837 | ) |
| | |
Share transactions–net: | | | | | | | | |
Class A | | | 11,477,672 | | | | (4,185,709 | ) |
Class B | | | (1,644,915 | ) | | | (3,085,126 | ) |
Class C | | | 1,727,455 | | | | 483,953 | |
Class Y | | | 12,595,354 | | | | (6,234,566 | ) |
Investor Class | | | (4,178,893 | ) | | | (2,668,843 | ) |
Net increase (decrease) in net assets resulting from share transactions | | | 19,976,673 | | | | (15,690,291 | ) |
Net increase (decrease) in net assets | | | 92,522,605 | | | | (72,548,128 | ) |
| | |
Net assets: | | | | | | | | |
Beginning of year | | | 248,542,487 | | | | 321,090,615 | |
End of year (includes undistributed net investment income (loss) of $(10,824,790) and $(13,533,361), respectively) | | $ | 341,065,092 | | | $ | 248,542,487 | |
Notes to Financial Statements
April 30, 2016
NOTE 1—Significant Accounting Policies
Invesco Gold & Precious Metals Fund (the “Fund”) is a series portfolio of AIM Sector Funds (Invesco Sector Funds) (the “Trust”). The Trust is a Delaware statutory trust registered under the Investment Company Act of 1940, as amended (the “1940 Act”), as an open-end series management investment company consisting of ten separate portfolios, each authorized to issue an unlimited number of shares of beneficial interest. The assets, liabilities and operations of each portfolio are accounted for separately. Information presented in these financial statements pertains only to the Fund. Matters affecting each portfolio or class will be voted on exclusively by the shareholders of such portfolio or class.
The Fund’s investment objective is long-term growth of capital.
The Fund currently consists of five different classes of shares: Class A, Class B, Class C, Class Y and Investor Class. Class Y and Investor Class shares are available only to certain investors. Class A shares are sold with a front-end sales charge unless certain waiver criteria are met and under certain circumstances load waived shares may be subject to contingent deferred sales charges (“CDSC”). Class C shares are sold with a CDSC. Class Y and Investor Class shares are sold at net asset value. Effective November 30, 2010, new or additional investments in Class B shares are no longer permitted. Existing shareholders of Class B shares may continue to reinvest dividends and capital gains distributions in Class B shares until they convert to Class A shares. Also, shareholders in Class B shares will be able to exchange those shares for Class B shares of other Invesco Funds offering such shares until they convert to Class A shares. Generally, Class B shares will automatically convert to Class A shares on or about the month-end, which is at least eight years after the date of purchase. Redemption of Class B shares prior to the conversion date will be subject to a CDSC.
The following is a summary of the significant accounting policies followed by the Fund in the preparation of its financial statements.
| A. | Security Valuations — Securities, including restricted securities, are valued according to the following policy. |
A security listed or traded on an exchange (except convertible securities) is valued at its last sales price or official closing price as of the close of the customary trading session on the exchange where the security is principally traded, or lacking any sales or official closing price on a particular day, the security may be valued at the closing bid price on that day. Securities traded in the over-the-counter market are valued based on prices furnished by independent pricing services or market makers. When such securities are valued by an independent pricing service they may be considered fair valued. Futures contracts are valued at the final settlement price set by an exchange on which they are principally traded. Listed options are valued at the mean between the last bid and asked prices from the exchange on which they are principally traded. Options not listed on an exchange are valued by an independent source at the mean between the last bid and asked prices. For purposes of determining net asset value (“NAV”) per share, futures and option contracts generally are valued 15 minutes after the close of the customary trading session of the New York Stock Exchange (“NYSE”).
Investments in open-end and closed-end registered investment companies that do not trade on an exchange are valued at the end-of-day net asset value per share. Investments in open-end and closed-end registered investment companies that trade on an exchange are valued at the last sales price or official closing price as of the close of the customary trading session on the exchange where the security is principally traded.
Debt obligations (including convertible securities) and unlisted equities are fair valued using an evaluated quote provided by an independent pricing service. Evaluated quotes provided by the pricing service may be determined without exclusive reliance on quoted prices, and may reflect appropriate factors such as institution-size trading in similar groups of securities, developments related to specific securities, dividend rate (for unlisted equities), yield (for debt obligations), quality, type of issue, coupon rate (for debt obligations), maturity (for debt obligations), individual
12 Invesco Gold & Precious Metals Fund
trading characteristics and other market data. Debt obligations are subject to interest rate and credit risks. In addition, all debt obligations involve some risk of default with respect to interest and/or principal payments.
Foreign securities’ (including foreign exchange contracts) prices are converted into U.S. dollar amounts using the applicable exchange rates as of the close of the NYSE. If market quotations are available and reliable for foreign exchange-traded equity securities, the securities will be valued at the market quotations. Because trading hours for certain foreign securities end before the close of the NYSE, closing market quotations may become unreliable. If between the time trading ends on a particular security and the close of the customary trading session on the NYSE, events occur that the Adviser determines are significant and make the closing price unreliable, the Fund may fair value the security. If the event is likely to have affected the closing price of the security, the security will be valued at fair value in good faith using procedures approved by the Board of Trustees. Adjustments to closing prices to reflect fair value may also be based on a screening process of an independent pricing service to indicate the degree of certainty, based on historical data, that the closing price in the principal market where a foreign security trades is not the current value as of the close of the NYSE. Foreign securities’ prices meeting the approved degree of certainty that the price is not reflective of current value will be priced at the indication of fair value from the independent pricing service. Multiple factors may be considered by the independent pricing service in determining adjustments to reflect fair value and may include information relating to sector indices, American Depositary Receipts and domestic and foreign index futures. Foreign securities may have additional risks including exchange rate changes, potential for sharply devalued currencies and high inflation, political and economic upheaval, the relative lack of issuer information, relatively low market liquidity and the potential lack of strict financial and accounting controls and standards.
Securities for which market prices are not provided by any of the above methods may be valued based upon quotes furnished by independent sources. The last bid price may be used to value equity securities. The mean between the last bid and asked prices is used to value debt obligations, including corporate loans.
Securities for which market quotations are not readily available or became unreliable are valued at fair value as determined in good faith by or under the supervision of the Trust’s officers following procedures approved by the Board of Trustees. Issuer specific events, market trends, bid/asked quotes of brokers and information providers and other market data may be reviewed in the course of making a good faith determination of a security’s fair value.
The Fund may invest in securities that are subject to interest rate risk, meaning the risk that the prices will generally fall as interest rates rise and, conversely, the prices will generally rise as interest rates fall. Specific securities differ in their sensitivity to changes in interest rates depending on their individual characteristics. Changes in interest rates may result in increased market volatility, which may affect the value and/or liquidity of certain Fund investments.
Valuations change in response to many factors including the historical and prospective earnings of the issuer, the value of the issuer’s assets, general economic conditions, interest rates, investor perceptions and market liquidity. Because of the inherent uncertainties of valuation, the values reflected in the financial statements may materially differ from the value received upon actual sale of those investments.
| B. | Securities Transactions and Investment Income — Securities transactions are accounted for on a trade date basis. Realized gains or losses on sales are computed on the basis of specific identification of the securities sold. Interest income (net of withholding tax, if any) is recorded on the accrual basis from settlement date. Dividend income (net of withholding tax, if any) is recorded on the ex-dividend date. |
The Fund may periodically participate in litigation related to Fund investments. As such, the Fund may receive proceeds from litigation settlements. Any proceeds received are included in the Statement of Operations as realized gain (loss) for investments no longer held and as unrealized gain (loss) for investments still held.
Brokerage commissions and mark ups are considered transaction costs and are recorded as an increase to the cost basis of securities purchased and/or a reduction of proceeds on a sale of securities. Such transaction costs are included in the determination of net realized and unrealized gain (loss) from investment securities reported in the Statement of Operations and the Statement of Changes in Net Assets and the net realized and unrealized gains (losses) on securities per share in the Financial Highlights. Transaction costs are included in the calculation of the Fund’s net asset value and, accordingly, they reduce the Fund’s total returns. These transaction costs are not considered operating expenses and are not reflected in net investment income reported in the Statement of Operations and the Statement of Changes in Net Assets, or the net investment income per share and the ratios of expenses and net investment income reported in the Financial Highlights, nor are they limited by any expense limitation arrangements between the Fund and the investment adviser.
The Fund allocates income and realized and unrealized capital gains and losses to a class based on the relative net assets of each class.
| C. | Country Determination — For the purposes of making investment selection decisions and presentation in the Schedule of Investments, the investment adviser may determine the country in which an issuer is located and/or credit risk exposure based on various factors. These factors include the laws of the country under which the issuer is organized, where the issuer maintains a principal office, the country in which the issuer derives 50% or more of its total revenues and the country that has the primary market for the issuer’s securities, as well as other criteria. Among the other criteria that may be evaluated for making this determination are the country in which the issuer maintains 50% or more of its assets, the type of security, financial guarantees and enhancements, the nature of the collateral and the sponsor organization. Country of issuer and/or credit risk exposure has been determined to be the United States of America, unless otherwise noted. |
| D. | Distributions — Distributions from net investment income and net realized capital gain, if any, are generally declared and paid annually and recorded on the ex-dividend date. The Fund may elect to treat a portion of the proceeds from redemptions as distributions for federal income tax purposes. |
| E. | Federal Income Taxes — The Fund intends to comply with the requirements of Subchapter M of the Internal Revenue Code of 1986, as amended (the “Internal Revenue Code”), necessary to qualify as a regulated investment company and to distribute substantially all of the Fund’s taxable earnings to shareholders. As such, the Fund will not be subject to federal income taxes on otherwise taxable income (including net realized capital gain) that is distributed to shareholders. Therefore, no provision for federal income taxes is recorded in the financial statements. |
The Fund recognizes the tax benefits of uncertain tax positions only when the position is more likely than not to be sustained. Management has analyzed the Fund’s uncertain tax positions and concluded that no liability for unrecognized tax benefits should be recorded related to uncertain tax positions. Management is not aware of any tax positions for which it is reasonably possible that the total amounts of unrecognized tax benefits will change materially in the next 12 months.
13 Invesco Gold & Precious Metals Fund
The Fund files tax returns in the U.S. Federal jurisdiction and certain other jurisdictions. Generally, the Fund is subject to examinations by such taxing authorities for up to three years after the filing of the return for the tax period.
| F. | Expenses — Fees provided for under the Rule 12b-1 plan of a particular class of the Fund and which are directly attributable to that class are charged to the operations of such class. All other expenses are allocated among the classes based on relative net assets. |
| G. | Accounting Estimates — The preparation of financial statements in conformity with accounting principles generally accepted in the United States of America (“GAAP”) requires management to make estimates and assumptions that affect the reported amounts of assets and liabilities at the date of the financial statements and the reported amounts of revenues and expenses during the reporting period including estimates and assumptions related to taxation. Actual results could differ from those estimates by a significant amount. In addition, the Fund monitors for material events or transactions that may occur or become known after the period-end date and before the date the financial statements are released to print. |
| H. | Indemnifications — Under the Trust’s organizational documents, each Trustee, officer, employee or other agent of the Trust is indemnified against certain liabilities that may arise out of the performance of their duties to the Fund. Additionally, in the normal course of business, the Fund enters into contracts, including the Fund’s servicing agreements, that contain a variety of indemnification clauses. The Fund’s maximum exposure under these arrangements is unknown as this would involve future claims that may be made against the Fund that have not yet occurred. The risk of material loss as a result of such indemnification claims is considered remote. |
| I. | Foreign Currency Translations — Foreign currency is valued at the close of the NYSE based on quotations posted by banks and major currency dealers. Portfolio securities and other assets and liabilities denominated in foreign currencies are translated into U.S. dollar amounts at date of valuation. Purchases and sales of portfolio securities (net of foreign taxes withheld on disposition) and income items denominated in foreign currencies are translated into U.S. dollar amounts on the respective dates of such transactions. The Fund does not separately account for the portion of the results of operations resulting from changes in foreign exchange rates on investments and the fluctuations arising from changes in market prices of securities held. The combined results of changes in foreign exchange rates and the fluctuation of market prices on investments (net of estimated foreign tax withholding) are included with the net realized and unrealized gain or loss from investments in the Statement of Operations. Reported net realized foreign currency gains or losses arise from (1) sales of foreign currencies, (2) currency gains or losses realized between the trade and settlement dates on securities transactions, and (3) the difference between the amounts of dividends, interest, and foreign withholding taxes recorded on the Fund’s books and the U.S. dollar equivalent of the amounts actually received or paid. Net unrealized foreign currency gains and losses arise from changes in the fair values of assets and liabilities, other than investments in securities at fiscal period end, resulting from changes in exchange rates. |
The Fund may invest in foreign securities, which may be subject to foreign taxes on income, gains on investments or currency repatriation, a portion of which may be recoverable. Foreign taxes, if any, are recorded based on the tax regulations and rates that exist in the foreign markets in which the Fund invests and are shown in the Statement of Operations.
| J. | Forward Foreign Currency Contracts — The Fund may engage in foreign currency transactions either on a spot (i.e. for prompt delivery and settlement) basis, or through forward foreign currency contracts, to manage or minimize currency or exchange rate risk. |
The Fund may also enter into forward foreign currency contracts for the purchase or sale of a security denominated in a foreign currency in order to “lock in” the U.S. dollar price of that security, or the Fund may also enter into forward foreign currency contracts that do not provide for physical settlement of the two currencies, but instead are settled by a single cash payment calculated as the difference between the agreed upon exchange rate and the spot rate at settlement based upon an agreed upon notional amount (non-deliverable forwards). The Fund will set aside liquid assets in an amount equal to daily mark-to-market obligation for forward foreign currency contracts.
A forward foreign currency contract is an obligation between two parties (“Counterparties”) to purchase or sell a specific currency for an agreed-upon price at a future date. The use of forward foreign currency contracts does not eliminate fluctuations in the price of the underlying securities the Fund owns or intends to acquire but establishes a rate of exchange in advance. Fluctuations in the value of these contracts are measured by the difference in the contract date and reporting date exchange rates and are recorded as unrealized appreciation (depreciation) until the contracts are closed. When the contracts are closed, realized gains (losses) are recorded. Realized and unrealized gains (losses) on the contracts are included in the Statement of Operations. The primary risks associated with forward foreign currency contracts include failure of the Counterparty to meet the terms of the contract and the value of the foreign currency changing unfavorably. These risks may be in excess of the amounts reflected in the Statement of Assets and Liabilities.
| K. | Other Risks — The Fund’s investments are concentrated in a comparatively narrow segment of the economy, which may make the Fund more volatile. |
The Fund may invest a large percentage of its assets in a limited number of securities or other instruments, which could negatively affect the value of the Fund.
Fluctuations in the price of gold and precious metals may affect the profitability of companies in the gold and precious metals sector. Changes in the political or economic conditions of countries where companies in the gold and precious metals sector are located may have a direct effect on the price of gold and precious metals.
14 Invesco Gold & Precious Metals Fund
NOTE 2—Advisory Fees and Other Fees Paid to Affiliates
The Trust has entered into a master investment advisory agreement with Invesco Advisers, Inc. (the “Adviser” or “Invesco”). Under the terms of the investment advisory agreement, the Fund pays an advisory fee to the Adviser based on the annual rate of the Fund’s average daily net assets as follows:
| | | | | | |
| Average Daily Net Assets | | Rate |
First $350 million | | | 0 | .75% | | |
Next $350 million | | | 0 | .65% | | |
Next $1.3 billion | | | 0 | .55% | | |
Next $2 billion | | | 0 | .45% | | |
Next $2 billion | | | 0 | .40% | | |
Next $2 billion | | | 0 | .375% | | |
Over $8 billion | | | 0 | .35% | | |
For the year ended April 30, 2016, the effective advisory fees incurred by the Fund was 0.75%.
Under the terms of a master sub-advisory agreement between the Adviser and each of Invesco Asset Management Deutschland GmbH, Invesco Asset Management Limited, Invesco Asset Management (Japan) Limited, Invesco Hong Kong Limited, Invesco Senior Secured Management, Inc. and Invesco Canada Ltd. (collectively, the “Affiliated Sub-Advisers”) the Adviser, not the Fund, may pay 40% of the fees paid to the Adviser to any such Affiliated Sub-Adviser(s) that provide(s) discretionary investment management services to the Fund based on the percentage of assets allocated to such Affiliated Sub-Adviser(s).
The Adviser has contractually agreed, through at least June 30, 2017, to waive advisory fees and/or reimburse expenses of all shares to the extent necessary to limit total annual fund operating expenses after fee waiver and/or expense reimbursement (excluding certain items discussed below) of Class A, Class B, Class C, Class Y and Investor Class shares to 2.00%, 2.75%, 2.75%, 1.75% and 2.00%, respectively, of average daily net assets (the “expense limits”). In determining the Adviser’s obligation to waive advisory fees and/or reimburse expenses, the following expenses are not taken into account, and could cause the total annual fund operating expenses after fee waivers and/or expense reimbursement to exceed the numbers reflected above: (1) interest; (2) taxes; (3) dividend expense on short sales; (4) extraordinary or non-routine items, including litigation expenses; and (5) expenses that the Fund has incurred but did not actually pay because of an expense offset arrangement. Unless Invesco continues the fee waiver agreement, it will terminate on June 30, 2017. During its term, the fee waiver agreement cannot be terminated or amended to increase the expense limits without approval of the Board of Trustees. The Adviser did not waive fees and/or reimburse expenses during the period under these expense limits.
Further, the Adviser has contractually agreed, through at least June 30, 2018, to waive the advisory fee payable by the Fund in an amount equal to 100% of the net advisory fees the Adviser receives from the affiliated money market funds on investments by the Fund of uninvested cash (excluding investments of cash collateral from securities lending) in such affiliated money market funds.
For the year ended April 30, 2016, the Adviser waived advisory fees of $9,339.
The Trust has entered into a master administrative services agreement with Invesco pursuant to which the Fund has agreed to pay Invesco for certain administrative costs incurred in providing accounting services to the Fund. For the year ended April 30, 2016, expenses incurred under the agreement are shown in the Statement of Operations as Administrative services fees.
The Trust has entered into a transfer agency and service agreement with Invesco Investment Services, Inc. (“IIS”) pursuant to which the Fund has agreed to pay IIS a fee for providing transfer agency and shareholder services to the Fund and reimburse IIS for certain expenses incurred by IIS in the course of providing such services. IIS may make payments to intermediaries that provide omnibus account services, sub-accounting services and/or networking services. All fees payable by IIS to intermediaries that provide omnibus account services or sub-accounting are charged back to the Fund, subject to certain limitations approved by the Trust’s Board of Trustees. For the year ended April 30, 2016, expenses incurred under the agreement are shown in the Statement of Operations as Transfer agent fees.
The Trust has entered into master distribution agreements with Invesco Distributors, Inc. (“IDI”) to serve as the distributor for the Class A, Class B, Class C, Class Y and Investor Class shares of the Fund. The Trust has adopted plans pursuant to Rule 12b-1 under the 1940 Act with respect to the Fund’s Class A, Class B, Class C and Investor Class shares (collectively, the “Plans”). The Fund, pursuant to the Plans, pays IDI compensation at the annual rate of 0.25% of the Fund’s average daily net assets of Class A shares, 1.00% of the average daily net assets of Class B and Class C shares and 0.25% of the average daily net assets of Investor Class shares. Of the Plan payments, up to 0.25% of the average daily net assets of each class of shares may be paid to furnish continuing personal shareholder services to customers who purchase and own shares of such classes. Any amounts not paid as a service fee under the Plans would constitute an asset-based sales charge. Rules of the Financial Industry Regulatory Authority (“FINRA”) impose a cap on the total sales charges, including asset-based sales charges, that may be paid by any class of shares of the Fund. For the year ended April 30, 2016, expenses incurred under the Plans are shown in the Statement of Operations as Distribution fees.
Front-end sales commissions and CDSC (collectively, the “sales charges”) are not recorded as expenses of the Fund. Front-end sales commissions are deducted from proceeds from the sales of Fund shares prior to investment in Class A shares of the Fund. CDSC are deducted from redemption proceeds prior to remittance to the shareholder. During the year ended April 30, 2016, IDI advised the Fund that IDI retained $61,298 in front-end sales commissions from the sale of Class A shares and $82, $2,321 and $6,634 from Class A, Class B and Class C shares, respectively, for CDSC imposed on redemptions by shareholders.
Certain officers and trustees of the Trust are officers and directors of the Adviser, IIS and/or IDI.
15 Invesco Gold & Precious Metals Fund
NOTE 3—Additional Valuation Information
GAAP defines fair value as the price that would be received to sell an asset or paid to transfer a liability in an orderly transaction between market participants at the measurement date, under current market conditions. GAAP establishes a hierarchy that prioritizes the inputs to valuation methods, giving the highest priority to readily available unadjusted quoted prices in an active market for identical assets (Level 1) and the lowest priority to significant unobservable inputs (Level 3), generally when market prices are not readily available or are unreliable. Based on the valuation inputs, the securities or other investments are tiered into one of three levels. Changes in valuation methods may result in transfers in or out of an investment’s assigned level:
| | Level 1 — | Prices are determined using quoted prices in an active market for identical assets. |
| | Level 2 — | Prices are determined using other significant observable inputs. Observable inputs are inputs that other market participants may use in pricing a security. These may include quoted prices for similar securities, interest rates, prepayment speeds, credit risk, yield curves, loss severities, default rates, discount rates, volatilities and others. |
| | Level 3 — | Prices are determined using significant unobservable inputs. In situations where quoted prices or observable inputs are unavailable (for example, when there is little or no market activity for an investment at the end of the period), unobservable inputs may be used. Unobservable inputs reflect the Fund’s own assumptions about the factors market participants would use in determining fair value of the securities or instruments and would be based on the best available information. |
The following is a summary of the tiered valuation input levels, as of April 30, 2016. The level assigned to the securities valuations may not be an indication of the risk or liquidity associated with investing in those securities. Because of the inherent uncertainties of valuation, the values reflected in the financial statements may materially differ from the value received upon actual sale of those investments.
| | | | | | | | | | | | | | | | |
| | | Level 1 | | | Level 2 | | | Level 3 | | | Total | |
Brazil | | $ | 7,928,113 | | | $ | — | | | $ | — | | | $ | 7,928,113 | |
Canada | | | 231,989,471 | | | | — | | | | — | | | | 231,989,471 | |
Mali | | | 12,216,579 | | | | — | | | | — | | | | 12,216,579 | |
Mexico | | | — | | | | 7,394,614 | | | | — | | | | 7,394,614 | |
Monaco | | | 3,139,282 | | | | — | | | | — | | | | 3,139,282 | |
South Africa | | | 5,732,524 | | | | — | | | | — | | | | 5,732,524 | |
United States | | | 72,362,171 | | | | — | | | | — | | | | 72,362,171 | |
Total Investments | | $ | 333,368,140 | | | $ | 7,394,614 | | | $ | — | | | $ | 340,762,754 | |
NOTE 4—Expense Offset Arrangement(s)
The expense offset arrangement is comprised of transfer agency credits which result from balances in demand deposit accounts used by the transfer agent for clearing shareholder transactions. For the year ended April 30, 2016, the Fund received credits from this arrangement, which resulted in the reduction of the Fund’s total expenses of $3,618.
NOTE 5—Trustees’ and Officers’ Fees and Benefits
Trustees’ and Officers’ Fees and Benefits include amounts accrued by the Fund to pay remuneration to certain Trustees and Officers of the Fund. Trustees have the option to defer compensation payable by the Fund, and Trustees’ and Officers’ Fees and Benefits also include amounts accrued by the Fund to fund such deferred compensation amounts. Those Trustees who defer compensation have the option to select various Invesco Funds in which their deferral accounts shall be deemed to be invested. Finally, certain current Trustees were eligible to participate in a retirement plan that provided for benefits to be paid upon retirement to Trustees over a period of time based on the number of years of service. The Fund may have certain former Trustees who also participate in a retirement plan and receive benefits under such plan. Trustees’ and Officers’ Fees and Benefits include amounts accrued by the Fund to fund such retirement benefits. Obligations under the deferred compensation and retirement plans represent unsecured claims against the general assets of the Fund.
NOTE 6—Cash Balances
The Fund is permitted to temporarily carry a negative or overdrawn balance in its account with State Street Bank and Trust Company, the custodian bank. Such balances, if any at period-end, are shown in the Statement of Assets and Liabilities under the payable caption Amount due custodian. To compensate the custodian bank for such overdrafts, the overdrawn Fund may either (1) leave funds as a compensating balance in the account so the custodian bank can be compensated by earning the additional interest; or (2) compensate by paying the custodian bank at a rate agreed upon by the custodian bank and Invesco, not to exceed the contractually agreed upon rate.
16 Invesco Gold & Precious Metals Fund
NOTE 7—Distributions to Shareholders and Tax Components of Net Assets
Tax Character of Distributions to Shareholders Paid During the Fiscal Years Ended April 30, 2016 and 2015:
There were no ordinary income and long-term gain distributions during the fiscal years ended April 30, 2016 and 2015.
Tax Components of Net Assets at Period–End:
| | | | |
| | | 2016 | |
Undistributed ordinary income | | $ | 19,800,552 | |
Net unrealized appreciation (depreciation) — investments | | | (24,206,488 | ) |
Net unrealized appreciation (depreciation) — other investments | | | (6,804 | ) |
Temporary book/tax differences | | | (107,457 | ) |
Capital loss carryforward | | | (152,265,483 | ) |
Shares of beneficial interest | | | 497,850,772 | |
Total net assets | | $ | 341,065,092 | |
The difference between book-basis and tax-basis unrealized appreciation (depreciation) is due to differences in the timing of recognition of gains and losses on investments for tax and book purposes. The Fund’s net unrealized appreciation (depreciation) difference is attributable primarily to wash sales and passive foreign investment companies.
The temporary book/tax differences are a result of timing differences between book and tax recognition of income and/or expenses. The Fund’s temporary book/tax differences are the result of the trustee deferral of compensation and retirement plan benefits.
Capital loss carryforward is calculated and reported as of a specific date. Results of transactions and other activity after that date may affect the amount of capital loss carryforward actually available for the Fund to utilize. Capital losses generated in years beginning after December 22, 2010 can be carried forward for an unlimited period, whereas previous losses expire in eight tax years. Capital losses with an expiration period may not be used to offset capital gains until all net capital losses without an expiration date have been utilized. Capital loss carryforwards with no expiration date will retain their character as either short-term or long-term capital losses instead of as short-term capital losses as under prior law. The ability to utilize capital loss carryforwards in the future may be limited under the Internal Revenue Code and related regulations based on the results of future transactions.
The Fund has a capital loss carryforward as of April 30, 2016, which expires as follows:
| | | | | | | | | | | | |
| Capital Loss Carryforward* | |
| Expiration | | Short-Term | | | Long-Term | | | Total | |
Not subject to expiration | | $ | 9,502,750 | | | $ | 142,762,733 | | | $ | 152,265,483 | |
| * | Capital loss carryforward as of the date listed above is reduced for limitations, if any, to the extent required by the Internal Revenue Code and may be further limited depending upon a variety of factors, including the realization of net unrealized gains or losses as of the date of any reorganization. |
NOTE 8—Investment Securities
The aggregate amount of investment securities (other than short-term securities, U.S. Treasury obligations and money market funds, if any) purchased and sold by the Fund during the year ended April 30, 2016 was $52,315,467 and $49,622,661, respectively. Cost of investments on a tax basis includes the adjustments for financial reporting purposes as of the most recently completed federal income tax reporting period-end.
| | | | |
| Unrealized Appreciation (Depreciation) of Investment Securities on a Tax Basis | |
Aggregate unrealized appreciation of investment securities | | $ | 27,935,983 | |
Aggregate unrealized (depreciation) of investment securities | | | (52,142,471 | ) |
Net unrealized appreciation (depreciation) of investment securities | | $ | (24,206,488 | ) |
Cost of investments for tax purposes is $364,969,242.
NOTE 9—Reclassification of Permanent Differences
Primarily as a result of differing book/tax treatment of passive foreign investment companies, on April 30, 2016, undistributed net investment income (loss) was increased by $4,801,245, undistributed net realized gain (loss) was decreased by $4,873,527 and shares of beneficial interest was increased by $72,282. This reclassification had no effect on the net assets of the Fund.
17 Invesco Gold & Precious Metals Fund
NOTE 10—Share Information
| | | | | | | | | | | | | | | | |
| | | Summary of Share Activity | |
| | | Years ended April 30, | |
| | | 2016(a) | | | 2015 | |
| | | Shares | | | Amount | | | Shares | | | Amount | |
Sold: | | | | | | | | | | | | | | | | |
Class A | | | 14,133,878 | | | $ | 48,723,945 | | | | 10,792,049 | | | $ | 47,372,962 | |
Class B | | | 77,565 | | | | 247,146 | | | | 117,850 | | | | 488,018 | |
Class C | | | 2,689,631 | | | | 9,463,131 | | | | 2,072,697 | | | | 9,328,283 | |
Class Y | | | 7,119,077 | | | | 25,614,495 | | | | 7,336,254 | | | | 36,671,015 | |
Investor Class | | | 3,342,494 | | | | 11,422,719 | | | | 5,210,081 | | | | 22,030,831 | |
| | | | |
Automatic conversion of Class B shares to Class A shares: | | | | | | | | | | | | | | | | |
Class A | | | 268,752 | | | | 958,771 | | | | 374,350 | | | | 1,664,909 | |
Class B | | | (285,280 | ) | | | (958,771 | ) | | | (394,128 | ) | | | (1,664,909 | ) |
| | | | |
Reacquired: | | | | | | | | | | | | | | | | |
Class A | | | (11,106,343 | ) | | | (38,205,044 | ) | | | (12,462,930 | ) | | | (53,223,580 | ) |
Class B | | | (292,125 | ) | | | (933,290 | ) | | | (471,222 | ) | | | (1,908,235 | ) |
Class C | | | (2,321,893 | ) | | | (7,735,676 | ) | | | (2,061,928 | ) | | | (8,844,330 | ) |
Class Y | | | (3,680,711 | ) | | | (13,019,141 | ) | | | (10,077,241 | ) | | | (42,905,581 | ) |
Investor Class | | | (4,625,611 | ) | | | (15,601,612 | ) | | | (5,900,833 | ) | | | (24,699,674 | ) |
Net increase (decrease) in share activity | | | 5,319,434 | | | $ | 19,976,673 | | | | (5,465,001 | ) | | $ | (15,690,291 | ) |
| (a) | There are entities that are record owners of more than 5% of the outstanding shares of the Fund and in the aggregate own 21% of the outstanding shares of the Fund. IDI has an agreement with these entities to sell Fund shares. The Fund, Invesco and/or Invesco affiliates may make payments to these entities, which are considered to be related to the Fund, for providing services to the Fund, Invesco and/or Invesco affiliates including but not limited to services such as securities brokerage, distribution, third party record keeping and account servicing. The Fund has no knowledge as to whether all or any portion of the shares owned of record by these entities are also owned beneficially. |
18 Invesco Gold & Precious Metals Fund
NOTE 11—Financial Highlights
The following schedule presents financial highlights for a share of the Fund outstanding throughout the periods indicated.
| | | | | | | | | | | | | | | | | | | | | | | | | | | | | | | | | | | | | | | | | | | | | | | | | | | | | | | | |
| | | Net asset
value,
beginning
of period | | | Net
investment
income (loss)(a) | | | Net gains
(losses) on securities (both realized and unrealized) | | | Total from
investment operations | | | Dividends
from net
investment income | | | Distributions from net
realized
gains | | | Total
distributions | | | Net asset value, end of period(b) | | | Total
return(c) | | | Net assets,
end of period (000’s omitted) | | | Ratio of expenses to average net assets with fee waivers and/or expenses absorbed | | | Ratio of expenses to average net assets without fee waivers and/or expenses absorbed | | | Ratio of net
investment
income (loss) to average
net assets | | | Portfolio
turnover(d) | |
Class A | | | | | | | | | | | | | | | | | | | | | | | | | | | | | | | | | | | | | | | | | | | | | | | | | | | | | | | | |
Year ended 04/30/16 | | $ | 4.00 | | | $ | (0.03 | ) | | $ | 1.08 | | | $ | 1.05 | | | $ | — | | | $ | — | | | $ | — | | | $ | 5.05 | | | | 26.25 | % | | $ | 160,494 | | | | 1.54 | %(e) | | | 1.54 | %(e) | | | (0.90 | )%(e) | | | 23 | % |
Year ended 04/30/15 | | | 4.75 | | | | (0.04 | ) | | | (0.71 | ) | | | (0.75 | ) | | | — | | | | — | | | | — | | | | 4.00 | | | | (15.79 | ) | | | 113,862 | | | | 1.45 | | | | 1.46 | | | | (0.89 | ) | | | 35 | |
Year ended 04/30/14 | | | 5.44 | | | | (0.02 | ) | | | (0.67 | ) | | | (0.69 | ) | | | — | | | | — | | | | — | | | | 4.75 | | | | (12.68 | ) | | | 141,237 | | | | 1.45 | | | | 1.46 | | | | (0.47 | ) | | | 18 | |
Year ended 04/30/13 | | | 7.78 | | | | (0.02 | ) | | | (2.17 | ) | | | (2.19 | ) | | | — | | | | (0.15 | ) | | | (0.15 | ) | | | 5.44 | | | | (28.65 | ) | | | 131,605 | | | | 1.32 | | | | 1.32 | | | | (0.21 | ) | | | 25 | |
Year ended 04/30/12 | | | 11.22 | | | | (0.04 | ) | | | (2.69 | ) | | | (2.73 | ) | | | (0.23 | ) | | | (0.48 | ) | | | (0.71 | ) | | | 7.78 | | | | (25.24 | ) | | | 198,717 | | | | 1.27 | | | | 1.27 | | | | (0.39 | ) | | | 14 | |
Class B | | | | | | | | | | | | | | | | | | | | | | | | | | | | | | | | | | | | | | | | | | | | | | | | | | | | | | | | |
Year ended 04/30/16 | | | 3.79 | | | | (0.05 | ) | | | 1.01 | | | | 0.96 | | | | — | | | | — | | | | — | | | | 4.75 | | | | 25.33 | | | | 4,289 | | | | 2.29 | (e) | | | 2.29 | (e) | | | (1.65 | )(e) | | | 23 | |
Year ended 04/30/15 | | | 4.52 | | | | (0.07 | ) | | | (0.66 | ) | | | (0.73 | ) | | | — | | | | — | | | | — | | | | 3.79 | | | | (16.15 | ) | | | 5,314 | | | | 2.20 | | | | 2.21 | | | | (1.64 | ) | | | 35 | |
Year ended 04/30/14 | | | 5.24 | | | | (0.06 | ) | | | (0.66 | ) | | | (0.72 | ) | | | — | | | | — | | | | — | | | | 4.52 | | | | (13.74 | ) | | | 9,733 | | | | 2.20 | | | | 2.21 | | | | (1.22 | ) | | | 18 | |
Year ended 04/30/13 | | | 7.54 | | | | (0.07 | ) | | | (2.08 | ) | | | (2.15 | ) | | | — | | | | (0.15 | ) | | | (0.15 | ) | | | 5.24 | | | | (29.03 | ) | | | 16,834 | | | | 2.07 | | | | 2.07 | | | | (0.96 | ) | | | 25 | |
Year ended 04/30/12 | | | 10.95 | | | | (0.11 | ) | | | (2.61 | ) | | | (2.72 | ) | | | (0.21 | ) | | | (0.48 | ) | | | (0.69 | ) | | | 7.54 | | | | (25.82 | ) | | | 32,217 | | | | 2.02 | | | | 2.02 | | | | (1.14 | ) | | | 14 | |
Class C | | | | | | | | | | | | | | | | | | | | | | | | | | | | | | | | | | | | | | | | | | | | | | | | | | | | | | | | |
Year ended 04/30/16 | | | 4.05 | | | | (0.06 | ) | | | 1.08 | | | | 1.02 | | | | — | | | | — | | | | — | | | | 5.07 | | | | 25.19 | | | | 36,157 | | | | 2.29 | (e) | | | 2.29 | (e) | | | (1.65 | )(e) | | | 23 | |
Year ended 04/30/15 | | | 4.84 | | | | (0.07 | ) | | | (0.72 | ) | | | (0.79 | ) | | | — | | | | — | | | | — | | | | 4.05 | | | | (16.32 | ) | | | 27,351 | | | | 2.20 | | | | 2.21 | | | | (1.64 | ) | | | 35 | |
Year ended 04/30/14 | | | 5.60 | | | | (0.06 | ) | | | (0.70 | ) | | | (0.76 | ) | | | — | | | | — | | | | — | | | | 4.84 | | | | (13.57 | ) | | | 32,640 | | | | 2.20 | | | | 2.21 | | | | (1.22 | ) | | | 18 | |
Year ended 04/30/13 | | | 8.05 | | | | (0.07 | ) | | | (2.23 | ) | | | (2.30 | ) | | | — | | | | (0.15 | ) | | | (0.15 | ) | | | 5.60 | | | | (29.05 | ) | | | 34,820 | | | | 2.07 | | | | 2.07 | | | | (0.96 | ) | | | 25 | |
Year ended 04/30/12 | | | 11.63 | | | | (0.11 | ) | | | (2.78 | ) | | | (2.89 | ) | | | (0.21 | ) | | | (0.48 | ) | | | (0.69 | ) | | | 8.05 | | | | (25.77 | ) | | | 51,017 | | | | 2.02 | | | | 2.02 | | | | (1.14 | ) | | | 14 | |
Class Y | | | | | | | | | | | | | | | | | | | | | | | | | | | | | | | | | | | | | | | | | | | | | | | | | | | | | | | | |
Year ended 04/30/16 | | | 4.07 | | | | (0.02 | ) | | | 1.10 | | | | 1.08 | | | | — | | | | — | | | | — | | | | 5.15 | | | | 26.54 | | | | 42,446 | | | | 1.29 | (e) | | | 1.29 | (e) | | | (0.65 | )(e) | | | 23 | |
Year ended 04/30/15 | | | 4.82 | | | | (0.03 | ) | | | (0.72 | ) | | | (0.75 | ) | | | — | | | | — | | | | — | | | | 4.07 | | | | (15.56 | ) | | | 19,530 | | | | 1.20 | | | | 1.21 | | | | (0.64 | ) | | | 35 | |
Year ended 04/30/14 | | | 5.52 | | | | (0.01 | ) | | | (0.69 | ) | | | (0.70 | ) | | | — | | | | — | | | | — | | | | 4.82 | | | | (12.68 | ) | | | 36,328 | | | | 1.20 | | | | 1.21 | | | | (0.22 | ) | | | 18 | |
Year ended 04/30/13 | | | 7.86 | | | | (0.00 | ) | | | (2.19 | ) | | | (2.19 | ) | | | — | | | | (0.15 | ) | | | (0.15 | ) | | | 5.52 | | | | (28.35 | ) | | | 17,777 | | | | 1.07 | | | | 1.07 | | | | 0.04 | | | | 25 | |
Year ended 04/30/12 | | | 11.32 | | | | (0.01 | ) | | | (2.73 | ) | | | (2.74 | ) | | | (0.24 | ) | | | (0.48 | ) | | | (0.72 | ) | | | 7.86 | | | | (25.14 | ) | | | 20,131 | | | | 1.02 | | | | 1.02 | | | | (0.14 | ) | | | 14 | |
Investor Class | | | | | | | | | | | | | | | | | | | | | | | | | | | | | | | | | | | | | | | | | | | | | | | | | | | | | | | | |
Year ended 04/30/16 | | | 4.02 | | | | (0.03 | ) | | | 1.09 | | | | 1.06 | | | | — | | | | — | | | | — | | | | 5.08 | | | | 26.37 | | | | 97,678 | | | | 1.54 | (e) | | | 1.54 | (e) | | | (0.90 | )(e) | | | 23 | |
Year ended 04/30/15 | | | 4.77 | | | | (0.04 | ) | | | (0.71 | ) | | | (0.75 | ) | | | — | | | | — | | | | — | | | | 4.02 | | | | (15.72 | ) | | | 82,486 | | | | 1.45 | | | | 1.46 | | | | (0.89 | ) | | | 35 | |
Year ended 04/30/14 | | | 5.48 | | | | (0.02 | ) | | | (0.69 | ) | | | (0.71 | ) | | | — | | | | — | | | | — | | | | 4.77 | | | | (12.96 | ) | | | 101,153 | | | | 1.45 | | | | 1.46 | | | | (0.47 | ) | | | 18 | |
Year ended 04/30/13 | | | 7.83 | | | | (0.02 | ) | | | (2.18 | ) | | | (2.20 | ) | | | — | | | | (0.15 | ) | | | (0.15 | ) | | | 5.48 | | | | (28.59 | ) | | | 124,703 | | | | 1.32 | | | | 1.32 | | | | (0.21 | ) | | | 25 | |
Year ended 04/30/12 | | | 11.28 | | | | (0.04 | ) | | | (2.70 | ) | | | (2.74 | ) | | | (0.23 | ) | | | (0.48 | ) | | | (0.71 | ) | | | 7.83 | | | | (25.20 | ) | | | 188,933 | | | | 1.27 | | | | 1.27 | | | | (0.39 | ) | | | 14 | |
| (a) | Calculated using average shares outstanding. |
| (b) | Includes redemption fees added to shares of beneficial interest which were less than $0.005 per share for the fiscal year ended April 30, 2012. |
| (c) | Includes adjustments in accordance with accounting principles generally accepted in the United States of America and as such, the net asset value for financial reporting purposes and the returns based upon those net asset values may differ from the net asset value and returns for shareholder transactions. Does not include sales charges and is not annualized for periods less than one year, if applicable. |
| (d) | Portfolio turnover is calculated at the fund level and is not annualized for periods less than one year, if applicable. |
| (e) | Ratios are based on average daily net assets (000’s omitted) of $100,341, $3,808, $23,227, $21,271 and $67,951 for Class A, Class B, Class C, Class Y and Investor Class shares, respectively. |
19 Invesco Gold & Precious Metals Fund
Report of Independent Registered Public Accounting Firm
To the Board of Trustees of AIM Sector Funds (Invesco Sector Funds)
and Shareholders of Invesco Gold & Precious Metals Fund:
In our opinion, the accompanying statement of assets and liabilities, including the schedule of investments, and the related statements of operations and of changes in net assets and the financial highlights present fairly, in all material respects, the financial position of Invesco Gold & Precious Metals Fund (one of the funds constituting AIM Sector Funds (Invesco Sector Funds), hereafter referred to as the “Fund”) at April 30, 2016, the results of its operations for the year then ended, the changes in its net assets for each of the two years in the period then ended and the financial highlights for each of the five years in the period then ended, in conformity with accounting principles generally accepted in the United States of America. These financial statements and financial highlights (hereafter referred to as “financial statements”) are the responsibility of the Fund’s management; our responsibility is to express an opinion on these financial statements based on our audits. We conducted our audits of these financial statements in accordance with the standards of the Public Company Accounting Oversight Board (United States). Those standards require that we plan and perform the audit to obtain reasonable assurance about whether the financial statements are free of material misstatement. An audit includes examining, on a test basis, evidence supporting the amounts and disclosures in the financial statements, assessing the accounting principles used and significant estimates made by management, and evaluating the overall financial statement presentation. We believe that our audits, which included confirmation of securities at April 30, 2016 by correspondence with the custodian and brokers, and the application of alternative auditing procedures where confirmations of security purchases have not been received, provide a reasonable basis for our opinion.
PRICEWATERHOUSECOOPERS LLP
June 22, 2016
Houston, Texas
20 Invesco Gold & Precious Metals Fund
Calculating your ongoing Fund expenses
Example
As a shareholder of the Fund, you incur two types of costs: (1) transaction costs, which may include sales charges (loads) on purchase payments or contingent deferred sales charges on redemptions, if any; and (2) ongoing costs, including management fees, distribution and/or service (12b-1) fees, and other Fund expenses. This example is intended to help you understand your ongoing costs (in dollars) of investing in the Fund and to compare these costs with ongoing costs of investing in other mutual funds. The example is based on an investment of $1,000 invested at the beginning of the period and held for the entire period November 1, 2015 through April 30, 2016.
Actual expenses
The table below provides information about actual account values and actual expenses. You may use the information in this table, together with the amount you invested, to estimate the expenses that you paid over the period. Simply divide your account value by $1,000 (for example, an $8,600 account value divided by $1,000 = 8.6), then multiply the result by the number in the table under the heading entitled “Actual Expenses Paid During Period” to estimate the expenses you paid on your account during this period.
Hypothetical example for comparison purposes
The table below also provides information about hypothetical account values and hypothetical expenses based on the Fund’s actual expense ratio and an assumed rate of return of 5% per year before expenses, which is not the Fund’s actual return.
The hypothetical account values and expenses may not be used to estimate the actual ending account balance or expenses you paid for the period. You may use this information to compare the ongoing costs of investing in the Fund and other funds. To do so, compare this 5% hypothetical example with the 5% hypothetical examples that appear in the shareholder reports of the other funds.
Please note that the expenses shown in the table are meant to highlight your ongoing costs only and do not reflect any transaction costs, such as sales charges (loads) on purchase payments or contingent deferred sales charges on redemptions, if any. Therefore, the hypothetical information is useful in comparing ongoing costs only, and will not help you determine the relative total costs of owning different funds. In addition, if these transaction costs were included, your costs would have been higher.
| | | | | | | | | | | | | | | | | | | | | | | | |
| Class | | Beginning Account Value
(11/01/15) | | | ACTUAL | | | HYPOTHETICAL (5% annual return before
expenses) | | | Annualized Expense Ratio | |
| | | Ending Account Value (04/30/16)1 | | | Expenses Paid During Period2 | | | Ending Account Value (04/30/16) | | | Expenses Paid During Period2 | | |
| A | | $ | 1,000.00 | | | $ | 1,623.80 | | | $ | 10.05 | | | $ | 1,017.21 | | | $ | 7.72 | | | | 1.54 | % |
| B | | | 1,000.00 | | | | 1,615.60 | | | | 14.89 | | | | 1,013.48 | | | | 11.46 | | | | 2.29 | |
| C | | | 1,000.00 | | | | 1,614.60 | | | | 14.89 | | | | 1,013.48 | | | | 11.46 | | | | 2.29 | |
| Y | | | 1,000.00 | | | | 1,624.60 | | | | 8.42 | | | | 1,018.45 | | | | 6.47 | | | | 1.29 | |
| Investor | | | 1,000.00 | | | | 1,623.00 | | | | 10.04 | | | | 1,017.21 | | | | 7.72 | | | | 1.54 | |
| 1 | The actual ending account value is based on the actual total return of the Fund for the period November 1, 2015 through April 30, 2016, after actual expenses and will differ from the hypothetical ending account value which is based on the Fund’s expense ratio and a hypothetical annual return of 5% before expenses. |
| 2 | Expenses are equal to the Fund’s annualized expense ratio as indicated above multiplied by the average account value over the period, multiplied by 182/366 to reflect the most recent fiscal half year. |
21 Invesco Gold & Precious Metals Fund
Trustees and Officers
The address of each trustee and officer is AIM Sector Funds (Invesco Sector Funds) (the “Trust”), 11 Greenway Plaza, Suite 1000, Houston, Texas 77046-1173. The trustees serve for the life of the Trust, subject to their earlier death, incapacitation, resignation, retirement or removal as more specifically provided in the Trust’s organizational documents. Each officer serves for a one year term or until their successors are elected and qualified. Column two below includes length of time served with predecessor entities, if any.
| | | | | | | | |
Name, Year of Birth and
Position(s) Held with the Trust | | Trustee and/
or Officer Since | | Principal Occupation(s) During Past 5 Years | | Number of Funds in Fund Complex Overseen by Trustee | | Other Directorship(s) Held by Trustee During Past 5 Years |
| Interested Persons | | | | | | | | |
Martin L. Flanagan1 — 1960 Trustee | | 2007 | | Executive Director, Chief Executive Officer and President, Invesco Ltd. (ultimate parent of Invesco and a global investment management firm); Advisor to the Board, Invesco Advisers, Inc. (formerly known as Invesco Institutional (N.A.), Inc.); Trustee, The Invesco Funds; Vice Chair, Investment Company Institute; and Member of Executive Board, SMU Cox School of Business Formerly: Chairman and Chief Executive Officer, Invesco Advisers, Inc. (registered investment adviser); Director, Chairman, Chief Executive Officer and President, IVZ Inc. (holding company), INVESCO Group Services, Inc. (service provider) and Invesco North American Holdings, Inc. (holding company); Director, Chief Executive Officer and President, Invesco Holding Company Limited (parent of Invesco and a global investment management firm); Director, Invesco Ltd.; Chairman, Investment Company Institute and President, Co-Chief Executive Officer, Co-President, Chief Operating Officer and Chief Financial Officer, Franklin Resources, Inc. (global investment management organization) | | 146 | | None |
Philip A. Taylor2 — 1954 Trustee and Senior Vice President | | 2006 | | Head of the Americas and Senior Managing Director, Invesco Ltd.; Director, Co-Chairman, Co-President and Co-Chief Executive Officer, Invesco Advisers, Inc. (formerly known as Invesco Institutional (N.A.), Inc.) (registered investment adviser); Director, Chairman, Chief Executive Officer and President, Invesco Management Group, Inc. (formerly known as Invesco AIM Management Group, Inc.) (financial services holding company); Director and Chairman, Invesco Investment Services, Inc. (formerly known as Invesco AIM Investment Services, Inc.) (registered transfer agent) Chief Executive Officer, Invesco Corporate Class Inc. (corporate mutual fund company) Director, Chairman and Chief Executive Officer, Invesco Canada Ltd. (formerly known as Invesco Trimark Ltd./Invesco Trimark Ltèe) (registered investment adviser and registered transfer agent); Trustee and Senior Vice President, The Invesco Funds; Director, Invesco Investment Advisers LLC (formerly known as Van Kampen Asset Management); Director, Chief Executive Officer and President, Van Kampen Exchange Corp. Formerly: President and Principal Executive Officer, The Invesco Funds (other than AIM Treasurer’s Series Trust (Invesco Treasurer’s Series Trust), Short-Term Investments Trust and Invesco Management Trust); Executive Vice President, The Invesco Funds (AIM Treasurer’s Series Trust (Invesco Treasurer’s Series Trust), Short-Term Investments Trust and Invesco Management Trust only); Director and President, INVESCO Funds Group, Inc. (registered investment adviser and registered transfer agent); Director and Chairman, IVZ Distributors, Inc. (formerly known as INVESCO Distributors, Inc.) (registered broker dealer); Director, President and Chairman, Invesco Inc. (holding company), Invesco Canada Holdings Inc. (holding company), Trimark Investments Ltd./Placements Trimark Ltèe and Invesco Financial Services Ltd/Services Financiers Invesco Ltèe; Chief Executive Officer, Invesco Canada Fund Inc. (corporate mutual fund company); Director and Chairman, Van Kampen Investor Services Inc.; Director, Chief Executive Officer and President, 1371 Preferred Inc. (holding company) and Van Kampen Investments Inc.; Director and President, AIM GP Canada Inc. (general partner for limited partnerships) and Van Kampen Advisors, Inc.; Director and Chief Executive Officer, Invesco Trimark Dealer Inc. (registered broker dealer); Director, Invesco Distributors, Inc. (formerly known as Invesco AIM Distributors, Inc.) (registered broker dealer); Manager, Invesco PowerShares Capital Management LLC; Director, Chief Executive Officer and President, Invesco Advisers, Inc.; Director, Chairman, Chief Executive Officer and President, Invesco AIM Capital Management, Inc.; President, Invesco Trimark Dealer Inc. and Invesco Trimark Ltd./Invesco Trimark Ltèe; Director and President, AIM Trimark Corporate Class Inc. and AIM Trimark Canada Fund Inc.; Senior Managing Director, Invesco Holding Company Limited; Director and Chairman, Fund Management Company (former registered broker dealer); President and Principal Executive Officer, The Invesco Funds (AIM Treasurer’s Series Trust (Invesco Treasurer’s Series Trust), and Short-Term Investments Trust only); President, AIM Trimark Global Fund Inc. and AIM Trimark Canada Fund Inc. | | 146 | | None |
| 1 | Mr. Flanagan is considered an interested person (within the meaning of Section 2(a)(19) of the 1940 Act) of the Trust because he is an officer of the Adviser to the Trust, and an officer and a director of Invesco Ltd., ultimate parent of the Adviser. |
| 2 | Mr. Taylor is considered an interested person (within the meaning of Section 2(a)(19) of the 1940 Act) of the Trust because he is an officer and a director of the Adviser. |
T-1 Invesco Gold & Precious Metals Fund
Trustees and Officers—(continued)
| | | | | | | | |
Name, Year of Birth and
Position(s) Held with the Trust | | Trustee and/
or Officer Since | | Principal Occupation(s) During Past 5 Years | | Number of Funds in Fund Complex Overseen by Trustee | | Other Directorship(s) Held by Trustee During Past 5 Years |
| Independent Trustees | | | | | | | | |
Bruce L. Crockett — 1944 Trustee and Chair | | 2003 | | Chairman, Crockett Technologies Associates (technology consulting company) Formerly: Director, Captaris (unified messaging provider); Director, President and Chief Executive Officer, COMSAT Corporation; Chairman, Board of Governors of INTELSAT (international communications company); ACE Limited (insurance company); Independent Directors Council and Investment Company Institute | | 146 | | ALPS (Attorneys Liability Protection Society) (insurance company) and Globe Specialty Metals, Inc. (metallurgical company); Member of the Audit Committee, Ferroglobe PLC and Investment Company Institute; Member of the Executive Committee and Chair of the Governance Committee, Independent Directors Council |
David C. Arch — 1945 Trustee | | 2010 | | Chairman of Blistex Inc., a consumer health care products manufacturer | | 146 | | Board member of the Illinois Manufacturers’ Association; Member of the Board of Visitors, Institute for the Humanities, University of Michigan |
James T. Bunch — 1942 Trustee | | 2000 | | Managing Member, Grumman Hill Group LLC (family office/private equity investments) Formerly: Chairman of the Board, Denver Film Society, Chairman of the Board of Trustees, Evans Scholarship Foundation; Chairman, Board of Governors, Western Golf Association | | 146 | | Trustee, Evans Scholarship Foundation |
Albert R. Dowden — 1941 Trustee | | 2003 | | Director of a number of public and private business corporations, including Nature’s Sunshine Products, Inc. Formerly: Director, The Boss Group, Ltd. and Reich & Tang Funds (5 portfolios) (registered investment company); Director, Homeowners of America Holding Corporation/Homeowners of America Insurance Company (property casualty company); Director, Continental Energy Services, LLC (oil and gas pipeline service); Director, CompuDyne Corporation (provider of product and services to the public security market) and Director, Annuity and Life Re (Holdings), Ltd. (reinsurance company); Director, President and Chief Executive Officer, Volvo Group North America, Inc.; Senior Vice President, AB Volvo; Director of various public and private corporations; Chairman, DHJ Media, Inc.; Director, Magellan Insurance Company; and Director, The Hertz Corporation, Genmar Corporation (boat manufacturer), National Media Corporation; Advisory Board of Rotary Power International (designer, manufacturer, and seller of rotary power engines); and Chairman, Cortland Trust, Inc. (registered investment company) | | 146 | | Director of Nature’s Sunshine Products, Inc. |
Jack M. Fields — 1952 Trustee | | 2003 | | Chief Executive Officer, Twenty First Century Group, Inc. (government affairs company); and Discovery Learning Alliance (non-profit) Formerly: Owner and Chief Executive Officer, Dos Angeles Ranch L.P. (cattle, hunting, corporate entertainment); Director, Insperity, Inc. (formerly known as Administaff); Chief Executive Officer, Texana Timber LP (sustainable forestry company); Director of Cross Timbers Quail Research Ranch (non-profit); and member of the U.S. House of Representatives | | 146 | | None |
Eli Jones — 1961 Trustee | | 2016 | | Professor and Dean, Mays Business School — Texas A&M University Formerly: Professor and Dean, Walton College of Business, University of Arkansas and E.J. Ourso College of Business, Louisiana State University and Director, Arvest Bank | | 146 | | Director of Insperity, Inc. (formerly known as Administaff) |
Prema Mathai-Davis — 1950 Trustee | | 2003 | | Retired. Formerly: Chief Executive Officer, YWCA of the U.S.A. | | 146 | | None |
Larry Soll — 1942 Trustee | | 1997 | | Retired. Formerly: Chairman, Chief Executive Officer and President, Synergen Corp. (a biotechnology company) | | 146 | | None |
Raymond Stickel, Jr. — 1944 Trustee | | 2005 | | Retired. Formerly: Director, Mainstay VP Series Funds, Inc. (25 portfolios) and Partner, Deloitte & Touche | | 146 | | None |
Robert C. Troccoli — 1949 Trustee | | 2016 | | Adjunct Professor and Executive-in-Residence, University of Denver — Daniels College of Business Formerly: Senior Partner, KPMG LLP | | 146 | | None |
T-2 Invesco Gold & Precious Metals Fund
Trustees and Officers—(continued)
| | | | | | | | |
Name, Year of Birth and
Position(s) Held with the Trust | | Trustee and/
or Officer Since | | Principal Occupation(s) During Past 5 Years | | Number of Funds in Fund Complex Overseen by Trustee | | Other Directorship(s) Held by Trustee During Past 5 Years |
| Independent Trustees—(continued) |
Suzanne H. Woolsey — 1941 Trustee | | 2014 | | Retired. Formerly: Chief Executive Officer of Woolsey Partners LLC | | 146 | | Director, SunShare LLC; Trustee, Ocean Conservancy; Emeritus Chair of the Board of Trustees of the Institute for Defense Analyses and of Colorado College; Trustee, Chair, Business and Finance Committee of California Institute of Technology; Prior to 2014, Director of Fluor Corp.; Prior to 2010, Trustee of the German Marshall Fund of the United States; Prior to 2010, Trustee of the Rocky Mountain Institute |
| Other Officers | | | | | | | | |
Sheri Morris — 1964 President, Principal Executive Officer and Treasurer | | 2003 | | President, Principal Executive Officer and Treasurer, The Invesco Funds; Vice President, Invesco Advisers, Inc. (formerly known as Invesco Institutional (N.A.), Inc.) (registered investment adviser); and Vice President, PowerShares Exchange-Traded Fund Trust, PowerShares Exchange-Traded Fund Trust II, PowerShares India Exchange-Traded Fund Trust, PowerShares Actively Managed Exchange-Traded Fund Trust, and PowerShares Actively Managed Exchange-Traded Commodity Fund Trust Formerly: Vice President and Principal Financial Officer, The Invesco Funds; Vice President, Invesco AIM Advisers, Inc., Invesco AIM Capital Management, Inc. and Invesco AIM Private Asset Management, Inc.; Assistant Vice President and Assistant Treasurer, The Invesco Funds and Assistant Vice President, Invesco Advisers, Inc., Invesco AIM Capital Management, Inc. and Invesco AIM Private Asset Management, Inc.; and Treasurer, PowerShares Exchange-Traded Fund Trust, PowerShares Exchange-Traded Fund Trust II, PowerShares India Exchange-Traded Fund Trust and PowerShares Actively Managed Exchange-Traded Fund Trust | | N/A | | N/A |
Russell C. Burk — 1958 Senior Vice President and Senior Officer | | 2005 | | Senior Vice President and Senior Officer, The Invesco Funds | | N/A | | N/A |
John M. Zerr — 1962 Senior Vice President, Chief Legal Officer and Secretary | | 2006 | | Director, Senior Vice President, Secretary and General Counsel, Invesco Management Group, Inc. (formerly known as Invesco AIM Management Group, Inc.) and Van Kampen Exchange Corp.; Senior Vice President, Invesco Advisers, Inc. (formerly known as Invesco Institutional (N.A.), Inc.) (registered investment adviser); Senior Vice President and Secretary, Invesco Distributors, Inc. (formerly known as Invesco AIM Distributors, Inc.); Director, Vice President and Secretary, Invesco Investment Services, Inc. (formerly known as Invesco AIM Investment Services, Inc.) Senior Vice President, Chief Legal Officer and Secretary, The Invesco Funds; Managing Director, Invesco PowerShares Capital Management LLC; Director, Secretary and General Counsel, Invesco Investment Advisers LLC (formerly known as Van Kampen Asset Management); Secretary and General Counsel, Invesco Capital Markets, Inc. (formerly known as Van Kampen Funds Inc.) and Chief Legal Officer, PowerShares Exchange-Traded Fund Trust, PowerShares Exchange-Traded Fund Trust II, PowerShares India Exchange-Traded Fund Trust, PowerShares Actively Managed Exchange-Traded Fund Trust, and PowerShares Actively Managed Exchange-Traded Commodity Fund Trust Formerly: Director, Vice President and Secretary, IVZ Distributors, Inc. (formerly known as INVESCO Distributors, Inc.); Director and Vice President, INVESCO Funds Group, Inc.; Director and Vice President, Van Kampen Advisors Inc.; Director, Vice President, Secretary and General Counsel, Van Kampen Investor Services Inc.; Director, Invesco Distributors, Inc. (formerly known as Invesco AIM Distributors, Inc.); Director, Senior Vice President, General Counsel and Secretary, Invesco AIM Advisers, Inc. and Van Kampen Investments Inc.; Director, Vice President and Secretary, Fund Management Company; Director, Senior Vice President, Secretary, General Counsel and Vice President, Invesco AIM Capital Management, Inc.; Chief Operating Officer and General Counsel, Liberty Ridge Capital, Inc. (an investment adviser); Vice President and Secretary, PBHG Funds (an investment company) and PBHG Insurance Series Fund (an investment company); Chief Operating Officer, General Counsel and Secretary, Old Mutual Investment Partners (a broker-dealer); General Counsel and Secretary, Old Mutual Fund Services (an administrator) and Old Mutual Shareholder Services (a shareholder servicing center); Executive Vice President, General Counsel and Secretary, Old Mutual Capital, Inc. (an investment adviser); and Vice President and Secretary, Old Mutual Advisors Funds (an investment company) | | N/A | | N/A |
T-3 Invesco Gold & Precious Metals Fund
Trustees and Officers—(continued)
| | | | | | | | |
Name, Year of Birth and
Position(s) Held with the Trust | | Trustee and/
or Officer Since | | Principal Occupation(s) During Past 5 Years | | Number of Funds in Fund Complex Overseen by Trustee | | Other Directorship(s) Held by Trustee During Past 5 Years |
| Other Officers—(continued) | | | | | | | | |
Karen Dunn Kelley — 1960 Senior Vice President | | 2003 | | Senior Managing Director, Investments, Invesco Ltd.; Director, Co-President, Co-Chief Executive Officer, and Co-Chairman, Invesco Advisers, Inc. (formerly known as Invesco Institutional (N.A.), Inc.) (registered investment adviser); Chairman and Director, Invesco Senior Secured Management, Inc.; Senior Vice President, Invesco Management Group, Inc. (formerly known as Invesco AIM Management Group, Inc.); Executive Vice President, Invesco Distributors, Inc. (formerly known as Invesco AIM Distributors, Inc.); Director, Invesco Mortgage Capital Inc. and Invesco Management Company Limited; Senior Vice President, The Invesco Funds Formerly: Vice President, The Invesco Funds (other than AIM Treasurer’s Series Trust (Invesco Treasurer’s Series Trust), Short-Term Investments Trust and Invesco Management Trust); and President and Principal Executive Officer, The Invesco Funds (AIM Treasurer’s Series Trust (Invesco Treasurer’s Series Trust), Short-Term Investments Trust and Invesco Management Trust only); Director and President, INVESCO Asset Management (Bermuda) Ltd., Director, INVESCO Global Asset Management DAC (formerly known as INVESCO Global Asset Management Limited) and INVESCO Management S.A.; Senior Vice President, Van Kampen Investments Inc. and Invesco Advisers, Inc. (formerly known as Invesco Institutional (N.A.), Inc.) (registered investment adviser); Director and President, Fund Management Company; Chief Cash Management Officer, Director of Cash Management, Senior Vice President, and Managing Director, Invesco AIM Capital Management, Inc.; Director of Cash Management, Senior Vice President, and Vice President, Invesco Advisers, Inc. and The Invesco Funds (AIM Treasurer’s Series Trust (Invesco Treasurer’s Series Trust), and Short-Term Investments Trust only) | | N/A | | N/A |
Kelli Gallegos — 1970 Vice President, Principal Financial Officer and Assistant Treasurer | | 2008 | | Vice President, Principal Financial Officer and Assistant Treasurer, The Invesco Funds; Assistant Treasurer, Invesco PowerShares Capital Management LLC, PowerShares Exchange-Traded Fund Trust, PowerShares Exchange-Traded Fund Trust II, PowerShares India Exchange-Traded Fund Trust, PowerShares Actively Managed Exchange-Traded Fund Trust, and PowerShares Actively Managed Exchange-Traded Commodity Fund Trust Formerly: Assistant Vice President, The Invesco Funds | | N/A | | N/A |
Tracy Sullivan — 1962 Vice President, Chief Tax Officer and Assistant Treasurer | | 2008 | | Vice President, Chief Tax Officer and Assistant Treasurer, The Invesco Funds; Assistant Treasurer, Invesco PowerShares Capital Management LLC, PowerShares Exchange-Traded Fund Trust, PowerShares Exchange-Traded Fund Trust II, PowerShares India Exchange-Traded Fund Trust, PowerShares Actively Managed Exchange-Traded Fund Trust, and PowerShares Actively Managed Exchange-Traded Commodity Fund Trust Formerly: Assistant Vice President, The Invesco Funds | | N/A | | N/A |
Crissie M. Wisdom — 1969 Anti-Money Laundering Compliance Officer | | 2013 | | Anti-Money Laundering Compliance Officer, Invesco Advisers, Inc. (formerly known as Invesco Institutional (N.A.), Inc.) (registered investment adviser), Invesco Capital Markets, Inc. (formerly known as Van Kampen Funds Inc.), Invesco Distributors, Inc., Invesco Investment Services, Inc., Invesco Management Group, Inc., Van Kampen Exchange Corp., The Invesco Funds, and PowerShares Exchange-Traded Fund Trust, PowerShares Exchange-Traded Fund Trust II, PowerShares India Exchange-Traded Fund Trust, PowerShares Actively Managed Exchange-Traded Fund Trust and PowerShares Actively Managed Exchange-Traded Commodity Fund Trust; Anti-Money Laundering Compliance Officer and Bank Secrecy Act Officer, INVESCO National Trust Company and Invesco Trust Company; and Fraud Prevention Manager and Controls and Risk Analysis Manager for Invesco Investment Services, Inc. | | N/A | | N/A |
Robert R. Leveille — 1969 Chief Compliance Officer | | 2016 | | Chief Compliance Officer, Invesco Advisers, Inc. (registered investment adviser); and Chief Compliance Officer, The Invesco Funds Formerly: Chief Compliance Officer, Putnam Investments and the Putnam Funds | | N/A | | N/A |
The Statement of Additional Information of the Trust includes additional information about the Fund’s Trustees and is available upon request, without charge, by calling 1.800.959.4246. Please refer to the Fund’s Statement of Additional Information for information on the Fund’s sub-advisers.
| | | | | | |
Office of the Fund 11 Greenway Plaza, Suite 1000 Houston, TX 77046-1173 | | Investment Adviser Invesco Advisers, Inc. 1555 Peachtree Street, N.E. Atlanta, GA 30309 | | Distributor Invesco Distributors, Inc. 11 Greenway Plaza, Suite 1000 Houston, TX 77046-1173 | | Auditors PricewaterhouseCoopers LLP 1000 Louisiana Street, Suite 5800 Houston, TX 77002-5678 |
| | | |
| | | | | | |
Counsel to the Fund Stradley Ronon Stevens & Young, LLP 2005 Market Street, Suite 2600 Philadelphia, PA 19103-7018 | | Counsel to the Independent Trustees Goodwin Procter LLP 901 New York Avenue, N.W. Washington, D.C. 20001 | | Transfer Agent Invesco Investment Services, Inc. 11 Greenway Plaza, Suite 1000 Houston, TX 77046-1173 | | Custodian State Street Bank and Trust Company 225 Franklin Street Boston, MA 02110-2801 |
T-4 Invesco Gold & Precious Metals Fund

Invesco mailing information
Send general correspondence to Invesco Investment Services, Inc., P.O. Box 219078, Kansas City, MO 64121-9078.
Important notice regarding delivery of security holder documents
To reduce Fund expenses, only one copy of most shareholder documents may be mailed to shareholders with multiple accounts at the same address (Householding). Mailing of your shareholder documents may be householded indefinitely unless you instruct us otherwise. If you do not want the mailing of these documents to be combined with those for other members of your household, please contact Invesco Investment Services, Inc. at 800 959 4246 or contact your financial institution. We will begin sending you individual copies for each account within 30 days after receiving your request.
Fund holdings and proxy voting information
The Fund provides a complete list of its holdings four times in each fiscal year, at the quarter ends. For the second and fourth quarters, the lists appear in the Fund’s semiannual and annual reports to shareholders. For the first and third quarters, the Fund files the lists with the Securities and Exchange Commission (SEC) on Form N-Q. The most recent list of portfolio holdings is available at invesco.com/completeqtrholdings. Shareholders can also look up the Fund’s Forms N-Q on the SEC website at sec.gov. Copies of the Fund’s Forms N-Q may be reviewed and copied at the SEC Public Reference Room in Washington, D.C. You can obtain information on the operation of the Public Reference Room, including information about duplicating fee charges, by calling 202 551 8090 or 800 732 0330, or by electronic request at the following email address: publicinfo@sec.gov. The SEC file numbers for the Fund are shown below.
A description of the policies and procedures that the Fund uses to determine how to vote proxies relating to portfolio securities is available without charge, upon request, from our Client Services department at 800 959 4246 or at invesco.com/proxyguidelines. The information is also available on the SEC website, sec.gov.
Information regarding how the Fund voted proxies related to its portfolio securities during the most recent 12-month period ended June 30 is available at invesco.com/proxysearch. The information is also available on the SEC website, sec.gov.
| | |
Invesco Advisers, Inc. is an investment adviser; it provides investment advisory services to individual and institutional clients and does not sell securities. Invesco Distributors, Inc. is the US distributor for Invesco Ltd.’s retail mutual funds, exchange-traded funds and institutional money market funds. Both are wholly owned, indirect subsidiaries of Invesco Ltd. | |  |
| | | | |
| SEC file numbers: 811-03826 and 002-85905 | | I-GPM-AR-1 | | Invesco Distributors, Inc. |
| | | | |
| | |
 | | Annual Report to Shareholders | | April 30, 2016 |
| | |
| | Invesco Mid Cap Growth Fund |
| | Nasdaq: |
| | A: VGRAX n B: VGRBX n C: VGRCX n R: VGRRX n Y: VGRDX n R5: VGRJX n R6: VGRFX |

Letters to Shareholders
| | |

Philip Taylor | | Dear Shareholders: This annual report includes information about your Fund, including performance data and a complete list of its investments as of the close of the reporting period. Inside is a discussion of how your Fund was managed and the factors that affected its performance during the reporting period. US economic data were generally positive over the reporting period, with the economy expanding modestly and employment numbers improving steadily. Throughout the reporting period, US consumers benefited from declining energy prices and greater credit availability, but a strengthening dollar crimped the profits of many large multi-national companies doing business overseas. Ending years of uncertainty, the US Federal Reserve in December 2015 finally raised short-term interest rates for the first time since 2006, signaling its confidence that the economy was likely to continue expanding and improving. Overseas, the economic story was less positive. |
The European Central Bank and central banks in China and Japan – as well as other countries – either instituted or maintained extraordinarily accommodative monetary policies in response to economic weakness. Stocks began 2016 on a weak note due to increased concerns about global economic weakness.
Short-term market volatility can prompt some investors to abandon their investment plans – and can cause others to settle for average results. The investment professionals at Invesco, in contrast, invest with high conviction and a long-term perspective. At Invesco, investing with high conviction means offering a wide range of strategies designed to go beyond market benchmarks. We trust our research-driven insights, have confidence in our investment processes and build portfolios that reflect our beliefs. Our goal is to look past market noise in an effort to find attractive opportunities at attractive prices – consistent with the investment strategies spelled out in each fund’s prospectus. Of course, investing with high conviction can’t guarantee a profit or ensure investment success; no investment strategy or risk analysis can. To learn more about how we invest with high conviction, visit invesco.com/HighConviction.
You, too, can invest with high conviction by maintaining a long-term investment perspective and by working with your financial adviser on a regular basis. During periods of short-term market volatility or uncertainty, your financial adviser can keep you focused on your long-term investment goals – a new home, a child’s college education, or a secure retirement. He or she also can share research about the economy, the markets and individual investment options.
Visit our website for more information on your investments
Our website, invesco.com/us, offers a wide range of market insights and investment perspectives. On the website, you’ll find detailed information about our funds, including performance, holdings and portfolio manager commentaries. You can access information about your account by completing a simple, secure online registration. Click on the “Need to register” link in the “Account Access” box on our homepage to get started. Invesco’s mobile apps for iPhone® and iPad® (both available free from the App StoreSM) allow you to obtain the same detailed information, monitor your account and create customizable watch lists.
In addition to the resources accessible on our website and through our mobile app, you can obtain timely updates to help you stay informed about the markets, the economy and investing by connecting with Invesco on Twitter, LinkedIn or Facebook. You can access our blog at blog.invesco.us.com. Our goal is to provide you the information you want, when and where you want it.
Have questions?
For questions about your account, contact an Invesco client services representative at 800 959 4246. For Invesco-related questions or comments, please email me directly at phil@invesco.com.
All of us at Invesco look forward to serving your investment management needs. Thank you for investing with us.
Sincerely,

Philip Taylor
Senior Managing Director, Invesco Ltd.
iPhone and iPad are trademarks of Apple Inc., registered in the US and other countries. App Store is a service mark of Apple Inc. Invesco Distributors, Inc. is not affiliated with Apple Inc.
2 Invesco Mid Cap Growth Fund
| | |

Bruce Crockett | | Dear Fellow Shareholders: Among the many important lessons I’ve learned in more than 40 years in a variety of business endeavors is the value of a trusted advocate. As independent chair of the Invesco Funds Board, I can assure you that the members of the Board are strong advocates for the interests of investors in Invesco’s mutual funds. We work hard to represent your interests through oversight of the quality of the investment management services your funds receive and other matters important to your investment, including but not limited to: |
| | n Ensuring that Invesco offers a diverse lineup of mutual funds that your financial adviser can use to strive to meet your financial needs as your investment goals change over time. n Monitoring how the portfolio management teams of the Invesco funds are performing in light of changing economic and market conditions. |
| n | | Assessing each portfolio management team’s investment performance within the context of the investment strategy described in the fund’s prospectus. |
| n | | Monitoring for potential conflicts of interests that may impact the nature of the services that your funds receive. |
We believe one of the most important services we provide our fund shareholders is the annual review of the funds’ advisory and sub-advisory contracts with Invesco Advisers and its affiliates. This review is required by the Investment Company Act of 1940 and focuses on the nature and quality of the services Invesco provides as the adviser to the Invesco funds and the reasonableness of the fees that it charges for those services. Each year, we spend months carefully reviewing information received from Invesco and a variety of independent sources, such as performance and fee data prepared by Lipper Inc., an independent, third-party firm widely recognized as a leader in its field. We also meet with our independent legal counsel and other independent advisers to review and help us assess the information that we have received. Our goal is to assure that you receive quality investment management services for a reasonable fee.
I trust the measures outlined above provide assurance that you have a worthy advocate when it comes to choosing the Invesco Funds.
As always, please contact me at bruce@brucecrockett.com with any questions or concerns you may have. On behalf of the Board, we look forward to continuing to represent your interests and serving your needs.
Sincerely,

Bruce L. Crockett
Independent Chair
Invesco Funds Board of Trustees
3 Invesco Mid Cap Growth Fund
Management’s Discussion of Fund Performance
| | | | |
Performance summary For the fiscal year ended April 30, 2016, Class A shares of Invesco Mid Cap Growth Fund, at net asset value (NAV), underperformed the Fund’s style-specific benchmark, the Russell Midcap Growth Index. Your Fund’s long-term performance appears later in this report. | |
Fund vs. Indexes Total returns, 4/30/15 to 4/30/16, at net asset value (NAV). Performance shown does not include applicable contingent deferred sales charges (CDSC) or front-end sales charges, which would have reduced performance. | |
Class A Shares | | | -7.43% | |
Class B Shares | | | -7.44 | |
Class C Shares | | | -8.12 | |
Class R Shares | | | -7.69 | |
| Class Y Shares | | | -7.21 | |
| Class R5 Shares | | | -7.08 | |
Class R6 Shares | | | -7.02 | |
S&P 500 Index▼ (Broad Market Index) | | | 1.21 | |
Russell Midcap Growth Index▼ (Style-Specific Index) | | | -4.13 | |
Lipper Mid-Cap Growth Funds Indexn (Peer Group Index) | | | -5.48 | |
Source(s): ▼FactSet Research Systems Inc.; nLipper Inc. | | | | |
Market conditions and your Fund
Although the health of individual economic sectors varied dramatically, the US economy overall continued its slow but steady growth during the fiscal year ended April 30, 2016. This modest growth led to recurring debate over whether the US economy could withstand global recessionary forces. Many energy, industrial and materials companies experienced cyclical downturns resembling a mild recession even as many consumer-related companies benefited from continued low interest rates, increased availability of credit and a better employment picture. Another significant downturn in oil prices reduced capital investment but also reduced consumers’ energy and gasoline costs.
In the first half of the reporting period, US equity market performance was greatly affected by expectations of when,
and whether, the US Federal Reserve (the Fed) might raise interest rates – and the impact the Fed’s action might have. Markets moved lower in the summer of 2015 as a significant downturn in China’s financial markets and weak global economic growth led to increased concern about the sustainability of US economic growth. In the fall, markets rallied and the Fed saw enough economic stabilization to finally raise interest rates.
US stocks began 2016 on a negative note. Together with a sharp decline in oil prices, this suggested a global recession might be imminent and caused investors to become decidedly risk averse; this helped short-term and income-oriented investments, but hurt longer-term and growth-oriented investments. As companies reported earnings and fundamentals that were better than had been feared, stocks rallied sharply in late February and March. Additionally, oil prices strengthened
modestly on the back of a weaker US dollar and as Saudi Arabia and Russia considered a freeze on their oil output. Overall, US equity markets were mixed, with the S&P 500 Index, considered representative of the performance of the US stock market, finishing the reporting period modestly higher.
In this environment, the Fund, at NAV, had negative returns for the reporting period and trailed its style-specific benchmark, the Russell Midcap Growth Index. The Fund’s outperformance relative to its style-specific index earlier in the fiscal year was erased in January by the sharply negative market that kicked off calendar year 2016. Due to its bottom-up focus on fundamentals and growing companies, the Fund dramatically underperformed its style-specific index during a period in which the market rewarded income-oriented stocks over longer-term growth stocks. While our long-term focus hindered performance during this period, we believe that over time a long-term focus adds value. Over the fiscal year, the Fund outperformed its style-specific index in the materials, industrials and health care sectors due to positive stock selection. This was offset, however, by relative underperformance in the financials, information technology and consumer staples sectors.
The Fund outperformed its style-specific benchmark by the widest margin in the materials sector due to stock selection. Valspar was a significant contributor to Fund performance after it announced that it would merge with a competitor in a complementary deal that significantly rewarded Valspar shareholders. We sold our holdings in Valspar before the end of the reporting period. Building materials company Vulcan Materials also made a strong contribution to Fund performance.
| | | | |
| Portfolio Composition | |
By sector | | | % of total net assets | |
| | | | |
| |
Consumer Discretionary | | | 22.1% | |
Information Technology | | | 18.1 | |
Health Care | | | 16.5 | |
Industrials | | | 15.3 | |
Financials | | | 11.0 | |
Consumer Staples | | | 5.8 | |
Materials | | | 3.6 | |
Energy | | | 3.4 | |
Telecommunication Services | | | 1.2 | |
Money Market Funds Plus Other Assets Less Liabilities | | | 3.0 | |
| | | | |
| Top 10 Equity Holdings* | |
| | | | % of total net assets | |
| | | | |
| | |
1.Constellation Brands,
Inc.-Class A | | | 2.5% | |
| 2. Burlington Stores, Inc. | | | 2.1 | |
| 3. S&P Global Inc. | | | 2.1 | |
| 4. VCA Inc. | | | 2.0 | |
| 5. Tractor Supply Co. | | | 2.0 | |
6.NXP Semiconductors N.V. | | | 2.0 | |
7.Intercontinental Exchange, Inc. | | | 2.0 | |
8.Cadence Design Systems, Inc. | | | 1.9 | |
| 9. Centene Corp. | | | 1.9 | |
| 10. Brunswick Corp. | | | 1.9 | |
| | | | |
| Total Net Assets | | $ | 2.6 billion | |
| |
| Total Number of Holdings* | | | 77 | |
The Fund’s holdings are subject to change, and there is no assurance that the Fund will continue to hold any particular security.
*Excluding money market fund holdings.
Data presented here are as of April 30, 2016.
4 Invesco Mid Cap Growth Fund
The Fund also outperformed its style-specific index in the industrials sector. Heating and cooling company Lennox International benefited from solid non-residential construction and an increase in residential unit replacements as consumers were forced to replace aging equipment they had delayed replacing since the global financial crisis. Lighting solutions company Acuity Brands continued to grow sales and benefited from the acquisition of two complementary businesses that investors believed would drive additional growth. In the health care sector, Synageva Biopharma was one of the largest contributors to Fund performance. Synageva Biopharma produces so-called “orphan drugs” that treat rare, life-threatening diseases. The stock appreciated when it was bought out by another company at a premium well over twice its trading price.
The Fund underperformed its style-specific benchmark by the widest margin in the financials sector. Due to poorly performing equity markets and macroeconomic uncertainty, the primary drag came from companies that had exposure to capital markets – companies including WisdomTree International and Lazard, both of which we sold during the reporting period. MGIC Investment, which provides mortgage insurance and related services, was another significant detractor in the sector; we sold our holdings in the stock before the close of the reporting period.
The Fund also underperformed its style-specific index in the information technology sector. LinkedIn was a significant detractor from relative Fund performance after it reported disappointing sales growth and expectations across several business lines. More distressing was the company’s decision to sell off its advertising platform. We sold our holding in the stock because we believed management was not monetizing user data efficiently. Western Digital was another stock that disappointed and that we sold before the close of the reporting period.
As we’ve discussed, the Fund’s performance was negative during the reporting period, and US equities remained volatile. However we caution investors against making investment decisions based on short-term Fund and market performance.
We thank you for your commitment to Invesco Mid Cap Growth Fund.
The views and opinions expressed in management’s discussion of Fund performance are those of Invesco Advisers, Inc. These views and opinions are subject to change at any time based on factors such as market and economic conditions. These views and opinions may not be relied upon as investment advice or recommendations, or as an offer for a particular security. The information is not a complete analysis of every aspect of any market, country, industry, security or the Fund. Statements of fact are from sources considered reliable, but Invesco Advisers, Inc. makes no representation or warranty as to their completeness or accuracy. Although historical performance is no guarantee of future results, these insights may help you understand our investment management philosophy.
See important Fund and, if applicable, index disclosures later in this report.
| | |

| | Jim Leach Chartered Financial Analyst, Portfolio Manager, is manager of Invesco Mid Cap Growth Fund. |
| He joined Invesco in 2011. Mr. Leach earned a BS in mechanical engineering from the University of California and an MBA from New York University Stern School of Business. |
5 Invesco Mid Cap Growth Fund
Your Fund’s Long-Term Performance
Results of a $10,000 Investment – Oldest Share Class(es)
Fund and index data from 4/30/06
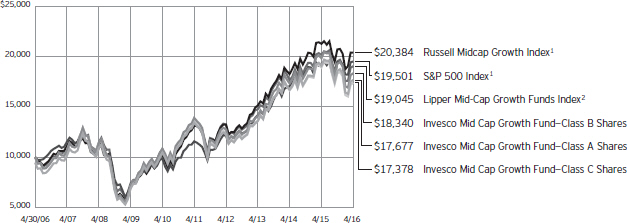
| 1 | Source: FactSet Research Systems Inc. |
Past performance cannot guarantee comparable future results.
The data shown in the chart include reinvested distributions, applicable sales charges and Fund expenses including management fees. Results for Class B shares are calculated as if a hypothetical shareholder had liquidated his entire investment in the Fund at the close of the reporting period and paid the contingent deferred sales charges, if applicable.
Index results include reinvested dividends, but they do not reflect sales charges. Performance of the peer group, if applicable, reflects fund expenses and management fees; performance of a market index does not. Performance shown in the chart and table(s) does not reflect deduction of taxes a shareholder would pay on Fund distributions or sale of Fund shares.
6 Invesco Mid Cap Growth Fund
| | | | |
Average Annual Total Returns As of 4/30/16, including maximum applicable sales charges | |
Class A Shares | | | | |
Inception (12/27/95) | | | 11.01 | % |
10 Years | | | 5.86 | |
5 Years | | | 4.48 | |
1 Year | | | -12.51 | |
| |
Class B Shares | | | | |
Inception (12/27/95) | | | 11.02 | % |
10 Years | | | 6.25 | |
5 Years | | | 5.38 | |
1 Year | | | -11.66 | |
| |
Class C Shares | | | | |
Inception (12/27/95) | | | 10.52 | % |
10 Years | | | 5.68 | |
5 Years | | | 4.90 | |
1 Year | | | -8.95 | |
| |
Class R Shares | | | | |
Inception (7/11/08) | | | 7.79 | % |
5 Years | | | 5.41 | |
1 Year | | | -7.69 | |
| |
Class Y Shares | | | | |
Inception (8/12/05) | | | 7.91 | % |
10 Years | | | 6.73 | |
5 Years | | | 5.94 | |
1 Year | | | -7.21 | |
| |
Class R5 Shares | | | | |
10 Years | | | 6.69 | % |
5 Years | | | 6.09 | |
1 Year | | | -7.08 | |
| |
Class R6 Shares | | | | |
10 Years | | | 6.59 | % |
5 Years | | | 5.92 | |
1 Year | | | -7.02 | |
Effective June 1, 2010, Class A, Class B, Class C, Class R and Class I shares of the predecessor fund, Van Kampen Mid Cap Growth Fund, advised by Van Kampen Asset Management were reorganized into Class A, Class B, Class C, Class R and Class Y shares, respectively, of Invesco Van Kampen Mid Cap Growth Fund (renamed Invesco Mid Cap Growth). Returns shown above for Class A, Class B, Class C, Class R and Class Y shares are blended returns of the predecessor fund and Invesco Mid Cap Growth Fund. Share class returns will differ from the predecessor fund because of different expenses.
Class R5 shares incepted on June 1, 2010. Performance shown prior to that date is that of the predecessor fund’s Class A shares and includes the 12b-1 fees applicable to Class A shares.
| | | | |
Average Annual Total Returns As of 3/31/16, the most recent calendar quarter end, including maximum applicable sales charges | |
Class A Shares | | | | |
Inception (12/27/95) | | | 11.00 | % |
10 Years | | | 5.83 | |
5 Years | | | 5.12 | |
1 Year | | | -14.76 | |
| |
Class B Shares | | | | |
Inception (12/27/95) | | | 11.00 | % |
10 Years | | | 6.21 | |
5 Years | | | 6.03 | |
1 Year | | | -13.92 | |
| |
Class C Shares | | | | |
Inception (12/27/95) | | | 10.51 | % |
10 Years | | | 5.64 | |
5 Years | | | 5.54 | |
1 Year | | | -11.26 | |
| |
Class R Shares | | | | |
Inception (7/11/08) | | | 7.72 | % |
5 Years | | | 6.06 | |
1 Year | | | -10.01 | |
| |
Class Y Shares | | | | |
Inception (8/12/05) | | | 7.86 | % |
10 Years | | | 6.70 | |
5 Years | | | 6.59 | |
1 Year | | | -9.57 | |
| |
Class R5 Shares | | | | |
10 Years | | | 6.65 | % |
5 Years | | | 6.75 | |
1 Year | | | -9.44 | |
| |
Class R6 Shares | | | | |
10 Years | | | 6.56 | % |
5 Years | | | 6.57 | |
1 Year | | | -9.35 | |
Class R6 shares incepted on July 15, 2013. Performance shown prior to that date is that of the Fund’s and the predecessor fund’s Class A shares and includes the 12b-1 fees applicable to Class A shares.
The performance data quoted represent past performance and cannot guarantee comparable future results; current performance may be lower or higher. Please visit invesco.com/performance for the most recent month-end performance. Performance figures reflect reinvested distributions, changes in net asset value and the effect of the maximum sales charge unless otherwise stated. Investment return and principal value will fluctuate so that you may have a gain or loss when you sell shares.
The total annual Fund operating expense ratio set forth in the most recent Fund prospectus as of the date of this report for Class A, Class B, Class C, Class R, Class Y, Class R5 and Class R6 shares was 1.19%, 1.19%, 1.91%, 1.44%, 0.94%, 0.81% and 0.72%, respectively. The expense ratios presented above may vary from the expense ratios presented in other sections of this report that are based on expenses incurred during the period covered by this report.
Class A share performance reflects the maximum 5.50% sales charge, and Class B and Class C share performance reflects the applicable contingent deferred sales charge (CDSC) for the period involved. For shares purchased prior to June 1, 2010, the CDSC on Class B shares declines from 5% at the time of purchase to 0% at the beginning of the sixth year. For shares purchased on or after June 1, 2010, the CDSC on Class B shares declines from 5% at the time of purchase to 0% at the beginning of the seventh year. The CDSC on Class C shares is 1% for the first year after purchase. Class R, Class Y, Class R5 and Class R6 shares do not have a front-end sales charge or a CDSC; therefore, performance is at net asset value.
The performance of the Fund’s share classes will differ primarily due to different sales charge structures and class expenses.
Fund performance reflects any applicable fee waivers and/or expense reimbursements. Had the adviser not waived fees and/or reimbursed expenses currently or in the past, returns would have been lower. See current prospectus for more information.
7 Invesco Mid Cap Growth Fund
Invesco Mid Cap Growth Fund’s investment objective is to seek capital growth.
| n | | Unless otherwise stated, information presented in this report is as of April 30, 2016, and is based on total net assets. |
| n | | Unless otherwise noted, all data provided by Invesco. |
| n | | To access your Fund’s reports/prospectus, visit invesco.com/fundreports. |
About share classes
| n | | Class B shares may not be purchased for new or additional investments. Please see the prospectus for more information. |
| n | | Class R shares are generally available only to employer sponsored retirement and benefit plans. Please see the prospectus for more information. |
| n | | Class Y shares are available only to certain investors. Please see the prospectus for more information. |
| n | | Class R5 shares and Class R6 shares are primarily intended for employer sponsored retirement and benefit plans that meet certain standards and for institutional investors. Please see the prospectus for more information. |
Principal risks of investing in the Fund
| n | | Foreign securities risk. The Fund’s foreign investments may be adversely affected by political and social instability, changes in economic or taxation policies, difficulty in enforcing obligations, decreased liquidity or increased volatility. Foreign investments also involve the risk of the possible seizure, nationalization or expropriation of the issuer or foreign deposits (in which the Fund could lose its entire investments in a certain market) and the possible adoption of foreign governmental restrictions such as exchange controls. Unless the Fund has hedged its foreign securities risk, foreign securities risk also involves the risk of negative foreign currency rate fluctuations, which may cause the value of securities denominated in such foreign currency (or other instruments through which the Fund has exposure to foreign currencies) to decline in value. Currency exchange rates may fluctuate significantly over short periods of time. Currency hedging strategies, if used, are not always successful. |
| n | | Growth investing risk. Growth stocks tend to be more expensive relative to the issuing company’s earnings or assets compared with other types of stock. As a result, they tend to be more sensitive to changes in, or investors’ expectations of, the issuing company’s earnings and can be more volatile. |
| n | | Management risk. The Fund is actively managed and depends heavily on the Adviser’s judgment about markets, interest rates or the attractiveness, relative values, liquidity, or potential appreciation of particular investments made for the Fund’s portfolio. The Fund could experience losses if these judgments prove to be incorrect. Additionally, legislative, regulatory, or tax developments may adversely affect management of the Fund and, therefore, the ability of the Fund to achieve its investment objective. |
| n | | Market risk. The market values of the Fund’s investments, and therefore the value of the Fund’s shares, will go up and down, sometimes rapidly or unpredictably. Market risk may affect a single issuer, industry or section of the economy, or it may affect the market as a whole. Individual stock prices tend to go up and down more dramatically than those of certain other types of investments, such as bonds. During a general downturn in the financial markets, multiple asset classes may decline in value. When markets perform well, there can be no assurance that specific investments held by the Fund will rise in value. |
| n | | Mid-capitalization risk. Mid-capitalization companies tend to be more vulnerable to changing market conditions and may have more limited product lines and markets, less experienced management and fewer financial resources than larger companies. These companies’ securities may be more volatile and less liquid than those of more established companies, and their returns may vary, sometimes significantly, from the overall securities market. |
|
This report must be accompanied or preceded by a currently effective Fund prospectus, which contains more complete information, including sales charges and expenses. Investors should read it carefully before investing. |
NOT FDIC INSURED | MAY LOSE VALUE | NO BANK GUARANTEE
About indexes used in this report
| n | | The S&P 500® Index is an unmanaged index considered representative of the US stock market. |
| n | | The Russell Midcap® Growth Index is an unmanaged index considered representative of mid-cap growth stocks. The Russell Midcap Growth Index is a trademark/service mark of the Frank Russell Co. Russell® is a trademark of the Frank Russell Co. |
| n | | The Lipper Mid-Cap Growth Funds Index is an unmanaged index considered representative of mid-cap growth funds tracked by Lipper. |
| n | | The Fund is not managed to track the performance of any particular index, including the index(es) described here, and consequently, the performance of the Fund may deviate significantly from the performance of the index(es). |
| n | | A direct investment cannot be made in an index. Unless otherwise indicated, index results include reinvested dividends, and they do not reflect sales charges. Performance of the peer group, if applicable, reflects fund expenses; performance of a market index does not. |
Other information
| n | | The returns shown in management’s discussion of Fund performance are based on net asset values (NAVs) calculated for shareholder transactions. Generally accepted accounting principles require adjustments to be made to the net assets of the Fund at period end for financial reporting purposes, and as such, the NAVs for shareholder transactions and the returns based on those NAVs may differ from the NAVs and returns reported in the Financial Highlights. |
| n | | Industry classifications used in this report are generally according to the Global Industry Classification Standard, which was developed by and is the exclusive property and a service mark of MSCI Inc. and Standard & Poor’s. |
8 Invesco Mid Cap Growth Fund
Schedule of Investments(a)
April 30, 2016
| | | | | | | | |
| | | Shares | | | Value | |
Common Stocks & Other Equity Interests–97.01% | |
| Airlines–1.39% | |
Southwest Airlines Co. | | | 555,535 | | | $ | 24,782,416 | |
United Continental Holdings Inc.(b) | | | 251,286 | | | | 11,511,412 | |
| | | | | 36,293,828 | |
|
| Apparel Retail–3.59% | |
Burlington Stores, Inc.(b) | | | 977,952 | | | | 55,713,925 | |
Foot Locker, Inc. | | | 205,612 | | | | 12,632,801 | |
L Brands, Inc. | | | 328,543 | | | | 25,721,632 | |
| | | | | 94,068,358 | |
|
| Apparel, Accessories & Luxury Goods–0.55% | |
Under Armour, Inc.–Class A(b)(c) | | | 327,044 | | | | 14,370,313 | |
|
| Application Software–4.59% | |
Cadence Design Systems, Inc.(b) | | | 2,161,423 | | | | 50,123,399 | |
Mobileye N.V.(b)(c) | | | 650,623 | | | | 24,821,267 | |
SS&C Technologies Holdings, Inc. | | | 308,890 | | | | 18,888,624 | |
Tyler Technologies, Inc.(b) | | | 178,844 | | | | 26,184,550 | |
| | | | | 120,017,840 | |
|
| Asset Management & Custody Banks–1.49% | |
Affiliated Managers Group, Inc.(b) | | | 228,409 | | | | 38,902,621 | |
|
| Automobile Manufacturers–0.61% | |
Tesla Motors, Inc.(b) | | | 66,488 | | | | 16,007,651 | |
|
| Automotive Retail–2.87% | |
Advance Auto Parts, Inc. | | | 194,182 | | | | 30,311,810 | |
O’Reilly Automotive, Inc.(b) | | | 170,309 | | | | 44,736,768 | |
| | | | | 75,048,578 | |
|
| Biotechnology–3.79% | |
Alexion Pharmaceuticals, Inc.(b) | | | 199,645 | | | | 27,806,556 | |
BioMarin Pharmaceutical Inc.(b) | | | 368,688 | | | | 31,220,500 | |
Medivation Inc.(b) | | | 692,837 | | | | 40,045,978 | |
| | | | | 99,073,034 | |
|
| Building Products–6.85% | |
A.O. Smith Corp. | | | 559,756 | | | | 43,224,358 | |
Allegion PLC | | | 500,081 | | | | 32,730,302 | |
Lennox International Inc. | | | 246,442 | | | | 33,257,348 | |
Masco Corp. | | | 1,212,209 | | | | 37,226,938 | |
Owens Corning | | | 712,326 | | | | 32,816,859 | |
| | | | | 179,255,805 | |
|
| Casinos & Gaming–0.72% | |
Wynn Resorts Ltd.(c) | | | 213,029 | | | | 18,810,461 | |
|
| Communications Equipment–1.68% | |
Palo Alto Networks, Inc.(b) | | | 291,630 | | | | 43,998,218 | |
|
| Construction Machinery & Heavy Trucks–0.75% | |
WABCO Holdings Inc.(b) | | | 175,562 | | | | 19,691,034 | |
| | | | | | | | |
| | | Shares | | | Value | |
| Construction Materials–0.97% | |
Vulcan Materials Co. | | | 235,787 | | | $ | 25,377,755 | |
|
| Consumer Electronics–0.82% | |
Harman International Industries, Inc. | | | 279,459 | | | | 21,451,273 | |
|
| Data Processing & Outsourced Services–2.64% | |
Alliance Data Systems Corp.(b) | | | 168,598 | | | | 34,277,659 | |
Fidelity National Information Services, Inc. | | | 527,387 | | | | 34,702,065 | |
| | | | | 68,979,724 | |
|
| Distillers & Vintners–2.51% | |
Constellation Brands, Inc.–Class A | | | 421,187 | | | | 65,730,443 | |
|
| Diversified Support Services–1.38% | |
KAR Auction Services Inc. | | | 962,100 | | | | 36,174,960 | |
|
| Electrical Components & Equipment–1.36% | |
Acuity Brands, Inc. | | | 145,956 | | | | 35,597,209 | |
|
| Electronic Components–1.82% | |
Amphenol Corp.–Class A | | | 850,813 | | | | 47,500,890 | |
|
| Footwear–1.70% | |
Skechers U.S.A., Inc.–Class A(b) | | | 1,346,193 | | | | 44,491,679 | |
|
| General Merchandise Stores–0.47% | |
Dollar Tree, Inc.(b) | | | 155,969 | | | | 12,432,289 | |
|
| Health Care Equipment–4.52% | |
Boston Scientific Corp.(b) | | | 2,148,067 | | | | 47,085,628 | |
DexCom Inc.(b) | | | 494,568 | | | | 31,840,288 | |
Hologic, Inc.(b) | | | 1,171,713 | | | | 39,357,840 | |
| | | | | 118,283,756 | |
|
| Health Care Facilities–2.04% | |
VCA Inc.(b) | | | 847,542 | | | | 53,369,720 | |
|
| Health Care Services–0.92% | |
Team Health Holdings, Inc.(b) | | | 574,866 | | | | 24,046,645 | |
|
| Health Care Supplies–0.94% | |
Penumbra, Inc.(b) | | | 449,890 | | | | 24,519,005 | |
|
| Homebuilding–0.66% | |
D.R. Horton, Inc. | | | 575,749 | | | | 17,307,015 | |
|
| Housewares & Specialties–0.51% | |
Newell Brands Inc. | | | 295,892 | | | | 13,474,915 | |
|
| Industrial Conglomerates–1.70% | |
Carlisle Cos. Inc. | | | 436,069 | | | | 44,435,431 | |
|
| Industrial Machinery–1.85% | |
Stanley Black & Decker Inc. | | | 432,391 | | | | 48,393,201 | |
|
| Integrated Telecommunication Services–1.22% | |
SBA Communications Corp.–Class A(b) | | | 311,043 | | | | 32,049,871 | |
See accompanying Notes to Financial Statements which are an integral part of the financial statements.
9 Invesco Mid Cap Growth Fund
| | | | | | | | |
| | | Shares | | | Value | |
| Internet Software & Services–0.97% | |
CoStar Group Inc.(b) | | | 128,510 | | | $ | 25,356,308 | |
|
| Investment Banking & Brokerage–1.23% | |
E*TRADE Financial Corp.(b) | | | 1,275,432 | | | | 32,115,378 | |
|
| IT Consulting & Other Services–1.12% | |
Gartner, Inc.(b) | | | 336,746 | | | | 29,354,149 | |
|
| Leisure Products–1.85% | |
Brunswick Corp. | | | 1,008,866 | | | | 48,455,834 | |
|
| Life Sciences Tools & Services–1.30% | |
VWR Corp.(b) | | | 1,280,061 | | | | 34,100,825 | |
|
| Managed Health Care–1.90% | |
Centene Corp.(b) | | | 801,040 | | | | 49,632,438 | |
|
| Metal & Glass Containers–0.84% | |
Berry Plastics Group Inc.(b) | | | 610,242 | | | | 21,980,917 | |
|
| Movies & Entertainment–1.30% | |
Cinemark Holdings, Inc. | | | 981,423 | | | | 34,006,307 | |
|
| Oil & Gas Exploration & Production–3.44% | |
Cabot Oil & Gas Corp. | | | 493,889 | | | | 11,557,003 | |
Diamondback Energy Inc.(b) | | | 362,873 | | | | 31,417,544 | |
Encana Corp. (Canada) | | | 2,312,576 | | | | 17,714,332 | |
Pioneer Natural Resources Co. | | | 176,884 | | | | 29,380,432 | |
| | | | | 90,069,311 | |
|
| Packaged Foods & Meats–1.61% | |
Hain Celestial Group, Inc. (The)(b) | | | 272,144 | | | | 11,391,948 | |
WhiteWave Foods Co. (The)(b) | | | 767,003 | | | | 30,841,190 | |
| | | | | 42,233,138 | |
|
| Pharmaceuticals–1.08% | |
Pacira Pharmaceuticals, Inc.(b)(c) | | | 522,646 | | | | 28,280,375 | |
|
| Regional Banks–2.64% | |
Signature Bank(b) | | | 258,197 | | | | 35,587,293 | |
SVB Financial Group(b) | | | 321,436 | | | | 33,519,346 | |
| | | | | 69,106,639 | |
|
| Restaurants–2.24% | |
Chipotle Mexican Grill, Inc.(b) | | | 59,024 | | | | 24,847,333 | |
Domino’s Pizza, Inc. | | | 280,475 | | | | 33,903,818 | |
| | | | | 58,751,151 | |
|
| Semiconductors–3.60% | |
Cavium Inc.(b) | | | 486,801 | | | | 24,033,365 | |
NXP Semiconductors N.V. (Netherlands)(b) | | | 618,429 | | | | 52,739,625 | |
| | | | | | | | |
| | | Shares | | | Value | |
| Semiconductors–(continued) | |
Qorvo, Inc.(b) | | | 384,627 | | | $ | 17,319,754 | |
| | | | | 94,092,744 | |
|
| Soft Drinks–1.64% | |
Monster Beverage Corp.(b) | | | 298,012 | | | | 42,979,291 | |
|
| Specialized Finance–4.08% | |
Intercontinental Exchange, Inc. | | | 216,602 | | | | 51,990,978 | |
S&P Global Inc. | | | 513,138 | | | | 54,828,795 | |
| | | | | 106,819,773 | |
|
| Specialized REIT’s–1.53% | |
Equinix, Inc. | | | 120,935 | | | | 39,950,877 | |
|
| Specialty Chemicals–1.81% | |
PPG Industries, Inc. | | | 427,935 | | | | 47,239,745 | |
|
| Specialty Stores–4.18% | |
Signet Jewelers Ltd. | | | 334,327 | | | | 36,294,539 | |
Tractor Supply Co. | | | 559,070 | | | | 52,921,566 | |
Ulta Salon, Cosmetics & Fragrance, Inc.(b) | | | 97,011 | | | | 20,205,451 | |
| | | | | 109,421,556 | |
|
| Systems Software–1.74% | |
ServiceNow, Inc.(b) | | | 636,823 | | | | 45,520,108 | |
Total Common Stocks & Other Equity Interests
(Cost $2,167,139,868) | | | | 2,538,620,386 | |
|
Money Market Funds–3.13% | |
Liquid Assets Portfolio–Institutional Class, 0.44%(d) | | | 40,971,706 | | | | 40,971,706 | |
Premier Portfolio–Institutional Class, 0.39%(d) | | | 40,971,707 | | | | 40,971,707 | |
Total Money Market Funds (Cost $81,943,413) | | | | | | | 81,943,413 | |
TOTAL INVESTMENTS (excluding investments purchased with cash collateral from securities on loan)–100.14%
(Cost $2,249,083,281) | | | | 2,620,563,799 | |
|
Investments Purchased with Cash
Collateral from Securities on Loan | |
Money Market Funds–2.12% | |
Liquid Assets Portfolio–Institutional Class, 0.44%
(Cost $55,348,385)(d)(e) | | | 55,348,385 | | | | 55,348,385 | |
TOTAL INVESTMENTS–102.26%
(Cost $2,304,431,666) | | | | 2,675,912,184 | |
OTHER ASSETS LESS LIABILITIES–(2.26)% | | | | (59,074,413 | ) |
NET ASSETS–100.00% | | | $ | 2,616,837,771 | |
Investment Abbreviations:
| | |
| REIT | | – Real Estate Investment Trust |
Notes to Schedule of Investments:
| (a) | Industry and/or sector classifications used in this report are generally according to the Global Industry Classification Standard, which was developed by and is the exclusive property and a service mark of MSCI Inc. and Standard & Poor’s. |
| (b) | Non-income producing security. |
| (c) | All or a portion of this security was out on loan at April 30, 2016. |
| (d) | The money market fund and the Fund are affiliated by having the same investment adviser. The rate shown is the 7-day SEC standardized yield as of April 30, 2016. |
| (e) | The security has been segregated to satisfy the commitment to return the cash collateral received in securities lending transactions upon the borrower’s return of the securities loaned. See Note 1I. |
See accompanying Notes to Financial Statements which are an integral part of the financial statements.
10 Invesco Mid Cap Growth Fund
Statement of Assets and Liabilities
April 30, 2016
| | | | |
Assets: | | | | |
Investments, at value (Cost $2,167,139,868)* | | $ | 2,538,620,386 | |
Investments in affiliated money market funds, at value and cost | | | 137,291,798 | |
Total investments, at value (Cost $2,304,431,666) | | | 2,675,912,184 | |
Receivable for: | | | | |
Fund shares sold | | | 2,826,315 | |
Dividends | | | 372,771 | |
Investment for trustee deferred compensation and retirement plans | | | 585,814 | |
Other assets | | | 275,256 | |
Total assets | | | 2,679,972,340 | |
| |
Liabilities: | | | | |
Payable for: | | | | |
Investments purchased | | | 2,412,307 | |
Fund shares reacquired | | | 2,654,864 | |
Collateral upon return of securities loaned | | | 55,348,385 | |
Accrued fees to affiliates | | | 1,901,898 | |
Accrued trustees’ and officers’ fees and benefits | | | 3,962 | |
Accrued other operating expenses | | | 134,245 | |
Trustee deferred compensation and retirement plans | | | 678,908 | |
Total liabilities | | | 63,134,569 | |
Net assets applicable to shares outstanding | | $ | 2,616,837,771 | |
| |
Net assets consist of: | | | | |
Shares of beneficial interest | | $ | 2,301,980,739 | |
Undistributed net investment income (loss) | | | (6,294,946 | ) |
Undistributed net realized gain (loss) | | | (50,328,540 | ) |
Net unrealized appreciation | | | 371,480,518 | |
| | | $ | 2,616,837,771 | |
| | | | |
Net Assets: | | | | |
Class A | | $ | 2,177,519,882 | |
Class B | | $ | 43,402,578 | |
Class C | | $ | 148,891,742 | |
Class R | | $ | 29,546,677 | |
Class Y | | $ | 76,291,385 | |
Class R5 | | $ | 91,700,062 | |
Class R6 | | $ | 49,485,445 | |
|
Shares outstanding, $0.01 par value per share,
with an unlimited number of shares authorized: | |
Class A | | | 65,669,385 | |
Class B | | | 1,557,105 | |
Class C | | | 5,724,656 | |
Class R | | | 912,140 | |
Class Y | | | 2,221,556 | |
Class R5 | | | 2,650,833 | |
Class R6 | | | 1,426,723 | |
Class A: | | | | |
Net asset value per share | | $ | 33.16 | |
Maximum offering price per share | | | | |
(Net asset value of $33.16 ¸ 94.50%) | | $ | 35.09 | |
Class B: | | | | |
Net asset value and offering price per share | | $ | 27.87 | |
Class C: | | | | |
Net asset value and offering price per share | | $ | 26.01 | |
Class R: | | | | |
Net asset value and offering price per share | | $ | 32.39 | |
Class Y: | | | | |
Net asset value and offering price per share | | $ | 34.34 | |
Class R5: | | | | |
Net asset value and offering price per share | | $ | 34.59 | |
Class R6: | | | | |
Net asset value and offering price per share | | $ | 34.68 | |
| * | At April 30, 2016, securities with an aggregate value of $52,899,715 were on loan to brokers. |
See accompanying Notes to Financial Statements which are an integral part of the financial statements.
11 Invesco Mid Cap Growth Fund
Statement of Operations
For the year ended April 30, 2016
| | | | |
Investment income: | |
Dividends (net of foreign withholding taxes of $5,203) | | $ | 19,349,604 | |
Dividends from affiliated money market funds (includes securities lending income of $300,452) | | | 462,086 | |
Total investment income | | | 19,811,690 | |
| |
Expenses: | | | | |
Advisory fees | | | 18,921,801 | |
Administrative services fees | | | 543,436 | |
Custodian fees | | | 61,729 | |
Distribution fees: | | | | |
Class A | | | 5,789,565 | |
Class B | | | 148,687 | |
Class C | | | 1,608,397 | |
Class R | | | 160,891 | |
Transfer agent fees — A, B, C, R and Y | | | 6,196,333 | |
Transfer agent fees — R5 | | | 88,574 | |
Transfer agent fees — R6 | | | 4,138 | |
Trustees’ and officers’ fees and benefits | | | 97,231 | |
Registration and filing fees | | | 154,951 | |
Reports to shareholders | | | 296,899 | |
Professional services fees | | | 72,007 | |
Other | | | 74,736 | |
Total expenses | | | 34,219,375 | |
Less: Fees waived, expenses reimbursed and expense offset arrangement(s) | | | (260,889 | ) |
Net expenses | | | 33,958,486 | |
Net investment income (loss) | | | (14,146,796 | ) |
| |
Realized and unrealized gain (loss) from: | | | | |
Net realized gain from investment securities (includes net gains from securities sold to affiliates of $21,372) | | | 113,017,507 | |
Change in net unrealized appreciation (depreciation) of investment securities | | | (321,151,557 | ) |
Net realized and unrealized gain (loss) | | | (208,134,050 | ) |
Net increase (decrease) in net assets resulting from operations | | $ | (222,280,846 | ) |
See accompanying Notes to Financial Statements which are an integral part of the financial statements.
12 Invesco Mid Cap Growth Fund
Statement of Changes in Net Assets
For the years ended April 30, 2016 and 2015
| | | | | | | | |
| | | 2016 | | | 2015 | |
Operations: | | | | | | | | |
Net investment income (loss) | | $ | (14,146,796 | ) | | $ | (11,810,488 | ) |
Net realized gain | | | 113,017,507 | | | | 377,353,435 | |
Change in net unrealized appreciation (depreciation) | | | (321,151,557 | ) | | | 28,592,561 | |
Net increase (decrease) in net assets resulting from operations | | | (222,280,846 | ) | | | 394,135,508 | |
| | |
Distributions to shareholders from net realized gains: | | | | | | | | |
Class A | | | (171,450,054 | ) | | | (213,815,087 | ) |
Class B | | | (4,921,422 | ) | | | (8,627,414 | ) |
Class C | | | (15,142,609 | ) | | | (18,432,412 | ) |
Class R | | | (2,437,421 | ) | | | (3,017,818 | ) |
Class Y | | | (5,895,511 | ) | | | (6,274,837 | ) |
Class R5 | | | (6,484,545 | ) | | | (7,131,010 | ) |
Class R6 | | | (3,672,306 | ) | | | (7,707,726 | ) |
Total distributions from net realized gains | | | (210,003,868 | ) | | | (265,006,304 | ) |
| | |
Share transactions–net: | | | | | | | | |
Class A | | | 49,575,046 | | | | (10,819,916 | ) |
Class B | | | (21,326,268 | ) | | | (25,880,669 | ) |
Class C | | | 2,196,193 | | | | 2,709,487 | |
Class R | | | (349,819 | ) | | | (2,571,907 | ) |
Class Y | | | 7,660,539 | | | | 15,134,287 | |
Class R5 | | | 18,682,817 | | | | 2,542,369 | |
Class R6 | | | (3,350,161 | ) | | | (21,555,552 | ) |
Net increase (decrease) in net assets resulting from share transactions | | | 53,088,347 | | | | (40,441,901 | ) |
Net increase (decrease) in net assets | | | (379,196,367 | ) | | | 88,687,303 | |
| | |
Net assets: | | | | | | | | |
Beginning of year | | | 2,996,034,138 | | | | 2,907,346,835 | |
End of year (includes undistributed net investment income (loss) of $(6,294,946) and $(5,218,119), respectively) | | $ | 2,616,837,771 | | | $ | 2,996,034,138 | |
Notes to Financial Statements
April 30, 2016
NOTE 1—Significant Accounting Policies
Invesco Mid Cap Growth Fund (the “Fund”) is a series portfolio of AIM Sector Funds (Invesco Sector Funds) (the “Trust”). The Trust is a Delaware statutory trust registered under the Investment Company Act of 1940, as amended (the “1940 Act”), as an open-end series management investment company consisting of ten separate portfolios, each authorized to issue an unlimited number of shares of beneficial interest. The assets, liabilities and operations of each portfolio are accounted for separately. Information presented in these financial statements pertains only to the Fund. Matters affecting each portfolio or class will be voted on exclusively by the shareholders of such portfolio or class.
The Fund’s investment objective is to seek capital growth.
The Fund currently consists of seven different classes of shares: Class A, Class B, Class C, Class R, Class Y, Class R5 and Class R6. Class Y shares are available only to certain investors. Class A shares are sold with a front-end sales charge unless certain waiver criteria are met and under certain circumstances load waived shares may be subject to contingent deferred sales charges (“CDSC”). Class C shares are sold with a CDSC. Class R, Class Y, Class R5 and Class R6 shares are sold at net asset value. Effective November 30, 2010, new or additional investments in Class B shares are no longer permitted. Existing shareholders of Class B shares may continue to reinvest dividends and capital gains distributions in Class B shares until they convert to Class A shares. Also, shareholders in Class B shares will be able to exchange those shares for Class B shares of other Invesco Funds offering such shares until they convert to Class A shares. Generally, Class B shares will automatically convert to Class A shares on or about the month-end, which is at least eight years after the date of purchase. Redemption of Class B shares prior to the conversion date will be subject to a CDSC.
The following is a summary of the significant accounting policies followed by the Fund in the preparation of its financial statements.
| A. | Security Valuations — Securities, including restricted securities, are valued according to the following policy. |
A security listed or traded on an exchange (except convertible securities) is valued at its last sales price or official closing price as of the close of the customary trading session on the exchange where the security is principally traded, or lacking any sales or official closing price on a particular day, the security may be valued at the closing bid price on that day. Securities traded in the over-the-counter market are valued based on prices furnished by independent pricing services or market makers. When such securities are valued by an independent pricing service they
13 Invesco Mid Cap Growth Fund
may be considered fair valued. Futures contracts are valued at the final settlement price set by an exchange on which they are principally traded. Listed options are valued at the mean between the last bid and asked prices from the exchange on which they are principally traded. Options not listed on an exchange are valued by an independent source at the mean between the last bid and asked prices. For purposes of determining net asset value (“NAV”) per share, futures and option contracts generally are valued 15 minutes after the close of the customary trading session of the New York Stock Exchange (“NYSE”).
Investments in open-end and closed-end registered investment companies that do not trade on an exchange are valued at the end-of-day net asset value per share. Investments in open-end and closed-end registered investment companies that trade on an exchange are valued at the last sales price or official closing price as of the close of the customary trading session on the exchange where the security is principally traded.
Debt obligations (including convertible securities) and unlisted equities are fair valued using an evaluated quote provided by an independent pricing service. Evaluated quotes provided by the pricing service may be determined without exclusive reliance on quoted prices, and may reflect appropriate factors such as institution-size trading in similar groups of securities, developments related to specific securities, dividend rate (for unlisted equities), yield (for debt obligations), quality, type of issue, coupon rate (for debt obligations), maturity (for debt obligations), individual trading characteristics and other market data. Debt obligations are subject to interest rate and credit risks. In addition, all debt obligations involve some risk of default with respect to interest and/or principal payments.
Foreign securities’ (including foreign exchange contracts) prices are converted into U.S. dollar amounts using the applicable exchange rates as of the close of the NYSE. If market quotations are available and reliable for foreign exchange-traded equity securities, the securities will be valued at the market quotations. Because trading hours for certain foreign securities end before the close of the NYSE, closing market quotations may become unreliable. If between the time trading ends on a particular security and the close of the customary trading session on the NYSE, events occur that the Adviser determines are significant and make the closing price unreliable, the Fund may fair value the security. If the event is likely to have affected the closing price of the security, the security will be valued at fair value in good faith using procedures approved by the Board of Trustees. Adjustments to closing prices to reflect fair value may also be based on a screening process of an independent pricing service to indicate the degree of certainty, based on historical data, that the closing price in the principal market where a foreign security trades is not the current value as of the close of the NYSE. Foreign securities’ prices meeting the approved degree of certainty that the price is not reflective of current value will be priced at the indication of fair value from the independent pricing service. Multiple factors may be considered by the independent pricing service in determining adjustments to reflect fair value and may include information relating to sector indices, American Depositary Receipts and domestic and foreign index futures. Foreign securities may have additional risks including exchange rate changes, potential for sharply devalued currencies and high inflation, political and economic upheaval, the relative lack of issuer information, relatively low market liquidity and the potential lack of strict financial and accounting controls and standards.
Securities for which market prices are not provided by any of the above methods may be valued based upon quotes furnished by independent sources. The last bid price may be used to value equity securities. The mean between the last bid and asked prices is used to value debt obligations, including corporate loans.
Securities for which market quotations are not readily available or became unreliable are valued at fair value as determined in good faith by or under the supervision of the Trust’s officers following procedures approved by the Board of Trustees. Issuer specific events, market trends, bid/asked quotes of brokers and information providers and other market data may be reviewed in the course of making a good faith determination of a security’s fair value.
The Fund may invest in securities that are subject to interest rate risk, meaning the risk that the prices will generally fall as interest rates rise and, conversely, the prices will generally rise as interest rates fall. Specific securities differ in their sensitivity to changes in interest rates depending on their individual characteristics. Changes in interest rates may result in increased market volatility, which may affect the value and/or liquidity of certain Fund investments.
Valuations change in response to many factors including the historical and prospective earnings of the issuer, the value of the issuer’s assets, general economic conditions, interest rates, investor perceptions and market liquidity. Because of the inherent uncertainties of valuation, the values reflected in the financial statements may materially differ from the value received upon actual sale of those investments.
| B. | Securities Transactions and Investment Income — Securities transactions are accounted for on a trade date basis. Realized gains or losses on sales are computed on the basis of specific identification of the securities sold. Interest income (net of withholding tax, if any) is recorded on the accrual basis from settlement date. Dividend income (net of withholding tax, if any) is recorded on the ex-dividend date. |
The Fund may periodically participate in litigation related to Fund investments. As such, the Fund may receive proceeds from litigation settlements. Any proceeds received are included in the Statement of Operations as realized gain (loss) for investments no longer held and as unrealized gain (loss) for investments still held.
Brokerage commissions and mark ups are considered transaction costs and are recorded as an increase to the cost basis of securities purchased and/or a reduction of proceeds on a sale of securities. Such transaction costs are included in the determination of net realized and unrealized gain (loss) from investment securities reported in the Statement of Operations and the Statement of Changes in Net Assets and the net realized and unrealized gains (losses) on securities per share in the Financial Highlights. Transaction costs are included in the calculation of the Fund’s net asset value and, accordingly, they reduce the Fund’s total returns. These transaction costs are not considered operating expenses and are not reflected in net investment income reported in the Statement of Operations and the Statement of Changes in Net Assets, or the net investment income per share and the ratios of expenses and net investment income reported in the Financial Highlights, nor are they limited by any expense limitation arrangements between the Fund and the investment adviser.
The Fund allocates income and realized and unrealized capital gains and losses to a class based on the relative net assets of each class.
| C. | Country Determination — For the purposes of making investment selection decisions and presentation in the Schedule of Investments, the investment adviser may determine the country in which an issuer is located and/or credit risk exposure based on various factors. These factors include the laws of the country under which the issuer is organized, where the issuer maintains a principal office, the country in which the issuer derives 50% or more of its total revenues and the country that has the primary market for the issuer’s securities, as well as other criteria. Among the other criteria that may be evaluated for making this determination are the country in which the issuer maintains 50% or more of its assets, the type of security, financial guarantees and enhancements, the nature of the collateral and the sponsor organization. Country of issuer and/or credit risk exposure has been determined to be the United States of America, unless otherwise noted. |
14 Invesco Mid Cap Growth Fund
| D. | Distributions — Distributions from net investment income and net realized capital gain, if any, are generally declared and paid annually and recorded on the ex-dividend date. The Fund may elect to treat a portion of the proceeds from redemptions as distributions for federal income tax purposes. |
| E. | Federal Income Taxes — The Fund intends to comply with the requirements of Subchapter M of the Internal Revenue Code of 1986, as amended (the “Internal Revenue Code”), necessary to qualify as a regulated investment company and to distribute substantially all of the Fund’s taxable earnings to shareholders. As such, the Fund will not be subject to federal income taxes on otherwise taxable income (including net realized capital gain) that is distributed to shareholders. Therefore, no provision for federal income taxes is recorded in the financial statements. |
The Fund recognizes the tax benefits of uncertain tax positions only when the position is more likely than not to be sustained. Management has analyzed the Fund’s uncertain tax positions and concluded that no liability for unrecognized tax benefits should be recorded related to uncertain tax positions. Management is not aware of any tax positions for which it is reasonably possible that the total amounts of unrecognized tax benefits will change materially in the next 12 months.
The Fund files tax returns in the U.S. Federal jurisdiction and certain other jurisdictions. Generally, the Fund is subject to examinations by such taxing authorities for up to three years after the filing of the return for the tax period.
| F. | Expenses — Fees provided for under the Rule 12b-1 plan of a particular class of the Fund are charged to the operations of such class. Transfer agency fees and expenses and other shareholder recordkeeping fees and expenses attributable to Class R5 and Class R6 are allocated to each share class based on relative net assets. Sub-accounting fees attributable to Class R5 are charged to the operations of the class. Transfer agency fees and expenses and other shareholder recordkeeping fees and expenses relating to all other classes are allocated among those classes based on relative net assets. All other expenses are allocated among the classes based on relative net assets. |
| G. | Accounting Estimates — The preparation of financial statements in conformity with accounting principles generally accepted in the United States of America (“GAAP”) requires management to make estimates and assumptions that affect the reported amounts of assets and liabilities at the date of the financial statements and the reported amounts of revenues and expenses during the reporting period including estimates and assumptions related to taxation. Actual results could differ from those estimates by a significant amount. In addition, the Fund monitors for material events or transactions that may occur or become known after the period-end date and before the date the financial statements are released to print. |
| H. | Indemnifications — Under the Trust’s organizational documents, each Trustee, officer, employee or other agent of the Trust is indemnified against certain liabilities that may arise out of the performance of their duties to the Fund. Additionally, in the normal course of business, the Fund enters into contracts, including the Fund’s servicing agreements that contain a variety of indemnification clauses. The Fund’s maximum exposure under these arrangements is unknown as this would involve future claims that may be made against the Fund that have not yet occurred. The risk of material loss as a result of such indemnification claims is considered remote. |
| I. | Securities Lending — The Fund may lend portfolio securities having a market value up to one-third of the Fund’s total assets. Such loans are secured by collateral equal to no less than the market value of the loaned securities determined daily by the securities lending provider. Such collateral will be cash or debt securities issued or guaranteed by the U.S. Government or any of its sponsored agencies. Cash collateral received in connection with these loans is invested in short-term money market instruments or affiliated money market funds and is shown as such on the Schedule of Investments. The Fund bears the risk of loss with respect to the investment of collateral. It is the Fund’s policy to obtain additional collateral from or return excess collateral to the borrower by the end of the next business day, following the valuation date of the securities loaned. Therefore, the value of the collateral held may be temporarily less than the value of the securities on loan. When loaning securities, the Fund retains certain benefits of owning the securities, including the economic equivalent of dividends or interest generated by the security. Lending securities entails a risk of loss to the Fund if, and to the extent that, the market value of the securities loaned were to increase and the borrower did not increase the collateral accordingly, and the borrower failed to return the securities. The securities loaned are subject to termination at the option of the borrower or the Fund. Upon termination, the borrower will return to the Fund the securities loaned and the Fund will return the collateral. Upon the failure of the borrower to return the securities, collateral may be liquidated and the securities may be purchased on the open market to replace the loaned securities. The Fund could experience delays and costs in gaining access to the collateral and the securities may lose value during the delay which could result in potential losses to the Fund. Some of these losses may be indemnified by the lending agent. The Fund bears the risk of any deficiency in the amount of the collateral available for return to the borrower due to any loss on the collateral invested. Dividends received on cash collateral investments for securities lending transactions, which are net of compensation to counterparties, are included in Dividends from affiliated money market funds on the Statement of Operations. The aggregate value of securities out on loan, if any, is shown as a footnote on the Statement of Assets and Liabilities. |
NOTE 2—Advisory Fees and Other Fees Paid to Affiliates
The Trust has entered into a master investment advisory agreement with Invesco Advisers, Inc. (the “Adviser” or “Invesco”). Under the terms of the investment advisory agreement, the Fund pays an advisory fee to the Adviser based on the annual rate of the Fund’s average daily net assets as follows:
| | | | |
| Average Daily Net Assets | | Rate | |
First $500 million | | | 0.75% | |
Next $500 million | | | 0.70% | |
Over $1 billion | | | 0.65% | |
For the year ended April 30, 2016, the effective advisory fees incurred by the Fund was 0.68%.
Under the terms of a master sub-advisory agreement between the Adviser and each of Invesco Asset Management Deutschland GmbH, Invesco Asset Management Limited, Invesco Asset Management (Japan) Limited, Invesco Hong Kong Limited, Invesco Senior Secured Management, Inc. and Invesco Canada Ltd. (collectively, the “Affiliated Sub-Advisers”) the Adviser, not the Fund, may pay 40% of the fees paid to the Adviser to any such Affiliated Sub-Adviser(s) that provide(s) discretionary investment management services to the Fund based on the percentage of assets allocated to such Affiliated Sub-Adviser(s).
15 Invesco Mid Cap Growth Fund
Effective August 1, 2015, the Adviser has contractually agreed, through at least June 30, 2017, to waive advisory fees and/or reimburse expenses of all shares to the extent necessary to limit total annual fund operating expenses after fee waiver and/or expense reimbursement (excluding certain items discussed above) of Class A, Class B, Class C, Class R, Class Y, Class R5 and Class R6 shares to 2.00%, 2.75%, 2.75%, 2.25%, 1.75%, 1.75% and 1.75%, respectively, of average daily net assets (the “expense limits”). Prior to August 1, 2015, the Adviser had contractually agreed to waive advisory fees and/or reimburse expenses of all shares to the extent necessary to limit total annual fund operating expenses after fee waiver and/or expense reimbursement (excluding certain items discussed below) of Class A, Class B, Class C, Class R, Class Y, Class R5 and Class R6 shares to 1.15%, 1.90%, 1.90%, 1.40%, 0.90%, 0.90% and 0.90%, respectively, of average daily net assets. In determining the Adviser’s obligation to waive advisory fees and/or reimburse expenses, the following expenses are not taken into account, and could cause the total annual fund operating expenses after fee waiver and/or expense reimbursement to exceed the numbers reflected above: (1) interest; (2) taxes; (3) dividend expense on short sales; (4) extraordinary or non-routine items, including litigation expenses; and (5) expenses that the Fund has incurred but did not actually pay because of an expense offset arrangement. Unless Invesco continues the fee waiver agreement, it will terminate on June 30, 2017. During its term, the fee waiver agreement cannot be terminated or amended to increase the expense limits without approval of the Board of Trustees.
Further, the Adviser has contractually agreed, through at least June 30, 2018, to waive the advisory fee payable by the Fund in an amount equal to 100% of the net advisory fees the Adviser receives from the affiliated money market funds on investments by the Fund of uninvested cash (excluding investments of cash collateral from securities lending) in such affiliated money market funds.
For the year ended April 30, 2016, the Adviser waived advisory fees of $114,357 and reimbursed class level expenses of $111,080, $2,853, $7,886, $1,543, and $3,840 of Class A, Class B, Class C, Class R, and Class Y shares, respectively.
The Trust has entered into a master administrative services agreement with Invesco pursuant to which the Fund has agreed to pay Invesco for certain administrative costs incurred in providing accounting services to the Fund. For the year ended April 30, 2016, expenses incurred under the agreement are shown in the Statement of Operations as Administrative services fees.
The Trust has entered into a transfer agency and service agreement with Invesco Investment Services, Inc. (“IIS”) pursuant to which the Fund has agreed to pay IIS a fee for providing transfer agency and shareholder services to the Fund and reimburse IIS for certain expenses incurred by IIS in the course of providing such services. IIS may make payments to intermediaries that provide omnibus account services, sub-accounting services and/or networking services. All fees payable by IIS to intermediaries that provide omnibus account services or sub-accounting are charged back to the Fund, subject to certain limitations approved by the Trust’s Board of Trustees. For the year ended April 30, 2016, expenses incurred under the agreement are shown in the Statement of Operations as Transfer agent fees.
Shares of the Fund are distributed by Invesco Distributors, Inc. (“IDI”). The Fund has adopted a distribution plan pursuant to Rule 12b-1 under the 1940 Act, and a service plan (collectively, the “Plans”) for Class A, Class B, Class C and Class R shares to compensate IDI for the sale, distribution, shareholder servicing and maintenance of shareholder accounts for these shares. Under the Plans, the Fund will incur annual fees of up to 0.25% of Class A average daily net assets, up to 1.00% each of Class B and Class C average daily net assets and up to 0.50% of Class R average daily net assets.
With respect to Class B and Class C shares, the Fund is authorized to reimburse in future years any distribution related expenses that exceed the maximum annual reimbursement rate for such class, so long as such reimbursement does not cause the Fund to exceed the Class B and Class C maximum annual reimbursement rate, respectively. With respect to Class A shares, distribution related expenses that exceed the maximum annual reimbursement rate for such class are not carried forward to future years and the Fund will not reimburse IDI for any such expenses.
For the year ended April 30, 2016, expenses incurred under these agreements are shown in the Statement of Operations as Distribution fees.
Front-end sales commissions and CDSC (collectively, the “sales charges”) are not recorded as expenses of the Fund. Front-end sales commissions are deducted from proceeds from the sales of Fund shares prior to investment in Class A shares of the Fund. CDSC are deducted from redemption proceeds prior to remittance to the shareholder. During the year ended April 30, 2016, IDI advised the Fund that IDI retained $398,704 in front-end sales commissions from the sale of Class A shares and $4,194, $5,385 and $5,182 from Class A, Class B and Class C shares, respectively, for CDSC imposed on redemptions by shareholders.
For the year ended April 30, 2016, the Fund incurred $13,166 in brokerage commissions with Invesco Capital Markets, Inc., an affiliate of the Adviser and IDI, for portfolio transactions executed on behalf of the Fund.
Certain officers and trustees of the Trust are officers and directors of the Adviser, IIS and/or IDI.
NOTE 3—Additional Valuation Information
GAAP defines fair value as the price that would be received to sell an asset or paid to transfer a liability in an orderly transaction between market participants at the measurement date, under current market conditions. GAAP establishes a hierarchy that prioritizes the inputs to valuation methods, giving the highest priority to readily available unadjusted quoted prices in an active market for identical assets (Level 1) and the lowest priority to significant unobservable inputs (Level 3), generally when market prices are not readily available or are unreliable. Based on the valuation inputs, the securities or other investments are tiered into one of three levels. Changes in valuation methods may result in transfers in or out of an investment’s assigned level:
| | Level 1 — | Prices are determined using quoted prices in an active market for identical assets. |
| | Level 2 — | Prices are determined using other significant observable inputs. Observable inputs are inputs that other market participants may use in pricing a security. These may include quoted prices for similar securities, interest rates, prepayment speeds, credit risk, yield curves, loss severities, default rates, discount rates, volatilities and others. |
| | Level 3 — | Prices are determined using significant unobservable inputs. In situations where quoted prices or observable inputs are unavailable (for example, when there is little or no market activity for an investment at the end of the period), unobservable inputs may be used. Unobservable inputs reflect the Fund’s own assumptions about the factors market participants would use in determining fair value of the securities or instruments and would be based on the best available information. |
16 Invesco Mid Cap Growth Fund
As of April 30, 2016, all of the securities in this Fund were valued based on Level 1 inputs (see the Schedule of Investments for security categories). The level assigned to the securities valuations may not be an indication of the risk or liquidity associated with investing in those securities. Because of the inherent uncertainties of valuation, the values reflected in the financial statements may materially differ from the value received upon actual sale of those investments.
NOTE 4—Security Transactions with Affiliated Funds
The Fund is permitted to purchase or sell securities from or to certain other Invesco Funds under specified conditions outlined in procedures adopted by the Board of Trustees of the Trust. The procedures have been designed to ensure that any purchase or sale of securities by the Fund from or to another fund or portfolio that is or could be considered an affiliate by virtue of having a common investment adviser (or affiliated investment advisers), common Trustees and/or common officers complies with Rule 17a-7 of the 1940 Act. Further, as defined under the procedures, each transaction is effected at the current market price. Pursuant to these procedures, for the year ended April 30, 2016, the Fund engaged in securities sales of $225,509, which resulted in net realized gains of $21,372.
NOTE 5—Expense Offset Arrangement(s)
The expense offset arrangement is comprised of transfer agency credits which result from balances in demand deposit accounts used by the transfer agent for clearing shareholder transactions. For the year ended April 30, 2016, the Fund received credits from this arrangement, which resulted in the reduction of the Fund’s total expenses of $19,330.
NOTE 6—Trustees’ and Officers’ Fees and Benefits
Trustees’ and Officers’ Fees and Benefits include amounts accrued by the Fund to pay remuneration to certain Trustees and Officers of the Fund. Trustees have the option to defer compensation payable by the Fund, and Trustees’ and Officers’ Fees and Benefits also include amounts accrued by the Fund to fund such deferred compensation amounts. Those Trustees who defer compensation have the option to select various Invesco Funds in which their deferral accounts shall be deemed to be invested. Finally, certain current Trustees were eligible to participate in a retirement plan that provided for benefits to be paid upon retirement to Trustees over a period of time based on the number of years of service. The Fund may have certain former Trustees who also participate in a retirement plan and receive benefits under such plan. Trustees’ and Officers’ Fees and Benefits include amounts accrued by the Fund to fund such retirement benefits. Obligations under the deferred compensation and retirement plans represent unsecured claims against the general assets of the Fund.
NOTE 7—Cash Balances
The Fund is permitted to temporarily carry a negative or overdrawn balance in its account with State Street Bank and Trust Company, the custodian bank. Such balances, if any at period-end, are shown in the Statement of Assets and Liabilities under the payable caption Amount due custodian. To compensate the custodian bank for such overdrafts, the overdrawn Fund may either (1) leave funds as a compensating balance in the account so the custodian bank can be compensated by earning the additional interest; or (2) compensate by paying the custodian bank at a rate agreed upon by the custodian bank and Invesco, not to exceed the contractually agreed upon rate.
NOTE 8—Distributions to Shareholders and Tax Components of Net Assets
Tax Character of Distributions to Shareholders Paid During the Fiscal Years Ended April 30, 2016 and 2015:
| | | | | | | | |
| | | 2016 | | | 2015 | |
Long-term capital gain | | $ | 210,003,868 | | | $ | 265,006,304 | |
Tax Components of Net Assets at Period-End:
| | | | |
| | | 2016 | |
Undistributed long-term gain | | $ | 10,645,039 | |
Net unrealized appreciation — investments | | | 365,720,211 | |
Temporary book/tax differences | | | (715,018 | ) |
Late-year ordinary loss deferrals | | | (5,579,927 | ) |
Capital loss carryforward | | | (55,213,273 | ) |
Shares of beneficial interest | | | 2,301,980,739 | |
Total net assets | | $ | 2,616,837,771 | |
The difference between book-basis and tax-basis unrealized appreciation (depreciation) is due to differences in the timing of recognition of gains and losses on investments for tax and book purposes. The Fund’s net unrealized appreciation difference is attributable primarily to wash sales.
The temporary book/tax differences are a result of timing differences between book and tax recognition of income and/or expenses. The Fund’s temporary book/tax differences are the result of the trustee deferral of compensation and retirement plan benefits.
Capital loss carryforward is calculated and reported as of a specific date. Results of transactions and other activity after that date may affect the amount of capital loss carryforward actually available for the Fund to utilize. Capital losses generated in years beginning after December 22, 2010 can be carried forward for an unlimited period, whereas previous losses expire in eight tax years. Capital losses with an expiration period may not be used to offset capital gains until all net capital losses without an expiration date have been utilized. Capital loss carryforwards with no expiration date will retain their character as either short-term or long-term capital losses instead of as short-term capital losses as under prior law. The ability to utilize capital loss carryforwards in the future may be limited under the Internal Revenue Code and related regulations based on the results of future transactions.
17 Invesco Mid Cap Growth Fund
The Fund has a capital loss carryforward as of April 30, 2016, which expires as follows:
| | | | | | | | | | | | |
| Capital Loss Carryforward* | |
| Expiration | | Short-Term | | | Long-Term | | | Total | |
April 30, 2017 | | $ | 55,213,273 | | | $ | — | | | $ | 55,213,273 | |
| * | Capital loss carryforward as of the date listed above is reduced for limitations, if any, to the extent required by the Internal Revenue Code and may be further limited depending upon a variety of factors, including the realization of net unrealized gains or losses as of the date of any reorganization. |
NOTE 9—Investment Securities
The aggregate amount of investment securities (other than short-term securities, U.S. Treasury obligations and money market funds, if any) purchased and sold by the Fund during the year ended April 30, 2016 was $1,637,999,859 and $1,844,456,725, respectively. Cost of investments on a tax basis includes the adjustments for financial reporting purposes as of the most recently completed federal income tax reporting period-end.
| | | | |
| Unrealized Appreciation (Depreciation) of Investment Securities on a Tax Basis | |
Aggregate unrealized appreciation of investment securities | | $ | 473,681,384 | |
Aggregate unrealized (depreciation) of investment securities | | | (107,961,173 | ) |
Net unrealized appreciation of investment securities | | $ | 365,720,211 | |
Cost of investments for tax purposes is $ 2,310,191,973.
NOTE 10—Reclassification of Permanent Differences
Primarily as a result of differing book/tax treatment of net operating losses on April 30, 2016, undistributed net investment income (loss) was increased by $13,069,969, undistributed net realized gain (loss) was increased by $632,826 and shares of beneficial interest was decreased by $13,702,795. This reclassification had no effect on the net assets of the Fund.
18 Invesco Mid Cap Growth Fund
NOTE 11—Share Information
| | | | | | | | | | | | | | | | |
| | | Summary of Share Activity | |
| | | Years ended April 30, | |
| | | 2016(a) | | | 2015 | |
| | | Shares | | | Amount | | | Shares | | | Amount | |
Sold: | | | | | | | | | | | | | | | | |
Class A | | | 5,892,996 | | | $ | 209,757,836 | | | | 4,472,728 | | | $ | 172,326,832 | |
Class B | | | 27,849 | | | | 854,005 | | | | 25,992 | | | | 860,089 | |
Class C | | | 783,132 | | | | 22,663,540 | | | | 455,692 | | | | 14,278,859 | |
Class R | | | 225,301 | | | | 7,971,324 | | | | 214,821 | | | | 8,113,261 | |
Class Y | | | 621,771 | | | | 23,246,797 | | | | 759,712 | | | | 30,295,433 | |
Class R5 | | | 707,552 | | | | 26,431,020 | | | | 581,281 | | | | 22,860,017 | |
Class R6 | | | 168,238 | | | | 6,339,325 | | | | 642,983 | | | | 25,333,447 | |
| | | | |
Issued as reinvestment of dividends: | | | | | | | | | | | | | | | | |
Class A | | | 4,849,844 | | | | 163,342,799 | | | | 5,752,418 | | | | 203,520,549 | |
Class B | | | 170,151 | | | | 4,816,968 | | | | 279,199 | | | | 8,423,448 | |
Class C | | | 540,776 | | | | 14,325,141 | | | | 610,921 | | | | 17,472,357 | |
Class R | | | 73,999 | | | | 2,436,780 | | | | 86,844 | | | | 3,016,968 | |
Class Y | | | 144,326 | | | | 5,029,788 | | | | 146,681 | | | | 5,342,124 | |
Class R5 | | | 184,366 | | | | 6,467,555 | | | | 194,159 | | | | 7,108,153 | |
Class R6 | | | 104,418 | | | | 3,671,357 | | | | 210,104 | | | | 7,702,412 | |
| | | | |
Automatic conversion of Class B shares to Class A shares: | | | | | | | | | | | | | | | | |
Class A | | | 560,593 | | | | 19,924,603 | | | | 620,832 | | | | 24,083,301 | |
Class B | | | (662,016 | ) | | | (19,924,603 | ) | | | (721,805 | ) | | | (24,083,301 | ) |
| | | | |
Reacquired: | | | | | | | | | | | | | | | | |
Class A | | | (9,705,298 | ) | | | (343,450,192 | ) | | | (10,706,855 | ) | | | (410,750,598 | ) |
Class B | | | (233,040 | ) | | | (7,072,638 | ) | | | (333,993 | ) | | | (11,080,905 | ) |
Class C | | | (1,248,083 | ) | | | (34,792,488 | ) | | | (922,805 | ) | | | (29,041,729 | ) |
Class R | | | (306,528 | ) | | | (10,757,923 | ) | | | (367,164 | ) | | | (13,702,136 | ) |
Class Y | | | (566,796 | ) | | | (20,616,046 | ) | | | (516,107 | ) | | | (20,503,270 | ) |
Class R5 | | | (385,584 | ) | | | (14,215,758 | ) | | | (703,806 | ) | | | (27,425,801 | ) |
Class R6 | | | (363,803 | ) | | | (13,360,843 | ) | | | (1,349,956 | ) | | | (54,591,411 | ) |
Net increase (decrease) in share activity | | | 1,584,164 | | | $ | 53,088,347 | | | | (568,124 | ) | | $ | (40,441,901 | ) |
| (a) | There are entities that are record owners of more than 5% of the outstanding shares of the Fund and in the aggregate own 31% of the outstanding shares of the Fund. IDI has an agreement with these entities to sell Fund shares. The Fund, Invesco and/or Invesco affiliates may make payments to these entities, which are considered to be related to the Fund, for providing services to the Fund, Invesco and/or Invesco affiliates including but not limited to services such as securities brokerage, distribution, third party record keeping and account servicing. The Fund has no knowledge as to whether all or any portion of the shares owned of record by these entities are also owned beneficially. |
19 Invesco Mid Cap Growth Fund
NOTE 12—Financial Highlights
The following schedule presents financial highlights for a share of the Fund outstanding throughout the periods indicated.
| | | | | | | | | | | | | | | | | | | | | | | | | | | | | | | | | | | | | | | | | | | | | | | | |
| | | Net asset
value,
beginning
of period | | | Net
investment
income
(loss)(a) | | | Net gains
(losses)
on securities
(both
realized and
unrealized) | | | Total from
investment
operations | | | Distributions
from net
realized
gains | | | Net asset
value, end
of period | | | Total
return(b) | | | Net assets,
end of period
(000’s omitted) | | | Ratio of
expenses
to average
net assets
with fee waivers
and/or expenses
absorbed | | | Ratio of
expenses
to average net
assets without
fee waivers
and/or expenses
absorbed | | | Ratio of net
investment
income (loss)
to average
net assets | | | Portfolio
turnover(c) | |
Class A | | | | | | | | | | | | | | | | | | | | | | | | | | | | | | | | | | | | | | | | | | | | | | | | |
Year ended 04/30/16 | | $ | 38.74 | | | $ | (0.18 | ) | | $ | (2.66 | ) | | $ | (2.84 | ) | | $ | (2.74 | ) | | $ | 33.16 | | | | (7.43 | )% | | $ | 2,177,520 | | | | 1.20 | %(d) | | | 1.21 | %(d) | | | (0.49 | )%(d) | | | 60 | % |
Year ended 04/30/15 | | | 37.30 | | | | (0.15 | ) | | | 5.18 | | | | 5.03 | | | | (3.59 | ) | | | 38.74 | | | | 14.39 | | | | 2,482,328 | | | | 1.14 | | | | 1.19 | | | | (0.38 | ) | | | 61 | |
Year ended 04/30/14 | | | 31.09 | | | | (0.16 | ) | | | 7.27 | | | | 7.11 | | | | (0.90 | ) | | | 37.30 | | | | 22.99 | | | | 2,384,362 | | | | 1.16 | | | | 1.21 | | | | (0.44 | ) | | | 95 | |
Year ended 04/30/13 | | | 28.15 | | | | (0.03 | )(e) | | | 2.97 | | | | 2.94 | | | | — | | | | 31.09 | | | | 10.44 | | | | 1,491,997 | | | | 1.29 | | | | 1.29 | | | | (0.11 | )(e) | | | 88 | |
Year ended 04/30/12 | | | 33.15 | | | | (0.16 | ) | | | (2.82 | ) | | | (2.98 | ) | | | (2.02 | ) | | | 28.15 | | | | (8.37 | ) | | | 1,199,482 | | | | 1.31 | | | | 1.31 | | | | (0.57 | ) | | | 109 | |
Class B | | | | | | | | | | | | | | | | | | | | | | | | | | | | | | | | | | | | | | | | | | | | | | | | |
Year ended 04/30/16 | | | 33.03 | | | | (0.15 | ) | | | (2.27 | ) | | | (2.42 | ) | | | (2.74 | ) | | | 27.87 | | | | (7.44 | )(f) | | | 43,403 | | | | 1.20 | (d)(f) | | | 1.21 | (d)(f) | | | (0.49 | )(d)(f) | | | 60 | |
Year ended 04/30/15 | | | 32.30 | | | | (0.13 | ) | | | 4.45 | | | | 4.32 | | | | (3.59 | ) | | | 33.03 | | | | 14.42 | (f) | | | 74,463 | | | | 1.14 | (f) | | | 1.19 | (f) | | | (0.38 | )(f) | | | 61 | |
Year ended 04/30/14 | | | 27.03 | | | | (0.14 | ) | | | 6.31 | | | | 6.17 | | | | (0.90 | ) | | | 32.30 | | | | 22.96 | (f) | | | 97,068 | | | | 1.16 | (f) | | | 1.21 | (f) | | | (0.44 | )(f) | | | 95 | |
Year ended 04/30/13 | | | 24.47 | | | | (0.03 | )(e) | | | 2.59 | | | | 2.56 | | | | — | | | | 27.03 | | | | 10.46 | (f) | | | 106,586 | | | | 1.29 | (f) | | | 1.29 | (f) | | | (0.11 | )(e)(f) | | | 88 | |
Year ended 04/30/12 | | | 29.11 | | | | (0.11 | ) | | | (2.51 | ) | | | (2.62 | ) | | | (2.02 | ) | | | 24.47 | | | | (8.29 | )(f) | | | 109,449 | | | | 1.21 | (f) | | | 1.21 | (f) | | | (0.47 | )(f) | | | 109 | |
Class C | | | | | | | | | | | | | | | | | | | | | | | | | | | | | | | | | | | | | | | | | | | | | | | | |
Year ended 04/30/16 | | | 31.24 | | | | (0.35 | ) | | | (2.14 | ) | | | (2.49 | ) | | | (2.74 | ) | | | 26.01 | | | | (8.12 | )(g) | | | 148,892 | | | | 1.92 | (d)(g) | | | 1.93 | (d)(g) | | | (1.21 | )(d)(g) | | | 60 | |
Year ended 04/30/15 | | | 30.95 | | | | (0.35 | ) | | | 4.23 | | | | 3.88 | | | | (3.59 | ) | | | 31.24 | | | | 13.59 | (g) | | | 176,447 | | | | 1.86 | (g) | | | 1.91 | (g) | | | (1.10 | )(g) | | | 61 | |
Year ended 04/30/14 | | | 26.11 | | | | (0.34 | ) | | | 6.08 | | | | 5.74 | | | | (0.90 | ) | | | 30.95 | | | | 22.12 | (g) | | | 170,355 | | | | 1.88 | (g) | | | 1.93 | (g) | | | (1.16 | )(g) | | | 95 | |
Year ended 04/30/13 | | | 23.82 | | | | (0.20 | )(e) | | | 2.49 | | | | 2.29 | | | | — | | | | 26.11 | | | | 9.62 | | | | 134,484 | | | | 2.04 | | | | 2.04 | | | | (0.86 | )(e) | | | 88 | |
Year ended 04/30/12 | | | 28.63 | | | | (0.32 | ) | | | (2.47 | ) | | | (2.79 | ) | | | (2.02 | ) | | | 23.82 | | | | (9.06 | ) | | | 95,998 | | | | 2.06 | | | | 2.06 | | | | (1.32 | ) | | | 109 | |
Class R | | | | | | | | | | | | | | | | | | | | | | | | | | | | | | | | | | | | | | | | | | | | | | | | |
Year ended 04/30/16 | | | 38.01 | | | | (0.26 | ) | | | (2.62 | ) | | | (2.88 | ) | | | (2.74 | ) | | | 32.39 | | | | (7.69 | ) | | | 29,547 | | | | 1.45 | (d) | | | 1.46 | (d) | | | (0.74 | )(d) | | | 60 | |
Year ended 04/30/15 | | | 36.74 | | | | (0.24 | ) | | | 5.10 | | | | 4.86 | | | | (3.59 | ) | | | 38.01 | | | | 14.14 | | | | 34,942 | | | | 1.39 | | | | 1.44 | | | | (0.63 | ) | | | 61 | |
Year ended 04/30/14 | | | 30.72 | | | | (0.24 | ) | | | 7.16 | | | | 6.92 | | | | (0.90 | ) | | | 36.74 | | | | 22.64 | | | | 36,184 | | | | 1.41 | | | | 1.46 | | | | (0.69 | ) | | | 95 | |
Year ended 04/30/13 | | | 27.88 | | | | (0.10 | )(e) | | | 2.94 | | | | 2.84 | | | | — | | | | 30.72 | | | | 10.19 | | | | 31,410 | | | | 1.54 | | | | 1.54 | | | | (0.36 | )(e) | | | 88 | |
Year ended 04/30/12 | | | 32.94 | | | | (0.23 | ) | | | (2.81 | ) | | | (3.04 | ) | | | (2.02 | ) | | | 27.88 | | | | (8.62 | ) | | | 16,080 | | | | 1.56 | | | | 1.56 | | | | (0.82 | ) | | | 109 | |
Class Y | | | | | | | | | | | | | | | | | | | | | | | | | | | | | | | | | | | | | | | | | | | | | | | | |
Year ended 04/30/16 | | | 39.92 | | | | (0.09 | ) | | | (2.75 | ) | | | (2.84 | ) | | | (2.74 | ) | | | 34.34 | | | | (7.21 | ) | | | 76,291 | | | | 0.95 | (d) | | | 0.96 | (d) | | | (0.24 | )(d) | | | 60 | |
Year ended 04/30/15 | | | 38.23 | | | | (0.05 | ) | | | 5.33 | | | | 5.28 | | | | (3.59 | ) | | | 39.92 | | | | 14.70 | | | | 80,736 | | | | 0.89 | | | | 0.94 | | | | (0.13 | ) | | | 61 | |
Year ended 04/30/14 | | | 31.78 | | | | (0.07 | ) | | | 7.42 | | | | 7.35 | | | | (0.90 | ) | | | 38.23 | | | | 23.24 | | | | 62,398 | | | | 0.91 | | | | 0.96 | | | | (0.19 | ) | | | 95 | |
Year ended 04/30/13 | | | 28.70 | | | | 0.04 | (e) | | | 3.04 | | | | 3.08 | | | | — | | | | 31.78 | | | | 10.73 | | | | 48,115 | | | | 1.04 | | | | 1.04 | | | | 0.14 | (e) | | | 88 | |
Year ended 04/30/12 | | | 33.66 | | | | (0.09 | ) | | | (2.85 | ) | | | (2.94 | ) | | | (2.02 | ) | | | 28.70 | | | | (8.12 | ) | | | 52,408 | | | | 1.06 | | | | 1.06 | | | | (0.32 | ) | | | 109 | |
Class R5 | | | | | | | | | | | | | | | | | | | | | | | | | | | | | | | | | | | | | | | | | | | | | | | | |
Year ended 04/30/16 | | | 40.14 | | | | (0.04 | ) | | | (2.77 | ) | | | (2.81 | ) | | | (2.74 | ) | | | 34.59 | | | | (7.08 | ) | | | 91,700 | | | | 0.82 | (d) | | | 0.82 | (d) | | | (0.11 | )(d) | | | 60 | |
Year ended 04/30/15 | | | 38.39 | | | | (0.02 | ) | | | 5.36 | | | | 5.34 | | | | (3.59 | ) | | | 40.14 | | | | 14.80 | | | | 86,090 | | | | 0.81 | | | | 0.81 | | | | (0.05 | ) | | | 61 | |
Year ended 04/30/14 | | | 31.87 | | | | (0.04 | ) | | | 7.46 | | | | 7.42 | | | | (0.90 | ) | | | 38.39 | | | | 23.40 | | | | 79,584 | | | | 0.83 | | | | 0.83 | | | | (0.11 | ) | | | 95 | |
Year ended 04/30/13 | | | 28.73 | | | | 0.10 | (e) | | | 3.04 | | | | 3.14 | | | | — | | | | 31.87 | | | | 10.93 | | | | 19,881 | | | | 0.84 | | | | 0.84 | | | | 0.34 | (e) | | | 88 | |
Year ended 04/30/12 | | | 33.64 | | | | (0.03 | ) | | | (2.86 | ) | | | (2.89 | ) | | | (2.02 | ) | | | 28.73 | | | | (7.97 | ) | | | 2,656 | | | | 0.85 | | | | 0.85 | | | | (0.11 | ) | | | 109 | |
Class R6 | | | | | | | | | | | | | | | | | | | | | | | | | | | | | | | | | | | | | | | | | | | | | | | | |
Year ended 04/30/16 | | | 40.21 | | | | (0.01 | ) | | | (2.78 | ) | | | (2.79 | ) | | | (2.74 | ) | | | 34.68 | | | | (7.02 | ) | | | 49,485 | | | | 0.73 | (d) | | | 0.73 | (d) | | | (0.02 | )(d) | | | 60 | |
Year ended 04/30/15 | | | 38.41 | | | | 0.02 | | | | 5.37 | | | | 5.39 | | | | (3.59 | ) | | | 40.21 | | | | 14.93 | | | | 61,029 | | | | 0.72 | | | | 0.72 | | | | 0.04 | | | | 61 | |
Year ended 04/30/14(h) | | | 34.50 | | | | (0.01 | ) | | | 4.82 | | | | 4.81 | | | | (0.90 | ) | | | 38.41 | | | | 14.05 | | | | 77,395 | | | | 0.73 | (i) | | | 0.73 | (i) | | | (0.01 | )(i) | | | 95 | |
| (a) | Calculated using average shares outstanding. |
| (b) | Includes adjustments in accordance with accounting principles generally accepted in the United States of America and as such, the net asset value for financial reporting purposes and the returns based upon those net asset values may differ from the net asset value and returns for shareholder transactions. Does not include sales charges and is not annualized for periods less than one year, if applicable. |
| (c) | Portfolio turnover is calculated at the fund level and is not annualized for periods less than one year, if applicable. For years ended April 30, 2014 and 2013, the portfolio turnover calculation excludes the value of securities purchased of $641,584,142 and $463,100,189 and sold of $469,954,370 and $427,869,406 in the effort to realign the Fund’s portfolio holdings after the reorganization of Invesco Dynamics Fund and Invesco Capital Development Fund, respectively, into the Fund. |
| (d) | Ratios are based on average daily net assets (000’s omitted) of $2,315,826, $59,475, $164,407, $32,178, $80,050, $88,908 and $54,818 for Class A, Class B, Class C, Class R, Class Y, Class R5 and Class R6 shares, respectively. |
| (e) | Net investment income (loss) per share and the ratio of net investment income (loss) to average net assets include significant cash dividends received during the period. Net investment income (loss) per share and the ratio of net investment income (loss) to average net assets excluding the significant dividends are $(0.18) and (0.63)%, $(0.15) and (0.63)%, $(0.32) and (1.38)%, $(0.24) and (0.88)%, $(0.11) and (0.38)% and $(0.05) and (0.18)% for Class A, Class B, Class C, Class R, Class Y and Class R5 shares, respectively. |
| (f) | The Total return, Ratio of expenses to average net assets and Ratio of net investment income (loss) to average net assets reflect actual 12b-1 fees of 0.25%, 0.25%, 0.25%, 0.25% and 0.15% for the years ended April 30, 2016, 2015, 2014, 2013 and 2012, respectively. |
| (g) | The Total return, Ratio of expenses to average net assets and Ratio of net investment income (loss) to average net assets reflect actual 12b-1 fees of 0.98%, 0.97% and 0.96% for the years ended April 30, 2016, 2015 and 2014, respectively. |
| (h) | Commencement date of July 15, 2013 for Class R6 shares. |
20 Invesco Mid Cap Growth Fund
Report of Independent Registered Public Accounting Firm
To the Board of Trustees of AIM Sector Funds (Invesco Sector Funds)
and Shareholders of Invesco Mid Cap Growth Fund:
In our opinion, the accompanying statement of assets and liabilities, including the schedule of investments, and the related statements of operations and of changes in net assets and the financial highlights present fairly, in all material respects, the financial position of Invesco Mid Cap Growth Fund (one of the funds constituting AIM Sector Funds (Invesco Sector Funds), hereafter referred to as the “Fund”) at April 30, 2016, the results of its operations for the year then ended, the changes in its net assets for each of the two years in the period then ended and the financial highlights for each of the five years in the period then ended, in conformity with accounting principles generally accepted in the United States of America. These financial statements and financial highlights (hereafter referred to as “financial statements”) are the responsibility of the Fund’s management; our responsibility is to express an opinion on these financial statements based on our audits. We conducted our audits of these financial statements in accordance with the standards of the Public Company Accounting Oversight Board (United States). Those standards require that we plan and perform the audit to obtain reasonable assurance about whether the financial statements are free of material misstatement. An audit includes examining, on a test basis, evidence supporting the amounts and disclosures in the financial statements, assessing the accounting principles used and significant estimates made by management, and evaluating the overall financial statement presentation. We believe that our audits, which included confirmation of securities at April 30, 2016 by correspondence with the custodian and brokers, and the application of alternative auditing procedures where confirmations of security purchases have not been received, provide a reasonable basis for our opinion.
PRICEWATERHOUSECOOPERS LLP
June 22, 2016
Houston, Texas
21 Invesco Mid Cap Growth Fund
Calculating your ongoing Fund expenses
Example
As a shareholder of the Fund, you incur two types of costs: (1) transaction costs, which may include sales charges (loads) on purchase payments or contingent deferred sales charges on redemptions, if any; and (2) ongoing costs, including management fees, distribution and/or service (12b-1) fees, and other Fund expenses. This example is intended to help you understand your ongoing costs (in dollars) of investing in the Fund and to compare these costs with ongoing costs of investing in other mutual funds. The example is based on an investment of $1,000 invested at the beginning of the period and held for the entire period November 1, 2015 through April 30, 2016.
Actual expenses
The table below provides information about actual account values and actual expenses. You may use the information in this table, together with the amount you invested, to estimate the expenses that you paid over the period. Simply divide your account value by $1,000 (for example, an $8,600 account value divided by $1,000 = 8.6), then multiply the result by the number in the table under the heading entitled “Actual Expenses Paid During Period” to estimate the expenses you paid on your account during this period.
Hypothetical example for comparison purposes
The table below also provides information about hypothetical account values and hypothetical expenses based on the Fund’s actual expense ratio and an assumed rate of return of 5% per year before expenses, which is not the Fund’s actual return.
The hypothetical account values and expenses may not be used to estimate the actual ending account balance or expenses you paid for the period. You may use this information to compare the ongoing costs of investing in the Fund and other funds. To do so, compare this 5% hypothetical example with the 5% hypothetical examples that appear in the shareholder reports of the other funds.
Please note that the expenses shown in the table are meant to highlight your ongoing costs only and do not reflect any transaction costs, such as sales charges (loads) on purchase payments or contingent deferred sales charges on redemptions, if any. Therefore, the hypothetical information is useful in comparing ongoing costs only, and will not help you determine the relative total costs of owning different funds. In addition, if these transaction costs were included, your costs would have been higher.
| | | | | | | | | | | | | | | | | | | | | | | | |
| Class | | Beginning
Account Value
(11/01/15) | | | ACTUAL | | | HYPOTHETICAL
(5% annual return before expenses) | | | Annualized
Expense
Ratio | |
| | | Ending
Account Value
(04/30/16)1 | | | Expenses
Paid During
Period2 | | | Ending
Account Value
(04/30/16) | | | Expenses
Paid During
Period2 | | |
| A | | $ | 1,000.00 | | | $ | 951.70 | | | $ | 6.02 | | | $ | 1,018.70 | | | $ | 6.22 | | | | 1.24 | % |
| B | | | 1,000.00 | | | | 951.50 | | | | 6.02 | | | | 1,018.70 | | | | 6.22 | | | | 1.24 | |
| C | | | 1,000.00 | | | | 948.30 | | | | 9.45 | | | | 1,015.17 | | | | 9.77 | | | | 1.95 | |
| R | | | 1,000.00 | | | | 950.40 | | | | 7.23 | | | | 1,017.45 | | | | 7.47 | | | | 1.49 | |
| Y | | | 1,000.00 | | | | 952.80 | | | | 4.81 | | | | 1,019.94 | | | | 4.97 | | | | 0.99 | |
| R5 | | | 1,000.00 | | | | 953.60 | | | | 4.03 | | | | 1,020.74 | | | | 4.17 | | | | 0.83 | |
| R6 | | | 1,000.00 | | | | 954.00 | | | | 3.60 | | | | 1,021.18 | | | | 3.72 | | | | 0.74 | |
| 1 | The actual ending account value is based on the actual total return of the Fund for the period November 1, 2015 through April 30, 2016, after actual expenses and will differ from the hypothetical ending account value which is based on the Fund’s expense ratio and a hypothetical annual return of 5% before expenses. |
| 2 | Expenses are equal to the Fund’s annualized expense ratio as indicated above multiplied by the average account value over the period, multiplied by 182/366 to reflect the most recent fiscal half year. |
22 Invesco Mid Cap Growth Fund
Tax Information
Form 1099-DIV, Form 1042-S and other year–end tax information provide shareholders with actual calendar year amounts that should be included in their tax returns. Shareholders should consult their tax advisors.
The following distribution information is being provided as required by the Internal Revenue Code or to meet a specific state’s requirement.
The Fund designates the following amounts or, if subsequently determined to be different, the maximum amount allowable for its fiscal year ended April 30, 2016:
| | | | |
Federal and State Income Tax | |
Long-Term Capital Gain Distributions | | $ | 210,003,868 | |
Qualified Dividend Income* | | | 0 | % |
Corporate Dividends Received Deduction* | | | 0 | % |
U.S. Treasury Obligations* | | | 0 | % |
| | * | The above percentages are based on ordinary income dividends paid to shareholders during the Fund’s fiscal year. |
23 Invesco Mid Cap Growth Fund
Trustees and Officers
The address of each trustee and officer is AIM Sector Funds (Invesco Sector Funds) (the “Trust”), 11 Greenway Plaza, Suite 1000, Houston, Texas 77046-1173. The trustees serve for the life of the Trust, subject to their earlier death, incapacitation, resignation, retirement or removal as more specifically provided in the Trust’s organizational documents. Each officer serves for a one year term or until their successors are elected and qualified. Column two below includes length of time served with predecessor entities, if any.
| | | | | | | | |
Name, Year of Birth and
Position(s) Held with the Trust | | Trustee and/
or Officer Since | | Principal Occupation(s) During Past 5 Years | | Number of Funds in Fund Complex Overseen by Trustee | | Other Directorship(s) Held by Trustee During Past 5 Years |
| Interested Persons | | | | | | | | |
Martin L. Flanagan1 — 1960 Trustee | | 2007 | | Executive Director, Chief Executive Officer and President, Invesco Ltd. (ultimate parent of Invesco and a global investment management firm); Advisor to the Board, Invesco Advisers, Inc. (formerly known as Invesco Institutional (N.A.), Inc.); Trustee, The Invesco Funds; Vice Chair, Investment Company Institute; and Member of Executive Board, SMU Cox School of Business Formerly: Chairman and Chief Executive Officer, Invesco Advisers, Inc. (registered investment adviser); Director, Chairman, Chief Executive Officer and President, IVZ Inc. (holding company), INVESCO Group Services, Inc. (service provider) and Invesco North American Holdings, Inc. (holding company); Director, Chief Executive Officer and President, Invesco Holding Company Limited (parent of Invesco and a global investment management firm); Director, Invesco Ltd.; Chairman, Investment Company Institute and President, Co-Chief Executive Officer, Co-President, Chief Operating Officer and Chief Financial Officer, Franklin Resources, Inc. (global investment management organization) | | 146 | | None |
Philip A. Taylor2 — 1954 Trustee and Senior Vice President | | 2006 | | Head of the Americas and Senior Managing Director, Invesco Ltd.; Director, Co-Chairman, Co-President and Co-Chief Executive Officer, Invesco Advisers, Inc. (formerly known as Invesco Institutional (N.A.), Inc.) (registered investment adviser); Director, Chairman, Chief Executive Officer and President, Invesco Management Group, Inc. (formerly known as Invesco AIM Management Group, Inc.) (financial services holding company); Director and Chairman, Invesco Investment Services, Inc. (formerly known as Invesco AIM Investment Services, Inc.) (registered transfer agent) Chief Executive Officer, Invesco Corporate Class Inc. (corporate mutual fund company) Director, Chairman and Chief Executive Officer, Invesco Canada Ltd. (formerly known as Invesco Trimark Ltd./Invesco Trimark Ltèe) (registered investment adviser and registered transfer agent); Trustee and Senior Vice President, The Invesco Funds; Director, Invesco Investment Advisers LLC (formerly known as Van Kampen Asset Management); Director, Chief Executive Officer and President, Van Kampen Exchange Corp. Formerly: President and Principal Executive Officer, The Invesco Funds (other than AIM Treasurer’s Series Trust (Invesco Treasurer’s Series Trust), Short-Term Investments Trust and Invesco Management Trust); Executive Vice President, The Invesco Funds (AIM Treasurer’s Series Trust (Invesco Treasurer’s Series Trust), Short-Term Investments Trust and Invesco Management Trust only); Director and President, INVESCO Funds Group, Inc. (registered investment adviser and registered transfer agent); Director and Chairman, IVZ Distributors, Inc. (formerly known as INVESCO Distributors, Inc.) (registered broker dealer); Director, President and Chairman, Invesco Inc. (holding company), Invesco Canada Holdings Inc. (holding company), Trimark Investments Ltd./Placements Trimark Ltèe and Invesco Financial Services Ltd/Services Financiers Invesco Ltèe; Chief Executive Officer, Invesco Canada Fund Inc. (corporate mutual fund company); Director and Chairman, Van Kampen Investor Services Inc.; Director, Chief Executive Officer and President, 1371 Preferred Inc. (holding company) and Van Kampen Investments Inc.; Director and President, AIM GP Canada Inc. (general partner for limited partnerships) and Van Kampen Advisors, Inc.; Director and Chief Executive Officer, Invesco Trimark Dealer Inc. (registered broker dealer); Director, Invesco Distributors, Inc. (formerly known as Invesco AIM Distributors, Inc.) (registered broker dealer); Manager, Invesco PowerShares Capital Management LLC; Director, Chief Executive Officer and President, Invesco Advisers, Inc.; Director, Chairman, Chief Executive Officer and President, Invesco AIM Capital Management, Inc.; President, Invesco Trimark Dealer Inc. and Invesco Trimark Ltd./Invesco Trimark Ltèe; Director and President, AIM Trimark Corporate Class Inc. and AIM Trimark Canada Fund Inc.; Senior Managing Director, Invesco Holding Company Limited; Director and Chairman, Fund Management Company (former registered broker dealer); President and Principal Executive Officer, The Invesco Funds (AIM Treasurer’s Series Trust (Invesco Treasurer’s Series Trust), and Short-Term Investments Trust only); President, AIM Trimark Global Fund Inc. and AIM Trimark Canada Fund Inc. | | 146 | | None |
| 1 | Mr. Flanagan is considered an interested person (within the meaning of Section 2(a)(19) of the 1940 Act) of the Trust because he is an officer of the Adviser to the Trust, and an officer and a director of Invesco Ltd., ultimate parent of the Adviser. |
| 2 | Mr. Taylor is considered an interested person (within the meaning of Section 2(a)(19) of the 1940 Act) of the Trust because he is an officer and a director of the Adviser. |
T-1 Invesco Mid Cap Growth Fund
Trustees and Officers—(continued)
| | | | | | | | |
Name, Year of Birth and
Position(s) Held with the Trust | | Trustee and/
or Officer Since | | Principal Occupation(s) During Past 5 Years | | Number of Funds in Fund Complex Overseen by Trustee | | Other Directorship(s) Held by Trustee During Past 5 Years |
| Independent Trustees | | | | | | | | |
Bruce L. Crockett — 1944 Trustee and Chair | | 2003 | | Chairman, Crockett Technologies Associates (technology consulting company) Formerly: Director, Captaris (unified messaging provider); Director, President and Chief Executive Officer, COMSAT Corporation; Chairman, Board of Governors of INTELSAT (international communications company); ACE Limited (insurance company); Independent Directors Council and Investment Company Institute | | 146 | | ALPS (Attorneys Liability Protection Society) (insurance company) and Globe Specialty Metals, Inc. (metallurgical company); Member of the Audit Committee, Ferroglobe PLC and Investment Company Institute; Member of the Executive Committee and Chair of the Governance Committee, Independent Directors Council |
David C. Arch — 1945 Trustee | | 2010 | | Chairman of Blistex Inc., a consumer health care products manufacturer | | 146 | | Board member of the Illinois Manufacturers’ Association; Member of the Board of Visitors, Institute for the Humanities, University of Michigan |
James T. Bunch — 1942 Trustee | | 2000 | | Managing Member, Grumman Hill Group LLC (family office/private equity investments) Formerly: Chairman of the Board, Denver Film Society, Chairman of the Board of Trustees, Evans Scholarship Foundation; Chairman, Board of Governors, Western Golf Association | | 146 | | Trustee, Evans Scholarship Foundation |
Albert R. Dowden — 1941 Trustee | | 2003 | | Director of a number of public and private business corporations, including Nature’s Sunshine Products, Inc. Formerly: Director, The Boss Group, Ltd. and Reich & Tang Funds (5 portfolios) (registered investment company); Director, Homeowners of America Holding Corporation/Homeowners of America Insurance Company (property casualty company); Director, Continental Energy Services, LLC (oil and gas pipeline service); Director, CompuDyne Corporation (provider of product and services to the public security market) and Director, Annuity and Life Re (Holdings), Ltd. (reinsurance company); Director, President and Chief Executive Officer, Volvo Group North America, Inc.; Senior Vice President, AB Volvo; Director of various public and private corporations; Chairman, DHJ Media, Inc.; Director, Magellan Insurance Company; and Director, The Hertz Corporation, Genmar Corporation (boat manufacturer), National Media Corporation; Advisory Board of Rotary Power International (designer, manufacturer, and seller of rotary power engines); and Chairman, Cortland Trust, Inc. (registered investment company) | | 146 | | Director of Nature’s Sunshine Products, Inc. |
Jack M. Fields — 1952 Trustee | | 2003 | | Chief Executive Officer, Twenty First Century Group, Inc. (government affairs company); and Discovery Learning Alliance (non-profit) Formerly: Owner and Chief Executive Officer, Dos Angeles Ranch L.P. (cattle, hunting, corporate entertainment); Director, Insperity, Inc. (formerly known as Administaff); Chief Executive Officer, Texana Timber LP (sustainable forestry company); Director of Cross Timbers Quail Research Ranch (non-profit); and member of the U.S. House of Representatives | | 146 | | None |
Eli Jones — 1961 Trustee | | 2016 | | Professor and Dean, Mays Business School — Texas A&M University Formerly: Professor and Dean, Walton College of Business, University of Arkansas and E.J. Ourso College of Business, Louisiana State University and Director, Arvest Bank | | 146 | | Director of Insperity, Inc. (formerly known as Administaff) |
Prema Mathai-Davis — 1950 Trustee | | 2003 | | Retired. Formerly: Chief Executive Officer, YWCA of the U.S.A. | | 146 | | None |
Larry Soll — 1942 Trustee | | 1997 | | Retired. Formerly: Chairman, Chief Executive Officer and President, Synergen Corp. (a biotechnology company) | | 146 | | None |
Raymond Stickel, Jr. — 1944 Trustee | | 2005 | | Retired. Formerly: Director, Mainstay VP Series Funds, Inc. (25 portfolios) and Partner, Deloitte & Touche | | 146 | | None |
Robert C. Troccoli — 1949 Trustee | | 2016 | | Adjunct Professor and Executive-in-Residence, University of Denver — Daniels College of Business Formerly: Senior Partner, KPMG LLP | | 146 | | None |
T-2 Invesco Mid Cap Growth Fund
Trustees and Officers—(continued)
| | | | | | | | |
Name, Year of Birth and
Position(s) Held with the Trust | | Trustee and/
or Officer Since | | Principal Occupation(s) During Past 5 Years | | Number of Funds in Fund Complex Overseen by Trustee | | Other Directorship(s) Held by Trustee During Past 5 Years |
| Independent Trustees—(continued) |
Suzanne H. Woolsey — 1941 Trustee | | 2014 | | Retired. Formerly: Chief Executive Officer of Woolsey Partners LLC | | 146 | | Director, SunShare LLC; Trustee, Ocean Conservancy; Emeritus Chair of the Board of Trustees of the Institute for Defense Analyses and of Colorado College; Trustee, Chair, Business and Finance Committee of California Institute of Technology; Prior to 2014, Director of Fluor Corp.; Prior to 2010, Trustee of the German Marshall Fund of the United States; Prior to 2010, Trustee of the Rocky Mountain Institute |
| Other Officers | | | | | | | | |
Sheri Morris — 1964 President, Principal Executive Officer and Treasurer | �� | 2003 | | President, Principal Executive Officer and Treasurer, The Invesco Funds; Vice President, Invesco Advisers, Inc. (formerly known as Invesco Institutional (N.A.), Inc.) (registered investment adviser); and Vice President, PowerShares Exchange-Traded Fund Trust, PowerShares Exchange-Traded Fund Trust II, PowerShares India Exchange-Traded Fund Trust, PowerShares Actively Managed Exchange-Traded Fund Trust, and PowerShares Actively Managed Exchange-Traded Commodity Fund Trust Formerly: Vice President and Principal Financial Officer, The Invesco Funds; Vice President, Invesco AIM Advisers, Inc., Invesco AIM Capital Management, Inc. and Invesco AIM Private Asset Management, Inc.; Assistant Vice President and Assistant Treasurer, The Invesco Funds and Assistant Vice President, Invesco Advisers, Inc., Invesco AIM Capital Management, Inc. and Invesco AIM Private Asset Management, Inc.; and Treasurer, PowerShares Exchange-Traded Fund Trust, PowerShares Exchange-Traded Fund Trust II, PowerShares India Exchange-Traded Fund Trust and PowerShares Actively Managed Exchange-Traded Fund Trust | | N/A | | N/A |
Russell C. Burk — 1958 Senior Vice President and Senior Officer | | 2005 | | Senior Vice President and Senior Officer, The Invesco Funds | | N/A | | N/A |
John M. Zerr — 1962 Senior Vice President, Chief Legal Officer and Secretary | | 2006 | | Director, Senior Vice President, Secretary and General Counsel, Invesco Management Group, Inc. (formerly known as Invesco AIM Management Group, Inc.) and Van Kampen Exchange Corp.; Senior Vice President, Invesco Advisers, Inc. (formerly known as Invesco Institutional (N.A.), Inc.) (registered investment adviser); Senior Vice President and Secretary, Invesco Distributors, Inc. (formerly known as Invesco AIM Distributors, Inc.); Director, Vice President and Secretary, Invesco Investment Services, Inc. (formerly known as Invesco AIM Investment Services, Inc.) Senior Vice President, Chief Legal Officer and Secretary, The Invesco Funds; Managing Director, Invesco PowerShares Capital Management LLC; Director, Secretary and General Counsel, Invesco Investment Advisers LLC (formerly known as Van Kampen Asset Management); Secretary and General Counsel, Invesco Capital Markets, Inc. (formerly known as Van Kampen Funds Inc.) and Chief Legal Officer, PowerShares Exchange-Traded Fund Trust, PowerShares Exchange-Traded Fund Trust II, PowerShares India Exchange-Traded Fund Trust, PowerShares Actively Managed Exchange-Traded Fund Trust, and PowerShares Actively Managed Exchange-Traded Commodity Fund Trust Formerly: Director, Vice President and Secretary, IVZ Distributors, Inc. (formerly known as INVESCO Distributors, Inc.); Director and Vice President, INVESCO Funds Group, Inc.; Director and Vice President, Van Kampen Advisors Inc.; Director, Vice President, Secretary and General Counsel, Van Kampen Investor Services Inc.; Director, Invesco Distributors, Inc. (formerly known as Invesco AIM Distributors, Inc.); Director, Senior Vice President, General Counsel and Secretary, Invesco AIM Advisers, Inc. and Van Kampen Investments Inc.; Director, Vice President and Secretary, Fund Management Company; Director, Senior Vice President, Secretary, General Counsel and Vice President, Invesco AIM Capital Management, Inc.; Chief Operating Officer and General Counsel, Liberty Ridge Capital, Inc. (an investment adviser); Vice President and Secretary, PBHG Funds (an investment company) and PBHG Insurance Series Fund (an investment company); Chief Operating Officer, General Counsel and Secretary, Old Mutual Investment Partners (a broker-dealer); General Counsel and Secretary, Old Mutual Fund Services (an administrator) and Old Mutual Shareholder Services (a shareholder servicing center); Executive Vice President, General Counsel and Secretary, Old Mutual Capital, Inc. (an investment adviser); and Vice President and Secretary, Old Mutual Advisors Funds (an investment company) | | N/A | | N/A |
T-3 Invesco Mid Cap Growth Fund
Trustees and Officers—(continued)
| | | | | | | | |
Name, Year of Birth and
Position(s) Held with the Trust | | Trustee and/
or Officer Since | | Principal Occupation(s) During Past 5 Years | | Number of Funds in Fund Complex Overseen by Trustee | | Other Directorship(s) Held by Trustee During Past 5 Years |
| Other Officers—(continued) | | | | | | | | |
Karen Dunn Kelley — 1960 Senior Vice President | | 2003 | | Senior Managing Director, Investments, Invesco Ltd.; Director, Co-President, Co-Chief Executive Officer, and Co-Chairman, Invesco Advisers, Inc. (formerly known as Invesco Institutional (N.A.), Inc.) (registered investment adviser); Chairman and Director, Invesco Senior Secured Management, Inc.; Senior Vice President, Invesco Management Group, Inc. (formerly known as Invesco AIM Management Group, Inc.); Executive Vice President, Invesco Distributors, Inc. (formerly known as Invesco AIM Distributors, Inc.); Director, Invesco Mortgage Capital Inc. and Invesco Management Company Limited; Senior Vice President, The Invesco Funds Formerly: Vice President, The Invesco Funds (other than AIM Treasurer’s Series Trust (Invesco Treasurer’s Series Trust), Short-Term Investments Trust and Invesco Management Trust); and President and Principal Executive Officer, The Invesco Funds (AIM Treasurer’s Series Trust (Invesco Treasurer’s Series Trust), Short-Term Investments Trust and Invesco Management Trust only); Director and President, INVESCO Asset Management (Bermuda) Ltd., Director, INVESCO Global Asset Management DAC (formerly known as INVESCO Global Asset Management Limited) and INVESCO Management S.A.; Senior Vice President, Van Kampen Investments Inc. and Invesco Advisers, Inc. (formerly known as Invesco Institutional (N.A.), Inc.) (registered investment adviser); Director and President, Fund Management Company; Chief Cash Management Officer, Director of Cash Management, Senior Vice President, and Managing Director, Invesco AIM Capital Management, Inc.; Director of Cash Management, Senior Vice President, and Vice President, Invesco Advisers, Inc. and The Invesco Funds (AIM Treasurer’s Series Trust (Invesco Treasurer’s Series Trust), and Short-Term Investments Trust only) | | N/A | | N/A |
Kelli Gallegos — 1970 Vice President, Principal Financial Officer and Assistant Treasurer | | 2008 | | Vice President, Principal Financial Officer and Assistant Treasurer, The Invesco Funds; Assistant Treasurer, Invesco PowerShares Capital Management LLC, PowerShares Exchange-Traded Fund Trust, PowerShares Exchange-Traded Fund Trust II, PowerShares India Exchange-Traded Fund Trust, PowerShares Actively Managed Exchange-Traded Fund Trust, and PowerShares Actively Managed Exchange-Traded Commodity Fund Trust Formerly: Assistant Vice President, The Invesco Funds | | N/A | | N/A |
Tracy Sullivan — 1962 Vice President, Chief Tax Officer and Assistant Treasurer | | 2008 | | Vice President, Chief Tax Officer and Assistant Treasurer, The Invesco Funds; Assistant Treasurer, Invesco PowerShares Capital Management LLC, PowerShares Exchange-Traded Fund Trust, PowerShares Exchange-Traded Fund Trust II, PowerShares India Exchange-Traded Fund Trust, PowerShares Actively Managed Exchange-Traded Fund Trust, and PowerShares Actively Managed Exchange-Traded Commodity Fund Trust Formerly: Assistant Vice President, The Invesco Funds | | N/A | | N/A |
Crissie M. Wisdom — 1969 Anti-Money Laundering Compliance Officer | | 2013 | | Anti-Money Laundering Compliance Officer, Invesco Advisers, Inc. (formerly known as Invesco Institutional (N.A.), Inc.) (registered investment adviser), Invesco Capital Markets, Inc. (formerly known as Van Kampen Funds Inc.), Invesco Distributors, Inc., Invesco Investment Services, Inc., Invesco Management Group, Inc., Van Kampen Exchange Corp., The Invesco Funds, and PowerShares Exchange-Traded Fund Trust, PowerShares Exchange-Traded Fund Trust II, PowerShares India Exchange-Traded Fund Trust, PowerShares Actively Managed Exchange-Traded Fund Trust and PowerShares Actively Managed Exchange-Traded Commodity Fund Trust; Anti-Money Laundering Compliance Officer and Bank Secrecy Act Officer, INVESCO National Trust Company and Invesco Trust Company; and Fraud Prevention Manager and Controls and Risk Analysis Manager for Invesco Investment Services, Inc. | | N/A | | N/A |
Robert R. Leveille — 1969 Chief Compliance Officer | | 2016 | | Chief Compliance Officer, Invesco Advisers, Inc. (registered investment adviser); and Chief Compliance Officer, The Invesco Funds Formerly: Chief Compliance Officer, Putnam Investments and the Putnam Funds | | N/A | | N/A |
The Statement of Additional Information of the Trust includes additional information about the Fund’s Trustees and is available upon request, without charge, by calling 1.800.959.4246. Please refer to the Fund’s Statement of Additional Information for information on the Fund’s sub-advisers.
| | | | | | |
Office of the Fund 11 Greenway Plaza, Suite 1000 Houston, TX 77046-1173 | | Investment Adviser Invesco Advisers, Inc. 1555 Peachtree Street, N.E. Atlanta, GA 30309 | | Distributor Invesco Distributors, Inc. 11 Greenway Plaza, Suite 1000 Houston, TX 77046-1173 | | Auditors PricewaterhouseCoopers LLP 1000 Louisiana Street, Suite 5800 Houston, TX 77002-5678 |
| | | |
| | | | | | |
Counsel to the Fund Stradley Ronon Stevens & Young, LLP 2005 Market Street, Suite 2600 Philadelphia, PA 19103-7018 | | Counsel to the Independent Trustees Goodwin Procter LLP 901 New York Avenue, N.W. Washington, D.C. 20001 | | Transfer Agent Invesco Investment Services, Inc. 11 Greenway Plaza, Suite 1000 Houston, TX 77046-1173 | | Custodian State Street Bank and Trust Company 225 Franklin Street Boston, MA 02110-2801 |
T-4 Invesco Mid Cap Growth Fund

Invesco mailing information
Send general correspondence to Invesco Investment Services, Inc., P.O. Box 219078, Kansas City, MO 64121-9078.
Important notice regarding delivery of security holder documents
To reduce Fund expenses, only one copy of most shareholder documents may be mailed to shareholders with multiple accounts at the same address (Householding). Mailing of your shareholder documents may be householded indefinitely unless you instruct us otherwise. If you do not want the mailing of these documents to be combined with those for other members of your household, please contact Invesco Investment Services, Inc. at 800 959 4246 or contact your financial institution. We will begin sending you individual copies for each account within 30 days after receiving your request.
Fund holdings and proxy voting information
The Fund provides a complete list of its holdings four times in each fiscal year, at the quarter ends. For the second and fourth quarters, the lists appear in the Fund’s semiannual and annual reports to shareholders. For the first and third quarters, the Fund files the lists with the Securities and Exchange Commission (SEC) on Form N-Q. The most recent list of portfolio holdings is available at invesco.com/completeqtrholdings. Shareholders can also look up the Fund’s Forms N-Q on the SEC website at sec.gov. Copies of the Fund’s Forms N-Q may be reviewed and copied at the SEC Public Reference Room in Washington, D.C. You can obtain information on the operation of the Public Reference Room, including information about duplicating fee charges, by calling 202 551 8090 or 800 732 0330, or by electronic request at the following email address: publicinfo@sec.gov. The SEC file numbers for the Fund are shown below.
A description of the policies and procedures that the Fund uses to determine how to vote proxies relating to portfolio securities is available without charge, upon request, from our Client Services department at 800 959 4246 or at invesco.com/proxyguidelines. The information is also available on the SEC website, sec.gov.
Information regarding how the Fund voted proxies related to its portfolio securities during the most recent 12-month
| | |
period ended June 30 is available at invesco.com/proxysearch. The information is also available on the SEC website, sec.gov. Invesco Advisers, Inc. is an investment adviser; it provides investment advisory services to individual and institutional clients and does not sell securities. Invesco Distributors, Inc. is the US distributor for Invesco Ltd.’s retail mutual funds, exchange-traded funds and institutional money market funds. Both are wholly owned, indirect subsidiaries of Invesco Ltd. | |  |
| | | | |
| SEC file numbers: 811-03826 and 002-85905 | | VK-MCG-AR-1 | | Invesco Distributors, Inc. |
| | | | |
| | |
 | | Annual Report to Shareholders | | April 30, 2016 |
| | |
| | Invesco Small Cap Value Fund |
| | Nasdaq: |
| | A: VSCAX n B: VSMBX n C: VSMCX n Y: VSMIX |
Letters to Shareholders
| | | | |

Philip Taylor | | | | Dear Shareholders: This annual report includes information about your Fund, including performance data and a complete list of its investments as of the close of the reporting period. Inside is a discussion of how your Fund was managed and the factors that affected its performance during the reporting period. US economic data were generally positive over the reporting period, with the economy expanding modestly and employment numbers improving steadily. Throughout the reporting period, US consumers benefited from declining energy prices and greater credit availability, but a strengthening dollar crimped the profits of many large multi-national companies doing business overseas. Ending years of uncertainty, the US Federal Reserve in December 2015 finally raised short-term interest rates for the first time since 2006, signaling its confidence that the economy was likely to continue expanding and improving. Overseas, the economic story was less positive. |
The European Central Bank and central banks in China and Japan – as well as other countries – either instituted or maintained extraordinarily accommodative monetary policies in response to economic weakness. Stocks began 2016 on a weak note due to increased concerns about global economic weakness.
Short-term market volatility can prompt some investors to abandon their investment plans – and can cause others to settle for average results. The investment professionals at Invesco, in contrast, invest with high conviction and a long-term perspective. At Invesco, investing with high conviction means offering a wide range of strategies designed to go beyond market benchmarks. We trust our research-driven insights, have confidence in our investment processes and build portfolios that reflect our beliefs. Our goal is to look past market noise in an effort to find attractive opportunities at attractive prices – consistent with the investment strategies spelled out in each fund’s prospectus. Of course, investing with high conviction can’t guarantee a profit or ensure investment success; no investment strategy or risk analysis can. To learn more about how we invest with high conviction, visit invesco.com/HighConviction.
You, too, can invest with high conviction by maintaining a long-term investment perspective and by working with your financial adviser on a regular basis. During periods of short-term market volatility or uncertainty, your financial adviser can keep you focused on your long-term investment goals – a new home, a child’s college education, or a secure retirement. He or she also can share research about the economy, the markets and individual investment options.
Visit our website for more information on your investments
Our website, invesco.com/us, offers a wide range of market insights and investment perspectives. On the website, you’ll find detailed information about our funds, including performance, holdings and portfolio manager commentaries. You can access information about your account by completing a simple, secure online registration. Click on the “Need to register” link in the “Account Access” box on our homepage to get started. Invesco’s mobile apps for iPhone® and iPad® (both available free from the App StoreSM) allow you to obtain the same detailed information, monitor your account and create customizable watch lists.
In addition to the resources accessible on our website and through our mobile app, you can obtain timely updates to help you stay informed about the markets, the economy and investing by connecting with Invesco on Twitter, LinkedIn or Facebook. You can access our blog at blog.invesco.us.com. Our goal is to provide you the information you want, when and where you want it.
Have questions?
For questions about your account, contact an Invesco client services representative at 800 959 4246. For Invesco-related questions or comments, please email me directly at phil@invesco.com.
All of us at Invesco look forward to serving your investment management needs. Thank you for investing with us.
Sincerely,

Philip Taylor
Senior Managing Director, Invesco Ltd.
iPhone and iPad are trademarks of Apple Inc., registered in the US and other countries. App Store is a service mark of Apple Inc. Invesco Distributors, Inc. is not affiliated with Apple Inc.
2 Invesco Small Cap Value Fund
| | | | |

Bruce Crockett | | | | Dear Fellow Shareholders: Among the many important lessons I’ve learned in more than 40 years in a variety of business endeavors is the value of a trusted advocate. As independent chair of the Invesco Funds Board, I can assure you that the members of the Board are strong advocates for the interests of investors in Invesco’s mutual funds. We work hard to represent your interests through oversight of the quality of the investment management services your funds receive and other matters important to your investment, including but not limited to: n Ensuring that Invesco offers a diverse lineup of mutual funds that your financial adviser can use to strive to meet your financial needs as your investment goals change over time. n Monitoring how the portfolio management teams of the Invesco funds are performing in light of changing economic and market conditions. |
| n | | Assessing each portfolio management team’s investment performance within the context of the investment strategy described in the fund’s prospectus. |
| n | | Monitoring for potential conflicts of interests that may impact the nature of the services that your funds receive. |
We believe one of the most important services we provide our fund shareholders is the annual review of the funds’ advisory and sub-advisory contracts with Invesco Advisers and its affiliates. This review is required by the Investment Company Act of 1940 and focuses on the nature and quality of the services Invesco provides as the adviser to the Invesco funds and the reasonableness of the fees that it charges for those services. Each year, we spend months carefully reviewing information received from Invesco and a variety of independent sources, such as performance and fee data prepared by Lipper Inc., an independent, third-party firm widely recognized as a leader in its field. We also meet with our independent legal counsel and other independent advisers to review and help us assess the information that we have received. Our goal is to assure that you receive quality investment management services for a reasonable fee.
I trust the measures outlined above provide assurance that you have a worthy advocate when it comes to choosing the Invesco Funds.
As always, please contact me at bruce@brucecrockett.com with any questions or concerns you may have. On behalf of the Board, we look forward to continuing to represent your interests and serving your needs.
Sincerely,

Bruce L. Crockett
Independent Chair
Invesco Funds Board of Trustees
3 Invesco Small Cap Value Fund
Management’s Discussion of Fund Performance
| | | | |
| Performance summary | |
For the fiscal year ended April 30, 2016, Class A shares of Invesco Small Cap Value Fund (the Fund), at net asset value (NAV), underperformed the Russell 2000 Value Index, the Fund’s style-specific benchmark. Your Fund’s long-term performance appears later in this report. | |
| Fund vs. Indexes | |
Total returns, 4/30/15 to 4/30/16, at net asset value (NAV). Performance shown does not include applicable contingent deferred sales charges (CDSC) or front-end sales charges, which would have reduced performance. | |
Class A Shares | | | -11.43 | % |
Class B Shares | | | -12.06 | |
Class C Shares | | | -12.11 | |
Class Y Shares | | | -11.19 | |
S&P 500 Index▼ (Broad Market Index) | | | 1.21 | |
Russell 2000 Value Index▼ (Style-Specific Index) | | | -3.71 | |
| Lipper Small-Cap Value Funds Indexn (Peer Group Index) | | | -3.99 | |
Source(s): ▼FactSet Research Systems Inc.; nLipper Inc. | | | | |
Market conditions and your Fund
During the fiscal year ended April 30, 2016, the US economy improved slowly but steadily, although the health of individual economic sectors varied dramatically. The energy sector saw a continued slowdown as oil prices fell in response to increasing supply and slowing global demand. In contrast, continued low interest rates, increased availability of credit and a better employment picture all helped consumer-related sectors. However, US equity markets moved lower in the summer of 2015 as a significant downturn in China’s financial markets and weak global economic growth led to increased investor uncertainty and market volatility. In the fall of 2015, US markets rallied and the US Federal Reserve (the Fed) saw enough economic stabilization to finally raise interest rates. US equity markets fell again in the first few months of 2016 due to continued concern about oil-price weakness and renewed uncertainty about Fed monetary policy. Market performance eventually
recovered, and the S&P 500 Index, considered representative of the performance of the US stock market, finished the reporting period modestly higher.
Within the Russell 2000 Value Index, the utilities and consumer staples sectors were the best-performing sectors during the reporting period, while energy and consumer discretionary were the worst-performing. Overall, investor fear rose through the fiscal year, leading to better short-term performance for defensive sectors and wider valuation disparities across the market. As investors, we believe it is important to take a long-term perspective.
During the fiscal year, we continued to use our intrinsic value strategy, seeking to create wealth by maintaining a long-term investment horizon and investing in companies that are selling at a significant discount to our estimate of their intrinsic value. We believe intrinsic value represents the inherent business value of portfolio holdings based on our estimates of future cash flow.
Since our application of this strategy is highly disciplined and relatively unique, it is important to understand the benefits and limitations of our process. First, the investment strategy is intended to preserve your capital while growing it at above-market rates over the long term. Second, our investments have little in common with popular stock market indexes and most of our peers. And third, the Fund’s short-term relative performance will naturally be different from stock market indexes and peers and have little information value since we typically structure the portfolio significantly differently than these benchmarks.
Drivers of Fund performance were mainly stock-specific during the fiscal year. Health care diagnostic and research company Alere was the largest contributor to overall Fund performance. Shares of the company rose after it was announced that Abbott Laboratories (not a Fund holding) was acquiring Alere. Asset management company Affiliated Managers and apparel company Tailored Brands (formerly Men’s Wearhouse) were also among the top contributors to Fund performance for the reporting period. We started buying Affiliated Managers in late 2015 as the stock came under pressure when its affiliate Third Avenue Management announced restrictions on investor withdrawals from a fund due to illiquidity, giving us an opportunity to buy stock in Affiliated Managers at a discount. The stock has risen since then as investor fear subsided. We also began buying Tailored Brands in late 2015 when the stock price went down mainly because of the underperformance of the company’s Jos. A. Bank brand. Investors reacted favorably after the company initiated a store rationalization program to help improve profitability and other operating aspects of the business.
| | | | |
| Portfolio Composition | |
By sector | | | % of total net assets | |
| | | | |
| |
Financials | | | 26.9% | |
Industrials | | | 17.7 | |
Consumer Discretionary | | | 16.5 | |
Information Technology | | | 15.9 | |
Materials | | | 6.1 | |
Energy | | | 5.1 | |
Health Care | | | 4.4 | |
Consumer Staples | | | 4.1 | |
Money Market Funds Plus Other Assets Less Liabilities | | | 3.3 | |
| | | | | |
| Top 10 Equity Holdings* |
| | | | % of total net assets | |
| | | | | |
1. Belden Inc. | | | | 5.2 | % |
| 2. AECOM | | | | 4.4 | |
| 3. Affiliated Managers Group, Inc. | | | | 3.8 | |
| 4. MDC Partners Inc.-Class A | | | | 3.6 | |
| 5. Zions Bancorp | | | | 3.3 | |
| 6. E*TRADE Financial Corp. | | | | 3.0 | |
| 7. ON Semiconductor Corp. | | | | 3.0 | |
| 8. AmTrust Financial Services, Inc. | | | | 3.0 | |
| 9. LPL Financial Holdings, Inc. | | | | 2.9 | |
| 10. ManpowerGroup Inc. | | | | 2.8 | |
| | | | | |
| Total Net Assets | | | | $2.8 billion | |
| |
| Total Number of Holdings* | | | | 64 | |
The Fund’s holdings are subject to change, and there is no assurance that the Fund will continue to hold any particular security.
*Excluding money market fund holdings.
Data presented here are as of April 30, 2016.
4 Invesco Small Cap Value Fund
Medical care company Hanger was the largest detractor from overall Fund results during the reporting period. The company did not meet the March 2016 New York Stock Exchange (NYSE) financial statement filing deadline and therefore was delisted from trading on the NYSE. The company currently trades on the over-the-counter market. As a result of the delisting, shares of Hanger fell materially. Despite not providing full financial statements, the company was able to provide select cash flow data for 2014 and 2015. Based on our analysis, at the end of the reporting period, we believed Hanger’s intrinsic value to be much higher than its share price.
Financial services company LPL Financial and education and training services company DeVry Education Group were also among the largest detractors from overall Fund performance during the fiscal year. LPL Financial’s stock price declined following weaker-than-expected financial results in the fourth quarter of 2015 and due to investor fear regarding the impact of the new Department of Labor Fiduciary Rule on the financial advisory firm. We took advantage of the price weakness in early 2016 to buy more shares as we believed the stock was trading at a significant discount to its intrinsic value. In January 2016, DeVry Education Group was sued by the Federal Trade Commission for misleading advertising between 2008 and 2015. After evaluating the potential negative effects if the company were to be found guilty, we decided to sell our position in DeVry Education Group in March. Additionally, the Fund’s avoidance of the utilities sector also detracted from relative Fund results, as it was the best-performing sector within the Russell 2000 Value Index during the reporting period.
We believe the single most important indicator of how the Fund is positioned for potential future success is not our recent investment results nor popular statistical measures, but rather the difference between current market prices and the Fund’s estimated intrinsic value – the aggregate business value of the portfolio based on our estimate of intrinsic value for each individual holding.
At the end of the fiscal year, the difference between the market price and the estimated intrinsic value of the Fund remained attractive, according to our estimation. While there is no assurance that market value will ever reflect our estimate of the Fund’s intrinsic value, we believe the gap between price and estimated intrinsic value may provide above-average capital appreciation.
We will continue to work hard to protect and grow the Fund’s estimated intrinsic value. We thank you for your investment and for sharing our long-term investment perspective.
The views and opinions expressed in management’s discussion of Fund performance are those of Invesco Advisers, Inc. These views and opinions are subject to change at any time based on factors such as market and economic conditions. These views and opinions may not be relied upon as investment advice or recommendations, or as an offer for a particular security. The information is not a complete analysis of every aspect of any market, country, industry, security or the Fund. Statements of fact are from sources considered reliable, but Invesco Advisers, Inc. makes no representation or warranty as to their completeness or accuracy. Although historical performance is no guarantee of future results, these insights may help you understand our investment management philosophy.
See important Fund and, if applicable, index disclosures later in this report.
| | |
 | | R. Canon Coleman II Chartered Financial Analyst, Portfolio manager, is lead manager of Invesco Small Cap Value |
| Fund. He joined Invesco in 1999. Mr. Coleman earned a BS and an MS in accounting from the University of Florida. He also earned an MBA from the Wharton School of the University of Pennsylvania. |
| | |
 | | Jonathan Edwards Chartered Financial Analyst, Portfolio manager, is manager of Invesco Small Cap Value Fund. He |
| joined Invesco in 2001. Mr. Edwards earned a BS in economics from Texas A&M University and an MBA from The University of Texas at Austin. |
| | |
 | | Jonathan Mueller Chartered Financial Analyst, Portfolio manager, is manager of Invesco Small Cap Value Fund. He |
| joined Invesco in 2001. Mr. Mueller earned a BBA in accounting from Texas Christian University and an MBA in finance from The University of Texas at Austin. He is also a Certified Public Accountant. |
5 Invesco Small Cap Value Fund
Your Fund’s Long-Term Performance
Results of a $10,000 Investment – Oldest Share Class(es)
Fund and index data from 4/30/06
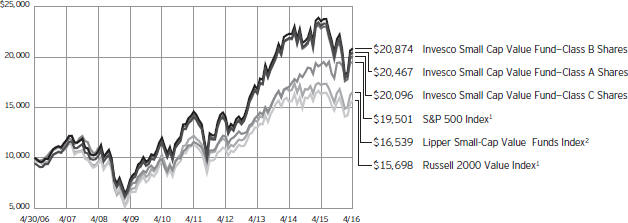
| 1 | Source: FactSet Research Systems Inc. |
Past performance cannot guarantee comparable future results.
The data shown in the chart include reinvested distributions, applicable sales charges and Fund expenses including management fees. Results for Class B shares are calculated as if a hypothetical
shareholder had liquidated his entire investment in the Fund at the close of the reporting period and paid the contingent deferred sales charges, if applicable. Index results include reinvested dividends, but they do not reflect sales charges. Performance of the peer group,
if applicable, reflects fund expenses and management fees; performance of a market index does not. Performance shown in the chart and table(s) does not reflect deduction of taxes a shareholder would pay on Fund distributions or sale of Fund shares.
continued from page 8
| n | | Small- and mid-capitalization risks. Small- and mid-capitalization companies tend to be more vulnerable to changing market conditions, may have little or no operating history or track record of success, and may have more limited product lines and markets, less experienced management and fewer financial resources than larger companies. These companies’ securities may be more volatile and less liquid than those of more established companies, and their returns may vary, sometimes significantly, from the overall securities market. |
| n | | Value investing style risk. A value investing style subjects the Fund to the risk that the valuations never improve or that the returns on value equity securities are less than returns on other styles of investing or the overall stock market. |
About indexes used in this report
| n | | The S&P 500® Index is an unmanaged index considered representative of the US stock market. |
| n | | The Russell 2000® Value Index is an unmanaged index considered representative of small-cap value stocks. The Russell 2000 Value Index is a trademark/service mark of the Frank Russell Co. Russell® is a trademark of the Frank Russell Co. |
| n | | The Lipper Small-Cap Value Funds Index is an unmanaged index considered representative of small-cap value funds tracked by Lipper. |
| n | | The Fund is not managed to track the performance of any particular index, including the index(es) described here, and consequently, the performance of the Fund may deviate significantly from the performance of the index(es). |
| n | | A direct investment cannot be made in an index. Unless otherwise indicated, index results include reinvested dividends, and they do not reflect sales charges. Performance of the peer group, if applicable, reflects fund expenses; performance of a market index does not. |
Other information
| n | | CPA® and Certified Public Accountant® are trademarks owned by the American Institute of Certified Public Accountants. |
| n | | The returns shown in management’s discussion of Fund performance are based on net asset values (NAVs) calculated for shareholder transactions. Generally accepted accounting principles require adjustments to be made to the net assets of the Fund at period end for financial reporting purposes, and as such, the NAVs for shareholder transactions and the returns based on those NAVs may differ from the NAVs and returns reported in the Financial Highlights. |
| n | | Industry classifications used in this report are generally according to the Global Industry Classification Standard, which was developed by and is the exclusive property and a service mark of MSCI Inc. and Standard & Poor’s. |
6 Invesco Small Cap Value Fund
| | | | | |
| Average Annual Total Returns |
| As of 4/30/16, including maximum applicable sales charges | |
| |
| Class A Shares | | | | | |
| Inception (6/21/99) | | | | 9.74 | % |
| 10 Years | | | | 7.42 | |
| 5 Years | | | | 6.59 | |
| 1 Year | | | | -16.29 | |
| |
| Class B Shares | | | | | |
| Inception (6/21/99) | | | | 9.71 | % |
| 10 Years | | | | 7.64 | |
| 5 Years | | | | 6.90 | |
| 1 Year | | | | -15.93 | |
| |
| Class C Shares | | | | | |
| Inception (6/21/99) | | | | 9.28 | % |
| 10 Years | | | | 7.23 | |
| 5 Years | | | | 7.00 | |
| 1 Year | | | | -12.88 | |
| |
| Class Y Shares | | | | | |
| Inception (8/12/05) | | | | 9.06 | % |
| 10 Years | | | | 8.30 | |
| 5 Years | | | | 8.08 | |
1 Year | | | | -11.19 | |
Effective June 1, 2010, Class A, Class B, Class C and Class I shares of the predecessor fund, Van Kampen Small Cap Value Fund, advised by Van Kampen Asset Management were reorganized into Class A, Class B, Class C and Class Y shares, respectively, of Invesco Van Kampen Small Cap Value Fund (renamed Invesco Small Cap Value Fund). Returns shown above for Class A, Class B, Class C and Class Y shares are blended returns of the predecessor fund and Invesco Small Cap Value Fund. Share class returns will differ from the predecessor fund because of different expenses.
The performance data quoted represent past performance and cannot guarantee comparable future results; current performance may be lower or higher. Please visit invesco.com/performance for the most recent month-end performance. Performance figures reflect reinvested distributions, changes in net asset value and the effect of the maximum sales charge unless otherwise stated. Investment return and principal value will fluctuate so that you may have a gain or loss when you sell shares.
| | | | | |
| Average Annual Total Returns |
As of 3/31/16, the most recent calendar quarter end, including maximum applicable sales charges |
| | | | | |
| |
| Class A Shares | | | | | |
| Inception (6/21/99) | | | | 9.72 | % |
| 10 Years | | | | 7.46 | |
| 5 Years | | | | 6.96 | |
| 1 Year | | | | -18.39 | |
| |
| Class B Shares | | | | | |
| Inception (6/21/99) | | | | 9.69 | % |
| 10 Years | | | | 7.67 | |
| 5 Years | | | | 7.28 | |
| 1 Year | | | | -18.05 | |
| |
| Class C Shares | | | | | |
| Inception (6/21/99) | | | | 9.26 | % |
| 10 Years | | | | 7.26 | |
| 5 Years | | | | 7.38 | |
| 1 Year | | | | -15.03 | |
| |
| Class Y Shares | | | | | |
| Inception (8/12/05) | | | | 9.01 | % |
| 10 Years | | | | 8.33 | |
| 5 Years | | | | 8.45 | |
1 Year | | | | -13.43 | |
The total annual Fund operating expense ratio set forth in the most recent Fund prospectus as of the date of this report for Class A, Class B, Class C and Class Y shares was 1.14%, 1.89%, 1.87% and 0.89%, respectively. The expense ratios presented above may vary from the expense ratios presented in other sections of this report that are based on expenses incurred during the period covered by this report.
Class A share performance reflects the maximum 5.50% sales charge, and Class B and Class C share performance reflects the applicable contingent deferred sales charge (CDSC) for the period involved. For shares purchased prior to June 1, 2010, the CDSC on Class B shares declines from 5% at the time of purchase to 0% at the beginning of the sixth year. For shares purchased on or after June 1, 2010, the CDSC on Class B shares declines from 5% at the time of purchase to 0% at the beginning of the seventh year. The CDSC on Class C shares is 1% for the first year after purchase. Class Y shares do not have a front-end sales charge or a CDSC; therefore, performance is at net asset value.
The performance of the Fund’s share classes will differ primarily due to different sales charge structures and class expenses.
Fund performance reflects any applicable fee waivers and/or expense reimbursements. Had the adviser not waived fees and/or reimbursed expenses currently or in the past, returns would have been lower. See current prospectus for more information.
7 Invesco Small Cap Value Fund
Invesco Small Cap Value Fund’s investment objective is long-term growth of capital.
| n | | Unless otherwise stated, information presented in this report is as of April 30, 2016, and is based on total net assets. |
| n | | Unless otherwise noted, all data provided by Invesco. |
| n | | To access your Fund’s reports/prospectus, visit invesco.com/fundreports. |
About share classes
| n | | Class B shares may not be purchased for new or additional investments. Please see the prospectus for more information. |
| n | | Class Y shares are available to only certain investors. Please see the prospectus for more information. |
Principal risks of investing in the Fund
| n | | Depositary receipts risk. Investing in depositary receipts involves the same risks as direct investments in foreign securities. In addition, the underlying issuers of certain depositary receipts are under no obligation to distribute shareholder communications or pass through any voting rights with respect to the deposited securities to the holders of such receipts. The Fund may therefore receive less timely information or have less control than if it invested directly in the foreign issuer. |
| n | | Derivatives risk. The value of a derivative instrument depends largely on (and is derived from) the value of an underlying security, currency, commodity, interest rate, index or other asset (each referred to as an underlying asset). In addition to risks relating to the underlying assets, the use of derivatives may include other, possibly greater, risks, including counterparty, leverage and liquidity risks. Counter-party risk is the risk that the counter-party to the derivative contract will default on its obligation to pay the Fund the amount owed or otherwise perform under the derivative contract. Derivatives create leverage risk because they do not require payment up front equal to the economic exposure created by owning the derivative. As a result, an adverse change in the value of the underlying asset could result in the Fund sustaining a loss that is substantially greater than the amount invested in the derivative, which may make the Fund’s returns more volatile and increase the risk of loss. Derivative instruments |
| | may also be less liquid than more traditional investments and the Fund may be unable to sell or close out its derivative positions at a desirable time or price. This risk may be more acute under adverse market conditions, during which the Fund may be most in need of liquidating its derivative positions. Derivatives may also be harder to value, less tax efficient and subject to changing government regulation that could impact the Fund’s ability to use certain derivatives or their cost. Also, derivatives used for hedging or to gain or limit exposure to a particular market segment may not provide the expected benefits, particularly during adverse market conditions. |
| n | | Emerging markets securities risk. Emerging markets (also referred to as developing markets) are generally subject to greater market volatility, political, social and economic instability, uncertain trading markets and more governmental limitations on foreign investment than more developed markets. In addition, companies operating in emerging markets may be subject to lower trading volume and greater price fluctuations than companies in more developed markets. Securities law and the enforcement of systems of taxation in many emerging market countries may change quickly and unpredictably. In addition, investments in emerging markets securities may also be subject to additional transaction costs, delays in settlement procedures, and lack of timely information. |
| n | | Foreign securities risk. The Fund’s foreign investments may be adversely affected by political and social instability, changes in economic or taxation policies, difficulty in enforcing obligations, decreased liquidity or increased volatility. Foreign investments also involve the risk of the possible seizure, nationalization or expropriation of the issuer or foreign deposits (in which the Fund could lose its entire investments in a certain market) and the possible adoption |
This report must be accompanied or preceded by a currently effective Fund prospectus, which contains more complete information, including sales charges and expenses. Investors should read it carefully before investing.
NOT FDIC INSURED | MAY LOSE VALUE | NO BANK GUARANTEE
| | | of foreign governmental restrictions such as exchange controls. Unless the Fund has hedged its foreign securities risk, foreign securities risk also involves the risk of negative foreign currency rate fluctuations, which may cause the value of securities denominated in such foreign currency (or other instruments through which the Fund has exposure to foreign currencies) to decline in value. Currency exchange rates may fluctuate significantly over short periods of time. Currency hedging strategies, if used, are not always successful. |
| | n | | Management risk. The Fund is actively managed and depends heavily on the Adviser’s judgment about markets, interest rates or the attractiveness, relative values, liquidity, or potential appreciation of particular investments made for the Fund’s portfolio. The Fund could experience losses if these judgments prove to be incorrect. Additionally, legislative, regulatory, or tax developments may adversely affect management of the Fund and, therefore, the ability of the Fund to achieve its investment objective. |
| | n | | Market risk. The market values of the Fund’s investments, and therefore the value of the Fund’s shares, will go up and down, sometimes rapidly or unpredictably. Market risk may affect a single issuer, industry or section of the economy, or it may affect the market as a whole. Individual stock prices tend to go up and down more dramatically than those of certain other types of investments, such as bonds. During a general downturn in the financial markets, multiple asset classes may decline in value. When markets perform well, there can be no assurance that specific investments held by the Fund will rise in value. |
| | n | | Real estate investment trust (REIT) risk/real estate risk. Investments in real estate related instruments may be affected by economic, legal, cultural, environmental or technological factors that affect property values, rents or occupancies of real estate related to the Fund’s holdings. Shares of real estate related companies, which tend to be small- and mid-cap companies, may be more volatile and less liquid. |
continued on page 6
8 Invesco Small Cap Value Fund
Schedule of Investments(a)
April 30, 2016
| | | | | | | | |
| | | Shares | | | Value | |
Common Stocks–96.66% | |
| Advertising–3.58% | |
MDC Partners Inc.–Class A(b) | | | 4,897,579 | | | $ | 99,126,999 | |
|
| Apparel Retail–1.61% | |
Tailored Brands, Inc.(b) | | | 2,566,456 | | | | 44,707,664 | |
|
| Asset Management & Custody Banks–3.98% | |
Affiliated Managers Group, Inc.(c) | | | 611,500 | | | | 104,150,680 | |
Virtus Investment Partners Inc. | | | 77,500 | | �� | | 6,062,050 | |
| | | | | | | | 110,212,730 | |
|
| Auto Parts & Equipment–6.02% | |
Dana Holding Corp. | | | 5,071,735 | | | | 65,577,534 | |
Gentex Corp. | | | 4,669,600 | | | | 74,900,384 | |
Modine Manufacturing Co.(b)(c) | | | 2,436,326 | | | | 26,336,684 | |
| | | | | | | | 166,814,602 | |
|
| Automobile Manufacturers–1.78% | |
Winnebago Industries, Inc.(b) | | | 2,281,061 | | | | 49,362,160 | |
|
| Building Products–0.88% | |
Owens Corning | | | 80,049 | | | | 3,687,857 | |
Ply Gem Holdings Inc.(c) | | | 1,420,630 | | | | 20,812,230 | |
| | | | | | | | 24,500,087 | |
|
| Construction & Engineering–4.40% | |
AECOM(c) | | | 3,749,399 | | | | 121,817,973 | |
|
| Construction Machinery & Heavy Trucks–1.89% | |
Meritor, Inc.(c) | | | 3,368,249 | | | | 28,630,116 | |
Terex Corp. | | | 866,500 | | | | 20,700,685 | |
WABCO Holdings Inc.(c) | | | 27,900 | | | | 3,129,264 | |
| | | | | | | | 52,460,065 | |
|
| Consumer Electronics–1.46% | |
Harman International Industries, Inc. | | | 528,600 | | | | 40,575,336 | |
|
| Consumer Finance–1.69% | |
Synchrony Financial(c) | | | 1,531,800 | | | | 46,827,126 | |
|
| Diversified Metals & Mining–0.44% | |
Ferroglobe PLC | | | 1,203,948 | | | | 12,268,230 | |
|
| Electronic Components–6.56% | |
Belden Inc.(b) | | | 2,266,899 | | | | 143,132,003 | |
Vishay Intertechnology, Inc. | | | 3,169,800 | | | | 38,544,768 | |
| | | | | | | | 181,676,771 | |
|
| Electronic Equipment & Instruments–1.63% | |
FLIR Systems, Inc. | | | 1,498,159 | | | | 45,259,383 | |
|
| Electronic Manufacturing Services–2.88% | |
Flextronics International Ltd.(c) | | | 5,854,900 | | | | 71,137,035 | |
KEMET Corp.(b)(c) | | | 3,744,102 | | | | 8,686,317 | |
| | | | | | | | 79,823,352 | |
| | | | | | | | |
| | | Shares | | | Value | |
| Health Care Facilities–2.00% | |
Brookdale Senior Living Inc.(c) | | | 1,235,477 | | | $ | 22,806,906 | |
Hanger, Inc.(b)(c) | | | 4,723,233 | | | | 32,543,075 | |
| | | | | | | | 55,349,981 | |
|
| Health Care Supplies–1.53% | |
Alere, Inc.(c) | | | 1,084,794 | | | | 42,306,966 | |
|
| Homebuilding–0.79% | |
Installed Building Products Inc.(c) | | | 823,279 | | | | 21,882,756 | |
|
| Human Resource & Employment Services–6.32% | |
Kelly Services, Inc.–Class A(b) | | | 2,757,195 | | | | 51,752,550 | |
Kforce Inc.(b) | | | 2,434,584 | | | | 46,281,442 | |
ManpowerGroup Inc. | | | 999,003 | | | | 76,953,201 | |
| | | | | | | | 174,987,193 | |
|
| Industrial Machinery–0.73% | |
Chart Industries, Inc.(c) | | | 456,200 | | | | 11,742,588 | |
Kennametal Inc. | | | 357,400 | | | | 8,356,012 | |
| | | | | | | | 20,098,600 | |
|
| Investment Banking & Brokerage–6.91% | |
E*TRADE Financial Corp.(c) | | | 3,343,100 | | | | 84,179,258 | |
LPL Financial Holdings, Inc. | | | 3,027,719 | | | | 79,931,782 | |
TD Ameritrade Holding Corp. | | | 917,600 | | | | 27,372,008 | |
| | | | | | | | 191,483,048 | |
|
| IT Consulting & Other Services–0.57% | |
Ciber, Inc.(b)(c) | | | 6,808,657 | | | | 15,796,084 | |
|
| Leisure Products–1.26% | |
Arctic Cat Inc.(b) | | | 2,095,362 | | | | 34,845,870 | �� |
|
| Life & Health Insurance–0.64% | |
CNO Financial Group, Inc. | | | 972,188 | | | | 17,859,094 | |
|
| Oil & Gas Equipment & Services–5.12% | |
C&J Energy Services Ltd.(c) | | | 2,948,100 | | | | 4,274,745 | |
Forum Energy Technologies Inc.(c) | | | 2,189,500 | | | | 36,652,230 | |
Helix Energy Solutions Group Inc.(c) | | | 3,004,500 | | | | 25,928,835 | |
Weatherford International PLC(c) | | | 9,240,909 | | | | 75,128,590 | |
| | | | | | | | 141,984,400 | |
|
| Personal Products–4.05% | |
Elizabeth Arden, Inc.(b)(c) | | | 5,362,021 | | | | 54,853,475 | |
Nu Skin Enterprises, Inc.–Class A | | | 1,410,378 | | | | 57,501,111 | |
| | | | | | | | 112,354,586 | |
|
| Pharmaceuticals–0.89% | |
Endo International PLC(c) | | | 913,400 | | | | 24,661,800 | |
|
| Property & Casualty Insurance–3.01% | |
AmTrust Financial Services, Inc. | | | 3,356,343 | | | | 83,405,124 | |
See accompanying Notes to Financial Statements which are an integral part of the financial statements.
9 Invesco Small Cap Value Fund
| | | | | | | | |
| | | Shares | | | Value | |
| Real Estate Services–1.65% | |
Realogy Holdings Corp.(c) | | | 1,277,938 | | | $ | 45,673,504 | |
|
| Regional Banks–5.99% | |
First Horizon National Corp. | | | 4,178,467 | | | | 58,832,815 | |
SVB Financial Group(c) | | | 143,800 | | | | 14,995,464 | |
Zions Bancorp. | | | 3,345,700 | | | | 92,073,664 | |
| | | | | | | | 165,901,943 | |
|
| Reinsurance–1.55% | |
Reinsurance Group of America, Inc. | | | 412,494 | | | | 39,277,679 | |
Validus Holdings, Ltd. | | | 79,700 | | | | 3,673,373 | |
| | | | | | | | 42,951,052 | |
|
| Research & Consulting Services–3.10% | |
FTI Consulting, Inc.(c) | | | 80,218 | | | | 3,232,785 | |
Huron Consulting Group Inc.(c) | | | 49,755 | | | | 2,766,876 | |
Navigant Consulting, Inc.(c) | | | 1,810,515 | | | | 28,895,819 | |
Resources Connection Inc.(b) | | | 3,446,770 | | | | 50,908,793 | |
| | | | | | | | 85,804,273 | |
|
| Semiconductor Equipment–1.20% | |
Brooks Automation, Inc. | | | 2,056,264 | | | | 19,452,257 | |
Lam Research Corp. | | | 180,717 | | | | 13,806,779 | |
| | | | | | | | 33,259,036 | |
|
| Semiconductors–3.01% | |
ON Semiconductor Corp.(c) | | | 8,813,500 | | | | 83,463,845 | |
| | | | | | | | |
| | | Shares | | | Value | |
| Specialty Chemicals–1.58% | |
Flotek Industries, Inc.(c) | | | 1,525,590 | | | $ | 14,416,825 | |
Kraton Performance Polymers, Inc.(c) | | | 1,296,007 | | | | 29,432,319 | |
| | | | | | | | 43,849,144 | |
|
| Steel–4.06% | |
Allegheny Technologies, Inc. | | | 2,682,500 | | | | 43,832,050 | |
Carpenter Technology Corp. | | | 1,939,078 | | | | 68,662,752 | |
| | | | | | | | 112,494,802 | |
|
| Thrifts & Mortgage Finance–1.46% | |
BofI Holding, Inc.(c) | | | 1,982,100 | | | | 40,375,377 | |
|
| Trading Companies & Distributors–0.44% | |
DXP Enterprises, Inc.(c) | | | 557,900 | | | | 12,190,115 | |
Total Common Stocks
(Cost $2,516,134,265) | | | | | | | 2,678,411,071 | |
| | |
Money Market Funds–3.30% | | | | | | | | |
Liquid Assets Portfolio–Institutional Class, 0.44%(d) | | | 45,722,701 | | | | 45,722,701 | |
Premier Portfolio–Institutional Class, 0.39%(d) | | | 45,722,701 | | | | 45,722,701 | |
Total Money Market Funds
(Cost $91,445,402) | | | | | | | 91,445,402 | |
TOTAL INVESTMENTS–99.96%
(Cost $2,607,579,667) | | | | 2,769,856,473 | |
OTHER ASSETS LESS LIABILITIES–0.04% | | | | 1,195,332 | |
NET ASSETS–100.00% | | | $ | 2,771,051,805 | |
Notes to Schedule of Investments:
| (a) | Industry and/or sector classifications used in this report are generally according to the Global Industry Classification Standard, which was developed by and is the exclusive property and a service mark of MSCI Inc. and Standard & Poor’s. |
| (b) | Affiliated company during the period. The Investment Company Act of 1940 defines an “affiliated person” as an issuance in which a fund holds 5% or more of the outstanding voting securities. The Fund has not owned enough of the outstanding voting securities of the issuer to have control (as defined in the Investment Company Act of 1940) of that issuer. The aggregate value of these securities as of April 30, 2016 was $658,333,116, which represented 23.76% of the Fund’s Net Assets. See Note 4. |
| (c) | Non-income producing security. |
| (d) | The money market fund and the Fund are affiliated by having the same investment adviser. The rate shown is the 7-day SEC standardized yield as of April 30, 2016. |
See accompanying Notes to Financial Statements which are an integral part of the financial statements.
10 Invesco Small Cap Value Fund
Statement of Assets and Liabilities
April 30, 2016
| | | | |
Assets: | |
Investments, at value (Cost $1,800,244,023) | | $ | 2,020,077,955 | |
Investments in affiliates, at value (Cost $807,335,644) | | | 749,778,518 | |
Total investments, at value (Cost $2,607,579,667) | | | 2,769,856,473 | |
Receivable for: | | | | |
Investments sold | | | 26,999,736 | |
Fund shares sold | | | 2,452,771 | |
Dividends | | | 580,417 | |
Investment for trustee deferred compensation and retirement plans | | | 222,923 | |
Other assets | | | 78,308 | |
Total assets | | | 2,800,190,628 | |
|
Liabilities: | |
Payable for: | | | | |
Investments purchased | | | 18,439,823 | |
Fund shares reacquired | | | 8,371,642 | |
Accrued fees to affiliates | | | 1,915,762 | |
Accrued trustees’ and officers’ fees and benefits | | | 6,129 | |
Accrued other operating expenses | | | 144,493 | |
Trustee deferred compensation and retirement plans | | | 260,974 | |
Total liabilities | | | 29,138,823 | |
Net assets applicable to shares outstanding | | $ | 2,771,051,805 | |
|
Net assets consist of: | |
Shares of beneficial interest | | $ | 2,618,216,640 | |
Undistributed net investment income | | | 4,920,695 | |
Undistributed net realized gain (loss) | | | (14,362,336 | ) |
Net unrealized appreciation | | | 162,276,806 | |
| | | $ | 2,771,051,805 | |
| | | | |
Net Assets: | |
Class A | | $ | 1,320,826,389 | |
Class B | | $ | 12,941,648 | |
Class C | | $ | 107,646,812 | |
Class Y | | $ | 1,329,636,956 | |
|
Shares outstanding, $0.01 par value per share,
with an unlimited number of shares authorized: | |
Class A | | | 81,478,967 | |
Class B | | | 996,620 | |
Class C | | | 8,609,613 | |
Class Y | | | 79,181,259 | |
Class A: | | | | |
Net asset value per share | | $ | 16.21 | |
Maximum offering price per share | | | | |
(Net asset value of $16.21 ¸ 94.50%) | | $ | 17.15 | |
Class B: | | | | |
Net asset value and offering price per share | | $ | 12.99 | |
Class C: | | | | |
Net asset value and offering price per share | | $ | 12.50 | |
Class Y: | | | | |
Net asset value and offering price per share | | $ | 16.79 | |
See accompanying Notes to Financial Statements which are an integral part of the financial statements.
11 Invesco Small Cap Value Fund
Statement of Operations
For the year ended April 30, 2016
| | | | |
Investment income: | |
Dividends (net of foreign withholding taxes of $518,807) | | $ | 33,784,353 | |
Dividends from affiliates | | | 7,901,461 | |
Total investment income | | | 41,685,814 | |
| |
Expenses: | | | | |
Advisory fees | | | 19,521,624 | |
Administrative services fees | | | 557,645 | |
Custodian fees | | | 71,416 | |
Distribution fees: | | | | |
Class A | | | 3,705,483 | |
Class B | | | 171,412 | |
Class C | | | 1,263,744 | |
Transfer agent fees | | | 5,911,672 | |
Trustees’ and officers’ fees and benefits | | | 76,564 | |
Registration and filing fees | | | 141,038 | |
Reports to shareholders | | | 244,056 | |
Professional services fees | | | 67,945 | |
Other | | | 71,073 | |
Total expenses | | | 31,803,672 | |
Less: Fees waived and expense offset arrangement(s) | | | (151,931 | ) |
Net expenses | | | 31,651,741 | |
Net investment income | | | 10,034,073 | |
| |
Realized and unrealized gain (loss) from: | | | | |
Net realized gain (loss) from: | | | | |
Investment securities (includes net gains from securities sold to affiliates of $15,452,593) | | | 113,430,579 | |
Foreign currencies | | | (13,864 | ) |
| | | | 113,416,715 | |
Change in net unrealized appreciation (depreciation) of investment securities | | | (534,397,359 | ) |
Net realized and unrealized gain (loss) | | | (420,980,644 | ) |
Net increase (decrease) in net assets resulting from operations | | $ | (410,946,571 | ) |
See accompanying Notes to Financial Statements which are an integral part of the financial statements.
12 Invesco Small Cap Value Fund
Statement of Changes in Net Assets
For the years ended April 30, 2016 and 2015
| | | | | | | | |
| | | 2016 | | | 2015 | |
Operations: | | | | | |
Net investment income | | $ | 10,034,073 | | | $ | 1,682,750 | |
Net realized gain | | | 113,416,715 | | | | 518,761,263 | |
Change in net unrealized appreciation (depreciation) | | | (534,397,359 | ) | | | (340,211,606 | ) |
Net increase (decrease) in net assets resulting from operations | | | (410,946,571 | ) | | | 180,232,407 | |
| | |
Distributions to shareholders from net investment income: | | | | | | | | |
Class A | | | (687,810 | ) | | | — | |
Class Y | | | (3,335,002 | ) | | | — | |
Total distributions from net investment income | | | (4,022,812 | ) | | | — | |
| | |
Distributions to shareholders from net realized gains: | | | | | | | | |
Class A | | | (140,503,127 | ) | | | (251,728,848 | ) |
Class B | | | (1,924,940 | ) | | | (4,288,875 | ) |
Class C | | | (15,046,944 | ) | | | (27,405,603 | ) |
Class Y | | | (137,836,409 | ) | | | (210,688,817 | ) |
Total distributions from net realized gains | | | (295,311,420 | ) | | | (494,112,143 | ) |
| | |
Share transactions–net: | | | | | | | | |
Class A | | | (92,017,771 | ) | | | 3,102,028 | |
Class B | | | (5,071,758 | ) | | | (3,533,885 | ) |
Class C | | | (10,410,051 | ) | | | 6,296,273 | |
Class Y | | | 49,882,360 | | | | 357,348,180 | |
Net increase (decrease) in net assets resulting from share transactions | | | (57,617,220 | ) | | | 363,212,596 | |
Net increase (decrease) in net assets | | | (767,898,023 | ) | | | 49,332,860 | |
| | |
Net assets: | | | | | | | | |
Beginning of year | | | 3,538,949,828 | | | | 3,489,616,968 | |
End of year (includes undistributed net investment income of $4,920,695 and $(1,019,244), respectively) | | $ | 2,771,051,805 | | | $ | 3,538,949,828 | |
Notes to Financial Statements
April 30, 2016
NOTE 1—Significant Accounting Policies
Invesco Small Cap Value Fund (the “Fund”) is a series portfolio of AIM Sector Funds (Invesco Sector Funds) (the “Trust”). The Trust is a Delaware statutory trust registered under the Investment Company Act of 1940, as amended (the “1940 Act”), as an open-end series management investment company consisting of ten separate portfolios, each authorized to issue an unlimited number of shares of beneficial interest. The assets, liabilities and operations of each portfolio are accounted for separately. Information presented in these financial statements pertains only to the Fund. Matters affecting each portfolio or class will be voted on exclusively by the shareholders of such portfolio or class.
The Fund’s investment objective is long-term growth of capital.
The Fund currently consists of four different classes of shares: Class A, Class B, Class C and Class Y. Class Y shares are available only to certain investors. Class A shares are sold with a front-end sales charge unless certain waiver criteria are met and under certain circumstances load waived shares may be subject to contingent deferred sales charges (“CDSC”). Class C shares are sold with a CDSC. Class Y shares are sold at net asset value. Effective November 30, 2010, new or additional investments in Class B shares are no longer permitted. Existing shareholders of Class B shares may continue to reinvest dividends and capital gains distributions in Class B shares until they convert to Class A shares. Also, shareholders in Class B shares will be able to exchange those shares for Class B shares of other Invesco Funds offering such shares until they convert to Class A shares. Generally, Class B shares will automatically convert to Class A shares on or about the month-end, which is at least eight years after the date of purchase. Redemption of Class B shares prior to the conversion date will be subject to a CDSC.
The following is a summary of the significant accounting policies followed by the Fund in the preparation of its financial statements.
| A. | Security Valuations — Securities, including restricted securities, are valued according to the following policy. |
A security listed or traded on an exchange (except convertible securities) is valued at its last sales price or official closing price as of the close of the customary trading session on the exchange where the security is principally traded, or lacking any sales or official closing price on a particular day, the security may be valued at the closing bid price on that day. Securities traded in the over-the-counter market are valued based on prices furnished by independent pricing services or market makers. When such securities are valued by an independent pricing service they may be considered fair valued. Futures contracts are valued at the final settlement price set by an exchange on which they are principally traded.
13 Invesco Small Cap Value Fund
Listed options are valued at the mean between the last bid and asked prices from the exchange on which they are principally traded. Options not listed on an exchange are valued by an independent source at the mean between the last bid and asked prices. For purposes of determining net asset value (“NAV”) per share, futures and option contracts generally are valued 15 minutes after the close of the customary trading session of the New York Stock Exchange (“NYSE”).
Investments in open-end and closed-end registered investment companies that do not trade on an exchange are valued at the end-of-day net asset value per share. Investments in open-end and closed-end registered investment companies that trade on an exchange are valued at the last sales price or official closing price as of the close of the customary trading session on the exchange where the security is principally traded.
Debt obligations (including convertible securities) and unlisted equities are fair valued using an evaluated quote provided by an independent pricing service. Evaluated quotes provided by the pricing service may be determined without exclusive reliance on quoted prices, and may reflect appropriate factors such as institution-size trading in similar groups of securities, developments related to specific securities, dividend rate (for unlisted equities), yield (for debt obligations), quality, type of issue, coupon rate (for debt obligations), maturity (for debt obligations), individual trading characteristics and other market data. Debt obligations are subject to interest rate and credit risks. In addition, all debt obligations involve some risk of default with respect to interest and/or principal payments.
Foreign securities’ (including foreign exchange contracts) prices are converted into U.S. dollar amounts using the applicable exchange rates as of the close of the NYSE. If market quotations are available and reliable for foreign exchange-traded equity securities, the securities will be valued at the market quotations. Because trading hours for certain foreign securities end before the close of the NYSE, closing market quotations may become unreliable. If between the time trading ends on a particular security and the close of the customary trading session on the NYSE, events occur that the Adviser determines are significant and make the closing price unreliable, the Fund may fair value the security. If the event is likely to have affected the closing price of the security, the security will be valued at fair value in good faith using procedures approved by the Board of Trustees. Adjustments to closing prices to reflect fair value may also be based on a screening process of an independent pricing service to indicate the degree of certainty, based on historical data, that the closing price in the principal market where a foreign security trades is not the current value as of the close of the NYSE. Foreign securities’ prices meeting the approved degree of certainty that the price is not reflective of current value will be priced at the indication of fair value from the independent pricing service. Multiple factors may be considered by the independent pricing service in determining adjustments to reflect fair value and may include information relating to sector indices, American Depositary Receipts and domestic and foreign index futures. Foreign securities may have additional risks including exchange rate changes, potential for sharply devalued currencies and high inflation, political and economic upheaval, the relative lack of issuer information, relatively low market liquidity and the potential lack of strict financial and accounting controls and standards.
Securities for which market prices are not provided by any of the above methods may be valued based upon quotes furnished by independent sources. The last bid price may be used to value equity securities. The mean between the last bid and asked prices is used to value debt obligations, including corporate loans.
Securities for which market quotations are not readily available or became unreliable are valued at fair value as determined in good faith by or under the supervision of the Trust’s officers following procedures approved by the Board of Trustees. Issuer specific events, market trends, bid/asked quotes of brokers and information providers and other market data may be reviewed in the course of making a good faith determination of a security’s fair value.
The Fund may invest in securities that are subject to interest rate risk, meaning the risk that the prices will generally fall as interest rates rise and, conversely, the prices will generally rise as interest rates fall. Specific securities differ in their sensitivity to changes in interest rates depending on their individual characteristics. Changes in interest rates may result in increased market volatility, which may affect the value and/or liquidity of certain Fund investments.
Valuations change in response to many factors including the historical and prospective earnings of the issuer, the value of the issuer’s assets, general economic conditions, interest rates, investor perceptions and market liquidity. Because of the inherent uncertainties of valuation, the values reflected in the financial statements may materially differ from the value received upon actual sale of those investments.
| B. | Securities Transactions and Investment Income — Securities transactions are accounted for on a trade date basis. Realized gains or losses on sales are computed on the basis of specific identification of the securities sold. Interest income (net of withholding tax, if any) is recorded on the accrual basis from settlement date. Dividend income (net of withholding tax, if any) is recorded on the ex-dividend date. |
The Fund may periodically participate in litigation related to Fund investments. As such, the Fund may receive proceeds from litigation settlements. Any proceeds received are included in the Statement of Operations as realized gain (loss) for investments no longer held and as unrealized gain (loss) for investments still held.
Brokerage commissions and mark ups are considered transaction costs and are recorded as an increase to the cost basis of securities purchased and/or a reduction of proceeds on a sale of securities. Such transaction costs are included in the determination of net realized and unrealized gain (loss) from investment securities reported in the Statement of Operations and the Statement of Changes in Net Assets and the net realized and unrealized gains (losses) on securities per share in the Financial Highlights. Transaction costs are included in the calculation of the Fund’s net asset value and, accordingly, they reduce the Fund’s total returns. These transaction costs are not considered operating expenses and are not reflected in net investment income reported in the Statement of Operations and the Statement of Changes in Net Assets, or the net investment income per share and the ratios of expenses and net investment income reported in the Financial Highlights, nor are they limited by any expense limitation arrangements between the Fund and the investment adviser.
The Fund allocates income and realized and unrealized capital gains and losses to a class based on the relative net assets of each class.
| C. | Country Determination — For the purposes of making investment selection decisions and presentation in the Schedule of Investments, the investment adviser may determine the country in which an issuer is located and/or credit risk exposure based on various factors. These factors include the laws of the country under which the issuer is organized, where the issuer maintains a principal office, the country in which the issuer derives 50% or more of its total revenues and the country that has the primary market for the issuer’s securities, as well as other criteria. Among the other criteria that may be evaluated for making this determination are the country in which the issuer maintains 50% or more of its assets, the type of security, financial guarantees and enhancements, the nature of the collateral and the sponsor organization. Country of issuer and/or credit risk exposure has been determined to be the United States of America, unless otherwise noted. |
14 Invesco Small Cap Value Fund
| D. | Distributions — Distributions from net investment income and net realized capital gain, if any, are generally declared and paid annually and recorded on the ex-dividend date. The Fund may elect to treat a portion of the proceeds from redemptions as distributions for federal income tax purposes. |
| E. | Federal Income Taxes — The Fund intends to comply with the requirements of Subchapter M of the Internal Revenue Code of 1986, as amended (the “Internal Revenue Code”), necessary to qualify as a regulated investment company and to distribute substantially all of the Fund’s taxable earnings to shareholders. As such, the Fund will not be subject to federal income taxes on otherwise taxable income (including net realized capital gain) that is distributed to shareholders. Therefore, no provision for federal income taxes is recorded in the financial statements. |
The Fund recognizes the tax benefits of uncertain tax positions only when the position is more likely than not to be sustained. Management has analyzed the Fund’s uncertain tax positions and concluded that no liability for unrecognized tax benefits should be recorded related to uncertain tax positions. Management is not aware of any tax positions for which it is reasonably possible that the total amounts of unrecognized tax benefits will change materially in the next 12 months.
The Fund files tax returns in the U.S. Federal jurisdiction and certain other jurisdictions. Generally, the Fund is subject to examinations by such taxing authorities for up to three years after the filing of the return for the tax period.
| F. | Expenses — Fees provided for under the Rule 12b-1 plan of a particular class of the Fund and which are directly attributable to that class are charged to the operations of such class. All other expenses are allocated among the classes based on relative net assets. Prior to June 1, 2010, incremental transfer agency fees which were unique to each class of shares were charged to the operations of such class. |
| G. | Accounting Estimates — The preparation of financial statements in conformity with accounting principles generally accepted in the United States of America (“GAAP”) requires management to make estimates and assumptions that affect the reported amounts of assets and liabilities at the date of the financial statements and the reported amounts of revenues and expenses during the reporting period including estimates and assumptions related to taxation. Actual results could differ from those estimates by a significant amount. In addition, the Fund monitors for material events or transactions that may occur or become known after the period-end date and before the date the financial statements are released to print. |
| H. | Indemnifications — Under the Trust’s organizational documents, each Trustee, officer, employee or other agent of the Trust is indemnified against certain liabilities that may arise out of the performance of their duties to the Fund. Additionally, in the normal course of business, the Fund enters into contracts, including the Fund’s servicing agreements, that contain a variety of indemnification clauses. The Fund’s maximum exposure under these arrangements is unknown as this would involve future claims that may be made against the Fund that have not yet occurred. The risk of material loss as a result of such indemnification claims is considered remote. |
| I. | Foreign Currency Translations — Foreign currency is valued at the close of the NYSE based on quotations posted by banks and major currency dealers. Portfolio securities and other assets and liabilities denominated in foreign currencies are translated into U.S. dollar amounts at date of valuation. Purchases and sales of portfolio securities (net of foreign taxes withheld on disposition) and income items denominated in foreign currencies are translated into U.S. dollar amounts on the respective dates of such transactions. The Fund does not separately account for the portion of the results of operations resulting from changes in foreign exchange rates on investments and the fluctuations arising from changes in market prices of securities held. The combined results of changes in foreign exchange rates and the fluctuation of market prices on investments (net of estimated foreign tax withholding) are included with the net realized and unrealized gain or loss from investments in the Statement of Operations. Reported net realized foreign currency gains or losses arise from (1) sales of foreign currencies, (2) currency gains or losses realized between the trade and settlement dates on securities transactions, and (3) the difference between the amounts of dividends, interest, and foreign withholding taxes recorded on the Fund’s books and the U.S. dollar equivalent of the amounts actually received or paid. Net unrealized foreign currency gains and losses arise from changes in the fair values of assets and liabilities, other than investments in securities at fiscal period end, resulting from changes in exchange rates. |
The Fund may invest in foreign securities, which may be subject to foreign taxes on income, gains on investments or currency repatriation, a portion of which may be recoverable. Foreign taxes, if any, are recorded based on the tax regulations and rates that exist in the foreign markets in which the Fund invests and are shown in the Statement of Operations.
| J. | Forward Foreign Currency Contracts — The Fund may engage in foreign currency transactions either on a spot (i.e. for prompt delivery and settlement) basis, or through forward foreign currency contracts, to manage or minimize currency or exchange rate risk. |
The Fund may also enter into forward foreign currency contracts for the purchase or sale of a security denominated in a foreign currency in order to “lock in” the U.S. dollar price of that security, or the Fund may also enter into forward foreign currency contracts that do not provide for physical settlement of the two currencies, but instead are settled by a single cash payment calculated as the difference between the agreed upon exchange rate and the spot rate at settlement based upon an agreed upon notional amount (non-deliverable forwards). The Fund will set aside liquid assets in an amount equal to daily mark-to-market obligation for forward foreign currency contracts.
A forward foreign currency contract is an obligation between two parties (“Counterparties”) to purchase or sell a specific currency for an agreed-upon price at a future date. The use of forward foreign currency contracts does not eliminate fluctuations in the price of the underlying securities the Fund owns or intends to acquire but establishes a rate of exchange in advance. Fluctuations in the value of these contracts are measured by the difference in the contract date and reporting date exchange rates and are recorded as unrealized appreciation (depreciation) until the contracts are closed. When the contracts are closed, realized gains (losses) are recorded. Realized and unrealized gains (losses) on the contracts are included in the Statement of Operations. The primary risks associated with forward foreign currency contracts include failure of the Counterparty to meet the terms of the contract and the value of the foreign currency changing unfavorably. These risks may be in excess of the amounts reflected in the Statement of Assets and Liabilities.
15 Invesco Small Cap Value Fund
NOTE 2—Advisory Fees and Other Fees Paid to Affiliates
The Trust has entered into a master investment advisory agreement with Invesco Advisers, Inc. (the “Adviser” or “Invesco”). Under the terms of the investment advisory agreement, the Fund pays an advisory fee to the Adviser based on the annual rate of the Fund’s average daily net assets as follows:
| | | | | | |
| Average Daily Net Assets | | Rate |
First $500 million | | | 0 | .67% | | |
Next $500 million | | | 0 | .645% | | |
Over $1 billion | | | 0 | .62% | | |
For the year ended April 30, 2016, the effective advisory fees incurred by the Fund was 0.63%.
Under the terms of a master sub-advisory agreement between the Adviser and each of Invesco Asset Management Deutschland GmbH, Invesco Asset Management Limited, Invesco Asset Management (Japan) Limited, Invesco Hong Kong Limited, Invesco Senior Secured Management, Inc. and Invesco Canada Ltd. (collectively, the “Affiliated Sub-Advisers”) the Adviser, not the Fund, may pay 40% of the fees paid to the Adviser to any such Affiliated Sub-Adviser(s) that provide(s) discretionary investment management services to the Fund based on the percentage of assets allocated to such Affiliated Sub-Adviser(s).
The Adviser has contractually agreed, through at least June 30, 2017, to waive advisory fees and/or reimburse expenses of all shares to the extent necessary to limit total annual fund operating expenses after fee waivers and/or expense reimbursements (excluding certain items discussed below) of Class A, Class B, Class C, and Class Y shares to 2.00%, 2.75%, 2.75% and 1.75%, respectively, of average daily net assets (the “expense limits”). In determining the Adviser’s obligation to waive advisory fees and/or reimburse expenses, the following expenses are not taken into account, and could cause the total annual fund operating expenses after fee waiver and/or expense reimbursement to exceed the numbers reflected above: (1) interest; (2) taxes; (3) dividend expense on short sales; (4) extraordinary or non-routine items, including litigation expenses; and (5) expenses that the Fund has incurred but did not actually pay because of an expense offset arrangement. Unless Invesco continues the fee waiver agreement, it will terminate on June 30, 2017. During its term, the fee waiver agreement cannot be terminated or amended to increase the expense limits without approval of the Board of Trustees. The Adviser did not waive fees and/or reimburse expenses during the period under these expense limits.
Further, the Adviser has contractually agreed, through at least June 30, 2018, to waive the advisory fee payable by the Fund in an amount equal to 100% of the net advisory fees the Adviser receives from the affiliated money market funds on investments by the Fund of uninvested cash in such affiliated money market funds.
For the year ended April 30, 2016, the Adviser waived advisory fees of $150,232.
The Trust has entered into a master administrative services agreement with Invesco pursuant to which the Fund has agreed to pay Invesco for certain administrative costs incurred in providing accounting services to the Fund. For the year ended April 30, 2016, expenses incurred under the agreement are shown in the Statement of Operations as Administrative services fees.
The Trust has entered into a transfer agency and service agreement with Invesco Investment Services, Inc. (“IIS”) pursuant to which the Fund has agreed to pay IIS a fee for providing transfer agency and shareholder services to the Fund and reimburse IIS for certain expenses incurred by IIS in the course of providing such services. IIS may make payments to intermediaries that provide omnibus account services, sub-accounting services and/or networking services. All fees payable by IIS to intermediaries that provide omnibus account services or sub-accounting are charged back to the Fund, subject to certain limitations approved by the Trust’s Board of Trustees. For the year ended April 30, 2016, expenses incurred under the agreement are shown in the Statement of Operations as Transfer agent fees.
Shares of the Fund are distributed by Invesco Distributors, Inc. (“IDI”). The Fund has adopted a distribution plan pursuant to Rule 12b-1 under the 1940 Act, and a service plan (collectively, the “Plans”) for Class A shares, Class B shares and Class C shares to compensate IDI for the sale, distribution, shareholder servicing and maintenance of shareholder accounts for these shares. Under the Plans, the Fund will incur annual fees of up to 0.25% of Class A average daily net assets and up to 1.00% each of Class B and Class C average daily net assets.
With respect to Class B and Class C shares, the Fund is authorized to reimburse in future years any distribution related expenses that exceed the maximum annual reimbursement rate for such class, so long as such reimbursement does not cause the Fund to exceed the Class B and Class C maximum annual reimbursement rate, respectively. With respect to Class A shares, distribution related expenses that exceed the maximum annual reimbursement rate for such class are not carried forward to future years and the Fund will not reimburse IDI for any such expenses.
For the year ended April 30, 2016, expenses incurred under these arrangements are shown in the Statement of Operations as Distribution fees.
Front-end sales commissions and CDSC (collectively, the “sales charges”) are not recorded as expenses of the Fund. Front-end sales commissions are deducted from proceeds from the sales of Fund shares prior to investment in Class A shares of the Fund. CDSC are deducted from redemption proceeds prior to remittance to the shareholder. During the year ended April 30, 2016, IDI advised the Fund that IDI retained $21,355 in front-end sales commissions from the sale of Class A shares and $10,792, $2,578 and $3,007 from Class A, Class B and Class C shares, respectively, for CDSC imposed on redemptions by shareholders.
For the year ended April 30, 2016, the Fund incurred $107,013 in brokerage commissions with Invesco Capital Markets, Inc., an affiliate of the Adviser and IDI, for portfolio transactions executed on behalf of the Fund.
Certain officers and trustees of the Trust are officers and directors of the Adviser, IIS and/or IDI.
NOTE 3—Additional Valuation Information
GAAP defines fair value as the price that would be received to sell an asset or paid to transfer a liability in an orderly transaction between market participants at the measurement date, under current market conditions. GAAP establishes a hierarchy that prioritizes the inputs to valuation methods, giving the highest priority to readily available unadjusted quoted prices in an active market for identical assets (Level 1) and the lowest priority to significant unobservable inputs (Level 3), generally when market prices are not readily available or are unreliable. Based on the valuation inputs, the securities or other investments are tiered into one of three levels. Changes in valuation methods may result in transfers in or out of an investment’s assigned level:
| | Level 1 — | Prices are determined using quoted prices in an active market for identical assets. |
16 Invesco Small Cap Value Fund
| | Level 2 — | Prices are determined using other significant observable inputs. Observable inputs are inputs that other market participants may use in pricing a security. These may include quoted prices for similar securities, interest rates, prepayment speeds, credit risk, yield curves, loss severities, default rates, discount rates, volatilities and others. |
| | Level 3 — | Prices are determined using significant unobservable inputs. In situations where quoted prices or observable inputs are unavailable (for example, when there is little or no market activity for an investment at the end of the period), unobservable inputs may be used. Unobservable inputs reflect the Fund’s own assumptions about the factors market participants would use in determining fair value of the securities or instruments and would be based on the best available information. |
As of April 30, 2016, all of the securities in this Fund were valued based on Level 1 inputs (see the Schedule of Investments for security categories). The level assigned to the securities valuations may not be an indication of the risk or liquidity associated with investing in those securities. Because of the inherent uncertainties of valuation, the values reflected in the financial statements may materially differ from the value received upon actual sale of those investments.
NOTE 4—Investments in Other Affiliates
The 1940 Act defines an “affiliated person” as an issuance in which a fund holds 5% or more of the outstanding voting securities. The Fund has not owned enough of the outstanding voting securities of the issuer to have control (as defined in the 1940 Act) of that issuer. The following is a summary of the investments in other affiliates for the year ended April 30, 2016.
| | | | | | | | | | | | | | | | | | | | | | | | | | | | |
| | | Value 04/30/15 | | | Purchases
at Cost | | | Proceeds
from Sales | | | Change in
Unrealized
Appreciation
(Depreciation) | | | Realized
Gain (Loss) | | | Value 04/30/16 | | | Dividend
Income | |
Arctic Cat Inc. | | $ | — | | | $ | 46,921,953 | | | $ | — | | | $ | (12,076,083 | ) | | $ | — | | | $ | 34,845,870 | | | $ | 290,050 | |
Belden Inc.(a) | | | 121,396,149 | | | | 58,361,556 | | | | (17,158,110 | ) | | | (18,780,193 | ) | | | (687,399 | ) | | | 143,132,003 | | | | 409,761 | |
Callaway Golf Co. | | | 46,183,648 | | | | — | | | | (43,325,914 | ) | | | (14,003,683 | ) | | | 11,145,949 | | | | — | | | | 131,905 | |
Ciber, Inc. | | | 23,832,089 | | | | 185,055 | | | | — | | | | (8,221,060 | ) | | | — | | | | 15,796,084 | | | | — | |
Elizabeth Arden, Inc. | | | 69,623,228 | | | | 4,194,970 | | | | — | | | | (18,964,723 | ) | | | — | | | | 54,853,475 | | | | — | |
Hanger, Inc. | | | 84,094,931 | | | | 14,792,424 | | | | — | | | | (66,344,280 | ) | | | — | | | | 32,543,075 | | | | — | |
Installed Building Products Inc.(b) | | | 39,793,798 | | | | 1,593,900 | | | | (32,767,361 | ) | | | (5,083,388 | ) | | | 18,345,807 | | | | 21,882,756 | | | | — | |
Kelly Services, Inc. — Class A | | | 30,408,050 | | | | 13,112,032 | | | | — | | | | 8,232,468 | | | | — | | | | 51,752,550 | | | | 464,564 | |
KEMET Corp. | | | 16,174,521 | | | | — | | | | — | | | | (7,488,204 | ) | | | — | | | | 8,686,317 | | | | — | |
Kforce Inc. | | | 41,780,156 | | | | 11,303,861 | | | | — | | | | (6,802,575 | ) | | | — | | | | 46,281,442 | | | | 916,737 | |
MDC Partners Inc. — Class A(a) | | | 19,932,786 | | | | 80,439,382 | | | | (5,517,031 | ) | | | 4,094,569 | | | | 177,293 | | | | 99,126,999 | | | | 2,939,908 | |
Modine Manufacturing Co.(a) | | | 21,936,691 | | | | 5,724,896 | | | | — | | | | (1,324,903 | ) | | | — | | | | 26,336,684 | | | | — | |
Quicksilver, Inc. | | | 49,755,293 | | | | — | | | | (345,987 | ) | | | 49,233,480 | | | | (98,642,786 | ) | | | — | | | | — | |
Resources Connection Inc. | | | 57,172,079 | | | | — | | | | (3,079,186 | ) | | | (3,390,923 | ) | | | 206,823 | | | | 50,908,793 | | | | 1,342,335 | |
Tailored Brands, Inc. | | | — | | | | 35,995,188 | | | | — | | | | 8,712,476 | | | | — | | | | 44,707,664 | | | | 461,962 | |
Winnebago Industries, Inc.(a) | | | 26,175,369 | | | | 21,166,898 | | | | — | | | | 2,019,893 | | | | — | | | | 49,362,160 | | | | 870,916 | |
Total | | $ | 648,258,788 | | | $ | 293,792,115 | | | $ | (102,193,589 | ) | | $ | (90,187,129 | ) | | $ | (69,454,313 | ) | | $ | 680,215,872 | | | $ | 7,828,138 | |
| (a) | At April 30, 2015, this security was not considered to be an affiliate of the Fund. |
| (b) | As of April 30, 2016, this security is no longer considered an affiliate of the Fund. |
NOTE 5—Security Transactions with Affiliated Funds
The Fund is permitted to purchase or sell securities from or to certain other Invesco Funds under specified conditions outlined in procedures adopted by the Board of Trustees of the Trust. The procedures have been designed to ensure that any purchase or sale of securities by the Fund from or to another fund or portfolio that is or could be considered an affiliate by virtue of having a common investment adviser (or affiliated investment advisers), common Trustees and/or common officers complies with Rule 17a-7 of the 1940 Act. Further, as defined under the procedures, each transaction is effected at the current market price. Pursuant to these procedures, for the year ended April 30, 2016, the Fund engaged in securities purchases of $2,513,669 and securities sales of $28,110,425, which resulted in net realized gains of $15,452,593.
NOTE 6—Expense Offset Arrangement(s)
The expense offset arrangement is comprised of transfer agency credits which result from balances in demand deposit accounts used by the transfer agent for clearing shareholder transactions. For the year ended April 30, 2016, the Fund received credits from this arrangement, which resulted in the reduction of the Fund’s total expenses of $1,699.
17 Invesco Small Cap Value Fund
NOTE 7—Trustees’ and Officers’ Fees and Benefits
Trustees’ and Officers’ Fees and Benefits include amounts accrued by the Fund to pay remuneration to certain Trustees and Officers of the Fund. Trustees have the option to defer compensation payable by the Fund, and Trustees’ and Officers’ Fees and Benefits also include amounts accrued by the Fund to fund such deferred compensation amounts. Those Trustees who defer compensation have the option to select various Invesco Funds in which their deferral accounts shall be deemed to be invested. Finally, certain current Trustees were eligible to participate in a retirement plan that provided for benefits to be paid upon retirement to Trustees over a period of time based on the number of years of service. The Fund may have certain former Trustees who also participate in a retirement plan and receive benefits under such plan. Trustees’ and Officers’ Fees and Benefits include amounts accrued by the Fund to fund such retirement benefits. Obligations under the deferred compensation and retirement plans represent unsecured claims against the general assets of the Fund.
NOTE 8—Cash Balances
The Fund is permitted to temporarily carry a negative or overdrawn balance in its account with State Street Bank and Trust Company, the custodian bank. Such balances, if any at period-end, are shown in the Statement of Assets and Liabilities under the payable caption Amount due custodian. To compensate the custodian bank for such overdrafts, the overdrawn Fund may either (1) leave funds as a compensating balance in the account so the custodian bank can be compensated by earning the additional interest; or (2) compensate by paying the custodian bank at a rate agreed upon by the custodian bank and Invesco, not to exceed the contractually agreed upon rate.
NOTE 9—Distributions to Shareholders and Tax Components of Net Assets
Tax Character of Distributions to Shareholders Paid During the Fiscal Years Ended April 30, 2016 and 2015:
| | | | | | | | |
| | | 2016 | | | 2015 | |
Ordinary income | | $ | 4,080,288 | | | $ | 15,021,256 | |
Long-term capital gain | | | 295,253,944 | | | | 479,090,887 | |
Total distributions | | $ | 299,334,232 | | | $ | 494,112,143 | |
Tax Components of Net Assets at Period-End:
| | | | |
| | | 2016 | |
Undistributed ordinary income | | $ | 5,198,624 | |
Net unrealized appreciation — investments | | | 161,492,095 | |
Temporary book/tax differences | | | (277,929 | ) |
Capital loss carryforward | | | (502,511 | ) |
Post-October deferrals | | | (13,075,114 | ) |
Shares of beneficial interest | | | 2,618,216,640 | |
Total net assets | | $ | 2,771,051,805 | |
The difference between book-basis and tax-basis unrealized appreciation (depreciation) is due to differences in the timing of recognition of gains and losses on investments for tax and book purposes. The Fund’s net unrealized appreciation (depreciation) difference is attributable primarily to wash sales.
The temporary book/tax differences are a result of timing differences between book and tax recognition of income and/or expenses. The Fund’s temporary book/tax differences are the result of the trustee deferral of compensation and retirement plan benefits.
Capital loss carryforward is calculated and reported as of a specific date. Results of transactions and other activity after that date may affect the amount of capital loss carryforward actually available for the Fund to utilize. Capital losses generated in years beginning after December 22, 2010 can be carried forward for an unlimited period, whereas previous losses expire in eight tax years. Capital losses with an expiration period may not be used to offset capital gains until all net capital losses without an expiration date have been utilized. Capital loss carryforwards with no expiration date will retain their character as either short-term or long-term capital losses instead of as short-term capital losses as under prior law. The ability to utilize capital loss carryforwards in the future may be limited under the Internal Revenue Code and related regulations based on the results of future transactions.
The Fund has a capital loss carryforward as of April 30, 2016, which expires as follows:
| | | | | | | | | | | | |
| Capital Loss Carryforward* | |
| Expiration | | Short-Term | | | Long-Term | | | Total | |
April 30, 2017 | | $ | 502,511 | | | $ | — | | | $ | 502,511 | |
| * | Capital loss carryforward as of the date listed above is reduced for limitations, if any, to the extent required by the Internal Revenue Code and may be further limited depending upon a variety of factors, including the realization of net unrealized gains or losses as of the date of any reorganization. |
18 Invesco Small Cap Value Fund
NOTE 10—Investment Securities
The aggregate amount of investment securities (other than short-term securities, U.S. Treasury obligations and money market funds, if any) purchased and sold by the Fund during the year ended April 30, 2016 was $1,355,350,435 and $1,675,548,306, respectively. Cost of investments on a tax basis includes the adjustments for financial reporting purposes as of the most recently completed federal income tax reporting period-end.
| | | | |
| Unrealized Appreciation (Depreciation) of Investment Securities on a Tax Basis | |
Aggregate unrealized appreciation of investment securities | | $ | 467,813,359 | |
Aggregate unrealized (depreciation) of investment securities | | | (306,321,264 | ) |
Net unrealized appreciation of investment securities | | $ | 161,492,095 | |
Cost of investments for tax purposes is $2,608,364,378.
NOTE 11—Reclassification of Permanent Differences
Primarily as a result of differing book/tax treatment of income distributions and foreign currency transactions, on April 30, 2016, undistributed net investment income was decreased by $71,322 and undistributed net realized gain (loss) was increased by $71,322. This reclassification had no effect on the net assets of the Fund.
NOTE 12—Share Information
| | | | | | | | | | | | | | | | |
| | | Summary of Share Activity | |
| | | Years ended April 30, | |
| | | 2016(a) | | | 2015 | |
| | | Shares | | | Amount | | | Shares | | | Amount | |
Sold: | | | | | | | | | | | | | | | | |
Class A | | | 14,380,494 | | | $ | 254,657,811 | | | | 18,314,715 | | | $ | 390,577,358 | |
Class B | | | 10,504 | | | | 161,454 | | | | 11,967 | | | | 223,954 | |
Class C | | | 333,290 | | | | 4,532,878 | | | | 420,804 | | | | 7,461,287 | |
Class Y | | | 25,707,776 | | | | 465,855,012 | | | | 30,754,496 | | | | 677,067,815 | |
| | | | |
Issued as reinvestment of dividends: | | | | | | | | | | | | | | | | |
Class A | | | 8,199,536 | | | | 132,094,525 | | | | 12,521,989 | | | | 232,032,465 | |
Class B | | | 142,891 | | | | 1,849,010 | | | | 265,185 | | | | 4,073,242 | |
Class C | | | 1,145,564 | | | | 14,273,723 | | | | 1,737,561 | | | | 25,802,775 | |
Class Y | | | 7,620,047 | | | | 127,026,183 | | | | 10,000,421 | | | | 191,008,045 | |
| | | | |
Automatic conversion of Class B shares to Class A shares: | | | | | | | | | | | | | | | | |
Class A | | | 213,251 | | | | 3,730,270 | | | | 191,845 | | | | 4,085,268 | |
Class B | | | (262,060 | ) | | | (3,730,270 | ) | | | (227,934 | ) | | | (4,085,268 | ) |
| | | | |
Reacquired: | | | | | | | | | | | | | | | | |
Class A | | | (27,452,832 | ) | | | (482,500,377 | ) | | | (28,813,185 | ) | | | (623,593,063 | ) |
Class B | | | (235,675 | ) | | | (3,351,952 | ) | | | (208,295 | ) | | | (3,745,813 | ) |
Class C | | | (2,173,846 | ) | | | (29,216,652 | ) | | | (1,553,548 | ) | | | (26,967,789 | ) |
Class Y | | | (31,103,588 | ) | | | (542,998,835 | ) | | | (23,257,507 | ) | | | (510,727,680 | ) |
Net increase (decrease) in share activity | | | (3,474,648 | ) | | $ | (57,617,220 | ) | | | 20,158,514 | | | $ | 363,212,596 | |
| (a) | There are entities that are record owners of more than 5% of the outstanding shares of the Fund and in the aggregate own 31% of the outstanding shares of the Fund. IDI has an agreement with these entities to sell Fund shares. The Fund, Invesco and/or Invesco affiliates may make payments to these entities, which are considered to be related to the Fund, for providing services to the Fund, Invesco and/or Invesco affiliates including but not limited to services such as securities brokerage, distribution, third party record keeping and account servicing. The Fund has no knowledge as to whether all or any portion of the shares owned of record by these entities are also owned beneficially. |
19 Invesco Small Cap Value Fund
NOTE 13—Financial Highlights
The following schedule presents financial highlights for a share of the Fund outstanding throughout the periods indicated.
| | | | | | | | | | | | | | | | | | | | | | | | | | | | | | | | | | | | | | | | | | | | | | | | | | | | | | | | |
| | | Net asset
value,
beginning
of period | | | Net
investment
income
(loss)(a) | | | Net gains
(losses)
on securities
(both
realized and
unrealized) | | | Total from
investment
operations | | | Dividends
from net
investment
income | | | Distributions
from net
realized
gains | | | Total
distributions | | | Net asset
value, end
of period(b) | | | Total
return(c) | | | Net assets,
end of period
(000’s omitted) | | | Ratio of
expenses
to average
net assets
with fee waivers
and/or expenses
absorbed | | | Ratio of
expenses
to average net
assets without
fee waivers
and/or expenses
absorbed | | | Ratio of net
investment
income (loss)
to average
net assets | | | Portfolio
turnover(d) | |
Class A | |
Year ended 04/30/16 | | $ | 20.33 | | | $ | 0.04 | | | $ | (2.37 | ) | | $ | (2.33 | ) | | $ | (0.01 | ) | | $ | (1.78 | ) | | $ | (1.79 | ) | | $ | 16.21 | | | | (11.43 | )% | | $ | 1,320,826 | | | | 1.11 | %(e) | | | 1.11 | %(e) | | | 0.24 | %(e) | | | 45 | % |
Year ended 04/30/15 | | | 22.75 | | | | (0.00 | ) | | | 0.95 | | | | 0.95 | | | | — | | | | (3.37 | ) | | | (3.37 | ) | | | 20.33 | | | | 5.59 | | | | 1,751,109 | | | | 1.13 | | | | 1.13 | | | | (0.02 | ) | | | 44 | |
Year ended 04/30/14 | | | 18.53 | | | | (0.06 | ) | | | 6.11 | | | | 6.05 | | | | — | | | | (1.83 | ) | | | (1.83 | ) | | | 22.75 | | | | 33.78 | | | | 1,909,149 | | | | 1.11 | | | | 1.11 | | | | (0.29 | ) | | | 33 | |
Year ended 04/30/13 | | | 17.80 | | | | (0.02 | )(f) | | | 3.17 | | | | 3.15 | | | | — | | | | (2.42 | ) | | | (2.42 | ) | | | 18.53 | | | | 20.27 | | | | 1,454,001 | | | | 1.12 | | | | 1.15 | | | | (0.13 | )(f) | | | 35 | |
Year ended 04/30/12 | | | 19.71 | | | | (0.04 | ) | | | (0.75 | ) | | | (0.79 | ) | | | — | | | | (1.12 | ) | | | (1.12 | ) | | | 17.80 | | | | (3.18 | ) | | | 1,326,668 | | | | 1.03 | | | | 1.17 | | | | (0.24 | ) | | | 50 | |
Class B | | | | | | | | | | | | | | | | | | | | | | | | | | | | | | | | | | | | | | | | | | | | | | | | | | | | | | | | |
Year ended 04/30/16 | | | 16.80 | | | | (0.07 | ) | | | (1.96 | ) | | | (2.03 | ) | | | — | | | | (1.78 | ) | | | (1.78 | ) | | | 12.99 | | | | (12.06 | ) | | | 12,942 | | | | 1.86 | (e) | | | 1.86 | (e) | | | (0.51 | )(e) | | | 45 | |
Year ended 04/30/15 | | | 19.54 | | | | (0.14 | ) | | | 0.77 | | | | 0.63 | | | | — | | | | (3.37 | ) | | | (3.37 | ) | | | 16.80 | | | | 4.81 | | | | 22,527 | | | | 1.88 | | | | 1.88 | | | | (0.77 | ) | | | 44 | |
Year ended 04/30/14 | | | 16.25 | | | | (0.19 | ) | | | 5.31 | | | | 5.12 | | | | — | | | | (1.83 | ) | | | (1.83 | ) | | | 19.54 | | | | 32.75 | | | | 29,312 | | | | 1.86 | | | | 1.86 | | | | (1.04 | ) | | | 33 | |
Year ended 04/30/13 | | | 16.01 | | | | (0.13 | )(f) | | | 2.79 | | | | 2.66 | | | | — | | | | (2.42 | ) | | | (2.42 | ) | | | 16.25 | | | | 19.44 | | | | 28,408 | | | | 1.81 | | | | 1.90 | | | | (0.82 | )(f) | | | 35 | |
Year ended 04/30/12 | | | 17.91 | | | | (0.08 | ) | | | (0.70 | ) | | | (0.78 | ) | | | — | | | | (1.12 | ) | | | (1.12 | ) | | | 16.01 | | | | (3.45 | ) | | | 34,194 | | | | 1.33 | | | | 1.81 | | | | (0.54 | ) | | | 50 | |
Class C | | | | | | | | | | | | | | | | | | | | | | | | | | | | | | | | | | | | | | | | | | | | | | | | | | | | | | | | |
Year ended 04/30/16 | | | 16.25 | | | | (0.07 | ) | | | (1.90 | ) | | | (1.97 | ) | | | — | | | | (1.78 | ) | | | (1.78 | ) | | | 12.50 | | | | (12.11 | ) | | | 107,647 | | | | 1.86 | (e) | | | 1.86 | (e) | | | (0.51 | )(e) | | | 45 | |
Year ended 04/30/15 | | | 19.02 | | | | (0.13 | ) | | | 0.73 | | | | 0.60 | | | | — | | | | (3.37 | ) | | | (3.37 | ) | | | 16.25 | | | | 4.80 | (g) | | | 151,196 | | | | 1.86 | (g) | | | 1.86 | (g) | | | (0.75 | )(g) | | | 44 | |
Year ended 04/30/14 | | | 15.86 | | | | (0.19 | ) | | | 5.18 | | | | 4.99 | | | | — | | | | (1.83 | ) | | | (1.83 | ) | | | 19.02 | | | | 32.75 | | | | 165,438 | | | | 1.86 | | | | 1.86 | | | | (1.04 | ) | | | 33 | |
Year ended 04/30/13 | | | 15.69 | | | | (0.13 | )(f) | | | 2.72 | | | | 2.59 | | | | — | | | | (2.42 | ) | | | (2.42 | ) | | | 15.86 | | | | 19.39 | | | | 138,382 | | | | 1.87 | | | | 1.90 | | | | (0.88 | )(f) | | | 35 | |
Year ended 04/30/12 | | | 17.65 | | | | (0.15 | ) | | | (0.69 | ) | | | (0.84 | ) | | | — | | | | (1.12 | ) | | | (1.12 | ) | | | 15.69 | | | | (3.85 | ) | | | 140,342 | | | | 1.76 | | | | 1.90 | | | | (0.97 | ) | | | 50 | |
Class Y | | | | | | | | | | | | | | | | | | | | | | | | | | | | | | | | | | | | | | | | | | | | | | | | | | | | | | | | |
Year ended 04/30/16 | | | 20.97 | | | | 0.09 | | | | (2.45 | ) | | | (2.36 | ) | | | (0.04 | ) | | | (1.78 | ) | | | (1.82 | ) | | | 16.79 | | | | (11.19 | ) | | | 1,329,637 | | | | 0.86 | (e) | | | 0.86 | (e) | | | 0.49 | (e) | | | 45 | |
Year ended 04/30/15 | | | 23.31 | | | | 0.05 | | | | 0.98 | | | | 1.03 | | | | — | | | | (3.37 | ) | | | (3.37 | ) | | | 20.97 | | | | 5.81 | | | | 1,614,118 | | | | 0.88 | | | | 0.88 | | | | 0.23 | | | | 44 | |
Year ended 04/30/14 | | | 18.90 | | | | (0.01 | ) | | | 6.25 | | | | 6.24 | | | | — | | | | (1.83 | ) | | | (1.83 | ) | | | 23.31 | | | | 34.13 | | | | 1,385,718 | | | | 0.86 | | | | 0.86 | | | | (0.04 | ) | | | 33 | |
Year ended 04/30/13 | | | 18.07 | | | | 0.02 | (f) | | | 3.23 | | | | 3.25 | | | | — | | | | (2.42 | ) | | | (2.42 | ) | | | 18.90 | | | | 20.54 | | | | 885,327 | | | | 0.87 | | | | 0.90 | | | | 0.12 | (f) | | | 35 | |
Year ended 04/30/12 | | | 19.94 | | | | 0.00 | | | | (0.75 | ) | | | (0.75 | ) | | | — | | | | (1.12 | ) | | | (1.12 | ) | | | 18.07 | | | | (2.93 | ) | | | 744,163 | | | | 0.78 | | | | 0.92 | | | | 0.01 | | | | 50 | |
| (a) | Calculated using average shares outstanding. |
| (b) | Includes redemption fees added to shares of beneficial interest which were less than $0.005 per share, for the years prior to April 30, 2013. |
| (c) | Includes adjustments in accordance with accounting principles generally accepted in the United States of America and as such, the net asset value for financial reporting purposes and the returns based upon those net asset values may differ from the net asset value and returns for shareholder transactions. Does not include sales charges and is not annualized for periods less than one year, if applicable. |
| (d) | Portfolio turnover is calculated at the fund level and is not annualized for periods less than one year, if applicable. For the period ending April 30, 2012, the portfolio turnover calculation excludes the value of securities purchased of $983,090,206 and sold of $586,342,254 in the effort to realign the Fund’s portfolio holdings after the reorganization of Invesco Special Value Fund, Invesco Small-Mid Special Value Fund, Invesco U.S. Small Cap Value Fund and Invesco U.S. Small-Mid Cap Value Fund into the Fund. |
| (e) | Ratios are based on average daily net assets (000’s omitted) of $1,482,193, $17,141, $126,374 and $1,462,456 for Class A, Class B, Class C and Class Y shares, respectively. |
| (f) | Net investment income (loss) per share and the ratio of net investment income (loss) to average net assets includes significant dividends received during the period. Net investment income (loss) per share and the ratio of net investment income (loss) to average net assets excluding the significant dividends are $(0.06) and (0.35)%, $(0.17) and (1.04)%, $(0.17) and (1.10)% and $(0.02) and (0.10)% for Class A, Class B, Class C and Class Y, respectively. |
| (g) | The total return, ratio of expenses to average net assets and ratio of net investment income (loss) to average net assets reflect actual 12b-1 fees of 0.99% for the year ended April 30, 2015. |
20 Invesco Small Cap Value Fund
Report of Independent Registered Public Accounting Firm
To the Board of Trustees of AIM Sector Funds (Invesco Sector Funds)
and Shareholders of Invesco Small Cap Value Fund:
In our opinion, the accompanying statement of assets and liabilities, including the schedule of investments, and the related statements of operations and of changes in net assets and the financial highlights present fairly, in all material respects, the financial position of Invesco Small Cap Value Fund (one of the funds constituting AIM Sector Funds (Invesco Sector Funds), hereafter referred to as the “Fund”) at April 30, 2016, the results of its operations for the year then ended, the changes in its net assets for each of the two years in the period then ended and the financial highlights for each of the five years in the period then ended, in conformity with accounting principles generally accepted in the United States of America. These financial statements and financial highlights (hereafter referred to as “financial statements”) are the responsibility of the Fund’s management; our responsibility is to express an opinion on these financial statements based on our audits. We conducted our audits of these financial statements in accordance with the standards of the Public Company Accounting Oversight Board (United States). Those standards require that we plan and perform the audit to obtain reasonable assurance about whether the financial statements are free of material misstatement. An audit includes examining, on a test basis, evidence supporting the amounts and disclosures in the financial statements, assessing the accounting principles used and significant estimates made by management, and evaluating the overall financial statement presentation. We believe that our audits, which included confirmation of securities at April 30, 2016 by correspondence with the custodian and brokers, and the application of alternative auditing procedures where confirmations of security purchases have not been received, provide a reasonable basis for our opinion.
PRICEWATERHOUSECOOPERS LLP
June 22, 2016
Houston, Texas
21 Invesco Small Cap Value Fund
Calculating your ongoing Fund expenses
Example
As a shareholder of the Fund, you incur two types of costs: (1) transaction costs, which may include sales charges (loads) on purchase payments or contingent deferred sales charges on redemptions, if any; and (2) ongoing costs, including management fees, distribution and/or service (12b-1) fees, and other Fund expenses. This example is intended to help you understand your ongoing costs (in dollars) of investing in the Fund and to compare these costs with ongoing costs of investing in other mutual funds. The example is based on an investment of $1,000 invested at the beginning of the period and held for the entire period November 1, 2015 through April 30, 2016.
Actual expenses
The table below provides information about actual account values and actual expenses. You may use the information in this table, together with the amount you invested, to estimate the expenses that you paid over the period. Simply divide your account value by $1,000 (for example, an $8,600 account value divided by $1,000 = 8.6), then multiply the result by the number in the table under the heading entitled “Actual Expenses Paid During Period” to estimate the expenses you paid on your account during this period.
Hypothetical example for comparison purposes
The table below also provides information about hypothetical account values and hypothetical expenses based on the Fund’s actual expense ratio and an assumed rate of return of 5% per year before expenses, which is not the Fund’s actual return.
The hypothetical account values and expenses may not be used to estimate the actual ending account balance or expenses you paid for the period. You may use this information to compare the ongoing costs of investing in the Fund and other funds. To do so, compare this 5% hypothetical example with the 5% hypothetical examples that appear in the shareholder reports of the other funds.
Please note that the expenses shown in the table are meant to highlight your ongoing costs only and do not reflect any transaction costs, such as sales charges (loads) on purchase payments or contingent deferred sales charges on redemptions, if any. Therefore, the hypothetical information is useful in comparing ongoing costs only, and will not help you determine the relative total costs of owning different funds. In addition, if these transaction costs were included, your costs would have been higher.
| | | | | | | | | | | | | | | | | | | | | | | | |
| Class | | Beginning
Account Value
(11/01/15) | | | ACTUAL | | | HYPOTHETICAL (5% annual return before
expenses) | | | Annualized
Expense
Ratio | |
| | | Ending
Account Value
(04/30/16)1 | | | Expenses
Paid During
Period2 | | | Ending
Account Value
(04/30/16) | | | Expenses
Paid During
Period2 | | |
| A | | $ | 1,000.00 | | | $ | 958.30 | | | $ | 5.45 | | | $ | 1,019.29 | | | $ | 5.62 | | | | 1.12 | % |
| B | | | 1,000.00 | | | | 955.00 | | | | 9.09 | | | | 1,015.56 | | | | 9.37 | | | | 1.87 | |
| C | | | 1,000.00 | | | | 954.70 | | | | 9.09 | | | | 1,015.56 | | | | 9.37 | | | | 1.87 | |
| Y | | | 1,000.00 | | | | 959.50 | | | | 4.24 | | | | 1,020.54 | | | | 4.37 | | | | 0.87 | |
| 1 | The actual ending account value is based on the actual total return of the Fund for the period November 1, 2015 through April 30, 2016, after actual expenses and will differ from the hypothetical ending account value which is based on the Fund’s expense ratio and a hypothetical annual return of 5% before expenses. |
| 2 | Expenses are equal to the Fund’s annualized expense ratio as indicated above multiplied by the average account value over the period, multiplied by 182/366 to reflect the most recent fiscal half year. |
22 Invesco Small Cap Value Fund
Tax Information
Form 1099-DIV, Form 1042-S and other year-end tax information provide shareholders with actual calendar year amounts that should be included in their tax returns. Shareholders should consult their tax advisors.
The following distribution information is being provided as required by the Internal Revenue Code or to meet a specific state’s requirement.
The Fund designates the following amounts or, if subsequently determined to be different, the maximum amount allowable for its fiscal year ended April 30, 2016:
| | | | |
Federal and State Income Tax | |
Long-Term Capital Gain Distributions | | $ | 295,253,944 | |
Qualified Dividend Income* | | | 100 | % |
Corporate Dividends Received Deduction* | | | 100 | % |
U.S. Treasury Obligations* | | | 0 | % |
| | * | The above percentages are based on ordinary income dividends paid to shareholders during the Fund’s fiscal year. |
23 Invesco Small Cap Value Fund
Trustees and Officers
The address of each trustee and officer is AIM Sector Funds (Invesco Sector Funds) (the “Trust”), 11 Greenway Plaza, Suite 1000, Houston, Texas 77046-1173. The trustees serve for the life of the Trust, subject to their earlier death, incapacitation, resignation, retirement or removal as more specifically provided in the Trust’s organizational documents. Each officer serves for a one year term or until their successors are elected and qualified. Column two below includes length of time served with predecessor entities, if any.
| | | | | | | | |
Name, Year of Birth and
Position(s) Held with the Trust | | Trustee and/
or Officer Since | | Principal Occupation(s) During Past 5 Years | | Number of Funds in Fund Complex Overseen by Trustee | | Other Directorship(s) Held by Trustee During Past 5 Years |
| Interested Persons | | | | | | | | |
Martin L. Flanagan1 — 1960 Trustee | | 2007 | | Executive Director, Chief Executive Officer and President, Invesco Ltd. (ultimate parent of Invesco and a global investment management firm); Advisor to the Board, Invesco Advisers, Inc. (formerly known as Invesco Institutional (N.A.), Inc.); Trustee, The Invesco Funds; Vice Chair, Investment Company Institute; and Member of Executive Board, SMU Cox School of Business Formerly: Chairman and Chief Executive Officer, Invesco Advisers, Inc. (registered investment adviser); Director, Chairman, Chief Executive Officer and President, IVZ Inc. (holding company), INVESCO Group Services, Inc. (service provider) and Invesco North American Holdings, Inc. (holding company); Director, Chief Executive Officer and President, Invesco Holding Company Limited (parent of Invesco and a global investment management firm); Director, Invesco Ltd.; Chairman, Investment Company Institute and President, Co-Chief Executive Officer, Co-President, Chief Operating Officer and Chief Financial Officer, Franklin Resources, Inc. (global investment management organization) | | 146 | | None |
Philip A. Taylor2 — 1954 Trustee and Senior Vice President | | 2006 | | Head of the Americas and Senior Managing Director, Invesco Ltd.; Director, Co-Chairman, Co-President and Co-Chief Executive Officer, Invesco Advisers, Inc. (formerly known as Invesco Institutional (N.A.), Inc.) (registered investment adviser); Director, Chairman, Chief Executive Officer and President, Invesco Management Group, Inc. (formerly known as Invesco AIM Management Group, Inc.) (financial services holding company); Director and Chairman, Invesco Investment Services, Inc. (formerly known as Invesco AIM Investment Services, Inc.) (registered transfer agent) Chief Executive Officer, Invesco Corporate Class Inc. (corporate mutual fund company) Director, Chairman and Chief Executive Officer, Invesco Canada Ltd. (formerly known as Invesco Trimark Ltd./Invesco Trimark Ltèe) (registered investment adviser and registered transfer agent); Trustee and Senior Vice President, The Invesco Funds; Director, Invesco Investment Advisers LLC (formerly known as Van Kampen Asset Management); Director, Chief Executive Officer and President, Van Kampen Exchange Corp. Formerly: President and Principal Executive Officer, The Invesco Funds (other than AIM Treasurer’s Series Trust (Invesco Treasurer’s Series Trust), Short-Term Investments Trust and Invesco Management Trust); Executive Vice President, The Invesco Funds (AIM Treasurer’s Series Trust (Invesco Treasurer’s Series Trust), Short-Term Investments Trust and Invesco Management Trust only); Director and President, INVESCO Funds Group, Inc. (registered investment adviser and registered transfer agent); Director and Chairman, IVZ Distributors, Inc. (formerly known as INVESCO Distributors, Inc.) (registered broker dealer); Director, President and Chairman, Invesco Inc. (holding company), Invesco Canada Holdings Inc. (holding company), Trimark Investments Ltd./Placements Trimark Ltèe and Invesco Financial Services Ltd/Services Financiers Invesco Ltèe; Chief Executive Officer, Invesco Canada Fund Inc. (corporate mutual fund company); Director and Chairman, Van Kampen Investor Services Inc.; Director, Chief Executive Officer and President, 1371 Preferred Inc. (holding company) and Van Kampen Investments Inc.; Director and President, AIM GP Canada Inc. (general partner for limited partnerships) and Van Kampen Advisors, Inc.; Director and Chief Executive Officer, Invesco Trimark Dealer Inc. (registered broker dealer); Director, Invesco Distributors, Inc. (formerly known as Invesco AIM Distributors, Inc.) (registered broker dealer); Manager, Invesco PowerShares Capital Management LLC; Director, Chief Executive Officer and President, Invesco Advisers, Inc.; Director, Chairman, Chief Executive Officer and President, Invesco AIM Capital Management, Inc.; President, Invesco Trimark Dealer Inc. and Invesco Trimark Ltd./Invesco Trimark Ltèe; Director and President, AIM Trimark Corporate Class Inc. and AIM Trimark Canada Fund Inc.; Senior Managing Director, Invesco Holding Company Limited; Director and Chairman, Fund Management Company (former registered broker dealer); President and Principal Executive Officer, The Invesco Funds (AIM Treasurer’s Series Trust (Invesco Treasurer’s Series Trust), and Short-Term Investments Trust only); President, AIM Trimark Global Fund Inc. and AIM Trimark Canada Fund Inc. | | 146 | | None |
| 1 | Mr. Flanagan is considered an interested person (within the meaning of Section 2(a)(19) of the 1940 Act) of the Trust because he is an officer of the Adviser to the Trust, and an officer and a director of Invesco Ltd., ultimate parent of the Adviser. |
| 2 | Mr. Taylor is considered an interested person (within the meaning of Section 2(a)(19) of the 1940 Act) of the Trust because he is an officer and a director of the Adviser. |
T-1 Invesco Small Cap Value Fund
Trustees and Officers—(continued)
| | | | | | | | |
Name, Year of Birth and
Position(s) Held with the Trust | | Trustee and/
or Officer Since | | Principal Occupation(s) During Past 5 Years | | Number of Funds in Fund Complex Overseen by Trustee | | Other Directorship(s) Held by Trustee During Past 5 Years |
| Independent Trustees | | | | | | | | |
Bruce L. Crockett — 1944 Trustee and Chair | | 2003 | | Chairman, Crockett Technologies Associates (technology consulting company) Formerly: Director, Captaris (unified messaging provider); Director, President and Chief Executive Officer, COMSAT Corporation; Chairman, Board of Governors of INTELSAT (international communications company); ACE Limited (insurance company); Independent Directors Council and Investment Company Institute | | 146 | | ALPS (Attorneys Liability Protection Society) (insurance company) and Globe Specialty Metals, Inc. (metallurgical company); Member of the Audit Committee, Ferroglobe PLC and Investment Company Institute; Member of the Executive Committee and Chair of the Governance Committee, Independent Directors Council |
David C. Arch — 1945 Trustee | | 2010 | | Chairman of Blistex Inc., a consumer health care products manufacturer | | 146 | | Board member of the Illinois Manufacturers’ Association; Member of the Board of Visitors, Institute for the Humanities, University of Michigan |
James T. Bunch — 1942 Trustee | | 2000 | | Managing Member, Grumman Hill Group LLC (family office/private equity investments) Formerly: Chairman of the Board, Denver Film Society, Chairman of the Board of Trustees, Evans Scholarship Foundation; Chairman, Board of Governors, Western Golf Association | | 146 | | Trustee, Evans Scholarship Foundation |
Albert R. Dowden — 1941 Trustee | | 2003 | | Director of a number of public and private business corporations, including Nature’s Sunshine Products, Inc. Formerly: Director, The Boss Group, Ltd. and Reich & Tang Funds (5 portfolios) (registered investment company); Director, Homeowners of America Holding Corporation/Homeowners of America Insurance Company (property casualty company); Director, Continental Energy Services, LLC (oil and gas pipeline service); Director, CompuDyne Corporation (provider of product and services to the public security market) and Director, Annuity and Life Re (Holdings), Ltd. (reinsurance company); Director, President and Chief Executive Officer, Volvo Group North America, Inc.; Senior Vice President, AB Volvo; Director of various public and private corporations; Chairman, DHJ Media, Inc.; Director, Magellan Insurance Company; and Director, The Hertz Corporation, Genmar Corporation (boat manufacturer), National Media Corporation; Advisory Board of Rotary Power International (designer, manufacturer, and seller of rotary power engines); and Chairman, Cortland Trust, Inc. (registered investment company) | | 146 | | Director of Nature’s Sunshine Products, Inc. |
Jack M. Fields — 1952 Trustee | | 2003 | | Chief Executive Officer, Twenty First Century Group, Inc. (government affairs company); and Discovery Learning Alliance (non-profit) Formerly: Owner and Chief Executive Officer, Dos Angeles Ranch L.P. (cattle, hunting, corporate entertainment); Director, Insperity, Inc. (formerly known as Administaff); Chief Executive Officer, Texana Timber LP (sustainable forestry company); Director of Cross Timbers Quail Research Ranch (non-profit); and member of the U.S. House of Representatives | | 146 | | None |
Eli Jones — 1961 Trustee | | 2016 | | Professor and Dean, Mays Business School — Texas A&M University Formerly: Professor and Dean, Walton College of Business, University of Arkansas and E.J. Ourso College of Business, Louisiana State University and Director, Arvest Bank | | 146 | | Director of Insperity, Inc. (formerly known as Administaff) |
Prema Mathai-Davis — 1950 Trustee | | 2003 | | Retired. Formerly: Chief Executive Officer, YWCA of the U.S.A. | | 146 | | None |
Larry Soll — 1942 Trustee | | 1997 | | Retired. Formerly: Chairman, Chief Executive Officer and President, Synergen Corp. (a biotechnology company) | | 146 | | None |
Raymond Stickel, Jr. — 1944 Trustee | | 2005 | | Retired. Formerly: Director, Mainstay VP Series Funds, Inc. (25 portfolios) and Partner, Deloitte & Touche | | 146 | | None |
Robert C. Troccoli — 1949 Trustee | | 2016 | | Adjunct Professor and Executive-in-Residence, University of Denver — Daniels College of Business Formerly: Senior Partner, KPMG LLP | | 146 | | None |
T-2 Invesco Small Cap Value Fund
Trustees and Officers—(continued)
| | | | | | | | |
Name, Year of Birth and
Position(s) Held with the Trust | | Trustee and/
or Officer Since | | Principal Occupation(s) During Past 5 Years | | Number of Funds in Fund Complex Overseen by Trustee | | Other Directorship(s) Held by Trustee During Past 5 Years |
| Independent Trustees—(continued) |
Suzanne H. Woolsey — 1941 Trustee | | 2014 | | Retired. Formerly: Chief Executive Officer of Woolsey Partners LLC | | 146 | | Director, SunShare LLC; Trustee, Ocean Conservancy; Emeritus Chair of the Board of Trustees of the Institute for Defense Analyses and of Colorado College; Trustee, Chair, Business and Finance Committee of California Institute of Technology; Prior to 2014, Director of Fluor Corp.; Prior to 2010, Trustee of the German Marshall Fund of the United States; Prior to 2010, Trustee of the Rocky Mountain Institute |
| Other Officers | | | | | | | | |
Sheri Morris — 1964 President, Principal Executive Officer and Treasurer | | 2003 | | President, Principal Executive Officer and Treasurer, The Invesco Funds; Vice President, Invesco Advisers, Inc. (formerly known as Invesco Institutional (N.A.), Inc.) (registered investment adviser); and Vice President, PowerShares Exchange-Traded Fund Trust, PowerShares Exchange-Traded Fund Trust II, PowerShares India Exchange-Traded Fund Trust, PowerShares Actively Managed Exchange-Traded Fund Trust, and PowerShares Actively Managed Exchange-Traded Commodity Fund Trust Formerly: Vice President and Principal Financial Officer, The Invesco Funds; Vice President, Invesco AIM Advisers, Inc., Invesco AIM Capital Management, Inc. and Invesco AIM Private Asset Management, Inc.; Assistant Vice President and Assistant Treasurer, The Invesco Funds and Assistant Vice President, Invesco Advisers, Inc., Invesco AIM Capital Management, Inc. and Invesco AIM Private Asset Management, Inc.; and Treasurer, PowerShares Exchange-Traded Fund Trust, PowerShares Exchange-Traded Fund Trust II, PowerShares India Exchange-Traded Fund Trust and PowerShares Actively Managed Exchange-Traded Fund Trust | | N/A | | N/A |
Russell C. Burk — 1958 Senior Vice President and Senior Officer | | 2005 | | Senior Vice President and Senior Officer, The Invesco Funds | | N/A | | N/A |
John M. Zerr — 1962 Senior Vice President, Chief Legal Officer and Secretary | | 2006 | | Director, Senior Vice President, Secretary and General Counsel, Invesco Management Group, Inc. (formerly known as Invesco AIM Management Group, Inc.) and Van Kampen Exchange Corp.; Senior Vice President, Invesco Advisers, Inc. (formerly known as Invesco Institutional (N.A.), Inc.) (registered investment adviser); Senior Vice President and Secretary, Invesco Distributors, Inc. (formerly known as Invesco AIM Distributors, Inc.); Director, Vice President and Secretary, Invesco Investment Services, Inc. (formerly known as Invesco AIM Investment Services, Inc.) Senior Vice President, Chief Legal Officer and Secretary, The Invesco Funds; Managing Director, Invesco PowerShares Capital Management LLC; Director, Secretary and General Counsel, Invesco Investment Advisers LLC (formerly known as Van Kampen Asset Management); Secretary and General Counsel, Invesco Capital Markets, Inc. (formerly known as Van Kampen Funds Inc.) and Chief Legal Officer, PowerShares Exchange-Traded Fund Trust, PowerShares Exchange-Traded Fund Trust II, PowerShares India Exchange-Traded Fund Trust, PowerShares Actively Managed Exchange-Traded Fund Trust, and PowerShares Actively Managed Exchange-Traded Commodity Fund Trust Formerly: Director, Vice President and Secretary, IVZ Distributors, Inc. (formerly known as INVESCO Distributors, Inc.); Director and Vice President, INVESCO Funds Group, Inc.; Director and Vice President, Van Kampen Advisors Inc.; Director, Vice President, Secretary and General Counsel, Van Kampen Investor Services Inc.; Director, Invesco Distributors, Inc. (formerly known as Invesco AIM Distributors, Inc.); Director, Senior Vice President, General Counsel and Secretary, Invesco AIM Advisers, Inc. and Van Kampen Investments Inc.; Director, Vice President and Secretary, Fund Management Company; Director, Senior Vice President, Secretary, General Counsel and Vice President, Invesco AIM Capital Management, Inc.; Chief Operating Officer and General Counsel, Liberty Ridge Capital, Inc. (an investment adviser); Vice President and Secretary, PBHG Funds (an investment company) and PBHG Insurance Series Fund (an investment company); Chief Operating Officer, General Counsel and Secretary, Old Mutual Investment Partners (a broker-dealer); General Counsel and Secretary, Old Mutual Fund Services (an administrator) and Old Mutual Shareholder Services (a shareholder servicing center); Executive Vice President, General Counsel and Secretary, Old Mutual Capital, Inc. (an investment adviser); and Vice President and Secretary, Old Mutual Advisors Funds (an investment company) | | N/A | | N/A |
T-3 Invesco Small Cap Value Fund
Trustees and Officers—(continued)
| | | | | | | | |
Name, Year of Birth and
Position(s) Held with the Trust | | Trustee and/
or Officer Since | | Principal Occupation(s) During Past 5 Years | | Number of Funds in Fund Complex Overseen by Trustee | | Other Directorship(s) Held by Trustee During Past 5 Years |
| Other Officers—(continued) | | | | | | | | |
Karen Dunn Kelley — 1960 Senior Vice President | | 2003 | | Senior Managing Director, Investments, Invesco Ltd.; Director, Co-President, Co-Chief Executive Officer, and Co-Chairman, Invesco Advisers, Inc. (formerly known as Invesco Institutional (N.A.), Inc.) (registered investment adviser); Chairman and Director, Invesco Senior Secured Management, Inc.; Senior Vice President, Invesco Management Group, Inc. (formerly known as Invesco AIM Management Group, Inc.); Executive Vice President, Invesco Distributors, Inc. (formerly known as Invesco AIM Distributors, Inc.); Director, Invesco Mortgage Capital Inc. and Invesco Management Company Limited; Senior Vice President, The Invesco Funds Formerly: Vice President, The Invesco Funds (other than AIM Treasurer’s Series Trust (Invesco Treasurer’s Series Trust), Short-Term Investments Trust and Invesco Management Trust); and President and Principal Executive Officer, The Invesco Funds (AIM Treasurer’s Series Trust (Invesco Treasurer’s Series Trust), Short-Term Investments Trust and Invesco Management Trust only); Director and President, INVESCO Asset Management (Bermuda) Ltd., Director, INVESCO Global Asset Management DAC (formerly known as INVESCO Global Asset Management Limited) and INVESCO Management S.A.; Senior Vice President, Van Kampen Investments Inc. and Invesco Advisers, Inc. (formerly known as Invesco Institutional (N.A.), Inc.) (registered investment adviser); Director and President, Fund Management Company; Chief Cash Management Officer, Director of Cash Management, Senior Vice President, and Managing Director, Invesco AIM Capital Management, Inc.; Director of Cash Management, Senior Vice President, and Vice President, Invesco Advisers, Inc. and The Invesco Funds (AIM Treasurer’s Series Trust (Invesco Treasurer’s Series Trust), and Short-Term Investments Trust only) | | N/A | | N/A |
Kelli Gallegos — 1970 Vice President, Principal Financial Officer and Assistant Treasurer | | 2008 | | Vice President, Principal Financial Officer and Assistant Treasurer, The Invesco Funds; Assistant Treasurer, Invesco PowerShares Capital Management LLC, PowerShares Exchange-Traded Fund Trust, PowerShares Exchange-Traded Fund Trust II, PowerShares India Exchange-Traded Fund Trust, PowerShares Actively Managed Exchange-Traded Fund Trust, and PowerShares Actively Managed Exchange-Traded Commodity Fund Trust Formerly: Assistant Vice President, The Invesco Funds | | N/A | | N/A |
Tracy Sullivan — 1962 Vice President, Chief Tax Officer and Assistant Treasurer | | 2008 | | Vice President, Chief Tax Officer and Assistant Treasurer, The Invesco Funds; Assistant Treasurer, Invesco PowerShares Capital Management LLC, PowerShares Exchange-Traded Fund Trust, PowerShares Exchange-Traded Fund Trust II, PowerShares India Exchange-Traded Fund Trust, PowerShares Actively Managed Exchange-Traded Fund Trust, and PowerShares Actively Managed Exchange-Traded Commodity Fund Trust Formerly: Assistant Vice President, The Invesco Funds | | N/A | | N/A |
Crissie M. Wisdom — 1969 Anti-Money Laundering Compliance Officer | | 2013 | | Anti-Money Laundering Compliance Officer, Invesco Advisers, Inc. (formerly known as Invesco Institutional (N.A.), Inc.) (registered investment adviser), Invesco Capital Markets, Inc. (formerly known as Van Kampen Funds Inc.), Invesco Distributors, Inc., Invesco Investment Services, Inc., Invesco Management Group, Inc., Van Kampen Exchange Corp., The Invesco Funds, and PowerShares Exchange-Traded Fund Trust, PowerShares Exchange-Traded Fund Trust II, PowerShares India Exchange-Traded Fund Trust, PowerShares Actively Managed Exchange-Traded Fund Trust and PowerShares Actively Managed Exchange-Traded Commodity Fund Trust; Anti-Money Laundering Compliance Officer and Bank Secrecy Act Officer, INVESCO National Trust Company and Invesco Trust Company; and Fraud Prevention Manager and Controls and Risk Analysis Manager for Invesco Investment Services, Inc. | | N/A | | N/A |
Robert R. Leveille — 1969 Chief Compliance Officer | | 2016 | | Chief Compliance Officer, Invesco Advisers, Inc. (registered investment adviser); and Chief Compliance Officer, The Invesco Funds Formerly: Chief Compliance Officer, Putnam Investments and the Putnam Funds | | N/A | | N/A |
The Statement of Additional Information of the Trust includes additional information about the Fund’s Trustees and is available upon request, without charge, by calling 1.800.959.4246. Please refer to the Fund’s Statement of Additional Information for information on the Fund’s sub-advisers.
| | | | | | |
Office of the Fund 11 Greenway Plaza, Suite 1000 Houston, TX 77046-1173 | | Investment Adviser Invesco Advisers, Inc. 1555 Peachtree Street, N.E. Atlanta, GA 30309 | | Distributor Invesco Distributors, Inc. 11 Greenway Plaza, Suite 1000 Houston, TX 77046-1173 | | Auditors PricewaterhouseCoopers LLP 1000 Louisiana Street, Suite 5800 Houston, TX 77002-5678 |
| | | |
| | | | | | |
Counsel to the Fund Stradley Ronon Stevens & Young, LLP 2005 Market Street, Suite 2600 Philadelphia, PA 19103-7018 | | Counsel to the Independent Trustees Goodwin Procter LLP 901 New York Avenue, N.W. Washington, D.C. 20001 | | Transfer Agent Invesco Investment Services, Inc. 11 Greenway Plaza, Suite 1000 Houston, TX 77046-1173 | | Custodian State Street Bank and Trust Company 225 Franklin Street Boston, MA 02110-2801 |
T-4 Invesco Small Cap Value Fund

Invesco mailing information
Send general correspondence to Invesco Investment Services, Inc., P.O. Box 219078, Kansas City, MO 64121-9078.
Important notice regarding delivery of security holder documents
To reduce Fund expenses, only one copy of most shareholder documents may be mailed to shareholders with multiple accounts at the same address (Householding). Mailing of your shareholder documents may be householded indefinitely unless you instruct us otherwise. If you do not want the mailing of these documents to be combined with those for other members of your household, please contact Invesco Investment Services, Inc. at 800 959 4246 or contact your financial institution. We will begin send-ing you individual copies for each account within 30 days after receiving your request.
Fund holdings and proxy voting information
The Fund provides a complete list of its holdings four times in each fiscal year, at the quarter ends. For the second and fourth quarters, the lists appear in the Fund’s semiannual and annual reports to shareholders. For the first and third quarters, the Fund files the lists with the Securities and Exchange Commission (SEC) on Form N-Q. The most recent list of portfolio holdings is available at invesco.com/completeqtrholdings. Shareholders can also look up the Fund’s Forms N-Q on the SEC website at sec.gov. Copies of the Fund’s Forms N-Q may be reviewed and copied at the SEC Public Reference Room in Washington, D.C. You can obtain information on the operation of the Public Reference Room, including information about duplicating fee charges, by calling 202 551 8090 or 800 732 0330, or by electronic request at the following email address: publicinfo@sec.gov. The SEC file numbers for the Fund are shown below.
A description of the policies and procedures that the Fund uses to determine how to vote proxies relating to portfolio securities is available without charge, upon request, from our Client Services department at 800 959 4246 or at invesco.com/proxyguidelines. The information is also available on the SEC website, sec.gov.
| | |
Information regarding how the Fund voted proxies related to its portfolio securities during the most recent 12-month period ended June 30 is available at invesco.com/proxysearch. The information is also available on the SEC website, sec.gov. Invesco Advisers, Inc. is an investment adviser; it provides investment advisory services to individual and institutional clients and does not sell securities. Invesco Distributors, Inc. is the US distributor for Invesco Ltd.’s retail mutual funds, exchange-traded funds and institutional money market funds. Both are wholly owned, indirect subsidiaries of Invesco Ltd. | |  |
| | | | |
| SEC file numbers: 811-03826 and 002-85905 | | VK-SCV-AR-1 | | Invesco Distributors, Inc. |
| | | | |
| | |
 | | Annual Report to Shareholders | | April 30, 2016 |
| | |
| | Invesco Technology Fund |
| | Nasdaq: |
| | A: ITYAX n B: ITYBX n C: ITHCX n Y: ITYYX n Investor: FTCHX n R5: FTPIX |

Letters to Shareholders
| | |

Philip Taylor | | Dear Shareholders: This annual report includes information about your Fund, including performance data and a complete list of its investments as of the close of the reporting period. Inside is a discussion of how your Fund was managed and the factors that affected its performance during the reporting period. US economic data were generally positive over the reporting period, with the economy expanding modestly and employment numbers improving steadily. Throughout the reporting period, US consumers benefited from declining energy prices and greater credit availability, but a strengthening dollar crimped the profits of many large multi-national companies doing business overseas. Ending years of uncertainty, the US Federal Reserve in December 2015 finally raised short-term interest rates for the first time since 2006, signaling its confidence that the economy was likely to continue expanding and improving. Overseas, the economic story was less positive. The European Central Bank and central banks in China and Japan – as well |
| |
as other countries – either instituted or maintained extraordinarily accommodative monetary policies in response to economic weakness. Stocks began 2016 on a weak note due to increased concerns about global economic weakness.
Short-term market volatility can prompt some investors to abandon their investment plans – and can cause others to settle for average results. The investment professionals at Invesco, in contrast, invest with high conviction and a long-term perspective. At Invesco, investing with high conviction means offering a wide range of strategies designed to go beyond market benchmarks. We trust our research-driven insights, have confidence in our investment processes and build portfolios that reflect our beliefs. Our goal is to look past market noise in an effort to find attractive opportunities at attractive prices – consistent with the investment strategies spelled out in each fund’s prospectus. Of course, investing with high conviction can’t guarantee a profit or ensure investment success; no investment strategy or risk analysis can. To learn more about how we invest with high conviction, visit invesco.com/HighConviction.
You, too, can invest with high conviction by maintaining a long-term investment perspective and by working with your financial adviser on a regular basis. During periods of short-term market volatility or uncertainty, your financial adviser can keep you focused on your long-term investment goals – a new home, a child’s college education, or a secure retirement. He or she also can share research about the economy, the markets and individual investment options.
Visit our website for more information on your investments
Our website, invesco.com/us, offers a wide range of market insights and investment perspectives. On the website, you’ll find detailed information about our funds, including performance, holdings and portfolio manager commentaries. You can access information about your account by completing a simple, secure online registration. Click on the “Need to register” link in the “Account Access” box on our homepage to get started. Invesco’s mobile apps for iPhone® and iPad® (both available free from the App StoreSM) allow you to obtain the same detailed information, monitor your account and create customizable watch lists.
In addition to the resources accessible on our website and through our mobile app, you can obtain timely updates to help you stay informed about the markets, the economy and investing by connecting with Invesco on Twitter, LinkedIn or Facebook. You can access our blog at blog.invesco.us.com. Our goal is to provide you the information you want, when and where you want it.
Have questions?
For questions about your account, contact an Invesco client services representative at 800 959 4246. For Invesco-related questions or comments, please email me directly at phil@invesco.com.
All of us at Invesco look forward to serving your investment management needs. Thank you for investing with us.
Sincerely,

Philip Taylor
Senior Managing Director, Invesco Ltd.
iPhone and iPad are trademarks of Apple Inc., registered in the US and other countries. App Store is a service mark of Apple Inc. Invesco Distributors, Inc. is not affiliated with Apple Inc.
2 Invesco Technology Fund
| | |

Bruce Crockett | | Dear Fellow Shareholders: Among the many important lessons I’ve learned in more than 40 years in a variety of business endeavors is the value of a trusted advocate. As independent chair of the Invesco Funds Board, I can assure you that the members of the Board are strong advocates for the interests of investors in Invesco’s mutual funds. We work hard to represent your interests through oversight of the quality of the investment management services your funds receive and other matters important to your investment, including but not limited to: |
| |
| | n Ensuring that Invesco offers a diverse lineup of mutual funds that your financial adviser can use to strive to meet your financial needs as your investment goals change over time. |
| | n Monitoring how the portfolio management teams of the Invesco funds are performing in light of changing economic and market conditions. |
| n | | Assessing each portfolio management team’s investment performance within the context of the investment strategy described in the fund’s prospectus. |
| n | | Monitoring for potential conflicts of interests that may impact the nature of the services that your funds receive. |
We believe one of the most important services we provide our fund shareholders is the annual review of the funds’ advisory and sub-advisory contracts with Invesco Advisers and its affiliates. This review is required by the Investment Company Act of 1940 and focuses on the nature and quality of the services Invesco provides as the adviser to the Invesco funds and the reasonableness of the fees that it charges for those services. Each year, we spend months carefully reviewing information received from Invesco and a variety of independent sources, such as performance and fee data prepared by Lipper Inc., an independent, third-party firm widely recognized as a leader in its field. We also meet with our independent legal counsel and other independent advisers to review and help us assess the information that we have received. Our goal is to assure that you receive quality investment management services for a reasonable fee.
I trust the measures outlined above provide assurance that you have a worthy advocate when it comes to choosing the Invesco Funds.
As always, please contact me at bruce@brucecrockett.com with any questions or concerns you may have. On behalf of the Board, we look forward to continuing to represent your interests and serving your needs.
Sincerely,

Bruce L. Crockett
Independent Chair
Invesco Funds Board of Trustees
3 Invesco Technology Fund
Management’s Discussion of Fund Performance
|
Performance summary |
For the fiscal year ended April 30, 2016, Class A shares of Invesco Technology Fund (the Fund), at net asset value (NAV), underperformed the Fund’s broad market/style-specific benchmark, the Nasdaq Composite Index. Your Fund’s long-term performance appears later in this report. |
| | | | | |
Fund vs. Indexes Total returns, 4/30/15 to 4/30/16, at net asset value (NAV). Performance shown does not include applicable contingent deferred sales charges (CDSC) or front-end sales charges, which would have reduced performance. |
| | | | | |
Class A Shares | | | | -6.83 | % |
Class B Shares | | | | -7.53 | |
Class C Shares | | | | -7.50 | |
Class Y Shares | | | | -6.61 | |
Investor Class Shares | | | | -6.73 | |
Class R5 Shares | | | | -6.36 | |
Nasdaq Composite Index▼ (Broad Market/Style-Specific Index)* | | | | -2.19 | |
S&P 500 Index▼ (Former Broad Market Index)* | | | | 1.21 | |
The BofA Merrill Lynch 100 Technology Index (price only)¢ (Former Style-Specific Index)* | | | | -3.36 | |
Lipper Science & Technology Funds Index¿ (Peer Group Index) | | | | -3.58 | |
| | | | | |
Source(s): ▼FactSet Research Systems; ¢Bloomberg LP; ¿Lipper Inc. * The Fund has elected to use the Nasdaq Composite Index as its broad market/style-specific index rather than using the S&P 500 Index as its broad market index and The BofA Merrill Lynch 100 Technology Index (price only) as its style-specific index because the Nasdaq Composite Index more closely reflects the performance of the types of securities in which the Fund invests. | | |
Market conditions and your Fund
Although the health of individual economic sectors varied dramatically, the US economy overall continued its slow but steady growth during the fiscal year ended April 30, 2016. This modest growth led to recurring debate over whether the US economy could withstand global recessionary forces. Many energy, industrial and materials companies experienced cyclical downturns resembling a mild recession even as many consumer-related companies benefited from continued low interest rates, increased availability of credit and a better employment picture. Another significant downturn in oil prices reduced capital investment but
also reduced consumers’ energy and gasoline costs.
In the first half of the reporting period, US equity market performance was greatly affected by expectations of when, and whether, the US Federal Reserve (the Fed) might raise interest rates – and the impact the Fed’s action might have. Markets moved lower in the summer of 2015 as a significant downturn in China’s financial markets and weak global economic growth led to increased concern about the sustainability of US economic growth. In the fall, markets rallied and the Fed saw enough economic stabilization to finally raise interest rates.
US stocks began 2016 on a negative note. Together with a sharp decline in oil
prices, this suggested a global recession might be imminent and caused investors to become decidedly risk averse; this helped short-term and income-oriented investments, but hurt longer-term and growth-oriented investments. As companies reported earnings and fundamentals that were better than had been feared, stocks rallied sharply in late February and March. Additionally, oil prices strengthened modestly on the back of a weaker US dollar and as Saudi Arabia and Russia considered a freeze on their oil output. Overall, US equity markets were mixed, with the S&P 500 Index, considered representative of the performance of the US stock market, finishing the reporting period modestly higher.
In this environment, the information technology sector posted a flat return for the fiscal year. Invesco Technology Fund had negative returns and trailed the Nasdaq Composite Index, its broad market/style-specific benchmark for the reporting period.
Among individual stocks, Facebook – a high conviction holding – was the leading contributor to Fund performance for the reporting period. The company reported increased usage, increased migration to mobile devices and increased video usage, which led to increased video advertising revenue. Facebook also reduced guidance for its future expenses. Amazon.com also contributed to Fund results as the company reported expanding profitability in major business segments; the stock was up more than 50% during the reporting period. Alphabet – a newly formed and renamed holding company formerly known as Google – was a strong contributor to Fund performance for the fiscal year. During the fiscal year, a new chief financial officer enhanced communication with investors and stressed cost
| | |
Portfolio Composition |
By sector | | % of total net assets |
| | |
| |
Information Technology | | 53.0% |
Health Care | | 24.0 |
Consumer Discretionary | | 14.8 |
Industrials | | 2.5 |
Telecommunication Services | | 1.5 |
Financials | | 0.6 |
Money Market Funds Plus Other Assets Less Liabilities | | 3.6 |
| | | | | | | |
Top 10 Equity Holdings* |
| % of total net assets |
| | | | |
| | |
1. | | Facebook Inc.-Class A | | 7.4% |
2. | | Alphabet Inc.-Class A | | 6.4 |
3. | | Apple Inc. | | 5.8 |
4. | | Amazon.com, Inc. | | 5.7 |
5. | | Microsoft Corp. | | 4.7 |
6. | | Visa Inc.-Class A | | 4.0 |
7. | | Broadcom Ltd. | | 3.9 |
8. | | Gilead Sciences, Inc. | | 3.7 |
9. | | salesforce.com, inc. | | 3.2 |
10. | | Celgene Corp. | | 3.1 |
| | | | | |
Total Net Assets | | $652.8 million |
| | | | | |
| |
Total Number of Holdings* | | | | 42 | |
The Fund’s holdings are subject to change, and there is no assurance that the Fund will continue to hold any particular security.
*Excluding money market fund holdings.
Data presented here are as of April 30, 2016.
4 Invesco Technology Fund
discipline for the company. This responsible messaging, combined with strength in the company’s YouTube and mobile-search businesses, pushed the stock higher.
In contrast, Apple was one of the largest detractors from Fund performance during the reporting period. Apple is one of the largest positions in the Fund and the stock was hurt by short-term product cycle factors which we do not believe will be long-term issues. LinkedIn also detracted from Fund performance. The company’s stock price fell after the company reported disappointing fourth-quarter results and shut down its ad platform, which was viewed as a key driver of future growth. We sold the stock before the close of the reporting period.
After a particularly strong run, biotechnology stocks were punished severely regardless of company-specific fundamentals, negatively impacting several Fund holdings. This negative performance was driven by political rhetoric regarding drug pricing, mixed earnings results and unsustainably high valuations in the small-cap biotech space, which led to significant outflows from biotechnology stocks as a group. Fund holdings Alkermes, Vertex Pharmaceuticals and Gilead Sciences detracted from Fund performance during the reporting period. At the close of the reporting period, the Fund remained tilted toward stocks of attractive growth companies in the biotechnology industry – companies that are innovating and developing promising new treatments.
At the close of the reporting period, the Fund was biased toward growth technology, including biopharmaceuticals, and away from mature technology. It emphasized innovation, transformative technology and opportunities which we expect to take market share from mature companies, including the game-changing technologies of mobile security, cloud and biopharmaceuticals. We remain optimistic about technology spending given strong corporate balance sheets and companies’ need to invest in more robust security solutions for future growth. In our opinion, the increased pace of health care innovation is likely to continue to produce attractive long-term growth rates due to successful mapping of the human genome and recent productivity improvements, both of which have fostered faster and more effective targeting of promising therapeutics. We attempt to harness multi-year secular trends, which may benefit long-term investors regardless of near-term economic conditions.
As we’ve discussed, stocks were volatile during the fiscal year, and we caution investors against making investment decisions based on short-term performance.
We thank you for your commitment to Invesco Technology Fund.
The views and opinions expressed in management’s discussion of Fund performance are those of Invesco Advisers, Inc. These views and opinions are subject to change at any time based on factors such as market and economic conditions. These views and opinions may not be relied upon as investment advice or recommendations, or as an offer for a particular security. The information is not a complete analysis of every aspect of any market, country, industry, security or the Fund. Statements of fact are from sources considered reliable, but Invesco Advisers, Inc. makes no representation or warranty as to their completeness or accuracy. Although historical performance is no guarantee of future results, these insights may help you understand our investment management philosophy.
See important Fund and, if applicable, index disclosures later in this report.
| | |
 | | Erik Voss Chartered Financial Analyst, Portfolio Manager, is lead manager of Invesco |
| Technology Fund. He joined Invesco in 2010. Mr. Voss earned a BS in mathematics and an MS in finance from the University of Wisconsin. |
| |
 | | Janet Luby Chartered Financial Analyst, Portfolio Manager, is manager of Invesco Technology |
| Fund. She joined Invesco in 2011. Ms. Luby earned a BBA in finance from Texas A&M University. She is also a Certified Public Accountant. |
Assisted by Invesco’s Large/Multi-Cap Growth Team
5 Invesco Technology Fund
Your Fund’s Long-Term Performance
Results of a $10,000 Investment – Oldest Share Class(es)
Fund and index data from 4/30/06
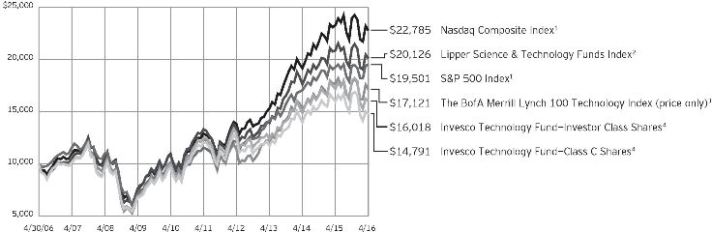
| 1 | Source: FactSet Research Systems Inc. |
| 4 | It is Invesco’s policy to chart the Fund’s oldest share class(es). Because Investor Class shares do not have a sales charge, we also show the oldest share class with a sales charge, Class C shares. |
Past performance cannot guarantee comparable future results.
During the reporting period, the Fund elected to use the Nasdaq Composite Index as its broad market/style-specific index rather than using the S&P 500 Index as its broad market index and The BofA Merrill Lynch 100 Technology Index (price only) as its style-specific index because the Nasdaq Composite Index more closely reflects the performance of the types of securities in which the Fund invests.
Because this is the first reporting period since we have adopted the new index, SEC guidelines require that we compare performance to both the old and new indexes.
The data shown in the chart include reinvested distributions, applicable sales charges and Fund expenses including management fees. Index results include reinvested dividends, but they do not reflect sales charges. Performance of the peer group, if applicable, reflects fund expenses and management fees;
performance of a market index does not. Performance shown in the chart and table(s) does not reflect deduction of taxes a shareholder would pay on Fund distributions or sale of Fund shares.
6 Invesco Technology Fund
| | | | | | |
| | | Average Annual Total Returns | |
| | As of 4/30/16, including maximum applicable sales charges | |
| | | Class A Shares | | | | |
| | | Inception (3/28/02) | | | 2.56 | % |
| | | 10 Years | | | 4.17 | |
| | | 5 Years | | | 3.89 | |
| | | 1 Year | | | -11.94 | |
| | |
| | | Class B Shares | | | | |
| | | Inception (3/28/02) | | | 2.53 | % |
| | | 10 Years | | | 4.15 | |
| | | 5 Years | | | 4.02 | |
| | | 1 Year | | | -11.82 | |
| | |
| | | Class C Shares | | | | |
| | | Inception (2/14/00) | | | -4.94 | % |
| | | 10 Years | | | 3.99 | |
| | | 5 Years | | | 4.31 | |
| | | 1 Year | | | -8.36 | |
| | |
| | | Class Y Shares | | | | |
| | | 10 Years | | | 4.96 | % |
| | | 5 Years | | | 5.35 | |
| | | 1 Year | | | -6.61 | |
| | |
| | | Investor Class Shares | | | | |
| | | Inception (1/19/84) | | | 9.34 | % |
| | | 10 Years | | | 4.82 | |
| | | 5 Years | | | 5.16 | |
| | | 1 Year | | | -6.73 | |
| | |
| | | Class R5 Shares | | | | |
| | | Inception (12/21/98) | | | 3.01 | % |
| | | 10 Years | | | 5.44 | |
| | | 5 Years | | | 5.70 | |
| | | 1 Year | | | -6.36 | |
| | | Performance includes litigation proceeds. Had these proceeds not been received, total returns would have been lower. | |
Class Y shares incepted on October 3, 2008. Performance shown prior to that date is that of Investor Class shares and includes the 12b-1 fees applicable to Investor Class shares.
The performance data quoted represent past performance and cannot guarantee comparable future results; current performance may be lower or higher. Please visit invesco.com/performance for the most recent month-end performance. Performance figures reflect reinvested distributions, changes in net asset value and the effect of the maximum sales charge unless otherwise stated. Investment return and principal value will fluctuate so that you may have a gain or loss when you sell shares.
The total annual Fund operating expense ratio set forth in the most recent Fund prospectus as of the date
| | | | | | |
| | | Average Annual Total Returns | |
| | As of 3/31/16, the most recent calendar quarter end, including maximum applicable sales charges | |
| | | Class A Shares | | | | |
| | | Inception (3/28/02) | | | 2.68 | % |
| | | 10 Years | | | 4.46 | |
| | | 5 Years | | | 4.79 | |
| | | 1 Year | | | -12.37 | |
| | |
| | | Class B Shares | | | | |
| | | Inception (3/28/02) | | | 2.64 | % |
| | | 10 Years | | | 4.44 | |
| | | 5 Years | | | 4.91 | |
| | | 1 Year | | | -12.23 | |
| | |
| | | Class C Shares | | | | |
| | | Inception (2/14/00) | | | -4.88 | % |
| | | 10 Years | | | 4.27 | |
| | | 5 Years | | | 5.19 | |
| | | 1 Year | | | -8.83 | |
| | |
| | | Class Y Shares | | | | |
| | | 10 Years | | | 5.25 | % |
| | | 5 Years | | | 6.24 | |
| | | 1 Year | | | -7.07 | |
| | |
| | | Investor Class Shares | | | | |
| | | Inception (1/19/84) | | | 9.41 | % |
| | | 10 Years | | | 5.11 | |
| | | 5 Years | | | 6.05 | |
| | | 1 Year | | | -7.21 | |
| | |
| | | Class R5 Shares | | | | |
| | | Inception (12/21/98) | | | 3.10 | % |
| | | 10 Years | | | 5.73 | |
| | | 5 Years | | | 6.60 | |
| | | 1 Year | | | -6.84 | |
| | | Performance includes litigation proceeds. Had these proceeds not been received, total returns would have been lower. | |
of this report for Class A, Class B, Class C, Class Y, Investor Class and Class R5 shares was 1.40%, 2.15%, 2.15%, 1.15%, 1.30% and 0.87%, respectively. The expense ratios presented above may vary from the expense ratios presented in other sections of this report that are based on expenses incurred during the period covered by this report.
Class A share performance reflects the maximum 5.50% sales charge, and Class B and Class C share performance reflects the applicable contingent deferred sales charge (CDSC) for the period involved. The CDSC on Class B shares declines from 5% beginning at the time of purchase to 0% at the beginning of the seventh year. The CDSC on Class C shares is 1% for the first year after purchase. Class Y, Investor Class and Class R5 shares do
not have a front-end sales charge or a CDSC; therefore, performance is at net asset value.
The performance of the Fund’s share classes will differ primarily due to different sales charge structures and class expenses.
Fund performance reflects any applicable fee waivers and/or expense reimbursements. Had the adviser not waived fees and/or reimbursed expenses currently or in the past, returns would have been lower. See current prospectus for more information.
7 Invesco Technology Fund
Invesco Technology Fund’s investment objective is long-term growth of capital.
| n | | Unless otherwise stated, information presented in this report is as of April 30, 2016, and is based on total net assets. |
| n | | Unless otherwise noted, all data provided by Invesco. |
| n | | To access your Fund’s reports/prospectus, visit invesco.com/fundreports. |
About share classes
| n | | Class B shares may not be purchased for new or additional investments. Please see the prospectus for more information. |
| n | | Class Y shares and Investor Class shares are available only to certain investors. Please see the prospectus for more information. |
| n | | Class R5 shares are primarily intended for employer sponsored retirement and benefit plans that meet certain standards and for institutional investors. Please see the prospectus for more information. |
Principal risks of investing
in the Fund
| n | | Depositary receipts risk. Investing in depositary receipts involves the same risks as direct investments in foreign securities. In addition, the underlying issuers of certain depositary receipts are under no obligation to distribute shareholder communications or pass through any voting rights with respect to the deposited securities to the holders of such receipts. The Fund may therefore receive less timely information or have less control than if it invested directly in the foreign issuer. |
| n | | Derivatives risk. The value of a derivative instrument depends largely on (and is derived from) the value of an underlying security, currency, commodity, interest rate, index or other asset (each referred to as an underlying asset). In addition to risks relating to the underlying assets, the use of derivatives may include other, possibly greater, risks, including counterparty, leverage and liquidity risks. Counter-party risk is the risk that the counter-party to the derivative contract will default on its obligation to pay the Fund the amount owed or otherwise perform under the derivative contract. Derivatives create leverage risk because they do not require payment up front equal to the economic exposure created by owning the derivative. As a result, an |
| | adverse change in the value of the underlying asset could result in the Fund sustaining a loss that is substantially greater than the amount invested in the derivative, which may make the Fund’s returns more volatile and increase the risk of loss. Derivative instruments may also be less liquid than more traditional investments and the Fund may be unable to sell or close out its derivative positions at a desirable time or price. This risk may be more acute under adverse market conditions, during which the Fund may be most in need of liquidating its derivative positions. Derivatives may also be harder to value, less tax efficient and subject to changing government regulation that could impact the Fund’s ability to use certain derivatives or their cost. Also, derivatives used for hedging or to gain or limit exposure to a particular market segment may not provide the expected benefits, particularly during adverse market conditions. |
| n | | Emerging markets securities risk. Emerging markets (also referred to as developing markets) are generally subject to greater market volatility, political, social and economic instability, uncertain trading markets and more governmental limitations on foreign investment than more developed markets. In addition, companies operating in emerging markets may be subject to lower trading volume and greater price fluctuations than companies in more developed markets. Securities law and the enforcement of systems of taxation in many emerging market countries may change quickly and unpredictably. In addition, investments in emerging markets securities may also be subject to additional transaction costs, delays in settlement procedures, and lack of timely information. |
| n | | Foreign securities risk. The Fund’s foreign investments may be adversely affected by political and social instability, changes in economic or taxation policies, difficulty in enforcing obligations, |
| | | | | |
| | This report must be accompanied or preceded by a currently effective Fund prospectus, which contains more complete information, including sales charges and expenses. Investors should read it carefully before investing. |
|
NOT FDIC INSURED | MAY LOSE VALUE | NO BANK GUARANTEE |
| | decreased liquidity or increased volatility. Foreign investments also involve the risk of the possible seizure, nationalization or expropriation of the issuer or foreign deposits (in which the Fund could lose its entire investments in a certain market) and the possible adoption of foreign governmental restrictions such as exchange controls. Unless the Fund has hedged its foreign securities risk, foreign securities risk also involves the risk of negative foreign currency rate fluctuations, which may cause the value of securities denominated in such foreign currency (or other instruments through which the Fund has exposure to foreign currencies) to decline in value. Currency exchange rates may fluctuate significantly over short periods of time. Currency hedging strategies, if used, are not always successful. |
| n | | Growth investing risk. Growth stocks tend to be more expensive relative to the issuing company’s earnings or assets compared with other types of stock. As a result, they tend to be more sensitive to changes in, or investors’ expectations of, the issuing company’s earnings and can be more volatile. |
| n | | Management risk. The Fund is actively managed and depends heavily on the Adviser’s judgment about markets, interest rates or the attractiveness, relative values, liquidity, or potential appreciation of particular investments made for the Fund’s portfolio. The Fund could experience losses if these judgments prove to be incorrect. Additionally, legislative, regulatory, or tax developments may adversely affect management of the Fund and, therefore, the ability of the Fund to achieve its investment objective. |
| n | | Market risk. The market values of the Fund’s investments, and therefore the value of the Fund’s shares, will go up and down, sometimes rapidly or unpredictably. Market risk may affect a single issuer, industry or section of the economy, or it may affect the market as a whole. Individual stock prices tend to go up and down more dramatically than those of certain other types of investments, such as bonds. During a general downturn in the financial markets, multiple asset classes may decline in value. When markets perform well, there can be no assurance that specific investments held by the Fund will rise in value. |
8 Invesco Technology Fund
| n | | Mid-capitalization risk. Mid-capitalization companies tend to be more vulnerable to changing market conditions and may have more limited product lines and markets, less experienced management and fewer financial resources than larger companies. These companies’ securities may be more volatile and less liquid than those of more established companies, and their returns may vary, sometimes significantly, from the overall securities market. |
| n | | Technology sector risk. The Fund will concentrate its investments in the securities of issuers engaged primarily in technology-related industries. Technology companies are subject to intense competition, rapid obsolescence of their products, issues with obtaining financing or regulatory approvals, product incompatibility, changing consumer preferences, high required corporate capital expenditure for research and development or infrastructure and development of new products, each of which make the prices of securities issued by these companies more volatile. |
About indexes used in this report
| n | | The Nasdaq Composite Index is a broad-based, capitalization-weighted, total return index of all Nasdaq domestic and international based common type stocks listed on the Nasdaq Stock Market. |
| n | | The S&P 500® Index is an unmanaged index considered representative of the US stock market. |
| n | | The BofA Merrill Lynch 100 Technology Index (price only) is an unmanaged, price-only, equal-dollar-weighted index of 100 stocks designed to measure the performance of a cross section of large, actively traded technology stocks and American Depositary Receipts. |
| n | | The Lipper Science & Technology Funds Index is an unmanaged index considered representative of science and technology funds tracked by Lipper. |
| n | | The Fund is not managed to track the performance of any particular index, including the index(es) described here, and consequently, the performance of the Fund may deviate significantly from the performance of the index(es). |
| n | | A direct investment cannot be made in an index. Unless otherwise indicated, index results include reinvested dividends, and they do not reflect sales charges. Performance of the peer group, if applicable, reflects fund expenses; performance of a market index does not. |
Other information
| n | | CPA® and Certified Public Accountant® are trademarks owned by the American Institute of Certified Public Accountants. |
| n | | The returns shown in management’s discussion of Fund performance are based on net asset values (NAVs) calculated for shareholder transactions. Generally accepted accounting principles require adjustments to be made to the net assets of the Fund at period end for financial reporting purposes, and as such, the NAVs for shareholder transactions and the returns based on those NAVs may differ from the NAVs and returns reported in the Financial Highlights. |
| n | | Industry classifications used in this report are generally according to the Global Industry Classification Standard, which was developed by and is the exclusive property and a service mark of MSCI Inc. and Standard & Poor’s. |
9 Invesco Technology Fund
Schedule of Investments(a)
April 30, 2016
| | | | | | | | |
| | | Shares | | | Value | |
Common Stocks & Other Equity Interests–96.45% | |
| Aerospace & Defense–2.52% | |
Raytheon Co. | | | 130,377 | | | $ | 16,473,134 | |
|
| Application Software–3.24% | |
salesforce.com, inc.(b) | | | 278,745 | | | | 21,128,871 | |
|
| Biotechnology–13.49% | |
Alexion Pharmaceuticals, Inc.(b) | | | 42,702 | | | | 5,947,535 | |
Alkermes PLC(b) | | | 331,109 | | | | 13,161,583 | |
Amgen Inc. | | | 70,271 | | | | 11,123,899 | |
Biogen Inc.(b) | | | 24,234 | | | | 6,664,108 | |
Celgene Corp.(b) | | | 195,983 | | | | 20,266,602 | |
Gilead Sciences, Inc. | | | 276,025 | | | | 24,348,165 | |
Vertex Pharmaceuticals Inc.(b) | | | 77,995 | | | | 6,578,098 | |
| | | | | 88,089,990 | |
|
| Cable & Satellite–3.13% | |
DISH Network Corp.–Class A(b) | | | 358,691 | | | | 17,679,879 | |
Time Warner Cable Inc. | | | 12,995 | | | | 2,756,370 | |
| | | | | 20,436,249 | |
|
| Communications Equipment–0.79% | |
Palo Alto Networks, Inc.(b) | | | 34,034 | | | | 5,134,710 | |
|
| Consumer Electronics–3.46% | |
Harman International Industries, Inc. | | | 126,685 | | | | 9,724,341 | |
Sony Corp. (Japan) | | | 530,100 | | | | 12,885,070 | |
| | | | | 22,609,411 | |
|
| Data Processing & Outsourced Services–8.52% | |
First Data Corp.–Class A(b) | | | 390,974 | | | | 4,453,194 | |
MasterCard, Inc.–Class A | | | 202,377 | | | | 19,628,545 | |
Vantiv, Inc.–Class A(b) | | | 96,370 | | | | 5,256,020 | |
Visa Inc.–Class A | | | 340,024 | | | | 26,263,454 | |
| | | | | 55,601,213 | |
|
| Health Care Equipment–2.15% | |
Medtronic PLC | | | 177,396 | | | | 14,040,893 | |
|
| Home Entertainment Software–5.44% | |
Activision Blizzard, Inc. | | | 568,049 | | | | 19,580,649 | |
Electronic Arts Inc.(b) | | | 154,898 | | | | 9,580,441 | |
Nintendo Co., Ltd. (Japan) | | | 47,100 | | | | 6,334,858 | |
| | | | | 35,495,948 | |
|
| Internet Retail–8.20% | |
Amazon.com, Inc.(b) | | | 56,448 | | | | 37,232,536 | |
Netflix Inc.(b) | | | 67,533 | | | | 6,079,996 | |
Priceline Group Inc. (The)(b) | | | 7,620 | | | | 10,238,689 | |
| | | | | 53,551,221 | |
| | | | | | | | |
| | | Shares | | | Value | |
| Internet Software & Services–16.73% | |
Alibaba Group Holding Ltd.–ADR (China)(b) | | | 50,825 | | | $ | 3,910,476 | |
Alphabet Inc.–Class A(b) | | | 59,363 | | | | 42,021,880 | |
Alphabet Inc.–Class C(b) | | | 21,818 | | | | 15,120,092 | |
Facebook Inc.–Class A(b) | | | 409,758 | | | | 48,179,346 | |
| | | | | 109,231,794 | |
|
| Investment Banking & Brokerage–0.59% | |
Charles Schwab Corp. (The) | | | 135,899 | | | | 3,860,891 | |
|
| IT Consulting & Other Services–0.58% | |
Cognizant Technology Solutions Corp.–Class A(b) | | | 64,293 | | | | 3,752,782 | |
|
| Life Sciences Tools & Services–2.56% | |
Thermo Fisher Scientific, Inc. | | | 115,796 | | | | 16,703,573 | |
|
| Managed Health Care–0.75% | |
UnitedHealth Group Inc. | | | 37,167 | | | | 4,894,151 | |
|
| Pharmaceuticals–5.10% | |
Allergan PLC(b) | | | 43,802 | | | | 9,485,761 | |
Bristol-Myers Squibb Co. | | | 211,498 | | | | 15,265,926 | |
Eli Lilly and Co. | | | 113,226 | | | | 8,551,960 | |
| | | | | 33,303,647 | |
|
| Semiconductors–6.35% | |
Broadcom Ltd. (Singapore) | | | 174,364 | | | | 25,413,553 | |
NXP Semiconductors N.V. (Netherlands)(b) | | | 188,030 | | | | 16,035,198 | |
| | | | | 41,448,751 | |
|
| Systems Software–5.57% | |
Microsoft Corp. | | | 608,115 | | | | 30,326,695 | |
ServiceNow, Inc.(b) | | | 84,351 | | | | 6,029,409 | |
| | | | | 36,356,104 | |
|
| Technology Hardware, Storage & Peripherals–5.77% | |
Apple Inc. | | | 401,599 | | | | 37,645,890 | |
|
| Wireless Telecommunication Services–1.51% | |
Sprint Corp.(b) | | | 2,877,915 | | | | 9,871,248 | |
Total Common Stocks & Other Equity Interests
(Cost $444,094,175) | | | | 629,630,471 | |
|
Money Market Funds–2.73% | |
Liquid Assets Portfolio–Institutional Class, 0.44%(c) | | | 8,913,228 | | | | 8,913,228 | |
Premier Portfolio–Institutional Class, 0.39%(c) | | | 8,913,228 | | | | 8,913,228 | |
Total Money Market Funds
(Cost $17,826,456) | | | | 17,826,456 | |
TOTAL INVESTMENTS–99.18%
(Cost $461,920,631) | | | | 647,456,927 | |
OTHER ASSETS LESS LIABILITIES–0.82% | | | | 5,356,731 | |
NET ASSETS–100.00% | | | $ | 652,813,658 | |
Investment Abbreviations:
| | |
| ADR | | – American Depositary Receipt |
Notes to Schedule of Investments:
| (a) | Industry and/or sector classifications used in this report are generally according to the Global Industry Classification Standard, which was developed by and is the exclusive property and a service mark of MSCI Inc. and Standard & Poor’s. |
| (b) | Non-income producing security. |
| (c) | The money market fund and the Fund are affiliated by having the same investment adviser. The rate shown is the 7-day SEC standardized yield as of April 30, 2016. |
See accompanying Notes to Financial Statements which are an integral part of the financial statements.
10 Invesco Technology Fund
Statement of Assets and Liabilities
April 30, 2016
| | | | |
Assets: | | | | |
Investments, at value (Cost $444,094,175) | | $ | 629,630,471 | |
Investments in affiliated money market funds, at value and cost | | | 17,826,456 | |
Total investments, at value (Cost $461,920,631) | | | 647,456,927 | |
Foreign currencies, at value (Cost $19,139) | | | 26,629 | |
Receivable for: | | | | |
Investments sold | | | 15,247,985 | |
Fund shares sold | | | 329,257 | |
Dividends | | | 391,013 | |
Investment for trustee deferred compensation and retirement plans | | | 200,463 | |
Other assets | | | 58,368 | |
Total assets | | | 663,710,642 | |
| |
Liabilities: | | | | |
Payable for: | | | | |
Investments purchased | | | 9,476,725 | |
Fund shares reacquired | | | 519,220 | |
Accrued fees to affiliates | | | 592,438 | |
Accrued trustees’ and officers’ fees and benefits | | | 2,362 | |
Accrued other operating expenses | | | 75,973 | |
Trustee deferred compensation and retirement plans | | | 230,266 | |
Total liabilities | | | 10,896,984 | |
Net assets applicable to shares outstanding | | $ | 652,813,658 | |
| |
Net assets consist of: | | | | |
Shares of beneficial interest | | $ | 474,787,696 | |
Undistributed net investment income (loss) | | | (1,494,841 | ) |
Undistributed net realized gain (loss) | | | (6,004,988 | ) |
Net unrealized appreciation | | | 185,525,791 | |
| | | $ | 652,813,658 | |
| | | | |
Net Assets: | | | | |
Class A | | $ | 279,233,893 | |
Class B | | $ | 5,662,571 | |
Class C | | $ | 27,898,300 | |
Class Y | | $ | 9,255,692 | |
Investor Class | | $ | 330,298,442 | |
Class R5 | | $ | 464,760 | |
|
Shares outstanding, $0.01 par value per share,
with an unlimited number of shares authorized: | |
Class A | | | 8,463,809 | |
Class B | | | 195,849 | |
Class C | | | 1,003,381 | |
Class Y | | | 278,439 | |
Investor Class | | | 10,077,560 | |
Class R5 | | | 12,315 | |
Class A: | | | | |
Net asset value per share | | $ | 32.99 | |
Maximum offering price per share | | | | |
(Net asset value of $32.99 ¸ 94.50%) | | $ | 34.91 | |
Class B: | | | | |
Net asset value and offering price per share | | $ | 28.91 | |
Class C: | | | | |
Net asset value and offering price per share | | $ | 27.80 | |
Class Y: | | | | |
Net asset value and offering price per share | | $ | 33.24 | |
Investor Class: | | | | |
Net asset value and offering price per share | | $ | 32.78 | |
Class R5: | | | | |
Net asset value and offering price per share | | $ | 37.74 | |
See accompanying Notes to Financial Statements which are an integral part of the financial statements.
11 Invesco Technology Fund
Statement of Operations
For the year ended April 30, 2016
| | | | |
Investment income: | |
Dividends (net of foreign withholding taxes of $6,756) | | $ | 4,834,690 | |
Dividends from affiliated money market funds (includes securities lending income of $41,534) | | | 76,694 | |
Total investment income | | | 4,911,384 | |
| |
Expenses: | | | | |
Advisory fees | | | 4,994,713 | |
Administrative services fees | | | 189,961 | |
Custodian fees | | | 22,673 | |
Distribution fees: | | | | |
Class A | | | 757,137 | |
Class B | | | 78,585 | |
Class C | | | 304,275 | |
Investor Class | | | 602,653 | |
Transfer agent fees — A, B, C, Y and Investor | | | 2,607,008 | |
Transfer agent fees — R5 | | | 1,118 | |
Trustees’ and officers’ fees and benefits | | | 43,951 | |
Registration and filing fees | | | 92,489 | |
Reports to shareholders | | | 122,307 | |
Professional services fees | | | 62,134 | |
Other | | | 27,658 | |
Total expenses | | | 9,906,662 | |
Less: Fees waived and expense offset arrangement(s) | | | (33,875 | ) |
Net expenses | | | 9,872,787 | |
Net investment income (loss) | | | (4,961,403 | ) |
| |
Realized and unrealized gain (loss) from: | | | | |
Net realized gain (loss) from: | | | | |
Investment securities | | | (4,592,611 | ) |
Foreign currencies | | | 1,265 | |
| | | | (4,591,346 | ) |
Change in net unrealized appreciation (depreciation) of: | | | | |
Investment securities | | | (41,273,483 | ) |
Foreign currencies | | | (10,942 | ) |
| | | | (41,284,425 | ) |
Net realized and unrealized gain (loss) | | | (45,875,771 | ) |
Net increase (decrease) in net assets resulting from operations | | $ | (50,837,174 | ) |
See accompanying Notes to Financial Statements which are an integral part of the financial statements.
12 Invesco Technology Fund
Statement of Changes in Net Assets
For the years ended April 30, 2016 and 2015
| | | | | | | | |
| | | 2016 | | | 2015 | |
Operations: | | | | | | | | |
Net investment income (loss) | | $ | (4,961,403 | ) | | $ | (6,454,194 | ) |
Net realized gain (loss) | | | (4,591,346 | ) | | | 91,116,418 | |
Change in net unrealized appreciation (depreciation) | | | (41,284,425 | ) | | | 19,567,221 | |
Net increase (decrease) in net assets resulting from operations | | | (50,837,174 | ) | | | 104,229,445 | |
| | |
Distributions to shareholders from net realized gains: | | | | | | | | |
Class A | | | (21,588,723 | ) | | | (38,747,261 | ) |
Class B | | | (565,799 | ) | | | (1,542,107 | ) |
Class C | | | (2,439,662 | ) | | | (4,285,234 | ) |
Class Y | | | (632,960 | ) | | | (986,633 | ) |
Investor Class | | | (24,548,720 | ) | | | (48,973,514 | ) |
Class R5 | | | (26,205 | ) | | | (267,544 | ) |
Total distributions from net realized gains | | | (49,802,069 | ) | | | (94,802,293 | ) |
| | |
Share transactions–net: | | | | | | | | |
Class A | | | 12,277,080 | | | | 20,722,994 | |
Class B | | | (2,785,580 | ) | | | (3,175,078 | ) |
Class C | | | 2,094,880 | | | | 3,201,412 | |
Class Y | | | 1,543,377 | | | | 3,102,651 | |
Investor Class | | | (4,667,465 | ) | | | 11,677,663 | |
Class R5 | | | (516,716 | ) | | | (460,031 | ) |
Net increase in net assets resulting from share transactions | | | 7,945,576 | | | | 35,069,611 | |
Net increase (decrease) in net assets | | | (92,693,667 | ) | | | 44,496,763 | |
| | |
Net assets: | | | | | | | | |
Beginning of year | | | 745,507,325 | | | | 701,010,562 | |
End of year (includes undistributed net investment income (loss) of $(1,494,841) and $(2,230,237), respectively) | | $ | 652,813,658 | | | $ | 745,507,325 | |
Notes to Financial Statements
April 30, 2016
NOTE 1—Significant Accounting Policies
Invesco Technology Fund (the “Fund”) is a series portfolio of AIM Sector Funds (Invesco Sector Funds) (the “Trust”). The Trust is a Delaware statutory trust registered under the Investment Company Act of 1940, as amended (the “1940 Act”), as an open-end series management investment company consisting of ten separate portfolios, each authorized to issue an unlimited number of shares of beneficial interest. The assets, liabilities and operations of each portfolio are accounted for separately. Information presented in these financial statements pertains only to the Fund. Matters affecting each portfolio or class will be voted on exclusively by the shareholders of such portfolio or class.
The Fund’s investment objective is long-term growth of capital.
The Fund currently consists of six different classes of shares: Class A, Class B, Class C, Class Y, Investor Class and Class R5. Class Y and Investor Class shares are available only to certain investors. Class A shares are sold with a front-end sales charge unless certain waiver criteria are met and under certain circumstances load waived shares may be subject to contingent deferred sales charges (“CDSC”). Class C shares are sold with a CDSC. Class Y, Investor Class and Class R5 shares are sold at net asset value. Effective November 30, 2010, new or additional investments in Class B shares are no longer permitted. Existing shareholders of Class B shares may continue to reinvest dividends and capital gains distributions in Class B shares until they convert to Class A shares. Also, shareholders in Class B shares will be able to exchange those shares for Class B shares of other Invesco Funds offering such shares until they convert to Class A shares. Generally, Class B shares will automatically convert to Class A shares on or about the month-end, which is at least eight years after the date of purchase. Redemption of Class B shares prior to the conversion date will be subject to a CDSC.
The following is a summary of the significant accounting policies followed by the Fund in the preparation of its financial statements.
| A. | Security Valuations — Securities, including restricted securities, are valued according to the following policy. |
A security listed or traded on an exchange (except convertible securities) is valued at its last sales price or official closing price as of the close of the customary trading session on the exchange where the security is principally traded, or lacking any sales or official closing price on a particular day, the security may be valued at the closing bid price on that day. Securities traded in the over-the-counter market are valued based on prices furnished by independent pricing services or market makers. When such securities are valued by an independent pricing service they may be considered fair valued. Futures contracts are valued at the final settlement price set by an exchange on which they are principally traded.
13 Invesco Technology Fund
Listed options are valued at the mean between the last bid and asked prices from the exchange on which they are principally traded. Options not listed on an exchange are valued by an independent source at the mean between the last bid and asked prices. For purposes of determining net asset value (“NAV”) per share, futures and option contracts generally are valued 15 minutes after the close of the customary trading session of the New York Stock Exchange (“NYSE”).
Investments in open-end and closed-end registered investment companies that do not trade on an exchange are valued at the end-of-day net asset value per share. Investments in open-end and closed-end registered investment companies that trade on an exchange are valued at the last sales price or official closing price as of the close of the customary trading session on the exchange where the security is principally traded.
Debt obligations (including convertible securities) and unlisted equities are fair valued using an evaluated quote provided by an independent pricing service. Evaluated quotes provided by the pricing service may be determined without exclusive reliance on quoted prices, and may reflect appropriate factors such as institution-size trading in similar groups of securities, developments related to specific securities, dividend rate (for unlisted equities), yield (for debt obligations), quality, type of issue, coupon rate (for debt obligations), maturity (for debt obligations), individual trading characteristics and other market data. Debt obligations are subject to interest rate and credit risks. In addition, all debt obligations involve some risk of default with respect to interest and/or principal payments.
Foreign securities’ (including foreign exchange contracts) prices are converted into U.S. dollar amounts using the applicable exchange rates as of the close of the NYSE. If market quotations are available and reliable for foreign exchange-traded equity securities, the securities will be valued at the market quotations. Because trading hours for certain foreign securities end before the close of the NYSE, closing market quotations may become unreliable. If between the time trading ends on a particular security and the close of the customary trading session on the NYSE, events occur that the Adviser determines are significant and make the closing price unreliable, the Fund may fair value the security. If the event is likely to have affected the closing price of the security, the security will be valued at fair value in good faith using procedures approved by the Board of Trustees.
Adjustments to closing prices to reflect fair value may also be based on a screening process of an independent pricing service to indicate the degree of certainty, based on historical data, that the closing price in the principal market where a foreign security trades is not the current value as of the close of the NYSE. Foreign securities’ prices meeting the approved degree of certainty that the price is not reflective of current value will be priced at the indication of fair value from the independent pricing service. Multiple factors may be considered by the independent pricing service in determining adjustments to reflect fair value and may include information relating to sector indices, American Depositary Receipts and domestic and foreign index futures. Foreign securities may have additional risks including exchange rate changes, potential for sharply devalued currencies and high inflation, political and economic upheaval, the relative lack of issuer information, relatively low market liquidity and the potential lack of strict financial and accounting controls and standards.
Securities for which market prices are not provided by any of the above methods may be valued based upon quotes furnished by independent sources. The last bid price may be used to value equity securities. The mean between the last bid and asked prices is used to value debt obligations, including corporate loans.
Securities for which market quotations are not readily available or became unreliable are valued at fair value as determined in good faith by or under the supervision of the Trust’s officers following procedures approved by the Board of Trustees. Issuer specific events, market trends, bid/asked quotes of brokers and information providers and other market data may be reviewed in the course of making a good faith determination of a security’s fair value.
The Fund may invest in securities that are subject to interest rate risk, meaning the risk that the prices will generally fall as interest rates rise and, conversely, the prices will generally rise as interest rates fall. Specific securities differ in their sensitivity to changes in interest rates depending on their individual characteristics. Changes in interest rates may result in increased market volatility, which may affect the value and/or liquidity of certain Fund investments.
Valuations change in response to many factors including the historical and prospective earnings of the issuer, the value of the issuer’s assets, general economic conditions, interest rates, investor perceptions and market liquidity. Because of the inherent uncertainties of valuation, the values reflected in the financial statements may materially differ from the value received upon actual sale of those investments.
| B. | Securities Transactions and Investment Income — Securities transactions are accounted for on a trade date basis. Realized gains or losses on sales are computed on the basis of specific identification of the securities sold. Interest income (net of withholding tax, if any) is recorded on the accrual basis from settlement date. Dividend income (net of withholding tax, if any) is recorded on the ex-dividend date. |
The Fund may periodically participate in litigation related to Fund investments. As such, the Fund may receive proceeds from litigation settlements. Any proceeds received are included in the Statement of Operations as realized gain (loss) for investments no longer held and as unrealized gain (loss) for investments still held.
Brokerage commissions and mark ups are considered transaction costs and are recorded as an increase to the cost basis of securities purchased and/or a reduction of proceeds on a sale of securities. Such transaction costs are included in the determination of net realized and unrealized gain (loss) from investment securities reported in the Statement of Operations and the Statement of Changes in Net Assets and the net realized and unrealized gains (losses) on securities per share in the Financial Highlights. Transaction costs are included in the calculation of the Fund’s net asset value and, accordingly, they reduce the Fund’s total returns. These transaction costs are not considered operating expenses and are not reflected in net investment income reported in the Statement of Operations and the Statement of Changes in Net Assets, or the net investment income per share and the ratios of expenses and net investment income reported in the Financial Highlights, nor are they limited by any expense limitation arrangements between the Fund and the investment adviser.
The Fund allocates income and realized and unrealized capital gains and losses to a class based on the relative net assets of each class.
| C. | Country Determination — For the purposes of making investment selection decisions and presentation in the Schedule of Investments, the investment adviser may determine the country in which an issuer is located and/or credit risk exposure based on various factors. These factors include the laws of the country under which the issuer is organized, where the issuer maintains a principal office, the country in which the issuer derives 50% or more of its total revenues and the country that has the primary market for the issuer’s securities, as well as other criteria. Among the other criteria that may be evaluated for making this determination are the country in which the issuer maintains 50% or more of its assets, the type of security, financial guarantees and enhancements, the nature of the collateral and the sponsor organization. Country of issuer and/or credit risk exposure has been determined to be the United States of America, unless otherwise noted. |
14 Invesco Technology Fund
| D. | Distributions — Distributions from net investment income and net realized capital gain, if any, are generally declared and paid annually and recorded on the ex-dividend date. The Fund may elect to treat a portion of the proceeds from redemptions as distributions for federal income tax purposes. |
| E. | Federal Income Taxes — The Fund intends to comply with the requirements of Subchapter M of the Internal Revenue Code of 1986, as amended (the “Internal Revenue Code”), necessary to qualify as a regulated investment company and to distribute substantially all of the Fund’s taxable earnings to shareholders. As such, the Fund will not be subject to federal income taxes on otherwise taxable income (including net realized capital gain) that is distributed to shareholders. Therefore, no provision for federal income taxes is recorded in the financial statements. |
The Fund recognizes the tax benefits of uncertain tax positions only when the position is more likely than not to be sustained. Management has analyzed the Fund’s uncertain tax positions and concluded that no liability for unrecognized tax benefits should be recorded related to uncertain tax positions. Management is not aware of any tax positions for which it is reasonably possible that the total amounts of unrecognized tax benefits will change materially in the next 12 months.
The Fund files tax returns in the U.S. Federal jurisdiction and certain other jurisdictions. Generally, the Fund is subject to examinations by such taxing authorities for up to three years after the filing of the return for the tax period.
| F. | Expenses — Fees provided for under the Rule 12b-1 plan of a particular class of the Fund are charged to the operations of such class. Transfer agency fees and expenses and other shareholder recordkeeping fees and expenses attributable to Class R5 are charged to such class. Transfer agency fees and expenses and other shareholder recordkeeping fees and expenses relating to all other classes are allocated among those classes based on relative net assets. All other expenses are allocated among the classes based on relative net assets. |
| G. | Accounting Estimates — The preparation of financial statements in conformity with accounting principles generally accepted in the United States of America (“GAAP”) requires management to make estimates and assumptions that affect the reported amounts of assets and liabilities at the date of the financial statements and the reported amounts of revenues and expenses during the reporting period including estimates and assumptions related to taxation. Actual results could differ from those estimates by a significant amount. In addition, the Fund monitors for material events or transactions that may occur or become known after the period-end date and before the date the financial statements are released to print. |
| H. | Indemnifications — Under the Trust’s organizational documents, each Trustee, officer, employee or other agent of the Trust is indemnified against certain liabilities that may arise out of the performance of their duties to the Fund. Additionally, in the normal course of business, the Fund enters into contracts, including the Fund’s servicing agreements, that contain a variety of indemnification clauses. The Fund’s maximum exposure under these arrangements is unknown as this would involve future claims that may be made against the Fund that have not yet occurred. The risk of material loss as a result of such indemnification claims is considered remote. |
| I. | Securities Lending — The Fund may lend portfolio securities having a market value up to one-third of the Fund’s total assets. Such loans are secured by collateral equal to no less than the market value of the loaned securities determined daily by the securities lending provider. Such collateral will be cash or debt securities issued or guaranteed by the U.S. Government or any of its sponsored agencies. Cash collateral received in connection with these loans is invested in short-term money market instruments or affiliated money market funds and is shown as such on the Schedule of Investments. The Fund bears the risk of loss with respect to the investment of collateral. It is the Fund’s policy to obtain additional collateral from or return excess collateral to the borrower by the end of the next business day, following the valuation date of the securities loaned. Therefore, the value of the collateral held may be temporarily less than the value of the securities on loan. When loaning securities, the Fund retains certain benefits of owning the securities, including the economic equivalent of dividends or interest generated by the security. Lending securities entails a risk of loss to the Fund if, and to the extent that, the market value of the securities loaned were to increase and the borrower did not increase the collateral accordingly, and the borrower failed to return the securities. The securities loaned are subject to termination at the option of the borrower or the Fund. Upon termination, the borrower will return to the Fund the securities loaned and the Fund will return the collateral. Upon the failure of the borrower to return the securities, collateral may be liquidated and the securities may be purchased on the open market to replace the loaned securities. The Fund could experience delays and costs in gaining access to the collateral and the securities may lose value during the delay which could result in potential losses to the Fund. Some of these losses may be indemnified by the lending agent. The Fund bears the risk of any deficiency in the amount of the collateral available for return to the borrower due to any loss on the collateral invested. Dividends received on cash collateral investments for securities lending transactions, which are net of compensation to counterparties, are included in Dividends from affiliated money market funds on the Statement of Operations. The aggregate value of securities out on loan, if any, is shown as a footnote on the Statement of Assets and Liabilities. |
| J. | Foreign Currency Translations — Foreign currency is valued at the close of the NYSE based on quotations posted by banks and major currency dealers. Portfolio securities and other assets and liabilities denominated in foreign currencies are translated into U.S. dollar amounts at date of valuation. Purchases and sales of portfolio securities (net of foreign taxes withheld on disposition) and income items denominated in foreign currencies are translated into U.S. dollar amounts on the respective dates of such transactions. The Fund does not separately account for the portion of the results of operations resulting from changes in foreign exchange rates on investments and the fluctuations arising from changes in market prices of securities held. The combined results of changes in foreign exchange rates and the fluctuation of market prices on investments (net of estimated foreign tax withholding) are included with the net realized and unrealized gain or loss from investments in the Statement of Operations. Reported net realized foreign currency gains or losses arise from (1) sales of foreign currencies, (2) currency gains or losses realized between the trade and settlement dates on securities transactions, and (3) the difference between the amounts of dividends, interest, and foreign withholding taxes recorded on the Fund’s books and the U.S. dollar equivalent of the amounts actually received or paid. Net unrealized foreign currency gains and losses arise from changes in the fair values of assets and liabilities, other than investments in securities at fiscal period end, resulting from changes in exchange rates. |
The Fund may invest in foreign securities, which may be subject to foreign taxes on income, gains on investments or currency repatriation, a portion of which may be recoverable. Foreign taxes, if any, are recorded based on the tax regulations and rates that exist in the foreign markets in which the Fund invests and are shown in the Statement of Operations.
| K. | Forward Foreign Currency Contracts — The Fund may engage in foreign currency transactions either on a spot (i.e. for prompt delivery and settlement) basis, or through forward foreign currency contracts, to manage or minimize currency or exchange rate risk. |
15 Invesco Technology Fund
The Fund may also enter into forward foreign currency contracts for the purchase or sale of a security denominated in a foreign currency in order to “lock in” the U.S. dollar price of that security, or the Fund may also enter into forward foreign currency contracts that do not provide for physical settlement of the two currencies, but instead are settled by a single cash payment calculated as the difference between the agreed upon exchange rate and the spot rate at settlement based upon an agreed upon notional amount (non-deliverable forwards). The Fund will set aside liquid assets in an amount equal to daily mark-to-market obligation for forward foreign currency contracts.
A forward foreign currency contract is an obligation between two parties (“Counterparties”) to purchase or sell a specific currency for an agreed-upon price at a future date. The use of forward foreign currency contracts does not eliminate fluctuations in the price of the underlying securities the Fund owns or intends to acquire but establishes a rate of exchange in advance. Fluctuations in the value of these contracts are measured by the difference in the contract date and reporting date exchange rates and are recorded as unrealized appreciation (depreciation) until the contracts are closed. When the contracts are closed, realized gains (losses) are recorded. Realized and unrealized gains (losses) on the contracts are included in the Statement of Operations. The primary risks associated with forward foreign currency contracts include failure of the Counterparty to meet the terms of the contract and the value of the foreign currency changing unfavorably. These risks may be in excess of the amounts reflected in the Statement of Assets and Liabilities.
| L. | Other Risks — The Fund’s investments are concentrated in a comparatively narrow segment of the economy, which may make the Fund more volatile. |
Many products and services offered in technology-related industries are subject to rapid obsolescence, which may lower the value of the issuers in this sector.
NOTE 2—Advisory Fees and Other Fees Paid to Affiliates
The Trust has entered into a master investment advisory agreement with Invesco Advisers, Inc. (the “Adviser” or “Invesco”). Under the terms of the investment advisory agreement, the Fund pays an advisory fee to the Adviser based on the annual rate of the Fund’s average daily net assets as follows:
| | | | | | |
| Average Daily Net Assets | | Rate |
First $350 million | | | 0 | .75% | | |
Next $350 million | | | 0 | .65% | | |
Next $1.3 billion | | | 0 | .55% | | |
Next $2 billion | | | 0 | .45% | | |
Next $2 billion | | | 0 | .40% | | |
Next $2 billion | | | 0 | .375% | | |
Over $8 billion | | | 0 | .35% | | |
For the year ended April 30, 2016, the effective advisory fees incurred by the Fund was 0.70%.
Under the terms of a master sub-advisory agreement between the Adviser and each of Invesco Asset Management Deutschland GmbH, Invesco Asset Management Limited, Invesco Asset Management (Japan) Limited, Invesco Hong Kong Limited, Invesco Senior Secured Management, Inc. and Invesco Canada Ltd. (collectively, the “Affiliated Sub-Advisers”) the Adviser, not the Fund, may pay 40% of the fees paid to the Adviser to any such Affiliated Sub-Adviser(s) that provide(s) discretionary investment management services to the Fund based on the percentage of assets allocated to such Affiliated Sub-Adviser(s).
The Adviser has contractually agreed, through at least June 30, 2017, to waive advisory fees and/or reimburse expenses of all shares to the extent necessary to limit total annual fund operating expenses after fee waiver and/or expense reimbursement (excluding certain items discussed above) of Class A, Class B, Class C, Class Y, Investor Class and Class R5 shares to 2.00%, 2.75%, 2.75%, 1.75%, 2.00% and 1.75%, respectively, of average daily net assets (the “expense limits”). In determining the Adviser’s obligation to waive advisory fees and/or reimburse expenses, the following expenses are not taken into account, and could cause the total annual fund operating expenses after fee waiver and/or expense reimbursement to exceed the numbers reflected above: (1) interest; (2) taxes; (3) dividend expense on short sales; (4) extraordinary or non-routine items, including litigation expenses; and (5) expenses that the Fund has incurred but did not actually pay because of an expense offset arrangement. Unless Invesco continues the fee waiver agreement, it will terminate on June 30, 2017. During its term, the fee waiver agreement cannot be terminated or amended to increase the expense limits without approval of the Board of Trustees. The Adviser did not waive fees and/or reimburse expenses during the period under these expense limits.
Further, the Adviser has contractually agreed, through at least June 30, 2018, to waive the advisory fee payable by the Fund in an amount equal to 100% of the net advisory fees the Adviser receives from the affiliated money market funds on investments by the Fund of uninvested cash (excluding investments of cash collateral from securities lending) in such affiliated money market funds.
For the year ended April 30, 2016, the Adviser waived advisory fees of $19,424.
The Trust has entered into a master administrative services agreement with Invesco pursuant to which the Fund has agreed to pay Invesco for certain administrative costs incurred in providing accounting services to the Fund. For the year ended April 30, 2016, expenses incurred under the agreement are shown in the Statement of Operations as Administrative services fees.
The Trust has entered into a transfer agency and service agreement with Invesco Investment Services, Inc. (“IIS”) pursuant to which the Fund has agreed to pay IIS a fee for providing transfer agency and shareholder services to the Fund and reimburse IIS for certain expenses incurred by IIS in the course of providing such services. IIS may make payments to intermediaries that provide omnibus account services, sub-accounting services and/or networking services. All fees payable by IIS to intermediaries that provide omnibus account services or sub-accounting are charged back to the Fund, subject to certain limitations approved by the Trust’s Board of Trustees. For the year ended April 30, 2016, expenses incurred under the agreement are shown in the Statement of Operations as Transfer agent fees.
The Trust has entered into master distribution agreements with Invesco Distributors, Inc. (“IDI”) to serve as the distributor for the Class A, Class B, Class C, Class Y, Investor Class and Class R5 shares of the Fund. The Trust has adopted plans pursuant to Rule 12b-1 under the 1940 Act with respect
16 Invesco Technology Fund
to the Fund’s Class A, Class B, Class C and Investor Class shares (collectively, the “Plans”). The Fund, pursuant to the Plans, pays IDI compensation at the annual rate of 0.25% of the Fund’s average daily net assets of Class A shares, 1.00% of the average daily net assets of Class B and Class C shares. The Fund, pursuant to the Investor Class Plan, reimburses IDI for its allocated share of expenses incurred pursuant to the Investor Class Plan for the period, up to a maximum annual rate of 0.25% of the average daily net assets of Investor Class shares. Of the Plan payments, up to 0.25% of the average daily net assets of each class of shares may be paid to furnish continuing personal shareholder services to customers who purchase and own shares of such classes. Any amounts not paid as a service fee under the Plans would constitute an asset-based sales charge. Rules of the Financial Industry Regulatory Authority (“FINRA”) impose a cap on the total sales charges, including asset-based sales charges, that may be paid by any class of shares of the Fund. For the year ended April 30, 2016, expenses incurred under the Plans are shown in the Statement of Operations as Distribution fees.
Front-end sales commissions and CDSC (collectively, the “sales charges”) are not recorded as expenses of the Fund. Front-end sales commissions are deducted from proceeds from the sales of Fund shares prior to investment in Class A shares of the Fund. CDSC are deducted from redemption proceeds prior to remittance to the shareholder. During the year ended April 30, 2016, IDI advised the Fund that IDI retained $44,503 in front-end sales commissions from the sale of Class A shares and $1,922, $1,048 and $1,300 from Class A, Class B and Class C shares, respectively, for CDSC imposed on redemptions by shareholders.
For the year ended April 30, 2016, the Fund incurred $8,402 in brokerage commissions with Invesco Capital Markets, Inc., an affiliate of the Adviser and IDI, for portfolio transactions executed on behalf of the Fund.
Certain officers and trustees of the Trust are officers and directors of the Adviser, IIS and/or IDI.
NOTE 3—Additional Valuation Information
GAAP defines fair value as the price that would be received to sell an asset or paid to transfer a liability in an orderly transaction between market participants at the measurement date, under current market conditions. GAAP establishes a hierarchy that prioritizes the inputs to valuation methods, giving the highest priority to readily available unadjusted quoted prices in an active market for identical assets (Level 1) and the lowest priority to significant unobservable inputs (Level 3), generally when market prices are not readily available or are unreliable. Based on the valuation inputs, the securities or other investments are tiered into one of three levels. Changes in valuation methods may result in transfers in or out of an investment’s assigned level:
| | Level 1 — | Prices are determined using quoted prices in an active market for identical assets. |
| | Level 2 — | Prices are determined using other significant observable inputs. Observable inputs are inputs that other market participants may use in pricing a security. These may include quoted prices for similar securities, interest rates, prepayment speeds, credit risk, yield curves, loss severities, default rates, discount rates, volatilities and others. |
| | Level 3 — | Prices are determined using significant unobservable inputs. In situations where quoted prices or observable inputs are unavailable (for example, when there is little or no market activity for an investment at the end of the period), unobservable inputs may be used. Unobservable inputs reflect the Fund’s own assumptions about the factors market participants would use in determining fair value of the securities or instruments and would be based on the best available information. |
The following is a summary of the tiered valuation input levels, as of April 30, 2016. The level assigned to the securities valuations may not be an indication of the risk or liquidity associated with investing in those securities. Because of the inherent uncertainties of valuation, the values reflected in the financial statements may materially differ from the value received upon actual sale of those investments.
| | | | | | | | | | | | | | | | |
| | | Level 1 | | | Level 2 | | | Level 3 | | | Total | |
Equity Securities | | $ | 628,236,999 | | | $ | 19,219,928 | | | $ | — | | | $ | 647,456,927 | |
NOTE 4—Expense Offset Arrangement(s)
The expense offset arrangement is comprised of transfer agency credits which result from balances in demand deposit accounts used by the transfer agent for clearing shareholder transactions. For the year ended April 30, 2016, the Fund received credits from this arrangement, which resulted in the reduction of the Fund’s total expenses of $14,451.
NOTE 5—Trustees’ and Officers’ Fees and Benefits
Trustees’ and Officers’ Fees and Benefits include amounts accrued by the Fund to pay remuneration to certain Trustees and Officers of the Fund. Trustees have the option to defer compensation payable by the Fund, and Trustees’ and Officers’ Fees and Benefits also include amounts accrued by the Fund to fund such deferred compensation amounts. Those Trustees who defer compensation have the option to select various Invesco Funds in which their deferral accounts shall be deemed to be invested. Finally, certain current Trustees were eligible to participate in a retirement plan that provided for benefits to be paid upon retirement to Trustees over a period of time based on the number of years of service. The Fund may have certain former Trustees who also participate in a retirement plan and receive benefits under such plan. Trustees’ and Officers’ Fees and Benefits include amounts accrued by the Fund to fund such retirement benefits. Obligations under the deferred compensation and retirement plans represent unsecured claims against the general assets of the Fund.
NOTE 6—Cash Balances
The Fund is permitted to temporarily carry a negative or overdrawn balance in its account with State Street Bank and Trust Company, the custodian bank. Such balances, if any at period-end, are shown in the Statement of Assets and Liabilities under the payable caption Amount due custodian. To compensate the custodian bank for such overdrafts, the overdrawn Fund may either (1) leave funds as a compensating balance in the account so the custodian bank can be compensated by earning the additional interest; or (2) compensate by paying the custodian bank at a rate agreed upon by the custodian bank and Invesco, not to exceed the contractually agreed upon rate.
17 Invesco Technology Fund
NOTE 7—Distributions to Shareholders and Tax Components of Net Assets
Tax Character of Distributions to Shareholders Paid During the Fiscal Years Ended April 30, 2016 and 2015:
| | | | | | | | |
| | | 2016 | | | 2015 | |
Ordinary income | | $ | — | | | $ | 1,696,107 | |
Long-term capital gain | | | 49,802,069 | | | | 93,106,186 | |
Total distributions | | $ | 49,802,069 | | | $ | 94,802,293 | |
Tax Components of Net Assets at Period-End:
| | | | |
| | | 2016 | |
Net unrealized appreciation — investments | | $ | 184,621,205 | |
Net unrealized appreciation (depreciation) — other investments | | | (10,504 | ) |
Temporary book/tax differences | | | (235,721 | ) |
Post-October capital loss deferral | | | (5,089,898 | ) |
Late-Year ordinary loss deferral | | | (1,259,120 | ) |
Shares of beneficial interest | | | 474,787,696 | |
Total net assets | | $ | 652,813,658 | |
The difference between book-basis and tax-basis unrealized appreciation (depreciation) is due to differences in the timing of recognition of gains and losses on investments for tax and book purposes. The Fund’s net unrealized appreciation difference is attributable primarily to wash sales.
The temporary book/tax differences are a result of timing differences between book and tax recognition of income and/or expenses. The Fund’s temporary book/tax differences are the result of the trustee deferral of compensation and retirement plan benefits.
Capital loss carryforward is calculated and reported as of a specific date. Results of transactions and other activity after that date may affect the amount of capital loss carryforward actually available for the Fund to utilize. Capital losses generated in years beginning after December 22, 2010 can be carried forward for an unlimited period, whereas previous losses expire in eight tax years. Capital losses with an expiration period may not be used to offset capital gains until all net capital losses without an expiration date have been utilized. Capital loss carryforwards with no expiration date will retain their character as either short-term or long-term capital losses instead of as short-term capital losses as under prior law. The ability to utilize capital loss carryforwards in the future may be limited under the Internal Revenue Code and related regulations based on the results of future transactions.
The Fund does not have a capital loss carryforward as of April 30, 2016.
NOTE 8—Investment Securities
The aggregate amount of investment securities (other than short-term securities, U.S. Treasury obligations and money market funds, if any) purchased and sold by the Fund during the year ended April 30, 2016 was $325,455,108 and $382,982,025, respectively. Cost of investments on a tax basis includes the adjustments for financial reporting purposes as of the most recently completed federal income tax reporting period-end.
| | | | |
| Unrealized Appreciation (Depreciation) of Investment Securities on a Tax Basis | |
Aggregate unrealized appreciation of investment securities | | $ | 217,893,287 | |
Aggregate unrealized (depreciation) of investment securities | | | (33,272,082 | ) |
Net unrealized appreciation of investment securities | | $ | 184,621,205 | |
Cost of investments for tax purposes is $462,835,722.
NOTE 9—Reclassification of Permanent Differences
Primarily as a result of differing book/tax treatment of net operating losses and fair fund settlement, on April 30, 2016, undistributed net investment income (loss) was increased by $5,696,799, undistributed net realized gain (loss) was increased by $2,868 and shares of beneficial interest was decreased by $5,699,667. This reclassification had no effect on the net assets of the Fund.
18 Invesco Technology Fund
NOTE 10—Share Information
| | | | | | | | | | | | | | | | |
| | | Summary of Share Activity | |
| | | Years ended April 30, | |
| | | 2016(a) | | | 2015 | |
| | | Shares | | | Amount | | | Shares | | | Amount | |
Sold: | | | | | | | | | | | | | | | | |
Class A | | | 1,926,254 | | | $ | 71,790,658 | | | | 1,010,582 | | | $ | 39,883,670 | |
Class B | | | 3,377 | | | | 109,483 | | | | 9,412 | | | | 334,523 | |
Class C | | | 208,493 | | | | 6,550,960 | | | | 138,902 | | | | 4,757,541 | |
Class Y | | | 98,908 | | | | 3,634,390 | | | | 118,993 | | | | 4,755,522 | |
Investor Class | | | 389,157 | | | | 14,076,824 | | | | 364,139 | | | | 14,261,281 | |
Class R5 | | | 32,371 | | | | 1,385,677 | | | | 21,948 | | | | 963,801 | |
| | | | |
Issued as reinvestment of dividends: | | | | | | | | | | | | | | | | |
Class A | | | 555,305 | | | | 20,218,651 | | | | 1,006,748 | | | | 36,625,492 | |
Class B | | | 17,341 | | | | 554,904 | | | | 46,348 | | | | 1,506,291 | |
Class C | | | 72,954 | | | | 2,244,796 | | | | 130,249 | | | | 4,083,317 | |
Class Y | | | 13,633 | | | | 499,641 | | | | 25,004 | | | | 912,901 | |
Investor Class | | | 651,719 | | | | 23,559,648 | | | | 1,301,690 | | | | 47,004,027 | |
Class R5 | | | 611 | | | | 25,396 | | | | 6,484 | | | | 265,851 | |
| | | | |
Automatic conversion of Class B shares to Class A shares: | | | | | | | | | | | | | | | | |
Class A | | | 67,911 | | | | 2,461,415 | | | | 81,722 | | | | 3,245,390 | |
Class B | | | (76,874 | ) | | | (2,461,415 | ) | | | (90,724 | ) | | | (3,245,390 | ) |
| | | | |
Reacquired: | | | | | | | | | | | | | | | | |
Class A | | | (2,317,080 | ) | | | (82,193,644 | ) | | | (1,505,018 | ) | | | (59,031,558 | ) |
Class B | | | (30,258 | ) | | | (988,552 | ) | | | (49,525 | ) | | | (1,770,502 | ) |
Class C | | | (220,054 | ) | | | (6,700,876 | ) | | | (165,484 | ) | | | (5,639,446 | ) |
Class Y | | | (71,023 | ) | | | (2,590,654 | ) | | | (62,366 | ) | | | (2,565,772 | ) |
Investor Class | | | (1,167,108 | ) | | | (42,303,937 | ) | | | (1,264,395 | ) | | | (49,587,645 | ) |
Class R5 | | | (43,236 | ) | | | (1,927,789 | ) | | | (40,858 | ) | | | (1,689,683 | ) |
Net increase in share activity | | | 112,401 | | | $ | 7,945,576 | | | | 1,083,851 | | | $ | 35,069,611 | |
| (a) | There is an entity that is a record owner of more than 5% of the outstanding shares of the Fund and owns 9% of the outstanding shares of the Fund. IDI has an agreement with this entity to sell Fund shares. The Fund, Invesco and/or Invesco affiliates may make payments to this entity, which is considered to be related to the Fund, for providing services to the Fund, Invesco and/or Invesco affiliates including but not limited to services such as, securities brokerage, distribution, third party record keeping and account servicing. The Fund has no knowledge as to whether all or any portion of the shares owned of record by this entity are also owned beneficially. |
19 Invesco Technology Fund
NOTE 11—Financial Highlights
The following schedule presents financial highlights for a share of the Fund outstanding throughout the periods indicated.
| | | | | | | | | | | | | | | | | | | | | | | | | | | | | | | | | | | | | | | | | | | | | | | | | | | | | | | | |
| | | Net asset
value,
beginning
of period | | | Net
investment
income
(loss)(a) | | | Net gains
(losses)
on securities
(both
realized and
unrealized) | | | Total from
investment
operations | | | Dividends
from net
investment
income | | | Distributions
from net
realized
gains | | | Total
distributions | | | Net asset
value, end
of period | | | Total
return(b) | | | Net assets,
end of period
(000’s omitted) | | | Ratio of
expenses
to average
net assets
with fee waivers
and/or expenses
absorbed | | | Ratio of
expenses
to average net
assets without
fee waivers
and/or expenses
absorbed | | | Ratio of net
investment
income (loss)
to average
net assets | | | Portfolio
turnover(c) | |
Class A | | | | | | | | | | | | | | | | | |
Year ended 04/30/16 | | $ | 37.86 | | | $ | (0.26 | ) | | $ | (2.09 | ) | | $ | (2.35 | ) | | $ | — | | | $ | (2.52 | ) | | $ | (2.52 | ) | | $ | 32.99 | | | | (6.83 | )% | | $ | 279,234 | | | | 1.39 | %(d) | | | 1.39 | %(d) | | | (0.70 | )%(d) | | | 46 | % |
Year ended 04/30/15 | | | 37.61 | | | | (0.35 | ) | | | 5.88 | | | | 5.53 | | | | — | | | | (5.28 | ) | | | (5.28 | ) | | | 37.86 | | | | 15.27 | | | | 311,682 | | | | 1.40 | | | | 1.40 | | | | (0.89 | ) | | | 67 | |
Year ended 04/30/14 | | | 34.19 | | | | (0.30 | ) | | | 7.07 | | | | 6.77 | | | | — | | | | (3.35 | ) | | | (3.35 | ) | | | 37.61 | | | | 20.22 | | | | 287,236 | | | | 1.45 | | | | 1.45 | | | | (0.80 | ) | | | 69 | |
Year ended 04/30/13 | | | 37.33 | | | | (0.24 | )(e) | | | (1.57 | )(f) | | | (1.81 | ) | | | (0.27 | ) | | | (1.06 | ) | | | (1.33 | ) | | | 34.19 | | | | (4.70 | )(f) | | | 253,013 | | | | 1.52 | | | | 1.52 | | | | (0.70 | )(e) | | | 41 | |
Year ended 04/30/12 | | | 35.86 | | | | (0.36 | ) | | | 1.83 | | | | 1.47 | | | | — | | | | — | | | | — | | | | 37.33 | | | | 4.10 | | | | 312,389 | | | | 1.55 | | | | 1.56 | | | | (1.06 | ) | | | 48 | |
Class B | | | | | | | | | | | | | | | | | |
Year ended 04/30/16 | | | 33.73 | | | | (0.47 | ) | | | (1.83 | ) | | | (2.30 | ) | | | — | | | | (2.52 | ) | | | (2.52 | ) | | | 28.91 | | | | (7.53 | ) | | | 5,663 | | | | 2.14 | (d) | | | 2.14 | (d) | | | (1.45 | )(d) | | | 46 | |
Year ended 04/30/15 | | | 34.27 | | | | (0.58 | ) | | | 5.32 | | | | 4.74 | | | | — | | | | (5.28 | ) | | | (5.28 | ) | | | 33.73 | | | | 14.41 | | | | 9,521 | | | | 2.15 | | | | 2.15 | | | | (1.64 | ) | | | 67 | |
Year ended 04/30/14 | | | 31.64 | | | | (0.54 | ) | | | 6.52 | | | | 5.98 | | | | — | | | | (3.35 | ) | | | (3.35 | ) | | | 34.27 | | | | 19.32 | | | | 12,567 | | | | 2.20 | | | | 2.20 | | | | (1.55 | ) | | | 69 | |
Year ended 04/30/13 | | | 34.61 | | | | (0.46 | )(e) | | | (1.45 | )(f) | | | (1.91 | ) | | | — | | | | (1.06 | ) | | | (1.06 | ) | | | 31.64 | | | | (5.39 | )(f) | | | 14,979 | | | | 2.27 | | | | 2.27 | | | | (1.45 | )(e) | | | 41 | |
Year ended 04/30/12 | | | 33.47 | | | | (0.57 | ) | | | 1.71 | | | | 1.14 | | | | — | | | | — | | | | — | | | | 34.61 | | | | 3.41 | | | | 23,803 | | | | 2.30 | | | | 2.31 | | | | (1.81 | ) | | | 48 | |
Class C | | | | | | | | | | | | | | | | | |
Year ended 04/30/16 | | | 32.53 | | | | (0.45 | ) | | | (1.76 | ) | | | (2.21 | ) | | | — | | | | (2.52 | ) | | | (2.52 | ) | | | 27.80 | | | | (7.53 | ) | | | 27,898 | | | | 2.14 | (d) | | | 2.14 | (d) | | | (1.45 | )(d) | | | 46 | |
Year ended 04/30/15 | | | 33.22 | | | | (0.56 | ) | | | 5.15 | | | | 4.59 | | | | — | | | | (5.28 | ) | | | (5.28 | ) | | | 32.53 | | | | 14.40 | | | | 30,645 | | | | 2.15 | | | | 2.15 | | | | (1.64 | ) | | | 67 | |
Year ended 04/30/14 | | | 30.76 | | | | (0.53 | ) | | | 6.34 | | | | 5.81 | | | | — | | | | (3.35 | ) | | | (3.35 | ) | | | 33.22 | | | | 19.32 | | | | 27,846 | | | | 2.20 | | | | 2.20 | | | | (1.55 | ) | | | 69 | |
Year ended 04/30/13 | | | 33.68 | | | | (0.45 | )(e) | | | (1.41 | )(f) | | | (1.86 | ) | | | — | | | | (1.06 | ) | | | (1.06 | ) | | | 30.76 | | | | (5.39 | )(f) | | | 24,716 | | | | 2.27 | | | | 2.27 | | | | (1.45 | )(e) | | | 41 | |
Year ended 04/30/12 | | | 32.58 | | | | (0.55 | ) | | | 1.65 | | | | 1.10 | | | | — | | | | — | | | | — | | | | 33.68 | | | | 3.38 | | | | 31,836 | | | | 2.30 | | | | 2.31 | | | | (1.81 | ) | | | 48 | |
Class Y | | | | | | | | | | | | | | | | | |
Year ended 04/30/16 | | | 38.04 | | | | (0.17 | ) | | | (2.11 | ) | | | (2.28 | ) | | | — | | | | (2.52 | ) | | | (2.52 | ) | | | 33.24 | | | | (6.61 | ) | | | 9,256 | | | | 1.14 | (d) | | | 1.14 | (d) | | | (0.45 | )(d) | | | 46 | |
Year ended 04/30/15 | | | 37.67 | | | | (0.25 | ) | | | 5.90 | | | | 5.65 | | | | — | | | | (5.28 | ) | | | (5.28 | ) | | | 38.04 | | | | 15.58 | | | | 9,013 | | | | 1.15 | | | | 1.15 | | | | (0.64 | ) | | | 67 | |
Year ended 04/30/14 | | | 34.16 | | | | (0.21 | ) | | | 7.07 | | | | 6.86 | | | | — | | | | (3.35 | ) | | | (3.35 | ) | | | 37.67 | | | | 20.51 | | | | 5,850 | | | | 1.20 | | | | 1.20 | | | | (0.55 | ) | | | 69 | |
Year ended 04/30/13 | | | 37.31 | | | | (0.16 | )(e) | | | (1.57 | )(f) | | | (1.73 | ) | | | (0.36 | ) | | | (1.06 | ) | | | (1.42 | ) | | | 34.16 | | | | (4.46 | )(f) | | | 3,716 | | | | 1.27 | | | | 1.27 | | | | (0.45 | )(e) | | | 41 | |
Year ended 04/30/12 | | | 35.74 | | | | (0.27 | ) | | | 1.84 | | | | 1.57 | | | | — | | | | — | | | | — | | | | 37.31 | | | | 4.39 | | | | 4,937 | | | | 1.30 | | | | 1.31 | | | | (0.81 | ) | | | 48 | |
Investor Class | | | | | | | | | | | | | | | | | |
Year ended 04/30/16 | | | 37.60 | | | | (0.22 | ) | | | (2.08 | ) | | | (2.30 | ) | | | — | | | | (2.52 | ) | | | (2.52 | ) | | | 32.78 | | | | (6.73 | )(g) | | | 330,298 | | | | 1.30 | (d)(g) | | | 1.30 | (d)(g) | | | (0.61 | )(d)(g) | | | 46 | |
Year ended 04/30/15 | | | 37.34 | | | | (0.31 | ) | | | 5.85 | | | | 5.54 | | | | — | | | | (5.28 | ) | | | (5.28 | ) | | | 37.60 | | | | 15.41 | (g) | | | 383,681 | | | | 1.30 | (g) | | | 1.30 | (g) | | | (0.79 | )(g) | | | 67 | |
Year ended 04/30/14 | | | 33.94 | | | | (0.27 | ) | | | 7.02 | | | | 6.75 | | | | — | | | | (3.35 | ) | | | (3.35 | ) | | | 37.34 | | | | 20.31 | (g) | | | 366,054 | | | | 1.36 | (g) | | | 1.36 | (g) | | | (0.71 | )(g) | | | 69 | |
Year ended 04/30/13 | | | 37.06 | | | | (0.22 | )(e) | | | (1.56 | )(f) | | | (1.78 | ) | | | (0.28 | ) | | | (1.06 | ) | | | (1.34 | ) | | | 33.94 | | | | (4.64 | )(f)(g) | | | 342,287 | | | | 1.48 | (g) | | | 1.48 | (g) | | | (0.66 | )(e)(g) | | | 41 | |
Year ended 04/30/12 | | | 35.58 | | | | (0.35 | ) | | | 1.83 | | | | 1.48 | | | | — | | | | — | | | | — | | | | 37.06 | | | | 4.16 | | | | 414,003 | | | | 1.52 | | | | 1.53 | | | | (1.03 | ) | | | 48 | |
Class R5 | | | | | | | | | | | | | | | | | |
Year ended 04/30/16 | | | 42.75 | | | | (0.08 | ) | | | (2.41 | ) | | | (2.49 | ) | | | — | | | | (2.52 | ) | | | (2.52 | ) | | | 37.74 | | | | (6.36 | ) | | | 465 | | | | 0.87 | (d) | | | 0.87 | (d) | | | (0.18 | )(d) | | | 46 | |
Year ended 04/30/15 | | | 41.63 | | | | (0.16 | ) | | | 6.56 | | | | 6.40 | | | | — | | | | (5.28 | ) | | | (5.28 | ) | | | 42.75 | | | | 15.91 | | | | 965 | | | | 0.87 | | | | 0.87 | | | | (0.36 | ) | | | 67 | |
Year ended 04/30/14 | | | 37.33 | | | | (0.10 | ) | | | 7.75 | | | | 7.65 | | | | — | | | | (3.35 | ) | | | (3.35 | ) | | | 41.63 | | | | 20.89 | | | | 1,457 | | | | 0.89 | | | | 0.89 | | | | (0.24 | ) | | | 69 | |
Year ended 04/30/13 | | | 40.64 | | | | (0.03 | )(e) | | | (1.70 | )(f) | | | (1.73 | ) | | | (0.52 | ) | | | (1.06 | ) | | | (1.58 | ) | | | 37.33 | | | | (4.08 | )(f) | | | 1,194 | | | | 0.89 | | | | 0.89 | | | | (0.07 | )(e) | | | 41 | |
Year ended 04/30/12 | | | 38.77 | | | | (0.14 | ) | | | 2.01 | | | | 1.87 | | | | — | | | | — | | | | — | | | | 40.64 | | | | 4.82 | | | | 1,038 | | | | 0.88 | | | | 0.89 | | | | (0.39 | ) | | | 48 | |
| (a) | Calculated using average shares outstanding. |
| (b) | Includes adjustments in accordance with accounting principles generally accepted in the United States of America and as such, the net asset value for financial reporting purposes and the returns based upon those net asset values may differ from the net asset value and returns for shareholder transactions. Does not include sales charges and is not annualized for periods less than one year, if applicable. |
| (c) | Portfolio turnover is calculated at the fund level and is not annualized for periods less than one year, if applicable. For the year ended April 30, 2012, the portfolio turnover calculation excludes the value of securities purchased of $90,282,548 and sold of $44,478,217 in the effort to realign the Fund’s portfolio holdings after the reorganization of Invesco Van Kampen Technology Fund into the Fund. |
| (d) | Ratios are based on average daily net assets (000’s omitted) of $302,855, $7,858, $30,428, $9,302, $365,665 and $1,113 for Class A, Class B, Class C, Class Y, Investor Class and Class R5 shares, respectively. |
| (e) | Net investment income (loss) per share and the ratio of net investment income (loss) to average net assets includes significant dividends received during the period. Net investment income (loss) per share and the ratio of net investment income (loss) to average net assets excluding the significant dividends are $(0.34) and (1.00)%, $(0.56) and (1.75)%, $(0.54) and (1.75)%, $(0.26) and (0.75)%, $(0.33) and (0.96)% and $(0.14) and (0.37)% for Class A, Class B, Class C, Class Y, Investor Class and Class R5 shares, respectively. |
| (f) | Includes litigation proceeds received during the period. Had the litigation proceeds not been received net gains (losses) on securities (both realized and unrealized) per share for the year ended April 30, 2013 would have been $(1.74), $(1.62), $(1.58), $(1.74), $(1.73) and $(1.87) for Class A, Class B, Class C, Class Y, Investor Class and Class R5 shares, respectively and total returns would have been lower. |
| (g) | The total return, ratio of expenses to average net assets and ratio of net investment income (loss) to average net assets reflect actual 12b-1 fees of 0.16%, 0.15%, 0.16% and 0.20% for the years ended April 30, 2016, April 30, 2015, April 30, 2014 and April 30, 2013, respectively. |
20 Invesco Technology Fund
Report of Independent Registered Public Accounting Firm
To the Board of Trustees of AIM Sector Funds (Invesco Sector Funds)
and Shareholders of Invesco Technology Fund:
In our opinion, the accompanying statement of assets and liabilities, including the schedule of investments, and the related statements of operations and of changes in net assets and the financial highlights present fairly, in all material respects, the financial position of Invesco Technology Fund (one of the funds constituting AIM Sector Funds (Invesco Sector Funds), hereafter referred to as the “Fund”) at April 30, 2016, the results of its operations for the year then ended, the changes in its net assets for each of the two years in the period then ended and the financial highlights for each of the five years in the period then ended, in conformity with accounting principles generally accepted in the United States of America. These financial statements and financial highlights (hereafter referred to as “financial statements”) are the responsibility of the Fund’s management; our responsibility is to express an opinion on these financial statements based on our audits. We conducted our audits of these financial statements in accordance with the standards of the Public Company Accounting Oversight Board (United States). Those standards require that we plan and perform the audit to obtain reasonable assurance about whether the financial statements are free of material misstatement. An audit includes examining, on a test basis, evidence supporting the amounts and disclosures in the financial statements, assessing the accounting principles used and significant estimates made by management, and evaluating the overall financial statement presentation. We believe that our audits, which included confirmation of securities at April 30, 2016 by correspondence with the custodian and brokers, and the application of alternative auditing procedures where confirmations of security purchases have not been received, provide a reasonable basis for our opinion.
PRICEWATERHOUSECOOPERS LLP
June 22, 2016
Houston, Texas
21 Invesco Technology Fund
Calculating your ongoing Fund expenses
Example
As a shareholder of the Fund, you incur two types of costs: (1) transaction costs, which may include sales charges (loads) on purchase payments or contingent deferred sales charges on redemptions, if any; and (2) ongoing costs, including management fees, distribution and/or service (12b-1) fees, and other Fund expenses. This example is intended to help you understand your ongoing costs (in dollars) of investing in the Fund and to compare these costs with ongoing costs of investing in other mutual funds. The example is based on an investment of $1,000 invested at the beginning of the period and held for the entire period November 1, 2015 through April 30, 2016.
Actual expenses
The table below provides information about actual account values and actual expenses. You may use the information in this table, together with the amount you invested, to estimate the expenses that you paid over the period. Simply divide your account value by $1,000 (for example, an $8,600 account value divided by $1,000 = 8.6), then multiply the result by the number in the table under the heading entitled “Actual Expenses Paid During Period” to estimate the expenses you paid on your account during this period.
Hypothetical example for comparison purposes
The table below also provides information about hypothetical account values and hypothetical expenses based on the Fund’s actual expense ratio and an assumed rate of return of 5% per year before expenses, which is not the Fund’s actual return.
The hypothetical account values and expenses may not be used to estimate the actual ending account balance or expenses you paid for the period. You may use this information to compare the ongoing costs of investing in the Fund and other funds. To do so, compare this 5% hypothetical example with the 5% hypothetical examples that appear in the shareholder reports of the other funds.
Please note that the expenses shown in the table are meant to highlight your ongoing costs only and do not reflect any transaction costs, such as sales charges (loads) on purchase payments or contingent deferred sales charges on redemptions, if any. Therefore, the hypothetical information is useful in comparing ongoing costs only, and will not help you determine the relative total costs of owning different funds. In addition, if these transaction costs were included, your costs would have been higher.
| | | | | | | | | | | | | | | | | | | | | | | | |
| Class | | Beginning
Account Value
(11/01/15) | | | ACTUAL | | | HYPOTHETICAL
(5% annual return before expenses) | | | Annualized
Expense
Ratio | |
| | | Ending
Account Value
(04/30/16)1 | | | Expenses
Paid During
Period2 | | | Ending
Account Value
(04/30/16) | | | Expenses
Paid During
Period2 | | |
| A | | $ | 1,000.00 | | | $ | 890.30 | | | $ | 6.53 | | | $ | 1,017.95 | | | $ | 6.97 | | | | 1.39 | % |
| B | | | 1,000.00 | | | | 886.80 | | | | 10.04 | | | | 1,014.22 | | | | 10.72 | | | | 2.14 | |
| C | | | 1,000.00 | | | | 887.10 | | | | 10.04 | | | | 1,014.22 | | | | 10.72 | | | | 2.14 | |
| Y | | | 1,000.00 | | | | 891.30 | | | | 5.36 | | | | 1,019.19 | | | | 5.72 | | | | 1.14 | |
| Investor | | | 1,000.00 | | | | 891.00 | | | | 6.11 | | | | 1,018.40 | | | | 6.52 | | | | 1.30 | |
| R5 | | | 1,000.00 | | | | 892.60 | | | | 4.14 | | | | 1,020.49 | | | | 4.42 | | | | 0.88 | |
| 1 | The actual ending account value is based on the actual total return of the Fund for the period November 1, 2015 through April 30, 2016, after actual expenses and will differ from the hypothetical ending account value which is based on the Fund’s expense ratio and a hypothetical annual return of 5% before expenses. |
| 2 | Expenses are equal to the Fund’s annualized expense ratio as indicated above multiplied by the average account value over the period, multiplied by 182/366 to reflect the most recent fiscal half year. |
22 Invesco Technology Fund
Tax Information
Form 1099-DIV, Form 1042-S and other year–end tax information provide shareholders with actual calendar year amounts that should be included in their tax returns. Shareholders should consult their tax advisors.
The following distribution information is being provided as required by the Internal Revenue Code or to meet a specific state’s requirement.
The Fund designates the following amounts or, if subsequently determined to be different, the maximum amount allowable for its fiscal year ended April 30, 2016:
| | | | |
Federal and State Income Tax | |
Long-Term Capital Gain Distributions | | $ | 49,802,069 | |
Qualified Dividend Income* | | | 0 | % |
Corporate Dividends Received Deduction* | | | 0 | % |
U.S. Treasury Obligations* | | | 0 | % |
| | * | The above percentages are based on ordinary income dividends paid to shareholders during the Fund’s fiscal year. |
23 Invesco Technology Fund
Trustees and Officers
The address of each trustee and officer is AIM Sector Funds (Invesco Sector Funds) (the “Trust”), 11 Greenway Plaza, Suite 1000, Houston, Texas 77046-1173. The trustees serve for the life of the Trust, subject to their earlier death, incapacitation, resignation, retirement or removal as more specifically provided in the Trust’s organizational documents. Each officer serves for a one year term or until their successors are elected and qualified. Column two below includes length of time served with predecessor entities, if any.
| | | | | | | | |
Name, Year of Birth and
Position(s) Held with the Trust | | Trustee and/
or Officer Since | | Principal Occupation(s) During Past 5 Years | | Number of Funds in Fund Complex Overseen by Trustee | | Other Directorship(s) Held by Trustee During Past 5 Years |
| Interested Persons | | | | | | | | |
Martin L. Flanagan1 — 1960 Trustee | | 2007 | | Executive Director, Chief Executive Officer and President, Invesco Ltd. (ultimate parent of Invesco and a global investment management firm); Advisor to the Board, Invesco Advisers, Inc. (formerly known as Invesco Institutional (N.A.), Inc.); Trustee, The Invesco Funds; Vice Chair, Investment Company Institute; and Member of Executive Board, SMU Cox School of Business Formerly: Chairman and Chief Executive Officer, Invesco Advisers, Inc. (registered investment adviser); Director, Chairman, Chief Executive Officer and President, IVZ Inc. (holding company), INVESCO Group Services, Inc. (service provider) and Invesco North American Holdings, Inc. (holding company); Director, Chief Executive Officer and President, Invesco Holding Company Limited (parent of Invesco and a global investment management firm); Director, Invesco Ltd.; Chairman, Investment Company Institute and President, Co-Chief Executive Officer, Co-President, Chief Operating Officer and Chief Financial Officer, Franklin Resources, Inc. (global investment management organization) | | 146 | | None |
Philip A. Taylor2 — 1954 Trustee and Senior Vice President | | 2006 | | Head of the Americas and Senior Managing Director, Invesco Ltd.; Director, Co-Chairman, Co-President and Co-Chief Executive Officer, Invesco Advisers, Inc. (formerly known as Invesco Institutional (N.A.), Inc.) (registered investment adviser); Director, Chairman, Chief Executive Officer and President, Invesco Management Group, Inc. (formerly known as Invesco AIM Management Group, Inc.) (financial services holding company); Director and Chairman, Invesco Investment Services, Inc. (formerly known as Invesco AIM Investment Services, Inc.) (registered transfer agent) Chief Executive Officer, Invesco Corporate Class Inc. (corporate mutual fund company) Director, Chairman and Chief Executive Officer, Invesco Canada Ltd. (formerly known as Invesco Trimark Ltd./Invesco Trimark Ltèe) (registered investment adviser and registered transfer agent); Trustee and Senior Vice President, The Invesco Funds; Director, Invesco Investment Advisers LLC (formerly known as Van Kampen Asset Management); Director, Chief Executive Officer and President, Van Kampen Exchange Corp. Formerly: President and Principal Executive Officer, The Invesco Funds (other than AIM Treasurer’s Series Trust (Invesco Treasurer’s Series Trust), Short-Term Investments Trust and Invesco Management Trust); Executive Vice President, The Invesco Funds (AIM Treasurer’s Series Trust (Invesco Treasurer’s Series Trust), Short-Term Investments Trust and Invesco Management Trust only); Director and President, INVESCO Funds Group, Inc. (registered investment adviser and registered transfer agent); Director and Chairman, IVZ Distributors, Inc. (formerly known as INVESCO Distributors, Inc.) (registered broker dealer); Director, President and Chairman, Invesco Inc. (holding company), Invesco Canada Holdings Inc. (holding company), Trimark Investments Ltd./Placements Trimark Ltèe and Invesco Financial Services Ltd/Services Financiers Invesco Ltèe; Chief Executive Officer, Invesco Canada Fund Inc. (corporate mutual fund company); Director and Chairman, Van Kampen Investor Services Inc.; Director, Chief Executive Officer and President, 1371 Preferred Inc. (holding company) and Van Kampen Investments Inc.; Director and President, AIM GP Canada Inc. (general partner for limited partnerships) and Van Kampen Advisors, Inc.; Director and Chief Executive Officer, Invesco Trimark Dealer Inc. (registered broker dealer); Director, Invesco Distributors, Inc. (formerly known as Invesco AIM Distributors, Inc.) (registered broker dealer); Manager, Invesco PowerShares Capital Management LLC; Director, Chief Executive Officer and President, Invesco Advisers, Inc.; Director, Chairman, Chief Executive Officer and President, Invesco AIM Capital Management, Inc.; President, Invesco Trimark Dealer Inc. and Invesco Trimark Ltd./Invesco Trimark Ltèe; Director and President, AIM Trimark Corporate Class Inc. and AIM Trimark Canada Fund Inc.; Senior Managing Director, Invesco Holding Company Limited; Director and Chairman, Fund Management Company (former registered broker dealer); President and Principal Executive Officer, The Invesco Funds (AIM Treasurer’s Series Trust (Invesco Treasurer’s Series Trust), and Short-Term Investments Trust only); President, AIM Trimark Global Fund Inc. and AIM Trimark Canada Fund Inc. | | 146 | | None |
| 1 | Mr. Flanagan is considered an interested person (within the meaning of Section 2(a)(19) of the 1940 Act) of the Trust because he is an officer of the Adviser to the Trust, and an officer and a director of Invesco Ltd., ultimate parent of the Adviser. |
| 2 | Mr. Taylor is considered an interested person (within the meaning of Section 2(a)(19) of the 1940 Act) of the Trust because he is an officer and a director of the Adviser. |
T-1 Invesco Technology Fund
Trustees and Officers—(continued)
| | | | | | | | |
Name, Year of Birth and
Position(s) Held with the Trust | | Trustee and/
or Officer Since | | Principal Occupation(s) During Past 5 Years | | Number of Funds in Fund Complex Overseen by Trustee | | Other Directorship(s) Held by Trustee During Past 5 Years |
| Independent Trustees | | | | | | | | |
Bruce L. Crockett — 1944 Trustee and Chair | | 2003 | | Chairman, Crockett Technologies Associates (technology consulting company) Formerly: Director, Captaris (unified messaging provider); Director, President and Chief Executive Officer, COMSAT Corporation; Chairman, Board of Governors of INTELSAT (international communications company); ACE Limited (insurance company); Independent Directors Council and Investment Company Institute | | 146 | | ALPS (Attorneys Liability Protection Society) (insurance company) and Globe Specialty Metals, Inc. (metallurgical company); Member of the Audit Committee, Ferroglobe PLC and Investment Company Institute; Member of the Executive Committee and Chair of the Governance Committee, Independent Directors Council |
David C. Arch — 1945 Trustee | | 2010 | | Chairman of Blistex Inc., a consumer health care products manufacturer | | 146 | | Board member of the Illinois Manufacturers’ Association; Member of the Board of Visitors, Institute for the Humanities, University of Michigan |
James T. Bunch — 1942 Trustee | | 2000 | | Managing Member, Grumman Hill Group LLC (family office/private equity investments) Formerly: Chairman of the Board, Denver Film Society, Chairman of the Board of Trustees, Evans Scholarship Foundation; Chairman, Board of Governors, Western Golf Association | | 146 | | Trustee, Evans Scholarship Foundation |
Albert R. Dowden — 1941 Trustee | | 2003 | | Director of a number of public and private business corporations, including Nature’s Sunshine Products, Inc. Formerly: Director, The Boss Group, Ltd. and Reich & Tang Funds (5 portfolios) (registered investment company); Director, Homeowners of America Holding Corporation/Homeowners of America Insurance Company (property casualty company); Director, Continental Energy Services, LLC (oil and gas pipeline service); Director, CompuDyne Corporation (provider of product and services to the public security market) and Director, Annuity and Life Re (Holdings), Ltd. (reinsurance company); Director, President and Chief Executive Officer, Volvo Group North America, Inc.; Senior Vice President, AB Volvo; Director of various public and private corporations; Chairman, DHJ Media, Inc.; Director, Magellan Insurance Company; and Director, The Hertz Corporation, Genmar Corporation (boat manufacturer), National Media Corporation; Advisory Board of Rotary Power International (designer, manufacturer, and seller of rotary power engines); and Chairman, Cortland Trust, Inc. (registered investment company) | | 146 | | Director of Nature’s Sunshine Products, Inc. |
Jack M. Fields — 1952 Trustee | | 2003 | | Chief Executive Officer, Twenty First Century Group, Inc. (government affairs company); and Discovery Learning Alliance (non-profit) Formerly: Owner and Chief Executive Officer, Dos Angeles Ranch L.P. (cattle, hunting, corporate entertainment); Director, Insperity, Inc. (formerly known as Administaff); Chief Executive Officer, Texana Timber LP (sustainable forestry company); Director of Cross Timbers Quail Research Ranch (non-profit); and member of the U.S. House of Representatives | | 146 | | None |
Eli Jones — 1961 Trustee | | 2016 | | Professor and Dean, Mays Business School — Texas A&M University Formerly: Professor and Dean, Walton College of Business, University of Arkansas and E.J. Ourso College of Business, Louisiana State University and Director, Arvest Bank | | 146 | | Director of Insperity, Inc. (formerly known as Administaff) |
Prema Mathai-Davis — 1950 Trustee | | 2003 | | Retired. Formerly: Chief Executive Officer, YWCA of the U.S.A. | | 146 | | None |
Larry Soll — 1942 Trustee | | 1997 | | Retired. Formerly: Chairman, Chief Executive Officer and President, Synergen Corp. (a biotechnology company) | | 146 | | None |
Raymond Stickel, Jr. — 1944 Trustee | | 2005 | | Retired. Formerly: Director, Mainstay VP Series Funds, Inc. (25 portfolios) and Partner, Deloitte & Touche | | 146 | | None |
Robert C. Troccoli — 1949 Trustee | | 2016 | | Adjunct Professor and Executive-in-Residence, University of Denver — Daniels College of Business Formerly: Senior Partner, KPMG LLP | | 146 | | None |
T-2 Invesco Technology Fund
Trustees and Officers—(continued)
| | | | | | | | |
Name, Year of Birth and
Position(s) Held with the Trust | | Trustee and/
or Officer Since | | Principal Occupation(s) During Past 5 Years | | Number of Funds in Fund Complex Overseen by Trustee | | Other Directorship(s) Held by Trustee During Past 5 Years |
| Independent Trustees—(continued) |
Suzanne H. Woolsey — 1941 Trustee | | 2014 | | Retired. Formerly: Chief Executive Officer of Woolsey Partners LLC | | 146 | | Director, SunShare LLC; Trustee, Ocean Conservancy; Emeritus Chair of the Board of Trustees of the Institute for Defense Analyses and of Colorado College; Trustee, Chair, Business and Finance Committee of California Institute of Technology; Prior to 2014, Director of Fluor Corp.; Prior to 2010, Trustee of the German Marshall Fund of the United States; Prior to 2010, Trustee of the Rocky Mountain Institute |
| Other Officers | | | | | | | | |
Sheri Morris — 1964 President, Principal Executive Officer and Treasurer | | 2003 | | President, Principal Executive Officer and Treasurer, The Invesco Funds; Vice President, Invesco Advisers, Inc. (formerly known as Invesco Institutional (N.A.), Inc.) (registered investment adviser); and Vice President, PowerShares Exchange-Traded Fund Trust, PowerShares Exchange-Traded Fund Trust II, PowerShares India Exchange-Traded Fund Trust, PowerShares Actively Managed Exchange-Traded Fund Trust, and PowerShares Actively Managed Exchange-Traded Commodity Fund Trust Formerly: Vice President and Principal Financial Officer, The Invesco Funds; Vice President, Invesco AIM Advisers, Inc., Invesco AIM Capital Management, Inc. and Invesco AIM Private Asset Management, Inc.; Assistant Vice President and Assistant Treasurer, The Invesco Funds and Assistant Vice President, Invesco Advisers, Inc., Invesco AIM Capital Management, Inc. and Invesco AIM Private Asset Management, Inc.; and Treasurer, PowerShares Exchange-Traded Fund Trust, PowerShares Exchange-Traded Fund Trust II, PowerShares India Exchange-Traded Fund Trust and PowerShares Actively Managed Exchange-Traded Fund Trust | | N/A | | N/A |
Russell C. Burk — 1958 Senior Vice President and Senior Officer | | 2005 | | Senior Vice President and Senior Officer, The Invesco Funds | | N/A | | N/A |
John M. Zerr — 1962 Senior Vice President, Chief Legal Officer and Secretary | | 2006 | | Director, Senior Vice President, Secretary and General Counsel, Invesco Management Group, Inc. (formerly known as Invesco AIM Management Group, Inc.) and Van Kampen Exchange Corp.; Senior Vice President, Invesco Advisers, Inc. (formerly known as Invesco Institutional (N.A.), Inc.) (registered investment adviser); Senior Vice President and Secretary, Invesco Distributors, Inc. (formerly known as Invesco AIM Distributors, Inc.); Director, Vice President and Secretary, Invesco Investment Services, Inc. (formerly known as Invesco AIM Investment Services, Inc.) Senior Vice President, Chief Legal Officer and Secretary, The Invesco Funds; Managing Director, Invesco PowerShares Capital Management LLC; Director, Secretary and General Counsel, Invesco Investment Advisers LLC (formerly known as Van Kampen Asset Management); Secretary and General Counsel, Invesco Capital Markets, Inc. (formerly known as Van Kampen Funds Inc.) and Chief Legal Officer, PowerShares Exchange-Traded Fund Trust, PowerShares Exchange-Traded Fund Trust II, PowerShares India Exchange-Traded Fund Trust, PowerShares Actively Managed Exchange-Traded Fund Trust, and PowerShares Actively Managed Exchange-Traded Commodity Fund Trust Formerly: Director, Vice President and Secretary, IVZ Distributors, Inc. (formerly known as INVESCO Distributors, Inc.); Director and Vice President, INVESCO Funds Group, Inc.; Director and Vice President, Van Kampen Advisors Inc.; Director, Vice President, Secretary and General Counsel, Van Kampen Investor Services Inc.; Director, Invesco Distributors, Inc. (formerly known as Invesco AIM Distributors, Inc.); Director, Senior Vice President, General Counsel and Secretary, Invesco AIM Advisers, Inc. and Van Kampen Investments Inc.; Director, Vice President and Secretary, Fund Management Company; Director, Senior Vice President, Secretary, General Counsel and Vice President, Invesco AIM Capital Management, Inc.; Chief Operating Officer and General Counsel, Liberty Ridge Capital, Inc. (an investment adviser); Vice President and Secretary, PBHG Funds (an investment company) and PBHG Insurance Series Fund (an investment company); Chief Operating Officer, General Counsel and Secretary, Old Mutual Investment Partners (a broker-dealer); General Counsel and Secretary, Old Mutual Fund Services (an administrator) and Old Mutual Shareholder Services (a shareholder servicing center); Executive Vice President, General Counsel and Secretary, Old Mutual Capital, Inc. (an investment adviser); and Vice President and Secretary, Old Mutual Advisors Funds (an investment company) | | N/A | | N/A |
T-3 Invesco Technology Fund
Trustees and Officers—(continued)
| | | | | | | | |
Name, Year of Birth and
Position(s) Held with the Trust | | Trustee and/
or Officer Since | | Principal Occupation(s) During Past 5 Years | | Number of Funds in Fund Complex Overseen by Trustee | | Other Directorship(s) Held by Trustee During Past 5 Years |
| Other Officers—(continued) | | | | | | | | |
Karen Dunn Kelley — 1960 Senior Vice President | | 2003 | | Senior Managing Director, Investments, Invesco Ltd.; Director, Co-President, Co-Chief Executive Officer, and Co-Chairman, Invesco Advisers, Inc. (formerly known as Invesco Institutional (N.A.), Inc.) (registered investment adviser); Chairman and Director, Invesco Senior Secured Management, Inc.; Senior Vice President, Invesco Management Group, Inc. (formerly known as Invesco AIM Management Group, Inc.); Executive Vice President, Invesco Distributors, Inc. (formerly known as Invesco AIM Distributors, Inc.); Director, Invesco Mortgage Capital Inc. and Invesco Management Company Limited; Senior Vice President, The Invesco Funds Formerly: Vice President, The Invesco Funds (other than AIM Treasurer’s Series Trust (Invesco Treasurer’s Series Trust), Short-Term Investments Trust and Invesco Management Trust); and President and Principal Executive Officer, The Invesco Funds (AIM Treasurer’s Series Trust (Invesco Treasurer’s Series Trust), Short-Term Investments Trust and Invesco Management Trust only); Director and President, INVESCO Asset Management (Bermuda) Ltd., Director, INVESCO Global Asset Management DAC (formerly known as INVESCO Global Asset Management Limited) and INVESCO Management S.A.; Senior Vice President, Van Kampen Investments Inc. and Invesco Advisers, Inc. (formerly known as Invesco Institutional (N.A.), Inc.) (registered investment adviser); Director and President, Fund Management Company; Chief Cash Management Officer, Director of Cash Management, Senior Vice President, and Managing Director, Invesco AIM Capital Management, Inc.; Director of Cash Management, Senior Vice President, and Vice President, Invesco Advisers, Inc. and The Invesco Funds (AIM Treasurer’s Series Trust (Invesco Treasurer’s Series Trust), and Short-Term Investments Trust only) | | N/A | | N/A |
Kelli Gallegos — 1970 Vice President, Principal Financial Officer and Assistant Treasurer | | 2008 | | Vice President, Principal Financial Officer and Assistant Treasurer, The Invesco Funds; Assistant Treasurer, Invesco PowerShares Capital Management LLC, PowerShares Exchange-Traded Fund Trust, PowerShares Exchange-Traded Fund Trust II, PowerShares India Exchange-Traded Fund Trust, PowerShares Actively Managed Exchange-Traded Fund Trust, and PowerShares Actively Managed Exchange-Traded Commodity Fund Trust Formerly: Assistant Vice President, The Invesco Funds | | N/A | | N/A |
Tracy Sullivan — 1962 Vice President, Chief Tax Officer and Assistant Treasurer | | 2008 | | Vice President, Chief Tax Officer and Assistant Treasurer, The Invesco Funds; Assistant Treasurer, Invesco PowerShares Capital Management LLC, PowerShares Exchange-Traded Fund Trust, PowerShares Exchange-Traded Fund Trust II, PowerShares India Exchange-Traded Fund Trust, PowerShares Actively Managed Exchange-Traded Fund Trust, and PowerShares Actively Managed Exchange-Traded Commodity Fund Trust Formerly: Assistant Vice President, The Invesco Funds | | N/A | | N/A |
Crissie M. Wisdom — 1969 Anti-Money Laundering Compliance Officer | | 2013 | | Anti-Money Laundering Compliance Officer, Invesco Advisers, Inc. (formerly known as Invesco Institutional (N.A.), Inc.) (registered investment adviser), Invesco Capital Markets, Inc. (formerly known as Van Kampen Funds Inc.), Invesco Distributors, Inc., Invesco Investment Services, Inc., Invesco Management Group, Inc., Van Kampen Exchange Corp., The Invesco Funds, and PowerShares Exchange-Traded Fund Trust, PowerShares Exchange-Traded Fund Trust II, PowerShares India Exchange-Traded Fund Trust, PowerShares Actively Managed Exchange-Traded Fund Trust and PowerShares Actively Managed Exchange-Traded Commodity Fund Trust; Anti-Money Laundering Compliance Officer and Bank Secrecy Act Officer, INVESCO National Trust Company and Invesco Trust Company; and Fraud Prevention Manager and Controls and Risk Analysis Manager for Invesco Investment Services, Inc. | | N/A | | N/A |
Robert R. Leveille — 1969 Chief Compliance Officer | | 2016 | | Chief Compliance Officer, Invesco Advisers, Inc. (registered investment adviser); and Chief Compliance Officer, The Invesco Funds Formerly: Chief Compliance Officer, Putnam Investments and the Putnam Funds | | N/A | | N/A |
The Statement of Additional Information of the Trust includes additional information about the Fund’s Trustees and is available upon request, without charge, by calling 1.800.959.4246. Please refer to the Fund’s Statement of Additional Information for information on the Fund’s sub-advisers.
| | | | | | |
Office of the Fund 11 Greenway Plaza, Suite 1000 Houston, TX 77046-1173 | | Investment Adviser Invesco Advisers, Inc. 1555 Peachtree Street, N.E. Atlanta, GA 30309 | | Distributor Invesco Distributors, Inc. 11 Greenway Plaza, Suite 1000 Houston, TX 77046-1173 | | Auditors PricewaterhouseCoopers LLP 1000 Louisiana Street, Suite 5800 Houston, TX 77002-5678 |
| | | |
| | | | | | |
Counsel to the Fund Stradley Ronon Stevens & Young, LLP 2005 Market Street, Suite 2600 Philadelphia, PA 19103-7018 | | Counsel to the Independent Trustees Goodwin Procter LLP 901 New York Avenue, N.W. Washington, D.C. 20001 | | Transfer Agent Invesco Investment Services, Inc. 11 Greenway Plaza, Suite 1000 Houston, TX 77046-1173 | | Custodian State Street Bank and Trust Company 225 Franklin Street Boston, MA 02110-2801 |
T-4 Invesco Technology Fund

Invesco mailing information
Send general correspondence to Invesco Investment Services, Inc., P.O. Box 219078, Kansas City, MO 64121-9078.
Important notice regarding delivery of security holder documents
To reduce Fund expenses, only one copy of most shareholder documents may be mailed to shareholders with multiple accounts at the same address (Householding). Mailing of your shareholder documents may be householded indefinitely unless you instruct us otherwise. If you do not want the mailing of these documents to be combined with those for other members of your household, please contact Invesco Investment Services, Inc. at 800 959 4246 or contact your financial institution. We will begin sending you individual copies for each account within 30 days after receiving your request.
Fund holdings and proxy voting information
The Fund provides a complete list of its holdings four times in each fiscal year, at the quarter ends. For the second and fourth quarters, the lists appear in the Fund’s semiannual and annual reports to shareholders. For the first and third quarters, the Fund files the lists with the Securities and Exchange Commission (SEC) on Form N-Q. The most recent list of portfolio holdings is available at invesco.com/completeqtrholdings. Shareholders can also look up the Fund’s Forms N-Q on the SEC website at sec.gov. Copies of the Fund’s Forms N-Q may be reviewed and copied at the SEC Public Reference Room in Washington, D.C. You can obtain information on the operation of the Public Reference Room, including information about duplicating fee charges, by calling 202 551 8090 or 800 732 0330, or by electronic request at the following email address: publicinfo@sec.gov. The SEC file numbers for the Fund are shown below.
A description of the policies and procedures that the Fund uses to determine how to vote proxies relating to portfolio securities is available without charge, upon request, from our Client Services department at 800 959 4246 or at invesco.com/proxyguidelines. The information is also available on the SEC website, sec.gov.
| | |
Information regarding how the Fund voted proxies related to its portfolio securities during the most
recent 12-month period ended June 30 is available at invesco.com/proxysearch. The information is also
available on the SEC website, sec.gov. Invesco Advisers, Inc. is an investment adviser; it provides investment advisory services to individual
and institutional clients and does not sell securities. Invesco Distributors, Inc. is the US distributor for
Invesco Ltd.’s retail mutual funds, exchange-traded funds and institutional money market funds. Both
are wholly owned, indirect subsidiaries of Invesco Ltd. | |  |
| | | | |
| SEC file numbers: 811-03826 and 002-85905 | | I-TEC-AR-1 | | Invesco Distributors, Inc. |
| | | | |
| | |
 | | Annual Report to Shareholders | | April 30, 2016 |
| | |
| | Invesco Technology Sector Fund |
| | Nasdaq: |
| | A: IFOAX n B: IFOBX n C: IFOCX n Y: IFODX |
Letters to Shareholders
| | | | |

Philip Taylor | | | | Dear Shareholders: This annual report includes information about your Fund, including performance data and a complete list of its investments as of the close of the reporting period. Inside is a discussion of how your Fund was managed and the factors that affected its performance during the reporting period. US economic data were generally positive over the reporting period, with the economy expanding modestly and employment numbers improving steadily. Throughout the reporting period, US consumers benefited from declining energy prices and greater credit availability, but a strengthening dollar crimped the profits of many large multi-national companies doing business overseas. Ending years of uncertainty, the US Federal Reserve in December 2015 finally raised short-term interest rates for the first time since 2006, signaling its confidence that the economy was likely to continue expanding and improving. Overseas, the economic story was less positive. |
The European Central Bank and central banks in China and Japan – as well as other countries – either instituted or maintained extraordinarily accommodative monetary policies in response to economic weakness. Stocks began 2016 on a weak note due to increased concerns about global economic weakness.
Short-term market volatility can prompt some investors to abandon their investment plans – and can cause others to settle for average results. The investment professionals at Invesco, in contrast, invest with high conviction and a long-term perspective. At Invesco, investing with high conviction means offering a wide range of strategies designed to go beyond market benchmarks. We trust our research-driven insights, have confidence in our investment processes and build portfolios that reflect our beliefs. Our goal is to look past market noise in an effort to find attractive opportunities at attractive prices – consistent with the investment strategies spelled out in each fund’s prospectus. Of course, investing with high conviction can’t guarantee a profit or ensure investment success; no investment strategy or risk analysis can. To learn more about how we invest with high conviction, visit invesco.com/HighConviction.
You, too, can invest with high conviction by maintaining a long-term investment perspective and by working with your financial adviser on a regular basis. During periods of short-term market volatility or uncertainty, your financial adviser can keep you focused on your long-term investment goals – a new home, a child’s college education, or a secure retirement. He or she also can share research about the economy, the markets and individual investment options.
Visit our website for more information on your investments
Our website, invesco.com/us, offers a wide range of market insights and investment perspectives. On the website, you’ll find detailed information about our funds, including performance, holdings and portfolio manager commentaries. You can access information about your account by completing a simple, secure online registration. Click on the “Need to register” link in the “Account Access” box on our homepage to get started. Invesco’s mobile apps for iPhone® and iPad® (both available free from the App StoreSM) allow you to obtain the same detailed information, monitor your account and create customizable watch lists.
In addition to the resources accessible on our website and through our mobile app, you can obtain timely updates to help you stay informed about the markets, the economy and investing by connecting with Invesco on Twitter, LinkedIn or Facebook. You can access our blog at blog.invesco.us.com. Our goal is to provide you the information you want, when and where you want it.
Have questions?
For questions about your account, contact an Invesco client services representative at 800 959 4246. For Invesco-related questions or comments, please email me directly at phil@invesco.com.
All of us at Invesco look forward to serving your investment management needs. Thank you for investing with us.
Sincerely,

Philip Taylor
Senior Managing Director, Invesco Ltd.
iPhone and iPad are trademarks of Apple Inc., registered in the US and other countries. App Store is a service mark of Apple Inc. Invesco Distributors, Inc. is not affiliated with Apple Inc.
2 Invesco Technology Sector Fund
| | | | |

Bruce Crockett | | | | Dear Fellow Shareholders: Among the many important lessons I’ve learned in more than 40 years in a variety of business endeavors is the value of a trusted advocate. As independent chair of the Invesco Funds Board, I can assure you that the members of the Board are strong advocates for the interests of investors in Invesco’s mutual funds. We work hard to represent your interests through oversight of the quality of the investment management services your funds receive and other matters important to your investment, including but not limited to: n Ensuring that Invesco offers a diverse lineup of mutual funds that your financial adviser can use to strive to meet your financial needs as your investment goals change over time. n Monitoring how the portfolio management teams of the Invesco funds are performing in light of changing economic and market conditions. |
| n | Assessing each portfolio management team’s investment performance within the context of the investment strategy described in the fund’s prospectus. |
| n | Monitoring for potential conflicts of interests that may impact the nature of the services that your funds receive. |
We believe one of the most important services we provide our fund shareholders is the annual review of the funds’ advisory and sub-advisory contracts with Invesco Advisers and its affiliates. This review is required by the Investment Company Act of 1940 and focuses on the nature and quality of the services Invesco provides as the adviser to the Invesco funds and the reasonableness of the fees that it charges for those services. Each year, we spend months carefully reviewing information received from Invesco and a variety of independent sources, such as performance and fee data prepared by Lipper Inc., an independent, third-party firm widely recognized as a leader in its field. We also meet with our independent legal counsel and other independent advisers to review and help us assess the information that we have received. Our goal is to assure that you receive quality investment management services for a reasonable fee.
I trust the measures outlined above provide assurance that you have a worthy advocate when it comes to choosing the Invesco Funds.
As always, please contact me at bruce@brucecrockett.com with any questions or concerns you may have. On behalf of the Board, we look forward to continuing to represent your interests and serving your needs.
Sincerely,

Bruce L. Crockett
Independent Chair
Invesco Funds Board of Trustees
3 Invesco Technology Sector Fund
Management’s Discussion of Fund Performance
| | | | | | |
| Performance summary | |
For the fiscal year ended April 30, 2016, Class A shares of Invesco Technology Sector Fund (the Fund), at net asset value (NAV), underperformed the Fund’s broad market/style-specific benchmark, the Nasdaq Composite Index. Your Fund’s long-term performance appears later in this report. | |
Fund vs. Indexes Total returns, 4/30/15 to 4/30/16, at net asset value (NAV). Performance shown does not include applicable contingent deferred sales charges (CDSC) or front-end sales charges, which would have reduced performance. | |
Class A Shares | | | -7.10 | % |
Class B Shares | | | -7.77 | |
Class C Shares | | | -7.83 | |
Class Y Shares | | | -6.90 | |
Nasdaq Composite Index▼ (Broad Market/Style-Specific Index)* | | | -2.19 | |
S&P 500 Index▼ (Former Broad Market Index)* | | | 1.21 | |
| The BofA Merrill Lynch 100 Technology Index (price only)n (Former Style-Specific Index)* | | | -3.36 | |
Lipper Science & Technology Funds Index¿ (Peer Group Index) | | | -3.58 | |
|
Source(s): ▼FactSet Research Systems; nBloomberg LP; ¿Lipper Inc. * The Fund has elected to use the Nasdaq Composite Index as its broad market/style-specific index rather than using the S&P 500 Index as its broad market index and The BofA Merrill Lynch 100 Technology Index (price only) as its style-specific index because the Nasdaq Composite Index more closely reflects the performance of the types of securities in which the Fund invests. | |
Market conditions and your Fund
Although the health of individual economic sectors varied dramatically, the US economy overall continued its slow but steady growth during the fiscal year ended April 30, 2016. This modest growth led to recurring debate over whether the US economy could withstand global recessionary forces. Many energy, industrial and materials companies experienced cyclical downturns resembling a mild recession even as many consumer-related companies benefited from continued low interest rates, increased availability of credit and a better employment picture. Another significant downturn in oil prices reduced capital investment but also reduced consumers’ energy and gasoline costs.
In the first half of the reporting period, US equity market performance was greatly affected by expectations of when, and whether, the US Federal Reserve (the Fed) might raise interest rates – and the
impact the Fed’s action might have. Markets moved lower in the summer of 2015 as a significant downturn in China’s financial markets and weak global economic growth led to increased concern about the sustainability of US economic growth. In the fall, markets rallied and the Fed saw enough economic stabilization to finally raise interest rates.
US stocks began 2016 on a negative note. Together with a sharp decline in oil prices, this suggested a global recession might be imminent and caused investors to become decidedly risk averse; this helped short-term and income-oriented investments, but hurt longer-term and growth-oriented investments. As companies reported earnings and fundamentals that were better than had been feared, stocks rallied sharply in late February and March. Additionally, oil prices strengthened modestly on the back of a weaker US dollar and as Saudi Arabia and Russia considered a freeze on their oil output.
Overall, US equity markets were mixed, with the S&P 500 Index, considered representative of the performance of the US stock market, finishing the reporting period modestly higher.
In this environment, the information technology sector posted a flat return for the fiscal year. Invesco Technology Sector Fund had negative returns and trailed the Nasdaq Composite Index, its broad market/style-specific benchmark for the reporting period.
Among individual stocks, Facebook – a high conviction holding – was the leading contributor to Fund performance for the reporting period. The company reported increased usage, increased migration to mobile devices and increased video usage, which led to increased video advertising revenue. Facebook also reduced guidance for its future expenses. Amazon.com also contributed to Fund results as the company reported expanding profitability in major business segments; the stock was up more than 50% during the reporting period. Alphabet – a newly formed and renamed holding company formerly known as Google – was a strong contributor to Fund performance for the fiscal year. During the fiscal year, a new chief financial officer enhanced communication with investors and stressed cost discipline for the company. This responsible messaging, combined with strength in the company’s YouTube and mobile-search businesses, pushed the stock higher.
In contrast, Apple was one of the largest detractors from Fund performance during the reporting period. Apple is one of the largest positions in the Fund and the stock was hurt by short-term product cycle factors which we do not believe will be long-term issues. LinkedIn also detracted from Fund performance. The company’s stock price fell after the company reported disappointing fourth-quarter results and shut down its ad platform, which was viewed as a key driver of
| | |
| By sector | | % of total net assets |
| | |
| |
| Information Technology | | 53.2% |
| Health Care | | 24.1 |
| Consumer Discretionary | | 14.8 |
| Industrials | | 2.5 |
| Telecommunication Services | | 1.5 |
| Financials | | 0.6 |
| Money Market Funds | | |
Plus Other Assets Less
Liabilities | | 3.3 |
| | | | | |
| Top 10 Equity Holdings* |
| | | | % of total net assets | |
| | | | | |
| 1. Facebook Inc.-Class A | | | | 7.4% | |
| 2. Alphabet Inc.-Class A | | | | 6.5 | |
| 3. Apple Inc. | | | | 5.8 | |
| 4. Amazon.com, Inc. | | | | 5.7 | |
| 5. Microsoft Corp. | | | | 4.7 | |
| 6. Visa Inc.-Class A | | | | 4.0 | |
| 7. Broadcom Ltd. | | | | 3.9 | |
| 8. Gilead Sciences, Inc. | | | | 3.7 | |
| 9. salesforce.com, inc. | | | | 3.2 | |
| 10. Celgene Corp. | | | | 3.1 | |
| | | | | |
| Total Net Assets | | | | $79.0 million | |
| |
| Total Number of Holdings* | | | | 42 | |
The Fund’s holdings are subject to change, and there is no assurance that the Fund will continue to hold any particular security.
*Excluding money market fund holdings.
Data presented here are as of April 30, 2016.
4 Invesco Technology Sector Fund
future growth. We sold the stock before the close of the reporting period.
After a particularly strong run, biotechnology stocks were punished severely regardless of company-specific fundamentals, negatively impacting several Fund holdings. This negative performance was driven by political rhetoric regarding drug pricing, mixed earnings results and unsustainably high valuations in the small-cap biotech space, which led to significant outflows from biotechnology stocks as a group. Fund holdings Alkermes, Vertex Pharmaceuticals and Gilead Sciences detracted from Fund performance during the reporting period. At the close of the reporting period, the Fund remained tilted toward stocks of attractive growth companies in the biotechnology industry – companies that are innovating and developing promising new treatments.
At the close of the reporting period, the Fund was biased toward growth technology, including biopharmaceuticals, and away from mature technology. It emphasized innovation, transformative technology and opportunities which we expect to take market share from mature companies, including the game-changing technologies of mobile security, cloud and biopharmaceuticals. We remain optimistic about technology spending given strong corporate balance sheets and companies’ need to invest in more robust security solutions for future growth. In our opinion, the increased pace of health care innovation is likely to continue to produce attractive long-term growth rates due to successful mapping of the human genome and recent productivity improvements, both of which have fostered faster and more effective targeting of promising therapeutics. We attempt to harness multi-year secular trends, which may benefit long-term investors regardless of near-term economic conditions.
As we’ve discussed, stocks were volatile during the fiscal year, and we caution investors against making investment decisions based on short-term performance.
We thank you for your commitment to Invesco Technology Sector Fund.
The views and opinions expressed in management’s discussion of Fund performance are those of Invesco Advisers, Inc. These views and opinions are subject to change at any time based on factors such as market and economic conditions. These views and opinions may not be relied upon as investment advice or recommendations, or as an offer for a particular security. The information is not a complete analysis of every aspect of any market, country, industry, security or the Fund. Statements of fact are from sources considered reliable, but Invesco Advisers, Inc. makes no representation or warranty as to their completeness or accuracy. Although historical performance is no guarantee of future results, these insights may help you understand our investment management philosophy.
See important Fund and, if applicable, index disclosures later in this report.
| | | | |
 | | | | Erik Voss Chartered Financial Analyst, Portfolio Manager, is lead manager of Invesco Technology Sector Fund. He joined |
| Invesco in 2010. Mr. Voss earned a BS in mathematics and an MS in finance from the University of Wisconsin. |
| | | | |
 | | | | Janet Luby Chartered Financial Analyst, Portfolio Manager, is manager of Invesco Technology Sector Fund. She joined |
| Invesco in 2011. Ms. Luby earned a BBA in finance from Texas A&M University. She is also a Certified Public Accountant. |
Assisted by Invesco’s Large/Multi-Cap Growth Team
5 Invesco Technology Sector Fund
Your Fund’s Long-Term Performance
Results of a $10,000 Investment – Oldest Share Class(es)
Fund and index data from 4/30/06
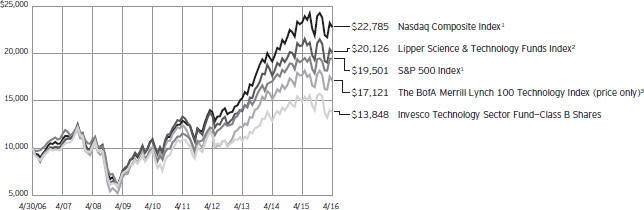
| 1 | Source: FactSet Research Systems Inc. |
Past performance cannot guarantee comparable future results.
During the reporting period, the Fund elected to use the Nasdaq Composite Index as its broad market/style-specific index rather than using the S&P 500 Index as its broad market index and The BofA Merrill Lynch 100 Technology Index (price only) as its style-specific index because the Nasdaq Composite Index more closely reflects the performance of the types of securities in which the Fund invests. Because this is the first reporting period since we have adopted the new index, SEC guidelines require that we compare performance to both the old and new indexes.
The data shown in the chart include reinvested distributions, applicable sales charges and Fund expenses including management fees. Results for Class B shares are calculated as if a hypothetical shareholder had liquidated his entire investment in the Fund at the close of the reporting period and paid the contingent deferred sales charges, if applicable. Index results include reinvested dividends, but they do not reflect sales charges. Performance of the peer group, if applicable, reflects fund expenses and management fees; performance of a market index does not. Performance shown in the chart and table(s) does not reflect deduction of taxes a shareholder would pay on Fund distributions or sale of Fund shares.
6 Invesco Technology Sector Fund
| | | | | |
| Average Annual Total Returns |
| As of 4/30/16, including maximum applicable sales charges |
| | | | | |
| |
| Class A Shares | | | | | |
| Inception (7/28/97) | | | | 3.78 | % |
| 10 Years | | | | 3.35 | |
| 5 Years | | | | 4.14 | |
| 1 Year | | | | -12.23 | |
| |
| Class B Shares | | | | | |
| Inception (11/28/95) | | | | 4.20 | % |
| 10 Years | | | | 3.31 | |
| 5 Years | | | | 4.20 | |
| 1 Year | | | | -12.38 | |
| |
| Class C Shares | | | | | |
| Inception (7/28/97) | | | | 3.31 | % |
| 10 Years | | | | 3.16 | |
| 5 Years | | | | 4.54 | |
| 1 Year | | | | -8.75 | |
| |
| Class Y Shares | | | | | |
| Inception (7/28/97) | | | | 4.33 | % |
| 10 Years | | | | 4.20 | |
| 5 Years | | | | 5.60 | |
| 1 Year | | | | -6.90 | |
| | | | | |
| Performance includes litigation proceeds. Had these proceeds not been received, total returns would have been lower. |
Effective June 1, 2010, Class A, Class B, Class C and Class I shares of the predecessor fund, Morgan Stanley Technology Fund, advised by Morgan Stanley Investment Advisors Inc. were reorganized into Class A, Class B, Class C and Class Y shares, respectively, of Invesco Technology Sector Fund. Returns shown above for Class A, Class B, Class C and Class Y shares are blended returns of the predecessor fund and Invesco Technology Sector Fund. Share class returns will differ from the predecessor fund because of different expenses.
The performance data quoted represent past performance and cannot guarantee comparable future results; current performance may be lower or higher. Please visit invesco.com/performance for the most recent month-end performance. Performance figures reflect reinvested distributions, changes in net asset value and the effect of the maximum sales charge unless otherwise stated. Investment return and principal value will fluctuate so that you may have a gain or loss when you sell shares.
| | | | | |
| Average Annual Total Returns |
| As of 3/31/16, the most recent calendar quarter end, including maximum applicable sales charges |
| | | | | |
| |
| Class A Shares | | | | | |
| Inception (7/28/97) | | | | 3.87 | % |
| 10 Years | | | | 3.41 | |
| 5 Years | | | | 4.98 | |
| 1 Year | | | | -12.71 | |
| |
| Class B Shares | | | | | |
| Inception (11/28/95) | | | | 4.28 | % |
| 10 Years | | | | 3.37 | |
| 5 Years | | | | 5.05 | |
| 1 Year | | | | -12.81 | |
| |
| Class C Shares | | | | | |
| Inception (7/28/97) | | | | 3.41 | % |
| 10 Years | | | | 3.22 | |
| 5 Years | | | | 5.38 | |
| 1 Year | | | | -9.20 | |
| |
| Class Y Shares | | | | | |
| Inception (7/28/97) | | | | 4.43 | % |
| 10 Years | | | | 4.26 | |
| 5 Years | | | | 6.45 | |
| 1 Year | | | | -7.33 | |
| | | | | |
| Performance includes litigation proceeds. Had these proceeds not been received, total returns would have been lower. |
The total annual Fund operating expense ratio set forth in the most recent Fund prospectus as of the date of this report for Class A, Class B, Class C and Class Y shares was 1.58%, 2.33%, 2.32% and 1.33%, respectively. The expense ratios presented above may vary from the expense ratios presented in other sections of this report that are based on expenses incurred during the period covered by this report.
Class A share performance reflects the maximum 5.50% sales charge, and Class B and Class C share performance reflects the applicable contingent deferred sales charge (CDSC) for the period involved. The CDSC on Class B shares declines from 5% beginning at the time of purchase to 0% at the beginning of the seventh year. The CDSC on Class C shares is 1% for the first year after purchase. Class Y shares do not have a front-end sales charge or a CDSC; therefore, performance is at net asset value.
The performance of the Fund’s share classes will differ primarily due to different sales charge structures and class expenses.
Fund performance reflects any applicable fee waivers and/or expense reimbursements. Had the adviser not waived fees and/or reimbursed expenses currently or in the past, returns would have been lower. See current prospectus for more information.
7 Invesco Technology Sector Fund
Invesco Technology Sector Fund’s investment objective is long-term growth of capital.
| n | | Unless otherwise stated, information presented in this report is as of April 30, 2016, and is based on total net assets. |
| n | | Unless otherwise noted, all data provided by Invesco. |
| n | | To access your Fund’s reports/prospectus, visit invesco.com/fundreports. |
About share classes
| n | | Class B shares may not be purchased for new or additional investments. Please see the prospectus for more information. |
| n | | Class Y shares are available to only certain investors. Please see the prospectus for more information. |
Principal risks of investing in the Fund
| n | | Depositary receipts risk. Investing in depositary receipts involves the same risks as direct investments in foreign securities. In addition, the underlying issuers of certain depositary receipts are under no obligation to distribute shareholder communications or pass through any voting rights with respect to the deposited securities to the holders of such receipts. The Fund may therefore receive less timely information or have less control than if it invested directly in the foreign issuer. |
| n | | Derivatives risk. The value of a derivative instrument depends largely on (and is derived from) the value of an underlying security, currency, commodity, interest rate, index or other asset (each referred to as an underlying asset). In addition to risks relating to the underlying assets, the use of derivatives may include other, possibly greater, risks, including counterparty, leverage and liquidity risks. Counterparty risk is the risk that the counterparty to the derivative contract will default on its obligation to pay the Fund the amount owed or otherwise perform under the derivative contract. Derivatives create leverage risk because they do not require payment up front equal to the economic exposure created by owning the derivative. As a result, an adverse change in the value of the underlying asset could result in the Fund sustaining a loss that is substantially greater than the amount invested in the derivative, which may make the Fund’s returns more volatile and increase the risk of loss. Derivative instruments may also be less liquid |
than more traditional investments and the Fund may be unable to sell or close out its derivative positions at a desirable time or price. This risk may be more acute under adverse market conditions, during which the Fund may be most in need of liquidating its derivative positions. Derivatives may also be harder to value, less tax efficient and subject to changing government regulation that could impact the Fund’s ability to use certain derivatives or their cost. Also, derivatives used for hedging or to gain or limit exposure to a particular market segment may not provide the expected benefits, particularly during adverse market conditions.
| n | | Emerging markets securities risk. Emerging markets (also referred to as developing markets) are generally subject to greater market volatility, political, social and economic instability, uncertain trading markets and more governmental limitations on foreign investment than more developed markets. In addition, companies operating in emerging markets may be subject to lower trading volume and greater price fluctuations than companies in more developed markets. Securities law and the enforcement of systems of taxation in many emerging market countries may change quickly and unpredictably. In addition, investments in emerging markets securities may also be subject to additional transaction costs, delays in settlement procedures, and lack of timely information. |
| n | | Foreign securities risk. The Fund’s foreign investments may be adversely affected by political and social instability, changes in economic or taxation policies, difficulty in enforcing obligations, decreased liquidity or increased volatility. Foreign investments also involve the risk of the possible seizure, nationalization or expropriation of the issuer or foreign deposits (in which the Fund could lose its entire investments in a certain market) and the possible adoption of foreign governmental restrictions such as exchange controls. |
This report must be accompanied or preceded by a currently effective Fund prospectus, which contains more complete information, including sales charges and expenses. Investors should read it carefully before investing.
NOT FDIC INSURED | MAY LOSE VALUE | NO BANK GUARANTEE
| | Unless the Fund has hedged its foreign securities risk, foreign securities risk also involves the risk of negative foreign currency rate fluctuations, which may cause the value of securities denominated in such foreign currency (or other instruments through which the Fund has exposure to foreign currencies) to decline in value. Currency exchange rates may fluctuate significantly over short periods of time. Currency hedging strategies, if used, are not always successful. |
| n | | Growth investing risk. Growth stocks tend to be more expensive relative to the issuing company’s earnings or assets compared with other types of stock. As a result, they tend to be more sensitive to changes in, or investors’ expectations of, the issuing company’s earnings and can be more volatile. |
| n | | Management risk. The Fund is actively managed and depends heavily on the Adviser’s judgment about markets, interest rates or the attractiveness, relative values, liquidity, or potential appreciation of particular investments made for the Fund’s portfolio. The Fund could experience losses if these judgments prove to be incorrect. Additionally, legislative, regulatory, or tax developments may adversely affect management of the Fund and, therefore, the ability of the Fund to achieve its investment objective. |
| n | | Market risk. The market values of the Fund’s investments, and therefore the value of the Fund’s shares, will go up and down, sometimes rapidly or unpredictably. Market risk may affect a single issuer, industry or section of the economy, or it may affect the market as a whole. Individual stock prices tend to go up and down more dramatically than those of certain other types of investments, such as bonds. During a general downturn in the financial markets, multiple asset classes may decline in value. When markets perform well, there can be no assurance that specific investments held by the Fund will rise in value. |
| n | | Mid-capitalization risk. Mid-capitalization companies tend to be more vulnerable to changing market conditions and may have more limited product lines and markets, less experienced management and fewer financial resources than larger companies. These |
8 Invesco Technology Sector Fund
companies’ securities may be more volatile and less liquid than those of more established companies, and their returns may vary, sometimes significantly, from the overall securities market.
| n | | Technology sector risk. The Fund will concentrate its investments in the securities of issuers engaged primarily in the communications and information industry. Technology companies are subject to intense competition, rapid obsolescence of their products, issues with obtaining financing or regulatory approvals, product incompatibility, changing consumer preferences, high required corporate capital expenditure for research and development or infrastructure and development of new products, each of which make the prices of securities issued by these companies more volatile. |
About indexes used in this report
| n | | The Nasdaq Composite Index is a broad-based, capitalization-weighted, total return index of all Nasdaq domestic and international based common type stocks listed on the Nasdaq Stock Market. |
| n | | The S&P 500® Index is an unmanaged index considered representative of the US stock market. |
| n | | The BofA Merrill Lynch 100 Technology Index (price only) is an unmanaged, price-only, equal-dollar-weighted index of 100 stocks designed to measure the performance of a cross section of large, actively traded technology stocks and American Depositary Receipts. |
| n | | The Lipper Science & Technology Funds Index is an unmanaged index considered representative of science and technology funds tracked by Lipper. |
| n | | The Fund is not managed to track the performance of any particular index, including the index(es) described here, and consequently, the performance of the Fund may deviate significantly from the performance of the index(es). |
| n | | A direct investment cannot be made in an index. Unless otherwise indicated, index results include reinvested dividends, and they do not reflect sales charges. Performance of the peer group, if applicable, reflects fund expenses; performance of a market index does not. |
Other information
| n | | CPA® and Certified Public Accountant® are trademarks owned by the American Institute of Certified Public Accountants. |
| n | | The returns shown in management’s discussion of Fund performance are based on net asset values (NAVs) calculated for shareholder transactions. Generally accepted accounting principles require adjustments to be made to the net assets of the Fund at period end for financial reporting purposes, and as such, the NAVs for shareholder transactions and the returns based on those NAVs may differ from the NAVs and returns reported in the Financial Highlights. |
| n | | Industry classifications used in this report are generally according to the Global Industry Classification Standard, which was developed by and is the exclusive property and a service mark of MSCI Inc. and Standard & Poor’s. |
9 Invesco Technology Sector Fund
Schedule of Investments(a)
April 30, 2016
| | | | | | | | |
| | | Shares | | | Value | |
Common Stocks & Other Equity Interests–96.67% | |
| Aerospace & Defense–2.53% | |
Raytheon Co. | | | 15,788 | | | $ | 1,994,814 | |
|
| Application Software–3.25% | |
salesforce.com, inc.(b) | | | 33,852 | | | | 2,565,982 | |
|
| Biotechnology–13.50% | |
Alexion Pharmaceuticals, Inc.(b) | | | 5,183 | | | | 721,888 | |
Alkermes PLC(b) | | | 39,264 | | | | 1,560,744 | |
Amgen Inc. | | | 8,534 | | | | 1,350,932 | |
Biogen Inc.(b) | | | 2,940 | | | | 808,471 | |
Celgene Corp.(b) | | | 23,801 | | | | 2,461,261 | |
Gilead Sciences, Inc. | | | 33,520 | | | | 2,956,799 | |
Vertex Pharmaceuticals Inc.(b) | | | 9,472 | | | | 798,869 | |
| | | | | | | | 10,658,964 | |
|
| Cable & Satellite–3.14% | |
DISH Network Corp.–Class A(b) | | | 43,557 | | | | 2,146,924 | |
Time Warner Cable Inc. | | | 1,572 | | | | 333,437 | |
| | | | | | | | 2,480,361 | |
|
| Communications Equipment–0.79% | |
Palo Alto Networks, Inc.(b) | | | 4,122 | | | | 621,886 | |
|
| Consumer Electronics–3.48% | |
Harman International Industries, Inc. | | | 15,381 | | | | 1,180,646 | |
Sony Corp. (Japan) | | | 64,400 | | | | 1,565,362 | |
| | | | | | | | 2,746,008 | |
|
| Data Processing & Outsourced Services–8.53% | |
First Data Corp.–Class A(b) | | | 47,178 | | | | 537,357 | |
MasterCard, Inc.–Class A | | | 24,508 | | | | 2,377,031 | |
Vantiv, Inc.–Class A (b) | | | 11,703 | | | | 638,282 | |
Visa Inc.–Class A | | | 41,178 | | | | 3,180,589 | |
| | | | | | | | 6,733,259 | |
|
| Health Care Equipment–2.16% | |
Medtronic PLC | | | 21,494 | | | | 1,701,250 | |
|
| Home Entertainment Software–5.46% | |
Activision Blizzard, Inc. | | | 68,994 | | | | 2,378,223 | |
Electronic Arts Inc.(b) | | | 18,812 | | | | 1,163,522 | |
Nintendo Co., Ltd. (Japan) | | | 5,700 | | | | 766,639 | |
| | | | | | | | 4,308,384 | |
|
| Internet Retail–8.21% | |
Amazon.com, Inc.(b) | | | 6,823 | | | | 4,500,383 | |
Netflix Inc.(b) | | | 8,185 | | | | 736,895 | |
Priceline Group Inc. (The)(b) | | | 926 | | | | 1,244,229 | |
| | | | | | | | 6,481,507 | |
| | | | | | | | |
| | | Shares | | | Value | |
| Internet Software & Services–16.81% | |
Alibaba Group Holding Ltd.–ADR
(China)(b) | | | 6,155 | | | $ | 473,566 | |
Alphabet Inc.–Class A(b) | | | 7,224 | | | | 5,113,725 | |
Alphabet Inc.–Class C(b) | | | 2,658 | | | | 1,842,020 | |
Facebook Inc.–Class A(b) | | | 49,727 | | | | 5,846,901 | |
| | | | | | | | 13,276,212 | |
|
| Investment Banking & Brokerage–0.59% | |
Charles Schwab Corp. (The) | | | 16,511 | | | | 469,078 | |
|
| IT Consulting & Other Services–0.58% | |
Cognizant Technology Solutions
Corp.–Class A(b) | | | 7,812 | | | | 455,986 | |
|
| Life Sciences Tools & Services–2.56% | |
Thermo Fisher Scientific, Inc. | | | 14,031 | | | | 2,023,972 | |
|
| Managed Health Care–0.75% | |
UnitedHealth Group Inc. | | | 4,522 | | | | 595,457 | |
|
| Pharmaceuticals–5.10% | |
Allergan PLC(b) | | | 5,244 | | | | 1,135,641 | |
Bristol-Myers Squibb Co. | | | 25,685 | | | | 1,853,943 | |
Eli Lilly and Co. | | | 13,753 | | | | 1,038,764 | |
| | | | | | | | 4,028,348 | |
|
| Semiconductors–6.37% | |
Broadcom Ltd. (Singapore) | | | 21,176 | | | | 3,086,402 | |
NXP Semiconductors N.V. (Netherlands)(b) | | | 22,802 | | | | 1,944,555 | |
| | | | | | | | 5,030,957 | |
|
| Systems Software–5.59% | |
Microsoft Corp. | | | 73,881 | | | | 3,684,446 | |
ServiceNow, Inc.(b) | | | 10,215 | | | | 730,168 | |
| | | | | | | | 4,414,614 | |
|
| Technology Hardware, Storage & Peripherals–5.78% | |
Apple Inc. | | | 48,673 | | | | 4,562,607 | |
|
| Wireless Telecommunication Services–1.49% | |
Sprint Corp.(b) | | | 341,980 | | | | 1,172,991 | |
Total Common Stocks & Other Equity Interests
(Cost $69,537,499) | | | | 76,322,637 | |
| | |
Money Market Funds–2.71% | | | | | | | | |
Liquid Assets Portfolio–Institutional Class, 0.44%(c) | | | 1,071,079 | | | | 1,071,079 | |
Premier Portfolio–Institutional Class, 0.39%(c) | | | 1,071,079 | | | | 1,071,079 | |
Total Money Market Funds
(Cost $2,142,158) | | | | | | | 2,142,158 | |
TOTAL INVESTMENTS–99.38%
(Cost $71,679,657) | | | | 78,464,795 | |
OTHER ASSETS LESS LIABILITIES–0.62% | | | | 492,593 | |
NET ASSETS–100.00% | | | $ | 78,957,388 | |
Investment Abbreviations:
| | |
| ADR | | – American Depositary Receipt |
Notes to Schedule of Investments:
| (a) | Industry and/or sector classifications used in this report are generally according to the Global Industry Classification Standard, which was developed by and is the exclusive property and a service mark of MSCI Inc. and Standard & Poor’s. |
| (b) | Non-income producing security. |
| (c) | The money market fund and the Fund are affiliated by having the same investment adviser. The rate shown is the 7-day SEC standardized yield as of April 30, 2016. |
See accompanying Notes to Financial Statements which are an integral part of the financial statements.
10 Invesco Technology Sector Fund
Statement of Assets and Liabilities
April 30, 2016
| | | | |
Assets: | |
Investments, at value (Cost $69,537,499) | | $ | 76,322,637 | |
Investments in affiliated money market funds, at value and cost | | | 2,142,158 | |
Total investments, at value (Cost $71,679,657) | | | 78,464,795 | |
Foreign currencies, at value (Cost $4,131) | | | 5,150 | |
Receivable for: | | | | |
Investments sold | | | 1,819,568 | |
Fund shares sold | | | 10,538 | |
Dividends | | | 48,038 | |
Investment for trustee deferred compensation and retirement plans | | | 27,869 | |
Other assets | | | 27,485 | |
Total assets | | | 80,403,443 | |
|
Liabilities: | |
Payable for: | | | | |
Investments purchased | | | 1,097,228 | |
Fund shares reacquired | | | 152,427 | |
Accrued fees to affiliates | | | 119,225 | |
Accrued trustees’ and officers’ fees and benefits | | | 1,787 | |
Accrued other operating expenses | | | 45,206 | |
Trustee deferred compensation and retirement plans | | | 30,182 | |
Total liabilities | | | 1,446,055 | |
Net assets applicable to shares outstanding | | $ | 78,957,388 | |
|
Net assets consist of: | |
Shares of beneficial interest | | $ | 74,234,532 | |
Undistributed net investment income (loss) | | | (274,063 | ) |
Undistributed net realized gain (loss) | | | (1,787,215 | ) |
Net unrealized appreciation | | | 6,784,134 | |
| | | $ | 78,957,388 | |
| | | | |
Net Assets: | |
Class A | | $ | 70,255,747 | |
Class B | | $ | 643,887 | |
Class C | | $ | 6,758,687 | |
Class Y | | $ | 1,299,067 | |
|
Shares outstanding, $0.01 par value per share,
with an unlimited number of shares authorized: | |
Class A | | | 4,509,157 | |
Class B | | | 47,985 | |
Class C | | | 503,577 | |
Class Y | | | 79,609 | |
Class A: | | | | |
Net asset value per share | | $ | 15.58 | |
Maximum offering price per share | | | | |
(Net asset value of $15.58 ¸ 94.50%) | | $ | 16.49 | |
Class B: | | | | |
Net asset value and offering price per share | | $ | 13.42 | |
Class C: | | | | |
Net asset value and offering price per share | | $ | 13.42 | |
Class Y: | | | | |
Net asset value and offering price per share | | $ | 16.32 | |
See accompanying Notes to Financial Statements which are an integral part of the financial statements.
11 Invesco Technology Sector Fund
Statement of Operations
For the year ended April 30, 2016
| | | | |
Investment income: | |
Dividends (net of foreign withholding taxes of $843) | | $ | 604,185 | |
Dividends from affiliated money market funds (includes securities lending income of $5,549) | | | 9,998 | |
Total investment income | | | 614,183 | |
| |
Expenses: | | | | |
Advisory fees | | | 598,182 | |
Administrative services fees | | | 50,000 | |
Custodian fees | | | 9,430 | |
Distribution fees: | | | | |
Class A | | | 197,500 | |
Class B | | | 9,844 | |
Class C | | | 75,817 | |
Transfer agent fees | | | 366,464 | |
Trustees’ and officers’ fees and benefits | | | 20,225 | |
Registration and filing fees | | | 50,953 | |
Reports to shareholders | | | 43,099 | |
Professional services fees | | | 35,250 | |
Other | | | 9,842 | |
Total expenses | | | 1,466,606 | |
Less: Fees waived and expense offset arrangement(s) | | | (2,723 | ) |
Net expenses | | | 1,463,883 | |
Net investment income (loss) | | | (849,700 | ) |
| |
Realized and unrealized gain (loss) from: | | | | |
Net realized gain from: | | | | |
Investment securities | | | 6,301,078 | |
Foreign currencies | | | 931 | |
| | | | 6,302,009 | |
Change in net unrealized appreciation (depreciation) of: | | | | |
Investment securities | | | (11,367,608 | ) |
Foreign currencies | | | (1,066 | ) |
| | | | (11,368,674 | ) |
Net realized and unrealized gain (loss) | | | (5,066,665 | ) |
Net increase (decrease) in net assets resulting from operations | | $ | (5,916,365 | ) |
See accompanying Notes to Financial Statements which are an integral part of the financial statements.
12 Invesco Technology Sector Fund
Statement of Changes in Net Assets
For the years ended April 30, 2016 and 2015
| | | | | | | | |
| | | 2016 | | | 2015 | |
Operations: | | | | | |
Net investment income (loss) | | $ | (849,700 | ) | | $ | (1,120,231 | ) |
Net realized gain | | | 6,302,009 | | | | 17,847,032 | |
Change in net unrealized appreciation (depreciation) | | | (11,368,674 | ) | | | (2,673,458 | ) |
Net increase (decrease) in net assets resulting from operations | | | (5,916,365 | ) | | | 14,053,343 | |
| | |
Share transactions–net: | | | | | | | | |
Class A | | | (10,956,691 | ) | | | (10,076,410 | ) |
Class B | | | (581,865 | ) | | | (630,321 | ) |
Class C | | | (774,023 | ) | | | (1,000,731 | ) |
Class Y | | | 452,285 | | | | 148,030 | |
Net increase (decrease) in net assets resulting from share transactions | | | (11,860,294 | ) | | | (11,559,432 | ) |
Net increase (decrease) in net assets | | | (17,776,659 | ) | | | 2,493,911 | |
| | |
Net assets: | | | | | | | | |
Beginning of year | | | 96,734,047 | | | | 94,240,136 | |
End of year (includes undistributed net investment income (loss) of $(274,063) and $(361,573), respectively) | | $ | 78,957,388 | | | $ | 96,734,047 | |
Notes to Financial Statements
April 30, 2016
NOTE 1—Significant Accounting Policies
Invesco Technology Sector Fund (the “Fund”) is a series portfolio of AIM Sector Funds (Invesco Sector Funds) (the “Trust”). The Trust is a Delaware statutory trust registered under the Investment Company Act of 1940, as amended (the “1940 Act”), as an open-end series management investment company consisting of ten separate portfolios, each authorized to issue an unlimited number of shares of beneficial interest. The assets, liabilities and operations of each portfolio are accounted for separately. Information presented in these financial statements pertains only to the Fund. Matters affecting each portfolio or class will be voted on exclusively by the shareholders of such portfolio or class.
The Fund’s investment objective is long-term growth of capital.
The Fund currently consists of four different classes of shares: Class A, Class B, Class C and Class Y. Class Y shares are available only to certain investors. Class A shares are sold with a front-end sales charge unless certain waiver criteria are met and under certain circumstances load waived shares may be subject to contingent deferred sales charges (“CDSC”). Class C shares are sold with a CDSC. Class Y shares are sold at net asset value. Effective November 30, 2010, new or additional investments in Class B shares are no longer permitted. Existing shareholders of Class B shares may continue to reinvest dividends and capital gains distributions in Class B shares until they convert to Class A shares. Also, shareholders in Class B shares will be able to exchange those shares for Class B shares of other Invesco Funds offering such shares until they convert to Class A shares. Generally, Class B shares will automatically convert to Class A shares on or about the month-end, which is at least eight years after the date of purchase. Redemption of Class B shares prior to the conversion date will be subject to a CDSC.
The following is a summary of the significant accounting policies followed by the Fund in the preparation of its financial statements.
| A. | Security Valuations — Securities, including restricted securities, are valued according to the following policy. |
A security listed or traded on an exchange (except convertible securities) is valued at its last sales price or official closing price as of the close of the customary trading session on the exchange where the security is principally traded, or lacking any sales or official closing price on a particular day, the security may be valued at the closing bid price on that day. Securities traded in the over-the-counter market are valued based on prices furnished by independent pricing services or market makers. When such securities are valued by an independent pricing service they may be considered fair valued. Futures contracts are valued at the final settlement price set by an exchange on which they are principally traded. Listed options are valued at the mean between the last bid and asked prices from the exchange on which they are principally traded. Options not listed on an exchange are valued by an independent source at the mean between the last bid and asked prices. For purposes of determining net asset value (“NAV”) per share, futures and option contracts generally are valued 15 minutes after the close of the customary trading session of the New York Stock Exchange (“NYSE”).
Investments in open-end and closed-end registered investment companies that do not trade on an exchange are valued at the end-of-day net asset value per share. Investments in open-end and closed-end registered investment companies that trade on an exchange are valued at the last sales price or official closing price as of the close of the customary trading session on the exchange where the security is principally traded.
Debt obligations (including convertible securities) and unlisted equities are fair valued using an evaluated quote provided by an independent pricing service. Evaluated quotes provided by the pricing service may be determined without exclusive reliance on quoted prices, and may reflect appropriate factors such as institution-size trading in similar groups of securities, developments related to specific securities, dividend rate (for unlisted equities), yield (for debt obligations), quality, type of issue, coupon rate (for debt obligations), maturity (for debt obligations), individual trading characteristics and other market data. Debt obligations are subject to interest rate and credit risks. In addition, all debt obligations involve some risk of default with respect to interest and/or principal payments.
13 Invesco Technology Sector Fund
Foreign securities’ (including foreign exchange contracts) prices are converted into U.S. dollar amounts using the applicable exchange rates as of the close of the NYSE. If market quotations are available and reliable for foreign exchange-traded equity securities, the securities will be valued at the market quotations. Because trading hours for certain foreign securities end before the close of the NYSE, closing market quotations may become unreliable. If between the time trading ends on a particular security and the close of the customary trading session on the NYSE, events occur that the Adviser determines are significant and make the closing price unreliable, the Fund may fair value the security. If the event is likely to have affected the closing price of the security, the security will be valued at fair value in good faith using procedures approved by the Board of Trustees. Adjustments to closing prices to reflect fair value may also be based on a screening process of an independent pricing service to indicate the degree of certainty, based on historical data, that the closing price in the principal market where a foreign security trades is not the current value as of the close of the NYSE. Foreign securities’ prices meeting the approved degree of certainty that the price is not reflective of current value will be priced at the indication of fair value from the independent pricing service. Multiple factors may be considered by the independent pricing service in determining adjustments to reflect fair value and may include information relating to sector indices, American Depositary Receipts and domestic and foreign index futures. Foreign securities may have additional risks including exchange rate changes, potential for sharply devalued currencies and high inflation, political and economic upheaval, the relative lack of issuer information, relatively low market liquidity and the potential lack of strict financial and accounting controls and standards.
Securities for which market prices are not provided by any of the above methods may be valued based upon quotes furnished by independent sources. The last bid price may be used to value equity securities. The mean between the last bid and asked prices is used to value debt obligations, including corporate loans.
Securities for which market quotations are not readily available or became unreliable are valued at fair value as determined in good faith by or under the supervision of the Trust’s officers following procedures approved by the Board of Trustees. Issuer specific events, market trends, bid/asked quotes of brokers and information providers and other market data may be reviewed in the course of making a good faith determination of a security’s fair value.
The Fund may invest in securities that are subject to interest rate risk, meaning the risk that the prices will generally fall as interest rates rise and, conversely, the prices will generally rise as interest rates fall. Specific securities differ in their sensitivity to changes in interest rates depending on their individual characteristics. Changes in interest rates may result in increased market volatility, which may affect the value and/or liquidity of certain Fund investments.
Valuations change in response to many factors including the historical and prospective earnings of the issuer, the value of the issuer’s assets, general economic conditions, interest rates, investor perceptions and market liquidity. Because of the inherent uncertainties of valuation, the values reflected in the financial statements may materially differ from the value received upon actual sale of those investments.
| B. | Securities Transactions and Investment Income — Securities transactions are accounted for on a trade date basis. Realized gains or losses on sales are computed on the basis of specific identification of the securities sold. Interest income (net of withholding tax, if any) is recorded on the accrual basis from settlement date. Dividend income (net of withholding tax, if any) is recorded on the ex-dividend date. |
The Fund may periodically participate in litigation related to Fund investments. As such, the Fund may receive proceeds from litigation settlements. Any proceeds received are included in the Statement of Operations as realized gain (loss) for investments no longer held and as unrealized gain (loss) for investments still held.
Brokerage commissions and mark ups are considered transaction costs and are recorded as an increase to the cost basis of securities purchased and/or a reduction of proceeds on a sale of securities. Such transaction costs are included in the determination of net realized and unrealized gain (loss) from investment securities reported in the Statement of Operations and the Statement of Changes in Net Assets and the net realized and unrealized gains (losses) on securities per share in the Financial Highlights. Transaction costs are included in the calculation of the Fund’s net asset value and, accordingly, they reduce the Fund’s total returns. These transaction costs are not considered operating expenses and are not reflected in net investment income reported in the Statement of Operations and the Statement of Changes in Net Assets, or the net investment income per share and the ratios of expenses and net investment income reported in the Financial Highlights, nor are they limited by any expense limitation arrangements between the Fund and the investment adviser.
The Fund allocates income and realized and unrealized capital gains and losses to a class based on the relative net assets of each class.
| C. | Country Determination — For the purposes of making investment selection decisions and presentation in the Schedule of Investments, the investment adviser may determine the country in which an issuer is located and/or credit risk exposure based on various factors. These factors include the laws of the country under which the issuer is organized, where the issuer maintains a principal office, the country in which the issuer derives 50% or more of its total revenues and the country that has the primary market for the issuer’s securities, as well as other criteria. Among the other criteria that may be evaluated for making this determination are the country in which the issuer maintains 50% or more of its assets, the type of security, financial guarantees and enhancements, the nature of the collateral and the sponsor organization. Country of issuer and/or credit risk exposure has been determined to be the United States of America, unless otherwise noted. |
| D. | Distributions — Distributions from net investment income and net realized capital gain, if any, are generally declared and paid annually and recorded on the ex-dividend date. The Fund may elect to treat a portion of the proceeds from redemptions as distributions for federal income tax purposes. |
| E. | Federal Income Taxes — The Fund intends to comply with the requirements of Subchapter M of the Internal Revenue Code of 1986, as amended (the “Internal Revenue Code”), necessary to qualify as a regulated investment company and to distribute substantially all of the Fund’s taxable earnings to shareholders. As such, the Fund will not be subject to federal income taxes on otherwise taxable income (including net realized capital gain) that is distributed to shareholders. Therefore, no provision for federal income taxes is recorded in the financial statements. |
The Fund recognizes the tax benefits of uncertain tax positions only when the position is more likely than not to be sustained. Management has analyzed the Fund’s uncertain tax positions and concluded that no liability for unrecognized tax benefits should be recorded related to uncertain tax positions. Management is not aware of any tax positions for which it is reasonably possible that the total amounts of unrecognized tax benefits will change materially in the next 12 months.
The Fund files tax returns in the U.S. Federal jurisdiction and certain other jurisdictions. Generally, the Fund is subject to examinations by such taxing authorities for up to three years after the filing of the return for the tax period.
14 Invesco Technology Sector Fund
| F. | Expenses — Fees provided for under the Rule 12b-1 plan of a particular class of the Fund and which are directly attributable to that class are charged to the operations of such class. All other expenses are allocated among the classes based on relative net assets. |
| G. | Accounting Estimates — The preparation of financial statements in conformity with accounting principles generally accepted in the United States of America (“GAAP”) requires management to make estimates and assumptions that affect the reported amounts of assets and liabilities at the date of the financial statements and the reported amounts of revenues and expenses during the reporting period including estimates and assumptions related to taxation. Actual results could differ from those estimates by a significant amount. In addition, the Fund monitors for material events or transactions that may occur or become known after the period-end date and before the date the financial statements are released to print. |
| H. | Indemnifications — Under the Trust’s organizational documents, each Trustee, officer, employee or other agent of the Trust is indemnified against certain liabilities that may arise out of the performance of their duties to the Fund. Additionally, in the normal course of business, the Fund enters into contracts, including the Fund’s servicing agreements, that contain a variety of indemnification clauses. The Fund’s maximum exposure under these arrangements is unknown as this would involve future claims that may be made against the Fund that have not yet occurred. The risk of material loss as a result of such indemnification claims is considered remote. |
| I. | Securities Lending — The Fund may lend portfolio securities having a market value up to one-third of the Fund’s total assets. Such loans are secured by collateral equal to no less than the market value of the loaned securities determined daily by the securities lending provider. Such collateral will be cash or debt securities issued or guaranteed by the U.S. Government or any of its sponsored agencies. Cash collateral received in connection with these loans is invested in short-term money market instruments or affiliated money market funds and is shown as such on the Schedule of Investments. The Fund bears the risk of loss with respect to the investment of collateral. It is the Fund’s policy to obtain additional collateral from or return excess collateral to the borrower by the end of the next business day, following the valuation date of the securities loaned. Therefore, the value of the collateral held may be temporarily less than the value of the securities on loan. When loaning securities, the Fund retains certain benefits of owning the securities, including the economic equivalent of dividends or interest generated by the security. Lending securities entails a risk of loss to the Fund if, and to the extent that, the market value of the securities loaned were to increase and the borrower did not increase the collateral accordingly, and the borrower failed to return the securities. The securities loaned are subject to termination at the option of the borrower or the Fund. Upon termination, the borrower will return to the Fund the securities loaned and the Fund will return the collateral. Upon the failure of the borrower to return the securities, collateral may be liquidated and the securities may be purchased on the open market to replace the loaned securities. The Fund could experience delays and costs in gaining access to the collateral and the securities may lose value during the delay which could result in potential losses to the Fund. Some of these losses may be indemnified by the lending agent. The Fund bears the risk of any deficiency in the amount of the collateral available for return to the borrower due to any loss on the collateral invested. Dividends received on cash collateral investments for securities lending transactions, which are net of compensation to counterparties, are included in Dividends from affiliated money market funds on the Statement of Operations. The aggregate value of securities out on loan, if any, is shown as a footnote on the Statement of Assets and Liabilities. |
| J. | Foreign Currency Translations — Foreign currency is valued at the close of the NYSE based on quotations posted by banks and major currency dealers. Portfolio securities and other assets and liabilities denominated in foreign currencies are translated into U.S. dollar amounts at date of valuation. Purchases and sales of portfolio securities (net of foreign taxes withheld on disposition) and income items denominated in foreign currencies are translated into U.S. dollar amounts on the respective dates of such transactions. The Fund does not separately account for the portion of the results of operations resulting from changes in foreign exchange rates on investments and the fluctuations arising from changes in market prices of securities held. The combined results of changes in foreign exchange rates and the fluctuation of market prices on investments (net of estimated foreign tax withholding) are included with the net realized and unrealized gain or loss from investments in the Statement of Operations. Reported net realized foreign currency gains or losses arise from (1) sales of foreign currencies, (2) currency gains or losses realized between the trade and settlement dates on securities transactions, and (3) the difference between the amounts of dividends, interest, and foreign withholding taxes recorded on the Fund’s books and the U.S. dollar equivalent of the amounts actually received or paid. Net unrealized foreign currency gains and losses arise from changes in the fair values of assets and liabilities, other than investments in securities at fiscal period end, resulting from changes in exchange rates. |
The Fund may invest in foreign securities, which may be subject to foreign taxes on income, gains on investments or currency repatriation, a portion of which may be recoverable. Foreign taxes, if any, are recorded based on the tax regulations and rates that exist in the foreign markets in which the Fund invests and are shown in the Statement of Operations.
| K. | Forward Foreign Currency Contracts — The Fund may engage in foreign currency transactions either on a spot (i.e. for prompt delivery and settlement) basis, or through forward foreign currency contracts, to manage or minimize currency or exchange rate risk. |
The Fund may also enter into forward foreign currency contracts for the purchase or sale of a security denominated in a foreign currency in order to “lock in” the U.S. dollar price of that security, or the Fund may also enter into forward foreign currency contracts that do not provide for physical settlement of the two currencies, but instead are settled by a single cash payment calculated as the difference between the agreed upon exchange rate and the spot rate at settlement based upon an agreed upon notional amount (non-deliverable forwards). The Fund will set aside liquid assets in an amount equal to daily mark-to-market obligation for forward foreign currency contracts.
A forward foreign currency contract is an obligation between two parties (“Counterparties”) to purchase or sell a specific currency for an agreed-upon price at a future date. The use of forward foreign currency contracts does not eliminate fluctuations in the price of the underlying securities the Fund owns or intends to acquire but establishes a rate of exchange in advance. Fluctuations in the value of these contracts are measured by the difference in the contract date and reporting date exchange rates and are recorded as unrealized appreciation (depreciation) until the contracts are closed. When the contracts are closed, realized gains (losses) are recorded. Realized and unrealized gains (losses) on the contracts are included in the Statement of Operations. The primary risks associated with forward foreign currency contracts include failure of the Counterparty to meet the terms of the contract and the value of the foreign currency changing unfavorably. These risks may be in excess of the amounts reflected in the Statement of Assets and Liabilities.
| L. | Other Risks — The Fund’s investments are concentrated in a comparatively narrow segment of the economy, which may make the Fund more volatile. |
15 Invesco Technology Sector Fund
Many products and services offered in technology-related industries are subject to rapid obsolescence, which may lower the value of the issuers in this sector.
NOTE 2—Advisory Fees and Other Fees Paid to Affiliates
The Trust has entered into a master investment advisory agreement with Invesco Advisers, Inc. (the “Adviser” or “Invesco”). Under the terms of the investment advisory agreement, the Fund pays an advisory fee to the Adviser based on the annual rate of the Fund’s average daily net assets as follows:
| | | | | | |
| Average Daily Net Assets | | Rate |
First $500 million | | | 0 | .67% | | |
Next $2.5 billion | | | 0 | .645% | | |
Over $3 billion | | | 0 | .62% | | |
For the year ended April 30, 2016, the effective advisory fees incurred by the Fund was 0.67%.
Under the terms of a master sub-advisory agreement between the Adviser and each of Invesco Asset Management Deutschland GmbH, Invesco Asset Management Limited, Invesco Asset Management (Japan) Limited, Invesco Hong Kong Limited, Invesco Senior Secured Management, Inc. and Invesco Canada Ltd. (collectively, the “Affiliated Sub-Advisers”) the Adviser, not the Fund, may pay 40% of the fees paid to the Adviser to any such Affiliated Sub-Adviser(s) that provide(s) discretionary investment management services to the Fund based on the percentage of assets allocated to such Affiliated Sub-Adviser(s).
The Adviser has contractually agreed, through at least June 30, 2017, to waive advisory fees and/or reimburse expenses of all shares to the extent necessary to limit total annual fund operating expenses after fee waiver and/or expense reimbursement (excluding certain items discussed below) of Class A, Class B, Class C, and Class Y shares to 2.00%, 2.75%, 2.75%, and 1.75%, respectively, of average daily net assets (the “expense limits”). In determining the Adviser’s obligation to waive advisory fees and/or reimburse expenses, the following expenses are not taken into account, and could cause the total annual fund operating expenses after fee waiver and/or expense reimbursement to exceed the numbers reflected above: (1) interest; (2) taxes; (3) dividend expense on short sales; (4) extraordinary or non-routine items, including litigation expenses; and (5) expenses that the Fund has incurred but did not actually pay because of an expense offset arrangement. Unless Invesco continues the fee waiver agreement, it will terminate on June 30, 2017. During its term, the fee waiver agreement cannot be terminated or amended to increase the expense limits without approval of the Board of Trustees. The Adviser did not waive fees and/or reimburse expenses during the period under these expense limits.
Further, the Adviser has contractually agreed, through at least June 30, 2018, to waive the advisory fee payable by the Fund in an amount equal to 100% of the net advisory fees the Adviser receives from the affiliated money market funds on investments by the Fund of uninvested cash (excluding investments of cash collateral from securities lending) in such affiliated money market funds.
For the year ended April 30, 2016, the Adviser waived advisory fees of $2,384.
The Trust has entered into a master administrative services agreement with Invesco pursuant to which the Fund has agreed to pay Invesco for certain administrative costs incurred in providing accounting services to the Fund. For the year ended April 30, 2016, expenses incurred under the agreement are shown in the Statement of Operations as Administrative services fees.
The Trust has entered into a transfer agency and service agreement with Invesco Investment Services, Inc. (“IIS”) pursuant to which the Fund has agreed to pay IIS a fee for providing transfer agency and shareholder services to the Fund and reimburse IIS for certain expenses incurred by IIS in the course of providing such services. IIS may make payments to intermediaries that provide omnibus account services, sub-accounting services and/or networking services. All fees payable by IIS to intermediaries that provide omnibus account services or sub-accounting are charged back to the Fund, subject to certain limitations approved by the Trust’s Board of Trustees. For the year ended April 30, 2016, the expenses incurred under the agreement are shown in the Statement of Operations as Transfer agent fees.
Shares of the Fund are distributed by Invesco Distributors, Inc. (“IDI”), an affiliate of the Adviser. The Fund has adopted a Plan of Distribution (the “Plan”) pursuant to Rule 12b-1 under the 1940 Act. The Plan provides that the Fund will reimburse IDI for distribution related expenses that IDI incurs up to a maximum of the following annual rates: (1) Class A — up to 0.25% of the average daily net assets of Class A shares; (2) Class B — up to 1.00% of the average daily net assets of Class B shares; and (3) Class C — up to 1.00% of the average daily net assets of Class C shares.
In the case of Class B shares, provided that the Plan continues in effect, any cumulative expenses incurred by IDI, but not yet reimbursed to IDI, may be recovered through the payment of future distribution fees from the Fund pursuant to the Plan and contingent deferred sales charges paid by investors upon redemption of Class B shares.
For the year ended April 30, 2016, expenses incurred under these agreements are shown in the Statement of Operations as Distribution fees.
Front-end sales commissions and CDSC (collectively, the “sales charges”) are not recorded as expenses of the Fund. Front-end sales commissions are deducted from proceeds from the sales of Fund shares prior to investment in Class A shares of the Fund. CDSC are deducted from redemption proceeds prior to remittance to the shareholder. During the year ended April 30, 2016, IDI advised the Fund that IDI retained $0 in front-end sales commissions from the sale of Class A shares and $143 from Class B shares, respectively, for CDSC imposed on redemptions by shareholders.
For the year ended April 30, 2016, the Fund incurred $1,065 in brokerage commissions with Invesco Capital Markets, Inc., an affiliate of the Adviser and IDI, for portfolio transactions executed on behalf of the Fund.
Certain officers and trustees of the Trust are officers and directors of the Adviser, IIS and/or IDI.
16 Invesco Technology Sector Fund
NOTE 3—Additional Valuation Information
GAAP defines fair value as the price that would be received to sell an asset or paid to transfer a liability in an orderly transaction between market participants at the measurement date, under current market conditions. GAAP establishes a hierarchy that prioritizes the inputs to valuation methods, giving the highest priority to readily available unadjusted quoted prices in an active market for identical assets (Level 1) and the lowest priority to significant unobservable inputs (Level 3), generally when market prices are not readily available or are unreliable. Based on the valuation inputs, the securities or other investments are tiered into one of three levels. Changes in valuation methods may result in transfers in or out of an investment’s assigned level:
| | Level 1 — | Prices are determined using quoted prices in an active market for identical assets. |
| | Level 2 — | Prices are determined using other significant observable inputs. Observable inputs are inputs that other market participants may use in pricing a security. These may include quoted prices for similar securities, interest rates, prepayment speeds, credit risk, yield curves, loss severities, default rates, discount rates, volatilities and others. |
| | Level 3 — | Prices are determined using significant unobservable inputs. In situations where quoted prices or observable inputs are unavailable (for example, when there is little or no market activity for an investment at the end of the period), unobservable inputs may be used. Unobservable inputs reflect the Fund’s own assumptions about the factors market participants would use in determining fair value of the securities or instruments and would be based on the best available information. |
The following is a summary of the tiered valuation input levels, as of April 30, 2016. The level assigned to the securities valuations may not be an indication of the risk or liquidity associated with investing in those securities. Because of the inherent uncertainties of valuation, the values reflected in the financial statements may materially differ from the value received upon actual sale of those investments.
| | | | | | | | | | | | | | | | |
| | | Level 1 | | | Level 2 | | | Level 3 | | | Total | |
Equity Securities | | $ | 76,132,794 | | | $ | 2,332,001 | | | $ | — | | | $ | 78,464,795 | |
NOTE 4—Expense Offset Arrangement(s)
The expense offset arrangement is comprised of transfer agency credits which result from balances in demand deposit accounts used by the transfer agent for clearing shareholder transactions. For the year ended April 30, 2016, the Fund received credits from this arrangement, which resulted in the reduction of the Fund’s total expenses of $339.
NOTE 5—Trustees’ and Officers’ Fees and Benefits
Trustees’ and Officers’ Fees and Benefits include amounts accrued by the Fund to pay remuneration to certain Trustees and Officers of the Fund. Trustees have the option to defer compensation payable by the Fund, and Trustees’ and Officers’ Fees and Benefits also include amounts accrued by the Fund to fund such deferred compensation amounts. Those Trustees who defer compensation have the option to select various Invesco Funds in which their deferral accounts shall be deemed to be invested. Finally, certain current Trustees were eligible to participate in a retirement plan that provided for benefits to be paid upon retirement to Trustees over a period of time based on the number of years of service. The Fund may have certain former Trustees who also participate in a retirement plan and receive benefits under such plan. Trustees’ and Officers’ Fees and Benefits include amounts accrued by the Fund to fund such retirement benefits. Obligations under the deferred compensation and retirement plans represent unsecured claims against the general assets of the Fund.
NOTE 6—Cash Balances
The Fund is permitted to temporarily carry a negative or overdrawn balance in its account with State Street Bank and Trust Company, the custodian bank. Such balances, if any at period-end, are shown in the Statement of Assets and Liabilities under the payable caption Amount due custodian. To compensate the custodian bank for such overdrafts, the overdrawn Fund may either (1) leave funds as a compensating balance in the account so the custodian bank can be compensated by earning the additional interest; or (2) compensate by paying the custodian bank at a rate agreed upon by the custodian bank and Invesco, not to exceed the contractually agreed upon rate.
NOTE 7—Distributions to Shareholders and Tax Components of Net Assets
Tax Character of Distributions to Shareholders Paid During the Fiscal Years Ended April 30, 2016 and 2015:
There were no ordinary or long term gain distributions paid during the years ended April 30, 2016 and 2015.
Tax Components of Net Assets at Period-End:
| | | | |
| | | 2016 | |
Net unrealized appreciation — investments | | $ | 6,700,728 | |
Net unrealized appreciation (depreciation) — other investments | | | (1,004 | ) |
Temporary book/tax differences | | | (31,090 | ) |
Post-October deferrals | | | (1,702,805 | ) |
Late-year ordinary loss deferral | | | (242,973 | ) |
Shares of beneficial interest | | | 74,234,532 | |
Total net assets | | $ | 78,957,388 | |
17 Invesco Technology Sector Fund
The difference between book-basis and tax-basis unrealized appreciation (depreciation) is due to differences in the timing of recognition of gains and losses on investments for tax and book purposes. The Fund’s net unrealized appreciation difference is attributable primarily to wash sales.
The temporary book/tax differences are a result of timing differences between book and tax recognition of income and/or expenses. The Fund’s temporary book/tax differences are the result of the trustee deferral of compensation and retirement plan benefits.
Capital loss carryforward is calculated and reported as of a specific date. Results of transactions and other activity after that date may affect the amount of capital loss carryforward actually available for the Fund to utilize. Capital losses generated in years beginning after December 22, 2010 can be carried forward for an unlimited period, whereas previous losses expire in eight tax years. Capital losses with an expiration period may not be used to offset capital gains until all net capital losses without an expiration date have been utilized. Capital loss carryforwards with no expiration date will retain their character as either short-term or long-term capital losses instead of as short-term capital losses as under prior law. The ability to utilize capital loss carryforwards in the future may be limited under the Internal Revenue Code and related regulations based on the results of future transactions.
The Fund does not have a capital loss carryforward as of April 30, 2016.
NOTE 8—Investment Securities
The aggregate amount of investment securities (other than short-term securities, U.S. Treasury obligations and money market funds, if any) purchased and sold by the Fund during the year ended April 30, 2016 was $39,033,054 and $53,475,650, respectively. Cost of investments on a tax basis includes the adjustments for financial reporting purposes as of the most recently completed federal income tax reporting period-end.
| | | | |
| Unrealized Appreciation (Depreciation) of Investment Securities on a Tax Basis | |
Aggregate unrealized appreciation of investment securities | | $ | 13,544,278 | |
Aggregate unrealized (depreciation) of investment securities | | | (6,843,550 | ) |
Net unrealized appreciation of investment securities | | $ | 6,700,728 | |
Cost of investments for tax purposes is $71,764,067.
NOTE 9—Reclassification of Permanent Differences
Primarily as a result of differing book/tax treatment of net operating losses, on April 30, 2016, undistributed net investment income (loss) was increased by $937,210, undistributed net realized gain (loss) was decreased by $14,026 and shares of beneficial interest was decreased by $923,184. This reclassification had no effect on the net assets of the Fund.
NOTE 10—Share Information
| | | | | | | | | | | | | | | | |
| | | Summary of Share Activity | |
| | | Years ended April 30, | |
| | | 2016(a) | | | 2015 | |
| | | Shares | | | Amount | | | Shares | | | Amount | |
Sold: | | | | | | | | | | | | | | | | |
Class A | | | 110,280 | | | $ | 1,836,154 | | | | 91,896 | | | $ | 1,488,325 | |
Class B | | | — | | | | — | | | | 1,575 | | | | 21,858 | |
Class C | | | 16,864 | | | | 234,225 | | | | 10,709 | | | | 157,927 | |
Class Y | | | 46,583 | | | | 775,751 | | | | 26,038 | | | | 433,480 | |
| | | | |
Automatic conversion of Class B shares to Class A shares: | | | | | | | | | | | | | | | | |
Class A | | | 25,960 | | | | 427,834 | | | | 28,544 | | | | 462,730 | |
Class B | | | (30,033 | ) | | | (427,834 | ) | | | (32,780 | ) | | | (462,730 | ) |
| | | | |
Reacquired: | | | | | | | | | | | | | | | | |
Class A | | | (794,117 | ) | | | (13,220,679 | ) | | | (746,476 | ) | | | (12,027,465 | ) |
Class B | | | (10,672 | ) | | | (154,031 | ) | | | (13,703 | ) | | | (189,449 | ) |
Class C | | | (70,174 | ) | | | (1,008,248 | ) | | | (83,489 | ) | | | (1,158,658 | ) |
Class Y | | | (18,943 | ) | | | (323,466 | ) | | | (16,915 | ) | | | (285,450 | ) |
Net increase (decrease) in share activity | | | (724,252 | ) | | $ | (11,860,294 | ) | | | (734,601 | ) | | $ | (11,559,432 | ) |
| (a) | There are entities that are record owners of more than 5% of the outstanding shares of the Fund and in the aggregate own 72% of the outstanding shares of the Fund. IDI has an agreement with these entities to sell Fund shares. The Fund, Invesco and/or Invesco affiliates may make payments to these entities, which are considered to be related to the Fund, for providing services to the Fund, Invesco and/or Invesco affiliates including but not limited to services such as securities brokerage, distribution, third party record keeping and account servicing. The Fund has no knowledge as to whether all or any portion of the shares owned of record by these entities are also owned beneficially. |
18 Invesco Technology Sector Fund
NOTE 11—Financial Highlights
The following schedule presents financial highlights for a share of the Fund outstanding throughout the periods indicated.
| | | | | | | | | | | | | | | | | | | | | | | | | | | | | | | | | | | | | | | | | | | | |
| | | Net asset
value,
beginning
of period | | | Net
investment
income
(loss)(a) | | | Net gains
(losses) on securities
(both
realized and
unrealized) | | | Total from
investment
operations | | | Net asset
value, end
of period | | | Total
return(b) | | | Net assets,
end of period
(000’s omitted) | | | Ratio of
expenses
to average net assets with fee waivers
and/or expenses
absorbed | | | Ratio of
expenses
to average net
assets without
fee waivers
and/or expenses
absorbed | | | Ratio of net
investment
income (loss)
to average
net assets | | | Portfolio
turnover(c) | |
Class A | |
Year ended 04/30/16 | | $ | 16.73 | | | $ | (0.15 | ) | | $ | (1.00 | ) | | $ | (1.15 | ) | | $ | 15.58 | | | | (6.87 | )% | | $ | 70,256 | | | | 1.58 | %(d) | | | 1.58 | %(d) | | | (0.89 | )%(d) | | | 44 | % |
Year ended 04/30/15 | | | 14.49 | | | | (0.17 | ) | | | 2.41 | | | | 2.24 | | | | 16.73 | | | | 15.46 | | | | 86,451 | | | | 1.58 | | | | 1.58 | | | | (1.07 | ) | | | 66 | |
Year ended 04/30/14 | | | 12.01 | | | | (0.14 | ) | | | 2.62 | | | | 2.48 | | | | 14.49 | | | | 20.65 | | | | 83,926 | | | | 1.68 | | | | 1.68 | | | | (1.02 | ) | | | 69 | |
Year ended 04/30/13 | | | 12.59 | | | | (0.12 | )(e) | | | (0.46 | )(f) | | | (0.58 | ) | | | 12.01 | | | | (4.61 | )(f) | | | 80,866 | | | | 1.82 | | | | 1.83 | | | | (1.00 | )(e) | | | 43 | |
One month ended 04/30/12 | | | 12.97 | | | | (0.01 | ) | | | (0.37 | ) | | | (0.38 | ) | | | 12.59 | | | | (2.93 | ) | | | 99,453 | | | | 1.71 | (g) | | | 1.71 | (g) | | | (1.34 | )(g) | | | 4 | |
Year ended 03/31/12 | | | 11.70 | | | | (0.15 | ) | | | 1.42 | (f) | | | 1.27 | | | | 12.97 | | | | 10.85 | (f) | | | 103,068 | | | | 1.81 | | | | 1.82 | | | | (1.29 | ) | | | 38 | |
Class B | |
Year ended 04/30/16 | | | 14.52 | | | | (0.24 | ) | | | (0.86 | ) | | | (1.10 | ) | | | 13.42 | | | | (7.58 | ) | | | 644 | | | | 2.33 | (d) | | | 2.33 | (d) | | | (1.64 | )(d) | | | 44 | |
Year ended 04/30/15 | | | 12.66 | | | | (0.25 | ) | | | 2.11 | | | | 1.86 | | | | 14.52 | | | | 14.69 | | | | 1,287 | | | | 2.33 | | | | 2.33 | | | | (1.82 | ) | | | 66 | |
Year ended 04/30/14 | | | 10.58 | | | | (0.21 | ) | | | 2.29 | | | | 2.08 | | | | 12.66 | | | | 19.66 | | | | 1,692 | | | | 2.43 | | | | 2.43 | | | | (1.77 | ) | | | 69 | |
Year ended 04/30/13 | | | 11.18 | | | | (0.18 | )(e) | | | (0.42 | )(f) | | | (0.60 | ) | | | 10.58 | | | | (5.37 | )(f) | | | 2,408 | | | | 2.57 | | | | 2.58 | | | | (1.75 | )(e) | | | 43 | |
One month ended 04/30/12 | | | 11.52 | | | | (0.02 | ) | | | (0.32 | ) | | | (0.34 | ) | | | 11.18 | | | | (2.95 | ) | | | 4,309 | | | | 2.46 | (g) | | | 2.46 | (g) | | | (2.09 | )(g) | | | 4 | |
Year ended 03/31/12 | | | 10.47 | | | | (0.20 | ) | | | 1.25 | (f) | | | 1.05 | | | | 11.52 | | | | 10.03 | (f) | | | 4,626 | | | | 2.56 | | | | 2.57 | | | | (2.04 | ) | | | 38 | |
Class C | |
Year ended 04/30/16 | | | 14.52 | | | | (0.24 | ) | | | (0.86 | ) | | | (1.10 | ) | | | 13.42 | | | | (7.58 | ) | | | 6,759 | | | | 2.33 | (d) | | | 2.33 | (d) | | | (1.64 | )(d) | | | 44 | |
Year ended 04/30/15 | | | 12.67 | | | | (0.25 | ) | | | 2.10 | | | | 1.85 | | | | 14.52 | | | | 14.60 | (h) | | | 8,087 | | | | 2.32 | (h) | | | 2.32 | (h) | | | (1.81 | )(h) | | | 66 | |
Year ended 04/30/14 | | | 10.58 | | | | (0.21 | ) | | | 2.30 | | | | 2.09 | | | | 12.67 | | | | 19.75 | (h) | | | 7,976 | | | | 2.41 | (h) | | | 2.41 | (h) | | | (1.75 | )(h) | | | 69 | |
Year ended 04/30/13 | | | 11.18 | | | | (0.18 | )(e) | | | (0.42 | )(f) | | | (0.60 | ) | | | 10.58 | | | | (5.37 | )(f) | | | 7,841 | | | | 2.57 | | | | 2.58 | | | | (1.75 | )(e) | | | 43 | |
One month ended 04/30/12 | | | 11.52 | | | | (0.02 | ) | | | (0.32 | ) | | | (0.34 | ) | | | 11.18 | | | | (2.95 | ) | | | 9,745 | | | | 2.46 | (g) | | | 2.46 | (g) | | | (2.09 | )(g) | | | 4 | |
Year ended 03/31/12 | | | 10.46 | | | | (0.20 | ) | | | 1.26 | (f) | | | 1.06 | | | | 11.52 | | | | 10.13 | (f) | | | 10,152 | | | | 2.54 | | | | 2.55 | | | | (2.02 | ) | | | 38 | |
Class Y | |
Year ended 04/30/16 | | | 17.49 | | | | (0.11 | ) | | | (1.06 | ) | | | (1.17 | ) | | | 16.32 | | | | (6.69 | ) | | | 1,299 | | | | 1.33 | (d) | | | 1.33 | (d) | | | (0.64 | )(d) | | | 44 | |
Year ended 04/30/15 | | | 15.10 | | | | (0.14 | ) | | | 2.53 | | | | 2.39 | | | | 17.49 | | | | 15.83 | | | | 909 | | | | 1.33 | | | | 1.33 | | | | (0.82 | ) | | | 66 | |
Year ended 04/30/14 | | | 12.49 | | | | (0.11 | ) | | | 2.72 | | | | 2.61 | | | | 15.10 | | | | 20.90 | | | | 647 | | | | 1.43 | | | | 1.43 | | | | (0.77 | ) | | | 69 | |
Year ended 04/30/13 | | | 13.06 | | | | (0.09 | )(e) | | | (0.48 | )(f) | | | (0.57 | ) | | | 12.49 | | | | (4.36 | )(f) | | | 630 | | | | 1.57 | | | | 1.58 | | | | (0.75 | )(e) | | | 43 | |
One month ended 04/30/12 | | | 13.45 | | | | (0.01 | ) | | | (0.38 | ) | | | (0.39 | ) | | | 13.06 | | | | (2.90 | ) | | | 560 | | | | 1.46 | (g) | | | 1.46 | (g) | | | (1.09 | )(g) | | | 4 | |
Year ended 03/31/12 | | | 12.10 | | | | (0.12 | ) | | | 1.47 | (f) | | | 1.35 | | | | 13.45 | | | | 11.16 | (f) | | | 555 | | | | 1.56 | | | | 1.57 | | | | (1.04 | ) | | | 38 | |
| (a) | Calculated using average shares outstanding. |
| (b) | Includes adjustments in accordance with accounting principles generally accepted in the United States of America and as such, the net asset value for financial reporting purposes and the returns based upon those net asset values may differ from the net asset value and returns for shareholder transactions. Does not include sales charges and is not annualized for periods less than one year, if applicable. |
| (c) | Portfolio turnover is calculated at the fund level and is not annualized for periods less than one year, if applicable. |
| (d) | Ratios are based on average daily net assets (000’s omitted) of $79,660, $984, $7,581 and $1,055 for Class A, Class B, Class C and Class Y shares, respectively. |
| (e) | Net investment income (loss) per share and the ratio of net investment income (loss) to average net assets includes significant dividends received during the period. Net investment income (loss) per share and the ratio of net investment income (loss) to average net assets excluding the significant dividends are $(0.15) and (1.30)%, $(0.21) and (2.05)%, $(0.21) and (2.05)% and $(0.13) and (1.05)% for Class A, Class B, Class C and Class Y shares, respectively. |
| (f) | Includes litigation proceeds received during the period. Had the litigation proceeds not been received Net gains on securities (both realized and unrealized) per share for the year ended April 30, 2013 would have been $(0.55), $(0.51), $(0.51) and $(0.57) for Class A, Class B, Class C and Class Y shares, respectively and total returns would have been lower. Net gains (losses) on securities (both realized and unrealized) per share for the year ended March 31, 2012 would have been $1.29, $1.12, $1.13 and $1.34 for Class A, Class B, Class C and Class Y shares, respectively and total returns would have been lower. |
| (h) | The total return, ratio of expenses to average net assets and ratio of net investment income (loss) to average net assets reflect actual 12b-1 fees of 0.99% and 0.98% for the years ended April 30, 2015 and 2014, respectively. |
19 Invesco Technology Sector Fund
Report of Independent Registered Public Accounting Firm
To the Board of Trustees of AIM Sector Funds (Invesco Sector Funds)
and Shareholders of Invesco Technology Sector Fund:
In our opinion, the accompanying statement of assets and liabilities, including the schedule of investments, and the related statements of operations and of changes in net assets and the financial highlights present fairly, in all material respects, the financial position of Invesco Technology Sector Fund (one of the funds constituting AIM Sector Funds (Invesco Sector Funds), hereafter referred to as the “Fund”) at April 30, 2016, the results of its operations for the year then ended, the changes in its net assets for each of the two years in the period then ended and the financial highlights for each of the five years in the period then ended, in conformity with accounting principles generally accepted in the United States of America. These financial statements and financial highlights (hereafter referred to as “financial statements”) are the responsibility of the Fund’s management; our responsibility is to express an opinion on these financial statements based on our audits. We conducted our audits of these financial statements in accordance with the standards of the Public Company Accounting Oversight Board (United States). Those standards require that we plan and perform the audit to obtain reasonable assurance about whether the financial statements are free of material misstatement. An audit includes examining, on a test basis, evidence supporting the amounts and disclosures in the financial statements, assessing the accounting principles used and significant estimates made by management, and evaluating the overall financial statement presentation. We believe that our audits, which included confirmation of securities at April 30, 2016 by correspondence with the custodian and brokers, and the application of alternative auditing procedures where confirmations of security purchases have not been received, provide a reasonable basis for our opinion.
PRICEWATERHOUSECOOPERS LLP
June 22, 2016
Houston, Texas
20 Invesco Technology Sector Fund
Calculating your ongoing Fund expenses
Example
As a shareholder of the Fund, you incur two types of costs: (1) transaction costs, which may include sales charges (loads) on purchase payments or contingent deferred sales charges on redemptions, if any; and (2) ongoing costs, including management fees, distribution and/or service (12b-1) fees, and other Fund expenses. This example is intended to help you understand your ongoing costs (in dollars) of investing in the Fund and to compare these costs with ongoing costs of investing in other mutual funds. The example is based on an investment of $1,000 invested at the beginning of the period and held for the entire period November 1, 2015 through April 30, 2016.
Actual expenses
The table below provides information about actual account values and actual expenses. You may use the information in this table, together with the amount you invested, to estimate the expenses that you paid over the period. Simply divide your account value by $1,000 (for example, an $8,600 account value divided by $1,000 = 8.6), then multiply the result by the number in the table under the heading entitled “Actual Expenses Paid During Period” to estimate the expenses you paid on your account during this period.
Hypothetical example for comparison purposes
The table below also provides information about hypothetical account values and hypothetical expenses based on the Fund’s actual expense ratio and an assumed rate of return of 5% per year before expenses, which is not the Fund’s actual return.
The hypothetical account values and expenses may not be used to estimate the actual ending account balance or expenses you paid for the period. You may use this information to compare the ongoing costs of investing in the Fund and other funds. To do so, compare this 5% hypothetical example with the 5% hypothetical examples that appear in the shareholder reports of the other funds.
Please note that the expenses shown in the table are meant to highlight your ongoing costs only and do not reflect any transaction costs, such as sales charges (loads) on purchase payments or contingent deferred sales charges on redemptions, if any. Therefore, the hypothetical information is useful in comparing ongoing costs only, and will not help you determine the relative total costs of owning different funds. In addition, if these transaction costs were included, your costs would have been higher.
| | | | | | | | | | | | | | | | | | | | | | | | |
| Class | | Beginning
Account Value
(11/01/15) | | | ACTUAL | | | HYPOTHETICAL (5% annual return before expenses) | | | Annualized
Expense
Ratio | |
| | | Ending
Account Value
(04/30/16)1 | | | Expenses
Paid During
Period2 | | | Ending
Account Value
(04/30/16) | | | Expenses
Paid During
Period2 | | |
| A | | $ | 1,000.00 | | | $ | 890.30 | | | $ | 7.24 | | | $ | 1,017.21 | | | $ | 7.72 | | | | 1.54 | % |
| B | | | 1,000.00 | | | | 887.60 | | | | 10.75 | | | | 1,013.48 | | | | 11.46 | | | | 2.29 | |
| C | | | 1,000.00 | | | | 887.00 | | | | 10.74 | | | | 1,013.48 | | | | 11.46 | | | | 2.29 | |
| Y | | | 1,000.00 | | | | 891.80 | | | | 6.07 | | | | 1,018.45 | | | | 6.47 | | | | 1.29 | |
| 1 | The actual ending account value is based on the actual total return of the Fund for the period November 1, 2015 through April 30, 2016, after actual expenses and will differ from the hypothetical ending account value which is based on the Fund’s expense ratio and a hypothetical annual return of 5% before expenses. |
| 2 | Expenses are equal to the Fund’s annualized expense ratio as indicated above multiplied by the average account value over the period, multiplied by 182/366 to reflect the most recent fiscal half year. |
21 Invesco Technology Sector Fund
Trustees and Officers
The address of each trustee and officer is AIM Sector Funds (Invesco Sector Funds) (the “Trust”), 11 Greenway Plaza, Suite 1000, Houston, Texas 77046-1173. The trustees serve for the life of the Trust, subject to their earlier death, incapacitation, resignation, retirement or removal as more specifically provided in the Trust’s organizational documents. Each officer serves for a one year term or until their successors are elected and qualified. Column two below includes length of time served with predecessor entities, if any.
| | | | | | | | |
Name, Year of Birth and
Position(s) Held with the Trust | | Trustee and/
or Officer Since | | Principal Occupation(s) During Past 5 Years | | Number of Funds in Fund Complex Overseen by Trustee | | Other Directorship(s) Held by Trustee During Past 5 Years |
| Interested Persons | | | | | | | | |
Martin L. Flanagan1 — 1960 Trustee | | 2007 | | Executive Director, Chief Executive Officer and President, Invesco Ltd. (ultimate parent of Invesco and a global investment management firm); Advisor to the Board, Invesco Advisers, Inc. (formerly known as Invesco Institutional (N.A.), Inc.); Trustee, The Invesco Funds; Vice Chair, Investment Company Institute; and Member of Executive Board, SMU Cox School of Business Formerly: Chairman and Chief Executive Officer, Invesco Advisers, Inc. (registered investment adviser); Director, Chairman, Chief Executive Officer and President, IVZ Inc. (holding company), INVESCO Group Services, Inc. (service provider) and Invesco North American Holdings, Inc. (holding company); Director, Chief Executive Officer and President, Invesco Holding Company Limited (parent of Invesco and a global investment management firm); Director, Invesco Ltd.; Chairman, Investment Company Institute and President, Co-Chief Executive Officer, Co-President, Chief Operating Officer and Chief Financial Officer, Franklin Resources, Inc. (global investment management organization) | | 146 | | None |
Philip A. Taylor2 — 1954 Trustee and Senior Vice President | | 2006 | | Head of the Americas and Senior Managing Director, Invesco Ltd.; Director, Co-Chairman, Co-President and Co-Chief Executive Officer, Invesco Advisers, Inc. (formerly known as Invesco Institutional (N.A.), Inc.) (registered investment adviser); Director, Chairman, Chief Executive Officer and President, Invesco Management Group, Inc. (formerly known as Invesco AIM Management Group, Inc.) (financial services holding company); Director and Chairman, Invesco Investment Services, Inc. (formerly known as Invesco AIM Investment Services, Inc.) (registered transfer agent) Chief Executive Officer, Invesco Corporate Class Inc. (corporate mutual fund company) Director, Chairman and Chief Executive Officer, Invesco Canada Ltd. (formerly known as Invesco Trimark Ltd./Invesco Trimark Ltèe) (registered investment adviser and registered transfer agent); Trustee and Senior Vice President, The Invesco Funds; Director, Invesco Investment Advisers LLC (formerly known as Van Kampen Asset Management); Director, Chief Executive Officer and President, Van Kampen Exchange Corp. Formerly: President and Principal Executive Officer, The Invesco Funds (other than AIM Treasurer’s Series Trust (Invesco Treasurer’s Series Trust), Short-Term Investments Trust and Invesco Management Trust); Executive Vice President, The Invesco Funds (AIM Treasurer’s Series Trust (Invesco Treasurer’s Series Trust), Short-Term Investments Trust and Invesco Management Trust only); Director and President, INVESCO Funds Group, Inc. (registered investment adviser and registered transfer agent); Director and Chairman, IVZ Distributors, Inc. (formerly known as INVESCO Distributors, Inc.) (registered broker dealer); Director, President and Chairman, Invesco Inc. (holding company), Invesco Canada Holdings Inc. (holding company), Trimark Investments Ltd./Placements Trimark Ltèe and Invesco Financial Services Ltd/Services Financiers Invesco Ltèe; Chief Executive Officer, Invesco Canada Fund Inc. (corporate mutual fund company); Director and Chairman, Van Kampen Investor Services Inc.; Director, Chief Executive Officer and President, 1371 Preferred Inc. (holding company) and Van Kampen Investments Inc.; Director and President, AIM GP Canada Inc. (general partner for limited partnerships) and Van Kampen Advisors, Inc.; Director and Chief Executive Officer, Invesco Trimark Dealer Inc. (registered broker dealer); Director, Invesco Distributors, Inc. (formerly known as Invesco AIM Distributors, Inc.) (registered broker dealer); Manager, Invesco PowerShares Capital Management LLC; Director, Chief Executive Officer and President, Invesco Advisers, Inc.; Director, Chairman, Chief Executive Officer and President, Invesco AIM Capital Management, Inc.; President, Invesco Trimark Dealer Inc. and Invesco Trimark Ltd./Invesco Trimark Ltèe; Director and President, AIM Trimark Corporate Class Inc. and AIM Trimark Canada Fund Inc.; Senior Managing Director, Invesco Holding Company Limited; Director and Chairman, Fund Management Company (former registered broker dealer); President and Principal Executive Officer, The Invesco Funds (AIM Treasurer’s Series Trust (Invesco Treasurer’s Series Trust), and Short-Term Investments Trust only); President, AIM Trimark Global Fund Inc. and AIM Trimark Canada Fund Inc. | | 146 | | None |
| 1 | Mr. Flanagan is considered an interested person (within the meaning of Section 2(a)(19) of the 1940 Act) of the Trust because he is an officer of the Adviser to the Trust, and an officer and a director of Invesco Ltd., ultimate parent of the Adviser. |
| 2 | Mr. Taylor is considered an interested person (within the meaning of Section 2(a)(19) of the 1940 Act) of the Trust because he is an officer and a director of the Adviser. |
T-1 Invesco Technology Sector Fund
Trustees and Officers—(continued)
��
| | | | | | | | |
Name, Year of Birth and
Position(s) Held with the Trust | | Trustee and/
or Officer Since | | Principal Occupation(s) During Past 5 Years | | Number of Funds in Fund Complex Overseen by Trustee | | Other Directorship(s) Held by Trustee During Past 5 Years |
| Independent Trustees | | | | | | | | |
Bruce L. Crockett — 1944 Trustee and Chair | | 2003 | | Chairman, Crockett Technologies Associates (technology consulting company) Formerly: Director, Captaris (unified messaging provider); Director, President and Chief Executive Officer, COMSAT Corporation; Chairman, Board of Governors of INTELSAT (international communications company); ACE Limited (insurance company); Independent Directors Council and Investment Company Institute | | 146 | | ALPS (Attorneys Liability Protection Society) (insurance company) and Globe Specialty Metals, Inc. (metallurgical company); Member of the Audit Committee, Ferroglobe PLC and Investment Company Institute; Member of the Executive Committee and Chair of the Governance Committee, Independent Directors Council |
David C. Arch — 1945 Trustee | | 2010 | | Chairman of Blistex Inc., a consumer health care products manufacturer | | 146 | | Board member of the Illinois Manufacturers’ Association; Member of the Board of Visitors, Institute for the Humanities, University of Michigan |
James T. Bunch — 1942 Trustee | | 2000 | | Managing Member, Grumman Hill Group LLC (family office/private equity investments) Formerly: Chairman of the Board, Denver Film Society, Chairman of the Board of Trustees, Evans Scholarship Foundation; Chairman, Board of Governors, Western Golf Association | | 146 | | Trustee, Evans Scholarship Foundation |
Albert R. Dowden — 1941 Trustee | | 2003 | | Director of a number of public and private business corporations, including Nature’s Sunshine Products, Inc. Formerly: Director, The Boss Group, Ltd. and Reich & Tang Funds (5 portfolios) (registered investment company); Director, Homeowners of America Holding Corporation/Homeowners of America Insurance Company (property casualty company); Director, Continental Energy Services, LLC (oil and gas pipeline service); Director, CompuDyne Corporation (provider of product and services to the public security market) and Director, Annuity and Life Re (Holdings), Ltd. (reinsurance company); Director, President and Chief Executive Officer, Volvo Group North America, Inc.; Senior Vice President, AB Volvo; Director of various public and private corporations; Chairman, DHJ Media, Inc.; Director, Magellan Insurance Company; and Director, The Hertz Corporation, Genmar Corporation (boat manufacturer), National Media Corporation; Advisory Board of Rotary Power International (designer, manufacturer, and seller of rotary power engines); and Chairman, Cortland Trust, Inc. (registered investment company) | | 146 | | Director of Nature’s Sunshine Products, Inc. |
Jack M. Fields — 1952 Trustee | | 2003 | | Chief Executive Officer, Twenty First Century Group, Inc. (government affairs company); and Discovery Learning Alliance (non-profit) Formerly: Owner and Chief Executive Officer, Dos Angeles Ranch L.P. (cattle, hunting, corporate entertainment); Director, Insperity, Inc. (formerly known as Administaff); Chief Executive Officer, Texana Timber LP (sustainable forestry company); Director of Cross Timbers Quail Research Ranch (non-profit); and member of the U.S. House of Representatives | | 146 | | None |
Eli Jones — 1961 Trustee | | 2016 | | Professor and Dean, Mays Business School — Texas A&M University Formerly: Professor and Dean, Walton College of Business, University of Arkansas and E.J. Ourso College of Business, Louisiana State University and Director, Arvest Bank | | 146 | | Director of Insperity, Inc. (formerly known as Administaff) |
Prema Mathai-Davis — 1950 Trustee | | 2003 | | Retired. Formerly: Chief Executive Officer, YWCA of the U.S.A. | | 146 | | None |
Larry Soll — 1942 Trustee | | 1997 | | Retired. Formerly: Chairman, Chief Executive Officer and President, Synergen Corp. (a biotechnology company) | | 146 | | None |
Raymond Stickel, Jr. — 1944 Trustee | | 2005 | | Retired. Formerly: Director, Mainstay VP Series Funds, Inc. (25 portfolios) and Partner, Deloitte & Touche | | 146 | | None |
Robert C. Troccoli — 1949 Trustee | | 2016 | | Adjunct Professor and Executive-in-Residence, University of Denver — Daniels College of Business Formerly: Senior Partner, KPMG LLP | | 146 | | None |
T-2 Invesco Technology Sector Fund
Trustees and Officers—(continued)
| | | | | | | | |
Name, Year of Birth and
Position(s) Held with the Trust | | Trustee and/
or Officer Since | | Principal Occupation(s) During Past 5 Years | | Number of Funds in Fund Complex Overseen by Trustee | | Other Directorship(s) Held by Trustee During Past 5 Years |
| Independent Trustees—(continued) |
Suzanne H. Woolsey — 1941 Trustee | | 2014 | | Retired. Formerly: Chief Executive Officer of Woolsey Partners LLC | | 146 | | Director, SunShare LLC; Trustee, Ocean Conservancy; Emeritus Chair of the Board of Trustees of the Institute for Defense Analyses and of Colorado College; Trustee, Chair, Business and Finance Committee of California Institute of Technology; Prior to 2014, Director of Fluor Corp.; Prior to 2010, Trustee of the German Marshall Fund of the United States; Prior to 2010, Trustee of the Rocky Mountain Institute |
| Other Officers | | | | | | | | |
Sheri Morris — 1964 President, Principal Executive Officer and Treasurer | | 2003 | | President, Principal Executive Officer and Treasurer, The Invesco Funds; Vice President, Invesco Advisers, Inc. (formerly known as Invesco Institutional (N.A.), Inc.) (registered investment adviser); and Vice President, PowerShares Exchange-Traded Fund Trust, PowerShares Exchange-Traded Fund Trust II, PowerShares India Exchange-Traded Fund Trust, PowerShares Actively Managed Exchange-Traded Fund Trust, and PowerShares Actively Managed Exchange-Traded Commodity Fund Trust Formerly: Vice President and Principal Financial Officer, The Invesco Funds; Vice President, Invesco AIM Advisers, Inc., Invesco AIM Capital Management, Inc. and Invesco AIM Private Asset Management, Inc.; Assistant Vice President and Assistant Treasurer, The Invesco Funds and Assistant Vice President, Invesco Advisers, Inc., Invesco AIM Capital Management, Inc. and Invesco AIM Private Asset Management, Inc.; and Treasurer, PowerShares Exchange-Traded Fund Trust, PowerShares Exchange-Traded Fund Trust II, PowerShares India Exchange-Traded Fund Trust and PowerShares Actively Managed Exchange-Traded Fund Trust | | N/A | | N/A |
Russell C. Burk — 1958 Senior Vice President and Senior Officer | | 2005 | | Senior Vice President and Senior Officer, The Invesco Funds | | N/A | | N/A |
John M. Zerr — 1962 Senior Vice President, Chief Legal Officer and Secretary | | 2006 | | Director, Senior Vice President, Secretary and General Counsel, Invesco Management Group, Inc. (formerly known as Invesco AIM Management Group, Inc.) and Van Kampen Exchange Corp.; Senior Vice President, Invesco Advisers, Inc. (formerly known as Invesco Institutional (N.A.), Inc.) (registered investment adviser); Senior Vice President and Secretary, Invesco Distributors, Inc. (formerly known as Invesco AIM Distributors, Inc.); Director, Vice President and Secretary, Invesco Investment Services, Inc. (formerly known as Invesco AIM Investment Services, Inc.) Senior Vice President, Chief Legal Officer and Secretary, The Invesco Funds; Managing Director, Invesco PowerShares Capital Management LLC; Director, Secretary and General Counsel, Invesco Investment Advisers LLC (formerly known as Van Kampen Asset Management); Secretary and General Counsel, Invesco Capital Markets, Inc. (formerly known as Van Kampen Funds Inc.) and Chief Legal Officer, PowerShares Exchange-Traded Fund Trust, PowerShares Exchange-Traded Fund Trust II, PowerShares India Exchange-Traded Fund Trust, PowerShares Actively Managed Exchange-Traded Fund Trust, and PowerShares Actively Managed Exchange-Traded Commodity Fund Trust Formerly: Director, Vice President and Secretary, IVZ Distributors, Inc. (formerly known as INVESCO Distributors, Inc.); Director and Vice President, INVESCO Funds Group, Inc.; Director and Vice President, Van Kampen Advisors Inc.; Director, Vice President, Secretary and General Counsel, Van Kampen Investor Services Inc.; Director, Invesco Distributors, Inc. (formerly known as Invesco AIM Distributors, Inc.); Director, Senior Vice President, General Counsel and Secretary, Invesco AIM Advisers, Inc. and Van Kampen Investments Inc.; Director, Vice President and Secretary, Fund Management Company; Director, Senior Vice President, Secretary, General Counsel and Vice President, Invesco AIM Capital Management, Inc.; Chief Operating Officer and General Counsel, Liberty Ridge Capital, Inc. (an investment adviser); Vice President and Secretary, PBHG Funds (an investment company) and PBHG Insurance Series Fund (an investment company); Chief Operating Officer, General Counsel and Secretary, Old Mutual Investment Partners (a broker-dealer); General Counsel and Secretary, Old Mutual Fund Services (an administrator) and Old Mutual Shareholder Services (a shareholder servicing center); Executive Vice President, General Counsel and Secretary, Old Mutual Capital, Inc. (an investment adviser); and Vice President and Secretary, Old Mutual Advisors Funds (an investment company) | | N/A | | N/A |
T-3 Invesco Technology Sector Fund
Trustees and Officers—(continued)
| | | | | | | | |
Name, Year of Birth and
Position(s) Held with the Trust | | Trustee and/
or Officer Since | | Principal Occupation(s) During Past 5 Years | | Number of Funds in Fund Complex Overseen by Trustee | | Other Directorship(s) Held by Trustee During Past 5 Years |
| Other Officers—(continued) | | | | | | | | |
Karen Dunn Kelley — 1960 Senior Vice President | | 2003 | | Senior Managing Director, Investments, Invesco Ltd.; Director, Co-President, Co-Chief Executive Officer, and Co-Chairman, Invesco Advisers, Inc. (formerly known as Invesco Institutional (N.A.), Inc.) (registered investment adviser); Chairman and Director, Invesco Senior Secured Management, Inc.; Senior Vice President, Invesco Management Group, Inc. (formerly known as Invesco AIM Management Group, Inc.); Executive Vice President, Invesco Distributors, Inc. (formerly known as Invesco AIM Distributors, Inc.); Director, Invesco Mortgage Capital Inc. and Invesco Management Company Limited; Senior Vice President, The Invesco Funds Formerly: Vice President, The Invesco Funds (other than AIM Treasurer’s Series Trust (Invesco Treasurer’s Series Trust), Short-Term Investments Trust and Invesco Management Trust); and President and Principal Executive Officer, The Invesco Funds (AIM Treasurer’s Series Trust (Invesco Treasurer’s Series Trust), Short-Term Investments Trust and Invesco Management Trust only); Director and President, INVESCO Asset Management (Bermuda) Ltd., Director, INVESCO Global Asset Management DAC (formerly known as INVESCO Global Asset Management Limited) and INVESCO Management S.A.; Senior Vice President, Van Kampen Investments Inc. and Invesco Advisers, Inc. (formerly known as Invesco Institutional (N.A.), Inc.) (registered investment adviser); Director and President, Fund Management Company; Chief Cash Management Officer, Director of Cash Management, Senior Vice President, and Managing Director, Invesco AIM Capital Management, Inc.; Director of Cash Management, Senior Vice President, and Vice President, Invesco Advisers, Inc. and The Invesco Funds (AIM Treasurer’s Series Trust (Invesco Treasurer’s Series Trust), and Short-Term Investments Trust only) | | N/A | | N/A |
Kelli Gallegos — 1970 Vice President, Principal Financial Officer and Assistant Treasurer | | 2008 | | Vice President, Principal Financial Officer and Assistant Treasurer, The Invesco Funds; Assistant Treasurer, Invesco PowerShares Capital Management LLC, PowerShares Exchange-Traded Fund Trust, PowerShares Exchange-Traded Fund Trust II, PowerShares India Exchange-Traded Fund Trust, PowerShares Actively Managed Exchange-Traded Fund Trust, and PowerShares Actively Managed Exchange-Traded Commodity Fund Trust Formerly: Assistant Vice President, The Invesco Funds | | N/A | | N/A |
Tracy Sullivan — 1962 Vice President, Chief Tax Officer and Assistant Treasurer | | 2008 | | Vice President, Chief Tax Officer and Assistant Treasurer, The Invesco Funds; Assistant Treasurer, Invesco PowerShares Capital Management LLC, PowerShares Exchange-Traded Fund Trust, PowerShares Exchange-Traded Fund Trust II, PowerShares India Exchange-Traded Fund Trust, PowerShares Actively Managed Exchange-Traded Fund Trust, and PowerShares Actively Managed Exchange-Traded Commodity Fund Trust Formerly: Assistant Vice President, The Invesco Funds | | N/A | | N/A |
Crissie M. Wisdom — 1969 Anti-Money Laundering Compliance Officer | | 2013 | | Anti-Money Laundering Compliance Officer, Invesco Advisers, Inc. (formerly known as Invesco Institutional (N.A.), Inc.) (registered investment adviser), Invesco Capital Markets, Inc. (formerly known as Van Kampen Funds Inc.), Invesco Distributors, Inc., Invesco Investment Services, Inc., Invesco Management Group, Inc., Van Kampen Exchange Corp., The Invesco Funds, and PowerShares Exchange-Traded Fund Trust, PowerShares Exchange-Traded Fund Trust II, PowerShares India Exchange-Traded Fund Trust, PowerShares Actively Managed Exchange-Traded Fund Trust and PowerShares Actively Managed Exchange-Traded Commodity Fund Trust; Anti-Money Laundering Compliance Officer and Bank Secrecy Act Officer, INVESCO National Trust Company and Invesco Trust Company; and Fraud Prevention Manager and Controls and Risk Analysis Manager for Invesco Investment Services, Inc. | | N/A | | N/A |
Robert R. Leveille — 1969 Chief Compliance Officer | | 2016 | | Chief Compliance Officer, Invesco Advisers, Inc. (registered investment adviser); and Chief Compliance Officer, The Invesco Funds Formerly: Chief Compliance Officer, Putnam Investments and the Putnam Funds | | N/A | | N/A |
The Statement of Additional Information of the Trust includes additional information about the Fund’s Trustees and is available upon request, without charge, by calling 1.800.959.4246. Please refer to the Fund’s Statement of Additional Information for information on the Fund’s sub-advisers.
| | | | | | |
Office of the Fund 11 Greenway Plaza, Suite 1000 Houston, TX 77046-1173 | | Investment Adviser Invesco Advisers, Inc. 1555 Peachtree Street, N.E. Atlanta, GA 30309 | | Distributor Invesco Distributors, Inc. 11 Greenway Plaza, Suite 1000 Houston, TX 77046-1173 | | Auditors PricewaterhouseCoopers LLP 1000 Louisiana Street, Suite 5800 Houston, TX 77002-5678 |
| | | |
| | | | | | |
Counsel to the Fund Stradley Ronon Stevens & Young, LLP 2005 Market Street, Suite 2600 Philadelphia, PA 19103-7018 | | Counsel to the Independent Trustees Goodwin Procter LLP 901 New York Avenue, N.W. Washington, D.C. 20001 | | Transfer Agent Invesco Investment Services, Inc. 11 Greenway Plaza, Suite 1000 Houston, TX 77046-1173 | | Custodian State Street Bank and Trust Company 225 Franklin Street Boston, MA 02110-2801 |
T-4 Invesco Technology Sector Fund

Invesco mailing information
Send general correspondence to Invesco Investment Services, Inc., P.O. Box 219078, Kansas City, MO 64121-9078.
Important notice regarding delivery of security holder documents
To reduce Fund expenses, only one copy of most shareholder documents may be mailed to shareholders with multiple accounts at the same address (Householding). Mailing of your shareholder documents may be householded indefinitely unless you instruct us otherwise. If you do not want the mailing of these documents to be combined with those for other members of your household, please contact Invesco Investment Services, Inc. at 800 959 4246 or contact your financial institution. We will begin sending you individual copies for each account within 30 days after receiving your request.
Fund holdings and proxy voting information
The Fund provides a complete list of its holdings four times in each fiscal year, at the quarter ends. For the second and fourth quarters, the lists appear in the Fund’s semiannual and annual reports to shareholders. For the first and third quarters, the Fund files the lists with the Securities and Exchange Commission (SEC) on Form N-Q. The most recent list of portfolio holdings is available at invesco.com/completeqtrholdings. Shareholders can also look up the Fund’s Forms N-Q on the SEC website at sec.gov. Copies of the Fund’s Forms N-Q may be reviewed and copied at the SEC Public Reference Room in Washington, D.C. You can obtain information on the operation of the Public Reference Room, including information about duplicating fee charges, by calling 202 551 8090 or 800 732 0330, or by electronic request at the following email address: publicinfo@sec.gov. The SEC file numbers for the Fund are shown below.
A description of the policies and procedures that the Fund uses to determine how to vote proxies relating to portfolio securities is available without charge, upon request, from our Client Services department at 800 959 4246 or at invesco.com/proxyguidelines. The information is also available on the SEC website, sec.gov.
| | |
Information regarding how the Fund voted proxies related to its portfolio securities during the most recent 12-month period ended June 30 is available at invesco.com/proxysearch. The information is also available on the SEC website, sec.gov. Invesco Advisers, Inc. is an investment adviser; it provides investment advisory services to individual and institutional clients and does not sell securities. Invesco Distributors, Inc. is the US distributor for Invesco Ltd.’s retail mutual funds, exchange-traded funds and institutional money market funds. Both are wholly owned, indirect subsidiaries of Invesco Ltd. | |  |
| | | | |
| SEC file numbers: 811-03826 and 002-85905 | | MS-TECH-AR-1 | | Invesco Distributors, Inc. |
| | | | |
| | |
 | | Annual Report to Shareholders | | April 30, 2016 |
| | |
| | Invesco Value Opportunities Fund |
| | Nasdaq: |
| | A: VVOAX n B: VVOBX n C: VVOCX n R: VVORX n Y: VVOIX n R5: VVONX |

Letters to Shareholders
| | |

Philip Taylor | | Dear Shareholders: This annual report includes information about your Fund, including performance data and a complete list of its investments as of the close of the reporting period. Inside is a discussion of how your Fund was managed and the factors that affected its performance during the reporting period. US economic data were generally positive over the reporting period, with the economy expanding modestly and employment numbers improving steadily. Throughout the reporting period, US consumers benefited from declining energy prices and greater credit availability, but a strengthening dollar crimped the profits of many large multi-national companies doing business overseas. Ending years of uncertainty, the US Federal Reserve in December 2015 finally raised short-term interest rates for the first time since 2006, signaling its confidence |
that the economy was likely to continue expanding and improving. Overseas, the economic story was less positive. The European Central Bank and central banks in China and Japan – as well as other countries – either instituted or maintained extraordinarily accommodative monetary policies in response to economic weakness. Stocks began 2016 on a weak note due to increased concerns about global economic weakness.
Short-term market volatility can prompt some investors to abandon their investment plans – and can cause others to settle for average results. The investment professionals at Invesco, in contrast, invest with high conviction and a long-term perspective. At Invesco, investing with high conviction means offering a wide range of strategies designed to go beyond market benchmarks. We trust our research-driven insights, have confidence in our investment processes and build portfolios that reflect our beliefs. Our goal is to look past market noise in an effort to find attractive opportunities at attractive prices – consistent with the investment strategies spelled out in each fund’s prospectus. Of course, investing with high conviction can’t guarantee a profit or ensure investment success; no investment strategy or risk analysis can. To learn more about how we invest with high conviction, visit invesco.com/HighConviction.
You, too, can invest with high conviction by maintaining a long-term investment perspective and by working with your financial adviser on a regular basis. During periods of short-term market volatility or uncertainty, your financial adviser can keep you focused on your long-term investment goals – a new home, a child’s college education, or a secure retirement. He or she also can share research about the economy, the markets and individual investment options.
Visit our website for more information on your investments
Our website, invesco.com/us, offers a wide range of market insights and investment perspectives. On the website, you’ll find detailed information about our funds, including performance, holdings and portfolio manager commentaries. You can access information about your account by completing a simple, secure online registration. Click on the “Need to register” link in the “Account Access” box on our homepage to get started. Invesco’s mobile apps for iPhone® and iPad® (both available free from the App StoreSM) allow you to obtain the same detailed information, monitor your account and create customizable watch lists.
In addition to the resources accessible on our website and through our mobile app, you can obtain timely updates to help you stay informed about the markets, the economy and investing by connecting with Invesco on Twitter, LinkedIn or Facebook. You can access our blog at blog.invesco.us.com. Our goal is to provide you the information you want, when and where you want it.
Have questions?
For questions about your account, contact an Invesco client services representative at 800 959 4246. For Invesco-related questions or comments, please email me directly at phil@invesco.com.
All of us at Invesco look forward to serving your investment management needs. Thank you for investing with us.
Sincerely,

Philip Taylor
Senior Managing Director, Invesco Ltd.
iPhone and iPad are trademarks of Apple Inc., registered in the US and other countries. App Store is a service mark of Apple Inc. Invesco Distributors, Inc. is not affiliated with Apple Inc.
2 Invesco Value Opportunities Fund
| | |

Bruce Crockett | | Dear Fellow Shareholders: Among the many important lessons I’ve learned in more than 40 years in a variety of business endeavors is the value of a trusted advocate. As independent chair of the Invesco Funds Board, I can assure you that the members of the Board are strong advocates for the interests of investors in Invesco’s mutual funds. We work hard to represent your interests through oversight of the quality of the investment management services your funds receive and other matters important to your investment, including but not limited to: |
| | n Ensuring that Invesco offers a diverse lineup of mutual funds that your financial adviser can use to strive to meet your financial needs as your investment goals change over time. |
| | n Monitoring how the portfolio management teams of the Invesco funds are performing in light of changing economic and market conditions. |
| n | | Assessing each portfolio management team’s investment performance within the context of the investment strategy described in the fund’s prospectus. |
| n | | Monitoring for potential conflicts of interests that may impact the nature of the services that your funds receive. |
We believe one of the most important services we provide our fund shareholders is the annual review of the funds’ advisory and sub-advisory contracts with Invesco Advisers and its affiliates. This review is required by the Investment Company Act of 1940 and focuses on the nature and quality of the services Invesco provides as the adviser to the Invesco funds and the reasonableness of the fees that it charges for those services. Each year, we spend months carefully reviewing information received from Invesco and a variety of independent sources, such as performance and fee data prepared by Lipper Inc., an independent, third-party firm widely recognized as a leader in its field. We also meet with our independent legal counsel and other independent advisers to review and help us assess the information that we have received. Our goal is to assure that you receive quality investment management services for a reasonable fee.
I trust the measures outlined above provide assurance that you have a worthy advocate when it comes to choosing the Invesco Funds.
As always, please contact me at bruce@brucecrockett.com with any questions or concerns you may have. On behalf of the Board, we look forward to continuing to represent your interests and serving your needs.
Sincerely,

Bruce L. Crockett
Independent Chair
Invesco Funds Board of Trustees
3 Invesco Value Opportunities Fund
Management’s Discussion of Fund Performance
| | | | | | |
| | | Performance summary | |
| | For the fiscal year ended April 30, 2016, Class A shares of Invesco Value Opportunities Fund (the Fund), at net asset value (NAV), underperformed the S&P 1500 Value Index, the Fund’s style-specific benchmark. Your Fund’s long-term performance appears later in this report. | |
| | | Fund vs. Indexes | |
| | Total returns, 4/30/15 to 4/30/16, at net asset value (NAV). Performance shown does not include applicable contingent deferred sales charges (CDSC) or front-end sales charges, which would have reduced performance. | |
| | | Class A Shares | | | -6.93 | % |
| | | Class B Shares | | | -6.97 | |
| | | Class C Shares | | | -7.57 | |
| | | Class R Shares | | | -7.12 | |
| | | Class Y Shares | | | -6.71 | |
| | | Class R5 Shares | | | -6.56 | |
| | | S&P 500 Index▼ (Broad Market Index) | | | 1.21 | |
| | | S&P 1500 Value Index▼ (Style-Specific Index) | | | 0.14 | |
| | | Lipper Multi-Cap Value Funds Index¢ (Peer Group Index) | | | -3.14 | |
| | | Source(s):▼FactSet Research Systems Inc.; ¢Lipper Inc. | | | | |
Market conditions and your Fund
During the fiscal year ended April 30, 2016, the US economy improved slowly but steadily, although the health of individual economic sectors varied dramatically. The energy sector saw a continued slowdown as oil prices fell in response to increasing supply and slowing global demand. In contrast, continued low interest rates, increased availability of credit and a better employment picture all helped consumer-related sectors. However, US equity markets moved lower in the summer of 2015 as a significant downturn in China’s financial markets and weak global economic growth led to increased investor uncertainty and market volatility. In the fall of 2015, US markets rallied and the US Federal Reserve (the Fed) saw enough economic stabilization to finally raise interest rates. US equity markets fell again in the first few months of 2016 due to continued concern about oil-price weakness and renewed uncertainty about Fed monetary policy. Market performance eventually recovered, and the S&P 500 In-
dex, considered representative of the performance of the US stock market, finished the reporting period modestly higher.
Within the S&P 1500 Value Index, the utilities and telecommunication services sectors were the best-performing sectors for the reporting period, while energy was the worst-performing sector. Overall, investor fear rose through the fiscal year, leading to better short-term performance for defensive sectors and wider valuation disparities across the market. As investors, we believe it is important to take a long-term perspective.
During the fiscal year, we continued to use our intrinsic value strategy, seeking to create wealth by maintaining a long-term investment horizon and investing in companies that are selling at a significant discount to our estimate of their intrinsic value. We believe intrinsic value represents the inherent business value of portfolio holdings based on our estimates of future cash flow. Since our application of this strategy is highly disciplined and relatively unique, it is important to understand the benefits and limitations of our
process. First, the investment strategy is intended to preserve your capital while growing it at above-market rates over the long term. Second, our investments have little in common with popular stock market indexes and most of our peers. And third, the Fund’s short-term relative performance will naturally be different from stock market indexes and peers and have little information value since we typically structure the portfolio significantly differently than these benchmarks.
Drivers of Fund performance were mainly stock-specific during the fiscal year. Health care diagnostic and research company Alere was the largest contributor to Fund performance during the reporting period. Shares of the company rose after it was announced that Abbott Laboratories (not a Fund holding) was acquiring Alere. Energy company Apache also made a large contribution to Fund performance during the reporting period, as did advertising agency Omnicom Group. We purchased Apache in late summer and early fall of 2015 when the decline in oil prices gave us an opportunity to buy shares of the company at a discount. Shares of Apache rebounded in the last couple of months of the fiscal year along with the energy sector in general.
The Fund’s financials sector holdings, including LPL Financial and Citigroup, were among the largest detractors from Fund performance during the reporting period. LPL Financial’s stock price declined following weaker-than-expected financial results in the fourth quarter of 2015 and due to investor fear regarding the impact of the new Department of Labor Fiduciary Rule on the financial advisory firm. We took advantage of the price weakness in early 2016 to buy more shares as we believed the stock was trading at a significant discount to its intrinsic value. Citigroup was negatively impacted by the rise in investor concern of macroeconomic weakness in international mar-
| | | | |
| | | Portfolio Composition |
| | By sector | | % of total net assets |
| | | | | | |
| | |
| | | Financials | | | 44.4 | % |
| | | Information Technology | | | 18.3 | |
| | | Consumer Discretionary | | | 10.1 | |
| | | Industrials | | | 7.9 | |
| | | Energy | | | 5.9 | |
| | | Health Care | | | 5.3 | |
| | | Materials | | | 2.9 | |
| | | Consumer Staples | | | 2.0 | |
| | | Money Market Funds Plus Other Assets Less Liabilities | | | 3.2 | |
| | | | |
| | |
1. | | Belden Inc. | | 6.1% |
2. | | AECOM | | 5.8 |
3. | | Affiliated Managers Group, Inc. | | 5.0 |
4. | | JPMorgan Chase & Co. | | 4.4 |
5. | | Zions Bancorp | | 3.7 |
6. | | Synchrony Financial | | 3.7 |
7. | | Citigroup Inc. | | 3.3 |
8. | | Gentex Corp. | | 3.1 |
9. | | Weatherford International PLC | | 3.1 |
10. | | TD Ameritrade Holding Corp. | | 3.0 |
| | | | |
| Total Net Assets | | $ | 758.7 million | |
| | | | |
| |
| Total Number of Holdings* | | | 41 | |
The Fund’s holdings are subject to change, and there is no assurance that the Fund will continue to hold any particular security.
*Excluding money market fund holdings.
Data presented here are as of April 30, 2016.
4 Invesco Value Opportunities Fund
kets over the course of the fiscal year. Consumer staples company Nu Skin Enterprises, a direct marketing business that sells skin care and beauty products, was also among the largest detractors from Fund performance during the reporting period. The company’s share price fell after it lowered its earnings guidance. The Fund’s avoidance of the utilities sector during the reporting period detracted from relative Fund results versus the S&P 1500 Value Index, as utilities was the best-performing sector within the S&P 1500 Value Index during the reporting period.
We believe the single most important indicator of how the Fund is positioned for potential future success is not our recent investment results nor popular statistical measures, but rather the difference between current market prices and the Fund’s estimated intrinsic value – the aggregate business value of the portfolio based on our estimate of intrinsic value for each individual holding.
At the end of the fiscal year, the difference between the market price and the estimated intrinsic value of the Fund was attractive, according to our estimation. While there is no assurance that market value will ever reflect our estimate of the Fund’s intrinsic value, we believe the gap between price and estimated intrinsic value may provide above-average capital appreciation.
We will continue to work hard to protect and grow the Fund’s estimated intrinsic value. We thank you for your investment and for sharing our long-term investment perspective.
The views and opinions expressed in management’s discussion of Fund performance are those of Invesco Advisers, Inc. These views and opinions are subject to change at any time based on factors such as market and economic conditions. These views and opinions may not be relied upon as investment advice or recommendations, or as an offer for a particular security. The information is not a complete analysis of every aspect of any market, country, industry, security or the Fund. Statements of fact are from sources considered reliable, but Invesco Advisers, Inc. makes no representation or warranty as to their completeness or accuracy. Although historical performance is no guarantee of future results, these insights may help you understand our investment management philosophy.
See important Fund and, if applicable, index disclosures later in this report.
| | |
 | | R. Canon Coleman II Chartered Financial Analyst, Portfolio Manager, is lead manager of Invesco Value Opportunities Fund. He joined Invesco |
| in 1999. Mr. Coleman earned a BS and an MS in accounting from the University of Florida. He also earned an MBA from the Wharton School of the University of Pennsylvania. |
| | |
 | | Jonathan Edwards Chartered Financial Analyst, Portfolio Manager, is manager of Invesco Value Opportunities Fund. He joined Invesco in 2001. |
| Mr. Edwards earned a BS in economics from Texas A&M University and an MBA from The University of Texas at Austin. |
| | |
 | | Jonathan Mueller Chartered Financial Analyst, Portfolio Manager, is manager of Invesco Value Opportunities Fund. He joined Invesco in 2001. |
| Mr. Mueller earned a BBA in accounting from Texas Christian University and an MBA in finance from The University of Texas at Austin. He is also a Certified Public Accountant. |
5 Invesco Value Opportunities Fund
Your Fund’s Long-Term Performance
Results of a $10,000 Investment – Oldest Share Class(es)
Fund and index data from 4/30/06
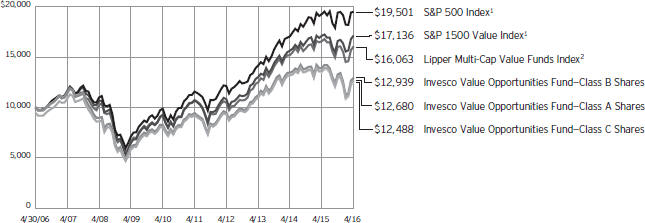
| 1 | Source: FactSet Research Systems Inc. |
Past performance cannot guarantee comparable future results.
The data shown in the chart include reinvested distributions, applicable sales charges and Fund expenses including management fees. Results for Class B shares are calculated as if a hypothetical
shareholder had liquidated his entire investment in the Fund at the close of the reporting period and paid the contingent deferred sales charges, if applicable. Index results include reinvested dividends, but they do not reflect sales charges. Performance of the peer group,
if applicable, reflects fund expenses and management fees; performance of a market index does not. Performance shown in the chart and table(s) does not reflect deduction of taxes a shareholder would pay on Fund distributions or sale of Fund shares.
6 Invesco Value Opportunities Fund
| | | | | |
| Average Annual Total Returns |
| As of 4/30/16, including maximum applicable sales charges |
| | | | | |
| |
| Class A Shares | | | | | |
| Inception (6/25/01) | | | | 4.13 | % |
| 10 Years | | | | 2.40 | |
| 5 Years | | | | 5.36 | |
| 1 Year | | | | -12.04 | |
| |
| Class B Shares | | | | | |
| Inception (6/25/01) | | | | 4.11 | % |
| 10 Years | | | | 2.61 | |
| 5 Years | | | | 6.23 | |
| 1 Year | | | | -10.97 | |
| |
| Class C Shares | | | | | |
| Inception (6/25/01) | | | | 3.77 | % |
| 10 Years | | | | 2.25 | |
| 5 Years | | | | 5.79 | |
| 1 Year | | | | -8.37 | |
| |
| Class R Shares | | | | | |
| 10 Years | | | | 2.73 | % |
| 5 Years | | | | 6.29 | |
| 1 Year | | | | -7.12 | |
| |
| Class Y Shares | | | | | |
| Inception (3/23/05) | | | | 4.21 | % |
| 10 Years | | | | 3.23 | |
| 5 Years | | | | 6.80 | |
| 1 Year | | | | -6.71 | |
| |
| Class R5 Shares | | | | | |
| 10 Years | | | | 3.23 | % |
| 5 Years | | | | 7.07 | |
| 1 Year | | | | -6.56 | |
Effective June 1, 2010, Class A, Class B, Class C and Class I shares of the predecessor fund, Van Kampen Value Opportunities Fund, advised by Van Kampen Asset Management were reorganized into Class A, Class B, Class C and Class Y shares, respectively, of Invesco Van Kampen Value Opportunities Fund (renamed Invesco Value Opportunities Fund). Returns shown above for Class A, Class B, Class C and Class Y shares are blended returns of the predecessor fund and Invesco Value Opportunities Fund. Share class returns will differ from the predecessor fund because of different expenses.
Class R shares incepted on May 23, 2011. Performance shown prior to that date is that of the Fund’s and the predecessor fund’s Class A shares, restated to reflect the higher 12b-1 fees applicable to Class R shares.
Class R5 shares incepted on May 23, 2011. Performance shown prior to that date is that of the Fund’s and the predecessor fund’s Class A shares and
| | | | | |
| Average Annual Total Returns |
| As of 3/31/16, the most recent calendar quarter end, including maximum applicable sales charges |
| | | | | |
| |
| Class A Shares | | | | | |
| Inception (6/25/01) | | | | 4.01 | % |
| 10 Years | | | | 2.38 | |
| 5 Years | | | | 5.33 | |
| 1 Year | | | | -13.92 | |
| |
| Class B Shares | | | | | |
| Inception (6/25/01) | | | | 3.98 | % |
| 10 Years | | | | 2.59 | |
| 5 Years | | | | 6.22 | |
| 1 Year | | | | -12.83 | |
| |
| Class C Shares | | | | | |
| Inception (6/25/01) | | | | 3.66 | % |
| 10 Years | | | | 2.24 | |
| 5 Years | | | | 5.80 | |
| 1 Year | | | | -10.36 | |
| |
| Class R Shares | | | | | |
| 10 Years | | | | 2.71 | % |
| 5 Years | | | | 6.28 | |
| 1 Year | | | | -9.10 | |
| |
| Class Y Shares | | | | | |
| Inception (3/23/05) | | | | 4.06 | % |
| 10 Years | | | | 3.21 | |
| 5 Years | | | | 6.82 | |
| 1 Year | | | | -8.63 | |
| |
| Class R5 Shares | | | | | |
| 10 Years | | | | 3.21 | % |
| 5 Years | | | | 7.05 | |
| 1 Year | | | | -8.56 | |
includes the 12b-1 fees applicable to Class A shares.
The performance data quoted represent past performance and cannot guarantee comparable future results; current performance may be lower or higher. Please visit invesco.com/performance for the most recent month-end performance. Performance figures reflect reinvested distributions, changes in net asset value and the effect of the maximum sales charge unless otherwise stated. Investment return and principal value will fluctuate so that you may have a gain or loss when you sell shares.
The net annual Fund operating expense ratio set forth in the most recent Fund prospectus as of the date of this report for Class A, Class B, Class C, Class R, Class Y and Class R5 shares was 1.23%, 1.23%, 1.96%, 1.48%, 0.98% and 0.83%, respectively.1 The total annual Fund operating expense ratio set forth in the most recent Fund prospectus as of the date of this report for Class A, Class B,
Class C, Class R, Class Y and Class R5 shares was 1.24%, 1.24%, 1.97%, 1.49%, 0.99% and 0.84%, respectively. The expense ratios presented above may vary from the expense ratios presented in other sections of this report that are based on expenses incurred during the period covered by this report.
Class A share performance reflects the maximum 5.50% sales charge, and Class B and Class C share performance reflects the applicable contingent deferred sales charge (CDSC) for the period involved. For shares purchased prior to June 1, 2010, the CDSC on Class B shares declines from 5% at the time of purchase to 0% at the beginning of the sixth year. For shares purchased on or after June 1, 2010, the CDSC on Class B shares declines from 5% at the time of purchase to 0% at the beginning of the seventh year. The CDSC on Class C shares is 1% for the first year after purchase. Class R, Class Y and Class R5 shares do not have a front-end sales charge or a CDSC; therefore, performance is at net asset value.
The performance of the Fund’s share classes will differ primarily due to different sales charge structures and class expenses.
Fund performance reflects any applicable fee waivers and/or expense reimbursements. Had the adviser not waived fees and/or reimbursed expenses currently or in the past, returns would have been lower. See current prospectus for more information.
| 1 | Total annual Fund operating expenses after any contractual fee waivers and/or expense reimbursements by the adviser in effect through at least June 30, 2018. See current prospectus for more information. |
7 Invesco Value Opportunities Fund
Invesco Value Opportunities Fund’s investment objective is total return through growth of capital and current income.
| n | | Unless otherwise stated, information presented in this report is as of April 30, 2016, and is based on total net assets. |
| n | | Unless otherwise noted, all data provided by Invesco. |
| n | | To access your Fund’s reports/prospectus, visit invesco.com/fundreports. |
About share classes
| n | | Class B shares may not be purchased for new or additional investments. Please see the prospectus for more information. |
| n | | Class R shares are generally available only to employer sponsored retirement and benefit plans. Please see the prospectus for more information. |
| n | | Class Y shares are available only to certain investors. Please see the prospectus for more information. |
| n | | Class R5 shares are primarily intended for employer sponsored retirement and benefit plans that meet certain standards and for institutional investors. Please see the prospectus for more information. |
Principal risks of investing in the Fund
| n | | Convertible securities risk. The market values of convertible securities are affected by market interest rates, the risk of actual issuer default on interest or principal payments and the value of the underlying common stock into which the convertible security may be converted. Additionally, a convertible security is subject to the same types of market and issuer risks as apply to the underlying common stock. In addition, certain convertible securities are subject to involuntary conversions and may undergo principal write-downs upon the occurrence of certain triggering events, and, as a result, are subject to an increased risk of loss. |
| n | | Depositary receipts risk. Investing in depositary receipts involves the same risks as direct investments in foreign securities. In addition, the underlying issuers of certain depositary receipts are under no obligation to distribute shareholder communications or pass through any voting rights with respect to the deposited securities to the holders of such receipts. The Fund may therefore receive less timely information or have less control than if it invested directly in the foreign issuer. |
| n | | Derivatives risk. The value of a derivative instrument depends largely on (and is derived from) the value of an underlying security, currency, commodity, interest rate, index or other asset (each referred to as an underlying asset). In addition to risks relating to the underlying assets, the use of derivatives may include other, possibly greater, risks, including counterparty, leverage and liquidity risks. Counterparty risk is the risk that the counterparty to the derivative contract will default on its obligation to pay the Fund the amount owed or otherwise perform under the derivative contract. Derivatives create leverage risk because they do not require payment up front equal to the economic exposure created by owning the derivative. As a result, an adverse change in the value of the underlying asset could result in the Fund sustaining a loss that is substantially greater than the amount invested in the derivative, which may make the Fund’s returns more volatile and increase the risk of loss. Derivative instruments may also be less liquid than more traditional investments and the Fund may be unable to sell or close out its derivative positions at a desirable time or price. This risk may be more acute under adverse market conditions, during which the Fund may be most in need of liquidating its derivative positions. Derivatives may also be harder to value, less tax efficient and subject to changing government regulation that could impact the Fund’s ability to use certain derivatives or their cost. Also, derivatives used for hedging or to gain or limit exposure to a particular market segment may not provide the expected benefits, particularly during adverse market conditions. |
| n | | Emerging markets securities risk. Emerging markets (also referred to as developing markets) are generally subject to greater market volatility, political, social and economic instability, uncertain trading markets and more |
This report must be accompanied or preceded by a currently effective Fund prospectus, which contains more complete information, including sales charges and expenses. Investors should read it carefully before investing.
NOT FDIC INSURED | MAY LOSE VALUE | NO BANK GUARANTEE
governmental limitations on foreign investment than more developed markets. In addition, companies operating in emerging markets may be subject to lower trading volume and greater price fluctuations than companies in more developed markets. Securities law and the enforcement of systems of taxation in many emerging market countries may change quickly and unpredictably. In addition, investments in emerging markets securities may also be subject to additional transaction costs, delays in settlement procedures, and lack of timely information.
| n | | Foreign securities risk. The Fund’s foreign investments may be adversely affected by political and social instability, changes in economic or taxation policies, difficulty in enforcing obligations, decreased liquidity or increased volatility. Foreign investments also involve the risk of the possible seizure, nationalization or expropriation of the issuer or foreign deposits (in which the Fund could lose its entire investments in a certain market) and the possible adoption of foreign governmental restrictions such as exchange controls. Unless the Fund has hedged its foreign securities risk, foreign securities risk also involves the risk of negative foreign currency rate fluctuations, which may cause the value of securities denominated in such foreign currency (or other instruments through which the Fund has exposure to foreign currencies) to decline in value. Currency exchange rates may fluctuate significantly over short periods of time. Currency hedging strategies, if used, are not always successful. |
| n | | Initial public offerings (IPO) risk. The prices of IPO securities often fluctuate more than prices of securities of companies with longer trading histories and sometimes experience significant price drops shortly after their initial issuance. In addition, companies offering securities in IPOs may have less experienced management or limited operating histories. |
| n | | Management risk. The Fund is actively managed and depends heavily on the Adviser’s judgment about markets, interest rates or the attractiveness, relative values, liquidity, or potential appreciation of particular investments made |
8 Invesco Value Opportunities Fund
| | for the Fund’s portfolio. The Fund could experience losses if these judgments prove to be incorrect. Additionally, legislative, regulatory, or tax developments may adversely affect management of the Fund and, therefore, the ability of the Fund to achieve its investment objective. |
| n | | Market risk. The market values of the Fund’s investments, and therefore the value of the Fund’s shares, will go up and down, sometimes rapidly or unpredictably. Market risk may affect a single issuer, industry or section of the economy, or it may affect the market as a whole. Individual stock prices tend to go up and down more dramatically than those of certain other types of investments, such as bonds. During a general downturn in the financial markets, multiple asset classes may decline in value. When markets perform well, there can be no assurance that specific investments held by the Fund will rise in value. |
| n | | Preferred securities risk. Preferred securities are subject to issuer-specific and market risks applicable generally to equity securities. Preferred securities also may be subordinated to bonds or other debt instruments, subjecting them to a greater risk of non-payment, may be less liquid than many other securities, such as common stocks, and generally offer no voting rights with respect to the issuer. |
| n | | Real estate investment trust (REIT) risk/real estate risk. Investments in real estate related instruments may be affected by economic, legal, cultural, environmental or technological factors that affect property values, rents or occupancies of real estate related to the Fund’s holdings. Shares of real estate related companies, which tend to be small- and mid-cap companies, may be more volatile and less liquid. |
| n | | Sector focus risk. The Fund may from time to time invest a significant amount of its assets (i.e. over 25%) in one market sector or group of related industries. In this event, the Fund’s performance will depend to a greater extent on the overall condition of the sector or group of industries and there is increased risk that the Fund will lose significant value if conditions adversely affect that sector or group of industries. |
| n | | Small- and mid-capitalization risks. Small- and mid-capitalization companies tend to be more vulnerable to changing market conditions, may have little or no operating history or track record of success, and may have more limited product lines and markets, less experienced |
| | | management and fewer financial resources than larger companies. These companies’ securities may be more volatile and less liquid than those of more established companies, and their returns may vary, sometimes significantly, from the overall securities market. |
| n | | Unseasoned issuer risk. Investments in unseasoned companies or companies with special circumstances often involve much greater risks than are inherent in other types of investments and securities of such companies may be more likely to experience fluctuations in price. In addition, investments made in anticipation of future events may, if the events are delayed or never achieved, cause stock prices to fall. |
| n | | Value investing style risk. A value investing style subjects the Fund to the risk that the valuations never improve or that the returns on value equity securities are less than returns on other styles of investing or the overall stock market. |
About indexes used in this report
| n | | The S&P 500® Index is an unmanaged index considered representative of the US stock market. |
| n | | The S&P 1500® Value Index combines the value stocks of the S&P 500, S&P MidCap 400 and the S&P SmallCap 600 indexes. |
| n | | The Lipper Multi-Cap Value Funds Index is an unmanaged index considered representative of multicap value funds tracked by Lipper. |
| n | | The S&P MidCap 400® Index is an unmanaged index considered representative of mid-sized US companies. |
| n | | The S&P SmallCap 600® Index is a market-value weighted index considered representative of small-cap US stocks. |
| n | | The Fund is not managed to track the performance of any particular index, including the index(es) described here, and consequently, the performance of the Fund may deviate significantly from the performance of the index(es). |
| n | | A direct investment cannot be made in an index. Unless otherwise indicated, index results include reinvested dividends, and they do not reflect sales charges. Performance of the peer group, if applicable, reflects fund expenses; performance of a market index does not. |
Other information
| n | | CPA® and Certified Public Accountant® are trademarks owned by the American Institute of Certified Public Accountants. |
| n | | The returns shown in management’s discussion of Fund performance are based on net asset values (NAVs) calculated for shareholder transactions. Generally accepted accounting principles require adjustments to be made to the net assets of the Fund at period end for financial reporting purposes, and as such, the NAVs for shareholder transactions and the returns based on those NAVs may differ from the NAVs and returns reported in the Financial Highlights. |
| n | | Industry classifications used in this report are generally according to the Global Industry Classification Standard, which was developed by and is the exclusive property and a service mark of MSCI Inc. and Standard & Poor’s. |
|
| 9 Invesco Value Opportunities Fund |
Schedule of Investments(a)
April 30, 2016
| | | | | | | | |
| | | Shares | | | Value | |
Common Stocks–96.78% | |
| Advertising–1.68% | |
Omnicom Group Inc. | | | 153,955 | | | $ | 12,773,646 | |
|
| Asset Management & Custody Banks–4.98% | |
Affiliated Managers Group, Inc.(b) | | | 221,800 | | | | 37,776,976 | |
|
| Auto Parts & Equipment–5.96% | |
Dana Holding Corp. | | | 1,684,800 | | | | 21,784,464 | |
Gentex Corp. | | | 1,462,400 | | | | 23,456,896 | |
| | | | | | | | 45,241,360 | |
|
| Building Products–0.20% | |
Owens Corning | | | 32,559 | | | | 1,499,993 | |
|
| Construction & Engineering–5.78% | |
AECOM(b) | | | 1,349,490 | | | | 43,844,930 | |
|
| Consumer Electronics–1.91% | |
Harman International Industries, Inc. | | | 188,800 | | | | 14,492,288 | |
|
| Consumer Finance–3.66% | |
Synchrony Financial(b) | | | 909,000 | | | | 27,788,130 | |
|
| Diversified Banks–10.84% | |
Bank of America Corp. | | | 1,565,566 | | | | 22,794,641 | |
Citigroup Inc. | | | 533,121 | | | | 24,672,840 | |
JPMorgan Chase & Co. | | | 525,464 | | | | 33,209,325 | |
Wells Fargo & Co. | | | 31,625 | | | | 1,580,617 | |
| | | | | | | | 82,257,423 | |
|
| Electronic Components–6.08% | |
Belden Inc. | | | 730,028 | | | | 46,093,968 | |
|
| Electronic Equipment & Instruments–2.06% | |
FLIR Systems, Inc. | | | 516,900 | | | | 15,615,549 | |
|
| Electronic Manufacturing Services–2.57% | |
Flextronics International Ltd.(b) | | | 1,606,000 | | | | 19,512,900 | |
|
| Health Care Facilities–1.21% | |
Brookdale Senior Living Inc.(b) | | | 494,962 | | | | 9,136,999 | |
|
| Health Care Supplies–1.10% | |
Alere, Inc.(b) | | | 214,425 | | | | 8,362,575 | |
|
| Hotels, Resorts & Cruise Lines–0.57% | |
Carnival Corp. | | | 88,100 | | | | 4,321,305 | |
|
| Human Resource & Employment Services–1.92% | |
ManpowerGroup Inc. | | | 189,200 | | | | 14,574,076 | |
|
| Investment Banking & Brokerage–7.52% | |
E*TRADE Financial Corp.(b) | | | 486,300 | | | | 12,245,034 | |
LPL Financial Holdings, Inc. | | | 823,340 | | | | 21,736,176 | |
TD Ameritrade Holding Corp. | | | 773,400 | | | | 23,070,522 | |
| | | | | 57,051,732 | |
| | | | | | | | |
| | | Shares | | | Value | |
| Life & Health Insurance–7.02% | |
Aflac, Inc. | | | 180,700 | | | $ | 12,462,879 | |
MetLife, Inc. | | | 426,800 | | | | 19,248,680 | |
Unum Group | | | 629,274 | | | | 21,527,464 | |
| | | | | 53,239,023 | |
|
| Oil & Gas Equipment & Services–4.02% | |
Halliburton Co. | | | 172,600 | | | | 7,130,106 | |
Weatherford International PLC(b) | | | 2,870,073 | | | | 23,333,694 | |
| | | | | 30,463,800 | |
|
| Oil & Gas Exploration & Production–1.81% | |
Apache Corp. | | | 253,000 | | | | 13,763,200 | |
|
| Personal Products–2.02% | |
Nu Skin Enterprises, Inc.–Class A | | | 375,064 | | | | 15,291,359 | |
|
| Pharmaceuticals–3.01% | |
Endo International PLC(b) | | | 373,100 | | | | 10,073,700 | |
Novartis AG (Switzerland) | | | 131,100 | | | | 10,004,712 | |
Pfizer Inc. | | | 84,700 | | | | 2,770,537 | |
| | | | | 22,848,949 | |
|
| Property & Casualty Insurance–3.01% | |
AmTrust Financial Services, Inc. | | | 918,452 | | | | 22,823,532 | |
|
| Real Estate Services–1.65% | |
Realogy Holdings Corp.(b) | | | 350,666 | | | | 12,532,803 | |
|
| Regional Banks–5.74% | |
First Horizon National Corp. | | | 788,400 | | | | 11,100,672 | |
SVB Financial Group(b) | | | 39,200 | | | | 4,087,776 | |
Zions Bancorp. | | | 1,031,100 | | | | 28,375,872 | |
| | | | | 43,564,320 | |
|
| Semiconductor Equipment–2.24% | |
Lam Research Corp. | | | 222,500 | | | | 16,999,000 | |
|
| Semiconductors–2.76% | |
ON Semiconductor Corp.(b) | | | 2,211,100 | | | | 20,939,117 | |
|
| Steel–2.90% | |
Allegheny Technologies, Inc. | | | 1,344,600 | | | | 21,970,764 | |
|
| Systems Software–2.56% | |
Oracle Corp. | | | 487,900 | | | | 19,447,694 | |
Total Common Stocks
(Cost $762,211,747) | | | | 734,227,411 | |
See accompanying Notes to Financial Statements which are an integral part of the financial statements.
10 Invesco Value Opportunities Fund
| | | | | | | | |
| | | Shares | | | Value | |
Money Market Funds–2.90% | |
Liquid Assets Portfolio–Institutional Class, 0.44%(c) | | | 10,983,386 | | | $ | 10,983,386 | |
Premier Portfolio–Institutional Class, 0.39%(c) | | | 10,983,386 | | | | 10,983,386 | |
Total Money Market Funds
(Cost $21,966,772) | | | | 21,966,772 | |
TOTAL INVESTMENTS–99.68%
(Cost $784,178,519) | | | | 756,194,183 | |
OTHER ASSETS LESS LIABILITIES–0.32% | | | | 2,458,815 | |
NET ASSETS–100.00% | | | $ | 758,652,998 | |
Notes to Schedule of Investments:
| (a) | Industry and/or sector classifications used in this report are generally according to the Global Industry Classification Standard, which was developed by and is the exclusive property and a service mark of MSCI Inc. and Standard & Poor’s. |
| (b) | Non-income producing security. |
| (c) | The money market fund and the Fund are affiliated by having the same investment adviser. The rate shown is the 7-day SEC standardized yield as of April 30, 2016. |
See accompanying Notes to Financial Statements which are an integral part of the financial statements.
11 Invesco Value Opportunities Fund
Statement of Assets and Liabilities
April 30, 2016
| | | | |
Assets: | |
Investments, at value (Cost $762,211,747) | | $ | 734,227,411 | |
Investments in affiliated money market funds, at value and cost | | | 21,966,772 | |
Total investments, at value (Cost $784,178,519) | | | 756,194,183 | |
Foreign currencies, at value (Cost $1,266) | | | 1,376 | |
Receivable for: | | | | |
Investments sold | | | 10,222,676 | |
Fund shares sold | | | 167,471 | |
Dividends | | | 885,148 | |
Investment for trustee deferred compensation and retirement plans | | | 447,089 | |
Other assets | | | 61,482 | |
Total assets | | | 767,979,425 | |
|
Liabilities: | |
Payable for: | | | | |
Investments purchased | | | 7,279,718 | |
Fund shares reacquired | | | 869,690 | |
Accrued fees to affiliates | | | 593,905 | |
Accrued trustees’ and officers’ fees and benefits | | | 2,476 | |
Accrued other operating expenses | | | 64,394 | |
Trustee deferred compensation and retirement plans | | | 516,244 | |
Total liabilities | | | 9,326,427 | |
Net assets applicable to shares outstanding | | $ | 758,652,998 | |
|
Net assets consist of: | |
Shares of beneficial interest | | $ | 793,169,597 | |
Undistributed net investment income | | | 546,017 | |
Undistributed net realized gain (loss) | | | (7,071,677 | ) |
Net unrealized appreciation (depreciation) | | | (27,990,939 | ) |
| | | $ | 758,652,998 | |
| | | | |
Net Assets: | |
Class A | | $ | 622,026,018 | |
Class B | | $ | 17,104,908 | |
Class C | | $ | 79,537,717 | |
Class R | | $ | 16,118,578 | |
Class Y | | $ | 21,016,249 | |
Class R5 | | $ | 2,849,528 | |
|
Shares outstanding, $0.01 par value per share,
with an unlimited number of shares authorized: | |
Class A | | | 53,634,974 | |
Class B | | | 1,500,157 | |
Class C | | | 7,101,445 | |
Class R | | | 1,395,657 | |
Class Y | | | 1,817,390 | |
Class R5 | | | 245,661 | |
Class A: | | | | |
Net asset value per share | | $ | 11.60 | |
Maximum offering price per share | | | | |
(Net asset value of $11.60 ¸ 94.50%) | | $ | 12.28 | |
Class B: | | | | |
Net asset value and offering price per share | | $ | 11.40 | |
Class C: | | | | |
Net asset value and offering price per share | | $ | 11.20 | |
Class R: | | | | |
Net asset value and offering price per share | | $ | 11.55 | |
Class Y: | | | | |
Net asset value and offering price per share | | $ | 11.56 | |
Class R5: | | | | |
Net asset value and offering price per share | | $ | 11.60 | |
See accompanying Notes to Financial Statements which are an integral part of the financial statements.
12 Invesco Value Opportunities Fund
Statement of Operations
For the year ended April 30, 2016
| | | | |
Investment income: | |
Dividends (net of foreign withholding taxes of $53,678) | | $ | 11,587,538 | |
Dividends from affiliated money market funds (includes securities lending income of $7,926) | | | 52,206 | |
Total investment income | | | 11,639,744 | |
| |
Expenses: | | | | |
Advisory fees | | | 5,462,769 | |
Administrative services fees | | | 213,111 | |
Custodian fees | | | 22,234 | |
Distribution fees: | | | | |
Class A | | | 1,665,352 | |
Class B | | | 57,063 | |
Class C | | | 849,709 | |
Class R | | | 89,890 | |
Transfer Agent Fees — A, B, C and Y | | | 2,137,123 | |
Transfer agent fees — R5 | | | 2,578 | |
Trustees’ and officers’ fees and benefits | | | 52,968 | |
Registration and filing fees | | | 91,118 | |
Reports to shareholders | | | 104,843 | |
Professional services fees | | | 49,268 | |
Other | | | 33,435 | |
Total expenses | | | 10,831,461 | |
Less: Fees waived and expense offset arrangement(s) | | | (49,200 | ) |
Net expenses | | | 10,782,261 | |
Net investment income | | | 857,483 | |
| |
Realized and unrealized gain (loss) from: | | | | |
Net realized gain from: | | | | |
Investment securities | | | 63,846,201 | |
Foreign currencies | | | 61,553 | |
| | | | 63,907,754 | |
Change in net unrealized appreciation (depreciation) of: | | | | |
Investment securities | | | (130,111,533 | ) |
Foreign currencies | | | (12,054 | ) |
| | | | (130,123,587 | ) |
Net realized and unrealized gain (loss) | | | (66,215,833 | ) |
Net increase (decrease) in net assets resulting from operations | | $ | (65,358,350 | ) |
See accompanying Notes to Financial Statements which are an integral part of the financial statements.
13 Invesco Value Opportunities Fund
Statement of Changes in Net Assets
For the years ended April 30, 2016 and 2015
| | | | | | | | |
| | | 2016 | | | 2015 | |
Operations: | | | | | |
Net investment income | | $ | 857,483 | | | $ | 7,839,847 | |
Net realized gain | | | 63,907,754 | | | | 189,670,176 | |
Change in net unrealized appreciation (depreciation) | | | (130,123,587 | ) | | | (165,832,016 | ) |
Net increase (decrease) in net assets resulting from operations | | | (65,358,350 | ) | | | 31,678,007 | |
| | |
Distributions to shareholders from net investment income: | | | | | | | | |
Class A | | | (6,374,595 | ) | | | (13,398,612 | ) |
Class B | | | (214,433 | ) | | | (598,258 | ) |
Class C | | | (604,296 | ) | | | (1,086,719 | ) |
Class R | | | (149,900 | ) | | | (329,420 | ) |
Class Y | | | (221,282 | ) | | | (496,839 | ) |
Class R5 | | | (28,190 | ) | | | (108,572 | ) |
Total distributions from net investment income | | | (7,592,696 | ) | | | (16,018,420 | ) |
| | |
Distributions to shareholders from net realized gains: | | | | | | | | |
Class A | | | (81,588,078 | ) | | | — | |
Class B | | | (2,744,475 | ) | | | — | |
Class C | | | (10,999,237 | ) | | | — | |
Class R | | | (2,137,815 | ) | | | — | |
Class Y | | | (2,566,931 | ) | | | — | |
Class R5 | | | (309,704 | ) | | | — | |
Total distributions from net realized gains | | | (100,346,240 | ) | | | — | |
| | |
Share transactions–net: | | | | | | | | |
Class A | | | 8,474,743 | | | | (67,932,974 | ) |
Class B | | | (6,773,271 | ) | | | (12,926,619 | ) |
Class C | | | (1,170,332 | ) | | | (9,406,607 | ) |
Class R | | | (806,697 | ) | | | (2,910,901 | ) |
Class Y | | | 2,873,928 | | | | 5,956,049 | |
Class R5 | | | 418,686 | | | | 675,619 | |
Net increase (decrease) in net assets resulting from share transactions | | | 3,017,057 | | | | (86,545,433 | ) |
Net increase (decrease) in net assets | | | (170,280,229 | ) | | | (70,885,846 | ) |
| | |
Net assets: | | | | | | | | |
Beginning of year | | | 928,933,227 | | | | 999,819,073 | |
End of year (includes undistributed net investment income of $546,017 and $7,032,311, respectively) | | $ | 758,652,998 | | | $ | 928,933,227 | |
Notes to Financial Statements
April 30, 2016
NOTE 1—Significant Accounting Policies
Invesco Value Opportunities Fund (the “Fund”) is a series portfolio of AIM Sector Funds (Invesco Sector Funds) (the “Trust”). The Trust is a Delaware statutory trust registered under the Investment Company Act of 1940, as amended (the “1940 Act”), as an open-end series management investment company consisting of ten separate portfolios, each authorized to issue an unlimited number of shares of beneficial interest. The assets, liabilities and operations of each portfolio are accounted for separately. Information presented in these financial statements pertains only to the Fund. Matters affecting each portfolio or class will be voted on exclusively by the shareholders of such portfolio or class.
The Fund’s investment objective is total return through growth of capital and current income.
The Fund currently consists of six different classes of shares: Class A, Class B, Class C, Class R, Class Y and Class R5. Class Y shares are available only to certain investors. Class A shares are sold with a front-end sales charge unless certain waiver criteria are met and under certain circumstances load waived shares may be subject to contingent deferred sales charges (“CDSC”). Class C shares are sold with a CDSC. Class R, Class Y and Class R5 shares are sold at net asset value. Effective November 30, 2010, new or additional investments in Class B shares are no longer permitted. Existing shareholders of Class B shares may continue to reinvest dividends and capital gains distributions in Class B shares until they convert to Class A shares. Also, shareholders in Class B shares will be able to exchange those shares for Class B shares of other Invesco Funds offering such shares until they
14 Invesco Value Opportunities Fund
convert to Class A shares. Generally, Class B shares will automatically convert to Class A shares on or about the month-end, which is at least eight years after the date of purchase. Redemption of Class B shares prior to the conversion date will be subject to a CDSC.
The following is a summary of the significant accounting policies followed by the Fund in the preparation of its financial statements.
| A. | Security Valuations — Securities, including restricted securities, are valued according to the following policy. |
A security listed or traded on an exchange (except convertible securities) is valued at its last sales price or official closing price as of the close of the customary trading session on the exchange where the security is principally traded, or lacking any sales or official closing price on a particular day, the security may be valued at the closing bid price on that day. Securities traded in the over-the-counter market are valued based on prices furnished by independent pricing services or market makers. When such securities are valued by an independent pricing service they may be considered fair valued. Futures contracts are valued at the final settlement price set by an exchange on which they are principally traded. Listed options are valued at the mean between the last bid and asked prices from the exchange on which they are principally traded. Options not listed on an exchange are valued by an independent source at the mean between the last bid and asked prices. For purposes of determining net asset value (“NAV”) per share, futures and option contracts generally are valued 15 minutes after the close of the customary trading session of the New York Stock Exchange (“NYSE”).
Investments in open-end and closed-end registered investment companies that do not trade on an exchange are valued at the end-of-day net asset value per share. Investments in open-end and closed-end registered investment companies that trade on an exchange are valued at the last sales price or official closing price as of the close of the customary trading session on the exchange where the security is principally traded.
Debt obligations (including convertible securities) and unlisted equities are fair valued using an evaluated quote provided by an independent pricing service. Evaluated quotes provided by the pricing service may be determined without exclusive reliance on quoted prices, and may reflect appropriate factors such as institution-size trading in similar groups of securities, developments related to specific securities, dividend rate (for unlisted equities), yield (for debt obligations), quality, type of issue, coupon rate (for debt obligations), maturity (for debt obligations), individual trading characteristics and other market data. Debt obligations are subject to interest rate and credit risks. In addition, all debt obligations involve some risk of default with respect to interest and/or principal payments.
Foreign securities’ (including foreign exchange contracts) prices are converted into U.S. dollar amounts using the applicable exchange rates as of the close of the NYSE. If market quotations are available and reliable for foreign exchange-traded equity securities, the securities will be valued at the market quotations. Because trading hours for certain foreign securities end before the close of the NYSE, closing market quotations may become unreliable. If between the time trading ends on a particular security and the close of the customary trading session on the NYSE, events occur that the Adviser determines are significant and make the closing price unreliable, the Fund may fair value the security. If the event is likely to have affected the closing price of the security, the security will be valued at fair value in good faith using procedures approved by the Board of Trustees. Adjustments to closing prices to reflect fair value may also be based on a screening process of an independent pricing service to indicate the degree of certainty, based on historical data, that the closing price in the principal market where a foreign security trades is not the current value as of the close of the NYSE. Foreign securities’ prices meeting the approved degree of certainty that the price is not reflective of current value will be priced at the indication of fair value from the independent pricing service. Multiple factors may be considered by the independent pricing service in determining adjustments to reflect fair value and may include information relating to sector indices, American Depositary Receipts and domestic and foreign index futures. Foreign securities may have additional risks including exchange rate changes, potential for sharply devalued currencies and high inflation, political and economic upheaval, the relative lack of issuer information, relatively low market liquidity and the potential lack of strict financial and accounting controls and standards.
Securities for which market prices are not provided by any of the above methods may be valued based upon quotes furnished by independent sources. The last bid price may be used to value equity securities. The mean between the last bid and asked prices is used to value debt obligations, including corporate loans.
Securities for which market quotations are not readily available or became unreliable are valued at fair value as determined in good faith by or under the supervision of the Trust’s officers following procedures approved by the Board of Trustees. Issuer specific events, market trends, bid/asked quotes of brokers and information providers and other market data may be reviewed in the course of making a good faith determination of a security’s fair value.
The Fund may invest in securities that are subject to interest rate risk, meaning the risk that the prices will generally fall as interest rates rise and, conversely, the prices will generally rise as interest rates fall. Specific securities differ in their sensitivity to changes in interest rates depending on their individual characteristics. Changes in interest rates may result in increased market volatility, which may affect the value and/or liquidity of certain Fund investments.
Valuations change in response to many factors including the historical and prospective earnings of the issuer, the value of the issuer’s assets, general economic conditions, interest rates, investor perceptions and market liquidity. Because of the inherent uncertainties of valuation, the values reflected in the financial statements may materially differ from the value received upon actual sale of those investments.
| B. | Securities Transactions and Investment Income — Securities transactions are accounted for on a trade date basis. Realized gains or losses on sales are computed on the basis of specific identification of the securities sold. Interest income (net of withholding tax, if any) is recorded on the accrual basis from settlement date. Dividend income (net of withholding tax, if any) is recorded on the ex-dividend date. |
The Fund may periodically participate in litigation related to Fund investments. As such, the Fund may receive proceeds from litigation settlements. Any proceeds received are included in the Statement of Operations as realized gain (loss) for investments no longer held and as unrealized gain (loss) for investments still held.
Brokerage commissions and mark ups are considered transaction costs and are recorded as an increase to the cost basis of securities purchased and/or a reduction of proceeds on a sale of securities. Such transaction costs are included in the determination of net realized and unrealized gain (loss) from investment securities reported in the Statement of Operations and the Statement of Changes in Net Assets and the net realized and unrealized gains (losses) on securities per share in the Financial Highlights. Transaction costs are included in the calculation of the Fund’s net asset value and, accordingly, they reduce the Fund’s total returns. These transaction costs are not considered operating expenses and are not reflected in net investment income reported in the Statement of Operations and the Statement of Changes in Net Assets, or the net investment income per share and the ratios of expenses and net investment income reported in the Financial Highlights, nor are they limited by any expense limitation arrangements between the Fund and the investment adviser.
15 Invesco Value Opportunities Fund
The Fund allocates income and realized and unrealized capital gains and losses to a class based on the relative net assets of each class.
| C. | Country Determination — For the purposes of making investment selection decisions and presentation in the Schedule of Investments, the investment adviser may determine the country in which an issuer is located and/or credit risk exposure based on various factors. These factors include the laws of the country under which the issuer is organized, where the issuer maintains a principal office, the country in which the issuer derives 50% or more of its total revenues and the country that has the primary market for the issuer’s securities, as well as other criteria. Among the other criteria that may be evaluated for making this determination are the country in which the issuer maintains 50% or more of its assets, the type of security, financial guarantees and enhancements, the nature of the collateral and the sponsor organization. Country of issuer and/or credit risk exposure has been determined to be the United States of America, unless otherwise noted. |
| D. | Distributions — Distributions from net investment income and net realized capital gain, if any, are generally declared and paid annually and recorded on the ex-dividend date. The Fund may elect to treat a portion of the proceeds from redemptions as distributions for federal income tax purposes. |
| E. | Federal Income Taxes — The Fund intends to comply with the requirements of Subchapter M of the Internal Revenue Code of 1986, as amended (the “Internal Revenue Code”), necessary to qualify as a regulated investment company and to distribute substantially all of the Fund’s taxable earnings to shareholders. As such, the Fund will not be subject to federal income taxes on otherwise taxable income (including net realized capital gain) that is distributed to shareholders. Therefore, no provision for federal income taxes is recorded in the financial statements. |
The Fund recognizes the tax benefits of uncertain tax positions only when the position is more likely than not to be sustained. Management has analyzed the Fund’s uncertain tax positions and concluded that no liability for unrecognized tax benefits should be recorded related to uncertain tax positions. Management is not aware of any tax positions for which it is reasonably possible that the total amounts of unrecognized tax benefits will change materially in the next 12 months.
The Fund files tax returns in the U.S. Federal jurisdiction and certain other jurisdictions. Generally, the Fund is subject to examinations by such taxing authorities for up to three years after the filing of the return for the tax period.
| F. | Expenses — Fees provided for under the Rule 12b-1 plan of a particular class of the Fund are charged to the operations of such class. Transfer agency fees and expenses and other shareholder recordkeeping fees and expenses attributable to Class R5 are charged to such class. Transfer agency fees and expenses and other shareholder recordkeeping fees and expenses relating to all other classes are allocated among those classes based on relative net assets. All other expenses are allocated among the classes based on relative net assets. |
| G. | Accounting Estimates — The preparation of financial statements in conformity with accounting principles generally accepted in the United States of America (“GAAP”) requires management to make estimates and assumptions that affect the reported amounts of assets and liabilities at the date of the financial statements and the reported amounts of revenues and expenses during the reporting period including estimates and assumptions related to taxation. Actual results could differ from those estimates by a significant amount. In addition, the Fund monitors for material events or transactions that may occur or become known after the period-end date and before the date the financial statements are released to print. |
| H. | Indemnifications — Under the Trust’s organizational documents, each Trustee, officer, employee or other agent of the Trust is indemnified against certain liabilities that may arise out of the performance of their duties to the Fund. Additionally, in the normal course of business, the Fund enters into contracts, including the Fund’s servicing agreements, that contain a variety of indemnification clauses. The Fund’s maximum exposure under these arrangements is unknown as this would involve future claims that may be made against the Fund that have not yet occurred. The risk of material loss as a result of such indemnification claims is considered remote. |
| I. | Securities Lending — The Fund may lend portfolio securities having a market value up to one-third of the Fund’s total assets. Such loans are secured by collateral equal to no less than the market value of the loaned securities determined daily by the securities lending provider. Such collateral will be cash or debt securities issued or guaranteed by the U.S. Government or any of its sponsored agencies. Cash collateral received in connection with these loans is invested in short-term money market instruments or affiliated money market funds and is shown as such on the Schedule of Investments. The Fund bears the risk of loss with respect to the investment of collateral. It is the Fund’s policy to obtain additional collateral from or return excess collateral to the borrower by the end of the next business day, following the valuation date of the securities loaned. Therefore, the value of the collateral held may be temporarily less than the value of the securities on loan. When loaning securities, the Fund retains certain benefits of owning the securities, including the economic equivalent of dividends or interest generated by the security. Lending securities entails a risk of loss to the Fund if, and to the extent that, the market value of the securities loaned were to increase and the borrower did not increase the collateral accordingly, and the borrower failed to return the securities. The securities loaned are subject to termination at the option of the borrower or the Fund. Upon termination, the borrower will return to the Fund the securities loaned and the Fund will return the collateral. Upon the failure of the borrower to return the securities, collateral may be liquidated and the securities may be purchased on the open market to replace the loaned securities. The Fund could experience delays and costs in gaining access to the collateral and the securities may lose value during the delay which could result in potential losses to the Fund. Some of these losses may be indemnified by the lending agent. The Fund bears the risk of any deficiency in the amount of the collateral available for return to the borrower due to any loss on the collateral invested. Dividends received on cash collateral investments for securities lending transactions, which are net of compensation to counterparties, are included in Dividends from affiliated money market funds on the Statement of Operations. The aggregate value of securities out on loan, if any, is shown as a footnote on the Statement of Assets and Liabilities. |
| J. | Foreign Currency Translations — Foreign currency is valued at the close of the NYSE based on quotations posted by banks and major currency dealers. Portfolio securities and other assets and liabilities denominated in foreign currencies are translated into U.S. dollar amounts at date of valuation. Purchases and sales of portfolio securities (net of foreign taxes withheld on disposition) and income items denominated in foreign currencies are translated into U.S. dollar amounts on the respective dates of such transactions. The Fund does not separately account for the portion of the results of operations resulting from changes in foreign exchange rates on investments and the fluctuations arising from changes in market prices of securities held. The combined results of changes in foreign exchange rates and the fluctuation of market prices on investments (net of estimated foreign tax withholding) are included with the net realized and unrealized gain or loss from investments in the Statement of Operations. Reported net realized foreign currency gains or losses arise from (1) sales of foreign currencies, (2) currency gains or losses realized between the trade and settlement dates on securities transactions, and (3) the difference between the amounts of dividends, interest, and foreign withholding taxes recorded on the Fund’s books and the U.S. dollar equivalent of the amounts actually received or paid. Net |
16 Invesco Value Opportunities Fund
| | unrealized foreign currency gains and losses arise from changes in the fair values of assets and liabilities, other than investments in securities at fiscal period end, resulting from changes in exchange rates. |
The Fund may invest in foreign securities, which may be subject to foreign taxes on income, gains on investments or currency repatriation, a portion of which may be recoverable. Foreign taxes, if any, are recorded based on the tax regulations and rates that exist in the foreign markets in which the Fund invests and are shown in the Statement of Operations.
| K. | Forward Foreign Currency Contracts — The Fund may engage in foreign currency transactions either on a spot (i.e. for prompt delivery and settlement) basis, or through forward foreign currency contracts, to manage or minimize currency or exchange rate risk. |
The Fund may also enter into forward foreign currency contracts for the purchase or sale of a security denominated in a foreign currency in order to “lock in” the U.S. dollar price of that security, or the Fund may also enter into forward foreign currency contracts that do not provide for physical settlement of the two currencies, but instead are settled by a single cash payment calculated as the difference between the agreed upon exchange rate and the spot rate at settlement based upon an agreed upon notional amount (non-deliverable forwards). The Fund will set aside liquid assets in an amount equal to daily mark-to-market obligation for forward foreign currency contracts.
A forward foreign currency contract is an obligation between two parties (“Counterparties”) to purchase or sell a specific currency for an agreed-upon price at a future date. The use of forward foreign currency contracts does not eliminate fluctuations in the price of the underlying securities the Fund owns or intends to acquire but establishes a rate of exchange in advance. Fluctuations in the value of these contracts are measured by the difference in the contract date and reporting date exchange rates and are recorded as unrealized appreciation (depreciation) until the contracts are closed. When the contracts are closed, realized gains (losses) are recorded. Realized and unrealized gains (losses) on the contracts are included in the Statement of Operations. The primary risks associated with forward foreign currency contracts include failure of the Counterparty to meet the terms of the contract and the value of the foreign currency changing unfavorably. These risks may be in excess of the amounts reflected in the Statement of Assets and Liabilities.
NOTE 2—Advisory Fees and Other Fees Paid to Affiliates
The Trust has entered into a master investment advisory agreement with Invesco Advisers, Inc. (the “Adviser” or “Invesco”). Under the terms of the investment advisory agreement, the Fund pays an advisory fee to the Adviser based on the annual rate of the Fund’s average daily net assets as follows:
| | | | | | |
| Average Daily Net Assets | | Rate |
First $250 million | | | 0 | .695% | | |
Next $250 million | | | 0 | .67% | | |
Next $500 million | | | 0 | .645% | | |
Next $1.5 billion | | | 0 | .62% | | |
Next $2.5 billion | | | 0 | .595% | | |
Next $2.5 billion | | | 0 | .57% | | |
Next $2.5 billion | | | 0 | .545% | | |
Over $10 billion | | | 0 | .52% | | |
For the year ended April 30, 2016, the effective advisory fees incurred by the Fund was 0.67%.
Under the terms of a master sub-advisory agreement between the Adviser and each of Invesco Asset Management Deutschland GmbH, Invesco Asset Management Limited, Invesco Asset Management (Japan) Limited, Invesco Hong Kong Limited, Invesco Senior Secured Management, Inc. and Invesco Canada Ltd. (collectively, the “Affiliated Sub-Advisers”) the Adviser, not the Fund, may pay 40% of the fees paid to the Adviser to any such Affiliated Sub-Adviser(s) that provide(s) discretionary investment management services to the Fund based on the percentage of assets allocated to such Affiliated Sub-Adviser(s).
The Adviser has contractually agreed, through at least June 30, 2017, to waive advisory fees and/or reimburse expenses of all shares to the extent necessary to limit total annual fund operating expenses after fee waiver and/or expense reimbursement (excluding certain items discussed above) of Class A, Class B, Class C, Class R, Class Y and Class R5 shares to 2.00%, 2.75%, 2.75%, 2.25%, 1.75% and 1.75%, respectively, of average daily net assets (the “expense limits”). In determining the Adviser’s obligation to waive advisory fees and/or reimburse expenses, the following expenses are not taken into account, and could cause the total annual fund operating expenses after fee waiver and/or expense reimbursement to exceed the numbers reflected above: (1) interest; (2) taxes; (3) dividend expense on short sales; (4) extraordinary or non-routine items, including litigation expenses; and (5) expenses that the Fund has incurred but did not actually pay because of an expense offset arrangement. Unless Invesco continues the fee waiver agreement, it will terminate on June 30, 2017. During its term, the fee waiver agreement cannot be terminated or amended to increase the expense limits without approval of the Board of Trustees. The Adviser did not waive fees and/or reimburse expenses during the period under these expense limits.
Further, the Adviser has contractually agreed, through at least June 30, 2018, to waive the advisory fee payable by the Fund in an amount equal to 100% of the net advisory fees the Adviser receives from the affiliated money market funds on investments by the Fund of uninvested cash (excluding investments of cash collateral from securities lending) in such affiliated money market funds.
For the year ended April 30, 2016, the Adviser waived advisory fees of $38,550.
The Trust has entered into a master administrative services agreement with Invesco pursuant to which the Fund has agreed to pay Invesco for certain administrative costs incurred in providing accounting services to the Fund. For the year ended April 30, 2016, expenses incurred under the agreement are shown in the Statement of Operations as Administrative services fees.
The Trust has entered into a transfer agency and service agreement with Invesco Investment Services, Inc. (“IIS”) pursuant to which the Fund has agreed to pay IIS a fee for providing transfer agency and shareholder services to the Fund and reimburse IIS for certain expenses incurred by IIS in the course of providing such services. IIS may make payments to intermediaries that provide omnibus account services, sub-accounting services and/or networking services. All fees payable by IIS to intermediaries that provide omnibus account services or sub-accounting are charged back to the Fund,
17 Invesco Value Opportunities Fund
subject to certain limitations approved by the Trust’s Board of Trustees. For the year ended April 30, 2016, expenses incurred under the agreement are shown in the Statement of Operations as Transfer agent fees.
Shares of the Fund are distributed by Invesco Distributors, Inc. (“IDI”). The Fund has adopted a distribution plan pursuant to Rule 12b-1 under the 1940 Act, and a service plan (collectively, the “Plans”) for Class A, Class B, Class C and Class R shares to compensate IDI for the sale, distribution, shareholder servicing and maintenance of shareholder accounts for these shares. Under the Plans, the Fund will incur annual fees of up to 0.25% of Class A average daily net assets, up to 1.00% each of Class B and Class C average daily net assets and up to 0.50% of Class R average daily net assets.
With respect to Class B and Class C shares, the Fund is authorized to reimburse in future years any distribution related expenses that exceed the maximum annual reimbursement rate for such class, so long as such reimbursement does not cause the Fund to exceed the Class B and Class C maximum annual reimbursement rate, respectively. With respect to Class A shares, distribution related expenses that exceed the maximum annual reimbursement rate for such class are not carried forward to future years and the Fund will not reimburse IDI for any such expenses.
For the year ended April 30, 2016, expenses incurred under these agreements are shown in the Statement of Operations as Distribution fees.
Front-end sales commissions and CDSC (collectively, the “sales charges”) are not recorded as expenses of the Fund. Front-end sales commissions are deducted from proceeds from the sales of Fund shares prior to investment in Class A shares of the Fund. CDSC are deducted from redemption proceeds prior to remittance to the shareholder. During the year ended April 30, 2016, IDI advised the Fund that IDI retained $72,179 in front-end sales commissions from the sale of Class A shares and $335, $2,444 and $2,408 from Class A, Class B and Class C shares, respectively, for CDSC imposed on redemptions by shareholders.
For the year ended April 30, 2016, the Fund incurred $21,186 in brokerage commissions with Invesco Capital Markets, Inc., an affiliate of the Adviser and IDI, for portfolio transactions executed on behalf of the Fund.
Certain officers and trustees of the Trust are officers and directors of the Adviser, IIS and/or IDI.
NOTE 3—Additional Valuation Information
GAAP defines fair value as the price that would be received to sell an asset or paid to transfer a liability in an orderly transaction between market participants at the measurement date, under current market conditions. GAAP establishes a hierarchy that prioritizes the inputs to valuation methods, giving the highest priority to readily available unadjusted quoted prices in an active market for identical assets (Level 1) and the lowest priority to significant unobservable inputs (Level 3), generally when market prices are not readily available or are unreliable. Based on the valuation inputs, the securities or other investments are tiered into one of three levels. Changes in valuation methods may result in transfers in or out of an investment’s assigned level:
| | Level 1 — | Prices are determined using quoted prices in an active market for identical assets. |
| | Level 2 — | Prices are determined using other significant observable inputs. Observable inputs are inputs that other market participants may use in pricing a security. These may include quoted prices for similar securities, interest rates, prepayment speeds, credit risk, yield curves, loss severities, default rates, discount rates, volatilities and others. |
| | Level 3 — | Prices are determined using significant unobservable inputs. In situations where quoted prices or observable inputs are unavailable (for example, when there is little or no market activity for an investment at the end of the period), unobservable inputs may be used. Unobservable inputs reflect the Fund’s own assumptions about the factors market participants would use in determining fair value of the securities or instruments and would be based on the best available information. |
As of April 30, 2016, all of the securities in this Fund were valued based on Level 1 inputs (see the Schedule of Investments for security categories). The level assigned to the securities valuations may not be an indication of the risk or liquidity associated with investing in those securities. Because of the inherent uncertainties of valuation, the values reflected in the financial statements may materially differ from the value received upon actual sale of those investments.
NOTE 4—Security Transactions with Affiliated Funds
The Fund is permitted to purchase or sell securities from or to certain other Invesco Funds under specified conditions outlined in procedures adopted by the Board of Trustees of the Trust. The procedures have been designed to ensure that any purchase or sale of securities by the Fund from or to another fund or portfolio that is or could be considered an affiliate by virtue of having a common investment adviser (or affiliated investment advisers), common Trustees and/or common officers complies with Rule 17a-7 of the 1940 Act. Further, as defined under the procedures, each transaction is effected at the current market price. Pursuant to these procedures, for the year ended April 30, 2016, the Fund engaged in securities purchases of $890,412.
NOTE 5—Expense Offset Arrangement(s)
The expense offset arrangement is comprised of transfer agency credits which result from balances in demand deposit accounts used by the transfer agent for clearing shareholder transactions. For the year ended April 30, 2016, the Fund received credits from this arrangement, which resulted in the reduction of the Fund’s total expenses of $10,650.
NOTE 6—Trustees’ and Officers’ Fees and Benefits
Trustees’ and Officers’ Fees and Benefits include amounts accrued by the Fund to pay remuneration to certain Trustees and Officers of the Fund. Trustees have the option to defer compensation payable by the Fund, and Trustees’ and Officers’ Fees and Benefits also include amounts accrued by the Fund to fund such deferred compensation amounts. Those Trustees who defer compensation have the option to select various Invesco Funds in which their deferral accounts shall be deemed to be invested. Finally, certain current Trustees were eligible to participate in a retirement plan that provided for benefits to be paid upon retirement to Trustees over a period of time based on the number of years of service. The Fund may have certain former Trustees who also participate in a retirement plan and receive benefits under such plan. Trustees’ and Officers’ Fees and Benefits include amounts accrued by the Fund to fund such retirement benefits. Obligations under the deferred compensation and retirement plans represent unsecured claims against the general assets of the Fund.
18 Invesco Value Opportunities Fund
NOTE 7—Cash Balances
The Fund is permitted to temporarily carry a negative or overdrawn balance in its account with State Street Bank and Trust Company, the custodian bank. Such balances, if any at period-end, are shown in the Statement of Assets and Liabilities under the payable caption Amount due custodian. To compensate the custodian bank for such overdrafts, the overdrawn Fund may either (1) leave funds as a compensating balance in the account so the custodian bank can be compensated by earning the additional interest; or (2) compensate by paying the custodian bank at a rate agreed upon by the custodian bank and Invesco, not to exceed the contractually agreed upon rate.
NOTE 8—Distributions to Shareholders and Tax Components of Net Assets
Tax Character of Distributions to Shareholders Paid During the Fiscal Years Ended April 30, 2016 and 2015:
| | | | | | | | |
| | | 2016 | | | 2015 | |
Ordinary income | | $ | 12,428,409 | | | $ | 16,018,420 | |
Long-term capital gain | | | 95,510,527 | | | | — | |
Total distributions | | $ | 107,938,936 | | | $ | 16,018,420 | |
Tax Components of Net Assets at Period-End:
| | | | |
| | | 2016 | |
Undistributed ordinary income | | $ | 1,099,628 | |
Undistributed long-term gain | | | 8,571,375 | |
Net unrealized appreciation (depreciation) — investments | | | (34,178,365 | ) |
Net unrealized appreciation (depreciation) — other investments | | | (6,603 | ) |
Temporary book/tax differences | | | (553,611 | ) |
Capital loss carryforward | | | (2,864,143 | ) |
Post-October deferrals | | | (6,584,880 | ) |
Shares of beneficial interest | | | 793,169,597 | |
Total net assets | | $ | 758,652,998 | |
The difference between book-basis and tax-basis unrealized appreciation (depreciation) is due to differences in the timing of recognition of gains and losses on investments for tax and book purposes. The Fund’s net unrealized appreciation (depreciation) difference is attributable primarily to wash sales.
The temporary book/tax differences are a result of timing differences between book and tax recognition of income and/or expenses. The Fund’s temporary book/tax differences are the result of the trustee deferral of compensation and retirement plan benefits.
Capital loss carryforward is calculated and reported as of a specific date. Results of transactions and other activity after that date may affect the amount of capital loss carryforward actually available for the Fund to utilize. Capital losses generated in years beginning after December 22, 2010 can be carried forward for an unlimited period, whereas previous losses expire in eight tax years. Capital losses with an expiration period may not be used to offset capital gains until all net capital losses without an expiration date have been utilized. Capital loss carryforwards with no expiration date will retain their character as either short-term or long-term capital losses instead of as short-term capital losses as under prior law. The ability to utilize capital loss carryforwards in the future may be limited under the Internal Revenue Code and related regulations based on the results of future transactions.
The Fund has a capital loss carryforward as of April 30, 2016, which expires as follows:
| | | | | | | | | | | | |
| Capital Loss Carryforward* | |
| Expiration | | Short-Term | | | Long-Term | | | Total | |
April 30, 2017 | | $ | 2,864,143 | | | $ | — | | | $ | 2,864,143 | |
| * | Capital loss carryforward as of the date listed above is reduced for limitations, if any, to the extent required by the Internal Revenue Code and may be further limited depending upon a variety of factors, including the realization of net unrealized gains or losses as of the date of any reorganization. |
NOTE 9—Investment Securities
The aggregate amount of investment securities (other than short-term securities, U.S. Treasury obligations and money market funds, if any) purchased and sold by the Fund during the year ended April 30, 2016 was $300,265,948 and $384,312,728, respectively. Cost of investments on a tax basis includes the adjustments for financial reporting purposes as of the most recently completed federal income tax reporting period-end.
| | | | |
| Unrealized Appreciation (Depreciation) of Investment Securities on a Tax Basis | |
Aggregate unrealized appreciation of investment securities | | $ | 56,577,260 | |
Aggregate unrealized (depreciation) of investment securities | | | (90,755,625 | ) |
Net unrealized appreciation (depreciation) of investment securities | | $ | (34,178,365 | ) |
Cost of investments for tax purposes is $790,372,548.
19 Invesco Value Opportunities Fund
NOTE 10—Reclassification of Permanent Differences
Primarily as a result of differing book/tax treatment of foreign currency transactions and fair fund distribution transactions, on April 30, 2016, undistributed net investment income was increased by $248,919 and undistributed net realized gain (loss) was decreased by $248,919. This reclassification had no effect on the net assets of the Fund.
NOTE 11—Share Information
| | | | | | | | | | | | | | | | |
| | | Summary of Share Activity | |
| | | Years ended April 30, | |
| | | 2016(a) | | | 2015 | |
| | | Shares | | | Amount | | | Shares | | | Amount | |
Sold: | | | | | | | | | | | | | | | | |
Class A | | | 2,354,104 | | | $ | 29,329,291 | | | | 2,716,314 | | | $ | 39,457,272 | |
Class B | | | 38,022 | | | | 469,743 | | | | 36,886 | | | | 531,104 | |
Class C | | | 337,380 | | | | 4,092,825 | | | | 337,383 | | | | 4,782,840 | |
Class R | | | 143,054 | | | | 1,807,758 | | | | 201,018 | | | | 2,906,789 | |
Class Y | | | 471,386 | | | | 5,672,449 | | | | 758,929 | | | | 11,122,721 | |
Class R5 | | | 46,312 | | | | 533,045 | | | | 210,209 | | | | 3,034,929 | |
| | | | |
Issued as reinvestment of dividends: | | | | | | | | | | | | | | | | |
Class A | | | 7,433,854 | | | | 83,482,158 | | | | 899,684 | | | | 12,613,579 | |
Class B | | | 262,715 | | | | 2,900,373 | | | | 42,307 | | | | 584,677 | |
Class C | | | 984,865 | | | | 10,705,485 | | | | 73,038 | | | | 1,000,620 | |
Class R | | | 204,428 | | | | 2,287,553 | | | | 23,529 | | | | 329,406 | |
Class Y | | | 226,316 | | | | 2,530,214 | | | | 31,795 | | | | 443,860 | |
Class R5 | | | 30,075 | | | | 337,140 | | | | 7,761 | | | | 108,425 | |
| | | | |
Automatic conversion of Class B shares to Class A shares: | | | | | | | | | | | | | | | | |
Class A | | | 538,406 | | | | 6,646,266 | | | | 635,219 | | | | 9,274,242 | |
Class B | | | (547,070 | ) | | | (6,646,266 | ) | | | (644,532 | ) | | | (9,274,242 | ) |
| | | | |
Reacquired: | | | | | | | | | | | | | | | | |
Class A | | | (8,893,592 | ) | | | (110,982,972 | ) | | | (8,885,952 | ) | | | (129,278,067 | ) |
Class B | | | (284,478 | ) | | | (3,497,121 | ) | | | (331,153 | ) | | | (4,768,158 | ) |
Class C | | | (1,326,216 | ) | | | (15,968,642 | ) | | | (1,072,227 | ) | | | (15,190,067 | ) |
Class R | | | (387,712 | ) | | | (4,902,008 | ) | | | (425,240 | ) | | | (6,147,096 | ) |
Class Y | | | (429,510 | ) | | | (5,328,735 | ) | | | (385,923 | ) | | | (5,610,532 | ) |
Class R5 | | | (35,493 | ) | | | (451,499 | ) | | | (169,277 | ) | | | (2,467,735 | ) |
Net increase (decrease) in share activity | | | 1,166,846 | | | $ | 3,017,057 | | | | (5,940,232 | ) | | $ | (86,545,433 | ) |
| (a) | There are entities that are record owners of more than 5% of the outstanding shares of the Fund and in the aggregate own 27% of the outstanding shares of the Fund. IDI has an agreement with these entities to sell Fund shares. The Fund, Invesco and/or Invesco affiliates may make payments to these entities, which are considered to be related to the Fund, for providing services to the Fund, Invesco and/or Invesco affiliates including but not limited to services such as securities brokerage, distribution, third party record keeping and account servicing. The Fund has no knowledge as to whether all or any portion of the shares owned of record by these entities are also owned beneficially. |
20 Invesco Value Opportunities Fund
NOTE 12—Financial Highlights
The following schedule presents financial highlights for a share of the Fund outstanding throughout the periods indicated.
| | | | | | | | | | | | | | | | | | | | | | | | | | | | | | | | | | | | | | | | | | | | | | | | | | | | | | | | |
| | | Net asset
value,
beginning
of period | | | Net
investment
income
(loss)(a) | | | Net gains
(losses)
on securities
(both
realized and
unrealized) | | | Total from
investment
operations | | | Dividends
from net
investment
income | | | Distributions
from net
realized
gains | | | Total
distributions | | | Net asset
value, end
of period | | | Total
return(b) | | | Net assets,
end of period
(000’s omitted) | | | Ratio of
expenses
to average
net assets
with fee waivers
and/or expenses
absorbed | | | Ratio of
expenses
to average net
assets without
fee waivers
and/or expenses
absorbed | | | Ratio of net
investment
income (loss)
to average
net assets | | | Portfolio
turnover(c) | |
Class A | |
Year ended 04/30/16 | | $ | 14.45 | | | $ | 0.02 | | | $ | (1.08 | ) | | $ | (1.06 | ) | | $ | (0.13 | ) | | $ | (1.66 | ) | | $ | (1.79 | ) | | $ | 11.60 | | | | (6.93 | )% | | $ | 622,026 | | | | 1.25 | %(d) | | | 1.25 | %(d) | | | 0.17 | %(d) | | | 38 | % |
Year ended 04/30/15 | | | 14.24 | | | | 0.13 | | | | 0.33 | | | | 0.46 | | | | (0.25 | ) | | | — | | | | (0.25 | ) | | | 14.45 | | | | 3.29 | | | | 754,084 | | | | 1.22 | | | | 1.23 | | | | 0.88 | | | | 64 | |
Year ended 04/30/14 | | | 11.97 | | | | 0.23 | (e) | | | 2.18 | | | | 2.41 | | | | (0.14 | ) | | | — | | | | (0.14 | ) | | | 14.24 | | | | 20.21 | | | | 809,243 | | | | 1.23 | | | | 1.24 | | | | 1.71 | (e) | | | 16 | |
Year ended 04/30/13 | | | 10.24 | | | | 0.12 | | | | 1.72 | | | | 1.84 | | | | (0.10 | ) | | | (0.01 | ) | | | (0.11 | ) | | | 11.97 | | | | 18.15 | | | | 749,819 | | | | 1.26 | | | | 1.27 | | | | 1.14 | | | | 15 | |
Year ended 04/30/12 | | | 10.18 | | | | 0.09 | | | | (0.03 | ) | | | 0.06 | | | | (0.00 | ) | | | — | | | | (0.00 | ) | | | 10.24 | | | | 0.60 | | | | 740,384 | | | | 1.40 | | | | 1.40 | | | | 0.92 | | | | 46 | |
Class B | | | | | | | | | | | | | | | | | | | | | | | | | | | | | | | | | | | | | | | | | | | | | | | | | | | | | | | | |
Year ended 04/30/16 | | | 14.24 | | | | 0.02 | | | | (1.07 | ) | | | (1.05 | ) | | | (0.13 | ) | | | (1.66 | ) | | | (1.79 | ) | | | 11.40 | | | | (6.97 | )(f) | | | 17,105 | | | | 1.25 | (d)(f) | | | 1.25 | (d)(f) | | | 0.17 | (d)(f) | | | 38 | |
Year ended 04/30/15 | | | 14.03 | | | | 0.13 | | | | 0.33 | | | | 0.46 | | | | (0.25 | ) | | | — | | | | (0.25 | ) | | | 14.24 | | | | 3.34 | (f) | | | 28,912 | | | | 1.22 | (f) | | | 1.23 | (f) | | | 0.88 | (f) | | | 64 | |
Year ended 04/30/14 | | | 11.80 | | | | 0.22 | (e) | | | 2.15 | | | | 2.37 | | | | (0.14 | ) | | | — | | | | (0.14 | ) | | | 14.03 | | | | 20.16 | (f) | | | 41,084 | | | | 1.23 | (f) | | | 1.24 | (f) | | | 1.71 | (e)(f) | | | 16 | |
Year ended 04/30/13 | | | 10.09 | | | | 0.12 | | | | 1.70 | | | | 1.82 | | | | (0.10 | ) | | | (0.01 | ) | | | (0.11 | ) | | | 11.80 | | | | 18.25 | (f) | | | 50,968 | | | | 1.26 | (f) | | | 1.27 | (f) | | | 1.14 | (f) | | | 15 | |
Year ended 04/30/12 | | | 10.04 | | | | 0.09 | | | | (0.04 | ) | | | 0.05 | | | | — | | | | — | | | | — | | | | 10.09 | | | | 0.50 | (f) | | | 67,547 | | | | 1.38 | (f) | | | 1.38 | (f) | | | 0.94 | (f) | | | 46 | |
Class C | |
Year ended 04/30/16 | | | 14.07 | | | | (0.07 | ) | | | (1.05 | ) | | | (1.12 | ) | | | (0.09 | ) | | | (1.66 | ) | | | (1.75 | ) | | | 11.20 | | | | (7.57 | )(f) | | | 79,538 | | | | 1.97 | (d)(g) | | | 1.97 | (d)(g) | | | (0.55 | )(d)(g) | | | 38 | |
Year ended 04/30/15 | | | 13.87 | | | | 0.02 | | | | 0.33 | | | | 0.35 | | | | (0.15 | ) | | | — | | | | (0.15 | ) | | | 14.07 | | | | 2.53 | (f) | | | 99,994 | | | | 1.95 | (g) | | | 1.96 | (g) | | | 0.15 | (g) | | | 64 | |
Year ended 04/30/14 | | | 11.67 | | | | 0.13 | (e) | | | 2.13 | | | | 2.26 | | | | (0.06 | ) | | | — | | | | (0.06 | ) | | | 13.87 | | | | 19.38 | (f) | | | 107,754 | | | | 1.94 | (g) | | | 1.95 | (g) | | | 1.00 | (e)(g) | | | 16 | |
Year ended 04/30/13 | | | 9.99 | | | | 0.05 | | | | 1.67 | | | | 1.72 | | | | (0.03 | ) | | | (0.01 | ) | | | (0.04 | ) | | | 11.67 | | | | 17.26 | (f) | | | 101,772 | | | | 1.96 | (g) | | | 1.97 | (g) | | | 0.44 | (g) | | | 15 | |
Year ended 04/30/12 | | | 10.00 | | | | 0.02 | | | | (0.03 | ) | | | (0.01 | ) | | | — | | | | — | | | | — | | | | 9.99 | | | | (0.10 | )(f) | | | 101,785 | | | | 2.11 | (g) | | | 2.11 | (g) | | | 0.21 | (g) | | | 46 | |
Class R | |
Year ended 04/30/16 | | | 14.41 | | | | (0.01 | ) | | | (1.07 | ) | | | (1.08 | ) | | | (0.12 | ) | | | (1.66 | ) | | | (1.78 | ) | | | 11.55 | | | | (7.12 | ) | | | 16,119 | | | | 1.50 | (d) | | | 1.50 | (d) | | | (0.08 | )(d) | | | 38 | |
Year ended 04/30/15 | | | 14.20 | | | | 0.09 | | | | 0.33 | | | | 0.42 | | | | (0.21 | ) | | | — | | | | (0.21 | ) | | | 14.41 | | | | 3.03 | | | | 20,696 | | | | 1.47 | | | | 1.48 | | | | 0.63 | | | | 64 | |
Year ended 04/30/14 | | | 11.94 | | | | 0.19 | (e) | | | 2.18 | | | | 2.37 | | | | (0.11 | ) | | | — | | | | (0.11 | ) | | | 14.20 | | | | 19.91 | | | | 23,247 | | | | 1.48 | | | | 1.49 | | | | 1.46 | (e) | | | 16 | |
Year ended 04/30/13 | | | 10.22 | | | | 0.09 | | | | 1.72 | | | | 1.81 | | | | (0.08 | ) | | | (0.01 | ) | | | (0.09 | ) | | | 11.94 | | | | 17.80 | | | | 20,272 | | | | 1.51 | | | | 1.52 | | | | 0.89 | | | | 15 | |
Year ended 04/30/12(h) | | | 9.89 | | | | 0.07 | | | | 0.26 | | | | 0.33 | | | | (0.00 | ) | | | — | | | | (0.00 | ) | | | 10.22 | | | | 3.35 | | | | 19,599 | | | | 1.65 | (i) | | | 1.65 | (i) | | | 0.67 | (i) | | | 46 | |
Class Y | |
Year ended 04/30/16 | | | 14.39 | | | | 0.05 | | | | (1.08 | ) | | | (1.03 | ) | | | (0.14 | ) | | | (1.66 | ) | | | (1.80 | ) | | | 11.56 | | | | (6.71 | ) | | | 21,016 | | | | 1.00 | (d) | | | 1.00 | (d) | | | 0.42 | (d) | | | 38 | |
Year ended 04/30/15 | | | 14.21 | | | | 0.16 | | | | 0.33 | | | | 0.49 | | | | (0.31 | ) | | | — | | | | (0.31 | ) | | | 14.39 | | | | 3.55 | | | | 22,295 | | | | 0.97 | | | | 0.98 | | | | 1.13 | | | | 64 | |
Year ended 04/30/14 | | | 11.94 | | | | 0.26 | (e) | | | 2.18 | | | | 2.44 | | | | (0.17 | ) | | | — | | | | (0.17 | ) | | | 14.21 | | | | 20.53 | | | | 16,266 | | | | 0.98 | | | | 0.99 | | | | 1.96 | (e) | | | 16 | |
Year ended 04/30/13 | | | 10.22 | | | | 0.15 | | | | 1.71 | | | | 1.86 | | | | (0.13 | ) | | | (0.01 | ) | | | (0.14 | ) | | | 11.94 | | | | 18.39 | | | | 12,799 | | | | 1.01 | | | | 1.02 | | | | 1.39 | | | | 15 | |
Year ended 04/30/12 | | | 10.14 | | | | 0.11 | | | | (0.03 | ) | | | 0.08 | | | | (0.00 | ) | | | — | | | | (0.00 | ) | | | 10.22 | | | | 0.80 | | | | 11,424 | | | | 1.15 | | | | 1.15 | | | | 1.17 | | | | 46 | |
Class R5 | |
Year ended 04/30/16 | | | 14.42 | | | | 0.08 | | | | (1.09 | ) | | | (1.01 | ) | | | (0.15 | ) | | | (1.66 | ) | | | (1.81 | ) | | | 11.60 | | | | (6.56 | ) | | | 2,850 | | | | 0.84 | (d) | | | 0.84 | (d) | | | 0.58 | (d) | | | 38 | |
Year ended 04/30/15 | | | 14.25 | | | | 0.19 | | | | 0.33 | | | | 0.52 | | | | (0.35 | ) | | | — | | | | (0.35 | ) | | | 14.42 | | | | 3.76 | | | | 2,952 | | | | 0.82 | | | | 0.83 | | | | 1.28 | | | | 64 | |
Year ended 04/30/14 | | | 11.99 | | | | 0.28 | (e) | | | 2.18 | | | | 2.46 | | | | (0.20 | ) | | | — | | | | (0.20 | ) | | | 14.25 | | | | 20.67 | | | | 2,225 | | | | 0.81 | | | | 0.82 | | | | 2.13 | (e) | | | 16 | |
Year ended 04/30/13 | | | 10.26 | | | | 0.18 | | | | 1.73 | | | | 1.91 | | | | (0.17 | ) | | | (0.01 | ) | | | (0.18 | ) | | | 11.99 | | | | 18.82 | | | | 2,029 | | | | 0.73 | | | | 0.74 | | | | 1.67 | | | | 15 | |
Year ended 04/30/12(h) | | | 9.85 | | | | 0.14 | | | | 0.27 | | | | 0.41 | | | | (0.00 | ) | | | — | | | | (0.00 | ) | | | 10.26 | | | | 4.18 | | | | 4,040 | | | | 0.81 | (i) | | | 0.81 | (i) | | | 1.51 | (i) | | | 46 | |
| (a) | Calculated using average shares outstanding. |
| (b) | Includes adjustments in accordance with accounting principles generally accepted in the United States of America and as such, the net asset value for financial reporting purposes and the returns based upon those net asset values may differ from the net asset value and returns for shareholder transactions. Does not include sales charges and is not annualized for periods less than one year, if applicable. |
| (c) | Portfolio turnover is calculated at the fund level and is not annualized for periods less than one year, if applicable. For the period ended April 30, 2012, the portfolio turnover calculation excludes the value of securities purchased of $846,280,438 and sold of $257,706,685 in the effort to realign the Fund’s portfolio holdings after the reorganization of Invesco Basic Value Fund into the Fund. |
| (d) | Ratios are based on average daily net assets (000’s omitted) of $666,141, $22,825, $87,489, $17,978, $20,859 and $2,579 for Class A, Class B, Class C, Class R, Class Y and Class R5 shares, respectively. |
| (e) | Net investment income (loss) per share and the ratio of net investment income (loss) to average net assets includes significant dividends received during the period. Net investment income (loss) per share and the ratio of net investment income (loss) to average net assets excluding the significant dividends are $0.15 and 1.07%, $0.14 and 1.07%, $0.05 and 0.36%, $0.11 and 0.82%, $0.18 and 1.32% and $0.20 and 1.49% for Class A, Class B, Class C, Class R, Class Y and Class R5 shares, respectively. |
| (f) | The total return, ratio of expenses to average net assets and ratio of net investment income (loss) to average net assets reflect actual 12b-1 fees of 0.25%, 0.25%, 0.25%, 0.25% and 0.23% for the years ended April 30, 2016, 2015, 2014, 2013 and 2012, respectively. |
| (g) | The total return, ratio of expenses to average net assets and ratio of net investment income (loss) to average net assets reflect actual 12b-1 fees of 0.97%, 0.98%, 0.96%, 0.95% and 0.96% for the years ended April 30, 2016, 2015, 2014, 2013 and 2012, respectively. |
| (h) | Commencement date of May 23, 2011. |
21 Invesco Value Opportunities Fund
Report of Independent Registered Public Accounting Firm
To the Board of Trustees of AIM Sector Funds (Invesco Sector Funds)
and Shareholders of Invesco Value Opportunities Fund:
In our opinion, the accompanying statement of assets and liabilities, including the schedule of investments, and the related statements of operations and of changes in net assets and the financial highlights present fairly, in all material respects, the financial position of Invesco Value Opportunities Fund (one of the funds constituting AIM Sector Funds (Invesco Sector Funds), hereafter referred to as the “Fund”) at April 30, 2016, the results of its operations for the year then ended, the changes in its net assets for each of the two years in the period then ended and the financial highlights for each of the five years in the period then ended, in conformity with accounting principles generally accepted in the United States of America. These financial statements and financial highlights (hereafter referred to as “financial statements”) are the responsibility of the Fund’s management; our responsibility is to express an opinion on these financial statements based on our audits. We conducted our audits of these financial statements in accordance with the standards of the Public Company Accounting Oversight Board (United States). Those standards require that we plan and perform the audit to obtain reasonable assurance about whether the financial statements are free of material misstatement. An audit includes examining, on a test basis, evidence supporting the amounts and disclosures in the financial statements, assessing the accounting principles used and significant estimates made by management, and evaluating the overall financial statement presentation. We believe that our audits, which included confirmation of securities at April 30, 2016 by correspondence with the custodian and brokers, and the application of alternative auditing procedures where confirmations of security purchases have not been received, provide a reasonable basis for our opinion.
PRICEWATERHOUSECOOPERS LLP
June 22, 2016
Houston, Texas
22 Invesco Value Opportunities Fund
Calculating your ongoing Fund expenses
Example
As a shareholder of the Fund, you incur two types of costs: (1) transaction costs, which may include sales charges (loads) on purchase payments or contingent deferred sales charges on redemptions, if any; and (2) ongoing costs, including management fees, distribution and/or service (12b-1) fees, and other Fund expenses. This example is intended to help you understand your ongoing costs (in dollars) of investing in the Fund and to compare these costs with ongoing costs of investing in other mutual funds. The example is based on an investment of $1,000 invested at the beginning of the period and held for the entire period November 1, 2015 through April 30, 2016.
Actual expenses
The table below provides information about actual account values and actual expenses. You may use the information in this table, together with the amount you invested, to estimate the expenses that you paid over the period. Simply divide your account value by $1,000 (for example, an $8,600 account value divided by $1,000 = 8.6), then multiply the result by the number in the table under the heading entitled “Actual Expenses Paid During Period” to estimate the expenses you paid on your account during this period.
Hypothetical example for comparison purposes
The table below also provides information about hypothetical account values and hypothetical expenses based on the Fund’s actual expense ratio and an assumed rate of return of 5% per year before expenses, which is not the Fund’s actual return.
The hypothetical account values and expenses may not be used to estimate the actual ending account balance or expenses you paid for the period. You may use this information to compare the ongoing costs of investing in the Fund and other funds. To do so, compare this 5% hypothetical example with the 5% hypothetical examples that appear in the shareholder reports of the other funds.
Please note that the expenses shown in the table are meant to highlight your ongoing costs only and do not reflect any transaction costs, such as sales charges (loads) on purchase payments or contingent deferred sales charges on redemptions, if any. Therefore, the hypothetical information is useful in comparing ongoing costs only, and will not help you determine the relative total costs of owning different funds. In addition, if these transaction costs were included, your costs would have been higher.
| | | | | | | | | | | | | | | | | | | | | | | | |
| Class | | Beginning
Account Value
(11/01/15) | | | ACTUAL | | | HYPOTHETICAL (5% annual return before
expenses) | | | Annualized
Expense
Ratio | |
| | | Ending
Account Value
(04/30/16)1 | | | Expenses
Paid During
Period2 | | | Ending
Account Value
(04/30/16) | | | Expenses
Paid During
Period2 | | |
| A | | $ | 1,000.00 | | | $ | 974.60 | | | $ | 6.28 | | | $ | 1,018.50 | | | $ | 6.42 | | | | 1.28 | % |
| B | | | 1,000.00 | | | | 974.10 | | | | 6.28 | | | | 1,018.50 | | | | 6.42 | | | | 1.28 | |
| C | | | 1,000.00 | | | | 970.50 | | | | 9.90 | | | | 1,014.82 | | | | 10.12 | | | | 2.02 | |
| R | | | 1,000.00 | | | | 973.40 | | | | 7.51 | | | | 1,017.26 | | | | 7.67 | | | | 1.53 | |
| Y | | | 1,000.00 | | | | 974.90 | | | | 5.06 | | | | 1,019.74 | | | | 5.17 | | | | 1.03 | |
| R5 | | | 1,000.00 | | | | 976.40 | | | | 4.18 | | | | 1,020.64 | | | | 4.27 | | | | 0.85 | |
| 1 | The actual ending account value is based on the actual total return of the Fund for the period November 1, 2015 through April 30, 2016, after actual expenses and will differ from the hypothetical ending account value which is based on the Fund’s expense ratio and a hypothetical annual return of 5% before expenses. |
| 2 | Expenses are equal to the Fund’s annualized expense ratio as indicated above multiplied by the average account value over the period, multiplied by 182/366 to reflect the most recent fiscal half year. |
23 Invesco Value Opportunities Fund
Tax Information
Form 1099-DIV, Form 1042-S and other year-end tax information provide shareholders with actual calendar year amounts that should be included in their tax returns. Shareholders should consult their tax advisors.
The following distribution information is being provided as required by the Internal Revenue Code or to meet a specific state’s requirement.
The Fund designates the following amounts or, if subsequently determined to be different, the maximum amount allowable for its fiscal year ended April 30, 2016:
| | | | |
Federal and State Income Tax | |
Long-Term Capital Gain Distributions | | $ | 95,510,527 | |
Qualified Dividend Income* | | | 100 | % |
Corporate Dividends Received Deduction* | | | 100 | % |
U.S. Treasury Obligations* | | | 0 | % |
| | * | The above percentages are based on ordinary income dividends paid to shareholders during the Fund’s fiscal year. |
| | | | |
Non-Resident Alien Shareholders | |
Qualified Short-Term Gains | | $ | 4,814,193 | |
24 Invesco Value Opportunities Fund
Trustees and Officers
The address of each trustee and officer is AIM Sector Funds (Invesco Sector Funds) (the “Trust”), 11 Greenway Plaza, Suite 1000, Houston, Texas 77046-1173. The trustees serve for the life of the Trust, subject to their earlier death, incapacitation, resignation, retirement or removal as more specifically provided in the Trust’s organizational documents. Each officer serves for a one year term or until their successors are elected and qualified. Column two below includes length of time served with predecessor entities, if any.
| | | | | | | | |
Name, Year of Birth and
Position(s) Held with the Trust | | Trustee and/
or Officer Since | | Principal Occupation(s) During Past 5 Years | | Number of Funds in Fund Complex Overseen by Trustee | | Other Directorship(s) Held by Trustee During Past 5 Years |
| Interested Persons | | | | | | | | |
Martin L. Flanagan1 — 1960 Trustee | | 2007 | | Executive Director, Chief Executive Officer and President, Invesco Ltd. (ultimate parent of Invesco and a global investment management firm); Advisor to the Board, Invesco Advisers, Inc. (formerly known as Invesco Institutional (N.A.), Inc.); Trustee, The Invesco Funds; Vice Chair, Investment Company Institute; and Member of Executive Board, SMU Cox School of Business Formerly: Chairman and Chief Executive Officer, Invesco Advisers, Inc. (registered investment adviser); Director, Chairman, Chief Executive Officer and President, IVZ Inc. (holding company), INVESCO Group Services, Inc. (service provider) and Invesco North American Holdings, Inc. (holding company); Director, Chief Executive Officer and President, Invesco Holding Company Limited (parent of Invesco and a global investment management firm); Director, Invesco Ltd.; Chairman, Investment Company Institute and President, Co-Chief Executive Officer, Co-President, Chief Operating Officer and Chief Financial Officer, Franklin Resources, Inc. (global investment management organization) | | 146 | | None |
Philip A. Taylor2 — 1954 Trustee and Senior Vice President | | 2006 | | Head of the Americas and Senior Managing Director, Invesco Ltd.; Director, Co-Chairman, Co-President and Co-Chief Executive Officer, Invesco Advisers, Inc. (formerly known as Invesco Institutional (N.A.), Inc.) (registered investment adviser); Director, Chairman, Chief Executive Officer and President, Invesco Management Group, Inc. (formerly known as Invesco AIM Management Group, Inc.) (financial services holding company); Director and Chairman, Invesco Investment Services, Inc. (formerly known as Invesco AIM Investment Services, Inc.) (registered transfer agent) Chief Executive Officer, Invesco Corporate Class Inc. (corporate mutual fund company) Director, Chairman and Chief Executive Officer, Invesco Canada Ltd. (formerly known as Invesco Trimark Ltd./Invesco Trimark Ltèe) (registered investment adviser and registered transfer agent); Trustee and Senior Vice President, The Invesco Funds; Director, Invesco Investment Advisers LLC (formerly known as Van Kampen Asset Management); Director, Chief Executive Officer and President, Van Kampen Exchange Corp. Formerly: President and Principal Executive Officer, The Invesco Funds (other than AIM Treasurer’s Series Trust (Invesco Treasurer’s Series Trust), Short-Term Investments Trust and Invesco Management Trust); Executive Vice President, The Invesco Funds (AIM Treasurer’s Series Trust (Invesco Treasurer’s Series Trust), Short-Term Investments Trust and Invesco Management Trust only); Director and President, INVESCO Funds Group, Inc. (registered investment adviser and registered transfer agent); Director and Chairman, IVZ Distributors, Inc. (formerly known as INVESCO Distributors, Inc.) (registered broker dealer); Director, President and Chairman, Invesco Inc. (holding company), Invesco Canada Holdings Inc. (holding company), Trimark Investments Ltd./Placements Trimark Ltèe and Invesco Financial Services Ltd/Services Financiers Invesco Ltèe; Chief Executive Officer, Invesco Canada Fund Inc. (corporate mutual fund company); Director and Chairman, Van Kampen Investor Services Inc.; Director, Chief Executive Officer and President, 1371 Preferred Inc. (holding company) and Van Kampen Investments Inc.; Director and President, AIM GP Canada Inc. (general partner for limited partnerships) and Van Kampen Advisors, Inc.; Director and Chief Executive Officer, Invesco Trimark Dealer Inc. (registered broker dealer); Director, Invesco Distributors, Inc. (formerly known as Invesco AIM Distributors, Inc.) (registered broker dealer); Manager, Invesco PowerShares Capital Management LLC; Director, Chief Executive Officer and President, Invesco Advisers, Inc.; Director, Chairman, Chief Executive Officer and President, Invesco AIM Capital Management, Inc.; President, Invesco Trimark Dealer Inc. and Invesco Trimark Ltd./Invesco Trimark Ltèe; Director and President, AIM Trimark Corporate Class Inc. and AIM Trimark Canada Fund Inc.; Senior Managing Director, Invesco Holding Company Limited; Director and Chairman, Fund Management Company (former registered broker dealer); President and Principal Executive Officer, The Invesco Funds (AIM Treasurer’s Series Trust (Invesco Treasurer’s Series Trust), and Short-Term Investments Trust only); President, AIM Trimark Global Fund Inc. and AIM Trimark Canada Fund Inc. | | 146 | | None |
| 1 | Mr. Flanagan is considered an interested person (within the meaning of Section 2(a)(19) of the 1940 Act) of the Trust because he is an officer of the Adviser to the Trust, and an officer and a director of Invesco Ltd., ultimate parent of the Adviser. |
| 2 | Mr. Taylor is considered an interested person (within the meaning of Section 2(a)(19) of the 1940 Act) of the Trust because he is an officer and a director of the Adviser. |
T-1 Invesco Value Opportunities Fund
Trustees and Officers—(continued)
| | | | | | | | |
Name, Year of Birth and
Position(s) Held with the Trust | | Trustee and/
or Officer Since | | Principal Occupation(s) During Past 5 Years | | Number of Funds in Fund Complex Overseen by Trustee | | Other Directorship(s) Held by Trustee During Past 5 Years |
| Independent Trustees | | | | | | | | |
Bruce L. Crockett — 1944 Trustee and Chair | | 2003 | | Chairman, Crockett Technologies Associates (technology consulting company) Formerly: Director, Captaris (unified messaging provider); Director, President and Chief Executive Officer, COMSAT Corporation; Chairman, Board of Governors of INTELSAT (international communications company); ACE Limited (insurance company); Independent Directors Council and Investment Company Institute | | 146 | | ALPS (Attorneys Liability Protection Society) (insurance company) and Globe Specialty Metals, Inc. (metallurgical company); Member of the Audit Committee, Ferroglobe PLC and Investment Company Institute; Member of the Executive Committee and Chair of the Governance Committee, Independent Directors Council |
David C. Arch — 1945 Trustee | | 2010 | | Chairman of Blistex Inc., a consumer health care products manufacturer | | 146 | | Board member of the Illinois Manufacturers’ Association; Member of the Board of Visitors, Institute for the Humanities, University of Michigan |
James T. Bunch — 1942 Trustee | | 2000 | | Managing Member, Grumman Hill Group LLC (family office/private equity investments) Formerly: Chairman of the Board, Denver Film Society, Chairman of the Board of Trustees, Evans Scholarship Foundation; Chairman, Board of Governors, Western Golf Association | | 146 | | Trustee, Evans Scholarship Foundation |
Albert R. Dowden — 1941 Trustee | | 2003 | | Director of a number of public and private business corporations, including Nature’s Sunshine Products, Inc. Formerly: Director, The Boss Group, Ltd. and Reich & Tang Funds (5 portfolios) (registered investment company); Director, Homeowners of America Holding Corporation/Homeowners of America Insurance Company (property casualty company); Director, Continental Energy Services, LLC (oil and gas pipeline service); Director, CompuDyne Corporation (provider of product and services to the public security market) and Director, Annuity and Life Re (Holdings), Ltd. (reinsurance company); Director, President and Chief Executive Officer, Volvo Group North America, Inc.; Senior Vice President, AB Volvo; Director of various public and private corporations; Chairman, DHJ Media, Inc.; Director, Magellan Insurance Company; and Director, The Hertz Corporation, Genmar Corporation (boat manufacturer), National Media Corporation; Advisory Board of Rotary Power International (designer, manufacturer, and seller of rotary power engines); and Chairman, Cortland Trust, Inc. (registered investment company) | | 146 | | Director of Nature’s Sunshine Products, Inc. |
Jack M. Fields — 1952 Trustee | | 2003 | | Chief Executive Officer, Twenty First Century Group, Inc. (government affairs company); and Discovery Learning Alliance (non-profit) Formerly: Owner and Chief Executive Officer, Dos Angeles Ranch L.P. (cattle, hunting, corporate entertainment); Director, Insperity, Inc. (formerly known as Administaff); Chief Executive Officer, Texana Timber LP (sustainable forestry company); Director of Cross Timbers Quail Research Ranch (non-profit); and member of the U.S. House of Representatives | | 146 | | None |
Eli Jones — 1961 Trustee | | 2016 | | Professor and Dean, Mays Business School — Texas A&M University Formerly: Professor and Dean, Walton College of Business, University of Arkansas and E.J. Ourso College of Business, Louisiana State University and Director, Arvest Bank | | 146 | | Director of Insperity, Inc. (formerly known as Administaff) |
Prema Mathai-Davis — 1950 Trustee | | 2003 | | Retired. Formerly: Chief Executive Officer, YWCA of the U.S.A. | | 146 | | None |
Larry Soll — 1942 Trustee | | 1997 | | Retired. Formerly: Chairman, Chief Executive Officer and President, Synergen Corp. (a biotechnology company) | | 146 | | None |
Raymond Stickel, Jr. — 1944 Trustee | | 2005 | | Retired. Formerly: Director, Mainstay VP Series Funds, Inc. (25 portfolios) and Partner, Deloitte & Touche | | 146 | | None |
Robert C. Troccoli — 1949 Trustee | | 2016 | | Adjunct Professor and Executive-in-Residence, University of Denver — Daniels College of Business Formerly: Senior Partner, KPMG LLP | | 146 | | None |
T-2 Invesco Value Opportunities Fund
Trustees and Officers—(continued)
| | | | | | | | |
Name, Year of Birth and
Position(s) Held with the Trust | | Trustee and/
or Officer Since | | Principal Occupation(s) During Past 5 Years | | Number of Funds in Fund Complex Overseen by Trustee | | Other Directorship(s) Held by Trustee During Past 5 Years |
| Independent Trustees—(continued) |
Suzanne H. Woolsey — 1941 Trustee | | 2014 | | Retired. Formerly: Chief Executive Officer of Woolsey Partners LLC | | 146 | | Director, SunShare LLC; Trustee, Ocean Conservancy; Emeritus Chair of the Board of Trustees of the Institute for Defense Analyses and of Colorado College; Trustee, Chair, Business and Finance Committee of California Institute of Technology; Prior to 2014, Director of Fluor Corp.; Prior to 2010, Trustee of the German Marshall Fund of the United States; Prior to 2010, Trustee of the Rocky Mountain Institute |
| Other Officers | | | | | | | | |
Sheri Morris — 1964 President, Principal Executive Officer and Treasurer | | 2003 | | President, Principal Executive Officer and Treasurer, The Invesco Funds; Vice President, Invesco Advisers, Inc. (formerly known as Invesco Institutional (N.A.), Inc.) (registered investment adviser); and Vice President, PowerShares Exchange-Traded Fund Trust, PowerShares Exchange-Traded Fund Trust II, PowerShares India Exchange-Traded Fund Trust, PowerShares Actively Managed Exchange-Traded Fund Trust, and PowerShares Actively Managed Exchange-Traded Commodity Fund Trust Formerly: Vice President and Principal Financial Officer, The Invesco Funds; Vice President, Invesco AIM Advisers, Inc., Invesco AIM Capital Management, Inc. and Invesco AIM Private Asset Management, Inc.; Assistant Vice President and Assistant Treasurer, The Invesco Funds and Assistant Vice President, Invesco Advisers, Inc., Invesco AIM Capital Management, Inc. and Invesco AIM Private Asset Management, Inc.; and Treasurer, PowerShares Exchange-Traded Fund Trust, PowerShares Exchange-Traded Fund Trust II, PowerShares India Exchange-Traded Fund Trust and PowerShares Actively Managed Exchange-Traded Fund Trust | | N/A | | N/A |
Russell C. Burk — 1958 Senior Vice President and Senior Officer | | 2005 | | Senior Vice President and Senior Officer, The Invesco Funds | | N/A | | N/A |
John M. Zerr — 1962 Senior Vice President, Chief Legal Officer and Secretary | | 2006 | | Director, Senior Vice President, Secretary and General Counsel, Invesco Management Group, Inc. (formerly known as Invesco AIM Management Group, Inc.) and Van Kampen Exchange Corp.; Senior Vice President, Invesco Advisers, Inc. (formerly known as Invesco Institutional (N.A.), Inc.) (registered investment adviser); Senior Vice President and Secretary, Invesco Distributors, Inc. (formerly known as Invesco AIM Distributors, Inc.); Director, Vice President and Secretary, Invesco Investment Services, Inc. (formerly known as Invesco AIM Investment Services, Inc.) Senior Vice President, Chief Legal Officer and Secretary, The Invesco Funds; Managing Director, Invesco PowerShares Capital Management LLC; Director, Secretary and General Counsel, Invesco Investment Advisers LLC (formerly known as Van Kampen Asset Management); Secretary and General Counsel, Invesco Capital Markets, Inc. (formerly known as Van Kampen Funds Inc.) and Chief Legal Officer, PowerShares Exchange-Traded Fund Trust, PowerShares Exchange-Traded Fund Trust II, PowerShares India Exchange-Traded Fund Trust, PowerShares Actively Managed Exchange-Traded Fund Trust, and PowerShares Actively Managed Exchange-Traded Commodity Fund Trust Formerly: Director, Vice President and Secretary, IVZ Distributors, Inc. (formerly known as INVESCO Distributors, Inc.); Director and Vice President, INVESCO Funds Group, Inc.; Director and Vice President, Van Kampen Advisors Inc.; Director, Vice President, Secretary and General Counsel, Van Kampen Investor Services Inc.; Director, Invesco Distributors, Inc. (formerly known as Invesco AIM Distributors, Inc.); Director, Senior Vice President, General Counsel and Secretary, Invesco AIM Advisers, Inc. and Van Kampen Investments Inc.; Director, Vice President and Secretary, Fund Management Company; Director, Senior Vice President, Secretary, General Counsel and Vice President, Invesco AIM Capital Management, Inc.; Chief Operating Officer and General Counsel, Liberty Ridge Capital, Inc. (an investment adviser); Vice President and Secretary, PBHG Funds (an investment company) and PBHG Insurance Series Fund (an investment company); Chief Operating Officer, General Counsel and Secretary, Old Mutual Investment Partners (a broker-dealer); General Counsel and Secretary, Old Mutual Fund Services (an administrator) and Old Mutual Shareholder Services (a shareholder servicing center); Executive Vice President, General Counsel and Secretary, Old Mutual Capital, Inc. (an investment adviser); and Vice President and Secretary, Old Mutual Advisors Funds (an investment company) | | N/A | | N/A |
T-3 Invesco Value Opportunities Fund
Trustees and Officers—(continued)
| | | | | | | | |
Name, Year of Birth and
Position(s) Held with the Trust | | Trustee and/
or Officer Since | | Principal Occupation(s) During Past 5 Years | | Number of Funds in Fund Complex Overseen by Trustee | | Other Directorship(s) Held by Trustee During Past 5 Years |
| Other Officers—(continued) | | | | | | | | |
Karen Dunn Kelley — 1960 Senior Vice President | | 2003 | | Senior Managing Director, Investments, Invesco Ltd.; Director, Co-President, Co-Chief Executive Officer, and Co-Chairman, Invesco Advisers, Inc. (formerly known as Invesco Institutional (N.A.), Inc.) (registered investment adviser); Chairman and Director, Invesco Senior Secured Management, Inc.; Senior Vice President, Invesco Management Group, Inc. (formerly known as Invesco AIM Management Group, Inc.); Executive Vice President, Invesco Distributors, Inc. (formerly known as Invesco AIM Distributors, Inc.); Director, Invesco Mortgage Capital Inc. and Invesco Management Company Limited; Senior Vice President, The Invesco Funds Formerly: Vice President, The Invesco Funds (other than AIM Treasurer’s Series Trust (Invesco Treasurer’s Series Trust), Short-Term Investments Trust and Invesco Management Trust); and President and Principal Executive Officer, The Invesco Funds (AIM Treasurer’s Series Trust (Invesco Treasurer’s Series Trust), Short-Term Investments Trust and Invesco Management Trust only); Director and President, INVESCO Asset Management (Bermuda) Ltd., Director, INVESCO Global Asset Management DAC (formerly known as INVESCO Global Asset Management Limited) and INVESCO Management S.A.; Senior Vice President, Van Kampen Investments Inc. and Invesco Advisers, Inc. (formerly known as Invesco Institutional (N.A.), Inc.) (registered investment adviser); Director and President, Fund Management Company; Chief Cash Management Officer, Director of Cash Management, Senior Vice President, and Managing Director, Invesco AIM Capital Management, Inc.; Director of Cash Management, Senior Vice President, and Vice President, Invesco Advisers, Inc. and The Invesco Funds (AIM Treasurer’s Series Trust (Invesco Treasurer’s Series Trust), and Short-Term Investments Trust only) | | N/A | | N/A |
Kelli Gallegos — 1970 Vice President, Principal Financial Officer and Assistant Treasurer | | 2008 | | Vice President, Principal Financial Officer and Assistant Treasurer, The Invesco Funds; Assistant Treasurer, Invesco PowerShares Capital Management LLC, PowerShares Exchange-Traded Fund Trust, PowerShares Exchange-Traded Fund Trust II, PowerShares India Exchange-Traded Fund Trust, PowerShares Actively Managed Exchange-Traded Fund Trust, and PowerShares Actively Managed Exchange-Traded Commodity Fund Trust Formerly: Assistant Vice President, The Invesco Funds | | N/A | | N/A |
Tracy Sullivan — 1962 Vice President, Chief Tax Officer and Assistant Treasurer | | 2008 | | Vice President, Chief Tax Officer and Assistant Treasurer, The Invesco Funds; Assistant Treasurer, Invesco PowerShares Capital Management LLC, PowerShares Exchange-Traded Fund Trust, PowerShares Exchange-Traded Fund Trust II, PowerShares India Exchange-Traded Fund Trust, PowerShares Actively Managed Exchange-Traded Fund Trust, and PowerShares Actively Managed Exchange-Traded Commodity Fund Trust Formerly: Assistant Vice President, The Invesco Funds | | N/A | | N/A |
Crissie M. Wisdom — 1969 Anti-Money Laundering Compliance Officer | | 2013 | | Anti-Money Laundering Compliance Officer, Invesco Advisers, Inc. (formerly known as Invesco Institutional (N.A.), Inc.) (registered investment adviser), Invesco Capital Markets, Inc. (formerly known as Van Kampen Funds Inc.), Invesco Distributors, Inc., Invesco Investment Services, Inc., Invesco Management Group, Inc., Van Kampen Exchange Corp., The Invesco Funds, and PowerShares Exchange-Traded Fund Trust, PowerShares Exchange-Traded Fund Trust II, PowerShares India Exchange-Traded Fund Trust, PowerShares Actively Managed Exchange-Traded Fund Trust and PowerShares Actively Managed Exchange-Traded Commodity Fund Trust; Anti-Money Laundering Compliance Officer and Bank Secrecy Act Officer, INVESCO National Trust Company and Invesco Trust Company; and Fraud Prevention Manager and Controls and Risk Analysis Manager for Invesco Investment Services, Inc. | | N/A | | N/A |
Robert R. Leveille — 1969 Chief Compliance Officer | | 2016 | | Chief Compliance Officer, Invesco Advisers, Inc. (registered investment adviser); and Chief Compliance Officer, The Invesco Funds Formerly: Chief Compliance Officer, Putnam Investments and the Putnam Funds | | N/A | | N/A |
The Statement of Additional Information of the Trust includes additional information about the Fund’s Trustees and is available upon request, without charge, by calling 1.800.959.4246. Please refer to the Fund’s Statement of Additional Information for information on the Fund’s sub-advisers.
| | | | | | |
Office of the Fund 11 Greenway Plaza, Suite 1000 Houston, TX 77046-1173 | | Investment Adviser Invesco Advisers, Inc. 1555 Peachtree Street, N.E. Atlanta, GA 30309 | | Distributor Invesco Distributors, Inc. 11 Greenway Plaza, Suite 1000 Houston, TX 77046-1173 | | Auditors PricewaterhouseCoopers LLP 1000 Louisiana Street, Suite 5800 Houston, TX 77002-5678 |
| | | |
| | | | | | |
Counsel to the Fund Stradley Ronon Stevens & Young, LLP 2005 Market Street, Suite 2600 Philadelphia, PA 19103-7018 | | Counsel to the Independent Trustees Goodwin Procter LLP 901 New York Avenue, N.W. Washington, D.C. 20001 | | Transfer Agent Invesco Investment Services, Inc. 11 Greenway Plaza, Suite 1000 Houston, TX 77046-1173 | | Custodian State Street Bank and Trust Company 225 Franklin Street Boston, MA 02110-2801 |
T-4 Invesco Value Opportunities Fund

Invesco mailing information
Send general correspondence to Invesco Investment Services, Inc., P.O. Box 219078, Kansas City, MO 64121-9078.
Important notice regarding delivery of security holder documents
To reduce Fund expenses, only one copy of most shareholder documents may be mailed to shareholders with multiple accounts at the same address (Householding). Mailing of your shareholder documents may be householded indefinitely unless you instruct us otherwise. If you do not want the mailing of these documents to be combined with those for other members of your household, please contact Invesco Investment Services, Inc. at 800 959 4246 or contact your financial institution. We will begin sending you individual copies for each account within 30 days after receiving your request.
Fund holdings and proxy voting information
The Fund provides a complete list of its holdings four times in each fiscal year, at the quarter ends. For the second and fourth quarters, the lists appear in the Fund’s semiannual and annual reports to shareholders. For the first and third quarters, the Fund files the lists with the Securities and Exchange Commission (SEC) on Form N-Q. The most recent list of portfolio holdings is available at invesco.com/completeqtrholdings. Shareholders can also look up the Fund’s Forms N-Q on the SEC website at sec.gov. Copies of the Fund’s Forms N-Q may be reviewed and copied at the SEC Public Reference Room in Washington, D.C. You can obtain information on the operation of the Public Reference Room, including information about duplicating fee charges, by calling 202 551 8090 or 800 732 0330, or by electronic request at the following email address: publicinfo@sec.gov. The SEC file numbers for the Fund are shown below.
A description of the policies and procedures that the Fund uses to determine how to vote proxies relating to portfolio securities is available without charge, upon request, from our Client Services department at 800 959 4246 or at invesco.com/proxyguidelines. The information is also available on the SEC website, sec.gov.
| | |
Information regarding how the Fund voted proxies related to its portfolio securities during the most recent 12-month period ended June 30 is available at invesco.com/proxysearch. The information is also available on the SEC website, sec.gov. Invesco Advisers, Inc. is an investment adviser; it provides investment advisory services to individual and institutional clients and does not sell securities. Invesco Distributors, Inc. is the US distributor for Invesco Ltd.’s retail mutual funds, exchange-traded funds and institutional money market funds. Both are wholly owned, indirect subsidiaries of Invesco Ltd. | |  |
| | | | |
| SEC file numbers: 811-03826 and 002-85905 | | VK-VOPP-AR-1 | | Invesco Distributors, Inc. |
| | |
ITEM 2. | | CODE OF ETHICS. |
| |
| | There were no amendments to the Code of Ethics (the “Code”) that applies to the Registrant’s Principal Executive Officer (“PEO”) and Principal Financial Officer (“PFO”) during the period covered by the report. The Registrant did not grant any waivers, including implicit waivers, from any provisions of the Code to the PEO or PFO during the period covered by this report. |
| |
ITEM 3. | | AUDIT COMMITTEE FINANCIAL EXPERT. |
| |
| | The Board of Trustees has determined that the Registrant has at least one audit committee financial expert serving on its Audit Committee. The Audit Committee financial expert is Raymond Stickel, Jr. Mr. Stickel is “independent” within the meaning of that term as used in Form N-CSR. |
| |
ITEM 4. | | PRINCIPAL ACCOUNTANT FEES AND SERVICES. |
| |
| | PricewaterhouseCoopers LLP (“PwC”), the Independent Accountant to the Registrant, has advised the Audit Committee of the Board of Trustees of the Registrant (the “Audit Committee”) that it identified an issue related to its independence under Rule 2-01(c)(1)(ii)(A) of Regulation S-X (referred to as the “Loan Rule”). The Loan Rule prohibits accounting firms, such as PwC, from being deemed independent if they have certain financial relationships with their audit clients or certain affiliates of those clients. |
| |
| | Specifically, the Loan Rule provides, in relevant part, that an accounting firm is not independent if it receives a loan from an audit client or it receives a loan from a lender that is a “record or beneficial owner of more than ten percent of the audit client’s equity securities.” Pursuant to the SEC’s interpretation of the Loan Rule, some of PwC’s relationships with lenders who also own shares of one or more funds within the Invesco investment company complex may implicate the Loan Rule. |
| |
| | However, after evaluating the facts and circumstances related to its lending relationships, PwC informed the Audit Committee that (1) PwC’s ability to exercise objective and impartial judgment with respect to its audits of the Registrant’s financial statements was not, and will not be, impaired; (2) a reasonable investor with knowledge of all relevant facts and circumstances would reach the same conclusion; and (3) PwC’s independence was not impaired and that it remained independent in conducting its audit of the Registrant’s financial statements. PwC informed the Audit Committee that its conclusion was based on a number of factors, including, among others, PwC’s belief that the lenders have no influence over the investment adviser to the Registrant, or the Registrant, and that the individuals at PwC who arranged the lending relationships have no oversight of, or ability to influence, the individuals at PwC who conducted the audit of the Registrant’s financial statements. |
| |
| | On June 20, 2016, the Staff of the Securities and Exchange Commission (the “SEC”) issued a “no-action” letter confirming that it would not recommend that the SEC commence enforcement action against a fund that relied on audit services performed by an audit firm that was not in compliance with the Loan Rule in certain specified circumstances. The circumstances described in the no-action letter were substantially similar to the circumstances that called into question PwC’s independence under the Loan Rule with respect to the Registrant. PwC has confirmed that it meets the conditions of the no-action relief. The Adviser and the Registrant believe that the Registrant can rely on the relief granted in the no-action letter and continue to issue financial statements that are audited by PwC. |
| |
| | If, in the future, the independence of PwC is called into question under the Loan Rule by circumstances that are not addressed in the no-action letter, the Registrant will need to take other actions for the Registrant’s filings containing financial statements to be compliant with applicable securities laws. |
(a) to (d)
Fees Billed by PWC Related to the Registrant
PWC billed the Registrant aggregate fees for services rendered to the Registrant for the last two fiscal years as follows:
| | | | | | | | | | | | | | | | |
| | | Fees Billed for
Services Rendered to
the Registrant for
fiscal year end 2016 | | | (e)(2)
Percentage of Fees
Billed Applicable to
Non-Audit Services
Provided for fiscal
year end 2016
Pursuant to Waiver of
Pre-Approval
Requirement(1) | | | Fees Billed for
Services Rendered to
the Registrant for
fiscal year end 2015 | | | (e)(2)
Percentage of Fees
Billed Applicable to
Non-Audit Services
Provided for fiscal
year end 2015
Pursuant to Waiver of
Pre-Approval
Requirement(1) | |
Audit Fees | | $ | 280,550 | | | | N/A | | | $ | 272,400 | | | | N/A | |
Audit-Related Fees | | $ | 0 | | | | 0 | % | | $ | 0 | | | | 0 | % |
Tax Fees(2) | | $ | 81,825 | | | | 0 | % | | $ | 82,775 | | | | 0 | % |
All Other Fees | | $ | 0 | | | | 0 | % | | $ | 0 | | | | 0 | % |
| | | | | | | | | | | | | | | | |
Total Fees | | $ | 362,375 | | | | 0 | % | | $ | 355,175 | | | | 0 | % |
(g) PWC billed the Registrant aggregate non-audit fees of $81,825 for the fiscal year ended 2016, and 82,775 for the fiscal year ended 2015, for non-audit services rendered to the Registrant.
| | (1) | With respect to the provision of non-audit services, the pre-approval requirement is waived pursuant to a de minimis exception if (i) such services were not recognized as non-audit services by the Registrant at the time of engagement, (ii) the aggregate amount of all such services provided is no more than 5% of the aggregate audit and non-audit fees paid by the Registrant to PWC during a fiscal year; and (iii) such services are promptly brought to the attention of the Registrant’s Audit Committee and approved by the Registrant’s Audit Committee prior to the completion of the audit. |
| | (2) | Tax fees for the fiscal year end April 30, 2016 includes fees billed for reviewing and/or preparing tax compliance services. Tax fees for fiscal year end April 30, 2015 includes fees billed for reviewing and/or preparing tax compliance services. |
Fees Billed by PWC Related to Invesco and Invesco Affiliates
PWC billed Invesco Advisers, Inc. (“Invesco”), the Registrant’s adviser, and any entity controlling, controlled by or under common control with Invesco that provides ongoing services to the Registrant (“Invesco Affiliates”) aggregate fees for pre-approved non-audit services rendered to Invesco and Invesco Affiliates for the last two fiscal years as follows:
| | | | | | | | | | | | | | | | |
| | | Fees Billed for Non-
Audit Services
Rendered to Invesco
and Invesco Affiliates
for fiscal year end
2016 That Were
Required
to be Pre-Approved
by the Registrant’s
Audit Committee | | | (e)(2)
Percentage of Fees
Billed Applicable to
Non-Audit Services
Provided for fiscal year
end 2016 Pursuant to
Waiver of Pre-
Approval
Requirement(1) | | | Fees Billed for Non-
Audit Services
Rendered to Invesco
and Invesco Affiliates
for fiscal year end
2015 That Were
Required
to be Pre-Approved
by the Registrant’s
Audit Committee | | | (e)(2)
Percentage of Fees
Billed Applicable to
Non-Audit Services
Provided for fiscal year
end 2015 Pursuant to
Waiver of Pre-
Approval
Requirement(1) | |
Audit-Related Fees | | $ | 634,963 | | | | 0 | % | | $ | 574,000 | | | | 0 | % |
Tax Fees | | $ | 0 | | | | 0 | % | | $ | 0 | | | | 0 | % |
All Other Fees | | $ | 3,750,000 | | | | 0 | % | | $ | 0 | | | | 0 | % |
| | | | | | | | | | | | | | | | |
Total Fees(2) | | $ | 4,384,963 | | | | 0 | % | | $ | 574,000 | | | | 0 | % |
| (1) | With respect to the provision of non-audit services, the pre-approval requirement is waived pursuant to a de minimis exception if (i) such services were not recognized as non-audit services |
| | by the Registrant at the time of engagement, (ii) the aggregate amount of all such services provided is no more than 5% of the aggregate audit and non-audit fees paid by the Registrant, Invesco and Invesco Affiliates to PWC during a fiscal year; and (iii) such services are promptly brought to the attention of the Registrant’s Audit Committee and approved by the Registrant’s Audit Committee prior to the completion of the audit. |
| (2) | Audit-Related fees for the year end 2016 include fees billed related to reviewing controls at a service organization. Audit-Related fees for the year end 2015 include fees billed related to reviewing controls at a service organization. |
All other fees for the year end 2016 include fees billed related to reviewing the operating effectiveness of strategic projects.
(g) Including the fees for services not required to be pre-approved by the registrant’s audit committee, PWC billed Invesco and Invesco Affiliates aggregate non-audit fees of $8,160,000 for the fiscal year ended April 30, 2016, and $4,660,000 for the fiscal year ended April 30, 2015, for non-audit services rendered to Invesco and Invesco Affiliates.
PWC provided audit services to the Investment Company complex of approximately $16 million.
(h) The Audit Committee also has considered whether the provision of non-audit services that were rendered to Invesco and Invesco Affiliates that were not required to be pre-approved pursuant to SEC regulations, if any, is compatible with maintaining PWC’s independence.
(f) Not applicable.
(e)(1)
PRE-APPROVAL OF AUDIT AND NON-AUDIT SERVICES
POLICIES AND PROCEDURES
As adopted by the Audit Committees
of the Invesco Funds (the “Funds”)
Last Amended March 23, 2016
| | I. | Statement of Principles |
The Audit Committees (the “Audit Committee”) of the Boards of Trustees of the Funds (the “Board”) have adopted these policies and procedures (the “Procedures”) with respect to the pre-approval of audit and non-audit services to be provided by the Funds’ independent auditor (the “Auditor”) to the Funds, and to the Funds’ investment adviser(s) and any entity controlling, controlled by, or under common control with the investment adviser(s) that provides ongoing services to the Funds (collectively, “Service Affiliates”).
Under Section 202 of the Sarbanes-Oxley Act of 2002, all audit and non-audit services provided to the Funds by the Auditor must be preapproved by the Audit Committee. Rule 2-01 of Regulation S-X requires that the Audit Committee also pre-approve a Service Affiliate’s engagement of the Funds’ Auditor for non-audit services if the engagement relates directly to the operations and financial reporting of the Funds (a “Service Affiliate’s Covered Engagement”).
These Procedures set forth the procedures and the conditions pursuant to which the Audit Committee may pre-approve audit and non-audit services for the Funds and a Service Affiliate’s Covered Engagement pursuant to rules and regulations of the SEC and other organizations and regulatory bodies applicable to the Funds (“Applicable Rules”).1 They address both general pre-approvals without consideration of specifics (“general pre-approvals”) and pre-approvals on a case-by-case basis (“specific pre-approvals”). Any services requiring pre-approval that are not within the scope of general pre-approvals hereunder are subject to specific pre-approval. These Procedures also address the delegation by the Audit Committee of pre-approval authority to the Audit Committee Chair and/or Vice Chair.
| | II. | Pre-Approval of Fund Audit Services |
The annual Fund audit services engagement, including terms and fees, is subject to specific pre-approval by the Audit Committee. Audit services include the annual financial statement audit and other procedures required to be performed by an Auditor to be able to form an opinion on the Funds’ financial statements. The Audit Committee will receive, review and consider sufficient information concerning a proposed Fund audit engagement to make a reasonable evaluation of the Auditor’s qualifications and independence. The Audit Committee will oversee the Fund audit services engagement as necessary, including approving any changes in terms, audit scope, conditions and fees.
In addition to approving the Fund audit services engagement at least annually and specifically approving any changes, the Audit Committee may generally or specifically pre-approve engagements for other audit services, which are those services that only an Auditor reasonably can provide. Other audit services may include services associated with SEC registration statements, periodic reports and other documents filed with the SEC.
| | III. | General and Specific Pre-Approval of Non-Audit Fund Services |
Appendix I to these Procedures lists the non-audit services and the related fee ranges for such services that have been granted general pre-approval by the Audit Committee. The Audit Committee will consider, at least annually, the list of General Pre-Approved Non-Audit Services which list may be terminated or modified at any time by the Audit Committee. To inform the Audit Committee’s review and approval of General Pre-Approved Non-Audit Services, the Funds’ Treasurer (or his or her designee) and Auditor shall provide such information regarding independence or other matters as the Audit Committee may request.
Any services or fee ranges that are not within the scope of General Pre-Approved Non-Audit Services have not received general pre-approval and require specific pre-approval. Each request for specific pre-approval
| 1 | Applicable Rules include, for example, New York Stock Exchange (“NYSE”) rules applicable to closed-end funds managed by Invesco and listed on NYSE. |
by the Audit Committee for services to be provided by the Auditor to the Funds must be submitted to the Audit Committee by the Funds’ Treasurer (or his or her designee) and must include detailed information about the services to be provided, the fees or fee ranges to be charged, and other relevant information sufficient to allow the Audit Committee to consider whether to pre-approve such engagement, including evaluating whether the provision of such services will impair the independence of the Auditor and is otherwise consistent with Applicable Rules. Additionally, the Funds’ Treasurer (or his or her designee) and the Auditor will provide the Audit Committee with a statement that, in their view, the proposed engagement will not impair the independence of the Auditor and is consistent with Applicable Rules.
| | IV. | Non-Audit Service Types |
The Audit Committee may provide either general or specific pre-approval of audit-related, tax or other services, each as described in more detail below.
“Audit-related services” are assurance and related services that are reasonably related to the performance of the audit or review of the Fund’s financial statements or that are traditionally performed by an Auditor. Audit-related services include, among others, accounting consultations related to accounting, financial reporting or disclosure matters not classified as “Audit services”; assistance with understanding and implementing new accounting and financial reporting guidance from rulemaking authorities; services related to mergers, acquisitions or dispositions; compliance with ratings agency requirements and interfund lending activities; and assistance with internal control reporting requirements.
“Tax services” include, but are not limited to, the review and signing of the Funds’ federal tax returns, the review of required distributions by the Funds and consultations regarding tax matters such as the tax treatment of new investments or the impact of new regulations. The Audit Committee will not approve proposed services of an Auditor which the Audit Committee believes are to be provided in connection with a service or transaction initially recommended by an Auditor, the sole business purpose of which may be tax avoidance and the tax treatment of which may not be supported in the Internal Revenue Code and related regulations. The Audit Committee will consult with the Funds’ Treasurer (or his or her designee) and may consult with outside counsel or advisers as necessary to ensure the consistency of tax services rendered by the Auditor with the foregoing policy. No Auditor shall represent any Fund or any Service Affiliate before a tax court, district court or federal court of claims.
Each request to provide tax services under either the general or specific pre-approval of the Audit Committee will include a description from the Auditor in writing of (i) the scope of the service, the fee structure for the engagement, and any side letter or other amendment to the engagement letter, or any other agreement (whether oral, written, or otherwise) between the Auditor and the Funds and/or Service Affiliate, relating to the service; and (ii) any compensation arrangement or other agreement, such as a referral agreement, a referral fee or fee-sharing arrangement, between the Auditor (or an affiliate of the Auditor) and any person (other than the Funds or Service Affiliates receiving the services) with respect to the promoting, marketing, or recommending of a transaction covered by the service. The Auditor will also discuss with the Audit Committee the potential effects of the services on the independence of the Auditor, and document the substance of its discussion with the Audit Committee.
The Audit Committee may pre-approve other non-audit services so long as the Audit Committee believes that the service will not impair the independence of the Auditor. Appendix I includes a list of services that would categorically impair the Auditor’s independence. Appendix I also includes a list of services that would impair the Auditor’s independence unless the Audit Committee can reasonably conclude that the results of the services will not be subject to audit procedures during an audit of the Funds’ financial statements.
| | V. | Pre-Approval of Service Affiliate’s Covered Engagements |
Rule 2-01 of Regulation S-X requires that the Audit Committee pre-approve a Service Provider’s engagement of the Funds’ Auditor for non-audit services if the engagement relates directly to the
operations and financial reporting of the Funds, defined above as a “Service Affiliate’s Covered Engagement”.
The Audit Committee may provide either general or specific pre-approval of any Service Affiliate’s Covered Engagement, including for audit-related, tax or other services, as described above, if the Audit Committee believes that the provision of the services to a Service Affiliate will not impair the independence of the Auditor with respect to the Funds. General Pre-Approved Non-Audit Services lists the Service Affiliate’s Covered Engagements and the related fee ranges that have been granted general pre-approval by the Audit Committee. Any Service Affiliate’s Covered Engagements that are not within the scope of General Pre-Approved Non-Audit Services have not received general pre-approval and require specific pre-approval.
Each request for specific pre-approval by the Audit Committee of a Service Affiliate’s Covered Engagement must be submitted to the Audit Committee by the Funds’ Treasurer (or his or her designee) and must include detailed information about the services to be provided, the fees or fee ranges to be charged, a description of the current status of the pre-approval process involving other audit committees in the Invesco investment company complex (as defined in Rule 2-201 of Regulation S-X) with respect to the proposed engagement, and other relevant information sufficient to allow the Audit Committee to consider whether the provision of such services will impair the independence of the Auditor from the Funds. Additionally, the Funds’ Treasurer (or his or her designee) and the Auditor will provide the Audit Committee with a statement that the proposed engagement requires pre-approval by the Audit Committee, the proposed engagement, in their view, will not impair the independence of the Auditor and is consistent with Applicable Rules, and the description of the proposed engagement provided to the Audit Committee is consistent with that presented to or approved by the Invesco audit committee.
Information about all Service Affiliate engagements of the Funds’ Auditor for non-audit services, whether or not subject to pre-approval by the Audit Committee, shall be provided to the Audit Committee at least quarterly, to allow the Audit Committee to consider whether the provision of such services is compatible with maintaining the Auditor’s independence from the Funds. The Funds’ Treasurer and Auditor shall provide the Audit Committee with sufficiently detailed information about the scope of services provided and the fees for such services, to ensure that the Audit Committee can adequately consider whether the provision of such services is compatible with maintaining the Auditor’s independence from the Funds.
| | VI. | Pre-Approved Fee Levels or Established Amounts |
Pre-approved fee levels or ranges for audit and non-audit services to be provided by the Auditor to the Funds, and for a Service Affiliate’s Covered Engagement, under general pre-approval or specific pre-approval will be set periodically by the Audit Committee. Any proposed fees exceeding 110% of the maximum pre-approved fee levels or ranges for such services or engagements will be promptly presented to the Audit Committee and will require specific pre-approval by the Audit Committee before payment of any additional fees is made.
The Audit Committee may from time to time delegate specific pre-approval authority to its Chair and/or Vice Chair, so that the Chair or, in his or her absence, Vice Chair may grant specific pre-approval for audit and non-audit services by the Auditor to the Funds and/or a Service Affiliate’s Covered Engagement between Audit Committee meetings. Any such delegation shall be reflected in resolutions adopted by the Audit Committee and may include such limitations as to dollar amount(s) and/or scope of service(s) as the Audit Committee may choose to impose. Any such delegation shall not preclude the Chair or Vice Chair from declining, on a case by case basis, to exercise his or her delegated authority and instead convening the Audit Committee to consider and pre-approve any proposed services or engagements.
Notwithstanding the foregoing, any non-audit services to be provided to a Fund for which the fees are estimated to exceed $500,000 and any Service Affiliate’s Covered Engagement for which the fees are estimated to exceed $500,000 must be pre-approved by the Audit Committee and may not be delegated to the Chair or Vice Chair.
| | VIII. Compliance | with Procedures |
Notwithstanding anything herein to the contrary, failure to pre-approve any services or engagements that are not required to be pre-approved pursuant to the de minimis exception provided for in Rule 2-01(c)(7)(i)(C) of Regulation S-X shall not constitute a violation of these Procedures. The Audit Committee has designated the Funds’ Treasurer to ensure services and engagements are pre-approved in compliance with these Procedures. The Funds’ Treasurer will immediately report to the Chair of the Audit Committee, or the Vice Chair in his or her absence, any breach of these Procedures that comes to the attention of the Funds’ Treasurer or any services or engagements that are not required to be pre-approved pursuant to the de minimis exception provided for in Rule 2-01(c)(7)(i)(C) of Regulation S-X.
On at least an annual basis, the Auditor will provide the Audit Committee with a summary of all non-audit services provided to any entity in the investment company complex (as defined in section 2-01(f)(14) of Regulation S-X, including the Funds and Service Affiliates) that were not pre-approved, including detail as to the nature of the engagement and the fees associated with those services.
| | IX. | Amendments to Procedures |
All material amendments to these Procedures must be approved in advance by the Audit Committee. Non-material amendments to these Procedures may be made by the Legal and Compliance Departments and will be reported to the Audit Committee at the next regularly scheduled meeting of the Audit Committee.
Appendix I
Non-Audit Services That May Impair the Auditor’s Independence
An Auditor is not independent if, at any point during the audit and professional engagement, the Auditor provides the following non-audit services:
| | • | | Broker-dealer, investment adviser, or investment banking services ; |
| | • | | Expert services unrelated to the audit; |
| | • | | Any service or product provided for a contingent fee or a commission; |
| | • | | Services related to marketing, planning, or opining in favor of the tax treatment of confidential transactions or aggressive tax position transactions, a significant purpose of which is tax avoidance; |
| | • | | Tax services for persons in financial reporting oversight roles at the Fund; and |
| | • | | Any other service that the Public Company Oversight Board determines by regulation is impermissible. |
An Auditor is not independent if, at any point during the audit and professional engagement, the Auditor provides the following non-audit services unless the Audit Committee can reasonably conclude that the results of the services will not be subject to audit procedures during an audit of the Funds’ financial statements:
| | • | | Bookkeeping or other services related to the accounting records or financial statements of the audit client; |
| | • | | Financial information systems design and implementation; |
| | • | | Appraisal or valuation services, fairness opinions, or contribution-in-kind reports; |
| | • | | Actuarial services; and |
| | • | | Internal audit outsourcing services. |
| | |
ITEM 5. | | AUDIT COMMITTEE OF LISTED REGISTRANTS. |
| |
| | Not applicable. |
| |
ITEM 6. | | SCHEDULE OF INVESTMENTS. |
| |
| | Investments in securities of unaffiliated issuers is included as part of the reports to stockholders filed under Item 1 of this Form. |
| |
ITEM 7. | | DISCLOSURE OF PROXY VOTING POLICIES AND PROCEDURES FOR CLOSED-END MANAGEMENT INVESTMENT COMPANIES. |
| |
| | Not applicable. |
| |
ITEM 8. | | PORTFOLIO MANAGERS OF CLOSED-END MANAGEMENT COMPANIES. |
| |
| | Not applicable. |
| |
ITEM 9. | | PURCHASES OF EQUITY SECURITIES BY CLOSED-END MANAGEMENT INVESTMENT COMPANY AND AFFILIATED PURCHASERS. |
| |
| | Not applicable. |
| |
ITEM 10. | | SUBMISSION OF MATTERS TO A VOTE OF SECURITY HOLDERS. |
| |
| | None |
| | |
ITEM 11. | | CONTROLS AND PROCEDURES. |
| |
(a) | | As of May 25, 2016, an evaluation was performed under the supervision and with the participation of the officers of the Registrant, including the PEO and PFO, to assess the effectiveness of the Registrant’s disclosure controls and procedures, as that term is defined in Rule 30a-3(c) under the Investment Company Act of 1940 (the “Act”), as amended. Based on that evaluation, the Registrant’s officers, including the PEO and PFO, concluded that, as of May 25, 2016, the Registrant’s disclosure controls and procedures were reasonably designed to ensure: (1) that information required to be disclosed by the Registrant on Form N-CSR is recorded, processed, summarized and reported within the time periods specified by the rules and forms of the Securities and Exchange Commission; and (2) that material information relating to the Registrant is made known to the PEO and PFO as appropriate to allow timely decisions regarding required disclosure. |
| |
(b) | | There have been no changes in the Registrant’s internal control over financial reporting (as defined in Rule 30a-3(d) under the Act) that occurred during the second fiscal quarter of the period covered by this report that have materially affected, or are reasonably likely to materially affect, the Registrant’s internal control over financial reporting. |
| |
ITEM 12. | | EXHIBITS. |
| |
12(a) (1) | | Code of Ethics. |
| |
12(a) (2) | | Certifications of principal executive officer and principal financial officer as required by Rule 30a-2(a) under the Investment Company Act of 1940. |
| |
12(a) (3) | | Not applicable. |
| |
12(b) | | Certifications of principal executive officer and principal financial officer as required by Rule 30a-2(b) under the Investment Company Act of 1940. |
SIGNATURES
Pursuant to the requirements of the Securities Exchange Act of 1934 and the Investment Company Act of 1940, the Registrant has duly caused this report to be signed on its behalf by the undersigned, thereunto duly authorized.
Registrant: AIM Sector Funds (Invesco Sector Funds)
| | |
| By: | | /s/ Sheri Morris |
| | Sheri Morris |
| | Principal Executive Officer |
| |
| Date: | | July 8, 2016 |
Pursuant to the requirements of the Securities and Exchange Act of 1934 and the Investment Company Act of 1940, this report has been signed below by the following persons on behalf of the Registrant and in the capacities and on the dates indicated.
| | |
| By: | | /s/ Sheri Morris |
| | Sheri Morris |
| | Principal Executive Officer |
| |
| Date: | | July 8, 2016 |
| |
| By: | | /s/ Kelli Gallegos |
| | Kelli Gallegos |
| | Principal Financial Officer |
| |
| Date: | | July 8, 2016 |
EXHIBIT INDEX
| | |
| 12(a) (1) | | Code of Ethics. |
| |
| 12(a) (2) | | Certifications of principal executive officer and principal financial officer as required by Rule 30a-2(a) under the Investment Company Act of 1940. |
| |
| 12(a) (3) | | Not applicable. |
| |
| 12(b) | | Certifications of principal executive officer and principal financial officer as required by Rule 30a-2(b) under the Investment Company Act of 1940. |